C.E. INFO SYSTEMS LIMITED - Kotak Investment Banking
329
RED HERRING PROSPECTUS Dated December 2, 2021 Please read section 32 of the Companies Act, 2013 Book Built Offer C.E. INFO SYSTEMS LIMITED Our Company was originally incorporated as ‘C.E. Info Systems Private Limited’ at New Delhi as a private limited company under the Companies Act, 1956, pursuant to the certificate of incorporation dated February 17, 1995 issued by the Registrar of Companies, National Capital Territory of Delhi and Haryana at New Delhi (the “RoC”).Our Company was converted from a private limited company to a public limited company pursuant to a special resolution passed by our Shareholders at the EGM held on July 7, 2021 and the name of our Company was changed to ‘C.E. Info Systems Limited’. Consequently, a fresh certificate of incorporation dated July 12, 2021 was issued by the RoC. For details in relation to the changes in the name and registered office of our Company, see “History and Certain Corporate Matters” on page 160. Registered and Corporate Office: First, Second, & Third Floor, Plot. No. 237, Okhla Industrial Estate, Phase- III, New Delhi 110 020, India Telephone: +91 11 4600 9900; Contact Person: Saurabh Surendra Somani, Company Secretary and Compliance Officer E-mail: [email protected]; Website: www.mapmyindia.com Corporate Identity Number: U74899DL1995PLC065551 PROMOTERS OF OUR COMPANY: RAKESH KUMAR VERMA AND RASHMI VERMA INITIAL PUBLIC OFFER OF UP TO 10,063,945 EQUITY SHARES OF FACE VALUE OF ₹2 EACH (“EQUITY SHARES”) OF C.E. INFO SYSTEMS LIMITED (“COMPANY” OR “ISSUER”) FOR CASH AT A PRICE OF ₹[●] PER EQUITY SHARE THROUGH AN OFFER FOR SALE OF UP TO 10,063,945 EQUITY SHARES AGGREGATING UP TO ₹[●] MILLION BY THE SELLING SHAREHOLDERS (“OFFER”), COMPRISING UP TO 4,251,044 EQUITY SHARES AGGREGATING UP TO ₹[●] MILLION BY RASHMI VERMA (THE “INDIVIDUAL SELLING SHAREHOLDER”), UP TO 2,701,407 EQUITY SHARES AGGREGATING UP TO ₹[●] MILLION BY QUALCOMM ASIA PACIFIC PTE. LTD., UP TO 1,369,961 EQUITY SHARES AGGREGATING UP TO ₹[●] MILLION BY ZENRIN CO., LTD. (COLLECTIVELY THE “INVESTOR SELLING SHAREHOLDERS”), UP TO 1,741,533 EQUITY SHARES AGGREGATING UP TO ₹[●] MILLION BY PERSONS REFERRED TO IN ANNEXURE A (COLLECTIVELY THE “OTHER SELLING SHAREHOLDERS” AND TOGETHER WITH THE INDIVIDUAL SELLING SHAREHOLDER AND THE INVESTOR SELLING SHAREHOLDERS, THE “SELLING SHAREHOLDERS” AND SUCH EQUITY SHARES OFFERED BY THE SELLING SHAREHOLDERS, THE “OFFERED SHARES”). THE OFFER SHALL CONSTITUTE 18.90% OF THE POST-OFFER PAID-UP EQUITY SHARE CAPITAL OF OUR COMPANY. THE FACE VALUE OF EQUITY SHARES IS ₹ 2 EACH. THE OFFER PRICE IS [●] TIMES THE FACE VALUE OF THE EQUITY SHARES. THE PRICE BAND AND THE MINIMUM BID LOT WILL BE DECIDED BY OUR COMPANY, THE INDIVIDUAL SELLING SHAREHOLDER, AND THE INVESTOR SELLING SHAREHOLDERS, IN CONSULTATION WITH THE BOOK RUNNING LEAD MANAGERS AND WILL BE ADVERTISED IN ALL EDITIONS OF FINANCIAL EXPRESS, AN ENGLISH NATIONAL DAILY NEWSPAPER AND ALL EDITIONS OF JANSATTA, A HINDI NATIONAL DAILY NEWSPAPER (HINDI ALSO BEING THE REGIONAL LANGUAGE OF NEW DELHI, WHERE OUR REGISTERED AND CORPORATE OFFICE IS LOCATED), EACH WITH WIDE CIRCULATION, AT LEAST TWO WORKING DAYS PRIOR TO THE BID/OFFER OPENING DATE AND SHALL BE MADE AVAILABLE TO BSE LIMITED (“BSE”) AND NATIONAL STOCK EXCHANGE OF INDIA LIMITED (“NSE”, AND TOGETHER WITH BSE, THE “STOCK EXCHANGES”) FOR THE PURPOSE OF UPLOADING ON THEIR RESPECTIVE WEBSITES. In case of any revision to the Price Band, the Bid/Offer Period will be extended by at least three additional Working Days following such revision of the Price Band, subject to the Bid/Offer Period not exceeding 10 Working Days. In cases of force majeure, banking strike or similar circumstances, our Company, the Individual Selling Shareholder, and the Investor Selling Shareholders, in consultation with the Book Running Lead Managers, may for reasons to be recorded in writing, extend the Bid/Offer Period for a minimum of three Working Days, subject to the Bid/Offer Period not exceeding 10 Working Days. Any revision in the Price Band and the revised Bid/Offer Period, if applicable, will be widely disseminated by notification to the Stock Exchanges, by issuing a public notice, and also by indicating the change on the respective websites of the Book Running Lead Managers and at the terminals of the Syndicate Members and by intimation to Self-Certified Syndicate Banks (“SCSBs”), other Designated Intermediaries and the Sponsor Bank, as applicable. The Offer is being made through the Book Building Process, in terms of Rule 19(2)(b) of the Securities Contracts (Regulation) Rules, 1957, as amended (“SCRR”) read with Regulation 31 of the SEBI ICDR Regulations and in compliance with Regulation 6(1) of the SEBI ICDR Regulations, wherein not more than 50% of the Offer shall be allocated on a proportionate basis to Qualified Institutional Buyers (“QIBs”, and such portion as “QIB Portion”), provided that our Company, the Individual Selling Shareholder, and the Investor Selling Shareholders may, in consultation with the Book Running Lead Managers, allocate up to 60% of the QIB Portion to Anchor Investors on a discretionary basis in accordance with the SEBI ICDR Regulations (“Anchor Investor Portion”), of which one-third shall be reserved for domestic Mutual Funds, subject to valid Bids being received from domestic Mutual Funds at or above the Anchor Investor Allocation Price. In the event of under- subscription, or non-allocation in the Anchor Investor Portion, the balance Equity Shares shall be added to the Net QIB Portion. Further, 5% of the Net QIB Portion shall be available for allocation on a proportionate basis only to Mutual Funds, and the remainder of the Net QIB Portion shall be available for allocation on a proportionate basis to all QIBs, including Mutual Funds, subject to valid Bids being received at or above the Offer Price. Further, not less than 15% of the Offer shall be available for allocation on a proportionate basis to Non-Institutional Bidders and not less than 35% of the Offer shall be available for allocation to Retail Individual Bidders (“RIBs”) in accordance with the SEBI ICDR Regulations, subject to valid Bids being received at or above the Offer Price. All potential Bidders (except Anchor Investors) are required to mandatorily utilise the Application Supported by Blocked Amount (“ASBA”) process providing details of their respective ASBA accounts, and UPI ID in case of RIBs using the UPI Mechanism, if applicable, in which the corresponding Bid Amounts will be blocked by the SCSBs or under the UPI Mechanism, as the case may be, to the extent of respective Bid Amounts. Anchor Investors are not permitted to participate in the Offer through the ASBA process. For details, see “Offer Procedure” beginning on page 298. RISKS IN RELATION TO THE FIRST OFFER This being the first public issue of Equity Shares of our Company, there has been no formal market for the Equity Shares. The face value of each Equity Share is ₹2. The Floor Price, Cap Price and Offer Price (determined and justified by our Company, the Individual Selling Shareholder and the Investor Selling Shareholders in consultation with the Book Running Lead Managers, in accordance with the SEBI ICDR Regulations, and on the basis of the assessment of market demand for the Equity Shares by way of the Book Building Process as stated in “Basis for Offer Price” beginning on page 87) should not be taken to be indicative of the market price of the Equity Shares after the Equity Shares are listed. No assurance can be given regarding an active or sustained trading in the Equity Shares or regarding the price at which the Equity Shares will be traded after listing. GENERAL RISK Investments in equity and equity-related securities involve a degree of risk and Bidders should not invest any funds in the Offer unless they can afford to take the risk of losing their investment. Bidders are advised to read the risk factors carefully before taking an investment decision in the Offer. For taking an investment decision, Bidders must rely on their own examination of our Company and the Offer, including the risks involved. The Equity Shares in the Offer have neither been recommended, nor approved by the Securities and Exchange Board of India (“SEBI”), nor does SEBI guarantee the accuracy or adequacy of the contents of this Red Herring Prospectus. Specific attention of the Bidders is invited to “Risk Factors” beginning on page 30. COMPANY’S AND SELLING SHAREHOLDER’S ABSOLUTE RESPONSIBILITY Our Company, having made all reasonable inquiries, accepts responsibility for and confirms that this Red Herring Prospectus contains all information with regard to our Company and the Offer, which is material in the context of the Offer, that the information contained in this Red Herring Prospectus is true and correct in all material aspects and is not misleading in any material respect, that the opinions and intentions expressed herein are honestly held and that there are no other facts, the omission of which makes this Red Herring Prospectus as a whole or any of such information or the expression of any such opinions or intentions misleading in any material respect. Further, each of the Selling Shareholders, severally and not jointly, accepts responsibility for and confirms only statements specifically made by such Selling Shareholder in this Red Herring Prospectus solely in relation to itself and its respective portion of the Offered Shares and assumes responsibility that such statements are true and correct in all material respects and not misleading in any material respect. However, each of the Selling Shareholders, severally and not jointly, assumes no responsibility for any other statements, including, inter alia, any of the statements made by or relating to our Company or in relation to our business or any other Selling Shareholders in this Red Herring Prospectus. LISTING The Equity Shares offered through this Red Herring Prospectus are proposed to be listed on the Stock Exchanges. Our Company has received ‘in-principle’ approvals from BSE and NSE for the listing of the Equity Shares pursuant to letters dated September 20, 2021 and October 14, 2021, respectively. For the purposes of the Offer, the Designated Stock Exchange shall be BSE. A copy of this Red Herring Prospectus and the Prospectus shall be delivered to the RoC for filing in accordance with Section 26(4) and Section 32 of the Companies Act. For details of the material contracts and documents available for inspection from the date of this Red Herring Prospectus up to the Bid/Offer Closing Date, see “Material Contracts and Documents for Inspection” beginning on page 319. BOOK RUNNING LEAD MANAGERS REGISTRAR TO THE OFFER Axis Capital Limited 1 st floor, Axis House C-2 Wadia International Centre P.B. Marg, Worli Mumbai 400 025 Maharashtra, India Tel: +91 22 4325 2183 E-mail: [email protected] Investor Grievance E-mail: [email protected] Website: www.axiscapital.co.in Contact Person: Ankit Bhatia SEBI Registration Number: INM000012029 JM Financial Limited 7 th floor, Cnergy Appasaheb Marathe Marg Prabhadevi Mumbai, 400 025 Maharashtra, India Tel: +91 22 6630 3030 E-mail: [email protected] Investor Grievance E-mail: [email protected] Website: www.jmfl.com Contact Person: Prachee Dhuri SEBI Registration Number: INM000010361 Kotak Mahindra Capital Company Limited 1 st Floor, 27 BKC Plot No. C-27, ‘G’ Block Bandra Kurla Complex, Bandra (East) Mumbai 400 051 Maharashtra, India Tel: +91 22 4336 0000 E-mail: [email protected] Investor Grievance E-mail: [email protected] Website: www.investmentbank.kotak.com Contact Person: Ganesh Rane SEBI Registration Number: INM000008704 DAM Capital Advisors Limited (Formerly IDFC Securities Limited) One BKC, Tower C, 15 th Floor, Unit No.1511 Bandra Kurla Complex, Bandra (East) Mumbai 400 051 Maharashtra, India Tel: +91 22 4202 2500 E-mail: [email protected] Investor Grievance ID: [email protected] Website: www.damcapital.in Contact Person: Chandresh Sharma SEBI Registration Number: MB/INM000011336 Link Intime India Private Limited C 101, 247 Park L.B.S. Marg Vikhroli (West) Mumbai 400 083 Maharashtra, India Tel: +91 22 4918 6200 E-mail: [email protected] Investor Grievance E-mail: [email protected] Website: www.linkintime.co.in Contact Person: Shanti Gopalkrishnan SEBI Registration Number: INR000004058 BID/OFFER PROGRAMME BID/OFFER OPENS ON * Thursday, December 9, 2021 BID/OFFER CLOSES ON Monday, December 13, 2021** * Our Company, the Individual Selling Shareholder, and the Investor Selling Shareholders may, in consultation with the Book Running Lead Managers, consider participation by Anchor Investors in accordance with the SEBI ICDR Regulations. The Anchor Investor Bid/Offer Period shall be one Working Day prior to the Bid/Offer Opening Date, i.e., Wednesday, December 8, 2021. **UPI mandate end time and date shall be at 12.00 pm on Tuesday, December 14, 2021.
-
Upload
khangminh22 -
Category
Documents
-
view
0 -
download
0
Transcript of C.E. INFO SYSTEMS LIMITED - Kotak Investment Banking

RED HERRING PROSPECTUS
Dated December 2, 2021
Please read section 32 of the Companies Act, 2013 Book Built Offer
C.E. INFO SYSTEMS LIMITED Our Company was originally incorporated as ‘C.E. Info Systems Private Limited’ at New Delhi as a private limited company under the Companies Act, 1956, pursuant to the certificate of incorporation dated
February 17, 1995 issued by the Registrar of Companies, National Capital Territory of Delhi and Haryana at New Delhi (the “RoC”).Our Company was converted from a private limited company to a public
limited company pursuant to a special resolution passed by our Shareholders at the EGM held on July 7, 2021 and the name of our Company was changed to ‘C.E. Info Systems Limited’. Consequently, a fresh
certificate of incorporation dated July 12, 2021 was issued by the RoC. For details in relation to the changes in the name and registered office of our Company, see “History and Certain Corporate Matters” on
page 160.
Registered and Corporate Office: First, Second, & Third Floor,
Plot. No. 237, Okhla Industrial Estate, Phase- III, New Delhi 110 020, India
Telephone: +91 11 4600 9900; Contact Person: Saurabh Surendra Somani, Company Secretary and Compliance Officer
E-mail: [email protected]; Website: www.mapmyindia.com
Corporate Identity Number: U74899DL1995PLC065551
PROMOTERS OF OUR COMPANY: RAKESH KUMAR VERMA AND RASHMI VERMA
INITIAL PUBLIC OFFER OF UP TO 10,063,945 EQUITY SHARES OF FACE VALUE OF ₹2 EACH (“EQUITY SHARES”) OF C.E. INFO SYSTEMS LIMITED (“COMPANY” OR “ISSUER”)
FOR CASH AT A PRICE OF ₹[●] PER EQUITY SHARE THROUGH AN OFFER FOR SALE OF UP TO 10,063,945 EQUITY SHARES AGGREGATING UP TO ₹[●] MILLION BY THE
SELLING SHAREHOLDERS (“OFFER”), COMPRISING UP TO 4,251,044 EQUITY SHARES AGGREGATING UP TO ₹[●] MILLION BY RASHMI VERMA (THE “INDIVIDUAL SELLING
SHAREHOLDER”), UP TO 2,701,407 EQUITY SHARES AGGREGATING UP TO ₹[●] MILLION BY QUALCOMM ASIA PACIFIC PTE. LTD., UP TO 1,369,961 EQUITY SHARES
AGGREGATING UP TO ₹[●] MILLION BY ZENRIN CO., LTD. (COLLECTIVELY THE “INVESTOR SELLING SHAREHOLDERS”), UP TO 1,741,533 EQUITY SHARES AGGREGATING
UP TO ₹[●] MILLION BY PERSONS REFERRED TO IN ANNEXURE A (COLLECTIVELY THE “OTHER SELLING SHAREHOLDERS” AND TOGETHER WITH THE INDIVIDUAL
SELLING SHAREHOLDER AND THE INVESTOR SELLING SHAREHOLDERS, THE “SELLING SHAREHOLDERS” AND SUCH EQUITY SHARES OFFERED BY THE SELLING
SHAREHOLDERS, THE “OFFERED SHARES”). THE OFFER SHALL CONSTITUTE 18.90% OF THE POST-OFFER PAID-UP EQUITY SHARE CAPITAL OF OUR COMPANY.
THE FACE VALUE OF EQUITY SHARES IS ₹ 2 EACH. THE OFFER PRICE IS [●] TIMES THE FACE VALUE OF THE EQUITY SHARES. THE PRICE BAND AND THE MINIMUM BID
LOT WILL BE DECIDED BY OUR COMPANY, THE INDIVIDUAL SELLING SHAREHOLDER, AND THE INVESTOR SELLING SHAREHOLDERS, IN CONSULTATION WITH THE
BOOK RUNNING LEAD MANAGERS AND WILL BE ADVERTISED IN ALL EDITIONS OF FINANCIAL EXPRESS, AN ENGLISH NATIONAL DAILY NEWSPAPER AND ALL EDITIONS
OF JANSATTA, A HINDI NATIONAL DAILY NEWSPAPER (HINDI ALSO BEING THE REGIONAL LANGUAGE OF NEW DELHI, WHERE OUR REGISTERED AND CORPORATE
OFFICE IS LOCATED), EACH WITH WIDE CIRCULATION, AT LEAST TWO WORKING DAYS PRIOR TO THE BID/OFFER OPENING DATE AND SHALL BE MADE AVAILABLE TO
BSE LIMITED (“BSE”) AND NATIONAL STOCK EXCHANGE OF INDIA LIMITED (“NSE”, AND TOGETHER WITH BSE, THE “STOCK EXCHANGES”) FOR THE PURPOSE OF
UPLOADING ON THEIR RESPECTIVE WEBSITES.
In case of any revision to the Price Band, the Bid/Offer Period will be extended by at least three additional Working Days following such revision of the Price Band, subject to the Bid/Offer Period not exceeding 10 Working Days. In cases of force
majeure, banking strike or similar circumstances, our Company, the Individual Selling Shareholder, and the Investor Selling Shareholders, in consultation with the Book Running Lead Managers, may for reasons to be recorded in writing, extend the
Bid/Offer Period for a minimum of three Working Days, subject to the Bid/Offer Period not exceeding 10 Working Days. Any revision in the Price Band and the revised Bid/Offer Period, if applicable, will be widely disseminated by notification to
the Stock Exchanges, by issuing a public notice, and also by indicating the change on the respective websites of the Book Running Lead Managers and at the terminals of the Syndicate Members and by intimation to Self-Certified Syndicate Banks
(“SCSBs”), other Designated Intermediaries and the Sponsor Bank, as applicable.
The Offer is being made through the Book Building Process, in terms of Rule 19(2)(b) of the Securities Contracts (Regulation) Rules, 1957, as amended (“SCRR”) read with Regulation 31 of the SEBI ICDR Regulations and in compliance with
Regulation 6(1) of the SEBI ICDR Regulations, wherein not more than 50% of the Offer shall be allocated on a proportionate basis to Qualified Institutional Buyers (“QIBs”, and such portion as “QIB Portion”), provided that our Company, the
Individual Selling Shareholder, and the Investor Selling Shareholders may, in consultation with the Book Running Lead Managers, allocate up to 60% of the QIB Portion to Anchor Investors on a discretionary basis in accordance with the SEBI ICDR
Regulations (“Anchor Investor Portion”), of which one-third shall be reserved for domestic Mutual Funds, subject to valid Bids being received from domestic Mutual Funds at or above the Anchor Investor Allocation Price. In the event of under-
subscription, or non-allocation in the Anchor Investor Portion, the balance Equity Shares shall be added to the Net QIB Portion. Further, 5% of the Net QIB Portion shall be available for allocation on a proportionate basis only to Mutual Funds, and
the remainder of the Net QIB Portion shall be available for allocation on a proportionate basis to all QIBs, including Mutual Funds, subject to valid Bids being received at or above the Offer Price. Further, not less than 15% of the Offer shall be
available for allocation on a proportionate basis to Non-Institutional Bidders and not less than 35% of the Offer shall be available for allocation to Retail Individual Bidders (“RIBs”) in accordance with the SEBI ICDR Regulations, subject to valid Bids being received at or above the Offer Price. All potential Bidders (except Anchor Investors) are required to mandatorily utilise the Application Supported by Blocked Amount (“ASBA”) process providing details of their respective ASBA accounts,
and UPI ID in case of RIBs using the UPI Mechanism, if applicable, in which the corresponding Bid Amounts will be blocked by the SCSBs or under the UPI Mechanism, as the case may be, to the extent of respective Bid Amounts. Anchor Investors
are not permitted to participate in the Offer through the ASBA process. For details, see “Offer Procedure” beginning on page 298.
RISKS IN RELATION TO THE FIRST OFFER This being the first public issue of Equity Shares of our Company, there has been no formal market for the Equity Shares. The face value of each Equity Share is ₹2. The Floor Price, Cap Price and Offer Price (determined and justified by our Company,
the Individual Selling Shareholder and the Investor Selling Shareholders in consultation with the Book Running Lead Managers, in accordance with the SEBI ICDR Regulations, and on the basis of the assessment of market demand for the Equity
Shares by way of the Book Building Process as stated in “Basis for Offer Price” beginning on page 87) should not be taken to be indicative of the market price of the Equity Shares after the Equity Shares are listed. No assurance can be given regarding
an active or sustained trading in the Equity Shares or regarding the price at which the Equity Shares will be traded after listing.
GENERAL RISK Investments in equity and equity-related securities involve a degree of risk and Bidders should not invest any funds in the Offer unless they can afford to take the risk of losing their investment. Bidders are advised to read the risk factors carefully
before taking an investment decision in the Offer. For taking an investment decision, Bidders must rely on their own examination of our Company and the Offer, including the risks involved. The Equity Shares in the Offer have neither been
recommended, nor approved by the Securities and Exchange Board of India (“SEBI”), nor does SEBI guarantee the accuracy or adequacy of the contents of this Red Herring Prospectus. Specific attention of the Bidders is invited to “Risk Factors”
beginning on page 30.
COMPANY’S AND SELLING SHAREHOLDER’S ABSOLUTE RESPONSIBILITY Our Company, having made all reasonable inquiries, accepts responsibility for and confirms that this Red Herring Prospectus contains all information with regard to our Company and the Offer, which is material in the context of the Offer, that the
information contained in this Red Herring Prospectus is true and correct in all material aspects and is not misleading in any material respect, that the opinions and intentions expressed herein are honestly held and that there are no other facts, the
omission of which makes this Red Herring Prospectus as a whole or any of such information or the expression of any such opinions or intentions misleading in any material respect. Further, each of the Selling Shareholders, severally and not jointly,
accepts responsibility for and confirms only statements specifically made by such Selling Shareholder in this Red Herring Prospectus solely in relation to itself and its respective portion of the Offered Shares and assumes responsibility that such
statements are true and correct in all material respects and not misleading in any material respect. However, each of the Selling Shareholders, severally and not jointly, assumes no responsibility for any other statements, including, inter alia, any of the
statements made by or relating to our Company or in relation to our business or any other Selling Shareholders in this Red Herring Prospectus.
LISTING The Equity Shares offered through this Red Herring Prospectus are proposed to be listed on the Stock Exchanges. Our Company has received ‘in-principle’ approvals from BSE and NSE for the listing of the Equity Shares pursuant to letters dated
September 20, 2021 and October 14, 2021, respectively. For the purposes of the Offer, the Designated Stock Exchange shall be BSE. A copy of this Red Herring Prospectus and the Prospectus shall be delivered to the RoC for filing in accordance with
Section 26(4) and Section 32 of the Companies Act. For details of the material contracts and documents available for inspection from the date of this Red Herring Prospectus up to the Bid/Offer Closing Date, see “Material Contracts and Documents
for Inspection” beginning on page 319.
BOOK RUNNING LEAD MANAGERS REGISTRAR TO THE OFFER
Axis Capital Limited
1st floor, Axis House
C-2 Wadia International Centre
P.B. Marg, Worli
Mumbai 400 025
Maharashtra, India
Tel: +91 22 4325 2183
E-mail: [email protected]
Investor Grievance E-mail:
Website: www.axiscapital.co.in
Contact Person: Ankit Bhatia
SEBI Registration Number:
INM000012029
JM Financial Limited
7th floor, Cnergy
Appasaheb Marathe Marg
Prabhadevi
Mumbai, 400 025
Maharashtra, India
Tel: +91 22 6630 3030
E-mail: [email protected]
Investor Grievance E-mail:
Website: www.jmfl.com
Contact Person: Prachee Dhuri
SEBI Registration Number:
INM000010361
Kotak Mahindra Capital Company
Limited
1st Floor, 27 BKC
Plot No. C-27, ‘G’ Block
Bandra Kurla Complex, Bandra (East)
Mumbai 400 051
Maharashtra, India
Tel: +91 22 4336 0000
E-mail: [email protected]
Investor Grievance E-mail:
Website:
www.investmentbank.kotak.com
Contact Person: Ganesh Rane
SEBI Registration Number:
INM000008704
DAM Capital Advisors Limited
(Formerly IDFC Securities Limited)
One BKC, Tower C, 15th Floor, Unit
No.1511
Bandra Kurla Complex, Bandra (East)
Mumbai 400 051
Maharashtra, India
Tel: +91 22 4202 2500
E-mail: [email protected]
Investor Grievance ID:
Website: www.damcapital.in
Contact Person: Chandresh Sharma
SEBI Registration Number:
MB/INM000011336
Link Intime India Private Limited
C 101, 247 Park
L.B.S. Marg
Vikhroli (West)
Mumbai 400 083
Maharashtra, India
Tel: +91 22 4918 6200
E-mail: [email protected]
Investor Grievance E-mail:
Website: www.linkintime.co.in
Contact Person: Shanti Gopalkrishnan
SEBI Registration Number:
INR000004058
BID/OFFER PROGRAMME
BID/OFFER OPENS ON* Thursday, December 9, 2021
BID/OFFER CLOSES ON Monday, December 13, 2021** * Our Company, the Individual Selling Shareholder, and the Investor Selling Shareholders may, in consultation with the Book Running Lead Managers, consider participation by Anchor Investors in accordance with the SEBI ICDR Regulations. The
Anchor Investor Bid/Offer Period shall be one Working Day prior to the Bid/Offer Opening Date, i.e., Wednesday, December 8, 2021.
**UPI mandate end time and date shall be at 12.00 pm on Tuesday, December 14, 2021.

(This page is intentionally left blank)

(i)
TABLE OF CONTENTS
SECTION I: GENERAL ........................................................................................................................................................... 2
DEFINITIONS AND ABBREVIATIONS .............................................................................................................................. 2 CERTAIN CONVENTIONS, PRESENTATION OF FINANCIAL, INDUSTRY AND MARKET DATA ......................... 16 FORWARD-LOOKING STATEMENTS ............................................................................................................................. 19 SUMMARY OF THE OFFER DOCUMENT ........................................................................................................................ 20
SECTION II: RISK FACTORS ............................................................................................................................................. 30
SECTION III: INTRODUCTION.......................................................................................................................................... 56
THE OFFER .......................................................................................................................................................................... 56 SUMMARY OF RESTATED CONSOLIDATED FINANCIAL INFORMATION ............................................................. 57 GENERAL INFORMATION ................................................................................................................................................ 62 CAPITAL STRUCTURE ...................................................................................................................................................... 70 OBJECTS OF THE OFFER ................................................................................................................................................... 85 BASIS FOR OFFER PRICE .................................................................................................................................................. 87 STATEMENT OF SPECIAL TAX BENEFITS .................................................................................................................... 89
SECTION IV: ABOUT OUR COMPANY ............................................................................................................................ 92
INDUSTRY OVERVIEW ..................................................................................................................................................... 92 OUR BUSINESS ................................................................................................................................................................. 132 KEY REGULATIONS AND POLICIES IN INDIA ............................................................................................................ 155 HISTORY AND CERTAIN CORPORATE MATTERS ..................................................................................................... 160 OUR MANAGEMENT ....................................................................................................................................................... 169 OUR PROMOTERS AND PROMOTER GROUP .............................................................................................................. 185 OUR GROUP COMPANIES ............................................................................................................................................... 188 DIVIDEND POLICY ........................................................................................................................................................... 190
SECTION V: FINANCIAL INFORMATION .................................................................................................................... 193
RESTATED CONSOLIDATED FINANCIAL INFORMATION ....................................................................................... 193 OTHER FINANCIAL INFORMATION ............................................................................................................................. 243 FINANCIAL INDEBTEDNESS ......................................................................................................................................... 245 CAPITALISATION STATEMENT .................................................................................................................................... 246 MANAGEMENT’S DISCUSSION AND ANALYSIS OF FINANCIAL CONDITION AND RESULTS OF OPERATIONS
............................................................................................................................................................................................. 247
SECTION VI: LEGAL AND OTHER INFORMATION .................................................................................................. 273
OUTSTANDING LITIGATION AND MATERIAL DEVELOPMENTS .......................................................................... 273 GOVERNMENT AND OTHER APPROVALS .................................................................................................................. 276 OTHER REGULATORY AND STATUTORY DISCLOSURES ....................................................................................... 278
SECTION VII: OFFER INFORMATION .......................................................................................................................... 291
TERMS OF THE OFFER .................................................................................................................................................... 291 OFFER STRUCTURE ......................................................................................................................................................... 296 OFFER PROCEDURE ........................................................................................................................................................ 298 RESTRICTIONS ON FOREIGN OWNERSHIP OF INDIAN SECURITIES ..................................................................... 314
SECTION VIII: MAIN PROVISIONS OF ARTICLES OF ASSOCIATION ................................................................. 315
SECTION IX: OTHER INFORMATION ........................................................................................................................... 319
MATERIAL CONTRACTS AND DOCUMENTS FOR INSPECTION ............................................................................. 319
DECLARATION ................................................................................................................................................................... 322
ANNEXURE A – LIST OF OTHER SELLING SHAREHOLDERS .................................................................................. 327

2
SECTION I: GENERAL
DEFINITIONS AND ABBREVIATIONS
This Red Herring Prospectus uses certain definitions and abbreviations which, unless the context otherwise indicates or implies,
or unless otherwise specified, shall have the meaning as provided below. References to any legislations, acts, regulations, rules,
guidelines, circulars, notifications, clarifications or policies shall be to such legislations, acts, regulations, rules, guidelines or
policies as amended, updated, supplemented, re-enacted or modified, from time to time, and any reference to a statutory
provision shall include any subordinate legislation framed, from time to time, under such provision.
The words and expressions used in this Red Herring Prospectus, but not defined herein shall have the meaning ascribed to such
terms under the SEBI ICDR Regulations, the Companies Act, the SCRA, and the Depositories Act and the rules and regulations
framed thereunder.
The terms not defined herein but used in “Statement of Special Tax Benefits”, “Industry Overview”, “Key Regulations and
Policies in India”, “Restated Consolidated Financial Information”, “Outstanding Litigation and Material Developments”,
“Offer Procedure”, and “Main Provisions of Articles of Association” beginning on pages 89, 92, 155, 193, 273, 298, and 315,
respectively, shall have the meanings ascribed to such terms in the relevant section.
General terms
Term Description
“our Company” or “the Issuer” or
“the Company”
C.E. Info Systems Limited (formerly known as C.E. Info Systems Private Limited), a public limited
company incorporated under the Companies Act, 1956 and having its Registered Office at First, Second,
& Third Floor, Plot. No. 237, Okhla Industrial Estate, Phase- III, New Delhi 110 020, India
“we” or “us” or “our” or “Group” Unless the context otherwise indicates or implies, our Company together with its Subsidiaries, on a
consolidated basis
Company related terms
Term Description
“Articles of Association” or “AoA”
or “Articles”
Articles of association of our Company, as amended from time to time
Audit Committee Audit committee of our Board, as described in “Our Management - Committees of our Board”
beginning on page 175
“Board” or “Board of Directors” Board of Directors of our Company or a duly constituted committee thereof
CE International CE Info Systems International Inc
Chairman and Managing Director Chairman and Managing Director of our Company, namely, Rakesh Kumar Verma
CIFCL Cholamandalam Investment and Finance Company Limited
“Chief Financial Officer” or
“CFO”
Chief Financial Officer of our Company, namely, Anuj Kumar Jain
Committee(s) Duly constituted committee(s) of our Board of Directors
“Compliance Officer” or
“Company Secretary”
Company Secretary and Compliance officer of our Company, namely, Saurabh Surendra Somani
“Corporate Social Responsibility
Committee” or “CSR Committee”
Corporate social responsibility committee of our Board, as described in “Our Management -
Committees of our Board” beginning on page 175
Director(s) Director(s) on the Board of our Company
Equity Shares Unless otherwise stated, equity shares of our Company bearing face value of ₹2 each
ESOP 2008 C.E. Info Systems Limited - Employee Stock Option Plan 2008
Executive Directors Executive directors on our Board, including our Chairman and Managing Director and Whole-time
Directors of our Company
Frost & Sullivan Frost & Sullivan (India) Private Limited
“Frost & Sullivan Report” or “F&S
Report”
The report titled “Digital Maps and Location Intelligence Technology & Service Market - B2B(2C) for
India & World” dated October 27, 2021 prepared and released by Frost & Sullivan, commissioned and
paid for by our Company exclusively for the purpose of the Offer and uploaded on the website of our
Company at https://www.mapmyindia.com/investors/drhp/materialdocuments
Flipkart Flipkart Private Limited

3
Term Description
Further Agreement Further agreement and amendment to the Investment Agreement dated July 29, 2021 entered into by
and among our Company, the Promoters, and the Investors and the deed of adherence to the Further
Agreement executed by PhonePe India dated September 16, 2021
Group Companies Our group companies namely, Spinclabs Private Limited and Cholamandalam Investment and Finance
Company Limited
Independent Director(s) Independent director(s) on our Board. For details of the Independent Directors, see “Our Management”
beginning on page 169
Investment Agreement Investment agreement dated September 30, 2015, as amended by the amendment dated October 28,
2015 and amendment no.2 dated October 30, 2015 entered into by and among our Company, the
Promoters, Qualcomm, Zenrin, and Flipkart read with the deed of adherence dated March 9, 2021
executed by PhonePe Singapore.
The Investment Agreement has been further amended by the Further Agreement.
Investor Selling Shareholders Collectively, Qualcomm and Zenrin
Investors Collectively, PhonePe Singapore, PhonePe India*, Qualcomm, and Zenrin
* PhonePe Singapore transferred 7,648,475 Equity Shares to PhonePe India on October 1, 2021.
IPO Committee The IPO committee of our Board
Key Managerial Personnel Key managerial personnel of our Company in terms of Regulation 2(1)(bb) of the SEBI ICDR
Regulations and Section 2(51) of the Companies Act, as described in “Our Management - Key
Managerial Personnel” beginning on page 182
Lightbox Lightbox Ventures I
“Memorandum of Association” or
“MoA”
Memorandum of association of our Company, as amended from time to time
“Nomination and Remuneration
Committee” or “NRC Committee”
Nomination and remuneration committee of our Board, as described in “Our Management -
Committees of the Board” beginning on page 175
Non-executive Directors Non-executive directors on our Board
Other Selling Shareholders Collectively, the persons listed in Annexure A
PhonePe India PhonePe Private Limited, a company incorporated under the laws of India
PhonePe Singapore/ Series E
Investor
PhonePe Private Limited, a company incorporated under the laws of Singapore with its registered office
at 80 Robinson Road, #02-00, Singapore 068 898
PhonePe SPA Share purchase agreement dated July 29, 2021 as amended by an addendum dated November 16, 2021
entered into by and among PhonePe Singapore, Rakesh Kumar Verma and our Company
Preference Shares Collectively, Series A Preference Shares, Series B Preference Shares, Series C Preference Shares,
Series D Preference Shares and Series E Preference Shares
Promoter Group Persons and entities constituting the promoter group of our Company in terms of Regulation 2(1)(pp)
of the SEBI ICDR Regulations, as disclosed in “Our Promoters and Promoter Group” on page 185
Individual Selling Shareholder Rashmi Verma
Promoters Promoters of our Company, being, Rakesh Kumar Verma and Rashmi Verma
Qualcomm/ Series C Investor Qualcomm Asia Pacific Pte. Ltd.
Qualcomm SPA Share purchase agreement dated July 29, 2021 as amended by an addendum dated November 16, 2021
entered into by and among Qualcomm, Rakesh Kumar Verma and our Company
Registered and Corporate Office The registered and corporate office of our Company located at First, Second, & Third Floor, Plot. No.
237, Okhla Industrial Estate, Phase- III, New Delhi 110 020, India
“Registrar of Companies” or
“RoC”
Registrar of Companies, National Capital Territory of Delhi, and Haryana at New Delhi
Restated Consolidated Financial
Information
Our restated consolidated summary statements of assets and liabilities as at September 30, 2021 and
September 30, 2020, and March 31, 2021, March 31, 2020 and March 31, 2019 and the restated
consolidated statements of profit and loss, cash flow statement and changes in equity for the six month
period ended September 30, 2021and September 30, 2020 and the years ended March 31, 2021, March
31, 2020 and March 31, 2019 of our Company together with the statement of significant accounting
policies, and other explanatory information thereon, derived from the audited consolidated financial
statements of our Company as at and for the six month period ended September 30, 2021 and September
30, 2020 and the years ended March 31, 2021, March 31, 2020 and March 31, 2019, together with the
annexures and notes thereto, and the examination report thereon, prepared in accordance with Ind AS,
and restated in accordance with the SEBI ICDR Regulations and the Guidance Note on “Reports in
Company Prospectuses (Revised 2019)” issued by the ICAI
Risk Management Committee Risk management committee of our Board, as described in “Our Management - Committees of the
Board” beginning on page 175

4
Term Description
Selling Shareholders Collectively, the Individual Selling Shareholder, the Investor Selling Shareholders, and the Other
Selling Shareholders
Series A Investors Murugan Capital and Sherpalo Mauritius LLC
Series A Preference Shares Series A non-cumulative participating fully convertible preference shares of our Company having face
value of ₹81 each
Series B Investor Nexus India Ventures I Investments
Series B Preference Shares Series B non-cumulative participating fully convertible preference shares of our Company having face
value of ₹114 each
Series C Preference Shares Series C non-cumulative participating fully convertible preference shares of our Company having face
value of ₹290 each
Series D Preference Shares Series D non-cumulative participating fully convertible preference shares of our Company having face
value of ₹630 each
Series E Preference Shares Series E non-cumulative participating fully convertible preference shares of our Company having face
value of ₹1,000 each
Shareholder(s) Shareholder(s) of our Company from time to time
SPAs Collectively, the PhonePe SPA, the Qualcomm SPA, and the Zenrin SPA
SPL Spinclabs Private Limited
Stakeholders’ Relationship
Committee
Stakeholders’ relationship committee of our Board, as described in “Our Management - Committees of
the Board” beginning on page 175
Statutory Auditors The statutory auditors of our Company, being Brijesh Mathur & Associates, Chartered Accountants
Subsidiaries The subsidiaries of our Company, namely, VIPL and C.E International
VIPL Vidteq (India) Private Limited
VIPL SPA Share purchase agreement dated July 31, 2017 entered into by and among Chandra Mohan
Thimmannagari, Muraleedhara Herur Navada, Karnataka Trustee Company Private Limited,
Karnataka Asset Management Company Private Limited, VIPL, and our Company
Whole-time Director(s) Whole-time director(s) of our Company. For details of our Whole-time Directors, see “Our
Management” beginning on page 169
Zenrin/ Series D Investor Zenrin Co., Ltd.
Zenrin SPA Share purchase agreement dated July 29, 2021 as amended by an addendum dated November 16, 2021
entered into by and among Zenrin, Rakesh Kumar Verma and our Company
Offer related terms
Term Description
Acknowledgement Slip The slip or document issued by the relevant Designated Intermediary to a Bidder as proof of
registration of the Bid cum Application Form
Addendum Addenda dated October 7, 2021 (short form) and October 16, 2021 (long form) to the Draft Red
Herring Prospectus issued in accordance with the SEBI ICDR Regulations
“Allot” or “Allotment” or
“Allotted”
Unless the context otherwise requires, the transfer of the Equity Shares offered by the Selling
Shareholders pursuant to the Offer to the successful Bidders
Allotment Advice A note or advice or intimation of Allotment sent to the successful Bidders who have been or are to be
Allotted the Equity Shares after the Basis of Allotment has been approved by the Designated Stock
Exchange
Allottee A successful Bidder to whom the Equity Shares are Allotted
Anchor Investor A Qualified Institutional Buyer, applying under the Anchor Investor Portion in accordance with the
requirements specified in the SEBI ICDR Regulations and this Red Herring Prospectus and who has
Bid for an amount of at least ₹100 million
Anchor Investor Allocation Price The price at which Equity Shares will be allocated to the Anchor Investors in terms of this Red Herring
Prospectus and the Prospectus, which will be decided by our Company, the Individual Selling
Shareholder, and the Investor Selling Shareholders, in consultation with the Book Running Lead
Managers during the Anchor Investor Bid/Offer Period
Anchor Investor Application Form The application form used by an Anchor Investor to make a Bid in the Anchor Investor Portion and
which will be considered as an application for Allotment in terms of this Red Herring Prospectus and
Prospectus
Anchor Investor Bid/Offer Period One Working Day prior to the Bid/ Offer Opening Date, on which Bids by Anchor Investors shall be
submitted and allocation to the Anchor Investors shall be completed

5
Term Description
Anchor Investor Offer Price The final price at which the Equity Shares will be Allotted to the Anchor Investors in terms of this
Red Herring Prospectus and the Prospectus, which price will be equal to or higher than the Offer Price
but not higher than the Cap Price.
The Anchor Investor Offer Price will be decided by our Company, the Individual Selling Shareholder,
and the Investor Selling Shareholders, in consultation with the Book Running Lead Managers
Anchor Investor Portion Up to 60% of the QIB Portion which may be allocated by our Company, the Individual Selling
Shareholder, and the Investor Selling Shareholders, in consultation with the Book Running Lead
Managers, to the Anchor Investors on a discretionary basis in accordance with the SEBI ICDR
Regulations.
One-third of the Anchor Investor Portion shall be reserved for domestic Mutual Funds, subject to valid
Bids being received from domestic Mutual Funds at or above the Anchor Investor Allocation Price, in
accordance with the SEBI ICDR Regulations
“Application Supported by Blocked
Amount” or “ASBA”
An application, whether physical or electronic, used by ASBA Bidders to make a Bid and authorising
an SCSB to block the Bid Amount in the ASBA Account and will include applications made by RIBs
using the UPI Mechanism where the Bid Amount will be blocked upon acceptance of UPI Mandate
Request by RIBs using the UPI Mechanism
ASBA Account A bank account maintained with an SCSB by an ASBA Bidder, as specified in the ASBA Form
submitted by ASBA Bidders for blocking the Bid Amount mentioned in the relevant ASBA Form and
includes the account of an RIB which is blocked upon acceptance of a UPI Mandate Request made by
the RIBs using the UPI Mechanism
ASBA Bid A Bid made by an ASBA Bidder
ASBA Bidders All Bidders except Anchor Investors
ASBA Form An application form, whether physical or electronic, used by ASBA Bidders to submit Bids, which
will be considered as the application for Allotment in terms of this Red Herring Prospectus and the
Prospectus
Axis Capital Axis Capital Limited
Banker(s) to the Offer Collectively, Escrow Collection Bank(s), Public Offer Bank(s), Sponsor Bank(s), and Refund Bank(s),
as the case may be
Basis of Allotment Basis on which Equity Shares will be Allotted to successful Bidders under the Offer as described in
“Offer Procedure” beginning on page 298
Bid An indication to make an offer during the Bid/ Offer Period by an ASBA Bidder pursuant to
submission of the ASBA Form, or during the Anchor Investor Bid/ Offer Period by an Anchor
Investor, pursuant to submission of the Anchor Investor Application Form, to subscribe to or purchase
the Equity Shares at a price within the Price Band, including all revisions and modifications thereto as
permitted under the SEBI ICDR Regulations and in terms of this Red Herring Prospectus and the Bid
cum Application Form. The term “Bidding” shall be construed accordingly
Bid Amount The highest value of optional Bids indicated in the Bid cum Application Form and, in the case of RIBs
Bidding at the Cut off Price, the Cap Price multiplied by the number of Equity Shares Bid for by such
RIBs and mentioned in the Bid cum Application Form and payable by the Bidder or blocked in the
ASBA Account of the ASBA Bidder, as the case may be, upon submission of the Bid
Bid cum Application Form Anchor Investor Application Form or the ASBA Form, as the context requires
Bid Lot [●] Equity Shares and in multiples of [●] Equity Shares thereafter
Bid/Offer Closing Date Except in relation to any Bids received from the Anchor Investors, the date after which the Designated
Intermediaries will not accept any Bids which shall be notified in all editions of Financial Express, an
English national daily newspaper and all editions of Jansatta, a Hindi national daily newspaper (Hindi
also being the regional language of New Delhi, where our Registered and Corporate Office is located),
each with wide circulation.
In case of any revision, the extended Bid/Offer Closing Date will be widely disseminated by
notification to the Stock Exchanges, by issuing a public notice, and shall also be notified on the
websites of the Book Running Lead Managers and at the terminals of the Syndicate Members and
communicated to the Designated Intermediaries and the Sponsor Bank, which shall also be notified in
an advertisement in the same newspapers in which the Bid/Offer Opening Date was published, as
required under the SEBI ICDR Regulations
Bid/ Offer Opening Date Except in relation to any Bids received from the Anchor Investors, the date on which the Designated
Intermediaries shall start accepting Bids, which shall be notified in all editions of Financial Express,
an English national daily newspaper, all editions of Jansatta, a Hindi national daily newspaper (Hindi
also being the regional language of New Delhi, where our Registered and Corporate Office is located),
each with wide circulation
Bid/ Offer Period Except in relation to Anchor Investors, the period between the Bid/ Offer Opening Date and the Bid/
Offer Closing Date, inclusive of both days, during which prospective Bidders can submit their Bids,
including any revisions thereof in accordance with the SEBI ICDR Regulations

6
Term Description
Bidder Any prospective investor who makes a Bid pursuant to the terms of this Red Herring Prospectus and
the Bid cum Application Form and unless otherwise stated or implied, includes an Anchor Investor
Bidding Centres The centres at which the Designated Intermediaries shall accept the Bid cum Application Forms, i.e.,
Designated Branches for SCSBs, Specified Locations for the Syndicate, Broker Centres for Registered
Brokers, Designated RTA Locations for RTAs, and Designated CDP Locations for CDPs
“Book Running Lead Managers” or
“BRLMs”
The book running lead managers to the Offer, namely, Axis Capital, JM Financial, Kotak and DAM
Capital
Book Building Process Book building process, as provided in Schedule XIII of the SEBI ICDR Regulations, in terms of which
the Offer is being made
Broker Centres The broker centres notified by the Stock Exchanges where ASBA Bidders can submit the ASBA
Forms to a Registered Broker.
The details of such Broker Centres, along with the names and the contact details of the Registered
Brokers are available on the respective websites of the Stock Exchanges (www.bseindia.com and
www.nseindia.com)
“CAN” Notice or intimation of allocation of the Equity Shares sent to Anchor Investors, who have been
allocated the Equity Shares, on or after the Anchor Investor Bid/ Offer Period
Cap Price The higher end of the Price Band, subject to any revisions thereto, above which the Offer Price and
the Anchor Investor Offer Price will not be finalised and above which no Bids will be accepted
Client ID The client identification number maintained with one of the Depositories in relation to demat account
“Collecting Depository Participant”
or “CDP”
A depository participant as defined under the Depositories Act, 1996 registered with SEBI and who is
eligible to procure Bids from relevant Bidders at the Designated CDP Locations in terms of the SEBI
circular number CIR/CFD/POLICYCELL/11/2015 dated November 10, 2015 issued by SEBI as per
the list available on the websites of BSE and NSE, as updated from time to time
Cut-off Price The Offer Price, finalised by our Company, the Individual Selling Shareholder, and the Investor
Selling Shareholders, in consultation with the Book Running Lead Managers, which shall be any price
within the Price Band.
Only Retail Individual Bidders Bidding in the Retail Portion are entitled to Bid at the Cut-off Price.
QIBs and Non-Institutional Bidders are not entitled to Bid at the Cut-off Price
DAM Capital DAM Capital Advisors Limited (Formerly IDFC Securities Limited)
Demographic Details Details of the Bidders including the Bidders’ address, name of the Bidders’ father/husband, investor
status, occupation, bank account details and UPI ID, wherever applicable
Designated Branches Such branches of the SCSBs which shall collect the ASBA Forms, a list of which is available on the
website of SEBI at https://www.sebi.gov.in/sebiweb/other/OtherAction.do?doRecognised=yes or at
such other website as may be prescribed by SEBI from time to time
Designated CDP Locations Such locations of the CDPs where Bidders can submit the ASBA Forms.
The details of such Designated CDP Locations, along with names and contact details of the CDPs
eligible to accept ASBA Forms are available on the respective websites of the Stock Exchanges
(www.bseindia.com and www.nseindia.com), as updated from time to time
Designated Date The date on which funds from the Escrow Account(s) are transferred to the Public Offer Account(s)
or the Refund Account(s), as appropriate, and the relevant amounts blocked in the ASBA Accounts
are transferred to the Public Offer Account(s) and /or are unblocked, as applicable, in terms of this
Red Herring Prospectus and the Prospectus, after finalization of the Basis of Allotment in consultation
with the Designated Stock Exchange, following which the Equity Shares may be Allotted to successful
Bidders in the Offer
Designated Intermediary(ies) In relation to ASBA Forms submitted by RIBs (not using the UPI mechanism) by authorising an SCSB
to block the Bid Amount in the ASBA Account, Designated Intermediaries shall mean SCSBs.
In relation to ASBA Forms submitted by RIBs where the Bid Amount will be blocked upon acceptance
of UPI Mandate Request by such RIB using the UPI Mechanism, Designated Intermediaries shall
mean Syndicate, sub-syndicate/agents, Registered Brokers, CDPs, SCSBs and RTAs.
In relation to ASBA Forms submitted by QIBs and Non-Institutional Bidders, Designated
Intermediaries shall mean Syndicate, Sub-Syndicate/ agents, SCSBs, Registered Brokers, the CDPs
and RTAs
Designated RTA Locations Such locations of the RTAs where Bidders can submit the ASBA Forms to RTAs. The details of such
Designated RTA Locations, along with names and contact details of the RTAs eligible to accept ASBA
Forms are available on the respective websites of the Stock Exchanges (www.bseindia.com and
www.nseindia.com), as updated from time to time
Designated Stock Exchange BSE Limited

7
Term Description
“Draft Red Herring Prospectus” or
“DRHP”
The draft red herring prospectus dated August 31, 2021 read with the Addendum issued in accordance
with the SEBI ICDR Regulations, which does not contain complete particulars of the price at which
the Equity Shares will be Allotted and the size of the Offer
Eligible NRI(s) NRI(s) from jurisdictions outside India where it is not unlawful to make an offer or invitation under
the Offer and in relation to whom the Bid cum Application Form and this Red Herring Prospectus will
constitute an invitation to subscribe to or to purchase the Equity Shares
Escrow and Sponsor Bank
Agreement
Agreement dated December 2, 2021 entered amongst our Company, the Selling Shareholders, the
Book Running Lead Managers, Syndicate Members, the Banker(s) to the Offer and Registrar to the
Offer, inter alia, for collection of the Bid Amounts from Anchor Investors, transfer of funds to the
Public Offer Account and where applicable, remitting refunds of the amounts collected from Bidders,
on the terms and conditions thereof
Escrow Account(s) The account(s) to be opened with the Escrow Collection Bank and in whose favour the Anchor
Investors will transfer money through NACH/direct credit/NEFT/RTGS in respect of the Bid Amount
when submitting a Bid
Escrow Collection Bank Bank which is a clearing member and registered with SEBI as a banker to an issue under the SEBI
BTI Regulations and with whom the Escrow Accounts will be opened, in this case being ICICI Bank
Limited
First Bidder or Sole Bidder Bidder whose name shall be mentioned in the Bid cum Application Form or the Revision Form and in
case of joint Bids, whose name shall also appear as the first holder of the beneficiary account held in
joint names
Floor Price The lower end of the Price Band, subject to any revision(s) thereto, not being less than the face value
of Equity Shares, at or above which the Offer Price and the Anchor Investor Offer Price will be
finalised and below which no Bids will be accepted
Fugitive Economic Offender An individual who is declared a fugitive economic offender under Section 12 of the Fugitive Economic
Offenders Act, 2018
“General Information Document”
or “GID”
The General Information Document for investing in public issues prepared and issued in accordance
with the SEBI circular no. SEBI/HO/CFD/DIL1/CIR/P/2020/37 dated March 17, 2020 and the UPI
Circulars, as amended from time to time. The General Information Document shall be available on the
websites of the Stock Exchanges and the Book Running Lead Managers
JM Financial JM Financial Limited
Kotak Kotak Mahindra Capital Company Limited
Mutual Fund Portion 5% of the Net QIB Portion, or 100,639 Equity Shares which shall be available for allocation to Mutual
Funds only on a proportionate basis, subject to valid Bids being received at or above the Offer Price
Net Proceeds Proceeds of the Offer less Offer expenses. For further details regarding the use of the Net Proceeds
and the Offer expenses, see “Objects of the Offer” beginning on page 85
Net QIB Portion The portion of the QIB Portion less the number of Equity Shares Allocated to the Anchor Investors
“Non-Institutional Bidders” or
“Non-Institutional Investors”
All Bidders that are not QIBs or Retail Individual Bidders and who have Bid for Equity Shares for an
amount of more than ₹200,000 (but not including NRIs other than Eligible NRIs)
Non-Institutional Portion The portion of the Offer being not less than 15% of the Offer consisting of 1,509,592 Equity Shares
which shall be available for allocation on a proportionate basis to Non-Institutional Bidders, subject
to valid Bids being received at or above the Offer Price
Non-Resident Person resident outside India, as defined under FEMA and includes a non-resident Indian, FVCIs and
FPIs
Offer The initial public offer of up to 10,063,945 Equity Shares for cash at a price of ₹[●] per Equity Share
aggregating up to ₹[●] million through an offer for sale by the Selling Shareholders
Offer for Sale The offer for sale of the Offered Shares, at the Offer Price aggregating up to ₹[●] million offered for
sale by the Selling Shareholders in the Offer
Offer Agreement Agreement dated August 31, 2021 entered amongst our Company, the Selling Shareholders, and the
Book Running Lead Managers, pursuant to which certain arrangements have been agreed to in relation
to the Offer, as amended by an amendment agreement dated November 26, 2021
Offer Price The final price at which Equity Shares will be Allotted to ASBA Bidders in terms of this Red Herring
Prospectus and the Prospectus. Equity Shares will be Allotted to Anchor Investors at the Anchor
Investor Offer Price, which will be decided by our Company, the Individual Selling Shareholder, and
the Investor Selling Shareholders, in consultation with the Book Running Lead Managers, in terms of
this Red Herring Prospectus and the Prospectus.
The Offer Price will be decided by our Company, the Individual Selling Shareholder, and the Investor
Selling Shareholders, in consultation with the Book Running Lead Managers, on the Pricing Date in
accordance with the Book Building Process and this Red Herring Prospectus

8
Term Description
Offer Proceeds The proceeds of the Offer. For further information about use of the Offer Proceeds, see “Objects of
the Offer” beginning on page 85
Offered Shares Up to 10,063,945 Equity Shares aggregating up to ₹[●] million being offered by the Selling
Shareholders in the Offer for Sale
Price Band The price band of a minimum price of ₹ [●] per Equity Share (Floor Price) and the maximum price of
₹ [●] per Equity Share (Cap Price) including any revisions thereof.
The Price Band and the minimum Bid Lot size for the Offer will be decided by our Company, the
Individual Selling Shareholder, and the Investor Selling Shareholders, in consultation with the Book
Running Lead Managers, and will be advertised, at least two Working Days prior to the Bid/Offer
Opening Date, in all editions of Financial Express, an English national daily newspaper and all editions
of Jansatta, a Hindi national daily newspaper (Hindi also being the regional language of New Delhi,
where our Registered and Corporate Office is located), each with wide circulation, and shall be made
available to the Stock Exchanges for the purpose of uploading on their respective websites
Pricing Date The date on which our Company, the Individual Selling Shareholder, and the Investor Selling
Shareholders, in consultation with the Book Running Lead Managers, will finalise the Offer Price
Prospectus The prospectus to be filed with the RoC on or after the Pricing Date in accordance with Section 26 of
the Companies Act, 2013 and the SEBI ICDR Regulations containing, inter alia, the Offer Price that
is determined at the end of the Book Building Process, the size of the Offer and certain other
information, including any addenda or corrigenda thereto
Public Offer Account Bank account to be opened with the Public Offer Bank, under Section 40(3) of the Companies Act,
2013 to receive monies from the Escrow Account and ASBA Accounts on the Designated Date
Public Offer Bank The bank with which the Public Offer Account(s) will be opened, in this case being ICICI Bank
Limited
QIB Portion The portion of the Offer (including the Anchor Investor Portion) being not more than 50% of the Offer
comprising 5,031,972 Equity Shares which shall be allocated to QIBs (including Anchor Investors),
subject to valid Bids being received at or above the Offer Price or Anchor Investor Offer Price
Qualified Institutional Buyers or
QIBs or QIB Bidders
Qualified institutional buyers as defined under Regulation 2(1)(ss) of the SEBI ICDR Regulations
Red Herring Prospectus or RHP This Red herring prospectus to be issued by our Company in accordance with Section 32 of the
Companies Act, 2013 and the provisions of the SEBI ICDR Regulations, which will not have complete
particulars of the Offer Price and the size of the Offer, including any addenda or corrigenda thereto.
This Red Herring Prospectus will be filed with the RoC at least three Working Days before the
Bid/Offer Opening Date and will become the Prospectus upon filing with the RoC after the Pricing
Date
Refund Account Account to be opened with the Refund Bank, from which refunds, if any, of the whole or part of the
Bid Amount to the Bidders shall be made
Refund Bank Bank which is a clearing member and registered with SEBI as a banker to an issue under the SEBI
BTI Regulations and with whom the Refund Account will be opened, in this case being ICICI Bank
Limited
Registered Brokers Stock brokers registered with SEBI and the stock exchanges having nationwide terminals, other than
the members of the Syndicate and eligible to procure Bids in terms of the SEBI circular number
CIR/CFD/14/2012 dated October 4, 2012 issued by SEBI
Registrar Agreement Agreement dated August 31, 2021 entered by and amongst our Company, the Selling Shareholders,
and the Registrar to the Offer, in relation to the responsibilities and obligations of the Registrar
pertaining to the Offer, as amended by an amendment agreement dated November 25, 2021
“Registrar and Share Transfer
Agents” or “RTAs”
Registrar and share transfer agents registered with SEBI and eligible to procure Bids from relevant
Bidders at the Designated RTA Locations as per the list available on the websites of BSE and NSE,
and the UPI Circulars
“Registrar to the Offer” or
“Registrar”
Link Intime India Private Limited
“Retail Individual Bidder(s)” or
“RIB(s)”
Individual Bidders, who have Bid for the Equity Shares for an amount not more than ₹200,000 in any
of the bidding options in the Offer (including HUFs applying through their Karta and Eligible NRIs)
Retail Portion Portion of the Offer being not less than 35% of the Offer consisting of 3,522,381 Equity Shares which
shall be available for allocation to Retail Individual Bidders (subject to valid Bids being received at
or above the Offer Price), basis
Revision Form Form used by the Bidders to modify the quantity of the Equity Shares or the Bid Amount in any of
their Bid cum Application Forms or any previous Revision Form(s), as applicable.
QIB Bidders and Non-Institutional Bidders are not allowed to withdraw or lower their Bids (in terms
of quantity of Equity Shares or the Bid Amount) at any stage. Retail Individual Bidders can revise
their Bids during the Bid/ Offer Period and withdraw their Bids until Bid/Offer Closing Date

9
Term Description
Self-Certified Syndicate Bank(s) or
SCSB(s)
The list of SCSBs notified by SEBI for the ASBA process is available at
http://www.sebi.gov.in/sebiweb/other/OtherAction.do?doRecognised=yes, or at such other website as
may be prescribed by SEBI from time to time. A list of the Designated SCSB Branches with which an
ASBA Bidder (other than a RII using the UPI Mechanism), not Bidding through Syndicate/Sub
Syndicate or through a Registered Broker, RTA or CDP may submit the Bid cum
Application Forms, is available at
https://www.sebi.gov.in/sebiweb/other/OtherAction.do?doRecognisedFpi=yes&intmId=34, or at
such other websites as may be prescribed by SEBI from time to time.
In relation to Bids (other than Bids by Anchor Investor) submitted to a member of the Syndicate, the
list of branches of the SCSBs at the Specified Locations named by the respective SCSBs to receive
deposits of Bid cum Application Forms from the members of the Syndicate is available on the
website of the SEBI
(https://www.sebi.gov.in/sebiweb/other/OtherAction.do?doRecognisedFpi=yes&intmId=35) and
updated from time to time. For more information on such branches collecting Bid cum Application
Forms from the Syndicate at Specified Locations, see the website of the SEBI at
https://www.sebi.gov.in/sebiweb/other/OtherAction.do?doRecognisedFpi=yes&intmId=35as
updated from time to time.
In accordance with SEBI Circular No. SEBI/HO/CFD/DIL2/CIR/P/2019/76 dated June 28, 2019 and
SEBI Circular No. SEBI/HO/CFD/DIL2/CIR/P/2019/85 dated July 26, 2019, Retail Individual
Investors Bidding using the UPI Mechanism may apply through the SCSBs and mobile applications
whose names appears on the website of the SEBI
(https://www.sebi.gov.in/sebiweb/other/OtherAction.do?doRecognisedFpi=yes&intmId=40) and
(https://www.sebi.gov.in/sebiweb/other/OtherAction.do?doRecognisedFpi=yes&intmId=43)
respectively, as updated from time to time
Share Escrow Agent The share escrow agent to be appointed pursuant to the Share Escrow Agreement, namely, Link Intime
India Private Limited.
Share Escrow Agreement Agreement dated December 1, 2021 entered amongst our Company, the Selling Shareholders and the
Share Escrow Agent in connection with the transfer of the respective portion of Offered Shares by the
Selling Shareholders and credit of such Offered Shares to the demat account of the Allottees in
accordance with the Basis of Allotment
Specified Locations Bidding Centres where the Syndicate shall accept Bid cum Application Forms
Sponsor Bank ICICI Bank Limited, being a Banker to the Offer, appointed by our Company to act as a conduit
between the Stock Exchanges and NPCI in order to push the mandate collect requests and / or payment
instructions of the RIBs using the UPI Mechanism and carry out other responsibilities, in terms of the
UPI Circulars
“Syndicate” or “Members of the
Syndicate”
Together, the Book Running Lead Managers and the Syndicate Members
Syndicate Agreement Agreement dated December 1, 2021 entered amongst our Company, the Selling Shareholders, the
Book Running Lead Managers, the Registrar, and the Syndicate Members, in relation to collection of
Bids by the Syndicate
Syndicate Members Intermediaries registered with SEBI, namely Kotak Securities Limited, JM Financial Services
Limited, and Sharekhan Limited
Underwriters [●]
Underwriting Agreement Agreement to be entered amongst our Company, the Selling Shareholders, the Registrar and the
Underwriters to be entered into on or after the Pricing Date but prior to filing of the Prospectus with
the RoC
UPI Unified payments interface which is an instant payment mechanism, developed by NPCI
UPI Circulars SEBI circular number SEBI/HO/CFD/DIL2/CIR/P/2018/138 dated November 1, 2018, SEBI circular
number SEBI/HO/CFD/DIL2/CIR/P/2019/50 dated April 3, 2019, SEBI circular number
SEBI/HO/CFD/DIL2/CIR/P/2019/76 dated June 28, 2019, SEBI circular number
SEBI/HO/CFD/DIL2/CIR/P/2019/85 dated July 26, 2019, SEBI circular number
SEBI/HO/CFD/DCR2/CIR/P/2019/133 dated November 8, 2019, SEBI circular number
SEBI/HO/CFD/DIL2/CIR/P/2020 dated March 30, 2020, SEBI circular number
SEBI/HO/CFD/DIL2/CIR/P/2021/2480/1/M dated March 16, 2021, SEBI circular number
SEBI/HO/CFD/DIL1/CIR/P/2021/47 dated March 31, 2021, SEBI circular number
SEBI/HO/CFD/DIL2/P/CIR/2021/570 dated June 2, 2021 and any subsequent circulars or
notifications issued by SEBI in this regard
UPI ID ID created on the UPI for single-window mobile payment system developed by the NPCI
UPI Mandate Request A request (intimating the RIB by way of a notification on the UPI linked mobile application and by
way of an SMS on directing the RIB to such UPI linked mobile application) to the RIB initiated by
the Sponsor Bank to authorise blocking of funds on the UPI application equivalent to Bid Amount and
subsequent debit of funds in case of Allotment.

10
Term Description
In accordance with SEBI Circular No. SEBI/HO/CFD/DIL2/CIR/P/2019/76 dated June 28, 2019 and
SEBI Circular No. SEBI/HO/CFD/DIL2/CIR/P/2019/85 da ted July 26, 2019, Retail Individual
Investors Bidding using the UPI Mechanism may apply through the SCSBs and mobile applications
whose names appears on the website of the SEBI
(https://www.sebi.gov.in/sebiweb/other/OtherAction.do?doRecognisedFpi=yes&int mId=40) and
(https://www.sebi.gov.in/sebiweb/other/OtherAction.do?doRecognisedFpi=yes&intmId=43)
respectively, as updated from time to time
UPI Mechanism The bidding mechanism that may be used by an RIB in accordance with the UPI Circulars to make an
ASBA Bid in the Issue
Wilful Defaulter A company or person, as the case may be, categorised as a wilful defaulter by any bank or financial
institution or consortium thereof, in accordance with the guidelines on wilful defaulters issued by the
RBI and includes any company whose director or promoter is categorised as such
Working Day All days on which commercial banks in Mumbai are open for business provided however, with
reference to (a) announcement of Price Band and (b) Bid/Offer Period, the term Working Day shall
mean all days, excluding Saturdays, Sundays and public holidays, on which commercial banks in
Mumbai are open for business and (c) the time period between the Bid/ Offer Closing Date and the
listing of the Equity Shares on the Stock Exchanges, “Working Day” shall mean all trading days of
the Stock Exchanges, excluding Sundays and bank holidays, as per circulars issued by SEBI
Technical, industry related terms or abbreviations
Term Description
2D 2-dimensional
2W 2-wheeler
3D 3-dimesional
4D 4-dimensional
4W 4-wheeler
AAI Airports Authority of India
A&M Automotive and Mobility Tech
ACC Adaptive cruise control
ACTIVE Active Company Tagging Identities and Verification
ADAS Advanced driver-assistance Systems
AEB Automatic Emergency Braking
AI Artificial Intelligence
AIS 140 Automotive Industry Standard 140
AMP Automotive Mission Plan
API Application Programming Interface
App Application
AR Augmented Reality
ARAI Automotive Research Association of India
ASP Active Server Pages
ATM Automated Teller Machine
B2B Business to business
B2B2C Business to business to consumer
B2C Business to consumer
BI Business Intelligence
BFSI Banking, Financial Services and Insurance
BVLOS Beyond Visual Line of Sight
C&E Consumer Tech and Enterprise Digital Transformation
CAR Civil Aviation Regulations
CII Confederation of Indian Industry
CMMI Capability Maturity Model Integration

11
Term Description
Contribution Margin Revenue from operations less variable costs. Variable costs are defined as those costs which are directly
related to earning operating revenue
CRM Customer Relationship Management
CSR Corporate Social Responsibility
DaaS Data as a Service
DBRS Dominion Bond Rating Service
DILRMP Digital India Land Records Modernization Programme
DST Guidelines/ Geospatial
Guidelines
Guidelines for acquiring and producing geospatial data and geospatial data services including Maps” dated
February 15, 2021 issued by Department of Science and Technology of the Government of India
EV Electric Vehicle
ESRI Environmental Systems Research Institute
FAME Faster Adoption and Manufacturing of Hybrid and Electric Vehicles in India
FICCI Federation of Indian Chambers of Commerce and Industry
FIFO First-In, First-Out
FMCG Fast-Moving Consumer Goods
FVTPL Fair value through profit or loss
GDP Gross Domestic Product
Geo-AI Geospatial Artificial Intelligence
Geo-CRM Geographic Customer Relationship Management
GIS Geographic Information System
GPS Global Positioning System
GSTN Goods and Service Tax Network
HD High Definition
ICEA Indian Cellular and Electronics Association
ICT Information and Communication Technology
IEC International Electrotechnical Commission
ILIMS Integrated Land Information Management System
IMF International Monetary Fund
IOCC Indian owned or controlled companies
IoT Internet of Things
IP Intellectual Property
IR Information-rich
ISO International Organisation for Standardization
ISRO Indian Space Research Organisation
JRM Journey Risk Management
LiDAR Light Detection and Ranging
MaaS Maps as a service
MilGIS Military Geographic Information System
MGRS GPS and GIS based minefield recording system
ML Machine Learning
MNC Multinational Corporation
MoRTH Ministry of Road, Transport and Highways
NASSCOM National Association of Software and Service Companies
NATRiP National Automotive Testing and R&D Infrastructure Project
N-CASE Navigation and Connected, Autonomous, Shared, Electric mobility
NGDRS National Generic Document Registration System
NITI Aayog National Institution for Transforming India
NPD Non-personal data
NRV Net realisable value

12
Term Description
OEM Original Equipment Manufacturer
OHSAS Occupational Health and Safety Assessment Series
PaaS Platform as a service
PDP Bill Personal Data Protection Bill, 2019
PE Private Equity
PMKSY Pradhan Mantri Kisan Sampada Yojana
POI Point of Interest
PSU Public Sector Undertaking
QSR Quick Service Restaurant
R&D Research and Development
RFID Radio-frequency identification
RS Remote Sensing
SaaS Software as a service
SAE Society of Automotive Engineers
S&P Standard and Poor’s
SBI State Bank of India
SDK Software Development Kit
SIAM Society of Indian Automobile Manufacturers
SUV Sport Utility Vehicle
UAS Unmanned Aero System
UAV Unmanned Air Vehicle
UPI Unified Payment Interface
ULPIN Unique Land Parcel Identification Number
UN United Nations
V2X Vehicle to everything
VC Venture Capital
VLT Vehicle Location Tracking
VR Virtual Reality
WDRA Warehouse Development and Regulatory Authority
Conventional and general terms or abbreviations
Term Description
“₹” or “Rs.” or “Rupees” or
“INR”
Indian Rupees
AGM Annual general meeting
AIF Alternative Investment Fund as defined in and registered with SEBI under the SEBI AIF Regulations
“AS” or “Accounting
Standards”
Accounting standards issued by the ICAI
AY Assessment year
“Bn” or “bn” Billion
BSE BSE Limited
CAGR Compounded annual growth rate
Category I AIF AIFs who are registered as “Category I Alternative Investment Funds” under the SEBI AIF Regulations
Category I FPIs FPIs who are registered as “Category I foreign portfolio investors” under the SEBI FPI Regulations
Category II AIF AIFs who are registered as “Category II Alternative Investment Funds” under the SEBI AIF Regulations
Category II FPIs FPIs who are registered as “Category II foreign portfolio investors” under the SEBI FPI Regulations
Category III AIF AIFs who are registered as “Category III Alternative Investment Funds” under the SEBI AIF Regulations
CDSL Central Depository Services (India) Limited

13
Term Description
CEO Chief Executive Officer
CIN Corporate Identity Number
Companies Act or Companies
Act, 2013
Companies Act, 2013, as applicable, along with the relevant rules, regulations, clarifications, and
modifications framed thereunder
Companies Act, 1956 Companies Act, 1956, along with the relevant rules framed thereunder
Competition Act Competition Act, 2002
CY Calendar Year
Depositories Together, NSDL and CDSL
Depositories Act Depositories Act, 1996
DIN Director Identification Number
DP ID Depository Participant’s Identification
“DP” or “Depository
Participant”
A depository participant as defined under the Depositories Act
DPIIT Department for Promotion of Industry and Internal Trade, Ministry of Commerce and Industry,
Government of India (formerly known as Department of Industrial Policy and Promotion)
EBIT Earnings before interest and taxes
EBITDA Earnings before interest, taxes, depreciation, and amortisation
EGM Extraordinary general meeting
EPS Earnings per share
FDI Foreign direct investment
FDI Policy Consolidated Foreign Direct Investment Policy notified by the DPIIT under DPIIT File Number 5(2)/2020-
FDI Policy dated the October 15, 2020, effective from October 15, 2020
FEMA The Foreign Exchange Management Act, 1999, read with rules and regulations thereunder
FEMA Rules Foreign Exchange Management (Non-debt Instruments) Rules, 2019
FEMA Regulations The FEMA NDI Rules, the Foreign Exchange Management (Mode of Payment and Reporting of Non-
Debt Instruments) Regulations, 2019 and the Foreign Exchange Management (Debt Instruments)
Regulations, 2019, as applicable
“Financial Year” or “Fiscal” or
“Fiscal Year” or “FY”
Unless stated otherwise, the period of 12 months ending March 31 of that particular year
FPI Foreign portfolio investors as defined under the SEBI FPI Regulations
FVCI Foreign venture capital investors as defined and registered under the SEBI FVCI Regulations
GAAP Generally Accepted Accounting Principles
GAAR General anti-avoidance rules
Gazette Official Gazette of India
GDP Gross domestic product
“GoI” or “Government” or
“Central Government”
Government of India
GST Goods and services tax
IBC The Insolvency and Bankruptcy Code, 2016
ICAI The Institute of Chartered Accountants of India
IFRS International Financial Reporting Standards
Income Tax Act The Income-tax Act, 1961
“Ind AS” or “Indian
Accounting Standards”
Indian Accounting Standards notified under Section 133 of the Companies Act and referred to in the
Companies (Indian Accounting Standards) Rules, 2015
India Republic of India
Indian GAAP Generally Accepted Accounting Principles in India
Indian Penal Code The Indian Penal Code, 1860
IPO Initial public offering
IRDAI Insurance Regulatory and Development Authority of India
IRDAI Investment Regulations Insurance Regulatory and Development Authority of India (Investment) Regulations, 2016, as amended
IST Indian Standard Time

14
Term Description
IT Information technology
IT Act The Information Technology, 2000
KYC Know Your Customer
MCA Ministry of Corporate Affairs, Government of India
MIM Multiple Investment Managers
“Mn” or “mn” Million
Mutual Funds Mutual funds registered under the Securities and Exchange Board of India (Mutual Funds) Regulations,
1996
NACH National Automated Clearing House
National Investment Fund National Investment Fund set up by resolution F. No. 2/3/2005-DD-II dated November 23, 2005 of the
GoI, published in the Gazette of India
NBFC Non-Banking Financial Companies
NAV Net asset value
NEFT National Electronic Fund Transfer
Negotiable Instruments Act The Negotiable Instruments Act, 1881
NPCI National Payments Corporation of India
NR Non-resident
NRE Account Non-resident external rupee account
NRI Person resident outside India, who is a citizen of India or a person of Indian origin, and shall have the
meaning ascribed to such term in the Foreign Exchange Management (Deposit) Regulations, 2016 or an
overseas citizen of India cardholder within the meaning of Section 7(A) of the Citizenship Act, 1955
NRO Account Non-resident ordinary account
NSDL National Securities Depository Limited
NSE National Stock Exchange of India Limited
“OCB” or “Overseas Corporate
Body”
A company, partnership, society or other corporate body owned directly or indirectly to the extent of at
least 60% by NRIs including overseas trusts, in which not less than 60% of beneficial interest is irrevocably
held by NRIs directly or indirectly and which was in existence on October 3, 2003 and immediately before
such date had taken benefits under the general permission granted to OCBs under FEMA. OCBs are not
allowed to invest in the Offer
ODI Off-shore Derivate Instruments
p.a. Per annum
P/E Ratio Price to Earnings Ratio
PAN Permanent Account Number
PAT Profit after tax
RBI Reserve Bank of India
RBI Act The Reserve Bank of India Act, 1934
RoCE Return on capital employed
RoE Return on equity
Regulation S Regulation S under the U.S. Securities Act
RoNW Return on Net Worth
RTGS Real Time Gross Settlement
SCRA Securities Contracts (Regulation) Act, 1956
SCRR Securities Contracts (Regulation) Rules, 1957
SEBI Securities and Exchange Board of India constituted under the SEBI Act
SEBI Act Securities and Exchange Board of India Act, 1992
SEBI AIF Regulations Securities and Exchange Board of India (Alternative Investment Funds) Regulations, 2012
SEBI BTI Regulations Securities and Exchange Board of India (Bankers to an Issue) Regulations, 1994
SEBI FPI Regulations Securities and Exchange Board of India (Foreign Portfolio Investors) Regulations, 2019
SEBI FVCI Regulations Securities and Exchange Board of India (Foreign Venture Capital Investors) Regulations, 2000
SEBI ICDR Regulations Securities and Exchange Board of India (Issue of Capital and Disclosure Requirements) Regulations, 2018

15
Term Description
SEBI Listing Regulations Securities and Exchange Board of India (Listing Obligations and Disclosure Requirements) Regulations,
2015
SEBI Merchant Bankers
Regulations
Securities and Exchange Board of India (Merchant Bankers) Regulations, 1992
SEBI SBEBSE Regulations Securities and Exchange Board of India (Share Based Employee Benefits and Sweat Equity) Regulations,
2021
SEBI Takeover Regulations Securities and Exchange Board of India (Substantial Acquisition of Shares and Takeovers) Regulations,
2011
Stamp Act The Indian Stamp Act, 1899
State Government The government of a state in India
Stock Exchanges BSE and NSE
STT Securities transaction tax
Systemically Important NBFC Systemically important non-banking financial company as defined under Regulation 2(1)(iii) of the SEBI
ICDR Regulations
TAN Tax deduction account number
Trusts Act The Indian Trusts Act, 1882
U.S. Securities Act U.S. Securities Act of 1933, as amended
“U.S.” or “USA” or “United
States”
United States of America
“USD” or “US$” United States Dollars
VCFs Venture Capital Funds as defined in and registered with SEBI under the SEBI VCF Regulations

16
CERTAIN CONVENTIONS, PRESENTATION OF FINANCIAL, INDUSTRY AND MARKET DATA
Certain Conventions
All references to “India” contained in this Red Herring Prospectus are to the Republic of India and its territories and possessions
and all references herein to the “Government”, “Indian Government”, “GoI”, “Central Government” or the “State Government”
are to the Government of India, central or state, as applicable. All references to the “U.S.”, “US”, “U.S.A” or “United States”
are to the United States of America and its territories and possessions.
Unless otherwise specified, any time mentioned in this Red Herring Prospectus is in Indian Standard Time (“IST”). Unless
indicated otherwise, all references to a year in this Red Herring Prospectus are to a calendar year.
Unless stated otherwise, all references to page numbers in this Red Herring Prospectus are to the page numbers of this Red
Herring Prospectus.
Financial Data
Unless stated otherwise, the financial information and financial ratios in this Red Herring Prospectus have been derived from
our Restated Consolidated Financial Information. For further information, see “Financial Information” beginning on page 193.
Restated Consolidated Financial Information consists of restated consolidated statements of assets and liabilities as at
September 30, 2021 and September 30, 2020, and as at March 31, 2021, March 31, 2020 and March 31, 2019 and the restated
consolidated statements of profit and loss, cash flow statement and changes in equity for the six month period ended September
30, 2021 and September 30, 2020 and for the year ended March 31, 2021, March 31, 2020 and March 31, 2019 of our Company
together with the statement of significant accounting policies, and other explanatory information thereon, derived from the
audited consolidated financial statements of our Company as at and for the six month period ended September 30, 2021 and
September 30, 2020 and for the years ended March 31, 2021, March 31, 2020 and March 31, 2019, together with the annexures
and notes thereto, and the examination report thereon, prepared in accordance with Ind AS, and restated in accordance with the
SEBI ICDR Regulations and the Guidance Note on “Reports in Company Prospectuses (Revised 2019)” issued by the ICAI.
Our Company’s financial year commences on April 1 and ends on March 31 of the next year. Accordingly, all references in
this Red Herring Prospectus to a particular Financial Year, Fiscal or Fiscal Year, unless stated otherwise, are to the 12-month
period ended on March 31 of that particular calendar year.
There are significant differences between Ind AS, U.S. GAAP and IFRS. Our Company does not provide reconciliation of its
financial information to IFRS or U.S. GAAP. Our Company has not attempted to explain those differences or quantify their
impact on the financial data included in this Red Herring Prospectus and it is urged that you consult your own advisors regarding
such differences and their impact on our financial data. Accordingly, the degree to which the financial information included in
this Red Herring Prospectus will provide meaningful information is entirely dependent on the reader’s level of familiarity with
Indian accounting policies and practices, the Companies Act, Ind AS, and the SEBI ICDR Regulations. Any reliance by persons
not familiar with Indian accounting policies and practices on the financial disclosures presented in this Red Herring Prospectus
should accordingly be limited. For risks relating to significant differences between Ind AS and other accounting principles, see
“Risk Factors – Our Company has prepared financial statements under Ind AS. Significant differences exist between Ind AS
and other accounting principles” beginning on page 52.
Unless the context otherwise indicates, any percentage amounts (excluding certain operational metrics), relating to the financial
information of our Company in “Risk Factors”, “Basis for Offer Price”, “Our Business”, “Other Financial information”,
“Capitalisation Statement” and “Management’s Discussion and Analysis of Financial Conditional and Results of Operations”
beginning on pages 30, 87, 132, 193, 246 and 247, respectively, have been calculated on the basis of our Restated Consolidated
Financial Information.
Non-GAAP Financial Measures
Certain non-GAAP financial measures relating to our financial performance such as, EBITDA, EBITDA margin, RoCE, RoE,
return on net worth, working capital, net worth, net asset value per share and debt equity ratio have been included in this Red
Herring Prospectus. We compute and disclose such non-GAAP financial measures relating to our financial performance as we
consider such information to be useful measures of our business and financial performance. These non-GAAP financial
measures and other information relating to financial performance may not be computed on the basis of any standard
methodology that is applicable across the industry and therefore may not be comparable to financial measures of similar
nomenclature that may be computed and presented by other companies and are not measures of operating performance or
liquidity defined by Ind AS and may not be comparable to similarly titled measures presented by other companies.

17
Currency and Units of Presentation
All references to:
• “Rupees” or “₹” or “INR” or “Rs.” are to Indian Rupee, the official currency of the Republic of India;
• “USD” or “US$” are to United States Dollar, the official currency of the United States; and
• “EUR” or “€” are to EURO, the official currency of the Eurozone
Our Company has presented certain numerical information in this Red Herring Prospectus in “million” units. One million
represents 1,000,000 and one billion represents 1,000,000,000.
However, where any figures that may have been sourced from third-party industry sources are expressed in denominations other
than millions, such figures appear in this Red Herring Prospectus in such denominations as provided in the respective sources.
In this Red Herring Prospectus, any discrepancies in any table between the total and the sums of the amounts listed are due to
rounding off. All figures derived from our Restated Consolidated Financial Information in decimals have been rounded off to
the second decimal and all percentage figures have been rounded off to one decimal place. However, where any figures may
have been sourced from third-party industry sources, such figures may be rounded off to such number of decimal places as
provided in such respective sources.
Exchange Rates
This Red Herring Prospectus contains conversion of certain other currency amounts into Indian Rupees that have been presented
solely to comply with the SEBI ICDR Regulations. These conversions should not be construed as a representation that these
currency amounts could have been, or can be converted into Indian Rupees, at any particular rate.
We have translated certain Rupee amounts included in this Red Herring Prospectus into US$. Unless otherwise indicated, all
financial information that is presented in US$ in this Red Herring Prospectus has been translated from Rupees using the
exchange rate of US$ 1.00 = ₹ 73.51 as of March 31, 2021, as reported by the RBI and the Financial Benchmarks India Private
Limited (the “FBIL”), and available on the website of the RBI and FBIL. The US$ equivalent information presented in this
Red Herring Prospectus is provided solely for the convenience of the reader and should not be construed as implying that the
Rupee amounts represent, could be or could have been converted into US$ at that rate or at any rate at all.
The following table sets forth, for the periods indicated, information with respect to the exchange rate between the Rupee and
the US$ (in Rupees per US$):
(amount in ₹, unless otherwise specified) Currency As at*
September 30, 2021 September 30, 2020 March 31, 2021 March 31, 2020 March 31, 2019
1 USD 74.26 73.80 73.51 75.39 69.17 (Source: www.rbi.org.in) * If the RBI reference rate is not available on a particular date due to a public holiday, exchange rates of the previous working day have been disclosed.
Industry and Market Data
Unless stated otherwise, industry and market data used in this Red Herring Prospectus has been obtained or derived from the
report titled “Digital Maps and Location Intelligence Technology & Service Market - B2B(2C) for India & World” dated
October 27, 2021 prepared by Frost & Sullivan (“F&S Report”) which report has been commissioned and paid for, by our
Company for the purposes of confirming our understanding of the industry in connection with the Offer and publicly available
information as well as other industry publications and sources.
Industry publications generally state that the information contained in such publications has been obtained from publicly
available documents from various sources believed to be reliable, but their accuracy and completeness are not guaranteed, and
their reliability cannot be assured. Accordingly, no investment decisions should be based on such information. The data used
in these sources may have been re-classified by us for the purposes of presentation. Data from these sources may also not be
comparable. Such data involves risk, uncertainties, and assumptions, and is subject to change based on various factors.
Accordingly, investment decisions should not be based solely on such information. For details in relation to the risks involving
the F&S Report, see “Risk Factors – Certain sections of this Red Herring Prospectus disclose information from the industry
report which has been commissioned and paid for by us exclusively in connection with the Offer and any reliance on such
information for making an investment decision in the Offer is subject to inherent risks” beginning on page 48.
The extent to which the market and industry data used in this Red Herring Prospectus is meaningful depends on the reader’s
familiarity with and understanding of the methodologies used in compiling such data. There are no standard data gathering

18
methodologies in the industry in which business of our Company is conducted, and methodologies and assumptions may vary
widely among different industry sources.
Disclaimer of Frost & Sullivan
This Red Herring Prospectus contains data and statistics from certain reports and the F&S Report, which is subject to the
following disclaimer:
“Digital Maps and Location Intelligence Technology & Service Market - B2B(2C) for India & World” has been prepared for
the proposed initial public offering of equity shares by C.E. Info Systems Limited (the “Company”).
This study has been undertaken through extensive primary and secondary research, which involves discussing the status of the
industry with leading market participants and experts, and compiling inputs from publicly available sources, including official
publications and research reports. Estimates provided by Frost & Sullivan (India) Private Limited (“Frost & Sullivan”) and its
assumptions are based on varying levels of quantitative and qualitative analyses, including industry journals, company reports and
information in the public domain.
Frost & Sullivan has prepared this study in an independent and objective manner, and it has taken all reasonable care to ensure
its accuracy and completeness. We believe that this study presents a true and fair view of the industry within the limitations of,
among others, secondary statistics and primary research, and it does not purport to be exhaustive. The results that can be or are
derived from these findings are based on certain assumptions and parameters/conditions. As such, a blanket, generic use of the
derived results or the methodology is not encouraged.
Forecasts, estimates, predictions, and other forward-looking statements contained in this report are inherently uncertain because
of changes in factors underlying their assumptions, or events or combinations of events that cannot be reasonably foreseen. Actual
results and future events could differ materially from such forecasts, estimates, predictions, or such statements.
In making any decision regarding the transaction, the recipient should conduct its own investigation and analysis of all facts and
information contained in the prospectus of which this report is a part and the recipient must rely on its own examination and the
terms of the transaction, as and when discussed. The recipients should not construe any of the contents in this report as advice
relating to business, financial, legal, taxation or investment matters and are advised to consult their own business, financial, legal,
taxation, and other advisors concerning the transaction.”

19
FORWARD-LOOKING STATEMENTS
This Red Herring Prospectus contains certain “forward-looking statements”. These forward-looking statements generally can
be identified by words or phrases such as “aim”, “anticipate”, “are likely”, “believe”, “expect”, “estimate”, “intend”,
“objective”, “plan”, “propose”, “project”, “seek”, “will”, “will continue”, “will pursue” or other words or phrases of similar
import. Similarly, statements that describe our strategies, objectives, plans, or goals are also forward-looking statements. All
forward-looking statements are subject to risks, uncertainties, expectations, and assumptions about us that could cause actual
results to differ materially from those contemplated by the relevant forward-looking statement.
Actual results may differ materially from those suggested by forward-looking statements due to risks or uncertainties associated
with expectations relating to and including, regulatory changes pertaining to the industries in India and other overseas
jurisdictions in which we operate and our ability to respond to them, our ability to successfully implement our strategy, our
growth and expansion, technological changes, our exposure to market risks, general economic and political conditions in India
which have an impact on its business activities or investments, the monetary and fiscal policies of India, inflation, deflation,
unanticipated turbulence in interest rates, foreign exchange rates, equity prices or other rates or prices, the performance of the
financial markets in India and globally, changes in domestic laws, regulations and taxes and changes in competition in the
industries in which we operate.
Certain important factors that could cause actual results to differ materially from our expectations include, but are not limited
to, the following:
• The Offer Price, market capitalization to revenue multiple, and price to earnings ratio based on the Offer Price of our
Company may not be indicative of the market price of the Equity Shares upon listing or thereafter;
• Our dependence on trends in the sectors where our enterprise customers operate;
• Dependence of our business on the performance of the automotive sector and any adverse changes affecting the
automotive sector;
• Inability to maintain or update our map database or errors in our map database which could harm our reputation and
affect our ability to sell our products and services; and
• Dependence on the success of our R&D and failure to develop new or improved products and services or process
improvements or updating of map data resulting in a negative impact on our competitive position.
For further details regarding factors that could cause actual results to differ from expectations, see “Risk Factors”, “Our
Business” and “Management’s Discussion and Analysis of Financial Condition and Results of Operations” beginning on pages
30, 132 and 247, respectively. By their nature, certain market risk disclosures are only estimates and could be materially
different from what actually occurs in the future. As a result, actual gains or losses could materially differ from those that have
been estimated.
There can be no assurance to Bidders that the expectations reflected in these forward-looking statements will prove to be correct.
Given these uncertainties, Bidders are cautioned not to place undue reliance on such forward-looking statements and not to
regard such statements to be a guarantee of our future performance.
Forward-looking statements reflect current views as of the date of this Red Herring Prospectus and are not a guarantee of future
performance. These statements are based on our management’s beliefs and assumptions, which in turn are based on currently
available information. Although we believe the assumptions upon which these forward-looking statements are based are
reasonable, any of these assumptions could prove to be inaccurate, and the forward-looking statements based on these
assumptions could be incorrect. Neither our Company, our Promoters, our Directors, the Selling Shareholders, the Syndicate
nor any of their respective affiliates have any obligation to update or otherwise revise any statements reflecting circumstances
arising after the date hereof or to reflect the occurrence of underlying events, even if the underlying assumptions do not come
to fruition.
In accordance with the SEBI ICDR Regulations, our Company and the Book Running Lead Managers will ensure that the
Bidders in India are informed of material developments from the date of this Red Herring Prospectus until the time of the grant
of listing and trading permission by the Stock Exchanges for the Offer.
In accordance with regulatory requirements including requirements of SEBI and as prescribed under applicable law, each of
the Selling Shareholders shall, severally and not jointly, ensure that the Bidders in India are informed of material developments
from the date of this Red Herring Prospectus, in relation to statements and undertakings specifically undertaken or confirmed
by it in relation to itself and its respective portion of the Offered Shares in this Red Herring Prospectus until the time of the
grant of listing and trading permission by the Stock Exchanges.

20
SUMMARY OF THE OFFER DOCUMENT
The following is a general summary of the terms of the Offer and is not exhaustive, nor does it purport to contain a summary
of all the disclosures in this Red Herring Prospectus or all details relevant to prospective investors. This summary should be
read in conjunction with, and is qualified in its entirety by, the more detailed information appearing in “Risk Factors”, “The
Offer”, “Capital Structure”, “Objects of the Offer”, “Industry Overview”, “Our Business”, “Our Promoters and Promoter
Group”, “Restated Consolidated Financial Information”, “Offer Procedure”, “Outstanding Litigation and Material
Developments” and “Main Provisions of Articles of Association” beginning on pages 30, 56, 70, 85, 92, 132, 185, 193, 298,
273, and 315 respectively.
Summary of the business of our Company
We are a data and technology products and platforms company, offering proprietary digital maps as a service, software as a
service and platform as a service. As per the F&S Report (commissioned and paid for by our Company exclusively for the
purpose of the Offer), we are India’s leading provider of advanced digital maps, geospatial software and location-based IoT
technologies. We provide products, platforms, APIs and solutions across a range of digital map data, software and IoT under
the MapmyIndia and Mappls brands to marquee and renowned global tech giants, new-age consumer IT companies, leading
automotive manufacturers, large businesses across industry segments including BFSI, telecom, FMCG, logistics and key
government organisations.
Summary of the industry in which our Company operates (Source: F&S Report)
As per the F&S Report (commissioned and paid for by our Company exclusively for the purpose of the Offer), the digital maps
and location intelligence services market consists of (i) digital maps services market, and (ii) navigation solutions and telematics
market, delivered in a B2B and a B2B2C setting. The total Indian addressable market of digital maps and location-based
intelligence services is expected to grow to USD 7.74 billion (` 474.9 billion) in 2025 at around 15.5% CAGR from 2019 to
2025. The total global addressable market is expected to reach around USD 173.61 billion (`12.9 trillion) by 2025 growing at
a CAGR (2019-2025) of 13%. (Source: F&S Report)
Our Promoters
Rakesh Kumar Verma and Rashmi Verma are our Promoters. For details, see “Our Promoters and Promoter Group” beginning
on page 185.
Offer Size
Offer for Sale of up to 10,063,945 Equity Shares for cash at a price of ₹[●] per Equity Share aggregating up to ₹[●] million.
The Offer shall constitute 18.90% of the post-Offer paid-up Equity Share capital of our Company. For further details, see “Offer
Structure” beginning on page 296.
Objects of the Offer
The objects of the Offer are to (i) to carry out the Offer for Sale of up to 10,063,945 Equity Shares aggregating up to ₹ [●]
million by the Selling Shareholders; and (ii) achieve the benefits of listing the Equity Shares on the Stock Exchanges.
For further details, see “Objects of the Offer” beginning on page 85.
Aggregate pre-Offer Shareholding of our Promoters, Promoter Group, and the Selling Shareholders
a) Promoters and Promoter Group
S. No. Category of Shareholders No. of Equity Shares % of total pre-Offer paid up
Equity Share capital
Promoters
1. Rakesh Kumar Verma 23,163,080 43.50
2. Rashmi Verma 9,404,633 17.66
Promoter Group
1. Rohan Verma 284,786 0.53
2. Rakhi Prasad 3,133 0.01
3. Rupa Amitabh 666 Negligible
Total 35,856,298 61.70

21
b) Selling Shareholders
S. No. Name of Shareholder No. of Equity Shares % of total pre-Offer paid up
Equity Share capital
Individual Selling Shareholder
1. Rashmi Verma 9,404,633 17.66
Investor Selling Shareholders
1. Qualcomm 2,701,407 5.07
2. Zenrin 4,673,719 8.78
Other Selling Shareholders
1. Harshad Dholakia 7,333 0.01
2. Jaya Jaipuriar 2,000 Negligible
3. Jaya Kumar 30,573 0.06
4. Manpreet Sukhija (Gaba) 20,993 0.04
5. Nayan Arun Jagjivan 1,983,633 3.73
6. Ranjan P.N. 33,413 0.06
7. Sapna Ahuja 103,826 0.20
Total 18,961,530 35.61
Summary of Restated Consolidated Financial Information
The following details are derived from the Restated Consolidated Financial Information:
(in ₹million other than share data) Particulars As at and for
the six month
period ended
September 30,
2021
As at and for
the six month
period ended
September 30,
2020
As at and for
the Financial
Year ended
March 31,
2021
As at and for
the Financial
Year ended
March 31,
2020
As at and for
the Financial
Year ended
March 31,
2019
Equity Share capital 79.86 1,327.96 1,327.96 1,327.96 1,327.96
Net worth (equity attributable to the owners) 4,061.59 3,162.96 3,579.97 2,977.39 2,851.99
Total income 1,225.79 739.37 1,922.74 1,634.78 1633.35
Profit after tax (attributable to owners) 467.66 178.62 594.33 231.95 335.66
Basic and diluted earnings per share (₹/ share)
- Basic (in ₹) 8.78 3.40 11.30 4.41 6.38
- Diluted (in ₹) 8.61 3.30 10.99 4.27 6.19
Net asset value per Equity Share (basic) (in ₹) 76.28 60.15 68.08 56.62 54.24
Total borrowings (as per balance sheet) Nil 7.38 5.90 8.80 0.00
EBITDA 461.23 144.12 543.24 371.87 404.60 Notes:
a) The ratios have been computed as under:
1. Basic and diluted earnings per equity share: Basic and diluted earnings per equity share are computed in accordance with Indian Accounting Standard 33 notified under the Companies (Indian Accounting Standards) Rules of 2015 (as amended).
2. EBITDA: EBITDA stands for Restated profit/ (loss) for the year + tax expense + exceptional items+ Finance costs + depreciation and amortization
– other income. 3. “Total Net worth” means aggregate of share capital, other equity and non-controlling interest.
(b) Pursuant to Board and Shareholders’ resolutions dated October 5, 2021 and October 7, 2021, respectively, our Company allotted 13,310,742 Equity
Shares as bonus shares on October 7, 2021 to the existing Shareholders of the Company, whose names appear in the Register of Members as on October 5, 2021 (“Record Date”) in the ratio of 1:3 i.e., one new bonus Equity Share for every three existing fully paid-up Equity Share held by them as on the
Record Date. For details, see “Capital Structure – Equity Share capital history of our Company” beginning on page 70.
For details, see “Restated Consolidated Financial Information” on page 194.
Qualifications of the Statutory Auditors which have not been given effect to in the Restated Consolidated Financial
Information
The Restated Consolidated Financial Information does not contain any qualifications by the Statutory Auditors.
Summary of Outstanding Litigation
A summary of outstanding litigation proceedings involving our Company and Promoters, as on the date of this Red Herring
Prospectus, is provided below:
Name of Entity Criminal
Proceedings
Tax Proceedings Statutory or
Regulatory
Proceedings
Disciplinary actions
by the SEBI or Stock
Exchanges against
our Promoters
Material Civil
Litigations
Aggregate amount
involved (` in
million) (to the extent
quantifiable)

22
Company
By the Company 1 Nil Nil Not applicable Nil Nil
Against the
Company
Nil Nil Nil Not applicable Nil Nil
Directors
By the Directors Nil Nil Nil Not applicable Nil Nil
Against the Directors Nil Nil Nil Not applicable Nil Nil
Promoters
By the Promoters 1 Nil Nil Nil Nil Nil
Against the
Promoters Nil Nil Nil Nil Nil Nil
Subsidiaries
By the
Subsidiaries Nil Nil Nil Not applicable Nil Nil
Against the
Subsidiaries Nil Nil Nil Not applicable Nil Nil
Note:
1) Our Company received a legal notice dated September 14, 2021 from a former employee of our Company, Konark Singhal alleging
that he has a right to exercise his vested options and accordingly, subscribe to 9,675 Equity Shares under the ESOP 2008. For
further details see Outstanding Litigation and Material Developments – Litigation involving our Company – Litigation by our
Company – Complaints received during the Offer on page 274.
As on the date of this Red Herring Prospectus, there are no outstanding litigation proceedings involving our Group Companies
which may have a material impact on our Company as on the date of this Red Herring Prospectus.
For further details of the outstanding litigation proceedings involving our Company and Promoters, see “Outstanding Litigation
and Material Developments” beginning on page 273.
Risk Factors
A summary of the top five risk factors is provided below:
1. The Offer Price, market capitalization to revenue multiple, and price to earnings ratio based on the Offer Price of
our Company may not be indicative of the market price of the Equity Shares upon listing or thereafter.
The consolidated revenue from operations for Financial Year 2021 and the six month period ended September 30,
2021 was `1,524.63 million and ₹ 1,000.27 million, respectively. The profit after tax of our Company for Financial
Year 2021 and the six month period ended September 30, 2021 was ̀ 594.33 million and ₹467.66 million, respectively.
The market capitalization to revenue (for Financial Year 2021) is [●] times and Price to Earnings Ratio (based on
profit after tax for Financial Year 2021) is [●], at the upper end of the Price Band. The Offer Price of the Equity Shares
is proposed to be determined on the basis of assessment of market demand for the Equity Shares offered through a
book-building process, and certain quantitative and qualitative factors as set out in “Basis for Offer Price” on page 87,
and the Offer Price and such multiples and ratios may not be indicative of the market price of the Equity Shares upon
listing or thereafter.
2. We are dependent on trends in the sectors where our enterprise customers operate.
Our revenue from operations can be significantly affected by a downturn trend or disruptions in the industries where
our customers operate. Negative sentiments or downturn in global macroeconomic conditions or disruption in business
activities can impact our customers, which in turn can impact our sales to our customers. We have particular exposure
to cyclical trends in the industries in which our enterprise consumers operate, such as automotive industries, logistics,
BFSI and FMCG. If economic growth and recovery in the sectors in which our customers operate does not take place
over an extended period of time, our business, results of operations or financial condition may be adversely affected.
3. A part of our business is dependent on the performance of the automotive sector, including in our key market,
India. Any adverse changes in the conditions affecting the sector can adversely impact our business, results of
operations and financial condition.
We are exposed to fluctuations in the performance of the automotive markets, particularly in India, and cannot assure
you that the demand for our products in India will grow, or will not decrease, in the future. Our income from our
automotive customers is cyclical because our sales are directly dependent on the level of automotive production and
affected by inventory levels of automotive manufacturers, and the length and timing of any cycle in the automotive
industry cannot be predicted with certainty. Reduced demand in the market segments we currently supply, deterioration
in the automotive market, continued uncertainty and other unexpected fluctuations or change in regulations, customs,
taxes or other barriers or restrictions adversely affecting the automotive market, particularly in India, and our inability

23
to expand our revenue base from other sectors, may have an adverse impact on our business, results of operations and
financial condition.
4. Our inability to maintain or update our map database or errors in our map database could harm our reputation or
adversely affect our ability to sell our products and services.
Our map database requires constant maintenance and updating. There is no assurance that our procedures and
programmes for maintaining and updating our digital map database will be sufficient to maintain the standard of quality
expected by our customers. The quality of our products and the success of our business are dependent upon the
availability and accuracy of the data, including from third party and community of users, and prices at which our third-
party suppliers provide us access to their map data. If we are unable to provide accurate and updated map data and
related services or if our map database becomes outdated, it could require us to expend significant costs and manpower
and reduce our sales, which could result in an adverse effect on our business, results of operations or financial
condition.
5. We are dependent on the success of our research and development (“R&D”) and the failure to develop competitive
new or improved products and services or process improvements or updated map data could adversely affect our
business, financial condition and results of operations and have a negative impact on our competitive position.
Our future growth depends on our ability to continue to develop and commercialize innovative, viable and sustainable
new geo-spatial software, APIs, SDKs and high definition maps and other solutions offerings in a timely and cost-
effective manner, improve our existing systems and components, or to develop process improvements that can improve
time, quality and cost efficiency. Our inability to accurately estimate the cost to design, develop and launch new
offerings could result in our failure to effectively manage our customers’ expectations. If we are unable to bring enough
offerings or services to market, or if offerings are brought to market after competing offerings are commercialized,
our growth strategy may not be successful, and our business would be adversely affected.
6. Any inability to protect our intellectual property or any third-party claims in relation to infringement of intellectual
property rights or in the future could adversely affect our business, reputation, financial condition, results of
operations and cash flows.
We rely on a wide portfolio of IP to operate our businesses. We may not be able to effectively protect these against
infringement or safeguard our IP in a cost-efficient manner. Any unauthorised use of our IP by any third party or any
attempt by a third party to pass-off products or services as ours or any third-party IP which may be misconstrued as
ours, intentionally or unintentionally, may dilute the value of our content offerings and the IP in such offerings. Any
legal action or litigation initiated by us for enforcement of our rights in such intellectual property may be time
consuming and costly. We may also receive claims that we have infringed the intellectual property rights of third
parties.
For details in relation to above the risk factors and certain other risks applicable to us, see “Risk Factors” beginning on page
30.
Summary of contingent liabilities
A summary table of our contingent liabilities as of September 30, 2021 as provided for in the Restated Consolidated Financial
Information is set forth below:
(in ₹ million)
Particulars As at September 30,
2021
Financial Year 2021 Financial Year 2020 Financial Year 2019
Bank guarantees 25.62 35.67 30.92 26.99
For further details, see “Financial Information” and “Management’s Discussion and Analysis of Financial Condition and
Results of Operations – Contingent Liabilities” on pages 193 and 269.
Summary of Related Party Transactions
A summary of related party transactions as per the requirements under Ind AS 24 entered into by our Company with related
parties as at and for the six month period ended September 30, 2021 and September 30, 2020 and financial years ended March
31, 2021, March 31, 2020 and March 31, 2019 are as follows:
(in ₹ million)

24
Particulars Period ended
S.
No.
Name of Related
Party
Nature of relationship Nature of transaction Six month
period
ended
September
30, 2021
Six month
period
ended
September
30, 2020
Financial
Year
ended
March
31, 2021
Financial
Year
ended
March
31, 2020
Financial
Year
ended
March
31, 2019
1. Spinclabs Private
Limited
Entities having common
director
Rent income - 0.01 0.01 0.03 0.10
2. Spinclabs Private
Limited
Entities having common
director
Sale of services 0.13 0.04 0.32 0.15 (4.60)
3. Spinclabs Private
Limited
Entities having common
director
Sale of goods - - - 0.02 1.10
4. Spinclabs Private
Limited
Entities having common
director
Sales return - - - - 6.47
5. Spinclabs Private
Limited
Entities having common
director
Sale of fixed assets - - 0.72 1.20 -
6. Spinclabs Private
Limited
Entities having common
director
Field survey expenses - - - 9.10 24.60
7. Spinclabs Private
Limited
Entities having common
director
Professional charges - 20.00 40.00 40.00 -
8. Cholamandalam
Investment and
Finance Company
Ltd
Entities having common
director
Sale of services - - - 0.54 -
9. Rakhi Prasad Director cum shareholder Professional charges 1.20 - - - -
10. Rakesh Kumar
Verma
Director cum shareholder Salary and allowances 37.50 25.00 30.00 39.64 38.40
11. Rashmi Verma Director cum shareholder Salary and allowances 37.50 25.00 30.00 39.64 37.20
12. Rohan Verma Director cum shareholder Salary and allowances 27.50 26.50 33.00 9.60 0.40
13. Shivalik Prasad Director cum shareholder Salary and allowances - - - 33.28 27.20
14. Rakesh Kumar
Verma
Director cum shareholder Rent expense 1.10 0.58 1.24 0.39 -
15. Rashmi Verma Director cum shareholder Rent expense - 0.80 1.44 1.44 1.20
Transactions within the Group: (these transactions got eliminated in Restated Consolidated financial information)
(As per Schedule VI (Para 11(I)(A)(i)(g)) of the SEBI ICDR Regulations)
(in ₹ million) Particulars Period ended
Name of Related Party Nature of Transaction Six month
period ended
September
30, 2021
Six month
period ended
September
30, 2020
Financial
Year ended
March 31,
2021
Financial
Year ended
March 31,
2020
Financial
Year ended
March 31,
2019
CE Info Systems international Inc Investment in Subsidiary - - - 56.30 15.40
CE Info Systems international Inc Sale of services 11.72 - 8.84 - -
Videteq (India) Private Limited Technical expenses 5.23 12.77 25.55 - 15.00
Videteq (India) Private Limited Rent income 0.06 0.09 0.12 0.10 1.80
For details of the related party transactions and as reported in the Restated Consolidated Financial Information, see “Restated
Consolidated Financial Information – Note 31” on page 233.
Issuances of Equity Shares made in the last one year for consideration other than cash or by way of bonus issue
Except has disclosed below, our Company has not issued any Equity Shares through bonus issue or for consideration other than
cash in the one year preceding the date of this Red Herring Prospectus:
Pursuant to Board and Shareholders resolutions dated October 5, 2021 and October 7, 2021, respectively, our Company issued
13,310,742 Equity Shares through a bonus issue in the ratio of 1:3, i.e., one Equity Share for every three Equity Shares held by
the Shareholders whose names appear in the register of members as on October 5, 2021. For details, see “Capital Structure –
Notes to the Capital Structure - Equity Share capital history of our Company” beginning on page 70.
Financing Arrangements
There have been no financing arrangements whereby the Promoters, members of the Promoter Groups, our Directors, and their
relatives have financed the purchase by any other person of securities of our Company (other than in the normal course of the
business of the relevant financing entity) during a period of six months immediately preceding the date of filing of this Red
Herring Prospectus.

25
Details of price at which specified securities were acquired in the last three years preceding the date of this Red Herring
Prospectus
S. No. Name of the
acquirer/shareholder
Date of acquisition of Equity
Shares
Number of Equity Shares
acquired
Acquisition price per Equity
Share
Promoters
1. Rakesh Verma October 7, 2021 1,877,485 -#
2. Rashmi Verma
(Individual Selling
Shareholder)
October 7, 2021 2,351,158 -#
3. Rakesh Verma November 25, 2021 9,028,540 94.875
4. Rakesh Verma November 25, 2021 1,812,133 94.50
5. Rakesh Verma November 25, 2021 4,812,467 94.50
Promoter Group
1. Rohan Verma June 3, 2021 38,708 81
2. Rakhi Prasad October 7, 2021 783 -#
3. Rohan Verma October 7, 2021 71,196 -#
4. Rupa Amitabh October 7, 2021 166 -#
Investor Selling Shareholders
1. Zenrin October 7, 2021 2,371,546 -#
2. Qualcomm October 7, 2021 1,128,385 -#
Other Selling Shareholders
1. Ranjan P.N. July 7, 2021 5,808 81
2. Sapna Ahuja July 7, 2021 12,006 81
3. Jaya Kumar July 7, 2021 1,752 81
4. Harshad Dholakia October 7, 2021 1,833 -#
5. Jaya Jaipuriar October 7, 2021 500 -#
6. Jaya Kumar October 7, 2021 7,643 -#
7. Manpreet Sukhija
(Gaba)
October 7, 2021 5,248 -#
8. Nayan Arun Jagjivan October 7, 2021 4,95,908 -#
9. Ranjan P.N. October 7, 2021 11,686 -#
10. Sapna Ahuja October 7, 2021 25,956 -#
Shareholders with nominee director rights or other rights
1. PhonePe India October 1, 2021 7,648,475 126.50
2. PhonePe India October 7, 2021 2,549,491 -#
3. PhonePe Singapore September 21, 2021 3,503,740 -
4. PhonePe Singapore September 21, 2021 4,691,630 -
5. PhonePe Singapore September 21, 2021 2,704,860 -
6. PhonePe Singapore* September 21, 2021 243,430 -
7. PhonePe Singapore October 7, 2021 22,57,135 -#
The above details have been certified by Statutory Auditor by way of their certificate dated December 2, 2021. # Not Applicable on account on bonus issuance. For further details, see Equity Share capital history of our Company beginning on page 70.
* PhonePe Singapore transferred 7,648,475 Equity Shares to PhonePe India on October 1, 2021. Pursuant to the PhonePe India DoA, all rights and obligations of PhonePe Singapore have been transferred and vest with PhonePe India, including but not limited to the right to nominate one director on
the Board post listing of the Company’s Equity Shares. For other details, see Summary of Key Agreements on page 164.
Weighted average price at which specified securities were acquired by our Promoters and the Shareholders
(1) Weighted average price at which Equity Shares were acquired by the Shareholders in the one year preceding
the date of this Red Herring Prospectus
Except as disclosed below, no other Shareholder has acquired Equity Shares and/or Preference Shares in the one year preceding
the date of this Red Herring Prospectus. The weighted average price at which Equity Shares acquired by the Shareholders in
the one year preceding the date of this Red Herring Prospectus is as follows:
a) Promoters and Promoter Group
S.
No.
Name of the Promoter Number of specified securities^ acquired in
the one year preceding the date of this Red
Herring Prospectus#
Weighted average price per
specified security (in ₹)*
Promoter
1. Rakesh Kumar Verma 17,530,625 84.57

26
S.
No.
Name of the Promoter Number of specified securities^ acquired in
the one year preceding the date of this Red
Herring Prospectus#
Weighted average price per
specified security (in ₹)*
2. Rashmi Verma 2,351,158 Nil
Promoter Group
1. Rohan Verma 2,64,736 11.84
2. Rakhi Prasad 783 -
3. Rupa Amitabh 166 - Note: The table above also includes allotments made in the preceding one year from the date of this Red Herring Prospectus.
^ Specified securities include both Equity Shares and Preference Shares. # Our Promoter and Promoter Group have only acquired Equity Shares in the one year preceding the date of this Red Herring Prospectus.
* As certified by our Statutory Auditors by way of their certificate dated December 2, 2021.
b) Selling Shareholders
S.
No.
Name of the Selling Shareholder Number of specified securities^ acquired in
the one year preceding the date of this Red
Herring Prospectus#
Weighted average price per
specified security (in ₹)*
Individual Selling Shareholder
1. Rashmi Verma 2,351,158 Nil
Investor Selling Shareholders
1. Qualcomm 4,513,540 Nil
2. Zenrin 8,117,576 Nil
Other Selling Shareholders
1. Harshad Dholakia 1,833 Nil
2. Jaya Jaipuriar 500 Nil
3. Jaya Kumar 16,403 8.65
4. Manpreet Sukhija (Gaba) 5,248 Nil
5. Nayan Arun Jagjivan 495,908 Nil
6. Ranjan P.N. 40,726 11.55
7. Sapna Ahuja 85,986 11.31 Note: The table above also includes allotments made in the preceding one year from the date of this Red Herring Prospectus.
^ Specified securities include both Equity Shares and Preference Shares.
# Our Selling Shareholders have only acquired Equity Shares in the one year preceding the date of this Red Herring Prospectus. * As certified by our Statutory Auditors by way of their certificate dated December 2, 2021.
c) Other Shareholders
S.
No.
Name of the Shareholder Number of specified securities^ acquired in
the one year preceding the date of this Red
Herring Prospectusα
Weighted average price per
specified security (in ₹)*
1. Aditya Sinha 7,713 12.15
2. Akhtar Ali 1,546 12.15
3. Amal Parikh 73,333 -
4. Animesh Chandra 5,646 12.15
5. Ankeet Bhat 52,320 12.15
6. Anuj Kumar Jain 10,120 12.15
7. Ashok Bhatt 9,880 12.15
8. Ashutosh Kumar 1,546 12.15
9. Bachi Singh 1,053 12.15
10. Balmukand 1,546 12.15
11. Bhupesh Kumar 1,546 12.15
12. Biswanath Panda 4,626 12.15
13. Chander Lekha Anand 13,333 94.50
14. Deepak Kumar Jain 1,546 12.15
15. Isha Rani 1,546 12.15
16. Krishna Kumar 4,626 12.15
17. Kunal Bharti 4,626 12.15
18. Leena Sharma 1,053 12.15
19. Madan Prakash Jha 3,086 12.15
20. Mahaveer Kumar Jain$ 30 -
21. Mamta 2,806 12.15
22. Mohammad Akram 4,753 12.15
23. Monika Jaipuria 9,293 12.15
24. Murleedhara Navada 3,460 12.15
25. Neetu Milind 1,220 12.15
26. Neha Mathur 2,498 -
27. Nirdesh Singh 3,086 12.15
28. Nishu Jain 9,293 12.15

27
S.
No.
Name of the Shareholder Number of specified securities^ acquired in
the one year preceding the date of this Red
Herring Prospectusα
Weighted average price per
specified security (in ₹)*
29. Parshuram Das 1,546 12.15
30. Piyush Saraswat 4,626 12.15
31. PhonePe India 10,197,966 94.875
32. PhonePe Singapore# 13,400,795 108.91
33. Pradeep Prasad Gupta 9,293 12.15
34. Priti Malik 4,626 12.15
35. Rajesh Singh 13,113 12.15
36. Rajiv Ranjan Prasad 3,086 12.15
37. Ramesh Chandra Mahani 1,546 12.15
38. Ravinder Pratap Singh 14,866 12.15
39. Rishin Kalra 17,220 12.15
40. Ritesh Arora 3,213 12.15
41. Roopesh Ram Gopal Gupta 2,750 -
42. Sanjay Shukla 2,193 12.15
43. Santosh Kumar Jha 773 12.15
44. Saurabh Kumar Paramjyoti 3,086 12.15
45. Shashank Shekhar Jaiswal 4,626 12.15
46. Shatrunjay Credit Services Ltd., 8,750 -
47. Shishir Kumar Verma 8,580 12.15
48. Sonam Rawat 8,726 12.15
49. Soumya Darbari 1,546 12.15
50. Subrat Kumar Dey 1,546 12.15
51. Sumit Gupta 4,626 12.15
52. Sunil Kumar Yadav 1,546 12.15
53. Supriya Nath 1,546 12.15
54. Vilas Kulkarni 4,626 12.15
55. Vishwajit Pathak 4,626 12.15 Note: The table above also includes allotments made in the preceding one year from the date of this Red Herring Prospectus.
^ Specified securities include both Equity Shares and Preference Shares. α Our Other Shareholders have only acquired Equity Shares in the one year preceding the date of this Red Herring Prospectus.
* As certified by our Statutory Auditors by way of their certificate dated December 2, 2021. # PhonePe Singapore transferred 7,648,475 Equity Shares to PhonePe India on October 1, 2021. $ Equity Shares being held on behalf of the shareholders to whom fractional Equity Shares have been allotted.
(2) Weighted average price at which Equity Shares were acquired by the Shareholders in the three years preceding
the date of this Red Herring Prospectus
Except as disclosed below, no other Shareholder has acquired Equity Shares and/or Preference Shares in the three years
preceding the date of this Red Herring Prospectus. The weighted average price at which Equity Shares were acquired by the
Shareholders in the three years preceding the date of this Red Herring Prospectus is as follows:
a) Promoters and Promoter Group
S.
No.
Name of the Promoter Number of specified securities^ acquired in
the one year preceding the date of this Red
Herring Prospectus
Weighted average price per
specified security (in ₹)*
Promoter
1. Rakesh Kumar Verma 17,530,625 84.57
2. Rashmi Verma 2,351,158 Nil
Promoter Group
1. Rohan Verma 2,64,736 11.84
2. Rakhi Prasad 783 -
3. Rupa Amitabh 166 - Note: The table above also includes allotments made in the preceding three years from the date of this Red Herring Prospectus.
^ Specified securities include both Equity Shares and Preference Shares.
* As certified by our Statutory Auditors by way of their certificate dated December 2, 2021.
b) Selling Shareholders
S.
No.
Name of the Selling Shareholder Number of specified securities^ acquired in
the one year preceding the date of this Red
Herring Prospectus
Weighted average price per
specified security (in ₹)*
Individual Selling Shareholder
1. Rashmi Verma 2,351,158 Nil
Investor Selling Shareholders
1. Qualcomm 1,128,385 Nil

28
S.
No.
Name of the Selling Shareholder Number of specified securities^ acquired in
the one year preceding the date of this Red
Herring Prospectus
Weighted average price per
specified security (in ₹)*
2. Zenrin 2,371,546 Nil
Other Selling Shareholders
1. Harshad Dholakia 1,833 Nil
2. Jaya Jaipuriar 500 Nil
3. Jaya Kumar 16,403 8.65
4. Manpreet Sukhija (Gaba) 5,248 Nil
5. Nayan Arun Jagjivan 495,908 Nil
6. Ranjan P.N. 40,726 11.55
7. Sapna Ahuja 85,986 11.31 Note: The table above also includes allotments made in the preceding three years from the date of this Red Herring Prospectus.
^ Specified securities include both Equity Shares and Preference Shares.
* As certified by our Statutory Auditors by way of their certificate dated December 2, 2021.
c) Other Shareholders
S.
No.
Name of the Shareholder Number of specified securities^ acquired in
the one year preceding the date of this Red
Herring Prospectus
Weighted average price per
specified security (in ₹)*
1. Aditya Sinha 7,713 12.15
2. Akhtar Ali 1,546 12.15
3. Amal Parikh 73,333 -
4. Animesh Chandra 5,646 12.15
5. Ankeet Bhat 52,320 12.15
6. Anuj Kumar Jain 10,120 12.15
7. Ashok Bhatt 9,880 12.15
8. Ashutosh Kumar 1,546 12.15
9. Bachi Singh 1,053 12.15
10. Balmukand 1,546 12.15
11. Bhupesh Kumar 1,546 12.15
12. Biswanath Panda 4,626 12.15
13. Chander Lekha Anand 13,333 94.50
14. Deepak Kumar Jain 1,546 12.15
15. Isha Rani 1,546 12.15
16. Krishna Kumar 4,626 12.15
17. Kunal Bharti 4,626 12.15
18. Leena Sharma 1,053 12.15
19. Madan Prakash Jha 3,086 12.15
20. Mahaveer Kumar Jain$ 30 -
21. Mamta 2,806 12.15
22. Mohammad Akram 4,753 12.15
23. Monika Jaipuria 9,293 12.15
24. Murleedhara Navada 3,460 12.15
25. Neetu Milind 1,220 12.15
26. Neha Mathur 2,498 -
27. Nirdesh Singh 3,086 12.15
28. Nishu Jain 9,293 12.15
29. Parshuram Das 1,546 12.15
30. Piyush Saraswat 4,626 12.15
31. PhonePe India 10,197,966 94.875
32. PhonePe Singapore# 13,400,795 108.91
33. Pradeep Prasad Gupta 9,293 12.15
34. Priti Malik 4,626 12.15
35. Rajesh Singh 13,113 12.15
36. Rajiv Ranjan Prasad 3,086 12.15
37. Ramesh Chandra Mahani 1,546 12.15
38. Ravinder Pratap Singh 14,866 12.15
39. Rishin Kalra 17,220 12.15
40. Ritesh Arora 3,213 12.15
41. Roopesh Ram Gopal Gupta 2,750 -
42. Sanjay Shukla 2,193 12.15
43. Santosh Kumar Jha 773 12.15
44. Saurabh Kumar Paramjyoti 3,086 12.15
45. Shashank Shekhar Jaiswal 4,626 12.15
46. Shatrunjay Credit Services Ltd., 8,750 -
47. Shishir Kumar Verma 8,580 12.15

29
S.
No.
Name of the Shareholder Number of specified securities^ acquired in
the one year preceding the date of this Red
Herring Prospectus
Weighted average price per
specified security (in ₹)*
48. Sonam Rawat 8,726 12.15
49. Soumya Darbari 1,546 12.15
50. Subrat Kumar Dey 1,546 12.15
51. Sumit Gupta 4,626 12.15
52. Sunil Kumar Yadav 1,546 12.15
53. Supriya Nath 1,546 12.15
54. Vilas Kulkarni 4,626 12.15
55. Vishwajit Pathak 4,626 12.15 Note: The table above also includes allotments made in the preceding three years from the date of this Red Herring Prospectus.
^ Specified securities include both Equity Shares and Preference Shares.
* As certified by our Statutory Auditors by way of their certificate dated December 2, 2021. # PhonePe Singapore transferred 7,648,475 Equity Shares to PhonePe India on October 1, 2021. $ Equity Shares being held on behalf of the shareholders to whom fractional Equity Shares have been allotted.
Average Cost of Acquisition for Promoters and Selling Shareholders
The average cost of acquisition per Equity Share acquired by our Promoters and the Selling Shareholders, as on the date of this
Red Herring Prospectus is:
a) Promoters
S.
No.
Name of the Promoter Number of Equity Shares held Average cost of acquisition
per Equity Share (in ₹)*
1. Rakesh Kumar Verma 23,163,080 64.11
2. Rashmi Verma 9,404,633 0.17 * As certified by our Statutory Auditors by way of their certificate dated December 2, 2021.
b) Selling Shareholders
S.
No.
Name of the Selling Shareholder Number of Equity Shares held Average cost of acquisition
per Equity Share (in ₹)*
Individual Selling Shareholder
1. Rashmi Verma 9,404,633 0.17
Investor Selling Shareholders
1. Qualcomm 27,01,407 52.20
2. Zenrin# 4,673,719 94.50
Other Selling Shareholders
1. Harshad Dholakia 7,333 8.45
2. Jaya Jaipuriar 2,000 Negligible
3. Jaya Kumar 30,573 7.46
4. Manpreet Sukhija (Gaba) 20,993 0.05
5. Nayan Arun Jagjivan 1,983,633 12.75
6. Ranjan P.N. 46,746 10.64
7. Sapna Ahuja 103,826 11.12 * As certified by our Statutory Auditors by way of their certificate dated December 2, 2021.
Details of pre-IPO placement
Our Company does not contemplate any issuance or placement of Equity Shares from the date of this Red Herring Prospectus
until the listing of the Equity Shares.
Split or Consolidation of Equity Shares in the last one year
Except as disclosed below, our Company has not undertaken a split or consolidation of the Equity Shares in the one year
preceding the date of this Red Herring Prospectus:
Pursuant to resolutions passed by our Board and the Shareholders in the meetings held on July 27, 2021 and July 29, 2021
respectively, our Company has sub-divided its authorised equity share capital, such that 4,500,000 equity shares of face value
of ₹10 each aggregating to ₹45,000,000 were sub-divided as 22,500,000 Equity Shares of ₹2 each aggregating to ₹45,000,000.
Therefore, the cumulative number of paid-up Equity Shares pursuant to the sub-division was 19,657,380 Equity Shares.
For details, see “Capital Structure – Equity Share capital history of our Company” and “History and Certain Corporate Matters
– Amendments to the Memorandum of Association” on pages 70 to 72 and 161, respectively.

30
SECTION II: RISK FACTORS
An investment in equity shares involves a high degree of risk. Prospective investors should carefully consider all the information
in this Red Herring Prospectus, including the risks and uncertainties described below, before making an investment in the
Equity Shares. The risks described below may not be exhaustive, or the only ones relevant to us, the Equity Shares or the
industry segments in which we currently operate. Additional risks and uncertainties not presently known to us, or which we
currently deem to be immaterial, may arise or may become material in the future. Unless specified or quantified in the relevant
risk factors below, we are not in a position to quantify the financial implication of any of the risks mentioned below. If any or
a combination of the following risks or other risks that are not currently known or are currently deemed immaterial actually
occur, our business, cash flows, prospects, results of operations and financial condition could suffer, the trading price of the
Equity Shares could decline and investors may lose all or part of their investment. Further, some events may be material
collectively rather than individually.
Prospective investors should read this section in conjunction with “Our Business”, “Industry Overview”, “Key Regulations
and Policies in India”, “Management’s Discussion and Analysis of Financial Condition and Results of Operations” and
“Outstanding Litigation and Other Material Developments” on pages 132, 92, 155, 246 and 273, respectively, as well as the
other financial and statistical information contained in this Red Herring Prospectus . In making an investment decision,
prospective investors must rely on their own examinations of us and the terms of the Offer, including the merits and the risks
involved, and consult their tax, financial and legal advisors about the consequences of investing in the Offer. Prospective
investors should pay particular attention to the fact that we are subject to extensive regulatory environments that may differ
significantly from one jurisdiction to another. This Red Herring Prospectus also contains forward-looking statements that
involve risks, assumptions, estimates and uncertainties. Our actual results could differ materially from those anticipated in
these forward-looking statements because of certain factors, including but not limited to the considerations described below
and elsewhere in this Red Herring Prospectus. For further details, see “Forward-Looking Statements” on page 19.
Unless otherwise stated or the context otherwise requires, the financial information used in this section is derived from our
Restated Consolidated Financial Information. For further details, please see “Financial Statements” on page 193.
Unless otherwise indicated, the industry-related information contained in this section is derived from the F&S Report. We
commissioned and paid for the F&S Report for the purposes of confirming our understanding of the industry and it has been
prepared for the purpose of the Offer.
RISKS RELATING TO OUR COMPANY, SUBSIDIARIES, BUSINESS, AND INDUSTRY
1. The Offer Price, market capitalization to revenue multiple, and price to earnings ratio based on the Offer Price of
our Company may not be indicative of the market price of the Equity Shares upon listing or thereafter.
The consolidated revenue from operations for Financial Year 2021 and the six month period ended September 30,
2021 was `1,524.63 million and ₹ 1,000.27 million, respectively. The profit after tax of our Company for Financial
Year 2021 and the six month period ended September 30, 2021 was ̀ 594.33 million and ₹467.66 million, respectively.
The market capitalization to revenue (for Financial Year 2021) is [●] times and Price to Earnings Ratio (based on
profit after tax for Financial Year 2021) is [●], at the upper end of the Price Band. The Offer Price of the Equity Shares
is proposed to be determined on the basis of assessment of market demand for the Equity Shares offered through a
book-building process, and certain quantitative and qualitative factors as set out in the “Basis for Offer Price” on page
87, and the Offer Price and such multiples and ratios may not be indicative of the market price of the Equity Shares
upon listing or thereafter.
Prior to the Offer, there has been no public market for the Equity Shares, and an active trading market on the Stock
Exchanges may not develop or be sustained after the Offer. Listing and quotation does not guarantee that a market for
the Equity Shares will develop, or if developed, the liquidity of such market for the Equity Shares.
There are no listed companies in India that engage in a business similar to that of our Company. Accordingly, any
valuation exercise undertaken for the purposes of the Offer by our Company and the Selling Shareholders, in
consultation with the Book Running Lead Managers, would not be based on a benchmark with our industry peers. The
relevant financial parameters based on which the Price Band would be determined, shall be disclosed in the
advertisement that would be issued for publication of the Price Band.
The market price of the Equity Shares may be subject to significant fluctuations in response to, among other factors,
variations in our operating results, market conditions specific to the industry we operate in, developments relating to
India, announcements by us or our competitors of significant acquisitions, strategic alliances, our competitors
launching new products or superior products, COVID-19 related or similar situations, announcements by third parties
or governmental entities of significant claims or proceedings against us, volatility in the securities markets in India
and other jurisdictions, variations in the growth rate of financial indicators, variations in revenue or earnings estimates
by research publications, and changes in economic, legal and other regulatory factors.

31
2. We are dependent on trends in the sectors where our enterprise customers operate.
Negative sentiments or downturn in global macroeconomic conditions or disruption in business activities can impact
our customers, which in turn can impact our sales to our customers. Our revenue from operations can be significantly
affected by a downturn trend or disruptions in the industries where our customers operate. We have particular exposure
to cyclical trends in the industries in which our enterprise consumers operate, such as automotive industries, logistics,
BFSI and FMCG.
We derive our revenue primarily from two key markets, namely, consumer technology and enterprise digital
transformation (“C&E”), and automotive and mobility technology (“A&M”). Set forth below is our revenue from
operations from each of those markets, for the six month period ended September 30, 2021 and Financial Years 2021,
2020 and 2019:
Customer
Markets
Six month period
ended September 30,
2021
Financial Year 2021 Financial Year 2020 Financial Year 2019
Amount
(in ₹
million)
As a
percentage
of our
revenue
from
operations
(%)
Amount
(in ₹
million)
As a
percentage
of our
revenue
from
operations
(%)
Amount
(in ₹
million)
As a
percentage
of our
revenue
from
operations
(%)
Amount
(in ₹
million)
As a
percentage
of our
revenue
from
operations
(%)
Consumer tech
and enterprise
digital
transformation
534.85 53.47 724.48 47.52 447.24 30.09 265.40 19.62
Automotive
and mobility
tech
465.42 46.53 800.15 52.48 1,039.05 69.91 1,087.15 80.38
Total 1,000.27 100.00 1,524.63 100.00 1,486.29 100 1,352.55 100.00
We are dependent on the automotive industry for sales of digital maps and data, navigation and mobility solutions to
vehicle manufacturers. During Financial Year 2021, our revenue from operations from our automotive and mobility
technology (“A&M”) customers was ₹800.15 million, comprising 52.48% of our overall revenue from operations
from our customers, and was 465.42 million, comprising 46.53% of our overall revenue from operations from our
customers, for the six month period ended September 30, 2021. As a result of the recent financial crisis and staggered
growth due to COVID-19 pandemic, motor vehicle manufacturers have experienced a challenging demand
environment for vehicle production and sales. A continued significant decline in the sale of new vehicles manufactured
by these manufacturers, or the loss or deterioration of our relationships with one or more of these manufacturers could
result in decrease in demand for our products and solutions. Similarly, our customers in the FMCG and BFSI segment
have seen slowdown due to the COVID-19 pandemic and resultant lockdowns and a decline in discretionary spending
by the end users.
The outlook for the industries in which some of our customers operate also depends to an extent on the nature and
extent of government initiatives to counteract the macroeconomic downturn and stimulate economic activity. To the
extent such initiatives may not involve investment in such industries, or other initiatives that would create demand for
our products and services, our business may exhibit detrimental effects of the macroeconomic downturn. If economic
growth and recovery in the sectors in which our customers operate does not take place over an extended period of
time, our business, results of operations or financial condition may be adversely affected.
3. A part of our business is dependent on the performance of the automotive sector, including in our key market,
India. Any adverse changes in the conditions affecting the sector can adversely impact our business, results of
operations and financial condition.
We design, engineer, manufacture and supply our map data, APIs, SDKs, and other solutions offerings for navigation,
mobility and connected use cases to both electrified and non-electrified 2W, 4W, commercial and other vehicle
segments both in the Indian and overseas markets. We are therefore exposed to fluctuations in the performance of the
automotive markets, particularly in India. For example, according to the F&S Report, sale of passenger vehicles faced
sharp fall in 2020 due to COVID-19 and the Indian passenger vehicle market was already going through a difficult
phase in Fiscal 2021 as sales declined by 7.9% as compared to Fiscal 2020.

32
The automotive market in India may perform differently and be subject to market and regulatory developments that
are dissimilar to the automotive markets in other parts of the world. We cannot assure you that the demand for our
products in India will grow, or will not decrease, in the future.
Further, our income from our automotive customers is cyclical because our sales are directly dependent on the level
of automotive production and affected by inventory levels of automotive manufacturers, which has been characterized
historically by significant periodic fluctuations in overall demand for vehicles resulting in corresponding fluctuations
in demand for our products and services. The length and timing of any cycle in the automotive industry cannot be
predicted with certainty. We cannot predict when manufacturers will decide to either build or reduce inventory levels
or whether new inventory levels will exceed historical inventory levels. Production and sales of the vehicles for which
we supply products are affected by, among other things, a variety of other factors that are beyond our control, including
changes in consumer demand, changes in government policies and regulations, product mix shifts favoring other types
of products or services, disruptions in the automotive manufacturing or supply chain, credit availability and cost of
credit, interest rates and general economic and industry conditions.
Reduced demand in the market segments we currently supply, deterioration in the automotive market, continued
uncertainty and other unexpected fluctuations or change in regulations, customs, taxes or other barriers or restrictions
adversely affecting the automotive market, particularly in India, and our inability to expand our revenue base from
other sectors, may have an adverse impact on our business, results of operations and financial condition.
4. Our inability to maintain or update our map database or errors in our map database could harm our reputation or
adversely affect our ability to sell our products and services.
Our map database requires constant maintenance and updating. We have procedures in place to regularly maintain and
update our database and to ensure our data continues to meet the requirements of our customers and the ultimate end
users.
There is, however, no assurance that our procedures and programmes for maintaining and updating our digital map
database will be sufficient to maintain the standard of quality expected by our customers. To create and update our
map database, we compile large amounts of data from a wide variety of sources and process the data so collected. If
this data is not made available to us at the requisite level of quality and quantity, it would adversely affect the cost and
timeliness of the development, maintenance and updating of our database. We also rely on community feedback from
existing users of our products to update and refresh our map databases. The quality of our products and the success of
our business are dependent to some extent upon the availability and accuracy of the data that we acquire from these
sources. The cost incurred by us towards data probes for traffic which we source from our third-party suppliers has
been negligible during the last three Financial Years and the six month period ended September 30, 2021, amounting
to `0.35 million for Financial Year 2020 and `0.62 million for Financial Year 2021. If our third-party suppliers were
to significantly increase the prices they charge us for access to their map data, or if our community users stopped
giving us accurate and timely updates in significant quantities, we would have to revert to traditional methods of
updating the information for our map databases, which may be more costly and lengthen the time needed to update the
map.
If we are unable to provide accurate and updated map data and related services or if our map database becomes
outdated, it could require us to expend significant costs and manpower and reduce our sales, which could result in an
adverse effect on our business, results of operations or financial condition.
5. We are dependent on the success of our research and development (“R&D”) and the failure to develop competitive
new or improved products and services or process improvements or updated map data could adversely affect our
business, financial condition and results of operations and have a negative impact on our competitive position.
Our business is characterized by rapid and frequent advancements in technology and changes in market demand can
often render existing technologies and solutions obsolete and could require substantial new R&D and capital
expenditures. Our future growth depends on our ability to continue to develop and commercialize innovative, viable
and sustainable new geo-spatial software, APIs, SDKs and high definition maps and other solutions offerings in a
timely and cost-effective manner, our existing systems and components, or to develop process improvements that can
improve time, quality improve and cost efficiency. Our major R&D activities are carried out through one of our
Subsidiaries, Vidteq (India) Private Limited (“Vidteq”). Our expenditure on R&D, primarily comprises of Vidteq’s
employee expenses. Our expenditure on R&D activities for the six month period ended September 30, 2021 and the
Financial Years 2021, 2020, and 2019 was ̀ 5.23 million, ₹7.60 million, ₹9.17 million, and ₹7.10 million, respectively.
We have built our core platform based on open, flexible and agile architecture, however, the launch of a new offering
is a complex process, the success of which depends on a wide range of factors, including readiness of our technology,
datasets and processes and ability to provide the solutions required by our customers. While we aim to plan the
development of our product portfolio based on known and anticipated customer needs, the development and
commercialization of new products and services could be complex, time-consuming and costly, and its outcome is
inherently uncertain. Our inability to accurately estimate the cost to design, develop and launch new offerings could

33
result in our failure to effectively manage our customers’ expectations. If we are unable to bring enough offerings or
services to market, or if offerings are brought to market after competing offerings are commercialized, our growth
strategy may not be successful, and our business would be adversely affected.
In addition, even where we successfully develop any such new or improved products and services in a timely manner
based on established customer needs, there can be no assurance that the new or improved offering will be commercially
successful and meet the price expectations of our customers. Further, if our competitors develop new processes or
production techniques, or improve existing processes or production techniques that may give them significant cost and
marketing advantages, we may be unable to retain our customers, which would adversely affect our revenues and
profitability. We also cannot guarantee that any investment we make in developing products and services will be
recouped, even if we are successful in commercializing those products, which in turn may have an adverse effect on
our results of operations and financial condition.
6. Any inability to protect our intellectual property (“IP”) or any third-party claims in relation to infringement of
intellectual property rights or in the future could adversely affect our business, reputation, financial condition,
results of operations and cash flows.
We rely on a wide portfolio of IP to operate our businesses. For details of our intellectual property, see “Our Business
– Intellectual Property” on page 152. We may not be able to effectively protect these against infringement or safeguard
our IP in a cost-efficient manner. While we believe we have included adequate provisions in our existing arrangements
with our employees, co-developers and third parties with whom we conduct business to confirm our ownership of IP
and to limit access to, and disclosure and use of, our proprietary information, we cannot assure you these contractual
arrangements and the other steps we have taken to protect our IP may not prevent the misappropriation of our
proprietary information or deter independent development of similar digital mapping by others.
Any unauthorised use of our IP by any third party or any attempt by a third party to pass-off products or services as
ours or any third-party IP which may be misconstrued as ours, intentionally or unintentionally, may dilute the value
of our content offerings and the IP in such offerings. Any legal action or litigation initiated by us for enforcement of
our rights in such intellectual property may be time consuming and costly.
We may also receive claims that we have infringed the intellectual property rights of third parties. Any such claims or
litigation relating to our IP or IP that we have licensed, whether justified or not, could be time-consuming and costly,
harm our reputation, require us to modify or discontinue our offerings, undertake rebranding or pay monetary amounts
as damages or enter into royalty or licensing arrangements, which in such circumstances may not be available to us on
commercially favourable terms or at all. Any of the foregoing could have an adverse effect on our business prospects,
financial condition, results of operations and cash flows, and result in disruptions to our business. We will not be able
to protect our intellectual property if we are unable to enforce our rights or if we do not detect unauthorized use of our
intellectual property.
7. The liberalization of the digital mapping industry may increase our competition and our inability to compete
effectively resulting in the loss of customers and our market share.
The Department of Science and Technology of the Government of India (“DST”) has issued “Guidelines for acquiring
and producing geospatial data and geospatial data services including Maps” dated February 15, 2021 (“DST
Guidelines”). One of the most significant provisions under the DST Guidelines is that there is no requirement for any
prior approval, license, clearance, or any other restriction on the collection, generation, preparation, storage,
dissemination, publication, updating and/or digitization of Geospatial Data and Maps within the territory of India,
unless specifically provided otherwise. While certain activities under the DST Guidelines are permitted only for
persons and entities which are Indian owned or controlled, the liberalisation under the DST Guidelines may result in
the entry of new players in the market and may increase the competition faced by our Company from both domestic
and multinational corporations. Our failure to maintain and increase our existing market share or effectively compete
with such new entrants could adversely affect our business, financial condition, and results of operations.
We compete on the basis of suite and quality of offerings, reputation, pricing and relationships with customers. We
may face pricing pressures from other companies, including multinational companies for few or most of our offerings.
There can be no assurance that we will be able to mitigate these competitive pressures which may adversely affect our
profitability. Additionally, some of our competitors in the digital mapping segment may have greater financial
resources, technology, research and development capability, greater market penetration and operations in diversified
geographies and product portfolios, which may allow our competitors to better respond to market trends. Accordingly,
we may not be able to compete effectively with our competitors across our product portfolio, which may have an
adverse impact on our business, financial condition, results of operations and future prospects. Further, we may incur
significant expense in preparing to meet anticipated customer requirements that we may not be able to recover or pass
on to our customers. Increased competition may force us to improve our process, technical, product and service
capabilities and/or lower our prices or result in loss of customers, which may adversely affect our profitability and
market share. There is no assurance that we will remain competitive with respect to technology, quality, or cost. In

34
addition, our competitors may develop competing technologies that gain market acceptance before or instead of our
products. Our competitors’ actions, including expansion of their operations to newer geographies or product segments
in which we compete, or the entry of new competitors into one or more of our markets could cause us to lower prices
in an effort to maintain our sales volume.
8. We depend on a limited number of customers for a significant portion of our revenues. The loss of our key
customers or significant reduction in sales of, or demand for our products and services from our significant
customers may adversely affect our business, results of operations and financial condition.
We depend on a limited number of customers for a significant portion of our revenues. The number of customers that
accounted for 80% of our revenue from operations were 17, 22, 25 and 18 in Financial Years 2019, 2020 and 2021
and in the six month period ended September 30, 2021, respectively. As a result, the loss of even a single customer
could have a significant impact on our financial results. It is difficult to forecast the success or sustainability of any
strategies undertaken by any of our key customers in response to the current economic or industry environment. A
sustained decline in the demand for products or services supplied by our customers could prompt them to cut their
production volumes or services. In addition to decline in demand for existing products and services, insufficient
demand for new products launched by our customers may also affect demand for our products and solutions from such
customers. Further, the volume and timing of sales to our customers may vary due to variation in demand for our
customers’ products, our customers’ attempts to manage their inventory, design changes, changes in their product mix,
manufacturing strategy and growth strategy, and macroeconomic factors affecting the economy in general, and our
customers in particular.
Our growth depends on the growth of our key customers. If our key customers do not successfully enter into new
growth segments, we may be prevented from capitalising on new growth opportunities. Since we are significantly
dependent on certain key customers for a significant portion of our sales, the loss of any one or few of our key
customers, a significant reduction in demand from such customers or the downturn in business of such customers could
have an adverse effect on our business, results of operations and financial condition. We may continue to remain
dependent upon our key customers for a substantial portion of our revenues. In the event of our failure to retain our
key customers or replace them with new customers, it may have an adverse effect on our financial performance and
result of operations.
In addition, as application developers and end-customers are also influenced by our APIs, SDKs and platform
offerings, our business is also dependent on the relationships we share with the community of developers. Our
relationship with our customers and developers is dependent to a large extent on our ability to regularly meet their
requirements, including by introducing differentiated solutions with marketability, price competitiveness, efficient and
timely embedding, and consistent quality. In the event we are unable to meet such requirements in the future, it may
result in decrease in orders or cessation of business from affected customers or developers. In addition, failure to
provide customers with efficient products and services may result in lesser sales of our products and services compared
to the demand. There are also a number of factors relating to our customers and developers beyond our control that
might result in the termination of our arrangement or the loss of a customer relationship, including change in
preferences of our customers as well as a demand for price reductions. The attractiveness of our products and services
to our customers and their willingness to partner with us depends upon, among other things: the variety and quality of
service and product offerings, payment options offered to consumers; the strength of our brand and reputation; the
amount of fees that we charge; our ability to sustain our value proposition to customers for consumer acquisition; the
attractiveness to merchants of our technology and data-driven platform; our competitors’ offerings; and our customer
satisfaction. While we typically enter into long-term contracts of three to five years’ duration with our customers, we
cannot assure you that such contracts will not be terminated before term or renewed in the most favourable terms
which may affect our margins. Further, the deterioration of the financial condition or business prospects of these
customers could affect their ability to maintain the arrangements with us and thus reduce demand for our products and
services and could result in a significant decline in the revenues we derive from such customers. Adverse changes in
our relationships with our customers, or the inability to develop new products for existing customers or developers or
to successfully establish relationships with new customers or developers, could therefore limit our business prospects,
which could adversely affect our financial performance. If we fail to deliver products and solutions services to our
customers in a timely manner, or if our customers fail to adhere to the terms of our arrangements, our business and
results of operations may be adversely affected.
9. Our Company will not receive any proceeds from the Offer for Sale.
The Offer comprises an Offer for Sale by the Selling Shareholders. Our Selling Shareholders will be entitled to the
proceeds from the Offer for Sale (after deducting applicable Offer related expenses) and our Company will not receive
any part of such proceeds. For further details, see “Objects of the Offer” on page 85.
10. Our operations and growth strategies in the international markets are subject to risks and uncertainties of
conducting business outside India.

35
Outside India, we conduct our business and plan to grow our business across emerging and developed markets and
increase the share of international sales in our revenues and profits. While we do not generate any revenue from
international operations, we generate revenue in foreign currency from our customers located outside of India. Our
total revenue from operations from customers located outside of India received in foreign currencies was ₹419.40
million, ₹534.76 million and ₹533.58 million in Financial Years 2019, 2020 and 2021, respectively, and was `464.09
million for the six month period ended September 30, 2021.
The markets in which we operate and in which we plan to grow are diverse and fragmented, with varying levels of
economic and infrastructure development and distinct legal and regulatory systems, and do not operate seamlessly
across borders as a single or common market. Therefore, we may be subject to risks inherent in doing business in
countries other than India, including:
• challenges caused by distance, language, and cultural differences;
• protectionist laws and business practices;
• complex local tax regimes;
• higher costs associated with doing business in multiple markets;
• imposition of international sanctions on one or more of the countries in which we operate;
• risks related to the legal and regulatory environment in non-Indian jurisdictions, including with respect to
privacy and data, or in relation to taxation or repatriation of our revenues or profits from foreign jurisdictions
to India;
• security, and unexpected changes in laws, regulatory requirements, and enforcement;
• burdens of complying with a variety of foreign laws in multiple jurisdictions and liability in case of any failure
to comply with such laws;
• potential damage to our brand and reputation due to compliance with local laws, including requirements to
provide player information to local authorities;
• fluctuations in currency exchange rates;
• political, social, or economic instability;
• the potential need to recruit and work through local partners;
• reduced protection for or increased violation of intellectual property rights in some countries;
• difficulties in managing global operations and legal compliance costs associated with multiple international
locations;
• natural disasters, including earthquakes, tsunamis, and floods;
• inadequate local infrastructure; and
• exposure to local banking, currency control and other financial-related risks.
Further, several of our agreements are governed by laws other than Indian law. We cannot assure you that in the event
of a dispute under such agreements, we will be able to successfully defend our position, and any adverse decision may
adversely impact our financial position, results of operations and cash flows. If we are unable to manage our global
operations successfully, our financial results could be adversely affected, which may impact profit margins or make it
increasingly difficult for us to conduct business in foreign markets.
We plan to continue the expansion of our offerings, as well as our user base, within existing regions where we operate
and to various other jurisdictions. For instance, we may seek to expand our customer base in the emerging markets in
Middle East, South East Asia and other counties in South East Asia where we seek to offer our full stack of products
and solutions. In the more advanced markets, such as North America and Europe, we plan to provide specific services
such as HD or indoor maps to customers in such geographies. We may have limited or no experience in marketing,
developing and deploying our offerings in such jurisdictions or to such target demographics. We may require
considerable management attention and resources for managing our growing business across markets.

36
11. Our customers may terminate contracts or arrangements prior to completion, record reduced volumes or
emoluments than initially estimated by them and us, negotiate adverse terms of the contract or choose not to renew
contracts in a timely manner on terms beneficial to us, which could adversely affect our business, financial
condition and results of operations.
We deliver our products and solutions based on actual or projected volumes given by our customers, that are agreed-
upon and recorded in agreements or purchase orders or minutes of meetings received from our customers (“Orders”).
Thus, we may not have enforceable and legal contracts with our customers in respect of Orders and to that extent, our
Orders may not result in revenue for us.
We maintain an internal booking system of our Orders, and record a new Order or renew an existing order each time
a contract or purchase order or minutes of meetings with customers, as applicable, are confirmed by our customers or
when the quantities mentioned in the order are delivered. We enter into fixed price or volume linked contracts with
our customers. The typical term of such Orders range from three to five years, which may or may not be mutually
extendable. Contracts for which the term is mutually extendable accounted for around 70% of our revenue from
operations in Financial Year 2021. Some of our Orders also depend on volumes generated by our customers, which in
turn affects usage of our products and solutions. Our customers may use our products and solutions in substantially
lower quantities or they may not use our products or solutions at all. This may result in our actual revenue being much
lower than what is stated or estimated in the Orders. Payments for such Orders are typically staggered over the duration
of the agreed term, and revenue for such products and solutions is recognized upon delivery. Orders may also assume
that usage and sales are higher towards the latter part of the arrangement and thus, if terminated, before the period
agreed, our revenues for such periods would be affected as the Orders would not exist. We typically receive a lump-
sum amount of our receivable payments upfront, as our IP is delivered to our customers in the first instance, which is
then applied by them in their products during the term of such Orders, based on actual volumes.
There is no assurance in relation to the sales volumes and revenue that our Orders will eventually generate for us. The
actual realisation of revenue from our Orders and obtaining new business or customers, is inherently subject to a
number of risks and uncertainties, including the accuracy of customer projections relating to the volumes to be
produced and sold by them, and the timing of such production and sale. Such volume projections of our customers are
based on a number of economic and business factors, variables and assumptions, some or all of which may change or
may not be accurate. Accordingly, our Orders are not necessarily an accurate and reliable indication of what our actual
sales and revenues would be, nor do we purport to project our results of operations, financial position or cash flows
for any future period or date based on our Orders.
Our customers can terminate many of our Orders with or without cause, including without any cancellation charge in
most cases. During the last three Financial Years 2019, 2020, 2021 and the six month period ended September 30,
2021, contracts with residual value aggregating to ̀ 11.01 million reached the expiry of their respective terms, including
two contracts with residual value of over `2.5 million each, (one contract expired in Financial Year 2019 and one
contract expired in Financial Year 2020), and contracts with residual value aggregating to `45.85 million were
terminated by our customers prior to expiry of their respective terms, including three contracts with residual value of
over `2.5 million each (one contract was terminated in Financial Year 2019 and two contracts were terminated in
Financial Year 2020). For details of our customer retention, see “Management’s Discussion and Analysis of Financial
Condition and Results of Operations – Significant Factors Affecting Results of Operations and Financial Condition -
Customer relationships and expansion of our customer base” on page 251. Our engagements with our customers are
typically for products or solutions that are singular in nature. Our Orders which are larger and more complex may
involve multiple engagements or stages, and a customer may choose not to retain us for additional stages or may cancel
or delay additional planned engagements. Since we rely on purchase orders, minutes from customers and customer
schedules to govern the volume and other terms of our Orders, which may be amended or cancelled, we may not have
any recourse in the event of an unexpected delay or cancellation of an Order. Further, there is no commitment on the
part of our customers to continue to place new Orders with us and as a result, our sales from period to period may
fluctuate significantly as a result of changes in our customers’ vendor preferences or the discontinuation of, loss of
business with respect to, or a lack of commercial success of, their products for which our products or solutions are
provided.
Several factors could cause the loss of an Order or reduction in revenues from a customer. These factors include,
among other things:
• the business or financial condition of our customers including owing to factors such as Covid-19;
• the economy in general;
• a change in strategic priorities by our customers, including reduced levels of spending on technology services;
• replacement of us by our competitors who may be able to provide products and services at more competitive
prices;

37
• changes in the personnel of our customers who are responsible for procurement of information technology,
or IT, services or with whom we primarily interact;
• a demand for price reductions by our customers;
• mergers, acquisitions or significant corporate restructurings involving our customer; and
• decision by our customer to move work in-house or to one or several of our competitors.
The loss or diminution in business from any of our major customers could have a material adverse effect on our revenue
from operations and results of operations. Please also see “Risk Factors - We depend on a limited number of customers
for a significant portion of our revenues. The loss of our key customers or significant reduction in sales of, or demand
for our products and services from our significant customers may adversely affect our business, results of operations
and financial condition.” on page 34. We may not be able to renew our Orders on favourable terms, or to replace any
customer that elects to terminate or not renew its Order with us, which could materially adversely affect our revenue
and thus our results of operations.
12. A failure of or disruption in our digital map database or system failures and resulting interruption in our platform,
including a disruption related to cybersecurity, internal misconduct or non-compliance with data protection, privacy
or information security related Indian or foreign laws, could adversely impact our business and operations.
As a technology-based platform, our business generates and processes a large quantity of location data, behavioural
and demographic data. We face risks inherent in handling and protecting large volumes of data, including protecting
the data hosted in our system, detecting and prohibiting unauthorized data share and transfer, preventing attacks on
our system by outside parties or fraudulent behaviour or improper use by our employees, and maintaining and updating
our database. Any system failure, security breach or third-party attacks or attempts to illegally obtain the data that
result in any actual or perceived release of such data could damage our reputation and brand, deter current and potential
consumers from using our products and services, damage our business, and expose us to potential legal liability. We
rely on the process, capacity, reliability and security of our digital map database and IT systems and infrastructure in
our operations. These include procurement, production, distribution, reporting and consolidation platforms, as well as
design and development of new offerings. IT systems are vulnerable to disruptions, including those resulting from
natural disasters, cyber-attacks or failures in third party-provided services. Cybersecurity risks can include breaches
of confidentiality, loss of integrity and/or availability of the data and/or transactions processed by the information
systems (system malfunction, data theft, data destruction and loss of data integrity). These may result from external
(denial of service, hacking, malware) or internal (tampering, breach of data confidentiality) threats. In addition, we
face threats in relation to onboard systems and offerings, in their design phase and also in their operational and service
phases, as the case may be.
We have experienced downtime and performance issues in the past due to dependencies on our infrastructure
providers, or due to technical system glitches. For instance, when the cowin.gov.in portal went live on March 1, 2021
and there was a sudden surge of online traffic to their portal that has our map APIs embedded, we experienced a few
hours of slow performance, after which our systems stabilized to match the surge in demand. However, the slow
performance of our system at that time did not have any material impact on our Company. We have not experienced
any material disruption to our system at any time during the last three financial years.
The techniques used to obtain unauthorized, improper, or illegal access to our systems, our or our customers’ data, or
to disable or degrade service or sabotage systems, are constantly evolving, may be difficult to detect quickly, and often
are not recognized until after they have been launched against a target. We may be unable to anticipate these
techniques, react in a timely manner, or implement adequate preventative or remedial measures. Unauthorized parties
may attempt to gain access to our systems or facilities through various means, including, among others, hacking into
our or our partners’ or customers’ systems or facilities, or attempting to fraudulently induce our employees, partners,
consumers or others into disclosing usernames, passwords, or other sensitive information, which may in turn be used
to access our information technology systems and gain access to our data or other confidential, proprietary, or sensitive
information. Such risks could result in incurring of costs for addressing such risks, diversion of management’s attention
and regulatory actions.
A large-scale malfunction or interruption of one or more of our digital map database, IT systems or cyber-attacks on
our network could compromise the security of our systems and our ability to protect our networks and the
confidentiality of sensitive data which may lead to tampering with or theft of our database, designs, proprietary
software and other trade secrets, information relating to our intellectual property or business strategy, and data of third
parties, including our employees and customers. We may be required to incur significant costs to protect against
damage caused by such cyber-attacks or disruptions in the future or failure by us to comply with Indian or foreign laws
and regulations, including laws and regulations regulating privacy, data protection or information security. These
consequently could cause significant damage to our reputation, disruption of our operations, result in a loss or damage
to our data or an inappropriate disclosure of confidential information, affect our relationships with our customers,

38
suppliers and employees, lead to legal claims, proceedings or actions against us, liability or regulatory penalties under
Indian or foreign laws protecting the privacy of personal information and ultimately adversely affect our business.
With the proposed enactment of the Personal Data Protection Bill, 2019 (“PDP Bill”), and the ongoing regulatory
discussions along proposed Indian regulation to govern non-personal data, the privacy and data protection laws are set
to be closely administered in India, and we may become subject to additional potential compliance requirements. The
PDP Bill proposes a legal framework governing the processing of personal data, where such data has been collected,
disclosed, shared or otherwise processed within India, as well as any processing of personal data by the Government
of India, Indian companies, Indian citizens or any person or body of persons incorporated or created under Indian law.
The PDP Bill defines personal data and sensitive personal data, prescribes rules for collecting, storing and processing
of such data and creates rights and obligations of data-subjects and processors. The Indian Government has also been
mooting a legislation governing non-personal data. In September 2019, the Ministry of Electronics and Information
Technology formed a committee of experts (“NPD Committee”) to recommend a regulatory regime to govern non-
personal data (“NPD”). The NPD Committee has released two reports till date, which recommend, among other items,
a framework to govern NPD (defined as any data other than personal data), access and sharing of NPD with
government and corporations alike and a registration regime and for “data businesses”, being business that collect,
process or store data, both personal and non-personal.
Although we have implemented security policies, processes, and layers of defense designed to help identify and protect
our systems and data from current and emerging technology threats and damage from intentional and unintentional
misappropriation or corruption of our systems and information due to computer viruses, unauthorized access, cyber-
attack and other similar disruptions, we may still continue to be, subjected to such attacks or disruptions. There is no
assurance that the security measures we have in place will be successful or sufficient to protect our IT systems and
data. Further, unavailability of, or failure to retain, well trained employees capable of constantly servicing our systems
may lead to inefficiency or disruption thereby adversely affecting our ability to operate efficiently.
The digital data set underlying our platform is highly complex and may contain undetected errors or vulnerabilities,
some of which may only be discovered at a subsequent stage or may not get discovered at all. Our practice is to release
frequent software updates. Any third-party services that we integrate into our platform, may also be subject to errors
or vulnerabilities. Any errors, vulnerabilities or infringements discovered in our code or from third-party services after
release could result in negative publicity, a loss of customer or loss of revenue, legal proceedings, and access or other
performance issues. Such vulnerabilities could also be exploited by malicious actors and result in exposure of data of
the participants on our platform, or otherwise result in a security breach or other security incident. We may need to
expend significant financial and development resources to analyze, correct, eliminate, or work around errors or defects
or to address and eliminate vulnerabilities. Any failure to timely and effectively resolve any such errors, defects, or
vulnerabilities could adversely affect our business, reputation, brand, financial condition, cash flows and results of
operations.
13. We rely on telecommunications and information technology systems, networks and infrastructure to operate our
business and any interruption or breakdown in such systems, networks or infrastructure or our technical systems
could impair our ability to effectively operate our platforms or provide our products and services.
Our business could be impacted by the failure of telecommunications network operators to provide us with the requisite
bandwidth which could also interfere with the speed and availability of our platform, as well as by breakdowns at the
level of our internet service providers. Additionally, systems, app components and software that are developed
internally may contain undetected errors, defects or bugs, which we may not be able to detect and repair in time, in a
cost-effective manner or at all. In such circumstances, we may be liable for all or some costs and damages, as we would
not be entitled to any indemnification or warranty that may have been available if we had obtained such systems or
software from third-party providers. Disruptions or instabilities in telecommunications networks, our platforms,
servers and databases as well as the functioning of internet service providers could lead to dissatisfaction and damage
our reputation.
In addition, to perform reliably, the fixed telecommunications networks and internet infrastructure of internet service
providers in India, and in any other locations that we may operate in, require maintenance and periodic upgrading of
the appropriate networks and infrastructure which are beyond our control. We cannot assure you that our back-up and
disaster recovery measures and business continuity planning would effectively eliminate or alleviate the risks arising
from the above contingencies. Our success will depend upon third parties maintaining and improving internet
infrastructure to provide a reliable network with adequate speed and data capacity and telecommunication networks
with good quality of services and lower congestion.
14. We have issued Equity Shares (other than bonus issues) at prices that may be lower than the Offer Price in the last
12 months prior to the date of this Red Herring Prospectus.
Pursuant to Board and Shareholders’ resolutions dated September 17, 2021 and September 20, 2021, respectively, and
in terms of the Investment Agreement and the Further Agreement, our Company converted 4,054,969 outstanding

39
Preference Shares into 20,274,845 Equity Shares and allotted 11,143,660 Equity Shares, 3,385,155 Equity Shares, and
5,746,030 Equity Shares, to PhonePe Singapore, Qualcomm, and Zenrin, respectively, on September 21, 2021, at
prices which may be lower than the Offer Price. For further details, see “Capital Structure – Notes to Capital Structure”
on page 70.
15. We may not be able to sustain our historical growth rates, and our historical performance may not be indicative of
our future growth or financial results.
Our business has grown substantially in recent years. Since our incorporation in 1995, we have evolved from a map
data provider to an extensive location intelligence and GIS platform products and service provider servicing multiple
industries. Our revenue from operations has grown from ₹ 1,352.55 million in Fiscal 2019 to ₹ 1,486.29 million in
Fiscal 2020 and ₹ 1,524.63 million in Fiscal 2021.
As we continue to grow our business, we will need to work with our existing and an increasingly large number of new
customers and developers to efficiently establish and maintain mutually beneficial relationships with them. We will
need to continue to expand our product and services portfolio and invest in R&D. We will also need to continue to
expand, train, manage and motivate our growing workforce. To support our expansion, we also expect to upgrade a
variety of new and upgraded managerial, operating, financial and human resource systems, procedures and controls,
which may lead to higher costs. Also, our offerings need to be constantly updated to be in sync with the latest
technological developments, innovations and market developments, which may require continuous investment and
working capital.
We cannot assure you that our historical growth rate will be sustainable or achieved at all in the future, that our new
business initiatives will be successful, or that we will be able to upgrade all these managerial, operating, financial and
human resource systems, procedures and control measures successfully. If we are not able to manage our growth or
execute our strategies effectively, our expansion may not be successful, and our business and prospects may be
materially and adversely affected. We may also experience a decline in our revenue growth rate as a result of a number
of factors, including slowing demand for our products, platforms, and services, and insufficient growth in the number
of customers that utilize our platform, increasing competition, a decrease in the growth of our overall market, our
failure to continue to capitalize on growth opportunities, and increasing regulatory costs, among others, all of which
may have an adverse impact on our cash flows, financial condition and results of operations.
16. Our business operations and future opportunities are characterised by rapid technological change, which could
render our offerings obsolete and could cause us to make substantial expenditures to update or replace our
offerings. Further, if we do not continue to innovate and further develop our services and platforms or we are not
able to keep pace with technological developments, we may not remain competitive.
Digital mapping, satellite navigation and geo-spatial technologies are undergoing rapid innovation and change.
Evolving technological conditions require us to continuously modify our products and services and develop new
products and services to remain competitive, attract new customers and maintain our time-to-market advantage and
market reputation. We also must continue to assess the projected development of the market for navigation and geo-
spatial technologies and to accordingly develop and manufacture our product and service offerings. There is no
assurance that we will have the financial or other resources including human resources required to successfully modify
our existing offerings or produce new offerings in a timely manner, or that any products or services we introduce will
gain market acceptance.
Our profitability and competitiveness are to a certain extent dependent on our ability to respond to technological
advances and emerging industry standards and practices on a cost-effective and timely basis. Changes in technology
may make newer generation navigation products and solutions more competitive than ours or may require us to make
additional capital expenditures to upgrade our offerings and related infrastructure. Our inability to continue to invest
in new and more advanced technologies and equipment, may result in our inability to respond to emerging industry
standards and practices in a cost-effective and timely manner that is competitive with other companies. The
development and implementation of such technology entails technical and business risks.
To remain competitive, we must continue to stay abreast of the constantly evolving industry trends and to enhance and
improve the responsiveness, functionality and features of our products, mobile applications, APIs, SDKs, and other
geo-spatial solutions systems. In order to attract and retain customers and compete against our competitors, we must
continue to invest significant resources in research and development to enhance our information technology and
improve our existing services. The navigation and geo-spatial solutions industry is characterized by rapid technological
evolution, changes in customer requirements and preferences, frequent introduction of new services and products
embodying new technologies, and the emergence of new industry standards and practices, any of which could render
our existing technologies and systems obsolete. Our success will depend, in part, on our ability to identify, develop,
acquire or license leading technologies useful in our business, and respond to technological advances and emerging
industry standards and practices in a cost-effective and timely way. There can be no assurance that we will be able to
use new technologies effectively or adapt our products and services to meet customer requirements or emerging

40
industry standards. If we are unable to adapt in a cost-effective and timely manner in response to changing market
conditions or customer preferences, whether for technical, legal, financial or other reasons, our business may be
materially and adversely affected.
While we have a track record of successfully expanding into new service categories, developing and launching
enhancements to our products, platforms and new services may involve significant technical risks and upfront capital
investments that may not generate return on investment. We may use new technologies ineffectively, or we may fail
to adapt to emerging industry standards. If we face material delays in introducing new or enhanced products and
platform features, and services or if our recently introduced offerings do not perform in accordance with our
expectations, the customers, and developers that utilize our platform may forego the use of our services in favor of
those of our competitors.
17. We may undertake strategic acquisitions or investments, which may prove to be difficult to integrate and manage
or may not be successful.
Our Company has not acquired any entity in the last three Financial Years or the six month period ended September
30, 2021. We may make acquisitions or enter into strategic alliances or joint ventures to explore opportunities or make
significant investments in entities that we do not control, and there can be no assurance that we will be successful in
doing so. It is also possible that we may not identify suitable acquisition or investment candidates, or that if we do
identify suitable candidates, we may not complete those transactions on terms commercially acceptable to us or at all.
The inability to identify suitable acquisition targets or investments or the inability to complete such transactions may
adversely affect our competitiveness or our growth prospects.
If we acquire another company we could face difficulty in integrating the acquired operations. In addition, the key
personnel of the acquired company may decide not to work for us. These difficulties could disrupt our ongoing
business, distract our management and employees and increase our expenses. There can be no assurance that we will
be able to achieve the strategic purpose of such acquisition or operational integration or our targeted return on
investment
18. Growth of our business will depend upon the strength of our brands, and any failure to maintain, protect and
enhance our brand could limit our ability to retain or expand our customer base.
We believe that our brand ‘MapmyIndia’ is well recognized and is important to continue to attract and retain customers.
We operate outside India under our ‘Mappls’ brand. We need to maintain, protect and enhance our brand in order to
expand our existing base of customers, and increase their engagement with our products and platforms. This will
depend largely on our ability to continue to provide differentiated services, and we may not be able to do so effectively.
While we may choose to engage in a broader marketing campaign to further promote our brand, this effort may not be
successful or cost effective. If we are unable to maintain or enhance customer awareness in a cost-effective manner,
our brand, business, results of operations and financial condition could be harmed. Furthermore, negative publicity
about us, including service problems or defects, impairment of the reputation of popular customers, issues with our
technology, data privacy breaches and complaints about our services, could diminish confidence in, and the use of,
our services, which could harm our results of operations and business. A public perception that we do not provide
satisfactory services to customers, even if factually incorrect or based on isolated incident or based on the aggregate
effect of individually insignificant incidents, could damage our reputation, diminish the value of our brands, undermine
the trust and credibility we have established and have a negative impact on our ability to attract and retain customers.
19. Failure to maintain or improve our technology infrastructure could harm our business and prospects.
It is critical to our success that all participants are able to access our platforms, at all times. Our systems, or those of
third-parties upon which we rely, may experience service interruptions or degradation or other performance problems
because of hardware and software defects or malfunctions, unexpected high volume of transactions, distributed denial-
of-service and other cyberattacks, infrastructure changes, human error, earthquakes, hurricanes, floods, fires, natural
disasters, power losses, disruptions in telecommunications services, unauthorized access, fraud, military or political
conflicts, terrorist attacks, legal or regulatory takedowns, computer viruses, ransomware, malware, or other events.
Our systems also may be subject to break-ins, sabotage, theft and intentional acts of vandalism, including by our own
employees, all of which would impact our ability to provide secure and seamless access to our platforms, which would
have an adverse impact on our operations and reputation.
Any failure to maintain and improve our technology infrastructure could result in unanticipated system disruptions,
slower response times, impaired consumer experience, delays in reporting accurate operating and financial information
and failures in risk management. In addition, much of the software and interfaces we use are internally developed and
proprietary technology. If we experience problems with the functionality and effectiveness of our software, interfaces
or platform, or are unable to maintain and continuously improve our technology infrastructure to handle our business
needs, our business, financial condition, cash flows, results of operations and prospects, as well as our reputation and
brand, could be materially and adversely affected.

41
Furthermore, our technology infrastructure, products and services, including our service offerings, incorporate third-
party-developed software, systems and technologies, as well as hardware purchased or commissioned from outside
and overseas suppliers. As our technology infrastructure, products and services expand and become increasingly
complex, we face increasingly serious risks to the performance and security of our technology infrastructure, products
and services that may be caused by these third-party-developed components, including risks relating to
incompatibilities among these components, service failures or delays or back-end procedures on hardware and
software. As a result we may be required to develop such software, systems and technologies in-house or incur
additional costs. We have a historical track record of innovation, and will continue to provide technology in the future.
We also need to continuously enhance our existing technology. Otherwise, we face the risk of our technology
infrastructure becoming unstable and susceptible to security breaches. This instability or susceptibility could create
serious challenges to the security and uninterrupted operation of our platforms, products and services, which would
materially and adversely affect our business and reputation.
20. The outbreak and after-effects of COVID-19, or outbreak of any other severe communicable disease could have a
potential impact on our business, financial condition, cash flows and results of operations.
The outbreak, or threatened outbreak, of any severe communicable disease or pandemic, as seen in the recent outbreak
and aftermath of COVID-19 including the second wave, could materially and adversely affect overall business
sentiment and environment across industries. In addition, our revenue and profitability could be impacted to the extent
that a natural disaster, health epidemic or other outbreak harms the Indian and global economy in general. The outbreak
has significantly increased economic uncertainty and caused economic slowdown. The outbreak of COVID-19 has
resulted in authorities implementing several measures such as travel bans and restrictions, quarantines, shelter in place
orders, and shutdowns. These measures have impacted and may further impact our workforce and operations, the
operations of our customers, and those of our respective vendors and suppliers. There is currently substantial medical
uncertainty regarding COVID-19 and no government-certified treatment is available. A rapid increase in severe cases
and deaths where measures taken by governments fail or are lifted prematurely, may cause significant economic
disruption in India and in the rest of the world. The scope, duration and frequency of such measures and the adverse
effects of COVID-19 remain uncertain and could be severe.
The spread of COVID-19 has caused us to modify our business practices (including employee travel, employee work
locations, and cancellation of physical participation in meetings, events and conferences), and we may take further
actions as may be required by government authorities or that we determine are in the best interests of our employees,
customers and partners. If any of our employees are suspected of contracting COVID-19 or any other epidemic disease,
this could require us to quarantine some or all of these employees or suspend operations in our facilities for
disinfection. There is no certainty that such measures will be sufficient to mitigate the risks posed by the outbreak, and
our ability to perform critical functions could be harmed.
The extent to which COVID-19 impacts our future results will depend on future developments, which are highly
uncertain and cannot be predicted, including new information which may emerge concerning the severity of the
coronavirus and the actions taken globally to contain the coronavirus or treat its impact, among others. Existing
insurance coverage may not provide protection for all costs that may arise from all such possible events. The spread
of any severe communicable disease may also adversely affect the operations of our customers and suppliers, which
could adversely affect our business, financial condition, cash flows and results of operations. We are still assessing
our business operations and system supports and the impact that COVID-19 may have on our results and financial
condition, but there can be no assurance that this analysis will enable us to avoid part or all of any impact from the
spread of COVID-19 or its consequences, including downturns in business sentiment generally or in our sector in
particular. The above risks can threaten the safe operation of our facilities and cause disruption of operational activities,
environmental harm, loss of life, injuries and impact the wellbeing of our people.
During the lockdown in response to the COVID-19 pandemic, we put in place certain interim measures to ensure
business continuity. All of our employees worked remotely, and our websites continued to operate. However, our
operations are dependent on various information technology systems and applications which may not be adequately
supported by a robust business continuity plan, which could seriously impact our business in the event of a disaster of
any nature. Although we continue to devote resources and management focus, there can be no assurance that these
programs will operate effectively.
21. Our inability to effectively manage our growth or to successfully implement our business plan and growth strategy
could have an adverse effect on our business, results of operations, financial condition, and cash flows.
While we have experienced significant growth and have expanded our operations extensively over the last 25 years,
we cannot assure you that our growth strategy will continue to be successful or that we will be able to continue to
expand further, or at the same rate. The success of our business will depend greatly on our ability to effectively
implement our business and growth strategy. Our growth strategy involves growing our portfolio of differentiated
products and solutions offerings, strengthening our brand, deepening our penetration in existing markets and

42
expanding our presence in select new sectors and geographic territories. For further information, see “Our Business –
Our Strategies” beginning on page 145.
Our success in implementing our growth strategies may be affected by our ability to identify new market opportunities,
develop differentiated products, increase our existing network of customers and ability to adapt to changes in the
Indian or international regulatory environment applicable to us. Many of these factors are beyond our control and there
can be no assurance that we will succeed in implementing our strategy. Any change in government policies and
regulations including any ban imposed on a particular product or services offerings by the respective governments, or
any duties, pre-conditions may have an adverse impact on our operations. In addition, there may be delays in the
anticipated timing of activities related to such growth initiatives, strategies and operating plans; increased difficulty
and cost in implementing these efforts; and the incurrence of other unexpected costs associated with operating the
business. Any of these factors could adversely impact our results of operations. If, for any reason, the benefits we
realize are less than our estimates or the implementation of these growth initiatives, strategies and operating plans
adversely affect our operations or cost more or take longer to effectuate than we expect, or if our assumptions prove
inaccurate, our results of operations may be materially adversely affected.
22. Our revenues from international customers are subject to fluctuation in foreign currency risks
We received revenues in foreign currencies from customers located outside of India (“International Customers”)
amounting to USD 5.89 million and Euro 0.12 million in Financial Year 2019, USD 7.36 million and Euro 0.17 million
in Financial Year 2020, USD 7.08 million and Euro 0.12 million in Financial Year 2021 and USD 6.27 million and
Euro 0.01 million during the six month period ended September 30, 2021, respectively, which comprised 31%, 36%,
35% and 46% of our total revenue from operations, respectively, for such periods. Our revenues from International
Customers are subject to risks inherent in operating abroad. We have significant exposure in foreign currencies like
USD on account of our offerings to customers outside India. We do not have a hedging policy to help mitigate these
risks and reduce the effects of fluctuations in exchange rates. Our efforts to manage these risks may not be successful
and we may incur losses on account of such fluctuations in exchange rates.
Fluctuations in foreign currency exchange rates against the Indian Rupee may have an adverse effect on our reported
revenues and financial results because of variations in the exchange rate prevailing in the previous comparative period
and also affect the value of our foreign assets and liabilities denominated in foreign currency and the relative prices at
which we and our foreign competitors sell products in the same markets.
23. We have contingent liabilities.
A summary table of our contingent liabilities as of September 30, 2021 as provided for in the Restated Consolidated
Financial Information is set forth below:
(in ₹ million)
Particulars Six month period
ended September
30, 2021
Financial Year
2021
Financial Year
2020
Financial Year 2019
Bank guarantees 25.62 35.67 30.92 26.99
For further details, see “Financial Information” and “Management’s Discussion and Analysis of Financial Condition
and Results of Operations – Contingent Liabilities” on pages 193 and 269. Any of these contingent liabilities may
become actual liabilities. In the event that any of our contingent liabilities become non-contingent, our business,
financial condition and results of operations may be adversely affected. Furthermore, there can be no assurance that
we will not incur similar or increased levels of contingent liabilities in the current financial year or in the future.
24. Personal privacy concerns may limit the growth of consumer GPS products.
Concerns have been raised by the possibility that GPS-based satellite navigation products could be used to violate
personal privacy by potentially making available a record of a person’s geographical location to others. The
technological potential of our current or future products may create similar concerns in the general public. While we
have company policies in place and abide by government regulations, should any formal government regulation impose
restrictions on such products, we will be required to develop alternate navigation systems or business. If these or other
problems with public opinion arise in connection with our products or in the industry, our business, results of
operations or financial condition could be adversely affected.
25. We rely on mobile operating systems and application marketplaces as well as operating systems fitted in vehicles to
make our services and app available to customers and users.
We depend on mobile operating systems, such as Android and iOS, and their respective application marketplaces and
developers to make our services and applications available to our customers and users. Any changes in such systems and

43
policies of the companies that control these systems could adversely affect distribution, accessibility and availability of
our mobile application. If such mobile operating systems or application marketplaces limit or prohibit us from making
our platform available to participants that utilize our platform, make changes that degrade the functionality of our
applications, increase the cost of using our platform, mobile applications or website, impose terms of use unsatisfactory
to us, or modify their search or ratings algorithms in ways that are detrimental to us, or if our competitors’ placement in
such mobile operating systems’ application marketplace is more prominent than the placement of our applications, our
customer growth could slow down. In order to update our map database, we need to ensure that our users mobiles are
designed to provide location feedback to our app or apps of our customers, which is dependent on mobile technologies,
networks, and app permissions. If our customers encounter any difficulty accessing or using our applications or services,
our customer growth and customer engagement would be adversely affected.
We also depend on operating systems embedded in vehicles for providing services such navigation assistance, vehicle
tracking and fleet monitoring. These operating systems are susceptible to downtime and other mechanical and software
glitches rendering non-availability of our offerings to the customers. We depend on these intermediary platforms in order
to provide our services efficiently without any disruptions. If these operating systems do not function properly, our
customer engagement would be adversely affected. Any of the foregoing risks could adversely affect our business,
financial condition, cash flows and result of operations.
26. Our online app marketing may constitute internet advertisement, which subjects us to laws, rules and regulations
applicable to advertising.
Indian and international advertising laws, rules and regulations require advertisers to ensure that the content of the
advertisements they prepare or distribute is fair and accurate and is in full compliance with applicable law. Violation of
these laws, rules or regulations may result in penalties, orders to cease dissemination of the advertisements and orders to
publish corrective information. Complying with these requirements and failure to comply may increase our costs and
could have a material adverse effect on our business, financial condition, cash flows and results of operations.
27. We may not be able to identify or effectively respond to evolving preferences, expectations or trends in a timely
manner, and a failure to derive the desired benefits from our product development efforts may impact our
competitiveness and profitability.
The success of our business depends in part on our ability to anticipate, identify and respond promptly to evolving
trends in customer expectations, needs and demands, and develop new/ differentiated products and services to meet
these requirements. The use cases for comprehensive map data base and related geo-spatial services is rapidly evolving,
and aligning our business to respond to evolving preferences for map based products and services is critical to our
future success. Our success is also dependent on our ability to identify and respond to the economic, social, and other
trends that affect demographic and end-customer preferences in a variety of our product categories.
We cannot assure you that our future products and services development initiatives will be successful or be completed
within the anticipated period or budget, or that our newly developed or improvised products will achieve wide market
acceptance from our dealers. For instance, we have in the past expended resources in developing and launching some
differentiated products that did not perform as expected once launched, or that we failed to launch altogether. Even if
these offerings are successfully developed, there is no guarantee that they will be accepted by our customers and
achieve anticipated sales targets in a profitable manner, which may affect our ability to grow our network of end-
customers and gain market share. In addition, there can be no guarantee that the time and effort that we spend in
developing these products and services would be beneficial to our Company. This could also adversely affect our
ability to pursue our growth strategy of continuing to develop niche and differentiated products to grow our market
share. Further, we cannot assure you that our existing or potential competitors will not develop products that are similar
or superior to our products. It is often difficult to estimate the time to market new products and there is a substantial
risk that we may have to abandon a potential product that is no longer commercially viable, even after we have invested
significant resources in the development of such product. If we fail in our product launching efforts, our business,
prospects, financial condition, results of operations, and cash flows may be adversely affected.
Further, as we continue to grow our business by expanding our products, brand offerings and our geographic reach,
maintaining quality and consistency may be more difficult and there can be no assurance that the customers’
confidence in our brand will not diminish. Failure or any delay on our part to identify such trends, to align our business
successfully and maintain quality could negatively affect our brand image, our relationship with our dealers, the rate
of growth of our business, our market share and our prospects.
28. Our business operations are being conducted on premises owned by and/or leased from third parties. Our inability
to continue operating from such premises, or to seek renewal or extension of such leases may materially affect our
business operations.
Our business operations are being conducted on premises owned by and/or leased from third parties, and we may
continue to enter such transactions in future. Our Registered Office is operated from leased premises, currently valid

44
for a period of eight years from the commencement date, i.e. April 1, 2017. The registered offices of our Subsidiaries
have been leased and are operated out of commercial office spaces or pursuant to no-objection certificates from third
parties. For further details, see “Our Business – Property” on page 154. Our leases may expire in the ordinary course.
We cannot assure you that we will be able to continue operating out of our existing premises or renew our existing
leases at favourable terms or at all. Any such event may adversely impact our operations and cash flows and may
divert management attention from our business operations.
Given that our business operations are conducted on premises leased from third parties, any encumbrance or adverse
impact on, or deficiency in, the title, ownership rights or development rights of the owners from whose premises we
operate, breach of the contractual terms of any lease or leave and license agreements, or any inability to renew such
agreements on acceptable terms or at all may materially affect our business operations.
29. If we fail to maintain an effective system of internal controls, we may not be able to successfully manage, or
accurately report, our financial risks.
Effective internal controls are necessary for us to prepare reliable financial reports and effectively avoid fraud.
Moreover, any internal controls that we may implement, or our level of compliance with such controls, may deteriorate
over time, due to evolving business conditions. There can be no assurance that additional deficiencies in our internal
controls will not arise in the future, or that we will be able to implement, and continue to maintain, adequate measures
to rectify or mitigate any such deficiencies in our internal controls.
30. Unfavourable media coverage or negative publicity of companies that our Company has partnered with, could harm
our brand, business, financial condition, cash flows and results of operations.
Unfavorable publicity of our Company or companies we have partnered with could adversely affect our reputation.
Such negative publicity could also harm the size of our network and the engagement and loyalty of our customers and
other participants that utilize our platform, which could adversely affect our business, cash flows, financial condition,
and results of operations.
As our platforms continue to scale and public awareness of our brand increases, any future issues that draw media
coverage could have an amplified negative effect on our reputation and brand. In addition, negative publicity of key
brands with which we have partnered or by any influencers may damage our reputation, even if the publicity is not
directly related to us. Any negative publicity that we may receive could diminish confidence in, and the use of, our
platforms and may result in increased regulation and legislative scrutiny of industry practices as well as increased
litigation, which may further increase our costs of doing business and adversely affect our brand. As a result, any
impairment or damage to our brand, including as a result of these or other factors, could adversely affect our business,
reputation, cash flows, results of operations and financial condition. Many social media platforms publish their
subscriber’s or participant’s content, often without filters on accuracy. The dissemination of inaccurate information
regarding our business, brand and services online could harm our business, reputation, prospects, financial condition
and operating results, regardless of the information’s accuracy. The damage may be immediate without affording us
an opportunity for redress or correction.
31. We are required to obtain, renew or maintain certain statutory and regulatory permits and approvals required to
operate our business, and if we fail to do so in a timely manner or at all and our business, financial conditions,
results of operations, and cash flows may be adversely affected.
Our operations are subject to government regulations and we are required to obtain and maintain several permits and
approvals under central, state and local government rules for operating our business. For details, see “Government and
other Approvals” beginning on page 276. Certain of these approvals are granted for a limited duration and are required
to be renewed or extended from time to time upon expiry. While we usually apply for the renewal of approvals in a
timely manner, we cannot assure you that such approvals will be issued or granted to us in a timely manner, or at all.
If we do not receive such approvals or are not able to renew the approvals in a timely manner, our business and
operations may be adversely affected. As on the date of this Red Herring Prospectus, all material approvals required
for operating our business are valid and our Company does not have any pending application for grant and/or renewal
of any material approval.
The approvals required by us are subject to numerous conditions and in some cases, consent of relevant authorities is
required in case there is any modification/ alteration/ change in nature of products and services offered. The conditions
and the obligation to renew the approval or license at regular intervals are also prescribed in such approvals and
licenses. We cannot assure you that these would not be suspended or revoked in the event of accidental non-compliance
or alleged non-compliance with any terms or conditions thereof, or pursuant to any regulatory action. If there is any
failure by us to comply with the applicable regulations or if the regulations governing our business are amended, we
may incur increased costs, be subject to penalties, have our approvals and permits revoked or suffer a disruption in our
operations, any of which could adversely affect our business, financial conditions, results of operations, and cash
flows.

45
32. We are in the process of expanding our operations and establishing a network of customers in sectors and regions
where we do not have a significant presence and prior experience. Any failure to expand into these new sectors and
regions could adversely affect our sales, financial condition, result of operations, and cash flows.
In order to cater to the growing market demand for our products and solutions and expand our presence across India
and other countries, we are in the process of deepening our presence in diverse sectors and use cases that we have
recently entered, and expanding our presence in the sectors where we have been present for a considerable period. We
have also started to build and release digital maps for countries outside India, such as Sri Lanka, Bangladesh, Nepal,
Bhutan, Myanmar, UAE and Egypt. We may not possess the same level of familiarity with the economic condition,
end-customer base and commercial operations in the new geographies, use cases and sectors we propose to enter into
and therefore, we will be initially exposed to a degree of risk in realization and volume of operations. There can be no
assurance that our expansion plans in these new ventures will be successful, as our competitors may have more
established brands, more experience in trends and deeper relationships with customers in these sectors. Further, having
limited or no presence in such new regions and sectors as compared to some of our competitors, may lead to lower
product and service pricing due to lack of brand presence and higher expenditure on brand building. As a result, it may
be more expensive for us to provide our products and services offerings in these new regions and customer base and
it may take longer to reach expected sales and profit levels than anticipated, which could affect the viability of these
operations or our overall profitability. There can be no assurance that our offerings will gain market acceptance or
meet the particular requirements of customers in these new markets and regions. If we do not successfully establish
our operations, reputation and brand image in these new markets and regions, our sales, financial condition, results of
operations, and cash flows could be materially and adversely affected.
33. Failure to have long term contracts or exclusive arrangements with any of our suppliers, partners and service
providers, and any major disruption to the timely and adequate supplies of hardware, software or cloud services for
any of our segments could adversely affect our business, results of operations and financial condition.
Our business, financial condition, results of operations and prospects are significantly impacted by the prices of
hardware, software or cloud services purchased or availed by us. The failure of our suppliers or service providers to
deliver such services as per the required schedule, of a specified quality/standard/specification, may adversely affect
our offerings to customers thereby giving rise to contractual penalties or liabilities, loss of customers and/or an adverse
effect on our reputation, which may in turn result in an adverse effect on our business, financial condition and results
of operations. Although we have not encountered any significant disruptions in the sourcing and/or supply from our
suppliers, we cannot assure you that such disruptions will not occur and/or we shall continue to be able to utilise such
services in a cost effective and timely manner.
34. We derive a certain portion of our revenue from business transactions and associations with governmental or
government-funded entities or agencies and any change in government policies or change preference or delay in
payment may affect our business and results of operations.
We generate certain portion of our revenue from the business transactions and associations with governmental or
government-funded entities or agencies such as Goods and Service Tax Network. The percentage of revenue pursuant
to contracts with government or government-funded entities during the last three financial years accounted for 9%,
4% and 3% of our total revenue from operations for the Financial Years 2021, 2020 and 2019, respectively, and 5%
of our total revenue from operations for the six month period ended September 30, 2021. Any change in the
government, government policies or focus of the Atmanirbhar initiative, or delay in payment may affect our business
and results of operations. We may also encounter disputes with these governmental entities, which could also have a
material adverse effect on the results of our operations. Our business is dependent on projects undertaken by
governmental authorities and other entities funded by the government. Any change in government policies that results
in a reduction in investment in projects requiring digital mapping affect us adversely. If there is any change in the
government or in governmental policies or practices which reduces focus on ‘Make in India’ campaign, our business,
prospects, financial condition, and results of operations may be adversely affected.
Further, payments from the Central, state, and local governmental authorities in India may be subject to several delays
due to regulatory scrutiny and long procedural formalities, including any audit by the Comptroller and Auditor General
of India. If payments under our contracts with the Central, state, and local governmental authorities in India are
delayed, our cash flow would be adversely affected. Any delay in payments from the Central, state, and local
governmental authorities in India may adversely affect our financial condition and results of operations. Further, any
change in the Central or state governments may result in a change in policy and reassessment of the existing contracts.
Any change in the terms of conditions of future contracts may result in rendering all or some projects unviable, which
may, in turn, result in reduction of our revenues. We may further encounter disputes with certain governmental
authorities in respect of the projects awarded by them which may cause delay to our receiving payments due from such
parties or may inhibit our ability to recover our costs. While the financial implication of such disputes individually
may not be significant, any adverse adjudication in these matters may have a material adverse impact on our business.

46
Further, we may be included in investigations or other proceedings in respect of offences alleged against the personnel
of government authorities that we engage with in the ordinary course of business.
35. An inability to renew quality accreditations in a timely manner or at all, or any deficiencies in the quality of our
products and services may adversely affect our business prospects and financial performance.
We obtain and maintain quality certifications and accreditations from independent certification entities and also
comply with prescribed specifications and standards of quality approved by the Government in connection with the
products and services we offer. We are certified as compliant with ISO/IEC 20000-1:2011 for our information
technology service management system, ISO 9001:2015 for our quality management systems, ISO 45001:2018 for our
occupational health and safety management systems and CMMI for the benchmark appraisal for the technology
division. Such specifications and standards of quality is an important factor in the success and wide acceptability of
our offerings. If we fail to comply with applicable quality standards or if the relevant accreditation institute or agency
declines to certify our products and services, or if we are otherwise unable to obtain such quality accreditations in the
future, in a timely manner or at all, our business prospects and financial performance will be materially and adversely
affected.
Further, if our offerings are alleged or found to be defective, we may be subject to product liability claims or
termination of customer arrangements. We may be subject to litigation for compensation in the future which could
result in substantial and unexpected expenditure and could materially and adversely affect our cash flow and operating
results. Further, there can be no assurance that we will be able to successfully defend such claims. If any such claims
against us are ultimately successful, we could be required to pay substantial damages, which could materially and
adversely affect our business, financial condition, results of operations, and cash flows. Moreover, product or services
failures or deficiencies, and any complaints or negative publicity, could result in a decrease in our operations. Even if
certain of the product or services defects are attributable to technological glitches beyond our control, we cannot
guarantee that we would be able to recover all or part of the damages.
36. An inability to maintain adequate insurance cover in connection with our business may adversely affect our
operations and profitability.
Our operations are subject to various risks including defects, malfunctions and failures of technology infrastructure,
fire, riots, strikes, explosions, accidents and natural disasters. As of March 31, 2021, our gross block of tangible assets
(excluding building) is ₹130.84 million, of which we have an insurance coverage of ₹136.16 million which is 104.07%
of gross block of tangible assets (excluding building). As of September 30, 2021, our gross block of tangible assets
(excluding building) is ₹141.81 million, of which we have an insurance coverage of ₹ 137.70 million which is 97.10%
of gross block of tangible assets (excluding building). As of March 31, 2020, our gross block of tangible assets
(excluding building) was ₹116.09 million, of which we have an insurance coverage of ₹180.15 million which is
155.49% of gross block of tangible assets (excluding building), and as of March 31, 2019, our gross block of tangible
assets (excluding building) was ₹71.39 million, of which we had an insurance coverage of ₹55.18 million which was
77.29% of gross block of tangible assets (excluding building). As of September 30, 2021, ₹137.70 million and ₹40
million, respectively, of our total fixed tangible assets (excluding building) and inventories was insured, which
represented 221.56% and 157.23%, respectively, of the written down value of our total fixed tangible assets and
inventories as per our Restated Consolidated Financial Information. Further, as of March 31, 2021, we had insured
₹136.16 million and ₹40.00 million, respectively, of our total fixed tangible assets (excluding building) and
inventories, which represented 212.78% and 144.71%, respectively, of the written down value of our total fixed
tangible assets and inventories as per our Restated Consolidated Financial Information. As of March 31, 2020, we had
insured ₹180.50 million and ₹43 million, respectively, of our total fixed tangible assets (excluding building) and
inventories, which represented 220.26% and 97.84%, respectively, of the written down value of our total fixed tangible
assets and inventories as per our Restated Consolidated Financial Information, and as of March 31, 2019, we had
insured ₹55.18 million and ₹80 million, respectively, of our total fixed tangible assets (excluding building) and
inventories, which represented 95.08% and 229.41%, respectively, of the written down value of our total fixed tangible
assets and inventories as per our Restated Consolidated Financial Information.
Our insurance may not be adequate to completely cover any or all of our risks and liabilities. Further, there is no
assurance that the insurance premiums payable by us will be commercially viable or justifiable. We cannot assure you
that, in the future, any claim under the insurance policies maintained by us will be honoured fully, in part or on time,
or that we have taken out sufficient insurance to cover all our losses.
Our inability to maintain adequate insurance cover in connection with our business could adversely affect our
operations and profitability. To the extent that we suffer loss or damage as a result of events for which we are not
insured, or for which we did not obtain or maintain insurance, or which is not covered by insurance, exceeds our
insurance coverage or where our insurance claims are rejected, the loss would have to be borne by us and our results
of operations, financial performance and cash flows could be adversely affected. For further information on our
insurance arrangements, see “Our Business –Insurance” on page 154.

47
37. We are dependent on our Promoters, Directors, and a number of Key Managerial Personnel, and the loss of or our
inability to attract or retain such persons could adversely affect our business, results of operations, financial
condition, and cash flows.
We are dependent on our Promoters, Directors and Key Managerial Personnel for setting our strategic business
direction and managing our business. Our Promoters, being Directors or Key Managerial Personnel of our Company
and several of our other Key Managerial Personnel have extensive experience in the industry that we operate in. Our
ability to meet continued success and future business challenges depends on our ability to attract, recruit and retain
experienced, talented and skilled professionals. Without a sufficient number of skilled employees, our operations and
manufacturing quality could suffer. Our experienced team has also developed a number of customer relationships that
would be difficult to replace. Competition for qualified technical personnel and operators as well as sales personnel
with established customer relationships is intense, both in retaining our existing employees and when replacing or
finding additional suitable employees. If we cannot hire additional qualified personnel or retain them, our ability to
expand our business will be impacted.
We may also be required to increase our levels of employee compensation more rapidly than in the past to remain
competitive in attracting suitable employees. For details of change in our Board of Directors and Key Managerial
Personnel in the last three years, please see “Our Management – Changes in our Board in the last three years” and
“Our Management – Changes in our Key Managerial Personnel in the three immediately preceding years” on pages
174 and 184, respectively. These changes did not have any material impact on the sustainable growth of our Company.
However, the loss of the services of our key personnel or our inability to recruit or train a sufficient number of
experienced personnel or our inability to manage the attrition levels in different employee categories may have an
adverse effect on our financial results and business prospects.
38. We engage our non-permanent employees through third-party payroll agencies for non-core tasks, and are exposed
to execution risks and liability, including under applicable Indian labour laws.
Our non-permanent employees are engaged by us from time to time, for certain non-core functions, such as basic
digitization for data updates, on a need basis. For details in relation to the number of employees engaged by our
Company on a permanent basis and on contractual basis in the last three financial years, see “Our Business – Human
Resources” on page 153. There can be no assurance that such non-permanent employees, in adequate numbers or with
appropriate qualifications, will be available to us every time for the relevant functions, as required to be performed or
that our non-permanent employees will continue to feel as incentivised as our permanent employees for performance
of such functions. While such employees are engaged by us through third-party payroll agencies, we are responsible
for the payment of applicable wages and statutory benefits to such non-permanent employees in the event of default
by such third-party payroll agencies which are independent contractors.
39. There is an outstanding litigation involving our Company and one of our Promoters.
Our Company and one of our Promoters, Rashmi Verma filed a criminal writ petition in October 2020 before the Delhi
High Court against the (i) Union of India through the Ministry of Defence through the Defence Secretary, (ii) Survey
of India through the Surveyor General of India, (iii) Additional Directorate, General Military Survey, Integrated
Headquarters of Ministry of Defence (Army), and (iv) Commissioner of Police, New Delhi (collectively, the
“Respondents”), praying for a writ of mandamus or any other writ or order for quashing the alleged illegal directions
(“Directions”) issued by the Respondents on several occasions in 2018, 2019, and 2020 to take down our Company’s
website and seize the server hosting such website and our Company’s data. While subsequently the DST Guidelines
were issued in February 2021 in supersession of anything else on the subject issued by the GoI or its relevant
departments and ministries, allowing Indian entities to among others, generate, distribute, publish, and/or create
geospatial data, including maps (subject to regulations on attributes in the negative lists as stated in the DST
Guidelines), without the requirement of obtaining any approvals from the GoI or any other department of the GoI, the
Directions have not been quashed by the Delhi High Court and our Petition remains pending before the Delhi High
Court as on the date of this Red Herring Prospectus. For further details regarding this writ petition, see “Outstanding
Litigation and Material Developments – Litigation involving our Company – Litigation by our Company – Criminal
Proceedings” on page 273.
There can be no assurance that the Petition will be decided in our favour and that the Directions will be quashed by
the Delhi High Court in a timely manner or at all. In addition, we cannot assure you that no additional liability will
arise out of the aforesaid proceedings or any other civil or criminal proceedings or regulatory actions that may arise in
in future. Decisions in such proceedings adverse to our interests may have an adverse effect on our business, results
of operations, financial condition and cash flows. For further details, see “Outstanding Litigation and Material
Developments” on page 273.
Our Company has also received a legal notice dated September 14, 2021 from a former-employee of our Company,
Konark Singhal alleging that that he has a right to exercise his vested options and accordingly, subscribe to 9,675
Equity Shares under the ESOP 2008. Our Company responded to the Legal Notice. With respect to the same, a

48
complaint has also been made by him to SEBI on October 20, 2021. In furtherance to the above, the Complainant has
filed another complaint with SEBI vide a letter dated November 22, 2021. The Company has responded to the same
vide letter dated November 30, 2021. No further communications have been received by us from SEBI. For further
details, see “Outstanding Litigation and Material Developments – Litigation involving our Company – Litigation by
our Company – Complaints received during the Offer” on page 274.
40. There have been certain instances of lapses on account of inadvertent factual errors, including with respect to
certain regulatory filings for corporate actions taken by our Company in the past. Further, one of our filings in
respect of a corporate action is not traceable.
There have been certain instances of lapses such as factual errors in our corporate records and filings, in relation to
certain corporate actions taken by our Company in the past. For instance, there have been the following instances of
factual errors:
• In relation to allotment of Series B Preference Shares made by our Company on July 26, 2007, the approval
received from RBI incorrectly records the nominal value of the Series B Preference Shares as ₹10 per
preference share; and
• In relation to transfers recorded by our Company on March 31, 2008, the corporate authorizations and form
FC-TRS filing made with RBI incorrectly records the nominal value of the equity shares allotted as ₹630 per
equity share.
Further, the filing made to RBI pursuant to the reorganization of 681,840 Series A Preference Shares of face value `83
each into 698,676 Series A Preference Shares of face value `81 each pursuant to allotment dated June 30, 2021 is not
traceable. While information in relation to the reorganization has been disclosed in “Capital Structure” on page 70,
we may not be able to furnish any further information, other than what is already disclosed in “Capital Structure” on
page 70.
While no legal proceedings or regulatory actions have been initiated against our Company in relation to the factual
errors in our corporate records and untraceable filing(s), as listed above, as of the date of this Red Herring Prospectus,
we cannot assure you that such legal proceedings or regulatory or statutory actions will not be initiated against our
Company in future.
41. We incorporate certain third-party open source software into our some of our offerings and our failure to comply
with the terms of the underlying open source software licenses could adversely impact us.
We use open source software in connection with certain of our offerings. Use of open source software may entail
greater risks than use of third-party commercial software, as open source licensors generally do not provide warranties
or other contractual protections regarding infringement claims or the quality of the code. Companies that incorporate
open source software into their products and services have, from time to time, faced claims challenging the ownership
of open source software and compliance with open source license terms. As a result, we could be subject to suits by
parties claiming ownership of what we believe to be open source software or noncompliance with open source
licensing terms.
Some open source software licenses require customers who distribute open source software as part of their software
to publicly disclose all or part of the source code to such software and make available any derivative works of the open
source code on unfavorable terms or at no cost. Any requirement to disclose our source code or pay damages for any
breach could be harmful to our business, financial condition, cash flows and results of operations.
42. We have in the past entered into related party transactions and may continue to do so in the future, which may
potentially involve conflicts of interest with the equity shareholders.
We have in the past entered into transactions with certain enterprises over which our Directors have a significant
influence. While we believe that all such transactions have been conducted on an arm’s length basis, we cannot assure
you that we might have obtained more favourable terms had such transactions been entered into with unrelated parties.
For further information on our related party transactions, see “Restated Consolidated Financial Information – Note
31” on page 233. We cannot assure you that any such future transactions, individually or in the aggregate, will always
be in the best interests of our minority shareholders and will not have an adverse effect on our business, results of
operations, cash flows and financial condition.
43. Certain sections of this Red Herring Prospectus disclose information from the industry report which has been
commissioned and paid for by us exclusively in connection with the Offer and any reliance on such information
for making an investment decision in the Offer is subject to inherent risks.

49
Certain sections of this Red Herring Prospectus include information based on, or derived from, the report titled “Digital
Maps and Location Intelligence Technology & Service Market - B2B(2C) for India & World” dated October 27, 2021,
which has been prepared by Frost & Sullivan.
The F&S Report has been commissioned and paid for by us for the purposes of confirming our understanding of the
industry, and has been prepared in connection with the Offer. Further, F&S Report is prepared based on information
as of specific dates and may no longer be current or reflect current trends. Certain information in the F&S Report is
also based on estimates, projections, forecasts and assumptions, that may prove to be incorrect. While industry sources
take due care and caution while preparing their reports, they do not guarantee the accuracy, adequacy or completeness
of the data. Accordingly, investors should not place undue reliance on, or base their investment decision solely on this
information. For the disclaimer regarding the F&S Report, see “Certain Conventions, Presentation of Financial,
Industry and Market Data – Industry and Market Data - Disclaimer of Frost & Sullivan” on page 18.
In view of the foregoing, you may not be able to seek legal recourse for any losses resulting from undertaking any
investment in the Offer pursuant to reliance on the information in this Red Herring Prospectus based on, or derived
from, the F&S Report. You should consult your own advisors and undertake an independent assessment of information
in this Red Herring Prospectus based on, or derived from, the Industry Report before making any investment decision
regarding the Offer. For further details, see “Industry Overview” on page 92.
44. This Red Herring Prospectus contains certain non-GAAP financial measures and certain other selected statistical
information related to our operations and financial performance. These non-GAAP measures and statistical
information may vary from any standard methodology that is applicable across the industries in which we operate,
and therefore may not be comparable with financial or statistical information of similar nomenclature computed
and presented by other IT companies.
Certain non-GAAP financial measures and certain other statistical information relating to our operations and financial
performance have been included in this Red Herring Prospectus. We compute and disclose such non-GAAP financial
measures and such other statistical information relating to our operations and financial performance as we consider
such information to be useful measures of our business and financial performance, and because such measures are
frequently used by securities analysts, investors and others to evaluate the operational performance of IT companies,
many of which provide such non-GAAP financial measures and other statistical and operational information when
reporting their financial results. These non-GAAP financial measures and other statistical and other information
relating to our operations and financial performance may not be comparable to financial measures and statistical
information of similar nomenclature that may be computed and presented by other IT companies.
45. If we are subject to any frauds, theft, or embezzlement by our employees, suppliers, contractors or dealers, it could
adversely affect our reputation, results of operations, financial condition, and cash flows.
Our operations may be subject to incidents of theft. We may also encounter some data loss on account of employee/
contractor/ customer fraud, theft, or embezzlement. Although we have set up various security measures in our offices
such as deployment of security guards and operational processes such as periodic checks, there can be no assurance
that we will not experience any fraud, theft, employee negligence, loss in transit or similar incidents in the future,
which could adversely affect our reputation, results of operations, financial condition, and cash flows.
46. Our ability to pay dividends in the future will depend on our earnings, financial condition, working capital
requirements, capital expenditures and restrictive covenants of our financing arrangements.
We have not declared dividend in two of the last three Financial Years. For further information, see “Dividend Policy”
on page 190. Our ability to pay dividends in the future will depend on our earnings, financial condition, cash flow,
working capital requirements, capital expenditure and restrictive covenants of our financing arrangements. The
declaration and payment of dividends will be recommended by the Board of Directors and approved by the
Shareholders, at their discretion, subject to the provisions of the Articles of Association and applicable law, including
the Companies Act, 2013. We may retain all future earnings, if any, for use in the operations and expansion of the
business. As a result, we may not declare dividends in the foreseeable future. Any future determination as to the
declaration and payment of dividends will be at the discretion of our Board in accordance with the dividend distribution
policy adopted by our Board on July 27, 2021 and will depend on factors that our Board deems relevant, including
among others, our Company’s profitability, capital requirements, financial commitments and requirements, including
business and expansions plans, applicable legal restrictions and any other financing arrangements. We cannot assure
you that we will be able to pay dividends in the future. Accordingly, realization of a gain on Shareholders’ investments
will depend on the appreciation of the price of the Equity Shares. There is no guarantee that our Equity Shares will
appreciate in value.
47. Certain Promoters, Directors, and Key Managerial Personnel are interested in our Company’s performance in
addition to their remuneration and reimbursement of expenses.
50
One of our Promoters, Director, and Key Managerial Personnel are interested in our Company, in addition to regular
remuneration or benefits and reimbursement of expenses and such interests are on account of their shareholding in our
Company, among other reasons. Pursuant to their shareholding in our Company, our Promoters also have the right to
nominate directors on our Board. Further, our Promoter, Rakesh Kumar Verma also receives certain rent income from
our Company in respect of certain properties leased by him to our Company and our Promoters, Rakesh Kumar Verma
and Rashmi Verma, received consideration in relation to certain property acquired by our Company in 2017. For
details, see “Our Management – Interest of Directors” and “Our Promoters and Promoter Group – Interest of our
Promoters” beginning on pages 174 and 185, respectively. We cannot assure you that our Promoters, Director, and
Key Managerial Personnel will exercise their rights to the benefit and best interest of our Company. As shareholders
of our Company, our Promoters, Directors or Key Managerial Personnel may take or block actions with respect to our
business which may conflict with the best interests of the Company or that of minority shareholders. For further
information on the interest of our Promoters, Director, and Key Managerial Personnel of our Company, other than
reimbursement of expenses incurred or normal remuneration or benefits, see “Our Management – Interest of
Directors”, “Our Management – Interest of Key Managerial Personnel”, “Our Promoters and Promoter Group” and
“Restated Consolidated Financial Information – Note 31” on pages 174, 183, 185 and 193, respectively.
External Risks
48. Financial instability in other countries may cause increased volatility in Indian financial markets.
The Indian market and the Indian economy are influenced by economic and market conditions in other countries,
including conditions in the United States, Europe and certain emerging economies in Asia. Financial turmoil in Asia,
Russia and elsewhere in the world in recent years has adversely affected the Indian economy. Any worldwide financial
instability may cause increased volatility in the Indian financial markets and, directly or indirectly, adversely affect
the Indian economy and financial sector and us. Although economic conditions vary across markets, loss of investor
confidence in one emerging economy may cause increased volatility across other economies, including India. Financial
instability in other parts of the world could have a global influence and thereby negatively affect the Indian economy.
Financial disruptions could materially and adversely affect our business, prospects, financial condition, results of
operations and cash flows. Further, economic developments globally can have a significant impact on our principal
markets. Concerns related to a trade war between large economies may lead to increased risk aversion and volatility
in global capital markets and consequently have an impact on the Indian economy. Following the United Kingdom’s
exit from the European Union (“Brexit”), there remains significant uncertainty around the terms of their future
relationship with the European Union and, more generally, as to the impact of Brexit on the general economic
conditions in the United Kingdom and the European Union and any consequential impact on global financial markets.
For example, Brexit could give rise to increased volatility in foreign exchange rate movements and the value of equity
and debt investments.
In addition, China is one of India’s major trading partners and there are rising concerns of a possible slowdown in the
Chinese economy as well as a strained relationship with India, which could have an adverse impact on the trade
relations between the two countries. In response to such developments, legislators and financial regulators in the United
States and other jurisdictions, including India, implemented a number of policy measures designed to add stability to
the financial markets. However, the overall long-term effect of these and other legislative and regulatory efforts on the
global financial markets is uncertain, and they may not have the intended stabilizing effects. Any significant financial
disruption could have a material adverse effect on our business, financial condition, results of operation, and cash
flows. These developments, or the perception that any of them could occur, have had and may continue to have a
material adverse effect on global economic conditions and the stability of global financial markets, and may
significantly reduce global market liquidity, restrict the ability of key market participants to operate in certain financial
markets or restrict our access to capital. This could have an adverse effect on our business, financial condition, results
of operations, and cash flows, and reduce the price of the Equity Shares.
49. The occurrence of natural or man-made disasters or outbreak of global pandemics, such as the COVID-19
pandemic, could adversely affect our results of operations, cash flows and financial condition. Hostilities, terrorist
attacks, civil unrest and other acts of violence could adversely affect the financial markets and our business.
The occurrence of natural disasters, including cyclones, storms, floods, earthquakes, tsunamis, tornadoes, fires,
explosions, infectious disease outbreaks such as the COVID-19 pandemic and man-made disasters, including acts of
terrorism and military actions, could adversely affect our results of operations, cash flows or financial condition.
Terrorist attacks and other acts of violence or war in India or globally may adversely affect the Indian securities
markets. In addition, any deterioration in international relations, especially between India and its neighbouring
countries, may result in investor concern regarding regional stability which could adversely affect the price of the
Equity Shares. In addition, India has witnessed local civil disturbances in recent years and it is possible that future
civil unrest as well as other adverse social, economic or political events in India could have an adverse effect on our
business. Such incidents could also create a greater perception that investment in Indian companies involves a higher
degree of risk and could have an adverse effect on our business and the market price of the Equity Shares.

51
50. Political, economic or other factors that are beyond our control may have an adverse effect on our business and
results of operations.
The Indian economy and its securities markets are influenced by economic developments and volatility in securities
markets in other countries. Investors’ reactions to developments in one country may have adverse effects on the market
price of securities of companies located elsewhere, including India. Adverse economic developments, such as rising
fiscal or trade deficit, in other emerging market countries may also affect investor confidence and cause increased
volatility in Indian securities markets and indirectly affect the Indian economy in general. Any of these factors could
depress economic activity and restrict our access to capital, which could have an adverse effect on our business,
financial condition, results of operations, and cash flows, and reduce the price of our Equity Shares. Any financial
disruption could have an adverse effect on our business, future financial performance, shareholders’ equity and the
price of our Equity Shares.
We are dependent on domestic, regional and global economic and market conditions. Our performance, growth and
market price of our Equity Shares are and will be dependent to a large extent on the health of the economy in which
we operate. There have been periods of slowdown in the economic growth of India. Demand for our products may be
adversely affected by an economic downturn in domestic, regional and global economies. Economic growth in the
countries in which we operate is affected by various factors including domestic consumption and savings, balance of
trade movements, namely export demand and movements in key imports, global economic uncertainty and liquidity
crisis, and volatility in exchange currency rates. Consequently, any future slowdown in the Indian economy could
harm our business, results of operations, financial condition, and cash flows. Also, a change in the government or a
change in the economic and deregulation policies could adversely affect economic conditions prevalent in the areas in
which we operate in general and our business in particular and high rates of inflation in India could increase our costs
without proportionately increasing our revenues, and as such decrease our operating margins.
51. Increased governmental regulations may place additional burdens on our business and growth.
In India, while the DST Guidelines have liberalised many aspects of our business, we cannot assure you that in the
future, government may not impose additional regulations that will impact our business activities including collection
and dissemination of geospatial data and maps within the territory of India. Further, the combination of heightened
security concerns relating to the breadth and accuracy of the map databases could result in more restrictive regulations
being applied to map databases. Further, such security concerns and data privacy regulations may impact certain
aspects of our business and our growth plans in geographies where we plan to grow our business.
In addition, automobile safety initiatives may result in restrictions or additional compliances being placed on the
automotive sector and our A&M customers, which in turn may lead to limiting our growth avenues in certain products
and services such as for autonomous vehicles. Policies and other regulatory initiatives may result in export control
laws, increased duties and taxes and other restrictions placed on our ability to conduct operations in various countries
throughout the world. Any of these occurrences could adversely affect our ability to improve, license or distribute our
products and services, which could result in a competitive disadvantage for us and the possible loss of customers and
revenue.
52. Majority of our revenue is derived from business in India and a slowdown in economic growth in India could cause
our business to suffer and could adversely affect our results of operations
We derive a majority of our revenue from our operations in India, accordingly, our performance and the growth of our
business are necessarily dependent on the health of the overall Indian economy. A slowdown in the Indian economy
could adversely affect the policy of the Government of India towards our industry, which may in turn adversely affect
our financial performance and our ability to implement our business strategy.
The Indian economy’s growth momentum moderated significantly in Fiscal 2018, 2019 and Fiscal 2020 as compared
to previous years. The Indian economy is also influenced by economic and market conditions in other countries,
particularly emerging market conditions in Asia. A loss of investor confidence in other emerging market economies
or any worldwide financial instability may adversely affect the Indian economy, which could materially and adversely
affect our business and results of operations and the market price of the Equity Shares. Any slowdown in the Indian
economy or future volatility in global markets could increase in our borrowing costs, result in freeze in lending
generally, thereby adversely affecting our business. Additionally, an increase in trade deficit, a downgrading in India’s
sovereign debt rating or a decline in India’s foreign exchange reserves could negatively affect interest rates and
liquidity, which could adversely affect the Indian economy and our business. Any downturn in the macroeconomic
environment in India could also adversely affect our business, results of operations, financial condition, cash flows
and the trading price of the Equity Shares.
Further, India’s economy could be adversely affected by a general rise in interest rates, and various other factors. A
slowdown in the Indian economy could adversely affect the policy of the Government of India towards our industry,
which may in turn adversely affect our financial performance and our ability to implement our business strategy.

52
India has from time to time experienced instances of social, religious and civil unrest and hostilities between
neighbouring countries. Military activity or terrorist attacks in the future could influence the Indian economy by
disrupting communications and making travel more difficult and such political tensions could create a greater
perception that investments in Indian companies involve higher degrees of risk. Events of this nature in the future, as
well as social and civil unrest within other countries in Asia, could influence the Indian economy. A number of
countries in Asia, including India, as well as countries in other parts of the world, are susceptible to contagious diseases
and, for example, have had confirmed cases of diseases such as the highly pathogenic H7N9, H5N1 and H1N1 strains
of influenza in birds and swine and more recently, the COVID-19 virus.
Other factors which may adversely affect the Indian economy are scarcity of credit or other financing in India, resulting
in an adverse impact on economic conditions in India and scarcity of financing of our developments and expansions;
volatility in, and actual or perceived trends in trading activity on India’s principal stock exchanges; changes in India’s
tax, trade, fiscal or monetary policies, like political instability, terrorism or military conflict in India or in countries in
the region or globally, including in India’s various neighboring countries; occurrence of natural or man-made disasters;
infectious disease outbreaks or other serious public health concerns; prevailing regional or global economic conditions,
including in India’s principal export markets; and other significant regulatory or economic developments in or
affecting India.
53. Our Company has prepared financial statements under Ind AS. Significant differences exist between Ind AS and
other accounting principles.
Our financial statements, including the financial statements provided in this Red Herring Prospectus, have been
prepared in accordance with Ind AS and the Companies Act, 2013 and restated in accordance with the SEBI ICDR
Regulations. We have not attempted to quantify the impact of IFRS, U.S. GAAP or any other system of accounting
principles on the financial data included in this Red Herring Prospectus, nor do we provide a reconciliation of our
financial statements to those of IFRS, U.S. GAAP or any other accounting principles. IFRS and U.S. GAAP differ in
certain respects from Ind AS. Accordingly, the degree to which the Ind AS financial statements included in this Red
Herring Prospectus will provide meaningful information is entirely dependent on the reader’s level of familiarity with
Ind AS. Any reliance by persons not familiar with Indian accounting practices on the financial disclosures presented
in this Red Herring Prospectus should accordingly be limited. In addition, some of our competitors may not present
their financial statements in accordance with Ind AS and their financial statements may not be directly comparable to
ours, and therefore reliance should accordingly be limited.
RISKS RELATING TO THE OFFER AND THE EQUITY SHARES
54. Fluctuation in the exchange rate between the Indian Rupee and foreign currencies may have an adverse effect on
the value of our Equity Shares, independent of our operating results.
On listing, our Equity Shares will be quoted in Indian Rupees on the Stock Exchanges. Any dividends in respect of
our Equity Shares will be paid in Indian Rupees and subsequently converted into the relevant foreign currency for
repatriation, if required. Any adverse movement in currency exchange rates during the time that it takes to undertake
such conversion may reduce the net dividend to foreign investors. In addition, any adverse movement in currency
exchange rates during a delay in repatriating outside India the proceeds from a sale of Equity Shares, for example,
because of a delay in regulatory approvals that may be required for the sale of Equity Shares, may reduce the proceeds
received by Shareholders. For example, the exchange rate between the Rupee and the U.S. dollar has fluctuated
substantially in recent years, in particular has significantly depreciated in the month of March 2020, and may continue
to fluctuate substantially in the future, which may have an adverse effect on the trading price of our Equity Shares and
returns on our Equity Shares, independent of our operating results.
55. The Equity Shares have never been publicly traded, and, after the Offer, the Equity Shares may experience price
and volume fluctuations, and an active trading market for the Equity Shares may not develop. Further, the price of
the Equity Shares may be volatile, and you may be unable to resell the Equity Shares at or above the Offer Price,
or at all.
Prior to the Offer, there has been no public market for the Equity Shares, and an active trading market on the Stock
Exchanges may not develop or be sustained after the Offer. Listing and quotation does not guarantee that a market for
the Equity Shares will develop, or if developed, the liquidity of such market for the Equity Shares. The Offer Price of
the Equity Shares is proposed to be determined through a book-building process and may not be indicative of the
market price of the Equity Shares at the time of commencement of trading of the Equity Shares or at any time thereafter.
The market price of the Equity Shares may be subject to significant fluctuations in response to, among other factors,
variations in our operating results, market conditions specific to the industry we operate in, developments relating to
India, announcements by us or our competitors of significant acquisitions, strategic alliances, joint operations or capital
commitments, announcements by third parties or governmental entities of significant claims or proceedings against
us, volatility in the securities markets in India and other jurisdictions, variations in the growth rate of financial

53
indicators, variations in revenue or earnings estimates by research publications, and changes in economic, legal and
other regulatory factors.
56. Holders of Equity Shares may be restricted in their ability to exercise pre-emptive rights under Indian law and
thereby may suffer future dilution of their ownership position.
Under the Companies Act, a company having share capital and incorporated in India must offer its holders of equity
shares pre-emptive rights to subscribe and pay for a proportionate number of equity shares to maintain their existing
ownership percentages before the issuance of any new equity shares, unless the pre-emptive rights have been waived
by adoption of a special resolution. However, if the laws of the jurisdiction the investors are located in do not permit
them to exercise their pre-emptive rights without our filing an offering document or registration statement with the
applicable authority in such jurisdiction, the investors will be unable to exercise their pre-emptive rights unless we
make such a filing. If we elect not to file a registration statement, the new securities may be issued to a custodian, who
may sell the securities for the investor's benefit. The value the custodian receives on the sale of such securities and the
related transaction costs cannot be predicted. In addition, to the extent that the investors are unable to exercise pre-
emption rights granted in respect of the Equity Shares held by them, their proportional interest in us would be reduced.
57. Rights of shareholders of companies under Indian law may be more limited than under the laws of other
jurisdictions.
Our Articles of Association, composition of our Board, Indian laws governing our corporate affairs, the validity of
corporate procedures, directors’ fiduciary duties, responsibilities and liabilities, and shareholders’ rights may differ
from those that would apply to a company in another jurisdiction. Shareholders’ rights under Indian law may not be
as extensive and widespread as shareholders' rights under the laws of other countries or jurisdictions. Investors may
face challenges in asserting their rights as shareholder in an Indian company than as a shareholder of an entity in
another jurisdiction.
58. Any future issuance of Equity Shares may dilute your shareholding and sale of Equity Shares by the Promoters
may adversely affect the trading price of the Equity Shares.
We may be required to finance our growth, whether organic or inorganic, through future equity offerings. Any future
equity issuances by us, including a primary offering, may lead to the dilution of investors’ shareholdings in our
Company. Any future equity issuances by us (including under an employee benefit scheme) or disposal of our Equity
Shares by the Promoters or any of our other principal shareholders or any other change in our shareholding structure
to comply with minimum public shareholding norms applicable to listed companies in India or any public perception
regarding such issuance or sales may adversely affect the trading price of the Equity Shares, which may lead to other
adverse consequences including difficulty in raising capital through offering of our Equity Shares or incurring
additional debt. There can be no assurance that we will not issue further Equity Shares or that our existing shareholders
including our Promoters will not dispose of further Equity Shares after the completion of the Offer (subject to
compliance with the lock-in provisions under the SEBI ICDR Regulations) or pledge or encumber their Equity Shares.
Any future issuances could also dilute the value of shareholder’s investment in the Equity Shares and adversely affect
the trading price of our Equity Shares. Such securities may also be issued at prices below the Offer Price. We may also
issue convertible debt securities to finance our future growth or fund our business activities. In addition, any perception
by investors that such issuances or sales might occur may also affect the market price of our Equity Shares.
59. Investors will not be able to sell immediately on an Indian stock exchange any of the Equity Shares they purchase
in the Offer.
The Equity Shares will be listed on the Stock Exchanges. Pursuant to applicable Indian laws, certain actions must be
completed before the Equity Shares can be listed and trading in the Equity Shares may commence. Investors’ book
entry, or ‘demat’ accounts with depository participants in India, are expected to be credited within one working day of
the date on which the Basis of Allotment is approved by the Stock Exchanges. The Allotment of Equity Shares in this
Offer and the credit of such Equity Shares to the applicant’s demat account with depository participant could take
approximately five Working Days from the Bid Closing Date and trading in the Equity Shares upon receipt of final
listing and trading approvals from the Stock Exchanges is expected to commence within six Working Days of the Bid
Closing Date. There could be a failure or delay in listing of the Equity Shares on the Stock Exchanges. Any failure or
delay in obtaining the approval or otherwise commence trading in the Equity Shares would restrict investors’ ability
to dispose of their Equity Shares. There can be no assurance that the Equity Shares will be credited to investors’ demat
accounts, or that trading in the Equity Shares will commence, within the time periods specified in this risk factor. We
could also be required to pay interest at the applicable rates if allotment is not made, refund orders are not dispatched
or demat credits are not made to investors within the prescribed time periods.

54
60. Investors may be subject to Indian taxes arising out of capital gains on the sale of the Equity Shares.
Under the current Indian tax laws and regulations, capital gains arising from the sale of equity shares in an Indian
company are generally taxable in India. A securities transaction tax (“STT”) is levied both at the time of transfer and
acquistion of the equity shares (unless exempted under a prescribed notification), and collected by an Indian stock
exchange on which equity shares are sold. Any gain realised on the sale of equity shares held for more than 12 months,
which are sold using any other platform other than on a recognised stock exchange and on which no STT has been
paid, are subject to long term capital gains tax in India. Such long term capital gains exceeding ₹ 100,000 arising from
the sale of listed equity shares on the stock exchange are subject to tax at the rate of 10% (plus applicable surcharge
and cess). With respect to capital gains arising in an off market sale, long term capital gains are subject to tax at the
rate of 10% (plus applicable surcharge and cess) without the exemption of ₹ 100,000. Short-term capital gains, arising
from the sale of such equity shares on a stock exchange would be subject to tax at the rate of 15% (plus applicable
surcharge and cess), while short term capital gains arising in an off-market sale would be subject to tax at a higher rate
of 40% (plus applicable surcharge and cess) in the case of foreign companies and 30% (plus applicable surcharge and
cess) in the case of other non-resident taxpayers.
The Finance Act, 2019 amended the Indian Stamp Act, 1899 with effect from July 1, 2020 and clarified that, in the
absence of a specific provision under an agreement, the liability to pay stamp duty in case of sale of securities through
stock exchanges will be on the buyer, while in other cases of transfer for consideration through a depository, the onus
will be on the transferor. The stamp duty for transfer of securities other than debentures, on a delivery basis is specified
at 0.015% and on a non-delivery basis is specified at 0.003% of the consideration amount. As such, there is no certainty
on the impact that the Finance Act, 2019 may have on our Company’s business and operations.
Further, any gain realised on the sale of listed equity shares held for a period of 12 months or less will be subject to
short term capital gains tax in India. In cases where the seller is a non-resident, capital gains arising from the sale of
the equity shares will be partially or wholly exempt from taxation in India in cases where the exemption from taxation
in India is provided under a treaty between India and the country of which the seller is resident. Additionally, the
Finance Act, 2020 does not require dividend distribution tax to be payable in respect of dividends declared, distributed
or paid by a domestic company after March 31, 2020, and accordingly, such dividends would not be exempt in the
hands of the shareholders, both resident as well as non-resident. Historically, Indian tax treaties do not limit India’s
ability to impose tax on capital gains. As a result, residents of other countries may be liable for tax in India as well as
in their own jurisdiction on a gain upon the sale of the equity shares.
Our Company cannot predict whether any tax laws or other regulations impacting it will be enacted, or predict the
nature and impact of any such laws or regulations or whether, if at all, any laws or regulations would have a material
adverse effect on our Company’s business, financial condition, results of operations and cash flows.
61. The requirements of being a publicly listed company may strain our resources.
We are not a publicly listed company and have not, historically, been subjected to the increased scrutiny of our affairs
by shareholders, regulators and the public at large that is associated with being a listed company. As a listed company,
we will incur significant legal, accounting, corporate governance and other expenses that we did not incur as an unlisted
company. We will be subject to the Listing Regulations which will require us to file audited annual and unaudited
quarterly reports with respect to our business and financial condition. If we experience any delays, we may fail to
satisfy our reporting obligations and/or we may not be able to readily determine and accordingly report any changes
in our results of operations as promptly as other listed companies. Further, as a publicly listed company, we will need
to maintain and improve the effectiveness of our disclosure controls and procedures and internal control over financial
reporting, including keeping adequate records of daily transactions. In order to maintain and improve the effectiveness
of our disclosure controls and procedures and internal control over financial reporting, significant resources and
management attention will be required. As a result, our management’s attention may be diverted from our business
concerns, which may adversely affect our business, prospects, financial condition, results of operations, and cash
flows. In addition, we may need to hire additional legal and accounting staff with appropriate experience and technical
accounting knowledge, but we cannot assure you that we will be able to do so in a timely and efficient manner.
62. QIBs and Non-Institutional Investors are not permitted to withdraw or lower their Bids (in terms of quantity of
Equity Shares or the Bid amount) at any stage after submitting a bid, and Retail Individual Investors are not
permitted to withdraw their Bids after bid/offer closing date.
Pursuant to the SEBI ICDR Regulations, QIBs and Non-Institutional Investors are required to block the Bid amount
on submission of the Bid and are not permitted to withdraw or lower their Bids (in terms of quantity of equity shares
or the Bid amount) at any stage after submitting a Bid. Similarly, Retail Individual Investors can revise or withdraw
their Bids at any time during the Bid/Offer Period and until the Bid/ Offer Closing Date, but not thereafter. While we
are required to complete all necessary formalities for listing and commencement of trading of the Equity Shares on all
Stock Exchanges where such Equity Shares are proposed to be listed, including Allotment, within six Working Days
from the Bid/ Offer Closing Date or such other period as may be prescribed by the SEBI, events affecting the Investors’

55
decision to invest in the Equity Shares, including adverse changes in international or national monetary policy,
financial, political or economic conditions, our business, results of operations, cash flows or financial condition may
arise between the date of submission of the Bid and Allotment. We may complete the Allotment of the Equity Shares
even if such events occur, and such events may limit the Investors’ ability to sell the Equity Shares Allotted pursuant
to the Offer or cause the trading price of the Equity Shares to decline on listing. Therefore, QIBs and Non-Institutional
Investors will not be able to withdraw or lower their bids following adverse developments in international or national
monetary policy, financial, political or economic conditions, our business, results of operations, cash flows or
otherwise between the dates of submission of their Bids and Allotment.
63. A third party could be prevented from acquiring control of our Company because of anti-takeover provisions under
Indian law.
There are provisions in Indian law that may delay, deter or prevent a future takeover or change in control of our
Company, even if a change in control would result in the purchase of your Equity Shares at a premium to the market
price or would otherwise be beneficial to you. Such provisions may discourage or prevent certain types of transactions
involving actual or threatened change in control of our Company. Under the SEBI Takeover Regulations, an acquirer
has been defined as any person who, directly or indirectly, acquires or agrees to acquire shares or voting rights or
control over a company, whether individually or acting in concert with others. Although these provisions have been
formulated to ensure that interests of investors/shareholders are protected, these provisions may also discourage a third
party from attempting to take control of our Company. Consequently, even if a potential takeover of our Company
would result in the purchase of the Equity Shares at a premium to their market price or would otherwise be beneficial
to its stakeholders, it is possible that such a takeover would not be attempted or consummated because of the SEBI
Takeover Regulations.

56
SECTION III: INTRODUCTION
THE OFFER
The following table summarizes the Offer details:
Offer of Equity Shares by way of an Offer for Sale by the Selling
Shareholders (1)(2)
Up to 10,063,945 Equity Shares aggregating up to ₹[●] million
The Offer comprises:
A) QIB Portion(3) Not more than 5,031,972 Equity Shares
of which:
(i) Anchor Investor Portion(4) Up to 3,019,183 Equity Shares
(ii) Net QIB Portion (assuming Anchor Investor
Portion is fully subscribed)
2,012,789 Equity Shares
of which:
Available for allocation to Mutual Funds only (5% of the
Net QIB Portion)(4)
1,00,639 Equity Shares
Balance of QIB Portion for all QIBs including Mutual
Funds
1,912,150 Equity Shares
B) Non-Institutional Portion(3) Not less than 1,509,592 Equity Shares
C) Retail Portion(3) Not less than 3,522,381 Equity Shares
Pre-Offer and post-Offer Equity Shares
Equity Shares outstanding prior to the Offer (as on date of this Red
Herring Prospectus)
53,242,967 Equity Shares
Equity Shares outstanding after the Offer(5) 53,242,967 Equity Shares
Use of Net Proceeds by our Company Our Company will not receive any proceeds from the Offer for Sale.
For further details, please see “Objects of the Offer” on page 85. (1) The Offer has been authorized by resolution of our Board of Directors at their meeting held on July 27, 2021. Further, our Board has taken on record
the consent of the Selling Shareholders for participation in the Offer for Sale pursuant to its resolution dated August 26, 2021 and further the IPO
Committee at its meeting held on November 25, 2021 has taken on record the revised consent letters from the Selling Shareholders. (2) Each of the Individual Selling Shareholder and the Other Selling Shareholders, severally and not jointly, specifically confirms that its respective portion
of the Offered Shares are eligible to be offered for sale in the Offer in accordance with the SEBI ICDR Regulations. Further, each of Qualcomm and Zenrin, severally and not jointly, specifically confirms that its respective Offered Shares are eligible to be offered for sale in the Offer in terms of the
SEBI ICDR Regulations. Further, each of the Selling Shareholders has confirmed and approved its participation in the Offer for Sale as set out below:
S.
No.
Name of the Selling Shareholder Maximum number of Offered
Shares
Date of Selling Shareholder’s
consent letter
Date of corporate
authorisation
Individual Selling Shareholder
1. Rashmi Verma Up to 4,251,044 Equity Shares November 25, 2021 -
Investor Selling Shareholders
1. Qualcomm Up to 2,701,407 Equity Shares November 25, 2021 March 11, 2016
2. Zenrin Up to 1,369,961 Equity Shares November 25, 2021 July 29, 2021 and October 7,
2021
Other Selling Shareholders
Persons listed in Annexure A Up to 1,741,533 Equity Shares As mentioned in Annexure A As mentioned in Annexure A
(3) Subject to valid Bids being received at or above the Offer Price, undersubscription, if any, in any category, except in the QIB Portion, would be allowed
to be met with spill-over from any other category or combination of categories of Bidders at the discretion of our Company, the Individual Selling
Shareholder, and the Investor Selling Shareholders, in consultation with the Book Running Lead Managers, and the Designated Stock Exchange, subject
to applicable laws. In case of under-subscription in the Offer, Equity Shares shall be allocated in the manner specified in the section “Terms of the Offer” beginning on page 291.
(4) Our Company, the Individual Selling Shareholder, and the Investor Selling Shareholders may, in consultation with the Book Running Lead Managers,
allocate up to 60% of the QIB Portion to Anchor Investors on a discretionary basis in accordance with the SEBI ICDR Regulations. The QIB Portion
will be accordingly reduced for the Equity Shares allocated to Anchor Investors. One-third of the Anchor Investor Portion shall be reserved for domestic
Mutual Funds only, subject to valid Bids being received from domestic Mutual Funds at or above the Anchor Investor Allocation Price. In the event of under-subscription or non-Allotment in the Anchor Investor Portion, the remaining Equity Shares shall be added to the Net QIB Portion. 5% of the QIB
Portion (excluding Anchor Investor Portion) shall be available for allocation on a proportionate basis to Mutual Funds only, and the remainder of the
QIB Portion (excluding Anchor Investor Portion) shall be available for allocation on a proportionate basis to all QIB Bidders (other than Anchor Investors), including Mutual Funds, subject to valid Bids being received at or above the Offer Price. In the event the aggregate demand from Mutual
Funds is less than as specified above, the balance Equity Shares available for Allotment in the Mutual Fund Portion will be added to the QIB Portion
and allocated proportionately to the QIB Bidders (other than Anchor Investors) in proportion to their Bids. For details, see “Offer Procedure” beginning on page 298.
Allocation to Bidders in all categories except the Anchor Investor Portion and the Retail Portion, if any, shall be made on a
proportionate basis subject to valid Bids received at or above the Offer Price. The allocation to each RIB shall not be less than
the minimum Bid Lot, subject to availability of Equity Shares in the Retail Portion, and the remaining available Equity Shares,
if any, shall be allocated on a proportionate basis. For further details, see “Offer Procedure” beginning on page 298.

57
SUMMARY OF RESTATED CONSOLIDATED FINANCIAL INFORMATION
The following tables provide the summary of financial information of our Company derived from the Restated Consolidated
Financial Information as at and for the six month period ended September 30, 2021 and September 30, 2020, and Financial
Years ended March 31, 2021, March 31, 2020, and March 31, 2019.
The Restated Consolidated Financial Information referred to above is presented under “Financial Information” beginning on
page 193. The summary of financial information presented below should be read in conjunction with the Restated Consolidated
Financial Information, the notes thereto and “Management’s Discussion and Analysis of Financial Condition and Results of
Operations” beginning on page 247.
(The remainder of this page is intentionally left blank)

58
RESTATED CONSOLIDATED BALANCE SHEET
(All amounts are in ₹ in million, unless otherwise stated)
As at
September 30, 2021
As at September 30,
2020
As at March 31,
2021
As at March 31,
2020
As at March 31,
2019
I. ASSETS
(1) Non-current assets
(a) Property, plant and equipment 62.15 74.02 63.99 81.95 58.03
(b) Investment properties 78.20 79.55 78.88 80.23 81.58
(c) Right of use assets 137.12 176.79 157.26 195.50 227.85
(d) Other intangible assets 24.73 37.86 28.27 47.45 75.35
(e) Financial assets
(i) Investments 1,771.09 873.12 1,147.70 1,101.99 1,025.13
(ii) Loans 8.82 8.92 8.82 9.39 9.00
(iii) Others 91.75 82.31 0.77 217.70 252.22
(f) Tax asset 26.09 75.01 65.80 79.20 57.40
(g) Deferred tax assets (net) 24.85 40.36 25.25 52.34 29.80
(2) Current assets
(a) Inventories 25.44 36.97 27.64 43.95 34.87
(b) Financial Assets
(i) Investments 1,164.07 1,380.48 1,541.80 885.00 982.28
(ii) Trade receivables 258.14 254.10 282.80 311.29 238.99
(iii) Cash and cash equivalents 614.09 187.27 336.27 150.67 82.49
(iv) Other bank balances 147.19 240.23 335.60 171.11 131.30
(v) Others 181.43 111.90 155.60 129.62 83.10
(d) Other current assets 44.42 9.71 12.11 20.87 23.20
TOTAL ASSETS 4,659.58 3,668.60 4,268.56 3,578.26 3,392.59
II. EQUITY
(a) Equity share capital 79.86 1,327.96 1,327.96 1,327.96 1,327.96
(b) Other equity 3,981.73 1,835.00 2,252.01 1,649.43 1,524.03
Total Equity 4,061.59 3,162.96 3,579.97 2,977.39 2,851.99
III. LIABILITIES
(1) Non current liabilities
(a) Financial liabilities
(i) Lease liabilities 130.74 168.72 157.29 187.36 225.20
(ii) Others - 4.35 2.74 5.90 -
(b) Provisions 38.48 21.70 25.06 24.82 16.76
(2) Current liabilities
(a) Financial liabilities
(i) Trade payables
1. Dues of micro enterprises and
small enterprises
4.83 1.16 3.09 - -
2. Dues of creditors other than micro
enterprises
and small enterprises
21.29 14.62 41.42 60.52 44.76
(ii) Lease liabilities 37.86 33.38 31.12 27.67 26.14
(iii) Others 73.38 125.00 145.10 175.82 131.69
(b) Other current liabilities 225.54 136.15 281.81 117.69 94.87
(c) Provisions 65.87 0.57 0.96 1.09 1.18
TOTAL EQUITY AND
LIABILITIES
4,659.58 3,668.60 4,268.56 3,578.26 3,392.59

59
RESTATED CONSOLIDATED STATEMENT OF PROFIT AND LOSS
(All amounts are in ₹ in million, unless otherwise stated)
For the six
month period
ended
September
30, 2021
For the six
month period
ended
September
30, 2020
For the year
ended March
31, 2021
For the year
ended March
31, 2020
For the year
ended March
31, 2019
I Revenue
Revenue from operations 1,000.27 551.80 1,524.63 1,486.29 1,352.55
Other income 225.52 187.57 398.11 148.49 280.80
Total income 1,225.79 739.37 1,922.74 1,634.78 1,633.35
II Expenses
Cost of materials consumed 73.99 33.40 133.00 133.99 172.01
Purchase of stock in trade 9.01 9.60 22.43 10.94 10.71
Change in inventory 2.44 2.47 8.45 0.67 15.78
Employee benefits expense 325.97 263.73 539.54 642.73 507.54
Finance cost 10.84 13.16 25.57 28.36 26.32
Depreciation and amortisation expense 38.73 48.13 98.97 97.69 91.50
Other expenses 136.33 131.60 307.12 404.44 391.47
Total expenses 597.31 502.09 1,135.08 1,318.82 1,215.33
III Profit before tax 628.48 237.28 787.66 315.96 418.02
IV Tax expense:
Current Tax 158.42 46.68 165.43 101.20 126.77
Deferred Tax charge /(credit) 2.40 11.98 27.90 (17.19) (44.41)
Total tax expenses 160.82 58.66 193.33 84.01 82.36
V Profit for the year 467.66 178.62 594.33 231.95 335.66
VI Other comprehensive income
(A) Items that will not be reclassified
subsequently to profit and loss
Remeasurements of the defined benefit
plans
7.85 (4.94) (3.20) 18.88 11.90
Income tax on above. (2.00) 1.24 0.82 (8.10) (3.50)
VII Total other comprehensive income 5.85 (3.70) (2.38) 10.78 8.40
VIII Total comprehensive income for the
year
461.81 182.32 596.71 221.17 327.26
Earnings per equity share of Rs. 2 each
Basic earnings per share 8.78 3.40 11.30 4.41 6.38
Diluted earnings per share 8.61 3.30 10.99 4.27 6.19

60
RESTATED CONSOLIDATED STATEMENT OF CASH FLOWS
(All amounts are in ₹ in million, unless otherwise stated)
For the six
month period
ended
September
30, 2021
For the six
month period
ended
September
30, 2020
For the year
ended March
31, 2021
For the year
ended March
31, 2020
For the year
ended
March 31,
2019
A. Cash flows from operating activities
Profit before tax 628.48 237.28 787.66 315.96 418.02
Adjustments for:
Depreciation and amortisation 38.73 48.13 98.97 97.69 91.50
Employee stock option expense 10.99 3.72 7.45 31.06 32.32
Provision for doubtful receivables and advances - - 5.73 11.53 -
Reversal of provision for doubtful receivables and
advances
(3.19) (7.59) - - (4.43)
Provision against Raw material and Finished goods - 2.72 - 6.17
Reversal of provision against Raw material and
Finished goods
(0.29) - - (8.49) -
Provision for security deposits - - - 0.18 4.76
Gain on sale of investments (133.42) (62.75) (128.00) (40.65) (195.17)
Dividend income from investments (0.24) (0.77) (1.43) (6.19) (26.24)
Interest income on fixed deposits (12.18) (12.29) (25.65) (25.95) (24.32)
Interest income on bonds (49.48) (25.77) (64.88) (48.20) (7.33)
Interest expense 10.48 12.43 24.33 27.34 25.40
Liabilities written back - - (2.94) (0.76) (8.48)
Unrealized foreign exchange fluctuation (gain)/ loss
(net)
(1.84) (0.31) (0.97) (4.32) 0.59
(Fair Value gain in investments) / Provision for
diminution in value of investment
(17.18) (47.28) (109.78) 63.45 127.84
Gain on de-recognition of Right-of-Use Assets (0.29) - - - -
Income from Investment property (4.32) (5.59) (10.27) (12.60) (6.03)
Others - - (0.68)
466.25 141.93 580.22 400.05 433.92
Adjustments for working capital changes
(Increase) / decrease in inventories 2.49 6.98 16.31 (0.58) 27.29
(Increase) / decrease in trade receivables 27.85 64.78 23.73 (83.50) 12.46
(Increase) / decrease in other financial assets and
other assets
(125.68) 177.54 243.90 (14.00) 16.57
Increase / (Decrease) in trade payables (18.39) (44.74) (16.01) 15.76 2.67
Increase/ (Decrease) in other financial liabilities,
provisions and other liabilities
(54.35) (31.21) 136.70 72.58 (63.05)
Cash flows generated from operations 298.17 315.26 984.85 390.31 429.85
Less: Income tax paid (118.71) (42.49) (152.03) (123.00) (161.72)
Net cash flows generated from operating activities 179.46 272.77 832.82 267.31 268.13
B. Cash flows from investing activities
Proceeds from sale of investments 2,039.52 1334.38 2,780.92 1,842.66 2,870.57
Purchase of investments (2,163.69) (1,490.96) (3,246.15) (1,861.35) (2,981.59)
Interest received on bank deposits and bonds 38.24 25.29 46.91 77.92 4.24
Dividend received 0.24 0.77 1.43 6.19 26.24
Purchase of property, plant and equipment (including
capital advances)
(13.55) (11.84) (23.61) (55.01) (33.30)
Sale of Property, plant and equipment - 0.64 - -
Sale of Property, plant and equipment - - 1.38 1.03 -
Income from Investment property 4.32 5.59 10.27 12.60 6.03
Deposit due to mature within 12 months of the
reporting date included 188.41 (69.12) (164.49) (39.81) (83.60)
Net cash flows used in investing activities 93.49 (205.27) (593.33) (15.78) (191.41)
C. Cash flows from financing activities
Receipt on issue of share 37.11 - - - -
Repayment of borrowings (5.90) (1.42) 2.94 (0.80) 0.04
Proceeds from borrowings - - - 9.52 -
Dividend paid - - - (110.43) -
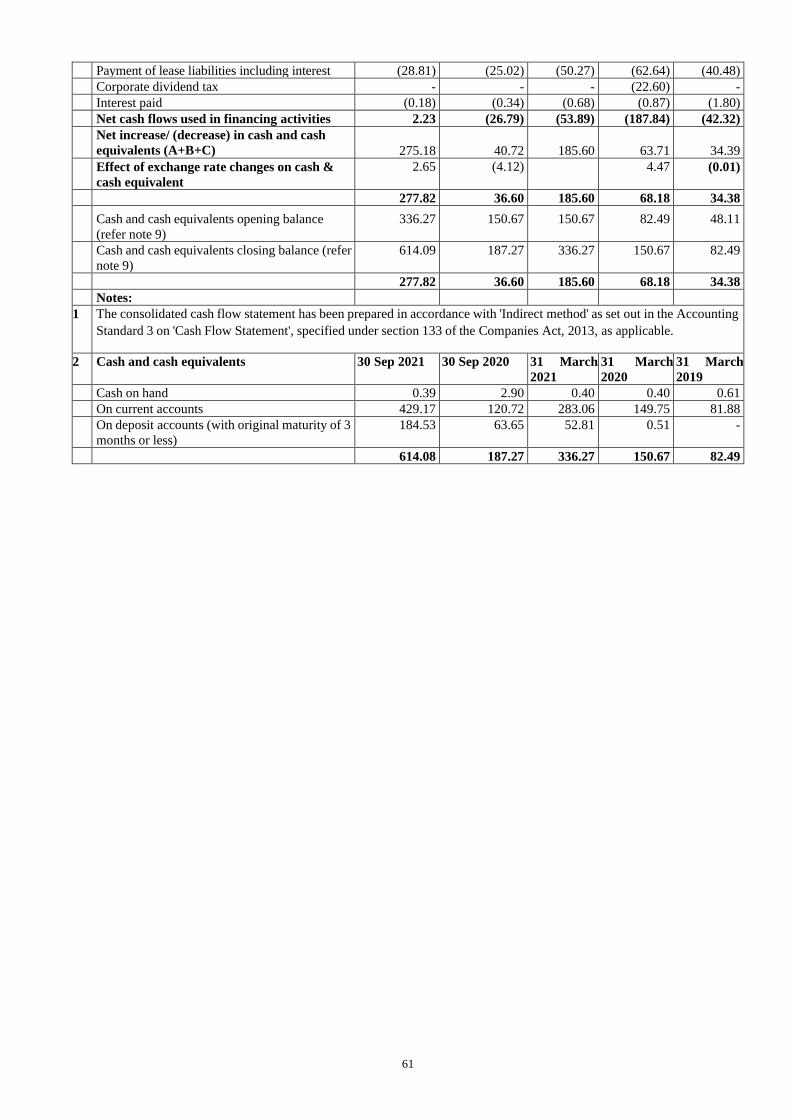
61
Payment of lease liabilities including interest (28.81) (25.02) (50.27) (62.64) (40.48)
Corporate dividend tax - - - (22.60) -
Interest paid (0.18) (0.34) (0.68) (0.87) (1.80)
Net cash flows used in financing activities 2.23 (26.79) (53.89) (187.84) (42.32)
Net increase/ (decrease) in cash and cash
equivalents (A+B+C)
275.18
40.72
185.60
63.71
34.39
Effect of exchange rate changes on cash &
cash equivalent
2.65 (4.12) 4.47 (0.01)
277.82 36.60 185.60 68.18 34.38
Cash and cash equivalents opening balance
(refer note 9)
336.27 150.67 150.67 82.49 48.11
Cash and cash equivalents closing balance (refer
note 9)
614.09 187.27 336.27 150.67 82.49
277.82 36.60 185.60 68.18 34.38
Notes:
1 The consolidated cash flow statement has been prepared in accordance with 'Indirect method' as set out in the Accounting
Standard 3 on 'Cash Flow Statement', specified under section 133 of the Companies Act, 2013, as applicable.
2 Cash and cash equivalents 30 Sep 2021 30 Sep 2020 31 March
2021
31 March
2020
31 March
2019
Cash on hand 0.39 2.90 0.40 0.40 0.61
On current accounts 429.17 120.72 283.06 149.75 81.88
On deposit accounts (with original maturity of 3
months or less)
184.53 63.65 52.81 0.51 -
614.08 187.27 336.27 150.67 82.49

62
GENERAL INFORMATION
Our Company was originally incorporated as ‘C.E. Info Systems Private Limited’ at New Delhi as a private limited company
under the Companies Act, 1956, pursuant to the certificate of incorporation dated February 17, 1995 issued by the RoC.
Thereafter, our Company was converted into a public limited company and consequently the name of our Company was
changed to ‘C.E. Info Systems Limited’ and a fresh certificate of incorporation dated July 12, 2021 was issued by the RoC.
For details of the business of our Company, see “Our Business” beginning on page 132.
Corporate Identity Number: U74899DL1995PLC065551
Company Registration Number: 065551
Registered and Corporate Office of our Company
First, Second, & Third Floor
Plot. No. 237, Okhla Industrial Estate, Phase- III
New Delhi 110 020
India
Address of the Registrar of Companies
Our Company is registered with the RoC situated at the following address:
The Registrar of Companies, National Capital Territory of Delhi and Haryana at New Delhi
4th Floor, IFCI Tower
61, Nehru Place
New Delhi 110 019
India
Board of Directors of our Company
Details regarding our Board as on the date of this Red Herring Prospectus are set forth below:
Name Designation DIN Address
Rakesh Kumar
Verma
Chairman and Managing
Director
01542842 E-10/4 Second Floor, Vasant Vihar, Vasant Vihar -2, South West Delhi, Delhi
110 057, India
Rohan Verma Whole-time Director and
CEO
01797489 E-10/4 Second Floor, Vasant Vihar, Vasant Vihar -2, South West Delhi, Delhi
110 057, India
Rakhi Prasad Non-executive Director 07621845 1801, Kingston tower, 18th Floor, G.D. Ambedkar Road, Opp. Wadia Baug,
Parel East, Mumbai 400 033, Maharashtra, India
Sonika Chandra Non-executive (Nominee)
Director*
09193853 Villa No. 31, Phase 1 lane 1, Adarsh Palm Retreat, Behind Intel Gate, VTC,
Devara Beesana Halli, Bellandur, Bengaluru 560 103, Karnataka, India
Shambhu Singh Independent Director 01219193 Flat 703, Janaki Apartments, Plot 7, Sector 22, Dwarka, New Delhi 110 077,
India
Anil Mahajan Independent Director 00003398 E-022, Windsor Park, 5 Vaibhav Khand, Indirapuram, Ghaziabad 201 014,
Uttar Pradesh, India
Kartheepan
Madasamy
Independent Director 03562906 972, Olive St, Menlo Park, CA 94025, USA
Tina Trikha Independent Director 02778940 Meadows 9, Street 12, Villa 2, Dubai, UAE * Nominee of PhonePe India
For further details of our Directors, see “Our Management” beginning on page 169.
Filing of this Red Herring Prospectus
A copy of the Draft Red Herring Prospectus has been filed electronically with SEBI at [email protected], in accordance with
the instructions issued by the SEBI on March 27, 2020, in relation to “Easing of Operational Procedure – Division of Issues
and Listing – CFD” and has also been uploaded on the SEBI intermediary portal at siportal.sebi.gov.in as specified in Regulation
25(8) of the SEBI ICDR Regulations and the SEBI circular no. SEBI/HO/CFD/DIL1/CIR/P/2018/011 dated January 19, 2018.
A copy of this Red Herring Prospectus, along with the documents required to be filed under Section 32 of the Companies Act,
2013 has been filed with the Registrar of Companies and a copy of the Prospectus to be filed under Section 26 of the Companies
Act, 2013 would be filed with the Registrar of Companies at its office located at the Registrar of Companies, National Capital
Territory of Delhi and Haryana, 4th Floor, IFCI Tower, 61, Nehru Place, New Delhi 110 019, India.

63
Company Secretary and Compliance Officer
Saurabh Surendra Somani is our Company Secretary and Compliance Officer. His contact details are as follows:
Saurabh Surendra Somani
Company Secretary and Compliance Officer
First, Second, & Third Floor
Plot. No. 237, Okhla Industrial Estate, Phase- III
New Delhi 110 020
India
Tel: +91 11 4600 9900
E-mail: [email protected]
Statutory Auditors to our Company
Brijesh Mathur & Associates, Chartered Accountants
6317, Sector C
Pocket 6 & 7, Vasant Kunj
New Delhi 100 070
India
Tel: +91 11 4606 5778/9
E-mail: [email protected]
Firm Registration Number: 022164N
Peer Review Number: 013215
Except as disclosed below, there has been no change in the Statutory Auditors during the three years immediately preceding
the date of this Red Herring Prospectus.
Particulars Date of change Reason for change
Brijesh Mathur & Associates, Chartered
Accountants
6317, Sector C
Pocket 6 & 7, Vasant Kunj
New Delhi 100 070 India
Tel: +91 11 4606 5778/9
E-mail: [email protected]
Firm Registration Number: 022164N
Peer Review Number: 013215
December 16, 2020 Appointment as statutory auditors with effect
from April 1, 2020 for a period of five years
until the AGM to be held in the year 2025
B S R & Co. LLP, Chartered Accountants
Building No. 10, 12th Floor
Tower – C, DLF Cyber City, Phase-II
Gurugram 122 002
Haryana, India
Tel: +91 124 719 1000
E-mail: [email protected]
Firm Registration Number: 101248W/W-
100022
Peer Review Number: 011748
December 16, 2020 Completion of term of appointment
Book Running Lead Managers
Axis Capital Limited
1st Floor, Axis House
C-2 Wadia International Centre
P. B. Marg, Worli
Mumbai 400 025
Maharashtra, India
Tel: +91 22 4325 2183
E-mail: [email protected]
Investor Grievance E-mail: [email protected]
Website: www.axiscapital.co.in
Contact Person: Ankit Bhatia
JM Financial Limited
7th Floor, Cnergy
Appasaheb Marathe Marg
Prabhadevi
Mumbai 400 025
Maharashtra, India
Tel: +91 22 6630 3030
E-mail: [email protected]
Investor Grievance E-mail: [email protected]
Website: www.jmfl.com
Contact Person: Prachee Dhuri

64
SEBI Registration Number: INM000012029 SEBI Registration No: INM000010361
Kotak Mahindra Capital Company Limited
1st Floor, 27 BKC
Plot No. C-27, ‘G’ Block
Bandra Kurla Complex, Bandra (East)
Mumbai 400 051
Maharashtra, India
Tel: +91 22 4336 0000
E-mail: [email protected]
Investor Grievance E-mail: [email protected]
Website: www.investmentbank.kotak.com
Contact Person: Ganesh Rane
SEBI Registration Number: INM000008704
DAM Capital Advisors Limited
(Formerly IDFC Securities Limited)
One BKC, Tower C, 15th Floor, Unit No.1511
Bandra Kurla Complex, Bandra (East)
Mumbai 400 051
Maharashtra, India
Tel: +91 22 4202 2500
E-mail: [email protected]
Investor Grievance ID: [email protected]
Website: www.damcapital.in
Contact Person: Chandresh Sharma
SEBI Registration Number: MB/INM000011336
Legal Advisors to the Offer
Legal counsel to our Company and the Individual Selling Shareholder as to Indian law
Cyril Amarchand Mangaldas
5th Floor, Peninsula Chambers
Peninsula Corporate Park
Ganpatrao Kadam Marg, Lower Parel
Mumbai 400 013
Maharashtra, India
Tel: +91 22 2496 4455
Legal counsel to the Book Running Lead Managers as to Indian law
Shardul Amarchand Mangaldas & Co
24th Floor, Express Towers
Nariman Point
Mumbai 400 021
Maharashtra, India
Tel: +91 22 4933 5555
International legal counsel to the Book Running Lead Managers
Linklaters Singapore Pte. Ltd.
One George Street
#17-01
Singapore 049145
Tel: +65 6692 5891
Legal Counsel to Qualcomm and Zenrin as to Indian Law
IndusLaw
2nd Floor, Block D
The MIRA, Mathura Road
New Delhi 110 065, India
Tel: +91 11 4782 1000
Legal counsel to the Other Selling Shareholder as to Indian law
Amicus
I-1 Jangpura Extension
New Delhi 110 014, India
Tel: +91 11 41553433
Registrar to the Offer
Link Intime India Private Limited
C-101, 1st Floor, 247 Park

65
Lal Bahadur Shastri Marg
Vikhroli (West)
Mumbai 400 083
Maharashtra, India
Tel: +91 22 4918 6200
E-mail: [email protected]
Investor Grievance E-mail: [email protected]
Website: www.linkintime.co.in
Contact Person: Shanti Gopalkrishnan
SEBI Registration Number: INR000004058
Bankers to the Offer
Escrow Collection Bank(s), Refund Bank, Public Offer Bank, and Sponsor Bank
ICICI Bank Limited
Capital Market Division, 1st Floor,
122, Mistry Bhavan, DinshawVachha Road,
Backbay Reclamation, Churchgate,
Mumbai – 400020
India
Tel: +91 22 66818911/23/24
E-mail: [email protected]
Website: www.icicibank.com
Contact Person: Mr. Sagar Welekar
SEBI Registration No.: INBI00000004
Bankers to our Company
Bank of India
M-78, Shopping Centre
Greater Kailash-II
New Delhi 110 048, India
Tel: +91 11 2321 2593
E-mail: [email protected]
Website: www.bankofindia.co.in
Contact Person: Chief Manager
ICICI Bank Limited
E-568, Greater Kailash-II
New Delhi 110 048, India
Tel: +91 98108 57717
E-mail: [email protected]
Website: www.icicibank.com
Contact Person: Sunita Gambhir
Syndicate Members
JM Financial Services Limited
2, 3 and 4, Kamanwala Chambers, Ground Floor
Sir P. M. Road, Fort
Mumbai 400 001
Maharashtra, India
Tel: +91 22 6136 3400
E-mail: [email protected]/ [email protected]
Website: www.jmfinancialservices.in
Contact Person: T. N. Kumar/ Sona Verghese
SEBI Registration No.: INZ000195834
Kotak Securities Limited
4th Floor, 12 BKC G Block
Bandra Kurla Complex Bandra (East)
Mumbai 400 051
Maharashtra, India
Tel: +91 22 6218 5470
E-mail: [email protected]
Website: www.kotak.com
Contact Person: Umesh Gupta
SEBI Registration No.: INZ000200137
Sharekhan Limited
10th Flr., Beta Building
Lodha Ithink Techno Campus
Opp. Kanjurmarg Railway Station
Kanjurmarg (E), Mumbai 400 042
Maharashtra, India
Tel: +91 22 6115 0000
Email: [email protected]
Investor Grievance Email: [email protected]/
Website: www.sharekhan.com
Contact person: Pravin Darji

66
SEBI Registration No.: INB231073330/INB011073351
Designated Intermediaries
Self-Certified Syndicate Banks
The list of SCSBs notified by SEBI for the ASBA process is available at http://www.sebi.gov.in/sebiweb/other/
OtherAction.do?doRecognised=yes, or at such other website as may be prescribed by SEBI from time to time. A list of the
Designated SCSB Branches with which an ASBA Bidder (other than a RIB using the UPI Mechanism), not bidding through
Syndicate/Sub Syndicate or through a Registered Broker, RTA or CDP may submit the Bid cum Application Forms, is
available at https://www.sebi.gov.in/sebiweb/other/OtherAction.do?doRecognisedFpi=yes&intmId=34, or at such other
websites as may be prescribed by SEBI from time to time.
SCSBs and mobile applications enabled for UPI Mechanism
In accordance with SEBI Circular No. SEBI/HO/CFD/DIL2/CIR/P/2019/76 dated June 28, 2019 and SEBI Circular No.
SEBI/HO/CFD/DIL2/CIR/P/2019/85 dated July 26, 2019, Retail Individual Investors Bidding using the UPI Mechanism may
apply through the SCSBs and mobile applications whose names appears on the website of the SEBI
(https://www.sebi.gov.in/sebiweb/other/OtherAction.do?doRecognisedFpi=yes&intmId=40) and (https://www.sebi.gov.in/
sebiweb/other/OtherAction.do?doRecognisedFpi=yes&intmId=43) respectively, as updated from time to time.
Syndicate SCSB Branches
In relation to Bids (other than Bids by Anchor Investor) submitted to a member of the Syndicate, the list of branches of the
SCSBs at the Specified Locations named by the respective SCSBs to receive deposits of Bid cum Application Forms from the
members of the Syndicate is available on the website of the SEBI (https://www.sebi.gov.in
/sebiweb/other/OtherAction.do?doRecognisedFpi=yes&intmId=35) and updated from time to time. For more information on
such branches collecting Bid cum Application Forms from the Syndicate at Specified Locations, see the website of the SEBI at
https://www.sebi.gov.in/sebiweb/other/OtherAction.do?doRecognisedFpi=yes&intmId=35 as updated from time to time.
Registered Brokers
Bidders can submit ASBA Forms in the Offer using the stock broker network of the stock exchange, i.e. through the Registered
Brokers at the Broker Centres. The list of the Registered Brokers, including details such as postal address, telephone number
and e-mail address, is provided on the websites of the Stock Exchanges at https://www.bseindia.com/ and
https://www.nseindia.com, as updated from time to time.
Registrar and Share Transfer Agents
The list of the RTAs eligible to accept ASBA Forms at the Designated RTA Locations, including details such as address,
telephone number and e-mail address, is provided on the websites of the Stock Exchanges at
https://www.bseindia.com/Static/PublicIssues/RtaDp.aspx and http://www.nseindia.com/products/content/
equities/ipos/asba_procedures.htm, respectively, as updated from time to time.
Collecting Depository Participants
The list of the CDPs eligible to accept ASBA Forms at the Designated CDP Locations, including details such as name and
contact details, is provided on the websites of the Stock Exchanges at
https://www.bseindia.com/Static/PublicIssues/RtaDp.aspx and http://www.nseindia.com/products/content/equities
/ipos/asba_procedures.htm, respectively, as updated from time to time.
Expert to the Offer
Except as disclosed below, our Company has not obtained any expert opinions:
Our Company has received written consent dated December 2, 2021, from our Statutory Auditors, Brijesh Mathur & Associates,
Chartered Accountants, to include their names in this Red Herring Prospectus as required under Section 26(1) of the Companies
Act read with SEBI ICDR Regulations and as “expert” as defined under Sections 2(38) and 26(5) of the Companies Act to the
extent and in their capacity as an auditor and in respect of their (i) examination report dated November 1, 2021 on the Restated
Consolidated Financial Information; and (ii) report dated November 25, 2021 on the statement of possible special tax benefits
included in this Red Herring Prospectus and such consents have not been withdrawn as on the date of this Red Herring
Prospectus.

67
IPO Grading
As the Offer is an offer for sale of Equity Shares by the Selling Shareholders, no credit agency registered with SEBI has been
appointed in respect of obtaining grading for the Offer.
Monitoring Agency
As the Offer is an offer for sale of Equity Shares by the Selling Shareholders, our Company is not required to appoint a
monitoring agency for this Offer.
Appraising Entity
As the Offer is an offer for sale of Equity Shares by the Selling Shareholders, our Company will not receive any proceeds from
the Offer. Accordingly, no appraising entity has been appointed for the Offer.
Credit Rating
As the Offer is an offer for sale of Equity Shares by the Selling Shareholders, there is no credit rating required.
Trustees
As the Offer is an offer for sale of Equity Shares by the Selling Shareholders, the appointment of trustees is not required.
Green Shoe Option
No green shoe option is contemplated under the Offer.
Inter-se Allocation of Responsibilities among the Book Running Lead Managers
The following table sets forth the inter-se allocation of responsibilities for various activities among the Book Running Lead
Managers:
S. No. Activity Responsibility Co-ordination
1. Capital structuring, positioning strategy and due diligence of the Company including its
operations/management/business plans/legal etc. Drafting and design of the Draft Red
Herring Prospectus, Red Herring Prospectus, Prospectus, abridged prospectus and
application form. The BRLMs shall ensure compliance with stipulated requirements and
completion of prescribed formalities with the Stock Exchanges, RoC and SEBI
including finalization of Prospectus and RoC filing
BRLMs Axis Capital
2. Drafting and approval of statutory advertisements BRLMs Axis Capital
3. Drafting and approval of all publicity material other than statutory advertisement as
mentioned above including corporate advertising, brochure, etc. and filing of media
compliance report.
BRLMs DAM Capital
4. Appointment of intermediaries viz., Registrar's, Printers, Advertising Agency,
Syndicate, Sponsor Bank, Bankers to the Issue and other intermediaries, including
coordination of all agreements to be entered into with such intermediaries
BRLMs Kotak
5. Preparation of road show marketing presentation and frequently asked questions BRLMs Kotak
6. International Institutional marketing of the Offer, which will cover, inter alia:
• Institutional marketing strategy;
• Finalizing the list and division of international investors for one-to-one
meetings; and
• Finalizing international road show and investor meeting schedule
BRLMs Kotak
7. Domestic Institutional marketing of the Offer, which will cover, inter alia:
• Institutional marketing strategy;
• Finalizing the list and division of domestic investors for one-to-one meetings;
and
• Finalizing domestic road show and investor meeting schedule
BRLMs Axis Capital
8. Retail marketing of the Offer, which will cover, inter alia:
• Formulating marketing strategies, preparation of publicity budget;
• Finalizing media, marketing and public relations strategy;
• Finalizing centres for holding conferences for brokers, etc.;
BRLMs JM Financial

68
S. No. Activity Responsibility Co-ordination
• Finalizing collection centres;
• Arranging for selection of underwriters and underwriting agreement; and
• Follow-up on distribution of publicity and offer material including form,
Prospectus and deciding on the quantum of the offer material
9. Non-Institutional marketing of the Offer, which will cover, inter alia:
• Finalizing media, marketing and public relations strategy; and
• Finalizing centres for holding conferences for brokers, etc.
BRLMs Axis Capital
10. Managing the book and finalization of pricing in consultation with the Company and the
Selling Shareholders.
BRLMs Kotak
11. Coordination with Stock-Exchanges for book building software, bidding terminals,
mock trading, payment of 1% security deposit, anchor co-ordination and intimation of
anchor allocation.
BRLMs DAM Capital
12. Post- Issue activities, which shall involve essential follow-up with bankers to the Issue
and SCSBs to get quick estimates of collection and advising our Company about the
closure of the Issue, based on correct figures, finalization of the basis of allotment or
weeding out of multiple applications, listing of instruments, dispatch of certificates or
demat credit and refunds, payment of STT on behalf of the Selling Shareholders and
coordination with various agencies connected with the post-Issue activity such as
Registrar to the Issue, Bankers to the Issue, SCSBs including responsibility for
underwriting arrangements, as applicable and submission of all post Offer reports
including the final post Offer report to SEBI, co-ordination with designated exchange
and SEBI for release of 1% security deposit.
BRLMs JM Financial
Book Building Process
Book building, in the context of the Offer, refers to the process of collection of Bids from bidders on the basis of this Red
Herring Prospectus and the Bid Cum Application Forms and the Revision Forms within the Price Band and the minimum Bid
Lot, which will be decided by our Company, the Individual Selling Shareholder, and the Investor Selling Shareholders in
consultation with the Book Running Lead Managers, and which will either be included in this Red Herring Prospectus or will
be advertised in all editions of Financial Express, an English national daily newspaper and all editions of Jansatta, a Hindi
national daily newspaper (Hindi also being the regional language of New Delhi, where our Registered and Corporate Office is
located), each with a wide circulation, at least two Working Days prior to the Bid/Offer Opening Date and shall be made
available to the Stock Exchanges for the purpose of uploading on their respective websites. The Offer Price shall be determined
by our Company, the Individual Selling Shareholder, and the Investor Selling Shareholders in consultation with the Book
Running Lead Managers after the Bid/Offer Closing Date. For details, see “Offer Procedure” beginning on page 298.
All Bidders (other than Anchor Investors) shall participate in this Offer mandatorily through the ASBA process by
providing the details of their respective bank accounts in which the corresponding Bid Amount will be blocked by the
SCSBs. In addition to this, the RIBs may participate through the ASBA process by either (a) providing the details of
their respective ASBA Account in which the corresponding Bid Amount will be blocked by the SCSBs; or (b) through
the UPI Mechanism. Anchor Investors are not permitted to participate in the Offer through the ASBA process.
In terms of the SEBI ICDR Regulations, QIBs and Non-Institutional Investors are not permitted to withdraw their Bids
or lower the size of their Bids (in terms of quantity of Equity Shares or the Bid Amount) at any stage. RIBs can revise
their Bids during the Bid/ Offer Period and withdraw their Bids until the Bid/ Offer Closing Date. Anchor Investors are
not allowed to revise or withdraw their Bids after the Anchor Investor Bidding Date. Except for Allocation to RIBs and
the Anchor Investors, allocation in the Offer will be on a proportionate basis.
For further details, see “Terms of the Offer” “Offer Structure” and “Offer Procedure” on pages 291, 296 and 298, respectively.
The process of Book Building under the SEBI ICDR Regulations and the Bidding Process are subject to change from
time to time and the investors are advised to make their own judgment about investment through this process prior to
submitting a Bid in the Offer.
Bidder should note that, the Offer is also subject to obtaining (i) the final approval of the RoC after the Prospectus is filed with
the RoC; and (ii) final listing and trading approvals of the Stock Exchanges, which our Company shall apply for after Allotment.
Underwriting Agreement
After the determination of the Offer Price and allocation of Equity Shares, but prior to the filing of the Prospectus with the RoC,
our Company the Selling Shareholders and the Registrar intend to enter into an Underwriting Agreement with the Underwriters
for the Equity Shares proposed to be offered through the Offer. Subject to the applicable laws and pursuant to the terms of the

69
Underwriting Agreement, the BRLMs will be responsible for bringing in the amount devolved in the event that the Syndicate
Members do not fulfil their underwriting obligations. The Underwriting Agreement is dated [●]. Pursuant to the terms of the
Underwriting Agreement, the obligations of each of the Underwriters will be several and will be subject to certain conditions
specified therein.
The Underwriters have indicated their intention to underwrite the following number of Equity Shares:
(This portion has been intentionally left blank and will be filled in before filing of the Prospectus with the RoC.)
Name, address, telephone number and e-mail
address of the Underwriters
Indicative number of Equity Shares
to be underwritten
Amount underwritten
(in ₹ million)
[●] [●] [●]
[●] [●] [●]
[●] [●] [●]
[●] [●] [●]
The aforementioned underwriting commitments are indicative and will be finalised after pricing of the Offer and actual
allocation in accordance with provisions of the SEBI ICDR Regulations.
In the opinion of our Board of Directors (based on the representation made to our Company and Selling Shareholders by the
Underwriters), the resources of the Underwriters are sufficient to enable them to discharge their respective underwriting
obligations in full. The Underwriters are registered with SEBI under Section 12(1) of the SEBI Act or registered as brokers
with the Stock Exchanges. Our Board of Directors/IPO Committee, at its meeting held on [●], approved the acceptance and
entering into the Underwriting Agreement mentioned above on behalf of our Company.
Allocation among the Underwriters may not necessarily be in proportion to their underwriting commitment set forth in the table
above.
Notwithstanding the above table, the Underwriters shall be severally responsible for ensuring payment with respect to the Equity
Shares allocated to investors respectively procured by them in accordance with the Underwriting Agreement. In the event of
any default in payment, the respective Underwriter, in addition to other obligations defined in the Underwriting Agreement,
will also be required to procure purchasers for or purchase the Equity Shares to the extent of the defaulted amount in accordance
with the Underwriting Agreement. The Underwriting Agreement has not been executed as on the date of this Red Herring
Prospectus and will be executed after determination of the Offer Price and allocation of Equity Shares, but prior to the filing of
the Prospectus with the RoC.

70
CAPITAL STRUCTURE
The share capital of our Company as at the date of this Red Herring Prospectus is set forth below:
(in ₹, except share data) Aggregate value at face
value
Aggregate value at
Offer Price
A AUTHORISED SHARE CAPITAL(1)
75,000,000 Equity Shares (having face value of ₹2 each) 150,000,000 -
1,229,629.63 Series A Preference Shares (having face value of ₹81 each)* 99,600,000 -
1,000,000 Series B Preference Shares (having face value of ₹114 each) 114,000,000 -
1,218,007 Series C Preference Shares (having face value of ₹290 each) 353,222,030 -
1,149,206 Series D Preference Shares (having face value of ₹630 each) 723,999,780 -
180,000 Series E Preference Shares (having face value of ₹1,000 each) 1,800,000,000 -
Total 1,620,821,810
B ISSUED, SUBSCRIBED AND PAID-UP SHARE CAPITAL BEFORE THE OFFER
53,242,967 Equity Shares (having face value of ₹2 each) 106,485,934 [●]
D PRESENT OFFER IN TERMS OF THIS RED HERRING PROSPECTUS
Offer of up to 10,063,945 Equity Shares (having face value of ₹ 2 each)
aggregating up to ₹[●] million (2)(3)
20,127,890 [●]
E ISSUED, SUBSCRIBED AND PAID-UP SHARE CAPITAL BEFORE AND AFTER THE OFFER
53,242,967 Equity Shares (having face value of ₹ 2 each) 106,485,934 [●]
F SECURITIES PREMIUM ACCOUNT
Before the Offer 1,337.00 million
After the Offer 1,337.00 million (1) For details in relation to the changes in the authorised share capital in the last 10 years of our Company, see “History and Certain Corporate Matters
– Amendments to our Memorandum of Association” on pages 161.
(2) The Offer has been authorised by a resolution of our Board of Directors at their meeting held on July 27, 2021. Each of the Selling Shareholders have, severally and not jointly, confirmed and authorised their respective participation in the Offer for Sale. Further, our Board has taken on record the consent
of the Selling Shareholders for participation in the Offer for Sale pursuant to its resolution dated August 26, 2021 and further the IPO Committee at its
meeting held on November 25, 2021 has taken on record the revised consent letters from the Selling Shareholders. For details of authorisations for the Offer for Sale, see “The Offer” and “Other Regulatory and Statutory Disclosures” on pages 56 and 278, respectively.
(3) The Individual Selling Shareholder specifically confirms that the Equity Shares being offered by the Individual Selling Shareholder have been held by
the Individual Selling Shareholder for a period of at least one year prior to the date of filing of the Draft Red Herring Prospectus in accordance with the SEBI ICDR Regulations and accordingly, are eligible for the Offer in accordance with the provisions of the SEBI ICDR Regulations. Further, each of
Qualcomm and Zenrin, severally and not jointly, specifically confirms that its respective Offered Shares (are eligible to be offered for sale in the Offer in
terms of the SEBI ICDR Regulations. Further each of the Other Selling Shareholders, severally and not jointly, specifically confirms that its respective Offered Shares are eligible to be offered for sale in the Offer in terms of the SEBI ICDR Regulations.
* Our Company had initially allotted 681,840 Series A Preference Shares at of face value ₹83 each and thereafter the Series A Preference Shares were
subdivided and the allotment of 698,676 Series A Preference Shares of face value ₹81 each was carried out on June 30, 2021 in order to allot the number of Series A Preference Shares agreed to be allotted in accordance with the Series A Investment Agreement. However, the RBI filing made in this regard
cannot be traced. Accordingly, we have relied on the corporate authorization and the filings made with RoC. For details see “Risk Factors - There have
been certain instances of lapses on account of inadvertent factual errors, including with respect to certain regulatory filings for corporate actions taken
by our Company in the past. Further, one of our filings in respect of a corporate action is not traceable” on page 48.
Notes to the Capital Structure
I. Equity Share capital history of our Company
(a) The history of the equity share capital of our Company is set forth below:
Date of
allotment
of equity
shares
Number of
equity
shares
allotted
Face
value
per
equity
share
(in ₹)
Issue price
per equity
share (in ₹)
Nature of
allotment
Nature of
consideration
Cumulative
number of
equity shares
Cumulative
paid-up
equity share
capital
February
24, 1995
20 10 10 Initial
subscription to
the
Memorandum of
Association(1)
Cash 20 200
March 30,
1996
9,980 10 10 Further issue(2) Cash 10,000 100,000
February 2,
2000
90,000 10 10 Further issue(3) Cash 100,000 1,000,000

71
Date of
allotment
of equity
shares
Number of
equity
shares
allotted
Face
value
per
equity
share
(in ₹)
Issue price
per equity
share (in ₹)
Nature of
allotment
Nature of
consideration
Cumulative
number of
equity shares
Cumulative
paid-up
equity share
capital
February
26, 2000
200,000 10 Not
Applicable
Bonus issue in
the ratio of 2:1 (4)
Not
Applicable
300,000 3,000,000
July 24,
2000
56,731 10 616.95 Further issue (5)
Cash 356,731 3,567,310
March 27,
2006
3,567,310 10 Not
Applicable
Bonus issue in
the ratio of 10:1
(6)
Not Applicable 3,924,041 39,240,410
April 2,
2009
(134,305) 10 (348) Buy-back(7) Cash 3,789,736 37,897,360
August 1,
2011
43,095 10 81 Allotment
pursuant to
ESOP 2008 (8)
Cash 3,832,831 38,328,310
June 3,
2021
38,708 10 81 Allotment
pursuant to
ESOP 2008(9)
Cash 3,871,539 38,715,390
July 7,
2021
59,937 10 81 Allotment
pursuant to
ESOP 2008(10)
Cash 3,931,476 39,314,760
July 29,
2021
Pursuant to a resolution passed by our Board and the Shareholders in the meeting held on July 27, 2021
and July 29, 2021, respectively, our Company has sub-divided its authorised equity share capital, such that
4,500,000 equity shares of face value of ₹10 each aggregating to ₹45,000,000 were sub-divided as
22,500,000 Equity Shares of ₹2 each aggregating to ₹45,000,000. Therefore, the cumulative number of
Equity Shares pursuant to the sub-division is 19,657,380 Equity Shares and cumulative paid-up Equity
Share capital of the Company is ₹39,314,760.
September
21, 2021
3,503,740 2 Not
Applicable
Allotment
pursuant to
conversion of
Series A
Preference
Shares(11)
Not Applicable 23,161,120 46,322,240
4,691,630 2 Not
Applicable
Allotment
pursuant to
conversion of
Series B
Preference
Shares(12)
Not Applicable 27,852,750 55,705,500
6,090,015 2 Not
Applicable
Allotment
pursuant to
conversion of
Series C
Preference
Shares(13)
Not Applicable 33,942,765 67,885,530
5,746,030 2 Not
Applicable
Allotment
pursuant to
conversion of
Series D
Preference
Shares(14)
Not Applicable 39,688,795 79,377,590
243,430 2 Not
Applicable
Allotment
pursuant to
conversion of
Series E
Preference
Shares(15)
Not Applicable 39,932,225 79,864,450
October 7,
2021
13,310,742 2 Not
Applicable
Bonus issue in
the ratio of 1:3(16)
Not Applicable 53,242,967 106,485,934
(1) Allotment of 10 equity shares each to Rakesh Kumar Verma and Rashmi Verma pursuant to subscription to the Memorandum of
Association.
(2) Allotment of 4,890 equity shares to Rakesh Kumar Verma and 5,090 equity shares to Rashmi Verma. (3) Allotment of 44,100 equity shares to Rakesh Kumar Verma and 45,900 equity shares to Rashmi Verma.
(4) Bonus issue of 97,200 equity shares to Rakesh Kumar Verma, 100,800 equity shares to Rashmi Verma, 180 equity shares to Rakhi Verma, 800 equity shares to Aditya Sinha, 40 equity shares to Jaya Jaipruiar, 200 equity shares to Neerja Mathur, Manpreet
Gabba and Swaminathan, 100 equity shares to Jaya Kumar,20 equity shares to Dilip Roy, Ajit Pandey, Anand Mohan, Ranjan
P.N, and Ramesh Koyi, 100 equity shares to Rupa Amitabh, 80 equity shares to V. Saxena in the ratio 2:1. (5) Allotment of 28,350 equity shares to Magnus Capital Corp Limited and 28,381 equity shares to SMIFS Venture Capital Limited.

72
(6) Bonus issue of 1,453,000 equity shares to Rakesh Kumar Verma, 1,469,500 equity shares to Rashmi Verma, 2,700 equity shares to
Rakhi Verma, 2,400 equity shares to Aditya Sinha, 3,000 equity shares each to Manpreet Gabba and Neha Mathur, 2,700 equity
shares to Jaya Kumar, 300 equity shares each to Dilip Roy and Ajit Pandey, 2,100 equity shares to Ranjan P.N, 1,500 equity shares each to Rupa Amitabh and Roopesh Ram Gopal Gupta, 1,800 equity shares to Jaya Jayapuriar, 283,810 equity shares Chentec
Investment Limited (formerly known as to SMIFS Venture Capital Limited),283,500 equity shares to Magnus Capital Corp Limited,
1,000 equity shares to Harshad Dholkia, 40,000 equity shares to Amal Pariakh, 5,000 equity shares to Shatrunjay Credit Services Private Limited, 3,400 equity shares each to Vilas Kulkarni, Mahender Vir and Sapna Ahuja. in the ratio 10:1.
(7) Buyback of 65,979 equity shares from Rakesh Kumar Verma, 53,055 equity shares from Rashmi Verma, 151 equity shares from
Manpreet Gabba, 136 equity shares from Jaya Kumar, 106 equity shares from Ranjan P.N, 14,305 equity shares from Nayan Arun Jagjivan, 250 equity shares from Shatrunjay Credit Services Private Limited, 151 equity shares from Neha Mathur and 172 equity
shares from Sapna Ahuja.
(8) Allotment of 5,933 equity shares to Sapna Ahuja, 849 equity shares each to Ranjan P.N, Animesh Chandra and Sandeep K. Daftuar, 1,695 equity shares each to Jaya Kumar and Chhavi Gupta, 9,492 equity shares each to Rohan Verma and Shivalik Prasad, 171
equity shares to Bachi Singh, 453 equity shares to Kavi Chaurasia, 170 equity shares to Leena Sharma, 848 equity shares each to
Monika Jaipuriar, Nishu Jain, Ravinder Pratap Singh, Pradeep Prasad Gupta and Ashok Bhatt,58 equity shares to Neetu Milind, 1130 equity shares to Rajesh Singh, 565 equity shares to Rishin Kalra, 86 equity shares to Shispal Singh, 283 equity shares to
Shrinath V, 678 equity shares to Vishal Pandey, 2,825 equity shares to Konark, 226 equity shares to Sonam Rawat and 1356 equity
shares to Tanya on exercise of options granted under the ESOP 2008. (9) Allotment of 38,708 equity shares to Rohan Verma on exercise of options granted under the ESOP 2008.
(10) Allotment of 158 equity shares to Leena Sharma, 183 equity shares to Neetu Milind, 519 equity shares to Muraleedhara Herur
Navada, 232 equity shares to Ashutosh Kumar,694 equity shares each to Kunal Bharti and Shashank Shekhar Jaiswal, 232 equity shares to Soumya Darbari, 1,157 equity shares to Aditya Sinha, 158 equity shares to Bachi Singh, 5,808 equity shares to Ranjan
P.N., 463 equity shares to Madan Prakash Jha, 1,967 equity shares to Rajesh Singh, 463 equity shares to Rajiv Ranjan Prasad,
694 equity shares Vilas Kulkarni, 482 equity shares to Ritesh Arora, 232 equity shares to Akhtar Ali, 847 equity shares to Animesh Chandra, 1,518 equity shares to Anuj Kumar Jain, 1,287 equity shares to Shishir Kumar Verma, 7,848 equity shares to Ankeet
Bhat, 12,006 equity shares to Sapna Ahuja, 1,394 equity shares each to Monika Jaipuria and Nishu Jain, 2,230 equity shares to
Ravinder Pratap Singh, 2,583 equity shares to Rishin Kalra, 329 equity shares to Sanjay Shukla, 694 equity shares each to Vishwajit Pathak, Biswanath Panda and Sumit Gupta, 232 equity shares to Bhupesh Kumar, 1,752 equity shares to Jaya Kumar,
232 equity shares to Parshuram Das, 463 equity shares each to Saurabh Kumar, Paramjyoti and Nirdesh Singh, 232 equity shares
each to Subrat Kumar Dey, Sunil Kumar Yadav, Supriya Nath, Ramesh Chandra Mahani, Isha Rani, Balmukand and Deepak Kumar Jain, 694 equity shares each to Krishna Kumar, Piyush Saraswat and Priti Malik, 116 equity shares to Santosh Kumar Jha,
1,394 equity shares to Pradeep Prasad Gupta, 421 equity shares to Mamta, 1,482 equity shares to Ashok Bhatt, 713 equity shares
to Mohammad Akram, 1,309 equity shares to Sonam Rawat on exercise of options granted under the ESOP 2008. (11) Allotment of 3,503,740 Equity Shares to PhonePe Singapore pursuant to conversion of 700,748 Series A Preference Shares held
by PhonePe Singapore.
(12) Allotment of 4,691,630 Equity Shares to PhonePe Singapore pursuant to conversion of 938,326 Series B Preference Shares held by PhonePe Singapore.
(13) Allotment of 2,704,860 Equity Shares to PhonePe Singapore pursuant to conversion of 540,972 Series C Preference Shares held
by PhonePe Singapore and allotment of 3,385,155 Equity Shares to Qualcomm pursuant to conversion of 677,031 Series C Preference Shares held by Qualcomm.
(14) Allotment of 5,746,030 Equity Shares to Zenrin pursuant to conversion of 1,149,206 Series D Preference Shares held by Zenrin.
(15) Allotment of 243,430 Equity Shares to PhonePe Singapore pursuant to conversion of 48,686 Series E Preference Shares held by PhonePe Singapore.
(16) Bonus issue of 18,77,485 Equity Shares to Rakesh Kumar Verma, 23,51,158 Equity Shares to Rashmi Verma, 783 Equity Shares
to Rakhi Prasad, 71,196 Equity Shares to Rohan Verma, 23,71,546 Equity Shares to Zenrin, 22,57,135 Equity Shares to PhonePe Singapore, 25,49,491 Equity Shares to PhonePe India, 11,28,385 Equity Shares to Qualcomm, 4,95,908 Equity Shares to Nayan
Arun Jagjivan, 73,333 Equity Shares to Amal Parikh,8,750 Equity Shares to Shatrunjay Credit Services Ltd., 2,750 Equity Shares
to Roopesh Ram Gopal Gupta, 1,833 Equity Shares to Harshad Dholkia, 25,956 Equity Shares to Sapna Ahuja, 5,248 Equity Shares to Manpreet Sukhija (Gaba), 7,643 Equity Shares to Jaya Kumar, 11,686 Equity Shares to RanJan P.N.,500 Equity Shares
to Jaya Jaipuriar, 166 Equity Shares to Rupa Amitabh, 2,498 Equity Shares to Neha Mathur,263 Equity Shares to Leena Sharma (Sahani),305 Equity Shares to Neetu Milind,865 Equity Shares to Murleedhara Navada, 1,928 Equity Shares to Aditya Sinha,263
Equity Shares to Bachi Singh,3,278 Equity Shares to Rajesh Singh,771 Equity Shares each to Rajiv Ranjan Prasad and Madan
Prakash Jha, 803 Equity Shares to Ritesh Arora, 1,411 Equity Shares to Animesh Chandra, 2,530 Equity Shares to Anuj Kumar Jain, 2,145 Equity Shares to Shishir Kumar Verma, 13,080 Equity Shares to Ankeet Bhat, 2,323 Equity Shares each to Nishu Jain
and Monika Jaipuriar, 3,716 Equity Shares to Ravinder Pratap Singh, 4,305 Equity Shares to Rishin Karla, 548 Equity Shares to
Sanjay Shukla, 1,156 Equity Shares each to Priti Malik, Piyush Saraswat, Krishna Kumar, Biswanath Panda, Sumit Gupta, Vishwajit Pathak and Vilas Kulkarni,386 Equity Shares each to Deepak Kumar Jain, Balmukund, Isha Rani, Ramesh Chandra
Mahani, Supriya Nath,Sunil Kumar Yadav, Subrat Kumar Dey, Parshuram Das, Bhupesh Kumar, Akhtar Ali, Soumya Darbari,
Kunal Bharti and Shashank Shekhar Jaiswal, 771 Equity Shares to Saurabh Kumar Paramjyoti, 2,181 Equity Shares to Sonam Rawat, 1,188 Equity Shares to Mohammad Akram, 2,470 Equity Shares to Ashok Bhatt,701 Equity Shares to Mamta, 2,323 Equity
Shares to Pradeep Prasad Gupta, 193 Equity Shares to Santosh Kumar Jha, 771 Equity Shares to Nirdesh Singh, 30 Equity Shares
to Mahaveer Kumar Jain (holding Equity Shares on behalf of the shareholders to whom fractional Equity Shares have been
allotted).
II. Preference Share capital history of our Company
The history of the Preference Share capital of our Company is set forth below:
Date of
allotment of
Preference
Shares
Number of
Preference
Shares
allotted
Face value
per
Preference
Share (in ₹)
Issue price
per
Preference
Share (in ₹)
Nature of
allotment
Nature of
consideration
Cumulative
number of
Preference
Shares
Cumulative
paid-up
Preference
Share capital
Series A Preference Shares
May 24, 2007 698,676 81* 81* Preferential
allotment(1)
Cash 698,676 56,592,756
August 31,
2007
2,072 81 81 Preferential
allotment (2)
Cash 700,748 56,760,588
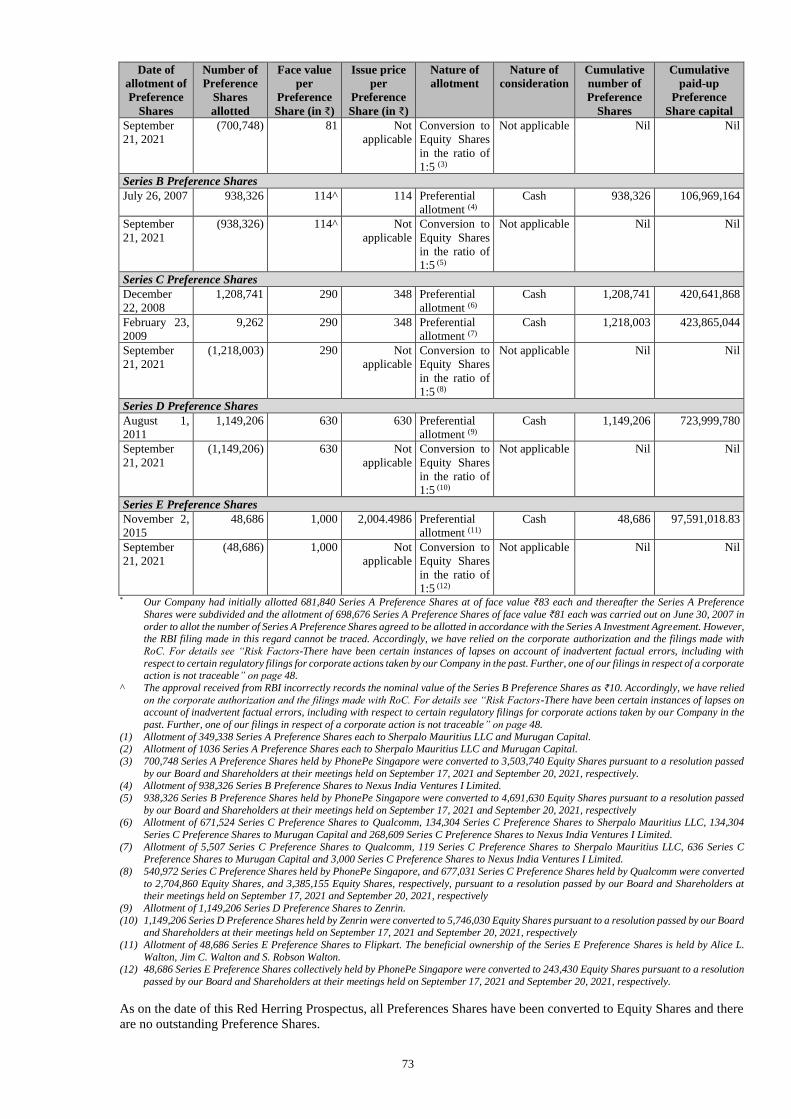
73
Date of
allotment of
Preference
Shares
Number of
Preference
Shares
allotted
Face value
per
Preference
Share (in ₹)
Issue price
per
Preference
Share (in ₹)
Nature of
allotment
Nature of
consideration
Cumulative
number of
Preference
Shares
Cumulative
paid-up
Preference
Share capital
September
21, 2021
(700,748) 81 Not
applicable
Conversion to
Equity Shares
in the ratio of
1:5 (3)
Not applicable Nil Nil
Series B Preference Shares
July 26, 2007 938,326
114^ 114 Preferential
allotment (4)
Cash 938,326 106,969,164
September
21, 2021
(938,326)
114^ Not
applicable
Conversion to
Equity Shares
in the ratio of
1:5 (5)
Not applicable Nil Nil
Series C Preference Shares
December
22, 2008
1,208,741 290 348 Preferential
allotment (6)
Cash 1,208,741 420,641,868
February 23,
2009
9,262 290 348 Preferential
allotment (7)
Cash 1,218,003 423,865,044
September
21, 2021
(1,218,003) 290 Not
applicable
Conversion to
Equity Shares
in the ratio of
1:5 (8)
Not applicable Nil Nil
Series D Preference Shares
August 1,
2011
1,149,206 630 630 Preferential
allotment (9)
Cash 1,149,206 723,999,780
September
21, 2021
(1,149,206) 630 Not
applicable
Conversion to
Equity Shares
in the ratio of
1:5 (10)
Not applicable Nil Nil
Series E Preference Shares
November 2,
2015
48,686 1,000 2,004.4986 Preferential
allotment (11)
Cash 48,686 97,591,018.83
September
21, 2021
(48,686) 1,000 Not
applicable
Conversion to
Equity Shares
in the ratio of
1:5 (12)
Not applicable Nil Nil
* Our Company had initially allotted 681,840 Series A Preference Shares at of face value ₹83 each and thereafter the Series A Preference
Shares were subdivided and the allotment of 698,676 Series A Preference Shares of face value ₹81 each was carried out on June 30, 2007 in
order to allot the number of Series A Preference Shares agreed to be allotted in accordance with the Series A Investment Agreement. However, the RBI filing made in this regard cannot be traced. Accordingly, we have relied on the corporate authorization and the filings made with
RoC. For details see “Risk Factors-There have been certain instances of lapses on account of inadvertent factual errors, including with
respect to certain regulatory filings for corporate actions taken by our Company in the past. Further, one of our filings in respect of a corporate action is not traceable” on page 48.
^ The approval received from RBI incorrectly records the nominal value of the Series B Preference Shares as ₹10. Accordingly, we have relied
on the corporate authorization and the filings made with RoC. For details see “Risk Factors-There have been certain instances of lapses on account of inadvertent factual errors, including with respect to certain regulatory filings for corporate actions taken by our Company in the
past. Further, one of our filings in respect of a corporate action is not traceable” on page 48.
(1) Allotment of 349,338 Series A Preference Shares each to Sherpalo Mauritius LLC and Murugan Capital. (2) Allotment of 1036 Series A Preference Shares each to Sherpalo Mauritius LLC and Murugan Capital.
(3) 700,748 Series A Preference Shares held by PhonePe Singapore were converted to 3,503,740 Equity Shares pursuant to a resolution passed
by our Board and Shareholders at their meetings held on September 17, 2021 and September 20, 2021, respectively. (4) Allotment of 938,326 Series B Preference Shares to Nexus India Ventures I Limited.
(5) 938,326 Series B Preference Shares held by PhonePe Singapore were converted to 4,691,630 Equity Shares pursuant to a resolution passed
by our Board and Shareholders at their meetings held on September 17, 2021 and September 20, 2021, respectively (6) Allotment of 671,524 Series C Preference Shares to Qualcomm, 134,304 Series C Preference Shares to Sherpalo Mauritius LLC, 134,304
Series C Preference Shares to Murugan Capital and 268,609 Series C Preference Shares to Nexus India Ventures I Limited.
(7) Allotment of 5,507 Series C Preference Shares to Qualcomm, 119 Series C Preference Shares to Sherpalo Mauritius LLC, 636 Series C
Preference Shares to Murugan Capital and 3,000 Series C Preference Shares to Nexus India Ventures I Limited.
(8) 540,972 Series C Preference Shares held by PhonePe Singapore, and 677,031 Series C Preference Shares held by Qualcomm were converted
to 2,704,860 Equity Shares, and 3,385,155 Equity Shares, respectively, pursuant to a resolution passed by our Board and Shareholders at their meetings held on September 17, 2021 and September 20, 2021, respectively
(9) Allotment of 1,149,206 Series D Preference Shares to Zenrin.
(10) 1,149,206 Series D Preference Shares held by Zenrin were converted to 5,746,030 Equity Shares pursuant to a resolution passed by our Board and Shareholders at their meetings held on September 17, 2021 and September 20, 2021, respectively
(11) Allotment of 48,686 Series E Preference Shares to Flipkart. The beneficial ownership of the Series E Preference Shares is held by Alice L.
Walton, Jim C. Walton and S. Robson Walton. (12) 48,686 Series E Preference Shares collectively held by PhonePe Singapore were converted to 243,430 Equity Shares pursuant to a resolution
passed by our Board and Shareholders at their meetings held on September 17, 2021 and September 20, 2021, respectively.
As on the date of this Red Herring Prospectus, all Preferences Shares have been converted to Equity Shares and there
are no outstanding Preference Shares.

74
1. Equity Shares issued for consideration other than cash or by way of bonus issue or out of revaluation reserves
Except as disclosed below, our Company has not issued equity shares or Preference Shares, through bonus issue or for
consideration other than cash or out of the revaluation reserves:
Date of
allotment
Number of
securities allotted
Face value per
security (₹)
Issue price per
security (₹)
Reason for allotment Benefits accrued to
our Company
Equity Shares
February 26,
2000
200,000 10 Not Applicable Bonus issue in the
ratio of 2:1 (1)
-
March 27,
2006
3,567,310 10 Not Applicable Bonus issue in the
ratio of 10:1 (2)
-
October 7,
2021
13,310,742 2 Not Applicable Bonus issue in the
ratio of 1:3(3)
-
(1) Bonus issue of 97,200 equity shares to Rakesh Kumar Verma, 100,800 equity shares to Rashmi Verma, 180 equity shares to Rakhi Verma, 800 equity shares to Aditya Sinha, 40 equity shares to Jaya Jaipuriar, 200 equity shares to Neerja Mathur, Manpreet Gabba and Swaminathan,
100 equity shares each to Jaya Kumar,20 equity shares to Dilip Roy, Ajit Pandey, Anand Mohan, Ranjan P.N , and Ramesh Koyi, 100 equity
shares to Rupa Amitabh, 80 equity shares to V. Saxena in the ratio 2:1. (2) Bonus issue of 1,453,000 equity shares to Rakesh Kumar Verma, 1,469,500 equity shares to Rashmi Verma, 2,700 equity shares to Rakhi
Verma, 2,400 equity shares to Aditya Sinha, 3,000 equity shares each to Manpreet Gabba and Neha Mathur, 2,700 equity shares to Jaya
Kumar, 300 equity shares each to Dilip Roy and Ajit Pandey, 2,100 equity shares to Ranjan P.N, 1,500 equity shares each to Rupa Amitabh and Roopesh Ram Gopal Gupta, 1,800 equity shares to Jaya Jaipuriar, 283,810 equity shares Chentec Investment Limited (formerly known
as to SMIFS Venture Capital Limited),283,500 equity shares to Magnus Capital Corp Limited, 1,000 equity shares to Harshad Dholkia, 40,000
equity shares to Amal Pariakh, 5,000 equity shares to Shatrunjay Credit Services Private Limited, 3,400 equity shares each to Vilas Kulkarni, Mahender Vir and Sapna Ahuja. in the ratio 10:1.
(3) Bonus issue of 18,77,485 Equity Shares to Rakesh Kumar Verma, 23,51,158 Equity Shares to Rashmi Verma, 783 Equity Shares to Rakhi
Prasad, 71,196 Equity Shares to Rohan Verma, 23,71,546 Equity Shares to Zenrin, 22,57,135 Equity Shares to PhonePe Singapore, 25,49,491 Equity Shares to PhonePe India, 11,28,385 Equity Shares to Qualcomm, 4,95,908 Equity Shares to Nayan Arun Jagjivan, 73,333 Equity
Shares to Amal Parikh,8,750 Equity Shares to Shatrunjay Credit Services Ltd., 2,750 Equity Shares to Roopesh Ram Gopal Gupta, 1,833
Equity Shares to Harshad Dholkia, 25,956 Equity Shares to Sapna Ahuja, 5,248 Equity Shares to Manpreet Sukhija (Gaba), 7,643 Equity Shares to Jaya Kumar, 11,686 Equity Shares to RanJan P.N.,500 Equity Shares to Jaya Jaipuriar, 166 Equity Shares to Rupa Amitabh, 2,498
Equity Shares to Neha Mathur,263 Equity Shares to Leena Sharma (Sahani),305 Equity Shares to Neetu Milind,865 Equity Shares to
Murleedhara Navada, 1,928 Equity Shares to Aditya Sinha,263 Equity Shares to Bachi Singh,3,278 Equity Shares to Rajesh Singh,771 Equity Shares each to Rajiv Ranjan Prasad and Madan Prakash Jha, 803 Equity Shares to Ritesh Arora, 1,411 Equity Shares to Animesh Chandra,
2,530 Equity Shares to Anuj Kumar Jain, 2,145 Equity Shares to Shishir Kumar Verma, 13,080 Equity Shares to Ankeet Bhat, 2,323 Equity
Shares each to Nishu Jain and Monika Jaipuriar, 3,716 Equity Shares to Ravinder Pratap Singh, 4,305 Equity Shares to Rishin Karla, 548 Equity Shares to Sanjay Shukla, 1,156 Equity Shares each to Priti Malik, Piyush Saraswat, Krishna Kumar, Biswanath Panda, Sumit Gupta,
Vishwajit Pathak and Vilas Kulkarni,386 Equity Shares each to Deepak Kumar Jain, Balmukund, Isha Rani, Ramesh Chandra Mahani, Supriya
Nath,Sunil Kumar Yadav, Subrat Kumar Dey, Parshuram Das, Bhupesh Kumar, Akhtar Ali, Soumya Darbari, Kunal Bharti and Shashank Shekhar Jaiswal, 771 Equity Shares to Saurabh Kumar Paramjyoti, 2,181 Equity Shares to Sonam Rawat, 1,188 Equity Shares to Mohammad
Akram, 2,470 Equity Shares to Ashok Bhatt,701 Equity Shares to Mamta, 2,323 Equity Shares to Pradeep Prasad Gupta, 193 Equity Shares
to Santosh Kumar Jha, 771 Equity Shares to Nirdesh Singh, 30 Equity Shares to Mahaveer Kumar Jain (holding Equity Shares on behalf of
the shareholders to whom fractional Equity Shares have been allotted).
2. Issue of equity shares under Sections 391 to 394 of the Companies Act, 1956 or Sections 230 to 234 of the
Companies Act, 2013
Our Company has not allotted any equity shares pursuant to any scheme approved under Sections 391 to 394 of the
Companies Act, 1956 or Sections 230 to 234 of the Companies Act, 2013.
3. Issue of equity shares under employee stock option schemes
For details of equity shares issued by our Company pursuant to the exercise of options which have been granted under
the ESOP 2008, see “equity share capital history of our Company” on pages 70.
4. Equity shares issued in the preceding one year below the Offer Price
Except for allotment of (i) 38,708 equity shares on June 3, 2021; and (ii) 59,937 equity shares on July 7, 2021 pursuant
to exercise of options vested under ESOP 2008, and (iii) 20,274,845 Equity Shares on account of conversion of
Preference Shares to Equity Shares on September 21, 2021, our Company has not issued equity shares at a price which
may be lower than the Offer Price during a period of one year preceding the date of this Red Herring Prospectus. The
entire consideration for Equity Shares (issued pursuant to the conversion of Preference Shares) was paid at the time of
issuance of such Preference Shares. For details, see “- equity share capital history of our Company” on page 70.
5. Shareholding pattern of our Company
The table below presents the shareholding pattern of our Company as on the date of filing of this Red Herring
Prospectus:

75
Catego
ry
(I)
Categor
y of
sharehol
der
(II)
Num
ber of
share
holde
rs
(III)
Number
of fully
paid up
equity
shares
held
(IV)
Numb
er of
Partly
paid-
up
equity
share
s held
(V)
Number
of
shares
underly
ing
Deposit
ory
Receipt
s
(VI)
Total
number
of
shares
held
(VII)
=(IV)+(
V)+ (VI)
Shareh
olding
as a %
of total
numbe
r of
shares
(calcula
ted as
per
SCRR,
1957)
(VIII)
As a %
of
(A+B+
C2)
Number of voting rights
held in each class of
securities
(IX)
Number
of shares
underlyi
ng
outstand
ing
converti
ble
securitie
s
(includin
g
warrant
s)
(X)
Sharehold
ing, as a
%
assuming
full
conversio
n of
convertibl
e
securities
( as a
percentag
e of
diluted
share
capital)
(XI)=
(VII)+(X)
As a % of
(A+B+C2)
Number of
locked in
shares
(XII)
Number of
shares
pledged or
otherwise
encumbere
d
(XIII)
Number of
equity
shares held
in
dematerial
ized form
(XIV)
Number of voting
rights Tota
l as a
% of
(A+
B+
C)
Numb
er (a) As a
%
of
total
shar
es
held
(b)
Numb
er (a) As a
%
of
total
shar
es
held
(b)
Class
e.g.:
equity
shares
Cl
as
s
e.
g.
:
O
th
er
s
Total
(A) Promote
r and
Promote
r Group
5 35,856,298 - - 35,856,298* 61.16* 35,856,298 - 35,856,298 61.16 - - - - 35,856,298
(B) Public 63 20,386,669 - - 20,386,669 38.29 20,386,669 - 20,386,669 38.29 - - - - 20,386,669
(C) Non
Promote
r- Non
Public
- - - - - - - - - - - - - - -
(C1) Shares
underlyi
ng
deposito
ry
receipts
- - - - - - - - - - - - - - -
(C2) Shares
held by
employe
e trusts
- - - - - - - - - - - - - - -
Total 68 53,242,967 - - 53,242,967 100.00 53,242,967 - 53,242,967 100.00 - - 53,242,967

76
6. Details of equity shareholding of the major shareholders of our Company
a) Set forth below is a list of shareholders holding 1% or more of the paid-up Equity Share capital of our
Company, as on the date of this Red Herring Prospectus:
S.
No.
Name of the shareholder Pre-Offer
Number of Equity Shares Percentage of the
Equity Share capital
(%)
1. PhonePe India* 10,197, 966 19.15
2. Zenrin 4,673,719 8.78
3. Rashmi Verma 9,404,633 17.66
4. Rakesh Kumar Verma 23,163,080 43.50
5. Qualcomm 2,701,407 5.07
6. Nayan Arun Jagjivan 1,983,633 3.73
Total 5,2124,438 97.89 *PhonePe Singapore transferred 7,648,475 Equity Shares to PhonePe India on October 1, 2021.
b) Set forth below is a list of shareholders holding 1% or more of the paid-up Equity Share capital of our
Company, as of 10 days prior to the date of this Red Herring Prospectus:
S.
No.
Name of the shareholder Pre-Offer
Number of Equity Shares Percentage of the
Equity Share capital
(%)
1. PhonePe India* 10,197, 966 19.15
2. Zenrin 9,486,186 17.82
3. Rashmi Verma 9,404,633 17.66
4. Rakesh Kumar Verma 7,509,540 14.11
5. Qualcomm 4,513,540 8.48
6. Nayan Arun Jagjivan 1,983,633 3.73
7. PhonePe Singapore 9,028,540 16.96
Total 5,2124,438 97.89 *PhonePe Singapore transferred 7,648,475 Equity Shares to PhonePe India on October 1, 2021
c) Set forth below is a list of shareholders holding 1% or more of the paid-up equity share capital of our
Company, as of one year prior to the date of this Red Herring Prospectus:
S.
No.
Name of the
shareholder
Pre-Offer
Number of equity
shares of face value
₹10 on a fully
diluted basis
Number of Equity Shares of face
value of ₹2 on a fully diluted basis
after sub-division of equity shares of
face value of ₹10 each to Equity
Shares of face value of ₹2 each
Percentage of the
Equity Share capital
on a fully diluted
basis (%)
1. Flipkart# 2,883,976 14,419,880 36.56
2. Zenrin 1,422,928 7,114,640 18.04
3. Rashmi Verma 1,410,695 7,053,475 17.88
4. Rakesh Kumar Verma 1,126,491 5,632,455 14.28
5. Qualcomm* 677,031 3,385,155 8.58
6. Nayan Arun Jagjivan 297,545 1,487,725 3.77
Total 7,818,666 39,093,330 99.11 # Flipkart transferred its entire shareholding in the Company to its subsidiary, PhonePe Singapore on March 12,2021.
d) Set forth below is a list of shareholders holding 1% or more of the paid-up equity share capital of our
Company, as of two years prior to the date of this Red Herring Prospectus:
S.
No.
Name of the shareholder Pre-Offer
Number of equity
shares of face
value ₹10 on a
fully diluted basis
Number of Equity Shares of face
value of ₹2 on a fully diluted basis
after sub-division of equity shares of
face value of ₹10 each to Equity
Shares of face value of ₹2 each
Percentage of the
Equity Share
capital on a fully
diluted basis (%)
1. Flipkart# 2,883,976 14,419,880 36.56
2. Zenrin 1,422,928 7,114,640 18.04
3. Rashmi Verma 1,410,695 7,053,475 17.88
4. Rakesh Kumar Verma 1,126,491 5,632,455 14.28
5. Qualcomm 677,031 3,385,155 8.58
6. Nayan Arun Jagjivan 297,545 1,487,725 3.77

77
S.
No.
Name of the shareholder Pre-Offer
Number of equity
shares of face
value ₹10 on a
fully diluted basis
Number of Equity Shares of face
value of ₹2 on a fully diluted basis
after sub-division of equity shares of
face value of ₹10 each to Equity
Shares of face value of ₹2 each
Percentage of the
Equity Share
capital on a fully
diluted basis (%)
Total 7,818,666 39,093,330 99.11 # Flipkart transferred its entire shareholding in the Company to its subsidiary, PhonePe Singapore on March 12,2021.
7. History of the equity share capital held by our Promoters
As on the date of this Red Herring Prospectus, our Promoters, in aggregate, hold 32,567,713 Equity Shares,
constituting 61.16% of the issued, subscribed and paid-up Equity Share capital of our Company. The details regarding
our Promoters’ shareholding is set forth below.
a) Build-up of Promoters’ equity shareholding in our Company
The build-up of the equity shareholding of our Promoters since incorporation of our Company is set forth
below.
Date of
allotment/
transfer
Nature of
transaction
Number of
equity shares
allotted/
transferred
Nature of
consideration
Face
value
per
equity
share
(₹)
Issue
price/
Transfer
price per
equity
share (₹)
Percentage of
the pre-Offer
capital
(%)*
Percentage of
the post-
Offer capital
(%)
Rakesh Kumar Verma
February
24, 1995
Initial
subscription
to the
Memorandum
of
Association
10 Cash 10 10 Negligible Negligible
March 30,
1996
Further issue 4,890 Cash 10 10 Negligible Negligible
April 30,
1996
Transfer to
Rakhi Verma
(90) Cash 10 10 Negligible Negligible
April 30,
1996
Transfer to
Ramesh Koyi
(10) Cash 10 10 Negligible Negligible
April 30,
1996
Transfer to
Aditya Sinha
(300) Cash 10 10 Negligible Negligible
February
2, 2000
Further issue 44,100 Cash 10 10 0.08 0.08
February
26, 2000
Bonus issue
in the ratio of
2:1
97,200 Not Applicable 10 Not
Applicable
0.18 0.18
October
30, 2000
Transfer to
Shatrunjay
Credit
Services
Private
Limited
(500) Cash 10 620 Negligible Negligible
October
30, 2000
Transfer to
Silgo
Properties &
Investment
Private
Limited
(4,000) Cash 10 620 0.01 0.01
July 14,
2001
Transfer to
Silgo
Properties &
Investment
Private
Limited
(950)
Cash 10 620 Negligible Negligible
October 1,
2001
Transfer from
Silgo
Properties &
Investment
4,950 Cash 10 620 0.01 0.01

78
Date of
allotment/
transfer
Nature of
transaction
Number of
equity shares
allotted/
transferred
Nature of
consideration
Face
value
per
equity
share
(₹)
Issue
price/
Transfer
price per
equity
share (₹)
Percentage of
the pre-Offer
capital
(%)*
Percentage of
the post-
Offer capital
(%)
Private
Limited
March 27,
2006
Bonus issue
in the ratio of
10:1
1,453,000 Not Applicable 10 Not
Applicable
2.73 2.73
March 31,
2008##
Transfer to
Sherpalo
Mauritius
LLC
(70,175) Cash 10 80.60 0.13 0.13
March 31,
2008
Transfer to
Murugan
Capital
(70,175) Cash 10 81.39 0.13 0.13
April 2,
2009
Buy-back (65,979) Cash 10 (348) 0.12 0.12
August 1,
2011
Transfer to
Zenrin
(135,651) Cash 10# 630 0.25 0.25
November
2, 2015
Transfer to
Flipkart**
(129,829) Cash 10 2004.498### 0.24 0.24
July 29,
2021
Pursuant to a resolution passed by our Board and the Shareholders in the meeting held on July 27, 2021
and July 29, 2021, respectively, our Company has sub-divided its authorised equity share capital, such that
4,500,000 equity shares of face value of ₹10 each aggregating to ₹45,000,000 were sub-divided as
22,500,000 Equity Shares of ₹2 each aggregating to ₹45,000,000. Therefore, the cumulative number of
Equity Shares pursuant to the sub-division is 19,657,380. Equity Shares and cumulative paid-up Equity
Share capital of the Company is ₹39,314,760. Therefore, the cumulative number of Equity Shares held by
Rakesh Kumar Verma pursuant to the sub-division was 5,632,455 Equity Shares.
October 7,
2021
Bonus issue
in the ratio of
1:3
1,877,485 Not Applicable 2 Not
Applicable
3.53 3.53
November
25, 2021
Transfer from
PhonePe
Singapore
9,028,540 Cash 2 94.875 16.96 16.96
November
25, 2021
Transfer from
Qualcomm
1,812,133 Cash 2 94.50 3.40 3.40
November
25, 2021
Transfer from
Zenrin
4,812,467 Cash 2 94.50 9.03 9.03
Sub-total (A)
23,163,080 43.50 43.50
Rashmi Verma
February
24, 1995
Initial
subscription
to the
Memorandum
of
Association
10 Cash
10 10 Negligible Negligible
March 30,
1996
Further issue 5,090 Cash 10 10 Negligible Negligible
April 30,
1996
Transfer to
Aditya Sinha
(100) Cash 10 10 Negligible Negligible
April 30,
1996
Transfer to
Neerja
Mathur
(100) Cash 10 10 Negligible Negligible
April 30,
1996
Transfer to
Manpreet
Gaba
(100) Cash 10 10 Negligible Negligible
April 30,
1996
Transfer to
Swaminathan
(100) Cash 10 10 Negligible Negligible
April 30,
1996
Transfer to
Jaya Kumar
(50) Cash 10 10 Negligible Negligible
April 30,
1996
Transfer to
Dilip Roy
(10) Cash 10 10 Negligible Negligible
April 30,
1996
Transfer to
Ajit Pandey
(10) Cash 10 10 Negligible Negligible

79
Date of
allotment/
transfer
Nature of
transaction
Number of
equity shares
allotted/
transferred
Nature of
consideration
Face
value
per
equity
share
(₹)
Issue
price/
Transfer
price per
equity
share (₹)
Percentage of
the pre-Offer
capital
(%)*
Percentage of
the post-
Offer capital
(%)
April 30,
1996
Transfer to
Anand
Mohan
(10) Cash 10 10 Negligible Negligible
April 30,
1996
Transfer to
Ranjan P.N
(10) Cash 10 10 Negligible Negligible
April 30,
1996
Transfer to
Rupa
Amitabh
(50) Cash 10 10 Negligible Negligible
April 30,
1996
Transfer to V
Saxena
(40) Cash 10 10 Negligible Negligible
April 30,
1996
Transfer to
Jaya Jaipuriar
(20) Cash 10 10 Negligible Negligible
February
2, 2000
Further issue 45,900 Cash 10 10 0.09 0.09
February
26, 2000
Bonus issue
in the ratio of
2:1
100,800 Not Applicable 10 Not
Applicable
0.19 0.19
October
30, 2000
Transfer to
Amal Parikh
and Uday
Shah
(4,000) Cash 10 620 0.01 0.01
October
30, 2000
Transfer to
Silgo
Properties &
Investment
Private
Limited
(250) Cash 10 620 Negligible Negligible
October
30, 2000
Transfer to
Harshad
Dholkia
(100) Cash 10 10 Negligible Negligible
July 14,
2001
Transfer to
Roopesh Ram
Gopal
(150) Cash 10 10 Negligible Negligible
July 14,
2001
Transfer to
Silgo
Properties &
Investment
Private
Limited
(2,000) Cash 10 620 Negligible Negligible
October 1,
2001
Transfer from
Silgo
Properties &
Investment
Private
Limited
2,250 Cash 10 620 Negligible Negligible
March 27,
2006
Bonus issue
in the ratio of
10:1
1,469,500 Not Applicable 10 Not
Applicable
2.76 2.76
March 31,
2008##
Transfer to
Sherpalo
Mauritius
LLC
(100,440) Cash 10 80.69 0.19 0.19
March 31,
2008##
Transfer to
Murugan
Capital
(44,260) Cash 10 80.87 0.08 0.08
April 2,
2009
Buy-back (53,055) Cash 10 (348) 0.10 0.10
August 1,
2011
Transfer to
Zenrin
(8,000) Cash 10# 630 0.02 0.02
July 29,
2021
Pursuant to a resolution passed by our Board and the Shareholders in the meeting held on July 27, 2021
and July 29, 2021, respectively, our Company has sub-divided its authorised equity share capital, such that
4,500,000 equity shares of face value of ₹10 each aggregating to ₹45,000,000 were sub-divided as
22,500,000 Equity Shares of ₹2 each aggregating to ₹45,000,000. Therefore, the cumulative number of
Equity Shares pursuant to the sub-division is 19,657,380 Equity Shares and cumulative paid-up Equity

80
Date of
allotment/
transfer
Nature of
transaction
Number of
equity shares
allotted/
transferred
Nature of
consideration
Face
value
per
equity
share
(₹)
Issue
price/
Transfer
price per
equity
share (₹)
Percentage of
the pre-Offer
capital
(%)*
Percentage of
the post-
Offer capital
(%)
Share capital of the Company is ₹39,314,760. Therefore, the cumulative number of Equity Shares held by
Rashmi Verma pursuant to the sub-division was 7,053,475 Equity Shares.
October 7,
2021
Bonus issue
in the ratio of
1:3
2,351,158 Not Applicable 2 Not
Applicable
4.42 4.42
Sub-total (B)
9,404,633 17.66 9.68
Total (A+B) 32,567,713 61.16 53.18 # The corporate authorizations and form FC-TRS filing made with RBI contains an inadvertent error and records the nominal
value of the equity shares allotted as ₹630 instead of ₹10. For details see “Risk Factors-There have been certain instances of lapses on account of inadvertent factual errors, including with respect to certain regulatory filings for corporate actions taken
by our Company in the past. Further, one of our filings in respect of a corporate action is not traceable” on page 48. ## While the share transfer forms were signed in October 2006 and the form FC-TRS filing made with RBI was signed in December
2007. Our Company received the duly acknowledged FC-TRS from AD-Bank in January 2008 and accordingly, recorded the
transfer on March 31, 2008. The share transfer forms were subsequently revalidated in April 2008. ### The amount of the total consideration paid in lieu of the transfer has inadvertently not been mentioned in the form FC-TRS filing
made with RBI. ** Flipkart transferred its entire shareholding in the Company to its subsidiary, PhonePe Singapore on March 12,2021.
For details of purchase of an aggregate of 15,653,140 Equity Shares by one of our Promoters, Rakesh Kumar
Verma, from the Investors, pursuant to the SPAs, see "History and Certain Corporate Matters - Summary of
Key Agreements" on page 164.
All the equity shares held by our Promoters were fully paid-up on the respective dates of allotment of such
equity shares. As of the date of this Red Herring Prospectus, none of the equity shares held by our Promoters
are subject to any pledge.
b) Shareholding of our Promoters and Promoter Group:
The details of shareholding of our Promoters and Promoter Group, as on the date of this Red Herring
Prospectus are set forth below:
S.
No.
Name of the
shareholder
Pre-Offer
Number of
Equity Shares
Percentage of the Pre-
Offer Equity Share
Capital (%)
Post-Offer
Number of Equity
Shares
Percentage of the Post-
Offer Equity Share
Capital (%)
Promoters
1. Rakesh Kumar
Verma
23,163,080 43.50 23,163,080 43.50
2. Rashmi Verma 9,404,633 17.66 5,153,589 9.68
Promoter Group
3. Rohan Verma 284,786 0.53 284,786 0.53
4. Rakhi Prasad 3,133 0.01 3,133 0.01
5. Rupa Amitabh 666 Negligible 666 Negligible
Total 32,856,298 61.70 28,028,168 53.72
c) Details of Promoters’ Contribution and Lock-in
In accordance with Regulation 14 and Regulation 16 of the SEBI ICDR Regulations, an aggregate of 20% of
the fully diluted post-Offer Equity Share capital of our Company held by our Promoters, shall be locked in
for a period of eighteen months from the date of Allotment and the shareholding of our Promoters in excess
of 20% of the fully diluted post-Offer Equity Share capital shall be locked in for a period of six months from
the date of Allotment.
The details of the Equity Shares held by our Promoters, which shall be locked-in for a period of eighteen
months from the date of Allotment are set forth below:
Name of
Promoter
Number of
Equity
Shares
locked-
in(1)(2)
Date of
allotment/
transfer*
Nature of
transaction
Face
value
(₹)
Issue/
Acquisition
price per
Equity Share
(₹)
Percentage of
pre-Offer paid-
up Equity
Share capital
Percentage of
post-Offer
paid-up Equity
Share Capital
[●] [●] [●] [●] 2 [●] [●] [●] * Subject to finalisation of Basis of Allotment

81
(1) For a period of eighteen months from the date of Allotment
(2) All Equity Shares were fully paid-up at the time of allotment/transfer
Our Company undertakes that the Equity Shares that are being locked-in are not ineligible for computation
of Promoters’ contribution in terms of Regulation 15 of the SEBI ICDR Regulations. For details of the build-
up of the share capital held by our Promoters, see “- History of the Equity Share Capital held by our
Promoters” beginning on page 77.
In this connection, we confirm the following:
(i) The Equity Shares offered for Promoters’ contribution do not include (a) equity shares acquired in
the three immediately preceding years for consideration other than cash and revaluation of assets or
capitalisation of intangible assets was involved in such transaction; (b) equity shares that have
resulted from bonus issue by utilisation of revaluation reserves or unrealised profits of our Company
or resulted from bonus issue against equity shares which are otherwise ineligible for computation of
Promoters’ contribution;
(ii) The Promoters’ contribution does not include any equity shares acquired during the immediately
preceding year at a price lower than the price at which the equity shares are being offered to the
public in the Offer;
(iii) Our Company has not been formed by the conversion of a partnership firm or a limited liability
partnership firm into a Company;
(iv) The equity shares held by the Promoters and offered for Promoters’ contribution are not subject to
any pledge; and
(v) All the equity shares held by the Promoters are held in dematerialised form.
d) Details of Equity Shares locked-in for six months:
In addition to 20% of the fully diluted post-Offer shareholding of our Company held by our Promoters and
locked-in for eighteen months as prescribed under the SEBI ICDR Regulations as specified above, in terms
of Regulation 16(b) and Regulation 17 of the SEBI ICDR Regulations, the entire pre-Offer Equity Share
capital of our Company will be locked-in for a period of six months from the date of Allotment as prescribed
under the SEBI ICDR Regulations, except for (i) the Equity Shares sold pursuant to the Offer for Sale; (ii)
any Equity Shares allotted to the employees of our Company under the ESOP 2008, as applicable; and (iii)
any Equity Shares held by a VCF or Category I AIF or Category II AIF or FVCI, as applicable, provided that
such Equity Shares shall be locked in for a period of at least one year from the date of purchase by such
shareholders. Further, any unsold portion of the Equity Shares offered pursuant to the Offer for Sale will be
locked-in as required under the SEBI ICDR Regulations.
In terms of Regulation 22 of the SEBI ICDR Regulations, the Equity Shares held by the Promoters, which
are locked-in may be transferred to and amongst the members of the Promoter Group or to any new promoter
or persons in control of our Company, subject to continuation of the lock-in in the hands of the transferees
for the remaining period and compliance with the Takeover Regulations, as applicable.
The Equity Shares held by the Promoters which are locked-in for a period of six months from the date of
Allotment as prescribed under the SEBI ICDR Regulations may be pledged only with scheduled commercial
banks or public financial institutions or Systemically Important NBFCs or housing finance companies, as
collateral security for loans granted by such banks or public financial institutions or Systemically Important
NBFCs or housing finance companies in terms of Regulation 21 of the SEBI ICDR Regulations.
However, the relevant lock in period shall continue post the invocation of the pledge referenced above, and
the relevant transferee shall not be eligible to transfer the Equity Shares till the relevant lock in period has
expired in terms of the SEBI ICDR Regulations.
In terms of Regulation 22 of the SEBI ICDR Regulations, the Equity Shares held by persons other than the
Promoters and locked-in for a period of six months from the date of Allotment as prescribed under the SEBI
ICDR Regulations in the Offer may be transferred to any other person holding the Equity Shares which are
locked-in, subject to continuation of the lock-in in the hands of transferees for the remaining period and
compliance with the Takeover Regulations.
Any unsubscribed portion of the Offered Shares would also be locked-in as required under the SEBI ICDR
Regulations.

82
e) Lock-in of the Equity Shares to be Allotted, if any, to the Anchor Investors
Any Equity Shares allotted to Anchor Investors under the Anchor Investor Portion shall be locked-in for a
period of 30 days from the date of Allotment.
8. Except for the issue of any Equity Shares pursuant to exercise of options granted under ESOP 2008, our Company
presently does not intend or propose to alter its capital structure for a period of six months from the Bid/Offer Opening
Date, by way of split or consolidation of the denomination of Equity Shares or further issue of Equity Shares (including
issue of securities convertible into or exchangeable, directly or indirectly for Equity Shares) whether on a preferential
basis or by way of issue of bonus shares or on a rights basis or by way of further public issue of Equity Shares or
otherwise.
9. As on the date of filing of this Red Herring Prospectus, the total number of shareholders of our Company is 68.
10. Except as disclosed below, our Promoters, any member of our Promoters, Promoter Group, any of the directors of our
Company or any of their relatives have not purchased or sold any securities of our Company during the period of six
months immediately preceding the date of this Red Herring Prospectus:
Date of
purchase/sale
Number of equity shares of
face value of ₹10 each
Number of equity
shares of face value
of ₹2 each
Name of the party Nature of
transaction
June 3, 2021 38,708 - Rohan Verma Allotment
pursuant to
ESOP 2008
November 25,
2021
- 9,028,540 Rakesh Kumar Verma Purchase#
November 25,
2021
- 1,812,133 Purchase#
November 25,
2021
- 4,812,467 Purchase#
# For further details regarding the share purchase agreements, see “- History and Certain Corporate Matters-Summary of Key Agreements”
beginning on page 164.
11. There have been no financing arrangements whereby our Promoters, members of their respective Promoter Groups,
our Directors and their relatives have financed the purchase by any other person of securities of our Company during
a period of six months immediately preceding the date of filing of this Red Herring Prospectus.
12. Neither our Company, nor any of our Directors have entered into any buy-back arrangements for purchase of equity
shares from any person. Further, the BRLMs have not made any buy-back arrangements for purchase of Equity Shares
from any person.
13. As on the date of this Red Herring Prospectus, the BRLMs and their respective associates (as defined under the
Securities and Exchange Board of India (Merchant Bankers) Regulations, 1992) do not hold any Equity Shares.
14. All Equity Shares transferred pursuant to the Offer will be fully paid-up at the time of Allotment and there are no
partly paid-up Equity Shares as on the date of this Red Herring Prospectus.
15. Except for the options granted pursuant to ESOP 2008, there are no outstanding warrants, options or rights to convert
debentures, loans or other instruments into, or which would entitle any person any option to receive Equity Shares as
on the date of this Red Herring Prospectus.
16. Any oversubscription to the extent of 1% of the Offer size can be retained for the purposes of rounding off to the
nearest multiple of minimum allotment lot while finalizing the Basis of Allotment.
17. Our Promoters and Promoter Group shall not participate in the Offer, except by way of participation as Selling
Shareholders, as applicable, in the Offer for Sale.
18. Except for any exercise of options vested pursuant to the ESOP 2008, there will be no further issue of Equity Shares
whether by way of issue of bonus shares, preferential allotment, rights issue or in any other manner during the period
commencing from filing of this Red Herring Prospectus with RoC until the Equity Shares have been listed on the Stock
Exchanges, or all application monies have been refunded, as the case may be.
19. Our Company shall ensure that there shall be only one denomination of the Equity Shares, unless otherwise permitted
by law.
20. No person connected with the Offer, including, but not limited to, the members of the Syndicate, our Company, the
Directors, members of our Promoter Group and the Promoters, shall offer or make payment of any incentive, direct or

83
indirect, in the nature of discount, commission and allowance, except for fees or commission for services rendered in
relation to the Offer, in any manner, whether in cash or kind or services or otherwise, to any Bidder for making a Bid.
21. Our Company shall ensure that transactions in the Equity Shares by our Promoters and the Promoter Group between
the date of filing of the Draft Red Herring Prospectus and the date of closure of the Offer shall be intimated to the
Stock Exchanges within 24 hours of such transaction.
ESOP 2008
22. Our Company, pursuant to the resolutions passed by our Board on December 11, 2008 and our Shareholders on
December 11, 2008, adopted ESOP 2008, which was last amended by our Company pursuant to resolutions passed by
our Board on August 22, 2021 and our Shareholders on August 24, 2021. The ESOP 2008 is in compliance with the
Companies Act and the SEBI SBEBSE Regulations.
The maximum number of options which can be granted under ESOP 2008 is 1,775,547 options and to the extent
granted will be vested in the next four subsequent years starting August 1, 2022.
The details of ESOP 2008, as certified by our Statutory Auditors, through a certificate dated December 2, 2021 are as
follows:
Particulars Details^* Fiscal 2019 Fiscal 2020 Fiscal 2021 From April 1, 2021 till the date
of this Red Herring Prospectus
Options granted during the year/period 193,333 56,667 0 743,000
Cumulative number of options that have been granted as on the date of the
Statutory Auditor’s certificate**: 1,668,600
Options vested (excluding options that have been
exercised)
199,167 197,500 65,833 0
Options exercised 0 0 0 657,633
Options forfeited/ lapsed/ cancelled/ surrendered 733,333 284,720 31,025 41,747
Options outstanding (including vested and unvested
options)
2,008,133 1,780,080 1,624,953 1,668,600
Exercise price of options (per option) 12.15 12.15 12.15 12.15
Total no. of Equity Shares that would arise as a
result of full exercise of options granted (net of
forfeited/ lapsed/ cancelled options) (only for
vested options)
2,008,133 1,780,080 1,624,953 1,668,600
Variation in terms of options No
variation
No
variation
No
variation
The vesting of options has been
modified pursuant to Shareholders’
approval dated July 29, 2021 and
October 7,2021
Money realised by exercise of options (In Rs.
million)
0 0 0 7.99
Total no. of options in force (excluding options not
granted)
2,008,133 1,780,080 1,624,953 1,688,600
Employee wise details of options granted to
(i) Key management personnel
- Anuj Kumar Jain, Chief Financial Officer 0 0 0 43,333
- Saurabh Surendra Somani, Company
Secretary and Compliance Officer
0 0 0 3,333
- Nikhil Kumar, President-geospatial 0 0 0 46,667
- Shishir Verma, Senior vice-president,
human resources and corporate affairs
0 0 0 10,000
- Ankeet Bhat, Chief strategy officer 166,667 0 0 0
(ii) Any other employee who received a grant in
any one year of options amounting to 5% or
more of the options granted during the year
- Ankeet Bhat, Chief strategy officer 166,667 0 0 0
- Ranjan P.N. 0 0 0 233,333
(iii) Identified employees who are granted options,
during any one year equal to or exceeding 1%
of the issued capital (excluding outstanding
warrants and conversions) of our Company at
the time of grant
Nil
Fully diluted EPS on a pre-Offer basis pursuant to
the issue of equity shares on exercise of options
calculated in accordance with the applicable
accounting standard on ‘Earnings Per Share’
6.19 4.27 10.99 Not applicable

84
Particulars Details^* Fiscal 2019 Fiscal 2020 Fiscal 2021 From April 1, 2021 till the date
of this Red Herring Prospectus
Difference between employee compensation cost
calculated using the intrinsic value of stock options
and the employee compensation cost that shall have
been recognised if the Company had used fair value
of options and impact of this difference on profits
and EPS of the Company
Not applicable, since the Company has calculated the employee
compensation cost using the fair value of the stock options (based on Black
Scholes Valuation model)
Description of the pricing formula and the method
and significant assumptions used during the year to
estimate the fair values of options, including
weighted-average information, namely, risk-free
interest rate, expected life, expected volatility,
expected dividends and the price of the underlying
share in market at the time of grant of the option
Options have been valued based on fair value method as prescribed under
Ind AS 102, share based payments, using Black Scholes valuation option
pricing model by using the fair value of the Company's securities on the grant
date and assumptions. Weighted average assumptions across grants are: Risk
free rate (6.02 %), expected life (8 years), expected volatility (32.92%),
expected dividends (nil), price per underlying security (Rs. 629.26)
Impact on profits and EPS of the last three years if
the Company had followed the accounting policies
specified in the SEBI SBEBSE Regulations in
respect of options granted in the last three years
NA - The Company is already following the accounting policies specified in
Regulation 15 of the SEBI SBEBSE Regulations, i.e., as per the applicable
Indian Accounting Standards
Intention of the key managerial personnel and
whole-time directors who are holders of Equity
Shares allotted on exercise of options granted under
an employee stock option scheme or allotted under
an employee stock purchase scheme, to sell their
Equity Shares within three months after the date of
listing of the Equity Shares in the initial public offer
(aggregate number of Equity Shares intended to be
sold by the holders of options), if any
No holder of Equity Shares allotted on exercise of options will sell such
Equity Shares within three months after the listing of the Equity Shares
Intention to sell Equity Shares arising out of an
employee stock option scheme or allotted under an
employee stock purchase scheme within three
months after the date of listing, by directors, senior
managerial personnel and employees having Equity
Shares issued under an employee stock option
scheme or employee stock purchase scheme
amounting to more than one per cent. of the issued
capital (excluding outstanding warrants and
conversions) of the Company
Not applicable as none of the Directors, senior managerial personnel and
employee hold Equity Shares issued under ESOP 2008 amounting to more
than one per cent. of the issued capital (excluding outstanding warrants and
conversions) of the Company
^ Pursuant to a resolution passed by the Board and the Shareholders in the meeting held on July 27, 2021 and July 29, 2021, respectively, our
Company has sub-divided its authorised equity share capital, such that 4,500,000 equity shares of face value of ₹10 each aggregating to
₹45,000,000 were sub-divided as 22,500,000 Equity Shares of ₹2 each aggregating to ₹45,000,000. Therefore, the cumulative number of Equity Shares pursuant to the sub-division is 19,657,380 Equity Shares and cumulative paid-up Equity Share capital of our Company is
₹39,314,760. Further, pursuant to Board and Shareholders’ resolutions dated October 5, 2021 and October 7, 2021, respectively, our
Company allotted 13,310,742 Equity Shares as bonus shares on October 7, 2021 to the existing Shareholders of the Company, whose names appear in the register of members as on October 5, 2021 (“Record Date”) in the ratio of 1:3 i.e., one new bonus Equity Share for every three
existing fully paid-up Equity Share held by them as on the Record Date. Accordingly, the number of Equity Shares to be issued upon exercise
of options granted under the ESOP 2008 prior to the sub-division of Equity Shares, have been adjusted proportionately in accordance with the relevant provisions of ESOP 2008.
* As per consent received from each of the option holders, all the options granted (vested or unvested) will be rolled over and shall be vested
equally in the four years starting from August 1, 2022. ** Cumulative number of options that have been granted as on the date of the Statutory Auditor’s certificate dated December 2,2021 represents
active grant options from the date of beginning to the date of such certificate.

85
OBJECTS OF THE OFFER
The objects of the Offer are to (i) to carry out the Offer for Sale of up to 10,063,945 Equity Shares aggregating up to ₹[●]
million by the Selling Shareholders; and (ii) achieve the benefits of listing the Equity Shares on the Stock Exchanges.
Further, our Company expects that listing of the Equity Shares will enhance our visibility and brand image and provide liquidity
to our Shareholders and will also provide a public market for the Equity Shares in India.
Our Company will not receive any proceeds from the Offer (the “Offer Proceeds”) and all the Offer Proceeds (net of any Offer
related expenses to be borne by the Selling Shareholders) will be received by the respective Selling Shareholders. For details
of the Selling Shareholders and their respective portion of the Offered Shares, see “The Offer” and “Other Regulatory and
Statutory Disclosures” beginning on pages 56 and 278, respectively.
Offer related expenses
The total expenses of the Offer are estimated to be approximately ₹[●] million. Other than (i) the listing fees, which will be
borne by our Company, and (ii) fees and expenses in relation to the legal counsel to the Selling Shareholders which shall be
borne by the respective Selling Shareholders, all the expenses relating to the Offer, including corporate advertisements, issue
advertising, printing, road show expenses, accommodation and travel expenses, stamp, transfer, issuance, documentary,
registration, costs for execution and enforcement of the Offer related agreements, Registrar’s fees, fees to be paid to the BRLMs,
fees and expenses of legal counsel to our Company and the BRLMs, fees and expenses of the auditors, fees to be paid to Sponsor
Banks, SCSBs (processing fees and selling commission), brokerage for Syndicate Members, commission to Registered Brokers,
Collecting DPs and Collecting RTAs, and payments to consultants, and advisors shall be shared among the Selling Shareholders
in the proportion of the Equity Shares sold by each of them in the Offer. The cost and expenses to be borne by the Selling
Shareholders and the Company and the mechanism for the same shall be as agreed in the Offer Agreement and the Escrow and
Sponsor Bank Agreement.
The break-up of the estimated Offer related expenses is as under:
Activity Estimated Offer
expenses (1)
(in ₹million)
As a % of the total
estimated Offer
expenses (1)
As a % of the total
Offer size (1)
BRLMs’ fees [●] [●] [●]
Selling commission/processing fee for SCSBs and Bankers to
the Offer and fee payable to the Sponsor Bank for Bids made
by Retail Individual Bidders using UPI (2)
[●] [●] [●]
Brokerage and selling commission and bidding charges for
Members of the Syndicate, Registered Brokers, RTAs and
CDPs(3)(4)
[●] [●] [●]
Fees payable to the Registrar to the Offer [●] [●] [●]
Fees payable to the other advisors to the Offer including
auditors and legal counsel
[●] [●] [●]
Others
- Listing fees, SEBI filing fees, upload fees, the Stock
Exchanges processing fees, book building software fees
and other regulatory expenses
[●] [●] [●]
- Printing and stationery [●] [●] [●]
- Advertising and marketing expenses [●] [●] [●]
- Fee payable to legal counsels [●] [●] [●]
- Miscellaneous [●] [●] [●]
Total estimated Offer expenses [●] [●] [●] (1) Amounts will be finalised and incorporated in the Prospectus on determination of Offer Price (2) Selling commission payable to the SCSBs on the portion for Retail Individual Bidders and Non-Institutional Investors which are directly procured by
the SCSBs, would be as follows:
Portion for Retail Individual Investors* 0.35% of the amount allotted (plus applicable taxes)
Portion for Non-Institutional Investors* 0.20% of the amount allotted (plus applicable taxes)
* Amount Allotted is the product of the number of Equity Shares Allotted and the Offer Price
(3) No processing fees shall be payable by our Company to the SCSBs on the Bid cum Applications Forms directly procured by them
Processing fees payable to the SCSBs on the portion for Retail Individual Bidders and Non-Institutional Bidders which are procured by the members of
the Syndicate/sub-Syndicate/Registered Broker/RTAs/ CDPs and submitted to SCSB for blocking, would be as follows:
Portion for Retail Individual Investors* ₹10 per valid Bid cum Application Form (plus applicable taxes)
Portion for Non-Institutional Investors* ₹10 per valid Bid cum Application Form (plus applicable taxes)
* Amount Allotted is the product of the number of Equity Shares Allotted and the Offer Price
(4) Selling commission on the portion for Retail Individual Bidders and Non-Institutional Bidders which are procured by members of the Syndicate (including
their sub-Syndicate Members), Registered Brokers, RTAs and CDPs would be as follows:
Portion for Retail Individual Investors* 0.35% of the amount allotted (plus applicable taxes)
Portion for Non-Institutional Investors* 0.20% of the amount allotted (plus applicable taxes)

86
* Amount Allotted is the product of the number of Equity Shares Allotted and the Offer Price
For Sponsor Bank
Processing fees for applications made by Retail Individual Bidders using the UPI Mechanism will be:
Sponsor Bank ₹3.50 per valid Bid cum Application Form* (plus applicable taxes).
The Sponsor Bank shall be responsible for making payments to the third parties such as remitter bank, NPCI and such other parties as required in connection with the performance of its duties
under the SEBI circulars, the Syndicate Agreement and other applicable laws.
* For each valid application.
The processing fees for applications made by RIBs using the UPI Mechanism may be released to the SCSBs only after such
banks provide a written confirmation on compliance with SEBI circular no: SEBI/HO/CFD/DIL2/P/CIR/2021/570 dated June
2, 2021 read with SEBI circular no: SEBI/HO/CFD/DIL2/CIR/P/2021/2480/1/M dated March 16, 2021.
Monitoring of Utilization of Funds
As the Offer is an offer for sale of Equity Shares by the Selling Shareholders, our Company will not receive any proceeds from
the Offer. Accordingly, a monitoring agency is not required to be appointed for the Offer in terms of the SEBI ICDR
Regulations.
Other Confirmations
Except to the extent of any proceeds received pursuant to the sale of Offered Shares proposed to be sold in the Offer by the
Selling Shareholders, none of our Promoters, Directors, Key Managerial Personnel, members of the Promoter Group or Group
Companies will receive any portion of the Offer Proceeds, and there are no material existing or anticipated transactions in
relation to utilization of the Offer Proceeds with our Promoters, Directors, Key Managerial Personnel or Promoter Group.

87
BASIS FOR OFFER PRICE
The Offer Price will be determined by our Company, the Individual Selling Shareholder, and the Investor Selling Shareholders,
in consultation with the Book Running Lead Managers, on the basis of assessment of market demand for the Equity Shares
offered through the Book Building Process and on the basis of quantitative and qualitative factors as described below. The face
value of the Equity Shares is ₹2 each and the Offer Price is [●] times the face value at the lower end of the Price Band and [●]
times the face value at the higher end of the Price Band.
Bidders should read “Risk Factors”, “Our Business”, “Restated Consolidated Financial Information” and “Management’s
Discussion and Analysis of Financial Condition and Results of Operations” beginning on pages 30, 132, 193 and 247,
respectively, to have an informed view before making an investment decision.
Qualitative Factors
We believe that some of the qualitative factors and our strengths which form the basis for computing the Offer Price are as
follows:
(a) B2B and B2B2C market leader in India with a comprehensive suite of SaaS, PaaS and MaaS offerings capitalizing on
early mover advantage;
(b) Independent, global geospatial products and platforms company, with strong data governance;
(c) Market position built around proprietary technology and network effect resulting in strong entry barriers;
(d) Marquee customers across sectors with strong relationships and capability to up-sell and cross-sell;
(e) Our offerings have ever expanding use cases and we innovate to address technology paradigm shifts; and
(f) Profitable business model with consistent financial track record, high operating leverage and strong cash flows.
For further details, see “Our Business – Our Strengths” on pages 139 to 144.
Quantitative Factors
Certain information presented below, relating to our Company, is based on the Restated Consolidated Financial Information.
For details, see “Restated Consolidated Financial Information” beginning on page 194.
Some of the quantitative factors which may form the basis for computing the Offer Price are as follows:
1. Basic and Diluted Earnings per Share (“EPS”), as adjusted for changes in capital
As per the Restated Consolidated Financial Information of our Company:
Financial Period Basic EPS (in ₹) Diluted EPS (in ₹) Weight
Financial Year 2021 11.30 10.99 3
Financial Year 2020 4.41 4.27 2
Financial Year 2019 6.38 6.19 1
Weighted Average 8.19 7.95
For six-month period September 30, 2021* 8.78 8.61 * Not annualized
Notes: (1) Weighted average = Aggregate of year-wise weighted EPS divided by the aggregate of weights i.e. (EPS x Weight) for each year/Total of
weights. (2) The face value of each Equity Share is ₹2. (3) The above statement should be read with Significant Accounting Policies and the Notes to the Restated Consolidated Financial Information
as appearing in “Restated Consolidated Financial Information” beginning on page 194.
2. Price/Earning (“P/E”) ratio in relation to the Price Band of ₹[●] to ₹[●] per Equity Share
As per the Restated Consolidated Financial Information of our Company:
Particulars P/E at the lower end of Price
Band (no. of times)
P/E at the higher end of Price
Band (no. of times)
Based on Basic EPS for Financial Year 2021 [●] [●]
Based on Diluted EPS for Financial Year 2021 [●] [●] Notes: (1) Price/ earning (P/E) ratio is computed by dividing the price per share by earnings per share.

88
3. Industry P/E ratio
There are no listed companies in India that engage in a business similar to that of our Company. Accordingly, it is not
possible to provide an industry P/E ratio.
4. Return on Net Worth (“RoNW”)
As per the Restated Consolidated Financial Information of our Company:
Particulars RoNW % Weight
Financial Year 2021 16.60 3
Financial Year 2020 7.79 2
Financial Year 2019 11.77 1
Weighted Average 12.86
For six-month period September 30, 2021* 11.51 * Not annualized
Notes: (1) Return on net worth (%) = Net profit attributable to equity shareholders / net worth (total equity net of minority interest)
5. Net Asset Value per Equity Share of face value of ₹2 each
As per the Restated Consolidated Financial Information of our Company:
Net Asset Value per Equity Share (₹)
As on March 31, 2021 68.08
As at September 30, 2021 76.28
After the completion of the Offer At the Floor Price: [●]
At the Cap Price: [●]
Offer Price [●] Notes: (1) Net Asset Value per equity share represents net worth as at the end of the fiscal year, as restated, divided by the number of equity shares
outstanding at the end of the period/year.
6. Comparison of Accounting Ratios with Listed Industry Peers
There are no listed companies in India that engage in a business similar to that of our Company. Accordingly, it is not
possible to provide an industry comparison in relation to our Company.
7. The Offer Price is [●] times of the face value of the Equity Shares
The Offer Price of ₹[●] has been determined by our Company, the Individual Selling Shareholder, and the Investor
Selling Shareholders, in consultation with the Book Running Lead Managers, on the basis of assessment of market
demand from investors for Equity Shares through the Book Building Process, and is justified in view of the above
qualitative and quantitative parameters set out above.
Bidders should read the above mentioned information along with “Risk Factors”, “Our Business”, “Management’s
Discussion and Analysis of Financial Condition and Results of Operations” and “Restated Consolidated Financial
Information” beginning on pages 30, 132, 247 and 193, respectively, to have a more informed view. The trading price
of Equity Shares could decline due to factors mentioned in “Risk Factors” beginning on page 30 and you may lose all
or part of your investments.

89
STATEMENT OF SPECIAL TAX BENEFITS
To,
The Board of Directors
C.E. Info Systems Limited
First, Second and Third Floor,
Plot No.237 Okhla Industrial Estate, Phase-III,
South Delhi 110020
New Delhi, India
Ladies and Gentlemen,
Re: Proposed initial public offer of C.E. Info Systems Limited (the “Company”, and such offering, the “Offer”)
1. We, Brijesh Mathur & Associates, Chartered Accountants, statutory auditors of the Company, hereby confirm that the
‘Statement of Special Tax Benefits’, enclosed herewith as Annexure A, prepared by the Company and initialled by
us and the Company (the “Statement”), provides the special tax benefits (under direct and indirect tax laws) available
to the Company, to its shareholders pursuant to (i) the Income-tax Act, 1961, as amended and read with the rules,
circulars and notifications issued in relation thereto; and (ii) applicable indirect taxation laws, as amended and read
with the rules, circulars and notifications issued in connection thereto. Several of such possible special tax benefits
forming part of the Statement are dependent on the Company and/or its shareholders fulfilling applicable conditions
prescribed within the relevant statutory provisions and accordingly, the ability of the Company and/or its shareholders
to derive such possible special tax benefits is entirely dependent upon the lawful fulfilment of such conditions by the
Company and/or its shareholders, as applicable
2. The special tax benefits discussed within the Statement are not exhaustive and are intended to provide an illustrative
understanding to prospective investors with respect to the special tax benefits available to the Company and/or its
shareholders and is neither designed nor intended to be a substitute for professional tax advice. In view of the individual
nature of the tax consequences and changing tax laws, each prospective investor is advised to consult their own tax
consultant with respect to the specific tax implications arising out of their participation in the Offer.
3. We do not express any opinion or provide any assurance as to whether the:
(i) Company and/or its shareholders will continue to obtain such special tax benefits in the future; or
(ii) conditions prescribed for availing such special tax benefits where applicable, have been/would be complied
with.
4. The contents of the Statement are based on information, explanations and representations obtained from the Company
on the basis of our understanding of the business activities and operations of the Company. Our views expressed herein
are based on the facts and assumptions indicated to us. No assurance is given that the revenue authorities/courts will
concur with the views expressed herein. Our views are based on the existing provisions of the tax laws and its
interpretation, which are subject to change from time to time.
5. Our examination of the Statement has been carried out in accordance with the Guidance Note on Reports or Certificates
for Special Purposes (Revised 2016) as issued by the Institute of Chartered Accountants of India (“ICAI”) and
accordingly, we confirm that we have complied with ethical requirements stipulated within the Code of Ethics issued
by the ICAI.
6. The enclosed statement is intended solely for your information and for inclusion in the Red Herring Prospectus and
the Prospectus and any other material in connection with the Offer and is not used, referred to or distributed for any
other purpose without our prior written consent.
Yours faithfully,
For and on behalf of Brijesh Mathur & Associates
Chartered Accountants
ICAI Firm registration number: 0022164N
Brijesh Mathur
Proprietor
Membership number: 080096
Place: New Delhi
Date: November 25, 2021
UDIN: 21080096AAAANL2495

90
ANNEXURE A
C.E. Info Systems Limited (Company)
LIST OF DIRECT AND INDIRECT TAX LAWS (‘TAX LAWS’)
1. Income-tax Act, 1961 and Income-tax Rules,1962
2. Central Goods and Service Tax Act, 2017
3. State Goods and Service Tax Act, 2017
4. Integrated Goods and Service Tax Act, 2017
5. Goods and Service Tax legislations as promulgated by various states
A. Special tax benefits available to the Company
1. Section 80M – Deduction in respect of Inter-Corporate Dividends
A new Section 80M has been inserted by the Finance Act, 2020 w.e.f., 1 April 2020 (Assessment Year (hereinafter
referred as “AY”) 2021-22) providing for deduction from Gross Total Income of a domestic company, of an amount
equal to dividends received by such company from another domestic company or a foreign company or a business
trust as does not exceed the amount of dividend distributed by it on or before one month prior to the date of filing its
return of income as prescribed under Section 139(1) of the Act. Where the company receives any such dividends
during a Financial Year and also, distributes dividend to its shareholders before the aforesaid date, as may be relevant
to the said Financial Year, it shall be entitled to the deduction under Section 80M of the Act.
2. Corporate Income Tax Rates :-
As per Taxation Laws (Amendment) Act, 2019, with effect from 1 April 2019 (AY 2020-21), a company has an option
to opt for lower tax rate under the provisions of section 115BAA of the Act. The Company has to exercise the option
before filing the return of income. The Company has assessed the impact and has exercised this option from Financial
Year 2019-20 onwards. The option once exercised cannot be subsequently withdrawn for the same or any other
Financial Year.
A. Special tax benefits available to Shareholders
1. Tax on Capital Gain :
Tax on short term capital gain on sale of Equity shares are charged at concessional rate of 15%+ surcharges on certain
shareholders under certain circumstances as specified under section 111 A of the Income tax Act, 1961.
Tax on long term capital gain on sale of shares( held for a period exceeding one year) are charged at special
concessional rate of 10% + surcharges (under certain circumstances on certain shareholders ) if such gain exceeds Rs.
1,00,000 in a year under section 112A of the Income Tax Act, 1961. There is no tax if the capital gain on such shares
is less than Rs.100,000/.
2. Tax on Dividend Income :
With effect from April 1, 2020 dividend income is taxable in the hands of the shareholders at the tax rates as prescribed
by Finance Acts for relevant year. While resident shareholders can claim credit for taxes withheld by respective
companies from dividends, the non- resident shareholders can not only claim that the taxes be withheld at rates
prescribed under applicable DTAA's ,if that is more beneficial to them, but also claim that taxes paid in India on such
dividend be given credit for in determining the tax payable by them in the Country of which they are residents/ citizens.
Apart from the tax benefits available to each class of shareholders as such, there are no special tax benefits available
to the shareholders of the Company under the Tax Laws identified supra.
NOTES:
1. The above is as per the current Tax Laws.
2. The above Statement of possible special tax benefits sets out the provisions of law in a summary manner only and is
not a complete analysis or listing of all potential tax consequences of the purchase, ownership, and disposal of equity
shares of the Company.
3. The above statement also does not discuss any tax consequences, in the country outside India, of an investment in the
shares of an Indian Company.
4. In respect of non-residents, the tax rates and consequent taxation mentioned above will be further subject to any
benefits available under the relevant Double Taxation Avoidance Agreement (“DTAA”), if any, between India and
the country in which the non-resident has fiscal domicile.

91
5. This statement is intended only to provide general information to the investors and is neither designed nor intended to
be a substitute for professional tax advice. In view of the individual nature of tax consequences, each investor is advised
to consult his/her own tax advisor with respect to specific tax consequences of his/ her investment in the shares of the
Company.
6. No assurance is given that the revenue authorities/ courts will concur with the views expressed herein. Our views are
based on the existing provisions of law and its interpretation, which are subject to changes from time to time. We do
not assume responsibility to update the views consequent to such changes.

92
SECTION IV: ABOUT OUR COMPANY
INDUSTRY OVERVIEW
Unless otherwise indicated, the information in this section is derived from the report titled “Independent Market Report -
Digital Maps and Location Intelligence Technology & Services Market B2B(2C)” dated October 27, 2021, prepared and
released by Frost & Sullivan, commissioned and paid for by our Company in connection with the Offer. Frost & Sullivan has
prepared the Frost & Sullivan Report in an independent and objective manner, and it has taken all reasonable care to ensure
its accuracy and completeness. Forecasts, estimates, predictions, and other forward-looking statements contained in the Frost
& Sullivan Report are inherently uncertain because of changes in factors underlying their assumptions, or events or
combinations of events that cannot be reasonably foreseen. Frost & Sullivan is not related to our Company, Promoters or
Directors. Accordingly, investors must rely on their independent examination of, and should not place undue reliance on, or
base their investment decision solely on this information. The recipient should not construe any of the contents in his report as
advice relating to business, financial, legal, taxation or investment matters and are advised to consult their own business,
financial, legal, taxation, and other advisors concerning the transaction.
India Macroeconomic Overview
India is expected to move from being the 7th largest economy in 2018 to 4th largest by 2030, depending on scenario conditions,
driven by factors such as strong consumer demand and structural reforms. India is also the second most populous country in
the world. According to the UN report of 2019, India is predicted to add 273 million people to its population and could cross
China to become the most populated country in the world by 2027. Thus, the domestic market itself is sizable in India, attracting
foreign investors and businesses to cater to this growing demand and utilise its workforce potential, with strong economic
fundamentals.
India’s information and communication technology (“ICT”) sector
India’s information and communication technology (“ICT”) sector contributes more than 8% to the GDP in 2020 and is
expected to reach 13% by 2030, driven by growth in its leading sub sectors like IT services, fintech, cyber security and e-
commerce. It is valued at USD 180 billion (INR 13.3 trillion) in 2020 and projected to reach USD 360 billion (INR 26 trillion)
by 2025.
The geographical expanse of India, its dynamism and complexity
The seventh largest country in the world, India is spread across a total landmass of about 3.3 million square kilometres, and has
28 states and 8 Union territories,
The dynamism and complexity of the Indian landmass can be understood from the nature of its urbanisation of the urban sprawl
in the country, where cities have expanded, and new cities have mushroomed. Addressing system is also complex in India and
completely non-standardised. Administrative boundaries change regularly with redistricting and new state and union territories
being announced. Names of cities/localities and roads change regularly too. This makes digital mapping very challenging in
India.
India has the world’s second largest road network after the United States of America spanning over 6.4 million kilometres. This
road network is used to transport more than 64% of all the goods in the country and 90% of the total passenger traffic commutes
using this road network. The expanding road network is an opportunity for growth in GIS (“Geospatial Information System”)
services and navigational services market.
Future Development of Transportation and Road Network
The Road and Highway sector is projected to grow at a CAGR of 36.16% between 2016-2025, on account of growing
government initiatives to improve transportation infrastructure in the country.
The government has allocated about USD 1.4 Trillion (INR 1,039 trillion) to be invested in infrastructure till 2025 which has
given a major push to the road infrastructure in the country.
The planned expansion of the national highway network is over 200,000 km. The Bharatmala Pariyojana was launched by the
government with an aim to build 66,000 km of economic corridors, border and coastal roads and expressways. The programme
will provide 4-lane connectivity to 550 districts thereby reducing supply chain costs by 5-6%.
Macro-Economic Enablers for Digital Maps and Location Intelligence
Liberalisation of Geospatial Sector
In 2021, the Ministry of Science and Technology announced the deregulation of the Geospatial sector in India. Under the old
Geospatial policy, there were stringent regulations on mapping and collection, use, storage, etc of geospatial data. With
dominance of the Government in this sector, it was difficult for private companies to get permissions from different departments
to map and collect geospatial data.

93
In the new Geospatial policy, there is no requirement to get approvals for the collection, preparation, storage and dissemination
of geospatial data and maps within India for Indian owned or controlled companies (“IOCC”). Indian government now
recognises that having access to a complete, granular, highly accurate, and regularly updated representation of geospatial data
will benefit a wide range of industries, support innovation, and improve the country's preparation of emergency and passed for
a deregulation in 2021. The new guideline in India allows all Indian entities to freely acquire, collect, generate prepare, analyse,
store or distribute geospatial data including maps. While it opens out huge scope for the geospatial sector in India, it restricts
foreign companies from doing granular level mapping - with a binding threshold of one meter in horizontal and three meter in
vertical mapping making it difficult to build accurate HD maps. They are also refrained from creating 360-degree street view
and doing terrestrial survey. As per the guidelines, there are restrictions on such data passing through foreign companies’ servers
hence APIs from Indian players need to be used.
The regulations have a significant impact on the existing competitive landscape in the geospatial market as it gives Indian
companies a clear regulatory advantage and restricts the operations of foreign players. Several mapping activities like terrestrial
mobile mapping survey, street view survey and Indian territorial waters survey are reserved only for Indian entities which
proves highly beneficial for Indian mapping companies. Geospatial data of accuracy finer than the defined threshold value, with
spatial accuracy of one meter for horizontal and three meters for vertical cannot be created/owned by foreign entities and they
would have to license the same through APIs from Indian players to serve their Indian customers, without such data passing
through their servers. This severely hampers the ability of foreign companies to create accurate maps for ADAS, HD and 3D.
Even the 2D maps of foreign entities will not be accurate to the doorstep.
Automotive Industry Standard 140
Automotive Industry Standard 140 (“AIS 140”) is a set of standards published by the Automotive Research Association of
India (“ARAI”) under which all State public transport vehicles need a vehicle tracking system, a camera surveillance system
and emergency SOS panic button. This would be applicable on State buses as well as institutional buses. In 2021, the Road
Transport and Highways (“MoRTH”) Ministry, made it mandatory for oxygen containers/tankers/vehicles to be fitted with
Vehicle Location Tracking (“VLT”) devices. This was done during the pandemic to manage the shortage of oxygen in hospitals.
GPS-based toll collection method
In 2021, the FASTag method of collecting toll, is proposed to be replaced by a GPS based toll collection method. Here, vehicles
would be fit with GPS based FASTags and the money would be collected using GPS imaging. It is proposed that the entire
National Highway network would be geofenced so as to record the entry and exit of commercial vehicles. This would ensure,
that vehicles pay for the exact distance they have covered.
Digital India Land Records Modernization Programme (“DILRMP”)
The Digital India Land Records Modernization Programme (DILRMP) has been extended up to 2020-21. It attempts to digitise
the existing land records and develop an Integrated Land Information Management System (“ILIMS”) across the country, on
which different States can also add State-specific needs as they may deem relevant and appropriate. Under the DILRMP, the
government has also launched the National Generic Document Registration System (“NGDRS”), which provides one nation
one software for registration of documents and properties, and the Unique Land Parcel Identification Number (“ULPIN”)
system which provide unique IDs for each land parcel based on geo reference coordinates.
ADAS Regulations
The Ministry of Road Transport and Highways (MoRTH) in India plans to make ADAS compulsory in all cars by 2022 in a
bid to make efforts for elimination road fatalities. Presently, a step-by-step plan has been created to implement different
regulations like Lane Department Warning, Collusion Warning System, and Automatic Emergency Braking and so on by the
end of 2030. These will have many geospatial and location based NCASE inputs.
Geotagging of Companies
With the aim to crack down on shell companies in India, the Government introduced mandatory filling of the E-form ACTIVE
(“Active Company Tagging Identities and Verification”) which requires all registered companies to file particulars about
the registered offices in the form. This Geotagging exercise helps the Government in tracking down companies who are
registered on the same address.
Telematics in Insurance
The IRDAI has proposed the adoption of Telematics in motor insurance. This would enable the tracking of driver behaviour
and habits, to determine the risk profile of the consumer. With the introduction of this, insurance policies would no longer be
based on model of the car, but it would be based on driving habits of the customer.
Regulations for UAV/UAS
India has allowed BVLOS (“Beyond Visual Line of Sight”) flight testing of drone systems during 2020 to enable last mile air
delivery within the country. The country also had over 20,000 commercial drone registrations during a grace period designed
to allow operators without permits to fly their UAS legally. The Digital Sky Platform, as part of Civil Aviation Regulations
(“CAR”), for registration of drones, pilots, and operators for online permission was recently launched. With the latest UAV

94
(unmanned air vehicles) /UAS (unmanned aero systems) laws, Nano drones in India can start flying legally. For micro and
above sized categories, operators and pilots are required to register on the Digital Sky Portal.
Drone Rules, 2021
The Drone Rules, 2021 have further liberalized and simplified drone regulations. Certain safety features include geo-fencing
capability and real-time tracking beacon will be mandated soon and will provide an impetus to the geospatial market in India.
The central government acknowledges need for interactive airspace map on the digital sky platform dividing the country into
red, yellow and green zones and would be accessible through a machine-readable Application Programming Interface (“API”).
The development of a drone corridor would be facilitated by the Ministry for transportation of goods by drones. These
developments suggest that the development of drone market in India will not be gradual but sudden, along the lines of the huge
regulatory push seen in geospatial market in 2021.
Digital India Initiatives
The Digital India initiatives are propelling growth in the geospatial and GIS market. One of the key vision areas of Digital India
is governance and services on demand which includes the leveraging of GIS for decision support systems and development.
With this focus, many digital India initiatives are growth drivers for the telematics and GIS market indirectly or directly.
Augmenting internet penetration has been a priority for the government due to its multiplier effects on economic growth,
industry and corporate demand in the country. The National Broadband mission government policy will facilitate laying 30
lakh route km of optical fiber cable especially in rural and remote areas, more than 110,000 have been linked so far, and increase
the tower density from 0.42 to 1 tower per thousand population by 2024. Government also plans expansion of the connectivity
coverage to rural areas and setting up of BSNL Wifi hotspots across the country to improve digital connectivity. With the
introduction of national optical fibre network, the government is aiming to connect 250,000 gram-panchayats across the country
through a high speed digital highway.
Key Macro Growth Drivers:
The following growth drivers will drive the overall digital story in India.
Growing demand for Mobile Applications
India was the fastest growing app market in 2020 across the world. In 2019, India had surpassed the US to become the second-
largest market in terms of number of app downloads. App downloads in the country is expected to reach 37.21 billion in 2022F.
There has been a 190% growth in app downloads from 2016 to 2019 backed by the rising number of mobile users and
availability of cheaper smartphones. More than 100 million apps are downloaded every month across Android Play store and
iOS App Store. On the basis of usage, Chat apps have the highest usage with around 92% of users aged 16 to 64 using them
each month. Map apps are used by 68% of the same users each month.
It is estimated that in 2021, there are 3.4 million apps available in the Google Play store and 2.2 million apps available in the
app store. Apps are increasingly offering mapping and location-based functionality and increasingly incorporating embedded
map and location-based APIs and SDKs for directly solving for location information like nearest ATM or indirectly in
personalising user experience of the app for each user. This growing app market acts as a driver for the navigation solutions
and digital map market.
App Downloads in India FY2016-22F (In billion)
Source: IBEF, App Annie
Note: Combined figure for iOS and Google play store
Enabling Mobile Penetration
Mobile Penetration
6.5
12
.1
18
.1
19
37
2 0 1 6 2 0 1 7 2 0 1 8 2 0 1 9 2 0 2 2 F

95
India hosts the second largest mobile subscriber base in the world as of 2021. As of today, mobile penetration represents 89%
of the total population of India and is still growing at a fast pace, expected to reach 95% penetration by 2024. In 2020, the
mobile subscriber base stood at 1.175 billion with a CAGR (2015-2020) of 3.9 % from 2015, on the back of increasing rolls
out by mobile players, increasing affordability, telecom infrastructure development. It is expected to grow with a CAGR of
5.5% to reach 1.368 billion by 2024. The tele-density in urban areas is at an average of 150% compared to the 60% coverage
in the rural areas. By the end of 2024, the tele-density in the urban areas is projected to be at 165% and the rural areas to cross
75%.
With deep data penetration into middle, we see that the market for applications is not restricted to urban India. With disposable
income in the Tier-2 and Tier-3 towns increasing and increasing mobile usage, information asymmetry is decreasing.
Smartphone Penetration
According to ICEA, by 2022, India is expected to reach 829 million smartphone users. Number of smartphones are projected
to grow to 12 billion by 2030 globally. Several factors have contributed to this smartphone user growth, including increased
affordability of mobile data, lower prices of smartphones, growth of rural users, and various Government initiatives. Regarding
the nature of connectivity according to NPCI, as much as 90% of Tier -2 cities own smart phones and as high as 73% of the
Tier -3 cities. The number of smartphone users in India is expected to reach 760 million in 2021.
The sales of GPS enabled smartphones is forecasted to increase from 1.2 billion in 2021 to 1.5 billion in 2025. This increasing
penetration of location enabled smartphones will provide an impetus to the location based services market.
Smartphone User Penetration, India – CY 2016-2023F
Source: Datareportal, Frost & Sullivan
With enhanced demand for smartphones, manufacturers are expanding capacity and increasing investment in the Indian
smartphone market.
Enabling Internet Penetration
India is the second largest online market in the world, next only after China, with a total of 765 million internet subscribers in
2021. For most part of 2015-2020, Indian internet subscribers grew from 0.4 billion in 2016 with a CAGR (2015-2020) of 16%,
driven primarily by internet absorption in Tier 1, followed by Tier 2 and rural. The pandemic, detrimental to other industries,
has resulted in a fillip to the growth rate for 2021. This number is further expected to increase to 1.3 billion by 2025 with a
CAGR of 25% on the back of growth in rural economy and increasing urbanisation. The CAGR (2020-2025) could witness a
fillip of 5 basis points if 5G wireless is rolled out in urban areas by 2025.
Despite this headway, the scope for internet penetration in rural India remains huge as half of the rural population of India still
remains unpenetrated. Penetration aside, there are differences in the way internet is used in rural and urban India. While rural
India has more users, urban areas continue to record higher internet usage riding on the metros.
47%
52%55%
59%63%
65%68%
75%
2016 2017 2018 2019 2020 2021E 2022F 2023F

96
Internet Penetration, India – CY 2016-2025
Mobile Internet Users, India – CY2016-2025 (in Billions)
Note: CAGR: from 2021-2025
Source: Datareportal, Frost & Sullivan
Next Billion Internet Users:
The next billion internet users, coming typically as they are from Tier 2,3 and rural India will likely not use internet like their
urban counterparts do. Given their education profile and earning profiles and preferences for regional languages, we find
keyboards, touchscreens and text input, will be increasingly replaced by voice-based and gesture-based commands. This will
help input data/commands faster and be more convenient for the rural internet consumer. It is estimated by Google that 60% of
users in India interact with voice assistants via their smart phones with the number being more in Tier 2 and 3 cities in 2020.
The unreliability of internet connectivity in these regions will also spur the features of light apps and availability of search
content offline.
28%35% 38% 41%
50% 54%62%
70%75%
80%
2016 2017 2018 2019 2020 2021E 2022F 2023F 2024F 2025F
0.3
0.440.49 0.52
0.69
0.85
0.97
1.1
1.3
1.6
2016 2017 2018 2019 2020 2021E 2022F 2023F 2024F 2025F
CAGR 2021-2025 17.1%

97
Number of Internet Subscribers CY2015-2025 (in Millions)
Source: TRAI (Govt. of India)
Speed and Data Consumption
The data consumption in India per user per month stood at 2.76 GB in 2016 and is currently estimated at 13.98 GB in 2020.
This segment is expected to grow at a CAGR of 39% to reach a value of 27.30 GB by 2023.
Source: Ookla, Frost & Sullivan
Impact of 5G on Internet Usage
5G has a higher bandwidth of connectivity with 1000 times more speed capability than the 4G bandwidth. 5G will be one of
the core drivers for complete digitization of India. Considering that already more than 96% of the internet subscribers access
the internet through their mobile devices, 5G could easily be adopted. The mobile devices with 5G connections will be able to
receive more data, have very low latency and hence can be used to provide more animated and large processing features on the
apps.
Its impact will also be felt by the GIS and IoT industry since it has many use cases in these industries. For the 5G rollout in
India, GIS will be crucial in providing accurate spatial data that will help in planning of network and placement of 5G related
infrastructure. 5G will also benefit the location based services as it provides higher capacity and improved coverage.
The market penetration of 5G in the total population is expected to increase reach 6% in 2025 and 93% by 2040. The
manufacturing sector will benefit the most from 5G and will account for one-fifth of the total benefit, followed by the retail
sector (12%) and ICT sector (11%). Other sectors who will benefit majorly from 5G include agriculture, logistics and healthcare.
Digital Transformation
The most important theme in the modern-day growth of the economy is that of Digital Transformation across industries and it
forms the cornerstone of the growth of the digital maps and location-based industry as well.
6.2
18.2
26.5 29.1
38.9
48.6
60.8
76
4.58.8 9.9 10.9 12.2
15.219
23.8
2016 2017 2018 2019 2020 2021E 2022F 2023F
Fixed Broadband Mobile

98
Digital, in today’s world, includes business-enablement via the utilization of advanced technologies as opposed to a
conventional IT-enablement process. In a constantly evolving environment, what was digital a few years back has become a
part of legacy technologies today, with the frontier of digital technologies evolving and upgrading constantly.
In India, digital services are expected to gain significant traction going forward and witness a growth of 12.2 per cent year-on-
year to reach USD 52 billion (INR 3.8 trillion) by 2025. Legacy services at the same time is expected to grow at a CAGR (2019-
2025) of 3.1% only.
IoT Growth
It is projected that across the world, spending on IoT related software and hardware will grow rapidly, from USD 726 billion
(INR 53.87 trillion) in 2019 to USD 1 trillion (INR 74.2 trillion) in 2023. It was reported that in 2019, Asia Pacific accounted
for the maximum share in spending on IoT, out of which India spent USD 20.6 billion (INR 1.53 trillion).
In 2019, there were more than 24.37 billion IoT devices in service. By 2026, there will be approximately 66.82 billion IoT
devices in service at a CAGR (2019-2015) of 15.5%.
The IoT growth is fuelled by many drivers including increasing smartphone penetration, mobile app growth, innovation in
offerings and government initiatives. The key sectors for IoT adoption will be utilities, manufacturing, healthcare, transport and
logistics and automotive sector.
Automotive
Indian Automotive Market:
Sale of passenger vehicles like sedans, hatchbacks and SUVs was over 3.4 million units in 2019 before facing a sharp fall in
2020 due to COVID-19. Commercial vehicle – trucks, minivans, bus, etc - sales also saw a similar trend. According to society
of Indian Automobile Manufacturers (SIAM), only 0.6 million units of commercial vehicles were sold in 2020 as opposed to 1
million units in 2020.
The Indian automotive sector is expected to reach USD 300 billion (INR 22.2 trillion) by 2026 and emerge as world’s third-
largest passenger vehicle market by 2021. Total number of on-road vehicles (2W, passenger cars and commercial vehicle) in
India in 2020 is 272 million of which 230 million are two-wheelers, 40 million passenger vehicles and 9.5 million commercial
vehicles. Indian vehicle sales is expected to increase mainly due to growing aspiration for owning vehicles and to meet the
rising demand of commercial vehicles. On an average, there are 22 million new vehicles sold every year- 3 million cars, 1
million commercial vehicles and 12 million 2 wheelers. The growth in automotive industry provides a scope for digital maps,
geospatial and navigation solutions for both consumers and enterprises as end users.
Growth Drivers for the Automotive Industry
• Rising middle class and young population coupled with increasing disposable incomes and urbanisation is
driving the growth of new vehicles sales in India. Demand for commercial vehicles increasing due to high
level of activity in the infrastructure sector.
• Greater availability of credit and financing options is leading to rise in demand for automobiles for both
passenger and commercial vehicles. Auto finance business of NBFCs in India is expected to grow and will
be driven by better macro-economic environment and government’s focus on infrastructure and rural areas.
• Automotive Mission Plan 2016-26- AMP 2026 targets a four-fold growth in the automobile sector in India
which include manufacturers of automobiles, auto components & tractors over the next 10 years. There is a
plan to set up R&D centres under NATRiP at a total cost of USD 375 million (INR 27.8 billion) to enable the
industry to be on par with global standards.
• The Government approved FAME (“Faster Adoption and Manufacturing of (Hybrid) and Electric
Vehicles in India”) and plans to cover all vehicle segments and all forms of hybrid & pure EVs. In February
2019, the Government of India approved FAME-II scheme with a fund requirement of USD 1.39 billion (INR
100 billion) for FY20-22.
Logistics Industry
The scope of the logistics industry has broadened from rudimentary transportation of goods to include end-to-end supply chain
solutions including warehousing & express delivery. With many use cases for telematics and geospatial solutions, the growth
of the logistics sector directly correlates with the growth of geospatial sector. The value chain of logistics comprises of the
following three segments:

99
Services provided by the Logistics Industry
Source: Frost & Sullivan
The major share of the market of around 88% is with the transportation segment, followed by 5% third party logistics and then
storage and others with 7-8%.
Growth Drivers
• Currently, metro and tier 1 cities account for the majority of demand of logistics. However, by 2025, this
tendency is likely to shift as tier 2 and smaller cities emerge as new demand hubs as internet penetration rises.
As a result, it is projected that in the next five years, a large percentage of demand would come from tier II
and below cities, owing to low-cost data plans and increased usage of smartphones and rising per capita
income.
• Technological disruptions are transforming the e-commerce supply chain business in order to keep up with
digital commerce. IoT, complex algorithms, data analytics, Artificial Intelligence (“AI”), and automation are
all new technologies that are helping businesses streamline their processes.
• With the Government pumping more money into road, rail, sea and air network expansion, the logistics sector
is benefitting by the expansion of the supply chain.
• With the expansion in the retail e-commerce sector, more businesses are penetrating deeper beyond Tier 1
cities. This is driving the demand for last mile delivery to Tier 2 and below locations.
• During the FY21 budget, the government had announced geo-tagging of warehouses and creating
warehousing, in line with Warehouse Development and Regulatory Authority (“WDRA”) norms.
• Government initiatives like Pradhan Mantri Kisan Sampada Yojana (“PMKSY”) ais to create modern
infrastructure with efficient supply chain management from farm gate to retail outlet. The purpose of PMKSY
is not only to provide big boost to the growth of food processing sector in the country but also to help in
providing better returns to the farmers.
E-Commerce
The Indian e-commerce industry is expected to surpass US to become the 2nd largest e-commerce market in the world by 2034.
In 2020, there were approximately 549 million e-commerce users in India which are projected to grow at a CAGR (2020-2024)
of 12.7% to 885 million by 2024. This sector has witnessed exponential growth over the last years owing to many drivers like,
convenience, internet penetration, digital literacy, supply chain infrastructure, etc. The availability of a wide range of brand
options, discount offers, personalisation, shorter delivery times, cash on delivery option, digital payment alternatives have all
contributed to the growth of e-commerce in India.
India B2C e-commerce is expected to reach USD 127 billion (INR 9.4 trillion) by 2025, growing at a 27% CAGR between
2019-24. Online penetration of retail is expected to reach 10.7% by 2024, versus 4.7% in 2019.
E-commerce retailers in 2020 deliver to around 20,000 out of 100,000 pin codes in the country. With the growth of the logistics
and warehousing industry, the e-commerce industry is expected to grow at 31% CAGR from 2.6 billion annual shipments in
FY20 to 10 billion shipments in FY25. Out of the total shipments, 3PL deliveries accounted for 0.7 billion shipments in 2020.
One of the fastest growing segments in e-commerce is online food delivery. Larger players like Zomato and Swiggy clock over
a million deliveries per day to 500+ cities in India in FY20. India has an estimated 40-50 million users for online food delivery.
These deliveries and their consequent kilometres driven have direct and huge scope to leverage geospatial and location-based
services.

100
Hyperlocal
Geolocation and contextual targeting techniques have effectively pushed the e-commerce industry into hyper-localism. AI/ML
skills are still being used by hyperlocal players to solve problems including route planning, calculating optimal time slots for
deliveries, and overall service costs.
Growth Drivers
• With the increase in awareness of using the internet and rising income especially in middle income
households, is propelling the growth of the e-commerce sector.
• In 2020, E-commerce and Consumer Internet companies raised over USD 8 billion (INR 593 billion) in PE /
VC capital spread over 400 deals. Foreign investment is also growing with the recent policy changes allowing
100% FDI under the automatic route for single brand retail trading.
• Metro cities like Bengaluru, Mumbai and Delhi still account for majority of the online shopping in absolute
numbers. But there has been an increasing demand from Tier 2, 3 cities. Rural per capita consumption will
grow 4.3 times by 2030, compared to 3.5 times in urban areas. Along with this, the rising internet penetration
in rural India, will give a boost to the e-commerce sector. Currently, three out of every five orders are from
tier-2 and smaller towns and this target market is expected to grow to 200 million online shoppers by 2025.
• India is the global leader in real-time digital payment transactions. With 25.5 billion transactions in 2020,
India is ahead of all other countries including China, South Korea, Thailand and the UK. In terms of the real-
time digital payment infrastructure, UPI and NEFT, have been driving digital payments. The COVID-19
pandemic has led to a further rise in digital, contactless payments a customer behaviour has shifted from cash
to card.
• The government has come up with various initiatives to boost the e-commerce sector like Start-up India,
Digital India, 5G rollout and Bharat Net (to increase rural broadband penetration) which are pushing people
to online mode for commerce.
• In 2020, there were approximately 549 million e-commerce users which are projected to grow at a CAGR of
12% to 885 million by 2024. This sector has witnessed exponential growth over the last years owing to many
drivers like, convenience, internet penetration, digital literacy, supply chain infrastructure, etc.
DIGITAL MAPS AND LOCATION INTELLIGENCE TECHNOLOGY & SERVICES – TOTAL AVAILABLE &
ADDRESSABLE MARKETS*
As defined by Frost and Sullivan in this report, the Digital Maps and Location Intelligence Services market consists of two
broad segments, which are delivered in a B2B and a B2B2C setting:
I. Digital Maps Services market
II. Navigation Solutions and Telematics Market
Digital Maps and Location Intelligence Technology & Service Market (Available & Addressable)
Source: Frost & Sullivan

101
Digital Maps and Location Intelligence Technology & Services – Total Addressable Market*
The Indian addressable market is expected to grow at around 15.5% CAGR (2019-2025) and is expected to be around USD
7.74 billion (INR 474.9 billion) market by 2025 and most of this growth would be from new projects and policies announced
by government that encourages domestic players of digital maps and associated solutions. The total global addressable market
stood at around USD 86.55 billion (INR 6.4 trillion) as of 2020 and is expected to reach around USD 173.61 billion (INR 12.9
trillion) by 2025 growing at a CAGR (2019-2025) of 13%. Mobile navigation devices, the wide usage of 3D platforms and
advanced survey technology, digital mapping etc., are the key driver for growth in the total addressable market.
Digital Maps services are gaining traction and include customized interactive maps that are cloud-based maps used for real-
time updates across different platforms, embedded maps with simple images and an easy-to-use interface, street view 2D/3D
maps, and HD satellite imagery. Map development and integration service market usually consists of a mix of digital maps
providers and also the third-party integration service providers. Geo-spatial analytics creates a conceptualized framework of a
geographic location to analyze location-specific data and trends. It integrates software, data, and processes to organize
information and visualize it for analysis. This market is expected to grow at a faster rate than any other part of the total
addressable market.
Global & India Total Addressable Market, CY 2019–2025, (in USD billion)
Source: Frost & Sullivan
*Please Note: The total addressable market consists of a combination of pure map software (refer section 4 of report) and
software & hardware-based devices/solutions of N-CASE Mobility solutions and logistics solutions (refer section 5 of the
report)
Digital Maps Services Market Overview & Market Sizing
Data is the new oil. Upstream mining for digital maps data involves acquiring and validating locational data from the ground
up. Processing of acquired data follows, to create value added geo spatial application and map data products. Finally, various
digital map data products and services are distributed downstream to various stakeholders. In the process, digitising,
transforming, and propelling the economy.
From the perspective of maps, the evolution of cartography and transformation from simple print maps to sophisticated digital
maps with high quality 3D, 4D images and accurate details is fast becoming a norm. As businesses and individuals continue
their journey towards digital transformation, having modern, highly accurate maps is fast becoming a necessity.
Digital Maps: Digital maps essentially are digital or electronic forms of the maps that combine graphics, imagery and location
information to create map and map data which helps individuals and businesses to access information in a simplified
representational manner. Digital maps are built from “ground-up” and are processed into digital cartographic data.
Digital Maps as such have enabled growth of other adjoining industries or sectors. For example, the geo-spatial and location
intelligence sectors use digital maps as an integral component while offering and implementing their solutions to their business
customers. Some of the key advantages of digital maps include
Digital Maps Advantages: With the improvement in data capturing technologies, 3D and 4D advancements, the digital maps
offered today provide real, life-like experience to its users. The accuracy offered by digital maps is enabling its applications on
various fronts and more importantly in geo-spatial solutions and location based solutions which are expected to revolutionize
the way maps and related map data is used by businesses and other stakeholders.

102
Geo-spatial Technology: Geo-spatial, in general means combination of geography and mapping technologies that gives rise to
location or place based information or data that is overlaid on to maps in order to make information rich and accurate. Geo-
spatial technologies is a combination of Geographic Information System (“GIS”), Remote Sensing (“RS”) and Global
Positioning System (“GPS”) that enables capturing the data with respect to earth and use it for analysis, modelling, simulations
and visualizations.
Application of geo-spatial technologies enhances map user experience and enriches map data which in-turn helps businesses
and individuals to make informed decisions. Geo-spatial technologies are being widely adopted in different verticals and
industries that are re-building their organizations to be digitally transformed. Geo-spatial technologies is enabling growth of
location based services which is re-defining the way businesses operate and build their future strategies for sustained growth.
Location Intelligence Platform: Location Intelligence platforms are solutions that harness location or map data to build analytics
on top of it to provide location intelligence to business users for building enhanced business strategies. Location intelligence
solutions identify and analyse relationship between certain objects and their location that helps businesses to make informed
decision making. Users of location intelligence solutions will be able to analyse the trends on the map and accordingly and
support their strategic business decisions. For example, an FMCG company can use location intelligence platforms to identify
the locations of its retail distributors and re-sellers and accordingly build optimized routing for their logistics team for efficient
and on-time replenishment of stocks. Location based intelligence solutions or platforms are fast gaining popularity as this
concept can be applied across different industries and verticals in order to build better business strategies.
Companies that provides customers with access to a range of location services which includes digital map tiles, location content
geocoding (converting street names into coordinates and vice-versa), traffic-optimized routing, local businesses or points of
interest (POIs) search, traffic flow and traffic incident information, and more all quality as location platform service providers.
Location platforms enable enterprises and long-tail developers to integrate these horizontal location services into their own
apps and services, so developers need not invest their own resources in building and maintaining their own maps and common
location service capabilities,
Building Digital Maps Ground up- A Complex and Continuous Process
Given the vastness of the geographical landscape in India, its unstructured, complex, dynamic nature and near constant pace of
changes, building a map company and maintaining the latest map data through continuous updating process is a hugely
challenging task.
Several factors like understanding of regional intricacies, technology used, innovations introduced, accuracy, map update
frequency, regional and local regulations and similar such factors greatly influences the success of a digital map company in
India.
Digital maps building involve developing not just technology expertise but also enhancing the capabilities to have local presence
and knowledge of local nuances that can reflect on the maps in a real-time and in an accurate manner. Some of the key reasons
or factors that influences the success or failure of digital maps company globally as well as in one geography includes:
• Vast Experience: Building maps from scratch would require years of experience in this domain. Map solution
providers who have grown regionally by building strong network of maps for one particular region or area
will have a natural competitive advantage over a global company who is trying to venture into new geography.
The domestically grown company would have better and information rich regional map data as compared to
its remotely located global competitor
• Deep Technology Expertise: As maps in general have gone digital, having cutting edge technologies such as
Artificial Intelligence, 3D and 4D imaging and similar others becomes extremely important for sustaining in
the map solution provider industry. Successful map companies today are exploring how they can enhance
map experience of its users and in the process are implementing technologies that automates processes and
provides information rich maps (For example: 4D HD IR maps for enhanced experience by MapmyIndia)
• Map Data updating Capabilities: If map building exercise requires vast years of experience and expertise, the
process of updating map data on a continuous basis is much more complex and challenging task for map
solution provider companies. Most of the large map companies who originate from developed countries like
USA and UK have strong reach in their headquartered geography.
• Localization of Maps and Map Accuracy: Creation of maps to suit the local business requirements and that
essentially contains map information in regional languages and dialect becomes extremely important in map
industry. Most of the globally operating players often neglect this aspect and the maps turn out to have
distorted names altogether and could be a hindrance for business customers using these maps. Also, the ability
to provide accurate real-time updates on maps plays a vital role. For example, a regionally grown digital map
provider would be more equipped to provide real-time data in terms of traffic updates or road closures than a
global player having regional presence.

103
To sum it up, providing map solutions and services is a complex task and requires years of experience and expertise not just in
technology but also at regional level to understand the regional dynamics in a better way. A domestically grown map solution
provider would, it appears have an advantage in terms of providing accurate maps with information rich data which a global
player operating regionally would often lack. In addition to this, the local regulations and restrictions makes it even more
difficult for global players to sustain and grow and hence opens up opportunities for regional map solution providers to grow.
Summary of Digital Map Services
The map services section has been essentially segment into 3 main segments namely,
• Digital Maps (Includes Map Data and Traffic Data) Market
• Map Development and Integration Services (Includes APIs and SDKs used in Maps) Market
• Geo-spatial Analytics (Location Intelligence) Market
The geo-spatial analytics market continues to be one of the biggest contributors to the overall map services section followed by
digital maps. Geo-spatial analytics market is expected to be growing at a higher CAGR (2019-2025) in comparison to other
two sections as different use cases are fast emerging among businesses and industry verticals that are implementing geo-spatial
analytics solutions. Verticals like Automotive continue to be biggest revenue contributing sector followed by others.
The total market for Indian digital map services is expected to grow from USD 1.7 bn (INR 126.14 billion) in 2019 to USD 4.2
billion (INR 311.64 billion) in 2025 at a CAGR of 16.1% between 2020 and 2025. USD 4.2 billion (INR 311.64 billion) in
2025 is expected to comprise of USD 0.32 billion (INR 23.74 billion) for digital maps, USD 0.14 billion (INR 9.64 billion) for
map development and integration services, and USD 3.7 billion (INR 274.5 billion) for geo-spatial.The global digital map
services total market is expected to grow from USD 70.9 billion (INR 5.26 trillion) in 2019 to USD 151.9 billion (INR 11.27
trillion) in 2025 at a CAGR of 13.6%. USD 151.9 billion (INR 11.27 trillion) in 2025 is expected to comprise of USD 27.1
billion (INR 2.01 trillion) for digital maps, USD 9.8 billion (INR 727.2 billion) for map development and integration services,
and USD 114.9 billion (INR 8.53 trillion) for geo-spatial analytics.
All the three sections of map services continue to grow strong and the table below provides a brief on to how each of these 3
markets are growing globally as well as in India.
Summary of Map Services – Indian Digital Map Services Market
DIGITAL MAPS
MAP
DEVELOPMENT
AND
INTEGRATIONS
SERVICES
GEO-SPATIAL
ANALYTICS TOTAL
Market Size, CY 2020 0.14 0.05 1.6 1.8
Market Size, CY 2021 0.16 0.06 1.9 2.1
Market Size, CY 2025 0.32 0.13 3.7 4.2
CAGR (2019-2025) 14.8% 16.9% 16.1% 16.0%
Growth Phase Growth Phase Growth Phase Growth Phase Growth Phase
*All Revenues in USD Billion
Note: Digital Maps consists of Map Data and Traffic Data sub-segments
Summary of Map Services – Global Digital Map Services Market
DIGITAL
MAPS
MAP DEVELOPMENT AND
INTEGRATIONS
SERVICES
GEO-SPATIAL
ANALYTICS TOTAL
Market Size, CY 2020 14.4 5.5 53.9 73.8
Market Size, CY 2021E 16.3 6.1 62.2 84.6
Market Size, CY 2025E 27.1 9.8 114.9 151.9
CAGR (2019-2025E) 11.4% 10.6% 14.4% 13.6%

104
Growth Phase Growth
Phase Growth Phase Growth Phase
Growth Phase
*All Market Size is Revenues in USD Billion
All the sections depicted in the table above are discussed in detail in subsequent sections under digital maps, map development
and integration services and geo-spatial analytics markets.
Ongoing Trends in Digital Maps Services
• Digital Maps for Navigation - The increase in population and traffic has intensified the usage of maps in
regular trips. With developments made in the past decade, users can now use these maps to receive real-time
information about traffic and their surroundings. Digital Maps are being integrated with multiple apps like
Audio streaming apps and voice assistants with the popular In-Car Navigation system. These systems are
available as an embedded application, provided along with the car at the time of purchase, or as an app-based
solution that can be implanted to the vehicle. This development is facilitating a new driving experience
supported by hi-tech technology. With In-Car Navigation, drivers can take full control of the dashboards; get
personalized map design, lane level guidance and AR navigation. These apps also have the capability to use
the travel data of the driver to provide personalized suggestions, information on favourite locations and alert
the driver when the fuel levels run low.
• Traffic Data and Driver Safety - Digital maps are using advanced technology to provide the drivers with
real traffic data, better routes, and warning alerts. The interactive dashboards of these maps show updated
speed limits, new and renamed routes to keep the driver informed of the constant real-world changes. Maps
are made to mirror the real world with quicker continuous updates via using high-tech techniques like
Machine learning and AI. Apart from the information related to Roads, these maps also provide information
on other relevant areas like detailed addresses, important amenities and other Points of Interest.
Going beyond sensors, digital maps are made to provide advanced driver assistance systems (ADAS) that can
anticipate the route ahead. Details like curvatures, lanes and speed limits help drivers leverage the high-
quality route information for a better driving experience. Drivers are also provided information on live traffic,
traffic signs, fuel levels, road closures and speed limit alerts. These maps rely on the vast traffic data coming
from millions of connected devices that are then synthesized to produce live traffic data and events.
• Indoor Maps and Venue Management - The revolutionary development in the space of Digital Maps is the
introduction of Indoor Mapping, a creative approach to visualizing indoor venue. This system arranges spatial
data on a 2-Dimensional or 3-D dimensional digital map and indicates the positioning of people and elements
inside the venue. Instead of GPS signals, this system uses Wi-Fi and other tech-based solutions for the
creation of maps. Users can mark and pin places on their route, analyse user behaviour and connect via real-
time direct messaging. Businesses can use this system to evaluate optimal utilization of resources, position
resources and service points, get real-time insights and improve overall business efficiency. With the help of
the insights, managers can also increase engagement with the visitors and monitor safety levels. These Indoor
maps can be installed in venues like retail stores, hospitality premises, office buildings, shopping centres,
universities, and business units for better workspace management and security. Indoor Mapping also supports
features that aid in live asset tracking and finding the exact location of a user.
• Digital Maps for athletes and adventurers - Specially designed digital mapping apps that provide
information on routes for unknown terrains are in the limelight with great scope in a post-pandemic world.
These apps are based on an online database that consists of pre-existing routes uploaded by different users. It
also comes with mapping tools that can be used to design a new route altogether. Riders can use GPS devices
like phones to record events and thread them alongside speed and duration related data on the map. The
system is widely used by adventurers and cyclists to track and improve their performances.
Growth Factors - Drivers of Digital Maps Services
• Innovation-led growth - The innovation-led growth model has emerged as a promising tool for stabilizing
the economy and helping businesses survive with the subsequent restrictions. Large and small businesses are
relying on Innovation to accelerate recovery from the effects of the COVID-19 pandemic. Integrating people,
process and technology not only fuels productivity but makes the workspace more inclusive.
• Technology Adoption - Increasing dependence on technology in general and due to the pandemic in
particular has facilitated a more tech-focused business approach. Digital transformation has become a key
factor to success with the focus on integrating process, people, data and technology. Large and small
businesses across various segments are speeding up the adoption of technology making lech-led innovation
an important parameter for growth and development. This is facilitating the adoption of digital maps as well.

105
• Growth in Mobile Usage - The number of mobile users is increasing each passing day, prompting businesses
to consider a Mobile-first approach in designing user experiences. Mapping and navigation apps constitute a
significant part of the overall smartphone user experience. This has led to tech companies regularly invest in
improving their map services with consistent updates and additional features. Integrating location-based
features and functions into navigation apps has further boosted the popularity of digital maps amongst
smartphone users.
• User-friendly Interface - The Digital Maps in the Market can be accessed by users in broadly two forms,
the first with in-built map in a smartphone/device, or an additional app to be installed manually in a
smartphone/device. In both the forms, the Digital Maps are designed to be user-friendly and easy to use. This
is driving their increased adoption.
Restraints for Digital Maps Services
• Regulatory Restrictions - Several regulatory restrictions across the globe are known to be hampering the
growth of digital maps due to regulatory restrictions on mapping of many of the critical physical
infrastructures in the country like airports, defence areas. These restrictions are even more stringent for non-
indigenous companies. Regulations on digital maps and geospatial data were significantly liberalized in India
in the New Geospatial Policy of February 2021 to achieve the vision of self-reliant India and motivate
business to innovate in mapping and geospatial services. Though this is favourable for Indian companies, it
restricts the scope of growth of foreign competition. Further, to unlock the full potential of this development,
it is imperative to streamline areas involving remote sensing and spatial infrastructure.
• Connectivity Challenges - With major cities advancing towards achieving the aim of becoming smarter,
rural and remote areas are falling behind. The limited availability of internet access in remote areas is
widening the digital divide between urban cities and remote areas. It is important to develop a cost-effective
solution that goes beyond the challenges of low population density and geographical barrier.
High Potential Verticals for Digital Maps Services
• Navigation - Navigation and location intelligence continues to be a significantly high potential vertical for
digital maps. Latest developments in digital mapping services have provided a platform to look beyond the
narrow scope for digital maps' role in navigation. They provide an extra advantage over fuel management by
showing the fastest route possible to reach the desired location using live traffic data, help estimate accurate
travel durations with live updates and get the most accurate directions for the most complex routes. In addition
to this, intelligent speed assistance systems can detect and alert the driver when the vehicle is crossing the
precise speed limit and can even automatically slow down the vehicle by leveraging speed restriction data
thereby improving driver safety.
• Healthcare - While the COVID pandemic has brought urban transportation to a standstill, the importance of
medical infrastructure transport is at its peak. Emergency and mobile health vehicles hold paramount
importance in today's time. The need for smooth, uninterrupted medical vehicle transportation was met by
digital mapping and advanced location-based solutions. Similar features also helped users track and locate
vaccination centres in nearby locations as a part of mobile applications. These applications also reflected the
opening and closing hours of the vaccination centres to help save users time.
• Agriculture - Growing concerns over the state of the agricultural sector have prompted the digitization of
agricultural activities. Digital maps have emerged as an important tool to help users in the Agriculture
Industry increase productivity and efficiency. Agriculture-based weather maps are specially designed maps
that map important parameters like climate change, which are pivotal to the agricultural economy. Digital
maps also help decision-makers in planning suitable cropping patterns in different areas by analysing their
water densities and soil nutrition quotient. Fertilizer application rates can also be customized in order to suit
different nutrition quotients of different land patches.
Key Applications and Use Cases
• CoWIN and Location-based solutions – The Government of India integrated advanced digital mapping
features developed by MapmyIndia into the CoWIN App,the official registration portal for Covid-19
vaccination. To ease up the vaccination process, MapmyIndia pinpointed all the vaccination centres across
the country on their maps. The MapmyIndia apps and portals were made accessible to users to help them
locate nearby vaccination centres with ease.
• Mapathon Keralam - Mapathon Keralam, launched in 2019 by the Kerala State IT Mission is a crowd-
sourcing initiative powered by digital mapping capabilities. The project has been successful at developing
micro-level maps for the state of Kerala and accurately identifying prime natural resources and developing

106
physical infrastructure. A free online map, Open Street Map, is being used to support this initiative. The map
is openly accessible to users who want to participate in the initiative. The government is actively using digital
mapping technology for mapping streams, ponds, buildings, roads, and other resources by drawing these
streams using satellite images.
• TomTom-Uber Collaboration - TomTom, a multinational creator of location technology and Uber
Technologies, popularly known for its ride-hailing services, have collaborated to integrate TomTom’s maps
and traffic data across Uber’s global platform. This collaboration has led to a seamless mapping experience
for Uber across 10,000+ cities around the world besides Uber serving as an efficient map editing partner.
Results are TomTom's maps increasingly gain more accuracy via Uber's navigation and location experiences,
better routing, accurate fare data, and travel time estimates.
Digital Map Market Forecast (2020-2025)
After witnessing a series of lockdowns due to multiple waves of pandemic, the global economy has shown early signs of
recovery in 2021. According to The International Monetary Fund’s (IMF) recent economic outlook report of April 2021, after
experiencing a contraction of nearly 3.3% in 2020, world GDP is on the recovery path and GDP growth in 2021 is estimated to
be around 6% and around 4.4% in 2022. The latest annual growth estimates from IMF for the Indian economy for FY2022 is
9.5% with a healthy rebound seen from the second COVID 19 wave.
The impact of pandemic has been felt by almost all types of businesses and entities worldwide. Due to the ongoing pandemic,
more and more businesses, governments and organizations have realized the importance of digital transformation. As a result,
in the near future, the digitization will emerge as a top priority for most. This digital transformation would also lead to growth
of markets like digital maps as, in the future, most of the digitization initiatives will include extensive use of digital maps and
the related solutions. Digital maps are finding new use cases and one of the latest examples for this is the use of digital maps
by governments to enable citizens to locate nearest vaccination centres.
As per Frost and Sullivan estimates, the digital maps market is expected to bounce back and is forecasted to reach USD 27.2
billion (INR 2.01 trillion) by end of 2025. The growth in technology adoption, the emerging new use cases of digital maps for
citizen services, increased penetration of mobile devices for telematics and navigation purposes would largely drive the growth
of digital maps market.
Digital Map Services Market
The global map market here refers to pure software offerings that map solution providers offer to their customers on an annual
or monthly or pay-as-you-go subscription models. The global map market essentially consists of three segments:
• Digital Maps (includes map data and traffic data): These are software solutions which is readily used by
businesses to integrate into their mobile or web based applications (mostly SaaS based offerings)
• Map Development and Integration Services: These include APIs/SDKs development and integration
services (mostly PaaS and integration services)
• Geo-spatial Analytics: Geo-spatial analytics, in simple terms are analytics on digital maps and map data to
build better insights and to take informed business decisions and to build business strategies.

107
Global Digital Map Services Market
Global Digital Map Services Market, CY 2019-2025 (in USD Billion)
Source: Frost & Sullivan
As shown in the above graph, the geo-spatial analytics market formed the major portion (around 73%) of the overall global
maps market followed by digital maps (19.5%). Among the three sections mentioned above, geo-spatial analytics market
segment is expected to continue to have a higher growth throughout the forecasted period (around 14.4%). The increasing
penetration of maps in businesses of every nature is expected to fuel the growth of geo-spatial analytics where businesses users
would look to implement different analytical, artificial intelligence (AI) and automated technologies to capture, collect and
analyze large volumes of map data from different aspects in order to not just improve their day-to-day business operations but
also to use the insights generated from the data captured to build business strategies and take informed decisions.
Global Digital Map Market 2020- Split by Geography
Adoptions of digital maps in developed countries continue to remain high. Map data and traffic data based applications and
solutions are extensively used by governments, authorities, businesses or individuals for navigation purposes, traffic
management and other commercial purposes. The high technology penetration, extensive usage of passenger vehicles and
navigation systems is driving the growth of usage of digital maps in this region. Along with this, these developed countries use
geospatial solutions and analytics in several sectors and industries and digital maps form a basic component in all the geospatial
related data capture and analytics activities.
Digital Map Market, CY 2020 – Split by Geography
Source: Frost & Sullivan Analysis
*Rest of the World includes Europe, Japan, China, South Korea, Australia, New Zealand, and South America
14.18 14.43 16.30 18.46 20.96 23.84 27.165.41 5.50 6.15 6.90 7.75 8.74 9.88
51.30 53.9562.23
72.1584.00
98.11
114.95
2019 2020 2021 2022 2023 2024 2025
Digital Maps Map Development & Integration Services Geo-spatial Analytics
70.89 73.8784.69
97.51
112.71
130.69
151.99CAGR (2019-25)
13.6%
North America, 45%
MEA, 5%SEA, 5%India, 1%
Rest of the World,
44%

108
Indian Digital Map Services Market
The Indian map market is in the initial growth phase and is a promising and high potential market. The businesses here are
realizing the importance and ease that maps bring to their businesses and are integrating maps in most of their business
functions. As global market continues to grow, the Indian market is expected to flourish further as experts predict that every
business and its functions in the future would have a map component attached to it. With digitization becoming a buzz word
among Indian businesses and the growing necessity to simplify business operations for effective cost and resource optimization,
the importance of maps and associated solutions is expected to grow further.
India Digital Map Services Market, CY 2019-2025 (in USD Billion)
SOURCE: Frost & Sullivan
Like the global trend, the Indian maps market is dominated by the geo-spatial analytics market segment. The overall India maps
market forms a small portion of the global market and has high growth potential, especially in the geo-spatial analytics market.
The geo-spatial analytics market is expected to be growing at a CAGR (2019-2025) of close to 16.1% until 2025 as per Frost
& Sullivan analysis. The recent announcements by Government of India about further liberalization of regulations and policies
related to geo-spatial data usage by private entities is expected to boost the growth of domestic map and geo-spatial solution
providers in a big way.
India is one of the high growth potential markets for digital maps as the level of penetration in the country has been largely
limited with a wide scope of possibilities of usage of digital maps for various applications. The increased interest by government
towards building its own digital map repository and announcement of new regulations and policies point towards the fact that
the growth of this industry will be huge in the near future. Also, the growing penetration of smart phones, the increase in number
of e-commerce and online platforms that require digital maps for their operations also is fueling the growth of digital maps. In
addition to this, the use of geo-spatial technologies and analytics in the country has been still in its nascent stage and going
forward, the usage of digital maps for building geo-spatial solutions would become common. This would also drive the need
for digital maps in the country.
Digital maps market in India is expected to grow at larger rate than global growth rate. The market today stands at USD 0.14
billion (INR 10.38 trillion) and is expected to grow at a CAGR (2019-2025) of close to 14.80% until 2025 as per Frost &
Sullivan estimates. This underpenetrated market has huge market potential, given the overall size of the global market.
Digital Maps – Split by Verticals
Vertical wise, the digital maps market has been broadly classified into three categories, the enterprise vertical, the government
and consumer verticals. The enterprise vertical comprises of all those businesses and entities which integrate digital maps into
their applications or offerings in order to build a comprehensive solution. For example, a logistics solution provider can integrate
digital maps into their existing routing solutions in order to make informed decisions with respect to route planning and
execution. In 2020, enterprise vertical contributed 55.1% of the overall market followed by the government and the consumer
vertical.
0.14 0.14 0.17 0.20 0.23 0.27 0.320.05 0.06 0.06 0.08 0.09 0.11 0.14
1.54 1.621.91
2.26
2.67
3.17
3.77
2019 2020 2021 2022 2023 2024 2025
Digital Maps Map Development & Integration Services Geo-spatial Analytics
1.73 1.822.14
2.532.99
3.564.23
CAGR (2019-25)
16.1%

109
Digital Maps Market, CY2020 – Split by Verticals
Source: Frost & Sullivan Analysis
Enterprise
Enterprise vertical comprises of key sectors like automotive, logistics, e-commerce, retail, manufacturing and similar others.
Most of the businesses today are integrating digital maps as a part of their operations for reasons such as smooth workforce
management, easy location of key potential areas or regions, navigation, route planning and similar such scenarios. For example,
a large FMCG company can integrate digital maps into their existing applications that help on-field sales teams to easily locate
key potential customers and also understand the key concentration of customers with respect to one particular region or locality.
Automotive Industry – A key Contributor: Sectors such as automotive have been one of the largest consumers of digital maps
among enterprise verticals. Most of the automobile manufacturers, be it the passenger car makers or the commercial vehicle
manufacturers are stressing upon integration of navigation systems that provide real-time updates through maps. As a result,
most of these manufacturers today partner with leading digital maps solution providers in order to integrate pre-built digital
maps into the vehicles that they manufacture. The integration of AI/ML and IoT kind of technologies into the existing digital
maps is generating map data like never before and this is helping digital map providers to provide high quality digital maps
especially to the automotive sector.
Enterprise vertical remains the biggest contributor to the overall digital maps market globally. The digital map market with
respect to enterprise is expected to grow at a CAGR of close to 11.7% until 2025.
Digital Maps Market, Enterprise Vertical –CY 2019-2025 (USD Billion)
Source: Frost & Sullivan Analysis
Enterprises, 55%
Government,
40%
Consumers, 5%
7.81 7.959.00
10.2311.64
13.29
15.19
0.00
2.00
4.00
6.00
8.00
10.00
12.00
14.00
16.00
2019 2020 2021 2022 2023 2024 2025
CAGR 2019-
2025
11.7%

110
Government
Government is another key vertical that contributed close to 40.1% of the overall digital maps market. Several countries in the
world use digital maps for different purposes. In technologically mature regions like North America and Europe, there is an
extensive use of digital maps for navigation purposes and for digitization. Digital maps, especially traffic data are extensively
used by city authorities for traffic management purposes. Similarly, the digital maps form a major component for geo-spatial
related projects or initiatives. Government vertical, going forward, has huge potential to grow as most countries are looking to
integrate digital maps for several citizen services.
Digital Maps Market, Government Vertical –CY2019-2025 (USD Billion)
Source: Frost & Sullivan Analysis
Consumer
Consumer as a vertical remains the least contributing vertical amongst all the three sectors discussed above. Most of the
applications and solutions designed keeping in mind the consumer needs are offered free of cost. However, the digital map
solution providers monetize mostly through devices or gadgets that come pre-loaded with maps and can be used by individuals
for their personal use. For example, an individual can buy map based devices for personal use and avail subscription services
from digital maps solution providers where these providers will analyses the usage pattern or movement pattern of the individual
and provide the consumer with insights.
The consumer market for digital maps is highly nascent as most of the digital maps comes pre-loaded and are offered free of
cost through mobile phones or through navigation devices in case of passenger cars. As per Frost & Sullivan estimates, the
consumer vertical contributed to around 5% of the overall digital map market in 2020.
Digital Maps Market, Consumer Vertical –CY2019-2025 (USD Billion)
Source: Frost & Sullivan Analysis
The enterprise vertical will continue to be the biggest contributor to the overall digital maps market until 2025. As more and
more businesses undergo digital transformation, digital maps would become an integral part of this transformation story. Usage
of digital maps will also grow among government verticals as governments and authorities are already finding it beneficial to
5.69 5.796.54
7.42
8.43
9.59
10.94
0.00
2.00
4.00
6.00
8.00
10.00
12.00
2019 2020 2021 2022 2023 2024 2025
CAGR 2019-2025
11.5%
0.68 0.690.76
0.820.89
0.961.04
0.00
0.20
0.40
0.60
0.80
1.00
1.20
2019 2020 2021 2022 2023 2024 2025
CAGR (2019-2025)
7.4%

111
use digital maps to offer several citizen services in the area of healthcare, land surveys, agriculture and similar others.
Governments and city authorities would also contribute to the growth of traffic data as this would enable them to build smarter
cities with enhanced transportation infrastructure and with better traffic management capabilities.
Global Map Development and Integration Services Market
The map development and integration services market is directly dependent on the growth of adoption of digital maps and geo-
spatial based solutions by businesses worldwide. As these businesses look to enhance their mapping tools for better business
outcomes, the demand for integration of map APIs and SDKs into the already existing mobile or web based maps will continue
to grow. This would in-turn fuel the demand for map development and integration services going forward. Although, year 2020
saw limited year-on-year growth due to pandemic, most of the businesses today are stressing upon digitizing their processes
and this in-turn would mean need for better and enhanced maps along with improved map related integrations.
Split by Geography
As the demand for digital maps and associated solutions like APIs and SDKs continue to grow, the need for integration of these
solutions into the web or mobile based applications of businesses are also growing. Most businesses who use digital map
solutions into their existing IT infrastructure would be requiring customizations and modifications in digital maps to suit their
business requirements. This, in-turn is expected to create greater demand for map development and integration services. Most
of the digital map solution providers also are involved in integration services and help business to enhance their digital maps.
The market also consists of third-party map API and SDK integrators who have programmers and experts that enhance maps
through their integration services.
Map Development and Integration Services Market, CY2020 – Split by Geography
Source: Frost & Sullivan Analysis
* Rest of the World includes Europe. Australian and Japan, New Zealand, China, South Korea and South America
Split by Verticals
The map development and integration services market is broadly classified into Enterprise and Government verticals. Enterprise
companies continue to be the biggest contributor to the market as businesses are implementing map solutions across their
different functions. The growth in e-commerce-based start-ups, the health-tech, ed-tech, and similar kind of companies is
driving the adoption in the enterprise segment. Maps are becoming an integral part of business operations and are convenient
method of visualizing and understanding trends like sales, live locations, logistical movements, location of healthcare centers
and type of services offered, ride tracking services in case of urban transport and similar others. All these factors will influence
the growth digital maps usage an in-turn will increase the demand for map development and integration services.
North
America, 45%
MEA, 5%SEA, 5%
India, 1%
Rest of the
World, 44%

112
Map Development and Integration Services Market, CY2020 – Split by Verticals
Source: Frost & Sullivan Analysis
India Map Development and Integration Services Market
As technology penetration continues to grow in India, the use of maps for various purposes are also on the rise. The increase in
number of e-commerce companies, tech start-ups, food delivery companies, online grocery companies and similar others have
all contributed to the growth of digital maps in India. The revised governmental policies with respect to maps that encourage
growth of domestic map solution providers is expected to further increase the growth of digital maps usage among businesses
of every size and shape. This in-turn will also give way to creation of advanced APIs and SDKs that are meant to be integrated
into the existing applications of businesses.
Map development and integration services in India are in its nascent stage. However, with new reforms in place, increasing
importance of digital transformation in both public and private sectors is expected to increase the adoption of maps solutions
and in-turn will increase demand of integration services related to maps.
Global Geo Spatial Analytical Services (Location Intelligence)
Geographic Information System (GIS) creates a conceptualized framework of a geographic location to analyze location-specific
data and trends. It integrates software, data, and processes to organize information and visualize it for analysis. Various
industries including engineering, management, and transport are deploying GIS for improved operations.
With the help of GIS and Sensor networks, it is possible to track every possible movement and measure changes. Large spatial
data are now being put into a multiprocessor environment that lets users analyze very large chunks of data remotely. Institutions
or Governments can allow anybody around the globe to remotely access the maps with 3D detailing of building or cities from
any of its servers. In Business, these maps are being used to enhance creation and communication using real-time data. Logistics
businesses can use this to track key success factors in a particular location and run in-depth analyses to optimize their business.
This also helps business in selecting locations for new office setup or expansion.
Geo-spatial Analytics Market Forecast (2020-2025)
After experiencing a below average growth in 2020, the geo-spatial analytics market would witness a considerable growth in
2021 and the following years. With governments across the globe actively using maps and geo-spatial analytics solutions to
provide citizen services like healthcare, vaccination centres, contamination zones and other basic services, the geo-spatial
market is expected to bounce back and close on a positive note. The revised global GDP prediction that was published by the
International Monetary Fund’s (IMF) and the recent economic stimulus packages announced by several governments to bring
economy back on track would influence the growth of geo-spatial analytics market.
With the emergence of mobile devices, location sensors and advancement of social media, the analytics would not be restricted
just to building of data to form meaningful insights on datasheets. Instead, with the help of geo-spatial analytics, the data
captured at various points can be used to build maps, statistics, cartograms, graphs and to create viewable data maps that are
easy to comprehend and analyse. Businesses are realizing the benefits associate with geo-spatial analytics as they would be able
to understand the accumulated data in a simpler manner when it is spread across maps. For example, for an on-field sales
professional, the sales data spread over a map would be more meaningful and understandable as it would be better for enhanced
Enterprises,
61%
Government,
39%

113
sales planning and execution without operational complexities.
Growth in geo-spatial analytics market would mostly be driven by increased usage in sectors like government, e-commerce,
agriculture, land mapping, healthcare, and similar others. In the post pandemic world, most businesses will start digitizing their
business and digital maps would become an integral part of this transformation. The data gathered through maps would further
be used to build insights and in-depth information using geo-spatial analytics solutions.
As per Frost and Sullivan estimates, the geo-spatial analytics market is expected to recover from the below average growth
experienced in 2020 and is estimated to double up in next 5 years. Most of this growth would be from extensive adoption of
these solutions by governments and other businesses that would be looking to digitally transform their business processes.
Geo-spatial Analytics Market 2020 – Split by Geography
The importance of geo-spatial analytics has grown throughout different geographies in recent years. The advancements in
digital maps like 3D and 4D capturing and also the increased use of sensors and IoT enabled mobile devices is enabling creation
of large volumes of map data that can be further elevated to build meaningful insights with the help of geo-spatial analytics
solutions. The emergence of need for smart cities, connected cities, connected cars, virtual traffic management are all
contributing to the growth of geo-spatial analytics and location intelligence solutions worldwide. The use of geo-referenced
data is expected to grow further in coming years in different areas and industries.
Geo-spatial Analytics Market, CY2020 – Split by Geography
Source: Frost & Sullivan Analysis
* Rest of the World includes Europe. Australian and Japan, New Zealand, China, South Korea and South America
India Geo Spatial Analytical Services Market
The several new reforms and policies announced and the push for digitization in both public and private sector is expected to
drive the growth geo-spatial kind of solutions across India. The strong emergence of map technologies and strong government
backing by encouraging domestic map and associated solution providers, the use of geo-spatial technologies in logistics, public
transport, agriculture, and several other sectors is expected to go up. The geo-spatial analytics space in India comprises of
foreign players like ESRI, AutoDesk and Trimble. In addition to this, there are several other players like Rolta, RMSI, Infotech
Enterprises. The geo-spatial analytics has tremendous potential to grow in India as state and central government has announced
several reform projects and infrastructure projects in power, land, and natural resource mining and rural and has made use of
geo-spatial technologies mandatory for these projects. The geo-spatial analytics solutions have a larger role to play in road,
railways, waterways, health, education, defense, and similar other areas going forward.
Geo-spatial analytics market in India is expected to grow at around 16.10% CAGR (2019-2025) and is expected to be around
USD 3.7 billion (INR 274.5 billion) market by 2025 and most of this growth would be from new projects and policies announced
by government that encourages domestic players of digital maps and associated solutions.
North
America,
43%
MEA, 4%SEA, 3%India, 3%
Rest of the
World, 47%

114
Geo-spatial Analytics Market, CY 2020 – Split by Verticals
Source: Frost & Sullivan Analysis
Navigation Solutions and Telematics Market
For this report, the Mobility Navigation Solutions and Telematics Market is divided into the following three sections, with each
section discussed separately with respect to trends, drivers, restraints and market sizing.
• N-CASE Mobility
• Logistics Solutions
• Transportation Infrastructure
Global Mobility Navigations Solutions and Telematics Market
Due to lower operating costs and increased need for fuel economy, the logistics segment is predicted to be the fastest growing
with a CAGR (2019-2025) 14.5%. Fleet management software aids in the smooth operation of a business by providing efficient
routes, reducing extra fuel usage, and recognizing and eliminating unsafe driving habits. Users can utilize fleet management
systems to locate company vehicles in real-time, collect and record engine/ vehicle problem codes, and monitor unsafe driving
habits including speeding, forceful braking, and idling. This information is priceless to firms, as it enables them to minimize
operational costs.
The global navigations solutions and telematics market stood at USD 157.5 billion (INR 11.7 trillion) in 2020 and is projected
to reach a value of USD 276.4 billion (INR 20.51 trillion) by 2025, growing at a CAGR (2019-2025) of 10.1%. Growing
consumer requirement for embedded navigation system, importance of improving of routing capabilities and implementation
and enforcement of stringent regulations for road safety globally will drive the uptake of these solutions in the market. These
solutions would also enable cities to become smarter and connected thereby redefining city commute and manage traffic.
Transport market is expected to reach USD 165 billion (INR 12.2 trillion) by 2025 as more cloud-based platforms, solutions,
and other services available to the logistics sector, fleet companies will use routing solutions hence increasing the demand for
transport related navigation solutions.
Enterprises,
68%
Government,
32%

115
Global Mobility Navigations Solutions and Telematics Market, CY 2019–2025,
(in USD billion)
Source: Frost & Sullivan
Note:
(i) N-CASE solutions includes Navigation Engine, Connected Vehicle Services, Autonomous Vehicles Safety Platform, Shared
Mobility Platform and EV Mobility Platform services; (ii) Logistics solutions include Fleet Monitoring Solution
(Commercial Fleet Tracking Solution, Cold Chain Tracking Solution, Solid Waste Management, School Bus Monitoring)
and Field workforce management;
(ii) Transport solutions includes Route Optimization, Emergency response, Intelligent traffic management, and Smart street
lighting
Indian Mobility Navigations Solutions and Telematics Market
The total market in India for navigation solutions and telematics market is expected to grow from USD 20.5 billion (INR 1.52
trillion) in 2020 to USD 44.9 billion (INR 3.33 trillion) in 2025 at a CAGR of 15.4% from 2019 to 2025. USD 44.9 billion
(INR 3.33 trillion) in 2025 is expected to comprise of USD 11.5 billion (INR 853.3 billion) for N-CASE, USD 7.0 billion (INR
519.4 billion) for logistics, and USD 26.3 billion (INR 1.95 trillion) for transportation.
The increased awareness of connected car services, as well as the expanding use of these services is likely to open huge
development prospects in the Indian market for navigation solution providers. Real-time traffic and directions information
services allow drivers to navigate their vehicles using live traffic data and routes to select the best route. Other services include
parking services, which displays the availability of parking spaces, weather information systems, which alerts users to climate
changes, and concierge services, which provide users with premier services such as notifications regarding various alerts on
GPS system screen boards. Furthermore, transportation infrastructure remains the dominant proportion in Indian market with
USD 17.6 billion in 2021; mainly due to requirement for public safety, demand for traffic congestion management, and growing
smart city infrastructure.
Indian Mobility Navigations Solutions and Telematics Market, CY 2019–2025,
(in USD billion)
Source: Frost & Sullivan

116
Note: (i) N-CASE solutions includes Navigation Engine, Connected Vehicle Services, Autonomous Vehicles Safety Platform,
Shared Mobility Platform and EV Mobility Platform services; (ii) Logistics solutions include Fleet Monitoring Solution
(Commercial Fleet Tracking Solution, Cold Chain Tracking Solution, Solid Waste Management, School Bus Monitoring) and
Field workforce management; (ii) Transport solutions includes Route Optimization, Emergency response, Intelligent traffic
management, and Smart street lighting
Evolution of Advanced Safety Features
Note: Automatic Emergency Braking (AEB), Adaptive cruise control (ACC), Vehicle to everything (V2X), Global Positioning
System (GPS), and Light Detection and Ranging (LiDAR)
Source: Frost & Sullivan
Navigations Solutions and Telematics Market – EV Mobility, CY2019-2025 (in USD Billions)
Source: Frost & Sullivan
Infinite Uses Cases
Maps, navigation solutions, geospatial technology, hardware and customized packages in IoT and Telematics have evolved
over time and have seen a magnitude of advances in their adoption by all kinds of consumers, in all walks of life and at all
points in time. The “Bouquet of Convenience” as one may easily call this collection of advanced technologies can find
application anywhere where humans interact with technology to attain a more productive and efficient outcome of day-to-day
tasks. One would be hard pressed to imagine our daily lives without this bouquet as it plays a significant role in simplifying
and advancing our lifestyle. The ability to overlay continuously upgraded geo spatial map data on any other intelligence, makes
this offering ubiquitous in its appeal and universal in its applicability, lending truly infinite use cases to the suite of offerings.
This Bouquet has entered our lives both actively and passively. It’s here to stay and transform the way consumers, businesses
and regulatory bodies interact with each other to make this world a better place through predictive analysis, accurate decision
making and avoidance of unpleasant incidents.
The n use cases, are discussed in five illustrative segments which give a broad canvas of applications and future potential but
are by no means exhaustive.
0.9 1.01.4
2.5
3.2
4.7
5.8
2019 2020 2021 2022 2023 2024 2025
CAGR
(2019-25)
37.6%

117
• Automotive and Mobility- Industry through its vast applications across connected, autonomous, shared and
Electric Vehicle segments.
• Enterprises irrespective of their size constantly use it to enhance business operations, reach and results to
ensure a superlative customer experience.
• End Consumer refers to direct services and applications offered by this bouquet of services which are
directly purchased/used by consumers to ensure simplicity and productivity in their lives.
• Government uses this Bouquet to ensure safety and wellbeing of citizens in a variety of ways.
• Sunrise Sectors suggests what the future holds for these technologies and applications.
Categorization of Multiple use cases
Automotive
Automotive Industry and Mobility have numerous used cases when it comes to Navigation, Maps, Traffic Management, IoT and
Software Application, Geospatial technology, Telematics and many more. The most common applications are shown below.
Use Cases in Automotive
Source: Frost & Sullivan
Connected Vehicle & Telematics
Connected vehicles use a number of different communication technologies to communicate with the driver, other vehicles,
travel related infrastructure and the Cloud. This technology is used to not only improve vehicle safety, but also to optimise time
and improve vehicle efficiency. Connected vehicles are a key factor in the advance of IoT. The multiple use cases range from
connected infotainment systems that connect with the driver’s personal device to Internet-connected vehicles that have
multidirectional communication with other drivers/vehicles, mobile phones and traffic lights etc.

118
Use Cases in Connected and Automated Vehicles
Source: Frost & Sullivan
Shared Mobility
Shared mobility has grown because of growing environmental, energy, and economic concerns encouraging the need for
sustainable alternatives. Advancements in electronic and wireless technologies have made sharing assets, technology and data
easier and highly efficient. Due to this, automobile OEMs, car rental companies, start-ups, and government-sponsored programs
are emerging with new applications designed to alter routes, fill empty seats, and combine fare media with real-time arrival/
departure information. There are physical IoT devices that can be built-in to the vehicle to remotely monitor it when someone
else is sharing it with you. Key-less controls, sensors and the platforms to view the real time location, battery status, quality of
driving (harsh acceleration or cornering for the distance/duration travelled) are major features which make the seamless sharing
and monitoring possible.
Electric Vehicle Mobility
With the electric vehicles (EVs) becoming prominent, the demand for high-tech advanced navigation with electric charging
infrastructure availability is becoming ever critical. EV navigation solutions help to plan optimized route with all the
distinctiveness of electric vehicles, like remaining battery level, accurate range spider maps and suggesting charging stations
as per the chosen route to ensure that an EV always reaches its destination.
Use Cases in Electric Vehicle Mobility
Source: Frost & Sullivan
Enterprise
Enterprises are transforming the way they do business. Adding location element to their business intelligence software helps to
see and understand data in a productive way. Digital mapping helps to organize and display the data for review and decision-
making. Any enterprise that has an app, website and digital surfaces can utilise a suite of solutions across corporate functions
to build in customer experience and optimise sales and distributions.

119
Use Cases in Enterprise
Source: Frost & Sullivan
Field force management
In today’s age of apps and real time information availability, a strict monitoring and tracking of field sales team often
defines the success or failure of the enterprise, especially when you consider the time and resources invested into fuelling the
field sales. This includes tracking the recurrent costs of maintaining field vehicles and others like phone bills, food bills etc.
Fleet Tracking
GPS fleet tracking uses satellite and cellular technology to allow enterprises to locate vehicles and other assets in real-time.
However modern fleet tracking systems go beyond locations on a map to provide actionable insights into a wide variety of areas
impacting driver behaviour and the management of vehicles/assets.
GPS fleet tracking tools, when paired with artificial intelligence can completely revolutionize a business, grouping millions of
available datapoints into easy-to-implement insights and actions. Additionally, it gives fleet managers up-to-date and accurate
data on key factors like vehicle usage, fuel consumption, total time spent on site and more. Armed with this information, fleet
managers have everything they need to make decisions with confidence and increase the return on investment from their
vehicles and assets
Use Cases in Fleet Tracking
Source: Frost & Sullivan
Industries Using GPS Fleet Tracking:
• Construction Industry
• Retail and manufacturing
• Services and specialty trades
• Consumer goods
• Logistics sector
• Pharmaceutical Industry
• Hypermarkets and retail stores

120
• Banking sector
• Vehicle Finance/Insurance
• Roadside emergency assistance companies
• Manufacturing sites/ thermal power plants etc.
Geospatial Planning
Any industry can benefit from Geospatial planning in management of sales and distribution. This location intelligence can help
them plan where their outlets need to be, where the marketing budgets need to be, where the sales people need to visit or even
generate leads according to their interest and requirements. For instance, a player in the paint industry can locate commercial
buildings, their height, age etc. A FMCG major can get the mapping of the local Kirana stores and population density to better
track market shares and actions.
Applications of GeoSpatial Technology
Source: Frost & Sullivan
Other Industry Applications
Source: Frost & Sullivan
Software Solutions -APIs and SDKs
Application Programming Interface refers to programming instructions and standards for accessing a web tool or database. For
example, a software company will often release its API publicly or privately to other software developers so that they can design
products powered by its service. An API can be packaged in an SDK (Software Development Kit).
Integrated driving experience: APIs/SDKs provide the same user experience in the car as on the smartphone but safely integrated
into the vehicle environment. Thanks to full integration and interoperability with vehicle sensor data, drivers can feel the
experience they are looking for – bigger screens, consistent information across screens, safety warnings, blind-spot detection
and lane guidance.
SDKs on Maps: SDKs built on comprehensive Map Data has been at the forefront of mapping innovations for decades, from
creating one of the first digital maps to a Digital Twin representation of the real world.
Consumers and enterprises can leverage the power of location with the most powerful and granular maps, detailed road network,
accurate addresses, extensive POI coverage and live traffic. Advanced Map SDKs built on comprehensive Map Data can be
used to easily integrate with any Mobile or Web based application: from locating a house in a real estate app; to tracking assets
reaching doorsteps via fleet/logistics app.

121
APIs SEARCH: APIs sense the world seamlessly by using a smart word ‘suggester’ mechanism that offers your application users
an autosuggest experience (type-as-you-go) when they search for locations. The Autosuggest API auto-populates an address or a
place name with suggestions based on multiple factors including proximity and relevancy. This helps users in finding what they
need with high accuracy. APIs work on relevancy and tuning mechanisms which recommend points of interest (POIs) that are
accurate and deliver meaningful, value-added information. Using a precise latitude longitude pair, a user gets place suggestions
based on proximity and category.
Geocoding API for location coordinates: Geocoding API is the point address finder that helps the application convert readable
addresses to latitude and longitude, resulting in precise doorstep locations. The Reverse Geocoding API works on ranking based
machine learning algorithms that convert any latitude-longitude to an address. In case the location coordinates are imprecise,
incomplete or of a sparsely populated area, the reverse geocoding API provides the best possible match with referenced results.
Routing: The Routing APIs are powered by dynamic routing, optimization, traffic data and different driving profiles like car,
bike, walking or trucks. They optimize routes for time by predicting bottlenecks on high traffic routes and surges in traffic
congestion - helping your users start their journeys on time. They can optimize routes for multiple destinations, by finding the
most optimal waypoint route sequence with hundreds of stops.
Distance Matrix API for multiple destinations: The Driving Distance API considers historic, live traffic data to help your
application predict travel time & distance from a single point of origin to multiple destinations (one-to-many), as well as from
many points of origin to multiple destinations (many-to-many). Powerful pre-trip analyses allow for smarter fleet allocation,
thereby boosting efficiency and lowering operating costs.
Snap to Road APIs: There were times when GPS points deviated from the actual road and started reflecting on obstructions
like trees, buildings, etc. These individual misalignments stack up while calculating distances or while retracing the path travelled
and thus lead to huge errors & costly overheads. Now these APIs take GPS points collected along a route and return a similar set
of corrected & aligned data with the points matched to the road with intelligent Snap to Road API. They now seamlessly calculate
accurate distances from points which follow the geometry of the road & show accurate positions on map. This API provides a
critical feature that is immensely valuable when tracking assets and for data analytics of path traversed by vehicle, people or
assets.
Geo-Analytics APIs: Geo-Analytics APIs are location-based APIs, which are capable of combining with various analytical
tools to provide location intelligence and thus offer seamless business analytics at your fingertips for smart decision-making.
These Geo-Analytics APIs allow you to make well-informed predictions about future opportunities of your business across
multiple sectors like Banking, Real Estate, FMCG etc.
• where to invest in the future?
• where are the risk prone areas?
• where are the growth opportunities geographically?
Geo-Analytics API can integrate with client data as additional layers and can empower business analytical skills by displaying
spatial pattern to analyse markets and develop predictive models that help you decide where to aim your business, how to stay
ahead of your competitors and have a competitive advantage. Any company, large or small, can get visibility of
• where their business is coming from,
• which business territories are over or under performing,
• where potential high-growth areas are, and
• other useful data points such as demographics-based queries.
Government
Governments across the world are faced with strategic issues of inclusive and responsible governance where citizens need to
be brought together for a common purpose of wellbeing and economic welfare. There are several initiatives of Government
which don’t reach the target beneficiary because of a lack of proper mechanism of making people aware about the benefits and
connecting them to the initiative through right technology. Being able to find community centres, vaccination points etc
accurately and in a touchless manner in most cases will hugely benefit the success of government initiatives.

122
Use Case in Government
Source: Frost & Sullivan
Consumer
Even as consumers go about ordering on ecommerce platforms, checking for and booking online tickets, tracking deliveries or
navigating on their drives to work or home, they are part of a market for Consumer location-based services.
Maps Service/ Apps for End Consumers
Maps and Navigation have made Customer’s day to day tasks more convenient and quicker. In fact, it’s hard to imagine one’s
daily life without navigation services. Many map companies offer satellite imagery, aerial photography, street maps, 360°
interactive panoramic views of streets, real-time traffic conditions, and route planning for traveling by foot, car and public
transportation. In 2020, Map services were being used by over 1 billion people every month around the world.
Map Services Use Cases
Source: Frost & Sullivan
Sunrise Sectors: A Gaze into the Future
The future of Navigation, IoT and Geospatial technology is very optimistic. It’s poised for even wider scale adoption than we’ve
seen in recent decades, as more organizations learn how much business value can come from geospatial data. As trends like
data analytics, mobility, AR, and IoT continue to take off around the world, we can expect geographic information science and
technology not only to be transformed but also to help change the way organizations and governments utilize these technologies.
Agriculture
The future growth in agriculture must come from new technologies which are not only cost-effective but also in conformity
with natural climatic regime of the country; technologies relevant to rain-fed areas specifically; continued genetic improvements

123
for better seeds and yields; data improvements for better research, better results, and sustainable planning; bridging the gap
between knowledge and practice; and judicious land use resource surveys, efficient management practices and sustainable use
of natural resources.
Use Cases in Agriculture
Source: Frost & Sullivan
Unmanned Aerial Systems (UAS)
UAS or drone technology is a topic of prominence amongst several disciplines, most of which are held together with GIS
technology. They are one of the newest and most innovative tools to be considered for commercial use. They survey data in
less time and use fewer natural resources.

124
Global Competitive Landscape
Competitive Analysis of Main Market Players, CY 2020
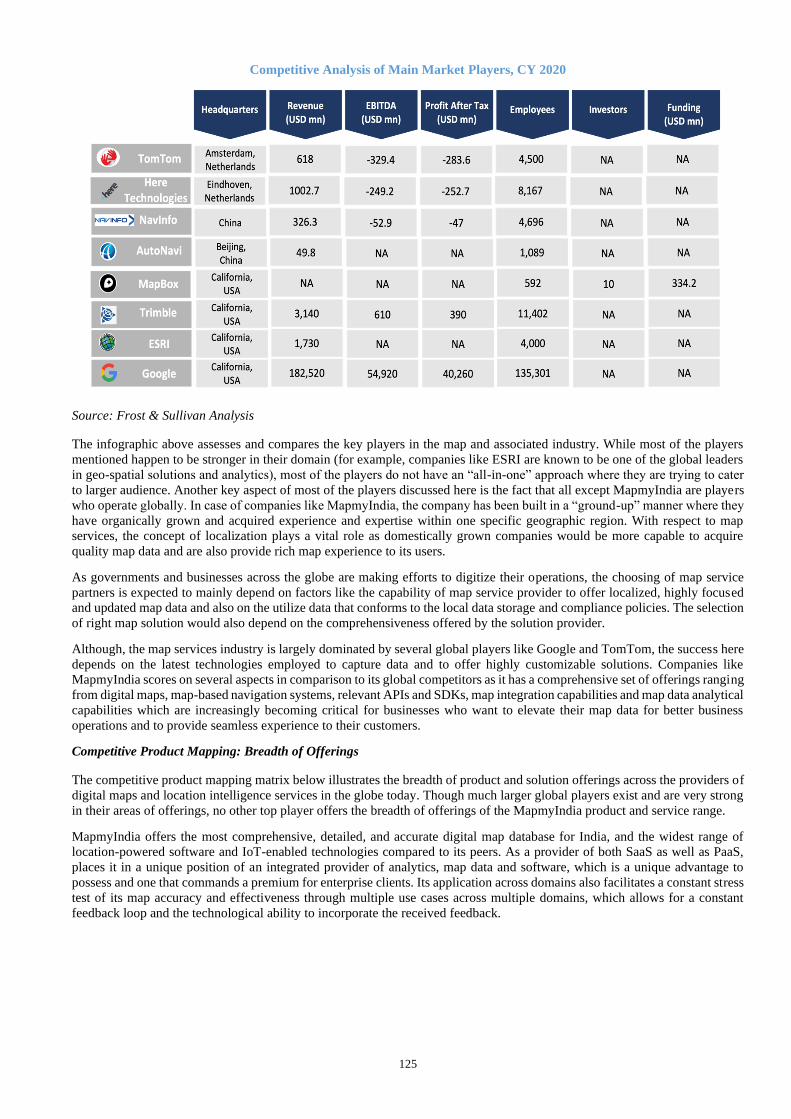
125
Competitive Analysis of Main Market Players, CY 2020
Source: Frost & Sullivan Analysis
The infographic above assesses and compares the key players in the map and associated industry. While most of the players
mentioned happen to be stronger in their domain (for example, companies like ESRI are known to be one of the global leaders
in geo-spatial solutions and analytics), most of the players do not have an “all-in-one” approach where they are trying to cater
to larger audience. Another key aspect of most of the players discussed here is the fact that all except MapmyIndia are players
who operate globally. In case of companies like MapmyIndia, the company has been built in a “ground-up” manner where they
have organically grown and acquired experience and expertise within one specific geographic region. With respect to map
services, the concept of localization plays a vital role as domestically grown companies would be more capable to acquire
quality map data and are also provide rich map experience to its users.
As governments and businesses across the globe are making efforts to digitize their operations, the choosing of map service
partners is expected to mainly depend on factors like the capability of map service provider to offer localized, highly focused
and updated map data and also on the utilize data that conforms to the local data storage and compliance policies. The selection
of right map solution would also depend on the comprehensiveness offered by the solution provider.
Although, the map services industry is largely dominated by several global players like Google and TomTom, the success here
depends on the latest technologies employed to capture data and to offer highly customizable solutions. Companies like
MapmyIndia scores on several aspects in comparison to its global competitors as it has a comprehensive set of offerings ranging
from digital maps, map-based navigation systems, relevant APIs and SDKs, map integration capabilities and map data analytical
capabilities which are increasingly becoming critical for businesses who want to elevate their map data for better business
operations and to provide seamless experience to their customers.
Competitive Product Mapping: Breadth of Offerings
The competitive product mapping matrix below illustrates the breadth of product and solution offerings across the providers of
digital maps and location intelligence services in the globe today. Though much larger global players exist and are very strong
in their areas of offerings, no other top player offers the breadth of offerings of the MapmyIndia product and service range.
MapmyIndia offers the most comprehensive, detailed, and accurate digital map database for India, and the widest range of
location-powered software and IoT-enabled technologies compared to its peers. As a provider of both SaaS as well as PaaS,
places it in a unique position of an integrated provider of analytics, map data and software, which is a unique advantage to
possess and one that commands a premium for enterprise clients. Its application across domains also facilitates a constant stress
test of its map accuracy and effectiveness through multiple use cases across multiple domains, which allows for a constant
feedback loop and the technological ability to incorporate the received feedback.

126
Competitive Product Mapping, CY 2020
# DEFINITIONS:
#1 & #2 includes standard vector data, customised data packages, geo-enriched intelligence, 3D vector data, Realview street imagery, ADAS data, HD map
data. These refer to licensing of Data (and not the APIs) #3 includes Map data acquisition, processing, and publishing platforms, ADAS data creation and Navigation platforms including customised
#4 includes Standard mapping SDK/API, All Routing, EV specific stack, SDKs for Navigation, Live Location & Tracking, Address Intelligence
#5 includes SaaS product, location data & intelligence, dashboarding platform, Geo AI and ML as a service #6 includes Fleet tracking solutions, shared mobility, EV, Connected platform, Workforce Tracking
#7 includes Full stack IoT Connected Vehicle and Vehicle Navigation platforms
#8 includes Consumer maps app, consumer vehicle tracking apps and consumer vehicle gadgets #9 includes field force automation solution, business intelligence solution, packaged suite, custom solutions & services
#10 includes integration of mobile advertising with location-based advertising
#11 includes positioning tools for large infrastructure construction
Source: Frost & Sullivan Analysis
Competitive Benchmarking on 10 Industry Parameters
10 parameters have been identified by Frost and Sullivan as critical to success in the Digital Maps and Location Intelligence
Technology and Service market for which the top seven players have been compared on the relative strength of each company
on that parameter based on qualitative assessment by Frost and Sullivan.
Localization (to India)
It plays a vital role as domestically grown companies would be more capable of acquiring quality map data due to its
accessibility to last meter details, and familiarity with the nuances of the country region and languages, not easily accessible
to foreign players.
• MapmyIndia: As a domestically grown map service provider, in comparison to its global competitors,
the company has an edge as it has broader coverage and penetration and can build digital maps that

127
accurately provide hyper local map detailing. It allows for accuracy in house address data in a complex
house addressing system like India’s and detailing of road conditions like potholes and speed breakers
which are possible due to its unhindered access to last meter details, restricted for foreign participants.
Its hyperlocal responsiveness has most recently been utilised in the context of emergency response for
the pandemic in India via the official government CoWIN app. It also supports 9 different regional
Indian languages.
• Hyper localisation is more limited for ESRI, TomTom and GoogleMaps. Though they support more
than 10 languages globally, most of those languages supported are either associated with European
region or US or Canada. Google Maps has in January 2021 introduced transliteration feature for 10
Indian languages, with accuracy in early stages of refinement.
With regard to hyper localisation of regional detaining and precision and variety of languages offered,
MapmyIndia scores the highest in the specific context of India.
Regulatory Advantage
The new Geospatial Policy 2021 guidelines in India allows all Indian entities to freely acquire, collect, generate
prepare, analyse, store or distribute geospatial data including maps. While it opens out huge scope for the
geospatial sector in India, it restricts foreign companies’ ability for most accurate, high resolution mapping.
Geospatial data with spatial accuracy of one meter for horizontal and three meters for vertical cannot be
created/owned by foreign entities and they would have to license the same from Indian players to serve their
Indian customers. This feature is important to create accurate maps for ADAS, HD and 3D. It is also essential
for virtual reality maps and Smart city simulation maps. Even the 2D maps of foreign entities may not be accurate
to the doorstep. Several mapping activities like terrestrial mobile mapping survey, 360-degree street view survey
and Indian territorial waters survey have also been reserved only for Indian entities only.
• MapmyIndia: Companies like MapmyIndia stand to benefit from this as it would help the company to
have an additional regulatory advantage over its global competitors.
• All foreign players fall in the same bucket as recent geospatial regulations pose a challenge for
TomTom, HERE, MapBox, ESRI, Trimble and Google Maps require to partner with local players
via licensing their APIs for restricted data which is not permitted to pass directly through their servers.
• MaymyIndia scores the highest in the context of regulatory advantage in India.
Product and Platform Integration
• MapmyIndia: provides a full stack, integrated, all-in-one ability to deliver digital maps, digital
technology products and digital transformation solutions with ability to customise any aspect of the stack
to meet the needs of its customers. MapmyIndia’s SaaS and PaaS based approach and tech-focused
product offerings has helped it to grow as not just a digital map service provider company but a full-
fledged map technology company covering wide aspects of product offerings and having map platforms
that are map data agnostic.
• Players like Google Maps, HERE, TomTom, MapBox are also highly integrated players offering fully
integrated solutions and share the top score with MapmyIndia.
• HERE’s platform approach is beginning to pay dividends and is driving non-automotive growth across
target sectors.
• Players like ESRI and Trimble are more focused on geo-spatial solutions and do not provide any digital
maps as such.
Global Product Readiness
The length and breadth of offering is an important factor in global product readiness.
• MapmyIndia: provides its solutions for the international market under the Mappls brand. They have
expanded their digital map database to cover other countries such as Sri Lanka, Bangladesh, Nepal,
Bhutan, Myanmar, UAE and Egypt. MapmyIndia’s technology suite consists of location-powered
technology suite that is globally usable as it is geography and data agnostic allowing their geospatial /
location platforms to ingest and enhance data from various providers, not limited to where they have

128
their own maps. Not only is the technology play data agnostic, their unique cost structures, and existing
capabilities / track record of having done for India also holds them in good stead for global readiness.
• HERE technologies: Leads in geographic reach mainly due to its key partnerships in markets such as
China, Japan, and S. Korea; supports ~90 languages highest among the platform competitors.
• TomTom: Leader in map content licensing and automotive mostly in Europe
• MapBox: Location leader in Business Intelligence (BI) sector and have presence in China and Japan
via joint ventures.
• Google Maps: Most of the offerings from Google Maps are APIs/SDKs and are more build keeping in
mind the map requirements of businesses in North America or Europe. Hence Google Maps are often
seen as not a preferred choice for businesses who are operating outside of North American or European
region.
• Players like ESRI and Trimble’s offerings are mostly concentrated on geo-spatial solutions and the
company predominantly caters to developed countries of the world than to regions like Asia or South
America. Their solutions are not built to customize based on other region’s or country’s map or geo-
spatial requirements.
Technical Expertise
• MapmyIndia: Cutting-edge technology to build, update and enhance maps and technological expertise
in providing professionally generated, technology-driven, premium quality digital map data products.
Their digital mapping and geospatial technologies also provide high definition (HD), 4-dimensional
(4D), and Information Rich (IR) capabilities. This means that it provides capabilities to build, enhance
and utilize maps with high level of detail, for both the outdoors and indoors, with high precision and
accuracy, with 360 degree and photo-realistic clarity, offered as information rich digital twins of the real
world. MapmyIndia has a very strong NCASE deployments at most relevant OEMs in India- Maruti
Suzuki, Hyundai, KIA, Honda, Ford, Audi, BMW, Mercedes Benz, Mahindra, MG, Skida, Toyota,
Suzuki, Honda, TVS, Ola Electric and others. It is also pioneering locational solutions for the drones
market in India- Map and Location APIs, mGIS geospatial platform, GPS based drone tracker IoT
devices, workforce monitoring. MapmyIndia is also enabling the Digital Sky Platform: India’s UAV
management System by AAI and is spearheading the Drone Innovation Challenge with the Drone
Federation of India to encourage technical innovations in the drone space in India.
• HERE technologies: Leading map provider in North America and Western Europe with strong
technological expertise in ADAS and HD Map. Also, offers hybrid navigation solutions in absence of
connectivity.
• TomTom: Focused on automotive and enterprise; leader in automotive navigation software with ~15
OEMs globally using their services.
• MapBox: Offers a camera API and a sky API to enhance 3D map visuals, including an update of 135
million square kilometres of satellite imagery. BMW is using Mapbox’s Navigation SDK and Mapbox
Studio to design its infotainment unit.
• Google Maps: Being one of the technology giant and dominant player in the global map market, Google
Maps has gained strong technological expertise that has helped it to dominate the global market,
especially the North American and European region. However, the company has not been able to
completely dominate the other geographic markets due to limited localization capabilities and due to
existing regulatory constraints.
• Players like ESRI and Trimble are also dominant players in geo-spatial solutions market and have
strong customer base globally. But these companies are also face security related restrictions in most of
the countries that they operate in.
• MapmyIndia, GoogleMaps, TomTom, HERE, ESRI share the top score

129
Frequency of Map Updates
• MapmyIndia: Company has mapped 10.54 million unique destinations till date, covered over 6.4
million kilometres of road network, ~7,500 cities at street level along with address level for 80 cities,
covered 750,000+ villages and 3D and 2D landmarks in 86+ different cities. Maps are daily and
dynamically updated by leveraging and utilizing not just crowd-sourced data, but professional geospatial
experts and digital map makers employing big data analytics, computer vision, AI/ML and exhaustive
geospatial algorithms on a comprehensive set of input data proactively and intelligently collected
through field surveys by 400 surveyors, advanced sensors and IoT devices. Digital maps get further
validated and enhanced on a continuous basis through the automated and manual feedback loops
generated during the usage of digital maps.
• HERE Technologies claims to make an average of 5 million updates daily and process 15 billion near
real-time probe data points per day.
• TomTom: Makes around 2 billion changes per month across 75 million kilometre of road in 169
countries. Transactional approach by TomTom enables rapid availability of verified map on its platform
compared to other platforms.
• MapBox: Claims more than 100K daily changes, which equates to 3 million per month, while in August
2020 OpenStreetMap reported around 4.5 million map changes per day (135 million per month).
• Google Maps: While frequency of map data update remains high by Google Maps in countries like
USA, Canada due to their strong presence in these regions, the frequency of updates in countries like
India is more limited. While the map related data like map labels, names and other information is also
updated in near real-time, the photogrammetry (map images) updating process in non-major cities
remains less frequent. Also, Google Maps', map update capabilities is largely crowdsourced and the
frequency of terrestrial surveys is limited.
• MapmyIndia and GoogleMaps share the top score.
Experience
• MapmyIndia: Partners with Indian government and have in market for 25+ years, also have industry
veterans as partners like Honda, Apple etc. which are their clients as well as tech partners. It has ground-
validate maps across the country for 25 years. Strong brand recall exists in the B2B segment in the areas
of mapping technologies.
• HERE technologies: Has 35+ years of experience in mapmaking and 8,000+ employees across 56
countries, 60 technology partners and 2 channel partners.
• TomTom: 29+ years of experience with 4,500+ employees globally, 4 technology partners and 3
channel partners (Esri, Alteryx, and Yext are the largest partners)
• MapBox: 11+ year of experience with 460+ employees globally, 5 technology partners and 1 channel
partner (Amazon Web Services, Foursquare, and Outreach are the largest partners)
• Google Maps: Google Maps came into existence in 2005 and has since made strong progress in the map
market globally. However, most of its popularity is among the individual user or consumer domain
rather than in the B2B segment.
• ESRI and Trimble are one of the strong players operating in geo-spatial space and are known to be in
the industry for more than 3 to 4 decades. The technological superiority of these companies and the
existing varied solution offerings makes these players standout from its competition.
• MapmyIndia, HERE and ESRI share the top score.
Horizontal Platforms to Suit Multiple Industry Verticals
• MapmyIndia: has strong horizontal and enabling plays with a superior ability to offer a much wider,
flexible suite of products, platforms, APIs and solutions enabling more use cases and more integration
and deployment possibilities with a wider range of customers and industry segments than its competitors.
Usage-diversity of maps across a variety of use cases and across variety of platforms, products, and

130
applications is higher than any of its peers. They enjoy a strong brand recall in the B2B and B2B2C
segments of mapping technologies. Some publicly available deployment details reveal that Apple
products use MapmyIndia maps as do payment gateways like PayTm, PhonePe, or e-commerce food
delivery platforms like McDonalds, REBEL Food~Eat Sure, Grofers, Cars24. Store locators by
companies like SBI Branch Locator, Bajaj Finserv, Single Interface, BFL, Prasar Bharti DTH Dealer
locator use the same. Ride hailing apps like Malbork or web apps like Magic Bricks, 99acres use
MapmyIndia too. Customer complaint app of India’s largest phone providers- Airtel. Emergency
response apps by Paras Hospital, CoWIN, or the GVK EMRI Emergency Ambulance Dispatching.
FMCGs like Patanjali Ayurveda or Asian paint and utilities like Tata Power use their products and
services too.
• HERE technologies: They offer enterprise-grade location services built on a robust and comprehensive
map to multiple industry such as Automotive, Transportation & Logistics, Telecommunications, Media,
Public Sector, Retail, Insurance, and Infrastructure Planning.
• TomTom: Primarily focused on automotive industry offering in-car GPS navigation devices, Maps,
Traffic and travel information, Navigation SDKs, and automated driving technology.
• MapBox: Provides map-based solutions for logistics, government, outdoors, consumer apps (B2C),
business intelligence, automotive, media, international organizations, drones, agriculture, real estate,
travel, telecom and fleet management industries.
• Google Maps predominantly operates APIs/SDKs for mobile phone and map-based device
manufacturers (as Google Maps is the default app of Android OS) as well as navigation space of the
automotive vertical.
• ESRI and Trimble cater to different industry verticals like health, education, government, petrol, water,
utilities, transport, public safety, construction and real-estate and similar others.
• ESRI has the top score followed by HERE and MapmyIndia.
Consumer Base
• MapmyIndia: Company has 2,000+ enterprise customers, 500 customers on SaaS platforms (used for
fleet management, location analytics, etc.) with 80% of all cars in Indian market using their navigation
solutions.
• HERE technologies: Since 2017, 17 million vehicles sold rely on HERE ADAS supported map functions
to power L1 and L2+ automation in those vehicles globally.
• TomTom: ADAS Map powers 1.5 million SAE Level 1 and Level 2 automated vehicles in 2019 and
doubled to 3 million during by 2020.
• MapBox: They have large developer community with more than 175K monthly active developers and
used in more than 45K apps globally.
• Google Maps primarily caters directly to a huge base of retail consumers (B2C) globally and amongst
enterprises to the mobile phone and map-based device manufacturers as Google Maps is the default app
of Android OS) as well as automotive businesses.
• Players like ESRI and Trimble have large customers across different domains including construction,
government, and similar others.
• MapmyIndia, ESRI share the top score in terms of size of customer base
Low Cost Business Model
• MapmyIndia: business model is primarily to charge customers royalties, subscriptions, and annuities
in return for providing licenses and usage rights to its intellectual property based digital map data,
platforms, APIs and software. Business has a relatively low fixed cost base on account of its asset light
nature as all products are deployed via the cloud or deployed in customer premises. Its SaaS (Software

131
as a Service), PaaS (Platform as a Service) and DaaS (Data as a Service) products are developed
indigenously at low relative cost in India. This is a unique cost structure in the industry.
• HERE technologies: Globally offers mapping, location data and related services to individuals and
companies via licensing presumably at relative higher costs.
• TomTom: Primarily focused on location Technology Company uniquely positioned to fulfil a central
role on location technologies.
• MapBox: It is a data and services company selling access to its platform; developed a scalable platform
for turning raw OSM data and raw location into usable services.
• Google Maps: Google maps makes most of its map related revenues through advertising and listing of
commercial establishments on the maps and not through licensing of its Maps. The API/SDKs offered
by Google Maps to enterprise businesses are charged based on the number of map views
• Companies like ESRI and Trimble provide geo-spatial and map-based solutions and software which
is consumed by large and small businesses and government organizations or local authorities via
licensing presumably at relative higher costs.
• In this cost-based parameter, MapmyIndia scores the highest
MapMyIndia’s competitive advantage as a future-ready player
MapmyIndia is a leading indigenous deep-tech digital map data and location-powered digital transformation products,
platforms, APIs and solutions company. MapmyIndia is a B2B and B2B2C market leader in advanced digital map data,
geospatial software and location based IoT technologies in India with a comprehensive suite of SaaS, PaaS and MaaS offerings
capitalizing on early mover advantage in 2020. This market leadership is established on the basis of its depth and breadth of
offerings, experience in the market and its competitive advantages as detailed in the preceding section. It is a position hard-
earned by being the first mover and pioneer of digital mapping in India in 1995 and a market creator and continuous innovator
for the industry. It offers a comprehensive suite of proprietary digital technology-based products, platforms and solutions to a
wide spectrum of industries for a large and growing set of use cases.
MapmyIndia has some clear advantages in the context of business in India, that are not easily replicable, putting up high barriers
to entry in the map and navigation business in India. MapmyIndia has a big head-start compared to any other existing player or
potential entrant, and has made substantial investments in technology including hardware, software and packages over the years.
As its products and solutions specifically localised for a challenging geography like India, which has a high level of complexity,
dynamic and constantly evolving nature of geographical expanse, also provides MapmyIndia with a base and preparedness to
offer robust offerings for the global market as well, having covered a challenging geography like India under its belt.
MapmyIndia defies being bucketed as they don't fall into well-defined zones of competition solely because of the scale and
breadth of technology offering they play across. They need to be seen as a digital transformation company rather than a just a
map company and with the solid foundation of powerful data mapping which can easily give birth to infinite integrations and
applications within technologies, corporates, governments and end-consumers creating an extremely favourable situation for
doing business.
MapmyIndia has built a strong moat by capitalizing on their early mover advantage, creating a niche market, developing
proprietary and integrated technologies, full stack product offerings, continuous innovation and robust sustainable business
model. This entry barrier is further exacerbated by the current regulatory environment which further consolidates advantages
of domestic players at the cost of global participants. The current geospatial policy not only acts as a barrier to entry for the
future, but very clearly will lead to a change in the current competitive landscape in digital maps and geospatial landscape in
India. This is because it affects the global players ability to accurately update their maps.

132
OUR BUSINESS
Unless otherwise stated, references in this section to “we”, “our” or “us” (including in the context of any financial information)
are to the Company along with its Subsidiaries, on a consolidated basis. To obtain a complete understanding of our Company
and our business, prospective investors should read this section in conjunction with “Risk Factors”, “Industry Overview”,
“Management’s Discussions and Analysis of Financial Condition and Results of Operations” and “Financial Information” on
pages 30, 92, 247 and 193, respectively, as well as financial and other information contained in this Red Herring Prospectus
as a whole. Additionally, please refer to “Definitions and Abbreviations” on page 2 for certain terms used in this section.
Some of the information set out in this section, especially information with respect to our plans and strategies, contain forward-
looking statements that involve risks and uncertainties. You should read “Forward Looking Statements” on page 19 for a
discussion of the risks and uncertainties related to those statements and also “Risk Factors” beginning on page 30 for a
discussion of certain factors that may affect our business, financial condition or results of operations.
The industry related information contained in this section is derived from the F&S Report, as well as certain other publicly
available sources. For more information, see “Risk Factors – Certain sections of this Red Herring Prospectus disclose
information from the industry report which has been commissioned and paid for by us exclusively in connection with the Offer
and any reliance on such information for making an investment decision in the Offer is subject to inherent risks.” on page 48.
We have included various operational and financial performance indicators in this Red Herring Prospectus, some of which
may not be derived from our Restated Consolidated Financial Information or otherwise subjected to an examination, audit or
review or any other services by our Statutory Auditor or any other expert. The manner of calculation and presentation of some
of the operational and financial performance indicators, and the assumptions and estimates used in such calculation, may vary
from that used by other companies in India and other jurisdictions. Our financial year ends on March 31 of every year, so all
references to a particular financial year are to the twelve-month period ended March 31 of that year.
The industry-related information contained in this section is derived from the F&S Report. We commissioned and paid for the
F&S Report for the purposes of confirming our understanding of the industry and it has been prepared for the purpose of the
Offer.
Overview
We are a data and technology products and platforms company, offering proprietary digital maps as a service (“MaaS”),
software as a service (“SaaS”) and platform as a service (“PaaS”). As per the F&S Report, we are India’s leading provider of
advanced digital maps, geospatial software and location-based IoT technologies. Having pioneered digital mapping in India in
1995, we have earned our market leadership position in this industry and built a strong moat by capitalizing on our early mover
advantage, developing proprietary and integrated technologies, full stack product offerings, continuous innovation and robust
sustainable business model. (Source: F&S Report)
We provide products, platforms, application programming interfaces (“APIs”) and solutions across a range of digital map data,
software and IoT for the Indian market under the (MapmyIndia) brand, and for the international market under
the (Mappls) brand.
As of September 30, 2021, we had serviced over 2,000 enterprise customers since our inception. During Financial Year 2021
and the six month period ended September 30, 2021, we had over 500 customers on our SaaS, PaaS and MaaS platforms. Our
customers include marquee and renowned global tech giants, new-age consumer internet technology companies, leading
automotive manufacturers, large businesses across industry segments such as BFSI, telecom, FMCG, industrials, logistics and
transportation, and key government organisations. Some of our customers include PhonePe, Flipkart, Yulu, HDFC Bank, Airtel,
Hyundai, MG Motor, Avis, Safexpress and Goods and Service Tax Network (“GSTN”).
The adoption of our solutions by new age companies and start-up companies across consumer tech, last-mile delivery, shared
mobility and e-commerce is helping us scale rapidly. A growing number of use cases of our products across multiple functions
within organizations including sales, distribution, marketing, analytics, engineering, IT, logistics, call centre and support
services provide us with growth opportunities. Increased adoption of our navigation, connected, autonomous, shared and electric
mobility technologies in the automotive sector, and of our IoT and telematics technologies in the mobility, transportation and
logistics sectors also help in our business growth.
A snapshot of our map and data and platform and IoT offerings is set out below:

133
Map and Data
Digital Maps and Geospatial Data Products: We use our proprietary, end-to-end technology-driven, and AI-assisted mapping
systems and processes to acquire and process digital geospatial data as well as to produce and disseminate digital map data. We
provide foundational and comprehensive digital maps across India. Our advanced maps represent the real world in 2D and 3D.
Our maps are standard definition as well as HD, providing photo-realistic virtual reality (“VR”) and augmented reality (“AR”)
ready maps of the outdoors and indoors, including geo-referenced 360-degree panoramas. These are capable of providing
accurate details about the physical world, including roads and buildings, for autonomous safety vehicle platforms and smart
city planning and simulations.
In addition, our maps are dynamic and update continuously in near real-time, including for place updates, location-based events,
changes in road conditions, location-based safety alerts, live traffic and weather. Because of this functionality, we call our
advanced maps 4D or four-dimensional, with time being the fourth dimension. Our maps are also hyper local, providing
information in regional languages and the ability to discover, and connect with local businesses. We have also started to build
and release digital maps for countries outside India, such as Sri Lanka, Bangladesh, Nepal, Bhutan, Myanmar, UAE and Egypt.
Our IR geospatial data products include location-based demographics, population density, income distribution, anonymised and
aggregated people movement behaviour and other location-based datasets to enable various analytics use cases.
Platform and IoT
Map, Location and Navigation Platforms: We provide 2D and 3D visual and voice-based navigation platforms that are
interactive, capable of outdoor and indoor map rendering, location search, geocoding and reverse geocoding, as well as traffic
and turn-by-turn route planning optimisation.
Our digital maps and navigation platforms and eLoc, our digital address and location identity system, are capable of use by
every industry sector, including corporates and the government. Our platform APIs are primarily used by entities that develop
applications comprising a geospatial requirement or element, for instance, to locate specific service centres, ATMs or other
such locations.
GIS, Geospatial Analytics and Geo-AI Products and Platforms: ‘Insight’ and ‘mGIS’ are our GIS and geo-analytics offerings
platforms. These consist of location-based APIs capable of ingesting, processing, publishing, visualising and analysing geo-
spatial data to provide locations.
Our geo-analytics offerings help our customers across industries to analyse their respective markets and develop predictive
models through spatial patterns provided by us. We also provide our customers near real-time dashboarding and monitoring
capabilities through these offerings. Our AI enabled technology platforms automatically and efficiently recognise and extract
insights from images through our computer vision and geospatial enabled AI algorithms.
These offerings are used by customers for optimising supply-chains and logistics, for instance to devise the optimal supply
routes for petroleum products to various pumps, or for governmental and regulatory authorities and agencies to understand the
locations of traders, tax payers etc. across locations.
Location-based IoT, Fleet and Workforce Automation Products and Platforms: Our IoT platform, ‘InTouch’, enables
connectivity with real world sensors, phones and IoT devices. It provides a wide range of applications for near real-time vehicle
and asset tracking, geo-fencing alerts, historical movement and driver behaviour analysis, predictive vehicle health alerts, as
well as fleet, transport and logistics management. ‘Workmate’, our software platform, enables workforce and workflow
management, monitoring and automation capabilities. These offerings are used by customers as B2C service providers to
provide location-based data to their end consumers, for instance, phone or other service centres, courier centres etc.

134
We also offer a wide range of IoT devices such as durable GPS-based tracking systems which can be installed inside vehicles
or carried portably, connected cameras and other sensors for fuel monitoring, RFID connectivity, panic buttons and remote
immobilisation.
Developer APIs and SDKs: We offer a large catalogue of APIs and SDKs, to help developers integrate the features,
functionalities and capabilities of all our map, geospatial and IoT products and platforms into their own web and mobile
applications.
These are typically used by independent software developers for geospatial SDKs and/or features, such as locations of COVID
vaccination centres, that they integrate into their products, including their consumer-facing apps, built-in to their vehicles and
IoT devices, or for their internal enterprise digital systems.
‘MapmyIndia Move’ App, Websites and ‘Move’ Gadgets: These comprise our B2C offerings. ‘MapmyIndia Move’ app is a
super app for maps, navigation, tracking, safety, mobility and other features, and is available on the Android and iOS platforms,
as well as an internet mapping portal, Maps.mapmyindia.com. Our MapmyIndia Move IoT gadgets include GPS tracking, safety
and navigation features.
N-CASE Automotive and Mobility Tech Solutions Suite: N-CASE stands for Navigation, Connected vehicle, Autonomous
safety and advanced driver assistance systems, Shared mobility and Electric mobility. These are typically used by automotive
OEMs, including two-wheel, four-wheel and commercial vehicles. We provide solutions aligned with industry requirements
including in-vehicle hyper-local, content-rich, turn-by-turn offline, online and hybrid navigation assistant systems. We also
offer platforms and companion apps for connected mobility (for better connectivity with the vehicle in terms of tracking, remote
controls and driving behaviour), telematics (remote tracking of vehicles and their health diagnostics), autonomous vehicle safety
and advanced driving assistance systems and HD maps, shared mobility and electric mobility solutions.
Location-powered Consumer Tech and Enterprise Digital Transformation: We provide a full-stack suite of APIs and
solutions to consumer technology companies and enterprises, such as banks and financial institutions, travel companies etc.,
that are looking to digitally transform their offerings by providing a complete range of digital maps, geospatial software and
location-based IoT. We can flexibly provide our solutions over the cloud or through hybrid and on-premise deployments. We
are able to customise any part of our full stack to meet specific requirements of customers and offer them a bespoke solution to
meet their complete needs.
Our digital maps comprehensively cover India, and as on the date of this Red Herring Prospectus, our digital maps cover 6.29
million kilometres of roads in India, representing 98.50% of India’s road network which was 6.39 million kilometres as at
March 31, 2019 on a provisional basis as per the Annual Report of the Ministry of Road Transport & Highways, Government
of India for the year 2020–2021. As on the date of this Red Herring Prospectus, our digital map data provides location,
navigation, analytics and other information for 7,933 towns, 6,37,472 villages, 17.79 million places across many categories
such as restaurants, retail shops, malls, ATMs, hotels, police stations, electric vehicle charging stations etc., and 14.51 million
house or building addresses. Our AI-powered, four-dimensional (“4D”), high-definition (“HD”), information-rich (“IR”),
multi-lingual, hyperlocal digital map twin digitally and geospatially represents the dynamically changing real world in near real
time. Our ‘RealView’ maps provide actual roadside and on-ground views based on over 400 million geo-referenced photos,
videos and 360-degree panoramas across India. Although our core business focuses on the Indian market, our geospatial
software and location-based IoT platforms, products, APIs and solutions are geography and data agnostic, enabling us to offer
global solutions.
We derive majority of our revenue from B2B and B2B2C enterprise customers. Our business model is to charge our customers
fees per period on a per vehicle, per asset, per transaction, per use case or per user basis, as applicable. Our arrangements with
automotive OEMs typically envisage payments on a per vehicle basis for the contract period and top-up payments for internet
services as subscription charges. For C&E customers, payments are typically received on a per geospatial transaction (or API
query) basis, i.e. when the feature requiring geospatial element is used by an end consumer, for instance, a search result for the
nearest service centre or merchant. We charge on a fixed price per term on a per use case basis, when the geospatial queries are
not specified or known to us. For our Move IoT devices, payments are typically received for the sale of devices and subscription
fees which are periodic in nature.
Accordingly, such payments take the form of subscription fees, royalties or annuities for licenses and usage rights to our
proprietary digital MaaS, PaaS and SaaS offerings. Subscription fees and royalty and annuity payments together contributed
over 90% of our revenue from operation for Fiscal 2021 and over 93% of our revenue from operation for the six month period
ended September 30, 2021.
Our consolidated revenue from operations increased from ₹1,352.55 million in Financial Year 2019 to ₹1,486.29 million in
Financial Year 2020, and to ₹1,524.63 million in Financial Year 2021. Our consolidated revenue from operations was impacted
by the COVID-19 pandemic in the six month period ended September 30, 2020 and was ₹ 551.80 million, and in the six month
period ended September 30, 2021 increased to ₹ 1,000.27 million. We have a high operating leverage in our business due to a
low variable cost base. Our Contribution Margin expanded from 76% in Financial Year 2019 to 82% in Financial Year 2020,
to 83% in Financial Year 2021, and was maintained at 85% in the six month period ended September 30, 2020 and in the six
135
month period ended September 30, 2021. Our EBITDA margins for Financial Years 2019, 2020 and 2021 were 29%, 25% and
35%, respectively, with EBITDA growing at a CAGR of 16%. Our EBITDA margins (excluding other income) for the six
month period ended September 30, 2020 was 25 % and 46 % for the six month period ended September 30, 2021. Our net
profits (after tax) in Financial Years 2019, 2020 and 2021 were ₹335.66 million, ₹231.95 million and ₹594.33 million,
respectively, growing at a CAGR of 33% during this period, with PAT margins of 21%, 14%, and 31% respectively and were
₹178.62 million and ₹467.66 million for the six month periods ended September 30, 2020 and September 30, 2021, respectively.
The net cash flows generated from operating activities for Financial Years 2019, 2020 and 2021 were ₹268.13 million, ₹267.31
million and ₹832.82 million, respectively, and ₹272.77 million and ₹179.46 million for the six month periods ended September
30, 2020 and September 30, 2021, respectively. Our returns on capital employed (ex-cash and financial investments) (“RoCE
ex-cash and financial investments”) were 50%, 41%, and 110% for Financial Years 2019, 2020 and 2021 and 16% and 95%
(not annualised) for the six month periods ended September 30, 2020 and September 30, 2021, respectively.
Note: Our total employee expenses decreased from `642.73 million in Financial Year 2020 to `539.54 million in Financial Year 2021, which was primarily due to a decrease in the number of our employees from 901 employees in Financial Year 2020 to 734 employees in Financial Year 2021, in particular, on
account of a decrease in the number of our non-permanent employees. Further, our other income increased from ₹148.49 million for Financial Year 2020 to
₹398.11 million for Financial Year 2021, primarily due to an increase in income on investments carried at FVTPL and profit on redemption of mutual funds. Further, for the six month period ended September 30, 2021, our employee related expenses was ₹ 325.97 million on 754 employees and our other income was
₹ 225.52 million. For further details, see “Management’s Discussion and Analysis of Financial Condition and Results of Operations – Significant Factors
Affecting Results of Operations and Financial Condition - Ability to manage costs and profitability”, “Management’s Discussion and Analysis of Financial
Condition and Results of Operations – Results of Operations” and “Financial Information – Annexure VI - Notes to Restated Consolidated Financial
Information – 19. Other Income” on pages 252, 260 and 222, respectively.
As per the F&S Report, the total Indian addressable market of digital maps and location based intelligence services is expected
to grow to USD 7.74 billion (₹ 474.9 billion) in 2025 at around 15.5% CAGR from 2019 to 2025, and most of this growth
would be from new projects and policies announced by the GoI that encourages domestic players of digital maps and associated
solutions. The total global addressable market stood at around USD 86.55 billion (₹ 6.4 trillion) as of 2020 and is expected to
reach around USD 173.61 billion (₹ 12.9 trillion) by 2025 growing at a CAGR (2019-2025) of 13%. (Source: F&S Report)
Mobile navigation devices, the wide usage of 3D platforms and advanced survey technology, digital mapping etc., are the key
driver for growth in the total addressable market. (Source: F&S Report) As a result of increasing awareness of the benefits of,
and growing number of use cases and applications of digital maps and location intelligence technologies, the rate of adoption
of digital maps and location intelligence is increasing in consumer apps, in enterprise digital transformation, in new vehicles
being introduced to the market, and for existing vehicles and fleets plying on the roads.
We categorise our market opportunities in the following manner:
(i) Consumer Tech and Enterprise Digital Transformation (“C&E”): We provide our products and platforms to
consumer tech companies and enterprises across industry verticals. We offer our suite of digital maps and SaaS, PaaS,
APIs and solutions in the areas of location intelligence, geospatial analytics, geographic information systems (“GIS”),
digital automation and AI, to our customers which they can embed into their consumer facing apps and leverage for
their digital transformation initiatives. Our offerings seek to help our B2B2C customers in increasing the value and
benefits of their apps to their users. Our offerings also seek to help our B2B or enterprise customers in achieving their
organisation- and industry-specific, strategic and operational objectives driving them towards higher revenue growth,
cost efficiencies, faster execution capabilities, and better user service.
Our new-age consumer internet technology customers include PhonePe, Flipkart and Yulu among many others across
verticals such as global operating system platforms, social media apps, fin-tech companies, ride sharing and food
delivery companies, IoT device manufacturers etc. Our enterprise customers include HDFC Bank, Airtel and GSTN
among many other customers across verticals such as BFSI, telecom, FMCG, industrials, government etc.
As per the F&S Report, the total market for Indian digital map services is expected to grow from USD 1.7 billion (₹
126.14 billion) in 2019 to USD 4.2 billion (₹ 311.64 billion) in 2025 at a CAGR of 16.1% between 2020 and 2025.
USD 4.2 billion (₹ 311.64 billion) in 2025 is expected to comprise of USD 0.32 billion (₹ 23.74 billion) for digital
maps, USD 0.14 billion (₹ 9.64 billion) for map development and integration services, and USD 3.7 billion (₹ 274.5
billion) for geo-spatial. The global digital map services total market is expected to grow from USD 70.9 billion (₹ 5.26
trillion) in 2019 to USD 151.9 billion (₹ 11.27 trillion) in 2025 at a CAGR of 13.6%. USD 151.9 billion (₹ 11.27
trillion) in 2025 is expected to comprise of USD 27.1 billion (₹ 2.01 trillion) for digital maps, USD 9.8 billion (₹ 727.2
billion) for map development and integration services, and USD 114.9 billion (₹ 8.53 trillion) for geo-spatial analytics.
(Source: F&S Report)
This market opportunity is driven by the proliferation of maps, navigation and location-based functionality in
smartphones and apps, increasing recognition of the ever expanding use cases and benefits of maps and geospatial
technologies in digital transformation, growing demand for integration of maps and geospatial technologies into both
consumer and enterprise applications, growing adoption of maps, geospatial technology, GIS systems into mainstream
business and government applications and systems across all sectors. In the new-age tech-enabled digital
transformation paradigm, APIs are most sought by technology developers who can integrate, through their software
code, complex functionality into their offerings, tech stack and operational systems. Our modularised API approach

136
gives us an important role to play in the consumer tech led growth and enterprise digital transformation of the global
economy.
(ii) Automotive and Mobility Tech (“A&M”): We service automotive OEMs (vehicle manufacturers) of four-wheelers,
two-wheelers, commercial vehicles, electric vehicles as well as organisations involved in people and goods
transportation, mobility and logistics. We offer them our suite of digital maps and SaaS, PaaS, APIs, IoT and solutions
in the areas of N-CASE mobility (Navigation, Connected vehicle, Autonomous safety and advanced driver assistance
systems, Shared mobility and Electric mobility), telematics, fleet management and logistics optimisation, which they
can embed into their new vehicles and integrate with their existing fleets of vehicles. Our offerings help our B2B2C
and B2B customers to increase the value and benefits of their vehicles to their owners, drivers, and passengers, and
help them in moving people and goods in a faster, safer and cheaper manner.
Some of our automotive OEM customers include Hyundai and MG Motor among many other market leading
manufacturers. Some of our mobility customers include Avis and Safexpress among many other leading goods and
people transportation and logistics companies.
As per the F&S Report, the total market in India for navigation solutions and telematics market is expected to grow
from USD 20.5 billion (₹ 1.52 trillion) in 2020 to USD 44.9 billion (₹ 3.33 trillion) in 2025 at a CAGR of 15.4% from
2019 to 2025. USD 44.9 billion (₹ 3.33 trillion) in 2025 is expected to comprise of USD 11.5 billion (₹ 853.3 billion)
for N-CASE, USD 7.0 billion (₹ 519.4 billion) for logistics, and USD 26.3 billion (₹ 1.95 trillion) for transportation
As per the F&S Report, this market opportunity is driven by the biggest technological theme that has emerged in the
global automotive sector during this 21st Century is CASE — Connected, Autonomous, Shared, and Electric —
technologies which have already started taking shape. The increased awareness of connected car services, as well as
the expanding use of these services is likely to open huge development prospects in the Indian market for navigation
solution providers. Near real-time traffic and direction information services allow drivers to navigate their vehicles
using live traffic data and select the best route. Other services include parking services, which displays the availability
of parking spaces, weather information systems, which alerts users to climate changes, and concierge services, which
provide users with premier services such as notifications regarding various alerts on GPS system screen boards. Other
key trends include increased applications of in-dash navigation services, rise of demand in electric vehicles, rise of
autonomous vehicles, and development of shared mobility platforms.
Additionally, as per the F&S Report, businesses use fleet management to increase their efficiency, productivity as well
as the safety of their fleet by tracking the various parameters which can affect the individual and collective performance
of vehicles through near real-time updates, leading to increase in logistics solutions. Also there has been an increase
in use of analytics, IoT and other modern technologies, to deal with the situation of growing traffic congestion. With
the help of intelligent automation like navigational solutions, telematics, shared and connected mobility, electric
vehicles are making transportation on roads safer and more efficient.
Further influencing our business growth, the Geospatial Data and Services Guidelines dated February 15, 2021 was issued by
the Department of Science and Technology, the Government of India (the “Geospatial Guidelines”). By way of the Geospatial
Guidelines, the Government has acknowledged that location information is an integral part of the modern digital ecosystem and
critical for unlocking economic, social and environmental opportunities for sustainable growth and development of the country.
The Geospatial Guidelines have liberalised the collection, generation, preparation, dissemination, storage, publication, updating
and digitization of geospatial data and maps within Indian territories, particularly by Indian entities and companies owned or
controlled by Indian residents while retaining some restrictions for foreign companies. The Government of India vide its press
release dated February 15, 2021, announcing the new guidelines said that this liberalisation will stimulate and empower Indian
industry, and will lead to a ₹ 1 trillion geospatial economy by 2030.
With a head-start of over 25 years, we have built a ground-validated proprietary digital map database for locations across India
and developed indigenous tools, technologies and systems for data acquisition, processing, productization and dissemination.
These are difficult to replicate and have created a high entry barrier in the map and navigation business. (Source: F&S Report)
We continuously update our map database by primarily leveraging our professionally collected or acquired data through
technology driven professional field surveys, advanced sensors, IoT devices, and platform usage, as well as by utilizing
professionally crowd-sourced and professionally authenticated data. Our database is built through collection and compilation
of accurately geo-tagged GPS data, photographs, videos, panoramic 360 degree images, names and other attributes about roads,
buildings, places and boundaries. Our spatial data collection techniques, which started in 1995 with physical surveys on paper
with measurement tools which we would then digitize into digital maps, has evolved by using technological advancements such
use of satellite imagery, GPS equipment, mobile mapping, 360 degree car surveys and is now moving towards AI-driven and
big data analytics driven technologies. Our core address database developed several years ago has been continuously updated
with names and hierarchical relationships of addresses, buildings, businesses, streets, localities, cities and districts and improved
with geometry and spatial geographical references. Our digital maps cover India comprehensively, providing detailed and
updated location data and other geospatially-linked information.

137
We believe that the recognition of our MapmyIndia brand and awards received by our Company over the years are attributable
to our endeavour to keep Indian innovation at the forefront. In 2005, we were shortlisted by NASSCOM as a “Showcase
Company for IT Innovation in India” for launching MapmyIndia.com in 2004. We also won the Government of India’s
“Aatmanirbhar Bharat App Innovation Challenge” in the “others” category in 2020, organised by Ministry of Electronics and
Information Technology, Government of India. We have also recently entered into various memorandums of understanding
with key government organisations such as the Indian Space Research Organisation (“ISRO”), NITI Aayog, National
eGovernance Division, Ministry of Electronics and Information Technology, Government of India, and National Institute of
Urban Affairs, Ministry of Housing and Urban Affairs, Government of India to provide ‘Aatmanirbhar’, or indigenous
geospatial solutions and capabilities to Indian users, through continuous participation and active contribution to key initiatives
in this space. We believe in the ‘Made in India’ but ‘Made for the World’ approach.
Our Company was founded by our Promoters out of their belief that a significant percentage of data would have a location
dimension and that such data would be critical in solving myriad problems faced by businesses, government and consumers.
The expertise, experience and commitment of our Promoters and management team has been instrumental in our growth. Our
Promoter and CMD, Rakesh Verma, is a pioneer in the geospatial field and currently serves as the FICCI National Committee
Chair of Geospatial Technologies and as member of the Government of India’s Department of Science and Technology’s Legal-
sub Committee for the National Geospatial Policy. Our Promoter, Rashmi Verma pioneered the concept and launch of one of
the earliest digital mapping products in India and played an important role in founding and developing our Company. Our CEO
and Whole-time Director, Rohan Verma, serves as a member of the CII National Committee on Space, and had conceptualized
and created India’s interactive mapping portal, MapmyIndia.com in 2004. For further details of the educational qualifications
and experience of our Directors, see “Our Management - Brief Biographies of Directors” on page 171. We have an experienced
management team and had a combined workforce of 754 employees for our Indian and overseas operations as of September
30, 2021. We also take pride in a diverse and skilled workforce and count them as a key attribute for our growth. We also have
the benefit of marquee investors such as PhonePe, which is a leading Indian payments and technology company, Qualcomm,
which is a leading global wireless technologies company, and Zenrin, which is a leading Japanese digital mapping and location
technologies company, actively involved in driving our growth.
Our solutions enable businesses, governments and people to harness the power of location intelligence. We build our products
and services as modular platforms which wrap complex functionality into easy to consume APIs. We provide several APIs
across all our platforms and continuously add newer APIs, SDKs and widgets to provide more functionalities and use cases to
our customers and developers. We also provide platform as a service, or PaaS, to our customers. These enable our customers
to enhance the value of their products and services by easily and meaningfully embedding our various digital map data, location-
powered software and IoT-enabled products and solutions in their business platforms. Our full-stack digital maps and
technology products and digital transformation solutions can be customised to meet varying needs of our customers. Our
technology, when embedded within our customers’ applications, enables them to service their end-users, for various daily
functions, such as payments, grocery, news and connects us to a large number of mobile phones users in India which in turn,
helps in updating and upgrading our databases.
Details of our geography-wise, product-wise and customer segment-wise revenue for the last three Financial Years are set out
below.
Geography wise revenue
Our total revenue from operations from customers located outside of India received in foreign currencies is as under:
Particulars Six month period ended September
30, 2021
Financial Year
2021
Financial Year
2021
Financial Year
2019 Revenue
(in ₹million)
% revenue Revenu
e
(in
₹million
)
%
reven
ue
Revenue
(in
₹million)
%
reven
ue
Reven
ue
(in
₹millio
n)
%
reven
ue
Revenue in foreign
currency
464.09 46% 533.58 35% 534.70 36% 419.40 31%
Revenue received 536.18 54% 991.05 65% 951.59 64% 933.15 69%
Total 1,000.27 100% 1,524.6
3
100% 1,486.29 100% 1,352.
55
100%
Product wise revenue
Particulars Six month period ended September
30, 2021
Financial Year
2021
Financial Year
2021
Financial Year
2019
By Product Revenue
(in ₹million)
% revenue Revenue
(in
₹million
)
%
reven
ue
Revenue
(in
₹million)
%
reven
ue
Reven
ue
(in
₹millio
n)
%
reven
ue

138
Map and data
products
448.99 45%
607.76
40% 886.68 60% 661.79 49%
Platform and IoT
products
551.28 55%
916.87
60% 599.61 40% 690.76 51%
Total 1,000.27 100%
1,524.6
3
100%
1,486.29
100% 1,352.
55
100%
Customer segment wise revenue
Particular
s
Six month period ended September 30,
2021
Financial Year
2021
Financial Year
2020
Financial Year
2019 Revenue
(in ₹million)
% revenue Revenue
(in
₹million)
%
revenu
e
Revenue
(in
₹million)
%
revenu
e
Revenu
e
(in
₹million
)
%
revenu
e
Automotiv
e
392.11 39.03% 671.96 44% 858.66 58%
876.54
65%
Corporate 537.20 53.90% 666.09 44% 489.10 33%
367.00
27%
Governme
nt
50.16 4.99% 139.59 9% 56.44 4% 43.94 3%
Retail 20.80 2.07% 46.99 3% 82.09 6% 65.07 5%
Total 1,000.27 100% 1,524.63 100% 1,486.29 100%
1,352.5
5
100%
Details of our per-head count costs, our selling, general and administrative (“SG&A”) expenses, day sales outstanding (“DSO”)
and average DSO and sub-contracting costs for the last three Financial Years are set out below.
Per head count cost
Six
month
period
ended
Septemb
er 30,
2021
Financi
al Year
2021
Financi
al Year
2020
Financial Year
2019
Total number of employees (permanent employees and non-
permanent employees)
754 734 901 911
Employee benefits expense (in ` million) 325.97 539.54 642.73 507.54
Per head count cost (in ` million) 0.43 0.74 0.71 0.56
SG&A Expenses
Six month
period ended
September
30, 2021
Financial Year 2021 Financial Year 2020 Financial Year 2019
SG&A expenses (in ` million) 201.31 405.48 463.22 331.67
DSO
Six month period ended September
30, 2021
Financial Year
2021
Financial Year
2020
Financi
al Year
2019
Trade receivables (in `
million)
258.14 282.80 311.29 238.99
Revenue from operation (in ` 1,000.27 1,524.63 1,486.29 1,352.5

139
million) 5
DSO (in days) 47 68 76 64
The average DSO for our key customers typically ranges from 30 to 90 days.
Sub-contracting cost
Six month period ended September
30, 2021
Financial Year
2021
Financ
ial
Year
2020
Financ
ial
Year
2019
Non-permanent employees*
Non-permanent employees 334 324 513 600
Cost of non permanent employees (in `
million)
45.04 87.91 131.40 122.98
Per head count cost (CTC per annum) (in
` million)
0.27 0.27 0.26 0.20
*Employees on third-party payrolls, deployed on-site by our Company Our Strengths
B2B and B2B2C market leader in India with a comprehensive suite of SaaS, PaaS and MaaS offerings capitalizing on early
mover advantage
We pioneered digital mapping in India in 1995 and have earned our leading market position today in the B2B and B2B2C
market for digital maps and location intelligence technologies and services by capitalizing on our early mover advantage,
creating a niche market, developing proprietary and integrated technologies, full stack product offerings, continuous innovation
and robust sustainable business model. (Source: F&S Report) See “Industry Overview – Global Competitive Landscape” on
page 124. We offer the most comprehensive, detailed and accurate digital map database for India, and we offer the widest range
of location-powered software and IoT-enabled technologies compared to our peers. (Source: F&S Report) We provide a
combined offering of map data, location content and platform through one integrated system. We have been present in the
Indian market for over 25 years and have leading enterprises including global and Indian tech giants and upcoming start-ups,
multi-national and domestic businesses across industry verticals, automotive OEMs, and key government organisations across
the central, state and local level, as our customers. We enjoy a strong brand recall in the B2B and B2B2C segments of mapping
technologies. (Source: F&S Report)
Our pioneering initiatives include:
• Built India’s digital maps in 1995
• Launched India’s internet mapping portal and internet mapping technologies in 2004
• Launched pan-India GPS navigation system in 2007
• Launched IoT (GPS-based telematics) platform in 2011
• Launched map and location API Platform for developers in 2015
• Building transportation, logistics and workforce automation platforms since 2016
• Building AI-powered 4D HD Digital Map Twin of the Real World since 2017
• Launched nation-wide unique digital address and location, eLoc, in 2017
• Launched geospatial analytics and GIS platform in 2019
• Launched N-CASE mobility suite for Digital Vehicle Transformation in 2019
Our innovations in the space of digital maps, geospatial and digital transformation and solutions and proprietary location based
data, specifically localised for a challenging geography such as India, have helped us create what we believe is a strong barrier
to entry for international and domestic companies looking to operate in India. (Source: F&S Report) This also places us in a
position to raise awareness about the need and usefulness of digital mapping and location-based technologies, and help
customers, users, media, the Government and regulators all understand their applications, in turn augmenting the market for
our products and solutions.

140
We offer standard-definition and high-definition digital maps as a service for India that are comprehensive and differentiated
through use of AI and analytics. This helps us to cater to a wide range of advanced enterprise-level applications in addition to
basic consumer-level applications. Our digital maps comprehensively cover India, and as on the date of this Red Herring
Prospectus, our digital maps cover 6.29 million kilometres of roads in India, representing 98.50% of India’s road network which
was 6.39 million kilometres as at March 31, 2019 on a provisional basis as per the Annual Report of the Ministry of Road
Transport & Highways, Government of India for the year 2020–2021. As on the date of this Red Herring Prospectus, our digital
map data provides location, navigation, analytics and other information for 7,933 towns, 6,37,472 villages, 17.79 million places
across many categories such as restaurants, retail shops, malls, ATMs, hotels, police stations, electric vehicle charging stations
etc., and 14.51 million house or building addresses. Our AI-powered, 4D, HD, IR, multi-lingual, hyperlocal digital map twin
digitally and geospatially represents the dynamically changing real world in near real time. Our ‘RealView’ maps provide actual
roadside and on-ground views based on over 400 million geo-referenced photos, videos and 360-degree panoramas across India.
We have also expanded our digital map database to cover other countries, such as Sri Lanka, Bangladesh, Nepal, Bhutan,
Myanmar, UAE and Egypt.
We offer a full stack of location-powered and in-house developed software products (SaaS), platforms (PaaS), APIs and
solutions with applications in advanced mapping, navigation, mobility, telematics, geospatial analytics across use cases
including logistics and transportation, geographic information systems, dash-boarding, workforce and workflow management.
We provide capabilities to build, enhance and utilize maps with high level of detail, for both the outdoors and indoors, with
high precision and accuracy, with 360 degree and photo-realistic clarity, in 2D, 3D, as well as 4D (wherein our maps get updated
in near real-time, time becoming the fourth dimension). We offer an intelligent, interactive digital map twin of the real world,
which digitally and geospatially represents the real world in near real-time.
Independent, global geospatial products and platforms company, with strong data governance
We are an independent maps, geospatial and location based IoT technology company which positions to work with various
partners across industries. The independent nature of our Company allows us to freely innovate for our customers. The data we
collect is used to provide direct value to our customers and users. With our products, we enable our customers to leverage and
deliver location and navigation products that meet the demand in their own markets. Additionally, we are able to provide our
solutions over the cloud, as well as through hybrid and in-premise deployments.
Our long-term success depends on capturing data to continuously improve our products. User trust is therefore very important.
We adhere to strict data protection policies and apply a privacy-by-design approach that ensures that the full life-cycle of our
products is designed to enable user privacy and control over their data. We are committed to creating products for a better future
without compromising personal data.
As governments and businesses across the globe are making efforts to digitize their operations, the selection of map service
partners is expected to primarily depend on factors like the capability of map service provider to offer localized, highly focused
and updated map data and also on the data that conforms to the local data storage and compliance policies. The selection of
right map solutions would also depend on the comprehensiveness offered by the solution provider.
Market position built around proprietary technology and network effect resulting in strong entry barriers
We have been able to create, update and maintain digital map data products for India, the world's second-largest country by
population, and thereby built what we believe is a highly differentiated, unique digital asset that is difficult to replicate. Our
technological capabilities of building and offering platforms, APIs, products, and solutions which integrate and leverage our
high-quality maps, have furthered our ability to grow our business as well as grow the value of our products. Our innovations
in the space of digital maps, geospatial and digital transformation and solutions, specifically localised for a challenging
geography such as India, have helped us build a moat and create what we believe is a strong barrier to entry for companies
looking to operate in India. The Geospatial Guidelines provide that all digital maps and geospatial data of finer accuracy will
be stored and used within domestic territories – cloud, servers, and other forms. This also gives us a competitive edge to partner
with global brands for providing navigation related services within India.
We have been able to create, update and maintain a digital map data product for India, which has a dynamically changing
geographical landscape, due to the hard-to-replicate combination of three inter-related aspects:
(i) our efforts over the past 25 years to ground-validate our maps across the country and create the first digital map data
product for India,
(ii) our proprietary end-to-end technology-driven and AI-assisted mapping systems and processes for (a) digital geospatial
near real-time data acquisition and processing, (b) digital map data productization and dissemination to continuously
update and provide quality near real-time updated maps to customers and users through a wide variety of applications,
and
(iii) the integration of our digital maps with our internet-connected platforms, products, and applications. which are further
used for a wide variety of use cases by our various B2B and B2B2C customers. This diverse and extensive usage of

141
our maps gives us high quality feedback and enrichment signals to continuously improve our maps. Our map database
is continually updated through use, with over 70 billion geospatial transactions recorded in Financial Year 2021 and
the six month period ended September 30, 2021. Our solutions have tracked over 1.2 billion kilometres of road in
Financial Year 2021 and the six month period ended September 30, 2021. This helps us in maintaining and expanding
our moat on digital maps and allows us to be in a position of choice for customers.
We have developed our comprehensive digital map database for India through inter alia professional field surveys, collection
and compilation of geographical data, names and other attributes about roads, buildings, places and boundaries to create a
detailed and ground-validated data base for the entire country, which offers much higher degree of accuracy, reliability and
comprehensiveness. Since our inception, we served a large number of enterprise customers who used our maps of different
parts of India for various applications through our platform helping us validate and improve our maps. In 2004 we released our
maps over the internet for a much larger set of users and consumers, and in 2007 we released our maps as part of our GPS
navigation systems which retail customers and automotive OEMs used for getting near real-time turn-by-turn voice and visual
guidance. Since then, we have built a whole suite of software and IoT platforms, APIs, products and solutions which deeply
integrate with our digital maps, and provide additional, valuable capabilities to customers. According to the F&S Report, we
are one among very few companies to offer not only products but APIs and platforms that other organizations can integrate and
leverage into their own products and services.
Since we have a comprehensive underlying database with a 25 year history, it is easier to professionally authenticate crowd-
sourced input and prevent inaccuracies. Our professional geospatial experts and digital map makers employ various
technologies and techniques including big data analytics, computer vision, AI/ML and exhaustive geospatial algorithms for
map feature extraction, change detection, validation, integrity and quality checks. This includes accurately geo-tagged GPS
data, photographs, videos, panoramic 360 degree images, and 3D point clouds. Further, our digital maps get further validated
and enhanced on a continuous basis through the automated and manual feedback loops generated during the usage of our digital
maps. Our digital maps are used for an extremely diverse set of use cases and wide set of customers and users covering both
consumer and enterprises.
Our map and internet-connected platform offerings are strategically integrated and connected to provide a continuous feedback
loop that creates a network effect. This helps us continuously enhance the value proposition of both sets of our offerings and
grow our business. Our customers pro-actively add geospatial, or geospatially linked data into our platform to achieve various
functionalities such as GPS tracking, geospatial search, geo-coding, routing, navigation, analytics etc, which helps continuously
validate, update and augment our digital map. The continuous flow of feedback from our customers and end users also stress
tests and validates the accuracy and comprehensiveness of our digital maps and helps us continuously improve and update our
digital maps. Increasing usage of our products by our customers, creates a network (flywheel) effect as our customers can feed
back their real-world observations, as they use our products, directly into our platform, further enhancing the freshness of our
data and improving the customer experience.
Our maps power our platforms and help differentiate us from pure play software and technology companies who do not own or
control the underlying maps. The usage of and improvements in our map enhances the value of our platform offerings, and the
usage of and enhancements in our connected platform offerings further improve our maps. Our customers historically came to
us for our digital maps. The platforms we built were differentiated as our quality maps were integrated. This attracted customers
to use our platforms. Usage of our platforms improves our maps and improvements in our maps enhance our platforms, creating
a cycle. Please see below a diagrammatic representation of this cycle:

142
Marquee customers across sectors with strong relationships and capability to up-sell and cross-sell
We follow a ‘customer first’ approach that has helped us in developing strong and long-standing customer relationships and
created up-selling and cross selling opportunities. We typically enter into long-term contracts of three to five years’ duration
which are mutually renewable, thereby providing continued synergy and revenue predictability with our customers. Many of
our customers are leading market players and renowned brands in their respective fields such as Hyundai, MG Motor, PhonePe,
Flipkart, GSTN, AVIS, Safexpress, Airtel, HDFC Bank, Yulu etc. and our strong relationship with them help us to up-sell and
cross-sell.
Some of the key attributes that we believe lead to high retention of our existing customers is our level of service, project
execution and solution-oriented approach towards their business and operational requirements, our ability to provide new use
cases and new solutions to meet their evolving needs. This is augmented by the deep integration of our data, products and
platforms into our customers’ own offerings, tech stack and operations requiring them stay dependent on us for the long term.
We charge our customers directly for our products and services, as opposed to offering free or subsidized products and earning
indirect revenue through ad sales. As a result, we are also able to ensure and promote user privacy and develop trust with our
customers and within the ecosystem at large.
We are able to up-sell and cross-sell our various products, platforms, APIs and solutions to new and existing customers. With
our expanding suite of location intelligent products and solutions, we target to increase our wallet share of key customers by
offering them customised solutions. For example, one of our automotive OEM customers that was earlier using only our map
and data for in-dash navigation has started using our navigation and mobility solution for connected vehicles and plans to use
our Advance Driver Assistance System (“ADAS”) and electric vehicle (“EV”) solutions in future. Our customers operate in a
wide variety of industry sectors that gives us sector knowledge and know-how across several industry verticals such as BFSI,
telecom, FMCG, industrials, logistics, transportation, vehicle manufactures and various government agencies, which helps us
to augment our offerings as well as target new customers in the industry vertical that we already cater. Our horizontal platform
comprising APIs, SDKs, IoT and automation products can find use in multitude of industries. For example, our Workmate app
aids live location tracking by allowing managers in construction, food delivery, automotive, logistics or supply chain
management industry to get near real-time visibility of their workforce’s location and activities to enable and optimize resources
and enhance efficiency.
New customers who leverage our offerings for a new use case create a potential up-sell and cross-sell opportunity for us to
approach our existing and prospective customers. We are also able to attract many more customers who want to start small at
the initial stage, by providing them relevant pay-as-you-go SaaS and PaaS APIs, based on our modular platform and API
architecture, and subsequently up-sell and cross-sell those once we are deeply integrated into their tech stack and operations
based on new use cases that they find valuable at a later stage. Customers on their own, or based on our up-selling initiatives,
integrate more of our APIs and SaaS product features across larger parts of their tech stack and organisations over time, to

143
address more use cases they need solutions for. The more SaaS product features and APIs our platforms provide, the more
integration points they create with our customers. This allows us to deeply embed our solutions into their solutions and systems.
Our offerings have ever expanding use cases and we innovate to address technology paradigm shifts
There are a large number of use cases for our products and solutions including:
• Automotive: proliferation of in-built navigation devices from luxury cars to mid-level cars to entry-level cars. Maps
are now being offered in two wheelers which provides a significant growth opportunity;
• Food delivery: address intelligence, last mile delivery tracking;
• Ecommerce: long haul first mile and last mile delivery tracking;
• Healthcare and Pharma: distribution and logistics of medical goods, indoor mapping of plants, GPS tracking for
ambulance;
• BFSI: geo-verification and on-boarding, usage-based auto insurance, geo-CRM for sales, claims and collection agents;
• Retail and QSR: location enabled online e-commerce, location-based digital advertising;
• Telecom and Utilities: field force monitoring, optical fiber mapping and distribution analytics;
• Transportation and Logistics: fleet and asset tracking, transportation data, truck routing solutions, driver safety, route
risk assessment;
• Government: Geo-tagging of public assets for repair and overhaul; for example, gas pipeline, water pipeline;
emergency response, smart city, taxation;
• Railways and waterways: network and route mapping; tracking of fleet;
• Forest department: geo-tagging and digital mapping.
According to the F&S Report, there is a number of use cases for our products and solutions, and as the technology and its
adoption evolves, and new technology paradigms emerge, we expect the applicability, relevance and usefulness of our products
and solutions to expand. We monitor evolving consumer and customer needs as well as trends and use cases in different markets
to determine more solutions that our horizontal portfolio of products and platform can address. Our understanding of the Indian
market and users, ability to pre-empt the evolving needs and use-cases, and ability to implement applications of our proprietary
digital map data and existing products, allows us to develop and provide quality offerings.
For example, as vehicles get re-invented and re-imagined with technology, the use cases for our maps and technologies have
also evolved from enabling standalone in-vehicle navigation, to supporting internet-connected navigation, connected vehicle
capabilities, driving behaviour monitoring and ADAS. With the advent of electric vehicles which require extremely advanced
battery-efficient route planning and range calculation, as well as integration of charging station location mapping, opportunities
for our products and offerings have increased. Additionally, as an example, we expanded the scope of our offerings in tune with
the growth of the commercial and shared mobility industries to offer IoT-enabled telematics, fleet management, logistics and
transportation monitoring and optimisation solutions.
We are building our high precision 4D Digital Map Twin of the Real World, which is a three-dimensional map of the world,
updated in near real-time (time being the fourth dimension), and provides high definition, high precision, photo-realistic and
panoramic maps of the outdoors, roads, buildings and indoor maps of public locations and indoor mapping technology to enable
map creation/visualisation/map-based services for any space. These are built using AI, LiDAR, cameras, and computer vision,
which allow advanced navigation and driving assistance systems for vehicles, simulations at city and country scales for planning
and analytics, as well as last-mile doorstep deliveries at any floor in multi-floor buildings. Similarly, eLoc, is a digital address
and location identity system, which gives a unique, simple and precise identification through a unique code to every place and
object (houses, a mud hut or a public infrastructure item), aiding in identifying information and getting directions to the exact
location of any place or object. For example, the ELoc code of our corporate office is shown below:

144
Profitable business model with consistent financial track record, high operating leverage and strong cash flows.
Our business model is to charge our customers fees per period based on per vehicle, per asset, per transaction, per use case, per
user, as applicable. These take the form of subscription fees, royalties, annuities in return for providing licenses and usage rights
to our proprietary digital MaaS, PaaS and SaaS offerings. Subscription fee, royalty and annuity payments together contributed
over 90% of our revenue from operation for Fiscal 2021.
Since most of our products, platforms and solutions are digital, created in-house, and then deployed and delivered over the
cloud, we as a business are asset light, with relatively low variable cost base. This enables us to have a high operating leverage
in the business. For the Financial Year 2021, our Contribution Margin was 83%, EBITDA margin (excluding other income)
was 35% and PAT margin was 31%.
Note: Our total employee expenses decreased from `642.73 million in Financial Year 2020 to ` 539.54 million in Financial Year 2021, which was primarily due to a decrease in the number of our employees from 901 employees in Financial Year 2020 to 734 employees in Financial Year 2021, in particular, on
account of a decrease in the number of our non-permanent employees. Further, our other income increased from ₹148.49 million for Financial Year 2020 to
₹398.11 million for Financial Year 2021, primarily due to an increase in income on investments carried at FVTPL and profit on redemption of mutual funds. Further, for the six month period ended September 30, 2021, our employee related expenses was ₹ 325.97 million on 754 employees and our other income was
₹ 225.52 million. For further details, see “Management’s Discussion and Analysis of Financial Condition and Results of Operations – Significant Factors
Affecting Results of Operations and Financial Condition - Ability to manage costs and profitability”, “Management’s Discussion and Analysis of Financial Condition and Results of Operations – Results of Operations” and “Financial Information – Annexure VI - Notes to Restated Consolidated Financial
Information – 19. Other Income” on pages 252, 260 and 222, respectively.
We have built our business since inception in a sustainable, customer-funded manner. In the book ‘Customer-funded Business
Models’, Professor John Mullins of London Business School describes our initial business model as an example of customer
centric ‘Develop-and-License’ model. This model, as described, for us entailed first winning a customer contract to develop
solution for the specific customer need and then entrenching deep into creating more functionalities to address other use cases
of similar nature. In our earlier phase of business growth, we saw opportunities through international companies such as leading
beverage and cellular companies that faced a practical challenge in operating in India on account of limited availability of
accurate maps. Our Promoters approached such companies starting in 1995 and obtained contracts to create digital maps that
contained specific company information such as bottlers’ territories or topographic features such as high ground suitable for
cell towers. We received advance payments from such companies, which enabled us to make high-quality maps to meet their
requirement on one side while developing our own products for wider set of clients. We then expanded in terms of geographical
coverage beyond the coverage under our early contracts and kept the IP rights with us to be able to license it to wider set of
clients across industries.
Our consolidated revenue from operations increased from ₹1,352.55 million in Financial Year 2019 to ₹1,486.29 million in
Financial Year 2020, and to ₹1,524.63 million in Financial Year 2021. Our consolidated revenue from operations was impacted
by the COVID-19 pandemic in the six month period ended September 30, 2020 and from ₹ 551.80 million, increased to ₹
1,000.27 million in the six month period ended September 30, 2021. Our net profits (after tax) in Financial Years 2019, 2020
and 2021 were ₹335.66 million, ₹231.95 million and ₹594.33 million, respectively, growing at a CAGR of 33% during this
period, with PAT margins of 21%, 14%, and 31% respectively and were ₹178.62 million and ₹467.66 million for the six month
periods ended September 30, 2020 and September 30, 2021, respectively. The net cash flows generated from operating activities
for Financial Years 2019, 2020 and 2021 were ₹268.13 million, ₹267.31 million and ₹832.82 million, respectively, and ₹272.77
million and ₹179.46 million for the six month periods ended September 30, 2020 and September 30, 2021, respectively. Our
RoCE ex-cash and financial investments were 50%, 41%, and 110% for Financial Years 2019, 2020 and 2021 and 16% and
95% (not annualised) for the six month periods ended September 30, 2020 and September 30, 2021, respectively.

145
Our Strategies
Augment our products, platforms and our technology lead
We seek to continuously enhance the scope and quality of our existing offerings to further differentiate us from the competition.
We will continue to build a deeper and broader stack of software products in a modular platform and API-driven manner to
increase use cases and adoptability of our products and offerings by an ever-increasing addressable market. We plan to increase
the range of our digital maps and geospatial data products both in terms of geographical coverage, as well as in terms of features
and functionalities. Our Digital Map Twin of the Real World, which is an AI-powered 4D, HD, information rich map that
digitally and geospatially represents the real world in near real-time, is a never ending exercise, that will help us build and own
an asset that will continue to be increasingly valuable and monetizable for an expanding set of use cases in the future. (Source:
F&S Report)
In addition to this, we will position ourselves to address emerging opportunities such as providing integrated maps, geospatial
software and location-based IoT for emerging platforms and market opportunities. For example, providing our offerings to
voice assistants, virtual, augmented and mixed reality platforms, autonomous vehicles, and AI-powered enterprise planning and
simulation systems. We will go deeper into solving for the needs of our automotive and mobility customers through N-CASE
automotive and mobility tech solutions, as well as serve a larger range of digital transformation solutions for our enterprise
customers across key industry segments and our consumer tech customers through our growing range of API and SDKs.
We plan to continue investing time and resources to further develop our innovation and technological capabilities, including in
AL, ML and deep tech, to augment our existing digital map dataset, and achieve a 4D high-definition, information rich digital
and geospatial representation of the real world. We aim to further develop the automation aspect of our map building platform
through our investments in artificial intelligence and machine learning, which will enable us to create better content, faster and
at a lower cost. For example, we are working with ISRO to integrate our digital map twin with their huge catalogue of satellite
imagery and earth observation data, which would then be available for use by app developers, businesses and government
organisations. Our in-house ideation and innovation team is currently working on many areas including drone-based technology
solutions to augment our current set of offering across sectors and are also developing ADAS based technology solutions for
automotive use cases.
We place a high priority on investments in research and development which allows us to make continued investments to improve
and adapt existing products and identify new and profitable applications. We will continue to innovate and optimize our
technology infrastructure to ensure high performance in a cost-effective manner. We believe continued investments in
infrastructure and systems will allow us to extend our technology leadership. We intend to continue expanding our domain
expertise by identifying sectors with growth potential and recruiting industry experts in these sectors who can add value to our
products and solutions and help us gain credibility in the market.
Continue to scale and expand our customer reach leveraging market presence in India
Expanding of our relationships with existing active customers will remain a key strategy going forward as we continue to
leverage our domain expertise and knowledge of emerging technology trends to drive incremental growth for our business. We
engage actively with the ecosystem of our customers, partners, technology developers and systems integrators across industry
verticals, and are focused on continuing to expand our relationships with existing customers by helping them solve new
problems and become more engaging, responsive and efficient. We have a demonstrated track record of expanding our work
with customers after an initial engagement. We aim to sustain and build on the annual revenue contribution of our customers
in subsequent years to acquisition and leverage the significant scope for penetration among our existing customers, including
leverage the favourable growth expected in the automotive segment.
We believe we have a first-mover advantage with the GoI’s increasing traction and domestic policy in the geospatial sector,
including the introduction of the Geospatial Guidelines, and would be able to fulfil the need for a home grown company to be
involved in and enable our existing solutions to assist in key digital transformation needs and initiatives for the country. Through
our developer platform and innovation challenges, we engage strongly with the developer and start-up community, who may
become potentially large customers in the future, or with whom we can partner to grow our business in different ways.
Through our API platform, we intend to embed ourselves into a large community of developers, who will be able to build a far
large range of applications serving an even wider set of use cases to a much larger set of users. This will help us augment our
reach significantly, and we will build an ecosystem and collaborative play to jointly take to market solutions in collaboration
with key developers.
Drive expansion in international markets and geospatial sector
We have built our technology suite to be globally usable and geography agnostic. This allows us to offer to the global market
our comprehensive suite of location-powered software for advanced mapping, navigation, GIS, geospatial analytics, AI, dash-
boarding, workforce and workflow management, and IoT-enabled software and hardware solutions for N-CASE mobility,
telematics, logistics and transportation.

146
Under our brand ‘Mappls’ we target international markets and intend to follow our MNCs customers who offer their own
products and solutions, or have business operations, in multiple countries. According to the F&S Report, global digital map
services total market is expected to grow from USD 70.9 billion (₹ 5.26 trillion) in 2019 to USD 151.9 billion (₹ 11.27 trillion)
in 2025 at a CAGR of 13.6%, and is expected to comprise of USD 27.1 billion (₹ 2.01 trillion) for digital maps, USD 9.8 billion
(₹ 727.2 billion) for map development and integration services, and USD 114.9 billion (₹ 8.53 trillion) for geo-spatial analytics.
We will segment our offerings and approach to international expansion, offering different solutions to different country markets
based on the local market needs and landscape. We plan to expand our international operations through our US subsidiary, CE
International and our Silicon Valley office in California, USA. In Japan, we operate through a business reseller agreement with
Zenrin. The international office is primarily a reseller of our products, solutions and services.
We expect such expansion would be based mainly on data agnostic software products, platforms, APIs and solutions, and we
believe we should be able to leverage our expertise and experience of over 25 years and success in building a profitable business
model in India. We intend to expand into new markets by replicating our Indian business model and re-creating the network-
effect of more use cases and more verticals leading to more products. We hope to be able to leverage our matured set of solutions
that have been tested in India, and therefore be able to grow in an efficient manner by offering products and solutions optimised
for markets of different levels of maturity.
Our map database combines core map data with location intelligence objects and other industry specific components in relevant
use cases of respective industries. We plan to extend our penetration in the traditional geospatial industry use cases across large
corporate and government organizations at national, state and local levels in India where we have the complete solution in form
of map data and platform solutions. Further, using our platform capabilities, we plan to explore the overseas geospatial market
by partnering with and integrating maps from other providers. We have integrated maps of over 200 countries into our geospatial
software and location-based IoT platforms, in addition to the maps we have built and are building for India and some other
select countries. This allows us to offer an integrated global, geospatial platform to our global customers.
Pursue selective strategic acquisitions and investments to grow our business
We have historically expanded our portfolio of business offerings and geographical reach through organic growth. We have
also considered acquisitions and investments where we have felt a strong need to augment our technology. In Financial Year
2018, we acquired Vidteq Private Limited to augment our products and capabilities in of HD maps and computer vision AI for
domestic and international geographies.
We intend to continue pursuing selective strategic acquisition and investment targets and opportunities while synergizing and
leveraging the existing businesses and brand equity, to enter into new business segments and geographies, to gain new
customers, diversify our revenue streams and obtain valuable employee talent. We intend to continue our strategic expansion
plans through inorganic growth opportunities in underserved and emerging markets and geographies that complement our
existing operations and enhance shareholders’ value and profitability. We also plan to invest in acquire businesses with
technologies complementing our suite of products and solutions, such as in the drone or IoT segments.
Attract, develop and retain skilled employees to sustain the product quality and customer experience
While our management leads us ably in achieving our growth and expansion goals, identification of the right talent continues
to be a key area of investment for us. We aim to continue focusing on attracting, training and retaining our employees, which
we believe is integral to us improving our products and technologies, and helping us deepen our relationships with our clients,
customers and users. Being a product and tech-focused company, we expect to especially expand our research and development
efforts by recruiting more technical employees in the areas of digital maps, geospatial software and location-based IoT. As a
growing business, we will also look to augment our sales and marketing teams to help us reach out to and engage with more
customers.
In the last three Financial Years, our combined key workforce across various departments has increased by approximately 10%,
and comprised 754 employees as of September 30, 2021. We have seen a very low attrition rate of our key employees, primarily
on account of employee satisfaction, our growth and employee friendly policies.
We intend to continue to provide leadership and soft skills training, intensive workshops and management and technical
advancement programs. We will continue to provide training to our employees by renowned industry experts, including in the
fields of brand and marketing, sales, business development as well as through technical training and internal innovation
challenges for software and product development. We are committed to systematically identifying and nurturing the
development of middle and senior management through formal leadership training programs. Some of the highlights are as per
below. As a tool for employee engagement and retention, our Company has also formulated the ESOP scheme for our
employees, as detailed under “Capital Structure – ESOP 2008” on page 83.
Our Operations
Our business has evolved since our inception, has and included a suite of products and solutions offerings, as described below:

147
Products and Platforms
• Digital Maps and Geospatial Data Products:
o We use our proprietary end-to-end technology-driven and AI-assisted mapping systems and processes for
digital geospatial data acquisition and processing as well as digital map data productization and
dissemination.
o We provide digital maps across India, containing administrative hierarchy and precise addresses, postal maps,
road network and transportation maps, places of interest and business, land use/land cover maps.
o Our advanced maps represent the real world in not just 2D, but also in 3D, including building heights, terrain
models, shoebox models and fully textured 3D city maps.
o Our maps are not just static, but dynamic, updated continuously in near real-time. These include new place
updates, location-based events, changes in road conditions, location-based safety alerts, live traffic and
weather etc. Hence, we call our advanced maps as 4D, time being the fourth dimension.
o Our maps are not just standard definition, but HD, providing photo-realistic Virtual Reality and Augmented
Reality ready maps of the outdoors and indoors including geo-referenced 360-degree panoramas, as well as
providing high accuracy detail and precision about the physical world, such as roads and buildings, for
autonomous safety vehicle platforms and advanced driving assistance systems, and smart city planning and
simulations.
o Our maps are extremely hyper local, providing information in regional languages as well as allowing for
discovery of and connecting with local businesses and services.
o Finally, our IR geospatial data products include location-based demographics, population density, income
distribution, anonymised and aggregated people movement behaviour as well as hundreds of other location-
based datasets to enable manifold analytics use cases.
o We have also started to build and release digital maps for countries outside India, such as Sri Lanka,
Bangladesh, Nepal, Bhutan, Myanmar, UAE and Egypt.
• Map, Location and Navigation Platforms:
o We provide interactive 2D, 3D, outdoor and indoor map rendering, as well as location search, geocoding,
reverse geocoding, and route planning, optimisation, traffic and turn-by-turn visual and voice-based
navigation platforms.
o Driving distance platforms considers historic, live traffic data to help predict travel time and distance from a
single point of origin to multiple destinations, as well as from many points of origin to multiple destinations.
Pre-trip analyses enables smarter fleet allocation, thereby boosting efficiency and lowering operating costs
for our customers.
o Our Snap to Road platform allows users to take GPS points collected along a route and return a similar set of
corrected and aligned data with the points matched to the road for tracking assets and for data analytics of
path traversed by vehicle, people or assets.
• GIS, Geospatial Analytics and Geo-AI Products and Platforms:
o Our geographic information system and geo-analytics offerings platforms, mGIS and Insight, consist of
location-based APIs capable of ingesting, processing, publishing, visualising and analysing geo-spatial data
to provide location.
o Our geo-analytics offerings help our customers across industries to analyse their markets and develop
predictive models through spatial patterns provided by us, as well as get near real-time dashboarding and
monitoring capabilities from us.
o We provide our customers with AI enabled technology platforms to automatically and efficiently recognise
and extract insights from images through our computer vision and geospatial enabled AI algorithms.

148
The diagram below represents our mGIS SaaS product and platform, which provides geospatial analytics, AI and visualisation
capabilities:
• Location-based IoT, Fleet and Workforce Automation Products and Platforms:
o We provide our IoT platform, InTouch, to enable connectivity with real world sensors, phones and IoT
devices.
o Our InTouch platform provides a wide range of applications for near real-time vehicle and asset tracking,
geo-fencing alerts, historical movement and driver behaviour analysis, predictive vehicle health alerts etc, as
well as fleet, transport and logistics management.
o We also offer a wide range of IoT devices such as durable GPS-based tracking systems which can be installed
inside vehicles or carried portably, connected cameras and a plethora of sensors for fuel monitoring, RFID
connectivity, panic buttons remote immobilisation etc.
o We also provide our software platform, Workmate, to enable workforce and workflow management,
monitoring and automation capabilities.
The diagram below represents our InTouch SaaS product and platform, which provides IoT connectivity, as well as asset
monitoring, fleet management, and logistics and transport optimisation capabilities:

149
• Developer APIs and SDKs:
o We offer a large catalogue of developer APIs and SDKs, to help them integrate the features, functionalities
and capabilities of all our map, geospatial and IoT products and platforms into their own web and mobile
applications, which could be for their consumer-facing apps, built-in to their vehicles and IoT devices, or for
their internal enterprise digital systems.
o Our wide range of map APIs and SDKs allow users to develop and create an interactive mapping experience
for indoor and outdoor environments by integrating up-to-date location data and pan-India map coverage into
their apps and websites.
o Map and traffic data - detailed and interactive maps with 2D/ 3D viewing options and near real-time traffic
flow details.
o Search function – relevant and accurate search results for an address, locations or a pair of geo-coordinates.
o Routes and navigation – turn-by-turn directions with alternative driving routes between specified locations
and traffic data.
o Geo-analytics – enabling query-based geo-visualisations for spatial analytics.
o Mobility and tracking – enabling integration of near real-time location tracking.
o Some of the key use-cases for our APIs include logistics platforms, navigation solutions, data visualisation
for business analytics and tracking and management of assets and individuals on a near real-time basis.
o A recent use-case for our APIs has been for enabling integration of COVID related information such as nearby
vaccine centres, hospitals and update on related statistics.
The diagrams below represent the suite of APIs offered by us and their key features:
• Consumer location-based apps and gadgets:
o Consumer facing MapmyIndia Move app, which is a super app for maps, navigation, tracking, safety,
mobility, hyper local and more, on the Android and iOS platforms.
o Internet mapping portal, Maps.mapmyindia.com.

150
o MapmyIndia Move IoT gadgets which include GPS tracking, safety and navigation features.
• N-CASE Automotive and Mobility Tech Solutions Suite:
o We provide in-vehicle hyper-local, content-rich, turn-by-turn offline, online and hybrid navigation assistant
systems, including connected navigation and in-vehicle commerce and voice assistant solutions.
o We also offer platforms and companion apps for connected mobility (for better connectivity with the vehicle
in terms of tracking, remote controls and driving behaviour), telematics (remote tracking of vehicles and their
health diagnostics), and connected vehicle services.
o autonomous vehicle and road safety platforms and advanced driving assistance systems, HD mapping
technology, AI training solutions and near real-time object detection solutions for autonomous vehicles.
o shared mobility platforms for enabling mobility as a service and ride sharing solutions.
o electric mobility solutions including analytics for selection of charge station locations, information related to
electric vehicles mobility such as nearby charge stations, spider model on range depiction, battery efficient
navigation,
o The solutions also align with industry requirements such as N-CASE technology.
o We also offer a suite of products and solutions suited for upcoming class of drone vehicles.
• Location-powered Consumer Tech and Enterprise Digital Transformation:
o We provide a suite of APIs and solutions to consumer tech companies and enterprises looking to digitally
transform based on our complete range of digital maps, geospatial software and location-based IoT.
o We can flexibly provide our solutions over the cloud or through hybrid and on-premise deployments.
o We are able to customise any part of our full stack to meet specific requirements of customers and offer them
a bespoke solution to meet their complete needs.
o Assisting organizations in map and location enablement of apps, products and platforms.
o Developing location insights by helping organizations in geo-tagging and geo-information management.
o Sale and distribution analytics for understanding gaps, opportunities, surrogates for growth and trends in
distribution.
o Location based advertising and personalization for targeted advertising on the basis of location footprint and
visitation.
o Logistics planning, monitoring and optimisation solutions for long haul and last-mile deliveries
○ Journey risk management (JRM) / Route risk planning - managing goods transportation risks by ensuring
safety of drivers and material during transportation.
○ Address standardisation and validation - to clean addresses and create clean and structured digital
information.
○ Contact/call centre solutions - provide location tools to capture addresses and provide relevant information
back to the agent.
○ Industry specific solutions -
■ BFSI – location enabling of loan management, collection systems and call centres, including geo-
risk and distribution analytics.
■ FMCG and Retail – location data and tools for rural and urban expansion as well as field automation
and distribution network.
■ Automotive – N-CASE solutions for 2W, 4W, commercial vehicle, agriculture vehicle, and
construction vehicle. We also provide solutions relating to drone mobility, vehicle logistics,
contactless service and CRM, and digital transformation.

151
■ Government – solutions relating to smart transportation and logistics, transport and management of
solid waste, public health, rural development, smart city initiatives, disaster management,
agriculture, change detection, and other emergency responses.
■ Defence and security solutions – outdoor and indoor 2D/3D maps for military operations, geographic
data analysis with natural landscape mapped onto a virtual globe (“Earthview”), GIS for battlefield
replication (“MilGIS”), GPS and GIS minefield recording systems (“MGRS”).
Our Customers
We primarily service enterprise customers across three major categories, i.e. (i) corporate, (ii) automotive, and (iii) government
and our customers in turn serve the larger community of end users. In addition, we also offer professional grade maps and
products directly to retail customers, through our ‘Move’ app and GPS IoT enabled gadgets and devices.
Corporate
The corporate vertical comprises of all non-automotive businesses and entities which integrate digital maps into their
applications or offerings in order to build a comprehensive solution. Our corporate customers include new-age, tech-enabled
companies as well as traditional businesses across various industry verticals such as BFSI, telecom, FMCG, industrials, logistics
and transportation, as represented in the diagram below:
Our digital mapping technology and AI-enabled features enable our enterprise customers to implement field force management,
fleet tracking, geospatial planning and to integrate our APIs and SDKs in their own apps and websites. We also provide
customised solutions to our enterprise clients, including custom map data, AI models location-based software solutions
customised according to specific business requirements and perform custom analysis on big data from our IoT and other
solutions. Applications of our enterprise segment offerings range from technology and IT solutions including vector map SDK,
search API, routing and navigation API, map tiles, traffic services and live , sales and distribution, marketing, field service and
operations, logistics and business intelligence.
Automotive OEMs
The automotive vertical includes manufacturers of four-wheelers, two-wheelers and commercial vehicles as well as upcoming
class of electric vehicles.
Our offerings in the automotive segment enable N-CASE mobility across passenger and commercial vehicles. Some of our key
customers in the automotive segment include MG Motor and Hyundai and our key mobility customers include Avis and
Safexpress.

152
We provide safe and efficient navigation supported by rapidly updated, feature-rich and granular maps. We have developed a
next-generation talking cockpit car-technology that enables proactive, intelligent voice interactions between the drivers and
vehicles. Our connected vehicle IoT platform creates digital twins of vehicle for continued connectivity. Our high-definition
maps are localised for Indian conditions, enabling precise localisation, safe driving experiences, and improved path planning
with voice instructions. We also offer a shared mobility platform offering end-to-end ride-sharing capabilities that are cost-
effective and environment friendly, as well as EV solutions such as mapping compatible EV charging stations on connected
interfaces.
Government
Our Government customers includes central, state and local government organisations, ministries, departments and public sector
undertakings.
Our key government sector offerings include geospatial dashboards for strategic planning, efficient operations and effective
management, community health solutions through GIS-based situational awareness for medical emergencies, pandemic
management and spatially enabled dashboards to study the health risks and plan mitigation, address standardization and
geocoding solutions that place addresses in a location perspective to generate highly desirable location insights, data collection,
assessment, demand generation and tax collection with separate modules for internal stakeholders and common citizens and
crime analytics through creation of geo-tags, crime patterns with geospatial AI and prediction analytics through locations and
modus operandi patterns.
Through the Citizen Connect solution, we enable creating awareness among citizens about administration led initiatives,
facilitate communications between citizens and administrators, track issues geographically with quick turnaround times for
grievance response and resolution.
Retail Consumers
We provide our maps and technologies to consumers through our MapmyIndia Move App, Maps.MapmyIndia.com internet
mapping portal and our MapmyIndia Move GPS-based IoT gadgets.
Intellectual property
Our intellectual property includes digital map data for India and platforms including API, SDK, IOT, GIS and geoanalytics
solutions.
As on the date of this Red Herring Prospectus, we have obtained the following trademark registrations in India:
S. No. Trademark Class Registration Number
1.
16 1844724

153
S. No. Trademark Class Registration Number
2.
42 1839364
3. “MAP MY INDIA” 16 2976766
4. “MAP MY INDIA” 42 2976768
5. “MAP MY INDIA-MAPS” 9 2976765
6.
9 3542107
7. “eLoc” 16 3531735
8. “eLoc” 42 3531737
9.
9 2291566
10.
9 2291567
11.
9 1913171
12. “Har Pata Humein Hai Pata” 9 3531731
13. “Har Pata Humein Hai Pata” 16 3531732
14. “Har Pata Humein Hai Pata” 38 3531733
15. “Har Pata Humein Hai Pata” 42 3531734
Our Promoter, Mr. Rakesh Verma, has obtained a registered literary copyright for “CE Info Spatial Database”, which comprises
map database of India, vide registration certificate bearing no. L-26848/2006 dated July 24, 2006.
Certifications
We are certified as compliant with ISO/IEC 20000-1:2018 for our information technology service management system,
ISO/IEC 27001:2013 for our information security management system, ISO 9001:2015 for our quality management systems,
ISO 45001:2018 for our occupational health and safety management systems, ISO 14001:2015 for our environmental
management system and CMMI for the benchmark appraisal for the technology division. Our Company is also part of the Dun
& Bradstreet Global Database.
Human Resources
Our operations are centrally located in India, with an office in United States and partner representation in Japan. As on March
31, 2021 we had a combined workforce of 734 employees, comprising 410 permanent and 324 non-permanent employees
spread across different teams, which increased to 754 employees as on September 30, 2021, comprising 420 permanent and
334 non-permanent employees. We have a largely younger workforce, with the average employee age being 32 and a key focus
for us is ensuring gender diversity across various departments and levels of seniority.
Details of the attrition rate in relation to our permanent employees of our Company during the last three Financial Years are as
follows:
Period Rate of Attrition
Six month period ended September 30, 2021 8.37%
Financial Year 2020-2021 13.50%
Financial Year 2019-2020 12.02%
Financial Year 2018-2019 17.29%
We believe that our people are our most valuable asset, which contributes towards creating products that helps us to serve our
customers and users. We seek to develop a culture which encourages and motivates our employees to achieve their potential.
We also continually look to augment our workforce at various levels and bring in talent with skills and external perspectives,
to enhance our ability to grow. To ensure a stable core across levels within our Company, we aim to build a culture of
development from within. We undertake formal and informal programmes to train our employees and management, including
by our internal human resources department and human resource consultants.
Competition
According to the F&S Report, we have a clear advantage that is not easily replicable with high barriers to entry in the map and
navigation business. As stated in the F&S Report, not only do we have a big head-start, but we have made a major investment
in technology including hardware, software and packages over the years.

154
In countries like India where the map services market is still in its nascent phase, having a home-grown, technologically superior
map service provider would help businesses on two fronts, one, the data security risks involved can be minimised and two, the
businesses that are operating locally would get richer and more accurate map related experience as the map solution providers
like MapmyIndia would clearly have an edge over its global competitors as they can provide focused, locally sourced and most
recent map related data that can be used for better business operations. (Source: F&S Report)
According to the F&S Report, we defy being bucketed as we don't fall into well-defined zones of competition solely because
of the scale and breadth of technology offering we play across. We are a digital transformation company with the foundation
of data mapping which can easily give birth to numerous integrations and applications within technologies, corporates,
governments and end-consumers creating a favourable situation for doing business. (Source: F&S Report) For further details
of our competition, see “Industry Overview – Global Competitive Landscape” on page 124.
Insurance
We maintain insurance coverage under various insurance policies for, among other things, directors’ and officers’ liability, and
medical insurance for our employees including family cover, group term life insurance, as well as group personal accident
policy to cover the medical expenses incurred by our employees during hospitalization, for any illness or injury suffered and
vehicle insurance. We also maintain insurance policy of unnamed persons and employees deposit linked insurance scheme.
Corporate Social Responsibility
We seek to be a socially responsible corporation and for us, corporate social responsibility (“CSR”) is an integral part of our
operations. We have adopted a Corporate Social Responsibility Policy in compliance with the requirements applicable laws
and spent ` 9.65 million for the Financial Year 2021 towards various schemes under our CSR activities.
In March 2020, the Government of India allowed spending of CSR funds towards COVID-19 relief. In light of this, we have
responded to the COVID-19 pandemic by contributing Rs. 2.50 million to the PM Cares Fund and incurring other operational
expenses of ₹7.20 million in assisting Central Government and various state governments and authorities by providing our
platforms and services for help in fight with COVID-19. Few of these authorities include National Disaster Management
Authority; MyGov; Karnataka State Remote Sensing Applications Centre, Karnataka Government; MP Covid Response App,
Madhya Pradesh Government; Delhi Government; Centre for Development of Advanced Computing and Defence Research
and Development Organisation.
The Government of India integrated advanced digital mapping features developed by MapmyIndia into the CoWIN App, the
official registration portal for Covid-19 vaccination. To ease up the vaccination process, MapmyIndia pinpointed all the
vaccination centres across the country on their maps. The MapmyIndia apps and portals were made accessible to users to help
them locate nearby vaccination centres with ease.
Property
Our Registered and Corporate Office is situated at First, Second, & Third Floor, Plot. No. 237, Okhla Industrial Estate, Phase-
III, New Delhi 110 020, India and our Bengaluru office is located at Ground floor, First floor, Second Floor, Third Floor, Fourth
Floor, SreeRam Nivas, Opposite Axis Bank, 100 Ft Road, Indiranagar, Bangalore 560 038, Karnataka, both of which are leased
by us. The registered offices of our Subsidiaries have been leased and are operated out of commercial office spaces. For further
details, see “Risk Factors - Our business operations are being conducted on premises owned by and/or leased from third parties.
Our inability to continue operating from such premises, or to seek renewal or extension of such leases may materially affect
our business operations.” on page 43.

155
KEY REGULATIONS AND POLICIES IN INDIA
The following description is an overview of certain laws and regulations in India, which are relevant to our Company. The
information in this section has been obtained from various legislations, including rules, regulations and policies promulgated
by regulatory and statutory bodies, which are available in the public domain. The description of laws, regulations and policies
set out below is not exhaustive and is only intended to provide general information to investors and is neither designed nor
intended to be a substitute for professional legal advice. The statements below are based on the current provisions of Indian
law and the judicial and administrative interpretations thereof, which are subject to change or modification by subsequent
legislative, regulatory, administrative or judicial decisions.
A. Laws in relation to our business
Guidelines for acquiring and producing geospatial data and geospatial data services including Maps dated
February 15, 2021 (the “Geospatial Guidelines”)
The Department of Science and Technology of the Government of India (“DST”) has issued the Geospatial Guidelines
with the aim of liberalising the regulations in relation to the collection, acquisition and use of geospatial data.
Previously, there existed a licensing regime administered by the Survey of India (SoI) for the use of their maps. Some
of the major reforms introduced by the Geospatial Guidelines include, among others:
• There will be no prior approval or license requirements for the collection, generation, preparation,
dissemination, storage, publication, updating and/or digitization of geospatial data and maps within the
territory of India. Individuals, companies, organizations, and Government agencies, shall be free to process
the acquired geospatial data, build applications and develop solutions in relation to such data and use such
data products, applications, solutions, etc. by way of selling, distributing, sharing, swapping, disseminating,
publishing, deprecating and destructing.
• There shall be a negative list of sensitive attributes that would require regulation before anyone can acquire
and/or use such sensitive attributes data. There will not be any negative list of prohibited areas. The negative
list of attributes will include attributes that shall not be marked on any Map i.e. no person or legal entity shall
identify or associate any location on a Map with a prohibited attribute.
• Indian entities, whether in Government or outside, will be free to acquire, collect, generate, prepare,
disseminate, store, share, publish, distribute, update, digitize and/or create geospatial data, including maps,
of any spatial accuracy within the territory of India including underwater within its territorial waters by using
any geospatial technology, subject to regulations on attributes in the negative lists. As per the Geospatial
Guidelines, an ‘Indian entity’ is defined as any Indian citizen, Government entities, societies registered under
applicable statutes, statutory bodies, autonomous institutions of the Government, or any Indian company or
Indian LLP owned by resident Indian citizens or any Indian company or Indian LLP controlled by resident
Indian citizens (as defined in the explanation to Rule 23 of the FEMA Rules.
• Maps/geospatial data of spatial accuracy/value finer than the threshold value can only be created and/or
owned by Indian Entities and must be stored and processed in India. As per the Geospatial Guidelines, the
threshold value for on-site spatial accuracy shall be one meter for horizontal or planimetry and three meters
for vertical or elevation with gravity anomaly of 1 milli-gal and vertical accuracy of bathymetric data in
territorial waters shall be 10 meters for up to 500 meters from the shore-line and 100 meters beyond that.
• Foreign companies and foreign owned or controlled Indian companies can license from Indian entities digital
maps/geospatial data of spatial accuracy/value finer than the threshold value only for the purpose of serving
their customers in India. Access to such maps/geospatial data shall only be made available through application
programming interface that do not allow maps/geospatial data to pass through licensee company or its servers.
Re-use or resale of such map data by licensees shall be prohibited.
• Digital maps/geospatial data of spatial accuracy/value up to the threshold value can be uploaded to the cloud
but those with accuracy finer than the threshold value shall only be stored and processed on a domestic cloud
or on servers physically located within territory of India.
• Ground truthing/verification, access to Indian ground stations and augmentation services for real time
positioning (Continuously Operating Reference Stations (CORS), etc.) and their data shall be made available
without any restrictions and with the ease of access to Indian entities only. Terrestrial mobile mapping survey,
street view survey and surveying in Indian territorial waters shall be permitted only for Indian entities
irrespective of accuracy.

156
• All geospatial data produced using public funds, except the classified geospatial data collected by security/law
enforcement agencies, shall be made easily accessible for scientific, economic and developmental purposes
to all Indian entities and without any restrictions on their use.
The Information Technology Act, 2000 (the “IT Act”)
The IT Act seeks to (i) provide legal recognition to transactions carried out by various means of electronic data
interchange involving alternatives to paper-based methods of communication and storage of information, (ii) facilitate
electronic filing of documents and (iii) create a mechanism for the authentication of electronic documentation through
digital signatures. The IT Act provides for extraterritorial jurisdiction over any offence or contravention under the IT
Act committed outside India by any person, irrespective of their nationality, if the act or conduct constituting the
offence or contravention involves a computer, computer system or computer network located in India. Additionally,
the IT Act empowers the Government of India to direct any of its agencies to intercept, monitor or decrypt any
information in the interest of sovereignty, integrity, defence and security of India, among other things. The Information
Technology (Procedure and Safeguards for Blocking for Access of Information by Public) Rules, 2009 specifically
permit the Government of India to block access of any information generated, transmitted, received, stored or hosted
in any computer resource by the public, the reasons for which are required to be recorded by it in writing. The IT Act
facilitates electronic commerce by recognizing contracts concluded through electronic means, protects intermediaries
in respect of third-party information liability and creates liability for failure to protect sensitive personal data.
The IT Act also prescribes civil and criminal liability including fines and imprisonment for computer related offences
including those relating to unauthorized access to computer systems, tampering with or unauthorised manipulation of
any computer, computer system or computer network and, damaging computer systems and creates liability for
negligence in dealing with or handling any sensitive personal data or information in a computer resource and in
maintaining reasonable security practices and procedures in relation thereto. The IT Act empowers the Government
of India to formulate rules with respect to reasonable security practices and procedures and sensitive personal data.
In exercise of this power, the Department of Information Technology, Ministry of Electronics and Information
Technology, Government of India (“DoIT”), in April 2011, notified the Information Technology (Reasonable Security
Practices and Procedures and Sensitive Personal Data or Information) Rules, 2011 (the “IT Security Rules”) which
prescribe directions for the collection, disclosure, transfer and protection of sensitive personal data by a body corporate
or any person acting on behalf of a body corporate.
The IT Security Rules require every such body corporate to provide a privacy policy for handling and dealing with
personal information, including sensitive personal data, ensuring security of all personal data collected by it and
publishing such policy on its website. The IT Security Rules further require that all such personal data be used solely
for the purposes for which it was collected and any third party disclosure of such data is made with the prior consent
of the information provider, unless contractually agreed upon between them or where such disclosure is mandated by
law. The DoIT also notified the Information Technology (Intermediaries Guidelines) Rules, 2011 (the “IT
Intermediary Rules”) requiring intermediaries receiving, storing, transmitting or providing any service with respect
to electronic messages to not knowingly host, publish, transmit, select or modify any information prohibited under
these IT Intermediaries Rules and to disable hosting, publishing, transmission, selection or modification of such
information once they become aware of it.
The Personal Data Protection Bill, 2019 (the “Bill”)
The Bill, which proposes to supersede the IT Act deals with the provisions relating to compensation payable by
companies for failure to protect personal data. The Bill also establishes a Data Protection Authority of India. Currently,
the Bill categorises two kinds of data, (a) “Personal Data” data about or relating to a natural person who is directly or
indirectly identifiable, having regard to any characteristic, trait, attribute or any other feature of the identity of such
natural person, whether online or offline, or any combination of such features with any other information, and shall
include any inference drawn from such data for the purpose of profiling; and (b) “Sensitive Personal Data” includes
such personal data, which may, reveal, be related to, or constitute: (i) financial data;(ii) health data;(iii) official
identifier;(iv) sex life;(v) sexual orientation; and (vi) biometric data. The applicability of the Bill also extends to foreign
companies that handle data of individuals in India. The Bill accords certain rights to individuals with respect to the
protection of their data. However, there are certain exceptions to protection offered under the Bill, such as, acts done
in interest of security of state, public order, sovereignty and integrity of India and friendly relations with foreign states,
and acts done for preventing incitement to commission of any cognisable offence relating to the above matters.
Processing of personal data is also exempted from provisions of the Bill under certain conditions, as long as such
processing is for a specific, clear and lawful purpose, this includes an act undertaken for prevention, investigation, or
prosecution of any offence, or personal, domestic, or journalistic purposes. As on date, the Bill is pending and is yet
to be notified and take effect.

157
Software Technology Parks Scheme (the “STP Scheme”)
To implement the STP Scheme, a 100% export oriented scheme for the development and export of computer software,
Software Technology Parks of India (“STPI”) was established and registered as an autonomous society under the
Societies Registration Act, 1860, under the Ministry of Electronics and Information Technology, Government of India
on June 5, 1991. The STP Scheme covers export of professional services using communication links or physical media
and any entity desiring to export its entire production of goods and services (except permissible sales in the domestic
tariff area) is eligible to register with the relevant STPI. The STP Scheme is governed by the Foreign Trade Policy,
2015-2020 read with the Handbook of Procedures, 2015-2020.
Consumer Protection Act, 2019 (the “COPRA”)
COPRA aims at providing better protection to the interests of consumers and for that purpose makes provisions for
the establishment of authorities for the settlement of consumer disputes. The COPRA has extended the definition of a
‘consumer’ to include purchase of goods or services through an offline and online transaction, and provides a
mechanism for the consumer to file a complaint against a service provider in cases of, inter alia, unfair trade practices,
restrictive trade practices, deficiency in services and price charged being unlawful. The COPRA provides for a three-
tier consumer grievance redressal mechanism at the national, state and district levels. Non-compliance of the orders
of these authorities attracts criminal penalties.
B. Regulations related to foreign trade
The foreign policy of India is governed and regulated by the Foreign Trade (Development and Regulation) Act, 1992
(the “Foreign Trade Act”). The Foreign Trade Act has empowered the Central Government to make provisions for
the development as well as regulation of foreign trade by the way of facilitating imports into as well as augmenting
exports from the country and in all the other matters related to foreign trade. It authorises the government to formulate
as well as announce the export and import policy and to keep amending the same on a timely basis. The government
has also been given a wide power to prohibit, restrict and regulate the exports and imports in general as well as specified
cases of foreign trade. The Foreign Trade Act provides for certain appointments especially that of the Director-General
to advise the Central Government in formulating import and export policy and to implement the same. Further, the
Foreign Trade Act requires every importer as well as exporter to obtain a code number called the Importer Exporter
Code Number (IEC) from the Director-General or the authorised officer.
The Foreign Trade Act provides the balancing of all the budgetary targets in terms of imports and exports. The principal
objectives here include the facilitation of sustain growth as to the exports of the country, the distribution of quality
goods and services to the domestic consumer at internationally competitive prices, stimulation of sustained economic
growth by providing access to essential raw materials as well as enhancement of technological strength, industry as
well as services and improvement of their competitiveness to meet all kinds of requirement of the global markets.
C. Intellectual Property Legislations
The Trademarks Act, 1999 (the “Trademarks Act”)
Trademarks enjoy protection under both statutory and common law and Indian trademark law permits the registration
of trademarks for both goods and services. The Trademarks Act governs the statutory protection of trademarks and the
prevention of the use of fraudulent marks in India. Under the provisions of the Trademarks Act, an application for
trademark registration may be made before the Trademark Registry by any person claiming to be the proprietor of a
trade mark, whether individual or joint applicants, and can be made on the basis of either actual use or intention to use
a trademark in the future. Once granted, a trademark registration is valid for 10 years unless cancelled, subsequent to
which, it can be renewed. If not renewed, the mark lapses and the registration is required to be restored. The
Trademarks Act prohibits registration of deceptively similar trademarks and provides for penalties for infringement,
falsifying and falsely applying trademarks. Further, pursuant to the notification of the Trademark (Amendment) Act,
2010 simultaneous protection of trademark in India and other countries has been made available to owners of Indian
and foreign trademarks. The Trademark (Amendment) Act, 2010 also seeks to simplify the law relating to transfer of
ownership of trademarks by assignment or transmission and to conform Indian trademark law with international
practice.
The Patents Act, 1970 (the “Patents Act”)
The Patents Act recognises both product and process patents and prescribes eligibility criteria for grant of patents,
including the requirement that an invention satisfy the requirements of novelty, inventive step and industrial
applicability in order for it to avail patent protection. However, the Patents Act also provides that patent protection
may not be granted to certain specified types of inventions and materials even if they satisfy such criteria. Application
by an Indian resident to any foreign authority in respect of an invention made outside India is prohibited without first
making an application for the invention in India. Once granted, a patent remains valid for a period of twenty years

158
from the date of filing of the patent application, subsequent to which it can be renewed. While the Patents Act prohibits
patentability of a ‘computer programme’ as such, computer programmes in combination with a novel hardware are
patentable. Computer programmes on their own are excluded from patent protection and are protected as a literary
work under the Copyright Act (defined below). In terms of the Patent Act, the patentee holds the exclusive right to
prevent third parties from the using, offering for sale, selling or importing for such purposes, the patented product or
product obtained directly by a process patented in India.
The Copyright Act, 1957 (the “Copyright Act”)
The Copyright Act governs copyrights subsisting in original literary, dramatic, musical or artistic works,
cinematograph films, and sound recordings, including computer programmes, tables and compilations including
computer databases. Software, both in source and object code, constitutes a literary work under Indian law and is
afforded copyright protection and the owner of such software becomes entitled to protect his works against
unauthorised use and misappropriation of the copyrighted work or a substantial part thereof. Any act of this nature
entitles the copyright owner to obtain relief from a court of law including injunction, damages and accounts of profits.
Further, copyright registration is not a prerequisite for acquiring or enforcing a copyright in an otherwise copyrightable
work and once registered, copyright protection remains valid until expiry of sixty years from the demise of the author.
Reproduction of a copyrighted software for sale or hire or commercial rental, offer for sale or commercial rental,
issuing copy(ies) of the computer programme or making an adaptation of the work without consent of the copyright
owner amount to infringement of the copyright. However, the Copyright Act prescribes certain fair use exceptions
which permit certain acts, which would otherwise be considered copyright infringement.
D. Laws governing foreign investments
Foreign investment in India is governed by the provisions of FEMA Rules along with the FDI Policy issued by the
DPIIT, from time to time. Further, the RBI has enacted the Foreign Exchange Management (Mode of Payment and
Reporting of Non-Debt Instruments) Regulations, 2019 which regulate the mode of payment and reporting
requirements for investments in India by a person resident outside India. Under the current FDI Policy (effective
October 15, 2020) 100% foreign direct investment is permitted in IT/ITES sector, under the automatic route, subject
to compliance with certain prescribed conditions. In terms of the SEBI FPI Regulations, the investment in Equity
Shares by a single FPI or an investor group (which means multiple entities registered as FPIs and directly or indirectly
having common ownership of more than 50% or common control) must be below 10% of our post-Offer Equity Share
capital. Further, in terms of the FEMA Rules, the total holding by each FPI or an investor group shall be below 10%
of the total paid-up Equity Share capital of our Company and the total holdings of all FPIs put together with effect
from April 1, 2020, can be up to the sectoral cap applicable to the sector in which our Company operates (i.e., up to
100%).
Overseas Direct Investment (“ODI”)
In terms of the Master Direction No. 15/2015-16 on “Direct Investment by Residents in Joint Venture/Wholly Owned
Subsidiary Abroad” issued by the RBI, dated January 1, 2016, as amended, an Indian entity is allowed to make ODI
under the automatic route up to limits prescribed by the RBI, which currently should not exceed 400% of its net worth.
ODI can be made by investing in either joint ventures or wholly owned subsidiaries outside India. Any financial
commitment exceeding USD one billion (or its equivalent) in a financial year would require the prior approval of the
RBI.
E. Laws relating to employment
The employment of workers, depending on the nature of activity, is regulated by a wide variety of generally applicable
labour laws. The following is an indicative list of labour laws which may be applicable to us due to the nature of our
business activities:
(i) Employees’ Provident Funds and Miscellaneous Provisions Act, 1952.
(ii) Employees’ State Insurance Act, 1948.
(iii) Minimum Wages Act, 1948.
(iv) Payment of Bonus Act, 1965.
(v) Payment of Gratuity Act, 1972.
(vi) Payment of Wages Act, 1936.
(vii) Maternity Benefit Act, 1961.

159
(viii) Industrial Disputes Act, 1947.
(ix) Sexual Harassment of Women at Workplace (Prevention, Prohibition and Redressal) Act, 2013.
(x) The Child Labour (Prohibition and Regulation) Act, 1986.
(xi) The Equal Remuneration Act, 1976.
(xii) The Code on Wages, 2019*.
(xiii) The Occupational Safety, Health and Working Conditions Code, 2020**.
(xiv) The Industrial Relations Code, 2020***.
(xv) The Code on Social Security, 2020****.
* The Government of India enacted ‘The Code on Wages, 2019’ which received the assent of the President of India on August 8, 2019. The provisions of this code are proposed to be brought into force by the Central Government on a date to be notified by the Central Government.
It proposes to subsume four separate legislations, namely, the Payment of Wages Act, 1936, the Minimum Wages Act, 1948, the Payment of
Bonus Act, 1965 and the Equal Remuneration Act, 1976. ** The Government of India enacted ‘The Occupational Safety, Health and Working Conditions Code, 2020’ which received the assent of the
President of India on September 28, 2020. The provisions of this code are proposed to be brought into force on a date to be notified by the
Central Government. It proposes to subsume several separate legislations, including the Factories Act, 1948, the Contract Labour (Regulation and Abolition) Act, 1970, the Inter-State Migrant Workmen (Regulation of Employment and Conditions of Service) Act, 1979 and the Building
and Other Construction Workers (Regulation of Employment and Conditions of Service) Act, 1996.
*** The Government of India enacted ‘The Industrial Relations Code, 2020’ which received the assent of the President of India on September 28, 2020. The provisions of this code are proposed to be brought into force on a date to be notified by the Central Government. It proposes to
subsume three separate legislations, namely, the Industrial Disputes Act, 1947, the Trade Unions Act, 1926 and the Industrial Employment
(Standing Orders) Act, 1946. **** The Government of India enacted ‘The Code on Social Security, 2020 which received the assent of the President of India on September 28,
2020. The provisions of this code are proposed to be brought into force on a date to be notified by the Central Government. It proposes to
subsume several separate legislations including the Employee’s Compensation Act, 1923, the Employees’ State Insurance Act, 1948, the Employees’ Provident Funds and Miscellaneous Provisions Act, 1952, the Maternity Benefit Act, 1961, the Payment of Gratuity Act, 1972,
the Building and Other Construction Workers’ Welfare Cess Act, 1996 and the Unorganised Workers’ Social Security Act, 2008.
Shops and establishments legislations
Under the provisions of local shops and establishments legislations applicable in the states in which establishments
are set up, establishments are required to be registered. Such legislations regulate the working and employment
conditions of the workers employed in shops and establishments including commercial establishments and provide for
fixation of opening and closing hours, daily and weekly working hours, rest intervals, overtime, holidays, leave, health
and safety measures, termination of service, wages for overtime work, maintenance of shops and establishments and
other rights and obligations of the employers and employees. There are penalties prescribed in the form of monetary
fine or imprisonment for violation of the legislations. In the case of our Company, the Delhi Shops and Establishments
Act, 1954 is an applicable law under this head.
F. Other applicable laws
In addition to the above, our Company is required to comply with the provisions of the Indian Contract Act, 1872,
Companies Act, 2013, Transfer of Property Act, 1882, Foreign Exchange Management Act, 1999, Prevention of
Corruption Act, 1988, to the extent applicable, Income Tax Act 1961, Income Tax Rules, 1962, Customs Tariff Act,
1975 and GST which includes the Central Goods and Services Tax Act, 2017, various State Goods and Services Tax
legislations and the Integrated Goods and Services Tax Act, 2017, SEBI Listing Regulations, RBI guidelines, IBC,
and other applicable laws and regulations imposed by the central and state governments and other authorities for its
day-to-day operations.

160
HISTORY AND CERTAIN CORPORATE MATTERS
Brief history of our Company
Our Company was originally incorporated as ‘C.E. Info Systems Private Limited’ at New Delhi as a private limited company
under the Companies Act, 1956, pursuant to the certificate of incorporation dated February 17, 1995 issued by the RoC.
Thereafter, our Company was converted into a public limited company pursuant to a special resolution passed by our
Shareholders at the EGM held on July 7, 2021 and the name of our Company was changed to ‘C.E. Info Systems Limited’.
Consequently, a fresh certificate of incorporation dated July 12, 2021 was issued by the RoC.
Changes in the Registered Office
Except as disclosed below, there has been no change in the registered office of our Company since the date of incorporation.
Date of change Details of change in the Registered Office Reasons for change
May 1, 2017 The registered office of our Company was changed from 68, Okhla Industrial
Estate, Phase-III, New Delhi, South Delhi, Delhi 110 019 to First, Second & Third
Floor, Plot No. 237, Okhla Industrial Estate, Phase- III, New Delhi, South Delhi,
Delhi 110 020
In view of operational efficiency
June 8, 2009 The registered office of our Company was changed from B-44, Shivalik Malviya
Nagar, New Delhi, Delhi 110 017 to 68, Okhla Industrial Estate, Phase- III, New
Delhi, South Delhi, Delhi 110 019
In view of operational efficiency
August 25, 2000 The registered office of our Company was changed from S-360, Greater Kailash,
Part II, New Delhi to B-44, Shivalik Malviya Nagar, New Delhi, Delhi 110 017
In view of operational efficiency
Main objects of our Company
The main objects contained in our Memorandum of Association are as follows:
1. “To establish and run Centers for providing full range of Services including Computer consultancy and Software
Engineering, Communication and Net working, Computer Education and Training, Software and Hardware products,
Marketing Services, Management Services, Human Resources Development, Operation and Supervision of Operations
in other Companies or Organizations in India or abroad and to establish bureaus to process data and develop systems
of all kinds of Processing Job and hiring out machine time.”
1A. To carry on in India or elsewhere, in any place or places in the world, either on its own account or on account of its
constituents, solely or in conjunction with others, the business of designing, and developing, importing, exporting,
sourcing, outsourcing and implementing systems and application software packages and related products, services
and designs, solutions of all kinds and description in the areas of information technology including but not limited to
geospatial technology, engineering, manufacturing and process control and automation, Geographic Information
Systems, surveys and navigation, image and video processing, artificial intelligence, natural language processing,
computer hardware and software, data communication, telecommunications, internet, intranet, for industrial,
commercial and consumer applications and to engage in the business of, among others things, navigation, mapping,
location, and local search and provides video map based navigation, location, and search solutions to its customers.
2. “To carry on the business of manufacturers, producers, assemblers, fabricator designers, installers, repairers,
suppliers, exporters, importers, buyers, sellers, dealers and distributors, in all kinds of information systems,
Computing Machines and Systems, Micro-processing and word processing systems and Equipment and apparatus to
aid computer installations including all software and hardware, all type of printers and all components and
accessories and sub-assemblies of the foregoing.”
3. “To act as consultants and Advisors in providing information systems and Information Technology Solutions based
on the use of Computers, Information and word processing equipments and business machines of all kinds and multi
disciplinary consultancy and for that purpose furnish to the users the systems, know-how, programmes and other
software relating to the use of such machines and allied peripherals.”
The main objects to be pursued by our Company and the matters necessary in furtherance of the objects as contained in our
Memorandum of Association enable our Company to carry on business presently being carried out.

161
Amendments to the Memorandum of Association
Set out below are the amendments to our Memorandum of Association in the last 10 years:
Date of Shareholder’s
resolution/ Effective
date
Particulars
October 1, 2015 Clause V of our Memorandum of Association was amended to reflect an increase and reclassification in
the authorised share capital of our Company from ₹1,335,821,810 divided into 4,500,000 equity shares
of face value of ₹10 each, 1,229,629.63 fully convertible series A preference shares of face value of ₹81
each, 1,000,000 fully convertible series B preference shares of face value of ₹114 each, 1,218,007 series
C preference shares of face value of ₹290 each, 1,149,206 series D preference shares of face value of ₹
630 each to ₹ 1,515,821,810 divided into 4,500,000 equity shares of face value of ₹10 each, 1,229,629.63
fully convertible series A preference shares of face value of ₹81 each, 1,000,000 fully convertible series
B preference shares of face value of ₹114 each, 1,218,007 series C preference shares of face value of
₹290 each, 1,149,206 series D preference shares of face value of ₹630 each, and 180,000 series E
preference shares of face value of ₹1,000 each
July 7, 2021 Amendment to Clause I of our Memorandum of Association to reflect the change in the name of our
Company from “C.E. Info Systems Private Limited” to ‘C.E. Info Systems Limited’ pursuant to the
conversion of our Company from a private limited company to a public limited company
July 29, 2021 Clause V of our Memorandum of Association was amended to reflect the sub-division in the authorised
share capital of our Company from ₹1,515,821,810 divided into 4,500,000 equity shares of face value of
₹10 each, 1,229,629.63 series A non-cumulative participating fully convertible preference shares of face
value of ₹81 each, 1,000,000 series B non-cumulative participating fully convertible preference shares of
face value of ₹114 each, 1,218,007 series C non-cumulative participating fully convertible preference
shares of face value of ₹290 each, 1,149,206 series D non-cumulative participating fully convertible
preference shares of face value of ₹630 each and 180,000 series E non-cumulative participating fully
convertible preference shares of face value of ₹1,000 each to ₹ 1,515,821,810 divided into 22,500,000
equity shares of face value of ₹ 2 each, 1,229,629.63 series A non-cumulative participating fully
convertible preference shares of face value of ₹81 each, 1,000,000 series B non-cumulative participating
fully convertible preference shares of face value of ₹114 each, 1,218,007 series C non-cumulative
participating fully convertible preference shares of face value of ₹290 each, 1,149,206 series D non-
cumulative participating fully convertible preference shares of face value of ₹630 each and 180,000 series
E non-cumulative participating fully convertible preference shares of face value of ₹1,000 each
July 29, 2021 Clause V of our Memorandum of Association was amended to reflect an increase in the authorised share
capital of our Company from ₹1,515,821,810 divided into 22,500,000 equity shares of face value of ₹2
each, 1,229,629.63 fully convertible series A preference shares of face value of ₹81 each, 1,000,000 fully
convertible series B preference shares of face value of ₹114 each, 1,218,007 series C preference shares
of face value of ₹290 each, 1,149,206 series D preference shares of face value of ₹630 each, and 180,000
series E preference shares of face value of ₹1,000 each to ₹ 1,555,821,810 divided into 42,500,000 equity
shares of face value of ₹2 each, 1,229,629.63 series A non-cumulative participating fully convertible
preference shares of face value of ₹81 each, 1,000,000 series B non-cumulative participating fully
convertible preference shares of face value of ₹114 each, 1,218,007 series C non-cumulative participating
fully convertible preference shares of face value of ₹290 each, 1,149,206 series D non-cumulative
participating fully convertible preference shares of face value of ₹630 each and 180,000 series E non-
cumulative participating fully convertible preference shares of face value of ₹1,000 each
August 24, 2021 (i) Clause (iii)A of our Memorandum of Association regarding our Company’s main objects was
amended to reflect the addition of the following sub-clause:
“1A. To carry on in India or elsewhere, in any place or places in the world, either on its
own account or on account of its constituents, solely or in conjunction with others,
the business of designing, and developing, importing, exporting, sourcing,
outsourcing and implementing systems and application software packages and
related products, services and designs, solutions of all kinds and description in the
areas of information technology including but not limited to geospatial technology,
engineering, manufacturing and process control and automation, Geographic
Information Systems, surveys and navigation, image and video processing, artificial
intelligence, natural language processing, computer hardware and software, data
communication, telecommunications, internet, intranet, for industrial, commercial
and consumer applications and to engage in the business of, among others things,
navigation, mapping, location, and local search and provides video map based
navigation, location, and search solutions to its customers.”; and
(ii) The entire other objects Clause IIIC was deleted from our Memorandum of our Association

162
Date of Shareholder’s
resolution/ Effective
date
Particulars
October 7, 2021 Clause V of our Memorandum of Association was amended to reflect an increase in the authorised share
capital of our Company from ₹ 1,555,821,810 divided into 42,500,000 equity shares of face value of ₹2
each, 1,229,629.63 series A non-cumulative participating fully convertible preference shares of face value
of ₹81 each, 1,000,000 series B non-cumulative participating fully convertible preference shares of face
value of ₹114 each, 1,218,007 series C non-cumulative participating fully convertible preference shares
of face value of ₹290 each, 1,149,206 series D non-cumulative participating fully convertible preference
shares of face value of ₹630 each and 180,000 series E non-cumulative participating fully convertible
preference shares of face value of ₹1,000 each to ₹ 1,620,821,810 divided into 75,000,000 equity shares
of face value of ₹2 each, 1,229,629.63 series A non-cumulative participating fully convertible preference
shares of face value of ₹81 each, 1,000,000 series B non-cumulative participating fully convertible
preference shares of face value of ₹114 each, 1,218,007 series C non-cumulative participating fully
convertible preference shares of face value of ₹290 each, 1,149,206 series D non-cumulative participating
fully convertible preference shares of face value of ₹630 each and 180,000 series E non-cumulative
participating fully convertible preference shares of face value of ₹1,000 each
Major events and milestones of our Company
The table below sets forth some of the key events in the history of our Company:
Calendar year Event
1995 • Incorporation of our Company
• Built India’s digital maps
2004 Launched India’s internet mapping portal and internet mapping technologies
2007 • Launched pan-India GPS navigation system
• Series A Investors invested an aggregate amount of ₹56.76 million in our Company
• Series B Investor invested an aggregate amount of ₹106.97 million in our Company
2008 • Qualcomm (Series C Investor) invested an aggregate amount of ₹235.61 million in our Company
• Series A Investors further invested an aggregate amount of ₹93.74 million in our Company
• Series B Investor further invested an aggregate amount of ₹94.52 million in our Company
2011 • Zenrin (Series D Investor) invested an aggregate amount of ₹723.99 million in our Company
• Launched IoT (GPS-based telematics) platform
2015 • Flipkart (Series E Investor)* invested an aggregate amount of ₹97.59 million in our Company
• Launched map and location API platform for developers
2016 Our Company started building transportation, logistics and workforce automation platforms
2017 • Our Company started building AI-powered 4D HD Digital Map Twin of the Real World
• Launched nation-wide unique digital address and location, eLoc
2019 • Launched geospatial analytics and GIS platform
• Launched N-CASE mobility suite for digital vehicle transformation
2021 • Entered into a MoU with the Department of Space, Government of India for exchange of select
geospatial services and APIs
• Integrated with the GoI’s Co-WIN app for providing real time maps for COVID-19 related
information such as tracking of vaccine centres
* Flipkart transferred its entire shareholding in our Company as of March 12, 2021 to its subsidiary, PhonePe Singapore, pursuant to a deed of adherence
dated March 9, 2021.

163
Awards and accreditations
The table below sets forth key awards and accreditations received by our Company:
Calendar Year Particulars
2004 Our Company was declared as a showcase company for the ‘IT Innovation in India’ by NASSCOM
2008 Our Company was awarded the ‘Geospatial Product of the Year’ for its product, ‘MapymyIndia
Navigator’ at the Indian Geospatial Awards 2008 by Geospatial Today
2009 Our Company was recognised as nominee for ‘Gender Inclusivity Awards 2009’ in ‘Corporate Awards
for Excellence in Gender Inclusivity 2009’ by NASSCOM
2011 Our Company was awarded the ‘Most Innovative Mobile Application of the Year’ in India IT &
Telecom Excellence Awards by Frost & Sullivan
2012 Our Company was declared as the ‘Most Popular Geospatial Data Portal in India – mapmyindia.com’
at the Indian Geospatial Forum, 2012 held at Gurugram, India
2014 Our Company was awarded the ‘Hall of Fame 2014’ in recognition of entrepreneurial zeal, growth and
excellence’ by Inc. India
2017 Our Company was awarded the ‘India’s Most Trusted Company 2017’ in the category of India’s Most
Trusted Navigation & Mapping Solutions Company by International Brand Consulting Corporation,
USA
2018 Our Company was awarded the News18 award for “Viewer’s Choice Brand for Driving vehicle Safety”
at the Tech and Auto Awards 2018
2020 • Our Company was awarded the first place in the Others category under the Digital India
AatmaNirbhar Bharat App Innovation Challenge by MyGov for MapmyIndia Move: Maps
Navigation & Tracking
• Our technology division performed benchmark appraisal and achieved CMMI V2.0 Maturity
Level 3 certification by IQI Consulting Services Private Limited
For details in relation to accreditations received by Our Company, see “Our Business-Certifications” beginning on page 153.
Corporate Profile of our Company
For details in relation to our corporate profile including details of our business, activities, services, market, growth, competition,
launch of key products, entry into new geographies or exit from existing markets, suppliers, customers, capacity build-up,
technology, and managerial competence, see “Risk Factors” “Our Business”, “Our Management” and “Management’s
Discussion and Analysis of Financial Condition and Results of Operations” beginning on pages 30, 132, 169, and 247,
respectively.
Time and cost overrun
There have been no time and cost over-runs in respect of our business operations.
Defaults or re-scheduling/restructuring of borrowings
There have been no defaults or rescheduling/restructuring of borrowings with financial institutions/ banks in respect of our
Company’s borrowings.
Significant financial and strategic partners
As on the date of this Red Herring Prospectus, our Company does not have any significant financial or strategic partners.
Details regarding material acquisitions or divestments of business/undertakings, mergers, amalgamation, any
revaluation of assets, etc. in the last 10 years
Except as stated below, our Company has not acquired any business or undertaking and has not undertaken any merger,
amalgamation, or revaluation of assets in the last 10 years.

164
Acquisition of VIPL pursuant to the share purchase agreement dated July 31, 2017 entered into by and among Chandra
Mohan Thimmannagari, Muraleedhara Herur Navada, Karnataka Trustee Company Private Limited, Karnataka Asset
Management Company Private Limited, VIPL, and our Company (the “VIPL SPA”)
Pursuant to the VIPL SPA, our Company acquired an aggregate of (i) 258,334 equity shares of face value of ₹1 each of VIPL,
constituting 54.40% of the paid-up equity share capital of VIPL as existing as of that date, from Chandra Mohan Thimmannagari
and Muraleedhara Herur Navada, for a total purchase consideration of ₹5.66 million; and (ii) 5,000 equity shares of face value
of ₹1 each of VIPL, constituting 1.05% of the paid-up equity share capital of VIPL as existing as of that date and 219,950
preference shares of face value of ₹100 each of VIPL, constituting 100% of the -up preference share capital of VIPL as existing
as of that date, from Karnataka Trustee Company Private Limited, for a total purchase consideration of ₹10.30 million. Further,
the VIPL SPA also enabled the purchase by our Company of an aggregate of 211,602 equity shares of face value of ₹1 each of
VIPL, from the minority shareholders of VIPL. Accordingly, our Company purchased an aggregate of 211,602 equity shares
of face value of ₹1 each of VIPL, constituting 44.55% paid-up equity share capital of VIPL as existing as of that date, for a
total purchase consideration of ₹4.64 million. Thus, our Company acquired the 100% paid-up equity share capital and 100%
paid-up preference share capital of VIPL and VIPL became a wholly owned Subsidiary of our Company in the year 2017. For
details regarding VIPL, see “Our Subsidiaries, Associates, and Joint Ventures” on page 167.
Summary of Key Agreements
A. Investments agreements entered into by our Company
1. Investment agreement dated August 1, 2006 as amended by an addendum dated January 9, 2007 entered into
by and among our Company, Promoters, Murugan Capital, and Sherpalo Mauritius LLC (the “Series A
Investors”) (the “Series A Investment Agreement”)
Our Company, its Promoters, and the Series A Investors entered into the Series A Investment Agreement for
the issuance of 700,748 Series A Preference Shares to the Series A Investors for an aggregate consideration
of ₹ 56.76 million. The Series A Investors also acquired 560,555 equity shares from our Promoters and
312,191 equity shares from Chentech Investments Limited.
2. Investment agreement dated June 15, 2007 entered into by and among our Company, Promoters, Series A
Investors, and Nexus India Ventures I Investments (the “Series B Investor”) (the “Series B Investment
Agreement”)
Our Company, its Promoters, the Series A Investors, and the Series B Investor entered into the Series B
Investment Agreement for the issuance of 938,326 Series B Preference Shares to the Series B Investor for an
aggregate consideration of ₹ 106.97 million.
3. Investment agreement dated December 5, 2008 as amended by an amendment dated February 2, 2009 entered
into by and among our Company, Promoters, Series A Investors, Series B Investor, and Qualcomm (the
“Series C Investor”) (the “Series C Investment Agreement”)
Our Company, its Promoters, the Series A Investors, the Series B Investor, and Qualcomm (Series C Investor)
entered into the Series C Investment Agreement pursuant to which 677,031 Series C Preference Shares were
issued to Qualcomm for an aggregate consideration of ₹ 235.61 million, 269,363 Series C Preference Shares
were issued to the Series A Investors for an aggregate consideration of ₹ 93.74 million, and 271,609 Series
C Preference Shares were issued to the Series B Investor for an aggregate consideration of ₹ 94.52 million.
4. Investment agreement dated June 27, 2011 entered into by and among our Company, its Promoters, Series A
Investors, Series B Investor, Qualcomm (Series C Investor), and Zenrin (the “Series D Investor”) (the
“Series D Investment Agreement”)
Our Company, its Promoters, the Series A Investors, the Series B Investor, Qualcomm (Series C Investor),
and Zenrin (Series D Investor) entered into the Series D Investment Agreement pursuant to which 1,149,206
Series D Preference Shares were issued to Zenrin for an aggregate consideration of ₹ 723.99 million.
5. Transfer of Series A Investors shareholding in our Company to Lightbox
On April 21, 2014, the Series A Investors transferred its entire shareholding in our Company to Lightbox.
6. Investment agreement dated September 30, 2015 as amended by the amendment dated October 28, 2015 and
amendment no. 2 dated October 30, 2015 entered into by and among our Company, its Promoters, Qualcomm
(Series C Investor), Zenrin (Series D Investor), and Flipkart (the “Series E Investor”) read along with the
deed of adherence dated March 9, 2021 executed by PhonePe Singapore (the “Investment Agreement”)

165
Our Company, its Promoters, Qualcomm (Series C Investor), Zenrin (Series D Investor), and Flipkart (Series
E Investor) (collectively the “Parties”) entered into the Investment Agreement. The Series A Investment
Agreement, the Series B Investment Agreement, the Series C Investment Agreement, and the Series D
Investment Agreement were superseded by the Investment Agreement and the Series A Investment
Agreement, Series B Investment Agreement, Series C Investment Agreement and the Series D Investment
Agreement do not subsist as on the date of this Red Herring Prospectus.
Further, in terms of the Investment Agreement, 48,686 Series E Preference Shares were allotted to Flipkart
by our Company on November 2, 2015 for an aggregate consideration of ₹ 97.59 million. Additionally,
Flipkart acquired 525,415 equity shares, 700,748 Series A Preference Shares, 938,326 Series B Preference
Shares, and 540, 972 Series C Preference Shares in the following manner:
i) 525,415 equity shares from Lightbox;
ii) 700,748 Series A Preference Shares and 269,363 Series C Preference Shares from Lightbox; and
iii) 938,326 Series B Preference Shares and 271,609 Series C Preference Shares from Nexus India
Ventures I Investments.
Further, in terms of amendment dated October 28, 2015 to the Investment Agreement, it was agreed between
the Parties that Flipkart will purchase 129,829 equity shares from Rakesh Kumar Verma. Accordingly,
Flipkart acquired additional 129,829 equity shares from Rakesh Kumar Verma pursuant to a share purchase
agreement dated October 28, 2015 entered into by and among Rakesh Kumar Verma, Flipkart, and the
Company.
On March 12, 2021, Flipkart transferred its entire shareholding in the Company, i.e., 655,244 equity shares,
700,748 Series A Preference Shares, 938,326 Series B Preference Shares, 540,972 Series C Preference
Shares, and 48,686 Series E Preference Shares to its subsidiary, PhonePe Singapore, pursuant to a deed of
adherence dated March 9, 2021 executed by PhonePe Singapore.
In terms of the Investment Agreement, Investors also have been provided with certain key rights such drag-
along rights, pre-emptive rights, anti-dilution adjustments, information rights and other such additional rights
in accordance with the terms of the Investment Agreement. Subject to the terms of the Further Agreement
(discussed below), the Investment Agreement shall automatically stand terminated upon listing of the Equity
Shares pursuant to the Offer without any further act or deed required on the part of any Party.
B. Share purchase agreements
Our Promoter, Rakesh Kumar Verma had entered into the following share purchase agreements with the Investors to
increase his shareholding in our Company:
(i) Share purchase agreement dated July 29, 2021 as amended by an addendum dated November 16, 2021
entered into by and among PhonePe Singapore, Rakesh Kumar Verma and our Company (the “PhonePe
SPA”)
In terms of the PhonePe SPA, Rakesh Kumar Verma purchased 9,028,540 Equity Shares held by PhonePe
Singapore aggregating to 16.96% of the shareholding of our Company on a fully diluted basis*, for an
aggregate consideration of ₹856.58 million.
(ii) Share purchase agreement dated July 29, 2021 as amended by an addendum dated November 16, 2021
entered into by and among Qualcomm, Rakesh Kumar Verma and our Company (the “Qualcomm SPA”)
In terms of the Qualcomm SPA, Rakesh Kumar Verma purchased 1,812,133 Equity Shares, held by
Qualcomm aggregating to 3.40% shareholding of our Company on a fully diluted basis*, for an aggregate
consideration of ₹171.25 million.
(iii) Share purchase agreement dated July 29, 2021 as amended by an addendum dated November 16, 2021
entered into by and among Zenrin, Rakesh Kumar Verma and our Company (the “Zenrin SPA”)
In terms of the Zenrin SPA, Rakesh Kumar Verma purchased 4,812,467 Equity Shares, held by Zenrin
aggregating to 9.04% shareholding of our Company on a fully diluted basis*, for an aggregate consideration
of ₹454.78 million.
(the PhonePe SPA, the Qualcomm SPA, and the Zenrin SPA are collectively referred to as the “SPAs”).

166
Accordingly, Rakesh Kumar Verma purchased an aggregate of 15,653,140 Equity Shares from the Investors
and pursuant to completion of the purchase of Equity Shares pursuant to the SPAs, he holds an aggregate of
43.50% of the paid-up Equity Share capital of our Company on a fully diluted basis* (as calculated in terms
of the SPAs), as on the date of this Red Herring Prospectus.
* In accordance with the terms of the SPAs, for the purposes of the calculation of the shareholding of the relevant Investor to be
purchased by Rakesh Kumar Verma in terms of the SPAs, fully diluted basis shall mean calculation of the shareholding assuming all securities (which are convertible to Equity Shares) existing at the time of determination have been exercised and converted into
Equity Shares. Therefore, all ESOPs, whether vested/not vested or granted/not granted and all Preference Shares shall be assumed
to be converted for the purposes of calculation of the shareholding on a fully diluted basis.
Our Promoters have entered into a loan agreement dated October 28, 2021 (the “Loan Agreement”) and an unattested deed of
pledge dated October 28, 2021 (among other security documents) as further modified on November 22, 2021 with JM Financial
Products Limited (the “Lender”) for availing a short term loan facility amounting up to ₹ 1,500 million (“Short Term Loan”) for
the acquisition of 15,653,140 Equity Shares aggregating to 29.40% paid-up Equity Share capital of our Company (“Acquisition
Shares”) by one of our Promoters, Rakesh Kumar Verma, from the Investors, namely, Qualcomm, Zenrin, and PhonePe Singapore,
in terms of the SPAs described above. As a security for the Short Term Loan, a first and exclusive pledge, in favour of the Lender,
was created over such number of Equity Shares aggregating to 11.77% of the paid-up Equity Share capital of our Company held
by our Promoters, prior to first drawdown request made by our Promoters for the Short Term Loan. Upon transfer of the Acquisition
Shares to Rakesh Kumar Verma by the Investors on November 25, 2021, the pledge on such number of Equity Shares aggregating
to 11.77% of the paid-up Equity Share capital of our Company held by our Promoters was released and instead the Acquisition
Shares were pledged in favour of the Lender. The pledge on the Acquisition Shares has been released by the Lender prior to filing
of this Red Herring Prospectus with the RoC, to facilitate the Offer and the offer for sale of 4,251,044 Equity Shares by the
Individual Selling Shareholder. In terms of the Loan Agreement and the security documents entered thereto by our Promoters, the
sale proceeds to be received by the Individual Selling Shareholder from the sale of 4,251,044 Equity Shares in the Offer for Sale
are required to be utilised for the repayment of the Short Term Loan.
C. Further agreement and amendment to the Investment Agreement dated July 29, 2021 entered into by and among
our Company, the Promoters, and the Investors (the “Further Agreement”) and the deed of adherence to the
Further Agreement executed by PhonePe India dated September 16, 2021 ( “PhonePe India DoA”)
Our Company, the Promoters, and the Investors (the “Parties”) have entered into the Further Agreement to amend
certain clauses of the Investment Agreement to facilitate the Offer and to record their understanding in relation to the
sale of the Equity Shares to Rakesh Kumar Verma pursuant to the SPAs.
The parties to the Further Agreement have agreed certain conditions relating to this Offer and the sale of the Equity
Shares of our Company in terms of the SPAs. It is further agreed among the Parties that in case the Offer fails or is
not completed on or prior to January 31, 2022 or other mutually agreed extended date or is withdrawn pursuant to the
terms of the Further Agreement, the Further Agreement shall be terminated and each of the Investors shall have the
option or an obligation, as the case may be, to repurchase such number of Equity Shares from Rakesh Kumar Verma
as were transferred pursuant to the SPAs. Further, in such an event, the Investment Agreement as it stood prior to the
execution of the Further Agreement shall be reinstated subject to survival of certain clauses of the Further Agreement.
The Parties have also agreed that PhonePe Singapore shall continue to have the right to nominate one director on the
Board post listing of the Company’s Equity Shares pursuant to the Offer as long as PhonePe Singapore holds at least
10% of the Company’s shareholding on a fully diluted basis, subject to such right being approved by the Shareholders
of the Company by way of a special resolution post the Offer in accordance with applicable law. Pursuant to the
PhonePe India DoA, all rights and obligations of PhonePe Singapore have been transferred and vest with PhonePe
India, including but not limited to the right to nominate one director on the Board post listing of the Company’s Equity
Shares.
The Parties have further agreed that on and from the date of listing of the Equity Shares on the Stock Exchanges
pursuant to the Offer, the Investment Agreement along with Further Agreement, shall automatically stand terminated,
without any further act or deed required on the part of any Party.
Company’s status as an ‘Indian entity’ in terms of the Geospatial Guidelines
Pursuant to completion of the transactions contemplated under the SPAs, our Promoter, Rakesh Kumar Verma holds
an aggregate of 43.50% of the paid-up Equity Share capital of our Company on a fully diluted basis*, as on the date of
this Red Herring Prospectus. Further, our other Promoter Rashmi Verma holds 17.66% of the paid-up Equity Share
capital of our Company on a fully diluted basis*, as on the date of this Red Herring Prospectus. Accordingly, in terms
of the Geospatial Guidelines read with Rule 23 of the FEMA Rules, our Company is an Indian entity owned and
controlled by resident Indian citizens as on the date of this Red Herring Prospectus. The Promoters of our Company
are resident Indian citizens as on the date of this Red Herring Prospectus and exercise management control over our
Company in terms of the Investment Agreement.

167
Post the Offer, our Promoters will collectively hold an aggregate of 53.18% of the paid-up Equity Share capital of our
Company on a fully diluted basis*. Thus, our Company will continue to be an Indian entity (in terms of the definition
prescribed under the Geospatial Guidelines read with Rule 23 of the FEMA Rules) owned as well as controlled by
resident Indian citizens, post the Offer.
* In accordance with the terms of the SPAs, fully diluted basis shall mean calculation of the shareholding assuming all securities (which are
convertible to Equity Shares) existing at the time of determination have been exercised and converted into Equity Shares. Therefore, all ESOPs, whether vested/not vested or granted/not granted and all Preference Shares shall be assumed to be converted for the purposes of
calculation of the shareholding on a fully diluted basis.
Agreements with Key Managerial Personnel, Directors, Promoters, or any other employee
There are no agreements entered into by a Key Managerial Personnel or Director or Promoter or any other employee of our
Company, either by themselves or on behalf of any other person, with any shareholder or any other third party with regard to
compensation or profit sharing in connection with dealings in the securities of our Company.
Key terms of other subsisting material agreements
Except the Investment Agreement, and the Further Agreement disclosed above, our Company has not entered into any other
material agreements, including with strategic partners or financial partners, other than in the ordinary course of business.
Guarantees given by the promoter(s) offering its shares in the offer for sale
No guarantees have been issued by one of our Promoters, Rashmi Verma (the Individual Selling Shareholder) who is offering
a certain portion of the Equity Shares held by her in terms of the Offer for Sale.
Our holding company
As of the date of this Red Herring Prospectus, our Company has no holding company.
Our Subsidiaries, associates, and joint ventures
As on the date of this Red Herring Prospectus, our Company has two wholly owned subsidiaries, details of which are set out
below. Our Company does not have any associates or joint ventures as on the date of this Red Herring Prospectus.
Indian Subsidiary
Vidteq (India) Private Limited (“VIPL”)
Corporate Information
VIPL was incorporated on May 28, 2008 as a private limited company under the Companies Act, 1956. Its corporate
identification number is U72200KA2008PTC046593. Its registered office is situated at No.1134, 4th Floor, Sree Ram Nivas,
Opposite Axis Bank, 100 Ft Road, Indiranagar, Bengaluru 560 038, Karnataka, India.
VIPL is authorised to engage in the business of, among other things, navigation, mapping, location, and local search and
provides video map-based navigation, location, and search solutions to its customers. As on the date of this Red Herring
Prospectus, VIPL is engaged in the business of providing mapping services only to our Company.
Capital Structure
The authorised share capital of VIPL is ₹ 22,775,000 divided into 775,000 equity shares of face value of ₹1 each and 220,000
preference shares of face value of ₹100 each. The issued and paid-up share capital of VIPL is ₹ 22,743,657 divided into 748,657
equity shares of face value of ₹1 each and 219,950 preference shares of face value of ₹100 each.
Shareholding Pattern
As on the date of this Red Herring Prospectus, the shareholding pattern of VIPL is as follows:
Name of the shareholder Number of equity
shares of face value of
₹1 each
Percentage of
shareholding (%)
Number of preference
shares of face value of
₹100 each
Percentage of
shareholding (%)
Our Company 748,656 99.99 219,950 100.00
Anuj Kumar Jain* 1 0.01 - -
Total 748,657 100.00 219,950 100.00 * As a nominee of our Company.
Accumulated profits or losses

168
As on the date of this Red Herring Prospectus, there are no accumulated profits or losses of VIPL which have not been accounted
for by our Company in the Restated Consolidated Financial Information.
Foreign Subsidiary
CE Info Systems International Inc (“CE International”)
Corporate Information
CE International was incorporated on April 6, 2018 as a corporation under the General Corporation Law of Delaware. Its file
number is 6833246 and its employer identification number is 82-5146817. Its registered office is situated at 691 S Milpitas
Blvd, St 217 Milpitas, CA 95035, U.S.A.
Nature of Business
C.E International is authorised to engage in the business of, among other things, selling our Company’s products and services
in the international market as a reseller. As on the date of this Red Herring Prospectus, CE International is engaged in the
business of selling our Company’s products and services in the international market as a reseller.
Capital Structure
As on the date of this Red Herring Prospectus, the share capital of CE International is USD 1,025,000 divided into 102,500,000
common stock of face value of USD 0.01 each.
Shareholding Pattern
As on the date of this Red Herring Prospectus, the shareholding pattern of CE International is as follows:
Name of the shareholder Number of common stock of face value of USD 0.01 each Percentage of shareholding (%)
Our Company 102,500,000 100.00
Total 102,500,000 100.00
Accumulated profits or losses
As on the date of this Red Herring Prospectus, there are no accumulated profits or losses of CE International which have not
been accounted for by our Company in the Restated Consolidated Financial Information.

169
OUR MANAGEMENT
In terms of our Articles of Association, our Company is required to have not less than three Directors and not more than fifteen
Directors. As on the date of this Red Herring Prospectus, our Board comprises eight Directors which include two Executive
Directors and six Non-executive Directors including three-women directors.
Details regarding our Board as on the date of this Red Herring Prospectus are set forth below:
S. No. Name, DIN, designation, term, period of directorship, address,
occupation, date of birth and age
Other Directorships
1. Rakesh Kumar Verma
Designation: Chairman and Managing Director
Term: Liable to retire by rotation*
Period of Directorship: Director since February 17, 1995
Address: E-10/4 Second Floor, Vasant Vihar, Vasant Vihar -2,
South West Delhi, Delhi 110 057, India
Occupation: Business
Date of Birth: December 16, 1950
DIN: 01542842
Age: 70 years
Nationality: Indian
Nil
2. Rohan Verma
Designation: Whole-time Director and CEO
Term: Liable to retire by rotation#
Period of Directorship: Director since July 26, 2007
Address: E-10/4, Second Floor, Vasant Vihar, Vasant Vihar-2,
South West Delhi, Delhi 110 057, India
Occupation: Business
Date of Birth: August 31, 1985
DIN: 01797489
Age: 36
Nationality: U.S.A with Overseas Citizenship of India
Indian companies:
• Infidreams Industries Private Limited
• Cholamandalam Investment and Finance
Company Limited
Foreign companies:
CE Info Systems International Inc
3. Rakhi Prasad
Designation: Non-executive Director
Term: Liable to retire by rotation
Period of Directorship: Director since September 28, 2020
Address: 1801, Kingston tower, 18th Floor, G.D. Ambedkar Road,
Opp. Wadia Baug, Parel East, Mumbai 400 033, Maharashtra, India
Occupation: Professional
Date of Birth: June 20, 1978
DIN: 07621845
Age: 43
Nationality: Indian
Spinclabs Private Limited
4. Sonika Chandra
Designation: Non-Executive (Nominee) Director^
Term: Not liable to retire by rotation
Period of Directorship: Director since June 3, 2021
Address: Villa No. 31, Phase 1 lane 1, Adarsh Palm Retreat, Behind
Intel Gate, VTC, Devara Beesana Halli, Bellandur, Bengaluru 560
103, Karnataka, India
Occupation: Service
Date of Birth: May 27, 1974
DIN: 09193853
Age: 47 years
Nil

170
S. No. Name, DIN, designation, term, period of directorship, address,
occupation, date of birth and age
Other Directorships
Nationality: U.S.A
5. Shambhu Singh
Designation: Independent Director
Term: Three years with effect from July 27, 2021
Period of Directorship: Director since July 27, 2021
Address: Flat 703, Janaki Apartments, Plot 7, Sector 22, Dwarka,
New Delhi 110 077, India
Occupation: Retired IAS Officer
Date of Birth: December 28, 1959
DIN: 01219193
Age: 61 years
Nationality: Indian
Nil
6. Anil Mahajan
Designation: Independent Director
Term: Three years with effect from July 27, 2021
Period of Directorship: Director since July 27, 2021
Address: E-022, Windsor Park, 5 Vaibhav Khand, Indirapuram,
Ghaziabad 201 014, Uttar Pradesh, India
Occupation: Professional
Date of Birth: July 11, 1964
DIN: 00003398
Age: 57 years
Nationality: Indian
• Kriti Mercantile Private Limited
• Kare India Insurance Brokers Private Limited
• Kriti Advisory Services Private Limited
7. Kartheepan Madasamy
Designation: Independent Director
Term: Three years with effect from July 31, 2021
Period of Directorship: Director since July 31, 2021
Address: 972, Olive St, Menlo Park, CA 94025, USA
Occupation: Service
Date of Birth: December 6, 1972
DIN: 03562906
Age: 48 years
Nationality: U.S.A with Overseas Citizenship of India
Sun Mobility Investors Limited
8. Tina Trikha
Designation: Independent Director
Term: Three years with effect from July 27, 2021
Period of Directorship: Director since July 27, 2021
Address: Meadows 9, Street 12, Villa 2, Dubai, UAE
Occupation: Professional
Date of Birth: July 9, 1975
DIN: 02778940
Age: 46 Years
Nationality: Indian
• Hero MotoCorp Limited
• Oberoi Realty Limited
• Flatiron Consulting Services Private Limited
* Rakesh Kumar Verma’s term as the Chairman and Managing Director of our Company was fixed for a period of four years with effect from August 26,
2021. His re-appointment as a Director liable to retire by rotation shall not be deemed to constitute a break in his term as the Chairman and Managing Director of our Company.
# Rohan Verma’s term as the Whole-time Director and CEO of our Company was fixed for a period of five years with effect from April 1, 2019. His re-
appointment as a Director liable to retire by rotation shall not be deemed to constitute a break in his term as the Whole-time Director and CEO of our Company.
^ Nominee of PhonePe India.

171
Relationship between our Directors and our Key Managerial Personnel
Rakesh Kumar Verma, our Chairman and Managing Director is the father of Rohan Verma, our Whole-time Director and CEO,
and Rakhi Prasad, our Non-executive Director. Further, Rohan Verma and Rakhi Prasad are siblings. Rashmi Verma, our co-
founder and chief technology officer, is the spouse of Rakesh Kumar Verma and mother of Rohan Verma and Rakhi Prasad.
Apart from this, none of our Directors are related to each other or to any of the Key Managerial Personnel.
Brief Biographies of Directors
Rakesh Kumar Verma is the Chairman and Managing Director of our Company. He received his bachelor’s degree in
mechanical engineering (hons.) from the Birla Institute of Technology and Science, Pilani, in 1972 and his master’s degree of
business administration from the Eastern Washington University, U.S.A, in 1979. He co-founded our Company along with
Rashmi Verma in 1995 and has significant experience as an entrepreneur in the field of digital maps and geospatial information
technologies. He worked for 10 years in the U.S.A. from 1979-1989 in various organisations in their business functions and as
faculty, including in EDS (General Motors). He is the FICCI National Committee Chair of Geospatial Technologies. He is also
currently a member of the Department of Science and Technology’s Legal-sub Committee for the National Geospatial Policy.
He has in the past served as a member of the Government of India’s Planning Commission’s National GIS Committee. He
received the Geospatial Business Leader of the Year 2015 award from Geospatial Media Communications. He also received
the BITS Pilani Distinguished Alumni Award in 2020 and was listed as top 50 alumni by BITSA in its 2017 book publication.
He has been a Director on our Board since February 17, 1995.
Rohan Verma is the Whole-time Director and the CEO of our Company. He received his bachelor’s degree in electrical
engineering from the Stanford University, U.S.A., in 2007, where he was awarded the President’s Award for academic
excellence. He received his master’s degree of business administration with distinction from the London Business School, in
2015, where he was awarded the Dean’s List Award. He has experience as an entrepreneur in the digital mapping, geospatial
technologies and automotive mobility technologies. As a 19-year-old, he built an interactive internet mapping portal,
MapmyIndia.com, in 2004, while still an undergraduate at the Stanford University. He currently serves as a member of the
Confederation of Indian Industry National Committee on Space and represents our Company as a core member in the Indian
Space Association. He also serves on the Internet and Mobile Association of India’s (IAMAI) Logistics Committee. He has
also been elected and serves on the CII Delhi State Executive Council. He is an independent director on the board of directors
of Cholamandalam Investment and Finance Company (listed on BSE and NSE), the financial services arm of Murugappa Group.
He joined our Company in 2007 and worked in various capacities and was appointed as CEO of our Company with effect from
April 1, 2019. He has been a Whole-time Director on our Board since July 26, 2007.
Rakhi Prasad is a Non-executive Director of our Company. She holds a bachelor's degree of science in computer science from
the University of Michigan and a bachelor’s degree of arts in economics honours from the Lady Shri Ram College, University
of Delhi. She also holds a master’s degree of science in financial engineering from the Columbia University, U.S.A. She has
significant experience in the field of finance and technology and has previously worked with Goldman Sachs, Enam Securities,
and Matrix Partners. She is currently an investment manager at Alder Capital. She is a member of Bloomberg Women's Buy-
side Network and has been featured in the list of India's Top 100 Women in Finance in 2020 by the Association of International
Wealth Management of India (AIWMI). She has been a Director on our Board since September 28, 2020.
Sonika Chandra is a Non-executive (Nominee) Director of our Company. She holds a master’s degree in business
administration from the Wharton School of Business, University of Pennsylvania, U.S.A. She has experience in the field of
financial services and technology and has previously worked in the U.S.A with Western Union. She is currently a vice president
at PhonePe India since March 2020. She has been a Director on our Board since June 3, 2021.
Shambhu Singh is an Independent Director of our Company. He holds a master’s degree in economics from the Patna
University. He is a retired IAS officer and the last position he held before retirement was Special Secretary and Financial
Advisor in Ministry of Road, Transport and Highways, Government of India. He has significant experience in government
administrative services and has served on the board of directors of various public sector undertakings such as Central Electronic
Limited, Dredging Corporation of India Limited, Shipping Corporation of India Limited, Indian Tourism Development
Corporation Limited, and India Port Rail & Ropeway Corporation Limited during his tenure as an IAS officer. He has been a
Director on our Board since July 27, 2021.
Anil Mahajan is an Independent Director of our Company. He holds a master’s degree in arts from the Punjab University and
is member of the Institute of Company Secretaries of India. He has significant experience in the field of corporate affairs and
governance, including corporate law and strategy. He is a founding director on the board of Kriti Advisory Services Private
Limited, which is engaged in advising corporates in the areas of corporate governance, start-up approvals, and FEMA and GST
advisory. He has been a Director on our Board since July 27, 2021.
Kartheepan Madasamy is an Independent Director of our Company. He holds a bachelor’s degree in electronics and
communication engineering from the College of Engineering, Anna University and a master’s in electrical engineering from
the University of Michigan. He also holds a master’s degree in business administration from the University of Chicago, Booth
School of Business. He is an experienced venture capital professional and has a technology background in operations and

172
investments across various technologies such as automation and robotics. He is the founding and managing partner of MFV
Partners Management, LLC which is engaged in investments across various technologies such as quantum computing, artificial
intelligence, robotics, smart manufacturing, shared mobility, automotive technologies, among others. He has previously worked
with Qualcomm Ventures, White Eagle Systems Technology Inc, and Rocktron Corporation. He has previously served on our
Board from 2011 to 2017. He has been a Director on our Board since July 31, 2021.
Tina Trikha is an Independent Director of our Company. She holds a bachelor’s degree of science in economics from the
Massachusetts Institute of Technology, U.S.A., and a master’s degree in business administration from the Wharton School of
Business, University of Pennsylvania, U.S.A. She is an associate certified coach and holds a certification from the International
Coaching Federation. She has experience in the field of finance and strategy and has previously worked with Credit Suisse First
Boston, McKinsey & Company, American Express, and Godrej Industries Limited. She has been a Director on our Board since
July 27, 2021.
Confirmations
None of our Directors is or was a director of any listed company during the five years immediately preceding the date of this
Red Herring Prospectus, whose shares have been or were suspended from being traded on any stock exchange during their
tenure.
None of our Directors is or was a director of any listed company which has been or was delisted from any stock exchange
during their tenure.
Except for Sonika Chandra, our Non-Executive (Nominee) Director, nominated by PhonePe India, one of the Investors, there
is no arrangement or understanding with the major shareholders, customers, suppliers or others, pursuant to which any of our
Directors were appointed on the Board or as a member of senior management. For details, see “History and Certain Corporate
Matters – Summary of Key Agreements” on pages 164 to 166.
Further, none of our Directors have been identified as Wilful Defaulters.
None of our Directors has entered into any service contracts with our Company providing for benefits upon termination of
employment.
Terms of Appointment of our Executive Directors
Rakesh Kumar Verma
Rakesh Kumar Verma is the Chairman and Managing Director on our Board since February 17, 1995. Our Shareholders,
pursuant to a special resolution passed on December 16, 2020, confirmed the continuation of his office as the Managing Director
of our Company on attaining the age of 70 years. Pursuant to a Board resolution dated April 12, 2021, his remuneration was
fixed at ₹ 15.00 million for Financial Year 2022 and he was paid a performance incentive of ₹ 30.00 million for Financial Year
2021. The remuneration and performance incentive were subsequently revised as per Board resolution dated August 26, 2021
as stated below.
Pursuant to the Board resolution dated August 26, 2021 and Shareholders’ resolution dated September 30, 2021, the term of
Rakesh Kumar Verma as our Chairman and Managing Director was fixed for a period of four years with effect from August
26, 2021 on a remuneration of ₹15.00 million per annum with the monthly break-up as stated below.
Particulars Remuneration (per month in ₹ million)
Basic salary 0.70
House rent allowance 0.35
Other allowances 0.20
Total 1.25
Further, pursuant to the Board resolution dated August 26, 2021 and Shareholders’ resolution dated September 30, 2021 ,
Rakesh Kumar Verma is entitled to a performance based incentive of up to 150% of his remuneration as stated above with a
provision of annual increment up to 10% of the remuneration on fiscal year basis.
Rohan Verma
Rohan Verma is the Whole-time Director and CEO of our Company. He was first appointed Whole-time Director of our
Company on August 31, 2007 and continued to be a Whole-time Director of our Company till March 31, 2018. From April 1,
2018 till March 31, 2019, he was a non-executive director of our Company. Thereafter, with effect from April 1, 2019, he was
appointed the Whole-time Director and CEO of our Company for a period of five years.
Pursuant to a Board resolution dated April 12, 2021, his remuneration was fixed at ₹ 15.00 million for Financial Year 2022 and
he was paid a performance incentive of ₹ 20.00 million for Financial Year 2021. The remuneration and performance incentive

173
were subsequently revised as per Board resolution dated August 26, 2021 as stated below.
Pursuant to the Board resolution dated August 26, 2021 and Shareholders’ resolution dated September 30, 2021 , his
remuneration as the Whole-time Director and CEO of our Company was fixed at ₹ 15.00 million per annum with the monthly
break-up as stated below with effect from August 26, 2021 for the remaining period of his tenure as the Whole-time Director
and CEO of our Company, i.e., up to March 31, 2024:
Particulars Remuneration (per month in ₹ million)
Basic salary 0.70
House rent allowance 0.35
Other allowances 0.20
Total 1.25
Further, pursuant to the Board resolution dated August 26, 2021 and Shareholders’ resolution dated September 30, 2021, Rohan
Verma is entitled to a performance based incentive of up to 150% of his remuneration as stated above with a provision of annual
increment up to 10% of the remuneration on fiscal year basis.
Payment or benefit to Directors of our Company
Details of the sitting fees or other remuneration, including any contingent or deferred compensation accrued for the year, paid
to our Directors in Financial Year 2021 are set forth below.
(a) Remuneration to our Executive Directors
Details of the remuneration paid to our Executive Directors in Financial Year 2021 are set forth below:
S. No. Name of Director Total remuneration
(in ₹ million)
1. Rakesh Kumar Verma 30.00
2. Rohan Verma 33.00
(b) Remuneration to our Non-executive Directors
Pursuant to a resolution dated August 26, 2021 passed by our Board, our Non-executive Directors including our
Independent Directors are entitled to a sitting fees of (a) ₹50,000.00 for attending each meeting of our Board; and (b)
₹25,000.00 for attending each meeting of the committees of our Board.
Details of the remuneration paid to our Non-executive Directors including our Independent Directors in the Financial
Year 2021 are set forth below.
S. No. Name of Director Sitting fees (in ₹
million)
Commission
(in ₹ million)
Total remuneration
(in ₹ million)
1. Rakhi Prasad Nil Nil Nil
2. Sonika Chandra Nil Nil Nil
3. Shambhu Singh* Nil Nil Nil
4. Anil Mahajan* Nil Nil Nil
5. Kartheepan Madasamy* Nil Nil Nil
6. Tina Trikha* Nil Nil Nil * Appointed as independent directors after March 31, 2021, accordingly, no remuneration was paid to our Independent Directors during
Financial Year 2021.
Bonus or Profit Sharing Plan for the Directors
Except for Rakesh Kumar Verma, our Chairman and Managing Director, and Rohan Verma, our Whole-time Director and
CEO, who are entitled to a performance bonus, none of our Directors are entitled to any bonus or profit-sharing plan of our
Company. For details of such performance bonus, see “Terms of Appointment of our Executive Directors” on page 172.
Remuneration paid to Directors of our Company by our Subsidiaries
None of our Directors are entitled to remuneration from our Subsidiaries.
Shareholding of Directors in our Company
As per our Articles of Association, our Directors are not required to hold any qualification shares.
Except as disclosed below, none of our Directors hold any Equity Shares as of the date of filing of this Red Herring Prospectus

174
Sr. No. Name of the Director Number of Equity Shares held
1. Rakesh Kumar Verma 23,163,080
2. Rohan Verma 284,786
3. Rakhi Prasad 3,133 #
Certain of our Directors have been granted certain options under the ESOP 2008. For details in relation to the options granted
to our Directors see, “Capital Structure – ESOP 2008” on page 83.
Interests of Directors
(a) All our Directors may be deemed to be interested to the extent of remuneration and reimbursement of expenses, if any,
payable to them by our Company as well as sitting fees, if any, payable to them for attending meetings of our Board
or Committees thereof. For further details, see “Terms of Appointment of our Executive Directors” and “Payment or
benefit to Directors of our Company”, on pages 172 and 173, respectively. In addition to his remuneration and
reimbursement of expenses as a Director of our Company, Rakesh Kumar Verma also has an interest in our Company
to the extent of rent income received by him from our Company pursuant to the lease agreement dated December 12,
2019 in respect of the premises situated at Building No. S-388, Greater Kailash Part II, New Delhi 110 048, India,
pursuant to which a rent of ₹0.22 million per month is payable to Rakesh Kumar Verma by our Company.
(b) Except for Rakesh Kumar Verma, who is also our Promoter, none of our Directors have any interests in the promotion
or formation of our Company.
(c) None of our Directors have any interest in any property acquired or proposed to be acquired of our Company or by
our Company in the last three years.
(d) None of our Directors have any interest in any transaction by our Company for acquisition of land, construction of
building or supply of machinery.
(e) No consideration in cash or shares or otherwise has been paid or agreed to be paid to any of our Directors or to the
firms or companies in which any of our Directors are interested as a member, by any person, either to induce them to
become, or to qualify them as a Director, or otherwise for services rendered by our Directors or by the firm or company
in which they are interested, in connection with the promotion or formation of our Company
(f) Our Directors may also be interested to the extent of Equity Shares, if any (together with dividends and other
distributions in respect of such Equity Shares), held by the entities in which they are associated, directly or indirectly,
as promoters, directors, partners, proprietors or trustees or held by their relatives.
(g) Rohan Verma our Whole-time Director and CEO is interested to the extent of his directorship on the board of directors
of our wholly owned Subsidiary, CE International.
(h) Anil Mahajan, one of our Independent Directors, is interested in our Company to the extent of being a shareholder, the
founding director and whole-time director in Kriti Advisory Services Private Limited, a consulting company, which
has received consulting income in the past three years from our Company.
(i) No loans have been availed by our Directors from our Company.
Changes in our Board in the last three years
Details of the changes in our Board in the last three years preceding the date of this Red Herring Prospectus are set forth below.
S. No. Name Date of Change Reason
1. Sonika Chandra September 30, 2021 Change in designation from Additional
Non-Executive (Nominee) Director to Non-
executive (Nominee) Director*
2. Kartheepan Madasamy July 31, 2021 Appointment as an Independent Director
3. Shambhu Singh July 27, 2021 Appointment as an Independent Director
4. Anil Mahajan July 27, 2021 Appointment as an Independent Director
5. Tina Trikha July 27, 2021 Appointment as an Independent Director
6. Rashmi Verma July 27, 2021 Resignation as a Whole-time Director
7. Noriaki Hagio July 27, 2021 Resignation as a Non-executive Director
8. Vijay Ajmera July 27, 2021 Resignation as a Non-executive Director
9. Sonika Chandra June 3, 2021 Appointment as an additional Non-
Executive (Nominee) Director (as a
nominee of PhonePe Singapore)*

175
S. No. Name Date of Change Reason
10. Vishal Gupta June 3, 2021 Resignation as a Non-executive Director
11. Rakhi Prasad December 16, 2020 Change in designation from additional
Director to Non-executive Director
12. Vijay Ajmera December 16, 2020 Appointment as a Non-executive Director
13. Rakhi Prasad September 28, 2020 Appointment as an additional Director
14. Shivalik Prasad September 28, 2020 Resignation as a Non-executive Director
15. Rashmi Verma April 17, 2020 Re-appointed as an Whole-time Director
16. Vijay Ajmera March 3, 2020 Appointment as an additional Director
17. Nishant Varman January 20, 2020 Resignation as a Non-executive Director
18. Shivalik Prasad September 30, 2019 Change in designation from Whole-time
Director to Non-executive Director
19. Vishal Gupta September 20, 2019 Change in designation from additional
Director to Non-executive Director * Pursuant to the PhonePe India DoA, all rights and obligations of PhonePe Singapore have been transferred and vest with PhonePe India. Consequently
Sonika Chandra is the nominee director of PhonePe India,
Borrowing Powers of Board
Pursuant to our Articles of Association, and in accordance with the provisions of the Companies Act and the rules made
thereunder, our Board is authorised to borrow money and create charge and/ or pledge, mortgage, hypothecate on its properties,
which together with the money already borrowed does not exceed aggregate of the paid-up share capital, free reserves and
securities premium of our Company, apart from temporary loans obtained from our Company’s bankers in the ordinary course
of business.
Corporate Governance
The provisions of the SEBI Listing Regulations with respect to corporate governance will be applicable to us immediately upon
the listing of our Equity Shares with the Stock Exchanges. We are in compliance with the requirements of the applicable
regulations, including the SEBI Listing Regulations, the Companies Act and other applicable regulations of SEBI, in respect of
corporate governance including in respect of the constitution of the Board and Committees thereof, and formulation and
adoption of policies. Our Board has been constituted in compliance with the Companies Act and the SEBI Listing Regulations.
As on the date of this Red Herring Prospectus, our Board comprises eight Directors, out of which two are Executive Directors,
two are Non-executive Directors, and four are Independent Directors including one-woman Independent Director. In
compliance with Section 152 of the Companies Act, not less than two thirds of the Directors (excluding Independent Directors)
are liable to retire by rotation.
Our Company undertakes to take all necessary steps to continue to comply with all the requirements of SEBI Listing Regulations
and the Companies Act.
Committees of our Board
Details of the Committees of our Board are set forth below. In addition to the Committees detailed below, our Board of Directors
may, from time to time constitute other committees for various functions.
Audit Committee
The members of the Audit Committee are:
Sr. No. Name of Director Committee designation
1. Shambhu Singh Chairperson
2. Anil Mahajan Member
3. Rakesh Kumar Verma Member
The Audit Committee was constituted pursuant to resolution passed by our Board in its meeting held on July 27, 2021 and
functions of the Audit Committee are in accordance with Section 177 of the Companies Act and the SEBI Listing Regulations
and its terms of reference as stipulated pursuant to resolution passed by our Board in its meeting held on July 27, 2021 are set
forth below.
• Overseeing our Company’s financial reporting process and disclosure of its financial information to ensure that its
financial statements are correct, sufficient and credible;
• Recommending to the Board the appointment, remuneration and terms of appointment of the statutory auditor of the
Company;

176
• Reviewing and monitoring the statutory auditor’s independence and performance, and effectiveness of audit process;
• Approving payments to statutory auditors for any other services rendered by the statutory auditors;
• Reviewing, with the management, the annual financial statements and auditor’s report thereon before submission to
the Board for approval, with particular reference to:
1. Matters required to be included in the Director’s Responsibility Statement to be included in the Board’s report
in terms of clause (c) of sub-section 3 of Section 134 of the Companies Act;
2. Changes, if any, in accounting policies and practices and reasons for the same;
3. Major accounting entries involving estimates based on the exercise of judgment by management;
4. Significant adjustments made in the financial statements arising out of audit findings;
5. Compliance with listing and other legal requirements relating to financial statements;
6. Disclosure of any related party transactions; and
7. Qualifications and modified opinion(s) in the draft audit report.
• Reviewing, with the management, the quarterly, half-yearly and annual financial statements before submission to the
Board for approval;
• Reviewing, with the management, the statement of uses/ application of funds raised through an issue (public issue,
rights issue, preferential issue, etc.), the statement of funds utilised for purposes other than those stated in the offer
document/ prospectus/ notice and the report submitted by the monitoring agency monitoring the utilisation of proceeds
of a public or rights issue, and making appropriate recommendations to the Board to take up steps in this matter. This
also includes monitoring the use/application of the funds raised through the proposed initial public offer by the
Company;
• Approval or any subsequent modifications of transactions of the Company with related parties and omnibus approval
for related party transactions proposed to be entered into by the Company subject to such conditions as may be
prescribed;
• Scrutinising of inter-corporate loans and investments;
• Valuation of undertakings or assets of the Company, wherever it is necessary;
• Evaluating of internal financial controls and risk management systems;
• Establishing a vigil mechanism for directors and employees to report their genuine concerns or grievances;
• Reviewing, with the management, the performance of statutory and internal auditors, and adequacy of the internal
control systems;
• Reviewing the adequacy of internal audit function if any, including the structure of the internal audit department,
staffing and seniority of the official heading the department, reporting structure coverage and frequency of internal
audit;
• Discussing with internal auditors on any significant findings and follow up thereon;
• Reviewing the findings of any internal investigations by the internal auditors into matters where there is suspected
fraud or irregularity or a failure of internal control systems of a material nature and reporting the matter to the Board;
• Discussing with statutory auditors before the audit commences, about the nature and scope of audit as well as post-
audit discussion to ascertain any area of concern;
• Looking into the reasons for substantial defaults in the payment to the depositors, debenture holders, shareholders (in
case of non-payment of declared dividends) and creditors;
• Reviewing the functioning of the whistle blower mechanism;
• Approving the appointment of the chief financial officer or any other person heading the finance function or
discharging that function after assessing the qualifications, experience, and background, etc. of the candidate; and

177
• Carrying out any other function as is mentioned in the terms of reference of the Audit Committee and any other terms
of reference as may be decided by the Board and/or specified/provided under the Companies Act, the Listing
Regulations or by any other regulatory authority.
• Reviewing the utilization of loans and/ or advances from/investment by the holding company in any subsidiary
exceeding rupees 100 crore or 10% of the asset size of the subsidiary, whichever is lower including existing loans /
advances / investments existing as per applicable law.
• Considering and commenting on the rationale, cost-benefits and impact of schemes involving merger, demerger,
amalgamation etc., on the Company and its shareholders.
• Such roles as may be prescribed under the Companies Act and SEBI Listing Regulations.
Powers of the Audit Committee
The powers of the Audit Committee shall include the following:
o To investigate any activity within its terms of reference;
o To seek information from any employee;
o To obtain outside legal or other professional advice; and
o To secure attendance of outsiders with relevant expertise, if it considers necessary as may be prescribed under the
Companies Act, 2013 (together with the rules thereunder) and SEBI Listing Regulations.
o To have full access to information contained in records of Company.
Reviewing Powers
The Audit Committee shall mandatorily review the following information:
o Management’s discussion and analysis of financial condition and results of operations;
o Statement of significant related party transactions (as defined by the Audit Committee), submitted by the management;
o Management letters / letters of internal control weaknesses issued by the statutory auditors;
o Internal audit reports relating to internal control weaknesses;
o The appointment, removal and terms of remuneration of the chief internal auditor shall be subject to review by the
audit committee;
o Examination of the financial statements and the auditors’ report thereon; and
o Statement of deviations:
i. quarterly statement of deviation(s) including report of monitoring agency, if applicable, submitted to stock
exchange(s) in terms of the Listing Regulations; and
ii. annual statement of funds utilised for purposes other than those stated in the document/prospectus/notice in
terms of the Listing Regulations.”
o The financial statements, in particular, the investments made by any unlisted subsidiary.
Nomination and Remuneration Committee
The members of the Nomination and Remuneration Committee are:
Sr. No. Name of Director Committee designation
1. Anil Mahajan Chairperson
2. Kartheepan Madasamy Member
3. Rakhi Prasad Member
The Nomination and Remuneration Committee was constituted pursuant to resolution passed by our Board in its meeting held
on July 27, 2021. However, the constitution of the Nomination and Remuneration Committee is effective from July 31, 2021.
The scope and functions of the Nomination and Remuneration Committee are in accordance with Section 178 of the Companies

178
Act and the SEBI Listing Regulations and its terms of reference as stipulated pursuant to resolution passed by our Board in its
meeting held on and last reconstituted pursuant to resolution passed by our Board in its meeting held on July 27, 2021 are set
forth below.
• Formulating the criteria for determining qualifications, positive attributes and independence of a director and
recommending to the Board a policy, relating to the remuneration of the directors, key managerial personnel and other
employees;
• Formulating of criteria for evaluation of the performance of the independent directors and the Board;
• Devising a policy on Board diversity;
• Identifying persons who qualify to become directors or who may be appointed in senior management in accordance
with the criteria laid down, recommending to the Board their appointment and removal, and carrying out evaluations
of every director’s performance (including independent directors);
• Determining whether to extend or continue the term of appointment of the independent director, on the basis of the
report of performance evaluation of independent directors;
• Analysing, monitoring and reviewing various human resource and compensation matters;
• Determining the company’s policy on specific remuneration packages for executive directors including pension rights
and any compensation payment, and determining remuneration packages of such directors;
• Determining compensation levels payable to the senior management personnel and other staff (as deemed necessary),
which shall be market-related, usually consisting of a fixed and variable component;
• Reviewing and approving compensation strategy from time to time in the context of the then current Indian market in
accordance with applicable laws;
• Performing such functions as are required to be performed by the compensation committee under the Securities and
Exchange Board of India (Share Based Employee Benefits) Regulations, 2014, as amended;
• Framing suitable policies and systems to ensure that there is no violation, by an employee of any applicable laws in
India or overseas, including:
1. the Securities and Exchange Board of India (Prohibition of Insider Trading) Regulations, 2015, as amended;
or
2. the Securities and Exchange Board of India (Prohibition of Fraudulent and Unfair Trade Practices relating to
the Securities Market) Regulations, 2003, as amended.
• Performing such other activities as may be delegated by the Board and/or specified/provided under the Companies
Act, the Listing Regulations or by any other regulatory authority;
• Recommend to the Board, all remuneration, in whatever form, payable to senior management; and
• Such terms of reference as may be prescribed under the Companies Act and SEBI Listing Regulations.
Stakeholders’ Relationship Committee
The members of the Stakeholders’ Relationship Committee are:
Sr. No. Name of Director Committee designation
1. Rakhi Prasad Chairperson
2. Rakesh Kumar Verma Member
3. Shambhu Singh Member
The Stakeholders’ Relationship Committee was constituted pursuant to resolution passed by our Board in its meeting held July
27, 2021. The scope and functions of the Stakeholders’ Relationship Committee are in accordance with Section 178 of the
Companies Act and the SEBI Listing Regulations and its terms of reference as stipulated pursuant to resolution passed by our
Board in its meeting held on July 27, 2021 are set forth below.
• Consider and resolve grievances of security holders of the Company, including complaints related to
transfer/transmission of shares, non-receipt of annual report, non-receipt of declared dividends, issue of new/duplicate
certificates, general meetings, etc.;

179
• Review of measures taken for effective exercise of voting rights by shareholders. Review of adherence to the service
standards adopted by the Company in respect of various services being rendered by the Registrar and Share Transfer
Agent.
• Review of the various measures and initiatives taken by the Company for reducing the quantum of unclaimed dividends
and ensuring timely receipt of dividend warrants/annual reports/statutory notices by the shareholders of the Company.
• Formulation of procedures in line with the statutory guidelines to ensure speedy disposal of various requests received
from shareholders from time to time;
• To approve, register, refuse to register transfer or transmission of shares and other securities;
• To sub-divide, consolidate and or replace any share or other securities certificate(s) of the Company;
• Allotment and listing of shares;
• To authorise affixation of common seal of the Company;
• To issue duplicate share or other security(ies) certificate(s) in lieu of the original share/security(ies) certificate(s) of
the Company;
• To approve the transmission of shares or other securities arising as a result of death of the sole/any joint shareholder;
• To dematerialize or rematerialize the issued shares;
• Ensure proper and timely attendance and redressal of investor queries and grievances;
• Carrying out any other functions contained in the Companies Act, 2013 and/or equity listing agreements (if applicable),
as and when amended from time to time; and
• To further delegate all or any of the power to any other employee(s), officer(s), representative(s), consultant(s),
professional(s), or agent(s).
• Such terms of reference as may be prescribed under the Companies Act and SEBI Listing Regulations.
Corporate Social Responsibility Committee
The members of the Corporate Social Responsibility Committee are:
Sr. No. Name of Director Committee designation
1. Rakesh Kumar Verma Chairperson
2. Rakhi Prasad Member
3. Sonika Chandra Member
4. Tina Trikha Member
The Corporate Social Responsibility Committee was re-constituted pursuant to resolution passed by our Board in its meeting
held on July 27, 2021. The scope and functions of the Corporate Social Responsibility Committee are in accordance with
Section 135 of the Companies Act and its terms of reference as stipulated in the charter of Corporate Social Responsibility
Committee adopted pursuant to resolution passed by our Board in its meeting held on July 27, 2021 are set forth below.
• To formulate and recommend to the Board of Directors, the CSR Policy, indicating the CSR activities to be undertaken
as specified in Schedule VII of the Companies Act, 2013, as amended;
• To recommend the amount of expenditure to be incurred on the CSR activities;
• To monitor the CSR Policy and its implementation by the Company from time to time;
• To perform such other functions or responsibilities and exercise such other powers as may be conferred upon the CSR
Committee in terms of the provisions of Section 135 of the Companies Act, 2013, as amended and the rules framed
thereunder.”
• To take note of the compliances made by implementing agency (if any) appointed for the CSR of the Company.
Risk Management Committee
The members of the Risk Management Committee are:

180
Sr. No. Name of Member Committee designation
1. Rohan Verma Chairperson
2. Kartheepan Madasamy Member
3. Sapna Ahuja Member
The Risk Management Committee was constituted pursuant to resolution passed by our Board in its meeting held on July 27,
2021. The scope and functions of the Risk Management Committee are in accordance with SEBI Listing Regulations and its
terms of reference as provided in the risk management policy adopted by our Board on July 27, 2021 are set forth below:
• Formulating a detailed risk management policy which shall include:
a. A framework for identification of internal and external risks specifically faced by the listed entity, in
particular including financial, operational, sectoral, sustainability (particularly, ESG related risks),
information, cyber security risks or any other risk as may be determined by the Committee.
b. Measures for risk mitigation including systems and processes for internal control of identified risks.
c. Business continuity plan;
• Ensuring that appropriate methodology, processes and systems are in place to monitor and evaluate risks associated
with the business of the Company;
• Monitoring and overseeing implementation of the risk management policy, including evaluating the adequacy of risk
management systems;
• Periodically reviewing the risk management policy, at least once in two years, including by considering the changing
industry dynamics and evolving complexity;
• Keeping the board of directors informed about the nature and content of its discussions, recommendations and actions
to be taken;
• Reviewing the appointment, removal and terms of remuneration of the Chief Risk Officer (if any);
• Coordinating its activities with other committees, in instances where there is any overlap with activities of such
committees, as per the framework laid down by the board of directors.
• Such terms of reference as may be prescribed under the SEBI Listing Regulations.

181
Management Organisation Structure

182
Key Managerial Personnel
The details of the Key Managerial Personnel, in terms of the Companies Act, as of the date of this Red Herring Prospectus are
as follows:
Rakesh Kumar Verma is the Chairman and Managing Director of our Company. For details, see “– Brief Biographies of
Directors” on page 171. For details of remuneration paid to him during Financial Year 2021, see “- Payment or benefit to
Directors of our Company – Remuneration to our Executive Directors” on page 173.
Rohan Verma is a Whole-time Director and the CEO of our Company. For details, see “– Brief Biographies of Directors” on
page 171. For details of remuneration paid to him during Financial Year 2021, see “- Payment or benefit to Directors of our
Company – Remuneration to our Executive Directors” on page 173.
Anuj Kumar Jain is the Chief Financial Officer of our Company and has been associated with our Company since May 2011.
He holds a bachelor’s degree in commerce from the University of Rajasthan. He is a qualified chartered accountant, company
secretary and a cost and management accountant and has significant experience in the field of finance, taxation, and accounting.
He joined our Company as deputy general manager (accounts) in the year 2011. He was subsequently appointed as the company
secretary of our Company in the year 2011. He was designated as company secretary and acting chief financial officer in the
year 2017. In the year 2021, he resigned as company secretary and was designated as the Chief Financial Officer of our
Company as per the provisions of the Companies Act, 2013. Prior to joining our Company, he was associated with Sunfest
Infratech & Power Private Limited. During the Financial Year 2021, he received a remuneration of ₹ 4.22 million.
Saurabh Surendra Somani is the Company Secretary and Compliance Officer of our Company with effect from July 27, 2021.
He holds a bachelor’s degree in commerce from the Raashtrasant Tukdoji Maharaj Nagpur University and diploma in corporate
laws from the Indian Law School, Pune. He is a qualified company secretary and has significant experience in the fields of
legal, secretarial and listing compliance. Prior to joining our Company, he was associated with Ceinsys Tech Limited, Saffron
Industries Limited, G.G. Dandekar Machine Works Limited, Abhijeet MADC Nagpur Energy Private Limited and Solar
Industries India Limited. As he joined our Company with effect from July 19, 2021, he was not paid any remuneration during
the Financial Year 2021.
In addition to the above, the details of the key managerial personnel as identified in terms of Regulation 2(bb) of the SEBI
ICDR Regulations are as follows:
Rashmi Verma is the co-founder and chief technology officer of our Company. Along with Rakesh Kumar Verma, she founded
our Company in 1995. She received her bachelor’s degree of chemical engineering with distinction from the University of
Roorkee (now known as the Indian Institute of Technology, Roorkee) in 1977 and her master’s degree of science from the
Eastern Washington University, U.S.A., in 1979. Prior to founding our Company, she worked in the U.S.A., including with the
IBM Corporation till 1988. She has significant experience as an entrepreneur in the fields of information technology,
management, and the geospatial industry, and digital mapping in India. She has been instrumental in the growth of our
Company, and continues to play an active leadership role, in driving our technology initiatives and human resource
development. She is responsible for spearheading innovations in our Company across AI and geospatial technologies’ division.
She also oversees the core human resources functions of our Company, with a focus on employee up-skilling and career
development. She was cited in the London Business School’s Professor John Mullin’s book ‘Customer Funded Business Model’
for the standardise-and-resell sustainable business model that she and Rakesh Kumar Verma applied for our Company. She
served on our Board as a Whole-time Director till July 27, 2021. During the Financial Year 2021, she received a remuneration
of ₹ 30.00 million as a Whole-time Director of our Company.
Shishir Verma is the senior vice-president, human resources and corporate affairs, and had joined our Company on January
17, 2014 as vice president - government business. In 2017, he was promoted as senior vice president to look after corporate
affairs and legal. In 2019, he was given the additional responsibility of human resources. He received his bachelor’s degree in
economics from the Patna University in 1988 and his post graduate diploma in systems development from NIIT in 1989. He
started his career in the geospatial industry with ESRI in May 2006. During his term with ESRI, he worked as a practice leader.
Subsequently he worked for Trident Techlabs as president-power division and A2Z Group as a whole-time. During the Financial
Year 2021, he received a remuneration of ₹ 3.72 million.
Nikhil Kumar is the president-geospatial of our Company and has been associated with our Company since July 16, 2021. He
is directly responsible for strategic initiatives and for accelerating the growth of our Company’s geospatial products, solutions
and services in India and abroad. He completed his master’s in science in electronics from the Kurukshetra University in 1995.
He has been associated with the geospatial industry for a significant number of years. Prior to joining our Company, he was
Director Strategic Alliances SAARC & SEA at Here Technologies from March 2019 to July 2021. He served at Trimble as a
director from July 2013 to March 2019, where he worked in capacity of regional institutional business development director.
He had a long tenure with ESRI from October 1997 till July 2013 and he was designated as general manager, GIS services &
solutions at the time of leaving ESRI. Out of his 16 years at ESRI, he worked at Redlands, California, U.S.A. at NIIT
Technologies Inc. and worked towards the growth of its GIS business for 5 years. He is also actively engaged with various
geospatial industry associations such as Association of Geospatial Industries (as Vice President), co-chaired the FICCI

183
committee on Geospatial Technologies. As he joined our Company with effect from July 16, 2021, he was not paid any
remuneration during the Financial Year 2021.
Sapna Ahuja is the chief operating officer of our Company. She started her career with our Company as a research associate
in 2004 and was appointed as the chief operating officer in April 2017. She holds a bachelor’s degree of science in computer
science and master’s degree of science in applied operations research from the University of Delhi where she also received the
university medal for being the best candidate. Currently, she is directly responsible for strategic initiatives and for accelerating
the growth of our Company’s automotive and mobility business, in addition to her overall responsibility of business operations.
In 2004, she worked in our mapmyindia.com product management team. Further, in 2006 she was promoted to assistant vice
president and led the development of navigation system and as a vice president in 2008, she led the product management and
alliances for our maps and data products. She serves on the Road Safety Sub-Committee formed by FICCI. During the Financial
Year 2021, she received a remuneration of ₹ 10.28 million.
Ankeet Bhat is the chief strategy officer of our Company. He joined our Company on July 5, 2010. He holds a bachelor’s
degree in electronics and instrumentation engineering (hons.) from the Birla Institute of Technology and Science, Pilani. He
joined our Company as a sales engineer in 2011 and was appointed as the vice-president – business development with effect
from April 1, 2016 and was responsible for sales management, customer solutions, revenue and key customer relationships
across all our different verticals, both in the domestic and international markets. After his appointment on April 1, 2019 as a
senior vice-president, he was responsible for the strategy of the core location platform products and its growth and strategy.
Subsequently on April 1, 2021, he was appointed as the chief strategy officer and took on the additional responsibilities of
company-wide marketing and international expansion through our international brand, Mappls. During the Financial Year 2021,
he received a remuneration of ₹ 9.96 million.
All our Key Managerial Personnel are permanent employees of our Company.
There is no arrangement or understanding with major shareholders, customers, suppliers or others, pursuant to which any of
our Key Managerial Personnel have been appointed.
Shareholding of Key Managerial Personnel in our Company
As on the date of this Red Herring Prospectus, none of our Key Managerial Personnel hold any Equity Shares, except as
disclosed below:
Sr. No. Name of the Key Managerial Personnel Number of Equity Shares held
1. Rakesh Kumar Verma 23,163,080
2. Rashmi Verma 9,404,633
3. Rohan Verma 284,786
4. Sapna Ahuja 103,826
5. Ankeet Bhat 52,320
6. Anuj Kumar Jain 10,120
7. Shishir Verma 8,580
Certain of our Key Managerial Personnel have been granted certain options under the ESOP 2008. For details in relation to the
options granted to our Key Managerial Personnel see, “Capital Structure – ESOP 2008” on pages 83 to 84.
Relationship between our Key Managerial Personnel
Except for Rakesh Kumar Verma, who is the father of Rohan Verma, and Rashmi Verma, who is the spouse of Rakesh Kumar
Verma and mother of Rohan Verma, none of our Key Managerial Personnel are related to each other.
Interests of Key Managerial Personnel
Except for Rakesh Kumar Verma, Chairman and Managing Director who receives rent income from our Company in respect
of certain premises leased by him to our Company, none of the Key Managerial Personnel of our Company have any interests
in our Company other than to the extent of the remuneration or benefits to which they are entitled to as per their terms of
appointment and reimbursement of expenses incurred by them during the ordinary course of business. For details of rent income
received by Rakesh Kumar Verma, see “ – Interest of Directors” and “Our Promoters and Promoter Group – Interest of our
Promoters” on page 174 and 185, respectively.
Additionally, Rohan Verma, our Whole-time Director and CEO is interested to the extent of his directorship on the board of
directors of our wholly-owned Subsidiary, CE International.
Further, Anuj Kumar Jain, our Chief Financial Officer, is interested to the extent of his directorship on the board of directors
of our wholly-owned Subsidiary, VIPL.
There is no contingent or deferred compensation accrued for the year payable to the Key Managerial Personnel, even if the
compensation is payable at a later date.

184
Further, the Key Managerial Personnel may be regarded as interested in the Equity Shares allotted to them (together with
dividends in respect of such Equity Shares) or which may be allotted to them. Our Key Managerial Personnel may also be
deemed to be interested to the extent of options granted to them under the ESOP 2008. For details, see “Capital Structure –
ESOP 2008” on page 83 to 84 and “– Interest of Directors” on page 174 .
Loans to Key Managerial Personnel
No loans have been availed by our Key Managerial Personnel from our Company.
Changes in our Key Managerial Personnel in the three immediately preceding years:
Other than as disclosed in “- Changes in the Board in the last three years” on page 174, the changes in our Key Managerial
Personnel in the three immediately preceding years are set forth below.
Name Date of change Reason
Rakesh Kumar Verma July 27, 2021 Designated as Key Managerial Personnel in terms of the Companies Act, 2013
Rohan Verma July 27, 2021 Designated as Key Managerial Personnel in terms of the Companies Act, 2013
Rashmi Verma July 27, 2021 Resignation as a Whole-time Director and appointment as the chief technology officer
Anuj Kumar Jain July 27, 2021 Resignation as Company Secretary and appointment as the Chief Financial Officer
Saurabh Surendra Somani July 27, 2021 Appointment as Compliance Officer and Company Secretary
Nikhil Kumar July 16, 2021 Appointment as president – geospatial business
Payment or benefit to officers of our Company
Except any statutory entitlements for benefits including leave encashment upon termination of their employment in our
Company or retirement, no officer of our Company, including our Directors, Key Managerial Personnel, is entitled to any
benefits upon termination of employment under any service contract entered into with our Company.
Except as disclosed in this Red Herring Prospectus and any statutory payments made by our Company, no amount or benefit
has been paid or given, and no consideration for payment of giving such benefit has been paid or given in the two years
preceding the date of this Red Herring Prospectus or is intended to be paid or given to any of our Company’s officers except
remuneration for services rendered as Directors, officers or employees of our Company.
Bonus or profit sharing plan for our Key Managerial Personnel
Except for Rakesh Kumar Verma, our Chairman and Managing Director, and Rohan Verma, our Whole-time Director and CEO,
who are entitled to a performance bonus, none of our Key Managerial Personnel are party to any bonus or profit-sharing plan
of our Company. For details of such performance bonus, see “-Terms of appointment of our Executive Directors” on page 172.
Employee stock option plan and employee stock purchase plan
For details of our employee stock option plan, see “Capital Structure – ESOP 2008” on page 83 to 84.

185
OUR PROMOTERS AND PROMOTER GROUP
Our Promoters
The Promoters of our Company are:
1. Rakesh Kumar Verma; and
2. Rashmi Verma.
As on the date of this Red Herring Prospectus, our Promoters, in aggregate, hold 32,567,713 Equity Shares, constituting 61.16%
of the issued, subscribed, and paid-up Equity Share capital of our Company. For details of the build-up of the Promoters’
shareholding in our Company, see “Capital Structure – History of the Equity Share capital held by our Promoters”, on page
77.
Details of our Promoters
1. Rakesh Kumar Verma
Rakesh Kumar Verma, born on December 16, 1950, aged 70 years, is a citizen of India. He
resides at E-10/4 Second Floor, Vasant Vihar, Vasant Vihar-2, South West Delhi, Delhi 110
057, India. For further details, see “Our Management – Brief biographies of Directors”
beginning on page 171.
His PAN is AAGPV1778G and his driving license number is DL-0320050291905.
His Aadhaar card number is 911706034893.
2. Rashmi Verma
Rashmi Verma, born on March 28, 1956, aged 65 years, is a citizen of India. She resides at
E-10/4 Second Floor, Vasant Vihar, Vasant Vihar-2, South West Delhi, Delhi 110 057, India.
She is the co-founder and chief technology officer of our Company. For further details, see
“Our Management – Key Managerial Personnel” beginning on page 182 .
Her PAN is ACRPV3869K. She does not have a driving license. Her Aadhaar card number is
775861780491.
Our Company confirms that the PAN, bank account numbers and passport numbers, to the extent available, of our Promoters
have been submitted to the Stock Exchanges at the time of filing of the Draft Red Herring Prospectus.
Change of control of our Company
Our Promoters are the original promoters of our Company and there has not been any change in the management or control of
our Company during the last five years preceding the date of this Red Herring Prospectus.
Interests of our Promoters
Our Promoters are interested in our Company to the extent that they have promoted our Company and hold Equity Shares in
our Company to the extent applicable and dividends and distributions declared thereon, if any. For details on the shareholding
of our Promoters in our Company, see “Capital Structure – Shareholding of our Promoters and Promoter Group” on page 80.
One of our Promoters, Rakesh Kumar Verma, is also a Director on our Board and may deemed to be interested to the extent of
his remuneration/ fees and reimbursement of expenses, payable to him. For further details, see “Our Management – Payment
or benefit to Directors of our Company – Remuneration to our Executive Directors” on page 173. Further, our Promoter, Rashmi
Verma is the chief technology officer of our Company and may deemed to be interested to the extent of her remuneration/ fees
and reimbursement of expenses, payable to her. For further details, see “Our Management – Key Managerial Personnel” on
page 182.
In addition to the remuneration and reimbursement of expenses as a Director and Key Managerial Personnel of our Company,
Rakesh Kumar Verma also has an interest in our Company to the extent of rent income received by him from our Company
pursuant to the lease agreement dated December 12, 2019 entered into by and between our Company and Rakesh Kumar Verma

186
in respect of the premises situated at Building no. S-388, Greater Kailash Part II, New Delhi 110 048, India, pursuant to which
a rent of ₹0.22 million per month is payable to Rakesh Kumar Verma by our Company. For details of rent paid to Rakesh
Kumar Verma in the last 3 financial years, see Restated Consolidated Financial Information – Note 31: Related Party
Disclosures” on page 233.
Our Company has acquired properties situated at JA0920, 9th floor, DLF Tower A, Jasola District Centre, New Delhi, and
JA0919, 9th floor, DLF Tower A, Jasola District Centre, New Delhi, from Rakesh Verma and Rashmi Verma respectively for
an aggregate consideration of ₹46.66 million in the year 2017.
Further, our Promoters are also directors on the boards, or are shareholders, members or partners, of certain Promoter Group
entities and may be deemed to be interested to the extent of the payments made by our Company, if any, to these Promoter
Group entities. For the payments that are made by our Company to certain members of the Promoter Group, see “Restated
Consolidated Financial Information – Note 31: Related Party Disclosures” on page 233.
Other than as disclosed in “Restated Consolidated Financial Information – Note 31: Related Party Disclosures” on page 233,
our Company has not entered into any contract, agreements or arrangements during the preceding two years from the date of
this Red Herring Prospectus in which our Promoters are directly or indirectly interested and no payments have been made to
our Promoters in respect of the contracts, agreements or arrangements which are proposed to be made with our Promoters other
than in the normal course of business. For the payments that are made by our Company to certain members of our Promoter
Group, see “Restated Consolidated Financial Information – Note 31: Related Party Disclosures” on page 233.
Our Promoters are not interested in the properties acquired by our Company in the three years preceding the date of filing of
this Red Herring Prospectus or proposed to be acquired by our Company, or in any transaction by our Company for the
acquisition of land, construction of building or supply of machinery.
No sum has been paid or agreed to be paid to any of our Promoters or to the firms or companies in which our Promoters are
interested as members in cash or shares or otherwise by any person, either to induce them to become or to qualify them, as
directors or promoters or otherwise for services rendered by our Promoters or by such firms or companies in connection with
the promotion or formation of our Company.
None of our Promoters are engaged in business activities similar to those of our Company.
Additionally, other than as disclosed in this section and “History and Certain Corporate Matters – Our Subsidiaries, Associates,
and Joint Ventures” beginning on page 167, our Promoters do not have any interest in any venture that is involved in any
activities similar to those conducted by our Company. Our Company will adopt the necessary procedures and practices as
permitted by law to address any conflict situation as and when it arises.
Payment of benefit to our Promoters or Promoter Group
Except in the ordinary course of business and as disclosed in “Restated Consolidated Financial Information – Note 31: Related
Party Disclosures” on page 233, no amount or benefit has been paid or given to our Promoters or members of our Promoter
Group during the two years preceding the filing of this Red Herring Prospectus nor is there any intention to pay or give any
amount or benefit to our Promoters or members of our Promoter Group.
Experience in the business of our Company
For details in relation to experience of Rakesh Kumar Verma in the business of our Company, see “Our Management – Brief
Biographies of Directors” on page 171. For details in relation to experience of Rashmi Verma, see “Our Management – Key
Managerial Personnel” on page 182.
Material guarantees given by our Promoters
Our Promoters have not given any material guarantee to any third party with respect to the Equity Shares, as on the date of this
Red Herring Prospectus.
Companies or firms with which our Promoters have disassociated in the last three years
Our Promoters have not disassociated themselves from any company or firm during the three years immediately preceding the
date of filing this Red Herring Prospectus.
Confirmations
There are no litigation or legal action pending or taken by any department of the Central Government or statutory authority
during the five years immediately preceding the date of this Red Herring Prospectus against our Promoters.
Our Promoters and members of our Promoter Group have not been declared as Wilful Defaulters.

187
Our Promoters and members of our Promoter Group have not been prohibited from accessing or operating in capital markets
under any order or direction passed by SEBI or any other regulatory or governmental authority.
Our Promoters and members of the Promoter Group are not promoters, directors or person in control of any other company
which is prohibited from accessing or operating in capital markets under any order or direction passed by SEBI or any other
regulatory or governmental authority.
Our Promoter Group
The persons forming part of our Promoter Group* (other than our Promoters) are as follows:
Name of Promoter Name of relative Relationship
Rakesh Kumar Verma Rashmi Verma Spouse
Rajat Verma Brother
Vandana Sheel Sister
Rohan Verma Son
Rakhi Prasad Daughter
Dr. B. B. Jaipuriar Spouse’s father
Madhulika Jaipuriar Spouse’s mother
Vineet Jaipuriar Spouse’s brother
Navneet Jaipuriar Spouse’s brother
Rupa Amitabh Spouse’s sister
Rashmi Verma Rakesh Kumar Verma Spouse
Dr. B. B. Jaipuriar Father
Madhulika Jaipuriar Mother
Vineet Jaipuriar Brother
Navneet Jaipuriar Brother
Rupa Amitabh Sister
Rohan Verma Son
Rakhi Prasad Daughter
Rajat Verma Spouse’s brother
Vandana Sheel Spouse’s sister
Entities forming part of the Promoter Group
1. Infidreams Industries Private Limited; and
2. Spinclabs Private Limited.
* Our Company has received an exemption from SEBI vide letter no. SEBI/HO/CFD/DIL-2/VJ/AS/P/OW/2021/33802/1 dated November 23, 2021 under Regulation 300(1)(c) of the SEBI ICDR Regulations from disclosing Mr. Deepak Verma and entities/bodies corporate/firms/HUFs in which he has an
interest, as members of the promoter group of our Company based on the exemption application dated August 31, 2021 filed by our Company.

188
OUR GROUP COMPANIES
In accordance with the SEBI ICDR Regulations, for the purpose of identification of group companies, our Company has
formulated a policy for identification of group companies and considered (i) the companies (other than our Subsidiaries) with
which there were related party transactions (in accordance with Ind AS 24), as disclosed in the Restated Consolidated Financial
Information; and (ii) such companies (other than our Subsidiaries) with whom our Company has entered into one or more
related party transactions during the period after the last completed financial year and the stub period, if any, as included in the
offer documents until the date of filing of the offer document, as ‘group companies’ of our Company.
Accordingly, in terms of the policy adopted by our Board for determining group companies pursuant to its resolution dated
August 26, 2021 and November 1, 2021, our Board has identified the following as group companies of our Company (“Group
Companies”).
1. Spinclabs Private Limited; and
2. Cholamandalam Investment and Finance Company Limited.
In accordance with the SEBI ICDR Regulations certain financial information in relation to our Group Companies for the
previous three financial years, extracted from their respective audited financial statements (as applicable) are available at the
respective websites indicated below. These are collectively referred to as the “Group Company Financial Information”.
Our Company is providing links to such websites solely to comply with the requirements specified under the SEBI ICDR
Regulations.
None of our Company, the BRLMs or any of the Company’s or the BRLMs’ respective directors, employees, affiliates,
associates, advisors, agents or representatives have verified the information available on the websites indicated below.
A. Details of our Group Companies
1. Cholamandalam Investment and Finance Company Limited (“CIFCL”)
Corporate Information
CIFCL was originally incorporated as Cholamandalam Investment and Finance Group Limited on August
17, 1978 under the Companies Act, 1956. Its name was subsequently changed to ‘Cholamandalam Investment
and Finance Company Limited’ vide a fresh certificate of incorporation issued on June 2, 2010. The registered
office of CIFCL is situated at Dare House, No. 2, N. S. C. Bose Road, Parrys, Chennai 600 001, Tamil Nadu,
India. CIFCL has listed debt securities in India.
As required under the SEBI ICDR Regulations, CIFCL’s financial information based on its standalone and
consolidated audited financial statements for Fiscals 2021, 2020, and 2019 is available on the website of
CIFCL at https://www.cholamandalam.com/files/Financials/AFR-last-3-Financial-Years.pdf.
2. Spinclabs Private Limited (“SPL”)
Corporate Information
SPL was incorporated as EINFI Retail Private Limited on February 8, 2012 under the Companies Act, 1956.
Its name was subsequently changed to ‘Spinclabs Private Limited’ vide a fresh certificate of incorporation
issued by the RoC on March 16, 2017. The registered office of SPL is situated at First Floor, Plot No. 237,
Okhla Industrial Estate, Phase-III, New Delhi 110 020, India.
As required under the SEBI ICDR Regulations, SPL’s financial information based on its standalone audited
financial statements for Fiscals 2021, 2020, and 2019 is available on the website of SPL at
https://www.spinclabs.com/financials.php.
B. Litigation
Our Group Companies are not party to any pending litigation which has a material impact on our Company.
C. Nature and extent of interest of Group Companies
In the promotion of our Company
Our Group Companies do not have any interest in the promotion of our Company.

189
In the properties acquired by our Company in the past three years prior to filing this Red Herring Prospectus or
proposed to be acquired by our Company
Our Group Companies are not interested in the properties acquired by our Company in the three years preceding the
filing of this Red Herring Prospectus or proposed to be acquired by our Company.
In transactions for acquisition of land, construction of building, supply of machinery, etc.
Our Group Companies are not interested in any transactions for the acquisition of land, construction of building or
supply of machinery, etc.
D. Common pursuits between our Group Companies and our Company
Except as disclosed in “Our Business” and “Restated Consolidated Financial Information – Note 31: Related Party
Disclosures” on pages 132 and 233, respectively, none of our Group Companies are in the same line of business as
our Company and our Subsidiaries and there are no common pursuits between our Group Companies and our Company
and our Subsidiaries.
E. Related business transactions within the Group Companies and significance on the financial performance of
our Company
Other than the transactions disclosed in “Restated Consolidated Financial Information – Note 31: Related Party
Disclosures” on page 233, there are no other related business transactions between the Group Companies and our
Company.
F. Business interests or other interests
There are related party transactions between the Group Companies and our Company as disclosed in “Restated
Consolidated Financial Information – Note 31: Related Party Disclosures” and “Management’s Discussion and
Analysis of Financial Condition and Results of Operations - Related Party Transactions” on pages 233 and 270. Other
than the related party transactions, our Group Companies do not have any business interest or other interest in our
Company.

190
DIVIDEND POLICY
The declaration and payment of dividends on our Equity Shares, if any, will be recommended by our Board and approved by
our Shareholders, at their discretion, subject to the provisions of the Articles of Association and the Companies Act. The
dividend distribution policy of our Company was approved and adopted by our Board on July 27, 2021.
The dividend, if any, will depend on a number of internal factors, including but not limited to our Company’s liquidity position
including its present and expected obligations, profits of our Company, present and future capital expenditure plans of our
Company including organic / inorganic growth opportunities, financial requirement for business expansion and/or
diversification, acquisition etc of new businesses, past dividend trend of our Company and the industry, cost of borrowings,
other corporate action options (for ex. bonus issue, buy back of shares) and any other relevant or material factor as may be
deemed fit by the Board. In addition, the dividend, if any, will also depend on a number of external factors including but not
limited to state of economy and capital markets, applicable taxes including dividend distribution tax, regulatory changes:
introduction of new or changes in existing tax or regulatory requirements (including dividend distribution tax) having significant
impact on the Company’s operations or finances and any other relevant or material factor as may be deemed fit by the Board.
Further, our Shareholders may not expect dividend in certain circumstances such as inadequacy of profits during any financial
year. As a rule, dividend for any particular financial year shall be recommended or paid out of the profit of that financial year
and the Board shall not declare or recommend any dividend out of the reserves, except for reasons to be expressly laid down.
Any decision in this regard shall be reflected in the Annual Report and website of the Company while declaring/ recommending
dividend. Our Company may also, from time to time, pay interim dividends. The amounts paid as dividends in the past are not
necessarily indicative of our Company’s dividend policy or dividend amounts, if any, in the future. For details in relation to
risks involved in this regard, see “Risk Factors - Our ability to pay dividends in the future will depend on our earnings, financial
condition, working capital requirements, capital expenditures and restrictive covenants of our financing arrangements.” on
page 49.
I. Equity Shares
The dividend declared and paid on equity shares by our Company during the last three Financial Years and the current
Financial Year is set out in the following table:
Particular From April 1,
2021 to the date of
this Red Herring
Prospectus
Financial Year
2021
Financial Year
2020
Financial Year
2019
Number of equity shares at Financial
Year/ period ended
53,242,967 3,832,831 3,832,831 3,832,831
Face value (₹) 2 10 10 10
Amount of dividend per equity share held
(₹)
Nil Nil 14.00 Nil
Rate of Dividend (%) Nil Nil 140% Nil
Interim Dividend (in ₹ million) Nil Nil 53.66 Nil
Final Dividend (in ₹ million) Nil Nil Nil Nil
Total dividend (in ₹ million) Nil Nil 53.66 Nil
Corporate dividend distribution tax (in ₹
million)
Nil Nil 11.03 Nil
Mode of payment of dividend Not applicable Not applicable By cash transfer
through bank
accounts
Not applicable
II. Preference Shares
The dividend declared and paid on Preference Shares by our Company during the last three Financial Years and the
current Financial Year is set out in the following table:
a) Series A Preference Shares
Particular From April 1, 2021 to
the date of this Red
Herring Prospectus
Financial Year
2021
Financial Year
2020
Financial Year
2019
Number of Preference
Shares at Financial Year/
period ended
Nil# 700,748 700,748 700,748
Face value (₹) 81 81 81 81
Equivalent face value of
Equity Shares (₹)
2 10 10 10

191
Particular From April 1, 2021 to
the date of this Red
Herring Prospectus
Financial Year
2021
Financial Year
2020
Financial Year
2019
Amount of dividend per
Preference Share held (₹)
Nil Nil 14.00 Nil
Rate of dividend (%) Nil Nil 140% Nil
Interim Dividend (in ₹
million)
Nil Nil 9.81 Nil
Final Dividend (in ₹
million)
Nil Nil Nil Nil
Total dividend (in ₹
million)
Nil Nil 9.81 Nil
Corporate dividend
distribution tax (in ₹
million)
Nil Nil 2.02 Nil
Mode of payment of
dividend
Not applicable Not applicable By cash transfer
through bank accounts
Not applicable
# All outstanding Preference Shares have been converted to Equity Shares pursuant to Board resolution dated September 21, 2021.
b) Series B Preference Shares
Particular From April 1, 2021 to
the date of this Red
Herring Prospectus
Financial Year
2021
Financial Year
2020
Financial Year
2019
Number of Preference
Shares at Financial Year/
period ended
Nil# 938,326 938,326 938,326
Face value (₹) 114 114 114 114
Equivalent face value of
Equity Shares (₹)
2 10 10 10
Amount of dividend per
Preference Share held (₹)
Nil Nil 14.00 Nil
Rate of dividend (%) Nil Nil 140% Nil
Interim Dividend (in ₹
million)
Nil Nil 13.14 Nil
Final Dividend (in ₹
million)
Nil Nil Nil Nil
Total dividend (in ₹
million)
Nil Nil 13.14 Nil
Corporate dividend
distribution tax (in ₹
million)
Nil Nil 2.70 Nil
Mode of payment of
dividend
Not applicable Not applicable By cash transfer
through bank accounts
Not applicable
# All outstanding Preference Shares have been converted to Equity Shares pursuant to Board resolution dated September 21, 2021.
c) Series C Preference Shares
Particular From April 1, 2021 to
the date of this Red
Herring Prospectus
Financial Year
2021
Financial Year
2020
Financial Year
2019
Number of Preference
Shares at Financial Year/
period ended
Nil# 1,218,003 1,218,003 1,218,003
Face value (₹) 290 290 290 290
Equivalent face value of
Equity Shares (₹)
2 10 10 10
Amount of dividend per
Preference Share held (₹)
Nil Nil 14.00 Nil
Rate of dividend (%) Nil Nil 140% Nil
Interim Dividend (in ₹
million)
Nil Nil 17.05 Nil
Final Dividend (in ₹
million)
Nil Nil Nil Nil
Total dividend (in ₹
million)
Nil Nil 17.05 Nil
Corporate dividend
distribution tax (in ₹
million)
Nil Nil 3.51 Nil

192
Particular From April 1, 2021 to
the date of this Red
Herring Prospectus
Financial Year
2021
Financial Year
2020
Financial Year
2019
Mode of payment of
dividend
Not applicable Not applicable By cash transfer
through bank accounts
Not applicable
# All outstanding Preference Shares have been converted to Equity Shares pursuant to Board resolution dated September 21, 2021.
d) Series D Preference Shares
Particular From April 1, 2021 to
the date of this Red
Herring Prospectus
Financial Year
2021
Financial Year
2020
Financial Year
2019
Number of Preference
Shares at Financial Year/
period ended
Nil# 1,149,206 1,149,206 1,149,206
Face value (₹) 630 630 630 630
Equivalent face value of
Equity Shares (₹)
2 10 10 10
Amount of dividend per
Preference Share held (₹)
Nil Nil 14.00 Nil
Rate of dividend (%) Nil Nil 140% Nil
Interim Dividend (in ₹
million)
Nil Nil 16.09 Nil
Final Dividend (in ₹
million)
Nil Nil Nil Nil
Total dividend (in ₹
million)
Nil Nil 16.09 Nil
Corporate dividend
distribution tax (in ₹
million)
Nil Nil 3.31 Nil
Mode of payment of
dividend
Not applicable Not applicable By cash transfer
through bank accounts
Not applicable
# All outstanding Preference Shares have been converted to Equity Shares pursuant to Board resolution dated September 21, 2021.
e) Series E Preference Shares
Particular From April 1, 2021 to
the date of this Red
Herring Prospectus
Financial Year
2021
Financial Year
2020
Financial Year
2019
Number of Preference
Shares at Financial Year/
period ended
Nil# 48,686 48,686 48,686
Face value (₹) 1,000 1,000 1,000 1,000
Equivalent face value of
Equity Shares (₹)
2 10 10 10
Amount of dividend per
Preference Share held (₹)
Nil Nil 14.00 Nil
Rate of dividend (%) Nil Nil 140% Nil
Interim Dividend (in ₹
million)
Nil Nil 0.68 Nil
Final Dividend (in ₹
million)
Nil Nil Nil Nil
Total dividend (in ₹
million)
Nil Nil 0.68 Nil
Corporate dividend
distribution tax (in ₹
million)
Nil Nil 0.14 Nil
Mode of payment of
dividend
Not applicable Not applicable By cash transfer
through bank accounts
Not applicable
# All outstanding Preference Shares have been converted to Equity Shares pursuant to Board resolution dated September 21, 2021.

193
SECTION V: FINANCIAL INFORMATION
RESTATED CONSOLIDATED FINANCIAL INFORMATION
(The remainder of this page is intentionally left blank)

INDEPENDENT AUDITORS’ EXAMINATION REPORT ON RESTATED CONSOLIDATED
FINANCIAL INFORMATION
To,
The Board of Directors
C.E. Info Systems Limited (formerly known as C.E. Info Systems Private Limited )
Plot No.237, Okhla Industrial Estate,
Phase 111,South Delhi 110020,
New Delhi, India.
Ladies and Gentlemen,
1. We have examined the attached Restated Consolidated Financial Information of C.E. Info Systems Limited
(formerly known as C.E. Info Systems Private Limited) (the “Company” or the “Holding Company” or the
“Issuer”) and its subsidia ries (the Company and its subsidiaries together referred to as the “Group”) comprising
the Restated Consolidated Balance Sheet as at 30 September 2021, 30 September 2020, 31 March 2021, 31 March
2020 and 31 March 2019, the Restated Consolidated Statement of Profit and Loss (including other comprehensive
income), the Restated Consolidated Statement of Changes in Equity, the Restated Consolidated Statement of Cash
Flows for the six month period ended September 30, 2021 and September 30, 2020 and for the years ended 31
March 2021, 31 March 2020 and 31 March 2019, the summary statement of significant accounting policies, and
other explanatory information (collectively, the “Restated Consolidated Financial Information”), as approved
by the Board of Directors of the Company at their meeting held on November 1, 2021 for the purpose of inclusion
in the Red Herring Prospectus (“RHP”) and Prospectus prepared by the Company in connection with its proposed
initial public offering of equity shares of the Company through an offer for sale by certain shareholders of the
Company (“Offer”) prepared in terms of the requirements of:
(a) Section 26 of Part I of Chapter III of the Companies Act, 2013 (the “Act”);
(b) The Securities and Exchange Board of India (Issue of Capital and Disclosure Requirements) Regulations,
2018, as amended (“ICDR Regulations”); and
(c) The Guidance Note on Reports in Company Prospectuses (Revised 2019) issued by the Institute of
Chartered Accountants of India (“ICAI”), as amended from time to time (the “Guidance Note”).
2. The Company’s Board of Directors is responsible for the preparation of the Restated Consolidated Financial
Information for the purpose of inclusion in the RHP and Prospectus to be filed with the Registrar of Companies,
Delhi and Haryana at Delhi (“RoC”), Securities and Exchange Board of India (“SEBI”) and the stock exchanges
where the equity shares of the Company are proposed to be listed (“Stock Exchanges”) in connection with the
Offer. The Restated Consolidated Financial Information have been prepared by the management of the Company
on the basis of preparation stated in [Note 2.1 of Annexure – V] to the Restated Consolidated Financial
Information. The management’s responsibility includes designing, implementing, and maintaining adequate
internal control relevant to the preparation and presentation of the Restated Consolidated Financial Information.
The respective Board of Directors of the companies are also responsible for identifying and ensuring that the
Group complies with the Act, the ICDR Regulations and the Guidance Note issued by ICAI.
3. We have examined such Restated Consolidated Financial Information taking into consideration:
(a) The terms of reference and terms of our engagement agreed upon with you in accordance with our
engagement letter dated 29 July 2021, in connection with the Offer;
(b) The Guidance Note. The Guidance Note also requires that we comply with the ethical requirements of
the Code of Ethics issued by the ICAI;
(c) Concepts of test checks and materiality to obtain reasonable assurance based on verification of evidence
supporting the Restated Consolidated Financial Information; and
194

(d) The requirements of Section 26 of the Act and the ICDR Regulations. Our work was performed solely
to assist you in meeting your responsibilities in relation to your compliance with the Act, the ICDR
Regulations and the Guidance Note in connection with the Offer.
4. These Restated Consolidated Financial Information have been compiled by the management from the audited
consolidated financial statements of the Group as at and for the six month period ended September 30 2021 and
September 30 2020 and the year ended 31 March 2021, 31 March 2020 and 31 March 2019 prepared in accordance
with the accounting principles generally accepted in India, including Ind AS specified under Section 13 3 of the
Act read with Companies (Indian Accounting Standards) Rules 2015, as amended, (the “Consolidated Financial
Statements”), which have been approved by the Board of Directors at their Board meetings held on 1 November
2021, 1 November 2021, 7 July 2021, 16 December 2020 and 10 July 2019, respectively.
5. For the purpose of our examination, we have relied on:
(a) Auditors’ reports issued by us dated 1 November 2021 and 7 July 2021 on the consolidated financial
statements of the Group as at and for the six month period ended September 30 2021 and for the year
ended 31 March 2021, as referred in paragraph 4 above, and;
(b) Auditors reports issued by previous auditors of the Company, M/s BSR & Co. LLP (“Previous
Auditor”), dated 16 December 2020 and 10 July 2019 on the consolidated financial statements of the
Group as at and for the years ended 31 March 2020 and 31 March 2019, respectively, as referred in
paragraphs 4 above.
6. The Restated Consolidated Financial Information includes the audited results of its Indian subsidiary company-
Vidteq ( India) Private Limited for the six month period ended September 30 2021 and September 30 2020 and
for the years ended 31 March 2021, 31 March 2020 and 31 March 2019, the audits of which were conducted by
other auditors. The total assets, total revenues, net cash flows/outflows of Vidteq (India) Private Limited included
in the consolidated financial statements are as given below. The audit reports of Vidteq ( India) Private Limited
have been furnished to us by the Company’s management and our opinion on the Restated Consolidated Financial
Information, in so far as it relates to the amounts and disclosures included in respect of these components, is based
solely on the reports of the other auditors.
(Rs in million)
Six month
period
ended
September
30, 2021
Six month
period
ended
September
30 2020
F.Y.
2020-21
F.Y.
2019-20
F.Y.
2018-19
Total Assets 19.88 22.38 30.27 12.57 30.52
Total Revenue 5.23 12.78 26.24 0.19 19.02
Net cash inflows/(outflows) (16.41) (1.36) 21.03 (1.42) 1.24
7. The Restated Consolidated Financial Information includes unaudited Ind AS financial statements for the six
month period ended September 30 2021 and September 30 2020 and for the years ended on 31 March 2021, 31
March 2020 and 31 March 2019, as tabulated below, of C.E. Info Systems International Inc., a wholly owned
subsidiary of the Company, located in Delware, USA, whose financial statements and other financial information
were prepared in accordance with accounting principles generally accepted in that Country. The Group ’s
management had converted the financial statements of this entity located outside India from accounting principles
generally accepted in USA to accounting principles generally accepted in India . We have audited these conversion
adjustments made by the Group’s management. Our opinion in so fa r it relates to the balances and affairs of this
entity located outside India is based on the conversion adjustments prepared .
195

(Rs in million)
Six month
period ended
September 30,
2021
Six month
period ended
September 30
2020
F.Y.
2020-21
F.Y.
2019-20
F.Y.
2018-19
Total Assets 77.82 66.54 66.93 76.52 15.62
Total Revenue 14.26 0 7.82 0 0
8. In our opinion and according to the information and explanations given to us by the Management, the financial
statements and other financial information of the subsidiaries were not material to the Group.
9. Based on our examination and a ccording to the information and explanations given to us, we report that the
Restated Consolidated Financial Information:
(a) have been prepared after incorporating adjustments for the change in accounting policies and regrouping/
reclassifications retrospectively in the financial years ended 31 March 2020 and 31 March 2019 to reflect
the same accounting treatment as per the accounting policies and grouping/ classifications followed as at
and for the six month period ended September 30, 2021 and September 30, 2020 and the for the year ended
31 March 2021.
(b) does not contain any qualifications requiring adjustments. However, those qualifications in the Companies
(Auditor’s Report) Order, 2016 issued by the Central Government of India in terms of sub section (11 ) of
section 143 of the Act, which do not require any corrective adjustments in the Restated Consolidated
Financial Information have been disclosed in Annexure VII to the Restated Consolidated Financial
Information; and
(c) have been prepared in accordance with the Act, the ICDR Regulations and the Guidance Note.
10. The Restated Consolidated Financial Information do not reflect the effects of events that occurred subsequent to
the respective dates of the reports and audited consolidated financial statements men tioned in paragraph 4 above
other than as disclosed in note 42 of Annexure VI to restated financials.
11. This report should not in any way be construed as a reissuance or re-dating of any of the previous audit reports
issued by us/other auditors/previous auditors, nor should this report be construed as a new opinion on any of the
financial statements referred to herein.
12. We have no responsibility to update our report for events and circumstances occurring after the date of the report.
13. Our report is intended solely for use of the Board of Directors and for inclusion in the RHP and Prospectus to be
filed with RoC, SEBI and Stock Exchanges in connection with the Offer. Our report should not be used, referred
to or distributed for any other purpose
For BRIJESH MATHUR & ASSOCIATES
Chartered Accountants
ICAI Firm’s Registration No: 022164N
Brijesh Mathur, Proprietor
Membership No.:500/80096
Place: New Delhi
Date: November 1, 2021
UDIN :21080096AAAANI6450
196

C. E. Info Systems Limited (formerly known as C.E. Info Systems Pvt Ltd)
Annexure I - Restated Consolidated Balance Sheet
(All amounts are in Indian Rupees in millions, unless otherwise stated)
NoteAs at
30 September 2021
As at
30 September 2020
As at
31 March 2021
As at
31 March 2020
As at
31 March 2019
I. ASSETS
(1) Non-current assets
(a) Property, plant and equipment 3(a) 62.15 74.02 63.99 81.95 58.03
(b) Investment properties 3(b) 78.20 79.55 78.88 80.23 81.58
(c) Right of use assets 35 137.12 176.79 157.26 195.50 227.85
(d) Other intangible assets 4 24.73 37.86 28.27 47.45 75.35
(e) Financial assets
(i) Investments 5 1,771.09 873.12 1,147.70 1,101.99 1,025.13
(ii) Loans 8.82 8.92 8.82 9.39 9.00
(iii) Others 6 91.75 82.31 0.77 217.70 252.22
(f) Tax asset 10 26.09 75.01 65.80 79.20 57.40
(g) Deferred tax assets (net) 27 24.85 40.36 25.25 52.34 29.80
(2) Current assets
(a) Inventories 7 25.44 36.97 27.64 43.95 34.87
(b) Financial Assets
(i) Investments 5 1,164.07 1,380.48 1,541.80 885.00 982.28
(ii) Trade receivables 8 258.14 254.10 282.80 311.29 238.99
(iii) Cash and cash equivalents 9 614.09 187.27 336.27 150.67 82.49
(iv) Other bank balances 9 147.19 240.23 335.60 171.11 131.30
(v) Others 6 181.43 111.90 155.60 129.62 83.10
(d) Other current assets 11 44.42 9.71 12.11 20.87 23.20
TOTAL ASSETS 4,659.58 3,668.60 4,268.56 3,578.26 3,392.59
II. EQUITY
(a) Equity share capital 12 79.86 1,327.96 1,327.96 1,327.96 1,327.96
(b) Other equity 3,981.73 1,835.00 2,252.01 1,649.43 1,524.03
Total Equity 4,061.59 3,162.96 3,579.97 2,977.39 2,851.99
III. LIABILITIES
(1) Non current liabilities
(a) Financial liabilities
(i) Lease liabilities 35 130.74 168.72 157.29 187.36 225.20
(ii) Others 13 - 4.35 2.74 5.90 -
(b) Provisions 15 38.48 21.70 25.06 24.82 16.76
(2) Current liabilities
(a) Financial liabilities
(i) Trade payables
1. Dues of micro enterprises and small enterprises 4.83 1.16 3.09 - -
2. Dues of creditors other than micro enterprises
and small enterprises16 21.29 14.62 41.42 60.52 44.76
(ii) Lease liabilities 35 37.86 33.38 31.12 27.67 26.14
(iii) Others 14 73.38 125.00 145.10 175.82 131.69
(b) Other current liabilities 17 225.54 136.15 281.81 117.69 94.87
(c) Provisions 15 65.87 0.56 0.96 1.09 1.18
TOTAL EQUITY AND LIABILITIES 4,659.58 3,668.60 4,268.56 3,578.26 3,392.59
As per our examination report of even date attached
For Brijesh Mathur & Associates For and on behalf of the Board of Directors of
Chartered Accountants C. E. Info Systems Limited
ICAI Firm Registration Number : 0022164N
Brijesh Mathur Rakesh Verma Rohan Verma
Proprietor Managing Director CEO and Whole time Director
Membership No.: 080096 DIN: 01542842 DIN: 01797489
Place: New Delhi Place: New Delhi Place: New Delhi
Date: November 1, 2021 Date: November 1, 2021 Date: November 1, 2021
UDIN :21080096AAAANI6450
Anuj Kumar Jain Saurabh Surendra Somani
Chief financial officer Company Secretary
PAN: AGRPJ2753L M. No.- ACS30051
Place: New Delhi Place: New Delhi
Date: November 1, 2021 Date: November 1, 2021
The above Annexure should be read with the basis of preparation and significant accounting policies appearing in Annexure V, Notes to the Restated Consolidated Financial Information appearing in
Annexure VI and Statement of Adjustments to the Restated Consolidated Financial information appearing in Annexure VII.
197

C. E. Info Systems Limited (formerly known as C.E. Info Systems Pvt Ltd)
Annexure II - Restated Consolidated Statement of Profit and Loss
(All amounts are in Indian Rupees in millions, unless otherwise stated)
Note
Six month period
ended
30 Sept. 2021
Six month period
ended
30 Sept. 2020
Year ended
31 March 2021
Year ended
31 March 2020
Year ended
31 March 2019
I Revenue
Revenue from operations 18 1,000.27 551.80 1,524.63 1,486.29 1,352.55
Other income 19 225.52 187.57 398.11 148.49 280.80
Total income 1,225.79 739.37 1,922.74 1,634.78 1,633.35
II Expenses
Cost of materials consumed 20 73.99 33.40 133.00 133.99 172.01
Purchase of stock in trade 21 9.01 9.60 22.43 10.94 10.71
Change in inventory 22 2.44 2.47 8.45 0.67 15.78
Employee benefits expense 23 325.97 263.73 539.54 642.73 507.54
Finance cost 24 10.84 13.16 25.57 28.36 26.32
Depreciation and amortisation expense 25 38.73 48.13 98.97 97.69 91.50
Other expenses 26 136.33 131.60 307.12 404.44 391.47
Total expenses 597.31 502.09 1,135.08 1,318.82 1,215.33
III Profit before tax 628.48 237.28 787.66 315.96 418.02
IV Tax expense: 27
Current Tax 158.42 46.68 165.43 101.20 126.77
Deferred Tax charge /(credit) 2.40 11.98 27.90 (17.19) (44.41)
Total tax expenses 160.82 58.66 193.33 84.01 82.36
V Profit for the year 467.66 178.62 594.33 231.95 335.66
VI Other comprehensive income 28
(A) Items that will not be reclassified
subsequently to profit and loss
Remeasurements of the defined benefit plans 7.85 (4.94) (3.20) 18.88 11.90
Income tax on above. (2.00) 1.24 0.82 (8.10) (3.50)
VII Total other comprehensive income 5.85 (3.70) (2.38) 10.78 8.40
VIII Total comprehensive income for the year 461.81 182.32 596.71 221.17 327.26
Earnings per equity share of Rs. 2 each 29
Basic earnings per share 8.78 3.40 11.30 4.41 6.38
Diluted earnings per share 8.61 3.30 10.99 4.27 6.19
Summary of significant accounting policies
As per our examination report of even date attached
For Brijesh Mathur & Associates For and on behalf of the Board of Directors ofChartered Accountants C. E. Info Systems LimitedICAI Firm Registration Number : 0022164N
Brijesh Mathur Rakesh Verma Rohan VermaProprietor Managing Director CEO and Whole time DirectorMembership No.: 080096 DIN: 01542842 ` DIN: 01797489
Place: New Delhi Place: New Delhi Place: New Delhi
Date: November 1, 2021 Date: November 1, 2021 Date: November 1, 2021
UDIN : 21080096AAAANI6450
Anuj Kumar Jain Saurabh Surendra Somani
Chief financial officer Company Secretary
PAN: AGRPJ2753L M. No.- ACS30051
Place: New Delhi Place: New Delhi
Date: November 1, 2021 Date: November 1, 2021
The above Annexure should be read with the basis of preparation and significant accounting policies appearing in Annexure V, Notes to the Restated Consolidated
Financial Information appearing in Annexure VI and Statement of Adjustments to the Restated Consolidated Financial information appearing in Annexure VII.
198

C. E. Info Systems Limited (formerly known as C.E. Info Systems Pvt Ltd)
Annexure III - Restated Consolidated Statement of Changes in Equity
'(All amounts are in Indian Rupees in millions, unless otherwise stated)
(A) Equity share capital
Number of shares Share capital
Balance as at 1 April 2018 78,87,800 1,327.96
Change during the year - -
Balance as at 1 April 2019 78,87,800 1,327.96
Change during the year - -
Balance as at 31 March 2020 78,87,800 1,327.96
Change during the half year - -
Balance as at 30 September 2020 78,87,800 1,327.96
Change during the year - -
Balance as at 1 April 2020 78,87,800 1,327.96
Change during the year - -
Balance as at 31 March 2021 78,87,800 1,327.96
Change during the half year
Issue of shares on exercise of stock options 98,645 0.99
Effect of split of face value of equity shares 1,57,25,904 -
Effect of Conversion of Non-cumulative participating convertible Preference shares into
equity shares and split in face value of equity shares 1,62,19,876 -
Transfer to security premium account on Conversion of Non-cumulative participating
convertible Preference shares into equity shares
- (1,249.09)
Balance as at 30 September 2021 3,99,32,225 79.86
* including CCPS which were convertible into one equity shares for each.
Particulars Equity share capital*
199

C. E. Info Systems Limited (formerly known as C.E. Info Systems Pvt Ltd)
Annexure III - Restated Consolidated Statement of Changes in Equity
'(All amounts are in Indian Rupees in millions, unless otherwise stated)
(B) Other equity
OCI
Securities
premium
account
General reserve
Capital
redemption
reserve
Employee stock
options reserveCapital reserve
Currency
translation
adjustment
reserve
Retained
earnings
Remeasurement
of the defined
benefit plans
Balance as at 1 April 2018 78.41 8.46 1.34 112.53 12.58 - 957.60 - 1,170.92
Profit for the year - - - - - - 335.66 - 335.66
Other comprehensive income - - - - - - - (8.40) (8.40)
Total comprehensive income - - - - - - 335.66 (8.40) 327.26
Charge during the year (refer note 23) - - - 32.32 - 0.21 - - 32.53
Transfer to general reserve on forfeiture of stock options - 10.78 - (10.78) - - - - -
Impact of IND AS 116 transition - - - (6.68) (6.68)
Balance as at 31 March 2019 78.41 19.24 1.34 134.07 12.58 0.21 1,286.58 (8.40) 1,524.03
Balance as at 1 April 2019 78.41 19.24 1.34 134.07 12.58 0.21 1,286.58 (8.40) 1,524.03
Profit for the year - - - - - 231.95 - 231.95
Other comprehensive income - - - - - - (10.78) (10.78)
Total comprehensive income - - - - - - 231.95 (10.78) 221.17
Charge during the year (refer note 23) - - - 31.06 - 5.70 - - 36.76
Transfer to general reserve on forfeiture of stock options - - - (0.49) - - - - (0.49)
Transfer from employee stock option reserve on forfeiture of
stock options
- 0.49 - - - - - - 0.49
Prior year Vidteq adjustments - - - - - 0.50 0.50
Dividend including taxes - - - - - - (110.43) - (110.43)
Dividend distribution tax - - - - - - (22.60) - (22.60)
Balance as at 31 March 2020 78.41 19.72 1.34 164.64 12.58 5.91 1,385.99 (19.18) 1,649.43
Balance as at 1 April 2020 78.41 19.72 1.34 164.64 12.58 5.91 1,385.99 (19.18) 1,649.43
Profit for the six month period ended - - - - - - 178.62 - 178.62
Other comprehensive income - - - - - - - 3.70 3.70
Total comprehensive income - - - - - - 178.62 3.70 182.32
Charge during the year (refer note 23) - - - 3.72 (0.46) - - 3.26
Balance as at 30 September 2020 78.41 19.72 1.34 168.35 12.58 5.45 1,564.61 (15.48) 1,835.00
Balance as at 1 April 2020 78.41 19.72 1.34 164.64 12.58 5.91 1,385.99 (19.18) 1,649.43
Profit for the year - - - - 594.33 - 594.33
Other comprehensive income - - - - - 2.38 2.38
Total comprehensive income - - - - - - 594.33 2.38 596.72
Charge during the year (refer note 23) - - - 7.45 - (1.58) - - 5.87
Transfer to general reserve on forfeiture of stock options - - - (19.67) - - - - (19.67)
Transfer from employee stock option reserve on forfeiture of
stock options
- 19.67 - - - - - - 19.67
Balance as at 31 March 2021 78.41 39.40 1.34 152.41 12.58 4.33 1,980.32 (16.80) 2,252.01
Particulars Reserves & Surplus
Total other
equity
200

C. E. Info Systems Limited (formerly known as C.E. Info Systems Pvt Ltd)
Annexure III - Restated Consolidated Statement of Changes in Equity
'(All amounts are in Indian Rupees in millions, unless otherwise stated)
Balance as at 1 April 2021 78.41 39.40 1.34 152.41 12.58 4.33 1,980.32 (16.80) 2,252.01
Profit for the half year ended - - - - - - 467.66 467.66
Other comprehensive income - - - - - - (5.85) (5.85)
Total comprehensive income - - - - - - 467.66 (5.85) 461.81
Charge during the year (refer note 23) - - - 10.99 - 0.83 - - 11.82
Changes due to issue of shares on exercise of stock options36.12 - - (29.12) - - - - 7.00
-Transfer to security premium on conversion of preference
shares
1,249.09- - - - - - -
1,249.09
Balance as at 30 September 2021 1,363.62 39.40 1.34 134.28 12.58 5.16 2,447.98 (22.64) 3,981.73
As per our examination report of even date attached
For Brijesh Mathur & Associates For and on behalf of the Board of Directors of
Chartered Accountants C. E. Info Systems Limited
ICAI Firm Registration Number : 0022164N
Brijesh Mathur Rakesh Verma Rohan Verma
Proprietor Managing Director CEO and Whole time Director
Membership No.: 080096 DIN: 01542842 DIN: 01797489
Place: New Delhi Place: New Delhi Place: New Delhi
Date: November 1, 2021 Date: November 1, 2021 Date: November 1, 2021
UDIN : 21080096AAAANI6450
Anuj Kumar Jain Saurabh Surendra Somani
Chief financial officer Company Secretary
PAN: AGRPJ2753L M. No.- ACS30051
Place: New Delhi Place: New Delhi
Date: November 1, 2021 Date: November 1, 2021
The above Annexure should be read with the basis of preparation and significant accounting policies appearing in Annexure V, Notes to the Restated Consolidated Financial Information appearing in Annexure VI and Statement of
201

C. E. Info Systems Limited (formerly known as C.E. Info Systems Pvt Ltd)
Annexure IV - Restated Consolidated Statement of Cash Flows
'(All amounts are in Indian Rupees in millions, unless otherwise stated)
Six month period
ended
Six month period
endedYear ended Year ended Year ended
30 September 2021 30 September 2020 31 March 2021 31 March 2020 31 March 2019
A. Cash flows from operating activities
Profit before tax 628.48 237.28 787.66 315.96 418.02
Adjustments for:
Depreciation and amortisation 38.73 48.13 98.97 97.69 91.50
Employee stock option expense 10.99 3.72 7.45 31.06 32.32
Provision for doubtful receivables and advances - - 5.73 11.53 -
Reversal of provision for doubtful receivables and advances (3.19) (7.59) - - (4.43)
Provision against Raw material and Finished goods - 2.72 - 6.17
Reversal of provision against Raw material and Finished goods (0.29) - - (8.49) -
Provision for security deposits - - - 0.18 4.76
Gain on sale of investments (133.42) (62.75) (128.00) (40.65) (195.17)
Dividend income from investments (0.24) (0.77) (1.43) (6.19) (26.24)
Interest income on fixed deposits (12.18) (12.29) (25.65) (25.95) (24.32)
Interest income on bonds (49.48) (25.77) (64.88) (48.20) (7.33)
Interest expense 10.48 12.43 24.33 27.34 25.40
Liabilities written back - - (2.94) (0.76) (8.48)
Unrealized foreign exchange fluctuation (gain)/ loss (net) (1.84) (0.31) (0.97) (4.32) 0.59
(Fair Value gain in investments) / Provision for diminution in value of investments (17.18) (47.28) (109.78) 63.45 127.84
Gain on de-recognition of Right-of-Use Assets (0.29) - - - -
Income from Investment property (4.32) (5.59) (10.27) (12.60) (6.03)
Others - - (0.68)
466.25 141.93 580.22 400.05 433.92
Adjustments for working capital changes
(Increase) / decrease in inventories 2.49 6.98 16.31 (0.58) 27.29
(Increase) / decrease in trade receivables 27.85 64.78 23.73 (83.50) 12.46
(Increase) / decrease in other financial assets and other assets (125.68) 177.54 243.90 (14.00) 16.57
Increase / (Decrease) in trade payables (18.39) (44.74) (16.01) 15.76 2.67
Increase/ (Decrease) in other financial liabilities, provisions and other liabilities (54.35) (31.21) 136.70 72.58 (63.05)
Cash flows generated from operations 298.17 315.26 984.85 390.31 429.85
Less: Income tax paid (118.71) (42.49) (152.03) (123.00) (161.72)
Net cash flows generated from operating activities 179.46 272.77 832.82 267.31 268.13
B. Cash flows from investing activities
Proceeds from sale of investments 2,039.52 1334.38 2,780.92 1,842.66 2,870.57
Purchase of investments (2,163.69) (1,490.96) (3,246.15) (1,861.35) (2,981.59)
Interest received on bank deposits and bonds 38.24 25.29 46.91 77.92 4.24
Dividend received 0.24 0.77 1.43 6.19 26.24
Purchase of property, plant and equipment (including capital advances) (13.55) (11.84) (23.61) (55.01) (33.30)
Sale of Property, plant and equipment - 0.64 - -
Sale of Property, plant and equipment - - 1.38 1.03 -
Income from Investment property 4.32 5.59 10.27 12.60 6.03
Deposit due to mature within 12 months of the reporting date included 188.41 (69.12) (164.49) (39.81) (83.60)
Net cash flows used in investing activities 93.49 (205.27) (593.33) (15.78) (191.41)
C. Cash flows from financing activities
Receipt on issue of share 37.11 - - - -
Repayment of borrowings (5.90) (1.42) 2.94 (0.80) 0.04
Proceeds from borrowings - - - 9.52 -
Dividend paid - - - (110.43) -
Payment of lease liabilities including interest (28.81) (25.02) (50.27) (62.64) (40.48)
Corporate dividend tax - - - (22.60) -
Interest paid (0.18) (0.34) (0.68) (0.87) (1.80)
Net cash flows used in financing activities 2.23 (26.79) (53.89) (187.84) (42.32)
Net increase/ (decrease) in cash and cash equivalents (A+B+C) 275.18 40.72 185.60 63.71 34.39
Effect of exchange rate changes on cash & cash equivalent 2.65 (4.12) 4.47 (0.01)
277.82 36.60 185.60 68.18 34.38
Cash and cash equivalents opening balance (refer note 9) 336.27 150.67 150.67 82.49 48.11
Cash and cash equivalents closing balance (refer note 9) 614.09 187.27 336.27 150.67 82.49
277.82 36.60 185.60 68.18 34.38
Notes:
1
2 Cash and cash equivalents 30 Sep 2021 30 Sep 2020 31 March 2021 31 March 2020 31 March 2019
Cash on hand 0.39 2.90 0.40 0.40 0.61
On current accounts 429.17 120.72 283.06 149.75 81.88
On deposit accounts (with original maturity of 3 months or less) 184.53 63.65 52.81 0.51 -
614.08 187.27 336.27 150.67 82.49
3 Figures in brackets indicate cash outflow.
As per our examination report of even date attached
For Brijesh Mathur & Associates For and on behalf of the Board of Directors ofChartered Accountants CE Info Systems LimitedICAI Firm Registration Number : 0022164N
Brijesh Mathur Rakesh Verma Rohan Verma
Proprietor Managing Director CEO and Whole time DirectorMembership No.: 080096 DIN: 01542842 DIN: 01797489
Place: New Delhi Place: New Delhi Place: New Delhi
Date: November 1, 2021 Date: November 1, 2021 Date: November 1, 2021
UDIN : 21080096AAAANI6450
Anuj Kumar Jain Saurabh Surendra Somani
Chief financial officer Company Secretary
PAN: AGRPJ2753L M. No.- ACS30051
Place: New Delhi Place: New Delhi
Date: November 1, 2021 Date: November 1, 2021
The consolidated cash flow statement has been prepared in accordance with 'Indirect method' as set out in the Accounting Standard 3 on 'Cash Flow Statement', specified under section 133 of the
Companies Act, 2013, as applicable.
202

C. E. Info Systems Limited (formerly known as C.E. Info Systems Pvt Ltd)
Annexure V - Significant accounting policies
'(All amounts are in Indian Rupees in millions, unless otherwise stated)
1
Name of the Subsidiary Country of
incorporation
%age of Interest
during the period of
restated financial
ststements
Vidteq (India) Private Limited India 100%
CE Info Systems International Inc USA 100%
2
2.1
a) Statement of compliance:
b) Basis of measurement:
c) Functional and presentation currency
d) Use of estimates and judgements
e) Current–non-current classification
Basis of preparation, measurement and significant accounting policies
Organization and nature of operations
C.E. Info Systems Limited (“the Company” or "the Holding Company") is a limited company (converted from Private Limited on July 12, 2021), popularly known as
Mapmylndia, incorporated under the Companies Act, 1956 on 17 February 1995, domiciled and headquartered in New Delhi, India. It provides digital map data, GPS
navigation and location-based services, licensing, royalty, annuity, subscription and customizing its products to customers.
Vidteq (India) Private Limited is wholly owned subsidiary of CE Info Limited and is engaged in the business of providing Mapping services to the holding Company
only. CE Info Systems International Inc (Wholly owned subsidiary company) is in the business of selling holding company's products and services in the international
market as a reseller.
The Restated Consolidated financial information comprises the financial information of member of the group as under:
Basis of preparation and measurement
The Restated Consolidated Balance Sheet of the Group as at 30 Septemmer 2021, 30 September 2020, 31 March 2021, 31 March 2020 and 31 March 2019 and the
Restated Consolidated Statement of Profit and Loss (including Other Comprehensive Income), the Restated Consolidated Statement of Changes in Equity and the
Restated Consolidated Statement of Cash flows for the six month periods ended 30 September 2021 & 2020 and for the years ended 31 March 2021, 31 March 2020
and 31 March 2019, and Restated Other Consolidated Financial Information (together referred to as ‘Restated Consolidated Financial Information’) has been prepared
under Indian Accounting Standards ('Ind AS') notified under Section 133 of the Companies Act, 2013. (the 'Act') and other relevant provisions of the Act as amended
from time to time.
These Restated Consolidated Financial Information have been prepared for the Group as a going concern on the basis of relevant Ind AS that are effective as at 30
September 2021. These Restated Consolidated Financial Information have been approved by the Board of Directors on November 1, 2021.
The Restated Consolidated Financial Information has been prepared for inclusion in the Offer Document to be filed by the Company with the Securities and Exchange
Board of India (‘SEBI’) in connection with proposed Initial Public Offering of its equity shares, in accordance with the requirements of:
(i) Section 26 of Chapter III of the Act;
(ii) relevant provisions of the Securities and Exchange Board of India (Issue of Capital and Disclosure Requirements) Regulations, 2018, issued by the Securities and
Exchange Board of India ('SEBI') on 11 September 2018 in pursuance of the Securities and Exchange Board of India Act, 1992; and
(iii) Guidance Note on Reports in Company Prospectuses (Revised 2019) issued by the Institute of Chartered Accountants of India (“ICAI”).
These Restated Consolidated Financial Information has been extracted by the Management from the Audited Consolidated Financial Statements for respective six
month periods and years ended and
(a) there were no changes in accounting policies during the years of these financial statements except for the new and amended Ind AS 116 'Leases' and - Refer
Annexure VII and Note 35.;
(b) there were no material amounts which have been adjusted for in arriving at profit/ loss of the respective years; and
c) there were no material adjustments for reclassification of the corresponding items of income, expenses, assets and liabilities, in order to bring them in line with the
groupings as per the audited Financial Statements of the Group as at and the requirements of the SEBI Regulations.
The Group has made adjustments for lease accounting in accordance with Ind AS 116 which came into effect on 1 April 2019 using modified retrospective approach
w.e.f from 01 Aoril 2018 and all the related figures have been reclassified/ regrouped to give effect to the requirements of Ind AS 116, refer Schedule VII - "Statement
of Adjustments to the Restated Consolidated Financial Information".
The Consolidated Restated financial information has been prepared on historical cost basis, except certain assets and liabilities that are measured at fair value or
amortised cost.
These Consolidated Restated financial information are presented in Indian Rupees (INR), which is also the Group’s functional currency.
The preparation of Consolidated Restated financial information is in conformity with Ind AS which requires the management to make estimates, judgements and
assumptions that affect the reported amounts of assets, liabilities, revenue, expenses and other comprehensive income (OCI) that are reported and disclosed in the
Consolidated Restated financial information and accompanying notes. These estimates are based on the management’s best knowledge of current events, historical
experience, actions that the Group may undertake in the future and on various other assumptions that are believed to be reasonable under the circumstances.
Significant estimates and assumptions are used for, but not limited to allowance for uncollectible accounts receivables, recognition of deferred tax assets, valuation of
share-based compensation, defined benefit obligations under employee benefit plans (key actuarial assumptions), estimation of useful lives of property, plant and
equipment and intangible assets, the measurement of lease liabilities and right of use assets, and other contingencies and commitments. Changes in estimates are
reflected in the financial statements in the year in which the changes are made. Actual results could differ from those estimates.
All assets and liabilities have been classified as current or non-current as per the Group's normal operating cycle and other criteria set out above which are in
accordance with the Schedule III of the Act. Based on the nature of services and the time between the acquisition of assets / inventories for processing and their
realisation in cash and cash equivalents, the Group has ascertained its operating cycle as 12 months for purpose of current - non-current classification of assets and
liabilities.
The Restated Consolidated Ind AS Consolidated Summary Financial Information has been compiled from:
a) audited interim consolidated financial statements of the Group as at and for the six month period ended Septembet 30, 2021 and September 30, 2020, which were
prepared in accordance with Indian Accounting Standard 34 "Interim Financial Reporting", as prescribed under Section 133 of the Act read with Companies (Indian
Accounting Standards) Rules 2015, as amended, and other accounting principles generally accepted in India (referred to as “Ind AS”), which have been approved by
the Board of Directors at their meeting held on November 1, 2021 ; and
b) audited consolidated financial statements of the Group as at and for the years ended March 31, 2021, March 31, 2020 and March 31, 2019 which were prepared in
accordance with the Indian Accounting Standards as prescribed under Section 133 of the Act read with Companies (Indian Accounting Standards) Rules 2015, as
amended, and other accounting principles generally accepted in India (referred to as “Ind AS”), which have been approved by the Board of Directors at their meetings
held on July 7 2021, December 16, 2020 and July 10, 2019 respectively.
203

C. E. Info Systems Limited (formerly known as C.E. Info Systems Pvt Ltd)
Annexure V - Significant accounting policies
'(All amounts are in Indian Rupees in millions, unless otherwise stated)
f) Measurement of fair values
2.2
a)
Recognition and measurement:
Depreciation methods and estimated useful lives:
Asset description Asset life (in years)
Computers (End user devices) 3
Computers (Servers and networks) 6
Research and development equipment 15
Furniture and fixtures 10
Electrical installation and equipment 10
Vehicle tracking devices 2
Vehicles 8
Map survey vehicles 3
b) Intangible assets
Recognition and measurement:
Amortization:
Asset Class Useful life
Internally generated map database 5 years
Right to non compete fee 2 years
Computer software 6 years
Subsequent expenditure is capitalised only when it increases the future economic benefits from the specific assets to which it relates.
The intangible assets are amortised using the straight-line method over their estimated useful lives, and is recognized in Restated Consolidated statement of profit and
loss. The useful lives of intangible assets are reviewed by the management at each financial year-end and revised, if appropriate. In case of a revision, the unamortized
depreciable amount is charged over the revised remaining useful life.
Depreciation on property, plant and equipment is provided on the straight-line method over their estimated useful lives, as determined by the management.
Depreciation is charged on a pro-rata basis for assets purchased/sold during the year.
The useful lives as given above best represent the period over which the management expects to use these assets, based on technical assessment. The estimated useful
lives for these assets are therefore different from the useful lives prescribed under Part C of Schedule II of the Companies Act 2013.
The useful lives of property, plant and equipments are reviewed by the management at each financial year-end and revised, if appropriate. In case of a revision, the
unamortized depreciable amount is charged over the revised remaining useful life.
Intangible assets acquired separately are measured on initial recognition at cost. The Group has a policy of capitalising direct and indirect costs of intangible assets
comprising self- generated map database and/or software based on management estimate of the costs attributable to the creation of the asset. The indirect costs include
general and administrative expenses which can be directly attributable to making of the asset for its intended use.
Property, plant and equipment are stated at cost of acquisition, less accumulated depreciation and impairment losses, if any. Cost comprises the purchase price and any
costs attributable to bringing the asset to their working condition for their intended use.
Subsequent expenditures related to an item of fixed asset are added to its carrying amount or recognised as a separate asset, as appropriately only when it is probable
that the future economic benefits associated with item will flow to the Group and the cost of the item can be measured reliably. The carrying amount of any component
accounted for as a separate asset is derecognized when replaced. All other repairs and maintenance are charged to Restated Consilidated Statement of Profit and Loss
during the reporting period in which they are incurred.
An item of property, plant and equipment and any significant part initially recognised is derecognised upon disposal or when no future economic benefits are expected
from its use or disposal. Any gain or loss arising on de-recognition of the asset (calculated as the difference between the net disposal proceeds and the carrying amount
of the asset) is included in the income statement when the asset is derecognised.
The Group records certain financial assets and liabilities at fair value on a recurring basis. The Group determines fair values based on the price it would receive to sell
an asset or pay to transfer a liability in an orderly transaction between market participants at the measurement date in the principal or most advantageous market for that
asset or liability. The Group’s accounting policies and disclosures require the measurement of fair values, for both financial and non-financial assets and liabilities.
The Group has an established control framework with respect to the measurement of fair values (including Level 3 fair values). The Group uses valuation techniques
that are appropriate in the circumstances and for which sufficient data are available to measure fair value, maximizing the use of relevant observable inputs and
minimizing the use of unobservable inputs. Fair values are categorized into different levels in a fair value hierarchy based on the inputs used in the valuation
techniques as follows :
Level 1: Quoted prices (unadjusted) in active markets for identical assets or liabilities.
Level 2: Quoted prices for similar instruments in active markets, quoted prices for identical or similar instruments in markets that are not active and model-derived
valuations, in which all significant inputs are directly or indirectly observable in active markets.
Level 3: Valuations derived from valuation techniques, in which one or more significant inputs are unobservable inputs which are supported by little or no market
activity.
In accordance with Ind AS 113, assets and liabilities are to be measured based on the following valuation techniques:
a) Market approach – Prices and other relevant information generated by market transactions involving identical or comparable assets or liabilities.
b) Income approach – Converting the future amounts based on market expectations to its present value using the discounting method.
c) Cost approach – Replacement cost method.
The Group recognizes transfers between levels of the fair value hierarchy at the end of the reporting period during which the change has occurred and for the purpose
of fair value disclosures, the Group has determined classes of assets and liabilities on the basis of the nature, characteristics and risks of the asset or liability and the
level of the fair value hierarchy as explained above.
Significant accounting policies
Property, plant and equipment
204

C. E. Info Systems Limited (formerly known as C.E. Info Systems Pvt Ltd)
Annexure V - Significant accounting policies
'(All amounts are in Indian Rupees in millions, unless otherwise stated)
c) Investment Property
Depreciation methods and estimated useful lives:
d) Revenue recognition
Contracts involving provision of services and material
Time-and-material / Volume based / Transaction based contracts
Proprietary products- Map data
Multiple performance obligation
Other incomeThe Group has elected to use the exemption available under Ind AS 101 to continue the carrying value for all of its Property, Plant and Equipment as recognized in the
Interest income
For all financial instruments measured at amortized cost, interest income is recorded using the effective interest rate (EIR). EIR is the rate which exactly discounts the
estimated future cash receipts over the expected life of the financial instrument to the gross carrying amount of the financial asset. When calculating the EIR the Group
estimates the expected cash flows by considering all the contractual terms of the financial instrument (for example, prepayments, extensions, call and similar options);
expected credit losses are considered if the credit risk on that financial instrument has increased significantly since initial recognition
Dividend income
Dividends are recognized in Restated Consolidated statement of profit and loss on the date on which the Group’s right to receive payment is established.
Gain of sale of investments
Gain on sale of investments is recognised on transfer of title from the Group and is determined on FIFO basis.
Revenue recognition for delivered elements is limited to the amount that is not contingent on the future delivery of products or services, future performance
obligations or subject to customer-specified return or refund privileges.
Revenue recognized but not billed to customers is classified either as contract assets or unbilled receivable in our Restated Consolidated statements of financial
position, contract assets primarily relate to unbilled amounts on those contracts utilizing the cost to cost method of revenue recognition and right to consideration is
not unconditional. Unbilled receivables represent contracts where right to consideration is unconditional (i.e. only the passage of time is required before the payment
is due).
Investment property is a property held either to earn rental income or for the capital appreciation or for both, but not for sale in the ordinary course of business, use in
supply of services or for administrative purpose. Upon, initial recognition, an investment property is measured at cost. Subsequent to initial recognition, investment
property is measured at cost less accumulated depreciation. There have not been any accumulated impairment losses on such properties.
Depreciation on investment property is provided on the straight-line method over their estimated useful lives, as determined by the management. Depreciation is
charged on a pro-rata basis for investment property purchased/sold during the year. The estimated economic life of building is 60 years.
Any gain or loss on disposal of an investment property is recognised in profit or loss
The Group has elected to use the exemption available under Ind AS 101 to continue the carrying value for all of its Property, Plant and Equipment as recognized in the
Revenue is recognized when, or as, control of a promised service or good transfers to a customer, in an amount that reflects the consideration to which the Group
expects to be entitled in exchange for transferring those products or services. To recognize revenues, the following five step approach is applied: (1) identify the
contract with a customer, (2) identify the performance obligations in the contract, (3) determine the transaction price, (4) allocate the transaction price to the
performance obligations in the contract, and (5) recognize revenues when a performance obligation is satisfied. A contract is accounted when it is legally enforceable
through executory contracts, approval and commitment from all parties, the rights of the parties are identified, payment terms are defined, the contract has commercial
substance and collectability of consideration is probable.
Revenue with respect to time-and-material, volume based and transaction based contracts is recognized as the related services are performed through efforts expended,
volume serviced transactions are processed etc. that correspond with value transferred to customer till date which is related to our right to invoice for services
performed.
Revenue from distinct proprietary perpetual license products is recognized at a point in time at the inception of the arrangement when control transfers to the client.
Revenue from proprietary term license is recognized at a point in time as no services are provided during the period of a term. Revenue from updates is recognized
over the contract term on a straight-line basis as the company is providing a service of unspecified upgrades on a when-and-if available basis over the contract term. In
case product license are bundled with a certain period of upgrades either for perpetual or term based license, such upgrade support contracts are generally priced as a
percentage of the net fees paid by the customer to purchase the license and are generally recognized as revenues ratably over the contractual period that the support
services are provided.
When a sales arrangement contains multiple performance, such as services, hardware and Licensed IPs (Map Data) or combinations of each of them revenue for each
element is based on a five step approach as defined above. To the extent a contract includes multiple promised deliverables, judgment is applied to determine whether
promised deliverables are capable of being distinct and are distinct in the context of the contract. If these criteria are not met, the promised deliverables are accounted
for as a combined performance obligation. For arrangements with multiple distinct performance obligations or series of distinct performance obligations, consideration
is allocated among the performance obligations based on their relative consolidated selling price. consolidated selling price is the price at which Group would sell a
promised good or service separately to the customer. When not directly observable, we estimate consolidated selling price by using the expected cost plus a margin
approach. We establish a consolidated selling price range for our deliverables, which is reassessed on a periodic basis or when facts and circumstances change.
205

C. E. Info Systems Limited (formerly known as C.E. Info Systems Pvt Ltd)
Annexure V - Significant accounting policies
'(All amounts are in Indian Rupees in millions, unless otherwise stated)
e) Income taxes
f) Retirement and other employee benefits
Short-term employee benefits
Post employment benefits
(a) Defined contribution plan
(b) Defined benefit plan
Other long term benefits
g) Inventories
Income tax expense comprises current and deferred income tax.
Income tax expense is recognized in the Restated Consolidated Statement of Profit and Loss except to the extent that it relates to items recognized directly in equity, in
which case it is recognized in equity. Current income tax for current and prior periods is recognized at the amount expected to be paid to or recovered from the tax
authorities, using the tax rates and tax laws that have been enacted or substantively enacted by the Balance Sheet date. Provision for income tax includes the impact of
provisions established for uncertain income tax positions.
Current tax assets and current tax liabilities are offset only if there is a legally enforceable right to set off the recognised amounts, and it is intended to realise the asset
and settle the liability on a net basis or simultaneously.
Deferred income tax assets and liabilities recognized for all temporary differences arising between the tax bases of assets and liabilities and their carrying amounts in
the Restated Consolidated financial information.
Deferred tax assets are reviewed at each reporting date and are reduced to the extent that it is no longer probable that the related tax benefit will be realized. Deferred
income tax assets and liabilities are measured using tax rates and tax laws that have been enacted or substantively enacted by the balance sheet date and are expected to
apply to taxable income in the years in which those temporary differences are expected to be recovered or settled.
Deferred tax assets and deferred tax liabilities are offset, if a legally enforceable right exists to set off current tax assets against current tax liabilities and the deferred
taxes relate to the same taxable entity and the same taxation authority.
The effect of changes in tax rates on deferred income tax assets and liabilities is recognized as income or expense in the year that includes the enactment or the
substantive enactment date. A deferred income tax asset is recognized to the extent that it is probable that future taxable profit will be available against which the
deductible temporary differences and tax losses can be utilized.
Employee benefits payable wholly within twelve months of rendering the service are classified as short-term employee benefits. Benefits such as salaries, wages and
bonus, etc. are recognised in the Restated Consolidated Statement of Profit and Loss in the period in which the employee renders the related service.
The employee’s provident fund scheme is a defined contribution plan. The Group makes specified monthly contributions towards employee provident fund to
Government administered provident fund scheme which is a defined contribution plan. The Group's contribution is recognised as an expense in the Restated
Consolidated Statement of Profit and Loss during the period in which the employee renders the related service.
The Group’s (other than US subsidiary, which does not have any employee) gratuity plan is a defined benefit plan. The Gratuity Plan provides a lump sum payment to
vested employees at retirement, death, incapacitation or termination of employment, of an amount based on the respective employee’s base salary and the tenure of
employment (subject to a maximum of Rs. 2 millions per employee). The liability is actuarially determined (using the projected unit credit method) at the end of each
year. Actuarial gains/losses are recognized in the Restated Consolidated Balance Sheet with a corresponding debit or credit to retained earnings through other
comprehensive income in the year in which they occur.
Remeasurement gains and losses arising from experience adjustments and changes in actuarial assumptions are recognized in the period in which they occur, directly
in other comprehensive income and are never reclassified to profit or loss. Changes in the present value of the defined benefit obligation resulting from plan
amendments or curtailments are recognized immediately in the profit or loss as past service cost.
The Group has taken a policy from an Insurance Company to cover its liabilities towards employees’ gratuity. Liability with respect to the Gratuity plan determined as
above and any differential between the fund amount as per the Insurance Company and the liability as per the actuarial valuation is recognized as an asset or liability.
The employees of the Group are entitled to compensated absences. The Group’s net obligation in respect of long-term employee benefits other than post-employment
benefits is the amount of future benefit that employees have earned in return for their service in the current and prior periods; that benefit is discounted to determine its
present value, and the fair value of any related assets is deducted.
The employees can carry-forward a portion of the unutilized accrued compensated absences and utilize it in future service periods or receive cash compensation on
termination of employment. Since the compensated absences do not fall due wholly within twelve months after the end of the period in which the employees render
the related service and are also not expected to be utilized wholly within twelve months after the end of such period, the benefit is classified as a long-term employee
benefit. The Group records an obligation for such compensated absences in the period in which the employee renders the services that increase this entitlement. The
obligation is measured on the basis of independent actuarial valuation using the projected unit credit method. Re measurements as a result of experience adjustments
and changes in actuarial assumptions are recognized in the profit or loss.
Inventories which comprise raw material, finished goods, stock-in-trade, stores and spares and project work-in-progress are carried at the lower of cost and net
realisable value (NRV).
Cost of inventories comprises all costs of purchase, costs of conversion and other costs incurred in bringing the inventories to their present location and condition. In
determining the cost, FIFO (First in First Out) method is used.
Project work-in-progress represents cost incurred on projects/portion of projects when revenue is yet to be recognized. Such costs include field survey expenses and
salary costs for technical team working on these projects.
Net realisable value is the estimated selling price in the ordinary course of business, less the estimated costs of completion and the estimated costs necessary to make
the sale. The comparison of cost and net realisable value is made on an item-by-item basis.
206

C. E. Info Systems Limited (formerly known as C.E. Info Systems Pvt Ltd)
Annexure V - Significant accounting policies
'(All amounts are in Indian Rupees in millions, unless otherwise stated)
h) Financial Instruments
b) Financial liabilities
Financial liabilities: Classification, subsequent measurement and gains and losses
Financial liabilities are classified as measured at amortised cost or FVTPL. A financial liability is classified as at FVTPL if it is classified as held-for-trading, or it is a
derivative or it is designated as such on initial recognition. Financial liabilities at FVTPL are measured at fair value and net gains and losses, including any interest
expense, are recognised in profit or loss.
Other financial liabilities are subsequently measured at amortised cost using the effective interest method. Interest expense and foreign exchange gains and losses are
recognised in profit or loss. Any gain or loss on derecognition is also recognised in profit or loss.
Derecognition
Financial assets
The Group derecognizes a financial asset when the contractual rights to the cash flows from the financial asset expire, or it transfers the rights to receive the contractual
cash flows in a transaction in which substantially of the risks and rewards of ownership of the financial asset are transferred or in which the Group neither transfers nor
retains substantially all of the risks and rewards of ownership and does not retain control of the financial asset. If the Group enters into transactions whereby it transfers
assets recognised on its Restated Consolidated Balance Sheet, but retains either all or substantially all of the risks and rewards of the transferred assets, the transferred
assets are not derecognised.
Impairment of financial assets
The Group recognizes loss allowances using the expected credit loss (ECL) model for the financial assets which are not fair valued through profit and loss. Lifetime
ECL allowance is recognized for trade receivables with no significant financing component. For all other financial assets, expected credit losses are measured at an
amount equal to the 12-month ECL, unless there has been a significant increase in credit risk from initial recognition in which case they are measured at lifetime ECL.
The amount of expected credit losses (or reversal) that is required to adjust the loss allowance at the reporting date is recognized in the Restated Consolidated
Statement of Profit and Loss.
All financial liabilities are recognized initially at fair value and, in the case of borrowings and payables, net of directly attributable transaction costs.
The subsequent measurement of financial liabilities depends on their classification, as described below:
Financial liabilities at fair value through profit or loss
Financial liabilities designated upon initial recognition at fair value through profit or loss are designated as such at the initial date of recognition, and only if the criteria
in Ind AS 109 are satisfied. Changes in fair value of such liability are recognized in the Restated Consolidated Statement of profit or loss.
Financial liabilities at amortized cost
The Group’s financial liabilities at amortized cost includes trade payables, borrowings including bank overdrafts and other payables.
After initial recognition, financial liabilities are subsequently measured at amortized cost using the effective interest rate (EIR) method except for deferred
consideration recognized in a business combination which is subsequently measured at fair value through profit and loss. Gains and losses are recognized in the
Restated Consolidated Statement of Profit and Loss when the liabilities are derecognized as well as through the EIR amortization process.
Amortized cost is calculated by taking into account any discount or premium on acquisition and fees or costs that are an integral part of the EIR. The EIR amortization
is included as finance costs in the Restated Consolidated Statement of Profit and Loss.
Derecognition
A financial liability is derecognized when the obligation under the liability is discharged or cancelled or expires
Offsetting of financial instruments
Financial assets and financial liabilities are offset and the net amount is reported in the Restated Consolidated Balance Sheet if there is a currently enforceable legal
right to offset the recognized amounts and there is an intention to settle on a net basis to realize the assets and settle the liabilities simultaneously.
All financial assets not classified as measured at amortised cost or FVOCI as described above are measured at FVTPL. On initial recognition, the Group may
irrevocably designate a financial asset that otherwise meets the requirements to be measured at amortised cost or at FVOCI as at FVTPL if doing so eliminates or
significantly reduces an accounting mismatch that would otherwise arise.
Financial assets at FVTPL
These assets are subsequently measured at fair value. Net gains and losses, including any interest or dividend income, are recognised in profit or loss.
Financial assets at amortised cost
These assets are subsequently measured at amortised cost using the effective interest method. The amortised cost is reduced by impairment losses. Interest income,
foreign exchange gains and losses and impairment are recognised in profit or loss. Any gain or loss on derecognition is recognised in profit or loss.
Financial assets at FVOCI
These assets are subsequently measured at fair value. Interest income under the effective interest method, foreign exchange gains and losses and impairment are
recognised in profit or loss. Other net gains and losses recognised in OCI. On derecognition, gains and losses accumulated in OCI are reclassified to profit or loss.
Equity investments at FVOCI
These assets are subsequently measured at fair value. Dividends are recognised as income in profit or loss unless the dividend clearly represents a recovery of part of
the cost of the investment. Other net gains and losses are recognised in OCI and are not reclassified to profit or loss.
A financial instrument is a contract that gives rise to a financial asset of one entity and a financial liability or equity instrument of another entity.
a) Financial assets
On initial recognition, a financial asset is classified as measured at:
i) amortised cost;
ii) fair value through other comprehensive income (FVOCI)-debt investment;
iii) fair value through other comprehensive income (FVOCI)-equity investment; or
iv) FVTPL
Financial assets are not reclassified subsequent to their initial recognition, except if and in the period the Group changes its business model for managing financial
assets.
A financial asset is measured at amortised cost if it meets both of the following conditions and is not designated as FTVPL:
a) the asset is held within a business model whose objective is to hold assets to collect contractual cash flows, and
b) the contractual terms of the financial asset give rise on specified dates to cash flows that are solely payments of principal and interest on the principal amount
outstanding.
A instrument is measured at FVOCI if it meets both of the following conditions and is not designated as FVTPL:
a) the asset is held within a business model whose objective is achieved by both collecting contractual cash flows and selling financial assets, and
b) the contractual terms of the financial asset give rise on specified dates to cash flows that are solely payments of principal and interest on the principal amount
outstanding.
207

C. E. Info Systems Limited (formerly known as C.E. Info Systems Pvt Ltd)
Annexure V - Significant accounting policies
'(All amounts are in Indian Rupees in millions, unless otherwise stated)
i)
j)
k) Leases
l)
m)
n) Provisions, Contingent Liabilities and Contingent Assets
Cash and cash equivalents
Cash and cash equivalents in the Restated Consolidated Balance Sheet comprise cash in banks and short-term deposits and investments with an original maturity of
three months or less, which are subject to an insignificant risk of changes in value.
A provision is recognized if, as a result of a past event, the Group has a present legal or constructive obligation that can be estimated reliably, and it is probable that an
outflow of resources embodying economic benefits will be required to settle the obligation. If the effect of the time value of money is material, provisions are
determined by discounting the expected future cash flows.
The Group uses significant judgement to disclose contingent liabilities. Contingent liabilities are disclosed when there is a possible obligation arising from past events,
the existence of which will be confirmed only by the occurrence or non-occurrence of one or more uncertain future events not wholly within the control of the Group
or a present obligation that arises from past events where it is either not probable that an outflow of resources will be required to settle the obligation or a reliable
estimate of the amount cannot be made. Contingent assets are neither recognised nor disclosed in the financial information.
Borrowing costs directly attributable to the acquisition, construction or production of an asset (if any) that necessarily takes a substantial period of time to get ready for
its intended use are capitalized as part of the cost of the asset. All other borrowing costs are expensed in the period in which they occur.
Borrowing costs consist of interest and other costs that an entity incurs in connection with the borrowing of funds.
Impairment of non- financial assets
The carrying amounts of assets are reviewed at each reporting date if there is any indication of impairment based on internal/external factors. An impairment loss is
recognized wherever the carrying amount of an asset (or cash generating unit) exceeds its recoverable amount. The recoverable amount is the greater of the asset's (or
cash generating unit's) net selling price and value in use. In assessing value in use, the estimated future cash flows are discounted to their present value using a pre-tax
discount rate that reflects current market assessments of the time value of money and risks specific to the asset (or cash generating unit).
An impairment loss is reversed if there has been a change in the estimates used to determine the recoverable amount. An impairment loss is reversed only to the extent
that the asset's carrying amount does not exceed the carrying amount that would have been determined net of depreciation or amortisation, if no impairment loss had
been recognised.
An assessment is made at each reporting date to determine whether there is an indication that previously recognised impairment losses no longer exist or have
decreased. If such indication exists, the Group estimates the asset's recoverable amount. A previously recognised impairment loss is reversed only if there has been a
change in the assumptions used to determine the asset's recoverable amount since the last impairment loss was recognised. The reversal is limited so that the carrying
of the asset does not exceed its recoverable amount, nor exceed the carrying amount that would have been determined, net of depreciation, had no impairment loss
been recognised for the asset in prior years. Such reversal is recognised in the Restated Consolidated Statement of Profit or Loss unless the asset is carried at a revalued
amount, in which case, the reversal is treated as an increase in revaluation.
Equity settled stock based compensation
Stock-based compensation represents the cost related to stock-based awards granted to employees. The Holding Company measures stock-based compensation cost at
grant date, based on the estimated fair value of the award and recognizes the cost on a straight line basis over the requisite service period for each separately vesting
portion of the award, as if award was in substance, multiple awards. The Holding Company estimates the fair value of stock options. The cost is recorded under the
head employee benefit expense in the Restated Consolidated Statement of Profit and Loss with corresponding increase in “Employee stock option Reserve”
Group as a lessee
Group assesses whether a contract is or contains a lease, at inception of a contract. The Group recognises a right to use asset and a corresponding lease liability with
respect to all lease agreements in which it is the lessee, except for short-term leases (defined as leases with a lease term of 12 months or less). For these leases, the
Group recognises the lease payments as an operating expense on a straight-line basis over the term of the lease unless another systematic basis is more representative of
the time pattern in which economic benefits from the leased asset are consumed.
The lease liability is initially measured at the present value of the lease payments that are not paid at the commencement date, discounted by using the rate implicit in
the lease. If this rate cannot be readily determined, the Group uses its incremental borrowing rate. Lease payments included in the measurement of the lease liability
comprise of fixed lease payments (less any lease incentives), variable lease payments, penalties, etc. The lease liability is presented, as a separate line in the Restated
Consolidated Balance sheet. The lease liability is subsequently measured by increasing the carrying amount to reflect interest on the lease liability (using the effective
interest method) and by reducing the carrying amount to reflect the lease payments made.
The Group remeasures the lease liability (and makes a corresponding adjustment to the related right-of-use asset) whenever
a) the lease term has changed or there is a change in the assessment of exercise of a purchase option, in which case the lease liability is remeasured by discounting the
revised lease payments using a revised discount rate.
b) the lease payments change due to changes in an index or rate or a change in expected payment under a guaranteed residual value, in which case the lease liability is
measured by discounting the revised lease payments using the initial discount rate (unless the lease payments change is due to a change in a floating interest rate, in
which case a revised discount rate is used).
c) a lease contract is modified, and the lease modification is not accounted. for as a separate lease, in which case the lease liability is remeasured by discounting the
revised lease payments using a revised discount rate.
The Group did not make any such adjustments during the periods presented.
The Right-of-Use assets comprise the initial measurement of the corresponding lease liability, lease payments made at or before the commencement day and any initial
direct costs. They are subsequently measured at cost less accumulated depreciation and impairment losses.
Whenever the Group incurs an obligation for costs to dismantle and remove a leased asset, restore the site on which it is located or restore the underlying asset to the
condition required by the terms and conditions of the lease, a provision is recognised and measured under Ind AS 37. The costs are included in the related right-of-use
asset, unless those costs are incurred to produce inventories.Group as a lessor
a) Determining whether an arrangement contains a lease
At inception of an arrangement, it is determined whether the arrangement is or contains a lease. At inception or on reassessment of the arrangement that contains a
lease, the payments and other consideration required by such an arrangement are separated into those for other elements on the basis of their relative fair values.
b) Assets held under leases
Leases in which the Group does not transfer substantially all the risks and rewards of ownership of an asset are classified as operating leases. Rental income arising is
accounted for on a straight line basis over the lease term. The lease term is the non-cancellable period together with any further term for which the tenant has the
option to continue the lease, where, at the inception of the lease, the Group is reasonably certain that the tenant will exercise that option. Leases are classified as
finance leases when substantially all of the risks and rewards of ownership transfer from the Group to the lessee. Amounts due from lessees under finance leases are
recorded as receivables at the Group’s net investment in the leases.
c) Initial direct costs
Initial direct costs such as brokerage expenses incurred specifically to earn revenues from an operating lease are capitalised to the carrying amount of leased asset and
recognised over the lease term on the same basis as rental income.
Borrowings
208

C. E. Info Systems Limited (formerly known as C.E. Info Systems Pvt Ltd)
Annexure V - Significant accounting policies
'(All amounts are in Indian Rupees in millions, unless otherwise stated)
o) Earnings per equity share
p)
q)
r)
Exchange difference arising on translation of the foreign operations are accumulated in a separate reserve within equity. The cumulative amount is reclassified to
Statement of Profit & loss when the investment is disposed off.
Share based payment reserve
The share options based payment reserve is used to recognize the grant date fair value of options issued to employees under Employee stock option plan.
Securities premium reserve
Securities premium reserve is used to record the premium on issue of shares. The reserve can be utilized only for limited purposes such as issuance of bonus shares
and buyback of shares in accordance with the provisions of the Companies Act, 2013.
Capital redemption reserve
The Group recognizes cancellation of the Holding Company’s own equity instruments to capital redemption reserve.
Currency translation adjustment reserve
Under the erstwhile Companies Act 1956, general reserve was created through an annual transfer of net income at a specified percentage in accordance with applicable
regulations. Consequent to introduction of Companies Act 2013, the requirement to mandatorily transfer a specified percentage of the net profit to general reserve has
been withdrawn.
Basic EPS amounts are computed by dividing the net profit attributable to the equity holders of the Holding Company by the weighted average number of equity
shares outstanding during the half year / year.
Diluted EPS amounts are computed by dividing the net profit attributable to the equity holders of the Holding Company by the weighted average number of equity
shares considered for deriving basic earnings per share and also the weighted average number of equity shares that could have been issued upon conversion of all
dilutive potential equity shares. The diluted potential equity shares are adjusted for the proceeds receivable had the shares been actually issued at fair value (i.e. the
average market value of the outstanding shares). Dilutive potential equity shares are deemed converted as at the beginning of the year, unless issued at a later date.
Dilutive potential equity shares are determined independently for each half year / year presented.
Foreign currency transaction and translation
Transactions in foreign currencies are initially recorded by the Group at their respective functional currency spot rates at the date of the transaction. Foreign-currency
denominated monetary assets and liabilities are translated to the relevant functional currency at exchange rates in effect at the Restated Consolidated Balance Sheet
date. Exchange differences arising on settlement or translation of monetary items are recognized in the Restated Consolidated Statement of Profit and Loss. Non-
monetary assets and non-monetary liabilities denominated in a foreign currency and measured at historical cost are translated at the exchange rate prevalent at the date
of initial transaction. Non-monetary assets and non-monetary liabilities denominated in a foreign currency and measured at fair value are translated at the exchange rate
prevalent at the date when the fair value was determined.
Transaction gains or losses realized upon settlement of foreign currency transactions are included in determining net profit for the year. Revenue, expenses and cash-
flow items denominated in foreign currencies are translated into the relevant functional currencies using the exchange rate in effect on the date of the transaction.
The translation of foreign operations from respective functional currency into INR (the reporting currency) for assets and liabilities is performed using the exchange
rates in effect at the balance sheet date, and for revenue, expenses and cash flows is performed using an appropriate daily weighted average exchange rate for the
respective years. The exchange differences arising on translation are reported as a component of ‘other comprehensive income (loss)’. On disposal of a foreign
operation, the component of OCI relating to that particular foreign operation is recognized in the Restated Consolidated Statement of Profit and Loss.
Dividends
Final dividend proposed by the Board of Directors are recognized upon approval by the shareholders who have the right to decrease but not increase the amount of
dividend recommended by the Board of Directors. Interim dividends are recognized on declaration by the Board of Directors.
Nature and purpose of reserves
General reserve
209

C. E. Info Systems Limited (formerly known as C.E. Info Systems Pvt Ltd)
Annexure VI - Notes to Restated Consolidated Financial Information
'(All amounts are in Indian Rupees in millions, unless otherwise stated)
3(a) Property, plant and equipment
Changes in the carrying value of property, plant and equipment for the six month period ended 30 September 2021:
Particulars Computer
(Server and
networks)
Computer
(End user
devices)
Research and
development
equipments
Furniture and
Fixtures
Electrical
Installation and
Equipments
Vehicle tracking
devices Vehicles
Map Survey
Vehicles
Total
Balance as at 1 April 2021 13.59 31.40 2.30 4.19 15.09 52.31 9.35 2.63 130.85
Additions during the period 0.53 4.06 - 0.18 0.12 0.72 4.76 - 10.36
Disposals during the period - - - - - - - - -
Gross block as at 30 September 2021 (A) 14.12 35.46 2.30 4.37 15.21 53.03 14.11 2.63 141.21
Accumulated depreciation as at 1 April 2021 6.07 21.19 0.41 0.42 12.81 25.36 0.49 0.13 66.88
Depreciation charged during the period 0.94 1.31 0.08 0.21 0.80 7.43 0.84 0.58 12.18
Disposals during the period - - - - - - - - -
Accumulated depreciation as at 30 September 2021 (B) 7.01 22.50 0.49 0.63 13.61 32.79 1.33 0.72 79.06
Net carrying amount as at 30 September 2021 (A) - (B) 7.11 12.96 1.80 3.74 1.60 20.24 12.78 1.91 62.15
Changes in the carrying value of property, plant and equipment for the year ended 31 March 2021:
Particulars Computer
(Server and
networks)
Computer
(End user
devices)
Research and
development
equipments
Furniture and
Fixtures
Electrical
Installation and
Equipments
Vehicle tracking
devices Vehicles
Map Survey
Vehicles
Total
Balance as at 1 April 2020 12.84 29.66 2.18 2.74 14.84 36.25 13.15 4.43 116.09
Additions during the year 0.74 1.77 0.11 1.45 0.30 16.07 - - 20.44
Disposals during the year - (0.03) - - - - (3.86) (1.80) (5.69)
Gross block as at 31 March 2021 (A) 13.58 31.40 2.29 4.19 15.14 52.32 9.29 2.63 130.84
Accumulated depreciation as at 1 April 2020 3.75 14.04 0.26 0.11 11.12 3.16 1.22 0.48 34.14
Depreciation charged during the year 2.33 7.16 0.15 0.31 1.68 22.21 2.33 0.82 36.99
Disposals during the year - (0.03) - - - - (3.08) (1.17) (4.28)
Accumulated depreciation as at 31 March 2021 (B) 6.08 21.17 0.41 0.42 12.80 25.37 0.47 0.13 66.85
Net carrying amount as at 31 March 2021 (A) - (B) 7.50 10.23 1.88 3.77 2.34 26.95 8.82 2.50 63.99
Changes in the carrying value of property, plant and equipment for the six month period ended 30 September 2020:
Particulars Computer
(Server and
networks)
Computer
(End user
devices)
Research and
development
equipments
Furniture and
Fixtures
Electrical
Installation and
Equipments
Vehicle tracking
devices Vehicles
Map Survey
Vehicles
Total
Balance as at 1 April 2020 12.84 29.66 2.18 2.74 14.84 36.25 13.15 4.43 116.09
Additions during the period - - 0.05 0.29 - 9.91 - - 10.25
Disposals during the period - (0.03) - - - - - (0.63) (0.66)
Gross block as at 30 September 2020 (A) 12.84 29.63 2.23 3.03 14.84 46.16 13.15 3.80 125.68
Accumulated depreciation as at 1 April 2020 3.75 14.04 0.26 0.11 11.12 3.16 1.22 0.48 34.14
Depreciation charged during the period 1.15 3.56 0.07 0.14 0.84 9.89 1.17 0.72 17.55
Disposals during the period - (0.02) - - - - - - (0.02)
Accumulated depreciation as at 30 September 2020 (B) 4.90 17.58 0.33 0.25 11.96 13.05 2.39 1.20 51.66
Net carrying amount as at 30 September 2020 (A) - (B) 7.94 12.05 1.90 2.78 2.89 33.11 10.75 2.60 74.02
210

C. E. Info Systems Limited (formerly known as C.E. Info Systems Pvt Ltd)
Annexure VI - Notes to Restated Consolidated Financial Information
'(All amounts are in Indian Rupees in millions, unless otherwise stated)
3(a) Property, plant and equipment
Changes in the carrying value of property, plant and equipment for the year ended 31 March 2020:
Particulars Computer
Server
Computer End
user devices
Research and
development
equipments
Furniture and
Fixtures
Electrical
Installation/
Equipments
Vehicle tracking
devices
Vehicles Map Survey
Vehicles
Total
Balance as at 1 April 2019 11.72 19.66 1.96 0.20 12.77 13.07 8.44 3.57 71.39
Additions during the year 1.12 10.56 0.22 2.54 2.07 23.18 6.74 3.56 49.99
Disposals during the year - (0.56) - - - - (2.03) (2.70) (5.29)
Gross block as at 31 March 2020 (A) 12.84 29.66 2.18 2.74 14.84 36.25 13.15 4.43 116.09
Accumulated depreciation as at 1 April 2019 1.50 6.82 0.10 0.02 1.39 0.95 1.40 1.18 13.36
Depreciation charged during the year 2.25 7.54 0.16 0.09 9.73 2.21 1.90 1.01 24.89
Disposals during the year - (0.32) - - - - (2.08) (1.71) (4.11)
Accumulated depreciation as at 31 March 2020 (B) 3.75 14.04 0.26 0.11 11.12 3.16 1.22 0.48 34.14
Net carrying amount as at 31 March 2020 (A) - (B) 9.09 15.62 1.92 2.63 3.72 33.09 11.93 3.95 81.95
Changes in the carrying value of property, plant and equipment for the year ended 31 March 2019:
ParticularsComputer
Server
Computer End
user devices
Research and
development
equipments
Furniture and
Fixtures
Electrical
Installation/
Equipments
Vehicle tracking
devicesVehicles
Map Survey
VehiclesTotal
Balance as at 1 April 2018 2.76 13.10 1.86 0.10 12.02 7.20 5.04 3.45 45.53
Additions during the year 8.96 6.56 0.10 0.10 0.75 5.87 3.40 0.12 25.86
Disposals during the year - - - - - - - - -
Gross block as at 31 March 2019 (A) 11.72 19.66 1.96 0.20 12.77 13.07 8.44 3.57 71.39
Accumulated depreciation as at 1 April 2018 - - - - - - - - -
Depreciation charged during the year 1.50 6.82 0.10 0.02 1.39 0.95 1.40 1.18 13.36
Disposals during the year - - - - - - - - -
Accumulated depreciation as at 31 March 2019 (B) 1.50 6.82 0.10 0.02 1.39 0.95 1.40 1.18 13.36
- - - - - - - - -
Net carrying amount as at 31 March 2019 (A) - (B) 10.22 12.84 1.86 0.18 11.38 12.12 7.04 2.39 58.03
211

C. E. Info Systems Limited (formerly known as C.E. Info Systems Pvt Ltd)
Annexure VI - Notes to Restated Consolidated Financial Information (Continued)
'(All amounts are in Indian Rupees in millions, unless otherwise stated)
3(b) Investment properties
Particulars
six month period
ended
30-09-2021
six month period
ended
30-09-2020
31-Mar-21 31-Mar-20 31-Mar-19
Gross block
Opening carrying value 82.93 82.93 82.93 82.93 82.93
Additions during the six month period ended /year - - - - -
Disposals during the six month period ended / year - - - - -
Closing carrying value 82.93 82.93 82.93 82.93 82.93
Depreciation
Opening accumulated depreciation 4.05 2.70 2.70 1.35 -
Charge for the six month period ended /year 0.68 0.68 1.35 1.35 1.35
Disposals during the six month period ended /year - - -
Closing accumulated depreciation 4.73 3.38 4.05 2.70 1.35
Net block 78.20 79.55 78.88 80.23 81.58
Net carrying amount as at 1 April, 2018 : Rs. 82932473
Information regarding income and expenditure of investment property for the six month period ended / year
Particulars
six month period
ended
30-09-2021
six month period
ended
30-09-2020
31-Mar-21 31-Mar-20 31-Mar-19
Rental income derived from investment property (A) 0.36 1.46 2.39 4.40 4.20
Direct operating expenses (including repairs and maintenance)# (B) - - - - 0.10
Profit arising from investment properties before depreciation and indirect expenses
C= (A-B)0.36 1.46 2.39 4.40 4.10
Less : Depreciation (D) 0.68 0.68 1.35 1.35 1.35
Profit arising from investment property before indirect expenses E=(C-D) (0.32) 0.78 1.04 3.05 2.75
*Zero value represent amount less than 0.05 Mn
Fair value hierarchy
Particulars
six month period
ended
30-09-2021
six month period
ended
30-09-2020
31-Mar-21 31-Mar-20 31-Mar-19
Opening balance 88.20 88.20 88.20 89.00 88.60
Fair value difference - - - (0.80) 0.40
Purchases - - - -
Closing balance 88.20 88.20 88.20 88.20 89.00
Valuation technique
Changes in the carrying value of investment properties for the six month period ended / year ended
#As per the lease agreement with lesseee, all the operating expenses such as water, electricity, maintenance and minor repairs are to be born by the lessee. Also, there
were no major repair and maintenance expenses during the six month periods ended September 30, 2021 and 2020 and during the years ended March 31, 2021,2020
and 2019.
Group's investment property consist of two commercial properties in New Delhi. As at 30 September 2021 and 30 September 2020, the FV of the properties have not
been obtained due to pandemic situation of the country and hence the values as on 31 March 2020 of Rs. 88.20 Mn has been taken as the fair value as on 30
September 2021, 30 September 2020 and 31 March 2021. However, the fair value of investment property as at 31st March 2020 and 31st March 2019 ware
determined by external, independent property valuers, having appropriate recognised professional qualifications and recent experience in the location and category of
the property being valued.
The Company has no restrictions on the realisability of its investment property and no contractual obligations to purchase, construct or develop investment properties
or for repairs, maintenance and enhancements.
In earlier years, the valuation methodologies used by the Group for fair valuation of investment property are direct comparison approach. In the direct comparison
approach, the subject property is compared to similar properties that have actually been sold in arms-length transactions or are offered for sale.
Note: The title deeds of immovable properties are held in the name of the Company
212

C. E. Info Systems Limited (formerly known as C.E. Info Systems Pvt Ltd)
Annexure VI - Notes to Restated Consolidated Financial Information (Continued)
'(All amounts are in Indian Rupees in millions, unless otherwise stated)
4 Other intangible assets
Changes in the carrying value of intangibles for the six month period ended 30 September 2021:
Particulars Computer
Software
Internally
Generated Map
Database
Right to Non
compete
Total
Balance as at 1 April 2021 24.86 102.29 3.00 130.15
Additions during the six month period 1.35 1.86 - 3.21
Disposals during the six month period - - - -
Cost as at 30 September 2021 (A) 26.21 104.15 3.00 133.36
Accumulated depreciation as at 1 April 2021 18.22 80.67 3.00 101.88
Depreciation charged during the six month period 1.66 5.09 - 6.75
Disposals during the six month period
Accumulated depreciation as at 30 September 2021 (B) 19.88 85.76 3.00 108.63
Net carrying amount as at 30 September 2021 (A) - (B) 6.33 18.39 - 24.73
Changes in the carrying value of intangibles for the year ended 31 March 2021:
Particulars Computer
Software
Internally
Generated Map
Database
Right to Non
compete
Total
Balance as at 1 April 2020 24.86 99.09 3.00 126.95
Additions during the year - 3.20 - 3.20
Disposals during the year - - - -
Cost as at 31 March 2021 (A) 24.86 102.29 3.00 130.15
Accumulated depreciation as at 1 April 2020 14.20 62.30 3.00 79.50
Depreciation charged during the year 4.02 18.37 - 22.39
Disposals during the year - - - -
Accumulated depreciation as at 31 March 2021 (B) 18.22 80.67 3.00 101.88
Net carrying amount as at 31 March 2021 (A) - (B) 6.64 21.63 - 28.27
Changes in the carrying value of intangibles for the six month period ended 30 September 2020:
Particulars Computer
Software
Internally
Generated Map
Database
Right to Non
compete
Total
Balance as at 1 April 2020 24.86 99.09 3.00 126.95
Additions during the six month period - 1.60 - 1.60
Disposals during the six month period - - - -
Cost as at 30 September 2020 (A) 24.86 100.69 3.00 128.55
Accumulated depreciation as at 1 April 2020 14.20 62.30 3.00 79.50
Depreciation charged during the six month period 2.01 9.19 11.19
Disposals during the six month period
Accumulated depreciation as at 30 September 2020 (B) 16.21 71.49 3.00 90.69
Net carrying amount as at 30 September 2020 (A) - (B) 8.65 29.21 - 37.86
213

C. E. Info Systems Limited (formerly known as C.E. Info Systems Pvt Ltd)
Annexure VI - Notes to Restated Consolidated Financial Information (Continued)
'(All amounts are in Indian Rupees in millions, unless otherwise stated)
4 Other intangible assets
Changes in the carrying value of intangibles for the year ended 31 March 2020:
Particulars Computer
Software
Internally
Generated Map
Database
Right to Non
compete
Total
Balance as at 1 April 2019 24.86 93.90 3.00 121.76
Additions during the year - 5.19 - 5.20
Disposals during the year - - - -
Cost as at 31 March 2020 (A) 24.86 99.09 3.00 126.95
- - - -
Accumulated depreciation as at 1 April 2019 8.01 36.15 2.25 46.41
Depreciation charged during the year 6.19 26.15 0.75 33.09
Disposals during the year - - - -
Accumulated depreciation as at 31 March 2020 (B) 14.20 62.30 3.00 79.50
Net carrying amount as at 31 March 2020 (A) - (B) 10.66 36.79 - 47.45
Changes in the carrying value of intangibles for the year ended 31 March 2019:
ParticularsComputer
Software
Internally
Generated Map
Database
Right to Non
competeTotal
Balance as at 1 April 2018 24.82 86.12 3.00 113.94
Additions during the year 0.04 7.78 - 7.82
Disposals during the year - - - -
Cost as at 31 March 2019 (A) 24.86 93.90 3.00 121.76
Accumulated depreciation as at 1 April 2018 - - - -
Depreciation charged during the year 8.01 36.15 2.25 46.41
Disposals during the year - - - -
Accumulated depreciation as at 31 March 2019 (B) 8.01 36.15 2.25 46.41
Net carrying amount as at 31 March 2019 (A) - (B) 16.85 57.80 0.70 75.35
214

C. E. Info Systems Limited (formerly known as C.E. Info Systems Pvt Ltd)
Annexure VI - Notes to Restated Consolidated Financial Information (Continued)
'(All amounts are in Indian Rupees in millions, unless otherwise stated)
5 Investments
Particulars
30-Sep-21 30-Sep-20 31-Mar-21 31-Mar-20 31-Mar-19
Financial assets
Non- current
i) Investment in equity instruments carried at cost (unquoted) 54.42 38.81 38.70 45.21 13.91
ii) Unquoted investments carried at fair value through profit and loss
Investment in preference shares#
50,000 Series A Preference shares of Rs. 140/- each (including a premium of Rs. 130/- each) of Visit
Internet Services Private Limited, fully paid-up- 7.00 7.00 7.00 7.00
Less: Provision for Impairment of Visit Internet Services - (0.80) (0.80) - -
{31,746 (31 March 2020, 31,746) Preference shares of Rs. 630 each (including a premium of Rs. 620 each)
of Briskworld Ventures Pvt Ltd, fully paid-up}20.00 20.00 20.00 20.00 20.00
Less: Provision for impairment of Briskworld Ventures Pvt Ltd (17.40) (17.40) (17.40) - -
{3,378 (31 March 2020, 3,378) Preference shares of Rs. 740 each (including a premium of Rs. 730/- each)
of Cusmat Technologies Pvt ltd, fully paid-up}2.50 2.50 2.50 2.50 -
-
{4,125 Preference Shares of Rs. 375 each ( including a premium of Rs. 365 each of E-Chargeup Solutions
Private Limited, fully paid up}
1.50 - 1.50 - -
iii) Unquoted investments in mutual funds including alternative investment funds carried at fair value
through profit and loss73.41 314.15 58.70 245.78 351.97
-
iv) Quoted investments in debt securities carried at amortized cost 1,629.06 501.26 1,029.90 773.90 624.65
-
v) Unquoted investments in debt securities carried at amortized cost 7.60 7.60 7.60 7.60 7.60
-
1,771.09 873.12 1,147.70 1,101.99 1,025.13
Current
i) Unquoted investments carried at fair value through profit and loss
Investment in mutual funds including alternative investment funds and portfolio management funds 953.47 996.47 998.80 885.00 982.28
ii) Quoted investments carried at amortised cost
Investment in debt securities carried at amortised cost 210.60 384.01 543.00 - -
1,164.07 1,380.48 1,541.80 885.00 982.28
Total investments- financial assets 2,935.16 2,253.60 2,689.50 1,986.99 2,007.41
Aggregate amount of unquoted investments 1,095.50 1,368.33 1,116.60 1,213.09 1,382.76
Aggregate amount of quoted investments 1,839.66 885.27 1,572.90 773.90 624.65
6 Other financial assets
Particulars
30-Sep-21 30-Sep-20 31-Mar-21 31-Mar-20 31-Mar-19
Non- current
Carried at amortized cost
Bank deposits with more than 12 months maturity 90.92 79.73 0.59 212.04 244.69
Interest accrued on bank deposits with more than 12 months maturity 0.83 2.58 0.06 5.45 1.47
Security deposits - - 0.12 0.21 6.06
91.75 82.31 0.77 217.70 252.22
Current
Interest receivable 94.61 38.59 71.96 22.95 30.70
Unbilled revenue* 78.79 63.02 77.13 95.87 48.90
Security deposits 8.03 10.29 6.51 10.80 3.50
181.43 111.90 155.60 129.62 83.10
* The aging of unbilled revenue is not more than 2 months.
7 Inventories (valued at lower of cost and net realisable value)
Particulars
30-Sep-21 30-Sep-20 31-Mar-21 31-Mar-20 31-Mar-19
Raw material 14.44 17.78 14.20 19.58 16.17
Finished goods 8.47 6.32 9.76 8.18 16.08
Stock-in-trade 7.30 17.87 8.45 18.48 11.25
Stores and spares 0.78 1.38 0.76 1.38 3.53
Total 30.98 43.36 33.17 47.62 47.03
- - Less: Provision against Raw material (1.85) (0.64) (1.85) (0.64) (0.80)
Less: Provision against Finished goods (3.68) (5.58) (3.68) (2.86) (11.19)
Less: Provision against Spares and Accessories - (0.17) - (0.17) (0.17)
Net inventory after provision 25.44 36.97 27.64 43.95 34.87
As at
As at
As at
215

C. E. Info Systems Limited (formerly known as C.E. Info Systems Pvt Ltd)
Annexure VI - Notes to Restated Consolidated Financial Information (Continued)
'(All amounts are in Indian Rupees in millions, unless otherwise stated)
8 Trade receivables
Particulars
30-Sep-21 30-Sep-20 31-Mar-21 31-Mar-20 31-Mar-19
Unsecured, considered good, unless stated otherwise 258.14 254.10 282.80 311.29 238.99
Trade Receivables which have significant increase in credit risk 61.63 59.30 66.10 66.90 58.61
Total 319.77 313.40 348.90 378.19 297.60
Impairment allowance for bad and doubtful debts (refer note 30 (B)(i)) (61.63) (59.30) (66.10) (66.90) (58.61)
Net trade receivables after provision 258.14 254.10 282.80 311.29 238.99
*refer note 31 for related party balances
Trade receivables ageing schedule
Trade receivables as at 30 September 21
Particulars
Less than 6
months
6 Months to 1
year1-2 years 2 to 3 years
More than 3
years
(i) Undisputed trade receivable - considered good 247.59 7.47 0.58 1.03 1.49 258.14
(ii) Undisputed trade receivable - which have significant increase in credit risk 18.03 4.74 7.34 3.27 28.25 61.63
(iii) Undisputed trade receivable - Credit impaired - - - - - -
(iv) Disputed trade receivable - considered good - - - - - -
(v) Disputed trade receivable - which have significant increase in credit risk - - - - - -
(iii) Disputed trade receivable - Credit impaired - - - - - -
Total 265.62 12.21 7.92 4.30 29.74 319.77
Trade receivables as at 31 March 21
Particulars
Less than 6
months
6 Months to 1
year1-2 years 2 to 3 years
More than 3
years
(i) Undisputed trade receivable - considered good 275.11 1.97 3.65 0.20 1.86 282.80
(ii) Undisputed trade receivable - which have significant increase in credit risk 15.73 3.47 13.31 4.88 28.71 66.10
(iii) Undisputed trade receivable - Credit impaired - - - - - -
(iv) Disputed trade receivable - considered good - - - - - -
(v) Disputed trade receivable - which have significant increase in credit risk - - - - - -
(iii) Disputed trade receivable - Credit impaired - - - - - -
Total 290.84 5.44 16.96 5.09 30.57 348.90
Trade receivables as at 30 September 20
Particulars
Less than 6
months
6 Months to 1
year1-2 years 2 to 3 years
More than 3
years
(i) Undisputed trade receivable - considered good 247.21 1.73 3.29 0.16 1.70 254.10
(ii) Undisputed trade receivable - which have significant increase in credit risk 14.12 3.05 12.02 3.90 26.22 59.30
(iii) Undisputed trade receivable - Credit impaired - - - - - -
(iv) Disputed trade receivable - considered good - - - - - -
(v) Disputed trade receivable - which have significant increase in credit risk - - - - - -
(iii) Disputed trade receivable - Credit impaired - - - - - -
Total 261.33 4.78 15.31 4.06 27.92 313.40
Trade receivables as at 31 March 20
Particulars
Less than 6
months
6 Months to 1
year1-2 years 2 to 3 years
More than 3
years
(i) Undisputed trade receivable - considered good 285.14 8.98 3.29 7.11 6.77 311.29
(ii) Undisputed trade receivable - which have significant increase in credit risk 18.09 9.10 4.55 5.62 29.54 66.90
(iii) Undisputed trade receivable - Credit impaired - - - - - -
(iv) Disputed trade receivable - considered good - - - - - -
(v) Disputed trade receivable - which have significant increase in credit risk - - - - - -
(iii) Disputed trade receivable - Credit impaired - - - - - -
Total 303.23 18.08 7.84 12.73 36.31 378.19
Trade receivables as at 31 March 19
Particulars
Less than 6
months
6 Months to 1
year1-2 years 2 to 3 years
More than 3
years
(i) Undisputed trade receivable - considered good 221.43 5.79 4.59 - 7.21 239.02
(ii) Undisputed trade receivable - which have significant increase in credit risk 15.78 4.36 13.10 25.37 58.61
(iii) Undisputed trade receivable - Credit impaired - - - - - -
(iv) Disputed trade receivable - considered good - - - - - -
(v) Disputed trade receivable - which have significant increase in credit risk - - - - - -
(iii) Disputed trade receivable - Credit impaired - - - - - -
Total 237.21 10.15 17.69 - 32.58 297.63
The average credit period ranges from 60 to 90 days for the above stated periods/ years. No interest is charged on delayed payments.
Total
Outstanding for following periods from due date of payment
Outstanding for following periods from due date of payment
Total
Outstanding for following periods from due date of payment
Total
Outstanding for following periods from due date of payment
Total
Outstanding for following periods from due date of payment
Total
As at
216

C. E. Info Systems Limited (formerly known as C.E. Info Systems Pvt Ltd)
Annexure VI - Notes to Restated Consolidated Financial Information (Continued)
'(All amounts are in Indian Rupees in millions, unless otherwise stated)
9 Cash and cash equivalents
Particulars
30-Sep-21 30-Sep-20 31-Mar-21 31-Mar-20 31-Mar-19
Balances with bank
- in current account 429.17 120.72 283.06 149.75 81.88
- deposits with original maturity of less than 3 months 184.53 63.65 52.81 0.51 -
Cash on hand 0.39 2.90 0.40 0.40 0.61
614.09 187.27 336.27 150.67 82.49
Bank balances other than cash and cash equivalents - -
Fixed deposits with original maturity of more than 3 months but less than 12 months of reporting date 147.19 240.23 335.60 171.11 131.30
147.19 240.23 335.60 171.11 131.30
10 Particulars
30-Sep-21 30-Sep-20 31-Mar-21 31-Mar-20 31-Mar-19
Advance tax (net of provision for tax) 26.09 75.01 65.80 79.20 57.40
26.09 75.01 65.80 79.20 57.40
11 Other current assets
Particulars
30-Sep-21 30-Sep-20 31-Mar-21 31-Mar-20 31-Mar-19
Unsecured, considered good, unless otherwise stated
Advances other than capital advances
Advance to suppliers 5.86 4.22 3.37 10.04 10.06
Advance to employees 2.46 0.68 1.04 0.23 1.08
Receivables from Government authorities 0.64 1.06 1.62 3.77 6.09
IPO expenses recoverable* 28.96 - - - -
Prepaid expenses 6.50 3.75 6.08 6.83 5.97
44.42 9.71 12.11 20.87 23.20
* Since the Company is in the process of filing an offer for sale, therefore the IPO expenses, other then listing fees, are recoverable from selling shareholders of the Company.
As at
As at
As at
217

C. E. Info Systems Limited (formerly known as C.E. Info Systems Pvt Ltd)
Annexure VI - Notes to Restated Consolidated Financial Information (Continued)
'(All amounts are in Indian Rupees in millions, unless otherwise stated)
12 Equity share capital
a) Details of authorised, issued and subscribed share capital
Particulars
Number Amount Number Amount Number Amount Number Amount Number Amount
Authorised capital ^
Equity Shares of Rs. 2 each 4,25,00,000 85.00 45,00,000 45.00 45,00,000 45.00 45,00,000 45.00 45,00,000 45.00
Non-cumulative participating convertible Preference shares:
- Series A preference shares of Rs. 81 each 12,29,630 99.60 12,29,630 99.60 12,29,630 99.60 12,29,630 99.60 12,29,630 99.60
- Series B preference shares of Rs. 114 each 10,00,000 114.00 10,00,000 114.00 10,00,000 114.00 10,00,000 114.00 10,00,000 114.00
- Series C preference shares of Rs. 290 each 12,18,007 353.22 12,18,007 353.22 12,18,007 353.22 12,18,007 353.22 12,18,007 353.22
- Series D preference shares of Rs. 630 each 11,49,206 724.00 11,49,206 724.00 11,49,206 724.00 11,49,206 724.00 11,49,206 724.00
- Series E preference shares of Rs. 1000 each 1,80,000 180.00 1,80,000 180.00 1,80,000 180.00 1,80,000 180.00 1,80,000 180.00
4,72,76,843 1,555.82 92,76,843 1,515.82 92,76,843 1,515.82 92,76,843 1,515.82 92,76,843 1,515.82
Issued, subscribed and paid up capital ^^
Equity shares of Rs. 2 each (fully paid up) 3,99,32,225 79.86 38,32,831 38.33 38,32,831 38.33 38,32,831 38.33 38,32,831 38.33
Non-cumulative participating convertible Preference shares:
- Series A preference shares of Rs. 81 each (fully paid up) - - 7,00,748 56.76 7,00,748 56.76 7,00,748 56.76 7,00,748 56.76
- Series B preference shares of Rs. 114 each (fully paid up) - - 9,38,326 106.97 9,38,326 106.97 9,38,326 106.97 9,38,326 106.97
- Series C preference shares of Rs. 290 each (fully paid up) - - 12,18,003 353.22 12,18,003 353.22 12,18,003 353.22 12,18,003 353.22
- Series D preference shares of Rs. 630 each (fully paid up) - - 11,49,206 724.00 11,49,206 724.00 11,49,206 724.00 11,49,206 724.00
- Series E preference shares of Rs. 1000 each (fully paid up) - - 48,686 48.69 48,686 48.69 48,686 48.69 48,686 48.69
3,99,32,225 79.86 78,87,800 1,327.96 78,87,800 1,327.96 78,87,800 1,327.96 78,87,800 1,327.96
b) Reconciliation of shares outstanding at the beginning and at the end of the six month period/ year
Particulars
Number Amount Number Amount Number Amount Number Amount Number Amount
Equity Shares
At the beginning of the year 38,32,831 38.33 38,32,831 38.33 38,32,831 38.33 38,32,831 38.33 38,32,831 38.33
Add: Issue of shares on exercise of stock options 98,645 0.99
Add : Additional shares issued as a result of the split of the face
value of equity share from Rs. 10 per share to Rs. 2 per share during
the period ((A multiply by 5) minus A) 1,57,25,904 - - - - - - - - - - - - - - - - -
Add : On conversion of non-cumulative participating convertible
Preference shares into equity shares and after considering split of the
face value of equity share from Rs. 10 per share to Rs. 2 per share
2,02,74,845 40.55 - - - - - - - -
At the end of the half year / year 3,99,32,225 79.86 38,32,831 38.33 38,32,831 38.33 38,32,831 38.33 38,32,831 38.33
Non-cumulative participating convertible Preference shares:
Series A preference shares
At the beginning of the half year /year 7,00,748 56.76 7,00,748 56.76 7,00,748 56.76 7,00,748 56.76 7,00,748 56.76
Less : Converted into equity shares 7,00,748 56.76 - - - - - - - -
At the end of the half year / year - - 7,00,748 56.76 7,00,748 56.76 7,00,748 56.76 7,00,748 56.76
Series B preference shares
At the beginning of the half year /year 9,38,326 106.97 9,38,326 106.97 9,38,326 106.97 9,38,326 106.97 9,38,326 106.97
Less : Converted into equity shares 9,38,326 106.97 - - - - - - - -
At the end of the half year / year - - 9,38,326 106.97 9,38,326 106.97 9,38,326 106.97 9,38,326 106.97
Series C preference shares
At the beginning of the half year /year 12,18,003 353.22 12,18,003 353.22 12,18,003 353.22 12,18,003 353.22 12,18,003 353.22
Less : Converted into equity shares 12,18,003 353.22 - - - - - - - -
At the end of the period / year - - 12,18,003 353.22 12,18,003 353.22 12,18,003 353.22 12,18,003 353.22
Series D preference shares
At the beginning of the half year /year 11,49,206 724.00 11,49,206 724.00 11,49,206 724.00 11,49,206 724.00 11,49,206 724.00
Less : Converted into equity shares 11,49,206 724.00 - - - - - - - -
At the end of the period / year - - 11,49,206 724.00 11,49,206 724.00 11,49,206 724.00 11,49,206 724.00
Series E preference shares
At the beginning of the half year /year 48,686 48.69 48,686 48.69 48,686 48.69 48,686 48.69 48,686 48.69
Less : Converted into equity shares 48,686 48.69 - - - - - - - -
At the end of the period / year - - 48,686 48.69 48,686 48.69 48,686 48.69 48,686 48.69
As at
31-Mar-21 31-Mar-20 31-Mar-19
31-Mar-21 31-Mar-20 31-Mar-19
30-Sep-21 30-Sep-20
As at
^
a) Pursuant to Board and shareholders' resolutions passed on July 07, 2021, the Company has sub-divided the face value of its equity shares from Rs. 10 each to Rs. 2 each. As a result to this split, the authorized equity shares capital of the comapnay has increased
from 4,500,000 Equity Shares of Rs. 10 each to 22,500,000 equity shares of Rs. 2 each.
b) Further, pursuant to a resolution passed by the Shareholders of the Company on 07 July 2021 through extra-ordinary general meeting, the authorized share capital of the Company was increased by creation of additional 20,000,000 equity shares of INR 2 each.
The total authorised capital now stands at INR 1,555.82 Million divided into 42,500,000 equity shares, 1,229,630 Series A non-cumulative participating fully convertible preference shares, 1,000,000 Series B non-cumulative participating fully convertible
preference shares, 1,218,007 Series C non-cumulative participating fully convertible preference shares, 1,149,206 Series D non-cumulative participating fully convertible preference shares and 180,000 Series E non-cumulative participating fully convertible
preference shares.
^^
Pursuant to Board and Shareholders’ resolutions dated September 17, 2021 and September 20, 2021, respectively, Company converted 4,054,969 outstanding Preference Shares into 20,274,845 Equity Shares. Accordingly, (i) 700,748 Series A Preference Shares,
938,326 Series B Preference Shares, 540,972 Series C Preference Shares, and 48,686 Series E Preference Shares collectively held by PhonePe were converted to 3,503,740 Equity Shares, 4,691,630 Equity Shares, 2,704,860 Equity Shares, and 243,430 Equity
Shares, respectively; (ii) 677,031 Series C Preference Shares held by Qualcomm were converted to 3,385,155 Equity Shares; and (iii) 1,149,206 Series D Preference Shares held by Zenrin were converted to 5,746,030 Equity Shares. Upon conversion of the
Preference Shares to the Equity Shares, pursuant to the Board resolution dated September 21, 2021, Company allotted 11,143,660 Equity Shares, 3,385,155 Equity Shares, and 5,746,030 Equity Shares, to PhonePe, Qualcomm, and Zenrin, respectively.
Consequently, the issued and paid-up Equity Share capital of the Company increased from ₹39,314,760 comprising 19,657,380 Equity Shares to ₹79,864,450 comprising 39,932,225 Equity Shares and the issued and paid-up Preference Share capital of our
Company became nil.
30-Sep-2030-Sep-21
218

C. E. Info Systems Limited (formerly known as C.E. Info Systems Pvt Ltd)
Annexure VI - Notes to Restated Consolidated Financial Information (Continued)
'(All amounts are in Indian Rupees in millions, unless otherwise stated)
c) Particulars of shareholders holding more than 5% of shares held
Particulars
Number % holding Number % holding Number % holding Number % holding Number Amount
Equity shares
Mrs. Rashmi Verma 70,53,475 17.66 14,10,695 36.81 14,10,695 36.81 14,10,695 36.81 14,10,695 36.81
Mr. Rakesh Kumar Verma 56,32,455 14.11 11,26,491 29.39 11,26,491 29.39 11,26,491 29.39 11,26,491 29.39
Zenrin Co. Ltd. 71,14,640 17.82 2,73,722 7.14 2,73,722 7.14 2,73,722 7.14 2,73,722 7.14
Flipkart Private Limited# - - - - - - 6,55,244 17.10 6,55,244 17.10
PhonePe Private Limited# 1,44,19,880 36.11 6,55,244 17.10 6,55,244 17.10 - - - -
Mr. Nayan Arun Jagjivan 14,87,725 3.73 2,97,545 7.76 2,97,545 7.76 2,97,545 7.76 2,97,545 7.76
Qualcomm Asia Pacific Private Limited 33,85,155 8.48
3,90,93,330 97.91 37,63,697 98.20 37,63,697 98.20 37,63,697 98.20 37,63,697 98.20
Series A Preference shares
Flipkart Private Limited# - - - - - - 7,00,748 100.00 7,00,748 100.00
PhonePe Private Limited# - - 7,00,748 100.00 7,00,748 100.00 - - - -
Series B Preference Shares - - - - -
Flipkart Private Limited# - - - - - - 9,38,326 100.00 9,38,326 100.00
PhonePe Private Limited# - - 9,38,326 100.00 9,38,326 100.00 - - - -
Series C Preference Shares
Flipkart Private Limited# - - - - - - 5,40,972 44.41 5,40,972 44.41
PhonePe Private Limited# - - 5,40,972 44.41 5,40,972 44.41 - - - -
Qualcomm Asia Pacific Private Limited - - 6,77,031 55.59 6,77,031 55.59 6,77,031 55.59 6,77,031 55.59
- - 12,18,003 100.00 12,18,003 100.00 12,18,003 100.00 12,18,003 100.00
Series D Preference Shares
Zenrin Co. Ltd. - - 11,49,206 100.00 11,49,206 100.00 11,49,206 100.00 11,49,206 100.00
Series E Preference Shares - - - - -
Flipkart Private Limited# - - - - - - 48,686 100.00 48,686 100.00
PhonePe Private Limited# - - 48,686 100.00 48,686 100.00 - - - -
# During the year ended 31 March 2021, these shares have been transferred by Flipkart Pvt Ltd to PhonePe Private Limited.
a) Rights, preferences and restrictions attached to equity shares
31-Mar-21 31-Mar-20 31-Mar-19
The company has a single class of equity shares. Accordingly all equity shares rank equally with regard to dividends and shares in the company's residual assets. The equity shares are entitled to receive dividend as declared from time to time. The voting rights of an
equity shareholder are in proportion to its share of the paid up equity capital of the company (on a fully diluted basis). Voting rights cannot be exercised in respect of shares on which any call or other sums presently payable have not been paid.
On winding up of the Company, the holders of equity shares will be entitled to receive the residual assets of the Company, remaining after distribution of all preferential amounts in proportion to the number of equity shares held.
b) Rights, preferences and restrictions attached to Series A, Series B, Series C, Series D and Series E preference shares
The prefrence shares had the following rights :
These shares were compulsorily convertible into equity shares in the ratio of 1:1 with liquidation preference, upon the earlier of the following events:
I. the end of ninteen years and eleven months from the date of their respective issuance: and
II. offer for sale by way of an IPO.
All the series of preference shares were ranking pari passu with each other in all respects.
30-Sep-21 30-Sep-20
Pursuant to Board and Shareholders’ resolutions dated September 17, 2021 and September 20, 2021, respectively, Company converted 4,054,969 outstanding Preference Shares into 20,274,845 Equity Shares. Accordingly, (i) 700,748 Series A Preference Shares,
938,326 Series B Preference Shares, 540,972 Series C Preference Shares, and 48,686 Series E Preference Shares collectively held by PhonePe were converted to 3,503,740 Equity Shares, 4,691,630 Equity Shares, 2,704,860 Equity Shares, and 243,430 Equity
Shares, respectively; (ii) 677,031 Series C Preference Shares held by Qualcomm were converted to 3,385,155 Equity Shares; and (iii) 1,149,206 Series D Preference Shares held by Zenrin were converted to 5,746,030 Equity Shares. Upon conversion of the
Preference Shares to the Equity Shares, pursuant to the Board resolution dated September 21, 2021, Company allotted 11,143,660 Equity Shares, 3,385,155 Equity Shares, and 5,746,030 Equity Shares, to PhonePe, Qualcomm, and Zenrin, respectively.
Consequently, the issued and paid-up Equity Share capital of the Company increased from ₹39,314,760 comprising 19,657,380 Equity Shares to ₹79,864,450 comprising 39,932,225 Equity Shares and the issued and paid-up Preference Share capital of our
Company became nil.
As at
*Percentage holding change is on account of following:
i. Company converted 4,054,969 outstanding Preference Shares into 20,274,845 Equity Shares pursuant to Board and Shareholders’ resolutions dated September 17, 2021 and September 20, 2021, respectively.
ii. Issue of shares on exercise of stock options during the half year ended 30 September 2021
219

C. E. Info Systems Limited (formerly known as C.E. Info Systems Pvt Ltd)
Annexure VI - Notes to Restated Consolidated Financial Information (Continued)
'(All amounts are in Indian Rupees in millions, unless otherwise stated)
c) Promoter Shareholding
Shareholding of promoters as on 30 September 2021
Number % holding% change during
the period
Equity shares*
Mrs. Rashmi Verma 70,53,475 17.66 -19.14
Mr. Rakesh Kumar Verma 56,32,455 14.11 -15.29
Total 1,26,85,930 31.77 -34.43
Shareholding of promoters as on 31 March 2021
Number % holding% change during
the Year
Equity shares
Mrs. Rashmi Verma 14,10,695 36.81 No Change
Mr. Rakesh Kumar Verma 11,26,491 29.39 No Change
Total 25,37,186 66.20 -
Shareholding of promoters as on 30 Sep 2020
Number % holding% change during
the period
Equity shares
Mrs. Rashmi Verma 14,10,695 36.81 No Change
Mr. Rakesh Kumar Verma 11,26,491 29.39 No Change
Total 25,37,186 66.20 -
Shareholding of promoters as on 31 March 2020
Number % holding% change during
the year
Equity shares
Mrs. Rashmi Verma 14,10,695 36.81 No Change
Mr. Rakesh Kumar Verma 11,26,491 29.39 No Change
Total 25,37,186 66.20 -
Shareholding of promoters as on 31 March 2019
Number % holding% change during
the Year
Equity shares
Mrs. Rashmi Verma 14,10,695 36.81 No Change
Mr. Rakesh Kumar Verma 11,26,491 29.39 No Change
Total 25,37,186 66.20 -
d) Employee stock options
Particulars30-Sep-21 30-Sep-20 31-Mar-21 31-Mar-20 31-Mar-19
Number Number Number Number Number
Employee stock options outstanding at the end of the year 12,82,740 12,18,715 12,18,715 13,35,060 15,06,100
Terms attached to stock options granted to employees are described in note 33 regarding employee share based payments.
Capital management
The primary objective of the Company’s capital management is to support business continuity and growth of the company while maximizing the shareholder value. The Company determines the capital requirement based on annual operating plans, long-term and
other strategic investment plans. The funding requirements are generally met through operating cash flows generated.
As at
As at
Promoter name
*Percentage holding change is on account of following:
1. Company converted 4,054,969 outstanding Preference Shares into 20,274,845 Equity Shares pursuant to Board and
Shareholders’ resolutions dated September 17, 2021 and September 20, 2021, respectively;
2. Issue of shares on exercise of stock options (to non promoters) during the half year ended 30 September 2021.
Promoter name
Promoter name
As at
Promoter name
As at
Promoter name
As at
As at
220

C. E. Info Systems Limited (formerly known as C.E. Info Systems Pvt Ltd)
Annexure VI - Notes to Restated Consolidated Financial Information (Continued)
'(All amounts are in Indian Rupees in millions, unless otherwise stated)
13 Other non- current financial liabilities
Particulars
30-Sep-21 30-Sep-20 31-Mar-21 31-Mar-20 31-Mar-19
Long term borrowings
Secured
Vehicle loans from banks - 4.35 2.74 5.90 -
- 4.35 2.74 5.90 -
Current
Current maturities of long term borrowings disclosed under Note 14 "Other financial liabilities" - 3.02 3.16 2.90 -- 3.02 3.16 2.90 -
14 Other current financial liabilities
Particulars
30-Sep-21 30-Sep-20 31-Mar-21 31-Mar-20 31-Mar-19
Carried at amortized cost
Current maturities of long-term borrowings - 3.02 3.16 2.90 -
Security deposits received 2.65 3.03 3.03 3.70 3.41
Employee related payables 70.73 118.95 138.91 169.22 122.78
Deferred amount payable to Vidteq's shareholders - - - - 5.50
73.38 125.00 145.10 175.82 131.69
15 Provisions
Particulars
30-Sep-21 30-Sep-20 31-Mar-21 31-Mar-20 31-Mar-19
Non- current
Provision for employee benefits
Gratuity 32.09 18.64 20.07 19.03 11.66
Compensated absences 6.39 3.06 4.99 5.79 5.10
38.48 21.70 25.06 24.82 16.76
Current
Provision for employee benefits
Gratuity 0.02 - 0.07 0.06 0.09
Compensated absences 1.15 0.36 0.69 0.83 0.35
Provision for employees incentive 60.00 - - - -
Provision for CSR 4.50 - - - -
Other provisions
Provision for warranties 0.20 0.20 0.20 0.20 0.20
Provision for pending C Form - - - 0.54
65.87 0.56 0.96 1.09 1.18
16 Trade payables
Particulars
30-Sep-21 30-Sep-20 31-Mar-21 31-Mar-20 31-Mar-19
Total outstanding due to micro and small enterprises 4.83 1.16 3.09 - -
Total outstanding due to creditors other than micro and small enterprises* 21.29 14.62 41.42 60.52 44.76
26.12 15.78 44.51 60.52 44.76*refer note 31 for related party balances
Further, there are no disputes related to any balances stated above.
The average credit period on purchase of goods and services for the above periods/ years is less than 43 days. No interest is charged on trade payables.
17 Other current liabilities
Particulars
30-Sep-21 30-Sep-20 31-Mar-21 31-Mar-20 31-Mar-19
Deferred revenue 179.35 68.16 247.12 72.49 70.96
Others
Advance from customers 5.26 8.40 2.64 17.87 7.31
Other expenses payable 32.85 40.57 3.80 1.02 5.72
Withholding and other taxes payable 8.08 19.02 28.25 26.31 10.88
225.54 136.15 281.81 117.69 94.87
As at
As at
As at
As at
As at
*Vehicle loans were secured by way of hypothecation of respective vehicles. The loans carried interest rates in the range of 9% to 11% per annum repayable in 60 equal monthly
instalments beginning from the month subsequent to the commencement of loans. These loans have been fully repaid during the six month period ended September 30, 2021.
The ageing for trade payables for the six months periods ended 30 Septemeber 2021 & 30 September 2020 and the years ended 31 March 2021, 31 March 2020 and 31 March
2019 is less than 1 year for all periods/ years respectively.
221

C. E. Info Systems Limited (formerly known as C.E. Info Systems Pvt Ltd)
Annexure VI - Notes to Restated Consolidated Financial Information (Continued)
'(All amounts are in Indian Rupees in millions, unless otherwise stated)
18 Revenue from operations
Particulars Six month
period ended
Six month
period endedYear ended Year ended Year ended
30-Sep-21 30-Sep-20 31-Mar-21 31-Mar-20 31-Mar-19Sale of IOT products 68.71 44.74 127.45 205.37 353.25
Sale of Mapdata and software (combined) through royalty, annuity, subscription and
software931.56 507.06 1,397.18 1,280.92 999.30
1,000.27 551.80 1,524.63 1,486.29 1,352.55
Disaggregate revenue Information
The disaggregated revenue from contracts with the customers as follow:
Particulars Six month
period ended
Six month
period endedYear ended Year ended Year ended
30-Sep-21 30-Sep-20 31-Mar-21 31-Mar-20 31-Mar-19Contract type
Fixed price 486.31 257.14 560.50 645.60 502.30
Time and material 513.96 294.66 964.13 840.69 850.25
Total 1,000.27 551.80 1,524.63 1,486.29 1,352.55
Remaining performance obligations
Contract balances
Contract liabilities : A contract liability arises when there is excess billing over the revenue recognized.
The below table discloses the movement in the balance of contract liabilities/ deferred revenue :
Particulars Six month
period ended
Six month
period endedYear ended Year ended Year ended
30-Sep-21 30-Sep-20 31-Mar-21 31-Mar-20 31-Mar-19Balance as at the beginning of the year 247.12 72.49 72.50 71.00 100.80
Additional amounts billed but not recognized as revenue 41.66 32.66 234.60 59.80 30.76
Deduction on account of revenues recognized during the six month period /year (109.43) (36.99) (59.98) (58.31) (60.60)
Balance as at the end of the year 179.35 68.16 247.12 72.49 70.96
19 Other income
Particulars Six month
period ended
Six month
period endedYear ended Year ended Year ended
30-Sep-21 30-Sep-20 31-Mar-21 31-Mar-20 31-Mar-19Interest income
Interest income from banks and others 12.18 12.29 25.65 25.95 24.32
Interest income from financial instruments carried at amortized cost 49.48 25.77 64.88 48.20 7.33
Interest income on financial assets carried at amortized cost - - - - 0.68
Income on investments carried at fair value through profit and loss 17.18 65.50 128.00 - -
Dividend income from current investments (other than trade) 0.24 0.77 1.43 6.19 26.24
Profit on redemption of mutual funds 133.42 62.75 156.94 40.65 195.17
Liability no longer required written back - - 2.94 0.76 8.48
Provision for doubtful debts/ bad debts written back 3.19 7.59 - - 4.43
Provision against raw material and finished goods written back 0.29 - - 8.49 -
Bad debts recovered written off in earlier years - - - - 1.38
Exchange differences, net - - - 5.28 3.25
Rental income from investment property/income from subletting leased premises 4.32 5.59 10.27 12.60 6.03
Lease benefits 4.27 7.30 7.30 - -
Gain on de-recognition of Right-of-Use Assets 0.29 - - - -
Miscellaneous income 0.66 0.01 0.70 0.37 3.50
225.52 187.57 398.11 148.49 280.80
The aggregate amount of transaction price allocated to remaining performance obligations as per the requirements of Ind AS 115 was Rs. 1751.80 Mn, Rs. 399.95 Mn,
Rs. 791.6 Mn, Rs 420.9 Mn as on 30 September 2021, 30 September 2020, 31 March 2021 and 31 March 2020 out of which, approximately 21%, 28% 41 % and 82%
respectively is/was to be recognized as revenues within one year and the balance beyond one year. This is after exclusions as below:
a) Contracts for which we recognize revenues based on the right to invoice for services performed
b) Variable consideration allocated entirely to a wholly unsatisfied performance obligation or to a wholly unsatisfied promise to transfer a distinct good or service that
forms part of a single performance obligation, or
c) Variable consideration in the form of a sales-based or usage-based royalty promised in exchange for a license of intellectual property.
Contract assets : A contract asset is a right to consideration that is conditional upon factors other than the passage of time. Contract assets are recognized where there is
excess of revenue over the billings. Revenue recognized but not billed to customers is classified either as contract assets or unbilled receivable in our balance sheet.
Unbilled receivables represent contracts where right to consideration is unconditional (i.e. only the passage of time is required before the payment is due). Out of Rs.
78.79 Mn, Rs. 63.02 Mn, Rs 77.13 Mn and Rs 95.87 Mn of contract assets as on 30 September 2021, 30 September 2020, 31 March 2021 and 31 March 2020
respectively, 100% pertain to respective years.
The Company earns revenue primarily from licensing and sale of Map data and Map data related services (i.e. GPS navigation and location-based services) primarily for
corporate business entities. We foresee that our revenue and deferred revenue would be mildly impacted in the short term due to COVID -19. However, in long-term, we
believe that our business model remains robust and sustainable. The impact assessment of COVID-19 is an ongoing process due to the high degree of uncertainty
associated and our assertions might change in future due to this.
222

C. E. Info Systems Limited (formerly known as C.E. Info Systems Pvt Ltd)
Annexure VI - Notes to Restated Consolidated Financial Information (Continued)
'(All amounts are in Indian Rupees in millions, unless otherwise stated)20 Cost of material consumed
Particulars Six month
period ended
Six month
period endedYear ended Year ended Year ended
30-Sep-21 30-Sep-20 31-Mar-21 31-Mar-20 31-Mar-19Opening inventory 14.20 19.58 19.58 16.17 23.70
Add: Purchases# 74.23 31.60 130.52 137.40 165.18
Less: Obsolete inventory written off - - 2.90 - 0.70
Less: Closing inventory* 14.44 17.78 14.20 19.58 16.17
73.99 33.40 133.00 133.99 172.01
21 Purchase of stock-in-trade
Particulars Six month
period ended
Six month
period endedYear ended Year ended Year ended
30-Sep-21 30-Sep-20 31-Mar-21 31-Mar-20 31-Mar-19Purchase of stock-in-trade 9.01 9.60 22.43 10.94 10.71
9.01 9.60 22.43 10.94 10.71
22 Change in inventory
Particulars Six month
period ended
Six month
period endedYear ended Year ended Year ended
30-Sep-21 30-Sep-20 31-Mar-21 31-Mar-20 31-Mar-19Opening inventories
Finished goods 9.76 8.18 8.18 16.08 26.65
Less: Stock of finished goods written off - - - - (4.09)
Stock-in-trade 8.45 18.48 18.48 11.25 20.55
18.21 26.66 26.66 27.33 43.11
Closing inventories -
Finished goods* 8.47 6.32 9.76 8.18 16.08
Stock-in-trade 7.3 17.87 8.45 18.48 11.25
15.77 24.19 18.21 26.66 27.33
- - - -
Net decrease in inventory 2.44 2.47 8.45 0.67 15.78
23 Employee benefits expense
Particulars Six month
period ended
Six month
period endedYear ended Year ended Year ended
30-Sep-21 30-Sep-20 31-Mar-21 31-Mar-20 31-Mar-19Salaries, incentives and bonus* 304.48 250.17 514.76 584.48 460.64
Employee stock option expense 10.99 3.72 7.45 31.06 32.32
Contributions to provident and other employee funds 5.42 4.76 9.85 8.52 5.60
Gratuity 4.11 4.59 4.40 9.02 4.03
Staff welfare expenses 0.97 0.49 3.08 9.65 4.95
325.97 263.73 539.54 642.73 507.54
24 Finance cost
Particulars Six month
period ended
Six month
period endedYear ended Year ended Year ended
30-Sep-21 30-Sep-20 31-Mar-21 31-Mar-20 31-Mar-19Interest
-on the lease liability 10.30 12.09 23.65 26.47 23.60
-on loans from banks 0.18 0.34 0.68 0.87 1.80
Bank charges 0.36 0.73 1.24 1.02 0.92
10.84 13.16 25.57 28.36 26.32
25 Depreciation and amortisation expense
Particulars Six month
period ended
Six month
period endedYear ended Year ended Year ended
30-Sep-21 30-Sep-20 31-Mar-21 31-Mar-20 31-Mar-19Depreciation of property, plant and equipment (refer note 3(a)) 12.18 17.55 36.99 24.92 14.97
Depreciation of investment property (refer note 3(b)) 0.68 0.68 1.35 1.30 -
Depreciation of right of use assets 19.12 18.71 38.24 38.38 30.49
Amortisation of intangible assets (refer note 4) 6.75 11.19 22.39 33.09 46.40
38.73 48.13 98.97 97.69 91.86
Less: Transferred to cost of development of Internally generated map database - - - 0.36
38.73 48.13 98.97 97.69 91.50
* Net of expenses capitalized on account of development of internally generated MAP database.
The expected benefits payouts were determined using a tailored approach based on a set of criteria considering the COVID-19 pandemic and the resulting economic
disruption.
* Closing value of Inventory includes provision against finished goods amounting to Rs 3.68 Mn, Rs 5.58 Mn, Rs. 3.68 Mn, 2.86 Mn and 11.19 Mn for the six month
period /year ended 30 September 2021, 30 September 2020, 31 March 2021, 31 March 2020 and 31 March 2019 respectively.
* Closing value of Inventory includes provision against raw material amounting to Rs 1.85 Mn, Rs 0.64 Mn, Rs. 1.85 Mn Rs. 0.64 Mn and 0.80 Mn for the six month
period ended 30 September 2021, 30 September 2020 and year ended 31 March 2021, 31 March 2020 and 31 March 2019 respectively.
223

C. E. Info Systems Limited (formerly known as C.E. Info Systems Pvt Ltd)
Annexure VI - Notes to Restated Consolidated Financial Information (Continued)
'(All amounts are in Indian Rupees in millions, unless otherwise stated)26 Other expenses
Particulars Six month
period ended
Six month
period endedYear ended Year ended Year ended
30-Sep-21 30-Sep-20 31-Mar-21 31-Mar-20 31-Mar-19Consumption of stores and spares parts 2.43 1.70 5.60 8.24 9.25
Rent* 0.83 1.06 2.91 3.04 1.53
Electricity and water* 7.72 5.81 12.93 15.85 14.21
Advertisement 17.72 12.93 31.27 54.08 29.63
Commission 0.06 1.82 1.94 0.21 0.43
Travelling 7.01 3.93 12.22 40.90 30.97
Legal and professional# 18.75 34.42 75.40 64.64 24.90
ROC fees & stamping 0.44 - 0.03 0.04 0.31
Field survey expenses 7.20 9.01 27.93 31.85 51.18
Communication expenses* 30.43 18.34 44.64 48.34 36.95
Repair and maintenance - Others* 8.22 5.33 12.31 20.10 18.41
Provision against raw material and finished goods - 2.72 1.86 - 6.17
Raw material and Finished goods inventory written off - - - - 3.41
Less: Provision against Raw material and Finished goods - - - - (3.41)
Provision for doubtful debts - - 5.73 11.53 -
Bad debts written off 1.30 - 6.50 3.26 4.89
Less: Provision for doubtful receivables (1.30) - (6.50) (3.26) (4.89)
Doubtful advances written off - - - - 1.97
Less: Provision for doubtful advances written off - - - - (1.97)
Provision for diminution in value of investments - 18.22 18.22 63.45 127.84
Obsolute inventory written off - - 2.90 - -
Freight outward 0.56 0.24 0.91 1.68 1.99
Provision for security deposits - - - 0.18 4.76
Foreign exchange fluctuation 0.62 2.43 5.24 - -
Insurance 4.30 2.35 3.38 3.07 2.68
Technical expenses 9.16 2.18 11.71 12.46 5.13
Corporate social responsibility 4.85 2.69 9.66 0.81 0.10
Miscellaneous expenses 16.03 6.42 20.33 23.97 25.03
136.33 131.60 307.12 404.44 391.47
* Net of expenses capitalized on account of development of internally generated MAP database. Refer Note 37
#Note : Payments to auditors (exclusive of taxes)
Six month
period ended
Six month
period endedYear ended Year ended Year ended
30-Sep-21 30-Sep-20 31-Mar-21 31-Mar-20 31-Mar-19Statutory audit 0.80 0.85 1.60 1.60 1.50
Tax audit - - 0.20 0.20 0.20
Other certification services* 2.00 - - - 0
Less :- Fee for IPO related services disclosed as Receivable
from IPO expenses recoverable (refer note 11) (2.00) - - - -
Out of pocket expenses - - 0.10 0.10 0.20
0.80 0.85 1.90 1.90 1.90
*Represent value less than 0.5 lakhs
224

C. E. Info Systems Limited (formerly known as C.E. Info Systems Pvt Ltd)
Annexure VI - Notes to Restated Consolidated Financial Information (Continued)
'(All amounts are in Indian Rupees in millions, unless otherwise stated)
27 Income taxes
Particulars
Six month
period ended
Six month
period endedYear ended Year ended Year ended
30-Sep-21 30-Sep-20 31-Mar-21 31-Mar-20 31-Mar-19Income tax charged to Restated Consolidated Statement of Profit and Loss
Current income tax charge 158.42 46.68 165.43 101.20 126.77
Deferred tax charge (credit) 2.40 11.98 27.90 (17.19) (44.41)
160.82 58.66 193.33 84.01 82.36
Income tax charged to other Restated Consolidated Comprehensive Income
Expense (benefit) on re-measurements of defined benefit plans (2.00) 1.24 0.82 (8.10) (3.50)
(2.00) 1.24 0.82 (8.10) (3.50)
Particulars
Six month
period ended
Six month
period endedYear ended Year ended Year ended
30-Sep-21 30-Sep-20 31-Mar-21 31-Mar-20 31-Mar-19Profit before income tax 628.48 237.28 787.66 315.96 418.02
Statutory tax rate in India 25% 25% 25% 25% 29%
Expected tax expense 158.18 59.72 198.24 79.52 121.73
Non taxable dividend income - - (0.04) (1.59) (7.64)
Income taxable at lower rate (13.20) (4.88) (8.92) (8.36) (39.90)
Impact of change in tax rate - - - 8.41 -
Others 15.85 3.82 4.05 6.04 8.17
Total taxes 160.83 58.66 193.33 84.02 82.36
Effective income tax rate 25.59% 24.72% 24.54% 26.59% 19.70%
Components of deferred tax assets and liabilities as on 30 September 2021
Particulars Opening
balance
Recognized in
profit and loss
Recognized in
OCI
Closing
balance
Deferred tax assets
Accrued employee costs 13.68 3.74 2.00 19.42
Provision for doubtful debts 16.65 (1.13) 15.51
Unrealized gain on fair valuation of investments (19.51) (4.32) (23.83)
Lease liabilities, net 6.69 0.13 6.82
Depreciation and amortization 5.60 (0.81) 4.79
Others 7.60 - 7.60
Gross deferred tax assets (A) 30.71 (2.41) 2.00 30.31
Deferred tax liabilities
Unrealized loss on fair valuation of investments 5.45 5.45
Gross deferred tax liabilities (B) 5.45 - - 5.45
Net deferred tax assets (A-B) 25.26 (2.41) 2.00 24.85
Components of deferred tax assets and liabilities as on 31 March 2021
Particulars Opening
balance
Recognized in
profit and loss
Recognized in
OCI
Closing
balanceDeferred tax assets
Accrued employee costs 14.51 (0.01) (0.82) 13.68
Provision for doubtful debts 16.84 (0.19) - 16.65
Unrealized gain on fair valuation of investments 12.70 (32.21) - (19.51)
Lease liabilities, net 5.74 0.95 - 6.69
Depreciation and amortization 1.80 3.80 - 5.60
Others 7.83 (0.23) - 7.60
Gross deferred tax assets (A) 59.42 (27.90) (0.82) 30.70
Deferred tax liabilities
Unrealized loss on fair valuation of investments 5.45 - - 5.45
Gross deferred tax liabilities (B) 5.45 - - 5.45
Net deferred tax assets (A-B) 53.97 (27.90) (0.82) 25.25
Components of deferred tax assets and liabilities as on 30 September 2020
Particulars Opening
balance
Recognized in
profit and loss
Recognized in
OCI
Closing
balance
Deferred tax assets
Accrued employee costs 14.36 (0.70) (1.24) 12.41
Provision for doubtful debts 16.84 (1.91) 14.93
Unrealized gain on fair valuation of investments 12.70 (11.90) 0.80
Lease liabilities, net 5.74 1.21 6.95
Depreciation and amortization 1.80 0.64 2.44
Others 7.59 0.68 8.27
Gross deferred tax assets (A) 59.03 (11.98) (1.24) 45.81
Deferred tax liabilities
Unrealized loss on fair valuation of investments 5.45 5.45
Gross deferred tax liabilities (B) 5.45 - - 5.45
Net deferred tax assets (A-B) 53.58 (11.98) (1.24) 40.36
The reconciliation between the Company’s provision for income tax and amount computed by applying the statutory income tax rate in India is as follows:
225

C. E. Info Systems Limited (formerly known as C.E. Info Systems Pvt Ltd)
Annexure VI - Notes to Restated Consolidated Financial Information (Continued)
'(All amounts are in Indian Rupees in millions, unless otherwise stated)
Components of deferred tax assets and liabilities as on 31 March 2020
Particulars Opening
balance
Recognized in
profit and loss
Recognized in
OCI
Closing
balance
Deferred tax assets
Accrued employee costs 4.64 1.62 8.10 14.36
Provision for doubtful debts 16.89 (0.05) - 16.84
Unrealized gain on fair valuation of investments - 12.70 - 12.70
Lease liabilities, net 6.75 (1.01) - 5.74
Depreciation and amortization 1.62 0.18 - 1.80
Others 2.60 3.75 - 6.35
Gross deferred tax assets (A) 32.50 17.19 8.10 57.79
Deferred tax liabilities
Unrealized loss on fair valuation of investments 5.45 - - 5.45
Gross deferred tax liabilities (B) 5.45 - - 5.45
Net deferred tax assets (A-B) 27.05 17.19 8.10 52.34
Components of deferred tax assets and liabilities as on 31 March 2019
Particulars Opening
balance
Recognized in
profit and loss
Recognized in
OCI
Closing
balance
Deferred tax assets
Accrued employee costs 1.20 3.40 3.50 8.10
Provision for doubtful debts 19.25 (2.40) - 16.85
Depreciation and amortization 1.40 0.20 - 1.60
Lease liabilities, net 2.74 4.01 - 6.75
Gross deferred tax assets (A) 24.59 5.21 3.50 33.30
Deferred tax liabilities
Unrealized loss on fair valuation of investments 31.10 (25.70) - 5.40
Others 11.60 (13.50) - (1.90)
Gross deferred tax liabilities (B) 42.70 (39.20) - 3.50
Net deferred tax assets (A-B) (18.11) 44.41 3.50 29.80
The Company has performed an assessment of COVID-19 pandemic’s impact to evaluate recoverability of its deferred tax assets and based on current expectation and
projections, believes that there is no impact on recoverability of deferred tax assets as of 31 March 2020, 30 September 2020, 31 March 2021 and 30 September 2021.
226

C. E. Info Systems Limited (formerly known as C.E. Info Systems Pvt Ltd)
Annexure VI - Notes to Restated Consolidated Financial Information (Continued)
'(All amounts are in Indian Rupees in millions, unless otherwise stated)
28 Components of other comprehensive income
Particulars
Six month
period ended
Six month
period endedYear ended Year ended Year ended
30-Sep-21 30-Sep-20 31-Mar-21 31-Mar-20 31-Mar-19Items that will not be reclassified to Restated Consolidated Statement of Profit and Loss
Retained earnings (Actuarial gain or loss relating to defined benefit plans)
Opening balance (net of tax) 16.80 19.18 19.18 8.40 -
Actuarial (gains) or loss 7.85 (4.94) (3.20) 18.88 11.90
Income tax expense (2.00) 1.24 0.82 (8.10) (3.50)
Closing balance (net of tax) 22.65 15.48 16.80 19.18 8.40
29 Earnings per share (EPS)
(All amounts are in Indian Rupees millions except share data and per share data, unless otherwise stated)
Particulars
30-Sep-21 30-Sep-20 31-Mar-21 31-Mar-20 31-Mar-19Restated Profit attributable to equity shareholders (A) 467.66 178.62 594.33 231.95 335.66
Number of equity shares outstanding for calculation of basic earnings per share (B)* 5,32,42,967 5,25,85,333 5,25,85,333 5,25,85,333 5,25,85,333
Weighted average number of equity shares outstanding for calculation of diluted earnings per share 5,43,34,120 5,40,69,953 5,40,69,953 5,42,79,593 5,42,69,629
Basic earnings per equity share of Rs. 2 Each (A/B)** 8.78 3.40 11.30 4.41 6.38
Diluted earnings per equity share of Rs. 2 Each (A/C)** 8.61 3.30 10.99 4.27 6.19
**Basic earning per shares and diluted earning per shares for half year ended are not annualised.
Particulars
30-Sep-21 30-Sep-20 31-Mar-21 31-Mar-20 31-Mar-19Opening Balance 38,32,831 38,32,831 38,32,831 38,32,831 38,32,831
Add: Additional shares issued due to share split from paid-up capital of Rs.10 per equity share to
Rs.2 per equity share and on conversion of prefrence shares into equity shares^ 1,53,31,324 1,53,31,324 1,53,31,324 1,53,31,324 1,53,31,324
Add: Issue of shares on exercise of stock options post split of Rs. 10 per equity share to Rs. 2 per
equity share. 4,93,225 - - - -
Add: Conversion of preference shares imto equity^^ 2,02,74,845 2,02,74,845 2,02,74,845 2,02,74,845 2,02,74,845
Add: Bonus issue of equity shares^^^ 1,33,10,742 1,31,46,333 1,31,46,333 1,31,46,333 1,31,46,333
Weighted average number of equity shares 5,32,42,967 5,25,85,333 5,25,85,333 5,25,85,333 5,25,85,333
Particulars
30-Sep-21 30-Sep-20 31-Mar-21 31-Mar-20 31-Mar-19
Weighted average number of equity shares outstanding during the period for calculating basic EPS 5,32,42,967 5,25,85,333 5,25,85,333 5,25,85,333 5,25,85,333
Effect of dilutive potential equity shares
Add: Employee stock options outstanding at the beginning of the year except already exercised 7,25,490 11,13,465 11,13,465 12,70,695 12,63,222
Add: Employee stock options issued during the period 92,875 - - - -
Add: Effect of bonus issue on employee stock options outstanding at the period of six month 2,72,788 3,71,155 3,71,155 4,23,565 4,21,074
Weighted average number of equity shares 5,43,34,120 5,40,69,953 5,40,69,953 5,42,79,593 5,42,69,629
As at
As at
As at
^ Pursuant to resolution passed by the shareholders on 07 July 2021 and by Board of Directors of the Company on 07 July 2021 the Company has sub-divided the face value of its
equity shares from Rs. 10 each to Rs. 2 each.
^^Pursuant to Board and Shareholders’ resolutions dated September 17, 2021 and September 20, 2021, respectively, Company converted 4,054,969 outstanding Preference Shares into
20,274,845 Equity Shares.
^^^Pursuant to Board and Shareholders’ resolutions dated October 07, 2021 respectively, Company has issued bonus shares to the existing shareholder of the Company in the ratio of
1:3. Further, in the same board meeting, the effect of above bonus issue has been approved to be passed on to the existing ESOP holders.
**Computation of weighted average number of equity shares used in calculating diluted earning per share is set out below:
*Computation of weighted average number of equity shares used in calculating basic earning per share is set out below:
227

C. E. Info Systems Limited (formerly known as C.E. Info Systems Pvt Ltd)
Annexure VI - Notes to Restated Consolidated Financial Information (Continued)
'(All amounts are in Indian Rupees in millions, unless otherwise stated)
30 Financial instruments – Fair values
A. Accounting classification and fair values
FVTPL FVOCI Amortised
Cost
Total Level 1 Level 2 Level 3 Total
Financial assets
Investments 1,033.49 - 1,847.25 2,880.74 926.62 100.27 6.60 1,033.49
Loans 8.82 - - 8.82 - - - -
Trade receivables - - 258.14 258.14 - - - -
Cash and cash equivalents - - 614.09 614.09 - - - -
Bank Balances other than Cash and cash equivalents - - 147.19 147.19 - - - -
Others - - 327.60 327.60 - - - -
1,042.31 - 3,194.27 4,236.58 926.62 100.27 6.60 1,033.49
Financial liabilities
Borrowings (including current portion) - - - - - - - -
Trade payables - - 26.12 26.12 - - - -
Lease liabilities - - 168.60 168.60 - - - -
Others - - 73.38 73.38 - - - -
- - 268.10 268.10 - - - -
FVTPL FVOCI Amortised Total Level 1 Level 2 Level 3 Total
Financial assets
Investments 1,070.30 - 1,580.49 2,650.79 998.80 58.70 12.80 1,070.30
Loans 8.82 - - 8.82 - - 8.82 8.82
Trade receivables - - 282.20 282.20 - - - -Cash and cash equivalents - - 336.27 336.27 - - - -Bank Balances other than Cash and cash equivalents - - 335.60 335.60 - - - -
Others - - 156.37 156.37 - - - -
1,080.12 - 2,690.93 3,770.05 998.80 58.70 21.62 1,079.12
Financial liabilities
Borrowings (including current portion) - - 5.90 5.90 - - - -
Trade payables - - 44.52 44.52 - - - -
Lease liabilities - - 188.41 188.41 - - - -
Others - - 141.94 141.94 - - -
- - 380.77 380.77 - -
FVTPL FVOCI Amortised Total Level 1 Level 2 Level 3 Total
Financial assets
Investments 1,321.92 - 892.86 2,214.79 1,223.80 86.82 11.30 1,321.92
Loans - - 8.92 8.92 - - - -
Trade receivables - - 254.10 254.10 - - - -
Cash and cash equivalents - - 187.27 187.27 - - - -
Bank Balances other than Cash and cash equivalents - - 240.23 240.23 - - - -
Others - - 233.02 233.02 - - - -
1,321.92 - 1,816.40 3,138.33 1,223.80 86.82 11.30 1,321.92
Financial liabilities
Borrowings (including current portion) - - 7.38 7.38 - - - -
Trade payables - - 15.78 15.78 - - - -
Lease liabilities - - 202.10 202.10 - - - -
Others - - 121.97 121.97 - - - -
- - 347.23 347.23 - - - -
The following table shows the carrying amounts and fair values of financial assets and financial liabilities, including their levels in the fair value hierarchy. It does not include fair value
information for financial assets and financial liabilities not measured at fair value if the carrying amount is a reasonable approximation of fair value.
Particulars As at 31 March 2021
Carrying amount Fair value
Particulars As at 30 September 2021Carrying amount Fair value
Particulars As at 30 September 2020Carrying amount Fair value
228

C. E. Info Systems Limited (formerly known as C.E. Info Systems Pvt Ltd)
Annexure VI - Notes to Restated Consolidated Financial Information (Continued)
'(All amounts are in Indian Rupees in millions, unless otherwise stated)
FVTPL FVOCI Amortised Total Level 1 Level 2 Level 3 Total
Financial assets
Investments 1,160.30 - 781.50 1,941.80 872.89 287.39 - 1,160.28
Loans 9.39 - 0.20 9.39 - - 9.39 9.39
Trade receivables - - 311.29 311.29 - - - -
Cash and cash equivalents - - 150.67 150.67 - - - -Bank Balances other than Cash and cash equivalents - - 171.11 171.11 - - - -
Others - - 347.10 347.10 - - - -
1,169.69 - 1,761.87 2,931.36 872.89 287.39 9.39 1,169.67
Financial liabilities
Borrowings (including current portion) - - 8.80 8.80 - - - -
Trade payables - - 60.52 60.52 - - - -
Lease liabilities - - 215.01 215.01 - - - -
Others - - 172.93 172.93 - - - -
- - 457.26 457.26 - - - -
FVTPL FVOCI Amortised Total Level 1 Level 2 Level 3 Total
Financial assets
Investments other than in subsidiaries 1,361.30 - 632.30 1,993.60 1,136.40 224.90 - 1,361.30
Loans 8.50 - 0.50 9.00 - - 8.50 8.50
Trade receivables - - 238.90 238.90 - - - -
Cash and cash equivalents - - 82.50 82.50 - - - -Bank Balances other than Cash and cash equivalents - - 131.30 131.30 - - - -
Others - - 334.80 334.80 - - - -
1,369.80 - 1,420.30 2,790.10 1,136.40 224.90 8.50 1,369.80
Financial liabilities
Trade payables - - 44.80 44.80 - - - -
Lease liabilities 251.33 251.33
Others - - 131.60 131.60 - - - -
- - 427.73 427.73 - -
B. Fair value hierarchy
Level 1: Quoted prices (unadjusted) in active markets for identical assets or liabilities.
Ind AS 107, ‘Financial Instrument - Disclosure’ requires classification of the valuation method of financial instruments measured at fair value in the Balance Sheet, using a three level fair-
value-hierarchy (which reflects the significance of inputs used in the measurements). The hierarchy gives the highest priority to un-adjusted quoted prices in active markets for identical assets
or liabilities (Level 1 measurements) and lowest priority to un-observable inputs (Level 3 measurements). The three levels of the fair-value-hierarchy under Ind AS 107 are described below:
ParticularsAs at 31 March 2020
Carrying amount Fair value
ParticularsAs at 1 April 2019
Carrying amount Fair value
The Group has considered the possible effects that may result from the pandemic relating to COVID-19 on the carrying amount of assets and liabilities. In developing the assumptions relating
to the possible future uncertainties in the economic conditions because of the pandemic, the Company, as at the date of approval of the Restated consolidated financial information has used
internal and external sources of information. The impact of COVID-19 on the Group’s Restated consolidated financial information may differ from the estimated as at the date of approval of
these Restated consolidated financial information.
Level 2: Quoted prices for similar instruments in active markets, quoted prices for identical or similar instruments in markets that are not active and model-derived valuations, in which all
significant inputs are directly or indirectly observable in active markets.
Level 3: Valuations derived from valuation techniques, in which one or more significant inputs are unobservable inputs which are supported by little or no market activity.
The Fair value of cash and cash equivalents, other bank balances, trade receivables, trade payables approximated their carrying value largely due to short term maturities of these instruments.
Assets measured using level 1 inputs primarily include investment securities in mutual funds and the fair value being marked to an active market which factors the impact of COVID-19, we
do not expect material volatility in these financial assets.
Assets and liabilities measured using level 2 inputs includes financial assets measured at amortised cost which includes Trade receivables, cash and cash equivalents, government bonds with
corporations and deposits with banks have been assessed basis counterparty credit risk.229

C. E. Info Systems Limited (formerly known as C.E. Info Systems Pvt Ltd)
Annexure VI - Notes to Restated Consolidated Financial Information (Continued)
'(All amounts are in Indian Rupees in millions, unless otherwise stated)Financial risk management
Credit risk
i) Trade receivables and other receivables
ParticularsAs at
30-Sept- 2021
As at
30-Sept- 2020
As at
31 March
2021
As at
31 March
2020
As at
31 March
2019
Opening balance 66.12 66.88 66.89 58.60 67.90
Bad debts written off (1.30) - (6.50) (2.63) (3.40)
Provision written back during the year (3.19) (7.59) - - (7.30)
Provision made during the year - - 5.73 10.91 -
Bad debts recovered - - - - 1.40
Closing balance 61.63 59.29 66.12 66.88 58.60
ii) Cash and cash equivalents and Other bank balances
iii) Investments
iv) Loans
Liquidity risk:
Liquidity risk is the risk that the Company will encounter difficulty in meeting the obligations associated with its financial liabilities that are settled by delivering cash or another financial
asset. Prudent liquidity risk management implies maintaining sufficient cash and marketable securities, the availability of funding through an adequate amount of committed credit facilities.
The Company’s approach to managing liquidity is to ensure, as far as possible, that it will have sufficient liquidity to meet its liabilities when they are due, under both normal and stressed
conditions.
The Company’ Board of Directors has overall responsibility for the establishment and oversight of the company’ risk management framework.
The Company has exposure to the following risks arising from financial instruments
- Credit risk
- Liquidity risk
- Market risk
Credit risk is the risk of financial loss to the Company if a customer or counterparty to a financial instrument fails to meet its contractual obligations, and arises principally from the
Company’s trade and other receivables and cash and cash equivalents. The maximum exposure to credit risk in case of all the financial instruments covered below is restricted to their
respective carrying amount.
The Company’s exposure to credit risk is influenced mainly by the individual characteristics of each customer. Credit risk is managed through credit approvals, establishing credit limits and
continuously monitoring the creditworthiness of customers to which the Company grants credit terms in the normal course of business. The Company establishes an allowance for doubtful
debts and impairment that represents its estimate of incurred losses in respect of trade and other receivables and investments.
The Company does not have any significant concentration of credit risk. Further, company has one customer which accounts for 10% or more of the total trade receivables at each reporting
date. The Company has used a practical expedient by computing the expected credit loss allowance for trade receivables based on a provision matrix.
Trade receivables forms a significant part of the financial assets carried at amortised cost, which is valued considering provision for allowance using expected credit loss method. Accounts
receivables and unbilled receivables have been valued after making reserve for allowances based on factors like ageing, likelihood of increased credit risk and expected realizability
considering impact of COVID – 19 on customers.
The cash and cash equivalents and other bank balances are basis the credit ratings of the banks. The client monitors changes in credit risk by tracking Published External Data.
The Company limits its exposure to credit risk by generally investing in liquid securities and only with counterparties that have a good credit rating. The Company does not expect any losses
from non-performance by these counter-parties, and does not have any significant concentration of exposures to specific industry sectors or specific country risks.
Loans in the form of security deposit pertains to rent deposit given to lessors, deposits against performance guarantees and tender deposits.
The movement in the provision for bad and doubtful debts for thesix month period ended / year ended 30 September 2021, 30 September 2020, 31 March 2021, 31 March 2020 and 31 March
2019 is as follows:
230

C. E. Info Systems Limited (formerly known as C.E. Info Systems Pvt Ltd)
Annexure VI - Notes to Restated Consolidated Financial Information (Continued)
'(All amounts are in Indian Rupees in millions, unless otherwise stated)
Maturities of financial liabilities
The table below analyses the Company's financial liabilities into relevant maturity groupings based on their contractual maturities:
As at 30 September 2021 Carrying Total Upto 1 year 1-3 years 3-5 years More than 5Non-derivative financial liabilities
Borrowings - - - - - -
Trade payables 26.12 26.12 26.12 - - -
Other financial liabilities 73.38 73.38 73.38 - - -
310.48 310.48 154.39 103.70 52.39 -
* Includes future cash outflow towards estimated interest on borrowings and lease liabilities. Refer Note 35
As at 31 March 2021 Carrying Total Upto 1 year 1-3 years 3-5 years More than 5Non-derivative financial liabilities
Borrowings 5.90 5.90 2.74 3.16 - -
Trade payables 41.42 41.42 41.42 - - -
Lease liabilities* 329.27 329.27 56.39 192.33 80.55 -
Other financial liabilities 141.94 141.94 141.94 - - -
518.53 518.53 242.49 195.49 80.55 -
* Includes future cash outflow towards estimated interest on borrowings and lease liabilities. Refer Note 35
As at 30 September 2020 Carrying Total Upto 1 year 1-3 years 3-5 years More than 5Non-derivative financial liabilities
Borrowings 7.38 7.38 3.02 4.35 - -
Trade payables 15.78 15.78 15.78 - - -
Other financial liabilities 129.35 129.35 - - - -
418.58 418.58 73.63 116.18 102.59 -
* Includes future cash outflow towards estimated interest on borrowings and lease liabilities. Refer Note 35
As at 31 March 2020 Carrying Total Upto 1 year 1-3 years 3-5 years More than 5Non-derivative financial liabilities
Borrowings 8.79 8.79 2.89 5.90 - -
Trade payables 60.52 60.52 60.52 - - -
Lease liabilities* 301.78 301.78 53.06 239.18 9.54 -
Other financial liabilities 172.93 172.93 172.93 - - -
544.02 544.02 289.40 245.08 9.54 -
* Includes future cash outflow towards estimated interest on borrowings and lease liabilities. Refer Note 35
As at 31 March 2019 Carrying Total Upto 1 year 1-3 years 3-5 years More than 5Non-derivative financial liabilities
Borrowings
Trade payables 44.80 44.80 44.80 - - -
Lease liabilities* 354.20 354.20 52.43 279.51 22.26
Other financial liabilities 131.70 131.70 13.17 - - -
530.70 530.70 110.40 279.51 22.26 -
* Includes future cash outflow towards estimated interest on borrowings and lease liabilities. Refer Note 35
The outflows disclosed in the above table represent the total contractual undiscounted cash flows and total interest payable on borrowings
Market risk:
a) Foreign currency risk
Market risk is the risk that changes in market prices – such as foreign exchange rates, interest rates and equity prices – will affect the Company’s income or the value of its holdings of
financial instruments. The Company is exposed to market risk primarily related to foreign exchange rate risk and interest rate risk. The objective of market risk management is to avoid
excessive exposure in foreign currency revenues and costs.
Currency risk is the risk that the fair value or future cash flows of a financial instrument will fluctuate because of changes in foreign exchange rates. The Company has foreign currency trade
payables and receivables and is therefore exposed to foreign exchange risk.231

C. E. Info Systems Limited (formerly known as C.E. Info Systems Pvt Ltd)
Annexure VI - Notes to Restated Consolidated Financial Information (Continued)
'(All amounts are in Indian Rupees in millions, unless otherwise stated)
Exposure to currency risk (Exposure in different currencies converted to functional currency i.e. INR)
The currency profile of financial assets and financial liabilities as at 31 March 2021, 31 March 2020 and 31 March 2019 are as below:
Particulars
USD EUR USD EUR USD EUR USD EUR USD EUR
Financial assets (A)
Trade and other receivables 45.93 0.00 26.00 2.72 23.61 2.80 21.69 2.71 33.00 2.50
Advance to suppliers - - - - 0.08 - 1.45 - 3.30 -
- - - - - -
Financial liabilities (B) - - - - - -
Trade and other payables 0.89 - 7.50 - 10.72 - 15.22 - 10.90 0.40
- - - - - -
Net exposure (A - B) 45.04 0.00 18.50 2.72 12.97 2.80 7.92 2.71 25.40 2.10
*Represent value less than 0.5 lakhs
Sensitivity analysis:
Particulars
Effect in INR Strengthening Weakening Strengthening Weakening Strengthening Weakening Strengthening Weakening Strengthening Weakening
1% movement
USD (0.45) 0.45 (0.18) 0.18 (0.13) 0.13 (0.20) 0.20 (0.30) 0.30
EUR - - (0.02) 0.02 (0.03) 0.03 (0.10) 0.10 - -
(0.45) 0.45 (0.20) 0.20 (0.16) 0.16 (0.30) 0.30 (0.30) 0.30
b) Interest rate risk
As at As at As at As at As at
30-Sep-21 30-Sep-20 31-Mar-21 31-Mar-20 31-Mar-19Investment in Bonds 1,839.66 885.27 1,572.90 773.90 624.65
Investment in FDR 422.64 383.61 389.00 383.66 375.99
2,262.30 1,268.88 1,961.90 1,157.56 1,000.64
31-Mar-1930-Sep-21 30-Sep-20
31-Mar-1930-Sep-21 30-Sep-20 31-Mar-21 31-Mar-20
Interest rate risk is the risk that the fair value or future cash flows of a financial instrument will fluctuate because of changes in market interest rates. The interest rate profile of the Company’s
interest bearing financial instruments as reported by the management of the Company is as follows:
31-Mar-21 31-Mar-20
232

C. E. Info Systems Limited (formerly known as C.E. Info Systems Pvt Ltd)
Annexure VI - Notes to Restated Consolidated Financial Information (Continued)
'(All amounts are in Indian Rupees in millions, unless otherwise stated)
31 Related Party Disclosures, as required by Indian Accounting Standard 24 (Ind AS 24) are given below:
a) Related parties with whom transactions have taken place during the year
Nature of relationship Name of the party
Videteq (India) Private Limited
CE Info Systems international inc.
Key managerial personnel:
Managing Director Rakesh Kumar Verma
Whole time Director Rashmi Verma
Whole time Director Rohan Verma
Whole time Director Shivalik Prasad (till 27-Aug-19)
Non- executive Director Rakhi Prasad
Entities having common director 1. Spinclabs Private Limited
2. Cholamandalam Investment and
Finance Company Ltd
b) Related party transactions for the period ended
Six month period
ended
Six month period
endedYear ended Year ended Year ended
Name of Related Party Nature of Transaction 30-Sep-21 30-Sep-20 31-Mar-21 31-Mar-20 31-Mar-19
Spinclabs Private Limited Rent income - 0.01 0.01 0.03 0.10
Spinclabs Private Limited Sale of services 0.13 0.04 0.32 0.15 (4.60)
Spinclabs Private Limited Sale of goods - - - 0.02 1.10
Spinclabs Private Limited Sale of fixed assets - - 0.72 1.20 -
Spinclabs Private Limited Field survey expenses - - - 9.10 24.60
Spinclabs Private Limited Professional charges - 20.00 40.00 40.00 -
Cholamandalam Investment and Finance Company Ltd Sale of services - - - 0.54 -
Rakhi Prasad Professional charges 1.20 -
Rakesh Kumar Verma Salary and allowances* 37.50 25.00 30.00 39.64 38.40
Rashmi Verma Salary and allowances* 37.50 25.00 30.00 39.64 37.20
Rohan Verma Salary and allowances* 27.50 26.50 33.00 9.60 0.40
Shivalik Prasad Salary and allowances* - - - 33.28 27.20
Rakesh Verma Rent expense 1.10 0.58 1.24 0.39 -
Rashmi Verma Rent expense - 0.80 1.44 1.44 1.20
*(i) Provision for gratuity and compensated absences is computed for the Company as a whole and hence has not been included above.
c) Outstanding balance as at 30 September 2021, 30 September 2020, 31 March 2021, 31 March 2020 and 31 March 2019
Six month period
ended
Six month period
endedYear ended Year ended Year ended
Name of Related Party Nature of Transaction 30-Sep-21 30-Sep-20 31-Mar-21 31-Mar-20 31-Mar-19
Spinclabs Private Limited Trade payable - 2.30
Spinclabs Private Limited Trade receivable 0.08 0.01 0.07 0.14 1.70
Rakhi Prasad Professional charges 0.18 - - - -
Rakesh Kumar Verma Employee benefit payable* 0.78 0.57 0.57 0.32 0.50
Rohan Verma Employee benefit payable* - 0.72 0.72 0.55 -
Rashmi Verma Employee benefit payable* 0.78 0.57 0.57 0.32 0.40
Shivalik Prasad Employee benefit payable* - - - - 0.40
d) Transactions within the Group: (these transactions got eliminated in Restated Consolidated financial information)*
Six month period
ended
Six month period
endedYear ended Year ended Year ended
Name of Related Party Nature of Transaction 30-Sep-21 30-Sep-20 31-Mar-21 31-Mar-20 31-Mar-19
CE Info Systems international inc. Investment in Subsidiary - - - 56.30 15.40
CE Info Systems international inc. Sale of services 11.72 - 8.84 - -
Videteq (India) Private Limited Technical expenses 5.23 12.77 25.55 - 15.00
Videteq (India) Private Limited Rent income 0.06 0.09 0.12 0.10 1.80
* As per Schedule VI (Para 11(I)(A)(i)(g)) of ICDR Regulations
e) The balances receivable from and payable within Group : (these transactions got eliminated in Restated Consolidated financial information)*
Six month period
ended
Six month period
endedYear ended Year ended Year ended
Name of Related Party Nature of Transaction 30-Sep-21 30-Sep-20 31-Mar-21 31-Mar-20 31-Mar-19
Videteq (India) Private Limited Trade Payable 5.65 10.82 - 0.10 3.70
Videteq (India) Private Limited Trade Receivable - 0.07 - - 1.20
* As per Schedule VI (Para 11(I)(A)(i)(g)) of ICDR Regulations
Subsidiary
u
233

C. E. Info Systems Limited (formerly known as C.E. Info Systems Pvt Ltd)
Annexure VI - Notes to Restated Consolidated Financial Information (Continued)
'(All amounts are in Indian Rupees in millions, unless otherwise stated)
32 Employee benefits
i) Defined contribution plans
ii) Defined benefit plans
A. Amount recognised in the Restated Consolidated Balance Sheet
Particulars
30-Sep-21 30-Sep-20 31-Mar-21 31-Mar-20 31-Mar-19
Present value of the obligation as at the end of the year 93.15 73.71 79.46 70.63 44.50
Fair value of plan assets as at the end of the year 63.27 55.90 59.32 51.53 32.74
Net liability recognised in the balance sheet (29.88) (17.81) (20.14) (19.09) (11.76)
B. Change in projected benefit obligation
Particulars
30-Sep-21 30-Sep-20 31-Mar-21 31-Mar-20 31-Mar-19
Projected benefit obligation at the beginning of the year 79.46 70.63 70.63 44.48 30.10
Current service cost 4.68 4.03 8.58 7.64 4.30
Interest cost 2.66 2.37 4.80 3.40 2.27
Re-measurement (gains)/ losses in OCI 7.96 (1.91) (3.30) 19.05 10.30
Benefits paid (0.65) (0.57) (1.25) (3.95) (2.58)
Projected benefit obligation at the end of the year 94.11 74.55 79.46 70.63 44.39
C. Change in plan assets
Particulars
30-Sep-21 30-Sep-20 31-Mar-21 31-Mar-20 31-Mar-19
Fair value of plan assets at the beginning of the year 59.31 51.54 51.53 32.74 27.78
Actual return on plan assets 4.20 4.78 9.03 2.37 2.44
Employer contributions - - - 19.00 5.00
Benefits paid 0.64 (0.42) (1.25) (2.57) (2.48)
Fair value of plan assets at the end of the year 64.15 55.90 59.31 51.54 32.74
D. Amount recognised in the Restated Consolidated Statement of Profit and Loss
Particulars
30-Sep-21 30-Sep-20 31-Mar-21 31-Mar-20 31-Mar-19
Current service cost 4.68 4.03 8.58 7.64 4.30
Interest cost 2.66 2.37 4.80 3.40 2.27
Expenses recognised in the statement of profit and loss 7.34 6.40 13.38 11.05 6.57
E. Amount recognised in Restated Consolidated Other Comprehensive Income
Particulars
30-Sep-21 30-Sep-20 31-Mar-21 31-Mar-20 31-Mar-19
Actuarial gain /(loss) for the year on Asset (A) 2.18 1.91 5.53 (0.13) 0.27
Unrecognized actuarial gain/(loss) for the year (B) (5.77) 3.03 8.73 (19.18) (10.12)
Actuarial gain / (loss) for the year on PBO (B-A) (3.59) 4.94 3.20 (19.05) (10.39)
F. Investment details
ParticularsAmount % Amount % Amount % Amount % Amount %
Kotak Group Balanced Fund 23.97 37.89% 18.12 32.42% 21.11 35.59% 15.40 29.90% 11.34 34.63%
Kotak Group Bond Fund 39.30 62.11% 37.78 67.58% 38.21 64.41% 36.10 70.10% 21.40 65.37%
63.27 100.00% 55.90 100.00% 59.32 100.00% 51.50 100.00% 32.74 100.00%
As at
The Company makes contribution, determined as a specified percentage of employee salaries, in respect of qualifying employees towards Provident Fund, which is a defined contribution plan. The contributions are charged
to the Statement of Profit and Loss as they accrue. The amount recognized as an expense towards contribution to Provident Fund for the six month period ended 30 September 2021 and 30 September 2020 and year ended 31
March 2021, 31 March 2020 and 31 March 2019 aggregates to INR 5.42 Mn, 4.76 Mn and INR 9.85 Mn, INR 8.52 Mn and INR 5.60 Mn respectively.
The Company has a defined benefit plan of gratuity. The gratuity plan entitles an employee, who has rendered at least five years of continuous service, to receive one-half month’s salary for each year of completed service.
The gratuity plan of the Company are funded through Kotak life Insurance. The compensated absences policy of the Company entitles an employee to encash actual earned leaves subject to maximum 18 days at the time of
retirement/exit from the Company. The details are as follows:
As at 31 March 2021 As at 31 March 2020 As at 31 March 2019
As at
As at
As at
As at
As at 30 September 2021 As at 30 September 2020
234

C. E. Info Systems Limited (formerly known as C.E. Info Systems Pvt Ltd)
Annexure VI - Notes to Restated Consolidated Financial Information (Continued)
'(All amounts are in Indian Rupees in millions, unless otherwise stated)
G. Assumptions used
Particulars
30-Sep-21 30-Sep-20 31-Mar-21 31-Mar-20 31-Mar-19
Discount rate 6.88% 6.80% 6.79% 6.80% 7.65%
Long-term rate of compensation increase 12.00% 12.00% 12.00% 12.00% 12.00%
Rate of return on plan assets 8.83% 7.65% 8.83% 7.65% 7.65%
Attrition rate
Up to 30 Years 17.00% 17.00% 17.00% 17.00% 25.00%
From 31 to 44 years 9.00% 9.00% 9.00% 9.00% 12.00%
Above 44 years 4.00% 4.00% 4.00% 4.00% 10.00%
Mortality Rate 100% of
IALM (2012-
14)
100% of
IALM (2012-
14)
100% of
IALM (2012-
14)
100% of IALM
(2012-14)
100% of
IALM (2006-
08)
H. Sensitivity analysis
ParticularsIncrease Decrease Increase Decrease Increase Decrease Increase Decrease Increase Decrease
Discount rate (0.5% movement) (4.89) 5.29 (4.03) 4.40 (4.30) 4.68 (2.37) 2.51 (1.64) 1.76
Future salary growth (0.5% movement) (5.20) 4.68 (4.16) 3.87 4.43 (4.12) 2.38 (2.28) 1.48 (1.43)
I. Maturity Profile of Defined Benefit Obligation
Particulars
As at
30
September
2021
As at
30
September
2020
As at 31
March 2021
As at 31
March
2020
As at 31 March
2019
Less than a year 3.86 3.20 3.50 3.50 3.73
Between 1-2 years 35.03 24.39 24.70 23.20 16.91
Between 2-5 years 11.55 9.77 10.80 9.30 7.36
Over 5 years 42.72 36.35 41.40 34.60 16.49
93.16 73.71 80.40 70.60 44.49
33 Employee share-based payments
Particulars ESOP
Maximum number of options under the plan as at 30 Sep 2021 13,31,660
Method of settlement (cash/equity) Equity
Vesting period (maximum) 4 years
Vesting conditions Service period
Movement in respect of stock options granted to employees of the Company, during the year and outstanding as at the 6 months period / year- end is set out below:
Particulars
No. of
options
Weighted
average
exercise
No. of options Weighted
average
exercise
No. of
options
Weighted
average
exercise
No. of
options
Weighted
average
exercise
No. of options Weighted
average
exerciseOutstanding at beginning of the period/ year 12,18,715 16.20 13,35,060 16.20 13,35,060 16.20 15,06,100 16.20 14,16,100 16.20
Considered for previous grants - - - - -
Options granted during the period/ year 5,57,250 - - - 42,500 1,45,000
Exercised during the period/ year 4,93,225 - - - - -
Surrendered during the period/ year - - (1,16,345) (1,16,345) (2,13,540) (55,000)
Forfeited during the period/ year - - - - - -
Outstanding at the end of the period/ year 12,82,740 16.20 12,18,715 16.20 12,18,715 16.20 13,35,060 16.20 15,06,100 16.20
Exercisable at the end of the period/ year 48,920 49,375 49,375 1,48,125 1,49,375
The above disclosure has been presented after giving the effect of sub-division of equity shares.
31-Mar-21 31-Mar-20 31-Mar-19
Reasonably possible changes at the reporting date to one of the relevant actuarial assumptions, holding other assumptions constant, would have affected the defined benefit obligation by the amounts shown below.
As at 31 March 2021 As at 31 March 2020 As at 31 March 2019
CE Info Systems Limited has a share based employee benefit program that allows employees to acquire shares of the Company. A share option scheme for employees was approved in December 2008 by the shareholders of
the Company under which the employees of the Company were granted stock options that vest in a granted manner over a period of 4 years. An exercise price of Rs. 81 was fixed for this purpose. Pursuant to Board and
shareholders' resolutions passed on July 07, 2021, the Company has sub-divided the face value of its equity shares from Rs. 10 each to Rs. 2 each. As a result to this split, the exercise price has been revised to Rs. 16.20.
The Company has provided share-based payment schemes to its employees. During the six month period ended / year ended 30 September 2021, 30 September 2020, 31 March 2021, 31 March 2020 and 31 March 2019, the
following scheme was in operation:
30-Sep-21 30-Sep-20
As at 30 September 2021 As at 30 September 2020
As at
235

C. E. Info Systems Limited (formerly known as C.E. Info Systems Pvt Ltd)
Annexure VI - Notes to Restated Consolidated Financial Information (Continued)
'(All amounts are in Indian Rupees in millions, unless otherwise stated)
34 Segment reporting
35 Leases
Transition to Ind AS 116
Group as a lessee
Particulars As at
30 Sep 2021
As at
30 Sep 2020
As at
31 March 2021
As at
31 March 2020
As at
31 March 2019
Balance as at begining of the year 157.26 195.50 195.50 227.85 -
Transition impact of Ind AS 116 - - - - 195.79
Additions during the year - - - - 62.55
Initial Direct Costs - - - 6.03 -
De-recognition of Right-of-Use Assets (1.02)
Depreciation charge for the year (19.12) (18.71) (38.24) (38.38) (30.49)
Closing balance 137.12 176.79 157.26 195.50 227.85
The reconciliation of lease liabilities is as follows:
Particulars As at
30 Sep 2021
As at
30 Sep 2020
As at
31 March 2021
As at
31 March 2020
As at
31 March 2019
Balance as at begening of the year 188.39 215.01 215.01 251.20 -
Transition impact of Ind AS 116 - - - 205.21
Additions during the year - - - 62.87
10.30 12.09 23.65 26.46 23.60
Change due to de-recognition of Right-of-Use Assets (1.31)
Payment of lease liabilities (28.78) (25.03) (50.27) (62.64) (40.48)
Closing balance 168.60 202.07 188.39 215.01 251.20
The following table presents a maturity analysis of expected undiscounted cash flows for lease liabilities as on 31 March
Particulars As at
30 Sep 2021
As at
30 Sep 2020
As at
31 March 2021
As at
31 March 2020
As at
31 March 2019
Within one year 54.89 54.83 56.39 53.06 52.43
One to Two years 103.70 111.83 111.78 111.87 109.52
Two to three years 52.39 99.41 80.54 127.31 170.00
Three to five years - 3.18 - 9.54 22.26
Total 210.98 266.07 248.72 301.78 354.20
Imputed Interest (42.38) (64.00) (60.32) (86.76) (103.01)
Total Lease Liabilities 168.60 202.07 188.39 215.01 251.20
Particulars As at
30 Sep 2021
As at
30 Sep 2020
As at
31 March 2021
As at
31 March 2020
As at
31 March 2019
Current Lease Liabilities 37.86 33.38 31.12 27.67 26.14
Non- Current Lease Liabilities 130.74 168.72 157.29 187.36 225.20
Total Lease Liabilities 168.60 202.07 188.41 215.03 251.20
Amount recognized in the Statement of Cash Flows
Particulars As at
30 Sep 2021
As at
30 Sep 2020
As at
31 March 2021
As at
31 March 2020
As at
31 March 2019
Total cash outflows for leases (principal + interest) (28.78) (25.03) 50.27 62.64 40.48
Company as a lessor
Ind AS 108 “Operating Segment” (“Ind AS 108”)establishes standards for the way that business enterprises reporting information about the operating segment and related disclosure made by the Chief Operating Decision Maker (CODM).The Group is engaged in the business of digital map data, GPS
navigation and location-based services, and is in the business of licensing, selling and customizing its products to dealers and enterprises. The CODM reviews these activities under the context of Ind AS 108 "Operating Segment" as one single primary segment to evaluate the overall performance
assessment of entity’s operating segment.
Lease standard i.e., Ind AS 116 has been notified to be effective w.e.f. 1 April 2019 for accounting of the lease contracts entered in the capacity of a lessee. The Group had adopted Ind AS 116 from 01 April 2019, however for the the purpose of preparation of these Restated Consolidated Financial
Information, the management has applied the standard w.e.f 01 April 2018 following modified retrospective method. The Group has measured the lease liability at the present value of the remaining lease payments, discounted using the lessee’s incremental borrowing rate and a right-of-use asset at an
amount equal its carrying amount as if the Standard had been applied since the commencement date, but discounted using the lessee’s incremental borrowing rate at the date of initial application.
The Group’s significant leasing arrangements are in respect of leases for office spaces. These lease arrangement range between 2 to 8 years, which include both cancellable and non-cancellable leases. Most of the lease are renewable for future period on mutually agreed terms and also include escalation
clause.
The Group has applied following practical expedients:
(1) Applied a single discount rate to a portfolio of leases with reasonably similar characteristics.
(2) Applied the exemption not to recognise right-of-use-assets and liabilities for leases with less than 12 months of lease term on the date of transition.
(3) The Weighted Average Incremental Borrowing Rate considered for lease liabilities recognized as at 01st April 2018 is 11.25 %.
The Group has also applied recognition exemptions of short-term leases to all categories of underlying assets.
The cumulative effect on transition (i.e. difference between ROU and Lease liabilities) for these consolidated restated financial information as at 01 April 2018 has been adjusted from retained earnings. The right-of-use assets and lease liabilities are presented separately on the face of Balance Sheet.
On application of Ind AS 116, the nature of expenses has changed from lease rent in previous periods to depreciation cost for the right-to-use asset, and finance cost for interest accrued on lease liability. The principal portion of the lease payments have been disclosed under cash flows from financing
activities. The lease payments for operating leases as per Ind AS 17 – Leases, were earlier reported under cash flows from operating activities.
The details of the right-of-use asset held by the Company is as follows:
Amounts recognized in Restated Consolidated Statement of Profit and Loss as interest expense
The lease rental expense relating to short-term leases recognized in the statement of profit and loss for the year amounted to INR 0.83 Mn, INR 1.06 Mn, INR 2.91 Mn, INR 3.04 Mn and INR 1.53 Mn, for the six month period ended and year ended 30 September 2021 , 30 September 2020 and year
ended 31 March 2021, 31 March 2020 and 31 March 2019 respectievly.
During the year ended 31 March 2021 and six month period ended 30 September 2021, the company benefited from temporary lease reductions amounting to INR 7.30 Mn and INR 4.27 Mn which have been recogonised as income in the same period.
Certain lease agreements include options to terminate or extend the leases. The lease agreements do not contain any material residual value guarantees or material restrictive covenants.
Most of the leases entered by the Company are long term in nature and the underlying leased properties are being used as offices. The Company doesn’t foresee any major changes in lease terms or the leases in the foreseeable future as per current business projections after considering the impact of
COVID - 19.
The Group has sub leased the premise to various parties under the terms constituting an Operating Lease.
236
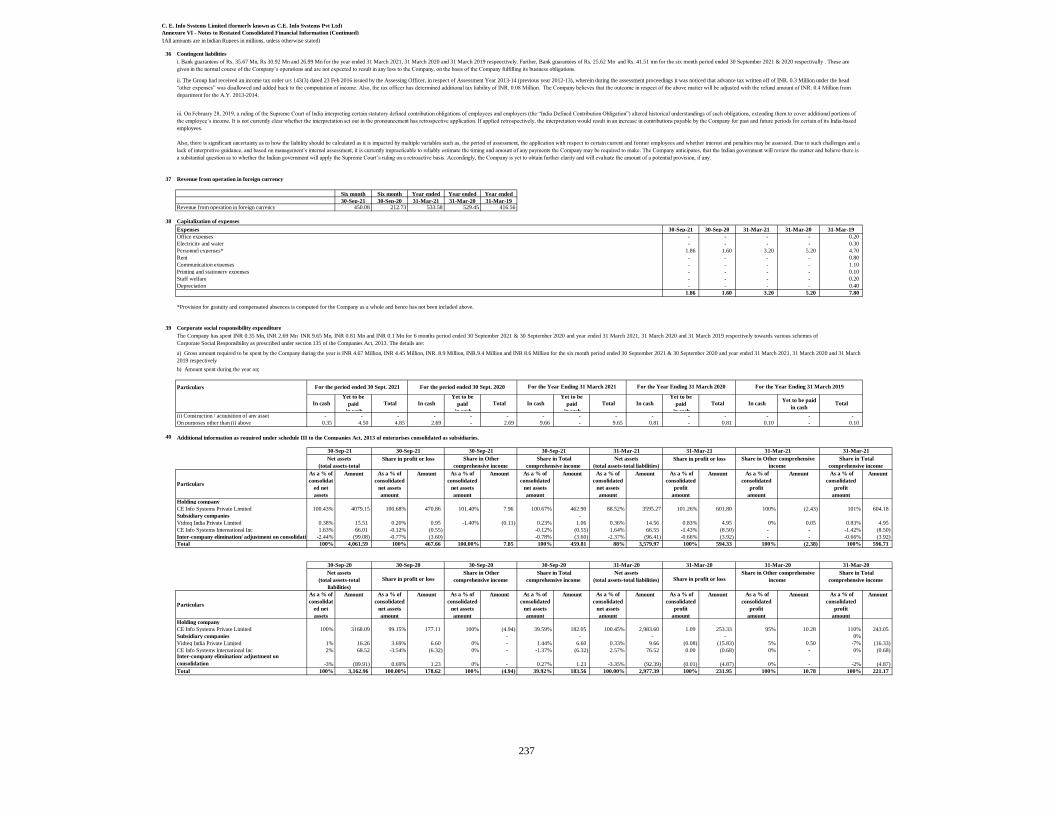
C. E. Info Systems Limited (formerly known as C.E. Info Systems Pvt Ltd)
Annexure VI - Notes to Restated Consolidated Financial Information (Continued)
'(All amounts are in Indian Rupees in millions, unless otherwise stated)
36 Contingent liabilities
37 Revenue from operation in foreign currency
Six month Six month Year ended Year ended Year ended
30-Sep-21 30-Sep-20 31-Mar-21 31-Mar-20 31-Mar-19Revenue from operation in foreign currency 450.08 212.73 533.58 529.45 416.56
38 Capitalization of expenses
Expenses 30-Sep-21 30-Sep-20 31-Mar-21 31-Mar-20 31-Mar-19
Office expenses - - - - 0.20
Electricity and water - - - - 0.30
Personnel expenses* 1.86 1.60 3.20 5.20 4.70
Rent - - - - 0.80
Communication expenses - - - - 1.10
Printing and stationery expenses - - - - 0.10
Staff welfare - - - - 0.20
Depreciation - - - - 0.40
1.86 1.60 3.20 5.20 7.80
*Provision for gratuity and compensated absences is computed for the Company as a whole and hence has not been included above.
39 Corporate social responsibility expenditure
b) Amount spent during the year on;
Particulars
In cash
Yet to be
paid
in cash
Total In cash
Yet to be
paid
in cash
Total In cash
Yet to be
paid
in cash
Total In cash
Yet to be
paid
in cash
Total In cashYet to be paid
in cashTotal
(i) Construction / acquisition of any asset - - - - - - - - - - - - - - -
On purposes other than (i) above 0.35 4.50 4.85 2.69 - 2.69 9.66 - 9.65 0.81 - 0.81 0.10 - 0.10
40 Additional information as required under schedule III to the Companies Act, 2013 of enterprises consolidated as subsidiaries.
Particulars
As a % of
consolidat
ed net
assets
amount
Amount As a % of
consolidated
net assets
amount
Amount As a % of
consolidated
net assets
amount
Amount As a % of
consolidated
net assets
amount
Amount As a % of
consolidated
net assets
amount
Amount As a % of
consolidated
profit
amount
Amount As a % of
consolidated
profit
amount
Amount As a % of
consolidated
profit
amount
Amount
Holding company
CE Info Systems Private Limited 100.43% 4079.15 100.68% 470.86 101.40% 7.96 100.67% 462.90 88.52% 3595.27 101.26% 601.80 100% (2.43) 101% 604.18
Subsidiary companies -
Vidteq India Private Limited 0.38% 15.51 0.20% 0.95 -1.40% (0.11) 0.23% 1.06 0.36% 14.56 0.83% 4.95 0% 0.05 0.83% 4.95
CE Info Systems International Inc 1.63% 66.01 -0.12% (0.55) -0.12% (0.55) 1.64% 66.55 -1.43% (8.50) - - -1.42% (8.50)
Inter-company elimination/ adjustment on consolidation -2.44% (99.08) -0.77% (3.60) -0.78% (3.60) -2.37% (96.41) -0.66% (3.92) - - -0.66% (3.92)
Total 100% 4,061.59 100% 467.66 100.00% 7.85 100% 459.81 88% 3,579.97 100% 594.33 100% (2.38) 100% 596.71
Particulars
As a % of
consolidat
ed net
assets
Amount As a % of
consolidated
net assets
amount
Amount As a % of
consolidated
net assets
amount
Amount As a % of
consolidated
net assets
amount
Amount As a % of
consolidated
net assets
amount
Amount As a % of
consolidated
profit
amount
Amount As a % of
consolidated
profit
amount
Amount As a % of
consolidated
profit
amount
Amount
Holding company
CE Info Systems Private Limited 100% 3168.09 99.15% 177.11 100% (4.94) 39.59% 182.05 100.45% 2,983.60 1.09 253.33 95% 10.28 110% 243.05
Subsidiary companies - - - - 0%
Vidteq India Private Limited 1% 16.26 3.69% 6.60 0% - 1.44% 6.60 0.33% 9.66 (0.08) (15.83) 5% 0.50 -7% (16.33)
CE Info Systems International Inc 2% 68.52 -3.54% (6.32) 0% - -1.37% (6.32) 2.57% 76.52 0.00 (0.68) 0% - 0% (0.68)Inter-company elimination/ adjustment on
consolidation -3% (89.91) 0.69% 1.23 0% - 0.27% 1.23 -3.35% (92.39) (0.01) (4.87) 0% - -2% (4.87)
Total 100% 3,162.96 100.00% 178.62 100% (4.94) 39.92% 183.56 100.00% 2,977.39 100% 231.95 100% 10.78 100% 221.17
31-Mar-20 31-Mar-20 31-Mar-2030-Sep-20 30-Sep-20 30-Sep-20 30-Sep-20 31-Mar-20
a) Gross amount required to be spent by the Company during the year is INR 4.67 Million, INR 4.45 Million, INR. 8.9 Million, INR.9.4 Million and INR 8.6 Million for the six month period ended 30 September 2021 & 30 September 2020 and year ended 31 March 2021, 31 March 2020 and 31 March
2019 respectively
i. Bank guarantees of Rs. 35.67 Mn, Rs 30.92 Mn and 26.99 Mn for the year ended 31 March 2021, 31 March 2020 and 31 March 2019 respeectively. Further, Bank guarantees of Rs. 25.62 Mn and Rs. 41.51 mn for the six month period ended 30 September 2021 & 2020 respectivally . These are
given in the normal course of the Company’s operations and are not expected to result in any loss to the Company, on the basis of the Company fulfilling its business obligations.
ii. The Group had received an income tax order u/s 143(3) dated 23 Feb 2016 issued by the Assessing Officer, in respect of Assessment Year 2013-14 (previous year 2012-13), wherein during the assessment proceedings it was noticed that advance tax written off of INR. 0.3 Million under the head
“other expenses” was disallowed and added back to the computation of income. Also, the tax officer has determined additional tax liability of INR. 0.08 Million. The Company believes that the outcome in respect of the above matter will be adjusted with the refund amount of INR. 0.4 Million from
department for the A.Y. 2013-2014.
iii. On February 28, 2019, a ruling of the Supreme Court of India interpreting certain statutory defined contribution obligations of employees and employers (the “India Defined Contribution Obligation”) altered historical understandings of such obligations, extending them to cover additional portions of
the employee’s income. It is not currently clear whether the interpretation set out in the pronouncement has retrospective application. If applied retrospectively, the interpretation would result in an increase in contributions payable by the Company for past and future periods for certain of its India-based
employees.
Also, there is significant uncertainty as to how the liability should be calculated as it is impacted by multiple variables such as, the period of assessment, the application with respect to certain current and former employees and whether interest and penalties may be assessed. Due to such challenges and a
lack of interpretive guidance, and based on management’s internal assessment, it is currently impracticable to reliably estimate the timing and amount of any payments the Company may be required to make. The Company anticipates, that the Indian government will review the matter and believe there is
a substantial question as to whether the Indian government will apply the Supreme Court’s ruling on a retroactive basis. Accordingly, the Company is yet to obtain further clarity and will evaluate the amount of a potential provision, if any.
The Company has spent INR 0.35 Mn, INR 2.69 Mn INR 9.65 Mn, INR 0.81 Mn and INR 0.1 Mn for 6 months period ended 30 September 2021 & 30 September 2020 and year ended 31 March 2021, 31 March 2020 and 31 March 2019 respectively towards various schemes of
Corporate Social Responsibility as prescribed under section 135 of the Companies Act, 2013. The details are:
Share in profit or loss Share in Other comprehensive
income
For the Year Ending 31 March 2019For the Year Ending 31 March 2021 For the Year Ending 31 March 2020
30-Sep-21 31-Mar-21 31-Mar-21 31-Mar-21 31-Mar-21
Share in Total
comprehensive income
Net assets
(total assets-total
Share in profit or loss Share in Other
comprehensive income
Share in Total
comprehensive income
Net assets
(total assets-total liabilities)
For the period ended 30 Sept. 2020For the period ended 30 Sept. 2021
30-Sep-21 30-Sep-21 30-Sep-21
Share in profit or lossShare in Other comprehensive
income
Share in Total
comprehensive income
Net assets
(total assets-total
liabilities)
Share in profit or lossShare in Other
comprehensive income
Share in Total
comprehensive income
Net assets
(total assets-total liabilities)
237

C. E. Info Systems Limited (formerly known as C.E. Info Systems Pvt Ltd)
Annexure VI - Notes to Restated Consolidated Financial Information (Continued)
'(All amounts are in Indian Rupees in millions, unless otherwise stated)
Particulars
As a % of
consolidated
net assets
amount
Amount
As a % of
consolidated
profit
amount
Amount
As a % of
consolidated
profit
amount
Amount
As a % of
consolidated
profit
amount
Amount
Miscellaneous expenses
CE Info Systems Private Limited 101% 2,868.70 105% 353.10 100.00 8.40 106% 344.70
Subsidiary companies - - -
Vidteq India Private Limited 1% 26.10 -2% (5.39) - - -2.00% (5.39)
CE Info Systems International Inc 1% 15.62 0% - - - 0.00% -
Minority interest in subsidiary company 0% - 0% (0.10) - - 0.00% (0.10)
Inter-company elimination/ adjustment on consolidation -2% (58.43) -4% (11.95) - - -3.56% (11.95)
Total 100% 2,851.99 100% 335.66 100% 8.40 100% 327.26
41 Ratios
Numerato
r (INR
Mn)
Denominator
(INR Mn)
Ratio-
Current
period
Ratio-
Previous
period*
Variance (%)
Current ratio 2,434.78 428.77 5.68 7.14 -21%
Trade Receivable turnover ratio 1,000.27 258.14 3.87 2.17 78%
Trade Payables turnover ratio 221.77 58.97 3.76 2.82 33%
Return on Equity 467.66 4,061.59 0.12 0.06 104%
Net profit ratio 467.66 1,225.79 0.38 0.24 58%
Net Capital turnover ratio 1,225.79 4,061.59 0.30 0.23 29%
* Previous period comparative for 30 September 2021 is 30 September 2020
Numerato Denominator Ratio
Current ratio 2,220.66 310.87 7.14 -Trade Receivable turnover ratio 551.80 254.10 2.17
Trade Payables turnover ratio 158.85 56.35 2.82
Return on Equity 178.62 3,162.96 0.06
Net profit ratio 178.62 739.37 0.24
Net Capital turnover ratio 739.37 3,162.96 0.23
Numerato
r (INR
Mn)
Denominator
(INR Mn)
Ratio-
Current
period
Ratio-
Previous
period*
Variance (%)
Current ratio 2,691.82 503.50 5.35 4.47 20%
Trade Receivable turnover ratio 1,524.63 282.80 5.39 4.77 13%
Trade Payables turnover ratio 442.29 48.31 9.16 7.72 19%
Return on Equity 594.33 3,579.97 0.17 0.08 113%
Net profit ratio 594.33 1,922.74 0.31 0.14 118%
Net Capital turnover ratio 1,922.74 3,579.97 0.54 0.55 -2%
* Previous period comparative for 31 March 2021 is 31 March 2020
Numerato
r (INR
Mn)
Denominator
(INR Mn)
Ratio-
Current
period
Ratio-
Previous
period*
Variance (%)
Current ratio 1,712.50 382.80 4.47 5.28 -15%
Trade Receivable turnover ratio 1,486.29 311.29 4.77 5.66 -16%
Trade Payables turnover ratio 475.06 61.54 7.72 8.94 -14%
Return on Equity 231.95 2,977.39 0.08 0.12 -34%
Net profit ratio 231.95 1,634.78 0.14 0.21 -31%
Net Capital turnover ratio 1,634.78 2,977.39 0.55 0.57 -4%
* Previous period comparative for 31 March 2020 is 31 March 2019
Numerato Denominator Ratio
Current ratio 1,576.23 298.65 5.28
Trade Receivable turnover ratio 1,352.55 238.99 5.66
Trade Payables turnover ratio 451.19 50.48 8.94
Return on Equity 335.66 2,851.99 0.12
Net profit ratio 335.66 1,633.35 0.21
Net Capital turnover ratio 1,633.35 2,851.99 0.57
1) The Company has no/ immaterial borrowings during the 6 months period ended 30 September 2021 and 30 September 2020 and the year ended 31 March 2021, 31 March 2020 and 31 March 2019, therefore debt equity ratio and debt service coverage ratio are not applicable
2) The Company has no/ immaterial borrowings during the 6 months period ended 30 September 2021 and 30 September 2020 and the year ended 31 March 2021, 31 March 2020 and 31 March 2019, therefore Return on Equity and Retun on capital employed have not been presented seperately.
3) The Company's inventory is used for providing services and is also used for the purpose of trading, therefore Inventory turnover ratio cannot be presented seperately.
42 Events after the reporting date
Balance as at
30 Sept. 2021
(numbers)
Addition due
Increase
Closing
Balance
(Numbers)
Authorised capital
Equity Shares of Rs.10 each* 4,25,00,000 3,25,00,000 7,50,00,000
Non-cumulative participating convertible Preference shares:
- Series A preference shares of Rs. 81 each 1229630 12,29,630
- Series B preference shares of Rs. 114 each 1000000 10,00,000
- Series C preference shares of Rs. 290 each 1218007 12,18,007
- Series D preference shares of Rs. 630 each 1149206 11,49,206
- Series E preference shares of Rs. 1000 each 180000 1,80,000
4,72,76,843 3,25,00,000 7,97,76,843
NA
NA
ParticularsAs at 31 March 2019
ParticularsReason for variance
NA
NA
Because of decrease by Rs. 132 Mn in other Income which was Rs 280.80 Mn
in 2019 and Rs. 148.49 Mn in 2020. This decrease in other income was
partially compensated by increase in operating revenue by 134 Mn.
Further, there was an increased in expenses.
As at 31 March 2020
ParticularsAs at 30 September 2020
all ratios were impacted by the COVID pandemic in the six month period
ended September 30, 2020
As at 30 September 2021
NA
NA
NA
ParticularsReason for varinace
NA
primarily due to increase in profit as compare to last year
As at 31 March 2021
31-Mar-19 31-Mar-19
Net assets
(total assets-total liabilities)Share in profit or loss
Share in Other comprehensive
income
Share in Total comprehensive
income
a) Pursuant to Board and Shareholders’ resolutions dated October 5, 2021 and October 7, 2021, respectively, Company increased its authorized Equity Share capital from ₹ 1,555,821,810 divided into 42,500,000 Equity Shares, 1,229,629.63 Series A Preference Shares, 1,000,000 Series B Preference Shares,
1,218,007 Series C Preference Shares, 1,149,206 Series D Preference Shares and 180,000 Series E Preference Shares to 1,620,821,810 divided into 75,000,000 Equity Shares, 1,229,629.63 Series A Preference Shares, 1,000,000 Series B Preference Shares, 1,218,007 Series C Preference Shares, 1,149,206 Series
D Preference Shares, and 180,000 Series E Preference Shares.
b) Reconciliation of authorised Capital post the balance sheet date:
ParticularsReason for varinace
Particulars
31-Mar-19 31-Mar-19
238

C. E. Info Systems Limited (formerly known as C.E. Info Systems Pvt Ltd)
Annexure VI - Notes to Restated Consolidated Financial Information (Continued)
'(All amounts are in Indian Rupees in millions, unless otherwise stated)
Particulars
Balance as at
30 Sept. 2021
(numbers)
Addition due
Increase
Closing
Balance
(Numbers)
Authorised capital
Equity Shares of Rs.10 each* 3,99,32,225 1,33,10,742 5,32,42,967
Non-cumulative participating convertible Preference
shares:
- Series A preference shares of Rs. 81 each - - -
- Series B preference shares of Rs. 114 each - - -
- Series C preference shares of Rs. 290 each - - -
- Series D preference shares of Rs. 630 each - - -
- Series E preference shares of Rs. 1000 each - - -
3,99,32,225 1,33,10,742 5,32,42,967
For Brijesh Mathur & Associates For and on behalf of the Board of Directors ofChartered Accountants CE Info Systems LimitedICAI Firm Registration Number : 0022164N
Brijesh Mathur Rakesh Verma Rohan VermaProprietor Managing Director CEO and Whole time DirectorMembership No.: 080096 DIN: 01542842 DIN: 01797489
Place: New Delhi
Date: November 1, 2021 Place: New Delhi Place: New Delhi
UDIN : Date: Date:
Anuj Kumar Jain Saurabh Surendra Somani
Chief financial officer and Company Secretary Company Secretary
PAN: AGRPJ2753L M. No.- ACS30051
Place: New Delhi Place: New Delhi
Date: Date:
d) Reconciliation of issued, subscribed and paid up capital post the balance sheet date:
e) PhonePe Private limited, Singapore have been transferred 76,48,475 equity shares to PhonePe Private limited, India dated on 1st Oct 2021.
c) Pursuant to Board and Shareholders’ resolutions dated October 5, 2021 and October 7, 2021, respectively, Company allotted 13,310,742 Equity Shares as bonus shares on October 7, 2021 to the existing Shareholders of the Company, whose names appear in the Register of Members as on October 5, 2021
(“Record Date”) in the ratio of 1:3 i.e., one new bonus Equity Share for every three existing fully paid-up Equity Share held by them as on the Record Date by capitalizing an amount of ₹ 26.62 million out of its securities premium account (the “Bonus Issue”). Pursuant to the Bonus Issue, the issued and paid-up
Equity Share capital of Company increased from ₹79,864,450 comprising 39,932,225 Equity Shares to ₹106,485,934 comprising 53,242,967 Equity Shares.
239

C. E. Info Systems Limited (formerly known as C.E. Info Systems Pvt Ltd)
Annexure VII - Statement of Adjustments to the Restated Consoildated Financial Statements
(All amounts are in millions of rupees, except for share data and if otherwise stated)
As at
30 September 2021
As at
30 September 2020
As at
31 March 2021
As at
31 March 2020
As at
31 March 2019
A 4,024.74 3,133.86 3,577.27 2,970.20 2,868.33
B Adjustements:
Material restatement Adjustments
(i) Audit Qualifications - - - - -
Total - - - - -
(ii) Adjustments due to prior period items/ other adjustments
Adjustment on account of adoption of Ind AS 116 from 01 April 2018 - - (1.29) (2.25) (23.02)
Total - - (1.29) (2.25) (23.02)
(iii) Deferred tax impact on adjustments in (i) and (ii), as applicable
Deferred tax impact on restatement adjustments - - 3.99 9.44 6.68
Total - - 3.99 9.44 6.68
C Total impact of adjustments (i + ii+ iii) - - 2.71 7.19 (16.34)
D Total equity as per Restated Consolidated Financial 4,024.74 3,133.86 3,579.97 2,977.39 2,851.99
As at
30 September 2021
As at
30 September 2020
As at
31 March 2021
As at
31 March 2020
As at
31 March 2019
A 438.39 145.78 598.28 234.20 345.20
B Adjustements:
Material restatement Adjustments
(i) Audit Qualifications - - - - -
Total - - - - -
(ii) Adjustments due to prior period items/ other adjustments
Adjustment on account of adoption of Ind AS 116 - - (1.29) (2.25) (13.68)
Total - - (1.29) (2.25) (13.68)
(iii) Deferred tax impact on adjustments in (i) and (ii), as applicable
Deferred tax impact on restatement adjustments - - (2.66) - 4.15
Total - - (2.66) - 4.15
C Total impact of adjustments (i + ii+ iii) - - (3.94) (2.25) (9.53)
D Net Profit after Tax as per Restated Consolidated 438.39 145.78 594.33 231.95 335.67
Net Profit after tax as per Audited Consolidated Financial Statements
Summarised below are the restatement adjustments made to the equity of the Audited Consolidated Financial Statements of the Group for the half year ended 30 September
2021 and 30 September 2020 and years ended 31 March 2021, 31 March 2020 and 31 March 2019.
Particulars
Total Equity as per Audited Consolidated Financial Statements
Summarised below are the restatement adjustments made to the net profit of the audited consolidated financial statements of the Group for the year ended 31 March 2021, 31
March 2020 and 31 March 2019 and their impact on the profit of the Group:
Particulars
240

C. E. Info Systems Limited (formerly known as C.E. Info Systems Pvt Ltd)
Annexure VII - Statement of Adjustments to the Restated Consoildated Financial Statements
(All amounts are in millions of rupees, except for share data and if otherwise stated)1 Adjustment for Audit Qualification : None
2 Material Regrouping: None
3 Material restatement adjustments:
A new lease standard i.e., Ind AS 116 has been notified to be effective w.e.f 1 April 2019 which provide guidelines for the accounting of the lease contracts entered in the capacity
of a lessee and a lessor.
In normal course, the Group had adopted Ind AS 116 from 01 April 2019, however for the purpsoe of these restated consolidate financial information, the Group has applied
'modified retrospective approach' on the opening balances from 01 April 2018. Therefore, the cumulative effect of adopting Ind AS 116 has been recognised as an adjustment to the
opening balance of retained earnings at 1 April 2018.
The Group has entered into various operating lease contacts in the capacity of a lessee and in lines with the accounting principals laid down in Ind AS 116, is required to make the
following adjustments:-
- The Group is required to recognise a right to use asset and a corresponding lease liability in respect of all the operating leases on the transition date considering the practical
expedient available in the standard.
- The Group shall measure the lease liability at the present value of the lease payments that are not paid at that date. The lease payments shall be discounted using the interest rate
implicit in the lease, if that rate can be readily determined. If that rate cannot be readily determined, incremental borrowing rate shall be substituted
- The lease payments included in the measurement of the lease liability comprise the payments for the right to use the underlying asset during the lease term that are not paid at the
commencement date and includes the following:
(a) fixed payments (including in-substance fixed payments as described in paragraph B42 of Ind AS 116), less any lease incentives receivable (if any);
(b) variable lease payments that depend on an index or a rate, initially measured using the index or rate as at the commencement date (as described in paragraph 28 of Ind AS 116).
- The right of use asset recognised in lines with the provisions of Ind AS 116 is required to be depreciated as per Ind AS 16, Property, plant and equipment).
241

C. E. Info Systems Limited (formerly known as C.E. Info Systems Pvt Ltd)
As at and for the
half year ended
30 September 2021
As at and for the
half year ended
30 September 2020
As at and for
the year ended
31 March 2021
As at and for
the year ended
31 March 2020
As at and for
the year ended
31 March 2019
467.66 178.62 594.33 231.95 335.66
5,32,42,967 5,25,85,333 5,25,85,333 5,25,85,333 5,25,85,333
5,43,34,120 5,40,69,953 5,40,69,953 5,42,79,593 5,42,69,629
8.78 3.40 11.30 4.41 6.38
8.61 3.30 10.99 4.27 6.19
Total Net Worth (A) 4,061.59 3,162.96 3,579.97 2,977.39 2,851.99
Restated profit for the year (B) 467.66 178.62 594.33 231.95 335.66
Return on Net Worth (C= B/A) % 11.51% 5.65% 16.60% 7.79% 11.77%
Total Net Worth (A) 4,061.59 3,162.96 3,579.97 2,977.39 2,851.99
Weighted average number of equity shares in calculating basic EPS 5,32,42,967 5,25,85,333 5,25,85,333 5,25,85,333 5,25,85,333
Net Asset Value per Equity Share (basic) (D = A/B) (in INR) 76.28 60.15 68.08 56.62 54.24
EBIDTA 461.23 144.12 543.24 371.87 404.60
EBIDTA Margin (%) 46% 25% 35% 25% 29%
Reconciliation of EBITDA and EBITDA Margin to restated consolidated profit for the years
As at and for the
year ended
30 September 2021
As at and for the
year ended
30 September 2020
As at and for
the year ended
31 March 2021
As at and for
the year ended
31 March 2020
As at and for
the year ended
31 March 2019
Profit for the year (A) 467.66 178.62 594.33 231.95 335.66
Tax expense (B) 160.82 58.66 193.33 84.01 82.36
Profit before tax (C) 628.48 237.28 787.66 315.96 418.02
Adjustments
Add: Finance cost (D) 10.84 13.16 25.57 28.36 26.32
Add: Depreciation and amortisation expenses (E) 38.73 48.13 98.97 97.69 91.50
Add: Provision for diminution in value of investments (F) - 18.22 18.22 63.45 127.84
Less: Other non Operating Income (G) (216.82) (172.67) (387.18) (133.59) (259.08)
461.23 144.12 543.24 371.87 404.60
Operating Income (I) 1,008.97 566.70 1,535.56 1,501.19 1,374.27
EBITDA Margin (EBITDA as a percentage of Total income) (J=H/I) 46% 25% 35% 25% 29%
The details of accounting ratios derived from Restated Financial Statements required to be disclosed under the SEBI ICDR Regulations are set forth below:
Particulars
Basic and diluted Earnings per share
Return on Net Worth
Restated Profit attributable to equity shareholders (A)
Weighted average number of equity shares in calculating basic EPS (B)*
Weighted average number of equity shares in calculating diluted EPS ©*
Particulars
Basic earnings per share of Rs 2 each (in Rs) (D = A/B)
Diluted earnings per share of Rs 2 each (in Rs) (E = A/C)
* after taking impact of result of splitting of the face value of equity shares of the company from Rs. 10 to Rs. 2 per equity share, by the Board and the Shareholders in the
meeting held on July 27, 2021 and July 29, 2021, respectively; and as a result of bonus issue in the ratio of 1:3 i.e., one new bonus Equity Share for every three existing fully paid-
up Equity Share to existing Shareholders of the Company, pursuant to Board and Shareholders’ resolutions dated October 5, 2021 and October 7, 2021.
Earnings before interest, tax expense, depreciation and amortisation
expenses (EBITDA) (H= C+D+E+F-G)
Net Asset Value per Equity Share
The ratios have been computed as under:
1. Basic and diluted earnings per equity share: Basic and diluted earnings per equity share are computed in accordance with Indian Accounting Standard 33 notified under the
Companies (Indian Accounting Standards) Rules of 2015 (as amended).
2. Return on Net Worth ratio: Profit after tax for the year from consolidated restated audited financial statement divided by the total Net Worth of the Group at the end of the
year.
3. EBITDA: Aggregate of profit after tax from consolidated restated audited financial statement before tax expense, finance cost and depreciation and amortisation for the
year/period.
4. “Total Net worth” means aggregate of share capital, other equity and non-controlling interest.
5. “EBITDA Margin” means EBITDA as a percentage of total income.
The table below reconciles restated consolidated profit for the years to EBITDA. EBITDA is calculated as restated consolidated profit for the year plus tax expense, finance costs,
depreciation and amortisation expenses, Provision for diminution in value of investments (non-operating expense) and less non operating income . EBITDA Margin is the
percentage of EBITDA divided by total operating income . Operating income is total income minus other non operating income.
242

243
OTHER FINANCIAL INFORMATION
The audited standalone financial statements of our Company as at and for the year ended March 31, 2021, March 31, 2020, and
March 31, 2019 respectively (“Audited Financial Statements”) are available at
https://www.mapmyindia.com/investors/drhp/financials. Our Company is providing a link to this website solely to comply with
the requirements specified in the SEBI ICDR Regulations. The Audited Financial Statements do not constitute, (i) a part of this
Red Herring Prospectus; or (ii) a prospectus, a statement in lieu of a prospectus, an offering circular, an offering memorandum,
an advertisement, an offer or a solicitation of any offer or an offer document to purchase or sell any securities under the
Companies Act, the SEBI ICDR Regulations, or any other applicable law in India or elsewhere in the world. The Audited
Financial Statements should not be considered as part of information that any investor should consider to subscribe for or
purchase any securities of our Company, or any entity in which it or its shareholders have significant influence (collectively,
the “Group”) and should not be relied upon or used as a basis for any investment decision. None of the Group or any of its
advisors, nor any Book Running Lead Manager or the Selling Shareholders, nor any of their respective employees, directors,
affiliates, agents or representatives accept any liability whatsoever for any loss, direct or indirect, arising from any information
presented or contained in the Audited Financial Statements, or the opinions expressed therein.
Set forth below are the details of accounting ratios required under Clause 11 of Part A of the SEBI ICDR Regulations as of six
month period ended September 30, 2021 and September 30, 2020 and Fiscals ended March 31, 2021, March 31, 2020 and
March 31, 2019 calculated on the basis of the Restated Consolidated Financial Information:
Particulars As at and for
the six
month
period ended
September
30, 2021
As at and for
the six
month
period ended
September
30, 2020
As at and for
the Financial
Year ended
March 31,
2021
As at and for
the Financial
Year ended
March 31,
2020
As at and for
the Financial
Year ended
March 31,
2019
Total equity (attributable to the owners) (in ₹ million) 4,061.59 3,162.96 3,579.97 2,977.39 2,851.99
Profit attributable to owners of the Company (in ₹ million) 467.66 178.62 594.33 231.95 335.66
Weighted average no. of equity shares outstanding during
the period/ year
- For basic earnings per equity share 53,242,967 52,585,333 52,585,333 52,585,333 52,585,333
- For diluted earnings per equity share 5,43,34,120 5,40,69,953 54,269,629 54,269,629 54,269,629
Basic and diluted earnings per share (₹/ share)
- Restated basic earnings per share (in ₹) 8.78 3.40 11.30 4.41 6.38
- Restated diluted earnings per share (in ₹) 8.61 3.30 10.99 4.27 6.19
Return on net worth 11.51% 5.65 16.60% 7.79% 11.77%
Net asset value per equity share (basic) (in ₹) 76.28 60.15 68.08 56.62 54.24
EBITDA (in ₹ million) 461.23 144.12 543.34 371.87 404.60
Notes:
The ratios have been computed as under:
1. Basic and diluted earnings/ (loss) per equity share: Basic and diluted earnings/ (loss) per equity share are computed in accordance with Indian
Accounting Standard 33 notified under the Companies (Indian Accounting Standards) Rules of 2015 (as amended). 2. Return on Net Worth ratio: Profit/ (loss) for the period attributable to owners of the Company divided by Net worth as attributable to owners of the
Company at the end of the year. 3. Net assets value per equity share (₹): Net worth as attributable to owners of the Company at the end of the year divided by weighted average number of
equity shares outstanding during the year.
4. EBITDA = EBITDA stands for restated profit/ (loss) for the year + tax expense + exceptional items+ Impairment + Finance costs + depreciation and amortization – other income. EBITDA does not have a standardized meaning and is not recognized measures under Ind AS or IFRS.
5. Net worth is derived as below:
(₹ in million)
Particulars As at and for the
six month period
ended September
30, 2021
As at and for the
six month period
ended September
30, 2020
As at
March 31,
2021
As at
March 31,
2020
As at
March 31,
2019
Equity share capital 79.86 38.33 38.33 38.33 38.33
Convertible preference shares 0 1,289.64 1,289.64 1,289.64 1,289.64
Securities premium account 1363.62 78.41 78.41 78.41 78.41
Capital redemption reserve 1.34 1.34 1.34 1.34 1.34
Capital reserve 12.58 12.58 12.58 12.58 12.58
Retained earnings 2447.98 1,564.61 1,980.23 1,385.90 1,286.58
General Reserve 39.40 19.72 39.39 19.72 19.23
Exchange difference of translation of foreign
operations
5.16 5.45 4.42 5.50 0.20
Employee stock options outstanding account 134.28 168.35 152.43 164.65 134.07
OCI 22.64 (15.48) (16.30) (18.68) (8.40)

244
Particulars As at and for the
six month period
ended September
30, 2021
As at and for the
six month period
ended September
30, 2020
As at
March 31,
2021
As at
March 31,
2020
As at
March 31,
2019
Restated net worth attributable to the owners
(Total)
4,061.59 3,162.96 3,579.97 2,977.39 2,851.99
6. Accounting and other ratios are based on or derived from the Restated Consolidated Financial Information.

245
FINANCIAL INDEBTEDNESS
As on October 31, 2021, our Company and Subsidiaries did not have any outstanding borrowings on a consolidated basis.

246
CAPITALISATION STATEMENT
The following table sets forth our Company’s capitalization as at September 30, 2021, on the basis of our Restated Consolidated
Financial Information, and as adjusted for the Offer. This table should be read in conjunction with “Risk Factors”, “Financial
Information” and “Management’s Discussion and Analysis of Financial Condition and Results of Operations”, beginning on
pages 30, 193 and 247, respectively.
(₹ in million) Particulars Pre-Offer as at
September 30, 2021
(A)
Adjusted for the
Proposed Offer
(B)*
Total borrowings^
Current borrowings# (A) - -
Non-current borrowings (including current maturities of long-term borrowings) #(B) - -
Total borrowings (C) - -
Total equity
Equity share capital# 79.86 79.86
Instruments entirely equity in nature (convertible preferential shares) # 0.00 0.00
Other equity# 3,981.73 3,981.73
Total equity (D) 4,061.59 4,061.59
Total non-current borrowings (including current maturities of long- term
borrowings)/ Total equity (B)/(D)
NA NA
Total borrowings/ total equity (C) / (D) NA NA * There will be no change in capital structure post the Offer since it is an initial public offering by way of an Offer for Sale by the Selling Shareholders. # These terms carry the same meaning as per Schedule III of the Companies Act.
^ Includes accrued interest.
Notes:
1) The amounts disclosed above are based on the Restated Consolidated Financial Information for the period ended and as at September 30, 2021.
2) Pursuant to Board and Shareholders’ resolutions dated October 5, 2021 and October 7, 2021, respectively, our Company allotted 13,310,742 Equity Shares as bonus shares on October 7, 2021 to the existing Shareholders of the Company, whose names appear in the Register of Members as on October
5, 2021 (“Record Date”) in the ratio of 1:3 i.e., one new bonus Equity Share for every three existing fully paid-up Equity Share held by them as on the
Record Date. For details, see “Capital Structure – Equity Share capital history of our Company” on page 70. The impact of the same has not been
considered in the calculation of “total equity” and “other equity”.

247
MANAGEMENT’S DISCUSSION AND ANALYSIS OF FINANCIAL CONDITION AND RESULTS OF
OPERATIONS
The following discussion should be read together with the information in the section “Summary of Financial Information”, and
our Restated Consolidated Financial Information included in the section “Financial Information” on page 193. Unless the
context requires otherwise, the following discussion and analysis of our financial condition and results of operations as of and
for Financial Years 2021, 2020 and 2019, the six month period ended September 30, 2021 and six month period ended
September 30, 2021, is derived from our Restated Consolidated Financial Information, including the related notes, which have
been derived from our audited financial statements and restated in accordance with the SEBI ICDR Regulations and ICAI
guidance, which differ in certain material respects from IFRS, U.S. GAAP and GAAP in other countries and other accounting
principles with which prospective investors may be familiar.
Our financial year ends on March 31 of each year. Accordingly, references to “Financial Year 2021”, “Financial Year 2020”
and “Financial Year 2019”, are to the 12-month period ended March 31 of the relevant year.
This discussion contains certain forward-looking statements that involve risks and uncertainties. Our actual results may differ
materially from those anticipated in these forward-looking statements as a result of certain factors, such as the risks set forth
in the chapters entitled “Risk Factors” and “Forward Looking Statements” beginning on pages 30 and 19, respectively, that
could affect our business, financial condition and results of operations. The industry-related information contained in this
section is derived from the F&S Report. We commissioned and paid for the F&S Report for the purposes of confirming our
understanding of the industry and it has been prepared for the purpose of the Offer.
OVERVIEW
We are a data and technology products and platforms company, offering proprietary digital maps as a service (“MaaS”),
software as a service (“SaaS”) and platform as a service (“PaaS”). As per the F&S Report, we are India’s leading provider of
advanced digital maps, geospatial software and location-based IoT technologies. Having pioneered digital mapping in India in
1995, we have earned our market leadership position in this industry and built a strong moat by capitalizing on our early mover
advantage, developing proprietary and integrated technologies, full stack product offerings, continuous innovation and robust
sustainable business model. (Source: F&S Report)
We provide products, platforms, application programming interfaces (“APIs”) and solutions across a range of digital map data,
software and IoT for the Indian market under the (MapmyIndia) brand, and for the international market under
the (Mappls) brand.
As of September 30, 2021, we had serviced over 2,000 enterprise customers since our inception. During Financial Year 2021
and the six month period ended September 30, 2021, we had over 500 customers on our SaaS, PaaS and MaaS platforms. Our
customers include marquee and renowned global tech giants, new-age consumer internet technology companies, leading
automotive manufacturers, large businesses across industry segments such as BFSI, telecom, FMCG, industrials, logistics and
transportation, and key government organisations. Some of our customers include PhonePe, Flipkart, Yulu, HDFC Bank, Airtel,
Hyundai, MG Motor, Avis, Safexpress and Goods and Service Tax Network (“GSTN”).
The adoption of our solutions by new age companies and start-up companies across consumer tech, last-mile delivery, shared
mobility and e-commerce is helping us scale rapidly. A growing number of use cases of our products across multiple functions
within organizations including sales, distribution, marketing, analytics, engineering, IT, logistics, call centre and support
services provide us with growth opportunities. Increased adoption of our navigation, connected, autonomous, shared and electric
mobility technologies in the automotive sector, and of our IoT and telematics technologies in the mobility, transportation and
logistics sectors also help in our business growth.
A snapshot of our map and data and platform and IoT offerings is set out below:

248
Our digital maps comprehensively cover India, and as on the date of this Red Herring Prospectus, our digital maps cover 6.29
million kilometres of roads in India, representing 98.50% of India’s road network which was 6.39 million kilometres as at
March 31, 2019 on a provisional basis as per the Annual Report of the Ministry of Road Transport & Highways, Government
of India for the year 2020–2021. As on the date of this Red Herring Prospectus, our digital map data provides location,
navigation, analytics and other information for 7,933 towns, 6,37,472 villages, 17.79 million places across many categories
such as restaurants, retail shops, malls, ATMs, hotels, police stations, electric vehicle charging stations etc., and 14.51 million
house or building addresses. Our AI-powered, four-dimensional (“4D”), high-definition (“HD”), information-rich (“IR”),
multi-lingual, hyperlocal digital map twin digitally and geospatially represents the dynamically changing real world in near real
time. Our ‘RealView’ maps provide actual roadside and on-ground views based on over 400 million geo-referenced photos,
videos and 360-degree panoramas across India. Although our core business focuses on the Indian market, our geospatial
software and location-based IoT platforms, products, APIs and solutions are geography and data agnostic, enabling us to offer
global solutions.
Our consolidated revenue from operations increased from ₹1,352.55 million in Financial Year 2019 to ₹1,486.29 million in
Financial Year 2020, and to ₹1,524.63 million in Financial Year 2021. Our consolidated revenue from operations was impacted
by the COVID-19 pandemic in the six month period ended September 30, 2020 and was ₹ 551.80 million, and in the six month
period ended September 30, 2021 increased to ₹ 1,000.27 million. We have a high operating leverage in our business due to a
low variable cost base. Our Contribution Margin expanded from 76% in Financial Year 2019 to 82% in Financial Year 2020,
to 83% in Financial Year 2021, and was maintained at 85% in the six month period ended September 30, 2020 and in the six
month period ended September 30, 2021. Our EBITDA margins for Financial Years 2019, 2020 and 2021 were 29%, 25% and
35%, respectively, with EBITDA growing at a CAGR of 16%. Our EBITDA margins (excluding other income) for the six
month period ended September 30, 2020 was 25 % and 46 % for the six month period ended September 30, 2021. Our net
profits (after tax) in Financial Years 2019, 2020 and 2021 were ₹335.66 million, ₹231.95 million and ₹594.33 million,
respectively, growing at a CAGR of 33% during this period, with PAT margins of 21%, 14%, and 31% respectively and were
₹178.62 million and ₹467.66 million for the six month periods ended September 30, 2020 and September 30, 2021, respectively.
The net cash flows generated from operating activities for Financial Years 2019, 2020 and 2021 were ₹268.13 million, ₹267.31
million and ₹832.82 million, respectively, and ₹272.77 million and ₹179.46 million for the six month periods ended September
30, 2020 and September 30, 2021, respectively. Our returns on capital employed (ex-cash and financial investments) (“RoCE
ex-cash and financial investments”) were 50%, 41%, and 110% for Financial Years 2019, 2020 and 2021 and 16% and 95%
(not annualised) for the six month periods ended September 30, 2020 and September 30, 2021, respectively.
Note: Our total employee expenses decreased from `642.73 million in Financial Year 2020 to `539.54 million in Financial Year 2021, which was primarily
due to a decrease in the number of our employees from 901 employees in Financial Year 2020 to 734 employees in Financial Year 2021, in particular, on account of a decrease in the number of our non-permanent employees. Further, our other income increased from ₹148.49 million for Financial Year 2020 to
₹398.11 million for Financial Year 2021, primarily due to an increase in income on investments carried at FVTPL and profit on redemption of mutual funds.
Further, for the six month period ended September 30, 2021, our employee related expenses was ₹ 325.97 million on 754 employees and our other income was ₹ 225.52 million. For further details, see “Management’s Discussion and Analysis of Financial Condition and Results of Operations – Significant Factors
Affecting Results of Operations and Financial Condition - Ability to manage costs and profitability”, “Management’s Discussion and Analysis of Financial
Condition and Results of Operations – Results of Operations” and “Financial Information – Annexure VI - Notes to Restated Consolidated Financial
Information – 19. Other Income” on pages 252, 260 and 222, respectively.
As per the F&S Report, the total Indian addressable market of digital maps and location based intelligence services is expected
to grow to USD 7.74 billion (₹ 474.9 billion) in 2025 at around 15.5% CAGR from 2019 to 2025, and most of this growth
would be from new projects and policies announced by the GoI that encourages domestic players of digital maps and associated
solutions. The total global addressable market stood at around USD 86.55 billion (₹ 6.4 trillion) as of 2020 and is expected to
reach around USD 173.61 billion (₹ 12.9 trillion) by 2025 growing at a CAGR (2019-2025) of 13%. (Source: F&S Report)
Mobile navigation devices, the wide usage of 3D platforms and advanced survey technology, digital mapping etc., are the key
driver for growth in the total addressable market. (Source: F&S Report) As a result of increasing awareness of the benefits of,
and growing number of use cases and applications of digital maps and location intelligence technologies, the rate of adoption
of digital maps and location intelligence is increasing in consumer apps, in enterprise digital transformation, in new vehicles
being introduced to the market, and for existing vehicles and fleets plying on the roads.
Further influencing our business growth, the Geospatial Data and Services Guidelines dated February 15, 2021 was issued by
the Department of Science and Technology, the Government of India (the “Geospatial Guidelines”). By way of the Geospatial
Guidelines, the Government has acknowledged that location information is an integral part of the modern digital ecosystem and
critical for unlocking economic, social and environmental opportunities for sustainable growth and development of the country.
The Geospatial Guidelines have liberalised the collection, generation, preparation, dissemination, storage, publication, updating
and digitization of geospatial data and maps within Indian territories, particularly by Indian entities and companies owned or
controlled by Indian residents while retaining some restrictions for foreign companies. The Government of India vide its press
release dated February 15, 2021, announcing the new guidelines said that this liberalisation will stimulate and empower Indian
industry, and will lead to a ₹ 1 trillion geospatial economy by 2030.
With a head-start of over 25 years, we have built a ground-validated proprietary digital map database for locations across India
and developed indigenous tools, technologies and systems for data acquisition, processing, productization and dissemination.
These are difficult to replicate and have created a high entry barrier in the map and navigation business. (Source: F&S Report)
We continuously update our map database by primarily leveraging our professionally collected or acquired data through

249
technology driven professional field surveys, advanced sensors, IoT devices, and platform usage, as well as by utilizing
professionally crowd-sourced and professionally authenticated data. Our database is built through collection and compilation
of accurately geo-tagged GPS data, photographs, videos, panoramic 360 degree images, names and other attributes about roads,
buildings, places and boundaries. Our spatial data collection techniques, which started in 1995 with physical surveys on paper
with measurement tools which we would then digitize into digital maps, has evolved by using technological advancements such
use of satellite imagery, GPS equipment, mobile mapping, 360 degree car surveys and is now moving towards AI-driven and
big data analytics driven technologies. Our core address database developed several years ago has been continuously updated
with names and hierarchical relationships of addresses, buildings, businesses, streets, localities, cities and districts and improved
with geometry and spatial geographical references. Our digital maps cover India comprehensively, providing detailed and
updated location data and other geospatially-linked information.
We believe that the recognition of our MapmyIndia brand and awards received by our Company over the years are attributable
to our endeavour to keep Indian innovation at the forefront. In 2005, we were shortlisted by NASSCOM as a “Showcase
Company for IT Innovation in India” for launching MapmyIndia.com in 2004. We also won the Government of India’s
“Aatmanirbhar Bharat App Innovation Challenge” in the “others” category in 2020, organised by Ministry of Electronics and
Information Technology, Government of India. We have also recently entered into various memorandums of understanding
with key government organisations such as the Indian Space Research Organisation (“ISRO”), NITI Aayog, National
eGovernance Division, Ministry of Electronics and Information Technology, Government of India, and National Institute of
Urban Affairs, Ministry of Housing and Urban Affairs, Government of India to provide ‘Aatmanirbhar’, or indigenous
geospatial solutions and capabilities to Indian users, through continuous participation and active contribution to key initiatives
in this space. We believe in the ‘Made in India’ but ‘Made for the World’ approach.
Our Company was founded by our Promoters out of their belief that a significant percentage of data would have a location
dimension and that such data would be critical in solving myriad problems faced by businesses, government and consumers.
The expertise, experience and commitment of our Promoters and management team has been instrumental in our growth. Our
Promoter and CMD, Rakesh Verma, is a pioneer in the geospatial field and currently serves as the FICCI National Committee
Chair of Geospatial Technologies and as member of the Government of India’s Department of Science and Technology’s Legal-
sub Committee for the National Geospatial Policy. Our Promoter, Rashmi Verma pioneered the concept and launch of one of
the earliest digital mapping products in India and played an important role in founding and developing our Company. Our CEO
and Whole-time Director, Rohan Verma, serves as a member of the CII National Committee on Space, and had conceptualized
and created India’s interactive mapping portal, MapmyIndia.com in 2004. For further details of the educational qualifications
and experience of our Directors, see “Our Management - Brief Biographies of Directors” on page 171. We have an experienced
management team and had a combined workforce of 734 employees for our Indian and overseas operations as of March 31,
2021. We also take pride in a diverse and skilled workforce and count them as a key attribute for our growth. We also have the
benefit of marquee investors such as PhonePe, which is a leading Indian payments and technology company, Qualcomm, which
is a leading global wireless technologies company, and Zenrin, which is a leading Japanese digital mapping and location
technologies company, actively involved in driving our growth.
For details of our offerings, market opportunities and key business and financial metrics, see “Our Business” beginning on page
132.
SIGNIFICANT FACTORS AFFECTING RESULTS OF OPERATIONS AND FINANCIAL CONDITION
Our results of operations and financial condition are affected by numerous factors, including those discussed in the section
“Risk Factors” beginning on page 30. In particular, we believe that the following specific factors have had a significant effect
on our results of operations and financial condition during the period under review, and may continue to affect our results of
operations and financial condition in the future.
Diversified revenue profile and business sustainability
We derive our revenue primarily from two key markets, namely, consumer technology and enterprise digital transformation
(“C&E”), and automotive and mobility technology (“A&M”).
We derive majority of our revenue from B2B and B2B2C enterprise customers. Our business model is to charge our customers
fees per period on a per vehicle, per asset, per transaction, per use case or per user basis, as applicable. Our arrangements with
automotive OEMs typically envisage payments on a per vehicle basis for the contract period and top-up payments for internet
services as subscription charges. For C&E customers, payments are typically received on a per geospatial transaction (or API
query) basis, i.e. when the feature requiring geospatial element is used by an end consumer, for instance, a search result for the
nearest service centre or merchant. We charge on a fixed price per term on a per use case basis, when the geospatial queries are
not specified or known to us. For our Move IoT devices, payments are typically received for the sale of devices and subscription
fees which are periodic in nature. Accordingly, such payments take the form of subscription fees, royalties or annuities for
licenses and usage rights to our proprietary digital MaaS, PaaS and SaaS offerings. Subscription fees and royalty and annuity
payments together contributed over 90% of our revenue from operation for Fiscal 2021 and over 93% of our revenue from
operation for the six month period ended September 30, 2021.

250
Set forth below is our revenue from operations from each of those markets, for the Financial Years 2021, 2020 and 2019 and
the six month periods ended September 30, 2021 and September 30, 2020, respectively:
Customer
markets
Six month period
ended September 30,
2021
Six month period
ended September 30,
2020
Financial Year 2021 Financial Year 2020 Financial Year 2019
Amount
(in ₹
million)
As a
percentage
of our
revenue
from
operations
(%)
Amount
(in ₹
million)
As a
percentage
of our
revenue
from
operations
(%)
Amount
(in ₹
million)
As a
percentage
of our
revenue
from
operations
(%)
Amount
(in ₹
million)
As a
percentage
of our
revenue
from
operations
(%)
Amount
(in ₹
million)
As a
percentage
of our
revenue
from
operations
(%)
Consumer tech
and enterprise
digital
transformation
534.85 53.47 292.96 53.09 724.48 47.52 447.24 30.09 265.40 19.62
Automotive
and mobility
tech
465.42 46.53 258.84 46.91 800.15 52.48 1,039.05 69.91 1,087.15 80.38
Total 1,000.27 100.00 551.80 100.00 1,524.63 100.00 1,486.29 100.00 1,352.55 100.00
Our customer mix is an important determinant of the degree to which we are exposed to market factors, and the relative impact
economic conditions within India or abroad may have on our business.
Our overall revenue has grown year on year, including during Financial Year 2021, despite the impact of COVID-19 on the
economy in India, particularly on production and movement and transportation of persons and goods due to lock-down
restrictions. This had a temporary negative effect on our A&M customers, significantly impacting our revenue for the first
quarter of Financial Year 2021 and consequently, the six month period ended September 30, 2020. We have diversified our
revenue profile by providing solutions across newly manufactured vehicles as well as for existing vehicles and fleets of vehicles
plying on the road for our A&M customers. Additionally, our continued focus to expand our base in the C&E markets and
leverage the accelerated adoption of e-commerce and technology-driven consumer businesses and digital transformation across
all industry segments has resulted in an increase in growth in revenues from these markets. Revenues from our C&E customers
increased by 61.9% in Financial Year 2021 from Financial Year 2020 and by 66% in the six month period ended September
30, 2021 compared to the six month period ended September 30, 2020. Despite the impact of COVID-19, our profitability
improved and our EBITDA margins (excluding other income) increased from 25% in Financial Year 2020 to 35% in Financial
Year 2021, and from 25% to 46% in the six month period ended September 30, 2020 and the six month period ended September
30, 2021, respectively.
Note: Our total employee expenses decreased from `642.73 million in Financial Year 2020 to `539.54 million in Financial Year 2021, which was primarily due to a decrease in the number of our employees from 901 employees in Financial Year 2020 to 734 employees in Financial Year 2021, in particular, on
account of a decrease in the number of our non-permanent employees. Further, our other income increased from ₹148.49 million for Financial Year 2020 to
₹398.11 million for Financial Year 2021, primarily due to an increase in income on investments carried at FVTPL and profit on redemption of mutual funds. Further, for the six month period ended September 30, 2021, our employee related expenses was ₹ 325.97 million on 754 employees and our other income was
₹ 225.52 million. For further details, see “Management’s Discussion and Analysis of Financial Condition and Results of Operations – Significant Factors Affecting Results of Operations and Financial Condition - Ability to manage costs and profitability”, “Management’s Discussion and Analysis of Financial
Condition and Results of Operations – Results of Operations” and “Financial Information – Annexure VI - Notes to Restated Consolidated Financial
Information – 19. Other Income” on pages 252, 260 and 222, respectively.
In addition to our mix between C&E and A&M revenue, we have a balanced mix of revenue from international and domestic
customers. During Financial Year 2021 and the six month period ended September 30, 2021, 35% and 45%, respectively, of
our total revenue from operations came from customers located outside of India in foreign currencies, primarily USD. We
believe our premium quality products are able to meet the international quality standards expected by such customers. We
believe this has helped us diversify our risk exposure across customer markets and geographies. We enter into fixed price or
volume linked contracts with our customers. We deliver our products and solutions based on actual or projected volumes or
pricing or fixed amounts given by our customers, that are initially agreed-upon and recorded in agreements or purchase orders
or minutes of meetings received from our customers, which are typically for a term of three to five years and mutually
extendable. We maintain an internal booking system of our Orders, and record a new Order or renew an existing Order each
time a contract or purchase order or minutes of meetings, as applicable, are confirmed by our customers or when the quantities
mentioned in the Order are delivered. Payments for such Orders are typically staggered over the duration of such term, and
revenue for such products and solutions is recognized upon delivery. For certain contracts, a large part of this payment may
also be towards the latter half of the arrangement. We typically receive a lump-sum amount of our receivable payments upfront,
as our IP is delivered to our customers in the first instance, which is then applied by them in their products during the term of
such Orders, in agreed upon volumes as per the Orders. We recorded new Orders worth `1,414.60 million, `2,714.46 million
and `4,681.51 million of which 29.91%, 20.95% and 30.11% new Orders were based on fixed pricing and 70.09%, 79.05% and
69.89% new Orders were based on volume projections for vehicles on which OEMs intend to bundle our solution or API

251
transactions that customers will consume in their application amongst others, during the Financial Years 2019, 2020 and 2021,
respectively. During the six month period ended September 30, 2020 and the six month period ended September 30, 2021, we
recorded new Orders worth ` 3,498.56 million and ` 2,589 million. The volume projections are based on either the projections
shared by OEMs or based on the historical usage trends amongst certain other parameters. See “Risk Factors - Our customers
may terminate contracts before completion, negotiate adverse terms of the contract or choose not to renew contracts, which
could materially adversely affect our business, financial condition and results of operations” on page 35.
Ability to grow our product portfolio to serve more use cases, customers and market opportunities
Our product strategy is to continuously update and enhance our product portfolio to improve the value of our existing offerings
as well as expand location intelligence and broad geospatial use cases for our offerings across diverse industry segments. For
details of our offerings, see “Our Business – Our Operations” on page 146.
As per the F&S Report, the total Indian addressable market of digital maps and location based intelligence services is expected
to grow to USD 7.74 billion (₹474.9 billion) in 2025 at around 15.5% CAGR from 2019 to 2025, and most of this growth would
be from new projects and policies announced by the GoI that encourages domestic players of digital maps and associated
solutions. The total global addressable market stood at around USD 86.55 billion (₹ 6.4 trillion) as of 2020 and is expected to
reach around USD 173.61 billion (₹12.9 trillion) by 2025 growing at a CAGR (2019-2025) of 13%. (Source: F&S Report)
Mobile navigation devices, the wide usage of 3D platforms and advanced survey technology, digital mapping etc., are the key
driver for growth in the total addressable market. (Source: F&S Report)
Our results of operations will continue to be linked to our ability to continuously develop and update accurate map data and
enhance our technological capabilities of building and offering platforms, products, APIs and solutions which integrate and
leverage our high-quality maps, which we believe will in turn allow us to grow the value of our products and our business. We
believe that the degree to which our customers have the need for our offerings, would lead to a higher budget allocation by such
customers for engaging our services. Our customer base helps us service new use cases in a targeted manner and ensure that
we are creating products and solutions to cater to all categories of customers and their end consumers, which in turn drives
increases in subscriptions and annuities towards our revenues.
Given the sensitivity around mapping technology and geospatial data, government regulations and policies also act as an
important factor in determining our results of operations. We have incurred and expect to continue incurring costs for
compliance with such laws and regulations. Regulations and policies, including tax regimes and incentives to which we are
subject could change at any time.
Customer relationships and expansion of our customer base
Customer retention and the expansion of our customer base are integral to our business. Our ability to achieve this depends on
continued levels of service, efficient project execution capabilities and solution-oriented approach for the business and
operational requirements of our customers through new use cases and solutions to meet their evolving needs and deep
integration of our data, products and platforms into our customers’ own offerings.
Our relationships with our customers have been gradually strengthened by proving our reliability and quality through initially
fulfilling their single or select use-case requirements, and eventually becoming a one stop solution provider to them. Continued
retention of, and demand for our products from, our customers has a significant impact on our results of operations and financial
condition, with our sales being particularly affected by the inventory or subscription levels of our key customers. The number
of customers that accounted for 80% of our revenue from operations were 17, 22 and 25 in Financial Years 2019, 2020 and
2021 and 24 and 18 in the six month periods ended September 30, 2020 and September 30, 2021, respectively. During this
period, 15 of the 17 customers from Financial Year 2019 continued to be paying customers in Financial Year 2020, and 14
customers continued in Financial Year 2021. Similarly, 20 out of the 22 customers from Financial Year 2020 continued to be
paying customers in Financial Year 2021, and 16 customers continued in the six month period ended September 30, 2021.
Accordingly, 90% of the customers that contributed 80% of our revenue in the last three Financial years were retained on a year
on year basis.
We also benefit from a multiplier effect on account of consumer-facing customers and enterprise customers who increase their
digital technology adoption, as well as automotive OEMs who are producing increasing number of vehicles, and mobility
customers who are transporting increasing number of people or goods. These customers embed our offerings into their apps,
vehicles and digital systems. When there is increase in demand or usage for their consumer apps, or as more vehicles are
produced, or as their usage of our offerings for their enterprise operations increase, our revenues grow due to our SaaS revenue
model of time period based per vehicle, per transaction and per use case fees. Our capabilities and ready-for-use digital products
and solutions enable us to expand our customer base in a considerably short period of time, as there is increase in awareness
about the benefits of our offerings and increased demand. Our diversified customer base with long-established relationships
with many of them is an important factor in our revenue growth, especially since we mainly derive revenues mainly from
customer subscription fees based on transactions and usage, royalties per vehicle or device, and annuity payments based on per
use case per year, that we charge our customers.

252
Our ability to increase income from existing customers will depend on a number of factors, including the size of our skilled
professional teams, customers’ level of satisfaction with our products, services, pricing, economic conditions and our customers’
overall budget and spending levels. Our revenue from existing customers has steadily grown and contributed a significant
portion of our revenue from contracts with customers over the years indicating a high degree of customer retention. Our
contracts with key customers also contain certain standards and performance obligations and our failure to meet such
specifications could result in a reduction of business from them, termination of contracts or additional costs and penalties. We
believe that our ability to establish and strengthen customer relationships and expand the scope of our products and services
will be an important factor in our future growth and our ability to continue increasing our profitability.
Our customers operate in a wide variety of industries that gives us sector knowledge across a number of verticals, such as BFSI,
telecom, FMCG, industrials, logistics, transportation, vehicle manufactures and various government agencies, which helps us
to augment our offerings as well as target new customers in the industry vertical that we already cater to. We rely on our ability
to cross-sell and up-sell our various products and solutions to new and existing customers based on these use cases.
We have served over 2,000 unique enterprise customers since our inception across a wide range of industry segments for
hundreds of use cases. Every time we get a new customer who leverages our offerings for a new use case, it becomes a potential
up-sell and cross-sell opportunity for us to approach our existing and prospective customers with. Additionally, we can look to
upsell our international market products (Mappls) to our existing internationally located customers, along with our domestic
customers who also have operations in international markets. This network effect keeps expanding our value proposition to not
only our existing customers, but also helps us attract new customers.
Our horizontal platform comprising APIs, SDKs and IoT and automation products can find use in a multitude of industries. For
example, our ‘Workmate’ application enables organisations to get real-time visibility and live location tracking for their
workforce, allowing entities across sectors such as construction, food delivery, automotive, logistics and supply chain
management, to optimize resources and enhance efficiency. Our diverse portfolio of location intelligent solutions helps us
expand the customer share of wallet on our products and services. For example, an automotive OEM who was initially using
only map and data for in-dash navigation, is now using our navigation and mobility solutions for connected vehicles, and going
forward, may use our ADAS or EV solutions.
Ability to manage costs and profitability
Since most of our products, platforms and solutions are digital, created, deployed and delivered in-house, we, are an asset light
business, with high Contribution Margins (as set out in the table below) and high operating leverage on a relatively low variable
cost base. Our Contribution Margins have grown from 76% in FY 19 to 82% in FY 20 to 83% in FY 21, and was maintained
at 85% in the six month period ended September 30, 2020 and the six month period ended September 30, 2021. We have
strategically and through our market insight and intelligence, deployed a value-based pricing policy for our offerings, allowing
us to maximise our average selling price.
The key costs incurred by us in the last three Financial Years and the six month periods ended September 30, 2020 and
September 30, 2021, are set out below:
(in ₹ million, unless specified) Six month
period
ended
September
30, 2021
Six month
period
ended
September
30, 2020
Financial
Year 2021
Financial
Year 2020
Financial
Year 2019
Operating revenue
1,000.27 551.80
1,524.63 1,486.29 1,352.55
Variable cost (direct Cost)
Software license fees and material cost
87.87 49.89
174.24 153.84 213.91
Cloud hosting fees
27.61 16.38
40.54 44.10 34.00
Customer customisation and servicing cost
29.69 16.52
51.95 64.42 74.73
Total variable cost 145.17 82.79
266.73 262.36 322.64
Percentage of direct cost to revenue from operation (%) 14.51% 15.00% 17.49% 17.65% 23.85%
Contribution margin 85.49% 85.00% 82.51% 82.35% 76.15%
Fixed cost (indirect cost)
People cost for product, sales and marketing, general and
administration 344.72 298.15
614.97 707.36 532.45
Marketing (including travel)
24.73 16.86
43.50 94.98 60.61

253
Six month
period
ended
September
30, 2021
Six month
period
ended
September
30, 2020
Financial
Year 2021
Financial
Year 2020
Financial
Year 2019
Infrastructure 11.38 8.83
19.93 23.13 18.69
Other fixed cost 21.73 15.95
47.20 41.50 35.28
Total fixed cost 402.57 339.79
725.60 866.97 647.03
Percentage of indirect cost to revenue from operation (%) 40.25% 61.58%
47.59% 58.33% 47.84%
Fixed (indirect) and variable (direct) costs:
Our fixed costs typically include product development, research and development, sales, marketing and general and
administrative costs. Our most significant fixed costs are employee costs and benefits, marketing including travel, and
infrastructure such as rent and utilities.
We have historically focussed on developing our own platform and products, however, to meet certain market requirements,
we have from time to time, entered into arrangements for sourcing products and services from third parties, and these costs are
directly related to the revenue. Being an asset-light and debt-free company, our non-operating expenses, namely, depreciation,
amortization and interest, are minimal.
Employee costs:
We are growing the base of our permanent employees, especially technical manpower, to provide long-term career prospects
to these employees and retaining knowledge and skill strength. In the last three Financial Years, we have reduced the number
of non-permanent employees from 600 employees in Financial Year 2019, to 513 employees in Financial Year 2020, 324
employees in Financial Year 2021 and 334 employees in the six month period ended September 30, 2021. The reduction in
number of non-permanent employees has helped manifest our ability to increase productivity and reduce dependency on
temporary staff.
Our permanent and non-permanent employees for the last three Financial Years and the six month period ended September 30,
2021 were as set out below:
Particulars Six month period ended
September 30, 2021
Financial Year 2021 Financial Year 2020 Financial Year 2019
Permanent employees 420 410 388 311
Non-permanent employees 334 324 513 600
Total 754 734 901 911
The following table provides a breakdown of our total workforce by function for the last three Financial Years and the six
month period ended September 30, 2021:
Function Six month period ended
September 30, 2021
Financial Year 2021 Financial Year 2020 Financial Year 2019
Technical (permanent) 304 303 274 216
Technical (non-permanent) 334 324 513 600
Sales and marketing 88 81 85 70
General and administration 28 26 29 25
Our employee benefit expenses for our Company have historically been our largest expense and we expect this trend to continue
going forward in the last three Financial Years, our combined key workforce across various departments including business
development, content, technology, publishing and accounts, has gone up by 10%. Our employee benefits expense was ₹ 532
million, ₹ 707 million and ₹ 615 million in Financial Years 2019, 2020 and 2021, respectively, and ₹ 345 million and the six
month period ended September 30, 2021, which as a percentage of our revenue from operations was 38%, 43%, 35% and 33%,
respectively. A major component of our employee benefits expense was salaries, wages and bonus. Our salaries, allowance and
bonus payments have increased by 6.30% from Financial Year 2019 to Financial Year 2021, while the number of our employees
decreased by 19% over the same period. Our salaries, allowance and bonus payments have increased by 16% from the six
month period ended September 30, 2020 to the six month period ended September 30, 2021, while the number of our employees
increased by 0.80%.

254
CRITICAL ACCOUNTING POLICIES
The discussion and analysis of our financial condition and results of operations are based upon our financial statements, except
where otherwise noted. The preparation of these financial statements requires us to make estimates and judgments that affect
the reported amounts of assets, liabilities, revenues and expenses, and related disclosure of contingent assets and liabilities. We
evaluate these estimates on an on-going basis. We base our estimates on our historical experience and on various other
assumptions that we believe to be reasonable under the circumstances, the results of which form the basis for making judgments
about the carrying amount values of assets and liabilities that are not readily apparent from other sources.
We believe that application of the following critical accounting policies entails the most significant judgments and estimates
used in the preparation of our financial statements.
1. Basis of preparation, measurement and significant accounting policies
Basis of preparation and measurement
a) Statement of compliance:
Our restated consolidated balance sheet as at March 31, 2021, March 31, 2020 and March 31, 2019, and our restated
consolidated statement of profit and loss (including other comprehensive income), our restated consolidated statement
of changes in equity and our restated consolidated statement of cash flows for the Financial Years ended March 31,
2021, March 31, 2020 and March 31, 2019, and restated other consolidated financial information (together, referred
to as “Restated Consolidated Financial Information”) has been prepared under Ind AS notified under Section 133
of the Companies Act, 2013 and other relevant provisions of the Companies Act, 2013 as amended from time to time.
These Restated Consolidated Financial Information has been extracted by our management from the audited
consolidated financial statements for the respective years, and:
(a) there were no changes in accounting policies during the years of these financial statements, except for ‘leases’,
under the new lease standard Ind AS 116, as amended. See “Financial Information – Annexure VI - Notes to
Restated Consolidated Financial Information – 35. Leases” and “Financial Information – Annexure VII -
Statement of Adjustments to the Restated Consolidated Financial Information” on pages 236 and 240
respectively;
(b) there were no material amounts which have been adjusted for in arriving at profit/ loss of the respective years;
and
(c) there were no material adjustments for reclassification of the corresponding items of income, expenses, assets
and liabilities, in order to bring them in line with the groupings as per the audited financial statements of our
Company and the Subsidiaries, as restated pursuant to the requirements of the SEBI ICDR Regulations.
b) Basis of measurement:
The Restated Consolidated Financial Information has been prepared on historical cost basis, except certain assets and
liabilities that are measured at fair value or amortized cost.
c) Functional and presentation currency
The Restated Consolidated Financial Information is presented in INR, which is also our functional currency.
d) Use of estimates and judgments
The preparation of Restated Consolidated Financial Information is in conformity with Ind AS, which requires the
management to make estimates, judgments and assumptions that affect the reported amounts of assets, liabilities,
revenue, expenses and other comprehensive income (“OCI”) that are reported and disclosed in the Restated
Consolidated Financial Information and accompanying notes. These estimates are based on our management’s best
knowledge of current events, historical experience, actions that we may undertake in the future and on various other
assumptions that are believed to be reasonable under the circumstances. Significant estimates and assumptions are
used for, but not limited to allowance for uncollectible accounts receivables, recognition of deferred tax assets,
valuation of share-based compensation, defined benefit obligations under employee benefit plans (key actuarial
assumptions), estimation of useful lives of property, plant and equipment and intangible assets, the measurement of
lease liabilities and right of use assets, and other contingencies and commitments. Changes in estimates are reflected
in the financial statements in the year in which the changes are made. Actual results could differ from those estimates.

255
e) Current–non-current classification
All assets and liabilities have been classified as current or non-current as per our normal operating cycle and other
criteria which are in accordance with the Schedule III of the Act. Based on the nature of services and the time between
the acquisition of assets / inventories for processing and their realisation in cash and cash equivalents, we have
ascertained our operating cycle as 12 months for purpose of current - non-current classification of assets and liabilities.
f) Measurement of fair values
We record certain financial assets and liabilities at fair value on a recurring basis. We determine fair values based on
the price we would receive to sell an asset or pay to transfer a liability in an orderly transaction between market
participants at the measurement date in the principal or most advantageous market for that asset or liability. Our
accounting policies and disclosures require the measurement of fair values, for both financial and non-financial assets
and liabilities. We have an established control framework with respect to the measurement of fair values (including
Level 3 fair values). We use valuation techniques that are appropriate in the circumstances and for which sufficient
data are available to measure fair value, maximizing the use of relevant observable inputs and minimizing the use of
unobservable inputs.
Significant accounting policies
a) Property, plant and equipment
Recognition and measurement:
Property, plant and equipment are stated at cost of acquisition, less accumulated depreciation and impairment losses,
if any. Cost comprises the purchase price and any costs attributable to bringing the asset to their working condition for
their intended use.
Subsequent expenditures related to an item of fixed asset are added to its carrying amount or recognised as a separate
asset, as appropriately only when it is probable that the future economic benefits associated with item will flow to our
Company and Subsidiaries and the cost of the item can be measured reliably. The carrying amount of any component
accounted for as a separate asset is derecognized when replaced. All other repairs and maintenance are charged to
restated consolidated statement of profit and loss during the reporting period in which they are incurred.
Depreciation methods and estimated useful lives:
Depreciation on property, plant and equipment is provided on the straight-line method over their estimated useful lives,
as determined by the management. Depreciation is charged on a pro-rata basis for assets purchased/sold during the
year.
Asset description Asset life (in years)
Computers (end-user devices) 3
Computers (servers and networks) 6
Research and development equipment 15
Furniture and fixtures 10
Electrical installation and equipment 10
Vehicle tracking devices 2
Vehicles 8
Map survey vehicles 3
The useful lives as given above best represent the period over which the management expects to use these assets, based
on technical assessment. The estimated useful lives for these assets are therefore different from the useful lives
prescribed under Part C of Schedule II of the Companies Act, 2013.
The useful lives of property, plant and equipment are reviewed by the management at each financial year-end and
revised, if appropriate. In case of a revision, the unamortized depreciable amount is charged over the revised remaining
useful life.
b) Intangible assets
Recognition and measurement:
Intangible assets acquired separately are measured on initial recognition at cost. We have a policy of capitalising direct
and indirect costs of intangible assets comprising self-generated map database and/or software based on management
estimate of the costs attributable to the creation of the asset. The indirect costs include general and administrative
expenses which can be directly attributable to making of the asset for its intended use.

256
Subsequent expenditure is capitalised only when it increases the future economic benefits from the specific assets to
which it relates
Amortization:
The intangible assets are amortised using the straight-line method over their estimated useful lives, and is recognized
in Restated Consolidated statement of profit and loss. The useful lives of intangible assets are reviewed by the
management at each financial year-end and revised, if appropriate. In case of a revision, the unamortized depreciable
amount is charged over the revised remaining useful life.
Asset Class Useful life (in years)
Internally generated map database 5
Right to non-compete fee 2
Computer software 6
c) Investment Property
Investment property is a property held either to earn rental income or for the capital appreciation or for both, but not
for sale in the ordinary course of business, use in supply of services or for administrative purpose. Upon initial
recognition, an investment property is measured at cost. Subsequent to initial recognition, investment property is
measured at cost less accumulated depreciation. There have not been any accumulated impairment losses on such
properties.
Depreciation methods and estimated useful lives:
Depreciation on investment property is provided on the straight-line method over their estimated useful lives, as
determined by the management. Depreciation is charged on a pro-rata basis for investment property purchased/sold
during the year. The estimated economic life of building is 60 years.
Any gain or loss on disposal of an investment property is recognised in profit or loss
d) Revenue recognition
Contracts involving provision of services and material:
Revenue is recognized when, or as, control of a promised service or good transfers to a customer, in an amount that
reflects the consideration to which we expect to be entitled in exchange for transferring those products or services.
Time-and-material / Volume based / Transaction based contracts:
Revenue with respect to time-and-material, volume based and transaction based contracts is recognized as the related
services are performed through efforts expended, volume serviced transactions are processed etc. that correspond with
value transferred to customer till date which is related to our right to invoice for services performed.
Proprietary products- Map data:
Revenue from distinct proprietary perpetual license products is recognized at a point in time at the inception of the
arrangement when control transfers to the client. Revenue from proprietary term license is recognized at a point in
time as no services are provided during the period of a term. Revenue from updates is recognized over the contract
term on a straight-line basis as our Company is providing a service of unspecified upgrades on a when-and-if available
basis over the contract term. In case product license are bundled with a certain period of upgrades either for perpetual
or term based license, such upgrade support contracts are generally priced as a percentage of the net fees paid by the
customer to purchase the license and are generally recognized as revenues ratably over the contractual period that the
support services are provided.
Multiple performance obligation:
When a sales arrangement contains multiple performance, such as services, IoT and licensed IPs (map data) or
combinations of each of them revenue for each element is based on a five-step approach as defined below. To the
extent a contract includes multiple promised deliverables, judgment is applied to determine whether promised
deliverables are capable of being distinct and are distinct in the context of the contract. If these criteria are not met,
the promised deliverables are accounted for as a combined performance obligation.
To recognize revenues, the following five step approach is applied:
(i) identify the contract with a customer,

257
(ii) identify the performance obligations in the contract,
(iii) determine the transaction price,
(iv) allocate the transaction price to the performance obligations in the contract, and recognize revenues when a
performance obligation is satisfied
Revenue recognized but not billed to customers is classified either as contract assets or unbilled receivable in our
Restated Consolidated statements of financial position, contract assets primarily relate to unbilled amounts on those
contracts utilizing the cost to cost method of revenue recognition and right to consideration is not unconditional.
Unbilled receivables represent contracts where right to consideration is unconditional (i.e. only the passage of time is
required before the payment is due).
e) Income taxes
Income tax expense comprises current and deferred income tax.
Income tax expense is recognized in the restated consolidated statement of profit and loss except to the extent that it
relates to items recognized directly in equity, in which case it is recognized in equity. Current income tax for current
and prior periods is recognized at the amount expected to be paid to or recovered from the tax authorities, using the
tax rates and tax laws that have been enacted or substantively enacted by the Balance Sheet date. Provision for income
tax includes the impact of provisions established for uncertain income tax positions.
Current tax assets and current tax liabilities are offset only if there is a legally enforceable right to set off the recognised
amounts, and it is intended to realise the asset and settle the liability on a net basis or simultaneously.
Deferred income tax assets and liabilities recognized for all temporary differences arising between the tax bases of
assets and liabilities and their carrying amounts in the Restated Consolidated financial information.
Deferred tax assets are reviewed at each reporting date and are reduced to the extent that it is no longer probable that
the related tax benefit will be realized. Deferred income tax assets and liabilities are measured using tax rates and tax
laws that have been enacted or substantively enacted by the balance sheet date and are expected to apply to taxable
income in the years in which those temporary differences are expected to be recovered or settled.
Deferred tax assets and deferred tax liabilities are offset, if a legally enforceable right exists to set off current tax assets
against current tax liabilities and the deferred taxes relate to the same taxable entity and the same taxation authority.
The effect of changes in tax rates on deferred income tax assets and liabilities is recognized as income or expense in
the year that includes the enactment or the substantive enactment date. A deferred income tax asset is recognized to
the extent that it is probable that future taxable profit will be available against which the deductible temporary
differences and tax losses can be utilized.
f) Retirement and other employee benefits
Short-term employee benefits:
Employee benefits payable wholly within twelve months of rendering the service are classified as short-term employee
benefits. Benefits such as salaries, wages and bonus, etc. are recognised in the Restated Consolidated Statement of
Profit and Loss in the period in which the employee renders the related service.
Post-employment benefits:
(i) Defined contribution plan
The employee’s provident fund scheme is a defined contribution plan. We make specified monthly
contributions towards employee provident fund to Government administered provident fund scheme which
is a defined contribution plan. Our contribution is recognised as an expense in the Restated Consolidated
Statement of Profit and Loss during the period in which the employee renders the related service.
(ii) Defined benefit plan
Other than CE Info Systems International Inc, which does not have any employee, our gratuity plan is a
defined benefit plan. The Gratuity Plan provides a lump sum payment to vested employees at retirement,
death, incapacitation or termination of employment, of an amount based on the respective employee’s base
salary and the tenure of employment (subject to a maximum of ₹ 2 million per employee). The liability is
actuarially determined (using the projected unit credit method) at the end of each year. Actuarial gains/losses

258
are recognized in the Restated Consolidated Balance Sheet with a corresponding debit or credit to retained
earnings through other comprehensive income in the year in which they occur.
Remeasurement gains and losses arising from experience adjustments and changes in actuarial assumptions
are recognized in the period in which they occur, directly in other comprehensive income and are never
reclassified to profit or loss. Changes in the present value of the defined benefit obligation resulting from plan
amendments or curtailments are recognized immediately in the profit or loss as past service cost.
Our Company and Indian Subsidiaries have taken insurance policies to cover its liabilities towards
employees’ gratuity. Liability with respect to the Gratuity plan determined as above and any differential
between the fund amount as per the Insurance Company and the liability as per the actuarial valuation is
recognized as an asset or liability.
Other long-term benefits
Our employees are entitled to compensated absences. Our net obligation in respect of long-term employee benefits
other than post-employment benefits is the amount of future benefit that employees have earned in return for their
service in the current and prior periods; that benefit is discounted to determine its present value, and the fair value of
any related assets is deducted.
g) Inventories
Inventories which comprise raw material, finished goods, stock-in-trade, stores and spares and project work-in-
progress are carried at the lower of cost and net realisable value (“NRV”).
Cost of inventories comprises all costs of purchase, costs of conversion and other costs incurred in bringing the
inventories to their present location and condition. In determining the cost, FIFO method is used.
Project work-in-progress represents cost incurred on projects/portion of projects when revenue is yet to be recognized.
Such costs include field survey expenses and salary costs for technical team working on these projects.
Net realisable value is the estimated selling price in the ordinary course of business, less the estimated costs of
completion and the estimated costs necessary to make the sale. The comparison of cost and net realisable value is made
on an item-by-item basis.
h) Financial Instruments
A financial instrument is a contract that gives rise to a financial asset of one entity and a financial liability or equity
instrument of another entity.
i) Impairment of non- financial assets
The carrying amounts of assets are reviewed at each reporting date if there is any indication of impairment based on
internal/external factors. An impairment loss is recognized wherever the carrying amount of an asset (or cash
generating unit) exceeds its recoverable amount. The recoverable amount is the greater of the asset's (or cash generating
unit's) net selling price and value in use. In assessing value in use, the estimated future cash flows are discounted to
their present value using a pre-tax discount rate that reflects current market assessments of the time value of money
and risks specific to the asset (or cash generating unit).
An impairment loss is reversed if there has been a change in the estimates used to determine the recoverable amount.
An impairment loss is reversed only to the extent that the asset's carrying amount does not exceed the carrying amount
that would have been determined net of depreciation or amortisation if no impairment loss had been recognised.
An assessment is made at each reporting date to determine whether there is an indication that previously recognised
impairment losses no longer exist or have decreased. If such indication exists, we estimate the asset's recoverable
amount. A previously recognised impairment loss is reversed only if there has been a change in the assumptions used
to determine the asset's recoverable amount since the last impairment loss was recognised. The reversal is limited so
that the carrying of the asset does not exceed its recoverable amount, nor exceed the carrying amount that would have
been determined, net of depreciation, had no impairment loss been recognised for the asset in prior years. Such reversal
is recognised in the Restated Consolidated Statement of Profit or Loss unless the asset is carried at a revalued amount,
in which case, the reversal is treated as an increase in revaluation.
j) Equity settled stock based compensation
Stock-based compensation represents the cost related to stock-based awards granted to employees. The Holding
Company measures stock-based compensation cost at grant date, based on the estimated fair value of the award and

259
recognizes the cost on a straight line basis over the requisite service period for each separately vesting portion of the
award, as if award was in substance, multiple awards. The Holding Company estimates the fair value of stock options.
The cost is recorded under the head employee benefit expense in the Restated Consolidated Statement of Profit and
Loss with corresponding increase in “employee stock option reserve”.
k) Leases
As a lessee:
We assesse whether a contract is or contains a lease, at inception of a contract. We recognise a right to use asset and a
corresponding lease liability with respect to all lease agreements in which it is the lessee, except for short-term leases
(defined as leases with a lease term of 12 months or less). For these leases, we recognise the lease payments as an
operating expense on a straight-line basis over the term of the lease unless another systematic basis is more
representative of the time pattern in which economic benefits from the leased asset are consumed.
The lease liability is initially measured at the present value of the lease payments that are not paid at the commencement
date, discounted by using the rate implicit in the lease. If this rate cannot be readily determined, we use the incremental
borrowing rate. Lease payments included in the measurement of the lease liability comprise of fixed lease payments
(less any lease incentives), variable lease payments, penalties, etc. The lease liability is presented, as a separate line in
the Restated Consolidated Balance sheet. The lease liability is subsequently measured by increasing the carrying
amount to reflect interest on the lease liability (using the effective interest method) and by reducing the carrying
amount to reflect the lease payments made.
We remeasure the lease liability (and make a corresponding adjustment to the related right-of-use asset) whenever:
a) the lease term has changed or there is a change in the assessment of exercise of a purchase option, in which
case the lease liability is remeasured by discounting the revised lease payments using a revised discount rate.
b) the lease payments change due to changes in an index or rate or a change in expected payment under a
guaranteed residual value, in which case the lease liability is measured by discounting the revised lease
payments using the initial discount rate (unless the lease payments change is due to a change in a floating
interest rate, in which case a revised discount rate is used).
c) a lease contract is modified, and the lease modification is not accounted. for as a separate lease, in which case
the lease liability is remeasured by discounting the revised lease payments using a revised discount rate.
We did not make any such adjustments during the periods presented.
The Right-of-Use assets comprise the initial measurement of the corresponding lease liability, lease payments made
at or before the commencement day and any initial direct costs. They are subsequently measured at cost less
accumulated depreciation and impairment losses.
Whenever we incur an obligation for costs to dismantle and remove a leased asset, restore the site on which it is located
or restore the underlying asset to the condition required by the terms and conditions of the lease, a provision is
recognised and measured under Ind AS 37. The costs are included in the related right-of-use asset, unless those costs
are incurred to produce inventories.
Right to use assets are depreciated over the shorter period of lease term and useful life of underlying assets.
We apply Ind AS 36 Impairment of Assets to determine whether a right-of-use asset is impaired.
Variable rents are not included in the measurement the lease liability and the right-of-use asset. The related payments
are recognised as an expense in the period in which the event or condition that triggers those payments occur and are
included in the line" Other expenses" in the Restated Consolidated Statement of Profit and Loss.
As a lessor:
a) Determining whether an arrangement contains a lease
At inception of an arrangement, it is determined whether the arrangement is or contains a lease. At inception
or on reassessment of the arrangement that contains a lease, the payments and other consideration required
by such an arrangement are separated into those for other elements on the basis of their relative fair values.
b) Assets held under leases

260
Leases in which we do not transfer substantially all the risks and rewards of ownership of an asset are
classified as operating leases. Rental income arising is accounted for on a straight line basis over the lease
term. The lease term is the non-cancellable period together with any further term for which the tenant has the
option to continue the lease, where, at the inception of the lease, we are reasonably certain that the tenant will
exercise that option. Leases are classified as finance leases when substantially all of the risks and rewards of
ownership transfer from us to the lessee. Amounts due from lessees under finance leases are recorded as
receivables at our net investment in the leases.
l) Borrowings
Borrowing costs directly attributable to the acquisition, construction or production of an asset (if any) that necessarily
takes a substantial period of time to get ready for its intended use are capitalized as part of the cost of the asset. All
other borrowing costs are expensed in the period in which they occur.
Borrowing costs consist of interest and other costs that an entity incurs in connection with the borrowing of funds.
m) Earnings per equity share
Basic EPS amounts are computed by dividing the net profit attributable to the equity holders and holders of equity
shares that will be issued upon the conversion of a mandatorily convertible preferential shares of the Holding Company
by the weighted average number of such equity shares outstanding during the year.
Diluted EPS amounts are computed by dividing the net profit attributable to the equity holders, holders of equity shares
that will be issued upon the conversion of a mandatorily convertible preferential shares and the weighted average
number of equity shares that could have been issued upon the conversion of ESOP. Dilutive potential equity shares
are deemed converted as at the beginning of the year, unless issued at a later date. Dilutive potential equity shares are
determined independently for each year presented.
n) Foreign currency transaction and translation
Transactions in foreign currencies are initially recorded by us at their respective functional currency spot rates at the
date of the transaction. Foreign-currency denominated monetary assets and liabilities are translated to the relevant
functional currency at exchange rates in effect at the Restated Consolidated Balance Sheet date. Exchange differences
arising on settlement or translation of monetary items are recognized in the Restated Consolidated Statement of Profit
and Loss. Non-monetary assets and non-monetary liabilities denominated in a foreign currency and measured at
historical cost are translated at the exchange rate prevalent at the date of initial transaction. Non-monetary assets and
non-monetary liabilities denominated in a foreign currency and measured at fair value are translated at the exchange
rate prevalent at the date when the fair value was determined.
Transaction gains or losses realized upon settlement of foreign currency transactions are included in determining net
profit for the year. Revenue, expenses and cash-flow items denominated in foreign currencies are translated into the
relevant functional currencies using the exchange rate in effect on the date of the transaction.
The translation of foreign operations from respective functional currency into INR (the reporting currency) for assets
and liabilities is performed using the exchange rates in effect at the balance sheet date, and for revenue, expenses and
cash flows is performed using an appropriate daily weighted average exchange rate for the respective years. The
exchange differences arising on translation are reported as a component of ‘other comprehensive income (loss). On
disposal of a foreign operation, the component of OCI relating to that particular foreign operation is recognized in the
restated consolidated statement of profit and loss.
RESULTS OF OPERATIONS
The table below sets forth our results of operation derived from our restated financial statements for the Financial Years 2021,
2020 and 2019, expressed in absolute terms and as a percentage of our total income for the periods indicated.
Six month period ended September 30 Financial Year
2021 2020 2021 2020 2019
Amount
(in ₹
million)
Percent
age of
total
income
(%)
Amount
(in ₹
million)
Percent
age of
total
income
(%)
Amount (in
₹ million)
Percentag
e of total
income
(%)
Amount
(in ₹
million)
Percentage
of total
income
(%)
Amount
(in ₹
million)
Percent
age of
total
income
(%)
Revenue
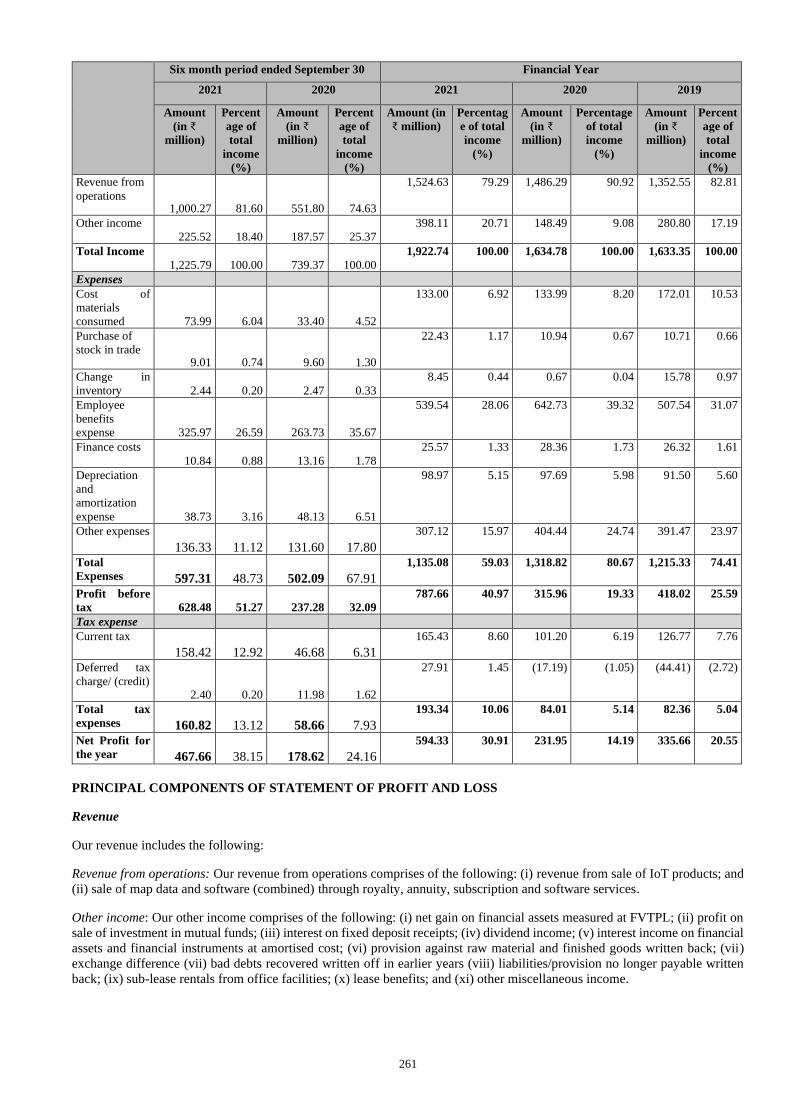
261
Six month period ended September 30 Financial Year
2021 2020 2021 2020 2019
Amount
(in ₹
million)
Percent
age of
total
income
(%)
Amount
(in ₹
million)
Percent
age of
total
income
(%)
Amount (in
₹ million)
Percentag
e of total
income
(%)
Amount
(in ₹
million)
Percentage
of total
income
(%)
Amount
(in ₹
million)
Percent
age of
total
income
(%)
Revenue from
operations
1,000.27
81.60
551.80
74.63
1,524.63 79.29 1,486.29 90.92 1,352.55 82.81
Other income
225.52
18.40
187.57
25.37
398.11 20.71 148.49 9.08 280.80 17.19
Total Income
1,225.79
100.00
739.37
100.00
1,922.74 100.00 1,634.78 100.00 1,633.35 100.00
Expenses
Cost of
materials
consumed
73.99
6.04
33.40
4.52
133.00 6.92 133.99 8.20 172.01 10.53
Purchase of
stock in trade
9.01
0.74
9.60
1.30
22.43 1.17 10.94 0.67 10.71 0.66
Change in
inventory
2.44
0.20
2.47
0.33
8.45 0.44 0.67 0.04 15.78 0.97
Employee
benefits
expense
325.97
26.59
263.73
35.67
539.54 28.06 642.73 39.32 507.54 31.07
Finance costs
10.84
0.88
13.16
1.78
25.57 1.33 28.36 1.73 26.32 1.61
Depreciation
and
amortization
expense
38.73
3.16
48.13
6.51
98.97 5.15 97.69 5.98 91.50 5.60
Other expenses
136.33
11.12
131.60
17.80
307.12 15.97 404.44 24.74 391.47 23.97
Total
Expenses
597.31
48.73
502.09
67.91
1,135.08 59.03 1,318.82 80.67 1,215.33 74.41
Profit before
tax
628.48
51.27
237.28
32.09
787.66 40.97 315.96 19.33 418.02 25.59
Tax expense
Current tax
158.42
12.92
46.68
6.31
165.43 8.60 101.20 6.19 126.77 7.76
Deferred tax
charge/ (credit)
2.40
0.20
11.98
1.62
27.91 1.45 (17.19) (1.05) (44.41) (2.72)
Total tax
expenses
160.82
13.12
58.66
7.93
193.34 10.06 84.01 5.14 82.36 5.04
Net Profit for
the year
467.66
38.15
178.62
24.16
594.33 30.91 231.95 14.19 335.66 20.55
PRINCIPAL COMPONENTS OF STATEMENT OF PROFIT AND LOSS
Revenue
Our revenue includes the following:
Revenue from operations: Our revenue from operations comprises of the following: (i) revenue from sale of IoT products; and
(ii) sale of map data and software (combined) through royalty, annuity, subscription and software services.
Other income: Our other income comprises of the following: (i) net gain on financial assets measured at FVTPL; (ii) profit on
sale of investment in mutual funds; (iii) interest on fixed deposit receipts; (iv) dividend income; (v) interest income on financial
assets and financial instruments at amortised cost; (vi) provision against raw material and finished goods written back; (vii)
exchange difference (vii) bad debts recovered written off in earlier years (viii) liabilities/provision no longer payable written
back; (ix) sub-lease rentals from office facilities; (x) lease benefits; and (xi) other miscellaneous income.

262
Expenses
Our expenses include the following:
Costs of materials consumed: Costs of materials consumed primarily consist of tracking devices purchased, IoT products and
software licenses.
Purchase of stock in trade: Purchase of stock in trade primarily consist of products that we resell without any modification,
such as spare parts of IoT products and navigational devices.
Change in inventory: Change in inventory primarily consists of costs attributable to an increase or decrease in inventory levels
during the relevant financial period in finished goods and stock in trade.
Employee benefits expense: Employee benefits expense includes remuneration to whole time directors and salaries, incentives
and bonuses paid to staff, employee stock option expense, contributions to provident and other employee funds, gratuity
expenses, and staff welfare expenses.
Finance costs: Finance costs include interest on car loan, interest on lease liabilities and bank charges.
Depreciation and amortization expense: Depreciation and amortization expense includes the depreciation of property, plant and
equipment, investment property, right of use assets and purchased software and amortisation of intangible assets including cost
of internally generated map data base.
Other expenses: Other expenses primarily include rental expense, electricity and water, advertisements, commissions on sale,
travelling, technical expenses, legal and professional fees, regulatory fees and stamping, field survey expenses, communication
expenses, repairs and maintenance, provisions and write-off against obsolete raw materials and finished goods, provisions
against doubtful debts and bad debts written-off, provisions for diminution in value of investments, freight outward, provisions
against security deposits, loss against foreign exchange fluctuation, insurance and CSR expenses.
Tax expense: Tax expenses include current tax, which includes and deferred tax. Current tax is the amount of tax payable on
the taxable income for the year as determined in accordance with the applicable tax rates and provisions of the applicable tax
laws. Deferred tax liability or credit is recognized based on the difference between taxable profit and book profit due to the
effect of timing differences. Our deferred tax is measured based on the applicable tax rates and tax laws that have been enacted
or substantively enacted by the relevant balance sheet date.
Six month period ended September 30, 2021 compared to Six month period ended September 30, 2020
Revenue
The table below sets forth details in relation to our income for the six month periods ended September 30, 2021 and September
30, 2020.
Six month period
ended September 30,
2021
Six month period
ended September 30,
2020
Percentage Change
(%)
Amount
(in ` million)
Amount
(in ` million)
Revenue
Revenue from operations 1,000.27 551.80 81.27
Other income 225.52 187.57 20.24
Total income 1,225.79 739.37 65.79
Our revenue from operations increased by ₹ 448.47 million, or 81.27%, from ₹551.80 million in the six month period ended
September 30, 2020 to ₹1000.27 million in the six month period ended September 30, 2021. The increase in our income during
this period was primarily due to the increase in number of customers and sale of our base platform products such as our APIs
and SDKs that are integrated into web and mobile applications of our consumer tech and enterprise digital transformation
business.
Revenue from sale of IoT products
Our revenue from sale of IoT products increased by ₹ 23.97 million, or 53.58%, from ₹44.74 million for the six month period
ended September 30, 2020 to ₹68.71 million for the six month period ended September 30, 2021. This increase was primarily
due to market recovery from COVID in the second quarter of this half year which led to increase in people mobility and hence
more demand for our IoT solutions

263
Revenue from sale of map data and software (combined) through royalty, annuity, subscription and software services
Revenue from these sales increased by ₹424.50 million, or 83.72%, from ₹507.06 million for the six month period ended
September 30, 2020 to ₹931.56 million for the six month period ended September 30, 2021, primarily due to increase in digital
transformation use cases by various corporates.
Other income
Our other income increased by ₹37.95 million, or 20.24%, from ₹187.57 million for the six month period ended September 30,
2020 to ₹225.52 million for the six month period ended September 30, 2021, primarily due to profit on redemption of mutual
funds and interest income on bonds.
Expenses
Our total expenses increased by ₹95.22 million, or 18.96%, from ₹502.09 million for the six month period ended September 30,
2020 to ₹597.31 million for the six month period ended September 30, 2021 as set out below.
Six month period ended
September 30, 2021
Six month period ended
September 30, 2020
Percentage
Change (%)
Amount
(in ₹ million)
Amount
(in ₹ million)
Expenses
Cost of materials consumed 73.99 33.40 121.53
Purchase of stock in trade 9.01 9.60 (6.15)
Change in inventory 2.44 2.47 (1.27)
Employee benefits expense 325.97 263.73 23.60
Finance cost 10.84 13.16 (17.63)
Depreciation and amortisation expense 38.73 48.13 (19.53)
Other expenses 136.33 131.60 3.60
Total expenses 597.31 502.09 18.96
Material related costs
Our material related costs, comprising of costs relating to materials consumed, purchase of stock in trade and changes in
inventory, increased by ₹39.97 million, from ₹45.47 million for the six month period ended September 30, 2020 to ₹85.44 million
for the six month period ended September 30, 2021, primarily on account of increase in sale of IOT products.
Employee benefits expense
Our employee benefits expense increased by ₹62.23 million, or 23.60%, from ₹263.73 million for the six month period ended
September 30, 2020 to ₹325.97 million for the six month period ended September 30, 2021, primarily due to annual increments
in salary and grants of ESOPs made in August 2021.
Finance costs
Our finance costs decreased by ₹2.32 million, or 17.63 %, from ₹13.16 million for the six month period ended September 30,
2020 to ₹10.84 million for the six month period ended September 30, 2021, primarily due to a decrease in our interest expenses
on lease liabilities incurred on the right-of-use assets.
Depreciation and amortization expense
Depreciation and amortization expenses decreased by ₹9.40 million, or 19.53%, from ₹48.13 million for the six month period
ended September 30, 2020 to ₹38.73 million for the six month period ended September 30, 2021, primarily due to decrease in
depreciation on property, plant and equipment and decrease in amortization cost of intangible assets during this period.
Other expenses
Other expenses increased by ₹4.73 million, or 3.59%, from ₹131.60 million for the six month period ended September 30, 2020
to ₹136.33 million for the six month period ended September 30, 2021. During the six month period ended September 30, 2020,
on account of the shift of operations from office to work from home, rent expenses, electricity expenses and water expenses,
travelling expenses, communication expenses, repair and maintenance expenses were lower as compared to six month period
ended September 30, 2021 when COVID restrictions were relatively eased.
CSR expenses increased by ₹2.16 million, from ₹2.69 million for the six month period ended September 30, 2020 to ₹4.85
million for the six month period ended September 30, 2021.

264
Profit before tax
Our profit before tax was ₹237.28 million in the six month period ended September 30, 2020, as compared to a profit before tax
of ₹628.48 million in the six month period ended September 30, 2021, which arose due to increased revenue.
Tax expenses
Our tax expenses increased by ₹102.16 million, or 174.16%, from ₹58.66 million for the six month period ended September 30,
2020 to ₹160.82 million for the six month period ended September 30, 2021, due to increase in profit before tax for the year.
Net profit
As a result of the foregoing, we made profit after tax of ₹178.62 million in the six month period ended September 30, 2021, as
compared to a profit after tax of ₹467.66 million in the six month period ended September 30, 2020.
Financial Year 2021 compared to Financial Year 2020
Revenue
The table below sets forth details in relation to our income for Financial Years 2021 and 2020.
Financial Year 2021 Financial Year 2020 Percentage Change
(%) Amount
(in million)
Amount
(in million)
Revenue
Revenue from operations 1,524.63 1,486.29 2.58
Other income 398.11 148.49 168.10
Total income 1,922.74 1,634.78 17.61
Our revenue from operations increased by ₹38.34 million, or 2.58%, from ₹1,486.29 million in Financial Year 2020 to
₹1,524.63 million in Financial Year 2021. The increase in our income during this period was primarily due to increase in
number of customers and sale of our base platform products such as our APIs and SDKs that are integrated into web and mobile
applications of our consumer tech and enterprise digital transformation business.
Revenue from sale of IoT products
Our revenue from sale of IoT products decreased by ₹77.92 million, or 37.94%, from ₹205.37 million in Financial Year 2020
to ₹127.45 million in Financial Year 2021. This decrease was primarily due to the impact of the COVID-19 pandemic and
related lockdowns. The majority of our IoT business caters to the use-cases around movement or transportation of people and
goods. Due to the lockdowns imposed on account of COVID-19 and consequent slow down in manufacturing and logistics
activities, there was a significantly low demand for our IoT products and solutions during the period.
Revenue from sale of map data and software (combined) through royalty, annuity, subscription and software services
Revenue from these sales increased by ₹116.26 million, or 9.08%, from ₹1,280.92 million for Financial Year 2020 to ₹1,397.18
million for Financial Year 2021, primarily due to an increase in the number of customers and use cases by existing customers.
Other income
Our other income increased by ₹249.62 million, or 168.10%, from ₹148.49 million for Financial Year 2020 to ₹398.11 million
for Financial Year 2021, primarily due to increases in income on investments carried at FVTPL and profit on redemption of
mutual funds.
Expenses
Our total expenses decreased by ₹183.74 million, or 13.93%, from ₹1,318.82 million for Financial Year 2020 to ₹1,135.08
million for Financial Year 2021.
Financial Year 2021 Financial Year 2020 Percentage
Change (%) Amount
(in million)
Amount
(in million)
Expenses
Cost of materials consumed 133.00 133.99 (0.74%)
Purchase of stock in trade 22.43 10.94 105.14%
Change in inventory 8.45 0.67 1,159.45%
Employee benefits expense 539.54 642.73 (16.06%)
Finance cost 25.57 28.35 (9.83%)

265
Financial Year 2021 Financial Year 2020 Percentage
Change (%) Amount
(in million)
Amount
(in million)
Depreciation and amortisation expense 98.97 97.69 1.31%
Other expenses 307.13 404.46 (24.06%)
Total expenses 1,135.08 1,318.82 (13.93%)
Material related costs
Our material related costs, comprising of costs relating to materials consumed, purchase of stock in trade and changes in
inventory, increased by ₹ 18.28 million, from ₹ 145.60 million in Financial Year 2020 to ₹ 163.88 million in Financial Year
2021, primarily on account of overall increase in cost of inputs and materials.
Employee benefits expense
Our employee benefits expense decreased by ₹ 103.19 million, or 16.06%, from ₹ 642.73 million for Financial Year 2020 to ₹
539.54 million for Financial Year 2021, primarily due to a decrease in our non-permanent employees.
Finance costs
Our finance costs decreased by ₹ 2.78 million, or 9.83%, from ₹ 28.35 million for Financial Year 2020 to ₹ 25.57 million for
Financial Year 2021, primarily due to a decrease in our interest expenses on lease liabilities incurred on the right-of-use assets.
Depreciation and amortization expense
Depreciation and amortization expenses increased by ₹ 1.28 million, or 1.31%, from ₹ 97.69 million for Financial Year 2020
to ₹ 98.97 million for Financial Year 2021 primarily due to an increase in the property, plant and equipment purchased. There
was an increase in depreciation on property, plant and equipment and decrease in amortization cost of intangible assets during
this period.
Other expenses
Other expenses decreased by ₹ 97.33 million, or 24.06%, from ₹ 404.46 million for Financial Year 2020 to ₹ 307.13 million
for Financial Year 2021, primarily due to decrease in rent expenses, electricity expenses and water expenses, travelling
expenses, communication expenses, repair and maintenance expenses, on account of the shift of operations from office to work
from home because of COVID-19.
CSR expenses increased by ₹ 8.84 million, from ₹ 0.81 million for Financial Year 2020 to ₹ 9.65 million for Financial Year
2021. Our Company contributed ₹ 2.50 million to PM Cares Fund and spent an amount of ₹ 6.79 million for providing COVID-
19 related services to the citizens through the MOVE application.
Profit before tax
Our profit before tax was ₹ 787.66 million in Financial Year 2021, as compared to a profit before tax of ₹ 315.96 million in
Financial Year 2020, arose due to increased revenue and lower costs as set out above.
Tax expenses
Our tax expenses increased by ₹ 109.33 million, or 130.13%, from ₹ 84.01 million for Financial Year 2020 to ₹ 193.34 million
for Financial Year 2021, due to increase in profit before tax for the year.
Net profit
As a result of the foregoing, we made profit after tax of ₹ 594.33 million in Financial Year 2021, as compared to a profit after
tax of ₹ 231.95 million in Financial Year 2020.
Financial Year 2020 compared to Financial Year 2019
Income
The table below sets forth details in relation to our income for Financial Years 2020 and 2019.
Revenue Financial Year 2020 Financial Year 2019 Percentage Difference
(%) Amount
(in ₹ million)
Amount
(in ₹ million)
Revenue from operations 1,486.29 1,352.55 9.89%
Other income 148.49 280.80 (47.12%)

266
Revenue Financial Year 2020 Financial Year 2019 Percentage Difference
(%) Amount
(in ₹ million)
Amount
(in ₹ million)
Total income 1,634.78 1,633.35 0.09%
Our revenue from operations increased by ₹ 133.74 million, or 9.89%, from ₹ 1,352.55 million in Financial Year 2019 to ₹
1,486.29 million in Financial Year 2020. The increase in our income was primarily due to an increase in base platform products
such as our APIs and SDKs that are integrated into web and mobile applications of our consumer tech and enterprise digital
transformation business.
Revenue from sale of IoT products
Our revenue from sale of IoT products decreased by ₹ 147.88 million, or 41.86%, from ₹ 353.25 million in Financial Year 2019
to ₹ 205.37 million in Financial Year 2020. This decrease was primarily due to upgradation of IoT product lines.
Revenue from sale of map data and software (combined) through royalty, annuity, subscription and software services
Revenue from these sales increased by ₹ 281.62 million, or 28.18%, from ₹ 999.30 million for Financial Year 2019 to ₹ 1,280.92
million for Financial Year 2020, primarily due to primarily due to an increase in the number of customers and use cases by
existing customers.
Other income
Our other income decreased by ₹ 132.31 million, or 47.11%, from ₹ 280.80 million for Financial Year 2019 to ₹ 148.49 million
for Financial Year 2020, primarily due to a decrease in profit on redemption of mutual funds
Expenses
Our total expenses increased by ₹ 103.49 million, or 8.51%, from ₹ 1,215.33 million for Financial Year 2019 to ₹ 1,318.82
million for Financial Year 2020.
Expenses Financial Year 2020 Financial Year 2019 Percentage Difference (%)
Amount
(in ₹ million)
Amount
(in ₹ million)
Cost of materials consumed 133.99 172.01 (22.10)
Purchase of stock in trade 10.94 10.71 2.11
Change in inventory 0.67 15.78 (95.75)
Employee benefits expense 642.73 507.54 26.63
Finance cost 28.35 26.32 7.74
Depreciation and amortisation expense 97.69 91.50 6.76
Other expenses 404.46 391.47 3.32
Total expenses 1,318.82 1,215.33 8.52
Material related costs
Our material related costs, comprising of costs relating to materials consumed, purchase of stock in trade and changes in
inventory, aggregating decreased by ₹ 52.90 million, or 26.65%, from ₹ 198.50 million for Financial Year 2019 to ₹ 145.60
million for Financial Year 2020, primarily due to a decrease in sales of our IoT products.
Employee benefits expense
Our employee benefits expense increased by ₹ 135.19 million, or 26.63%, from ₹ 507.54 million for Financial Year 2019 to ₹
642.73 million for Financial Year 2020, primarily due to annual increments and increase in performance-linked incentives
mainly for our management and sales personnel and increase in our total number of permanent employees.
Finance costs
Our finance costs increased by ₹ 2.03 million, or 7.72%, from ₹ 26.32 million for Financial Year 2019 to ₹ 28.35 million for
Financial Year 2020, primarily due to an increase in lease liabilities incurred on the right-of-use assets.
Depreciation and amortization expense
Depreciation and amortization expenses increased by ₹ 6.19 million, or 6.76%, from ₹ 91.50 million for Financial Year 2019
to ₹ 97.69 million for Financial Year 2020, primarily due to an increase in property, plant and equipment. There was an increase
in depreciation on property, plant and equipment and decrease in amortization cost of intangible assets during this period.

267
Other expenses
Other expenses increased by ₹ 12.99 million, or 3.32%, from ₹ 391.47 million for Financial Year 2019 to ₹ 404.46 million for
Financial Year 2020, primarily due to an increase in advertisement expense, travelling expenses, legal and professional
expenses, communication expenses, provision for doubtful debts and technical expenses, and there was a decrease in the
provision for diminution in the value of investments and field survey expenses.
Profit before tax
Our profit before tax was ₹ 315.96 million in Financial Year 2020, as compared to a profit before tax of ₹ 418.02 million in
Financial Year 2019 due to increase in employee expenses.
Tax expenses
Our tax expenses increased by ₹ 1.65 million, or 2%, from ₹ 82.36 million for Financial Year 2019 to ₹ 84.01 million for
Financial Year 2020.
Net profit
As a result of the foregoing, we made profit after tax of ₹ 231.95 million in Financial Year 2020, as compared to a profit after
tax of ₹ 335.66 million in Financial Year 2019.
LIQUIDITY AND CAPITAL RESOURCES
As of March 31, 2021, we had cash and cash equivalents of ₹ 336.27 million. Cash and cash equivalents primarily consist of
balances with banks in current accounts, deposit accounts with original maturity of three months or less as on the balance sheet
date and cash on hand. Our primary liquidity requirements have been and will continue to be to discharge our day to day
requirements on timely basis. We expect to meet our working capital needs and liquidity requirements for the next 12 months
primarily from the cash flows from our business operations, as determined by the management.
Summary of Cash flows
Set forth below is a table of selected information from our statements of cash flows for the Financial Years 2021, 2020 and
2019 and the six month periods ended September 30, 2021 and September 30, 2020:
(in ₹ million)
For the six
month period
ended
September 30,
2021
For the six
month period
ended
September 30,
2020
Financial Year
2021
Financial Year
2020
Financial Year
2019
Net cash flows generated from
operating activities 179.45 272.77 832.82 267.31 268.13
Net cash flows used in investing
activities 93.49 -205.27 -593.33 -15.78 -191.41
Net cash flows used in financing
activities 2.23 -26.79 -53.89 -187.84 -42.32
Net increase/ (decrease) in cash and
cash equivalents 277.82 36.60 185.6 68.18 34.38
Cash and cash equivalents opening
balance 336.27 150.67 150.67 82.49 48.11
Cash and cash equivalents closing
balance 614.09 187.27 336.27 150.67 82.49
Cash flows from operating activities
Net cash generated from operating activities was ₹ 832.82 million for the financial year 2021. We had a profit before tax for
the year of ₹ 787.66 million from continuing operations. The adjustments were primarily for depreciation and amortisation
expenses of ₹ 98.97 million, profit on redemption of mutual funds of ₹ 127.99 million, fair value gain on investment of ₹ 109.78
million, employee stock option expenses of ₹ 7.45 million, provision for doubtful debts of ₹ 5.73 million, interest income on
bonds of ₹ 64.88 million, interest income on fixed deposits ₹ 25.65 million, income from investment property and sub-lease
property of ₹ 10.27 million and finance costs of ₹ 24.33 million. There were also changes in working capital primarily
comprising a decrease in inventories of ₹ 16.31 million, a decrease in trade receivables of ₹ 23.73 million, a decrease in financial
assets and other assets of ₹ 243.90 million, an increase in financial liabilities of ₹ 136.69 million and a decrease of trade payable
of ₹ 16.01 million. In addition, we paid income tax of ₹ 152.04 million.

268
Net cash generated from operating activities in Financial Year 2021 was due to increased EBITDA, increased deferred revenue
and also due to consideration of a fixed deposit of ₹ 212.04 million which was reflected under other financial assets as on March
31, 2020, being treated as current assets after its removal from non-current assets.
Net cash generated from operating activities was ₹ 267.31 million for the financial year 2020. We had a profit before tax for
the year of ₹ 315.96 million from continuing operations. The adjustments were primarily for depreciation and amortisation
expenses of ₹ 97.69 million, profit on redemption of mutual funds of ₹ 40.65 million, fair value loss on investment of ₹ 63.45
million employee stock option expenses ₹ 31.06 million, provision for doubtful debts ₹11.53 million , interest income on bond
₹48.20 million, interest income on fixed deposits ₹ 25.95 million, income from investment property and sub-lease property of
₹ 12.60 million and finance costs of ₹ 27.33 million. There were also changes in working capital primarily comprising an
increase in inventories of ₹ 0.58 million, an increase in trade receivables of ₹ 83.50 million, an increase in financial assets and
other assets of ₹ 14.00 million, an increase in financial liabilities of ₹ 72.58 million and an increase of trade payable of ₹ 15.76
million. In addition, we paid income tax of ₹ 123.00 million.
Net cash generated from operating activities was ₹ 268.13 million for the financial year 2019. We had a profit before tax for
the year of ₹ 418.02 million from continuing operations The adjustments were primarily for depreciation and amortisation
expenses of ₹ 91.50 million, profit on redemption of mutual funds of ₹ 195.17 million, fair value loss on investment of ₹ 127.84
million, employee stock option expenses of ₹ 32.32 million, Interest income on bond of ₹ 7.33 million, interest income on fixed
deposits of ₹ 24.32 million, income from investment property and sub-lease property of ₹ 6.03 million and finance costs of ₹
25.40 million. There were also changes in working capital primarily comprising a decrease in inventories of ₹ 27.29 million, a
decrease in trade receivables of ₹ 12.46 million, a decrease in financial assets and other assets of ₹ 16.57 million, and decrease
in financial liabilities of ₹ 63.06 million and an increase of trade payable of ₹ 2.67 million. In addition, we paid income tax of
₹ 161.72 million.
Net cash generated from operating activities was ₹179.45 million for the six month period ended September 30, 2021. We had
a profit before tax for the year of ₹628.48 million from continuing operations. The adjustments were primarily for depreciation
and amortisation expenses of ₹38.73 million, profit on redemption of mutual funds of ₹133.42 million, fair value profit on
investment of ₹17.18 million, employee stock option expenses of ₹10.99 million, interest income on bond of ₹49.48 million,
interest income on fixed deposits of ₹12.18 million, income from investment property and sub-lease property of ₹4.32 million
and finance costs of ₹10.48 million. There were also changes in working capital primarily comprising a decrease in inventories
of ₹2.48 million, a decrease in trade receivables of ₹27.85 million, an increase in financial assets and other assets of ₹125.69
million, and decrease in financial liabilities of ₹54.35 million and a decrease of trade payable of ₹18.39 million. In addition, we
paid income tax of ₹118.71 million.
Net cash generated from operating activities was ₹272.77 million for the six month period ended September 30, 2020. We had
a profit before tax for the year of ₹237.28 million from continuing operations. The adjustments were primarily for depreciation
and amortisation expenses of ₹48.13 million, profit on redemption of mutual funds of ₹62.75 million, fair value profit on
investment of ₹47.28 million, employee stock option expenses of ₹3.72 million, interest income on bond of ₹25.77 million,
interest income on fixed deposits of ₹12.29 million, income from investment property and sub-lease property of ₹5.59 million
and finance costs of ₹12.43 million. There were also changes in working capital primarily comprising a decrease in inventories
of ₹6.98 million, a decrease in trade receivables of ₹64.77 million, a decrease in financial assets and other assets of ₹177.55
million, and decrease in financial liabilities of ₹31.20 million and an increase of trade payable of ₹44.74 million. In addition,
we paid income tax of ₹42.49 million.
Cash flows from investing activities
Net cash used in investing activities was ₹ 593.33 million for the Financial Year 2021, primarily comprising of proceeds from
sale of investments of ₹ 2,780.92 million, purchase of investments of ₹ 3,246.15 million, income from investment property and
sub-lease property of ₹ 10.27 million, interest received on bank deposits and bonds of ₹ 46.91 million, purchase of property,
plant and equipment, ₹ 23.61 million and investment in fixed deposit ₹ 164.49 million.
Net cash used in investing activities in Financial Year 2021 was also due to consideration of a fixed deposit of ₹ 212.04 million
which was reflected under other financial assets as on March 31, 2020 being treated as current assets after its removal from
non-current assets during the year.
Net cash used in investing activities was ₹ 15.78 million for the Financial Year 2020, primarily comprising of proceeds from
sale of investments of ₹ 1842.66 million, purchase of investments of ₹ 1861.35 million, interest received on bank deposits and
bonds of ₹ 77.92 million, income from investment property and sub-lease property of ₹ 12.60 million, purchase of property,
plant and equipment, ₹ 55.01 million and investment in fixed deposit of ₹ 39.81 million.
Net cash used in investing activities was ₹ 191.41 million for the Financial Year 2019, primarily comprising of proceeds from
sale of investments of ₹ 2870.57 million, purchase of investments of ₹ 2981.59 million, interest received on bank deposits and
bonds of ₹ 4.24 million, income from investment property and sub-lease property ₹ 6.03 million, dividend received of ₹ 26.24
million, purchase of property, plant and equipment, ₹ 33.30 million and investment in fixed deposit ₹ 83.60 million.

269
Net cash used in investing activities was ₹93.49 million for the six month period ended September 30, 2021, primarily
comprising of proceeds from sale of investments of ₹2039.51 million, purchase of investments of ₹2163.69 million, income
from investment property and sub-lease property of ₹4.32 million, interest received on bank deposits and bonds of ₹38.24
million, purchase of property, plant and equipment of ₹13.55 million and investment in fixed deposit of ₹188.41 million.
Net cash used in investing activities was ₹205.27 million for the six month period ended September 30, 2020, primarily
comprising of proceeds from sale of investments of ₹1334.38 million, purchase of investments of ₹1490.96 million, income
from investment property and sub-lease property of ₹5.59 million, interest received on bank deposits and bonds of ₹25.29
million, purchase of property, plant and equipment of ₹ 11.84 million and investment in fixed deposit of ₹69.12 million.
Cash flows from financing activities
Net cash used from financing activities was ₹ 53.89 million for the financial year 2021, primarily comprising of repayment of
lease liabilities of ₹ 50.27 million and repayment of vehicle loan of ₹ 2.94 million.
Net cash used from financing activities was ₹ 187.84 million for the financial year 2020, primarily comprising of proceeding
from borrowing was ₹ 9.60 million, dividend paid was ₹ 110.43 million, corporate dividend tax paid was ₹ 22.70 million,
repayment of lease liabilities of ₹ 62.64 million and repayment of vehicle loan of ₹ 0.80 million.
Net cash used from financing activities was ₹ 42.32 million for the financial year 2019, primarily comprising of repayment of
lease liabilities of ₹ 40.48 million and repayment of vehicle loan of ₹ 0.04 million.
Net cash used from financing activities was ₹2.23 million for the six month period ended September 30, 2021, primarily
comprising of receipt of issue of shares due to exercise of employee stock options of ₹37.11 million and payment of lease
liabilities of ₹28.79 million and repayment of loan of ₹5.90 million.
Net cash used from financing activities was ₹26.79 million for the six month period ended September 30, 2020, primarily
comprising payment of lease liabilities of ₹25.03 million and repayment of loan of ₹1.42 million.
Trade receivables, cash and cash equivalents and other bank balances
Our trade receivables decreased from ₹ 311.29 million as at March 31, 2020 to ₹ 282.80 million as at March 31, 2021, owing
to better control on trade receivables through continuous review of our receivables and timely action in the event of inordinate
delay in collections. While there was increase in the turnover of our Company, owing to such control, our trade receivables saw
a limited increase from ₹254.10 million as at September 30, 2020 to ₹258.14 million as at September 30, 2021. Our cash and
cash equivalents of ₹ 150.67 million and other bank balances ₹ 171.11 million, aggregating to ₹ 321.78 million as at March 31,
2020 increased to cash and cash equivalents of ₹ 336.27 million and other bank balances ₹ 335.60 million, aggregating to ₹
671.87 million as at March 31, 2021. Our cash and cash equivalents and other bank balances increased from ₹427.50 million
as at September 30, 2020 to ₹761.27 million as at September 30, 2021.
Trade payables
Our trade payables decreased from ₹15.78 million as at September 30, 2020 to ₹26.12 million as at September 30, 2021, on
account of better management of payables by ensuring payments to small and medium creditors within 30 days and to larger
creditors within agreed upon credit periods.
CONTINGENT LIABILITIES, CAPITAL COMMITMENTS AND CONTRACTUAL OBLIGATIONS
Capital Commitments and Contractual Obligations
The table below summarizes our contractual obligations as of September 30, 2021:
(in ₹ million) Particulars Payments due within
one year
Payments due
between one and five
years
Payments due after
more than five years
Total
Trade payables 26.12 Nil Nil 26.12
Borrowings Nil Nil Nil Nil
Other financial liabilities 73.38 Nil Nil 73.38
Total 99.50 Nil Nil 99.50
Contingent Liabilities
Details of bank guarantees provided by our Company in the last three Financial Years and the six month periods ended
September 30, 2021 and September 30, 2020 are as follows:

270
(in ₹ million) Particulars Six month
period ended
September 30,
2021
Six month
period ended
September 30,
2020
Financial Year
2021
Financial Year
2020
Financial Year
2019
Bank guarantees 25.62 41.51 35.67 30.92 26.99
These are given in the normal course of our Company’s operations and are not expected to result in any loss to our Company,
on the basis of our Company fulfilling its business obligations. For further details, see “Financial Information” on page 193.
Capital Expenditure
Our capital expenditure in the last three Financial Years, comprising of primarily vehicle tracking devices, internally generated
map database, computer server and networks and end user devices and research and development equipment, was ₹ 23.64
million, ₹ 54.93 million, and ₹ 33.69 million for Financial Years 2021, 2020 and 2019, respectively.
Off-Balance Sheet Arrangements
We do not have any material off-balance sheet arrangements, derivative instruments, swap transactions or relationships with
unconsolidated entities or financial partnerships established or contemplated for the purpose of facilitating off-balance sheet
transactions. Except as disclosed in “Outstanding Litigation and Material Developments” on page 273, we are currently not
involved in any material legal proceedings.
Related Party Transactions
We have engaged in the past, and may engage in the future, in transactions with related parties. For details of our related party
transactions, see “Financial Information – Annexure VI - Notes to Restated Consolidated Financial Information – 31. Related
Party Disclosures” on page 233.
QUANTITATIVE AND QUALITATIVE DISCLOSURE ABOUT MARKET RISK
Credit risk
Credit risk is the risk of financial loss to our Company if a customer or counterparty to a financial instrument fails to meet its
contractual obligations, and arises principally from our Company’s trade and other receivables and cash and cash equivalents.
The maximum exposure to credit risk in case of financial instruments covered below is restricted to their respective carrying
amount.
(i) Trade receivables and other receivables
Our Company’s exposure to credit risk is influenced mainly by the individual characteristics of each customer. Credit
risk is managed through credit approvals, establishing credit limits and continuously monitoring the creditworthiness
of customers to which our Company grants credit terms in the normal course of business. Our Company establishes
an allowance for doubtful debts and impairment that represents its estimate of incurred losses in respect of trade and
other receivables and investments. Our Company does not have any significant concentration of credit risk. As on
March 31, 2021, our Company had one customer which accounted for 10% or more of the total trade receivables as at
the respective reporting date, which was subsequently collected. Similarly, our Company had two customers as on
March 31, 2020 and one customer as on March 31, 2019, respectively, which accounted for 10% or more of the total
trade receivables at respective reporting date, which was subsequently collected. Our Company has computed the
expected credit loss allowance for trade receivables based on a provision matrix validated by auditors.
Trade receivables forms a significant part of the financial assets carried at amortised cost, which is valued considering
provision for allowance using expected credit loss method. Accounts receivables and unbilled receivables have been
valued after making reserve for allowances based on factors like ageing, likelihood of increased credit risk and
expected realizability considering impact of COVID – 19 on customers.
(ii) Cash and cash equivalents and other bank balances
The cash and cash equivalents and other bank balances are basis the credit ratings of banks. Our Company monitors
changes in credit risk by tracking published external data.
(iii) Investments
Our Company limits its exposure to credit risk by generally investing in liquid securities and only with counterparties
that have a good credit rating. Our Company does not expect any losses from non-performance by these counter-

271
parties, and does not have any significant concentration of exposures to specific industry sectors or specific country
risks.
(iv) Security deposits classified under loans and current and non-current financial assets
Our Company is exposed to risks against security deposit given to lessors, deposit against performance guarantee and
tender deposits.
Liquidity risk
Our Company’s approach to managing liquidity is to ensure, as far as possible, that it will have sufficient liquidity to meet its
liabilities when they are due, under both normal and stressed conditions.
Market risk
Market risk is the risk that changes in market prices, such as foreign exchange rates, interest rates and equity prices, will affect
our Company’s income or the value of its holdings of financial instruments. Our Company is exposed to market risk primarily
related to foreign exchange rate risk and interest rate risk. The objective of market risk management is to avoid excessive
exposure in foreign currency revenues and costs.
(i) Foreign currency risk
Currency risk is the risk that the fair value or future cash flows of a financial instrument will fluctuate because of
changes in foreign exchange rates. Our Company has foreign currency trade payables and receivables and is therefore
exposed to foreign exchange risk. As on the date of this Red Herring Prospectus, our Company does not undertake
hedging of our net foreign currency exposure or have a hedging policy with respect to such risks.
(ii) Interest rate risk
Interest rate risk is the risk that the fair value or future cash flows of a financial instrument will fluctuate because of
changes in market interest rates. The interest rate profile of our Company’s interest bearing financial instruments as
reported by the management of our Company is as follows:
(in ₹ million) Six month
period ended
September 30,
2021
Six month
period ended
September 30,
2020
Financial Year
2021
Financial
Year 2020
Financial
Year 2019
A Investment in bonds
1,839.66 885.27
1,572.90
773.90
624.65
B Investment in fixed deposit
receipts 422.64 383.61
388.43
383.66
375.99
For further details, see “Financial Information – Annexure VI - Notes to Restated Consolidated Financial Information
– 30. Financial instruments – Financial risk management” on page 228 and “Financial Indebtedness” on page 245,
respectively.
OTHER QUALITATIVE FACTORS
Significant economic changes that materially affect or are likely to affect income from continuing operations
Our business has been subject, and we expect it to continue to be subject, to significant economic changes that materially affect
or are likely to affect income from continuing operations identified above in “ - Significant Factors Affecting our Results of
Operations” and the uncertainties described in the section “Risk Factors” on page 249 and 30, respectively.
Unusual or infrequent events or transactions
Except as described in this Red Herring Prospectus including with respect to the impact of COVID-19, there have been no other
events or transactions to the best of our knowledge which may be described as "unusual" or "infrequent".
Future relationship between cost and income
Other than as described in the sections “Risk Factors”, “Our Business” and “Management’s Discussion and Analysis of
Financial Condition and Results of Operations” on pages 30, 132 and 247 respectively, to our knowledge there are no known
factors that may adversely affect our business prospects, results of operations and financial condition.

272
Publicly announced new business segments or applications/ material increases in revenue due to increased disbursements
and introduction of new apps
There are no new business segments or apps that have or are expected to have a material impact on our business prospects,
results of operations or financial condition.
Dependence on a few customers and suppliers
We are not dependent on any specific suppliers. See, “– Significant Factors Affecting our Results of Operations - Customer
relationships and expansion of our customer base” and “Risk Factors - We depend on a limited number of customers for a
significant portion of our revenues. The loss of our key customers or significant reduction in sales of, or demand for our
products and services from our significant customers may adversely affect our business, results of operations and financial
condition” on pages 251 and 34, respectively.
Total turnover of each major industry segment
See “- Significant Factors Affecting our Results of Operations” and “- Results of Operations” above, beginning on pages 249
and 260, respectively.
Future relationship between expenses and income
Except as described in the sections titled "Risk Factors" and "Our Business" beginning on pages 30 and 132, respectively, and
this section, to the best of our knowledge there are no known factors that will have a material adverse impact on our operations
and finances.
Known trends or uncertainties
Except for the trends identified above in “ - Significant Factors Affecting our Results of Operations” on page 249, and the
uncertainties described in the section "Risk Factors" beginning on page 30, this section and elsewhere in this Red Herring
Prospectus, to the best of our knowledge there are no known trends or uncertainties that have or had or expected to have any
material adverse impact on our revenue or income from continuing operations.
New product or business segment
We introduce new products from time to time based on the requirements of our customers and end-users. Other than as described
in the section “Our Business” beginning on page 132, there are no new products or business segments that have or are expected
to have a significant impact on our business prospects, results of operations or financial condition.
Inflation
In recent years, although India has experienced fluctuation in inflation rates, inflation has not had material impact on our
business and results of operations save in respect of its effects on interest rates.
Seasonality of business
Our business is not seasonal in nature.
Competitive Conditions
For further details on our industry and competition, please refer to the discussions of our competition in the sections titled “Risk
Factors”, “Industry Overview” and “Our Business” on pages 30, 124 and 132, respectively.
SUMMARY OF RESERVATIONS, QUALIFICATIONS AND ADVERSE REMARKS OF AUDITORS
The Restated Consolidated Financial Information do not contain any reservations, qualifications or adverse remarks by the
Statutory Auditors.
SIGNIFICANT DEVELOPMENTS AFTER SEPTEMBER 30, 2021
Except as discussed above and stated in “Our Business”, “Risk Factors”, “Capital Structure” and “Restated Consolidated
Financial Information-Note 41-Events after the Reporting Date” on pages 132, 30, 70 and 238, respectively, in the opinion of
our Board, no circumstances have arisen since the date of the last financial statements as disclosed in this Red Herring
Prospectus which materially and adversely affect or are likely to affect our trading and profitability, the value of our assets or
our ability to pay our liabilities within the next 12 months.

273
SECTION VI: LEGAL AND OTHER INFORMATION
OUTSTANDING LITIGATION AND MATERIAL DEVELOPMENTS
Except as stated in this section, there are no outstanding (i) criminal proceedings, (ii) actions taken by statutory or regulatory
authorities, (iii) claims related to direct and indirect taxes, in a consolidated manner or (iv) material civil litigation (including
tax proceedings), in each case involving our Company, Subsidiaries, Promoters or our Directors (collectively, the “Relevant
Parties”). Further, there are no disciplinary actions including penalty imposed by SEBI or stock exchanges against the
Promoters in the last five Financial Years including outstanding action.
In relation to (iv) above, our Board in its meeting held on August 26, 2021 has considered and adopted a policy of materiality
for identification of material civil litigation involving the Relevant Parties (“Materiality Policy”). In terms of the Materiality
Policy, any single outstanding civil litigation involving the Relevant Parties which exceed the amount of ₹10.00 million have
been considered material.
Accordingly, disclosures of the following types of civil litigation involving the Relevant Parties have been considered material
and accordingly disclosed, as applicable, (a) where the aggregate amount involved in such individual civil litigation (including
tax proceedings) exceeds the relevant monetary threshold disclosed above, individually; (b) where the decision in one litigation
is likely to affect the decision in similar litigations, even though the amount involved in an individual litigation may not exceed
₹10.00 million; (c) which may not meet the monetary threshold, but where an adverse outcome would materially and adversely
affect the business, operations or financial position or reputation of the Company.
There are no outstanding legal proceedings involving Group Companies, the outcome of which could have a material impact
on the Company or the Offer.
Except as stated in this section, there are no outstanding material dues to creditors of our Company. For this purpose, our
Board has considered and adopted a policy of materiality for identification of material outstanding dues to creditors. In terms
of this materiality policy, outstanding dues to any creditor of our Company having monetary value exceeding ₹2.61 million,
which is 10% of the total trade payables of our Company as on September 30, 2021, as per the Restated Consolidated Financial
Information of our Company included in this Red Herring Prospectus, shall be considered as ‘material’. Accordingly, as on
September 30, 2021, any outstanding dues exceeding ₹2.61 million have been considered as material outstanding dues for the
purpose of disclosure in this section. Further, for outstanding dues to any party which is a micro, small or medium enterprise
(“MSME”), the disclosure will be based on information available with the Company regarding status of the creditor as defined
under Section 2 of the Micro, Small and Medium Enterprises Act, 2006, as amended, as has been relied upon by the Statutory
Auditors.
It is clarified that for the purposes of the above, pre-litigation notices received by the Relevant Parties from third parties
(excluding those notices issued by statutory/regulatory/tax authorities) shall, unless otherwise decided by our Board, not be
considered as material until such time that the Relevant Parties, as applicable, is impleaded as defendant in litigation
proceedings before any judicial forum.
I. Litigation involving our Company
Litigation by our Company
Criminal Proceedings
Our Company along with one of our Promoters, Rashmi Verma (“Petitioners”), filed a criminal writ petition in
October 2020 under Article 226 of the Constitution of India read with Section 482 of the Code of Criminal Procedure
(the “Petition”) before the Delhi High Court against the (i) Union of India through the Ministry of Defence through
the Defence Secretary (“Respondent No. 1”), (ii) Survey of India through the Surveyor General of India
(“Respondent No. 2”), (iii) Additional Directorate, General Military Survey, Integrated Headquarters of Ministry of
Defence (Army) (“Respondent No. 3”), and (iv) Commissioner of Police, New Delhi (“Respondent No. 4” and
collectively, the “Respondents”), praying for a writ of mandamus or any other writ or order for quashing the alleged
illegal directions (“Directions”) issued by the Respondent No.1 on several occasions in 2018, 2019, and 2020 to take
down our Company’s website and seize the server hosting such website and our Company’s data. The Petitioners have
alleged that since there was no regulatory framework governing digital mapping including the making and publishing
of digital maps at the time when the Directions were issued by the Respondents, such Directions had no statutory
backing and were therefore violative of the Petitioners’ fundamental rights under Part III of the Constitution of India
including Article 19(1)(g). The Petitioners have further alleged that the Respondents failed to state the provisions of
law which were being violated by the Petitioners, if any, before issuing the Directions and that the Directions were
illegally issued without granting a hearing to the Petitioners and thereby violating principles of natural justice. It was
also alleged that despite fully co-operating with all the Respondents, the Respondent No. 1 had issued directions to the
Respondent No. 4 to take down our Company’s website and seize the server hosting such website as well as the data
of our Company. Accordingly, the Petitioners filed the Petition seeking a writ of mandamus or any other writ or order

274
directing, among others, that (i) the Directions be declared illegal and should be set aside; and (ii) restraining the
Respondent No.4 from taking any further action against the Petitioners in furtherance of the Directions issued by
Respondent No. 1. Pursuant to an order dated October 23, 2020, the Delhi High Court directed the Respondents to file
their respective status reports. However, only Respondent No. 4 filed its status report on November 7, 2020 through
which it was clarified that the police personnel (on behalf of the Respondent No. 4) were acting only at the behest of
the Respondent No. 1 whereby the Respondent no. 4 was directed to take down the website of our Company and seize
the server hosting such website and data of our Company. It was further stated in the said status report of the
Respondent No. 4 that since the direction was received by Respondent No. 1, it was kept in the category of
urgent/important matters and regular follow ups were conducted by the Respondent No. 4 on our Company.
Subsequently, pursuant to orders dated November 9, 2020 and January 15, 2021 passed by the Delhi High Court, the
remaining Respondents were allowed an extension of time to file their status reports at their request. As on the date of
this Red Herring Prospectus, the status report has not been filed by the remaining Respondents.
While subsequently the Geospatial Guidelines have been issued in February 2021 in supersession of anything to the
contrary on the subject issued from time to time by the DST, Ministry of Defence, and/or any other department of the
Government of India, allowing Indian entities to among others, generate, distribute, publish, and/or create geospatial
data, including maps subject to regulations on attributes in the negative lists (as stated in the Geospatial Guidelines),
without the requirement of obtaining any approvals from the Government of India or any other department of the
Government of India, the Petition is currently pending before the Delhi High Court.
Complaints received during the Offer
Our Company received a legal notice dated September 14, 2021 (the “Legal Notice”) from a former-employee of our
Company, Konark Singhal (the “Complainant”), alleging that he has a right to exercise his vested options and
accordingly, subscribe to 9,675 Equity Shares under the ESOP 2008. Our Company responded to the Legal Notice
vide a letter dated October 1, 2021 (the “Response”) denying all claims and allegation made therein, and stated among
other things that, the Complainant had tendered his resignation on September 1, 2011 after which he had ceased to be
an “eligible employee” of the Company, in terms of the ESOP 2008, and accordingly, the erstwhile ESOP committee
of the Company in its meeting held on October 28, 2011 had concluded that all options granted to the Complainant,
shall stand surrendered on account of his resignation / willingness to leave the Company. Subsequently, the Company
received another letter dated October 5, 2021 from the Complainant (“Rejoinder”) on the same matter. The Company
has responded to the Rejoinder through a letter dated October 20, 2021 (“Second Response”). With respect to the
same, a complaint has also been made by the Complainant to SEBI on October 20, 2021, the Company has responded
to the same through its letter dated November 17, 2021. Further, the same was informed to SEBI on November 1,
2021. In furtherance to the above, the Complainant has filed another complaint with SEBI vide a letter dated November
22, 2021. The Company has responded to the same vide letter dated November 30, 2021. No further communications
have been received by us from SEBI.
II. Litigation involving our Promoters
Rashmi Verma
Litigation by our Promoters
Criminal Proceedings
Rashmi Verma, one of our Promoters, along with our Company, filed a criminal writ petition in October 2020 under
Article 226 of the Constitution of India read with Section 482 of the Code of Criminal Procedure before the Delhi
High Court. For details, see “- Litigation involving our Company – Litigation by our Company – Criminal Proceedings
by our Company” on page 273.
Outstanding dues to creditors
Our Board, in its meeting held on August 26, 2021 has considered and adopted a policy of materiality for identification
of material outstanding dues to creditors. In terms of the materiality policy, creditors of our Company to whom an
amount exceeding 10% of our total trade payables as on September 30, 2021 was outstanding, were considered
‘material’ creditors. As per the Restated Consolidated Financial Information, our total trade payables as on September
30, 2021, was ₹26.12 million and accordingly, creditors to whom outstanding dues exceed ₹2.61 million have been
considered as material creditors for the purposes of disclosure in this Red Herring Prospectus.
Based on this criteria, details of outstanding dues owed as on September 30, 2021 by our Company are set out below:
Type of Creditors Number of Creditors Amount
(in ₹ million)
Micro, small and medium enterprises 5 4.83

275
Type of Creditors Number of Creditors Amount
(in ₹ million)
Material creditors 1 5.07
Other creditors 89 16.22
Total 95 26.12
The details pertaining to outstanding dues to the material creditors along with names and amounts involved for each
such material creditor are available on the website of our Company at
https://www.mapmyindia.com/investors/drhp/creditors.
Material Developments
Other than as stated in “Management’s Discussion and Analysis of Financial Condition and Results of Operations”
on page 247, there have not arisen, since the date of the last financial statements disclosed in this Red Herring
Prospectus, any circumstances which materially and adversely affect, or are likely to affect, our business or results of
operations or, our profitability taken as a whole or the value of our consolidated assets or our ability to pay our
liabilities within the next 12 months.

276
GOVERNMENT AND OTHER APPROVALS
We have set out below a list of material approvals, consents, licences and permissions from various governmental and
regulatory authorities obtained by our Company which are considered material and necessary for the purpose of undertaking
our business activities and operations (“Material Approvals”). In view of the approvals listed below, our Company can
undertake this Offer and its business activities, as applicable. In addition, certain of our Material Approvals may have lapsed
or expired or may lapse in their normal course and our Company has either already made applications to the appropriate
authorities for renewal of such Material Approvals or is in the process of making such renewal applications in accordance with
applicable requirements and procedures. Unless otherwise stated, Material Approvals as set out below, are valid as on date of
this Red Herring Prospectus.
For further details in connection with the regulatory and legal framework within which we operate, see “Key Regulations and
Policies in India” beginning on page 155.
I. APPROVALS IN RELATION TO THE OFFER
For details regarding the approvals and authorisations obtained by our Company in relation to the Offer, see “Other
Regulatory and Statutory Disclosures - Authority for the Offer” on page 278.
II. INCORPORATION DETAILS OF OUR COMPANY
For details in relation to incorporation of our Company, see “History and Certain Corporate Matters” on page 160.
III. APPROVALS IN RELATION TO OUR BUSINESS OPERATIONS
For information on our business operations, see “Our Business” on page 132 to 154.
An indicative list of the Material Approvals required by us to undertake our businesses are set out below.
1. Approvals in relation to our business
(a) Udyam registration certificate bearing no. UDYAM-DL-08-0000011 dated July 3, 2020, issued by
the Ministry of Micro, Small and Medium Enterprises certifying our Company as a medium
enterprise in manufacturing.
(b) Certificate of renewal of registration dated October 11, 2019 issued by the Joint Director, Software
Technology Parks of India under the Software Technology Parks of India Scheme.
2. Registrations under employment laws
The registrations and approvals obtained by our Company under applicable labour laws, include the
following:
(a) Provident fund code intimation letter dated December 19, 2014 issued by the Employees’ Provident
Fund Organisation, India evidencing registration under the Employees’ Provident Funds and
Miscellaneous Provisions Act, 1952.
(b) Certificate of registration dated May 18, 2010 issued by Employees State Insurance Corporation,
India under the Employees State Insurance Act, 1948.
3. Foreign Trade related approvals
Certificate of Importer Exporter Code issued by the Director General of Foreign Trade, New Delhi to our
Company.
4. Tax related approvals
(a) GST obtained by our Company for the states where applicable.
(b) PAN bearing #AAACC5585B issued by the Income Tax Department under the IT Act.
(c) TAN bearing #DELC06331D issued by the Income Tax Department under the IT Act.
5. Intellectual Property
As on the date of this Red Herring Prospectus, we have 15 trademark registrations under classes 9, 16, 38 and
42 in India. One of our Promoters, Rakesh Kumar Verma (also our Managing Director and Chairman), is the

277
owner of the registered literary work copyright for the CE Info Spatial Database, which comprises map
database of India.
For further details of our intellectual property, see “Our Business – Intellectual Property” on page 152.
IV. LICENSES / APPROVALS WHICH HAVE EXPIRED AND FOR WHICH RENEWAL APPLICATIONS
HAVE BEEN MADE
Nil
V. LICENSES / APPROVALS WHICH ARE REQUIRED BUT NOT YET APPLIED FOR
Nil
VI. LICENSES / APPROVALS EXPIRED FOR WHICH NO APPLICATION HAS BEEN MADE
Nil
VII. LICENSES / APPROVALS FOR WHICH APPLICATION HAS BEEN MADE AND HAS BEEN REJECTED
Nil

278
OTHER REGULATORY AND STATUTORY DISCLOSURES
Authority for the Offer
Our Board has approved the Offer pursuant to the resolution passed at its meeting held on July 27, 2021. Further, our Board
has taken on record the consent of the Selling Shareholders to participate in the Offer for Sale pursuant to a resolution passed
at its meeting held on August 26, 2021 and further the IPO Committee at its meeting held on November 25, 2021 has taken on
record the revised consent letters from the Selling Shareholders.
Our Board, on December 2, 2021, has approved and adopted this Red Herring Prospectus for filing with the RoC, and thereafter
with SEBI and the Stock Exchanges.
The Selling Shareholders have, severally and not jointly, specifically confirmed and authorised the transfer and Allotment of
their respective portion of Offered Shares pursuant to the Offer for Sale, as set out below:
S.
No.
Name of the Selling
Shareholder
Maximum number of Offered
Shares
Date of Selling
Shareholder’s consent letter
Date of corporate
authorisation
Individual Selling Shareholder
1. Rashmi Verma Up to 4,251,044 Equity Shares November 25, 2021 -
Investor Selling Shareholders
2. Qualcomm Up to 2,701,407 Equity Shares November 25, 2021 March 11, 2016
3. Zenrin Up to 1,369,961 Equity Shares November 25, 2021 July 29, 2021 and October 7,
2021
Other Selling Shareholders
Persons listed in Annexure A Up to 1,741,533 Equity Shares As mentioned in Annexure
A
As mentioned in Annexure
A
Our Company has received in-principle approvals from BSE and NSE for the listing of the Equity Shares pursuant to letters
dated September 20, 2021 and October 14, 2021, respectively.
Prohibition by SEBI or other governmental authorities
Our Company, Subsidiaries, Promoters, members of the Promoter Groups, Directors and persons in control of our Company,
are not prohibited from accessing the capital market or debarred from buying, selling or dealing in securities under any order
or direction passed by SEBI or any securities market regulator in any other jurisdiction or any other authority/court.
Each Selling Shareholder, severally and not jointly, specifically confirms that it is not prohibited from accessing the capital
markets or debarred from buying, selling or dealing in securities under any order or direction passed by the SEBI or any
securities market regulator in any other jurisdiction or any authority or court.
Our Directors and Promoters are not directors or promoters of any other company which is debarred from accessing the capital
markets by SEBI.
Our Company, Promoters and Directors have not been declared as Wilful Defaulters by any bank or financial institution or
consortium thereof in accordance with the guidelines on Wilful Defaulters issued by the RBI.
Our Promoters or Directors have not been declared as Fugitive Economic Offenders.
Our Company, Promoters and Directors have not been declared as ‘Fraudulent Borrowers’ by the lending banks or financial
institution or consortium, in terms of RBI master circular dated July 1, 2016.
Directors associated with the securities market
None of our Directors, are associated with the securities market in any manner including securities market related business.
No action has been initiated by SEBI against the Directors of our Company in the five years preceding the date of this Red
Herring Prospectus.
Compliance with the Companies (Significant Beneficial Owners) Rules, 2018
Our Company, Promoters, and members of the Promoter Group are in compliance with the Companies (Significant Beneficial
Owners) Rules, 2018, as amended, to the extent applicable to each of them as on the date of this Red Herring Prospectus.
Each of the Selling Shareholders, severally and not jointly, has confirmed that it is in compliance with the Companies
(Significant Beneficial Owners) Rules, 2018, as amended, to the extent applicable to it, in relation to the Company, as on the
date of this Red Herring Prospectus.

279
Eligibility for the Offer
Our Company confirms that it is not ineligible to make the Offer in terms of the SEBI ICDR Regulations, to the extent
applicable.
Other than the options granted pursuant to the ESOP 2008, there are no outstanding warrants, options or rights to convert
debentures, loans or other instruments convertible into, or which would entitle any person any option to receive Equity Shares,
as on the date of this Red Herring Prospectus. For further information, see “Capital Structure –ESOP 2008” beginning on page
83.
The Individual Selling Shareholder confirms that it has held its portion of Offered Shares for a period of at least one year prior
to the date of the Draft Red Herring Prospectus and that it is in compliance with Regulation 8 of the SEBI ICDR Regulations.
Further, each of Qualcomm and Zenrin, severally and not jointly, specifically confirms that its respective Offered Shares are
eligible to be offered for sale in the Offer in terms of the SEBI ICDR Regulations.
Further, each of the Other Selling Shareholder, severally and not jointly, specifically confirms that its respective Offered Shares
are eligible to be offered for sale in the Offer in terms of the SEBI ICDR Regulations.
Our Company is eligible for the Offer in accordance with the Regulation 6(1) of the SEBI ICDR Regulations, and is in
compliance with the conditions specified therein in the following manner:
• Our Company has had net tangible assets of at least ₹30 million, calculated on a restated basis, in each of the preceding
three full years (of 12 months each), of which not more than 50% are held in monetary assets. As the Offer is being
made entirely through an Offer for Sale, the limit of not more than 50% of the net tangible assets being monetary
assets, is not applicable;
• Our Company has an average operating profit of at least ₹150 million, calculated on a restated basis, during the
preceding three years (of 12 months each), with operating profit in each of these preceding three years;
• Our Company has a net worth of at least ₹10 million in each of the preceding three full years (of 12 months each),
calculated on a restated basis; and
• Our Company has not changed its name within the last one year, except for conversion from private limited company
to public limited company.
Our Company’s net tangible assets, monetary assets, monetary assets as a percentage of the net tangible assets, operating profit,
and net worth derived from the Restated Consolidated Financial Information included in this Red Herring Prospectus for the
last three Financial years, are set forth below:
(₹ in million, unless stated otherwise) S.
No.
Particulars Financial Year ended March
31, 2021
Financial Year ended March
31, 2020
Financial Year ended March
31, 2019
1. Net tangible assets, as restated(1) 3,557.60 2,897.13 2,770.33
2. Operating profit, as restated(2) 444.28 274.18 313.11
3. Net worth, as restated(3) 3,579.97 2,977.39 2,851.99 Notes:
(1) ‘Net tangible assets’ on a restated and consolidated basis, means the sum of all net assets of the Company on a restated and consolidated basis excluding
intangible assets, and intangible assets under development as defined in Indian Accounting Standard 38 and right-of-use assets. (2) ‘Operating profit’, on a restated and consolidated basis, has been calculated as net profit before tax of the Company excluding other income, finance
costs and provision for diminution in value of investments. The average operating profit for Financial Years ended March 31, 2021, March 31, 2020,
and March 31, 2019 is ₹ 343.85 million based on the Restated Consolidated Financial Information. (3) ‘Net worth’, on a restated and consolidated basis, has been defined as the aggregate of share capital, other equity and non-controlling interest of the
Company.
We are eligible to undertake the Offer as per Rule 19(2)(b) of the SCRR read with Regulations 6(1) of the SEBI ICDR
Regulations. Accordingly, in accordance with Regulation 32(1) of the SEBI ICDR Regulations we are required to allocate not
more than 50% of the Offer to QIBs. Further, not less than 15% of the Offer shall be available for allocation on a proportionate
basis to Non-Institutional Bidders and not less than 35% of the Offer shall be available for allocation to RIBs in accordance
with the SEBI ICDR Regulations, subject to valid Bids being received at or above the Offer Price. In the event we fail to do so,
the full application money shall be refunded to the Bidders.
Further, in terms of Regulation 49(1) of the SEBI ICDR Regulations, our Company shall ensure that the number of Allottees
shall not be less than 1,000, failing which the entire application monies shall be refunded forthwith. In case of delay, if any, in
refund within such timeline as prescribed under applicable laws, our Company shall be liable to pay interest on the application
money in accordance with applicable laws.

280
Further, our Company confirms that it is in compliance with the conditions specified in Regulation 7(1) of the SEBI ICDR
Regulations, to the extent applicable, and will ensure compliance with the conditions specified in Regulation 7(2) of the SEBI
ICDR Regulations, to the extent applicable.
DISCLAIMER CLAUSE OF SEBI
IT IS TO BE DISTINCTLY UNDERSTOOD THAT SUBMISSION OF THE DRAFT RED HERRING PROSPECTUS
TO SEBI SHOULD NOT, IN ANY WAY, BE DEEMED OR CONSTRUED THAT THE SAME HAS BEEN CLEARED
OR APPROVED BY SEBI. SEBI DOES NOT TAKE ANY RESPONSIBILITY EITHER FOR THE FINANCIAL
SOUNDNESS OF ANY SCHEME OR THE PROJECT FOR WHICH THE OFFER IS PROPOSED TO BE MADE
OR FOR THE CORRECTNESS OF THE STATEMENTS MADE OR OPINIONS EXPRESSED IN THE DRAFT RED
HERRING PROSPECTUS. THE BOOK RUNNING LEAD MANAGERS, BEING AXIS CAPITAL LIMITED, JM
FINANCIAL LIMITED, KOTAK MAHINDRA CAPITAL COMPANY LIMITED AND DAM CAPITAL ADVISORS
LIMITED HAVE CERTIFIED THAT THE DISCLOSURES MADE IN THE DRAFT RED HERRING PROSPECTUS
ARE GENERALLY ADEQUATE AND ARE IN CONFORMITY WITH THE SECURITIES AND EXCHANGE
BOARD OF INDIA (ISSUE OF CAPITAL AND DISCLOSURE REQUIREMENTS) REGULATIONS, 2018, AS
AMENDED. THIS REQUIREMENT IS TO FACILITATE INVESTORS TO TAKE AN INFORMED DECISION FOR
MAKING AN INVESTMENT IN THE PROPOSED OFFER.
IT SHOULD ALSO BE CLEARLY UNDERSTOOD THAT WHILE OUR COMPANY IS PRIMARILY
RESPONSIBLE FOR THE CORRECTNESS, ADEQUACY AND DISCLOSURE OF ALL RELEVANT
INFORMATION IN THE DRAFT RED HERRING PROSPECTUS AND EACH OF THE SELLING
SHAREHOLDERS, SEVERALLY AND NOT JOINTLY, WILL BE RESPONSIBLE ONLY FOR THE
STATEMENTS SPECIFICALLY CONFIRMED OR UNDERTAKEN BY IT IN THE DRAFT RED HERRING
PROSPECTUS IN RELATION TO ITSELF AND ITS RESPECTIVE PORTION OF THE OFFERED SHARES, THE
BOOK RUNNING LEAD MANAGERS ARE EXPECTED TO EXERCISE DUE DILIGENCE TO ENSURE THAT
OUR COMPANY AND THE SELLING SHAREHOLDERS, SEVERALLY AND NOT JOINTLY, DISCHARGE
THEIR RESPONSIBILITY ADEQUATELY IN THIS BEHALF AND TOWARDS THIS PURPOSE, THE BOOK
RUNNING LEAD MANAGERS BEING AXIS CAPITAL LIMITED, JM FINANCIAL LIMITED, KOTAK
MAHINDRA CAPITAL COMPANY LIMITED AND DAM CAPITAL ADVISORS LIMITED HAVE FURNISHED
TO SEBI, A DUE DILIGENCE CERTIFICATE DATED AUGUST 31, 2021, IN THE FORMAT PRESCRIBED
UNDER SCHEDULE V(A) OF THE SECURITIES AND EXCHANGE BOARD OF INDIA (ISSUE OF CAPITAL
AND DISCLOSURE REQUIREMENTS) REGULATIONS, 2018, AS AMENDED.
THE FILING OF THE DRAFT RED HERRING PROSPECTUS DOES NOT, HOWEVER, ABSOLVE OUR
COMPANY FROM ANY LIABILITIES UNDER THE COMPANIES ACT OR FROM THE REQUIREMENT OF
OBTAINING SUCH STATUTORY OR OTHER CLEARANCES AS MAY BE REQUIRED FOR THE PURPOSE OF
THE OFFER. SEBI FURTHER RESERVES THE RIGHT TO TAKE UP, AT ANY POINT OF TIME, WITH THE
BOOK RUNNING LEAD MANAGERS, ANY IRREGULARITIES OR LAPSES IN THE DRAFT RED HERRING
PROSPECTUS.
Disclaimer from our Company, the Directors, the Selling Shareholders, and the Book Running Lead Managers
Our Company, the Directors and the Book Running Lead Managers accept no responsibility for statements made in relation to
the Company or the Offer other than those confirmed by it in this Red Herring Prospectus or in the advertisements or any other
material issued by or at our Company’s instance and anyone placing reliance on any other source of information, would be
doing so at his or her or their own risk.
Each of the Selling Shareholders, its respective partners, directors, key persons, affiliates, associates and officers accept or
undertake no responsibility for any statements including without limitation any statement made by or in relation to the Company
or its business, other than those specifically undertaken or confirmed by such Selling Shareholders in relation to itself and its
respective portion of the Offered Shares.
The Book Running Lead Managers accept no responsibility, save to the limited extent as provided in the Offer Agreement and
the Underwriting Agreement.
All information shall be made available by our Company, the Selling Shareholders (to the extent that the information pertains
to itself and its respective portion of the Offered Shares), and the Book Running Lead Managers to the public and investors at
large and no selective or additional information would be available for a section of the investors in any manner whatsoever,
including at road show presentations, in research or sales reports, at Bidding Centres or elsewhere.
None among our Company, the Selling Shareholders or any member of the Syndicate shall be liable for any failure in (i)
uploading the Bids due to faults in any software/ hardware system or otherwise or (ii) the blocking of Bid Amount in the ASBA
Account on receipt of instructions from the Sponsor Bank on account of any errors, omissions or non-compliance by various
parties involved in, or any other fault, malfunctioning or breakdown in, or otherwise, in the UPI Mechanism.

281
Bidders will be required to confirm and will be deemed to have represented to our Company, the Selling Shareholders,
Underwriters and their respective directors, officers, agents, affiliates, and representatives that they are eligible under all
applicable laws, rules, regulations, guidelines and approvals to acquire the Equity Shares and will not issue, allot, sell, pledge,
or transfer the Equity Shares to any person who is not eligible under any applicable laws, rules, regulations, guidelines and
approvals to acquire the Equity Shares. Our Company, the Selling Shareholders, Underwriters and their respective directors,
officers, agents, affiliates, and representatives accept no responsibility or liability for advising any investor on whether such
investor is eligible to acquire the Equity Shares.
The Book Running Lead Managers and their respective associates and affiliates may engage in transactions with, and perform
services for, our Company, the Selling Shareholders and their respective group companies, affiliates or associates or third parties
in the ordinary course of business and have engaged, or may in the future engage, in commercial banking and investment
banking transactions with or become customers to our Company, the Selling Shareholders and their respective group companies,
affiliates or associates or third parties, for which they have received, and may in the future receive, compensation.
Disclaimer in respect of Jurisdiction
Any dispute arising out of this Offer will be subject to the jurisdiction of appropriate court(s) in New Delhi, only.
Bidders eligible under Indian law to participate in the Offer
This Offer is being made in India to persons resident in India (who are competent to contract under the Indian Contract Act,
1872, including Indian nationals resident in India, HUFs, companies, other corporate bodies and societies registered under the
applicable laws in India and authorised to invest in shares, domestic Mutual Funds registered with the SEBI, Indian financial
institutions, commercial banks, regional rural banks, co-operative banks (subject to RBI permission), or trusts under applicable
trust law and who are authorised under their constitution to hold and invest in equity shares, multilateral and bilateral
development financial institutions, state industrial development corporations, insurance companies registered with IRDAI,
provident funds (subject to applicable law) and pension funds, National Investment Fund, insurance funds set up and managed
by army, navy or air force of Union of India, insurance funds set up and managed by the Department of Posts, GoI, systemically
important NBFCs registered with the RBI) and permitted Non-Residents including FPIs and Eligible NRIs, QIBs, AIFs, FVCIs
(under Schedule I of the FEMA NDI Rules) and other eligible foreign investors, if any, provided that they are eligible under all
applicable laws and regulations to purchase the Equity Shares.
This Red Herring Prospectus does not, however constitute an invitation to subscribe to shares offered hereby in any jurisdiction,
other than India to any person to whom it is unlawful to make an offer or invitation in such jurisdiction. Any person into whose
possession this Red Herring Prospectus comes is required to inform himself or herself about, and to observe, any such
restrictions. Invitations to subscribe to or purchase the Equity Shares in the Offer will be made only pursuant to this Red Herring
Prospectus if the recipient is in India or the preliminary offering memorandum for the Offer, which comprises this Red Herring
Prospectus and the preliminary international wrap for the Offer, if the recipient is outside India.
Bidders are advised to ensure that any Bid from them does not exceed investment limits or the maximum number of
Equity Shares that can be held by them under applicable law.
Eligibility and Transfer Restrictions
The Equity Shares offered in the Offer have not been and will not be registered under the U.S. Securities Act or any
other applicable law of the United States and, unless so registered, may not be offered or sold within the United States,
except pursuant to an exemption from, or in a transaction not subject to, the registration requirements of the U.S.
Securities Act and applicable state securities laws. Accordingly, the Equity Shares are only being offered and sold
outside the United States in “offshore transactions” in reliance on Regulation S under the U.S. Securities Act and the
applicable laws of the jurisdiction where those offers, and sales are made.
The Equity Shares have not been and will not be registered, listed or otherwise qualified in any other jurisdiction outside
India and may not be offered or sold, and Bids may not be made by persons in any such jurisdiction, except in compliance
with the applicable laws of such jurisdiction.
Bidders are advised to ensure that any Bid from them does not exceed investment limits or maximum number of Equity Shares
that can be held by them under applicable law. Further, each Bidder where required must agree in the Allotment Advice that
such Bidder will not sell or transfer any Equity Shares or any economic interest therein, including any off-shore derivative
instruments, such as participatory notes, issued against the Equity Shares or any similar security, other than in accordance with
applicable laws.
Disclaimer Clause of BSE
As required, a copy of the Draft Red Herring Prospectus has been submitted to BSE. The disclaimer clause as intimated by BSE
to our Company, is set out below:

282
“BSE Limited (“the Exchange”) has given vide its letter dated September 20, 2021 permission to this Company to use the
Exchange’s name in this offer document as one of the stock exchanges on which this company’s securities are proposed to be
listed. The Exchange has scrutinized this offer document for its limited internal purpose of deciding on the matter of granting
the aforesaid permission to this Company. The Exchange does not in any manner: -
a) warrant, certify or endorse the correctness or completeness of any of the contents of this offer document; or
b) warrant that this Company’s securities will be listed or will continue to be listed on the Exchange; or
c) take any responsibility for the financial or other soundness of this Company, its promoters, its management or any scheme
or project of this Company;
and it should not for any reason be deemed or construed that this offer document has been cleared or approved by the Exchange.
Every person who desires to apply for or otherwise acquires any securities of this Company may do so pursuant to independent
inquiry, investigation and analysis and shall not have any claim against the Exchange whatsoever by reason of any loss which
may be suffered by such person consequent to or in connection with such subscription/acquisition whether by reason of anything
stated or omitted to be stated herein or for any other reason whatsoever.”
Disclaimer Clause of NSE
As required, a copy of the Draft Red Herring Prospectus has been submitted to NSE. The disclaimer clause as intimated by
NSE to our Company, is set out below:
“As required, a copy of this Offer Document has been submitted to National Stock Exchange of India Limited (hereinafter
referred to as NSE). NSE has given vide its letter Ref.: NSE/LIST/1218 dated October 14, 2021 permission to the Issuer to use
the Exchange’s name in this Offer Document as one of the Stock Exchanges on which this Issuer’s securities are proposed to
be listed. The Exchange has scrutinized this draft offer document for its limited internal purpose of deciding on the matter of
granting the aforesaid permission to this Issuer. It is to be distinctly understood that the aforesaid permission given by NSE
should not in any way be deemed or construed that the offer document has been cleared or approved by NSE; nor does it in any
manner warrant, certify or endorse the correctness or completeness of any of the contents of this offer document; nor does it
warrant that this Issuer’s securities will be listed or will continue to be listed on the Exchange; nor does it take any responsibility
for the financial or other soundness of this Issuer, its promoters, its management or any scheme or project of this Issuer. Every
person who desires to apply for or otherwise acquire any securities of this Issuer may do so pursuant to independent inquiry,
investigation and analysis and shall not have any claim against the Exchange whatsoever by reason of any loss which may be
suffered by such person consequent to or in connection with such subscription /acquisition whether by reason of anything stated
or omitted to be stated herein or any other reason whatsoever.”
Listing
The Equity Shares proposed to be Allotted pursuant to this Red Herring Prospectus and the Prospectus are proposed to be listed
on the BSE and the NSE. Applications have been made to the Stock Exchanges for permission to deal in and for an official
quotation of the Equity Shares. BSE will be the Designated Stock Exchange with which the Basis of Allotment will be finalised.
If the permissions to deal in, and for an official quotation of, the Equity Shares are not granted by any of the Stock Exchanges
mentioned above, our Company will forthwith repay, without interest, all monies received from the Bidders in pursuance of
this Red Herring Prospectus. If such money is not repaid within the prescribed time, then our Company and every officer in
default shall be liable to repay the money, with interest, as prescribed under applicable law. Any expense incurred by our
Company on behalf of any of the Selling Shareholders with regard to interest on such refunds will be reimbursed by such Selling
Shareholder in proportion to its respective portion of the Offered Shares. For the avoidance of doubt, subject to applicable law,
a Selling Shareholder shall not be responsible to pay and/or reimburse any expenses towards refund or any interest thereon for
any delay, unless such failure or default or delay , as the case may be, is by, and is directly attributable to, an act or omission,
of to such Selling Shareholder and such liability shall be limited to the extent of its respective portion of the Offered Shares.
Our Company shall ensure that all steps for the completion of the necessary formalities for listing and commencement of trading
at the Stock Exchanges are taken within six Working Days from the Bid/ Offer Closing Date. Further, each of the Selling
Shareholders, severally and not jointly, specifically confirms that it shall provide reasonable assistance to our Company, and
the Book Running Lead Managers, with respect to its respective portion of the Offered Shares, for the completion of the
necessary formalities for listing and commencement of trading at the Stock Exchanges within six Working Days from the Bid/
Offer Closing Date, to the extent of the Offered Shares.
If our Company does not Allot Equity Shares pursuant to the Offer within six Working Days from the Bid/ Offer Closing Date
or within such timeline as prescribed by SEBI, it shall repay, without interest, all monies received from Bidders, failing which
interest shall be due to be paid to the Bidders at the rate of 15% per annum for the delayed period.
Consents

283
Consents in writing from each of the Selling Shareholders, our Directors, our Statutory Auditors, our Company Secretary and
Compliance Officer, Legal Counsel to our Company as to Indian law, Legal Counsel to the Book Running Lead Managers as
to Indian law, International Legal Counsel to the Book Running Lead Managers, the Book Running Lead Managers, Frost &
Sullivan, the bankers to our Company, and the Registrar to the Offer to act in their respective capacities, have been obtained
and consents in writing of the Syndicate Members, Banker(s) to the Offer/ Escrow Collection Bank, Refund Bank, and Sponsor
Bank to act in their respective capacities, will be obtained, and will be filed along with a copy of this Red Herring Prospectus
with the RoC as required under the Companies Act and such consents shall not be withdrawn up to the time of delivery of this
Red Herring Prospectus for registration with the RoC.
Experts to the Offer
Except as stated below, our Company has not obtained any expert opinions:
Our Company has received written consent dated December 2, 2021 from our Statutory Auditors, Brijesh Mathur & Associates,
Chartered Accountants, to include their name in this Red Herring Prospectus as required under Section 26(1) of the Companies
Act read with SEBI ICDR Regulations and as “expert” as defined under Sections 2(38) and 26(5) of the Companies Act to the
extent and in their capacity as an auditor and in respect of their (i) examination report dated November 1, 2021 on the Restated
Consolidated Financial Information; and (ii) report dated November 25, 2021 on the statement of possible special tax benefits
and such consent has not been withdrawn as on the date of Draft Red Herring Prospectus.
Capital issue during the preceding three years by our Company
Other than as disclosed in “Capital Structure – Equity Share Capital History of our Company” on page 70, our Company has
not made any capital issues during the three years preceding the date of this Red Herring Prospectus.
Capital issue (public /rights /composite issues) during the previous three years by our listed Group
Companies/Subsidiaries/associates
Our listed Group Company, CIFCL, has not undertaken capital issues (public /rights / composite issues) during the previous
three years.
Particulars regarding public or rights issues during the last five years
Our Company has not made any rights issues or public issues during the last five years.
Performance vis-à-vis Objects
Our Company has not undertaken any rights issue in the five years preceding the date of this Red Herring Prospectus. Our
Company has not made any public issues in the five years preceding the date of this Red Herring Prospectus.
Performance vis-à-vis Objects – Last public/rights issue of our listed Subsidiaries/Promoters
As on date of this Red Herring Prospectus, none of our Subsidiaries are listed. Our Promoters consist of only individuals.
Stock Market Data of the Equity Shares
This being the initial public offering of the Equity Shares of our Company, the Equity Shares are not listed on any stock
exchange as on the date of this Red Herring Prospectus, and accordingly, no stock market data is available for the Equity Shares.
Commission or brokerage on previous issues in last five years
Since this is the initial public issue of Equity Shares, no sum has been paid or has been payable as commission or brokerage for
subscribing to or procuring or agreeing to procure subscription for the Equity Shares since our Company’s inception.
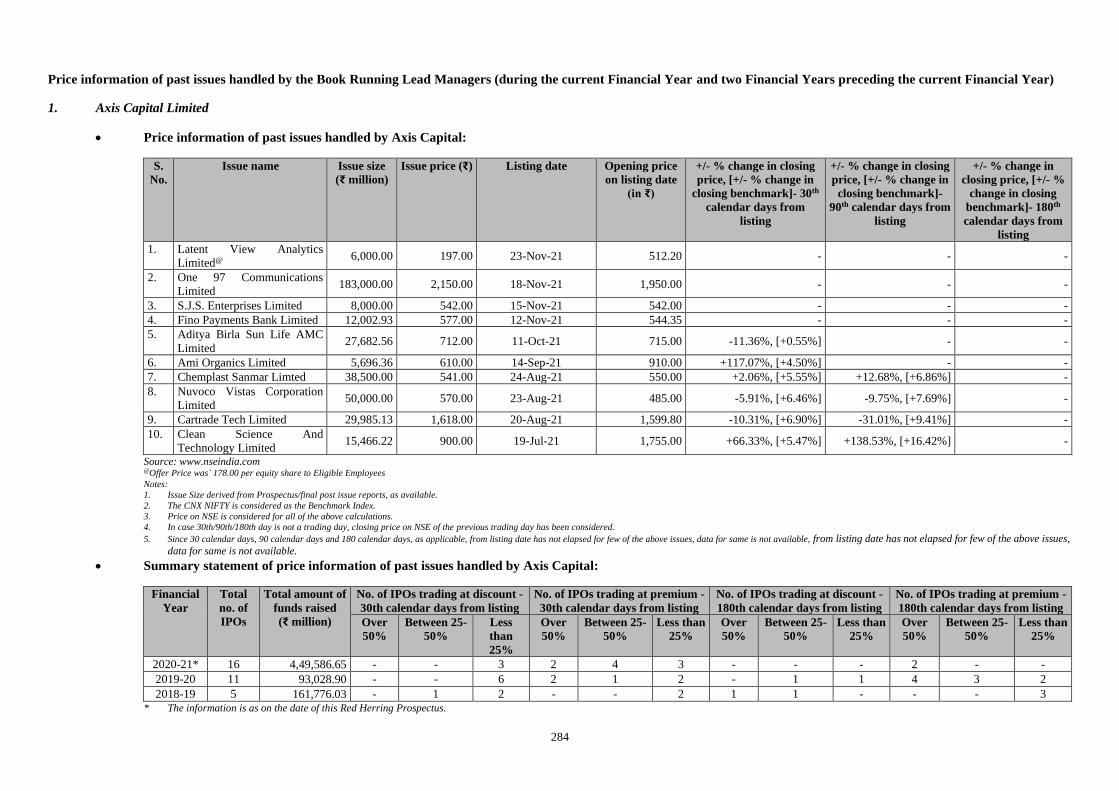
284
Price information of past issues handled by the Book Running Lead Managers (during the current Financial Year and two Financial Years preceding the current Financial Year)
1. Axis Capital Limited
• Price information of past issues handled by Axis Capital:
S.
No.
Issue name Issue size
(₹ million)
Issue price (₹) Listing date Opening price
on listing date
(in ₹)
+/- % change in closing
price, [+/- % change in
closing benchmark]- 30th
calendar days from
listing
+/- % change in closing
price, [+/- % change in
closing benchmark]-
90th calendar days from
listing
+/- % change in
closing price, [+/- %
change in closing
benchmark]- 180th
calendar days from
listing
1. Latent View Analytics
Limited@ 6,000.00 197.00 23-Nov-21 512.20 - - -
2. One 97 Communications
Limited 183,000.00 2,150.00 18-Nov-21 1,950.00 - - -
3. S.J.S. Enterprises Limited 8,000.00 542.00 15-Nov-21 542.00 - - -
4. Fino Payments Bank Limited 12,002.93 577.00 12-Nov-21 544.35 - - -
5. Aditya Birla Sun Life AMC
Limited 27,682.56 712.00 11-Oct-21 715.00 -11.36%, [+0.55%] - -
6. Ami Organics Limited 5,696.36 610.00 14-Sep-21 910.00 +117.07%, [+4.50%] - -
7. Chemplast Sanmar Limted 38,500.00 541.00 24-Aug-21 550.00 +2.06%, [+5.55%] +12.68%, [+6.86%] -
8. Nuvoco Vistas Corporation
Limited 50,000.00 570.00 23-Aug-21 485.00 -5.91%, [+6.46%] -9.75%, [+7.69%] -
9. Cartrade Tech Limited 29,985.13 1,618.00 20-Aug-21 1,599.80 -10.31%, [+6.90%] -31.01%, [+9.41%] -
10. Clean Science And
Technology Limited 15,466.22 900.00 19-Jul-21 1,755.00 +66.33%, [+5.47%] +138.53%, [+16.42%] -
Source: www.nseindia.com @Offer Price was` 178.00 per equity share to Eligible Employees
Notes:
1. Issue Size derived from Prospectus/final post issue reports, as available.
2. The CNX NIFTY is considered as the Benchmark Index.
3. Price on NSE is considered for all of the above calculations.
4. In case 30th/90th/180th day is not a trading day, closing price on NSE of the previous trading day has been considered.
5. Since 30 calendar days, 90 calendar days and 180 calendar days, as applicable, from listing date has not elapsed for few of the above issues, data for same is not available, from listing date has not elapsed for few of the above issues,
data for same is not available.
• Summary statement of price information of past issues handled by Axis Capital:
Financial
Year
Total
no. of
IPOs
Total amount of
funds raised
(₹ million)
No. of IPOs trading at discount -
30th calendar days from listing
No. of IPOs trading at premium -
30th calendar days from listing
No. of IPOs trading at discount -
180th calendar days from listing
No. of IPOs trading at premium -
180th calendar days from listing
Over
50%
Between 25-
50%
Less
than
25%
Over
50%
Between 25-
50%
Less than
25%
Over
50%
Between 25-
50%
Less than
25%
Over
50%
Between 25-
50%
Less than
25%
2020-21* 16 4,49,586.65 - - 3 2 4 3 - - - 2 - -
2019-20 11 93,028.90 - - 6 2 1 2 - 1 1 4 3 2
2018-19 5 161,776.03 - 1 2 - - 2 1 1 - - - 3 * The information is as on the date of this Red Herring Prospectus.

285
The information for each of the financial years is based on issues listed during such financial year Notes:
Since 30 calendar days and 180 calendar days, as applicable, from listing date has not elapsed for few of the above issues, data for same is not available
2. JM Financial Limited
• Price information of past issues handled by JM Financial:
Sr.
No.
Issue name Issue Size
(₹ million)
Issue
price
(₹)
Listing
Date
Opening
price on
Listing Date
(in ₹)
+/- % change in closing
price, [+/- % change in
closing benchmark] - 30th
calendar days from listing
+/- % change in closing
price, [+/- % change in
closing benchmark] - 90th
calendar days from listing
+/- % change in closing price,
[+/- % change in
closing benchmark] - 180th
calendar days from listing
1. Go Fashion (India)
Limited
10,136.09 690.00 November 30, 2021 1,310.00 Not Applicable Not Applicable Not Applicable
2. Sapphire Foods India
Limited
20,732.53 1,180.00 November 18, 2021 1,350.00 Not Applicable Not Applicable Not Applicable
3. FSN – E-Commerce
Ventures Limited8
53,497.24 1,125.00 November 10, 2021 2018.00 Not Applicable Not Applicable Not Applicable
4. Aditya Birla Sun Life
AMC Limited
27,682.56 712.00 October 11, 2021 715.00 -11.36% [0.55%] Not Applicable Not Applicable
5. Krsnaa Diagnostics
Limited9
12,133.35 954.00 August 16, 2021 1,005.55 -9.42% [4.93%] -27.73% [9.30%] Not Applicable
6. Rolex Rings Limited 7,310.00 900.00 August 09, 2021 1,250.00 22.28% [6.79%] 31.50% [10.20%] Not Applicable
7. Tatva Chintan Pharma
Chem Limited
5,000.00 1,083.00 July 29, 2021 2,111.85 92.54% [5.87%] 136.37% [15.78%] Not Applicable
8. Clean Science and
Technology Limited
15,466.22 900.00 July 19, 2021 1,755 66.33% [5.47%] 138.53% [16.42%] Not Applicable
9. India Pesticides Limited 8,000.00 296.00 July 5, 2021 350.00 12.64% [1.87%] 4.26% [10.72%] Not Applicable
10. Shyam Metalics and
Energy Limited7
9,085.50 306.00 June 24, 2021 380.00 40.95% [0.42%] 22.65% [11.22%] Not Applicable
11. Sona BLW Precision
Forgings Limited
55,500.00 291.00 June 24, 2021 301.00 45.45% [0.42%] 93.40% [11.22%] Not Applicable
Source: www.nseindia.com for price information and prospectus/basis of allotment for issue details
Notes:
1. Opening price information as disclosed on the website of NSE.
2. Change in closing price over the issue/offer price as disclosed on NSE.
3. Change in closing price over the closing price as on the listing date for benchmark index viz. NIFTY 50.
4. In case of reporting dates falling on a trading holiday, values for the trading day immediately preceding the trading holiday have been considered.
5. 30th calendar day has been taken as listing date plus 29 calendar days; 90th calendar day has been taken as listing date plus 89 calendar days; 180th calendar day has been taken a listing date plus 179 calendar
days.
6. Restricted to last 10 issues.
7. A discount of 4.90 % on the Offer Price was offered to the Eligible Employees Bidding in the Employee Reservation Portion (“Employee Discount”) equivalent to ₹15 per Equity Share.
8. A discount of Rs. 100 per Equity Share was offered to Eligible Employees bidding in the Employee Reservation Portion.
9. A discount of Rs. 93 per Equity Share was offered to Eligible Employees bidding in the Employee Reservation Portion.
10. Not Applicable – Period not completed

286
• Summary statement of price information of past issues handled by JM Financial:
Financial
Year
Total
no. of
IPOs
Total funds
raised
(₹ Millions)
Nos. of IPOs trading at discount on as on
30th calendar days from listing date
Nos. of IPOs trading at premium on as on
30th calendar days from listing date
Nos. of IPOs trading at
discount as on 180th
calendar days from listing
date
Nos. of IPOs trading at
premium as on 180th calendar
days from listing date
Over 50% Between
25% - 50%
Less than
25%
Over 50% Between
25%-50%
Less than
25%
Over
50%
Between
25%-50%
Less than
25%
Over 50% Between
25%-50%
Less
than
25%
2021-2022 12 2,49,543.49 - - 2 2 3 2 - - - 1 - -
2020-2021 8 62,102.09 - - 3 2 1 2 - - - 5 2 1
2019-2020 4 36,400.83** - - 1 - 1 2 - 1 1 - 1 1 ** Spandana Sphoorty Financial Limited raised Rs. 11,898.49 million as against the issue size of Rs. 12,009.36 million
3. Kotak Mahindra Capital Company Limited
• Price information of past issues handled by Kotak:
S. No. Issue name Issue size
(₹ million)
Issue
price
(₹)
Listing date
Opening price
on listing date
(in ₹)
+/- % change in closing
price, [+/- % change in
closing benchmark]- 30th
calendar days from listing
+/- % change in closing price, [+/-
% change in closing benchmark]-
90th calendar days from listing
+/- % change in closing
price, [+/- % change in
closing benchmark]-
180th calendar days
from listing
1. PB Fintech Limited 57,097.15 980 November 15, 2021 1,150.00 - - -
2. FSN E-commerce Ventures Limited 53,497.24 1,1251 November 10, 2021 2,018.00 - - -
3. Aditya Birla Sun Life AMC Limited 27,682.56 712 October 11, 2021 715.00 -11.36%,[+0.55%] - -
4. Vijaya Diagnostic Centre Limited 18,942.56 5312 September 14, 2021 540.00 +5.41%, [+4.50%] - -
5. Aptus Value Housing Finance India Limited 27,800.52 353 August 24, 2021 333.00 -2.82%, [+5.55%] -0.82% [+6.86%] -
6. Cartrade Tech Limited 29,985.13 1,618 August 20, 2021 1,599.80 -10.31%, [+6.90%] -32.68% [+8.80%] -
7. Devyani International Limited 18,380.00 90 August 16, 2021 140.90 +32.83%, [+4.93%] +63.06% [+7.91%] -
8. Glenmark Life Sciences Limited 15,136.00 720 August 6, 2021 750.00 -6.40%, [+6.68%] -12.85%, [+9.80%] -
9. Zomato Limited 93,750.00 76 July 23, 2021 116.00 +83.29%, [+3.75%] +81.45%, [+15.20%] -
10. Clean Science and Technology Limited 15,466.22 900 July 19, 2021 1,755.00 +66.33%, [+5.47%] +138.53%, [+16.42%] -
Source. www.nseindia.com Notes:
1. In FSN E-Commerce Ventures Limited, the issue price to eligible employees was ₹ 1,025 after a discount of ₹ 100 per equity share
2. In Vijaya Diagnostic Centre Limited, the issue price to eligible employees was ₹ 479 after a discount of ₹ 52 per equity share 3. In the event any day falls on a holiday, the price/index of the immediately preceding trading day has been considered.
4. The 30th, 90th, 180th calendar days from listed day have been taken as listing day plus 29, 89 and 179 calendar days.
5. Restricted to last 10 equity initial public issues.
• Summary statement of price information of past issues handled by Kotak:
Financial
Year
Total
no. of
IPOs
Total amount
of funds raised
(₹ million)
No. of IPOs trading at discount - 30th
calendar days from listing
No. of IPOs trading at premium - 30th
calendar days from listing
No. of IPOs trading at discount - 180th
calendar days from listing
No. of IPOs trading at premium - 180th
calendar days from listing
Over 50% Between 25-
50%
Less than
25%
Over
50%
Between 25-
50%
Less than
25%
Over
50%
Between 25-
50%
Less than
25%
Over
50%
Between 25-
50%
Less than
25%
2021-22 14 468,798.16 - - 4 3 4 1 - - - 1 - -

287
2020-21 6 140,143.77 - - 1 2 1 2 - - - 4 1 1
2019-20 4 136,362.82 - 1 - - 1 2 - - 1 - 1 2
Notes: 1. The information is as on the date of this Red Herring Prospectus.
2. The information for each of the financial years is based on issues listed during such financial year.
4. DAM Capital Advisors Limited
• Price information of past issues handled by DAM Capital:
Sr.
No.
Issue name Issue size
(₹ millions)
Issue price
(₹)
Listing date Opening price
on listing date
(in ₹)
+/- % change in closing
price, [+/- % change in
closing benchmark]- 30th
calendar days from listing
+/- % change in closing price,
[+/- % change in closing
benchmark]- 90th calendar
days from listing
+/- % change in closing
price, [+/- % change in
closing benchmark]-
180th calendar days from
listing
1 Mazagon Dock
Shipbuilders
Limited
4,436.86 145.00 October 12, 2020 214.90 +18.90%,
[+5.87%]
+52.90%,
[+20.25%]
+45.79%,
[+24.34%]
2 Indian Railway
Finance
Corporation
Limited
46,333.79 26.00 January 29, 2021 24.90 -5.19%,
[+6.56%]
-18.65%,
[+9.02%]
-11.15%,
[+15.49%]
3. Laxmi Organic
Industries Limited
6,000.00 130.00 March 25, 2021 155.50 +37.85%,
[+0.11%]
+71.96%,
[+10.11%]
+294.50%
[+21.45%]
4. Glenmark Life
Sciences Limited
15,136.00 720.00 August 6, 2021 750.00 -6.40%
[+6.68%]
-12.85%
[+9.80%]
Not applicable
5. Windlas Biotech
Limited
4,015.35 460.00 August 16, 2021 437.00 -18.04%,
[+4.93%]
-34.46%
[+9.30%]
Not applicable
6. Krsnaa Diagnostics
Limited
12,133.35 954.00* August 16, 2021 1,005.55 -9.42%,
[+4.93%]
-27.73%
[+9.30%]
Not applicable
7. Go Fashion (India)
Limited
10,136.09 690.00 November 30, 2021 1,310.00 Not applicable Not applicable Not applicable
Source. www.nseindia.com
* A discount of INR 93 per equity share to eligible employees bidding in the employee reservation portion. Notes:
1. Issue size derived from prospectus
2. Price on NSE is considered for all of the above calculations 3. % of change in closing price on 30th / 90th / 180th calendar day from listing day is calculated vs issue price. % change in closing benchmark index is calculated based on closing index on listing day vs closing
index on 30th/ 90th / 180th calendar day from listing day.
4. Wherever 30th/ 90th / 180th calendar day from listing day is a holiday, the closing data of the previous trading day has been considered. 5. The Nifty 50 index is considered as the benchmark index
6. Not applicable – Period not completed
• Summary statement of price information of past issues handled by DAM Capital:

288
Financial
Year
Total
no. of
IPOs
Total funds
raised (₹ in
Millions)
Nos. of IPOs trading at discount on
as on 30th calendar days from
listing date
Nos. of IPOs trading at
premium on as on 30th
calendar days from listing date
Nos. of IPOs trading at discount
as on 180th calendar days from
listing date
Nos. of IPOs trading at premium as on
180th calendar days from listing date
Over 50% Between
25%-50%
Less
than
25%
Over
50%
Between
25%-50%
Less
than
25%
Over
50%
Between
25%-50%
Less
than
25%
Over
50%
Between
25%-50%
Less than 25%
2021-22 4 41,420.79 - - 3 - - - - - - - - -
2020-21 3 56,770.65 - - 1 - 1 1 - - 1 1 1 -
2019-20 - - - - - - - - - - - - - - Notes:
1. The information is as on the date of this offer document 2. The information for each of the financial years is based on issues listed during such financial year.
3. Since 30/180 calendar days from listing date has not elapsed for few issues, hence data for same is not available.

289
Track record of past issues handled by the Book Running Lead Managers
For details regarding the track record of the Book Running Lead Managers, as specified in circular bearing number
CIR/MIRSD/1/2012 dated January 10, 2012 issued by SEBI, please see the websites of the Book Running Lead Managers, as
provided in the table below:
S. No. Name of the Lead Manager Website
1. Axis Capital Limited www.axiscapital.co.in
2. JM Financial Limited www.jmfl.com
3. Kotak Mahindra Capital Company Limited www.investmentbank.kotak.com
4. DAM Capital Advisors Limited www.damcapital.in
Disposal of Investor Grievances by our Company
The Registrar Agreement provides for retention of records with the Registrar to the Offer for a period of at least eight years
from the date of listing and commencement of trading of the Equity Shares on the Stock Exchanges to enable the Bidders to
approach the Registrar to the Offer for redressal of their grievances.
All grievances in relation to the Bidding process may be addressed to the Registrar to the Offer with a copy to the relevant
Designated Intermediary to whom the Bid cum Application Form was submitted. The Bidder should give full details such as
name of the sole or first Bidder, Bid cum Application Form number, Bidder DP ID, Client ID, PAN, UPI ID (in case of RIBs
using the UPI Mechanism), date of the submission of Bid cum Application Form, address of the Bidder, number of the Equity
Shares applied for and the name and address of the Designated Intermediary where the Bid cum Application Form was
submitted by the Bidder.
In terms of SEBI circular SEBI/HO/CFD/DIL2/CIR/P/2018/22 dated February 15, 2018, SEBI circular
SEBI/HO/CFD/DIL2/CIR/P/2021/2480/1/M dated March 16, 2021, as amended pursuant to SEBI circular
SEBI/HO/CFD/DIL2/P/CIR/2021/570 dated June 2, 2021 and subject to applicable law, any ASBA Bidder whose Bid has not
been considered for Allotment, due to failure on the part of any SCSB, shall have the option to seek redressal of the same by
the concerned SCSB within three months of the date of listing of the Equity Shares. SCSBs are required to resolve these
complaints within 15 days, failing which the concerned SCSB would have to pay interest at the rate of 15% per annum for any
delay beyond this period of 15 days. Further, the investors shall be compensated by the SCSBs in accordance with SEBI circular
SEBI/HO/CFD/DIL2/CIR/P/2021/2480/1/M dated March 16, 2021 in the events of delayed unblock for
cancelled/withdrawn/deleted applications, blocking of multiple amounts for the same UPI application, blocking of more amount
than the application amount, delayed unblocking of amounts for non-allotted/partially-allotted applications for the stipulated
period. In an event there is a delay in redressal of the investor grievance in relation to unblocking of amounts, the Book Running
Lead Managers shall compensate the investors at the rate higher of ₹100 or 15% per annum of the application amount for the
period of such delay.
For helpline details of the Book Running Lead Managers pursuant to SEBI circular
SEBI/HO/CFD/DIL2/CIR/P/2021/2480/1/M dated March 16, 2021, see “General Information – Book Running Lead
Managers” on page 63 and 64.
Further, the Bidder shall also enclose a copy of the Acknowledgment Slip duly received from the concerned Designated
Intermediary in addition to the information mentioned hereinabove.
The Registrar to the Offer shall obtain the required information from the SCSBs for addressing any clarifications or grievances
of ASBA Bidders. Our Company, the Book Running Lead Managers and the Registrar to the Offer accept no responsibility for
errors, omissions, commission or any acts of SCSBs including any defaults in complying with its obligations under the SEBI
ICDR Regulations. Bidders can contact the Compliance Officer or the Registrar to the Offer in case of any pre-Offer or post-
Offer related problems such as non-receipt of letters of Allotment, non-credit of Allotted Equity Shares in the respective
beneficiary account, non-receipt of refund intimations and non-receipt of funds by electronic mode.
Anchor Investors are required to address all grievances in relation to the Offer to the Book Running Lead Managers.
Our Company estimates that the average time required by our Company or the Registrar to the Offer or the relevant Designated
Intermediary, for this Redressal of routine investor grievances shall be 15 Working Days from the date of receipt of the
complaint. In case of non-routine complaints and complaints where external agencies are involved, our Company will seek to
redress these complaints as expeditiously as possible.
Our Company has also appointed Saurabh Surendra Somani, Company Secretary of our Company, as the Compliance Officer
for the Offer. For details, see “General Information” beginning on page 62.
Our Company has constituted a Stakeholders’ Relationship Committee comprising Rakhi Prasad, Rakesh Kumar Verma, and
Shambhu Singh as its members to review and redress the shareholders’ and investors’ grievances such as transfer of Equity
Shares, non-recovery of balance payments, declared dividends, approve subdivision, consolidation, transfer and issue of

290
duplicate shares. For further details about the Stakeholders’ Relationship Committee, see “Our Management – Committees of
the Board – Stakeholders’ Relationship Committee” on page 178 to 179.
Our Company has obtained authentication on SEBI SCORES in terms of the SEBI circular bearing number CIR/OIAE/1/2013
dated April 17, 2013 and shall comply with SEBI circular bearing number CIR/OIAE/1/2014 dated December 18, 2014 in
relation to redressal of investor grievances through SCORES.
Our Company has not received any investor complaint during the three years preceding the date of this Red Herring Prospectus.
Further, no investor complaint in relation to our Company and our listed Group Company is pending as on the date of this Red
Herring Prospectus.

291
SECTION VII: OFFER INFORMATION
TERMS OF THE OFFER
The Equity Shares being offered and Allotted and transferred pursuant to this Offer shall be subject to the provisions of the
Companies Act, SEBI ICDR Regulations, SEBI Listing Regulations, SCRA, SCRR, our Memorandum and Articles of
Association, the terms of this Red Herring Prospectus, the Prospectus, the abridged prospectus, the Bid cum Application Form,
the Revision Form, the CAN or Allotment Advice and other terms and conditions as may be incorporated in the Allotment
Advices and other documents or certificates that may be executed in respect of the Offer. The Equity Shares shall also be subject
to laws as applicable, guidelines, rules, notifications and regulations relating to the issue of capital and listing and trading of
securities issued from time to time by SEBI, the Government of India, the Stock Exchanges, the RBI, the RoC and/or other
authorities, as in force on the date of the Offer and to the extent applicable or such other conditions as may be prescribed by
SEBI, the RBI, the Government of India, the Stock Exchanges, the RoC and/or any other authorities while granting its approval
for the Offer.
The Offer
The Offer is an Offer for Sale by the Selling Shareholders.
Expenses for the Offer shall be shared amongst our Company and each of the Selling Shareholders in the manner specified in
“Objects of the Offer - Offer Expenses” on page 85 to 86.
Ranking of the Equity Shares
The Equity Shares being offered and transferred pursuant to the Offer shall be subject to the provisions of the Companies Act,
SEBI ICDR Regulations, SEBI Listing Regulations, SCRA, SCRR, our Memorandum and Articles of Association and shall
rank pari passu in all respects with the existing Equity Shares including in respect of the right to receive dividend, voting and
other corporate benefits, if any, declared by our Company after the date of Allotment. For further details, see “Main Provisions
of Articles of Association” beginning on page 315.
Mode of Payment of Dividend
Our Company shall pay dividends, if declared, to the Shareholders in accordance with the provisions of the Companies Act,
our Articles of Association and provisions of the SEBI Listing Regulations and any other guidelines or directions which may
be issued by the Government in this regard. Dividends, if any, declared by our Company after the date of Allotment (pursuant
to the transfer of Equity Shares from the Offer for Sale), will be payable to the Bidders who have been Allotted Equity Shares
in the Offer, for the entire year, in accordance with applicable laws. For further details in relation to dividends, see “Dividend
Policy” and “Main Provisions of Articles of Association” beginning on pages 190 and 315, respectively.
Face Value, Offer Price, Floor Price and Price Band
The face value of each Equity Share is ₹2, and the Offer Price is ₹[●] per Equity Share. The Floor Price is ₹[●] per Equity Share
and at the Cap Price is ₹[●] per Equity Share, being the Price Band. The Anchor Investor Offer Price is ₹[●] per Equity Share.
The Price Band and the minimum Bid Lot will be decided by our Company, the Individual Selling Shareholder, and the Investor
Selling Shareholders in consultation with the Book Running Lead Managers and advertised in all editions of Financial Express,
an English national daily newspaper and all editions of Jansatta, a Hindi national daily newspaper (Hindi also being the regional
language of New Delhi, where our Registered and Corporate Office is located), each with wide circulation, at least two Working
Days prior to the Bid/Offer Opening Date and shall be made available to the Stock Exchanges for the purpose of uploading the
same on their websites. The Price Band, along with the relevant financial ratios calculated at the Floor Price and at the Cap
Price, shall be pre-filled in the Bid cum Application Forms available on the websites of the Stock Exchanges. The Offer Price
shall be determined by our Company, the Individual Selling Shareholder, and the Investor Selling Shareholders, in consultation
with the Book Running Lead Managers, after the Bid/Offer Closing Date. On the basis of assessment of market demand for the
Equity Shares offered by way of Book Building Process.
At any given point of time there shall be only one denomination of Equity Shares.
Compliance with disclosure and accounting norms
Our Company shall comply with all disclosure and accounting norms as specified by SEBI from time to time.
Rights of the Equity Shareholders
Subject to applicable laws, rules, regulations and guidelines and our Articles of Association, our Shareholders shall have the
following rights:

292
• Right to receive dividends, if declared;
• Right to attend general meetings and exercise voting rights, unless prohibited by law;
• Right to vote on a poll either in person or by proxy or “e-voting”, in accordance with the provisions of the Companies
Act;
• Right to receive offers for rights shares and bonus shares, if announced;
• Right to receive surplus on liquidation, subject to any statutory and preferential claim being satisfied;
• Right of free transferability of Equity Shares, subject to applicable laws; and
• Such other rights, as may be available to a shareholder of a listed public company under the Companies Act, the SEBI
Listing Regulations and our Articles of Association.
For a detailed description of the main provisions of the Articles of Association of our Company relating to voting rights,
dividend, forfeiture and lien, transfer, transmission, consolidation or sub-division, see “Main Provisions of Articles of
Association” beginning on page 315.
Allotment only in Dematerialised Form
Pursuant to Section 29 of the Companies Act and the SEBI ICDR Regulations, the Equity Shares shall be Allotted only in
dematerialised form. As per the SEBI ICDR Regulations, the trading of the Equity Shares shall only be in dematerialised form.
In this context, two agreements have been signed amongst our Company, the respective Depositories and the Registrar to the
Offer:
• Tripartite agreement dated July 2, 2021 among our Company, CDSL and the Registrar to the Offer; and
• Tripartite agreement dated July 7, 2021 among our Company, NSDL and the Registrar to the Offer.
Market Lot and Trading Lot
Since trading of the Equity Shares is in dematerialised form, the tradable lot is one Equity Share. Allotment in the Offer will be
only in electronic form in multiples of one Equity Share subject to a minimum Allotment of [●] Equity Shares. For further
details, see “Offer Procedure” beginning on page 298.
Joint Holders
Subject to the provisions contained in our Articles of Association, where two or more persons are registered as the holders of
the Equity Shares, they shall be entitled to hold the same as joint tenants with benefits of survivorship.
Nomination facility to Bidders
In accordance with Section 72 of the Companies Act read with the Companies (Share Capital and Debentures) Rules, 2014, as
amended, the sole Bidder, or the first Bidder along with other joint Bidders, may nominate any one person in whom, in the
event of the death of sole Bidder or in case of joint Bidders, death of all the Bidders, as the case may be, the Equity Shares
Allotted, if any, shall vest. A person, being a nominee, entitled to the Equity Shares by reason of the death of the original
holder(s), shall be entitled to the same advantages to which he or she would be entitled if he or she were the registered holder
of the Equity Share(s). Where the nominee is a minor, the holder(s) may make a nomination to appoint, in the prescribed
manner, any person to become entitled to Equity Share(s) in the event of his or her death during the minority. A nomination
shall stand rescinded upon a sale, transfer or alienation of Equity Share(s) by the person nominating. A nomination may be
cancelled or varied by nominating any other person in place of the present nominee by the holder of Equity Shares who has
made the nomination by giving a notice of such cancellation. A buyer will be entitled to make a fresh nomination in the manner
prescribed. Fresh nomination can be made only on the prescribed form available on request at our Registered Office or to the
registrar and transfer agents of our Company.
Any person who becomes a nominee by virtue of the provisions of Section 72 of the Companies Act shall upon the production
of such evidence as may be required by our Board, elect either:
a) to register himself or herself as the holder of the Equity Shares; or
b) to make such transfer of the Equity Shares, as the deceased holder could have made.
Further, our Board may at any time give notice requiring any nominee to choose either to be registered himself or herself or to
transfer the Equity Shares, and if the notice is not complied with within a period of 90 days, our Board may thereafter withhold

293
payment of all dividends, interests, bonuses or other monies payable in respect of the Equity Shares, until the requirements of
the notice have been complied with.
Since the Allotment of Equity Shares in the Offer will be made only in dematerialised mode there is no need to make a separate
nomination with our Company. Nominations registered with respective Depository Participant of the Bidder would prevail. If
the Bidder wants to change their nomination, they are requested to inform their respective Depository Participant.
Withdrawal of the Offer
Our Company, the Individual Selling Shareholder, and the Investor Selling Shareholders, in consultation with the Book Running
Lead Managers, reserve the right not to proceed with the Offer, in whole or in part thereof, to the extent of their respective
portion of Offered Shares after the Bid/Offer Opening Date but before the Allotment. In such an event, our Company would
issue a public notice in the newspapers in which the pre-Offer advertisements were published, within two days of the Bid/Offer
Closing Date or such other time as may be prescribed by SEBI, providing reasons for not proceeding with the Offer. The Book
Running Lead Managers through the Registrar to the Offer, shall notify the SCSBs and the Sponsor Bank, in case of RIBs using
the UPI Mechanism, to unblock the bank accounts of the ASBA Bidders (other than Anchor Investors) shall notify the Escrow
Collection Banks to release the Bid Amounts to the Anchor Investors, within one Working Day from the date of receipt of such
notification. Our Company shall also inform the same to the Stock Exchanges on which Equity Shares are proposed to be listed.
Notwithstanding the foregoing, the Offer is also subject to obtaining (i) the final listing and trading approvals of the Stock
Exchanges, which our Company shall apply for after Allotment, and (ii) filing of the Prospectus with the RoC. If our Company,
the Individual Selling Shareholder, and the Investor Selling Shareholders, in consultation with the Book Running Lead
Managers, withdraw the Offer after the Bid/Offer Closing Date and thereafter determine that they will proceed with a public
offering of the Equity Shares, our Company shall file a fresh draft red herring prospectus with SEBI and the Stock Exchanges.
Bid/Offer Programme
BID/OFFER OPENS ON Thursday, December 9, 2021*
BID/OFFER CLOSES ON Monday, December 13, 2021# * Our Company, the Individual Selling Shareholder, and the Investor Selling Shareholders may, in consultation with the Book Running Lead Managers,
consider participation by Anchor Investors in accordance with the SEBI ICDR Regulations. The Anchor Investor Bid/Offer Period shall be one Working
Day prior to the Bid/Offer Opening Date in accordance with the SEBI ICDR Regulations, i.e., Wednesday, December 8, 2021. # UPI mandate end time and date shall be at 12.00 pm on Tuesday, December 14, 2021.
An indicative timetable in respect of the Offer is set out below:
Event Indicative Date
Finalisation of Basis of Allotment with the Designated Stock Exchange On or about Thursday, December 16, 2021
Initiation of refunds (if any, for Anchor Investors)/unblocking of funds from ASBA Account* On or about Friday, December 17, 2021
Credit of Equity Shares to demat accounts of Allottees On or about Monday, December 20, 2021
Commencement of trading of the Equity Shares on the Stock Exchanges On or about Tuesday, December 21, 2021 * In case of (i) any delay in unblocking of amounts in the ASBA Accounts (including amounts blocked through the UPI Mechanism) for cancelled/
withdrawn/ deleted ASBA Forms, the Bidder shall be compensated by the SCSB responsible for causing such delay in unblocking at a uniform rate of ₹100 per day or 15% per annum of the Bid Amount, whichever is higher from the date on which the request for cancellation/ withdrawal/ deletion is
placed in the Stock Exchanges bidding platform until the date on which the amounts are unblocked (ii) any blocking of multiple amounts for the same
ASBA Form (for amounts blocked through the UPI Mechanism), the Bidder shall be compensated by the SCSB responsible for causing such delay in unblocking at a uniform rate ₹100 per day or 15% per annum of the total cumulative blocked amount except the original application amount, whichever
is higher from the date on which such multiple amounts were blocked till the date of actual unblock; (iii) any blocking of amounts more than the Bid
Amount, the Bidder shall be compensated by the SCSB responsible for causing such delay in unblocking at a uniform rate of ₹100 per day or 15% per annum of the difference in amount, whichever is higher from the date on which such excess amounts were blocked till the date of actual unblock; (iv) any
delay in unblocking of non-allotted/ partially allotted Bids, exceeding four Working Days from the Bid/Offer Closing Date, the Bidder shall be compensated at a uniform rate of ₹100 per day or 15% per annum of the Bid Amount, whichever is higher for the entire duration of delay exceeding four
Working Days from the Bid/ Offer Closing Date by the SCSB responsible for causing such delay in unblocking. The post Offer BRLM(s) shall be liable
for compensating the Bidder at a uniform rate of ₹100 per day or 15% per annum of the Bid Amount, whichever is higher from the date of receipt of the investor grievance until the date on which the blocked amounts are unblocked. The Bidder shall be compensated in the manner specified in the SEBI
circular no. SEBI/HO/CFD/DIL1/CIR/P/2021/47 dated March 31, 2021 and SEBI circular no. SEBI/HO/CFD/DIL2/CIR/P/2021/2480/1/M dated March
16, 2021, as amended pursuant to SEBI circular no. SEBI/HO/CFD/DIL2/P/CIR/2021/570 dated June 2, 2021, which for the avoidance of doubt, shall
be deemed to be incorporated in the deemed agreement of the Company with the SCSBs, to the extent applicable.
The above timetable is indicative and does not constitute any obligation or liability on our Company or the Selling
Shareholders or the Book Running Lead Managers.
While our Company shall ensure that all steps for the completion of the necessary formalities for the listing and the
commencement of trading of the Equity Shares on the Stock Exchanges are taken within six Working Days of the
Bid/Offer Closing Date or such other time as may be prescribed by SEBI, the timetable may be subject to change due
to various factors, such as extension of the Bid/Offer Period by our Company, the Individual Selling Shareholder, and
the Investor Selling Shareholders, in consultation with the Book Running Lead Managers, revision of the Price Band or
any delay in receiving the final listing and trading approval from the Stock Exchanges or delay in receipt of final
certificates from SCSBs, etc. The commencement of trading of the Equity Shares will be entirely at the discretion of the
Stock Exchanges and in accordance with the applicable laws. Each Selling Shareholders, severally and not jointly,

294
confirms that it shall extend reasonable co-operation to the extent of its respective portion of the Offered Shares as may
be required by our Company and the Book Running Lead Managers to facilitate the completion of the necessary
formalities for listing and commencement of trading of the Equity Shares at the Stock Exchanges within six Working
Days from the Bid/Offer Closing Date or such other time as may be prescribed by SEBI.
SEBI is in the process of streamlining and reducing the post issue timeline for IPOs. Any circulars or notifications from
SEBI after the date of this Red Herring Prospectus may result in changes to the above mentioned timelines. Further,
the offer procedure is subject to change basis any revised SEBI circulars to this effect.
In terms of the UPI Circulars, in relation to the Offer, the Book Running Lead Managers will be required to submit reports of
compliance with timelines and activities prescribed by SEBI in connection with the allotment and listing procedure within six
Working Days from the Bid/Offer Closing Date, identifying non-adherence to timelines and processes and an analysis of entities
responsible for the delay and the reasons associated with it.
In case of any delay in unblocking of amounts in the ASBA Accounts (including amounts blocked through the UPI Mechanism)
exceeding four days from the Bid/Offer Closing Date, the Bidder shall be compensated at a uniform rate of ₹100 per day for
the entire duration of delay exceeding four days from the Bid/Offer Closing Date by the intermediary responsible for causing
such delay in unblocking. The Book Running Lead Managers shall, in their sole discretion, identify and fix the liability on such
intermediary or entity responsible for such delay in unblocking.
Submission of Bids (other than Bids from Anchor Investors):
Bid/Offer Period (except the Bid/Offer Closing Date)
Submission and Revision in Bids Only between 10.00 a.m. and 5.00 p.m. (Indian Standard Time (“IST”)
Bid/Offer Closing Date
Submission and Revision in Bids Only between 10.00 a.m. and 3.00 p.m. IST
On the Bid/Offer Closing Date, the Bids shall be uploaded until:
(i) 4.00 p.m. IST in case of Bids by QIBs and Non-Institutional Bidders, and
(ii) until 5.00 p.m. IST or such extended time as permitted by the Stock Exchanges, in case of Bids by RIBs.
On Bid/Offer Closing Date, extension of time will be granted by Stock Exchanges only for uploading Bids received by RIBs
after taking into account the total number of Bids received and as reported by the Book Running Lead Managers to the Stock
Exchanges.
The Registrar to the Offer shall submit the details of cancelled/withdrawn/deleted applications to the SCSB’s on daily basis
within 60 minutes of the Bid closure time from the Bid/ Offer Opening Date till the Bid/Offer Closing Date by obtaining the
same from the Stock Exchanges. The SCSB’s shall unblock such applications by the closing hours of the Working Day.
To avoid duplication, the facility of re-initiation provided to Syndicate Members shall preferably be allowed only once per
bid/batch and as deemed fit by the Stock Exchanges, after closure of the time for uploading Bids.
It is clarified that Bids not uploaded on the electronic bidding system or in respect of which the full Bid Amount is not
blocked by SCSBs or not blocked under the UPI Mechanism in the relevant ASBA Account, as the case may be, would
be rejected.
Due to limitation of time available for uploading the Bids on the Bid/Offer Closing Date, Bidders are advised to submit their
Bids one day prior to the Bid/Offer Closing Date. Any time mentioned in this Red Herring Prospectus is IST. Bidders are
cautioned that, in the event a large number of Bids are received on the Bid/Offer Closing Date, some Bids may not get uploaded
due to lack of sufficient time. Such Bids that cannot be uploaded will not be considered for allocation under the Offer. Bids and
any revision in Bids will be accepted only during Working Days.
None among our Company and the Selling Shareholders or any member of the Syndicate is liable for any failure in uploading
the Bids due to faults in any software/ hardware system or the blocking of Bid Amount in the ASBA Account on receipt of
instructions from the Sponsor Bank on account of any errors, omissions or non-compliance by various parties involved in, or
any other fault, malfunctioning or breakdown in, or otherwise, in the UPI Mechanism.
In case of any discrepancy in the data entered in the electronic book vis-à-vis the data contained in the physical Bid cum
Application Form, for a particular Bidder, the details as per the Bid file received from the Stock Exchanges shall be taken as
the final data for the purpose of Allotment.
Our Company, the Individual Selling Shareholder, and the Investor Selling Shareholders, in consultation with the Book Running
Lead Managers, reserve the right to revise the Price Band during the Bid/Offer Period in accordance with the SEBI ICDR
Regulations. The revision in the Price Band shall not exceed 20% on either side, i.e. the Floor Price can move up or down to

295
the extent of 20% of the Floor Price and the Cap Price will be revised accordingly, but the Floor Price shall not be less than the
face value of the Equity Shares. In all circumstances, the Cap Price shall be less than or equal to 120% of the Floor Price.
In case of any revision to the Price Band, the Bid/Offer Period will be extended by at least three additional Working
Days following such revision of the Price Band, subject to the Bid/Offer Period not exceeding 10 Working Days. In cases
of force majeure, banking strike or similar circumstances, our Company may, for reasons to be recorded in writing,
extend the Bid/Offer Period for a minimum of three Working Days, subject to the Bid/Offer Period not exceeding 10
Working Days. Any revision in the Price Band and the revised Bid/Offer Period, if applicable, will be widely
disseminated by notification to the Stock Exchanges, by issuing a public notice, and also by indicating the change on the
respective websites of the Book Running Lead Managers and at the terminals of the Syndicate Members and by
intimation to Self-Certified Syndicate Banks (“SCSBs”), other Designated Intermediaries and the Sponsor Bank, as
applicable.
Minimum Subscription
As this is an offer for sale by the Selling Shareholders, the requirement of minimum subscription of 90% of the Fresh Issue
under the SEBI ICDR Regulations is not applicable to this Offer. However, if our Company does not receive the minimum
subscription in the Offer as specified under the terms of Rule 19(2)(b) of the SCRR, as applicable, on the date of closure of the
Offer or withdrawal of applications; or after technical rejections; or if the listing or trading permission are not obtained from
the Stock Exchanges for the Equity Shares so offered under the Offer document, our Company shall forthwith refund the entire
subscription amount received. If there is a delay beyond the prescribed time, our Company and every Director of our Company,
who is an officer in default, shall pay interest at the rate as prescribed under the applicable law.
Further, our Company shall ensure that the number of prospective Allottees to whom the Equity Shares will be Allotted shall
not be less than 1,000 in compliance with Regulation 49(1) of SEBI ICDR Regulations, failing which, the entire application
money shall be unblocked in the respective ASBA Accounts of the Bidders. In case of an under-subscription in the Offer, the
Equity Shares proposed for sale by each Selling Shareholder shall be in proportion to the Offered Shares by such Selling
Shareholder.
Arrangements for Disposal of Odd Lots
Since the Equity Shares will be traded in dematerialised form only, and the market lot for our Equity Shares will be one Equity
Share, no arrangements for disposal of odd lots are required.
New Financial Instruments
Our Company is not issuing any new financial instruments through this Offer.
Restrictions, if any on Transfer and Transmission of Equity Shares
Except for the lock-in of the pre-Offer capital of our Company, lock-in of the Promoters’ contribution and the Anchor Investor
lock-in as provided in “Capital Structure” beginning on page 70 and except as provided under the Articles of Association, there
are no restrictions on transfer of the Equity Shares. Further, there are no restrictions on transmission of the Equity Shares of our
Company and on their consolidation or splitting, except as provided in the Articles of Association. For details, see “Main
Provisions of Articles of Association” beginning on page 315.

296
OFFER STRUCTURE
The Offer is of up to 10,063,945 Equity Shares of face value of ₹2 each at an Offer Price of ₹[●] per Equity Share for cash
aggregating up to ₹[●] million comprising an Offer of Sale of up to 10,063,945 Equity Shares aggregating up to ₹[●] million
by the Selling Shareholders.
Subject to conversion of the Preference Shares, the Offer will constitute 18.90% of the post-Offer paid-up Equity Share capital
of our Company. The face value of the Equity Shares is ₹2 each.
In terms of Rule 19(2)(b) of the SCRR, the Offer is being made through the Book Building Process, in compliance with
Regulation 31 of the SEBI ICDR Regulations.
Particulars QIBs(1) Non-Institutional Bidders Retail Individual Bidders
Number of Equity Shares
available for Allotment/
allocation*(2)
Not more than 5,031,972 Equity Shares Not less than 1,509,592 Equity Shares
available for allocation or Offer less
allocation to QIB Bidders and Retail
Individual Bidders
Not less than 3,522,381
Equity Shares available for
allocation or Offer less
allocation to QIB Bidders and
Non-Institutional Bidders
Percentage of Offer size
available for Allotment/
allocation
Not more than 50% of the Offer being
available for allocation to QIB Bidders.
However, up to 5% of the Net QIB
Portion will be available for allocation
proportionately to Mutual Funds only.
Mutual Funds participating in the
Mutual Fund Portion will also be
eligible for allocation in the remaining
QIB Portion. The unsubscribed portion
in the Mutual Fund Portion will be
added to the Net QIB Portion
Not less than 15% of the Offer or the
Offer less allocation to QIB Bidders
and RIBs
Not less than 35% of the Offer
or the Offer less allocation to
QIB Bidders and Non-
Institutional Bidders
Basis of Allotment if
respective category is
oversubscribed*
Proportionate as follows (excluding the
Anchor Investor Portion):
(a) Up to 100,639 Equity Shares shall
be available for allocation on a
proportionate basis to Mutual
Funds only; and
(b) Up to 1,912,150 Equity Shares
shall be available for allocation
on a proportionate basis to all
QIBs, including Mutual Funds
receiving allocation as per (a)
above.
Up to 60% of QIB Portion (up to
3,019,183 Equity Shares may be
allocated on a discretionary basis to
Anchor Investors of which one-third
shall be available for allocation to
Mutual Funds only, subject to valid Bid
received from Mutual Funds at or above
the Anchor Investor Allocation Price
Proportionate The allotment to each Retail
Individual Bidder shall not be
less than the minimum Bid
Lot, subject to availability of
Equity Shares in the Retail
Portion and the remaining
available Equity Shares if any,
shall be Allotted on a
proportionate basis. For
further details, see “Offer
Procedure” beginning on page
298.
Minimum Bid Such number of Equity Shares and in
multiples of [●] Equity Shares that the
Bid Amount exceeds ₹200,000
Such number of Equity Shares in
multiples of [●] Equity Shares that the
Bid Amount exceeds ₹200,000
[●] Equity Shares and in
multiples of [●] Equity Shares
thereafter
Maximum Bid Such number of Equity Shares in
multiples of [●] Equity Shares not
exceeding the size of the Offer, subject
to applicable limits
Such number of Equity Shares in
multiples of [●] Equity Shares not
exceeding the size of the Offer
(excluding the QIB portion), subject
to applicable limits to the Bidder
Such number of Equity Shares
in multiples of [●] Equity
Shares so that the Bid Amount
does not exceed ₹200,000
Mode of Allotment Compulsorily in dematerialised form
Bid Lot [●] Equity Shares and in multiples of [●] Equity Shares thereafter
Allotment Lot [●] Equity Shares and in multiples of one Equity Share thereafter
Trading Lot One Equity Share
Who can apply(3) Public financial institutions as specified
in Section 2(72) of the Companies Act
2013, scheduled commercial banks,
Mutual Funds, FPIs (other than
Resident Indian individuals, Eligible
NRIs, HUFs (in the name of the karta),
companies, corporate bodies,
scientific institutions societies and
Resident Indian individuals,
Eligible NRIs and HUFs (in
the name of the karta)

297
Particulars QIBs(1) Non-Institutional Bidders Retail Individual Bidders
individuals, corporate bodies and
family offices), VCFs, AIFs, FVCIs
registered with SEBI, multilateral and
bilateral development financial
institutions, state industrial
development corporation, insurance
company registered with IRDAI,
provident funds with minimum corpus
of ₹250 million, pension funds with
minimum corpus of ₹250 million
National Investment Fund set up by the
Government of India, insurance funds
set up and managed by army, navy or
air force of the Union of India,
insurance funds set up and managed by
the Department of Posts, India and
Systemically Important NBFCs.
trusts and any individuals, corporate
bodies and family offices including
FPIs which are individuals, corporate
bodies and family offices which are
re-categorised as Category II FPIs and
registered with SEBI
Terms of Payment In case of Anchor Investors: Full Bid Amount shall be payable by the Anchor Investors at the time of
submission of their Bids(4)
In case of all other Bidders: Full Bid Amount shall be blocked by the SCSBs in the bank account of the ASBA
Bidder (other than Anchor Investors) or by the Sponsor Bank through the UPI Mechanism, that is specified in
the ASBA Form at the time of submission of the ASBA Form.
Mode of Bid Only through the ASBA process (except for Anchor Investors)
* Assuming full subscription in the Offer
(1) Our Company, the Individual Selling Shareholder, and the Investor Selling Shareholders may, in consultation with the Book Running Lead Managers,
allocate up to 60% of the QIB Portion to Anchor Investors on a discretionary basis in accordance with the SEBI ICDR Regulations. One-third of the Anchor Investor Portion shall be reserved for domestic Mutual Funds, subject to valid Bids being received from domestic Mutual Funds at or above the
price Anchor Investor Allocation Price. In the event of under-subscription or non-allotment in Anchor Investor Portion, the balance Equity Shares in
Anchor Investor Portion shall be added to Net QIB Portion. (2) Subject to valid Bids being received at or above the Offer Price. This is an Offer in terms of Rule 19(2)(b) of the SCRR read with Regulation 45 of the
SEBI ICDR Regulations. This Offer is being made in compliance with Regulation 6(1) of the SEBI ICDR Regulations, wherein not more than 50% of the
Offer shall be available for allocation on a proportionate basis to Qualified Institutional Buyers. Such number of Equity Shares representing 5% of the Net QIB Portion shall be available for allocation on a proportionate basis to Mutual Funds only. The remainder of the QIB Portion shall be available
for allocation on a proportionate basis to QIBs, including Mutual Funds, subject to valid Bids being received from them at or above the Offer Price. However, if the aggregate demand from Mutual Funds is less than 5% of the QIB Portion, the balance Equity Shares available for allocation in the
Mutual Fund Portion will be added to the remaining QIB Portion for proportionate allocation to all QIBs. Further, not less than 15% of the Offer shall
be available for allocation on a proportionate basis to Non-Institutional Investors and not less than 35% of the Offer shall be available for allocation to Retail Individual Investors in accordance with the SEBI ICDR Regulations, subject to valid Bids being received from them at or above the Offer Price.
Subject to valid Bids being received at or above the Offer Price, under-subscription, if any, in the Non-Institutional Portion or the Retail Portion would
be allowed to be met with spill-over from other categories or a combination of categories at the discretion of our Company and the Promoter Selling Shareholder, in consultation with the BRLMs and the Designated Stock Exchange, on a proportionate basis. For further details, please see “Terms of
the Offer” on page 291.
(3) Anchor Investors are not permitted to use the ASBA process. (4) In case of joint Bids, the Bid cum Application Form should contain only the name of the first Bidder whose name should also appear as the first holder
of the beneficiary account held in joint names. The signature of only such first Bidder would be required in the Bid cum Application Form and such first
Bidder would be deemed to have signed on behalf of the joint holders. (5) Full Bid Amount shall be payable by the Anchor Investors at the time of submission of the Anchor Investor Application Forms provided that any difference
between the Anchor Investor Allocation Price and the Anchor Investor Offer Price shall be payable by the Anchor Investor Pay-In Date as indicated in
the CAN. The Bids by FPIs with certain structures as described under “Offer Procedure - Bids by FPIs” on page 302 to 303 and having same PAN may be collated
and identified as a single Bid in the Bidding process. The Equity Shares Allocated and Allotted to such successful Bidders (with same PAN) may be
proportionately distributed. Bidders will be required to confirm and will be deemed to have represented to our Company, the Selling Shareholders, the Underwriters, their respective
directors, officers, agents, affiliates and representatives that they are eligible under applicable law, rules, regulations, guidelines and approvals to
acquire the Equity Shares.
Subject to valid Bids being received at or above the Offer Price, under-subscription, if any, in any category except the QIB
Portion, would be met with spill-over from the other categories or a combination of categories at the discretion of our Company,
the Individual Selling Shareholder, and the Investor Selling Shareholders, in consultation with the Book Running Lead
Managers, and the Designated Stock Exchange, on a proportionate basis. For further details, see the “Terms of the Offer”
beginning on page 291.

298
OFFER PROCEDURE
All Bidders should read the General Information Document for investing in Public Issues prepared and issued in accordance
with the circular no. SEBI/HO/CFD/DIL1/CIR/P/2020/37 dated march 17, 2020 and UPI Circulars (the “General Information
Document”), which highlights the key rules, processes and procedures applicable to public issues in general in accordance
with the provisions of the Companies Act, the SCRA, the SCRR and the SEBI ICDR Regulations which is part of abridged
prospectus accompanying the Bid cum Application Form. The General Information Document is available on the websites of
the Stock Exchanges and the Book Running Lead Managers. Please refer to the relevant provisions of the General Information
Document which are applicable to the Offer especially in relation to the process for Bids by RIBs through the UPI Mechanism.
The investors should note that the details and process provided in the General Information Document should be read along
with this section.
Additionally, all Bidders may refer to the General Information Document for information in relation to (i) category of investors
eligible to participate in the Offer; (ii) maximum and minimum Bid size; (iii) price discovery and allocation; (iv) payment
instructions for ASBA Bidders; (v) issuance of Confirmation of Allocation Note (“CAN”)) and Allotment in the Offer; (vi) price
discovery and allocation; (vii) general instructions (limited to instructions for completing the Bid cum Application Form); (viii)
designated date; (ix) disposal of applications; (x) submission of Bid cum Application Form; (xi) other instructions (limited to
joint bids in cases of individual, multiple bids and instances when an application would be rejected on technical grounds); (xii)
applicable provisions of the Companies Act relating to punishment for fictitious applications; (xiii) mode of making refunds;
and (xiv) interest in case of delay in Allotment or refund.
SEBI vide its circular no. SEBI/HO/CFD/DIL2/CIR/P/2018/138 dated November 1, 2018 read with its circular no.
SEBI/HO/CFD/DIL2/CIR/P/2019/50 dated April 3, 2019, has introduced an alternate payment mechanism using Unified
Payments Interface (“UPI”) and consequent reduction in timelines for listing in a phased manner. From January 1, 2019, the
UPI Mechanism for RIBs applying through Designated Intermediaries was made effective along with the existing process and
existing timeline of T+6 days. (“UPI Phase I”). The UPI Phase I was effective till June 30, 2019.
With effect from July 1, 2019, SEBI vide its circular no. SEBI/HO/CFD/DIL2/CIR/P/2019/76 dated June 28, 2019, read with
circular bearing number SEBI/HO/CFD/DIL2/CIR/P/2019/85 dated July 26, 2019 with respect to Bids by RIBs through
Designated Intermediaries (other than SCSBs), the existing process of physical movement of forms from such Designated
Intermediaries to SCSBs for blocking of funds has been discontinued and only the UPI Mechanism for such Bids with existing
timeline of T+6 days was mandated for a period of three months or launch of five main board public issues, whichever is later
(“UPI Phase II”). Subsequently, however, SEBI vide its circular no. SEBI/HO/CFD/DIL2/CIR/P/2020/50 dated March 30,
2020 extended the timeline for implementation of UPI Phase II till further notice. The final reduced timeline of T+3 days will
be made effective using the UPI Mechanism for applications by RIBs (“UPI Phase III”), as may be prescribed by SEBI. The
Offer will be undertaken pursuant to the processes and procedures under UPI Phase II, subject to any circulars, clarification
or notification issued by the SEBI from time to time. Further, SEBI vide its circular no.
SEBI/HO/CFD/DIL2/CIR/P/2021/2480/1/M dated March 16, 2021 as amended pursuant to SEBI circular no.
SEBI/HO/CFD/DIL2/P/CIR/2021/570 dated June 2, 2021 has introduced certain additional measures for streamlining the
process of initial public offers and redressing investor grievances. This circular shall come into force for initial public offers
opening on/or after May 1, 2021 except as amended pursuant to SEBI circular no. SEBI/HO/CFD/DIL2/P/CIR/2021/570 dated
June 2, 2021, and the provisions of this circular are deemed to form part of this Red Herring Prospectus. Additionally, SEBI
vide its circular no. SEBI/HO/CFD/DIL1/CIR/P/2021/47 dated March 31, 2021 has reduced the time period for refund of
application monies from 15 days to four days.
Our Company, the Selling Shareholders and the Book Running Lead Managers are not liable for any amendment, modification
or change in the applicable law which may occur after the date of this Red Herring Prospectus. Bidders are advised to make
their independent investigations and ensure that their Bids are submitted in accordance with applicable laws and do not exceed
the investment limits or maximum number of the Equity Shares that can be held by them under applicable law or as specified
in this Red Herring Prospectus and the Prospectus.
Book Building Procedure
The Offer is being made in terms of Rule 19(2)(b) of SCRR through the Book Building Process in accordance with Regulation
6(1) of the SEBI ICDR Regulations wherein not more than 50% of the Offer shall be allocated on a proportionate basis to QIBs,
provided that our Company, the Individual Selling Shareholder, and the Investor Selling Shareholders, in consultation with the
BRLMs, may allocate up to 60% of the QIB Portion to Anchor Investors on a discretionary basis in accordance with the SEBI
ICDR Regulations, of which one-third shall be reserved for domestic Mutual Funds, subject to valid Bids being received from
domestic Mutual Funds at or above the Anchor Investor Allocation Price. In the event of under-subscription, or non-allotment
in the Anchor Investor Portion, the balance Equity Shares shall be added to the Net QIB Portion. Further, 5% of the Net QIB
Portion shall be available for allocation on a proportionate basis only to Mutual Funds, and the remainder of the Net QIB Portion
shall be available for allocation on a proportionate basis to all QIBs (other than Anchor Investors), including Mutual Funds,
subject to valid Bids being received at or above the Offer Price. Further, not less than 15% of the Offer shall be available for
allocation on a proportionate basis to Non-Institutional Bidders and not less than 35% of the Offer shall be available for

299
allocation to Retail Individual Bidders in accordance with the SEBI ICDR Regulations, subject to valid Bids being received at
or above the Offer Price.
Under-subscription, if any, in any category, except in the QIB Portion, would be allowed to be met with spill over from any
other category or combination of categories of Bidders at the discretion of our Company in consultation with the BRLMs and
the Designated Stock Exchange subject to receipt of valid Bids received at or above the Offer Price. Under-subscription, if any,
in the QIB Portion, would not be allowed to be met with spill-over from any other category or a combination of categories.
The Equity Shares, on Allotment, shall be traded only in the dematerialised segment of the Stock Exchanges.
Bidders should note that the Equity Shares will be Allotted to all successful Bidders only in dematerialised form. The
Bid cum Application Forms, which do not have the details of the Bidders’ depository account, including DP ID, Client
ID, UPI ID (in case of RIBs using the UPI Mechanism) and PAN, shall be treated as incomplete and will be rejected.
Bidders will not have the option of being Allotted Equity Shares in physical form. However, they may get their Equity
Shares rematerialized subsequent to Allotment of Equity Shares in Offer, subject to applicable laws.
Investors must ensure that their PAN is linked with Aadhaar and are in compliance with CBDT notification dated February 13,
2020 and press release dated June 25, 2021.
Phased implementation of UPI for Bids by RIBs as per the UPI Circulars
SEBI has issued UPI Circulars in relation to streamlining the process of public issue of equity shares and convertibles by
introducing an alternate payment mechanism using UPI. Pursuant to the UPI Circulars, UPI has been introduced in a phased
manner as a payment mechanism (in addition to mechanism of blocking funds in the account maintained with SCSBs under the
ASBA) for applications by RIBs through intermediaries with the objective to reduce the time duration from public issue closure
to listing from six Working Days to up to three Working Days. Considering the time required for making necessary changes to
the systems and to ensure complete and smooth transition to the UPI payment mechanism, the UPI Circulars have introduced
and implemented the UPI payment mechanism in three phases in the following manner:
a) Phase I: This phase was applicable from January 1, 2019 until March 31, 2019 or floating of five main board public
issues, whichever was later. Subsequently, the timeline for implementation of Phase I was extended until June 30,
2019. Under this phase, a RIB also had the option to submit the ASBA Form with any of the intermediary and use his
/ her UPI ID for the purpose of blocking of funds. The time duration from public issue closure to listing would continue
to be six Working Days.
b) Phase II: This phase has become applicable from July 1, 2019 and was to initially continue for a period of three
months or floating of five main board public issues, whichever is later. SEBI vide its circular no.
SEBI/HO/CFD/DCR2/CIR/P/2019/133 dated November 8, 2019 has decided to extend the timeline for
implementation of UPI Phase II until March 31, 2020. Under this phase, submission of the physical ASBA Form by a
RIB through Designated Intermediaries (other than SCSBs) to SCSBs for blocking of funds has been discontinued and
is replaced by the UPI payment mechanism. However, the time duration from public issue closure to listing continues
to be six Working Days during this phase. Subsequently, SEBI vide its circular no.
SEBI/HO/CFD/DIL2/CIR/P/2020/50 dated March 30, 2020 extended the timeline for implementation of UPI Phase II
till further notice. However, the time duration from public issue closure to listing continues to be six Working Days
during this phase.
c) Phase III: The commencement period of Phase III is yet to be notified. In this phase, the time duration from public
issue closure to listing would be reduced to be three Working Days. Accordingly, upon commencement of Phase III,
the reduced time duration shall be applicable for the Offer.
The Offer will be made under UPI Phase II of the UPI Circular, unless UPI Phase III of the UPI Circular becomes effective and
applicable on or prior to the Bid/Offer Opening Date. If the Offer is made under UPI Phase III of the UPI Circular, the same
will be advertised in all editions of Financial Express, an English national daily newspaper and all editions of Jansatta, a Hindi
national daily newspaper (Hindi also being the regional language of New Delhi, where our Registered and Corporate Office is
located), each with wide circulation, on or prior to the Bid/Offer Opening Date and such advertisement shall also be made
available to the Stock Exchanges for the purpose of uploading on their websites.
All SCSBs offering facility of making application in public issues shall also provide facility to make application using UPI.
The Company will be required to appoint one of the SCSBs as a sponsor bank to act as a conduit between the Stock Exchanges
and NPCI in order to facilitate collection of requests and / or payment instructions of the RIBs using the UPI.
For further details, refer to the General Information Document available on the websites of the Stock Exchanges and the Book
Running Lead Managers.

300
Bid cum Application Form
Copies of the Bid cum Application Form (other than for Anchor Investors) and the abridged prospectus will be available with
the Designated Intermediaries at the relevant Bidding Centres, and at our Registered and Corporate Office. An electronic copy
of the Bid cum Application Form will also be available for download on the websites of NSE (www.nseindia.com) and BSE
(www.bseindia.com) at least one day prior to the Bid / Offer Opening Date. Copies of Anchor Investor Application Form will
be available at offices of BRLMs.
All Bidders (other than Anchor Investors) shall mandatorily participate in the Offer only through the ASBA process. ASBA
Bidders must provide either (i) the bank account details and authorisation to block funds in their respective ASBA Form, or (ii)
the UPI ID (in case of RIBs), as applicable, in the relevant space provided in the ASBA Form. The ASBA Forms that do not
contain such details will be rejected. Applications made by the RIBs using third party bank account or using third party linked
bank account UPI ID are liable for rejection. Anchor Investors are not permitted to participate in the Offer through the ASBA
process.
ASBA Bidders shall ensure that the Bids are made on ASBA Forms bearing the stamp of the Designated Intermediary, submitted
at the Bidding Centres only (except in case of electronic ASBA Forms) and the ASBA Forms not bearing such specified stamp
are liable to be rejected. RIBs using UPI Mechanism, shall submit their ASBA Forms with Syndicate Members, Registered
Brokers, RTA or Depository Participants. ASBA Bidders are also required to ensure that the ASBA Account has sufficient
credit balance as an amount equivalent to the full Bid Amount which can be blocked by the SCSB.
For Anchor Investor, the Anchor Investor Application Form will be available at the offices of the Book Running Lead Managers.
The prescribed colour of the Bid cum Application Form for the various categories is as follows:
Category Colour of Bid cum
Application Form*
Resident Indians, including QIBs, Non-institutional Investors and Retail Individual Investors, each resident in India
and Eligible NRIs applying on a non-repatriation basis
White
Non-Residents including Eligible NRIs, their sub-accounts (other than sub-accounts which are foreign corporates or
foreign individuals under the QIB Portion), FPIs or FVCIs registered multilateral and bilateral development financial
institutions applying on a repatriation basis
Blue
Anchor Investors White** * Excluding electronic Bid cum Application Form
** Bid cum Application Forms for Anchor Investors will be made available at the office of the Book Running Lead Managers.
Electronic Bid cum Application forms will also be available for download on the website of NSE (www.nseindia.com) and BSE (www.bseindia.com).
The Designated Intermediaries (other than SCSBs) shall submit/deliver the Bid cum Application Form to the respective SCSB,
where the Bidder has a bank account and shall not submit it to any non-SCSB bank or any Escrow Collection Bank. Further,
SCSBs shall upload the relevant Bid details (including UPI ID in case of ASBA Forms under the UPI Mechanism) in the
electronic bidding system of the Stock Exchanges. Stock Exchanges shall validate the electronic bids with the records of the
CDP for DP ID/Client ID and PAN, on a real time basis and bring inconsistencies to the notice of the relevant Designated
Intermediaries, for rectification and re-submission within the time specified by Stock Exchanges. Stock Exchanges shall allow
modification of either DP ID/Client ID or PAN ID, bank code and location code in the Bid details already uploaded.
For RIBs using UPI mechanism, the Stock Exchanges shall share the bid details (including UPI ID) with Sponsor Bank on a
continuous basis to enable the Sponsor Bank to initiate UPI Mandate Request to RIBs for blocking of funds. The Sponsor Bank
shall initiate request for blocking of funds through NPCI to RIBs, who shall accept the UPI Mandate Request for blocking of
funds on their respective mobile applications associated with UPI ID linked bank account. The NPCI shall maintain an audit
trail for every Bid entered in the Stock Exchanges bidding platform, and the liability to compensate RIBs (using the UPI
Mechanism) in case of failed transactions shall be with the concerned entity (i.e. the Sponsor Bank, NPCI or the Bankers to the
Offer) at whose end the lifecycle of the transaction has come to a halt. The NPCI shall share the audit trail of all disputed
transactions/ investor complaints to the Sponsor Banks and the Bankers to the Offer. The Book Running Lead Managers shall
also be required to obtain the audit trail from the Sponsor Banks and the Bankers to the Offer for analysing the same and fixing
liability. For ensuring timely information to investors, SCSBs shall send SMS alerts as specified in SEBI circular no.
SEBI/HO/CFD/DIL2/CIR/P/2021/2480/1/M dated March 16, 2021, as amended pursuant to SEBI circular no.
SEBI/HO/CFD/DIL2/P/CIR/2021/570 dated June 2, 2021.
Electronic registration of Bids
a) The Designated Intermediary may register the Bids using the on-line facilities of the Stock Exchanges. The Designated
Intermediaries can also set up facilities for off-line electronic registration of Bids, subject to the condition that they
may subsequently upload the off-line data file into the on-line facilities for Book Building on a regular basis before
the closure of the Offer.

301
b) On the Bid/Offer Closing Date, the Designated Intermediaries may upload the Bids till such time as may be permitted
by the Stock Exchanges and as disclosed in this Red Herring Prospectus.
c) Only Bids that are uploaded on the Stock Exchanges Platform are considered for allocation/Allotment. The Designated
Intermediaries are given till 1:00 pm on the next Working Day following the Bid/Offer Closing Date to modify select
fields uploaded in the Stock Exchange Platform during the Bid/Offer Period after which the Stock Exchange(s) send
the bid information to the Registrar to the Offer for further processing.
The processing fees for applications made by RIBs using the UPI Mechanism may be released to the SCSBs only after such
banks provide a written confirmation on compliance with SEBI circular no: SEBI/HO/CFD/DIL2/P/CIR/2021/570 dated June
2, 2021 read with SEBI circular no: SEBI/HO/CFD/DIL2/CIR/P/2021/2480/1/M dated March 16, 2021.
The Equity Shares offered in the Offer have not been and will not be registered under the U.S. Securities Act or any
other applicable law of the United States and, unless so registered, may not be offered or sold within the United States,
except pursuant to an exemption from, or in a transaction not subject to, the registration requirements of the U.S.
Securities Act and applicable state securities laws. Accordingly, the Equity Shares are only being offered and sold
outside the United States in “offshore transactions” in reliance on Regulation S under the U.S. Securities Act and the
applicable laws of the jurisdiction where those offers, and sales are made.
The Equity Shares have not been and will not be registered, listed or otherwise qualified in any other jurisdiction outside
India and may not be offered or sold, and Bids may not be made by persons in any such jurisdiction, except in compliance
with the applicable laws of such jurisdiction.
Participation by Promoters, members of their respective Promoter Groups, the Book Running Lead Managers, the
Syndicate Members and persons related to Promoters/Promoter Groups/the Book Running Lead Managers
The Book Running Lead Managers and the Syndicate Members shall not be allowed to purchase Equity Shares in this Offer in
any manner, except towards fulfilling their underwriting obligations. However, the associates and affiliates of the Book Running
Lead Managers and the Syndicate Members may Bid for Equity Shares in the Offer, either in the QIB Portion or in the Non-
Institutional Portion as may be applicable to such Bidders, where the allocation is on a proportionate basis, and such subscription
may be on their own account or on behalf of their clients. All categories of investors, including associates or affiliates of the
Book Running Lead Managers and Syndicate Members, shall be treated equally for the purpose of allocation to be made on a
proportionate basis.
Except as stated below, neither the Book Running Lead Managers nor any associate of the Book Running Lead Managers can
apply in the Offer under the Anchor Investor Portion:
(i) mutual funds sponsored by entities which are associate of the Book Running Lead Managers;
(ii) insurance companies promoted by entities which are associate of the Book Running Lead Managers;
(iii) AIFs sponsored by the entities which are associate of the Book Running Lead Managers; or
(iv) FPIs sponsored by the entities which are associate of the Book Running Lead Managers.
Further, the Promoters and members of their respective Promoter Groups shall not participate by applying for Equity Shares in
the Offer. Further, persons related to the Promoters and their respective Promoter Groups shall not apply in the Offer under the
Anchor Investor Portion. However, a qualified institutional buyer who has any of the following rights in relation to the Company
shall be deemed to be a person related to the Promoters or Promoter Groups of our Company:
(i) Rights under a shareholders’ agreement or voting agreement entered into with the Promoters or Promoter Groups of
our Company;
(ii) veto rights; or
(iii) right to appoint any nominee director on our Board.
Further, an Anchor Investor shall be deemed to be an “associate of the BRLM” if:
(i) either of them controls, directly or indirectly through its subsidiary or holding company, not less than 15% of the
voting rights in the other; or
(ii) either of them, directly or indirectly, by itself or in combination with other persons, exercises control over the other;
or

302
(iii) there is a common director, excluding nominee director, amongst the Anchor Investors and the Book Running Lead
Managers.
Bids by Mutual Funds
With respect to Bids by Mutual Funds, a certified copy of their SEBI registration certificate must be lodged along with the Bid
cum Application Form. Failing this, our Company, the Individual Selling Shareholder, and the Investor Selling Shareholders,
in consultation with the Book Running Lead Managers, reserve the right to reject any Bid without assigning any reason thereof,
subject to applicable law.
Bids made by asset management companies or custodians of Mutual Funds shall specifically state names of the concerned
schemes for which such Bids are made.
In case of a Mutual Fund, a separate Bid can be made in respect of each scheme of the Mutual Fund registered with SEBI and
such Bids in respect of more than one scheme of the Mutual Fund will not be treated as multiple Bids provided that the Bids
clearly indicate the scheme concerned for which such Bid has been made.
No Mutual Fund scheme shall invest more than 10% of its NAV in equity shares or equity-related instruments of any single
company, provided that the limit of 10% shall not be applicable for investments in case of index funds or sector or industry
specific schemes. No Mutual Fund under all its schemes should own more than 10% of any company’s paid-up share capital
carrying voting rights.
Bids by Eligible NRIs
Eligible NRIs Bidding on non-repatriation basis are advised to use the Bid cum Application Form for residents (white in colour).
Eligible NRIs Bidding on a repatriation basis are advised to use the Bid cum Application Form meant for Non-Residents (blue
in colour).
Eligible NRIs may obtain copies of Bid cum Application Form from the Designated Intermediaries. Eligible NRI Bidders
Bidding on a repatriation basis by using the Non-Resident Forms should authorize their SCSB (if they are Bidding directly
through the SCSB) or confirm or accept the UPI Mandate Request (in case of RIBs Bidding through the UPI Mechanism) to
block their Non-Resident External (“NRE”) accounts, or Foreign Currency Non-Resident (“FCNR”) Accounts, and eligible
NRI Bidders Bidding on a non-repatriation basis by using Resident Forms should authorize their respective SCSBs (if they are
Bidding directly through SCSB) or confirm or accept the UPI Mandate Request (in case of RIBs Bidding through the UPI
Mechanism) to block their Non-Resident Ordinary (“NRO”) accounts for the full Bid Amount, at the time of the submission of
the Bid cum Application Form. Participation of Eligible NRIs in the Offer shall be subject to the FEMA Rules.
NRIs will be permitted to apply in the Offer through Channel I or Channel II (as specified in the UPI Circular). Further, subject
to applicable law, NRIs may use Channel IV (as specified in the UPI Circular) to apply in the Offer, provided the UPI facility
is enabled for their NRE/ NRO accounts.
NRIs applying if Offer using UPI Mechanism are advised to enquire with relevant bank whether their bank account is UPI
linked prior to making such applications.
For details of restrictions on investment by NRIs, see “Restrictions on Foreign Ownership of Indian Securities” beginning on
page 314.
Participation of Eligible NRIs in the Offer shall be subject to the FEMA Rules.
Bids by HUFs
Bids by Hindu Undivided Families or HUFs should be made in the individual name of the Karta. The Bidder/applicant should
specify that the Bid is being made in the name of the HUF in the Bid cum Application Form/Application Form as follows:
“Name of sole or first Bidder/applicant: XYZ Hindu Undivided Family applying through XYZ, where XYZ is the name of the
Karta”. Bids/Applications by HUFs may be considered at par with Bids/Applications from individuals.
Bids by FPIs
In terms of the SEBI FPI Regulations, the issue of Equity Shares to a single FPI or an investor group (which means the same
set of ultimate beneficial owner(s) investing through multiple entities) must be below 10% of our total paid-up Equity Share
capital on a fully diluted basis. Further, in terms of the FEMA Rules, the total holding by each FPI shall be less than 10% of
the total paid-up Equity Share capital of our Company and the total holdings of all FPIs could be up to 100%, being the sectoral
cap, of the paid-up Equity Share capital of our Company on a fully diluted basis.
FPIs are permitted to participate in Offer subject to compliance with conditions and restrictions which may be specified by the
Government of India from time to time.

303
In case of Bids made by FPIs, a certified copy of the certificate of registration issued under the SEBI FPI Regulations is required
to be attached to the Bid cum Application Form, failing which our Company reserves the right to reject any Bid without
assigning any reason. FPIs who wish to participate in the Offer are advised to use the Bid cum Application Form for Non-
Residents (blue in colour).
In case the total holding of an FPI increases beyond 10% of the total paid-up Equity Share capital, on a fully diluted basis or
10% or more of the paid-up value of any series of debentures or preference shares or share warrants issued that may be issued
by our Company, the total investment made by the FPI will be re-classified as FDI subject to the conditions as specified by
SEBI and the RBI in this regard and our Company and the investor will be required to comply with applicable reporting
requirements.
As specified in 4.1.4.2 (b)(i) and 4.1.4.2 (c)(iv) of the General Information Document, it is hereby clarified that Bids received
from FPIs bearing the same PAN shall be treated as multiple Bids and are liable to be rejected, except for Bids from FPIs that
utilize the multiple investment manager structure in accordance with the Operational Guidelines for Foreign Portfolio Investors
and Designated Depository Participants issued to facilitate implementation of SEBI FPI Regulations (“MIM Structure”),
provided such Bids have been made with different beneficiary account numbers, Client IDs and DP IDs. Accordingly, it should
be noted that multiple Bids received from FPIs, who do not utilize the MIM Structure, and bear the same PAN, are liable to be
rejected. In order to ensure valid Bids, FPIs making multiple Bids using the same PAN, and with different beneficiary account
numbers, Client IDs and DP IDs, are required to provide a confirmation along with each of their Bid cum Application Forms
that the relevant FPIs making multiple Bids utilize the MIM Structure and indicate the name of their respective investment
managers in such confirmation. In the absence of such confirmation from the relevant FPIs, such multiple Bids are liable to be
rejected. Further, in the following cases, the bids by FPIs will not be considered as multiple Bids: involving (i) the MIM
Structure and indicating the name of their respective investment managers in such confirmation; (ii) offshore derivative
instruments (“ODI”) which have obtained separate FPI registration for ODI and proprietary derivative investments; (iii) sub
funds or separate class of investors with segregated portfolio who obtain separate FPI registration; (iv) FPI registrations granted
at investment strategy level/sub fund level where a collective investment scheme or fund has multiple investment strategies/sub-
funds with identifiable differences and managed by a single investment manager; (v) multiple branches in different jurisdictions
of foreign bank registered as FPIs; (vi) Government and Government related investors registered as Category 1 FPIs; and (vii)
Entities registered as Collective Investment Scheme having multiple share classes.
With effect from the April 1, 2020, the aggregate limit are the sectoral caps applicable to the Indian company as prescribed in
the FEMA Rules with respect to its paid-up equity capital on a fully diluted basis. While the aggregate limit as provided above
could have been decreased by the concerned Indian companies to a lower threshold limit of 24% or 49% or 74% as deemed fit,
with the approval of its board of directors and its shareholders through a resolution and a special resolution, respectively before
March 31, 2020, our Company has not decreased such limit and accordingly the applicable limit with respect to our Company
is 100%.
The FEMA Rules was enacted on October 17, 2019 in supersession of the Foreign Exchange Management (Transfer or Issue
of Security by a Person Resident Outside India) Regulations, 2017, except as respects things done or omitted to be done before
such supersession. FPIs are permitted to participate in the Offer subject to compliance with conditions and restrictions which
may be specified by the Government from time to time.
Subject to compliance with all applicable Indian laws, rules, regulations, guidelines and approvals in terms of Regulation 21 of
the SEBI FPI Regulations, an FPI, may issue, subscribe to or otherwise deal in offshore derivative instruments (as defined under
the SEBI FPI Regulations as any instrument, by whatever name called, which is issued overseas by a FPI against securities held
by it in India, as its underlying) directly or indirectly, only in the event (i) such offshore derivative instruments are issued only
by persons registered as Category I FPIs; (ii) such offshore derivative instruments are issued only to persons eligible for
registration as Category I FPIs; (iii) such offshore derivative instruments are issued after compliance with ‘know your client’
norms; and (iv) such other conditions as may be specified by SEBI from time to time.
An FPI issuing offshore derivative instruments is also required to ensure that any transfer of offshore derivative instruments
issued by or on its behalf, is carried out subject to inter alia the following conditions:
(a) such offshore derivative instruments are transferred only to persons in accordance with Regulation 22(1) of the SEBI
FPI Regulations; and
(b) prior consent of the FPI is obtained for such transfer, except when the persons to whom the offshore derivative
instruments are to be transferred to are pre-approved by the FPI.
Participation of FPIs in the Offer shall be subject to the FEMA Rules.
Bids under Power of Attorney
In case of Bids made pursuant to a power of attorney or by limited companies, corporate bodies, registered societies, eligible
FPIs, AIFs, Mutual Funds, insurance companies, insurance finds set up by the army, navy or air force of India, insurance funds

304
set up by the Department of Posts, India or the National Investment Fund and provident funds with a minimum corpus of ₹250
million and pension funds with a minimum corpus of ₹250 million (in each case, subject to applicable law and in accordance
with their respective constitutional documents), a certified copy of the power of attorney or the relevant resolution or authority,
as the case may be, along with a certified copy of the memorandum of association and articles of association and/or bye laws,
as applicable must be lodged along with the Bid cum Application Form. Failing this, our Company, the Individual Selling
Shareholder, and the Investor Selling Shareholders reserve the right to accept or reject any Bid in whole or in part, in either
case, without assigning any reasons thereof.
Our Company, the Individual Selling Shareholder, and the Investor Selling Shareholders, in consultation with the Book Running
Lead Managers in their absolute discretion, reserve the right to relax the above condition of simultaneous lodging of the power
of attorney along with the Bid cum Application Form.
Bids by SEBI registered VCFs, AIFs and FVCIs
The SEBI FVCI Regulations, SEBI VCF Regulations, inter alia, prescribe the investment restrictions on VCFs and FVCIs
registered with SEBI. Further, the SEBI AIF Regulations prescribe, amongst others, the investment restrictions on AIFs.
Accordingly, the holding in any company by any individual VCF or FVCI registered with SEBI should not exceed 25% of the
corpus of the VCF or FVCI. Further, VCFs and FVCIs can invest only up to 33.3% of the investible funds in various prescribed
instruments, including in public offerings.
Category I AIFs and Category II AIFs cannot invest more than 25% of the investible funds in one investee company. A Category
III AIF cannot invest more than 10% of the investible funds in one investee company. A VCF registered as a Category I AIF,
as defined in the SEBI AIF Regulations, cannot invest more than one-third of its investible funds by way of subscription to an
initial public offering of a venture capital undertaking. Pursuant to the repeal of the SEBI VCF Regulations, the VCFs which
have not re-registered as an AIF under the SEBI AIF Regulations shall continue to be regulated by the SEBI VCF Regulations
until the existing fund or scheme managed by the fund is wound up and such fund shall not launch any new scheme after the
notification of the SEBI AIF Regulations. Our Company, the Selling Shareholders, and the Book Running Lead Managers will
not be responsible for loss, if any, incurred by the Bidder on account of conversion of foreign currency.
Participation of VCFs, AIFs or FVCIs in the Offer shall be subject to the FEMA Rules.
Further, the shareholding of VCFs, category I AIFs or category II AIFs and FVCIs holding equity shares of a company prior to
an initial public offering being undertaken by such company, shall be exempt from lock-in requirements, Provided that such
equity shares shall be locked in for a period of at least one year from the date of purchase by the venture capital fund or
alternative investment fund or foreign venture capital investor.
All non-resident investors should note that refunds (in case of Anchor Investors), dividends and other distributions, if
any, will be payable in Indian Rupees only and net of bank charges and commission.
Bids by Limited Liability Partnerships
In case of Bids made by limited liability partnerships registered under the Limited Liability Partnership Act, 2008, a certified
copy of certificate of registration issued under the Limited Liability Partnership Act, 2008, must be attached to the Bid cum
Application Form. Failing this, our Company, the Individual Selling Shareholder, and the Investor Selling Shareholders in
consultation with the Book Running Lead Managers reserve the right to reject any Bid without assigning any reason thereof.
Bids by Banking Companies
In case of Bids made by banking companies registered with the RBI, certified copies of (i) the certificate of registration issued
by the RBI, and (ii) the approval of such banking company’s investment committee are required to be attached to the Bid cum
Application Form. Failing this, our Company, the Individual Selling Shareholder, and the Investor Selling Shareholders, in
consultation with the Book Running Lead Managers, reserve the right to reject any Bid without assigning any reason thereof,
subject to applicable law.
The investment limit for banking companies in non-financial services companies as per the Banking Regulation Act, 1949, as
amended, (the “Banking Regulation Act”), and the Master Directions - Reserve Bank of India (Financial Services provided
by Banks) Directions, 2016, as amended, is 10% of the paid-up share capital of the investee company, not being its subsidiary
engaged in non-financial services, or 10% of the bank’s own paid-up share capital and reserves, whichever is lower. Further,
the aggregate investment by a banking company in subsidiaries and other entities engaged in financial services company cannot
exceed 20% of the investee company’s paid up share capital and reserves. However, a banking company would be permitted to
invest in excess of 10% but not exceeding 30% of the paid-up share capital of such investee company if (i) the investee company
is engaged in non-financial activities permitted for banks in terms of Section 6(1) of the Banking Regulation Act, or (ii) the
additional acquisition is through restructuring of debt/corporate debt restructuring/strategic debt restructuring, or to protect the
bank’s interest on loans/investments made to a company. The bank is required to submit a time-bound action plan for disposal
of such shares within a specified period to the RBI. A banking company would require a prior approval of the RBI to make (i)

305
investment in excess of 30% of the paid-up share capital of the investee company, (ii) investment in a subsidiary and a financial
services company that is not a subsidiary (with certain exceptions prescribed), and (iii) investment in a non-financial services
company in excess of 10% of such investee company’s paid-up share capital as stated in 5(a)(v)(c)(i) of the Reserve Bank of
India (Financial Services provided by Banks) Directions, 2016, as amended.
Bids by SCSBs
SCSBs participating in the Offer are required to comply with the terms of the circulars bearing numbers CIR/CFD/DIL/12/2012
and CIR/CFD/DIL/1/2013 dated September 13, 2012 and January 2, 2013, respectively, issued by SEBI. Such SCSBs are
required to ensure that for making applications on their own account using ASBA, they should have a separate account in their
own name with any other SEBI registered SCSBs. Further, such account shall be used solely for the purpose of making
application in public issues and clear demarcated funds should be available in such account for such applications.
Bids by Insurance Companies
In case of Bids made by insurance companies registered with the IRDAI, a certified copy of certificate of registration issued by
IRDAI must be attached to the Bid cum Application Form. Failing this, our Company, the Individual Selling Shareholder, and
the Investor Selling Shareholders in consultation with the Book Running Lead Managers reserve the right to reject any Bid
without assigning any reason thereof, subject to applicable law.
The exposure norms for insurers are prescribed under the IRDAI Investment Regulations, based on investments in the equity
shares of a company, the entire group of the investee company and the industry sector in which the investee company operates.
Insurance companies participating in the Offer are advised to refer to the IRDAI Investment Regulations for specific investment
limits applicable to them and shall comply with all applicable regulations, guidelines and circulars issued by IRDAI from time
to time.
Bids by Provident Funds/Pension Funds
In case of Bids made by provident funds/pension funds with minimum corpus of ₹250 million, subject to applicable law, a
certified copy of a certificate from a chartered accountant certifying the corpus of the provident fund/pension fund must be
attached to the Bid cum Application Form. Failing this, our Company, the Individual Selling Shareholder, and the Investor
Selling Shareholders in consultation with the Book Running Lead Managers reserve the right to reject any Bid, without
assigning any reason thereof.
Bids by Systemically Important NBFCs
In case of Bids made by Systemically Important NBFCs registered with RBI, certified copies of: (i) the certificate of registration
issued by RBI, (ii) certified copy of its last audited financial statements on a standalone basis, (iii) a net worth certificate from
its statutory auditor, and (iv) such other approval as may be required by the Systemically Important NBFCs, are required to be
attached to the Bid cum Application Form. Failing this, our Company, the Individual Selling Shareholder, and the Investor
Selling Shareholders, in consultation with the Book Running Lead Managers, reserves the right to reject any Bid without
assigning any reason thereof, subject to applicable law. Systemically Important NBFCs participating in the Offer shall comply
with all applicable regulations, guidelines and circulars issued by RBI from time to time.
The investment limit for Systemically Important NBFCs shall be as prescribed by RBI from time to time.
Bids by Anchor Investors
(a) In accordance with the SEBI ICDR Regulations, in addition to details and conditions mentioned in this section the key
terms for participation by Anchor Investors are provided below. Anchor Investor Application Forms will be made
available for the Anchor Investor Portion at the offices of the BRLMs.
(b) The Bid must be for a minimum of such number of Equity Shares so that the Bid Amount exceeds ₹100 million. A
Bid cannot be submitted for over 60% of the QIB Portion. In case of a Mutual Fund, separate bids by individual
schemes of a Mutual Fund will be aggregated to determine the minimum application size of ₹100 million.
(c) One-third of the Anchor Investor Portion will be reserved for allocation to domestic Mutual Funds.
(d) Bidding for Anchor Investors will open one Working Day before the Bid/Offer Opening Date, and will be completed
on the same day.
(e) Our Company, the Individual Selling Shareholder, and the Investor Selling Shareholders, in consultation with the
BRLMs may finalise allocation to the Anchor Investors on a discretionary basis, provided that the minimum number
of Allottees in the Anchor Investor Portion will not be less than:
• maximum of two Anchor Investors, where allocation under the Anchor Investor Portion is up to ₹100 million;

306
• minimum of two and maximum of 15 Anchor Investors, where the allocation under the Anchor Investor
Portion is more than ₹100 million but up to ₹2,500 million, subject to a minimum Allotment of ₹50 million
per Anchor Investor; and
• in case of allocation above ₹2,500 million under the Anchor Investor Portion, a minimum of five such
investors and a maximum of 15 Anchor Investors for allocation up to ₹2,500 million, and an additional 10
Anchor Investors for every additional ₹2,500 million, subject to minimum Allotment of ₹50 million per
Anchor Investor.
(f) Allocation to Anchor Investors will be completed on the Anchor Investor Bid/Offer Period. The number of Equity
Shares allocated to Anchor Investors and the price at which the allocation is made, will be made available in the public
domain by the BRLMs before the Bid/Offer Opening Date, through intimation to the Stock Exchanges.
(g) Anchor Investors cannot withdraw or lower the size of their Bids at any stage after submission of the Bid.
(h) If the Offer Price is greater than the Anchor Investor Allocation Price, the additional amount being the difference
between the Offer Price and the Anchor Investor Offer Price will be payable by the Anchor Investors on the Anchor
Investor pay-in date specified in the CAN. If the Offer Price is lower than the Anchor Investor Offer Price, Allotment
to successful Anchor Investors will be at the higher price.
(i) Equity Shares Allotted in the Anchor Investor Portion will be locked in for a period of 30 days from the date of
Allotment.
(j) Neither the BRLMs nor any associate of the BRLMs (except Mutual Funds sponsored by entities which are associates
of the BRLMs or insurance companies promoted by entities which are associate of BRLMs or AIFs sponsored by the
entities which are associate of the BRLMs or FPIs, other than individuals, corporate bodies and family offices
sponsored by the entities which are associate of the and BRLMs) shall apply in the Offer under the Anchor Investor
Portion.
(k) Bids made by QIBs under both the Anchor Investor Portion and the QIB Portion will not be considered multiple Bids.
The information set out above is given for the benefit of the Bidders. Our Company, the Selling Shareholders, and the
Book Running Lead Managers are not liable for any amendments or modification or changes to applicable laws or
regulations, which may occur after the date of this Red Herring Prospectus. Bidders are advised to make their
independent investigations and ensure that any single Bid from them does not exceed the applicable investment limits
or maximum number of the Equity Shares that can be held by them under applicable law or regulations, or as specified
in this Red Herring Prospectus or as will be specified in this Red Herring Prospectus and the Prospectus.
Information for Bidders
The relevant Designated Intermediary will enter a maximum of three Bids at different price levels opted in the Bid cum
Application Form and such options are not considered as multiple Bids. It is the Bidder’s responsibility to obtain the
acknowledgment slip from the relevant Designated Intermediary. The registration of the Bid by the Designated Intermediary
does not guarantee that the Equity Shares shall be allocated/Allotted. Such Acknowledgement Slip will be non-negotiable and
by itself will not create any obligation of any kind. When a Bidder revises his or her Bid, he /she shall surrender the earlier
Acknowledgement Slip and may request for a revised acknowledgment slip from the relevant Designated Intermediary as proof
of his or her having revised the previous Bid.
In relation to electronic registration of Bids, the permission given by the Stock Exchanges to use their network and software of
the electronic bidding system should not in any way be deemed or construed to mean that the compliance with various statutory
and other requirements by our Company, the Selling Shareholders and/or the BRLMs are cleared or approved by the Stock
Exchanges; nor does it in any manner warrant, certify or endorse the correctness or completeness of compliance with the
statutory and other requirements, nor does it take any responsibility for the financial or other soundness of our Company, the
management or any scheme or project of our Company; nor does it in any manner warrant, certify or endorse the correctness
or completeness of any of the contents of this Red Herring Prospectus or this Red Herring Prospectus; nor does it warrant that
the Equity Shares will be listed or will continue to be listed on the Stock Exchanges.
General Instructions
Please note that QIBs and Non-Institutional Bidders are not permitted to withdraw their Bid(s) or lower the size of their Bid(s)
(in terms of quantity of Equity Shares or the Bid Amount) at any stage. RIBs can revise their Bid(s) during the Bid/Offer Period
and withdraw or lower the size of their Bid(s) until Bid/Offer Closing Date. Anchor Investors are not allowed to withdraw their
Bids after the Anchor Investor Bid/Offer Period.

307
Do’s:
1. Check if you are eligible to apply as per the terms of this Red Herring Prospectus and under applicable law, rules,
regulations, guidelines and approvals. All Bidders (other than Anchor Investors) should submit their Bids through the
ASBA process only;
2. Ensure that you have Bid within the Price Band;
3. Read all the instructions carefully and complete the Bid cum Application Form in the prescribed form;
4. Ensure that you (other than the Anchor Investors) have mentioned the correct details of ASBA Account (i.e. bank
account number or UPI ID, as applicable) in the Bid cum Application Form if you are not an RIB bidding using the
UPI Mechanism in the Bid cum Application Form and if you are an RIB using the UPI Mechanism ensure that you
have mentioned the correct UPI ID (with maximum length of 45 characters including the handle) in the Bid cum
Application Form;
5. Ensure that your Bid cum Application Form bearing the stamp of a Designated Intermediary is submitted to the
Designated Intermediary at the relevant Bidding Centre (except in case of electronic Bids) within the prescribed time.
Bidders (other than Anchor Investors) shall submit the Bid cum Application Form in the manner set out in the General
Information Document;
6. RIBs Bidding in the Offer shall ensure that they use only their own ASBA Account or only their own bank account
linked UPI ID (only for RIBs using the UPI Mechanism) to make an application in the Offer and not ASBA Account
or bank account linked UPI ID of any third party;
7. Ensure that you have funds equal to the Bid Amount in the ASBA Account maintained with the SCSB before
submitting the ASBA Form to the relevant Designated Intermediaries;
8. Ensure that the signature of the first Bidder in case of joint Bids, is included in the Bid cum Application Forms. If the
first Bidder is not the ASBA Account holder, ensure that the Bid cum Application Form is also signed by the ASBA
Account holder;
9. Ensure that the names given in the Bid cum Application Form is/are exactly the same as the names in which the
beneficiary account is held with the Depository Participant. In case of joint Bids, the Bid cum Application Form should
contain the name of only the first Bidder whose name should also appear as the first holder of the beneficiary account
held in joint names;
10. Ensure that you request for and receive a stamped acknowledgement in the form of a counterfoil or acknowledgment
specifying the application number as a proof of having accepted the Bid cum Application Form for all your Bid options
from the concerned Designated Intermediary;
11. Investors must ensure that their PAN is linked with Aadhaar and are in compliance with CBDT notification dated
February 13, 2020 and press release dated June 25, 2021.
12. Ensure that you submit the revised Bids to the same Designated Intermediary, through whom the original Bid was
placed and obtain a revised acknowledgment;
13. Except for Bids (i) on behalf of the Central or State Governments and the officials appointed by the courts, who, in
terms of the circular no. MRD/DoP/Cir-20/2008 dated June 30, 2008 issued by SEBI, may be exempt from specifying
their PAN for transacting in the securities market, (ii) submitted by investors who are exempt from requirement of
obtaining/specifying their PAN for transacting in the securities market, and (iii) Bids by persons resident in the state
of Sikkim, who, in terms of the circular dated July 20, 2006 issued by SEBI, may be exempted from specifying their
PAN for transacting in the securities market, all Bidders should mention their PAN allotted under the IT Act. The
exemption for the Central or the State Government and officials appointed by the courts and for investors residing in
the State of Sikkim is subject to (a) the Demographic Details received from the respective depositories confirming the
exemption granted to the beneficial owner by a suitable description in the PAN field and the beneficiary account
remaining in “active status”; and (b) in the case of residents of Sikkim, the address as per the Demographic Details
evidencing the same. All other applications in which PAN is not mentioned will be rejected;
14. Ensure that thumb impressions and signatures other than in the languages specified in the Eighth Schedule to the
Constitution of India are attested by a Magistrate or a Notary Public or a Special Executive Magistrate under official
seal;
15. Ensure that the category and the investor status is indicated in the Bid cum Application Form to ensure proper upload
of your Bid in the electronic Bidding system of the Stock Exchanges;

308
16. Ensure that in case of Bids under power of attorney or by limited companies, corporates, trust, etc., relevant documents
including a copy of the power of attorney, if applicable, are submitted;
17. Ensure that Bids submitted by any person outside India is in compliance with applicable foreign and Indian laws;
18. However, Bids received from FPIs bearing the same PAN shall not be treated as multiple Bids in the event such FPIs
utilise the MIM Structure and such Bids have been made with different beneficiary account numbers, Client IDs and
DP IDs;
19. FPIs making MIM Bids using the same PAN, and different beneficiary account numbers, Client IDs and DP IDs, are
required to submit a confirmation that their Bids are under the MIM structure and indicate the name of their investment
managers in such confirmation which shall be submitted along with each of their Bid cum Application Forms. In the
absence of such confirmation from the relevant FPIs, such MIM Bids shall be rejected;
20. Since the Allotment will be in dematerialised form only, ensure that the depository account is active, the correct DP
ID, Client ID, UPI ID (for RIBs bidding through UPI mechanism) and the PAN are mentioned in their Bid cum
Application Form and that the name of the Bidder, the DP ID, Client ID, UPI ID (for RIBs bidding through UPI
mechanism) and the PAN entered into the online IPO system of the Stock Exchanges by the relevant Designated
Intermediary, as applicable, matches with the name, DP ID, Client ID, UPI ID (for RIBs bidding through UPI
mechanism) and PAN available in the depository database;
21. In case of QIBs and NIBs, ensure that while Bidding through a Designated Intermediary, the ASBA Form is submitted
to a Designated Intermediary in a Bidding Centre and that the SCSB where the ASBA Account, as specified in the
ASBA Form, is maintained has named at least one branch at that location for the Designated Intermediary to deposit
ASBA Forms (a list of such branches is available on the website of SEBI at http://www.sebi.gov.in);
22. Ensure that you have correctly signed the authorisation / undertaking box in the Bid cum Application Form, or have
otherwise provided an authorisation to the SCSB or the Sponsor Bank, as applicable, via the electronic mode, for
blocking funds in the ASBA Account equivalent to the Bid Amount mentioned in the Bid cum Application Form at
the time of submission of the Bid. In case of RIBs submitting their Bids and participating in the Offer through the UPI
Mechanism, ensure that you authorise the UPI Mandate Request, including in case of any revision of Bids, raised by
the Sponsor Bank for blocking of funds equivalent to Bid Amount and subsequent debit of funds in case of Allotment;
23. Ensure that the Demographic Details are updated, true and correct in all respects;
24. The ASBA Bidders shall use only their own bank account or only their own bank account linked UPI ID for the
purposes of making Application in the Offer, which is UPI 2.0 certified by NPCI;
25. Bidders (except RIBs Bidding through the UPI Mechanism) should instruct their respective banks to release the funds
blocked in the ASBA account under the ASBA process. In case of RIBs, once the Sponsor Bank issues the Mandate
Request, the RIBs would be required to proceed to authorize the blocking of funds by confirming or accepting the UPI
Mandate Request to authorize the blocking of funds equivalent to application amount and subsequent debit of funds
in case of Allotment, in a timely manner;
26. Bidding through UPI Mechanism shall ensure that details of the Bid are reviewed and verified by opening the
attachment in the UPI Mandate Request and then proceed to authorize the UPI Mandate Request using his/her UPI
PIN. Upon the authorization of the mandate using his/her UPI PIN, a RIB Bidding through UPI Mechanism shall be
deemed to have verified the attachment containing the application details of the RIB Bidding through UPI Mechanism
in the UPI Mandate Request and have agreed to block the entire Bid Amount and authorized the Sponsor Bank issue
a request to block the Bid Amount specified in the Bid cum Application Form in his/her ASBA Account;
27. RIBs bidding using the UPI Mechanism should mention valid UPI ID of only the Bidder (in case of single account)
and of the first Bidder (in case of joint account) in the Bid cum Application Form;
28. RIBs using the UPI Mechanism who have revised their Bids subsequent to making the initial Bid should also approve
the revised UPI Mandate Request generated by the Sponsor Bank to authorize blocking of funds equivalent to the
revised Bid Amount and subsequent debit of funds in case of Allotment in a timely manner;
29. Bids by Eligible NRIs for a Bid Amount of less than ₹200,000 would be considered under the Retail Category for the
purposes of allocation and Bids for a Bid Amount exceeding ₹200,000 would be considered under the Non-Institutional
Category for allocation in the Offer;
30. Ensure that Anchor Investors submit their Bid cum Application Forms only to the Book Running Lead Managers;
31. RIBs using UPI Mechanism through the SCSBs and mobile applications shall ensure that the name of the bank appears
in the list of SCSBs which are live on UPI, as displayed on the SEBI website. RIBs shall ensure that the name of the

309
app and the UPI handle which is used for making the application appears in Annexure ‘A’ to the SEBI circular no.
SEBI/HO/CFD/DIL2/COR/P/2019/85 dated July 26, 2019; and
32. Ensure that you have accepted the UPI Mandate Request received from the Sponsor Bank prior to 12:00 p.m. of the
Working Day immediately after the Bid/ Offer Closing Date.
The Bid cum Application Form is liable to be rejected if the above instructions, as applicable, are not complied with. Application
made using incorrect UPI handle or using a bank account of an SCSB or SCSBs which is not mentioned in the Annexure ‘A’
to the SEBI circular no. SEBI/HO/CFD/DIL2/CIR/P/2019/85 dated July 26, 2019 is liable to be rejected.
Don’ts:
1. Do not Bid for lower than the minimum Bid Lot;
2. Do not submit a Bid using UPI ID, if you are not a RIB;
3. Do not Bid for a Bid Amount exceeding ₹200,000 (for Bids by RIBs);
4. Do not Bid on another Bid cum Application Form and the Anchor Investor Application Form, as the case may be, after
you have submitted a Bid to any of the Designated Intermediary;
5. Do not Bid/ revise the Bid amount to less than the floor price or higher than the cap price;
6. Do not pay the Bid Amount in cheques, demand drafts or by cash, money order, postal order or by stock invest;
7. Do not send Bid cum Application Forms by post; instead submit the same to the Designated Intermediary only;
8. Do not Bid at Cut-off Price (for Bids by QIBs and Non-Institutional Bidders);
9. Do not instruct your respective banks to release the funds blocked in the ASBA Account under the ASBA process;
10. Do not submit the Bid for an amount more than funds available in your ASBA account;
11. Do not submit Bids on plain paper or on incomplete or illegible Bid cum Application Forms or on Bid cum Application
Forms in a colour prescribed for another category of Bidder;
12. Do not submit a Bid in case you are not eligible to acquire Equity Shares under applicable law or your relevant
constitutional documents or otherwise;
13. Do not Bid if you are not competent to contract under the Indian Contract Act, 1872 (other than minors having valid
depository accounts as per Demographic Details provided by the depository);
14. Do not fill up the Bid cum Application Form such that the Bids for Equity Shares for exceeds the Offer size and / or
investment limit or maximum number of the Equity Shares that can be held under the applicable laws or regulations
or maximum amount permissible under the applicable regulations or under the terms of this Red Herring Prospectus;
15. Do not Bid for Equity Shares more than specified by respective Stock Exchanges for each category;
16. In case of ASBA Bidders (other than RIBs using UPI mechanism), do not submit more than one Bid cum Application
Form per ASBA Account;
17. Do not make the Bid cum Application Form using third party bank account or using third party linked bank account
UPI ID;
18. Anchor Investors should not bid through the ASBA process;
19. Do not submit the Bid cum Application Form to any non-SCSB bank or our Company;
20. Do not Bid on another Bid cum Application Form and the Anchor Investor Application Form, as the case may be, after
you have submitted a Bid to any of the Designated Intermediaries;
21. Do not submit the General Index Register (GIR) number instead of the PAN;
22. Anchor Investors should submit Anchor Investor Application Form only to the Book Running Lead Managers;
23. Do not Bid on a Bid cum Application Form that does not have the stamp of a Designated Intermediary;

310
24. If you are a QIB, do not submit your Bid after 3 p.m. on the QIB Bid / Offer Closing Date;
25. Do not withdraw your Bid or lower the size of your Bid (in terms of quantity of the Equity Shares or the Bid Amount)
at any stage, if you are a QIB or a Non-Institutional Bidder;
26. Do not submit the ASBA Forms to any Designated Intermediary that is not authorised to collect the relevant ASBA
Forms or to our Company;
27. Do not submit Bids to a Designated Intermediary at a location other than at the relevant Bidding Centres. If you are
RIB and are using UPI mechanism, do not submit the ASBA Form directly with SCSBs;
28. Do not submit incorrect details of the DP ID, Client ID, PAN and UPI ID details if you are a RIB Bidding through the
UPI Mechanism. Further, do not provide details for a beneficiary account which is suspended or for which details
cannot be verified to the Registrar to the Offer;
29. Do not submit the Bid without ensuring that funds equivalent to the entire Bid Amount are available for blocking in
the relevant ASBA account;
30. Do not link the UPI ID with a bank account maintained with a bank that is not UPI 2.0 certified by the NPCI in case
of Bids submitted by RIBs using the UPI Mechanism;
31. Do not Bid if you are an OCB;
32. RIBs Bidding through the UPI Mechanism using the incorrect UPI handle or using a bank account of an SCSB or a
banks which is not mentioned in the list provided in the SEBI website is liable to be rejected; and
33. Do not submit more than one Bid cum Application Form for each UPI ID in case of RIBs Bidding using the UPI
Mechanism.
The Bid cum Application Form is liable to be rejected if the above instructions, as applicable, are not complied with.
Grounds for Technical Rejection
In addition to the grounds for rejection of Bids on technical grounds as provided in the GID, Bidders are requested to note that
Bids maybe rejected on the following additional technical grounds:
1. Bids submitted without instruction to the SCSBs to block the entire Bid Amount;
2. Bids which do not contain details of the Bid Amount and the bank account details in the ASBA Form;
3. Bids submitted on a plain paper;
4. Bids submitted by RIBs using the UPI Mechanism through an SCSBs and/or using a mobile application or UPI handle,
not listed on the website of SEBI;
5. Bids under the UPI Mechanism submitted by RIBs using third party bank accounts or using a third party linked bank
account UPI ID (subject to availability of information regarding third party account from Sponsor Bank);
6. ASBA Form submitted to a Designated Intermediary does not bear the stamp of the Designated Intermediary;
7. Bids submitted without the signature of the First Bidder or sole Bidder;
8. The ASBA Form not being signed by the account holders, if the account holder is different from the Bidder;
9. ASBA Form by the RIBs by using third party bank accounts or using third party linked bank account UPI IDs;
10. Bids by persons for whom PAN details have not been verified and whose beneficiary accounts are
“suspended for credit” in terms of SEBI circular CIR/MRD/DP/ 22 /2010 dated July 29, 2010;
11. GIR number furnished instead of PAN;
12. Bids by RIBs with Bid Amount of a value of more than ₹200,000 (net of retail discount);
13. Bids by persons who are not eligible to acquire Equity Shares in terms of all applicable laws, rules, regulations,
guidelines and approvals;
14. Bids accompanied by stock invest, money order, postal order or cash; and

311
15. Bids uploaded by QIBs after 4.00 pm on the QIB Bid/ Offer Closing Date and by Non-Institutional Bidders uploaded
after 4.00 p.m. on the Bid/ Offer Closing Date, and Bids by RIBs uploaded after 5.00 p.m. on the Bid/ Offer Closing
Date, unless extended by the Stock Exchanges.
Further, in case of any pre-Offer or post Offer related issues regarding share certificates/demat credit/refund orders/unblocking
etc., investors shall reach out to our Company Secretary and Compliance Officer. For details of our Company Secretary and
Compliance Officer, see “General Information” beginning on page 62.
In case of any delay in unblocking of amounts in the ASBA Accounts (including amounts blocked through the UPI Mechanism)
exceeding four Working Days from the Bid/Offer Closing Date, the Bidder shall be compensated at a uniform rate of ₹100 per
day for the entire duration of delay exceeding four Working Days from the Bid/Offer Closing Date by the intermediary
responsible for causing such delay in unblocking. The Book Running Lead Managers shall, in their sole discretion, identify and
fix the liability on such intermediary or entity responsible for such delay in unblocking.
Names of entities responsible for finalising the basis of allotment in a fair and proper manner
The authorised employees of the Stock Exchanges, along with the Book Running Lead Managers and the Registrar, shall ensure
that the Basis of Allotment is finalised in a fair and proper manner in accordance with the procedure specified in SEBI ICDR
Regulations.
Method of allotment as may be prescribed by SEBI from time to time
Our Company will not make any Allotment in excess of the Equity Shares offered through the Offer through this Red Herring
Prospectus except in case of oversubscription for the purpose of rounding off to make Allotment, in consultation with the
Designated Stock Exchange. Further, upon oversubscription, an Allotment of not more than 1% of the Offer to public may be
made for the purpose of making Allotment in minimum lots.
The allotment of Equity Shares to Bidders other than to the Retail Individual Bidders and Anchor Investors shall be on a
proportionate basis within the respective investor categories and the number of securities allotted shall be rounded off to the
nearest integer, subject to minimum allotment being equal to the minimum application size as determined and disclosed.
The allotment of Equity Shares to each Retail Individual Bidders shall not be less than the minimum bid lot, subject to the
availability of shares in Retail Individual Bidders Portion, and the remaining available shares, if any, shall be allotted on a
proportionate basis.
Payment into Anchor Investor Escrow Accounts
Our Company, the Individual Selling Shareholder, and the Investor Selling Shareholders, in consultation with the Book Running
Lead Managers will decide the list of Anchor Investors to whom the CAN will be sent, pursuant to which, the details of the
Equity Shares allocated to them in their respective names will be notified to such Anchor Investors. For Anchor Investors, the
payment instruments for payment into the Escrow Account(s) should be drawn in favour of:
(a) In case of resident Anchor Investors: “C.E. Info Systems Ltd-IPO ANCHOR INVESTOR-R ACCOUNT”
(b) In case of non-resident Anchor Investors: “C.E. Info Systems Ltd-IPO ANCHOR INVESTOR-NR ACCOUNT”
Anchor Investors should note that the escrow mechanism is not prescribed by SEBI and has been established as an arrangement
between our Company, the Selling Shareholders, the Syndicate, the Escrow Collection Bank and the Registrar to the Offer to
facilitate collections of Bid amounts from Anchor Investors.
Pre-Offer Advertisement
Subject to Section 30 of the Companies Act, our Company shall, after filing this Red Herring Prospectus with the RoC, publish
a pre-Offer advertisement, in the form prescribed under the SEBI ICDR Regulations, in all editions of Financial Express, an
English national daily newspaper and all editions of Jansatta, a Hindi national daily newspaper (Hindi also being the regional
language of New Delhi, where our Registered and Corporate Office is located), each with wide circulation.
In the pre-Offer advertisement, we shall state the Bid/Offer Opening Date and the Bid/Offer Closing Date. This advertisement,
subject to the provisions of Section 30 of the Companies Act, shall be in the format prescribed in Part A of Schedule X of the
SEBI ICDR Regulations.
Allotment Advertisement
Our Company, the Book Running Lead Managers and the Registrar shall publish an allotment advertisement before
commencement of trading, disclosing the date of commencement of trading in all editions of Financial Express, an English

312
national daily newspaper and all editions of Jansatta, a Hindi national daily newspaper (Hindi also being the regional language
of New Delhi, where our Registered and Corporate Office is located), each with wide circulation.
The information set out above is given for the benefit of the Bidders. Our Company, the Selling Shareholders, and the
Book Running Lead Managers are not liable for any amendments or modification or changes in applicable laws or
regulations, which may occur after the date of this Red Herring Prospectus. Bidders are advised to make their
independent investigations and ensure that the number of Equity Shares Bid for do not exceed the prescribed limits
under applicable laws or regulations.
Signing of the Underwriting Agreement and Filing with the RoC
(a) Our Company, the Selling Shareholders, the Underwriters, and the Registrar to the Offer intend to enter into an
Underwriting Agreement on or immediately after the finalisation of the Offer Price which shall be a date prior to the
filing of Prospectus.
(b) After signing the Underwriting Agreement, the Prospectus will be filed with the RoC in accordance with applicable
law. The Prospectus will contain details of the Offer Price, the Anchor Investor Offer Price, Offer size, and
underwriting arrangements and will be complete in all material respects.
Impersonation
Attention of the applicants is specifically drawn to the provisions of sub-section (1) of Section 38 of the Companies Act,
which is reproduced below:
“Any person who:
(a) makes or abets making of an application in a fictitious name to a company for acquiring, or subscribing for, its
securities; or
(b) makes or abets making of multiple applications to a company in different names or in different combinations of his
name or surname for acquiring or subscribing for its securities; or
(c) otherwise induces directly or indirectly a company to allot, or register any transfer of, securities to him, or to any
other person in a fictitious name,
shall be liable for action under Section 447.”
The liability prescribed under Section 447 of the Companies Act, for fraud involving an amount of at least ₹1 million or 1% of
the turnover of the Company, whichever is lower, includes imprisonment for a term which shall not be less than six months
extending up to 10 years and fine of an amount not less than the amount involved in the fraud, extending up to three times such
amount (provided that where the fraud involves public interest, such term shall not be less than three years.) Further, where the
fraud involves an amount less than ₹1 million or one per cent of the turnover of the company, whichever is lower, and does not
involve public interest, any person guilty of such fraud shall be punishable with imprisonment for a term which may extend to
five years or with fine which may extend to ₹5 million or with both.
Undertakings by our Company
Our Company undertakes the following:
• adequate arrangements shall be made to collect all Bid cum Application Forms;
• the complaints received in respect of the Offer shall be attended to by our Company expeditiously and satisfactorily;
• all steps for completion of the necessary formalities for listing and commencement of trading at all the Stock
Exchanges where the Equity Shares are proposed to be listed shall be taken in consultation with the Book Running
Lead Managers within such period as may be prescribed under applicable law;
• if Allotment is not made within the prescribed time period under applicable law, the entire subscription amount
received will be refunded/unblocked within the time prescribed under applicable law. If there is delay beyond the
prescribed time, our Company shall pay interest prescribed under the Companies Act, 2013, the SEBI ICDR
Regulations and applicable law for the delayed period;
• the funds required for making refunds/unblocking (to the extent applicable) as per the mode(s) disclosed shall be made
available to the Registrar to the Offer by our Company;

313
• where refunds (to the extent applicable) are made through electronic transfer of funds, a suitable communication shall
be sent to the Bidder within the time prescribed under applicable law, giving details of the bank where refunds shall
be credited along with amount and expected date of electronic credit of refund;
• compliance with all disclosure and accounting norms as may be specified by SEBI from time to time;
• Promoters’ contribution, if any, shall be brought in advance before the Bid/Offer Opening Date and the balance, if
any, shall be brought in on a pro rata basis before calls are made on the Allottees; and
• no further issuance of Equity Shares shall be undertaken by the Company till the Equity Shares offered through this
Red Herring Prospectus are listed or until the Bid monies are unblocked in ASBA Account/refunded on account of
non-listing, under-subscription, etc.
• Our Company, the Individual Selling Shareholder, and the Investor Selling Shareholders, in consultation with the Book
Running Lead Managers, reserve the right not to proceed with the Offer, and each of the Selling Shareholder reserve
the right not to proceed with the Offer for Sale, in whole or in part thereof, to the extent of its respective portion of the
Offered Shares, after the Bid/ Offer Opening Date but before the Allotment. In such an event, our Company will issue
a public notice in all editions of Financial Express, an English national daily newspaper and all editions of Jansatta, a
Hindi national daily newspaper (Hindi also being the regional language of New Delhi, where our Registered and
Corporate Office is located), each with wide circulation, within two days of the Bid/ Offer Closing Date or such other
time as may be prescribed by SEBI, providing reasons for not proceeding with the Offer.
Undertakings by the Selling Shareholders
Each of the Selling Shareholder specifically undertakes, severally and not jointly, in relation to itself as a Selling Shareholder
and its respective portion of the Offered Shares that:
• the Equity Shares offered by it in the Offer for Sale are eligible for being offered in the Offer for Sale in terms of
Regulation 8 of the SEBI ICDR Regulations and shall be in dematerialized form at the time of transfer;
• the Offered Shares are, held by it, shall be free and clear of encumbrances, any defect to good, valid, and marketable
title, and shall be transferred pursuant to the Offer, free and clear of any encumbrances;
• it shall provide such reasonable assistance and cooperation as may be reasonably required by our Company and the
Book Running Lead Managers in redressal of such investor grievances in relation to its Offered Shares and statements
specifically made or confirmed by it in this Red Herring Prospectus in relation to itself as a selling shareholder;
• it shall provide such reasonable support and cooperation as required under applicable law or requested by our Company
and/or the Book Running Lead Managers in relation to its Offered Shares, (a) for the completion of the necessary
formalities for listing and commencement of trading at the Stock Exchanges, and/ or (b) refund orders (if applicable);
and
• it shall not have recourse to the proceeds of the Offer for Sale which shall be held in escrow in favour of such Selling
Shareholder, until final approval for trading of the Equity Shares from the Stock Exchanges has been received.
The decisions with respect to the Price Band, the minimum Bid lot, revision of Price Band, Offer Price will be taken by our
Company, the Individual Selling Shareholder, and the Investor Selling Shareholders, in consultation with the Book Running
Lead Managers. The Offer Price will be decided by our Company, the Individual Selling Shareholder, and the Investor Selling
Shareholders, in consultation with the Book Running Lead Managers, on the Pricing Date in accordance with the Book Building
Process and this Red Herring Prospectus.
Only the statements and undertakings in relation to each of the Selling Shareholders and its respective portion of the Equity
Shares offered in the Offer for Sale which are specifically “confirmed” or “undertaken” by it in this Red Herring Prospectus,
shall be deemed to be “statements and undertakings specifically confirmed or undertaken” by such Selling Shareholders. All
other statements and/ or undertakings in this Red Herring Prospectus shall be statements and undertakings made by our
Company even if the same relates to the Selling Shareholders.

314
RESTRICTIONS ON FOREIGN OWNERSHIP OF INDIAN SECURITIES
Foreign investment in Indian securities is regulated through the Industrial Policy, 1991 of the Government of India and FEMA.
While the Industrial Policy, 1991 prescribes the limits and the conditions subject to which foreign investment can be made in
different sectors of the Indian economy, FEMA regulates the precise manner in which such investment may be made. The
Government has from time to time made policy pronouncements on foreign direct investment (“FDI”) through press notes and
press releases.
The Department for Promotion of Industry and Internal Trade, Ministry of Commerce and Industry, Government of India,
earlier known as Department of Industrial Policy and Promotion (“DPIIT”) issued the Consolidated FDI Policy Circular of
2020 (“FDI Policy”) by way of circular bearing number DPIIT file number 5(2)/2020-FDI Policy dated October 15, 2020,
which with effect from October 15, 2020, consolidates and supersedes all previous press notes, press releases and clarifications
on FDI issued by the DPIIT that were in force and effect as on October 15, 2020. The FDI Policy will be valid until the DPIIT
issues an updated circular. FDI in companies engaged in sectors/ activities which are not listed in the FDI Policy is permitted
up to 100% of the paid-up share capital of such company under the automatic route, subject to compliance with certain
prescribed conditions. For details, see “Key Regulations and Policies in India” beginning on page 155.
Under the current FDI Policy, 100% foreign direct investment is permitted in IT/ITES sector, under the automatic route, subject
to compliance with certain prescribed conditions.
The transfer of shares between an Indian resident and a non-resident does not require the prior approval of the RBI, provided
that (i) the activities of the investee company are under the automatic route under the FDI Policy and transfer does not attract
the provisions of the Takeover Regulations; (ii) the non-resident shareholding is within the sectoral limits under the FDI Policy;
and (iii) the pricing is in accordance with the guidelines prescribed by the SEBI/RBI.
Further, in accordance with the FDI Policy, the Press Note No. 3 (2020 Series), dated April 17, 2020 issued by the DPIIT and
the Foreign Exchange Management (Non-debt Instruments) Amendment Rules, 2020 which came into effect from April 22,
2020, any investment, subscription, purchase or sale of equity instruments by entities of a country which shares land border
with India or where the beneficial owner of an investment into India is situated in or is a citizen of any such country (“Restricted
Investors”), will require prior approval of the Government, as prescribed in the FDI Policy and the FEMA Rules. Further, in
the event of transfer of ownership of any existing or future foreign direct investment in an entity in India, directly or indirectly,
resulting in the beneficial ownership falling within the aforesaid restriction/ purview, such subsequent change in the beneficial
ownership will also require approval of the Government. Furthermore, on April 22, 2020, the Ministry of Finance, Government
of India has also made a similar amendment to the FEMA Rules. Each Bidder should seek independent legal advice about its
ability to participate in the Offer. In the event such prior approval of the Government of India is required, and such approval
has been obtained, the Bidder shall intimate our Company and the Registrar in writing about such approval along with a copy
thereof within the Bid/Offer Period.
As per the existing policy of the Government, OCBs cannot participate in this Offer.
The Equity Shares offered in the Offer have not been and will not be registered under the U.S. Securities Act or any
other applicable law of the United States and, unless so registered, may not be offered or sold within the United States,
except pursuant to an exemption from, or in a transaction not subject to, the registration requirements of the U.S.
Securities Act and applicable state securities laws. Accordingly, the Equity Shares are only being offered and sold
outside the United States in “offshore transactions” in reliance on Regulation S under the U.S. Securities Act and the
applicable laws of the jurisdiction where those offers, and sales are made.
The Equity Shares have not been and will not be registered, listed or otherwise qualified in any other jurisdiction outside
India and may not be offered or sold, and Bids may not be made by persons in any such jurisdiction, except in compliance
with the applicable laws of such jurisdiction.
For further details, see “Offer Procedure” beginning on page 298.
The above information is given for the benefit of the Bidders. Our Company, the Selling Shareholders and the BRLMs are not
liable for any amendments or modification or changes in applicable laws or regulations, which may occur after the date of this
Red Herring Prospectus. Bidders are advised to make their independent investigations and ensure that the number of Equity
Shares Bid for do not exceed the applicable limits under laws or regulations.

315
SECTION VIII: MAIN PROVISIONS OF ARTICLES OF ASSOCIATION
Capitalized terms used in this section have the meanings that have been given to such terms in the Articles of Association of
our Company.
The Articles of Association of the Company comprise two parts, Part A and Part B, which parts shall, unless the context
otherwise requires, co-exist with each other until the listing of equity shares of the Company pursuant to the initial public
offering of the equity shares of the Company on a recognized stock exchange in India (the “IPO” of the “Equity Shares” of
the Company). In case of any inconsistency or contradiction, conflict or overlap between Part A and Part B, the provisions of
Part B shall, subject to applicable law, prevail and be applicable. All articles of Part B shall automatically terminate and cease
to have any force and effect from the date of Consummation of the IPO (as defined in Part A) and the provisions of Part A shall
continue to be in effect and be in force, without any further corporate or other action, by the Company or by its shareholders.
Pursuant to Schedule I of the Companies Act and the SEBI ICDR Regulations, the main provisions of the Articles of Association
of our Company are detailed below:
Part A
Authorised Share Capital
The authorized share capital of the Company shall be such amount, divided into such class(es), denomination(s) and number of
shares in the Company as stated in Clause V of the MoA or as altered from time to time, with power to increase or reduce such
capital from time to time and power to divide the shares in the capital for the time being into other classes and to attach thereto
such preferential, convertible, deferred, qualified, or other special rights, privileges, conditions or restrictions and to vary,
modify or abrogate the same in such manner as may be determined by or in accordance with the Articles of the Company,
subject to the provisions of applicable law for the time being in force.
Alteration of Capital
Power to sub-divide, consolidate and cancel share certificate.
The Company may, by Ordinary Resolution in its General Meetings, from time to time, alter the conditions of MoA as follows:
a. Increase the share capital by such amount to be divided into shares of such amount as it thinks expedient;
b. Consolidate and divide all or any its share capital into shares of larger amount than its existing shares; provided that
any consolidation and division which results in changes in the voting percentage of Members shall require applicable
approvals under the Act;
c. Sub-divide its existing shares or any of them into shares of smaller amount than is fixed by MoA;
d. Cancel any shares which, at the date of the passing of the resolution, have not been taken or agreed to be taken by any
person; and
e. Convert all or any one its fully paid-up shares into stock, and reconvert that stock into fully paid-up shares of any
denomination.
Shares at the disposal of the Directors
Subject to the provisions of the Act and these Articles, the shares in the capital of the Company for the time being shall be
under the control of the Board who may issue, allot or otherwise dispose of the same or any of them to such persons, in such
proportion and on such terms and conditions and either at a premium or at par or at a discount and at such time as they may
from time to time think fit and with the sanction of the Company in the General Meeting to give to any person the option or
right to call for any shares either at par or premium during such time and for such consideration as the Board think fit, and with
the sanction of the Company in General Meeting give to any person the option or right to call for any shares either at par or at
a premium during such time and for such consideration as the Board thinks fit.
Lien
The Company shall subject to applicable law have a first and paramount lien on every share / Debenture (not being a fully paid
share / Debenture) registered in the name of each Member (whether solely or jointly with others) and upon the proceeds of sale
thereof for all moneys (whether presently payable or not) called, or payable at a fixed time, in respect of that share / Debenture
and no equitable interest in any share shall be created upon the footing and condition that this article will have full effect. The
Company may sell, in such manner as the Board thinks fit, any shares on which the Company has a lien: provide that no sale
shall be made until the expiration of 14 days’ after a notice in writing stating and demanding payment of such part of the amount
in respect of which the lien exists as is presently payable, has been given to the registered holder of the share.

316
Share Certificate
Every Member of the Company shall be entitled, without payment to one or more certificates in marketable lots, for all the
shares of each class or denomination registered in his name, or if the Directors approve, to several certificates, each for one or
more of such shares and the Company shall complete and have ready for delivery such certificates, unless prohibited by any
provision of law or any order of court, tribunal or other authority having jurisdiction, within two (2) months from the date of
allotment, or within one (1) month of the receipt of application of registration of transfer, transmission, sub division,
consolidation or renewal of any of its shares as the case maybe or within a period of six (6) months from the date of allotment
in the case of any allotment of Debenture. The provisions of the Act shall be complied with in the issue, reissue, renewal of
share certificates and the format, sealing and signing of the certificates and records of the certificates issued shall be maintained
in accordance with the said Act.
Every certificate of shares shall be under the Seal of the Company and shall specify the shares to which it relates and the amount
paid-up thereon.
If any certificate be defaced, mutilated, torn or old, decrepit, worn- out or if there be no further space on the back thereof for
endorsement of transfer, then upon production and surrender thereof to the Company, a new certificate may be issued in lieu
thereof, and if any certificate is lost or destroyed then upon proof thereof to the satisfaction of the Company and on execution
of such indemnity as the Company deem adequate, being given, a new certificate in lieu thereof shall be given to the party
entitled to such lost or destroyed certificate.
No fee shall be charged for sub-division and consolidation of share / debenture certificates and for sub-division of letters of
allotment, split and consolidation.
Transfer of Shares
The instrument of transfer of any share shall be in writing and all the provisions of the Act shall be duly complied with in
respect of all transfer of shares and registration thereof. The Company shall use the form of transfer, as prescribed under the
Act, in all cases. In case of transfer of shares, where the Company has not issued any certificates and where the shares are held
in dematerialized form, the provisions of the Depositories Act shall apply. The Board may decline to recognize any instrument
of transfer unless the instrument of transfer is in the form prescribed under the Act, is in respect of only one class of shares and
is accompanied by the certificate of shares to which it relates, and such other evidence as the Board may reasonably require to
show the right of the transferor to make the transfer.
Transmission of shares
The executors or administrators or the holders of a succession certificate issued in respect of the shares of a deceased Member
and not being one of several joint holders shall be the only person whom the Company shall recognize as having any title to the
shares registered in the name of such Members and in case of the death of one or more of the joint holders of any registered
share, the survivor or survivors shall be entitled to the title or interest in such shares but nothing herein contained shall be taken
to release the estate of a deceased joint holder from any liability on shares held by him jointly with any other person. Before
recognizing any legal representative or heir or a person otherwise claiming title to the shares the Company may require him to
obtain a grant of probate or letters of administration or succession certificate or other legal representation as the case may be
from a competent court, provided nevertheless that in any case where the Board in its absolute discretion think fit, it shall be
lawful for the Board to dispense with production of the probate or letter of administration or a secession certificate or such other
legal representation upon such terms as to indemnity or otherwise as the Board may consider desirable.
Any person becoming entitled to shares in consequence of the death, lunacy, bankruptcy or insolvency of any Members, or by
any lawful means other than by a transfer in accordance with these Articles, may with the consent of the Board (which it shall
not be under any obligation to give), upon producing such evidence as the Board thinks sufficient, that he sustains the character
in respect of which he proposes to act under this Article, or of his title, elect to either be registered himself as holder of the
shares or elect to have some person nominated by him and approved by the Board, registered as such holder or to make such
transfer of the share as the deceased or insolvent member could have made. If the person so becoming entitled shall elect to be
registered as holder of the share himself, he shall deliver or send to the Company a notice in writing signed by him stating that
he so elects. Provided, nevertheless, if such person shall elect to have his nominee registered, he shall testify that election by
executing in favour of his nominee an instrument of transfer in accordance with the provision herein contained and until he
does so he shall not be freed from any liability in respect of the shares.
Borrowing Powers
The Board may, from time to time and at its discretion, raise or borrow or secure the payment of any sums or sum of money for
the purposes of the Company in such manner and upon such terms and conditions in all respects as it thinks fit.

317
Issue of Bonus Shares
The Company in its General Meeting may resolve to issue the bonus shares to its shareholders subject to the applicable
provisions of the Act and other laws as may be applicable in this behalf from time to time.
General Meetings
All General Meetings of the Company other than the Annual General Meeting shall be called an Extra-ordinary General
Meeting. The notice of a General Meeting shall be given to the Members of the Company, the persons entitled to a share in
consequence of the death or insolvency of a Member, the Directors of the Company and the auditors for the time being of the
Company.
Meetings of Directors
The Board of Directors shall meet at least once in every three months with a maximum gap of four months between two
meetings of the Board for the dispatch of business, adjourn and otherwise regulate its meetings and proceedings as it thinks fit
in accordance with the Act, provided that at least four such meetings shall be held in every year. Notice of at least seven days,
in writing of every meeting of the Board shall be given to every Director and every alternate Director at his usual address
whether in India or abroad. The notice shall include the time, venue and agenda of such meeting.
The quorum for a meeting of the Board shall be one third of its total strength (any fraction contained in that one-third being
rounded off as one) or two Directors whichever is higher and the participation of the Directors by video conferencing or by
other audio visual means shall also be counted for the purposes of quorum. If within half an hour from the time appointed for a
meeting of the Board, a quorum is not present, the meeting, shall stand adjourned to the same day in the next week at the same
time and place or to such other day and at such other time and place as the Directors may determine.
Managing Directors
Subject to the provision of the Act, the Board may, from time to time, appoint one or more Directors to be managing director
and/or whole-time directors of the Company for such term and subject to such remuneration, terms and conditions as it may
think fit.
Board of Directors
Unless otherwise determined by General Meeting, the number of Directors shall not be less than three (3) and not more than
fifteen (15), and at least one (1) Director shall be resident of India in the previous year. Provided that the Company may appoint
more than fifteen (15) directors after passing a Special Resolution.
After the Consummation of the IPO, PhonePe India will have the right to nominate 1 (one) Director on the Board as long as
PhonePe India continues to hold at least 10% of the shareholding of the Company on a fully diluted basis, subject to such right
being approved by the Shareholders of the Company by way of a Special Resolution after the Consummation of the IPO in
accordance with applicable law.
Votes of Members
On a show of hands every Member present in person and being a holder of Equity Shares shall have one vote and every person
present either as a Proxy on behalf of a holder of Equity Shares or as a duly authorized representative of a body corporate being
a holder of Equity Shares, if he is not entitled to vote in his own right, shall have one vote.
On a poll, the voting rights of holder of Equity Shares shall be in proportion to his share in the paid-up Equity Share capital of
the Company. A Member may exercise his vote at a meeting by electronic means in accordance with the Act and shall vote
only once.
A person becoming entitled to a share shall not before being registered as Member in respect of the share be entitled to exercise
in respect thereof any right conferred by membership in relation to meeting of the Company.
No Member shall be entitled to exercise any voting rights either personally or by Proxy at any meeting of the Company in
respect of any shares registered in his name on which any calls or other sums presently payable by him have not been paid or
in regard to which the Company has exercised any right or lien.
Dividend
The Company in General Meeting may declare the Dividends, but no Dividend shall exceed the amount recommended by the
Board. The Board may from time to time pay to the Members such interim dividends of such amount on such class of shares
and at such times as it may think fit.

318
All Dividends shall be apportioned and paid proportionately to the amounts paid or credited as paid on the shares during any
portion or portions of the period in respect of which the Dividend is paid; but if any share is issued on terms providing that it
shall rank for Dividend as from a particular date such share shall rank for Dividend accordingly.
No Dividend shall bear interest against the Company.
Unpaid or Unclaimed Dividend
Any Dividend remaining unpaid or unclaimed after having been declared shall be dealt in accordance with the provisions of
the applicable law.
Where the Company has declared a Dividend but which has not been paid or claimed within 30 days from the date of declaration
to any shareholder entitled to the payment of the Dividend, the Company shall within seven days from the date of expiry of the
said period of 30 days, open a special account in that behalf in any scheduled bank and transfer to such account, the total amount
of the Dividend which remains unpaid or in relation to which no divided warrant has been posted.
Any money transferred to the said special account of the Company which remains unpaid or unclaimed for a period of seven
years from the date of such transfer, shall be transferred by the Company to the fund known as “Investor Education and
Protection Fund” established under the Act.
No unclaimed or unpaid Dividend shall be forfeited by the Board before the claim becomes barred by law and the Company
shall comply with the provisions of the applicable laws in respect of such Dividend.
Winding Up
Subject to the provisions of applicable law, the assets of the Company shall, on its winding up, be applied in satisfaction of its
liabilities pari passu and, subject to such application, such assets shall be distributed among the Members according to their
rights and interests in the Company.
Indemnity
Subject to the provisions the Act, the Company shall indemnify every Director and Officer of the Company against any liability
incurred by them in defending any proceedings, whether civil or criminal, in which judgment is given in their favour or in which
they are acquitted or in which relief is granted to them by the court or the tribunal. However, such indemnification shall not
apply in respect of any cost or loss or expenses to the extent it is finally judicially determined to have resulted from the
negligence, willful misconduct or bad faith acts or omissions of such Director.
Part B
Part B of the Articles of Association provides for, amongst other things, the rights of certain shareholders pursuant to the
Investment Agreement. For details, see “History and Certain Corporate Matters – Summary of Key Agreements” on page 164
to 166.

319
SECTION IX: OTHER INFORMATION
MATERIAL CONTRACTS AND DOCUMENTS FOR INSPECTION
The copies of the following contracts which have been entered or are to be entered into by our Company (not being contracts
entered into in the ordinary course of business carried on by our Company or contracts entered into more than two years before
the date of this Red Herring Prospectus) which are or may be deemed material will be attached to the copy of this Red Herring
Prospectus/ Prospectus which will be delivered to the RoC for filing. Copies of the contracts and also the documents for
inspection referred to hereunder, may be inspected at the Registered Office between 10 a.m. and 5 p.m. on all Working Days
from date of this Red Herring Prospectus until the Bid/Offer Closing Date. The Copies of the contracts and the documents for
inspection referred to hereunder have also been uploaded on the website of our Company at
https://www.mapmyindia.com/investors/drhp/materialdocuments and are available for inspection from date of this Red Herring
Prospectus until the Bid/ Offer Closing Date.
A. Material Contracts for the Offer
1. Offer Agreement dated August 31, 2021 among our Company, the Selling Shareholders, and the Book
Running Lead Managers, as amended by amendment agreement dated November 26, 2021.
2. Registrar Agreement dated August 31, 2021 among our Company, the Selling Shareholders, and the Registrar
to the Offer, as amended by amendment agreement dated November 25, 2021.
3. Escrow and Sponsor Bank Agreement dated December 2, 2021 among our Company, the Selling
Shareholders, the Registrar to the Offer, the Book Running Lead Managers, the Syndicate Members, and the
Banker(s) to the Offer.
4. Share Escrow Agreement dated December 1, 2021 among our Company, the Selling Shareholders, and the
Share Escrow Agent.
5. Syndicate Agreement dated December 1, 2021 among our Company, the Selling Shareholders, the Book
Running Lead Managers, the Syndicate Members, and the Registrar to the Offer.
6. Underwriting Agreement dated [●] among our Company, the Selling Shareholders, the Underwriters, and the
Registrar to the Offer.
B. Material Documents
1. Certified copies of the Memorandum and Articles of Association of our Company, as amended from time to
time.
2. Certificate of incorporation dated February 17, 1995 issued to our Company under the name of ‘C.E. Info
Systems Private Limited’ by the RoC.
3. Fresh certificate of incorporation dated July 12, 2021 issued by the RoC upon change in the name of our
Company from ‘C.E. Info Systems Private Limited’ to ‘C.E. Info Systems Private Limited’, pursuant to
conversion to a public limited company.
4. Copies of of the audited financial statements along with the statutory auditors’ report and directors’ report of
our Company for the Financial Years 2021, 2020, and 2019.
5. Resolution of our Board of Directors dated July 27, 2021 authorising the Offer and other related matters.
6. Consent letter dated November 25, 2021 provided by Rashmi Verma, consenting to participate in the Offer
for Sale.
7. Consent letter dated November 25, 2021 provided by Qualcomm, consenting to participate in the Offer for
Sale.
8. Resolution of the board of directors of Qualcomm dated March 11, 2016, granting authority for investment
activities.
9. Consent letter dated November 25, 2021 provided by Zenrin, authorizing participation in the Offer for Sale.
10. Certificate of resolutions of the board of directors of Zenrin dated July 29, 2021 and October 7, 2021
consenting to participate in the Offer for Sale.

320
11. Consent letters and corporate authorisation(s), as applicable, of the Other Selling Shareholders for their
participation in the Offer for Sale, as detailed in Annexure A on page 327.
12. Resolution of our Board of Directors dated August 26, 2021 approving the Draft Red Herring Prospectus.
13. Resolution of our Board of Directors dated December 2, 2021 approving this Red Herring Prospectus.
14. Investment Agreement dated September 30, 2015, as amended by the amendment dated October 28, 2015
and amendment no.2 dated October 30, 2015 entered into by and among our Company, the Promoters,
Qualcomm, Zenrin, and Flipkart and the deed of adherence dated March 9, 2021 executed by PhonePe India.
15. Share purchase agreement dated July 29, 2021 as amended by an addendum dated November 16, 2021 entered
into by and among PhonePe Singapore, Rakesh Kumar Verma and our Company.
16. Share purchase agreement dated July 29, 2021 as amended by an addendum dated November 16, 2021
entered into by and among Qualcomm, Rakesh Kumar Verma and our Company
17. Share purchase agreement dated July 29, 2021 as amended by an addendum dated November 16, 2021 entered
into by and among Zenrin, Rakesh Kumar Verma and our Company.
18. Further Agreement and amendment to the Investment Agreement dated July 29, 2021 entered into by and
among our Company, the Promoters, and the Investors and the deed of adherence to the Further Agreement
executed by PhonePe India dated September 16, 2021.
19. The examination report dated November 1, 2021 of our Statutory Auditors on the Restated Consolidated
Financial Information.
20. The report dated November 25, 2021 on the statement of possible special tax benefits issued by our Statutory
Auditors.
21. Consents in writing of each of the Selling Shareholders, our Directors, our Company Secretary and
Compliance Officer, Legal Counsel to our Company as to Indian Law, Legal Counsel to the Book Running
Lead Managers as to Indian Law, International Legal Counsel to the Book Running Lead Managers, bankers
to our Company, the Book Running Lead Managers, the Syndicate Member(s), the Banker(s) to the Offer and
the Registrar to the Offer, to act in their respective capacities.
22. Consent letter dated December 2, 2021 from our Statutory Auditors, to include their name as required under
section 26(1) of the Companies Act read with the SEBI ICDR Regulations, in this Red Herring Prospectus
and as an “expert” as defined under section 2(38) of the Companies Act to the extent and in their capacity as
our Statutory Auditors, and in respect of their (i) examination report dated November 1, 2021 on our Restated
Consolidated Financial Information; and (ii) report dated November 25, 2021 on the statement of possible
special tax benefits included in this Red Herring Prospectus and such consent has not been withdrawn as on
the date of this Red Herring Prospectus.
23. Board resolution dated August 26, 2021 and Shareholders’ resolution dated September 30, 2021 approving
the terms of appointment of our Chairman and Managing Director, Rakesh Kumar Verma.
24. Board resolution dated August 26, 2021 and Shareholders’ resolution dated September 30, 2021 approving
the terms of appointment of our Whole-time Director and CEO, Rohan Verma.
25. Report titled “Digital Maps and Location Intelligence Technology & Service Market - B2B(2C) for India &
World” dated October 27, 2021 issued by Frost & Sullivan, commissioned and paid for by our Company
exclusively for the purpose of the Offer.
26. Consent letter from Frost & Sullivan dated November 24, 2021 to rely on and reproduce part or whole of the
F&S Report (commissioned and paid for by our Company exclusively for the purpose of the Offer) and
include their name in this Red Herring Prospectus.
27. C.E. Info Systems Limited - Employee Stock Option Plan 2008.
28. Due diligence certificate dated August 31, 2021 addressed from the Book Running Lead Managers to SEBI.
29. In-principle listing approvals dated September 20, 2021 and October 14, 2021 issued by BSE and NSE,
respectively.
30. Tripartite agreement dated July 2, 2021 among our Company, CDSL and the Registrar to the Offer.

321
31. Tripartite agreement dated July 7, 2021 among our Company, NSDL and the Registrar to the Offer.
32. Wrap letter agreement dated November 22, 2021 among our Promoters and JM Financial Products Limited.
33. Loan agreement dated October 28, 2021 among our Promoters and JM Financial Products Limited.
34. Unattested deed of pledge dated October 28, 2021 among our Promoters and JM Financial Products Limited.
35. SEBI letter no. SEBI/HO/CFD/DIL-2/VJ/AS/P/OW/2021/33802/1 dated November 23, 2021 granting
exemption from disclosing Mr. Deepak Verma and entities/bodies corporate/firms/HUFs in which he has an
interest, as members of the promoter group of our Company.
36. Compliant made to SEBI by Konark Singhal by letter dated October 20, 2021, email dated November 16,
2021 and letter dated November 22, 2021 pertaining to non-issuance of shares consequent to options granted
under ESOP 2008.
37. SEBI interim observation letter bearing reference no. SEBI/HO/CFD/DIL-2/P/OW/2021/0000025224/1
dated September 22, 2021.
38. SEBI final observation letter bearing reference no. SEBI/HO/CFD/DIL1/P/OW/2021/33801/1 dated
November 23, 2021.
Any of the contracts or documents mentioned in Draft Red Herring Prospectus may be amended or modified at any time if so
required in the interest of our Company or if required by the other parties, without reference to our Shareholders, subject to
compliance with the provisions contained in the Companies Act and other relevant statutes.

322
DECLARATION
We hereby certify and declare that all relevant provisions of the Companies Act, 2013 and the guidelines or regulations issued
by the Government of India or the guidelines or regulations issued by the SEBI, established under Section 3 of the SEBI Act,
1992, as the case may be, have been complied with and no statement made in this Red Herring Prospectus is contrary to the
provisions of the Companies Act, 2013, the SCRA, the SCRR, the SEBI Act or the rules framed or guidelines or regulations
issued thereunder, as the case may be. We further certify that all the statements in this Red Herring Prospectus are true and
correct.
SIGNED BY ALL THE DIRECTORS OF OUR COMPANY
Rakesh Kumar Verma
Chairman and Managing Director
Rohan Verma
Whole-time Director and CEO
Rakhi Prasad
Non-executive Director
Sonika Chandra
Non-executive (Nominee) Director
Shambhu Singh
Independent Director
Anil Mahajan
Independent Director
Kartheepan Madasamy
Independent Director
Tina Trikha
Independent Director
SIGNED BY THE CHIEF FINANCIAL OFFICER OF OUR COMPANY
___________________________
Anuj Kumar Jain
(Chief Financial Officer)
Date: December 2, 2021

323
DECLARATION
I, Rashmi Verma, hereby confirm that all statements, disclosures and undertakings specifically made or confirmed by me in
this Red Herring Prospectus in relation to myself, as the Individual Selling Shareholder and my Offered Shares, are true and
correct. I assume no responsibility for any other statements, disclosures and undertakings including any of the statements made
by or confirmed by or relating to the Company or any other Selling Shareholder or any other person(s) in this Red Herring
Prospectus.
SIGNED BY RASHMI VERMA
Date: December 2, 2021

324
DECLARATION
We, Qualcomm Asia Pacific Pte. Ltd., hereby confirm that all statements, disclosures and undertakings specifically made or
confirmed by us in this Red Herring Prospectus in relation to ourselves as one of the Investor Selling Shareholder and our
portion of the Offered Shares, are true and correct. We assume no responsibility for any other statements, disclosures and
undertakings including any of the statements made by or confirmed by or relating to the Company or any other Selling
Shareholder or any other person(s) in this Red Herring Prospectus.
FOR AND ON BEHALF OF QUALCOMM ASIA PACIFIC PTE. LTD.
_________________________________
Name: Adam P. Schwenker
Designation: Authorized Signatory
Date: December 2, 2021

325
DECLARATION
We, Zenrin Co., Ltd., hereby confirm that all statements, disclosures and undertakings specifically made or confirmed by us in
this Red Herring Prospectus in relation to ourselves as one of the Investor Selling Shareholder and our portion of the Offered
Shares, are true and correct. We assume no responsibility for any other statements, disclosures and undertakings including any
of the statements made by or confirmed by or relating to the Company or any other Selling Shareholder or any other person(s)
in this Red Herring Prospectus.
FOR AND ON BEHALF OF ZENRIN CO., LTD.
_________________________________
Name: Masami Matsuo
Designation: Director, Senior Vice President & Head of Corporate Administration
Date: December 2, 2021

326
DECLARATION
I, Rakesh Kumar Verma, hereby confirm on behalf of the Other Selling Shareholders that all statements, disclosures and
undertakings specifically made or confirmed by them in this Red Herring Prospectus in relation to themselves and their
respective portion of the Offered Shares, are true and correct. The Other Selling Shareholders assume no responsibility for any
other statements, disclosures and undertakings including any of the statements made by or confirmed by or relating to the
Company or any other Selling Shareholder or any other person(s) in this Red Herring Prospectus.
SIGNED BY RAKESH KUMAR VERMA ON BEHALF OF THE OTHER SELLING SHAREHOLDERS
Date: December 2, 2021

327
ANNEXURE A – LIST OF OTHER SELLING SHAREHOLDERS
S.
No.
Name of the Selling Shareholder Maximum number of
Offered Shares
Date of Selling Shareholder’s
consent letter
Date of corporate
authorisation
1. Harshad Dholakia Up to 1,833 Equity Shares November 25, 2021 -
2. Jaya Jaipuriar Up to 1,335 Equity Shares November 25, 2021 -
3. Jaya Kumar Up to 18,893 Equity Shares November 25, 2021 -
4. Manpreet Sukhija (Gaba) Up to 20,993 Equity Shares November 25, 2021 -
5. Nayan Arun Jagjivan Up to 1,666,667 Equity
Shares
November 25, 2021 -
6. Ranjan P.N. Up to 8,026 Equity Shares November 25, 2021 -
7. Sapna Ahuja Up to 23,786 Equity Shares November 25, 2021 -


![[Kotak] India Daily, May 07, 2018 - Kotak Securities](https://static.fdokumen.com/doc/165x107/633c43a3f3eeefb08b0c1dc3/kotak-india-daily-may-07-2018-kotak-securities.jpg)


![[Kotak] India Daily, April 2, 2019 - Kotak Securities](https://static.fdokumen.com/doc/165x107/63265a4f5c2c3bbfa803a474/kotak-india-daily-april-2-2019-kotak-securities.jpg)


![[Kotak] India Daily, October 26, 2016 - Kotak Securities](https://static.fdokumen.com/doc/165x107/631c83236c6907d3680156e0/kotak-india-daily-october-26-2016-kotak-securities.jpg)