Dish TV - May 2012.pmd - Kotak Securities
24
One-year performance (Rel to Sensex) Source: ACE Equity Registered Office: Kotak Securities Limited, Bakhtawar, 1st floor, 229 Nariman Point, Mumbai 400021 India. Dish TV India Ltd PRICE : RS.57 RECOMMENDATION : ACCUMULATE TARGET PRICE : RS.68 FY14E P/E: 28.6X Dish TV is well placed to benefit from changing viewer preferences as well as significant regulatory changes underway in the broadcasting space. We forecast strong long-term earnings growth for the company, and find the valuations attractive at CMP. Near-term, we believe implemen- tation of digitization, possible rise in foreign investment limits are poten- tial positive triggers. Industry issues, particularly relating with high churn, are being tackled by the DTH industry, in our understanding. Digitization and (consequent) possibility of sharp upward move in ARPUs shall over- power expectedly unimpressive earnings performance in the next few quarters. Irrational competiton during digitization remains the key risk. We initiate with ACCUMULATE rating and price target of Rs.68. Pure-Play on Changing Viewership Platform: Dish TV, leading the DTH revolution in India, is a pure-play on changing viewership choices. The DTH in- dustry merges the masses from India's faraway villages (scale) with upscale viewers demanding a high quality viewing experiences (channel choice, HDTV, on-demand content). Dish TV, which has led voluntary digitization in the country via DTH, is a pure-play on the necessity of cable and satellite TV (rural areas) and demand for improved services (urban areas). Rising Subscriber Base, Improving Economies: Dish TV's rising subscriber base (now ~8% of India's C&S universe) has been the driver of revenues. Ris- ing clout in the Indian C&S space has also brought along economies in con- tent expenses as well as subscriber acquisition costs. We expect Dish TV to continue adding subscribers at a robust pace over the next three years (3mn/ year), mandatory digitization being the incremental driver. Industry is pushing for higher ARPUs, which, in addition to economies in S&D expenses, will help margins. We foresee a 8.4 ppt rise in the company's margins over FY12- FY16E. Projections, Valuations Suggest Significant Upsides, Barring Irrational Competition: We expect DTH industry to continue growing at 22% CAGR over the next five years. Dish TV, the leader in the DTH space, is likely to grow 23% CAGR in revenues and 33% CAGR in EBITDA over FY12E-FY14E. We assess fair value of Dish TV stock at Rs 68/ share, while assuming com- petitive intensity to be high, but not irrational. Expect Digitization to Have a Positive Impact on DTH; ARPUs, Earnings may see an unexpected growth: We believe digitization of Indian broad- casting, approved by the parliament and kicking off in the metros from July, 2012, shall have a beneficial impact on Dish TV. Compression in LCOs mar- gins impact ARPU positively, which would either improve DTH ARPU (along with revenues and margins), or reduce switching costs, enabling stronger sub- scriber adds than current estimates. We believe sharply rising ARPUs in the analogue space are a real possibility, and the likelihood of the event is a prime reason why one should invest in Dish TV, in spite of weakening metrics of the company. Stock details BSE code : 532839 NSE code : DISHTV Market cap (Rs.mn) : 60.6 Free float (%) : 35.25 52-wk Hi/Lo (Rs) : 97/52 Avg. Daily Volume (BSE+NSE) : 4034.77 Shares o/s (mn) : 1,064 Summary table (Rs mn) FY12E FY13E FY14E Sales 19,418 23,884 29,457 Growth (%) 35.2 23.0 23.3 EBITDA 5,008 6,757 8,801 EBITDA margin (%) 25.8 28.3 29.9 PBT (1,212) 403 2,120 Net profit (1,212) 403 2,120 EPS (Rs) (1.1) 0.4 2.0 Growth (%) (29.7) (133.2) 426.4 CEPS (Rs) 3.3 5.5 7.4 Book value (Rs/share) (0.8) (0.4) 1.6 Dividend per share (Rs) - - - ROE (%) NM NM 341.7 ROCE (%) (0.3) 9.3 19.2 Net cash (debt) (7,457) (6,104) (3,044) Net Working Capital (Days)-25 -29 -33 P/E (x) (50.0) 150.6 28.6 P/BV (x) (72.0) (138.0) 36.1 EV/Sales (x) 3.6 2.9 2.3 EV/EBITDA (x) 14.0 10.3 7.6 Source: Company, Kotak Securities - Private Client Research INITIATING COVERAGE MAY 11, 2012 PRIVATE CLIENT RESEARCH Shareholding pattern Source: ACE Equity Ritwik Rai [email protected] +91 22 6621 6310 Promoters 65% Foreign 11% Institu‐ tions 5% Corporates 4% Public 15%
-
Upload
khangminh22 -
Category
Documents
-
view
0 -
download
0
Transcript of Dish TV - May 2012.pmd - Kotak Securities

One-year performance (Rel to Sensex)
Source: ACE Equity
Registered Office: Kotak Securities Limited, Bakhtawar, 1st floor, 229 Nariman Point, Mumbai 400021 India.
Dish TV India Ltd
PRICE : RS.57 RECOMMENDATION : ACCUMULATETARGET PRICE : RS.68 FY14E P/E: 28.6X
Dish TV is well placed to benefit from changing viewer preferences aswell as significant regulatory changes underway in the broadcastingspace. We forecast strong long-term earnings growth for the company,and find the valuations attractive at CMP. Near-term, we believe implemen-tation of digitization, possible rise in foreign investment limits are poten-tial positive triggers. Industry issues, particularly relating with high churn,are being tackled by the DTH industry, in our understanding. Digitizationand (consequent) possibility of sharp upward move in ARPUs shall over-power expectedly unimpressive earnings performance in the next fewquarters. Irrational competiton during digitization remains the key risk.We initiate with ACCUMULATE rating and price target of Rs.68.
Pure-Play on Changing Viewership Platform: Dish TV, leading the DTHrevolution in India, is a pure-play on changing viewership choices. The DTH in-dustry merges the masses from India's faraway villages (scale) with upscaleviewers demanding a high quality viewing experiences (channel choice,HDTV, on-demand content). Dish TV, which has led voluntary digitization inthe country via DTH, is a pure-play on the necessity of cable and satellite TV(rural areas) and demand for improved services (urban areas).
Rising Subscriber Base, Improving Economies: Dish TV's rising subscriberbase (now ~8% of India's C&S universe) has been the driver of revenues. Ris-ing clout in the Indian C&S space has also brought along economies in con-tent expenses as well as subscriber acquisition costs. We expect Dish TV tocontinue adding subscribers at a robust pace over the next three years (3mn/year), mandatory digitization being the incremental driver. Industry is pushingfor higher ARPUs, which, in addition to economies in S&D expenses, will helpmargins. We foresee a 8.4 ppt rise in the company's margins over FY12-FY16E.
Projections, Valuations Suggest Significant Upsides, Barring IrrationalCompetition: We expect DTH industry to continue growing at 22% CAGRover the next five years. Dish TV, the leader in the DTH space, is likely togrow 23% CAGR in revenues and 33% CAGR in EBITDA over FY12E-FY14E.We assess fair value of Dish TV stock at Rs 68/ share, while assuming com-petitive intensity to be high, but not irrational.
Expect Digitization to Have a Positive Impact on DTH; ARPUs, Earningsmay see an unexpected growth: We believe digitization of Indian broad-casting, approved by the parliament and kicking off in the metros from July,2012, shall have a beneficial impact on Dish TV. Compression in LCOs mar-gins impact ARPU positively, which would either improve DTH ARPU (alongwith revenues and margins), or reduce switching costs, enabling stronger sub-scriber adds than current estimates. We believe sharply rising ARPUs in theanalogue space are a real possibility, and the likelihood of the event is aprime reason why one should invest in Dish TV, in spite of weakening metricsof the company.
Stock details
BSE code : 532839
NSE code : DISHTV
Market cap (Rs.mn) : 60.6
Free float (%) : 35.25
52-wk Hi/Lo (Rs) : 97/52
Avg. Daily Volume (BSE+NSE) : 4034.77
Shares o/s (mn) : 1,064
Summary table(Rs mn) FY12E FY13E FY14E
Sales 19,418 23,884 29,457Growth (%) 35.2 23.0 23.3EBITDA 5,008 6,757 8,801EBITDA margin (%) 25.8 28.3 29.9PBT (1,212) 403 2,120Net profit (1,212) 403 2,120EPS (Rs) (1.1) 0.4 2.0Growth (%) (29.7) (133.2) 426.4CEPS (Rs) 3.3 5.5 7.4Book value (Rs/share) (0.8) (0.4) 1.6Dividend per share (Rs) - - -ROE (%) NM NM 341.7ROCE (%) (0.3) 9.3 19.2Net cash (debt) (7,457) (6,104) (3,044)Net Working Capital (Days)-25 -29 -33P/E (x) (50.0) 150.6 28.6P/BV (x) (72.0) (138.0) 36.1EV/Sales (x) 3.6 2.9 2.3EV/EBITDA (x) 14.0 10.3 7.6
Source: Company,
Kotak Securities - Private Client Research
INITIATING COVERAGEMAY 11, 2012
PRIVATE CLIENT RESEARCH
Shareholding pattern
Source: ACE Equity
Ritwik [email protected]+91 22 6621 6310
Promoters65%
Foreign11%
Institu‐tions5%
Corporates4%
Public15%
Kotak Securities - Private Client Research Please see the disclaimer on the last page For Private Circulation 2
INITIATING COVERAGE May 11, 2012
Near-Term Earnings View - The Weaknesses are in the Price: Dish TV is al-ready experiencing fairly high churn (19%, annualized) on account of height-ened competitive activity, and we duly account for the same in our estimates.We also believe that industry actions in the recent past provide reason to be-lieve that churn may be contained at lower levels, going forward. Based on ourestimates, we think there is a possibility that earnings revisions thus far havebeen more than adequate, and current multiples (10.3x EV/ EBITDA FY13E) arean insufficient reflection of the potential in Dish TV stock.
Sentiment Likely to be Positive, leading to improving valuations, limit-ing downside risks: We believe that as the digitization rolls out, and issuesrelating with concerns on DTH/ Dish TV are resolved, the sentiment on thestock is likely to be positive. Further positive impact could come in from a risein foreign investment limit in the cable/DTH segment. We find the risk-rewardfavorable at CMP, and initiate with ACCUMULATE recommendation, and aprice target of Rs 68.
Key Risks: Downside risks include higher competitive intensity, persistently lowARPUs in Indian C&S sector, value chain risks and forex risk.
We initiate coverage withACCUMULATE rating on Dish TV
India with a price target of Rs.68
Kotak Securities - Private Client Research Please see the disclaimer on the last page For Private Circulation 3
INITIATING COVERAGE May 11, 2012
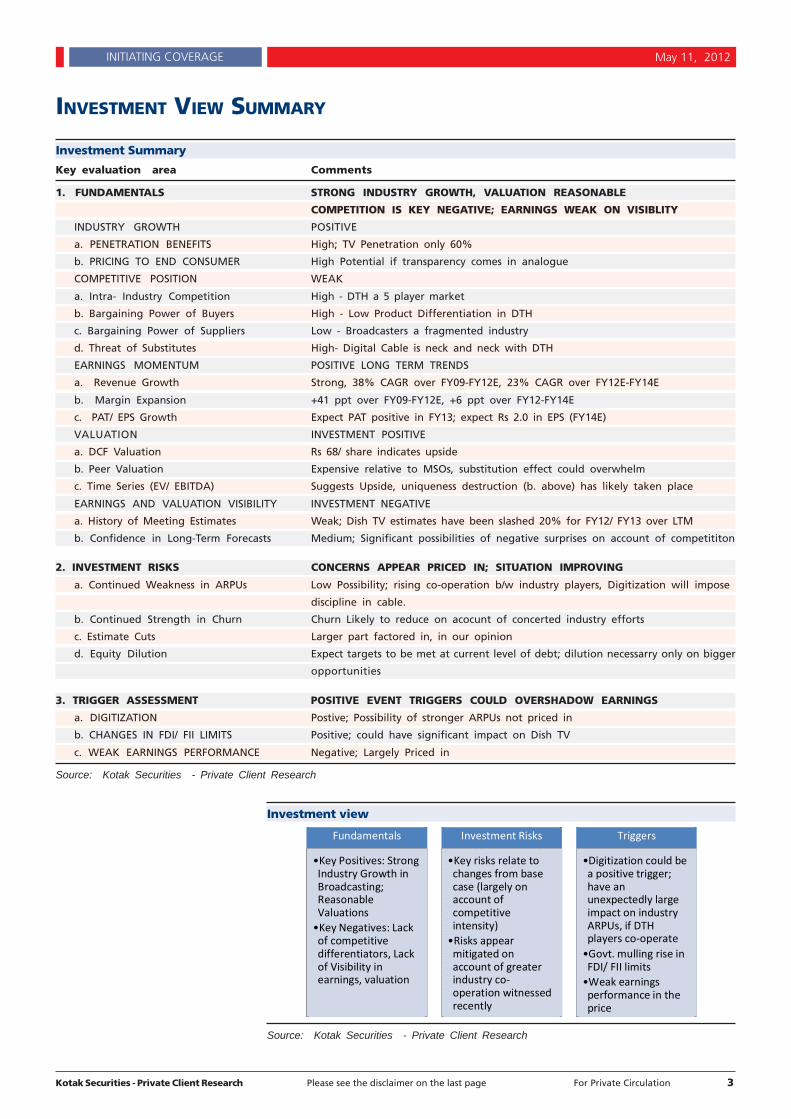
INVESTMENT VIEW SUMMARY
Investment Summary
Key evaluation area Comments
1. FUNDAMENTALS STRONG INDUSTRY GROWTH, VALUATION REASONABLE
COMPETITION IS KEY NEGATIVE; EARNINGS WEAK ON VISIBLITY
INDUSTRY GROWTH POSITIVE
a. PENETRATION BENEFITS High; TV Penetration only 60%
b. PRICING TO END CONSUMER High Potential if transparency comes in analogue
COMPETITIVE POSITION WEAK
a. Intra- Industry Competition High - DTH a 5 player market
b. Bargaining Power of Buyers High - Low Product Differentiation in DTH
c. Bargaining Power of Suppliers Low - Broadcasters a fragmented industry
d. Threat of Substitutes High- Digital Cable is neck and neck with DTH
EARNINGS MOMENTUM POSITIVE LONG TERM TRENDS
a. Revenue Growth Strong, 38% CAGR over FY09-FY12E, 23% CAGR over FY12E-FY14E
b. Margin Expansion +41 ppt over FY09-FY12E, +6 ppt over FY12-FY14E
c. PAT/ EPS Growth Expect PAT positive in FY13; expect Rs 2.0 in EPS (FY14E)
VALUATION INVESTMENT POSITIVE
a. DCF Valuation Rs 68/ share indicates upside
b. Peer Valuation Expensive relative to MSOs, substitution effect could overwhelm
c. Time Series (EV/ EBITDA) Suggests Upside, uniqueness destruction (b. above) has likely taken place
EARNINGS AND VALUATION VISIBILITY INVESTMENT NEGATIVE
a. History of Meeting Estimates Weak; Dish TV estimates have been slashed 20% for FY12/ FY13 over LTM
b. Confidence in Long-Term Forecasts Medium; Significant possibilities of negative surprises on account of competititon
2. INVESTMENT RISKS CONCERNS APPEAR PRICED IN; SITUATION IMPROVING
a. Continued Weakness in ARPUs Low Possibility; rising co-operation b/w industry players, Digitization will impose
discipline in cable.
b. Continued Strength in Churn Churn Likely to reduce on acocunt of concerted industry efforts
c. Estimate Cuts Larger part factored in, in our opinion
d. Equity Dilution Expect targets to be met at current level of debt; dilution necessarry only on bigger
opportunities
3. TRIGGER ASSESSMENT POSITIVE EVENT TRIGGERS COULD OVERSHADOW EARNINGS
a. DIGITIZATION Postive; Possibility of stronger ARPUs not priced in
b. CHANGES IN FDI/ FII LIMITS Positive; could have significant impact on Dish TV
c. WEAK EARNINGS PERFORMANCE Negative; Largely Priced in
Source: Kotak Securities - Private Client Research
Investment view
Source: Kotak Securities - Private Client Research
Fundamentals
•Key Positives: Strong Industry Growth in Broadcasting; Reasonable Valuations
•Key Negatives: Lack of competitive differentiators, Lack of Visibility in earnings, valuation
Investment Risks
•Key risks relate to changes from base case (largely on account of competitive intensity)
•Risks appear mitigated on account of greater industry co‐operation witnessed recently
Triggers
•Digitization could be a positive trigger; have an unexpectedly large impact on industry ARPUs, if DTH players co‐operate
•Govt. mulling rise in FDI/ FII limits
•Weak earnings performance in the price

Kotak Securities - Private Client Research Please see the disclaimer on the last page For Private Circulation 4
INITIATING COVERAGE May 11, 2012
INVESTMENT DISCUSSION
India's broadcasting Opportunity: Penetration, Transparency, Seg-mentation
Dish TV is a part of the great Indian broadcasting story - filling of penetration gaps,rise of organized players in the cable and satellite space, and clogged analoguepipe (see appendix "The Problem With Analogue Cable"). The subscriptionrevenues of Indian broadcasting industry, sized at Rs 237Bn, have been witnessingmodest growth over the past five years (12% CAGR), which in turn have been heldback on account of stagnancy in analogue cable.
There are three important growth opportunities in Indian broadcasting, based on: 1/penetration, 2/ transparency, and 3/ segmentation.
Firstly, India's television penetration statistics indicate there is a lot more growth tocome. TV Penetration in India is 61%, which is low compared with global peers.Broadcasting industry has plenty of scope to grow, therefore, from rising penetrationof cable and satellite TV as well as TV penetration. Pay TV is also a play on somebroad trends such as urbanization, rise of the middle class, and rise of nuclearfamilies in India.
Penetration of TV (%)
Source: FICCI-KPMG Report
Secondly, the larger part of the Indian cable and satellite universe (~70%) continuesto be serviced by analogue cable. Analogue cable has been a pillar of non-transparency in Indian broadcasting on account of which various inefficiencies havecrept into the system. Organized players (broadcasters, larger MSOs) have sufferedat the hands of Local Cable Operators, and customer pricing has been weak.
A third (although related to the second point raised above) issue is that of customersegmentation. The feed received by the analogue subscriber is a 'one size fits all'package. While there may be over 600 channels in India, the subscriber is forced towatch what is made available by the MSO that the subscriber's LCO has chosen.Therefore, while willingness to pay may exist, product availability is an issue.Digitization allows for segmentation of the consumer, thus aligning customer wantswith product, and (therefore) extracting superior pricing.
Rs 237 Bn are generated in broadcasting industry subscription revenues - of which ~Rs 150 Bn is received from analogue subscribers. About 85% of the analoguerevenues are appropriated by the LCO. The distribution of the subscription revenuesgenerated in the value chain is undergoing a shift as consumers switch fromanalogue to digital viewing platforms.
61%
78%
90%97% 98%
0%
20%
40%
60%
80%
100%
India Indonesia Brazil Germany China
Three guiding forces in broadcasting subscription revenues:Penetration Transparency and
Segmentation
Shift from analogue to digitalplatforms to aid transparency...

Kotak Securities - Private Client Research Please see the disclaimer on the last page For Private Circulation 5
INITIATING COVERAGE May 11, 2012
Indian Pay TV Model(Rs mn) 2009 2010E 2011E 2012E 2013E 2014E 2015E 2016E 2017E 2018E 2019E 2020E
Derivation, Subscription Revenues:
Population (‘000) 1,155,348 1,170,368 1,185,582 1,200,995 1,216,608 1,232,424 1,248,445 1,263,427 1,278,588 1,293,931 1,309,458 1,325,171
Growth (%) 1.3 1.3 1.3 1.3 1.3 1.3 1.2 1.2 1.2 1.2 1.2
# per household 4.7 4.6 4.5 4.4 4.3 4.3 4.2 4.1 4.0 3.9 3.8 3.8
Households (‘000) 245,507 253,774 262,320 271,153 280,284 289,722 299,478 309,257 319,355 329,783 340,551 351,671
- o/w Television Households 147,304 152,265 162,638 173,538 184,987 197,011 209,635 222,665 236,323 250,635 265,630 281,337
% Penetration (TV) 60 60 62 64 66 68 70 72 74 76 78 80
- o/w C&S Households 91,329 106,585 123,605 133,624 146,140 159,579 173,997 189,265 205,601 225,571 239,067 253,203
% Penetration (C&S TV) 37 42 47 49 52 55 58 61 64 68 70 72
% Grw. (C&S TV) 17 16 8 9 9 9 9 9 10 6 6
- o/w Analogue Households 69,000 74,985 80,045 68,696 49,980 34,995 35,017 36,387 37,435 40,589 35,587 29,375
- o/w Digital Cable Households 4,000 6,000 9,000 20,000 40,000 60,000 66,000 72,600 79,860 87,846 96,631 106,294
- o/w DTH Households 16,000 25,600 34,560 44,928 56,160 64,584 72,980 80,278 88,306 97,136 106,850 117,535
ARPU (Rs/ Month)
- Analogue Households 160 160 160 160 160 160 160 160 160 171 183 196
- Digital Cable 160 160 160 160 180 193 206 221 236 252 270 289
- DTH 160 160 160 170 180 193 206 221 236 252 270 289
Revenues, Ind (Distrbn. Chain) Rs mn 170,880 204,644 237,322 261,950 303,667 355,129 410,927 474,393 548,006 643,792 737,824 845,439
- Analogue Households 132,480 143,972 153,687 131,897 95,962 67,190 67,232 69,864 71,875 83,386 78,227 69,092
- Digital Cable 7,680 11,520 17,280 38,400 86,400 138,672 163,217 192,106 226,109 266,130 313,236 368,678
- DTH 30,720 49,152 66,355 91,653 121,306 149,267 180,478 212,423 250,022 294,275 346,362 407,668
Source: Kotak Securities - Private Client Research
The Indian broadcasting industry is expected to rise in revenues to Rs 355 Bn byFY2015, if digitization is implemented as per plan. Dish TV, along with otherdistribution and broadcasting operators has an opportunity to be a part of thegrowth. As per our estimates, DTH opportunity in India shall see a growth of 22%CAGR over the next ten years (see table above).
Mandatory Digitization or not, DTH Placed Well
Demand for DTH has been met by improving economies of the sector: decliningset-top box prices, and reducing content costs per subscriber (incentives frombroadcasters) have enabled the DTH service providers to remain competitive withanalogue cable players, which has satisfied urban demand. Rural demand, on theother hand, can be, very often, met only by DTH players (analogue cableeconomies are poor in sparsely populated areas).
India's broadcasting space is still largely analogue. A key development that hashappened recently is the passage of the Cable Networks Amendment Bill, 2011,which makes digitization mandatory, in three phases, the summary of which isprovided below:
Digitization Timeline
Source: Industry
Phase 1 (4 Metro Cities, June 2012)
Phase 2 (cities with pop. > 1mn, Mar 2013) Rest of India (Dec, 2014)
All urban areas (Sep, 2014)Cable Networks Amendment Billwill create opportunities for
organized players in broadcasting
Kotak Securities - Private Client Research Please see the disclaimer on the last page For Private Circulation 6
INITIATING COVERAGE May 11, 2012
We believe that DTH operators are placed well whether or not the same is adheredto - and this makes Dish TV a somewhat unique candidate in the listed distributionspace. If digitization timelines cannot be met, we think that the inefficiencies ofanalogue cable viewing will give way to DTH take-up in urban areas. If digitizationis in fact made mandatory, DTH would likely gain on certain urban areas whereDTH shall have taken longer to penetrate.
DTH has several positives going for it, in so far as the race to gain subscribers isconcerned: 1/ DTH can reach far flung areas, where MSOs are sometimes notviable. This is indeed the reason for DTH's success in rural areas, and shall remainso, 2/ the DTH industry has invested aggressively in branding (over Rs 10Bn havebeen cumulatively invested by the industry in brand promotion); we believe recallwould be a factor in gaining subscribers if digitization mandate plays out, 3/ MSOsare connected to the subscriber through the tenuous link of an LCO, while DTHcompanies have a billing relationship, and systems in place for customersatisfaction, 4/ DTH companies have a 100% prepaid model which improved cashflows, 5/ despite digitization, even cable companies admit that the viewingexperience is better in DTH. Further, DTH companies have also rolled out valueadded equipment/ services such as movie on demand, HDTV, and PVRs, not all ofwhich are available with most MSOs.
In our opinion, rainfall attenuation is a relatively smaller issue, and the disturbancesare somewhat minor. The captive subscriber base and lower acquisition costs ofMSOs are advantages that come with a rider: no last mile connectivity, and nodirect connect with the subscriber. Further, as we discuss in our next section, it isunlikely that LCOs shall be able to manage operations without significantly raisingbill payments, which may bring DTH more on par with digital cable.
Lastly, it is believed that MSOs can localize content to a greater extent, givengreater channel capacity. This argument has its limitations, for: 1/ DTH operatorswould themselves ramp up capacity to 400 channels (currently carry 200+channels), 2/ it is our view that such 400 channels can satisfy a larger part of theIndian C&S audience.
Digital Cable versus DTH
Source: Hathway Cable Investor Presentation, Kotak Securities - Private Client Research?
Positives for DTH
Scalability
Established Brands
Last Mile Ownership
Prepaid Model
Superior Viewing Experience
Positives for Cable
Captive Subscriber base
Lower Sub. Acq. Costs
No Rainfall Attentuation
Higher Number of Channels
Potential for greater localization
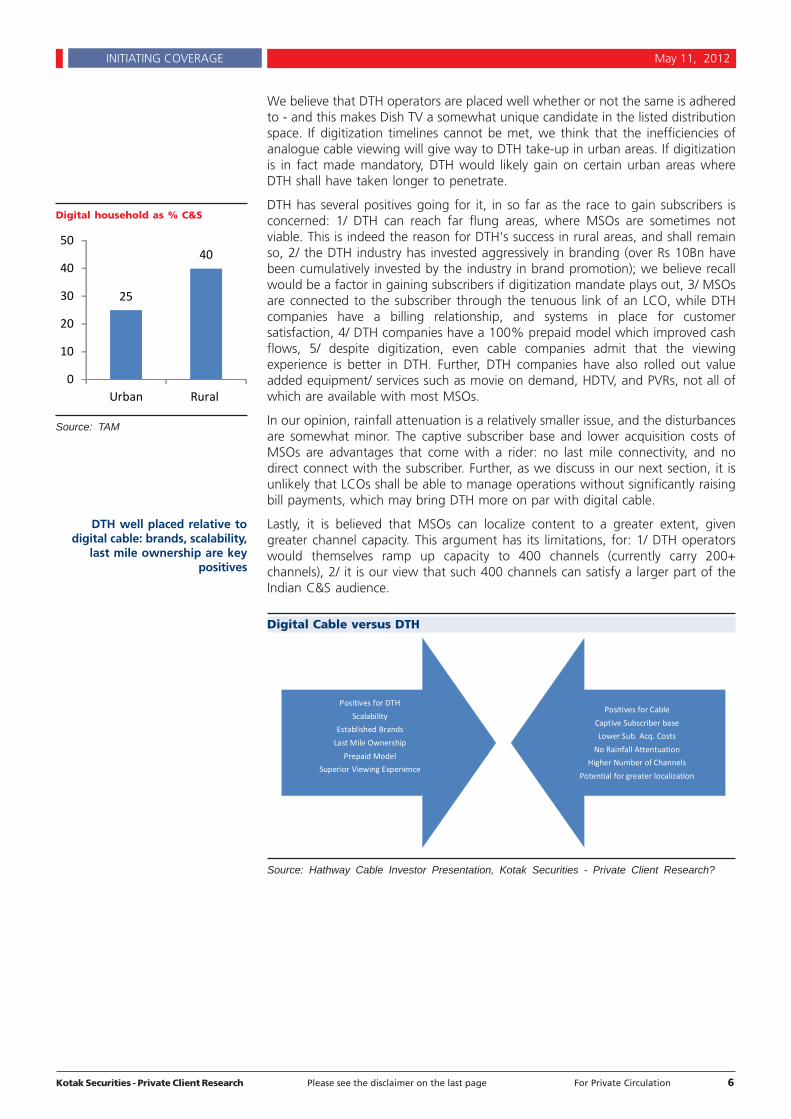
25
40
0
10
20
30
40
50
Urban Rural
Digital household as % C&S
Source: TAM
DTH well placed relative todigital cable: brands, scalability,
last mile ownership are keypositives

Kotak Securities - Private Client Research Please see the disclaimer on the last page For Private Circulation 7
INITIATING COVERAGE May 11, 2012
Consumer Economics: DTH Not at a Disadvantage in a Digitized India
DTH industry has an ARPU of Rs 160/ month, approximately the same as ARPU ofDish TV. This is equivalent to the ARPU of analogue cable operators, and is a keybottleneck for DTH operators in making progress in urban areas (given additionalcost of equipment that the customer would have to pay, compared with zeroinstallation cost in case of analogue TV). We believe that mandatory digitizationshall alter the economics of LCOs in such a way as to force many out of operation,unless consumer payments for the same rise significantly. In an illustration below,we see that operating earnings of a local cable operator with 10,000 subscribersmay potentially fall by 70% in a situation where 35% of subscriber payments areretained by the LCO, if billing rates do not rise.
Illustration: LCO Economics - Pre and Post Digitization
Pre- Digitization Post-Digitization
Subscribers 1,000 1,000 1,000 1,000 1,150
ARPU (Rs / month) 160 160 200 250 300
Revenues/ Month 160,000 160,000 200,000 250,000 345,000
Ent. Tax Paid (@10% of reported revs.) 2,400 16,000 20,000 25,000 34,500
Underreporting 85% - - - -
Revenues Paid Out to MSO (65% of reported revs.) 15,600 104,000 130,000 162,500 224,250
Gross Profit 142,000 40,000 50,000 62,500 86,250
Personnel and Billing Expenses 30,000 20,000 20,000 20,000 20,000
EBITDA 112,000 20,000 30,000 42,500 66,250
EBITDA Margin 70.0% 12.5% 15.0% 17.0% 19.2%
Source: Kotak Securities - Private Client Research, Industry Discussions
Our discussions with some of the MSOs suggest that industry ARPUs are set to riseto Rs 220 - Rs.250/ month over the medium term. This would affect the DTHindustry positively, in our opinion. Keeping DTH industry ARPUs constant, this wouldmean that the higher installation expenses that a customer may have to bear for aDTH connection (~Rs 1000 in excess of the cable STB), shall have an offsettingcomponent in the monthly bill payments, making DTH competitive versus digitalcable.
Illustration: Consumer Economics - DTH versus Digital Cable
DTH Cable
STB Cost to consumer 1400 500
ARPU (Rs/ month) 200 250
Payment (assuming 2-yr holding) 6200 6500
Payment (assuming 3-yr holding) 8600 9500
Source: Kotak Securities - Private Client Research
The same shall have one of these implications, depending on how DTH industry'sconsumer prices move: a/ ARPU of DTH industry may see a sharper rise thanforecasts (the larger part of which will flow into EBITDA, raising margins in theshort-term), or b/ take-up of DTH may turn out to be stronger than expected byconsensus/ industry, which will have a positive long-term impact on margins viascale.
Large number of LCOs may seeprofits decline substantially if
ARPUs do not rise postdigitization
Rise in digital cable ARPUs willmake DTH competitive, even in
terms of cost to consumer

Kotak Securities - Private Client Research Please see the disclaimer on the last page For Private Circulation 8
INITIATING COVERAGE May 11, 2012
The Story So Far: DTH Growing at a Fast Clip, Dish TV Industry Leader
Dish TV is the largest player in the fast-growing Indian DTH market. DTHsubscribers in India have risen to 37mn in a space of six years (Dish TV, the firstIndian DTH company, launched operations in 2005).
Summary of Indian Broadcasting Distribution Landscape (mn subscribers)
Source: FICCI - KPMG Report, 2012
Two factors, namely channel proliferation and inability of analog cable to convertcustomers to digital subscribers, and the inability of cable to reach sparselypopulated locations, have propelled the demand for DTH services in India.
Dish TV has 12.6 mn subscribers (CY2011- end), and has been the market leaderof the industry since inception.
Dish TV Market Share
Source: Company Reports
Growth in the DTH industry shall be dependent on: 1/ further growth in subscribers,on account of stronger DTH take-up, and 2/ changes in ARPUs, on account ofgreater customization of content (MOD, HDTV etc), and greater transparency in theanalogue value chain (which will force ARPUs upwards). For this reason, we believeDTH subscribers shall grow at a fast phase in a digital addressable environment.
0
40
80
120
160
200
2009 2010 2011 2012E 2013E 2014E 2015E 2016E
IPTV DD Direct DTH Digital Cable Analog
Dish TV, 29.4
Tata Sky, 18.4Sun Direct, 14.1
Big TV, 8.2
Airtel Digital, 18.6
Videocon d2h, 11.3
DTH, digital cable to co-exist in adigitized environment
Dish TV: Market leader in acompetitive market
Kotak Securities - Private Client Research Please see the disclaimer on the last page For Private Circulation 9
INITIATING COVERAGE May 11, 2012
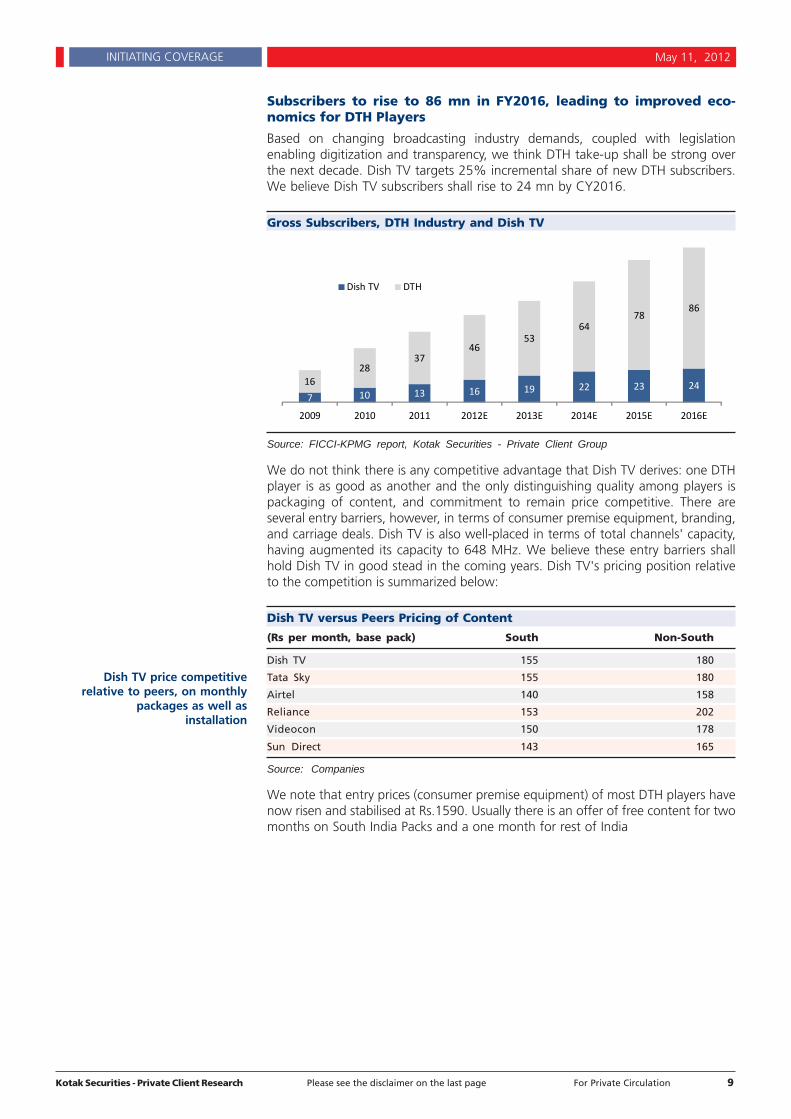
Subscribers to rise to 86 mn in FY2016, leading to improved eco-nomics for DTH Players
Based on changing broadcasting industry demands, coupled with legislationenabling digitization and transparency, we think DTH take-up shall be strong overthe next decade. Dish TV targets 25% incremental share of new DTH subscribers.We believe Dish TV subscribers shall rise to 24 mn by CY2016.
Gross Subscribers, DTH Industry and Dish TV
Source: FICCI-KPMG report, Kotak Securities - Private Client Group
We do not think there is any competitive advantage that Dish TV derives: one DTHplayer is as good as another and the only distinguishing quality among players ispackaging of content, and commitment to remain price competitive. There areseveral entry barriers, however, in terms of consumer premise equipment, branding,and carriage deals. Dish TV is also well-placed in terms of total channels' capacity,having augmented its capacity to 648 MHz. We believe these entry barriers shallhold Dish TV in good stead in the coming years. Dish TV's pricing position relativeto the competition is summarized below:
Dish TV versus Peers Pricing of Content
(Rs per month, base pack) South Non-South
Dish TV 155 180
Tata Sky 155 180
Airtel 140 158
Reliance 153 202
Videocon 150 178
Sun Direct 143 165
Source: Companies
We note that entry prices (consumer premise equipment) of most DTH players havenow risen and stabilised at Rs.1590. Usually there is an offer of free content for twomonths on South India Packs and a one month for rest of India
7 10 13 16 19 22 23 2416
2837
4653
6478
86
2009 2010 2011 2012E 2013E 2014E 2015E 2016E
Dish TV DTH
Dish TV price competitiverelative to peers, on monthly
packages as well asinstallation

Kotak Securities - Private Client Research Please see the disclaimer on the last page For Private Circulation 10
INITIATING COVERAGE May 11, 2012
Industry ARPUs Bottomed Out, Likely to See Gains
We believe ARPUs of DTH industry have bottomed out, and are headed upwards.Our belief in rising ARPUs going forward has its roots in the following:
1/ technological changes, such as onset of HD, and availability of Video onDemand, are changing consumer's viewing experience and are effectivelyredrawing pricing. Dish TV is already marketing HDTV set-top-boxes, which are 5%of the gross adds. HDTV ARPUs are over Rs 400/ month. We believe that as Indianviewers make a switch from analog TV to HDTV, there shall be an upwardmovement in ARPUs. We note that HDTV-enabled TV sets are already seeingsignificant take-up in India, and this trend is likely to continue.
Television Sales (mn units)
Source: FICCI- KPMG Report, 2012
2/ ARPUs of cable have not risen at all in the past five years. The ARPU of analogueoperators acts as a ceiling for DTH players. As digitization is implemented theceiling imposed over DTH players shall change. While we in our model assume aslow growth of ARPUs, there is a case for expecting a sharp rise in ARPUs postdigitization.
3/ recent trends indicate that Dish TV is able to raise ARPU while still havingsignificant subscriber gains; therefore, at least for now, it appears that irrationalactivities have been limited. The company has, in November, raised the price of itsbase pack, which would have a positive impact on ARPUs in the coming quarters.
Dish TV Quarterly ARPU Trends (x-axis to read 1QFY10-3QFY12)
Source: Company Reports, Kotak Securities - Private Client Research
Our model, we believe, is a conservative statement of the opportunity from risingARPUs in India. A comparison of Indian ARPUs with global benchmarks shows thatat current price, there may be a willingness to pay that is 45-50% higher thanpresent levels. Given expectations of rising disposable incomes (est. at 10% CAGRthrough the next ten years), there is a case for expecting ARPUs to rise 4X, if theIndian broadcasting markets were left to market forces.
0
5
10
15
20
25
FY06 FY07 FY08 FY09 FY10 FY11 FY12E FY13E FY14E FY15E
Television Sales Analogue LCD Plasma Other Digital
Pay TV ARPU in India
Source: PWC, Industry Discussions
0
30
60
90
120
150
180
0
2
4
6
8
10
130
140
150
160
170
180Net Active sub base (RHS)
ARPU (LHS)
Take up of value-added services,rise in cable ARPUs and greaterindustry co-operation can take
ARPUs upward

Kotak Securities - Private Client Research Please see the disclaimer on the last page For Private Circulation 11
INITIATING COVERAGE May 11, 2012
Cable ARPUs - India verus Global Peers
Source: Industry
Opportunity to gain from economies of scale
In the past, substantial margin gains have been made by Dish TV as subscribernumbers have ramped up (+25 ppt over past four years). Two key sources of marginexpansion have been: a) better content cost management (higher gross margins), b)declining sales and distribution expenses as % of sales on operating leaverage. A20%+ share in a market of over 86 mn subscribers (as projected) can havesubstantial benefits to the leading players. Viewership depends on distribution, andrising competitive pressures among broadcasters can lead to lower pay-outs (persubscriber basis, if not on the whole) to the broadcasters. Currently, content costsare 32% of sales of Dish TV.
We also believe substantial leverage gains shall emanate from selling anddistribution expenses of companies, which is largely constituted of commissions andadvertising and promotion expenses. We believe that Dish TV shall make margingains of ~8 ppt in this line item as subscriber base ramps up, industry commisiondecline and subscriber base reaches a steady state. Incremental advertisingrequirements are low, we believe, while agent commissions would be guided byabsolute figures rather than on a per subscriber basis.
Commissions are also closely related with churn; for there exists a trade-off inselling a recharge versus a new package. We note that in recent months, industryhas taken concerted action in this regard, reducing commissions on sale of CPE;which raises our confidence in the belief that there shall be leverage to obtain fromselling and distribution expenses. This is to say that subscriber acquisition costs andcontent costs should likely turn downward (as % sales).
Margin Drivers, Dish TV
Source: Company reports, Kotak Securities - Private Client Research
0
9
18
27
36
45
India Thailand Singapore Hong Kong Japan UK
‐60%
‐30%
0%
30%
60%
90%
‐30000
‐15000
0
15000
30000
45000
Revenues (Rs mn ‐ LHS) Gross Margins (RHS)
EBITDA Margins (RHS) S&D Expenses as % Sales (RHS)
Modest gains from contentexpenses, substantial gains in
marketing and distributionexpenses to drive margins

Kotak Securities - Private Client Research Please see the disclaimer on the last page For Private Circulation 12
INITIATING COVERAGE May 11, 2012
FINANCIAL PROJECTIONS
Stronger Subscriber Adds, Improving ARPUS to Guide 22% ToplineGrowth (FY12-FY14E)
We present below our revenue model for Dish TV: 1/ We have modeled for grosssubscribers of the company to rise to 23mn by FY16-end, 2/ we provision for risingchurn of the company and model for 73% active subscribers by the end of FY16,implying 16.8mn net subscribers by FY16-end, 3/ ARPUs have been modeled to rise~7-10% annually, due to an amalgam of factors such as rising pressures in cableARPU, company initiatives, migration to HD services, and usage of other value-added services (such as VoD), 4/ we have assumed that current upfront charges (Rs1590) received by the company per set-top-box shall be maintained into perpetuity,5/ bandwidth charges have been held constant at Rs 187mn in our model. Net-netwe forecast 23% CAGR in company’s topline over 2012E-2016E.
Our revenue model thus factors in significant benefits coming from the DASmandate in so far as the subscriber growth of the company is concerned. We alsofactor in a reasonably high level of competitive activity, which will keep churn high.However, we do not factor in : 1/ possibility of sharply higher ARPU in the near –term, and 2/ Irrational competition that may impact revenues/churn negatively.
Dish TV Revenue Model
Rs mn, FY Ends Mar FY07 FY08 FY09 FY10 FY11 FY12E FY13E FY14E FY15E FY16E
Revenues 1,916 4,128 7,381 10,850 14,367 19,418 23,884 29,457 36,451 42,189
-o/w Subscription Revenues 1,219 3,288 5,897 8,353 11,927 16,828 21,520 27,357 34,398 40,492
- o/w Lease Rentals 218 604 1,007 1,501 1,985 2,185 1,998 1,755 1,711 1,356
-o/w Other 479 236 477 996 454 405 366 345 342 341
Growth (%) - Key Revenue Drivers
- Net revenues 115.4 78.8 47.0 32.4 35.2 23.0 23.3 23.7 15.7
- Subscription revenues 169.8 79.3 41.6 42.8 41.1 27.9 27.1 25.7 17.7
Revenue Assumptions
Gross Subs 2.0 3.0 5.1 6.9 10.4 13.0 16.0 19.0 22.0 23.0
Gross Adds 1.0 2.1 1.8 3.5 2.6 3.0 3.0 3.0 1.0
Cumulative Churn 0.3 0.5 0.8 1.1 1.9 2.9 4.0 4.9 5.7 6.2
Churn for the year 0.2 0.3 0.3 0.8 1.0 1.1 0.9 0.8 0.5
Cum. Churn as % Gross Subs 17.0 17.6 15.8 16.0 18.0 22.0 25.0 26.0 26.0 27.0
Churn as % Gross Adds 18.8 13.1 16.6 21.9 38.3 38.0 31.3 26.0 49.0
Net Subs 1.7 2.5 4.3 5.8 8.6 10.1 12.0 14.1 16.3 16.8
ARPU (Rs/ month) 131 146 139 143 150 162 175 189 204
% Active 82.4 84.2 84.0 82.0 78.0 75.0 74.0 74.0 73.0
Source: Company Data, Kotak Securities – Private Client Research
Margins to Improve to 8.4 ppt over FY12-FY16
We forecast 30% CAGR in Dish TV’s EBITDA over FY12-FY16E. Our positive view onthe company’s EBITDA growth is built on rising margins (leverage on account ofsignificant customer adds), in addition to the company’s topline. We believe Dish TVshall be able to gather substantially higher bargaining power with broadcastersgoing forward, leading to further rise in gross margins of the company. We alsobelieve that with improving scale of DTH operations, there shall be leverage toobtain from other expenses, leading to EBITDA margin expansion of 8.4 ppt overFY12E-FY16E.
Dish TV’s balance sheet currently carries debt of Rs.12 Bn, a significant part ofwhich is now denominated and carries lower interest rates, following a restructuringexercise undertaken in 1HFY12. Therefore interest expenses are likely to be lowergoing forward (FY12 financial expenses include the forex impact of over Rs 450mn.We forecast FY12/FY13 EPS at Rs 0.4/ Rs 2.0.
We factor in gross subscriberadds of 3 mn per year through
FY13-FY15
Kotak Securities - Private Client Research Please see the disclaimer on the last page For Private Circulation 13
INITIATING COVERAGE May 11, 2012
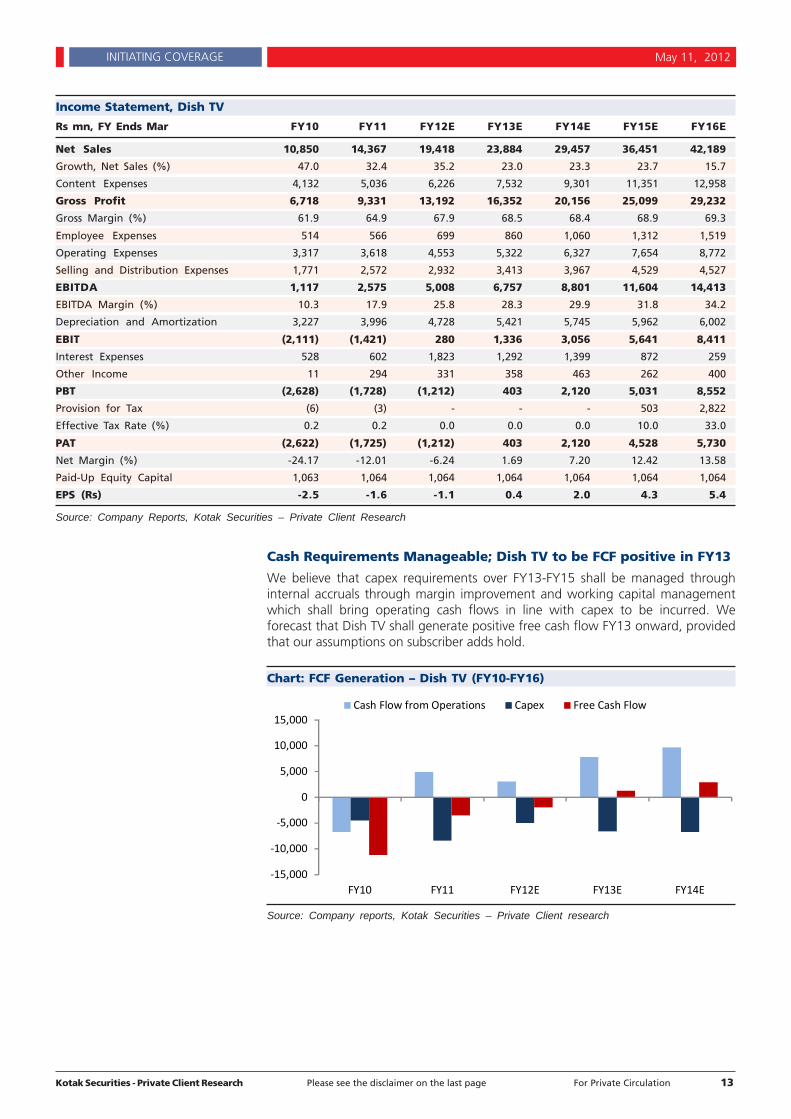
Income Statement, Dish TV
Rs mn, FY Ends Mar FY10 FY11 FY12E FY13E FY14E FY15E FY16E
Net Sales 10,850 14,367 19,418 23,884 29,457 36,451 42,189
Growth, Net Sales (%) 47.0 32.4 35.2 23.0 23.3 23.7 15.7
Content Expenses 4,132 5,036 6,226 7,532 9,301 11,351 12,958
Gross Profit 6,718 9,331 13,192 16,352 20,156 25,099 29,232
Gross Margin (%) 61.9 64.9 67.9 68.5 68.4 68.9 69.3
Employee Expenses 514 566 699 860 1,060 1,312 1,519
Operating Expenses 3,317 3,618 4,553 5,322 6,327 7,654 8,772
Selling and Distribution Expenses 1,771 2,572 2,932 3,413 3,967 4,529 4,527
EBITDA 1,117 2,575 5,008 6,757 8,801 11,604 14,413
EBITDA Margin (%) 10.3 17.9 25.8 28.3 29.9 31.8 34.2
Depreciation and Amortization 3,227 3,996 4,728 5,421 5,745 5,962 6,002
EBIT (2,111) (1,421) 280 1,336 3,056 5,641 8,411
Interest Expenses 528 602 1,823 1,292 1,399 872 259
Other Income 11 294 331 358 463 262 400
PBT (2,628) (1,728) (1,212) 403 2,120 5,031 8,552
Provision for Tax (6) (3) - - - 503 2,822
Effective Tax Rate (%) 0.2 0.2 0.0 0.0 0.0 10.0 33.0
PAT (2,622) (1,725) (1,212) 403 2,120 4,528 5,730
Net Margin (%) -24.17 -12.01 -6.24 1.69 7.20 12.42 13.58
Paid-Up Equity Capital 1,063 1,064 1,064 1,064 1,064 1,064 1,064
EPS (Rs) -2.5 -1.6 -1.1 0.4 2.0 4.3 5.4
Source: Company Reports, Kotak Securities – Private Client Research
Cash Requirements Manageable; Dish TV to be FCF positive in FY13
We believe that capex requirements over FY13-FY15 shall be managed throughinternal accruals through margin improvement and working capital managementwhich shall bring operating cash flows in line with capex to be incurred. Weforecast that Dish TV shall generate positive free cash flow FY13 onward, providedthat our assumptions on subscriber adds hold.
Chart: FCF Generation – Dish TV (FY10-FY16)
Source: Company reports, Kotak Securities – Private Client research
‐15,000
‐10,000
‐5,000
0
5,000
10,000
15,000
FY10 FY11 FY12E FY13E FY14E
Cash Flow from Operations Capex Free Cash Flow

Kotak Securities - Private Client Research Please see the disclaimer on the last page For Private Circulation 14
INITIATING COVERAGE May 11, 2012
Dish TV shall create economic profits from FY13 onwards, and is therefore a self-sustaining economic entity from that year, in our model.
ROIC versus WACC, Dish TV (2010-2016E)
Source: Company Data, Kotak Securities – Private Client research
(50.0)
(25.0)
‐
25.0
50.0
‐14,000
‐7,000
0
7,000
14,000
FY10 FY11 FY12E FY13E FY14E
Invested capital (LHS) WACC (RHS) ROIC (RHS)

Kotak Securities - Private Client Research Please see the disclaimer on the last page For Private Circulation 15
INITIATING COVERAGE May 11, 2012
VALUATIONS & TRIGGERS
DCF Valuation: Modest Upside Exists
Given the high capital intensity of Dish TV’s business, as also our belief that certaincritical parameters (ARPU, for example) shall change meaningfully over the nextfew years, we use the DCF methodology as our primary valuation tool for Dish TV.
The following are key assumptions for our DCF valuation – 1/ WACC is set at12.1%, 15.4% being the cost of equity, and setting 1:1 as the target debt-equityratio 2/ Terminal growth is set at 4%, 3/ Long – term EBIT margins are set at 24%,broadly in line with international peers (Dish Networks, BSkyB).
We see fair value of Dish TV at Rs 68, at FY – ending March, 2013. 58% of ourassessed value is generated over the explicit forecast period. We believe our DCFvalue is short of aggressive, and, unless significant competitive pressures arise, isindicative of reasonable upsides in the stock.
DCF Valuation, Dish TV
Rs mn, FY Ends Mar FY13E FY14E FY15E FY16E FY17E FY18E FY19E FY20E FY21E FY22E FY23E
Revenues 23,884 29,457 36,451 42,189 46,365 50,952 56,374 62,726 72,135 82,955 95,398
EBITDA 6,757 8,801 11,604 14,413 15,667 17,060 18,961 21,214 23,307 26,803 30,824
EBITDA Margin (%) 28 30 32 34 34 33 34 34 32 32 32
EBIT 1,336 3,056 5,641 8,411 9,690 11,057 12,889 15,053 17,010 19,561 22,496
EBIT Margin (%) 6 10 15 20 21 22 23 24 24 24 24
NOPLAT 1,336 3,056 5,138 5,589 6,276 6,840 7,629 8,910 10,069 11,579 13,316
Add: Depreciation 5,421 5,745 5,962 6,002 5,977 6,003 6,072 6,161 6,297 7,242 8,328
Less: WC Changes 718 1,457 98 519 456.58 401.41 355.29 316.26 290.96 267.68 246.27
Cash Flows from Operations 7,475 10,258 11,199 12,110 12,709 13,244 14,057 15,388 16,657 19,088 21,890
Less: Capital Expenditures (6,582) (6,709) (6,344) (5,838) (6,166) (5,986) (5,908) (5,863) (5,993) (6,292) (6,607)
Free Cash Flow to Firm 893 3,549 4,855 6,273 6,543 7,258 8,149 9,524 10,664 12,796 15,283
Discounted FCF - FY13E 3,167 3,866 4,458 4,149 4,107 4,115 4,292 4,289 4,592 4,894
Risk Free Rate 8.7%
Beta 1.2
Target Debt-Equity Ratio 1:1
Cost of Equity 15.4%
Cost of Debt (1-t) 9%
WACC 12.1%
Terminal Growth 4.0%
Terminal ROIC 20.0%
% Value
Present Value (FCF, 1-10) 41,930 57.8%
Terminal Value 132,494
PV-Terminal Value 42,432 58.4%
Enterprise Value 84,362
Less: Net Debt 11,763 -16.2%
Market Cap on Fair Value 72,599
Fair Value/ Share 68
Source: Kotak Securities – Private Client Research
DCF valuation suggests fair valueof Rs.68 per share (FY13-end)
Kotak Securities - Private Client Research Please see the disclaimer on the last page For Private Circulation 16
INITIATING COVERAGE May 11, 2012
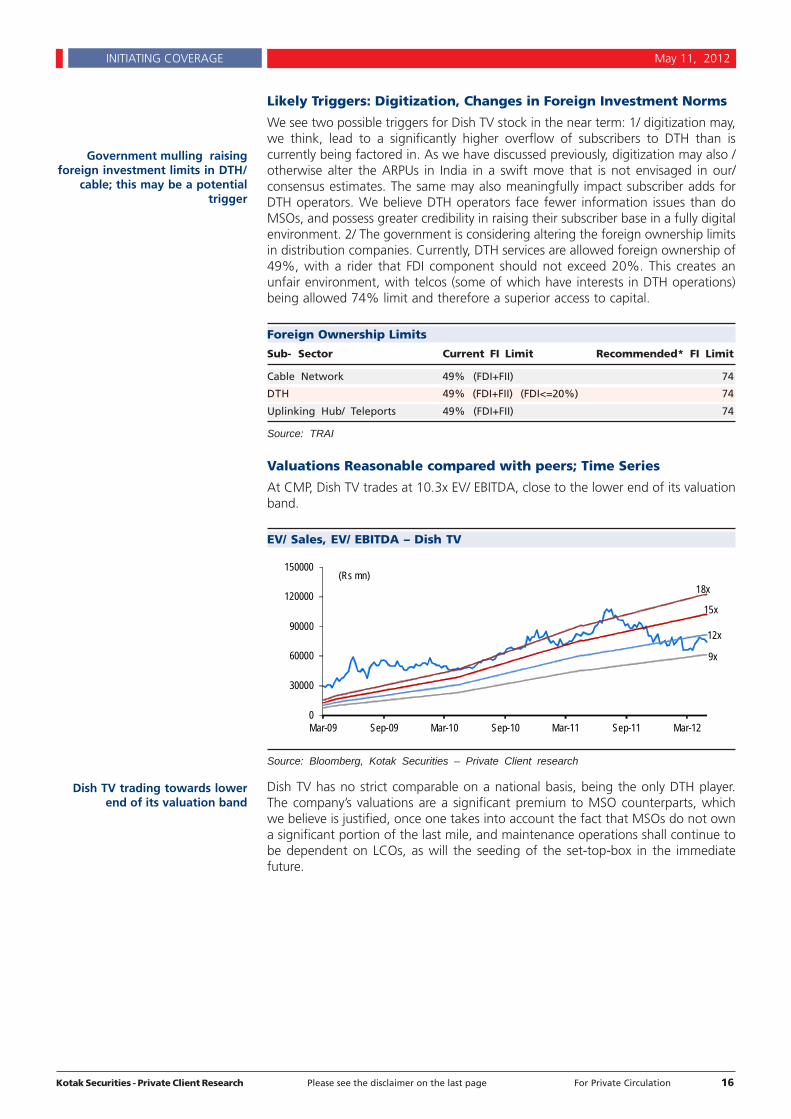
Likely Triggers: Digitization, Changes in Foreign Investment Norms
We see two possible triggers for Dish TV stock in the near term: 1/ digitization may,we think, lead to a significantly higher overflow of subscribers to DTH than iscurrently being factored in. As we have discussed previously, digitization may also /otherwise alter the ARPUs in India in a swift move that is not envisaged in our/consensus estimates. The same may also meaningfully impact subscriber adds forDTH operators. We believe DTH operators face fewer information issues than doMSOs, and possess greater credibility in raising their subscriber base in a fully digitalenvironment. 2/ The government is considering altering the foreign ownership limitsin distribution companies. Currently, DTH services are allowed foreign ownership of49%, with a rider that FDI component should not exceed 20%. This creates anunfair environment, with telcos (some of which have interests in DTH operations)being allowed 74% limit and therefore a superior access to capital.
Foreign Ownership Limits
Sub- Sector Current FI Limit Recommended* FI Limit
Cable Network 49% (FDI+FII) 74
DTH 49% (FDI+FII) (FDI<=20%) 74
Uplinking Hub/ Teleports 49% (FDI+FII) 74
Source: TRAI
Valuations Reasonable compared with peers; Time Series
At CMP, Dish TV trades at 10.3x EV/ EBITDA, close to the lower end of its valuationband.
EV/ Sales, EV/ EBITDA – Dish TV
Source: Bloomberg, Kotak Securities – Private Client research
Dish TV has no strict comparable on a national basis, being the only DTH player.The company’s valuations are a significant premium to MSO counterparts, whichwe believe is justified, once one takes into account the fact that MSOs do not owna significant portion of the last mile, and maintenance operations shall continue tobe dependent on LCOs, as will the seeding of the set-top-box in the immediatefuture.
9x
12x
15x
18x
0
30000
60000
90000
120000
150000
Mar-09 Sep-09 Mar-10 Sep-10 Mar-11 Sep-11 Mar-12
(Rs mn)
Government mulling raisingforeign investment limits in DTH/
cable; this may be a potentialtrigger
Dish TV trading towards lowerend of its valuation band

Kotak Securities - Private Client Research Please see the disclaimer on the last page For Private Circulation 17
INITIATING COVERAGE May 11, 2012
Dish TV versus Peers
CMP Mkt. Ent. Sales EBITDA EV/ Sales EV/ EBITDA
(Rs) Cap. Val. Grw* Grw* FY12E FY13E FY13E FY14E
Dish TV versus Indian peers (broadcasting and distribution)
Dish TV 57 60,517 67,895 29.1% 69.5% 3.5 2.8 13.8 10.1
Hathway Cable and Datacom 172 24,543 27,102 16.5% 28.9% 2.7 2.3 15.5 10.9
Den Networks 100 13,293 12,475 10.9% 11.5% 1.1 1.0 11.3 8.1
Sun TV Network 294 115,881 110,167 3.4% 3.5% 5.9 5.2 7.8 7.0
Zee Entertainment 122 116,778 115,056 7.4% 13.2% 3.9 3.4 14.6 12.6
Peer Average (Domestic) 9.5% 14.3% 3.4 3.0 12.3 9.7
Dish TV Verus International Peers (cable and DTH)
Dish TV 57 60,517 67,895 29.1% 69.5% 3.5 2.8 13.8 10.1
BskyB ($) 692 11,719 12,683 5.6% 9.8% 1.9 1.8 8.1 7.6
Dish Networks ($) 31 13,783 18,480 2.9% -4.1% 1.3 1.2 5.6 5.5
Comcast ($) 30 79,620 131,701 5.8% 6.7% 2.1 2.1 6.7 6.3
Peer average 4.7% 4.2% 1.8 1.7 6.8 6.5
Source: Bloomberg Consensus Estimates; * Over FY11 to FY13
Earnings Performance Shall Continue to be Subdued; Weakness is inconsensus estimates
We note the following on Dish TV’s quarterly summary: 1/ the company has beenadding over half a million subscribers/ quarter over the past seven quarters, 2/ churnhas risen in the recent past on account of heightened competitive activity, with3QFY12 churn rising to 1.6%, 3/ ARPUs have risen on account of discontinuation ofthe silver pack, and two hikes taken by the company in the course of the year onits base pack (~50% of subs), 4/ q/q revenue growth has declined to low singledigits on account of weakening subscription revenue growth (higher churn) as wellas weakening lease rentals, 5/ the company’s EBITDA margin has continued toimprove on account of declining subscriber acquisition costs (led by reducingcommissions), 6/ Below the EBITDA line, the company’s financials have suffereddue to forex losses to the tune of Rs 460 mn in 9MFY12.
Quarterly Financials and 4QFY12 Estimates
Rs mn, FY Ends March Q1FY10 Q2FY10 Q3FY10 Q4FY10 Q1FY11 Q2FY11 Q3FY11 Q4FY11 Q1FY12 Q2FY12 Q3FY12 Q4FY12E
Revenues 2,467 2,573 2,775 3,031 3,043 3,261 3,732 4,330 4,604 4,823 4,905 5,087
Growth, q/q 4% 8% 9% 0% 7% 14% 16% 6% 5% 2% 4%
EBITDA 145 229 116 349 322 497 667 901 1,122 1,218 1,248 1,420
Margin 5.9% 8.9% 4.2% 11.5% 10.6% 15.2% 17.9% 20.8% 24.4% 25.3% 25.4% 27.9%
Depreciation and Amortization 689 730 779 846 889 843 902 1,020 1,107 1,162 1,232 1,226
EBIT (544) (501) (663) (497) (567) (346) (235) (119) 14 56 15 194
PBT (692) (565) (762) (598) (632) (452) (443) (371) (183) (486) (383) (160)
Provision for Tax 0 (0) - 0 - - - - - - - -
PAT (692) (565) (762) (598) (632) (452) (443) (371) (183) (486) (383) (160)
Source: Company, Kotak Securities – Private Client research
WE forecast Rs 5087mn in revenues, Rs 1420mn EBITDA, and Rs (160)mn PAT in4QFY12.
Near term weakness inearnings: likely, and factored in

Kotak Securities - Private Client Research Please see the disclaimer on the last page For Private Circulation 18
INITIATING COVERAGE May 11, 2012
RISKS
Significant Capex requirements may arise, leading to equity dilution
Dish has obtained permission from FIPB for rising $200mn of equity. The companyhas said that the same is on account of substantial capex that the company mayhave to undertake.
Phase 1 of the DAS regime has a deadline of June 30, 2012. This means that about11mn subscribers would have to come into the DTH fold. MSOs, which hold amajority of such subscribers, are prepared to ensure that they get the majority ofthese benefits. Our discussions with the industry suggest that there is likely to be amigration of 15%-20% to DTH players, bringing 2.2mn incremental subscribers tothe DTH fold. Assuming 25% of these opt for Dish TV, Dish TV shall add 0.5mnsubs on account of migration to DAS. This has been, we believe factored into ourestimates, which account for gross adds of 3.0mn subscribers in FY13.
However, Dish TV may choose to be more aggressive in its expansion, given thatthese are high quality subscribers (read – larger ARPUs), which may mean also thatthe company may discount its equipment aggressively/ offer attractive ‘teaser’packages and the like. All the above may lead to higher cash outflow thananticipated in our model, and may adversely impact Dish TV’s financials. The sameshall translate into requirements for funds. As such, equity dilution/ substantiallyhigher debt can’t be ruled out.
Churn Rates Rising, May Rise Further if consumers switch to digitalcable
Dish TV’s churn rates have been rising at a fast pace in the recent past, on accountof: 1/ reduced stickiness post the busy cricket season, 2/ rising STB prices and hikesin monthly plans. In 3QFY12, the (monthly) churn has climbed to over 1.5%(implying annualized 19%).
Rising churn in especially a source of concern in the face of digitization. Followingmandatory digitization, consumers shall also be able to receive digital transmissionfrom digital cable. Our discussions with MSOs suggest that an “open season”irrational competitive event can’t be completely ruled out, with MSOs budgeting fora significant number of free set-top boxes.
Monthly Churn Rate (%)
Source: Company Reports, Kotak Securities – Private Client Research
We believe our estimates account sufficiently for churn. Churn rates have risen, sofar largely on intra-industry competition, which has led to incentive issues in agentcommissions. Also a large amount of subscribers added on low entry prices in FY12(Rs.999) have been responsible for high churn witnessed recently.
0.0%
0.3%
0.6%
0.9%
1.2%
1.5%
1.8%

Kotak Securities - Private Client Research Please see the disclaimer on the last page For Private Circulation 19
INITIATING COVERAGE May 11, 2012
High Intra-Industry Competition May lead to suboptimal returns oncapital
While we see that DTH is competitively placed relative to cable, and changingdynamics in the cable industry are likely to have a positive impact on DTH (risingARPUs), it may also be argued that there may be rising competition in the DTHspace itself. This view is not without its merits. DTH players may resort to irrationalcompetition in order to ramp up subscribers.
The experience of the Indian industry does not show any reason to believe there aresignificant entry barriers in the DTH space. As has been shown earlier, costs of set-top-boxes are a somewhat minor consideration over a period that lasts over a year.
Dish TV would then face any/ all of the following: 1/ rising churn, 2/ risingsubscriber acquisition costs, 3/ rising content costs (as % sales) leading to weakergross margins, 4/ pressures on ARPU, 5/ changes in working capital requirements.All the above can lead to suboptimal returns on capital.
Greater Bargaining Power of Aggregator may Impact Margins
In recent times, there have been moves from the broadcasting industry to createaggregation powerhouses that can improve bargaining power with distributioncompanies. The most significant of these has been Mediapro – the distribution JVformed by Zee-Turner and Star-Den. Our estimates factor in modest improvementsin margins on account of continued leverage on content costs. However, alliancesof broadcasters may impact the content costs adversely.
Other Risks
Dish TV is exposed to significant technological risks, as well as macroeconomicrisks, apart from competitive risks detailed above. The company may losesubscribers to competing technologies/ may need to upgrade equipment of existingsubscribers, which may imply significant capex requirements. Macroeconomic risksrelate in the medium-term to forex risks, since most of the consumer premiseequipment is imported, and 7.5Bn of the company’s debt is denominated in foreigncurrency. Also a large part of equipment required by the company is imported, andexposed negatively to rupee depreciation.

Kotak Securities - Private Client Research Please see the disclaimer on the last page For Private Circulation 20
INITIATING COVERAGE May 11, 2012
APPENDIX 1
Broadcasting Distribution Value ChainThe broadcasting value chain typically consists of: 1/ content producer, 2/broadcaster, 3/ aggregator, 4/ distributor. The distribution aspect of the value chaininvolves downlinking signals from the satellite and providing the same to theconsumer. In India, there are two prevalent distribution platforms: cable and DirectTo Home (DTH). DTH differs from cable primarily in the fact that the signals aredownlinked by a dish placed at the consumer’s end. On the other hand, Multi-System Operators (MSOs) downlink signals, package the same in a set offrequencies, and deliver it to the Local Cable Operator (LCO). The LCO has theprimary responsibility for maintaining the last mile, including customer services.
As per TRAI the number of MSOs in India could be upto 10,000, and the number ofLCOs in India could be 60,000. The LCO is the key intermediary for Multi-SystemOperators, as also the key appropriator of consumer payouts. Typically, the LCO is amonopoly provider in a particular area. This limits subscriber migration andcompetition between LCOs. LCOs, as per industry discussions, take up 85% of thevalue generated by the customer, by ‘underreporting’ revenues to the MSOs. TheMSOs, broadcasters, and aggregators then share the smaller pie (15% of consumerpayments) left over by the LCO.
The DTH operator differs from the cable operators in that the company has a directbilling relationship with the customer, and is responsible for services andmaintenance. The DTH operator shares the proceeds with the broadcaster andaggregators.
Distribution Value Chain (Cable)
Source: TRAI
Distribution Value Chain (DTH)
Source: TRAI

Kotak Securities - Private Client Research Please see the disclaimer on the last page For Private Circulation 21
INITIATING COVERAGE May 11, 2012
APPENDIX 2
What’s the problem with analogue cable?Analogue cable has brought cable and satellite television to the homes of millions,and is the prime reason for the growth of the broadcasting industry in India.However, the system is inept to cope up with the demands of the industry as ofnow. The primary problem with analogue cable is the fact that it can deliver arather limited amount of channels. As of now, there are over 600 broadcastedchannels in India, while an analogue line can carry only about 100 channels.
This has led to several problems: 1/ rationing has been done based on auctionswhich have led to a big market for carriage fees. As per industry estimates, over Rs15 Bn is paid out by broadcasters as carriage and placement fees, 2/ since the feedfrom MSO is the same, there is no choice for the consumer (the channels hereceives are not the same that he would like to watch), 3/ since there is no choice,there is no willingness to pay.
Number of Channels
Source: FICCI-KPMG Report,2012
Capacity to carry channels by bandwidth
Bandwidth Max. # Channels
300 36
450 54
550 67
750 92
860 106
Source: TRAI
0
150
300
450
600
750
1991 1993 1995 1999 2002 2005 2007 2010

Kotak Securities - Private Client Research Please see the disclaimer on the last page For Private Circulation 22
INITIATING COVERAGE May 11, 2012
APPENDIX 3
How Cable Rates haven’t changed over five years (and whythey might change now)One of the most intriguing aspects of the Indian broadcasting sector has been thestagnancy of ARPUs over the years. In the past five years, average cable rates haveremained stagnant at Rs 160/ subscriber/ month. That is to say, the cable priceshave fallen on a real basis. The same is enabled by under-reporting of thesubscriber base that the LCO resort to. By under-reporting revenues to the extent of80-85% (as per industry discussions), the LCO is able to earn margins of upto 80%.This provides the LCO an incentive to consistently under-report revenues.
The DTH revolution has further aggravated the problem. While broadcasters andMSOs would like to pressurize LCO, and an LCO – a monopoly in the analoguecable regime, would have been able to raise prices, the emergence of the DTHplatform in the past five years has been a game changer. DTH players have, in theaspiration to add subscribers, been willing to provide services at monthly paymentsthat have bottomed at Rs 70/ month in certain regions (for certain packs). This hasplaced an additional pressure on LCOs to maintain ARPUs at low levels.
To this extent, mandatory digitization shall place a ‘do-or-die’ pressure over LCOs.Small operators who have been used to reporting 15% subscribers shall see profitsdwindle, perhaps below opportunity cost of time and effort, when they have toreport subscribers in full; the larger operators shall see their margins erode in a verysignificant fashion, unless prices are raised. There are, no doubt, minor benefits thatthe cable operators shall be offered from MSOs (example: benefits of double TVhouseholds), but the damage control will be too little in our view.
There is likely to be substantial erosion in benefits derived by LCOs. Since the LCOsare integral part of the analogue chain, the MSOs would not like to lose themimmediately. Therefore, there is a high probability that the MSOs shall provide forLCOs much larger shares in the beginning, and look to wean them away slowly.Even so, there is a likelihood of atleast a 50% decline in LCO margins, as long asthe LCO reports revenues and pays out 40% to broadcasters/ MSOs.
This will lead to many LCOs shutting shop, in our opinion, unless they believe thatsubstantial hikes can be passed on to the consumer. In certain parts of Mumbai andDelhi, cable rates are, in fact higher than Rs 300/ month. We believe significantlyhigher ARPUs will be the norm post digitization.
We also believe, based on discussions with the industry, that collections ofsubscriber fees is less than perfect in analogue cable homes. Firstly, multiple TVhomes don't always pay a higher fee; secondly, defaulters are often not penalizedwith a disconnection.
Kotak Securities - Private Client Research Please see the disclaimer on the last page For Private Circulation 23
INITIATING COVERAGE May 11, 2012
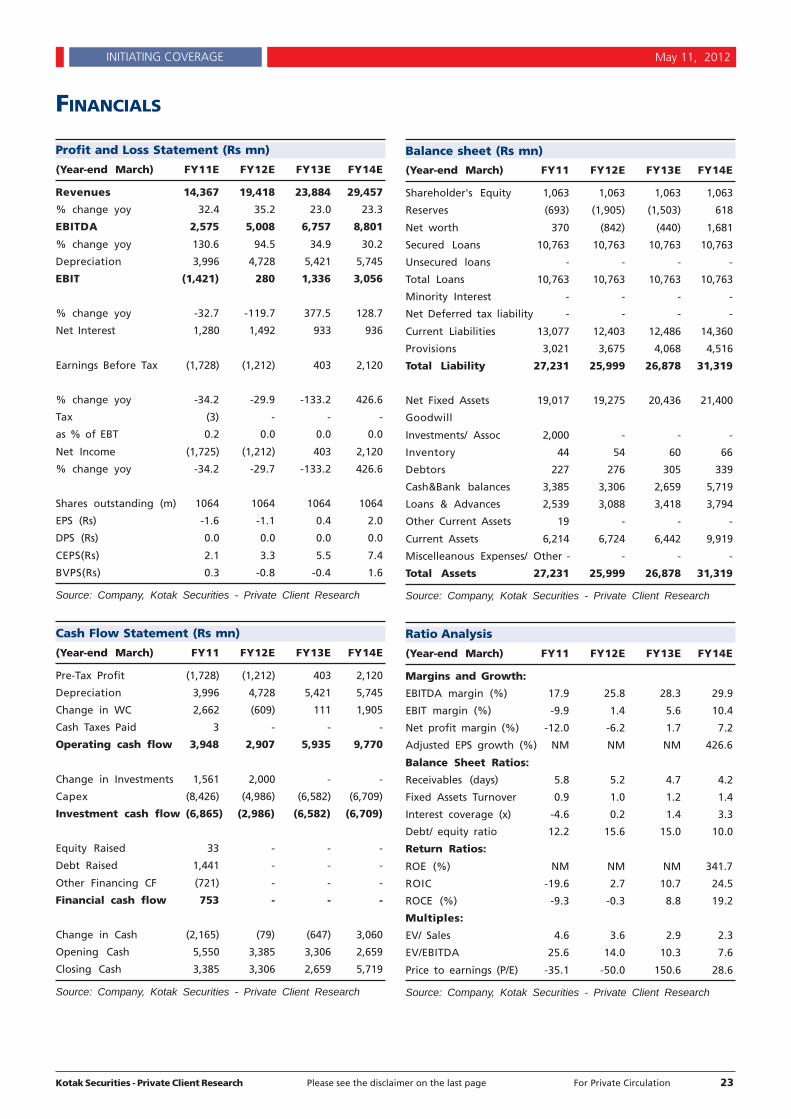
FINANCIALS
Profit and Loss Statement (Rs mn)
(Year-end March) FY11E FY12E FY13E FY14E
Revenues 14,367 19,418 23,884 29,457
% change yoy 32.4 35.2 23.0 23.3
EBITDA 2,575 5,008 6,757 8,801
% change yoy 130.6 94.5 34.9 30.2
Depreciation 3,996 4,728 5,421 5,745
EBIT (1,421) 280 1,336 3,056
% change yoy -32.7 -119.7 377.5 128.7
Net Interest 1,280 1,492 933 936
Earnings Before Tax (1,728) (1,212) 403 2,120
% change yoy -34.2 -29.9 -133.2 426.6
Tax (3) - - -
as % of EBT 0.2 0.0 0.0 0.0
Net Income (1,725) (1,212) 403 2,120
% change yoy -34.2 -29.7 -133.2 426.6
Shares outstanding (m) 1064 1064 1064 1064
EPS (Rs) -1.6 -1.1 0.4 2.0
DPS (Rs) 0.0 0.0 0.0 0.0
CEPS(Rs) 2.1 3.3 5.5 7.4
BVPS(Rs) 0.3 -0.8 -0.4 1.6
Source: Company, Kotak Securities - Private Client Research
Cash Flow Statement (Rs mn)
(Year-end March) FY11 FY12E FY13E FY14E
Pre-Tax Profit (1,728) (1,212) 403 2,120
Depreciation 3,996 4,728 5,421 5,745
Change in WC 2,662 (609) 111 1,905
Cash Taxes Paid 3 - - -
Operating cash flow 3,948 2,907 5,935 9,770
Change in Investments 1,561 2,000 - -
Capex (8,426) (4,986) (6,582) (6,709)
Investment cash flow (6,865) (2,986) (6,582) (6,709)
Equity Raised 33 - - -
Debt Raised 1,441 - - -
Other Financing CF (721) - - -
Financial cash flow 753 - - -
Change in Cash (2,165) (79) (647) 3,060
Opening Cash 5,550 3,385 3,306 2,659
Closing Cash 3,385 3,306 2,659 5,719
Source: Company, Kotak Securities - Private Client Research
Balance sheet (Rs mn)
(Year-end March) FY11 FY12E FY13E FY14E
Shareholder's Equity 1,063 1,063 1,063 1,063
Reserves (693) (1,905) (1,503) 618
Net worth 370 (842) (440) 1,681
Secured Loans 10,763 10,763 10,763 10,763
Unsecured loans - - - -
Total Loans 10,763 10,763 10,763 10,763
Minority Interest - - - -
Net Deferred tax liability - - - -
Current Liabilities 13,077 12,403 12,486 14,360
Provisions 3,021 3,675 4,068 4,516
Total Liability 27,231 25,999 26,878 31,319
Net Fixed Assets 19,017 19,275 20,436 21,400
Goodwill
Investments/ Assoc 2,000 - - -
Inventory 44 54 60 66
Debtors 227 276 305 339
Cash&Bank balances 3,385 3,306 2,659 5,719
Loans & Advances 2,539 3,088 3,418 3,794
Other Current Assets 19 - - -
Current Assets 6,214 6,724 6,442 9,919
Miscelleanous Expenses/ Other - - - -
Total Assets 27,231 25,999 26,878 31,319
Source: Company, Kotak Securities - Private Client Research
Ratio Analysis
(Year-end March) FY11 FY12E FY13E FY14E
Margins and Growth:
EBITDA margin (%) 17.9 25.8 28.3 29.9
EBIT margin (%) -9.9 1.4 5.6 10.4
Net profit margin (%) -12.0 -6.2 1.7 7.2
Adjusted EPS growth (%) NM NM NM 426.6
Balance Sheet Ratios:
Receivables (days) 5.8 5.2 4.7 4.2
Fixed Assets Turnover 0.9 1.0 1.2 1.4
Interest coverage (x) -4.6 0.2 1.4 3.3
Debt/ equity ratio 12.2 15.6 15.0 10.0
Return Ratios:
ROE (%) NM NM NM 341.7
ROIC -19.6 2.7 10.7 24.5
ROCE (%) -9.3 -0.3 8.8 19.2
Multiples:
EV/ Sales 4.6 3.6 2.9 2.3
EV/EBITDA 25.6 14.0 10.3 7.6
Price to earnings (P/E) -35.1 -50.0 150.6 28.6
Source: Company, Kotak Securities - Private Client Research

Kotak Securities - Private Client Research Please see the disclaimer on the last page For Private Circulation 24
INITIATING COVERAGE May 11, 2012
Disclaimer
This document is not for public distribution and has been furnished to you solely for your information and must not be reproduced or redistributed to any otherperson. Persons into whose possession this document may come are required to observe these restrictions.
This material is for the personal information of the authorized recipient, and we are not soliciting any action based upon it. This report is not to be construedas an offer to sell or the solicitation of an offer to buy any security in any jurisdiction where such an offer or solicitation would be illegal. It is for the gen-eral information of clients of Kotak Securities Ltd. It does not constitute a personal recommendation or take into account the particular investment objectives,financial situations, or needs of individual clients.
We have reviewed the report, and in so far as it includes current or historical information, it is believed to be reliable though its accuracy or completenesscannot be guaranteed. Neither Kotak Securities Limited, nor any person connected with it, accepts any liability arising from the use of this document. Therecipients of this material should rely on their own investigations and take their own professional advice. Price and value of the investments referred to inthis material may go up or down. Past performance is not a guide for future performance. Certain transactions -including those involving futures, options andother derivatives as well as non-investment grade securities - involve substantial risk and are not suitable for all investors. Reports based on technical analy-sis centers on studying charts of a stock's price movement and trading volume, as opposed to focusing on a company's fundamentals and as such, may notmatch with a report on a company's fundamentals.
Opinions expressed are our current opinions as of the date appearing on this material only. While we endeavor to update on a reasonable basis the informationdiscussed in this material, there may be regulatory, compliance, or other reasons that prevent us from doing so. Prospective investors and others are cautionedthat any forward-looking statements are not predictions and may be subject to change without notice. Our proprietary trading and investment businesses maymake investment decisions that are inconsistent with the recommendations expressed herein.
Kotak Securities Limited has two independent equity research groups: Institutional Equities and Private Client Group. This report has been prepared by thePrivate Client Group . The views and opinions expressed in this document may or may not match or may be contrary with the views, estimates, rating, targetprice of the Institutional Equities Research Group of Kotak Securities Limited.
We and our affiliates, officers, directors, and employees world wide may: (a) from time to time, have long or short positions in, and buy or sell the securitiesthereof, of company (ies) mentioned herein or (b) be engaged in any other transaction involving such securities and earn brokerage or other compensation oract as a market maker in the financial instruments of the company (ies) discussed herein or act as advisor or lender / borrower to such company (ies) or haveother potential conflict of interest with respect to any recommendation and related information and opinions. Our research should not be considered as anadvertisement or advice, professional or otherwise the investor is requested to take into consideration all the risk factors including their financial condition,suitability to risk return profile, and the like and take professional advice before investing. As on 11 May, 2012, Kotak Securities Limited had no holdings inits proprietary account”. Kotak Securities Limited is also a Portfolio Manager. Portfolio Management Team (PMS) takes its investment decisions independentof the PCG research and accordingly PMS may have positions contrary to the PCG research recommendation.
The analyst for this report certifies that all of the views expressed in this report accurately reflect his or her personal views about the subject company orcompanies and its or their securities, and no part of his or her compensation was, is or will be, directly or indirectly related to specific recommendations orviews expressed in this report.
No part of this material may be duplicated in any form and/or redistributed without Kotak Securities' prior written consent.
Analyst holding in stock: Nil
Correspondence address: Infinity IT Park, Bldg. No 21, Opp Film City Road, A K Vaidya Marg, Malad (East), Mumbai 400097. Tel No : 66056825.Securities and Exchange Board Of India: Registration No's: NSE INB/INF/INE 230808130, BSE INB 010808153/INF 011133230/INE 011207251, OTC INB 200808136, MCXSX INE 260808130. AMFI No: 0164.
Technical Research Team
Shrikant [email protected]+91 22 6621 6360
Amol [email protected]+91 20 6620 3350
Premshankar [email protected]+91 22 6621 6261
Derivatives Research TeamSahaj [email protected]+91 22 6621 6343
Rahul [email protected]+91 22 6621 6198
Malay [email protected]+91 22 6621 6350
Prashanth [email protected]+91 22 6621 6110
Fundamental Research TeamDipen ShahIT, [email protected]+91 22 6621 6301
Sanjeev ZarbadeCapital Goods, [email protected]+91 22 6621 6305
Teena VirmaniConstruction, Cement, Mid [email protected]+91 22 6621 6302
Saurabh AgrawalMetals, [email protected]+91 22 6621 6309
Saday SinhaBanking, NBFC, [email protected]+91 22 6621 6312
Arun [email protected]+91 22 6621 6143
Ruchir KhareCapital Goods, [email protected]+91 22 6621 6448
Ritwik RaiFMCG, [email protected]+91 22 6621 6310
Sumit PokharnaOil and [email protected]+91 22 6621 6313
Amit AgarwalLogistics, [email protected]+91 22 6621 6222
Jayesh [email protected]+91 22 6652 9172
K. [email protected]+91 22 6621 6311

![[Kotak] India Daily, October 26, 2016 - Kotak Securities](https://static.fdokumen.com/doc/165x107/631c83236c6907d3680156e0/kotak-india-daily-october-26-2016-kotak-securities.jpg)


![[Kotak] India Daily, May 07, 2018 - Kotak Securities](https://static.fdokumen.com/doc/165x107/633c43a3f3eeefb08b0c1dc3/kotak-india-daily-may-07-2018-kotak-securities.jpg)