India Equity Strategy - HDFC securities
64
India Equity Strategy PLI: Spearheading India’s manufacturing push
-
Upload
khangminh22 -
Category
Documents
-
view
2 -
download
0
Transcript of India Equity Strategy - HDFC securities

India Equity Strategy
PLI: Spearheading India’s manufacturing push

India Equity Strategy
While India’s nominal GDP increase of ~49% in the last five years is anencouraging development, it is worth highlighting that this growth has come atthe expense of growing reliance on Chinese imports. India’s imports fromChina have grown from USD 61bn in FY17 to USD 93bn in FY22, accounting for16% of overall imports on average over this period. Currently, the key goodsimported from China are mainly electronic goods, mechanical appliances, andchemicals. In the wake of pandemic-led global supply chain disruptions, Indiahas realised the importance of reducing its dependence on China and creating aself-sustaining manufacturing ecosystem. The Production Linked Incentive(PLI) is the government’s flagship fiscal response to the country’s rising importdependence, which aims to boost the country’s manufacturing sector from 15-17% of the total GDP at present to a target of 25%.
Varun [email protected]+91-22-6171-7334
Amit Kumar, [email protected]+91-22-6171-7354
Atishray [email protected]+91-22-6171-7363

13 April 2022 Strategy
India Equity Strategy
HSIE Research is also available on Bloomberg ERH HDF <GO> & Thomson Reuters
PLI: Spearheading India’s manufacturing push While India’s nominal GDP increase of ~49% in the last five years is an encouraging development, it is worth highlighting that this growth has come at the expense of growing reliance on Chinese imports. India’s imports from China have grown from USD 61bn in FY17 to USD 93bn in FY22, accounting for 16% of overall imports on average over this period. Currently, the key goods imported from China are mainly electronic goods, mechanical appliances, and chemicals. In the wake of pandemic-led global supply chain disruptions, India has realised the importance of reducing its dependence on China and creating a self-sustaining manufacturing ecosystem. The Production Linked Incentive (PLI) is the government’s flagship fiscal response to the country’s rising import dependence, which aims to boost the country’s manufacturing sector from 15-17% of the total GDP at present to a target of 25%. With a total incentive outlay of ~USD 35 bn during the life of all 15 announced PLI schemes, we estimate total incremental sales to be in the range of USD 470-500 bn, attracting a total investment of ~USD 62 bn and directly generating ~3.1 mn jobs. The schemes cover a multitude of sectors, with each one having reached a different level of manufacturing and technological maturity in India so far. Based on the underlying themes, these 15 PLI schemes can be divided into three categories:
Sunrise sectors: Schemes targeting industries and goods that are in their nascentstages of development or manufacturing; semiconductors, ACC battery,advanced automobiles and drones.
Import substitution: Schemes targeting to strengthen the domesticmanufacturing ecosystem in industries and goods that have prominent domesticdemand, which is primarily being met by imports; telecom & networkingproducts, solar PV modules, pharma APIs, medical devices, IT hardware andspecialty steel.
Export focus: Schemes targeting industries where the government aims to makeIndia a global manufacturing hub and an export leader; large-scale electronicsmanufacturing, white goods, textiles, food processing, pharmaceutical drugs.
Based on our analysis, we expect the large-scale electronics, telecom & networking products, and textile product PLI schemes to outperform due to factors like a presently conducive domestic ecosystem, lucrative economics of the PLI schemes, and ancillary government support. Correspondingly, the semiconductor, IT hardware, medical devices, and drones PLI schemes are expected to be slow starters due to certain supply chain bottlenecks, unfavorable domestic factors, and insufficient R&D expenditure. We believe that continued government dialogue with industry participants will help bring modifications in the schemes to overcome these challenges and ensure the success of these PLI schemes. Explicit supply chain gaps: Based on our analysis, the printed circuit board assembly (PCBA) and key battery raw material such as lithium and cobalt are the key input materials on which the success of six out of 15 schemes hinges upon. PCBA constitutes ~40% of Bill of Material (BoM) of electronic goods, while battery cells account for 25% of the total cost of an electric vehicle. India is grossly dependent on foreign imports of these materials. Securing indigenous manufacturing of these materials will be a key driver in ensuring high domestic value addition and unleashing the full potential of the respective PLI schemes. We estimate that the 15 PLI schemes would scale up from FY23 onwards and contribute total incremental sales of ~USD 157 bn and GDP addition of ~USD 53 bn (1.1% of GDP) in FY27, resulting in a blended manufacturing GVA of ~34%.
PLI: Scheme-wise incentive outlay
PLI Scheme Govt Outlay (INR Bn)
Semiconductor 760
Electronics 386
IT hardware 73
White goods 62
Automobiles 259
ACC Battery 181
Telecom 122
Solar modules 240
Pharma APIs 69
Pharma drugs 150
Medical devices 32
Food products 109
Specialty steel 63
Textile 107
Drones 1
Total 2,616
Varun Lohchab [email protected] +91-22-6171-7334
Amit Kumar, CFA [email protected] +91-22-6171-7354
Atishray Malhan [email protected] +91-22-6171-7363

Page | 2
India Equity Strategy PLI Overall Snapshot
Sr. No
Targeted Industry
Committed Govt
Incentive (INR bn)
Projected Increase
in CAPEX (INR bn)
Incremental sales of
companies over scheme tenure (INR
bn)
Tenure of Scheme
Scheme Status Expected
direct Job creation
1 Semiconductor 760 1,700 5,000* FY23-27 Applications phase 450,000
2 Large Scale Electronics Manufacturing 386 110 10,500 FY21-26 Production started
in H2 FY21 200,000
3 IT Hardware(Laptop/Tab) 73 25 1,600 FY21-26 Production started
in FY22 36,000
4 White Goods (ACs & LED) 62 46 810 FY 21-29 Production started
in FY22 44,000
5 Automobiles & Auto Components 259 425 2,300 FY23-28 Capex phase 750,000 6 Advance Chemistry Cell (ACC) Battery 181 450 920 FY23-29 Capex phase 200,000
7 Telecom & Networking Products 122 33 1,820
FY21-27 Production started
In FY22 40,000
8 High-Efficiency Solar PV Modules 240 910 500 FY22-27 2nd round
application ongoing
160,000
9 (KSMs)/DIs and pharma APIs 69 54 420 FY21-30 Production started
in FY22 12,000
10 Manufacturing of Pharmaceutical Drugs 150 180 1,800 FY21-29 Capex phase 100,000 11 Mfg of Medical Devices 32 10 650 FY21-28 Capex phase 18,000 12 Food Products 109 61 1,200* FY21-27 Capex phase 250,000
13 Specialty Steel 63 396 5,600* FY23-31 Application phase 68,000
14 Textile Products 107 190 3,000 FY23-30 Approvals
Pending 750,000
15 Drones and Components 1 50 15 FY22-25 Application phase 10,000 Total Sum 2,616 4,641 36,135 3,088,000
*HSIE estimates based on government disclosures The table above reflects the government’s estimated incentive outlay, investment, incremental sales, and direct job creation estimates for all 15 schemes over the tenure of their schemes. Considering a typical production tenure of 5 years, the average annual asset turnover of the PLI schemes is ~2x. The largest government outlay is for the semiconductors PLI scheme, accounting for ~29% of the total incentive outlay, highlighting the need for a massive fiscal push to kick-start India’s semiconductor chip manufacturing. The largest incremental sales are expected to come from the large scale electronics manufacturing scheme (mobile phones), accounting for ~29% of total incremental sales, accenting the government’s push towards achieving USD 126 bn of domestic mobile phone sales and USD 300 bn of electronics goods manufacturing by FY26.

Page | 3
India Equity Strategy PLI: Incentives vs Investments for a participating company
Sr. No
Targeted Industry
Min. Inv amount per
company (INR bn)
Incentive per company based on
estimated sales (INR bn)
Investment recoverable from
incentive (%)
Adequacy level
1 Semiconductor 200 80* 40% Medium
2 Large Scale Electronics
Manufacturing 10 37.2 372% Very high
3 IT Hardware(Laptop/Tab) 5 4.15 83% Medium
4 White Goods (ACs &
LED) 6 4.80 80% Medium
5 Automobiles & Auto
Components 20 20 100% High
6 Advance Chemistry Cell
(ACC) Battery NA( incentive depends upon multiple factor along with production
7 Telecom & Networking
Products 1 2** 200% Very high
8 High-Efficiency Solar PV
Modules NA( incentive depends upon multiple factor along with
production)
9 (KSMs)/DIs and pharma
APIs NA( API specific)
10 Manufacturing of
Pharmaceutical Drugs 10 12 120% High
11 Mfg of Medical Devices 1.8 1.21 67% Medium 12 Food Products 1 1.50 150% High 13 Specialty Steel NA (Depends upon future steel prices) 14 Textile Products 3 2 67% Medium 15 Drones and Components 0.4 12.5 <5% Very Low
*Average amount chosen based on the three incentivized node size. Incentives for semiconductor PLI to be given on total project cost ** The reported minimum and maximum incentive as a % of invested capital is 48% and 348% respectively. Based on the Year 1 on-the-ground performance of the telecom PLI scheme, we estimate on average The table above highlights our estimates regarding the incentives each applicant can earn on average based on the minimum incremental investment required. It is important to note that many schemes have different segments and categories of applicants based on the product and company size; we have chosen to highlight the largest segments by revenue addition to be representatives of their respective schemes. As seen in the table, the incentives relative to investment vary from scheme to scheme. We have found that schemes such as large scale electronics manufacturing and telecom & networking products have garnered immense attention from industry participants because applicants can comfortably recover their entire cost of investment over the tenure of the schemes. Schemes such as IT hardware and medical devices, servicing the domestic industries that are already plagued with cost disabilities in comparison to global peers, have had a much more tepid response because the incentives offered are not lucrative enough to make additional production more feasible.
In the forthcoming sections of this report, we will analyze each PLI scheme and their respective targeted industries, highlighting the individual strengths, opportunities, and challenges that need to be overcome.

Page | 4
India Equity Strategy
Contents Semiconductors ................................................................................................ 5 Large-scale electronics ................................................................................... 10 IT hardware ..................................................................................................... 16 White goods .................................................................................................... 20 Automobile and auto components .............................................................. 24 Advanced chemistry cells (ACC) battery ................................................... 30 Telecom and networking products .............................................................. 35 High efficiency solar PV modules ............................................................... 38 Active pharmaceuticals ingredients (API).................................................. 41 Pharmaceuticals.............................................................................................. 44 Medical devices .............................................................................................. 47 Food processing .............................................................................................. 50 Specialty steel.................................................................................................. 53 Textiles ............................................................................................................. 56 Drones and components ............................................................................... 59

Page | 5
India Equity Strategy 1. Semiconductors Semiconductor chips are the brains behind the smooth functioning of modern day electronic devices such as smart phones, smart TVs, laptops, washing machines, advanced vehicles, etc. They are indispensable in our daily lives, thus making it imperative to understand the global semiconductor ecosystem.
The semiconductor chip industry is a market worth USD 556bn globally. It is growing at an impressive 9% per year rate, driven by consumer electronics, 5G implementations, and automotive innovations. China has grown to be the largest consumer of semiconductor chips in the world, mirroring the growth in its consumer electronics, telecom, and automobile sectors over the last two decades. Chart 1.1 shows the consumption market share trend of various countries over the years; China’s extraordinary growth is evident:
Chart 1.1: Semiconductor consumption share trend across countries
Source: The McLean Report, HSIE Research Having understood the consumption patterns across countries, the next part of the puzzle is to understand the various steps involved in semiconductor manufacturing and the countries that play important roles in the process. Chart 1.2 below explains the key processes involved: research, design, manufacturing, assembly, testing, marking & packaging (ATMP), and distribution.
Chart 1.2: Semiconductor value chain
Source: Semiconductor Industry Association, HSIE Research
19% 20% 25% 29% 35% 40% 43% 42% 47% 53% 56% 57% 59% 61%
0%
20%
40%
60%
80%
100%20
03
2004
2005
2006
2007
2008
2009
2010
2011
2012
2013
2014
2015
2019
China America Europe Japan Rest of the world

Page | 6
India Equity Strategy
Research & development: This involves pre-production work to improve processing capability and speed at a reduced cost. This step is capital intensive and accounts for ~25% of final sales value.
Design: This step is highly skill intensive and involves design software and electronic design automation (EDA); it decides the design of electronic circuit to be printed on wafers for specific end uses.
Manufacturing/fabrication: This process starts with making polysilicon, which is a purified form of Silicon (99.9999999% pure i.e., 9 Nines). It is melted at 1,500 degree Celsius and p or n type conducting elements are added for imparting electrical properties to form ingots. These ingots are cut into thin slices to form wafers. Photolithography machines are then used for optically printing electronic circuits (as per electronic designs) on to a silicon wafer covered with light sensitive photo resist material. It produces a printed wafer.
Image 1.1: Polysilicon Image 1.2: Silicon Image 1.3: Wafers cut from Ingots
Image 1.4: Printed wafer
Source: OCI Source: Sumco Corporation Source: Sumco Corporation Source: Samsung
Assembly & testing: This is a labour-intensive process. The printed wafer is cut along scribed lines to separate each die, which is later connected electrically to produce final chip. It is tested for performance.
Image 1.5: Die getting separated
Image 1.6: Standalone Chip
Image 1.7: Assembled Chip
Source: TSMC Source: TSMC Source: TSMC
Distribution: Finished semiconductors are sold to OEMs for use in electronic goods etc.
Leading companies: There are two models of manufacturing semiconductors:
Integrated device model: Under this model, design and manufacturing both are carried out by the same company. Leading examples are Intel, Samsung, and Texas Instruments.
Fab-foundry model: This is a more prevalent model, under which design and fabrication are done by separate companies. Design companies outsource manufacturing & assembly works to contract manufacturers. Companies involved in various processes are mentioned below:
Fabless (chip designing) - AMD (USA), Qualcomm (USA)

Page | 7
India Equity Strategy Foundry (contract manufacturing)- TSMC (Taiwan), SMIC (China),
Samsung (S Korea)
Assembly, test, packaging - Amkor (S Korea), SPIL (Taiwan)
Contribution of various countries in global value chain Chart 1.3 reflects the percentage of global sales done by various countries across the semiconductor value chain:
Chart 1.3: % of Global sales by various countries
Source: McKinsey, HSIE Research
Key findings from the above chart can be summarised as below:
Equipment and chip designing domains are dominated by the US. Taiwan has the lion’s share in foundry as well as assembly & testing, making it a country of strategic significance.
In spite of being the largest consumer of semiconductors (~60%), China has a miniscule share in the overall value chain of production. It only has minor shares in fabless, foundry and assembly. In most of the value chain segments, China is dependent on imports from other countries, which pushes its trade deficit higher and makes it vulnerable to supply chain fluctuations.
It is evident that the value chain is heavily concentrated in favour of a few countries; the U.S. controls design and Taiwan controls foundry and assembly of chips. Furthermore, the key equipment lithography machine is 67% controlled by ASML (Netherlands), other suppliers being Kodak (Japan) and Nikon (Japan) and Ultratech (US). Furthermore, all these suppliers make Deep Ultraviolet lithography (DUV) machine, which can take 193 nm wavelengths of lasers for printing of electronic circuits. ASML is the only company in the world that makes EUV or extreme ultraviolet lithography machine, which uses 13 nm wavelength of laser to improve chip density by 3x. This means three times more circuits can be printed in the same-sized wafer, thereby improving processing capacity and enabling reduction in size and cost of electronic devices that use these chips. An EUV costs approximately USD 150 mn. ASML enjoys dominance in the semiconductor world due to its exclusivity vis-à-vis EUV lithography machine production. The biggest foundry in the world which belongs to Taiwan semiconductor manufacturing company (TSMC), also depends on ASML for supply of these machines. Hence, it won’t be an exaggeration to say that the semiconductor value chain revolves around ASML.
4528
63 58 4711 11
120
1 182 71
4920
3014
19 4
10
31 1
1
16
1
11
1534 40
65
17 440
425
0%20%40%60%80%
100%
Equi
pmen
t
Mat
eria
ls (N
onw
afer
s) Waf
er
Elec
tron
icde
sign
auto
mat
ion
Fabl
ess
Inte
grat
edde
vice
Mfg
Foun
dary
Ass
embl
y &
test
ing
USA Taiwan Europe China Others

Page | 8
India Equity Strategy Due to heavy concentration in this value chain, countries with specific
product abilities can exert dominance on other competing countries by denying them to use their products or facilities. Interestingly, the Dutch company ASML denied selling EUV machines to China in 2019 and this policy has been continued till date. Reportedly, the US administration lobbied with the Dutch government to make them decline requests of China amidst the ongoing trade war. Hence, this advanced micro-processing capability remained inaccessible to China and it became dependent on other countries for buying chips. This can partially explain China’s recent increased interest over Taiwan. Its import of semiconductor has grown at 23% to reach USD 350 bn approximately in 2020; China spends more on semiconductor chip imports than it does on importing oil. China’s crude oil trade deficit was USD 185bn in 2020 while it was USD 233Bn for semiconductor chips in the same year. Building its own EUV lithography machine will be an uphill battle for China as it would take roughly 10 years along with support of US based machine component suppliers, coupled with billions of dollars.
Therefore, it can be summarised that semiconductor foundries, equipments and materials have the potential to be used as tools of geopolitical dominance.
Indian context
Annual consumption of semiconductors was $15bn in 2020, most of which was made available through imports.
Most of the major semiconductor companies (TI, Broadcom, Intel, Qualcomm, Samsung, and Huawei) have their fabless IP & chip design houses in India, employing 30,000 Indian engineers for designing 3,000 chips.
India has a cost advantage vis-à-vis western countries due to lower salaries of design staff; however, higher power and capital costs remain impediments to development of the ecosystem.
Vibrant IC design ecosystem: global design houses based in India added value worth USD 33bn in 2020.
India has a limited presence in assembly & test, where the leading companies are SPEL, ChipTest, and Tessolve.
Raw material and other enablers required are large quantities of pure water, uninterrupted power, ultra pure sand with high silicon content and a pollution-free environment. Even an impurity of micro meter diameter can disrupt the circuit. Purity at nano meter scale is expected.
The supply of high precision lithography machine; heavy Capex requirement (>USD 10 bn), steep expensive learning curve with technology access and risk of low capacity utilisation remain key factors to success.

Page | 9
India Equity Strategy Semiconductors - PLI scheme highlights
Silicon semiconductor fab: Minimum investment required is INR 200 bn; capital support offered by scheme is 30-50% of the project cost, as per the node size of the fab.
Display fab: Minimum investment required is INR 100bn; capital support offered by the scheme is up to 50% of the project cost (maximum allowed per beneficiary: INR 120bn).
Compound semi-conductors/silicon photonics/sensors fab: Minimum investment required is INR 1 bn and capital support offered is 30% of the Capex amount.
Semiconductor assembly, testing, marketing, and packaging: Minimum investment required is INR 500 mn and capital support offered is 30% of the Capex amount.
Additionally, semiconductor design for integrated circuits:
Design-linked incentive: Reimbursement of 50% of expenditure to a ceiling of INR 150 mn/applicant.
Deployment-linked incentive: Incentive of 4-6% of net sales over five years, up to INR 300 mn/applicant.
Scheme envisages selecting two candidates each for semiconductor fabs and displaying fabs.
Current applicants
Semiconductor fabs (two to be approved): Vedanta in JV with Foxconn, IGSS Ventures, Singapore, ISMC Analog (with Tower semiconductor Israel) (investments - USD13.6bn; government support sought - USD 5.6bn).
Display fabs (two to be approved): Vedanta & Elest (investments - USD 6.7bn; government support sought - USD 2.7 bn).
Our opinion: Although this PLI scheme has the right intentions, its success will depend not only on government support but also on technological prowess of manufacturing companies, heavy Capex, availability of large chip fabrication orders to ascertain high capacity utilisation and ensure low cost per chip, availability of EUV lithography machine, pure raw material, pollution-free environment and uninterrupted power supply. In the absence of any such experienced company and environment enablers, the visibility of success of scheme is currently low. We need to track its progress and ground level execution periodically.

Page | 10
India Equity Strategy 2. Large-scale electronics
Manufacturing background of mobile phones:
Domestic mobile phone manufacturing has come a long way; India manufactured mobile phones worth USD 30 bn in FY21, a ten-fold increase from FY15 production value of USD 3bn. At the start of 2014, India boasted only three mobile phone manufacturing units - Nokia’s Chennai factory, Samsung’s Noida factory, and LG’s Pune factory. After the Nokia factory shut down due to tax disputes, the country was left with only two mobile phone manufacturing sites. Fast forward to 2019, and the company had a total of 268 mobile phone manufacturing units. From having a trade deficit of ~USD 8 bn in FY15, India became a net mobile phone exporter in FY20 (Chart 2.1), mainly due to a massive domestic manufacturing push by the government.
Recognising the importance of the electronic manufacturing sector, India created a favorable environment, adopting several crucial policies over the past 7-8 years. India designed National Policy on Electronics, 2012, to create a globally competitive Electronics System Design and Manufacturing (ESDM) industry, serving both the budding domestic demand and a possible export opportunity. Manufacturing mobiles domestically was further made attractive by the central government’s flagship programme ‘Make in India’ in 2014. The government supplemented ‘Make in India’ with the Digital India Programme in 2015. Several initiatives launched under the programme helped boost the domestic demand for mobile phones and facilitated the expansion of domestic mobile phone manufacturing.
The real game changer for the industry came in the FY16 Union Budget in the form of the Phased Manufacturing Programme (PMP), which was designed to encourage domestic production of mobile handsets through offering a differential excise duty for domestic mobile manufacturers. A countervailing duty (CVT) on imports at 12.5% and excise duty at 1% without input tax credit (or 12.5% with input tax credit) were implemented. The government first announced a duty of 10% on mobile phones in July 2017, which was subsequently raised to 15% in December 2017. The Union Budget of 2018-19 further raised the customs duties on mobile phones from 15% to 20% to encourage domestic manufacturing of mobile phones. All the aforementioned reasons led to a massive influx of foreign manufacturers, especially Chinese firms, into India.
Starting with OPPO in August 2015, companies such as Xiaomi, HTC, Asus, Motorola, and Gionee followed suit shortly after and set up their own manufacturing units in India. Simultaneously, the demand for mobile phones in the country picked up rapidly. Increasing digital adoption and globalisation, a rising Indian middle class, and enhancement of smartphone importance in day-to-day life kick-started the domestic mobile phone market. The key catalyst came in 2016 with the launch of Jio, ushering India into the world of dirt-cheap data prices, making it much easier for the masses to afford and use mobile phones. The resultant effect of these factors was the doubling of domestic mobile phone consumption from ~USD 14 bn in FY16 to ~USD 28 bn in FY21. Growth in mobile phone production can be seen below in chart 2.2.

Page | 11
India Equity Strategy
Chart 2.1: Mobile Phone Balance of Trade (USD Bn) Chart 2.2: Mobile Phone Production in India (Mn)
Source: MEITY, HSIE Research Source: MEITY, HSIE Research
Mobile phones have a huge part to play in the government’s aim to reach a total electronics manufacturing value of USD 300 billion in FY26 from USD 74 bn in FY21 (table 2.1). As of 2021, the estimated global mobile phone market size was USD 540 bn, with India accounting for a mere 6-7% of it. The government holds an ambition of achieving total mobile phone production value of USD 126 bn by FY26. PLI for large scale electronics is an impetus to industry in order to achieve this goal. It would mean that India’s market share in the mobile phone world market, which is estimated to reach USD 650 bn by 2026, would be in the range of 19-20%. India currently exports ~10% of the USD 30 billion worth of mobile phones manufactured. The government anticipates the share of exports to increase massively to 60% by FY26 as a result of incremental production from the PLI scheme.
Table 2.1: Roadmap to USD 300 bn electronics manufacturing Product segment FY21 FY26(E) IT hardware (laptops, tablets) 3 25 Mobile Phones 30 126 Consumer electronics (TV and audio) 9.5 23 Strategic electronics 4 12 Industrial electronics 10.5 25 Wearables and hearables - 8 PCBA 0.5 12 Auto electronics 6 23 LED lighting 2.2 16 Telecom equipment - 12 Electronic components 9 18 Total 74.7 300 Source: ICEA, HSIE Research
-7.7
-5.8
-3.6 -3.3
0.0
2.8
0.9
2.7
FY15 FY16 FY17 FY18 FY19 FY20 FY21 FY22*
58
110
175
225
290330
300321
2014 2015 2016 2017 2018 2019 2020 2021
Page | 12
India Equity Strategy Large-scale electronics PLI details: The eligibility criteria for first round of PLI for large-scale electronics are given below:
Segment Proposed incentive rate (%)
Incremental investment over base year
Incremental sales of manufactured goods over base year
Mobile (Invoice value>INR 15000)
Year 1: 6% Year 2: 6% Year 3: 5% Year 4: 5% Year 5: 4%
INR 10 bn over 4 years Year 1: 2.5 Year 2: 5.0 Year 3: 7.5 Year 4: 10.0
Year 1: INR 40 bn Year 2: INR 80 bn Year 3: INR 150 bn Year 4: INR 200 bn Year 5: INR 250 bn
Mobile-domestic INR 2 bn over 4 years Year 1: 0.5 Year 2: 1.0 Year 3: 1.5 Year 4: 2.0
Year 1: INR 5 bn Year 2: INR 10 bn Year 3: INR 20 bn Year 4: INR 35 bn Year 5: INR 50 bn
Specified electronic components
INR 1 bn over 4 years Year 1: 0.25 Year 2: 0.5 Year 3: 0.75 Year 4: 1.0
Year 1: INR 1 bn Year 2: INR 2 bn Year 3: INR 3 bn Year 4: INR 4.5 bn Year 5: INR 6 bn
With success in the first round, a second round was rolled out. The eligibility criteria for the second round of PLI are:
Segment Proposed incentive rate
Incremental investment over base year
Incremental sales of manufactured goods over base year
Specified electronic components
Year 1:5% Year 2: 4% Year 3: 4% Year 4: 3%
INR 250 mn over 4 years Cumulative minimum at the end of Year 1: INR 50 mn Year 2: INR 110 mn Year 3: INR 180 mn Year 4: INR 250 mn
Year 1: INR 150 mn Year 2: INR 350 mn Year 3: INR 600 mn Year 4: INR 1 bn
Specified electronic components considered are: transistors, diodes, resistors, capacitors, PCB, PCB printing inks, sensors, transducers, actuators, assembly, testing, packaging, etc.
The incentives ranges from 3-6% of sales, based on the year of production, provided companies fulfill the incremental investment and revenue over base year requirements. A total of 16 companies have been approved for the large-scale electronics PLI:
Mobile phones (invoice value of INR 15,000 and above): Foxconn, Samsung, Pegatron, Rising Star, and Wistron.
Mobile phones (domestic companies): Lava, Micromax, Optiemus, Padget (Dixon), United Telelinks Neolyncs.
Specified electronic components: AT&S, Neolync, Sahasra Electronics, Ascent Circuits, Silicon Power.
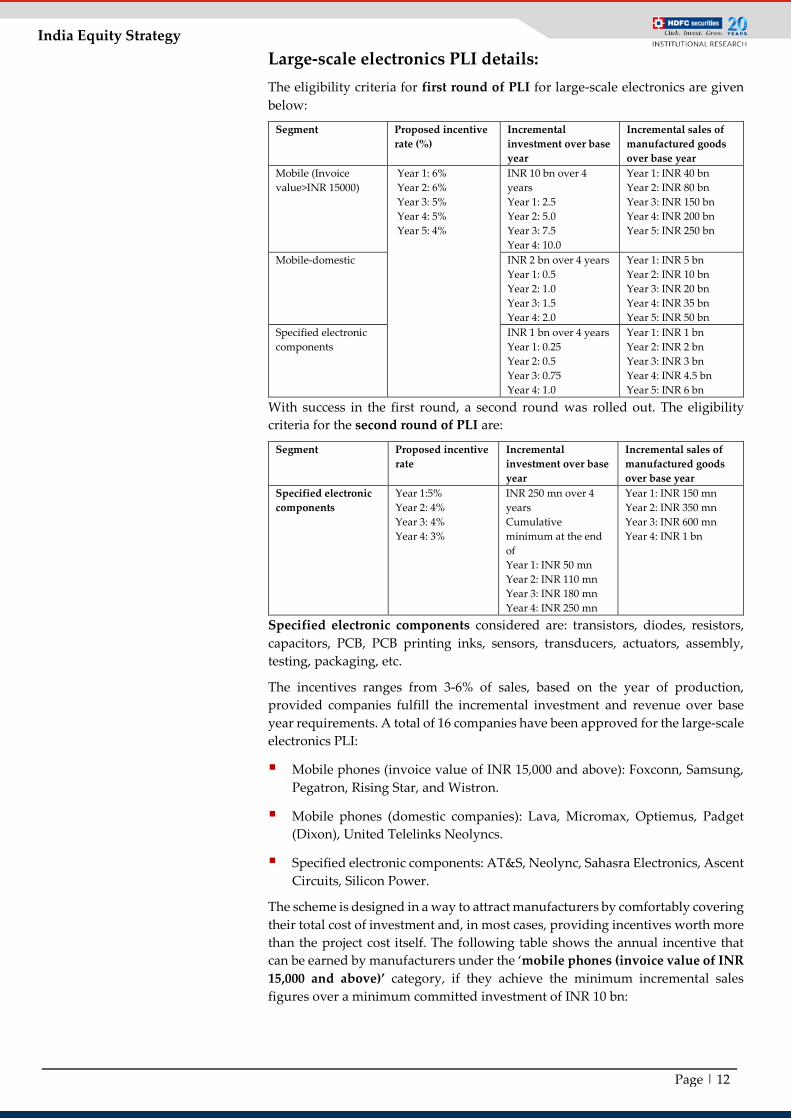
The scheme is designed in a way to attract manufacturers by comfortably covering their total cost of investment and, in most cases, providing incentives worth more than the project cost itself. The following table shows the annual incentive that can be earned by manufacturers under the ‘mobile phones (invoice value of INR 15,000 and above)’ category, if they achieve the minimum incremental sales figures over a minimum committed investment of INR 10 bn:
Page | 13
India Equity Strategy
Year of Production Minimum Incremental Sales (INR bn) Incentive Rate (%) Annual Incentive (INR
bn) FY22 40 6 2.4 FY23 80 6 4.8 FY24 150 5 7.5 FY25 200 5 10.0 FY26 250 4 10.0 Total 34.7
As seen in the table above, a total incentive of INR 34.7 bn can be earned on a cumulative investment of INR 10 bn over the tenure of the scheme. It becomes evident as to why the scheme is a lucrative one for manufacturers. It is imperative to note that the incentive per company is capped in each category by an annual ceiling. For example, since there are five approved applicants in the ‘mobile phones (invoice value of INR 15,000 and above)’ segment, the year-wise incentive ceiling is capped at 1/5th of the annual outlay for the segment.
The FY22 production from the PLI schemes has been encouraging. Based on the production trajectory, total domestic production under the scheme is expected to overshoot government estimates of USD 6 bn. Samsung, Wistron, and Pegatron alone are expected to account for USD 5 bn of production under the scheme in FY22, with Foxconn and Bharat FIH (Rising Star) expected to start production in Q1FY23.
The PLI scheme, coupled with other incentives, aims to offset India’s overall cost disadvantage when compared to its global competitors; India had an estimated 7.5-9.8% cost disability differential compared to Vietnam and ~17.3-19% compared to China in 2018. The disability gap has certainly narrowed since then as China faces its own issues in areas such as power. India as well has seen marginal cost improvements.
According to the ICEA estimates, if USD 100 is the cost of producing a phone without subsidies, after adding all the incentives and subsidies provided by each respective country, China can manufacture it for ~USD80 while Vietnam can manufacture it for ~USD89. The PLI helps bridge some of the cost discrepancy and after factoring in the PLI and other incentives, the average cost of manufacturing in India comes to ~USD92.
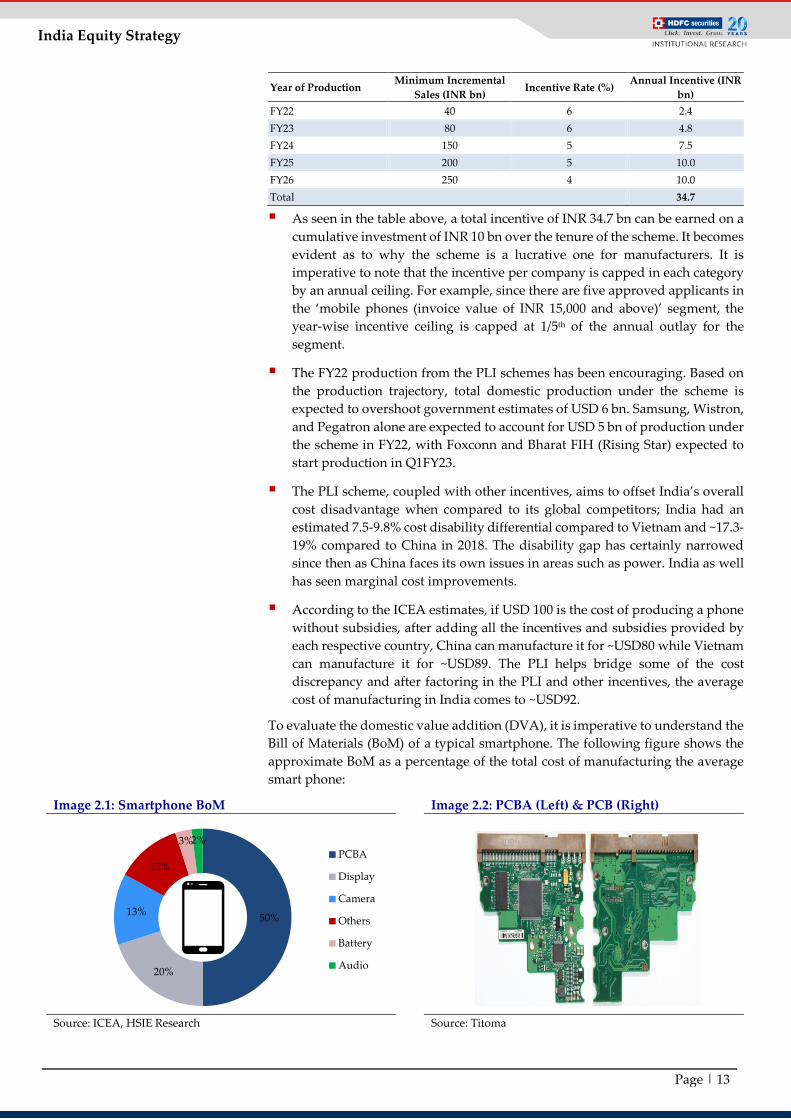
To evaluate the domestic value addition (DVA), it is imperative to understand the Bill of Materials (BoM) of a typical smartphone. The following figure shows the approximate BoM as a percentage of the total cost of manufacturing the average smart phone:
Image 2.1: Smartphone BoM Image 2.2: PCBA (Left) & PCB (Right)
Source: ICEA, HSIE Research Source: Titoma
50%
20%
13%
12%
3%2%PCBA
Display
Camera
Others
Battery
Audio
Page | 14
India Equity Strategy
The Printed Circuit Board Assembly (PCBA) accounts for nearly half of the cost of manufacturing a smart phone. A PCBA (LHS of Image 2.1) is a Printed Circuit Board (PCB) (RHS of image 2.2) with all required electronic components like IC chips, transistors, and diode mounted and soldered on to it. All electronic devices derive their functionality and intelligence from the PCBA. It can be considered as the brain of every electronic device such as mobile phones, tablets, computers, routers, televisions, washing machines, refrigerators, and air conditioners. As seen in image 2.2, the right half is a bare PCB that has circuits printed on it, but as it doesn’t have any components; it has no functionality in isolation.
India currently imports most of the electronic components and assembles them domestically, essentially hampering the country’s domestic value addition considerably. According to the ICEA estimates, the Indian market size for PCBAs was ~USD 19 bn, as of FY21, of which ~USD 16 bn came from mobile phones. The large proportion is essentially a function of mobile phones’ share in domestic electronics manufacturing (~40%) and because compared to other electronics’ BoM, PCBAs account for a higher percentage of mobile phones.
Based on estimates, ~15-35% of India’s PCBA demand is indigenously met. Currently, the major players in India’s PCBA manufacturing are Foxconn, Jabil, Flex, Sanmina, HiPad, and Samsung while Wistron is expected to start PCB assembly this year. For the remaining demand, various components such as semi-conductor chips are imported and assembled in India. While not all-encompassing, the total import bills of key components for PCBAs were as follows in FY 21:
Semiconductor chips (HS Code 8542): USD 9.2 bn
Diodes, transistors, etc (HS Code 8541): USD 2.8 bn
Parts & accessories of Automatic Data Processing Machines (HS Code 847330): USD 1.3 bn
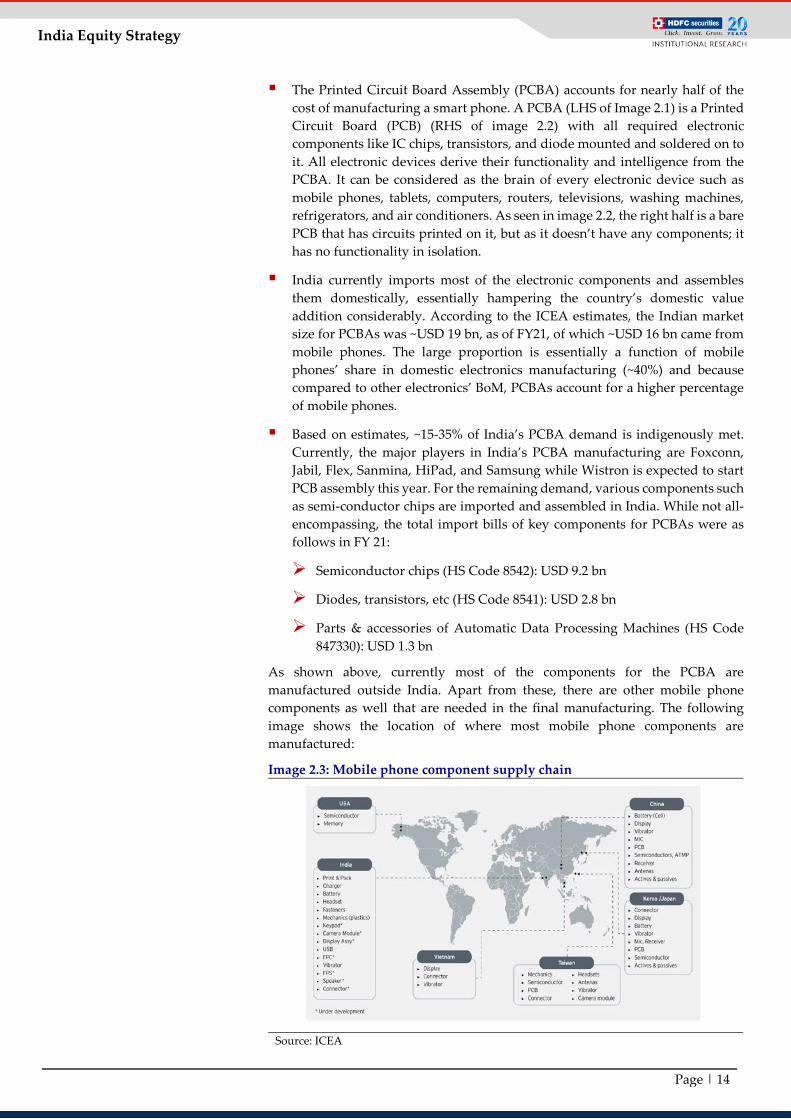
As shown above, currently most of the components for the PCBA are manufactured outside India. Apart from these, there are other mobile phone components as well that are needed in the final manufacturing. The following image shows the location of where most mobile phone components are manufactured:
Image 2.3: Mobile phone component supply chain
Source: ICEA
Page | 15
India Equity Strategy
As seen in the map above, India currently manufactures the battery pack, phone vibrator, and key plastics needed to make mobile phones. Based on the BoM breakdown provided earlier, an optimistic figure for the percentage of total manufacturing cost from domestic manufacturing would be in the range of 10-15%. Assuming a 5% operating profit margin, which is the industry average, the Domestic Value Addition (DVA) comes up to be 14-19%, broadly in line with the government’s current DVA calculation of 15-20%. Other critical components besides the PCBA, namely the display and the camera, are imported from Vietnam, China, Taiwan, Korea, and Japan.
The government has estimated that the domestic value addition of mobile phone manufacturing can increase from the current 15-20% to 35-40%. For reference, China currently has a DVA of 25-40% across different product categories in electronics manufacturing despite its immense size of USD 1 trillion worth electronic products. One of the key reasons for China’s success is that the localisation of components used is ~70%.
The Indian government’s DVA figure seems to be optimistic, given India's dependence on imports for key mobile components such as semi-conductor chips. While the semi-conductor PLI aims to curb this dependence and the electronics PLI has a small outlay dedicated to specific mobile phone components, the proposed cumulative production is not enough to compensate for the import dependency.
While the electronics manufacturing PLI is a step in the right direction for India, to truly extract the maximum value addition from the budding mobile phone manufacturing ecosystem in India, it is imperative to invest more in the ‘n-1’ electronic components. Even a partial success in production of semiconductor, diode, transistor, or PCB will pave the way for significantly improving DVA for mobile manufacturers.
Our opinion: The PLI scheme further strengthens the government’s ambitious plan of making the mobile phone segment contribute significantly and attaining electronics manufacturing worth USD 300 bn by FY26. However, the government’s estimated DVA expansion of mobile phone manufacturing from the current 15-20% to 35-40% seems optimistic. In order to achieve DVA ambitions, the industry needs to invest more in production of electronic components, viz. semiconductor chips, diodes, and PCB. Nevertheless, we expect the manufacturing of finished mobile phones to do very well on the back of a budding and rapidly growing domestic manufacturing ecosystem, and even possibly outperform the government’s expectations.
Page | 16
India Equity Strategy 3. IT hardware
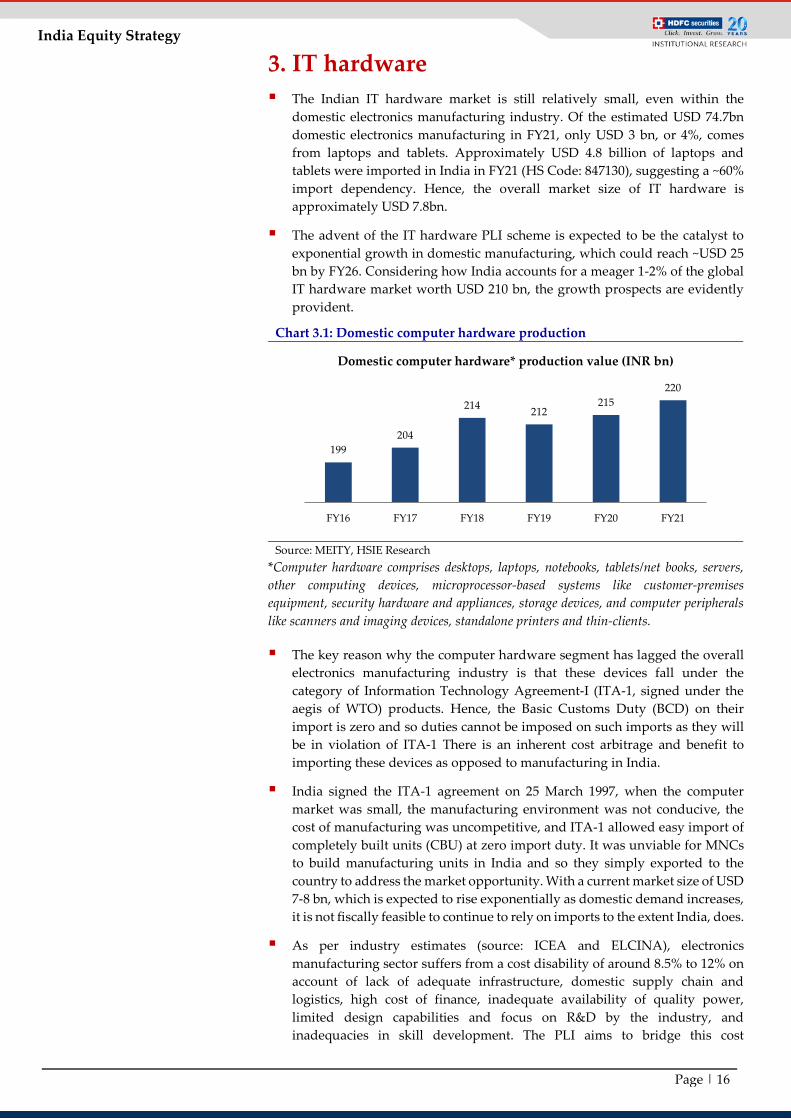
The Indian IT hardware market is still relatively small, even within the domestic electronics manufacturing industry. Of the estimated USD 74.7bn domestic electronics manufacturing in FY21, only USD 3 bn, or 4%, comes from laptops and tablets. Approximately USD 4.8 billion of laptops and tablets were imported in India in FY21 (HS Code: 847130), suggesting a ~60% import dependency. Hence, the overall market size of IT hardware is approximately USD 7.8bn.
The advent of the IT hardware PLI scheme is expected to be the catalyst to exponential growth in domestic manufacturing, which could reach ~USD 25 bn by FY26. Considering how India accounts for a meager 1-2% of the global IT hardware market worth USD 210 bn, the growth prospects are evidently provident.
Chart 3.1: Domestic computer hardware production
Source: MEITY, HSIE Research
*Computer hardware comprises desktops, laptops, notebooks, tablets/net books, servers, other computing devices, microprocessor-based systems like customer-premises equipment, security hardware and appliances, storage devices, and computer peripherals like scanners and imaging devices, standalone printers and thin-clients.
The key reason why the computer hardware segment has lagged the overall electronics manufacturing industry is that these devices fall under the category of Information Technology Agreement-I (ITA-1, signed under the aegis of WTO) products. Hence, the Basic Customs Duty (BCD) on their import is zero and so duties cannot be imposed on such imports as they will be in violation of ITA-1 There is an inherent cost arbitrage and benefit to importing these devices as opposed to manufacturing in India.
India signed the ITA-1 agreement on 25 March 1997, when the computer market was small, the manufacturing environment was not conducive, the cost of manufacturing was uncompetitive, and ITA-1 allowed easy import of completely built units (CBU) at zero import duty. It was unviable for MNCs to build manufacturing units in India and so they simply exported to the country to address the market opportunity. With a current market size of USD 7-8 bn, which is expected to rise exponentially as domestic demand increases, it is not fiscally feasible to continue to rely on imports to the extent India, does.
As per industry estimates (source: ICEA and ELCINA), electronics manufacturing sector suffers from a cost disability of around 8.5% to 12% on account of lack of adequate infrastructure, domestic supply chain and logistics, high cost of finance, inadequate availability of quality power, limited design capabilities and focus on R&D by the industry, and inadequacies in skill development. The PLI aims to bridge this cost
199204
214 212215
220
FY16 FY17 FY18 FY19 FY20 FY21
Domestic computer hardware* production value (INR bn)

Page | 17
India Equity Strategy discrepancy and make it economically viable to manufacture tablets and laptops in India.
To determine the factors that hinder the creation of a sizable and sustainable manufacturing ecosystem in India, it is imperative to analyse the disabilities faced by Indian manufacturers compared to those in China and Vietnam. The following table shows the breakdown of factors that lead to the aforementioned cost disability. It is evident that, as Vietnam and China support their products so aggressively, India also needs to support its producers with fiscal incentives. The PLI attempts to address this requirement.
Factors resulting in cost reduction India Vietnam China Corporate income tax exemption/reductions 0.73% - 0.95% 1.5% - 2% 2% Subsidy for machinery and equipment Nil 0.2% 3% State subsidies in India for capital investments 0.6% - 1.2% NA NA Cost of power 0% 1% 1% Interest subvention on working capital 0% 1.5% - 2% 3% - 3.5% R&D Subsidy 0.15% 0.4% - 1% 2% Incentive for supporting industry 0% 0.5% - 1% 0% Manufacturing incentives - 0% 1% - 2% Exemption/reduction of land rental 0% 0.5% 0.6% Industrial land development support 0.4% 0.5% 0.6% Building (or plug and play) Negligible 0.3% 1% Labor subsidy Negligible 0.5% 2% Logistics 0% 0.5% 1% Factors assisting ‘Ease of Doing Business’ - 1.5% - 2.5% 2% - 3% Duty-free imports for creating fixed assets, and of inputs not available domestically
0% 0.5% -
Total 1.88% - 2.7% 9.4% - 12.5% 19.2% - 21.7% Cost disability differential for India vs others - 7.5% - 9.8% 17.3% - 19% Source: ICEA, HSIE Research
PLI scheme details The below table reflects sales and investments-related eligibility criteria for applicants, after achieving which, they will be considered for incentives. Overall, the government outlay is INR 73.25bn.
Eligibility threshold criteria (INR bn)
Segment Proposed incentive rate Incremental Investment over Base Year (FY21)
Incremental sales of Manufactured Goods over Base
Year (FY21) IT Hardware Companies 1. Laptops (Invoice value
of INR 30,000 & above) 2. Tablets (Invoice value
of INR 15,000 & above) 3. All-in-one PCs 4. Servers
Year 1: 4% Year 2:3% Year 3: 2%
Year 4: 2%/1%
INR 5 bn over 4 years with a cumulative minimum of:
Year 1: INR 0.5 bn Year 2: INR 1.5 bn Year 3: INR 3.0 bn Year 4: INR 5.0 bn
Year 1: INR 10 bn Year 2: INR 25 bn Year 3: INR 50 bn
Year 4: INR 100 bn
Domestic Companies 1. Laptops 2. Tablets 3. All-in-one PCs 4. Servers
INR 200 mn over 4 years with a cumulative minimum of:
Year 1: INR 40 mn Year 2: INR 80 mn Year 3: INR 140 mn Year 4: INR 200 mn
Year 1: INR 0.5 bn Year 2: INR 1.0 bn Year 3: INR 2.0 bn Year 4: INR 3.0 bn

Page | 18
India Equity Strategy
Expected government incentive outlay Annual ceiling on net incremental sales Financial year Total incentive (INR bn)
FY22 7.20
FY23 13.05
FY24 18.20
FY25 34.80
Total 73.25
Financial year IT Hardware
companies (INR bn)
Domestic companies (INR
bn) FY22 30.0 3.0
FY23 75.0 6.0
FY24 150.0 16.0
FY25 300.0 24.0
Total 555.0 49.0
The incentives range from 1-4%, based on the year of production, provided companies fulfill the incremental investment and revenue over base year requirements. The companies that have been selected under the scheme are as follows:
IT hardware companies: Dell, ICT (Wistron), Flextronics, and Rising Stars Hi-Tech (Foxconn).
Domestic companies: Lava International Ltd, Dixon Technologies (India) Ltd, Infopower Technologies (JV of Sahasra and MiTAC), Bhagwati (Micromax) Neolync, Optiemus, Netweb, Smile Electronics, VVDN, and Panache Digilife.
Of the total estimated production of INR 1.6 trillion over the scheme period, the approved companies under IT Hardware category have proposed a production of INR 847bn. Also, the approved companies under the Domestic Companies category have proposed a production of INR 760bn. The IT Hardware PLI is expected to add total incremental sales of ~USD 21 bn from FY22 to FY25, and aid India’s IT hardware market to grow to an estimated size of ~USD 25 bn by FY26.
The following table shows the annual incentive that can be earned by manufacturers under the ‘IT Hardware Companies’ category, if they achieve the minimum incremental sales figures over a minimum committed investment of INR 5 bn:
Year of production Minimum incremental sales (INR bn) Incentive rate (%) Annual incentive
(INR bn) FY22 10 4 0.4 FY23 25 3 0.75 FY24 50 2 1.0 FY25 100 1 / 2 1.0 / 2.0 Total 3.15 / 4.15
As seen in the above table, the incentives earned over minimum incremental sales and the minimum cumulative investment does not cover the total project cost. For earning higher incentives, companies need to achieve higher sales amounts, which will help them recover their entire initial investments. Further, earlier, when the government had announced the scheme, estimated production of up to INR 3.26 trillion was assumed to be plausible, but, later, seeing the industry’s muted response, production target was reduced to INR 1.6 trillion.
IT hardware manufacturers blamed this on the low incentive structure which works out to an average of 2-2.5% over a four-year period, figures that do not justify the relocation of units from China or Vietnam, especially for hardware products where import duties are nil. Industry executives believe that the ideal incentive structure for IT hardware should be roughly 7% - 8%. As is the issue with the PLI scheme for mobile phones, the PCB bottleneck is one that is standing in the way of maximising value unlocking. PCBAs account for
Page | 19
India Equity Strategy ~40% of the total bill of materials (BoM) for tablets and laptops, and the individual components are primarily being imported into the country.
For stepping up efforts to manufacture these components domestically and hence improving domestic value addition in final electronic products, the government has been diligently strategising. It launched Scheme for Promotion of Manufacturing of Electronic Components & Semiconductors (SPECS) in 2020.
The scheme provides financial incentive of 25% on capital expenditure for the identified list of electronic goods that comprise downstream value chain of electronic products, i.e., electronic components, semiconductor/display fabrication units, ATMP units, specialised sub-assemblies and capital goods for manufacture of aforesaid goods, all of which involve high value-added manufacturing.
As of Jan 2022, the government has approved proposals of 20 companies under SPECS, with an estimated investment of INR 200bn. While this is definitely a step in the right direction, the government will need to expand the range and size of incentives it provides to intermediary electronic component manufacturers in order to achieve its DVA ambitions of 25-30%, from the current 10-15% in IT hardware manufacturing.
Our opinion: The government will need to expand the range and size of the incentives it provides to intermediary electronic component manufacturers in order to achieve its DVA ambitions of 25-30%, from the current 10-15% in IT hardware manufacturing. The incentive rates provided in the PLI scheme should also be increased to make India more cost competitive (compared to peers). The scheme has been under-subscribed for this very reason, as industry executives feel that the ideal incentive structure for IT hardware should be in the range of 7-8%. Based on the current scheme structure, we expect the IT hardware scheme to face difficulties in meeting the government’s expectations.

Page | 20
India Equity Strategy 4. White goods
The Indian AC industry was sized at ~USD 2.7 bn in FY20. With an estimated import value of USD 1.2 bn, India’s import dependency was pegged at nearly 50%. The white goods PLI aims to address this discrepancy and make India a net exporter of AC and AC components. It highlights the government’s plan to reduce imports completely, 70% of which come from China and Thailand.
The white goods PLI targets key AC components that are used to manufacture ACs, when combined together. Currently, a total value of USD 1.8 bn worth of key AC components (HS Code 8414), including compressors and vacuum pumps, are imported in India, hampering the domestic value add potential.
The PLI aims to address these shortcomings, as they come under the targeted goods in the ‘high value AC intermediates’ and ‘low value AC intermediate’ segments. With a total government outlay of INR 63.4bn, the government intends to add a total incremental production value of AC components of USD 11 bn during FY22-FY28, and consequently a total of AC production value of USD13 Bn.
The LED segment in the scheme is imperative to have, considering the massive amount of imports into the company for these targeted components. The estimated FY22 total imports for LEDs, excluding solar cells, are estimated to be ~USD1.5 bn (HS code: 8541). Trends of trade balances of key AC components and LEDs over the years can be seen in the chart 4.1 below. The PLI attempts to counter these prevalent trade deficits.
The incremental total sales from FY22-28 led by the PLI scheme are expected to be around USD 2-3 bn.
Chart 4.1: AC components trade balance
*FY22 (Apr – Jan) Source: Ministry of Commerce & Industry, HSIE Research
*FY22 (Apr – Jan) Source: Ministry of Commerce & Industry, HSIE Research
0.8 0.7 0.6 0.8 0.8 0.8 0.9 1.01.5 1.4 1.4 1.6 1.8 1.9 1.7 1.8
-0.8 -0.7 -0.7 -0.8 -1.0 -1.0 -0.8 -0.8
FY15 FY16 FY17 FY18 FY19 FY20 FY21 FY22*
Trade balance of key AC components HS Code: 8414 (USD bn)
Export Import Trade Balance
0.2 0.2 0.1 0.2 0.2 0.3 0.2 0.21.53.1 4.0 4.7 3.2 2.7 2.8
4.8
-1.3-2.9 -3.9 -4.6 -3.0 -2.4 -2.6
-4.6
FY15 FY16 FY17 FY18 FY19 FY20 FY21 FY22*
Trade balance of LEDs HS code: 8541 (USD bn)
Export Import Trade Balance
Page | 21
India Equity Strategy PLI scheme details:
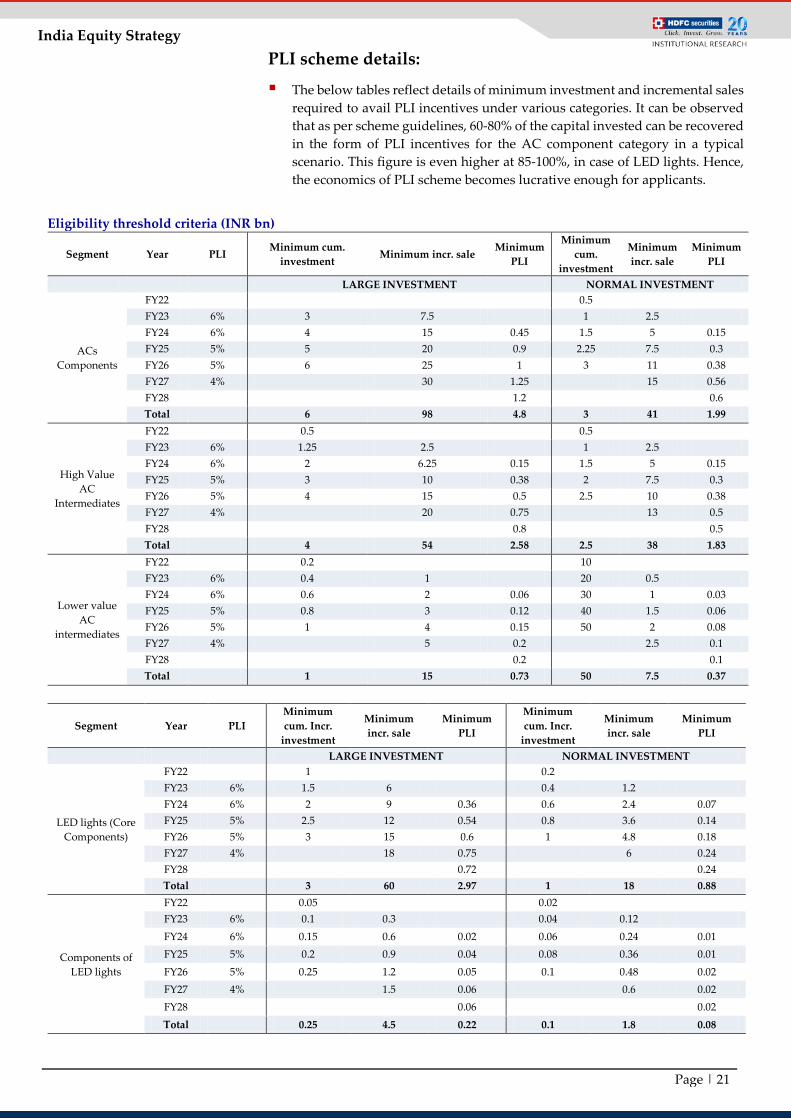
The below tables reflect details of minimum investment and incremental sales required to avail PLI incentives under various categories. It can be observed that as per scheme guidelines, 60-80% of the capital invested can be recovered in the form of PLI incentives for the AC component category in a typical scenario. This figure is even higher at 85-100%, in case of LED lights. Hence, the economics of PLI scheme becomes lucrative enough for applicants.
Eligibility threshold criteria (INR bn)
Segment Year PLI Minimum cum. investment Minimum incr. sale Minimum
PLI
Minimum cum.
investment
Minimum incr. sale
Minimum PLI
LARGE INVESTMENT NORMAL INVESTMENT
ACs Components
FY22 0.5 FY23 6% 3 7.5 1 2.5 FY24 6% 4 15 0.45 1.5 5 0.15 FY25 5% 5 20 0.9 2.25 7.5 0.3 FY26 5% 6 25 1 3 11 0.38 FY27 4% 30 1.25 15 0.56 FY28 1.2 0.6 Total 6 98 4.8 3 41 1.99
High Value AC
Intermediates
FY22 0.5 0.5 FY23 6% 1.25 2.5 1 2.5 FY24 6% 2 6.25 0.15 1.5 5 0.15 FY25 5% 3 10 0.38 2 7.5 0.3 FY26 5% 4 15 0.5 2.5 10 0.38 FY27 4% 20 0.75 13 0.5 FY28 0.8 0.5 Total 4 54 2.58 2.5 38 1.83
Lower value AC
intermediates
FY22 0.2 10 FY23 6% 0.4 1 20 0.5 FY24 6% 0.6 2 0.06 30 1 0.03 FY25 5% 0.8 3 0.12 40 1.5 0.06 FY26 5% 1 4 0.15 50 2 0.08 FY27 4% 5 0.2 2.5 0.1 FY28 0.2 0.1 Total 1 15 0.73 50 7.5 0.37
Segment Year PLI Minimum cum. Incr.
investment
Minimum incr. sale
Minimum PLI
Minimum cum. Incr.
investment
Minimum incr. sale
Minimum PLI
LARGE INVESTMENT NORMAL INVESTMENT
LED lights (Core Components)
FY22 1 0.2 FY23 6% 1.5 6 0.4 1.2 FY24 6% 2 9 0.36 0.6 2.4 0.07 FY25 5% 2.5 12 0.54 0.8 3.6 0.14 FY26 5% 3 15 0.6 1 4.8 0.18 FY27 4% 18 0.75 6 0.24 FY28 0.72 0.24 Total 3 60 2.97 1 18 0.88
Components of LED lights
FY22 0.05 0.02 FY23 6% 0.1 0.3 0.04 0.12 FY24 6% 0.15 0.6 0.02 0.06 0.24 0.01 FY25 5% 0.2 0.9 0.04 0.08 0.36 0.01 FY26 5% 0.25 1.2 0.05 0.1 0.48 0.02 FY27 4% 1.5 0.06 0.6 0.02 FY28 0.06 0.02 Total 0.25 4.5 0.22 0.1 1.8 0.08

Page | 22
India Equity Strategy In the first round of the PLI application, a total of 42 companies were
approved for both the AC and LED segments. INR 39bn investment was committed by 26 companies in the AC segment while INR 7.1bn was committed by 16 companies in the LED segment. The government has opened the second round of applications from 10 March 2022 to 25 April 2022 to fulfill the remaining outlay.
As mentioned earlier, the PLI scheme is not for finished goods but rather for the key components that are then assembled by OEMs to make the finished goods, which in this case are ACs. It is, hence, imperative to have a look at a typical AC bill of material (BoM). Compressor, heat exchanger, and PCB contribute majorly towards the cost of a typical inverter AC. Most of these components are covered under the PLI scheme.
Chart 4.2: Inverter AC component cost break-up
Source: HSIE Research Image 4.1: Compressor Image 4.2: Heat exchanger Image 4.3: Fan
Motor
Source: LG Source: Amber Enterprises Source: Daikin
Key products and approved applicants The below table lists key products that selected applicants have committed to invest and build capacities in.
Applicant Eligible product Committed investment (INR bn)
Hindalco Industries Copper tubes, aluminium for heat exchanger 5.39 Diakin AC Compressor, control assembly, motor, heat exchanger 5.39 Amber Enterprises control assembly, motor, heat exchanger 4.60 HI-Volt Enterprises Compressor, motor 3.54
PG Technoplast Compressor, control Assy, motor, heat exchanger, plastic moulding
3.21
Mettube India Copper tube 3.0
EPAC Durables Display, control assembly, heat exchanger, plastic moulding, fan
3.0
Midea India Compressor 2.5
Syska LED LED driver, printed circuit board, LED light management systems
1.5
Dixon Tech LED engine, LED module, LED light management systems
1.0
Total 46.14
Compressor (ODU), 23%
Heat Exchanger (ODU), 11%
Sheet Metal, 9%
Fan Blade (ODU), 3%Fan Motor
(ODU), 4%
Refrigerant (ODU), 4%
Others, 16%
Heat Exchanger (IDU), 8%
Fan Motor (IDU), 4%
PCB (ODU), 18%

Page | 23
India Equity Strategy
The PLI scheme essentially targets most of the costs associated with an AC’s BoM; ~80% of the total cost, to be precise. The government boasts an expected domestic value addition increase from 25% to 75% as a direct result of the PLI scheme. Based on the estimated revenue generation of USD 11 billion over the tenure of the scheme, the expectation is that India will become largely self-reliant in the manufacturing of ACs. This in turn is likely to help the country reduce its import dependence for ACs and eventually become a net exporter. The quantum of incremental sales and the targeted components make DVA expansion plausible.
The white goods PLI scheme also targets the LED lights segment. As shown in the figure above, India’s imports of LEDs, excluding solar cells, are expected to touch USD 1.5 bn in FY22, clearly indicating the need to incentivise and push domestic manufacturing in the industry. LEDs have a wide variety of applications; they are used in smart phones, digital watches, cameras, automotive heat lamps, aviation lighting, digital computers, and calculators. This versatile usage of LED lights has led to its inclusion in the PLI scheme.
Through this scheme, India is planning to promote efficient lighting technologies. LED lights due to their energy efficiencies are expected to gradually replace high-power-consuming lighting sources and incandescent bulbs.
The LED segment of the PLI also targets key components and aims to make the country self-reliant in LED supply chain, as opposed to simply assembling LEDs in the country. The scheme targets key components such as LED drivers and LED chips, which are primarily being imported from China currently. While the intention behind the scheme is a step in the right direction, the size of the scheme is simply not enough to make a meaningful impact.
Domestic LED lights manufacturing is estimated to be USD 2.2bn while imports excluding solar cell LEDs account for USD 1.5 bn, pegging the current domestic demand at ~USD 3.7 bn. With the advent of Government of India’s UJALA scheme and the increased adoption of LED lights, the industry is expected to ramp up significantly in the coming years, requiring a larger and more sustainable LED component ecosystem in the country.
So far, the committed investment by applicants has only been to the tune of INR 7.2bn by 16 companies, nowhere near the investment required for the country to be self-reliant. The economies of scale achieved by Chinese companies in LED components have made it unviable for most domestic countries to operate in the space. Further, even with the presence of custom duties, it is still cheaper for OEMs to import components from China. The quantum of incentives provided to LED component manufacturers needs to be larger to invite a higher level of committed investments to increase the scale of domestic production.
Our opinion: Based on the key components of AC targeted by the government through the scheme, the DVA expansion from 25% to 75% seems plausible. Furthermore, the estimated revenue generation of USD 10-11 bn is likely to make India a net exporter of ACs by the end of the scheme’s tenure. Also, given increasing demand of LED lights, trade deficits are increasing in this segment. At present, the committed investments under the scheme are far from enough. Incentives offered should be much higher to attract more players to participate in this scheme. . We expect the white goods scheme to largely perform in line with the government’s expectations.
Source: Designua

Page | 24
India Equity Strategy 5. Automobile and auto components The automotive industry is a major economic contributor in India. The sector, a key growth driver, is responsible for 35% of manufacturing GDP of India. The PLI scheme for this sector proposes financial incentives to boost domestic manufacturing of advanced automotive technology products and attract investments in the automotive manufacturing value chain.
The most prevalent automotive technology is electric vehicles and, hence, it becomes imperative to understand its constitution and key components.
Electric vehicles (four-wheelers) As shown in the below diagram, an electric vehicle (EV) is much different from an internal combustion engine (ICE) as it does not have any fuel tank, combustion mechanism, or exhaust pipe. Hence, it doesn’t contribute to pollution. Given the world’s increasing focus on sustainability, pollution control and environment protection, an EV is expected to rapidly replace ICE across geographies. EVs use battery packs as their energy source for driving. Electric traction motor and power electronics controller are the other important components:
Image 5.1: Electric 4 wheeler (4W EV)
Source: U.S. Department of Energy
The list below provides a break-up of various components required to make an electric four wheeler. It suggests that 42% of the overall bill of material (BOM) is import dependent. It includes battery cell, electric traction motor, semiconductors and other power electronics controller. Chassis, drive train and battery management system are domestically manufactured. It is worth mentioning that the key component battery cell has been considered as a part of another PLI scheme for reducing dependence on expensive imports (PLI scheme for ACC battery).
Table 5.1: Cost break-up of a four-wheeler electric vehicle Component % Cost Sourcing Battery cell 24% Import Battery mgt system 11% Domestic Electric traction motor 10% Import Semiconductors 4% Import Rest of power electronics controller 4% Import Chassis & body 20% Domestic Drive train 7% Domestic Other 20% domestic Total 100%

Page | 25
India Equity Strategy Key component of EV- battery A battery, which consists of battery cells and battery management system, accounts for approximately 35% of the overall cost of a 4W EV. It is the most important component of the vehicle as it drives its function. The most popular advanced chemistries are lithium ferrum phosphate (LFP) or nickel cobalt aluminum (NCA) batteries. In both of these cases, the key fundamental element is a battery cell (image 5.2). It consists of a cathode, anode, electrolyte, and separator. Cathode and anode help in electron movement through the electrolyte resuting in current flow, while a separator ensures that cathode and anode remain insulated from each other. If the separator malfunctions, it could cause a short circuit and battery could burn up in flames. Separators are made of polyolefin, which is composed of polyethylene, polypropylene, or the lamination of one over another. The desired quality of a separator is to withstand high temprature; otherwise, it may dissolve in the high temperature environment, resulting in a short circuit.
In a typical battery, 74 such wired cells are connected parallelly to form a group. Eight such groups are connected electrically in series to form a module (Image 2.3). Battery pack is formed by connecting 16 such modules in a series arrangement. Battery pack entails two rows of seven modules each in the flat section, while two other modules are stacked in the front (image 2.4, 2.5, and 2.6). Hence, overall 9,472 cells are required to form a typical battery pack for a 4W EV.
Image 5.2: Battery cell Image 5.3: Battery module
Source: Lesics Engineers Pvt Ltd Source: Lesics Engineers Pvt Ltd
Images 5.4, 5.5 & 5.6: Battery modules arranged to form battery pack and fitted in vehicle ‘
Source: Lesics Engineers Pvt Ltd Source: U.S. Department of Energy Source: “Car” Magazine UK

Page | 26
India Equity Strategy Electric vehicles - key raw material and supply locations
Image 5.7: Key raw materials found in South Africa, China, Indonesia & Congo
Image 5.8: Lithium ion battery raw materials reserves across countries
Source: Niti Aayog Source: Niti Aayog
The above two images (image 5.7 & 5.8) reflect the geographical locations where key raw materials for both the popular battery chemistries are available.
It can be observed in image 5.7 that cobalt, manganese, nickel and graphite, key to NMC chemistry, are found mainly in South Africa, Congo, Indonesia, and China. Furthermore, image 2.8 indicates that the key material lithium for LFP chemistry is found in China, Bolivia, Chile, and Australia. Remarkably, Australia has the greatest availability of key material for li-ion battery manufacturing.
Having understood the saliency of lithium, it is worthwhile to know its global sources. Table 5.2 reflects that Bolivia has the largest lithium reserves (21 mn tonnes) in the world. In spite of this, it isn’t the largest producer as most of its reserves are available at steep elevation, where it is difficult to extract.
Bolivia, Chile, and Argentina account for ~56% of global lithium reserves of 89 mn tons and are collectively called the lithium-triangle. Chinese firms have already received mining concessions in this region and hence, are pioneers in battery production.
Table 5.2: Lithium reserves across countries
Country Lithium reserves (Mn Tonnes) (Mn tonnes)
Bolivia 21 Argentina 19 Chile 9.8 Australia 7.3 China 5.1 Congo 3 Source: U.S. Geological Survey, HSIE Research
Australia, Chile, and China are the leading lithium producing countries. The below table underscores lithium production by countries in 2021:

Page | 27
India Equity Strategy Lithium production across countries (2020)
Country 2020 Lithium production (Tonnes) (Mn tonnes) % of World total
Australia 55,000 52.4% Chile 26,000 24.8% China 14,000 13.3% Argentina 6,200 5.9% Others 4,600 4.4% Total 105,000 100% Source: U.S. Geological Survey, HSIE Research
Indian efforts: So far, India has been lagging in securing substantial lithium or other key battery material reserves. The geological survey of India has been exploring lithium reserves in Arunachal Pradesh, Chhattisgarh, Rajasthan, J&K, Jharkhand, and Andhra Pradesh. Preliminary findings suggest a very small reserve of 1,600 tonnes in Karnataka.
Khanij Bidesh Nigam Ltd (KABIL) is a JV between NALCO, Mineral Exploration Corporation Ltd (MECL), and Hindustan Copper (HCL). Through this, India is working on acquiring mines of strategic minerals such as lithium and cobalt in producing countries like Australia, Argentina, Bolivia, and Chile.
Hence, India has remained dependent on imported lithium so far. We need to track progress on acquisition of mines by Indian companies.
Electric Vehicle – two-wheelers (E2W) components break-up
As shown in image 5.9, battery cells and motor and electronic control units are imported for manufacturing an electric two-wheeler. This means that approximately 53% of the cost of overall raw material is import dependent. Hence, price of E2W will be a function of import prices of these key components. And, hence, the price of E2W is at the mercy of global supply & pricing of these key components.
Image 5.9: Cost breakup of an electric 2 wheeler (E2W)
Source: Goldman Sachs, HSIE Research

Page | 28
India Equity Strategy
Policy support: Government has extended support by way of FAME-II policy (faster adoption of manufacturing of hybrid & electric vehicles). It is a budgetary support of INR 100bn to generate demand by way of supporting 7,000 e-buses, 5 lakh e-3 wheelers, 55,000 four-wheeler EVs and 1 mn electric two-wheelers. So far, it has supported sales of more than 3 lakh vehicles and spent INR 11 bn on incentives. It is valid until 31 Mar 2024. For a E2W buyer, policy offers a subsidy of INR 15,000 per KWH of vehicle up to a ceiling of 40% of the vehicle cost. This typically means a support of INR 45-50K for an E2W costing INR 150,000. This is leading to faster adoption of E2W and its growing sales.
In our view, the cost of the vehicle needs to come down by way of securing raw material supplies, battery innovations, and economy of scale. FAME-II support can take industry to only a small extent further; however, for real growth and development of industry, E2W prices need to come at par with conventional petrol two wheeler prices without subsidy.
Automobile and auto components - PLI scheme highlights
Scheme has two parts - Champion OEM and component champion incentive scheme.
Eligibility: Investments to be done for approved products with 50% value addition.
Cumulative new domestic investment (INR bn)
Champion OEM (Except
2W/3W)
Champion OEM (2W/3W)
Component champion
New non-auto investor(OEM)
New non auto investor
(component)
Upto FY23 3 1.5 0.4 3 0.8 Up to FY24 8 4 1 8 2 Up to FY25 14 7 1.75 14 3.5 Up to FY26 17.5 8.75 2.2 17.5 4.4 Up to FY27 (Total Investment) 20 10 2.5 20 5
Champion OEM & OEM investor: Minimum INR 1.25 bn sales in first year and 10% YoY growth
Determined sales value (INR bn)
<20 20-30 30-40 >40 Additional 2% incentive if cumulative sales >100 bn over 5 years
Incentives (% of sales) Base yr-FY20
13% 14% 15% 16%
Component champion & component investor: Minimum INR 0.25 bn sales in first year and 10% YoY growth
Determined sales value (INR bn)
<2.5 2.5-5 5-7.5 >7.5 Additional 2% incentive if cumulative sales >12.5 bn over 5 years 5% more for BEV & hydrogen fuel components
Incentives (% of sales) Base year-FY20
8% 9% 10% 11%
Page | 29
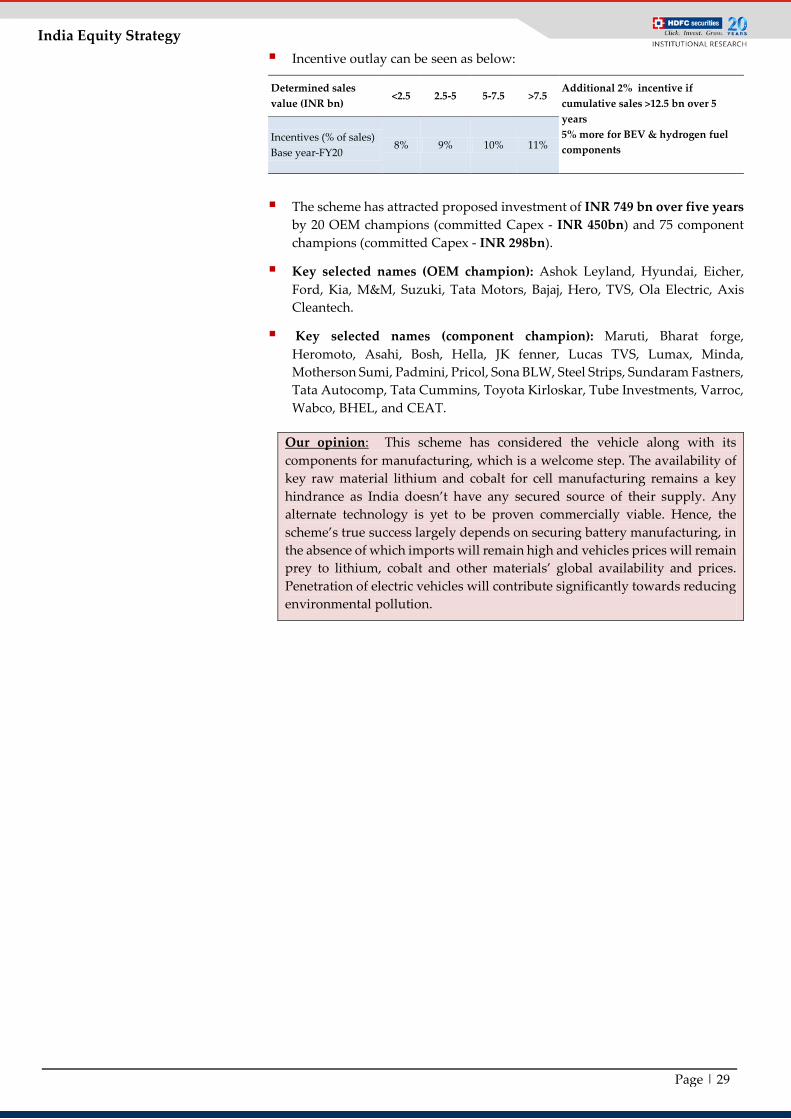
India Equity Strategy Incentive outlay can be seen as below:
Determined sales value (INR bn)
<2.5 2.5-5 5-7.5 >7.5 Additional 2% incentive if cumulative sales >12.5 bn over 5 years 5% more for BEV & hydrogen fuel components
Incentives (% of sales) Base year-FY20
8% 9% 10% 11%
The scheme has attracted proposed investment of INR 749 bn over five years by 20 OEM champions (committed Capex - INR 450bn) and 75 component champions (committed Capex - INR 298bn).
Key selected names (OEM champion): Ashok Leyland, Hyundai, Eicher, Ford, Kia, M&M, Suzuki, Tata Motors, Bajaj, Hero, TVS, Ola Electric, Axis Cleantech.
Key selected names (component champion): Maruti, Bharat forge, Heromoto, Asahi, Bosh, Hella, JK fenner, Lucas TVS, Lumax, Minda, Motherson Sumi, Padmini, Pricol, Sona BLW, Steel Strips, Sundaram Fastners, Tata Autocomp, Tata Cummins, Toyota Kirloskar, Tube Investments, Varroc, Wabco, BHEL, and CEAT.
Our opinion: This scheme has considered the vehicle along with its components for manufacturing, which is a welcome step. The availability of key raw material lithium and cobalt for cell manufacturing remains a key hindrance as India doesn’t have any secured source of their supply. Any alternate technology is yet to be proven commercially viable. Hence, the scheme’s true success largely depends on securing battery manufacturing, in the absence of which imports will remain high and vehicles prices will remain prey to lithium, cobalt and other materials’ global availability and prices. Penetration of electric vehicles will contribute significantly towards reducing environmental pollution.
Page | 30
India Equity Strategy 6. Advanced chemistry cells (ACC) battery Advanced chemistry cells (ACCs) are advanced energy storage technologies
that can store electric energy either as electrochemical or chemical energy and convert it back to electrical energy as and when required.
Integrated battery value can be divided into battery pack assembly and ACCs. A few companies in the country have already started investing in battery pack assembly, although the current overall capacity is miniscule as compared to global capacity. Investments in ACCs manufacturing and overall value addition is negligible. Hence, entire domestic demand of ACCs is met only through imports.
Through the PLI scheme for ACCs, government intends to optimally incentivize potential investors to set up mega scale ACC manufacturing facilities with emphasis on maximum value addition, quality output, and achieving a pre-committed capacity. No incentive is being offered to conventional battery pack technology as it is already being manufactured in India currently.
Various ACC battery technologies being researched in the country are li-ion battery, hydrogen as fuel solid state batteries, and sodium ion batteries.
Lithium-ion batteries
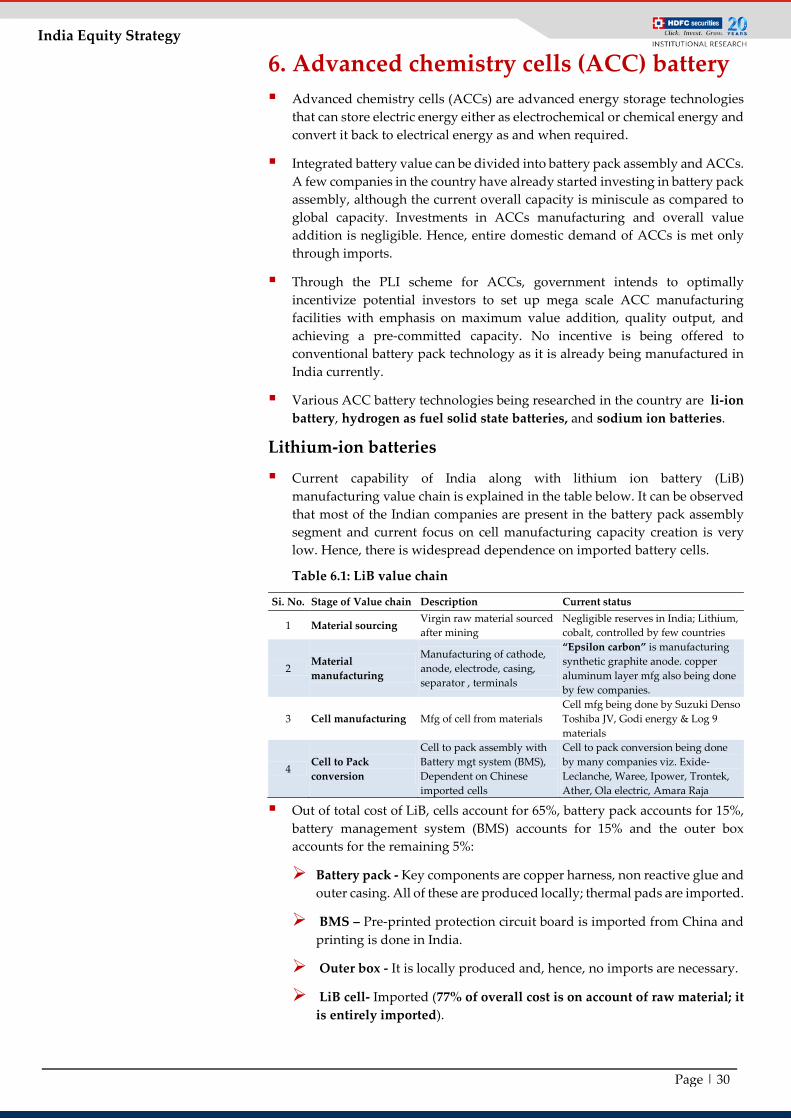
Current capability of India along with lithium ion battery (LiB) manufacturing value chain is explained in the table below. It can be observed that most of the Indian companies are present in the battery pack assembly segment and current focus on cell manufacturing capacity creation is very low. Hence, there is widespread dependence on imported battery cells.
Table 6.1: LiB value chain
Si. No. Stage of Value chain Description Current status
1 Material sourcing Virgin raw material sourced after mining
Negligible reserves in India; Lithium, cobalt, controlled by few countries
2 Material manufacturing
Manufacturing of cathode, anode, electrode, casing, separator , terminals
“Epsilon carbon” is manufacturing synthetic graphite anode. copper aluminum layer mfg also being done by few companies.
3 Cell manufacturing Mfg of cell from materials Cell mfg being done by Suzuki Denso Toshiba JV, Godi energy & Log 9 materials
4 Cell to Pack conversion
Cell to pack assembly with Battery mgt system (BMS), Dependent on Chinese imported cells
Cell to pack conversion being done by many companies viz. Exide-Leclanche, Waree, Ipower, Trontek, Ather, Ola electric, Amara Raja
Out of total cost of LiB, cells account for 65%, battery pack accounts for 15%, battery management system (BMS) accounts for 15% and the outer box accounts for the remaining 5%:
Battery pack - Key components are copper harness, non reactive glue and outer casing. All of these are produced locally; thermal pads are imported.
BMS – Pre-printed protection circuit board is imported from China and printing is done in India.
Outer box - It is locally produced and, hence, no imports are necessary.
LiB cell- Imported (77% of overall cost is on account of raw material; it is entirely imported).

Page | 31
India Equity Strategy Currently li-ion battery costs around USD 132/KWH; it has fallen from USD
1220/KWH in 2010, mainly driven by achieved economies of scale by Chinese battery producers.
ACC battery KWH required: A typical two-wheeler vehicle may require 2.5-3KWH battery, while a four-wheeler EV will require approximately 35KWH as battery storage. Battery storage requirement may vary with different models of cars; for example, a BMW requires 85 KWH batteries and offers a higher drive range in a charge. Also, electric buses require a 250KWH battery.
Two of the common li-Ion cell chemistries are lithium ferrous phosphate (LFP) and nickel manganese cobalt (NMC).
LFP Vs NMC:
LFP can operate in a temperature range of -4 degrees to 70 degrees, while for NMC, the optimum operating temperature range is from -20 degrees to +55 degree Celsius. Due to this reason, NMC may catch fire in high temperature geographies.
LFP requires more space than NMC so it is suitable for larger vehicles (3W/4W/fleet).
LFP uses phosphorus as cathode, which is less expensive than cobalt used in NMC.
LFP has a long lifecycle of cell (3,000 charge/discharge) and, hence, it lasts 5-7 years while NMC has a lower lifecycle of cells (750 charge/discharge cycle) and lasts only 2-3 years.
Given the benefits, the overall LFP chemistry is the optimum choice for four-wheeler electric vehicles.
Planned investments in battery space and cell manufacturing
Globally, li-ion battery capacity has grown from 250 GWH in 2018 to 700 GWH in 2021 (75% in China); battery prices have reduced from USD 185/KWH to USD 132/KWH during the same period.
The projected global capacity of li-ion is expected to grow to 2,250 GWH by 2025 (country-wise break-up of the same is expected to be China-55%, EU-20%, US-10%). The US and Europe are committing large investments to manufacture large capacities, while China continues its investment journey.
Table 6.2 lists down the ongoing projects in the development of battery ecosystem. Many companies are exploring these projects even without PLI support, indicating their conviction on future growth of industry and projected growth in demand.
Table 6.2: Battery ecosystem development Company Description Location Amara Raja USD 1 bn investment in battery mfg in next 5 yrs Tirupati Log 9 materials Developed high power cell, fast charging and long life, planning to implement in 2W/3W Bengaluru Exide-Leclanche Invested INR 25 bn for 1.5GWH battery assembly facility Ahmedabad Suzuki denso Toshiba INR 50 bn invested for manufacturing 30 mn cells (1GWH capacity) Ahmedabad
Adani group Plans to invest in li-ion battery manufacturing complex; USD 20 bn allocated for renewable space in next decade
Ahmedabad
Reliance Battery manufacturing complex to be set up. Giga factory to be part of INR 750 bn Investment Jamnagar Tata Chemicals Giga facility. 2 GWH (INR 8bn) in phase-1 & 10GWH (INR 40Bn in phase-2) Dholera C4V 5GWH capacity with investments of INR 40 bn Karnataka Godi Energy 5GWH capacity of cell manufacturing in the next five years Hyderabad Epsilon advanced 1 lakh tonne of synthetic graphite anode Bangalore Greenko energy Plan of setting up gigafactory (5GWH) by investing USD 1 bn Telangana Lucas TVS Initial investment of INR 25 bn; plan of having 10GWH facility in two phases Chennai
Page | 32
India Equity Strategy Alternate battery technologies
Hydrogen fuel cell: Hydrogen fuel cell consists of an anode, a cathode, an electrolyte, and a synthetic membrane. This membrane works as a separator, keeping hydrogen and oxygen separate, and allows passage of only certain ions (H+ or protons). Hydrogen atoms enter the fuel cell at the anode, where they are stripped off of electrons. These electrons flow through the vehicle’s circuit to cathode, generating electricity in the process. The beauty of hydrogen fuel cell is that it generates electricity and takes hydrogen and oxygen as input. Both these elements are abundantly available. The process is pollution free and generates only heat and water as by-products, which are not harmful.
Advantages: Hydrogen used has ten times energy to weigh ratio than lithium ion and, hence, they offer a much greater range, once charged. Also, it is lighter and occupies less space. It can also be recharged in a few minutes.
Disadvantages: Fuel cell input hydrogen is produced by electrolysis of water by using electricity. It breaks water into hydrogen and oxygen. Now, depending upon the source of electricity, this process could be polluting or green. If the input electricity is generated through a thermal process, then the cell is called grey hydrogen cell, and it adds to pollution; however, if the input electricity is generated through renewable means, it is called green hydrogen cell. As most electricity generated in the country is from thermal sources, green hydrogen cell production remains dependent on development of renewable energy ecosystem in India.
Other drawbacks: Storing hydrogen is expensive and energy intensive, sometimes half as much as it produces. Also, it is highly inflammable and tends to escape containment. It is very reactive as well and can break certain metal containers by reacting with it. It can work amicably only in a defined temperature range, so in India where temperature can vary widely across geographies, hydrogen cell can’t be adopted so easily.
Hydrogen fuel cells can be very useful for heavy duty long haul mobility, but their current cost of approx USD 1,200/KWH needs to reduce to critical level of around USD 150/KWH, so the cells could become commercially viable. Long-range buses and trucks can see earlier adoption of fuel cells due to its higher range in spite of higher cost. Adoption by 2W/3W/4W users will take place much later when it is more affordable.
Key Indian companies working in the hydrogen segment for its development are Reliance, Adani, NTPC, IOCL, GAIL, JSW, and L&T.
Sodium ion In this technology, energy is stored through transfer of sodium ions. Several sodium compounds are being experimented as cathodes, while hard carbon has been found useful as anode. It is being researched to overcome sustainability challenges posed by lithium, as sodium, unlike lithium, is available in abundance and is fairly distributed across the world. Based on prototype level findings, these batteries are expected to have a longer life cycle and higher charge/discharge rates but lower energy density will limit its usage to only stationary applications.
Key Indian companies working in this segment include Faradion UK, which has recently been bought by Reliance Industries’ arm.
Solid state battery: To address the lower safety of battery materials at elevated temperatures, significant research is being done by companies on temperature management. One of the main reasons of battery safety risk has been the presence of highly flammable liquid electrolytes. Hence, solid state batteries are being experimented, in which solid state electrolytes could

Page | 33
India Equity Strategy replace liquid electrolytes. Ceramics, glasses, and sulphides are key solid state materials that are being researched. They may increase stability of the battery; however, it faces the difficulty of lower electricity conductivity and, hence, lowers energy density. Also, mass production of solid state batteries is very complex.
Key companies working in this domain are Quantumscape, US, Prologium China and Solid Power US. Other companies involved in R&D are Lucas TVS and C4V, US. C4V intends to make India its manufacturing destination.
ACC battery-PLI scheme highlights
This scheme envisages setting up of 50GWH cumulative ACC manufacturing capacity.
Individual beneficiaries will need to commit to set up minimum 5GWH of ACC manufacturing capacity. Total annual subsidy to be disbursed by the government will be capped at 20 GWH per beneficiary firm.
The beneficiary has to ensure investing INR 2.25bn/GWH and achieving 25% value addition within two years and raising it to 60% value addition within five years. As the battery’s main cost comes from the cell, this required 60% value addition would, in effect, mean building cell manufacturing capacity as well.
Manufacturing capacity needs to be built within two years and subsidy will be disbursed thereafter over a period of five years.
The amount of subsidy will be calculated as per the below formula:
Amount of subsidy = applicable subsidy amount/KWH*sale of ACC (KWH)*domestic value addition (%).
Incentive goes up with energy density, lifecycle, and value addition. Hence, it rewards value addition. It is evident that policy focus is on cell manufacturing and not on assembly. Also, subsidy amount is capped at 20% of ACC sale price (net of GST).
In addition to the abovementioned PLI support, 5GWH of cumulative capacity would be offered to “Niche ACC Technologies” of higher performance with a threshold capacity of 500MWH. This initiative would be technology agnostic as long as expected performance parameters are met.
Total incentive payout is INR 18,100 cr ( INR 181bn) as below:
Budgetary Provision
FY 2022-23 2023-24 2024-25 2025-26 2026-27 2027-28 2028-29 Total
Subsidy (INR Bn)
Setting up of Manufacturing Facilities
27 38 45 43 28 181
Applicants: The below 10 companies had applied under ACC PLI scheme.
Reliance new energy
Hyundai Global Ola Electric Lucas-TVS Mahindra & Amara Raja Exide Rajesh Exports L&T India Power corp

Page | 34
India Equity Strategy
Winners: After considering applications of applicants, following 4 companies have been selected:
Company Capacity allocated Hyundai Global 20 GWH Ola Electric 20 GWH Reliance new energy solar 5 GWH Rajesh Exports 5 GWH
Our opinion: The scheme has rightfully focused on cell manufacturing for higher value addition, however true success will depend on availability of raw material (lithium, cobalt, etc). India is yet to secure its long-term supply of key minerals and raw material. Backward integration with economies of scale will also be needed for extracting maximum benefit of the policy. Also, focused R&D work needs to be done for developing alternative battery technologies at a commercially viable scale. Hence, the current ground level success probability remains low to medium. We need to track execution by PLI beneficiaries periodically.
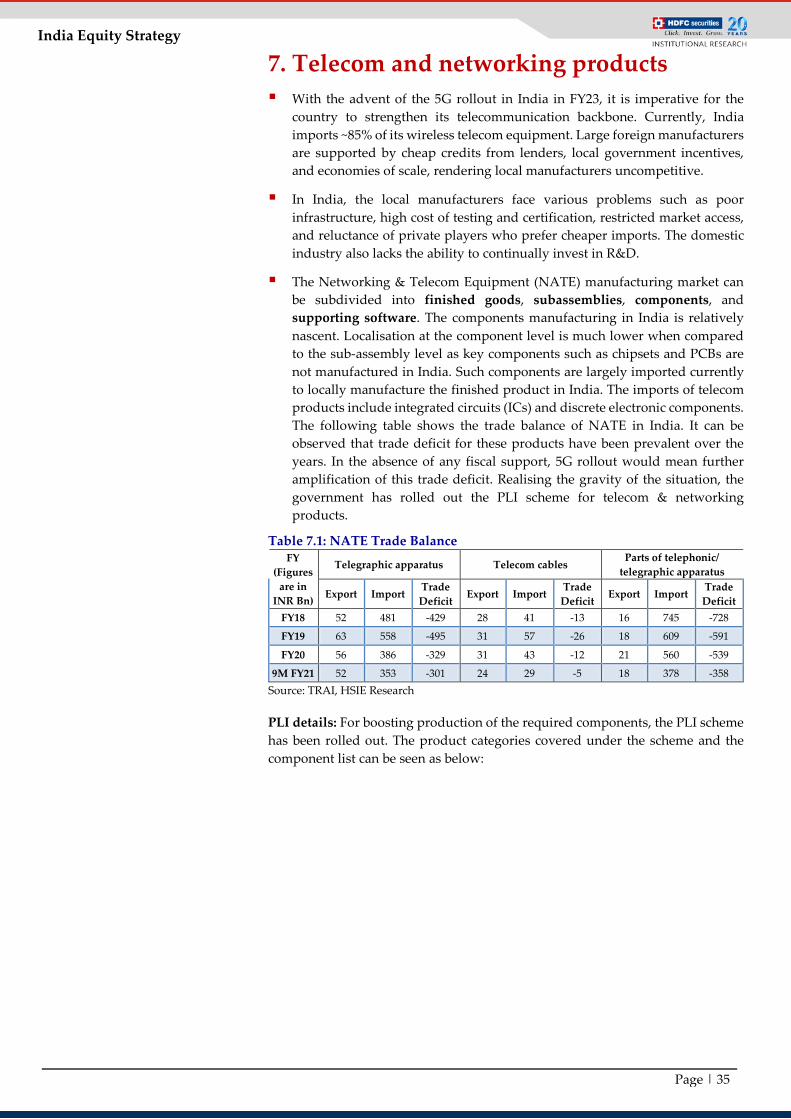
Page | 35
India Equity Strategy 7. Telecom and networking products With the advent of the 5G rollout in India in FY23, it is imperative for the
country to strengthen its telecommunication backbone. Currently, India imports ~85% of its wireless telecom equipment. Large foreign manufacturers are supported by cheap credits from lenders, local government incentives, and economies of scale, rendering local manufacturers uncompetitive.
In India, the local manufacturers face various problems such as poor infrastructure, high cost of testing and certification, restricted market access, and reluctance of private players who prefer cheaper imports. The domestic industry also lacks the ability to continually invest in R&D.
The Networking & Telecom Equipment (NATE) manufacturing market can be subdivided into finished goods, subassemblies, components, and supporting software. The components manufacturing in India is relatively nascent. Localisation at the component level is much lower when compared to the sub-assembly level as key components such as chipsets and PCBs are not manufactured in India. Such components are largely imported currently to locally manufacture the finished product in India. The imports of telecom products include integrated circuits (ICs) and discrete electronic components. The following table shows the trade balance of NATE in India. It can be observed that trade deficit for these products have been prevalent over the years. In the absence of any fiscal support, 5G rollout would mean further amplification of this trade deficit. Realising the gravity of the situation, the government has rolled out the PLI scheme for telecom & networking products.
Table 7.1: NATE Trade Balance FY
(Figures are in
INR Bn)
Telegraphic apparatus Telecom cables Parts of telephonic/ telegraphic apparatus
Export Import Trade Deficit Export Import Trade
Deficit Export Import Trade Deficit
FY18 52 481 -429 28 41 -13 16 745 -728
FY19 63 558 -495 31 57 -26 18 609 -591
FY20 56 386 -329 31 43 -12 21 560 -539
9M FY21 52 353 -301 24 29 -5 18 378 -358 Source: TRAI, HSIE Research PLI details: For boosting production of the required components, the PLI scheme has been rolled out. The product categories covered under the scheme and the component list can be seen as below:

Page | 36
India Equity Strategy Goods covered under telecom PLI scheme
The table below reflects the eligibility threshold criteria of investments, incremental sales, and corresponding incentives. This also explains how beneficial this scheme is for applicable companies.
It can be noticed that for a total committed investment of “X” over the scheme period of four years, cumulative maximum eligible incentives earned could be as high as 3.48X for MSMEs and 3.22X for non-MSMEs. The minimum threshold value of this “X” is INR 100mn in case of MSMEs and INR 1bn for non-MSMEs.
Hence, the economics of this theme is very lucrative for applicant companies as it promises recovery of their capital as well as additional profits, if they are able to deliver on the sales front, as required by the scheme guidelines. Also, the planned outlay of INR 121.9bn by the government for a combined committed investment of INR 33.5bn shows that, with adequate production, companies can easily recover their cost of investment over the tenure of the scheme.
Eligibility threshold criteria (INR bn)
Year Incentive rate on incremental sales
Cumulative investment
Minimum Incremental sales
over the base year (FY20)
Maximum eligible sales over the base year (FY20)
Max eligible incentive
MSMEs- Minimum Threshold of Investment INR 100 mn FY22 7% >= 20% of X 60% of X 4*X 0.28X FY23 7% >=40% of X 120% of X 8*X 0.56X FY24 6% >=70% of X 210% of X 14*X 0.84X FY25 5% >= X 3*X 20*X X FY26 4% 3*X 20*X 0.8X
Total-3.48X Other than MSMEs- Minimum Threshold of Investment INR 1 bn
FY22 6% >=20% of X 60% of X 4*X 0.24X FY23 6% >=40% of X 120% of X 8*X 0.48X FY24 5% >=70% of X 210% of X 14*X 0.7X FY25 5% >=X 3*X 20*X X FY26 4% 3*X 20*X 0.8X
Total-3.22X Where X = Committed Total Investment by the Company over FY22-FY25

Page | 37
India Equity Strategy The approved companies under various categories are:
Global non-MSME: Commscope India Pvt Ltd, Flextronics, Technologies (India) Pvt Ltd, Foxconn Technology (India) Pvt Ltd, Jabil Circuit India Pvt Ltd, Nokia Solutions and Networks India Pvt Ltd, Rising Stars Hi-Tech Pvt Ltd, Sanmina-SCI India Pvt Ltd.
Domestic non-MSME: Akashastha Technologies Pvt Ltd, Dixon Electro Appliances Pvt Ltd, HFCL Technologies Pvt Ltd, ITI Ltd, Neolync Tele Communications Pvt Ltd, Syrma Technology Pvt Ltd, Tejas Networks Ltd, and VVDN Technologies Pvt Ltd.
MSME: Coral Telecom Ltd, Ehoome IoT Pvt Ltd, Elcom Innovations Pvt Ltd, Frog Cellsat Ltd, GDN Enterprises Pvt Ltd, GX India Pvt Ltd, Lekha Wireless Solutions Pvt Ltd, Panache Digilife Ltd, Priyaraj Electronics Ltd, Sixth Energy Technologies Pvt Ltd, Skyquad Electronics and Appliances Pvt Ltd, STL Networks Ltd, Surbhi Satcom Pvt Ltd, Synegra Ems Ltd, Systrome Technologies Pvt Ltd, Tianyin Worldtech India Pvt Ltd.
Domestic telecom equipment manufacturers currently have a ~10-15% cost disability compared to international peers. With most equipment having an import duty of up to 20%, coupled with the PLI incentives, the government intends to address the discrepancy in production cost. In terms of the minutiae of the scheme, it heavily incentivises application and production for NATE manufacturers.
As of Feb 2022, the telecom PLI sales have amounted to INR 82.4bn, with ~87% coming from global companies and ~13% coming from domestic MSME and non-MSME companies. The total on-the-ground investment done so far has been INR 3.3bn, with ~53% by global companies and the remainder by domestic companies.
Our opinion: The large number of applications and the rapid start of production is testament to how well the scheme has been structured. The incentives are large enough for most companies, including MSMEs, to recoup their total investment costs. From the government’s perspective, the domestic manufacturing of NATEs helps reduce the total cost of the pan-India 5G rollout, which has been estimated to be around USD 25-30 bn. We remain optimistic about the execution of the scheme.

Page | 38
India Equity Strategy 8. High efficiency solar PV modules According to the Central Electricity Authority (CEA), India’s overall power
requirement will be 817GW by 2030. Considering that half of this could come from green sources, the government has set ambitious targets of 175 GW of renewable energy capacity by 2022 and 450 GW by 2030. Hence, as per the optimum energy mix projections, solar capacity should touch 280 GW by 2030. To meet this target, 25 GW of solar capacity needs to be installed every year. The current installed capacity of solar is approx 50GW.
Solar capacity addition presently depends largely on imported solar PV cells and modules as domestic industry has extremely limited annual capacities of around 2.5GW for solar PV cells and 10GW for solar PV modules. Current utilisation of modules is around 30% as Chinese imports are 15-20% cheaper. Furthermore, there is no domestic capacity of other raw materials - polysilicon, ingots, and wafers.
To promote domestic manufacturing and compete with cheap Chinese imports, the government has imposed 40% custom duty on solar panel and 25% duty on solar cell imports with effect from 1 Apr 2022. This is expected to bridge the gap between costs of domestic and imported solar PV modules.
Manufacturing value chain of solar PV modules can be observed as below:
Image 8.1: Solar PV module manufacturing process
Source: National Renewable Energy Laboratory
Polysilicon->Silicon Ingots->Silicon Wafers->Solar cells-> PV modules
Manufacturing of polysilicon: Polysilicon is produced from metallurgical grade silicon by a chemical purification process, called the Siemens process. It involves distillation of silicon compounds at high temperatures (~2,000 degree Celsius).
Silicon ingot: It is made from molten polysilicon with desired crystal structure by seeding with crystal silicon rod and adding required impurities in the process.
Wafers: Wafers are formed by slicing a cooled and purified ingot into thin discs with the use of diamond edged saws (purity: 99.9999% i.e. 5 nines).
Solar cells: these are formed by doping silicon wafers with phosphorus and boron for imparting desired electrical properties and creating the positive-negative (p-n) junction.

Page | 39
India Equity Strategy Solar modules: Solar cells are soldered together to form a solar module.
Usually, 60 or 72 cells are used. Other key components are a backseat for protecting bottom of cell, a glass front for allowing light to fall on cells and protecting, a metal frame to combine all layers, and a junction box to safeguard electrical wires of module. Final module is tested for efficacy.
Other materials required: Other material required in manufacturing are phosphorus, boron, aluminium panel, copper wire for stringing cell, silver, ethyl vinyl acetate (EVA) for waterproof lamination and glasses for panel making.
Set-up cost (per GW): The set-up cost for overall manufacturing is approximately INR 34bn/GW. This may vary slightly in specific cases, depending on the scale of CAPEX. It can be noticed that it becomes more CAPEX heavy as we move backwards in the value chain. CAPEX for early steps i.e. setting up of polysilicon & wafer capacity will require approximately INR 25bn/GW; however, as we proceed in the value chain, processes become less Capex heavy. Wafer to cell conversion line requires 6bn/GW and cell to module conversion line needs INR 2.5bn/GW. Hence, many smaller players are found in the wafer to cell and cell to module segments, which are easier and cheaper to set up. However, for making final solar module cost competitive, one needs to be present across the value chain and be completely backward integrated. The same hypothesis has been validated in the selection of PLI candidates, where we see applicants for fully integrated facilities have been selected. The PLI scheme has stayed away from various smaller bidders who wanted to set up standalone wafer to cell or cell to module capacities, as it is believed that it would be tough for them to build efficient businesses.
High efficiency solar PV modules - PLI scheme highlights
The overall outlay of INR 240bn for manufacturing 54.5 GW of solar equipment. So far, in the first round, 10GW capacity has been allocated with an outlay of INR 45bn. The ministry has invited fresh applications for the second round (an outlay of INR 195bn). The entire scheme will attract investments of INR 900bn from participants for integrated facilities and add 160,000 jobs.
Under the scheme, the stipulated time for commissioning is as below:
For fully integrated facility, producing polysilicon to ingots, wafer, cells and module: within three years of sanction.
Manufacturing facilities with imported polysilicon and producing ingots, cells and modules: within two years of sanction.
Manufacturing facilities with imported wafers and producing cells and modules: within 1.5 years of sanction.
Selected companies: In the first round, the following companies are selected (all for integrated capacities):
Reliance New Energy Solar
Shirdi Sai Electricals
Adani Infrastructure Pvt Ltd
Page | 40
India Equity Strategy
Minimum module performance: In order to qualify for incentives, beneficiaries have to fulfil performance parameters as detailed below:
Minimum module efficiency of 19.5% with temperature coefficient of Pmax* better than -0.3% per degree Celsius
or
Minimum module efficiency of 20.0%with temperature co-efficient of Pmax equal to or better than -0.4% per degree Celsius
*Where temperature coefficient Pmax tells us how much power (compared to rated power) solar panel loses for every degree Celsius that the panel is hotter than 25 degrees (standard test temperature of cell). Hence, for example, a module with Pmax of -0.3% will lose 1.5% of rated power at 30 degree Celsius.
The PLI incentive amount will be decided, based upon the formula below:
Eligible PLI amount=A*B*C*D where, A=sales volume (wp)
B=base PLI rate ranging from INR 2.25/wp to INR 3.75/wp based on module performance
C=tapering factor (1.4,1.2,1,0.8,0.6 for 1st,2nd, 3rd, 4th and 5th year respectively)
D= domestic value addition (as %)
Our opinion: As Chinese supply of cells and modules is much cheaper than the domestic products, current utilisation of existing domestic capacity of modules is <25%. It indicates that the scheme beneficiaries will have to face Chinese competition once they start producing and selling in domestic markets. Also, it is not very tough to observe that complete backward integration holds the key to affordable production. Hence, only large fully-integrated players will have economy of scale to thwart competition. Given the expected steep demand growth and large business houses in the winners list, this appears feasible in the medium to long term but custom duty would be necessary in the short term.

Page | 41
India Equity Strategy 9. Active pharmaceuticals ingredients (API) The API PLI scheme set forward by the Department of Pharmaceuticals aims
to primarily support the domestic production of essential medicines that are currently being imported in India. On an average, 40-45% of the demand for most APIs covered by the PLI scheme is currently being met by Chinese imports. A large majority of the APIs have been commoditised as the final formulations have been off-patent for a while, making it commercially unviable for pharmaceutical companies to endeavor with the production.
Indian antibiotic formulators rely heavily on Chinese imports for their API requirements. The below chart reflects the growing trade deficit over the years. As witnessed during the first COVID wave in early 2020, any disruption in the Chinese supply chain could mean a shortage of essential life saving medications in India. Furthermore, the commoditisation of antibiotics such as Penicillin has led to companies making wafer-thin profit margins and, hence, simply stopping production, given the business risk.
Antibiotics API trade balance (USD Bn)
*FY22 (Apr – Jan) Source: Ministry of Commerce & Industry, HSIE Research
PLI scheme for active pharma ingredients
The focus of the PLI scheme has, therefore, been to address the above-mentioned shortcomings in the antibiotic segment. Of the total INR69.4bn government outlay, INR 46.0bn has been allotted to fermentation-based KSMs and APIs and INR40.0bn in the fermentation segment is for antibiotic APIs. Hence, two-thirds of the API PLI scheme is dedicated to fermentation-based products, a segment where China has gained significant dominance in two decades, representing 70% of global production.
The below table depicts key approved products and applicants under PLI:
Key products and approved applicants
Applicant Eligible product Committed
investment (INR bn)
Max incentive to be won in 6 years (INR bn)
Aurobindo Pharma Penicilin G 13.92 12.0 Aurobindo Pharma Erythromycin
8.34 3.0
Aurobindo Pharma 7-ACA 8.13 6.0 Kinvan Pvt Ltd Clavulanic Acid 4.47 3.0 Karnataka antibiotics 7-ACA 2.75 6.0 Macleods Pharma Rifampicin 1.98 0.50 Sadhana Nitrochem Para amino phenol 1.97 0.60
Others 12.75 Total 54.31
0.9 0.8 0.8 0.8 0.9 0.8 0.90.6
1.0 1.0 1.0 1.21.5 1.3 1.5 1.4
-0.2 -0.2 -0.2 -0.3-0.6 -0.5 -0.5
-0.8FY15 FY16 FY17 FY18 FY19 FY20 FY21 FY22*
Export Import Trade Balance

Page | 42
India Equity Strategy PLI incentives are reflected in the charts below. It can be seen fermentation-
based products have received priority.
Maximum Government Incentive per Target Segment (INR bn)
Rate of incentive over base year (FY20)
As shown in one of the charts above, penicillin is easily the largest API on the list, and rightfully so. Of the estimated INR160bn domestic antibiotics formulation market, penicillin derivatives such as amoxicillin, piperacillin, and tazobactam account for ~25% of the demand. Penicillin G is a key antibiotic used to treat diseases such as rheumatic heart disease (RHD); India accounts for 40% of the total number of people in the world with RHD. India is a net importer of Penicillin, having had a trade deficit of USD 198mn in FY21.
India boasted of six manufacturers of Penicillin G in 1997. However, as Chinese companies achieved massive economies of scale as a result of government subsidies in the 1980s, import dumping became a common malpractice. The low prices and commoditisation of the drug due to continuous innovation in antibiotics led to further lowering of prices by the Chinese companies over the years as other companies continued to shut operations. The thin margins and the low selling prices simply made it commercially unviable for Indian pharmaceutical companies to manufacture the drug. Even few manufacturers from the US went out of business due to the same reason. As China is the dominant player in this segment, so it is using its bargaining power and pushing up prices of APIs to take advantage of its monopoly. In the process, all consumer countries including India are suffering. So, in a way, it can be said all consumer countries of these APIs are becoming victims of China’s well-executed long-term business strategy of creating a monopoly.
0
2
4
6
8
10
FY21 FY22 FY23 FY24 FY25 FY26 FY27 FY28 FY29
Fermentation based Chemical synthesis based
Capex phase
0%
5%
10%
15%
20%
25%
FY23 FY24 FY25 FY26 FY27 FY28 FY29
Fermentation based Chemical synthesis based
36.0
10.0
9.6
13.8
Total Government Outlay (INR bn)
Fermentation basedAPIs & KSMs
Fermentation basedniche APIs & KSMs
Chemical synthesisbased APIs & KSMs
Chemical synthesisbased niche APIs &KSMs
Penicillin G, 24.7%
Others, 75.3%
Penicillin's share in total PLI committed investment

Page | 43
India Equity Strategy
Currently, there are five major companies globally that produce the active pharmaceutical ingredient for benzathine penicillin G. Four of the five are located in China: Semisyntech, Sinopharm, CSPC Pharma Group and Jiangxi Dongfeng. The fifth company is Austria-based Sandoz GmbH.
Aurobindo Pharma is the lone approved PLI applicant to manufacture Penicillin G. The scale that the company can achieve, coupled with its indigenous 6-APA manufacturing process, makes it the best candidate to help improve the present situation in the market. The company has announced a revised Capex amount of INR 19bn for the PLI Penicillin G project and is expected to start commercialisation in H2FY24.
Image 9.1: Bioreactors
Source: Cotter Brothers Corporation
The PLI incentives are expected to improve the economics for greenfield projects but the expected shortfall in the committed incentive outlay utilisation might suggest insufficiency in some aspects of the scheme. Of the INR 69bn total government outlay for the PLI scheme, currently ~85% is expected to be utilised. There are certain bottlenecks in the supply chain that can get in the way of the scheme’s ability to maximise gross value addition. For example, India is severely lacking in fermentation appliances such as bioreactors (as shown in the image above); the estimated trade deficit for fermentation equipment was USD 730 mn in FY21 (HS Code: 84798999).
Our opinion: With Aurobindo’s committed investment accounting for ~56% of the committed investment, there is certainly a high level of concentration risk. The government needs to spread its outlay more evenly across applicants, and possibly add some APIs that are more commercially viable to manufacture, thereby attracting more committed investment. Also, incentives for key capital goods such as bioreactors would help the country reduce its import dependence and help approved applicants reduce their total project costs.
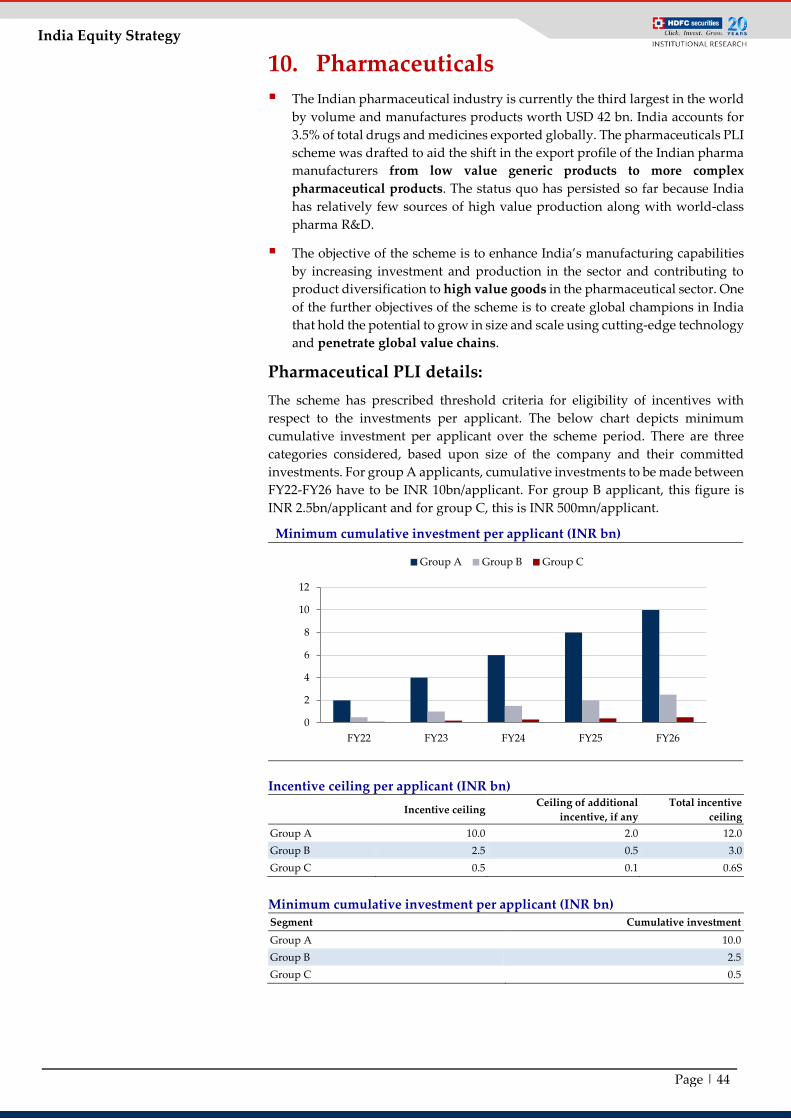
Page | 44
India Equity Strategy 10. Pharmaceuticals
The Indian pharmaceutical industry is currently the third largest in the world by volume and manufactures products worth USD 42 bn. India accounts for 3.5% of total drugs and medicines exported globally. The pharmaceuticals PLI scheme was drafted to aid the shift in the export profile of the Indian pharma manufacturers from low value generic products to more complex pharmaceutical products. The status quo has persisted so far because India has relatively few sources of high value production along with world-class pharma R&D.
The objective of the scheme is to enhance India’s manufacturing capabilities by increasing investment and production in the sector and contributing to product diversification to high value goods in the pharmaceutical sector. One of the further objectives of the scheme is to create global champions in India that hold the potential to grow in size and scale using cutting-edge technology and penetrate global value chains.
Pharmaceutical PLI details: The scheme has prescribed threshold criteria for eligibility of incentives with respect to the investments per applicant. The below chart depicts minimum cumulative investment per applicant over the scheme period. There are three categories considered, based upon size of the company and their committed investments. For group A applicants, cumulative investments to be made between FY22-FY26 have to be INR 10bn/applicant. For group B applicant, this figure is INR 2.5bn/applicant and for group C, this is INR 500mn/applicant.
Minimum cumulative investment per applicant (INR bn)
Incentive ceiling per applicant (INR bn)
Incentive ceiling Ceiling of additional incentive, if any
Total incentive ceiling
Group A 10.0 2.0 12.0 Group B 2.5 0.5 3.0 Group C 0.5 0.1 0.6S
Minimum cumulative investment per applicant (INR bn) Segment Cumulative investment Group A 10.0 Group B 2.5 Group C 0.5
0
2
4
6
8
10
12
FY22 FY23 FY24 FY25 FY26
Group A Group B Group C

Page | 45
India Equity Strategy The scheme is structured in such a way that the incentive ceiling for an
applicant is equal to minimum cumulative investment for them. If the remainder of the companies are unable to meet their threshold requirements, then companies can get an additional incentive to the tune of 20%. Hence, the absolute best case scenario for companies is earning incentives worth 1.2x the total cumulative investment.
In most cases, given the complexity of the projects, the cumulative investment would likely exceed the respective minimum threshold investment amount, reducing the incentives as a percentage of total project cost. Essentially, the success of individual companies will depend on their operational capabilities to make the PLI projects commercially viable. Considering that the manufacturing of complex pharmaceuticals is R&D heavy, the onus is on individual applicants to make the projects feasible for themselves.
Product categories: following product categories have been considered in the scheme.
Category 1: Bio pharma, complex generics, patented drugs, special empty capsules
Category 2: API/key starting material other than covered under the API PLI
Category 3: Auto immune drugs, anti-cancer, anti-diabetic, anti-infective, cardiovascular, anti-retroviral
Rate of incentive over base year (FY20): The below chart explains applicable incentive rates for various categories of products. It can be observed that incentives are higher for the first two categories. Hence, selected candidates can choose the product categories, based upon their expertise and targeted incentives.
0%
2%
4%
6%
8%
10%
12%
FY23 FY24 FY25 FY26 FY27 FY28
Incentive Rate (Category-1 & 2) Incentive Rate (Category-3)

Page | 46
India Equity Strategy Key approved applicants: The following companies have been approved under various groups.
Group A (11 approvals): Sun Pharma, Aurobindo Pharma, Dr. Reddy’s, Lupin, Mylan, Cadila, Cipla, Amneal Pharma, Glenmark Pharma, Intas Pharma, Torrent Pharma.
Group B (9 approvals): Biocon, MSN Ltd, Wockhardt, Alembic Pharma, Emcure Pharma, Macleods Pharma, Biological E Limited, Natco Pharma.
Group C (35 approvals): Vindhya Pharma (India) Pvt Ltd, Aarti Industries Ltd, SymbiotecPharmalab Pvt Ltd, Transasia Bio-Medicals Ltd, Sai Life Sciences Ltd, Poly Medicure Ltd, Concord Biotech Ltd, Amoli Organics Pvt Ltd, BDR Pharmaceuticals International Pvt Ltd, Malladi Drugs & Pharmaceuticals Ltd, Symed Labs Ltd, BalPharma Ltd, Acme Formulation Private Ltd, Panacea Biotec Ltd, Abhilash Life Sciences LLP.
The government has outlined a total outlay of INR 150bn for the scheme, with an estimated total investment of INR 180bn and total cumulative estimated incremental sales of INR 1,800bn.
Our opinion: So far, there is little clarity on the individual products needed to be manufactured and individual investment commitments. In the optimistic scenario, the total incentives on offer are adequate to cover the investments during the scheme’s tenure. Hence, the success of the scheme depends on R&D capabilities of individual companies to make their respective PLI projects feasible. As incentives on offer are adequate, the scheme should see appreciable execution.

Page | 47
India Equity Strategy 11. Medical devices The domestic medical devices industry is estimated to be valued at ~USD 10
bn. ~65 percent of the manufacturers in India are domestic players operating in the consumables segment and catering to local consumption with limited exports. On the other hand, MNCs lead the high-technology end of the medical devices market with extensive service networks.
There are 750-800 domestic medical devices manufacturers in India, with average turnover in the range of USD 6-7mn. India’s import dependency for medical devices is extremely high; based on different estimates, the import dependency range is from 60-85%. The following graph shows the medical devices trade balance over the years. It can be noticed that trade deficit has been persistent over the years due to structural problems faced by domestic manufacturers.
Chart 11.1: Medical devices trade balance
Source: Ministry of Commerce & Industry, HSIE Research
It has been estimated that the domestic medical device sector suffers from a cost of manufacturing disability of 12-15 per cent as compared to manufacturers from competing economies on account of lack of adequate infrastructure, domestic supply chain and logistics, high cost of finance, inadequate availability of quality power, limited design capabilities, and low focus on R&D and skill development.
While domestic manufacturing is limited to surgical, cardiac stents and general medical devices and consumables, electronics and equipment constitute a considerable percentage of imports, thereby necessitating particular attention towards this medical device segment. So, incentivising domestic manufacturing is one critical step towards addressing these issues. The following charts show the estimated breakdown of India’s medical devices exports and imports in FY20:
Chart 11.2: Medical Devices exports & imports breakdown
Source: EEPC India, HSIE Research
1.7 2.1 2.3 2.64.6
5.7 5.8 6.2
-2.9 -3.6 -3.6 -3.6
FY18 FY19 FY20 FY21
Medical devices balance of trade (USD bn)
Export Import Trade Balance
62%3%
19%
9%7%
ImportsElectronic Equipment
Surgical Instruments
Consumables &DisposablesIVD Reagent
Implants
44%
2%
47%
3% 4%
Exports
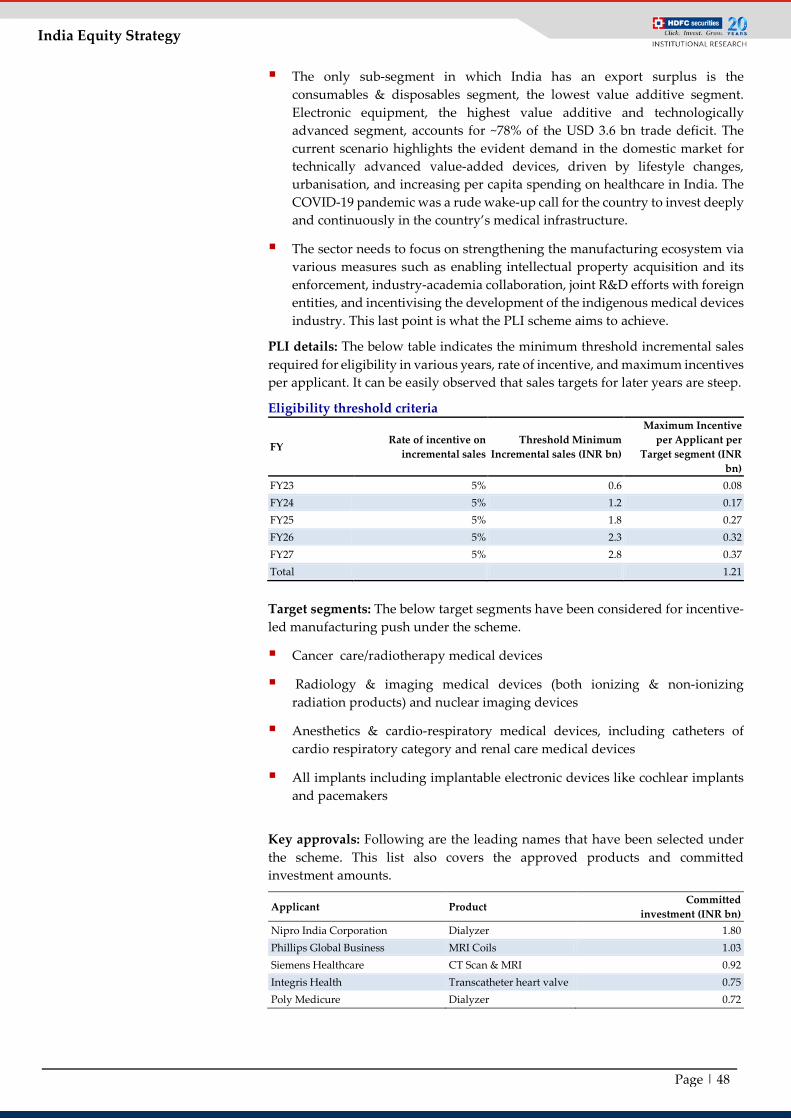
Page | 48
India Equity Strategy The only sub-segment in which India has an export surplus is the
consumables & disposables segment, the lowest value additive segment. Electronic equipment, the highest value additive and technologically advanced segment, accounts for ~78% of the USD 3.6 bn trade deficit. The current scenario highlights the evident demand in the domestic market for technically advanced value-added devices, driven by lifestyle changes, urbanisation, and increasing per capita spending on healthcare in India. The COVID-19 pandemic was a rude wake-up call for the country to invest deeply and continuously in the country’s medical infrastructure.
The sector needs to focus on strengthening the manufacturing ecosystem via various measures such as enabling intellectual property acquisition and its enforcement, industry-academia collaboration, joint R&D efforts with foreign entities, and incentivising the development of the indigenous medical devices industry. This last point is what the PLI scheme aims to achieve.
PLI details: The below table indicates the minimum threshold incremental sales required for eligibility in various years, rate of incentive, and maximum incentives per applicant. It can be easily observed that sales targets for later years are steep.
Eligibility threshold criteria
FY Rate of incentive on incremental sales
Threshold Minimum Incremental sales (INR bn)
Maximum Incentive per Applicant per
Target segment (INR bn)
FY23 5% 0.6 0.08 FY24 5% 1.2 0.17 FY25 5% 1.8 0.27 FY26 5% 2.3 0.32 FY27 5% 2.8 0.37 Total 1.21
Target segments: The below target segments have been considered for incentive-led manufacturing push under the scheme.
Cancer care/radiotherapy medical devices
Radiology & imaging medical devices (both ionizing & non-ionizing radiation products) and nuclear imaging devices
Anesthetics & cardio-respiratory medical devices, including catheters of cardio respiratory category and renal care medical devices
All implants including implantable electronic devices like cochlear implants and pacemakers
Key approvals: Following are the leading names that have been selected under the scheme. This list also covers the approved products and committed investment amounts.
Applicant Product Committed investment (INR bn)
Nipro India Corporation Dialyzer 1.80 Phillips Global Business MRI Coils 1.03 Siemens Healthcare CT Scan & MRI 0.92 Integris Health Transcatheter heart valve 0.75 Poly Medicure Dialyzer 0.72

Page | 49
India Equity Strategy With such an incredible need for local manufacturing and well laid-out PLI
scheme, one would imagine that domestic medical manufacturers would be chomping at the bits to get approvals. However, only 22 applicants have received approvals, out of a maximum limit of 28, with a total investment commitment of INR 10bn. According to the Association of Indian Medical Device Industry, which represents the interest of 1,200 manufacturers, nearly 95 per cent of its members happen to be MSMEs, for whom the minimum incremental sales under the eligibility threshold criteria are too high. For example, Nipro India, which has been selected under the scheme, has the highest committed investment under the scheme of INR 1.8bn but the company’s FY20 topline was only INR 3.6bn. Achieving the higher required incremental sales in various years is a tall task for most medical device manufacturers. Also, committing this relatively larger investment is not a very smooth endeavour for MSMEs.
Our opinion: We expect the medical devices PLI scheme to face challenges on the account of low incentives and high incremental sales requirements. Achieving the high incremental sales required for various years under the scheme is a tall task for most domestic medical manufacturers (which are mostly MSMEs). Furthermore, by its very nature, the industry is very capital intensive, and most companies need to raise substantial debt to finance their CAPEX, leading to leveraged balance sheets. Many of these companies would be reluctant to leverage significantly for setting up greenfield capacities, given the smaller size of their balance sheets.
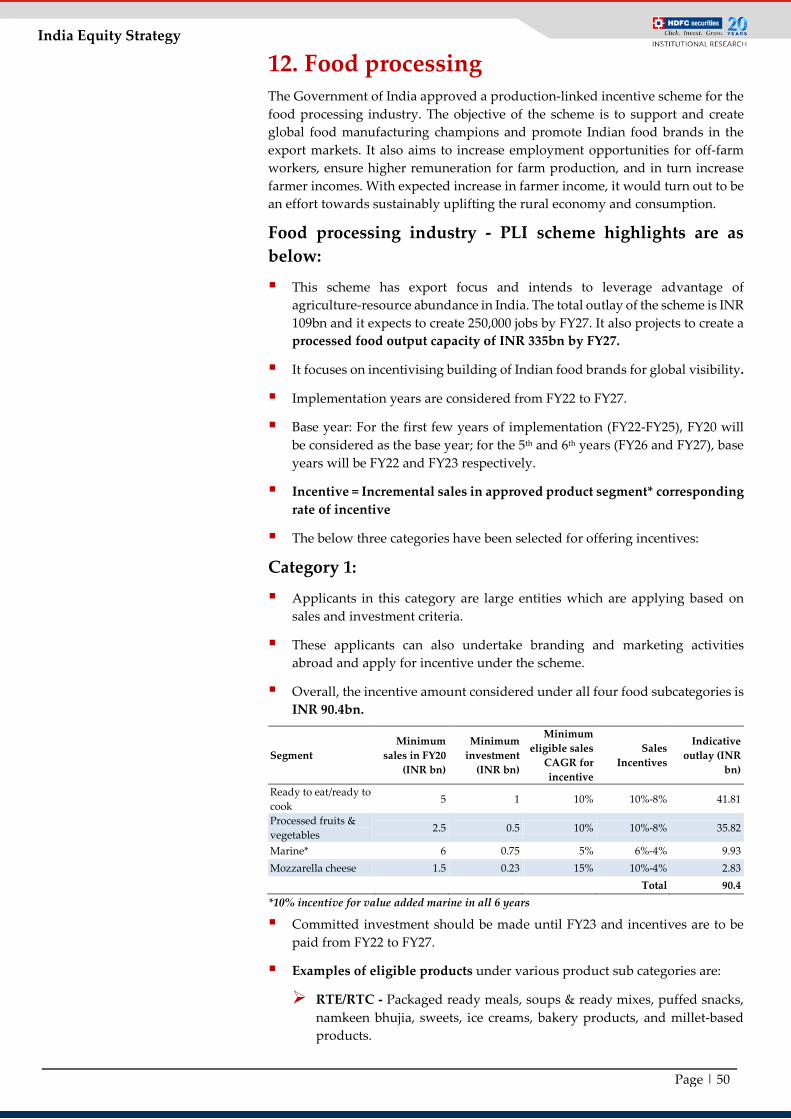
Page | 50
India Equity Strategy 12. Food processing The Government of India approved a production-linked incentive scheme for the food processing industry. The objective of the scheme is to support and create global food manufacturing champions and promote Indian food brands in the export markets. It also aims to increase employment opportunities for off-farm workers, ensure higher remuneration for farm production, and in turn increase farmer incomes. With expected increase in farmer income, it would turn out to be an effort towards sustainably uplifting the rural economy and consumption.
Food processing industry - PLI scheme highlights are as below:
This scheme has export focus and intends to leverage advantage of agriculture-resource abundance in India. The total outlay of the scheme is INR 109bn and it expects to create 250,000 jobs by FY27. It also projects to create a processed food output capacity of INR 335bn by FY27.
It focuses on incentivising building of Indian food brands for global visibility.
Implementation years are considered from FY22 to FY27.
Base year: For the first few years of implementation (FY22-FY25), FY20 will be considered as the base year; for the 5th and 6th years (FY26 and FY27), base years will be FY22 and FY23 respectively.
Incentive = Incremental sales in approved product segment* corresponding rate of incentive
The below three categories have been selected for offering incentives:
Category 1:
Applicants in this category are large entities which are applying based on sales and investment criteria.
These applicants can also undertake branding and marketing activities abroad and apply for incentive under the scheme.
Overall, the incentive amount considered under all four food subcategories is INR 90.4bn.
Segment Minimum
sales in FY20 (INR bn)
Minimum investment
(INR bn)
Minimum eligible sales
CAGR for incentive
Sales Incentives
Indicative outlay (INR
bn)
Ready to eat/ready to cook
5 1 10% 10%-8% 41.81
Processed fruits & vegetables
2.5 0.5 10% 10%-8% 35.82
Marine* 6 0.75 5% 6%-4% 9.93 Mozzarella cheese 1.5 0.23 15% 10%-4% 2.83 Total 90.4 *10% incentive for value added marine in all 6 years
Committed investment should be made until FY23 and incentives are to be paid from FY22 to FY27.
Examples of eligible products under various product sub categories are:
RTE/RTC - Packaged ready meals, soups & ready mixes, puffed snacks, namkeen bhujia, sweets, ice creams, bakery products, and millet-based products.
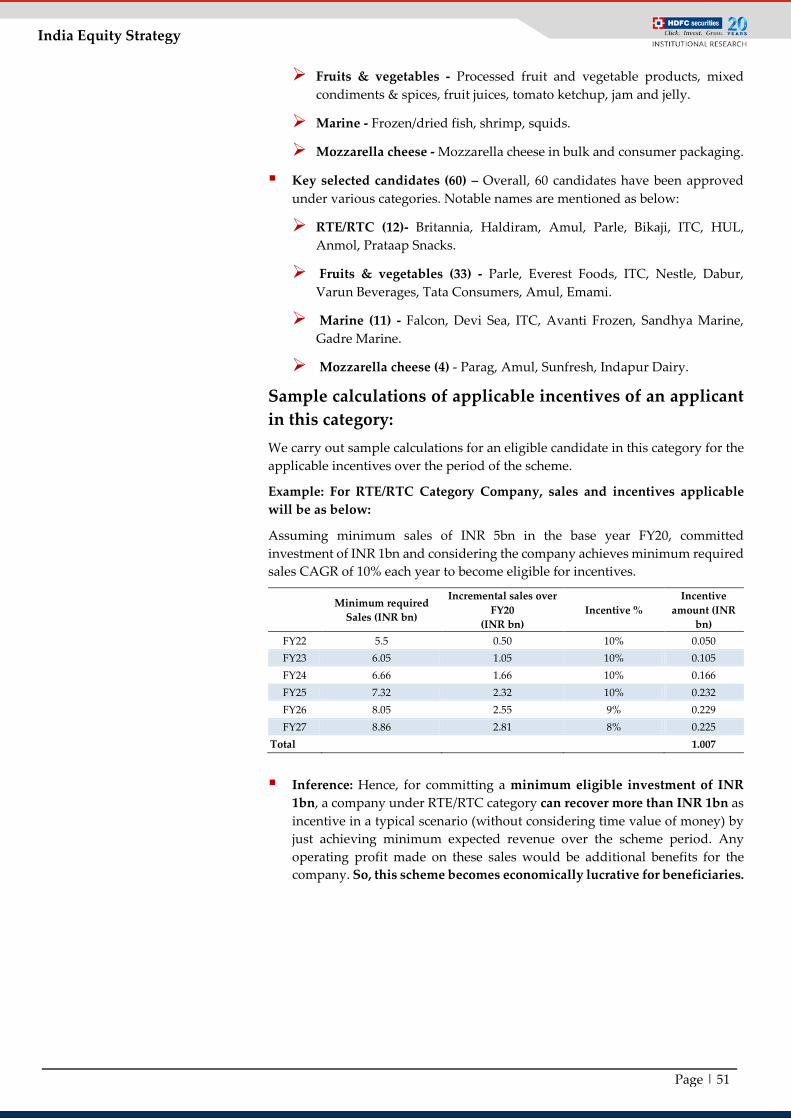
Page | 51
India Equity Strategy
Fruits & vegetables - Processed fruit and vegetable products, mixed condiments & spices, fruit juices, tomato ketchup, jam and jelly.
Marine - Frozen/dried fish, shrimp, squids.
Mozzarella cheese - Mozzarella cheese in bulk and consumer packaging.
Key selected candidates (60) – Overall, 60 candidates have been approved under various categories. Notable names are mentioned as below:
RTE/RTC (12)- Britannia, Haldiram, Amul, Parle, Bikaji, ITC, HUL, Anmol, Prataap Snacks.
Fruits & vegetables (33) - Parle, Everest Foods, ITC, Nestle, Dabur, Varun Beverages, Tata Consumers, Amul, Emami.
Marine (11) - Falcon, Devi Sea, ITC, Avanti Frozen, Sandhya Marine, Gadre Marine.
Mozzarella cheese (4) - Parag, Amul, Sunfresh, Indapur Dairy.
Sample calculations of applicable incentives of an applicant in this category: We carry out sample calculations for an eligible candidate in this category for the applicable incentives over the period of the scheme.
Example: For RTE/RTC Category Company, sales and incentives applicable will be as below:
Assuming minimum sales of INR 5bn in the base year FY20, committed investment of INR 1bn and considering the company achieves minimum required sales CAGR of 10% each year to become eligible for incentives.
Minimum required Sales (INR bn)
Incremental sales over FY20
(INR bn) Incentive %
Incentive amount (INR
bn) FY22 5.5 0.50 10% 0.050 FY23 6.05 1.05 10% 0.105 FY24 6.66 1.66 10% 0.166 FY25 7.32 2.32 10% 0.232 FY26 8.05 2.55 9% 0.229 FY27 8.86 2.81 8% 0.225
Total 1.007
Inference: Hence, for committing a minimum eligible investment of INR
1bn, a company under RTE/RTC category can recover more than INR 1bn as incentive in a typical scenario (without considering time value of money) by just achieving minimum expected revenue over the scheme period. Any operating profit made on these sales would be additional benefits for the company. So, this scheme becomes economically lucrative for beneficiaries.

Page | 52
India Equity Strategy Category 2:
This category includes SMEs manufacturing innovative and organic products, and they will be given incentives based on incremental sales over the base year.
Selection is done based on nature of products, stage of products, and market development.
Eligibility:
The applicant company should have achieved minimum sales of INR 10mn during FY20 for each of the innovative/organic products proposed to be incentivised.
Applicant for organic product shall be registered with agriculture and processed food product export development authority (APEDA).
Total outlay - INR 2.5bn; products covered are free range eggs, poultry meat, and egg products.
Key selected candidates: Totally, 12 candidates have been selected.
Innovative products (2) - Akay Natural, and Drums Food.
Organic products (10) - Organic India, Shanti Agro, Phalada Agro, Parvata Foods, and Minocha.
Category 3: Branding and marketing expenditure
This category offers incentives worth INR 15bn for promoting only Indian brands abroad for developing its market.
It entails financial incentives of 50% on branding & marketing expenditures carried out abroad for Indian brands. Further, it offers a maximum grant of 3% of sales of food products or INR 500mn per year, whichever is less.
Eligibility:
Only Indian brands are covered for selling food products completely manufactured in India.
Branding and marketing shall be undertaken either by applicant or its subsidiary or any agency.
Key selected candidates (71) - There are 71 companies selected under this category. Names of a few such leading companies are Amul, Tata Consumer, Zydus, Vadilal, Desai Foods, ADF Foods, Rasna, KRBL, LT foods, ITC, Marico, Haldiram, Almond House, National Foods, Hatsun, Parag, Haldiram, Everest, and Parle.
Raw materials and supply chain:
Key raw material includes wheat, sugar, curd, cheese, fish, milk and other agriculture products that are available in abundance domestically.
Our opinion: The incentives offered compared to investments are lucrative enough to attract various food processing players. However the quantum of incentives or incremental sales will not be significant enough for large players like ITC, HUL etc to offer attention. For relatively smaller players, it will be a winning proposition. Incentives for branding abroad will be very useful for export focused companies like ADF foods, KRBL etc.
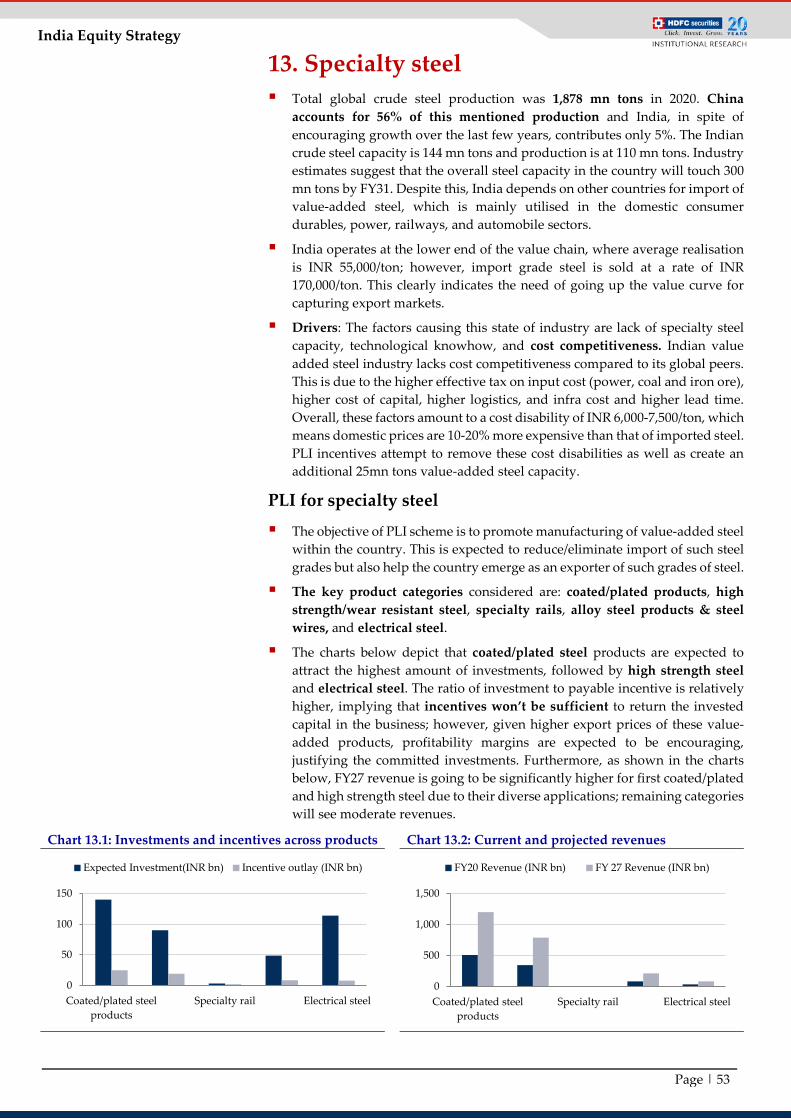
Page | 53
India Equity Strategy 13. Specialty steel Total global crude steel production was 1,878 mn tons in 2020. China
accounts for 56% of this mentioned production and India, in spite of encouraging growth over the last few years, contributes only 5%. The Indian crude steel capacity is 144 mn tons and production is at 110 mn tons. Industry estimates suggest that the overall steel capacity in the country will touch 300 mn tons by FY31. Despite this, India depends on other countries for import of value-added steel, which is mainly utilised in the domestic consumer durables, power, railways, and automobile sectors.
India operates at the lower end of the value chain, where average realisation is INR 55,000/ton; however, import grade steel is sold at a rate of INR 170,000/ton. This clearly indicates the need of going up the value curve for capturing export markets.
Drivers: The factors causing this state of industry are lack of specialty steel capacity, technological knowhow, and cost competitiveness. Indian value added steel industry lacks cost competitiveness compared to its global peers. This is due to the higher effective tax on input cost (power, coal and iron ore), higher cost of capital, higher logistics, and infra cost and higher lead time. Overall, these factors amount to a cost disability of INR 6,000-7,500/ton, which means domestic prices are 10-20% more expensive than that of imported steel. PLI incentives attempt to remove these cost disabilities as well as create an additional 25mn tons value-added steel capacity.
PLI for specialty steel
The objective of PLI scheme is to promote manufacturing of value-added steel within the country. This is expected to reduce/eliminate import of such steel grades but also help the country emerge as an exporter of such grades of steel.
The key product categories considered are: coated/plated products, high strength/wear resistant steel, specialty rails, alloy steel products & steel wires, and electrical steel.
The charts below depict that coated/plated steel products are expected to attract the highest amount of investments, followed by high strength steel and electrical steel. The ratio of investment to payable incentive is relatively higher, implying that incentives won’t be sufficient to return the invested capital in the business; however, given higher export prices of these value-added products, profitability margins are expected to be encouraging, justifying the committed investments. Furthermore, as shown in the charts below, FY27 revenue is going to be significantly higher for first coated/plated and high strength steel due to their diverse applications; remaining categories will see moderate revenues.
Chart 13.1: Investments and incentives across products Chart 13.2: Current and projected revenues
0
50
100
150
Coated/plated steelproducts
Specialty rail Electrical steel
Expected Investment(INR bn) Incentive outlay (INR bn)
0
500
1,000
1,500
Coated/plated steelproducts
Specialty rail Electrical steel
FY20 Revenue (INR bn) FY 27 Revenue (INR bn)

Page | 54
India Equity Strategy Current status: The application process is currently ongoing and the deadline
to apply was until 31 March, 2022 (PLI period has been extended by a year on request of industry players). The incentive outlay for the scheme is INR 63.22 bn, and the year wise break-up is given in the chart below. It is expected to attract investments worth INR 396.25bn. The first commercial production is expected to begin by FY24 and the first incentive will be payable by FY25.
Chart 13.3: Incentive outlay
Eligibility for incentive: Eligibility for incentive will depend upon achieving hurdle investment amount, installed capacity and year-wise sales growth as prescribed.
Calculation of Incentive: Incentive will be offered to selected candidates as per below formula
Incentive= (A/B)*(B or C, lower of the two)*(PLI rate as applicable)/100
A=Incremental sales in current year; B= B=Weighted average sale price in current year
C=Weighted average sale price in base year (FY20)
PLI incentive percentage for various categories are given in the below table:
Category Key products FY24 FY25 FY26 FY27 FY28
PLI-A Galvaneal, coated/plated, HR coil, sheets, rails, alloy steel
4% 5% 5% 5% 3%
PLI-B Boiler quality, valve steel, automotive steel, tyre wire/cord, tin mill coated
8% 9% 10% 9% 7%
PLI-C CRGO (cold rolled grain oriented)
12% 15% 15% 13% 11%
We observe that lower % incentive has been offered for steel category applied in construction, agriculture (colour coated, zinc coated steel), while higher % incentive has been considered for export grade (tin mill coated & boiler quality) and import substitute (cold rolled grain oriented for electrical uses). Higher incentive has been offered for higher value additions, which involve complex production processes.
02468
10121416
FY25 FY26 FY27 FY28 FY29 FY30 FY31
Incentive outlay (INR bn)

Page | 55
India Equity Strategy Raw material: The table below lists the raw materials required to produce
steel under various categories considered for PLI. Most of the raw material is available domestically. It also covers applications of various steel categories.
PLI Category Applications Raw materials
Coated/plated products Automobile & roof products Aluminium, Zinc, tin, Phosphorus
High strength/wear resistant Propeller shaft, electrical machines, LPG cylinders
Manganese, Silicon, Sulphur, carbon, phosphorus
Specialty rails Railways Carbon, Manganese, silicon, titanium, vanadium, Nitrogen
Alloy steel/wires Automobile, precision ball bearing, tyres
Manganese, Silicon, Sulphur, carbon, Phosphorus
Electrical steel Power transformer, motor and generators
Iron & silicon
Our opinion: The incentives offered are lower than the investments required but this scheme is compensating for the cost disability compared to peer countries. Hence, it will work for larger steel players as a catalyst to set up plants. Given expected growth of electrical goods, auto & auto ancillaries, future demand growth of value added steels to be used in mentioned sectors will justify the investments made for large steel players. In our view, the scheme will be fruitful in the long term.

Page | 56
India Equity Strategy 14. Textiles The PLI scheme is intended to promote production of manmade fibres
(MMF) apparel & fabrics and technical textile products so that domestic textile industry becomes globally competitive and achieves scale. This also intends to create significant employment opportunities for people.
Manmade fibres are mainly of two types, viz., synthetic and cellulosic. Synthetic fibres are made from crude oil and cellulosic fibres are made from wood pulp. The main varieties of synthetic fibres are polyester, acrylic, and polypropylene while examples of cellulosic fibres are viscose fibre and modal fibres.
Globally, the demand of MMF is increasing rapidly as a substitute for cotton amid changes in global fashion trends. Currently, global overall textile fibre consumption is dominated by MMF, with 72% share, while cotton forms the rest 28% (India - 40% and 60% respectively). Global trends suggest that the consumption of MMF is expected to grow higher while cotton will stagnate, given versatility of MMF and raw material availability.
As seen in chart 14.1, global trend is shifting fast from cotton to manmade fibres. The world has moved away from cotton to MMF, but India is slow to react. Other peer countries, viz. China, Bangladesh, and Vietnam, have adapted the change swiftly and their MMF exports and consumption share have been rising.
Chart 14.1: Textile fibre demand
Source: SRTEPC, HSIE Research
The Indian textile industry is dominated by cotton, as India is the largest producer (25% of global output). India produces almost all types of synthetic fibres, namely polyester, viscose, nylon, or acrylic. Although the MMF industry in India is self reliant across the value chain, right from raw material to garmenting, it lacks an exports push. Despite the fact that India is a net exporter of textile products, with exports of USD 30 bn, the share of MMF in exports is low. In FY20, India’s exports of textile & apparel (T&A) were USD 34bn, of which apparels (MMF and cotton) were USD 16.2 bn. MMF apparels formed only a small portion of this pie with 16% share (USD 2.6bn), indicating the need of external support. The PLI scheme intends to offer this reinforcement to MMF exports.
India has had a favourable tax regime for cotton historically, which has boosted its growth. The current applicable uniform GST on cotton value chain is 5%. On similar lines, to promote MMF production and exports, uniform GST for MMF fibres, yarns, fabrics and apparels has been notified at 12%, starting Jan 2022.
25.1 24.3 24.424.9
48.265.8
78.8
94.373.3
90.1103.2 119.2
0
20
40
60
80
100
120
140
2010 2015 2020 2025E
Global end use demand for textile fibres (mn tonnes)
Cotton Non-cotton Total

Page | 57
India Equity Strategy
Key raw materials: purified terapthalic acid (PTA) for polyester staple fibre (PSF) and viscose staple fibre (VSF) are key raw materials. PSF and VSF are available in India and manufactured by Reliance and Grasim respectively.
Cost competitiveness: Indian exports are less competitive than competing countries due to high power, logistics, and labour costs. Labour cost in India is higher than that in Bangladesh and Sri Lanka. Also, market access to peer countries is also easier. For example, Vietnam has free trade agreements (FTAs) with the UK, Canada, and the EU. Also, it has the most-favoured nation status with the US. Bangladesh exports to Canada and the EU at zero duty on account of its least developed nation status. It also has an FTA with the UK. Hence, these other countries are gradually becoming MMF textile export hubs, outpacing India. The PLI is attempting to address these cost disabilities.
The Indian textile sector is self-sufficient and, with a smart push offered by PLI, can capture a significant share of the global market.
PLI scheme
PLI intends to develop 50-60 globally competitive champions as global industry growth is led by MMF. This scheme intends to promote production of manmade fibres (MMF) apparel & fabrics and technical textiles by offering incentives to neutralise various cost disabilities. Overall incentive outlay is INR 106.8bn and it has attracted INR 230bn worth of investments. The scheme will have FY23 and FY24 as gestation years, FY25 to FY29 as performance years, and FY26 to FY30 as incentives years.
Approved products: Overall, 64 products have been approved. Key examples are given below:
MMF apparels (40): Swimwear, night dresses, bathrobes, baby garments, overcoat, raincoat, jacket, jerseys, synthetic trousers, wind-cheaters, etc.
MMF fabrics (14): Polyester suiting, shirting, nylon, rayon woven fabric, etc.
Technical textiles (10): Geo, agro, medical, defence, sports, construction textiles, etc.
Incentives = net incremental sales of notified products* rate of incentive
Applicants (67): Overall 67 candidates have applied under the scheme. Few leading names are : Reliance, Arvind, Welspun, Indorama, Bombay Dyeing, Vardhman and Trident.
Eligibility: Targeted investment and sales in the first performance year (FY25) and 25% YoY incremental growth in every next year.
Performance year
Incentives claim year
Scheme-1( Min Inv-INR 3.0 bn) Scheme-2 (Min Inv-INR 1.0 bn) Minimum
eligible turnover(INR
Bn)
Incentive rate
Minimum incentive if eligible (INR Bn)
Minimum eligible
turnover(INR Bn)
Incentive rate
Minimum incentive if eligible (INR Bn)
FY25 FY26 6 15% 0.9 2 11% 0.22 FY26 FY27 7.5 14% 0.21 2.5 10% 0.05 FY27 FY28 9.4 13% 0.25 3.1 9% 0.05 FY28 FY29 11.7 12% 0.28 3.9 8% 0.06 FY29 FY30 14.7 11% 0.33 4.9 7% 0.07
Total 1.97 0.45
Page | 58
India Equity Strategy Example: In the table above, we have taken example of a typical sample scenario in which an applicant company invests INR 3.0 bn under scheme-1 and achieves INR 6.0bn turnover (both minimum eligible figures) in first performance year (FY25). Also, we assume that the company achieves 25% YoY incremental growth (minimum for eligibility) in turnover in every other year until FY29. The above table depicts under scheme-1 how the sales turnover and applicable incentives would work out in various years. It is noteworthy that, in scheme-1, with initial investment of INR 3bn, this applicant company would be able to receive INR 1.97bn as overall incentives during the scheme period. Similarly, in scheme-2, with minimum investment of INR 1bn, a company will be able to receive INR 0.45bn as collective incentive under scheme period. While not as lucrative as some other aforementioned schemes, The PLI is an additional tailwind besides the ‘Scheme for Integrated Textiles Parks’ to propel India’s textile industry. The Indian textiles industry is at an inflexion point, as the government has clearly outlined its position to rival Bangladesh and Vietnam to make India a major export hub.
Our opinion: Due to an extremely supportive cotton policy over the years and cost disabilities in MMF manufacturing, India is already late in joining the global trend of shifting from cotton to manmade fibers. Hence, adopting this cotton to MMF shift is necessary to make a global mark in textile exports. This PLI scheme is opportune and is a welcome step by the government. It will open a new export market for Indian companies, given their expertise in textile manufacturing. Hence, we are optimistic about this scheme’s execution.
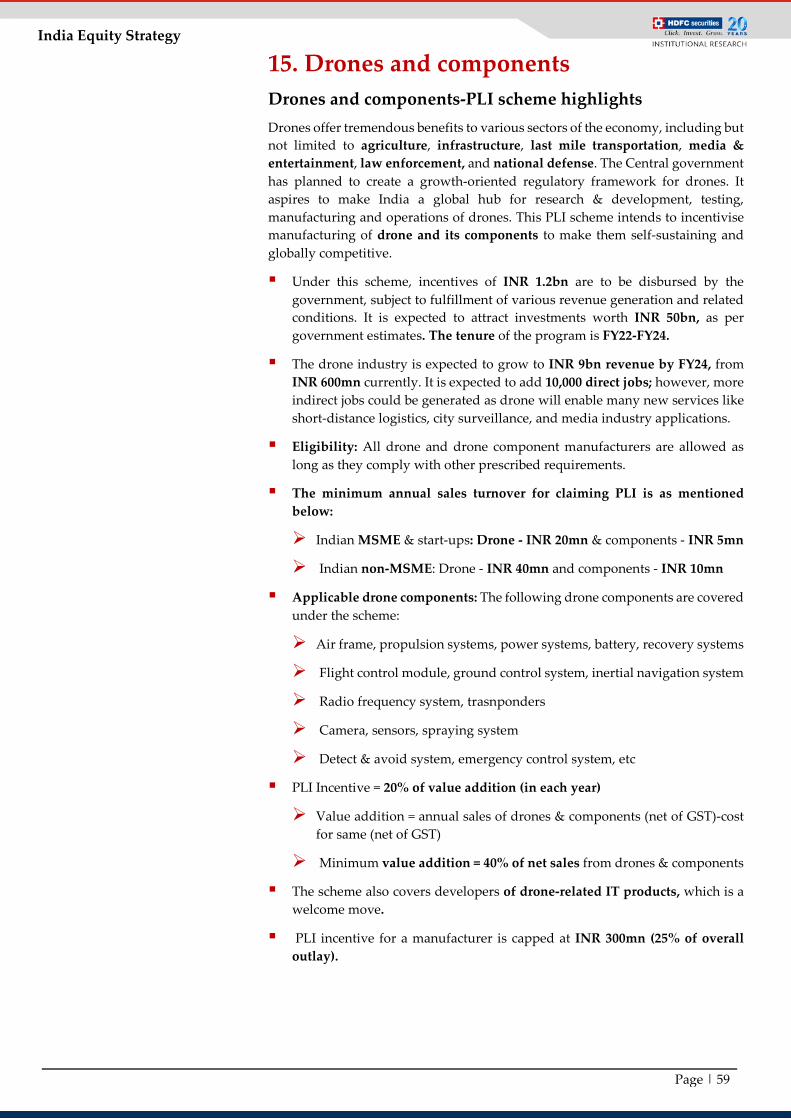
Page | 59
India Equity Strategy 15. Drones and components Drones and components-PLI scheme highlights Drones offer tremendous benefits to various sectors of the economy, including but not limited to agriculture, infrastructure, last mile transportation, media & entertainment, law enforcement, and national defense. The Central government has planned to create a growth-oriented regulatory framework for drones. It aspires to make India a global hub for research & development, testing, manufacturing and operations of drones. This PLI scheme intends to incentivise manufacturing of drone and its components to make them self-sustaining and globally competitive.
Under this scheme, incentives of INR 1.2bn are to be disbursed by the government, subject to fulfillment of various revenue generation and related conditions. It is expected to attract investments worth INR 50bn, as per government estimates. The tenure of the program is FY22-FY24.
The drone industry is expected to grow to INR 9bn revenue by FY24, from INR 600mn currently. It is expected to add 10,000 direct jobs; however, more indirect jobs could be generated as drone will enable many new services like short-distance logistics, city surveillance, and media industry applications.
Eligibility: All drone and drone component manufacturers are allowed as long as they comply with other prescribed requirements.
The minimum annual sales turnover for claiming PLI is as mentioned below:
Indian MSME & start-ups: Drone - INR 20mn & components - INR 5mn
Indian non-MSME: Drone - INR 40mn and components - INR 10mn
Applicable drone components: The following drone components are covered under the scheme:
Air frame, propulsion systems, power systems, battery, recovery systems
Flight control module, ground control system, inertial navigation system
Radio frequency system, trasnponders
Camera, sensors, spraying system
Detect & avoid system, emergency control system, etc
PLI Incentive = 20% of value addition (in each year)
Value addition = annual sales of drones & components (net of GST)-cost for same (net of GST)
Minimum value addition = 40% of net sales from drones & components
The scheme also covers developers of drone-related IT products, which is a welcome move.
PLI incentive for a manufacturer is capped at INR 300mn (25% of overall outlay).
Page | 60
India Equity Strategy Estimated payout schedule:
Claim Year
Sales – net of GST (INR bn)
Purchase- net of
GST (INR bn)
Eligible Value
addition (INR bn)
PLI rate (%)
Applicable PLI (INR bn)
Disbursement year
FY22 2 1.2 0.8 20% 0.16 FY23 FY23 4 2.4 1.6 20% 0.32 FY24 FY24 9 5.4 3.6 20% 0.72 FY25 Total 15 9 6 20% 1.2
Raw material and supply chain:
Although drone components are also covered under this PLI scheme, some components need to be imported. Lithium ion battery could be one of them.
Applicable candidates:
The ministry of civil aviation has invited applications from interested parties. The deadline for submitting applications was 31 Mar 2022. Further details about selected candidates are awaited.
Our opinion: Under this scheme, the amount of incentive appears lower compared to investments envisaged. Also, execution of scheme is going slow, given it is still in application phase. Furthermore, as existing drone companies are too small with respect to business revenues, expecting very large investments from them won’t be realistic. In our view, the scheme should witness some modifications to make it more implementable.
Concluding Remarks In this report, we have analyzed each PLI scheme individually and highlighted their respective merits, but also possible roadblocks ahead. In summary, some schemes are expected to outperform the government’s expectations, while some others will require meticulous oversight and policy modifications to help them achieve their respective objectives. Going forward, we will be tracking the progress of existing schemes, probable new additions, and possible changes to the PLI schemes.

Page | 61
India Equity Strategy
Thematic reports by HSIE
Cement: WHRS – A key cog in the flywheel
Autos: Where are we on “S” curve?
FMCG: Defensive businesses but not
valuations
Autos: A changed landscape
Banks: Double whammy for some
India Equity Strategy: Atma Nirbhar Bharat
Indian IT: Demand recovery in sight
Life Insurance: Recovery may be swift with protection driving
margins
Retail: Whole flywheel is broken?
Appliances: Looing beyond near-term
disruption
Pharma: Chronic therapy – A portfolio prescription
Indian Gas: Looking beyond the pandemic
India Equity Strategy: Quarterly flipbook
Real Estate: Ripe for consumption
Indian IT: expanding centre of
gravity Indian Chemical:
Evolution to revolution! Life Insurance: ULIP vs.
MF Infrastructure: On the
road to rerating Cement: Spotting the
sweet spot Pharma: Cardiac: the heartbeat of domestic
market
Life Insurance: Comparative annual
report analysis
Indian microfinance: Should you look micro as macros disappoint?
India Equity Strategy: Quarterly flipbook
Autos: Divergent trends in PVs and 2Ws
India Internet: the stage is set
FMCG: Opportunity in adversity - A comparative
scorecard
Logistics: Indian Railways - getting aggressive
Industrials: Triggering a new cycle
Indian IT: raising the bar India Equity Strategy:
Quarterly flipbook FinTech Playbook: P2M
Payments | Surging pool, dwindling yields
India Hospitals: capital discipline improving,
sustenance is key
Autos: Will EVs impact the ‘EV’?
Cement: Riding High Power: Reforms essential for rennaissance
Fashion & Lifestyle: From a disruptor’s lens II
India Equity Strategy: Quarterly flipbook
Indian Gas Sector: Resilience in the eye of the
storm
Consumer Durables: Fans - a compounding story but
underrated
Quarterly flipbook: Q2FY22–Demand
environment improves but input cost inflation dents
profitability
FinTech Playbook: Discount Brokers
Footwear: No bargains here!
Holdcos for portfolio diversification
Cement: A concrete road for net-zero emissions
FinTech Playbook: Buy Now Pay Later
India Equity Strategy: Institutional Investors’ shareholding pattern
Real Estate: On a cyclical high
Fluorination: Fluorine reacting fantastically!
FMCG: D2C – changing landscape not fully
factored in
India Internet: 2021: the age of the unicorns
Page | 62
India Equity Strategy
Disclosure: We, Varun Lohchab, PGDM, Amit Kumar, CFA & Atishray Malhan, BBA authors and the names subscribed to this report, hereby certify that all of the views expressed in this research report accurately reflect our views about the subject issuer(s) or securities. HSL has no material adverse disciplinary history as on the date of publication of this report. We also certify that no part of our compensation was, is, or will be directly or indirectly related to the specific recommendation(s) or view(s) in this report. Research Analyst or his/her relative or HDFC Securities Ltd. does not have any financial interest in the subject company. Also Research Analyst or his relative or HDFC Securities Ltd. or its Associate may have beneficial ownership of 1% or more in the subject company at the end of the month immediately preceding the date of publication of the Research Report. Further Research Analyst or his relative or HDFC Securities Ltd. or its associate does not have any material conflict of interest. Any holding in stock –No HDFC Securities Limited (HSL) is a SEBI Registered Research Analyst having registration no. INH000002475. Disclaimer: This report has been prepared by HDFC Securities Ltd and is solely for information of the recipient only. The report must not be used as a singular basis of any investment decision. The views herein are of a general nature and do not consider the risk appetite or the particular circumstances of an individual investor; readers are requested to take professional advice before investing. Nothing in this document should be construed as investment advice. Each recipient of this document should make such investigations as they deem necessary to arrive at an independent evaluation of an investment in securities of the companies referred to in this document (including merits and risks) and should consult their own advisors to determine merits and risks of such investment. The information and opinions contained herein have been compiled or arrived at, based upon information obtained in good faith from sources believed to be reliable. Such information has not been independently verified and no guaranty, representation of warranty, express or implied, is made as to its accuracy, completeness or correctness. All such information and opinions are subject to change without notice. Descriptions of any company or companies or their securities mentioned herein are not intended to be complete. HSL is not obliged to update this report for such changes. HSL has the right to make changes and modifications at any time. This report is not directed to, or intended for display, downloading, printing, reproducing or for distribution to or use by, any person or entity who is a citizen or resident or located in any locality, state, country or other jurisdiction where such distribution, publication, reproduction, availability or use would be contrary to law or regulation or what would subject HSL or its affiliates to any registration or licensing requirement within such jurisdiction. If this report is inadvertently sent or has reached any person in such country, especially, United States of America, the same should be ignored and brought to the attention of the sender. This document may not be reproduced, distributed or published in whole or in part, directly or indirectly, for any purposes or in any manner. Foreign currencies denominated securities, wherever mentioned, are subject to exchange rate fluctuations, which could have an adverse effect on their value or price, or the income derived from them. In addition, investors in securities such as ADRs, the values of which are influenced by foreign currencies effectively assume currency risk. It should not be considered to be taken as an offer to sell or a solicitation to buy any security. This document is not, and should not, be construed as an offer or solicitation of an offer, to buy or sell any securities or other financial instruments. This report should not be construed as an invitation or solicitation to do business with HSL. HSL may from time to time solicit from, or perform broking, or other services for, any company mentioned in this mail and/or its attachments. HSL and its affiliated company(ies), their directors and employees may; (a) from time to time, have a long or short position in, and buy or sell the securities of the company(ies) mentioned herein or (b) be engaged in any other transaction involving such securities and earn brokerage or other compensation or act as a market maker in the financial instruments of the company(ies) discussed herein or act as an advisor or lender/borrower to such company(ies) or may have any other potential conflict of interests with respect to any recommendation and other related information and opinions. HSL, its directors, analysts or employees do not take any responsibility, financial or otherwise, of the losses or the damages sustained due to the investments made or any action taken on basis of this report, including but not restricted to, fluctuation in the prices of shares and bonds, changes in the currency rates, diminution in the NAVs, reduction in the dividend or income, etc. HSL and other group companies, its directors, associates, employees may have various positions in any of the stocks, securities and financial instruments dealt in the report, or may make sell or purchase or other deals in these securities from time to time or may deal in other securities of the companies / organizations described in this report. HSL or its associates might have managed or co-managed public offering of securities for the subject company or might have been mandated by the subject company for any other assignment in the past twelve months. HSL or its associates might have received any compensation from the companies mentioned in the report during the period preceding twelve months from the date of this report for services in respect of managing or co-managing public offerings, corporate finance, investment banking or merchant banking, brokerage services or other advisory service in a merger or specific transaction in the normal course of business. HSL or its analysts did not receive any compensation or other benefits from the companies mentioned in the report or third party in connection with preparation of the research report. Accordingly, neither HSL nor Research Analysts have any material conflict of interest at the time of publication of this report. Compensation of our Research Analysts is not based on any specific merchant banking, investment banking or brokerage service transactions. HSL may have issued other reports that are inconsistent with and reach different conclusion from the information presented in this report. Research entity has not been engaged in market making activity for the subject company. Research analyst has not served as an officer, director or employee of the subject company. We have not received any compensation/benefits from the subject company or third party in connection with the Research Report. HDFC securities Limited, I Think Techno Campus, Building - B, "Alpha", Office Floor 8, Near Kanjurmarg Station, Opp. Crompton Greaves, Kanjurmarg (East), Mumbai 400 042 Phone: (022) 3075 3400 Fax: (022) 2496 5066 Compliance Officer: Binkle R. Oza Email: [email protected] Phone: (022) 3045 3600 HDFC Securities Limited, SEBI Reg. No.: NSE, BSE, MSEI, MCX: INZ000186937; AMFI Reg. No. ARN: 13549; PFRDA Reg. No. POP: 11092018; IRDA Corporate Agent License No.: CA0062; SEBI Research Analyst Reg. No.: INH000002475; SEBI Investment Adviser Reg. No.: INA000011538; CIN - U67120MH2000PLC152193
HDFC securities Institutional Equities Unit No. 1602, 16th Floor, Tower A, Peninsula Business Park, Senapati Bapat Marg, Lower Parel,Mumbai - 400 013 Board : +91-22-6171 7330 www.hdfcsec.com