Interglobe Aviation Ltd. - HDFC securities
19
Interglobe Aviation Ltd. 1 Lorem ipsum dolor sit amet, consectetuer adipiscing elit, sed diam nonummy nibh euismod tincidunt ut laoreet dolore magna aliquam erat volutpat. Ut wisi enim ad minim veniam, quis nostrud exerci tation ullamcorper suscipit lobortis nisl ut aliquip ex ea commodo consequat. Duis autem vel eum iriure dolor in hendrerit in vulputate velit esse molestie consequat, vel illum dolore eu feugiat nulla ▪ Lorem ipsum dolor sit amet, consectetuer adipiscing elit, sed diam nonummy nibh euismod tincidunt ut laoreet dolore magna aliquam erat volutpat. Ut wisi enim ad minim veniam, ▪ quis nostrud exerci tation ullamcorper suscipit lobortis nisl ut aliquip ex ea commodo consequat. Duis autem vel eum iriure dolor in hendrerit in vulputate velit esse molestie consequat, ▪ vel illum dolore eu feugiat nulla facilisis at vero eros et accumsan et iusto odio dignissim qui blandit praesent luptatum zzril delenit augue duis dolore te feugait nulla facilisi. et iusto odio dignissim qui blandit praesent luptatum zzril delenit Initiating Coverage Interglobe Aviation Ltd. 31-May-2021
-
Upload
khangminh22 -
Category
Documents
-
view
5 -
download
0
Transcript of Interglobe Aviation Ltd. - HDFC securities
Interglobe Aviation Ltd.
1
Lorem ipsum dolor sit amet, consectetuer adipiscing elit, sed diam nonummy nibh euismod tincidunt ut laoreet dolore magna aliquam erat volutpat. Ut wisi enim ad minim veniam, quis nostrud exerci tation ullamcorper suscipit lobortis nisl ut aliquip ex ea commodo consequat. Duis autem vel eum iriure dolor in hendrerit in vulputate velit esse molestie consequat, vel illum dolore eu feugiat nulla
▪ Lorem ipsum dolor sit amet, consectetuer adipiscing elit, sed diam nonummy
nibh euismod tincidunt ut laoreet dolore magna aliquam erat volutpat. Ut wisi enim ad minim veniam,
▪ quis nostrud exerci tation ullamcorper suscipit lobortis nisl ut aliquip ex ea commodo consequat. Duis autem vel eum iriure dolor in hendrerit in vulputate velit esse molestie consequat,
▪ vel illum dolore eu feugiat nulla facilisis at vero eros et accumsan et iusto odio dignissim qui blandit praesent luptatum zzril delenit augue duis dolore te feugait nulla facilisi. et iusto odio dignissim qui blandit praesent luptatum zzril delenit
Initiating Coverage
Interglobe Aviation Ltd. 31-May-2021
Interglobe Aviation Ltd.
2
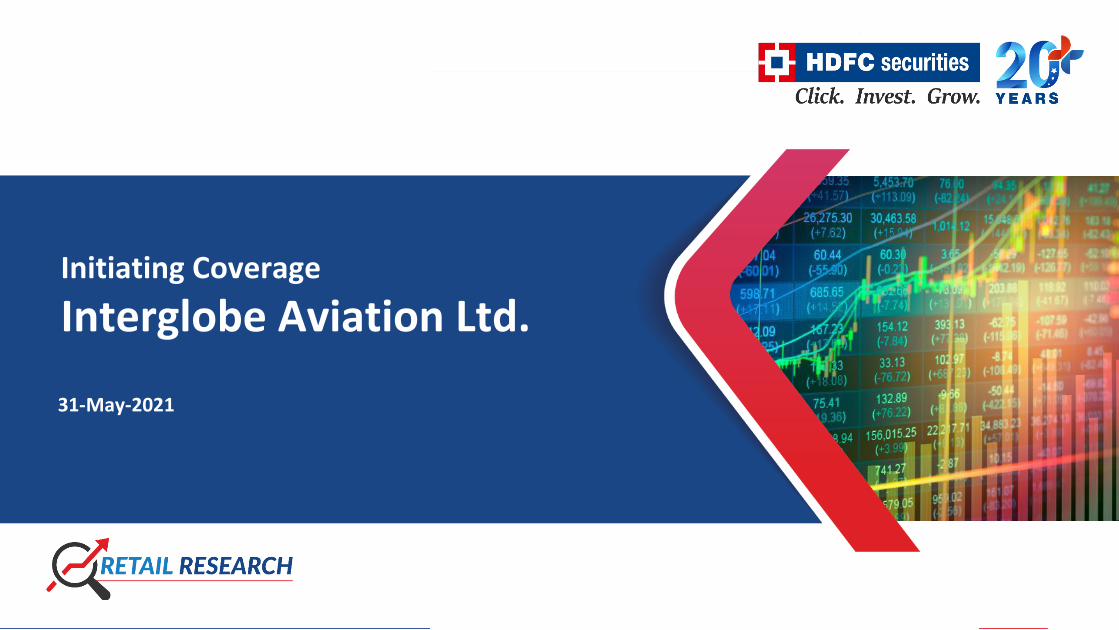
Industry LTP Recommendation Base Case Fair Value Bull Case Fair Value Time Horizon
Aviation Rs.1776 Buy on dips at Rs.1644 and add more at Rs.1511 Rs.1742 Rs.1906 2 quarters
Our take
Interglobe Aviation (IndiGo) is the largest aviation company in India with a market share of 54.4% (9MFY21). The company has 120 A320neo, 111 A320ceo, 30 A321neo and 26 ATR aircraft (as of 9MFY21). The fleet capacity of the company has grown by ~25% CAGR from FY10-20 compared to ~11% CAGR during FY10-20 for the industry. IndiGo fleet capacity is expected to grow by 7% CAGR in FY20-23E. India is hugely under-penetrated in air traffic, but it is growing steadily year on year. As the largest aviation player, IndiGo stands to benefit the most in converting this growth to revenue..
The company has focused on controlling its cost through retiring old ceo aircraft and replacing them with fuel-efficient neo aircraft. Also, IndiGo is concentrating on two types of fleets, which have rationalized staff training and aircraft maintenance costs. A320neo and A320ceo account for ~80% of the total fleet. IndiGo is 1st in On-Time Performance (OTP) of scheduled domestic airlines. Neos aircraft are ~52% of total capacity, which would help reduce fuel cost.
We expect that Covid-led travel restrictions, negative sentiment for travel, and slowdown in the economy will all lead to revenue degrowth, while higher fixed costs will adversely affect the company’s profitability amidst this scenario. The industry has a greater dependence on economic growth and corporate spending growth, which are expected to slow down. Vaccine passports would help countries to open borders to those who have been vaccinated. IndiGo has been operating at reduced capacity -- at ~70% of its total domestic capacity in Q3FY21 and ~80% capacity in January-21.
Valuations and recommendation We expect the company to benefit from the leading market positioning in the highly under-penetrated growing Indian aviation space. Its asset-light leasehold operational business model, ready capacity, strong balance sheet, and fragile competition landscape provide comfort. Vulnerability of most of its peers is an added trigger for the company. The rapid growth of COVID-19 cases, economic slowdown, restrictions on travel, higher fixed costs, and fuel price volatility will slow down revenue growth. Yield risks on full scale operations with changed customer mix and lower than expected traffic pick-up are key downside risks. InterGlobe Aviation plans to raise Rs 3,000 crore through a qualified institutions placement (QIP) process to raise liquidity, as the second coronavirus wave has left the aviation industry grappling with low demand with states tightening restrictions. We expect 1% topline CAGR and -23% EPS CAGR over FY20-23E. Interglobe
HDFC Scrip Code INDIGOEQNR
BSE Code 539448
NSE Code INDIGO
Bloomberg INDIGO:IN
CMP May 28, 2021 1776
Equity Capital (cr) 385
Face Value (Rs) 10
Eq- Share O/S(cr) 38.48
Market Cap (Rscr) 68340
Book Value (Rs) 152
Avg.52 Wk Volume 2019490
52 Week High 1830.00
52 Week Low 873.10
Share holding Pattern % (March, 2021)
Promoters 74.84
Institutions 23.14
Non Institutions 2.02
Total 100.0
Fundamental Research Analyst Jimit Zaveri [email protected]

Interglobe Aviation Ltd.
3
could be one of the key reopening trades; however one is not sure as to what extent of this is already reflected in the current price. While our long-term expectation of a full recovery in the industry and Indigo’s increased dominance stays, the near-term may be tougher than earlier expectations.
The stock is currently trading at 8x FY23E EV/EBITDAR. We believe the base case fair value of the stock is Rs.1742 (7.8x FY23E EV/EBITDAR, 26.53x FY23E EPS) and bull case fair value of the stock is Rs.1906 (8.5x FY23E EV/EBITDAR). Investors willing to take some risk can look to buy the stock on falls to Rs.1644 (7.3x FY23E EV/EBITDAR) and add more on dips to Rs.1511 (6.7x FY23E EV/EBITDA).
Financial Summary (Standalone) Particulars (Rs cr) Q3FY21 Q3FY20 YoY-% Q2FY21 QoQ-% FY19 FY20 FY21E FY22E FY23E
Total Operating Income 4910 9932 -51% 2741 79% 28,497 35,756 15,917 25,969 36,830
EBITDAR 903 1804 -50% 281 222% 7,338 10,402 367 3,996 8,268
APAT -627 490 PL -1195 LL 1,667 5,619 -3,848 -867 2,526
Diluted EPS (Rs) -16.3 12.7 PL -31.05 LL 43.3 146.0 -100.0 -22.5 65.7
RoE-% 23.8 87.7 -97.8 -55.0 107.0
P/E (x) 41.0 12.2 -17.8 -78.8 27.1
EV/EBITDAR 9.0 6.4 180.2 16.6 8.0 (Source: Company, HDFC sec)
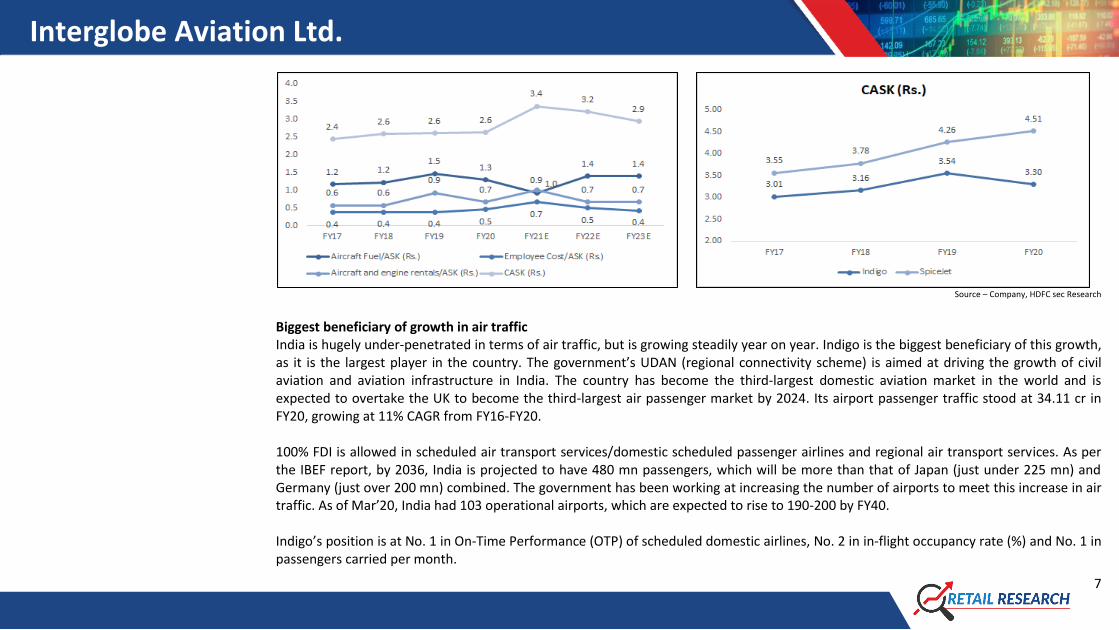
Q3FY21 result update The company’s revenue stood at Rs.4910 cr, -51/79% YoY/QoQ. The net loss of the company stood at Rs.627 cr, loss to profit. RASK
(Rs.) of the company stood at Rs.3.27, -17/+4% YoY/QoQ. EBITDAR of the company stood at Rs.903 Cr, -50%/+222% YoY/QoQ. CASK (Rs.) of the company stood at Rs.3.68, -0.3%/20% YoY/QoQ.
RASK-CASK (Rs.) of the company stood at Rs.-0.47 vs 0.22. The company has increased its fleet size to 287 aircraft from 257 in Q3FY20, 282 in Q2FY21. Capacity has increased from 8,900 mn
ASKs in the Q2FY21 to 15,300 mn ASKs in Q3FY21.

Interglobe Aviation Ltd.
4
During Q3FY21, the company operated at ~70% of overall domestic capacity and, in Jan-21, at ~80% of capacity. International capacity continues to be severely constrained, as the company is only operating at around 28% of it. Overall, the company operated at ~60% of its total capacity. Load factor has fallen by 1,560bps to 72% YoY and improved by 690bps QoQ.
The company has operated ~1,500 cargo charter flights in Q3FY21. Net cash burn per day reduced from Rs.25 cr per day in Q2FY21 to an average of Rs.15 cr per day in Q3FY21. This was helped primarily
due to increase in flight operations. Long-term triggers Largest and growing market share in air carrier in India Indigo is presently the largest player in the growing Indian airline industry. The company has expanded its market share from 14% in FY10 to 54.4% in 9MFY21. Market share has grown, given its strategy of being a low-cost carrier, which has essentially driven profitability growth, which in turn has worked as a fuel to the company’s growth.
Source – Company, HDFC sec Research

Interglobe Aviation Ltd.
5
The company is continuously adding to its fleet to gain market share. It has grown its fleet capacity much more rapidly than the industry average. The industry average was ~11% in fleet growth from FY10-20 whereas Indigo grew by 25% during the same period. The airline company plans to have a fleet of 325 aircraft by FY23 from 262 aircraft in FY20, and 287 aircraft in 9MFY21. It has made a strategic shift in its asset acquisition policy. It now owns some aircraft as against its traditional model of leasing them. The company believes this would reduce rental costs, like it did for peers in the US and Europe that successfully adopted the strategy of owning and leasing aircraft.

Interglobe Aviation Ltd.
6
Most cost competitive aviation player Indigo had placed large orders with Airbus at competitive terms and negotiated with different vendors for maintenance and operations. The company has demonstrated a lower cost of operations than its peers in the Indian airline industry. Additionally, maintenance of a single type of fleet and younger fleet kept fuel costs low and the tight control on overheads contributed to the lowest CASK among Indian airlines, which compares favorably with other global LCCs. However, due to emerging regional opportunities, it is now transitioning away from a single-type fleet model and metro route focus. Still, as the company has ~80.5% of the total fleet size dominated by two types of fleet, its staff training and aircraft maintenance costs are rationalized.
The ceo aircraft, which the company operates, has higher ownership cost due to higher maintenance fuel burn. Indigo is now working on retiring its ceo aircraft. It has brought down this aircraft’s usage (from 59.9% of its total fleet in FY19 to 38.7% in 9MFY21). Its investments in new neo aircraft gives it greater fuel efficiency than the older ceo aircraft, which allows it to lower costs.
Source – Company, HDFC sec Research
IndiGo has been constantly reducing its fixed costs, which are 40% of the total expenses. There has been a 5-25% salary cut. According to management, the phase-out of older ceo planes will also make savings in supplementary rentals, which would result in additional liquidity over the year.
Interglobe Aviation Ltd.
7
Source – Company, HDFC sec Research
Biggest beneficiary of growth in air traffic India is hugely under-penetrated in terms of air traffic, but is growing steadily year on year. Indigo is the biggest beneficiary of this growth, as it is the largest player in the country. The government’s UDAN (regional connectivity scheme) is aimed at driving the growth of civil aviation and aviation infrastructure in India. The country has become the third-largest domestic aviation market in the world and is expected to overtake the UK to become the third-largest air passenger market by 2024. Its airport passenger traffic stood at 34.11 cr in FY20, growing at 11% CAGR from FY16-FY20. 100% FDI is allowed in scheduled air transport services/domestic scheduled passenger airlines and regional air transport services. As per the IBEF report, by 2036, India is projected to have 480 mn passengers, which will be more than that of Japan (just under 225 mn) and Germany (just over 200 mn) combined. The government has been working at increasing the number of airports to meet this increase in air traffic. As of Mar’20, India had 103 operational airports, which are expected to rise to 190-200 by FY40. Indigo’s position is at No. 1 in On-Time Performance (OTP) of scheduled domestic airlines, No. 2 in in-flight occupancy rate (%) and No. 1 in passengers carried per month.

Interglobe Aviation Ltd.
8
Source – Company, HDFC sec Research

Interglobe Aviation Ltd.
9
India’s exports and imports have grown strongly in the past decade. Growth in trade bodes well for the aviation industry as it handles
about 30% of India’s total trade by value. In FY2010, routes between the six metros (Delhi, Mumbai, Bengaluru, Hyderabad, Chennai and
Kolkata) accounted for 41.6% of total domestic traffic. This declined to 25.7% by FY2020 as air services spread to more and more cities. In
the ten years to FY2020, traffic on metro–non-metro routes increased at a CAGR of 15.2%, almost twice the 7.7% CAGR on metro–metro
routes, reflecting the under-penetration and potential of non-metro routes.
Route type FY2010–FY2015 CAGR (%) FY2015–FY2020 CAGR (%)
Metro–metro 7.8 7.7
Metro–non-metro 14 16.5
Non-metro–non-metro 10.5 31.2 Source – Go Air DRHP, Company, HDFC sec Research Over the 10 years to FY2020, there was a very strong positive correlation between GDP growth and domestic revenue passenger kilometres (RPKs) in India. This mirrors the relationship that has been observed globally over several decades. Over the last 20 years, domestic traffic in India has grown on average at around 1.8 times the GDP growth. Urbanisation is a further driver of rising incomes. In the 10 years to 2020 the proportion of the Indian population residing in urban areas increased from 30.9% in 2010 to 34.9% in 2020, and is expected to rise further to 40.1% in 2030. The transition to urban areas is driving strong population and economic growth in Tier 2 and Tier 3 centres, which in turn will continue to drive increasing demand for air travel to/from these non-metro cities.

Interglobe Aviation Ltd.
10
Source: Go Air DRHP, IATA/Tourism Economics, Air Passenger Forecasts
Interglobe Aviation Ltd.
11
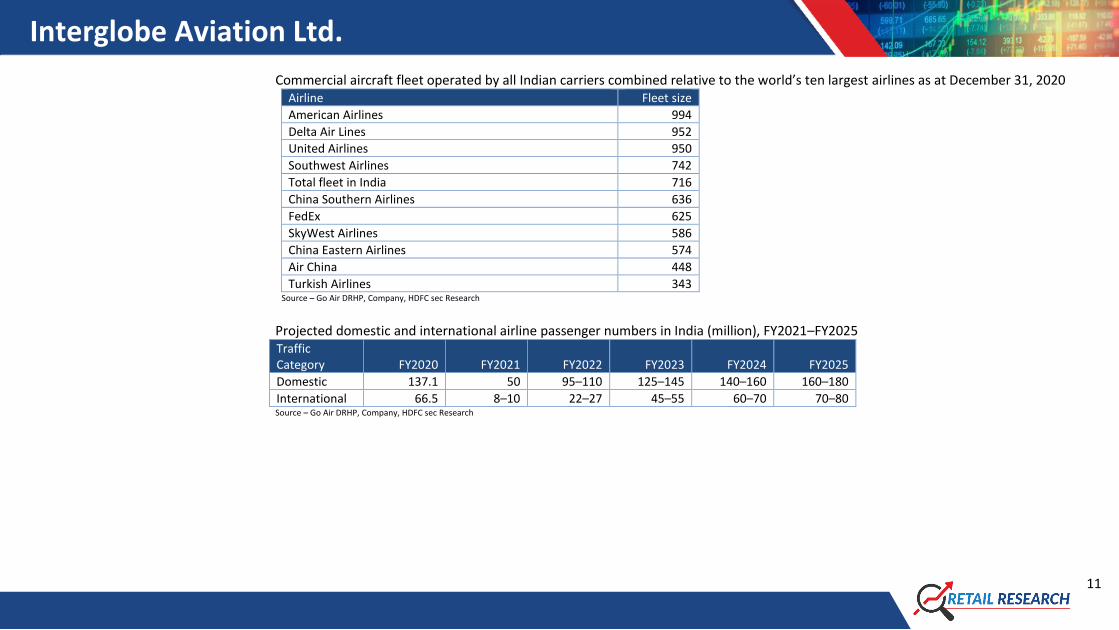
Commercial aircraft fleet operated by all Indian carriers combined relative to the world’s ten largest airlines as at December 31, 2020 Airline Fleet size
American Airlines 994
Delta Air Lines 952
United Airlines 950
Southwest Airlines 742
Total fleet in India 716
China Southern Airlines 636
FedEx 625
SkyWest Airlines 586
China Eastern Airlines 574
Air China 448
Turkish Airlines 343 Source – Go Air DRHP, Company, HDFC sec Research Projected domestic and international airline passenger numbers in India (million), FY2021–FY2025 Traffic Category FY2020 FY2021 FY2022 FY2023 FY2024 FY2025
Domestic 137.1 50 95–110 125–145 140–160 160–180
International 66.5 8–10 22–27 45–55 60–70 70–80 Source – Go Air DRHP, Company, HDFC sec Research

Interglobe Aviation Ltd.
12
Average fleet age across foreign and Indian LCCs, as on March 9, 2021
Source – Go Air DRHP, Company, HDFC sec Research What could go wrong? COVID-led lockdown and sentiment will impact profitability 50% of India’s domestic air travel demand comes from corporates, 30% from visiting friends/family and 20% is pure discretionary and leisure based. We believe that business and relocation related demand should be the first to recover once normalcy resumes and demand from other segments should take more time to recover. Certainly, in the short term, travel will become more defined by purpose. Companies may reduce official travel. Globally, companies would be more conscious of travel spending, especially if technology can be effectively utilized instead and travel can be avoided. Investment in virtual tools such as Zoom could become the norm, given it is more cost-efficient, and managements could reduce dependence on air travel.
Interglobe Aviation Ltd.
13
Domestic and international air travel has been suspended during the lockdown, which has increased the burden of fixed costs for aviation companies. With the onset of the second wave of COVID-19, countries have adopted regulations for keeping travelers isolated for two weeks (after their arrival from another country) if they test positive for COVID-19. Those without a permanent residence are being sent directly to the isolation wards. Also, many countries have again cancelled flights from India. A vaccine passport is a digital document showing that people have been vaccinated or tested for the virus. Vaccine passports will help countries to open borders to those who have been vaccinated or have taken the tests before travelling. Against this backdrop, airlines may not be able to raise prices as much as they would prefer to, given stiff competition and hesitation to travel by air. Aviation companies are also experiencing increased In-flight costs due to safety/cleaning/cabin crew gear (as cabin crew wear PPE provided by the airline), regular aircraft sanitization, etc. A dispute between promoters can hamper decision making at company level There is an ongoing dispute between Rakesh Gangwal and Rahul Bhatia, the two main promoters of Indigo. The main reason for their public fallout has been related-party transactions. Gangwal alleges that IndiGo entered related-party transactions with companies associated with Bhatia. Related-party transactions can influence the decision making of Indigo. Additionally, these transactions carry a risk that the related party may be given undue favors, harming the company’s and shareholders’ interests. Indigo has settled a case with the SEBI involving an alleged violation of corporate governance norms raised by its co-founder and director Rakesh Gangwal. The company paid Rs.2.10 cr to the regulator. The watchdog initiated an investigation against the airlines after it had received several complaints from Mr Gangwal alleging several violations. Volatility in crude oil prices The profitability of airlines is dependent on fuel cost. As airlines have high earnings sensitivity to oil prices, a sudden jump will affect overall profitability. There is an inverse relation between crude prices and operational performance.
Interglobe Aviation Ltd.
14
Source – Company, HDFC sec Research
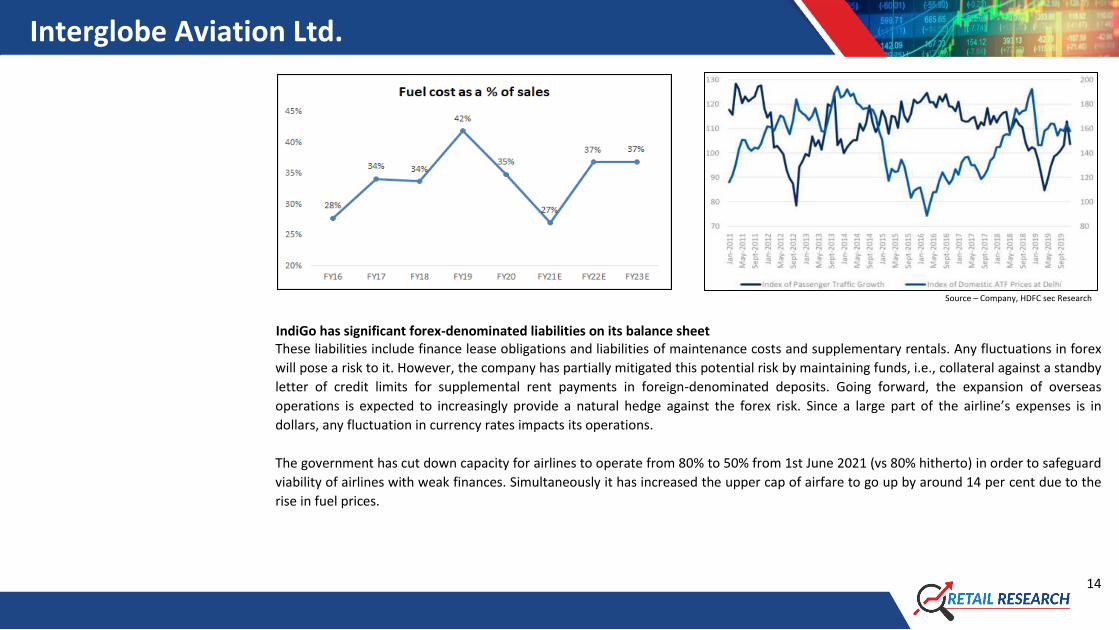
IndiGo has significant forex-denominated liabilities on its balance sheet These liabilities include finance lease obligations and liabilities of maintenance costs and supplementary rentals. Any fluctuations in forex
will pose a risk to it. However, the company has partially mitigated this potential risk by maintaining funds, i.e., collateral against a standby
letter of credit limits for supplemental rent payments in foreign-denominated deposits. Going forward, the expansion of overseas
operations is expected to increasingly provide a natural hedge against the forex risk. Since a large part of the airline’s expenses is in
dollars, any fluctuation in currency rates impacts its operations.
The government has cut down capacity for airlines to operate from 80% to 50% from 1st June 2021 (vs 80% hitherto) in order to safeguard
viability of airlines with weak finances. Simultaneously it has increased the upper cap of airfare to go up by around 14 per cent due to the
rise in fuel prices.
Interglobe Aviation Ltd.
15
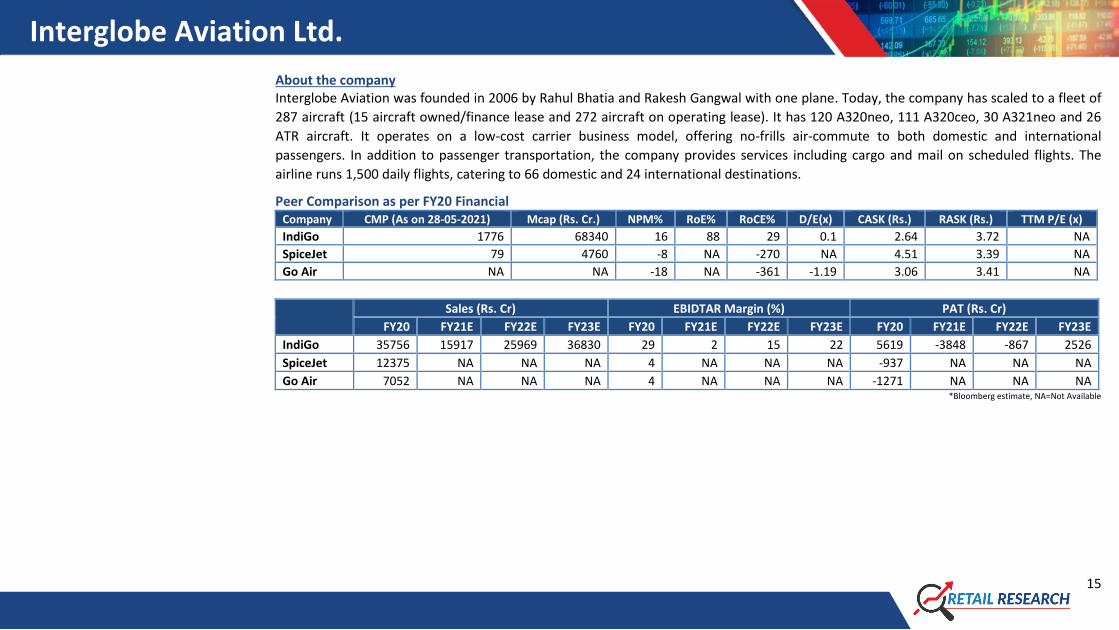
About the company Interglobe Aviation was founded in 2006 by Rahul Bhatia and Rakesh Gangwal with one plane. Today, the company has scaled to a fleet of
287 aircraft (15 aircraft owned/finance lease and 272 aircraft on operating lease). It has 120 A320neo, 111 A320ceo, 30 A321neo and 26
ATR aircraft. It operates on a low-cost carrier business model, offering no-frills air-commute to both domestic and international
passengers. In addition to passenger transportation, the company provides services including cargo and mail on scheduled flights. The
airline runs 1,500 daily flights, catering to 66 domestic and 24 international destinations.
Peer Comparison as per FY20 Financial Company CMP (As on 28-05-2021) Mcap (Rs. Cr.) NPM% RoE% RoCE% D/E(x) CASK (Rs.) RASK (Rs.) TTM P/E (x)
IndiGo 1776 68340 16 88 29 0.1 2.64 3.72 NA
SpiceJet 79 4760 -8 NA -270 NA 4.51 3.39 NA
Go Air NA NA -18 NA -361 -1.19 3.06 3.41 NA
Sales (Rs. Cr) EBIDTAR Margin (%) PAT (Rs. Cr)
FY20 FY21E FY22E FY23E FY20 FY21E FY22E FY23E FY20 FY21E FY22E FY23E
IndiGo 35756 15917 25969 36830 29 2 15 22 5619 -3848 -867 2526
SpiceJet 12375 NA NA NA 4 NA NA NA -937 NA NA NA
Go Air 7052 NA NA NA 4 NA NA NA -1271 NA NA NA *Bloomberg estimate, NA=Not Available
Interglobe Aviation Ltd.
16
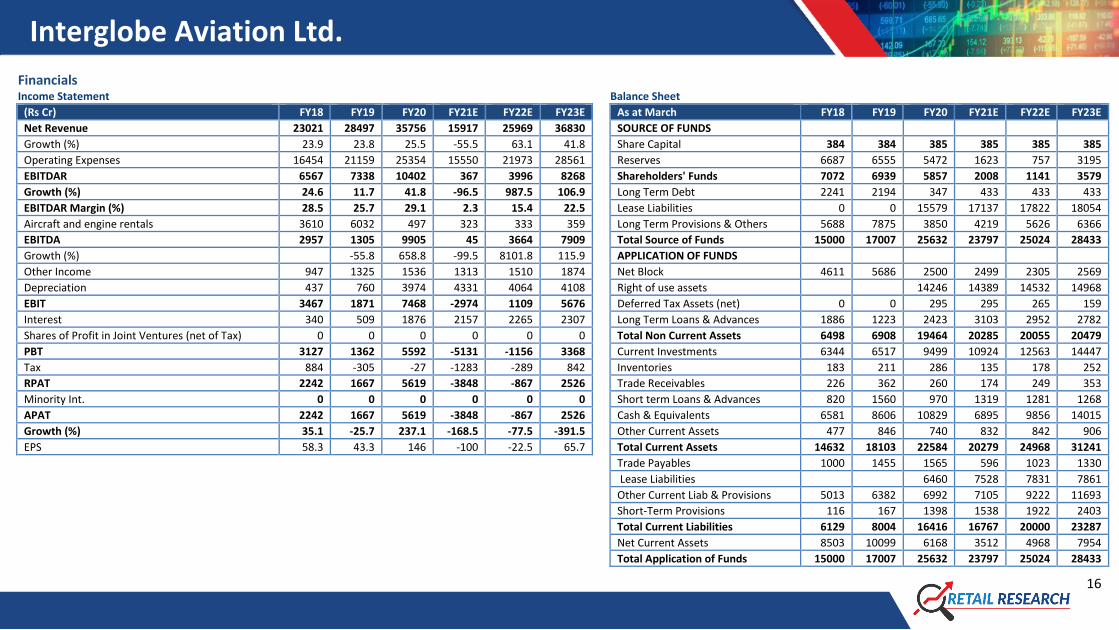
Financials Income Statement Balance Sheet
(Rs Cr) FY18 FY19 FY20 FY21E FY22E FY23E As at March FY18 FY19 FY20 FY21E FY22E FY23E
Net Revenue 23021 28497 35756 15917 25969 36830 SOURCE OF FUNDS
Growth (%) 23.9 23.8 25.5 -55.5 63.1 41.8 Share Capital 384 384 385 385 385 385
Operating Expenses 16454 21159 25354 15550 21973 28561 Reserves 6687 6555 5472 1623 757 3195
EBITDAR 6567 7338 10402 367 3996 8268 Shareholders' Funds 7072 6939 5857 2008 1141 3579
Growth (%) 24.6 11.7 41.8 -96.5 987.5 106.9 Long Term Debt 2241 2194 347 433 433 433
EBITDAR Margin (%) 28.5 25.7 29.1 2.3 15.4 22.5 Lease Liabilities 0 0 15579 17137 17822 18054
Aircraft and engine rentals 3610 6032 497 323 333 359 Long Term Provisions & Others 5688 7875 3850 4219 5626 6366
EBITDA 2957 1305 9905 45 3664 7909 Total Source of Funds 15000 17007 25632 23797 25024 28433
Growth (%) -55.8 658.8 -99.5 8101.8 115.9 APPLICATION OF FUNDS
Other Income 947 1325 1536 1313 1510 1874 Net Block 4611 5686 2500 2499 2305 2569
Depreciation 437 760 3974 4331 4064 4108 Right of use assets 14246 14389 14532 14968
EBIT 3467 1871 7468 -2974 1109 5676 Deferred Tax Assets (net) 0 0 295 295 265 159
Interest 340 509 1876 2157 2265 2307 Long Term Loans & Advances 1886 1223 2423 3103 2952 2782
Shares of Profit in Joint Ventures (net of Tax) 0 0 0 0 0 0 Total Non Current Assets 6498 6908 19464 20285 20055 20479
PBT 3127 1362 5592 -5131 -1156 3368 Current Investments 6344 6517 9499 10924 12563 14447
Tax 884 -305 -27 -1283 -289 842 Inventories 183 211 286 135 178 252
RPAT 2242 1667 5619 -3848 -867 2526 Trade Receivables 226 362 260 174 249 353
Minority Int. 0 0 0 0 0 0 Short term Loans & Advances 820 1560 970 1319 1281 1268
APAT 2242 1667 5619 -3848 -867 2526 Cash & Equivalents 6581 8606 10829 6895 9856 14015
Growth (%) 35.1 -25.7 237.1 -168.5 -77.5 -391.5 Other Current Assets 477 846 740 832 842 906
EPS 58.3 43.3 146 -100 -22.5 65.7 Total Current Assets 14632 18103 22584 20279 24968 31241
Trade Payables 1000 1455 1565 596 1023 1330
Lease Liabilities 6460 7528 7831 7861
Other Current Liab & Provisions 5013 6382 6992 7105 9222 11693
Short-Term Provisions 116 167 1398 1538 1922 2403
Total Current Liabilities 6129 8004 16416 16767 20000 23287
Net Current Assets 8503 10099 6168 3512 4968 7954
Total Application of Funds 15000 17007 25632 23797 25024 28433

Interglobe Aviation Ltd.
17
Cash Flow Statement Key Ratios
(Rs Cr) FY18 FY19 FY20 FY21E FY22E FY23E FY18 FY19 FY20 FY21E FY22E FY23E
Reported PBT 3,127 -149 -275 -5,131 -1,156 3,368 Profitability (%)
Adjustments 4 525 5,932 5,176 4,819 4,541 EBITDAR Margin 28.5 25.7 29.1 2.3 15.4 22.5
Working Capital Change 1,510 2,879 1,593 -2,347 1,201 1,144 EBIT Margin 15.1 6.6 20.9 -18.7 4.3 15.4
Tax Paid -738 -95 -306 1,283 289 -842 APAT Margin 9.7 5.8 15.7 -24.2 -3.3 6.9
OPERATING CASH FLOW ( a ) 3,903 3,160 6,943 -1,019 5,154 8,211 RoE 41.3 23.8 87.7 -97.8 -55 107
Capex -1,220 -1,706 -1,060 -142 -50 700 RoCE 23.1 11 29.1 -12.5 4.4 20
Free Cash Flow 2,683 1,454 5,883 -1,161 5,104 8,911 Solvency Ratio
Investments -3,463 -1,320 -3,881 -679 180 276 D/E 0.3 0.3 0.1 0.2 0.4 0.1
Non-operating income 531 501 369 1,313 1,510 1,874 Interest Coverage 10.2 3.7 4 -1.4 0.5 2.5
INVESTING CASH FLOW ( b ) -4,152 -2,526 -4,573 491 1,640 2,851 PER SHARE DATA
Debt Issuance / (Repaid) -53 -285 -2,166 456 1,407 740 EPS 58.3 43.3 146 -100 -22.5 65.7
Interest Expenses -21 -29 -34 -2,157 -2,265 -2,307 CEPS 69.7 63.1 249.3 12.5 83.1 172.4
FCFE 2,609 1,140 3,683 -2,863 4,246 7,344 BV 184 181 152 52 30 93
Share Capital Issuance 2,508 0 24 -6 0 0 Dividend 34 6 5 0 0 2.3
Dividend -1,230 -231 -192 0 0 -89 Turnover Ratios (days)
Other financial Activity -438 -47 -40 -484 -383 -202 Debtor days 4 5 3 4 4 4
FINANCING CASH FLOW ( c ) 766 -592 -2,407 -2,191 -1,240 -1,858 Inventory days 3 3 3 3 3 3
NET CASH FLOW (a+b+c) 518 42 -37 -2,719 5,554 9,203 Creditors days 20 21 22 14 17 17 Working Capital Days -13 -14 -17 -7 -11 -11
VALUATION
P/E 30.5 41 12.2 -17.8 -78.8 27.1
P/BV 9.7 9.8 11.7 34 59.8 19.1
EV/EBITDAR 10.1 9 6.4 180.2 16.6 8
Dividend Yield 1.9 0.3 0.3 0 0 0.1
Dividend Payout 76.3 13.9 3.4 0 0 3.5 Source: Company, HDFC sec Research

Interglobe Aviation Ltd.
18
Abbreviations
Term Description
ASK Available Seat Kilometer
CASK Total Cost net of finance income per Available Seat Kilometer
CASK ex fuel Total Cost excluding fuel cost net of finance income per Available Seat Kilometer
EBITDAR Earnings before finance income and cost, tax, depreciation, amortization and aircraft and engine rentals
EBITDAR margin EBITDAR / Revenue from Operations
Load Factor Revenue Passenger Kilometer/Available Seat Kilometer
OTP On Time Performance
RASK Total Revenue net of finance income per Available Seat Kilometer
RPK Revenue Passenger Kilometer
Yield Passenger Ticket Revenue / Revenue Passenger Kilometer
One Year Price Chart
(Source: Company, HDFC sec)

Interglobe Aviation Ltd.
19
Disclosure: I, Jimit Zaveri, (MBA - Finance), authors and the names subscribed to this report, hereby certify that all of the views expressed in this research report accurately reflect our views about the subject issuer(s) or securities. HSL has no material adverse disciplinary history as on the date of
publication of this report. We also certify that no part of our compensation was, is, or will be directly or indirectly related to the specific recommendation(s) or view(s) in this report.
Research Analyst or his relative or HDFC Securities Ltd. does not have any financial interest in the subject company. Also Research Analyst or his relative or HDFC Securities Ltd. or its Associate may have beneficial ownership of 1% or more in the subject company at the end of the month
immediately preceding the date of publication of the Research Report. Further Research Analyst or his relative or HDFC Securities Ltd. or its associate does not have any material conflict of interest.
Any holding in stock – No
HDFC Securities Limited (HSL) is a SEBI Registered Research Analyst having registration no. INH000002475.
Disclaimer:
This report has been prepared by HDFC Securities Ltd and is meant for sole use by the recipient and not for circulation. The information and opinions contained herein have been compiled or arrived at, based upon information obtained in good faith from sources believed to be reliable.
Such information has not been independently verified and no guaranty, representation of warranty, express or implied, is made as to its accuracy, completeness or correctness. All such information and opinions are subject to change without notice. This document is for information
purposes only. Descriptions of any company or companies or their securities mentioned herein are not intended to be complete and this document is not, and should not be construed as an offer or solicitation of an offer, to buy or sell any securities or other financial instruments.
This report is not directed to, or intended for display, downloading, printing, reproducing or for distribution to or use by, any person or entity who is a citizen or resident or located in any locality, state, country or other jurisdiction where such distribution, publication, reproduction,
availability or use would be contrary to law or regulation or what would subject HSL or its affiliates to any registration or licensing requirement within such jurisdiction.
If this report is inadvertently sent or has reached any person in such country, especially, United States of America, the same should be ignored and brought to the attention of the sender. This document may not be reproduced, distributed or published in whole or in part, directly or
indirectly, for any purposes or in any manner.
Foreign currencies denominated securities, wherever mentioned, are subject to exchange rate fluctuations, which could have an adverse effect on their value or price, or the income derived from them. In addition, investors in securities such as ADRs, the values of which are influenced
by foreign currencies effectively assume currency risk.
It should not be considered to be taken as an offer to sell or a solicitation to buy any security. HSL may from time to time solicit from, or perform broking, or other services for, any company mentioned in this mail and/or its attachments.
HSL and its affiliated company(ies), their directors and employees may; (a) from time to time, have a long or short position in, and bu y or sell the securities of the company(ies) mentioned herein or (b) be engaged in any other transaction involving such secur ities and earn brokerage or
other compensation or act as a market maker in the financial instruments of the company(ies) discussed herein or act as an advisor or lender/borrower to such company(ies) or may have any other potential conflict of interests with respect to any recommendation and other related
information and opinions.
HSL, its directors, analysts or employees do not take any responsibility, financial or otherwise, of the losses or the damages sustained due to the investments made or any action taken on basis of this report, including but not restricted to, fluctuation in the prices of shares and bonds,
changes in the currency rates, diminution in the NAVs, reduction in the dividend or income, etc.
HSL and other group companies, its directors, associates, employees may have various positions in any of the stocks, securities and financial instruments dealt in the report, or may make sell or purchase or other deals in these securities from time to time or may deal in other securities
of the companies / organizations described in this report.
HSL or its associates might have managed or co-managed public offering of securities for the subject company or might have been mandated by the subject company for any other assignment in the past twelve months.
HSL or its associates might have received any compensation from the companies mentioned in the report during the period preceding twelve months from t date of this report for services in respect of managing or co-managing public offerings, corporate finance, investment banking or
merchant banking, brokerage services or other advisory service in a merger or specific transaction in the normal course of business.
HSL or its analysts did not receive any compensation or other benefits from the companies mentioned in the report or third party in connection with preparation of the research report. Accordingly, neither HSL nor Research Analysts have any material conflict of interest at the time of
publication of this report. Compensation of our Research Analysts is not based on any specific merchant banking, investment banking or brokerage service transactions. HSL may have issued other reports that are inconsistent with and reach different conclusion from the information
presented in this report.
Research entity has not been engaged in market making activity for the subject company. Research analyst has not served as an officer, director or employee of the subject company. We have not received any compensation/benefits from the subject company or third party in
connection with the Research Report.
HDFC securities Limited, I Think Techno Campus, Building - B, "Alpha", Office Floor 8, Near Kanjurmarg Station, Opp. Crompton Greaves, Kanjurmarg (East), Mumbai 400 042 Phone: (022) 3075 3400 Fax: (022) 2496 5066
Compliance Officer: Binkle R. Oza Email: [email protected] Phone: (022) 3045 3600
HDFC Securities Limited, SEBI Reg. No.: NSE, BSE, MSEI, MCX: INZ000186937; AMFI Reg. No. ARN: 13549; PFRDA Reg. No. POP: 11092018; IRDA Corporate Agent License No.: CA0062; SEBI Research Analyst Reg. No.: INH000002475; SEBI Investment Adviser Reg. No.: INA000011538; CIN -
U67120MH2000PLC152193
Mutual Funds Investments are subject to market risk. Please read the offer and scheme related documents carefully before investing.