Infosys Ltd. - HDFC securities
11
Initiating Coverage Infosys Ltd. 31-Aug-2020
-
Upload
khangminh22 -
Category
Documents
-
view
3 -
download
0
Transcript of Infosys Ltd. - HDFC securities
Infosys Ltd.
1
Lorem ipsum dolor sit amet, consectetuer adipiscing elit, sed diam nonummy nibh euismod tincidunt ut laoreet dolore magna aliquam erat volutpat. Ut wisi enim ad minim veniam, quis nostrud exerci tation ullamcorper suscipit lobortis nisl ut aliquip ex ea commodo consequat. Duis autem vel eum iriure dolor in hendrerit in vulputate velit esse molestie consequat, vel illum dolore eu feugiat nulla
Lorem ipsum dolor sit amet, consectetuer adipiscing elit, sed diam nonummy
nibh euismod tincidunt ut laoreet dolore magna aliquam erat volutpat. Ut wisi enim ad minim veniam,
quis nostrud exerci tation ullamcorper suscipit lobortis nisl ut aliquip ex ea commodo consequat. Duis autem vel eum iriure dolor in hendrerit in vulputate velit esse molestie consequat,
vel illum dolore eu feugiat nulla facilisis at vero eros et accumsan et iusto odio dignissim qui blandit praesent luptatum zzril delenit augue duis dolore te feugait nulla facilisi. et iusto odio dignissim qui blandit praesent luptatum zzril delenit
Initiating Coverage
Infosys Ltd. 31-Aug-2020
Infosys Ltd.
2
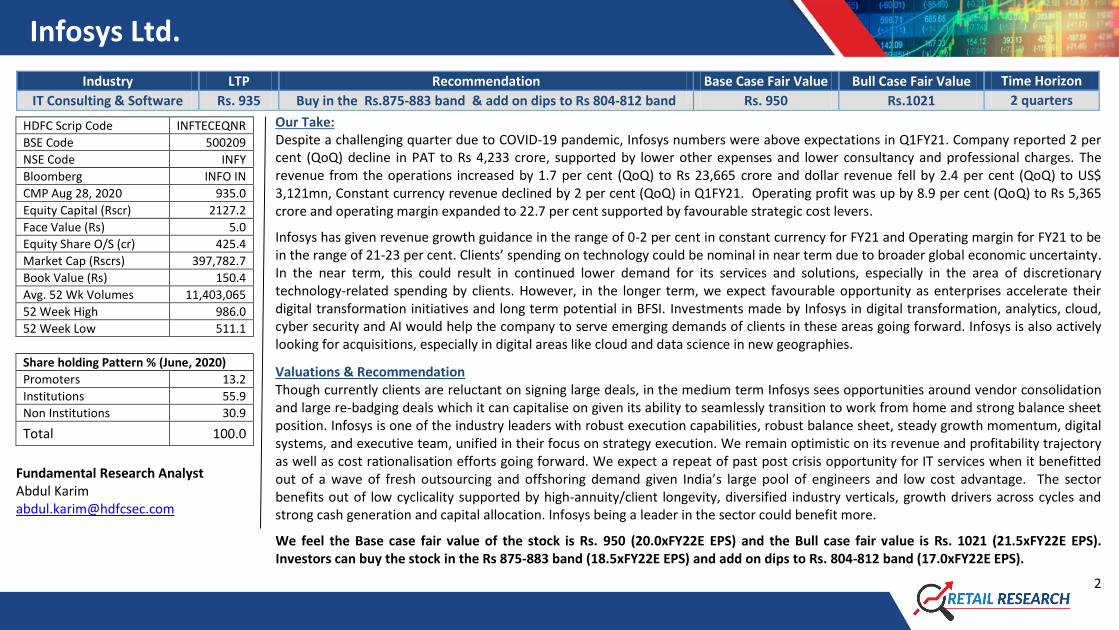
Industry LTP Recommendation Base Case Fair Value Bull Case Fair Value Time Horizon
IT Consulting & Software Rs. 935 Buy in the Rs.875-883 band & add on dips to Rs 804-812 band Rs. 950 Rs.1021 2 quarters
Our Take: Despite a challenging quarter due to COVID-19 pandemic, Infosys numbers were above expectations in Q1FY21. Company reported 2 per cent (QoQ) decline in PAT to Rs 4,233 crore, supported by lower other expenses and lower consultancy and professional charges. The revenue from the operations increased by 1.7 per cent (QoQ) to Rs 23,665 crore and dollar revenue fell by 2.4 per cent (QoQ) to US$ 3,121mn, Constant currency revenue declined by 2 per cent (QoQ) in Q1FY21. Operating profit was up by 8.9 per cent (QoQ) to Rs 5,365 crore and operating margin expanded to 22.7 per cent supported by favourable strategic cost levers.
Infosys has given revenue growth guidance in the range of 0-2 per cent in constant currency for FY21 and Operating margin for FY21 to be in the range of 21-23 per cent. Clients’ spending on technology could be nominal in near term due to broader global economic uncertainty. In the near term, this could result in continued lower demand for its services and solutions, especially in the area of discretionary technology-related spending by clients. However, in the longer term, we expect favourable opportunity as enterprises accelerate their digital transformation initiatives and long term potential in BFSI. Investments made by Infosys in digital transformation, analytics, cloud, cyber security and AI would help the company to serve emerging demands of clients in these areas going forward. Infosys is also actively looking for acquisitions, especially in digital areas like cloud and data science in new geographies.
Valuations & Recommendation Though currently clients are reluctant on signing large deals, in the medium term Infosys sees opportunities around vendor consolidation and large re-badging deals which it can capitalise on given its ability to seamlessly transition to work from home and strong balance sheet position. Infosys is one of the industry leaders with robust execution capabilities, robust balance sheet, steady growth momentum, digital systems, and executive team, unified in their focus on strategy execution. We remain optimistic on its revenue and profitability trajectory as well as cost rationalisation efforts going forward. We expect a repeat of past post crisis opportunity for IT services when it benefitted out of a wave of fresh outsourcing and offshoring demand given India’s large pool of engineers and low cost advantage. The sector benefits out of low cyclicality supported by high-annuity/client longevity, diversified industry verticals, growth drivers across cycles and strong cash generation and capital allocation. Infosys being a leader in the sector could benefit more.
We feel the Base case fair value of the stock is Rs. 950 (20.0xFY22E EPS) and the Bull case fair value is Rs. 1021 (21.5xFY22E EPS). Investors can buy the stock in the Rs 875-883 band (18.5xFY22E EPS) and add on dips to Rs. 804-812 band (17.0xFY22E EPS).
HDFC Scrip Code INFTECEQNR
BSE Code 500209
NSE Code INFY
Bloomberg INFO IN
CMP Aug 28, 2020 935.0
Equity Capital (Rscr) 2127.2
Face Value (Rs) 5.0
Equity Share O/S (cr) 425.4
Market Cap (Rscrs) 397,782.7
Book Value (Rs) 150.4
Avg. 52 Wk Volumes 11,403,065
52 Week High 986.0
52 Week Low 511.1
Share holding Pattern % (June, 2020)
Promoters 13.2
Institutions 55.9
Non Institutions 30.9
Total 100.0
Fundamental Research Analyst Abdul Karim [email protected]
Infosys Ltd.
3
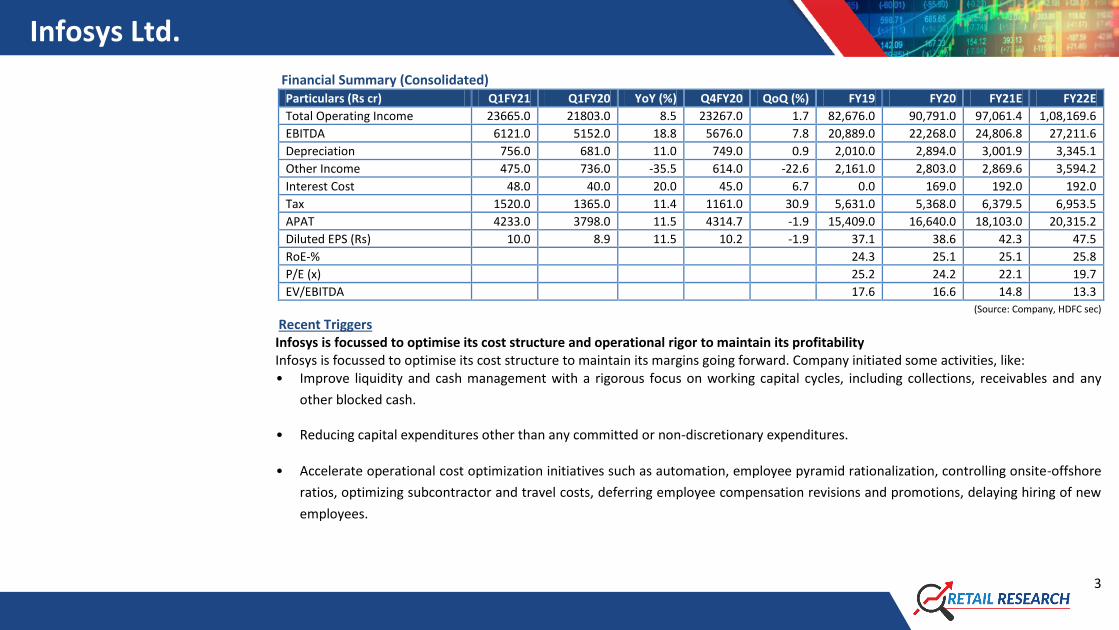
Financial Summary (Consolidated) Particulars (Rs cr) Q1FY21 Q1FY20 YoY (%) Q4FY20 QoQ (%) FY19 FY20 FY21E FY22E
Total Operating Income 23665.0 21803.0 8.5 23267.0 1.7 82,676.0 90,791.0 97,061.4 1,08,169.6
EBITDA 6121.0 5152.0 18.8 5676.0 7.8 20,889.0 22,268.0 24,806.8 27,211.6
Depreciation 756.0 681.0 11.0 749.0 0.9 2,010.0 2,894.0 3,001.9 3,345.1
Other Income 475.0 736.0 -35.5 614.0 -22.6 2,161.0 2,803.0 2,869.6 3,594.2
Interest Cost 48.0 40.0 20.0 45.0 6.7 0.0 169.0 192.0 192.0
Tax 1520.0 1365.0 11.4 1161.0 30.9 5,631.0 5,368.0 6,379.5 6,953.5
APAT 4233.0 3798.0 11.5 4314.7 -1.9 15,409.0 16,640.0 18,103.0 20,315.2
Diluted EPS (Rs) 10.0 8.9 11.5 10.2 -1.9 37.1 38.6 42.3 47.5
RoE-% 24.3 25.1 25.1 25.8
P/E (x) 25.2 24.2 22.1 19.7
EV/EBITDA 17.6 16.6 14.8 13.3
(Source: Company, HDFC sec)
Recent Triggers Infosys is focussed to optimise its cost structure and operational rigor to maintain its profitability Infosys is focussed to optimise its cost structure to maintain its margins going forward. Company initiated some activities, like: • Improve liquidity and cash management with a rigorous focus on working capital cycles, including collections, receivables and any
other blocked cash.
• Reducing capital expenditures other than any committed or non-discretionary expenditures.
• Accelerate operational cost optimization initiatives such as automation, employee pyramid rationalization, controlling onsite-offshore
ratios, optimizing subcontractor and travel costs, deferring employee compensation revisions and promotions, delaying hiring of new
employees.
Infosys Ltd.
4
Infosys sees healthy deal pipeline with delayed conversions Infosys deal pipeline is healthier than before, though cost-cutting and cash conservation measures by clients have led to delayed conversions. Infosys announced large deal wins worth US$ 1.74bn in Q1FY21 (excluding the deal from Vanguard) vs. US$ 1.65bn in Q4FY20. Digital revenues stood at US$ 1,389mn, grew by 3.6 per cent (QoQ) and 25.5 per cent (YoY). It contributes 44.5 per cent of total revenues vs 41.9 per cent in Q4FY20. On August, 2020, Infosys has signed a five-year deal with cloud customer experience and contact centre solutions provider, Genesys. Company’s five-year partnership with Genesys enables both companies to develop and deploy innovation and best-in-class solutions in the customer experience market. As a part of the partnership, Infosys will bring to market Genesys' contact centre solutions. On July, 2020, Infosys and German firm LANXESS entered into a long term partnership for digital and workplace transformation. LANXESS manufactures chemical intermediates, additives, specialty chemicals in Germany. Infosys will support LANXESS in its IT infrastructure digitisation strategy and enable its global workforce spread across 33 countries using a secure and fully managed modern workplace. The long-term contracts with large fortune 500 companies make the sector (including Infosys) less vulnerable to downturns. Also, Covid-19 is driving enterprises to increase spend on modernising the IT infrastructure and applications at a much faster pace than ever before to move to Public/Private cloud. In addition, Infosys should be able to maintain margins on increasing digital mix, lower sub-contracting costs, rising utilization and optimizing the employee structures. Infosys has seen an increase in client discussions, and in the near-term, sees demand in areas of collaboration, cost take-outs and increasing automation. Infosys is seeing significant traction in cloud, digital, cyber security, workplace transformation, cost efficiency, and consolidation related opportunities. Over the medium term, the company sees an accelerated shift to digital at clients in areas of core modernisation, cloud migration, network virtualisation and cyber security. Its large deals team is focused on engaging with clients to take on their entire IT landscape and facilitate the shift to digital by cost savings in offshoring, automation and analytics. While currently clients are reluctant on signing large deals, in the medium term, Infosys sees opportunities around vendor consolidation and large re-badging deals. Infosys launches Artificial Intelligence-driven solution to automate helpdesk operations Infosys announced the launch of its AI-driven 'Cognitive Email Workbench' solution that gives enterprises the ability to augment query management and scale their helpdesk operations. Infosys leveraged its partnership with Blue Prism, a Robotic Process Automation (RPA)
Infosys Ltd.
5
provider and a strategic partner to develop the solution that promises to significantly enhance productivity and customer satisfaction. Apart from this, Infosys has aggressively invested in digital technologies in the past couple of years to capture the large portion of upcoming digital spends. Given strong relationships with clients and robust execution capabilities, Infosys is well positioned to capitalise on opportunities as and when clients boost their technology spends. Long term Triggers Leading player in the Indian IT services space, with established position across verticals and service lines Infosys is a global leading consulting and next generation service provider and Company has a diversified range of offerings across service segments and industry verticals. It has steadily increased the share of revenue from digital services, (45 per cent of revenue in Q1FY21, compared with 41.9 per cent of revenue in Q4FY20, 40.6 per cent in Q3FY20, and 36 per cent in Q1FY20) which comprise offerings based on artificial intelligence, big data, Internet of Things (IoT), cloud applications, and advanced cyber security systems, driven by better client acceptance of its digital products and services. The company's core services (56 per cent of revenue in Q1FY21 compared with 58 per cent in Q4FY20 and 64 per cent in Q1FY20) comprise traditional offerings and primarily include application development and management services, product engineering and management, infrastructure management services, support and integration services. In terms of verticals, Infosys derived about one third of its revenue from the banking, financial services, and insurance (BFSI) segment in Q1FY21. Company also has a large presence in other verticals, such as retail (14 per cent), communication (13 per cent), energy and utilities (13 per cent), and manufacturing (10 per cent).
Historical Nasscom data suggests that India gains market share in global sourcing every year and larger players gain market shares (at the cost of others). Infosys could be a beneficiary of this trend.
Healthy operating efficiency Infosys's business risk profile is supported by its leading market position, large scale of operations with a skilled resource base of 239,000 employees (as on 30th June, 2020), proven project execution skills, and strong offshore delivery capability. Company's profitability remains among the best in the industry supported by its superior revenue mix, cost optimisation measures, and delivery effectiveness. Company offers end-to-end service offering capabilities in consulting, software application development, integration, maintenance, validation, enterprise system implementation, product engineering, infrastructure management and business process management. Company has built specific industry domain and technology expertise, and in methodologies such as Design Thinking and Agile software development.
Infosys Ltd.
6
Sound fundamentals led by Comfortable capital structure and strong debt coverage indicators
Infosys financial profile has been robust led by debt free balance sheet and healthy cash generating ability over the past.
Financial flexibility is strong, supported by robust liquidity in the form of cash and cash equivalent of Rs 27,276 cr as on March 31,
2020. Liquidity will remain robust supported by sufficient funds to finance working capital and capital expenditure (capex)
requirement over the medium term.
Infosys has given revenue growth guidance in the range of 0-2 per cent in constant currency for FY21 and Operating margin for FY21 to
be in the range of 21-23 per cent.
Infosys has recommended a final dividend of Rs 17.5 per equity share (F.V of Rs 5 per equity share) in FY20, subject to the approval of
the shareholders, dividend yield stands at 2.5 per cent at current market price.
What could go wrong?
INR appreciation against the USD, pricing pressure, retention of the skilled headcounts, strict immigration norms as well as ban on US
H-1B and L1 visa, and rise in visa costs are key concerns.
Infosys American arm is facing a race discrimination suit in a Texas district court filed by its former diversity chief. Any significant
adverse observations or findings from the ongoing investigations by regulators and government agencies into the whistle-blower
complaints could impact its profitability.
Many of Its clients’ business operations may be negatively impacted due to the economic downturn – resulting in postponement,
termination, suspension of some ongoing projects with Infosys and / or reduced demand for its services and solutions.
Political uncertainty due to presidential election in the US further impacting IT spending decisions in key verticals such as BFSI and
Retail.
Sustained reduction in cash surplus due to large acquisitions or capital return to investors, affecting financial flexibility.
Infosys Ltd.
7
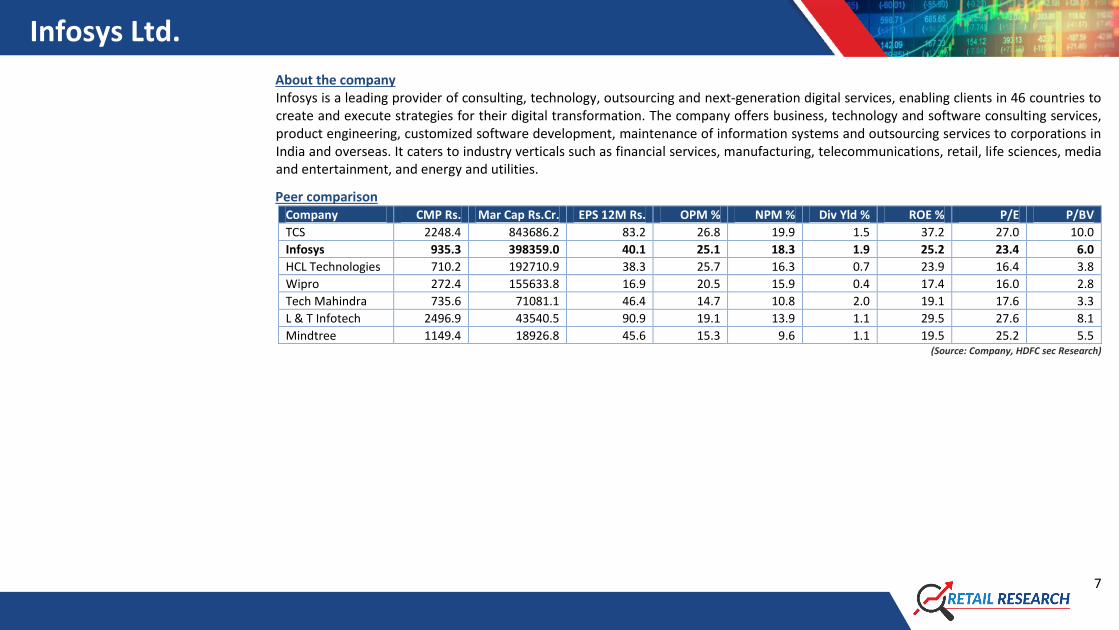
About the company Infosys is a leading provider of consulting, technology, outsourcing and next-generation digital services, enabling clients in 46 countries to create and execute strategies for their digital transformation. The company offers business, technology and software consulting services, product engineering, customized software development, maintenance of information systems and outsourcing services to corporations in India and overseas. It caters to industry verticals such as financial services, manufacturing, telecommunications, retail, life sciences, media and entertainment, and energy and utilities.
Peer comparison Company CMP Rs. Mar Cap Rs.Cr. EPS 12M Rs. OPM % NPM % Div Yld % ROE % P/E P/BV
TCS 2248.4 843686.2 83.2 26.8 19.9 1.5 37.2 27.0 10.0
Infosys 935.3 398359.0 40.1 25.1 18.3 1.9 25.2 23.4 6.0
HCL Technologies 710.2 192710.9 38.3 25.7 16.3 0.7 23.9 16.4 3.8
Wipro 272.4 155633.8 16.9 20.5 15.9 0.4 17.4 16.0 2.8
Tech Mahindra 735.6 71081.1 46.4 14.7 10.8 2.0 19.1 17.6 3.3
L & T Infotech 2496.9 43540.5 90.9 19.1 13.9 1.1 29.5 27.6 8.1
Mindtree 1149.4 18926.8 45.6 15.3 9.6 1.1 19.5 25.2 5.5 (Source: Company, HDFC sec Research)

Infosys Ltd.
8
Financials (Consolidated) Income Statement
Balance Sheet (Rs Cr) FY18 FY19 FY20 FY21E FY22E
As at March FY18 FY19 FY20 FY21E FY22E
Net Revenues 70522.0 82676.0 90791.0 97061.4 108169.6
SOURCE OF FUNDS
Growth (%) 3.0 17.2 9.8 6.9 11.4
Share Capital 1088 2170 2122 2122 2122
Operating Expenses 51512.0 61787.0 68523.0 72254.6 80958.1
Reserves 63835 62778 63328 69386.24 75958.3
EBITDA 19010.0 20889.0 22268.0 24806.8 27211.6
Shareholders' Funds 64923 64948 65450 71508.24 78080.3
Growth (%) 2.2 9.9 6.6 11.4 9.7
Long Term Debt 0 0 0 0 0
EBITDA Margin (%) 27.0 25.3 24.5 25.6 25.2
Net Deferred Taxes -741 -700 -776 -776 -776
Depreciation 1862.0 2010.0 2894.0 3001.9 3345.1
Long Term Provisions & Others 644 422 5100 5100 5100
EBIT 17148.0 18879.0 19374.0 21804.9 23866.5
Minority Interest 1 58 394 394 394
Other Income 3311.0 2161.0 2803.0 2869.6 3594.2
Total Source of Funds 64827 64728 70168 76226.24 82798.3
Interest expenses 0.0 0.0 169.0 192.0 192.0
APPLICATION OF FUNDS
PBT 20459.0 21040.0 22008.0 24482.5 27268.7
Net Block & Goodwill 12574 15710 23789 25136 26406.24
Tax 4242.0 5631.0 5368.0 6379.5 6953.5
CWIP 1606 1388 954 954 954
RPAT 16217.0 15409.0 16640.0 18103.0 20315.2
Other Non-Current Assets 9110 9136 7972 7988.506 8017.748
APAT 16217.0 15772.6 16403.9 17947.0 20159.2
Total Non Current Assets 23290 26234 32715 34078.51 35377.99
Growth (%) 13.0 -2.7 4.0 9.4 12.3
Current Investments 0 0 0 0 0
EPS 34.7 37.1 38.6 42.3 47.5
Inventories 0 0 0 0 0
Trade Receivables 13142 14827 18487 19763.79 22025.66
Cash & Equivalents 31765 30690 27276 31348.47 35444.3
Other Current Assets 10411 11615 12546 13186.22 14394.78
Total Current Assets 55318 57132 58309 64298.48 71864.74
Short-Term Borrowings 0 0 0 0 0
Trade Payables 694 1655 2852 3048.972 3397.912
Other Current Liab & Provisions 13087 16983 18004 19101.78 21046.52
Total Current Liabilities 13781 18638 20856 22150.75 24444.43
Net Current Assets 41537 38494 37453 42147.73 47420.31
Total Application of Funds 64827 64728 70168 76226.24 82798.3

Infosys Ltd.
9
Cash Flow Statement
Key Ratios (Rs Cr) FY18 FY19 FY20 FY21E FY22E
(Rs Cr) FY18 FY19 FY20 FY21E FY22E
Reported PBT 20,459.0 21,040.0 22,008.0 24,482.5 27,268.7
EBITDA Margin 27.0 25.3 24.5 25.6 25.2
Non-operating & EO items -2,170.0 -926.0 -980.0 -2,121.8 -2,677.7
EBIT Margin 24.3 22.8 21.3 22.5 22.1
Interest Expenses 0.0 0.0 169.0 192.0 192.0
APAT Margin 23.0 19.1 18.1 18.5 18.6
Depreciation 1,862.0 2,010.0 2,894.0 3,001.9 3,345.1
RoE 25.0 24.3 25.1 25.1 25.8
Working Capital Change 84.0 -453.0 -2,367.0 -622.3 -1,176.8
RoCE 31.5 32.4 33.9 34.5 35.2
Tax Paid -6,829.0 -6,832.0 -4,550.0 -6,379.5 -6,953.5
Solvency Ratio
OPERATING CASH FLOW ( a ) 13,406.0 14,839.0 17,174.0 18,552.8 19,997.8
Net Debt/EBITDA (x) 0.0 0.0 0.0 0.0 0.0
Capex -1,998.0 -2,445.0 -3,307.0 -4,217.6 -4,382.7
Net D/E 0.0 0.0 0.0 0.0 0.0
Free Cash Flow 11,408.0 12,394.0 13,867.0 14,335.2 15,615.1
PER SHARE DATA
Investments 59.0 77.0 -26.0 0.0 0.0
EPS 34.7 37.1 38.6 42.3 47.5
Non-operating income 2,170.0 926.0 980.0 2,121.8 2,677.7
CEPS 38.1 40.9 44.3 48.1 54.0
INVESTING CASH FLOW ( b ) 231.0 -1,442.0 -2,353.0 -2,095.8 -1,705.0
Dividend 16.8 21.5 17.5 28.0 32.0
Debt Issuance / (Repaid) 0.0 0.0 0.0 0.0 0.0
BVPS 149.1 149.2 150.4 164.3 179.4
Interest Expenses 0.0 0.0 -169.0 -192.0 -192.0
Turnover Ratios (days)
FCFE 11,408.0 12,394.0 13,698.0 14,143.2 15,423.1
Debtor days 68.0 65.5 74.3 74.3 74.3
Share Capital Issuance 5.0 6.0 6.0 0.0 0.0
Inventory days 0.0 0.0 0.0 0.0 0.0
Dividend -20,510.0 -14,518.0 -17,026.0 -11,888.7 -13,587.1
Creditors days 3.6 7.3 11.5 11.5 11.5
Others 0.0 0.0 0.0 0.0 0.0
VALUATION
FINANCING CASH FLOW ( c ) -20,505.0 -14,512.0 -17,189.0 -12,080.7 -13,779.1
P/E 26.9 25.2 24.2 22.1 19.7
NET CASH FLOW (a+b+c) -6,868.0 -1,115.0 -2,368.0 4,376.3 4,513.6
P/BV 6.3 6.3 6.2 5.7 5.2
EV/EBITDA 19.3 17.6 16.6 14.8 13.3
EV / Revenues 5.2 4.4 4.1 3.8 3.3
Dividend Yield (%) 1.8 2.3 1.9 3.0 3.4
Dividend Payout 48.3 57.9 45.3 66.2 67.4 (Source: Company, HDFC sec Research)
Infosys Ltd.
10
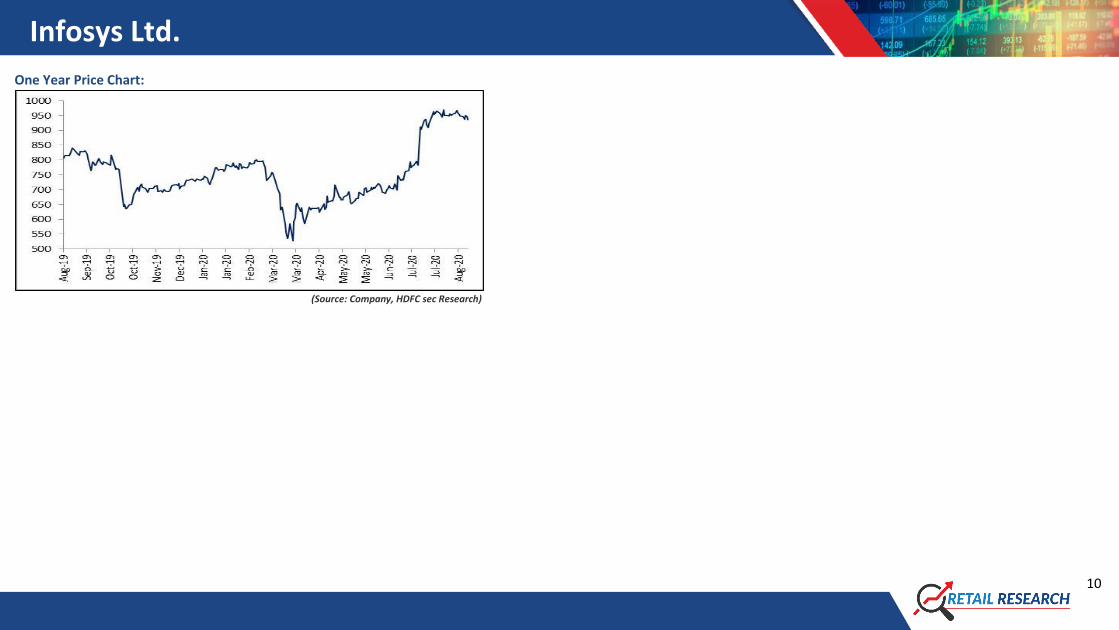
One Year Price Chart:
(Source: Company, HDFC sec Research)
Infosys Ltd.
11
Disclosure: I, Abdul Karim (MBA), authors and the names subscribed to this report, hereby certify that all of the views expressed in this research report accurately reflect our views about the subject issuer(s) or securities. HSL has no material adverse disciplinary history as on the date of publication of this report. We also certify that no part of our compensation was, is, or will be directly or indirectly related to the specific recommendation(s) or view(s) in this report. Research Analyst or his/her relative or HDFC Securities Ltd. does not have any financial interest in the subject company. Also Research Analyst or his relative or HDFC Securities Ltd. or its Associate does not have beneficial ownership of 1% or more in the subject company at the end of the month immediately preceding the date of publication of the Research Report. Further Research Analyst or his relative or HDFC Securities Ltd. or its associate does not have any material conflict of interest. Any holding in stock – No HDFC Securities Limited (HSL) is a SEBI Registered Research Analyst having registration no. INH000002475.
Disclaimer: This report has been prepared by HDFC Securities Ltd and is meant for sole use by the recipient and not for circulation.The information and opinions contained herein have been compiled or arrived at, based upon information obtained in good faith from sources believed to be reliable. Such information has not been independently verified and no guaranty, representation of warranty, express or implied, is made as to its accuracy, completeness or correctness. All such information and opinions are subject to change without notice. This document is for information purposes only. Descriptions of any company or companies or their securities mentioned herein are not intended to be complete and this document is not, and should not be construed as an offer or solicitation of an offer, to buy or sell any securities or other financial instruments.
This report is not directed to, or intended for display, downloading, printing, reproducing or for distribution to or use by, any person or entity who is a citizen or resident or located in any locality, state, country or other jurisdiction where such distribution, publication, reproduction, availability or use would be contrary to law or regulation or what would subject HSL or its affiliates to any registration or licensing requirement within such jurisdiction. If this report is inadvertently send or has reached any individual in such country, especially, USA, the same may be ignored and brought to the attention of the sender. This document may not be reproduced, distributed or published for any purposes without prior written approval of HSL. Foreign currencies denominated securities, wherever mentioned, are subject to exchange rate fluctuations, which could have an adverse effect on their value or price, or the income derived from them. In addition, investors in securities such as ADRs, the values of which are influenced by foreign currencies effectively assume currency risk. It should not be considered to be taken as an offer to sell or a solicitation to buy any security. HSL may from time to time solicit from, or perform broking, or other services for, any company mentioned in this mail and/or its attachments. HSL and its affiliated company(ies), their directors and employees may; (a) from time to time, have a long or short position in, and buy or sell the securities of the company(ies) mentioned herein or (b) be engaged in any other transaction involving such securities and earn brokerage or other compensation or act as a market maker in the financial instruments of the company(ies) discussed herein or act as an advisor or lender/borrower to such company(ies) or may have any other potential conflict of interests with respect to any recommendation and other related information and opinions. HSL, its directors, analysts or employees do not take any responsibility, financial or otherwise, of the losses or the damages sustained due to the investments made or any action taken on basis of this report, including but not restricted to, fluctuation in the prices of shares and bonds, changes in the currency rates, diminution in the NAVs, reduction in the dividend or income, etc. HSL and other group companies, its directors, associates, employees may have various positions in any of the stocks, securities and financial instruments dealt in the report, or may make sell or purchase or other deals in these securities from time to time or may deal in other securities of the companies / organizations described in this report.
HSL or its associates might have managed or co-managed public offering of securities for the subject company or might have been mandated by the subject company for any other assignment in the past twelve months. HSL or its associates might have received any compensation from the companies mentioned in the report during the period preceding twelve months from t date of this report for services in respect of managing or co-managing public offerings, corporate finance, investment banking or merchant banking, brokerage services or other advisory service in a merger or specific transaction in the normal course of business. HSL or its analysts did not receive any compensation or other benefits from the companies mentioned in the report or third party in connection with preparation of the research report. Accordingly, neither HSL nor Research Analysts have any material conflict of interest at the time of publication of this report. Compensation of our Research Analysts is not based on any specific merchant banking, investment banking or brokerage service transactions. HSL may have issued other reports that are inconsistent with and reach different conclusion from the information presented in this report. Research entity has not been engaged in market making activity for the subject company. Research analyst has not served as an officer, director or employee of the subject company. We have not received any compensation/benefits from the subject company or third party in connection with the Research Report.
This report is intended for non-Institutional Clients only. The views and opinions expressed in this report may at times be contrary to or not in consonance with those of Institutional Research or PCG Research teams of HDFC Securities Ltd. and/or may have different time horizons. Disclaimer : HDFC securities Ltd is a financial services intermediary and is engaged as a distributor of financial products & services like Corporate FDs & Bonds, Insurance, MF, NPS, Real Estate services, Loans, NCDs & IPOs in strategic distribution partnerships. Investment in securities market are subject to market risks, read all the related documents carefully before investing. Customers need to check products &features before investing since the contours of the product rates may change from time to time. HDFC securities Ltd is not liable for any loss or damage of any kind arising out of investments in these products. Investments in Equity, Currency, Futures & Options are subject to market risk. Clients should read the Risk Disclosure Document issued by SEBI & relevant exchanges & the T&C on www.hdfcsec.com before investing. Equity SIP is not an approved product of Exchange and any dispute related to this will not be dealt at Exchange platform.
HDFC securities Limited, I Think Techno Campus, Building - B, "Alpha", Office Floor 8, Near Kanjurmarg Station, Opp. Crompton Greaves, Kanjurmarg (East), Mumbai 400 042 Phone: (022) 3075 3400 Fax: (022) 3075 3450 Compliance Officer: Binkle R. Oza Email: [email protected] Phone: (022) 3045 3600
SEBI Registration No.: INZ000186937 (NSE, BSE, MSEI, MCX) |NSE Trading Member Code: 11094 | BSE Clearing Number: 393 | MSEI Trading Member Code: 30000 | MCX Member Code: 56015 | IN-DP-372-2018 (CDSL, NSDL) | CDSL DP ID: 12086700 | NSDL DP ID: IN304279 | AMFI Reg No. ARN -13549 | PFRDA Reg. No - POP 11092018 | IRDA Corporate Agent Licence No.CA0062 | Research Analyst Reg. No. INH000002475 | Investment Adviser: INA000011538 | CIN U67120MH2000PLC152193.