
Reliance Industries - HDFC securities
66
HDFC securities Institutional Research is also available on Bloomberg ERH HDF <GO> & Thomson Reuters 14 April 2020 Company Update Reliance Industries Investment in consumer business paying off, upgrade to Buy RIL stock has corrected by 25% from its peak over the past 4 months driven by global economic slowdown concerns. Our view that the stock price correction is overdone, and the stock should outperform, is premised on 1) Non-cyclical domestic consumer business accounting for 56% of FY21E EBITDA (31% in FY19), 2) The stock factoring only an USD 3.0/bbl FY21E refining margin, 49% lower than Global Financial Crises (GFC) quarterly trough and 3) Interest Coverage ratio of 4.3x and Net Debt/EBITDA of 1.6x in FY22E (12-35% better than the FY19 lows). The stock offers 18% upside at our TP of INR 1,400. No financial stress even under economic slowdown conditions We estimate that even with refining margins of USD 5.9/bbl (lowest quarterly margin during the Global Financial Crises and 36% lower than 3QFY20) and Petchem margins at a discount of 29% to 3QFY20 (lowest quarterly margin in last 13 years), RIL’s FY21E EBITDA would be INR 775bn, more than adequate to service its INR 2.9trn of debt. Jio: Next catalysts-Mobile revenue growth, fibre broadband ramp-up With about USD 50bn (50% of market cap) invested in telecom, Jio’s revenue market share growth and monetisation continues to drive a significant proportion of the value creation opportunity for RIL’s shareholders. Our current forecasts imply CAGR of 13.6% in mobile subs, 4.7% in ARPUs over FY19– FY23E and 8mn fibre subs by FY23E supporting EBITDA of INR 390bn and EV of INR 4,806bn. Retail: India’s ‘Everything store’ continues to gain market share Reliance Retail (RR) should gain further market share as it improves upon assortment, pricing and distribution. Grocery (46% of incremental EBITDA) should be the key EBITDA growth driver over FY19-22E. We bake in Rev/EBITDA/PAT CAGR of 20/28/34% over FY19-22E and value RR at an EV of INR 2.4trn, implying 18.5x FY22 EV/EBITDA. Valuation: We value RIL on SOTP We have cut FY21/22E EPS by up to 33% and our TP by 11% to INR 1,400 factoring up to 31% lower downstream margins driven by slowing global economy. We use EV/EBITDA to value downstream at Sep-21E EV/e, Retail on peer benchmarked EV/e and E&P, Jio on DCF. Fig.1: Consolidated Financial Summary YE Mar (Rs bn) FY16 FY17 FY18 FY19 FY20E FY21E FY22E Net Revenues 2,740 3,054 3,917 5,671 5,365 4,793 5,540 EBITDA 417 462 642 839 843 819 981 APAT 329 299 361 396 390 382 514 Diluted EPS (Rs) 55.6 50.5 60.9 66.8 61.5 60.2 81.2 P/E (x) 21.4 23.6 19.6 17.8 19.4 19.8 14.7 EV / EBITDA (x) 20.9 19.5 14.3 11.6 11.1 11.5 9.4 RoE (%) 14.3 11.8 12.9 11.6 9.7 8.9 11.0 Source: Company, HDFC sec Inst Research BUY CMP (as on 13 Apr 20) Rs 1,191 Target Price Rs 1,400 NIFTY 8,994 KEY CHANGES OLD NEW Rating ADD BUY Price Target Rs 1,566 Rs 1,400 EPS % FY21E FY22E -27% -10% KEY STOCK DATA Bloomberg code RIL IN No. of Shares (mn) 6,339 MCap (Rs bn) / ($ mn) 7,737/101,358 6m avg traded value (Rs mn) 17,400 52 Week high / low Rs 1,618/876 STOCK PERFORMANCE (%) 3M 6M 12M Absolute (%) (21.2) (7.9) (8.6) Relative (%) 3.6 10.5 11.4 SHAREHOLDING PATTERN (%) Dec-19 Sep-19 Promoters 50.03 50.05 FIs & Local MFs 13.78 14.42 FPIs 24.51 23.70 Public & Others 11.68 11.84 Pledged Shares 0.00 0.00 Source : BSE Harshad Katkar [email protected] +91-22-6171-7319 Nilesh Ghuge [email protected] +91-22-6171-7342 Jay Gandhi [email protected] +91-22-6171-7320 Divya Singhal [email protected] +91-22-6171-7348 Rutvi Chokshi [email protected] +91-22-6171-7356
-
Upload
khangminh22 -
Category
Documents
-
view
0 -
download
0
Transcript of Reliance Industries - HDFC securities

HDFC securities Institutional Research is also available on Bloomberg ERH HDF <GO> & Thomson Reuters
14 April 2020 Company Update
Reliance Industries
Investment in consumer business paying
off, upgrade to Buy RIL stock has corrected by 25% from its peak over the past 4 months driven by
global economic slowdown concerns. Our view that the stock price correction
is overdone, and the stock should outperform, is premised on 1) Non-cyclical
domestic consumer business accounting for 56% of FY21E EBITDA (31% in
FY19), 2) The stock factoring only an USD 3.0/bbl FY21E refining margin, 49%
lower than Global Financial Crises (GFC) quarterly trough and 3) Interest
Coverage ratio of 4.3x and Net Debt/EBITDA of 1.6x in FY22E (12-35% better
than the FY19 lows). The stock offers 18% upside at our TP of INR 1,400.
No financial stress even under economic slowdown conditions
We estimate that even with refining margins of USD 5.9/bbl (lowest quarterly
margin during the Global Financial Crises and 36% lower than 3QFY20) and
Petchem margins at a discount of 29% to 3QFY20 (lowest quarterly margin in
last 13 years), RIL’s FY21E EBITDA would be INR 775bn, more than adequate to
service its INR 2.9trn of debt.
Jio: Next catalysts-Mobile revenue growth, fibre broadband ramp-up
With about USD 50bn (50% of market cap) invested in telecom, Jio’s revenue
market share growth and monetisation continues to drive a significant
proportion of the value creation opportunity for RIL’s shareholders. Our current
forecasts imply CAGR of 13.6% in mobile subs, 4.7% in ARPUs over FY19–
FY23E and 8mn fibre subs by FY23E supporting EBITDA of INR 390bn and EV
of INR 4,806bn.
Retail: India’s ‘Everything store’ continues to gain market share
Reliance Retail (RR) should gain further market share as it improves upon
assortment, pricing and distribution. Grocery (46% of incremental EBITDA)
should be the key EBITDA growth driver over FY19-22E. We bake in
Rev/EBITDA/PAT CAGR of 20/28/34% over FY19-22E and value RR at an EV of
INR 2.4trn, implying 18.5x FY22 EV/EBITDA.
Valuation: We value RIL on SOTP
We have cut FY21/22E EPS by up to 33% and our TP by 11% to INR 1,400
factoring up to 31% lower downstream margins driven by slowing global
economy. We use EV/EBITDA to value downstream at Sep-21E EV/e, Retail on
peer benchmarked EV/e and E&P, Jio on DCF.
Fig.1: Consolidated Financial Summary
YE Mar (Rs bn) FY16 FY17 FY18 FY19 FY20E FY21E FY22E
Net Revenues 2,740 3,054 3,917 5,671 5,365 4,793 5,540
EBITDA 417 462 642 839 843 819 981
APAT 329 299 361 396 390 382 514
Diluted EPS (Rs) 55.6 50.5 60.9 66.8 61.5 60.2 81.2
P/E (x) 21.4 23.6 19.6 17.8 19.4 19.8 14.7
EV / EBITDA (x) 20.9 19.5 14.3 11.6 11.1 11.5 9.4
RoE (%) 14.3 11.8 12.9 11.6 9.7 8.9 11.0
Source: Company, HDFC sec Inst Research
BUY
CMP (as on 13 Apr 20) Rs 1,191
Target Price Rs 1,400
NIFTY 8,994
KEY CHANGES OLD NEW
Rating ADD BUY
Price Target Rs 1,566 Rs 1,400
EPS % FY21E FY22E
-27% -10%
KEY STOCK DATA
Bloomberg code RIL IN
No. of Shares (mn) 6,339
MCap (Rs bn) / ($ mn) 7,737/101,358
6m avg traded value (Rs mn) 17,400
52 Week high / low Rs 1,618/876
STOCK PERFORMANCE (%)
3M 6M 12M
Absolute (%) (21.2) (7.9) (8.6)
Relative (%) 3.6 10.5 11.4
SHAREHOLDING PATTERN (%)
Dec-19 Sep-19
Promoters 50.03 50.05
FIs & Local MFs 13.78 14.42
FPIs 24.51 23.70
Public & Others 11.68 11.84
Pledged Shares 0.00 0.00
Source : BSE
Harshad Katkar
+91-22-6171-7319
Nilesh Ghuge
+91-22-6171-7342
Jay Gandhi
+91-22-6171-7320
Divya Singhal
+91-22-6171-7348
Rutvi Chokshi
+91-22-6171-7356
Page | 2
Reliance Industries : Company Update
Contents Story in charts ....................................................................................................................... 2
A strong Balance Sheet even in a slowing economic environment ............................ 5
Debt concerns overdone .................................................................................................. 5
Strong cashflow even under stressed downstream margins scenario ....................... 6
Major capex cycle over ..................................................................................................... 7
With capex over, Net Debt and Net Debt/Equity to decline ....................................... 7
Telecom/Digital Services: Activating more levers of revenue growth ........................ 8
We value Jio’s telecom business at an EV of INR 4.5trn .............................................. 8
Subscriber adds and ARPU improvement to continue................................................ 8
After two years of YoY decline expect ARPU growth from FY21E ...........................9
Pricing strategy: Transitioning from a tool for faster customer acquisition to
monetization .................................................................................................................... 10
Fibre broadband: the next revenue driver ................................................................... 10
Additional revenue streams: Incremental Revenue opportunities Cloud .............. 11
The strength of ~500mn subs ......................................................................................... 11
Jio’s massive investment signals a constructive view of Indian telecom sector ..... 12
Jio’s revenue market share across circles ..................................................................... 12
Deals/partnerships for content ......................................................................................... 15
InvIT ...................................................................................................................................... 23
Media and Entertainment .................................................................................................. 25
RIL to merge its distribution, media business into Network18 ................................ 26
Investment in Hathway Cable and Den Network ...................................................... 26
Reliance Retail- De-coding India’s Everything store ................................................... 28
Story in Charts ................................................................................................................. 28
Grocery to be the growth anchor ................................................................................. 31
Cost of retailing inching down ...................................................................................... 33
Attempting an Indian Ling Shou Tong! ...................................................................... 36
Trends the quarterback in Fashion & Lifestyle ........................................................... 38
The COVID-19 Impact .................................................................................................... 47
SOTP – Valuation ............................................................................................................ 48
Refining: Lower margins on weak global economic outlook ..................................... 49
Petroleum Product Demand To Take A Hit On Covid 19 Impact ........................... 49
Petroleum Product Supply ............................................................................................ 50
Light-Heavy differential to widen ................................................................................ 50
IMO impact on gasoil has been negated by demand reduction ............................... 53
Petrochemical: Feedstock flexibility to ensure robust cashflow fall ......................... 54
Exploration and Production: Domestic capex to raise production ............................. 57
KG D6 ............................................................................................................................... 57
R-Cluster development .................................................................................................. 57
Satellite Cluster ............................................................................................................... 57
MJ field ............................................................................................................................. 57
CBM .................................................................................................................................. 58
Shale Gas .......................................................................................................................... 58
Oil And Gas Portfolio ..................................................................................................... 58
Valuation .............................................................................................................................. 59
Assumptions ........................................................................................................................ 60
Changes in estimates .......................................................................................................... 61
Peer comparison .................................................................................................................. 62
Financials .............................................................................................................................. 63

Page | 3
Reliance Industries: Company update
Story in charts
Fig.2: RIL - EBITDA Growth Of 7.9% CAGR Over FY20-
22E
Fig.3: RIL - Interest Coverage Ratio To Improve Over
FY20-22E
Source: Company, HDFC sec Inst Research Source: Company, HDFC sec Inst Research
Fig.4: RIL - Rising EBITDA And Declining Net Debt Fig.5: Jio – Subscribers Should Touch 500mn By FY23E
Source: Company, HDFC sec Inst Research Source: TRAI, HDFC sec Inst Research
Fig.6: Jio - ARPU To Grow Over FY20-24E After A
Decline In The Last Two Years
Fig.7: Retail – RR’s Market Share In The Organised
Food And Groceries Business Is On A Rise
Source: Company, HDFC sec Inst Research Source: Company, HDFC sec Inst Research
9.9
7.6
6.3 6.2
7.8 8.2 9.0
5.9
3.8 3.1 3.1
4.3
-
2.0
4.0
6.0
8.0
10.0
12.0
FY
11
FY
12
FY
13
FY
14
FY
15
FY
16
FY
17
FY
18
FY
19
FY
20
E
FY
21
E
FY
22
E
xInterest Coverage (x)
0.9
0.4 0.3
1.8
2.3
2.8 3.0
2.4 2.5
2.0 2.1
1.6
-
0.5
1.0
1.5
2.0
2.5
3.0
3.5
FY
11
FY
12
FY
13
FY
14
FY
15
FY
16
FY
17
FY
18
FY
19
FY
20
E
FY
21
E
FY
22
E
x
Net Debt/EBITDA (x)
187
307
385
440 480
510 530
0
100
200
300
400
500
600
FY
18
FY
19
FY
20
E
FY
21
E
FY
22
E
FY
23
E
FY
24
E
mn
Wireless subs (mn)
14
4
13
1
12
8
13
6
14
5
15
8
17
3
-9.2
-2.1
5.56.8
8.9 9.8
-15.0
-10.0
-5.0
0.0
5.0
10.0
15.0
0
50
100
150
200
250
300
350
FY
18
FY
19
FY
20
E
FY
21
E
FY
22
E
FY
23
E
FY
24
E
%INR/sub/month
ARPU (INR/sub/month) YoY growth (%)- RHS
27.1 20.0 17.8 19.6
25.6 29.4
0%
20%
40%
60%
80%
100%
FY
15
FY
16
FY
17
FY
18
FY
19
FY
20
E
Reliance (Grocery)
DMART
FRL
ABRL
Spencers
Star
Big Basket (B2B)
Grofers
Metro
Vishal (B2C)
Others

Page | 4
Reliance Industries: Company update
Fig.8: Retail- In Fashion and Lifestyle (F&L) Too, RR
Has Been Consistently Gaining Share Courtesy Its
Value Fashion Play – Reliance Trends
Fig.9: Refining - After A Dip In FY21, Expect Margins
To Bounce Back In FY22E
Source: Bloomberg, Company, HDFC sec Inst Research Source: Bloomberg, Company, HDFC sec Inst Research
Fig.10: Petrochemicals - RIL’s Margins To Decline
Given The Declining Global Demand
Fig.11: RIL – One Year Forward EV/EBITDA
Source: Bloomberg, HDFC sec Inst Research Source: Bloomberg, HDFC sec Inst Research
Fig.12: We Value RIL At INR 1,400/share Fig.13: RIL And Nifty PER
Source: HDFC sec Inst Research Source: Bloomberg, Company, HDFC sec Inst Research
5.0
10.0
15.0
20.0
25.0
Ma
r-0
6
Ma
r-0
7
Ma
r-0
8
Ma
r-0
9
Ma
r-1
0
Ma
r-1
1
Ma
r-1
2
Ma
r-1
3
Ma
r-1
4
Ma
r-1
5
Ma
r-1
6
Ma
r-1
7
Ma
r-1
8
Ma
r-1
9
Ma
r-2
0
xEV/EBITDA
5.0
10.0
15.0
20.0
25.0
30.0
35.0
Ma
r-0
6
Ma
r-0
7
Ma
r-0
8
Ma
r-0
9
Ma
r-1
0
Ma
r-1
1
Ma
r-1
2
Ma
r-1
3
Ma
r-1
4
Ma
r-1
5
Ma
r-1
6
Ma
r-1
7
Ma
r-1
8
Ma
r-1
9
Ma
r-2
0
xRIL PER NIFTY PER
5.8
5.4
5.1
6.1
8.8
10
.31
1.7
15
.0
12
.26
.6
8.4 8.6 9
.28
.1 8.6
10
.81
1.0 11
.69
.28
.27
.09
.0
4
6
8
10
12
14
16
FY
01
FY
02
FY
03
FY
04
FY
05
FY
06
FY
07
FY
08
FY
09
FY
10
FY
11
FY
12
FY
13
FY
14
FY
15
FY
16
FY
17
FY
18
FY
19
FY
20
E
FY
21
E
FY
22
E
USD/bbl
RIL GRM
6.6 6.8 7.3
8.1
10.6
-
2.0
4.0
6.0
8.0
10.0
12.0
FY15 FY16 FY17 FY18 FY19
RR (F&L) Market share

Page | 5
Reliance Industries: Company update
A strong Balance Sheet even in a slowing
economic environment
Debt concerns overdone
One of the biggest investor concerns of late has been the increasing debt
levels and the ability of company to continue its aggressive expansion into
the consumer businesses (telecom, digital and retail) especially in a
worsening global economic environment. However, RIL has started moving
on a sustainable path of deleveraging, as announced in the AGM. It is
evident from (1) Reducing capex intensity in its energy as well as the
consumer businesses, (2) Hiving off of the Fiber and Tower assets into an
InvIT structure, and (3) Potential stake sale in O2C business.
In 9MFY20, RIL’s capital expenditure has declined sharply by 44% to INR
557bn versus INR 998bn in 9MFY19. Besides, the company guided that the
investment cycle in Jio is largely over.
The transfer of fiber and tower assets into InvIT structure has already
shaved off INR 1.07trn in debt from RIL’s balance sheet.
The company has concluded a partnership with BP valued at USD 1bn in the
fuel retail business. Moreover, Saudi Aramco and RIL have signed a non-
binding letter of intent (LOI) for Saudi Aramco to take a 20% stake in RIL’s
Oil to Chemicals (O2C) business valued at an EV of USD 75bn. Its due
diligence is currently in progress. The potential completion of this stake sale
is a key step to enable RIL to meet its deleveraging target.
With the worsening global economic environment, investors appear to be
concerned about increasing potential risks to (timely completion of) RIL’s
deal with Saudi Aramco. We expect the deal to be completed because of the
strategic importance for both the parties. We believe that apart from this,
RIL’s other options to reduce debt could include potential partnerships in its
digital platform as well as monetization of its retail business.
Investor concerns on debt level seem overdone as RIL is likely to generate
over ~INR 2.37trn of operating cash flow over FY20-22E. Even if RIL’s deal
with Aramco is delayed, earnings from RIL’s energy (Refining + Petchem)
businesses will be more than adequate to service the debt in a stressed
downstream margin environment.
In our stress case, we assume RIL’s GRM equal to the lowest it achieved
during GFC in 3QFY10 (USD 5.9/bbl) and lowest EBITDA per unit
production of petrochemicals it reported in 2QFY13 (USD 71/t). We arrive at
an EBITDA of INR 331bn in FY21E from its energy business while interest
payable for FY21E would be INR 181bn. This implies that the EBITDA from
the energy business alone is sufficient to take care of the interest cost.

Page | 6
Reliance Industries: Company update
Fig. 14: EBITDA Of Energy Business Is Sufficient For Interest Payment
Unit Current Lowest in last 10 yrs
Refining business
Exchange rate INR/USD 73.5
GRM USD/bbl 5.9 5.9
Annual crude throughput mmt 68
Opex USD/bbl 2.5
EBITDA USD/bbl 3.4
EBITDA INR mn 124,560
Petchem business
EBITDA/t USD/t 71.04 71.04
Annual Production (000 tonne) 39,600
EBITDA INR mn 206,770
EBITDA (Refining+ Petchem) INR mn 331,330
Interest payment FY21E INR mn 180,549
Consolidated EBITDA for FY21E INR mn 819,494
Source: Company, HDFC Sec Inst Research
Fig. 15: Maturity Of Long Term Bonds And Debentures
INR bn FY21 FY22 FY23
Secured NCD 5 55 10
Unsecured NCD 120 70 100
Unsecured Bonds 75 110 6
Total 200 235 116
Fig. 16: Maturity Of Long Term Loans
INR bn Over FY21-FY25
Secured term loans 3.85
Unsecured term loans 20.66
Total 24.51
Source: Company, HDFC Sec Inst Research
Strong cashflow even under stressed downstream margins
scenario
We estimate that even with refining margins of USD 5.9/bbl (the lowest
quarterly margin during the Global Financial Crises (GFC) in 3QFY10 and
36% lower than 3QFY20) and Petchem margins at a discount of 29% to
3QFY20 (the lowest quarterly margin in last 13 years), RIL’s EBITDA would
decline from INR 839bn in FY19 to INR 775bn in FY21E, more than adequate
to service its INR 3 trn debt even if the Saudi Aramco deal takes longer time
to be completed. Every USD 1/bbl decline in refining margins adversely
impacts its Consolidated EBITDA by 3.6% or INR 30bn. The completion of
largest capex cycle in its history and spinning off of the Fibre & Tower InVits
which has help shave off INR 1.07trn in debt, should help RIL in its
endeavour to reduce its Net Debt.
We forecast RIL’s EBITDA to grow 19.7% over FY21 – 22E driven by
improved downstream margins and gradual improvement in the consumer
businesses after a mere 0.5% YoY increase in EBITDA in FY20E because of
the adverse impact of global economic slowdown on refining & petchem
margins. We estimate RJIO and Reliance Retail to achieve EBITDA of INR
341bn & INR 128bn by FY22E.

Page | 7
Reliance Industries: Company update
Major capex cycle over
Since FY13, RIL has undertaken a significant capex-led growth program –
largest in its history- under which it has already invested over INR 5,085bn
on key projects including telecom (over INR 3,500bn) and refining &
petrochemicals (over INR 2,570bn). Most of these projects have now been
commissioned. RIL’s capex in FY19 was at INR 406bn, lower than INR 842bn
in FY18. We expect capex to jump further to INR 448bn in FY21E and to INR
454bn in FY22E.
With capex over, Net Debt and Net Debt/Equity to decline
RIL’s leverage peaked in FY19 with Net Debt/Equity at 0.5x and Interest
Coverage at 3.8x, as it completed its recent capex cycle in FY18 with most of
the new capacities commissioned and ramped up by FY19. We expect RIL’s
Net Debt /Equity and Interest Coverage to improve to 0.3x and 4.3x by
FY22E after spinning off of the Fibre & Tower InvITs despite lower
downstream margins and even if the deal with Saudi Aramco is delayed.
Fig.17: Stronger Balance Sheet In Volatile Times Fig.18: Rising EBITDA With Declining Net Debt
Source: Company, HDFC Sec Inst Research Source: Company, HDFC Sec Inst Research
Fig.19: Interest Coverage Ratio Will Improve By FY22E
Source: Company, HDFC Sec Inst Research
9.9
7.6
6.3 6.2
7.8 8.2 9.0
5.9
3.8 3.1 3.1
4.3
-
2.0
4.0
6.0
8.0
10.0
12.0
FY
11
FY
12
FY
13
FY
14
FY
15
FY
16
FY
17
FY
18
FY
19
FY
20
E
FY
21
E
FY
22
E
xInterest Coverage (x)
0.9
0.4 0.3
1.8
2.3
2.8 3.0
2.4 2.5
2.0 2.1
1.6
-
0.5
1.0
1.5
2.0
2.5
3.0
3.5
FY
11
FY
12
FY
13
FY
14
FY
15
FY
16
FY
17
FY
18
FY
19
FY
20
E
FY
21
E
FY
22
E
x
Net Debt/EBITDA (x)
0.2
0.1 0.1
0.3
0.4
0.5
0.5 0.5 0.5
0.4 0.4
0.3
-
0.1
0.2
0.3
0.4
0.5
0.6
FY
11
FY
12
FY
13
FY
14
FY
15
FY
16
FY
17
FY
18
FY
19
FY
20
E
FY
21
E
FY
22
E
x
Net Debt/Equity (x)

Page | 8
Reliance Industries: Company update
Telecom/Digital Services: Activating more levers
of revenue growth
We value Jio’s telecom business at an EV of INR 4.8trn
We forecast Jio to achieve a revenue of INR 671bn and EBITDA of INR
307bn in FY21E, scaling up to INR 1,231bn and INR 499bn by FY25E (at a
CAGR of 16.4/12.9%). We expect Jio to have around 440mn subs by end
FY21 with an average ARPU (Average Revenue per User) of INR 135 rising
to 550mn subs at ARPU of INR 190 by FY25E. (Faster) Ramp-up in the new
revenue streams viz home broadband, NB IoT, Enterprise, Cloud, etc
provides further revenue growth and value upside.
Fig. 20: Jio’s Key Metrics
FY18 FY19 FY20E FY21E FY22E
Closing Subs (mn) 186.6 306.7 385.0 440.0 480.0
ARPU (INR) 144 131 128 135 145
Net Revenues (INR bn) 159 341 396 671 799
YoY growth (%) - 115.1 45.3 35.3 19.1
EBITDA (INR bn) 67 146 222 307 341
EBITDA Margin (%) 42.4 42.8 44.7 45.8 42.7
Source: TRAI, Company, HDFC Sec Inst Research
Subscriber adds and ARPU improvement to continue
Within 40 months from its commercial launch in Sep 2016 with 370mn
subscribers, Jio is the largest telecom service provider in India by revenue
market share. We expect Jio to continue subscriber addition, though at a
slower rate compared to the past, with incremental 55mn subs in FY21E as it
continues to offer over 35% cheaper tariffs vs competitors and better
coverage. We expect ARPU to improve at a CAGR of 7.8% over FY20-FY24E
on the back of tariff hikes across the industry as competitors are faced with
increased regulatory costs.
Fig. 21: Jio’s Monthly Mobile Subscriber Additions
Source: TRAI, HDFC Sec Inst Research
72109 123 139
160187
215252
280307
331355 370
6394 93 107
133160
178208
234258
278 290 305
-
50
100
150
200
250
300
350
400
Q3
FY
17
Q4
FY
17
Q1
FY
18
Q2
FY
18
Q3
FY
18
Q4
FY
18
Q1
FY
19
Q2
FY
19
Q3
FY
19
Q4
FY
19
Q1
FY
20
Q2
FY
20
Q3
FY
20
Total Subs Active Subs
Numbers (mn)

Page | 9
Reliance Industries: Company update
Fig. 22: Adjusted Revenue Market Share trend
Source: TRAI, HDFC Sec Inst Research
Fig. 23: Jio’s Tariffs Are At A Significant Discount To Competitors’
Operator Tariff
(INR) Days
Data
(GB)
Tariff/day
(INR/day)
Jio’s discount vs peers
(%)
Jio 199 28 42 7.1
Airtel 219 28 28 7.8 -9.1
Voda-Idea 219 28 28 7.8 -9.1
Jio 555 84 126 6.6
Airtel 598 84 126 7.1 -7.2
Voda-Idea 599 84 252 7.1 -7.3
Source: Company, HDFC Sec Inst Research
After two years of YoY decline expect ARPU growth from
FY21E
Jio’s aggressive launch offers adversely impacted ARPUs for its incumbent
peers (Fig. 32). For instance, Bharti’s ARPU fell from a level of INR 198 pre
Jio in 4QFY15 to a trough of INR 135 in 3QFY20. Voda-Idea’s ARPU’s
similarly fell from INR 184 pre Jio in 4QFY15 to a trough of INR 109 in
3QFY20.
We expect Jio’s ARUs to rise from INR 131 in FY19 to INR 145 in FY22E
driven by the IUC related tariff increase and the move across the industry to
raise ARPUs because of weaker finances of the competitors and increased
regulatory costs. With rising ARPUs, we expect operational leverage to
drive EBITDA CAGR of 7.8% over FY20 – FY24E.
Fig. 24: Adjusted Revenue Per User Trend
Source: Company, HDFC sec Inst Research
0
50
100
150
200
250
Q4
FY
15
Q1
FY
16
Q2
FY
16
Q3
FY
16
Q4
FY
16
Q1
FY
17
Q2
FY
17
Q3
FY
17
Q4
FY
17
Q1
FY
18
Q2
FY
18
Q3
FY
18
Q4
FY
18
Q1
FY
19
Q2
FY
19
Q3
FY
19
Q4
FY
19
Q1
FY
20
Q2
FY
20
Q3
FY
20
INR/sub/month
Voda-Idea Bharti India Jio
41
.8
45
.4
44
.2
45
.2
47
.8
49
.3
47
.2
44
.8
40
.1
38
.9
34
.1
30
.5
26
.8
24
.1
22
.1
21
.2
20
.9
19
.7
18
.4
19
.1
30
.6
33
.8
33
.4
34
.3
35
.3
37
.7
36
.7
33
.7
30
.4
29
.0
26
.0
22
.5
20
.8
19
.7
19
.7
18
.9
17
.4
21
.9
21
.4
23
.9
12
.5
15
.9
18
.3
20
.9
24
.3
27
.8
28
.9
31
.7
33
.8
37
.1
0
20
40
60
80
100
Q4
FY
15
Q1
FY
16
Q2
FY
16
Q3
FY
16
Q4
FY
16
Q1
FY
17
Q2
FY
17
Q3
FY
17
Q4
FY
17
Q1
FY
18
Q2
FY
18
Q3
FY
18
Q4
FY
18
Q1
FY
19
Q2
FY
19
Q3
FY
19
Q4
FY
19
Q1
FY
20
Q2
FY
20
Q3
FY
20
%
Voda-Idea Bharti India Jio

Page | 10
Reliance Industries: Company update
Pricing strategy: Transitioning from a tool for faster
customer acquisition to monetisation
Jio has consistently maintained that it will ensure its pricing will be
competitive compared to the incumbents. With its current tariff plans Jio is
still ~9/7% cheaper compared to its competitors. With Jio being consistently
profitable despite such aggressive pricing, we do not foresee any change in
its wildly successful pricing strategy as a key weapon in its quest to garner
subscribers. We do expect Jio to turn its focus to monetizing once it acquires
close to 500mn wireless subscribers by end of FY22E.
Fig. 25: Tariff Comparison
Operator Tariff
(INR) Days
Data
(GB)
Tariff/day
(INR/day)
Additional on
offer
Jio’s discount to
peers (%)
Jio 199 28 42 7.11 Unlimited calls
Airtel 219 28 28 7.82 Unlimited calls
and 100 SMS -9.1
Voda-Idea 219 28 28 7.82 Unlimited calls -9.1
Jio 555 84 126 6.61 Unlimited calls
Airtel 598 84 126 7.12 Unlimited calls
and 100 SMS -7.2
Voda-Idea 599 84 252 7.13 Unlimited calls -7.3
Source: Company, HDFC Sec Inst Research
Fibre broadband: the next revenue driver
The current broadband market is significantly underserved – there are only
19mn wired broadband connections compared to total urban households of
over 80mn. Jio’s extensive fibre network and access to Den and Hathaway’s
customers should allow Jio to address 30mn households. Jio is targeting 20
million homes over the next 3 years. Our current estimates assume 10mn
households at an ARPU of INR 800 by FY23E.
Fig. 26: Active DTH And Wired Broadband Subscribers (mn)
Source: TRAI, HDFC sec Inst Research
41
.2
39
.7
41
.1
56
.0
58
.5
60
.5
61
.9
62
.7
63
.6
65
.3
66
.1
67
.6
67
.5
69
.4
69
.5
70
.5
72
.4
68
.9
69
.3
15
.5
15
.7
16
.1
16
.5
17
.0
17
.3
17
.8
18
.1
18
.2
18
.3
18
.0
17
.9
18
.0
17
.9
18
.0
18
.2
18
.4
18
.4
19
.0
19
.1
0
10
20
30
40
50
60
70
80
Q4
FY
15
Q1
FY
16
Q2
FY
16
Q3
FY
16
Q4
FY
16
Q1
FY
17
Q2
FY
17
Q3
FY
17
Q4
FY
17
Q1
FY
18
Q2
FY
18
Q3
FY
18
Q4
FY
18
Q1
FY
19
Q2
FY
19
Q3
FY
19
Q4
FY
19
Q1
FY
20
Q2
FY
20
Q3
FY
20
mn
Active DTH subs Wired broadband subs

Page | 11
Reliance Industries: Company update
Additional revenue streams: Incremental Revenue
opportunities Cloud
RIL has entered into a partnership with Microsoft for its cloud infrastructure
Azure which includes RIL setting up the data centres. At its AGM, RIL
announced that it could offer these services (Azure, Azure AI, Office 360),
including connectivity, to the SMEs at about INR 1500/month, almost one-
tenth of what it would cost a SME for equivalent services.
Narrow Band IoT (NB IoT)
Jio estimates about 2 billion connected IOT devices in the country by FY23. It
intends to target 50% market share in NB-IoT which translates to an INR
200bn revenue opportunity.
Enterprise for SMEs
Jio is targeting 15 million business establishments in 1600 towns.
The strength of ~500mn subs
Jio’s strategy in it’s over 3 years since launch has been to acquire subscribers
through aggressive pricing and improved content and / customer
experience. It has amassed industry leading 370mn subscribers in short span
of 40 months. It has never been shy in articulating its ambition to garner
450mn-500mn (~50% market share). A strong subscriber base also affords Jio
a stronger bargaining position while negotiating with content providers as
well as opens up additional revenue generating opportunities such as
targeted advertisements using data analytics, eventual content monetization,
etc.
Content is likely to emerge as the next lever for subscriber acquisition and
retention, as has been the case in many markets that have seen an explosion
in data consumption. Jio could consider reviving its Jio Prime programme in
order to monetize its content.Jio had initially flirted with content
monetization through its Prime subscription. We do not rule out
reintroduction of a similar monetization strategy once it crosses 450mn subs.
In its endeavour to offer exclusive content, which could further be
monetised for subscriber acquisition & retention as well as to enable content
monetization, Jio is likely to scale up investments on exclusive content in the
area of sports, entertainment, gaming, education, etc.

Page | 12
Reliance Industries: Company update
Fig. 27: Industry ARPUs Rising After A Period Of Decline
Source: Company, HDFC Sec Inst Research
Jio’s massive investment signals a constructive view of
Indian telecom sector
At the end of 3QFY20, Jio reported total investment of USD 50bn in its
telecom/digital services business. This is significantly higher compared to
the investments made by the incumbents likely indicating a constructive
outlook on eventual returns in the business once the industry stabilizes. To
its credit, over a short span of 3 years since launch Jio has influenced
consumer behaviour by driving a dramatic increase in data consumption by
offering better content, network reach and significantly improved consumer
experience. Jio has expanded the market in terms of potential revenue
streams for telecom operators in its quest to graduate to a digital services
company from a pure telco.
Fig. 28: Jio’s Capital Employed Is Significantly Ahead Of Peers (Dec-19)
Source: Company, HDFC Sec Inst Research
Jio’s revenue market share across circles
Since its launch in September 2016, Jio’s ramp-up of its mobile business has
been impressive and significantly ahead of market expectations. Its entry
precipitated a raft of operator exits and a rapid industry consolidation. Over
the past 3 years, Jio has gained 31.0% share of active subscribers and 34.5%
revenue market share.
0
50
100
150
200
250
Q4
FY
15
Q1
FY
16
Q2
FY
16
Q3
FY
16
Q4
FY
16
Q1
FY
17
Q2
FY
17
Q3
FY
17
Q4
FY
17
Q1
FY
18
Q2
FY
18
Q3
FY
18
Q4
FY
18
Q1
FY
19
Q2
FY
19
Q3
FY
19
Q4
FY
19
Q1
FY
20
Q2
FY
20
Q3
FY
20
INR/sub/month
Voda-Idea Bharti India Jio
20.73
28.90
50.00
0
10
20
30
40
50
60
Voda-Idea Bharti India Jio
USD bnCapital Employed

Page | 13
Reliance Industries: Company update
The Indian telecoms market is divided into circles for purposes of licensing
and spectrum allocation. There are four categories of circles: metros and
categories A, B and C- the nomenclature largely reflecting the economic
potential of the market.
As we note in Fig. 29 and Fig. 30, Jio’s circle wise performance correlates
well with the level of urbanization of the market. We use the share of urban
subscribers-to-total active subscribers as a proxy to the level of urbanization
of a market. Jio’s outperformance has consistently been higher for rural
dominated markets such as Himachal Pradesh, Bihar, UP, etc and lower for
metro markets (Delhi/Mumbai) and urbanized states like TN, Karnataka,
Maharashtra, etc. Jio’s greatest success seems to have come from attracting
affluent subscribers in smaller markets. But lately it has narrowed the gap
even in markets with higher share of urban subscribers.
Fig. 29: Adjusted Revenue Market Share trend
Source: TRAI, HDFC Sec Inst Research
41
.8
45
.4
44
.2
45
.2
47
.8
49
.3
47
.2
44
.8
40
.1
38
.9
34
.1
30
.5
26
.8
24
.1
22
.1
21
.2
20
.9
19
.7
18
.4
19
.1
30
.6
33
.8
33
.4
34
.3
35
.3
37
.7
36
.7
33
.7
30
.4
29
.0
26
.0
22
.5
20
.8
19
.7
19
.7
18
.9
17
.4
21
.9
21
.4
23
.9
12
.5
15
.9
18
.3
20
.9
24
.3
27
.8
28
.9
31
.7
33
.8
37
.1
0
20
40
60
80
100
Q4
FY
15
Q1
FY
16
Q2
FY
16
Q3
FY
16
Q4
FY
16
Q1
FY
17
Q2
FY
17
Q3
FY
17
Q4
FY
17
Q1
FY
18
Q2
FY
18
Q3
FY
18
Q4
FY
18
Q1
FY
19
Q2
FY
19
Q3
FY
19
Q4
FY
19
Q1
FY
20
Q2
FY
20
Q3
FY
20
%
Voda-Idea Bharti India Jio

Page | 14
Reliance Industries: Company update
Fig. 30: Circle-Wise Market Share Of Telcos as on Dec-19
Basis Net revenue (%) Basis Active Subs (%) R-Jio (%)
Circle Bharti Voda-
Idea R-Jio Others* Bharti
Voda-
Idea R-Jio Others*
Lead/(Lag) in
Revenue
share vs
Subs share
Mumbai 23.4 32.6 31.3 12.7 26.5 36.5 35.2 1.8 (3.9)
Kolkata 27.3 32.2 32.7 7.7 27.3 31.7 36.4 4.7 (3.6)
Delhi 38.0 17.5 37.3 7.2 32.1 35.9 31.1 0.9 6.2
Sub total 30.2 26.2 34.1 9.5 29.2 35.1 33.6 2.1 0.5
Maharashtra 18.9 37.3 38.6 5.2 16.8 46.0 32.4 4.7 6.2
Karnataka 48.7 15.4 27.2 8.7 46.6 19.0 27.1 7.4 0.1
Andhra Pradesh 35.7 18.3 38.5 7.4 39.2 22.6 29.7 8.4 8.8
Tamil Nadu(Incl. Chennai) 36.3 24.0 33.5 6.2 34.2 27.9 25.8 12.1 7.7
Gujarat 12.6 37.6 45.0 4.8 18.2 45.2 31.3 5.3 13.7
Sub total 31.0 26.2 36.3 6.5 30.6 32.4 29.4 7.6 6.9
Haryana 17.9 20.8 53.2 8.1 22.2 39.6 29.2 9.0 24.1
MP 17.9 18.0 60.8 3.4 23.8 32.0 39.6 4.6 21.1
Kerala 14.5 51.2 23.4 10.8 15.2 47.7 16.7 20.4 6.7
Punjab 26.9 20.9 43.6 8.7 33.7 27.5 30.8 8.0 12.8
UP (E) 20.9 22.3 48.5 8.3 25.5 40.8 29.0 4.7 19.5
UP(W) 29.0 16.6 51.2 3.2 37.9 28.0 28.9 5.3 22.3
Rajasthan 29.1 14.1 52.1 4.7 37.5 23.7 33.5 5.3 18.6
West Bengal 22.4 22.3 52.9 2.5 30.6 35.4 30.4 3.6 22.4
Sub total 22.9 22.5 48.9 5.7 29.6 33.1 30.6 6.7 18.3
Orissa 29.1 6.3 58.0 6.6 39.0 10.8 36.3 13.9 21.7
HP 33.7 5.2 53.0 8.1 42.3 11.6 31.4 14.8 21.6
Bihar 28.8 5.2 63.9 2.1 43.7 17.5 35.2 3.7 28.7
Assam 32.4 12.0 51.8 3.8 40.4 19.3 32.9 7.4 18.9
J&K 32.8 3.1 53.6 10.6 55.3 5.1 32.2 7.4 21.4
North East 39.9 10.5 43.8 5.7 47.1 14.4 28.5 10.0 15.4
Sub total 30.9 6.7 58.0 4.4 43.2 15.2 34.2 7.4 23.7
Total 28.0 22.4 43.4 6.3 32.0 30.3 31.0 6.7 12.4
Others 43.4 40.3 3.5 12.8 - - - - 3.5
Grand Total 31.4 26.4 34.5 7.7 32.0 30.3 31.0 6.7 3.5
Source: TRAI, HDFC sec Inst Research | *Others include MTNL, BSNL, Rcom, Tata Telecom

Page | 15
Reliance Industries: Company update
Fig. 31: State-Wise Total Subscriber mix as on Sep-19
Rural Urban Lead/(Lag) in revenue
share vs subs share
Delhi 3.5 96.5 3.8
Subtotal 3.5 96.5 3.8
Maharashtra Incl. Mumbai 32.9 67.1 3.3
Karnataka 37.1 62.9 2.7
Andhra Pradesh 54.4 45.6 8.5
Tamil Nadu (incl. Chennai) 28.0 72.0 10.5
Gujarat 39.4 60.6 11.8
Subtotal 36.2 63.8 6.7
Haryana 38.1 61.9 29.8
Madhya Pradesh 43.3 56.7 19.1
Kerala 46.3 53.7 6.7
Punjab 36.2 63.8 12.7
Uttar Pradesh (UPE + UPW) 52.5 47.5 22.9
Rajasthan 51.4 48.6 16.3
West Bengal Incl. Kolkata 45.0 55.0 12.4
Subtotal 47.1 52.9 17.6
Orrisa 64.2 35.8 22.7
Himachal Pradesh 67.0 33.0 23.9
Bihar 67.7 32.3 25.7
Assam 51.6 48.4 19.3
Jammu & Kashmir 42.7 57.3 23.8
North East 40.7 59.3 16.9
Subtotal 60.3 39.7 22.8
Total 43.2 56.8 12.6
Others 43.9 56.1 2.3
Grand total 43.3 56.7 4.0
Source: TRAI, HDFC sec Inst Research
Fig. 32: Jio’s Competitive Position Is Stronger In Less Urbanised Markets
Source: TRAI, HDFC sec Inst Research
96
6763
46
72
61 6257 54
64
47 4955
36 33 32
48
57 5956
4 3 38
10 12
30
197
13
2316 12
23 24 2619
2417 2
-
10
20
30
40
50
60
70
80
90
100
DE
L
MA
H
KA
R
AP
TN
GU
J
HA
R
MP
KE
R
PU
NJ
UP
RA
JS
WB
OR
ISS
A
HP
BIH
AS
SA
M
J&K
NE
OT
HE
RS
Urban population (%) Lead/(Lag) in revenue share vs subs share (%)

Page | 16
Reliance Industries: Company update
Fig. 33: Deals / Partnerships For Content
No Acquirer Acquire
Acquisition
cost (INR
mn)
Remarks About the company Financial details
1 Indiavidual Learning
Private Limited
(“Embibe”), s
subsidiary of RIL
eDreams Edusoft
Private Limited
(“Funtoot”)
716.44 1) Representing 90.5%
holding in the equity share
capital of Funtoot
2) Embibe will make
further acquisition of
equity shares of up to
INR100mn. This will be be
completed by December
2021 and the shareholding
of Embibe will thereafter
increase to 100% of share
capital of Funtoot.
3) The aforesaid
acquisition is expected to
accelerate Embibe’s digital
education technology
platform development
initiatives.
Funtoot, an education
technology company,
incorporated in India on
July 09, 2010, is engaged
in the business of
developing e-learning
products and providing
practice, testing and
analysis modules to the
students appearing for
K-12 for the subjects of
mathematics and
science as per
methodologies
developed by Funtoot. It
has operations in India
Funtoot is an early
revenue stage company
with turnover of INR
7.34 crore, INR 9.30
crore and INR 4.93
crore, and Net Profit
(Loss) of INR 27.74 lakh,
INR 246.39 lakh and
INR (200.59) lakh in FY
2018-19, FY 2017-18 and
FY 2016-17 respectively.
2 Reliance Strategic
Business Ventures
Limited (“RSBVL”),
NowFloats
Technologies
Pvt. Ltd.
(“Nowfloats”)
1,416.38 1)The said investment
represents 85% holding in
the equity share capital of
Nowfloats.
2) RSBVL proposes to
make a further investment
of up to INR 75 crore
(Indian Rupees seventy
five crore only), subject to
achieving agreed
milestones. The further
investment is expected to
be completed by
December 2020. Post the
further investment, the
shareholding of RSBVL
will increase to 89.66% of
the equity share capital of
Nowfloats.
The aforesaid
investment will further
enable the group’s
digital and new
commerce initiatives.
Nowfloats, incorporated
in India on May 9, 2012,
offers SaaS solutions to
Small and Medium
Enterprises (SMEs) that
enable them to get a
digital presence. Other
solutions include local
content discovery
platform, online
business management
suite, website
promotion / marketing
solutions, and various
other offerings for
SMEs. It has operations
in India.
Nowfloats is an early
stage company, with
turnover of INR 32.56
crore, INR 18.73 crore
and INR 10.38 crore,
and Net Profit (Loss) of
INR (43.24) crores, INR
(47.49) crores and INR
(31.43) crores in FY 2019,
FY 2018 and FY 2017
respectively.
3 Reliance Strategic
Business Ventures
Limited ("RSBVL")
Asteria
Aerospace
Private Limited
("Asteria")
- 1) The said investment
represents 51.78% holding
in the equity share capital
of Asteria.
2) RSBVL proposes to
make a further investment
of up to INR1250mn
3) The further investment
is expected to be
completed by December
2021. Post the further
investment, the
shareholding of RSBVL
will increase to 87.3% of
the equity share capital of
Asteria
4) The aforesaid
investment will further
enable the group's
initiatives 1n emerging
technology
Asteria, incorporated in
India on June 6, 2011, is
a full-stack drone
technology company
with in-house drone
manufacturing
capabilities, and also
offers software solutions
to provide actionable
insights from aerial
data, intending to
deliver "droneas-a-
service" digital platform.
It has operations in
India.
Asteria is an early stage
company, with turnover
of INR 1.96 crore, INR
2.04 crore and INR 1
Lakh in FY 2019, FY
2018 and FY2017
respectively, and Net
Profit (Loss) of INR
(12.71) crore, INR (2.47)
crore and INR (2.43)
crore in FY 2019, FY
2018 and FY 2017
respectively

Page | 17
Reliance Industries: Company update
No Acquirer Acquire Acquisition
cost (INR
mn)
Remarks About the company Financial details
4 Reliance Brands
Limited
Future101
Design Private
Limited
(Future101)
95.00 1) Future101, incorporated
in July, 2013 is engaged in
manufacturing,
distribution and sale of
luxury apparels, etc. in
India. Future101 belongs
to a similar industry as
Reliance Brands Limited.
2) acquired a further stake
of 2.5% in Future101
Design Private Limited
(Future101) on 7th
February,2019 for a
consideration of
INR19.9mn taking its total
stake to 15%
Future101 reported
annual turnover of INR.
22.18 crore, INR. 20.85
crore and INR.17.11
crore in FY 2017-18, FY
2016-17 and FY 2015-16,
respectively.
5 Reliance Retail
Ventures Limited
(RRV
Genesis Colors
Limited (GCL),
450.00 1) Taking its total stake in
GCL to 29.07% on the
enhanced capital of GCL.
Consequently, the stake of
RBL in GCL shall be
43.66% and the aggregate
equity shareholding of
RRVL and RBL in GCL
stands at 72.73%
The aforesaid
acquisitions will help
the Company to
strengthen its footage in
the retail industry and
support its long term
strategy to enhance its
value in the retail
industry.
6 Reliance Industrial
Investments and
Holdings Limited
(“RIIHL”
Shopsense
Retail
Technologies
Pvt. Ltd.
(“Shopsense” or
“Fynd”)
2,952.50 1) RIIHL has an option to
further invest an amount
of up to INR 100 crore
which is likely to be
completed by December
2021. The total investment
will translate into ~87.6%
of equity share capital in
Fynd on a fully diluted
and converted basis.
2) Fynd is a software
technology company
incorporated on 27
September 2012. Fynd
provides technology
platform and solutions to
merchants to manage their
inventory and sales across
multiple demand channels
for consumers, including
e-commerce platforms.
Fynd is an early stage
company, with turnover
of INR 4.84 crore, INR
0.70 crore and INR 0.52
crore, and Net Profit
(Loss) of INR (18.64)
crore, INR (10.64) crore
and INR (1.51) crore in
FY 2018, FY 2017 and FY
2016 respectively.
7 RIL “Reliance Navi
Mumbai Infra
Limited
0.50 RNMIL is incorporated
with the purpose of
undertaking real estate
and related infrastructure
activities. RNMIL is yet to
commence its business
operations.

Page | 18
Reliance Industries: Company update
No Acquirer Acquire Acquisition
cost (INR
mn)
Remarks About the company Financial details
8 Reliance Industrial
Investments and
Holdings Limited
('RIIHL'),
SkyTran Inc. - 1) On 17th Oct, 2018
acquired 12.7%
shareholding in SkyTran
Inc. on a fully diluted basis
with an option to further
invest an amount upto
USD 25 million in
convertible notes
2) On November 6, 2019,
RSBVL has acquired
further shares in SkyTran
Inc. to increase its
shareholding in SkyTran
Inc. to 17.37% on a fully
diluted basis.
1) SkyTran, is a venture
capital-funded technology
company incorporated
under the laws of Delaware,
United States of America
(USA) in 2011. SkyTran is
focused on developing state
of the art technology in the
field of Personal Rapid
Transit Systems. SkyTran,
which has partnered with
National Aeronautics and
Space Administration
(NASA) in the US and Israel
Aerospace Industries (IAI) in
Israel, has developed
breakthrough magnetic
levitation technology for
implementing personal
transportation systems
aimed at solving the
problem of traffic congestion
globally. SkyTran has 8
approved patents and 40+
patents pending approval,
globally, including in India.
The technology has been
developed by SkyTran to
create Smart Mobility
Solutions. The proposed
SkyTran network would
consist of computer-
controlled passenger pods
running on its state-of-the-
art, patented Passive
Magnetic Levitation
technology and would use
cutting edge IT, Telecom, loT
and Advanced Materials
technologies to transport
passengers in a fast, safe,
green, and economical
manner.
2) R¢1iance has made the
investment in SkyTran with
the aim to foster a11
exclusive partnership in
India where it would work
closely with SkyTran to
develop implementations
followed by implementation
of its network in India at
scale. Reliance would play
an active role in advancing
the SkyTran solution,
especially in Telecom
(4G/5G/IoT/Giga Fiber),
Digital Platforms and
Services, Advanced
Materials & Electric
Batteries.

Page | 19
Reliance Industries: Company update
No Acquirer Acquire Acquisition
cost (INR
mn)
Remarks About the company Financial details
9 Reliance Brands
Limited
Hamleys Global
Holdings
Limited
(“HGHL”),
- 1) Completed acquisition
of 100% stake of HGHL
through a special purpose
vehicle company set up in
United Kingdom for cash
consideration of GBP 67.96
million
HGHL was incorporated on
August 3, 2012 in England
and Wales and together
with its subsidiaries is a
retailer of toys under the
world-renowned brand
“Hamleys”. Hamleys is
more than 250 years old
and was founded in the
year 1760. It currently has
167 stores across 18
countries. Reliance Lifestyle
Holdings Limited, a
subsidiary of the Company,
runs and operates the
Indian franchise of the
Hamleys brand and has 88
stores in India. This
acquisition will catapult
RBL to be a major player in
the global toy retail
industry.
HGHL reported
annual
(consolidated)
turnover of GBP
62.88 million, GBP
66.27 million and
GBP 67.99 million for
the years ended
December 2018, 2017
and 2016,
respectively. HGHL
reported
Profit/(Loss) after tax
of GBP 2.44 million,
GBP (11.24) million,
and GBP 1.94 million
for the years ended
December 2018, 2017
and 2016,
respectively.
10 Reliance Industries
Limited (“RIL”) and
JM Financial Asset
Reconstruction
Company Limited
(“JMFARC”)
Alok Industries
Limited
11 C–Square Info
Solutions Private
Limited**
12 Dronagiri
Bokadvira
East/West/North
/South Infra
Dronagiri Bokadvira
East/west/north/south Infra
Limited is a Public
incorporated on 28 January
2019. It is classified as Non-
govt company and is
registered at Registrar of
Companies, Mumbai. Its
authorized share capital is
INR. 1,000,000 and its paid
up capital is INR. 500,000. It
is inolved in Real estate
activities with own or
leased property. [This class
includes buying, selling,
renting and operating of
self-owned or leased real
estate such as apartment
building and dwellings,
non-residential buildings,
developing and
subdividing real estate into
lots etc. Also included are
development and sale of
land and cemetery lots,
operating of apartment
hotels and residential
mobile home sites
Page | 20
Reliance Industries: Company update
No Acquirer Acquire Acquisition
cost (INR
mn)
Remarks About the company Financial details
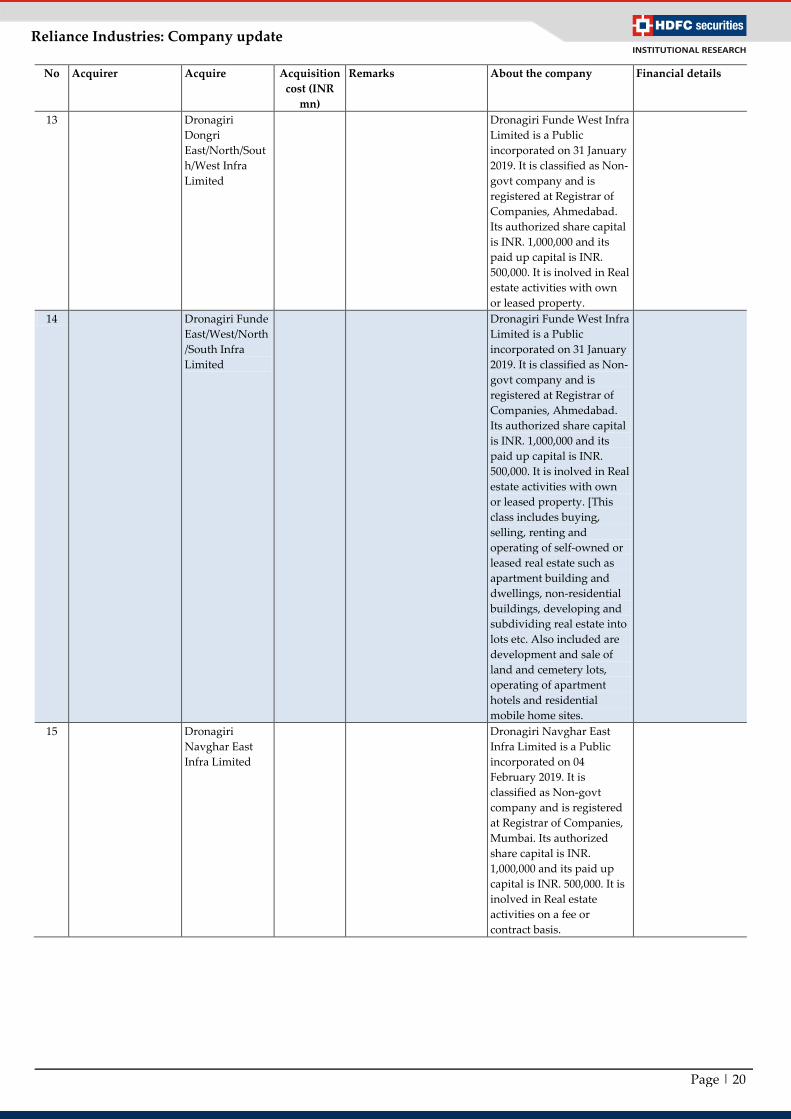
13 Dronagiri
Dongri
East/North/Sout
h/West Infra
Limited
Dronagiri Funde West Infra
Limited is a Public
incorporated on 31 January
2019. It is classified as Non-
govt company and is
registered at Registrar of
Companies, Ahmedabad.
Its authorized share capital
is INR. 1,000,000 and its
paid up capital is INR.
500,000. It is inolved in Real
estate activities with own
or leased property.
14 Dronagiri Funde
East/West/North
/South Infra
Limited
Dronagiri Funde West Infra
Limited is a Public
incorporated on 31 January
2019. It is classified as Non-
govt company and is
registered at Registrar of
Companies, Ahmedabad.
Its authorized share capital
is INR. 1,000,000 and its
paid up capital is INR.
500,000. It is inolved in Real
estate activities with own
or leased property. [This
class includes buying,
selling, renting and
operating of self-owned or
leased real estate such as
apartment building and
dwellings, non-residential
buildings, developing and
subdividing real estate into
lots etc. Also included are
development and sale of
land and cemetery lots,
operating of apartment
hotels and residential
mobile home sites.
15 Dronagiri
Navghar East
Infra Limited
Dronagiri Navghar East
Infra Limited is a Public
incorporated on 04
February 2019. It is
classified as Non-govt
company and is registered
at Registrar of Companies,
Mumbai. Its authorized
share capital is INR.
1,000,000 and its paid up
capital is INR. 500,000. It is
inolved in Real estate
activities on a fee or
contract basis.

Page | 21
Reliance Industries: Company update
No Acquirer Acquire Acquisition
cost (INR
mn)
Remarks About the company Financial details
16 Dronagiri Pagote
East/North/North
first/north
second/south
first/west/east/north
/south/west Infra
Limited
Dronagiri Pagote East Infra
Limited is a Public
incorporated on 16 January
2019. It is classified as Non-
govt company and is
registered at Registrar of
Companies, Mumbai. Its
authorized share capital is
INR. 1,000,000 and its paid
up capital is INR. 500,000. It
is inolved in Real estate
activities with own or
leased property.
17 Genesis La Mode
Private Limited
Genesis La Mode Private
Limited is a Private
incorporated on 30 March
2012. It is classified as Non-
govt company and is
registered at Registrar of
Companies, Delhi. Its
authorized share capital is
INR. 120,000,000 and its
paid up capital is INR.
120,000,000. It is inolved in
Wholesale on a fee or
contract basis.
18 Genesis Luxury
Fashion Private ltd.
19 GLB Body Care
Private Limited
20 GLF Lifestyle
Brands Private
Limited
21 GML India Fashion
Private Limited
22 Grab A Grub
Services Private
Limited
23 Jio Payments Bank
Limited
Reliance Industries Limited
was granted an in-principle
approval by the Reserve
Bank of India ('RBI') to
establish a new Payments
Bank under the Banking
Regulation Act, 1949. It
then partnered with the
State Bank of India to
support this ambitious
initiative of building
Payments Bank capabilities
for every Indian and
accordingly, Jio Payments
Bank Limited, was
incorporated in November
2016.

Page | 22
Reliance Industries: Company update
No Acquirer Acquire Acquisition
cost (INR
mn)
Remarks About the company Financial details
24 Radisys
Corporation
The company's products
are used in mobile network
applications such as small
cell radio access networks,
wireless core network
elements, deep packet
inspection and policy
management equipment;
conferencing, and media
services including voice,
video and data.
25 Reliance Content
Distribution
Limited
Reliance Content
Distribution Limited is a
Public incorporated on 04
September 2017. It is
classified as Non-govt
company and is registered
at Registrar of Companies,
Mumbai. Its authorized
share capital is INR.
99,999,998,000 and its paid
up capital is INR.
53,401,100,000.
26 Reliance GAS
Lifestyle India
Private
Reliance Gas Lifestyle India
Private Limited is a Private
incorporated on 10
February 2017. It is
classified as Non-govt
company and is registered
at Registrar of Companies,
Mumbai. Its authorized
share capital is INR.
1,000,000,000 and its paid
up capital is INR.
1,000,000,000. It is involved
in Repair of personal and
household goods
27 Reverie
Language
Technologies
Private Limited
Reverie Language
Technologies Private
Limited is a Private
incorporated on 12
November 2009. It is
classified as Non-govt
company and is registered
at Registrar of Companies,
Bangalore. Its authorized
share capital is INR. 617,530
and its paid up capital is
INR. 167,380.
28 Saavn Media
Private Limited
Saavn Media Private
Limited operates as a
platform as a service
company. The Company
provides platform for
English, Hindi, and Indian
regional songs. Saavn
Media offers customized
radio station. Saavn Media
serves customers in India.
Page | 23
Reliance Industries: Company update
No Acquirer Acquire Acquisition
cost (INR
mn)
Remarks About the company Financial details
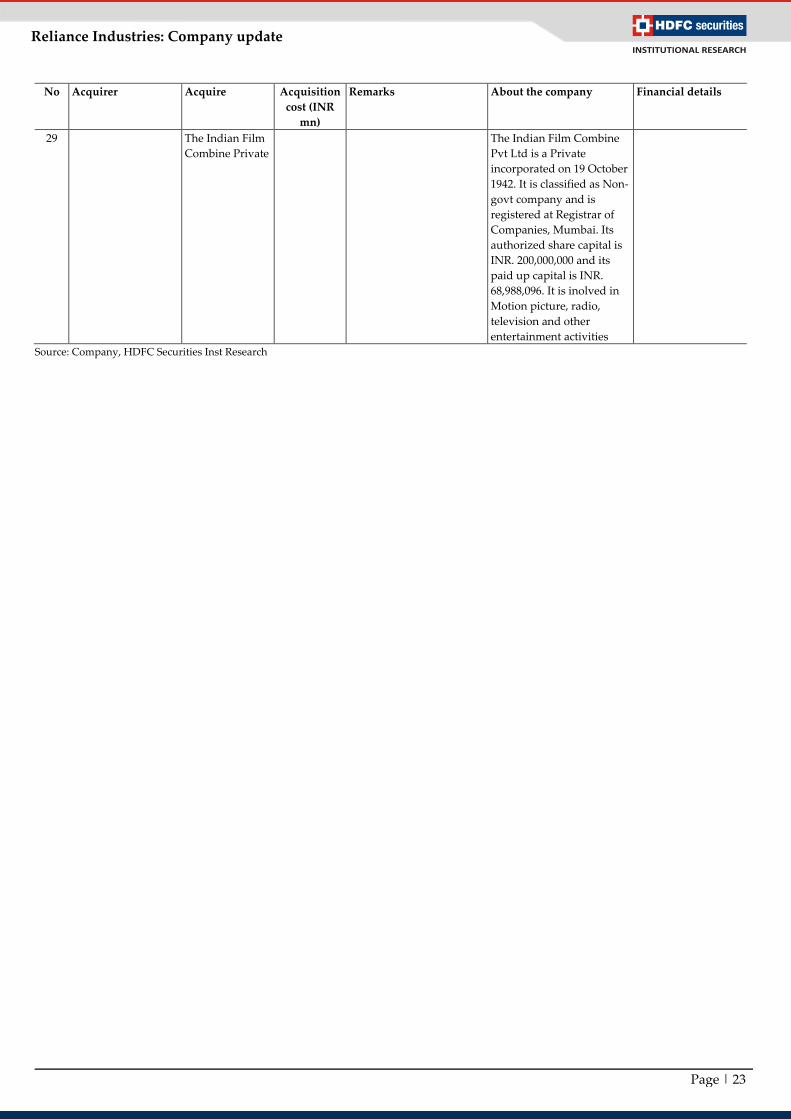
29 The Indian Film
Combine Private
The Indian Film Combine
Pvt Ltd is a Private
incorporated on 19 October
1942. It is classified as Non-
govt company and is
registered at Registrar of
Companies, Mumbai. Its
authorized share capital is
INR. 200,000,000 and its
paid up capital is INR.
68,988,096. It is inolved in
Motion picture, radio,
television and other
entertainment activities
Source: Company, HDFC Securities Inst Research
Page | 24
Reliance Industries: Company update
InvIT
RIL has set up two Infrastructure Investment Trusts (InvITs) as sponsors.
Reliance Jio Infocomm Ltd (RJIL) has spun off its fiber and tower businesses into
two Special Purpose Vehicles (SPVs). Fiber and Tower undertakings will be
transferred to Jio Digital Fiber Private Ltd (JDFPL) and Reliance Jio Infratel
Private Ltd (RJIPL) respectively. Both these entities are operating as independent
entities with the transfer of control to the SEBI registered InvIT. The InvITs will
acquire 51% in the SPVs.
InvIT has its independent business plan and would need to meet its own
obligations. This includes operating expenses and capex as well as future
rollouts. RJio is an anchor tenant for all the towers and for ~50% of fiber
pairs. It has signed a 20 year contract with InvITs. RJio will pay rentals at
market rate which will come down with new tenants. RJio’s payout should
enable it to meet its near-term obligations. InvIT would raise funds by
issuing units to new holders.
Jio has transferred assets worth INR 1.25trn. The corresponding liabilities
which move off its balance sheet include bank debt INR 380bn, Capex
creditors INR 327bn and issue of NCDs to RIL INR 536bn. However, Jio paid
an advance of INR 170bn to SPV for use of assets. SPV repaid RIL NCDs
worth INR 170bn. Thus, net NCDs of RIL outstanding are worth INR 366bn.
Brookfield has invested INR 252bn for its units and will be a key sponsor. In
future, it could choose to refinance this amount with co-investors; however,
as of now, it has completely underwritten this investment. INR 2bn infused
by Brookfield will help InvIT take full 100% stake (51% ownership by InvIT
was earlier funded through bridge loan by InvIT and the balance 49% is to
be purchased from RIL now) in Asset SPV (RJIPL) and the balance INR
250bn will be infused by InvIT in RJIPL through NCDs as long term interest
bearing quasi-equity/debt. InvIT would control RJIPL through a Brookfield-
appointed investment manager and decide on the future course of the tower
business.
Transfer of fiber and tower assets to the SPV will enable a revaluation gain
of INR 910bn. It has a GST component of INR 130bn and thus, net gain is
INR 780bn. RJio’s fiber assets worth INR 880bn were valued at INR 1.66trn.
The InvIT issued preference shares to RIL for the difference (INR 780bn),
repayment of which is contingent on the cash flows of the InvIT. This has
potential to unlock value to RIL, as any additional cash flow from new users
will flow to RIL.
Besides, the re-engineering of balance sheet will make an asset light
model for RJio and make it substantially deleveraged and right size its
balance sheet. This will enable it to monetize infrastructure assets and
create value through external tenancies.

Page | 25
Reliance Industries: Company update
Fig. 34: InvIT Structure
Fig. 35: Balance Sheet Of Fiber And Tower Cos Now Controlled By InvITs
INR bn JDFPL RJIPL Total
Assets 1,664.0 368.0 2,032.0
Equity Shares 5.0 2.0 7.0
Preference Shares (Marketable security) 781.0 1.0 782.0
Share Capital 786.0 3.0 789.0
Liabilities
Bank borrowing 270.0 110.0 380.0
Other Liabilities 190.0 137.0 327.0
RIL NCDs 248.0 118.0 366.0
Advance Paid by Jio 170.0 - 170.0
Sub Total 878.0 365.0 1,243.0
Total Liabilities 1,664.0 368.0 2,032.0
Source: Company, HDFC Sec Inst research

Page | 26
Reliance Industries: Company update
Media and Entertainment
Investment in Network18 Media and its subsidiary TV18 Broadcast (TV18)
enables RJio to provide a combination of telecom, web and digital
commerce. Network18 is a diversified media conglomerate with footprint
across television broadcasting, movie production and distribution, digital
content and commerce, print magazines, mobile content and allied media
services. Its 20 domestic channels span over 15 languages. Network18’s
television channels reach out to more than 800mn people in India,
representing ~95% of the TV viewing universe. Its digital content properties
across news and entertainment are consumed by over 130mn people.
Moreover, RIL is focusing on offering exclusive content to its users and
investing in creation of original content so as to deliver it to diverse
populace. RIL has set up Jio Studios, with the vision to build content
ecosystem of films, web series, music and other content in Hindi and
regional languages. It has also acquired stakes in companies like Eros, Balaji
and Viacom-18 that has given them access to varied content. This provides
RIL with an edge as it offers its viewers a myriad of content to choose from,
enabling it to become value differentiator. Network18 fits together within
the Jio ecosystem across content creation and distribution so as to deliver
Indian and global content.
Fig. 36: Network18 Verticals
Source: Company, HDFC Sec Inst Research

Page | 27
Reliance Industries: Company update
The company has stated that it is looking to target 50mn households for its
fiber broadband product. Currently, the company’s focus is on ramping up
subscriber base. RIL’s rollout is progressing at a slower pace but
management is confident that it will connect 20mn home connect and 15mn
enterprises over 2-3 years.
RIL is testing waters initially with Jio Saavn on content monetisation. The
company has taken a first step in this direction by launching a freemium
music app. The company is in process of finding the right mix and price
point.
RIL to merge its distribution, media business into
Network18
RIL will consolidate its media and distribution businesses, which are
currently spread across multiple entities, into Network18. Under this
scheme of arrangement, TV18 broadcast, Hathway Cable & Datacom and
Den Networks will merge into Network18 Media & Investments. The
broadcasting business will be hosted in Network18 and the cable and
Internet Service Provider (ISP) businesses in two separate wholly owned
subsidiaries of Network18.
Consolidation of cable businesses of Den and Hathway should leverage the
combined strength of the more than 27,000 local cable operators (LCOs).
Currently, these LCOs act as a touch points to 15-17mn households.
Investment in Hathway Cable and Den Network
Jio has set out a target to connect 50mn homes across the country with its
GigaFiber services. These services would include home broadband, wireline,
content and smart home Internet of Things (IoT) solutions. Jio GigaFiber is
designed to provide fast and secure ultra-broadband home experience. To
accelerate this rollout, RIL has made strategic investments in Hathway Cable
and Datacom and in DEN Networks. Through these investments, Jio will be
strengthening the 27,000 LCOs aligned with DEN and Hathway to provide
Jio Home solutions with millions of homes. This will accelerate Jio’s
commitment to provide services to 50mn homes in the shortest time
possible.
RIL has acquired 51.34% in Hathway Cable Datacom for a consideration of
INR 29bn and a further 20.61% through an open offer at INR 12bn. Similarly,
it has acquired 66.01% in Den Networks for a consideration of INR 23bn and
subsequently, acquired an additional 12.05% stake for INR 4bn.
Page | 28
Reliance Industries: Company update
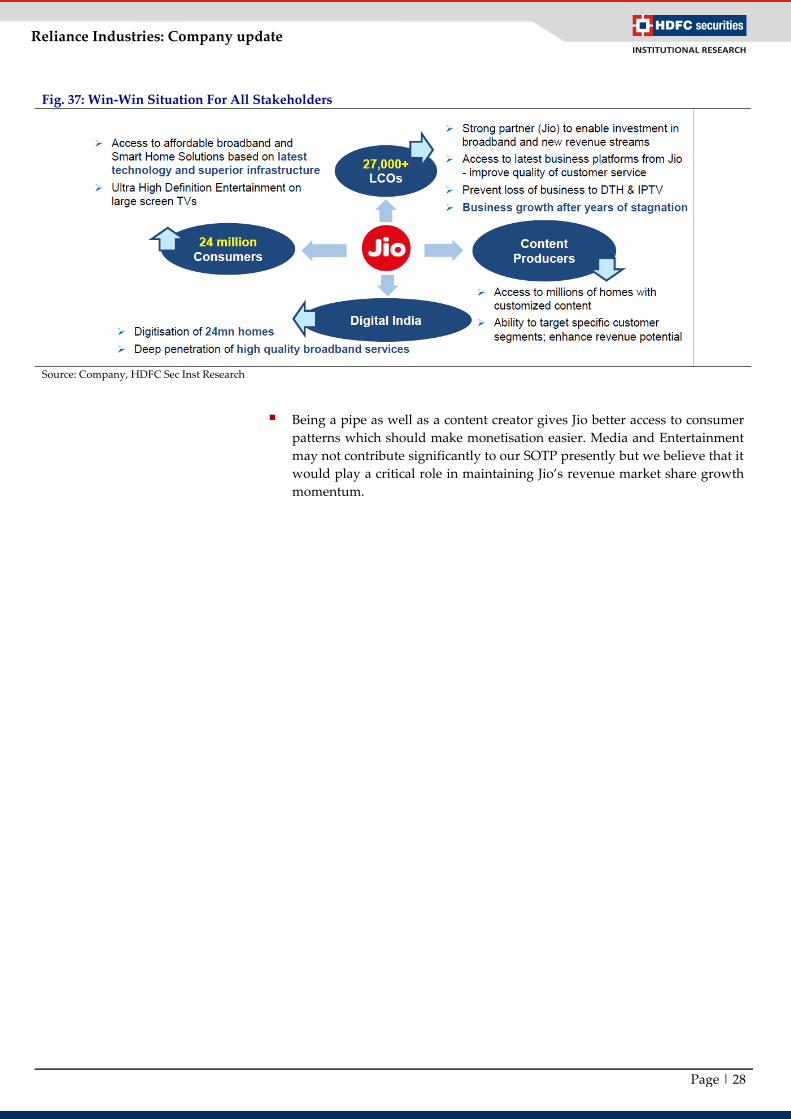
Fig. 37: Win-Win Situation For All Stakeholders
Source: Company, HDFC Sec Inst Research
Being a pipe as well as a content creator gives Jio better access to consumer
patterns which should make monetisation easier. Media and Entertainment
may not contribute significantly to our SOTP presently but we believe that it
would play a critical role in maintaining Jio’s revenue market share growth
momentum.

Page | 29
Reliance Industries: Company update
Reliance Retail- De-coding India’s Everything
store Story in Charts
Fig. 39: Food & Grocery (F&G) Getting Increasingly Top-Heavy. Leaner (Lower Cost Of Retailing) Grocers Like RR,
DMART Gaining Share
Fig. 40: In Fashion and Lifestyle (F&L) Too, RR Has Been Consistently Gaining Share Courtesy Its Value Fashion
Play – Reliance Trends
Source: Company, HDFC sec Inst Research
Fig. 41: Category-Wise Movement In Opex (% Of Sales) Fig. 42: RRVL-Cost Of Retailing Movement (Consol)
Source: Company, HDFC sec Inst Research Source: Company, HDFC sec Inst Research, Note: FY19 increase in
cost of retailing is due to operating leases for Jio Phones
DMART,
23.1
FRL,
18.9
ABRL,
4.1 Spencers,
2.3 Star, 1.0
Reliance
(Grocery), 29.4
Big
Basket (B2B),
3.4
Grofers ,
1.8
Metro,
6.4
Vishal
(B2C), 4.0
Others,
5.6
FY20E
DMART,
20.0
FRL, 5.5
ABRL,
9.0
Spencers,
5.2
Star, 2.5 Reliance
(Grocery), 27.1
Big
Basket (B2B),
0.5
Grofers ,
-
Metro,
12.3
Vishal
(B2C), 5.1
Others,
12.9
FY15
DMART,
21.3
FRL,
26.1
ABRL,
5.7 Spencers,
2.9
Star, 1.3
Reliance
(Grocery), 19.6
Big
Basket (B2B),
2.2
Grofers ,
0.8
Metro,
8.2
Vishal
(B2C), 4.2
Others,
7.6
FY18
40 43 41 42
34 35 33 31
48 47 46 43
-
10
20
30
40
50
60
FY16 FY17 FY18 FY19
Top 6 market share Top 5 market share (ex-RR)
Top 5 rel. market share (ex-RR)
6.6 6.8 7.3
8.1
10.6
-
2.0
4.0
6.0
8.0
10.0
12.0
FY15 FY16 FY17 FY18 FY19
RR (F&L) Market share
17.9 16.3
14.0 13.1
7.2 9.0
-
2.0
4.0
6.0
8.0
10.0
12.0
14.0
16.0
18.0
20.0
-
20,000
40,000
60,000
80,000
100,000
120,000
FY
14
FY
15
FY
16
FY
17
FY
18
FY
19
Total operating expenses As % of revenue - RHS
14 14 12
9
12 12 14
12
31 29
27
23
7
12
17
22
27
32
37
1Q
FY
17
2Q
FY
17
3Q
FY
17
4Q
FY
17
1Q
FY
18
2Q
FY
18
3Q
FY
18
4Q
FY
18
1Q
FY
19
2Q
FY
19
3Q
FY
19
4Q
FY
19
1Q
FY
20
2Q
FY
20
3Q
FY
20
Grocery Consumer Electronics
Fashion & Lifestyle

Page | 30
Reliance Industries: Company update
Fig. 43: On A High Base, Core Retail Revenue To Grow
At ~25% CAGR Over FY19-22E
Fig. 44: Core Retail Productivity Estimated At ~41k
Per Sq. Ft
Source: Company, HDFC sec Inst Research Source: HDFC sec Inst Research estimates
Fig. 45: Retail Revenue Mix Fig. 46: Core Retail Revenue Mix
Source: Company, HDFC sec Inst Research Source: Company, HDFC sec Inst Research
Fig. 47: Largest Retail Network In India - 10,901 Stores Fig. 48:...24.5mn Sq. Ft In Retail Space
Source: Company, HDFC sec Inst Research Source: Company, HDFC sec Inst Research
-
20
40
60
80
100
120
-
500
1,000
1,500
2,000
2,500
FY
14
FY
15
FY
16
FY
17
FY
18
FY
19
FY
20
E
FY
21
E
FY
22
E
Retail revenue (Rs. Bn)
Core Retail revenue (Rs. Bn)
Core Retail YoY (%)
-
5,000
10,000
15,000
20,000
25,000
30,000
35,000
40,000
45,000
FY
14
FY
15
FY
16
FY
17
FY
18
FY
19
FY
20
E
FY
21
E
FY
22
E
Core Retail revenue per sq. ft
Jio Phone Launch
55 50 40
32 20 18
21 22
28 33
21 30
34 34
24 20 21
16 10
9
-8 10
19 15 10
0%
20%
40%
60%
80%
100%
FY
14
FY
15
FY
16
FY
17
FY
18
FY
19
Grocery Consumer Electronics
Connectivity Fashion & Lifestyle
55 54 45 40 39
32
21 24 31 41 41 53
24 22 24 19 20 15
0%
20%
40%
60%
80%
100%
FY
14
FY
15
FY
16
FY
17
FY
18
FY
19
Grocery Consumer Electronics Fashion & Lifestyle
-
500
1,000
1,500
2,000
2,500
3,000
3,500
4,000
4,500
-
2,000
4,000
6,000
8,000
10,000
12,000
14,000
16,000
FY
14
FY
15
FY
16
FY
17
FY
18
FY
19
FY
20
E
FY
21
E
FY
22
E
Total Retail Stores (#) Addition (#) - RHS
-
1
2
3
4
5
6
7
-
5
10
15
20
25
30
35
40
FY
14
FY
15
FY
16
FY
17
FY
18
FY
19
FY
20
E
FY
21
E
FY
22
E
Total Retail Area (mn Sq. ft) Addition (mn sq. ft)

Page | 31
Reliance Industries: Company update
Fig. 49: Core Retail To Add >1250 Stores Over FY19-22E Fig. 50: Ergo, Building In 20% Area CAGR Over
GY19-22E
Source: Company, HDFC sec Inst Research Source: Company, HDFC sec Inst Research
-
100
200
300
400
500
600
700
800
900
1,000
-
1,000
2,000
3,000
4,000
5,000
6,000
7,000
FY
14
FY
15
FY
16
FY
17
FY
18
FY
19
FY
20
E
FY
21
E
FY
22
E
Core Retail Stores (#) Addition (#) - RHS
-
1
2
3
4
5
6
7
-
5
10
15
20
25
30
35
40
FY
14
FY
15
FY
16
FY
17
FY
18
FY
19
FY
20
E
FY
21
E
FY
22
E
Core Retail Area (mn. Sq. ft) Addition (mn sq. ft) - RHS

Page | 32
Reliance Industries: Company update
Grocery to be the growth anchor
Stock-up format gaining preference
Grocery biz is expected to take centre-stage in RR’s growth narrative as
Consumer Electronics biz cools off courtesy 1. moderating JIO phone sales; 2.
High base, 3. Ever intensifying e-tail onslaught in the category
Stock-up format (Reliance SMART) gaining preference as top-up format remains
store economics-crushing for all industry participants. Ergo,
productivity/profitability per sq ft has improved significantly over FY16-20.
Recent acquisitions validate the step-up in focus on stock-up too.
Focus remains on lowering cost of retailing via 1. Making the store network
denser, 2. Improving omni-channel capabilities.
Our store network analysis across key grocers suggests that while D-MART ranks
best on real estate choices and density of network. RR too is playing catch up.
Stock-up format (Reliance SMART) gaining preference as top-up format remains
store economics-crushing for all industry participants. Ergo,
productivity/profitability per sq ft has improved significantly over FY16-20.
Focus remains of lowering cost of retailing via 1. Making the store network
denser, 2. Improving omni-channel capabilities
Grocery to take centre-stage in growth narrative: While Consumer Electronics
vertical (CE) was the growth lever contributing 61/47% of incremental
revenue/EBITDA over FY15-19, it is expected to cool off courtesy moderating Jio
phone sales. Grocery biz is expected to take centre-stage in RR’s growth narrative
over FY19-22E (to contribute >45%/46% of incremental revenue/EBITDA) as
expansion plans are revved up. The company operates the grocery vertical via 3
formats: 1. Reliance Fresh (Convenience store), 2. Reliance Smart (stock-up
format) and Reliance Market (Cash & Carry).
Fig. 51: Revenue Contributors (FY15-22E) Fig. 52: EBITDA Contributors (FY15-22E)
Source: Company, HDFC sec Inst Research Source: Company, HDFC sec Inst Research
Stock-up format gaining preference; ergo productivity should improve: Perhaps
opportunistic, but focus has decisively shifted towards the more profitable stock-
up format (Reliance Smart). RR added 171/248 Smart stores (est) in just over 2
years (3QFY18-3QFY20). On the other hand, Reliance Fresh’s expansion (top-up
format), has been reined in. Understandably so, as the top-up format remains
store economics-crushing for all industry participants. F&G productivity has
improved significantly over FY16-20 (HDFCSec est. ~INR 43.8k/sq. ft; 28%
CAGR) as a consequence. Given the young store age profile of Reliance Smart,
we expect SSSG to be healthy for the grocery biz and build in revenue CAGR of
~33% over FY19-22E.
162
732
1,442
146 76
349 -
316 92
302
-
400
800
1,200
1,600
FY
15
Co
re R
eta
il
Rev G
roce
ry
F&
L
CE
FY
19
Co
re R
eta
il
Rev G
roce
ry
F&
L
CE
FY
22
E C
ore
Ret
ail
Rev
9
54
115
- 11 13
22
28
16 17
-
20
40
60
80
100
120
140
FY
15
Co
re R
eta
il
EB
ITD
A
Gro
cery
F&
L
CE
FY
19
Co
re R
eta
il
EB
ITD
A
Gro
cery
F&
L
CE
FY
22
E C
ore
Ret
ail
EB
ITD
A

Page | 33
Reliance Industries: Company update
Fig. 53: Stock-Up Format Reliance Smart Gaining Preference In Expansion Strategy (Mix Of No. Of Stores, Area)
Source: Company, HDFC sec Inst Research estimates Source: Company, HDFC sec Inst Research eatimates
Recent acquisition also validates the ‘focus on stock-up’ narrative: The recent
acquisition of Shri Kannan Department stores (SKDS) also validates the focus on
the stock-up format. SKDS (incorporated in FY2000), is a stock-up grocer (avg.
store size: 20,690 sq. ft) with a network of 29 stores and 0.6mn sq. ft retail space
predominantly in Coimbatore.
SKDS has a dwindling top-line (-7% CAGR over FY17-19, INR 4bn in FY19) with
a burgeoning working capital cycle and a precarious leverage position (Net
Debt/EBITDA: 5x, Interest cover: 1.1x). However, from RRVL’s point of view, if
executed well, the deal may turn out to be a steal as
1. It gives RR access to a potentially lucrative and relatively virgin geography
for org. retail - Coimbatore. The district has a PCI range of INR 200-250k and
a reasonable population density of ~730/sq. km (Indian avg 464/sq. km). Big
box retailers hardly have a presence in Coimbatore (Big box retailers - 5
stores; DMART has 2 stores)
2. There are enough cost synergies to milk. Also, current rev/sq ft (INR 6900)
and GPM can easily be improved upon by a rejig of product mix and better
utilising the asset through its omni-initiatives. Even, if RR gains a 20% share
in Coimbatore we are looking at a ~15% rev CAGR for RR in this market.
Fig. 54: Enough Cost Synergies To Milk From The Recent SKDS Acquisition
Rs. mn SKDS
Estimated P&L
(Reliance -Grocery)
FY17 FY18 FY19 FY22E FY19 Comments
Revenue 4,812 4,502 4,147 5,459 216,867 @ 20% household market share, RR could improve its throughput and revenue
per sq. ft by ~15% CAGR over FY19-22E
GPM 11.9 12.8 13.0 15.0 15.0 Better sourcing margins for RR and product mix change can bring GPMs closer
to estimated company average of ~16%
Cost structure (As % of
sales) 9.1 9.9 9.9 8.2 8.7
Savings in Employee, Rent and A&P expenses (courtesy brand equity) along
with operating leverage could help save ~170bp in opex
Emp. Exp 3.5 3.8 4.0 3.0 3.0
Rent 1.8 1.8 1.9 1.9 2.0
A&P spends 0.3 0.3 0.3 0.1 0.2
Other expenses 3.5 3.9 3.7 3.2 3.5
EBITDA 136 132 128 372 13,736
EBITDA margin (%) 2.8 2.9 3.1 6.8 6.3
PAT 42 33 20 278
RoE (%) 9.8 8.5 4.7
RoCE (%) 5.5 6.9 4.0
Revenue/sq. Ft 7,503 7,254 6,912 9,099
EBITDA/sq. ft 212 212 213 637
EV (money paid by RIL)
(Rs. mn) 1525
Equity Value (Rs. mn)
903
EV/EBITDA (x)
11.9
P/B (x)
2.1
Source: Company, HDFC sec Inst Research estimates
0%
20%
40%
60%
80%
100%F
Y1
5
FY
16
FY
17
FY
18
FY
19
9M
FY
20
E
FY
20
E
FY
21
E
FY
22
E
Reliance Smart Reliance Fresh Reliance Market
0%
20%
40%
60%
80%
100%
FY
17
FY
18
FY
19
FY
20
E
FY
21
E
FY
22
E
Reliance Smart Reliance Market Reliance Fresh

Page | 34
Reliance Industries: Company update
Cost of retailing inching down:
Network is getting denser: Channel checks, store analysis and recent
acquisitions also suggest that RR is trying to make its network denser (especially
in South)
Ramping up its omni-footprint too:
1. The company has launched a new small store format in 3Q -SMART point
(500-1, 500 sq. footers) with presence in residential neighbourhoods and
Reliance SMART’s price promise. 18 stores have been launched in Navi
Mumbai, Thane and Kalyan in 3Q. These outlets will double up as last mile
delivery (LMD) hubs for online fulfilment as well as act as Pick-up-points
(PuP) – A la D-MART Ready.
2. RR’s ‘New Commerce’ initiative wherein it connects Kirana stores to a
consumer base and manages their inventory via an M-POS system is
expected to bring down LMD costs too as Kirana stores act as LMD agents.
As store networks get denser and omni-footprint increases across
formats/categories, supply chain costs come off, which can in turn be fed into
smarter assortment pricing to gain market share. An inkling of this, can be seen
in RRVL’s reducing cost of retailing across core categories – F&G, F&L,
Consumer Electronics (Note: These are estimates).
Fig. 55: Category-Wise Movement In Opex (As % Of
Sales)
Fig. 56: RRVL: Cost Of Retailing Movement (Consol)
Source: Company, HDFC sec Inst Research Source: Company, HDFC sec Inst Research, Note: FY19 increase in cost
of retailing is due to operating leases for Jio Phones
Fig. 57: Peer-Wise Gross Margins And Cost Of Retailing (%)
Source: Company, HDFC sec Inst Research (FY19), Note: Reliance Grocerry figures on Gross Sales basis
17.9 16.3
14.0 13.1
7.2 9.0
-
2.0
4.0
6.0
8.0
10.0
12.0
14.0
16.0
18.0
20.0
-
20,000
40,000
60,000
80,000
100,000
120,000
FY
14
FY
15
FY
16
FY
17
FY
18
FY
19
Total operating expenses As % of revenue - RHS
14 14 12
9
12 12 14
12
31 29
27
23
7
12
17
22
27
32
37
1Q
FY
17
2Q
FY
17
3Q
FY
17
4Q
FY
17
1Q
FY
18
2Q
FY
18
3Q
FY
18
4Q
FY
18
1Q
FY
19
2Q
FY
19
3Q
FY
19
4Q
FY
19
1Q
FY
20
2Q
FY
20
3Q
FY
20
Grocery Consumer Electronics
Fashion & Lifestyle
1519
28
1721
15
20 2220
26
10 11
3
9
-
10.0
20.0
30.0
40.0
50.0
D-MART Reliance
(Grocery)
Big Bazaar EasyDay Spencers Vishal ABRL Star Spar Natures
Basket
Walmart
India
Metro Booker
India
E-tail
Stock-up retailers Top-up retailers B2B Online
Opex (As % of sales) Gross Margins (%)

Page | 35
Reliance Industries: Company update
Tier2/3-heavy store network allows RR to focus on ‘Fresh’: Our district-wise
store analysis (based on per capita income and population density) clearly shows
that D-MART trumps peers in real estate choices (most dense network among
peers, operating in the most-densely populated districts with one of the highest
per capita income profiles). Ergo, enjoys one of the highest sales velocities in
trade.
In this backdrop, RR’s higher sales velocity (for Reliance Smart) seems disjointed
with its store location profile (higher tier 2/3 presence). However, we believe, its
focus on high frequency and high margin (if supply chain/wastage costs reined
in) Fresh category in near virgin markets with weak fruits & vegetables (F&V)
vendor base may perhaps be aiding its throughput/sq. ft. However, supply chain
costs are likely to be higher vs D-MART. (Cost of retailing est: ~10% for RR’s
grocery biz vs D-MART’s 6.5%)
Fig. 58: Grocer-Wise Revenue Per Sq. Ft Fig. 59: Grocer-Wise Profitability Per Sq. Ft
Source: Company, HDFC sec Inst Research (FY19). RR and D-
MART’s figures are on annualized FY20 financials
Source: Company, HDFC sec Inst Research, RR and D-MART’s
figures are on annualized FY20 financials
-
10,000
20,000
30,000
40,000
50,000
RR
(G
roce
ry)
D-M
AR
T
Wa
lma
rt I
nd
ia
AB
RL
Sp
ence
rs
FR
L
Sp
ar
Sta
r Revenue per sq ft (Rs.)
(4,000)
(2,000)
-
2,000
4,000
6,000
8,000
RR
(G
roce
ry)
D-M
AR
T
Wa
lma
rt I
nd
ia
AB
RL
Sp
ence
rs
FR
L
Sp
ar
Sta
r
GP/sq. ft (Rs.) EBITDA/sq. ft (Rs.)

Page | 36
Reliance Industries: Company update
Fig. 60: District Wise Store Mapping Across Per Capita Income and Population Density of India
Store Mix (%)
PCI/Population
density Population (mn) District (#) D Mart
Reliance
Smart Big Bazaar Star Bazaar
Vishal
Megamart Spencers Spar
Natures
Basket
<INR100K 498 220 2.5 14.1 15.3 - 29.6 18.7 4.0 -
<300 105 79 0.5 5.8 2.2 - 4.4 - - -
1000-3000 162 47 - - 8.4 - 13.2 17.1 - -
3000-5000 7 2 0.5 1.7 2.2 - 3.8 1.6 4.0 -
300-500 47 24 1.5 2.1 0.7 - 1.3 - - -
500-1000 177 68 - 4.6 1.8 - 6.9 - - -
INR 100-150K 225 118 12.4 18.7 14.9 - 20.1 8.1 - -
<300 78 56 4.0 5.0 1.1 - 5.0 0.8 - -
1000-3000 33 6 - 0.8 2.5 - 1.3 2.4 - -
3000-5000 5 1 - - 0.7 - - 0.8 - -
300-500 83 43 6.0 7.9 6.2 - 7.5 3.3 - -
500-1000 26 12 2.5 5.0 4.4 - 6.3 0.8 - -
INR 150-200K 191 86 21.9 20.7 20.0 2.6 18.9 40.7 12.0 3.0
<300 67 31 6.5 5.4 1.8 - 3.1 1.6 - -
1000-3000 14 3 3.0 1.2 1.5 - 1.3 - - -
300-500 56 29 5.0 5.4 3.3 - 5.0 8.1 - -
5000+ 9 2 0.5 2.5 8.7 - 1.3 30.9 12.0 3.0
500-1000 46 21 7.0 6.2 4.7 2.6 8.2 - - -
INR 200-250K 72 30 4.5 10.0 7.6 - 6.3 5.7 12.0 -
<300 3 3 - - 0.4 - - - 4.0 -
1000-3000 23 7 - 1.7 2.9 - 1.3 4.1 - -
300-500 18 8 1.5 2.1 1.5 - 0.6 - - -
500-1000 28 12 3.0 6.2 2.9 - 4.4 1.6 8.0 -
INR 250-300K 21 6 10.9 8.7 9.1 20.5 1.9 - - 6.1
1000-3000 9 3 3.5 3.3 5.1 - 0.6 - - -
300-500 1 1 - 0.4 0.7 - - - - -
500-1000 10 2 7.5 5.0 3.3 20.5 1.3 - - 6.1
INR 300-500K 57 12 32.8 17.4 25.5 76.9 18.9 19.5 68.0 90.9
<300 0 1 - - - - - - - -
1000-3000 2 1 - 0.4 0.4 - 1.3 1.6 - -
3000-5000 10 1 9.0 3.7 6.9 46.2 2.5 1.6 32.0 24.2
300-500 3 2 - 0.8 1.5 - 1.3 - 8.0 -
5000+ 35 4 23.9 11.6 16.0 30.8 12.6 15.4 28.0 66.7
500-1000 8 3 - 0.8 0.7 - 1.3 0.8 - -
INR 500K+ 3 2 - 2.1 2.9 - 3.8 6.5 4.0 -
1000-3000 3 2 - 2.1 2.9 - 3.8 6.5 4.0 -
Gujarat 55 26 14.9 8.3 4.7 - 0.6 0.8 - -
<300 19 12 1.0 3.3 1.1 - - - - -
1000-3000 0 1 0.5 - - - - - - -
300-500 13 5 2.5 0.8 0.4 - - - - -
500-1000 22 8 10.9 4.1 3.3 - 0.6 0.8 - -
Grand Total 1,122 500 100.0 100.0 100.0 100.0 100.0 100.0 100.0 100.0
Source: HDFC Sec Inst Research

Page | 37
Reliance Industries: Company update
Attempting an Indian Ling Shou Tong!
Attempting an Indian Ling Shou Tong! RR’s ‘New Commerce’ initiative is aimed at
creating an ecosystem that connects the 3 key stakeholders in retail (Brands,
Merchants & Consumers) – A la Ling Shou Tong (Alibaba’s B2B play). Being the
largest retailer across categories/2nd largest telecom operator (by subscribers), it
certainly has the Brands and Consumer leg of the equation sorted and now intends to
bridge the only gap – Merchants. The retailer intends to connect ~25-30mn mom-&-
pop merchants via its M-POS. Benefits to the latter are multi-fold - 1. Better
procurement rates, 2. Better customer profiling, 3. superior inventory management,
ergo better margins and 4. Better financing terms. What’s in it for RR? - It could
charge an origination fee for its services sans the balance sheet risk.
…Some perspective: Globally, jury is still out on how to localize inventory? Why is
this important? – To bring down fulfillment costs. Globally, Amazon and Alibaba
have chosen divergent paths to achieve this. While Amazon has been adding
fulfillment centers, Alibaba has been building a partner ecosystem alongwith
acquiring physical store assets across formats to inch closer to the consumer. RR
intends to go the Alibaba way. However, roadmap to success remains hazy as 1. In
India, only the top 0.5-1mn odd Kirana stores can afford an M-POS, 2. Trust deficit
remains, as most may view RR as a competitor rather than a partner 3. Consistent
service levels may be a challenge at-least initially.
In China, while Alibaba’s Lingshoutong platform (part of China Alibaba’s Wholesale
commerce) has successfully penetrated 1/6th the small retailer network in China
(6mn), Its China Wholesale commerce vertical still remains sub-scale (USD 1.8bn,
2.7% of sales) after 5 years of launch, and most of its heavy-lifting is still done by
another format called 1688.com - An integrated domestic wholesale marketplace
which connects wholesale buyers and sellers who trade in apparel, general
merchandise, home decoration and furnishing materials, electronics, packaging
materials and shoes, etc.
Hence, we remain circumspect of the scalability of this model in India (Not factored
in estimates).
Fig. 61: Bulk Of The Growth In China Wholesale Is
Courtesy 1688.com
Fig. 62: China Commerce Wholesale Losing Relevance
In Alibaba’s Portfolio
Source: Company, HDFC sec Inst Research, FY20 is annualized Source: Company, HDFC sec Inst Research
7.7
36.0
27.9
23.7
34.7 31.9
26.3
-
5
10
15
20
25
30
35
40
-
0.5
1.0
1.5
2.0
FY
13
FY
14
FY
15
FY
16
FY
17
FY
18
FY
19
FY
20
*
China commerce wholesale (USD bn) YoY (%) - RHS
6.6 4.6 4.6 4.6 4.2 3.3 3.1 2.8
0%
20%
40%
60%
80%
100%
FY
13
FY
14
FY
15
FY
16
FY
17
FY
18
FY
19
9M
FY
20
China commerce retail Others
International commerce retail Cainiao logistics services
China commerce wholesale International commerce wholesale

Page | 38
Reliance Industries: Company update
Fig. 63: RR: Expect Grocery To Grow At 35% CAGR Fig. 64: RR: Grocery Margins To Remain Steady Over
FY20-22E
Source: Company, HDFC sec Inst Research Source: Company, HDFC sec Inst Research
Fig. 65: We Build In 370 Store Additions In Grocery Fig. 66: …and 28% Area CAGR Over FY19-22E
Source: Company, HDFC sec Inst Research, FY20 is annualized Source: Company, HDFC sec Inst Research
(10)
-
10
20
30
40
50
60
70
80
-
100
200
300
400
500
600
FY
14
FY
15
FY
16
FY
17
FY
18
FY
19
FY
20
E
FY
21
E
FY
22
E
Grocery (Rs. Bn) YoY (%) - RHS
-
1.0
2.0
3.0
4.0
5.0
6.0
7.0
8.0
-
10,000
20,000
30,000
40,000
50,000
FY
15
FY
16
FY
17
FY
18
FY
19
FY
20
E
FY
21
E
FY
22
E
Grocery EBITDA (Rs. Bn) EBITDA margin (%) - RHS
(100)
(50)
-
50
100
150
-
200
400
600
800
1,000
1,200
FY
15
FY
16
FY
17
FY
18
FY
19
FY
20
E
FY
21
E
FY
22
E
Stores (#) Additions (#) - RHS
(1)
(1)
-
1
1
2
2
3
3
-
2
4
6
8
10
12
14
16 F
Y1
5
FY
16
FY
17
FY
18
FY
19
FY
20
E
FY
21
E
FY
22
E
Area (mn. Sq. ft) Additions (mn. Sq. ft) - RHS

Page | 39
Reliance Industries: Company update
Trends the quarterback in Fashion & Lifestyle
RR’s value fashion format Reliance Trends remains the anchor format in this INR
140bn F&L biz accounting for ~80% of segmental revenues.
The format seems to have got the troika of apparel retailing right – Assortment,
Pricing and distribution. On assortment, It retails the highest proportion of SKUs
priced in INR 500-1000 range in Men and Women and <INR 500 in Kids. On
distribution, it sports the most dense network across nearly all Indian districts
(512 districts used as sample). This helps, the format 1. increase top-of-the-mind
recall and 2. Reduce cost of retailing, savings from which can in turn be fed into
competitive pricing to gain market share.
Meanwhile, the value fashion tail seems out of gas with footfalls sliding and
working capital ballooning. Presenting, Reliance Trends an opportunity gain
market share in several districts (Refer Table on district-wise store mapping)
RR’s F&L portfolio straddles multiple price points/income groups through
multiple formats and categories. The largest within its portfolio is its value
fashion format – Reliance Trends/extensions (est: at >INR 100bn, ~80% of RR’s
F&L revenue) with a presence of >840 stores. In addition, RR has JVs with 39
international brands (via Reliance Brands – A subsidiary), a presence in footwear
(Reliance Footprint) and Jewellery (Reliance Jewels) making the F&L portfolio
one of the most well-rounded in India. (F&L grew at 26% CAGR over FY14-20E).
We expect Trends to be the growth anchor (given its value positioning) and build
in a 22% revenue CAGR over FY19-22E for the F&L segment.
Note: While international brand JVs/footwear/jewellery make RR’s F&L portfolio
a well-rounded one, its relevance in profitability remains low.
Fig. 67: Trends Leads The INR 4trn Value Fashion Play Fig. 68: Relative Market Share Gain/(Loss)
FY16 FY17 FY18 FY19 FY20
FBB 29.1 27.6 25.3 21.2 18.4
Pantaloons 15.3 14.9 13.3 11.4 10.8
Zudio 0.7 0.7 0.7 0.7 1.3
Max 12.5 13.8 13.5 12.8 12.9
VMART 5.7 5.9 5.7 5.1 5.1
V2 Retail 2.3 2.8 2.6 2.7 2.3
Reliance Trends 19.4 19.3 22.5 29.3 32.7
Unlimited 8.2 7.1 5.9 4.7 4.1
1India Mart 3.7 3.6 3.3 2.7 2.0
Baazar Kolkata 0.6 0.9 1.1 1.2 1.4
City Kart 3.9 2.3 2.3 2.2 2.3
City Life 0.2 0.9 0.9 0.8 0.9
BF 1.5 1.3 2.3 2.3 2.5
Source: Company, HDFC sec Inst Research Source: Company, HDFC sec Inst Research
What makes Reliance Trends tick? 1. Assortment selection & pricing, 2. Real
estate choices and 3. Cost of retailing typically separate the wheat from the chaff
in retailing - value fashion (VF) is no different. Our SKU, store network and
financial analysis across the VF universe suggests that Reliance Trends trumps
peers across all of the aforementioned yardsticks.
1) Along with Max Fashion, Reliance Trends sports highest proportion of Men
/Women SKUs within the INR 500-1000 price range and Kids’ SKUs in the <INR
500 price range among peers. It also typically offers the highest assortment range
in each category. This helps, as value seekers have a higher tendency for
discovery-based shopping vs purposeful shopping.
4.2
3.1
1.8 1.6
0.7 0.4 0.4 0.3 0.3 0.2 0.2 0.1 0.1 0.1
-0.5 1.0 1.5 2.0 2.5 3.0 3.5 4.0 4.5
Tre
nd
s
FB
B
Ma
x
Pa
nta
loo
ns
VM
AR
T
Un
lim
ited
V2
Ret
ail
Cit
y L
ife
Ba
az
ar
Ko
lkat
a
M B
az
aa
r
Ind
ia 1
Ma
rt
Cit
y K
art
Zu
dio
V-B
az
aar
Market share (%)

Page | 40
Reliance Industries: Company update
2) The store network density of Reliance Trends also remains the highest in peer-
set (assessed by store-to-district ratio) across income and population density
profiles in India. (512 districts assessed on per capita income and population
density). Benefits of this are two-fold – a) It increases top-of-the-mind recall for
the store brand in the catchment, ergo revenue per sq. ft, b) Keeps a tight leash on
supply chain costs. Cost savings can in turn be fed into pricing and increase
competitiveness. Note: Cost of retailing for Reliance’s F&L biz is estimated to be
the lowest among peers.
Fig. 69: Men SKUs (INR 500-1000) Fig. 70: Women SKUs (INR 500-1000) Fig. 71: Kids SKUs (<INR 500)
Fig. 72: Men T-shirts (<INR 500) Fig. 73: Men Casual shirts (<INR 500) Fig. 74: Men Casual shirts (INR 500-
1000)
Fig. 75: Mens Trousers (INR 500-
1000)
Fig. 76: Mens Jeans (INR 500-1000) Fig. 77: Women’s Tops/Tees (<INR
500)
Source: Company websites, HDFC sec Inst Research
50 53
72
54
97
72 78
63
-10 20 30 40 50 60 70 80 90 100
0
500
1,000
1,500
2,000
2,500
fbb
Ma
x
Pa
nta
loo
ns
Tre
nd
s
Zu
dio
Un
lim
ited V
2
V M
art
SKUS (#) % SKUs (<Rs. 500) - RHS
20
-
46
15
53
13
40
63
-10 20 30 40 50 60 70 80 90 100
0100200300400500600700800900
1,000
fbb
Ma
x
Pa
nta
loo
ns
Tre
nd
s
Zu
dio
Un
lim
ited V
2
V M
art
SKUs (#) % SKUs (<Rs. 500) - RHS
56
93
49
66
47
76
60
28
-10 20 30 40 50 60 70 80 90 100
0
200
400
600
800
1,000
1,200
1,400
1,600fb
b
Ma
x
Pa
nta
loo
ns
Tre
nd
s
Zu
dio
Un
lim
ited V
2
V M
art
SKUs (#) % SKUs (Rs. 500 - 1000) - RHS
41 38
52 50
86
41
67 67
-10 20 30 40 50 60 70 80 90 100
0
200
400
600
800
1,000
1,200
1,400
1,600
fbb
Ma
x
Pa
nta
loo
ns
Tre
nd
s
Zu
dio
Un
lim
ited V
2
V M
art
SKUs (#) % SKUs (Rs. 500-1000) - RHS
37 30
56
21
92
66
44 42
-10 20 30 40 50 60 70 80 90 100
0
200
400
600
800
1,000
1,200
1,400
fbb
Ma
x
Pa
nta
loo
ns
Tre
nd
s
Zu
dio
Un
lim
ited V
2
V M
art
SKUs (#) % SKUs (Rs. 500-1000) - RHS
49
61
85
52
90 83
41
59
-10 20 30 40 50 60 70 80 90 100
0
1,000
2,000
3,000
4,000
5,000
6,000
7,000
fbb
Ma
x
Pa
nta
loo
ns
Tre
nd
s
Zu
dio
Un
lim
ited V
2
V M
art
SKUs (#) % SKUs (<Rs. 500) - RHS
40
57
28
45
30
55
44 36
-10 20 30 40 50 60 70 80 90 100
0
1,000
2,000
3,000
4,000
5,000
6,000
7,000
8,000
fbb
Ma
x
Pa
nta
loo
ns
Tre
nd
s
Zu
dio
Un
lim
ited V
2
V M
art
SKUs (#) % SKUs (Rs. 500 - 1000) - RHS
38
59
27
48
33 24
42
-10 20 30 40 50 60 70 80 90 100
0
1,000
2,000
3,000
4,000
5,000
6,000
fbb
Ma
x
Pa
nta
loo
ns
Tre
nd
s
Un
lim
ited
Zu
dio
V M
art
SKUs (#) % SKUs (Rs. 500 - 1000) - RHS
58 78
90
75
97
78
-10 20 30 40 50 60 70 80 90 100
0
500
1,000
1,500
2,000
2,500
3,000
3,500
4,000
fbb
Ma
x
Pa
nta
loo
ns
Tre
nd
s
Zu
dio
Un
lim
ited
SKUs (#) % SKUs (<Rs 500) - RHS

Page | 41
Reliance Industries: Company update
Fig. 78: Women Shirts (<INR 500) Fig. 79: Women Shirts (INR 500-1000) Fig. 80: Women Dresses (<INR 1000)
Source: Company websites, HDFC sec Inst Research
Fig. 81: District Wise Store Mapping Across Per Capita Income And Population Density of India
Row Labels Population
(mn)
District
(#) Pantaloons Max Fbb Zudio V Mart V2 Retail
Style
Bazaar
Citykart
Retail Citylife M Baazar
Baazar
Kolkata
1 India
Mart
Reliance
Trends
<100K 507 228 1.4 1.7 1.8
1.4 1.1 1.4 1.2 1.3 1.1 1.2 1.4 1.7
<500 140 97 1.0 1.0 1.1 #DIV/0! 1.1 1.0 1.0 #DIV/0! 1.0 1.0 1.0 1.0 1.6
1000-3000 165 48 1.4 1.8 2.3 #DIV/0! 1.7 1.2 1.3 1.3 1.5 1.0 1.3 1.6 2.2
3000-5000 5 1 7.0 3.0 5.0 #DIV/0! #DIV/0! #DIV/0! #DIV/0! #DIV/0! #DIV/0! #DIV/0! #DIV/0! 1.0 8.0
500-1000 181 71 1.0 2.0 1.2 #DIV/0! 1.2 1.0 1.5 1.0 1.3 1.3 1.3 1.2 1.4
<300 3 4 #DIV/0! #DIV/0! #DIV/0! #DIV/0! #DIV/0! #DIV/0! #DIV/0! #DIV/0! #DIV/0! #DIV/0! #DIV/0! #DIV/0! 1.3
300-500 13 7 #DIV/0! #DIV/0! #DIV/0! #DIV/0! #DIV/0! #DIV/0! #DIV/0! #DIV/0! #DIV/0! #DIV/0! #DIV/0! #DIV/0! 1.6
>500k 3 2
1000-3000 3 2 10.0 3.5 4.0 #DIV/0! 1.0 1.0 #DIV/0! 1.0 1.0 #DIV/0! #DIV/0! #DIV/0! 5.5
100-200k 410 206 1.8 2.1 1.8 1.2 1.2 1.1 1.7 1.0 2.3 1.8 2.3 0.7 2.5
<500 281 158 1.1 1.3 1.1 1.0 1.0 1.0 1.3 1.0 1.5 1.0 1.5 - 2.0
>5000 9 2 15.0 18.0 10.0 1.0 #DIV/0! #DIV/0! 1.0 #DIV/0! 5.0 5.0 7.0 #DIV/0! 26.5
1000-3000 41 9 1.8 1.2 1.8 #DIV/0! 1.3 1.0 3.5 #DIV/0! 2.5 1.7 2.3 #DIV/0! 3.7
3000-5000 5 1 1.0 #DIV/0! 2.0 #DIV/0! #DIV/0! #DIV/0! 1.0 #DIV/0! #DIV/0! 2.0 2.0 #DIV/0! 3.0
500-1000 74 34 1.5 1.6 1.7 1.3 1.3 1.5 1.0 #DIV/0! 1.0 1.0 1.0 1.0 2.3
300-500 1 2 #DIV/0! #DIV/0! #DIV/0! #DIV/0! #DIV/0! #DIV/0! #DIV/0! #DIV/0! #DIV/0! #DIV/0! #DIV/0! #DIV/0! 1.0
200-300k 100 36 2.2 2.7 2.9 1.2 2.5 1.5 4.0
1.0 2.0 3.0 1.5 5.2
<500 22 12 1.3 1.5 1.8 2.0 #DIV/0! 1.0 #DIV/0! #DIV/0! #DIV/0! #DIV/0! #DIV/0! #DIV/0! 2.8
1000-3000 40 10 2.0 3.3 4.2 1.0 4.0 2.0 4.0 #DIV/0! 1.0 2.0 3.0 2.0 6.4
500-1000 38 14 2.6 2.5 2.7 1.0 2.0 #DIV/0! #DIV/0! #DIV/0! #DIV/0! #DIV/0! #DIV/0! 1.0 5.8
300-500k 58 13 7.0 18.5 6.6 5.3 2.0 1.0
1.0 12.3
<500 3 3 2.0 2.0 2.0 #DIV/0! #DIV/0! 1.0 #DIV/0! #DIV/0! #DIV/0! #DIV/0! #DIV/0! #DIV/0! 6.0
>5000 17 3 12.5 23.5 14.5 5.0 #DIV/0! 1.0 #DIV/0! #DIV/0! #DIV/0! #DIV/0! #DIV/0! #DIV/0! 19.7
1000-3000 2 1 2.0 #DIV/0! 1.0 #DIV/0! #DIV/0! 1.0 #DIV/0! #DIV/0! #DIV/0! #DIV/0! #DIV/0! #DIV/0! 2.0
3000-5000 10 1 17.0 25.0 17.0 6.0 #DIV/0! #DIV/0! #DIV/0! #DIV/0! #DIV/0! #DIV/0! #DIV/0! #DIV/0! 47.0
500-1000 8 3 1.5 #DIV/0! 1.0 #DIV/0! 2.0 #DIV/0! #DIV/0! #DIV/0! #DIV/0! #DIV/0! #DIV/0! 1.0 2.3
300-500 1 1 #DIV/0! #DIV/0! #DIV/0! #DIV/0! #DIV/0! #DIV/0! #DIV/0! #DIV/0! #DIV/0! #DIV/0! #DIV/0! #DIV/0! 1.0
5000+ 17 1 #DIV/0! #DIV/0! #DIV/0! #DIV/0! #DIV/0! #DIV/0! #DIV/0! #DIV/0! #DIV/0! #DIV/0! #DIV/0! #DIV/0! 13.0
Gujarat 61 27
2.5
1000-3000 6 2 #DIV/0! #DIV/0! #DIV/0! #DIV/0! #DIV/0! #DIV/0! #DIV/0! #DIV/0! #DIV/0! #DIV/0! #DIV/0! #DIV/0! 1.5
500-1000 22 8 #DIV/0! #DIV/0! #DIV/0! #DIV/0! #DIV/0! #DIV/0! #DIV/0! #DIV/0! #DIV/0! #DIV/0! #DIV/0! #DIV/0! 5.0
<300 19 12 #DIV/0! #DIV/0! #DIV/0! #DIV/0! #DIV/0! #DIV/0! #DIV/0! #DIV/0! #DIV/0! #DIV/0! #DIV/0! #DIV/0! 1.3
300-500 13 5 #DIV/0! #DIV/0! #DIV/0! #DIV/0! #DIV/0! #DIV/0! #DIV/0! #DIV/0! #DIV/0! #DIV/0! #DIV/0! #DIV/0! 1.5
Grand
Total 1,138 512 2.3 3.0 2.4 1.9 1.4 1.1 1.5 1.2 1.4 1.3 1.6 1.3 2.9
Source: HDFC sec Inst Research
5 5
50 39
100
55
80 83
-10 20 30 40 50 60 70 80 90 100
0
50
100
150
200
250
300
fbb
Ma
x
Pa
nta
loo
ns
Tre
nd
s
Zu
dio
Un
lim
ited V
2
V M
art
SKUs (#) % SKUs (<Rs. 500) - RHS
47
94
45 49
-
45
20 17
-10 20 30 40 50 60 70 80 90 100
0
100
200
300
400
500
600
700
fbb
Ma
x
Pa
nta
loo
ns
Tre
nd
s
Zu
dio
Un
lim
ited V
2
V M
art
SKUs (#) % SKUs (Rs. 500 - 1000) - RHS
39
87
71 69
93 100
82
-10 20 30 40 50 60 70 80 90 100
0
100
200
300
400
500
600
700
800
900
fbb
Ma
x
Pa
nta
loo
ns
Tre
nd
s
Un
lim
ited
Zu
dio V2
SKUs (#) % SKUs (<Rs. 1000) - RHS

Page | 42
Reliance Industries: Company update
Fig. 82: Troika Of Denser Distribution, SKU Selection And Pricing Leads To Higher Revenue/Profitability Per Sq.
Ft
Source: Company, HDFC sec Inst Research
Fig. 83: Cost Of Retailing (Opex As % Of Sales) Is Estimated To Have Come Down
By 770bp Over FY17-20
Source: HDFC sec Inst Research
Meanwhile, value fashion’s tail seems out of gas! Vendors of select VF retailers
(tail-end) may very well be at the end of their tether as creditor cycles for some
run up as high as 6 months (on COGS). Unless store productivity and inventory
management improves, an existential crisis may be lurking around the corner.
Strong incumbents such as Reliance Trends and VMART will be a key
benefactors.
While leverage position for some of these troubled firms may be comfortable and
the working capital issue could be partly mitigated by raising more debt, others
seem precariously placed within the ecosystem. We believe, in the short term,
there could be some margin pressure on the ecosystem as inventory gets
liquidated across the tail-end, however, in the medium-to-long term, one could
expect some consolidation of market share in favour of the industry leaders. Even
if strong incumbents captures 50% of the revenue (of weak operators) at risk, we
are looking at a >INR 10bn opportunity just from the consolidation exercise.
Hence, we build in a healthy 22% revenue CAGR (8.5% SSSG), a 985 store
additions and 19% Area CAGR (similar to FY16-19) over FY19-22E.
-
4,000
8,000
12,000
16,000
20,000
Ba
az
ar
Ko
lka
ta
FB
B
Rel
ian
ce T
ren
ds
Ma
x
V2
Ret
ail
Zu
dio
VM
AR
T
Pa
nta
loo
ns
Cit
y K
art
Un
lim
ited
Ind
ia 1
Ma
rt
Cit
y L
ife
Revenue per Sq ft (Rs.)
(2,000)
(1,000)
-
1,000
2,000
3,000
Rel
ian
ce T
ren
ds
FB
B
Ma
x
Pa
nta
loo
ns
FB
B (
std
)
Un
lim
ited
Zu
dio
BK
VM
AR
T
Sty
le B
az
aa
r
M-B
az
aa
r
V2
Ret
ail
Cit
y L
ife
Cit
y K
art
Ind
ia 1
Ma
rt
V-B
az
aa
r
Vis
ha
l (B
2C
)
EBITDA per sq. Ft (Rs.)
31
28 27
26
23
15
17
19
21
23
25
27
29
31
33
1Q
FY
17
2Q
FY
17
3Q
FY
17
4Q
FY
17
1Q
FY
18
2Q
FY
18
3Q
FY
18
4Q
FY
18
1Q
FY
19
2Q
FY
19
3Q
FY
19
4Q
FY
19
1Q
FY
20
2Q
FY
20
3Q
FY
20
Fashion & Lifestyle

Page | 43
Reliance Industries: Company update
Fig. 84: In Value Fashion, Sales Velocity Across The Tail Seems To Be Coming Off
Source: Company, HDFC Securities, estimates used for VF forward retailers
Fig. 85: Ex V-MART, Payables’ Support For The VF Mass Tail Has Been On The Rise; SOMETHING HAS GOT TO
GIVE!
Source: Company, HDFC Securities, estimates used for VF forward retailers
Fig. 86: Building In 22% Revenue CAGR (8.5% SSSG)
In F&L
Fig. 87: …And 24% EBITDA CAGR Over FY19-22E
Source: Company, HDFC sec Inst Research estimates Source: Company, HDFC sec Inst Research estimates
-
10
20
30
40
50
60
-
50
100
150
200
250
FY
14
FY
15
FY
16
FY
17
FY
18
FY
19
FY
20
E
FY
21
E
FY
22
E
Fashion & Lifestyle (Rs. Bn) YoY (%) - RHS
-
2.0
4.0
6.0
8.0
10.0
12.0
14.0
16.0
18.0
-
10,000
20,000
30,000
40,000
FY
15
FY
16
FY
17
FY
18
FY
19
FY
20
E
FY
21
E
FY
22
E
F&L EBITDA (Rs. Bn) EBITDA margin (%) - RHS
-
4,000
8,000
12,000
16,000
20,000
24,000
FB
B
Pa
nta
loo
ns
Zu
dio
Ma
x
Rel
ian
ce T
ren
ds
Un
lim
ited
VM
AR
T
Ba
az
ar
Ko
lka
ta
V2
Ret
ail
Ind
ia 1
Ma
rt
Cit
y K
art
Cit
y L
ife
M-B
az
aar
V-B
az
aar
FY14 FY15 FY16 FY17 FY18 FY19
Revenue per sqft (Rs)
41
16
45
103
86
103
84 76
151
40
113
83
49
108
24
119
38
68
-
20
40
60
80
100
120
140
160
180
VMART BK V2 Retail 1IndiaMart City Kart City Life V-Bazaar M-Bazaar Vishal (B2C)
Payable Days
FY14 FY15 FY16 FY17 FY18 FY19

Page | 44
Reliance Industries: Company update
Fig. 88: Expect A Little Under 1000 Store Additions In
F&L
Fig. 89: …Building In 19% Area CAGR Over FY19-22E
(similar to FY16-19)
Source: Company, HDFC sec Inst Research estimates Source: Company, HDFC sec Inst Research estimates
Fig. 90: Reliance Retail’s Portfolio Of Formats/Brands
Business / Brand Product / Service End Uses
Ajio Online fashion store Curated online fashion store offering apparels, accessories, footwear and much more
Jio Stores Speciality Store for mobility & communication Latest assortment of mobiles, tablets, laptops, accessories
Project Eve Apparel speciality store Speciality stores catering to entire fashion & lifestyle needs of women
Reliance Digital Electronics speciality store Offering wide range of consumer electronics, home appliances, entertainment, gaming merchandise
Reliance Footprint Footwear speciality store Speciality stores dealing in footwear, handbags and accessories
Reliance Fresh Neighbourhood store Dealing in fresh fruits & vegetables, food, grocery and items of daily use
Reliance Jewels Jewellery speciality store Fine jewellery with offerings across gold, silver, diamond, precious stones and other precious metals
Reliance Market Wholesale cash & carry store Dealing in grocery, clothing, footwear, electronics and general merchandise
Reliance Resq Consumer electronics after sales service provider Service provider for consumer electronic products
Reliance Smart Supermarket Dealing in fresh fruits & vegetables, food, clothing, footwear, electronics and general merchandise
Reliance Smart.in Online grocery store Dealing in fresh fruits & vegetables, food and general merchandise
Reliance Trends Apparel speciality store Offers wide range of apparel, handbags, footwear and accessories
Reliance Trends Woman Apparel speciality store Offers curated collections of Indian women wear and accessories
Reliance Trends Man Apparel speciality store Offers curated collections of Indian men wear and accessories
In-store Brand
Avaasa Ethnic Indianwear inspired by Indian ethos and art forms
Apparel for women
DNMX Denim inspired casuals Apparel for men, women and children
Netplay Smart casuals for the free spirited Apparel for men
Performax Activewear for sports and fitness Apparel and footwear for men, women and children
Point Cove Smart casuals for kids inspired by California Apparel for children
Teamspirit Sport Inspired Casualwear Apparel for men, women and children
LYF 4G Mobile Handsets and Connectivity Devices Mobile and connectivity devices
Reconnect Exclusive Brand from Reliance Digital Electronic gadgets and accessories
Enzo Matic Detergent Powder brand Detergent
Best Farms Premium Grade Farm Produce brand Food
Good Life Clean, Hygienic and Wholesome products brand Food
Scrubz Dishwash liquid brand Dishwash liquid
Freshomz Room Freshener brand Room Freshener
Expelz Toilet Cleaner Brand Liquid toilet cleaner
Graphite Men's deodorant and perfumes Men's deodorant and perfumes
Mopz Surface cleaner brand Liquid surface cleaner
John Players Menswear Men's apparel and accessories
Source: Company websites, HDFC sec Inst Research
-
100
200
300
400
500
-
500
1,000
1,500
2,000
2,500
3,000
FY
15
FY
16
FY
17
FY
18
FY
19
FY
20
E
FY
21
E
FY
22
E
Stores (#) Additions (#) - RHS
-
1
1
2
2
3
3
-
2
4
6
8
10
12
14
16
FY
15
FY
16
FY
17
FY
18
FY
19
FY
20E
FY
21E
FY
22E
Area (mn. Sq. ft)

Page | 45
Reliance Industries: Company update
Fig. 91: Exclusive Brand Partnership
Business / Brand Product / Service End Uses
Armani Exchange Unisex casual wear brand from the Armani house, its global in spirit, this is a
brand for the young citizens Casual wear, Denims
Bally World’s second oldest luxury brand Shoes, bags and fashion accessories
Bottega Veneta Italian Luxury accessories brand, founded in 1966, known for discretion, quality,
and craftsmanship Luxury bags, Shoes, Accessories
Brooks Brothers American iconic brand that has redefined & shaped classic American style for
nearly two centuries Apparel and accessories for men
Canali Tailor-made Italian luxury men’s wear, leader for more than 80 years. Men’s formal wear
Cherokee Iconic American family lifestyle brand Apparel and accessories for kids
Coach Founded in 1941, Coach is a leading design house of modern luxury accessories
and lifestyle collections with an all-American attitude Bags & Accessories
DC American sportswear brand inspired by skateboarding and snowboarding Apparel, accessories, footwear and skateboards
Diesel Iconic Italian lifestyle brand Apparel, accessories and footwear
Dune Distinctive fashion footwear & accessories Accessories and footwear for men and women
Emporio Armani Emporio Armani is a sub label of Giorgio Armani, includes ready-to wear clothes,
sunglasses, perfume, accessories and watches. Luxury Men’s wear and Women’s wear
Ermenegildo Zegna Italian luxury men’s clothing Apparel, accessories and footwear for men
Flormar Leading beauty and colour cosmetic brand Colour cosmetic products
Furla Furla deals in Italian handbags, shoes and accessories since 1927. These collections
are constructed with high quality craftsmanship and contemporary style Luxury Bags, Shoes and Accessories
Giorgio Armani Italian label founded in 1975, known for clean tailored lines and unisex occasion
wear Luxury Men’s wear and Women’s wear
GAS Italian clothing brand offering quality products for intelligent, aware consumers,
with an international, cosmopolitan attitude Apparel, accessories and footwear for men & women
G Star Raw G-Star RAW is a Dutch designer clothing company, known for technologically
advanced denims Denim, casual wear
Hamleys The finest toy shop in the world Toys
Hugo Boss German brand founded in 1924, Sophisticated, modern and iconic Men’s wear
label, market leaders in the upper premium segment of the global apparel market. Men’s wear, formal and semi formal
Hunkemoller Leading European lingerie brand Lingerie, nightwear, swimwear and accessories
ICONIX Diversified portfolio of fashion and home brands Apparel, footwear, accessory and home fashion
Istore Exclusive Apple Products Store Mobile, Laptops and Connectivity Devices
Jimmy Choo
Jimmy Choo is a 21st century luxury accessories brand, with shoes at its heart,
more than 150 stores and is present in the most prestigious department and
specialty stores worldwide
Women’s footwear and accessories
Kate Spade Accessible luxury for women Handbags, small leather goods, apparel and
footwear
Marks & Spencer Iconic British lifestyle brand Apparel for women, men and children, lingerie,
beauty and home décor
Michael Kors
Luxury accessories and ready-to-wear brand established in 1981. Products include
accessories, footwear, watches, jewelry, men’s and women’s ready-to-wear
apparel, eyewear and a full line of fragrance products.
Bags, Footwear and accessories
MUJI Iconic Japanese lifestyle brand Accessories, home, apparel, travel, beauty,
stationery, etc.
Paul & Shark Italian luxury and casual sportswear brand Apparel, accessories and footwear for men
Paul Smith Paul Smith is Britain’s foremost designer, he combines tradition and modernity
for his Men’s wear high fashion and formalwear label Men’s formal wear
Payless Affordable fashion footwear specialty store Footwear, handbags and accessories
Thomas Pink British shirt authority Apparel and accessories for men
Quiksilver Premium youth Lifestyle and culture clothing brand representing action sports Apparel, accessories, footwear, skateboards and
surfboards
Roxy Global lifestyle brand, offering products for every aspect of an active girl’s life Apparel, accessories, swimwear and footwear for
girls
Scotch & Soda European couture brand Shoes, bags and fashion accessories
Steve Madden Fashion forward Footwear & Accessories Brand Accessories and footwear for men and women
Superdry Fashion brand that fuses design influences from Japanese graphics and vintage
Americana, with the values of British tailoring Apparel, accessories and footwear
TUMI Founded in 1975, leading international business, accessory and travel lifestyle
brand. Travel bags, wallets and Bags
Villeroy & Boch
Luxurious and timeless pieces since 1748 for bathroom and wellness, tableware
and tiling. Headquartered in Germany, this large manufacturer of ceramics
specialises in innovative products
Tableware
Vision Express Optical specialty store Spectacles, sunglasses, contact lenses and eyewear
care accessories
Source: Company websites, HDFC sec Inst Research

Page | 46
Reliance Industries: Company update
Consumer Electronics (CE) growth to moderate: CE is RR’s biggest (~INR 49bn)
and fastest growing segment (59% CAGR over FY14-20E) and now accounts for
51% of core retail revenue (up from 41% in FY18). The big revenue bump up
came in 4QFY18 courtesy JIO phone/device launch. However, growth in
consumer electronics will cool off as 1. Revenue from JIO devices moderate, 2.
High base effect. Hence we build in moderating growth in core CE ie ex-JIO
devices of ~18% CAGR (7% SSSG) over FY19-22E.
Fig. 92: Consumer Electronics (CE) Growth To Remain
Healthy, Albeit Will Cool Off Over FY19-22E
Fig. 93: … EBITDA Margins To Moderate Too As JIO
Device Sales Cool Off
Source: Company, HDFC sec Inst Research Source: Company, HDFC sec Inst Research
Fig. 94: Building In Area CAGR of 13% In CE Over
FY19-22E
Fig. 95: Sales Velocity/EBITDA Per Sq. Ft To Remain
Healthy
Source: Company, HDFC sec Inst Research Source: Company, HDFC sec Inst Research
-
20
40
60
80
100
120
140
160
180
-
100
200
300
400
500
600
700
800
FY
14
FY
15
FY
16
FY
17
FY
18
FY
19
FY
20
E
FY
21
E
FY
22
E
Consumer Electronics (Rs. Bn) YoY (%) - RHS
-
1.0
2.0
3.0
4.0
5.0
6.0
7.0
-
10,000
20,000
30,000
40,000
50,000
FY
15
FY
16
FY
17
FY
18
FY
19
FY
20
E
FY
21
E
FY
22
E
Consumer Electronics EBITDA (Rs. Bn)
EBITDA margin (%) - RHS
0.0
0.2
0.4
0.6
0.8
1.0
1.2
1.4
1.6
1.8
-
1
2
3
4
5
6
7
8
9
FY
15
FY
16
FY
17
FY
18
FY
19
FY
20
E
FY
21
E
FY
22
E
Area (mn. Sq. ft) Additions (mn. Sq. ft) - RHS
-
20,000
40,000
60,000
80,000
100,000
FY
16
FY
17
FY
18
FY
19
FY
20
E
FY
21
E
FY
22
E
Consumer Electronics - Revenue per sq. ft
Consumer Electronics - EBITDA per sq. ft

Page | 47
Reliance Industries: Company update
Fig. 96: Leverage Position Remains Comfortable, Inching
Up Though!
Fig. 97: FY19 Saw Moderation In Payables, Expect A
Steady Working Capital Over FY19-22E
Source: Company, HDFC sec Inst Research Source: Company, HDFC sec Inst Research
Fig. 98: Inching Closer To Free Cash Generation Fig. 99: Returns Profile To Remain Steady
Source: Company, HDFC sec Inst Research Source: Company, HDFC sec Inst Research
Fig. 100: RIL Putting Money Where Its Mouth Is…Investments In RRVL Increasing
Source: Company, HDFC sec Inst Research
0.2 0.2 0.1
(0.1)
0.3 0.7 0.5 0.4 0.2
3.7
1.9
0.6
(0.7)
0.9
1.5 1.1
0.9 0.5
(1.0)
-
1.0
2.0
3.0
4.0
FY
14
FY
15
FY
16
FY
17
FY
18
FY
19
FY
20
E
FY
21
E
FY
22
E
Net Debt/Equity (x) Net Debt/EBITDA (x)
87 83
53
20 19 29 27 26 26
-
20
40
60
80
100
FY
14
FY
15
FY
16
FY
17
FY
18
FY
19
FY
20
E
FY
21
E
FY
22
E
Inventory (days)
Debtors (days)
Payables (days)
Cash Conversion Cycle (days)
(60)
(40)
(20)
-
20
40
60
80
100
FY
14
FY
15
FY
16
FY
17
FY
18
FY
19
FY
20
E
FY
21
E
FY
22
E
OCF (Rs. Bn) FCFF (Rs. Bn) FCFE (Rs. Bn)
4 4 7
23 19
21 20
21
-
5
10
15
20
25
30
35
40
FY
15
FY
16
FY
17
FY
18
FY
19
FY
20
E
FY
21
E
FY
22
E
RoIC (%) RoE (%) RoCE (%)
57 57 57 57
67 73
-
10
20
30
40
50
60
70
80
FY
14
FY
15
FY
16
FY
17
FY
18
FY
19
RIL's Investment in Reliance Retail (Rs. bn)

Page | 48
Reliance Industries: Company update
The COVID-19 Impact The 21-day India lockdown (effective 25-Mar-2020 onwards, now extended)
courtesy the COVID-19 outbreak will impact RRVL’s operations too (especially
ex-grocery segments). While the situation remains fluid, and we must confess, do
that extent our estimates, we have tried to estimate the impact on earnings if
there is a 1 month lock-down in India
We have estimated a one-month washout in F&L and Consumer Electronics as
stores remain. The subsequent footfall loss and slow recovery underpins the 3-
4%/10-14% revenue/EBITDA cut in FY21/22E.
We’ve cut Consumer electronics revenue by 5-5.5% and EBITDA margin by 60-
100bp in FY21/22E. Note: The margin cut is extended to FY22E also in part due to
the ever-heightening competitive intensity in the category courtesy e-tail.
F&L revenue takes a haircut of 5% each in FY21/22E. Note the COVID-19 Impact
is expected to fasten the inventory liquidation process by the value fashion tail
(already dealing with burgeoning working capital) once the lock-down is lifted.
Reliance Trends, as a result, may find itself competing in a market froth with
extended discounts. Hence, the 125-170bp EBITDA margin cut for the F&L biz in
FY21/22E.
Fig. 101: Estimate Changes
(INR mn)
FY20E FY21E FY22E
New Old Change
(%) New Old
Change
(%) New Old
Change
(%)
Revenue 14,68,069 15,14,654 (3.1) 17,29,958 17,92,556 (3.5) 20,39,179 20,87,308 (2.3)
Gross Profit 2,09,724 2,16,379 (3.1) 2,48,002 2,56,976 (3.5) 2,93,351 3,00,274 (2.3)
Gross Profit Margin (%) 14.3 14.3 0 bps 14.3 14.3 (0 bps) 14.4 14.4 (0 bps)
EBITDA 89,460 97,612 (8.4) 1,02,579 1,18,864 (13.7) 1,28,710 1,42,948 (10.0)
EBITDA margin (%) 6.1 6.4 (35 bps) 5.9 6.6 (70 bps) 6.3 6.8 (54 bps)
APAT 55,067 61,148 (9.9) 62,227 74,612 (16.6) 79,659 91,054 (12.5)
APAT margin (%) 3.8 4.0 (29 bps) 3.6 4.2 (57 bps) 3.9 4.4 (46 bps)
EPS (Rs) 9.2 10.2 (9.9) 10.4 12.4 (16.6) 13.3 15.2 (12.5)
Gross Revenue Split (INR
mn)
FY20E FY21E FY22E
New Old Change
(%) New Old
Change
(%) New Old
Change
(%)
Grocery 3,30,016 3,40,863 (3.2) 4,34,899 4,46,934 (2.7) 5,49,301 5,62,998 (2.4)
Consumer Electronics 4,95,671 5,13,738 (3.5) 5,88,362 6,19,188 (5.0) 6,89,524 7,29,784 (5.5)
Connectivity 5,39,135 5,49,646 (1.9) 6,03,831 6,15,603 (1.9) 6,94,406 6,77,164 2.5
Fashion & Lifestyle 1,41,361 1,47,388 (4.1) 1,67,755 1,76,285 (4.8) 2,03,160 2,14,659 (5.4)
Petro Retail 1,39,307 1,46,070 (4.6) 1,44,183 1,51,182 (4.6) 1,49,230 1,54,962 (3.7)
Total Gross Revenue 16,45,490 16,97,705 (3.1) 19,39,029 20,09,193 (3.5) 22,85,620 23,39,566 (2.3)
Source: HDFC sec Inst Research

Page | 49
Reliance Industries: Company update
Fig. 102: RRVL – Is One Of The Fastest Growing Retailers, Model Has Demanded Heavy Investments To Back That
Growth Though!
FY14 FY15 FY16 FY17 FY18 FY19 Total
Cash from Operations (excl WC change) 3,527 7,477 7,674 11,846 21,218 51,471 103,214
Other Income 467 198 50 232 54 228 1,229
Total 3,994 7,676 7,724 12,079 21,272 51,699 104,443
Application of funds (INR bn)
Working Capital 10,771 4,475 (2,657) (10,529) 16,063 39,067 57,189
Capex 4,139 2,309 5,203 13,594 49,336 49,638 124,218
Investments - - - - - 33,801 33,801
Dividend - - - - - - -
Proceeds from equity/pref. Issuance 2,017 - - - (10,485) (7,377) (15,845)
Borrowings (13,773) 2,427 9,449 7,090 (34,266) (93,840) (122,913)
Others 209 (667) (4,100) 652 996 29,108 26,199
Net change in cash 631 (868) (171) 1,271 (371) 1,302 1,794
Total 3,994 7,676 7,724 12,079 21,272 51,699 104,443
Cumm. WC + Capex as % of sources of funds (FY14-19)
174
Source: Company, HDFC sec Inst Research
Fig. 103: SOTP - Valuation
Revenue
(INR Mn)
FY22E EBITDA
(INR Mn)
Target EV/EBITDA
(x)
EV (INR Mn)
Rev CAGR (FY19-22E)
EBITDA CAGR
(FY19-22E) Comments
Grocery 4,34,899 41,747 25 10,43,673 33.1 44.1
Avenue trading at 38x EV/EBITDA, Our target multiple for Avenue is ~28x. Valuing Reliance's Grocery biz at ~10% discount to Avenue
F&L 1,67,755 33,521 20 6,70,427 22.2 24.5 @18% premium to V-MART (closest peer by trade)
Consumer Electronics
5,88,362 39,484 15 5,92,257 21.1 20.2 Great Franchise but category at risk of increasingly moving online
Connectivity 6,03,831 12,152 5 60,760 16.6 23.9 Commodity biz. just a master distributor
Petro Retail 1,44,183 1,806 5 9,028 3.3 5.0 Commodity biz
Total 19,39,029 1,28,710 18.5 23,76,146
Net Debt
88,165
Equity Value (INR Mn)
22,87,981
Per Share (INR) on RRVL count
381
Per Share (INR) on RIL count
386
Core Retail
1,14,752 20.1 23,06,357
Source: Company, HDFC sec Inst Research, Per share equity value on RRVL share count*

Page | 50
Reliance Industries: Company update
Refining: Lower margins on weak global economic
outlook
We estimate EBITDA for refining and marketing business to grow from INR
230bn in FY19 to INR 252bn in FY22E (3.1% CAGR), owing to increase in GRM.
The share of refining and marketing EBITDA in consolidated EBITDA will
decrease from 27.5% in FY19 to 25.2% in FY22E. We build in GRM of USD
8.2/7.0/9.0 bbl for FY20/21/22E versus USD 9.2/bbl in FY19.
We estimate the rapid demand reduction in the near term to pressurize refining
margins which should recover as refineries globally cut back capacity utilization.
We expect refining margins to gradually recover with demand as expected
reduction in lighter shale crude production and increase in medium heavy crude
oil from Saudi should support Light - Heavy (L-H) crude differential. We expect
L-H differential to widen from USD 2.2/bbl YTDFY20 to USD 2.5-3/bbl in
FY21/22E, partially mitigating the adverse impact of lower crack spreads on RIL’s
margins.
Petroleum Product Demand To Take A Hit On Covid 19 Impact
The onset of Covid-19 will likely have a significant adverse impact on the global
economy as well as petroleum product demand. There is significant uncertainty
on the economic front currently.
IEA expects world oil demand to fall YoY in CY20 by 0.09 million barrel per day
(mbpd) but chatter of a YoY decline in CY20 demand (as much as 5mbpd+) is
rising because of Covid-19’s devastating impact on economies of China, US,
Europe and India. The corona virus outbreak in China (and subsequently rest of
the world) and its impact on transportation and industrial fuels demand in China
and other regions is the key reason for this bleak outlook. The pandemic has
already impacted transportation fuel and particularly aviation fuel demand.
Flight cancellations leading to declining jet fuel demand globally and falling
gasoline demand in the US has had an adverse impact on refining margins
though partially offset by rapidly declining crude price.
Transportation fuel margins plunged to multi-year lows in 4QFY20 after more
countries imposed lockdown and curbed domestic movement as part of
measures to slow the spread of the virus. Transportation fuel (ATF, Gasoline and
Gasoil) is ~55% of RIL’s refinery output, thus the correction in the margins of
these fuels will impact RIL’s GRMs adversely. We expect RIL’s GRM to decline
from USD 8.2/bbl in FY20E to USD7.0/bbl in FY21E.

Page | 51
Reliance Industries: Company update
Fig. 104: Global Oil Demand
Source: IEA, HDFC sec Inst Research
Petroleum Product Supply
We estimate 3.1mbpd incremental global refining capacity addition over CY2020-
24. Given that these new additions far exceed the increase in demand for refined
products this will exert downward pressure on Gross Refinery Margin (GRMs).
Fig. 105: Global Crude Refining Capacity
Source: Bloomberg, HDFC sec Inst Research
Light-Heavy differential to widen
The current light – heavy crude oil imbalance is creating challenges for complex
refineries like RIL. Involuntary/unplanned production cuts from countries like
Venezuela and Iran and voluntary/planned production cuts (till March 2020)
from OPEC+ has contributed to a large deficit in heavy sour crudes. In recent
times most of the supply gains have come in the light sweet category
predominantly owing to strong growth in US shale- the light sweet-medium sour
crude- resulting in narrower light-heavy (L-H) spreads.
Lower L-H differentials do not usually have any significant impact on the
profitability of an average-complexity ‘simple’ refiner. However, they have a
negative impact on the margin for complex refiners like RIL by increasing the
cost of the heavier crudes.
0.7
0
0.7
0
1.0
0
4.0
0
1.4
0
0.8
0
0.9
0
2.2
0
-2.9
0
3.4
0
0.7
0
1.0
0
1.2
0 1.9
0
2.0
0
1.2
0 1.8
8
1.0
8
0.8
9
0.0
9
-3.5
-2.5
-1.5
-0.5
0.5
1.5
2.5
3.5
4.5
CY
20
01
CY
20
02
CY
20
03
CY
20
04
CY
20
05
CY
20
06
CY
20
07
CY
20
08
CY
20
09
CY
20
10
CY
20
11
CY
20
12
CY
20
13
CY
20
14
CY
20
15
CY
20
16
CY
20
17
CY
20
18
CY
20
19
CY
20
20
mbpd
94.394.8
96.1
97.2 97.798.1
98.6
100.0101.1
90
92
94
96
98
100
102
CY
20
11
CY
20
12
CY
20
13
CY
20
14
CY
20
15
CY
20
16
CY
20
17
CY
20
18
CY
20
19
mn bbl/d
Global refining capacity

Page | 52
Reliance Industries: Company update
Sustained oil prices below USD 35/bbl driven by Opec+’s decision to raise oil
production should induce cuts in US shale oil production as it becomes unviable
to continue production at these low oil prices. Reduction in light grade shale
production from US should support L-H differential. We expect L-H differential
to improve from USD 2.2/bbl in FY20 to USD 2.5-3/bbl in FY21/22E which should
support RIL’s GRM.
Fig. 106: Light-Heavy Differential (Arab Light-Arab Heavy)
Source: Bloomberg, HDFC sec Inst Research
Fig. 107: RIL GRMs Have Consistently Outperformed Benchmark Singapore
GRMs
Source: Company, Bloomberg, HDFC sec Inst Research
Demand for refined products has nosedived because of the COVID-19 outbreak,
which is causing governments around the world to restrict travel and economic
activity, weighing heavily petroleum product demand and refining margins.
For RIL, the current lower LNG price because of the economic slowdown
substantially reduces the benefits derived out of the petcoke gasifier. The petcoke
gasifier could have improved refining margins by USD 1.5 - 2.0/bbl in a
‘normalised’ environment which, with the low LNG price now, could add only
about USD 0.5/bbl.
1.6
1.0 1.0 1.4
3.8
5.0
5.6 5.3
6.3
1.7
3.2 3.6 3.6
4.2 4.3
3.0 2.8
2.2 2.3 2.2
-
1.0
2.0
3.0
4.0
5.0
6.0
7.0
FY
01
FY
03
FY
05
FY
07
FY
09
FY
11
FY
13
FY
15
FY
17
FY
19
USD/bblAL-AH
5.8 5.4 5.16.1
8.8
10.3
11.7
15
12.2
6.6
8.4 8.6 9.2
8.1 8.6
10.8 11.0 11.6
9.2
3.32 2.3
3.9
6.2 5.8 5.7
7.6
5.84.5
5.2
7.8 7.7
5.9 6.3 7.5
5.8 6.8
4.9
0.0
2.0
4.0
6.0
8.0
10.0
12.0
14.0
16.0
FY
01
FY
03
FY
05
FY
07
FY
09
FY
11
FY
13
FY
15
FY
17
FY
19
USD/bbl
RIL GRM Singapore GRM

Page | 53
Reliance Industries: Company update
Fig. 108: Gasoline Spread Trend
Source: Bloomberg, HDFC sec Inst Research
Fig. 109: Gasoil Spread Trend
Source: Bloomberg, HDFC sec Inst Research
Fig. 110: Jet Kero Spread Trend
Source: Bloomberg, HDFC sec Inst Research
5.3
2.8
4.3
8.0
11.5
9.7
10.2 11.6
3.4
5.8
8.6
11.2
12.4
9.6
11.3
14.3
9.3
10.3
5.3
6.0
-
2.0
4.0
6.0
8.0
10.0
12.0
14.0
16.0
FY
01
FY
03
FY
05
FY
07
FY
09
FY
11
FY
13
FY
15
FY
17
FY
19
USD/bbl
Gasoline
7.9
5.0 5.3
6.6
15.8
18.9
18.7
20.0 24.6
7.8
14.6
18.8 18.6 16.6
15.7
13.0 12.1
13.2
15.2
13.2
-
5.0
10.0
15.0
20.0
25.0
30.0
FY
01
FY
03
FY
05
FY
07
FY
09
FY
11
FY
13
FY
15
FY
17
FY
19
USD/bbl
Jet Kero
5.9 4.3
5.0 6.0
13.3 14.3
16.0
18.9
22.2
7.2
13.7
17.8 17.8 16.8
15.6
12.2 11.5
13.1
14.4
13.3
-
5.0
10.0
15.0
20.0
25.0
FY
01
FY
03
FY
05
FY
07
FY
09
FY
11
FY
13
FY
15
FY
17
FY
19
USD/bbl
Gasoil

Page | 54
Reliance Industries: Company update
Fig. 111: Naphtha Spread Trend
Source: Bloomberg, HDFC sec Inst Research
IMO impact on gasoil has been negated by demand reduction
In January, the application of the International Maritime Organisation’s (IMO)
new regulations on Sulphur levels in marine fuels came into effect. Preparation
and transitioning of fuel systems and logistics began in 4QCY19. Since then, fuel
oil prices have displayed the largest reaction as cracks for High Sulphur Fuel Oil
(HSFO) get weaker while compliant fuel oil grades strengthen.
It was expected that, the implementation of these regulations will boost middle
distillate spreads, particularly gasoil spreads. However, gasoil cracks are at 16-
quarter low of USD 10.3/bbl in Q4FY20 because lower demand driven by
economic slowdown. Demand from ships to comply with IMO’s sulphur
regulation has disappointed. Sustained recovery in diesel cracks appears unlikely
owing to (1) Expected slowdown in industrial activity in China, and (2) If any,
future surge in Marine Gasoil (MGO) demand is likely to be met by rise in supply
of diesel from large refining capacity additions in CY19-CY20.
Fig. 112: Gasoil Spread- At 16-Quarter Low
Source: Bloomberg, HDFC sec Inst Research
10.
8
11.
0
12.
5
11.
8
11.
0 1
3.7
13.
1
14.
6
14.
4
14.
5
14.
7
13.
8
12.
9 1
5.4
14.
6
10.
3
0.00
2.00
4.00
6.00
8.00
10.00
12.00
14.00
16.00
18.00
1QF
Y17
2QF
Y17
3QF
Y17
4QF
Y17
1QF
Y18
2QF
Y18
3QF
Y18
4QF
Y18
1QF
Y19
2QF
Y19
3QF
Y19
4QF
Y19
1QF
Y20
2QF
Y20
3QF
Y20
4QF
Y20
USD/bbl
2.2 0.9
2.0
3.4
7.1
1.1 2.6
5.9
-5.4
-0.9
0.2
-4.6
-5.8
-4.7
-1.8
2.8
0.5 0.3
-3.8
-6.0 -8.0
-6.0
-4.0
-2.0
-
2.0
4.0
6.0
8.0
FY
01
FY
03
FY
05
FY
07
FY
09
FY
11
FY
13
FY
15
FY
17
FY
19
USD/bbl
Naphtha

Page | 55
Reliance Industries: Company update
Petrochemical: Feedstock flexibility to ensure
robust cashflow fall
We estimate petchem EBITDA to grow from INR 376bn in FY19 to INR 233bn in
FY22E (CAGR -14.8%) based on similar petchem production of 38mmt. The share
of petchem EBITDA in consolidated EBITDA will reduce from 44.9% in FY19E to
23.3% in FY22E. We estimate per unit EBITDA to decline from USD142/t in FY19
to USD 81/t in FY22E. Ethylene spreads are under pressure currently owing to
surge in capacity addition. Slowdown in global economy initially triggered by US
- China trade war has been aggravated by outbreak of Covid-19 virus. Petchem
demand should lag supply addition in near term as global economic growth
takes a hit in CY2020 because of the Covid-19 impact. This should contract
ethylene spreads in the near term but support a recovery over the medium term.
Shale gas revolution has triggered a wave of low-cost production of feedstock,
primarily Natural Gas Liquids (NGLs) or Ethane. NGLs/ethane-based ethylene
capacity has grown considerably over last decade, especially in USA. Most of the
petrochemical plants that have come online globally in the last five years are
relying heavily on NGLs, primarily ethane, as the feedstock. Moreover, with new
ethane-only crackers in the US and the recently started exports of US
NGLs/ethane, many upcoming petrochemical plants are biased towards
maximizing ethylene production from ethane. Surge of these low-cost feedstock
capacities resulted in correction in ethylene spreads over naphtha in last five
quarters (Fig. 113).
The demand for ethylene grew at 3.9% CAGR from 108.6mmt in CY07 to
159.4mmt in CY17. The Covid-19 pandemic is likely to hit the global economy in
near term. Global GDP growth is expected to fall from 3.6% in CY18. This will
decelerate the growth of ethylene demand to 2.8% CAGR over CY20-24. Thus,
incremental demand for ethylene will be 21mmt between CY20-CY24.
Incremental supply of ethylene would be in excess of 18mmt. This would most
likely put upward pressure on global ethylene margins.
Fig. 113: Ethylene-Naphtha Margin Trend
Source: Bloomberg, HDFC Ins research
1,0
39
1,0
59
1,1
28
1,0
76
72
8
-
200
400
600
800
1,000
1,200
FY
16
FY
17
FY
18
FY
19
YD
TF
Y20
USD/MTEthylene-Naphtha

Page | 56
Reliance Industries: Company update
Restriction on production of key base chemicals like propylene, and aromatics
(benzene, xylene, and toluene) is the primary drawback of rising ethane based
petrochemical plant capacities. The yield of other base chemicals like propylene
and aromatics is especially constrained when ethane is used as feedstock since
ethylene yield (from ethane) is ~80%, which leaves little room for production of
other base chemicals. Due to such heavy reliance on ethane for feedstock,
propylene capacity increases are likely to lag demand growth. The demand of
Propylene grew at 4.5% CAGR from 68.8mmt in CY07 to 106.6mmt in CY17.
During the same period world GDP grew at an average of 3.6%. We believe, the
slowdown in global GDP will result in slowdown in demand growth for
propylene. We expect propylene demand to increase by 18mmt (at 3.4% CAGR
over CY20-24). However, supply is expected to increase merely by 3.1mmt.
Fig. 114: Polypropylene-Propylene Margin Trend
Source: Bloomberg, HDFC Ins research
Fig. 115: Paraxylene-Naphtha Margin Trend
Source: Bloomberg, HDFC Ins research
28
5
20
8
19
5
14
7
13
4
-
50
100
150
200
250
300
FY
16
FY
17
FY
18
FY
19
YD
TF
Y20
USD/MTPolypropylene-Propylene
70
4
68
5
72
8 94
6
67
2
-
100
200
300
400
500
600
700
800
900
1,000
FY
16
FY
17
FY
18
FY
19
YD
TF
Y20
USD/MTParaxylene-Naphtha

Page | 57
Reliance Industries: Company update
Fig. 116: PTA-Paraxylene Margin Trend
Source: Bloomberg, HDFC Ins research
Fig. 117: HDPE-Naphtha Margin Trend
Source: Bloomberg, HDFC Ins research
Fig. 118: Petchem Margins At A Glance
$/MT FY07 FY08 FY09 FY10 FY11 FY12 FY13 FY14 FY15 FY16 FY17 FY18 FY19 YTD
FY20
RIL petchem
margin 106 121 104 107 119 104 80 83 87 88 103 128 142 122
HDPE-Ethylene 250 374 432 366 236 306 287 329 346 218 147 139 194 216
Ethylene-Naptha 1,087 1,116 916 912 1,012 1,058 1,103 1,183 1,121 1,039 1,059 1,128 1,076 728
HDPE-Naptha 1,337 1,490 1,349 1,277 1,248 1,364 1,389 1,512 1,467 1,257 1,206 1,267 1,270 944
PP-P 101 259 196 110 114 26 79 80 192 285 208 195 147 134
Px-Naphtha 1,096 1,014 936 890 1,130 1,385 1,321 1,201 923 704 685 728 946 672
PTA-Px 133 166 176 255 290 196 138 137 119 112 132 153 195 184
MEG-Ethylene 100 405 75 111 216 364 236 148 81 9 (16) 98 54 36
PVC-EDC/Naptha 233 344 405 296 320 422 452 361 333 285 364 412 317 389
Butadiene-LPG 1,285 1,174 1,563 1,356 2,008 3,147 1,870 1,300 1,055 895 1,578 1,123 1,282 958
Source: Bloomberg, Company, HDFC Sec Ins research
11
2
13
2
15
3 19
5
18
4
-
50
100
150
200
250
FY
16
FY
17
FY
18
FY
19
YD
TF
Y20
USD/MTPTA-Px
1,2
57
1,2
06
1,2
67
1,2
70
94
4
-
200
400
600
800
1,000
1,200
1,400
FY
16
FY
17
FY
18
FY
19
YD
TF
Y20
USD/MTHDPE-Naphtha

Page | 58
Reliance Industries: Company update
Exploration and Production: Domestic capex to
raise production
We estimate RIL’s exploration and production EBITDA to increase from INR
11bn in FY19 to INR 24bn in FY22E. The share of exploration and production
EBITDA in consolidated EBITDA should increase from 1.3% in FY19 to 2.0% in
FY22E. We expect gas production from KG basin to increase by 5mmscmd in
FY21E to 6.2mmscmd and further to 11.2mmscmd in FY22E. We have estimated
gas price of USD5.3/mmbtu for incremental gas produced from deepwater fields
in FY21/22E.
RIL’s domestic upstream portfolio includes operation in conventional deepwater
acreages and the unconventional Coal Bed Methane (CBM) block. Besides, with a
focus on US shale oil, RIL has two joint ventures with Pioneer Natural Resources
and Chevron for drilling and completion activities.
KG D6
RIL-BP is jointly developing three deepwater fields namely, R-Cluster, Satellite
Cluster and D55 (MJ) fields with an investment of USD 5bn to monetise ~3 trillion
cubic feet (tcf) of discovered gas resources. First gas from R-Cluster is expected
by mid-2020, followed by Satellite Cluster and MJ fields over the next two years.
These fields are expected to produce ~28mmscmd of natural gas when fully
developed in 2022. The JV is allowed to sell the gas produced from these fields at
a market determined price.
R-Cluster development
Drilling and completion activity for six development wells has already been
completed and upper completions are underway. The final campaign for
installation of subsea structures, umbilicals, flowlines have commenced.
Additionally, the subsea gas gathering hub was installed during the last quarter
(i.e. 3QFY20). Gas production is expected to commence from this field from
2QFY20 with peak production expected to be 12mmscmd.
Meanwhile, the KG D6 JV has successfully conducted first round of gas bidding
in Nov-19 for 5mmscmd of gas. Gas Sales and Purchase Agreement (GSPA) being
signed with customers at a price between USD5.29 to 5.41/mmbtu (floor of 9% of
average 3-month Brent price and cap of HTHP gas price as decided by PPAC).
Satellite Cluster
The JV will drill five wells in this cluster. At the end of CY19, top hole drilling has
been completed for 3 out of 5 wells and the first installation campaign has
started. The production is expected to commence by mid-2021E with peak
production from this field expected to be 7mmscmd.
MJ field
Engineering is ongoing for Floating Production Storage Offload (FPSO), Subsea
Production System (SPS) & Subsea Installation. RIL expects to start production by
mid-2022 with peak production at 12mmscmd.

Page | 59
Reliance Industries: Company update
CBM
RIL commenced production from its Coal Bed Methane (CBM) block SP (West)–
in Mar-17. Currently, more than 238 wells are on production, producing ~
0.94mmscmd of gas. The production is expected to increase to 3mmscmd by Mar-
21. Reliance Gas Pipeline Ltd, a subsidiary of RIL, operates the 302 km long
Shahdol-Phular pipeline. This pipeline connects the CBM gas fields of RIL with
the national gas grid. Currently, RIL is purchasing its own gas at USD
6.26/mmbtu and will continue to purchase it till Mar-21.
Development activities on these CBM blocks are currently underway to sustain
plateau production. This Phase-II activity includes drilling and completion of
more than 100 wells along with an additional gas gathering station and
associated water gathering stations for collection and processing of CBM gas and
water respectively. As of now, more than 67 wells have been put on production
under Phase-II.
Shale Gas
Reliance is restructuring its shale gas assets through cross-border merger of
Reliance Holding USA Inc.(RHUSA) with RIL. This will allow shale gas assets to
benefit from the expected up cycle in commodities.
US oil and gas prices have corrected resulting in an activity slowdown.
Production was down ~23.34% to 56.5 billion cubic feet of oil equivalent (bcfe) in
9MCY19 from 73.7bcfe in 9MCY18.
Fig. 119: Oil And Gas Portfolio
Block Partner RIL JV acreage
Status Stake (%) (in acres)
Conventional
Domestic
KG-DWN-98/3 BP-33.33% 66.67% 316,216
One producing Fields, Field Development Plan (FDP)
approved for R-Cluster, Satellite Cluster and MJ, Field
Development activities underway
NEC-OSN-97/2 BP-33.33% 66.7% 205,520 FDP Submitted. Under review with GoI
GS-OSN-2000/1 Hardy-10% 90.0% 148,263 Declaration Of Commerciality (DOC) reviewed
International
Block 39 Perenco–55%, Petro Vietnam -35% 10.0% 213,746 RIL has withdrawn from the PSC. Assignment under approval
with Government of Peru.
Unconventional
Domestic
CBM
SP(East)-CBM-
2001/1 100.0% 122,317 Development ongoing
SP(West)-CBM-
2001/1 100.0% 123,552 Production started
International
Shale
Pioneer JV Pioneer-46.4%,Newpek-8.6% 45.0% 149,128 Producing
Chevron JV Chevron-60% 40.0% 218,104 Producing
Source: Company, HDFC sec Inst Research

Page | 60
Reliance Industries: Company update
Valuation
We value RIL on an SOTP basis, using EV/EBITDA for refining, petrochemicals
and retail, and DCF (WACC of 10.0%) for the telecom and E&P. We value RIL’s
investments at a 15% discount to their market price (for listed) or book value (for
unlisted). As of Dec-19, RIL had gross debt of INR 3,069bn and cash and cash
equivalents of INR 1,537bn.
Fig. 120: SOTP valuation
Business EV (INR bn) Value per share Valuation basis
Petrochemicals 1,500 253 EV/EBITDA on Sep 21E
Refining 1,379 233 EV/EBITDA on Sep 21E
E & P 215 36 NPV
Investments in Retail 2,065 349 EV/EBITDA on Sep 21E
Investments in Telecom 4,806 811 NPV
Consolidated net Debt (1,673) -282 As on Sep-21
Value per share 8,293 1,400
Source: HDFC sec Inst Research
Fig. 121: One-Year Forward PER Of RIL
Source: Company, HDFC sec Inst Research
Fig. 122: One-Year Forward EV/EBITDA Of RIL
Source: Company, HDFC sec Inst Research
5.0
10.0
15.0
20.0
25.0
30.0
35.0
Ma
r-0
6
Ma
r-0
7
Ma
r-0
8
Ma
r-0
9
Ma
r-1
0
Ma
r-1
1
Ma
r-1
2
Ma
r-1
3
Ma
r-1
4
Ma
r-1
5
Ma
r-1
6
Ma
r-1
7
Ma
r-1
8
Ma
r-1
9
Ma
r-2
0
xRIL PER
5.0
10.0
15.0
20.0
25.0
Ma
r-0
6
No
v-0
6
Jul-
07
Ma
r-0
8
No
v-0
8
Jul-
09
Ma
r-1
0
No
v-1
0
Jul-
11
Ma
r-1
2
No
v-1
2
Jul-
13
Ma
r-1
4
No
v-1
4
Jul-
15
Ma
r-1
6
No
v-1
6
Jul-
17
Ma
r-1
8
No
v-1
8
Jul-
19
Ma
r-2
0
x EV/EBITDA

Page | 61
Reliance Industries: Company update
Fig. 123: RIL PER vs NIFTY PER
Source: Bloomberg, HDFC sec Inst Research
Fig. 124: Assumptions Particulars FY16 FY17 FY18 FY19 FY20E FY21E FY22E
Crude price (US$/bbl) 47.0 48.0 57.5 78.0 57.3 36.3 41.3
INR-USD 65.8 66.9 66.0 70.1 71.7 73.5 75.3
Refining business
GRM (US$/bbl) 10.8 11.0 11.6 9.2 8.2 7.0 9.0
Crude thruput (mmt) 69.6 70.1 69.8 68.3 70.6 65.6 71.9
Upstream Business
PMT
Gas (BCF) 72 63 62 51 36 - -
Oil (mmbbl) 7 6 5 4 2 - -
KG
Gas (mmscmd) 10 8 5 3 2 7 15
Gas price (US$/mmbtu) 4.7 3.1 3.5 4.0 3.1 4.7 5.1
Petrochemicals
Sales volume (mmt) 10.2 10.1 12.7 14.8 14.7 14.7 14.7
EBIT/kg of sales volumes
(INR/kg) 10.1 13.0 16.5 21.3 13.6 7.6 9.3
R-Jio
ARPU (INR/user/month) - - 144.5 131.2 128.4 135.5 144.8
Subscribers (No. mn) - - 187 307 385 440 480
R-Retail
Grocery
Revenue per sq. ft (INR) 40,861 43,797 43,739 44,542
Area addition (mn sq. ft) 1.3 2.3 2.5 2.3
F&L
SSSG (%) 25.4 12.5 5.5 7.8
Expansion-led growth (%) 23.9 12.7 12.5 12.3
Consumer Electronics (ex-
JIO devices)
SSSG (%) 9.7 8.0 8.0
Expansion-led growth (%) 31.2 16.0 12.8
Source: Company, HDFC Sec Inst Research
5.0
10.0
15.0
20.0
25.0
30.0
35.0
Ma
r-0
6
Ma
r-0
7
Ma
r-0
8
Ma
r-0
9
Ma
r-1
0
Ma
r-1
1
Ma
r-1
2
Ma
r-1
3
Ma
r-1
4
Ma
r-1
5
Ma
r-1
6
Ma
r-1
7
Ma
r-1
8
Ma
r-1
9
Ma
r-2
0
xRIL PER NIFTY PER

Page | 62
Reliance Industries: Company update
Fig. 125: Change in estimates
FY20E FY21E FY22E
Old New % Ch Old New % Ch Old New % Ch
Crude oil (USD/bbl) 75.0 57.3 (23.7) 75.0 36.3 (51.7) 75.0 41.3 (45.0)
Exchange rate
(INR/USD) 72.0 71.7 (0.4) 72.0 73.5 2.0 72.0 75.3 4.6
Standalone
business
GRM (USD/bbl) 9.0 8.2 (8.9) 10.2 7.0 (31.4) 10.7 9.0 (15.9)
Petchem margin
(INR/kg) 16.6 13.6 (18.3) 18.7 7.6 (59.3) 18.8 9.3 (50.6)
EBITDA (INR bn) 564 482 (14.6) 647 361 (44.3) 680 462 (32.0)
EPS (INR/share) 54.1 46.5 (14.0) 60.9 31.0 (49.1) 65.8 44.3 (32.6)
Retail
Revenue (INR bn) 1,468 1,515 (3.1) 1,730 1,793 (3.5) 2,039 2,087 (2.3)
EBITDA (INR bn) 89 98 (8.4) 103 119 (13.7) 129 143 (10.0)
APAT (INR bn) 55 61 (9.9) 62 75 (16.6) 80 91 (12.5)
EPS (INR) 9.2 10.2 (9.9) 10.4 12.4 (16.6) 13.3 15.2 (12.5)
Consolidated
business
EBITDA (INR bn) 919 843 (8.3) 1,109 819 (26.1) 1,182 981 (17.0)
EPS (INR/share) 68.3 61.5 (10.0) 82.9 60.2 (27.4) 89.8 81.2 (9.6)
Source: Company, HDFC Sec Inst Research
Fig. 126: Peer Comps
Company Rating Currency CMP
Apr 7 TP
P/E (x) EV/EBITDA (x) P/BV (x) ROE (%)
FY20E FY21E FY22E FY20E FY21E FY22E FY20E FY21E FY22E FY20E FY21E FY22E
Refining &
marketing
Caltex NA AUD 1,135 NA 17.1 11.8 11.3 7.8 5.9 5.5 1.9 1.8 1.7 10.4 14.9 15.5
SK Innovation NA KRW 5,857 NA 23.6 8.7 8.2 8.8 5.7 5.4 0.5 0.5 0.5 2.3 5.3 5.6
S-Oil Corp NA KRW 4,212 NA 37.3 11.0 9.5 12.7 7.7 6.7 1.2 1.1 1.0 3.9 10.5 11.6
GS Holdings NA KRW 2,460 NA 7.2 5.0 4.4 6.0 5.0 4.9 0.4 0.4 0.4 6.4 7.7 8.5
Thai Oil PCL NA THB 85 NA 13.4 7.8 7.2 9.9 8.3 8.2 0.6 0.6 0.6 3.9 8.0 8.5
RIL BUY INR 1,191* 1400 19.4 19.8 14.7 11.1 11.5 9.4 1.8 1.7 1.5 9.7 8.9 11.0
IOC BUY INR 83* 184 6.5 5.1 4.5 5.5 4.3 3.8 0.6 0.6 0.6 10.2 12.4 13.3
BPCL REDU INR 350* 456 10.6 9.5 9.6 8.2 7.5 7.5 1.7 1.5 1.4 16.2 16.9 15.4
HPCL BUY INR 206* 320 7.9 6.8 6.4 8.0 7.0 6.1 0.9 0.9 0.8 12.6 13.3 13.0
Average 15.9 9.5 8.4 8.7 7.0 6.4 1.1 1.0 0.9 8.4 10.9 11.4
Petrochem
IRPC PCL NA THB 5 NA 32.7 11.9 9.8 8.7 6.7 6.1 0.6 0.6 0.5 1.5 5.2 5.9
PTT Global NA THB 85 NA 16.9 10.0 10.1 8.3 6.3 5.5 0.6 0.5 0.5 3.3 5.7 6.2
Kumho Petchem NA KRW 4,107 NA 7.6 6.4 6.5 5.1 4.3 3.9 0.7 0.7 0.6 10.0 10.8 9.2
Hanwha Chem NA KRW 813 NA 7.0 5.4 4.9 7.5 6.7 6.3 0.4 0.3 0.3 5.0 6.2 6.3
Lotte Chem NA KRW 10,795 NA 9.1 7.0 6.3 4.0 3.4 3.1 0.4 0.4 0.4 5.1 6.3 6.4
RIL BUY INR 1,191* 1400 19.4 19.8 14.7 11.1 11.5 9.4 1.8 1.7 1.5 9.7 8.9 11.0
Average 15.4 10.1 8.7 7.5 6.5 5.7 0.7 0.7 0.7 5.8 7.2 7.5
Source: Bloomberg, Company, HDFC sec Inst Research| *Price as on 13-Apr
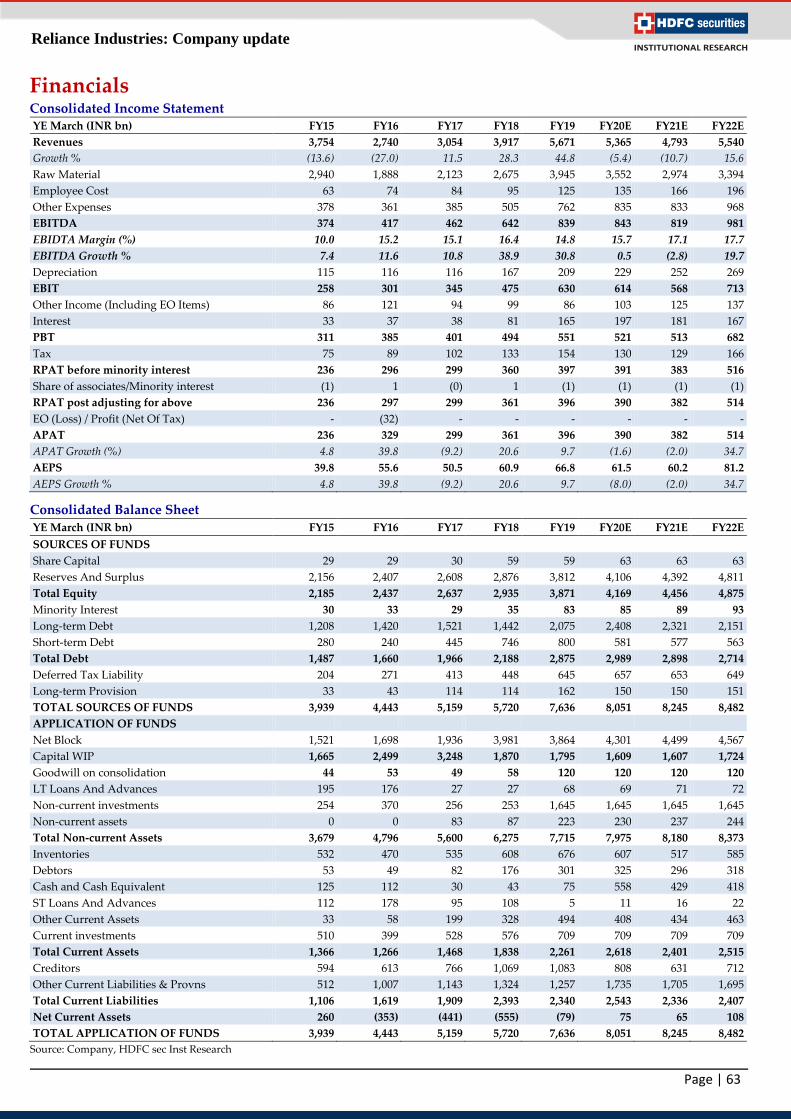
Page | 63
Reliance Industries: Company update
Financials Consolidated Income Statement YE March (INR bn) FY15 FY16 FY17 FY18 FY19 FY20E FY21E FY22E
Revenues 3,754 2,740 3,054 3,917 5,671 5,365 4,793 5,540
Growth % (13.6) (27.0) 11.5 28.3 44.8 (5.4) (10.7) 15.6
Raw Material 2,940 1,888 2,123 2,675 3,945 3,552 2,974 3,394
Employee Cost 63 74 84 95 125 135 166 196
Other Expenses 378 361 385 505 762 835 833 968
EBITDA 374 417 462 642 839 843 819 981
EBIDTA Margin (%) 10.0 15.2 15.1 16.4 14.8 15.7 17.1 17.7
EBITDA Growth % 7.4 11.6 10.8 38.9 30.8 0.5 (2.8) 19.7
Depreciation 115 116 116 167 209 229 252 269
EBIT 258 301 345 475 630 614 568 713
Other Income (Including EO Items) 86 121 94 99 86 103 125 137
Interest 33 37 38 81 165 197 181 167
PBT 311 385 401 494 551 521 513 682
Tax 75 89 102 133 154 130 129 166
RPAT before minority interest 236 296 299 360 397 391 383 516
Share of associates/Minority interest (1) 1 (0) 1 (1) (1) (1) (1)
RPAT post adjusting for above 236 297 299 361 396 390 382 514
EO (Loss) / Profit (Net Of Tax) - (32) - - - - - -
APAT 236 329 299 361 396 390 382 514
APAT Growth (%) 4.8 39.8 (9.2) 20.6 9.7 (1.6) (2.0) 34.7
AEPS 39.8 55.6 50.5 60.9 66.8 61.5 60.2 81.2
AEPS Growth % 4.8 39.8 (9.2) 20.6 9.7 (8.0) (2.0) 34.7
Consolidated Balance Sheet
YE March (INR bn) FY15 FY16 FY17 FY18 FY19 FY20E FY21E FY22E
SOURCES OF FUNDS
Share Capital 29 29 30 59 59 63 63 63
Reserves And Surplus 2,156 2,407 2,608 2,876 3,812 4,106 4,392 4,811
Total Equity 2,185 2,437 2,637 2,935 3,871 4,169 4,456 4,875
Minority Interest 30 33 29 35 83 85 89 93
Long-term Debt 1,208 1,420 1,521 1,442 2,075 2,408 2,321 2,151
Short-term Debt 280 240 445 746 800 581 577 563
Total Debt 1,487 1,660 1,966 2,188 2,875 2,989 2,898 2,714
Deferred Tax Liability 204 271 413 448 645 657 653 649
Long-term Provision 33 43 114 114 162 150 150 151
TOTAL SOURCES OF FUNDS 3,939 4,443 5,159 5,720 7,636 8,051 8,245 8,482
APPLICATION OF FUNDS
Net Block 1,521 1,698 1,936 3,981 3,864 4,301 4,499 4,567
Capital WIP 1,665 2,499 3,248 1,870 1,795 1,609 1,607 1,724
Goodwill on consolidation 44 53 49 58 120 120 120 120
LT Loans And Advances 195 176 27 27 68 69 71 72
Non-current investments 254 370 256 253 1,645 1,645 1,645 1,645
Non-current assets 0 0 83 87 223 230 237 244
Total Non-current Assets 3,679 4,796 5,600 6,275 7,715 7,975 8,180 8,373
Inventories 532 470 535 608 676 607 517 585
Debtors 53 49 82 176 301 325 296 318
Cash and Cash Equivalent 125 112 30 43 75 558 429 418
ST Loans And Advances 112 178 95 108 5 11 16 22
Other Current Assets 33 58 199 328 494 408 434 463
Current investments 510 399 528 576 709 709 709 709
Total Current Assets 1,366 1,266 1,468 1,838 2,261 2,618 2,401 2,515
Creditors 594 613 766 1,069 1,083 808 631 712
Other Current Liabilities & Provns 512 1,007 1,143 1,324 1,257 1,735 1,705 1,695
Total Current Liabilities 1,106 1,619 1,909 2,393 2,340 2,543 2,336 2,407
Net Current Assets 260 (353) (441) (555) (79) 75 65 108
TOTAL APPLICATION OF FUNDS 3,939 4,443 5,159 5,720 7,636 8,051 8,245 8,482
Source: Company, HDFC sec Inst Research

Page | 64
Reliance Industries: Company update
Consolidated Cash Flow YE March (INR bn) FY15 FY16 FY17 FY18 FY19 FY20E FY21E FY22E
Reported PBT 311 385 401 494 551 521 513 682
Non-operating & EO Items (87) (87) (95) (99) (88) (105) (127) (138)
Interest Expenses 33 37 38 81 165 197 181 167
Depreciation 115 116 116 167 209 229 252 269
Working Capital Change 173 600 6 127 (443) 328 (119) (54)
Tax Paid 10 (21) 40 (99) 44 (118) (133) (170)
OPERATING CASH FLOW ( a ) 555 1,029 507 670 439 1,051 566 756
Capex (1,016) (1,136) (1,100) (843) (79) (481) (448) (454)
Free Cash Flow (FCF) (460) (107) (593) (173) 360 571 118 302
Investments 14 (116) 114 4 (1,393) - - -
Non-operating Income 86 121 94 99 86 103 125 137
Others (16) 19 67 (3) (178) (8) (8) (9)
INVESTING CASH FLOW ( b ) (931) (1,112) (826) (743) (1,564) (385) (331) (326)
Debt Issuance/(Repaid) 149 172 306 222 687 114 (92) (183)
Interest Expenses (33) (37) (38) (81) (165) (197) (181) (167)
FCFE (344) 28 (325) (32) 883 488 (154) (48)
Share Capital Issuance 0 0 0 30 0 4 - -
Dividend (33) (73) - (39) (48) (44) (30) (42)
Others 38 7 (31) (46) 683 (60) (62) (48)
FINANCING CASH FLOW ( c ) 121 70 237 85 1,157 (184) (364) (441)
NET CASH FLOW (a+b+c) (254) (13) (82) 12 33 482 (129) (11)
EO Items, Others - - - - - - - -
Closing Cash & Equivalents 125 112 30 43 75 558 429 418
Key Ratios FY15 FY16 FY17 FY18 FY19 FY20E FY21E FY22E
PROFITABILITY %
EBITDA Margin 10.0 15.2 15.1 16.4 14.8 15.7 17.1 17.7
EBIT Margin 6.9 11.0 11.3 12.1 11.1 11.4 11.8 12.9
APAT Margin 6.3 12.0 9.8 9.2 7.0 7.3 8.0 9.3
RoE 11.3 14.3 11.8 12.9 11.6 9.7 8.9 11.0
RoIC 10.4 16.3 17.2 13.7 12.1 11.3 9.9 11.9
RoCE 7.0 8.5 6.8 7.7 7.7 6.9 6.3 7.7
EFFICIENCY
Tax Rate % 24.0 23.1 25.4 27.0 27.9 24.9 25.2 24.4
Fixed Asset Turnover (x) 1.4 0.9 0.9 0.8 1.0 0.9 0.7 0.8
Inventory (days) 52 63 64 57 43 41 39 39
Debtor (days) 5 7 10 16 19 22 23 21
Other Current Assets (days) 14 31 35 41 32 29 34 32
Payables (days) 74 118 132 146 100 83 77 77
Other Current Liab & Provns (days) 64 195 196 181 116 178 209 182
Cash Conversion Cycle (days) (66) (212) (219) (213) (122) (169) (190) (167)
Net Debt/EBITDA (x) 2.3 2.8 3.0 2.4 2.5 2.0 2.1 1.6
Net D/E 0.4 0.5 0.5 0.5 0.5 0.4 0.4 0.3
Interest Coverage 7.8 8.2 9.0 5.9 3.8 3.1 3.1 4.3
PER SHARE DATA (INR)
EPS 39.8 55.6 50.5 60.9 66.8 61.5 60.2 81.2
CEPS 58.0 73.9 68.9 87.3 99.8 97.6 99.9 123.5
Dividend 4.8 5.4 6.2 6.8 6.5 6.0 4.0 5.7
Book Value 344.7 384.4 416.0 463.0 610.7 657.7 702.9 769.0
VALUATION
P/E (x) 29.9 21.4 23.6 19.6 17.8 19.4 19.8 14.7
P/Cash EPS (x) 20.5 16.1 17.3 13.6 11.9 12.2 11.9 9.6
P/BV (x) 3.5 3.1 2.9 2.6 2.0 1.8 1.7 1.5
EV/EBITDA (x) 22.6 20.9 19.5 14.3 11.6 11.1 11.5 9.4
EV/Revenue (x) 2.2 3.2 2.9 2.3 1.7 1.7 2.0 1.7
Dividend Yield (%) 0.4 0.5 0.5 0.6 0.5 0.5 0.3 0.5
OCF/EV (%) 6.6 11.8 5.6 7.3 4.5 11.2 6.0 8.2
FCFF/EV (%) (5.5) (1.2) (6.6) (1.9) 3.7 6.1 1.3 3.3
FCFE/M Cap (%) (4.6) 0.4 (4.3) (0.4) 11.7 6.5 (2.0) (0.6)
Source: Company, HDFC sec Inst Research

Page | 65
Reliance Industries: Company update
Rating Criteria
BUY: >+15% return potential
ADD: +5% to +15% return potential
REDUCE: -10% to +5% return potential
SELL: >10% Downside return potential
Date CMP Reco Target
9-Apr-19 1,335 NEU 1,387
22-Apr-19 1,383 BUY 1,535
9-Jul-19 1,279 NEU 1,296
22-Jul-19 1,249 NEU 1,302
22-Sep-19 1,152 NEU 1,350
11-Oct-19 1,362 NEU 1,350
21-Oct-19 1,416 NEU 1,526
10-Jan-20 1,548 NEU 1,527
19-Jan-20 1,580 NEU 1,562
2-Mar-20 1,329 ADD 1,566
14-Apr-20 1,191 BUY 1,400
From 2nd March 2020, we have moved to a new rating system
RECOMMENDATION HISTORY
800
900
1,000
1,100
1,200
1,300
1,400
1,500
1,600
Ap
r-1
9
Ma
y-1
9
Jun
-19
Jul-
19
Au
g-1
9
Sep
-19
Oct
-19
No
v-1
9
Dec
-19
Jan
-20
Feb
-20
Ma
r-2
0
Ap
r-2
0
Reliance Inds TP

Page | 66
Reliance Industries: Company update
HDFC securities
Institutional Equities
Unit No. 1602, 16th Floor, Tower A, Peninsula Business Park,
Senapati Bapat Marg, Lower Parel, Mumbai - 400 013
Board: +91-22-6171-7330 www.hdfcsec.com
Disclosure:
We, Harshad Katkar, MBA, Nilesh Ghuge, MMS, Divya Singhal, CA, Jay Gandhi, MBA & Rutvi Chokshi, CA, authors and the names subscribed to this report, hereby certify that all of the views expressed in this research report accurately reflect our views about the subject issuer(s) or securities. HSL has no material adverse disciplinary history as on the date of publication of this report. We also certify that no part of our compensation was, is,
or will be directly or indirectly related to the specific recommendation(s) or view(s) in this report. Research Analyst or his/her relative or HDFC Securities Ltd. does not have any financial interest in the subject company. Also Research Analyst or his relative or HDFC Securities Ltd. or its Associate may have beneficial ownership of 1% or more in the subject company at the end of the month
immediately preceding the date of publication of the Research Report. Further Research Analyst or his relative or HDFC Securities Ltd. or its associate does not have any material conflict of interest. Any holding in stock –No
HDFC Securities Limited (HSL) is a SEBI Registered Research Analyst having registration no. INH000002475. Disclaimer:
This report has been prepared by HDFC Securities Ltd and is solely for information of the recipient only. The report must not be used as a singular basis of any investment decision. The views herein are of a general nature and do not consider the risk appetite or the particular circumstances of an individual investor; readers are requested to take professional advice before investing. Nothing in this document should be construed as investment
advice. Each recipient of this document should make such investigations as they deem necessary to arrive at an independent evaluation of an investment in securities of the companies referred to in this document (including merits and risks) and should consult their own advisors to determine merits and risks of such investment. The information and opinions contained herein have been compiled or arrived at, based upon
information obtained in good faith from sources believed to be reliable. Such information has not been independently verified and no guaranty, representation of warranty, express or implied, is made as to its accuracy, completeness or correctness. All such information and opinions are subject to change without notice. Descriptions of any company or companies or their securities mentioned herein are not intended to be complete. HSL is not
obliged to update this report for such changes. HSL has the right to make changes and modifications at any time. This report is not directed to, or intended for display, downloading, printing, reproducing or for distribution to or use by, any person or entity who is a citizen or resident or located in any locality, state, country or other jurisdiction where such distribution, publication, reproduction, availability or
use would be contrary to law or regulation or what would subject HSL or its affiliates to any registration or licensing requirement within such jurisdiction. If this report is inadvertently sent or has reached any person in such country, especially, United States of America, the same should be ignored and
brought to the attention of the sender. This document may not be reproduced, distributed or published in whole or in part, directly or indirectly, for any purposes or in any manner. Foreign currencies denominated securities, wherever mentioned, are subject to exchange rate fluctuations, which could have an adverse effect on
their value or price, or the income derived from them. In addition, investors in securities such as ADRs, the values of which are influenced by foreign currencies effectively assume currency risk. It should not be considered to be taken as an offer to sell or a solicitation to buy any security. This document is not, and should not, be construed as an offer or solicitation of an offer, to buy or sell any securities or other financial instruments.
This report should not be construed as an invitation or solicitation to do business with HSL. HSL may from time to time solicit from, or perform broking, or other services for, any company mentioned in this mail and/or its attachments. HSL and its affiliated company(ies), their directors and employees may; (a) from time to time, have a long or short position in, and buy or sell the
securities of the company(ies) mentioned herein or (b) be engaged in any other transaction involving such securities and earn brokerage or other compensation or act as a market maker in the financial instruments of the company(ies) discussed herein or act as an advisor or lender/borrower to such company(ies) or may have any other potential conflict of interests with respect to any recommendation and other related information and
opinions. HSL, its directors, analysts or employees do not take any responsibility, financial or otherwise, of the losses or the damages sustained due to the investments made or any action taken on basis of this report, including but not restricted to, fluctuation in the prices of shares and bonds, changes in
the currency rates, diminution in the NAVs, reduction in the dividend or income, etc. HSL and other group companies, its directors, associates, employees may have various positions in any of the stocks, securities and financial instruments dealt in the report, or may make sell or purchase or other deals in these securities from time to time or may deal in other securities of the
companies / organizations described in this report. HSL or its associates might have managed or co-managed public offering of securities for the subject company or might have been mandated by the subject company for any other assignment in the past twelve months.
HSL or its associates might have received any compensation from the companies mentioned in the report during the period preceding twelve months from t date of this report for services in respect of managing or co-managing public offerings, corporate finance, investment banking or merchant banking, brokerage services or other advisory service in a merger or specific transaction in the normal course of business.
HSL or its analysts did not receive any compensation or other benefits from the companies mentioned in the report or third party in connection with preparation of the research report. Accordingly, neither HSL nor Research Analysts have any material conflict of interest at the time of publication of this report. Compensation of our Research Analysts is not based on any specific merchant banking, investment banking or brokerage service
transactions. HSL may have issued other reports that are inconsistent with and reach different conclusion from the information presented in this report. Research entity has not been engaged in market making activity for the subject company. Research analyst has not served as an officer, director or
employee of the subject company. We have not received any compensation/benefits from the subject company or third party in connection with the Research Report. HDFC securities Limited, I Think Techno Campus, Building - B, "Alpha", Office Floor 8, Near Kanjurmarg Station, Opp. Crompton Greaves,
Kanjurmarg (East), Mumbai 400 042 Phone: (022) 3075 3400 Fax: (022) 2496 5066 Compliance Officer: Binkle R. Oza Email: [email protected] Phone: (022) 3045 3600 HDFC Securities Limited, SEBI Reg. No.: NSE, BSE, MSEI, MCX: INZ000186937; AMFI Reg. No. ARN: 13549; PFRDA Reg. No. POP: 11092018;
IRDA Corporate Agent License No.: CA0062; SEBI Research Analyst Reg. No.: INH000002475; SEBI Investment Adviser Reg. No.: INA000011538; CIN - U67120MH2000PLC152193