Cement & Building Materials - Reliance Securities
123
Research Analyst Binod Modi Contact: 022 4303 4626/9870009382 Email: [email protected] Research Associate: Girija Shankar Ray Email : [email protected] 1. Cement industry added capacity to the tune of 19mnT in FY20 and despite current pandemic situation, the industry is set to add 25mnT cement capacity in FY21 and 51mnT in next three years. 2. Last two weeks of March are always crucial, as higher billing is done during this period, which was adversely affected by COVID-led nationwide lockdown. Resultantly, cement demand contracted by 1% in FY20. 3. Cement demand is expected to de-grow by 12% in FY21E and likely to rebound by 11.4% and 7.8% in FY22E and FY23E, respectively. 4. Incremental consumption is seen at 20mnT over FY20-FY23E from the base cement consumption of 329mnT in FY20, whereas incremental supply during the period is pegged at 51mnT. 5. Eastern region is expected to add the highest 21mnT capacity (43% of total) followed by 11.5mnT in Western region (23% of total) and 10.5mnT in Central region, while Northern and Southern regions are expected to witness minimal capacity addition (4mnT each). 6. Lower fuel prices are likely to aid the industry to withstand the adverse impact of lower utilization in near-to-medium-term. 7. Strong pricing scenario across regions is likely to aid the companies to report healthy unitary operating performance in 1HFY21E. 8. New capacity addition is not expected to witness very high growth in next decade unlike last decade owing to limited resources. Hence, the demand growth should outpace supply growth in the next decade, in our view. Outlook & Valuation Prolonged slowdown in construction activities due to COVID-led disruptions significantly impacted the cement demand, which is expected to see recovery only in 2HFY21 led by strong rural demand and pick-up in infrastructure activities. Unlike pre-COVID, net incremental supply is expected to be 31mnT in next three years. However, we expect the scenario to improve substantially from FY22E onwards led by revival in demand scenario. Further, the industry is likely to add only 24mnT of clinker capacity in next three years and thereafter, there is hardly any capacity addition plan as of now, which bodes well for the cement industry and indicates that supply glut is likely to wane, going forward. We continue to prefer Northern and Central region among others due to favourable demand supply situation. We maintain UltraTech as our Top Pick in large-cap space, while JK Cement, JK Lakshmi Cement, HeidelbergCement India are our Top Picks in mid-cap space. We prefer Somany Ceramics in tiles Building Materials space. Coverage Summary Company Rating CMP 2 yr % (Rs) TP (Rs) chg ACC Ltd BUY 1,388 1,718 24% Ambuja Cements BUY 219 252 15% UltraTech Cement BUY 4,035 4,825 20% Shree Cement BUY 21,513 24,053 12% Ramco Cements BUY 670 802 20% India Cements SELL 115 81 -30% J.K. Cement BUY 1,500 1,711 14% JK Lakshmi BUY 270 401 49% Mangalam Cement BUY 197 295 50% HeidelbergCement BUY 193 226 17% Sagar Cement BUY 471 619 31% Kajaria Ceramics SELL 408 384 -6% Somany Ceramics BUY 133 173 30% Price Performance Mkt. Cap. Absolute Perfromance Company (Rsbn) 1 M 3 M 12 M ACC 261 6.6 22.1 (13.0) Ambuja Cements 435 14.7 28.2 3.2 UltraTech Cement 1,165 5.1 21.2 (4.7) Shree Cement 776 (1.3) 18.2 10.2 Ramco Cements 158 4.3 26.3 (7.0) India Cements 36 (1.9) (3.1) 45.8 J.K. Cement 116 8.2 38.3 48.8 JK Lakshmi 32 (3.7) 43.3 (17.0) Mangalam Cement 5 (1.1) 28.4 (20.3) HeidelbergCement 44 11.2 31.0 (3.1) Sagar Cement 10 19.0 68.7 (19.1) Kajaria Ceramics 65 3.1 34.1 (16.4) Somany Ceramics 6 17.8 51.7 (55.2) Key Sectoral Updates: Cement industry to add 51mmT capacity over three years Cement demand to contract by 12% in FY21E and to grow by 11% in FY22E and 8.5% in FY23E Northern and Southern regions to witness minimal cement capacity addition Cement prices unlikely to see sharp up-tick hereon Cost deflation to offer cushion in case of low utilization Building materials (tiles) segments unlikely to see recovery in medium-term Click Image for Video Presentation Cement & Building Materials Sector Update | 18 Aug 2020 Institutional Equity Research Growth Prospects Remain Bright despite Near-term Disruptions We request for your valuable vote and support We have made changes to our Recommendation and Target Price. Please refer to Page no. 123 at the end of the report.
-
Upload
khangminh22 -
Category
Documents
-
view
3 -
download
0
Transcript of Cement & Building Materials - Reliance Securities

Research Analyst
Binod ModiContact: 022 4303 4626/9870009382Email: [email protected]
Research Associate:
Girija Shankar RayEmail : [email protected]
1. Cement industry added capacity to the tune of 19mnT in FY20 and despite current pandemic situation, the industry is set to add 25mnT cement capacity in FY21 and 51mnT in next three years.
2. Last two weeks of March are always crucial, as higher billing is done during this period, which was adversely affected by COVID-led nationwide lockdown. Resultantly, cement demand contracted by 1% in FY20.
3. Cement demand is expected to de-grow by 12% in FY21E and likely to rebound by 11.4% and 7.8% in FY22E and FY23E, respectively.
4. Incremental consumption is seen at 20mnT over FY20-FY23E from the base cement consumption of 329mnT in FY20, whereas incremental supply during the period is pegged at 51mnT.
5. Eastern region is expected to add the highest 21mnT capacity (43% of total) followed by 11.5mnT in Western region (23% of total) and 10.5mnT in Central region, while Northern and Southern regions are expected to witness minimal capacity addition (4mnT each).
6. Lower fuel prices are likely to aid the industry to withstand the adverse impact of lower utilization in near-to-medium-term.
7. Strong pricing scenario across regions is likely to aid the companies to report healthy unitary operating performance in 1HFY21E.
8. New capacity addition is not expected to witness very high growth in next decade unlike last decade owing to limited resources. Hence, the demand growth should outpace supply growth in the next decade, in our view.
Outlook & Valuation
Prolonged slowdown in construction activities due to COVID-led disruptions significantly
impacted the cement demand, which is expected to see recovery only in 2HFY21 led by strong
rural demand and pick-up in infrastructure activities. Unlike pre-COVID, net incremental supply
is expected to be 31mnT in next three years. However, we expect the scenario to improve
substantially from FY22E onwards led by revival in demand scenario. Further, the industry is
likely to add only 24mnT of clinker capacity in next three years and thereafter, there is hardly any
capacity addition plan as of now, which bodes well for the cement industry and indicates that
supply glut is likely to wane, going forward. We continue to prefer Northern and Central region
among others due to favourable demand supply situation. We maintain UltraTech as our Top
Pick in large-cap space, while JK Cement, JK Lakshmi Cement, HeidelbergCement India
are our Top Picks in mid-cap space. We prefer Somany Ceramics in tiles Building Materials
space.
Coverage Summary
Company Rating CMP 2 yr %
(Rs) TP (Rs) chg
ACC Ltd BUY 1,388 1,718 24%
Ambuja Cements BUY 219 252 15%
UltraTech Cement BUY 4,035 4,825 20%
Shree Cement BUY 21,513 24,053 12%
Ramco Cements BUY 670 802 20%
India Cements SELL 115 81 -30%
J.K. Cement BUY 1,500 1,711 14%
JK Lakshmi BUY 270 401 49%
Mangalam Cement BUY 197 295 50%
HeidelbergCement BUY 193 226 17%
Sagar Cement BUY 471 619 31%
Kajaria Ceramics SELL 408 384 -6%
Somany Ceramics BUY 133 173 30%
Price Performance
Mkt. Cap. Absolute
Perfromance
Company (Rsbn) 1 M 3 M 12 M
ACC 261 6.6 22.1 (13.0)
Ambuja Cements 435 14.7 28.2 3.2
UltraTech Cement 1,165 5.1 21.2 (4.7)
Shree Cement 776 (1.3) 18.2 10.2
Ramco Cements 158 4.3 26.3 (7.0)
India Cements 36 (1.9) (3.1) 45.8
J.K. Cement 116 8.2 38.3 48.8
JK Lakshmi 32 (3.7) 43.3 (17.0)
Mangalam Cement 5 (1.1) 28.4 (20.3)
HeidelbergCement 44 11.2 31.0 (3.1)
Sagar Cement 10 19.0 68.7 (19.1)
Kajaria Ceramics 65 3.1 34.1 (16.4)
Somany Ceramics 6 17.8 51.7 (55.2)
Key Sectoral Updates:Cement industry to add 51mmT capacity over three yearsCement demand to contract by 12% in FY21E and to grow by 11% in FY22E and 8.5% in FY23ENorthern and Southern regions to witness minimal cement capacity additionCement prices unlikely to see sharp up-tick hereon Cost deflation to offer cushion in case of low utilization Building materials (tiles) segments unlikely to see recovery in medium-term
Click Image for Video Presentation
Cement & Building Materials Sector Update | 18 Aug 2020Institutional Equity Research
Growth Prospects Remain Bright despite Near-term Disruptions
We request for your valuable vote and support
We have made changes to our Recommendation and Target Price. Please refer to Page no. 123 at the end of the report.

Table of Contents
Content Page No.
Executive Summary 1-3
f Channel Check ........................................................................................................................................ 3
f Region-wise Demand Scenario Post COVID-led Lockdown............................................................... 4
f Investment Matrix .................................................................................................................................. 5
f Companies Comparative Analysis ....................................................................................................... 6-7
f Key Charts ............................................................................................................................................... 8
f Change in Ratings & Estimates ............................................................................................................ 9-10
f Key Sectoral Takeaways ........................................................................................................................ 11-14
f Annexure Table ...................................................................................................................................... 15
Company Section 13-79
UltraTech Cement .......................................................................................................................................... 17-24
ACC ................................................................................................................................................................. 25-32
Ambuja Cements .......................................................................................................................................... 33-40
Shree Cement ................................................................................................................................................ 41-48
Ramco Cements ............................................................................................................................................ 49-56
Indian Cements ............................................................................................................................................. 57-64
JK Cement ...................................................................................................................................................... 65-72
JK Lakshmi Cement ....................................................................................................................................... 73-80
HeidelbergCement India .............................................................................................................................. 81-88
Mangalam Cement ....................................................................................................................................... 89-96
Sagar Cement ............................................................................................................................................... 97-104
Kajaria Ceramics ........................................................................................................................................... 105-113
Somany Ceramics ......................................................................................................................................... 114-122
3
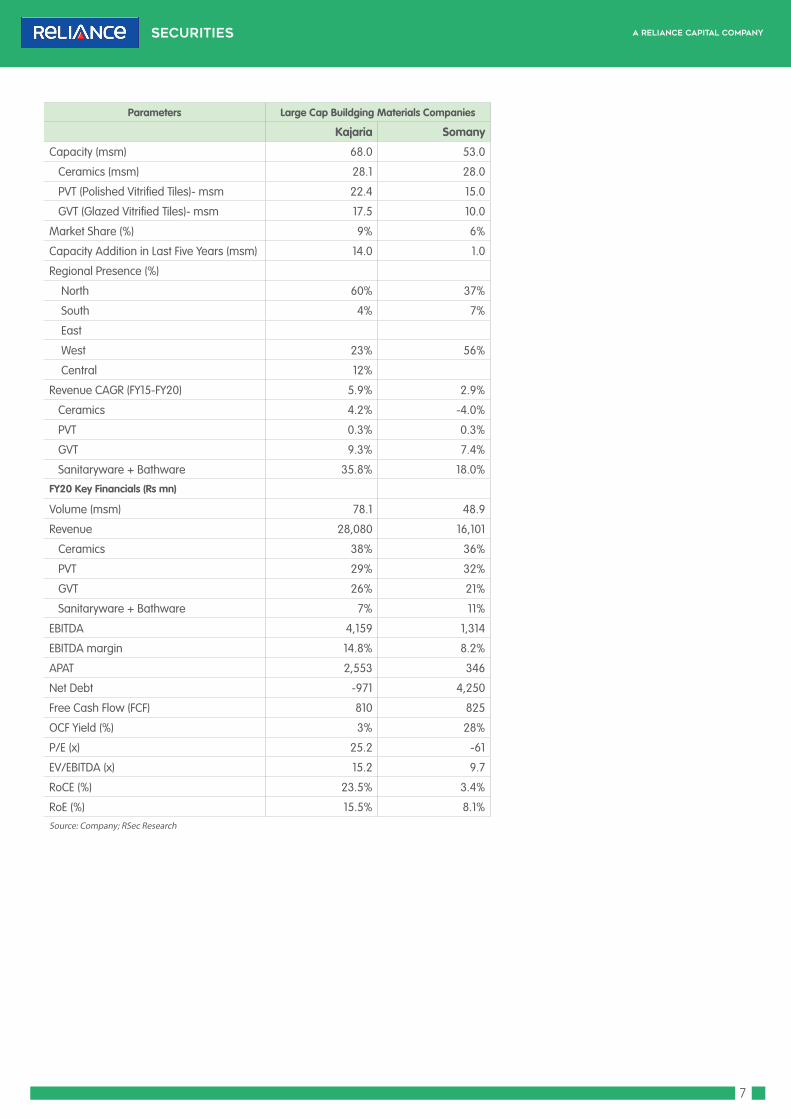
Channel Check
f Having seen continued improvement in demand on month-on-month (MoM) basis
in May and June owing to pent-up demand and strong rural traction, the demand
momentum softened in most part of the country in July.
f Notably, demand continued to remain steady in most rural pockets. However, demand
was significantly impacted in urban and semi urban markets due to local lockdown.
Further, workforce availability issues continued to remain a concern despite the
labourers started coming back to several sites. Overall demand still remains at ~60-70%
of normal level. However, non-trade demand continued to suffer with no meaningful
improvement, which resulted in steep price contraction in non-trade segment in Jun’20
and July’20.
f On positive side, the urban demand is expected to recover from current month onwards,
as several real estate developers are trying to finish their near-completion projects,
which were stuck due to COVID-19 pandemic. Further, demand from rural segment is
expected to sustain even in coming months.
f Notably, all Infrastructure projects restarted as of now, but acute shortage of labourers
is impacting the pace of execution. We further note that a large number of infrastructure
projects are seeing just 40-50% of workforce as of now due to exodus of migrant
labourers, who will come back only after monsoon. Hence, the project segment
demand is likely to remain subdued even in 2QFY21.
f With limited availability of drivers/labourers and complete lockdown (shutdown) in
various districts, most cement companies started working on daily plan from logistic
aspects, despite it being an expensive proposition.
f Cement consumption in cities and metros was impacted adversely due to continued
shortage of labourers and its only rural segment demand, which was main demand
driver in 1QFY21.
f Direct transfer of money under Mahatma Gandhi National Rural Employment Guarantee
Act (MGNREGA) and better Rabi yield ensured decent surplus in the hands of rural
population, which is supporting rural economy. Hence, rural demand is expected to
sustain at least for some period of time.
f While proliferation of Work from Home (WFH) trend is a threat for commercial real estate
segment, it can potentially generate better-than-estimated sales volume in residential
space (especially in affordable housing segment), which is likely to arrest any potential
decline in cement demand. As per industry’s sources, urban real estate demand in
India was hovering in the range of ~35-40mnT during pre-COVID. Further, government’s
Pradhan Mantri Awas Yojana (Urban) is expected to get continuous traction, going
ahead.
f Sustainability of steady pricing environment depends upon the demand recovery. In
case, the demand fails to recover, the prices are unlikely to remain at the current levels.

4
Region-wise Demand Scenario Post COVID-led Lockdown
Northern Southern f Pre Unlock 1.0: After allowing the non-essential manufacturing
units to operate from 20th April, the cement industry witnessed very slow progress for want of approval from the local authorities to resume operations at plants. However, demand witnessed recovery in May led by pent-up demand. Non-trade sales, which essentially account for >40%, were significantly impacted due to exodus to migrant labourers from the key states like Delhi, Punjab and Rajasthan.
f Post Unlock 1.0: Demand momentum improved further starting from 1st June mainly supported by increasing movement of inter-state road transport and revival in rural trade demand. Capacity utilization of cement companies reached 60-70% levels in June, which albeit tapered down marginally in July due to monsoon.
f Pre Unlock 1.0: The region, which was already struggling before COVID-19 outbreak, got further hit after lockdown. However, since the beginning of May, the region witnessed decent up-tick in sales volume mainly due to pent-up demand. However, the region witnessed average price improvement to the tune of ~Rs60-70/bag from 20th April to 31st May with which the prices in most pockets surpassed Rs400/bag mark.
f Post Unlock 1.0: Demand scenario improved significantly in June’20 especially in non-metro areas mainly led by sharp up-tick in sales volume for state governments’ funded projects in Andhra Pradesh (AP) and Telangana. Sales volume for select companies reached close to year-ago levels. However, continued lockdown in key cities like Hyderabad, Chennai and Bangalore are still impacting the urban demand. Despite marginal correction, the prices continued to remain steady.
Western Eastern f Pre Unlock 1.0: Demand, which was significantly impacted in
April, witnessed moderate improvement in May. Region witnessed maximum impact of exodus of migrant labourers. A large number of infrastructure projects came to grinding halt with just 10-15% kind of workforce availability in May. As non-trade segment accounts for a large part of cement consumption in the region, it was impacted the most compared to other regions.
f Post Unlock 1.0: While the demand momentum improved on month-on-month comparison in June, shortage of labourers remained a key concern for most projects. Infrastructure projects in cities like Mumbai, Pune and Ahmedabad etc. continued to see just 30-40% workforce availability in June, and the situation worsened in July with heavy downpour. Further, sharp surge in new COVID cases in Maharashtra and lockdown/shutdown imposed by various local authorities also took a toll on demand.
f Pre Unlock 1.0: Demand witnessed a sharp up-tick in May mainly led by pent-up demand and strong recovery in rural segment. The demand in the region is dominated by trade segment. Further, unlike other regions, intensification of COVID-19 was relatively slower in the region, as barring few pockets of West Bengal, most other pockets was under non-containment zone, which also aided the consumption.
f Post Unlock 1.0: Demand continued to remain decent in June, while it got impacted in July due to flood situation in Bihar and other parts of the region. Further, improving cash flows in the hand of farmer and rural population and migrant labourers coming back to their native places resulted in construction/extension of houses, which also aided the demand. Demand in the region is expected to remain firm in ensuing months as well.
Central f Pre Unlock 1.0: Demand in the region has consistently been favourable for last three years. COVID-led lockdown was a temporary blip in
April. However, it improved moderately in May’20 mainly led by pre-monsoon trade demand especially from villages. Further, favourable monsoon, bumper Rabi yields and various government programme to support rural economy led to improvement in rural demand.
f Post Unlock 1.0: Demand in June improved further with the commencement of a number of infrastructure projects. Despite seeing higher COVID cases in select pockets, demand in Uttar Pradesh improved significantly on month-on-month basis in June. However, the demand in Madhya Pradesh is primarily getting support from the rural markets. Notably, the prices continued to remain firm in the region.
5
Parameters UltraTech ACC Ambuja Shree Cem. Ramco Cem. India Cem. JK Cement JK Lakshmi Cem. HiedelbergCem Sagar Cem. Mangalam Cem. Kajaria Ceramics Somany Ceram.
Score Risk Score Risk Score Risk Score Risk Score Risk Score Risk Score Risk Score Risk Score Risk Score Risk Score Risk Score Risk Score Risk
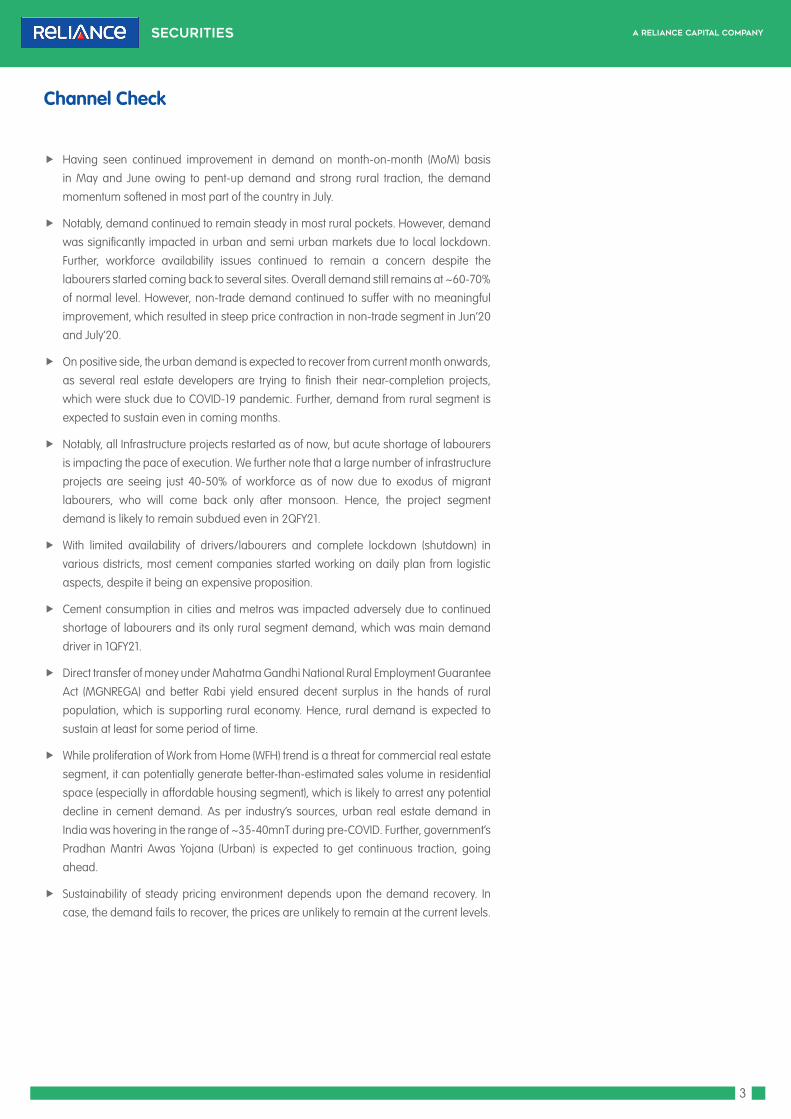
Management Quality 8 Low 7 Low 7 Low 9 Low 8 Low 5 Medium 8 Low 7 Low 8 Low 7 Low 5 Medium 8 Low 6 Low
Promoter's Holding Pledge 10 Low 10 Low 10 Low 10 Low 9 Low 5 Medium 10 Low 10 Low 10 Low 8 Low 9 Low 9 Low 9 Low
Board of Directors Profile 8 Low 8 Low 8 Low 8 Low 8 Low 6 Low 8 Low 8 Low 8 Low 8 Low 8 Low 8 Low 7 Low
Industry Growth 8 Low 8 Low 8 Low 8 Low 8 Low 8 Low 8 Low 8 Low 8 Low 8 Low 8 Low 5 Medium 5 Medium
Regulatory Environment / Risk 5 Medium 5 Medium 5 Medium 5 Medium 5 Medium 5 Medium 5 Medium 5 Medium 5 Medium 5 Medium 5 Medium 5 Medium 5 Medium
Entry Barriers / Competition 5 Medium 5 Medium 5 Medium 5 Medium 5 Medium 5 Medium 5 Medium 5 Medium 5 Medium 5 Medium 5 Medium 4 High 4 High
New Business/Client Potential 6 Low 5 Medium 5 Medium 8 Low 8 Low 4 High 8 Low 5 Medium 5 Medium 8 Low 5 Medium 7 Low 6 Low
Business Diversification 9 Low 9 Low 8 Low 8 Low 6 Low 4 High 9 Low 8 Low 4 High 7 Low 5 Medium 9 Low 9 Low
Market Share Potential 9 Low 4 High 4 High 9 Low 7 Low 4 High 7 Low 6 Low 5 Medium 8 Low 8 Low 8 Low 7 Low
Margin Expansion Potential 8 Low 7 Low 8 Low 9 Low 7 Low 5 Medium 8 Low 8 Low 8 Low 8 Low 8 Low 5 Medium 5 Medium
Earning Growth 9 Low 3 High 4 High 7 Low 6 Low 3 High 7 Low 6 Low 7 Low 7 Low 7 Low 7 Low 9 Low
Balance Sheet Strength 7 Low 8 Low 8 Low 8 Low 7 Low 4 High 7 Low 7 Low 8 Low 8 Low 6 Low 7 Low 6 Low
Debt Profile 7 Low 8 Low 9 Low 9 Low 7 Low 3 High 7 Low 7 Low 8 Low 6 Low 6 Low 8 Low 6 Low
FCF Generation 8 Low 8 Low 9 Low 9 Low 8 Low 6 Low 7 Low 7 Low 8 Low 6 Low 6 Low 8 Low 4 High
Dividend Policy 7 Low 8 Low 8 Low 8 Low 8 Low 7 Low 8 Low 8 Low 8 Low 8 Low 8 Low 7 Low 7 Low
Total Score Out of 150 114 103 106 120 107 74 112 105 105 107 99 105 95
Total Score (%) 76% Low 69% Low 71% Low 80% Low 71% Low 49% High 75% Low 70% Low 70% Low 71% Low 66% Low 70% Low 63% Low
For < 5 Red High Risk For 5 Blue Medium Risk For > 5 Green Low Risk
Investment Decision Matrix (IDM)

6
Parameters Large Cap Cement Companies Key Mid Cap Cement Companies
UltraTech Shree Cement ACC Ambuja Ramco JK Lakshmi JK Cement Heidelberg
Cement Capacity (mnT in FY20) 114.8 44.4 33.1 29.7 19.7 13.2 14.0 6.3
Captive Power (CPP)- MW 934 742 359 417 157 102 126 12
Regional Presence (%)
North 21% 55% 18% 33% 59% 68%
South 18% 7% 30% 84% 21% 9%
East 14% 25% 26% 23% 16% 27%
West 24% 12% 38% 14%
Central 20% 5% 14% 6% 11% 91%
Overseas 3% 9.0%
Capacity Addition in Last Five Years (mnT) 52.3 20.8 2.0 0.9 3.0 4.7 6.5 1.0
Capacity Addition in Next Three Years (mnT) 5.4 6.0 5.9 3.6 3.1 0.0 0.7 0.0
Capacity Utilisation in FY20 73% 62% 87% 81% 57% 86% 61% 75%
Volume CAGR in Last Five Years 12% 9% 4% 2% 7% 9% 6% 2%
FY20 Key Financials (Rs mn)
Volume (mnT) 82.3 24.9 28.9 24.0 11.2 9.2 9.8 4.7
Revenue 4,21,248 1,19,301 1,53,431 1,13,530 52,854 40,435 54,040 21,576
EBITDA 92,836 36,745 20,959 18,340 10,536 6,724 11,217 5,158
EBITDA/tonne (Rs) 1,128 1,446 672 765 940 725 1,146 1,096
APAT 36,985 15,702 13,589 14,255 6,011 2,552 4,004 2,681
Net Debt 1,80,760 30,360 -45,381 -46,584 29,327 10,016 19,889 -907
Free Cash Flow (FCF) -32,481 24,530 17,549 14,994 -11,800 4,489 -746 4,152
OCF Yield (%) 7.4% 4.9% 8.3% 5.9% 4.5% 15.3% 8.0% 10.9%
EV/tonne (US$) 163 254 92 122 131 57 116 88
EV/EBITDA (x) 14.8 21.0 10.8 13.7 18.4 6.7 12.0 8.0
RoCE (%) 10.2% 13.4% 18.1% 9.4% 12.2% 17.5% 16.6% 27.9%
RoE (%) 11.9% 13.9% 12.3% 7.1% 12.8% 14.5% 13.3% 21.6%Source: Company; RSec Research
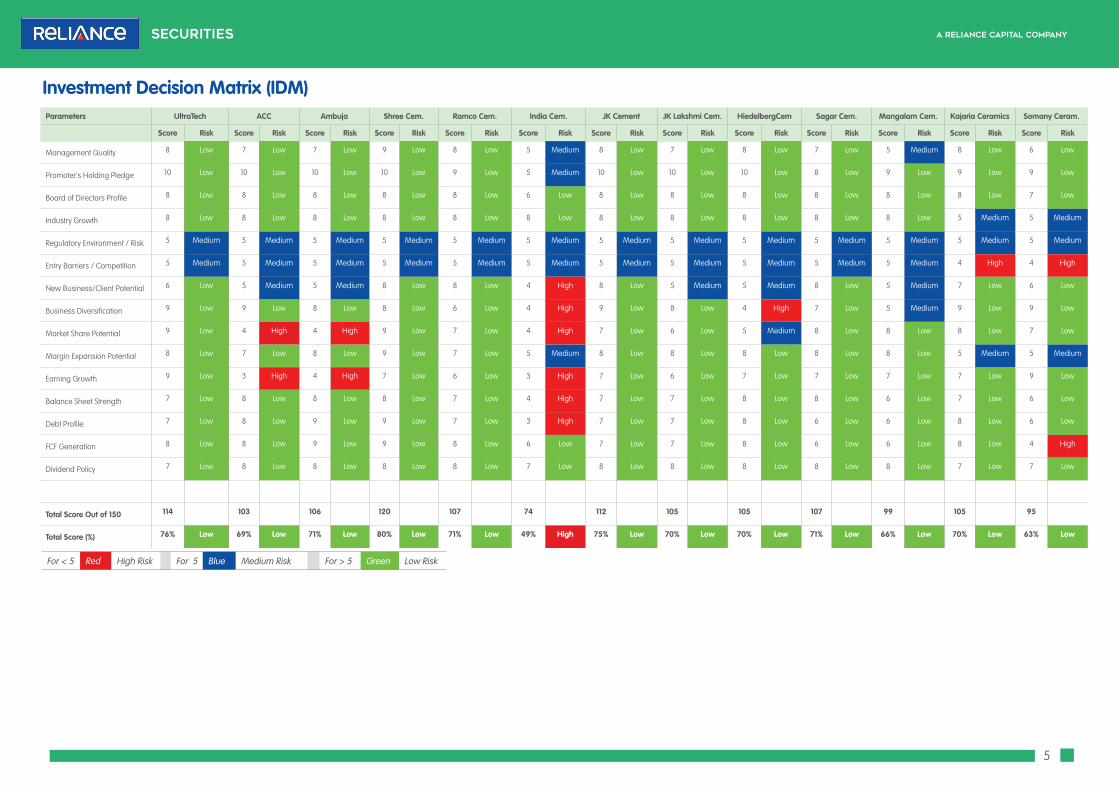
Companies Comparative Analysis
7
Parameters Large Cap Buildging Materials Companies
Kajaria Somany
Capacity (msm) 68.0 53.0
Ceramics (msm) 28.1 28.0
PVT (Polished Vitrified Tiles)- msm 22.4 15.0
GVT (Glazed Vitrified Tiles)- msm 17.5 10.0
Market Share (%) 9% 6%
Capacity Addition in Last Five Years (msm) 14.0 1.0
Regional Presence (%)
North 60% 37%
South 4% 7%
East
West 23% 56%
Central 12%
Revenue CAGR (FY15-FY20) 5.9% 2.9%
Ceramics 4.2% -4.0%
PVT 0.3% 0.3%
GVT 9.3% 7.4%
Sanitaryware + Bathware 35.8% 18.0%
FY20 Key Financials (Rs mn)
Volume (msm) 78.1 48.9
Revenue 28,080 16,101
Ceramics 38% 36%
PVT 29% 32%
GVT 26% 21%
Sanitaryware + Bathware 7% 11%
EBITDA 4,159 1,314
EBITDA margin 14.8% 8.2%
APAT 2,553 346
Net Debt -971 4,250
Free Cash Flow (FCF) 810 825
OCF Yield (%) 3% 28%
P/E (x) 25.2 -61
EV/EBITDA (x) 15.2 9.7
RoCE (%) 23.5% 3.4%
RoE (%) 15.5% 8.1%Source: Company; RSec Research

8
Sector At a Glance
Key Charts
Exhibit 1: Cement Capacity Over the Years
Source: Industry; RSec Research
Exhibit 2: Capacity Addition
Source: Industry; RSec Research
Exhibit 3: Cement Demand Over the Years
Source: Industry; RSec Research
f Cement capacity, which witnessed over 7% CAGR in last 10 years, is likley to register only 3.4% CAGR over next three years. Hence, demand growth is likley to outpace supply growth in the long-run.
f Industry added 243mnT in last ten years with an annual supply rate of 24mnT.
f Industry would be adding 51mnT in next three years with an annual supply of 17mnT.
f Industry demand has clocked ~5% CAGR over last ten years and we expect this to clock over next three years.
f Industry is likley to see demand contraction of 12% in FY21E due to COVID-led disruption. However, demand is likely to register 9.6% CAGR over FY21E-FY23E.
f Eastern region is expected to see maximum capacity addtion in next three years followed by the Western region.
f Northern and Southern regions are likely to see least capacity addtion over next three years, which offer an edge to these regions.
243281
314341
369408 429 443 455 467 486
511 531 538
0
100
200
300
400
500
600
FY10
FY11
FY12
FY13
FY14
FY15
FY16
FY17
FY18
FY19
FY20
FY21
E
FY22
E
FY23
E
Cement Capacity
206 216 230247 256 271 283 280
298
337 334
293327
352
0
50
100
150
200
250
300
350
400
FY10
FY11
FY12
FY13
FY14
FY15
FY16
FY17
FY18
FY19
FY20
FY21
E
FY22
E
FY23
E
Cement Demand
Exhibit 4: Region-wise capacity addition in next three years
mnT FY21E FY22E FY23E Total
North 1.8 2.0 0.0 3.8
South 1.0 1.8 1.5 4.3
West 5.7 3.9 2.0 11.6
Central 3.5 5.8 1.2 10.5
East 12.0 7.2 2.0 21.2
Total Addition 24.0 20.7 6.7 51.4
Source: Industry; RSec Research
3638
33
27 28
39
21
1511 13
19
2421
7
0
5
10
15
20
25
30
35
40
45FY
10
FY11
FY12
FY13
FY14
FY15
FY16
FY17
FY18
FY19
FY20
FY21
E
FY22
E
FY23
E
New Capaity Addition

9
Change in Ratings & Estimates
We continue to maintain our long-term positive stance on the sector mainly on following grounds.
f New capacity addition is not expected to witness very high growth unlike last ten years here on owing to limited resources. Hence, the demand growth should outpace supply growth in the next decade, in our view.
f A significant Rs102trilliion investment in infrastructure development in next five years under National Infrastructure Pipeline (NIP) is likely to aid cement consumption in ensuing quarters.
f Steady pricing environment is expected to sustain with possibility of demand recovery.
f Continued traction in rural economy augurs well for the cement industry.
f Cost deflation pertaining to benign fuel prices is likely to remain a key tailwind for the sector.
We believe the companies, which are more exposed to Northern and Central regions, are likely to do relatively better due to strong demand supply equilibrium.
Exhibit 5: Change in TP & Rating
Old 1-Yr TP New 2-Yr TP Old Rating New Rating
ACC Ltd 1,310 1,718 BUY BUY
Ambuja Cements 210 252 BUY BUY
UltraTech Cement 4,400 4,825 BUY BUY
Shree Cement 24,050 24,053 BUY BUY
Ramco Cements 600 802 BUY BUY
India Cements 70 81 SELL SELL
J.K. Cement 1,320 1,711 BUY BUY
JK Lakshmi 380 401 BUY BUY
Mangalam Cement 270 295 BUY BUY
HeidelbergCement India 210 226 BUY BUY
Sagar Cement 350 619 BUY BUY
Kajaria Ceramics 400 370 HOLD SELL
Somany Ceramics 180 173 BUY BUYSource: RSec Research ; Note: RSec Research has migrated from one year based Target Price to two years based
Target Price
Exhibit 6: Valuation Table
CMP Reco. Target Price M.Cap EV/tone (US$) EV/EBIDTA (x) RoE (%)
(Rs) (Rs) (Rs bn) FY22E FY23E FY22E FY23E FY22E FY23E
ACC Ltd 1,388 BUY 1,718 261 71 66 10.4 8.7 10 10.1
Ambuja Cements 219 BUY 252 435 97 93 11.8 10.5 6.8 6.9
UltraTech Cement 4,035 BUY 4,825 1,165 142 135 12.6 10.9 12.1 13
Shree Cement 21,513 BUY 24,053 776 210 202 17.6 14.9 13.6 15.3
Ramco Cements 670 BUY 802 158 108 102 13.1 10.9 14.4 15.3
India Cements 115 SELL 81 36 56 53 9.4 7.8 1.9 4.6
J.K. Cement 1,500 BUY 1,711 116 104 98 10 8.1 17.1 18.2
JK Lakshmi 270 BUY 401 32 40 34 4.8 3.9 17 15.9
Mangalam Cement 197 BUY 295 5 25 21 3.8 2.8 12.4 15.9
HeidelbergCement India 193 BUY 226 44 83 76 7.4 6.6 22.4 21.4
Sagar Cement 471 BUY 619 10 56 52 6.2 5 6.3 7.9
Kajaria Ceramics 408 SELL 384 65 13.8 11.5 13 14.3
Somany Ceramics 133 BUY 173 6 6.4 4.6 5.1 11.5
Source: RSec Research

10
Exhibit 7: Change in Estimates
Y/E Mar Old Revised % Change
(Rsmn) FY21E FY22E FY23E FY21E FY22E FY23E FY21E FY22E FY23E
Sales Volume (mnT)
ACC 25.5 27.3 25.0 28.3 30.3 (2.0) 3.7
Ambuja 21.8 24.8 21.8 24.9 25.9 (0.1) 0.4
Shree Cement 22.2 26.7 30.6 23.4 27.7 30.9 5.7 3.8 0.8
Ramco Cements 11.2 13.5 10.4 12 13.5 (7.1) (11.1)
India Cements 10 11.6 8.96 9.97 11.0 (10.4) (14.1)
JK Cement 9 10.1 8 9.6 10.3 (11.1) (5.0)
JK Lakshmi Cem. 8.6 9.9 8.54 9.98 10.37 (0.7) 0.8
HeidelbergCement 4.5 5.1 4.2 4.9 5.2 (6.7) (3.9)
Sagar Cements 3.2 4 2.8 3.4 3.9 (12.2) (16.0)
Mangalam Cement 2.6 2.9 2.3 2.7 3.0 (11.5) (6.9)
Kajaria Ceramics (msm) 77.3 85.8 66.4 79.6 89.2 (14.1) (7.2)
Somany Ceramics (msm) 49.2 54.1 39.1 46.1 51.6 (20.6) (14.8)
Revenue (Rs mn)
ACC 1,36,026 1,46,804 1,35,535 1,52,659 1,65,024 (0.4) 4.0
Ambuja 1,03,520 1,19,844 1,07,547 1,23,382 1,29,739 3.9 3.0
Shree Cement 1,07,785 1,29,572 1,49,106 1,12,594 1,34,036 1,49,884 4.5 3.4 0.5
Ramco Cements 51,654 63,893 52,586 60,759 68,263 1.8 (4.9)
India Cements 48,050 55,987 43,918 48,465 53,578 (8.6) (13.4)
JK Cement 54,885 61,743 51,483 61,589 67,629 (6.2) (0.2)
JK Lakshmi Cem. 38,201 44,435 36,453 43,199 45,375 (4.6) (2.8)
HeidelbergCement 20,520 23,685 19,456 22,752 24,332 (5.2) (3.9)
Sagar Cements 12,155 15,371 12,171 13,776 15,882 0.1 (10.4)
Mangalam Cement 11,702 13,343 10,746 12,797 14,263 (8.2) (4.1)
Kajaria Ceramics 29,437 33,400 24,592 29,865 33,781 (16.5) (10.6)
Somany Ceramics 17,640 19,809 13,236 15,790 17,883 (25.0) (20.3)
EBITDA (Rs mn)
ACC 16,739 18,312 19,359 19,869 22,162 15.7 8.5
Ambuja 16,023 19,688 20,042 22,984 24,384 25.1 16.7
Shree Cement 32,245 40,305 46,970 33,193 41,547 47,086 2.9 3.1 0.2
Ramco Cements 9,632 13,240 12,010 14,123 15,967 24.7 6.7
India Cements 5,995 7,288 6,475 6,884 7,880 8.0 (5.5)
JK Cement 10,887 12,813 10,305 12,851 14,749 (5.3) 0.3
JK Lakshmi Cem. 5,509 6,987 5,614 7,273 7,483 1.9 4.1
HeidelbergCement 4,245 5,152 4,310 5,253 5,394 1.5 2.0
Sagar Cements 1,695 2,357 3,110 2,868 3,301 83.5 21.7
Mangalam Cement 1,510 1,873 1,567 2,028 2,225 3.8 8.3
Kajaria Ceramics 4,268 5,180 2,838 4,460 5,261 (33.5) (13.9)
Somany Ceramics 1,537 1,960 981 1,365 1,829 (36.2) (30.3)
APAT (Rs mn)
ACC 10,558 11,150 13,259 13,159 14,431 25.6 18.0
Ambuja 11,240 13,876 14,246 16,337 17,338 26.7 17.7
Shree Cement 11,352 17,979 24,112 14,883 20,240 25,488 31.1 12.6 5.7
Ramco Cements 3,584 7,944 5,413 8,352 10,150 51.0 5.1
India Cements 475 1,625 546 1,019 2,608 14.9 (37.3)
JK Cement 4,938 6,334 4,672 6,498 8,109 (5.4) 2.6
JK Lakshmi Cem. 1,522 3,070 1,708 3,412 3,710 12.2 11.1
HeidelbergCement 2,432 3,313 2,527 3,306 3,528 3.9 (0.2)
Sagar Cements 197 546 1,131 697 942 474.1 27.6
Mangalam Cement 529 979 451 813 1,198 (14.7) (17.0)
Kajaria Ceramics 2,506 3,160 1,190 2,429 2,944 (52.5) (23.1)
Somany Ceramics 455 766 (36) 260 610 (107.9) (66.0)
Source: RSec Research

11
I. Industry to Add 51mmT Capacity over Next Three YearDespite delay by 3-6 months, capacity expansion plan of companies continues to remain intact. We further note that cement industry added 19mnT capacity in FY20 and despite the current pandemic situation the industry is set to add 25mnT incremental capacity in FY21 and 51mnT in next three years. Hence, the industry will be adding 16-17mnT annual capacity over next three years.
Exhibit 8: A Snapshot of Cement Capacity & Expansion Exhibit 9: Company-wise Capacity Addition
Source: Industry, RSec Research Source: Industry, RSec Research
0
5
10
15
20
25
30
35
40
45
0
100
200
300
400
500
600
FY10
FY11
FY12
FY13
FY14
FY15
FY16
FY17
FY18
FY19
FY20
FY21
E
FY22
E
FY23
E
Installed Cement Capacity Capaccity Addition
mnT FY21E FY22E FY23EAmbuja Cement 1.8Wonder Cement 2Bharathi Cement 1.5Ramco Cements 2JSW Cements 3
Sanghi industries 2 2
JK Cement 2.2Shree Cement 6Birla Corp 3.9 1.2UltraTech 2 3.4Sagar Cements 2.5ACC 5.9
Dalmia Bharat 6 2Star Cement 2Total 24 21 7
II. Demand to Contract by 12% in FY21EDespite slowdown in government’s spending in infrastructure development and absence of any visible revival in private capex, cement demand witnessed steady growth till 9MFY20. However, impact of COVID-19 and lockdown across the nation in Mar’20 significantly impacted the sales volume. Last two weeks of March are always crucial for the companies, as higher billing is done during this period, which was adversely affected by COVID-led nationwide lockdown. Resultantly, cement demand contracted by 1% in FY20.
Exhibit 10: A Snapshot of Demand Growth over the Years
Source: Industry, RSec Research
(15%)
(10%)
(5%)
0%
5%
10%
15%
0
50
100
150
200
250
300
350
400
FY10
FY11
FY12
FY13
FY14
FY15
FY16
FY17
FY18
FY19
FY20
FY21
E
FY22
E
FY23
E
Cement Demand (mnT) Demand Growth (%)
Key Sectoral TakeawaysI. Industry to Add 51mmT Capacity over Next Three YearsII. Demand to Contract by 12% in FY21EIII. Northern & Southern Regions to Witness Least Capacity AdditionIV. Pricing Scenario unlikely to see Sharp Up-tickV. Input Cost Deflation to Aid Operating PerformanceVI. We Continue to Prefer Northern & Central RegionsVII. Building Materials (Tiles) Segment is Unlikely to Recover in Medium-term Term

12
Given almost complete plant shutdown in Apr’20 and lower utilization post resumption of operations subsequently, we expect cement demand to de-grow by 12% in FY21E and likely to rebound by 11.4% and 7.8% in FY22E and FY23E, respectively. Incremental consumption is seen at 20mnT over FY20-FY23E from the base cement consumption of 329mnT in FY20, whereas incremental supply during the period is pegged at 51mnT, which does not bode well for the industry from pricing discipline perspective.
(70)(60)(50)(40)(30)(20)(10)
010203040
FY10 FY11
FY12
FY13
FY14
FY15
FY16
FY17
FY18
FY19
FY20
FY21
E
FY22
E
FY23
E
Net Incemental Demand (mnT)
Exhibit 11: Net Incremental Demand (Demand-Supply) over the Years
Source: Industry, RSec Research
III. Northern & Southern Regions to Witness Least Capacity AdditionOut of the estimated 51mnT cement capacity addition over next three years, Northern and Southern regions are expected to add just 4mnT each. While the minimal capacity addition bodes well for both the regions in terms of pricing discipline, Northern region seems to be the most benefitted, as capacity utilization in the region has already surpassed the-industry’s average capacity utilization of 68% in FY20.
Further, Eastern region is expected to add the highest 21mnT capacity (43% of total capacity addition) followed by 11.5mnT in Western region (23% of total addition) and 10.5mnT in Central region. We believe that strong demand growth in these regions during last couple of years encouraged several companies to expand their base in these regions, which led to high capacity addition pipeline.
Exhibit 12: Reigion-Wise Cement Capacity Additon and Outlook
mnT FY11 FY12 FY13 FY14 FY15 FY16 FY17 FY18 FY19 FY20E FY21E FY22E FY23E
North 7.0 3.2 4.5 6.5 11.5 6.6 1.1 3.6 0.0 1.0 1.8 2.0 0.0
South 14.6 14.4 10.0 3.5 7.9 4.6 0.5 2.3 6.2 3.6 1.0 1.8 1.5
West 6.0 4.9 2.7 2.0 5.8 2.3 2.6 1.2 2.0 2.4 5.7 3.9 2.0
Central 7.7 4.5 5.3 9.6 3.0 2.0 0.8 0.0 3.5 6.3 3.5 5.8 1.2
East 2.7 6.2 5.0 6.6 10.3 5.5 9.6 4.1 1.2 5.4 12.0 7.2 2.0
Total Addition 38.0 33.2 27.4 28.1 38.5 21.0 14.5 11.2 12.9 18.7 24.0 20.7 6.7
Source: Industry, RSec Research
Exhibit 13: Region-wise Clinker Capacity Addition and Outlook
mnT FY18 FY19 FY20 FY21E FY22E FY23E
North 65 65 70 74 76 76
South 116 119 123 127 127 128
West 36 36 36 39 42 42
Central 38 41 41 42 45 45
East 44 44 44 46 46 46
Total Addition 299 303 313 328 336 337
Source: Industry, RSec Research

13
IV. Pricing Scenario Unlikely to See Sharp Up-tickWhile demand supply equation does not augur well from the pricing perspective in light of substantial net incremental supply (adjusted with incremental demand) of 31mnT over next three years, we are of the view that the pricing scenario is unlikely to see a sharp up-tick, going forward as sharp increase in supply is mostly limited to Eastern and Central regions. However, we note that recent rebound in the prices, which led all India average prices to historical high in the backdrop of higher fixed cost owing to no operating leverages and logistic bottlenecks, may witness some degree of reversal in subsequent months. Also, onset of monsoon may essentially result in partial roll-back in the prices.
Further, compared to 51mnT of cement capacity addition, the industry will be adding only 24mnT clinker over next three years. Current 313mnT of clinker capacity and 486mnT cement capacity, clearly suggest that there is shortage of clinker in the country. Hence, it will be difficult for several cement companies to operate at 100% utilization level due to clinker constraints. Hence, we believe pricing trend of the industry will not see sharp disruption in case capacity utilization is maintained in the excess of 70% level.
Exhibit 14: All India Average Cement Price Movement Exhibit 15: Average Northern Cement Price Movement
Source: RSec Research Source: RSec Research
Exhibit 16: Average Southern Cement Price Movement Exhibit 17: Average Western Cement Price Movement
Source: RSec Research Source: RSec Research
Exhibit 18: Average Eastern Cement Price Movement Exhibit 19: Average Central Cement Price Movement
Source: RSec Research Source: RSec Research
200
220
240
260
280
300
320
340
Oct
-07
Jul-0
8
Ap
r-09
Jan-
10
Oct
-10
Jul-1
1
Ap
r-12
Jan-
13
Oct
-13
Jul-1
4
Ap
r-15
Jan-
16
Oct
-16
Jul-1
7
Ap
r-18
Jan-
19
Oct
-19
Jul-2
0
200
220
240
260
280
300
320
340
Oct-0
7Ap
r-08
Oct-0
8M
ay-0
9No
v-09
Jun-
10De
c-10
Jun-
11Ja
n-12
Jul-1
2Fe
b-13
Aug-
13Fe
b-14
Sep-
14M
ar-1
5Oc
t-15
Apr-1
6Oc
t-16
May
-17
Nov-
17Ju
n-18
Dec-
18Ju
n-19
Jan-
20Ju
l-20
(Rs)
Price (Rs/bag)
180
230
280
330
380
430
Oct
-07
Apr
-08
Oct
-08
May
-09
Nov
-09
Jun-
10
Dec
-10
Jun-
11
Jan-
12
Jul-1
2
Feb-
13
Aug
-13
Feb-
14
Sep
-14
Mar
-15
Oct
-15
Apr
-16
Oct
-16
May
-17
Nov
-17
Jun-
18
Dec
-18
Jun-
19
Jan-
20
Jul-2
0
(Rs)
Price (Rs/bag)
180
200
220
240
260
280
300
320
340
360
Oct
-07
Apr-0
8O
ct-0
8M
ay-0
9No
v-09
Jun-
10D
ec-1
0Ju
n-11
Jan-
12Ju
l-12
Feb-
13Au
g-13
Feb-
14Se
p-14
Mar
-15
Oct
-15
Apr-1
6O
ct-1
6M
ay-1
7No
v-17
Jun-
18D
ec-1
8Ju
n-19
Jan-
20Ju
l-20
(Rs)
Price (Rs/bag)
200
220
240
260
280
300
320
340
360
Nov-
07M
ay-0
8No
v-08
Jun-
09D
ec-0
9Ju
n-10
Jan-
11Ju
l-11
Jan-
12Au
g-12
Feb-
13Se
p-13
Mar
-14
Sep-
14Ap
r-15
Oct
-15
May
-16
Nov-
16M
ay-1
7D
ec-1
7Ju
n-18
Dec
-18
Jul-1
9Ja
n-20
Jul-2
0
(Rs)
Price (Rs/bag)
200
220
240
260
280
300
320
340
360
Oct
-07
Apr
-08
Oct
-08
May
-09
Nov
-09
Jun-
10
Dec
-10
Jun-
11
Jan-
12
Jul-1
2
Feb-
13
Aug
-13
Feb-
14
Sep
-14
Mar
-15
Oct
-15
Apr
-16
Oct
-16
May
-17
Nov
-17
Jun-
18
Dec
-18
Jun-
19
Jan-
20
Jul-2
0
(Rs)
Price (Rs/bag)

14
V. Input Costs Likely to Remain Benign Given subdued capacity utilization, which resulted in increase in fixed expenditures in the absence of operating leverage, reduction in fuel prices especially domestic and international petcoke prices already aided the companies to arrest sharp deterioration in operating performance. We note that average domestic petcoke price (Reliance petcoke) declined by ~20% YoY and 4% QoQ to Rs6,235/tonne in 1QFY21 (excluding GST). Similarly, the USA petcoke prices fell by 28% YoY and 3% QoQ to US$67 in 1QFY21. However, we note that petcoke prices have increased in last two months, which may negate low fuel price benefits in the ensuing quarters. However, we continue to believe that fuel prices are unlikely to move-up significantly hereon due to bleak outlook of crude prices. Additionally, the prices of other inputs like fly-ash and slag remained broadly flat on sequential comparison during the quarter.
Exhibit 20: Domestic Petcoke price trend (Reliance Petcoke) Exhibit 21: USA Petcoke price trend
Source: RSec Research Source: RSec Research
VI. We Continue to Prefer Northern & Central RegionWe prefer Northern and Central region over other regions mainly due to favourable demand supply equation and resultant favourable pricing environment. While Northern region is expected to see the lowest capacity addition at 4mnT over next three year, estimated capacity utilization to the tune of 80%/86% in FY22E/FY23E offers an edge. Further, imminent clinker constraint in the region offers cushion against any deterioration in pricing scenario. Moreover, Central region is expected to witness 10.5mnT (20% of total supply) capacity addition in next three years. We expect steady demand in the region should get a boost due to pre-election spending in Uttar Pradesh, which is likely to keep utilization level at second best level at 67%/71% in FY22E/FY23E.
VII. Building Materials (Tiles) Segment is Unlikely to Recover in Medium-term Term COVID-led business disruptions aggravated the concerns of the tiles segments, which have been witnessing soft demand for some period of time. Most tiles manufacturers witnessed almost zero production in Apr’20 & May’20, which improved to the extent of 30-40% in Jun’20. Industry demand, which witnessed 4-6% de-growth in FY20, is expected to decline by ~15-25% in FY21E. Average utilization of Morbi players now hovers in the range of ~30-35%. Only 500 players are operating now in Morbi, which were impacted due to ban of coal gasifiers. Given poor demand from real estate and slowdown in private capex, demand revival in this segment is unlikely to happen in the medium-term. We expect revival in sales volume to happen only from 2HFY22E with pick-up real estate sales.
20
40
60
80
100
120
140
Aug-
15
Nov
-15
Feb-
16
May
-16
Aug-
16
Nov
-16
Feb-
17
May
-17
Aug-
17
Nov
-17
Feb-
18
May
-18
Aug-
18
Nov
-18
Feb-
19
May
-19
Aug-
19
Nov
-19
Feb-
20
May
-20
Aug-
20
(US$/tonne)
5,000
5,500
6,000
6,500
7,000
7,500
8,000
8,500
1st A
pr'19
1st M
ay'19
1st J
une'
19
1st J
uly'
19
1st A
ug'19
1st S
ept'1
9
1st O
ct'19
1st N
ov'19
1st D
ec'19
1st J
an'2
0
1st F
eb'2
0
1st M
ar'2
0
1st A
pr'2
0
1st M
ay'2
0
1st J
une'
20
1st J
uly'
20
1st A
ug 2
0
(Rs/tonne)

15
Annexure Table
Exhibit 22: Region wise capacity
(mnT) FY10 FY11 FY12 FY13 FY14 FY15 FY16 FY17 FY18 FY19 FY20 FY21E FY22E FY23E
North 50 63 68 73 79 90 97 98 102 102 103 105 107 107
% total 21 22 22 21 21 22 23 22 22 22 21 20 20 20
South 92 107 120 130 133 141 146 146 149 155 158 159 161 163
% total 38 38 38 38 36 35 34 33 33 33 33 31 30 30
West 38 43 47 50 52 57 60 62 64 66 68 74 78 80
% total 16 15 15 15 14 14 14 14 14 14 14 14 15 15
East 34 35 39 44 51 61 66 76 80 81 87 99 107 108
% total 14 12 12 13 14 15 15 17 18 17 18 20 20 20
Central 29 33 40 45 55 58 60 61 61 64 70 74 80 81
% total 12 12 13 13 15 14 14 14 13 14 14 14 15 15
Total Capacity 243 281 314 341 369 408 429 443 455 467 486 510 531 538
Source:
Exhibit 23: Region Wise Demand/Consumption Snapshot
Demand (mnT) FY10 FY11 FY12 FY13 FY14 FY15 FY16 FY17 FY18 FY19 FY20 FY21E FY22E FY23E
North 38.0 40.0 44.0 48.1 51.2 54.2 57.3 57.4 62.5 71.8 73.5 65.1 73.5 79.4
% total 19% 19% 20% 20% 20% 20% 20% 21% 21% 21% 22% 22% 23% 22%
South 61.0 61.0 60.0 62.9 62.7 63.7 64.6 63.9 69.1 77.6 70.2 62.7 68.6 73.0
% total 30% 29% 27% 26% 25% 24% 23% 23% 23% 23% 21% 21% 21% 21%
West 38.0 42.0 47.0 50.6 52.5 55.6 57.5 57.4 53.9 59.0 57.5 48.4 53.9 58.1
% total 19% 20% 21% 21% 21% 21% 20% 21% 18% 18% 17% 17% 17% 16%
East 33.0 35.0 37.0 41.9 44.8 49.6 53.9 52.7 58.1 67.4 70.2 63.9 71.9 79.0
% total 16% 17% 17% 17% 18% 18% 19% 19% 20% 20% 21% 22% 22% 22%
Central 31.0 34.0 36.0 38.2 39.7 42.8 45.1 43.7 49.1 56.3 57.5 50.1 54.9 58.8
% total 15% 16% 16% 16% 16% 16% 16% 16% 17% 17% 17% 17% 17% 17%
Total 201.0 212.0 224.0 241.8 250.8 265.9 278.4 275.0 292.7 332.1 328.9 290.2 322.8 348.3
Export 5.3 4.2 5.5 5.0 5.0 5.0 5.0 5.0 5.0 5.0 5.0 3.0 4.0 4.0
Total Dispatches 206.3 216.2 229.5 246.8 255.8 270.9 283.4 280.0 297.7 337.1 333.9 293.2 326.8 352.3
Source:
Exhibit 24: Region Wise Capacity Utilisation
Regional Utilization FY10 FY11 FY12 FY13 FY14 FY15 FY16 FY17 FY18 FY19 FY20 FY21E FY22E FY23E
North 94% 81% 82% 84% 83% 76% 75% 74% 78% 82% 83% 72% 80% 86%
South 77% 69% 60% 58% 56% 54% 53% 52% 56% 60% 53% 47% 51% 54%
West 79% 72% 79% 80% 80% 76% 76% 72% 67% 71% 67% 52% 55% 58%
East 85% 86% 79% 80% 74% 68% 68% 58% 61% 70% 68% 54% 57% 61%
Central 103% 97% 88% 82% 70% 72% 73% 70% 79% 85% 79% 66% 67% 71%
Industry Utilization 84.9% 76.9% 73.1% 72.3% 69.2% 66.4% 66.1% 63.1% 65.5% 72.1% 68.7% 57.3% 61.6% 65.5%
Source:

16
COMPANY SECTION

17
Share price (%) 1 mth 3 mth 12 mth
Absolute performance 5.1% 21.2% -4.7%
Relative to Nifty 1% 8% -6%
Shareholding Pattern (%) Mar'20 June'20
Promoter 60 60
Public 40 40
1 Year Stock Price Performance
Note: * CMP as on 17 Aug 2020
Reduction in Debt to Holds the Key
UltraTech CementCement | India
Institutional Equity Research
BUY2 Year Target Price: Rs.4,825
CMP* 4,035
Upside/Downside (%) 20
Bloomberg Ticker UTCEM IN
Market Cap. (Rs bn) 1,165
Free Float (%) 40
Shares O/S (mn) 289Company Update | 18 Aug 2020
1. UltraTech Cement (UTCEM) – which enjoys ~23% market share on pan-India level with dominant presence across regions – is on the firm footing to cash in the secular consumption opportunity for cement due to absence of any meaningful alternatives.
2. With the successful acquisition of Binani’s assets, UTCEM has now got added advantage in terms of new limestone resources in imminent clinker deficit Northern region.
3. While UTCEM has sufficiently built capacity to outpace industry’s growth in next couple of years, it continued to focus on setting up maximum capacity in demand-rich regions. It is likely to commission 0.6mnT each in Dankuni (west bengal) and Pataliputra (Bihar) shortly in FY21 and Phase-II 2mnT cement capacity at Bara is expected to be commissioned in 3QFY21E.
4. Despite acquisition of Century Textile’s cement assets in FY20, UTCEM’s gross debt remained broadly flat on YoY basis at Rs229bn, while net debt to EBITDA and D/E ratio improved from 3x and 0.7x in FY19 to 2x and 0.5x in FY20 led by strong cash flow generation. UTCEM is committed to take it to 1x in FY21.
Impact of COVID-19: Nationwide lockdown resulted in sharp contraction in demand in 1QFY21, which led UTCEM to witness 31% YoY drop sales volume. Going forward, with consistent pick-up in monthly sales volume, we expect 2QFY21 volume to be sequentially better. However, volume momentum is still down by 10-15% compared to pre-COVID period. We expect UTCEM’s sales volume to decline by 12% in FY21E.
Outlook & ValuationConsistent efforts to trim cost along with focus on improvement in RoCE by balance-sheet deleveraging augurs well for UTCEM. Going forward, we expect demand to recover post monsoon followed by pick-up in infrastructure activities led by improved workforce availability. At CMP, the stock trades at attractive levels of 13x/11x EBITDA FY22E/FY23E. Hence, we maintain BUY on UTCEM with a revised 2-Year Target Price of Rs4,825 (13x of EBITDA FY23E).
Key Triggers:Strong market share (23%) in Indian cement industry with dominant presence across
regions
Adequate limestone reserve in imminent clinker deficit region offers an edge
New capacities in high consumption region to result in sustained volume growth
RoCE is set to improve from 11.8% in FY20 to 12.7% FY23E, while free cash flow (FCF) is seen at ~Rs204bn over FY20-FY23E.
Research Analyst
Binod ModiContact: 022 4303 4626/9870009382Email: [email protected]
Research Associate:
Girija Shankar RayEmail : [email protected]
Key Financials (Rs mn) FY19 FY20 FY21E FY22E FY23E Sales 416,088 421,248 383,534 440,316 487,235EBITDA 73,469 92,836 87,478 99,621 109,249APAT 24,767 36,985 34,603 46,020 53,899EPS (Rs) 90.2 128.1 119.9 159.4 186.7DPS (Rs) 10.5 13.0 13.0 15.0 15.0P/E (x) 44.7 31.5 33.7 25.3 21.6P/B (x) 3.3 3.0 2.8 2.5 2.3
EV/EBITDA (x) 18.2 14.5 14.9 12.6 10.9
RoE (%) 10.0 11.9 10.2 12.1 13.0Divi. Yield (%) 0.3 0.3 0.3 0.4 0.4
Source: Company, RSec Research
TOP PICK in Large-cap
2,500
3,000
3,500
4,000
4,500
5,000
Jul-
19
Aug
-19
Sep-
19
Oct
-19
Nov
-19
Dec
-19
Jan-
20
Feb-
20
Mar
-20
Apr
-20
May
-20
Jun-
20
Jul-
20

18
Key Criteria Score Risk Comments
Management Quality 8 Low The management has displayed remarkable quality over the years in terms of maintaining industry leadership
Promoter’s Holding Pledge 10 Low Zero pledged shares, despite the promoter group has varied interest in other businesses as well
Board of Directors Profile 8 Low A perfect blend of experience, expertise and professionalism with sound track record offers comfort
Industry Growth 8 Low Demand clocked ~7% demand CAGR over last 15 years; expected to be maintained in coming fiscals
Regulatory Environment / Risk 5 Medium Regulatory risk in terms of hike in duties was quite visible historically
Entry Barriers / Competition 5 Medium Any new player with strong capital base can enter into business and competition has been high in the industry
New Business/Client Potential 6 Low Strong brand equity always helps to get more customers
Business Diversification 9 Low It has presence across all geographies in India and has presence overseas also
Market Share Potential 9 Low Necessary resources are in place to maintain market share
Margin Expansion Potential 8 Low Working on various measures to contain opex further
Earnings Growth (10 Years) 9 Low Earnings clocked 18% CAGR in 10 year; expected to clock 13% CAGR in next three years
Balance Sheet Strength 7 Low Despite doing back-to-back acquisition, its balance sheet remains resilient and strong
Debt Profile 7 Low Net Debt to EBITDA ratio stood at 2x in FY20, which is likely to witness further improvement in FY21
FCF Generation 8 Low It generated FCF of Rs218bn in last ten years (which is the best) despite doing huge capex
Dividend Policy 7 Low Average dividend payout ratio stood at 9%
Total Score Out of 150 114 Low
Percentage Score 76%
Investment Decision Matrix (IDM)
For < 5 Red High Risk For 5 Blue Medium Risk For > 5 Green Low Risk

19
Exhibit 1: Scenario Analysis
FY20 FY21E FY22E FY23E CAGR (FY20-FY23E)
Base Case
Volume (mnT) 82.3 72.4 83.6 91.9 8.3%
Realization/tonne (Rs) 4,721 4,877 4,871 4,920 0.3%
Revenue 421,248 383,534 440,316 487,235 8.3%
EBITDA 92,836 87,478 99,621 109,249 7.7%
EBITDA/tonne 1,128 1,209 1,192 1,189
EBITDA margin (%) 22.0 22.8 22.6 22.4
APAT 36,985 34,603 46,020 53,899 15.9%
Target EV/EBITDA multiple (x) 13.0
Target Price 4,825
Bull Case
Volume (mnT) 82.3 76.2 91.6 105.2 11.3%
Realization/tonne (Rs) 4,721 5,026 5,021 5,121 0.6%
Revenue 421,248 397,286 473,523 567,622 12.6%
EBITDA 92,836 87,851 104,178 143,661 17.8%
EBITDA/tonne 1,128 1,153 1,138 1,366
EBITDA margin (%) 22.0 22.1 22.0 25.3
APAT 36,985 36,059 49,430 79,650 30.2%
Target EV/EBITDA multiple (x) 13.5
Target Price 6,464
Bear Case
Volume (mnT) 82.3 70.2 77.8 81.7 5.2%
Realization/tonne (Rs) 4,721 4,726 4,721 4,674 -0.4%
Revenue 421,248 368,230 406,676 411,274 3.8%
EBITDA 92,836 81,176 88,722 75,185 -2.5%
EBITDA/tonne 1,128 1,157 1,141 921
EBITDA margin (%) 22.0 22.0 21.8 18.3
APAT 36,985 31,064 37,864 28,409 -2.9%
Target EV/EBITDA multiple (x) 12.5
Target Price 3,178
Source: RSec Research
Scenario AnalysisBase Case: In base case scenario, we assume 8.3% volume CAGR in FY21E-FY23E with 0.3% growth in realization. Revenue, EBITDA and APAT are expected to clock 8.3%, 7.7% and 16% CAGR, respectively over the same period.
Bull Case: In bull case scenario, we assume 11.3% volume CAGR in FY21E-FY23E with 0.6% growth in realization. Revenue, EBITDA and APAT CAGR are expected to clock 12.6%, 17.8% and 30% CAGR, respectively over the same period.
Bear Case: In bear case scenario, we assume 11.3% volume CAGR in FY21E-FY23E with 0.6% growth in realization. Revenue, EBITDA and APAT CAGR are estimated at 3.8%, -2.5% and -2.9%, respectively over the same period.

20
I. Leadership Status Bodes WellUTCEM – which enjoys ~23% market share on pan-India level with dominant presence across regions – is on the firm footing to cash in the secular consumption opportunity for cement due to absence of any meaningful alternatives. With the acquisition of Century Cement’s assets, UTCEM has crossed the 100mnT-mark in domestic cement industry, which is unmatched. Surprisingly, capacity utilization of Century’s assets improved to 83% in 4QFY20 (from 55% in 3QFY20) despite COVID-led disruptions. Its EBITDA/tonne is expected to improve to Rs800-900/tonne in FY21E from Rs575 in 4QFY20 with 100% brand conversion. Going forward, we expect UTCEM’s volume to clock 4% CAGR through FY20-FY23E and 13% over FY21E-FY23E.
II. Abundant Limestone Resource – AdvantageIn a scenario of looming higher limestone cost due to exorbitant higher price in new auction of mines, the companies having rich limestone resources are considered to be the winners in future. Notably, with the successful acquisition of Binani’s assets, UTCEM has now got added advantage in terms of new limestone resources in imminent clinker deficit Northern region.
III. Capacity Expansion in High Consumption RegionsWhile UTCEM has sufficiently built capacity to outpace industry’s growth in next couple of years, it continued to focus on putting maximum capacity in demand-rich regions. It is likely to commission 0.6mnT each in Dankuni (west bengal) and Pataliputra (Bihar) shortly in FY21 and Phase-II 2mnT cement capacity at Bara is expected to be commissioned in 3QFY21E. Further, clinker unit (2.3mnT) at Dalla (Uttar Pradesh) is expected to be commissioned in Mar’21. However, 2.2mnT Split Grinding Unit (SGU) in Cuttack (Odisha) is expected to come on stream in FY22E.
IV. Acquisitions Well-Absorbed in Balance-sheet; Now Focus on Improving RoCEDespite acquisition of Century Textile’s cement assets in FY20, UTCEM’s gross debt remained broadly flat on YoY basis at Rs229bn in FY20, while net debt to EBITDA and D/E ratio improved from 3x and 0.7x in FY19 to 2x and 0.5x in FY20 led by strong cash flow generation. UTCEM is committed to take it to 1x in FY21. We foresee its RoCE to improve from 11.8% in FY20 to 12.7% FY23E, while free cash flow (FCF) is seen at ~Rs204bn over FY20-FY23E.
Exhibit 2: Cost per tonne Analysis and Assumptions (Rs)
Rs/tonne FY17 FY18 FY19 FY20 FY21E FY22E FY23E
Raw Materials 802 836 762 767 797 805 805
Employees 282 286 240 305 349 332 332
Power & Fuel 782 1,001 984 1,029 987 1,007 1,017
Freight 1,165 1,155 1,033 1,181 1,205 1,193 1,193
Other Exps. 740 646 552 708 736 721 721
Realisation 4,186 3,965 4,465 4,721 4,790 4,796 4,843
Source: RSec Research
Investment RationaleOur investment thesis is based on the following premises:I. Leadership Status Bodes WellII. Abundant Limestone Resource – AdvantageIII. Capacity Expansion in High Consumption RegionsIV. Acquisitions Well-Absorbed in Balance-sheet; Now Focus on Improving RoCE
21
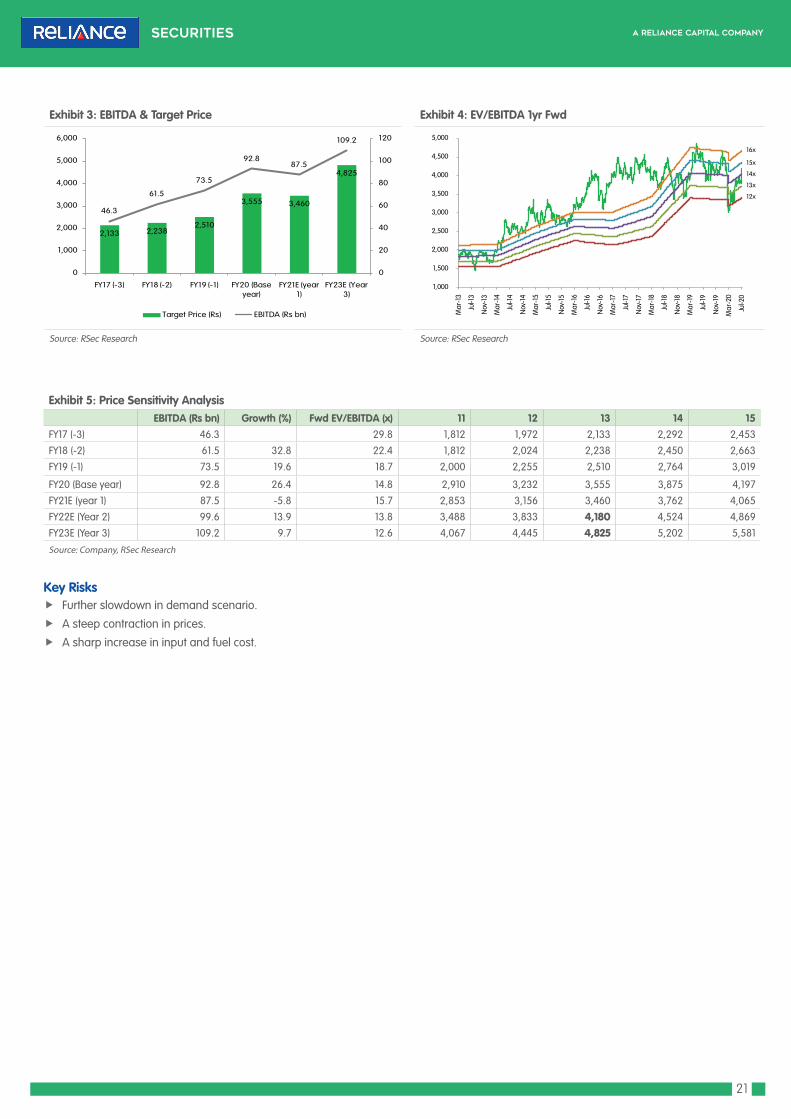
Exhibit 3: EBITDA & Target Price Exhibit 4: EV/EBITDA 1yr Fwd
Source: RSec Research Source: RSec Research
Exhibit 5: Price Sensitivity Analysis EBITDA (Rs bn) Growth (%) Fwd EV/EBITDA (x) 11 12 13 14 15FY17 (-3) 46.3 29.8 1,812 1,972 2,133 2,292 2,453
FY18 (-2) 61.5 32.8 22.4 1,812 2,024 2,238 2,450 2,663
FY19 (-1) 73.5 19.6 18.7 2,000 2,255 2,510 2,764 3,019
FY20 (Base year) 92.8 26.4 14.8 2,910 3,232 3,555 3,875 4,197
FY21E (year 1) 87.5 -5.8 15.7 2,853 3,156 3,460 3,762 4,065
FY22E (Year 2) 99.6 13.9 13.8 3,488 3,833 4,180 4,524 4,869
FY23E (Year 3) 109.2 9.7 12.6 4,067 4,445 4,825 5,202 5,581
Source: Company, RSec Research
Key Risks f Further slowdown in demand scenario.
f A steep contraction in prices.
f A sharp increase in input and fuel cost.
1,000
1,500
2,000
2,500
3,000
3,500
4,000
4,500
5,000
Mar
-13
Jul-1
3
Nov
-13
Mar
-14
Jul-1
4
Nov
-14
Mar
-15
Jul-1
5
Nov
-15
Mar
-16
Jul-1
6
Nov
-16
Mar
-17
Jul-1
7
Nov
-17
Mar
-18
Jul-1
8
Nov
-18
Mar
-19
Jul-1
9
Nov
-19
Mar
-20
Jul-2
0
12x
13x
14x
15x
16x
2,133 2,2382,510
3,555 3,460
4,825
46.3
61.5
73.5
92.887.5
109.2
0
20
40
60
80
100
120
0
1,000
2,000
3,000
4,000
5,000
6,000
FY17 (-3) FY18 (-2) FY19 (-1) FY20 (Base year)
FY21E (year 1)
FY23E (Year 3)
Target Price (Rs) EBITDA (Rs bn)

22
Exhibit 7: Revenue Trend Exhibit 8: EBITDA Trend
Source: Company, RSec Research Source: Company, RSec Research
Exhibit 9: PAT Trend Exhibit 10: ROCE vs. RoE
Source: Company, RSec Research Source: Company, RSec Research
Exhibit 6: Volume (mt)
Source: Industry, RSec Research
Outlook & Valuations
Consistent efforts to trim cost along with focus on improvement in RoCE by balance-sheet deleveraging augurs well for UTCEM. Going forward, we expect demand to recover post monsoon followed by pick-up in infrastructure activities led by improved workforce availability. At CMP, the stock trades at attractive levels of 13x/11x EBITDA FY22E/FY23E. Hence, we maintain BUY on UTCEM with a revised 2-Year Target Price of Rs4,825 (13x of EBITDA FY23E).
46.1 49.3 50.2
63.3
85.7 82.3
72.4
83.6
91.9
-
10.0
20.0
30.0
40.0
50.0
60.0
70.0
80.0
90.0
100.0
FY15 FY16 FY17 FY18 FY19 FY20 FY21E FY22E FY23E
Volume(mt)
227 237 239
310
416 421 381
439 485
-
100
200
300
400
500
600
FY15 FY16 FY17 FY18 FY19 FY20 FY21E FY22E FY23E
Revenue (Rs bn)
39 46 50
61
73
93 87
100 109
-
20
40
60
80
100
120
FY15 FY16 FY17 FY18 FY19 FY20 FY21E FY22E FY23E
EBITDA (Rs bn)
20 24
26 25 25
37 35
46
54
-
10
20
30
40
50
60
FY15 FY16 FY17 FY18 FY19 FY20 FY21E FY22E FY23E
PAT (Rs bn)
14.1 13.6
14.5
12.2
8.2
10.2
8.5
10.4
11.0
11.2 11.7 11.5
8.9
10.0
11.9
10.2
12.1
13.0
7
8
9
10
11
12
13
14
15
FY15 FY16 FY17 FY18 FY19 FY20 FY21E FY22E FY23E
RoCE (%) RoE (%)

23
Profit & Loss StatementY/E Mar (Rs mn) FY19 FY20 FY21E FY22E FY23E
Net Sales 4,16,088 4,21,248 3,83,534 4,40,316 4,87,235 Total Cost 3,42,619 3,28,413 2,96,056 3,40,695 3,77,986
Cost of Materials 69,831 63,131 57,712 67,339 74,763
Employee 22,911 25,094 25,596 28,156 30,971
Power & Fuel 94,361 84,679 71,456 84,200 93,484
Freight & Forwarding 1,03,145 97,254 88,051 1,00,704 1,11,807
Others 52,371 58,255 53,242 60,296 66,960
EBIDTA 73,469 92,836 87,478 99,621 1,09,249 EBIDTA Margin (%) 17.7% 22.0% 22.8% 22.6% 22.4%
Depreciation and Amortisation 24,507 27,022 28,124 28,978 29,716
Interest 17,779 19,857 17,478 15,798 14,560
Other Income 4,634 6,478 5,959 6,675 7,075
Excrptional items (1,139) - (1,574) - -
PBT 34,679 52,435 46,262 61,519 72,048 Tax 10,681 (5,682) 11,639 15,479 18,130
% Tax 31% -11% 25% 25% 25%
Net Profit 23,998 58,117 34,623 46,040 53,919 APAT 24,767 36,985 34,603 46,020 53,899
Net Profit Margin (%) 6% 9% 9% 10% 11%
Balance SheetY/E Mar (Rs mn) FY19 FY20 FY21E FY22E FY23E
Share Capital 2,746 2,886 2,886 2,886 2,886
Reserves & Surplus 3,34,760 3,88,268 4,19,120 4,60,810 5,10,379
Total Shareholder's funds 3,37,506 3,91,155 4,22,006 4,63,696 5,13,266
Long Term Borrowings 2,06,504 1,73,675 1,53,675 1,33,675 1,13,675
Deferred Tax Liabilities (net) 64,114 49,120 49,120 49,120 49,120
Other LT Liabilities and Prov. 1,917 13,114 11,947 13,704 15,156
Total NC Liabilities 2,72,535 2,35,909 2,14,742 1,96,499 1,77,951
Short Term Borrowings 36,684 39,851 38,851 37,851 36,851
Trade Payables 31,597 35,014 31,880 36,599 40,499
Other Curren Liabilities and Prov. 87,052 91,442 85,615 94,388 1,01,638
Total Current Liabilities 1,55,333 1,66,308 1,56,345 1,68,839 1,78,988
TOTAL LIABILITIES 7,65,374 7,93,371 7,93,092 8,29,034 8,70,205
Gross Block 5,71,584 5,99,345 6,19,345 6,36,345 6,51,345
Less: Accumulated Depreciation 67,371 92,046 1,20,170 1,49,148 1,78,864
Net Block 5,04,213 5,07,299 4,99,175 4,87,198 4,72,481
CWIP 11,486 9,095 4,095 4,095 4,095
Goodwill 62,233 62,525 62,525 62,525 62,525
Intangible Assets under development
47 101 101 101 101
Non Current Investment 14,048 16,850 17,050 17,250 17,450
Other NC Assets 43,804 47,428 46,991 53,525 58,923
Total Non-Current Assets 6,35,832 6,43,298 6,29,937 6,24,693 6,15,576
Inventories 40,990 41,483 37,769 43,361 47,981
Investments 15,165 42,437 52,437 67,437 92,437
Trade Receivables 27,870 22,383 20,379 23,396 25,889
Cash and Bank 7,397 5,392 16,665 30,518 45,617
Other Current Assets 38,121 38,379 35,906 39,629 42,705
Total Current Assets 1,29,542 1,50,074 1,63,156 2,04,341 2,54,629
Total Assets 7,65,374 7,93,371 7,93,092 8,29,034 8,70,205
Key Financials

24
Cash Flow StatementY/E Mar (Rs mn) FY19 FY20 FY21E FY22E FY23E
PBT 34,685 52,423 46,242 61,499 72,028
Adjustments for: Depreciation and Obsolescence 24,507 27,022 28,124 28,978 29,716
Interest & Dividend Income (1,188) (1,422) - - -
Interest Expense 17,779 19,857 17,478 15,798 14,560
Others (2,168) (4,447) - - -
Operating Profit Before WC Changes 73,615 93,432 91,844 1,06,275 1,16,304
Net change in WC (6,957) 4,503 (1,502) (3,615) (2,987)
Tax Paid (7,101) (8,914) (11,639) (15,479) (18,130)
Net Cash from Operating activities 59,557 89,020 78,703 87,181 95,187
Purchase of fixed assets (net) (15,959) (16,272) (15,000) (17,000) (15,000)
(Purchase)/Proceeds of Investment 27,667 (26,907) (10,200) (15,200) (25,200)
Others (570) 1,086 - - -
Net Cash from Investing activities 11,138 (42,094) (25,200) (32,200) (40,200) Proceeds from Issue of Share Capital 52 27 - - -
Purchase of Treasury Shares(net) (812) (31) - - -
Proceeds / (Repayment) of Loans (Net) (46,482) (27,164) (21,000) (21,000) (21,000)
Others (20,312) (22,744) (21,230) (20,128) (18,889)
Net Cash from Financing activities (67,553) (49,911) (42,230) (41,128) (39,889) Opening Cash & Bank Balance 771.9 4,412.4 1,465.3 12,737.9 26,591.4
Net Increase or decrease in Cash 3,142 (2,985) 11,273 13,854 15,099
Cash & Cash Equiv. transferred from UNCL 385.2 - - - -
Cash and Cash Equivalents transferred from Century Cement Division
123.9 - - - -
Effect of Exchange rate fluctuation on Cash and Cash Equivalents
4.5 37.5 - - -
Closing Cash & Bank 4,427 1,465 12,738 26,591 41,690
Key RatiosY/E Mar (Rs mn) FY19 FY20 FY21E FY22E FY23E
P/E 44.7 31.5 33.7 25.3 21.6
P/CEPS 22.8 13.7 18.6 15.5 13.9
P/BV 3.3 3.0 2.8 2.5 2.3
EV/EBIDTA 18.2 14.5 14.9 12.6 10.9
EV/Sales 3.2 3.2 3.4 2.8 2.4
EV/tonne (USD) 186 160 152 142 135
Dividend Payout (%) 11.6 10.1 10.8 9.4 8.0
Dividend Yield (%) 0.3 0.3 0.3 0.4 0.4
Per Share Data (Rs)EPS (Basic) 90.2 128.1 119.9 159.4 186.7
CEPS 176.6 295.0 217.4 259.9 289.8
DPS 10.5 13.0 13.0 15.0 15.0
Book Value 1,229 1,355 1,462 1,607 1,778
EBIDTA/tone 857.6 1,127.6 1,208.8 1,191.6 1,188.7
Returns (%)RoCE 8.2 10.2 8.5 10.4 11.0
RoE 10.0 11.9 10.2 12.1 13.0
Turnover ratios (x) Asset Turnover 0.7 0.7 0.6 0.7 0.7
Inventory (days) 36 36 36 36 36
Receivables (days) 24 19 19 19 19
Payables (days) 28 30 30 30 30
WCC (days) 33 25 25 25 25
25
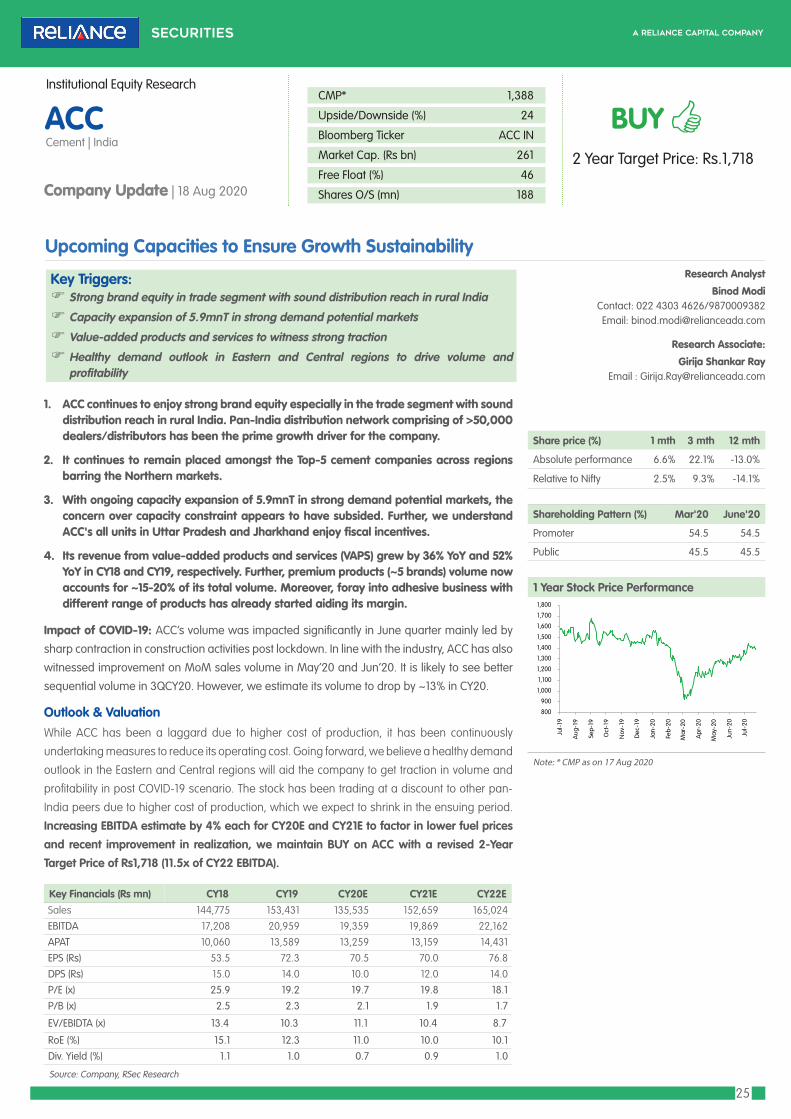
Share price (%) 1 mth 3 mth 12 mth
Absolute performance 6.6% 22.1% -13.0%
Relative to Nifty 2.5% 9.3% -14.1%
Shareholding Pattern (%) Mar'20 June'20
Promoter 54.5 54.5
Public 45.5 45.5
1 Year Stock Price Performance
Note: * CMP as on 17 Aug 2020
Upcoming Capacities to Ensure Growth Sustainability
Key Financials (Rs mn) CY18 CY19 CY20E CY21E CY22ESales 144,775 153,431 135,535 152,659 165,024EBITDA 17,208 20,959 19,359 19,869 22,162APAT 10,060 13,589 13,259 13,159 14,431EPS (Rs) 53.5 72.3 70.5 70.0 76.8DPS (Rs) 15.0 14.0 10.0 12.0 14.0P/E (x) 25.9 19.2 19.7 19.8 18.1P/B (x) 2.5 2.3 2.1 1.9 1.7
EV/EBIDTA (x) 13.4 10.3 11.1 10.4 8.7
RoE (%) 15.1 12.3 11.0 10.0 10.1Div. Yield (%) 1.1 1.0 0.7 0.9 1.0
Source: Company, RSec Research
ACCCement | India
Institutional Equity Research
BUY2 Year Target Price: Rs.1,718
CMP* 1,388
Upside/Downside (%) 24
Bloomberg Ticker ACC IN
Market Cap. (Rs bn) 261
Free Float (%) 46
Shares O/S (mn) 188Company Update | 18 Aug 2020
1. ACC continues to enjoy strong brand equity especially in the trade segment with sound distribution reach in rural India. Pan-India distribution network comprising of >50,000 dealers/distributors has been the prime growth driver for the company.
2. It continues to remain placed amongst the Top-5 cement companies across regions barring the Northern markets.
3. With ongoing capacity expansion of 5.9mnT in strong demand potential markets, the concern over capacity constraint appears to have subsided. Further, we understand ACC's all units in Uttar Pradesh and Jharkhand enjoy fiscal incentives.
4. Its revenue from value-added products and services (VAPS) grew by 36% YoY and 52% YoY in CY18 and CY19, respectively. Further, premium products (~5 brands) volume now accounts for ~15-20% of its total volume. Moreover, foray into adhesive business with different range of products has already started aiding its margin.
Impact of COVID-19: ACC’s volume was impacted significantly in June quarter mainly led by
sharp contraction in construction activities post lockdown. In line with the industry, ACC has also
witnessed improvement on MoM sales volume in May’20 and Jun’20. It is likely to see better
sequential volume in 3QCY20. However, we estimate its volume to drop by ~13% in CY20.
Outlook & ValuationWhile ACC has been a laggard due to higher cost of production, it has been continuously
undertaking measures to reduce its operating cost. Going forward, we believe a healthy demand
outlook in the Eastern and Central regions will aid the company to get traction in volume and
profitability in post COVID-19 scenario. The stock has been trading at a discount to other pan-
India peers due to higher cost of production, which we expect to shrink in the ensuing period.
Increasing EBITDA estimate by 4% each for CY20E and CY21E to factor in lower fuel prices and recent improvement in realization, we maintain BUY on ACC with a revised 2-Year Target Price of Rs1,718 (11.5x of CY22 EBITDA).
Key Triggers:Strong brand equity in trade segment with sound distribution reach in rural India
Capacity expansion of 5.9mnT in strong demand potential markets
Value-added products and services to witness strong traction
Healthy demand outlook in Eastern and Central regions to drive volume and profitability
Research Analyst
Binod ModiContact: 022 4303 4626/9870009382Email: [email protected]
Research Associate:
Girija Shankar RayEmail : [email protected]
800
900
1,000
1,100
1,200
1,300
1,400
1,500
1,600
1,700
1,800
Jul-
19
Aug
-19
Sep-
19
Oct
-19
Nov
-19
Dec
-19
Jan-
20
Feb-
20
Mar
-20
Apr
-20
May
-20
Jun-
20
Jul-
20
26
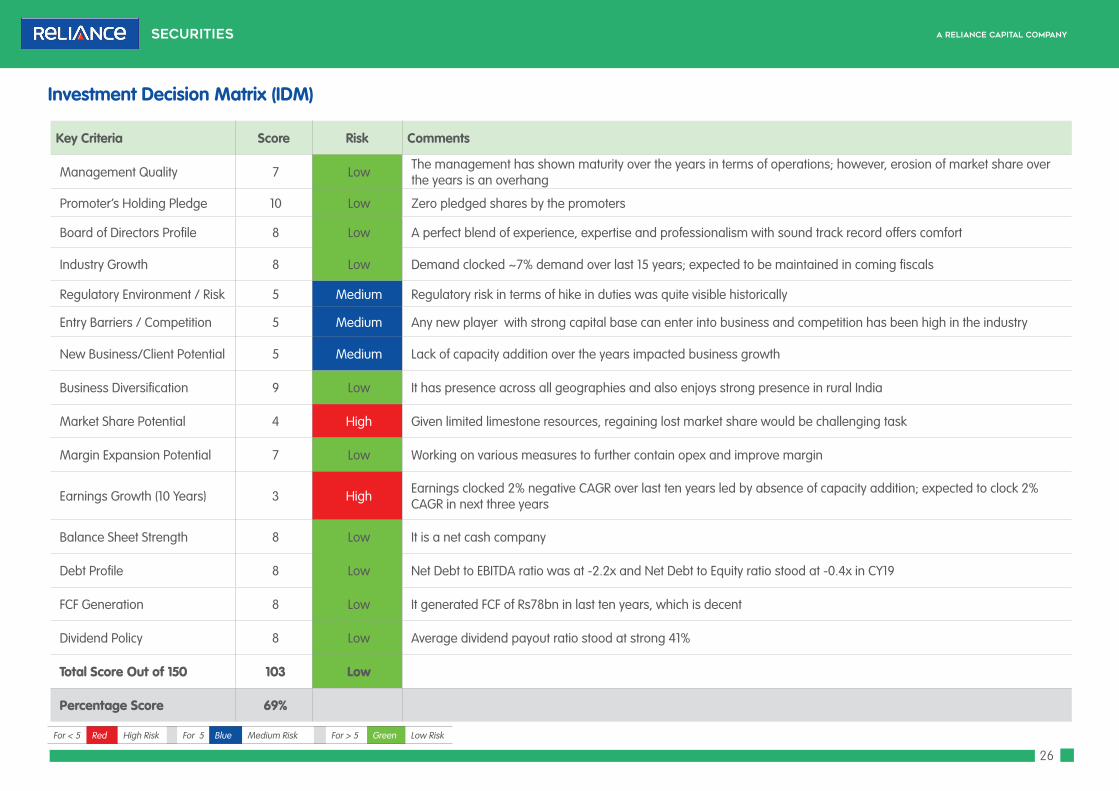
Key Criteria Score Risk Comments
Management Quality 7 Low The management has shown maturity over the years in terms of operations; however, erosion of market share over the years is an overhang
Promoter’s Holding Pledge 10 Low Zero pledged shares by the promoters
Board of Directors Profile 8 Low A perfect blend of experience, expertise and professionalism with sound track record offers comfort
Industry Growth 8 Low Demand clocked ~7% demand over last 15 years; expected to be maintained in coming fiscals
Regulatory Environment / Risk 5 Medium Regulatory risk in terms of hike in duties was quite visible historically
Entry Barriers / Competition 5 Medium Any new player with strong capital base can enter into business and competition has been high in the industry
New Business/Client Potential 5 Medium Lack of capacity addition over the years impacted business growth
Business Diversification 9 Low It has presence across all geographies and also enjoys strong presence in rural India
Market Share Potential 4 High Given limited limestone resources, regaining lost market share would be challenging task
Margin Expansion Potential 7 Low Working on various measures to further contain opex and improve margin
Earnings Growth (10 Years) 3 High Earnings clocked 2% negative CAGR over last ten years led by absence of capacity addition; expected to clock 2% CAGR in next three years
Balance Sheet Strength 8 Low It is a net cash company
Debt Profile 8 Low Net Debt to EBITDA ratio was at -2.2x and Net Debt to Equity ratio stood at -0.4x in CY19
FCF Generation 8 Low It generated FCF of Rs78bn in last ten years, which is decent
Dividend Policy 8 Low Average dividend payout ratio stood at strong 41%
Total Score Out of 150 103 Low
Percentage Score 69%
Investment Decision Matrix (IDM)
For < 5 Red High Risk For 5 Blue Medium Risk For > 5 Green Low Risk

27
Exhibit 1: Scenario Analysis
CY19 CY20E CY21E CY22E CAGR (CY20E-CY22E)
Base Case
Volume (mnT) 28.9 25.0 28.3 30.3 10.1%
Realization/tonne (Rs) 4,171 4,206 4,279 4,279 0.9%
Revenue 153,431 135,535 152,659 165,024 10.3%
EBITDA 20,959 19,359 19,869 22,162 7.0%
EBITDA/tonne 672 722 652 683
EBITDA margin (%) 13.7 14.3 13.0 13.4
APAT 13,589 13,259 13,159 14,431 4.3%
Target EV/EBITDA multiple (x) 11.5
Target Price 1,718
Bull Case
Volume (mnT) 28.9 25.6 29.9 33.2 14.0%
Realization/tonne (Rs) 4,171 4,939 5,080 5,207 2.7%
Revenue 153,431 139,210 165,888 187,256 16.0%
EBITDA 20,959 20,523 25,481 30,823 22.6%
EBITDA/tonne 672 751 804 884
EBITDA margin (%) 13.7 14.7 15.4 16.5
APAT 13,589 14,115 17,305 20,822 21.5%
Target EV/EBITDA multiple (x) 12.0
Target Price 2,291
Bear Case
Volume (mnT) 28.9 24.6 27.2 27.7 6.0%
Realization/tonne (Rs) 4,862 4,871 4,759 4,736 -1.4%
Revenue 153,431 132,937 143,088 145,428 4.6%
EBITDA 20,959 18,400 15,851 14,685 -10.7%
EBITDA/tonne 672 694 532 478
EBITDA margin (%) 13.7 13.8 11.1 10.1
APAT 13,589 12,552 10,191 8,916 -15.7%
Target EV/EBITDA multiple (x) 11.0
Target Price 1,227
Source: RSec Research
Scenario AnalysisBase Case: In base case scenario, we assume 10% volume CAGR over CY20E-CY22E with 0.9% growth in realization. Revenue, EBITDA and APAT are expected to clock 10%, 7% and 4% CAGR, respectively over the same period.
Bull Case: In bull case scenario, we assume 14% volume CAGR over CY20E-CY22E with 2.7% growth in realization. Revenue, EBITDA and APAT are expected to clock 16%, 23% and 22% CAGR, respectively over the same period.
Bear Case: In bear case scenario, we assume 6% volume CAGR over CY20E-CY22E with 1.4% de-growth in realization. Revenue, EBITDA and APAT are expected to clock 5%, -11% and -16% CAGR, respectively over the same period.

28
I. Strong Brand Equity & Healthy Rural PresenceACC – being one of the oldest cement manufacturers in India – enjoys strong brand equity especially in the trade segment with sound distribution reach in rural India. While the company has been losing its market share with no meaningful capacity addition, its strong distribution network comprising of >50,000 dealers/distributors has been the prime growth driver. Notably, ACC continues to remain placed amongst the Top-5 cement companies across regions barring the Northern markets.
II. Capacity Expansion Moving SatisfactorilyCapacity constraints have been the major cause of concern for ACC for last couple of years despite healthy balance sheet. With ongoing capacity expansion of 5.9mnT in strong demand potential markets, the said concern appears to have subsided. Further, we understand that all units in Uttar Pradesh and Jharkhand enjoy fiscal incentives, as per the policy of respective state governments. Though ACC has not secured any limestone mine in last four years, we believe it is still having abundant limestone reserves in Southern and Eastern units for next leg of expansion.
III. Value-added Premium Products & Services Augur WellACC’s blended realization growth has been surpassing industry’s average for last couple of quarters on the back of focus on VAPS. Its VAPS revenue grew by 36% YoY and 52% YoY in CY18 and CY19, respectively. Further, premium products volume now accounts for ~15-20% of its total volume. Currently, ACC has ~5 different premium brands. Further, foray into adhesive business with different range of products has already started aiding its margin. We believe continued traction in premium products segment is likely to enable ACC to enjoy better pricing at blended level, going ahead.
Exhibit 2: Change in Estimates
Y/E Mar CY20E CY21E CY22E
(Rsmn) Old Revised % change Old Revised % change Introduction
Volume (mnT) 25.5 25.0 (2.0) 27.3 28.3 3.9 30.3
Realization (Rs/tonne) 4,822 4,904 1.7 4,888 4,900 0.3 4,974
Sales (Rs mn) 1,36,026 1,35,535 (0.4) 1,46,804 1,52,659 4.0 1,65,024
EBITDA (Rs mn) 16,739 19,359 15.7 18,312 19,869 8.5 22,162
EBITDA/tonne (Rs) 604 722 19.4 621 652 4.9 683
APAT (Rs mn) 10,558 13,259 25.6 11,150 13,159 18.0 14,431
EPS (Rs) 56.2 70.5 25.6 59.3 70.0 18.0 76.8
Source: RSec Research
Exhibit 3: Cost per tonne Analysis and Assumptions (Rs)
Rs/tonne CY16 CY17 CY18 CY19 CY20E CY21E CY22E
Raw Materials 1,006 1,040 1,080 1,087 1,086 1,123 1,131
Employees 328 312 311 299 320 310 319
Power & Fuel 938 1,036 1,057 1,084 1,067 1,078 1,089
Freight 1,155 1,317 1,414 1,401 1,415 1,430 1,444
Other Exps. 712 635 635 713 758 744 729
Realisation 4,379 4,565 4,672 4,862 4,904 4,900 4,974
Source: RSec Research
Investment RationaleOur investment thesis is based on the following premises:
f Strong Brand Equity & Healthy Rural Presence
f Capacity Expansion Moving Satisfactorily
f Value-added Premium Products & Services Augur Well
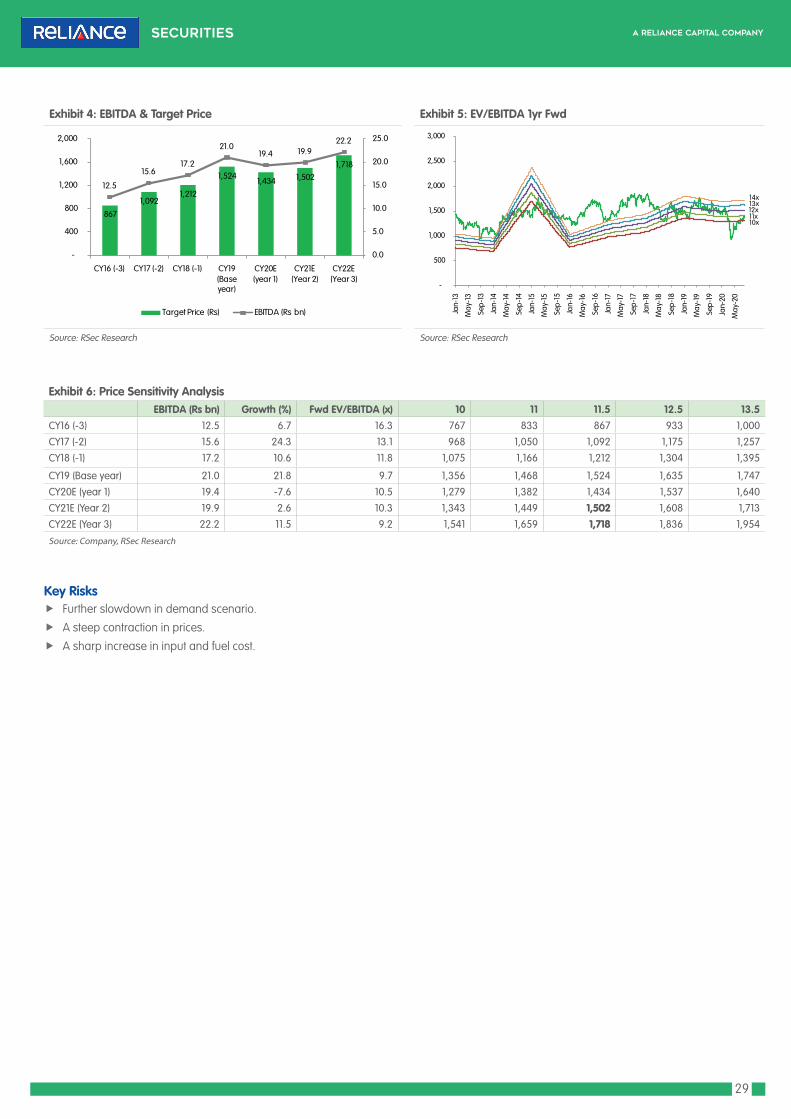
29
Exhibit 6: Price Sensitivity Analysis EBITDA (Rs bn) Growth (%) Fwd EV/EBITDA (x) 10 11 11.5 12.5 13.5CY16 (-3) 12.5 6.7 16.3 767 833 867 933 1,000
CY17 (-2) 15.6 24.3 13.1 968 1,050 1,092 1,175 1,257
CY18 (-1) 17.2 10.6 11.8 1,075 1,166 1,212 1,304 1,395
CY19 (Base year) 21.0 21.8 9.7 1,356 1,468 1,524 1,635 1,747
CY20E (year 1) 19.4 -7.6 10.5 1,279 1,382 1,434 1,537 1,640
CY21E (Year 2) 19.9 2.6 10.3 1,343 1,449 1,502 1,608 1,713
CY22E (Year 3) 22.2 11.5 9.2 1,541 1,659 1,718 1,836 1,954
Source: Company, RSec Research
Key Risks f Further slowdown in demand scenario.
f A steep contraction in prices.
f A sharp increase in input and fuel cost.
Exhibit 4: EBITDA & Target Price Exhibit 5: EV/EBITDA 1yr Fwd
Source: RSec Research Source: RSec Research
867
1,092 1,212
1,524 1,434 1,502
1,718
12.5
15.617.2
21.019.4 19.9
22.2
0.0
5.0
10.0
15.0
20.0
25.0
-
400
800
1,200
1,600
2,000
CY16 (-3) CY17 (-2) CY18 (-1) CY19 (Base year)
CY20E (year 1)
CY21E (Year 2)
CY22E (Year 3)
Target Price (Rs) EBITDA (Rs bn)
-
500
1,000
1,500
2,000
2,500
3,000
Jan-
13
May
-13
Sep-
13
Jan-
14
May
-14
Sep-
14
Jan-
15
May
-15
Sep-
15
Jan-
16
May
-16
Sep-
16
Jan-
17
May
-17
Sep-
17
Jan-
18
May
-18
Sep-
18
Jan-
19
May
-19
Sep-
19
Jan-
20
May
-20
10x11x12x13x14x

30
Exhibit 8: Revenue Trend Exhibit 9: EBITDA Trend
Source: RSec Research Source: RSec Research
Exhibit 10: PAT Trend Exhibit 11: ROCE vs. RoE
Source: RSec Research Source: RSec Research
Exhibit 7: Volume(mt)
Source: Industry, RSec Research
24.2 23.6 23.0
26.2 28.4 28.9
25.0
28.3 30.3
-
5.0
10.0
15.0
20.0
25.0
30.0
35.0
CY14 CY15 CY16 CY17 CY18 CY19 CY20E CY21E CY22E
Volume(mt)
115 114 108
129 145
153
136
153 165
-
20
40
60
80
100
120
140
160
180
CY14 CY15 CY16 CY17 CY18 CY19 CY20E CY21E CY22E
Revenue (Rs bn)
13 12 13
16 17
21 19 20
22
-
5
10
15
20
25
CY14 CY15 CY16 CY17 CY18 CY19 CY20E CY21E CY22E
EBITDA (Rs bn)
8.6
6.0 6.8
9.2 10.1
13.6 13.3 13.2 14.4
-
2.0
4.0
6.0
8.0
10.0
12.0
14.0
16.0
CY14 CY15 CY16 CY17 CY18 CY19 CY20E CY21E CY22E
PAT (Rs bn)
14.2
9.6 10.4
14.5 15.0
18.1
14.6 13.4 13.6
14.6
7.1 7.5
10.0
15.1
12.3 11.0
10.0 10.1
0
2
4
6
8
10
12
14
16
18
20
CY14 CY15 CY16 CY17 CY18 CY19 CY20E CY21E CY22E
RoCE (%) RoE (%)
Outlook & Valuations
While ACC has been a laggard due to higher cost of production, it has been continuously undertaking measures to reduce its operating cost. Going forward, we believe a healthy demand outlook in the Eastern and Central regions will aid the company to get traction in volume and profitability in post COVID-19 scenario. The stock has been trading at a discount to other pan-India peers due to higher cost of production, which we expect to shrink in the ensuing period. Increasing EBITDA estimate by 4% each for CY20E and CY21E to factor in lower fuel prices and recent improvement in realization, we maintain BUY on ACC with a revised 2-Year Target Price of Rs1,718 (11.5x of CY22 EBITDA).

31
Profit & Loss Statement Y/E Dec (Rs mn) CY18 CY19 CY20E CY21E CY22E
Net Sales 1,44,775 1,53,431 1,35,535 1,52,659 1,65,024
% yoy growth 12.0 6.0 (11.7) 12.6 8.1
Total Cost 1,27,567 1,32,472 1,16,176 1,32,790 1,42,862
Raw Materials Cost 30,639 31,405 27,147 31,840 34,289
Employee Costs 8,811 8,640 7,990 8,799 9,662
Power & Fuel 29,981 31,313 26,690 30,556 33,022
Freight and Forwardings 40,114 40,501 35,393 40,519 43,789
Other Expenditures 18,023 20,613 18,956 21,077 22,101
EBITDA 17,208 20,959 19,359 19,869 22,162
EBIDTA Margin (%) 11.9 13.7 14.3 13.0 13.4
Depreciation and Amortisation 5,996 6,030 6,287 7,294 8,318
Interest 892 862 934 1,027 1,094
Other Income 4,624 6,248 5,581 6,038 6,535
PBT 14,943 20,315 17,719 17,585 19,285
Tax (123) 6,726 4,460 4,426 4,854
% Tax (0.8) 33.1 25.2 25.2 25.2
Net Profit 15,066 13,589 13,259 13,159 14,431
YoY Growth (%) 64.6 (9.8) (2.4) (0.8) 9.7
Net Profit Margin (%) 10.4 8.9 9.8 8.6 8.7
Adjusted Profit 10,060 13,589 13,259 13,159 14,431
Key Financials
Balance Sheet Y/E Dec (Rs mn) CY18 CY19 CY20E CY21E CY22E
Share Capital 1,880 1,880 1,880 1,880 1,880
Reserves & Surplus 1,03,396 1,13,333 1,24,712 1,35,615 1,47,414
Total Shareholder's funds 1,05,276 1,15,213 1,26,591 1,37,495 1,49,293
Deferred Tax Liability 6,631 6,422 6,422 6,422 6,422
TOTAL LIABILITIES 1,11,907 1,21,635 1,33,014 1,43,917 1,55,716
Gross Block 88,774 93,972 99,472 1,24,972 1,30,972
Less: Accumulated Depre. 18,280 24,059 30,346 37,640 45,958
Net Block 70,494 69,914 69,127 87,332 85,014
CWIP 3,922 4,353 18,353 3,353 2,353
Investments 2,302 2,302 2,802 3,302 3,802
Other Non Current Assets 17,829 18,765 16,576 18,670 20,183
Inventories 16,786 11,410 11,140 12,547 13,564
Sundry Debtors 8,683 6,284 5,551 6,253 6,759
Cash & Bank 30,003 45,381 46,910 53,866 68,154
Other Current Assets 7,134 8,034 7,097 7,994 8,641
Loans & Advances 3,099 4,064 4,564 5,064 5,564
Total Current Assets 65,704 75,173 75,263 85,724 1,02,682
Current Liablities 46,675 46,296 46,848 51,884 55,540
Provisions 1,668 2,575 2,258 2,581 2,777
Net Current Assets 17,361 26,301 26,156 31,259 44,364
Total Assets 1,11,907 1,21,635 1,33,014 1,43,917 1,55,716
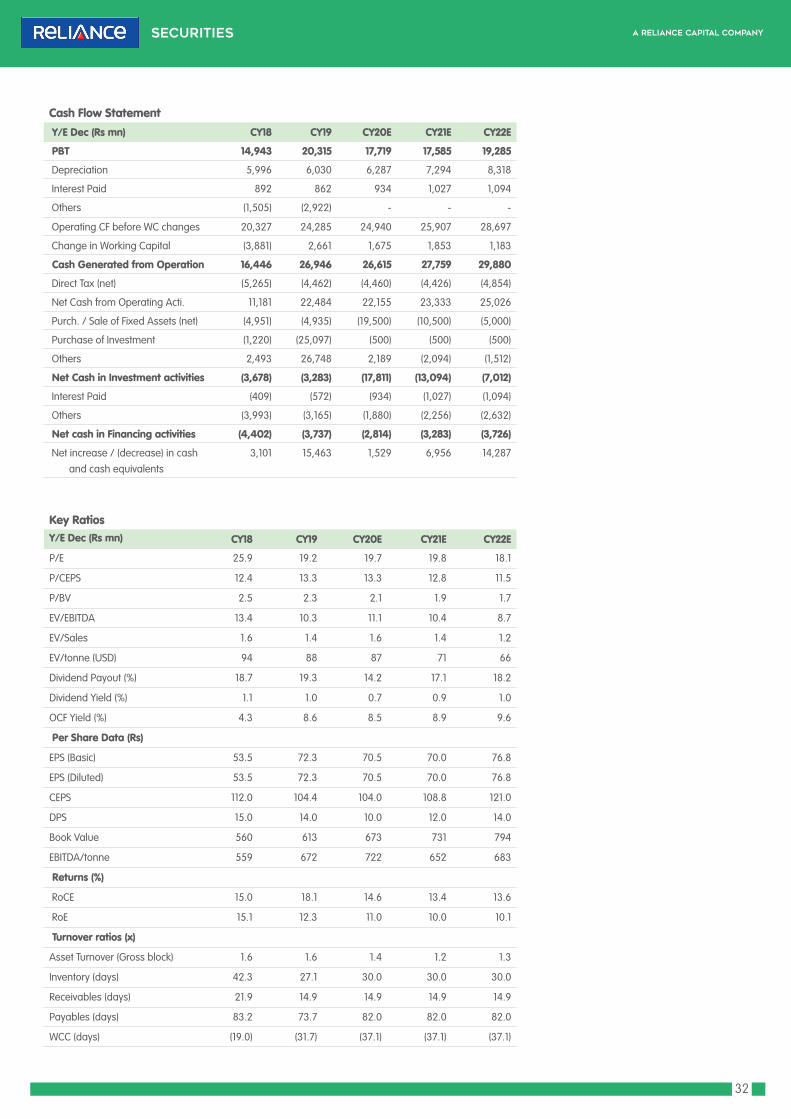
32
Key RatiosY/E Dec (Rs mn) CY18 CY19 CY20E CY21E CY22E
P/E 25.9 19.2 19.7 19.8 18.1
P/CEPS 12.4 13.3 13.3 12.8 11.5
P/BV 2.5 2.3 2.1 1.9 1.7
EV/EBITDA 13.4 10.3 11.1 10.4 8.7
EV/Sales 1.6 1.4 1.6 1.4 1.2
EV/tonne (USD) 94 88 87 71 66
Dividend Payout (%) 18.7 19.3 14.2 17.1 18.2
Dividend Yield (%) 1.1 1.0 0.7 0.9 1.0
OCF Yield (%) 4.3 8.6 8.5 8.9 9.6
Per Share Data (Rs)
EPS (Basic) 53.5 72.3 70.5 70.0 76.8
EPS (Diluted) 53.5 72.3 70.5 70.0 76.8
CEPS 112.0 104.4 104.0 108.8 121.0
DPS 15.0 14.0 10.0 12.0 14.0
Book Value 560 613 673 731 794
EBITDA/tonne 559 672 722 652 683
Returns (%)
RoCE 15.0 18.1 14.6 13.4 13.6
RoE 15.1 12.3 11.0 10.0 10.1
Turnover ratios (x)
Asset Turnover (Gross block) 1.6 1.6 1.4 1.2 1.3
Inventory (days) 42.3 27.1 30.0 30.0 30.0
Receivables (days) 21.9 14.9 14.9 14.9 14.9
Payables (days) 83.2 73.7 82.0 82.0 82.0
WCC (days) (19.0) (31.7) (37.1) (37.1) (37.1)
Cash Flow Statement Y/E Dec (Rs mn) CY18 CY19 CY20E CY21E CY22E
PBT 14,943 20,315 17,719 17,585 19,285
Depreciation 5,996 6,030 6,287 7,294 8,318
Interest Paid 892 862 934 1,027 1,094
Others (1,505) (2,922) - - -
Operating CF before WC changes 20,327 24,285 24,940 25,907 28,697
Change in Working Capital (3,881) 2,661 1,675 1,853 1,183
Cash Generated from Operation 16,446 26,946 26,615 27,759 29,880
Direct Tax (net) (5,265) (4,462) (4,460) (4,426) (4,854)
Net Cash from Operating Acti. 11,181 22,484 22,155 23,333 25,026
Purch. / Sale of Fixed Assets (net) (4,951) (4,935) (19,500) (10,500) (5,000)
Purchase of Investment (1,220) (25,097) (500) (500) (500)
Others 2,493 26,748 2,189 (2,094) (1,512)
Net Cash in Investment activities (3,678) (3,283) (17,811) (13,094) (7,012)
Interest Paid (409) (572) (934) (1,027) (1,094)
Others (3,993) (3,165) (1,880) (2,256) (2,632)
Net cash in Financing activities (4,402) (3,737) (2,814) (3,283) (3,726)
Net increase / (decrease) in cash and cash equivalents
3,101 15,463 1,529 6,956 14,287

33
Share price (%) 1 mth 3 mth 12 mth
Absolute performance 14.7% 28.2% 3.2%
Relative to Nifty 10.6% 15.5% 2.1%
Shareholding Pattern (%) Mar'20 June'20
Promoter 63.3 63.3
Public 36.7 36.7
1 Year Stock Price Performance
Note: * CMP as on 17 Aug 2020
New Capacity to Drive Growth
Key Financials (Rs mn) CY18 CY19 CY20E CY21E CY22ESales 109,770 113,530 107,547 123,382 129,739EBITDA 15,107 18,340 20,042 22,984 24,384APAT 12,017 14,255 14,246 16,337 17,338EPS (Rs) 6.1 7.2 7.2 8.2 8.7DPS (Rs) 2.3 1.5 1.5 2.0 2.5P/E (x) 36.2 30.5 30.5 26.6 25.1P/B (x) 2.1 2.0 1.9 1.8 1.7
EV/EBITDA (x) 17.0 13.5 13.7 11.8 10.5
RoE (%) 7.3 7.1 6.3 6.8 6.9Divi. Yield (%) 1.0 0.8 0.7 0.9 1.1
Source: Company, RSec Research
Ambuja CementsCement | India
Institutional Equity Research
BUY2 Year Target Price: Rs.252
CMP* 219
Upside/Downside (%) 15
Bloomberg Ticker ACEM IN
Market Cap. (Rs bn) 435
Free Float (%) 37
Shares O/S (mn) 1985Company Update | 18 Aug 2020
1. Ambuja Cements (ACEM) continues to be among Top-5 players in Northern and Western regions. State-of-the-art plants and well-maintained machineries help ACEM in lowering power and maintenance cost.
2. Further, the company has also secured a limestone mine in Nagaur (Rajasthan) with estimated reserve of 199mnT so as to front-load resources to capitalize on the demand recovery in the region.
3. ACEM’s capacity expansion programme is moving as per the schedule. Its 3.2mnT clinker unit and 1.8mnT grinding unit (GU) at Marwar (Rajasthan) is expected to be commissioned by the end of CY20E.
4. Likely up-tick in cement consumption led by significant pick-up in infrastructure activities in J&K and line of control areas after recent stand-off with China will benefit ACEM the most, as its Northern plants are located in Punjab and Himachal Pradesh belt.
Impact of COVID-19: ACEM’s volume was impacted significantly in June quarter mainly led by sharp contraction in construction activities post lockdown. In line with the industry, the company has also witnessed improvement on MoM sales volume in May’20 and Jun’20 despite poor recovery in Western region. Its 3QCY20 sales volume is expected to be better on QoQ basis. We estimate its volume to drop by ~9% in CY20.
Outlook & ValuationAmbiguity over parent’s strategy to drive domestic business has been the prime concern for the investors, which has also resulted in de-rating in valuation multiples. Going forward, we believe timely capacity expansion and improvement in operating synergies will be the key catalysts for the stock. Broadly maintaining our EBITDA estimate for CY21E and rolling over our estimate to CY22E, we maintain BUY on ACEM with a revised 2-Year Target Price of Rs252 (12.5x of CY22E).
Key Triggers:One of the Top-5 players in Northern region (~11.5mnT capacity) and Western region
(12mnT capacity)
Likely up-tick in cement consumption led by significant pick-up in infrastructure activities in J&K and line of control areas after recent stand-off with China will benefit ACEM the most
Improved trade segment sales (>80%) along with higher premium products will continue to aid its blended realization
Research Analyst
Binod ModiContact: 022 4303 4626/9870009382Email: [email protected]
Research Associate:
Girija Shankar RayEmail : [email protected]
120
140
160
180
200
220
240
Jul-
19
Aug
-19
Sep-
19
Oct
-19
Nov
-19
Dec
-19
Jan-
20
Feb-
20
Mar
-20
Apr
-20
May
-20
Jun-
20
Jul-
20

34
Key Criteria Score Risk Comments
Management Quality 7 Low The management has shown maturity over the years in terms of operations; however, erosion of market share over the years is an overhang
Promoter’s Holding Pledge 10 Low Zero pledged shares by the promoters
Board of Directors Profile 8 Low A perfect blend of experience, expertise and professionalism with sound track record offers comfort
Industry Growth 8 Low Demand clocked ~7% demand CAGR over last 15 years; expected to be maintained in coming fiscals
Regulatory Environment / Risk 5 Medium Regulatory risk in terms of hike in duties was quite visible historically
Entry Barriers / Competition 5 Medium Any new player with strong capital base can enter into business and competition has been high in the industry
New Business/Client Potential 5 Medium Lack of capacity addition over the years impacted business growth
Business Diversification 8 Low It has presence across all geographies barring Southern region and maintains strong brand equity
Market Share Potential 4 High It has already lost market share over last couple of years; difficult to regain
Margin Expansion Potential 8 Low Working on various measures to further contain opex and improve margin
Earnings Growth (10 Years) 4 High Earnings clocked just 2% earnings CAGR over last ten years led by absence of capacity addition; expected to clock 7% CAGR in next three years
Balance Sheet Strength 8 Low It is a net cash company
Debt Profile 9 Low Net Debt to EBITDA ratio was at -2.5x and Net Debt to Equity ratio stood at -0.2x in CY19
FCF Generation 9 Low It generated FCF of Rs98bn in last ten years, which is decent given muted profit growth
Dividend Policy 8 Low Average dividend payout ratio stood at strong 46%
Total Score Out of 150 106 Low
Percentage Score 71%
Investment Decision Matrix (IDM)
For < 5 Red High Risk For 5 Blue Medium Risk For > 5 Green Low Risk

35
Exhibit 1: Scenario Analysis
CY19 CY20E CY21E CY22E CAGR (CY20E-CY22E)
Base Case
Volume (mnT) 24.0 21.8 24.9 25.9 9.1%
Realization/tonne (Rs) 4,738 4,937 4,953 5,002 0.7%
Revenue 113,530 107,547 123,382 129,739 9.8%
EBITDA 18,340 20,042 22,984 24,384 10.3%
EBITDA/tonne 765 920 923 940
EBITDA margin (%) 16.2 18.6 18.6 18.8
APAT 14,255 14,246 16,337 17,338 10.3%
Target EV to EBITDA multiple (x) 12.5
Target Price 252
Bull Case
Volume (mnT) 24.0 22.1 25.9 26.9 10.3%
Realization/tonne (Rs) 4,738 5,024 5,252 5,410 3.8%
Revenue 113,530 111,217 136,249 145,695 14.5%
EBITDA 18,340 22,411 32,021 36,621 27.8%
EBITDA/tonne 765 1,012 1,234 1,360
EBITDA margin (%) 16.2 20.2 23.5 25.1
APAT 14,255 16,043 23,163 26,533 28.6%
Target EV to EBITDA multiple (x) 13.0
Target Price 337
Bear Case
Volume (mnT) 24.0 21.4 23.9 24.6 7.1%
Realization/tonne (Rs) 4,738 4,821 4,534 4,489 -3.5%
Revenue 113,530 103,320 108,150 110,444 3.4%
EBITDA 18,340 17,117 11,681 10,048 -23.4%
EBITDA/tonne 765 799 490 408
EBITDA margin (%) 16.2 16.6 10.8 9.1
APAT 14,255 12,031 7,817 6,553 -26.2%
Target EV to EBITDA multiple (x) 12.0
Target Price 152
Source: RSec Research
Scenario Analysis
Base Case: In base case scenario, we assume 9% volume CAGR in CY20E-CY22E with 0.7% growth in realization. Revenue, EBITDA and APAT are expected to clock 9.8%, 10.3% and 10.3% CAGR, respectively over the same period.
Bull Case: In bull case scenario, we assume 10.3% volume CAGR in CY20E-CY22E with 3.8% growth in realization. Revenue, EBITDA and APAT are expected to clock 15%, 28% and 29% CAGR, respectively over the same period.
Bear Case: In bear case scenario, we assume 7% volume CAGR in CY20E-CY22E with 3.5% de-growth in realization. Revenue, EBITDA and APAT are expected to clock 3%, -23% and -26% CAGR, respectively over the same period.
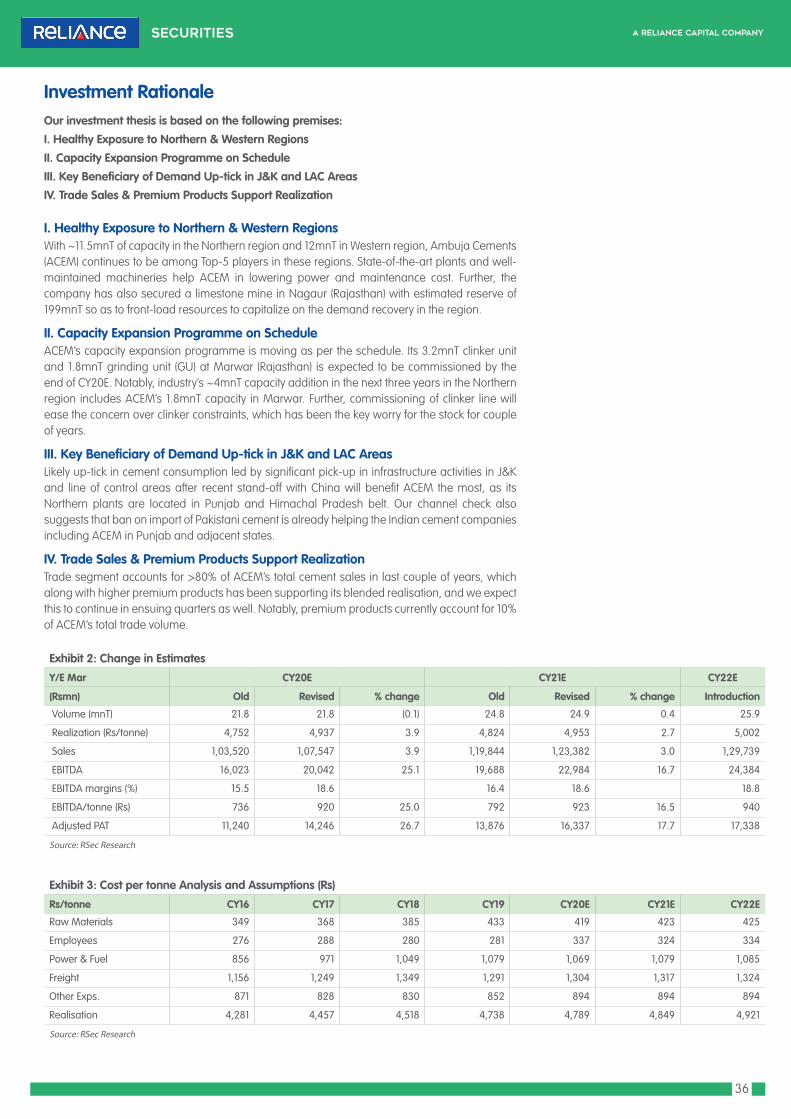
36
I. Healthy Exposure to Northern & Western RegionsWith ~11.5mnT of capacity in the Northern region and 12mnT in Western region, Ambuja Cements (ACEM) continues to be among Top-5 players in these regions. State-of-the-art plants and well-maintained machineries help ACEM in lowering power and maintenance cost. Further, the company has also secured a limestone mine in Nagaur (Rajasthan) with estimated reserve of 199mnT so as to front-load resources to capitalize on the demand recovery in the region.
II. Capacity Expansion Programme on ScheduleACEM’s capacity expansion programme is moving as per the schedule. Its 3.2mnT clinker unit and 1.8mnT grinding unit (GU) at Marwar (Rajasthan) is expected to be commissioned by the end of CY20E. Notably, industry’s ~4mnT capacity addition in the next three years in the Northern region includes ACEM’s 1.8mnT capacity in Marwar. Further, commissioning of clinker line will ease the concern over clinker constraints, which has been the key worry for the stock for couple of years.
III. Key Beneficiary of Demand Up-tick in J&K and LAC AreasLikely up-tick in cement consumption led by significant pick-up in infrastructure activities in J&K and line of control areas after recent stand-off with China will benefit ACEM the most, as its Northern plants are located in Punjab and Himachal Pradesh belt. Our channel check also suggests that ban on import of Pakistani cement is already helping the Indian cement companies including ACEM in Punjab and adjacent states.
IV. Trade Sales & Premium Products Support RealizationTrade segment accounts for >80% of ACEM’s total cement sales in last couple of years, which along with higher premium products has been supporting its blended realisation, and we expect this to continue in ensuing quarters as well. Notably, premium products currently account for 10% of ACEM’s total trade volume.
Exhibit 2: Change in Estimates
Y/E Mar CY20E CY21E CY22E
(Rsmn) Old Revised % change Old Revised % change Introduction
Volume (mnT) 21.8 21.8 (0.1) 24.8 24.9 0.4 25.9
Realization (Rs/tonne) 4,752 4,937 3.9 4,824 4,953 2.7 5,002
Sales 1,03,520 1,07,547 3.9 1,19,844 1,23,382 3.0 1,29,739
EBITDA 16,023 20,042 25.1 19,688 22,984 16.7 24,384
EBITDA margins (%) 15.5 18.6 16.4 18.6 18.8
EBITDA/tonne (Rs) 736 920 25.0 792 923 16.5 940
Adjusted PAT 11,240 14,246 26.7 13,876 16,337 17.7 17,338
Source: RSec Research
Exhibit 3: Cost per tonne Analysis and Assumptions (Rs)
Rs/tonne CY16 CY17 CY18 CY19 CY20E CY21E CY22E
Raw Materials 349 368 385 433 419 423 425
Employees 276 288 280 281 337 324 334
Power & Fuel 856 971 1,049 1,079 1,069 1,079 1,085
Freight 1,156 1,249 1,349 1,291 1,304 1,317 1,324
Other Exps. 871 828 830 852 894 894 894
Realisation 4,281 4,457 4,518 4,738 4,789 4,849 4,921
Source: RSec Research
Investment RationaleOur investment thesis is based on the following premises:I. Healthy Exposure to Northern & Western RegionsII. Capacity Expansion Programme on ScheduleIII. Key Beneficiary of Demand Up-tick in J&K and LAC AreasIV. Trade Sales & Premium Products Support Realization

37
Exhibit 4: EBITDA & SOTP Target Price Exhibit 5: EV/EBITDA 1yr Fwd
Source: RSec Research Source: RSec Research
Exhibit 6: Price Sensitivity analysis at parent level EBITDA (Rs bn) Growth (%) Fwd EV/EBITDA (x) 10 11.5 12.5 13 14CY16 (-3) 16.8 10.0 21.0 97 110 118 123 131
CY17 (-2) 19.4 15.7 18.2 115 130 140 144 154
CY18 (-1) 18.9 -2.5 18.6 112 126 136 140 150
CY19 (Base year) 21.5 13.7 16.4 132 148 159 164 175
CY20E (year 1) 22.3 3.9 15.8 133 150 162 167 178
CY21E (Year 2) 25.6 14.6 13.8 155 174 187 194 207
CY22E (Year 3) 27.1 5.9 13.0 171 191 205 212 225
Source: Company, RSec Research
Key Risks f Further slowdown in demand scenario.
f A steep contraction in prices.
f A sharp increase in input and fuel cost.
165186 182
206 208234
252
16.819.4 18.9
21.5 22.3
25.627.1
0
5
10
15
20
25
30
0
50
100
150
200
250
300
CY16 (-3) CY17 (-2) CY18 (-1) CY19 (Base year)
CY20E (year 1)
CY21E (Year 2)
CY22E (Year 3)
SOTP TP (Rs) EBITDA (Rs bn)
120
140
160
180
200
220
240
260
280
300
Jan-
13
Jun-
13
Nov-
13
Apr-1
4
Sep-
14
Feb-
15
Jul-1
5
Dec-
15
May
…
Oct-1
6
Mar
-17
Aug-
17
Jan-
18
Jun-
18
Nov-
18
Apr-1
9
Sep-
19
Feb-
20
Jul-2
0
12x13x14x
15x
16x

38
Exhibit 8: Revenue Trend Exhibit 9: EBITDA Trend
Source: Company, RSec Research Source: Company, RSec Research
Exhibit 10: PAT Trend Exhibit 11: ROCE vs. RoE
Source: Company, RSec Research Source: Company, RSec Research
Exhibit 7: Volume(mt)
Source: Industry, RSec Research
Outlook & Valuations
Ambiguity over parent’s strategy to drive domestic business has been the prime concern for the investors, which has also resulted in de-rating in valuation multiples. Going forward, we believe timely capacity expansion and improvement in operating synergies will be the key catalysts for the stock. Broadly maintaining our EBITDA estimate for CY21E and rolling over our estimate to CY22E, we maintain BUY on ACEM with a revised 2-Year Target Price of Rs252 (12.5x of CY22E).
22.2 21.8 21.4 23.0
24.3 24.0
21.8
24.9 25.9
-
5.0
10.0
15.0
20.0
25.0
30.0
CY14 CY15 CY16 CY17 CY18 CY19 CY20E CY21E CY22E
Volume(mt)
99 94 91
103 110 114
108
123 130
-
20
40
60
80
100
120
140
CY14 CY15 CY16 CY17 CY18 CY19 CY20E CY21E CY22E
Revenue (Rs bn)
18.5
14.3 15.8
17.3 15.1
18.3 20.0
23.0 24.4
-
5.0
10.0
15.0
20.0
25.0
30.0
CY14 CY15 CY16 CY17 CY18 CY19 CY20E CY21E CY22E
EBITDA (Rs bn)
13.2
8.3 9.3
12.5 12.0
14.3 14.2
16.3 17.3
-
2.0
4.0
6.0
8.0
10.0
12.0
14.0
16.0
18.0
20.0
CY14 CY15 CY16 CY17 CY18 CY19 CY20E CY21E CY22E
PAT (Rs bn)
18.8
12.3
9.1 8.8 7.7
9.4 8.6
9.5 9.5
15.3
7.9 6.3 6.4
7.3 7.1 6.3 6.8 6.9
0
2
4
6
8
10
12
14
16
18
20
CY14 CY15 CY16 CY17 CY18 CY19 CY20E CY21E CY22E
RoCE (%) RoE (%)

39
Profit & Loss StatementY/E Dec (Rs mn) CY18 CY19 CY20E CY21E CY22E
Revenue 1,09,770 1,13,530 1,07,547 1,23,382 1,29,739 % yoy growth 7.1 3.4 (5.3) 14.7 5.2
Total Cost 94,663 95,190 87,505 1,00,398 1,05,355
Cost/tone (Rs) 3,896 3,973 4,017 4,030 4,062
Raw Materials Consumed 9,364 10,372 9,132 10,547 11,035
Employee Costs 6,796 6,726 7,197 7,874 8,661
Power & Fuel 25,497 25,864 23,282 26,888 28,133
Freight & Forwarding 32,776 30,942 28,415 32,817 34,337
Others 20,171 20,403 19,479 22,273 23,189
EBITDA 15,107 18,340 20,042 22,984 24,384 EBITDA Margin (%) 13.8 16.2 18.6 18.6 18.8 Depreciation and Amortisation 5,481 5,438 6,766 7,374 7,952
Interest & Fin. Charges 823 835 579 851 889
Less : Self Consumption of clinker, cement & limestone
(10) - - - -
Exceptional Items 1,300 - - - -
Other Income 7,547 7,416 6,339 7,073 7,626
Profit before Tax 15,061 19,483 19,037 21,832 23,170 Tax 190 4,195 4,792 5,495 5,832
% Tax 1.3 21.5 25.2 25.2 25.2
Net Profit 14,871 15,288 14,246 16,337 17,338 YoY Growth (%) 19.0 2.8 (6.8) 14.7 6.1
Net Profit Margin (%) 13.5 13.5 13.2 13.2 13.4
Adjusted profit 12,017 14,255 14,246 16,337 17,338
Key Financials
Balance Sheet Y/E Dec (Rs mn) CY18 CY19 CY20E CY21E CY22E EQUITY AND LIABILITIES Share Capital 3,971 3,971 3,971 3,971 3,971 Reserves and Surplus 2,06,158 2,18,081 2,29,348 2,41,714 2,54,088 Shareholder's funds 2,10,129 2,22,053 2,33,320 2,45,686 2,58,060 Long-Term Borrowings 397 353 353 353 353 Deferred Tax Liabilities (Net) 3,722 2,161 2,161 2,161 2,161 Other Long-Term Liabilities 84 365 335 384 403 Long Term Provisions 385 503 463 531 557 Non-Current Liabilities 4,587 3,381 3,311 3,429 3,474 Trade Payables 11,095 9,360 8,604 9,872 10,359 Other Current Liabilities 19,097 25,198 17,741 20,355 21,071 Short-Term Provisions 6,962 9,916 9,115 10,458 10,975 Current Liabilities 37,153 44,473 35,460 40,685 42,405
Total Liabilities 2,51,870 2,69,907 2,72,091 2,89,799 3,03,939 ASSETS Tangible Assets 56,636 58,125 73,358 77,985 75,033 Intangible Assets 3 - - - - Capital Work-in-Progress 6,100 11,087 5,000 3,000 2,000 Fixed Assets 62,739 69,212 78,358 80,985 77,033 Non-Current Investments 1,18,138 1,17,890 1,17,890 1,17,890 1,17,890 Long term Loans and Adv. 603 877 830 953 1,002 Other Non-Current Assets 12,987 13,696 12,974 14,884 15,651 Non-Current Assets 1,31,728 1,32,462 1,31,694 1,33,727 1,34,543 Current Investments - - - - - Inventories 12,778 9,541 9,038 10,369 10,903 Trade Receivables 4,703 5,132 4,862 5,578 5,865 Cash and Bank Balances 33,300 46,995 41,919 52,006 68,092 ST Loans and Advances 2,429 2,334 2,211 2,536 2,667 Other Current Assets 4,195 4,231 4,008 4,598 4,835 Current Assets 57,403 68,233 62,038 75,087 92,362 Total Assets 2,51,870 2,69,907 2,72,091 2,89,799 3,03,939

40
Cash Flow Statement Y/E Dec (Rs mn) CY18 CY19 CY20E CY21E CY22E
Profit Before tax 15,061 19,483 19,037 21,832 23,170 Depreciation and Obsolescence 5,481 5,438 6,766 7,374 7,952
Interest and Finance charges 823 835 579 851 889
Others (1,820) (2,717) - - -
Operating profit before WC changes 19,545 23,039 26,382 30,057 32,010
Change in Working Capital (6,166) 3,877 (7,196) 348 (240)
Cash Generated from Operation 13,379 26,916 19,186 30,404 31,770
Direct Tax Paid (6,251) (808) (4,792) (5,495) (5,832)
Net Cash from Operating Activities 7,129 26,108 14,394 24,909 25,938
Purchase / Sale of Fixed Assets (5,936) (11,114) (15,913) (10,000) (4,000)Others 1,981 2,402 - - -
Net Cash used in Investing Activities (3,955) (8,713) (15,913) (10,000) (4,000)
Proceeds from Borrowings 216 - - - -
Interest and finance charges paid (513) (558) (579) (851) (889)Dividend Paid (including DDT) (4,498) (3,320) (2,978) (3,971) (4,964)
Net Cash Generated / (Used) in Financing Activities
(4,795) (3,878) (3,557) (4,822) (5,853)
Net Inc. in Cash and Cash Equivalents (1,621) 13,517 (5,076) 10,087 16,086
Opening Cash 34,971 33,300 46,995 41,919 52,006
Closing Cash 33,300 46,995 41,919 52,006 68,092
Key RatiosY/E Dec (Rs mn) CY18 CY19 CY20E CY21E CY22E
P/E 36.2 30.5 30.5 26.6 25.1
P/CEPS 20.2 21.0 20.7 18.3 17.2
P/BV 2.1 2.0 1.9 1.8 1.7
EV/EBITDA 17.0 13.5 13.7 11.8 10.5
EV/Sales 2.2 2.0 2.3 1.9 1.7
EV/tonne (USD) 116 112 110 97 93
Dividend Payout (%) 30 22 21 24 29
Dividend Yield (%) 1.0 0.8 0.7 0.9 1.1
Per Share Data (Rs) EPS (Basic) 6.1 7.2 7.2 8.2 8.7
EPS (Diluted) 6.1 7.2 7.2 8.2 8.7
CEPS 10.2 10.4 10.6 11.9 12.7
DPS 2.3 1.5 1.5 2.0 2.5
Book Value 106 112 118 124 130
EBITDA/tone 622 765 920 923 940
Returns (%) RoCE 7.7 9.4 8.6 9.5 9.5
RoE 7.3 7.1 6.3 6.8 6.9
Turnover ratios (x) Asset Turnover (Gross block) 1.5 1.4 1.0 1.1 1.1
Inventory (days) 42.5 30.7 30.7 30.7 30.7
Receivables (days) 15.6 16.5 16.5 16.5 16.5
Payables (days) 42.8 35.9 35.9 35.9 35.9
WCC (days) 15.3 11.3 11.3 11.3 11.3

41
Premium Valuation to Sustain
Shree CementCement | India
Institutional Equity Research
BUYCMP* (Rs) xxx
Upside/ (Downside) (%) xx
Bloomberg Ticker xxx IN
Market Cap. (Rs bn) xxx
Free Float (%) xxx
Shares O/S (mn) xxx Company Update | 18 Aug 2020
1. Shree Cement (SRCM) continues to enjoy a leadership position in Northern markets despite UTCEM ramping up its presence through inorganic means. We believe SRCM strikes the best balance between growth and balance-sheet discipline, which justifies its premium valuation.
2. Strong demand outlook in Northern and Eastern regions will aid SRCM to improve its sales volume, going forward. It has recently commissioned 2.5mnT split grinding unit (SGU) in Jharkhand and is likely to commission another 3mnT SGU in Odisha shortly.
3. Contrary to the past trend, SRCM has started placing itself as a value player and intends to get remunerative growth rather than volumetric growth. It had launched 2 value-added products including Shree Roofon in the Southern markets last year, which already has yielded desired result so far.
4. Cost leadership has aided the company to generate better than industry’s profitability over the years, which is expected to be accentuated, going forward with further emphasis of remunerative growth.
Impact of COVID-19: As per its latest FY20 Annual Report, COVID-19 pandemic has dented the cement demand due to nationwide lockdown and resultant decline in overall economic activities. As per the company, it is difficult to give any near-term guidance in light of uncertainty over any extended impact of the pandemic. However, SRCM has delivered a better volume performance compared to its peers in 1QFY21, as its volume declined by 18% YoY vs. ~30% decline expected to be witnessed by the industry.
Outlook & ValuationWe believe SRCM has been moving in the right direction in its pursuit to dominate the markets by adding capacity at regular intervals, which we expect to aid the company in growing its market share and profitability without much stress on balance sheet. Hence, its premium multiple is expected to sustain, going forward which can be supported by thin liquidity and meagre non-institutional holdings. Keeping our earnings estimates unchanged for forward years, we maintain BUY on SRCM with an unrevised SOTP-based 2-Year Target Price of Rs24,053 (valuing standalone entity at Rs22,953 and UAE subsidiary at Rs1,100).
Research Analyst
Binod ModiContact: 022 4303 4626/9870009382Email: [email protected]
Research Associate:
Girija Shankar RayEmail : [email protected]
Key Financials (Rs mn) FY19 FY20 FY21E FY22E FY23E Sales 117,599 119,301 112,594 134,036 149,884EBITDA 26,528 36,745 33,193 41,547 47,086Net Profit 10,685 15,702 14,883 20,240 25,488EPS (Rs) 273 435 412 561 706DPS (Rs) 55 144 80 135 150P/E (x) 78.8 49.4 52.2 38.4 30.5P/B (x) 7.8 6.0 5.5 5.0 4.4
EV/EBITDA 29.2 21.1 22.8 17.6 14.9
RoE (%) 10.3 13.9 11.0 13.6 15.3Divi. Yield (%) 0.003 0.007 0.004 0.006 0.007
Source: Company, RSec Research
Share price (%) 1 mth 3 mth 12 mth
Absolute performance -1.3% 18.2% 10.2%
Relative to Nifty -5.3% 5.5% 9.1%
Shareholding Pattern (%) Mar'20 June'20
Promoter 62.5 62.5
Public 37.5 37.5
1 Year Stock Price Performance
ote: * CMP as on 17 Aug 2020
Cement | India
Institutional Equity Research
BUY2 Year Target Price: Rs.24,053
CMP* 21,513
Upside/Downside (%) 12
Bloomberg Ticker SRCM IN
Market Cap. (Rs bn) 776
Free Float (%) 37
Shares O/S (mn) 36
Key Triggers:Leadership position in Northern region offers an edgeMaintains the best balance between growth and balance-sheet discipline Expected to deliver better than industry’s growth led by upcoming capacities and
revival in demand scenario in 2HFY21Placing itself as a value player with focus on remunerative growth in lieu of volumetric growthBest-in-class EBITDA/tonne despite higher incentives to dealers/distributors
2,500
7,500
12,500
17,500
22,500
27,500
Jul-
19
Aug
-19
Sep-
19
Oct
-19
Nov
-19
Dec
-19
Jan-
20
Feb-
20
Mar
-20
Apr
-20
May
-20
Jun-
20
Jul-
20
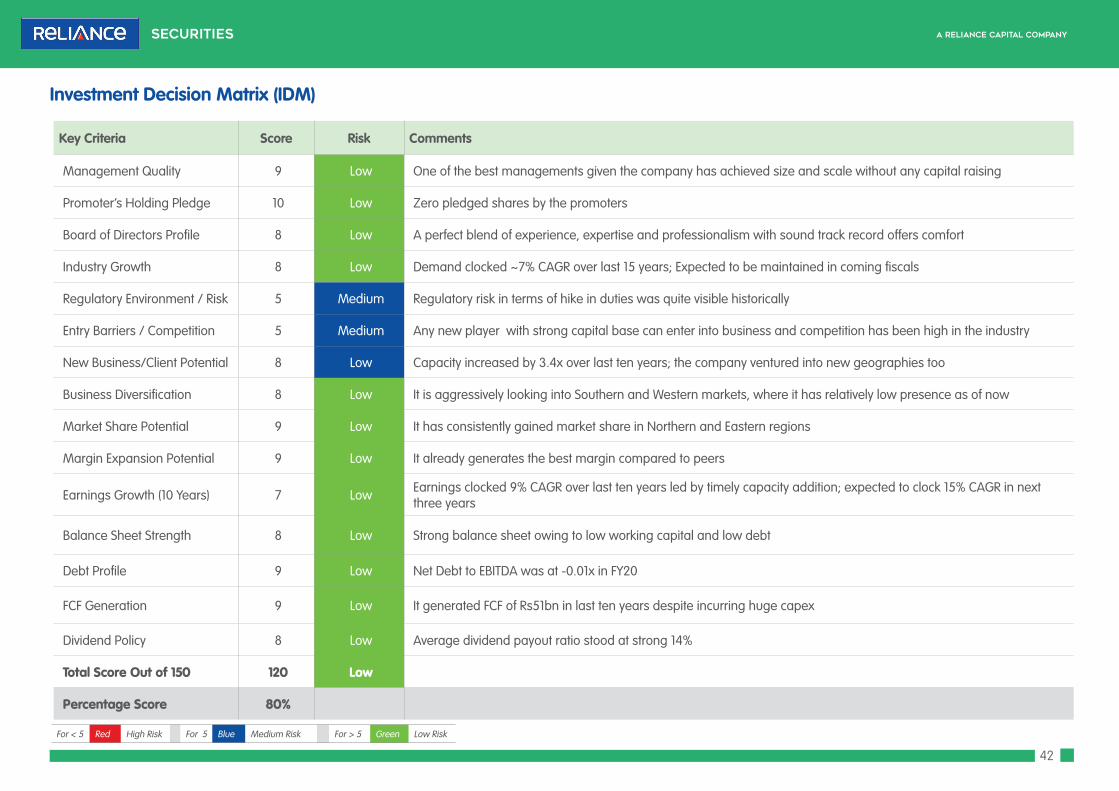
42
Key Criteria Score Risk Comments
Management Quality 9 Low One of the best managements given the company has achieved size and scale without any capital raising
Promoter’s Holding Pledge 10 Low Zero pledged shares by the promoters
Board of Directors Profile 8 Low A perfect blend of experience, expertise and professionalism with sound track record offers comfort
Industry Growth 8 Low Demand clocked ~7% CAGR over last 15 years; Expected to be maintained in coming fiscals
Regulatory Environment / Risk 5 Medium Regulatory risk in terms of hike in duties was quite visible historically
Entry Barriers / Competition 5 Medium Any new player with strong capital base can enter into business and competition has been high in the industry
New Business/Client Potential 8 Low Capacity increased by 3.4x over last ten years; the company ventured into new geographies too
Business Diversification 8 Low It is aggressively looking into Southern and Western markets, where it has relatively low presence as of now
Market Share Potential 9 Low It has consistently gained market share in Northern and Eastern regions
Margin Expansion Potential 9 Low It already generates the best margin compared to peers
Earnings Growth (10 Years) 7 Low Earnings clocked 9% CAGR over last ten years led by timely capacity addition; expected to clock 15% CAGR in next three years
Balance Sheet Strength 8 Low Strong balance sheet owing to low working capital and low debt
Debt Profile 9 Low Net Debt to EBITDA was at -0.01x in FY20
FCF Generation 9 Low It generated FCF of Rs51bn in last ten years despite incurring huge capex
Dividend Policy 8 Low Average dividend payout ratio stood at strong 14%
Total Score Out of 150 120 Low
Percentage Score 80%
Investment Decision Matrix (IDM)
For < 5 Red High Risk For 5 Blue Medium Risk For > 5 Green Low Risk

43
Exhibit 1: Scenario Analysis
FY20 FY21E FY22E FY23E CAGR (FY20-FY23E)
Base Case
Volume (mnT) 24.9 23.4 27.7 30.9 14.8%
Relisation/tonne (Rs) 4,622 4,645 4,699 4,746 1.1%
Revenue 1,19,301 1,12,594 1,34,036 1,49,884 15.4%
EBITDA 36,745 33,193 41,547 47,086 19.1%
EBITDA/tonne 1,446 1,385 1,473 1,505
EBITDA margin (%) 30.8 29.5 31.0 31.4
APAT 15,702 14,883 20,240 25,488 19.6%
Target EV/EBITDA multiple (x) 16
Target Price 24,053
Bull Case
Volume (mnT) 24.9 22.9 28.0 32.5 19.1%
Relisation/tonne (Rs) 4,622 4,834 5,028 5,179 3.5%
Revenue 1,19,301 1,14,512 1,44,534 1,71,663 22.4%
EBITDA 36,745 35,405 48,286 59,227 29.3%
EBITDA/tonne 1,446 1,513 1,699 1,804
EBITDA margin (%) 30.8 30.9 33.4 34.5
APAT 15,702 13,658 23,805 33,283 34.6%
Target EV/EBITDA multiple (x) 16.5
Target Price 29,888
Bear Case
Volume (mnT) 24.9 21.2 24.7 27.8 14.5%
Relisation/tonne (Rs) 4,622 4,585 4,493 4,493 -1.0%
Revenue 1,19,301 1,01,077 1,14,781 1,28,534 12.8%
EBITDA 36,745 29,407 33,761 37,791 13.4%
EBITDA/tonne 1,446 1,350 1,337 1,334
EBITDA margin (%) 30.8 29.1 29.4 29.4
APAT 15,702 9,280 13,202 17,243 22.9%
Target EV/EBITDA multiple (x) 15.5
Target Price 19,647
Source: RSec Research
Scenario AnalysisBase Case: In base case scenario, we assume 17.6% volume CAGR in FY21E-FY23E with 0.6% growth in realization. Revenue, EBITDA and APAT are expected to clock 18%, 21% and 29% CAGR, respectively over the same period.
Bull Case: In bull case scenario, we assume 19.1% volume CAGR in FY21E-FY23E with 3.5% growth in realization. Revenue, EBITDA and APAT are expected to clock 22%, 29% and 35% CAGR, respectively over the same period.
Bear Case: In bear case scenario, we assume 14.5% volume CAGR in FY21E-FY23E with 1% de-growth in realization. Revenue, EBITDA and APAT are expected to clock 12.8%, 13.4% and 22.9% CAGR, respectively over the same period.

44
I. Dominant Presence in Northern & Eastern RegionsShree Cement (SRCM) continues to enjoy a leadership position in Northern markets despite UTCEM ramping up its presence through inorganic means. We believe SRCM strikes the best proper balance between growth and balance-sheet discipline, which justifies its premium valuation. While SRCM is currently expanding more in other regions to become a pan-India player, we believe it has sufficient scope to grow further in Northern and Eastern regions with current level of resources.
II. Ongoing Expansion to Ensure Healthy VolumeWhile SRCM’s sales volume was adversely impacted in 4QFY20 owing to slowdown in construction activities led by COVID-19, we continue to believe that it can potentially grow in double-digit over the next 2 years led by upcoming capacities and meaningful revival in demand. Further, strong demand outlook in Northern and Eastern regions will aid the company to improve its sales volume, going forward. It has recently commissioned 2.5mnT SGU in Jharkhand and is likely to commission another 3mnT SGU in Odisha shortly. However, in order to overcome a likely situation of clinker deficit in the Eastern region, SRCM may soon announce clinker expansion plan in the region for which it has already obtained required regulatory clearances/approvals.
III. Shift in Strategy from Volume to Value Contrary to the past trend, SRCM has started placing itself as a value player and intends to get remunerative growth rather than volumetric growth. It had launched 2 value-added products including Shree Roofon in the Southern markets last year, which already has yielded desired result so far. Currently, the premium products account for 5% of its total sales volume. Going forward, we expect healthy realization trend in its key markets and improving volume of premium products to result in sustainably strong operating profit.
IV. Superior Operating PerformanceDespite offering higher Rs322/tonne rebate/discounts/incentives to its dealers/distributors (vs. Rs222/tonne in FY19), SRCM’s EBITDA/tonne remained the best among peers at Rs1,446 in FY20. Notably, cost leadership has aided the company to generate better than industry’s profitability over the years, which is expected to be accentuated, going forward with further emphasis of remunerative growth.
Exhibit 3: Cost per tonne Analysis and Assumptions (Rs)
Rs/tonne FY17 FY18 FY19 FY20 FY21E FY22E FY23E
Raw Materials 305 342 334 308 317 313 309
Employees 261 261 262 293 337 309 316
Power & Fuel 702 878 1,062 942 904 931 940
Freight 744 882 890 864 882 886 890
Other Exps. 954 928 974 904 951 897 876
Realisation 3,817 4,166 4,223 4,622 4,645 4,699 4,746 Source: RSec Research
Investment RationaleOur investment thesis is based on the following premises:I. Dominant Presence in Northern & Eastern RegionsII. Ongoing Expansion to Ensure Healthy VolumeIII. Shift in Strategy from Volume to ValueIV. Superior Operating Performance
Exhibit 2: Change in Estimates
Y/E Mar FY21E FY22E FY23E
(Rsmn) Old Revised % change Old Revised % change Old Revised % change
Sales Volume - Cement (mnT) 22.15 23.42 5.8 26.71 27.72 3.8 30.62 30.86 0.8
Realizations-Cement (Rs/tone) 4,695 4,645 (1.1) 4,709 4,699 (0.2) 4,757 4,746 (0.2)
Sales Volume - Power (mn units) 950 950 0.0 900 900 0.0 800 800 0.0
Sales (Rs mn) 107,785 112,594 4.5 129,572 134,036 3.4 149,106 149,884 0.5
EBIDTA (Rs mn) 32,245 33,193 2.9 40,305 41,547 3.1 46,970 47,086 0.2
Cement EBITDA/tonne (Rs) 1,422 1,385 (2.6) 1,482 1,473 (0.6) 1,513 1,505 (0.5)
EBIDTA margins (%) 29.9 29.5 31.1 31.0 31.5 31.4
PAT (Rs mn) 11,352 14,883 31.1 17,979 20,240 12.6 24,112 25,488 5.7
Source: RSec Research

45
Exhibit 4: EBITDA & SOTP Target Price Exhibit 5: EV/EBITDA 1yr Fwd
Source: RSec Research Source: RSec Research
Exhibit 6: Price Sensitivity at Standalone EBITDA (Rs bn) Growth (%) Fwd EV/EBITDA (x) 14 15 16 17 18FY17 (-3) 25.1 30.7 9,605 10,302 10,998 11,695 12,392
FY18 (-2) 24.7 -1.6 31.2 9,326 10,011 10,696 11,382 12,067
FY19 (-1) 26.5 7.3 29.1 9,612 10,347 11,083 11,818 12,553
FY20 (Base year) 36.7 38.5 21.0 14,272 15,290 16,309 17,327 18,345
FY21E (year 1) 33.2 -9.7 23.2 13,463 14,383 15,303 16,223 17,142
FY22E (Year 2) 41.5 25.2 18.6 17,392 18,544 19,695 20,847 21,998
FY23E (Year 3) 47.1 13.3 16.4 20,342 21,648 22,953 24,258 25,563
Source: RSec Research
Key Risks f Further slowdown in demand scenario.
f A steep contraction in prices.
f A sharp increase in input and fuel cost.
-
5,000
10,000
15,000
20,000
25,000
30,000
Mar
-13
Jul-1
3N
ov-1
3M
ar-1
4Ju
l-14
Nov
-14
Mar
-15
Jul-1
5N
ov-1
5M
ar-1
6Ju
l-16
Nov
-16
Mar
-17
Jul-1
7N
ov-1
7M
ar-1
8Ju
l-18
Nov
-18
Mar
-19
Jul-1
9N
ov-1
9M
ar-2
0Ju
l-20
15x
18x20x21x22x
12,098 11,796 12,183
17,409 16,403
20,795
24,053
25.1 24.7 26.5
36.733.2
41.547.1
05101520253035404550
0
5,000
10,000
15,000
20,000
25,000
30,000
FY17 (-3) FY18 (-2) FY19 (-1) FY20 (Base year)
FY21E (year 1)
FY22E (Year 2)
FY23E (Year 3)
SOTP TP (Rs) EBITDA (Rs bn)
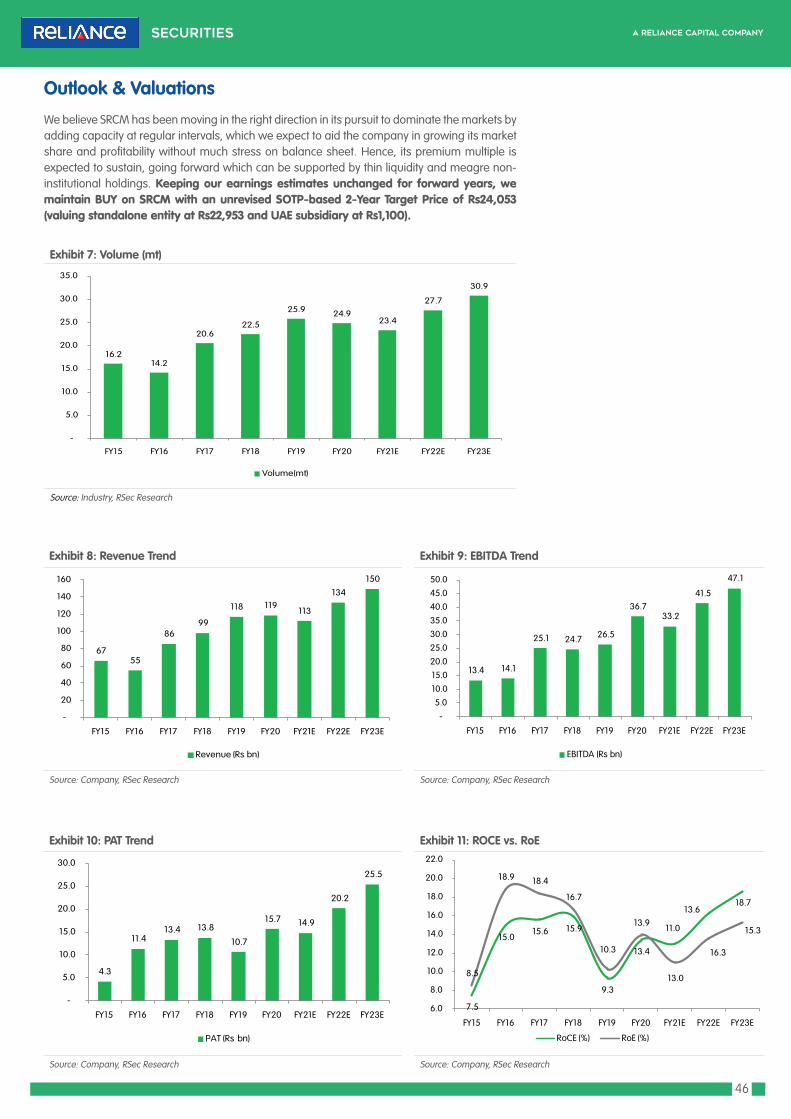
46
Exhibit 8: Revenue Trend Exhibit 9: EBITDA Trend
Source: Company, RSec Research Source: Company, RSec Research
Exhibit 10: PAT Trend Exhibit 11: ROCE vs. RoE
Source: Company, RSec Research Source: Company, RSec Research
Exhibit 7: Volume (mt)
Source: Industry, RSec Research
Outlook & Valuations
We believe SRCM has been moving in the right direction in its pursuit to dominate the markets by adding capacity at regular intervals, which we expect to aid the company in growing its market share and profitability without much stress on balance sheet. Hence, its premium multiple is expected to sustain, going forward which can be supported by thin liquidity and meagre non-institutional holdings. Keeping our earnings estimates unchanged for forward years, we maintain BUY on SRCM with an unrevised SOTP-based 2-Year Target Price of Rs24,053 (valuing standalone entity at Rs22,953 and UAE subsidiary at Rs1,100).
16.2 14.2
20.6 22.5
25.9 24.9 23.4
27.7
30.9
-
5.0
10.0
15.0
20.0
25.0
30.0
35.0
FY15 FY16 FY17 FY18 FY19 FY20 FY21E FY22E FY23E
Volume(mt)
67 55
86 99
118 119 113
134
150
-
20
40
60
80
100
120
140
160
FY15 FY16 FY17 FY18 FY19 FY20 FY21E FY22E FY23E
Revenue (Rs bn)
13.4 14.1
25.1 24.7 26.5
36.7 33.2
41.5
47.1
-
5.0
10.0
15.0
20.0
25.0
30.0
35.0
40.0
45.0
50.0
FY15 FY16 FY17 FY18 FY19 FY20 FY21E FY22E FY23E
EBITDA (Rs bn)
4.3
11.4 13.4 13.8
10.7
15.7 14.9
20.2
25.5
-
5.0
10.0
15.0
20.0
25.0
30.0
FY15 FY16 FY17 FY18 FY19 FY20 FY21E FY22E FY23E
PAT (Rs bn)
7.5
15.0 15.6 15.9
9.3
13.4
13.0
16.3
18.7
8.5
18.9 18.4
16.7
10.3
13.9 11.0
13.6
15.3
6.0
8.0
10.0
12.0
14.0
16.0
18.0
20.0
22.0
FY15 FY16 FY17 FY18 FY19 FY20 FY21E FY22E FY23E
RoCE (%) RoE (%)

47
Profit & Loss Statement FY19 FY20 FY21E FY22E FY23E
Revenue 1,17,599 1,19,301 1,12,594 1,34,036 1,49,884 % yoy growth 18.9 1.4 (5.6) 19.0 11.8
Total Cost 91,072 82,555 79,402 92,489 1,02,798
Raw Materials Consumed 8,642 7,682 7,419 8,678 9,543
Cost/tonne (Rs) 334 308 317 313 309
Employee Costs 6,779 7,310 7,882 8,578 9,742
Cost/tonne (Rs) 262 293 337 309 316
Power & Fuel 27,450 23,476 21,172 25,811 29,019
Cost/tonne (Rs) 1,062 942 904 931 940
Freight and Forwarding 23,025 21,547 20,646 24,559 27,475
Cost/tonne (Rs) 890 864 882 886 890
Other Expenditures 25,175 22,540 22,283 24,862 27,020
Cost/tonne (Rs) 974 904 951 897 876
EBIDTA 26,528 36,745 33,193 41,547 47,086 EBIDTA Margin (%) 22.6 30.8 29.5 31.0 31.4 Depreciation and Amortisation 13,917 16,994 13,892 16,691 17,906
Interest & Fin. Charges 2,470 2,865 2,396 1,676 1,271
Preoperative Expenses written back 1,781 - - - -
Other Income 2,454 2,716 3,483 4,545 6,153
Profit before Tax 10,814 19,602 20,388 27,725 34,062 Tax 1,304 3,900 5,505 7,486 8,573
Net Profit (Reported) 9,510 15,702 14,883 20,240 25,488 YoY Growth (%) (31.3) 65.1 (5.2) 36.0 25.9
Net Profit Margin (%) 8.1 13.2 13.2 15.1 17.0
Net Profit (Adjusted) 10,685 15,702 14,883 20,240 25,488
Balance SheetY/E Mar (Rs mn) FY19 FY20 FY21E FY22E FY23E
SOURCES OF FUNDS
Share Capital 348 361 361 361 361
Reserves & Surplus 95,625 1,29,003 1,41,000 1,56,368 1,76,444
Total Shareholder's funds 95,974 1,29,364 1,41,360 1,56,729 1,76,805
Secured Loans 27,980 31,042 21,042 15,042 12,042
Unsecured Loans - 400 400 400 400
Total Debt 27,980 31,442 21,442 15,442 12,442
TOTAL LIABILITIES 1,23,953 1,60,806 1,62,802 1,72,171 1,89,247
APPLICATION OF FUNDS
Gross Block 88,365 1,03,634 1,18,634 1,28,634 1,36,634
Less: Accumulated Depreciation 43,608 60,602 74,494 91,185 1,09,090
Net Block 44,757 43,032 44,140 37,450 27,544
CWIP 11,211 9,621 6,621 3,621 2,121
Investments 44,439 89,179 97,179 1,15,179 1,39,179
Deferred Tax Assets (net) 6,126 7,438 7,438 7,438 7,438
Inventories 15,891 14,279 13,476 16,042 17,939
Sundry Debtors 7,324 8,285 7,819 9,308 10,408
Cash & Bank 3,078 1,082 3,627 4,449 6,351
Loans & Advances 6,921 8,701 8,212 9,776 10,932
Other Current Assets 12,186 11,630 11,385 12,108 13,939
Total Current Assets 45,400 43,976 44,518 51,683 59,569
Current Liablities 27,886 32,337 36,982 43,077 46,470
Provisions 93 103 112 122 133
Net Current Assets 17,420 11,536 7,424 8,484 12,966
Total Assets 1,23,953 1,60,806 1,62,802 1,72,171 1,89,247
Key Financials

48
Cash Flow StatementY/E Mar (Rs mn) FY19 FY20 FY21E FY22E FY23E
PBT 10,814 19,602 20,388 27,725 34,062
Depreciation 13,917 16,994 13,892 16,691 17,906
Interest Expenses 2,470 2,865 2,396 1,676 1,271
Others 998 -2,680 0 0 0
Operating profit before WC changes 28,198 36,782 36,676 46,092 53,239
Trade and Other Receivables (4,007) (30) 1,201 (3,776) (4,087)
Inventories (200) 1,612 803 (2,566) (1,897)
Trade Payables and Other Liabilities -1,094 4,010 4,654 6,106 3,404
Cash Generated from Operation 22,896 42,373 43,333 45,855 50,659
Direct Taxes and Others (2,300) (4,859) (5,505) (7,486) (8,573)
Net Cash from Operating Activities 20,596 37,514 37,828 38,369 42,086
Purchase of Fixed Assets (18,993) (12,984) (12,000) (7,000) (6,500)
Others 10,867 (40,749) (8,000) (18,000) (24,000)
Net Cash used in Investment activities (8,126) (53,733) (20,000) (25,000) (30,500)
Proceeds from Borrowings (7,591) 1,175 (10,000) (6,000) (3,000)
Interest Paid (2,753) (2,868) (2,396) (1,676) (1,271)
Dividend and Tax thereon (2,308) (6,231) (2,886) (4,871) (5,412)
Net Cash from Financing Activities (12,653) (7,924) (15,283) (12,547) (9,683)
Net Increase / (Decrease) in Cash (182) (24,143) 2,545 822 1,902
Opening Cash 1,209 3,078 1,082 3,627 4,449
Closing Cash 3,078 1,082 3,627 4,449 6,351
Key RatiosY/E Mar (Rs mn) FY19 FY20 FY21E FY22E FY23E
P/E 78.8 49.4 52.2 38.4 30.5
P/CEPS 32.0 23.7 27.0 21.0 17.9
P/BV 7.8 6.0 5.5 5.0 4.4
EV/EBIDTA 29.2 21.1 22.8 17.6 14.9
EV/Sales 6.6 6.5 6.7 5.4 4.7
EV/tonne (USD) 272 256 217 210 202
Dividend Payout (%) 20.1 33.0 19.4 24.1 21.2
Dividend Yield (%) 0.003 0.007 0.004 0.006 0.007
Adj. OCF Yield 2.4 4.5 4.6 4.7 5.3
Per Share Data (Rs) EPS (Basic) 273 435 412 561 706
EPS (Diluted) 273 435 412 561 706
CEPS 672 906 798 1,024 1,203
DPS 55 144 80 135 150
Book Value 2,755 3,585 3,918 4,344 4,900
EBIDTA/tone 955 1,446 1,385 1,473 1,505
Returns (%) RoCE 9.3 13.1 13.0 16.3 18.7
RoE 10.3 13.9 11.0 13.6 15.3
Turnover ratios (x) Asset Turnover 1.3 1.2 0.9 1.0 1.1
Inventory (days) 49 44 44 44 44
Receivables (days) 23 25 25 25 25
Payables (days) 34 44 44 44 44
WCC (days) 38 25 25 25 25

49
A perfect Bet on South Play
Ramco CementsCement | India
Institutional Equity Research
BUY2 Year Target Price: Rs
CMP* (Rs) xxx
Upside/ (Downside) (%) xx
Bloomberg Ticker xxx IN
Market Cap. (Rs bn) xxx
Free Float (%) xxx
Shares O/S (mn) xxx Company Update | 18 Aug 2020
1. Ramco Cements Ltd. (TRCL) enjoys a strong market share in Tamil Nadu (~40%) and Kerala (~20-25%), where realization has mostly been healthier compared to other regions. These two states jointly account for >60% of TRCL’s total sales mostly in trade segment.
2. In order to strengthen its presence in Eastern region and de-risk its geographical concentration, TRCL plans to enhance its presence in Eastern market with new grinding units (GUs). It has already commissioned 1.1mnT GU in Vizag in Mar’20, while 1mnT GU in Odisha is scheduled to be commissioned in Aug’20.
3. We expect TRCL’s net debt to EBITDA to peak at 3.1x in FY21E and then to improve to 1.3x in FY23E. We foresee TRCL to generate Rs17.8bn FCF over next three years
4. Against 51mnT expected cement capacity addition in next three years on pan-India level, Southern region is likely to witness a mere 4.3mnT capacity addition that bodes well for the region.
Impact of COVID-19: Demand momentum was significantly impacted in the Southern markets due to COVID-led disruptions. Despite significant up-tick in monthly volume in May’20 and Jun’20, its current volume still remains lower than pre-COVID level. TRCL reported ~28% drop in sales volume in 1QFY21 and we expect it to report 7% volume drop in FY21E.
Outlook & ValuationTRCL has been demonstrating strong performance despite being in the region that has been witnessing supply glut for several years. Strong free cash flow (FCF) generation led by healthy operating efficiency and decent corporate governance aided the stock to command premium valuation over peers. Trimming our EBITDA estimate by ~4% for FY22E and rolling over our estimate to FY23E, we maintain BUY on TRCL with a 2-Year Target Price of Rs802 (12x of FY23 EBITDA).
Research Analyst
Binod ModiContact: 022 4303 4626/9870009382Email: [email protected]
Research Associate:
Girija Shankar RayEmail : [email protected]
Key Financials (Rs mn) FY19 FY20 FY21E FY22E FY23ESales 50,603 52,854 52,586 60,759 68,263EBITDA 9,505 10,536 12,010 14,123 15,967Net Profit 5,059 6,011 5,413 8,352 10,150EPS (Rs) 21.5 25.5 23.0 35.5 43.1DPS (Rs) 3.0 2.5 2.0 3.0 3.0P/E (x) 31.2 26.3 29.2 18.9 15.6EV/EBITDA (x) 18.2 17.8 16.0 13.1 10.9
RoE (%) 11.9 12.8 10.5 14.4 15.3
Divi. Yield (%) 0.4 0.4 0.3 0.4 0.4
Source: Company, RSec Research
Share price (%) 1 mth 3 mth 12 mth
Absolute performance 4.3% 26.3% -7.0%
Relative to Nifty 0.2% 13.5% -8.1%
Shareholding Pattern (%) Mar'20 June'20
Promoter 42.7 42.7
Public 57.3 57.3
1 Year Stock Price Performance
Note: * CMP as on 17 Aug 2020
Cement | India
Institutional Equity Research
BUY2 Year Target Price: Rs.802
CMP* 670
Upside/Downside (%) 20
Bloomberg Ticker TRCL IN
Market Cap. (Rs bn) 158
Free Float (%) 57
Shares O/S (mn) 236
Key Triggers:Strong market share in Southern states, where realization has mostly been healthier
New capacities in Eastern region to minimize dependence on Southern region
Likely rise in total cement capacity to 18.6mnT (excluding 4.2mnT satellite capacity) by 3QFY22E from 15.5mnT in FY20
Low capacity addition in Southern region along with likely revival in demand scenario
300
400
500
600
700
800
900
Jul-
19
Aug
-19
Sep-
19
Oct
-19
Nov
-19
Dec
-19
Jan-
20
Feb-
20
Mar
-20
Apr
-20
May
-20
Jun-
20
Jul-
20

50
Key Criteria Score Risk Comments
Management Quality 8 Low The management has displayed its excellence several times starting from operation to improving balance sheet
Promoter’s Holding Pledge 9 Low Merely 1.9% promoters holding is pledged
Board of Directors Profile 8 Low A perfect blend of experience, expertise and professionalism with sound track record offers comfort
Industry Growth 8 Low Demand clocked ~7% CAGR over last 15 years; expected to be maintained in coming fiscals
Regulatory Environment / Risk 5 Medium Regulatory risk in terms of hike in duties was quite visible historically
Entry Barriers / Competition 5 Medium Any new player with strong capital base can enter into business and competition has been high in the industry
New Business/Client Potential 8 Low It is expanding its capacity in its existing markets in Eastern and Southern regions
Business Diversification 6 Low Considered to be a regional player due to presence in only Southern and Eastern markets
Market Share Potential 7 Low Excess supply situation in Southern region did not allow the company to set up new capacity for long; however, it has started expanding now
Margin Expansion Potential 7 Low Enjoys sound operational efficiency; presence in rich realisation market continue to aid margin
Earnings Growth (10 Years) 6 Low Earnings clocked 5.5% CAGR over last ten years; expected to clock 17% earnings CAGR over next three years
Balance Sheet Strength 7 Low Low working capital and healthy cash from operation continue to offer support to balance sheet
Debt Profile 7 Low Net Debt to EBITDA ratio peaked out at 2.8x in FY20 due to new expansion
FCF Generation 8 Low It generated FCF of Rs15bn in last ten years; expected to generate Rs18bn FCF in next three years
Dividend Policy 8 Low Average dividend payout ratio stood at strong 13%
Total Score Out of 150 107 Low
Percentage Score 71%
Investment Decision Matrix (IDM)
For < 5 Red High Risk For 5 Blue Medium Risk For > 5 Green Low Risk

51
Exhibit 1: Scenario Analysis
FY20 FY21E FY22E FY23E CAGR (FY20-FY23E)
Base Case
Volume (mnT) 11.2 10.4 12.1 13.5 6.3%
Realisation/tonne (Rs) 4,718 5,057 5,041 5,066 2.4%
Revenue 52,854 52,586 60,759 68,263 8.9%
EBITDA 10,536 12,010 14,123 15,967 14.9%
EBITDA/tonne 940 1,155 1,172 1,185
EBITDA margin (%) 19.9 22.8 23.2 23.4
APAT 6,011 5,413 8,352 10,150 19.1%
Target EV/EBITDA multiple (x) 12.0
Target Price 802
Bull Case
Volume (mnT) 11.2 11.0 13.3 14.8 9.7%
Realisation/tonne (Rs) 4,718 5,053 5,169 5,280 3.8%
Revenue 52,854 55,429 68,546 78,260 14.0%
EBITDA 10,536 12,791 17,658 21,243 26.3%
EBITDA/tonne 940 1,166 1,332 1,433
EBITDA margin (%) 19.9 23.1 25.8 27.1
APAT 6,011 5,998 10,997 14,098 32.9%
Target EV/EBITDA multiple (x) 12.5
Target Price 1,144
Bear Case
Volume (mnT) 11.2 9.8 11.2 12.5 3.7%
Realisation/tonne (Rs) 4,718 4,668 4,690 4,691 -0.2%
Revenue 52,854 45,968 52,439 58,624 3.5%
EBITDA 10,536 8,040 9,935 11,259 2.2%
EBITDA/tonne 940 816 888 901
EBITDA margin (%) 19.9 17.5 18.9 19.2
APAT 6,011 2,443 5,218 6,627 3.3%
Target EV/EBITDA multiple (x) 11.5
Target Price 553
Source: RSec Research
Scenario AnalysisBase Case: In base case scenario, we assume 6.3% volume CAGR in FY20-FY23E with 2.4% growth in realization. Revenue, EBITDA and APAT are expected to clock 9%, 15% and 19% CAGR, respectively over the same period.
Bull Case: In bull case scenario, we assume 9.7% volume CAGR in FY20-FY23E with 3.8% growth in realization. Revenue, EBITDA and APAT are expected to clock 14%, 26% and 33% CAGR, respectively over the same period.
Bear Case: In bear case scenario, we assume 3.7% volume CAGR in FY20-FY23E with 0.2% de-growth in realization. Revenue, EBITDA and APAT are expected to clock 4%, 2% and 3% CAGR, respectively over the same period.

52
I. Strong Hold in Key Southern Markets to Drive RealizationTRCL enjoys a strong market share in Tamil Nadu (~40%) and Kerala (~20-25%), where realization has mostly been healthier compared to other regions. These two states jointly account for >60% of TRCL’s total sales mostly in trade segment. Further, TRCL established a decent presence in Andhra Pradesh, Karnataka and West Bengal. Going forward, new capacities in Eastern region will aid TRCL to get additional volume from other markets to minimize its dependence on Southern region.
II. Focus on Capacity Expansion In order to strengthen its presence in Eastern region and de-risk its geographical concentration, TRCL plans to enhance its presence in Eastern market with new GUs. It has already commissioned 1.1mnT GU in Vizag in Mar’20, while 1mnT GU in Odisha is scheduled to be commissioned in Aug’20. Additionally, 1.5mnT clinker expansion at Jayanthipuram with 27MW Waste Heat Recovery Systems (WHRS) is scheduled to be commissioned in Mar’21. Notably, 2.25mnT clinker and 1mnT cement in Kurnool (Andhra Pradesh) are expected to be commissioned by Mar’21. The proposed plant includes railway siding, 12.15MW WHRS and 18MW thermal power plant. We expect TRCL’s total cement capacity to reach at 18.6mnT (excluding 4.2mnT satellite capacity) by 3QFY22E.
III. Disciplined Balance Sheet Getting Leveraged for Fresh Capacity AdditionTRCL witnessed a sharp reduction in its debt over FY14-FY18 led by strong cash generation and absence of capacity addition. It generated Rs27bn free cash flow (FCF) during FY14-FY18 and reduced net debt to Rs19bn in FY18 from Rs29bn in FY14 and thereby improving net debt to EBITDA from 5.6x to 1x. However, with ongoing capacity expansion programme, we expect TRCL’s net debt to EBITDA to peak at 3.1x in FY21E and then to improve to 1.3x in FY23E. We foresee TRCL to generate Rs17.8bn FCF over next three years.
IV. Minimal Capacity Addition in Southern RegionAgainst 51mnT expected cement capacity addition in next three years on pan-India level, Southern region is likely to witness a mere 4.3mnT capacity addition that bodes well for the region. Minimal capacity addition along with likely revival in demand scenario post current pandemic is likely to aid TRCL to register strong profitable growth, going forward.
Exhibit 2: Change in Estimates
Y/E Mar FY21E FY22E FY23E
(Rsmn) Old Revised % change Old Revised % change Introduction
Volume (mnT) 11.20 10.40 (7.2) 13.50 12.05 (10.7) 13.47
Net Realization (Rs/tonne) 4,631 5,057 9.2 4,728 5,041 6.6 5,066
Sales (Rs mn) 51,654 52,586 1.8 63,893 60,759 (4.9) 68,263
EBIDTA (Rs mn) 9,632 12,010 24.7 13,240 14,123 6.7 15,967
EBIDTA margins (%) 18.6 22.8 20.7 23.2 23.4
EBITDA/tonne (Rs) 864 1,155 33.7 980.0 1,172 19.6 1,185
PAT (Rs mn) 3,584 5,413 51.0 7,944 8,352 5.1
PAT margins (%) 6.9 10.3 12.4 13.7
Source: RSec Research
Exhibit 3: Cost per tonne Analysis and Assumptions (Rs)
Rs/tonne FY17 FY18 FY19 FY20 FY21E FY22E FY23E
Raw Materials 766 774 762 780 843 834 846
Employees 333 326 296 329 364 343 344
Power & Fuel 619 783 951 938 901 919 919
Freight 884 997 1,068 1,016 1,036 1,046 1,057
Other Exps. 699 671 619 715 758 727 715
Realisation 4,636 4,775 4,509 4,718 5,057 5,041 5,066
Source: RSec Research
Investment RationaleOur investment thesis is based on the following premises:I. Strong Hold in Key Southern Markets to Drive RealizationII. Focus on Capacity ExpansionIII. Disciplined Balance Sheet Getting Leveraged for Fresh Capacity AdditionIV. Minimal Capacity Addition in Southern Region

53
Exhibit 4: EBITDA & Target Price Exhibit 5: EV/EBITDA 1yr Fwd
Source: RSec Research Source: RSec Research
Exhibit 6: Price Sensitivity at Standalone EBITDA (Rs bn) Growth (%) Fwd EV/EBITDA (x) 10 11 12 13 14FY17 (-3) 11.9 4.9 16.2 452 502 553 629 654
FY18 (-2) 11.0 -8.0 17.6 424 471 518 588 611
FY19 (-1) 10.4 -5.7 18.7 375 419 463 529 551
FY20 (Base year) 11.4 9.7 17.0 358 406 454 527 551
FY21E (year 1) 12.9 13.6 15.0 405 460 514 597 624
FY22E (Year 2) 15.2 17.9 12.7 532 596 661 758 790
FY23E (Year 3) 17.2 12.8 11.3 657 730 802 912 948
Source: RSec Research
Key Risks f Further slowdown in demand scenario.
f A steep contraction in prices.
f A sharp increase in input and fuel cost.
-
100
200
300
400
500
600
700
800
900
1,000
Mar
-13
Jul-1
3
Nov
-13
Mar
-14
Jul-1
4
Nov
-14
Mar
-15
Jul-1
5
Nov
-15
Mar
-16
Jul-1
6
Nov
-16
Mar
-17
Jul-1
7
Nov
-17
Mar
-18
Jul-1
8
Nov
-18
Mar
-19
Jul-1
9
Nov
-19
Mar
-20
Jul-2
0
13x14x15x16x17x
553 518463 454
514
661
802
11.911 10.4
11.412.9
15.2
17.2
0
2
4
6
8
10
12
14
16
18
20
0
100
200
300
400
500
600
700
800
900
FY17 (-3) FY18 (-2) FY19 (-1) FY20 (Base year)
FY21E (year 1)
FY22E (Year 2)
FY23E (Year 3)
Target Price (Rs) EBITDA (Rs bn)

54
Exhibit 8: Revenue Trend Exhibit 9: EBITDA Trend
Source: Company, RSec Research Source: Company, RSec Research
Exhibit 10: PAT Trend Exhibit 11: ROCE vs. RoE
Source: Company, RSec Research Source: Company, RSec Research
Exhibit 7: Volume(mt)
Source: Industry, RSec Research
Outlook & Valuations
TRCL has been demonstrating strong performance despite being in the region that has been witnessing supply glut for several years. Strong free cash flow (FCF) generation led by healthy operating efficiency and decent corporate governance aided the stock to command premium valuation over peers. Trimming our EBITDA estimate by ~4% for FY22E and rolling over our estimate to FY23E, we maintain BUY on TRCL with a 2-Year Target Price of Rs802 (12x of FY23 EBITDA).
7.9 7.2
8.3 9.3
11.1 11.2 10.4
12.0
13.5
-
2.0
4.0
6.0
8.0
10.0
12.0
14.0
16.0
FY15 FY16 FY17 FY18 FY19 FY20 FY21E FY22E FY23E
Volume(mt)
35.9 35.9 38.6 43.2
50.6 52.9 52.6
60.8
68.3
-
10.0
20.0
30.0
40.0
50.0
60.0
70.0
80.0
FY15 FY16 FY17 FY18 FY19 FY20 FY21E FY22E FY23E
Revenue (Rs bn)
6.6
10.5 11.0 10.1 9.5
10.5 12.0
14.1
16.0
-
2.0
4.0
6.0
8.0
10.0
12.0
14.0
16.0
18.0
FY15 FY16 FY17 FY18 FY19 FY20 FY21E FY22E FY23E
EBITDA (Rs bn)
2.4
5.6 6.5
5.6 5.1
6.0 5.4
8.4
10.2
-
2.0
4.0
6.0
8.0
10.0
12.0
FY15 FY16 FY17 FY18 FY19 FY20 FY21E FY22E FY23E
PAT (Rs bn)
7.9
12.5
18.2
16.4
13.6 12.2 11.2
14.8 16.6
9.5
19.5 19.0
14.3
11.9 12.8 10.5
14.4 15.3
-
5.0
10.0
15.0
20.0
25.0
FY15 FY16 FY17 FY18 FY19 FY20 FY21E FY22E FY23E
RoCE (%) RoE (%)
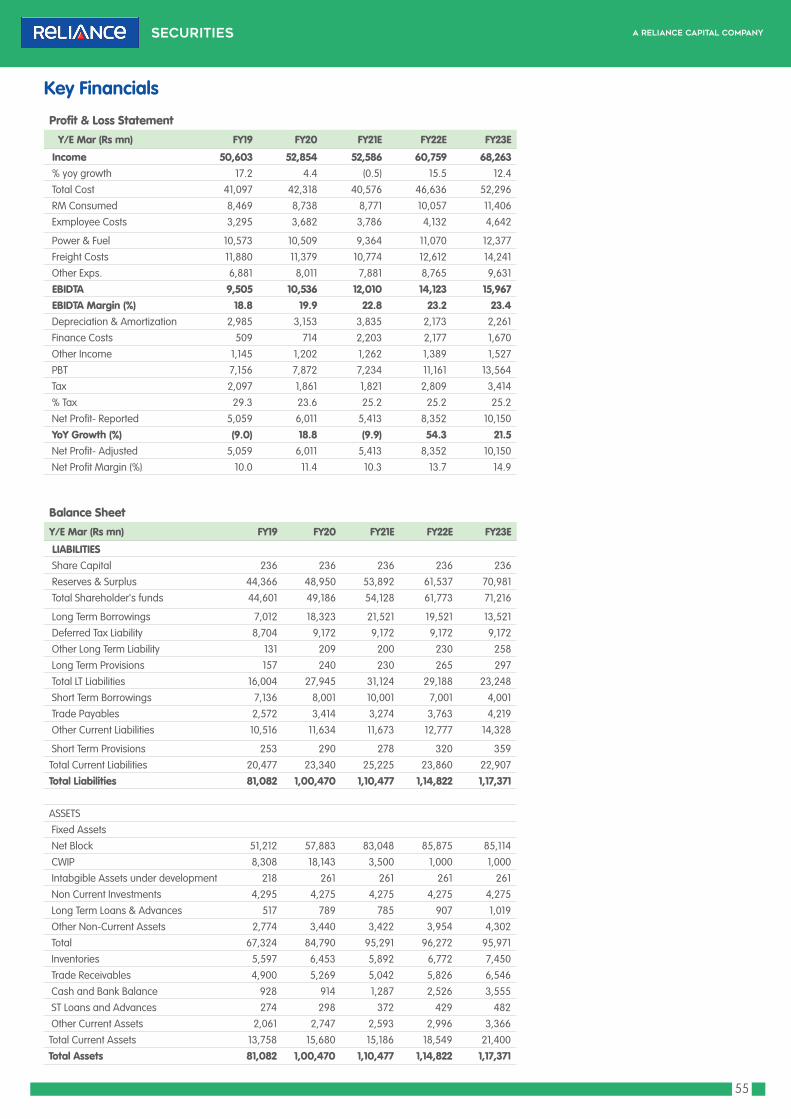
55
Profit & Loss Statement Y/E Mar (Rs mn) FY19 FY20 FY21E FY22E FY23E
Income 50,603 52,854 52,586 60,759 68,263 % yoy growth 17.2 4.4 (0.5) 15.5 12.4
Total Cost 41,097 42,318 40,576 46,636 52,296
RM Consumed 8,469 8,738 8,771 10,057 11,406
Exmployee Costs 3,295 3,682 3,786 4,132 4,642
Power & Fuel 10,573 10,509 9,364 11,070 12,377
Freight Costs 11,880 11,379 10,774 12,612 14,241
Other Exps. 6,881 8,011 7,881 8,765 9,631
EBIDTA 9,505 10,536 12,010 14,123 15,967 EBIDTA Margin (%) 18.8 19.9 22.8 23.2 23.4 Depreciation & Amortization 2,985 3,153 3,835 2,173 2,261
Finance Costs 509 714 2,203 2,177 1,670
Other Income 1,145 1,202 1,262 1,389 1,527
PBT 7,156 7,872 7,234 11,161 13,564
Tax 2,097 1,861 1,821 2,809 3,414
% Tax 29.3 23.6 25.2 25.2 25.2
Net Profit- Reported 5,059 6,011 5,413 8,352 10,150
YoY Growth (%) (9.0) 18.8 (9.9) 54.3 21.5 Net Profit- Adjusted 5,059 6,011 5,413 8,352 10,150
Net Profit Margin (%) 10.0 11.4 10.3 13.7 14.9
Balance SheetY/E Mar (Rs mn) FY19 FY20 FY21E FY22E FY23E
LIABILITIES Share Capital 236 236 236 236 236
Reserves & Surplus 44,366 48,950 53,892 61,537 70,981
Total Shareholder's funds 44,601 49,186 54,128 61,773 71,216
Long Term Borrowings 7,012 18,323 21,521 19,521 13,521
Deferred Tax Liability 8,704 9,172 9,172 9,172 9,172
Other Long Term Liability 131 209 200 230 258
Long Term Provisions 157 240 230 265 297
Total LT Liabilities 16,004 27,945 31,124 29,188 23,248
Short Term Borrowings 7,136 8,001 10,001 7,001 4,001
Trade Payables 2,572 3,414 3,274 3,763 4,219
Other Current Liabilities 10,516 11,634 11,673 12,777 14,328
Short Term Provisions 253 290 278 320 359
Total Current Liabilities 20,477 23,340 25,225 23,860 22,907
Total Liabilities 81,082 1,00,470 1,10,477 1,14,822 1,17,371
ASSETS
Fixed Assets
Net Block 51,212 57,883 83,048 85,875 85,114
CWIP 8,308 18,143 3,500 1,000 1,000
Intabgible Assets under development 218 261 261 261 261
Non Current Investments 4,295 4,275 4,275 4,275 4,275
Long Term Loans & Advances 517 789 785 907 1,019
Other Non-Current Assets 2,774 3,440 3,422 3,954 4,302
Total 67,324 84,790 95,291 96,272 95,971
Inventories 5,597 6,453 5,892 6,772 7,450
Trade Receivables 4,900 5,269 5,042 5,826 6,546
Cash and Bank Balance 928 914 1,287 2,526 3,555
ST Loans and Advances 274 298 372 429 482
Other Current Assets 2,061 2,747 2,593 2,996 3,366
Total Current Assets 13,758 15,680 15,186 18,549 21,400
Total Assets 81,082 1,00,470 1,10,477 1,14,822 1,17,371
Key Financials

56
Cash Flow StatementY/E Mar (Rs mn) FY19 FY20 FY21E FY22E FY23E
PBT 7,156 7,872 7,234 11,161 13,564
(Profit)/Loss on sale of assets (15) (2) - - -
Depreciation 2,985 3,153 3,835 2,173 2,261
Interest and dividend received (112) (155) - - -
Rent Receipt (89) - - - -
Interest Paid 509 714 2,203 2,177 1,670
Others (16) 116 - - -
Operating profit before WC changes 10,418 11,697 13,272 15,512 17,495
Trade and Othe receivables (1,104) (1,103) 327 (1,899) (1,602)
Inventories 3 (856) 561 (880) (679)
Trade Payables 172 (962) 284 2,199 2,106
Cash generated from operations 9,489 8,776 14,444 14,932 17,320
Direct Taxes Paid (1,584) (1,376) (1,821) (2,809) (3,414)
Net Cash from Operating activities 7,904 7,400 12,623 12,123 13,906Purchase of Fixed Assets (12,063) (19,199) (14,357) (2,500) (1,500)
Sale fo Fixed Assets 45 6 - - -
Interest and dividend received 75 152 - - -
Purchase of investments (162) (150) - - -
Rent receipts from investment property 89 104 - - -
Others 108 (237) - - -
Net cash in Investing activities (11,909) (19,325) (14,357) (2,500) (1,500)Borrowings (net) 7,755 14,271 4,780 (5,500) (9,000)
Payment of dividend and tax threron (853) (1,564) (471) (707) (707)
Interest paid (476) (580) (2,203) (2,177) (1,670)
Net cash from financing activities 6,426 12,127 2,106 (8,384) (11,377)Net Inc/(Dec) in cash & cash equivalent 2,422 202 372 1,239 1,029
Key RatiosY/E Mar (Rs mn) FY19 FY20 FY21E FY22E FY23E
P/E 31.2 26.3 29.2 18.9 15.6
P/CEPS 19.6 17.2 17.1 15.0 12.7
P/BV 3.5 3.2 2.9 2.6 2.2
EV/EBIDTA 18.2 17.8 16.0 13.1 10.9
EV/Sales 3.4 3.5 3.6 3.0 2.6
EV/tonne (USD) 138 127 117 108 102
Dividend Payout (%) 14.0 9.8 8.7 8.5 7.0
Dividend Yield (%) 0.4 0.4 0.3 0.4 0.4
Adj. OCF Yield 4.7 4.3 6.6 6.3 7.8
Per Share Data (Rs) 4.0 3.6 5.6 6.9 EPS (Basic) 21.5 25.5 23.0 35.5 43.1
EPS (Diluted) 21.5 25.5 23.0 35.5 43.1
CEPS 34.1 38.9 39.3 44.7 52.7
DPS 3.0 2.5 2.0 3.0 3.0
Book Value 189 209 230 262 302
EBIDTA/tone (Cement) 855 940 1,155 1,172 1,185
Returns (%) RoCE 13.6 12.2 11.2 14.8 16.6
RoE 11.9 12.8 10.5 14.4 15.3
Turnover ratios (x) Asset Turnover (Gross block) 0.6 0.6 0.4 0.5 0.5
Inventory (days) 50 56 53 53 52
Receivables (days) 35 36 35 35 35
Payables (days) 23 29 29 29 29
WCC (days) 62 63 59 59 58

57
Higher Debt sans New Capacity Addition
India CementsCement | India
Institutional Equity Research
2 Year Target Price: Rs
Company Update | 18 Aug 2020
1. India Cements Ltd. (ICEM) has not set up any capacity since FY10, as continued supply glut in the Southern region did not encourage the company to enhance its capacity, which led to continued to fall in market share.
2. While ICEM did not add any capacity for last one decade, it has not been able to bring down its debt level either. On the contrary, its net debt position has consistently increased over the years and peaked to Rs36bn in FY20 from Rs21bn in FY10.
3. On accumulated basis, it generated interest-adjusted free cash flow (FCF) to the tune of negative Rs1.9bn over FY10-FY20 despite accumulated FCF of Rs34.5bn.
4. Unlike its peers, ICEM’s cost of production has been on higher side due to vintage plants, which consume higher power and fuel with low efficiency. We note its cost of production has consistently been in the excess of Rs4,000/tonne over the years.
5. Inability to improve its balance sheet due to consistent increase in working capital requirement will lead to further delay in capacity expansion.
Impact of COVID-19: ICEM’s sales volume fell by 53% YoY in 1QFY21 due to COVID-led disruptions. However, the company stated that the demand momentum is now looking up from Jun’20 onwards. Its fixed cost and freight cost reduced significantly during the quarter. A sharp slowdown in government projects along with labour issues impacted sales volume in 1QFY21. The company significantly reduced the number of contract labourers as well as the number of godowns/Carrying & Forwarding agents during the quarter.
Outlook & ValuationInability to improve its balance sheet due to consistent increase in working capital requirement will lead to further delay in capacity expansion. We continue to believe that strong cash generation and debt reduction will be the key catalysts for the stock until which, the stock might
not get re-rated. Keeping EBITDA estimate broadly unchanged for FY22E and rolling over our estimates to FY23E, we maintain SELL on ICEM with a revised 2-Year Target Price of Rs81 (6.5x of FY23 EBITDA).
Research Analyst
Binod ModiContact: 022 4303 4626/9870009382Email: [email protected]
Research Associate:
Girija Shankar RayEmail : [email protected]
Key Financials (Rs mn) FY19 FY20 FY21E FY22E FY23ESales 56,280 50,575 43,918 48,465 53,578EBITDA 6,379 5,852 6,475 6,884 7,880APAT 694 312 546 1,019 2,608EPS (Rs) 2.2 1.0 1.8 3.3 8.4DPS (Rs) 1.1 0.8 1.0 1.0 1.0P/E (x) 51.3 114.2 65.2 35.0 13.7P/B (x) 0.7 0.7 0.7 0.6 0.6
EV/EBITDA (x) 10.9 12.3 10.5 9.4 7.8
RoE (%) 1.3 0.6 1.0 1.9 4.6Divi. Yield (%) 0.9 0.7 0.9 0.9 0.9
Share price (%) 1 mth 3 mth 12 mth
Absolute performance -1.9% -3.1% 45.8%
Relative to Nifty -6.0% -15.9% 44.7%
Shareholding Pattern (%) Mar'20 June'20
Promoter 28.3 28.3
Public 71.7 71.7
1 Year Stock Price Performance
Note: * CMP as on 17 Aug 2020
Cement | India
Institutional Equity Research
2 Year Target Price: Rs.81
CMP* 115
Upside/Downside (%) -30
Bloomberg Ticker ICEM IN
Market Cap. (Rs bn) 36
Free Float (%) 72
Shares O/S (mn) 310
Key Setbacks:Erosion in market share owing to no capacity addition since FY10
Constant rise in net debt over the years, which peaked to Rs36bn in FY20
Higher cost of production due to vintage plants, which consume higher power/fuel with low efficiency
Change in sales practice may impact volume growth adversely
SELL
-
20
40
60
80
100
120
140
160
Jul-
19
Aug
-19
Sep-
19
Oct
-19
Nov
-19
Dec
-19
Jan-
20
Feb-
20
Mar
-20
Apr
-20
May
-20
Jun-
20
Jul-
20

58
Key Criteria Score Risk Comments
Management Quality 5 Medium The management could not be able to ramp-up operational efficiency and performance
Promoter’s Holding Pledge 5 Medium Around 27% promoters holding is pledged mainly to meet working capital requirements
Board of Directors Profile 6 Low Board of Directors consists of sixteen members including nine independent and non-executive directors
Industry Growth 8 Low Demand clocked ~7% demand CAGR over last 15 years; expected to be maintained in coming fiscals
Regulatory Environment / Risk 5 Medium Regulatory risk in terms of hike in duties was quite visible historically
Entry Barriers / Competition 5 Medium Any new player with strong capital base can enter into business and competition has been high in the industry
New Business/Client Potential 4 High Absence of new capacity over the years hurt company’s ability to get incremental sales volume
Business Diversification 4 High It is mainly concentrated in Southern and Northern markets
Market Share Potential 4 High Highly leveraged balance sheet with no capacity addition in the pipeline; tough to get additional market share
Margin Expansion Potential 5 Medium Given vintage plants, margin expansion is mainly dependent on realisation increase and decline in input prices
Earnings Growth (10 Years) 3 High Earnings clocked negative CAGR of 22% over last ten years
Balance Sheet Strength 4 High Low profitability and relatively higher working capital; higher non-trade sales continue to weaken balance sheet
Debt Profile 3 High Net Debt to EBITDA ratio stood at 6.2x and net Debt to Equity ratio stood at 0.7x in FY20
FCF Generation 6 Low It generated FCF of Rs35bn in last ten years and is expected to generate Rs20bn FCF in next three years
Dividend Policy 7 Low Average dividend payout ratio stood at strong 25%
Total Score Out of 150 74 High
Percentage Score 49%
Investment Decision Matrix (IDM)
For < 5 Red High Risk For 5 Blue Medium Risk For > 5 Green Low Risk

59
Exhibit 1: Scenario Analysis
FY20 FY21E FY22E FY23E CAGR (FY20-FY23E)
Base Case
Volume (mnT) 11.0 9.0 10.0 11.0 -0.2%
Realisation/tonne (Rs) 4,461 4,822 4,807 4,831 2.7%
Revenue 50,575 43,918 48,465 53,578 1.9%
EBITDA 5,852 6,475 6,884 7,880 10.4%
EBITDA/tonne 531 723 691 719
EBITDA margin (%) 11.6 14.7 14.2 14.7
APAT 312 546 1,019 2,608 102.9%
Target EV/EBITDA multiple (x) 6.5
Target Price 81
Bull Case
Volume (mnT) 11.0 9.4 10.7 12.0 2.8%
Realisation/tonne (Rs) 4,461 4,997 5,205 5,309 6.0%
Revenue 50,575 47,478 56,275 64,268 8.3%
EBITDA 5,852 8,468 11,704 14,423 35.1%
EBITDA/tonne 531 905 1,093 1,203
EBITDA margin (%) 11.6 17.8 20.8 22.4
APAT 312 2,037 4,627 7,505 188.6%
Target EV/EBITDA multiple (x) 7.0
Target Price 233
Bear Case
Volume (mnT) 11.0 8.6 9.4 10.2 -2.5%
Realisation/tonne (Rs) 4,461 4,783 4,669 4,669 1.5%
Revenue 50,575 41,660 44,670 48,258 -1.6%
EBITDA 5,852 5,706 5,090 5,482 -2.2%
EBITDA/tonne 531 667 539 537
EBITDA margin (%) 11.6 13.7 11.4 11.4
APAT 312 (29) (323) 814 37.7%
Target EV/EBITDA multiple (x) 6.0
Target Price 40
Source: RSec Research
Scenario AnalysisBase Case: In base case scenario, we assume a negative volume CAGR of 0.2% in FY20-FY23E with 2.7% growth in realization. Revenue, EBITDA and APAT expected to clock 2%, 10% and 103%, CAGR respectively over the same period.
Bull Case: In bull case scenario, we assume 3% volume CAGR in FY20-FY23E with 6% growth in realization. Revenue, EBITDA and APAT are expected to clock 8%, 35% and 188% CAGR, respectively over the same period.
Bear Case: In bear case scenario, we assume a negative volume CAGR of 2.5% in FY20-FY23E with 1.5% growth in realization. Revenue, EBITDA and APAT are expected to clock -1.6%, -2% and 38% CAGR, respectively over the same period.

60
I. No Capacity Addition on the AnvilICEM has not set up any capacity since FY10, as continued supply glut in the Southern region did not encourage the company to bring new capacity. However, ICEM had entered into a share purchase agreement (SPA) with Madhya Pradesh-based Springway Mining in 2018 to acquire entire stake for Rs1.8bn to set up an integrated cement plant in the state. However, the capacity expansion programme is yet to begin on the ground due to various reasons.
II. High Debt to Weigh on ProfitabilityWhile ICEM did not add any capacity for last one decade, it has not been able to bring down its debt level either. On the contrary, its net debt position has consistently increased over the years and peaked to Rs36bn in FY20 from Rs21bn in FY10. On accumulated basis, it generated interest-adjusted FCF to the tune of negative Rs1.9bn over FY10-FY20 despite accumulated FCF of Rs34.5bn. It shows that ICEM’s inability of repay debt over the years. Going forward, even we expect its debt level to come down to Rs28bn, this is not sufficient for the stock to get re-rated.
III. Higher Cost of ProductionUnlike its peers, ICEM’s cost of production has been on higher side due to vintage plants, which relatively consume higher power and fuel with low efficiencies. We note its cost of production has consistently been in the excess of Rs4,000/tonne over the years. This aggravates the company’s concern in a scenario of higher debt and additional required expenditures for up-gradation of kilns and machineries. While lower fuel prices at current scenario may offer some cushion to the company, a reversal in the fuel prices may hurt its profitability more than its peers.
IV. Volume Loss Risk on Scrapping Discount PolicyIn recent conference call, the management cited that the company has scrapped discount policies for the dealers. Hence, any dealer selling cement below invoice price will not be compensated hereon. We believe it may result in volume loss for the company, even though its realization will improve.
Exhibit 3: Cost per tonne Analysis and Assumptions (Rs)
Rs/tonne FY17 FY18 FY19 FY20 FY21E FY22E FY23E
Raw Materials 962 984 930 924 977 963 967
Employees 326 344 282 317 383 361 345
Power & Fuel 960 1,106 1,319 1,229 1,193 1,216 1,229
Freight 1,419 1,416 1,354 1,415 1,444 1,448 1,454
Other Exps. 154 152 126 172 185 183 173
Realisation 4,601 4,504 4,376 4,461 4,822 4,807 4,831
Source: RSec Research
Rationale for SELL RecommendationOur SELL recommendation is based on the following premises:I. No Capacity Addition on the AnvilII. High Debt to Weigh on ProfitabilityIII. Higher Cost of ProductionIV. Volume Loss Risk on Scrapping Discount Policy
Exhibit 2: Change in Estimates
Y/E Mar FY21E FY22E FY23E
(Rsmn) Old Revised % change Old Revised % change Introduction
Volume (mnT) 10.00 8.96 (10.4) 11.60 9.97 (14.1) 10.96
Realization (Rs/tonne) 4,712 4,822 2.3 4,780 4,807 0.6 4,831
Sales (Rs mn) 48,050 43,918 (8.6) 55,987 48,465 (13.4) 53,578
EBIDTA (Rs mn) 5,995 6,475 8.0 7,288 6,884 (5.5) 7,880
EBIDTA margins (%) 12.5 14.7 13.0 14.2 14.7
EBITDA/tonne (Rs) 598 723 20.9 628 691 10.0 719
PAT (Rs mn) 475 546 15.0 1,625 1,019 (37.3) 2,608
Source: RSec Research

61
Exhibit 6: Price Sensitivity EBITDA (Rs bn) Growth (%) Fwd EV/EBITDA (x) 5.5 6 6.5 7 8FY17 (-3) 8.6 8.4 59 73 87 100 128
FY18 (-2) 6.9 -19.5 10.4 22 34 45 56 78
FY19 (-1) 6.4 -7.9 11.3 5 15 25 36 56
FY20 (Base year) 5.9 -8.3 12.3 -13 -3 6 16 35
FY21E (year 1) 6.5 10.6 11.1 11 21 32 42 63
FY22E (Year 2) 6.9 6.3 10.5 28 39 50 61 84
FY23E (Year 3) 7.9 14.5 9.1 56 69 81 94 119
Source: RSec Research
Key Risks f Sharp increase in average realization.
f Meaningful contraction in fuel and input cost.
f Higher-than-expected recovery in demand scenario.
87
45
25
6
32
50
81
8.6
6.96.4
5.96.5
6.9
7.9
0.0
2.0
4.0
6.0
8.0
10.0
-
20
40
60
80
100
FY17 (-3) FY18 (-2) FY19 (-1) FY20 (Base year)
FY21E (year 1)
FY22E (Year 2)
FY23E (Year 3)
Target Price (Rs) EBITDA (Rs bn)
Exhibit 4: EBITDA & Target Price Exhibit 5: EV/EBITDA 1yr Fwd
Source: RSec Research Source: RSec Research
-
50
100
150
200
250
300
Mar
-13
Jul-1
3
Nov
-13
Mar
-14
Jul-1
4
Nov
-14
Mar
-15
Jul-1
5
Nov
-15
Mar
-16
Jul-1
6
Nov
-16
Mar
-17
Jul-1
7
Nov
-17
Mar
-18
Jul-1
8
Nov
-18
Mar
-19
Jul-1
9
Nov
-19
Mar
-20
Jul-2
0
8x
9x10x11x
12x

62
Exhibit 8: Revenue Trend Exhibit 9: EBITDA Trend
Source: Company, RSec Research Source: Company, RSec Research
Exhibit 10: PAT Trend Exhibit 11: ROCE vs. RoE
Source: Company, RSec Research Source: Company, RSec Research
Exhibit 7: Volume(mt)
Source: Industry, RSec Research
Outlook & Valuations
Inability to improve its balance sheet due to consistent increase in working capital requirement will lead to further delay in capacity expansion. We continue to believe that strong cash generation and debt reduction will be the key catalysts for the stock until which, the stock might
not get re-rated. Keeping EBITDA estimate broadly unchanged for FY22E and rolling over our estimates to FY23E, we maintain SELL on ICEM with a revised 2-Year Target Price of Rs81 (6.5x of FY23 EBITDA).
8.6 8.4
10.8 11.1
12.5
11.0
9.0
10.0
11.0
-
2.0
4.0
6.0
8.0
10.0
12.0
14.0
FY15 FY16 FY17 FY18 FY19 FY20 FY21E FY22E FY23E
Volume(mnT)
44.2 42.3
50.8 51.8 56.3
50.6
43.9 48.5
53.6
-
10.0
20.0
30.0
40.0
50.0
60.0
FY15 FY16 FY17 FY18 FY19 FY20 FY21E FY22E FY23E
Revenue (Rs bn)
6.8
7.8 8.6
6.9 6.4
5.9 6.5
6.9
7.9
-
1.0
2.0
3.0
4.0
5.0
6.0
7.0
8.0
9.0
10.0
FY15 FY16 FY17 FY18 FY19 FY20 FY21E FY22E FY23E
EBITDA (Rs bn)
0.3
1.3
1.7
1.0
0.7
0.3 0.5
1.0
2.6
-
0.5
1.0
1.5
2.0
2.5
3.0
FY15 FY16 FY17 FY18 FY19 FY20 FY21E FY22E FY23E
PAT (Rs bn)
6.3
7.2 7.0
5.1 4.5
2.8
4.3 4.8
5.9
0.8
3.1 3.4
2.0 1.3
0.6 1.0
1.9
4.6
0
1
2
3
4
5
6
7
8
FY15 FY16 FY17 FY18 FY19 FY20 FY21E FY22E FY23E
RoCE (%) RoE (%)

63
Profit & Loss Statement Y/E Mar (Rs mn) FY19 FY20 FY21E FY22E FY23E
Net sales 56,280 50,575 43,918 48,465 53,578 % yoy growth 8.7 (10.1) (13.2) 10.4 10.5
Total Cost 49,901 44,723 37,443 41,582 45,698
Ram Material Expenditures 11,572 10,187 8,746 9,602 10,608
Employee Costs 3,505 3,499 3,429 3,600 3,780
Power and Fuel 16,410 13,551 10,679 12,125 13,470
Freight and Forewarding 16,842 15,592 12,932 14,434 15,938
Other Expenditures 1,572 1,895 1,656 1,820 1,902
EBITDA 6,379 5,852 6,475 6,884 7,880 EBITDA Margin (%) 11.3 11.6 14.7 14.2 14.7 Depreciation 2,513 2,469 2,547 2,570 2,582
Interest 3,242 3,345 3,420 3,195 2,080
Other Income 310 277 222 244 269
Exceptional Items - 1,000 - - -
PBT 934 (684) 730 1,362 3,486 Tax 240 (329) 184 343 877
Effective tax rate (%) 25.7 48.1 25.2 25.2 25.2
Net Profit 694 (355) 546 1,019 2,608 YoY Growth (%) (31.0) (151.1) (253.8) 86.6 155.9
APAT 694 312 546 1,019 2,608 PAT % 1.2 0.6 1.2 2.1 4.9
Balance SheetY/E Mar (Rs mn) FY19 FY20 FY21E FY22E FY23E
Share Capital 3,099 3,099 3,099 3,099 3,099
Reserves & Surplus 49,298 51,050 51,287 51,996 54,294
Total Shareholder's funds 52,397 54,149 54,386 55,095 57,393
Secured Loans 29,837 36,170 33,170 31,170 28,170
Unsecured Loans 3,838 - - - -
Total Debt 33,675 36,170 33,170 31,170 28,170
Deffered Tax liability 6,308 5,910 5,910 5,910 5,910
Other NC Liabilities 1,694 2,336 1,955 2,172 2,387
TOTAL LIABILITIES 94,074 98,565 95,421 94,347 93,860
APPLICATION OF FUNDS
Net Block 67,130 68,258 66,411 64,591 62,809
CWIP 1,770 1,958 1,958 1,958 1,958
Investments 6,946 7,369 7,369 7,369 7,369
Other NC Assets 13,984 15,185 13,186 13,278 14,679
Inventories 8,232 8,263 7,175 7,918 8,753
Real-estate - - - - -
Sundry Debtors 7,290 7,163 6,016 6,373 6,606
Cash & Bank 67 66 890 1,987 2,121
Loans & Advances 5,630 6,262 5,776 5,710 5,872
Current Liablities & Prov. 16,976 15,958 13,361 14,837 16,306
Net Current Assets 4,243 5,795 6,496 7,150 7,045
Total Assets 94,074 98,565 95,421 94,347 93,860

64
Cash Flow StatementY/E Mar (Rs mn) FY19 FY20 FY21E FY22E FY23E
PBT before Extraordinary Items 934 316 730 1,362 3,486
Depreciation 2,513 2,469 2,547 2,570 2,582
Interest Exp. 3,157 3,138 3,420 3,195 2,080
Others (202) (168) - - -
Operation Profit before WC changes 6,402 5,754 6,697 7,128 8,148
Trade and Other Receivables (2,812) (31) 3,631 (383) (1,795)
Inventories (1,510) (578) 1,088 (743) (835)
Trade Payables 1,253 (661) (2,978) 1,693 1,684
Cash generated from Operation 3,333 4,485 8,438 7,695 7,202
Direct Taxes (88) (312) (184) (343) (877)
Net cash from Operating Activities 3,245 4,173 8,254 7,352 6,325
Purchase of Fixed Assets (1,784) (1,401) (700) (750) (800)
Others (620) (2,002) - - -
Net cash from Investing activities (2,404) (3,403) (700) (750) (800)
Proceed from issue of Share Capital 17 - - - -
Proceed from Long Term Borrowings 5,424 5,718 (3,000) (2,000) (3,000)
Int paid/dividend paid (net of remission) (3,471) (3,300) (3,730) (3,505) (2,390)
Others (2,746) (3,155) - - -
Net Cash from financing activities (776) (738) (6,730) (5,505) (5,390)
Inc / (Dec) in cash and cash equivalent 65 33 824 1,097 134
Key RatiosY/E Mar (Rs mn) FY19 FY20 FY21E FY22E FY23E
P/E 51.3 114.2 65.2 35.0 13.7
P/CEPS 11.1 12.8 11.5 9.9 6.9
P/BV 0.7 0.7 0.7 0.6 0.6
EV/EBIDTA 10.9 12.3 10.5 9.4 7.8
EV/Sales 1.2 1.4 1.5 1.3 1.2
EV/tonne (USD) 59 62 58 56 53
Dividend Payout (%) 48.2 (70.7) 56.7 30.4 11.9
Dividend Yield (%) 0.9 0.7 0.9 0.9 0.9
OCF Yeild (%) 9.1 11.7 23.2 20.6 17.7
Per Share Data (Rs) EPS (Basic) 2.2 1.0 1.8 3.3 8.4
EPS (Diluted) 2.2 1.0 1.8 3.3 8.4
CEPS 10.3 9.0 10.0 11.6 16.7
DPS 1.1 0.8 1.0 1.0 1.0
Book Value 169 175 175 178 185
EBIDTA/tone 513 531 723 691 719
Returns (%) RoCE 4.5 2.8 4.3 4.8 5.9
RoE 1.3 0.6 1.0 1.9 4.6
Turnover ratios (x) Asset Turnover (Gross block) 0.7 0.6 0.5 0.6 0.6
Inventory (days) 53 60 60 60 60
Receivables (days) 47 52 50 48 45
Payables (days) 34 34 34 34 34
WCC (days) 67 78 76 74 71

65
Continues to be the Best Pick in Mid-cap Space
JK CementCement | India
Institutional Equity Research
BUY2 Year Target Price: Rs
CMP* (Rs) xxx
Upside/ (Downside) (%) xx
Bloomberg Ticker xxx IN
Market Cap. (Rs bn) xxx
Free Float (%) xxx
Shares O/S (mn) xxx Company Update | 18 Aug 2020
1. J.K. Cement (JKCE) has been able to add capacity consistently given its abundant resources. Over the last five years, JKCE has expanded its grey cement capacity by ~50% to 14mnT, which aided it to clock >6% CAGR in volume over FY15-FY20.
2. JKCE had undertaken a number of measures in last two years to improve its grey cement operating performance, which have already started paying off. Resultantly, its grey cement EBITDA/tonne improved from Rs439 in FY19 to Rs861 in FY20. JKCE expects ~Rs80-100/tonne opex savings in FY22E led by improvement in efficiency owing to new clinker unit (2.6mnT) at Mangrol and savings on raw material logistics cost front.
3. We expect its grey cement’s unitary EBITDA to improve further to Rs900 and Rs986 in FY22E and FY23E, respectively.
4. JKCE has already acquired 425 acres of land out of targeted 500 acres in Panna for Rs900mn. It expects to acquire remaining land in FY21 for another Rs500-700mn. With current resources, JKCE can essentially set up 3.5mnT integrated cement unit.
Impact of COVID-19: JKCE’s volume was impacted meaningfully in 4QFY20 due to COVID-19 pandemic, as some of its plants were under containment zones, which could not start immediately after ease in lockdown restrictions. Despite improvement in demand momentum in May’20 and June’20, the management is uncertain about sustainability of demand in near-to-medium term. JKCE has already taken various measures to mitigate its fixed cost elements and expects to reduce fixed cost by ~Rs50-60mn/month. JKCE is estimated to report ~23% volume decline in 1QFY21.
Outlook & ValuationStrong back-up of value-added products, which ensures healthy and consistent cash flow, offers an edge to JKCE over its peers. Further, recent capacity expansion, operating synergies and steady pricing trend in its key markets are likely to aid its profitability in ensuing quarters. We continue to see JKCE as the best play in mid-cap cement space. Keeping EBITDA estimate for FY22E broadly unchanged and rolling over estimates to FY23E, we maintain BUY on JKCE with a revised 2-Year SOTP Target Price of Rs.1,711 (8.5x of FY23E EBITDA).
Research Analyst
Binod ModiContact: 022 4303 4626/9870009382Email: [email protected]
Research Associate:
Girija Shankar RayEmail : [email protected]
Key Financials (Rs mn) FY19 FY20 FY21E FY22E FY23ESales 49,192 54,040 51,483 61,589 67,629EBITDA 7,480 11,217 10,305 12,851 14,749PAT 3,249 4,004 4,672 6,498 8,109EPS (Rs) 42.0 51.8 60.5 84.1 104.9DPS (Rs) 9.0 7.5 10.0 10.0 10.0P/E (x) 35.7 28.9 24.8 17.8 14.3P/B (x) 4.0 3.7 3.3 2.8 2.4
EV/EBITDA (x) 17.5 12.1 13.0 10.0 8.1
RoE (%) 12.9 13.3 14.1 17.1 18.2Divi. Yield (%) 0.6 0.5 0.7 0.7 0.7
Source: Company, RSec Research
Share price (%) 1 mth 3 mth 12 mth
Absolute performance 8.2% 38.3% 48.8%
Relative to Nifty 4.2% 25.6% 47.7%
Shareholding Pattern (%) Mar'20 June'20
Promoter 58.1 58.1
Public 41.9 41.9
1 Year Stock Price Performance
Note: * CMP as on 17 Aug 2020
Cement | India
Institutional Equity Research
BUY2 Year Target Price: Rs.1,711
CMP* 1,500
Upside/Downside (%) 14
Bloomberg Ticker JKCE IN
Market Cap. (Rs bn) 116
Free Float (%) 42
Shares O/S (mn) 77
Key Triggers:Expansion of grey cement capacity by ~50% to 14mnT over the last five years
Measures undertaken to improve grey cement operating performance have started paying off
Embarking on next line of expansion, which offers comfort for sustainable growth
Low capacity addition in the Northern region augurs well for grey cement profitability
Value-added products continue to remain cash cow
300
500
700
900
1,100
1,300
1,500
1,700
Jul-
19
Aug
-19
Sep-
19
Oct
-19
Nov
-19
Dec
-19
Jan-
20
Feb-
20
Mar
-20
Apr
-20
May
-20
Jun-
20
Jul-
20

66
Key Criteria Score Risk Comments
Management Quality 8 Low The management has been quite prudent in terms of timely expansion and expanding value-added portfolio
Promoter’s Holding Pledge 10 Low Zero pledge by the promoters offers comfort
Board of Directors Profile 8 Low A perfect blend of experience, expertise and professionalism with sound track record offers comfort
Industry Growth 8 Low Demand clocked ~7% demand CAGR over last 15 years; expected to be maintained in coming fiscals
Regulatory Environment / Risk 5 Medium Regulatory risk in terms of hike in duties was quite visible historically
Entry Barriers / Competition 5 Medium Any new player with strong capital base can enter into business and competition has been high in the industry
New Business/Client Potential 8 Low The company is expanding into new geographies with new capacity addition
Business Diversification 9 Low The company enjoys the best product diversification led by strong presence in white cement and wall putty segment
Market Share Potential 7 Low New capacity addition and strong resources for new leg of expansion augur well for gaining market share
Margin Expansion Potential 8 Low The company has been showing strong improvement in operating efficiency for last two years
Earning Growth (10 Years) 7 Low Earnings clocked 10% CAGR over last ten years; expected to clock 27% CAGR over next three years
Balance Sheet Strength 7 Low Low working capital and healthy cash flow from operation continue to support balance sheet
Debt Profile 7 Low Net Debt to EBITDA ratio stood at 1.8x in FY20 due to new expansion; Net Debt to Equity ratio stood at 0.6x
FCF Generation 7 Low It generated FCF of Rs8.6bn in last ten years despite huge capacity addition; expected to generate Rs24bn FCF in next three years
Dividend Policy 8 Low Average dividend payout ratio stood at strong 15%
Total Score Out of 150 112 Low
Percentage Score 75%
Investment Decision Matrix (IDM)
For < 5 Red High Risk For 5 Blue Medium Risk For > 5 Green Low Risk

67
Exhibit 1: Scenario Analysis
FY20 FY21E FY22E FY23E CAGR (FY20-FY23E)
Base Case
Volume (mnT) 8.5 8.0 9.6 10.3 6.7%
Realisation/tonne (Rs) 4,527 4,611 4,666 4,666 1.0%
Revenue 54,040 51,483 61,589 67,629 7.8%
EBITDA 11,217 10,305 12,851 14,749 9.6%
EBITDA/tonne 1,146 1,115 1,172 1,252
EBITDA margin (%) 20.8 20.0 20.9 21.8
APAT 4,004 4,672 6,498 8,109 26.5%
Target EV/EBITDA multiple (x) 9.0
Target Price 1,711
Bull Case
Volume (mnT) 8.5 8.4 10.0 10.8 8.4%
Realisation/tonne (Rs) 4,527 4,811 5,011 5,011 3.4%
Revenue 54,040 55,027 67,291 71,732 9.9%
EBITDA 11,217 11,740 15,520 16,317 13.3%
EBITDA/tonne 1,146 1,218 1,356 1,327
EBITDA margin (%) 20.8 21.3 23.1 22.7
APAT 4,004 5,677 8,367 9,206 32.0%
Target EV/EBITDA multiple (x) 9.5
Target Price 1,945
Bear Case
Volume (mnT) 8.5 7.6 9.1 9.8 4.9%
Realisation/tonne (Rs) 4,527 4,511 4,311 4,311 -1.6%
Revenue 54,040 48,867 56,133 62,758 5.1%
EBITDA 11,217 9,462 10,340 12,685 4.2%
EBITDA/tonne 1,146 1,071 986 1,126
EBITDA margin (%) 20.8 19.4 18.4 20.2
APAT 4,004 4,083 4,741 6,664 18.5%
Target EV/EBITDA multiple (x) 8.5
Target Price 1,422
Source: RSec Research
Scenario AnalysisBase Case: In base case scenario, we assume 6.7% volume CAGR in FY20-FY23E with 1% growth in realization. Revenue, EBITDA and APAT are expected to clock 8%, 10% and 27% CAGR, respectively over the same period.
Bull Case: In bull case scenario, we assume 8.4% volume CAGR in FY20-FY23E with 3.4% growth in realization. Revenue, EBITDA and APAT are expected to clock 10%, 13% and 32% CAGR, respectively over the same period.
Bear Case: In bear case scenario, we assume 4.9% volume CAGR in FY20-FY23E with 1.6% de-growth in realization. Revenue, EBITDA and APAT are expected to clock 5%, 4% and 19% CAGR, respectively over the same period.

68
I. Timely Expansion over the Years Paying offJKCE has been able to add capacity rather consistently given its abundant resources. Over the last five years, it has expanded its grey cement capacity by ~50% to 14mnT, which aided it to clock >6% CAGR in volume over FY15-FY20. Further, it commissioned 3.5mnT new capacity in FY20, while 0.7mnT capacity is likely to be commissioned shortly, which will help the company to witness volume traction in ensuing quarters.
II. Cost Saving Measures Aided Grey Cement PerformanceJKCE had undertaken a number of measures in last two years to improve its grey cement operating performance, which already started paying off. Resultantly, its grey cement EBITDA/tonne improved from Rs439 in FY19 to Rs861 in FY20. JKCE expects ~Rs80-100/tonne opex savings in FY22E led by improvement in efficiency owing to new clinker unit (2.6mnT) at Mangrol and savings on raw material logistics cost front. We note that appointing BCG as consultant has already saved ~Rs50-70/tonne on logistic front. We calculate its grey cement’s unitary EBITDA to improve further to Rs900 in FY22 to Rs986 in FY23E.
III. Next Line of Expansion on the AnvilJKCE has already started working on for the next line of expansion in the Central region. It is currently in the process of converting 2 prospective licenses (PLs) into mining licenses (MLs) in Panna (Madhya Pradesh). JKCE has already acquired 425 acres of land out of targeted 500 acres in Panna for Rs900mn. It expects to acquire remaining land in the current fiscal with additional investment of Rs500-700mn. Thereafter, it will seek approval of the Board for new expansion programme. With current resources, the company can essentially set up 3.5mnT integrated cement unit.
IV. Minimal Capacity Addition in North to Aid CompanyNorthern region is expected to see only 4mnT of cement capacity in next three years out of 51mnT capacity addition on pan-India basis. The region has already been witnessing superior capacity utilization for last two years. Hence, likely improvement in utilization further with minimal capacity addition will lead to strong pricing environment in the region, which will aid JKCE’s performance on grey cement front, going ahead.
Exhibit 3: Cost per tonne Analysis and Assumptions (Rs)
Rs/tonne FY17 FY18 FY19 FY20 FY21E FY22E FY23E
Raw Materials 1,148 1,159 1,187 1,244 1,297 1,301 1,312
Employees 349 347 358 399 446 416 425
Power & Fuel 793 947 1,067 1,031 990 1,010 1,020
Freight 1,179 1,318 1,284 1,253 1,268 1,272 1,282
Other Exps. 414 307 333 448 457 437 442
Realisation (Grey Cement) 3,662 3,906 4,002 4,527 4,611 4,611 4,785
Source: RSec Research
Exhibit 2: Change in Estimates
Y/E Mar FY21E FY22E FY23E
(Rsmn) Old Revised % change Old Revised % change Introduction
Grey Cement Realization/tonne- (Rs) 4,435 4,611 4.0 4,479 4,611 2.9 4,785
Grey- Volume (mnT) 8.99 8.04 (10.6) 10.12 9.57 (5.5) 10.3
Sales (Rs mn) 54,885 51,483 (6.2) 61,743 61,589 (0.2) 67,629
EBIDTA (Rs mn) 10,887 10,305 (5.3) 12,813 12,851 0.3 14,749
EBIDTA margins (%) 19.8 20.0 20.8 20.9 21.8
PAT (Rs mn) 4,938 4,672 (5.4) 6,334 6,498 2.6 8,109
PAT margins (%) 9.0 9.1 10.3 10.6 12.0
Source: RSec Research
Investment RationaleOur investment thesis is based on the following premises:I. Timely Expansion over the Years Paying offII. Cost Saving Measures Aided Grey Cement PerformanceIII. Next Line of Expansion on the AnvilIV. Minimal Capacity Addition in North to Aid Company

69
Exhibit 6: Price Sensitivity at Standalone EBITDA (Rs bn) Growth (%) Fwd EV/EBITDA (x) 7.5 8 8.5 9 10FY17 (-3) 6.4 32.1 20.2 344 386 469 552 635
FY18 (-2) 7.1 11.0 18.2 467 513 605 697 789
FY19 (-1) 7.5 5.0 17.3 535 583 680 777 873
FY20 (Base year) 11.2 50.0 11.6 831 904 1,049 1,194 1,340
FY21E (year 1) 10.3 -8.1 12.6 765 831 965 1,098 1,232
FY22E (Year 2) 12.9 24.7 10.1 1,092 1,175 1,341 1,508 1,674
FY23E (Year 3) 14.7 14.8 8.8 1,378 1,473 1,664 1,855 2,046
Source: RSec Research
Key Risks f Further slowdown in demand scenario.
f A steep contraction in prices.
f A sharp increase in input and fuel cost.
516652
727
1,0961,012
1,388
1,711
6.47.1 7.5
11.210.3
12.9
14.7
0
2
4
6
8
10
12
14
16
0
200
400
600
800
1000
1200
1400
1600
1800
FY17 (-3) FY18 (-2) FY19 (-1) FY20 (Base year)
FY21E (year 1)
FY22E (Year 2)
FY23E (Year 3)
SOTP TP (Rs) EBITDA (Rs bn)
Exhibit 4: EBITDA & SOTP Target Price Exhibit 5: EV/EBITDA 1yr Fwd
Source: RSec Research Source: RSec Research
-
200
400
600
800
1,000
1,200
1,400
1,600
1,800
2,000
Ma
r-13
Jul-1
3
Nov
-13
Ma
r-14
Jul-1
4
Nov
-14
Ma
r-15
Jul-1
5
Nov
-15
Ma
r-16
Jul-1
6
Nov
-16
Ma
r-17
Jul-1
7
Nov
-17
Ma
r-18
Jul-1
8
Nov
-18
Ma
r-19
Jul-1
9
Nov
-19
Ma
r-20
Jul-2
0
8x9x
10x11x12x

70
Exhibit 8: Revenue Trend Exhibit 9: EBITDA Trend
Source: Company, RSec Research Source: Company, RSec Research
Exhibit 10: PAT Trend Exhibit 11: ROCE vs. RoE
Source: Company, RSec Research Source: Company, RSec Research
Exhibit 7: Volume(mt)
Source: Industry, RSec Research
Outlook & Valuations
Strong back-up of value-added products, which ensures healthy and consistent cash flow, offers an edge to JKCE over its peers. Further, recent capacity expansion, operating synergies and steady pricing trend in its key markets are likely to aid its profitability in ensuing quarters. We continue to see JKCE as the best play in mid-cap cement space. Keeping EBITDA estimate for FY22E broadly unchanged and rolling over estimates to FY23E, we maintain BUY on JKCE with a revised 2-Year SOTP Target Price of Rs.1,711 (8.5x of FY23E EBITDA).
7.2 7.8 7.9
9.4 9.9 9.6
8.0
9.6 10.3
-
2.0
4.0
6.0
8.0
10.0
12.0
FY15 FY16 FY17 FY18 FY19 FY20 FY21E FY22E FY23E
Volume(mnT)
33.4 35.2 37.0
45.4 49.2
54.0 51.5
61.6 67.6
-
10.0
20.0
30.0
40.0
50.0
60.0
70.0
80.0
FY15 FY16 FY17 FY18 FY19 FY20 FY21E FY22E FY23E
Revenue (Rs bn)
4.4 4.9
6.4 7.1 7.5
11.2 10.3
12.9
14.7
-
2.0
4.0
6.0
8.0
10.0
12.0
14.0
16.0
FY15 FY16 FY17 FY18 FY19 FY20 FY21E FY22E FY23E
EBITDA (Rs bn)
1.6 1.0
2.1
3.4 3.2 4.0
4.7
6.5
8.1
-
1.0
2.0
3.0
4.0
5.0
6.0
7.0
8.0
9.0
FY15 FY16 FY17 FY18 FY19 FY20 FY21E FY22E FY23E
PAT (Rs bn)
9.5 10.0
14.0 15.8
14.9 16.6
15.6
19.0
21.5
9.2
6.2
11.8
17.0
12.9 13.3 14.1
17.1 18.2
0
5
10
15
20
25
FY15 FY16 FY17 FY18 FY19 FY20 FY21E FY22E FY23E
RoCE (%) RoE (%)
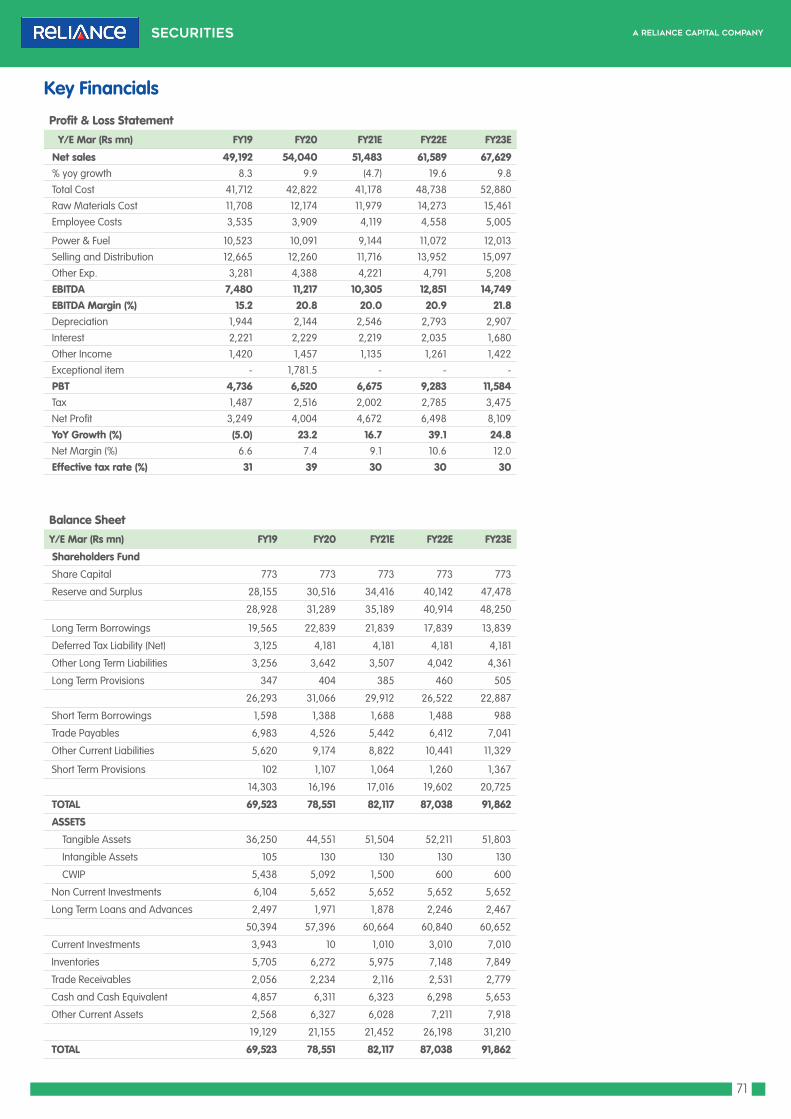
71
Profit & Loss Statement Y/E Mar (Rs mn) FY19 FY20 FY21E FY22E FY23E
Net sales 49,192 54,040 51,483 61,589 67,629 % yoy growth 8.3 9.9 (4.7) 19.6 9.8
Total Cost 41,712 42,822 41,178 48,738 52,880
Raw Materials Cost 11,708 12,174 11,979 14,273 15,461
Employee Costs 3,535 3,909 4,119 4,558 5,005
Power & Fuel 10,523 10,091 9,144 11,072 12,013
Selling and Distribution 12,665 12,260 11,716 13,952 15,097
Other Exp. 3,281 4,388 4,221 4,791 5,208
EBITDA 7,480 11,217 10,305 12,851 14,749 EBITDA Margin (%) 15.2 20.8 20.0 20.9 21.8 Depreciation 1,944 2,144 2,546 2,793 2,907
Interest 2,221 2,229 2,219 2,035 1,680
Other Income 1,420 1,457 1,135 1,261 1,422
Exceptional item - 1,781.5 - - -
PBT 4,736 6,520 6,675 9,283 11,584 Tax 1,487 2,516 2,002 2,785 3,475
Net Profit 3,249 4,004 4,672 6,498 8,109
YoY Growth (%) (5.0) 23.2 16.7 39.1 24.8 Net Margin (%) 6.6 7.4 9.1 10.6 12.0
Effective tax rate (%) 31 39 30 30 30
Balance SheetY/E Mar (Rs mn) FY19 FY20 FY21E FY22E FY23E
Shareholders Fund
Share Capital 773 773 773 773 773
Reserve and Surplus 28,155 30,516 34,416 40,142 47,478
28,928 31,289 35,189 40,914 48,250
Long Term Borrowings 19,565 22,839 21,839 17,839 13,839
Deferred Tax Liability (Net) 3,125 4,181 4,181 4,181 4,181
Other Long Term Liabilities 3,256 3,642 3,507 4,042 4,361
Long Term Provisions 347 404 385 460 505
26,293 31,066 29,912 26,522 22,887
Short Term Borrowings 1,598 1,388 1,688 1,488 988
Trade Payables 6,983 4,526 5,442 6,412 7,041
Other Current Liabilities 5,620 9,174 8,822 10,441 11,329
Short Term Provisions 102 1,107 1,064 1,260 1,367
14,303 16,196 17,016 19,602 20,725
TOTAL 69,523 78,551 82,117 87,038 91,862
ASSETS
Tangible Assets 36,250 44,551 51,504 52,211 51,803
Intangible Assets 105 130 130 130 130
CWIP 5,438 5,092 1,500 600 600
Non Current Investments 6,104 5,652 5,652 5,652 5,652
Long Term Loans and Advances 2,497 1,971 1,878 2,246 2,467
50,394 57,396 60,664 60,840 60,652
Current Investments 3,943 10 1,010 3,010 7,010
Inventories 5,705 6,272 5,975 7,148 7,849
Trade Receivables 2,056 2,234 2,116 2,531 2,779
Cash and Cash Equivalent 4,857 6,311 6,323 6,298 5,653
Other Current Assets 2,568 6,327 6,028 7,211 7,918
19,129 21,155 21,452 26,198 31,210
TOTAL 69,523 78,551 82,117 87,038 91,862
Key Financials

72
Cash Flow StatementY/E Mar (Rs mn) FY19 FY20 FY21E FY22E FY23E
PBT 4,736 6,520 6,675 9,283 11,584
Depreciation 1,944 2,144 2,546 2,793 2,907
Interests 2,160 2,135 2,219 2,035 1,680
Others (323) (398) - - -
Operating Profit before WC changes 8,516 10,401 11,440 14,112 16,171
Change in Working Capital (471) 271 1,174 256 111
Tax Paid (977) (1,529) (2,002) (2,785) (3,475)
Deferred Rev Expenditures - - - - -
Net Cash from Operating activities 7,069 9,143 10,612 11,582 12,807
Purchase of FA including capital advances
(6,045) (9,890) (5,908) (2,600) (2,500)
Sale of Fixed Assets 35 76 - - -
Purchase of Investments (7,884) (15,843) (1,000) (2,000) (4,000)
Sale of Investments 627 8,678 - - -
Others 5,200 3,866 - - -
Net Cash from Investing activities (8,067) (13,113) (6,908) (4,600) (6,500)
QIP Proceedings and Inc in Sh. Capital 5,043 - - - -
Net Borrowings 68 4,040 (700) (4,200) (4,500)
Interest paid (2,178) (2,166) (2,219) (2,035) (1,680)
Others (861) (1,651) (773) (773) (773)
Net Cash from Financing activities 2,071 223 (3,692) (7,007) (6,952)
Net Increase / (decrease) in cash 1,072 (3,747) 12 (25) (645)
Key RatiosY/E Mar (Rs mn) FY19 FY20 FY21E FY22E FY23E
P/E 35.7 28.9 24.8 17.8 14.3
P/CEPS 22.3 18.9 16.1 12.5 10.5
P/BV 4.0 3.7 3.3 2.8 2.4
EV/EBIDTA 17.5 12.1 13.0 10.0 8.1
EV/Sales 2.7 2.5 2.6 2.1 1.8
EV/tonne (USD) 146 117 109 104 98
Dividend Payout (%) 21.5 14.5 16.5 11.9 9.5
Dividend Yield (%) 0.6 0.5 0.7 0.7 0.7
OCF Yield (%) 6.10 7.89 9.16 9.99 11.05
Per Share Data (Rs) EPS (Basic) 42.0 51.8 60.5 84.1 104.9
EPS (Diluted) 42.0 51.8 60.5 84.1 104.9
CEPS 67.2 79.6 93.4 120.3 142.6
DPS 9.0 7.5 10.0 10.0 10.0
Book Value 374 405 455 530 624
EBIDTA/tone 759 1,146 1,115 1,172 1,252
Returns (%) RoCE 14.9 16.6 15.6 19.0 21.5
RoE 12.9 13.3 14.1 17.1 18.2
Turnover ratios (x) Asset Turnover (Gross block) 9.5 8.7 7.2 8.2 8.7
Inventory (days) 42 42 42 42 42
Receivables (days) 15 15 15 15 15
Payables (days) 61 39 39 38 38
WCC (days) (4) 19 19 19 19

73
Valuation Rerating on the Cards
JK Lakshmi CementCement | India
Institutional Equity Research
BUY2 Year Target Price: Rs
CMP* (Rs) xxx
Upside/ (Downside) (%) xx
Bloomberg Ticker xxx IN
Market Cap. (Rs bn) xxx
Free Float (%) xxx
Shares O/S (mn) xxx Company Update | 18 Aug 2020
1. JK Lakshmi Cement (JKLC) has a balanced presence in key Northern, Eastern and Western (Gujarat) markets. With ~7.8mnT cement capacity in Northern region, it currently enjoys ~8% market share in Northern markets. JKLC is expected to maintain its market share given its rich limestone reserves in Sirohi and Udaipur (Rajasthan).
2. Following the recent price up-tick in Chhattisgarh (~Rs20-40/bag in last four months), JKLC’s profitability is expected to improve hereon.
3. With commissioning of 0.8mnT SGU in Odisha, we believe JKLC’s blended realisation will improve further due to higher realization.
4. The company has already repaid debt to the tune of Rs7.2bn over last three years. This has already resulted in sharp improvement in return ratios with RoCE and RoE coming in at 17.6% and 14.5%, respectively in FY20.
5. Likely improvement in utilization with minimal capacity addition in the Northern region will lead to strong pricing environment in the region, which will aid JKLC’s performance.
Impact of COVID-19: JKLC witnessed ~18% volume decline in 1QFY21 due to COVID-led demand slowdown, which is albeit better than the industry’s decline of >30%. As per the company, the demand momentum has picked up meaningfully in June’20 and July’20. Despite YoY improvement in July’20 volume, the management it is still not certain about demand sustainability due to recent frequent lockdowns in Eastern, Northern and Western markets.
Outlook & ValuationRecent initiatives in the form of commissioning of 20MW captive power plant (CPP), SGU in Odisha and lower clinker sales have started paying off. Further, recent price hike and cost deflation are expected to aid JKLC on margin front despite volume pressure due to COVID-led disruptions. Current valuations at US$42 and US$37 of EV for FY22E and FY23E, respectively appear to be very attractive. We believe improved return ratio warrants a valuation re-rating. Keeping our FY22E EBITDA estimate broadly unchanged and rolling over our estimates to FY23E, we maintain BUY on JKLC with a revised 2-year Target Price of Rs401 (6x of 23E EBITDA).
Research Analyst
Binod ModiContact: 022 4303 4626/9870009382Email: [email protected]
Research Associate:
Girija Shankar RayEmail : [email protected]
Key Financials (Rs mn) FY19 FY20 FY21E FY22E FY23ESales 38,823 40,435 36,453 43,199 45,375EBITDA 4,150 6,724 5,614 7,273 7,483APAT 795 2,552 1,708 3,412 3,710EPS (Rs) 6.8 21.7 14.5 29.0 31.5DPS (Rs) 0.8 2.5 2.0 3.0 4.0P/E (x) 40.0 12.5 18.6 9.3 8.6P/B (x) 2.1 1.9 1.7 1.5 1.3
EV/EBITDA (x) 10.6 6.2 7.0 4.8 3.9
RoE (%) 5.3 14.5 9.6 17.0 15.9Divi. Yield (%) 0.3 0.9 0.7 1.1 1.5
Source: Company, RSec Research
Share price (%) 1 mth 3 mth 12 mth
Absolute performance -3.7% 43.3% -17.0%
Relative to Nifty -7.8% 30.5% -18.1%
Shareholding Pattern (%) Mar'20 June'20
Promoter 46.2 46.2
Public 53.8 53.8
1 Year Stock Price Performance
Note: * CMP as on 17 Aug 2020
Cement | India
Institutional Equity Research
BUY2 Year Target Price: Rs.401
CMP* 270
Upside/Downside (%) 49
Bloomberg Ticker JKLC IN
Market Cap. (Rs bn) 32
Free Float (%) 54
Shares O/S (mn) 118
Key Triggers:Diversified presence with strong hold in northern markets
Split Grinding Unit (SGU) in Odisha and realisation recovery in Chhattisgarh to improve profitability
Favourable demand-supply scenario in northern region
Balance sheet deleveraging to result in sharp improvement in return ratios
150
200
250
300
350
400
Jul-
19
Aug
-19
Sep-
19
Oct
-19
Nov
-19
Dec
-19
Jan-
20
Feb-
20
Mar
-20
Apr
-20
May
-20
Jun-
20
Jul-
20

74
Key Criteria Score Risk Comments
Management Quality 7 Low The management could not handle its Eastern expansion in a better way (being addressed now); however, it has done excellent job in other regions
Promoter’s Holding Pledge 10 Low Zero pledge by the promoters offers comfort
Board of Directors Profile 8 Low A perfect blend of experience, expertise and professionalism with sound track record offers comfort. Independent Directors form 64% of the board of directors
Industry Growth 8 Low Demand clocked ~7% CAGR over last 15 years; expected to be maintained in coming fiscals
Regulatory Environment / Risk 5 Medium Regulatory risk in terms of hike in duties was quite visible historically
Entry Barriers / Competition 5 Medium Any new player with strong capital base can enter into business and competition has been high in the industry
New Business/Client Potential 5 Medium Clinker constraints may pose a challenge for generating incremental volume
Business Diversification 8 Low Barring Southern and Central regions, it has made a decent presence in other three regions
Market Share Potential 6 Low It holds additional resources in Durg and Udaipur units to expand its capacity
Margin Expansion Potential 8 Low The company has been witnessing strong improvement in operating efficiency for last two years
Earnings Growth (10 Years) 6 Low Earnings clocked 1% CAGR over last ten years; expected to clock 16% CAGR over next three years
Balance Sheet Strength 7 Low Low profitability from Durg unit was an overhang, which impacted cash flow and did not reflect in faster debt reduction
Debt Profile 7 Low Net Debt to EBITDA ratio stood at 1.5x in FY20 due to new expansion and Net Debt to Equity ratio stood at 0.6x
FCF Generation 7 Low It generated FCF of Rs8.8bn in last ten years and is expected to generate Rs16bn FCF in next three years
Dividend Policy 8 Low Average dividend payout ratio stood at strong 15%
Total Score Out of 150 105 Low
Percentage Score 70%
Investment Decision Matrix (IDM)
For < 5 Red High Risk For 5 Blue Medium Risk For > 5 Green Low Risk

75
Exhibit 1: Scenario Analysis
FY20 FY21E FY22E FY23E CAGR (FY20-FY23E)
Base Case
Volume (mnT) 9.2 8.5 10.0 10.4 4.0%
Realisation/tonne (Rs) 4,207 4,094 4,158 4,199 -0.1%
Revenue 40,435 36,453 43,199 45,375 3.9%
EBITDA 6,724 5,614 7,273 7,483 3.6%
EBITDA/tonne 725 657 729 721
EBITDA margin (%) 16.6 15.4 16.8 16.5
APAT 2,552 1,708 3,412 3,710 13.3%
Target EV/EBITDA multiple (x) 6
Target Price 401
Bull Case
Volume (mnT) 9.2 9.0 10.5 11.0 6.0%
Relisation/tonne (Rs) 4,207 4,194 4,258 4,299 0.7%
Revenue 40,435 39,098 46,320 49,093 6.7%
EBITDA 6,724 6,756 8,636 9,003 10.2%
EBITDA/tonne 725 753 825 819
EBITDA margin (%) 16.6 17.3 18.6 18.3
APAT 2,552 2,456 4,420 4,833 23.7%
Target EV/EBITDA multiple (x) 6.5
Target Price 543
Bear Case
Volume (mnT) 9.2 7.7 8.8 8.9 -1.0%
Relisation/tonne (Rs) 4,207 4,080 4,120 4,120 -0.7%
Revenue 40,435 32,715 38,181 38,631 -1.5%
EBITDA 6,724 4,487 5,754 5,358 -7.3%
EBITDA/tonne 725 586 650 599
EBITDA margin (%) 16.6 13.7 15.1 13.9
APAT 2,552 973 2,298 2,150 -5.6%
Target EV/EBITDA multiple (x) 5.5
Target Price 256
Source: RSec Research
Scenario AnalysisBase Case: In base case scenario, we assume 4% volume CAGR in FY20-FY23E with flat growth in realization. Revenue, EBITDA and APAT are expected to clock 4%, 3.6% and 13% CAGR, respectively over the same period.
Bull Case: In bull case scenario, we assume 6% volume CAGR in FY20-FY23E with 1% growth in realization. Revenue, EBITDA and APAT are expected to clock 7%, 10% and 24% CAGR, respectively over the same period.
Bear Case: In bear case scenario, we assume a negative volume CAGR of -1% in FY20-FY23E with -1% de-growth in realization. Revenue, EBITDA and APAT are expected to clock -1.5%, -7.3% and -5.6% CAGR, respectively over the same period.

76
I. Diversified Presence with Strong Hold in Northern MarketsJKLC has a balanced presence in key Northern, Eastern and Western (Gujarat) markets. With ~7.8mnT cement capacity in Northern region, it currently enjoys ~8% market share in Northern markets. The company is expected to maintain its market share given its rich limestone reserves in Sirohi and Udaipur. Further, as JKLC also possesses state-of-the-art plant and machineries, its energy consumption is relatively lower than the industry’s average at 69 units/tonne of cement and 701Kcal/kg of clinker.
II. Odisha SGU & Realisation Recovery in Chhattisgarh to Improve ProfitabilityA subdued realisation scenario in Chhattisgarh, where JKLC sells >60% of its total production, has been a major cause of worry for lower margin. With recent price up-tick in Chhattisgarh (~Rs20-40/bag in last four months), JKLC’s profitability is expected to improve hereon. Additionally, with commissioning of 0.8mnT SGU in Odisha, we believe JKLC’s blended realisation will improve further due to higher realization in the Odisha market. JKLC in its latest earnings conference call stated that it has undertaken price hike to the tune of ~Rs10-15/bag in May’20 in Eastern and Northern regions.
III. Balance Sheet Deleveraging to Lead to Sharp Improvement in Return RatiosWhile JKLC has not put up any additional capacity (except for 0.8mnT SGU in Odisha) in last three years, it has already repaid debt to the tune of Rs7.2bn over last three years. This has already resulted in sharp improvement in its return ratios with RoCE and RoE coming in at 17.6% and 14.5%, respectively in FY20. It further plans to pare down debt by Rs2.5bn each in FY21E and FY22E on standalone level. Notably, gross standalone debt stood at Rs14.5bn, while the debt for Udaipur Cement Works stood at Rs5.5bn as on FY20.
IV. Favourable Demand-Supply Scenario in Northern RegionNorthern region – which has already been witnessing the superior capacity utilization for last two years – is expected to see merely 4mnT of cement capacity in next three years. Hence, likely improvement in utilization with minimal capacity addition will lead to strong pricing environment in the region, which will aid JKLC’s performance.
Exhibit 3: Cost per tonne Analysis and Assumptions (Rs)
Rs/tonne FY17 FY18 FY19 FY20 FY21E FY22E FY23E
Raw Materials 959 914 1,003 923 961 997 1,008
Employees 262 276 269 338 406 390 411
Power & Fuel 713 935 952 915 887 896 905
Freight 906 1,025 987 886 904 913 922
Other Exps. 362 375 379 592 454 405 406
Realisation 3,950 3,828 3,844 4,207 4,094 4,158 4,199
Source: RSec Research
Exhibit 2: Change in Estimates
Y/E Mar FY21E FY22E FY23E
(Rsmn) Old Revised % change Old Revised % change Introduction
Volume (mnT) 8.65 8.54 (1.3) 9.93 9.98 0.4 10.37
Realization (Rs/tonne) 4,236 4,094 (3.4) 4,292 4,158 (3.1) 4,199
Sales (Rs mn) 38,201 36,453 (4.6) 44,435 43,199 (2.8) 45,375
EBIDTA (Rs mn) 5,509 5,614 1.9 6,987 7,273 4.1 7,483
EBIDTA margins (%) 14.4 15.4 15.7 16.8 16.5
APAT (Rs mn) 1,522 1,708 12.2 3,070 3,412 11.2 3,710
Source: RSec Research
Investment RationaleOur investment thesis is based on the following premises:I. Diversified Presence with Strong Hold in Northern MarketsII. Odisha SGU & Realisation Recovery in Chhattisgarh to Improve ProfitabilityIII. Balance Sheet Deleveraging to Lead to Sharp Improvement in Return RatiosIV. Favourable Demand-Supply Scenario in Northern Region

77
Exhibit 4: EBITDA & Target Price Exhibit 5: EV/EBITDA 1yr Fwd
Source: RSec Research Source: RSec Research
Exhibit 6: Price Sensitivity at Standalone EBITDA (Rs bn) Growth (%) Fwd EV/EBITDA (x) 5 5.5 6.0 7 8FY17 (-3) 3.7 34.3 12.4 14 30 45 76 107
FY18 (-2) 4.1 12.6 11.0 41 59 76 111 146
FY19 (-1) 4.1 0.9 10.9 72 89 107 142 177
FY20 (Base year) 6.7 62.0 6.7 201 229 258 315 372
FY21E (year 1) 5.6 -16.5 8.1 176 200 224 271 319
FY22E (Year 2) 7.3 29.5 6.2 285 316 347 409 470
FY23E (Year 3) 7.5 2.9 6.1 337 369 401 464 528
Source: RSec Research
Key Risks f Further slowdown in demand scenario.
f A steep contraction in prices.
f A sharp increase in input and fuel cost.
-100
-
100
200
300
400
500
600
700
Mar
-13
Jul-1
3
Nov
-13
Mar
-14
Jul-1
4
Nov
-14
Mar
-15
Jul-1
5
Nov
-15
Mar
-16
Jul-1
6
Nov
-16
Mar
-17
Jul-1
7
Nov
-17
Mar
-18
Jul-1
8
Nov
-18
Mar
-19
Jul-1
9
Nov
-19
Mar
-20
Jul-2
0
6x
8x
9x
10x
12x
4576
107
258224
347
401
3.74.1 4.1
6.7
5.6
7.3 7.5
0
1
2
3
4
5
6
7
8
0
50
100
150
200
250
300
350
400
450
FY17 (-3) FY18 (-2) FY19 (-1) FY20 (Base year)
FY21E (year 1) FY22E (Year 2) FY23E (Year 3)
SOTP TP (Rs) EBITDA (Rs bn)

78
Exhibit 8: Revenue Trend Exhibit 9: EBITDA Trend
Source: Company, RSec Research Source: Company, RSec Research
Exhibit 10: PAT Trend Exhibit 11: ROCE vs. RoE
Source: Company, RSec Research Source: Company, RSec Research
Exhibit 7: Volume(mt)
Source: Industry, RSec Research
Outlook & Valuations
Recent initiatives in the form of commissioning of 20MW captive power plant (CPP), SGU in Odisha and lower clinker sales have started paying off. Further, recent price hike and cost deflation are expected to aid JKLC on margin front despite volume pressure due to COVID-led disruptions. Current valuations at US$42 and US$37 of EV for FY22E and FY23E, respectively appear to be very attractive. We believe improved return ratio warrants a valuation re-rating. Keeping our FY22E EBITDA estimate broadly unchanged and rolling over our estimates to FY23E, we maintain BUY on JKLC with a revised 2-year Target Price of Rs401 (6x of 23E EBITDA).
6.0
7.3 8.0
8.5
9.7 9.2
8.5
10.0 10.4
-
2.0
4.0
6.0
8.0
10.0
12.0
FY15 FY16 FY17 FY18 FY19 FY20 FY21E FY22E FY23E
Volume(mnT)
23.1 26.2
29.1
34.1
38.8 40.4 36.5
43.2 45.4
-
5.0
10.0
15.0
20.0
25.0
30.0
35.0
40.0
45.0
50.0
FY15 FY16 FY17 FY18 FY19 FY20 FY21E FY22E FY23E
Revenue (Rs bn)
3.5
2.7
3.7 4.1 4.1
6.7
5.6
7.3 7.5
-
1.0
2.0
3.0
4.0
5.0
6.0
7.0
8.0
FY15 FY16 FY17 FY18 FY19 FY20 FY21E FY22E FY23E
EBITDA (Rs bn)
1.4
-0.0
0.8 0.8 0.8
2.6
1.7
3.4 3.7
-0.5
-
0.5
1.0
1.5
2.0
2.5
3.0
3.5
4.0
FY15 FY16 FY17 FY18 FY19 FY20 FY21E FY22E FY23E
PAT (Rs bn)
7.1 4.9
8.3 9.1 9.6
17.6
14.2
21.1 21.5
10.4
-0.1
6.1 5.9 5.3
14.5
9.6
17.0 15.9
-5.0
-
5.0
10.0
15.0
20.0
25.0
FY15 FY16 FY17 FY18 FY19 FY20 FY21E FY22E FY23E
RoCE (%) RoE (%)

79
Profit & Loss Statement Y/E Mar (Rs mn) FY19 FY20 FY21E FY22E FY23E
Net Sales 38,823 40,435 36,453 43,199 45,375 % yoy growth 13.8 4.2 (9.8) 18.5 5.0
Total Cost 34,673 33,711 30,839 35,926 37,892
RM Consumed 9,687 8,513 8,206 9,950 10,457
Employee Costs 2,599 3,120 3,463 3,888 4,265
Power & Fuel 9,198 8,439 7,577 8,940 9,390
Freight Costs 9,533 8,176 7,719 9,108 9,567
Other Exps. 3,656 5,464 3,874 4,040 4,213
EBIDTA 4,150 6,724 5,614 7,273 7,483 EBIDTA Margin (%) 10.7 16.6 15.4 16.8 16.5 Depreciation and Amortisation 1,794 1,884 2,006 2,065 2,129
Interest 1,874 1,644 1,421 1,129 901
Other Income 563 501 401 481 505
Excep. Items - 302 - - -
PBT 1,044 3,395 2,588 4,560 4,958 Tax 249 1,042 880 1,148 1,248
% Tax 23.8 30.7 34.0 25.2 25.2
Net Profit (Reported) 795 2,352 1,708 3,412 3,710 Net Profit (Adjusted) 795 2,552 1,708 3,412 3,710 Net Profit Margin (%) 2.0 5.8 4.7 7.9 8.2
EPS (Basic) 6.8 21.7 14.5 29.0 31.5
Balance SheetY/E Mar (Rs mn) FY19 FY20 FY21E FY22E FY23E
I. EQUITY AND LIABILITIES Share Capital 589 589 589 589 589
Reserves and Surplus 14,638 16,538 18,011 21,070 24,309
SHAREHOLDERS’ FUNDS 15,227 17,127 18,599 21,658 24,898
Long-Term Borrowings 12,604 10,782 8,132 4,132 2,432
Deferred Tax Liabilities (Net) - 205 205 205 205
Other Long-Term Liabilities 3,513 3,961 3,624 4,221 4,452
Long Term Provisions 109 114 103 113 124
NON-CURRENT LIABILITIES 16,225 15,062 12,063 8,671 7,213
Short-Term Borrowings 586 1,048 729 729 729
Trade Payables 5,114 4,685 4,394 4,921 5,087
Other Current Liabilities 7,343 7,522 6,881 7,382 7,786
Short-Term Provisions 60 55 50 59 62
CURRENT LIABILITIES 13,102 13,310 12,054 13,091 13,664
Total Liabilities 44,554 45,499 42,716 43,420 45,774 II. ASSETS Tangible Assets 26,334 27,994 26,989 26,124 25,195
Intangible Assets 51 38 38 38 38
Capital Work-in-Progress 4,111 1,519 800 600 600
Fixed Assets 30,495 29,551 27,827 26,762 25,833
Non-Current Investments 3,579 3,678 3,678 3,678 3,678
Long term Loans and Advances 874 1,005 1,099 1,184 1,243
Other Non-Current Assets 220 - - - -
NON -CURRENT ASSETS 4,673 4,683 4,777 4,862 4,921
Current Investments 3,624 4,169 3,500 3,500 3,500
Inventories 3,117 4,128 3,722 4,411 4,633
Trade Receivables 1,066 882 795 942 990
Cash and Bank Balances 180 314 500 1,052 3,911
Short-term Loans and Advances 98 581 524 621 652
Other Current Assets 1,302 1,189 1,072 1,271 1,335
CURRENT ASSETS 9,387 11,265 10,113 11,796 15,020
Total Assets 44,554 45,499 42,716 43,420 45,774
Key Financials

80
Cash Flow StatementY/E Mar (Rs mn) FY19 FY20 FY21E FY22E FY23E
PBT 1,044 3,697 2,588 4,560 4,958
Depreciation and Amortisation 1,794 1,884 2,006 2,065 2,129
Interest & Dividend Income (25) (70) - - -
Profi t on sale of Assets & Current Investments (Net)
(195) (461) - - -
Interest Expenses (Gross) 1,874 1,644 1,421 1,129 901
Others (115) (164) - - -
Operating Profit before Working Capital changes
4,378 6,530 6,015 7,753 7,988
Adjustment for working capital changes 2,698 (359) (712) 429 390
Income Tax Payments (181) (758) (880) (1,148) (1,248)
Net cash from operating activities 6,894 5,413 4,423 7,034 7,130
Purchase of Fixed Assets (1,906) (924) (281) (1,000) (1,200)
Sale of Fixed Assets 18 58 - - -
Others 1,095 (721) 669 - -
Net Cash from / (used in) Investing Activities (794) (1,586) 388 (1,000) (1,200)
Buy-Back of Equity Shares - - - - -
Debt Proceeds / (Repayments)- Net (3,934) (1,469) (2,969) (4,000) (1,700)
Others (2,102) (2,224) (1,657) (1,482) (1,372)
Net Cash from / (used in) Financing Activities (6,036) (3,693) (4,626) (5,482) (3,072)
Increase / (Decrease) in Cash and Cash Equivalents
64 134 185 552 2,859
Key RatiosY/E Mar (Rs mn) FY19 FY20 FY21E FY22E FY23E
P/E 40.0 12.5 18.6 9.3 8.6
P/CEPS 12.3 7.5 8.6 5.8 5.4
P/BV 2.1 1.9 1.7 1.5 1.3
EV/EBITDA 10.6 6.2 7.0 4.8 3.9
EV/Sales 1.1 1.0 1.1 0.8 0.7
EV/tonne (US$) 55 52 45 40 34
Dividend Payout (%) 11.1 12.5 13.8 10.3 12.7
Dividend Yield (%) 0.3 0.9 0.7 1.1 1.5
OCF Yield (%) 21.7 17.0 13.9 22.1 22.4
Per Share Data (Rs)EPS (Basic) 6.8 21.7 14.5 29.0 31.5
EPS (Diluted) 6.8 21.7 14.5 29.0 31.5
CEPS 22.0 36.0 31.6 46.5 49.6
DPS 0.8 2.5 2.0 3.0 4.0
Book Value 129 146 158 184 212
EBITDA/tone (Rs) 427 725 657 729 721
Returns (%)RoCE 9.6 17.6 14.2 21.1 21.5
RoE 5.3 14.5 9.6 17.0 15.9
Turnover ratios (x)Asset Turnover (Gross block) 1.2 1.1 1.0 1.1 1.1
Inventory (days) 29 37 37 37 37
Receivables (days) 10 8 8 8 8
Payables (days) 54 51 52 50 49

81
Best Play for Central Region
HeidelbergCement IndiaCement | India
Institutional Equity Research
BUY2 Year Target Price: Rs
CMP* (Rs) xxx
Upside/ (Downside) (%) xx
Bloomberg Ticker xxx IN
Market Cap. (Rs bn) xxx
Free Float (%) xxx
Shares O/S (mn) xxx Company Update | 18 Aug 2020
1. HeidelbergCement India Ltd. (HEIM) enjoys a strong presence in Central region, which currently accounts for >90% of its total sales. While Central region is likely to witness incremental capacity of 10.5mnT (20% of total capacity addition) in next three years, a favourable demand environment is likely to help the pricing scenario in the region.
2. HEIM’s volume is expected to clock ~3% CAGR over FY20-FY23E and 11% CAGR over FY21E-FY23E owing to recent capacity expansion of 1mnT through debottlenecking.
3. HEIM had undertaken several initiatives, which have started paying off in the form of remarkable improvement in its performance in the last two years.
4. Favourable realization scenario in central markets is expected to result in healthy operating performance.
5. HEIM enjoys strong parentage of German promoter Heidelberg AG – world’s largest cement manufacturer – in the form of operational support and rich technical expertise.
6. Strong cash generation and resultant debt reduction helped HEIM to enjoy the best RoE and RoCE in the cement industry. It became a net cash company in FY20. Notably, HEIM’s interest-adjusted operating cash flow yield reached 10% in FY20, which is impressive, in our view.
Impact of COVID-19: Demand – which witnessed a sharp 85% YoY drop in Apr’20 – has been consistently improving since May’20 (down 22%) onwards. The management indicated that demand remained almost flat/grew marginally in Jun’20 and is likely to remain flat in Jul’20. A voluntary payment cut taken by a number of employees due of COVID-19 pandemic resulted in sequential drop in quarterly employee cost. Further, there was a sharp drop in discretionary expenditures as well.
Outlook & ValuationHEIM has been demonstrating a remarkable performance for last two years. It continues to be in a sweet spot on the back of healthy demand outlook owing to favourable monsoon, up-tick in infrastructure development in Uttar Pradesh and steady pricing environment. Further, capacity expansion by way of debottlenecking bodes well for its performance on volume front. Going ahead, we expect clinker expansion would be the key catalyst for stock to get re-rated. Upwardly revising our EBITDA estimate by 2% for FY22E and rolling over our estimates to FY23E, we maintain BUY on HEIM with a revised 2-Year Target Price of Rs226 (8x of FY23E EBITDA).
Research Analyst
Binod ModiContact: 022 4303 4626/9870009382Email: [email protected]
Research Associate:
Girija Shankar RayEmail : [email protected]
Key Financials (Rs mn) FY19 FY20E FY21E FY22E FY23ESales 21,094 21,576 19,456 22,752 24,332EBITDA 4,594 5,158 4,310 5,253 5,394Net Profit 2,207 2,681 2,527 3,306 3,528EPS (Rs) 9.7 11.8 11.2 14.6 15.6DPS (Rs) 3.5 4.5 7.5 7.5 7.5P/E (x) 19.8 16.3 17.3 13.2 12.4P/B (x) 3.7 3.3 3.1 2.8 2.5
EV/EBITDA (x) 9.9 8.3 9.6 7.4 6.6
RoE (%) 19.9 21.6 18.6 22.4 21.4 Divi. Yield (%) 1.8 2.3 3.9 3.9 3.9
Share price (%) 1 mth 3 mth 12 mth
Absolute performance 11.2% 31.0% -3.1%
Relative to Nifty 7.1% 18.2% -4.2%
Shareholding Pattern (%) Mar'20 June'20
Promoter 69.4 69.4
Public 30.6 30.6
1 Year Stock Price Performance
Note: * CMP as on 17 Aug1 2020
Cement | India
Institutional Equity Research
BUY2 Year Target Price: Rs.226
CMP* 193
Upside/Downside (%) 17
Bloomberg Ticker HEIM IN
Market Cap. (Rs bn) 44
Free Float (%) 31
Shares O/S (mn) 227
Key Triggers:Strong presence in Central region, which currently accounts for >90% of its total sales
Volume is likely to clock ~3% CAGR over FY20-FY23E and 11% CAGR over FY21E-FY23E
Remarkable improvement in operating performance in last two years
Favourable realization scenario in central region to help operating performance
Strong MNC parentage and best-in-class return ratios
120
130
140
150
160
170
180
190
200
210
220
Jul-
19
Aug
-19
Sep-
19
Oct
-19
Nov
-19
Dec
-19
Jan-
20
Feb-
20
Mar
-20
Apr
-20
May
-20
Jun-
20
Jul-
20

82
Key Criteria Score Risk Comments
Management Quality 8 Low The management quality has significantly improved in last three years, which is reflected in operating performance of the company
Promoter’s Holding Pledge 10 Low Zero pledge by the promoters offers comfort
Board of Directors Profile 8 Low A perfect blend of experience, expertise and professionalism with sound track record offers comfort
Industry Growth 8 Low Demand clocked ~7% CAGR over last 15 years; expected to be maintained in coming fiscals
Regulatory Environment / Risk 5 Medium Regulatory risk in terms of hike in duties was quite visible historically
Entry Barriers / Competition 5 Medium Any new player with strong capital base can enter into business and competition has been high in the industry
New Business/Client Potential 5 Medium Capacity constraints may hurt its growth in the long-run; however, we expect announcement of expansion programme
Business Diversification 4 High As the company is majorly present in central region, any sharp decline in regional demand may adversely impact its performance
Market Share Potential 5 Medium Absence of expansion plan may hamper its market share
Margin Expansion Potential 8 Low The company has been showing strong improvement in operating efficiency for last three years
Earnings Growth (10 Years) 7 Low Earnings clocked 7% CAGR over last ten years; expected to clock 10% CAGR over next three years
Balance Sheet Strength 8 Low With improvement in balance sheet, the company now generates the best return ratio in the industry
Debt Profile 8 Low Net Debt to EBITDA ratio stood at -0.2x and Net Debt to Equity ratio stood at -0.1x in FY20
FCF Generation 8 Low It generated FCF of Rs2.8bn in last ten years and is expected to generate Rs12.8bn FCF in next three years
Dividend Policy 8 Low Average dividend payout ratio stood at strong 10%
Total Score Out of 150 105 Low
Percentage Score 70%
Investment Decision Matrix (IDM)
For < 5 Red High Risk For 5 Blue Medium Risk For > 5 Green Low Risk
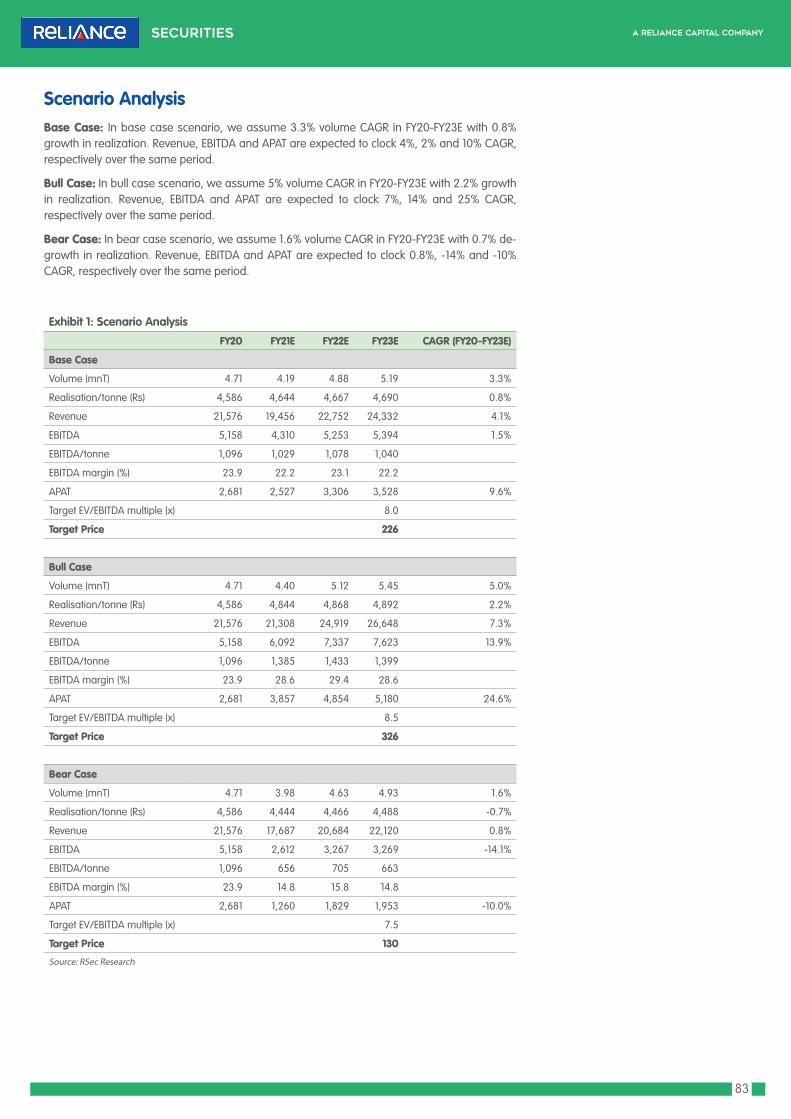
83
Exhibit 1: Scenario Analysis
FY20 FY21E FY22E FY23E CAGR (FY20-FY23E)
Base Case
Volume (mnT) 4.71 4.19 4.88 5.19 3.3%
Realisation/tonne (Rs) 4,586 4,644 4,667 4,690 0.8%
Revenue 21,576 19,456 22,752 24,332 4.1%
EBITDA 5,158 4,310 5,253 5,394 1.5%
EBITDA/tonne 1,096 1,029 1,078 1,040
EBITDA margin (%) 23.9 22.2 23.1 22.2
APAT 2,681 2,527 3,306 3,528 9.6%
Target EV/EBITDA multiple (x) 8.0
Target Price 226
Bull Case
Volume (mnT) 4.71 4.40 5.12 5.45 5.0%
Realisation/tonne (Rs) 4,586 4,844 4,868 4,892 2.2%
Revenue 21,576 21,308 24,919 26,648 7.3%
EBITDA 5,158 6,092 7,337 7,623 13.9%
EBITDA/tonne 1,096 1,385 1,433 1,399
EBITDA margin (%) 23.9 28.6 29.4 28.6
APAT 2,681 3,857 4,854 5,180 24.6%
Target EV/EBITDA multiple (x) 8.5
Target Price 326
Bear Case
Volume (mnT) 4.71 3.98 4.63 4.93 1.6%
Realisation/tonne (Rs) 4,586 4,444 4,466 4,488 -0.7%
Revenue 21,576 17,687 20,684 22,120 0.8%
EBITDA 5,158 2,612 3,267 3,269 -14.1%
EBITDA/tonne 1,096 656 705 663
EBITDA margin (%) 23.9 14.8 15.8 14.8
APAT 2,681 1,260 1,829 1,953 -10.0%
Target EV/EBITDA multiple (x) 7.5
Target Price 130
Source: RSec Research
Scenario AnalysisBase Case: In base case scenario, we assume 3.3% volume CAGR in FY20-FY23E with 0.8% growth in realization. Revenue, EBITDA and APAT are expected to clock 4%, 2% and 10% CAGR, respectively over the same period.
Bull Case: In bull case scenario, we assume 5% volume CAGR in FY20-FY23E with 2.2% growth in realization. Revenue, EBITDA and APAT are expected to clock 7%, 14% and 25% CAGR, respectively over the same period.
Bear Case: In bear case scenario, we assume 1.6% volume CAGR in FY20-FY23E with 0.7% de-growth in realization. Revenue, EBITDA and APAT are expected to clock 0.8%, -14% and -10% CAGR, respectively over the same period.

84
I. Healthy Presence in Central RegionHEIM enjoys a strong presence in Central region, which currently accounts for >90% of its total sales. While Central region is likely to witness 10.5mnT (20% of total capacity addition) in next three years, a favourable demand environment led by a strong pipeline of infrastructure projects and robust rural demand are likely to help the pricing scenario in the region. HEIM’s volume is expected to witness ~3% CAGR over FY20-FY23E and 11% CAGR over FY21E-FY23E owing to recent capacity expansion of 1mnT through debottlenecking.
II. Improved Operating Efficiency Ensures Better ProfitabilityWith a view to improving operating efficiency, HEIM had undertaken several initiatives including commissioning of Waste Heat Recovery Systems (WHRS) at Damoh plant, setting up railway sidings, increased usage of petcoke, balanced rail-road mix (50:50) and increased proportion of premium products MycemPower (~13% of trade volume), which have started paying off in the form of remarkable improvement in its performance in the last two years. Further, a favourable realization scenario in central markets is expected to result in healthy operating performance, going ahead. We foresee HEIM’s EBITDA/tonne to remain over Rs1,000-mark in ensuing fiscals.
III. Strong Parentage Offers Comfort & Best Return RatiosHEIM enjoys strong parentage of German promoter Heidelberg AG – world’s largest cement manufacturer – in the form of operational support and rich technical expertise. Besides, strong cash generation owing to its improved operating performance and resultant debt reduction enabled HEIM to enjoy the best RoE and RoCE in the industry. It became a net cash company in FY20. Notably, HEIM’s interest-adjusted operating cash flow yield reached 10% in FY20, which is impressive, in our view.
Exhibit 3: Cost per tonne Analysis and Assumptions (Rs)
Rs/tonne FY17 FY18 FY19 FY20 FY21E FY22E FY23E
Raw Materials 806 797 789 826 859 868 868
Employees 257 259 253 279 344 326 367
Power & Fuel 959 955 1,031 1,007 986 1,006 1,026
Freight 535 610 629 612 624 630 637
Other Exps. 659 663 668 766 801 760 753
Realisation 3,772 4,004 4,308 4,586 4,644 4,667 4,690
Source: RSec Research
Exhibit 2: Change in Estimates
Y/E Mar FY21E FY22E FY23E
(Rsmn) Old Revised % change Old Revised % change Introduction
Volume (mnT) 4.48 4.19 (6.5) 5.13 4.88 (5.0) 5.19
Sales (Rs mn) 20,520 19,456 (5.2) 23,685 22,752 (3.9) 24,332
Realizations (Rs/tonne) 4,576 4,644 1.5 4,621 4,667 1.0 4,690
EBIDTA (Rs mn) 4,245 4,310 1.5 5,152 5,253 2.0 5,394
Margins (%) 20.7 22.2 21.8 23.1 22.2
EBITDA/tonne (Rs) 947 1,029 8.6 1,005 1,078 7.2 1,040
PAT (Rs mn) 2,432 2,527 3.9 3,313 3,306 (0.2) 3,528
Source: RSec Research
Investment RationaleOur investment thesis is based on the following premises:I. Healthy Presence in Central RegionII. Improved Operating Efficiency Ensures Better ProfitabilityIII. Strong Parentage Offers Comfort & Best Return Ratios

85
Exhibit 6: Price Sensitivity at Standalone EBITDA (Rs bn) Growth (%) Fwd EV/EBITDA (x) 6 7 8.0 8.5 9FY17 (-3) 2.5 18.0 16.3 35 46 57 63 68
FY18 (-2) 3.3 34.4 12.1 71 85 100 108 115
FY19 (-1) 4.6 37.3 8.8 114 134 154 164 175
FY20 (Base year) 5.2 12.3 7.9 141 163 186 197 209
FY21E (year 1) 4.3 -16.4 9.4 124 143 162 172 181
FY22E (Year 2) 5.3 21.9 7.7 161 184 207 219 230
FY23E (Year 3) 5.4 2.7 7.5 178 202 226 238 249
Source: RSec Research
Key Risks f Further slowdown in demand scenario.
f A steep contraction in prices.
f A sharp increase in input and fuel cost.
57
100
154
186162
207226
2.5
3.3
4.6
5.2
4.3
5.3 5.4
0
1
2
3
4
5
6
0
50
100
150
200
250
FY17 (-3) FY18 (-2) FY19 (-1) FY20 (Base year)
FY21E (year 1) FY22E (Year 2)
FY23E (Year 3)
Target Price (Rs) EBITDA (Rs bn)
Exhibit 4: EBITDA & Target Price Exhibit 5: EV/EBITDA 1yr Fwd
Source: RSec Research Source: RSec Research
-
50
100
150
200
250
300
Mar
-15
Jul-1
5
Oct
-15
Jan-
16
Apr-
16
Jul-1
6
Oct
-16
Jan-
17
Apr-
17
Jul-1
7
Oct
-17
Jan-
18
Apr-
18
Jul-1
8
Oct
-18
Jan-
19
Apr-
19
Jul-1
9
Oct
-19
Jan-
20
Apr-
20
Jul-2
0
6x7x8x9x
10x

86
Exhibit 8: Revenue Trend Exhibit 9: EBITDA Trend
Source: Company, RSec Research Source: Company, RSec Research
Exhibit 10: PAT Trend Exhibit 11: ROCE vs. RoE
Source: Company, RSec Research Source: Company, RSec Research
Exhibit 7: Volume(mt)
Source: Industry, RSec Research
Outlook & Valuations
HEIM has been demonstrating a remarkable performance for last two years. It continues to be in a sweet spot on the back of healthy demand outlook owing to favourable monsoon, up-tick in infrastructure development in Uttar Pradesh and steady pricing environment. Further, capacity expansion by way of debottlenecking bodes well for its performance on volume front. Going ahead, we expect clinker expansion would be the key catalyst for stock to get re-rated. Upwardly revising our EBITDA estimate by 2% for FY22E and rolling over our estimates to FY23E, we maintain BUY on HEIM with a revised 2-Year Target Price of Rs226 (8x of FY23E EBITDA).
5.3
4.4 4.5 4.6
4.9 4.7
4.2
4.9 5.2
-
1.0
2.0
3.0
4.0
5.0
6.0
FY15 FY16 FY17 FY18 FY19 FY20 FY21E FY22E FY23E
Volume(mnT)
20.1
16.3 16.9 18.6
21.1 21.6 19.5
22.8 24.3
-
5.0
10.0
15.0
20.0
25.0
30.0
FY15 FY16 FY17 FY18 FY19 FY20 FY21E FY22E FY23E
Revenue (Rs bn)
2.9
2.1 2.5
3.3
4.6
5.2
4.3
5.3 5.4
-
1.0
2.0
3.0
4.0
5.0
6.0
FY15 FY16 FY17 FY18 FY19 FY20 FY21E FY22E FY23E
EBITDA (Rs bn)
0.6 0.4
0.8
1.3
2.2
2.7 2.5
3.3 3.5
-
0.5
1.0
1.5
2.0
2.5
3.0
3.5
4.0
FY15 FY16 FY17 FY18 FY19 FY20 FY21E FY22E FY23E
PAT (Rs bn)
11.9
7.5
11.3
16.9
24.8 27.9
23.5
29.1 29.1
7.0 4.0
8.2
13.2
19.9 21.6
18.6
22.4 21.4
0
5
10
15
20
25
30
35
FY15 FY16 FY17 FY18 FY19 FY20 FY21E FY22E FY23E
RoCE (%) RoE (%)

87
Profit & Loss Statement Y/E Mar (Rs mn) FY19 FY20 FY21E FY22E FY23E
Net Sales 21,094 21,576 19,456 22,752 24,332 % yoy growth 13.4 2.3 (9.8) 16.9 6.9
Total Cost 16,500 16,418 15,145 17,499 18,938
Cost/tone (Rs) 3,369 3,490 3,615 3,590 3,651
Cost of Materials 3,863 3,887 3,599 4,230 4,501
Employee 1,239 1,312 1,443 1,587 1,905
Power & Fuel 5,049 4,736 4,133 4,905 5,324
Freight & Forwarding 3,079 2,879 2,615 3,073 3,303
Others 3,269 3,605 3,355 3,704 3,905
EBIDTA 4,594 5,158 4,310 5,253 5,394 EBIDTA Margin (%) 21.8 23.9 22.2 23.1 22.2 Depreciation and Amortisation 1,018 1,086 1,043 1,067 1,090
Interest 748 738 558 450 388
Other Income 587 647 668 681 800
PBT 3,416 3,981 3,377 4,417 4,715 Tax 1,210 1,300 850 1,112 1,187
% Tax 35.4 32.7 25.2 25.2 25.2
Net Profit 2,207 2,681 2,527 3,306 3,528 YoY Growth (%) 65.7 21.5 (5.7) 30.8 6.7
Net Profit Margin (%) 10.5 12.4 13.0 14.5 14.5
Balance SheetY/E Mar (Rs mn) FY19 FY20 FY21E FY22E FY23E
I. EQUITY AND LIABILITIES Share Capital 2,266 2,266 2,266 2,266 2,266
Reserves & Surplus 9,446 10,881 11,708 13,314 15,143
Total Shareholder's funds 11,712 13,147 13,974 15,580 17,409
Long Term Borrowings 3,918 2,801 1,801 801 501
Deferred Tax Liabilities (net) 1,303 1,903 1,903 1,903 1,903
Other Long Term Liabilities 197 167 161 165 184
Long Term Provisions 691 621 597 614 685
Total NC Liabilities 6,110 5,492 4,461 3,483 3,273
Trade Payables 2,778 2,584 2,485 2,556 2,851
Other Current Liabilities 4,013 4,034 3,879 3,990 4,451
Short Term Provisions 2,342 2,672 2,570 2,643 2,948
Total Curr Liabilities 9,133 9,290 8,934 9,190 10,251
TOTAL LIABILITIES 26,956 27,929 27,370 28,253 30,933 Gross Block 21,378 22,026 22,526 23,026 23,526
Less: Accumulated Depreciation 4,010 5,096 6,139 7,206 8,296
Net Block 17,369 16,930 16,387 15,820 15,230
CWIP 172 160 160 160 160
Total 17,541 17,090 16,547 15,980 15,390
Long Term Loans and Advances 285 288 277 285 317
Other NC Assets 255 309 297 306 341
Current Investments - - 3,000 4,500 6,000
Inventories 1,674 1,458 1,402 1,442 1,608
Receivables 253 257 247 254 283
Cash & Bank 3,377 4,707 1,926 1,708 2,778
ST Loans & Advances 145 138 133 137 152
Other CA 3,425 3,683 3,541 3,643 4,063
Total Current Assets 8,874 10,242 10,249 11,683 14,885
Total Assets 26,956 27,929 27,370 28,253 30,933
Key Financials

88
Cash Flow StatementY/E Mar (Rs mn) FY19 FY20 FY21E FY22E FY23E
Depreciation and Obsolescence 1,018 1,086 1,043 1,067 1,090
Interest & Dividend Income (177) (296) - - -
Interest and Finance Expense 721 705 558 450 388
Others (160) (205) - - -
Operating Profit Before Working Capital Changes
4,818 5,271 4,978 5,934 6,194
Net change in WC (174) 67 (152) 109 451
Tax Paid (713) (751) (850) (1,112) (1,187)
Net Cash from Operating activities 3,931 4,587 3,976 4,931 5,458
Purchase of fixed assets (net) (420) (435) (500) (500) (500)
Investment (net) (4) (3) (3,000) (1,500) (1,500)
Others 160 297 - - -
Net Cash from Investing activities (263) (141) (3,500) (2,000) (2,000)
Proceeds / (Repayment) of Loans (Net) (827) (1,250) (1,000) (1,000) (300)
Finance Costs (639) (591) (558) (450) (388)
Divident Paid (952) (1,227) (1,700) (1,700) (1,700)
Others - (44) - - -
Net Cash from Financing activities (2,419) (3,112) (3,257) (3,150) (2,388)
Net Increase or decrease in Cash 1,249 1,334 (2,781) (219) 1,070
Key RatiosY/E Mar (Rs mn) FY19 FY20 FY21E FY22E FY23E
P/E 19.8 16.3 17.3 13.2 12.4
P/CEPS 13.6 11.6 12.2 10.0 9.5
P/BV 3.7 3.3 3.1 2.8 2.5
EV/EBIDTA 9.9 8.3 9.6 7.4 6.6
EV/Sales 2.2 2.0 2.1 1.7 1.5
EV/tonne (USD) 116 91 88 83 76
Dividend Payout (%) 35.9 38.0 67.3 51.4 48.2
Dividend Yield (%) 1.81 2.33 3.89 3.89 3.89
Adj. OCF Yield 7.5 9.1 7.8 10.2 11.6
Per Share Data (Rs)EPS (Basic) 9.7 11.8 11.2 14.6 15.6
EPS (Diluted) 9.7 11.8 11.2 14.6 15.6
CEPS 14.2 16.6 15.8 19.3 20.4
DPS 3.5 4.5 7.5 7.5 7.5
Book Value 52 58 62 69 77
EBIDTA/tonne 938 1,096 1,029 1,078 1,040
Returns (%)RoCE 24.8 27.9 23.5 29.1 29.1
RoE 19.9 21.6 18.6 22.4 21.4
Turnover ratios (x)Asset Turnover 1.0 1.0 0.9 1.0 1.0
Inventory (days) 31 25 25 25 25
Receivables (days) 5 4 4 4 4
Payables (days) 51 44 44 44 44
WCC (days) -16 -15 -15 -15 -15

89
Great Prospects; Inexpensive Valuation
Mangalam CementCement | India
Institutional Equity Research
BUY2 Year Target Price: Rs
CMP* (Rs) xxx
Upside/ (Downside) (%) xx
Bloomberg Ticker xxx IN
Market Cap. (Rs bn) xxx
Free Float (%) xxx
Shares O/S (mn) xxx Company Update | 18 Aug 2020
1. Mangalam Cement (MGC) is likely to see healthy traction hereon in terms of higher production and volume post COVID-19 scenario, led by 5-year supply agreement for fly-ash.
2. MGC has recently commissioned 75% of its 11MW WHRS unit at Morak, which is expected to save ~Rs250mn annually at 100% utilization level.
3. Higher proportion of PPC production from now onwards, further US$3-4/tonne drop in petcoke prices as indicated by the company and steady realization trend are expected to aid MGC’s operating performance in ensuing quarters.
4. MGC is currently in the process of expanding clinker capacity by 0.3mnT in Kiln-1 Morak via debottlenecking with an estimated capex of Rs1.25bn, which is expected to be completed in next 7-8 months.
5. MGC has established ‘Birla Uttam’ as a strong brand name in Northern and Central (Western Uttar Pradesh) markets. Given strong demand scenario in these markets along with healthy demand supply equation, we expect MGC to witness decent volume, going ahead.
Impact of COVID-19: Following volume loss to the tune of 0.15mnT in Mar’20 and 4QFY20 due to lockdown, MGC witnessed sharp 33% volume drop in 1QFY21. Its plants started functioning from beginning of Jun’20. As per the management, the industry and company’s utilization level for FY21E is likely to be ~65%. However, the management continued to remain skeptical about the demand scenario in coming months due to local lockdowns. We expect MGC to report 13% volume decline in FY21E.
Outlook & ValuationWe maintain our positive stance on MGC in the backdrop of improving operating synergy, healthy market mix and steady pricing scenario. Going ahead, impact of newly commissioned WHRS and higher PPC production are expected to ensure sustainably strong operating performance, which should essentially result in valuation rerating. Current valuations at US$25 and US$20 of EV for FY22E and FY23E, respectively appear to be very attractive. Upgrading EBITDA estimate by 8% for FY22E and rolling over our estimates to FY23E, we maintain BUY on MGC with a revised 2-Year Target Price of Rs295 (4x of 23E EBITDA).
Research Analyst
Binod ModiContact: 022 4303 4626/9870009382Email: [email protected]
Research Associate:
Girija Shankar RayEmail : [email protected]
Key Financials (Rs mn) FY19 FY20 FY21E FY22E FY23ESales 11,996 12,283 10,746 12,797 14,263EBITDA 571 1,994 1,567 2,028 2,225Net Profit (97) 759 451 813 1,198EPS (Rs) (3.6) 28.4 16.9 30.5 44.9DPS (Rs) 0.5 0.5 1.0 1.0 1.0P/E (x) (54.0) 6.9 11.7 6.5 4.4
P/B (x) 1.0 0.9 0.9 0.8 0.6
EV/EBITDA (x) 15.5 4.4 5.3 3.8 2.8
RoE (%) (1.9) 14.1 7.6 12.4 15.9Divi. Yield (%) 0.3 0.3 0.5 0.5 0.5
Source: Company, RSec Research
Share price (%) 1 mth 3 mth 12 mth
Absolute performance -1.1% 28.4% -20.3%
Relative to Nifty -5.2% 15.7% -21.4%
Shareholding Pattern (%) Mar'20 June'20
Promoter 20.8 22.1
Public 79.2 77.9
1 Year Stock Price Performance
Note: * CMP as on 17 Aug 2020
Cement | India
Institutional Equity Research
BUY2 Year Target Price: Rs.295
CMP* 1947
Upside/Downside (%) 50
Bloomberg Ticker MGC IN
Market Cap. (Rs bn) 5
Free Float (%) 78
Shares O/S (mn) 27
Key Triggers:Improved fly-ash availability to result in strong operating performance
Cost savings from its new Waste Heat Recovery Systems (WHRS) unit offers comfort
Clinker expansion of 0.3mnT is progressing well
Trades at significant discount to replacement cost
120
170
220
270
320
370
Jul-
19
Aug
-19
Sep-
19
Oct
-19
Nov
-19
Dec
-19
Jan-
20
Feb-
20
Mar
-20
Apr
-20
May
-20
Jun-
20
Jul-
20

90
Key Criteria Score Risk Comments
Management Quality 5 Medium Management quality cannot be considered strong as financial performance was extremely volatile over the years and it is the only co. which has generated negative FCF in last ten years from our coverage universe
Promoter’s Holding Pledge 9 Low Zero pledge by the promoters offers comfort
Board of Directors Profile 8 Low A perfect blend of experience, expertise and professionalism; there are three independent directors out of total six board members
Industry Growth 8 Low Demand clocked ~7% demand CAGR over last 15 years; expected to be maintained in coming fiscals
Regulatory Environment / Risk 5 Medium Regulatory risk in terms of hike in duties was quite visible historically
Entry Barriers / Competition 5 Medium Any new player with strong capital base can enter into business and competition has been high in the industry
New Business/Client Potential 5 Medium Its presence is limited to Northern markets and Western Uttar Pradesh
Business Diversification 5 Medium The company has no plan for any geographical diversification as of now
Market Share Potential 8 Low It has abundant resources to expand further in case of significant improvement in utilisation
Margin Expansion Potential 8 Low The company has taken up a number to measures to improve operating efficiency
Earnings Growth (10 Years) 7 Low Earnings clocked a negative CAGR of 4% over last ten years; expected to clock 16% CAGR over next three years
Balance Sheet Strength 6 Low Balance sheet strength deteriorated led by volatile operating performance and lower utilisation
Debt Profile 6 Low Net Debt to EBITDA ratio stood at 1.7x and Net Debt to Equity ratio stood at 0.6x in FY20
FCF Generation 6 Low It generated negative FCF of Rs1.4bn in last ten years and is expected to generate Rs3.9bn FCF in next three years
Dividend Policy 8 Low Average dividend payout ratio stood at strong 14%
Total Score Out of 150 99 Low
Percentage Score 66%
Investment Decision Matrix (IDM)
For < 5 Red High Risk For 5 Blue Medium Risk For > 5 Green Low Risk

91
Exhibit 1: Scenario Analysis
FY20 FY21E FY22E FY23E CAGR (FY20-FY23E)
Base Case
Volume (mnT) 2.68 2.33 2.72 3.00 3.8%
Realisation/tonne (Rs) 4,576 4,603 4,708 4,755 1.3%
Revenue 12,283 10,746 12,797 14,263 5.1%
EBITDA 1,994 1,567 2,028 2,225 3.7%
EBITDA/tonne 743 671 746 742
EBITDA margin (%) 16.2 14.6 15.8 15.6
APAT 759 451 813 1,198 16.4%
Target EV/EBITDA multiple (x) 4
Target Price 295
Bull Case
Volume (mnT) 2.68 2.45 2.85 3.15 5.5%
Realisation/tonne (Rs) 4,576 4,803 4,908 4,957 2.7%
Revenue 12,283 11,773 14,008 15,613 8.3%
EBITDA 1,994 2,151 2,714 2,987 14.4%
EBITDA/tonne 743 877 951 948
EBITDA margin (%) 16.2 18.3 19.4 19.1
APAT 759 836 1,266 1,769 32.6%
Target EV/EBITDA multiple (x) 4.5
Target Price 451
Bear Case
Volume (mnT) 2.68 2.22 2.58 2.85 2.0%
Realisation/tonne (Rs) 4,576 4,403 4,508 4,508 -0.5%
Revenue 12,283 9,765 11,641 12,846 1.5%
EBITDA 1,994 1,026 1,392 1,401 -11.1%
EBITDA/tonne 743 463 539 492
EBITDA margin (%) 16.2 10.5 12.0 10.9
APAT 759 94 393 582 -8.5%
Target EV/EBITDA multiple (x) 3.5
Target Price 145
Source: RSec Research
Scenario AnalysisBase Case: In base case scenario, we assume 3.8% volume CAGR in FY20-FY23E with 1.3% growth in realization. Revenue, EBITDA and APAT are expected to clock 5%, 4% and 16% CAGR, respectively over the same period.
Bull Case: In bull case scenario, we assume 5.5% volume CAGR in FY20-FY23E with 2.7% growth in realization. Revenue, EBITDA and APAT are expected to clock 8%, 14% and 33% CAGR, respectively over the same period.
Bear Case: In bear case scenario, we assume 2% volume CAGR in FY20-FY23E with 0.5% de-growth in realization. Revenue, EBITDA and APAT are expected to clock 1.5%, -11% and -9% CAGR, respectively over the same period.

92
I. Improved Fly-ash Availability Bodes WellMGC was impacted in last three years especially after commissioning of 0.8mnT (SGU) in Aligarh. However, for Morak (Rajasthan) unit, the company has started getting fly-ash from Jhalawar power plant (40km away from the plant) at Rs700-800/tonne under recently concluded 5-years supply contract, which helped MGC to ramp-up its PPC production in recent times. We expect MGC’s production to increase further with improvement in construction activities after the COVID-led crisis wanes. On the flip side, fly-ash availability at Aligarh plant is still an issue despite signing supply agreement at Rs250/tonne, for which the capacity utilization for Aligarh SGU continues to remain very low.
II. WHRS & Cost Saving Measures to Aid MarginMGC has recently commissioned 75% of its 11MW WHRS unit at Morak, which is expected to save ~Rs250mn annually at 100% utilization level. Further, higher proportion of PPC production from now onwards, further US$3-4/tonne drop in petcoke prices as indicated by the company and steady realization trend are expected to aid MGC’s operating performance in ensuing quarters. We note that MGC has reported strong EBITDA/tonne in last two quarters despite higher power and fuel cost. Hence, we expect the company to sustain healthy unitary operating performance, going ahead.
III. Clinker Expansion Progressing WellMGC is currently in the process of expanding clinker capacity by 0.3mnT in Kiln-1 Morak via debottlenecking with an estimated capex of Rs1.25bn, which is expected to be completed in next 7-8 months. Commissioning of 0.3mnT clinker capacity will take its total clinker capacity to 2.7mnT as against cement capacity of 4mnT. Cement clinker ratio of 1.5x looks to healthy, which also gives legroom to MGC to enhance cement capacity further with higher PPC production.
IV. Presence in Strong Markets Offers Comfort‘Birla Uttam’ has been established as a strong brand name in Northern and Central (Western Uttar Pradesh) markets. Given strong demand scenario in these markets along with healthy demand supply equation, we expect MGC to witness decent volume traction, going forward.
Exhibit 3: Cost per tonne Analysis and Assumptions (Rs)
Rs/tonne FY17 FY18 FY19 FY20 FY21E FY22E FY23E
Raw Materials 703 705 719 530 583 595 607
Employees 320 320 300 405 499 471 469
Power & Fuel 818 1,088 1,290 1,253 1,190 1,214 1,238
Freight 945 1,068 1,221 1,242 1,255 1,267 1,280
Other Exps. 443 451 328 403 405 414 418
Realisation 3,697 3,944 4,041 4,576 4,603 4,708 4,755
Source: RSec Research
Exhibit 2: Change in Estimates
Y/E Mar FY21E FY22E FY23E
(Rsmn) Old Revised % change Old Revised % change Introduction
Volume (mnT) 2.55 2.3 (8.5) 2.88 2.72 (5.6) 3.00
Sales (Rs mn) 11,702 10,746 (8.2) 13,343 12,797 (4.1) 14,263
Realizations (Rs/tonne) 4,587 4,603 0.4 4,633 4,708 1.6 4,755
EBIDTA (Rs mn) 1,510 1,567 3.8 1,873 2,028 8.3 2,225
EBITDA/tonne (Rs) 592 671 13.4 650 746 14.8 742
Margins (%) 12.9 14.6 14.0 15.8 15.6
PAT (Rs mn) 529 451 (14.8) 979 813 (17.0) 1,198
Source: RSec Research
Investment RationaleOur investment thesis is based on the following premises:I. Improved Fly-ash Availability Bodes WellII. WHRS & Cost Saving Measures to Aid MarginIII. Clinker Expansion Progressing WellIV. Presence in Strong Markets Offers Comfort

93
Exhibit 6: Price Sensitivity at Standalone EBITDA (Rs bn) Growth (%) Fwd EV/EBITDA (x) 3.5 3.8 4 5 6FY17 (-3) 1.2 163.1 7.4 28 41 51 94 138
FY18 (-2) 0.9 -26.6 10.1 -4 5 12 44 76
FY19 (-1) 0.6 -33.8 15.3 -60 -53 -48 -28 -6
FY20 (Base year) 2.0 249.2 4.4 133 155 171 245 319
FY21E (year 1) 1.6 -21.4 5.6 92 110 123 180 239
FY22E (Year 2) 2.0 29.4 4.3 177 200 217 291 367
FY23E (Year 3) 2.2 9.7 3.9 251 276 295 376 460
Source: RSec Research
Key Risks f Further slowdown in demand scenario.
f A steep contraction in prices.
f A sharp increase in input and fuel cost.
51 12
-48
171123
217
295
1.2
0.9
0.6
2
1.6
22.2
0
0.5
1
1.5
2
2.5
(100)
(50)
0
50
100
150
200
250
300
350
FY17 (-3) FY18 (-2) FY19 (-1) FY20 (Base year)
FY21E (year 1)
FY22E (Year 2)
FY23E (Year 3)
Target Price (Rs) EBITDA (Rs bn)
Exhibit 4: EBITDA & Target Price Exhibit 5: EV/EBITDA 1yr Fwd
Source: RSec Research Source: RSec Research
-200
-100
-
100
200
300
400
500
Ma
r-13
Jun-
13
Sep
-13
Dec
-13
Ma
r-14
Jun-
14
Sep
-14
Dec
-14
Ma
r-15
Jun-
15
Sep
-15
Dec
-15
Ma
r-16
Jun-
16
Sep
-16
Dec
-16
Ma
r-17
Jun-
17
Sep
-17
Dec
-17
Ma
r-18
Jun-
18
Sep
-18
Dec
-18
Ma
r-19
Jun-
19
Sep
-19
Dec
-19
Ma
r-20
Jun-
20
8x
9x
10x
11x
12x

94
Exhibit 8: Revenue Trend Exhibit 9: EBITDA Trend
Source: Company, RSec Research Source: Company, RSec Research
Exhibit 10: PAT Trend Exhibit 11: ROCE vs. RoE
Source: Company, RSec Research Source: Company, RSec Research
Exhibit 7: Volume (mt)
Source: Industry, RSec Research
Outlook & Valuations
We maintain our positive stance on MGC in the backdrop of improving operating synergy, healthy market mix and steady pricing scenario. Going ahead, impact of newly commissioned WHRS and higher PPC production are expected to ensure sustainably strong operating performance, which should essentially result in valuation rerating. Current valuations at US$25 and US$20 of EV for FY22E and FY23E, respectively appear to be very attractive. Upgrading EBITDA estimate by 8% for FY22E and rolling over our estimates to FY23E, we maintain BUY on MGC with a revised 2-Year Target Price of Rs295 (4x of 23E EBITDA).
2.4 2.4 2.4
2.8 3.0
2.7
2.3
2.7
3.0
-
0.5
1.0
1.5
2.0
2.5
3.0
3.5
FY15 FY16 FY17 FY18 FY19 FY20 FY21E FY22E FY23E
Volume(mnT)
9.2 8.4
9.0
10.9 12.0 12.3
10.7
12.8
14.3
-
2.0
4.0
6.0
8.0
10.0
12.0
14.0
16.0
FY15 FY16 FY17 FY18 FY19 FY20 FY21E FY22E FY23E
Revenue (Rs bn)
0.9
0.4
1.2
0.9
0.6
2.0
1.6
2.0 2.2
-
0.5
1.0
1.5
2.0
2.5
FY15 FY16 FY17 FY18 FY19 FY20 FY21E FY22E FY23E
EBITDA (Rs bn)
0.18
-0.21
0.37
0.11
-0.10
0.76
0.45
0.81
1.20
-0.4
-0.2
-
0.2
0.4
0.6
0.8
1.0
1.2
1.4
FY15 FY16 FY17 FY18 FY19 FY20 FY21E FY22E FY23E
PAT (Rs bn)
5.9
1.5
10.3
7.1
3.7
17.5
11.6
15.3 16.6
3.5
-4.3
7.5
2.2
-1.9
14.1
7.6
12.4
15.9
(10)
(5)
0
5
10
15
20
FY15 FY16 FY17 FY18 FY19 FY20 FY21E FY22E FY23E
RoCE (%) RoE (%)

95
Profit & Loss Statement Y/E Mar (Rs mn) FY19 FY20 FY21E FY22E FY23E
Net Sales 11,996 12,283 10,746 12,797 14,263 % yoy growth 10.4 2.4 (12.5) 19.1 11.5
Total Cost 11,425 10,289 9,179 10,769 12,039
Raw Materials Consumed 2,130 1,423 1,362 1,617 1,820
Employee Cost 889 1,088 1,164 1,280 1,408
Power & Fuel 3,819 3,363 2,779 3,301 3,715
Selling and Distribution Exp. 3,615 3,334 2,929 3,445 3,839
Other Expenditures 972 1,081 946 1,126 1,255
EBIDTA 571 1,994 1,567 2,028 2,225 EBIDTA Margin (%) 4.8 16.2 14.6 15.8 15.6 Depreciation and Amortisation 461 487 576 596 617
Interest 508 633 620 528 351
Other Income 239 297 312 328 344
PBT (159) 1,171 683 1,232 1,602
Tax (62) 412 232 419 403
% Tax 38.9 35.2 34.0 34.0 25.2
Net Profit (97) 759 451 813 1,198 YoY Growth (%) (185.5)
Net Profit Margin (%) (0.8) 6.2 4.2 6.4 8.4
Balance SheetY/E Mar (Rs mn) FY19 FY20 FY21E FY22E FY23E
I. EQUITY AND LIABILITIES Share Capital 267 267 267 267 267
Reserves & Surplus 4,769 5,492 5,916 6,702 7,874
Total Shareholder's funds 5,036 5,759 6,183 6,969 8,141
Secured Loans 4,056 4,926 4,726 4,226 3,226
Total Debt 4,056 4,926 4,726 4,226 3,226
Other Liabilities 397 465 406 484 540
TOTAL LIABILITIES 9,489 11,149 11,315 11,679 11,906 Gross Block 9,878 11,310 11,720 12,130 12,540
Less: Accumulated Depreciation 1,669 2,156 2,732 3,328 3,945
Net Block 8,209 9,154 8,989 8,802 8,596
Other NC Assets 322 885 774 922 1,028
CWIP 730 207 200 200 200
Investments 330 652 652 652 652
Inventories 1,166 1,642 1,325 1,578 1,759
Sundry Debtors 352 269 294 351 391
Cash & Bank 137 836 1,045 1,212 1,493
Loans & Advances 2,894 2,281 2,326 2,454 2,579
Total Current Assets 4,549 5,028 4,990 5,595 6,221
Current Liablities 3,900 3,984 3,521 3,688 3,958
Provisions 392 228 204 239 267
Net Current Assets 258 816 1,266 1,668 1,996
Net Deferred Tax (360) (565) (565) (565) (565)
Total Assets 9,489 11,149 11,315 11,679 11,906
Key Financials

96
Cash Flow StatementY/E Mar (Rs mn) FY19 FY20 FY21E FY22E FY23E
Net Profit before Tax & Extraordinary Items (159) 1,171 683 1,232 1,602
Depreciation 461 487 576 596 617
Interest (Net) 508 633 620 528 351
Dividend Received (66) (185) - - -
Others (57) (34) - - -
Operating profit before WC Changes 687 2,072 1,879 2,356 2,569
Working Capital Changes 155 201 (130) (383) (154)
Direct Tax 2 (114) (232) (419) (403)
Extraordinary Items - - - - -
Net Cash from Operating Activities 844 2,158 1,516 1,554 2,012
Purchase of Fixed Assets (1,024) (1,672) (403) (410) (410)
Purchase of Investments (2,096) (1,095) - - -
Others 1,357 1,206 - - -
Cash from Investment Activities (1,764) (1,561) (403) (410) (410)
Proceeds from LT Borrowings 2,272 2,285 (200) (500) (1,000)
Dividend Paid (16) (16) (27) (27) (27)
Interest Paid (541) (634) (620) (528) (351)
Others (887) (1,606) (58) 78 55
Cash from Financing Activities 828 29 (905) (977) (1,322)
Net Inc/(Dec) in Cash and Cash Equivalent (93) 627 209 167 281
Key RatiosY/E Mar (Rs mn) FY19 FY20 FY21E FY22E FY23E
P/E (54.0) 6.9 11.7 6.5 4.4
P/CEPS 14.5 4.2 5.1 3.7 2.9
P/BV 1.0 0.9 0.9 0.8 0.6
EV/EBIDTA 15.5 4.4 5.3 3.8 2.8
EV/Sales 15.5 4.4 5.3 3.8 2.8
EV/tonne (US$) 29.5 29.0 27.6 25.4 21.1
Dividend Payout (%) (13.7) 1.8 5.9 3.3 2.2
Dividend Yield (%) 0.3 0.3 0.5 0.5 0.5
OCF Yield (%) 16.0 41.0 28.8 29.6 38.3
Per Share Data (Rs)EPS (Basic) (3.6) 28.4 16.9 30.5 44.9
EPS (Diluted) (3.6) 28.4 16.9 30.5 44.9
CEPS 13.6 46.7 38.5 52.8 68.0
DPS 0.5 0.5 1.0 1.0 1.0
Book Value 189 216 232 261 305
EBIDTA/tone (Rs) 193 743 671 746 742
Returns (%)RoCE 3.7 17.5 11.6 15.3 16.6
RoE (1.9) 14.1 7.6 12.4 15.9
Turnover ratios (x)Asset Turnover (Gross block) 1.2 1.1 0.9 1.1 1.1
Inventory (days) 35 49 45 45 45
Receivables (days) 11 8 10 10 10
Payables (days) 125 141 140 125 120
WCC (days) (78) (85) (85) (70) (65)

97
Sustainability in Operating Performance Holds the Keys
Sagar Cements Cement | India
Institutional Equity Research
BUY2 Year Target Price: Rs
CMP* (Rs) xxx
Upside/ (Downside) (%) xx
Bloomberg Ticker xxx IN
Market Cap. (Rs bn) xxx
Free Float (%) xxx
Shares O/S (mn) xxx Company Update | 18 Aug 2020
1. Acquisition of BMM Cements – concluded in August 2015 – has enabled Sagar Cements (SGC) to scale-up operations and enjoy tremendous synergy by way of savings in freight cost through reducing lead distance in Karnataka, Tamil Nadu and Kerala.
2. Foray into Eastern markets by acquiring 0.3mnT Bayyavaram grinding unit (GU) in FY18 and expanding it to 1.5mnT in FY19 aided SGC to save on logistic cost in the Eastern markets.
3. Southern region witnessed ~17% QoQ price recovery in 1QFY21 led by sharp recovery in AP and Telangana markets, where SGC sells 50-60% of its total volume.
4. Opex/tonne is likely to see further improvement with increase in utilization level and higher volume from newly ventured markets due to superior realization.
5. Ongoing capacity expansion in Satguru Cements (1mnT integrated) and Jajpur (1.5mnT split grinding unit) is expected to be commissioned in early FY22E.
Impact of COVID-19: While volume improved in May’20 on month-on-month basis after the ease of lockdown restrictions at various parts of the country, labour issues and funding constraints continued to pose challenge on demand front. Its utilization stood at ~25-30% in May’20, which improved to >50% in Jun’20. It recorded 32% volume drop in 1QFY21. The company cited that it would take at least 3-4 months to get a proper understanding of the demand outlook for subsequent quarters. We expect SGC to witness 10% volume drop in FY21E.
Outlook & ValuationCurrently, SGC’s opex/tonne is very much comparable with all cement companies now on the back of several cost saving initiatives undertaken by the company over last five years. Further, opex/tonne may see further improvement with increase in utilization level and higher volume from newly ventured markets due to superior realization. Recent improvement in realization in its key markets will lead to healthier operating performance in subsequent quarters. A likely surge in debt level due to large capex programme could be a near-term concern, which can be eased with superior operating performance. Keeping our EBITDA estimate for FY22E broadly unchanged and rolling over our estimates to FY23E, we maintain BUY on SGC with a revised 2-Year Target Price of Rs619 (6x of FY23E EBITDA).
Research Analyst
Binod ModiContact: 022 4303 4626/9870009382Email: [email protected]
Research Associate:
Girija Shankar RayEmail : [email protected]
Key Financials (Rs mn) FY19 FY20 FY21E FY22E FY23ESales 12,176 11,752 12,171 13,776 15,882EBITDA 1,494 1,855 3,110 2,868 3,301Net Profit 136 265 1,131 697 942EPS (Rs) 6.7 11.9 50.8 31.3 42.3DPS (Rs) 1.5 2.5 - 2.5 2.5P/E (x) 70.7 39.6 9.3 15.1 11.1P/B (x) 1.1 1.1 1.0 0.9 0.9
EV/EBITDA (x) 9.6 8.2 5.5 6.2 5.0
RoE (%) 1.7 2.9 11.1 6.3 7.9Divi. Yield (%) 0.3 0.5 - 0.5 0.5
Source: Company; RSec Research
Share price (%) 1 mth 3 mth 12 mth
Absolute performance 19.0% 68.7% -19.1%
Relative to Nifty 15.0% 56.0% -20.2%
Shareholding Pattern (%) Mar'20 June'20
Promoter 50.8 50.9
Public 49.2 49.1
1 Year Stock Price Performance
Note: * CMP as on 17 Aug 2020
Cement | India
Institutional Equity Research
BUY2 Year Target Price: Rs.619
CMP* 471
Upside/Downside (%) 31
Bloomberg Ticker SGC IN
Market Cap. (Rs bn) 10
Free Float (%) 49
Shares O/S (mn) 24
Key Triggers:Long-term advantage of strategic expansion initiatives
Sharp realization recovery in Andhra Pradesh (AP) and Telangana markets
Ongoing expansion to ensure presence in new geographies
Sharp improvement in operating efficiencies over last five years
120
220
320
420
520
620
720
Jul-
19
Aug
-19
Sep-
19
Oct
-19
Nov
-19
Dec
-19
Jan-
20
Feb-
20
Mar
-20
Apr
-20
May
-20
Jun-
20
Jul-
20

98
Key Criteria Score Risk Comments
Management Quality 7 Low The management quality has improved in recent years in terms of prudent decision making; however, this is yet to reflect in financials
Promoter’s Holding Pledge 8 Low 6.6% of promoters holding is pledged
Board of Directors Profile 8 Low A perfect blend of experience, expertise and professionalism; There are three independent directors out of total nine board members
Industry Growth 8 Low Demand clocked ~7% CAGR over last 15 years; expected to be maintained in coming fiscals
Regulatory Environment / Risk 5 Medium Regulatory risk in terms of hike in duties was quite visible historically
Entry Barriers / Competition 5 Medium Any new player with strong capital base can enter into business and competition has been high in the industry
New Business/Client Potential 8 Low Ongoing expansion in Central and Eastern region will help the company to increase its business in ensuing years
Business Diversification 7 Low The company is majorly present in Southern, Eastern and Western Maharashtra; it is also expanding into Central region.
Market Share Potential 8 Low Consistent capacity addition aided the company to gain market share in recent years
Margin Expansion Potential 8 Low The company has taken up a number to measures to improve operating efficiency
Earnings Growth (10 Years) 7 Low Earnings clocked a mere 3% CAGR over last ten years; expected to clock 53% CAGR over next three years
Balance Sheet Strength 8 Low With improvement in balance sheet, the company now generates the best return ratio in the industry
Debt Profile 6 Low Net Debt to EBITDA ratio stood at 2.6x and Net Debt to Equity ratio stood at 0.5x in FY20
FCF Generation 6 Low It generated FCF of Rs0.5bn in last ten years; expected to generate Rs15.7bn FCF in next three years
Dividend Policy 8 Low Average dividend payout ratio stood at strong 16%
Total Score Out of 150 107 Low
Percentage Score 71%
Investment Decision Matrix (IDM)
For < 5 Red High Risk For 5 Blue Medium Risk For > 5 Green Low Risk

99
Exhibit 1: Scenario Analysis
FY20 FY21E FY22E FY23E CAGR (FY20-FY23E)
Base Case
Volume (mnT) 3.13 2.81 3.36 3.85 7.1%
Realisation/tonne (Rs) 3,753 4,328 4,100 4,130 3.2%
Revenue 11,752 12,171 13,776 15,882 10.6%
EBITDA 1,855 3,110 2,868 3,301 21.2%
EBITDA/tonne 592 1,106 854 858
EBITDA margin (%) 15.8 25.6 20.8 20.8
APAT 265 1,131 697 942 52.6%
Target EV/EBITDA multiple (x) 6.0
Target Price 619
Bull Case
Volume (mnT) 3.13 2.95 3.53 3.94 8.0%
Realisation/tonne (Rs) 3,753 4,478 4,250 4,231 4.1%
Revenue 11,752 13,222 14,994 16,679 12.4%
EBITDA 1,855 3,743 3,580 3,804 27.0%
EBITDA/tonne 592 1,268 1,015 965
EBITDA margin (%) 15.8 28.3 23.9 22.8
APAT 265 1,605 1,229 1,318 70.6%
Target EV/EBITDA multiple (x) 6.5
Target Price 847
Bear Case
Volume (mnT) 3.13 2.67 3.19 3.57 4.4%
Realisation/tonne (Rs) 3,753 4,178 3,950 4,031 2.4%
Revenue 11,752 11,162 12,609 14,377 7.0%
EBITDA 1,855 2,519 2,207 2,645 12.6%
EBITDA/tonne 592 943 691 742
EBITDA margin (%) 15.8 22.6 17.5 18.4
APAT 265 689 202 451 19.4%
Target EV/EBITDA multiple (x) 5.5
Target Price 379
Source: RSec Research
Scenario AnalysisBase Case: In base case scenario, we assume 7% volume CAGR in FY20-FY23E with 3.2% growth in realization. Revenue, EBITDA and APAT are expected to clock 11%, 21% and 53% CAGR, respectively over the same period.
Bull Case: In bull case scenario, we assume 8% volume CAGR in FY20-FY23E with 4.1% growth in realization. Revenue, EBITDA and APAT are expected to clock 12%, 27% and 71% CAGR, respectively over the same period.
Bear Case: In bear case scenario, we assume 4.4% volume CAGR in FY20-FY23E with 2.4% growth in realization. Revenue, EBITDA and APAT are expected to clock 7%, 13% and 19% CAGR, respectively over the same period.

100
I. Strategic Expansion Initiatives; Long-term AdvantageSGC has been very active in last five years in terms of expanding its businesses and various strategic initiatives. Acquisition of BMM Cements – concluded in August 2015 – has enabled the company to scale-up operations and enjoy tremendous synergy by way of savings in freight cost through reducing lead distance in Karnataka, Tamil Nadu and Kerala. SGC is estimated to have saved ~Rs150-200/tonne in freight cost due to reduced lead distance, as BMM’s plant is strategically located at Tadipatri in Anantapur district of AP, which shares border with Karnataka and caters to Tamil Nadu, Karnataka and AP markets. It has also reduced lead distance to sub-400 km from 500 km earlier. Further, SGC forayed into Eastern markets by acquiring 0.3mnT Bayyavaram GU in FY18 and expanding it to 1.5mnT in FY19. This also aided SGC to save on logistic cost in the Eastern markets.
II. Sharp Realization Recovery in AP & TelanganaA volatile pricing scenario in its key markets of AP and Telangana adversely impacted SGC’s margin in recent times. However, with recent sharp recovery in cement prices in these key states, SGC’s operating performance is expected to improve substantially in ensuing quarters. AP and Telangana jointly account for 50-60% of SGC’s total sales volume. Further, given minimal capacity addition in Southern region in next three years, the pricing trend is unlikely to witness any sharp deterioration, going forward.
III. Ongoing Expansion Delayed by 3-6 MonthsLockdown and labourers’ exodus have impacted the pace of ongoing capacity expansion programme at Satguru Cements (1mnT integrated) and Jajpur (1.5mnT SGU) units. Now, the company expects the commissioning date to get deferred by 3-6 months depending upon labourers’ availability. It has already incurred ~Rs2bn capex (including Letters of Credit) as against total project cost of Rs8bn for both projects. These capacities are expected to be commissioned in early FY22E, which will enable SGC to venture into Central region as well as to consolidate its presence in Eastern region.
Exhibit 3: Cost per tonne Analysis and Assumptions (Rs)
Rs/tonne FY17 FY18 FY19 FY20 FY21E FY22E FY23E
Raw Materials 474 535 719 726 748 755 763
Employees 280 256 236 286 345 320 299
Power & Fuel 1,235 1,221 1,092 987 958 977 987
Freight 788 899 827 715 729 736 744
Other Exps. 502 424 400 526 541 547 552
Realisation 3,716 3,826 3,664 3,753 4,328 4,100 4,130Source: RSec Research
Exhibit 2: Change in Estimates
Y/E Mar FY21E FY22E FY23E
(Rsmn) Old Revised % change Old Revised % change Introduction
Volume (mnT) 3.20 2.81 (12.1) 4.0 3.36 (15.4) 3.85
Realisation (Rs/tonne) 3,812 4,343 13.9 3,900 4,091 4.9 4,116
Sales (Rs mn) 12,155 12,171 0.1 15,371 13,776 (10.4) 15,882
EBIDTA (Rs mn) 1,695 3,110 83.5 2,357 2,868 21.7 3,301
EBIDTA margins (%) 13.9 25.6 15.3 20.8 20.8
EBITDA/tonne (Rs) 530 1,106 108.7 594 854 43.7 858
APAT (Rs mn) 197 1,131 474.1 546 697 27.6 942
Source: RSec Research
Investment RationaleOur investment thesis is based on the following premises:I. Strategic Expansion Initiatives; Long-term AdvantageII. Sharp Realization Recovery in AP & TelanganaIII. Ongoing Expansion Delayed by 3-6 Months

101
Exhibit 4: EBITDA & Target Price Exhibit 5: EV/EBITDA 1yr Fwd
Source: RSec Research Source: RSec Research
Exhibit 6: Price Sensitivity
EBITDA (Rs bn) Growth (%) Fwd EV/EBITDA (x) 4 5 6 7 8FY17 (-3) 1.1 -10.4 13.4 56 106 155 205 254
FY18 (-2) 1.5 37.1 9.8 83 151 219 287 355
FY19 (-1) 1.5 -1.2 9.9 53 120 187 254 321
FY20 (Base year) 1.9 24.2 8.0 120 203 286 369 453
FY21E (year 1) 3.1 67.7 4.7 263 402 542 682 821
FY22E (Year 2) 2.9 -7.8 5.1 185 314 442 571 700
FY23E (Year 3) 3.3 15.1 4.5 323 471 619 768 916
Key Risks f Further slowdown in demand scenario.
f A steep contraction in prices.
f A sharp increase in input and fuel cost.
-
200
400
600
800
1,000
1,200
Mar
-18
Apr-
18M
ay-1
8
Jun-
18Ju
l-18
Aug-
18
Sep-
18O
ct-1
8
Nov
-18
Dec
-18
Jan-
19
Feb-
19M
ar-1
9
Apr-
19M
ay-1
9
Jun-
19Ju
l-19
Aug-
19
Sep-
19O
ct-1
9
Nov
-19
Dec
-19
Jan-
20
Feb-
20M
ar-2
0
Apr-
20M
ay-2
0
Jun-
20Ju
l-20
7x
8x
10x
14x
12x
155
219187
286
542
442
619
1.1
1.5 1.5
1.9
3.12.9
3.3
0
0.5
1
1.5
2
2.5
3
3.5
0
100
200
300
400
500
600
700
FY17 (-3) FY18 (-2) FY19 (-1) FY20 (Base year)
FY21E (year 1) FY22E (Year 2) FY23E (Year 3)
Target Price (Rs) EBITDA (Rs bn)

102
Exhibit 8: Revenue Trend Exhibit 9: EBITDA Trend
Source: Company, RSec Research Source: Company, RSec Research
Exhibit 10: PAT Trend Exhibit 11: ROCE vs. RoE
Source: Company, RSec Research Source: Company, RSec Research
Exhibit 7: Volume(mt)
Source: Industry, RSec Research
Outlook & ValuationsCurrently, SGC’s opex/tonne is very much comparable with all cement companies now on the back of several cost saving initiatives undertaken by the company over last five years. Further, opex/tonne may see further improvement with increase in utilization level and higher volume from newly ventured markets due to superior realization. Recent improvement in realization in its key markets will lead to healthier operating performance in subsequent quarters. A likely surge in debt level due to large capex programme could be a near-term concern, which can be eased with superior operating performance. Keeping our EBITDA estimate for FY22E broadly unchanged and rolling over our estimates to FY23E, we maintain BUY on SGC with a revised 2-Year Target Price of Rs619 (6x of FY23E EBITDA).
1.6 1.7
2.2
2.7
3.3 3.1
2.8
3.4
3.8
-
0.5
1.0
1.5
2.0
2.5
3.0
3.5
4.0
4.5
FY15 FY16 FY17 FY18 FY19 FY20 FY21E FY22E FY23E
Volume(mnT)
5.8
7.5 8.1
10.4
12.2 11.8 12.2
13.8
15.9
-
2.0
4.0
6.0
8.0
10.0
12.0
14.0
16.0
18.0
FY15 FY16 FY17 FY18 FY19 FY20 FY21E FY22E FY23E
Revenue (Rs bn)
0.6
1.2 1.1
1.5 1.5
1.9
3.1 2.9
3.3
-
0.5
1.0
1.5
2.0
2.5
3.0
3.5
FY15 FY16 FY17 FY18 FY19 FY20 FY21E FY22E FY23E
EBITDA (Rs bn)
3.0
0.4
-0.0
0.3 0.1 0.3
1.1
0.7 0.9
-0.5
-
0.5
1.0
1.5
2.0
2.5
3.0
3.5
FY15 FY16 FY17 FY18 FY19 FY20 FY21E FY22E FY23E
PAT (Rs bn)
10.7
5.9
8.4
6.6 7.9
13.3
9.5 10.8
8.3
-0.6
3.4
1.7 2.9
11.1
6.3
7.9
(2)
0
2
4
6
8
10
12
14
16
FY16 FY17 FY18 FY19 FY20 FY21E FY22E FY23E
RoCE (%) RoE (%)

103
Profit & Loss Statement Y/E Mar (Rs mn) FY19 FY20 FY21E FY22E FY23E
Net Sales 12,176 11,752 12,171 13,776 15,882 % yoy growth 17.3% -3.5% 3.6% 13.2% 15.3%
Total Cost 10,681 9,897 9,061 10,908 12,581
EBIDTA 1,494 1,855 3,110 2,868 3,301
EBIDTA Margin (%) 12.3% 15.8% 25.6% 20.8% 20.8%
EBITDA/tonne (Rs) 450 592 1,106 854 858
Depreciation and Amortisation 657 789 956 1,081 1,171
Interest 634 610 685 900 917
Other Income 29 40 42 44 47
PBT 232 497 1,511 931 1,259 Tax 96 231 380 234 317
% Tax 41.4 46.6 25.2 25.2 25.2
Net Profit 136 265 1,131 697 942 YoY Growth (%) (48.2) 95.2 326.3 (38.4) 35.2
Net Profit Margin (%) 1.1 2.3 9.3 5.1 5.9
Balance SheetY/E Mar (Rs mn) FY19 FY20 FY21E FY22E FY23E
Share Capital 204 223 223 223 223
Reserves & Surplus 8,234 9,444 10,575 11,216 12,102
Total Shareholder's funds 8,438 9,667 10,798 11,439 12,325
Non-Current Liabilities
Long Term Borrowings 3,058 2,872 5,372 6,372 5,872
Deferred Tax Liabilities (net) 411 439 439 439 439
Other Long Term Liabilities 569 1,289 1,289 1,353 1,469
Long Term Provisions 73 97 83 84 86
Total 4,111 4,698 7,184 8,249 7,867
Short Term Borrowings 1,389 1,406 1,606 1,806 1,406
Trade Payables 2,038 2,230 2,230 2,418 2,764
Other Current Liabilities 1,607 1,351 1,445 1,474 1,507
Short Term Provisions 28 36 38 39 40
Total 5,062 5,023 5,319 5,738 5,717
TOTAL LIABILITIES 17,611 19,388 23,300 25,425 25,909 Non-current Assets
Fixed Assets
Tangible Assets 11,783 12,832 13,376 17,295 17,723
In-Tangible Assets 271 592 592 592 592
Capital Work - in- Progress 1,101 1,080 3,580 1,080 180
Goodwill on Consolidation 387 416 416 416 416
Deferred Tax Asets (Net) 328 212 212 212 212
Long - term Loans & Advances 353 1,084 1,084 1,102 1,138
Current Assets
Inventories 1,450 1,158 1,158 1,256 1,435
Receivables 1,156 1,368 1,368 1,483 1,695
Cash & Bank 295 128 996 1,427 1,875
ST Advances 208 39 39 43 49
Other current Assets 279 480 479 520 594
Total Current Assets 3,388 3,172 4,040 4,729 5,649
Total Assets 17,611 19,388 23,300 25,425 25,909
Key Financials

104
Cash Flow StatementY/E Mar (Rs mn) FY19 FY20 FY21E FY22E FY23E
PBT 232 497 1,511 931 1,259
Depreciation 657 789 956 1,081 1,171
Interest and Fin Charges 634 610 685 900 917
Others 16 20 - - -
Cash generated from Operations 1,539 1,916 3,152 2,913 3,348
Change in WC (107) 306 82 8 (10)
Net Cash generated from Operations 1,431 2,222 3,235 2,921 3,338
Income Tax paid (38) (99) (380) (234) (317)
Net Generation from Op. Actitivities 1,393 2,123 2,854 2,686 3,021
Purchase of Fixed Assets (1,954) (2,279) (4,000) (2,500) (700)
Others 36 (25) - - -
Net cash used in Investing Activities (1,918) (2,304) (4,000) (2,500) (700)
Proceed/(Repayment) of Loans (Net) 307 (227) 2,700 1,200 (900)
Proceeds from Issue of Shares & Warrants 566 1,027 - - -
Dividend Paid (37) (62) - (56) (56)
Interest and Finance charges (618) (625) (685) (900) (917)
Others 90 - - - -
Net cash used in Financing Activities 307 113 2,015 244 (1,873)
Net Change in Cash (217) (67) 869 431 448
Key RatiosY/E Mar (Rs mn) FY19 FY20 FY21E FY22E FY23E
P/E 70.7 39.6 9.3 15.1 11.1
P/CEPS 12.1 10.0 5.0 5.9 5.0
P/BV 1.1 1.1 1.0 0.9 0.9
EV/EBIDTA 9.6 8.2 5.5 6.2 5.0
EV/Sales 1.2 1.3 1.4 1.3 1.0
EV/tonne (US$) 45.2 47.8 53.6 56.0 51.8
Dividend Payout (%) 22.5 21.0 0.0 8.0 5.9
Dividend Yield (%) 0.3 0.5 - 0.5 0.5
Per Share Data (Rs)EPS (Basic) 6.7 11.9 50.8 31.3 42.3
EPS (Diluted) 5.8 11.3 48.1 29.7 40.1
CEPS 38.9 47.3 93.7 79.8 94.9
DPS 1.5 2.5 - 2.5 2.5
Book Value 414 434 485 513 553
EBIDTA/tone (Rs) 450 592 1,106 854 858
Returns (%)RoCE 6.6 7.9 13.3 9.5 10.8
RoE 1.7 2.9 11.1 6.3 7.9
Turnover ratios (x)Asset Turnover 0.8 0.7 0.6 0.6 0.6
Inventory (days) 47 35 35 35 35
Receivables (days) 37 42 42 42 42
Payables (days) 66 68 68 68 68
WCC (days) 18 9 9 9 9

105
Valuation Re-rating Unlikely
Kajaria Ceramics Cement | India
Institutional Equity Research
2 Year Target Price: Rs
CMP* (Rs) xxx
Upside/ (Downside) (%) xx
Bloomberg Ticker xxx IN
Market Cap. (Rs bn) xxx
Free Float (%) xxx
Shares O/S (mn) xxx Company Update | 18 Aug 2020
1. Unlike other industries, the tile industry is unlikely to witness meaningful recovery in the near-term owing to delayed recovery in real estate sector and private capex. Hence, volume recovery may not be sharp in subsequent quarters.
2. Owing to wide pricing gap (enjoys price premium ~5%-20%), Kajaria Ceramics (KJE) won’t be able to hike prices even following similar move by the unorganized players. Thus, even though KJE won’t see any traction on margin front in the near-to-medium term, it will continue to generate better margin than peers.
3. Despite a number of measures to improve shop-floor efficiencies, KJE continues to make losses at subsidiary level. Its joint ventures/subsidiaries have been continuously incurring losses over the last three years, which is a key drag on its bottom-line front.
4. KJE has reported a mere ~7% earnings CAGR over last five years despite being the leader in the industry and commanding a strong price premium. Profit CAGR for next three years is expected at ~5%.
Impact of COVID-19: COVID-19 has adversely impacted the consumer sentiment, which has further slowed down the recovery. Further, imminent recovery in rural economy in the medium-term on the back of favourable monsoon and several government initiatives are not enough to boost sectoral demand. Plants were operated at very thin utilization level in May’20 after seeing almost zero utilization in Apr'20. KJC further cited that the plants operated at 26% capacity utilization in June’20, which further improved to 78% in July’20.
Outlook & ValuationProlonged slowdown in real estate sector and delayed revivial of private capex in India have impacted industry’s performance and hence KJE has reported a mere ~7% earnings CAGR over last five years despite being the leader in the industry. While we believe that improvement in KJE’s product-mix should offer some comfort on margin front, we do not expect its RoE to come back to 20% level in the next three years. Hence, we see very limited scope for valuation re-rating for KJE. Downwardly revising our earnings estimate by 52%/22% for FY21E/FY22E and rolling over our valuations to FY23E, we downgrade KJE to SELL with a revised 2-Year Target Price of Rs384 (20x FY23E).
Research Analyst
Binod ModiContact: 022 4303 4626/9870009382Email: [email protected]
Research Associate:
Girija Shankar RayEmail : [email protected]
Key Financials (Rs mn) FY19 FY20E FY21E FY22E FY23ESales 29,562 28,080 24,592 29,865 33,781 EBITDA 4,495 4,159 2,838 4,460 5,261 Net Profit 2,314 2,553 1,207 2,471 3,054 EPS (Rs) 14.2 16.1 7.6 15.5 19.2 DPS (Rs) 3.0 3.0 2.0 3.0 3.0 P/E (x) 28.6 25.4 53.7 26.3 21.2 P/B (x) 4.1 3.8 3.6 3.2 2.9
EV/EBIDTA (x) 14.1 15.4 22.1 13.8 11.5
RoE (%) 15.8 15.5 6.9 13.0 14.3 Div. Yield (%) 0.7 0.7 0.5 0.7 0.7
Source: Company, RSec Research
Share price (%) 1 mth 3 mth 12 mth
Absolute performance 3.1% 34.1% -16.4%
Relative to Nifty -1.0% 21.3% -17.5%
Shareholding Pattern (%) Mar'20 June'20
Promoter 47.6 47.6
Public 52.4 52.4
1 Year Stock Price Performance
Note: * CMP as on 17 Aug 2020
Cement | India
Institutional Equity Research
2 Year Target Price: Rs.384
CMP* 408
Upside/Downside (%) -6
Bloomberg Ticker KJC IN
Market Cap. (Rs bn) 65
Free Float (%) 52
Shares O/S (mn) 159
Key Setbacks: Prolonged slowdown in real estate sector may delay volume recovery
Minimal scope of price recovery to cap operating margin
Continued loss at joint venture/subsidiary level
RoE unlikely to reach 20% in next three years
SELL
270
320
370
420
470
520
570
620
Jul-
19
Aug
-19
Sep-
19
Oct
-19
Nov
-19
Dec
-19
Jan-
20
Feb-
20
Mar
-20
Apr
-20
May
-20
Jun-
20
Jul-
20

106
Key Criteria Score Risk Comments
Management Quality 8 LowThe management has been displaying remarkable perseverance over the years in terms of maintaining industry leadership
Promoter’s Holding Pledge 9 Low Zero share pledging offer comfort
Board of Directors Profile 8 Low A perfect blend of experience, expertise and professionalism with sound track record offers comfort
Industry Growth 5 MediumGiven the cyclicality and slowdown in real estate sector, the industry has been witnessing volatility volatile over the years
Regulatory Environment / Risk 5 Medium Regulatory risk in terms of hike in duties was quite visible historically
Entry Barriers / Competition 4 HighAny new player with strong capital base can enter into business and competition has been high in the industry. Unorganised players still account for ~50% of the total market
New Business/Client Potential 7 Low Strong brand equity always helps to get more customers
Business Diversification 9 Low The company has forayed in to Sanitary ware and Faucet segment
Market Share Potential 8 Low Necessary resources are in place to maintain market share
Margin Expansion Potential 5 Medium Absence of price hike was prime hindrance for margin improvement for last couple of years
Earnings Growth (10 Years) 7 Low Earnings clocked 22% CAGR in 10 year; expected to clock 5% CAGR in next three years
Balance Sheet Strength 7 Low Prudent management of working capital and strong franchise enabled the company to remain net cash rich
Debt Profile 8 Low Net debt to EBITDA ratio stood at -0.2x and Net Debt to Equity ratio stood at -0.1x in FY20
FCF Generation 8 Low It generated FCF of ~Rs5.5bn in last ten years
Dividend Policy 7 Low Average dividend payout ratio stood at 20% in last 10 years
Total Score Out of 150 105 Low
Percentage Score 70% Low
Investment Decision Matrix (IDM)
For < 5 Red High Risk For 5 Blue Medium Risk For > 5 Green Low Risk

107
Exhibit 1: Scenario Analysis
FY20 FY21E FY22E FY23E CAGR (FY20-FY23E)
Base Case
Volume (MSM) 78.1 66.4 79.6 89.2 4.5%
Realisation/SM (Rs) 334 337 339 340 0.7%
Revenue 28,080 24,592 29,865 33,781 6.4%
EBITDA 4,159 2,838 4,460 5,261 8.1%
EBITDA margin (%) 14.8 11.5 14.9 15.6
APAT 2,553 1,207 2,471 3,054 6.2%
Target P/E Multiple (x) 20.0
Target Price 384
Bull Case
Volume (MSM) 78.1 70.3 87.8 102.8 9.6%
Realisation/SM (Rs) 334 344 352 361 2.7%
Revenue 28,080 26,376 33,834 40,527 13.0%
EBITDA 4,159 3,393 5,917 7,834 23.5%
EBITDA margin (%) 14.8 12.9 17.5 19.3
APAT 2,553 1,598 3,530 4,898 24.3%
Target P/E Multiple (x) 25.0
Target Price 770
Bear Case
Volume (MSM) 78.1 62.5 71.8 76.9 -0.5%
Realisation/SM (Rs) 334 335 335 335 0.2%
Revenue 28,080 23,173 26,980 29,195 1.3%
EBITDA 4,159 2,648 3,968 4,467 2.4%
EBITDA margin (%) 14.8 11.4 14.7 15.3
APAT 2,553 1,049 2,057 2,341 -2.9%
Target P/E Multiple (x) 15.0
Target Price 220
Source: RSec Research
Scenario AnalysisBase Case: In base case scenario, we assume 4.5% volume CAGR in FY20-FY23E with 0.7% growth in realization. Revenue, EBITDA and APAT are expected to clock 6%, 8% and 6% CAGR, respectively over the same period.
Bull Case: In bull case scenario, we assume 9.6% volume CAGR in FY20-FY23E with 2.7% growth in realization. Revenue, EBITDA and APAT are expected to clock 13%, 23.5% and 24.3% CAGR, respectively over the same period.
Bear Case: In bear case scenario, we assume a negative volume CAGR of 0.5% in FY20-FY23E with 0.2% growth in realization. Revenue, EBITDA and APAT are expected to clock 1.3%, 2.4% and -2.9% CAGR, respectively over the same period.

108
I. Recovery to Take Relatively Longer TimeUnlike other industries, meaningful recovery in Ceramics & Tiles industry is likely to take longer due to delayed recovery in real estate (residential and commercial) sector and private sector capex. COVID-19 has adversely impacted the consumer sentiment, which has further slowed down real estate development in the country. Further, imminent recovery in rural economy in the medium-term on the back of favourable monsoon and several government initiatives are not enough to revive sectoral demand.
II. Minimal Scope of Price Recovery to Cap Operating MarginKJE continues to enjoy premium pricing to the tune of 5-20% vis-à-vis its peers led by strong brand equity. Thus, any pricing actions would be very difficult especially in a muted demand scenario. Owing to wide pricing gap, the company won’t be able to hike prices even after similar move by the unorganized players. However, even though KJE won’t see any traction on margin front in the near-to-medium term, it will continue to generate better margin than peers.
III. Continued Loss at Joint Venture/Subsidiary LevelDespite a number of measures to improve shop-floor efficiencies, KJE continues to incur losses at subsidiary level. Its joint ventures/subsidiaries have been continuously incurring losses over the years, which is a key drag on its bottom-line front.
Exhibit 3: Cost per tonne Analysis and Assumptions (Rs)
Rs/SM FY17 FY18 FY19 FY20 FY21E FY22E FY23E
Raw Materials 136 147 143 141 148 145 144
Power & Fuel 66 72 77 72 77 75 77
Employee costs 43 44 43 46 48 46 46
Advt. and sales promotion 12 15 11 10 13 13 12
Other expenses 47 35 38 37 43 41 40
Realisation 360 357 343 334 337 339 340
Source: RSec Research
Exhibit 2: Change in Estimates
Y/E Mar FY21E FY22E FY23E
(Rsmn) Old Revised % change Old Revised % change Introduction
Volume (msm) 77.3 66.4 -14.1 85.8 79.6 -7.2 89.2
Avg. Realisation (Rs/SM) 350 337 -3.7 353 339 -4.1 340
Revenue 29,437 24,592 -16.5 33,400 29,865 -10.6 33,781
EBITDA 4,268 2,838 -33.5 5,180 4,460 -13.9 5,261
EBITDA Margin (%) 14.5 11.5 15.5 14.9 15.6
PAT 2,506 1,207 -51.8 3,160 2,471 -21.8 3,054
EPS (Rs) 15.8 7.6 -51.8 19.9 15.5 -21.8 19.2
Source: RSec Research
Rationale for SELL RecommendationOur SELL recommendation is based on the following premises:I. Recovery to Take Relatively Longer TimeII. Minimal Scope of Price Recovery to Cap Operating MarginIII. Continued Loss at Joint Venture/Subsidiary Level

109
Exhibit 4: EBITDA & Target Price Exhibit 5: P/E 1yr Fwd
Source: RSec Research Source: RSec Research
Exhibit 6: Price Sensitivity EPS (Rs) Growth (%) Fwd PE (x) 14 17 20 25 30FY17 (-3) 15.9 25.6 223 270 318 398 477
FY18 (-2) 14.8 -7.1 27.6 207 251 296 369 443
FY19 (-1) 14.2 -3.6 28.6 199 242 285 356 427
FY20 (Base year) 16.1 12.7 25.4 225 273 321 401 482
FY21E (year 1) 7.6 -52.7 53.7 106 129 152 190 228
FY22E (Year 2) 15.5 104.6 26.3 218 264 311 388 466
FY23E (Year 3) 19.2 23.6 21.2 269 327 384 480 576
Source: RSec Research
Key Risks f A better than expected demand recovery from 2HFY21 onwards
f Any meaningful uptick in realisation
f A steep decline in gas prices
0
100
200
300
400
500
600
700
800
Date
Aug-
13
Dec-
13
Apr-1
4
Sep-
14
Jan-
15
Jun-
15
Oct-1
5
Feb-
16
Jul-1
6
Nov-
16
Mar
-17
Aug-
17
Dec-
17
May
-18
Sep-
18
Jan-
19
Jun-
19
Oct-1
9
Feb-
20
Jul-2
0
15x
20x25x
35x
45x
318 296 285 321 152 311 384
15.914.8 14.2
16.1
7.6
15.5
19.2
0
5
10
15
20
25
0
50
100
150
200
250
300
350
400
450
FY17 (-3) FY18 (-2) FY19 (-1) FY20 (Base year)
FY21E (year 1) FY22E (Year 2) FY23E (Year 3)
Target Price (Rs) EBITDA (Rs bn)

110
Exhibit 8: Revenue Trend Exhibit 9: EBITDA Trend
Source: Company, RSec Research Source: Company, RSec Research
Exhibit 10: PAT Trend Exhibit 11: ROCE vs. RoE
Source: Company, RSec Research Source: Company, RSec Research
Exhibit 7: Volume(mt)
Source: Industry, RSec Research
Outlook & ValuationsProlonged slowdown in real estate sector and delayed revivial of private capex in India have impacted industry’s performance and hence KJE has reported a mere ~7% earnings CAGR over last five years despite being the leader in the industry. While we believe that improvement in KJE’s product-mix should offer some comfort on margin front, we do not expect its RoE to come back to 20% level in the next three years. Hence, we see very limited scope for valuation re-rating for KJE. Downwardly revising our earnings estimate by 52%/22% for FY21E/FY22E and rolling over our valuations to FY23E, we downgrade KJE to SELL with a revised 2-Year Target Price of Rs384 (20x FY23E).
58.7 64.3
67.7 72.0
80.3 78.0
66.4
79.6
89.2
-
10.0
20.0
30.0
40.0
50.0
60.0
70.0
80.0
90.0
100.0
FY15 FY16 FY17 FY18 FY19 FY20 FY21E FY22E FY23E
Volume(msm)
21.9 24.1
25.5 27.1
29.6 28.1
24.6
29.9
33.8
-
5.0
10.0
15.0
20.0
25.0
30.0
35.0
40.0
FY15 FY16 FY17 FY18 FY19 FY20 FY21E FY22E FY23E
Revenue (Rs bn)
3.5
4.6 5.0
4.6 4.5 4.2
2.8
4.5
5.3
-
1.0
2.0
3.0
4.0
5.0
6.0
FY15 FY16 FY17 FY18 FY19 FY20 FY21E FY22E FY23E
EBITDA (Rs bn)
1.8
2.3 2.5
2.3 2.3 2.6
1.2
2.5
3.1
-
0.5
1.0
1.5
2.0
2.5
3.0
3.5
FY15 FY16 FY17 FY18 FY19 FY20 FY21E FY22E FY23E
PAT (Rs bn)
35.7 33.6 32.2 31.3
26.0 23.5
18.8
9.6
17.1
27.7 26.4 23.5
18.5 15.8 15.5
6.9
13.0
14.3
-
5.0
10.0
15.0
20.0
25.0
30.0
35.0
40.0
FY15 FY16 FY17 FY18 FY19 FY20 FY21E FY22E FY23E
RoCE (%) RoE (%)

111
Profit & Loss Statement Y/E Mar (Rs mn) FY19 FY20 FY21E FY22E FY23E
Net Sales 29,562 28,080 24,592 29,865 33,781
Total operating income 29,562 28,080 24,592 29,865 33,781
% chg 9.1 (5.0) (12.4) 21.4 13.1
Total Expenditure 25,067 23,921 21,754 25,405 28,521
Cost of Materials 11,464 11,011 9,801 11,532 12,839
Power & Fuel 6,162 5,644 5,085 5,980 6,899
Employee costs 3,455 3,569 3,185 3,663 4,103
Others 3,987 3,698 3,682 4,229 4,680
EBITDA 4,495 4,159 2,838 4,460 5,261
% chg (1.5) (7.5) (31.8) 57.2 18.0
(% of Net Sales) 15.2 14.8 11.5 14.9 15.6
Depreciation& Amortisation 891 1,081 1,210 1,301 1,392
EBIT 3,604 3,078 1,628 3,159 3,868
% chg (2.0) (14.6) (47.1) 94.1 22.5
(% of Net Sales) 12.2 11.0 6.6 10.6 11.5
Interest & other Charges 156 195 155 110 95
Other Income 180 242 165 220 248
(% of PBT) 5.0 7.7 10.1 6.7 6.2
PBT (reported) 3,628 3,125 1,638 3,269 4,021
Tax 1,293 589 412 823 1,012
(% of PBT) 35.6 18.9 25.2 25.2 25.2
PAT 2,336 2,535 1,226 2,446 3,009
% chg 2.5 8.6 (51.7) 99.6 23.0
(% of Net Sales) 7.9 9.0 5.0 8.2 8.9
Minority interest (22) 18 (18) 24 45
Net profit 2,314 2,553 1,207 2,471 3,054
Basic EPS (Rs) 14.2 16.1 7.6 15.5 19.2
Fully Diluted EPS (Rs) 14.2 16.1 7.6 15.5 19.2
% chg (3.6) 12.7 (52.7) 104.6 23.6
Key Financials
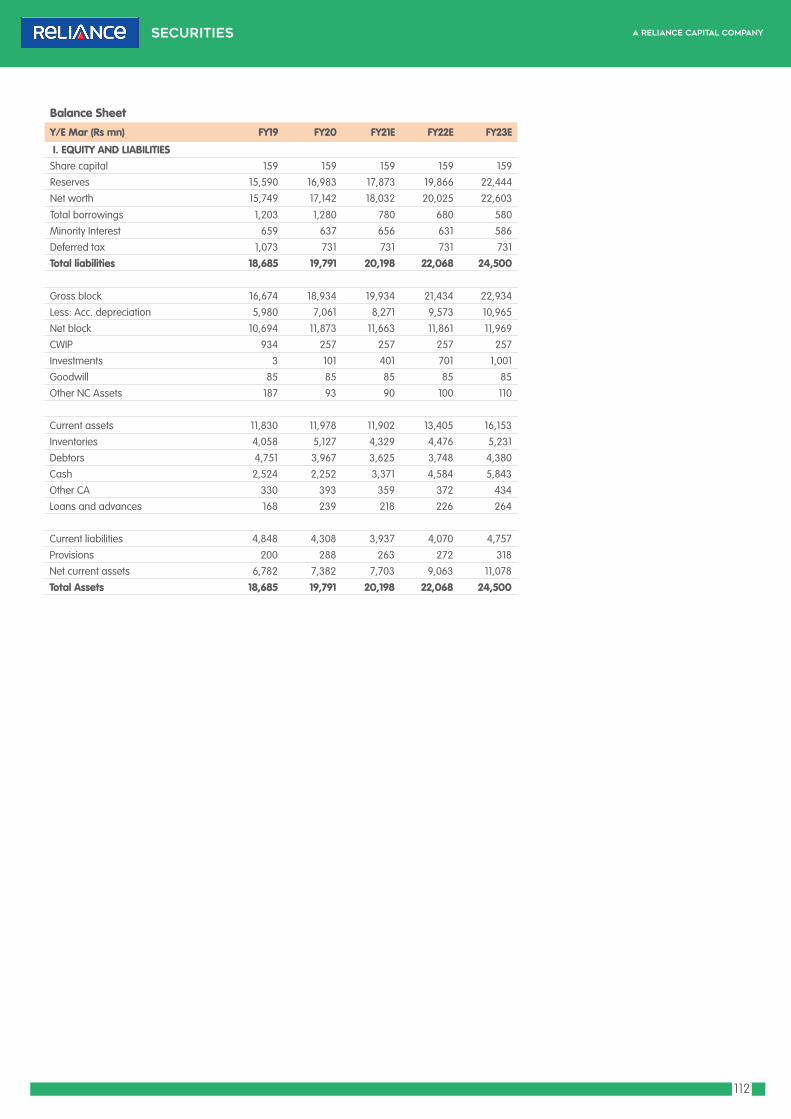
112
Balance SheetY/E Mar (Rs mn) FY19 FY20 FY21E FY22E FY23E
I. EQUITY AND LIABILITIES Share capital 159 159 159 159 159
Reserves 15,590 16,983 17,873 19,866 22,444
Net worth 15,749 17,142 18,032 20,025 22,603
Total borrowings 1,203 1,280 780 680 580
Minority Interest 659 637 656 631 586
Deferred tax 1,073 731 731 731 731
Total liabilities 18,685 19,791 20,198 22,068 24,500
Gross block 16,674 18,934 19,934 21,434 22,934
Less: Acc. depreciation 5,980 7,061 8,271 9,573 10,965
Net block 10,694 11,873 11,663 11,861 11,969
CWIP 934 257 257 257 257
Investments 3 101 401 701 1,001
Goodwill 85 85 85 85 85
Other NC Assets 187 93 90 100 110
Current assets 11,830 11,978 11,902 13,405 16,153
Inventories 4,058 5,127 4,329 4,476 5,231
Debtors 4,751 3,967 3,625 3,748 4,380
Cash 2,524 2,252 3,371 4,584 5,843
Other CA 330 393 359 372 434
Loans and advances 168 239 218 226 264
Current liabilities 4,848 4,308 3,937 4,070 4,757
Provisions 200 288 263 272 318
Net current assets 6,782 7,382 7,703 9,063 11,078
Total Assets 18,685 19,791 20,198 22,068 24,500

113
Cash Flow StatementY/E Mar (Rs mn) FY19 FY20 FY21E FY22E FY23E
Net profit 2,265 2,553 1,207 2,471 3,054
Depn and w/o 891 1,081 1,210 1,301 1,392
Deferred tax -26 -342 0 0 0
Change in working cap 117 993 798 -147 -756
Others -229 -2,235 21 -34 -55
Operating cash flow 3,018 2,050 3,237 3,591 3,636
Capital expenditure -1,235 -1,240 -1,000 -1,500 -1,500
Investments 1 -98 -300 -300 -300
Investing cash flow -1,235 -1,338 -1,300 -1,800 -1,800
Free cash flow 1,783 810 2,237 2,091 2,136
Dividend -575 -1,150 -318 -477 -477
Fresh equity 0 0 0 0 0
Debt/Preference shares -500 77 -500 -100 -100
Financing cash flow -1,075 -1,073 -818 -577 -577
Others -7 -170 0 0 0
Net change in cash 702 -531 1,119 1,214 1,259
Key RatiosY/E Mar (Rs mn) FY19 FY20 FY21E FY22E FY23E
Valuation Ratio (x)
P/E (on FDEPS) 28.6 25.4 53.7 26.3 21.2
P/CEPS 20.6 17.9 26.8 17.2 14.6
P/BV 4.1 3.8 3.6 3.2 2.9
Dividend yield (%) 0.7 0.7 0.5 0.7 0.7
EV/Sales 2.1 2.3 2.5 2.1 1.8
EV/EBITDA 14.1 15.4 22.1 13.8 11.5
Per Share Data (Rs) EPS (Basic) 14.2 16.1 7.6 15.5 19.2
Core EPS 14.2 16.1 7.6 15.5 19.2
Cash EPS 19.8 22.9 15.2 23.7 28.0
DPS 3.0 3.0 2.0 3.0 3.0
Book Value 99.1 107.8 113.4 125.9 142.2
Returns (%)
RoCE 26.0 23.5 18.8 9.6 17.1
RoE 15.8 15.5 6.9 13.0 14.3
Turnover ratios (x) Asset Turnover (Gross Block) 1.8 1.6 1.3 1.5 1.5
Inventory / Sales (days) 50 67 64 55 57
Receivables (days) 59 52 54 46 47
Payables (days) 60 56 58 50 51
Cash conversion cycle (days) 49 62 60 51 52

114
Likely Improvement in Operating Performance May Warrant Re-rating
Somany Ceramics Cement | India
Institutional Equity Research
BUY2 Year Target Price: Rs
CMP* (Rs) xxx
Upside/ (Downside) (%) xx
Bloomberg Ticker xxx IN
Market Cap. (Rs bn) xxx
Free Float (%) xxx
Shares O/S (mn) xxx Company Update | 18 Aug 2020
1. Somany Ceramics (SOMC) has been actively focusing on improving product-mix as well as launching new bath fitting variants, which we expect to aid the company on margin front in ensuing quarters. With improvement in utilization level, we expect SOMC’s margin to improve significantly in FY22E.
2. Despite challenging demand environment, SOMC emphasized on collections which resulted in improvement in receivable cycle to 53 days in FY20 from 89 days in FY19. Improvement in payment collection aided SOMC to witness positive free cash flow (FCF) of Rs825mn after five years.
3. The company has undertaken several cost rationalization measures to mitigate higher fixed cost due to low demand, which should arrest margin erosion in ensuing quarters.
4. SOMC commissioned Glazed Vitrified Tiles (GVT) manufacturing unit in Tirupati (Andhra Pradesh) in 4QFY19 with ~3.5mn annual capacity, which we see as a gateway to southern markets by reducing delivery time and logistic cost. We believe benefit from this would be more pronounced with the pick-up in demand scenario.
Impact of COVID-19: Unlike other industries, any meaningful recovery in Ceramics & Tiles industry is likely to take longer owing to delayed recovery in real estate sector and private sector capex. COVID-19 has adversely impacted the consumer sentiment, which has further slowed down the recovery. While SOMC witnessed zero utilization in Apr’20 and negligible utilization in May’20, its capacity utilization improved to 44% and 66% in June’20 in July’20, respectively mainly due to inventory restocking.
Outlook & ValuationWith likely demand recovery in 2HFY22, SOMC will witness visible improvement in operating parameters, which can result in re-rating of the stock. Again, being the second largest segmental player after Kajaria, we believe SOMC should not trade at a steep discount. At CMP, the stock trades at 9.7x/6.1x for FY22E/FY23E earnings, which is quite attractive in our view. Downwardly revising our earnings estimate by 96%/32% for FY21E/FY22E to factor in soft demand led by COVID-led disruptions and rolling over our estimates to FY23E, we maintain BUY on SOMC with a revised 2-Year Target Price of Rs173 (12x of FY23 Earnings).
Research Analyst
Binod ModiContact: 022 4303 4626/9870009382Email: [email protected]
Research Associate:
Girija Shankar RayEmail : [email protected]
Key Financials (Rs mn) FY19 FY20 FY21E FY22E FY23ESales 17,151 16,101 13,236 15,790 17,883EBITDA 1,634 1,311 981 1,365 1,829Net profit 464 147 (36) 260 610EPS Rs) 12.9 8.1 (0.9) 6.1 14.4DPS (Rs) 2.7 4.0 2.0 3.0 4.0P/E (x) 10.3 16.5 (156.0) 21.7 9.3P/B (x) 0.9 0.9 0.9 0.9 0.9
EV/EBITDA (x) 6.3 7.7 9.1 6.4 4.6
ROE (%) 8.7 2.8 (0.7) 5.1 11.5Dividend yield (%) 2.0 3.0 1.5 2.3 3.0
Source: Company, RSec Research
Share price (%) 1 mth 3 mth 12 mth
Absolute performance 17.8% 51.7% -55.2%
Relative to Nifty 13.7% 39.0% -56.3%
Shareholding Pattern (%) Mar'20 June'20
Promoter 51.5 51.5
Public 48.5 48.5
1 Year Stock Price Performance
Note: * CMP as on 17 Aug 2020
Cement | India
Institutional Equity Research
BUY2 Year Target Price: Rs.173
CMP* 133
Upside/Downside (%) 30
Bloomberg Ticker SOMC.IN
Market Cap. (Rs bn) 6
Free Float (%) 49%
Shares O/S (mn) 42
Key Triggers:Improved product-mix to aid margin expansion
Significant improvement in receivable cycle
Several cost rationalization measures to offer downward protection to margin
Re-rating on the cards with likely improvement in operating performance in 2HFY22
50
100
150
200
250
300
350
400
450
Jul-
19
Aug
-19
Sep-
19
Oct
-19
Nov
-19
Dec
-19
Jan-
20
Feb-
20
Mar
-20
Apr
-20
May
-20
Jun-
20
Jul-
20
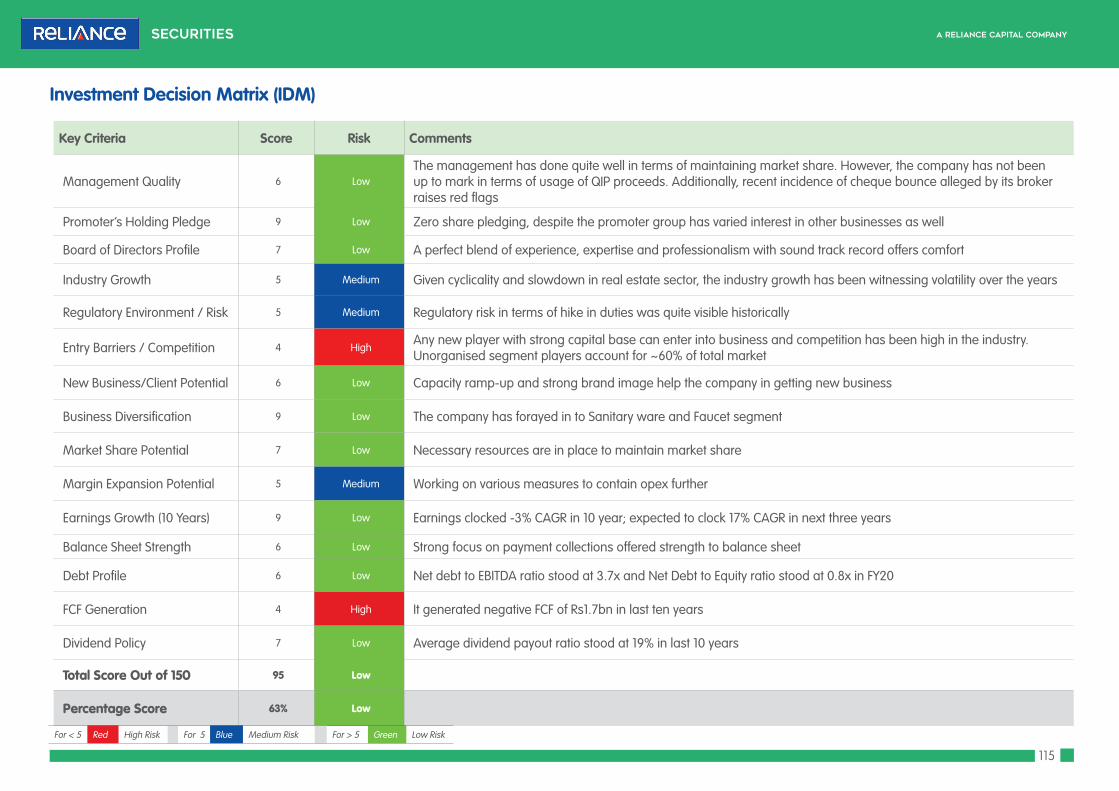
115
Key Criteria Score Risk Comments
Management Quality 6 LowThe management has done quite well in terms of maintaining market share. However, the company has not been up to mark in terms of usage of QIP proceeds. Additionally, recent incidence of cheque bounce alleged by its broker raises red flags
Promoter’s Holding Pledge 9 Low Zero share pledging, despite the promoter group has varied interest in other businesses as well
Board of Directors Profile 7 Low A perfect blend of experience, expertise and professionalism with sound track record offers comfort
Industry Growth 5 Medium Given cyclicality and slowdown in real estate sector, the industry growth has been witnessing volatility over the years
Regulatory Environment / Risk 5 Medium Regulatory risk in terms of hike in duties was quite visible historically
Entry Barriers / Competition 4 HighAny new player with strong capital base can enter into business and competition has been high in the industry. Unorganised segment players account for ~60% of total market
New Business/Client Potential 6 Low Capacity ramp-up and strong brand image help the company in getting new business
Business Diversification 9 Low The company has forayed in to Sanitary ware and Faucet segment
Market Share Potential 7 Low Necessary resources are in place to maintain market share
Margin Expansion Potential 5 Medium Working on various measures to contain opex further
Earnings Growth (10 Years) 9 Low Earnings clocked -3% CAGR in 10 year; expected to clock 17% CAGR in next three years
Balance Sheet Strength 6 Low Strong focus on payment collections offered strength to balance sheet
Debt Profile 6 Low Net debt to EBITDA ratio stood at 3.7x and Net Debt to Equity ratio stood at 0.8x in FY20
FCF Generation 4 High It generated negative FCF of Rs1.7bn in last ten years
Dividend Policy 7 Low Average dividend payout ratio stood at 19% in last 10 years
Total Score Out of 150 95 Low
Percentage Score 63% Low
Investment Decision Matrix (IDM)
For < 5 Red High Risk For 5 Blue Medium Risk For > 5 Green Low Risk

116
Exhibit 1: Scenario Analysis
FY20 FY21E FY22E FY23E CAGR (FY20-FY23E)
Base Case
Volume (MSM) 48.9 39.1 46.1 51.6 1.9%
Relisation/SM (Rs) 298 301 303 304 0.7%
Revenue 16,101 13,236 15,790 17,883 3.6%
EBITDA 1,311 981 1,365 1,829 11.8%
EBITDA margin (%) 8.1 7.4 8.6 10.2
APAT 343 (36) 260 610 21.2%
Target PE Multiple (x) 12
Target Price 173
Bull Case
Volume (MSM) 48.9 41.5 51.1 59.8 6.9%
Relisation/SM (Rs) 298 304 309 313 1.7%
Revenue 16,101 14,095 17,599 20,895 9.1%
EBITDA 1,311 1,171 1,830 2,657 26.6%
EBITDA margin (%) 8.1 8.3 10.4 12.7
APAT 343 106 608 1,229 53.1%
Target PE Multiple (x) 14
Target Price 406
Bear Case
Volume (MSM) 48.9 36.6 41.4 44.3 -3.2%
Relisation/SM (Rs) 298 300 300 300 0.2%
Revenue 16,101 12,446 14,240 15,448 -1.4%
EBITDA 1,311 858 1,088 1,365 1.4%
EBITDA margin (%) 8.1 6.9 7.6 8.8
APAT 343 (128) 53 262 -8.5%
Target PE Multiple (x) 10
Target Price 62
Source: RSec Research
Scenario AnalysisBase Case: In base case scenario, we assume 2% volume CAGR in FY20-FY23E with 0.7% growth in realization. Revenue, EBITDA and APAT are expected to clock 3.6%, 10% and 16.5% CAGR, respectively over the same period.
Bull Case: In bull case scenario, we assume 6.9% volume CAGR in FY20-FY23E with 1.3% growth in realization. Revenue, EBITDA and APAT are expected to clock 8.8%, 22% and 44% CAGR, respectively over the same period.
Bear Case: In bear case scenario, we assume a negative volume CAGR of 3.2% in FY20-FY23E with 0.2% growth in realization. Revenue, EBITDA and APAT are expected to clock -1.4%, -1% and -17.2% CAGR, respectively over the same period.

117
I. Focus in Product-mix to Aid Margin Expansion from FY22ESOMC has been actively focusing on improving product-mix with premium value-added products across tiles segments as well as launching new bath fitting variants. We believe improvement in products-mix along with incremental contribution of high-margin sanitary and bath fittings segment is likely to aid SOMC on margin front in ensuing quarters, and with likely improvement in utilization level, we expect SOMC’s margin to improve significantly in FY22E. Notably, SOMC has been experiencing contraction in average realization for last three years, which we expect to improve albeit marginally in ensuing quarters.
II. Focus on Collection & Cost Rationalization SOMC emphasized on collections in FY20 despite challenging demand environment, which aided the company to improve its receivable cycle from 89 days in FY19 to 53 days in FY20. Improvement in collection aided SOMC to witness positive free cash flow (FCF) of Rs825mn after five years. We expect improvement in balance sheet to negate demand concern to some extent, as strong balance sheet can essentially help the company to materialize the maximum business when demand revives. Additionally, the company has undertaken cost rationalization measures to mitigate higher fixed cost due to low demand, which should arrest margin erosion in the near-term.
III. Benefits of New AP Unit to Flow with Volume Pick-upSOMC has commissioned GVT manufacturing unit in Tirupati (Andhra Pradesh) in 4QFY19 with a capacity of 11,000-12,000 sq meter/day (~3.5mn annual capacity). While Southern market already contributed around 25-30% to its total revenue, SOMC incurs higher logistic cost due to higher lead distance. This plant serves as a geographic gateway to the southern markets by shrinking delivery time at less logistic cost. We believe the benefits from this would be more pronounced with the pick-up in demand scenario.
Exhibit 2: Change in Estimates
Y/E Mar FY21E FY22E FY23E
(Rsmn) Old Revised % change Old Revised % change Introduction
Volume (msm) 49.2 39.1 -20.57 54 46.1 -14.8 51.6
Realisation (Rs/sm) 304 301 -0.96 307 303 -1.4 304
Net Sales 17,640 13,236 -24.97 19,809 15,790 -20.3 17,883
EBITDA 1,537 981 -36.2 1,960 1,365 -30.3 1,829
EBITDA Margin (%) 8.7 7.4 9.9 8.6 10.2
APAT 455 -36 -107.9 766 260 -66.0 610
EPS (Rs) 10.7 -0.9 -108.0 18.1 6.1 -66.1 14.4
Source: RSec Research
Exhibit 3: Cost per tonne Analysis and Assumptions (Rs)
Rs/SM FY17 FY18 FY19 FY20 FY21E FY22E FY23E
Raw Materials 142 143 141 137 143 145 145
Power & Fuel 65 70 72 71 75 72 72
Employee costs 39 44 44 49 50 49 48
Advt. and sales promotion 13 12 10 11 8 10 10
Other expenses 42 39 36 36 37 36 35
Realisation 352 315 298 298 301 303 304
Source: RSec Research
Investment RationaleOur investment thesis is based on the following premises:I. Focus in Product-mix to Aid Margin Expansion from FY22EII. Focus on Collection & Cost RationalizationIII. Benefits of New AP Unit to Flow with Volume Pick-up

118
Exhibit 4: EBITDA & Target Price Exhibit 5: P/E 1yr Fwd
Source: RSec Research Source: RSec Research
Exhibit 6: Price Sensitivity at Standalone EPS (Rs) Growth (%) Fwd PE (x) 8 10 12 13 15FY17 (-3) 23.2 51.7 5.6 185 232 278 301 347
FY18 (-2) 16.6 -28.2 7.8 133 166 199 216 249
FY19 (-1) 10.9 -34.2 11.8 87 109 131 142 164
FY20 (Base year) 3.5 -68.4 37.3 28 35 42 45 52
FY21E (year 1) -0.9 -124.6 -151.3 -7 -9 -10 -11 -13
FY22E (Year 2) 6.1 -819.9 21.0 49 61 74 80 92
FY23E (Year 3) 14.4 134.2 9.0 115 144 173 187 216
Source: RSec Research
Key Risks f A prolonged slowdown in economy due to ongoing pandemic
f Contraction in realisation
f Sharp increase in gas prices
-200
0
200
400
600
800
1000
-
41,4
91
41,6
25
41,7
59
41,8
91
42,0
27
42,16
3
42,2
92
42,4
25
42,5
62
42,6
96
42,8
25
42,9
57
43,0
89
43,2
24
43,3
54
43,4
89
43,6
26
43,7
61
43,8
89
44,0
26
5x
10x
20x
30x
35x278
199
131
42
-10
74
173
23.2
16.6
10.9
3.5
-0.9
6.1
14.4
-5
0
5
10
15
20
25
-50
0
50
100
150
200
250
300
FY17 (-3) FY18 (-2) FY19 (-1) FY20 (Base year)
FY21E (year 1)
FY22E (Year 2)
FY23E (Year 3)
Target Price (Rs) EPS (Rs)

119
Exhibit 8 Revenue Trend Exhibit 9: EBITDA Trend
Source: Company, RSec Research Source: Company, RSec Research
Exhibit 10: PAT Trend Exhibit 11: ROCE vs. RoE
Source: Company, RSec Research Source: Company, RSec Research
Exhibit 7: Volume(mt)
Source: Industry, RSec Research
Outlook & ValuationsWith likely demand recovery in 2HFY22, SOMC will witness visible improvement in operating parameters, which can result in re-rating of the stock. Again, being the second largest segmental player after Kajaria, we believe SOMC should not trade at a steep discount. At CMP, the stock trades at 9.7x/6.1x for FY22E/FY23E earnings, which is quite attractive in our view. Downwardly revising our earnings estimate by 96%/32% for FY21E/FY22E to factor in soft demand led by COVID-led disruptions and rolling over our estimates to FY23E, we maintain BUY on SOMC with a revised 2-Year Target Price of Rs173 (12x of FY23 Earnings).
42.4
46.5 49.7 49.5
51.2 48.9
39.1
46.1
51.6
-
10.0
20.0
30.0
40.0
50.0
60.0
FY15 FY16 FY17 FY18 FY19 FY20 FY21E FY22E FY23E
Volume(msm)
15.4
17.1 17.3 17.1 17.2 16.1
13.2
15.8
17.9
-
2.0
4.0
6.0
8.0
10.0
12.0
14.0
16.0
18.0
20.0
FY15 FY16 FY17 FY18 FY19 FY20 FY21E FY22E FY23E
Revenue (Rs bn)
1.1
1.4
2.3
1.9
1.6
1.3
1.0
1.4
1.8
-
0.5
1.0
1.5
2.0
2.5
FY15 FY16 FY17 FY18 FY19 FY20 FY21E FY22E FY23E
EBITDA (Rs bn)
0.46
0.69
0.99
0.70
0.46
0.34
-0.04
0.26
0.61
-0.2
-
0.2
0.4
0.6
0.8
1.0
1.2
FY15 FY16 FY17 FY18 FY19 FY20 FY21E FY22E FY23E
PAT (Rs bn)
22.4 23.4 26.5
15.2
12.0
7.4
4.1
7.7
12.0
20.9 20.4 22.9
14.4
8.7
2.8
-0.7
5.1
11.5
-5.0
-
5.0
10.0
15.0
20.0
25.0
30.0
FY15 FY16 FY17 FY18 FY19 FY20 FY21E FY22E FY23E
RoCE (%) RoE (%)

120
Profit & Loss Statement Y/E Mar (Rs mn) FY19 FY20 FY21E FY22E FY23E
Net Sales 17,151 16,101 13,236 15,790 17,883 Total operating income 17,151 16,101 13,236 15,790 17,883 % chg 0.1 (6.1) (17.8) 19.3 13.3 Total Expenditure 15,517 14,790 12,255 14,425 16,054
Cost of Materials 7,218 6,673 5,589 6,707 7,487 Power & Fuel 3,699 3,459 2,933 3,323 3,722 Employee costs 2,262 2,390 1,960 2,254 2,480 Others 2,337 2,268 1,772 2,140 2,366 EBITDA 1,634 1,311 981 1,365 1,829 % chg (12.1) (19.8) (25.2) 39.2 34.0 (% of Net Sales) 9.5 8.1 7.4 8.6 10.2 Depreciation& Amortisation 443 590 644 671 698 EBIT 1,191 721 337 694 1,131 % chg (17.6) (39.5) (53.3) 106.0 62.9 (% of Net Sales) 6.9 4.5 2.5 4.4 6.3 Interest & other Charges 459 494 421 396 372 Other Income 192 127 102 122 128 (% of PBT) 20.7 36.0 571.6 29.1 14.5 Exceptionl Item (122.4) (261.8) 0.0 0.0 0.0 Recurring PBT 924 354 18 421 887 % chg (22.0) (61.6) (95.0) 2258.6 111.0 PBT (reported) 801 92 18 421 887 Tax 268 (99) 4 106 223 (% of PBT) 33.5 (107.3) 25.2 25.2 25.2 PAT 533 192 13 315 664 % chg (32.7) (64.0) (93.0) 2258.6 111.0 (% of Net Sales) 3.1 1.2 0.1 2.0 3.7 Minority interest (69) (45) (50) (54) (54) Net profit 464 147 (36) 260 610 APAT 545 343 (36) 260 610 Basic EPS (Rs) 12.9 8.1 (0.9) 6.1 14.4 Fully Diluted EPS (Rs) 12.9 8.1 (0.9) 6.1 14.4 % chg (25.8) (37.1) (110.6) (819.9) 134.2
Balance SheetY/E Mar (Rs mn) FY19 FY20 FY21E FY22E FY23E
Share capital 85 85 85 85 85 Reserves 6,046 5,979 5,859 5,992 6,432
Net worth 6,130 6,064 5,944 6,077 6,517
Total borrowings 5,731 4,980 4,680 4,380 4,080
Minority Interest 867 941 990 1,045 1,099
Deferred tax 532 413 413 413 413
Other NC Liabilities - 549 485 479 556
Total liabilities 13,260 12,947 12,511 12,393 12,665 Gross block 8,039 9,232 9,632 10,032 10,432
Less: Acc. depreciation 983 1,526 2,170 2,841 3,539
Net block 7,056 7,706 7,462 7,191 6,892
CWIP 247 60 60 60 60
Goodwill 44 73 73 73 73
Investments 683 341 341 341 341
Current assets 8,551 7,393 7,241 7,721 8,723
Inventories 2,545 3,282 2,527 2,578 2,952
Debtors 4,179 2,798 2,619 3,094 3,542
Cash 400 201 1,054 991 1,049
Other CA 601 640 650 619 708
Loans and advances 825 472 391 438 472
Current liabilities 3,265 2,530 2,569 2,883 3,301
Provisions 56 96 97 109 125
Net current assets 5,230 4,767 4,575 4,728 5,298
Total Assets 13,260 12,947 12,511 12,393 12,665
Key Financials

121
Cash Flow StatementY/E Mar (Rs mn) FY19 FY20 FY21E FY22E FY23E
PBT 801 92 18 421 887
Depreciation 443 590 644 671 698
Finance Cost 459 494 421 396 372
Others (147) 248 - - -
Operating Profit Before WC Changes 1,556 1,425 1,083 1,488 1,957
Change in Working Capital (381) 255 981 (222) (435)
Income Taxes Refund /(Paid) (315) (152) (4) (106) (223)
Net Cash Flow From Operating Activities 859 1,528 2,059 1,160 1,299
Capex (1,604) (703) (400) (400) (400)
Investment (net) 973 176 - - -
Others (229) 378 - - -
Net Cash Outflow From Investing Activities (861) (148) (400) (400) (400)
Proceeds from Borrowings 2,988 2,886 (300) (300) (300)
Repayment of Loans (2,267) (3,664) - - -
Proceeds/Redemption of Shares 69 - - - -
Interest Paid (410) (456) (421) (396) (372)
Dividend including DDT -138 -204 -85 -127 -170
Net Cash Inflow From Financing Activities 241 (1,438) (806) (823) (841)
Net Increase/ (Decrease) in Cash 239 (58) 853 (63) 58
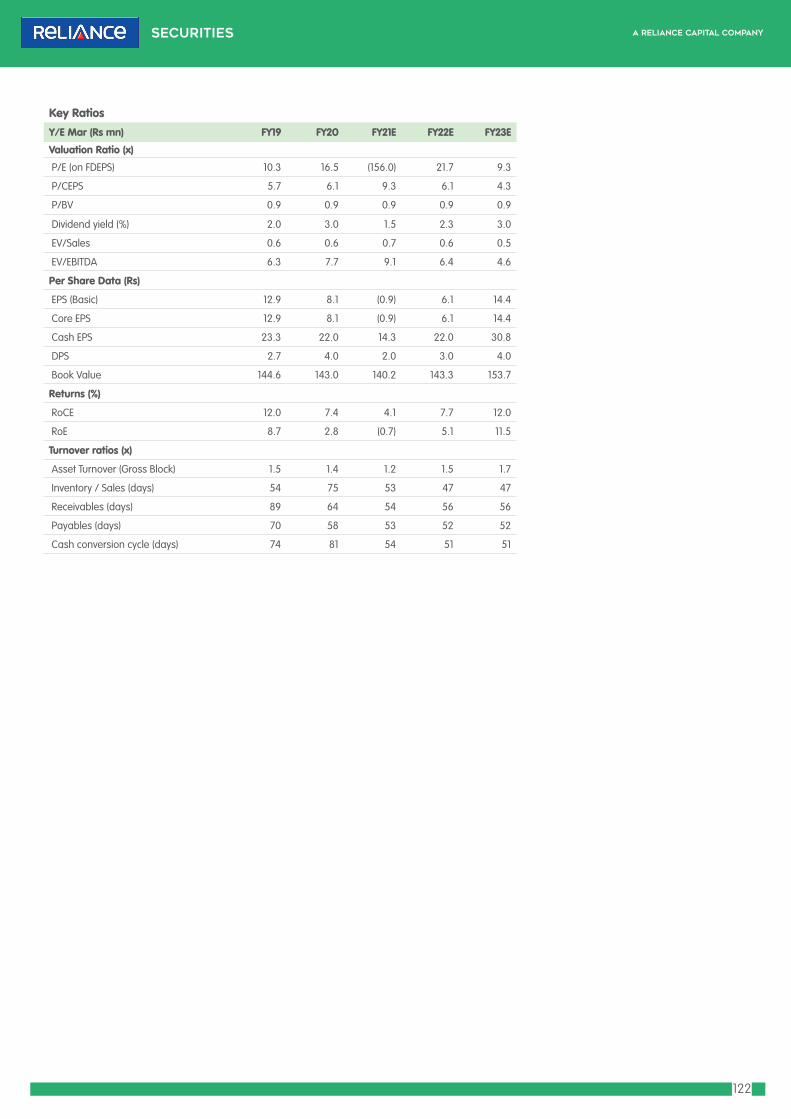
122
Key RatiosY/E Mar (Rs mn) FY19 FY20 FY21E FY22E FY23E
Valuation Ratio (x)
P/E (on FDEPS) 10.3 16.5 (156.0) 21.7 9.3
P/CEPS 5.7 6.1 9.3 6.1 4.3
P/BV 0.9 0.9 0.9 0.9 0.9
Dividend yield (%) 2.0 3.0 1.5 2.3 3.0
EV/Sales 0.6 0.6 0.7 0.6 0.5
EV/EBITDA 6.3 7.7 9.1 6.4 4.6
Per Share Data (Rs)
EPS (Basic) 12.9 8.1 (0.9) 6.1 14.4
Core EPS 12.9 8.1 (0.9) 6.1 14.4
Cash EPS 23.3 22.0 14.3 22.0 30.8
DPS 2.7 4.0 2.0 3.0 4.0
Book Value 144.6 143.0 140.2 143.3 153.7
Returns (%)
RoCE 12.0 7.4 4.1 7.7 12.0
RoE 8.7 2.8 (0.7) 5.1 11.5
Turnover ratios (x)
Asset Turnover (Gross Block) 1.5 1.4 1.2 1.5 1.7
Inventory / Sales (days) 54 75 53 47 47
Receivables (days) 89 64 54 56 56
Payables (days) 70 58 53 52 52
Cash conversion cycle (days) 74 81 54 51 51

123
Reliance Securities Limited (RSL), the broking arm of Reliance Capital is one of the India’s leading retail broking houses. Reliance Capital is amongst India’s leading and most valuable financial services companies in the private sector. Reliance Capital has interests in asset management and mutual funds, life and general insurance, commercial finance, equities and commodities broking, wealth management services, distribution of financial products, private equity, asset reconstruction, proprietary investments and other activities in financial services. The list of associates of RSL is available on the website www.reliancecapital.co.in. RSL is registered as a Research Analyst under SEBI (Research Analyst) Regulations, 2014
General Disclaimers: This Research Report (hereinafter called ‘Report’) is prepared and distributed by RSL for information purposes only. The recommendations, if any, made herein are expression of views and/or opinions and should not be deemed or construed to be neither advice for the purpose of purchase or sale of any security, derivatives or any other security through RSL nor any solicitation or offering of any investment /trading opportunity on behalf of the issuer(s) of the respective security(ies) referred to herein. These information / opinions / views are not meant to serve as a professional investment guide for the readers. No action is solicited based upon the information provided herein. Recipients of this Report should rely on information/data arising out of their own investigations. Readers are advised to seek independent professional advice and arrive at an informed trading/investment decision before executing any trades or making any investments. This Report has been prepared on the basis of publicly available information, internally developed data and other sources believed by RSL to be reliable. RSL or its directors, employees, affiliates or representatives do not assume any responsibility for, or warrant the accuracy, completeness, adequacy and reliability of such information / opinions / views. While due care has been taken to ensure that the disclosures and opinions given are fair and reasonable, none of the directors, employees, affiliates or representatives of RSL shall be liable for any direct, indirect, special, incidental, consequential, punitive or exemplary damages, including lost profits arising in any way whatsoever from the information / opinions / views contained in this Report.
Risks: Trading and investment in securities are subject to market risks. There are no assurances or guarantees that the objectives of any of trading / investment in securities will be achieved. The trades/ investments referred to herein may not be suitable to all categories of traders/investors. The names of securities mentioned herein do not in any manner indicate their prospects or returns. The value of securities referred to herein may be adversely affected by the performance or otherwise of the respective issuer companies, changes in the market conditions, micro and macro factors and forces affecting capital markets like interest rate risk, credit risk, liquidity risk and reinvestment risk. Derivative products may also be affected by various risks including but not limited to counter party risk, market risk, valuation risk, liquidity risk and other risks. Besides the price of the underlying asset, volatility, tenor and interest rates may affect the pricing of derivatives.
Disclaimers in respect of jurisdiction: The possession, circulation and/or distribution of this Report may be restricted or regulated in certain jurisdictions by appropriate laws. No action has been or will be taken by RSL in any jurisdiction (other than India), where any action for such purpose(s) is required. Accordingly, this Report shall not be possessed, circulated and/or distributed in any such country or jurisdiction unless such action is in compliance with all applicable laws and regulations of such country or jurisdiction. RSL requires such recipient to inform himself about and to observe any restrictions at his own expense, without any liability to RSL. Any dispute arising out of this Report shall be subject to the exclusive jurisdiction of the Courts in India.
Disclosure of Interest: The research analysts who have prepared this Report hereby certify that the views /opinions expressed in this Report are their personal independent views/opinions in respect of the securities and their respective issuers. None of RSL, research analysts, or their relatives had any known direct /indirect material conflict of interest including any long/short position(s) in any specific security on which views/opinions have been made in this Report, during its preparation. RSL’s Associates may have other potential/material conflict of interest with respect to any recommendation and related information and opinions at the time of publication of research report. RSL, its Associates, the research analysts, or their relatives might have financial interest in the issuer company(ies) of the said securities. RSL or its Associates may have received a compensation from the said issuer company(ies) in last 12 months for the brokerage or non brokerage services.RSL, its Associates, the research analysts or their relatives have not received any compensation or other benefits directly or indirectly from the said issuer company(ies) or any third party in last 12 months in any respect whatsoever for preparation of this report.
The research analysts has served as an officer, director or employee of the said issuer company(ies)?: No
RSL, its Associates, the research analysts or their relatives holds ownership of 1% or more, in respect of the said issuer company(ies).?: No
Copyright: The copyright in this Report belongs exclusively to RSL. This Report shall only be read by those persons to whom it has been delivered. No reprinting, reproduction, copying, distribution of this Report in any manner whatsoever, in whole or in part, is permitted without the prior express written consent of RSL.
RSL’s activities were neither suspended nor have defaulted with any stock exchange with whom RSL is registered. Further, there does not exist any material adverse order/judgments/strictures assessed by any regulatory, government or public authority or agency or any law enforcing agency in last three years. Further, there does not exist any material enquiry of whatsoever nature instituted or pending against RSL as on the date of this Report.
Important These disclaimers, risks and other disclosures must be read in conjunction with the information / opinions / views of which they form part of.
RSL CIN: U65990MH2005PLC154052. SEBI registration no. (Stock Broker: INZ000172433, Depository Participants: CDSL IN-DP-257-2016 IN-DP-NSDL-363-2013, Research Analyst: INH000002384); AMFI ARN No.29889.
Change in Ratings
f We have shifted to BUY & SELL ratings only and no longer continue with HOLD rating.
f We have also shifted to 2-year Target Price from 1-year Target Price earlier.