Reliance Industries (RELIND) - ICICI Direct
14
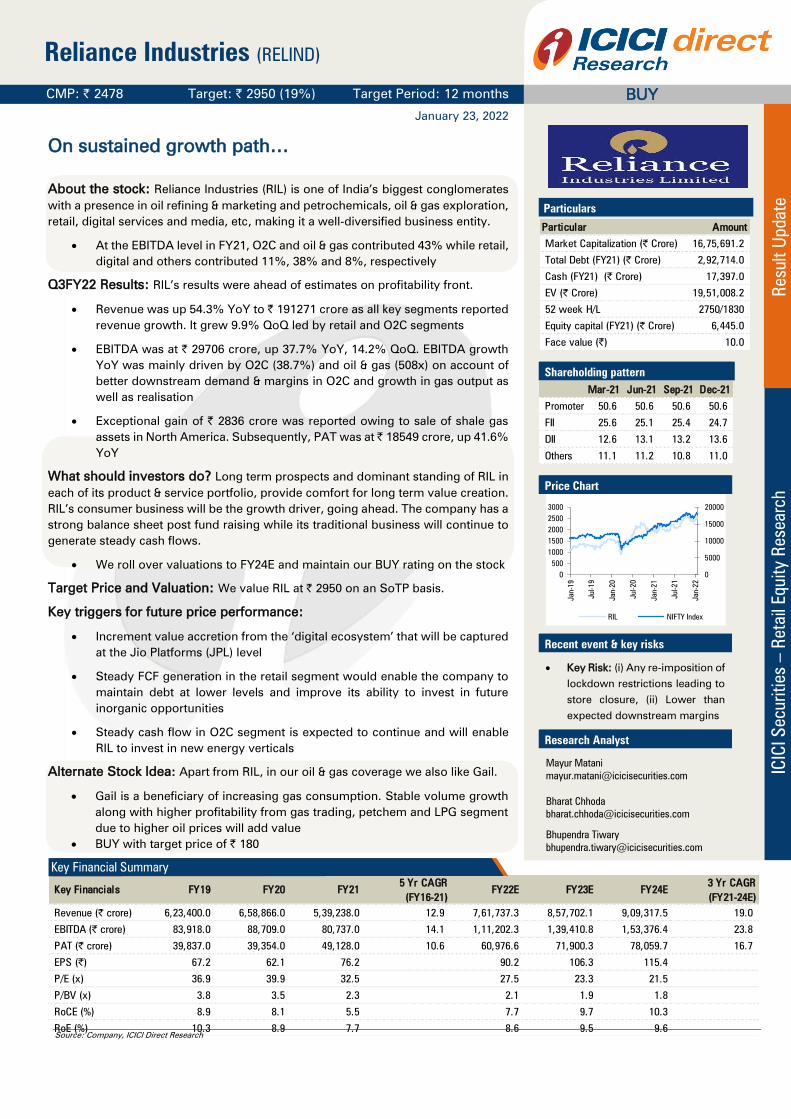
ICICI Securities – Retail Equity Research Result Update January 23, 2022 CMP: | 2478 Target: | 2950 (19%) Target Period: 12 months Reliance Industries (RELIND) BUY On sustained growth path… About the stock: Reliance Industries (RIL) is one of India’s biggest conglomerates with a presence in oil refining & marketing and petrochemicals, oil & gas exploration, retail, digital services and media, etc, making it a well-diversified business entity. At the EBITDA level in FY21, O2C and oil & gas contributed 43% while retail, digital and others contributed 11%, 38% and 8%, respectively Q3FY22 Results: RIL’s results were ahead of estimates on profitability front. Revenue was up 54.3% YoY to | 191271 crore as all key segments reported revenue growth. It grew 9.9% QoQ led by retail and O2C segments EBITDA was at | 29706 crore, up 37.7% YoY, 14.2% QoQ. EBITDA growth YoY was mainly driven by O2C (38.7%) and oil & gas (508x) on account of better downstream demand & margins in O2C and growth in gas output as well as realisation Exceptional gain of | 2836 crore was reported owing to sale of shale gas assets in North America. Subsequently, PAT was at | 18549 crore, up 41.6% YoY What should investors do? Long term prospects and dominant standing of RIL in each of its product & service portfolio, provide comfort for long term value creation. RIL’s consumer business will be the growth driver, going ahead. The company has a strong balance sheet post fund raising while its traditional business will continue to generate steady cash flows. We roll over valuations to FY24E and maintain our BUY rating on the stock Target Price and Valuation: We value RIL at | 2950 on an SoTP basis. Key triggers for future price performance: Increment value accretion from the ‘digital ecosystem’ that will be captured at the Jio Platforms (JPL) level Steady FCF generation in the retail segment would enable the company to maintain debt at lower levels and improve its ability to invest in future inorganic opportunities Steady cash flow in O2C segment is expected to continue and will enable RIL to invest in new energy verticals Alternate Stock Idea: Apart from RIL, in our oil & gas coverage we also like Gail. Gail is a beneficiary of increasing gas consumption. Stable volume growth along with higher profitability from gas trading, petchem and LPG segment due to higher oil prices will add value BUY with target price of | 180 Key Financials FY19 FY20 FY21 5 Yr CAGR (FY16-21) FY22E FY23E FY24E 3 Yr CAGR (FY21-24E) Revenue (| crore) 6,23,400.0 6,58,866.0 5,39,238.0 12.9 7,61,737.3 8,57,702.1 9,09,317.5 19.0 EBITDA (| crore) 83,918.0 88,709.0 80,737.0 14.1 1,11,202.3 1,39,410.8 1,53,376.4 23.8 PAT (| crore) 39,837.0 39,354.0 49,128.0 10.6 60,976.6 71,900.3 78,059.7 16.7 EPS (|) 67.2 62.1 76.2 90.2 106.3 115.4 P/E (x) 36.9 39.9 32.5 27.5 23.3 21.5 P/BV (x) 3.8 3.5 2.3 2.1 1.9 1.8 RoCE (%) 8.9 8.1 5.5 7.7 9.7 10.3 RoE (%) 10.3 8.9 7.7 8.6 9.5 9.6 Particulars Particular Amount Market Capitalization (| Crore) 16,75,691.2 Total Debt (FY21) (| Crore) 2,92,714.0 Cash (FY21) (| Crore) 17,397.0 EV (| Crore) 19,51,008.2 52 week H/L 2750/1830 Equity capital (FY21) (| Crore) 6,445.0 Face value (|) 10.0 Shareholding pattern Mar-21 Jun-21 Sep-21 Dec-21 Promoter 50.6 50.6 50.6 50.6 FII 25.6 25.1 25.4 24.7 DII 12.6 13.1 13.2 13.6 Others 11.1 11.2 10.8 11.0 Price Chart Recent event & key risks Key Risk: (i) Any re-imposition of lockdown restrictions leading to store closure, (ii) Lower than expected downstream margins Research Analyst Mayur Matani [email protected] Bharat Chhoda [email protected] Bhupendra Tiwary [email protected] 0 5000 10000 15000 20000 0 500 1000 1500 2000 2500 3000 Jan-19 Jul-19 Jan-20 Jul-20 Jan-21 Jul-21 Jan-22 RIL NIFTY Index Key Financial Summary Source: Company, ICICI Direct Research
-
Upload
khangminh22 -
Category
Documents
-
view
0 -
download
0
Transcript of Reliance Industries (RELIND) - ICICI Direct
ICIC
I S
ecurit
ies –
Retail E
quit
y R
esearch
Result U
pdate
January 23, 2022
CMP: | 2478 Target: | 2950 (19%) Target Period: 12 months
Reliance Industries (RELIND)
BUY
On sustained growth path…
About the stock: Reliance Industries (RIL) is one of India’s biggest conglomerates
with a presence in oil refining & marketing and petrochemicals, oil & gas exploration,
retail, digital services and media, etc, making it a well-diversified business entity.
At the EBITDA level in FY21, O2C and oil & gas contributed 43% while retail,
digital and others contributed 11%, 38% and 8%, respectively
Q3FY22 Results: RIL’s results were ahead of estimates on profitability front.
Revenue was up 54.3% YoY to | 191271 crore as all key segments reported
revenue growth. It grew 9.9% QoQ led by retail and O2C segments
EBITDA was at | 29706 crore, up 37.7% YoY, 14.2% QoQ. EBITDA growth
YoY was mainly driven by O2C (38.7%) and oil & gas (508x) on account of
better downstream demand & margins in O2C and growth in gas output as
well as realisation
Exceptional gain of | 2836 crore was reported owing to sale of shale gas
assets in North America. Subsequently, PAT was at | 18549 crore, up 41.6%
YoY
What should investors do? Long term prospects and dominant standing of RIL in
each of its product & service portfolio, provide comfort for long term value creation.
RIL’s consumer business will be the growth driver, going ahead. The company has a
strong balance sheet post fund raising while its traditional business will continue to
generate steady cash flows.
We roll over valuations to FY24E and maintain our BUY rating on the stock
Target Price and Valuation: We value RIL at | 2950 on an SoTP basis.
Key triggers for future price performance:
Increment value accretion from the ‘digital ecosystem’ that will be captured
at the Jio Platforms (JPL) level
Steady FCF generation in the retail segment would enable the company to
maintain debt at lower levels and improve its ability to invest in future
inorganic opportunities
Steady cash flow in O2C segment is expected to continue and will enable
RIL to invest in new energy verticals
Alternate Stock Idea: Apart from RIL, in our oil & gas coverage we also like Gail.
Gail is a beneficiary of increasing gas consumption. Stable volume growth
along with higher profitability from gas trading, petchem and LPG segment
due to higher oil prices will add value
BUY with target price of | 180
Key Financials FY19 FY20 FY21 5 Yr CAGR
(FY16-21)
FY22E FY23E FY24E 3 Yr CAGR
(FY21-24E)
Revenue (| crore) 6,23,400.0 6,58,866.0 5,39,238.0 12.9 7,61,737.3 8,57,702.1 9,09,317.5 19.0
EBITDA (| crore) 83,918.0 88,709.0 80,737.0 14.1 1,11,202.3 1,39,410.8 1,53,376.4 23.8
PAT (| crore) 39,837.0 39,354.0 49,128.0 10.6 60,976.6 71,900.3 78,059.7 16.7
EPS (|) 67.2 62.1 76.2 90.2 106.3 115.4
P/E (x) 36.9 39.9 32.5 27.5 23.3 21.5
P/BV (x) 3.8 3.5 2.3 2.1 1.9 1.8
RoCE (%) 8.9 8.1 5.5 7.7 9.7 10.3
RoE (%) 10.3 8.9 7.7 8.6 9.5 9.6
Particulars
Particular Amount
Market Capitalization (| Crore) 16,75,691.2
Total Debt (FY21) (| Crore) 2,92,714.0
Cash (FY21) (| Crore) 17,397.0
EV (| Crore) 19,51,008.2
52 week H/L 2750/1830
Equity capital (FY21) (| Crore) 6,445.0
Face value (|) 10.0
Shareholding pattern
Mar-21 Jun-21 Sep-21 Dec-21
Promoter 50.6 50.6 50.6 50.6
FII 25.6 25.1 25.4 24.7
DII 12.6 13.1 13.2 13.6
Others 11.1 11.2 10.8 11.0
Price Chart
Recent event & key risks
Key Risk: (i) Any re-imposition of
lockdown restrictions leading to
store closure, (ii) Lower than
expected downstream margins
Research Analyst
Mayur Matani
Bharat Chhoda
Bhupendra Tiwary
0
5000
10000
15000
20000
0
500
1000
1500
2000
2500
3000
Jan-1
9
Jul-1
9
Jan-2
0
Jul-2
0
Jan-2
1
Jul-21
Jan-2
2
RIL NIFTY Index
Key Financial Summary
Source: Company, ICICI Direct Research
ICICI Securities | Retail Research 2
ICICI Direct Research
Result Update | Reliance Industries
Key takeaways of recent quarter & conference call highlights
Segmental details
Reliance Jio
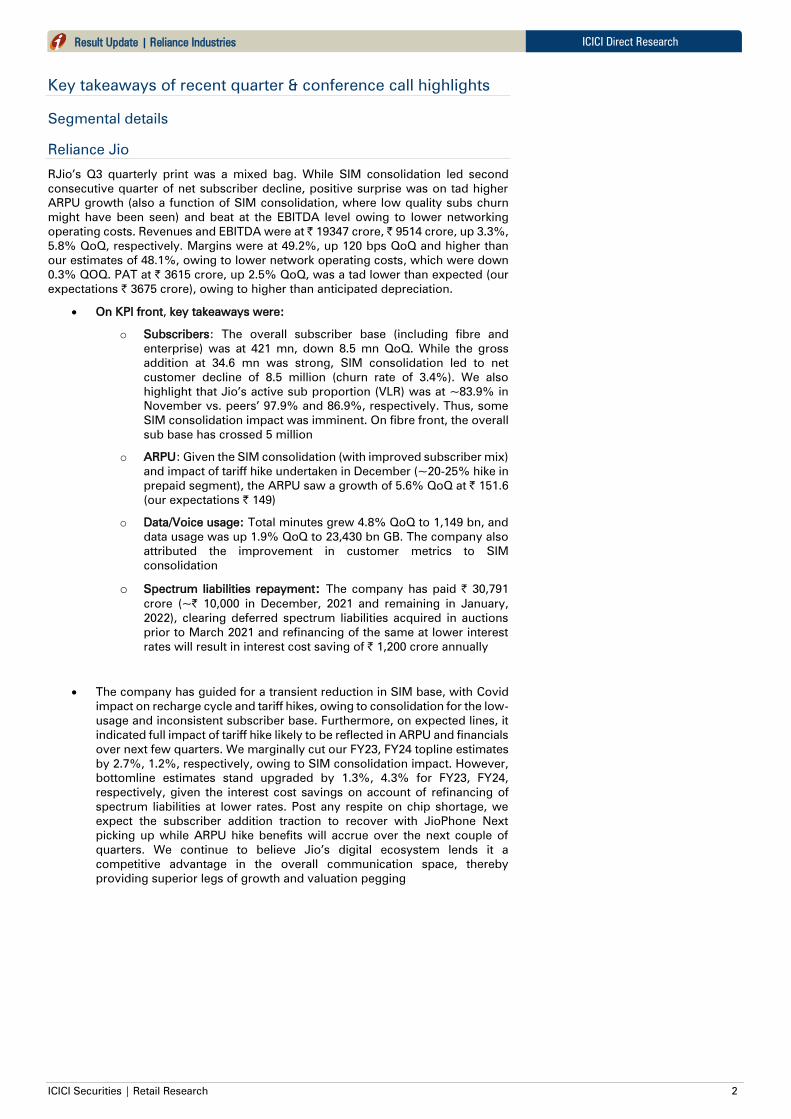
RJio’s Q3 quarterly print was a mixed bag. While SIM consolidation led second
consecutive quarter of net subscriber decline, positive surprise was on tad higher
ARPU growth (also a function of SIM consolidation, where low quality subs churn
might have been seen) and beat at the EBITDA level owing to lower networking
operating costs. Revenues and EBITDA were at | 19347 crore, | 9514 crore, up 3.3%,
5.8% QoQ, respectively. Margins were at 49.2%, up 120 bps QoQ and higher than
our estimates of 48.1%, owing to lower network operating costs, which were down
0.3% QOQ. PAT at | 3615 crore, up 2.5% QoQ, was a tad lower than expected (our
expectations | 3675 crore), owing to higher than anticipated depreciation.
On KPI front, key takeaways were:
o Subscribers: The overall subscriber base (including fibre and
enterprise) was at 421 mn, down 8.5 mn QoQ. While the gross
addition at 34.6 mn was strong, SIM consolidation led to net
customer decline of 8.5 million (churn rate of 3.4%). We also
highlight that Jio’s active sub proportion (VLR) was at ~83.9% in
November vs. peers’ 97.9% and 86.9%, respectively. Thus, some
SIM consolidation impact was imminent. On fibre front, the overall
sub base has crossed 5 million
o ARPU: Given the SIM consolidation (with improved subscriber mix)
and impact of tariff hike undertaken in December (~20-25% hike in
prepaid segment), the ARPU saw a growth of 5.6% QoQ at | 151.6
(our expectations | 149)
o Data/Voice usage: Total minutes grew 4.8% QoQ to 1,149 bn, and
data usage was up 1.9% QoQ to 23,430 bn GB. The company also
attributed the improvement in customer metrics to SIM
consolidation
o Spectrum liabilities repayment: The company has paid | 30,791
crore (~| 10,000 in December, 2021 and remaining in January,
2022), clearing deferred spectrum liabilities acquired in auctions
prior to March 2021 and refinancing of the same at lower interest
rates will result in interest cost saving of | 1,200 crore annually
The company has guided for a transient reduction in SIM base, with Covid
impact on recharge cycle and tariff hikes, owing to consolidation for the low-
usage and inconsistent subscriber base. Furthermore, on expected lines, it
indicated full impact of tariff hike likely to be reflected in ARPU and financials
over next few quarters. We marginally cut our FY23, FY24 topline estimates
by 2.7%, 1.2%, respectively, owing to SIM consolidation impact. However,
bottomline estimates stand upgraded by 1.3%, 4.3% for FY23, FY24,
respectively, given the interest cost savings on account of refinancing of
spectrum liabilities at lower rates. Post any respite on chip shortage, we
expect the subscriber addition traction to recover with JioPhone Next
picking up while ARPU hike benefits will accrue over the next couple of
quarters. We continue to believe Jio’s digital ecosystem lends it a
competitive advantage in the overall communication space, thereby
providing superior legs of growth and valuation pegging

ICICI Securities | Retail Research 3
ICICI Direct Research
Result Update | Reliance Industries
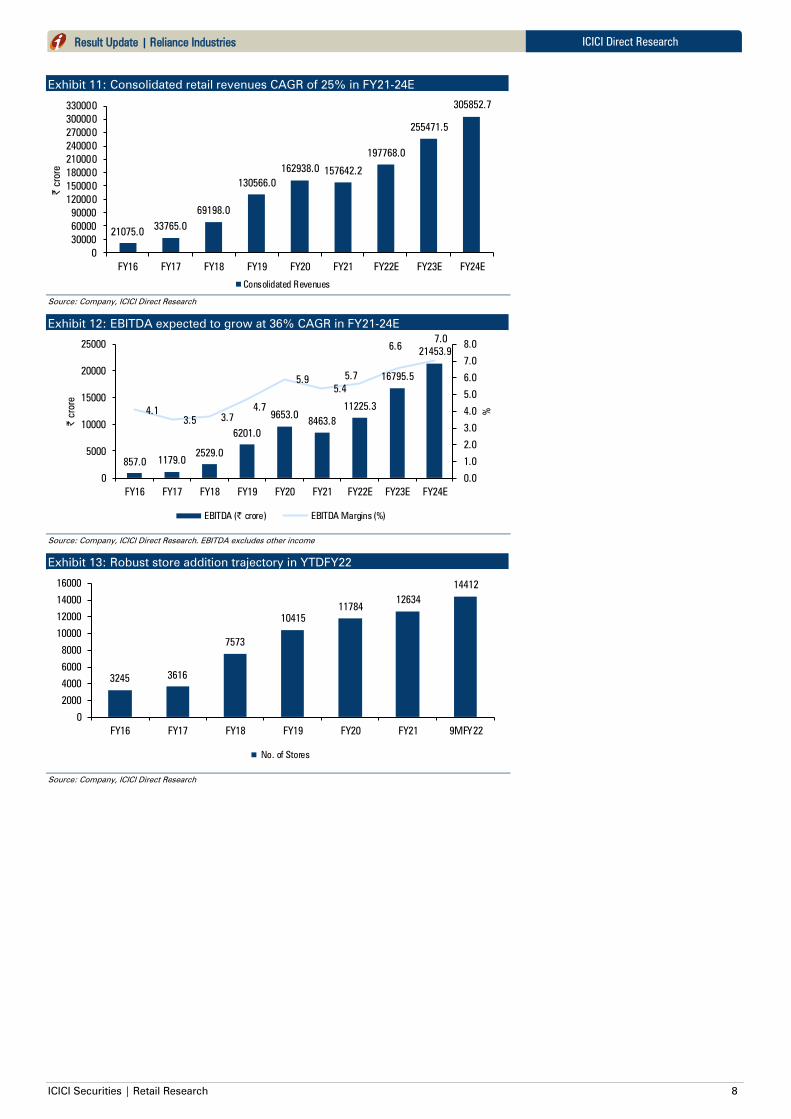
Reliance Retail: Robust store addition trajectory continues
Reliance Retail reported one of its best quarterly performance on account of record
number of store additions (837 added in Q3FY22) and normalisation of footfalls to
pre-Covid levels (95%). Revenues for Q3FY22 crossed the | 50,000 crore mark and
grew 53% YoY (27% QoQ) to | 57714 crore (I-direct estimate: | 52600 crore). Core
retail revenue (excluding connectivity) grew 90% YoY. The management during the
call highlighted that demand was robust across all consumption categories, with
fashion and electronics segment outperforming (2x YoY growth). On the profitability
front, EBITDA margins (excluding other investments) remained constant YoY at
6.1%, with absolute EBITDA increasing 53% YoY to | 3522 crore (I-direct estimate:
| 3576 crore). Other income came in at | 300 crore vs. | 775 crore in Q3FY21. The
company continues to fill white spaces through acquisitions; as it bought 25.8% in
Dunzo for US$200 mn (India’s leading last mile delivery and quick commerce player),
acquired ‘Jaisuryas’ (leading grocery chain in South India), and stakes in ‘Amante’
(premium woman intimate-wear brand), Kalanikethan (leading saree and ethnic wear
retailer). For YTDFY22, it has spent ~| 7600 crore towards acquiring new businesses.
The company in YTDFY22 added ~1778 stores (850, 1369 added in FY21, FY20,
respectively) taking total store count to 14412 (40.0 million sq ft). The company also
added 73 new supply chain locations to strengthen its omni-channel play. Digital
commerce orders (up 2x YoY) and merchant partnerships (up 4x YoY) continue to
scale new highs. While the new strain has resulted in sporadic disruptions, the
company expects to accelerate the growth momentum with normalisation of the
operating environment. Reliance Retail’s widespread physical store network would
further enhance its omni channel capabilities and position it as a frontrunner to
garner consistent business growth by capturing a larger pie of the Indian retail sector
opportunity. We roll our estimates to FY24E and model in revenue, EBITDA CAGR of
25% and 36% in FY21-24E.
Fashion & lifestyle:
Apparel and footwear registered highest quarterly sales with sales up 2x
YoY driven by festive and winter-wear. Footfalls back to pre-Covid levels
with conversion ratio and average transaction higher than pre-Covid levels
Trends “Small Town” (tier III/!V cities) launched its 500th
store with highest
ever monthly sales.
AJIO sustained its strong track record (3x YoY), with monthly active users
up 2x YoY. The business grew its catalogue 2x YoY by adding national and
regional brands to its offerings
In the luxury/premium brands business, revenue grew 2x YoY with
resumption of mall stores and pick up in footfalls
Grocery:
Grocery continued its growth trajectory and registered all-time high revenue
and record store sales driven by higher bill values and footfall recovery
JioMart created new high with 10x growth in merchant base
Launched experiential premium gourmet superstore. ‘Freshpik’, in JioWorld
drive in Mumbai. Expansion planned in this format
Consumer electronics:
Consumer electronics registered its best ever Diwali sales with conversion
and average basket value at record high. Revenues doubled YoY, boosted
from sale of devices
Broad based double double-digit growth across all key categories like
phones, TVs and home appliances

ICICI Securities | Retail Research 4
ICICI Direct Research
Result Update | Reliance Industries
Energy segments
O2C profitability marginally below estimates; E&P growth continues
O2C revenue was at | 131427 crore, up 56.8% YoY, 9.1% QoQ, ahead of
our estimate of | 124448 crore. Higher demand across key segments led to
revenue growth
EBITDA grew 38.7% YoY (6.4% QoQ) to | 13530 crore, marginally below
our estimate of | 14570 crore, mainly due to increase in feedstock prices.
On a QoQ basis, higher feedstock and product prices limited growth in
EBITDA
O2C EBITDA is expected at | 52748.1 crore in FY22E. Going ahead, we
estimate O2C EBITDA at | 60296.6 crore and | 61565 crore in FY23E and
FY24E, respectively, as we estimate stability in GRMs with economic
recovery over medium term
E&P segment revenue was driven by increase in realisation for gas output
from KG basin. Revenue at | 2599 crore was up 493.7% YoY (and 55.7%
QoQ). Domestic production was 42.2 BCFe, up 1% QoQ
Both KG-D6 and CBM realisation improved QoQ. KG-D6 realisation
increased 69% post revision in gas prices in October that led to EBITDA
growth. EBITDA was at | 2033 crore vs. EBITDA of | 1071 crore in Q2FY22
and EBITDA of | 4 crore in Q3FY21
We revise estimates taking into account current oil & gas prices trend. Gas
realisation is expected to remain healthy in the near term, which augurs well
for the segment. E&P EBITDA is expected at | 5371.2 crore. Going ahead,
we estimate E&P EBITDA at | 10129.8 crore and | 12204.9 crore in FY23E
and FY24E, respectively.

ICICI Securities | Retail Research 5
ICICI Direct Research
Result Update | Reliance Industries
Exhibit 1: Variance Analysis
Q3FY22 Q3FY22E Q3FY21 YoY (% ) Q2FY22 QoQ (% ) Comments
Total Revenues 1,91,271.0 1,79,317.6 1,23,997.0 54.3 1,74,104.0 9.9Above estimates mainly on account of higher than
expected O2C and retail revenue
Raw materials costs 1,26,169.0 1,14,092.2 72,249.0 74.6 1,13,429.0 11.2
Employees Cost 4,660.0 4,583.5 4,244.0 9.8 4,580.0 1.7
Other Expenses 30,736.0 30,331.4 25,938.0 18.5 -15,578.0 -297.3
Total Expenditure 1,61,565.0 1,49,007.1 1,02,431.0 57.7 1,02,431.0 57.7
EBITDA 29,706.0 30,310.5 21,566.0 37.7 26,020.0 14.2 Broadly in line with expectations
EBITDA margins (%) 15.5 16.9 17.4 -186 bps 14.9 59 bps
Depreciation 7,683.0 7,378.0 6,665.0 15.3 7,230.0 6.3
EBIT 22,023.0 22,932.5 14,901.0 47.8 18,790.0 17.2
Interest 3,812.0 3,250.0 4,326.0 -11.9 3,819.0 -0.2
Other Income 4,180.0 4,000.0 4,528.0 -7.7 4,263.0 -1.9
Extra Ordinary Item 2,836.0 0.0 -121.0 NA 0.0 NAExceptional gain on account of sale of shale gas assets
in North America
PBT 25,227.0 23,682.5 14,982.0 68.4 19,234.0 31.2
Total Tax 4,688.0 5,968.0 88.0 5,227.3 3,755.0 24.8
PAT 18,549.0 15,615.0 13,101.0 41.6 13,680.0 35.6
Key Metrics
Exchange rate (|/$) 75.0 75.0 73.8 1.6 74.1 1.2
ARPU (|) 151.6 149.3 151.0 0.4 143.6 5.6
Subscribers (mn) 421.0 437.5 410.8 2.5 429.5 -2.0
Retail revenue (| crore) 57717.0 52599.0 36887.0 56.5 45450.0 27.0 Store addition: 837, footfalls: 95%
Retail EBITDA (| crore) 3835.0 3963.0 3102.0 23.6 2923.0 31.2EBITDA margins (excluding other investments) remained
constant YoY at 6.1%.
O2C EBITDA (| crore) 13530.0 14569.7 9756.0 38.7 12720.0 6.4 Lower than estimates
E&P EBITDA (| crore) 2033.0 1564.8 4.0 50,725.0 1071.0 89.8
Source: Company, ICICI Direct Research
Exhibit 2: Change in estimates
(| Crore) Old New % Change Old New % Change
Revenue 752856.0 761737.3 1.2 855223.1 857702.1 0.3
EBITDA 1,11,763.0 1,11,202.3 -0.5 142895.1 1,39,410.8 -2.4Marginal revision in estimates across key segments led
to change in estimates
EBITDA Margin (%) 14.8 14.6 -25 bps 16.7 16.3 -45 bps
PAT 57,867.7 60,976.6 5.4 74189.3 71,900.3 -3.1
EPS (|) 85.6 90.2 5.4 109.7 106.3 -3.1
FY22E FY23E
Source: Company, ICICI Direct Research
Exhibit 3: Assumptions
FY20 FY21 FY22E FY23E FY22E FY23E
Exchange rate (|/$) 70.8 74.0 74.3 74.5 74.2 74.0
ARPU (|) 130.4 143.1 146.3 163.2 146.3 163.2
Subscribers 387.5 426.2 434.4 463.4 458.4 476.9 Realigned estimates post Q3FY22 results
Retail revenue (| crore) 163029.0 153818.0 197167.0 255661.0 193571.0 246317.0
Retail EBITDA (| crore) 9695.0 9842.0 12780.0 17774.4 13271.0 18596.1
O2C EBITDA (| crore) 53803.0 38170.0 52748.1 60296.6 52608.5 61396.6
E&P EBITDA (| crore) 353.0 258.0 5371.2 10129.8 5208.5 10998.4
Gas output (mmscmd) 9.8 8.3 15.1 16.4 16.1 20.1Revised gas output estimates post sale of shale gas
assets
Current Earl ier
Source: Company, ICICI Direct Research

ICICI Securities | Retail Research 6
ICICI Direct Research
Result Update | Reliance Industries
Exhibit 4: Jio Variance Analysis
Q3FY22 Q3FY22E Q3FY21 Q2FY22 YoY (% ) QoQ (% ) Comments
Revenue 19,347 19,387 18,492 18,735 4.6 3.3Topline in line as lower sub was offset by superior
ARPU
Other Income 155 17 52 14 198.1 1,007.1
Network operating expenses 6,243 6,476 5,653 6,264 10.4 -0.3
Access charges 229 220 1,549 217 -85.2 5.5
Employee cost 361 360 343 355 5.2 1.7
Selling & Distribution expenses 269 267 298 264 -9.7 1.9
Other expenses 479 461 496 452
EBITDA 9,514 9,333 8,114 8,989 17.3 5.8EBITDA beat owing to lower networking operating
costs
EBITDA Margin (%) 49.2 48.1 43.9 48.0 530 bps 120 bps
Depreciation 3,568 3,208 2,910 3,188 22.6 11.9
Interest 1,254 1,213 850 1,084 47.5 11.9
Exceptional Items 0 0 0 0 NA NA
Total Tax 1,232 1,253 1,115 1,203 10.5 2.4
PAT 3,615 3,675 3,291 3,528 9.8 2.5
Subs (mn) 421 438 411 430 2.5 -2.0
While tha gross addition at 34.6 mn was robust, SIM
consolidation led to net customer decline of 8.5
million
ARPU (|) 152 149 151 144 0.4 5.6ARPU growth was driven by partial pass through of
tariff hike undertaken in December, 2021
Source: Company, ICICI Direct Research
ICICI Securities | Retail Research 7
ICICI Direct Research
Result Update | Reliance Industries
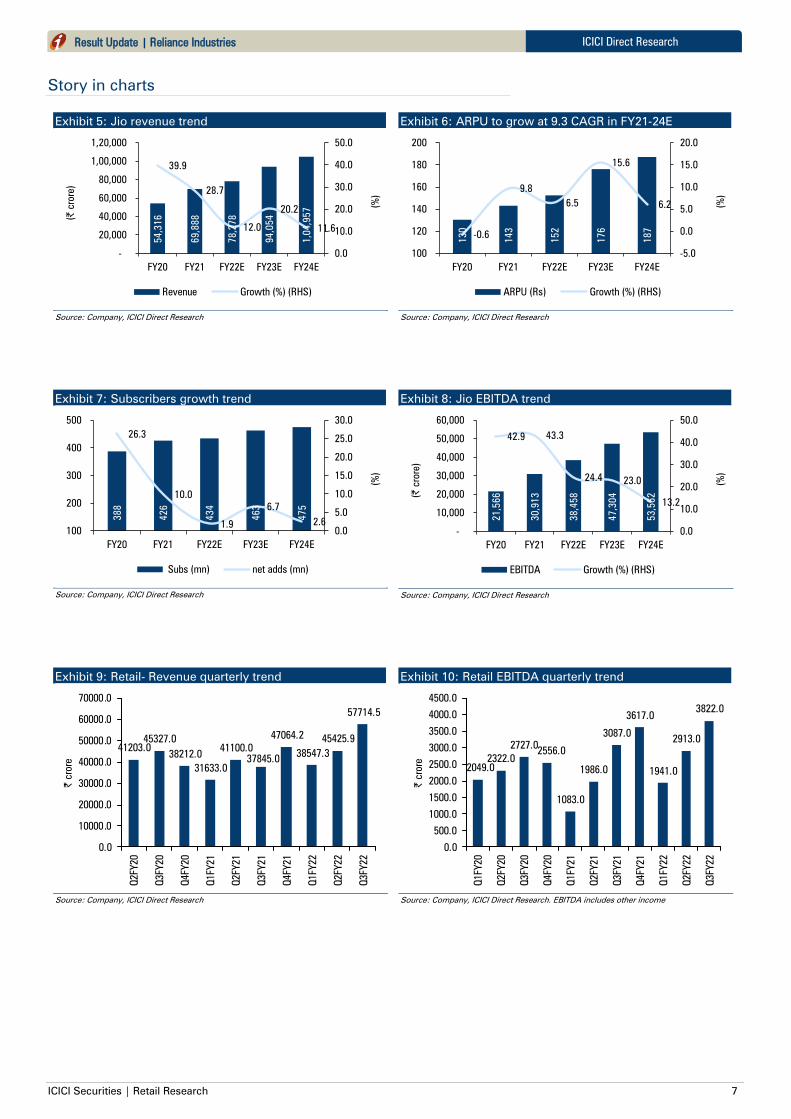
Story in charts
Exhibit 5: Jio revenue trend
Source: Company, ICICI Direct Research
Exhibit 6: ARPU to grow at 9.3 CAGR in FY21-24E
Source: Company, ICICI Direct Research
Exhibit 7: Subscribers growth trend
Source: Company, ICICI Direct Research
Exhibit 8: Jio EBITDA trend
Source: Company, ICICI Direct Research
Exhibit 9: Retail- Revenue quarterly trend
Source: Company, ICICI Direct Research
Exhibit 10: Retail EBITDA quarterly trend
Source: Company, ICICI Direct Research. EBITDA includes other income
54,3
16
69,8
88
78,2
78
94,0
54
1,0
4,9
57
39.9
28.7
12.0
20.2
11.6
0.0
10.0
20.0
30.0
40.0
50.0
-
20,000
40,000
60,000
80,000
1,00,000
1,20,000
FY20 FY21 FY22E FY23E FY24E
(%
)
(|
crore)
Revenue Growth (%) (RHS)
130
143
152
176
187
-0.6
9.8
6.5
15.6
6.2
-5.0
0.0
5.0
10.0
15.0
20.0
100
120
140
160
180
200
FY20 FY21 FY22E FY23E FY24E
(%
)
ARPU (Rs) Growth (%) (RHS)
388
426
434
463
475
26.3
10.0
1.9
6.7
2.6
0.0
5.0
10.0
15.0
20.0
25.0
30.0
100
200
300
400
500
FY20 FY21 FY22E FY23E FY24E
(%
)
Subs (mn) net adds (mn)
21,5
66
30,9
13
38,4
58
47,3
04
53,5
62
42.9 43.3
24.423.0
13.2
0.0
10.0
20.0
30.0
40.0
50.0
-
10,000
20,000
30,000
40,000
50,000
60,000
FY20 FY21 FY22E FY23E FY24E
(%
)
(|
crore)
EBITDA Growth (%) (RHS)
41203.0
45327.0
38212.0
31633.0
41100.0
37845.0
47064.2
38547.3
45425.9
57714.5
0.0
10000.0
20000.0
30000.0
40000.0
50000.0
60000.0
70000.0
Q2FY20
Q3FY20
Q4FY20
Q1FY21
Q2FY21
Q3FY21
Q4FY21
Q1FY22
Q2FY22
Q3FY22
| crore
2049.0
2322.0
2727.02556.0
1083.0
1986.0
3087.0
3617.0
1941.0
2913.0
3822.0
0.0
500.0
1000.0
1500.0
2000.0
2500.0
3000.0
3500.0
4000.0
4500.0
Q1FY20
Q2FY20
Q3FY20
Q4FY20
Q1FY21
Q2FY21
Q3FY21
Q4FY21
Q1FY22
Q2FY22
Q3FY22
| crore
ICICI Securities | Retail Research 8
ICICI Direct Research Result Update | Reliance Industries
Exhibit 11: Consolidated retail revenues CAGR of 25% in FY21-24E
Source: Company, ICICI Direct Research
Exhibit 12: EBITDA expected to grow at 36% CAGR in FY21-24E
Source: Company, ICICI Direct Research. EBITDA excludes other income
Exhibit 13: Robust store addition trajectory in YTDFY22
Source: Company, ICICI Direct Research
21075.033765.0
69198.0
130566.0
162938.0 157642.2
197768.0
255471.5
305852.7
0
30000
60000
90000
120000
150000
180000
210000
240000
270000
300000
330000
FY16 FY17 FY18 FY19 FY20 FY21 FY22E FY23E FY24E
| crore
Consolidated Revenues
857.0 1179.0
2529.0
6201.0
9653.08463.8
11225.3
16795.5
21453.9
4.1
3.5 3.7
4.7
5.9
5.4
5.7
6.6
7.0
0.0
1.0
2.0
3.0
4.0
5.0
6.0
7.0
8.0
0
5000
10000
15000
20000
25000
FY16 FY17 FY18 FY19 FY20 FY21 FY22E FY23E FY24E%
| crore
EBITDA (| crore) EBITDA Margins (%)
32453616
7573
10415
11784
12634
14412
0
2000
4000
6000
8000
10000
12000
14000
16000
FY16 FY17 FY18 FY19 FY20 FY21 9MFY22
No. of Stores

ICICI Securities | Retail Research 9
ICICI Direct Research
Result Update | Reliance Industries
Exhibit 14: O2C EBITDA quarterly trend
Source: Company, ICICI Direct Research
Exhibit 15: O2C EBITDA trend
Source: Company, ICICI Direct Research
Exhibit 16: E&P EBITDA quarterly trend
Source: Company, ICICI Direct Research
Exhibit 17: E&P EBITDA trend
Source: Company, ICICI Direct Research
Exhibit 18: Gas production trend
Source: Company, ICICI Direct Research
13568
11961
81668841
9756
1140712231
1272013530
0
2000
4000
6000
8000
10000
12000
14000
16000
Q3FY
20
Q4FY
20
Q1FY
21
Q2FY
21
Q3FY
21
Q4FY
21
Q1FY
22
Q2FY
22
Q3FY
22
| cro
re
53803
38170
52748
6029761565
0
10000
20000
30000
40000
50000
60000
70000
FY20 FY21 FY22E FY23E FY24E
| cro
re
64
-46 -32
-194
4
480
797
1071
2033
-500
0
500
1000
1500
2000
2500
Q3FY
20
Q4FY
20
Q1FY
21
Q2FY
21
Q3FY
21
Q4FY
21
Q1FY
22
Q2FY
22
Q3FY
22
| cro
re
353 258
5371
10130
12205
0
2000
4000
6000
8000
10000
12000
14000
FY20 FY21 FY22E FY23E FY24E
| cro
re
3.02.2
12.9
16.4
20.8
6.8
6.1
2.2
0.0
0.0
0.0
5.0
10.0
15.0
20.0
25.0
FY20 FY21 FY22E FY23E FY24E
mm
scm
d
Domestic Production Shale Gas

ICICI Securities | Retail Research 10
ICICI Direct Research
Result Update | Reliance Industries
Exhibit 19: RIL consolidated revenue
Source: Company, ICICI Direct Research
Exhibit 20: RIL consolidated EBIT
FY20 FY21 FY22E FY23E FY24E
O2C 45191.0 29773.0 44875.1 51296.6 52565.0
Oil & gas -1407.0 -1477.0 2803.2 7229.8 9004.9
Retail 8292.0 7991.0 10575.4 15124.3 18887.2
Digital Services 14634.0 21181.0 26148.0 32451.0 35910.0
Financial Services 811.0 1357.0 933.0 1600.0 1600.0
Others 2671.0 3635.0 4148.0 3800.0 3800.0
Total 70192.0 62460.0 89482.7 111501.8 121767.1
Source: Company, ICICI Direct Research
Exhibit 21: Percentage share of business segments in RIL’s EBIT mix
FY20 FY21 FY22E FY23E FY24E
O2C 64.4% 47.7% 50.1% 46.0% 43.2%
Oil & gas -2.0% -2.4% 3.1% 6.5% 7.4%
Retail 11.8% 12.8% 11.8% 13.6% 15.5%
Digital Services 20.8% 33.9% 29.2% 29.1% 29.5%
Financial Services 1.2% 2.2% 1.0% 1.4% 1.3%
Others 3.8% 5.8% 4.6% 3.4% 3.1%
Total 100% 100% 100% 100% 100%
Source: Company, ICICI Direct Research
Exhibit 22: Valuation
Busienss segments Valuation Methodology Value (| crore) |/share
Energy
Oil to Chemicals 8x FY24E EBITDA 492520 728
Oil & Gas 8x FY24E EBITDA 97639 144
Value of Energy business 590159 873
Consumer Business
Retail (RIL share) 40x FY24E EBITDA 730291 1080
Digital services (RIL share) DCF 530598 785
Value of Consumer business 1260888 1865
Others 154200 228
Net debt 10494 16
Equity value 1994754 2950
Source: Company, ICICI Direct Research
658866
539238
761737
857702
909317
0
100000
200000
300000
400000
500000
600000
700000
800000
900000
1000000
FY20 FY21 FY22E FY23E FY24E
| cro
re

ICICI Securities | Retail Research 11
ICICI Direct Research
Result Update | Reliance Industries
Consolidated Financial Summary
Exhibit 23: Profit and loss statement | crore
(Year-end March) FY21 FY22E FY23E FY24E
Revenue 539238.0 761737.3 857702.1 909317.5
Growth (%) -18.2 41.3 12.6 6.0
(Inc.)/Dec. in stock trade 199915.0 322742.0 312691.4 326865.0
Raw material Costs 92786.0 121972.3 170088.4 180421.8
Employee Costs 14817.0 17791.1 19214.4 20751.5
Excise Duty 72314.0 95712.3 119364.0 126123.0
Other Expenditure 78669.0 92317.3 96933.2 101779.8
Op. Expenditure 4,58,501.0 6,50,535.0 7,18,291.3 7,55,941.1
EBITDA 80737.0 111202.3 139410.8 153376.4
Growth (%) -9.0 37.7 25.4 10.0
Depreciation 26572.0 29667.6 34309.1 38009.3
EBIT 54165.0 81534.7 105101.8 115367.1
Interest 21189.0 14278.0 13000.0 13000.0
Other Income 16843.0 16875.0 17400.0 17400.0
PBT 55461.0 86967.7 109501.8 119767.1
Growth (%) 3.5 56.8 25.9 9.4
Tax 1722.0 18266.6 27594.4 30181.3
Minority Interest 4611.0 7724.4 10007.0 11526.1
Reported PAT 49128.0 60976.6 71900.3 78059.7
Growth (%) 24.8 24.1 17.9 8.6
EPS 76.2 90.2 106.3 115.4
Source: Company, ICICI Direct Research
Exhibit 24: Cash flow statement | crore
(Year-end March) FY21 FY22E FY23E FY24E
Profit after Tax 53,739.0 68,701.0 81,907.3 89,585.8
Add: Depreciation 26,572.0 29,667.6 34,309.1 38,009.3
Add: Others -17,122.0 5,275.0 5,275.0 5,275.0
Cash Profit 63,189.0 1,03,643.6 1,21,491.4 1,32,870.1
Increase/(Decrease) in CL -83,978.0 75,805.4 35,967.3 18,452.5
(Increase)/Decrease in CA -55,312.0 -10,357.2 -7,749.2 1,298.1
CF from Operating Activities -76,101.0 1,69,091.8 1,49,709.5 1,52,620.7
Purchase of Fixed Assets 52,019.0 89,882.0 40,240.0 60,000.0
(Inc)/Dec in Investments -88,061.0 -16,854.0 -8,500.0 -8,500.0
Others 87079 8000 8000 8000
CF from Investing Activities -53,001.0 -98,736.0 -40,740.0 -60,500.0
Inc/(Dec) in Loan Funds -81,689.0 -35,000.0 -35,000.0 -35,000.0
Inc/(Dec) in Sh. Cap. & Res. 2,01,189.0 32,153.6 -10,007.0 -11,526.1
Dividend Paid 3921 5071.5 6085.8 6085.8
CF from financing activities 1,15,579.0 -7,917.9 -51,092.8 -52,611.9
Change in cash Eq. -13,523.0 62,437.9 57,876.7 39,508.8
Op. Cash and cash Eq. 30,920.0 17,397.0 79,834.9 1,37,711.6
Cl. Cash and cash Eq. 17,397.0 79,834.9 1,37,711.6 1,77,220.4
Source: Company, ICICI Direct Research
Exhibit 25: Balance Sheet | crore
(Year-end March) FY21 FY22E FY23E FY24E
Source of Funds
Equity Capital 6,445.0 6,762.0 6,762.0 6,762.0
Preference Capital 0.0 0.0 0.0 0.0
Reserves & Surplus 6,93,727.0 7,89,193.1 8,55,007.6 9,26,981.5
Shareholder's Fund 7,00,172.0 7,95,955.1 8,61,769.6 9,33,743.5
Loan Funds 2,92,714.0 2,57,714.0 2,22,714.0 1,87,714.0
Deferred Tax Liability 37,001.0 42,276.0 47,551.0 52,826.0
Minority Interest and others 99,260.0 1,07,260.0 1,15,260.0 1,23,260.0
Source of Funds 11,29,147.0 12,03,205.1 12,47,294.6 12,97,543.5
Application of Funds
Gross Block 7,75,812.0 8,79,812.0 9,34,052.0 9,97,052.0
Less: Acc. Depreciation 2,34,554.0 2,64,221.6 2,98,530.7 3,36,540.0
Net Block 5,41,258.0 6,15,590.4 6,35,521.3 6,60,512.0
Capital WIP 1,25,953.0 1,11,835.0 97,835.0 94,835.0
Total Fixed Assets 6,67,211.0 7,27,425.4 7,33,356.3 7,55,347.0
Investments 3,64,828.0 3,81,682.0 3,90,182.0 3,98,682.0
Inventories 81,672.0 93,912.8 1,05,744.1 1,12,107.6
Debtor 19,014.0 27,130.4 30,548.3 32,386.6
Cash 17,397.0 79,834.9 1,37,711.6 1,77,220.4
Loan & Advance, Other CA 1,71,090.0 1,61,090.0 1,53,590.0 1,44,090.0
Total Current assets 2,89,173.0 3,61,968.1 4,27,594.0 4,65,804.7
Current Liabilities 1,86,936.0 2,60,868.9 2,93,733.6 3,11,410.1
Provisions 5,129.0 7,001.4 10,104.1 10,880.1
Total CL and Provisions 1,92,065.0 2,67,870.4 3,03,837.7 3,22,290.2
Net Working Capital 97,108.0 94,097.7 1,23,756.3 1,43,514.5
Miscellaneous expense 0.0 0.0 0.0 0.0
Application of Funds 11,29,147.0 12,03,205.1 12,47,294.6 12,97,543.5
Source: Company, ICICI Direct Research
Exhibit 26: Key ratios
(Year-end March) FY21 FY22E FY23E FY24E
Per share data (|)
Book Value 1,086.4 1,177.1 1,274.4 1,380.9
Cash per share 27.0 118.1 203.7 262.1
EPS 76.2 90.2 106.3 115.4
Cash EPS 117.5 134.0 157.1 171.6
DPS 7.0 7.5 9.0 9.0
Profitabil ity & Operating Ratios
EBITDA Margin (%) 15.0 14.6 16.3 16.9
PAT Margin (%) 10.0 9.0 9.5 9.9
Fixed Asset Turnover (x) 0.8 1.0 1.2 1.2
Inventory Turnover (Days) 55.3 45.0 45.0 45.0
Debtor (Days) 12.9 13.0 13.0 13.0
Current Liabilities (Days) 126.5 125.0 125.0 125.0
Return Ratios (% )
RoE 7.7 8.6 9.5 9.6
RoCE 5.5 7.7 9.7 10.3
RoIC 5.6 8.4 11.1 12.2
Valuation Ratios (x)
PE 32.5 27.5 23.3 21.5
Price to Book Value 2.3 2.1 1.9 1.8
EV/EBITDA 23.2 16.7 12.6 11.0
EV/Sales 3.5 2.4 2.1 1.9
Leverage & Solvency Ratios
Debt to equity (x) 0.4 0.3 0.3 0.2
Interest Coverage (x) 2.6 5.7 8.1 8.9
Debt to EBITDA (x) 3.6 2.3 1.6 1.2
Current Ratio 1.5 1.4 1.4 1.4
Quick ratio 1.1 1.0 1.1 1.1
Source: Company, ICICI Direct Research

ICICI Securities | Retail Research 12
ICICI Direct Research
Result Update | Reliance Industries
Exhibit 27: ICICI Direct coverage universe
CMP TP M Cap
(|) (|) (| Cr) FY21 FY22E FY23E FY21 FY22E FY23E FY21 FY22E FY23E FY21 FY22E FY23E FY21 FY22E FY23E
BPCL (BHAPET) 381 520 Buy 79,740 91.0 42.8 40.6 4.2 8.9 9.4 6.2 6.6 6.4 14.8 14.5 13.5 34.9 18.8 16.4
GAIL (India) (GAIL) 144 180 Buy 63,942 11.0 20.8 18.2 13.1 6.9 7.9 10.6 5.2 6.1 8.7 17.9 13.5 10.5 17.4 13.9
Gujarat Gas (GUJGA) 701 645 Hold 48,257 18.5 18.5 23.0 37.8 37.9 30.4 23.5 23.4 19.0 31.7 28.1 30.7 28.5 23.4 24.3
HPCL (HINPET) 310 325 Hold 43,986 70.6 52.6 40.0 4.4 5.9 7.8 5.5 6.3 6.7 15.6 11.3 8.5 29.5 18.6 13.2
Indian Oil Corp (INDOIL) 122 155 Buy 1,12,009 23.8 24.1 18.0 5.1 5.1 6.8 2.9 2.7 3.2 13.3 13.7 10.0 19.8 17.6 12.3
Indraprastha Gas (INDGAS) 425 560 Hold 29,750 14.4 18.1 21.4 29.6 23.4 19.9 19.4 15.9 12.9 20.0 22.0 22.8 17.1 18.7 18.9
Mahanagar Gas (MAHGAS) 853 1120 Hold 8,426 62.7 78.6 101.8 13.6 10.9 8.4 8.5 6.9 4.9 23.1 25.6 28.3 19.2 20.9 22.8
ONGC (ONGC) 164 180 Hold 2,10,467 8.9 30.0 26.6 18.3 5.5 6.2 6.9 4.0 3.2 4.5 12.8 14.4 5.5 16.1 12.8
Petronet LNG (PETLNG) 213 245 Hold 31,950 19.7 19.3 21.2 10.8 11.1 10.0 6.6 6.4 5.7 26.0 24.3 24.7 25.3 23.2 23.5
Reliance Industries (RELIND) 2,478 2,950 Buy 16,75,691 76.2 90.2 106.3 32.5 27.5 23.3 23.2 16.7 12.6 5.5 7.7 9.7 7.7 8.6 9.5
RoCE (% ) RoE (% )
Sector / Company
EPS (|) P/E (x) EV/EBITDA (x)
Rating
Source: Bloomberg, ICICI Direct Research

ICICI Securities | Retail Research 13
ICICI Direct Research
Result Update | Reliance Industries
RATING RATIONALE
ICICI Direct endeavours to provide objective opinions and recommendations. ICICI Direct assigns ratings to its
stocks according -to their notional target price vs. current market price and then categorizes them as Buy, Hold,
Reduce and Sell. The performance horizon is two years unless specified and the notional target price is defined
as the analysts' valuation for a stock
Buy: >15%
Hold: -5% to 15%;
Reduce: -15% to -5%;
Sell: <-15%
Pankaj Pandey Head – Research [email protected]
ICICI Direct Research Desk,
ICICI Securities Limited,
1st Floor, Akruti Trade Centre,
Road No 7, MIDC,
Andheri (East)
Mumbai – 400 093

ICICI Securities | Retail Research 14
ICICI Direct Research
Result Update | Reliance Industries
ANALYST CERTIFICATION
I/We, Mayur Matani, MBA, Bharat Chhoda, MBA, Bhupendra Tiwary, MBA, Research Analysts, authors and the names subscribed to this report, hereby certify that all of the views expressed in this research report accurately reflect
our views about the subject issuer(s) or securities. We also certify that no part of our compensation was, is, or will be directly or indirectly related to the specific recommendation(s) or view(s) in this report. It is also confirmed that
above mentioned Analysts of this report have not received any compensation from the companies mentioned in the report in the preceding twelve months and do not serve as an officer, director or employee of the companies
mentioned in the report.
Terms & conditions and other disclosures:
ICICI Securities Limited (ICICI Securities) is a full-service, integrated investment banking and is, inter alia, engaged in the business of stock brokering and distribution of financial products.
ICICI Securities is Sebi registered stock broker, merchant banker, investment adviser, portfolio manager and Research Analyst. ICICI Securities is registered with Insurance Regulatory Development Authority of India Limited (IRDAI)
as a composite corporate agent and with PFRDA as a Point of Presence. ICICI Securities Limited Research Analyst SEBI Registration Number – INH000000990. ICICI Securities Limited SEBI Registration is INZ000183631 for stock
broker. ICICI Securities is a subsidiary of ICICI Bank which is India’s largest private sector bank and has its various subsidiaries engaged in businesses of housing finance, asset management, life insurance, general insurance, venture
capital fund management, etc. (“associates”), the details in respect of which are available on www.icicibank.com.
ICICI Securities is one of the leading merchant bankers/ underwriters of securities and participate in virtually all securities trading markets in India. We and our associates might have investment banking and other business relationship
with a significant percentage of companies covered by our Investment Research Department. ICICI Securities and its analysts, persons reporting to analysts and their relatives are generally prohibited from maintaining a financial
interest in the securities or derivatives of any companies that the analysts cover.
Recommendation in reports based on technical and derivative analysis centre on studying charts of a stock's price movement, outstanding positions, trading volume etc. as opposed to focusing on a company's fundamentals and, as
such, may not match with the recommendation in fundamental reports. Investors may visit icicidirect.com to view the Fundamental and Technical Research Reports.
Our proprietary trading and investment businesses may make investment decisions that are inconsistent with the recommendations expressed herein.
ICICI Securities Limited has two independent equity research groups: Institutional Research and Retail Research. This report has been prepared by the Retail Research. The views and opinions expressed in this document may or may
not match or may be contrary with the views, estimates, rating, and target price of the Institutional Research.
The information and opinions in this report have been prepared by ICICI Securities and are subject to change without any notice. The report and information contained herein is strictly confidential and meant solely for the selected
recipient and may not be altered in any way, transmitted to, copied or distributed, in part or in whole, to any other person or to the media or reproduced in any form, without prior written consent of ICICI Securities. While we would
endeavour to update the information herein on a reasonable basis, ICICI Securities is under no obligation to update or keep the information current. Also, there may be regulatory, compliance or other reasons that may prevent ICICI
Securities from doing so. Non-rated securities indicate that rating on a particular security has been suspended temporarily and such suspension is in compliance with applicable regulations and/or ICICI Securities policies, in
circumstances where ICICI Securities might be acting in an advisory capacity to this company, or in certain other circumstances.
This report is based on information obtained from public sources and sources believed to be reliable, but no independent verification has been made nor is its accuracy or completeness guaranteed. This report and information herein
is solely for informational purpose and shall not be used or considered as an offer document or solicitation of offer to buy or sell or subscribe for securities or other financial instruments. Though disseminated to all the customers
simultaneously, not all customers may receive this report at the same time. ICICI Securities will not treat recipients as customers by virtue of their receiving this report. Nothing in this report constitutes investment, legal, accounting
and tax advice or a representation that any investment or strategy is suitable or appropriate to your specific circumstances. The securities discussed and opinions expressed in this report may not be suitable for all investors, who
must make their own investment decisions, based on their own investment objectives, financial positions and needs of specific recipient. This may not be taken in substitution for the exercise of independent judgment by any recipient.
The recipient should independently evaluate the investment risks. The value and return on investment may vary because of changes in interest rates, foreign exchange rates or any other reason. ICICI Securities accepts no liabilities
whatsoever for any loss or damage of any kind arising out of the use of this report. Past performance is not necessarily a guide to future performance. Investors are advised to see Risk Disclosure Document to understand the risks
associated before investing in the securities markets. Actual results may differ materially from those set forth in projections. Forward-looking statements are not predictions and may be subject to change without notice.
ICICI Securities or its associates might have managed or co-managed public offering of securities for the subject company or might have been mandated by the subject company for any other assignment in the past twelve months.
ICICI Securities or its associates might have received any compensation from the companies mentioned in the report during the period preceding twelve months from the date of this report for services in respect of managing or co-
managing public offerings, corporate finance, investment banking or merchant banking, brokerage services or other advisory service in a merger or specific transaction.
ICICI Securities encourages independence in research report preparation and strives to minimize conflict in preparation of research report. ICICI Securities or its associates or its analysts did not receive any compensation or other
benefits from the companies mentioned in the report or third party in connection with preparation of the research report. Accordingly, neither ICICI Securities nor Research Analysts and their relatives have any material conflict of
interest at the time of publication of this report.
Compensation of our Research Analysts is not based on any specific merchant banking, investment banking or brokerage service transactions.
ICICI Securities or its subsidiaries collectively or Research Analysts or their relatives do not own 1% or more of the equity securities of the Company mentioned in the report as of the last day of the month preceding the publication of
the research report.
Since associates of ICICI Securities and ICICI Securities as a entity are engaged in various financial service businesses, they might have financial interests or beneficial ownership in various companies including the subject
company/companies mentioned in this report.
ICICI Securities may have issued other reports that are inconsistent with and reach different conclusion from the information presented in this report.
Neither the Research Analysts nor ICICI Securities have been engaged in market making activity for the companies mentioned in the report.
We submit that no material disciplinary action has been taken on ICICI Securities by any Regulatory Authority impacting Equity Research Analysis activities.
This report is not directed or intended for distribution to, or use by, any person or entity who is a citizen or resident of or located in any locality, state, country or other jurisdiction, where such distribution, publication, availability or
use would be contrary to law, regulation or which would subject ICICI Securities and affiliates to any registration or licensing requirement within such jurisdiction. The securities described herein may or may not be eligible for sale in
all jurisdictions or to certain category of investors. Persons in whose possession this document may come are required to inform themselves of and to observe such restriction.