Indraprashtha Gas - Reliance Securities
24
Counting on New Geographies Financial Summary (Rs mn) FY19 FY20 FY21E FY22E FY23E Net Revenue 57,648 64,853 44,885 72,159 87,030 Gross Profit 23,675 28,059 22,797 34,692 39,945 EBITDA 12,570 15,196 13,325 21,006 24,420 PAT 7,867 11,365 8,941 14,453 16,928 EPS 11.2 16.2 12.8 20.6 24.2 P/E 39.4 27.3 34.7 21.5 18.3 EV/EBITDA 23.0 18.9 21.5 13.4 11.2 Dividend yield (%) 0.5% 0.6% 0.6% 1.0% 1.1% Source: Company, RSec Research 1. Indraprashtha Gas (IGL) is expected to benefit from the new geographical areas (Ajmer, Rewari, Kanpur, Kaithal, Meerut and Karnal) which will contribute 60% to its projected volume growth. 2. With BS-VI emission norms in place, IGL expects the next leg of growth from conversion of Delhi based heavy commercial vehicles to CNG. CNG-fuelled vehicles offer significant cost saving to the tune of ~50% vs. petrol/diesel vehicles following the waiver of VAT on CNG by the Delhi Government. 3. Following the Supreme Court’s (SC) directive, ~2,600 out of 4,700 industrial units in Delhi- NCR have shifted to PNG (Lok Sabha Link). Shifting to PNG by the remaining industrial units over the next 2 years will boost IGL’s annual sales by 11%. 4. Likely reduction in APM gas prices in 2HFY21 will help IGL to improve margin with which the company’s EBITDA/scm is expected to improve to Rs7.8 in FY23E from Rs6.4 in FY20. The COVID-19 Impact: We expect IGL’s CNG volume to decline by ~50% YoY in 1QFY21. In Delhi/ NCR, CNG sales stood at only ~15% of normal level in Apr’20, which improved to ~30-40% in May’20. Current month is better so far with CNG sales recovering to ~60% of normal level. Whilst project implementation delay by 3-6 months cannot be ruled out, we do not expect any penalty from the Petroleum & Natural Gas Regulatory Board (PNGRB). Outlook & Valuation IGL’s valuation is inexpensive, as we believe the stock does not reflect likely 10% volume CAGR over FY20-23E and expected expansion in EBITDA margin. The stock is trading at a P/E of 18.3x FY23E (vs. Bloomberg’s 3-year average of 21x) and EV/EBITDA of 11.2x FY23E (vs. Bloomberg’s 3-year average of 13x). The Free Cash Flow (FCF) yield for FY23E is pegged at ~3%. We value IGL’s standalone business at Rs569 (DCF basis), and its 50% stake in Maharashtra Natural Gas (MNGL) and Central UP Gas at ~Rs33 (18x of FY23E EPS). We initiate coverage on IGL with BUY and an SOTP-based 2-Year Target Price of Rs602. Share price (%) 1 mth 3 mth 12 mth Absolute performance -3.1 22.2 42.5 Relative to Nifty -14.6 2.1 54.8 Shareholding Pattern (%) Dec-19 Mar-20 Promoter 45.0 45.0 Public 55.0 55.0 1 Year Stock Price Performance Note: * CMP as on 26 June 2020 Research Analyst: Yogesh Patil Contact : (022) 3303 4632/9763153797 Email : [email protected] Research Associate: Pratik Oza Contact : 9960358990 Email : [email protected] Click Image for Video Presentation Indraprashtha Gas CMP* (Rs) 443 Upside/ (Downside) (%) 36 Bloomberg Ticker IGL IN Market Cap. (Rs bn) 309 Free Float (%) 55 Shares O/S (mn) 700 Oil & Gas | India Institutional Equity Research Initiating Coverage | June 29, 2020 BUY Key Triggers New geographical areas to account for 60% of total volume growth in next 3 years Stringent pollution norms to push CNG & PNG industrial volume in the National Capital Region (NCR) CNG-fuelled vehicles save~ 50% cost vs. petrol/diesel vehicles - cost advantage Lower gas prices will lead to super normal gross margin 2 Year Target Price: Rs.602 200 250 300 350 400 450 500 550 Jun-19 Jul-19 Aug-19 Sep-19 Oct-19 Nov-19 Dec-19 Jan-20 Feb-20 Mar-20 Apr-20 May-20 Jun-20 We request for your valuable vote and support
-
Upload
khangminh22 -
Category
Documents
-
view
1 -
download
0
Transcript of Indraprashtha Gas - Reliance Securities

Counting on New Geographies
Financial Summary (Rs mn) FY19 FY20 FY21E FY22E FY23E
Net Revenue 57,648 64,853 44,885 72,159 87,030
Gross Profit 23,675 28,059 22,797 34,692 39,945
EBITDA 12,570 15,196 13,325 21,006 24,420
PAT 7,867 11,365 8,941 14,453 16,928
EPS 11.2 16.2 12.8 20.6 24.2
P/E 39.4 27.3 34.7 21.5 18.3
EV/EBITDA 23.0 18.9 21.5 13.4 11.2
Dividend yield (%) 0.5% 0.6% 0.6% 1.0% 1.1%
Source: Company, RSec Research
1. Indraprashtha Gas (IGL) is expected to benefit from the new geographical areas (Ajmer, Rewari, Kanpur, Kaithal, Meerut and Karnal) which will contribute 60% to its projected volume growth.
2. With BS-VI emission norms in place, IGL expects the next leg of growth from conversion of Delhi based heavy commercial vehicles to CNG. CNG-fuelled vehicles offer significant cost saving to the tune of ~50% vs. petrol/diesel vehicles following the waiver of VAT on CNG by the Delhi Government.
3. Following the Supreme Court’s (SC) directive, ~2,600 out of 4,700 industrial units in Delhi-NCR have shifted to PNG (Lok Sabha Link). Shifting to PNG by the remaining industrial units over the next 2 years will boost IGL’s annual sales by 11%.
4. Likely reduction in APM gas prices in 2HFY21 will help IGL to improve margin with which the company’s EBITDA/scm is expected to improve to Rs7.8 in FY23E from Rs6.4 in FY20.
The COVID-19 Impact: We expect IGL’s CNG volume to decline by ~50% YoY in 1QFY21. In Delhi/
NCR, CNG sales stood at only ~15% of normal level in Apr’20, which improved to ~30-40% in
May’20. Current month is better so far with CNG sales recovering to ~60% of normal level. Whilst
project implementation delay by 3-6 months cannot be ruled out, we do not expect any penalty
from the Petroleum & Natural Gas Regulatory Board (PNGRB).
Outlook & ValuationIGL’s valuation is inexpensive, as we believe the stock does not reflect likely 10% volume CAGR
over FY20-23E and expected expansion in EBITDA margin. The stock is trading at a P/E of 18.3x
FY23E (vs. Bloomberg’s 3-year average of 21x) and EV/EBITDA of 11.2x FY23E (vs. Bloomberg’s
3-year average of 13x). The Free Cash Flow (FCF) yield for FY23E is pegged at ~3%. We value IGL’s
standalone business at Rs569 (DCF basis), and its 50% stake in Maharashtra Natural Gas (MNGL)
and Central UP Gas at ~Rs33 (18x of FY23E EPS). We initiate coverage on IGL with BUY and an SOTP-based 2-Year Target Price of Rs602.
Share price (%) 1 mth 3 mth 12 mth
Absolute performance -3.1 22.2 42.5
Relative to Nifty -14.6 2.1 54.8
Shareholding Pattern (%) Dec-19 Mar-20
Promoter 45.0 45.0
Public 55.0 55.0
1 Year Stock Price Performance
Note: * CMP as on 26 June 2020
Research Analyst:
Yogesh PatilContact : (022) 3303 4632/9763153797
Email : [email protected]
Research Associate:
Pratik OzaContact : 9960358990
Email : [email protected]
Click Image for Video Presentation
Indraprashtha GasCMP* (Rs) 443
Upside/ (Downside) (%) 36
Bloomberg Ticker IGL IN
Market Cap. (Rs bn) 309
Free Float (%) 55
Shares O/S (mn) 700
Oil & Gas | India
Institutional Equity Research
Initiating Coverage | June 29, 2020
BUY
Key TriggersNew geographical areas to account for 60% of total volume growth in next 3 yearsStringent pollution norms to push CNG & PNG industrial volume in the National Capital
Region (NCR)CNG-fuelled vehicles save~ 50% cost vs. petrol/diesel vehicles - cost advantageLower gas prices will lead to super normal gross margin
2 Year Target Price: Rs.602
200
250
300
350
400
450
500
550
Jun-
19
Jul-
19
Aug
-19
Sep-
19
Oct
-19
Nov
-19
Dec
-19
Jan-
20
Feb-
20
Mar
-20
Apr
-20
May
-20
Jun-
20
We request for your valuable vote and support

1
Our Thesis
Key Sectoral Theme
f Lower Gas Prices: CNG and domestic PNG are accorded with “Priority Sector” status. Given their No. 1 rank, domestic gas is used as the feedstock for 100% of CNG and domestic PNG sales (~81% of total volume for IGL). Nearly 90% of domestically produced gas is APM. As the domestic gas prices are not directly exposed to the risk of higher oil prices, we expect APM gas prices to remain at ~US$3/mmbtu in FY21 and FY22.
f Gas Sourcing – Policy Support for the CGD Players: Allocation of 100% domestic gas and according top priority to the CGD players are the very important decision taken by the government. Given domestic gas is now cheaper than RLNG procured from the spot market, the allocation of top priority in domestic gas goes a long way in improving the competitiveness of CNG and also securing margin of the City Gas Distribution (CGD) players.
f Cheap Imported LNG to Boost PNG Industrial Margin: We expect IGL’s margin in PNG industrial and commercial segment to expand on the back of:
1. Fall in crude prices, which is likely to reduce cost of crude-linked LNG;
2. Continued softness in spot LNG prices;
3. Positive LPG cracks leading to higher LPG prices.
Out of total LNG sourcing, IGL purchases ~40% crude-linked LNG and 60% spot LNG. In lower spot LNG price environment, we expect IGL‘s EBITDA margin to expand to Rs7.6/7.8/scm in FY22E/FY23E from the level of Rs6.4/scm in FY20.
f New Geographical Areas to Boost Growth: IGL has won 6 geographical areas in the CGD rounds (6 to 10), which we believe to be the growth engine for IGL. Total volume of ~1.2mmscmd (equivalent to 19% of existing sales volume) will be added by these new geographical areas in the next 3 years..
f Pollution Control Norms Drive CNG Growth: IGL has posted 10% CAGR in CNG volume over the last 5 years driven by favourable fuel economics and measure taken by the government to curb pollution level in the NCR. We think the promotion of environment friendly fuel (CNG/PNG) is a structural push. With BS-VI coming to effect, pollution norms will become more stringent and CNG will capture market, vacated by diesel. The run-rate of conversion to CNG is 50-60k vehicles per year. The CNG segment has recorded 8.5% growth in FY20 mainly due to conversion of Heavy Commercial Vehicles (HCV) to CNG, these are majorly interstate HCVs. The company sees the next leg of growth to come from the conversion of Delhi-based HCVs to CNG.
f Industrial Units Shifting to Gas: As per the SC directive, all industrial units in Delhi/NCR have to mandatorily stop using liquid fuel for meeting their energy requirements and move to cleaner natural gas (NG). Out of ~4,700 industrial units in Delhi-NCR, ~2,600 units have shifted to PNG till Mar’20 (Lok Sabha Link). IGL expects the remaining smaller industrial units to gradually move to NG over the next 2 years, thereby boosting sales by 11% pa. The share of industrial sales in the overall basket remains low at 13% as of 4QFY20, and expected to improve going forward.
f Valuation: IGL’s valuation is inexpensive, as we believe the stock does not reflect likely 10% volume CAGR over FY20-23E and expected expansion in EBITDA margin. The stock is trading at a P/E of 18.3x FY23E (vs. Bloomberg’s 3-year average of 21x) and EV/EBITDA of 11.2x FY23E (vs. Bloomberg’s 3-year average of 13x). The Free Cash Flow (FCF) yield for FY23E is pegged at ~3%. We value IGL’s standalone business at Rs569 (DCF basis), and its 50% stake in Maharashtra Natural Gas (MNGL) and Central UP Gas at ~Rs33 (18x of FY23E EPS). We initiate coverage on IGL with BUY and an SOTP-based 2-Year Target Price of Rs602.
Key Investment Themes

2
EPS & Target Price
Source: Company, RSec Research
Price Sensitivity Analysis (IGL Standalone)EPS (Rs) Growth (%) FWD P/E 10.0 23.5 25.6 26.6 27.6
FY17 (-3) 8.2 54.5 82 192 209 217 225
FY18 (-2) 9.6 17.5 46.4 96 225 245 255 264
FY19 (-1) 11.2 17.3 39.6 112 264 288 299 310
FY20 (Base Year) 16.2 44.5 27.4 162 382 416 432 448
FY21E (Year 1) 12.8 -21.3 34.8 128 301 327 340 353
FY22E (Year 2) 20.6 61.6 21.6 206 486 529 549 570
FY23E (Year 3) 24.2 17.1 18.4 242 569 619 643 667
Soure: RSec Research
IGL’s target price sensitivity analysis to Terminal growth rate & Cost of Equity
Terminal growth rate %
CoE
%
2.0% 3.4% 4.4% 5.4% 6.4%
7% 772 979 1269 1951 5473
8% 611 723 859 1104 1681
9% 502 569 642 757 965
10% 426 468 511 573 670
11% 370 397 424 460 513
Source: Company, RSec Research
IGL’s Total Volume Growth Scenario on DCF value of the IGL (Standalone)Bull Case Base Case Bear Case
Total Volume CAGR (FY20-23E) (%) 15 10 5
IGL's (Standalone) DCF value (rs/sh) 637 569 491
Soure: RSec Research
8.2 9.6 11.2
16.2 12.8
20.6 24.2
192 225
264
382 301
486 569
-
100
200
300
400
500
600
-
5.0
10.0
15.0
20.0
25.0
30.0
FY17 (-3) FY18 (-2) FY19 (-1) FY20 (Base Year)
FY21E (Year 1)
FY22E (Year 2)
FY23E (Year 3)
EPS (Rs) Target Price (Rs)
Sensitivity Analysis f Sensitivity of Target Price (core value of IGL standalone business) to Terminal Growth
Rate (Base Case: 3.4%) and Cost of Equity (Base Case: 9%)
Scenario AnalysisBase Case: We expect total volume CAGR of 10% over period of FY20-23E. We value IGL’s standalone business on DCF methodology at Rs569.
Bull Case: We expect total volume CAGR of 15% over period of FY20-23E. We value IGL’s standalone business on DCF methodology at Rs637.
Bear Case: We expect total volume CAGR of 5% over period of FY20-23E. We value IGL’s standalone business on DCF methodology at Rs491.

3
The COVID-19 Impact f We expect IGL’s CNG volume to decline by ~50% YoY in 1QFY21. In Delhi/NCR, CNG sales
stood at only ~15% of normal level in Apr’20, which improved to ~30-40% in May’20. Current month is better so far with CNG sales recovering to ~60% of normal level. Whilst project implementation delay by 3-6 months cannot be ruled out, we do not expect any penalty from the PNGRB.
f To ensure the vehicles are disinfected in a scientific manner, the government is planning to provide disinfection facilities at CNG filling stations. There will be a nominal charge of ~Rs20 for the facility and the vehicles will be provided with a certificate of disinfection.
f Around 4,000 buses are back on Delhi roads as all public transport (except Delhi Metro) and private vehicles have been allowed to ply, although there is restriction on the number of passengers.
f As per lockdown 5.0 guidelines, the industries are allowed to resume operations in Gurgaon, Noida, Greater Noida, Manesar, Bhiwadi, Bawal, Neemrana and Ghiloth with certain restrictions on working hours and number of employees. We expect PNG industrial volume to reach 100% of pre-COVID-19 level by the end of August 2020.
f COVID-19 has impacted the project implementation of all CGD entities and thus a shortfall in achieving the minimum work programme cannot be ruled out. Project execution is expected to be delayed owing to lack of adequate workers and equipment even after the lockdown is lifted. However, given the fact that the delay is beyond the control of the CGD players, we believe the PNGRB to provide an extension for the same. We expect a three to six month levy on this front by the regulator to ensure that penalties/PBG invocation is not levied on the CGD players.
f The PNGRB is planning to come up with the 11th bidding round for 44 new geographical areas. The 11th bidding round will further enhance the CGD network in the country. However, on account of the lockdown, we expect the bidding to get delayed.

4
Open Access Policy
f As IGL’s marketing exclusivity in Delhi region ended in 2012, it awaits regulations on tariff for open access. However, it does not expect any directive in this regard within next ~1.5 year. Further, it would be time-consuming for any new player to take away the current CNG/PNG volume of IGL in Delhi region, as its infrastructure exclusivity will remain till 2023 end.
f IGL is of the view that the PNGRB does not have jurisdiction on the pricing of gas (CNG/PNG) citing the final decision of the Supreme Court.
f However, the regulator has jurisdiction to determine the charges to be paid by a third party shipper/marketer. So, the regulator is entitled to set the tariffs for transportation services or gas distribution services.
Outlook on Capex & Addition of CNG Stations
f IGL added 55 CNG stations in FY20 and plans to add ~95 stations in FY21 (~55 in existing geographical areas and ~40 in new geographical areas).
f Total capex is earmarked at Rs20bn for next three years (50% in new geographical areas and 50% in existing geographical areas), while capex for FY21 is pegged at ~Rs12bn.
f IGL will have to pay one-time acquisition cost for Haryana City Gas (if the acquisition is completed) in addition to afore-mentioned capex.
Gas Sourcing Mix
IGL’s current gas sourcing-mix is as follows.
f RLNG = ~19% (40% from long-term contract with RasGas and 60% from spot market)
f Domestic gas = 81%
New Geographical Areas to Add ~5mmscmd Volume
f As per the management, Karnal, Rewari, Muzaffarnagar are estimated to have total potential of ~1-1.5mmscmd. Work at Rewari is in the most advanced stage, CNG supply has started in Karnal through pipeline.
f The company sees volume potential of ~3mmscmd in Ajmer. Incidentally, Ajmer also gives ~650km of highway access to IGL, which could boost inter-city CNG volume. Other new geographical areas won in 10th round are likely to add ~0.5-0.75mmscmd.
Management ConCall – Key Takeaways

5
f A potential boost in volume is expected, as several people are either shifting away from shared mobility under social distancing norms or moving from bigger to smaller vehicles. This along with the implementation of BS-VI emission norm is likely to result in higher conversion of private vehicles to CNG.
f Delhi Transport Corporation (DTC) has a fleet of 3,724 buses and Delhi Integrated Multi-Modal Transit System (DIMTS) has 2,830 cluster buses. While DIMTS claims that its entire fleet of 2,830 buses is operational, DTC has been able to operate about 50% of its fleet. Notably, DTC buses are the major consumers of CNG. IGL’s private:public transport CNG volume mix stands at 40:60. DTC may need to run a higher number of buses due to restriction on the number of passengers under social distancing norm.
f Currently, total volume reached to ~60% of normal level. Our channel check suggests volume to normalise by end of 3QFY21 only.
f Despite being operational for 24/7, utilisation rate of CNG stations is 40% lower than normal level. (Utilisation = Average daily CNG sales to CNG compression capacity).
f PNG commercial sales volume will only pick up in case the government allows restaurants and hotels to operate at pre-COVID level.
f For CNG pumps, IGL has maintained its payment terms. Credit payable days are 30 for CNG pump owners for sale of CNG.
f Most auto rickshaws/Ola/Uber drivers have returned to their native places due to COVID-19 epidemic. Post Unlock 0.1, just few of them are back, while a significant chunk are yet to come back.
f Auto rickshaws account for ~29% of total CNG vehicles in Delhi, while cars and taxis account for 70%.
Key Risks f Delay in execution of work programme in new geographical areas i.e. Ajmer, Rewari
and Karnal.
f Adverse regulatory development altering the priority accorded to CGD sector over fertiliser and power sectors for domestic APM gas.
f Earlier-than-expected implementation on open access policy.
Channel Check Takeaways

6
IGL Mahanagar Gas
Investment View
Gas sales volume (FY20) & Break up
IGL is into the business of distribution of CNG and PNG across the NCT of Delhi, Noida, Greater Noida and Ghaziabad. It supplies CNG to transport undertakings such as DTC’s, UPSRTC’s and DIMTS Cluster Busses as well It offers PNG for domestic, commercial and industrial purpose.
f CNG : 74%
f PNG Industrial/Commercial: 13%
f PNG Households: 6%
f PNG sales to others: 8%
MGL is into the business of distribution of CNG and PNG in Mumbai and its adjoining areas and in Raigad district in Maharashtra. It supplies CNG to the buses owned and operated by Brihanmumbai Electricity Supply and Transport (BEST)/Thane Municipal Transport (TMT)/Maharashtra State Road Transport Corporation (MSRTC)/ Navi Mumbai Municipal Transport (NMMT). It offers PNG for domestic, commercial and industrial purpose.
f CNG : 73%
f PNG Industrial/Commercial: 14%
f PNG Households: 13%
Infrastructure f CNG Stations - 555
f CNG Stations Breakup - ( IGL-136, DTC/UPSRTC- 84, OMC-318, DODO-17)
f PNG pipeline network - 13,951 Km
f CNG station - 256
f CNG stations Breakup - (MGL ~15, DODO~60, OMC~181)
f PNG pipeline network - 5,630 km
Consumer details f CNG Vehicle ~ 11.3 Lakh
f PNG Domestic Connections ~ 13.8 Lakh
f PNG Industrial Connections ~ 5,352
f CNG Vehicle ~7.5 Lakh
f PNG Domestic Connections ~ 12.6 Lakh
f PNG Industrial connections ~ 4,021
Growth Story f IGL has won 6 new geograpical areas (GA) in last 4 bidding round. 66% of total volume growth will be contributed by new GA
f MAHGL has not won any new GA in last few bidding rounds
Speciality f Consistently maintained ~ 10% volume growth (p.a.) in last 5 years
f Guided 6% to 8% volume growth while reported total volume growth of only 5% (p.a.) in last 5 years
Financials (Rs mn) FY20 FY21E FY22E FY23E FY20 FY21E FY22E FY23E
Net Revenues 64,853 44,885 72,159 87,030 32,645 23,841 33,123 34,495
EBITDA 15,196 13,325 21,006 24,420 10,528 8,906 11,697 11,337
Adjusted PAT 11,365 8,941 14,453 16,928 7,935 6,501 8,873 8,914
Growth (%)
Net Revenues 12.50 -30.79 60.76 20.61 6.8 -27.0 38.9 4.1
EBITDA 20.90 -12.32 57.64 16.26 18.9 -15.4 31.3 -3.1
Adjusted PAT 44.47 -21.33 61.64 17.12 45.2 -18.1 36.5 0.5
Margin (%)
EBITDA Margin (%) 23.43 29.69 29.11 28.06 32.3 37.4 35.3 32.9
Net Margin (%) 17.52 19.92 20.03 19.45 24.3 27.3 26.8 25.8
Per share (Rs)
EPS 16.2 12.8 20.6 24.2 80 65.8 88.9 88.4
Book Value 72.3 82.4 98.8 117.9 299 337 385 432
DPS 2.80 2.67 4.31 5.05 29 23.8 32.2 32.0
Valuation (X)
P/E 27.3 34.7 21.5 18.3 13.7 16.7 12.4 12.4
EV/EBITDA 18.9 21.5 13.4 11.2 9.3 10.8 7.9 7.7
P/BV 6.13 5.37 4.49 3.76 3.7 3.27 2.83 2.50
Return Ratio (%)
ROCE (%) 22.64 15.68 21.68 22.14 29.3 21.2 24.2 23.2
ROE (%) 24.73 16.51 22.79 22.32 29.7 20.7 24.8 21.8Source: Company; RSec Research
Company Comparative Analysis

7
Key Charts/TableExhibit 1: Detail break-of volume growth from new geographical areas
Source: Company, RSec Research
f IGL has won 6 geographical areas in the CGD rounds (6 to 10), which we believe will drive IGL’s growth engine for IGL. Total volume of ~1.2mmscmd equivalent to 19% of existing sales volume will be added by these new geographical areas in the next 3 years.
f Domestic PNG sales volume are set to grow by 9% annually on the back of aggressive push given to convenient piped gas. At current rate, PNG domestic gas prices are 21% cheaper than LPG subsidised cylinder.
Exhibit 3: PNG domestic gas prices are 21% cheaper than LPG subsidised cylinder
Unit Mumbai DelhiPNG Domestic price Rs per scm 29.6 28.6Subsidised domestic LPG Rs per cyl 579.0 581.5Subsidised domestic LPG Rs per kg 40.8 41.0Non Subsidised LPG Rs per cyl 714.5 744.0Non Subsidised LPG Rs per kg 50.3 52.4PNG GCV Kcal/scm 9,500 9,500 LPG GCV Kcal/kg 10,800 10,800 PNG domestic cost Rs /mn Kcal 3,116 3,011 LPG subsdised cost Rs /mn Kcal 3,775 3,792 LPG Non -subsdised cost 4,659 4,851 % premium or dis. of PNG over LPG (Sub) (17) (21)% premium or dis. of PNG over LPG (Non Sub) (33) (38)Source: Company, RSec Research
Ajmer, Pali, Rajsamand
32%
Rewari17%
Karnal19%
Kaithal15%
Kanpur, Fatehpur, Hamipur
9%Meerut, Muzaff
arnagar & Shamali
8%
Exhibit 2: Detailed volume growth story of new geographical areas
Vehicle registered
CNG Stations
CNG Sales assumption
Industrial Units PNG Households
PNG Sales assumption
Total Volume
Units Million No. mmscmd No. Million mmscmd mmscmdAjmer, Pali, Rajsamand 0.25 198 0.18 26,000 (MSME), 575 (textile unit) 1.0 0.2 0.38Rewari 0.1 NA 0.10 286 industrial units (mid size) 0.0 0.1 0.20Karnal 0.1 NA 0.10 579 ( Mid size unit) 0.1 0.1 0.23Kaithal 0.1 27 0.10 110 ( Mid size unit) 0.1 0.1 0.18Kanpur, Fatehpur, Hamipur 45 0.05 0.1 0.1 0.10Meerut, Muzaffarnagar & Shamali 36 0.05 0.1 0.1 0.10Total 0.58 0.61 1.19Source: Company; RSec Research
Exhibit 4: APM gas price formula
1. VHH is the total annual volume of natural gas consumed in the USA and Mexico.
2. VAC is the total annual volume of natural gas consumed in Canada.
3. VNBP is the total annual volume of natural gas consumed in the EU and FSU, excluding Russia.
4. VR is the total annual volume of natural gas consumed in Russia.
5. PHH and PNBP are the annual average of daily prices at Henry Hub (HH) and National Balancing Point (NBP), respectively, less $0.50/MMBtu towards transportation and treatment charges.
6. PAC and PR are the annual average of monthly prices at the Alberta ‘Hub’ and in Russia, respectively, less $0.50/MMBtu towards transportation and treatment charges.
Source: Natural Gas Pricing Guidelines 2014
APM gas prices (GCV US$2.39/mmbtu) are weighted average of Henry Hub, NBP, Alberta Bub and Russia (Ref Exhbit No.28). The weights are calculated on the basis of volume of natural gas consumed in the respective countries. Henry Hub prices slipped to low of US$1.5/mmbtu in Apr’20, and we expect this fall would lead to decline in APM gas prices in 2HFY21E. We expect the Henry Hub prices to stay in range of US$1.8 to US$2/mmbtu in FY21 and FY22.
Domestic gas price = VHH+PHH+VAC*PAC+VNBP*PNBP+VR*PR
VHH+VAC+VNBP+VR

8
Exhibit5: IGL delivered total volume CAGR of 11% over FY15 -FY20 Exhibit 6: IGL’s CNG volume CAGR of 10% over FY15-FY20
Source: Company; RSec Research Source: RSec Research
Investment Rationale
Our investment thesis is based on the following premises
New Geographical Areas & Higher CNG Conversion to Drive VolumeLower Gas Prices to Lead to Super Normal EBITDA MarginOpen Access Policy – A Long Way to GoAppealing Valuation
I. New Geographical Areas & Higher CNG Conversion to Drive VolumeIGL’s volume has clocked a robust 11% CAGR over FY15-FY20 driven by a strong 10% growth in CNG segment, 15% in domestic PNG segment and 14% in industrial/commercial segment. Mandatory CNG conversion of radio/inter-city cabs and LCVs, and strong rise in the number of DTC fleet were the key volume drivers in the past.
Looking ahead, we believe IGL’s volume growth will be driven by:
1. Expected ~1.2mmscmd volume (19% of FY20 total sales volume) from new geographical areas
2. Expected ~1mmscmd volume (15% of FY20 total sales volume) led by pollution control norms to push growth of CNG and PNG industrial in the NCR
3. Gurugram assets acquisition
4. Likely savings to the tune of 50% in CNG-fuelled vehicles vs. petrol/diesel-driven vehicles
5. At current rate, PNG domestic gas prices are 21% cheaper than LPG non-subsidised cylinder.
Exhibit 7: IGL’s PNG volume CAGR of 13% over FY15-FY20 Exhibit 8: Avg. CNG vehicle addition run rate of 5k/month over FY15-FY20
Source: Company; RSec Research Source: RSec Research
1%
4%
14%13%
14%
9%
0%
2%
4%
6%
8%
10%
12%
14%
16%
-
500
1,000
1,500
2,000
2,500
FY15 FY16 FY17 FY18 FY19 FY20
mmscm
Total volumes (mscm) YoY Growth (%)
4% 5%
13%11%
13%
8%
0%
4%
8%
12%
16%
0
400
800
1200
1600
2000
FY15 FY16 FY17 FY18 FY19 FY20
Compressed Natural Gas (mscm) YoY Growth (%)
mmscm
330 342406
479
553619
(10%)
(5%)
0%
5%
10%
15%
20%
0
100
200
300
400
500
600
700
FY15 FY16 FY17 FY18 FY19 FY20
Piped Natural Gas (mscm) YoY Growth (%)
mmscm
8%
6%
12%
6% 6%
1%
0%
2%
4%
6%
8%
10%
12%
14%
-
2,000
4,000
6,000
8,000
10,000
FY15 FY16 FY17 FY18 FY19 FY20
CNG Vehicle addition/month CNG Vehicle Growth %
Units

9
Exhibit 9: PNG Industrial/Commercial volume growth touched ~ 20% in recent years
Source: Company; RSec Research
Extraordinary Volume Growth: IGL delivered total volume growth of 9.5% YoY in FY20, while the CNG and domestic PNG segments reported 8.5% and 17.1% growth, respectively. The industrial/commercial segment reported 18.7% growth.
Mandatory conversion of radio taxis, inter-city cabs and LCVs to CNG following the Supreme Court order in 2016 and ban on 10 year old diesel vehicle drove CNG volume over FY15-20, in our view. Further, the Delhi Government has added 6,729 CNG buses over period of last five years, besides the steady monthly ~4,000 conversion run-rate of private vehicles to CNG.
The domestic PNG volume growth has been driven by the sharp increase in number of households consumers in the last five years. IGL’s PNG household connections witnessed 18% CAGR over FY15-FY20. In recent CGD biding round, the PNGRB has given higher weightage of 50% to PNG household connections. Notably, in line with the government’s vision to provide 10mn connections by 2020/21, IGL has set high targets for PNG domestic connections for the next two years.
The order of the National Green Tribunal (NGT) and the Supreme Court to ban the usage of petcoke and fuel oil in NCR has benefited to PNG industrial and commercial volume growth over the last 2 years. PNG industrial and commercial consumers have increased to 5,352 from 3,429 in FY18. Notably, PNG industrial and commercial volume clocked 20% CAGR over the last two years.
Exhibit 10: Private cars & Taxi addition @ of 4k/month in last 5 years Exhibit 11: Trend showing rise in number of Buses ( including DTC)
Source: Company; RSec Research Source: RSec Research
1%
9%
17%
23%
19%
0%
5%
10%
15%
20%
25%
-
50
100
150
200
250
300
350
FY16 FY17 FY18 FY19 FY20
PNG Industrial Volume YoY Growth (%)
mmscm
-
1,000
2,000
3,000
4,000
5,000
6,000
7,000
8,000
9,000
FY15 FY16 FY17 FY18 FY19 FY20
Taxis Addition Auto/LTV/ others
Units
1927221500
2290024850
26150
0
5000
10000
15000
20000
25000
30000
FY16 FY17 FY18 FY19 FY20
Buses in delhi (CNG)
buses

10
New Geographical Areas to Boost Growth: IGL has won 6 geographical areas in the CGD rounds (6 to 10), the details of which are given in Exhibit No. 14, Which we believe to be the growth engine for IGL. Total volume of ~1.2mmscmd equivalent to 19% of existing sales volume will be added by these new geographical areas in the next 3 years.
Ajmer, Pali, Rajsamand
32%
Rewari17%
Karnal19%
Kaithal15%
Kanpur, Fatehpur, Hamipur
9%Meerut, Muzaff
arnagar & Shamali
8%
Exhibit 12: IGL will deliver robust total volume CAGR of 10% over FY20 -FY23E
Exhibit 13: Detail break-of volume growth from new geographical areas
Source: Company; RSec Research Source: RSec Research
14%9%
-20%
48%
13%
(40%)
(20%)
0%
20%
40%
60%
-
500
1,000
1,500
2,000
2,500
3,000
3,500
FY19 FY20 FY21E FY22E FY23E
Total volumes (mscm) YoY Volume (%)
mmscm
Exhibit 14: Detailed volume growth story of new geographical areas
Vehicle registered
CNG Stations
CNG Sales assumption
Industrial Units PNG Households
PNG Sales assumption
Total Volume
Units Million No. mmscmd No. Million mmscmd mmscmd
Ajmer, Pali, Rajsamand 0.25 198 0.18 26,000 (MSME), 575 (textile unit) 1.0 0.2 0.38
Rewari 0.1 NA 0.10 286 industrial units (mid size) 0.0 0.1 0.20
Karnal 0.1 NA 0.10 579 ( Mid size unit) 0.1 0.1 0.23
Kaithal 0.1 27 0.10 110 ( Mid size unit) 0.1 0.1 0.18
Kanpur, Fatehpur, Hamipur 45 0.05 0.1 0.1 0.10
Meerut, Muzaffarnagar & Shamali
36 0.05 0.1 0.1 0.10
Total 0.58 0.61 1.19Source: Company; RSec Research

11
f Ajmer, Pali and Rajsamand Districts (Rajasthan): IGL has won this geographical area in 10th CGD round. Pali district industrial cluster is included as polluted region in Nov’2019 as per the National Green Tribunal (NGT). Comprehensive Environmental Pollution Index (CEPI) score is 80.48%, where air pollution is critical at Pali industrial cluster. Due to COVID-19, the NGT is not able to take strict actions against the polluting industrial units. We believe that the NGT would continue to seek compliance on its Nov’19 order (Link of NGT order). The order had asked the State Pollution Control Board to take strict action against critically and severely polluting industrial areas within 3 months.
f Ajmer – A Major Industrial Town in Rajasthan: The major industries of the district are of textile, food products, leather/leather products, wood products, felspars and quartz grinding, marble, asbestos/cement, engineering and casting/rerolling mill. Along with this ~26k medium scale units are operational in Ajmer district. All these could be potential PNG industrial/ commercial consumers in next 3 years. Ajmer could be long term growth driver for IGL’s PNG industrial volume. Based on our assessment, initially, in Ajmer PNG industrial + domestic volume could be 0.2mmscmd based on:
1. NGT orders for Pali district textile industrial cluster;
2. The PNGRB has set a minimum work programme target of 1mn PNG household connections for this GA; and
3. ~26k SMEs to consume gas.
f This geographical are would be the biggest boost for IGL’s CNG volume growth as total (petrol/ diesel) vehicle registered stands at ~0.25mn, even if we consider 20% conversion of existing registered vehicle to CNG then 0.18mmscmd kind of volume growth could come in the next 3 to 4 years. This GA will receive gas through Mehsana-Bhatinda pipeline. Around 440km of the said pipeline was commissioned in Nov’18. Till date, another 218km is completed out of the remaining 930 km at the rate of 3-4km/day. Rs13bn has already been spent for Phase-I. The entire Mehsana-Bhatinda pipeline is expected to be completed by Mar’21.
f Rewari (Haryana): IGL has won this geographical area in the 6th CGD round and also set up 10 CNG pumps and few PNG connections. This district is cluster of 286 industrial units, out of which 53% of industrial units are machinery manufacturers, motor industry, chemical, textile and small refinery units. These are the most probable candidates to switch from existing pollutant fuel to cleaner fuel PNG (industrial). We expect Rewari to drive PNG industrial and commercial volume growth, based on our calculation, Rewari to provide ~0.1mmscmd of PNG industrial and commercial volume upside in next 2 to 3 years. As guided, Rewari region will take time for pick-up in CNG volume. We expect this geographical area to see 0.1mmscmd CNG volume growth in next 3 years. In Rewari district, ~ 10,000 vehicles are registered annually out of which 20% can be converted to CNG.
f Karnal (Haryana): Karnal geographical area is connected to major gas network of IGL, which has started supplying CNG & PNG. Karnal geographical area, being the major industrial cluster among Rewari and Kaithal, is likely to boost PNG industrial volume. Karnal region houses 579 industrial units, majority dominated by mining, textile, dying, chemical plastics and rubber units. All these units are 68% of the total industrial units. Most of these units are major consumer of energy which will lead to higher consumption of PNG industrial in the region. On an average, single industrial unit consumes 170 scm/day of PNG industrial gas. But we expect the rate of PNG industrial gas consumption would be higher. Based on our assessment, Karnal will post ~0.13mmscmd PNG industrial and commercial volume growth over a period of next 3 years. As guided, CNG volume growth in Karnal will pick up slowly, as ~9,000 vehicles are registered annually. Even if we consider 20% conversion out of the total vehicles, it will lead to only 0.1mmscmd kind of volume consumption in this region.
f Kaithal (Haryana): IGL has won this geographical area in 10th CGD round. Under the minimum work programme, IGL has to set up 27 CNG stations and provide connection to ~1 lakh PNG households. PNG household and PNG industrial consumer base will lead higher consumption of PNG gas in Kaithal. This is a cluster of 100 industrial units, which can consume ~0.1mmscmd of PNG industrial volume in next 3 years. We expect Kaithal to add total volume growth of ~0.2mmscmd in the next 3 years.

12
f Meerut (barring the authorised areas), Shamli, Muzaffarnagar (UP): The company has started building infrastructure in geographical area of Meerut (barring the authorised areas), Muzaffarnagar and Shamli districts of Uttar Pradesh. This geographical area was won in 9th CGD round (2018), As per the minimum work programme, IGL has to set up 36 CNG stations and to provide PNG connection to ~1lakh households. We expect 40% of PNG domestic connections (~40k) and ~21 new CNG stations in this geographical area by the end of FY23. We expect total volume growth of 0.1mmscmd in next 3 years.
f Kanpur (barring the authorised areas), Fatehpur, Hamipur (UP): The company has started building infrastructure in geographical area of Kanpur (barring the authorised areas), Fatehpur, Hamipur districts in Uttar Pradesh. This geographical area was won in 10th CGD round (2019), As per the PNGRB’s minimum work programme guidelines, IGL has to set up 45 CNG stations and to provide PNG connections to ~1.44 households. We expect by the end of FY23, 30% of PNG domestic connections (~ 44k) and ~20 new CNG stations in this geographical area, and expect total volume growth of 0.1mmscmd in next 3 years.
Pollution Control Norms Drive CNG Growth
IGL has posted 10% CAGR in CNG volume over the last 5 years driven by favourable fuel economics and measure taken by the government to curb pollution level in the NCR. We think the promotion of environment friendly fuel (CNG/PNG) is a structural push. With BS-VI norms in p[ace, pollution norms will become more stringent and CNG will capture market, vacated by diesel. The run-rate of conversion to CNG is 50-60k vehicles per year. The CNG segment has recorded 8.5% growth in FY20 mainly due to conversion of HCV to CNG, these are majorly interstate HCV. The company sees next leg of growth from the conversion of Delhi-based HCVs to CNG. As of date, the company has a network of 555 CNG stations, and it is planning to add 80 CNG stations per year in the next 3 years. We expect the NCR to post a CNG volume growth of ~1mmscmd over next 3 years.
Exhibit 15: IGL to add ~250 CNG stations over next 3 year time Exhibit 16: IGL to deliver CNG volume CAGR of 10% over FY20-FY23E
Source: Company; RSec Research Source: RSec Research
37
55
80
70 70
0
10
20
30
40
50
60
70
80
90
FY19 FY20 FY21E FY22E FY23E
CNG addition
16021738
1347
2039
2304
13%8%
-22%
51%
13%
(40%)
(20%)
0%
20%
40%
60%
0
500
1000
1500
2000
2500
FY19 FY20 FY21E FY22E FY23E
CNG Volume (mscm) Growth
mmscm
13
Exhibit 17: Post ban on petcoke and fuel oil in NCR, more number of industrial units will swich to PNG
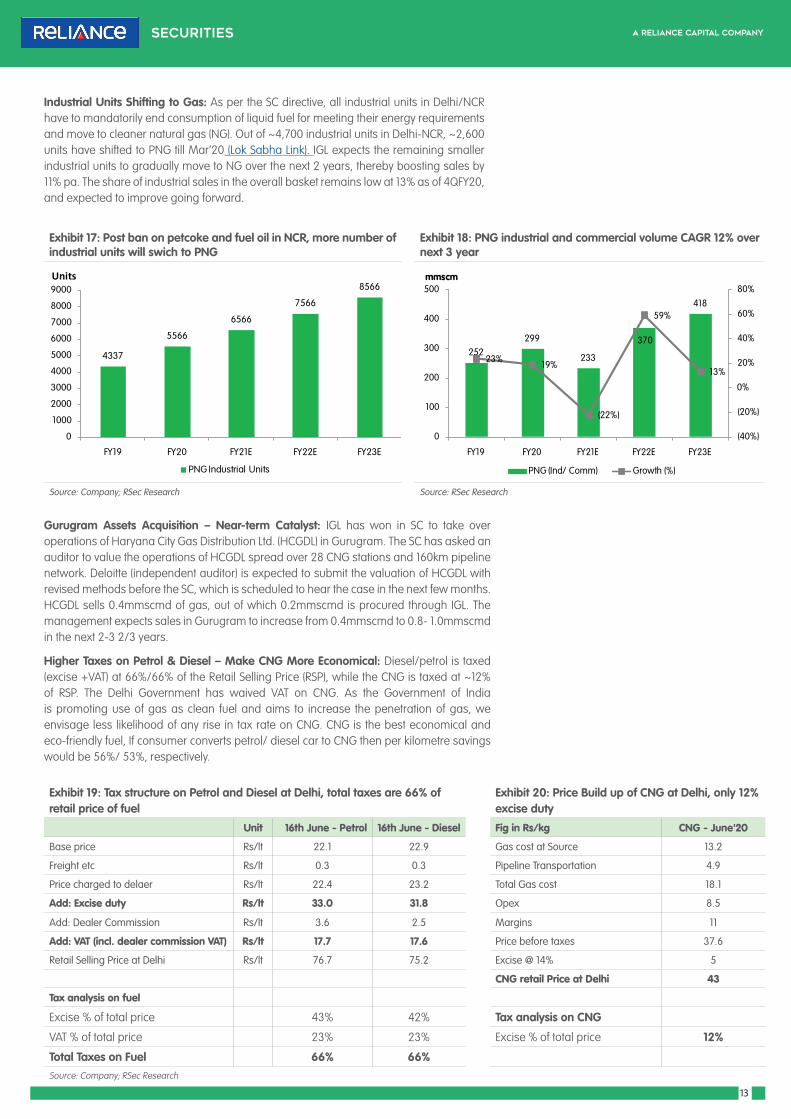
Exhibit 18: PNG industrial and commercial volume CAGR 12% over next 3 year
Source: Company; RSec Research Source: RSec Research
Industrial Units Shifting to Gas: As per the SC directive, all industrial units in Delhi/NCR have to mandatorily end consumption of liquid fuel for meeting their energy requirements and move to cleaner natural gas (NG). Out of ~4,700 industrial units in Delhi-NCR, ~2,600 units have shifted to PNG till Mar’20 (Lok Sabha Link). IGL expects the remaining smaller industrial units to gradually move to NG over the next 2 years, thereby boosting sales by 11% pa. The share of industrial sales in the overall basket remains low at 13% as of 4QFY20, and expected to improve going forward.
Gurugram Assets Acquisition – Near-term Catalyst: IGL has won in SC to take over operations of Haryana City Gas Distribution Ltd. (HCGDL) in Gurugram. The SC has asked an auditor to value the operations of HCGDL spread over 28 CNG stations and 160km pipeline network. Deloitte (independent auditor) is expected to submit the valuation of HCGDL with revised methods before the SC, which is scheduled to hear the case in the next few months. HCGDL sells 0.4mmscmd of gas, out of which 0.2mmscmd is procured through IGL. The management expects sales in Gurugram to increase from 0.4mmscmd to 0.8- 1.0mmscmd in the next 2-3 2/3 years.
Higher Taxes on Petrol & Diesel – Make CNG More Economical: Diesel/petrol is taxed (excise +VAT) at 66%/66% of the Retail Selling Price (RSP), while the CNG is taxed at ~12% of RSP. The Delhi Government has waived VAT on CNG. As the Government of India is promoting use of gas as clean fuel and aims to increase the penetration of gas, we envisage less likelihood of any rise in tax rate on CNG. CNG is the best economical and eco-friendly fuel, If consumer converts petrol/ diesel car to CNG then per kilometre savings would be 56%/ 53%, respectively.
4337
5566
6566
7566
8566
0
1000
2000
3000
4000
5000
6000
7000
8000
9000
FY19 FY20 FY21E FY22E FY23E
PNG Industrial Units
Units
252299
233
370
418
23% 19%
(22%)
59%
13%
(40%)
(20%)
0%
20%
40%
60%
80%
0
100
200
300
400
500
FY19 FY20 FY21E FY22E FY23E
PNG (Ind/ Comm) Growth (%)
mmscm
Exhibit 19: Tax structure on Petrol and Diesel at Delhi, total taxes are 66% of retail price of fuel
Exhibit 20: Price Build up of CNG at Delhi, only 12% excise duty
Unit 16th June - Petrol 16th June - Diesel Fig in Rs/kg CNG - June'20
Base price Rs/lt 22.1 22.9 Gas cost at Source 13.2
Freight etc Rs/lt 0.3 0.3 Pipeline Transportation 4.9
Price charged to delaer Rs/lt 22.4 23.2 Total Gas cost 18.1
Add: Excise duty Rs/lt 33.0 31.8 Opex 8.5
Add: Dealer Commission Rs/lt 3.6 2.5 Margins 11
Add: VAT (incl. dealer commission VAT) Rs/lt 17.7 17.6 Price before taxes 37.6
Retail Selling Price at Delhi Rs/lt 76.7 75.2 Excise @ 14% 5
CNG retail Price at Delhi 43
Tax analysis on fuel
Excise % of total price 43% 42% Tax analysis on CNG
VAT % of total price 23% 23% Excise % of total price 12%
Total Taxes on Fuel 66% 66%Source: Company; RSec Research

14
Exhibit 22: PNG household connection of ~7.5 lakh to be added in next 3 years
Exhibit 23: PNG household sales volume growth story to remain intact
Source: Company; RSec Research Source: RSec Research
Growth in Domestic PNG Connections Continue; PNG Continues to be Cheaper vs. LPG Cylinder: IGL has added record 0.27m domestic PNG consumers in FY20 and clocked 20% CAGR over FY15-FY20. Domestic PNG sales volume are set to grow by 9% annually on the back of aggressive push given to convenient piped gas. At current rate, PNG domestic gas prices are 21% cheaper than LPG subsidised cylinder. We expect, IGL to continue to add ~0.3mn consumer each year, which will lead to 0.1mmscmd of PNG domestic volume growth over 3 years.
Infrastructure Bottleneck – Not an Issue for IGL: Average waiting time for CNG refilling is the highest in Mumbai ranging from 25 minutes to 1 hour. Waiting time in Delhi is ~20 minutes, which is likely come down after addition of new CNG stations. In last 2 years, IGL has added 109 CNG stations and increased CNG compression capacity by 1.2mn kg/day, it has helped in bringing down the average waiting time for CNG refilling.
Exhibit 24: IGL has added 230 CNG stations over period of last 5 years
Exhibit 25: IGL’s CNG asset utilization has improved to 38% from 32% over period of last 5 year
Source: Company; RSec Research Source: RSec Research
0.56 0.640.74
0.921.10
1.381.58
1.85
2.12
0.0
0.5
1.0
1.5
2.0
2.5
FY15 FY16 FY17 FY18 FY19 FY20 FY21E FY22E FY23E
PNG Connections
(Mn)
70 86 94
109 120
141 152
162 183
23%
9%
16%
11%
17%
8% 7%
13%
0.00
0.05
0.10
0.15
0.20
0.25
-
30
60
90
120
150
180
210
FY15 FY16 FY17 FY18 FY19 FY20 FY21E FY22E FY23E
PNG (Domestic) (mmscm) Growth
mmscm
0
10
20
30
40
50
60
70
80
90
0
10
20
30
40
50
60
70
80
90
FY16 FY17 FY18 FY19 FY20
CNG Addition CNG Compression capacity
Lakh Kg/dayUnits
32%33%
34%
37%37%
38%
28%
30%
32%
34%
36%
38%
40%
FY15 FY16 FY17 FY18 FY19 FY20
Asset utilisation % of CNG stations
Exhibit 21: PNG domestic gas prices are 21% cheaper than LPG subsidised cylinder
Unit Mumbai DelhiPNG Domestic price Rs per scm 29.6 28.6Subsidised domestic LPG Rs per cyl 579.0 581.5Subsidised domestic LPG Rs per kg 40.8 41.0Non Subsidised LPG Rs per cyl 714.5 744.0Non Subsidised LPG Rs per kg 50.3 52.4PNG GCV Kcal/scm 9,500 9,500 LPG GCV Kcal/kg 10,800 10,800 PNG domestic cost Rs /mn Kcal 3,116 3,011 LPG subsdised cost Rs /mn Kcal 3,775 3,792 LPG Non -subsdised cost 4,659 4,851 % premium or discount of PNG over LPG (Sub) (17) (21)% premium or discount of PNG over LPG (Non Sub) (33) (38)Source: Company, RSec Research

15
Exhibit 27: Spot LNG prices are at 10 year low Exhibit 28: APM gas price formula
1. VHH is the total annual volume of natural gas consumed in the USA and Mexico.
2. VAC is the total annual volume of natural gas consumed in Canada.
3. VNBP is the total annual volume of natural gas consumed in the EU and FSU, excluding Russia.
4. VR is the total annual volume of natural gas consumed in Russia.
5. PHH and PNBP are the annual average of daily prices at Henry Hub (HH) and National Balancing Point (NBP), respectively, less $0.50/MMBtu towards transportation and treatment charges.
6. PAC and PR are the annual average of monthly prices at the Alberta ‘Hub’ and in Russia, respectively, less $0.50/MMBtu towards transportation and treatment charges.
Source: Bloomberg Source: Natural Gas Pricing Guidelines 2014
IGL on Expansion Spree: IGL has accelerated its annual installation of residential piped connections from 110,000 to 2,70,000 which requires higher capex. The share of OMC-owned pumps (~2 dispensers/station) is lower in case of IGL at 57% compared to MGL’s 70%. It is also easier to set up CNG station in Delhi than Mumbai due to faster regulatory approvals and space constraint. The number of vehicles per km of road is much lower in Delhi than Mumbai, which bodes well for IGL’s longer term growth potential.
Exhibit 26: Vehicle density per km in Mumbai is the highest and the lowest in Delhi
Source: Business Today
II. Lower Gas Prices to Lead to Super Normal EBITDA MarginCNG and domestic PNG are accorded with “Priority Sector” status. Given their No. 1 rank, domestic gas is used as the feedstock for 100% of CNG and domestic PNG sales (~81% of total volume for IGL). Nearly 90% of domestically produced gas is APM. APM gas prices (GCV US$2.39/mmbtu) are weighted average of Henry Hub, NBP, Alberta Bub and Russia (Ref Exhbit No.28). The weights are calculated on the basis of volume of natural gas consumed in the respective countries. Henry Hub prices slipped to low of US$1.5/mmbtu in Apr’20, and we expect this fall would lead to decline in APM gas prices in 2HFY21E. We expect the Henry Hub prices to stay in range of US$1.8 to US$2/mmbtu in FY21 and FY22. As the domestic gas prices are not directly exposed to the risk of higher oil prices, we expect APM gas prices to remain at ~US$3/mmbtu in FY21 and FY22. Average spot LNG/oil-linked LNG prices are US$2.4/US$3.9 per mmbtu in 1QFY21QTD, which are higher than domestic gas prices. However, we believe the global LNG prices will continue to remain under pressure in long-term owing to higher LNG supply.
0.0
5.0
10.0
15.0
20.0
25.0
Jul-
10
Dec
-10
May
-11
Oct
-11
Mar
-12
Aug
-12
Jan-
13
Jun-
13
Nov
-13
Apr
-14
Sep-
14
Feb-
15
Jul-
15
Dec
-15
May
-16
Oct
-16
Mar
-17
Aug
-17
Jan-
18
Jun-
18
Nov
-18
Apr
-19
Sep-
19
Feb-
20
$/mmbtu
Domestic gas price = VHH+PHH+VAC*PAC+VNBP*PNBP+VR*PR
VHH+VAC+VNBP+VR
108
510
Delhi Mumbai
0
100
200
300
400
500
600
Vehicles per Km

16
Exhibit 29: APM gas price trend over the periods (Near to 10 yr low) Exhibit 30: IGL gas sourcing mix; LNG portion to rise
Source: Company; RSec Research Source: Company, RSec Research
Gas Sourcing – Policy Support for the CGD Players: Allocation of 100% domestic gas and according top priority to the CGD players are the very important decision taken by the government. Given domestic gas is now cheaper than RLNG procured from the spot market, the allocation of top priority in domestic gas goes a long way in improving the competitiveness of CNG and also securing margin of the CGD players.
Lower APM Prices – Margin on CNG & PNG Domestic to Improve: In Apr’20, the government reduced APM gas prices from US$3.23/mmbtu to US$2.39/mmbtu. While IGL was expected to cut CNG prices by Rs3.3/kg and PNG household prices by Rs2.5/scm, IGL reduced CNG prices by ~Rs2.0/kg (ex-tax including June price change) and PNG domestic by Rs1.6/scm. As IGL has not passed on full benefits of fall in APM gas prices to consumers, its margin is expected to improve by Rs0.3/scm in 1HFY21. We expect the APM gas prices will be lower in 2HFY21. We believe, IGL’s EBITDA/scm to improve from Rs6.4 in FY20 to Rs7.8 in FY23E on lower domestic gas prices.
Going forward, if the crude prices jump from US$35/bbl to US$45/bbl, the government will raise the prices of petrol and diesel, which will create strong case of vehicle conversion to CNG from petrol/diesel and also give IGL a pricing power not to pass on all benefits to the consumers.
Exhibit 31: CNG/ PNG prices are stable over period of last 5 years compred to other fuels
Exhibit 32: IGL’s gross profit and EBITDA per unit
Source: Company; RSec Research Source: Company, RSec Research
2.2 2.1
4.3 4.7
5.1 4.7
3.8
3.1 2.5 2.5
2.9 3.1 3.4
3.7 3.2
2.4
-
1.0
2.0
3.0
4.0
5.0
6.0
FY09
FY10
FY11
FY12
-Nov
'14
Nov
'14-
Mar
'15
1HFY
16
2HFY
16
1HFY
17
2HFY
17
1HFY
18
2HFY
18
1HFY
19
2HFY
19
1HFY
20
2HFY
20
1HFY
21
$/mmbtu
56% 47% 47% 44% 41%
24% 33% 33% 35% 38%
20% 21% 20% 21% 21%
0%
20%
40%
60%
80%
100%
120%
FY19 FY20 FY21E FY22E FY23E
APM gas KG-D6/ Non APM/ PMT LNG
0.0
10.0
20.0
30.0
40.0
50.0
60.0
Feb'
13
Jun'
13
Sept
'13
Dec
'13
Feb'
14
May
'14
May
'15
Mar
-18
Apr
-18
May
-18
Sep-
18
Oct
-18
Nov
-18
Apr
-19
Jul-
19
Oct
-19
Apr
'20
June
'20
CNG PNG
Per Kg or Rs/scm
11.011.9 12.1 12.5 12.7
5.86.4
7.17.6 7.8
4.0
6.0
8.0
10.0
12.0
14.0
16.0
FY19 FY20 FY21E FY22E FY23E
Gross Profit EBITDA
Rs/Scm

17
Cheap Imported LNG to Boost PNG Industrial Margin: We expect IGL’s margin in PNG industrial and commercial segment to expand on the back of: (1) fall in crude prices, which is likely to reduce cost of crude-linked LNG; (2) continued softness in spot LNG prices; (3) positive LPG cracks leading to higher LPG prices. Out of total LNG sourcing, IGL purchases ~40% crude-linked LNG and 60% spot LNG. In lower spot LNG price environment, we expect IGL‘s EBITDA margin to expand to Rs7.6/7.8/scm in FY22E/ FY23E from the level of Rs6.6/scm in FY20.
Exhibit 33 Fall in oil prices to led fall in LNG prices Exhibit 34: LPG prices still strong; pricing power for PNG industrial
Source: Bloomberg Source: Company, RSec Research
III. Open Access Policy – A Long Way to GoEven if the marketing exclusivity of any geographical area gets over, the PNGRB has to declare that area for open access, which has been challenged in the Delhi High Court. The issue is sub-judice now with MGL joining as a party subsequently. IGL challenged the stance of the PNGRB on the ground of the lack of processes and procedure for the geographical areas, where the marketing exclusivity has expired. IGL’s marketing exclusivity in the NCT expired in Dec’11, while its infrastructure exclusivity expires in 2023. Since FY13, the PNGRB has been proposing to allow competition in all the geographical areas, where the marketing exclusivity has expired. However, the process has been delayed due to legal issues, while the PNGRB is yet to formulate the code for open access policy. Whilst the PNGRB has recently floated concept paper, it will likely take longer time to get finalised.
Key Issues for the Third Party to Enter into Existing Geographical Areas: Current policy of domestic gas allocation provides for the use of APM natural gas only for selling to CNG and domestic PNG incumbent and has no clarity for any third-party distributor. This continues to be a barrier for entering into a geographical area as a third party marketing company. Although marketing exclusivity has expired for most geographical areas, there is only one CGD operator in each area. It makes more sense for an entity to enter into a new geographical area rather than an existing geographical area where they would face competition from the incumbent and earn lower margin after paying for the use of infrastructure.
Returns of CGD Players are Not Regulated; Focus on Expansion Only: The returns of the CGD companies are currently not regulated in India. The focus is currently on creating infrastructure as the penetration of CNG and PNG in India is still quite low. Regulating the returns would reduce the incentive to invest in infrastructure. While there is no official intervention, the regulator keeps an eye on their margin based on data which they submit to the regulator periodically.
Open Access Policy: Key Takeaways of Discussion with IGL
f Open access policy is only for 20% of network capacity, at the maximum; 80% of the volume would continue to be with the incumbent utility.
f New players with capabilities in economic sourcing of gas on a sustainable basis to service the consumers would avail open access. In addition, the commercial terms on ship-or-pay for booking of network capacity would ensure access only by serious players.
f Further, the overhang of competition usually compels the incumbents to innovate and improve quality of services to end consumers.
2.03.04.05.06.07.08.09.010.011.012.0
0.010.020.030.040.050.060.070.080.090.0
Ap
r-15
Jul-
15
Oct
-15
Jan
-16
Ap
r-16
Jul-
16
Oct
-16
Jan
-17
Ap
r-17
Jul-
17
Oct
-17
Jan
-18
Ap
r-18
Jul-
18
Oct
-18
Jan
-19
Ap
r-19
Jul-
19
Oct
-19
Jan
-20
Ap
r-2
0
$/mmbtu$/bbl
Brent ($/bbl) LNG LT contract price ($/mmbtu) (RHS)
(40)(30)(20)(10)
010203040506070
Ap
r-15
Jul-
15
Oct
-15
Jan
-16
Ap
r-16
Jul-
16
Oct
-16
Jan
-17
Ap
r-17
Jul-
17
Oct
-17
Jan
-18
Ap
r-18
Jul-
18
Oct
-18
Jan
-19
Ap
r-19
Jul-
19
Oct
-19
Jan
-20
Ap
r-2
0
$/bbl
LPG price ($/bbl) LPG cracks ($/bbl)

18
New Business Model to Lower Capex per CNG Station: To minimise waiting time at CNG stations, IGL plans to add ~80 CNG stations each year. However, in light of challenges in land acquisition, it adopts dealer owned dealer operated model (DODO) model. In Delhi, IGL is targeting DODO model with 40% of total new CNG stations.
IV. Appealing Valuation Over 2017-20, IGL’s valuation was re-rated to ~26x of 1-year forward P/E, as it delivered fast volume growth (CAGR 12% over FY17-20) vis-à-vis other CGD players. However, the current valuation ignores its potential to deliver a total volume CAGR of 10% over FY20-23E on the back of expansion into new geographical areas. We expect IGL’s revenue to grow by 10% annually between FY20-FY23E driven by 10% volume CAGR. The volume growth along with margin expansion and lower tax rate should result in an annual PAT growth of 14%. We expect IGL’s EBITDA/scm to grow to Rs7.8 by FY23E from Rs6.4 in FY120. IGL is expected to generate operating cash flow of ~Rs45bn during FY21-23E against the capex requirement of Rs28bn, resulting in FCF yield of 0.3%/2.2%/3.0% in FY21E/FY22E/FY23E. The strong cash flow generation should keep the company debt-free with net cash of around Rs 35bn in FY23E.
IGL’s valuation is inexpensive, as we believe the stock does not reflect likely 10% volume CAGR over FY20-23E and expected expansion in EBITDA margin. The stock is trading at a P/E of 18.3x FY23E (vs. Bloomberg’s 3-year average of 21x) and EV/EBITDA of 11.2x FY23E (vs. Bloomberg’s 3-year average of 13x). The Free Cash Flow (FCF) yield for FY23E is pegged at ~3%. We value IGL’s standalone business at Rs569 (DCF basis), and its 50% stake in Maharashtra Natural Gas (MNGL) and Central UP Gas at ~Rs33 (18x of FY23E EPS).
Initiate with BUY & SOTP-based Target Price of Rs6021. Standalone Business is valued at Rs569 (on DCF Methodology): Our valuation builds
cost of equity of 9% to discount the future cash flows. We expect operating leverage should result in improvement in EBITDA margin from Rs6.4/scm in FY20 to Rs7.8/scm by FY23-end.
2. Subsidiaries are valued at ~Rs33 (18x of FY23E EPS): We have valued IGL’s 50% stake in Maharashtra Natural Gas (MNGL) and Central UP Gas at ~Rs33/share based on 18x of FY23E EPS. We assign lower multiple due to historical poor operating performance vis-à-vis other CGD companies.
Exhibit 35: DCF valuation and WACC calculation and terminal growth rate (3.4%)
(Rs mn) FY21 E FY22E FY23E FY24E FY25E FY26E FY27E FY28E FY29E FY30E
PAT 8,941 14,453 16,928 16,336 22,692 28,992 34,654 41,205 48,779 55,205
(+) Depreciation 2,876 3,318 3,760 3,892 4,025 4,157 4,290 4,423 4,533 4,644
(-) Capex 8,000 10,000 10,000 3,000 3,000 3,000 3,000 3,000 2,500 2,501
(-/+) Change in WC 1,320 (716) (591) (1,130) 156 (47) (177) (180) (181) (677)
FCFE 2,497 8,487 11,278 18,358 23,560 30,196 36,121 42,808 50,993 58,024
Disc FCFE 2,294 7,159 8,738 13,063 15,397 18,124 19,913 21,674 23,713 24,782
SOPT base valuation of IGL. IGL’s standalone Business Valued on DCF & Subsidiary on 18x of FY23E
DCF Mar'21 Mar'22
Cost of Equity (%) 9 9
NPV - Continuing Business (Rs mn) 168,529 180,775
NPV - Terminal Value (Rs mn) 199,705 217,439
NPV per share (standalone) 526 569
18x FY23E EPS from CUGL & MNGL 23 33
NPV (consolidated) = Target Price 549 602
CMP 443 443
Upside (%) 24 36
Source: Company; RSec Research

19
f Strong Operating Cash Flow Enough to Fund Capex: IGL is planning to incur capex of ~Rs12bn/annum in the next 3 years (excluding acquisitions), which will be met through internal accruals only. Operating cash flow in the range of ~Rs15bn/annum is sufficient to fund the capex.
f To remain Debt-free Even Post Capex; Return Ratio to Stabilise: We believe that post capex, IGL will generate FCF of ~Rs5.7bn per year and cash on books would be Rs35bn, which is 42% of its net worth by FY23E. Rising margin is expected to stabilize its RoCE and RoE.
Exhibit 38: IGL’s FCF to remain positive despite higher capex Exhibit 39: ROE & ROCE likely to remain stable
Source: Company; RSec Research Source: RSec Research
Exhibit 40: 1 year forward P/E band chart Exhibit 41: 1 year forward EV/EBITDA chart
Source: Bloomberg Source: Bloomberg
8.0
13.0
18.0
23.0
28.0
33.0
Jun-15 Jun-16 Jun-17 Jun-18 Jun-19 Jun-20
BEST_PE_12M_BF AVG STDEV+1 STDEV-1
6.0
8.0
10.0
12.0
14.0
16.0
18.0
20.0
22.0
24.0
Jun-15 Jun-16 Jun-17 Jun-18 Jun-19 Jun-20
BEST_EV/EBITDA_12M_BF AVG STDEV+1 STDEV-1
20%19.2%
18.4%
22.6%
15.7%
21.7% 22.1%
21% 20.8% 20.6%
24.7%
16.5%
22.8% 22.3%
12%
14%
16%
18%
20%
22%
24%
26%
FY17 FY18 FY19 FY20 FY21E FY22E FY23E
ROCE RoE
Exhibit 36: IGL’s revenue CAGR of 10% over period of FY20-FY23E Exhibit 37: IGL’s net profit CAGR of 14% over FY20 to FY23E
Source: Company; RSec Research Source: RSec Research
27%
12%
-31%
61%
21%
(40%)
(20%)
0%
20%
40%
60%
80%
-
20,000
40,000
60,000
80,000
1,00,000
FY19 FY20 FY21E FY22E FY23ERevenue YoY Growth (%)
(Rs Mn)
17%
44%
(21%)
62%
17%
(40%)
(20%)
0%
20%
40%
60%
80%
-
2,000
4,000
6,000
8,000
10,000
12,000
14,000
16,000
18,000
FY19 FY20 FY21E FY22E FY23ENet Profit Yoy Growth (%)
(Rs Mn)
12,065 14,878
9,038
16,927 19,395
(7,380)
(12,309)
(8,000) (10,000) (10,000)
4,685 2,569
1,038
6,927 9,395
(15,000)
(10,000)
(5,000)
-
5,000
10,000
15,000
20,000
25,000
FY19 FY20 FY21E FY22E FY23E
Operating Cash flow Capex FCF
(Rs Mn)

20
Profit & Loss Statement
Y/E Mar (Rs mn) FY19 FY20 FY21E FY22E FY23E
Net Revenue 57,648 64,853 44,885 72,159 87,030 Revenue (Rs/scm) 26.8 27.5 23.9 26.0 27.7
Cost of Natural Gas 33,973 36,794 22,088 37,467 47,085
Cost of natural gas (Rs/scm) 15.8 15.6 11.8 13.5 15.0
Gross Profit 23,675 28,059 22,797 34,692 39,945
Gross margins (Rs/scm) 11.0 11.9 12.1 12.5 12.7
Operating & other expenses 11,105 12,863 9,472 13,686 15,524
EBITDA 12,570 15,196 13,325 21,006 24,420 EBITDA margin (Rs/scm) 5.8 6.4 7.1 7.6 7.8 Depreciation & Amortisation 2,011 2,523 2,876 3,318 3,760
Other Income 1,462 1,564 1,341 1,369 1,660
EBIT 12,021 14,238 11,790 19,057 22,320
PBT 12,000 14,157 11,790 19,057 22,320 Taxes 4,133 2,791 2,848 4,604 5,393
PAT 7,867 11,365 8,941 14,453 16,928 PAT margin (Rs/scm) 3.7 4.8 4.8 5.2 5.4
EPS 11.2 16.2 12.8 20.6 24.2
Balance Sheet Statement
Y/E Mar (Rs mn) FY19 FY20 FY21E FY22E FY23E
Capital 1,400 1,400 1,400 1,400 1,400
Reserve and surplus 39,899 49,224 56,299 67,735 81,130
Shareholders fund 41,299 50,624 57,699 69,135 82,530
Long term debt 4 782 782 782 782
Deferred tax liability (Net) 2,678 2,119 2,001 1,811 1,587
Deposits from customers 9,778 12,217 12,217 12,217 12,217
Total Debt/ deposits 12,460 15,118 15,000 14,809 14,586
Total Funds & Debt 53,759 65,742 72,699 83,944 97,116
Gross block 47,762 57,085 65,085 75,085 85,085
less: Depreciation 18,994 21,516 24,392 27,710 31,470
CWIP 4,781 7,767 7,767 7,767 7,767
Net block 33,549 43,336 48,460 55,142 61,382
Investments 15,440 2,581 2,581 2,581 2,581
Inventories 509 511 375 602 726
Sundry debtors 2,215 1,704 1,249 2,007 2,421
Cash & Cash balances 6,071 21,799 22,313 27,592 35,114
Other current assets 1,557 1,637 1,200 1,929 2,326
Loans & advances 153 154 113 181 218
Current Asset 10,504 25,805 25,248 32,312 40,806
Current liabilities 3,905 3,173 1,905 3,231 4,061
Provisions 1,830 2,808 1,685 2,859 3,593
Current Libilities 5,735 5,981 3,591 6,090 7,654
Total Asset 53,759 65,742 72,699 83,944 97,116

21
Cash Flow Statement
Y/E Mar (Rs mn) FY19 FY20 FY21E FY22E FY23E
PAT (Reported) 7,867 11,365 8,941 14,453 16,928
Non cash charges 2,441 1,968 2,758 3,127 3,537
Change in customer deposits 1,801 2,440 - - -
Others (5) (5) - - -
Other income (1,462) (1,564) (1,341) (1,369) (1,660)
Operating Cash Flow before WC change 10,642 14,205 10,359 16,211 18,805
Working Capital Inflow / (Outflow) 1,423 674 (1,320) 716 591
Net Cash flow from Operating Activities 12,065 14,878 9,038 16,927 19,395
Cash Flow from Investing Activities
Purchase of fixed assets (7,380) (12,309) (8,000) (10,000) (10,000)
Sale of Investments (3,963) 12,859 - - -
Others 1,462 1,564 1,341 1,369 1,660
Net cash flow from investing activities (9,881) 2,113 (6,659) (8,631) (8,340)
Cash Flow from Financing Activities
Change in Net Worth 211 717 - - -
Proceeds from fresh borrowings 4 777 - - -
Dividend paid including tax (1,908) (2,757) (1,866) (3,017) (3,533)
Net Cash flow from Financing Activites (e)
(1,693) (1,263) (1,866) (3,017) (3,533)
Total Increase / (Decrease) in Cash 491 15,729 513 5,280 7,522
Opening Cash and Bank balance 5,580 6,071 21,799 22,313 27,592
Closing Cash and Bank balance 6,071 21,799 22,313 27,592 35,114
Key Ratios
Y/E Mar FY19 FY20 FY21E FY22E FY23E
Valuation Ratio (x)
P/E 39.4 27.3 34.7 21.5 18.3
P/CEPS 33.8 23.2 27.9 18.3 15.7
P/BV 7.51 6.13 5.37 4.49 3.76
Dividend yield (%) 0.5% 0.6% 0.6% 1.0% 1.1%
EV/EBITDA 23.0 18.9 21.5 13.4 11.2
BVPS 59.0 72.3 82.4 98.8 117.9
Per Share Data (Rs)
EPS 11.2 16.2 12.8 20.6 24.2
Cash EPS 13.1 19.1 15.9 24.2 28.3
DPS 2.40 2.80 2.67 4.31 5.05
Returns (%)
RoCE 18.4% 22.6% 15.7% 21.7% 22.1%
RoE 20.6% 24.7% 16.5% 22.8% 22.3%
Turnover ratios (x)
Asset Turnover (Gross Block) 1.00 0.93 1.01 1.62 1.16
Inventory (days) 7.67 5.47 5.07 6.19 5.87
Receivables (days) 18.2 14.0 9.6 10.2 10.2
Payables (days) 55.5 42.0 31.5 31.5 31.5

22
IGL is a Joint Venture Company (JVC) of GAIL (India) and BPCL each holding 22.5% stake, while the Government of the National Capital Territory (NCT) of Delhi holds 5% of equity. IGL started its operations in NCT of Delhi in 1999 with only 9 CNG stations and 1,000 PNG consumers. The company provides CNG across the NCT of Delhi, Noida, Greater Noida and Ghaziabad. IGL’s CNG network includes 555 CNG stations across the NCT of Delhi and in new geographical areas serving ~1.13mn vehicles. Its PNG network includes 1.38mn domestic and 5,352 commercial connections served via a 13.9k km pipeline network across the NCT of Delhi and in new geographical area. Separately, IGL has a 50% stake in Maharashtra Natural Gas, which is engaged in CGD activities in Pune and the nearby areas. IGL had acquired 50% equity share capital of Central UP Gas (CUGL) for Rs680mn in 2013. CUGL is engaged in CGD in Kanpur and Bareilly, Unnao and Jhansi in Uttar Pradesh.
IGL's sales volume mix for FY20, dominated by CNG CNG stations break up of total 555 (FY20)
Source: Company, RSec Research Source: Company, RSec Research
Company Overview
Shareholding Pattern as on 31st March, 2020
Holder's Name % Shareholding
Promoter 45.0Mutual Fund 7.5Foreign Portfolio Investors 22.7Financial Institutions/Banks 0.2Insurance companies 9.1Central Govt 5.0Non-Institutions 10.5
Key Institutional Shareholders % Holding
Kotak Balanced Advantage Fund (MF) 3.3Fidelity Investment Trust Fidelity Series Emerging (FII) 1.7Vontobel Fund - Mtx Sustainable Asian Leaders (FII) 3.1Schroder International Selection Fund Emerging ASI (FII) 1.2LIC Of India (Insurance) 8.4Govt Of Nct Of Delhi 5.0Hdfc Life Insurance Company Limited (Other) 2.0Source: BSE
Compressed Natural Gas (mscm), 74%
PNG -Household (mscm), 6%
PNG -Commercia/
Industrial (mscm), 13%
Others (mscm), 8%
IGL, 136
DTC/UPSRTC, 84OMC, 318
DODO, 17

23
Reliance Securities Limited (RSL), the broking arm of Reliance Capital is one of the India’s leading retail broking houses. Reliance Capital is amongst India’s leading and most valuable
financial services companies in the private sector. Reliance Capital has interests in asset management and mutual funds, life and general insurance, commercial finance, equities and
commodities broking, wealth management services, distribution of financial products, private equity, asset reconstruction, proprietary investments and other activities in financial services.
The list of associates of RSL is available on the website www.reliancecapital.co.in. RSL is registered as a Research Analyst under SEBI (Research Analyst) Regulations, 2014
General Disclaimers: This Research Report (hereinafter called ‘Report’) is prepared and distributed by RSL for information purposes only. The recommendations, if any, made herein are
expression of views and/or opinions and should not be deemed or construed to be neither advice for the purpose of purchase or sale of any security, derivatives or any other security
through RSL nor any solicitation or offering of any investment /trading opportunity on behalf of the issuer(s) of the respective security(ies) referred to herein. These information / opinions /
views are not meant to serve as a professional investment guide for the readers. No action is solicited based upon the information provided herein. Recipients of this Report should rely
on information/data arising out of their own investigations. Readers are advised to seek independent professional advice and arrive at an informed trading/investment decision before
executing any trades or making any investments. This Report has been prepared on the basis of publicly available information, internally developed data and other sources believed by
RSL to be reliable. RSL or its directors, employees, affiliates or representatives do not assume any responsibility for, or warrant the accuracy, completeness, adequacy and reliability of such
information / opinions / views. While due care has been taken to ensure that the disclosures and opinions given are fair and reasonable, none of the directors, employees, affiliates or
representatives of RSL shall be liable for any direct, indirect, special, incidental, consequential, punitive or exemplary damages, including lost profits arising in any way whatsoever from the
information / opinions / views contained in this Report.
Risks: Trading and investment in securities are subject to market risks. There are no assurances or guarantees that the objectives of any of trading / investment in securities will be achieved.
The trades/ investments referred to herein may not be suitable to all categories of traders/investors. The names of securities mentioned herein do not in any manner indicate their prospects
or returns. The value of securities referred to herein may be adversely affected by the performance or otherwise of the respective issuer companies, changes in the market conditions,
micro and macro factors and forces affecting capital markets like interest rate risk, credit risk, liquidity risk and reinvestment risk. Derivative products may also be affected by various risks
including but not limited to counter party risk, market risk, valuation risk, liquidity risk and other risks. Besides the price of the underlying asset, volatility, tenor and interest rates may affect
the pricing of derivatives.
Disclaimers in respect of jurisdiction: The possession, circulation and/or distribution of this Report may be restricted or regulated in certain jurisdictions by appropriate laws. No action
has been or will be taken by RSL in any jurisdiction (other than India), where any action for such purpose(s) is required. Accordingly, this Report shall not be possessed, circulated and/
or distributed in any such country or jurisdiction unless such action is in compliance with all applicable laws and regulations of such country or jurisdiction. RSL requires such recipient to
inform himself about and to observe any restrictions at his own expense, without any liability to RSL. Any dispute arising out of this Report shall be subject to the exclusive jurisdiction of the
Courts in India.
Disclosure of Interest: The research analysts who have prepared this Report hereby certify that the views /opinions expressed in this Report are their personal independent views/opinions
in respect of the securities and their respective issuers. None of RSL, research analysts, or their relatives had any known direct /indirect material conflict of interest including any long/short
position(s) in any specific security on which views/opinions have been made in this Report, during its preparation. RSL’s Associates may have other potential/material conflict of interest
with respect to any recommendation and related information and opinions at the time of publication of research report. RSL, its Associates, the research analysts, or their relatives might
have financial interest in the issuer company(ies) of the said securities. RSL or its Associates may have received a compensation from the said issuer company(ies) in last 12 months for the
brokerage or non brokerage services.RSL, its Associates, the research analysts or their relatives have not received any compensation or other benefits directly or indirectly from the said
issuer company(ies) or any third party in last 12 months in any respect whatsoever for preparation of this report.
The research analysts has served as an officer, director or employee of the said issuer company(ies)?: No
RSL, its Associates, the research analysts or their relatives holds ownership of 1% or more, in respect of the said issuer company(ies).?: No
Copyright: The copyright in this Report belongs exclusively to RSL. This Report shall only be read by those persons to whom it has been delivered. No reprinting, reproduction, copying,
distribution of this Report in any manner whatsoever, in whole or in part, is permitted without the prior express written consent of RSL.
RSL’s activities were neither suspended nor have defaulted with any stock exchange with whom RSL is registered. Further, there does not exist any material adverse order/judgments/
strictures assessed by any regulatory, government or public authority or agency or any law enforcing agency in last three years. Further, there does not exist any material enquiry of
whatsoever nature instituted or pending against RSL as on the date of this Report.
Important These disclaimers, risks and other disclosures must be read in conjunction with the information / opinions / views of which they form part of.
RSL CIN: U65990MH2005PLC154052. SEBI registration no. (Stock Broker: INZ000172433, Depository Participants: CDSL IN-DP-257-2016 IN-DP-NSDL-363-2013, Research Analyst:
INH000002384); AMFI ARN No.29889.
Change in Ratings
We have now only BUY and SELL Recommendation and have discontinued HOLD Recommendation.
We now have 2 Year Target Price and have discontinued with 1 year Target Price.