Consumer Staples & Discretionary - ICICI Securities
11
Please refer to important disclosures at the end of this report Equity Research March 25, 2020 BSE Sensex: 28536 ICICI Securities Limited is the author and distributor of this report Sector update Consumer Staples & Discretionary Bolt-on acquisitions – Balance Sheet to drive value creation in 2020-2030 Research Analysts: Manoj Menon [email protected] +91 22 6637 7209 Vismaya Agarwal, CFA vismaya.agarwal @icicisecurities.com +91 22 2277 7632 Karan Bhuwania [email protected] +91 22 6637 7351 INDIA Value creation in India consumer staples over the past 20 years has largely been driven by strong P&L performance and rarely by the balance sheet. We believe that this construct is likely to see substantial changes in 2020–2030 as staples companies start utilising their strong balance sheets to grow through bolt-on acquisitions. The current operating environment enables new players to demonstrate the proof of concept, thereby presenting a large acquirer with an opportunity to accelerate growth through its superior distribution reach and higher resources availability. HUL (rated BUY) is already implementing this template of bolt-ons. We chronicle Unilever and P&G global’s bolt-on growth story over 50 years. The era of bolt-ons are here: We believe that India consumer is likely to see substantial changes in growth construct over the next decade. We expect large players to use their balance sheet strengths (no debt, negative or low working capital, etc.) to fuel growth – case in point being HUL’s acquisitions of Indulekha, Aditya Milk, GSK Consumer’s brands and VWash. New brands have demonstrated proof of concept: The operating environment for new brands has become easier driven by (1) availability of contract manufacturing, (2) digital communication enabling micro-targeting the consumers, (3) rising share of modern retail and ecommerce and (4) increased accessibility to venture capital funding. The new template, in our opinion, will revolve around acquiring these small brands that have shown the proof of concept and expanding them through acquirer’s superior distribution reach and higher resources availability. Global FMCG’s bolt-on acquisitions: Globally, acquisitions have been an integral part of growth strategy in FMCG. We note (figure 3) sizable acquisitions by Unilever in the early 1900s and numerous later (1970–2000). HUL had its decade of acquisitions (1990-1999) adding brands like Kissan, Lakmé, Kwality etc. Even P&G had a similar journey (figure 4), acquiring 17 companies over 1984–2009. The strategy of bolt-on acquisitions continues even today – Unilever has acquired 29 companies since 2015 with a total investment of ~EUR10bn. Indian FMCG’ value creation, historically led by P&L, could change now: Barring a few exceptions where value creation was led by strong balance sheet metric improvement (Emami, GSK Consumer), Indian FMCG’s value creation over the past 15 years (+20% market capitalisation CAGR over Mar-05 – Mar-20) has been primarily driven by consistently strong earnings growth (+14% CAGR over the same period). Godrej Consumer Products (GCPL) is a case in point – which witnessed 24% market capitalisation CAGR over the past 15 years, driven by 21% earnings CAGR despite some deterioration in balance sheet ratios (RoCE and working capital). We believe that given the current economic slowdown, the construct is likely to shift towards balance sheet led value creation.
-
Upload
khangminh22 -
Category
Documents
-
view
0 -
download
0
Transcript of Consumer Staples & Discretionary - ICICI Securities

Please refer to important disclosures at the end of this report
Equity Research March 25, 2020
BSE Sensex: 28536
ICICI Securities Limited is the author and distributor of this report
Sector update
Consumer Staples & Discretionary
Bolt-on acquisitions – Balance Sheet to drive value creation in 2020-2030
Research Analysts:
Manoj Menon [email protected]
+91 22 6637 7209
Vismaya Agarwal, CFA vismaya.agarwal @icicisecurities.com
+91 22 2277 7632
Karan Bhuwania [email protected]
+91 22 6637 7351
INDIA
Value creation in India consumer staples over the past 20 years has largely been
driven by strong P&L performance and rarely by the balance sheet. We believe
that this construct is likely to see substantial changes in 2020–2030 as staples
companies start utilising their strong balance sheets to grow through bolt-on
acquisitions. The current operating environment enables new players to
demonstrate the proof of concept, thereby presenting a large acquirer with an
opportunity to accelerate growth through its superior distribution reach and
higher resources availability. HUL (rated BUY) is already implementing this
template of bolt-ons. We chronicle Unilever and P&G global’s bolt-on growth story
over 50 years.
The era of bolt-ons are here: We believe that India consumer is likely to see
substantial changes in growth construct over the next decade. We expect large
players to use their balance sheet strengths (no debt, negative or low working
capital, etc.) to fuel growth – case in point being HUL’s acquisitions of Indulekha,
Aditya Milk, GSK Consumer’s brands and VWash.
New brands have demonstrated proof of concept: The operating environment for
new brands has become easier driven by (1) availability of contract manufacturing,
(2) digital communication enabling micro-targeting the consumers, (3) rising share of
modern retail and ecommerce and (4) increased accessibility to venture capital
funding. The new template, in our opinion, will revolve around acquiring these small
brands that have shown the proof of concept and expanding them through acquirer’s
superior distribution reach and higher resources availability.
Global FMCG’s bolt-on acquisitions: Globally, acquisitions have been an integral
part of growth strategy in FMCG. We note (figure 3) sizable acquisitions by Unilever
in the early 1900s and numerous later (1970–2000). HUL had its decade of
acquisitions (1990-1999) adding brands like Kissan, Lakmé, Kwality etc. Even P&G
had a similar journey (figure 4), acquiring 17 companies over 1984–2009. The
strategy of bolt-on acquisitions continues even today – Unilever has acquired 29
companies since 2015 with a total investment of ~EUR10bn.
Indian FMCG’ value creation, historically led by P&L, could change now:
Barring a few exceptions where value creation was led by strong balance sheet
metric improvement (Emami, GSK Consumer), Indian FMCG’s value creation over
the past 15 years (+20% market capitalisation CAGR over Mar-05 – Mar-20) has
been primarily driven by consistently strong earnings growth (+14% CAGR over the
same period). Godrej Consumer Products (GCPL) is a case in point – which
witnessed 24% market capitalisation CAGR over the past 15 years, driven by 21%
earnings CAGR despite some deterioration in balance sheet ratios (RoCE and
working capital). We believe that given the current economic slowdown, the
construct is likely to shift towards balance sheet led value creation.

Consumer Staples & Discretionary, March 25, 2020 ICICI Securities
2
The era of bolt-ons are here
We believe that the Indian consumption space is likely to see substantial changes in
growth construct over the next decade. We expect large players to utilise their balance
sheet strengths (no debt, negative or low working capital, etc.) to fuel growth. The new
template will revolve around acquiring small brands that have demonstrated the proof
of concept and expanding them through the acquirer’s superior distribution reach and
higher resources availability.
What has changed?
We note that in recent years, there are numerous instances of Indian entrepreneurs
identifying consumer needs, building the right product / service offering and reaching a
meaningful scale. These brands have succeeded in offering a differentiated product
proposition and have gained a share of the consumer’s shopping basket which has
traditionally been dominated by the larger players.
Apart from the right product, we believe that the industry landscape is changing
towards lower barriers to entry driven by:
Availability of contract manufacturing
Digital communication enabling micro-targeting the consumers and thereby
reducing the need for ATL (above-the-line) spend
Rising share of modern retail and ecommerce (at 10% of total FMCG market)
enabling new entrants a meaningful reach even without entering the general trade
channel
Increased accessibility to venture capital funding
Bolt-on acquisitions
We believe that the large staples players will incrementally focus on bolt-on
acquisitions of brands with a differentiated offering, providing them with an entry into
either a new category or a new region.
We are already witnessing the start of this phenomenon, with HUL’s recent
acquisitions of Adityaa Milk Ice creams, Indulekha herbal hair oil and now VWash.
Adityaa Milk provides HUL with learnings about the low cost operating models for ice
creams, access to key innovations that can be potentially transferred to the Kwality
Wall’s portfolio, as well as has a good presence in certain parts of southern India.
Indulekha on the other hand helped the company strengthen its naturals portfolio and
has already grown 4x in its three years since acquisition (~Rs4bn revenues now).
VWash’s acquisition is an opportunity for HUL to gain market leadership in a
completely new category with scope for market development.
There is also the acquisition of GSK Consumer Healthcare that marks HUL’s entry into
the healthy food drinks category. HUL is also in the process of acquiring Dinshaw’s
Dairy business, as per media articles (link).

Consumer Staples & Discretionary, March 25, 2020 ICICI Securities
3
Similarly, for ITC, the acquisition of the Nimyle brand in 2018 provided it an entry into
the floor cleaner category that is currently dominated by Reckitt Benkiser’s Lizol.
Male grooming has been a popular category growing in importance with rising
consumer demand. The category saw various acquisitions / investments – (1) Marico
acquired 43% stake in Beardo, (2) Emami acquired 30% stake in The Man Company,
(3) Wipro Consumer Care acquired Ustraa and (4) Colgate Palmolive (US) acquired
stake in Bombay Shaving Company. These acquisitions provide the incumbents with
significant learnings in the digital / ecommerce space, as well as give them entry into
the much-coveted male grooming space. This trend is visible even globally, where
Unilever Plc had acquired the Dollar Shave Club in late 2016.
Figure 1: Recent acquisitions
Brand Company Investors Announcement date
Food & Beverages
Adityaa Milk Ice Creams Vijaykant Dairy & Food Products HUL Aug-18 GSK Consumer Healthcare GlaxoSmithKline Consumer Healthcare HUL Dec-18
Health & Personal Care
Nimyle ITC Jun-18 VWash Glenmark Pharma HUL Mar-20 Indulekha Mosons Group HUL Dec-15 Bombay Shaving Company Visage Lines Personal Care Colgate Global Aug-18 Beardo Zed Lifestyle Marico (45% stake) Mar-17 Ustra Happily Unmarried Wipro Consumer Nov-17 The Man Company Helios Lifestyle Emami (30% stake) Dec-17
Source: Company data, I-Sec research
New brands have shown proof of concept – potential targets
New brands are differentiating themselves to cater to the increasing consumer
demand towards naturals and wellness products. Brands like Paper Boat (from Hector
Beverages) and Raw Pressery (from Rakyan Beverages) have benefitted from the
naturals offering, while Too Yum (from Guiltfree Industries) brought the healthier
proposition to snacking while claiming to maintain the taste.
We also note similar health / naturals trend in Home and Personal Care category as
well with fairly strong success witnessed by Forest Essentials, WOW, Mcaffeine etc.
Figure 2: List of new players having shown proof of concept
Brand Company Investors Revenue (Rs mn)
Valuation/ Funding (Rs mn)
Food & Beverages
Epigamia Drums Food International Danone is invested 200 1,800
Bira91 B9 Beverages Sequoia and Sofina 5,700 12,000
Teabox Teaxpress Pvt. Ltd RB Investments 400 500
Raw Pressery Rakyan Beverages Sequoia Capital, Saama Capital and DSG Consumer Partners 170 700
Paper Boat Hector Beverages A91 Partners 630 2,100
Too Yum Guiltfree Industries (CESC)
1,800 Mojo Bar Pure Snacks Pvt. Ltd.
10
iD Foods ID Fresh Food (India) Pvt. Ltd. Premji Invest 4,000 6,000
Veeba Foods Veeba Food Services Pvt. Ltd. Saama Capital and Verlinvest 1,000 6,500
Yoga Bars Sproutlife Foods Pvt. Ltd.
400 120
Health & Personal
Care
Forest essential Forest Essentials India Puig 1,800 Fit and glow -
WoW Brand Fit & Glow Health Care Pvt. Ltd. 1,420
Mcaffeine
Clutch of angel investors from Mumbai 70 30
Distribution
Peerless
Unilever Udaan Hiveloop Technology Pvt. Ltd. ST Global, Lightspeed 700 70,000
Source: Company data, I-Sec research

Consumer Staples & Discretionary, March 25, 2020 ICICI Securities
4
Global FMCG’s bolt-on acquisitions history
Globally, acquisitions have been a key driver for large FMCG companies to create a
diverse portfolio of brands. Unilever’s acquisitions started in early 1900s with Pears
(1917) and Wall’s (1922). The company later entered into a spree of acquisitions in
late 1900s, scripting 10 large acquisitions over 1971 – 2000. Even Hindustan Unilever
(HUL) has had a decade of acquisitions earlier (1990-1999) adding brands like Kissan,
Lakmé, Kwality etc. to its portfolio (see figure 3).
Procter & Gamble (P&G) also went through a similar strategy, acquiring 17 sizable
companies over 1984 – 2009 (see figure 4).
The strategy of bolt-on acquisitions continues for some global FMCG players even
today. We note that Unilever has acquired 29 companies since 2015 with a total
investment of ~EUR10bn over the period.
Figure 3: Unilever and HUL – Bolt-on acquisition history
Year Acquisition of brands by Unilever / HUL
1917 Pears
1922 Wall's
1943 Batchelors
1971 Lipton
1973 Frigo ice cream
1978 National Starch
1984 PG Tips (Brooke Bond)
1986 Chesebrough Pond's
1989 Cosmetics with Calvin Klein and Elizabeth Arden
1992 Kothari General Foods (Instant Coffee) acquired by Brooke Bond
1993 Breyers ice cream
1993 Kissan from UB Group
1993 Dollops Ice Cream from Cadbury India
1994 Kimberly-Clark (US) getting it access to Huggies and Kotex
1995 Milkfood (Kwality)
1997 Kibon (Brazil)
1998 Lakme
2000 Bestfoods
2000 Knorr
2007 Buavita vitality drinks (Indonesia) and Inmarko ice cream (Russia)
2010 Alberto Culver (TRESemme)
Source: Company data, I-Sec research *Acquisitions by HUL highlighted in blue

Consumer Staples & Discretionary, March 25, 2020 ICICI Securities
5
Figure 4: P&G – Bolt-on acquisition history
Year Acquisition of brands by P&G
1963 Folger's Coffee
1984 Gillette acquires Oral B
1985 Vicks, Pantene, Oil of Olay
1989 Noxell, Cover Girl, Navy fragrance
1990 Old Spice
1991 Max Factor
1994 Giorgio Beverly Hills
1996 Baby Fresh (US baby wipes brand)
1996 Gillette acquires Duracell
1997 Tambrands
2001 Clairol (hair colour)
2001 Joy Perfume by Jean Patou, Lacoste
2003 Wella
2005 Gillette
2005 Dolce & Gabbana
2008 Nioxin
2009 Zirh
2009 Art of Shaving
2018 Merck's consumer health business
Source: Company data, I-Sec research

Consumer Staples & Discretionary, March 25, 2020 ICICI Securities
6
Indian consumer staples value creation has historically been led by P&L
Indian consumer staples companies had witnessed significant value creation over the
past 15 years, with 20% market capitalisation CAGR over Mar-05 – Mar-20.
This performance has been primarily driven by consistently strong 14% 15-year CAGR
earnings expansion for the sector over the same period.
Figure 5: Consumer staples: earnings CAGR (FY04-19)
17 16
14
19
23
19
23
9
15
18
20
13
-
5
10
15
20
25B
aja
jC
onsu
mer̂
Brita
nnia
Colg
ate
Dabur
Em
am
i
GS
K C
H
GC
PL
HU
L
ITC
Jyoth
yLabs^
Marico
Nest
le
(%)
Source: Company data, I-Sec research ^10-year CAGR for Bajaj Consumer and Jyothy Labs
Figure 6: Consumer staples sector P/E expansion
10
15
20
25
30
35
40
45
50
55
60
Mar-
05
Mar-
06
Mar-
07
Mar-
08
Mar-
09
Mar-
10
Mar-
11
Mar-
12
Mar-
13
Mar-
14
Mar-
15
Mar-
16
Mar-
17
Mar-
18
Mar-
19
Mar-
20
(x)
FMCG (ex-ITC) -1 Std Dev. Mean +1 Std Dev.
Source: Company data, I-Sec research
Consumer Staples & Discretionary, March 25, 2020 ICICI Securities
7
Figure 7: Consumer staples – Gross margin Figure 8: Consumer staples – EBITDA margin
51
52
53
54
55
56F
Y2004
FY
2005
FY
2006
FY
2007
FY
2008
FY
2009
FY
2010
FY
2011
FY
2012
FY
2013
FY
2014
FY
2015
FY
2016
FY
2017
FY
2018
FY
2019
(%)
16
17
18
19
20
21
22
23
24
25
26
27
FY
2004
FY
2005
FY
2006
FY
2007
FY
2008
FY
2009
FY
2010
FY
2011
FY
2012
FY
2013
FY
2014
FY
2015
FY
2016
FY
2017
FY
2018
FY
2019
(%)
Source: Company data, I-Sec research
Source: Company data, I-Sec research
We note that barring a few cases, this valuation expansion has been driven by strong
Profit & Loss performance and not by the Balance Sheet improvement.
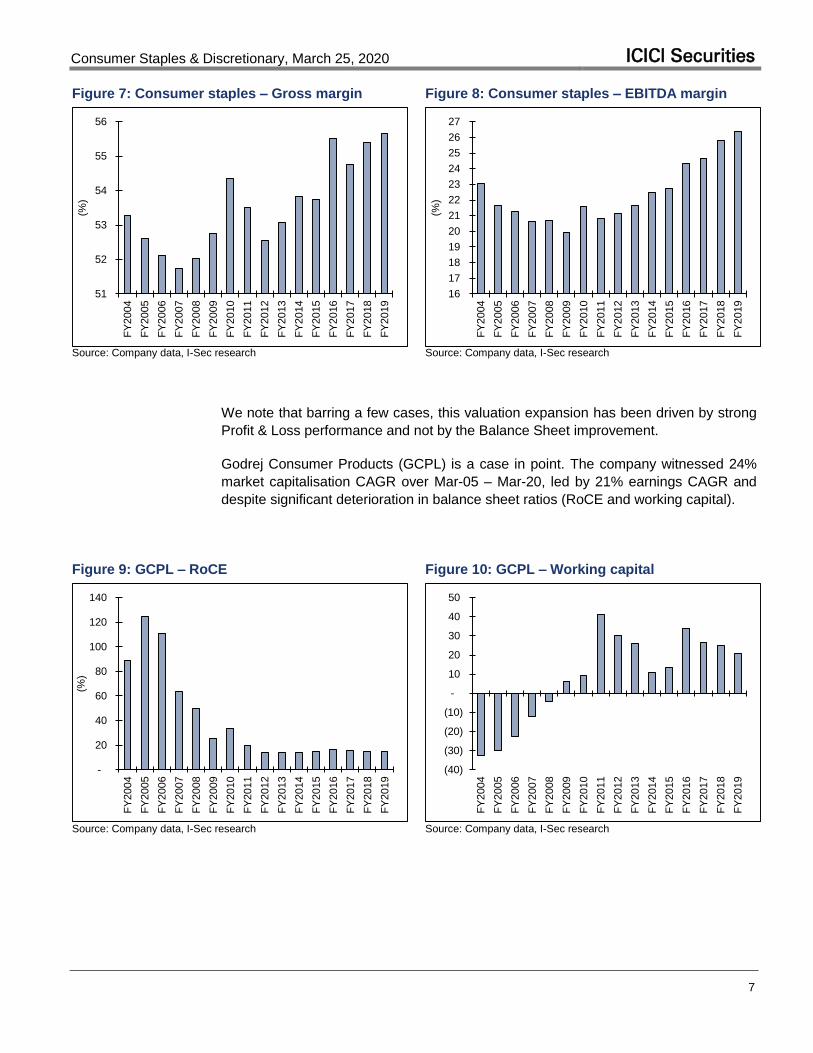
Godrej Consumer Products (GCPL) is a case in point. The company witnessed 24%
market capitalisation CAGR over Mar-05 – Mar-20, led by 21% earnings CAGR and
despite significant deterioration in balance sheet ratios (RoCE and working capital).
Figure 9: GCPL – RoCE Figure 10: GCPL – Working capital
-
20
40
60
80
100
120
140
FY
2004
FY
2005
FY
2006
FY
2007
FY
2008
FY
2009
FY
2010
FY
2011
FY
2012
FY
2013
FY
2014
FY
2015
FY
2016
FY
2017
FY
2018
FY
2019
(%)
(40)
(30)
(20)
(10)
-
10
20
30
40
50
FY
2004
FY
2005
FY
2006
FY
2007
FY
2008
FY
2009
FY
2010
FY
2011
FY
2012
FY
2013
FY
2014
FY
2015
FY
2016
FY
2017
FY
2018
FY
2019
Source: Company data, I-Sec research
Source: Company data, I-Sec research
Consumer Staples & Discretionary, March 25, 2020 ICICI Securities
8
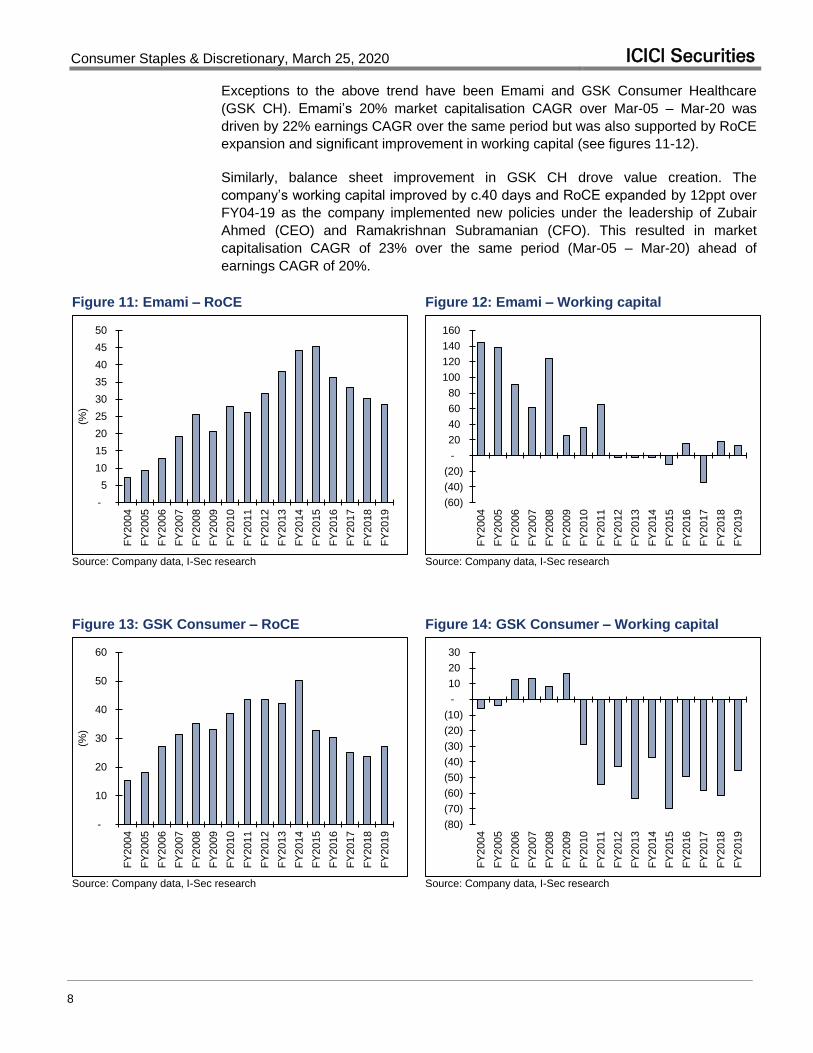
Exceptions to the above trend have been Emami and GSK Consumer Healthcare
(GSK CH). Emami’s 20% market capitalisation CAGR over Mar-05 – Mar-20 was
driven by 22% earnings CAGR over the same period but was also supported by RoCE
expansion and significant improvement in working capital (see figures 11-12).
Similarly, balance sheet improvement in GSK CH drove value creation. The
company’s working capital improved by c.40 days and RoCE expanded by 12ppt over
FY04-19 as the company implemented new policies under the leadership of Zubair
Ahmed (CEO) and Ramakrishnan Subramanian (CFO). This resulted in market
capitalisation CAGR of 23% over the same period (Mar-05 – Mar-20) ahead of
earnings CAGR of 20%.
Figure 11: Emami – RoCE Figure 12: Emami – Working capital
-
5
10
15
20
25
30
35
40
45
50
FY
2004
FY
2005
FY
2006
FY
2007
FY
2008
FY
2009
FY
2010
FY
2011
FY
2012
FY
2013
FY
2014
FY
2015
FY
2016
FY
2017
FY
2018
FY
2019
(%)
(60)
(40)
(20)
-
20
40
60
80
100
120
140
160
FY
2004
FY
2005
FY
2006
FY
2007
FY
2008
FY
2009
FY
2010
FY
2011
FY
2012
FY
2013
FY
2014
FY
2015
FY
2016
FY
2017
FY
2018
FY
2019
Source: Company data, I-Sec research
Source: Company data, I-Sec research
Figure 13: GSK Consumer – RoCE Figure 14: GSK Consumer – Working capital
-
10
20
30
40
50
60
FY
2004
FY
2005
FY
2006
FY
2007
FY
2008
FY
2009
FY
2010
FY
2011
FY
2012
FY
2013
FY
2014
FY
2015
FY
2016
FY
2017
FY
2018
FY
2019
(%)
(80)
(70)
(60)
(50)
(40)
(30)
(20)
(10)
-
10
20
30
FY
2004
FY
2005
FY
2006
FY
2007
FY
2008
FY
2009
FY
2010
FY
2011
FY
2012
FY
2013
FY
2014
FY
2015
FY
2016
FY
2017
FY
2018
FY
2019
Source: Company data, I-Sec research
Source: Company data, I-Sec research

Consumer Staples & Discretionary, March 25, 2020 ICICI Securities
9
Figure 15: Valuation summary
Company CMP (Rs)
TP (Rs)
Upside (%) Rating
PE (x) EV/EBITDA (x) ADTV Market Cap
FY21E FY22E FY21E FY22E (US$ mn) (Rs bn) (US$ bn)
Staples
Bajaj Consumer 120 200 66 BUY 8 7 6 6 0.7 19 0.3 Britannia 2,451 2,600 6 REDUCE 37 33 30 27 17.7 603 8.1 Colgate 1,122 1,400 25 BUY 34 30 22 20 10.7 308 4.2 Dabur 405 520 28 BUY 37 33 35 30 14.3 732 9.9 Emami 155 250 61 BUY 12 11 9 8 2.4 86 1.2 GCPL 471 700 49 BUY 27 24 21 19 12.9 535 7.2 HUL 2,088 2,400 15 BUY 51 44 37 32 50.5 4,175 56.4 ITC 147 220 49 BUY 11 11 8 8 50.5 1,852 25.0 Jyothy Labs 94 150 60 BUY 14 12 11 10 0.8 36 0.5 Marico 248 320 29 BUY 28 26 19 17 11.6 321 4.3 Nestle 14,444 15,000 4 HOLD 63 52 43 37 20.4 1,305 17.6 Discretionary Avenue Supermarts 1,899 2,100 11 HOLD 62 48 41 32 35.4 1,249 16.9 Bata 1,153 1,800 56 BUY 31 27 23 20 14.0 154 2.1 Jubilant Foodworks 1,347 2,000 48 BUY 39 29 16 13 25.2 165 2.2 Page Industries 16,610 27,000 63 BUY 37 30 26 21 11.6 207 2.8 Sheela Foam 1,179 1,700 44 ADD 23 19 14 12 0.2 69 0.9 Titan 881 1,300 48 BUY 40 33 26 21 39.2 826 11.2 United Spirits 466 680 46 BUY 32 26 21 17 21.7 410 5.5 Westlife Development 311 500 61 BUY 48 37 21 17 2.1 48 0.6 Paints Akzo Nobel 1,980 3,100 57 BUY 30 26 20 17 0.9 98 1.3 Asian Paints 1,593 1,800 13 HOLD 45 38 31 26 39.2 1,555 21.0 Berger Paints 450 560 24 HOLD 50 42 32 27 10.3 423 5.7 Kansai Nerolac 328 565 72 ADD 26 22 18 15 2.0 211 2.8
Source: Company data, I-Sec research
EV/ sales (x) P/B (x) P/CEPS (x) RoE (%) RoCE (%) CAGR (FY20-22E) (%)
Company FY21E FY22E FY21E FY22E FY21E FY22E FY21E FY22E FY21E FY22E Revenues EBITDA PAT
Staples Bajaj Consumer 1.6 1.5 2 2 8 7 30 27 32 29 6 3 5 Britannia 4.7 4.2 10 8 33 29 26 25 21 20 10 9 12 Colgate 6.0 5.5 19 20 27 25 62 72 73 85 9 10 11 Dabur 7.2 6.4 10 8 33 30 28 27 21 20 11 14 13 Emami 2.4 2.2 3 3 13 11 26 27 31 34 8 8 6 GCPL 4.6 4.2 6 5 24 22 22 23 17 18 8 10 12 HUL 9.9 8.8 13 13 46 40 43 30 36 26 18 21 24 ITC 3.2 2.9 3 3 10 10 28 32 31 35 9 8 5 Jyothy Labs 1.8 1.6 2 2 12 10 16 17 16 17 9 9 17 Marico 3.9 3.5 9 9 25 23 33 35 31 34 10 10 9 Nestle 9.9 8.6 61 50 55 46 105 106 40 41 13 14 17
Discretionary Avenue Supermarts 3.8 3.0 9 8 51 40 16 17 20 23 26 29 33
Bata 4.0 3.6 6 6 27 24 22 22 25 25 13 15 17 Jubilant Foodworks 3.7 3.2 9 8 21 17 26 29 38 40 16 17 27 Page Industries 5.3 4.5 18 16 33 27 52 55 41 43 15 19 21 Sheela Foam 1.9 1.7 5 4 19 16 24 22 28 26 13 18 19 Titan 3.0 2.6 10 8 34 28 26 27 33 35 16 19 23 United Spirits 3.4 3.1 7 5 26 21 23 23 23 25 9 14 21 Westlife Development 2.6 2.2 6 5 24 20 14 16 15 18 19 26 41 Paints
Akzo Nobel 2.9 2.5 7 6 23 20 23 23 23 23 11 14 13 Asian Paints 6.1 5.3 12 10 38 33 29 28 26 26 14 17 18 Berger Paints 5.7 4.9 12 10 41 35 27 26 23 23 15 20 21 Kansai Nerolac 2.9 2.5 4 4 22 19 17 18 16 18 8 13 14
Source: Company data, I-Sec research

Consumer Staples & Discretionary, March 25, 2020 ICICI Securities
10
Price charts
Akzo Nobel Asian Paints Avenue Supermarts Bajaj Consumer
1,300
1,500
1,700
1,900
2,100
2,300
2,500
2,700
Ma
r-17
Se
p-1
7
Ma
r-18
Se
p-1
8
Ma
r-19
Se
p-1
9
Ma
r-20
(Rs)
600
800
1,000
1,200
1,400
1,600
1,800
2,000
Mar-
17
Se
p-1
7
Mar-
18
Se
p-1
8
Mar-
19
Se
p-1
9
Mar-
20
(Rs)
400
800
1,200
1,600
2,000
2,400
2,800
Ma
r-17
Se
p-1
7
Ma
r-18
Se
p-1
8
Ma
r-19
Se
p-1
9
Ma
r-20
(Rs)
100
175
250
325
400
475
550
Ma
r-17
Se
p-1
7
Mar-
18
Se
p-1
8
Ma
r-19
Se
p-1
9
Ma
r-20
(Rs)
Bata India Berger Paints Britannia Colgate
0
500
1,000
1,500
2,000
Ma
r-17
Se
p-1
7
Ma
r-18
Se
p-1
8
Ma
r-19
Se
p-1
9
Ma
r-20
(Rs)
100
200
300
400
500
600
700
Ma
r-17
Se
p-1
7
Ma
r-18
Se
p-1
8
Ma
r-19
Se
p-1
9
Mar-
20
(Rs)
1,000
1,500
2,000
2,500
3,000
3,500
4,000
Mar-
17
Se
p-1
7
Mar-
18
Se
p-1
8
Ma
r-19
Se
p-1
9
Ma
r-20
(Rs)
600
800
1,000
1,200
1,400
1,600
1,800
Ma
r-17
Se
p-1
7
Ma
r-18
Se
p-1
8
Mar-
19
Se
p-1
9
Mar-
20
(Rs)
Dabur Emami GCPL HUL
200240280320360400440480520560
Mar-
17
Se
p-1
7
Mar-
18
Se
p-1
8
Mar-
19
Se
p-1
9
Mar-
20
(Rs)
0
200
400
600
800
Ma
r-1
7
Se
p-1
7
Ma
r-1
8
Se
p-1
8
Ma
r-1
9
Se
p-1
9
Ma
r-2
0
(Rs)
320
420
520
620
720
820
920
1,020
Mar-
17
Se
p-1
7
Ma
r-18
Se
p-1
8
Ma
r-19
Se
p-1
9
Mar-
20
(Rs)
500
800
1100
1400
1700
2000
2300
2600
Ma
r-1
7
Sep-1
7
Ma
r-1
8
Sep-1
8
Ma
r-1
9
Sep-1
9
Ma
r-2
0
(Rs)
ITC Jubilant Foodworks Jyothy Labs Kansai Nerolac
125
175
225
275
325
Ma
r-1
7
Se
p-1
7
Ma
r-1
8
Se
p-1
8
Ma
r-1
9
Se
p-1
9
Ma
r-2
0
(Rs)
200
700
1,200
1,700
2,200
Ma
r-17
Se
p-1
7
Mar-
18
Se
p-1
8
Mar-
19
Se
p-1
9
Ma
r-20
(Rs)
50
100
150
200
250
300
Ma
r-17
Se
p-1
7
Ma
r-18
Se
p-1
8
Ma
r-19
Se
p-1
9
Ma
r-20
(Rs)
250
300
350
400
450
500
550
600
Ma
r-17
Se
p-1
7
Ma
r-18
Se
p-1
8
Ma
r-19
Se
p-1
9
Ma
r-20
(Rs)
Marico Nestle Page Industries Sheela Foam
200
250
300
350
400
450
Ma
r-17
Se
p-1
7
Ma
r-18
Se
p-1
8
Ma
r-19
Se
p-1
9
Ma
r-20
(Rs)
4,000
6,000
8,000
10,000
12,000
14,000
16,000
18,000
Ma
r-17
Se
p-1
7
Ma
r-18
Se
p-1
8
Ma
r-19
Se
p-1
9
Ma
r-20
(Rs)
2,000
12,000
22,000
32,000
42,000
Ma
r-17
Se
p-1
7
Ma
r-18
Se
p-1
8
Mar-
19
Se
p-1
9
Ma
r-20
(Rs)
800
1,000
1,200
1,400
1,600
1,800
2,000
Mar-
17
Se
p-1
7
Mar-
18
Se
p-1
8
Mar-
19
Se
p-1
9
Mar-
20
(Rs)
Titan United Spirits Westlife Development
150
350
550
750
950
1,150
1,350
1,550
Ma
r-17
Se
p-1
7
Ma
r-18
Se
p-1
8
Ma
r-19
Se
p-1
9
Ma
r-20
(Rs)
200
400
600
800
1,000
Ma
r-17
Se
p-1
7
Ma
r-18
Se
p-1
8
Ma
r-19
Se
p-1
9
Mar-
20
(Rs)
100
200
300
400
500
600
Mar-
17
Se
p-1
7
Mar-
18
Se
p-1
8
Mar-
19
Se
p-1
9
Ma
r-20
(Rs)
Source: Bloomberg

Consumer Staples & Discretionary, March 25, 2020 ICICI Securities
11
In case of industry/sector reports or a report containing multiple stocks, the rating/recommendation for a particular stock may be based on the last released stock
specific report for that company.”
This report may be distributed in Singapore by ICICI Securities, Inc. (Singapore branch). Any recipients of this report in Singapore should contact ICICI Securities,
Inc. (Singapore branch) in respect of any matters arising from, or in connection with, this report. The contact details of ICICI Securities, Inc. (Singapore branch) are
as follows: Address: 10 Collyer Quay, #40-92 Ocean Financial Tower, Singapore - 049315, Tel: +65 6232 2451 and email: [email protected],
"In case of eligible investors based in Japan, charges for brokerage services on execution of transactions do not in substance constitute charge for research reports
and no charges are levied for providing research reports to such investors."
New I-Sec investment ratings (all ratings based on absolute return; All ratings and target price refers to 12-month performance horizon, unless mentioned otherwise)
BUY: >15% return; ADD: 5% to 15% return; HOLD: Negative 5% to Positive 5% return; REDUCE: Negative 5% to Negative 15% return; SELL: < negative 15% return
ANALYST CERTIFICATION I/We, Manoj Menon, MBA, CMA; Vismaya Agarwal, CFA, BTech, PGDM; Karan Bhuwania, MBA; authors and the names subscribed to this report, hereby certify that all of the views expressed in this research report accurately reflect our views about the subject issuer(s) or securities. We also certify that no part of our compensation was, is, or will be directly or indirectly related to the specific recommendation(s) or view(s) in this report. Analysts are not registered as research analysts by FINRA and are not associated persons of the ICICI Securities Inc. It is also confirmed that above mentioned Analysts of this report have not received any compensation from the companies mentioned in the report in the preceding twelve months and do not serve as an officer, director or employee of the companies mentioned in the report. Terms & conditions and other disclosures: ICICI Securities Limited (ICICI Securities) is a full-service, integrated investment banking and is, inter alia, engaged in the business of stock brokering and distribution of financial products. ICICI Securities Limited is a SEBI registered Research Analyst with SEBI Registration Number – INH000000990. ICICI Securities Limited SEBI Registration is INZ000183631 for stock broker. ICICI Securities is a subsidiary of ICICI Bank which is India’s largest private sector bank and has its various subsidiaries engaged in businesses of housing finance, asset management, life insurance, general insurance, venture capital fund management, etc. (“associates”), the details in respect of which are available on www.icicibank.com. ICICI Securities is one of the leading merchant bankers/ underwriters of securities and participate in virtually all securities trading markets in India. We and our associates might have investment banking and other business relationship with a significant percentage of companies covered by our Investment Research Department. ICICI Securities generally prohibits its analysts, persons reporting to analysts and their relatives from maintaining a financial interest in the securities or derivatives of any companies that the analysts cover. Recommendation in reports based on technical and derivative analysis centre on studying charts of a stock's price movement, outstanding positions, trading volume etc as opposed to focusing on a company's fundamentals and, as such, may not match with the recommendation in fundamental reports. Investors may visit icicidirect.com to view the Fundamental and Technical Research Reports. Our proprietary trading and investment businesses may make investment decisions that are inconsistent with the recommendations expressed herein. ICICI Securities Limited has two independent equity research groups: Institutional Research and Retail Research. This report has been prepared by the Institutional Research. The views and opinions expressed in this document may or may not match or may be contrary with the views, estimates, rating, target price of the Retail Research. The information and opinions in this report have been prepared by ICICI Securities and are subject to change without any notice. The report and information contained herein is strictly confidential and meant solely for the selected recipient and may not be altered in any way, transmitted to, copied or distributed, in part or in whole, to any other person or to the media or reproduced in any form, without prior written consent of ICICI Securities. While we would endeavour to update the information herein on a reasonable basis, ICICI Securities is under no obligation to update or keep the information current. Also, there may be regulatory, compliance or other reasons that may prevent ICICI Securities from doing so. Non-rated securities indicate that rating on a particular security has been suspended temporarily and such suspension is in compliance with applicable regulations and/or ICICI Securities policies, in circumstances where ICICI Securities might be acting in an advisory capacity to this company, or in certain other circumstances. This report is based on information obtained from public sources and sources believed to be reliable, but no independent verification has been made nor is its accuracy or completeness guaranteed. This report and information herein is solely for informational purpose and shall not be used or considered as an offer document or solicitation of offer to buy or sell or subscribe for securities or other financial instruments. Though disseminated to all the customers simultaneously, not all customers may receive this report at the same time. ICICI Securities will not treat recipients as customers by virtue of their receiving this report. Nothing in this report constitutes investment, legal, accounting and tax advice or a representation that any investment or strategy is suitable or appropriate to your specific circumstances. The securities discussed and opinions expressed in this report may not be suitable for all investors, who must make their own investment decisions, based on their own investment objectives, financial positions and needs of specific recipient. This may not be taken in substitution for the exercise of independent judgment by any recipient. The recipient should independently evaluate the investment risks. The value and return on investment may vary because of changes in interest rates, foreign exchange rates or any other reason. ICICI Securities accepts no liabilities whatsoever for any loss or damage of any kind arising out of the use of this report. Past performance is not necessarily a guide to future performance. Investors are advised to see Risk Disclosure Document to understand the risks associated before investing in the securities markets. Actual results may differ materially from those set forth in projections. Forward-looking statements are not predictions and may be subject to change without notice. ICICI Securities or its associates might have managed or co-managed public offering of securities for the subject company or might have been mandated by the subject company for any other assignment in the past twelve months. ICICI Securities or its associates might have received any compensation from the companies mentioned in the report during the period preceding twelve months from the date of this report for services in respect of managing or co-managing public offerings, corporate finance, investment banking or merchant banking, brokerage services or other advisory service in a merger or specific transaction. ICICI Securities or its associates might have received any compensation for products or services other than investment banking or merchant banking or brokerage services from the companies mentioned in the report in the past twelve months. ICICI Securities encourages independence in research report preparation and strives to minimize conflict in preparation of research report. ICICI Securities or its associates or its analysts did not receive any compensation or other benefits from the companies mentioned in the report or third party in connection with preparation of the research report. Accordingly, neither ICICI Securities nor Research Analysts and their relatives have any material conflict of interest at the time of publication of this report. Compensation of our Research Analysts is not based on any specific merchant banking, investment banking or brokerage service transactions. ICICI Securities or its subsidiaries collectively or Research Analysts or their relatives do not own 1% or more of the equity securities of the Company mentioned in the report as of the last day of the month preceding the publication of the research report. Since associates of ICICI Securities are engaged in various financial service businesses, they might have financial interests or beneficial ownership in various companies including the subject company/companies mentioned in this report. ICICI Securities may have issued other reports that are inconsistent with and reach different conclusion from the information presented in this report. Neither the Research Analysts nor ICICI Securities have been engaged in market making activity for the companies mentioned in the report. We submit that no material disciplinary action has been taken on ICICI Securities by any Regulatory Authority impacting Equity Research Analysis activities. This report is not directed or intended for distribution to, or use by, any person or entity who is a citizen or resident of or located in any locality, state, country or other jurisdiction, where such distribution, publication, availability or use would be contrary to law, regulation or which would subject ICICI Securities and affiliates to any registration or licensing requirement within such jurisdiction. The securities described herein may or may not be eligible for sale in all jurisdictions or to certain category of investors. Persons in whose possession this document may come are required to inform themselves of and to observe such restriction. This report has not been prepared by ICICI Securities, Inc. However, ICICI Securities, Inc. has reviewed the report and, in so far as it includes current or historical information, it is believed to be reliable, although its accuracy and completeness cannot be guaranteed.