consumer discretionary - Gear4music (Holdings) plc
49
www.progressive-research.com This publication should not be seen as an inducement under MiFID II regulations. Please refer to important disclosures at the end of the document. 1 September 2020 GEAR4MUSIC CONSUMER DISCRETIONARY G4M.L 565p Market Cap: £118.3m SHARE PRICE (p) 12m high/low 595p/143p Source: LSE Data KEY DATA Net (Debt)/Cash £(5.5)m (at 31/03/20) Enterprise value £123.9m Index/market AIM Next news H1 trading update -Oct Shares in Issue (m) 20.9 Chairman Ken Ford Chief Executive Andrew Wass CFO Chris Scott COMPANY DESCRIPTION Gear4music is a leading international online retailer of musical instruments and equipment. www.gear4musicplc.com Scaling up….. …with a change of key to more profitable growth Gear4music is the leading UK online retailer of musical instruments and music equipment and has established operating bases in Sweden and Germany to spearhead its expansion into mainland Europe. It operates a low-cost model, with further efficiency gains targeted, and is profitable from the first customer transaction, achieving a 250% gross margin return on its marketing investment in new customer acquisition. A unique business: Gear4music (G4M) is the only UK listed online retailer of musical instruments and music equipment. With just over an estimated 7% of the UK market and around 1.5% of the European market, it has significant growth potential from market share expansion in a highly fragmented product market seeing a structural shift from traditional bricks and mortar retailers into the online channel. Barriers to entry: G4M benefits from several barriers to entry. The most significant of these - and a source of sustainable competitive advantage - is its proprietary and bespoke e-commerce platform, developed over a 14-year period. An expanding product offer, now over 55,000 lines, particularly its highly profitable own brand ranges, long-term relationships with suppliers and its European distribution infrastructure also constitute notable barriers to entry. Company fundamentals: The company has built a flexible and scalable business model, including a European distribution infrastructure with local buying capabilities, which mitigates Brexit risks. It operates 20 localised country websites in 15 languages with 9 currencies and can ship its products to 190 countries. G4M’s primary growth drivers are further international expansion, range extensions, investment in its proprietary platform and data- led enhancements to digital marketing and web content. Valuation: G4M’s valuation metrics lag the average and median of our selected online retailer peer group by around 31% and 22% respectively. The valuation gap may reflect a lower rate of forecast sales growth compared with the peer group, with G4M successfully focussing on profitable sales growth in FY20, achieving both gross and EBIT margin enhancement. 0 200 400 600 800 FYE MAR (£M) 2019 2020 2021E 2022E 2023E Revenue 118.2 120.3 144.6 151.3 167.1 Adj EBITDA 2.3 7.8 11.5 11.6 13.1 Fully Adj PBT -0.6 3.1 6.8 6.7 7.9 Fully Adj EPS (p) -0.8 12.2 26.8 26.4 31.2 EV/Sales (x) 1.0x 1.0x 0.9x 0.8x 0.7x EV/EBITDA (x) 54.3x 16.0x 10.8x 10.7x 9.5x PER (x) N/A 46.2x 21.0x 21.4x 18.1x Source: Company Information and Progressive Equity Research estimates GEAR4MUSIC IS A RESEARCH CLIENT OF PROGRESSIVE ANALYSTS David Jeary +44 (0) 20 7781 5306 [email protected]
-
Upload
khangminh22 -
Category
Documents
-
view
5 -
download
0
Transcript of consumer discretionary - Gear4music (Holdings) plc

www.progressive-research.com This publication should not be seen as an inducement under MiFID II regulations.
Please refer to important disclosures at the end of the document.
1 September 2020
GEAR4MUSIC
CONSUMER DISCRETIONARY
G4M.L
565p
Market Cap: £118.3m
SHARE PRICE (p)
12m high/low 595p/143p
Source: LSE Data
KEY DATA
Net (Debt)/Cash £(5.5)m (at 31/03/20)
Enterprise value £123.9m
Index/market AIM
Next news H1 trading update -Oct
Shares in Issue (m) 20.9
Chairman Ken Ford
Chief Executive Andrew Wass
CFO Chris Scott
COMPANY DESCRIPTION
Gear4music is a leading international online retailer of musical instruments and equipment.
www.gear4musicplc.com
Scaling up…..
…with a change of key to more profitable growth
Gear4music is the leading UK online retailer of musical instruments and music equipment and has established operating bases in Sweden and Germany to spearhead its expansion into mainland Europe. It operates a low-cost model, with further efficiency gains targeted, and is profitable from the first customer transaction, achieving a 250% gross margin return on its marketing investment in new customer acquisition.
A unique business: Gear4music (G4M) is the only UK listed online retailer of musical instruments and music equipment. With just over an estimated 7% of the UK market and around 1.5% of the European market, it has significant growth potential from market share expansion in a highly fragmented product market seeing a structural shift from traditional bricks and mortar retailers into the online channel.
Barriers to entry: G4M benefits from several barriers to entry. The most significant of these - and a source of sustainable competitive advantage - is its proprietary and bespoke e-commerce platform, developed over a 14-year period. An expanding product offer, now over 55,000 lines, particularly its highly profitable own brand ranges, long-term relationships with suppliers and its European distribution infrastructure also constitute notable barriers to entry.
Company fundamentals: The company has built a flexible and scalable business model, including a European distribution infrastructure with local buying capabilities, which mitigates Brexit risks. It operates 20 localised country websites in 15 languages with 9 currencies and can ship its products to 190 countries. G4M’s primary growth drivers are further international expansion, range extensions, investment in its proprietary platform and data-led enhancements to digital marketing and web content.
Valuation: G4M’s valuation metrics lag the average and median of our selected online retailer peer group by around 31% and 22% respectively. The valuation gap may reflect a lower rate of forecast sales growth compared with the peer group, with G4M successfully focussing on profitable sales growth in FY20, achieving both gross and EBIT margin enhancement.
0
200
400
600
800
FYE MAR (£M) 2019 2020 2021E 2022E 2023E
Revenue 118.2 120.3 144.6 151.3 167.1
Adj EBITDA 2.3 7.8 11.5 11.6 13.1
Fully Adj PBT -0.6 3.1 6.8 6.7 7.9
Fully Adj EPS (p) -0.8 12.2 26.8 26.4 31.2
EV/Sales (x) 1.0x 1.0x 0.9x 0.8x 0.7x
EV/EBITDA (x) 54.3x 16.0x 10.8x 10.7x 9.5x
PER (x) N/A 46.2x 21.0x 21.4x 18.1x
Source: Company Information and Progressive Equity Research estimates
GEAR4MUSIC IS A RESEARCH CLIENT OF PROGRESSIVE
ANALYSTS
David Jeary
+44 (0) 20 7781 5306

1 September 2020
2 Gear4music
TABLE OF CONTENTS
EXECUTIVE SUMMARY ................................................................. 3
BACKGROUND AND HISTORY ........................................................ 7
MARKET BACKDROP .................................................................. 8
Market size ................................................................................................ 9
Competition and structural shift............................................................... 11
CUSTOMER PROPOSITION ........................................................... 13
Clear identity - “a business for musicians run by musicians” ..................... 13
Customer base ......................................................................................... 13
Product offer and branding ...................................................................... 18
OPERATIONAL INFRASTRUCTURE ................................................... 23
E-commerce platform .............................................................................. 24
Warehousing and distribution .................................................................. 27
Customer marketing, services and showrooms ........................................ 28
Sourcing and buying ................................................................................. 30
SENIOR MANAGEMENT TEAM ....................................................... 31
GROWTH DRIVERS .................................................................... 32
FINANCIALS AND FORECASTS........................................................ 33
Profit and loss account ............................................................................. 34
Cash flow and balance sheet .................................................................... 37
Forecasts .................................................................................................. 38
VALUATION ............................................................................ 43
RISKS .................................................................................... 45
External risk factors .................................................................................. 45
Internal risk factors .................................................................................. 46
MAJOR SHAREHOLDINGS ............................................................ 47

1 September 2020
3 Gear4music
Executive summary
Overview
The original gear4music.com website launched in 2003 by founder and current CEO, Andrew Wass, and Gear4music (G4M) has grown since then to become the leading UK retailer of musical instruments and music equipment with a current estimated market share of just over 7% of the UK market. It began selling into Europe in 2012 and has subsequently opened operating bases in Sweden and Germany, commanding an estimated market share of around 1.5% of the Continental European market. G4M has the capability to ship products to 190 countries around the globe. The company benefits from several barriers to entry, prime among which is the bespoke proprietary end-to-end e-commerce platform it has developed over the past 14 years.
G4M is a unique business, being the only UK listed online retailer of musical instruments and music equipment. We believe it has substantial scope to profitably expand both its domestic and especially its European market share over the longer-term. While the share price has risen substantially from its current year low at the end of March, it trades at a discount of around 20% - 30% to our selected group of online peer comparators.
Profitable from the first transaction
With its product market characterised by relatively infrequent purchases, it is imperative that G4M is efficient in generating good financial returns from its marketing investment in customer acquisition. Aided by a high average order value relative to other product categories (£117 in FY20) and a product gross margin of over 30% (some 450bps higher than the reported gross margin), G4M is profitable from the first customer order, with the gross margin return on the cost of customer acquisition ranging from 200% - 250% over the last five years.
G4M profitable from first customer transaction
Source: Gear4music; Progressive Equity Research
30.033.5 32.3
26.830.2
14.6 14.5 14.8 13.2 11.9
205%232% 219%
202%
253%
0%
50%
100%
150%
200%
250%
0.0
5.0
10.0
15.0
20.0
25.0
30.0
35.0
40.0
FY16 FY17 FY18 FY19 FY20
Gross profit per transaction (£)
Acquisition cost per new customer (£)
GMROI (%)
Gear4music is the leading UK retailer of musical instruments and equipment….
….with scope to significantly expand both its domestic and European market share
High average order value and efficient marketing deliver profit from first transaction

1 September 2020
4 Gear4music
Key strengths
G4M benefits from significant strengths across many areas of its business operations, including:
▪ Management and staff – with in-depth specialist knowledge, many of whom play or produce music.
▪ Bespoke and proprietary end-to-end e-commerce platform – currently supporting 20 websites, using 15 languages and 9 currencies
▪ Supplier relationships – these have been developed and maintained over many years, facilitating the ….
▪ continuous extension of its product range - currently with over 55,000 stock keeping units (SKU’s or lines) offered to customers, including its….
▪ ….own brand range – this is a key area of superior competitive differentiation, highly productive and profitable, currently comprising just over 3,400 SKU’s
Own brands yield 43% of gross profit, from 6% of SKU’s…. …. driven by higher gross margins and sales productivity
Source: Gear4music; Progressive Equity Research
▪ European distribution infrastructure – operating from three distribution centres in the UK, Sweden and Germany, with local showrooms to support dealership contracts with third-party suppliers, and local buying capabilities. This should substantially mitigate potential Brexit risks.
▪ Customer acquisition – G4M has consistently grown its total customer database and email subscriber base, supported by data-led digital marketing activities
▪ Delivery of customer satisfaction – as warranted by high customer rating on Trustpilot of 4.8 (out of five).
0.0
5.0
10.0
15.0
20.0
25.0
30.0
35.0
FY16 FY17 FY18 FY19 FY20
3.86.0 8.6
12.915.0
6.1
10.814.6
18.7 20.110.0
16.8
23.2
31.635.1
Own brand (£m) Third party brand (£m) Total (£m)
41.9%
24.6%
29.1%
42.2%
25.3%
30.5%
0.0%
5.0%
10.0%
15.0%
20.0%
25.0%
30.0%
35.0%
40.0%
45.0%
Own brand margin Third party brand margin Total product margin
FY16 FY17 FY18 FY19 FY20
Many key strengths underpin its competitive advantages

1 September 2020
5 Gear4music
Growth drivers
We believe continued market share growth from the structural shift to the online channel in the highly fragmented market for musical instruments and music equipment will be a key growth driver for G4M over the medium- and longer-term. We believe its growth will be faster than the secular growth of the online channel due to four specific areas of self-help action. These are:
▪ International expansion: The main thrust of international expansion will be on Europe over the medium-term, continuing to build on the investments in Sweden and Germany. This will deliver both market share gains and efficiency gains as economies of scale build. This could also see new localised websites for entry into new markets. While G4M has a US $ website, the market opportunity in Europe, building on existing infrastructure, remains more attractive and less risky over the medium-term.
▪ Product range extension: There remains considerable potential for G4M to expand both the breadth and depth of its product offer, giving customers more reasons to buy from the company and fewer to consider competitive alternatives. G4M believes its product offer could grow to 80,000 SKU’s, an increase of 45% from the current assortment. This would include further expansion of its more productive own brand offer. In FY20, own brand products accounted for 6.3% of SKU’s, 31% of brand sales and 43% of product gross profit.
▪ Investment in its proprietary e-commerce platform: G4M will continue to invest in its platform to develop new features and functionality to drive website traffic, increase conversion rates and maximise operational efficiencies and reliability. This will enhance the overall customer experience and engender higher levels of customer satisfaction and repeat purchasing. We expect to see the introduction of more new services, such as the planned introduction of digital downloads, over the coming years.
▪ Enhanced digital marketing and content: Greater marketing efficiencies will be delivered through further enhancements to the personalisation of product and service offers to customers, both on the website and to email subscribers. Website content will be further enriched to increase customer engagement.
We believe G4M’s longer-term market share potential points to a significantly larger business. Assuming G4M attains a 10% share of the UK market (compared with 7.2% in FY20) and a 4% share of the European market (compared with 1.5% currently), both of which are certainly feasible in our view, G4M’s turnover could reach around £250m, based on FY20 market size estimates. This is more than twice the level of the group’s FY20 turnover.
Beneficiary of structural shift and self-help measures
Feasible market share targets suggest G4M’s turnover can more than double to £250m

1 September 2020
6 Gear4music
Forecasts
The following table summarises our key forecast headlines for the next three years along with the FY20 figures as a baseline. These show our assumption of a strong period of growth, with a more measured level of 3-year CAGR growth at the turnover line (12%) magnified at each level of profitability as we move down the P&L account, culminating in an impressive 3-year CAGR of just under 37% at the PBT and EPS level. Our forecasts also show a swing into a net cash position in FY22E.
Summary of key forecast measures – FY21E – FY23E
Source: Gear4music; Progressive Equity Research
The FY21E profit outturn will reflect what amounts to an exceptional rate of sales growth achieved year-to-date, together with favourable gross margin and marketing efficiencies. The rate of sales growth is considerably higher than what should be considered a reflection of more normalised or underlying sales growth. The exceptional trading pattern of FY21E is highly likely to adversely impact the reported rate of sales and profit growth in FY22E, especially in H1, masking the steadier progression that would have been delivered ordinarily under a more consistent rate of sales growth.
Valuation
G4M’s valuation metrics, especially EV/sales, align most closely with those of electrical goods retailer AO World from our selected peer comparator group. Despite some superficial similarities (hard goods rather than clothing retail and a European presence), we view this is as an inappropriate comparator, with G4M’s business model and competitive strengths having the potential to drive superior market share and profits growth.
G4M’s valuation metrics lag the average and median of our selected online retailer peer group by around 20% - 30%. The valuation gap may reflect a lower rate of forecast sales growth compared with the wider peer group, with G4M successfully focussing on profitable sales growth in FY20, achieving margin enhancement at gross, EBITDA, EBIT and PBT level.
FY20 FY21E FY22E FY23E 3-yr CAGR
Turnover 120.326 144.557 151.285 167.056 11.6%
Gross profit 31.156 38.886 39.788 44.270 12.4%
Gross margin (%) 25.9% 26.9% 26.3% 26.5%
Operating costs (exc DA) 23.402 27.384 28.199 31.202 10.1%
Opex as % of turnover 19.4% 18.9% 18.6% 18.7%
EBITDA 7.754 11.502 11.589 13.068 19.0%
EBITDA margin (%) 6.4% 8.0% 7.7% 7.8%
Operating profit 4.067 7.481 7.262 8.353 27.1%
Operating margin (%) 3.4% 5.2% 4.8% 5.0%
Adjusted pre-tax profit 3.078 6.781 6.662 7.853 36.6%
Adjusted diluted EPS (p) 12.2 26.8 26.4 31.2 36.6%
Net cash/(debt) (5.549) (2.530) 1.278 6.009
Our forecasts deliver a 3-year PBT CAGR of 37%
FY21E to deliver exceptional profit growth ahead of normal underlying trends – with impact on shape of FY22E’s figures
Valuation metrics lag the peer cohort by 20% - 30%

1 September 2020
7 Gear4music
Background and History
Gear4music (G4M) is the leading UK retailer and a major European retailer of musical instruments and music equipment. It trades primarily as an online retailer, with the original gear4music.com website launched in 2003 by founder and current CEO, Andrew Wass. The group operates 20 websites in 15 languages with nine currencies. G4M also has three retail showrooms on the site of its three distribution centres in York, Stockholm (Sweden) and Mulheim (Germany). The group started selling into Europe in 2012 and beyond Europe from 2017, with the capability to ship to 190 countries worldwide.
G4M’s product offering currently extends to over 55,000 lines, sourced from 894 suppliers. The majority of product sales come from third-party brands and suppliers, including many famous names within the music industry, such as Fender, Roland and Yamaha. Just over 30% of product sales are generated by G4M’s own brand range, comprising some 3,400 lines. The price architecture extends from kazoos at 99p and descant recorders at £1.99 to guitars, drum kits, digital pianos and other instruments costing several thousand pounds. The company’s proprietary and bespoke e-commerce platform provides both a source of sustainable competitive advantage and a considerable barrier to entry.
G4M was admitted to AIM in 2015 with a placing price of 139p and a concomitant market capitalisation at the placing price of £28m. Group turnover has climbed from £24.2m in FY15 to £120.3m in FY20, equating to a 5-year compound annual growth rate (CAGR) of just under 38%.
It should be noted that FY19 financial figures throughout this note cover a 13-month period to March 2019, following a change to the year-end, which ran to end February previously.
Gear4music - History and summary of milestone events
Source: Company data; Progressive Equity Research
Date Event
1995Gear4music was founded by Andrew Wass to supply PC-based digital recording equipment to educational establisments and
smaller, independent recording studios.
2003
Having researched the opportunity for own brand instruments at beginner level, Andrew Wass placed a bulk order for
guitars, sold through the newly launched gear4music website. The site generated turnover of £0.7m in its first year of
trading.
2007 Gear4music launched its bespoke operating platform, including upgrades to website design
2012Key Capital Partners (KCP) invested £3.4m in the group, providing capital to further develop the e-commerce platform and
proposition.
2013The group re-located to its current UK distribution centre location in York. It also started the launch of multi-lingual
European websites.
2014 The company opened a 9,000 sq.ft. showroom adjoining the York distribution centre
2015Gear4music listed on AIM, generating £9.0m of net proceeds, which paid down all private equity debt, leaving £4.4m to
invest within the group.
2016 Gear4music opened its distribution centre in Sweden in November. KCP sold its final tranche of shares in Gear4music.
2017
In January, G4M acquired and brought in-house its software development team and certain assets from the external
technology company, Venditan. A distribution centre was opened in Germany in February. Turnover in the year to February
2017 passed the £50m level. In May, the group opened a showroom in Sweden adjacent to its distribution centre and raised
net equity proceeds of £4.2m for further development purposes. The company acquired a 50,000 sq.ft. freehold office
property in June, re-locating Head Office staff into the building in September.
2018
The German showroom was opened in March. In October, the group re-located its Swedish distribution centre to a larger
purpose-built facilty to underpin future growth. In September, the group announced it was changing its year-end from
February to March.
2019 Revenues in the year to March 2019 crossed the £100m threshold.
2020In July, Gear4music reported FY21E's Q1 revenues to end June up 68%, benefiting strongly from the lockdown and closure of
its High Street competitors.
G4M operates 20 websites in 15 languages and 9 currencies
Range extends to 55,000 lines, including 3,400 own brand products

1 September 2020
8 Gear4music
Market Backdrop
The market for musical instruments and musical equipment is highly fragmented on both the supply and demand side. Thousands of manufacturers make many tens of thousands of products and accessories, reflecting both global categories and local cultural heritage, on the supply side of the industry. Consumer demand is addressed through a likewise fragmented retail industry, which has traditionally been characterised by small local independent stores or chains.
As in other retail segments, the internet and the arrival of e-commerce has seen the launch of pure play online competitors, such as G4M, which have disrupted the traditional market channels with a new business model, compounding the competitive and economic pressures afflicting smaller, bricks and mortar retailers.
The nature of the market for musical instruments and musical equipment is very different from many other categories, such as food and fashion, where purchase frequency is higher, where seasonal influences (primarily weather-related) play a significant role on product offer and consumer requirements, and where the average life time value of a loyal customer can consequently run into thousands of pounds.
G4M – average order value and lifetime customer value
Source: Gear4music; Progressive Equity Research
Even if viewed in the simplest of ways, that of replacement cycles, musical instruments and musical equipment have a longer product life expectancy and therefore longer replacement cycle than food or fashion. As will be seen later, this requires a level of new customer acquisition every year to drive sales growth.
116 124 127 117 117
199 210 214 207 212
1.0
1.1
1.2
1.3
1.4
1.5
1.6
1.7
1.8
0
50
100
150
200
250
300
FY16 FY17 FY18 FY19 FY20
Average order value (£)
Lifetime customer value (£)
Implied transactions per customer (x)
Fragmented markets…..
…disrupted by arrival of online players
Low frequency of purchase….
…means new customer acquisition is a key part of the business model

1 September 2020
9 Gear4music
Market size
The market is less well researched than many product markets that are larger in value and/or shopped more frequently with a higher volume of sales. There are sources of market information, some of which are used and cited by G4M. One such source is the American trade magazine and industry specialist, Music Trades.
According to Music Trades, the 2019 global market for musical instruments and equipment was worth $16bn at retail prices, with the USA market accounting for around half. A separate report published by Music Trades in April 2020 looked at the 40 largest online retailers in this market. Based in 10 countries, this group increased their aggregate sales in 2019 by over 7% to $4.22bn, compared to global industry growth of less than 2%. This saw an increase in market share or penetration of the global market size cited above to an implied 26.3%, compared with an estimated 25.1% in 2018. We expect online retailers to continue to increase their share of this market over time, in line with the trend seen in most other product categories.
The chart below shows revenues of the top 40 online retailers and share by country of origin. Companies based in two countries account for 80% of the global online market, namely the USA with 51% and Germany with 29%. The UK is the third largest with a global market share of 9%, from estimated revenues of $377m (or around £295m at the average 2019 exchange rate of $1.2772 = £1).
Top 40 global online music retailers – aggregate sales ($bn) - ………and by country where based ($m and % of total)
Source: Music Trades, Progressive Equity Research
G4M estimates the market size of ten selected major European markets to be just under £5bn in 2019. This estimate is based on extrapolating market size data used in its Admission Document in 2015. This has a base year of 2012, and has been grossed up for each country and therefore also the total by 2% per annum. The sales participation of each country is therefore unchanged from the base year data but is a solid representation of the relative market sizes.
2148USA
50.9%
17Singapore
0.4% 1205Germany
28.6%
22Korea0.5%
377UK
8.9%25
Italy0.6%
170Japan 4.0%
141Netherlands
3.3%90France2.1%25
Czech Republic 0.6%
3.1 3.2
3.83.9
4.2
3%
19%
4%7%
0%
5%
10%
15%
20%
25%
0.0
0.5
1.0
1.5
2.0
2.5
3.0
3.5
4.0
4.5
2015 2016 2017 2018 2019
$bn YOY growth (%)
Global market worth $16bn at retail prices
European market size c. £5bn

1 September 2020
10 Gear4music
Estimated market size of selected top European markets – 2012 and 2019
Source: Key Capital Partners DD 2012; Gear4music; Progressive Equity Research
The UK ranks as the third largest market within Europe with an estimated market value of £860m, with a sales mix of 18% of the selected markets. Germany, where G4M has one of its two European distribution hubs, is estimated to be almost 60% bigger, accounting for 28% of the selected markets. Sweden, where G4M established its first European distribution centre, is naturally a smaller market by dint of its population, but is an important hub for the other Nordic markets.
We have for reference included the population for each market, which in turn permits the calculation of per capita spending. On average this comes to just over £13 per capita across these selected markets, with the spread ranging from just over £4 in Spain to a high of just over £23 in Austria. The UK per capita spend is marginally below the overall average. This level of spend underlines our earlier point above that this is a relatively small and specialised market within the context of other product categories and household spending. For context, the ONS reports that family spending on clothing and shoes in 2019 was £24.40 per week (or over £1250 per annum). While these are admittedly spending figures for a family, rather than per capita spend, they serve to underline the smaller and more specialist nature of the market for musical instruments and equipment.
Based on the UK market size, G4M estimates its market share to be around 7.2% in 2019. In terms of its share of the UK online market (G4M estimate of c £300m), we calculate this to be around 20%, allowing and adjusting for revenues from its York showroom. Each of these market share figures show there is considerably more growth potential for G4M in its domestic market.
Within the broader European market, the growth potential is even higher from G4M’s current estimated share of 1.5% (of the total market), based on the market size of the nine other selected markets quantified above. Based on the Music Trades online market estimates by country above, this would give G4M around a 5% share of the European online music market, excluding the UK. Given that this is based only on the largest 40 online retailers, this will overstate G4M’s share, again underlining the growth potential within the broader European market.
Mix Population Spend per
2012 2019 % (m) capita (£)
Germany 1,194 1,371 28.0% 83.8 16.36
France 863 991 20.2% 65.3 15.18
UK 749 860 17.6% 67.9 12.67
Italy 578 664 13.6% 60.5 10.98
Netherlands 202 232 4.7% 17.1 13.54
Austria 181 208 4.2% 9.0 23.10
Spain 166 191 3.9% 46.8 4.09
Switzerland 142 163 3.3% 8.7 18.83
Sweden 107 123 2.5% 10.1 12.18
Norway 83 95 1.9% 5.4 17.54
Total 4,265 4,898 100.0% 374.5 13.08
Market size (£m)
G4M’s UK estimated market share at 7.2%....
…with European share of 1.5%

1 September 2020
11 Gear4music
Competition and structural shift
The smaller and specialised nature of the market has naturally resulted in it being served at the retail level by specialty stores. Many of these were local independent stores founded by music enthusiasts, some of which have been family-run for generations. As in other retail sectors, chains of stores have developed over time, most typically at local, regional and national level. In the UK, there are a number of small chains, such as S&T Audio (PMT), Guitar Guitar and Dawsons Music, but all of these also operate online as multi-channel players.
The arrival of e-commerce has seen a major shift to the online channel within this marketplace. Websites can display a breadth and depth of product that is impossible to replicate in a physical store. This is facilitated by the benefits of a centralised warehouse enabling companies to hold and sell a substantially broader range of lines far more economically than can an individual store or even chains with a greater degree of scale. Some stock will also be held by suppliers, but can be accessed easily and efficiently via linked systems. As in the physical world, some products will not be immediately available in the online channel but are available to order.
Major European competitors and G4M delivery timescales
Source: Gear4music; Music Trades
Centralised stockholding of online retailers more economical and more attractive to consumers

1 September 2020
12 Gear4music
The chart above shows G4M’s main competitors within Europe. These companies generate the majority of their revenues from their online channels, although most also operate a handful of stores (eg PMT, Woodbrass) or a flagship store/showroom (eg Thomann, Andertons and indeed G4M). Operating a showroom or stores gives access to certain brands, which insist on their customers (retailers) having display facilities to the end retail consumer, backed up by knowledgeable product specialists. This aims to prevent the commoditisation of brands and maintain a more stable pricing environment.
The chart also shows that even larger companies, like Luthman in Sweden, are not immune to economic and competitive pressure. This £100m turnover business ceased trading in October 2019, with G4M well placed to increase its market share in Scandinavia in light of its Swedish distribution centre and established relationships with local as well as international couriers for product distribution to customers.
By the very nature of the internet and e-commerce capabilities, the majority of these competitors have a number of localised websites catering for non-domestic European markets. The major competitor across Europe is the German company, Thomann, whose 2018 turnover was greater than the sum of other seven companies in the chart. While Thomann has sold into the UK market for many years, G4M’s believes Thomann’s UK revenues are considerably smaller than its own.
Despite the substantial market share inroads made in this market by the online channel, it is not without some irony that the global giant of e-commerce has been unable to participate fully in this structural shift. While Amazon sells both musical instruments and musical equipment, many of G4M’s suppliers and distributors, especially in the “better/best” segments, have a contractual requirement for their products to be displayed in face-to-face retail facilities, supported by knowledgeable sales staff. This therefore creates a significant barrier to entry for pure play online retailers as it limits the choice of brands to their customers.
German company Thomann is the biggest operator in Europe
Brand access is a barrier to entry for Amazon

1 September 2020
13 Gear4music
Customer Proposition
In this chapter, we look in more detail at Gear4music, its customer product and service offering and the underlying operating infrastructure that supports and delivers the customer proposition.
Clear identity - “a business for musicians run by musicians”
We start by looking at how G4M positions itself and formulates its objectives. This is important, as in our experience those businesses with a clear identity, with clearly communicated and easily understood objectives, are more likely to succeed than those that do not possess these attributes. This focus typically brings with it a better buy-in from all stakeholders, which in turn and most importantly translates into superior delivery of the customer proposition, engendering high levels of customer satisfaction, customer loyalty and word of mouth recommendation, arguably the best (and free) form of marketing and endorsement.
G4M does not have a formal mission statement, though it does articulate its purpose, which we will come to shortly. It does however encapsulate its essence in the simple description of itself as “a business for musicians run by musicians”. This aptly and simply conveys what the business is and is about to customers, employees, shareholders and all stakeholders alike. It conveys a shared love of music and creating music between the company and its customers, creates confidence in its credentials, products and services through empathy with its customers, and underpins a specialist knowledge of its products.
In terms of its purpose or objective, G4M lays this out as follows:
“Leveraging a market-leading bespoke e-commerce technology platform, a wide range of products including a unique own brand offering, and a low-cost European logistics infrastructure, our objective is to deliver value to customers and shareholders through long-term profitable growth.”
The objective is arguably no different to that of most B2C companies, be they listed or private. More interesting are the four core components that G4M seeks to leverage in order to deliver its objective, specifically its bespoke technology, range breadth (ie customer choice), own brand offer and distribution infrastructure. These represent not only core strengths of the business, but also act - to varying degrees - as barriers to entry, thereby providing sources of competitive advantage. We discuss these in more detail later in this chapter.
Customer base
Driving the numbers
In a smaller and specialised market, especially with relatively infrequent purchases and modest growth prospects given its maturity, the key to commercial growth is expansion of the customer base – and on a relentlessly consistent basis. It is of course here that the online channel has a substantial advantage over traditional store-based retailers. An online retailer’s website can reach far more eyeballs over a far wider geography and generate far more customer “footfall” than the shop window(s) of any traditional store. Store retailers had to open more stores (at least historically) to reach more customers to generate incremental income, increasing their fixed cost base in the process. While driving eyeballs to websites also has associated costs, these are typically more variable in nature.
Encapsulating the business ethos in a phrase
Seeking to leverage four core components
Expansion of the customer base is key

1 September 2020
14 Gear4music
G4M has been very successful in growing its customer base over time, as would be expected given its 38% revenue CAGR of the last five years (and around 30% since 2010). This can clearly be seen in the following chart, showing the growth of the total database, the email subscriber base, which has opted in to receive company emails, and active customers, namely those that have purchased in that financial year. The decrease in the email subscriber base in FY20 resulted from a review for compliance with the new GDPR regime and a consequent cleansing and tidying up of the database, and we would expect to see continued growth from the revised base from FY21E onwards. We also see the consistently impressive growth in active customer numbers, which has broadly grown at a similar rate as total group revenue over the past five years with a 5-year CAGR of 36.7%.
Growth of G4M’s customer base – FY15 – FY20
Source: Gear4music; Progressive Equity Research
In the next charts, we give an overview of customer dynamics, including repeat customers.
Active, repeat and newly acquired customers UK, Europe and total repeat customers (% of actives)
Source: Gear4music; Progressive Equity Research
297306
650
840890
650
169226
341
475
727
807
0.0
0.5
1.0
1.5
2.0
2.5
3.0
3.5
4.0
0
100
200
300
400
500
600
700
800
900
1000
FY15 FY16 FY17 FY18 FY19 FY20
Email subscriber base ('000) Active customers ('000) Total database (m)
0.0%
5.0%
10.0%
15.0%
20.0%
25.0%
30.0%
0
100
200
300
400
500
600
700
800
900
FY15 FY16 FY17 FY18 FY19 FY20
Active customers ('000) New customers acquired ('000)
Returning customers ('000) Repeat customers (%) RHS
10%
15%
20%
25%
FY15 FY16 FY17 FY18 FY19 FY20
16.7% 17.0% 17.6%
26.1% 24.9% 24.2%
24.8% 25.5%
23.7%22.1%
21.3% 21.0%
Europe repeat customers (%) UK repeat customers (%) Total repeat customers (%)
Active customers have grown at 5-year CAGR of 37%

1 September 2020
15 Gear4music
As alluded to earlier, the importance of newly acquired customers is abundantly clear when comparing this number with the total number of active customers making a purchase in any given year. Newly acquired customers typically make up at least 85% of active customers each year. This is not to say that returning or repeat customers are unimportant, and this is a metric carefully monitored by G4M. Repeat/returning customers includes customers who have purchased in previous years, and all those making more than one purchase in any given year, regardless of when they first purchased. This means that repeat/returning customers includes newly acquired customers making more than one purchase in the year of their acquisition.
The repeat customers metric remains above 20% for the group, though it has been on a declining trend since FY16. European repeat customer penetration remains lower than the UK but is on an upward trajectory. While the UK trend has seen declines, the overall decline is as much driven by the lower repeat rate from the faster growing European customer base. The declining trend in overall group repeat customers percentage could possibly continue to nudge downwards, yet would still generate good growth in the absolute number of repeat customers.
Website visitors have consistently risen………. ……..as have page views
Source: Gear4music; Progressive Equity Research
The charts above show the evolution in unique website visitors, both in aggregate and split between UK and Europe. In the FY18 – FY20 period, the aggregate visitor number is greater than the sum of UK and Europe. This is because the aggregate total includes other international visitors beyond Europe, which constitute the difference. The crossover year in visitor numbers, when Europe overtook the UK was FY18, though Europe/Rest of World revenue has not yet overtaken the UK figure. The second chart looks at page views along with a calculation of page views per unique visitor. This has fallen over the past two years, driven by the substantial increase in mobile visitors.
This trend mirrors that seen within e-commerce in general, with consumers moving away from desktop access, preferring to access the internet through mobile devices. This is driven by convenience and more viewing session opportunities, but typically results in shorter sessions with fewer page views, as shown above.
52
88
123
145150
5.2
7.07.3
5.4 5.3
0.0
1.0
2.0
3.0
4.0
5.0
6.0
7.0
8.0
0
20
40
60
80
100
120
140
160
FY16 FY17 FY18 FY19 FY20
Total pages viewed (m) Page views per unique visitor
5.7 6.5 8.210.9 11.0
4.46.2
8.5
15.2 16.6
10.1
12.6
16.9
27.1 28.4
0.0
5.0
10.0
15.0
20.0
25.0
30.0
FY16 FY17 FY18 FY19 FY20
UK website visitors (m) European website visitors (m)
Unique website visitors (m)
Newly acquired customers make up 85% of active customers
Repeat customers above 20% for the group

1 September 2020
16 Gear4music
The charts below show the dramatic surge in mobile visitors experience at G4M, such that they accounted for 56% of visitors in FY20, compared with just 26% in FY16. This growth has not been reflected directly or rather proportionately in revenue generation. Mobile accounted for 36% of revenues in FY20, compared with 56% of visitors, though up from 10% in FY16 (with 26% of visitors). The percentage differential between share of visitors and share of revenue is however certainly narrowing, as shoppers become more accustomed to purchasing via mobile devices, aided by improved mobile websites to facilitate and execute purchases. This gap will likely narrow further, though desktop research will likely remain an important part of considered purchases of very high value items.
Mobile visitor numbers….. ……..and share of overall visitors and revenue
Source: Gear4music; Progressive Equity Research
The overall group conversion rate has been on an improving trend over the past five years, with a small 11bps decline seen in FY20, partly reflecting selective price increases introduced to support the adjusted focus to profits growth rather than sales growth in reaction to the weaker profit performance of FY19. This was reflected across UK, Europe and (our derived calculation of) desktop, offset by the continued rise in mobile conversion rate. The other key points that stand out from the chart are the much higher conversion rate achieved in the UK compared with Europe and the higher conversion rate from desktops compared with mobile devices. We believe these conversion rates will converge over the medium-term through a levelling up process, which will of itself underpin an element of future sales growth, independent of the growth in customer numbers.
1.70.9
2.62.31.7
4.03.3 3.6
6.9
5.3
8.2
13.5
6.2
9.8
16.0
0.0
2.0
4.0
6.0
8.0
10.0
12.0
14.0
16.0
18.0
UK mobile visitors (m) European mobile visitors(m)
Total mobile visitors (m)
FY16 FY17 FY18 FY19 FY20
25.8%
31.7%
40.8%
49.8%
56.3%
9.6%
14.3%
19.5%
28.2%
36.3%
0.0%
10.0%
20.0%
30.0%
40.0%
50.0%
60.0%
FY16 FY17 FY18 FY19 FY20
Mobile % of all visitors Mobile % of total revenue
Mobile growing fast and now accounts for 56% of visitors and 36% of revenues
Conversion rates on improving trend

1 September 2020
17 Gear4music
Comparison of conversion rates by region and device
Source: Gear4music; Progressive Equity Research
UK customer age profile
The UK customer age profile of G4M is shown in the following pie chart. There is a core concentration within the 25 - 54 year age band, spread evenly across the three component age tranches, accounting together for around two thirds of customers. Customers span the full competence spectrum from absolute beginners to professional musicians across all types of instrument and equipment, which underlines the importance of product choice in terms of both breadth (categories) and depth (choice within categories).
UK customer profile by age group
Source: Gear4music; Progressive Equity Research
0.0%
1.0%
2.0%
3.0%
4.0%
5.0%
Overallconversion rate
UK conversionrate
Europeanconversion rate
Mobileconversion rate
Derived desktopconversion
FY16 FY17 FY18 FY19 FY20
13%
22%
25%
22%
12%
6%
18-24
25-34
35-44
45-54
55-64
65+
Two thirds of customers in the 25 – 54 age band

1 September 2020
18 Gear4music
With over 95% of customers being private household consumers, rather than educational or commercial institutions, this concentration is not surprising, given two factors. As well as there being many practising musicians within these age groups, there will also be many parents buying instruments for their children. The remaining sales come from schools and other educational establishments. The lowest level of customer penetration comes from the 65+ age bracket at just 6%.
Product offer and branding
G4M currently offers customers a choice of over 55,000 lines, with third-party and own brands, sourced from 894 suppliers, ranging in price from under £1 to several thousands of pounds, as outlined above in the Background and History section. The breadth of choice (number of categories and sub-categories) and depth of choice (options within categories) of a retailer’s range are a key factor in determining consumer choice and a fundamental means of competitive differentiation. G4M’s range has been developed and extended continuously from its original small range of guitars at inception and will continue to expand for many more years. Management believes the range could ultimately reach around 80,000 SKU’s, which equates to an increase of almost 50% from the current assortment.
The easiest way to summarise and visualise G4M’s core category offer is to look at the company’s home or landing page on its consumer website. For many customers this would be their first view of the company’s range offer through the equivalent of its shop window.
The following image has been snipped from G4M’s home page to show how the company introduces, summarises and categorises its products. There are six core categories, supported by a strong and simple visual image, together with the key sub-categories to help customers browse and narrow their search. These six categories are those used by G4M to report on their product sales. There are many more sub-categories than those shown at this top introductory level when clicking through into one of the six major categories, but those displayed will reflect the most popular based on customer searches and demand.
Categories outlined on G4M’s homepage
Source: Gear4music website
Over 95% of customers are private household consumers
Range extends to over 55,000 options….
….across six core categories

1 September 2020
19 Gear4music
The following charts show the evolution of product category sales in two ways. The left-hand table shows the sales achieved within each category over the last three years, and the right-hand side shows the percentage mix or sales participation over the last five years. We remind again that FY19 was a 13-month period, which therefore magnifies the underlying 12-month performance.
It is unsurprising given the company’s sales growth track record to see that most categories show absolute monetary growth on an annual basis, even for FY20 over the 13-month FY19. There are occasionally years, where a category does not grow, though this is usually for a specific reason. The only example in the last three years is the decline seen in Live & PA in FY20. This reflects two factors. First, G4M re-priced products from a high-volume brand to drive a better product return (from a lower volume of sales) and, second, falling demand for these products in the latter part of the year, as coronavirus reared up, mass participation events banned and consumer lockdowns introduced. This said, the underlying decline, adjusting FY19 to a 12-month basis, is less marked than it appears at first glance. The impact could be more marked for Live & PA in FY21, depending on the rate of relaxation of coronavirus restrictions, though there has been significant upside for G4M in the extraordinary, though unsustainable, growth rate seen in the early months of lockdown. This saw group sales in Q1 FY21E increase by 68%, with UK sales up 80% and Europe & the Rest of the World up 55%. Just as Live & PA has been adversely affected, the corollary has been explosive growth in podcast equipment as musicians (and others) seek to reach their audience through other channels.
Product sales by key categories (£m) Product category sales mix
Source: Gear4music; Progressive Equity Research
In terms of sales mix, movements are less marked with more gradual changes over time. The last five years have seen Keyboards, and Drums increasing their mix participation, reflecting growth rates above the company average, with Drums, Orchestral and Guitars seeing a lower sales mix, albeit Guitars and Orchestral have been relatively stable in mix terms over the past four years. Live & PA has also seen its mix increase over the period, notwithstanding its performance in FY20.
32% 27% 27% 27% 27%
18%20% 21% 21% 22%
15% 19% 20% 21% 19%
14% 13% 12% 11% 11%
11% 12% 11% 12% 13%
9% 7% 7% 7% 7%
0%
10%
20%
30%
40%
50%
60%
70%
80%
90%
100%
FY16 FY17 FY18 FY19 FY20
Guitars Keys Live & PA Drums Studio Orchestral
21.230.3 31.6
16.4
24.2 25.015.3
24.3 21.8
9.2
12.4 12.9
8.6
13.9 14.6
5.5
7.4 7.8
0
20
40
60
80
100
120
FY18 FY19 FY20
Orchestral
Studio
Drums
Live & PA
Keys
Guitars
Sales mix movements tend to be gradual
Most categories show absolute annual growth

1 September 2020
20 Gear4music
G4M offers a wide range of brands from its supplier base of 894 companies. The vast majority of brands are third-party brands (or “other brands” in G4M parlance), which are complemented by a small but very important number of own brands.
Selected prestige third-party brands
Source: Gear4music
The third-party brands, some of which are shown above, include many major and iconic names from within the music industry. Some of these are specialists within a specific category, such as Fender and Gibson in guitars, Roland and Korg in keyboards, Focusrite in studio recording hardware, while others such as Yamaha make products in several categories. Yamaha is the single most important brand for G4M, accounting for around 6% of sales.
The left-hand chart below shows how the range has grown over the past five years. The range has broadly doubled in the last five years whereas product sales are five times higher. While range extension has underpinned G4M’s growth, it is important to note that average sales per stock keeping unit (SKU – or product option) has more than doubled over the same period. Extended customer choice converts more customers, while increasing G4M’s product authority and reputation, driving more/new customers to its website. Inventory levels have increased over the period, partly driven by the success of own brand products, which in effect have to be in stock for immediate dispatch, though these have not increased at the same rate as sales. In other words, sales increases are not dependent on or driven by a proportionate increase in underlying inventories. This is captured by the simple metric of product sales divided by year-end inventory. While not a true stock turn measure, it nevertheless shows an increased efficiency of stock utilisation.
The range includes iconic brands like Fender, Gibson, Roland and Korg
Range extension adds value to consumers and continues apace; but with increased efficiency of stock utilisation

1 September 2020
21 Gear4music
Number of SKU’s and average sales per SKU (£) Product sales and year-end inventories (£m)
Source: Gear4music; Progressive Equity Research
The own brand portfolio shown below comprises 9 brands, including Gear4music. Substantial time, effort and care goes into the development of these own brand products in order to underpin the company’s credentials and minimise reputational risk to the G4M name. The Gear4music brand serves across all categories, offering good quality products and outstanding value. The other own brands typically are spread between those offering step up products from the Gear4music brand in specific categories (eg WHD in drumkits) and those specialising in specific product categories (eg Archer in string instruments and Rosedale in woodwind). These own brands are positioned in the good/better categories of the traditional good/better/best price architecture of product categories. Own brands also constitute a key source of differentiation from other competitors and therefore also one of competitive advantage.
Gear4music’s portfolio of own brands
Source: Gear4music
This translates into powerful economic and commercial benefits for G4M, as can clearly be seen in the right-hand chart below. Own brand products represent just over 6% of the total SKU’s offered, yet they punch weight above this representation on the sales front, where they now deliver almost 31% of total product sales, some 5x higher than their range mix.
0
250
500
750
1,000
1,250
1,500
1,750
2,000
2,250
0
10,000
20,000
30,000
40,000
50,000
60,000
FY15 FY16 FY17 FY18 FY19 FY20
SKU's (LHS) Product sales per SKU (£)
5.3 6.911.7
17.1 18.7 22.023.2
34.0
53.8
77.0
113.4 114.8
4.4
4.94.6 4.5
6.1
5.2
0.0
1.0
2.0
3.0
4.0
5.0
6.0
0.0
25.0
50.0
75.0
100.0
125.0
150.0
FY15 FY16 FY17 FY18 FY19 FY20
Inventories (£m) Product sales (£m) Product sales /inventory RHS (x)
Own brand ranges are not only complementary and a competitive differentiator…..
….but also highly productive and profitable….

1 September 2020
22 Gear4music
SKU expansion supporting product sales growth….. …….and notably so in highly productive own brand ranges
Source: Gear4music; Progressive Equity Research
This would be impressive and a good investment in its own right, but the positive effects are magnified further by the significantly higher gross margins achieved on own brand sales, partly derived from working directly with factories and cutting out middlemen, such as importers and agents.. Both own brand and third-party brand margins are higher in FY20 than in FY15, but own brands margin almost 17 percentage points higher – at 42.2% compared with 25.3% for third-party brands in FY20. The level of own brand gross margin has also been more stable than that of third-party margins over this period, showing the intrinsic greater control the company has over these than third-party margins, aided by the lack of direct price comparison with other products on the market due to their exclusive nature.
Own brands yield 43% of gross profit, from 6% of SKU’s…. …. driven by higher gross margins and sales productivity
Source: Gear4music; Progressive Equity Research
20,000
25,000
30,000
35,000
40,000
45,000
50,000
55,000
0.0
20.0
40.0
60.0
80.0
100.0
120.0
140.0
FY16 FY17 FY18 FY19 FY20
Product sales (£m) SKU's (RHS)
26.9% 26.9% 27.2% 27.6%
30.9%
5.1%6.5% 5.9% 6.2% 6.3%
0.0%
5.0%
10.0%
15.0%
20.0%
25.0%
30.0%
35.0%
FY16 FY17 FY18 FY19 FY20
Own brand as % product sales Own brand % of SKU's
0.0
5.0
10.0
15.0
20.0
25.0
30.0
35.0
FY16 FY17 FY18 FY19 FY20
3.86.0 8.6
12.915.0
6.1
10.814.6
18.7 20.110.0
16.8
23.2
31.635.1
Own brand (£m) Third party brand (£m) Total gross profit (£m)
41.9%
24.6%
29.1%
42.2%
25.3%
30.5%
0.0%
5.0%
10.0%
15.0%
20.0%
25.0%
30.0%
35.0%
40.0%
45.0%
Own brand margin Third party brand margin Total product margin
FY16 FY17 FY18 FY19 FY20
…as gross margin 17% higher than third-party brands….

1 September 2020
23 Gear4music
The left-hand chart above shows the gross profit attributable to own brands and third-party brands at an aggregate level. Own brand gross profit has been increasing its participation in overall product gross profit, to the extent that they account for almost 43% of overall gross profit from just over 6% of SKU’s. Their gross profit participation is therefore almost 7x that of their SKU participation. We expect further expansion of the own brand ranges, supporting both sales growth and gross profit generation over the medium- and longer-term.
Given the lower achieved gross margin percentage on third-party brands, and more generally to encourage a higher order value, G4M offers a wide choice of product bundles. These will typically include higher margin accessories, especially if own brand merchandise, to complement the main purchase and boost the overall gross profit achieved. Simple examples would be offering a stool to go with a piano or a mini-amp with an electric guitar, with bigger accessory bundles for other items such as music stand, rosin, shoulder rest and bow for a violin purchase.
Operational infrastructure
There is a significant and substantial operating infrastructure in place to effect the delivery of both product and services to the end customer, some of which is visible to the customer – most notably the showrooms and website (ie the front end of the web platform) – and much of which is invisible, such as the European warehousing and distribution system and the in-house software development team.
The tables below look at the development of average staff numbers and the associated payroll costs as a percentage of total revenue, together with a breakdown of average staff numbers into functional areas for the FY20 financial year. Staff numbers have increased over the last five years with a CAGR of just over 35%, a little below the 38% CAGR at total revenue level. While payroll costs as a percentage of turnover have risen at group level, this primarily reflects investment in the European infrastructure from FY17, as UK labour costs have shown good efficiencies in recent years, with their cost ratio falling 50bps from 7.4% in FY17 to 6.9% in FY20. As European scale builds further, despite the inherently higher labour costs in both Sweden and Germany, we would expect to see scale benefits manifesting themselves through an improving labour to sales ratio. This in turn should benefit the group’s overall labour cost ratio. This was already evident in FY20, when European distribution costs declined as a percentage of total sales.
…accounting for 43% of product gross profit from just 6% of line options
Product bundling, often with own brand products, helps to boost overall gross profit
Staff number CAGR just below turnover CAGR

1 September 2020
24 Gear4music
Average staff numbers and payroll costs Average staff numbers by functional area (FY20)
Source: Gear4music; Progressive Equity Research
In terms of functional areas, the highest staff number is employed within the warehousing & distribution function, covering the three distribution centres (DC’s) in York, Stockholm and Mulheim. When combined with purchasing & merchandising, the third largest group, these two areas, which are centred around product, account for over half of all staff. Along with the operation of the three showrooms on the DC sites, customer services constitutes another important group, covering customer call centres, sales advice, and product support. This is a multi-lingual service operation, employing native speakers to cover the languages across the group’s portfolio of websites.
Marketing focusses primarily on G4M’s digital marketing activities. Last, but not least, in terms of staff groupings is that comprising platform development (situated predominantly in Manchester) and facilities/IT. The bespoke and proprietary development of its web platform, the customer facing “front office”, and its integration into the “back office”, the operational, financial and administrative infrastructure, is a hugely important key strength of G4M, a major competitive differentiator and a sustainable source of competitive advantage.
E-commerce platform
G4M describes its own bespoke and proprietary e-commerce platform as “a cornerstone of our business and source of competitive advantage, delivering reliability, scalability and unique functionality”. The platform is an end-to-end solution covering all aspects of the group’s retail operations including website content, inventory management, multi-currency pricing, logistics and dispatch, customer relationship management (CRM), automated marketing, purchasing, customer receipts and management reporting.
The platform was originally developed by a ring-fenced team of developers within an external technology company, Venditan, based in Manchester, with G4M retaining all IP rights. In October 2016, G4M announced it was buying out the development team to bring it in house to underpin the group’s growth and international expansion. G4M announced at the time that it planned to accelerate recruitment to continue to build a market-leading platform. The deal was struck at a price of £1.5m, payable in 15 quarterly instalments of £100K from January 2017, with the last payment made recently. This purchase underlined the importance of its proprietary platform, being fully in control of its development and the pace at which it could be developed.
103138
210
313
431466
7.0%
7.2%
7.4%
7.6%
7.8%
8.0%
8.2%
8.4%
8.6%
8.8%
9.0%
0
50
100
150
200
250
300
350
400
450
500
FY15 FY16 FY17 FY18 FY19 FY20
Average staff numbers Payroll costs as % of turnover
14
16
20
49
77
102
188
0 50 100 150 200
Marketing
Facilities and IT
Finance & Admin
Platform Development
Purchasing and Merchandising
Customer Services/Showrooms
Warehouse & Distribution
Web platform development based in Manchester
Proprietary e-commerce platform a cornerstone of business and source of sustainable competitive advantage
Development team brought in-house in 2017

1 September 2020
25 Gear4music
Gear4music’s international websites and languages
Source: Gear4music
The European front-end websites are fully localised sites, which are multilingual, multicurrency, and supported by robust, flexible, fully integrated back-office systems, including logistics and payment method. The e-commerce platform currently operates 20 websites in 15 languages and nine currencies. The platform’s capabilities are open-ended, unlike many off-the-shelf packages, with its flexible and bespoke nature facilitating rapid development and deployment of new features and functionality. Creation of a new country website would take some time, but this could be done efficiently and on a marginal cost basis, as was the case with the introduction of the US ($) website a few years ago.
The group’s approach to its platform is one of continuous improvement, adding new features and functionality on a regular basis. In FY19, the development team rolled out 1,149 updates and upgrades to the platform, equivalent to just over three per day. In FY20, over a thousand website and systems deployments were made. These included enhanced product listing pages, a new returns platform, and a host of other system upgrades.
The following pictogram highlights many of the key features of G4M’s platform.
Platform philosophy is one of continuous improvement

1 September 2020
26 Gear4music
Selected features of G4M’s proprietary, bespoke, end-to-end e-commerce platform
Source: Gear4music
The company has already outlined some of the developments lined up for FY21, focusing on mobile website development, upgraded customer communications, as well as further efficiency improvements. One notable development to be introduced in FY21 will allow customers to buy and immediately download digital products, including sample libraries and music software, with further innovative and transformational purchase methods to be rolled out in future years.
To date, G4M has invested £12.1m over 14 years in developing this platform to meet its exact requirements. The coding costs of platform development are capitalised on the balance sheet, with a more prudent accounting approach recently introduced, with 95% amortised over a six-year period (previously 100% over 8 years).
FY21 developments will include digital downloading of products
Over £12m invested to date in last 14 years

1 September 2020
27 Gear4music
Warehousing and distribution
G4M’s warehousing function is run in-house with distribution of product ex-warehouse to customers executed through a number of third-party courier companies. There are three warehousing facilities with a combined footprint of 284,000 sq ft. York is the largest at 135,000 square feet, with a 72,000 square feet facility at Mülheim, near Cologne in Germany, and a 77,000 square feet warehouse near Stockholm in Sweden in the vicinity of Arlanda airport.
Warehousing – or rather warehouse capacity - became a focus of investor attention early in 2019, when G4M announced in its January trading update that it had reached maximum capacity at its York warehouse between Black Friday and Christmas 2018, which had constrained further sales growth (while still reporting a 41% increase for the period). With the constrained sales growth unable to compensate for lower (though improving) gross margins, G4M warned that FY19 EBITDA would be below market expectations and slightly below the level achieved in FY18. Coincidentally and somewhat ironically, the update confirmed the move of the Swedish facility into much larger premises, doubling its size, meaning that both European locations had significant headroom for future growth. In April, G4M announced a further cut to the FY19 EBITDA outturn due to a combination of the additional distribution costs associated with the York capacity constraints, some short-term courier cost inflation and a clean-up of overstocked and slower moving inventory.
This drove a reassessment and re-calibration of the growth levers for FY20, with a more focused approach on delivering more profitable sales growth, rather than simply driving the greatest level of top line growth. The subsequent FY20 focus on improving gross margin, even if at the expense of some top line growth, successfully delivered a much-improved EBITDA (and gross margin) result.
The improved performance was also supported by delivery of many of the planned FY20 actions to meet the various challenges of FY19. On the operational front, this included increasing the warehouse capacity ahead of FY20 peak by operating on a 24/7 basis between November and January and the introduction of a new Warehouse Management System. G4M was also targeting a capacity of 10,000 orders per day from the York DC, compared with the maximum 7,200 orders processed on the busiest day in the peak trading period in FY19.
Another target was to increase the York DC’s capacity to £100m+ of revenue, compared with the £88m of revenue it shipped in FY19. It also set a target for 30% of orders to be shipped from the European DC’s in FY20, compared with the 22% achieved in FY19. Progress was undoubtedly made towards these targets in FY20, though the FY20 prelims did not formally report on the progress made against the targets given at the time of the FY19 prelims. It was reported that FY20 hub shipments from the Swedish DC increased by 36%, with the German DC’s hub shipments increasing by 20% (against the group’s sales increase of 2% - or 9% on a 12m on 12m comparison).
Management has stated that it does not expect to need any new DC’s over the next two to three years. With the UK targeting a capacity in excess of £100m of revenue, Germany around £35m and the potential capacity in Sweden greater than Germany, this totals a minimum of £170m of revenue, which is greater than our forecast of £167m for FY23E. The planned introduction of digital downloads should also take out some capacity requirements, helping to lower pressure at the potential pinch point of the peak trading period.
Three warehouses in York, Stockholm and Mülheim
Warehouse capacity issue over 2018 peak Christmas season…
….led to focus shift from sales growth to more profitable sales growth….
…which was successfully delivered in FY20 with margin and profit increases at all levels of the P&L account
Current warehouse capacity above our FY23E forecast turnover level

1 September 2020
28 Gear4music
On our site visit to York in early August, an open area external and adjacent to the DC building was pointed out to us, which has been earmarked for expansion of the footprint as additional storage for bulk containers. There is also further potential to extend the capacity of the Swedish DC. We also believe that management will be acutely aware of this issue and plan accordingly, so as not to see a repeat of Christmas 2018.
Stock levels continue to increase and will grow further, ahead of the end of the UK’s transition period out of the EU, ensuring that a significant majority of orders to Sweden, Norway, Denmark and Finland can be satisfied directly from G4M’s Swedish hub.
Returns at the York DC have long been handled in-house. Returns are much lower at around 6% than for many other product sectors such as fashion, given the nature of the product. Around 50% of returned products are returned to the pick face for re-sale, primarily due to customers simply changing their mind about the product. In Summer 2019, returns handling centres were also opened in Sweden and Germany, which will deliver improved levels of customer service through the faster processing of customer returns from across Europe. These centres include a team of repair specialists to deal with faulty goods wherever possible, though some returned products may end up broken down for spare parts and future repairs.
On the distribution side, fulfilled by couriers, there is a huge array of delivery options, with specialisation needed for some areas, most notably large and bulky items. Reliable delivery with competitive pricing is fundamental to G4M’s customer proposition, customer satisfaction and ultimately its success. G4M pays considerable attention to the careful wrapping of the products it dispatches, including for example a lack of obvious G4M branding, as customers used to complain that the branding took away the element of surprise from Christmas gifts. That is a good example of attention to detail and heeding customer feedback.
G4M’s proprietary and bespoke e-commerce platform is configured to select the most cost-effective delivery options from 17 different delivery service providers, to give customers a class-leading range of delivery options. The most appropriate courier delivery services are automatically selected from more than 9,400 permutations depending on the weight, size, value and destination of the goods being purchased. Multiple line orders can also be dispatched from multiple countries if necessary, with local courier integrations providing enhanced service levels.
Following the difficulties in FY19, which included a spike in courier inflation, G4M decided to seek a higher level of customer contribution towards carriage costs, which totalled £8.8m gross (ie before any offsetting customer delivery charge receipts) or 7.3% of total revenues. In 2019, G4M started to charge for returns as part of this aim to recoup a larger percentage of its gross carriage costs. We estimate c 56% of gross carriage charges were recouped via customer charges/receipts in FY20, up from around 48% in FY19.
Customer marketing, services and showrooms
The consistent and strong growth in G4M’s database, email subscriber base and annually acquired new customers bear eloquent testament not only to the totality of its customer product and service offerings but also and more specifically to the efficacy of its marketing efforts.
All three warehouses now have their own returns handling centres
European stock levels to build ahead of UK transition period out of EU
Huge array of delivery options; reliable delivery key to customer satisfaction
Over 9,400 delivery permutations from 17 service providers
G4M started to charge for returns in 2019 to help recover more of their gross carriage costs

1 September 2020
29 Gear4music
Effective digital marketing is one of G4M’s key competitive strengths, with the overwhelming majority of marketing investment focused on its online activities. Online techniques used to drive website traffic and revenues include pay per click (PPC) marketing, affiliate schemes and email marketing. The vast majority of this activity is PPC with Google. PPC is both highly data driven and return focussed, operated by a team of experts in this field. Automated marketing emails are tailored to customer purchase history, though not yet language specific.
In addition, search engine optimisation (SEO) techniques are utilised throughout all of G4M’s websites to help maximise organic (ie not paid for) traffic to the sites. Digital marketing spend is described as direct, data driven and return focused.
Gear4music has also established a wide social media presence, including a YouTube video channel with almost 53K subscribers that has attracted over 40 million views as at 27 August. It is also present on Facebook, Twitter and the more visual and lifestyle apps, Instagram and Pinterest.
Other but less important marketing tools used by G4M include affiliate programmes, as well as advertisements and product placement articles in specialist music magazines and other publications.
Multilingual support for overseas customers in non-English speaking countries continues to be a key investment focus, especially in the call centre, where native speakers are employed to field enquiries and calls from Europe. This capability is also a pre-requisite for many of the company’s dealership agreements when selling outside the UK. Ongoing product training is routinely undertaken to ensure staff have relevant and up to date knowledge to enable them to advise customers. Many staff have first-hand musical instrument and equipment knowledge from playing in bands and/or producing their own music and are therefore already highly motivated and engaged in keeping abreast of new developments and product trends.
Customers are able to directly access a wide range of products and the specialist knowledge of staff in the group’s three showrooms. These also benefit from the stock availability of the adjacent warehouses and DC’s. The showrooms could be seen and viewed as part of the group’s marketing activities – and they certainly support and contribute to the brand image – but they are run as profit centres rather than cost centres.
The York 9,000 sq.ft. showroom is an impressive and attractive space, divided into a number of discrete product areas including siderooms adjoining the main display area, where larger products including a selection of keyboards are arranged. In non-Covid times, customers are able and encouraged to try the instruments, with many coming from some distance and making a day out of their visit. We estimate its turnover to be in excess of £2.2m per annum, which excludes click and collect orders from the showroom. The showroom is profitable on a fully costed basis according to management.
In 2015 G4M completed its in-house video production facility, which creates broadcast quality product demonstration videos. These inhouse videos add a further feature to the platform, which is particularly helpful in promoting the own brand proposition, and drive higher levels of customer engagement and conversion.
G4M scores highly on Trustpilot and Google reviews, achieving a high rating on each of 4.8 out of 5, and also receives positive products reviews on Amazon. This level of customer approval supports the view that G4M delivers a high level of all-round customer service.
Majority of G4M’s digital marketing is pay per click (PPC) with Google
Multi-lingual support for overseas customers
Group has customer showrooms adjoining each warehouse
York showroom has turnover of more than £2.2m and is profitable on fully costed basis
In-house broadcast quality video production facility
High Trustpilot and Google review scores from customers

1 September 2020
30 Gear4music
Sourcing and buying
Sourcing and buying activities are based out of the UK for obvious reasons, given the group’s history and the greater size of its DC capacity in York. This will undoubtedly remain the case for some time, though local buying is now operational in both Sweden and Germany. This adds a further measure of Brexit protection, with more European orders able to be fulfilled from the European DC’s, purchased in local currency utilising euro and Swedish krona customer receipts, providing a natural currency hedge. This reduces both translational FX exposure (back into sterling for group financial reporting) and transactional FX risks, with inventory purchases able to be procured in the most favourable currency.
This therefore gives the group more sourcing options and potentially, subject to the basis and terms of the UK’s eventual trading relationship with the EU, the ability to deliver product cross-border to customers from the lowest price source.
The own brand buying team has developed relationships with 50 suppliers, mostly in China, many of which are longstanding. Given the greater stock upfront commitment required when purchasing and commissioning own brand products, G4M must be confident that any new own brand product will generate sufficient consumer demand and pay back to warrant the stock investment. The lead time to develop a new own brand product is therefore typically between 6 to 12 months.
The Buying & Merchandising team averaged 77 people in FY20, with significant experience of and expertise in the music market.
Own brand ranges from 50 suppliers, usually direct from factories to cut out middlemen
Local buying capabilities in Sweden and Germany

1 September 2020
31 Gear4music
Senior management team
Ken Ford, Non-Executive Chairman
Ken was previously Chief Executive of the quoted investment bank Teather & Greenwood. Ken brings over 36 years of City experience and a strong understanding of shareholder value, strategic planning and corporate transactions. Ken is currently Chairman of AIM-quoted company SDI Group plc and a Non-Executive Director of PrimaryBid Limited.
Dean Murray, Non-Executive Director
Dean joined the board of Gear4music in March 2012 as a Non-Executive Director and originally as Chairman. His previous roles include Chairman of French Connection Group plc and the Neville Johnson Group. Dean is currently Chairman of BHID Group Limited, Construction Materials Online Limited, Yumi International Limited, and Weird Fish Holdings Limited, and is a Director of M.S. Team Limited
Andrew Wass, CEO
Andrew has over 20 years’ business management experience, having founded Gear4music Limited (then called Soundpro Limited) in 1995. In 1998 he began selling IT systems for the audio recording market before launching ‘Gear4music’ in 2003. Since then Andrew has retained overall responsibility for driving the group’s growth. Between 1992 and 1998, Andrew set up and ran his own recording studio business, having studied Popular Music and Sound Recording at the University of Salford. Andrew is a keen pianist.
Chris Scott, CFO
Before joining Gear4music in October 2012, Chris was the Finance Director at Officers Club, overseeing the sale of the business to Blue Inc. Chris joined KPMG LLP in Leeds in 1997, qualified as a Chartered Accountant in 2000 and went on to spend a further nine years in their advisory practice including a year on secondment at Barclays Bank.
Gareth Bevan, COO
Gareth joined Gear4music in July 2012. He was previously at DV247, the largest UK-based musical equipment retailer at that time, where he was responsible for purchasing, sales and marketing. He has 21 years’ experience in musical equipment retail.
Three senior managers, together with the three executive board members above, comprise the Operational Board. These are:
▪ Jonathan Meager, E-commerce Director (joined 2007)
▪ Robert Newport, Operations Director (joined 2016)
▪ Charlotte Mahon, HR Director (joined 2015)
Other senior UK management roles include Head of Buying, Head of Digital Marketing, UK Logistics Manager and Head of Customer Service. The German and Swedish operations each have a Commercial Manager and a Logistics Manager.

1 September 2020
32 Gear4music
Growth Drivers
We believe continued market share growth from the structural shift to the online channel in the highly fragmented market for musical instruments and music equipment will be a key growth driver for G4M over the medium- and longer-term. While G4M will benefit from operating within the growth channel in its marketplace, its growth will be faster than the secular growth of this channel due to four specific areas of self-help action. These are:
▪ International expansion: The main thrust of international expansion will be on Europe over the medium-term, building on the investments in Sweden and Germany. This will deliver market share gains and efficiency gains as economies of scale build. Localised websites could be built for entry into new markets. While G4M has a US $ website, it is not US-localised, and the market opportunity in Europe, building on existing infrastructure, remains more attractive and less risky over the medium-term.
▪ Product range extension: There remains considerable potential for G4M to expand both the breadth and depth of its product offer, giving customers more reasons to buy from the company and fewer to consider competitive alternatives. G4M believes its product offer could grow to 80,000 SKU’s, an increase of 45% from the current assortment. This would include further expansion of its more productive own brand offer, which currently stands at over 3,400 lines. In FY20, own brand products accounted for 6.3% of SKU’s, 31% of brand sales and 43% of product gross profit.
▪ Investment in its proprietary e-commerce platform: G4M will continue to invest in its platform to develop new features and functionality to drive website traffic, increase conversion rates and maximise operational efficiencies and reliability. This will enhance the overall customer experience and engender higher levels of customer satisfaction and repeat purchasing. We expect to see the introduction of more new services, such as the planned introduction of digital downloads, over the coming years.
▪ Enhanced digital marketing and content: Greater marketing efficiencies will be delivered through further enhancements to the personalisation of product and service offers to customers, both on the website and to email subscribers. Website content will be further enriched to increase customer engagement.
For reference, G4M articulates its strategic priorities around three pillars of growth, within each of which it highlights four areas to evolve, improve, accelerate and enhance. The three growth pillars are:
1. E-commerce excellence
2. Supply chain evolution
3. International expansion
We believe G4M’s longer-term market share potential points to a significantly larger business. Assuming G4M attains a 10% share of the UK market (compared with 7.2% in FY20) and a 4% share of the European market (compared with 1.5% currently), both of which are certainly feasible in our view, G4M’s turnover could be around £250m, based on FY20 market size estimates. This is more than twice the level of the group’s FY20 turnover.
Four key growth drivers
G4M references three pillars of growth in its strategic priorities
Feasible market share targets suggest G4M’s turnover can more than double to £250m

1 September 2020
33 Gear4music
Financials and Forecasts
The principal purpose of this chapter is to lay out our medium-term forecasts for G4M, along with some of the key assumptions and drivers behind them. Our analysis is presented later showing three years of history and three years of forecasts up to FY23E. We also highlight certain definitions, such as gross margin, where G4M’s definition differs from that of some other online retailers and has the effect of depressing the reported gross margin percentage on a comparative basis.
We would also stress again a change of emphasis in the wake of FY19, which prompted G4M to change its financial priority to a focus on profit growth rather than sales growth. That is not however to say that G4M will no longer be a growth company. It is more a recognition of the old retail adage of “sales for vanity, profits for sanity”. This touch on the tiller has had a number of implications, including some price increases, reduced focus on some brands where profit return was deemed unacceptable (which coincidentally sends out a message to other third-party brands), and a change from marketing ROI data being driven primarily by revenues to taking account of margin as well. While this approach may slightly dampen sales growth, it will underpin superior EBITDA and profit growth.
As importantly, there have been lessons learnt in the recent months of exceptionally (and unsustainably) strong trading since the advent of Covid. G4M has benefitted hugely, both from roughly two thirds of the market (namely bricks & mortar stores) being temporarily closed and locked down consumers returning to/taking up music and/or looking to keep their children gainfully occupied and entertained. This period has shown G4M that it can leverage its investments (notably stock and marketing) more efficiently in the future, with improved efficiencies yielding a higher quality earnings stream.
We highlight two changes to the presentation of the financials:
▪ G4M changed its year end from February to March in FY19, which consequently was a 13-month period. This has the effect of inflating reported sales growth in FY19 and deflating the sales growth in FY20. Other metrics are also affected, so care should be taken on comparisons involving FY19. Our forecast projections are all made against a prior 12-month period, and growth metrics therefore comparable.
▪ FY20 saw the first-time adoption of IFRS16, relating to operating leases, whereas prior years were reported under the IAS17 standard. IAS17 saw operating leases charged to the P&L account as an operating expense, with no balance sheet implications. IFRS16 aims to align the financial presentation of leased assets more closely to that of owned assets, with balance sheets recognising right of use assets (ROUA) and a lease liability. Under IFRS16, instead of a rental charge, the profit and loss account recognises a depreciation charge on the ROUA and a finance charge within interest. This has the most noticeable effect of increasing EBITDA, with typically less marked changes at EBIT and PBT level. It has no impact on cash flows generated. In FY20, the impact of IFRS16 was to increase EBITDA by £1.4m (to £7.8m), to increase EBIT by £0.2m, and to reduce PBT by £0.2m. Under IFRS16 presentation, FY19’s 12-month EBITDA would have been £3.7m, compared with the 13-month IAS17 figure reported of £2.3m. G4M’s FY20 prelims presentation pack includes a slide showing the impact of these accounting changes.
Implications from focus shift to more profitable growth
Lessons from Covid that business can leverage its marketing and stock investments more efficiently
G4M changed year end to March in FY19, which was therefore a 13-month period
FY20 saw introduction of IFRS16, relating to treatment of leases

1 September 2020
34 Gear4music
Profit and loss account
G4M’s reported turnover comprises not only product sales, accounting for over 95% of group turnover, but also carriage receipts, finance commission and warranty income. The latter two categories have been specifically identified in the last three years, thus in the following table we have assumed the balance of other income represents carriage receipts from customers. In prior years, we show the total for Other income, together with finance commissions on credit sales. These were introduced for the first time in FY16.
Composition of total group revenue (£m) – FY15 – FY20
Source: Gear4music; Progressive Equity Research
The growing share of international sales within the sales mix can be clearly seen in the following chart. The shape of our forecasts does not anticipate international sales overtaking the UK in revenue terms in FY21E however, due to the UK’s extraordinarily strong sales growth of 80% in Q1 of the current FY21E year, compared with 56% for Europe and the Rest of the World. International sales should become the greater part of group sales over the course of our forecast horizon.
UK and International sales participation FY15 to FY20 - % of total revenue
Source: Gear4music; Progressive Equity Research
FY15 FY16 FY17 FY18 FY19 FY20
Reported own brand sales 6.901 9.164 14.449 20.947 31.289 35.432
Reported third party brand sales 16.323 24.842 39.351 56.075 82.125 79.416
Reported product sales 23.224 34.006 53.800 77.022 113.414 114.848
Warranty income n.a. n.a. n.a. 0.302 0.296 0.337
Finance commissions 0.000 0.038 0.102 0.112 0.240 0.285
Carriage receipts n.a. n.a. n.a. 2.664 4.205 4.856
Total other income 1.016 1.483 2.328 3.078 4.741 5.478
Total turnover 24.240 35.489 56.128 80.100 118.155 120.326
77.4% 73.3%62.1%
55.3% 53.9% 51.4%
22.6% 26.7%37.9%
44.7% 46.1% 48.6%
0%
10%
20%
30%
40%
50%
60%
70%
80%
90%
100%
FY15 FY16 FY17 FY18 FY19 FY20
UK sales mix International sales mix
Composition of group turnover includes not only product sales
International revenues increasing their share of the total

1 September 2020
35 Gear4music
G4M’s reported gross margin has averaged 25.4% over the past five years. This is at the lower end of the spectrum of retailer gross margins, especially when compared with fashion retailers, whose gross margins are typically in the 50’s or even 60’s in percentage terms, but ahead of electrical retailers currently operating with a gross margin of around 20%. A better indication of gross margin is to look at the margin achieved on product sales alone, which has averaged 29.7% over the past five years, and was 30.5% in FY20. This FY20 product margin is therefore some 500bps higher than the average reported gross margin over the past five years.
Product gross margin is 400bps – 500bps higher than reported gross margin
Source: Gear4music; Progressive Equity Research
The reason for this difference lies in how G4M accounts for its carriage costs. Customer receipts from carriage charges are included in turnover, as seen above. These are then netted off against the gross cost of carriage charges, which is higher than the carriage receipts from customers (for both dispatches and returns), within the cost of goods sold (COGS) line between turnover and gross profit in the P&L account. G4M refers to “net carriage receipts” within the gross margin calculation, which is a drag on gross margin percentage as G4M effectively subsidises carriage costs to some customers by not charging/recouping the actual cost to the company. Some online retailers report gross or net carriage costs within operating expenses and therefore do not report a similar dilutive impact on their gross margin.
A more positive differentiation from many online retailers is that G4M is profitable from the very first customer transaction. It could be argued that this needs to be the case with a relatively low level of repeat purchases at this stage of the growth cycle, but this should not detract from this impressive return on effective marketing investment. FY20 saw a 253% gross margin return on investment on new customer acquisition and their first transaction. Retailers in other sectors with higher customer lifetime values can afford to be more sanguine on this point and able to justify higher initial customer acquisition costs.
0.0%
5.0%
10.0%
15.0%
20.0%
25.0%
30.0%
35.0%
FY16 FY17 FY18 FY19 FY20
29.1%31.0% 30.1%
27.8%
30.5%
25.9% 27.0%25.4%
22.8%
25.9%
3.2% 4.0% 4.7% 5.0% 4.6%
Product gross margin (%) Reported gross margin (%) Difference
Reported gross margin belies the underlying product margin, which is up to 500bps higher
Reason for difference is G4M’s inclusion of (net) carriage costs within cost of goods sold (COGS), which lowers reported gross margin
G4M model is profitable from first customer transaction
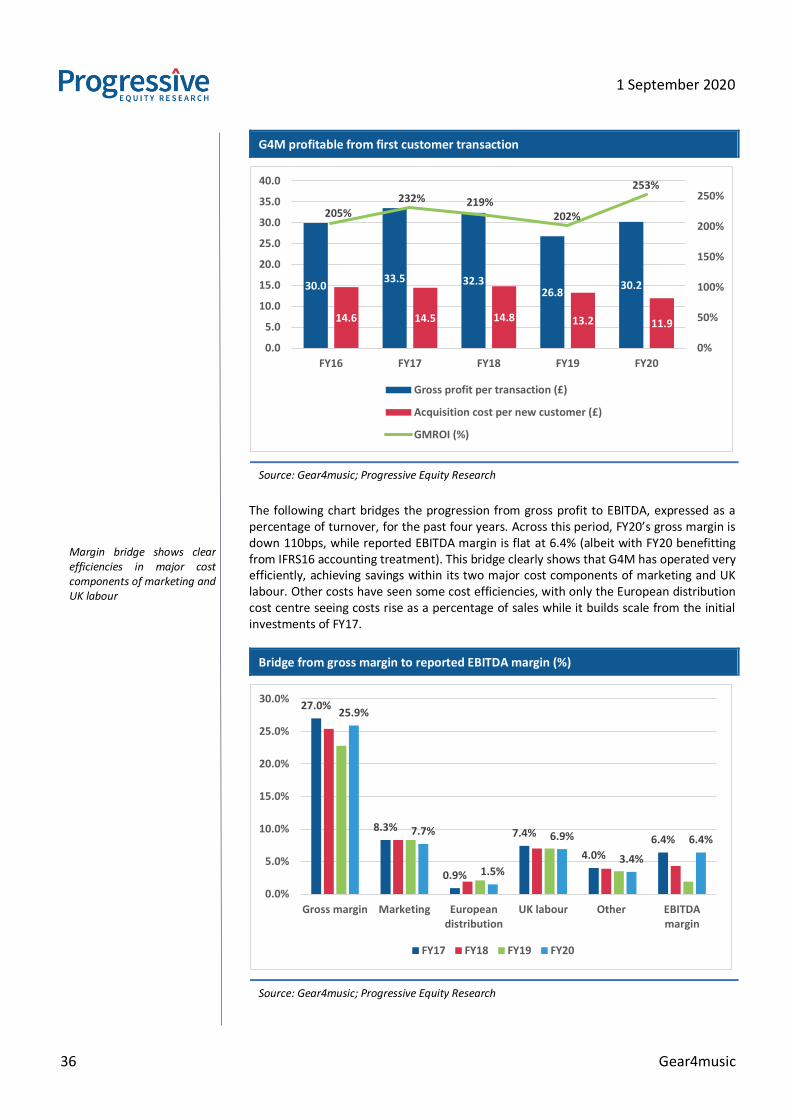
1 September 2020
36 Gear4music
G4M profitable from first customer transaction
Source: Gear4music; Progressive Equity Research
The following chart bridges the progression from gross profit to EBITDA, expressed as a percentage of turnover, for the past four years. Across this period, FY20’s gross margin is down 110bps, while reported EBITDA margin is flat at 6.4% (albeit with FY20 benefitting from IFRS16 accounting treatment). This bridge clearly shows that G4M has operated very efficiently, achieving savings within its two major cost components of marketing and UK labour. Other costs have seen some cost efficiencies, with only the European distribution cost centre seeing costs rise as a percentage of sales while it builds scale from the initial investments of FY17.
Bridge from gross margin to reported EBITDA margin (%)
Source: Gear4music; Progressive Equity Research
30.033.5 32.3
26.830.2
14.6 14.5 14.8 13.2 11.9
205%232% 219%
202%
253%
0%
50%
100%
150%
200%
250%
0.0
5.0
10.0
15.0
20.0
25.0
30.0
35.0
40.0
FY16 FY17 FY18 FY19 FY20
Gross profit per transaction (£)
Acquisition cost per new customer (£)
GMROI (%)
27.0%
8.3%
0.9%
7.4%
4.0%
6.4%
25.9%
7.7%
1.5%
6.9%
3.4%
6.4%
0.0%
5.0%
10.0%
15.0%
20.0%
25.0%
30.0%
Gross margin Marketing Europeandistribution
UK labour Other EBITDAmargin
FY17 FY18 FY19 FY20
Margin bridge shows clear efficiencies in major cost components of marketing and UK labour

1 September 2020
37 Gear4music
Another way of looking at this is that if G4M can re-build its gross margin to that achieved in FY17, it could be delivering a reported EBITDA margin of 7.5%. In FY20, this would have delivered an incremental £1.3m of EBITDA (EBIT and PBT). With further cost efficiencies targeted over the medium- and longer-term, this suggests G4M has the potential to deliver and sustain an EBITDA margin of at least 8%.
G4M has yet to declare a dividend, preferring to maintain a cash balance to support future growth. The group has said it will continue to review its dividend position on an annual basis. Our forecasts do not therefore assume the declaration of dividends within our forecast horizon. This said, our forecast of a continued build in cash on the balance sheet and a swing into a net cash position suggests a maiden dividend declaration could well be considered towards the back end of our forecast horizon.
Cash flow and balance sheet
G4M delivered a net cash increase of £2.0m in FY20, and we forecast this positive momentum to continue over our forecast horizon, such that we forecast the company will be net cash positive in FY22E.
The net cash outflow of FY19 primarily reflected the trading difficulties the company encountered. FY18 saw an outflow of £5.3m, which was the net result of several component parts. The outflow was driven by continued investment in stock, driven by the establishment of the European hubs, an elevated capex figure (£9.1m) following the debt-funded (mortgage) freehold purchase of its new Head Office in York for £5.35m, offset by a £4.2m equity raise for acceleration for the group’s strategy.
In accordance with the group’s accounting policy, the group’s Head Office has been re-valued twice and now stands on the balance sheet at £7.5m, proving to be good business as well as providing sufficient office space with ample room for expansion as the group continues to grow. Including its mortgage facility, G4M ended FY20 with £13.4m of loan liabilities, the remainder being an Import Loan facility. Interest on each loan under the Import Loan facilities, which cover 140 day terms, is paid on maturity of the loan. All facilities, including an overdraft facility if required are with HSBC. The combined overdraft and import loans facilities have been agreed and raised to £14m for FY21E (FY20: £10m).
Excluding the mortgage debt on the Head Office, the group’s indebtedness would have been markedly lower over the past three years. Indeed in FY20, net debt would have been only £1.5m, excluding the (reducing) mortgage balance. The group has always maintained a healthy level of cash balances, which enables it to take advantage of supplier deals and of early settlement discounts on its purchases.
Taking advantage of early settlement discounts, combined with the generally lower credit periods available in the music industry, is reflected in G4M’s creditor days, which at 24 days in FY20 are considerably lower than for many retailers operating between 60 and 90 days. In terms of the broader working capital characteristics, these usually show small outflows, predominantly driven by the inexorable increase in inventory as the business continues to grow. The 18% increase in the FY20 year-end inventory snapshot reflects G4M accelerating its stock intake in February and March ahead of the Covid-19 related lockdown. Our forecasts assume likely small working capital outflows going forward over our forecast horizon.
Reported future EBITDA margin of 8% feasible in our view – aided by IFRS16
G4M yet to declare a dividend, preferring use of cash balances to support future growth
We forecast G4M to be net cash positive in FY22E
Freehold purchase of York Head Office in FY19 for £5.35m….
..re-valued twice since to now stand at £7.5m on balance sheet
FY20 net debt of just £1.5m excluding the (reducing) mortgage balance

1 September 2020
38 Gear4music
With regard to capex, this can be reviewed in terms of additions to property, plant and equipment (PPE) or tangible fixed assets, and to the ongoing investment in the proprietary software platform (in intangible fixed assets). The latter will drive the overall total of capex in our forecasts. We assume PPE-related capex to be £1m per annum, with software platform investment of £3.25m in the current year FY21E, rising by £250K per annum in both FY22E and FY23E. As stated previously, this investment underlines both the importance of the software platform to G4M’s overall proposition and its commitment to maintaining the competitive advantage it confers.
The balance sheet adjustments required under IFRS16 at the beginning of FY20 saw the recognition of £10.2m of ROUA with a corresponding lease liability of £11.0m. At the FY20 year-end, ROUA had depreciated to £9.0m with the lease liability paid down to £10.1m.
Forecasts
The following table summarises our key forecast headlines for the next three years along with the FY20 figures as a baseline. These show our assumption of a strong period of growth, with a more measured top line growth showing a 3-year CAGR of just under 12%. The CAGR rate is magnified however at each level of profitability as we move down the P&L account from gross margin though to PBT, which shows compound annual growth of just under 37% over the period.
Summary of key forecast measures – FY21E – FY23E
Source: Gear4music; Progressive Equity Research
This magnifying effect through to FY23E reflects cumulative improvements from the FY20 baseline in all areas, although the trajectory of individual lines is not of consistent improvement, a point we return to shortly. Our key assumptions regarding FY23E in comparison with FY20 are:
▪ Gross margin: an improvement of 60bps to a reported 26.5%. We forecast at the reported level, but this should equate to a product margin of around 31%.
▪ Operating costs: these are forecast to rise at a lower rate than turnover, reflecting continuing incremental improvements in marketing and labour efficiencies in
FY20 FY21E FY22E FY23E 3-yr CAGR
Turnover 120.326 144.557 151.285 167.056 11.6%
Gross profit 31.156 38.886 39.788 44.270 12.4%
Gross margin (%) 25.9% 26.9% 26.3% 26.5%
Operating costs (exc DA) 23.402 27.384 28.199 31.202 10.1%
Opex as % of turnover 19.4% 18.9% 18.6% 18.7%
EBITDA 7.754 11.502 11.589 13.068 19.0%
EBITDA margin (%) 6.4% 8.0% 7.7% 7.8%
Operating profit 4.067 7.481 7.262 8.353 27.1%
Operating margin (%) 3.4% 5.2% 4.8% 5.0%
Adjusted pre-tax profit 3.078 6.781 6.662 7.853 36.6%
Adjusted diluted EPS (p) 12.2 26.8 26.4 31.2 36.6%
Net cash/(debt) (5.549) (2.530) 1.278 6.009
Capex to be driven by ongoing investment in software platform
Forecasts show magnifying CAGR rate moving down the P&L to 3-year CAGR of 37% at PBT level
Our key forecast assumptions

1 September 2020
39 Gear4music
particular. These enhancements see a 70bps reduction in the opex to sales ratio, which we forecast to fall to 18.7% by FY23E.
▪ EBITDA: the combination of gross margin improvement and operating cost efficiencies lead to a 140bps increase in the EBITDA margin to 7.8% in FY23E.
▪ Operating profit: with combined depreciation and amortisation growth lagging that of turnover, this also declines by 30bps as a percentage of sales, with the operating profit margin rising by 160bps over the forecast horizon to 5.0%. Operating profit CAGR over the period is forecast at just over 27%.
▪ PBT: With the aggregate interest charges forecast to fall, aided by cash generation and some pay down of debt, PBT CAGR of 37% is achieved, with EPS growth almost identical.
▪ Net debt: With improved profitability and cash generation, we are forecasting a swing of £11.5m over the period to a net cash position of £6.0m.
While the direction of travel between FY20 and FY23E, namely onwards and upwards, should be delivered, the course between the start and end points of the forecast horizon is more difficult to map. This is in some part due to the unforeseen impact and consequences of coronavirus. While these have been negative for most businesses, there are some which have benefitted in the short-term from the pandemic, seeing significant and exceptional uplifts in demand for their products and services. G4M has been one of these. With the enforced closure of around the two thirds of its market serviced by traditional shops, consumer demand was channelled and squeezed into the online channel, dominated by the pure play specialists like G4M. In turn, with consumers locked down at home, many of whom were furloughed and not working, and having to educate and entertain small children, demand for musical instruments and equipment has seen a significant boost.
This combination of a supply squeeze and a demand surge resulted in the extraordinary 68% surge to £37.3m in G4M’s Q1 sales to the end of June 2020, with the UK up 80% and the international business up 55%. In addition, G4M indicated that this was achieved with higher gross margins and lower marketing costs than would normally be expected. This resulted in market upgrades to profits, with revenue forecasts broadly unchanged. With consensus figures showing a 19% - 21% rise in group revenues for FY21E to £143m - £146m, this implies a more muted sales increase of around 8% - 11% for the rest of the year. It is difficult to know to what extent the sales performance in Q1 (only 19% of FY20 revenues) is driven by each of market share gain and consumer demand, and indeed the extent to which it may have pulled forward consumer demand. What can be said with certainty is that G4M will face a very tough sales and profit comparative in H1 FY22E.
Our forecasts have adopted a conservative stance on sales growth for FY21E (+20%), with risk weighted to the upside in our view. With a combination a forecast 100bps gross margin gain and greater operating efficiencies, as indicated by G4M, this results in a substantial 260bps increase in the EBITDA margin to 8.0% and PBT more than doubling to £6.8m. For FY22, with the bricks & mortar channel re-opened, albeit probably with less capacity but more capability in the online channel, and in light of higher revenues in FY21E than would have been expected from more typical underlying demand patterns, we adopt a more cautious revenue growth assumption of 5%, before returning to a double digit growth assumption (10.4%) again for FY23E. We also assume some unwinding of the gross margin enhancement and marketing efficiencies forecast (and seen year to date) of FY21E. This results in broadly flat EBITDA and PBT for FY22E, with growth resumed in FY23E.
G4M has seen exceptional FY21E YTD performance on back of Covid….
……which will make for tough sales and profit comparatives in FY22E, especially H1

1 September 2020
40 Gear4music
We shall review the shape of forecasts around company news flow and updates. There remains a high degree of forecasting risk for all companies in the current environment and the impact of coronavirus. Further lockdowns for consumers and retail businesses should favour online players including G4M, though demand could be weaker if it has been pulled forward in the initial lockdown period. This said, we believe G4M’s focused strategy, combined with its competitive strengths and advantages, are well set to deliver further sales growth and market share gains over the longer-term.
G4M set for profitable sales growth and market share gains over the longer-term

1 September 2020
41 Gear4music
Summary of profit & loss account and cash flow forecasts
Source: Gear4music; Progressive Equity Research
Profit and loss account IAS17 IAS17 IFRS16 IFRS16 IFRS16 IFRS16
Year to March FY18 FY19 (13 m) FY20 FY21E FY22E FY23E
Turnover 80.1 118.2 120.3 144.6 151.3 167.1
Cost of sales (59.8) (91.2) (89.2) (105.7) (111.5) (122.8)
Gross profit 20.3 26.9 31.2 38.9 39.8 44.3
Gross margin (GM) (%) 25.4% 22.8% 25.9% 26.9% 26.3% 26.5%
Operating costs (18.4) (26.9) (27.1) (31.4) (32.5) (35.9)
Operating profit 2.0 (0.0) 4.1 7.5 7.3 8.4
Operating profit margin (%) 2.4% 0.0% 3.4% 5.2% 4.8% 5.0%
Depreciation and amortisation (1.5) (2.3) (3.7) (4.0) (4.3) (4.7)
EBITDA 3.5 2.3 7.8 11.5 11.6 13.1
EBITDA margin (%) 4.3% 1.9% 6.4% 8.0% 7.7% 7.8%
Interest charge (0.5) (0.6) (1.0) (0.7) (0.6) (0.5)
Adjusted PBT 1.5 (0.6) 3.1 6.8 6.7 7.9
Exceptional charges 0.0 0.0 0.0 0.0 0.0 0.0
Profit before tax 1.5 (0.6) 3.1 6.8 6.7 7.9
Adjusted diluted EPS (p) 6.7 (0.8) 12.2 26.8 26.4 31.2
Diluted EPS (p) 6.7 (0.8) 12.2 26.8 26.4 31.1
Dividend (p) 0.0 0.0 0.0 0.0 0.0 0.0
Cash flow
Year to March FY18 FY19 (13 m) FY20 FY21E FY22E FY23E
Operating profit 2.0 (0.0) 4.1 7.5 7.3 8.4
Depreciation and amortisation 1.5 2.3 3.7 4.0 4.3 4.7
Inventory (increase)/decrease (5.4) (1.6) (3.4) (2.0) (1.0) (1.3)
Debtors (increase)/decrease (1.4) 1.0 (0.8) (0.2) (0.1) (0.1)
Creditors increase/(decrease) 3.6 0.5 3.3 1.1 0.5 0.7
Other (0.2) (0.3) 0.4 0.0 0.0 0.0
Operating cash flow 0.1 2.0 7.2 10.4 11.0 12.3
Interest (0.2) (0.4) (0.8) (0.7) (0.6) (0.5)
Tax 0.0 0.6 0.5 (1.1) (1.1) (1.3)
Dividends 0.0 0.0 0.0 0.0 0.0 0.0
Deferred tax 0.0 0.0 0.0 0.0 0.0 0.0
Capital expenditure (9.1) (4.5) (3.6) (4.3) (4.5) (4.8)
Trading cash flow (9.2) (2.3) 3.3 4.3 4.8 5.7
Acquisition of businesses (0.4) (0.4) (0.4) (0.2) 0.0 0.0
Disposal of businesses 0.0 0.0 0.0 0.0 0.0 0.0
Share issues 4.2 0.1 0.0 0.0 0.0 0.0
Currency effects, other 0.0 0.0 (1.0) (1.1) (1.0) (1.0)
Net cash inflow/(outflow) (5.3) (2.5) 2.0 3.0 3.8 4.7
Net (debt)/cash (5.0) (7.5) (5.5) (2.5) 1.3 6.0

1 September 2020
42 Gear4music
Summary of balance sheet forecasts
Source: Gear4music; Progressive Equity Research
Balance sheet IAS17 IAS17 IFRS16 IFRS16 IFRS16 IFRS16
Year to March FY18 FY19 (13 m) FY20 FY21E FY22E FY23E
Tangible fixed asssets 10.1 10.8 20.2 19.1 18.2 17.1
Intangible fixed assets 6.4 7.8 9.1 10.4 11.5 12.6
Investments and other 0.0 0.0 0.0 0.0 0.0 0.0
Total fixed assets 16.4 18.6 29.3 29.5 29.7 29.7
Stock 17.1 18.7 22.0 24.0 25.0 26.3
Trade and other debtors 2.7 1.7 2.5 2.7 2.9 3.0
Deferred tax 0.0 0.0 0.0 0.0 0.0 0.0
Cash and short term deposits 3.5 5.3 7.8 9.4 10.7 11.9
Current assets 23.3 25.6 32.4 36.1 38.5 41.2
Total assets 39.7 44.2 61.6 65.6 68.2 70.9
Trade and other payables (10.9) (11.5) (14.4) (15.5) (16.0) (16.7)
Borrowings (3.9) (8.6) (9.9) (8.9) (6.9) (3.9)
Other current liabilities 0.0 0.0 (1.1) (1.1) (1.1) (1.1)
Current liabilities (14.8) (20.1) (25.5) (25.6) (24.1) (21.8)
Borrowings (4.6) (4.3) (3.4) (2.9) (2.4) (1.9)
Other non-current liabilities (1.4) (1.1) (11.0) (11.0) (11.0) (11.0)
Non-current liabilities (6.0) (5.4) (14.5) (14.0) (13.5) (13.0)
Total liabilities (20.8) (25.5) (40.0) (39.6) (37.6) (34.8)
Net assets 18.9 18.7 21.6 26.0 30.6 36.1

1 September 2020
43 Gear4music
Valuation
While there are no listed businesses that are directly comparable to Gear4music, there are several quoted UK and European online retailers. This enables Gear4music’s valuation metrics to be compared with those in this universe of online peers, either individually or in aggregate.
The selected peer comparator companies (compcos) are drawn primarily from the UK (AO World, ASOS, boohoo, Naked Wines and Sosandar), with the inclusion of two businesses listed in Germany (Zalando and Zooplus). The majority of these compcos are clothing retailers, with electrical goods, wine and pets represented by AO World, Naked Wines and Zooplus respectively. As with Gear4music, these online retailers can be viewed as disruptors with regard to the traditional bricks & mortar model, based on physical stores (most of which now embrace a multi-channel approach including e-commerce).
The youngest and therefore least established to date of these companies is Sosandar, which has yet to deliver a positive EBITDA, but the other companies are longer established, all EBITDA positive and mostly delivering positive EPS figures. The relative maturity of online retailers has a direct impact on selected valuation metrics. Typically in their early years of very high sales growth (from a low base), when building scale, their focus is on revenue generation rather than profit generation. In this phase, EBITDA and EPS metrics are generally negative and therefore of little use. For this reason, sales- or growth-related valuation metrics – such as EV/sales and PEG ratios) - are preferred.
In the following table, we compare Gear4music to the selected compcos using three valuation metrics – EV/EBITDA, EV/sales and PER (price/earnings ratio). This table is based on consensus forecast data from Thomson Reuters and is presented on a calendar year basis to permit direct comparability. It does not therefore coincide with Gear4music’s March year end. CY1 refers to the calendar year to December 2020, CY2 to end December 2021 and CY3 to end December 2022. It should also be remembered that the quantum of analyst coverage of individual stocks will vary considerably, the number of forecast years may vary between analysts (typically meaning some fall-off in the number of FY3E estimates) and that no forecast aggregator has access to all analyst forecasts.
A cursory glance at the table shows a wide variance across valuation metrics and across companies. To smooth out the impact of metric outliers, we have also included unweighted averages and the median for each metric for each year, which also include Gear4music. The median figures have not been adjusted, though we have excluded some companies from both the EV/EBITDA and the PER average calculation, as they were causing too great a distortion and producing an unhelpful comparative figure. These exclusions are annotated in the footnote to the table.
The median and average figures for the EV/sales metric include no adjustments. While there is a spread of performance, this remains in a tighter band, all delivering a positive outturn. This is another reason for the enduring use of the EV/sales metric, although of itself it gives no direct insight into sales growth, profitability and margins. The EV/sales can be argued to give indirect insight into these, but it should be recognised that EV/sales as a standalone metric can be a somewhat limited and blunt instrument in our view.
No directly comparable listed companies to G4M
Our selected compco cohort of online retailers
Compco valuation metrics based on consensus forecasts and for calendar years
A wide spread of valuation metrics
Average and median figures also shown for the cohort

1 September 2020
44 Gear4music
Valuation metrics for selected online retailer peer comparators (as at 25 August, based on consensus forecasts)
Source: Thomson Reuters; Progressive Equity Research
Note*: Average EV/EBITDA excludes Naked Wines and Sosandar; average PER excludes Naked Wines, Sosandar and Zooplus
We have also indexed Gear4music’s valuation metrics to the average and median figures collated (where 100 would equate to the compco average/median). The index figures show that Gear4music’s valuation lags the average and median performance of the selected compcos, notwithstanding the share price increase since both 1 January (>2x) and its 52-week low in March 2020 (>3.5x), as the market priced in the perceived risks of Covid-19 and consumer lockdown across Europe. Taking a simple arithmetic average of the indexed valuations across all three years suggests G4M’s valuation is around 31% and 22% lower respectively than the average and median for the compco cohort.
It is difficult to directly attribute the reasons for this valuation gap to its compco peers. This may imply that investor confidence has yet to fully return or that concerns remain following the warehouse capacity issue of Christmas 2018 and other costs incurred in H2 FY19, which impacted on FY19 profitability (though not sales growth). It could possibly reflect a lower rate of forecast sales growth compared with the peer group, given G4M’s successful refocussing on more profitable sales growth, which delivered gross and EBIT margin enhancement in FY20.
CY1E CY2E CY3E CY1E CY2E CY3E CY1E CY2E CY3E
Gear4music Holdings PLC 16.9 14.4 12.1 1.0 0.9 0.9 36.5 28.8 23.8
AO World PLC 28.6 17.9 16.9 0.8 0.8 0.8 53.7 30.6 26.6
ASOS PLC 21.9 19.0 15.8 1.6 1.4 1.2 50.5 44.4 34.9
Boohoo Group PLC 25.6 20.3 16.2 2.4 1.9 1.6 43.6 33.2 26.0
Naked Wines PLC 1223.0 107.0 31.0 1.1 1.0 0.8 -177.1 3603.5 63.3
Sosandar PLC -6.9 135.0 7.7 1.5 0.9 0.7 -7.7 -142.6 11.0
Zalando SE 39.1 32.1 25.1 2.3 2.0 1.7 131.4 94.7 69.5
Zooplus AG 30.1 28.2 22.3 0.7 0.6 0.5 155.6 187.2 105.2
Unweighted average* 27.1 22.0 18.1 1.4 1.2 1.0 63.1 46.3 36.2
Gear4music indexed to average 62.6 65.4 67.0 69.0 77.7 90.7 57.8 62.1 65.9
Median 27.1 24.2 16.6 1.3 0.9 0.9 47.0 38.8 30.8
Gear4music indexed to median 62.5 59.4 73.2 76.3 97.7 105.9 77.6 74.1 77.5
EV/EBITDA PEREV/Sales
Valuation metrics lag the peer cohort by 20% - 30%

1 September 2020
45 Gear4music
Risks
All companies face risks which could impact on their trading performance and reputation. In turn and by extension, these could have an impact on our forecasts, to the upside as well as the downside. We focus in this section on the factors which could apply downside risk. This is not intended to be a fully comprehensive list, nor do we address all the mitigating actions thatG4M undertakes to minimise such risks. We would generally characterise risk factors as falling into two high level categories, namely external and internal. The company’s annual report & accounts includes a more extensive section on the risks and uncertainties faced by the companies along with mitigating actions.
External risk factors
External factors are typically those beyond the direct control of the company, but which do have an impact – either direct or indirect - on the company. Risk arises when changes occur which are different to or impact on a company’s planning assumptions. Examples of external factors include:
▪ macro-economic events/change, such as Brexit
▪ legislation
▪ competition
▪ technology
▪ currency movements
▪ natural disasters, such as the coronavirus pandemic.
These can have a direct impact on factors including, but not limited to, economic growth, disposable income, consumer confidence and behaviour. In turn, these will impact consumers’ willingness and ability to purchase goods, with discretionary items deferred or consumers trading down for example in economic downturns. When retailers are faced with falling demand against planned buying commitments and budgets, the need to realise cash from inventories often leads to price discounting. This may stimulate short-term demand and competitive advantage, but often becomes a zero sum game when competitors adopt a similar discounting stance, resulting in industry- or sector wide margin contraction.
Sudden and dramatic moves in foreign exchange rates and raw material costs lead to an increase in a retailer’s intake prices. Retailers must then decide whether to absorb these higher costs, resulting in lower margins, or to increase selling prices, which could result in reduced consumer demand, especially if competitors choose not to pass on these price increases. Currency hedging, or natural hedging, where companies like G4M have foreign currency receipts from non-UK revenues, can offset such risks.
Legislative and regulatory risks can impact in many ways, for example on data security and fraud prevention. These can lead to increased operating costs when companies have to invest in systems and processes to comply with new legislation and inevitably when they fail to comply, or data systems and security measures are breached. In the event of entry into a new market, companies may face a different legislative environment requiring changes to business practices in their existing markets.
External and internal risks summarised

1 September 2020
46 Gear4music
Keeping abreast of technological change and responding to advances in technology is of critical importance to online retailers, especially for those including G4M, who have developed proprietary and bespoke systems as a source of competitive advantage. G4M’s historical track record in investing in its platform and plans to continue investing in it should minimise risk in this area. Similarly, G4M needs to be aware and on top of the changes that search engines frequently make to their search algorithms, which impact on a company’s ranking in so-called natural (ie not paid for) search results. G4M addresses this through its Search Engine Optimisation (SEO) team.
Competition is a fact of life. G4M competes against a wide range of competitors, including some with greater financial resources, such as Amazon. Commercial success depends on a wide range of factors, with G4M’s growth record suggesting it competes effectively in its market.
Brexit remains a risk, in so far as businesses are still unaware of the basis of the UK’s trading stance from 2021 with other countries, from which the majority of goods sold in the UK are imported. The application of unfavourable tariffs on imported goods would have a direct impact on consumer demand, retail prices and/or margins. Together with coronavirus, these two issues present considerable risks and uncertainty to the wider business community.
Internal risk factors
Internal risk factors relate to the company and usually fall within the company’s management to oversee and control. These are no less important than external factors, in that they can have a significant impact on the ability of a company to operate, to compete, and to meet - or better exceed - customer expectations. Operational disruption can arise from a wide range of factors.
Any disruption in a distribution centre, whether from mechanical failure or an IT/systems issue, can adversely affect product flow, customer deliveries and brand image and reputation. Systems failures or poorly managed systems upgrades in any functional area can have a detrimental impact on the execution of a company’s daily activity and routines. Such failures can impact on the collection and collation of data used to manage the business or which would help to identify issues and rectify problems. This risk is magnified for online businesses where stock is typically held in a single centralised facility rather than across a chain of physical stores. Such a risk is mitigated to a degree where stock is held in more than one DC, as is the case with G4M.
The departure of key management or senior personnel for whatever reason can also have a disruptive influence, not only in terms of business operations and staff morale, but also on City and market perception. The loss of business contacts, supplier relationships and business knowledge with a departing key manager has an opportunity cost in terms of replacement, which is damaging in its own right, but would be viewed even more negatively if the individual involved moved to a competing business.

1 September 2020
47 Gear4music
Major shareholdings
The following table shows the major shareholders of the group as at 29 July 2020.
Major shareholders as at 29 July 2020
Source: Gear4music; Progressive Equity Research
Name Number of Shares % of share capital
Andrew Wass 7,161,993 34.2%
AXA Investment Managers S.A. 2,292,297 10.9%
TB Amati Investment Funds 1,269,789 6.1%
FIL Limited 1,144,767 5.5%
BlackRock Investment Ltd 978,742 4.7%
Octopus Investment Limited 841,039 4.0%
Canaccord Genuity Group Inc 799,968 3.8%

1 September 2020
48 Gear4music
Financial Summary: Gear4music
Year end: March (£m unless shown) PROFIT & LOSS 2019 2020 2021E 2022E 2023E Revenue 118.2 120.3 144.6 151.3 167.1 Adj EBITDA 2.3 7.8 11.5 11.6 13.1 Adj EBIT 1.2 5.6 9.5 9.6 11.0 Reported PBT (0.6) 3.1 6.8 6.7 7.9 Fully Adj PBT (0.6) 3.1 6.8 6.7 7.9 NOPAT (0.4) 4.7 6.3 6.1 7.0 Reported EPS (p) (0.8) 12.2 26.8 26.4 31.1 Fully Adj EPS (p) (0.8) 12.2 26.8 26.4 31.2 Dividend per share (p) 0.0 0.0 0.0 0.0 0.0
CASH FLOW & BALANCE SHEET 2019 2020 2021E 2022E 2023E Operating cash flow 2.0 7.2 10.4 11.0 12.3 Free Cash flow (2.3) 3.3 4.3 4.8 5.7 FCF per share (p) (10.9) 15.9 20.7 23.0 27.4 Acquisitions (0.4) (0.4) (0.2) 0.0 0.0 Disposals 0.0 0.0 0.0 0.0 0.0 Shares issued 0.1 0.0 0.0 0.0 0.0 Net cash flow (2.5) 2.0 3.0 3.8 4.7 Overdrafts / borrowings (12.8) (13.4) (11.9) (9.4) (5.9) Cash & equivalents 5.3 7.8 9.4 10.7 11.9 Net (Debt)/Cash (7.5) (5.5) (2.5) 1.3 6.0
NAV AND RETURNS 2019 2020 2021E 2022E 2023E Net asset value 18.7 21.6 26.0 30.6 36.1 NAV/share (p) 89.3 103.2 124.0 145.7 172.3 Net Tangible Asset Value 10.8 20.2 19.1 18.2 17.1 NTAV/share (p) 51.4 96.4 91.3 86.6 81.7 Average equity 18.8 20.2 24.5 30.1 36.2 Post-tax ROE (%) 16.4% 33.6% 27.2% 0.0% 0.0%
METRICS 2019 2020 2021E 2022E 2023E Revenue growth 47.5% 1.8% 20.1% 4.7% 10.4% Adj EBITDA growth (34.0%) 239.8% 48.3% 0.8% 12.8% Adj EBIT growth (55.8%) 352.9% 67.9% 1.8% 14.8% Adj PBT growth (140.6%) (605.4%) 120.3% (1.8%) 17.9% Adj EPS growth (111.7%) (1670.4%) 119.4% (1.8%) 18.2% Dividend growth N/A N/A N/A N/A N/A Adj EBIT margins 1.1% 4.7% 6.5% 6.4% 6.6%
VALUATION 2019 2020 2021E 2022E 2023E EV/Sales (x) 1.0 1.0 0.9 0.8 0.7 EV/EBITDA (x) 54.3 16.0 10.8 10.7 9.5 EV/NOPAT (x) (303.7) 26.6 19.6 20.2 17.7 PER (x) N/A 46.2 21.0 21.4 18.1 Dividend yield N/A N/A N/A N/A N/A FCF yield (1.9%) 2.8% 3.7% 4.1% 4.9%
Source: Company information and Progressive Equity Research estimates

1 September 2020
To arrange a meeting with the management team, or for further information about Progressive, please contact: Emily Ritchie +44 (0) 20 7781 5311 [email protected]
Disclaimers and Disclosures
Copyright 2020 Progressive Equity Research Limited (“PERL”). All rights reserved. Progressive’s research is commissioned by the subject company under contract and is freely available to the public and all institutional investors. Progressive does not offer investors the ability to trade securities. Our publications should not, therefore, be considered an inducement under MiFID II regulations. PERL provides professional equity research services, and the companies researched pay a fee in order for this research to be made available. This report has been commissioned by the subject company and prepared and issued by PERL for publication in the United Kingdom only. All information used in the publication of this report has been compiled from publicly available sources that are believed to be reliable; however, PERL does not guarantee the accuracy or completeness of this report. Opinions contained in this report represent those of the research department of PERL at the time of publication, and any estimates are those of PERL and not of the companies concerned unless specifically sourced otherwise. PERL is authorised and regulated by the Financial Conduct Authority (FCA) of the United Kingdom (registration number 697355).
This document is provided for information purposes only, and is not a solicitation or inducement to buy, sell, subscribe, or underwrite securities or units. Investors should seek advice from an Independent Financial Adviser or regulated stockbroker before making any investment decisions. PERL does not make investment recommendations. Any valuation given in a research note is the theoretical result of a study of a range of possible outcomes, and not a forecast of a likely share price. PERL does not undertake to provide updates to any opinions or views expressed in this document.
This document has not been approved for the purposes of Section 21(2) of the Financial Services & Markets Act 2000 of the United Kingdom. It has not been prepared in accordance with the legal requirements designed to promote the independence of investment research. It is not subject to any prohibition on dealing ahead of the dissemination of investment research.
PERL does not hold any positions in the securities mentioned in this report. However, PERL’s directors, officers, employees and contractors may have a position in any or related securities mentioned in this report. PERL or its affiliates may perform services or solicit business from any of the companies mentioned in this report.
The value of securities mentioned in this report can fall as well as rise and may be subject to large and sudden swings. In addition, the level of marketability of the shares mentioned in this report may result in significant trading spreads and sometimes may lead to difficulties in opening and/or closing positions. It may be difficult to obtain accurate information about the value of securities mentioned in this report. Past performance is not necessarily a guide to future performance.