UK Power Networks - Losses Discretionary Reward (LDR)
38
1 | Losses Discretionary Reward Submission Tranche 1 UK Power Networks Losses Discretionary Reward (LDR) Submission for Tranche 2 February 2018
-
Upload
khangminh22 -
Category
Documents
-
view
0 -
download
0
Transcript of UK Power Networks - Losses Discretionary Reward (LDR)

1 | Losses Discretionary Reward Submission Tranche 1
UK Power Networks Losses Discretionary Reward (LDR) Submission for Tranche 2
February 2018

| Losses Discretionary Reward Submission Tranche 2
2
Executive Summary
As the Distribution Network Operator (DNO)1 for London, the East of England, and the South East of England, UK Power Networks serves over eight million customers covering more than 29,000 square kilometres. We distribute approximately 27% of the UK’s electricity via more than 80,000 substations and 187,000 km of overhead lines and underground cables and have approximately 6,400 staff working to serve our customers.
Britain’s transition to a low carbon economy is underway and the passive networks that DNOs have previously managed are rapidly evolving to become much more dynamic. The continued influx of Low Carbon Technologies (LCT), increasing network utilisation, bi-directional power flows and the evolving needs of our customers are all things which Distribution System Operators2 (DSO) such as UK Power Networks are responding to.
Increasingly dynamic networks require significantly more measurement capability than was previously necessary. Smart meters and network monitoring on Low Voltage (LV) networks will bring visibility and, for network operators with sufficient levels of ambition, will enable losses to be measured rather than estimated as they currently are. The development of this measurement capability will lead to a step change in understanding of where and how losses occur. But this capability will take time to establish and it is important that network operators continue to develop their understanding of, and focus on, losses in the interim. This document describes what we have learnt over the past two years and what we now plan to do with that knowledge in order to improve our ability to manage network losses.
Managing losses is an integral part of delivering sustainable electricity. With 27TWh of electricity lost each year within Great Britain3, equivalent to the annual power consumption of approximately eight million domestic households4, we are leading the technical improvements which will bring benefits for customers, the environment and the wider community.
Losses are inherently difficult to understand due to their dynamic nature. Consumers’ use of the network will cause spikes in losses which electricity metering cannot accurately capture over averaged time periods. Network topologies vary widely within a network operator’s geographic area and each type has different losses characteristics. Supply characteristics such as phase unbalance, power factor and harmonic distortion, which all vary over time, will affect losses. The magnitude of losses are a product of the severity of these characteristics and the network topologies on which they are present. Therefore, generic assessment will never fully capture the extent and complexity of the issue.
Losses are currently estimated by comparing the measured energy entering the DNO’s network and aggregated energy leaving the network which customers are billed for. To fully understand and manage losses we believe that the ability to more accurately measure network losses will be the foundation of this capability.
Our tranche 1 submission proposed an ambitious portfolio of projects, designed to significantly improve our understanding of losses. We have delivered, and in many cases exceeded, these commitments and we begin tranche 2 with a much clearer vision of what we must do throughout RIIO-ED1 and beyond to develop better network losses management capability. Our learning has been developed so that it is not only relevant to our networks but also to the wider electricity distribution community.
Our successes in tranche 1 include:
- Identification of a new category of network losses which we call Contact Voltage Loss (CVL). We believe we are the first network operator in the world to consider this category of loss. Working with Princeton University, New Jersey we have estimated the magnitude of CVL to be as high as 590GWh annually across Britain (section 4). This is equivalent to the annual energy consumption of 184,000 homes. Unlike most technical losses this category could be almost completely eliminated with sufficient investment;
1 A full glossary of terms can be found in ‘Losses Discretionary Reward Tranche 2 – Annex’ 2 http://futuresmart.ukpowernetworks.co.uk/ 3 Ofgem (2015) Energy Efficiency Directive: An assessment of the energy efficiency potential of Great Britain’s gas and electricity infrastructure. https://www.ofgem.gov.uk/sites/default/files/docs/2015/06/energy_efficiency_directive_report_-_final_for_publication.pdf
4 https://www.ofgem.gov.uk/sites/default/files/docs/2015/03/tdcv_2015_open_letter_-_final_0.pdf - assuming an average consumption of 3,200kWh per household
The development of an LV losses measurement capability will lead to a
step change in understanding of where and how losses occur
| Losses Discretionary Reward Submission Tranche 2
3
- Development of a losses measurement capability on our EHV network. Integration of a losses algorithm into our Kent Active System Management5 (KASM) project provides holistic visibility and measurement capability on our and National Grid’s networks in the South East of England (section 4). This project acts as a precursor to establishing our ultimate ambition of losses measurement on LV networks;
- Development of a new transformer specification which exceeds the proposed ECO20216 fixed losses requirements whilst still being commercially viable. We will begin installing this equipment in 2018 (section 2) and we initially forecast annual losses reductions of 32MWh per annum. By developing further sizes of transformers we expect to increase this value to 500MWh per annum by the end of the RIIO-ED1 period;
- Extensive engagement with stakeholders from Britain, United States of America, Australia, New Zealand, Hong Kong and Japan has enabled us to produce a number of technical reports7 (A3.1). These include benchmarking the performance and approaches to losses management of our peers across the international community. An assessment of how smart meters are currently being used within that community to manage technical and non-technical losses was also undertaken (section 3). We have conducted a collaborative project with Scottish and Southern Electricity Networks (SSEN) to better understand losses behaviours at the boundaries of our licence areas;
- Holistic modelling of our three licence areas using Imperial College London’s (ICL’s) Load Related Expenditure (LRE) model. This has enabled the development of network losses heat maps and has reached significant conclusions which have highlighted which networks we should target, and specific supply characteristics that we should target within those networks. We will use these conclusions to refine our Losses Strategy (section 1).
- The development of a dedicated losses webpage8, which we believe to be an industry first (section 2), is allowing us to engage with a wider range of international stakeholders; and
- ICL identified a number of key components (such as phase imbalance and power factor) which cause losses on our networks. We selected the powerPerfector iQ, the UK’s leading Voltage Optimisation (VO) technology9, and tested it at the Power Networks Demonstration Centre10 (PNDC) to understand how it can be used to optimally tackle these key components (section 4).
Our tranche 1 focus has been multifaceted. It has shown which of our networks suffer most losses and which supply characteristics cause the majority of these losses. We have seen the success that measuring losses has and have seen tangible results from collaboration with manufacturers which has exceeded our expectations. Stakeholder engagement has provided valuable insights which have allowed us to more effectively focus our future projects. The suite of projects which we propose for tranche 2 has been developed to capitalise on current understanding, continue to develop appropriate understanding and implement key learning into our usual business processes.
Taking on board Ofgem’s comments in their ‘LDR tranche 1 decision for 201611’ document, we have increased our focus to include commitments around effective use of smart meter data, non-technical losses, collaboration with other DNOs and increased quantification of the benefits that our projects are forecast to deliver.
Highlights of our tranche 2 proposals include:
- The development of a network-wide LV measurement capability. Given the magnitude of the LV network this is a significant undertaking. By combining existing and new measurement capabilities at LV with a bespoke data set, which we will develop during tranche 2, we will mirror the successful approach taken in our KASM project.
5 http://innovation.ukpowernetworks.co.uk/innovation/en/Projects/tier-2-projects/kent-active-system-management/ 6 http://www.cibse.org/getmedia/d82f564d-07b1-4a4c-9522-bc9f54f257df/150909-Eco-Design-Transformer-Presentation.pdf.aspx 7 Managing Losses: International Best Practice and Smart Meters and Losses: Best Practice Review 8 https://www.ukpowernetworks.co.uk/losses/index.html 9 www.powerperfector.com 10 http://pndc.co.uk/ 11 https://www.ofgem.gov.uk/publications-and-updates/riio-ed1-losses-discretionary-reward-decision-tranche-one-2016
Our tranche 1 focus has been multifaceted. It has shown
which of our networks suffer most losses and which supply
characteristics cause the majority of these losses

| Losses Discretionary Reward Submission Tranche 2
4
- Developing a project partnership which addresses a number of the issues highlighted in our smart meter benchmarking report12 which are indicated as barriers to effective smart meter usage. We believe that this work is fundamental to fully realise smart meter benefits within the losses arena and across the wider smart meter community;
- Use of our Power Potential13 project to better understand how to actively manage losses in a complex DSO environment. The project will provide significant data from within a DSO network and, whilst it predominantly focusses on maximising network capacity availability to enable further connection of LCTs, we anticipate losses reduction opportunities based on what we have discovered with our other DSO-related studies;
- Development of a power factor state estimation methodology. Power factor has been proven to be a major cause of network losses and we plan to reduce reliance on expensive hardware currently used to indicate where areas of poor power factor exist. By reducing the cost of measurement we plan to extend the list of sites where intervention is commercially viable;
- Continued collaboration with manufacturers to develop products which exceed ‘off the shelf’ specification. This includes the on-going development of additional amorphous steel transformer sizes, development of the iESCO powerPerfector for use in a network environment and a Power Factor Correction (PFC) collaboration project to align with ICL’s recommendations which were made during tranche 1;
- Undertake a series of webinars to disseminate key learning from our recently published technical reports; - Collaboration with our DNO peers via the Electricity Networks Association (ENA) losses working group to share
key technical information with subject matter experts from each DNO group. We will begin by sharing the amorphous steel transformer specification with the aim to establish widespread British uptake;
- Reduction of non-technical losses at UK Power Networks’ sites. We will undertake a data-logging and analytics assessment of a range of our Grid and Primary substations to better quantify our unmetered energy consumption. This will provide significant benefits including the potential to reduce non-technical losses on our assets, provide a better understanding of the split between technical losses and own consumption and ultimately enable improved energy efficiency of our substations; and
- Working with ICL, we will investigate different approaches to incorporating the cost of losses into connection offers. Based on the fundamental methodology previously developed by ICL on behalf of the Competition and Markets Authority14, and accepted by Ofgem, we will quantify the impact of location specific connections and corresponding demand/generation patterns on network losses at the distribution network level.
We believe that successful delivery of our ambitious tranche 2 proposals will enable the widespread implementation of our innovative approaches into BAU activities during the third LDR tranche and beyond. This shift in capability will allow us to begin RIIO-ED2 in a strong position to manage network losses in a dynamic environment and we believe this will help underpin the creation of a losses incentive mechanism for RIIO-ED2.
Report structure
We have undertaken a huge amount of significant and complex work over the past two years. To aid the reader’s understanding of the extent of this work and the technical detail associated with each project we structure the information so that high-level details of tranche 1 work, along with tranche 2 commitments, sit within the relevant sections of this document. A detailed summary of each of our projects is contained within the annex to this document. Further technical details related to many of the projects can be found in technical reports published on our webpage. These include:
- Managing Losses: International Best Practice (A3.1); - Smart Meters and Losses: Best Practice Review (A3.2); - KASM Distribution Network Losses and Strategies for Reducing Losses (A1.3); - Strategies for Reducing Losses in Distribution Networks (A1.1); - UK Power Networks Collaboration Project with Scottish and Southern Energy (A2.1); - Analysis of Contact-Voltage Losses in Low-Voltage Electricity Distribution Systems of the U.K. (A4.1); and - LV Voltage Optimisation for Losses Mitigation: Analysis of powerPerfector iQ PNDC Trial (A4.2).
12 Smart Meters and Losses: Best Practice Review 13 http://innovation.ukpowernetworks.co.uk/innovation/en/Projects/tier-2-projects/power-potential/ 14 http://www.nera.com/publications/archive/2016/160309_NERA_Final_Report_on_Losses0.html

| Losses Discretionary Reward Submission Tranche 2
5
1. Our approach to understanding losses
Overview
Our tranche 1 submission recognised that one of the biggest challenges to effective losses management is a lack of network visibility due to the limited availability of measured data. Historically LV networks have not been monitored other than at the consumer’s metering position, and yet it is accepted that most losses occur in these networks. Consumers’ energy bills are often calculated via statistical estimates, are subject to an 18 month reconciliation delay, and do not directly align with the measured energy values entering the DNO’s network. This results in published losses levels having to be estimated. There is an expectation that smart meters will provide important visibility that has long been lacking and will enable losses to be measured. We agree with this view and plan to enhance it by increasing the amount of measurements that we take from our LV networks. In the interim, our tranche 1 (summarised in Figure 1) activities have focussed on making immediate progress. Our proposals were developed against the following criteria: improved understanding of the source of losses, holistic visibility of the network, transferrable learning to all network types, and measurement of data.
Figure 1 – An overview of our tranche 1 and 2 activities to better understand network losses LRE model, Imperial College London The LRE model has enabled us to consider our networks holistically, providing us with a number of important insights into the electrical losses present on our networks. Most significantly:
- 75% of losses occur between the customer’s meter and the primary substation 11kV busbar. Therefore, the majority of our future focus will target these LV and HV networks;
- The largest components of losses in these networks are attributable to poor power factor and phase imbalance. ICL have indicated that improvement through mitigation may be as high as 25% and 45% respectively. Whilst there are other causes, our tranche 2 projects will predominantly focus on these two characteristics;
70% of our HV losses occur in only 20% of the
HV network
Consumer’s energy bills are often
calculated via statistical estimates

| Losses Discretionary Reward Submission Tranche 2
6
- A large percentage of losses occur in a disproportionately small amount of network. 70% of our HV losses occur in only 20% of the HV network, and 70% of our LV losses occur in 50% of the LV network. The LRE model specifically highlighted which networks these are and we will target them in order to deliver maximum economic benefit; and
- Given the very specific nature of losses it is incredibly difficult to define “typical” network types where losses occur. Therefore the development of a detailed ‘losses framework’ has not been possible. What we have learnt though is that most losses occur in the ‘outlying’ networks – those types which are bespoke to each network operator, exhibit fairly unique characteristics and do not necessarily comply with a network operator’s current design standards. It is these where most benefits can be realised in the management of network losses.
Highlights of our work with ICL are detailed further in Appendix A1.1, and captured in ICL’s published report15, and include:
a. Operational measures – Development of specific operational activities within our networks which can be implemented with almost immediate effect. These include the optimal configuration of 10% of our HV network which is causing a disproportionate amount of losses and the identification of 30 circuits in each licence area which are particularly susceptible to losses attributable to poor power factor. These operations will be undertaken through usual business practices in line with our published Losses Strategy. Any reconfiguration to improve losses will always be a balance between improvements that can be achieved without worsening other performance characteristics, such as CIs and CMLs.
b. DSO modelling – We have extensive existing data from our innovation projects which we have used to show that new technologies, when used to manage losses rather than maximising network utilisation, can help to reduce losses. The data used was specific to our networks but we believe that the principles can be extended to other networks more generally. We were able to determine that:
1. Load balancing across circuits through dynamic impedance management provides a 15% reduction in 33kV circuit losses (Flexible Plug and Play – Quadrature Booster);
2. Energy Storage can reduce upstream losses by 15% (Smarter Network Storage – Battery storage); 3. LV load balancing can lead to a 15% reduction in LV network losses (FUN-LV – Soft Open Points); 4. Active Network Management can provide a 10% reduction in transformer losses; 5. Load reduction of 2.8% attributable to smart meter usage generates a 5.5% reduction in overall
network losses; and 6. Demand Side Response (DSR) can reduce losses in the networks to which it is connected by 3%.
Given how prevalent these technologies will become in the DSO environment we are keen to build on this knowledge. During tranche 2, in collaboration with ICL, we will use network data from Power Potential to further understand how losses can be managed in a complex DSO environment.
15 Strategies for Reducing Losses in Distribution Networks
Given the very specific nature of losses it is
incredibly difficult to define “typical” network types
where losses occur

| Losses Discretionary Reward Submission Tranche 2
7
c. Losses heat maps – Assessment of our
network on a 250m x 250m basis has enabled the development of a neural network methodology. Using this approach the network within the assessment area has been classified into one of twenty two network types. This information has enabled ICL to develop losses heat maps for our three license areas – EPN’s heatmap is shown in Figure 2.
d. Losses strategy validation – Assessment of our Losses Strategy activities, relative to specific network types, has enabled us to redefine the hierarchy of interventions based on their relative benefits. Key opportunities for losses reduction lie in HV network optimisation (15% reduction), Power Factor correction (20-25% reduction) and phase imbalance (up to 45% reduction for circuits with very poor phase balance).
Kent Active System Management (KASM) – Holistic network measurement The East Kent region faces a number of challenges that make it an ideal test-bed for a contingency-analysis software tool, previously developed in the KASM project. The area contains several distributed generation sources, it has extensive reverse power flow issues, it has two HVDC interconnectors with Europe, and it is subject to increasing generation-related constraints. All these factors lead to increasingly unpredictable power flows across the network and provide an indication of how DSO networks may operate.
By using network measurements taken from our existing network management system, and comparing with impedance data taken from our network modelling tool, the KASM Losses Analytics Tool is able to calculate network losses at 30 minute intervals. A communication link established between UK Power Networks’ and National Grid’s control rooms enables a holistic view of both operators’ networks. This means we can see what impact a losses mitigation action on our 132kV network will have on National Grid’s 400kV and 275kV networks, and on their supergrid transformers. As such, it ensures we do not unintentionally make overall system losses worse by focussing only on our network.
In addition to losses calculations of the intact network, losses have been calculated for each contingency scenario. This has demonstrated the potential efficiencies achievable through network reconfiguration. Some scenarios provide losses reductions of circa 2% on our EHV networks. We will investigate the impact that any changes may have on quality of supply and implement where appropriate.
In addition to whole network losses calculation, KASM also provides real/reactive losses measurements at an individual network component level. We are using this visibility to determine trends in losses and key dependencies between network components and wider network behaviours.
Figure 2 – Losses heat map of the EPN licence area

| Losses Discretionary Reward Submission Tranche 2
8
Our initial published report16 summarises the key learning to date. We have learned that losses are highly variable and strongly influenced by network configuration and generation. It is extremely difficult to generalise about how losses behave on such a dynamic network. Particular circuits on the 33kV network can exhibit hugely disproportionate levels of network losses for periods of several hours. Our conclusion from this is that we need to continue to use the KASM tool over an extended period of time to further identify patterns in losses. Once this has been done, we can work with our control engineers to understand how high losses events can be mitigated whilst maintaining system resilience. The findings from this work will then move through to implementation in our network control policy documents. We intend to continue using the software over the next two years to further refine and validate these conclusions.
Losses Data analytics The success of the KASM project clearly shows the benefits of bringing network measurements and impedance data together from multiple systems. The next stage is to replicate this for the LV network. We want to be able to rank every LV circuit on our network by how vulnerable it is to losses. To achieve this, our first task is to bring LV impedance data from multiple sources into a single data set. In the short term this can be used to identify network characteristics which ICL have indicated that we should focus on.
The strength of the KASM Losses Analytics Tool lies in combining an actual network impedance model (derived from UK Power Networks’ DIgSILENT model of SPN) with empirical measurements. These measurements are taken at half-hourly intervals and thus allow for a near-real time dynamic model. By applying these values to a network model, KASM allows us to observe power flows and losses with unprecedented levels of accuracy and precision: not only can we see whole-system losses in near-real time, we can see individual element system losses in near-real time.
KASM has provided us with losses measurement capabilities at EHV – we now plan to replicate this at LV. The rapid increase in the volumes of LV connections, and the changing use profiles of these connections, has resulted in the development of projects which aim to improve network visibility by collecting LV measurements, such as our LV System Monitoring Programme. Combining these with our smart meter data system is expected to provide a comprehensive set of LV measurements. It is important that this data is available in a format which is compatible with our network impedance data project and we commit to collaboration across all relevant projects to ensure that this alignment is achieved.
Successful integration of LV impedance and network measurement data will provide a capability to measure losses within the LV network and will help us to move from the existing losses estimations that are used. This capability will enable us to efficiently target our losses mitigation activities. Given the size of our LV networks this is a significant project, therefore we see the commitment to gain LV losses visibility as an essential but challenging one. Targeting a single source of impedance data within the timescales of tranche 2 is ambitious, but we believe, achievable. The integration of LV measurement data within this project is targeted during the tranche 3 timescales.
2. Stakeholder engagement and sharing of best practice
Overview
The past two years have seen significant engagement with our stakeholders. These have included members of the International Utility Working Group (IUWG)17, Cheung Kong Infrastructure Holdings (CKI)18, global network operators, academics and manufacturers. We have researched existing material on a wide range of subjects related to network losses. The diversity of stakeholders consulted far exceeds anything undertaken previously and we attribute much of the success that we have had over this period to the level and quality of engagement that we have received. In many cases sharing feedback from one stakeholder with the wider community has enabled themes and concepts to be developed far beyond what would otherwise have been possible.
16 KASM Distribution Network Losses and Strategies for Reducing Losses 17 IUWG members include EDF, Enedis, China Light and Power, State Grid Corporation of China, ComEd (Chicago), Con Edison (New York), Ausgrid (Sydney), Tokyo Electric Power Co and Kaisai Electric Power Corporation
18 Further details of CKI group members can be found at http://www.cki.com.hk/english/ourBusiness/home/index.htm
Our KASM losses analytics
tool was a finalist at the
2017 EIC innovation
awards
| Losses Discretionary Reward Submission Tranche 2
9
Prior to the first tranche of the LDR we learnt that many of our stakeholders were interested in the subject of network losses and felt more able to engage when communication was clear, concise and simple. Consequently, in 2016, we revised our Losses Strategy to make it more accessible to a wider audience. Our stakeholders responded well to the changes and we intend to take this approach in all future losses engagement.
We recognise that the type of engagement that we use needs to be tailored to the audience and the material that is being presented. As a result we have developed a range of communication methods and have observed different levels of engagement with each. We commit to continue developing methods to best suit the audience that we target.
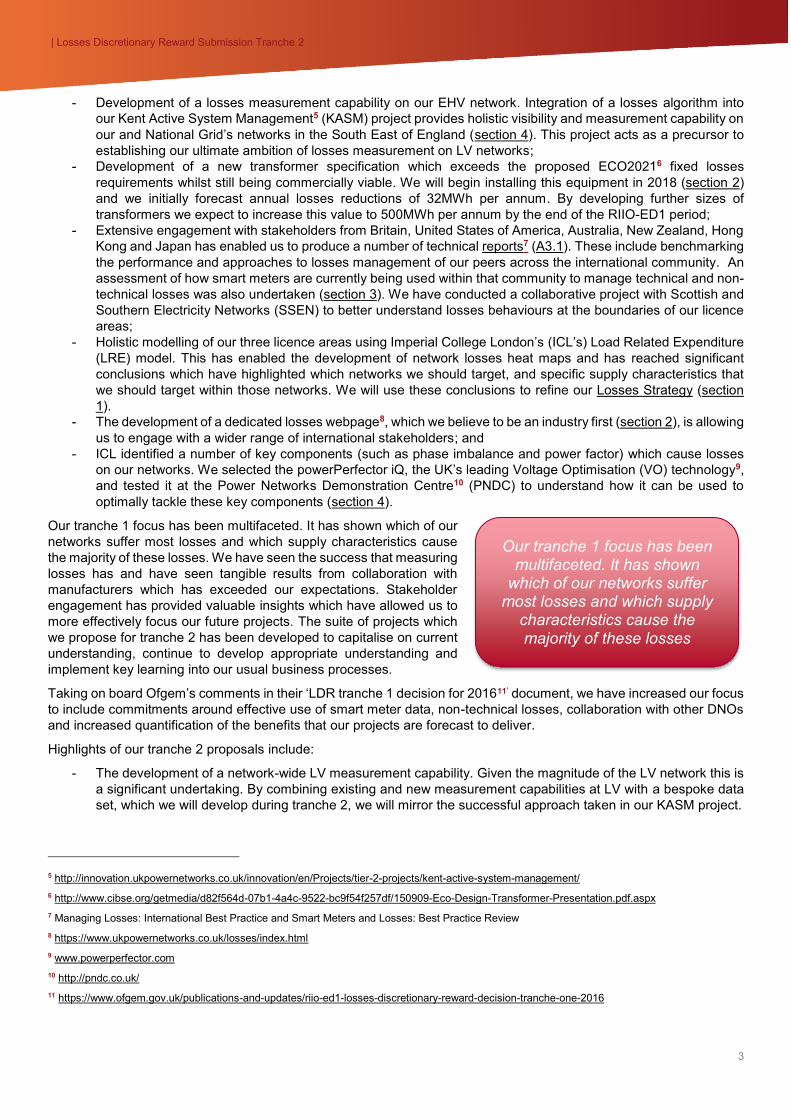
Liaison with manufacturers has delivered benefits greater than we had originally expected and we therefore commit to undertake further collaboration wherever it is appropriate. Our continued engagement with the ENA losses working group has enabled DNOs to share understanding with each other. In collaboration with WSP19 the group undertook an assessment of various LCT uptake scenarios and the impact they may have on network losses. This material was presented at the Low Carbon Networks & Innovation (LCNI) conference in December 2017.
The six GB DNO groups have agreed to optimise losses stakeholder engagement in 2018 and 2019 through alignment of local communications and industry wide event collaboration. This has the potential to enhance shared knowledge and facilitate future collaboration while improving the experience for our stakeholders. Additionally, to aid development of future losses projects and transfer to BAU, a workshop for the subject matter experts in each network organisation has been agreed in principal and is expected to be organised via the ENA Technical Losses Task Group.
Figure 3 – An overview of our tranche 1 and 2 activities undertaken to develop our stakeholder engagement capabilities and to
share best practice with our peers
19 http://www.wsp-pb.com/en/WSP-UK/Who-we-are/About-us/
The six GB DNO groups have agreed to optimise
losses stakeholder engagement in 2018 and
2019
| Losses Discretionary Reward Submission Tranche 2
10
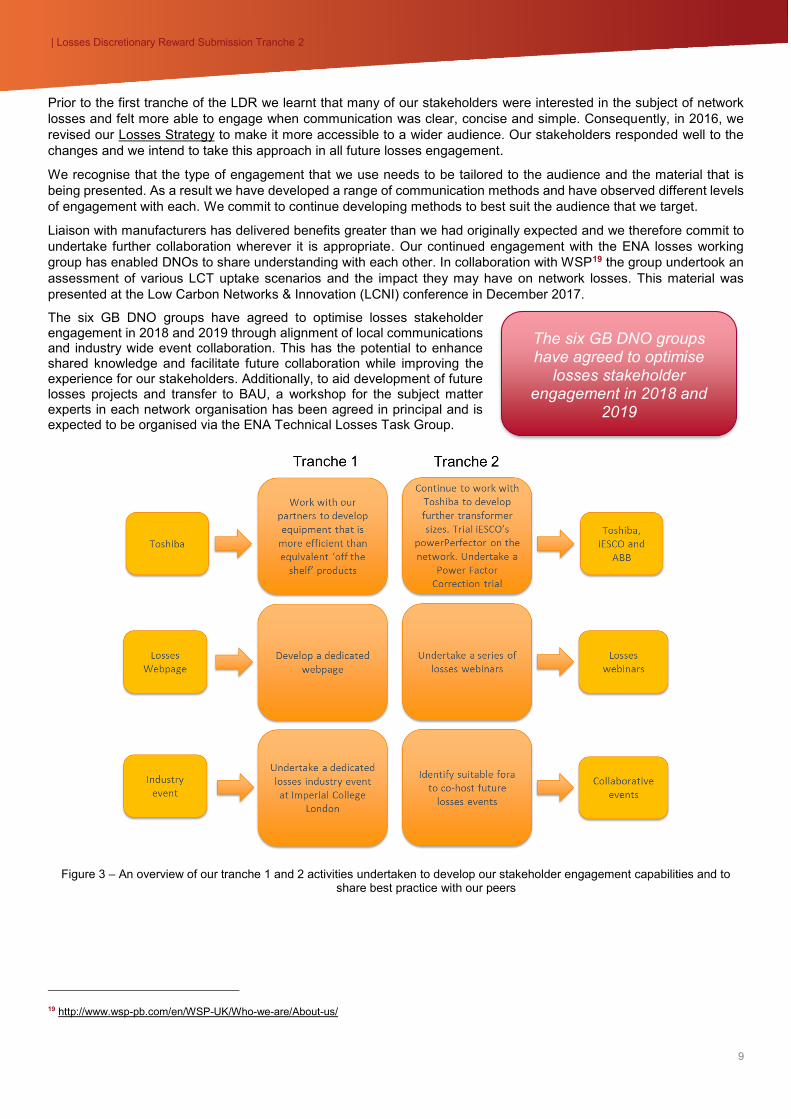
Losses webpage We developed a dedicated losses webpage, which we believe to be the first of its kind, to allow us to engage with a broad audience; both in terms of their technical understanding and geographic location. Interactive content on the page explains in an accessible manner the key points of our Losses Strategy and the concepts behind losses mechanisms. Initial feedback has been encouraging, with many users commenting on the quality of material presented and general accessibility. As the concepts being described relate to basic physics and electrical engineering we are engaging with members of the educational community to promote the site. We believe that students of Science, Technology, Engineering and Mathematics (STEM) subjects will find the topics interesting. It will promote the subject of electrical engineering to an important audience who will hopefully have novel views of the subject enabling them to provide feedback that we may never have considered previously.
We use the webpage to publish all our losses-related written material. Over the tranche 1 period we have published our losses conference material and the technical reports that we have produced. We recognise the importance of sharing all material, irrespective of the source, and we are actively engaging with our stakeholders to agree which material of theirs can be shared. Ultimately our ambition is to encourage the losses community to engage each other through the site, potentially independently of UK Power Networks, and subject to volumes of traffic plan to develop this capability.
We found the webpage to be an excellent medium to publish material that can be easily accessed across the globe, but real-time dialogue and communication is restricted as a result. We believe that face to face communication will always be the most effective but, given that it can often be time consuming in terms of travel requirements, we plan to undertake a series of webinars during tranche 2 to trial their effectiveness. These will initially focus on our published technical reports following which we will let the subject matter develop organically.
Network losses conference On 6 July 2017 we held a network losses conference at ICL. The event was attended by a wide range of industry experts including network operators, manufacturers, consultants, academia and Ofgem. We used the event to share what we had learnt to date whilst also seeking feedback on how to realise the maximum benefit from projects moving forward. The feedback that we received enabled us to develop projects beyond their original scope; one example being the engagement of Princeton University to address queries related to our Mobile Asset Assessment Vehicle (MAAV). Feedback from the event was excellent and is summarised in Appendix A6. 72% of people surveyed at the conference suggested that they would do something differently related to network losses as a result of attending the event.
We were delighted to see delegates from the United States of America and Japan at our conference but we are aware that other international delegates wished to attend the event but simply could not justify the expense, in terms of time requirements and travel costs.
International engagement Engagement from the international community has been excellent throughout the period with stakeholders from more than 10 countries participating in at least one form of engagement. To develop our International Benchmarking report we circulated a questionnaire amongst global network operators to help us to understand the levels of their reported losses and the activities which they undertook to achieve their reported levels.
We engaged with international delegates at the 2017 meeting of the IUWG in London to update them on our progress made during tranche 1 and to test our understanding of the questionnaire survey responses that we received. We also used the dialogue to understand what the international community is doing in relation to smart meter data usage. We believe that adding the subject of losses to an existing agenda of an international collective will be the most effective
72% of attendees surveyed will do
something different as a result of our
losses conference
Figure 4 – UK Power Networks' losses webpage
| Losses Discretionary Reward Submission Tranche 2
11
way to reach multiple international stakeholders in person. We therefore commit to targeting suitable future events that we can attend to disseminate our key learning and will seek collaboration with our DNO peers wherever possible.
Manufacturer collaboration – development of amorphous steel transformer We committed to ‘initiate talks with manufacturers to shape a new product’ in our tranche 1 submission. Recognising that fixed losses account for 30% of the overall technical losses figure, and 55% of those losses relate to secondary network transformers, large amounts of energy can be saved if secondary network transformers are targeted. One way to reduce these losses is to focus on the materials used to manufacture the transformer core. Amorphous steel is known to reduce iron losses but has not been widely used due to the increased cost and physical transformer size required to accommodate it.
In collaboration with Toshiba we considered our most commonly used pole mounted transformer – the 100kVA three phase unit. Physical size requirements when using amorphous steel cores meant that larger poles and mounting platforms would be required making the business case for this size of transformer marginal. Therefore, we targeted the 50kVA single phase unit, our second most commonly used size. This can be accommodated on existing hardware and the business case for this unit proved to be positive. The transformer has been developed with variable losses that are compliant with ECO2015 limits and exceed the proposed ECO2021 limits for fixed losses. It represents a reduction in fixed losses of 76% against an equivalent ECO2015 specification and we forecast an improvement of 32MWh per annum attributable to the first consignment of 54 units that we have ordered and will install throughout 2018. This approach is scalable across Britain if other DNOs wish to use this specification of transformer and we plan to promote this technology to other DNOs during the collaborative DNO workshops planned to commence in 2018.
We will continue to work with Toshiba over the next two years to develop further sizes of transformer for use on our network. We anticipate an annual improvement within our networks of 500MWh if the entire range of pole mounted transformer sizes can be adopted. We therefore commit to develop not only additional transformer sizes but also the transformer mounting hardware so that it no longer represents a barrier to the use of this new technology moving forward.
Manufacturer collaboration – powerPerfector iQ trial Our work with ICL showed that 75% of losses occur below the 11kV primary busbar, and that targeting specific supply characteristics at LV and HV will deliver the largest benefits when managing network losses. These characteristics include elevated voltages on the LV network, poor power factor and phase imbalance. Harmonics also exhibited a lesser influence on losses, but are a growing issue in their own right as the increasing volume of inverter-connected low carbon technology on our networks have the potential to cause further harmonic distortion. Although we operate our network voltages within statutory limits, for historical reasons the actual system voltages are often at the higher end of the acceptable band. This is despite the fact that most modern customer appliances are optimised for lower voltages than exist in the UK.
We surveyed a number of technical solutions to these challenges and found that a particular product – the iESCO powerPerfector iQ – had the ability to address many of these issues concurrently. The powerPerfector iQ is the UK’s leading power optimisation device and was developed to improve energy efficiency in large buildings. It manages the incoming voltage supply level at a customer’s building to an optimal level to minimise energy usage and reduce the customer’s electricity bill.
Using the specialist capabilities of our project partners at the PNDC, we created a series of “real life” test networks, and tested the powerPerfector iQ under these representative networks. The device performed well in our trials. It is highly efficient with tested efficiencies of around 99.9%, matching the manufacturer’s claims. Using the device we were able to achieve losses reductions of up to 17% for our trial network when the average UK voltage of 242 volts is applied to the input. If voltages were set higher, at 253 volts for example, losses reductions of up to 20% can be achieved. Depending on the nature of loading and voltage at a particular site, this means significant losses reduction can be achieved on the real-world distribution network: our trials indicate that for a representative feeder (350 amps, 242 volts), a losses reduction of 9.6 kW can be achieved. More significantly, customers also benefit from increased energy efficiency by reducing the voltage supplied to their appliances.
Our amorphous steel transformer represents a reduction in fixed
losses of 76% against an equivalent ECO2015 specification
Using the powerPerfector iQ we were able to achieve losses
reductions of up to 17% for our trial
network
| Losses Discretionary Reward Submission Tranche 2
12
As well as mitigating losses and reducing customer’s electricity bills, the powerPerfector iQ offers a number of potential ancillary benefits that align with UK Power Networks’ vision to become a DSO. By reducing observed customer loads, it can be used as an alternative to reinforcement of the network. If embedded generation or connection of low-carbon technologies cause volts to vary outside acceptable parameters, the device represents a potential tool for the DSO to manage voltages. In an increasingly dynamic and changing network, the ability to control voltages with a high degree of precision and responsiveness is a valuable asset in and of itself, and helps manage the challenges presented by increased uptake of electric vehicles and embedded generation on the LV distribution network. In addition to aiding the connection, load management and low-carbon technology elements of the DSO transition; the powerPerfector iQ is also a Distributed Energy Resource (DER). Because the powerPerfector iQ is capable of highly rapid and precise voltage adjustment, it represents an opportunity for the DSO to facilitate the provision of frequency response to the system operator.
Because this technology presents so many interesting and varied opportunities, we commit to undertake a real-world distribution network trial of the device. We will continue to work collaboratively with our partners at ICL and other academic institutions to develop a detailed testing methodology that will allow us to optimise the voltages seen by our customers at the point of installation of the device. Using the outputs of the LRE model and our own data analytics exercise, we will identify an area of network demonstrating poor supply quality characteristics, establish suitable measurement capability within that network, and trial the unit for a period of up to 12 months. The equipment may require development for use in a distribution network environment and, given the benefits that we have seen through collaboration with Toshiba, we commit to collaboration with iESCO to develop the unit as required. As an output of this project we will demonstrate the practicality of near real-time LV power optimisation to mitigate losses, reduce customer’s electricity bills, and facilitate UK Power Networks transition to a DSO.
Manufacturer collaboration – Power Factor Correction (PFC) trial ICL highlighted the significance of network losses attributable to poor power factor. Our international benchmarking exercise strengthened the message, demonstrating that a number of our international peers already use PFC to effectively manage network losses. Through network modelling ICL identified 30 circuits in each of our network licence areas which are likely to have particularly large losses when subject to poor power factor. During tranche 2 we will validate, through measurement, whether these feeders do suffer from poor power factor. We will then select the most suitable feeders to undertake our PFC trial and commit to address power factor issues where the CBA is positive.
PFC projects need to consider the network holistically for a number of reasons. The first is that the proliferation of distributed generation is raising voltages in many circuits. Installation of substantial lengths of underground cables (increasingly prevalent now that planning permission for overhead networks is becoming more difficult to obtain) are changing the network impedance characteristics. This change can lead to difficulties managing network voltages within statutory limits. PFC projects may worsen the situation if they are not carefully coordinated and implemented and for this reason our PFC projects will take constraints on our networks, and those of our stakeholders such as National Grid, into consideration.
3. Processes to manage losses
Overview
Through the extensive stakeholder engagement that we have undertaken during the past two years we have seen first-hand the significant benefits that can be realised by engaging with the right stakeholders. The international community is at different stages in terms of smart meter roll-out, the activities underway on their networks to manage losses, the regulatory frameworks within which they operate and their general view of the relevance of network losses management.
In tranche 1 we committed to undertake an international benchmarking and best practice exercise. We also committed to ‘validate the business case for an end-to-end IT system architecture for effective smart meter data use’. There is an obvious synergy between these two activities and we therefore combined the undertaking whilst delivering two separate reports as the outputs of this work.
We have identified 30 circuits in each of our three networks which are likely to
have particularly large losses when subject to poor
power factor
| Losses Discretionary Reward Submission Tranche 2
13
We engaged extensively prior to writing these reports, which involved direct contact with network operators, as well as undertaking reviews of material that already existed related to the management of losses. We are fortunate to sit within the CKI group and we reached out to other members of the group as well as other organisations within the IUWG, which we are also a member of. A comprehensive list of network operators, consultants, academic institutions and manufacturers that we engaged with are listed as an annex within each of our published reports.
The exercise has proven to be very effective, helping us to channel our focus on specific activities that strengthen alignment with the ambitions of our overall losses activities programme. Now that we have undertaken a ‘broad’ sweep of what we consider to be the majority of relevant activities we will continue to refine this focus as our understanding continues to develop.
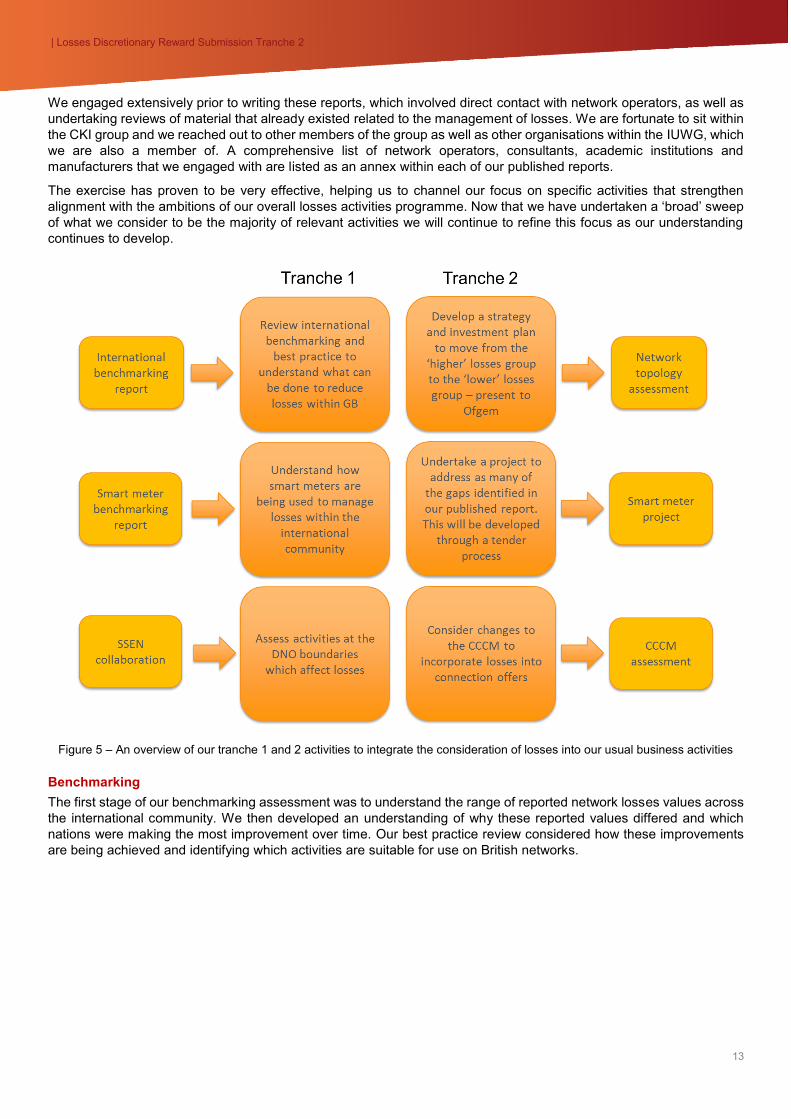
Figure 5 – An overview of our tranche 1 and 2 activities to integrate the consideration of losses into our usual business activities Benchmarking The first stage of our benchmarking assessment was to understand the range of reported network losses values across the international community. We then developed an understanding of why these reported values differed and which nations were making the most improvement over time. Our best practice review considered how these improvements are being achieved and identifying which activities are suitable for use on British networks.
| Losses Discretionary Reward Submission Tranche 2
14
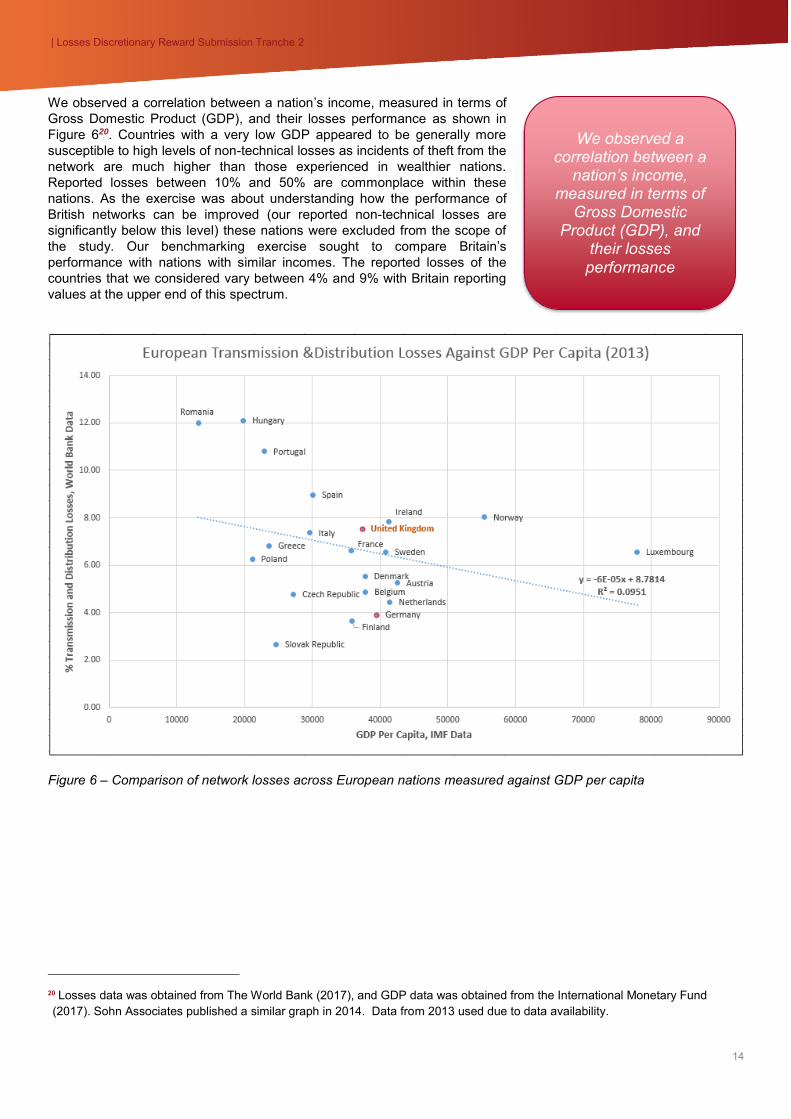
We observed a correlation between a nation’s income, measured in terms of Gross Domestic Product (GDP), and their losses performance as shown in Figure 620. Countries with a very low GDP appeared to be generally more susceptible to high levels of non-technical losses as incidents of theft from the network are much higher than those experienced in wealthier nations. Reported losses between 10% and 50% are commonplace within these nations. As the exercise was about understanding how the performance of British networks can be improved (our reported non-technical losses are significantly below this level) these nations were excluded from the scope of the study. Our benchmarking exercise sought to compare Britain’s performance with nations with similar incomes. The reported losses of the countries that we considered vary between 4% and 9% with Britain reporting values at the upper end of this spectrum.
Figure 6 – Comparison of network losses across European nations measured against GDP per capita
20 Losses data was obtained from The World Bank (2017), and GDP data was obtained from the International Monetary Fund (2017). Sohn Associates published a similar graph in 2014. Data from 2013 used due to data availability.
We observed a correlation between a
nation’s income, measured in terms of
Gross Domestic Product (GDP), and
their losses performance

| Losses Discretionary Reward Submission Tranche 2
15
Investigation into the reasons behind these differences identified a number of early conclusions. Networks with fewer transformation stages demonstrated lower losses than networks with similar network capacity but which utilise more transformation stages. It is widely known that networks with larger capacity will generally have lower variable losses. Our benchmarking showed that older networks generally have higher losses compared with their more modern counterparts mainly due to improvements in transformer performance. Network development pre-1970 was in an environment of low energy costs and high material costs. Anecdotally, there is suggestion that these networks may have been developed only to accommodate the short-term load requirements. Network development post-1970s was typically subject to lower material costs and were increasingly influenced by energy costs. Anecdotal evidence suggests that these networks are more likely to have developed surplus capacity and now report lower fixed and variable losses.
It is therefore important to note that our networks have significant history to them. From our investigations it appears likely that networks which undertook major development in a post-1970s environment tend to sit in the 4-6% reporting range. Countries such as Britain, where major investment occurred in the pre-1970s period generally sit in the 6-9% range. The other factor that must be considered is that losses directly relate to how electricity consumers use those networks.
For a nation to transition from the higher range of reported losses value to the lower range will require significant investment. The level of investment required to do this is currently unknown but it’s unlikely to be justified by the current regulatory drivers which are applied to network development. Nor will it be justified solely by the current valuation of losses at £48.42 per MWh. Timescales for change will be in the order of decades and a significant shift in strategic approach will be required to make this transition. But, just because this represents a difficult prospect does not mean that DNOs should not attempt to transition to the group which reports lower overall losses.
For tranche 2, working with ICL, we commit to investigating what the magnitude of this investment would need to be, and the strategy of how these changes could be made efficiently and incrementally. We will apply this to our existing programmes of work to understand how they could be amended to develop a network with fundamentally lower losses. We plan to present our findings to our wider stakeholders to test how the transition may be achieved – both within the current regulatory framework, as well as considering how regulatory changes could drive different network development behaviours.
Best practice Having identified the nations which outperform their peers the question that must be asked is ‘why’? Through stakeholder engagement we found that a number of our peers are managing reactive power flow by using PFC to good effect. Many European nations supply their domestic customers with three phase services and consequently appear to have less phase imbalance. Portugal uses smart meters to manage technical losses and demonstrates benefits attributable to management of phase unbalance. New Zealand are using basic Demand Side Response (DSR) to manage customer load profiles and, through tighter statutory voltage limits, they are encouraged to utilise shorter circuit lengths and conductors with larger cross sectional areas. Other countries also appear to have lower levels of network utilisation which will also result in lower losses.
The recommendations of ICL to focus on power factor and phase unbalance in LV and HV networks align with the practices that have been observed through our international review and we have used this to reinforce the justification for the approaches that we are taking.
Use of Smart Meter data Our international benchmarking exercise considered countries such as Portugal, Canada and United States of America, which are ahead of Britain in the roll-out of their smart meter programmes. We wanted to understand where, and how, smart meter data is being used to manage losses. By answering this question we better understand the end-to-end IT system architecture that will be required to fully utilise this data once it becomes widely available to network operators in Britain.
Of the network operators currently utilising smart meter data nearly all are using them to detect and reduce non-technical losses on their networks. The specifics of how they do this vary, but generally, they measure the energy that flows into their network and that which flows out of it; termed differential metering. Typically measurement at the consumer’s upstream substation, and measurement of all consumers supplied by a substation, will be required to enable this assessment to be completed.
It is therefore important to note that our networks have
significant history to them

| Losses Discretionary Reward Submission Tranche 2
16
Those network operators that are using smart meter data to manage technical losses are reliant on significant smart meter penetration to do so. Where gaps in data exist they may fill these through the introduction of generic load profiles for those customers using traditional metering methods. Smart meter data and the generic profiles could then be incorporated into a network model. Where nations are using smart meter data to manage technical losses they focus on phase imbalance, power factor and DSR.
Reported benefits vary but an average improvement of 10% in technical losses is achievable. BC Hydro, a Canadian electricity utility company, reported a 50% improvement in non-technical losses over a three year period which is encouraging. It should however be noted that their starting value for non-technical losses was significantly higher than that reported in Britain.
Our smart meter summary paper summarises some of the barriers to effective smart meter use to manage losses, which include:
- Aggregation of data; - Addressing metering inaccuracies; - Use of generic profiles where penetration is less than 100%; - Identification of phase connectivity; - Availability of upstream substation measurements; and - Time periods over which average measurements are taken.
Given the overall cost of the smart meter programme, any activity which makes even a marginal improvement in the effective use of those meters will offer significant value. Also, given that losses account for 3-4% of energy distributed across the LV network, incremental improvement in meter accuracy will also add significant value in the losses arena i.e. detecting losses less than 2% may be difficult where meter accuracy is specified as +/- 2%. Some of these issues, use of generic profiles for example, will be resolved once the smart meter roll-out is complete and 100% penetration is achieved – but this will take time. Others, such as phase connectivity, will remain problematic until specifically addressed. We therefore plan to undertake a Call for Proposals which will seek to address as many of these areas as possible through a single project. The aim will be to provide a scalable solution which is of benefit to the wider smart meter community. It must also enhance the usefulness of smart meters in relation to effective management of network losses.
Common Connection Charging Methodology (‘CCCM’) review In our tranche 1 proposal we committed to ‘establish an holistic British view of losses’; part of which included working with our neighbouring network operator SSEN to better understand network interactions at the boundaries of our networks. The work concluded with a summary report21 which we have shared on our losses webpage.
Through this project we investigated a pair of major connections which were geographically situated close to the border between our two networks. In each case the customers had asked for connection quotations from both DNOs.
Respecting commercial confidentiality, UK Power Networks analysed the lifetime network losses value associated with our connection offer and asked SSEN to do the same. Both DNOs used a consistent methodology and consistent assumptions about customer load profiles. Using Ofgem’s losses evaluation of £48.42/MWh, we discovered that the difference in the whole-life value of the losses between the two connection offers could be as high as £344,000. Accepting that there will be errors attributable to assumptions and, to a degree a lack of clarity as both DNOs were careful to share minimal information so as not to breach commercial confidence of the customer, the figure is sufficiently large to warrant further investigation.
The second part of our collaboration with SSEN related to convenience customers, those which are geographically located in one DNO area but have their electricity distributed from the neighbouring DNO. Our findings concluded that they represent no real issue in terms of losses. Whilst their supply may have more losses than other ‘typical’ supplies it is not economic to transfer them to an alternative point of connection. We noted that there are several hundred such customers in our network and, considering what we deemed to be worst case, societal benefits of less than 21 pence
21 UK Power Networks Collaboration Project with Scottish and Southern Energy
A 10% improvement in technical losses
may be achievable
through the use of smart meters
The difference in whole-life value of losses
between two connection offers could be as high
as £344,000
| Losses Discretionary Reward Submission Tranche 2
17
per annum attributable to the reconnection of the convenience customer would be realised. The cost of making this transfer is not economically viable.
Given the magnitude of the potential cost difference that we have observed between two connection offers we plan to investigate further during tranche 2. Working with ICL we will apply the same methodology used in their project ‘Modelling the Impact of Zonal Transmission Loss Multipliers22’; a project commissioned by the Competition Market Authority, and accepted by Ofgem, to determine an effective solution to the issue within the distribution network.
4. Innovative approaches to losses management
Overview
We believe that the term ‘innovation’ may be interpreted in a number of ways. Identifying cutting edge technologies that can be used to manage losses is one way, using processes that already exist but are not currently used within the electricity industry is another. One of our greatest achievements during tranche 1 is the identification of a new category of losses which had not been previously considered – Contact Voltage Losses (CVL). This is of huge significance as the magnitude of this category of losses may be equivalent to that of non-technical losses within Britain. Unlike technical losses, the associated value may be reduced to zero with sufficient intervention.
We also committed to use of the PNDC as a stepping stone between the academic work undertaken by ICL and network trials of equipment. The facilities at PNDC have enabled us to test equipment under a variety of test conditions, using network data which represents a variety of the network types that we operate, to understand the potential benefits that may be achieved (see section 2). We also committed to trialling the use of software to determine losses under varying network configurations with the intention that losses would act as a driver, alongside quality of supply, when deciding how networks are configured long-term. Finally we committed to transferring the knowledge gained back into our usual business practices to ensure that losses started to feature as a driver in all the work that we undertake.
For tranche 2 we commit to continuing to analyse MAAV data to refine the conclusions made in Princeton University’s report which quantified the potential scale of Contact Voltage Losses. Power factor has been noted to be a major cause of losses across the globe but power factor measurement is often not available. Typically, measurements are taken through conventional transducers. To enable an economic, scalable solution to this problem we commit to undertaking a project to estimate power factor to avoid the need for conventional measurement capabilities. We also commit to a project which seeks to target non-technical losses attributable to the energy usage of our substations. We expect that this project will help us to better define our unmetered energy profiles. We also seek to more accurately assess the split between technical losses and own consumption at our unmetered sites.
An overview of our tranche 1 and 2 activities to develop innovative approaches to the management of network losses is shown in Figure 7.
22 http://www.nera.com/publications/archive/2016/160309_NERA_Final_Report_on_Losses0.html

| Losses Discretionary Reward Submission Tranche 2
18
Figure 7 – An overview of our tranche 1 and 2 activities to develop innovative approaches to the management of network losses
Contact Voltage Losses (CVL) – Identification of a new category of losses Contact voltages describe points of elevated voltage on the surface of footways, roads, street furniture, and lighting columns. They are called contact voltages because a member of the public may come into ‘contact’ with them. They are caused by defects on the LV distribution network. Whilst we have experience of using MAAV dating back to 2012, the losses attributable to these defects have not previously been considered. Having devised a suitable method of taking earth current leakage measurements at the time of a repair, we have been able to calculate that these persistent phase-to-earth leakage defects typically cause losses of 6.1kW23. We call the losses attributable to these defects Contact Voltage Losses (CVL). Combining this 6.1kW value with the number of defects that we discovered in our initial survey of the Central London area, and extrapolating to the wider LPN network, the
23 Analysis of Contact-Voltage Losses in Low-Voltage Electricity Distribution Systems of the U.K
Figure 8 – Photograph of our Mobile Asset Assessment Vehicle in use
| Losses Discretionary Reward Submission Tranche 2
19
total losses figure rises to approximately 17.2GWh annually. This further rises to 38GWh for LPN when losses associated with defects on customer’s equipment and local authority-owned lighting columns are included in the calculation.
Extending these calculations to the whole British electricity distribution industry results in an estimate of 590GWh in wasted energy per year for the whole of Britain attributable to CVL. This figure is not expected to raise the overall losses value reported within Britain – it is currently captured within the technical losses values that are reported. While it is an estimate based on high-level analysis, it uses conservative assumptions, and highlights that this previously unconsidered source of losses is comparable to the estimated magnitude of non-technical losses for Britain.
These figures were challenged at our network losses conference. It is understandable that such challenges should arise, due to the novelty of the CVL concept. Most questions relate to the volume of defects present at any time, the duration of the defect and the magnitude of the associated leakage current. Accepting these challenges, and going beyond our original tranche 1 commitments, we commissioned the Energy Systems Analysis Group (ESAG) at Princeton University, New Jersey, to validate the calculations and assumptions we had made. We used the ESAG due to their extensive experience in the arena of energy-related societal problems. Their report24, which we have published on our losses webpage, confirms the accuracy of the assumptions and calculations used to-date. We are incredibly excited about the discovery of CVL as we believe that this represents a new category of losses not previously considered. It does not fit within the definition of a technical losses i.e. energy usage required for the network to operate. Nor does it fit within the category of a non-technical losses i.e. energy that is used but unaccounted. We believe that CVL represents a third category of losses – a genuine ‘leakage’ from the system which, with suitable levels of investment, could be removed almost entirely.
We are moving the MAAV into business-as-usual operations to detect contact voltages with the primary driver being safety. Using monthly operational updates we plan to further develop our understanding of the CVL challenges. We will refine our assumptions accordingly and, where appropriate, commission further academic study to understand more about CVL. In the meantime we remain convinced that this is one of the most significant discoveries in the network losses arena in recent times.
Power factor estimation The KASM Losses Analytics tool provided us with extensive learning opportunities to study losses on the 132kV and 33kV network in the KASM area. Our work with ICL determined that poor power factor was a significant losses driver. In general, there is an increasing business and engineering need to monitor and understand reactive power flows. This need is driven both by losses considerations, and by increased levels of distributed generation. We currently have insufficient penetration of power factor monitoring devices on the 11kV network for network-wide analysis. Installation of new hardware represents a significant investment, and we need to approach this challenge in a cost-effective manner.
We commit to extend the functionality of the KASM software tool in two directions: we will incorporate the 11kV network in the KASM area by integrating our existing network models with the KASM tool; and we will use this model to accurately estimate power factor on that network without the need to add costly monitoring devices. We plan to use this exercise to prove the concept of power factor state estimation. Once proven, we will roll out to our wider systems and business processes.
Establishing visibility of specific network elements that have poor power factor will enable us to precisely target cost-effective measures to manage reactive power flows (e.g. capacitor banks), and hence mitigate losses.
Non-technical losses management within UK Power Networks’ substations Our distribution licence requires that we actively target non-technical losses on our networks. This focus traditionally relates to the activities of our customers and concentrates on, amongst other things, under-declared unmetered connections. However, in order to distribute electricity, we are a legitimate user of that electricity. Our substations have an electricity demand requirement and we have a mixture of metered and unmetered connections to them.
24 Analysis of Contact-Voltage Losses in Low-Voltage Electricity Distribution Systems of the UK
We are convinced that CVL is one of the most significant discoveries in the network
losses arena in recent times
We estimate that there is 590GWh in wasted energy per year for the whole of
Britain attributable to CVL

| Losses Discretionary Reward Submission Tranche 2
20
During tranche 2 we will undertake data logging at a range of unmetered substation types in order to better understand the load profiles of these sites. We will determine the split between own use, such as heating and lighting which we are charged for, and technical losses, such as tap changer operations – which we are not. By better defining unmetered profiles and the split between energy usage we will be able to ensure that non-technical losses attributable to the use of our own equipment are minimised as far as possible.
Developing more accurate unmetered profiles will enable us to ensure that our connection agreements accurately capture our electricity usage, hence reducing our contribution to non-technical losses. Further to this, by establishing an expected envelope of energy usage, we will be able to identify those metered sites which sit outside the expected operational envelope. Once highlighted, we can identify why energy consumption is high at those sites and target energy efficiencies.
5. Conclusion The past two years have seen a step change in UK Power Networks’ understanding of network losses. By undertaking a multifaceted approach we have developed incremental improvements in a number of losses-related areas.
The discovery of a new category of losses, validated by a respected academic institution, is ground breaking. The topic of losses is one which has been discussed for decades and yet there is no evidence that we have found to suggest that anyone has ever attempted to identify or quantify this losses category. This is an area which network operators can target to directly reduce electricity losses on their network.
We firmly believe that measurement of losses will ultimately be the way to target and optimise network efficiencies. Our KASM losses analytics project has demonstrated the power of combining network impedance data with actual network measurements. By transferring this methodology to the LV network, and combining with smart meter data, we expect to make significant and rapid progress in this domain later in RIIO-ED1.
We expected to achieve improvements in transformer efficiency through collaboration with Toshiba. But we did not expect to develop a commercially viable transformer which exceeds proposed ECO2021 specifications. Given the volume of transformers which are installed within Britain each year, and the scalability of this solution, we are excited at the potential that this new technology has to offer.
Through engagement with the international community we have been able to produce technical reports that we can share with the wider community. We have used the knowledge that we have gained to directly influence the direction that our future projects are taking. Development of a dedicated losses webpage and our losses conference have furthered our engagement activities.
The ethos of the LDR has always been to develop understanding through innovative approaches which can then be implemented into usual business practices. We are already doing this with outputs from our work with ICL and from some of our other projects, amorphous steel transformers for example. Some of our project outputs have longer timescales and we expect to start transferring these into usual business practices during tranche 2. For the tranche 2 period we also propose further projects which capitalise on learning to-date.
Our benchmarking exercise showed that smart meters can be used to better manage losses and, having highlighted potential barriers that are currently faced, we now propose to find a solution to as many of these as practicable. We will consider the long-term development of the network and seek opportunities to transition to the topologies used by nations which report significantly lower losses than Britain. These changes will take time and significant investment but identifying what these changes are is the first step towards achieving them.
We look towards RIIO-ED2 with excitement at the possibilities that the DSO environment will bring in terms of network visibility and the opportunities to better manage losses that this will create. We genuinely believe that the projects that we have undertaken during the past two years have produced a paradigm shift in our understanding of network losses. Building on this over the next two years will further strengthen our ability to manage network losses in a dynamic environment.
Developing more accurate unmetered profiles will enable us
to ensure that our connection agreements accurately capture our
electricity usage
The past two years have seen a step
change in our understanding of network losses

| Losses Discretionary Reward Submission Tranche 2
21
Annex A1: Better Understanding Network Losses
A1.1 Collaboration with Imperial College London
As indicated in the introduction, data availability has been a challenge for DNOs that attempt to view their networks holistically. This challenge often includes problems like unknown load characteristics, details of network elements and making provision for changing load characteristics in an environment where low carbon technologies are rapidly changing the way we manage and utilise existing networks.
DNOs most often use various software packages, each one tailored to meet specific challenges unique to the different voltage levels of their networks. As a consequence, modelling practices across the different voltage levels have become segregated and isolated, which presents an obstacle to a DNO that wishes to understand their network’s functioning in a detailed and holistic way.
To address this challenge, we collaborated with ICL to conduct a detailed losses study using our Load Related Expenditure (LRE) model as the key instrument. This model contains details of our network assets, and it conducts a load flow calculation using all relevant elements. Using this approach, we studied the impacts that various electrical phenomena and network characteristics exert on losses performance. The key learning points are described as follows:
Losses differ across the various parts of our networks for various reasons. In EPN, for example, some of our networks serve areas that are not densely populated. Circuits in these networks are lengthy and so have higher resistance. In LPN and the southern parts of EPN, our circuits are shorter, but highly utilised due to higher population density. The high level of utilisation increases losses exponentially given that power losses are proportional to the square of current. The benefit in having this improved understanding is that we can tailor our losses mitigation efforts accordingly.
Figure 9 – Magnitude of losses per feeder
The second influential outcome of our losses study is that not all feeders in a given geographical area produce similar losses – Figure 9 indicates how losses vary across our HV feeders. Losses on feeders at the left hand side of the graph are much higher than losses on feeders towards the right hand side of the graph. This variance in losses led to the conclusion that we could make a substantial impact on losses by targeting a limited number of HV and LV feeders with carefully selected interventions.

| Losses Discretionary Reward Submission Tranche 2
22
The third key message that emerged from our study was that smart approaches to defer network upgrades increase losses appreciably. Economics drive these deferrals, but losses also have an effect on the overall economic impact. This has reinforced the understanding that there is a need for DNOs to consider losses in any decision to defer network augmentation work. Next we shifted the focus to better understand specific load and network characteristics such as power factor, load imbalance, conductor temperature increases and voltage changes. The following key messages emerged from this part of the study:
The greatest losses occur on heavily utilised, lengthy feeders with load predominantly placed further away from primary substations;
Power factor, where poor, is a major driver of losses. The relationship between power factor improvement and losses mitigated is nonlinear, which means that we can mitigate substantial energy losses on feeders where power factor is poor i.e. a small percent of feeders cause a large percentage of related losses;
Energy efficiency gains from voltage management could be beneficial. Loads can be categorised as constant power, constant current or constant impedance. Dependent on the combination of these loads, we could decrease losses by either raising or lowering feeder voltages;
The relationship between load imbalance in three-phase circuits and losses is not linear. From this information, we now better understand the quantum of benefit obtainable from curtailing load imbalance;
Harmonic distortion levels are limited through network design policy, and consequently, the impact of harmonic distortion on losses is insufficient to warrant investment;
Elevated conductor temperature does not affect losses to the extent that the topic deserves further attention; A strong relationship exists between load profile and loss magnitude, and the proliferation of low carbon
technologies will make a significant impact on losses in some instances. For example, ICL’s assessment indicated that extending the peak load duration for non-domestic Economy seven customers by 20% almost doubles associated network losses; and
We could reduce losses on HV feeders by up to 15% by reconfiguring HV feeders to optimise load balancing across networks. The study took thermal and voltage constraints on network components into consideration.
The study further produced a number of specific outputs that we will use to guide losses mitigation actions in the future. Highlights include:
Adopting amorphous steel transformers on overhead networks will reduce losses by over 500MWh per annum; Using our LRE Model, ICL produced a list of HV feeders recommended for power factor improvement based on
their electrical composition; Using data from our Flexible Plug and Play project, ICL estimated that we could save 15% of local 33kV circuit
losses per annum by altering settings on the quad booster in this network. We plan to determine the feasibility of implementing this during tranche 2;
We could utilise our battery storage facility at Leighton Buzzard for a combination of reactive compensation and load support to reduce losses in the surrounding networks by 0.15MWh/day;
Distributed generators connected to our EHV networks could be used for reactive compensation purposes. The benefit of using these generators to improve power factor could reduce losses in our EHV networks by 0.3%;
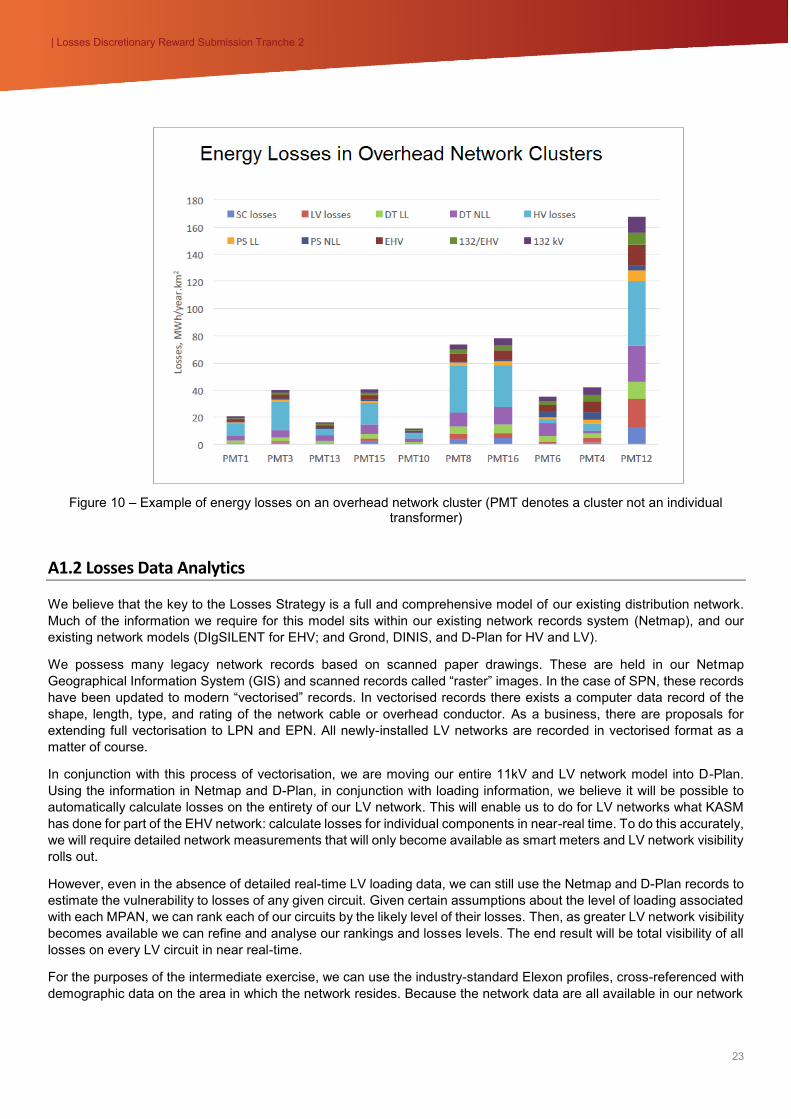
ICL developed heat maps that highlight losses-intensive areas in our networks; and It is further possible to divide our networks into clusters using neural networks. However, our networks contain
some atypical elements that produce disproportionate levels of losses. Nevertheless, the clusters can be used in conjunction with heat maps to pinpoint where losses proliferate and consequently, how to lessen them in the most effective way. Figure 6 shows a number of clusters and the corresponding breakdown of network losses within them.
| Losses Discretionary Reward Submission Tranche 2
23
Figure 10 – Example of energy losses on an overhead network cluster (PMT denotes a cluster not an individual transformer)
A1.2 Losses Data Analytics
We believe that the key to the Losses Strategy is a full and comprehensive model of our existing distribution network. Much of the information we require for this model sits within our existing network records system (Netmap), and our existing network models (DIgSILENT for EHV; and Grond, DINIS, and D-Plan for HV and LV).
We possess many legacy network records based on scanned paper drawings. These are held in our Netmap Geographical Information System (GIS) and scanned records called “raster” images. In the case of SPN, these records have been updated to modern “vectorised” records. In vectorised records there exists a computer data record of the shape, length, type, and rating of the network cable or overhead conductor. As a business, there are proposals for extending full vectorisation to LPN and EPN. All newly-installed LV networks are recorded in vectorised format as a matter of course.
In conjunction with this process of vectorisation, we are moving our entire 11kV and LV network model into D-Plan. Using the information in Netmap and D-Plan, in conjunction with loading information, we believe it will be possible to automatically calculate losses on the entirety of our LV network. This will enable us to do for LV networks what KASM has done for part of the EHV network: calculate losses for individual components in near-real time. To do this accurately, we will require detailed network measurements that will only become available as smart meters and LV network visibility rolls out.
However, even in the absence of detailed real-time LV loading data, we can still use the Netmap and D-Plan records to estimate the vulnerability to losses of any given circuit. Given certain assumptions about the level of loading associated with each MPAN, we can rank each of our circuits by the likely level of their losses. Then, as greater LV network visibility becomes available we can refine and analyse our rankings and losses levels. The end result will be total visibility of all losses on every LV circuit in near real-time.
For the purposes of the intermediate exercise, we can use the industry-standard Elexon profiles, cross-referenced with demographic data on the area in which the network resides. Because the network data are all available in our network

| Losses Discretionary Reward Submission Tranche 2
24
records in a database format, we can automate the process of calculating the likely losses. This means we will be able to target mitigation efforts where they are most effective.
Another benefit of this data analytics exercise is that it allows us to perform cost benefit analyses on a variety of other losses-mitigation strategies, for example, conservation voltage optimisation, power factor correction, and phase balancing. It also allows us to identify those circuits where such approaches are likely to be most effective.
In addition to the undertaking described above, there are many other opportunities to leverage our existing network records. Some of these opportunities are listed as follows:
Identify the total length of underground PILC (Paper Insulated Lead Cable) most vulnerable to CVL, so as to more precisely estimate total CVL;
Quantify the effect of dropping voltage on EHV and HV networks; Identify suitable locations for moving LV and HV open points; Identify customer connection imbalance; List LV networks by losses performance; Perform HV network losses calculations over our entire network; Identify suitable locations for LV voltage optimisation installation; and Identify sections of EHV and HV network for which we have full visibility of real time network data. 25
A1.3 KASM
KASM was originally developed as a contingency-analysis software tool. The East Kent area faces a number of challenges that make it an ideal test-bed for such tools: it contains a number of distributed generation sources, it has extensive reverse power flow issues, it has two HVDC interconnectors with Europe, and it is subject to increasing generation-related constraints. All of these factors lead to increasingly unpredictable power flows across the network. The East Kent area has 34 credible contingency scenarios that required manual analysis by control engineers. These factors all contribute to long lead-times and high cost for future generation connections.
KASM automates the analysis of alternative contingency scenarios, with the objective of maximising the amount of embedded generation that can connect and export through the identification of network violations under various scenarios. KASM provides accurate forecasts for planning in operational timeframes and more cost-efficient and informative management of customer connections. It also, for the first time, provides direct visibility to our control engineers of National Grid’s 275kV and 400kV network. This visibility is provided by an Inter Control Centre Protocol (ICCP) link.
The KASM software tool operates in three modes: near real-time, look ahead, and study mode. Near real-time uses network data taken at 30 minute intervals from our existing SCADA control system. Look ahead mode integrates 0-120 hour weather, load, and generation forecasts. The study mode uses recorded data to analyse the system over an extended period of historical time. The KASM tool has a number of use-cases: reliability management by control engineers, outage management by outage planners, and network capacity management by infrastructure planners. These use-cases have been extended by adding a network losses analytics tool.
The loss analytics tool augments KASM, calculating network losses and losses sensitivity on a per-component basis. Loss sensitivity is defined for each component relative to a baseline load flow model. Using the losses sensitivity calculation we can identify which components of the network are most vulnerable to an increase in losses if loading increases. For example, this would allow us to identify if a particular line was consistently experiencing high losses, and hence might benefit from opportunistic reinforcement. This information also helps infrastructure planners in calculating the whole-life costs of new connections. In the near real-time mode the KASM losses analytics tool performs on-line losses calculation every 30 minutes for the whole network, and on-line losses sensitivity calculation every 15 minutes.
25 The benefit of this is that it will allow us to target our network visibility programmes. If we know where network visibility is particularly bad, we will be able to focus on these first. Alternatively, if we decide that achieving fully-comprehensive and fully-accurate visibility of a particular part of the network is a priority, this also helps.

| Losses Discretionary Reward Submission Tranche 2
25
In addition to this, the KASM losses analytics tool determines the optimal network configuration for reducing network losses. By switching out particular lines, the network can be run more efficiently. This is achieved by applying a Particle Swarm Optimisation26 algorithm to the set of all possible network configurations. The tool has identified potential losses reductions of between 2% and 30%. The results of the line switching optimisation over three representative days in July 2017 are shown in Figure 11. The losses mitigation benefit is shown in percentage terms in Figure 12.
Figure 11 – The effectiveness of line switching for losses reduction.
Figure 12 – Losses reduction percentage by line switching.
This analysis shows us that line switching at times of peak loading can effectively reduce system losses, while it introduces no reduction or negligible reduction in losses in normal loading conditions. From this we conclude that line
26 https://en.wikipedia.org/wiki/Particle_swarm_optimization
0
20
40
60
80
100
120
140
160
7/5/2017 0:00 7/5/2017 12:00 7/6/2017 0:00 7/6/2017 12:00 7/7/2017 0:00 7/7/2017 12:00 7/8/2017 0:00
Syst
em L
oss
(M
W)
Date Time
Effectiveness of Line Switching for System Loss Reduction
Before Line Switching
After Line Switching
-5%
0%
5%
10%
15%
20%
25%
30%
35%
7/5/2017 0:00 7/5/2017 12:00 7/6/2017 0:00 7/6/2017 12:00 7/7/2017 0:00 7/7/2017 12:00 7/8/2017 0:00
Syst
em R
eal L
oss
Red
uct
ion
Date Time
Loss Reduction by Line Switching

| Losses Discretionary Reward Submission Tranche 2
26
switching is an enabling tool for reducing system losses. This is achieved by switching off no more than three lines in the whole KASM network.
The KASM losses analytics tool also enables us to investigate correlations and relationships between losses in different parts of the network and the overall status of the rest of the system. For example, it was found that overall system losses were only weakly correlated with overall system load, suggesting that losses are mostly a product of particular subsections of the network, rather than the network overall. This raises the possibility of focusing on particular components of the network.
To this end, we identified the worst performing non-transformer components of the KASM network. Four circuits with the highest losses are shown in Figure 13, and their correlations with overall system losses are shown in Figure 14. What these correlations show is that there is often no consistent relationship between individual circuit element losses and overall system losses, and moreover there is no consistent relationship between losses individual classes of circuit elements and overall system losses. This supports our view that we need to focus on long-term analysis and circuit-level analysis to understand the idiosyncrasies of specific parts of the network. This is the approach we are taking both in our LV losses analytics project and in the KASM project going forward.
Figure 13: Worst performing circuits being studied.

| Losses Discretionary Reward Submission Tranche 2
27
Figure 14: Correlation between worst performing circuits and overall system losses.
In addition, KASM can be used to calculate optimal capacitor placement to mitigate losses on the network. Placing capacitors reduces unnecessary reactive power flow. Through placing capacitors using the KASM tool network losses reductions of between 11% and 40% were achieved. The results of this exercise are shown in Figure 15.
Figure 15: Potential losses savings via optimal capacitor placement and control.
0.00%
5.00%
10.00%
15.00%
20.00%
25.00%
30.00%
35.00%
40.00%
45.00%
0
10
20
30
40
50
60
Capacitor Placement
Original Loss (MW) Optimal Loss (MW) Reduction (%)

| Losses Discretionary Reward Submission Tranche 2
28
A2: Stakeholder Engagement A2.1 SSEN
Historically DNO licence areas have been operated as separate entities without significant inter-connection between licence areas below National Grid voltage levels. We investigated the possibility of exploiting existing or future interconnection between DNOs so as to reduce network losses.
We reached out to our peers in SSEN to discuss approaches to mitigating losses in co-operation with other DNOs. SSEN borders our SPN, LPN, and EPN networks to the west. Our work with SSEN investigated two channels for potentially reducing network losses. The first related to convenience customers, the second to a proposed major connection near the border of our two networks.
Working with our peers at SSEN, we reviewed several hundred instances of so-called “convenience customers” at LV. These are customers who sit within the geographical area of one network whilst being connected to the adjacent electricity network. These customers were typically connected in this fashion for (electrical) convenience and cost, hence the name.
Many of these convenience customers are connected via long stretches of LV overhead line. As such, we were keen to understand if there might be a losses benefit to re-connecting the customers to their local network.
Using our network records, we calculated the losses associated with all the convenience customers situated in SSEN’s geographical area. The average length of LV circuit between the DNO border and the convenience customer was 69 metres, ranging from 2.3 metres to 335.5 metres. Based on standard Elexon load data, the maximum annual losses value was calculated as approximately 21 pence. As such, we deem it unlikely that it could ever be economically justified to physically amend the convenience customer connections, as the cost of even a few hours labour would outweigh the possible saving even if the losses continued at their current rate into perpetuity.
Moreover, we investigated a sample of five convenience customer connections and found that in four out of five cases the corresponding hypothetical connection to SSEN would yield greater losses than the existing connection to our network. The fifth case did have higher losses than the hypothetical alternative, but the value of the difference in losses was only 21 pence per year, so it was deemed uneconomical to reconnect this customer. This level of losses delta value is typical of the LV convenience customers we investigated. The second part of our collaboration with SSEN related to our investigation into a particular major connection project which was geographically situated close to the border between our two networks. We considered two connections offers of different sizes where the customer had requested connections quotations from both DNOs.
Whilst respecting commercial confidentiality, we analysed the lifetime network losses value associated with each of our respective connection offers. We did this analysis using a consistent methodology and consistent assumptions about customer load profiles. Using Ofgem’s losses evaluation of £48.42/MWh, we discovered that the difference in the value of the losses between the two connection offers was £344,336 for the 45 MVA connection and £115,096 for the 20 MVA connection. Much of this difference is attributable to the differing voltage levels of the connection offer, and the fact that the 45 MVA SSEN offer was a circuit breaker extension with minimal additional cable laid.
Because these values are significant enough to have a material economic impact, we commit to working with ICL to produce an academic report describing what a future, improved CCCM would look like. This will build on existing analysis undertaken by ICL in a transmission context. As well as investigating how smart meters can be used to better account for network losses on LV connections, we will investigate how better to analyse the long-term whole-life cost of losses associated with major connection projects. This academic report will contribute to the ongoing conversation in the industry about how to leverage the benefits of smart meters and run as efficient a network as practicable.
A2.2 Amorphous Steel Transformers
Most often metals have a crystalline structure in which the atoms are orderly arranged. This orderly arrangement is broken when the metal is heated to the point where it melts. In the molten state, there is no clear structure in the steel, which leads to metal in this state being described as “amorphous”. To preserve this amorphous state, steel used for amorphous transformer cores is produced by rapidly solidifying the alloy metal melt.

| Losses Discretionary Reward Submission Tranche 2
29
Using amorphous metal to produce transformer cores helps to minimise hysteresis and eddy current27 losses. Eddy currents are induced in a transformer’s iron core under the influence of the magnetic field that transfers energy between windings. Losses linked to these eddy currents can be reduced by minimising the thickness of steel laminations used in the transformer’s iron core, while the higher resistivity of amorphous steel further helps to reduce eddy current losses. The absence of a crystalline structure in amorphous steel leads to easier magnetisation of the material, which lowers hysteresis losses. Table 1 shows the extent to which the use of amorphous steel could reduce no load losses.
Transformer Ratings CRGO Steel Transformer Amorphous Transformer Reduction in No Load Losses
No Load
Losses (W) Load Losses
(W) No Load
Losses (W) Load Losses
(W)
25 kVA 1Ph 11/0.25 kV 70 900 15 900 79% 50 kVA 1Ph 11/0.25 kV 90 1100 22 1100 76% 50 kVA 1Ph 11/0.25-0-
0.25 kV 90 1100 22 1100 76%
100 kVA 1Ph 11/0.25-0-0.25 kV
145 1750 38 1750 74%
100 kVA 3Ph 11/0.43 kV 145 1750 53 1750 63% 200 kVA 3Ph 11/0.43 kV 300 2750 90 2750 70%
Table 1 – Transformer specifications received from Toshiba
There are however a few complicating factors to bear in mind considering the use of amorphous steel transformers. The amorphous material is more expensive than the silicon steel used in Cold Rolled Grain Oriented (CRGO) Steel transformers, and the magnetic saturation point of amorphous steel is lower than the saturation point of silicon steel, which leads to more steel being required to manufacture amorphous steel transformers. Due to these factors, amorphous steel transformers are more expensive, heavier and larger.
Bearing these facts in mind, we approached Toshiba for a quote to manufacture and supply amorphous steel pole mounted transformers. Toshiba indicated that they were able to meet our request, and that their amorphous steel transformers would cost between 15-18% more, and weigh between 15-40% more than the transformers we use at present.
Using the advice presented to us, we used Ofgem’s CBA spreadsheet to determine if the energy savings could justify the additional cost. We initially assumed that our existing hardware would be adequately rated and sized to accommodate increases in weight and size. Subsequent work revealed that this assumption does not hold for sizes above 50kVA. As a result, we ordered 54 new 50kVA units from Toshiba to install on our networks in 2018.
Amorphous Steel Transformer Losses Benefits
Rated kVA Annual MWh benefit
25 kVA category 36
50 kVA category 51
100 kVA category 167
200 kVA category 259
Total Annual Savings 512MWh
Table 2 – Annual benefits associated with amorphous steel transformers
27 https://en.wikipedia.org/wiki/Hysteresis

| Losses Discretionary Reward Submission Tranche 2
30
We made provision for these transformers to undergo our usual acceptance tests before they are shipped to the UK and we estimate that the first shipment of amorphous steel transformers will reach us near the end of the first quarter of 2018 if we do not encounter any unexpected difficulties.
Our ambition does not stop at this point. We believe that our customers can benefit greatly from expanding the range of amorphous steel transformers on our networks, and as a consequence, we will dedicate focus in tranche 2 to overcome the problems that we have encountered in tranche 1. The 54 units ordered so far will save 32.17MWh per annum, and adopting the full range of sizes will increase the energy savings to circa 512MWh per annum (dependent on the annual number of renewals and new installations). Table 2 above shows how the total benefit of 512MWh per annum was calculated.
A3: Processes to manage losses A3.1 International Benchmarking and Best Practice Review
Collaboration with ICL to study losses enhanced our learning from an academic perspective. We increased opportunity to learn by conducting an international benchmarking and best practice review. The emphasis in this study was to find useful practical approaches deployed by other network operators that carry potential to decrease losses in our own networks.
At the beginning of the study, statistical analysis was used to identify Germany as a suitable case study, based on losses and GDP data. The resulting focus on Germany uncovered a number of valuable learning points in terms of network topology:
They use less transformation in the MV levels of their networks, which influences variable and fixed losses; They use higher voltages at the HV level (10kV & 20kV versus 6.6kV &11kV in Britain); They use three-phase service connections at the LV level. This arrangement decreases load imbalances, and
as a direct consequence, high losses associated with load imbalance; and No-load losses in German distribution transformers are low compared to values in Britain. This difference can
be overcome by continued optimisation of transformer utilisation and transformer specifications.
The differences between networks in Germany and Britain led us to focus on a network more similar to our own. New Zealand’s networks and practices were studied next since they are placed in an island setting and their network operators also use 11kV & 33kV networks. One of the key observations from their environment was using narrower statutory limits for voltage regulation at the LV level (230V±6% compared to 230V-6%+10% in the UK).
These relatively narrow limits compel network operators to use larger diameter conductors and limit feeder lengths; both aspects limit circuit resistance. The relatively narrow voltage boundaries further prevent very high LV feeder loading, which is useful in the sense that it curtails high variable losses associated with intensive asset utilisation. Network operators in New Zealand further use “ripple control28” to switch customers’ hot water cylinders on or off, thereby avoiding costly network upgrades. This ripple control alters load peaks and overall load profiles, thereby reducing variable network losses.
Narrower voltage limits to curtail losses is an important finding, since a number of British DNOs are installing larger conductors to curtail variable losses. These larger cables could be used to connect more customers to an established network, which would erode the anticipated benefits. In addition, transformer specifications are improving due to the introduction of Ecodesign transformers, which presents an opportunity for network operators to review the balance between fixed and variable losses in their networks. Narrower voltage limits at the LV level could be used to optimise and maintain the balance between fixed and variable losses in LV and HV networks.
The next section of our review involved reaching out to fellow members of the IUWG and other members of Cheung Kong Infrastructure Holdings Limited. We learned from some peers that they correct poor power factor on their networks at various voltage levels to curtail losses, which supported one of the key academic messages that we received from ICL. We further learned that some utilities are making use of voltage optimisation to accommodate increased levels of
28 “Ripple control” consists of a relatively high frequency signal conveyed from a central signal generator through HV and LV conductors to devices that respond to these higher frequency signals. The devices that respond to the higher frequency signals (usually called “relays”) are used to switch customers’ electrical hot water cylinders on or off as required.

| Losses Discretionary Reward Submission Tranche 2
31
distributed generation on their networks. There is a widespread expectation that voltage optimisation will exert a beneficial influence on losses.
We further established that one international respondent increases supply voltages to reduce demand, and variable losses as a result. This finding motivated UK Power Networks to assess the potential of powerPerfectoriQ technology to reduce losses.
A3.2 Smart Meter Implementation Strategy
UK Power Networks’ initial work to benchmark losses performance internationally was extended to develop an early strategy for smart meters. This phase of our studies covered smart meter-related losses activities in Poland, Italy, the United States of America, Canada, Australia and Portugal.
The most important finding from this work was that other network operators mainly use smart meter data to detect and manage non-technical losses. We found two approaches used to detect non-technical losses:
Aggregated smart meter data is compared to readings from another meter at an upstream location (i.e. “differential metering”); and
Statistical analysis is used to detect meter failures or meter bypassing.
Following these findings, we conducted a gap analysis to identify constraints that require consideration while we await smart meter data. The most important items identified were as follows:
Smart meter accuracy of ±2% might not be adequate to reveal small non-technical losses using differential metering techniques, since many LV networks contain more than 100 customers. One customer’s consumption hence amounts to less than 1% of the total, compared to the aforementioned ±2% accuracy level;
Smart meter uptake is voluntary, and the older electromechanical meters will hence create “data gaps” across DNOs’ networks. DNOs could use statistically derived profiles to fill these gaps, but the reliability of the result depends on the accuracy of assumed load profiles;
Smart meters in Britain record consumption over 30-minute intervals. The length of this interval is sufficient to mask the losses impact of large loads that appear for shorter periods. ICL have suggested use of a 5 second interval showed losses to be 90% higher than those measured over a 30-minute period;
Data aggregation would require dedicated attention, since aggregated data from customers on the same network phase would be more useful for network simulation purposes than data from different phases for example; and
Phase connectivity will also require dedicated attention to make smart meter data optimally useful to DNOs. At present, customer phase connections are seldom available.
While reviewing activities in Portugal, we learned about efforts from EDP Distribuição to optimise the use of smart grid infrastructure. Different to the other publications reviewed, this company addressed technical losses using smart meter data. They indicated that demand side response (DSR), load imbalance reduction and voltage management could reduce technical losses by up to 10%.
Following these studies, we initiated conversations with prospective academic partners, who indicated that they would be able to address a number of the challenges listed above. UK Power Networks will, as a result, monitor smart meter penetration levels across our networks, and initiate a trial once smart meter data availability permits.
A4: Innovative Approaches to Losses Management
A4.1 MAAV
The MAAV is a truck equipped with electromagnetic sensors that enable it to detect contact voltages. These contact voltages are points of elevated voltage on the surface of footways, roads, street furniture, and lighting columns. They are caused by defects on the LV distribution network.
As part of the MAAV Innovation project the central London area was scanned in late 2016, and again in early 2017. In total, 62 contact voltages were discovered, energising 155 objects at 1 volt or greater. While all contact voltages were energised from the LV system voltage of 230 volts, the voltages measured on the surface vary because of varying fault impedance.
| Losses Discretionary Reward Submission Tranche 2
32
A subset of the contact voltage defects detected by the MAAV were attributable to persistent phase-to-earth faults on LV cables of the Paper Insulated Lead Cable (PILC) type. These defects occur where a section of PILC undergoes an earth fault. In normal conditions the lead sheath would provide a low impedance pathway back to the LV fuse board in the distribution substation. Thus the lead sheath facilitates fuse operation by ensuring sufficient earth fault current. If, however, the integrity of the lead sheath has been diminished by age, corrosion, or third party damage, the defect may not lead to fuse operation. Instead, the defect will energise the outer sheath of the faulted section of cable and remain in that state for an extended and indefinite period of time.
It should be noted that not all the contact voltage defects detected by the MAAV are attributable to earth faults of this type. Some are caused by neutral-to-earth faults on LV distribution cables. However, compared to phase-to-earth faults, the level of network losses associated with neutral-to-earth defects is relatively small. Other contact voltages are attributable to customer-side faults or faults on local authority-owned lighting columns. These are still reported as part of the MAAV operations, and the relevant parties are alerted.
In the case of the phase-to-earth faults, these energised cable sheaths manifest as contact voltage defects on the surface. Because the cable sheath is energised at 230 volts nominal, an appreciable fault current is associated with each of these defects. This type of energised sheath defect can be modelled as a horizontal ground rod using well-understood earthing principles dating back to the 1930s. We can calculate the average fault current associated with these contact voltage defects by taking the system voltage and the calculated earth loop impedance; which in turn is based on the empirical data on the length and thickness of excavated faulted PILC, and soil resistivity data taken from the British Geological Survey. We found that using conservative assumptions for all relevant parameters, a typical persistent phase-to-earth fault of this type will lead to losses of 6.1kW per fault on average.
According to the work undertaken by Princeton University, by extrapolating these phase-to-earth fault Contact Voltage Losses from the central London area to the wider London Power Networks (LPN) area the estimate of total contact voltage losses in the LPN area amount to 17.2GWh annually. If customer-side losses and lighting column phase to earth faults are included that figure rises to 37.8GWh per year for LPN. To address these losses, we propose to use the MAAV to identify contact voltage defects and pro-actively address them. As well as removing a public safety hazard, this will reduce network losses. If the figures for LPN are extrapolated to the rest of Britain, Princeton University estimate that losses of this type account for an amount similar in magnitude to non-technical losses, i.e. around 590GWh per year. Of this, 118GWh – 20% of the total – are metered losses, since they occur due to contact voltages on the customer’s side of the meter. When the losses associated with delivering these contact voltages are considered, the total losses amount to 617GWh per year. The 474GWh of Contact Voltage Losses that are unmetered losses represent 2.5% of total technical losses on distribution systems across Britain. This is perhaps the single largest avoidable source of losses in the system.
A4.2 Power Networks Demonstration Centre (PNDC)
The ICL modelling exercise highlighted a number of significant losses drivers. These include high voltage (associated with higher loading for constant-impedance loads), poor power factor, phase load imbalance, and poor voltage and current harmonics. We were seeking devices that could provide a technical solution to mitigate these losses drivers. One device that we discovered in our market research was the powerPerfectoriQ, manufactured by iESCO. This is a conservation voltage optimisation device that filters harmonics, reduces voltage imbalance, improves power factor, and reduces voltage on LV circuits.
The device is used to economic advantage by customers on their own private LV networks. Most electrical appliances sold in the UK are optimised to function at continental voltages of around 220 volts, and as such are run at an inefficiently high voltage when they are installed in the UK. Customers who use the powerPerfectoriQ reduce the voltage from the UK average of 242 volts to 220 volts, and thus benefit by reducing their electricity bills. By analogy to these exercises, it should be economically rational to reduce voltage at distribution substation level in the UK.
We were loaned a powerPerfector iQ by iESCO and tested it on the PNDC network, which is a distribution network test centre operated in conjunction with the University of Strathclyde. The PNDC consists of a reconfigurable test LV and 11kV network, including load banks, transformers, and triphase load simulator. The benefits of testing the device on the PNDC are threefold:
1) It allows us to validate the powerPerfector iQ as a device; 2) It allows us to benchmark the ICL modelling exercise; and

| Losses Discretionary Reward Submission Tranche 2
33
3) It gives us generic information about different configurations and circumstances of network that we can extrapolate to the real network as part of our data analytics exercise.
Our testing regime of the device incorporated five elements:
Variable cable length; Variable load level; Variable power factor; Variable output voltage; and Variable Total Harmonic Distortion.
For each configuration of the test network, we measured the losses with and without the powerPerfector iQ being in service. The difference in losses measured on the network was calculated and used to measure the potential losses mitigation benefit of the powerPerfector device at different voltage levels and degrees of voltage imbalance. Our findings are detailed in full in a technical report, available on our website. Headline figures are as follows:
The powerPerfector iQ efficiency sits at around 99.9%, which is in line with the manufacturer’s claims; The device is capable of highly precise targeted voltage output, and can return to a given voltage set point within
half a second when a perturbation is applied to the input; Network losses reductions are proportional to the voltage level applied to the device; Varying the cable length increases network losses, and the extent of losses reduction attributable to the
powerPerfector iQ device varies between 15% for 600 metres and 21% for 1,200 metres of 185 mm2 LV cable; and
Varying the load level saw the expected nonlinear increase in losses, and the powerPerfector iQ was similarly capable of reducing losses by an increasing amount as the applied voltage was increased. The highest load level we tested was 350 amps and we saw a 20% decrease in losses when the powerPerfector iQ was energised.
A more detailed report is published on our network losses website.
A4.3 Reactive Compensation to Reduce Losses
We increased emphasis on the influence of poor power factor in the academic component of our work following the practical information that our international benchmarking had revealed. In short, power factor measures the extent to which current and voltage sinusoids coincide or drift apart in a power system. Reactive compensation refers to reactive elements (capacitors or inductors) in a network to improve poor power factor.
The theory behind reactive compensation is well established and understood, but introducing power factor correction equipment on modern HV networks presents a number of challenges. Power electronic equipment increasingly inject harmonic currents into networks, while using capacitors to improve power factor shifts natural resonant points in electrical networks. Very high voltages could result from resonance when a harmonic current of a specific order meets a matching resonant point in a network (resonance happens when inductive and capacitive elements exchange energy at a preferred frequency called the “resonant frequency”). Very high voltages resulting from resonance could damage customers’ equipment.
Distributed generation also increases voltages at various network levels, while using capacitors to improve reactive power flows leads to the same effect. In this context, it is worth noting that large amounts of distributed generation have been connected to networks serving the southern part of Britain, whilst underground cable networks in this region also contain substantial amounts of capacitance. This combination has led to voltage constraints on National Grid’s network in this region.
Consequently, work on our networks will take these voltage constraints into consideration – we will correct power factor in areas where such voltage constraints do not exist.

| Losses Discretionary Reward Submission Tranche 2
34
As mentioned earlier, the ICL study confirmed that poor power factor is a dominant driver of losses in electrical networks. Adding to this confirmation, they developed a technique to identify a number of feeders in each of our DNOs that will deliver the most benefit from power factor correction. In the absence of precise power factor measurements on HV feeders, ICL used existing network characteristics, load flow analysis and power factor scenarios to identify these feeders – Figure 16 shows a number of examples.
Figure 16 – Best feeders for single point reactive compensation.
The next step involved proving that reactive compensation could deliver sufficient losses benefits to warrant procurement and installation costs. To begin with, we obtained a quote for a typical 11kV three-phase capacitor bank and its associated controller. We added to these expense provisions for communication equipment, a pole of increased strength, earthing, design and commissioning work. We fed the total cost of this work into Ofgem’s CBA, and determined from this work that we could target feeders that would deliver in excess of 18.7 MWh per annum due to reactive compensation.
Figure 17 shows that reactive power flows typically fluctuate in a cyclical manner. This cyclic nature of reactive power flows could not be considered during earlier academic work due to the absence of relevant data at feeder level. As a result, Figure 17 might overstate the quantum of benefits obtainable to some extent, which presents a risk to our undertaking.
Figure 17 – Best feeders for single point reactive compensation.
| Losses Discretionary Reward Submission Tranche 2
35
To manage and contain this risk, we will start to measure reactive power flows at the suggested sites during tranche 2. We will then use the recorded reactive power flow data to quantify losses benefits with high accuracy in a suitable power system simulation environment. These simulations will enable us to confirm the validity of our initial economic appraisal for each site prior to work commencing.
Readers might notice that our proposals for the powerPerfectorIQ coincide with proposals in this section of our report in the sense that powerPerfectorIQ also influences reactive power flow. We justify this overlap due to the following considerations:
powerPerfectorIQ is used at the LV level whereas reactive compensation is used at the HV level; powerPerfectorIQ does not use capacitors to correct power factor. Improved reactive power flow, in the case of
powerPerfectorIQ, results from lowered voltage across customers’ equipment; HV capacitor bank capabilities stretch into the MVAr range, much larger than the powerPerfectorIQ’s potential
impact on reactive power flows; and Overhead capacitor banks can be used on rural overhead networks without any special housing requirements
unlike ground mounted units.
A4.4 Unmetered Supplies
Electricity supplies are most often metered on site to account for energy consumed and to provide customers with suitable billing information. Historically, installing meters was, however, not always the most appropriate solution due to the following reasons:
Meter readers experienced difficulty to access restricted areas; Metering equipment required funding to install and maintain; and Some installations exhibit stable and predictable consumption patterns that were used to circumvent the need
for metering equipment and the associated costs.
In line with many other network operators, due to these benefits and complexities, we previously agreed with our incumbent energy supplier to treat energy supplies to various parts of our network as unmetered supplies. Lately, the introduction of smart meters has begun to mitigate the need for meter readers to visit customers’ premises, since smart meters communicate electronically. We further acknowledge that changes in technology do make a difference to energy demand inside our primary and grid substations; heating and lighting loads, for example, are decreasing in magnitude due to equipment becoming more energy efficient. Installing smart meters in a selection of our primary and grid substations will help engineers to form a more complete and comprehensive understanding of consumption patterns inside substations of various sizes and configurations, but there are further considerations that need to be addressed:
A smart meter will typically record the total amount of energy consumed on site, hence operational losses and own consumption combined; and
DNOs are required to reimburse suppliers for own consumption only.
As a result, more data is required to quantify own consumption beyond the meter. To enable engineers to make this distinction, we will install data loggers on a representative sample of sites. This data will be used to better understand own consumption patterns at unmetered sites, and address non-technical losses in the form of inefficient energy consumption or inaccurate estimation once detected.
Our contract with our current supplier expires in 2018, and we have not yet chosen who our next supplier will be, but negotiations with the next supplier will involve installing a limited number of smart meters at selected grid and primary substations. These smart meters will yield a number of benefits:
An opportunity to access own individual smart meter data at an early stage; Continued long-term visibility to improve understanding of consumption patterns; and Opportunities to detect and address non-technical losses.

| Losses Discretionary Reward Submission Tranche 2
36
A5: Glossary Term Definition BAU Business as Usual CBA Cost Benefit Analysis CCCM Common Connection Charging Methodology CKI Group Cheung Kong Infrastructure Holdings Limited CRGO Cold Rolled Grain Oriented DNO Distribution Network Operator DSO Distribution System Operator DSR Demand Side Response ENA Electricity Networks Association EPN Eastern Power Networks EU European Union FUN-LV Flexible Urban Network – Low Voltage GB Great Britain GWh Gigawatt hour HV High Voltage HVDC High Voltage Direct Current ICCP Inter Control Centre Protocal IUWG International Utility Working Group KASM Kent Active System Management kV Kilo-Volt LDR Losses Discretionary Reward LPN London Power Networks LRE Load Related Expenditure LV Low Voltage MAAV Mobile Asset Assessment Vehicle MPAN Meter Point Administration Number MV Medium Voltage PILC Paper Insulated Lead Cable PNDC Power Networks Demonstration Centre SCADA Supervisory Control And Data Acquisition SPN South Eastern Power Networks SSEN Scottish and Southern Electricity Networks TWh Terawatt hour UK United Kingdom

| Losses Discretionary Reward Submission Tranche 2
37
A6: Losses conference Summary
On 6 July 2017 we facilitated a Network Losses Conference as one of the commitments made as part of UK Power Networks’ Losses Discretionary Reward Tranche 1. The event was well attended, with over 30 attendees from 50 invitees. The feedback was overwhelmingly positive, with the losses community (consisting of industry, academia, and regulatory interests) establishing a high level of interest in losses-related collaborative work and future conferences.
Response to presentations and overall conference The general response to the content of the conference was positive, with all respondents agreeing or strongly agreeing with the statement “I found the topics covered interesting and informative”. While all presentations were described as Of Some Use (i.e. a score of 3) at the very least, the most useful was the “Use of Mobile Asset Assessment Vehicle To Detect Contact Voltage Losses”, presented by Jeremy Wright of UK Power Networks, and Stuart Hanebuth and David Kalokitis of Power Surveys Ltd.
We received several pieces of specific written feedback on the event itself, all positive. One ICP director commented: “Very interesting event, our customers are now looking into losses on their networks so very relevant.”
Response to the prospect of future collaborative projects As part of the networking and discussion element of the conference we sought input from the losses community on future projects and collaborative exercises we could undertake. In general, the response to this was very positive. This conclusion is also reflected in the response to the online survey.
Would you be interested in attending future events related to network losses? The losses community are keen for another event to attend – all those who completed the survey said they would be interested in attending another such event.

| Losses Discretionary Reward Submission Tranche 2
38
A7: Network losses questionnaire Issued by: UK Power Networks
Responding company:
Contact person:
E-mail address:
Background: UK Power Networks wish to engage with our international stakeholders to better understand their approach to tackling electricity network distribution losses. Throughout our current regulatory period (RIIO-ED1; 2016 - 2023) we will, on a regular basis, be updating our published Losses Strategy. The last update of this document was made in October 2015 (http://www.ukpowernetworks.co.uk/internet/en/about-us/documents/Losses-Strategy.pdf).
In addition to this we will be submitting an application to Ofgem in relation to tranche 1 of their Losses Discretionary Reward
(https://www.ofgem.gov.uk/publications-and-updates/losses-discretionary-reward-ldr-guidance-document-changes-response-our-march-2015-consultation) and expect our focus on losses to evolve through the current regulatory period, as a result of this.
To help us to better understand opportunities that exist in relation to network distribution losses, and to begin to benchmark our approach against that of our international peers, we wish to understand the following:
1. To what extent does your organisation consider network losses? 2. Are you economically incentivised to consider losses? 3. What economic value is placed on losses; ideally quoted as a cost per MWh? 4. What level of investment related specifically to tackling losses do you anticipate making over the next 5 years?
What is this as a percentage of your overall network investment budget? 5. Do you consider the wider benefits of tackling losses such as societal and environmental?
a. If so, how are these quantified? 6. In terms of the weighting placed on investment drivers how are losses ranked against other drivers such as
asset health, network capacity, network reliability and quality of supply? 7. Are losses considered in your network design policies?
a. If so, how? 8. What are your key areas of focus related to losses? 9. Do you estimate the level of technical losses incurred on your networks or are you able to accurately measure
network losses? a. If so, what are your estimated/measured values currently and are you able to split the values across
voltage levels? 10. Does your company publish a Losses Strategy?
If so are you able to forward us a copy? 11. How will innovative approaches to network operation such as Active Network Management, Demand Side
Response and Embedded Generation impact your estimated losses forecast? 12. How do you intend to incorporate minimisation of losses into innovative ways of managing your networks? 13. How do you tackle non-technical losses such as theft from suppliers, theft in conveyance under-declaration of
unmetered supplies? 14. Which single activity do you consider to provide the largest opportunity for improvement in network losses?