FACT SHEET - ICICI Pru Amc logo
44
Assets Under Management Rs. 30180.62 Crore (As on June 30, 2006) THE FACT SHEET Past performance is no guarantee of future results. F or Aw ard details please see th e b ack cov er.
-
Upload
khangminh22 -
Category
Documents
-
view
2 -
download
0
Transcript of FACT SHEET - ICICI Pru Amc logo

Assets Under Management Rs. 30180.62 Crore (As on June 30, 2006)
THE
FACT SHEET
Past performance is no guarantee of future results. F or Aw ard details please see th e b ack cov er.

The month of May was a roller-coaster-ride in the equity markets.
The month witnessed an all time high and then tested the nerves
of investors as the markets plummeted on news of fed rate hikes,
global commodity meltdown and unwinding of leveraged positions
in the markets.
As the well-known adage goes, 'every cloud has a silver lining.'
W hile the month of May came as bad news for a large number
of speculators, interestingly, it also came as a month of relief for
those genuine long term investors who were for long, ex pecting
a correction. Think about it… if you were a long-term investor, May
06 was your golden chance to pick up stocks cheap. For S IP
investors, it is bad months like these (where you pick up larger
number of units) that help you increase your average returns over
the long term.
V olatility is inherent in equity markets and no one has the power
to predict which way the market will go in the short term. H owever,
we do believe that in the long term, equity markets will give
investors returns that are in line with earnings growth of companies.
W e are bullish on Indian equities in the long term given that the
fundamental strength of the Indian economy is intact. The Indian
economy remains a promising growth story because it is driven
by a huge consumption led demand, continued infrastructure
spending, reforms and continued good prospects for service and
agriculture industries. The earnings momentum of Indian companies
is still very strong and some of the numbers have been well ahead
of the consensus estimates.
W ith so many opportunities opening up, this is a great time for
the youth of India. G iven the promising India story, I would
recommend that young investors start equity investing early. L et
me introduce you to a powerful idea in the world of investing
- the power of 'compounding' capital appreciation over the long
term. Compounding works in your favour day and night as is
illustrated below:
Your investment of Rs. 1000 @ 15% annual return 35
y ears ag o w ould h ave g row n more th an 133 times. T o
g et th e same maturity value, y ou w ould h ave to invest
• four times more ten years later
• 16 times more 20 years later
• 66 times more 30 years later
From theM a n a g in g D irec tor’s D es k
Pankaj RazdanManaging Director
The power of compounding can multiply your wealth in the long
run. So, there is no better time to invest than today if you have
a long-term time horiz on so long as you follow a proper investment
process.
O n the debt side, we expect interest rates to be stable with an
upward bias. Hence, investors may want to invest into funds with
shorter-term maturities with a view to minimiz e the impact of
market volatility on their portfolios.
In summation, the question is not about 'when' to invest, it is
about 'how' to invest and 'how much' to invest. Hence the focus
should be on following the right asset allocation and investing
through a proper investment process. We strongly recommend that
retail investors don't try to time the markets and refrain from
making lumpsum investment into the markets at any time. They
must seek to invest into the market on a regular basis either directly
or though the Systematic Investment Plan. More importantly,
investors must have a long holding period so as to ensure that
they can withstand volatility.
It is heartening for me to inform you that your mutual fund
company has become the N umber O ne mutual fund in India in
terms of assets under management. We have attained this leadership
position, thanks to the faith that you have bestowed in us. How
else would a company that started 8 years ago with a 0.4 % market
share succeed in accomplishing a feat as large as this one!
The last 8 years were a great journey in the life of Prudential ICICI.
We started modestly with a staff of 6 employees that today has
grown to over 300 highly skilled professionals across India. Having
started with 2 closed ended equity schemes we today have over
30 schemes across asset classes to meet your varying investment
needs. We have also launched various facilities like the Systematic
Investment Plans, Trigger facility, E CS facility, Pru Tracker and
PruICICI Instaphone facility with a view to enhance your convenience
while dealing with us. While we started our operations in 2 cities
in India, we now carry out business across around 7 0 cities and
are equipped with an ambitious expansion plan for the year to
come. I wish to thank you for placing your faith in us.
2

3
O v e r v i e wThe Market
Nilesh ShahChief Investment Officer
Fixed Income Market Snapshot
Impact on Interest Rates
FA C TO RS Short Term Medium Term(1-3 Months) (3-6 Months)
Inflation N egative N egative
Inflation for the week ended June 17 touched 5.44%, within striking distance from theupper end of RB I's comfort zone of 5.00% -5.50%, due to increase in prices of primaryarticles and impact of hike in prices of petrol and diesel. The govt. is monitoring inflationnumbers cautiously and announced measures such as lowering of import duties andbanning exports in some essential commodities to arrest the sharp rise in prices.
Money Supply P ositive N eutral
Money Supply (M3) outstanding as on Jun 09 was Rs. 27.9 trillion. and the Y oYincrease in money supply was at 18.5%. RB I policy projects Money supply (M3) toexpand by around 15% for 2006-07 though in normal circumstances, the preferencewould for maintaining a lower order of money supply growth. Liquidity declined asthe average outstanding LAF Reverse Repo amount dropped to Rs. 49 5bn. from Rs618bn. during the previous month.
C redit D emand N egative N egative
The credit-deposit ratio showed signs of a slight dip due to slack season but stillremains around 70%. Recent hike in interest rates coupled with possibility of furtherincrease this year is likely to cool off the robust credit demand in the economy.
G overnment B orrowings N egative N egative
The Central bank surprised markets by announcing a higher borrowing than scheduledat a govt. security auction. This move was probably aimed at controlling liquidity inthe market to target inflation. Clarification by the govt. that this was an advancementof a part of its July borrowing program removed fears of the govt. overshooting itsborrowing program.
Foreign E xchange Market N egative N eutral
The Rupee appreciated against dollar, ending higher by 0.72% at 46.04. The rupeegained as banks and exporters sold the dollar following dovish comments from theUS Fed. Lower trade deficit numbers for May and surprise surplus in the currentaccount for 1Q 06 (Jan-Mar) also improved the sentiment for the rupee.
RB I P olicy N egative N egative
The RB I unexpectedly raised the reverse repo rate by 25bps. The central bank said thatit had taken this decision based on a review of the current macroeconomic and overallmonetary conditions. Rise in fuel prices, abundant liquidity in the system and tighteningmeasures of other central banks would have prompted this move from the RB I.
Market Sentiment N egative N egative
Market sentiment remained bearish due to higher than scheduled borrowing by thegovernment, unexpected rise in the Reverse Repo rate and higher cut-off yields beingannounced at the auction. Hike in oil prices along with higher inflation numbersadded to the prevailing negative sentiment. The market followed the US Treasuries astheir yields moved up in anticipation of the Fed action but failed to follow them whenthe US treasuries rallied after dovish comments from the Fed due to concerns overimpending RB I action in the July policy.
O U TL O O K
The market expects the U S Fed rate to reach 5.50% b y A ug 06 , b arring unforeseenweakness in data. A ssuming a gap of 50-7 5 b asis points, Indian Reverse Reporate should b e b etween 6 .00%-6 .2 5% b y A ug 06 . The 10-year gilt should thenrange b etween 8 %-8 .50% depending upon the inflation expectations and creditgrowth. The market sentiment is pretty b earish inspite of adeq uate liq uidity dueto the pressure of the governments b orrowing program.
W e recommend investors to use deb t as an asset class from an asset allocationpoint of view. W e recommend investors to invest in funds like L iq uid, FMP 's,Floating Rate Funds and Short Term P lan where interest rate risk is minimal. Timeto invest in income funds will come when U S Fed rates would have paused orpeaked out at the top.
FA C TO RS
Fundamentals
India posted an unexpected surplus of US$ 1.8bn on its current account in 4Q FY 06, as alarger than expected jump in invisibles surplus of US$ 13.3bn. more than offset trade deficitof US$ 11.5bn. For the full year 05-06 the invisibles surplus surged 31% to US$ 40.9 bn. butfell short of the trade deficit of US$ 51.5bn. resulting in deterioration of the current accountdeficit to US$ 10.6bn. Industrial output growth for April came way above market expectations,registering a gain of 9 .5% Y oY - the strongest number since October 2005. Industrial growthin April was driven by a 10.4% Y oY rise in manufacturing, which has now expanded by over8% for 19 of the past 24 months, reflecting the higher growth trajectory. Rainfall trendimproved during the month but it is still too early in the season to form a view. Clearassessment of the agricultural growth for the year can be made only after mid July as bulkof the sowing is done in July.
Technicals
E q uity Market Snapshot
Market Sentiments
The Sensex witnessed bouts of volatility with huge swings but managed to close with a gainof 2% for Jun 06. A sell-off across global equity markets on worries over rising US interestrates, concerns over redemptions with domestic mutual funds and adverse impact of higherdomestic oil prices and interest rates impacted the market negatively. The only silver liningfor the month was the revival of interest from long only FII's who bought small amounts ona regular basis. FII's were net buyers to the tune of Rs. 1416cr. during the month. D omesticmutual funds sold stocks worth Rs. 19 76 cr. as they built up cash levels to meet redemptions.Leveraged positions in the market were reduced further as the open interest in index andstock futures contracts came down further to Rs. 14100 cr. from Rs. 20800cr. at the previousmonths expiry. The govt. went ahead with some bold announcements as it hiked prices ofpetrol and diesel by Rs.4/lt and Rs.2/lt respectively and it also approved 10% divestment inNalco & Neyveli Lignite through the public offer route. B SE Tech, FMCG and Oil Gas indiceswere the best performing indices for Jun 06 with gains of 1.7%, 3.2% and 4.1% respectively.
G lob al E vents
Global equity markets went down in tandem on concerns over higher oil prices and USinterest rate hikes. European stocks touched their lowest levels for the year after the ECBrate hike announcement and Nikkei went below 15000 for the first time this year. The USFed increased the Fed fund rate for the 17th straight time to 5.25% but the accompanyingstatement was viewed as being dovish as the Fed said that additional policy firming thatmay be needed to address the inflation risks will depend on new information about theeconomy. Following the statement global equity markets rallied smartly. Though Japan'scentral bank kept intact the near-zero interest rate policy, comments by B OJ governor andother policy makers suggest that rates could move up before end of summer. China warnedits banks to curb lending and also announced an increase in its reserve requirement ratio tocurb the surge in loans, which are prompting excessive investment.
O U TL O O K
Central banks around the world are raising interest rates and reducing liquidity to keepinflation under control. Normally higher interest rates work like gravity against rising stockprices. India is posing a good conundrum to investors; under leveraged balance-sheet, betterROE and high capacity utilization are giving comfort on corporate performance. Infrastructurespending, virtuous cycle of consumption-demand-job creation, arbitrage of humanintelligence, revolution in agriculture sector and creation of SEZ 's are giving comfort on theeconomy and sustenance of growth. Valuations, after a long awaited correction are settlingdown in a fair value zone and for an aggressive investor who is willing to discount FY 08earning, the market is looking attractive. Globally rising interest rates and reversal of carrytrade create a doubt on flows towards emerging markets including India. IPO supply canincrease at the higher level of the market and retails investors' behavior after suffering fromexcessive volatility will be crucial for the market
The markets are at a stage where valuations are fair and positions are light. Therefore,despite the volatility comfort level is pretty high. Small orders on either buy or sell side are
Avg Daily Volumes Q106 Q206(R s. C r .) (Jan -M ar ) (Ap r -Jun )C AS H S egmen tBSE 4122 3913N SE 8 10 2 8 6 33T otal 12224 125 4 6Derivative S egmen tN SE 28 116 328 6 6BSE - -T otal 28 116 3 28 66
Avg Ad van c e Dec lin e R atioBSE R a tio 1.15 1.8 2N SE R a tio 1.0 6 1.6 4
S ec toral In d ic es Q106 Q206P erforman c e (Jan -M ar )% (Ap r -Jun )%
BSE C o n s u m e r D u ra b le s -1.8 0 -14.7 9
Ba n k e x 3.6 0 -17 .40
BSE T e c k In d e x 10 .92 -8 .0 7
BSE O il & G a s 11.5 2 7 .6 0
BSE P SU 13.37 -19.0 5
BSE H e a lth c a re 23.8 5 -18 .8 2
BSE A u to 25 .0 7 -10 .6 9
BSE F M C G 34.24 -11.8 0
BSE M e ta ls 36 .7 8 -4.6 8
BSE C a p ita l G o o d s 40 .6 1 -13.99
In vestmen ts b y Q106 Q206In stitution s (R s. C rs.) (Jan -M ar ) (Ap r -Jun )F IIs (N e t P u rc h a s e s / Sa le s ) 17 323 -6 293M F s (N e t P u rc h a s e s / Sa le s ) 3136 8 7 5 9Avg Daily O p en In terest(R s. C rs.)In d e x F u tu re s 8 8 99 8 45 5Sto c k F u tu re s 20 8 7 2 218 0 2In d e x O p tio n s 5 7 6 6 5 8 21Sto c k O p tio n s 20 17 20 22T otal 3 7 5 5 4 3 8 09 9
Valuation R atios Q106 Q206
(Average) (Jan -M ar ) (Ap r -Jun )P /E ra tio - Se n s e x 20 .92 19.40
P /E ra tio - N ifty 20 .26 18 .44
P ric e /Bo o k V a lu e R a tio -Se n s e x 5 .13 4.38
P ric e /Bo o k V a lu e R a tio -N ifty 5 .15 4.6 6
D iv id e n d Y ie ld -Se n s e x 1.24 1.46
D iv id e n d Y ie ld -N ifty 1.33 1.49

4
Equity Market Snapshot (Contd....)
Performance Record * - Growth Option
* Returns < 1Year : Absolute, > = 1Year : CAGRBenchmark is ^ Nifty Junior Index. For computation of returns the allotmentNAV has been taken as Rs. 10.00. Past performance may or may not besustained in future.
PruICICI Fusion Fund
Snapshot:
Fund Managers : Anil SarinIndicative Investment Horiz on: 5 yrs and moreInception date: 25-03-2006Fund Siz e: Rs. 547.83 croresN AV (As on 30-June-06):
G row th option : Rs. 9.32Dividend option : Rs. 9.32
* * E x pense Ratio for th e month of Jun'06:Retail option : 2.22%FII option : 1.00%
* * This is a close approximation of the number.
Style Box
StyleValue Blend Growth Siz e
L arg e
Mid
S m all
Figures as on 30-June, 2006
* Pertains to the equity investments only.
WH Y SH OULD ONE INV EST?Exploit the long-term investment potential of equity
Portfolio
Company/Issuer Mkt V alue (Rs. Lakh) % to NAV
Auto Ancillaries 3,170.18 5.78%• Amtek India Ltd 1,792.89 3.27%
Sundram Fastners Ltd 1,002.81 1.83%Rico Auto Industries Ltd 374.48 0.68%Banks 73.4 4 0.13%Punjab National Bank Ltd 73.44 0.13%Cement 133.55 0.24 %Ramco Industries Ltd 133.55 0.24%Construction 5,612.05 10.24 %
• Mahindra Gesco Developers Ltd 2,755.97 5.03%IVRCL Infrastructure & Projects Ltd 842.68 1.54%Unity Infraprojects Ltd 764.08 1.39%Jai Prakash Associates Ltd 698.42 1.27%Ansal Housing & Construction Ltd 550.90 1.01%Consumer Non-Durable 3,14 9 .85 5.75%
• ITC Ltd 2,006.40 3.66%Triveni Engineering & Industries Ltd 706.09 1.29%Synergy Multibase Ltd 404.62 0.74%Shrenuj & Company Ltd 32.74 0.06%Ferrous Metals 1,628.11 2.9 7%
• K alyani Steels Ltd 1,628.11 2.97%Industrial Capital Goods 4 ,4 72.70 8.16%
• Aban Lloyd Chiles Offshore Ltd 1,862.23 3.40%Bharat Earth Movers Ltd 1,142.00 2.08%Bharat Bijlee Ltd 808.37 1.48%Jyoti Ltd 660.10 1.20%Industrial Products 4 ,077.78 7.4 4 %
• Jain Irrigation Systems Ltd 2,460.88 4.49%Enkei Castalloy Ltd 845.00 1.54%AIA Engineering Ltd 771.90 1.41%Media & Entertainment 2,34 1.4 1 4 .27%
• Deccan Chronicle Holdings Ltd 1,683.62 3.07%Jagran Prakashan Pvt Ltd 592.10 1.08%Crest Communication Ltd 65.69 0.12%Pesticides 1,9 9 6.83 3.64 %United Phosphorus Ltd 1,289.83 2.35%Rallis India Ltd 707.00 1.29%Petroleum Products 3,9 32.64 7.18%
• Reliance Industries Ltd 3,932.64 7.18%Pharmaceuticals 4 ,067.33 7.4 2%
• Elder Pharmaceuticals Ltd 2,127.67 3.88%• Cadila Healthcare Ltd 1,722.60 3.14%
Torrent Pharmaceuticals Ltd 217.06 0.40%Software 4 ,4 52.32 8.12%Zenith Infotech Ltd 1,309.11 2.39%Megasoft Ltd 1,256.34 2.29%Subex Systems Ltd 1,179.25 2.15%Prithvi Information Solutions Ltd 249.57 0.46%Mphasis BFL Software Ltd 248.27 0.45%Sasken Communications Technologies Ltd 209.78 0.38%Textiles - Products 1,827.84 3.33%K ewal K iran Clothing Ltd 1,211.83 2.21%Siyaram Silk Mills Ltd 616.01 1.12%Textiles - Synthetic 4 8.4 2 0.09 %Sarla Polyester Ltd 48.42 0.09%Nifty Futures 2,581.79 4 .71%Cash, Call, CBLO & Reverse Repo 7,139 .35 13.03%Term Deposits 3,215.20 5.87%ICICI Bank 3,215.20 5.87%Other Current Assets 861.9 8 1.63%
Total Net Assets 54 ,782.77 100.00%
• Top Ten Holdings
-6.8 0 %
-1 6.8 0 %-1 8 .0 0 %-1 6.0 0 %
-1 4 .0 0 %-1 2 .0 0 %-1 0 .0 0 %
-8 .0 0 %-6.0 0 %-4 .0 0 %
-2 .0 0 %0 .0 0 %
S inc e Inc ep tion
P ru IC IC I F us ion F und N IF T Y Junior Index
able to move the prices with high impact costs.
Therefore our recommendation to investors is as follows;
� In a fair value market maintain NEUTRAL allocation towards equities (See guide toAsset Alloc ation)
� Do not worry about volatility as small orders are creating high impacts and globalevents are also contributing to volatility, even though they may not be related.
� Fundamentally both the economy & the corporate sector is on a sound footing and isdiscounting the current oil prices, interest rates and below normal monsoon prediction.
� Take the extreme predictions of experts with a pinch of salt as they are trying to drawyour attention and create sensation value.
� Asset allocation and systematic investment plans are the best way to safeguard againstvolatility. They are tools for optimum return and not maximum return
� The past experience suggests that large caps moves ahead of mid caps in times likethis, notwithstanding mid-caps' valuations.
� Mid cap stocks look fairly attractive in terms of valuations but will have large bouts ofvolatility, as impact costs are very high.
� Investors should look at a blend of large & mid cap funds at current levels with 3-5 yearhorizon on a systematic investment basis.
Asset Allocation Guide
This asset allocation guide helps you to determine the suggested equity exposure at differentvaluations levels based on the Sensex.
5 0 0 0
60 0 0
7 0 0 0
8 0 0 0
9 0 0 0
1 0 0 0 0
1 1 0 0 0
1 2 0 0 0
1 3 0 0 0
2 -Jan-0 6
9 -Jan-0 6
1 6-Ja
n-0 6
2 3-Ja
n-0 6
3 0-Ja
n-0 6
6-F e
b -0 6
1 3-Feb
-06
2 0-Feb
-06
2 7-Feb
-06
6-Mar-06
1 3-M
ar-06
2 0-M
ar-06
2 7-M
ar-06
3 -A p
r-06
1 0-A
p r-06
1 7-A
p r-06
2 4-A
p r-06
1 -May
-06
8 -May-06
1 5-M
ay-06
2 2-M
ay-06
2 9-M
ay-06
5 -Jun-0 6
1 2-Ju
n-0 6
STRE TCHE D 17X -20X
FAIR VAL U E PL U S 16X -17X
FAIR 13X -16X
ATTRACTIVE 11X -13X
CHE AP 9X -11X
MA R K E T C H E A P A T T R A C T IVE F A IR
F A IR
VA L U E
P L U S
S T R E T C H E D BU BBL E
E x itN eutral N eutral -
5 % -1 0 %
E Q U IT Y
A L L O C A T IO N
U nder Inv es ted
7 0 % -8 0 % 5 5 % -65 % 5 0 % 3 5 % -4 5 % 1 5 % -2 5 %
O v er Inv es ted N eutral +
V aluation lev els of the Sensex b ased on F Y 07 earnings estim ate of Rs. 65 0/- Suggested E q uity Alloc ation (Assum ing 5 0% eq uity alloc ation as neutral)
1 0 .2 4 %
8 .1 6%
8 .1 2 %
7 .4 4 %
7 .4 2 %
7 .1 8 %
5 .7 8 %
5 .7 5 %
4 .2 7 %
3 .64 %
3 .3 3 %
2 .9 7 %
0 .2 4 %
0 .1 3 %
0 .0 9 %
0 .0 0 % 2 .0 0 % 4 .0 0 % 6.0 0 % 8 .0 0 % 1 0 .0 0 % 1 2 .0 0 %
C ons truc tion
Indus trial C ap ital Goods
S oftware
Indus trial P roduc ts
P harm ac eutic als
P etroleum P roduc ts
A uto A nc illaries
C onsum er N on-D urab le
Media & E ntertainm ent
P es tic ides
T ex tiles - P roduc ts
F errous Metals
C em ent
Bank s
T ex tiles - S y nthetic
Sector Allocation*
Q uantitative Indicators:
Average P/E : 22.95 Average Dividend Yield : 0.63Average P/BV : 4.47 Annual Portfolio Turnover Ratio : 0.91 times
Portfolio turnov er has b een c om p uted as the ratio of the higher v alue ofav erage p urc hase and av erage sales, to the av erage net assets in the p astone y ear (sinc e inc ep tion for sc hem es that hav e not c om p leted a y ear). T hefigures are not netted for deriv ativ e transac tions.

5
12.56%
55.87% 54.29%
41.88%
16.75%
10.28%
40.87% 40.20%
23.04%
7.82%
0.00%
10.00%
20.00%
30.00%
40.00%
50.00%
60.00%
Last 6Months
Last 1years
Last 3years
Last 5years
SinceInception
Pru ICICI Power S&P CNX Nifty
SIP Returns: As on 30 June, 2006
Period SIP Start Date Total Amount Total No. Market Value SIPInvested of Units Returns
1 Year SIP 29-Jul-05 12,000.00 215.68 13,316.08 24.98%
3 Year SIP 31-Jul-03 36,000.00 1,051.03 64,890.59 44.67%
5 Year SIP 31-Jul-01 60,000.00 3,053.46 188,520.62 49.17%
Since Inception 1-Oct-94 142,000.00 11,848.95 731,554.17 25.78%
Fund Manager Comment
The fund maintained an average equity exposure of 89% during the month.The Exposure to Non-Ferrous Metals was reduced substantially and holdings inTelecom stocks were reduced to zero. The fund added Software stocks to theportfolio and also increased holding in Auto & Consumer Non-Durable stocks.
PruICICI Power
Snapshot:
Fund Managers : Anil SarinIndicative Investment Horizon: 5 yrs & moreInception date: 01-10-1994Fund Size: Rs. 1,276.83 croresNAV (As on 30-June-06):
Cumulative option: Rs. 61.74Dividend option: Rs. 18.62
**Expense Ratio for the month of Jun'06:Retail option : 2.16%FII option : 1.00%
**This is a close approximation of the number.
WHY SHOULD ONE INVEST?Long term investment of funds for capital appreciation
in a concentrated multi sector portfolio
Performance Record* - Cumulative Option
Rs. 10000 invested at inception: Power Plan Vs S&P CNX Nifty
CAGR – Power : 16.75%; Benchmark : 7.82%Past performance may or may not be sustained in future.
Sector Allocation*
*Returns < 1Year : Absolute, > = 1Year : CAGR. Benchmark is S&P CNXNifty. For computation of returns the allotment NAV has been taken asRs. 10.00. Past performance may or may not be sustained in future.31-Dec-2005 was a non business day.
Quantitative Indicators:
Average P/E : 15.94Average P/BV : 3.34Average Dividend Yield : 1.08Annual Portfolio Turnover Ratio : 2.62 times
Portfolio
Company/Issuer Mkt Value (Rs. Lakh) % to NAVStyle Box
Figures as on 30-June, 2006
*Pertains to the equity investments only.
Portfolio turnover has been computed as the ratio of the higher value of average purchase and averagesales, to the average net assets in the past one year (since inception for schemes that have not completeda year). The figures are not netted for derivative transactions.
^ Risk-free rate based on the JP Morgan 3 month T-Bill Index.
Auto 7,450.83 5.84%• Maruti Udyog Ltd 3,983.50 3.12%• Mahindra & Mahindra Ltd 3,406.05 2.67%
Hero Honda Ltd 61.28 0.05%Auto Ancillaries 2,273.86 1.78%Amtek Auto Ltd 2,273.86 1.78%Banks 13,666.39 10.70%
• ICICI Bank Ltd 4,801.54 3.76%• State Bank of India Ltd 3,776.96 2.96%• Punjab National Bank Ltd 2,964.00 2.32%
Bank of Baroda Ltd 1,588.82 1.24%Kotak Mahindra Bank Ltd 535.07 0.42%Cement 9,567.70 7.50%Grasim Industries Ltd 2,612.02 2.05%Century Textiles & Industries Ltd 2,504.25 1.96%Associated Cement Companies Ltd 2,147.33 1.68%JK Cements Ltd 1,922.35 1.51%Ambuja Cement Eastern Ltd 381.75 0.30%Construction 2,369.76 1.85%Jai Prakash Associates Ltd 2,329.67 1.82%Patel Engineering Ltd 40.09 0.03%Consumer Non-Durable 8,131.67 6.36%
• ITC Ltd 4,166.63 3.26%Triveni Engineering & Industries Ltd 2,722.90 2.13%Ruchi Soya Industries Ltd 1,242.14 0.97%Ferrous Metals 3,348.22 2.62%Jindal Steel & Power Company Ltd 2,104.21 1.65%Usha Martin Ltd 1,244.01 0.97%Finance 696.38 0.55%Housing Development Finance Corporation Ltd 696.38 0.55%Industrial Capital Goods 16,893.66 13.24%
• Bharat Heavy Electricals Ltd 4,255.01 3.33%• Bharat Electonics Ltd 3,202.23 2.51%
Thermax Ltd 2,524.33 1.98%Siemens India Ltd 2,497.46 1.96%Larsen & Toubro Ltd 2,242.00 1.76%Bharat Earth Movers Ltd 2,172.63 1.70%Industrial Products 3,945.51 3.09%AIA Engineering Ltd 2,325.24 1.82%Jain Irrigation Systems Ltd 1,620.27 1.27%Media & Entertainment 2,420.89 1.90%Deccan Chronicle Holdings Ltd 2,420.89 1.90%Non-Ferrous Metals 2,091.77 1.64%Hindalco Industries Ltd 973.37 0.76%Sterlite Industries (India) Ltd 750.17 0.59%National Aluminium Company Ltd 20.86 0.02%National Aluminium Company Ltd - Futures 347.37 0.27%Oil 2,216.10 1.74%Oil & Natural Gas Company Ltd 2,216.10 1.74%Paper 1,703.31 1.33%Ballarpur Industries Ltd 1,703.31 1.33%Pesticides 2,616.56 2.05%United Phosphorus Ltd 2,616.56 2.05%Petroleum Products 10,545.45 8.26%
• Reliance Industries Ltd 10,545.45 8.26%Pharmaceuticals 3,182.22 2.50%Plethico Pharmaceuticals Ltd 1,234.96 0.97%Wyeth Lederle Ltd 1,057.81 0.83%Lupin Ltd 889.45 0.70%Power 3,670.99 2.88%PTC India Ltd 1,888.51 1.48%National Thermal Power Corporation Ltd 1,782.48 1.40%Software 6,815.02 5.33%
• Tata Consultancy Services Ltd 4,346.88 3.40%Infosys Technologies Ltd 2,309.21 1.81%HCL Technologies Ltd 158.93 0.12%Textiles - Products 3,362.00 2.63%Aditya Birla Nuvo Ltd 1,710.22 1.34%Raymond Ltd 1,651.78 1.29%Transportation 2,967.51 2.33%Containers Corporation of India Ltd 1,696.99 1.33%Great Eastern Shipping Co. Ltd 1,270.52 1.00%Nifty Futures 3,741.72 2.93%Cash, Call, CBLO & Reverse Repo 18,553.91 14.53%Term Deposits 2,378.00 1.86%ICICI Bank 2,378.00 1.86%Other Current Assets (6,926.59) -5.44%
Total Net Assets 127,682.84 100.00%
• Top Ten Holdings
Std Dev : 7.26Sharpe Ratio^ : 0.45Portfolio Beta : 0.94R squared : 0.86
Rs 61740.00
Rs 23781.72
6,056
16,056
26,056
36,056
46,056
56,056
66,056
76,056
86,056
Oct
-94
Jul-
95
Apr
-96
Jan-
97
Oct
-97
Jul-
98
Apr
-99
Jan-
00
Oct
-00
Jul-
01
Apr
-02
Jan-
03
Oct
-03
Jul-
04
Apr
-05
Jan-
06
Pru ICICI Power S&P CNX Nifty
13.24%
10.70%
8.26%
7.50%
6.36%
5.84%
5.33%
3.09%
2.88%
2.63%
2.62%
2.50%
2.33%
2.05%
1.90%
1.85%
1.78%
1.74%
1.64%
1.33%
0.55%
0.00% 4.00% 8.00% 12.00%
Industrial Capital Goods
Banks
Petroleum Products
Cement
Consumer Non-Durable
Auto
Software
Industrial Products
Power
Textiles - Products
Ferrous Metals
Pharmaceuticals
Transportation
Pesticides
Media & Entertainment
Construction
Auto Ancillaries
Oil
Non-Ferrous Metals
Paper
Finance
Past performance may or may not be sustained in future. Assume Rs. 1000 invested every month. Thehigh level of returns come from the sharp appreciation in market, in the year 2001, 2003 and 2005.

6
Fund Manager Comment
The fund maintained an average equity exposure of 92% during the month. Exposure to Non-FerrousMetals was reduced substantially while positions in Construction companies were also trimmed. Thefund added Banks & Oil company stocks to the portfolio.
Sector Allocation*
Performance Record *- Growth Option
*Returns < 1Year : Absolute, > = 1Year : CAGRBenchmark is S&P CNX Nifty. For computation of returns the allotment NAVhas been taken as Rs. 10.00. Past performance may or may not be sustainedin future. 31-Dec-2005 was a non business day.
Quantitative Indicators:
Average P/E : 12.55Average P/BV : 2.44Average Dividend Yield : 1.55Annual Portfolio Turnover Ratio : 2.86 times
Portfolio turnover has been computed as the ratio of the higher value ofaverage purchase and average sales, to the average net assets in the pastone year (since inception for schemes that have not completed a year). Thefigures are not netted for derivative transactions.
PruICICI Infrastructure Fund
Snapshot:
Fund Managers : Sankaran Naren
Indicative Investment Horizon: 5 yrs and more
Inception date: 12-09-2005
Fund Size: Rs. 1,210.45 crores
NAV (As on 30-June-06):Growth option : Rs. 12.94Dividend option : Rs. 12.04
**Expense Ratio for the month of Jun'06: 1.97%
**This is a close approximation of the number.
Style Box
Figures as on 30-June, 2006
*Pertains to the equity investments only.
WHY SHOULD ONE INVEST?Long term investment of funds for capital appreciation derivedfrom the growth and development of the infrastructure sector
Std Dev : 10.04Sharpe Ratio^ : 0.26Portfolio Beta : 1.11R squared : 0.80
^ Risk-free rate based on the JP Morgan 3 month T-Bill Index.
Portfolio
Company/Issuer Mkt Value (Rs. Lakh) % to NAV
Auto Ancillaries 3,746.86 3.10%• Kesoram Industries Ltd 3,746.86 3.10%
Banks 14,650.84 12.10%ICICI Bank Ltd 3,092.99 2.56%Punjab National Bank Ltd 2,978.13 2.46%State Bank of India Ltd 2,885.25 2.38%Andhra Bank Ltd 2,664.10 2.20%Oriental Bank of Commerce 1,251.85 1.03%Corporation Bank Ltd 1,234.38 1.02%Union Bank of India Ltd 544.14 0.45%Cement 12,616.74 10.42%
• Grasim Industries Ltd 5,374.60 4.44%OCL India Ltd 2,429.69 2.01%Century Textiles & Industries Ltd 1,788.75 1.48%Gujarat Ambuja Cement Ltd 1,392.30 1.15%India Cements Ltd 1,058.40 0.87%JK Cements Ltd 573.00 0.47%Construction 7,913.92 6.54%
• Patel Engineering Ltd 4,115.24 3.40%Jai Prakash Associates Ltd 2,749.25 2.27%BL Kashyap and Sons Ltd 1,049.43 0.87%Ferrous Metals 10,467.41 8.65%
• Sesa Goa Ltd 3,156.12 2.61%Jindal Steel & Power Company Ltd 2,732.83 2.26%Usha Martin Ltd 2,425.23 2.00%Adhunik Metaliks Ltd 1,117.98 0.92%Monnet Ispat Ltd 1,035.25 0.86%Finance 1,702.19 1.41%Housing Development Finance Corporation Ltd 1,702.19 1.41%Hotels 7,880.04 6.51%
• EIH Ltd 5,366.46 4.43%Indian Hotels Company Ltd 2,288.90 1.89%Hotel Leela Ventures Ltd 224.68 0.19%Industrial Capital Goods 19,740.63 16.31%
• Bharat Heavy Electricals Ltd 5,723.43 4.73%• Crompton Greaves Ltd 4,701.77 3.88%• Siemens India Ltd 3,770.39 3.11%
Bharat Earth Movers Ltd 2,841.53 2.35%Alfa-Laval (India) Ltd 2,611.06 2.16%Bharat Bijlee Ltd 92.45 0.08%Industrial Products 4,576.79 3.78%
• Electrosteel Castings Ltd 4,576.79 3.78%Minerals/Mining 522.38 0.43%Gujarat NRE Coke Ltd 522.38 0.43%Non-Ferrous Metals 2,999.05 2.47%National Aluminium Company Ltd 1,162.89 0.96%National Aluminium Company Ltd - Futures 61.76 0.05%Sterlite Industries (India) Ltd 887.69 0.73%Hindalco Industries Ltd 886.71 0.73%Oil 7,887.84 6.52%
• Oil & Natural Gas Company Ltd 4,709.12 3.89%Oil & Natural Gas Company Ltd - Futures 1,108.04 0.92%Hindustan Oil Exploration Ltd 1,127.50 0.93%Reliance Natural Resources Ltd 943.18 0.78%Petroleum Products 6,341.44 5.24%Reliance Industries Ltd 2,649.63 2.19%Indian Oil Corporation Ltd 1,999.25 1.65%Madras Refineries Ltd 1,077.11 0.89%Reliance Petroleum Ltd - Futures 615.45 0.51%Power 7,030.72 5.81%Gujarat Industries Power Company Ltd 2,642.92 2.18%National Thermal Power Corporation Ltd 2,218.00 1.83%Reliance Energy Ventures Ltd 1,015.50 0.84%CESC Ltd 758.70 0.63%PTC India Ltd 395.60 0.33%Telecom Services 2,958.66 2.44%Reliance Communications Ventures Ltd 1,244.75 1.03%Bharti Televentures Ltd 937.92 0.77%Mahanagar Telephone Nigam Ltd 775.99 0.64%Transportation 3,922.16 3.24%Containers Corporation of India Ltd 2,179.20 1.80%Jet Airways India Ltd 1,726.79 1.43%Jet Airways India Ltd - Futures 16.17 0.01%Cash, Call, CBLO & Reverse Repo 6,740.23 5.57%Term Deposits 4,495.00 3.71%ICICI Bank 4,495.00 3.71%Other Current Assets (5,147.64) -4.25%
Total Net Assets 121,045.26 100.00%
• Top Ten Holdings
10.88%
2 9 .4 0%
10.2 8%
3 1.18%
0.00%
5 .00%
10.00%
15 .00%
2 0.00%
2 5 .00%
3 0.00%
3 5 .00%
L a s t 6 M o n th s S in c e In c e p tio n
P ru d e n tia l IC IC I In fra s tru c tu re F u n d S & P C N X N ifty
16.31%
12.10%
10.42%
8.65%
6.54%
6.52%
6.51%
5.81%
5.24%
3.78%
3.24%
3.10%
2.47%
2.44%
1.41%
0.43%
0.00% 5.00% 10.00% 15.00% 20.00%
Industrial Capital Goods
Banks
Cement
Ferrous Metals
Construction
Oil
Hotels
Power
Petroleum Products
Industrial Products
Transportation
Auto Ancillaries
Non-Ferrous Metals
Telecom Services
Finance
Minerals/Mining

7
Fund Manager Comment
The fund maintained an average equity exposure of 92% during the month. Expo-sure to both Ferrous & Non-Ferrous metals was reduced significantly and holdingsin Auto stocks were reduced to zero. The fund built positions in Oil Marketing &Refining companies along with Banks and Pharmaceutical companies.
SIP Returns: As on 30 June, 2006
Period SIP Start Date Total Amount Total No. Market Value SIPInvested of Units Returns
1 Year SIP 29-Jul-05 12,000.00 572.70 12,542.13 10.05%Since Inception 16-Aug-04 24,000.00 1,564.00 34,251.60 42.07%
Rs. 10000 invested at inception: Discovery Fund Vs S & P CNX Nifty
CAGR – Discovery Plan : 52.03%; Benchmark : 43.13%Past performance may or may not be sustained in future.
Quantitative Indicators:
Average P/E :10.53Average P/BV : 1.93Average Dividend Yield : 1.89Annual Portfolio Turnover Ratio : 2.48 times
Portfolio
PruICICI Discovery Fund
Snapshot:
Fund Managers : Sankaran NarenIndicative Investment Horizon: 5 yrs and moreInception date: 16-08-2004Fund Size: Rs. 964.46 croresNAV (As on 30-June-06):
Growth option: Rs. 21.90Dividend option: Rs. 16.76
**Expense Ratio for the month of Jun'06:Retail option : 2.07%FII option : 1.00%
**This is a close approximation of the number.
WHY SHOULD ONE INVEST?Long term investment of funds for capital appreciation
following value investment philosophy
Performance Record *- Growth Option
Sector Allocation*
Company/Issuer Mkt Value (Rs. Lakh) % to NAVStyle Box
*Returns < 1Year : Absolute, > 1Year : CAGRBenchmark is S&P CNX Nifty. For computation of returns the allotment NAV hasbeen taken as Rs. 10.00. Past performance may or may not be sustained in future.31-Dec-2005 was a non business day.
Figures as on 30-June, 2006
*Pertains to the equity investments only.
Auto Ancillaries 7,802.21 8.09%• Kesoram Industries Ltd 3,048.98 3.16%• Exide Industries Ltd 2,835.78 2.94%
India Nippon Electricals Ltd 978.54 1.01%Apollo Tyres Ltd 721.77 0.75%Jay Bharat Maruti Ltd 217.14 0.23%Banks 9,427.17 9.77%
• State Bank of India Ltd 4,602.95 4.77%Andhra Bank Ltd 2,062.50 2.14%Punjab National Bank Ltd 1,045.73 1.08%Oriental Bank of Commerce 991.19 1.03%Union Bank of India Ltd 724.80 0.75%Cement 6,093.71 6.33%Century Textiles & Industries Ltd 2,146.50 2.23%Grasim Industries Ltd 1,366.70 1.42%Shree Cement Ltd 1,282.05 1.33%Orient Paper & Industries Ltd 682.60 0.71%Birla Corporation Ltd 615.86 0.64%Chemicals 1,558.35 1.62%India Glycols Ltd 1,558.35 1.62%Consumer Non-Durable 11,923.65 12.38%
• E.I.D. Parry (India) Ltd 2,680.49 2.78%• Sakthi Sugars Ltd' 2,293.65 2.38%
Pidilite Industries Ltd 1,856.93 1.93%Rajshree Sugars & Chemicals Ltd 1,423.85 1.48%Ruchi Soya Industries Ltd 1,242.14 1.29%Nirma Ltd 1,230.32 1.28%Balrampur Chini Mills Ltd 718.80 0.75%Uttam Sugar Mills Ltd 270.81 0.28%Jindal Photo Films Ltd 206.66 0.21%Ferrous Metals 3,651.46 3.79%
• Jindal Steel & Power Company Ltd 2,524.88 2.62%Sesa Goa Ltd 1,126.58 1.17%Fertiliz ers 5,533.05 5.73%
• Gujarat State Fertilisers & Chemicals Ltd 3,630.00 3.76%DCM Shriram Consolidated Ltd 1,272.98 1.32%Zuari Industries Ltd 630.07 0.65%Hardware 1,958.25 2.03%HCL Infosystems Ltd 1,958.25 2.03%Industrial Capital Goods 2,622.56 2.71%Bharat Electonics Ltd 1,461.13 1.51%Kirloskar Oil Engines Ltd 1,161.43 1.20%Industrial Products 1,157.42 1.20%Finolex Cables Ltd 586.10 0.61%MM Forgings Ltd 453.08 0.47%Jindal Poly Films Ltd 118.24 0.12%Non-Ferrous Metals 1,973.17 2.04%Nav Bharat Ferro Alloys Ltd 782.75 0.81%National Aluminium Company Ltd 667.44 0.69%National Aluminium Company Ltd - Futures 301.06 0.31%Sterlite Industries (India) Ltd 221.92 0.23%Oil 1,559.46 1.62%Oil & Natural Gas Company Ltd 1,559.46 1.62%Paper 3,962.21 4.10%JK Paper Ltd 2,039.03 2.11%Tamil Nadu Newsprint & Papers Ltd 1,488.34 1.54%Seshashayee Paper & Boards Ltd 434.84 0.45%Pesticides 1,414.00 1.47%Rallis India Ltd 1,414.00 1.47%Petroleum Products 5,438.27 5.63%Hindustan Petroleum Corporation Ltd 1,619.90 1.68%IBP Company Ltd 1,360.42 1.41%Bharat Petroleum Corporation Ltd 1,189.48 1.23%Cochin Refineries Ltd 776.33 0.80%Indian Oil Corporation Ltd 492.14 0.51%Pharmaceuticals 9,974.32 10.33%
• Cadila Healthcare Ltd 4,556.00 4.72%• Ipca Laboratories Limited 2,202.26 2.28%
Novartis India Ltd 1,283.81 1.33%Lupin Ltd 1,042.83 1.08%FDC Ltd 885.75 0.92%Plethico Pharmaceuticals 3.67 0.00%Power 2,553.78 2.65%Gujarat Industries Power Company Ltd 1,355.09 1.41%Reliance Energy Ventures Ltd 1,198.69 1.24%Software 1,747.15 1.81%3i Infotech Ltd 724.13 0.75%Mastek Ltd 676.01 0.70%Visual Soft (India) Ltd 347.01 0.36%Telecom Services 463.61 0.48%Mahanagar Telephone Nigam Ltd 463.61 0.48%Textiles - Cotton 1,372.03 1.42%Mahavir Spinning Mills Ltd 1,295.66 1.34%Vardhaman Spinning & General Mills Ltd 76.37 0.08%Textiles - Products 5,932.33 6.15%
• Raymond Ltd 4,156.95 4.31%Aditya Birla Nuvo Ltd 1,157.08 1.20%Gokaldas Exports Ltd 618.30 0.64%Textiles - Synthetic 2,458.40 2.55%SRF Ltd 1,818.51 1.89%Nahar Spinning Mill Ltd 558.25 0.58%Indo Rama Synthetics Ltd 81.64 0.08%Transportation 1,080.99 1.12%Containers Corporation of India Ltd 1,080.99 1.12%Cash, Call, CBLO & Reverse Repo 4,356.12 4.52%Term Deposits 3,045.00 3.16%ICICI Bank 3,045.00 3.16%Other Current Assets (2,612.73) -2.70%
Total Net Assets 96,445.94 100.00%
• Top Ten Holdings
Std Dev : 7.24Sharpe Ratio^ : 0.44Portfolio Beta : 0.89R squared : 0.64
Portfolio turnover has been computed as the ratio of the higher value of average purchase and averagesales, to the average net assets in the past one year (since inception for schemes that have not completeda year). The figures are not netted for derivative transactions.
^ Risk-free rate based on the JP Morgan 3 month T-Bill Index.
Rs 21900.00
Rs 19561.649,819
14,819
19,819
24,819
29,819
34,819
Aug
-04
Sep-
04O
ct-0
4N
ov-0
4D
ec-0
4Ja
n-05
Feb-
05M
ar-0
5A
pr-0
5M
ay-0
5Ju
n-05
Jul-0
5A
ug-0
5Se
p-05
Oct
-05
Nov
-05
Dec
-05
Jan-
06Fe
b-06
Mar
-06
Apr
-06
May
-06
Jun-
06
Pru ICICI Discovery Fund S&P CNX Nifty
3.84%
45.81%52.03%
10.28%
40.87% 43.13%
0.00%
50.00%
100.00%
Last 6 Months Last 1 years Since Inception
Pru ICICI Discovery Fund S&P CNX Nifty
12.38%
10.33%
9.77%
8.09%
6.33%
6.15%
5.73%
5.63%
4.10%
3.79%
2.71%
2.65%
2.55%
2.04%
2.03%
1.81%
1.62%
1.62%
1.47%
1.42%
1.20%
1.12%
0.48%
0.00% 4.00% 8.00% 12.00%
Consumer Non-Durable
Pharmaceuticals
Banks
Auto Ancillaries
Cement
Textiles - Products
Fertiliz ers
Petroleum Products
Paper
Ferrous Metals
Industrial Capital Goods
Power
Textiles - Synthetic
Non-Ferrous Metals
Hardware
Software
Chemicals
Oil
Pesticides
Textiles - Cotton
Industrial Products
Transportation
Telecom Services
Past performance may or may not be sustained in future. Assume Rs. 1000 invested every month. Thehigh level of returns come from the sharp appreciation in market, in the year 2004.

8
SIP Returns: As on 30 June, 2006
Period SIP Start Date Total Amount Total No. Market Value SIPInvested of Units Returns
1 Year SIP 29-Jul-05 12,000.00 283.05 13,409.38 26.82%3 Year SIP 31-Jul-03 36,000.00 1,458.75 69,107.70 49.99%Since Inception 31-Oct-02 45,000.00 2,276.34 107,840.70 52.36%
Fund Manager Comment
The fund maintained an average equity exposure of 89% during the month. Exposure to both Ferrous &Non-Ferrous metals was reduced significantly and holdings in Telecom stocks were reduced to zero. Thefund added Software and Pharmaceutical company stocks to the portfolio and also increased holding inAuto stocks.
Past performance may or may not be sustained in future. Assume Rs. 1000 invested every month. Thehigh level of returns come from the sharp appreciation in market, in the year 2003 and 2005.
Quantitative Indicators:
Average P/E : 17.92Average P/BV : 3.68Average Dividend Yield : 0.80Annual Portfolio Turnover Ratio : 2.64 times
Portfolio
Company/Issuer Mkt Value (Rs. Lakh) % to NAV
PruICICI Dynamic Plan
Snapshot:
Fund Managers : Anil Sarin
Indicative Investment Horizon: 3 yrs & more
Inception date: 31-10-2002
Fund Size: Rs. 962.43 croresNAV (As on 30-June-06):
Growth option : Rs. 47.3746Dividend option : Rs. 16.2045
**Expense Ratio for the month of Jun'06: 2.08%
**This is a close approximation of the number.
WHY SHOULD ONE INVEST?Medium term investment of funds for capital appreciation
by managing cash and equity portfolio
Auto 4,115.56 4.28%• Mahindra & Mahindra Ltd 2,522.16 2.62%
Maruti Udyog Ltd 1,593.40 1.66%Auto Ancillaries 2,023.87 2.10%Amtek Auto Ltd 2,023.87 2.10%Banks 7,818.79 8.13%
• State Bank of India Ltd 2,770.59 2.88%• ICICI Bank Ltd 2,199.84 2.29%
Bank of Baroda Ltd 1,591.61 1.65%Punjab National Bank Ltd 1,256.75 1.31%Cement 9,160.42 9.53%Century Textiles & Industries Ltd 2,087.85 2.17%Grasim Industries Ltd 2,038.74 2.12%Associated Cement Companies Ltd 1,634.18 1.70%Orient Paper & Industries Ltd 1,382.65 1.44%Shree Cement Ltd 1,284.90 1.34%Hyderabad Industries Ltd 732.10 0.76%Chemicals 54.31 0.06%Navin Flourine International Ltd 54.31 0.06%Construction 2,815.49 2.92%Jai Prakash Associates Ltd 1,178.49 1.22%IVRCL Infrastructure & Projects Ltd 1,176.34 1.22%Patel Engineering Ltd 460.66 0.48%Consumer Non-Durable 8,245.83 8.57%
• ITC Ltd 3,086.77 3.21%• Triveni Engineering & Industries Ltd 2,456.85 2.55%
E.I.D. Parry (India) Ltd 2,140.51 2.22%Uttam Sugar Mills Ltd 457.19 0.48%McDowell & Company Ltd 104.51 0.11%Ferrous Metals 1,300.62 1.35%Mukand Ltd 1,300.62 1.35%Fertilizers 811.57 0.84%Coromandel Fertilisers Ltd 811.57 0.84%Finance 715.92 0.74%Housing Development Finance Corporation Ltd 715.92 0.74%Hotels 339.88 0.35%Viceroy Hotels Ltd 339.88 0.35%Industrial Capital Goods 8,300.34 8.62%Bharat Earth Movers Ltd 1,938.56 2.01%Larsen & Toubro Ltd 1,910.70 1.99%Kalpataru Power Transmission Ltd 1,902.57 1.98%Texmaco Ltd 1,476.84 1.53%Siemens India Ltd 864.97 0.90%Lokesh Machines Ltd 206.70 0.21%Industrial Products 6,794.18 7.06%
• Jain Irrigation Systems Ltd 3,037.98 3.16%AIA Engineering Ltd 2,184.22 2.27%Sterlite Optical Technologies Ltd 1,571.98 1.63%Media & Entertainment 6,043.81 6.28%
• Deccan Chronicle Holdings Ltd 3,971.47 4.13%Zee Telefilms Ltd 2,072.34 2.15%Non-Ferrous Metals 1,411.58 1.47%Sterlite Industries (India) Ltd 1,411.58 1.47%Petroleum Products 6,785.21 7.05%
• Reliance Industries Ltd 6,785.21 7.05%Pharmaceuticals 2,786.33 2.90%Strides Arcolab Ltd 1,463.47 1.52%Dr. Reddy's Laboratories Ltd 1,267.95 1.32%Plethico Pharmaceuticals Ltd 54.91 0.06%Power 324.35 0.34%Reliance Energy Ventures Ltd 324.35 0.34%Software 13,237.32 13.76%
• Tata Consultancy Services Ltd 3,129.75 3.25%• Infosys Technologies Ltd 3,078.95 3.20%
Subex Systems Ltd 2,047.70 2.13%Mastek Ltd 1,616.74 1.68%Satyam Computer Services Ltd 1,419.30 1.47%HCL Technologies Ltd 1,400.84 1.46%Mphasis BFL Software Ltd 544.04 0.57%Nifty Futures 4,031.70 4.22%Cash, Call, CBLO & Reverse Repo 15,871.78 16.49%Term Deposits 1,777.00 1.85%ICICI Bank 1,777.00 1.85%Other Current Assets (8,523.04) -8.91%
Total Net Assets 96,242.82 100.00%
• Top Ten Holdings
Performance Record *- Cumulative Option
Rs. 10000 invested at inception: Dynamic Plan Vs S&P CNX Nifty
CAGR – Dynamic Plan: 52.86%; Benchmark : 38.36%Past performance may or may not be sustained in future.
Sector Allocation*
Style Box
*Returns < 1Year : Absolute, > = 1Year : CAGR. Benchmark is S&P CNXNifty. For computation of returns the allotment NAV has been taken asRs. 10.00. Past performance may or may not be sustained in future.31-Dec-2005 was a non business day.
Figures as on 30-June, 2006
*Pertains to the equity investments only.
Portfolio turnover has been computed as the ratio of the higher value of average purchase and averagesales, to the average net assets in the past one year (since inception for schemes that have not completeda year). The figures are not netted for derivative transactions.
^ Risk-free rate based on the JP Morgan 3 month T-Bill Index.
Std Dev : 7.97Sharpe Ratio^ : 0.42Portfolio Beta : 0.99R squared : 0.78
Rs 47374.60
Rs 32879.979,665
19,665
29,665
39,665
49,665
59,665
69,665
Oct
-02
Dec
-02
Feb-
03A
pr-0
3Ju
n-03
Aug
-03
Oct
-03
Dec
-03
Feb-
04A
pr-0
4Ju
n-04
Aug
-04
Oct
-04
Dec
-04
Feb-
05A
pr-0
5Ju
n-05
Aug
-05
Oct
-05
Dec
-05
Feb-
06A
pr-0
6Ju
n-06
Pru ICICI Dynamic Plan S&P CNX Nifty
13.97%
61.47%54.52% 52.86%
10.28%
40.87% 40.20% 38.36%
0.00%
10.00%
20.00%
30.00%
40.00%
50.00%
60.00%
70.00%
Last 6 Months Last 1 years Last 3 years SinceInception
Pru ICICI Dynamic Plan S&P CNX Nifty
13.76%
9.53%
8.62%
8.57%
8.13%
7.06%
7.05%
6.28%
4.28%
2.92%
2.90%
2.10%
1.47%
1.35%
0.84%
0.74%
0.35%
0.34%
0.06%
0.00% 4.00% 8.00% 12.00% 16.00%
Software
Cement
Industrial Capital Goods
Consumer Non-Durable
Banks
Industrial Products
Petroleum Products
Media & Entertainment
Auto
Construction
Pharmaceuticals
Auto Ancillaries
Non-Ferrous Metals
Ferrous Metals
Fertilizers
Finance
Hotels
Power
Chemicals

9
Rs 20760.00
Rs 15094.33
9,93311,93313,93315,93317,93319,93321,93323,93325,93327,93329,933
Oct
-04
Nov
-04
Dec
-04
Jan-
05
Feb-
05M
ar-0
5
Apr
-05
May
-05
Jun-
05
Jul-0
5
Aug
-05
Sep-
05
Oct
-05
Nov
-05
Dec
-05
Jan-
06
Feb-
06M
ar-0
6
Apr
-06
May
-06
Jun-
06
Pru ICICI Emerging S.T.A.R. Fund NIFTY Junior Index
Fund Manager Comment
The fund maintained an average equity exposure of 88% during the month. Exposure was trimmed inConstruction companies & Ferrous metals and the fund exited out of some bank stocks. Holdings inIndustrial Capital goods, Auto ancillaries and Pharmaceutical companies were increased.
Sector Allocation*
*Pertains to the equity investments only.
Performance Record *- Growth Option
*Returns < 1Year : Absolute, > 1Year : CAGR. Benchmark is Nifty Junior.For computation of returns the allotment NAV has been taken asRs. 10.00. Past performance may or may not be sustained in future.31-Dec-2005 was a non business day.
SIP Returns: As on 30 June, 2006
Period SIP Start Date Total Amount Total No. Market Value SIPInvested of Units Returns
1 Year SIP 29-Jul-05 12,000.00 601.07 12,478.21 8.85%Since Inception 28-Oct-04 22,000.00 1,466.32 30,440.80 42.42%
Quantitative Indicators:
Average P/E : 16.12Average P/BV : 3.16Average Dividend Yield : 0.76Annual Portfolio Turnover Ratio : 2.31 times
Portfolio turnover has been computed as the ratio of the higher value ofaverage purchase and average sales, to the average net assets in the pastone year (since inception for schemes that have not completed a year). Thefigures are not netted for derivative transactions.
^ Risk-free rate based on the JP Morgan 3 month T-Bill Index.
Portfolio
WHY SHOULD ONE INVEST?Long term investment of funds for
capital appreciation on a mid-cap portfolio
Company/Issuer Mkt Value (Rs. Lakh) % to NAVStyle Box
Figures as on 30-June, 2006
PruICICI Emerging S.T.A.R. Fund
Auto Ancillaries 5,209.73 6.45%• Amtek Auto Ltd 1,622.49 2.01%
Bosch Chassis Systems India Ltd 1,602.86 1.99%Munjal Auto Industries Ltd 623.48 0.77%Sundram Fastners Ltd 428.69 0.53%Amtek India Ltd 334.79 0.41%Govind Rubber Ltd 333.36 0.41%Talbros Automotive Components Ltd 264.06 0.33%Banks 1,598.60 1.98%Andhra Bank Ltd 970.63 1.20%Syndicate Bank Ltd 627.97 0.78%Cement 5,930.39 7.34%Ramco Industries Ltd 1,546.75 1.92%India Cements Ltd 1,373.78 1.70%Orient Paper & Industries Ltd 799.97 0.99%Birla Corporation Ltd 740.02 0.92%OCL India Ltd 646.89 0.80%Hyderabad Industries Ltd 349.26 0.43%Century Textiles & Industries Ltd 286.38 0.35%Chettinad Cements Ltd 187.34 0.23%Chemicals 619.90 0.77%Beck India Ltd 619.90 0.77%Construction 2,916.07 3.61%Patel Engineering Ltd 1,477.09 1.83%Mahindra Gesco Developers Ltd 1,211.07 1.50%Sunil Hitech Engineers Ltd 227.91 0.28%Consumer Durables 2,966.47 3.67%
• Lloyd Electric & Engineering Ltd 2,166.56 2.68%Fedders Lloyd Corporation Ltd 799.91 0.99%Consumer Non-Durable 3,985.77 4.93%
• Triveni Engineering & Industries Ltd 1,776.02 2.20%Mirza International Ltd 1,310.25 1.62%Uttam Sugar Mills Ltd 713.74 0.88%Rajshree Sugars & Chemicals Ltd 113.74 0.14%Shrenuj & Company Ltd 72.02 0.09%Ferrous Metals 5,435.57 6.75%
• Mukand Ltd 1,781.09 2.21%Adhunik Metaliks Ltd 747.52 0.93%Kalyani Steels Ltd 698.49 0.87%Indian Seamless Steels & Alloys Ltd 528.89 0.66%Gallantt Metal Ltd 409.51 0.51%Raipur Alloys & Steel Ltd 399.01 0.49%Kamdhenu Ispat Ltd 329.39 0.41%Usha Martin Ltd 296.57 0.37%Jindal Saw Ltd 245.10 0.30%Industrial Capital Goods 9,762.44 12.10%
• Aban Lloyd Chiles Offshore Ltd 2,427.51 3.01%• Kalpataru Power Transmission Ltd 1,620.69 2.01%
Bharat Earth Movers Ltd 1,583.26 1.96%Stone India Ltd 1,139.81 1.41%RPG Transmission Ltd 997.82 1.24%Crompton Greaves Ltd 909.67 1.13%Thermax Ltd 711.71 0.88%Indo Tech Transformers Ltd 371.97 0.46%Industrial Products 6,376.25 7.88%
• Graphite India Ltd 1,737.62 2.15%Sterlite Optical Technologies Ltd 1,535.70 1.90%AIA Engineering Ltd 1,252.45 1.55%Sintex Industries Ltd 688.75 0.85%Finolex Cables Ltd 597.57 0.74%Shree Ganesh Forgings Ltd 407.64 0.50%Torrent Cable Ltd 156.52 0.19%Media & Entertainment 2,706.91 3.35%
• Deccan Chronicle Holdings Ltd 2,510.16 3.11%Jagran Prakashan Pvt Ltd 196.75 0.24%Non-Ferrous Metals 625.19 0.77%Nav Bharat Ferro Alloys Ltd 625.19 0.77%Paper 686.23 0.85%Tamil Nadu Newsprint & Papers Ltd 686.23 0.85%Pharmaceuticals 3,598.31 4.46%Glenmark Pharmaceuticals Ltd 1,459.10 1.81%Matrix Laboratories Ltd 946.82 1.17%Cadila Healthcare Ltd 710.97 0.88%Vivimed Labs Ltd 405.27 0.50%Plethico Pharmaceuticals Ltd 38.57 0.05%Avon Organics Ltd 37.58 0.05%Power 465.31 0.58%Webel SL Energy Ltd 465.31 0.58%Software 8,337.81 10.32%
• Subex Systems Ltd 2,443.50 3.03%Geodesic Information Systems Ltd 1,357.90 1.68%Nucleus Software Exports Ltd 1,221.02 1.51%Megasoft Ltd 998.21 1.24%Mastek Ltd 964.52 1.19%Prithvi Information Solutions Ltd 350.62 0.43%Infotech Enterprises Ltd 321.61 0.40%Saksoft Ltd 309.63 0.38%Mphasis BFL Software Ltd 237.26 0.29%Zenith Infotech Ltd 133.54 0.17%Telecom Services 992.90 1.23%Aksh Optifibre Ltd 992.90 1.23%Textiles - Products 2,149.02 2.66%Kewal Kiran Clothing Ltd 840.25 1.04%Gokaldas Exports Ltd 711.66 0.88%Siyaram Silk Mills Ltd 597.11 0.74%Textiles - Synthetic 394.65 0.49%Sarla Polyester Ltd 394.65 0.49%Transportation 336.82 0.42%Shreyas Shipping Ltd 336.82 0.42%Nifty Futures 5,768.49 7.16%Cash, Call, CBLO & Reverse Repo 13,560.93 16.80%Term Deposits 2,025.00 2.51%
• ICICI Bank 2,025.00 2.51%Other Current Assets (5,719.91) -7.08%
Total Net Assets 80,728.85 100.00%
• Top Ten Holdings
Snapshot:
Fund Managers : Anil Sarin
Indicative Investment Horizon: 3 years & more
Inception date: 28-10-2004
Fund Size: Rs. 807.29 croresNAV (As on 30-June-06):
Growth option: Rs. 20.76Dividend option: Rs. 16.87
**Expense Ratio for the month of Jun'06:Retail option : 2.15%FII option : 1.00%
**This is a close approximation of the number.
Rs. 10000 invested at inception: Emerging S.T.A.R Fund Vs S&P CNX Nifty
CAGR – Emerging S.T.A.R. Fund : 54.82%; Benchmark : 27.94%Past performance may or may not be sustained in future.
Past performance may or may not be sustained in future. Assume Rs. 1000 invested every month.The high level of returns come from the sharp appreciation in market, in the year 2004.
Std Dev : 8.57Sharpe Ratio^ : 0.39Portfolio Beta : 0.97R squared : 0.78
2.52%
53.66% 54.82%
-5.00%
19.83%
27.94%
-10.00%
0.00%
10.00%
20.00%
30.00%
40.00%
50.00%
60.00%
Last 6 Months Last 1 years Since Inception
Pru ICICI Emerging S.T.A.R. Fund NIFTY Junior Index
12.10%10.32%
7.88%7.34%
6.75%6.45%
4.93%4.46%
3.67%3.61%
3.35%2.66%
1.98%1.23%
0.85%0.77%0.77%
0.58%0.49%0.42%
0.00% 4.00% 8.00% 12.00%
Industrial Capital GoodsSoftware
Industrial ProductsCement
Ferrous MetalsAuto Ancillaries
Consumer Non-DurablePharmaceuticals
Consumer DurablesConstruction
Media & EntertainmentTextiles - Products
BanksTelecom Services
PaperNon-Ferrous Metals
ChemicalsPower
Textiles - SyntheticTransportation

10
Performance Record *- Growth Option
*Returns < 1Year : Absolute, > = 1Year : CAGR. Benchmark is S&P CNX Nifty.For computation of returns the allotment NAV has been taken asRs. 10.00. Past performance may or may not be sustained in future.31-Dec-2005 was a non business day.
Sector Allocation*
*Pertains to the equity investments only.
PruICICI Tax Plan
Snapshot:
Fund Managers : Sankaran Naren
Indicative Investment Horizon: 3 yrs & more
Inception date: 19-08-1999
Fund Size: Rs. 380.16 croresNAV (As on 30-June-06):
Growth option: Rs. 73.12Dividend option: Rs. 23.48
**Expense Ratio for the month of Jun'06: 2.32%
**This is a close approximation of the number.
WHY SHOULD ONE INVEST?
Medium term investment of funds with tax benefits for capital appreciation
Auto Ancillaries 6,735.38 17.72%• Sundaram Clayton Ltd 1,748.92 4.60%• Kesoram Industries Ltd 1,726.00 4.54%
Rane Madras Ltd 795.47 2.09%Exide Industries Ltd 771.77 2.03%Carborandum Universal Ltd 596.08 1.57%Rane Holdings Ltd 437.74 1.15%Sundaram Brake Linings Ltd 378.43 1.00%Rane Brake Linings Ltd 280.97 0.74%Banks 1,440.35 3.79%Union Bank of India Ltd 543.60 1.43%Karnataka Bank Ltd 459.25 1.21%Andhra Bank Ltd 437.50 1.15%Cement 1,970.49 5.18%Orient Paper & Industries Ltd 1,117.92 2.94%Century Textiles & Industries Ltd 715.50 1.88%Pokarna Ltd 137.07 0.36%Chemicals 2,577.38 6.78%Andhra Sugars Ltd 919.46 2.42%Atul Ltd 662.54 1.74%India Glycols Ltd 486.23 1.28%Clariant Chemicals (India) Ltd 236.57 0.62%Deepak Fertilisers & Petrochemical Corporation Ltd 179.13 0.47%Ultramarine & Pigments Ltd 93.45 0.25%Consumer Non-Durable 2,553.52 6.72%Gillette India Ltd 738.22 1.94%ICI India Ltd 545.59 1.44%Harrisons Malyalam Ltd 435.88 1.15%Sakthi Sugars Ltd' 349.60 0.92%Pidilite Industries Ltd 285.49 0.75%United Breweries Ltd 109.45 0.29%Venky's (India) Ltd 89.29 0.23%Ferrous Metals 75.09 0.20%Tinplate Company of India Ltd 37.57 0.10%Tayo Rolls Ltd 37.52 0.10%Fertilizers 3,395.60 8.94%
• DCM Shriram Consolidated Ltd 1,443.20 3.80%• Zuari Industries Ltd 1,226.40 3.23%
Gujarat State Fertilisers & Chemicals Ltd 726.00 1.91%Hotels 342.41 0.90%Oriental Hotels Ltd 186.56 0.49%Taj Gvk Hotels & Resorts Ltd 155.85 0.41%Industrial Capital Goods 1,761.31 4.63%
• Aban Lloyd Chiles Offshore Ltd 1,219.00 3.21%Numeric Power Systems Ltd 400.73 1.05%Indo Tech Transformers Ltd 141.58 0.37%Industrial Products 1,970.22 5.19%H.E.G. Ltd 1,202.87 3.16%Poleplex Corporation Ltd 298.54 0.79%MM Forgings Ltd 249.15 0.66%Bharat Forge Ltd 219.66 0.58%Non-Ferrous Metals 693.87 1.83%Hindustan Zinc Limited 693.87 1.83%Oil 1,163.50 3.06%Hindustan Oil Exploration Ltd 1,163.50 3.06%Petroleum Products 1,531.14 4.03%
• IBP Company Ltd 1,375.87 3.62%Cochin Refineries Ltd 155.27 0.41%Pharmaceuticals 4,501.00 11.85%
• Dr. Reddy's Laboratories Ltd 1,267.95 3.34%Cadila Healthcare Ltd 1,185.87 3.12%FDC Ltd 1,074.67 2.83%Alembic Ltd 676.15 1.78%Fulford India Ltd 211.15 0.56%Ahlcon Parenterals (India) Ltd 77.00 0.20%Plethico Pharmaceuticals Ltd 8.21 0.02%Retailing 1,497.92 3.94%
• Trent Ltd 1,497.92 3.94%Textiles - Cotton 897.84 2.36%Precot Mills Ltd 759.55 2.00%Maral Overseas Ltd 138.29 0.36%Textiles - Products 1,451.14 3.81%
• Raymond Ltd 1,358.66 3.57%K.G. Denim Ltd 92.48 0.24%Textiles - Synthetic 2,336.35 6.15%
• SRF Ltd 1,964.31 5.17%Sangam India Ltd 372.04 0.98%Cash, Call, CBLO & Reverse Repo 713.68 1.88%Term Deposits 450.00 1.18%ICICI Bank 450.00 1.18%Other Current Assets (42.31) -0.14%
Total Net Assets 38,015.88 100.00%
• Top Ten Holdings
SIP Returns: As on 30 June, 2006
Period SIP Start Date Total Amount Total No. Market Value SIPInvested of Units Returns
1 Year SIP 29-Jul-05 12,000.00 163.26 11,937.57 -1.13%
3 Year SIP 31-Jul-03 36,000.00 946.18 69,184.68 50.09%
5 Year SIP 31-Jul-01 60,000.00 2,971.53 217,278.27 55.76%
Since Inception 19-Aug-99 84,000.00 4,799.97 350,973.81 41.33%
Quantitative Indicators:
Average P/E : 13.18Average P/BV : 2.26Average Dividend Yield : 1.39Annual Portfolio Turnover Ratio : 2.88 times
Portfolio
Company/Issuer Mkt Value (Rs. Lakh) % to NAVStyle Box
Figures as on 30-June, 2006
Portfolio turnover has been computed as the ratio of the higher value of average purchase and averagesales, to the average net assets in the past one year (since inception for schemes that have not completeda year). The figures are not netted for derivative transactions.
^ Risk-free rate based on the JP Morgan 3 month T-Bill Index.
CAGR – Tax Plan: 33.60%; Benchmark : 13.08%Past performance may or may not be sustained in future.
Rs. 10000 invested at inception: Tax Plan Vs S&P CNX Nifty
Past performance may or may not be sustained in future. Assume Rs. 1000 invested every month. Thehigh level of returns come from the sharp appreciation in market, in the year 2001 and 2003.
Std Dev : 9.08Sharpe Ratio^ : 0.44Portfolio Beta : 1.00R squared : 0.62
Rs 73120.00
Rs 23257.99
6,301
26,301
46,301
66,301
86,301
106,301
126,301
Aug
-99
Jan-
00
Jun-
00
Nov
-00
Apr
-01
Sep-
01
Feb-
02
Jul-
02
Dec
-02
May
-03
Oct
-03
Mar
-04
Aug
-04
Jan-
05
Jun-
05
Nov
-05
Apr
-06
Pru ICICI Tax Plan S&P CNX Nifty
-0.40%
36.32%
64.35%
47.64%
33.60%
10.28%
40.87% 40.20%
23.04%
13.08%
-10.00%
0.00%
10.00%
20.00%
30.00%
40.00%
50.00%
60.00%
70.00%
Last 6Months
Last 1years
Last 3years
Last 5years
SinceInception
Pru ICICI Tax Plan S&P CNX Nifty
17.72%
11.85%
8.94%
6.78%
6.72%
6.15%
5.19%
5.18%
4.63%
4.03%
3.94%
3.81%
3.79%
3.06%
2.36%
1.83%
0.90%
0.20%
0.00% 5.00% 10.00% 15.00% 20.00%
Auto Ancillaries
Pharmaceuticals
Fertilizers
Chemicals
Consumer Non-Durable
Textiles - Synthetic
Industrial Products
Cement
Industrial Capital Goods
Petroleum Products
Retailing
Textiles - Products
Banks
Oil
Textiles - Cotton
Non-Ferrous Metals
Hotels
Ferrous Metals
11
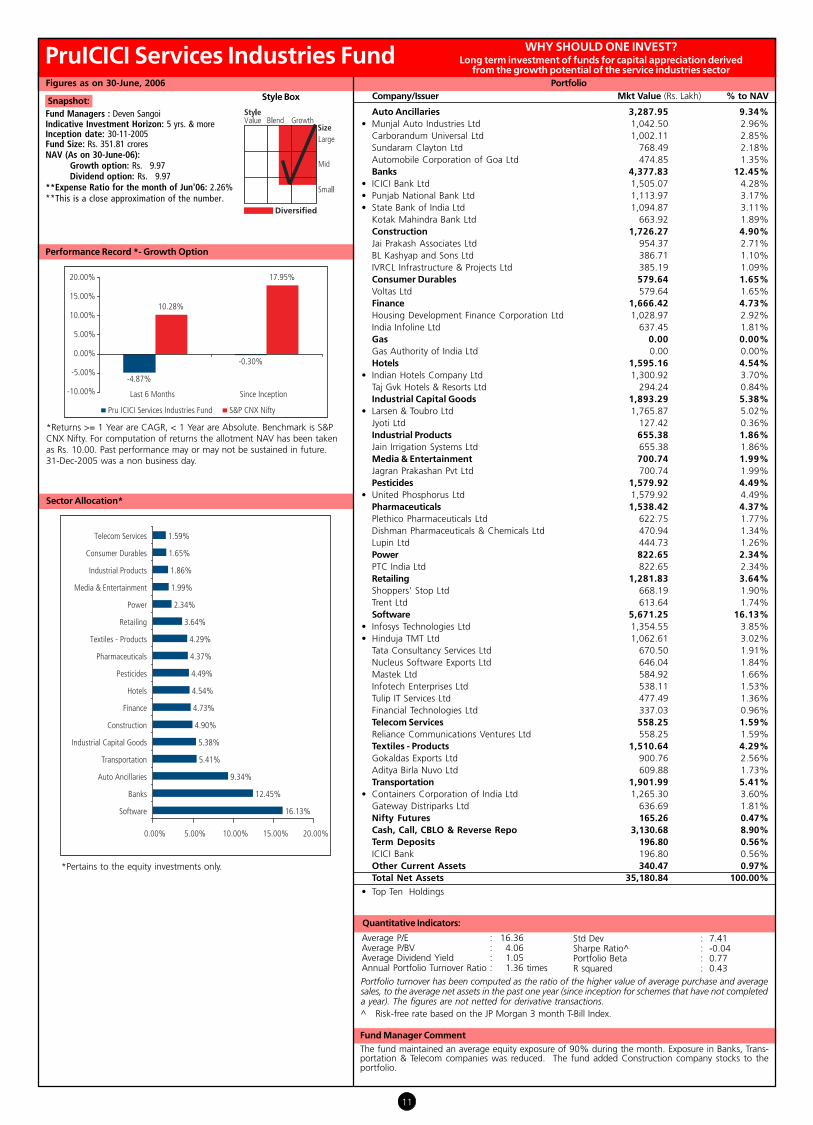
Fund Manager Comment
The fund maintained an average equity exposure of 90% during the month. Exposure in Banks, Trans-portation & Telecom companies was reduced. The fund added Construction company stocks to theportfolio.
Average P/E : 16.36Average P/BV : 4.06Average Dividend Yield : 1.05Annual Portfolio Turnover Ratio : 1.36 times
Portfolio turnover has been computed as the ratio of the higher value of average purchase and averagesales, to the average net assets in the past one year (since inception for schemes that have not completeda year). The figures are not netted for derivative transactions.
^ Risk-free rate based on the JP Morgan 3 month T-Bill Index.
Quantitative Indicators:
Std Dev : 7.41Sharpe Ratio^ : -0.04Portfolio Beta : 0.77R squared : 0.43
Portfolio
Company/Issuer Mkt Value (Rs. Lakh) % to NAVSnapshot:
Fund Managers : Deven SangoiIndicative Investment Horizon: 5 yrs. & moreInception date: 30-11-2005Fund Size: Rs. 351.81 croresNAV (As on 30-June-06):
Growth option: Rs. 9.97Dividend option: Rs. 9.97
**Expense Ratio for the month of Jun'06: 2.26%**This is a close approximation of the number.
WHY SHOULD ONE INVEST?Long term investment of funds for capital appreciation derived
from the growth potential of the service industries sector
Auto Ancillaries 3,287.95 9.34%
• Munjal Auto Industries Ltd 1,042.50 2.96%
Carborandum Universal Ltd 1,002.11 2.85%
Sundaram Clayton Ltd 768.49 2.18%
Automobile Corporation of Goa Ltd 474.85 1.35%
Banks 4,377.83 12.45%
• ICICI Bank Ltd 1,505.07 4.28%
• Punjab National Bank Ltd 1,113.97 3.17%
• State Bank of India Ltd 1,094.87 3.11%
Kotak Mahindra Bank Ltd 663.92 1.89%
Construction 1,726.27 4.90%
Jai Prakash Associates Ltd 954.37 2.71%
BL Kashyap and Sons Ltd 386.71 1.10%
IVRCL Infrastructure & Projects Ltd 385.19 1.09%
Consumer Durables 579.64 1.65%
Voltas Ltd 579.64 1.65%
Finance 1,666.42 4.73%
Housing Development Finance Corporation Ltd 1,028.97 2.92%
India Infoline Ltd 637.45 1.81%
Gas 0.00 0.00%
Gas Authority of India Ltd 0.00 0.00%
Hotels 1,595.16 4.54%
• Indian Hotels Company Ltd 1,300.92 3.70%
Taj Gvk Hotels & Resorts Ltd 294.24 0.84%
Industrial Capital Goods 1,893.29 5.38%
• Larsen & Toubro Ltd 1,765.87 5.02%
Jyoti Ltd 127.42 0.36%
Industrial Products 655.38 1.86%
Jain Irrigation Systems Ltd 655.38 1.86%
Media & Entertainment 700.74 1.99%
Jagran Prakashan Pvt Ltd 700.74 1.99%
Pesticides 1,579.92 4.49%
• United Phosphorus Ltd 1,579.92 4.49%
Pharmaceuticals 1,538.42 4.37%
Plethico Pharmaceuticals Ltd 622.75 1.77%
Dishman Pharmaceuticals & Chemicals Ltd 470.94 1.34%
Lupin Ltd 444.73 1.26%
Power 822.65 2.34%
PTC India Ltd 822.65 2.34%
Retailing 1,281.83 3.64%
Shoppers' Stop Ltd 668.19 1.90%
Trent Ltd 613.64 1.74%
Software 5,671.25 16.13%
• Infosys Technologies Ltd 1,354.55 3.85%
• Hinduja TMT Ltd 1,062.61 3.02%
Tata Consultancy Services Ltd 670.50 1.91%
Nucleus Software Exports Ltd 646.04 1.84%
Mastek Ltd 584.92 1.66%
Infotech Enterprises Ltd 538.11 1.53%
Tulip IT Services Ltd 477.49 1.36%
Financial Technologies Ltd 337.03 0.96%
Telecom Services 558.25 1.59%
Reliance Communications Ventures Ltd 558.25 1.59%
Textiles - Products 1,510.64 4.29%
Gokaldas Exports Ltd 900.76 2.56%
Aditya Birla Nuvo Ltd 609.88 1.73%
Transportation 1,901.99 5.41%
• Containers Corporation of India Ltd 1,265.30 3.60%
Gateway Distriparks Ltd 636.69 1.81%
Nifty Futures 165.26 0.47%
Cash, Call, CBLO & Reverse Repo 3,130.68 8.90%
Term Deposits 196.80 0.56%
ICICI Bank 196.80 0.56%
Other Current Assets 340.47 0.97%
Total Net Assets 35,180.84 100.00%
• Top Ten Holdings
Performance Record *- Growth Option
Sector Allocation*
*Returns >= 1 Year are CAGR, < 1 Year are Absolute. Benchmark is S&PCNX Nifty. For computation of returns the allotment NAV has been takenas Rs. 10.00. Past performance may or may not be sustained in future.31-Dec-2005 was a non business day.
*Pertains to the equity investments only.
Figures as on 30-June, 2006
PruICICI Services Industries Fund
Style Box
-4.87%
-0.30%
10.28%
17.95%
-10.00%
-5.00%
0.00%
5.00%
10.00%
15.00%
20.00%
Last 6 Months Since Inception
Pru ICICI Services Industries Fund S&P CNX Nifty
16.13%
12.45%
9.34%
5.41%
5.38%
4.90%
4.73%
4.54%
4.49%
4.37%
4.29%
3.64%
2.34%
1.99%
1.86%
1.65%
1.59%
0.00% 5.00% 10.00% 15.00% 20.00%
Software
Banks
Auto Ancillaries
Transportation
Industrial Capital Goods
Construction
Finance
Hotels
Pesticides
Pharmaceuticals
Textiles - Products
Retailing
Power
Media & Entertainment
Industrial Products
Consumer Durables
Telecom Services

12
Fund Manager Comment
The fund maintained an average equity exposure of 91% during the month. Exposure in Banks andFerrous & Non-Ferrous Metals was reduced. The increased its holdings in Auto, Power & Cementcompanies.
SIP Returns: As on 30 June, 2006
Period SIP Start Date Total Amount Total No. Market Value SIPInvested of Units Returns
1 Year SIP 29-Jul-05 12,000.00 183.36 13,392.61 26.49%
3 Year SIP 31-Jul-03 36,000.00 858.81 62,727.48 41.85%
5 Year SIP 31-Jul-01 60,000.00 2,167.87 158,341.22 41.24%
Since Inception 9-Jul-98 97,000.00 4,415.59 322,514.69 29.28%
Quantitative Indicators:
Average P/E : 19.19Average P/BV : 3.88Average Dividend Yield : 1.10Annual Portfolio Turnover Ratio : 2.88 times
Portfolio turnover has been computed as the ratio of the higher value of average purchase and averagesales, to the average net assets in the past one year (since inception for schemes that have not completeda year). The figures are not netted for derivative transactions.
^ Risk-free rate based on the JP Morgan 3 month T-Bill Index.
Past performance may or may not be sustained in future. Assume Rs. 1000 invested every month. Thehigh level of returns come from the sharp appreciation in market, in the year 2001, 2003 and 2005.
Std Dev : 7.31Sharpe Ratio^ : 0.41Portfolio Beta : 0.98R squared : 0.92
Portfolio
Company/Issuer Mkt Value (Rs. Lakh) % to NAV
PruICICI Growth Plan
Snapshot:
Fund Managers : Deven SangoiIndicative Investment Horizon: 5 years & moreInception date: 09-07-1998Fund Size: Rs. 332.88 croresNAV (As on 30-June-06):
Growth option: Rs. 73.04Dividend option: Rs. 19.87
**Expense Ratio for the month of Jun'06:Retail option : 2.32%FII option : 1.00%
**This is a close approximation of the number.
WHY SHOULD ONE INVEST?
Long term investment of funds for capital appreciation
Performance Record *- Growth Option
Rs. 10000 invested at inception: Growth Plan Vs S & P CNX Nifty
CAGR – Growth Plan : 28.29%; Benchmark : 15.94%Past performance may or may not be sustained in future.
Sector Allocation*
*Returns < 1Year : Absolute, > 1Year : CAGR. Benchmark is S&P CNX Nifty.For computation of returns the allotment NAV has been taken as Rs. 10.00.Past performance may or may not be sustained in future.31-Dec-2005 was a non business day.
Style Box
Figures as on 30-June, 2006
*Pertains to the equity investments only.
Auto 2,078.76 6.24%
Maruti Udyog Ltd 696.75 2.09%
Mahindra & Mahindra Ltd 692.80 2.08%
Hero Honda Ltd 689.21 2.07%
Banks 1,954.81 5.87%
State Bank of India Ltd 787.43 2.37%
ICICI Bank Ltd 587.52 1.76%
Punjab National Bank Ltd 579.86 1.74%
Cement 2,789.01 8.38%
• Grasim Industries Ltd 1,095.75 3.29%
Associated Cement Companies Ltd 973.38 2.92%
Ambuja Cement Eastern Ltd 381.75 1.15%
Gujarat Ambuja Cement Ltd 338.13 1.02%
Consumer Non-Durable 3,890.08 11.68%
• ITC Ltd 1,301.00 3.91%
• Hindustan Lever Ltd 1,008.93 3.03%
Bajaj Hindustan Ltd 569.27 1.71%
Triveni Engineering & Industries Ltd 350.33 1.05%
Dabur India Ltd 332.98 1.00%
E.I.D. Parry (India) Ltd 327.57 0.98%
Industrial Capital Goods 4,890.87 14.69%
• Bharat Heavy Electricals Ltd 1,338.61 4.02%
• Larsen & Toubro Ltd 1,020.11 3.06%
• Siemens India Ltd 978.97 2.94%
Bharat Earth Movers Ltd 701.03 2.11%
ABB Ltd 635.48 1.91%
Suzlon Energy Ltd 216.67 0.65%
Non-Ferrous Metals 1,508.38 4.53%
Hindalco Industries Ltd 821.71 2.47%
Sterlite Industries (India) Ltd 686.67 2.06%
Oil 1,026.03 3.08%
• Oil & Natural Gas Company Ltd 1,026.03 3.08%
Pesticides 854.90 2.57%
United Phosphorus Ltd 854.90 2.57%
Petroleum Products 1,512.84 4.54%
• Reliance Industries Ltd 1,512.84 4.54%
Pharmaceuticals 1,842.47 5.53%
Cipla Ltd 970.25 2.91%
Glaxo Smothkline Pharma Ltd 545.54 1.64%
Lupin Ltd 326.68 0.98%
Power 1,861.38 5.59%
Reliance Energy Ltd 955.75 2.87%
National Thermal Power Corporation Ltd 905.63 2.72%
Software 2,717.84 8.17%
• Infosys Technologies Ltd 1,570.26 4.72%
• Tata Consultancy Services Ltd 1,147.58 3.45%
Telecom Services 1,825.67 5.48%
Bharti Televentures Ltd 965.70 2.90%
Mahanagar Telephone Nigam Ltd 859.97 2.58%
Nifty Futures 1,247.24 3.75%
Cash, Call, CBLO & Reverse Repo 4,358.82 13.09%
Term Deposits 1,125.00 3.38%
ICICI Bank 1,125.00 3.38%
Other Current Assets (2,196.04) -6.57%
Total Net Assets 33,288.06 100.00%
• Top Ten Holdings
Rs 73040.00
Rs 32549.82
8,36518,36528,365
38,36548,36558,36568,365
78,36588,36598,365
Jul-
98
Dec
-98
May
-99
Oct
-99
Mar
-00
Aug
-00
Jan-
01
Jun-
01
Nov
-01
Apr
-02
Sep-
02
Feb-
03
Jul-
03
Dec
-03
May
-04
Oct
-04
Mar
-05
Aug
-05
Jan-
06
Jun-
06
Pru ICICI Growth Plan S&P CNX Nifty
11.70%
54.03%48.43%
32.29%28.29%
10.28%
40.87% 40.20%
23.04%
15.94%
0.00%
10.00%
20.00%
30.00%
40.00%
50.00%
60.00%
Last 6Months
Last 1years
Last 3years
Last 5years
SinceInception
Pru ICICI Growth Plan S&P CNX Nifty
14.69%
11.68%
8.38%
8.17%
6.24%
5.87%
5.59%
5.53%
5.48%
4.54%
4.53%
3.08%
2.57%
0.00% 4.00% 8.00% 12.00% 16.00%
Industrial Capital Goods
Consumer Non-Durable
Cement
Software
Auto
Banks
Power
Pharmaceuticals
Telecom Services
Petroleum Products
Non-Ferrous Metals
Oil
Pesticides

13
Quantitative Indicators:
Portfolio
Company/Issuer Mkt Value (Rs. Lakh) % to NAV
PruICICI Technology Fund
Snapshot:
Fund Managers : Deven Sangoi
Indicative Investment Horizon: 5 yrs & more
Inception date: 03-03-2000
Fund Size: Rs. 104.69 croresNAV (As on 30-June-06):
Growth option: Rs. 9.55**Expense Ratio for the month of Jun'06: 2.49%
**This is a close approximation of the number.
WHY SHOULD ONE INVEST?
Long term investment of funds for capital appreciation in technology sector
Consultancy 25.82 0.25%
Quality Assurance Institute (I) Ltd 25.82 0.25%
Industrial Capital Goods 241.55 2.31%
Solectron Centum Electronics Ltd 241.55 2.31%
Media & Entertainment 1,235.47 11.80%
• Deccan Chronicle Holdings Ltd 1,235.47 11.80%
Pharmaceuticals 1,106.57 10.58%
• Elder Pharmaceuticals Ltd 466.43 4.46%
Vivimed Labs Ltd 293.68 2.81%
RPG Life Science Ltd 215.63 2.06%
Plethico Pharmaceuticals Ltd 130.83 1.25%
Software 6,776.41 64.72%
• Infosys Technologies Ltd 849.24 8.11%
• Mastek Ltd 802.18 7.66%
• Subex Systems Ltd 746.11 7.13%
• Tata Consultancy Services Ltd 659.56 6.30%
• Satyam Computer Services Ltd 496.76 4.74%
• Nucleus Software Exports Ltd 491.56 4.70%
• I-Flex Solutions Ltd 402.46 3.84%
• Aztec Software & Technology Services Ltd 362.33 3.46%
Hinduja TMT Ltd 362.33 3.46%
Megasoft Ltd 333.26 3.18%
Geometric Software Solutions Ltd 324.62 3.10%
Tulip IT Services Ltd 261.16 2.49%
HCL Technologies Ltd 249.77 2.39%
Hexaware Technologies Ltd. 225.88 2.16%
Mphasis BFL Software Ltd 209.19 2.00%
Ampersand Software Applications Ltd 0.00 0.00%
SIP Technologies Limited 0.00 0.00%
Telecom Services 234.86 2.25%
Videsh Sanchar Nigam Ltd 120.17 1.15%
Avaya Global Connect Ltd 114.69 1.10%
Cash, Call, CBLO & Reverse Repo 756.06 7.22%
Other Current Assets 92.49 0.87%
Total Net Assets 10,469.23 100.00%
• Top Ten Holdings
Performance Record *- Growth Option
Rs. 10000 invested at inception: Technology Fund Vs BSE Tech Index
CAGR – Technology Fund: -0.72%; Benchmark : -8.89%Past performance may or may not be sustained in future.
Sector Allocation*
*Returns < 1Year : Absolute, > = 1Year : CAGR. Benchmark is BSE Tech Index.For computation of returns the allotment NAV has been taken as Rs. 10.00.Past performance may or may not be sustained in future. 31-Dec-2005 was anon business day.
SIP Returns: As on 30 June, 2006
Period SIP Start Date Total Amount Total No. Market Value SIPInvested of Units Returns
1 Year SIP 29-Jul-05 12,000.00 1,233.66 11,781.45 -3.95%
3 Year SIP 31-Jul-03 36,000.00 5,761.60 55,023.28 31.26%
5 Year SIP 31-Jul-01 60,000.00 14,159.99 135,227.90 34.23%
Since Inception 3-Mar-00 77,000.00 17,566.65 167,761.51 24.61%
Average P/E : 18.47Average P/BV : 5.26Average Dividend Yield : 0.66Annual Portfolio Turnover Ratio : 1.68 times
Style Box
*Pertains to the equity investments only.
Portfolio turnover has been computed as the ratio of the higher value of average purchase and averagesales, to the average net assets in the past one year (since inception for schemes that have not completeda year). The figures are not netted for derivative transactions.
^ Risk-free rate based on the JP Morgan 3 month T-Bill Index.
Figures as on 30-June, 2006
Past performance may or may not be sustained in future. Assume Rs. 1000 invested every month. Thehigh level of returns come from the sharp appreciation in market, in the year 2001 and 2003.
Std Dev : 7.78Sharpe Ratio^ : 0.37Portfolio Beta : 0.94R squared : 0.63
Rs 9550.00
Rs 5547.261,177
3,177
5,177
7,177
9,177
11,177
13,177
Mar
-00
Jul-
00
Nov
-00
Mar
-01
Jul-
01
Nov
-01
Mar
-02
Jul-
02
Nov
-02
Mar
-03
Jul-
03
Nov
-03
Mar
-04
Jul-
04
Nov
-04
Mar
-05
Jul-
05
Nov
-05
Mar
-06
Pru ICICI Technology Fund BSE Tech Index
-5.35%
25.00%
48.21%
24.57%
-0.72%1.96%
32.39%
50.87%
21.91%
-8.89%-20.00%
-10.00%
0.00%
10.00%
20.00%
30.00%
40.00%
50.00%
60.00%
Last 6Months
Last 1years
Last 3years
Last 5years
SinceInception
Pru ICICI Technology Fund BSE Tech Index
64.72%
11.80%
10.58%
2.31%
2.25%
0.25%
0.00% 20.00% 40.00% 60.00%
Software
Media &
Entertainment
Pharmaceuticals
Industrial Capital
Goods
Telecom Services
Consultancy
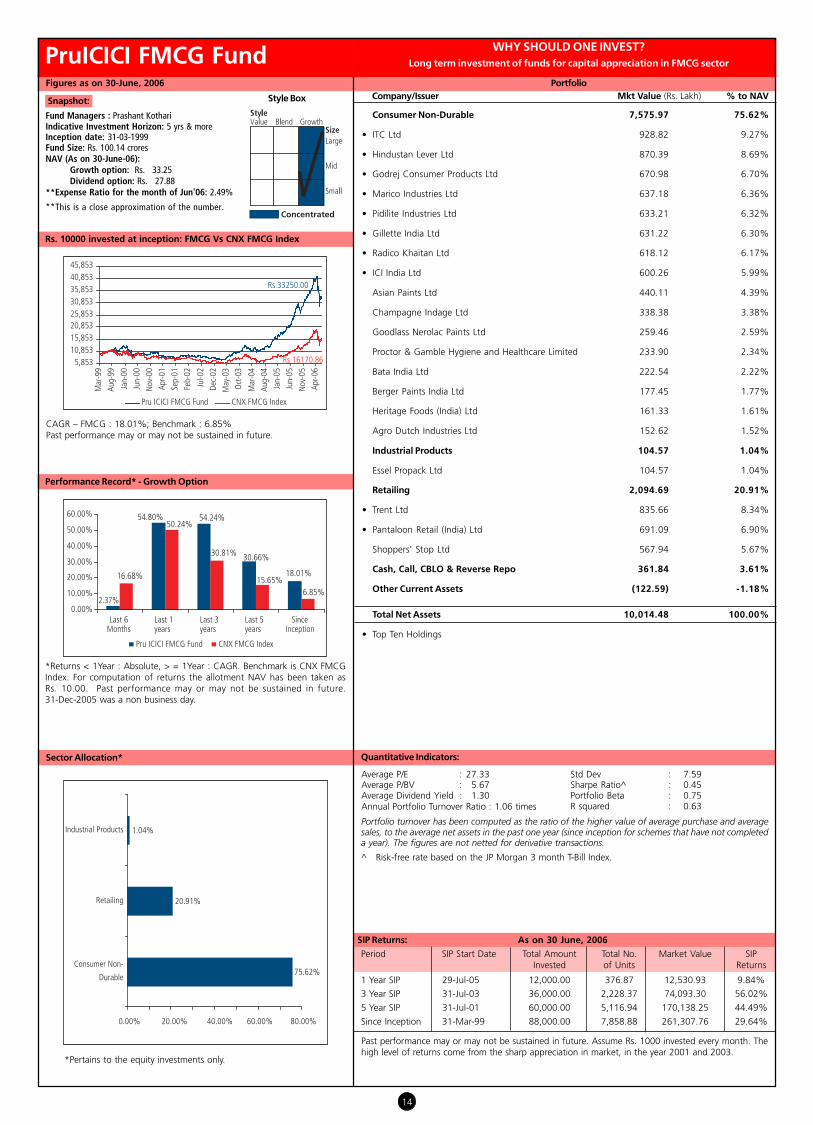
14
Portfolio
Company/Issuer Mkt Value (Rs. Lakh) % to NAV
PruICICI FMCG Fund
Snapshot:
Fund Managers : Prashant KothariIndicative Investment Horizon: 5 yrs & moreInception date: 31-03-1999Fund Size: Rs. 100.14 croresNAV (As on 30-June-06):
Growth option: Rs. 33.25Dividend option: Rs. 27.88
**Expense Ratio for the month of Jun'06: 2.49%
**This is a close approximation of the number.
WHY SHOULD ONE INVEST?
Long term investment of funds for capital appreciation in FMCG sector
Performance Record* - Growth Option
Rs. 10000 invested at inception: FMCG Vs CNX FMCG Index
CAGR – FMCG : 18.01%; Benchmark : 6.85%Past performance may or may not be sustained in future.
Sector Allocation*
*Returns < 1Year : Absolute, > = 1Year : CAGR. Benchmark is CNX FMCGIndex. For computation of returns the allotment NAV has been taken asRs. 10.00. Past performance may or may not be sustained in future.31-Dec-2005 was a non business day.
SIP Returns: As on 30 June, 2006
Period SIP Start Date Total Amount Total No. Market Value SIPInvested of Units Returns
1 Year SIP 29-Jul-05 12,000.00 376.87 12,530.93 9.84%
3 Year SIP 31-Jul-03 36,000.00 2,228.37 74,093.30 56.02%
5 Year SIP 31-Jul-01 60,000.00 5,116.94 170,138.25 44.49%
Since Inception 31-Mar-99 88,000.00 7,858.88 261,307.76 29.64%
Quantitative Indicators:
Average P/E : 27.33Average P/BV : 5.67Average Dividend Yield : 1.30Annual Portfolio Turnover Ratio : 1.06 times
Consumer Non-Durable 7,575.97 75.62%
• ITC Ltd 928.82 9.27%
• Hindustan Lever Ltd 870.39 8.69%
• Godrej Consumer Products Ltd 670.98 6.70%
• Marico Industries Ltd 637.18 6.36%
• Pidilite Industries Ltd 633.21 6.32%
• Gillette India Ltd 631.22 6.30%
• Radico Khaitan Ltd 618.12 6.17%
• ICI India Ltd 600.26 5.99%
Asian Paints Ltd 440.11 4.39%
Champagne Indage Ltd 338.38 3.38%
Goodlass Nerolac Paints Ltd 259.46 2.59%
Proctor & Gamble Hygiene and Healthcare Limited 233.90 2.34%
Bata India Ltd 222.54 2.22%
Berger Paints India Ltd 177.45 1.77%
Heritage Foods (India) Ltd 161.33 1.61%
Agro Dutch Industries Ltd 152.62 1.52%
Industrial Products 104.57 1.04%
Essel Propack Ltd 104.57 1.04%
Retailing 2,094.69 20.91%
• Trent Ltd 835.66 8.34%
• Pantaloon Retail (India) Ltd 691.09 6.90%
Shoppers' Stop Ltd 567.94 5.67%
Cash, Call, CBLO & Reverse Repo 361.84 3.61%
Other Current Assets (122.59) -1.18%
Total Net Assets 10,014.48 100.00%
• Top Ten Holdings
Style Box
Figures as on 30-June, 2006
*Pertains to the equity investments only.
Portfolio turnover has been computed as the ratio of the higher value of average purchase and averagesales, to the average net assets in the past one year (since inception for schemes that have not completeda year). The figures are not netted for derivative transactions.
^ Risk-free rate based on the JP Morgan 3 month T-Bill Index.
Past performance may or may not be sustained in future. Assume Rs. 1000 invested every month. Thehigh level of returns come from the sharp appreciation in market, in the year 2001 and 2003.
Std Dev : 7.59Sharpe Ratio^ : 0.45Portfolio Beta : 0.75R squared : 0.63
Rs 33250.00
Rs 16170.865,853
10,853
15,853
20,853
25,853
30,853
35,853
40,853
45,853
Mar
-99
Aug
-99
Jan-
00
Jun-
00
Nov
-00
Apr
-01
Sep-
01
Feb-
02
Jul-
02
Dec
-02
May
-03
Oct-
03
Mar
-04
Aug
-04
Jan-
05
Jun-
05
Nov
-05
Apr
-06
Pru ICICI FMCG Fund CNX FMCG Index
2.37%
54.80% 54.24%
30.66%
18.01%16.68%
50.24%
30.81%
15.65%
6.85%
0.00%
10.00%
20.00%
30.00%
40.00%
50.00%
60.00%
Last 6Months
Last 1years
Last 3years
Last 5years
SinceInception
Pru ICICI FMCG Fund CNX FMCG Index
75.62%
20.91%
1.04%
0.00% 20.00% 40.00% 60.00% 80.00%
Consumer Non-
Durable
Retailing
Industrial Products

15
SIP Returns: As on 30 June, 2 006
P e rio d S IP S ta rt D a te T o ta l A m o u n t T o ta l N o . M a rk e t V a lu e S IPIn v e s te d o f U n its R e tu r n s
1 Y e a r S IP 2 9 -Ju l-0 5 12 ,0 0 0 .0 0 4 8 9 .0 4 13 ,510 .56 2 8 .8 3 %
3 Y e a r S IP 3 1-Ju l-0 3 3 6 ,0 0 0 .0 0 2 ,118 .58 58 ,52 9 .3 7 3 6 .19 %
S in c e In c e p tio n 2 6 -F e b -0 2 54 ,0 0 0 .0 0 4 ,150 .7 6 114 ,6 7 1.8 0 3 5.8 0 %
Portfolio
C om p a ny /Issuer M k t V a lue (R s . L a k h ) % to N AV
PruIC IC I Ind ex F und
Sna p sh ot:
Fund Managers : Yogesh BhattIndicative Investment Horizon: 5 y rs & m oreIncep tion date: 2 6 -0 2 -2 0 0 2F u nd S ize: R s. 7 .4 1 c roresN A V (A s on 3 0 -J u ne-0 6 ): R s. 2 7 .6 2 6 7* * E x p ense R atio for th e month of J u n'0 6 : 1 .2 5 %
* * T his is a c lose ap p rox im ation of the n u m b er.
WHY SHOULD ONE INVEST?Lo n g t e r m in v e s t m e n t o f f u n d s f o r c a p it a l a p p r e c ia t io n
b y r e p lic a t in g S& P C NX Nif t y in d e x
A u t o 5 5 .5 7 7 .5 0 %Tata Motors Ltd 1 5 .0 7 2 .0 3 %B ajaj A u to Ltd 1 3 .7 7 1 .8 6 %Maru ti U dy og Ltd 1 1 .3 8 1 .5 4 %H e ro H on da Ltd 7 .8 5 1 .0 6 %Mah in dra & Mah in dra Ltd 7 .5 0 1 .0 1 %B a n k s 6 0 .0 4 8 .1 1 %
• IC IC I B an k Ltd 2 1 .5 3 2 .9 0 %S tate B an k of In dia Ltd 1 8 .9 5 2 .5 6 %H D F C B an k Ltd 1 2 .3 6 1 .6 7 %P u n jab N ation al B an k Ltd 5 .0 8 0 .6 9 %O rie n tal B an k of C om m e rc e 2 .1 2 0 .2 9 %C e m e n t 2 2 .6 6 3 .0 6 %G rasim In du strie s Ltd 8 .7 6 1 .1 8 %A ssoc iate d C e m e n t C om p an ie s Ltd 7 .2 4 0 .9 8 %G u jarat A m b u ja C e m e n t Ltd 6 .6 6 0 .9 0 %C h e m ic a ls 3 .2 4 0 .4 4 %In dian P e troc h e m ic als C orp oration Ltd 3 .2 4 0 .4 4 %C o n s u m e r No n -Du r a b le 6 5 .0 5 8 .7 8 %
• ITC Ltd 3 3 .8 9 4 .5 7 %• H in du stan Le v e r Ltd 2 4 .9 9 3 .3 7 %
D ab u r In dia Ltd 4 .0 4 0 .5 5 %Tata Te a Ltd 2 .1 3 0 .2 9 %F e r ro u s M e t a ls 3 1 .2 2 4 .2 1 %S te e l A u th ority of In dia Ltd 1 6 .6 0 2 .2 4 %Tata Iron & S te e l C om p an y Ltd 1 4 .6 2 1 .9 7 %F in a n c e 1 4 .0 9 1 .9 0 %H ou sin g D e v e lop m e n t F in an c e C orp oration Ltd 1 4 .0 9 1 .9 0 %G a s 1 0 .7 5 1 .4 5 %G as A u th ority of In dia Ltd 1 0 .7 5 1 .4 5 %In d u s t r ia l C a p it a l G o o d s 6 6 .4 9 8 .9 8 %
• B h arat H e av y E le c tric als Ltd 2 3 .6 1 3 .1 9 %Larse n & Tou b ro Ltd 1 5 .4 2 2 .0 8 %S u z lon E n e rg y Ltd 1 4 .8 2 2 .0 0 %S ie m e n s In dia Ltd 7 .4 1 1 .0 0 %A B B Ltd 5 .2 3 0 .7 1 %M e d ia & En t e r t a in m e n t 4 .9 3 0 .6 7 %Z e e Te le film s Ltd 4 .9 3 0 .6 7 %No n -F e r r o u s M e t a ls 1 7 .5 2 2 .3 7 %H in dalc o In du strie s Ltd 1 0 .2 9 1 .3 9 %N ation al A lu m in iu m C om p an y Ltd 7 .2 3 0 .9 8 %Oil 7 8 .1 7 1 0 .5 5 %
• O il & N atu ral G as C om p an y Ltd 7 8 .1 7 1 0 .5 5 %P e t r o le u m P r o d u c t s 8 1 .9 9 1 1 .0 6 %
• R e lian c e In du strie s Ltd 7 3 .0 7 9 .8 6 %B h arat P e trole u m C orp oration Ltd 4 .9 7 0 .6 7 %H in du stan P e trole u m C orp oration Ltd 3 .9 5 0 .5 3 %P h a r m a c e u t ic a ls 3 1 .2 9 4 .2 3 %C ip la Ltd 8 .3 1 1 .1 2 %S u n P h arm ac e u tic als Ltd 7 .2 5 0 .9 8 %R an b ax y Lab oratorie s Ltd 6 .5 7 0 .8 9 %D r. R e ddy 's Lab oratorie s Ltd 4 .8 1 0 .6 5 %G lax o S m oth k lin e P h arm a Ltd 4 .3 5 0 .5 9 %P o w e r 9 .2 5 1 .2 5 %Tata P ow e r C om p an y Ltd 4 .7 2 0 .6 4 %R e lian c e E n e rg y Ltd 4 .5 3 0 .6 1 %So ftw a r e 1 4 0 .0 6 1 8 .8 9 %
• In fosy s Te c h n olog ie s Ltd 4 2 .1 2 5 .6 8 %• Tata C on su ltan c y S e rv ic e s Ltd 4 2 .0 8 5 .6 8 %• W ip ro Ltd 3 6 .3 4 4 .9 0 %
S aty am C om p u te r S e rv ic e s Ltd 1 1 .4 5 1 .5 4 %H C L Te c h n olog ie s Ltd 8 .0 7 1 .0 9 %Te le c o m Se r v ic e s 4 5 .1 7 6 .0 9 %
• B h arti Te le v e n tu re s Ltd 3 4 .6 9 4 .6 8 %V ide sh S an c h ar N ig am Ltd 5 .6 5 0 .7 6 %Mah an ag ar Te le p h on e N ig am Ltd 4 .8 3 0 .6 5 %Tra n s p o r t a t io n 2 .5 2 0 .3 4 %Je t A irw ay s In dia Ltd 2 .5 2 0 .3 4 %C a s h , C a ll, C B LO & R e v e r s e R e p o 0 .1 0 0 .0 1 %Ot h e r C u r r e n t A s s e t s 1 .0 4 0 .1 1 %
To t a l Ne t A s s e t s 7 4 1 .1 5 1 0 0 .0 0 %
• Top Te n H oldin g s
P e r f o r m a n c e R e c o r d * - C u m u la t iv e Op t io n
R s . 1 0 0 0 0 in v e s t e d a t in c e p t io n : In d e x F u n d Vs S& P C NX Nif t y
C A G R – In de x F u n d : 2 6 .3 7 % ; B e n c h m ark : 2 4 .9 4 %P ast p e rform an c e m ay or m ay n ot b e su stain e d in fu tu re .
Se c t o r A llo c a t io n *
* R e tu rn s > = 1 Y e ar are C A G R , < 1 Y e ar are A b solu te . B e n c h m ark is S & P C N XN ifty. F or c om p u tation of re tu rn s th e allotm e n t N A V h as b e e n tak e n asR s. 1 0 .0 0 . P ast p e rform an c e m ay or m ay n ot b e su stain e d in fu tu re .3 1 -D e c -2 0 0 5 w as a n on b u sin e ss day.
Q u a n t it a t iv e In d ic a t o r s :
A v e rag e P /E : 1 7 .4 6A v e rag e P /B V : 4 .1 7A v e rag e D iv ide n d Y ie ld : 1 .4 8A n n u al P ortfolio Tu rn ov e r R atio : 5 .0 6 tim e s
* P e rtain s to th e e q u ity in v e stm e n ts on ly.
Portfolio turnover has been computed as the ratio of the higher value of average purchase and averagesales, to the average net assets in the past one y ear (since inception for schemes that have not completeda y ear). T he figures are not netted for derivative transactions.
^ R isk -fre e rate b ase d on th e JP Morg an 3 m on th T-B ill In de x .
F ig u r e s a s o n 3 0 -J u n e , 2 0 0 6
P ast p e rform an c e m ay or m ay n ot b e su stain e d in fu tu re . A ssu m e R s. 1 0 0 0 in v e ste d e v e ry m on th . Th eh ig h le v e l of re tu rn s c om e from th e sh arp ap p re c iation in m ark e t, in th e y e ar 2 0 0 3 an d 2 0 0 5 .
S td D e v : 7 .3 6S h arp e R atio^ : 0 .3 6P ortfolio B e ta : 1 .0 3R sq u are d : 1 .0 0
Rs 27626.70
Rs 263 00.66
7,708
1 2,708
1 7,708
22,708
27,708
3 2,708
3 7,708
Feb-
02
May
-02
Aug
-02
Nov
-02
Feb-
03
May
-03
Aug
-03
Nov
-03
Feb-
04
May
-04
Aug
-04
Nov
-04
Feb-
05
May
-05
Aug
-05
Nov
-05
Feb-
06
May
-06
P ru IC IC I In d e x F u n d S & P C N X N ifty
11.41%
45 .3 2 %41.5 8 %
2 6 .3 7 %
10 .2 8 %
40 .8 7 % 40 .2 0 %
2 4.9 4%
0 .0 0 %5 .0 0 %
10 .0 0 %15 .0 0 %2 0 .0 0 %2 5 .0 0 %3 0 .0 0 %3 5 .0 0 %40 .0 0 %45 .0 0 %5 0 .0 0 %
L a s t 6 M o n th s L a s t 1 y e a rs L a s t 3 y e a rs S in c eIn c e p tio n
P ru IC IC I In d e x F u n d S & P C N X N ifty
1 8 .8 9 %
1 1 .06%
1 0.5 5 %
8 .9 8 %
8 .78 %
8 .1 1 %
7.5 0%
6.09 %
4 .23 %
4 .21 %
3 .06%
2.3 7%
1 .9 0%
1 .4 5 %
1 .25 %
0.67%
0.4 4 %
0.3 4 %
0.00% 5 .00% 1 0.00% 1 5 .00% 20.00%
S o ftw a re
P e tro le u m P ro d u c ts
O il
In d u stria l C a p ita l
C o n su m e r N o n -D u ra b le
B a n k s
A u to
T e le c o m S e rv ic e s
P h a rm a c e u tic a ls
F e rro u s M e ta ls
C e m e n t
N o n -F e rro u s M e ta ls
F in a n c e
G a s
P o w e r
M e d ia & E n te rta in m e n t
C h e m ic a ls
T ra n sp o rta tio n

16
Quantitative Indicators:
A v e ra g e P /E : 19 .8 6A v e ra g e P /B V : 4 .3 9A v e ra g e D iv id e n d Y ie ld : 1.19A n n u a l P o rtfo lio T u rn o v e r R a tio : 0 .17 tim e s
P ortfolio
S P IcE F und
S nap sh ot:
Fund Managers : Yogesh Bhatt
Inv estm ent H o riz o n: 5 y ears & m ore
Inc ep tio n date: 1 0 -0 1 -2 0 0 3
Fund S iz e: R s. 0 .8 6 c rores
N A V (A s o n 3 0 -June-0 6 ): R s. 1 0 8 .6 6 5 2* * E x p ense R atio fo r t h e m o nth o f Jun'0 6 : 0 .8 0 %
* * T his is a c lose ap p rox im ation of the n u m b er.
W H Y S H O U L D O N E IN V E S T ?
L ong term investm ent of funds for cap ital ap p reciation b y rep licating th e B S E S ensitive Index
A uto 6 .9 7 8 .1 4 %
B a ja j A u to L td 2 .4 6 2 .8 7 %
T a ta M o to rs L td 2 .3 3 2 .7 2 %
M a ru ti U d y o g L td 1.17 1.3 7 %
H e ro H o n d a L td 1.0 1 1.18 %
B ank s 1 0 .2 5 1 1 .9 8 %
• IC IC I B a n k L td 5 .5 3 6.4 6%
H D F C B a n k L td 2 .5 3 2 .9 6%
S ta te B a n k o f In d ia L td 2 .19 2 .5 6%
C em ent 4 .4 8 5 .2 3 %
G ra s im In d u s trie s L td 1.8 0 2 .10 %
G u ja ra t A m b u ja C e m e n t L td 1.3 7 1.60 %
A s s o c ia te d C e m e n t C o m p a n ie s L td 1.3 1 1.5 3 %
C onsum er N on-D urab le 9 .3 2 1 0 .8 9 %
• H in d u s ta n L e v e r L td 3 .2 2 3 .7 6%
• IT C L td 6.10 7 .13 %
F errous M etals 2 .8 2 3 .3 0 %
• T a ta Iro n & S te e l C o m p a n y L td 2 .8 2 3 .3 0 %
F inance 3 .4 1 3 .9 9 %
• H o u s in g D e v e lo p m e n t F in a n c e C o rp o ra tio n L td 3 .4 1 3 .9 9 %
Industrial C ap ital G oods 5 .6 7 6 .6 3 %
• L a rs e n & T o u b ro L td 3 .5 4 4 .14 %
B h a ra t H e a v y E le c tric a ls L td 2 .13 2 .4 9 %
N on-F errous M etals 1 .7 4 2 .0 3 %
H in d a lc o In d u s trie s L td 1.7 4 2 .0 3 %
O il 3 .0 1 3 .5 2 %
• O il & N a tu ra l G a s C o m p a n y L td 3 .0 1 3 .5 2 %
P etroleum P roducts 1 0 .3 3 1 2 .0 7 %
• R e lia n c e In d u s trie s L td 10 .3 3 12 .0 7 %
P h arm aceuticals 3 .3 9 3 .9 7 %
C ip la L td 1.2 8 1.5 0 %
R a n b a x y L a b o ra to rie s L td 1.18 1.3 8 %
D r. R e d d y 's L a b o ra to rie s L td 0 .9 3 1.0 9 %
P ow er 2 .3 4 2 .7 4 %
N a tio n a l T h e rm a l P o w e r C o rp o ra tio n L td 1.7 5 2 .0 5 %
R e lia n c e E n e rg y L td 0 .5 9 0 .69 %
S oftw are 1 5 .3 4 1 7 .9 4 %
• In fo s y s T e c h n o lo g ie s L td 8 .65 10 .11%
S a ty a m C o m p u te r S e rv ic e s L td 2 .65 3 .10 %
T a ta C o n s u lta n c y S e rv ic e s L td 2 .17 2 .5 4 %
W ip ro L td 1.8 7 2 .19 %
T elecom S ervices 5 .6 5 6 .6 0 %
• B h a rti T e le v e n tu re s L td 3 .13 3 .66%
R e lia n c e C o m m u n ic a tio n s V e n tu re s L td 2 .5 2 2 .9 4 %
C ash , C all, C B L O & R everse R ep o 2 .0 0 2 .3 4 %
O th er C urrent A ssets (1 .1 5 ) - 1 .3 7 %
T otal N et A ssets 8 5 .5 7 1 0 0 .0 0 %
• T o p T e n H o ld in g s
P erform ance R ecord* - G row th O p tion
R s. 1 0 0 0 0 invested at incep tion: S P IC E V s B S E S ensitive Index
C A G R – S P Ic E F u n d : 4 0 .2 5 % ; B e n c h m a rk : 3 9 .2 8 %P a s t p e rfo rm a n c e m a y o r m a y n o t b e s u s ta in e d in fu tu re .
S ector A llocation*
* R e tu r n s < 1Y e a r : A b s o lu te , > = 1Y e a r : C A G R . B e n c h m a rk is B S E S E N S E XIn d e x .F o r c o m p u ta tio n o f re tu r n s th e a llo tm e n t N A V h a s b e e n ta k e n a sR s . 10 .0 0 . P a s t p e r fo r m a n c e m a y o r m a y n o t b e s u s t a in e d in f u t u re .3 1-D e c -2 0 0 5 w a s a n o n b u s in e s s d a y.
C om p any /Issuer M k t V alue (R s . L a k h ) % to N A V
* P e rta in s to th e e q u ity in v e s tm e n ts o n ly.
Portfolio turnover has been computed as the ratio of the higher value of average purchase and averagesales, to the average net assets in the past one y ear (since inception for schemes that have not completeda y ear). T he figures are not netted for derivative transactions.
^ R is k -fre e ra te b a s e d o n th e JP M o rg a n 3 m o n th T -B ill In d e x .
F ig ures as on 3 0 -June, 2 0 0 6
S td D e v : 6.68S h a rp e R a tio ^ : 0 .4 1P o rtfo lio B e ta : 0 .9 9R s q u a re d : 1.0 0
Rs 32350.46
Rs 31 58 4.64
8 ,655
1 3,655
1 8 ,655
23,655
28 ,655
33,655
38 ,655
43,655
Jan-
03M
ar-0
3
May
-03
Jul-
03
Sep-
03
Nov
-03
Jan-
04
Mar
-04
May
-04
Jul-
04
Sep-
04
Nov
-04
Jan-
05M
ar-0
5
May
-05
Jul-
05
Sep-
05N
ov-0
5
Jan-
06M
ar-0
6
May
-06
S P Ic E F u n d B S E S E N S E X
13.77%
4 8 .33%4 4 .16 %
4 0 .2 5 %
12 .8 9 %
4 7.4 8 %4 3.2 3%
39 .2 8 %
0 .0 0 %
10 .0 0 %
2 0 .0 0 %
30 .0 0 %
4 0 .0 0 %
5 0 .0 0 %
6 0 .0 0 %
L a s t 6 M o n th s L a s t 1 y e a rs L a s t 3 y e a rs S in c eIn c e p tio n
S P Ic E F u n d B S E S E N S E X
1 7 .9 4%
1 2.07 %
1 1 .9 8 %
1 0.8 9 %
8 .1 4%
6.63%
6.60%
5.23%
3.9 8 %
3.9 7 %
3.52%
3.30%
2.7 4%
2.03%
0.00% 5.00% 1 0.00% 1 5.00% 20.00%
S o ftw a re
P e tro le u m P ro d u c ts
B a n k s
C o n su m e r N o n -D u ra b le
A u to
In d u stria l C a p ita l G o o d s
T e le c o m S e rv ic e s
C e m e n t
F in a n c e
P h a rm a c e u tic a ls
O il
F e rro u s M e ta ls
P o w e r
N o n -F e rro u s M e ta ls

17
59.65%
3 8 .2 0 %
1 .2 8 %
0 .8 6%
0 .0 0 % 2 0 .0 0 % 4 0 .0 0 % 60 .0 0 % 8 0 .0 0 %
< 1 8 2 d a y s
1 -3 y e a rs
1 8 2 d a y s - 1 y e a r
O th e r C u rre n t A s s e ts
Quantitative Indicators – Debt Component Quantitative Indicators – E q uity Component
A v e ra g e M a tu rity : 0 .8 4 y e a rM o d ifie d D u ra tio n : 0 .76 y e a rY ie ld T o M a tu rity : 7.0 1%
A v e ra g e P /E : 14 .8 7A v e ra g e P /B V : 2 .6 9A v e ra g e D iv id e n d Y ie ld : 1.12
S IP R eturns: A s on 3 0 June, 2 0 0 6
P e rio d S IP S ta rt D a te T o ta l A m o u n t T o ta l N o . M a rk e t V a lu e S IPIn v e s te d o f U n its R e tu r n s
1 Y e a r S IP 2 9 -Ju l-0 5 12 ,0 0 0 .0 0 70 5 .0 7 12 ,4 4 3 .71 8 .19 %3 Y e a r S IP 3 1-Ju l-0 3 3 6 ,0 0 0 .0 0 2 ,3 4 0 .4 8 4 1,3 0 6 .9 0 9 .6 5 %5 Y e a r S IP 3 1-Ju l-0 1 6 0 ,0 0 0 .0 0 4 ,3 3 2 .2 8 76 ,4 5 9 .9 8 9 .9 4 %S in c e In c e p tio n 10 -N o v -0 0 6 9 ,0 0 0 .0 0 5 ,19 2 .5 5 9 1,6 4 2 .8 0 10 .0 5 %
P a s t p e rfo rm a n c e m a y o r m a y n o t b e s u s ta in e d in fu tu re . A s s u m e R s . 10 0 0 in v e s te d e v e ry m o n th .
P ruICICI M onth ly Income P lan
S napsh ot:
Fund Managers: E q uity : Jignesh ShahD eb t : C haitany a P and e
Indic ativ e Inv estm ent H o riz o n: 1 y r & ab o v eInc ep tio n date: 1 0 -1 1 -2 0 0 0Fund S iz e: R s. 6 0 2 .9 4 c ro resN A V (A s o n 3 0 -June-0 6 ): C um ulativ e o p t io n : R s. 1 7 .6 4 8 9* * E x p ense R atio fo r t h e m o nth o f Jun'0 6 : 1 .9 5 %* * T his is a c lo se ap p ro x im atio n o f the nu m b er.
W H Y S H O U L D O N E IN V E S T ?M edium term investment in a portfolio of debtand eq uity (upto 1 5 % ) for capital appreciation.
R s. 1 0 0 0 0 invested at inception* : M IP V s Crisil M IP B lended Index
P erformance R ecord* - Cumulative O ption
R ating P rof ile (as % of debt h olding )
* B e n c h m a rk s ta rt d a te : 3 1-0 3 -2 0 0 2 . C A G R – M IP : 9 .9 8 % ; B e n c h m a rk :8 .9 1% . B e n c h m a rk is C ris il M IP B le n d e d In d e x . P a s t p e rfo rm a n c e m a y o r m a yn o t b e s u s ta in e d in fu tu re .
* R e tu r n s > = 1 Y e a r a re C A G R , < 1 Y e a r a re A b s o lu te . B e n c h m a rk is C ris il M IPB le n d e d In d e x . S ta rt d a te : 3 1/3 /0 2 . F o r c o m p u ta tio n o f re tu rn s th e a llo tm e n tN A V h a s b e e n ta k e n a s R s . 10 .0 0 . P a s t p e rfo rm a n c e m a y o r m a y n o t b es u s ta in e d in fu tu re . 3 0 -Ju n -2 0 0 1 a n d 3 1-D e c -2 0 0 5 w e re n o n b u s in e s s d a y s .
E q uity H olding s 8 ,4 2 2 .2 8 1 3 .9 5 %
R e lia n c e In d u s trie s L td P e tro le u m P ro d u c ts 1,70 7.4 3 2 .8 3 %
T a ta Iro n & S te e l C o m p a n y L td F e rro u s M e ta ls 4 8 4 .9 8 0 .8 0 %
S te rlite In d u s trie s (In d ia ) L td N o n -F e rro u s M e ta ls 4 17.9 7 0 .6 9 %
In d ia C e m e n ts L td C e m e n t 3 13 .6 0 0 .5 2 %
IT C L td C o n s u m e r N o n -D u ra b le 2 8 4 .8 6 0 .4 7%
O C L In d ia L td C e m e n t 2 72 .14 0 .4 5 %
L a rs e n & T o u b ro L td In d u s tria l C a p ita l G o o d s 2 6 9 .0 4 0 .4 5 %
S ta te B a n k o f In d ia L td B a n k s 2 4 5 .70 0 .4 1%
P a te l E n g in e e rin g L td C o n s tru c tio n 2 0 1.4 9 0 .3 3 %
C ip la L td P h a rm a c e u tic a ls 2 0 0 .8 8 0 .3 3 %
In fo s y s T e c h n o lo g ie s L td S o ftw a re 2 0 0 .13 0 .3 3 %
P u n ja b N a tio n a l B a n k L td B a n k s 19 5 .3 3 0 .3 2 %
B a ja j H in d u s ta n L td C o n s u m e r N o n -D u ra b le 18 8 .4 5 0 .3 1%
IC IC I B a n k L td B a n k s 18 4 .4 3 0 .3 1%
N a tio n a l A lu m in iu m C o m p a n y L td N o n -F e rro u s M e ta ls 171.8 0 0 .2 8 %
A s h o k L e y la n d L td A u to 14 9 .6 0 0 .2 5 %
U tta m S u g a r M ills L td C o n s u m e r N o n -D u ra b le 14 9 .2 7 0 .2 5 %
In d o T e c h T ra n s fo rm e rs L td In d u s tria l C a p ita l G o o d s 14 2 .2 3 0 .2 4 %
A v e n tis P h a rm a L td P h a rm a c e u tic a ls 13 9 .5 0 0 .2 3 %
B h a ra t E a rth M o v e rs L td In d u s tria l C a p ita l G o o d s 13 8 .5 6 0 .2 3 %
D e c c a n C h ro n ic le H o ld in g s L td M e d ia & E n te rta in m e n t 13 4 .8 5 0 .2 2 %
A m te k A u to L td A u to A n c illa rie s 13 3 .13 0 .2 2 %
O il & N a tu ra l G a s C o m p a n y L td O il 13 2 .9 7 0 .2 2 %
A IA E n g in e e rin g L td In d u s tria l P ro d u c ts 13 1.9 2 0 .2 2 %
P o k a r n a L td C e m e n t 12 7.0 1 0 .2 1%
In d ia n H o te ls C o m p a n y L td H o te ls 114 .4 5 0 .19 %
V ic e ro y H o te ls L td H o te ls 8 9 .0 8 0 .15 %
G la x o S m o th k lin e P h a rm a L td P h a rm a c e u tic a ls 70 .5 4 0 .12 %
Jin d a l S te e l & P o w e r C o m p a n y L td F e rro u s M e ta ls 6 6 .5 7 0 .11%
R e lia n c e C o m m u n ic a tio n s V e n tu re s L td T e le c o m S e rv ic e s 6 6 .3 3 0 .11%
S u n il H ite c h E n g in e e rs L td C o n s tru c tio n 4 6 .3 1 0 .0 8 %
V is a S te e l L td F e rro u s M e ta ls 3 7.2 0 0 .0 6 %
P re m ie r E x p lo s iv e s L td In d u s tria l P ro d u c ts 3 4 .9 6 0 .0 6 %
S o la r E x p lo s iv e s L td In d u s tria l P ro d u c ts 2 5 .8 7 0 .0 4 %
N ifty F u tu re s 1,15 3 .70 1.9 1%
Debt H olding s 5 2 ,5 7 0 .5 4 8 7 .1 9 %
P S U / P F I B onds 6 ,4 0 3 .9 4 1 0 .6 1 %
In d ia n R a ilw a y F in a n c e C o rp o ra tio n A A A 3 ,0 3 4 .8 2 5 .0 3 %
In d u s tria l D e v e lo p m e n t B a n k o f In d ia A A + 2 ,4 14 .2 6 4 .0 0 %
In fra s tru c tu re D e v e lo p m e n t F in a n c e C o rp n A A A 9 5 4 .8 6 1.5 8 %
P rivate Corporate S ecurities 1 8 ,6 7 3 .8 6 3 0 .9 9 %
• P T C U B L T ru s t In d u s In d B a n k A A A (S O ) 6 ,117.9 1 10 .15 %
• P T C C iti F le e t T ru s t C itib a n k A A A (S O ) 4 ,116 .19 6 .8 3 %
P T C IB L T ru s t In d u s In d B a n k A A A (S O ) 2 ,75 3 .9 4 4 .5 7%
C itic o rp M a ru ti F in a n c e L td A A A 1,9 75 .0 1 3 .2 8 %
P T C R P S T a ta T e le s e rv ic e s A A A (S O ) 1,5 78 .2 2 2 .6 2 %
S u n d a ra m F in a n c e L td A A A 1,4 5 3 .4 6 2 .4 1%
P T C C iti M o b ile T ru s t C itib a n k A A A (S O ) 6 3 3 .8 3 1.0 5 %
In d ia In fra s tru c tu re D e v e lo p e rs L td A 1+ (S O ) 4 5 .3 0 0 .0 8 %
G overnment S ecurities 5 ,8 9 8 .0 0 9 .7 8 %
• 6 .6 5 % G O I 2 0 0 9 S o v e re ig n 5 ,8 9 8 .0 0 9 .78 %
CP s and CDs 5 ,9 1 5 .9 9 9 .8 1 %
• H D F C B a n k - C D P 1+ 3 ,9 5 6 .5 1 6 .5 6 %
U T I B a n k L td - C D P 1+ 9 8 6 .19 1.6 4 %
A m e ric a n E x p re s s B a n k L td - C D P 1+ 9 73 .2 9 1.6 1%
T erm Deposits 1 2 ,7 0 2 .0 0 2 1 .0 6 %
• C itib a n k 12 ,0 0 0 .0 0 19 .9 0 %
IC IC I B a n k 70 2 .0 0 1.16 %
Cash , Call, CB L O & R everse R epo 2 ,9 7 6 .7 5 4 .9 4 %
O th er Current A ssets (6 9 9 .0 2 ) -1 .1 4 %
T otal N et A ssets 6 0 ,2 9 3 .8 0 1 0 0 .0 0 %
• T o p F iv e H o ld in g s
P ortfolio
Company /Issuer S ector/R ating M k t V alue (R s . L a k h ) % to N A V
M aturity P rof ile (as % of debt h olding )
(A n o p e n e n d e d fu n d . M o n th ly in c o m e is n o t a s s u re d a n d is s u b je c t to th e a v a ila b ility o f d is trib u ta b le s u rp lu s .)
A n n u a l P o rtfo lio T u r n o v e r R a tio : 0 .8 5 tim e s% U n lis te d B o n d s : 5 .6 9 %
F ig ures as on 3 0 -June, 2 0 0 6
S ty le B ox :
D e b t E q u ity
R s 1 4 97 9.2 9
R s 1 4 3 68 .8 4
9,8 2 3
1 0 ,8 2 3
1 1 ,8 2 3
1 2 ,8 2 3
1 3 ,8 2 3
1 4 ,8 2 3
1 5,8 2 3
Apr
-02
Jul-
02
Oct
-02
Jan-
03
Apr
-03
Jul-
03
Oct
-03
Jan-
04
Apr
-04
Jul-
04
Oct
-04
Jan-
05
Apr
-05
Jul-
05
Oct
-05
Jan-
06
Apr
-06
P ru IC IC I M o n th ly In c o m e P la n C ris il M IP B le n d e d in d e x
4 .7 3 %
1 1 .4 4 %1 0 .0 0 % 1 0 .1 0 % 1 0 .60 %
2 .7 3 %
8 .2 7 % 8 .53 %
0 .0 0 %
2 .0 0 %
4 .0 0 %
6.0 0 %
8 .0 0 %
1 0 .0 0 %
1 2 .0 0 %
1 4 .0 0 %
L a s t 6M o n th s
L a s t 1y e a rs
L a s t 3y e a rs
L a s t 5y e a rs
S in c eIn c e p tio n
P ru IC IC I M o n th ly In c o m e P la n C ris il M IP B le n d e d in d e x
Sovereign
Securities1 1 .1 2 %
A A a n d E q uiv a len t
4 .6 5 %
C a ll,C urren tA ssets,B a n kD ep o sits a n d R ev erse R ep o s
2 8 .8 9 %
A A A a n d E q uiv a len t5 5 .0 9 %

18
93.88%
2 9.2 1 %
4 .98%
-2 8.0 7 %
-5 0 .0 0 % 0 .0 0 % 5 0 .0 0 % 1 0 0 .0 0 %
< 1 82 d a y s
1 -3 y e a rs
1 82 d a y s - 1 y e a r
O th e r C u rre n tA s s e ts
Snapshot:
Fund Managers :Equity : Yogesh BhattD eb t : C haitan y a P an d e
Indic ativ e Inv estm ent H o riz o n: 6 m on ths-1 y earInc ep tio n date: 3 1 -0 5 -2 0 0 5Fund S iz e: R s. 7 8 2 .1 9 c roresN A V (A s o n 3 0 -June-0 6 ):
G ro w th o p tio n: R s. 1 0 .8 3 5 6D iv idend o p tio n: R s. 1 0 .3 2 1 8
* * Ex p ense R atio fo r th e m o nth o f Jun'0 6 : 1 .5 0 %* * T his is a c lose ap p rox im ation of the n u m b er.
P r u IC IC I B le nd e d P lan A P ortfolio
C om pany /Issu e r Se c tor/R ating M k t V alu e % N A V M k t V alu e(R s . L a k h ) (R s. L a k h )-F u tu re s
F ig u r e s as on 3 0 -J u ne , 2 0 0 6
E q u ity H old ing s 5 8 ,3 5 8 .9 7 7 4 .5 8 % ( 5 9 ,0 8 8 .1 3 )• R e lia n c e In d u s trie s L td P e tro le u m P ro d u c ts 8,2 6 6 .83 10 .5 7 %
R e lia n c e In d u s trie s L td - F u tu re s -8,2 7 8.14• S ta te B a n k o f In d ia L td B a n k s 4 ,5 3 0 .2 4 5 .7 9 %
S ta te B a n k o f In d ia L td - F u tu re s -4 ,5 6 2 .3 0• H in d a lc o In d u s t r ie s L t d N o n - F e r r o u s M e t a ls 2 ,7 4 0 .4 4 3 . 5 0 %
H in d a lc o In d u s t r ie s L t d - R ig h t s N o n - F e r r o u s M e t a ls 6 3 6 .6 5 0 .81%H in d a lc o In d u s t r ie s L t d - F u t u r e s - 3 ,9 4 0 .17
• In d ia n P e t r o c h e m ic a ls C o r p o r a t io n L t d C h e m ic a ls 3 ,3 6 9 .3 4 4 . 3 1%In d ia n P e tro c h e m ic a ls C o rp o ra tio n L td - F u tu re s -3 ,3 9 8.0 9R a n b a x y L a b o ra to rie s L td P h a rm a c e u tic a ls 2 ,9 89 .0 6 3 .82 %R a n b a x y L a b o ra to rie s L td - F u tu re s -3 ,0 0 9 .2 0M a h a n a g a r T e le p h o n e N ig a m L td T e le c o m S e rv ic e s 2 ,9 2 0 .5 0 3 .7 3 %M a h a n a g a r T e le p h o n e N ig a m L td - F u tu re s -2 ,9 2 5 .2 1B h a rti T e le v e n tu re s L td T e le c o m S e rv ic e s 2 ,5 9 0 .0 0 3 .3 1%B h a rti T e le v e n tu re s L td - F u tu re s -2 ,6 0 3 .6 5B a n k o f B a ro d a L td B a n k s 2 ,0 4 8.7 4 2 .6 2 %B a n k o f B a ro d a L td - F u tu re s -2 ,0 6 1.0 9In d ia C e m e n ts L td C e m e n t 1,9 14 .3 7 2 .4 5 %In d ia C e m e n ts L td - F u tu re s -1,9 2 7 .80C e n tu ry T e x tile s & In d u s trie s L td C e m e n t 1,9 12 .7 1 2 .4 5 %C e n tu ry T e x tile s & In d u s trie s L td - F u tu re s -1,9 2 6 .6 1S te rlite In d u s trie s (In d ia ) L td N o n -F e rro u s M e ta ls 1,5 5 5 .2 3 1.9 9 %S te rlite In d u s trie s (In d ia ) L td - F u tu re s -1,5 6 1.3 6O rie n ta l B a n k o f C o m m e rc e B a n k s 1,5 14 .9 6 1.9 4 %O rie n ta l B a n k o f C o m m e rc e - F u tu re s -1,5 2 1.6 1G ra s im In d u s trie s L td C e m e n t 1,4 9 9 .9 5 1.9 2 %G ra s im In d u s trie s L td - F u tu re s -1,4 9 0 .6 1M a trix L a b o ra to rie s L td P h a rm a c e u tic a ls 1,4 3 3 .0 3 1.83 %M a trix L a b o ra to rie s L td - F u tu re s -1,4 4 2 .6 5A s s o c ia te d C e m e n t C o m p a n ie s L td C e m e n t 1,2 4 6 .4 8 1.5 9 %A s s o c ia te d C e m e n t C o m p a n ie s L td - F u tu re s -1,2 5 2 .6 8E s s a r O il L td O il 1,182 .84 1.5 1%E s s a r O il L td - F u tu re s -1,186 .4 7P u n ja b N a tio n a l B a n k L td B a n k s 1,0 80 .17 1.3 8%P u n ja b N a tio n a l B a n k L td - F u tu re s -1,0 88.4 7G u ja ra t A m b u ja C e m e n t L td C e m e n t 1,0 7 4 .81 1.3 7 %G u ja ra t A m b u ja C e m e n t L td - F u tu re s -1,0 7 4 .81R e lia n c e C a p ita l F in a n c e L td F in a n c e 9 6 4 .7 1 1.2 3 %R e lia n c e C a p ita l F in a n c e L td - F u tu re s -9 6 9 .7 3In d u s tria l D e v e lo p m e n t B a n k o f In d ia B a n k s 9 5 0 .5 3 1.2 2 %In d u s tria l D e v e lo p m e n t B a n k o f In d ia - F u tu re s -9 2 9 .9 2T a ta Iro n & S te e l C o m p a n y L td F e rro u s M e ta ls 7 4 5 .6 4 0 .9 5 %T a ta Iro n & S te e l C o m p a n y L td - F u tu re s -7 5 0 .0 4S R F L td T e x tile s - S y n th e tic 7 3 7 .0 2 0 .9 4 %S R F L td - F u tu re s -7 3 0 .0 9Jin d a l S te e l & P o w e r C o m p a n y L td F e rro u s M e ta ls 7 0 7 .7 3 0 .9 0 %Jin d a l S te e l & P o w e r C o m p a n y L td - F u tu re s -7 11.6 0G u ja ra t N a rm a d a V a lle y F e rtilis e rs C o . L td F e rtiliz e rs 6 9 6 .0 1 0 .89 %G u ja ra t N a rm a d a V a lle y F e rtilis e rs C o . L td - F u tu re s -6 9 9 .9 8IT C L td C o n s u m e r N o n -D u ra b le 6 0 3 .2 9 0 .7 7 %IT C L td - F u tu re s -5 9 4 .6 9IC IC I B a n k L td B a n k s 5 9 4 .2 6 0 .7 6 %IC IC I B a n k L td - F u tu re s -5 85 .9 2C ip la L td P h a rm a c e u tic a ls 5 6 7 .0 0 0 .7 2 %C ip la L td - F u tu re s -5 7 0 .2 8B h a ra t H e a v y E le c tric a ls L td In d u s tria l C a p ita l G o o d s 5 0 8.81 0 .6 5 %B h a ra t H e a v y E le c tric a ls L td - F u tu re s -5 0 8.3 2In fo s y s T e c h n o lo g ie s L td S o ftw a re 4 6 8.0 0 0 .6 0 %In fo s y s T e c h n o lo g ie s L td - F u tu re s -4 7 0 .2 6N e w D e lh i T e le v is io n L td M e d ia & E n te rta in m e n t 4 4 9 .5 3 0 .5 7 %N e w D e lh i T e le v is io n L td - F u tu re s -4 5 0 .4 4P u n j L ly o d L td C o n s tru c tio n 3 7 0 .5 9 0 .4 7 %P u n j L ly o d L td - F u tu re s -3 7 2 .16Jin d a l S ta in le s s L td F e rro u s M e ta ls 3 7 0 .15 0 .4 7 %Jin d a l S ta in le s s L td - F u tu re s -3 7 1.3 2M p h a s is B F L S o ftw a re L td S o ftw a re 3 6 6 .6 3 0 .4 7 %M p h a s is B F L S o ftw a re L td - F u tu re s -3 6 9 .0 4V id e s h S a n c h a r N ig a m L td T e le c o m S e rv ic e s 3 4 0 .2 9 0 .4 4 %V id e s h S a n c h a r N ig a m L td - F u tu re s -3 4 0 .9 2U n io n B a n k o f In d ia L td B a n k s 3 3 1.0 5 0 .4 2 %U n io n B a n k o f In d ia L td - F u tu re s -3 3 1.6 0A s h o k L e y la n d L td A u to 3 2 8.6 0 0 .4 2 %A s h o k L e y la n d L td - F u tu re s -3 17 .6 1Ja i P ra k a s h H y d ro P o w e r L td P o w e r 3 2 6 .7 2 0 .4 2 %Ja i P ra k a s h H y d ro P o w e r L td - F u tu re s -3 2 9 .2 8In d ia n O il C o rp o ra tio n L td P e tro le u m P ro d u c ts 2 9 7 .4 9 0 .3 8%In d ia n O il C o rp o ra tio n L td - F u tu re s -2 9 6 .0 0S y n d ic a te B a n k L td B a n k s 2 82 .5 3 0 .3 6 %S y n d ic a te B a n k L td - F u tu re s -2 84 .80O rc h id C h e m ic a ls L td P h a rm a c e u tic a ls 2 2 7 .6 4 0 .2 9 %O rc h id C h e m ic a ls L td - F u tu re s -2 2 9 .4 2B h a ra t F o rg e L td In d u s tria l P ro d u c ts 2 19 .6 6 0 .2 8%B h a ra t F o rg e L td - F u tu re s -2 15 .0 4S ie m e n s In d ia L td In d u s tria l C a p ita l G o o d s 2 12 .9 2 0 .2 7 %S ie m e n s In d ia L td - F u tu re s -2 13 .9 4H in d u s ta n P e tro le u m C o rp o ra tio n L td P e tro le u m P ro d u c ts 2 0 8.14 0 .2 7 %H in d u s ta n P e tro le u m C o rp o ra tio n L td - F u tu re s -2 0 9 .3 3V ija y a B a n k B a n k s 19 8.7 1 0 .2 5 %V ija y a B a n k - F u tu re s -2 0 0 .2 2P o la ris S o ftw a re L a b L td S o ftw a re 16 7 .9 5 0 .2 1%P o la ris S o ftw a re L a b L td - F u tu re s -16 9 .0 8A rv in d M ills L td T e x tile s - P ro d u c ts 15 7 .4 1 0 .2 0 %A rv in d M ills L td - F u tu re s -15 7 .9 6N a tio n a l T h e rm a l P o w e r C o rp o ra tio n L td P o w e r 15 1.3 8 0 .19 %N a tio n a l T h e rm a l P o w e r C o rp o ra tio n L td - F u tu re s -15 2 .6 1In d u s tria l F in a n c e C o rp o ra tio n o f In d ia L td F in a n c e 14 6 .19 0 .19 %In d u s tria l F in a n c e C o rp o ra tio n o f In d ia L td - F u tu re s -14 7 .80G la x o S m o th k lin e P h a rm a L td P h a rm a c e u tic a ls 13 6 .9 2 0 .18%G la x o S m o th k lin e P h a r m a L td - F u tu re s -13 7 .6 9L IC H o u s in g F in a n c e L td F in a n c e 12 9 .4 1 0 .17 %L IC H o u s in g F in a n c e L td - F u tu re s -12 5 .5 3C h a m b a l F e rtilis e rs & C h e m ic a ls L td F e rtiliz e rs 12 4 .2 6 0 .16 %C h a m b a l F e rtilis e rs & C h e m ic a ls L td - F u tu re s -118.11In d u s In d B a n k L td B a n k s 12 0 .2 5 0 .15 %In d u s In d B a n k L td - F u tu re s -12 0 .6 1S h ip p in g C o rp o ra tio n o f In d ia L td T ra n s p o rta tio n 9 2 .0 3 0 .12 %S h ip p in g C o rp o ra tio n o f In d ia L td - F u tu re s -9 2 .2 0E s c o rts L td A u to 86 .0 5 0 .11%E s c o rts L td - F u tu re s -86 .7 8C u m m in s In d ia L td In d u s tria l P ro d u c ts 83 .2 7 0 .11%C u m m in s In d ia L td - F u tu re s -83 .0 5B a n k o f In d ia B a n k s 7 1.88 0 .0 9 %B a n k o f In d ia - F u tu re s -6 9 .9 1A n d h ra B a n k L td B a n k s 6 6 .13 0 .0 8%A n d h ra B a n k L td - F u tu re s -6 6 .4 4W o c k h a rd t L td P h a rm a c e u tic a ls 5 2 .4 4 0 .0 7 %W o c k h a rd t L td - F u tu re s -5 2 .81G re a t E a s te rn S h ip p in g C o . L td T ra n s p o rta tio n 4 7 .13 0 .0 6 %G re a t E a s te rn S h ip p in g C o . L td - F u tu re s -4 7 .3 0S u z lo n E n e rg y L td In d u s tria l C a p ita l G o o d s 4 1.6 7 0 .0 5 %S u z lo n E n e rg y L td - F u tu re s -4 1.2 4B a lla rp u r In d u s trie s L td P a p e r 2 6 .0 2 0 .0 3 %B a lla rp u r In d u s trie s L td - F u tu re s -2 6 .2 7A u ro b in d o P h a rm a L td P h a rm a c e u tic a ls 2 4 .4 5 0 .0 3 %A u ro b in d o P h a rm a L td - F u tu re s -2 4 .5 9M a n g a lo re R e fin e rie s & P e tro c h e m ic a ls L td P e tro le u m P ro d u c ts 12 .80 0 .0 2 %M a n g a lo re R e fin e rie s & P e tro c h e m ic a ls L td - F u tu re s -12 .9 1C o rp o ra tio n B a n k L td B a n k s 11.9 9 0 .0 2 %C o rp o ra tio n B a n k L td - F u tu re s -11.9 7P a tn i C o m p u te r S y s te m s L td S o ftw a re 10 .9 2 0 .0 1%P a tn i C o m p u te r S y s te m s L td - F u tu re s -2 2 .0 0K a r n a ta k a B a n k L td B a n k s 9 .19 0 .0 1%K a r n a ta k a B a n k L td - F u tu re s -9 .2 0Ja m m u & K a s h m ir B a n k L td B a n k s 6 .87 0 .0 1%Ja m m u & K a s h m ir B a n k L td - F u tu re s -6 .89Je t A irw a y s T ra n s p o rta tio n 2 .3 6 0 .0 0 %Je t A irw a y s - F u tu re s -2 .3 1D e b t H old ing s 1 9 ,8 6 0 .3 1 2 5 .4 2 %P r iv ate C orporate Se c u r itie s 6 ,7 9 0 .9 1 8 .6 8 %C itic o rp M a ru ti F in a n c e L td A A A 1,9 7 5 .0 1 2 .5 2 %H in d a lc o In d u s trie s L td A A A 1,9 6 4 .86 2 .5 1%P T C IB L T ru s t In d u s In d B a n k A A A (S O ) 1,3 7 6 .9 7 1.7 6 %M a h in d ra & M a h in d ra F in a n c ia l S e rv ic e s L td A A + 9 89 .5 8 1.2 7 %S u n d a ra m F in a n c e L td A A A 4 84 .4 9 0 .6 2 %T e r m D e posits 1 8 ,6 3 0 .0 0 2 3 .8 2 %
• IC IC I B a n k 18,6 3 0 .0 0 2 3 .82 %C ash, C all, C B L O & R e v e r se R e po 1 5 .0 9 0 .0 2 %O the r C u r r e nt A sse ts (5 ,5 7 5 .6 9 ) - 7 .1 0 %
T otal N e t A sse ts 7 8 ,2 1 9 .2 8 1 0 0 .0 0 %
• T o p F iv e H o ld in g s
P e r for m anc e R e c ord * - G row th O ption
* R e tu rn s > = 1 Y e a r a re C A G R , < 1 Y e a r a re A b s o lu te . B e n c h m a rk is C ris ilS h o rt T e rm B o n d F u n d In d e x . F o r C o m p u ta tio n o f re tu rn s th e a llo tm e n t N A Vh a s b e e n ta k e n a s R s 10 .0 0 . P a s t p e rfo rm a n c e m a y o r m a y n o t b e s u s ta in e din fu tu re . 3 1-D e c -2 0 0 5 w a s a n o n b u s in e s s d a y.
R ating P rof ile (as % of total d e b t c om pone nts)
M atu r ity P rof ile : (as % of total d e b t c om pone nts)
A sse t A lloc ation: (as % of N e t A sse ts)
Q u antitativ e Ind ic ators:
A v e ra g e M a tu rity : 0 .4 1 y e a rM o d ifie d D u ra tio n : 0 .3 7 y e a rY ie ld T o M a tu rity : 7 .3 0 %% U n lis te d B o n d s : 4 .4 1%A n n u a l P o rtfo lio T u rn o v e r R a tio : 1.6 1 tim e s
W H Y SH O U L D O N E IN V E ST ?O pportu nity to e nhanc e r e tu rns f rom a b le nd of e q u ity & e q u ity ar b itrag e (atle ast 5 1 % ) and low
v olatility r e tu rns f rom a m inim u m d e b t e x posu r e of 2 5 % for a short tim e hor iz on
T o ta l H e d g e d E q u ity
7 4 .5 8%
T o ta l D e b t2 5 .4 2 %
4 .39%
7 .91 % 7 .7 0 %
2 .4 2 %
4 .30 % 4 .39%
0 .0 0 %
1 .0 0 %
2 .0 0 %
3.0 0 %
4 .0 0 %
5 .0 0 %
6 .0 0 %
7 .0 0 %
8.0 0 %
9.0 0 %
L a s t 6 M o n th s L a s t 1 y e a rs S in c e In c e p tio n
P ru IC IC I B la n d e d P la n A C ris il S h o rt T e rm B o n d F u n d In d e x
A A A a n d
E q u iv a le n t
2 9.2 1 %C a ll,C u rre n t
A s s e ts ,B a n k
D e p o s its a n d
R e v e rs e R e p o s
6 5 .81 %
A A a n d E q u iv a le n t
4 .98%

19
3.69%
6.65 % 6.61 %
2 .4 2 %
4 .30 % 4 .39%
0 .0 0 %
1 .0 0 %
2 .0 0 %
3.0 0 %
4 .0 0 %
5 .0 0 %
6.0 0 %
7 .0 0 %
L a s t 6 M o n th s L a s t 1 y e a rs S in c e In c e p tio n
P ru IC IC I B la n d e d P la n B C ris il S h o rt T e rm B o n d F u n d In d e x
A A A a n d
E q u iv a le n t
8 4 .7 6%C a ll,C u rre n tA s s e ts ,B a n kD e p o s its a n d R e v e rs e R e p o s
1 5 .2 4 %
8 8 .0 0 %
1 3.5 9%
-1 .5 9%
-2 0 .0 0 % 0 .0 0 % 2 0 .0 0 % 4 0 .0 0 % 60 .0 0 % 8 0 .0 0 % 1 0 0 .0 0 %
< 1 8 2 d a y s
1 -3 y e a rs
O th e r C u rre n t
A s s e ts
Performance Record* - Growth Option
* R e tu rn s > = 1 Y e a r a re C A G R , < 1 Y e a r a re A b s o lu te . B e n c h m a rk is C ris ilS h o rt T e rm B o n d F u n d In d e x . F o r C o m p u ta tio n o f re tu rn s th e a llo tm e n t N A Vh a s b e e n ta k e n a s R s 10 .0 0 . P a s t p e rfo rm a n c e m a y o r m a y n o t b e s u s ta in e din fu tu re . 3 1-D e c -2 0 0 5 w a s a n o n b u s in e s s d a y.
Q u antitativ e Indicators :
Rating Profile (as % of total deb t components )
M atu rity Profile: (as % of total deb t components )
S naps hot:
Fund Managers: D eb t : Chaitanya PandeE q uity : Y o g esh B hatt
Indic ativ e Inv estm ent H o riz o n: 6 m o nths -1 yearInc ep tio n date: 3 1 -0 5 -2 0 0 5Fund S iz e: R s . 2 0 4 .3 9 c ro resN A V (A s o n 3 0 -June-0 6 ):
G ro w th o p t io n: R s . 1 0 .7 1 7 3D iv idend o p tio n: R s . 1 0 .0 7 5 2
* * E x p ense R atio fo r t h e m o nth o f Jun'0 6 :B lended Plan B : 1 .5 0 %B lended Plan B - Ins t.: 1 .0 0 %
* * T his is a c lo s e ap p ro x im atio n o f the nu m b er.
Pru IC IC I B lended Plan BPortfolio
C ompany /Is s u er S ector/Rating M k t V alu e % N A V M k t V alu e(R s . L a k h ) (R s. L a k h )-F u tu re s
E q u ity H olding s 2 ,4 9 8 .2 0 1 2 .2 4 % (2 ,5 0 2 .1 7 )
B a n k o f B a ro d a L td B a n k s 6 18 .8 0 3 .0 3 %
B a n k o f B a ro d a L td - F u tu re s -6 2 2 .5 3
S te rlite In d u s trie s (In d ia ) L td N o n -F e rro u s M e ta ls 4 0 4 .7 9 1.98 %
S te rlite In d u s trie s (In d ia ) L td - F u tu re s -4 0 6 .3 8
N e w D e lh i T e le v is io n L td M e d ia & E n te rta in m e n t 3 94 .0 6 1.93 %
N e w D e lh i T e le v is io n L td - F u tu re s -3 94 .8 5
S ta te B a n k o f In d ia L td B a n k s 2 5 4 .7 1 1.2 5 %
S ta te B a n k o f In d ia L td - F u tu re s -2 5 6 .5 2
O rie n ta l B a n k o f C o m m e rc e B a n k s 2 2 0 .5 3 1.0 8 %
O rie n ta l B a n k o f C o m m e rc e - F u tu re s -2 2 1.4 9
S R F L td T e x tile s - S y n th e tic 17 2 .8 8 0 .8 5 %
S R F L td - F u tu re s -17 1.2 6
In d u s tria l D e v e lo p m e n t B a n k o f In d ia B a n k s 12 3 .14 0 .6 0 %
In d u s tria l D e v e lo p m e n t B a n k o f In d ia - F u tu re s -12 0 .4 7
C e n tu ry T e x tile s & In d u s trie s L td C e m e n t 10 6 .4 3 0 .5 2 %
C e n tu ry T e x tile s & In d u s trie s L td - F u tu re s -10 7 .2
G u ja ra t N a rm a d a V a lle y F e rtilis e rs C o . L td F e rtiliz e rs 93 .7 5 0 .4 6 %
G u ja ra t N a rm a d a V a lle y F e rtilis e rs C o . L td - F u tu re s -94 .2 8
B o n g a ig o n R e fin e ry & P e tro c h e m ic a ls L td P e tro le u m P ro d u c ts 5 0 .11 0 .2 5 %
B o n g a ig o n R e fin e ry & P e tro c h e m ic a ls L td - F u tu re s -5 0 .5 4
C h a m b a l F e rtilis e rs & C h e m ic a ls L td F e rtiliz e rs 4 6 .0 2 0 .2 3 %
C h a m b a l F e rtilis e rs & C h e m ic a ls L td - F u tu re s -4 3 .7 5
H in d a lc o In d u s trie s L td N o n -F e rro u s M e ta ls 8 .4 0 0 .0 4 %
H in d a lc o In d u s trie s L td - F u tu re s -8 .3 1
Ja m m u & K a s h m ir B a n k L td B a n k s 4 .5 8 0 .0 2 %
Ja m m u & K a s h m ir B a n k L td - F u tu re s -4 .5 9
D eb t H olding s 1 7 ,9 4 1 .0 2 8 7 .7 6 %
Priv ate C orporate S ecu rities 4 ,4 9 4 .3 2 2 1 .9 9 %
• P T C U B L T ru s t In d u s In d B a n k A A A (S O ) 1,5 2 9.4 8 7 .4 8 %
• P T C C iti F le e t T ru s t C itib a n k A A A (S O ) 1,5 2 0 .18 7 .4 4 %
P T C IB L T ru s t In d u s In d B a n k A A A (S O ) 917 .98 4 .4 9%
P T C T V S F in a n c e A A A (S O ) 5 2 6 .6 8 2 .5 8 %
C Ps and C D s 1 0 ,7 1 3 .1 4 5 2 .4 1 %
• H D F C B a n k - C D P 1+ 7 ,4 6 6 .8 9 3 6 .5 3 %
• P u n ja b N a tio n a l B a n k - C D P 1+ 1,7 7 5 .5 2 8 .6 9%
A m e ric a n E x p re s s B a n k L td - C D P 1+ 97 3 .2 9 4 .7 6 %
IN G V y s y a B a n k - C D P 1+ 4 97 .4 4 2 .4 3 %
T e rm D e p o s its 2 ,2 2 1.0 0 10 .8 7 %
• IC IC I B a n k 2 ,2 2 1.0 0 10 .8 7 %
C as h, C all, C B L O & Rev ers e Repo 7 9 7 .6 4 3 .9 0 %
Other C u rrent A s s ets (2 8 5 .0 8 ) -1 .4 1 %
T otal N et A s s ets 2 0 ,4 3 9 .2 2 1 0 0 .0 0 %
• T o p F iv e H o ld in g s
A v e ra g e M a tu rity : 0 .3 1 y e a rM o d ifie d D u ra tio n : 0 .2 9 y e a rY ie ld T o M a tu rity : 6 .4 0 %% U n lis te d B o n d s : 0 .0 0 %A n n u a l P o rtfo lio T u rn o v e r R a tio : 1.6 6 tim e s
F ig u res as on 3 0 -J u ne, 2 0 0 6
W H Y S H OU L D ON E IN V E S T ?Generate low v olaility retu rns from deb t (atleas t 5 1 % ) along with
an opportu nity to enhance retu rns from eq u ity arb itrag e (max imu m 4 9 % )

20
85.40%
2 3 .52 %
-8.9 2 %
-2 0.00% 0.00% 2 0.00% 40.00% 6 0.00% 80.00% 1 00.00%
< 1 82 d a y s
1 -3 y e a rs
O th e r C u rre n tA s s e ts
SIP Return: A s o n 3 0 June, 2 0 0 6
P e rio d S IP S ta rt D a te T o ta l A m o u n t T o ta l N o . M a rk e t V a lu e S IPIn v e s te d o f U n its R e tu r n s
1 Y e a r S IP 29 -Ju l-05 1 2,000.00 4 4 7 .9 7 1 2,8 5 2.26 1 5 .9 5 %3 Y e a r S IP 3 1 -Ju l-03 3 6 ,000.00 1 ,9 29 .5 5 5 5 ,3 5 8 .7 9 3 1 .7 4 %5 Y e a r S IP 3 1 -Ju l-01 6 0,000.00 4 ,5 6 1 .7 0 1 3 0,8 7 5 .1 7 3 2.8 0%S in c e In c e p tio n 3 -N o v -9 9 8 1 ,000.00 6 ,6 6 1 .4 7 1 9 1 ,1 1 7 .5 7 25 .6 6 %
P a s t p e rfo rm a n c e m a y o r m a y n o t b e s u s ta in e d in fu tu re . A s s u m e R s . 1 000 in v e s te d e v e ry m o n th . T h eh ig h le v e l o f re tu rn s c o m e fro m th e s h a rp a p p re c ia tio n in m a rk e t, in th e y e a r 2001 a n d 2003 .
Q ua ntita tiv e Ind ic a to rs – D eb t C o m p o nent Q ua ntita tiv e Ind ic a to rs – E q uity C o m p o nent
A v e ra g e M a tu rity : 0.4 8 y e a rM o d ifie d D u ra tio n : 0.4 4 y e a rY ie ld T o M a tu rity : 6 .7 7 %
A v e ra g e P /E : 1 6 .21A v e ra g e P /B V : 3 .6 1A v e ra g e D iv id e n d Y ie ld : 1 .23
A n n u a l P o rtfo lio T u r n o v e r R a tio : 2.5 4 tim e s% U n lis te d B o n d s : .0.00%
M a turity Pro f ile (a s % o f d eb t h o ld ing )
Sec to r A llo c a tio n* (a s % o f eq uity p o rtf o lio )
PruIC IC I B a la nc ed F und
Sna p s h o t:
Fund Managers: E q uity : Deven SangoiD eb t : P ank aj K aji
Indic ativ e Inv estm ent H o riz o n: 3 y rs & m oreInc ep tio n date: 0 3 -1 1 -1 9 9 9Fund S iz e: R s . 3 8 9 .0 2 c roresN A V (A s o n 3 0 -June-0 6 ):
G ro w t h o p t io n: R s . 2 8 .6 9D iv idend o p tio n: R s . 1 6 .0 5
* * E x p ense R atio fo r t h e m o nth o f Jun'0 6 : 2 .2 6 %
* * T h is is a c los e ap p rox im ation of th e nu m b er.
W H Y SH O U L D O N E IN V E ST ?M ed ium term inv es tm ent o f fund s in a p o rtf o lio o f
eq uity (m inim um ) 5 1 % a nd d eb t f o r c a p ita l a p p rec ia tio n.
Rs . 1 0 0 0 0 inv es ted a t incep tio n* : B a la nced F und V s C ris il B a la nced F und Ind ex
Perf o rm a nc e Rec o rd * - G ro w th O p tio n
* B e n c h m a rk s ta rt d a te - 3 1 .03 .2002. C A G R – B a la n c e d F u n d : 3 0.22% ;B e n c h m a rk : 1 8 .8 8 % . P a s t p e rfo rm a n c e m a y o r m a y n o t b e s u s ta in e d infu tu re .
* R e tu r n s < 1 Y e a r : A b s o lu te , > = 1 Y e a r : C A G R . B e n c h m a rk - C ris il B a la n c e dF u n d In d e x a n d s ta r t d a te - 3 1 .03 .2002. F o r c o m p u ta tio n o f re tu rn s th ea llo tm e n t N A V h a s b e e n ta k e n a s R s . 1 0.00. P a st p e rfo rm a n c e m a y o r m a y n o tb e su sta in e d in fu tu re . 3 0-Ju n -2001 a n d 3 1 -D e c -2005 w e re n o n b u sin e ss d a y s.
E q uity H o ld ing s 2 7 ,5 4 5 .6 1 7 0 .8 1 %• R e lia n c e In d u s trie s L td P e tro le u m P ro d u c ts 2,1 3 1 .23 5 .4 8 %
H in d u s ta n L e v e r L td C o n s u m e r N o n -D u ra b le 1 ,29 7 .26 3 .3 3 %B h a ra t H e a v y E le c tric a ls L td In d u s tria l C a p ita l G o o d s 1 ,21 0.9 2 3 .1 1 %In fo s y s T e c h n o lo g ie s L td S o ftw a re 1 ,05 5 .7 7 2.7 1 %O il & N a tu ra l G a s C o m p a n y L td O il 9 22.7 0 2.3 7 %IT C L td C o n s u m e r N o n -D u ra b le 9 1 0.8 2 2.3 4 %B h a rti T e le v e n tu re s L td T e le c o m S e rv ic e s 8 9 1 .29 2.29 %A IA E n g in e e rin g L td In d u s tria l P ro d u c ts 8 8 5 .5 6 2.28 %L a rs e n & T o u b ro L td In d u s tria l C a p ita l G o o d s 8 5 3 .3 9 2.1 9 %G ra s im In d u s trie s L td C e m e n t 8 3 6 .5 5 2.1 5 %M a h a n a g a r T e le p h o n e N ig a m L td T e le c o m S e rv ic e s 8 1 3 .1 8 2.09 %B a n k o f B a ro d a L td B a n k s 7 7 2.3 3 1 .9 9 %B h a ra t E le c to n ic s L td In d u s tria l C a p ita l G o o d s 7 7 1 .4 0 1 .9 8 %A s s o c ia te d C e m e n t C o m p a n ie s L td C e m e n t 7 29 .8 6 1 .8 8 %H in d a lc o In d u s trie s L td N o n -F e rro u s M e ta ls 7 1 2.03 1 .8 3 %A s h o k L e y la n d L td A u to 6 5 0.5 2 1 .6 7 %O C L In d ia L td C e m e n t 6 3 0.6 2 1 .6 2%M a h in d ra & M a h in d ra L td A u to 6 21 .8 7 1 .6 0%M a ru ti U d y o g L td A u to 5 9 7 .5 3 1 .5 4 %IC IC I B a n k L td B a n k s 5 6 3 .7 2 1 .4 5 %A s ia n P a in ts L td C o n s u m e r N o n -D u ra b le 5 5 6 .04 1 .4 3 %Ja in Irrig a tio n S y s te m s L td In d u s tria l P ro d u c ts 5 5 0.3 2 1 .4 1 %E .I.D . P a rry (In d ia ) L td C o n s u m e r N o n -D u ra b le 5 4 2.4 6 1 .3 9 %U n ite d P h o s p h o ru s L td P e s tic id e s 5 24 .5 1 1 .3 5 %G u ja ra t S ta te F e rtilis e rs & C h e m ic a ls L td F e rtiliz e rs 4 9 8 .5 0 1 .28 %G o d re j C o n s u m e r P ro d u c ts L td C o n s u m e r N o n -D u ra b le 4 8 8 .08 1 .25 %M a s te k L td S o ftw a re 4 8 0.6 5 1 .24 %A B B L td In d u s tria l C a p ita l G o o d s 4 7 0.3 6 1 .21 %T riv e n i E n g in e e rin g & In d u s trie s L td C o n s u m e r N o n -D u ra b le 4 4 2.7 4 1 .1 4 %G re a t E a s te rn S h ip p in g C o . L td T ra n s p o rta tio n 4 3 2.7 2 1 .1 1 %G la x o S m o th k lin e P h a rm a L td P h a rm a c e u tic a ls 4 1 4 .4 5 1 .07 %G u ja ra t A m b u ja C e m e n t L td C e m e n t 3 9 7 .8 0 1 .02%C o n ta in e rs C o rp o ra tio n o f In d ia L td T ra n s p o rta tio n 3 7 3 .7 0 0.9 6 %N a tio n a l T h e rm a l P o w e r C o rp o ra tio n L td P o w e r 3 7 2.9 0 0.9 6 %U tta m S u g a r M ills L td C o n s u m e r N o n -D u ra b le 3 7 2.08 0.9 6 %S u n d a ra m C la y to n L td A u to A n c illa rie s 3 3 7 .1 0 0.8 7 %In d o T e c h T ra n s fo rm e rs L td In d u s tria l C a p ita l G o o d s 3 1 0.29 0.8 0%S u n il H ite c h E n g in e e rs L td C o n s tru c tio n 1 4 2.4 6 0.3 7 %N u c le u s S o ftw a re E x p o rts L td S o ftw a re 1 1 5 .28 0.3 0%N ifty F u tu re s 1 ,8 6 4 .6 2 4 .7 9 %D eb t H o ld ing s 1 4 ,4 0 0 .2 1 3 7 .0 2 %PSU /PF I B o nd s 1 ,9 0 9 .2 0 4 .9 1 %
• In fra s tru c tu re D e v e lo p m e n t F in a n c e C o rp n A A A 1 ,4 3 2.29 3 .6 8 %P o w e r F in a n c e C o rp o ra tio n L td A A A 4 7 6 .9 1 1 .23 %Priv a te C o rp o ra te Sec urities 4 ,0 6 8 .0 4 1 0 .4 6 %
• P T C U B L T ru s t In d u s In d B a n k A A A (S O ) 2,8 6 7 .7 7 7 .3 7 %P T C R P S T a ta T e le s e rv ic e s A A A (S O ) 7 1 0.20 1 .8 3 %R e lia n c e In d u s trie s L td A A A 4 9 0.07 1 .26 %C Ps a nd C D s 1 ,9 7 7 .1 7 5 .0 9 %H D F C B a n k - C D P 1 + 9 9 4 .8 8 2.5 6 %S ta te B a n k o f B ik a n e r & Ja ip u r - C D P 1 + 9 8 2.29 2.5 3 %T erm D ep o s its 5 ,9 9 7 .0 0 1 5 .4 1 %
• C itib a n k 4 ,000.00 1 0.28 %• IC IC I B a n k 1 ,9 9 7 .00 5 .1 3 %
C a s h , C a ll, C B L O & Rev ers e Rep o 4 4 8 .8 0 1 .1 5 %O th er C urrent A s s ets (3 ,0 4 4 .0 1 ) - 7 .8 3 %
T o ta l N et A s s ets 3 8 ,9 0 1 .8 1 1 0 0 .0 0 %
• T o p F iv e H o ld in g s
Po rtfo lio
C o m p a ny /Is s uer Sec to r/Ra ting M k t V a lue (R s . L a k h ) % to N A V
F ig ures a s o n 3 0 -June, 2 0 0 6
* P e rta in s to th e e q u ity in v e s tm e n ts o n ly.
Sty le B o x :D e b t E q u ity
1 7 .9 5%1 4.08%
1 0.1 1 %8.3 0%
7 .2 8%6 .6 4%6 .43 %
5.59 %5.2 1 %
3 .59 %3 .1 5%
2 .7 7 %2 .04%1 .9 4%
1 .6 1 %1 .44%1 .3 1 %
0.55%
0.00% 5.00% 1 0.00% 1 5.00% 2 0.00%
C o n s u m e r N o n -D u ra b leIn d u s tria l C a p ita l
C e m e n tP e tro le u m P ro d u c ts
A u toT e le c o m S e rv ic e s
S o ftw a reIn d u s tria l P ro d u c ts
B a n k sO il
T ra n s p o rta tio nN o n -F e rro u s M e ta ls
P e s tic id e sF e rtiliz e rs
P h a rm a c e u tic a lsP o w e r
A u to A n c illa rie sC o n s tru c tio n
R s 3 06 84.49
R s 2 0840.42
8,9 86
1 3 ,9 86
1 8,9 86
2 3 ,9 86
2 8,9 86
3 3 ,9 86
3 8,9 86
Apr
-02
Jul-
02
Oct
-02
Jan-
03
Apr
-03
Jul-
03
Oct
-03
Jan-
04
Apr
-04
Jul-
04
Oct
-04
Jan-
05
Apr
-05
Jul-
05
Oct
-05
Jan-
06
Apr
-06
P ru IC IC I B a la n c e d F u n d C ris il B a la n c e d F u n d In d e x
7 .1 7 %
3 8.2 7 % 3 8.1 1 %
2 7 .1 5%
1 7 .1 5%
7 .1 4%
2 5.2 1 % 2 5.3 8%
0.00%5.00%
1 0.00%1 5.00%2 0.00%2 5.00%3 0.00%3 5.00%40.00%45.00%
L a s t 6M o n th s
L a s t 1y e a rs
L a s t 3y e a rs
L a s t 5y e a rs
S in c eIn c e p tio n
P ru IC IC I B a la n c e d F u n d C ris il B a la n c e d F u n d In d e x

21
55.47%
41 .1 3 %
3 .2 0 %
0 .2 0 %
0 .0 0 % 2 0 .0 0 % 40 .0 0 % 6 0 .0 0 %
< 1 8 2 d a y s
1 -3 y e a rs
1 8 2 d a y s - 1 y e a r
O th e r C u rre n t A s s e ts
Performance Record* - Cumulative option
S IP Returns A s on 3 0 June, 2 0 0 6
P e rio d S IP S ta rt D a te T o ta l A m o u n t T o ta l N o . M a rk e t V a lu e S IPIn v e s te d o f U n its R e tu r n s
1 Y e a r S IP 29 -Ju l-0 5 12,0 0 0 .0 0 9 6 0 .6 3 12,4 6 8 .5 9 8 .6 6 %
S in c e In c e p tio n 3 0 -M a r-0 4 28 ,0 0 0 .0 0 2,5 0 3 .9 0 3 2,4 9 9 .6 2 13 .7 9 %
S ector A llocation (as % of th e eq uity portfolio)*
Q uantitative Indicators – E q uity Component
A v e ra g e P /E : 19 .15A v e ra g e P /B V : 4 .6 9A v e ra g e D iv id e n d Y ie ld : 1.0 7
A n n u a l P o rtfo lio T u rn o v e r R a tio : 0 .6 9 tim e s
Q uantitative Indicators – D eb t Component
A v e ra g e M a tu rity : 0 .9 0 y e a rM o d ifie d D u ra tio n : 0 .8 1 y e a rsY ie ld T o M a tu rity : 6 .9 1%
% U n lis te d B o n d s : 4 .5 1%
Rating Profile (as % of deb t h olding s )
PruICICI Income M ultiplier F und
S naps h ot:
Fund Managers : Equity : Prashant KothariDebt : C haitany a Pand e
In d ic a tiv e In v es tm en t H o r iz o n : 1 y r & ab ov eIn c ep tio n d a te: 3 0 -0 3 -2 0 0 4F u n d S iz e: R s. 3 2 9 .1 3 c rore sN A V (A s o n 3 0 -J u n e-0 6 ):C u m u la tiv e o p tio n : R s. 1 2 .9 7 9 6 Div id en d o p tio n : R s. 1 1 .4 1 1 4* * E x p en s e R a tio fo r th e m o n th o f J u n '0 6 : 2 .0 8 %* * T his is a c lose ap p rox im ation of the nu m b e r.
WHY SHOULD ONE INVEST?M e d iu m t e r m in v e s t m e n t in a p o r t f o lio o f d e b t a n d
e q u it y (u p t o 3 0 % ) f o r c a p it a l a p p r e c ia t io n .
R s . 1 0 0 0 0 in v e s t e d a t in c e p t io n : IM P Vs C r is il M IP B le n d e d In d e x
CAGR – Income Multiplier Fund : 12.28%; Benchmark : 5.94%Benchmark is Cris il MIP Blended Index .P as t performance may or may not b e sus tained in future.
* Returns > = 1 Y ear are CAGR, < 1 Y ear are Ab solute. Benchmark is Cris il MIPBlended Index . For computation of returns the allotment N AV has b een taken asRs . 10 .0 0 . P as t performance may or may not b e s us tained in future.3 1-D ec-20 0 5 w as a non b us ines s day.
Eq u it y Ho ld in g s 7 ,7 8 0 .1 8 2 3 .6 6 %Bharti T elev entures L td Telecom S erv ices 7 0 7 .0 7 2.15%ICICI Bank L td Banks 3 83 .0 0 1.16 %T rent L td Retailing 3 57 .10 1.0 8%ICI India L td Consumer N on-D urab le 3 3 8.59 1.0 3 %Godrej Consumer P roducts L td Consumer N on-D urab le 3 28.29 1.0 0 %Tata Consultancy S erv ices L td S oftw are 3 0 4.28 0 .92%H ero H onda L td Auto 3 0 2.7 0 0 .92%E x ide Indus tries L td Auto Ancillaries 3 0 2.21 0 .92%Chettinad Cements L td Cement 292.6 5 0 .89%Marico Indus tries L td Consumer N on-D urab le 292.53 0 .89%Bharat H eav y E lectricals L td Indus trial Capital Goods 26 8.81 0 .82%Glax o S mothkline P harma L td P harmaceuticals 255.45 0 .7 8%P antaloon Retail (India) L td Retailing 245.7 5 0 .7 5%S hoppers ' S top L td Retailing 215.22 0 .6 5%P idilite Indus tries L td Consumer N on-D urab le 213 .29 0 .6 5%Av entis P harma L td P harmaceuticals 192.6 2 0 .59%Mahindra & Mahindra L td Auto 186 .59 0 .57 %Geometric S oftw are S olutions L td S oftw are 16 5.84 0 .50 %Cadila H ealthcare L td P harmaceuticals 16 1.6 3 0 .49%V imta L ab s L td H ealthcare S erv ices 155.94 0 .47 %Blue S tar L td Consumer D urab les 151.58 0 .46 %Bajaj Auto L td Auto 151.18 0 .46 %S ub ros L td Auto Ancillaries 144.42 0 .44%Indian O v erseas Bank L td Banks 142.80 0 .43 %T inplate Company of India L td Ferrous Metals 13 9.6 3 0 .42%H indalco Indus tries L td N on-Ferrous Metals 13 6 .7 2 0 .42%Bank of Baroda L td Banks 13 0 .81 0 .40 %Gras im Indus tries L td Cement 123 .44 0 .3 8%K otak Mahindra Bank L td Banks 117 .6 1 0 .3 6 %Cipla L td P harmaceuticals 10 8.0 0 0 .3 3 %Century T ex tiles & Indus tries L td Cement 10 7 .3 3 0 .3 3 %S hree Cement L td Cement 10 2.0 6 0 .3 1%U nion Bank of India L td Banks 97 .48 0 .3 0 %Radico K haitan L td Consumer N on-D urab le 97 .10 0 .3 0 %Indo T ech T rans formers L td Indus trial Capital Goods 92.26 0 .28%Alemb ic L td P harmaceuticals 89.6 4 0 .27 %D eccan Chronicle H olding s L td Media & E ntertainment 6 7 .45 0 .20 %Containers Corporation of India L td T ransportation 3 0 .53 0 .0 9%N ational Aluminium Company L td N on-Ferrous Metals 28.6 6 0 .0 9%S unil H itech E ng ineers L td Cons truction 27 .7 8 0 .0 8%P lethico P harmaceuticals L td P harmaceuticals 15.6 1 0 .0 5%P atel E ng ineering L td Cons truction 8.53 0 .0 3 %De b t Ho ld in g s 2 5 ,0 8 3 .7 4 7 6 .2 1 %P SU/P F I B o n d s 2 ,8 6 5 .8 5 8 .7 1 %Indian Railw ay Finance Corporation AAA 1,43 3 .56 4.3 6 %Infras tructure D ev elopment Finance Corporation AAA 1,43 2.29 4.3 5%P r iv a t e C o r p o r a t e Se c u r it ie s 7 ,7 2 9 .9 7 2 3 .4 8 %
• Reliance Indus tries L td AAA 1,96 0 .29 5.96 %• P T C U BL T rus t Indus Ind Bank AAA(S O ) 1,911.85 5.81%
H indalco Indus tries L td AAA 1,0 80 .6 7 3 .28%U ltratech Cement Company L td AA+ 194.94 0 .59%Gras im Indus tries L td AAA 98.23 0 .3 0 %K otak Mahindra P rimus L td AA 80 4.53 2.44%P T C IBL T rus t Indus Ind Bank AAA(S O ) 6 42.59 1.95%P T C RP S T ata T eleserv ices AAA(S O ) 552.3 8 1.6 8%S undaram Finance L td AAA 484.49 1.47 %G o v e r n m e n t Se c u r it ie s 2 ,4 5 7 .5 0 7 .4 7 %
• 6 .6 5% GO I 20 0 9 S ov ereig n 2,457 .50 7 .47 %C P s a n d C Ds 6 ,3 6 5 .9 7 1 9 .3 4 %
• H D FC Bank - CD P 1+ 3 ,90 4.29 11.86 %U T I Bank L td - CD P 1+ 986 .19 3 .0 0 %S tate Bank of Bikaner & Jaipur - CD P 1+ 982.29 2.98%P unjab N ational Bank - CD P 1+ 493 .20 1.50 %Te r m De p o s it s 5 ,5 5 8 .0 0 1 6 .8 9 %
• Citib ank 5,0 0 0 .0 0 15.19%ICICI Bank 558.0 0 1.7 0 %C a s h , C a ll, C B LO & R e v e r s e R e p o 1 0 6 .4 5 0 .3 2 %Ot h e r C u r r e n t A s s e t s 4 9 .0 2 0 .1 3 %To t a l Ne t A s s e t s 3 2 ,9 1 2 .9 4 1 0 0 .0 0 %
• Top Fiv e H olding s
P o rtfo lio
C o m p a n y /Is s u e r Se c to r/R a tin g M k t Va lu e (Rs . L akh) % t o NA V
M a t u r it y P ro f ile (a s % o f d e b t h o ld in g s )
F ig u r e s a s o n 3 0 -J u n e , 2 0 0 6
Sty le B o x :
P as t performance may or may not b e sus tained in future. As sume Rs . 10 0 0 inv es ted ev ery month.
E q uityD eb t
16.32%11.20 %
10 .5 8 %10 .5 2%
9 .0 9 %8 .23%8 .0 4 %
6.0 4 %5 .7 4 %
4 .65 %2.13%2.0 0 %1.9 5 %1.7 9 %
0 .8 7 %0 .4 7 %0 .39 %
0 .0 0 % 5 .0 0 % 10 .0 0 % 15 .0 0 % 20 .0 0 %
C o n s u m e r N o n -D u ra b leB a n k s
P h a rm a c e u tic a lsR e ta ilin g
T e le c o m S e rv ic e sA u to
C e m e n tS o ftw a re
A u to A n c illa rie sIn d u s tria l C a p ita l
N o n -F e rro u s M e ta lsH e a lth c a re S e rv ic e sC o n s u m e r D u ra b le s
F e rro u s M e ta lsM e d ia & E n te rta in m e n t
C o n s tru c tio nT ra n s p o rta tio n
R s 130 0 0 .0 1
R s 1128 1.62
9 ,4 4 4
9 ,9 4 4
10 ,4 4 4
10 ,9 4 4
11,4 4 411,9 4 4
12,4 4 4
12,9 4 4
13,4 4 4
13,9 4 4
Apr
-04
Jun-
04
Aug
-04
Oct
-04
Dec
-04
Feb-
05
Apr
-05
Jun-
05
Aug
-05
Oct
-05
Dec
-05
Feb-
06
Apr
-06
Jun-
06
P ru IC IC I In c o m e M u ltip lie r C ris il M IP B le n d e d in d e x
3.8 6%
16.29 %
12.28 %
2.7 3%
8 .27 %
5 .9 4 %
0 .0 0 %
2.0 0 %
4 .0 0 %
6.0 0 %
8 .0 0 %
10 .0 0 %
12.0 0 %
14 .0 0 %
16.0 0 %
18 .0 0 %
L a s t 6 M o n th s L a s t 1 y e a rs S in c e In c e p tio n
P ru IC IC I In c o m e M u ltip lie r C ris il M IP B le n d e d in d e x
AAA and E q u iv ale nt6 3 .5 1 %
C all,C u rre ntAs s e ts ,B ankD e p o s its and R e v e rs e R e p o s
2 2 .7 3 %
AA and E q u iv ale nt
3 .9 8 %
S o v e re ig nS e c u ritie s
9 .7 8 %
* P ertains to the eq uity pos itions only.

22
57.95%
2 7.95%
1 6 .4 5%
0 .4 2 %
-2 .77%
-2 0 .0 0 % 0 .0 0 % 2 0 .0 0 % 4 0 .0 0 % 6 0 .0 0 % 8 0 .0 0 %
< 1 8 2 d a y s
1 -3 y e a rs
1 8 2 d a y s - 1 y e a r
3 -5 y e a rs
O th e r C u rre n t A s s e ts
Sector Allocation* (as % of equity portfolio)
SIP R eturns As on 3 0 June, 2 0 0 6
P e rio d S IP S ta rt D a te T o ta l A m o u n t T o ta l N o . M a rk e t V a lu e S IPIn v e s te d o f U n its R e tu r n s
1 Y e a r S IP 29 -Ju l-0 5 1 2,0 0 0 .0 0 3 7 8 .28 1 2,3 24 .3 6 5 .9 7 %3 Y e a r S IP 3 1 -Ju l-0 3 3 6 ,0 0 0 .0 0 1 ,5 9 9 .9 9 5 2,1 27 .6 7 27 .0 2%S in c e In c e p tio n 3 1 -A u g -0 1 5 9 ,0 0 0 .0 0 3 ,7 3 2.4 5 1 21 ,6 0 3 .22 3 0 .9 2%
F ig ures as on 3 1 st Aug , 2 0 0 4F ig ures as on 3 1 st Aug , 2 0 0 4
P ruIC IC I C h ild C are P lan (G ift)W H Y SH O U L D O N E IN V E ST ?
F or your ch ild b etw een 1 -1 3 years and seek ing to sav e ov er a long term h oriz on
Snapsh ot:
Fund Managers: E q uity : Jignesh ShahD eb t : P ank aj K aji
Indic ativ e Inv estm ent H o riz o n: 6 -1 7 y rsInc ep tio n date: 3 1 -0 8 -2 0 0 1Fund S iz e: R s. 7 6 .6 8 c ro resN A V (A s o n 3 0 -June-0 6 ): R s. 3 2 .5 8* * E x p ense R atio fo r t h e m o nth o f Jun'0 6 : 2 .0 0 %* * T his is a c lo se ap p ro x im atio n o f the nu m b er.
E quity H old ing s 4 ,9 5 5 .2 1 6 4 .6 3 %• R e lia n c e In d u s trie s L td P e tro le u m P ro d u c ts 3 21 .0 3 4 .1 9 %
S te rlite In d u s trie s (In d ia ) L td N o n -F e rro u s M e ta ls 26 6 .6 9 3 .4 8 %T h e rm a x L td In d u s tria l C a p ita l G o o d s 23 7 .1 5 3 .0 9 %S in te x In d u s trie s L td In d u s tria l P ro d u c ts 23 4 .5 9 3 .0 6 %M a h in d ra & M a h in d ra L td A u to 226 .4 1 2.9 5 %B h a ra t E a rth M o v e rs L td In d u s tria l C a p ita l G o o d s 1 9 7 .9 4 2.5 8 %N o id a T o ll B rid g e C o . L td T ra n s p o rta tio n 1 8 9 .7 7 2.4 7 %A IA E n g in e e rin g L td In d u s tria l P ro d u c ts 1 8 6 .8 1 2.4 4 %M a s te k L td S o ftw a re 1 7 5 .9 6 2.29 %G a te w a y D is trip a rk s L td T ra n s p o rta tio n 1 7 1 .26 2.23 %S ie m e n s In d ia L td In d u s tria l C a p ita l G o o d s 1 6 7 .0 1 2.1 8 %S u n d a ra m C la y to n L td A u to A n c illa rie s 1 6 4 .4 3 2.1 4 %O rie n t P a p e r & In d u s trie s L td C e m e n t 1 6 4 .1 2 2.1 4 %B h a ra t E le c to n ic s L td In d u s tria l C a p ita l G o o d s 1 6 0 .6 5 2.1 0 %L a rs e n & T o u b ro L td In d u s tria l C a p ita l G o o d s 1 5 6 .9 4 2.0 5 %O C L In d ia L td C e m e n t 1 5 0 .6 9 1 .9 7 %S ta te B a n k o f In d ia L td B a n k s 1 4 5 .5 5 1 .9 0 %B a ja j H in d u s ta n L td C o n s u m e r N o n -D u ra b le 1 4 1 .7 7 1 .8 5 %H in d a lc o In d u s trie s L td N o n -F e rro u s M e ta ls 1 3 8 .0 2 1 .8 0 %In d ia In fo lin e L td F in a n c e 1 3 7 .7 0 1 .8 0 %IT C L td C o n s u m e r N o n -D u ra b le 1 23 .6 1 1 .6 1 %C o n ta in e rs C o rp o ra tio n o f In d ia L td T ra n s p o rta tio n 1 23 .0 4 1 .6 0 %B a lra m p u r C h in i M ills L td C o n s u m e r N o n -D u ra b le 1 1 9 .8 0 1 .5 6 %R ic o A u to In d u s trie s L td A u to A n c illa rie s 9 6 .7 8 1 .26 %D iv is L a b o ra to rie s L td P h a rm a c e u tic a ls 9 5 .27 1 .24 %IT D C e m e n ta tio n In d ia L td C o n s tru c tio n 7 7 .8 8 1 .0 2%R a m c o In d u s trie s L td C e m e n t 7 6 .5 0 1 .0 0 %A m te k A u to L td A u to A n c illa rie s 5 9 .1 7 0 .7 7 %U tta m S u g a r M ills L td C o n s u m e r N o n -D u ra b le 5 5 .4 6 0 .7 2%N a v B h a ra t F e rro A llo y s L td N o n -F e rro u s M e ta ls 4 8 .5 6 0 .6 3 %S u n il H ite c h E n g in e e rs L td C o n s tru c tio n 4 6 .3 1 0 .6 0 %R e lia n c e C o m m u n ic a tio n s V e n tu re s L td T e le c o m S e rv ic e s 4 5 .0 5 0 .5 9 %A g ro D u tc h In d u s trie s L td C o n s u m e r N o n -D u ra b le 4 0 .4 4 0 .5 3 %P a te l E n g in e e rin g L td C o n s tru c tio n 3 8 .1 5 0 .5 0 %F in a n c ia l T e c h n o lo g ie s L td S o ftw a re 3 3 .5 5 0 .4 4 %W y e th L e d e rle L td P h a rm a c e u tic a ls 3 2.1 0 0 .4 2%In d o T e c h T ra n s fo rm e rs L td In d u s tria l C a p ita l G o o d s 28 .0 5 0 .3 7 %P re c o t M ills L td T e x tile s - C o tto n 22.8 6 0 .3 0 %V is a S te e l L td F e rro u s M e ta ls 20 .7 4 0 .27 %A u to m o b ile C o rp o ra tio n o f G o a L td A u to A n c illa rie s 1 4 .9 8 0 .20 %U n io n B a n k o f In d ia L td B a n k s 7 .7 2 0 .1 0 %P le th ic o P h a rm a c e u tic a ls L td P h a rm a c e u tic a ls 5 .1 6 0 .0 7 %R e lia n c e E n e rg y V e n tu re s L td P o w e r 4 .7 7 0 .0 6 %S o la r E x p lo s iv e s L td In d u s tria l P ro d u c ts 4 .6 3 0 .0 6 %R e lia n c e N a tu ra l R e s o u rc e s L td G a s 0 .1 4 0 .0 0 %D eb t H old ing s 2 ,7 8 7 .9 3 3 6 .3 6 %P SU / P F I B ond s 2 8 6 .7 1 3 .7 4 %
• In d ia n R a ilw a y F in a n c e C o rp o ra tio n A A A 28 6 .7 1 3 .7 4 %P riv ate C orporate Securities 1 ,2 3 2 .6 2 1 6 .0 7 %
• M a h in d ra & M a h in d ra F in a n c ia l S e rv ic e s L td A A + 29 7 .3 4 3 .8 8 %• R e lia n c e In d u s trie s L td A A A 29 6 .1 2 3 .8 6 %• P T C IB L T ru s t In d u s In d B a n k A A A (S O ) 27 5 .3 9 3 .5 9 %
A B N A m ro B a n k L td A A A 20 3 .4 6 2.6 5 %T ita n In d u s trie s L td A 1 1 .3 2 0 .1 5 %K o ta k M a h in d ra P rim u s L td A A 1 4 8 .9 9 1 .9 4 %C P s and C D s 1 9 2 .9 0 2 .5 2 %S ta n d a rd C h a rte re d In v e s tm e n t & L o a n (In d ia ) L td -C P P 1 + 1 9 2.9 0 2.5 2%T erm D eposits 2 0 0 .0 0 2 .6 1 %IC IC I B a n k 20 0 .0 0 2.6 1 %C ash , C all, C B L O & R ev erse R epo 8 7 5 .7 0 1 1 .4 2 %O th er C urrent Assets (7 5 .1 1 ) - 0 .9 9 %
T otal N et Assets 7 ,6 6 8 .0 3 1 0 0 .0 0 %
• T o p F iv e H o ld in g s
R s. 1 0 0 0 0 inv ested at inception*: C C P - G ift V s C risil B alanced F undI n d e x
* B e n c h m a r k s t a r t d a t e - 3 1 .0 3 .20 0 2. C A G R – C C P - G if t : 28 .3 5 % ;B e n c h m a rk : 1 8 .8 8 % . P a s t p e rfo rm a n c e m a y o r m a y n o t b e s u s ta in e d infu tu re .
P ortfolio
C om pany/Issuer Sector/R ating M k t V alue (R s . L a k h ) % to N AV
F ig ures as on 3 0 -June, 2 0 0 6
Q uantitativ e Ind icators – D eb t C om ponent Q uantitativ e Ind icators – E quity C om ponent
A v e ra g e M a tu rity : 0 .7 0 y e a rM o d ifie d D u ra tio n : 0 .6 4 y e a rY ie ld T o M a tu rity : 7 .0 9 %
A v e ra g e P /E : 1 7 .8 1A v e ra g e P /B V : 3 .7 1A v e ra g e D iv id e n d Y ie ld : 0 .8 3
A n n u a l P o rtfo lio T u r n o v e r R a tio : 0 .7 7 tim e s% U n lis te d B o n d s : 8 .6 2%
Style B ox
M aturity P rofile (as % of d eb t h old ing )
R ating P rofile (as % of d eb t h old ing )
P erform ance R ecord *- C um ulativ e O ption
* R e tu r n s > = 1 Y e a r a re C A G R , < 1 Y e a r a re A b s o lu te . B e n c h m a rk is C ris ilB a la n c e d F u n d In d e x a n d s ta rt d a te - 3 1 .0 3 .20 0 2. F o r c o m p u ta tio n o f re -tu r n s th e a llo tm e n t N A V h a s b e e n ta k e n a s R s . 1 0 .0 0 . P a s t p e rfo rm a n c e m a yo r m a y n o t b e s u s ta in e d in fu tu re . 3 1 -D e c -20 0 5 w a s a n o n b u s in e s s d a y.
P a s t p e rfo rm a n c e m a y o r m a y n o t b e s u s ta in e d in fu tu re . A s s u m e R s . 1 0 0 0 in v e s te d e v e ry m o n th . T h eh ig h le v e l o f re tu rn s c o m e fro m th e sh a rp a p p re c ia tio n in m a rk e t, in th e y e a r 20 0 3 .
D e b t E q u ity
1 9.1 3 %9.77%9.71 %
9.1 5%8 .59%
7.8 9%6 .76 %6 .4 8 %
4 .57%4 .2 3 %
3 .2 7%3 .1 0 %2 .78 %2 .6 7%
0 .91 %0 .4 6 %0 .4 2 %
0 .1 0 %
0 .0 0 % 5.0 0 % 1 0 .0 0 % 1 5.0 0 % 2 0 .0 0 % 2 5.0 0 %
In d u s tria l C a p ita l G o o d sT ra n s p o rta tio n
C o n s u m e r N o n -D u ra b leN o n -F e rro u s M e ta lsIn d u s tria l P ro d u c ts
C e m e n tA u to A n c illa rie s
P e tro le u m P ro d u c tsA u to
S o ftw a reC o n s tru c tio n
B a n k sF in a n c e
P h a rm a c e u tic a lsT e le c o m S e rv ic e sT e x tile s - C o tto n
F e rro u s M e ta lsP o w e r
R s 2 8 8 57.4 0
R s 2 0 8 4 0 .4 2
8 ,98 6
1 3 ,98 6
1 8 ,98 6
2 3 ,98 6
2 8 ,98 6
3 3 ,98 6
3 8 ,98 6
Apr
-02
Jul-
02
Oct
-02
Jan-
03
Apr
-03
Jul-
03
Oct
-03
Jan-
04
Apr
-04
Jul-
04
Oct
-04
Jan-
05
Apr
-05
Jul-
05
Oct
-05
Jan-
06
Apr
-06
P ru IC IC I C h ild C a re G ift C ris il B a la n c e d F u n d In d e x
2 .2 6 %
3 0 .6 9%
3 6 .3 9%
2 7.6 8 %
7.1 4 %
2 5.2 1 % 2 5.3 8 %
0 .0 0 %
5.0 0 %
1 0 .0 0 %
1 5.0 0 %
2 0 .0 0 %
2 5.0 0 %
3 0 .0 0 %
3 5.0 0 %
4 0 .0 0 %
L a s t 6 M o n th s L a s t 1 y e a rs L a s t 3 y e a rs S in c eIn c e p tio n
P ru IC IC I C h ild C a re G ift C ris il B a la n c e d F u n d In d e x
A A a n d E q u iv a le n t1 6 .4 5%
A A A a n d E q u iv a le n t4 6 .2 5%
A a n d E q u iv a le n t
0 .4 2 %
C a ll,C u rre n tA s s e ts ,B a n kD e p o s its a n d R e v e rs e R e p o s
3 6 .8 8 %
F und M anag er C om m ent
T h e �e x te n d in g b e y o n d th e re d p o rtio n re p re s e n ts th e m a rg in a l c h a n g e in th e s ty le o f th e p o rtfo lio .
E q u ity a llo c a tio n to la rg e c a p s to c k s h a s b e e n in c re a s e d to p ro te c t c a p ita l a t c u rre n t v a lu a tio n s .
* P e rta in s to th e e q u ity p o s itio n s o n ly.

23
73.79%
1 3.4 4 %
1 1 .8 9%
1 .71 %
-0 .8 4 %
-2 0 .0 0 % 0 .0 0 % 2 0 .0 0 % 4 0 .0 0 % 6 0 .0 0 % 8 0 .0 0 %
< 1 8 2 d a y s
1 -3 y e a rs
1 8 2 d a y s - 1 y e a r
3-5 y e a rs
O th e r C u rre n tA s s e ts
P a s t p e rfo rm a n c e m a y o r m a y n o t b e s u s ta in e d in fu tu re . A s s u m e R s . 1 0 0 0 in v e s te d e v e ry m o n th .
SIP Returns A s o n 3 0 June, 2 0 0 6
P e rio d S IP S ta rt D a te T o ta l A m o u n t T o ta l N o . M a rk e t V a lu e S IPIn v e s te d o f U n its R e tu r n s
1 Y e a r S IP 29 -Ju l-0 5 1 2,0 0 0 .0 0 6 9 7 .4 3 1 2,4 4 6 .27 8 .24 %
3 Y e a r S IP 31 -Ju l-0 3 36 ,0 0 0 .0 0 2,39 0 .1 3 4 2,6 5 4 .0 2 1 1 .9 7 %
S in c e In c e p tio n 31 -A u g -0 1 5 9 ,0 0 0 .0 0 4 ,4 9 4 .30 8 0 ,20 4 .8 3 1 2.8 6 %
Q ua ntita tiv e Ind ic a to rs – E q uity C o m p o nent
A v e ra g e P /E : 1 8 .7 1A v e ra g e P /B V : 3.7 1A v e ra g e D iv id e n d Y ie ld : 1 .0 0
A n n u a l P o rtfo lio T u rn o v e r R a tio : 0 .4 0 tim e s
Q ua ntita tiv e Ind ic a to rs – D eb t C o m p o nent
A v e ra g e M a tu rity : 0 .5 1 y e a rM o d ifie d D u ra tio n : 0 .4 7 y e a rY ie ld T o M a tu rity : 6 .8 0 %% U n lis te d B o n d s : 1 4 .4 4 %
Ra ting Pro f ile (a s % o f d eb t h o ld ing )
M a turity Pro f ile (a s % o f d eb t h o ld ing )
PruIC IC I C h ild C a re Pla n (Stud y )
Sna p sh o t:
Fund Managers: E q uity : Jignesh ShahD eb t : P ank aj K aji
Indic ativ e Inv estm ent H o riz o n: 3 -5 y rsInc ep tio n date: 3 1 -0 8 -2 0 0 1Fund S iz e: R s. 2 7 .3 4 c ro resN A V (A s o n 3 0 -June-0 6 ): R s. 1 7 .8 4 5 9* * E x p ense R atio fo r t h e m o nth o f Jun'0 6 : 1 .5 0 %* * T his is a c lo se ap p ro x im atio n o f the nu m b er.
W H Y SH O U L D O N E IN V E ST ?F o r y o ur c h ild b etw een 1 3 -1 7 y ea rs a nd o n th e th resh o ld o f h ig h er stud ies
Perf o rm a nc e Rec o rd * - G ro w th O p tio n
* R e tu r n s > = 1 Y e a r a re C A G R , < 1 Y e a r a re A b s o lu te . B e n c h m a rk is C ris il M IPB le n d e d In d e x a n d s ta rt d a te - 31 .0 3.20 0 2. F o r c o m p u ta tio n o f re tu rn s th ea llo tm e n t N A V h a s b e e n ta k e n a s R s . 1 0 .0 0 . P a s t p e rfo rm a n c e m a y o r m a y n o tb e s u s ta in e d in fu tu re . 31 -D e c -20 0 5 w a s a n o n b u s in e s s d a y.
E q uity H o ld ing s 5 6 5 .0 8 2 0 .6 6 %
V is a S te e l L td F e rro u s M e ta ls 3.0 5 0 .1 1 %
U tta m S u g a r M ills L td C o n s u m e r N o n -D u ra b le 25 .4 2 0 .9 3%
U n io n B a n k o f In d ia L td B a n k s 2.8 2 0 .1 0 %
S u n il H ite c h E n g in e e rs L td C o n s tru c tio n 1 8 .5 2 0 .6 8 %
S o la r E x p lo s iv e s L td In d u s tria l P ro d u c ts 1 .6 2 0 .0 6 %
R e lia n c e In d u s trie s L td P e tro le u m P ro d u c ts 4 7 .4 0 1 .7 3%
R e lia n c e C o m m u n ic a tio n s V e n tu re s L td T e le c o m S e rv ic e s 4 .9 8 0 .1 8 %
P re c o t M ills L td T e x tile s - C o tto n 1 4 .29 0 .5 2%
P o k a r n a L td C e m e n t 4 .30 0 .1 6 %
P le th ic o P h a rm a c e u tic a ls L td P h a rm a c e u tic a ls 1 .7 0 0 .0 6 %
P a te l E n g in e e rin g L td C o n s tru c tio n 0 .8 7 0 .0 3%
N o id a T o ll B rid g e C o . L td T ra n s p o rta tio n 5 8 .20 2.1 3%
N a v B h a ra t F e rro A llo y s L td N o n -F e rro u s M e ta ls 9 2.5 1 3.38 %
M a s te k L td S o ftw a re 5 1 .29 1 .8 8 %
L a rs e n & T o u b ro L td In d u s tria l C a p ita l G o o d s 33.6 3 1 .23%
IT D C e m e n ta tio n In d ia L td C o n s tru c tio n 4 1 .9 3 1 .5 3%
In d o T e c h T ra n s fo rm e rs L td In d u s tria l C a p ita l G o o d s 9 .8 3 0 .36 %
B lu e S ta r L td C o n s u m e r D u ra b le s 8 0 .9 8 2.9 6 %
B a ja j H in d u s ta n L td C o n s u m e r N o n -D u ra b le 4 3.1 9 1 .5 8 %
A u to m o b ile C o rp o ra tio n o f G o a L td A u to A n c illa rie s 1 1 .9 5 0 .4 4 %
A IA E n g in e e rin g L td In d u s tria l P ro d u c ts 1 6 .6 0 0 .6 1 %
D eb t H o ld ing s 2 ,1 8 7 .3 1 8 0 .0 0 %
PSU /PF I B o nd s 6 9 8 .9 6 2 5 .5 7 %
• In d ia n R a ilw a y F in a n c e C o rp o ra tio n A A A 29 5 .8 4 1 0 .8 2%
• K o n k a n R a ilw a y C o rp o ra tio n L td A A A 20 1 .9 5 7 .39 %
• B h a ra t H e a v y E le c tric a ls L td A A A 20 1 .1 7 7 .36 %
Priv a te C o rp o ra te Sec urities 5 9 0 .8 9 2 1 .6 1 %
• R e lia n c e In d u s trie s L td A A A 1 9 6 .0 3 7 .1 7 %
K o ta k M a h in d ra P rim u s L td A A 1 29 .1 2 4 .7 2%
M a h in d ra & M a h in d ra F in a n c ia l S e rv ic e s L td A A + 1 28 .8 5 4 .7 1 %
C itiF in a n c ia l C o n s u m e r F in a n c e In d ia L td A A A 9 9 .8 3 3.6 5 %
T re n t L td A A - 37 .0 6 1 .36 %
C Ps a nd C D s 3 0 8 .4 3 1 1 .2 8 %
• S ta te B a n k o f B ik a n e r & Ja ip u r - C D P 1 + 21 8 .6 0 7 .9 9 %
IN G V y s y a B a n k - C D P 1 + 8 9 .8 3 3.29 %
C a sh , C a ll, C B L O & Rev erse Rep o 5 8 9 .0 3 2 1 .5 4 %
O th er C urrent A ssets (1 8 .1 3 ) - 0 .6 6 %
T o ta l N et A ssets 2 ,7 3 4 .2 6 1 0 0 .0 0 %
• T o p F iv e H o ld in g s
Po rtfo lio
C o m p a ny /Issuer Sec to r/Ra ting M k t V a lue (R s . L a k h ) % to N A V
F ig ures a s o n 3 0 -June, 2 0 0 6
Sty le B o x :
Rs. 1 0 0 0 0 inv ested a t inc ep tio n* : C C P - Stud y V s C risil M IP B lend edI n d e x
* B e n c h m a rk s ta rt d a te - 31 .0 3.20 0 2.C A G R – C C P - S tu d y : 1 2.29 % ; B e n c h m a rk : 8 .9 1 % .P a s t p e rfo rm a n c e m a y o r m a y n o t b e s u s ta in e d in fu tu re .
D e b t E q u ity
R s 1 6 35 7.38
R s 1 4 36 8 .8 4
9,72 1
1 0 ,72 1
1 1 ,72 1
1 2 ,72 1
1 3,72 1
1 4 ,72 1
1 5 ,72 1
1 6 ,72 1
1 7,72 1
1 8 ,72 1
Apr
-02
Jul-
02
Oct
-02
Jan-
03
Apr
-03
Jul-
03
Oct
-03
Jan-
04
Apr
-04
Jul-
04
Oct
-04
Jan-
05
Apr
-05
Jul-
05
Oct
-05
Jan-
06
Apr
-06
P ru IC IC I C h ild C a re S tu d y C ris il M IP B le n d e d in d e x
4 .1 3%
1 7.0 9%
1 3.5 7% 1 2 .73%
2 .73%
8 .2 7% 8 .5 3%
0 .0 0 %2 .0 0 %4 .0 0 %6 .0 0 %8 .0 0 %
1 0 .0 0 %1 2 .0 0 %1 4 .0 0 %1 6 .0 0 %1 8 .0 0 %
L a s t 6 M o n th s L a s t 1 y e a rs L a s t 3 y e a rs S in c eIn c e p tio n
P ru IC IC I C h ild C a re S tu d y C ris il M IP B le n d e d in d e x
A A a n d
E q u iv a le n t
1 3.6 0 %
C a ll,C u rre n t
A s s e ts ,B a n k
D e p o s its a n d
R e v e rs e R e p o s
2 6 .32 %
A A A a n d
E q u iv a le n t
6 0 .0 8 %

24
INVESTMENT HORIZON • Q u a r te rly • H a lf Y e a rly • Y e a rly
P r u IC IC I F ix e d Ma tu r it y P la nW HY SHOU L D ONE INVEST?
Th o s e w h o h a v e a f ix e d in v e s t m e n t h o r iz o n f o ra p p r o x im a t e ly 9 0 d a y s , 1 8 2 d a y s a n d 3 7 9 d a y s
F ig u r e s a s o n 3 0 -J u n e , 2 0 0 6
Fund Managers : Chaitanya Pande
Fund Size R s . 1 ,9 7 2 .7 5 C r o res
P r u IC IC I FM P Ser. 2 8 - 1 6 M t h s P la n
P r iv a te C o r p o r a te Sec ur it ies 1 3 ,2 2 7 .7 8 9 5 .7 5 %
Kotak Mahindra Prim u s L td A A 2 ,6 6 7 .5 3 1 9 .3 1 %
Mahindra & Mahindra F inanc ial S e rv ic e s L td A A + 2 ,6 4 6 .3 7 1 9 .1 6 %
G E C ap ital S e rv ic e s India L td A A A 1 ,9 0 6 .9 7 1 3 .8 0 %
H indalc o Indu s trie s L td A A A 1 ,8 6 6 .6 2 1 3 .5 1 %
G ras im Indu s trie s L td A A A 1 ,8 6 6 .2 8 1 3 .5 1 %
G E C ou ntry w ide F inac ial S e rv ic e s L td A A A 1 ,2 9 3 .8 7 9 .3 7 %
R e lianc e Indu s trie s L td A A A 9 8 0 .1 4 7 .0 9 %
C P s a nd C D s 1 0 6 .1 0 0 .7 7 %
S tandard C harte re d Inv e s tm e nt & L oan(India) L td-C P P1 + 1 0 6 .1 0 0 .7 7 %
C a s h , C a ll, C B L O & R ev er s e R ep o 1 1 2 .5 5 0 .8 1 %
O t h er C ur rent A s s et s 3 6 8 .6 6 2 .6 7 %
T o t a l N et A s s et s 1 3 ,8 1 5 .0 9 1 0 0 .0 0 %
P ru IC IC I FM P Y ea r ly 5
C P s a nd C D s 5 ,6 6 4 .7 4 9 9 .5 5 %A m e ric an E x p re s s B ank L td - C D P1 + 1 ,1 4 0 .1 2 2 0 .0 4 %
U C O B ank - C D P1 + 1 ,1 3 9 .2 5 2 0 .0 2 %
Kotak Mahindra B ank L td - C D P1 + 1 ,1 3 9 .1 7 2 0 .0 2 %G E C ap ital S e rv ic e s India L td - C P P1 + 9 4 1 .2 7 1 6 .5 4 %
Indu s trial D e v e lop m e nt B ank of India L td - C D P1 + 9 2 9 .5 0 1 6 .3 4 %
S tate B ank of S au rashtra L td - C D P1 + 3 2 8 .5 2 5 .7 7 %S tate B ank of Indore L td - C D P1 + 4 6 .9 1 0 .8 2 %
C a s h , C a ll, C B L O & R ev er s e R ep o 1 1 .5 9 0 .2 0 %
O t h er C ur rent A s s et s 1 3 .3 9 0 .2 5 %
T o t a l N et A s s et s 5 ,6 8 9 .7 2 1 0 0 .0 0 %
P ru IC IC I FM P 2 8 - 1 3 M t h s P la n
P SU / P FI B o nds 1 ,0 3 4 .4 2 1 .5 0 %
N ab ard A A A 1 ,0 3 4 .4 2 1 .5 0 %
P r iv a te C o r p o r a te Sec ur it ies 1 4 ,3 9 9 .5 1 2 0 .9 5 %
Kotak Mahindra Prim u s L td A A + 1 0 ,0 0 0 .0 0 1 4 .5 4 %
Mahindra & Mahindra F inanc ial S e rv ic e s L td A A + 3 ,2 0 9 .2 2 4 .6 7 %
G E C ap ital S e rv ic e s India L td A A A 6 0 2 .2 0 0 .8 8 %
R e lianc e Indu s trie s L td A A A 5 8 8 .0 9 0 .8 6 %
C P s a nd C D s 2 3 ,6 5 9 .8 4 3 4 .4 1 %
A llahab ad B ank L td - C D P1 + 1 4 ,1 1 5 .9 5 2 0 .5 3 %
Jam m u & Kashm ir B ank L td - C D P1 + 9 ,4 1 2 .0 8 1 3 .6 9 %
U C O B ank - C D P1 + 1 3 1 .8 1 0 .1 9 %
T er m D ep o s it s 2 8 ,4 5 0 .0 0 4 1 .3 7 %
IC IC I B ank 1 3 ,4 5 0 .0 0 1 9 .5 6 %
U nion B ank of India 1 0 ,0 0 0 .0 0 1 4 .5 4 %
O rie ntal B ank of C om m e rc e 5 ,0 0 0 .0 0 7 .2 7 %
O t h er C ur rent A s s et s 1 ,2 1 6 .2 8 1 .7 7 %
T o t a l N et A s s et s 6 8 ,7 6 0 .0 5 1 0 0 .0 0 %
P ru IC IC I FM P 3 1 - 4 M t h s P la n
P r iv a te C o r p o r a te Sec ur it ies 9 9 6 .3 0 2 7 .2 0 %
H indalc o Indu s trie s L td A A A 5 0 0 .3 5 1 3 .6 6 %
C itic orp Maru ti F inanc e L td A A A 4 9 5 .9 5 1 3 .5 4 %
C P s a nd C D s 1 ,1 6 7 .9 7 3 1 .9 0 %
Kotak Mahindra B ank L td - C D P1 + 6 9 8 .9 2 1 9 .0 9 %
U C O B ank - C D P1 + 4 6 9 .0 5 1 2 .8 1 %
T er m D ep o s it s 1 ,4 0 0 .0 0 3 8 .2 2 %
S tate B ank of Patiala 7 0 0 .0 0 1 9 .1 1 %
IC IC I B ank 7 0 0 .0 0 1 9 .1 1 %
C a s h , C a ll, C B L O & R ev er s e R ep o 7 .0 0 0 .1 9 %
O t h er C ur rent A s s et s 9 0 .7 8 2 .4 9 %
T o t a l N et A s s et s 3 ,6 6 2 .0 5 1 0 0 .0 0 %
P r u IC IC I FM P Y ea r ly 2 5 -1 5 m o nt h o p t io n
P SU / P FI B o nds 6 ,9 5 5 .3 5 2 7 .0 6 %
E x p ort Im p ort B ank of India L td A A A 2 ,9 6 3 .8 1 1 1 .5 3 %N ab ard A A A 2 ,9 0 6 .2 2 1 1 .3 1 %
Infrastru c tu re D e v e lop m e nt F inanc e C orp oration A A A 9 8 4 .7 4 3 .8 3 %
Indian R ailw ay F inanc e C orp oration A A A 1 0 0 .5 8 0 .3 9 %P r iv a te C o r p o r a te Sec ur it ies 1 6 ,4 6 5 .1 6 6 4 .0 6 %
Kotak Mahindra Prim u s L td A A 3 ,7 1 3 .8 2 1 4 .4 5 %
G E C ou ntry w ide F inac ial S e rv ic e s L td A A A 3 ,6 8 2 .5 6 1 4 .3 3 %Mahindra & Mahindra F inanc ial S e rv ic e s L td A A + 3 ,6 1 9 .6 5 1 4 .0 8 %
H indalc o Indu s trie s L td A A A 2 ,9 7 4 .5 5 1 1 .5 7 %
C itiF inanc ial R e tail S e rv ic e s India L td A A A 2 ,4 7 4 .5 8 9 .6 3 %C P s a nd C D s 8 4 9 .1 9 3 .3 0 %
H D F C B ank - C D P1 + 4 1 6 .8 6 1 .6 2 %
A m e ric an E x p re s s B ank L td - C D P1 + 1 8 8 .4 5 0 .7 3 %S tandard C harte re d Inv e s tm e nt & L oan(India) L td-C P P1 + 1 5 9 .1 4 0 .6 2 %
U C O B ank - C D P1 + 8 4 .7 4 0 .3 3 %
T er m D ep o s it s 6 5 0 .0 0 2 .5 3 %IC IC I B ank 6 5 0 .0 0 2 .5 3 %
O t h er C ur rent A s s et s 7 8 1 .4 8 3 .0 5 %
T o t a l N et A s s et s 2 5 ,7 0 1 .1 8 1 0 0 .0 0 %
P ru IC IC I FM P Y ea r ly 2 5 Ser ies
P r iv a te C o r p o r a te Sec ur it ies 2 ,3 0 0 .0 0 1 4 .3 3 %
G lob al T rade F inanc e L td P1 + 2 ,3 0 0 .0 0 1 4 .3 3 %
C P s a nd C D s 7 ,4 4 5 .3 6 4 6 .4 0 %
L ars e n & Tou b ro L td - C P P1 + 2 ,4 9 1 .2 3 1 5 .5 2 %
U C O B ank - C D P1 + 2 ,4 6 4 .7 2 1 5 .3 6 %
B ajaj A u to L td - C P P1 + 1 ,9 9 1 .1 0 1 2 .4 1 %
H D F C B ank L td - C P P1 + 4 9 8 .3 1 3 .1 1 %
T er m D ep o s it s 6 ,2 0 0 .0 0 3 8 .6 4 %
Jam m u & Kashm ir B ank 3 ,1 0 0 .0 0 1 9 .3 2 %
IC IC I B ank 3 ,1 0 0 .0 0 1 9 .3 2 %
O t h er C ur rent A s s et s 1 0 1 .9 5 0 .6 3 %
T o t a l N et A s s et s 1 6 ,0 4 7 .3 1 1 0 0 .0 0 %
P ruIC IC I FM P 3 2 -3 M o nt h s P la n
P r iv a te C o r p o r a te Sec ur it ies 9 ,5 0 0 .0 0 1 8 .0 6 %
B ajaj H indu s tan L im ite d F 1 + 7 ,5 0 0 .0 0 1 4 .2 6 %
H indu s tan N ational G las s & Indu s trie s L td PR 1 + 2 ,0 0 0 .0 0 3 .8 0 %
C P s a nd C D s 1 0 ,5 4 8 .6 4 2 0 .0 6 %
Jam m u & Kashm ir B ank - C D P1 + 4 ,9 2 4 .7 2 9 .3 6 %
S tate b ank of Indore - C D P1 + 3 ,4 5 3 .8 4 6 .5 7 %
Pu njab N ational B ank - C D P1 + 2 ,1 7 0 .0 8 4 .1 3 %
T er m D ep o s it s 3 0 ,0 0 0 .0 0 5 7 .0 4 %
S tate B ank of H y de rab ad 1 0 4 0 0 .0 0 1 9 .7 7 %
U T I B ank L td. 1 0 4 0 0 .0 0 1 9 .7 7 %
Y e s B ank L td 5 2 0 0 .0 0 9 .8 9 %
S tate B ank of Patiala 2 5 0 0 .0 0 4 .7 5 %
C anara B ank 1 5 0 0 .0 0 2 .8 5 %
C a s h , C a ll, C B L O & R ev er s e R ep o 2 4 8 0 .5 7 4 .7 2 %
O t h er C ur rent A s s et s 6 4 .7 6 0 .1 2 %
T o t a l N et A s s et s 5 2 ,5 9 3 .9 7 1 0 0 .0 0 %
P O R T FO L IO
C o m p a ny / Is s uer Sec to r / M k t .V a lue % t oR a t ing (R s .L ac s ) N A V
P ru IC IC I T rus t L td.-FM P Y 1 2
C P s a nd C D s 1 0 ,9 9 1 .8 7 9 9 .8 7 %
S tate B ank of Indore L td - C D P1 + 2 ,2 1 4 .2 9 2 0 .1 2 %
A m e ric an E x p re s s B ank L td - C D P1 + 1 ,8 7 5 .0 8 1 7 .0 4 %
G E C ap ital S e rv ic e s India L td - C P P1 + 1 ,4 1 1 .9 0 1 2 .8 3 %
U nion B ank of India L td - C D P1 + 1 ,4 0 6 .5 5 1 2 .7 8 %
Indu s trial D e v e lop m e nt B ank of India L td - C D P1 + 1 ,3 9 4 .2 5 1 2 .6 7 %
Kotak Mahindra B ank L td - C D P1 + 9 4 1 .4 6 8 .5 5 %
S tate B ank of S au rashtra L td - C D P1 + 9 3 8 .6 2 8 .5 3 %
U C O B ank - C D P1 + 8 0 9 .7 2 7 .3 6 %
C a s h , C a ll, C B L O & R ev er s e R ep o 3 .0 0 0 .0 3 %
O t h er C ur rent A s s et s 1 1 .0 2 0 .1 0 %
T o t a l N et A s s et s 1 1 ,0 0 5 .8 9 1 0 0 .0 0 %
P E R FO R M A N C E
P er f o r m a nc e R ec o rds f o r FM P C um ula t iv e O p t io n
S c he m e D ate Pe riod N A V N A V as of R e tu rns
N am e 3 0 -Ju n-0 6
F MP Y 1 2 * 2 5 -A p r-0 6 S inc e inc e p tion 1 0 .7 8 3 0 1 0 .9 1 5 8 1 .2 3 %
F MP 2 8 - 1 6 Mths 3 0 -Jan-0 6 S inc e inc e p tion 1 0 .0 0 0 0 1 0 .2 2 6 0 2 .2 6 %
F M2 5 Y 1 * 2 0 -A p r-0 6 S inc e inc e p tion 1 0 .2 0 4 7 1 0 .3 3 1 4 1 .2 4 %
F MP Y 2 5 - 1 5 Mths * 1 6 -N ov -0 5 S inc e inc e p tion 1 0 .6 4 5 5 1 0 .9 3 7 0 2 .7 4 %
F MPY 5 * 1 8 -A p r-0 6 S inc e inc e p tion 1 0 .7 5 9 7 1 0 .9 0 7 9 1 .3 8 %
F MP 2 8 -1 3 Mths 2 8 -Mar-0 6 S inc e inc e p tion 1 0 .0 0 0 0 1 0 .2 1 2 9 2 .1 3 %
F MP 3 1 - 4 Mths 2 9 -Mar-0 6 S inc e inc e p tion 1 0 .0 0 0 0 1 0 .1 9 6 5 1 .9 7 %
F MP 3 2 - 3 Mths 2 3 -Ju n-0 6 S inc e inc e p tion 1 0 .0 0 0 0 1 0 .0 1 6 1 0 .1 6 %
* S inc e the s c he m e w as rolle d ov e r, the N A V as of the roll-ov e r date has b e e n take n for c om p u tationof re tu rns .
R e tu rns > = 1 Y e ar are C A G R , < 1 Y e ar are A b solu te . N ote : F or c om p u tation of re tu rns the allotm e ntN A V has b e e n take n as R s 1 0 .0 0 . Pas t p e rform anc e m ay or m ay not b e s u s taine d in the fu tu re .

25
Fund Manager Comment
T h e �a p p e a rin g a w a y fro m th e re d p o rtio n in d ic a te s a c h a n g e in th e p o rtfo lio s ty le . M a tu rity is re d u c e d
o n a c c o u n t o f a u c tio n s u p p ly c o n c e rn s a n d h ig h o il p ric e s
Maturity P rofile Q uantitativ e Indic ators
A v e ra g e M a tu rity : 2.1 4 Y e a rs
M o d ifie d D u ra tio n : 1 .55 Y e a rs
Y ie ld to M a tu rity : 7 .3 3 %
% U n lis te d B o n d s : 0 .0 0 %
P erformanc e R ec ord* - G row th O p tion
R s . 1 0 0 0 0 inv es ted at inc ep tion* : Inc ome P lan V s Cris il Comp os ite B ond Fund Index
R ating P rofile
P S U / P FI B onds 5 ,4 9 0 .0 7 2 2 .4 8 %
• S ta te B a n k o f In d ia A A A 2,8 9 2.53 1 1 .8 4 %
• In d ia n O il C o rp o ra tio n L td A A A 2,59 7 .54 1 0 .6 4 %
P riv ate Corp orate S ec urities 8 7 5 .9 4 3 .5 9 %
G ra s im In d u s trie s L td A A A 58 3 .53 2.3 9 %
U ltra te c h C e m e n t C o m p a n y L td A A + 29 2.4 1 1 .20 %
G ov ernment S ec urities 1 ,9 9 9 .0 0 8 .1 9 %
7 .55% G O I 20 1 0 S o v e re ig n 1 ,9 9 9 .0 0 8 .1 9 %
CP s and CD s 7 ,4 0 3 .2 7 3 0 .3 2 %
• H D F C B a n k - C D P 1 + 4 ,9 7 4 .4 0 20 .3 7 %
S ta te B a n k o f B ik a n e r & Ja ip u r - C D P 1 + 2,4 28 .8 7 9 .9 5%
T reas ury B ills 9 3 8 .0 4 3 .8 4 %
3 6 4 D a y T B ill (M D 0 8 /0 6 /20 0 7 ) S o v e re ig n 9 3 8 .0 4 3 .8 4 %
T erm D ep os its 6 ,5 0 0 .0 0 2 6 .6 2 %
• C a n a ra B a n k 4 ,0 0 0 .0 0 1 6 .3 8 %
• S ta te B a n k O f S a u ra s h tra 2,50 0 .0 0 1 0 .24 %
Cas h , Call, CB L O & R ev ers e R ep o 6 7 5 .1 8 2 .7 6 %
O th er Current A s s ets 5 3 9 .2 2 2 .2 0 %
T otal N et A s s ets 2 4 ,4 2 0 .7 2 1 0 0 .0 0 %
• T o p F iv e H o ld in g s
S nap s h ot:
Fund Managers : Pankaj KajiIndic ativ e Inv estm ent H o riz o n: 1 y e ar & ab o v eInc ep tio n date: 0 9 -0 7 -1 9 9 8Fund S iz e: R s . 2 4 4 .2 1 c ro re sN A V (A s o n 3 0 -June-0 6 ):
R etail G ro w t h o p t io n : R s . 2 0 .5 2 2 4Institutio nal G ro w t h o p t io n : R s . 2 0 .9 8 9 2
* * E x p ense R atio fo r t h e m o nth o f Jun'0 6 :Inc o m e Plan: 2 .0 4 %Inc o m e Ins t. Plan: 1 .5 0 %
* * T h is is a c lo s e ap p ro x im atio n o f th e nu m b e r.
W H Y S H O U L D O N E IN V E S T ?Medium term inv es tment for s teady returns w ith mark et v olatility
* R e tu rn s < 1 : A b s o lu te , > = 1 Y e a r : C A G R . B e n c h m a rk - C ris il C o m p o s iteB o n d F u n d In d e x . S ta rt d a te - 3 1 .0 3 .20 0 2. F o r c o m p u ta tio n o f re tu rn s th ea llo tm e n t N A V h a s b e e n ta k e n a s R s . 1 0 .0 0 . P a s t p e rfo rm a n c e m a y o r m a yn o t b e s u s ta in e d in fu tu re . 3 0 -Ju n -20 0 1 a n d 3 1 -D e c -20 0 5 w e re n o n b u s in e s sd a y s .
P ruICICI Inc ome P lan
* B e n c h m a rk s ta rt d a te : 3 1 -0 3 -20 0 2.C A G R – In c o m e P la n : 5.6 4 % ; B e n c h m a rk : 5.53 %P a s t p e rfo rm a n c e m a y o r m a y n o t b e s u s ta in e d in fu tu re .
P ortfolio
Comp any /Is s uer R ating Mk t V alue (R s . L a k h ) % to N A V
Figures as on 3 0 -June, 2 0 0 6
Rs 12621.40
Rs 125 7 0.16
9 ,7 9 0
10,29 0
10,7 9 0
11,29 0
11,7 9 0
12,29 0
12,7 9 0
13 ,29 0
Apr
-02
Jul-
02
Oct
-02
Jan-
03
Apr
-03
Jul-
03
Oct
-03
Jan-
04
Apr
-04
Jul-
04
Oct
-04
Jan-
05
Apr
-05
Jul-
05
Oct
-05
Jan-
06
Apr
-06
P ru IC IC I In c o m e P la n C risil C o m p o site B o n d F u n d In d e x
0.9 7 %
2.5 8 %3 .08 %
7 .17 %
9 .43 %
1.07 %
2.8 4% 3 .15 %
0.00%1.00%2.00%3 .00%4.00%5 .00%6.00%7 .00%8 .00%9 .00%
10.00%
L a st 6M o n th s
L a st 1y e a rs
L a st 3y e a rs
L a st 5y e a rs
S in c eIn c e p tio n
P ru IC IC I In c o m e P la n C risil C o m p o site B o n d F u n d In d e x
SovereignSec u rities1 2 .0 3 %
A A a nd E q u iva lent
1 .2 0 %
C a ll,C u rrentA s s ets ,B a nkD ep os its a nd R evers e R ep os
3 1 .5 9 %
A A A a ndE q u iva lent5 5 .1 8 %
5 9 .7 0%
16.18 %
10.15 %
7 .9 3 %
3 .8 4%
2.21%
0.00% 20.00% 40.00% 60.00% 8 0.00%
< 18 2 d a y s
5 -10 y e a rs
3 -5 y e a rs
1-3 y e a rs
18 2 d a y s - 1 y e a r
O th e r C u rre n t A sse ts
S ty le B ox

26
86.73%
1 1 .5 0 %
1 .76%
0 .0 0 % 2 0 .0 0 % 4 0 .0 0 % 60 .0 0 % 80 .0 0 % 1 0 0 .0 0 %
< 1 82 d a y s
1 -3 y e a rs
O th e r C u rre n t
A s s e ts
Maturity profile:
Q uan titativ e In d ic ators :
A v e ra g e M a tu rity : 0 .26 y e a rM o d ifie d D u ra tio n : 0 .23 y e a rY ie ld T o M a tu rity : 8 .3 5 %% U n lis te d B o n d s : 1 6.8 7 %
R atin g P rofile
P ortfolio
S n aps h ot:
Fund Managers : Rahul GoswamiIndic ativ e Inv estm ent H o riz o n: 1 y e ar & moreInc ep tio n date: 2 8 -0 3 -2 0 0 2Fund S iz e: Rs. 1 1 8 .5 4 c rore sN A V (A s o n 3 0 -June-0 6 ):
G ro w t h o p t io n : Rs. 1 4 .8 3 8 0D iv idend o p t io n : Rs. 1 0 .4 8 7 1
* * E x p ense R atio fo r t h e m o nth o f Jun'0 6 : 0 .7 5 %* * T his is a c lose ap p rox imation of the n umb e r.
W H Y S H O U L D O N E IN V E S T ?Med ium term in v es tm en t for s tead y return s w ith m ark et v olatility
C om pan y/Is s uer Mk t V alue (R s . L a k h ) % to N A V
P ruIC IC I L on g T erm P lan
P riv ate C orporate S ec urities 3 ,3 6 3 .7 2 2 8 .3 7 %
O s c a r In v e s tm e n ts L td U n ra te d 2,0 0 0 .0 0 1 6.8 7 %
U ltra te c h C e m e n t C o m p a n y L td A A + 9 7 4 .7 0 8 .22%
G ra s im In d u s trie s L td A A A 3 8 9 .0 2 3 .28 %
T erm D epos its 7 ,8 0 0 .0 0 6 5 .8 0 %
IC IC I B a n k 5 ,5 0 0 .0 0 4 6.4 0 %
C e n tra l B a n k o f In d ia 2,3 0 0 .0 0 1 9 .4 0 %
C as h , C all, C B L O & R ev ers e R epo 4 8 1 .2 7 4 .0 6 %
O th er C urren t A s s ets 2 0 8 .7 3 1 .7 7 %
T otal N et A s s ets 1 1 ,8 5 3 .7 2 1 0 0 .0 0 %
R s . 1 0 0 0 0 in v es ted at in c eption : L on g T erm P lan V s C ris il C om pos ite B on d F un d In d ex
* B e n c h m a rk s ta rt d a te : 3 1 -0 3 -20 0 2C A G R – L o n g T e rm P la n : 9 .5 3 % ; B e n c h m a rk : 5 .4 2%P a s t p e rfo rm a n c e m a y o r m a y n o t b e s u s ta in e d in fu tu re .
F ig ures as on 3 0 -Jun e, 2 0 0 6
P erform an c e R ec ord * - G row th O ption
* R e tu rn s < 1 Y e a r : A b s o lu te , > = 1 Y e a r : C A G R . B e n c h m a rk is C ris il C o m p o s ite B o n d F u n dIn d e x . F o r c o m p u ta tio n o f re tu r n s th e a llo tm e n t N A V h a s b e e n ta k e n a s R s . 1 0 .0 0 .P a s t p e rfo rm a n c e m a y o r m a y n o t b e s u s ta in e d in fu tu re . 3 1 -D e c -20 0 5 w a s a n o n b u s in e s sd a y .
S tyle B ox
N otes to N um b ers an d D ata in th e F ac t S h eet
1 . Y ie ld to m a tu rity, m o d ifie d d u ra tio n a n d a v e ra g e m a tu rity a re th e w e ig h te da v e ra g e o f th e s e n u m b e rs , c o m p u te d fo r e a c h s e c u rity in th e p o rtfo lio , a n dw e ig h te d b y th e m a rk e t v a lu e o f e a c h s e c u rity to th e to ta l m a rk e t v a lu e o f th ep o rtfo lio .
2. A v e ra g e m a tu rity fo r P T C s a n d p a p e rs w ith p a rtia l re d e m p tio n s , a re w e ig h te da v e ra g e s o f te n o r a n d q u a n tity o f c a s h flo w s u n til m a tu rity.
3 . P ric e /E a r n in g R a tio , P ric e /B o o k V a lu e R a tio , a n d D iv id e n d Y ie ld a re b a s e d o n th eh is to ric a l e a rn in g n u m b e rs , a n d a c c o u n tin g n u m b e rs , a n d h a v e b e e n s o u rc e dfro m B lo o m b e rg â . T h e y h a v e b e e n c o m p u te d o n ly fo r th e in v e s te d p o rtio n o fth e p o rtfo lio .
4 . A v e ra g e d a y s to re s e t fo r th e F lo a tin g ra te p la n , is th e w e ig h te d a v e ra g e o f th en e x t in te re s t re s e t d a te o f th e flo a tin g ra te b o n d s , w e ig h te d b y th e ir m a rk e tv a lu e s .
5 . B a n k d e p o s its a re in te rn a lly c re d it ra te d a n d p o s s e s a n in te rn a l ra tin g e q u iv a le n tto A A A . T h e y h a v e b e e n d is c lo s e d s e p a ra te ly in th e c re d it p ro file s e c tio n o n ly inth e in te re s t o f c la rity, s o th a t in v e s to rs d o n o t p re s u m e th e y a re in d e p e n d e n tlyc re d it ra te d .
6. O th e r c u rre n t a s s e ts a re n o t in c lu d e d fo r th e p u rp o s e s o f c o m p u tin g p o rtfo lioa g g re g a te n u m b e rs s u c h a s Y T M , M o d ifie d D u ra tio n a n d a v e ra g e (e x c e p t in th ec a s e o f L iq u id P la n ).
7 . W h e re th e in d iv id u a l h o ld in g in a s e c u rity /is s u e r is le s s th a n 1 % o f th e N A V ,s u c h h o ld in g s h a v e b e e n a g g re g a te d , w h e re v e r a p p ro p ria te , in th e in te re s to f c la rity .
8 . D iv id e n d s d e c la re d in a s c h e m e h a v e b e e n s e p a ra te ly d is c lo s e d .
9 . A ll p o rtfo lio s a re c o m m o n p o rtfo lio s h e ld u n d e r a g iv e n s c h e m e , a n d a ll re tu rnn u m b e rs u n le s s o th e rw is e s ta te d , re p re s e n t th e G ro w th O p tio n .
1 0 . F o r c o m p u tin g th e % o f lis te d s e c u ritie s , in s tru m e n ts w h ic h c a n n o t b e lis te du n d e r th e e x is tin g ru le s a n d re g u la tio n s s u c h a s C P s , C D s , C B L O s , B a n k F D s , TB ills , a n d P T C s a re e x c lu d e d fro m th e u n lis te d c a te g o ry.
1 1 . T h e s ta n d a rd d e v ia tio n is u s e d to m e a s u re th e v o la tility o f re tu rn s .
1 2. S h a rp e R a tio is th e m e a s u re o f th e ris k -a d ju s te d p e rfo rm a n c e . It is c a lc u la te d b ys u b tra c tin g th e ris k -fre e ra te fro m th e a v e ra g e ra te o f re tu rn fo r a p o rtfo lio a n dd iv id in g th e re s u lt b y th e s ta n d a rd d e v ia tio n o f th e p o rtfo lio re tu rn s .
1 3 . B e ta is th e m e a s u re o f th e p o rtfo lio ’s v o la tility to its re s p e c tiv e b e n c h m a rk .
1 4 . R -s q u a re d is a m e a s u re m e n t o f h o w c lo s e ly a p o rtfo lio ’s p e rfo rm a n c e c o rre la te sw ith th e p e rfo rm a n c e o f b e n c h m a rk in d e x . A h ig h e r R -s q u a re d v a lu e in d ic a te s am o re u s e fu l b e ta .
1 5 T h e S td . D e v ., S h a rp e R a tio , P o rtfo lio B e ta & R -s q u a re d a re b a s e d o n m o n th lyre tu rn s c a lc u la te d u s in g la s t 3 y e a rs d a ta .
R s 1 4 70 5 .65
R s 1 2 5 0 5 .75
9 ,85 7
1 0 ,85 7
1 1 ,85 7
1 2 ,85 7
1 3,85 7
1 4 ,85 7
1 5 ,85 7
Apr
-02
Jun-
02A
ug-0
2O
ct-0
2D
ec-0
2Fe
b-03
Apr
-03
Jun-
03A
ug-0
3O
ct-0
3D
ec-0
3Fe
b-04
Apr
-04
Jun-
04A
ug-0
4O
ct-0
4D
ec-0
4Fe
b-05
Apr
-05
Jun-
05A
ug-0
5O
ct-0
5D
ec-0
5Fe
b-06
Apr
-06
Jun-
06
P ru IC IC I L o n g T e rm P la n C ris il C o m p o s ite B o n d F u n d In d e x
2 .9 1 %
5 .2 0 %
7.78%
9 .70 %
1 .0 7%
2 .84 % 3.1 5 %
0 .0 0 %
2 .0 0 %
4 .0 0 %
6.0 0 %
8.0 0 %
1 0 .0 0 %
1 2 .0 0 %
L a s t 6 M o n th s L a s t 1 y e a rs L a s t 3 y e a rs S in c e In c e p tio n
P ru IC IC I L o n g T e rm P la n C ris il C o m p o s ite B o n d F u n d In d e x
Unrated1 6 .8 7 %
A A and E q u iv alent
8 .2 2 %
C all,C u rrent A s s ets ,B ank D ep o s its and
R ev ers e R ep o s7 1 .6 3 %
A A A and E q u iv alent
3 .2 8 %

27
1.65%
9 8 .3 5%
-2 0 .0 0 % 10 .0 0 % 4 0 .0 0 % 7 0 .0 0 % 10 0 .0 0 %
< 18 2 d a y s
O th e r C u rre n t A s s e ts
Fund Manager Comment
T h e �a p p e a rin g a w a y fro m th e re d p o rtio n in d ic a te s a c h a n g e in th e p o rtfo lio s ty le . M a tu rity is re d u c e d
o n a c c o u n t o f a u c tio n s u p p ly c o n c e rn s a n d h ig h o il p ric e s
Q uantitativ e Indic ators :
A v e ra g e M a tu rity : 0 .0 9 y e a rY ie ld T o M a tu rity : 7.3 1 %M o d ifie d D u ra tio n : 0 .0 9 y e a r% U n lis te d B o n d s : 9 .27%
Maturity p rofile:P erformanc e R ec ord * - Cumulativ e O p tion
R s . 1 0 0 0 0 inv es ted at inc ep tion: Flex ib le V s Cris il Comp os ite B ond Fund Index
R ating P rofile
P riv ate Corp orate S ec urities 1 ,2 5 1 .4 2 2 3 .2 0 %
P T C S h rira m T ra n s p o rt F in a n c e H S B C A A A (S O ) 75 1 .4 2 1 3 .9 3 %
O s c a r In v e s tm e n ts L td U n ra te d 5 0 0 .0 0 9 .27%
CP s and CD s 2 9 1 .4 6 5 .4 0 %
S ta te B a n k o f B ik a n e r & Ja ip u r - CD P1+ 291.46 5.40%
Term Deposits 2 ,5 0 0 .0 0 4 6 .3 5 %
ICICI B a n k 1,000.00 18 .54%
Ca n a ra B a n k 1,000.00 18 .54%
Ce n tra l B a n k o f In d ia 500.00 9.27 %
C a sh , C a ll, C B L O & R ev erse R epo 1 ,2 6 1 .1 0 2 3 .3 8 %
O th er C u rren t A ssets 8 8 .8 5 1 .6 7 %
Tota l N et A ssets 5 ,3 9 2 .8 3 1 0 0 .0 0 %
S n a psh ot:
Fund Managers : Rahul GoswamiIndic ativ e Inv estm ent H o riz o n: 1 y e ar & ab ov eInc ep tio n date: 2 7 -0 9 -2 0 0 2Fund S iz e: Rs. 5 3 .9 3 c rore sN A V (A s o n 3 0 -June-0 6 ):C um ulativ e o p t io n : Rs. 1 2 .9 9 0 9* * E x p ense R atio fo r t h e m o nth o f Jun'0 6 : 1 .1 0 %
* * T his is a c lose ap p rox imation of the n umb e r.
W H Y S H O U L D O N E IN V E S T?M ed iu m term in v estmen t for retu rn s g en era ted
from ma n a g in g in terest ra te v ola tility
* R e tu r n s > = 1 Y e a r a re CA G R , < 1 Y e a r a re A b s o lu te . B e n c h m a rk is Cris ilCo m p o s ite B o n d F u n d In d e x . F o r c o m p u ta tio n o f re tu rn s th e a llo tm e n t N A Vh a s b e e n ta k e n a s R s . 10.00. Pa s t p e rfo rm a n c e m a y o r m a y n o t b e s u s ta in e din fu tu re . 3 1-De c -2005 w a s a n o n b u s in e s s d a y.
P ru IC IC I F lex ib le In c ome P la n
CA G R – F le x ib le In c o m e Pla n : 7 .21%; B e n c h m a rk : 4.92%Pa s t p e rfo rm a n c e m a y o r m a y n o t b e s u s ta in e d in fu tu re .
P ortfolio
C ompa n y /Issu er R a tin g M k t V a lu e (R s . L a k h ) % to N A VS ty le B ox
F ig u res a s on 3 0 -J u n e, 2 0 0 6
Rs 12990.90
Rs 1197 8 .03
9,95 0
10,4 5 0
10,95 0
11,4 5 0
11,95 0
12,4 5 0
12,95 0
13 ,4 5 0
Sep-
02N
ov-0
2Ja
n-03
Mar
-03
May
-03
Jul-
03Se
p-03
Nov
-03
Jan-
04M
ar-0
4M
ay-0
4Ju
l-04
Sep-
04N
ov-0
4Ja
n-05
Mar
-05
May
-05
Jul-
05Se
p-05
Nov
-05
Jan-
06M
ar-0
6M
ay-0
6
P ru IC IC I F le x ib le In c o m e P la n C risil C o m p o site B o n d F u n d In d e x
2.6 3 %
5 .06 %4 .6 3 %
7 .21%
1.07 %
2.8 4 % 3 .15 %
4 .92%
0.00%
1.00%
2.00%
3 .00%
4 .00%
5 .00%
6 .00%
7 .00%
8 .00%
L a st 6 M o n th s L a st 1 y e a rs L a st 3 y e a rs S in c e In c e p tio n
P ru IC IC I F le x ib le In c o m e P la n C risil C o m p o site B o n d F u n d In d e x
AAA and E q u iv ale nt1 9 .3 4 %
U nrate d9 .2 7 %
C all,C u rre nt As s e tsB ank D e p o s its and
R e v e rs e R e p o s7 1 .3 9 %

28
59.63%
4 0 .30 %
1 2 .8 1 %
-1 2 .7 3%
-2 0 .0 0 % 0 .0 0 % 2 0 .0 0 % 4 0 .0 0 % 60 .0 0 % 8 0 .0 0 %
< 1 8 2 d a y s
1 8 2 d a y s - 1 y e a r
1 -3 y e a rs
O th e rC u rre n t A s s e ts
Fund Manager Comment
T h e �a p p e a rin g a w a y fro m th e re d p o rtio n in d ic a te s a c h a n g e in th e p o rtfo lio s ty le . M a -
tu rity is re d u c e d o n a c c o u n t o f a u c tio n s u p p ly c o n c e rn s a n d h ig h o il p ric e s
Maturity p rofile:
P erformanc e R ec ord - G row th op tion
Q uantitativ e Indic ators : Inv es tment P F P lan
A v e ra g e M a tu rity : 2.82 y e a rsY ie ld T o M a tu rity : 7 .6 1 %M o d ifie d D u ra tio n : 2.4 4 y e a rs% U n lis te d B o n d s : 0 .0 0 %
R s . 1 0 0 0 0 inv es ted at inc ep tion: G ilt -Inv es tement P F V s I S ec L i B exR s . 1 0 0 0 0 inv es ted at inc ep tion: G ilt -Treas ury P F V s I S ec S i B ex
Maturity P rofile:
Q uantitativ e Indic ators : Treas ury P F P lan
A v e ra g e M a tu rity : 0 .4 2 y e a rsY ie ld T o M a tu rity : 6 .4 4 %M o d ifie d D u ra tio n : 0 .3 9 y e a rs% U n lis te d B o n d s : 0 .0 0 %
P erformanc e R ec ord - G row th op tion
S nap s h ot: Treas ury P lan P F op tion
Fund Managers : Rahul GoswamiIndic ativ e Inv estm ent H o riz o n: 3 -6 mon thsInc ep t io n date: 1 1 -F e b -0 4Fund S iz e: Rs. 3 8 .8 8 c rore sN A V (A s o n 3 0 -June-0 6 ): G ro w t h o p t io n: Rs. 1 1 .0 2 1 8* * E x p ense R atio fo r t h e m o nth o f Jun'0 6 : 1 .5 0 %
* * T his is a c lose ap p rox imation of the n umb e r.
W H Y S H O U L D O N E IN V E S T?Treas ury : S h ort term dep loy ment of f unds in p ortfolio of G -S ec s w ith low v olatility
Inv es tment: Medium term inv es tment for s teady returns w ith mark et v olatility
R e tu r n s > = 1 Y e a r a re C A G R , < Y e a r a re A b s o lu te . B e n c h m a rk is I-S e c S i B e x In d e x .F o r c o m p u ta tio n o f re tu rn s th e a llo tm e n t N A V h a s b e e n ta k e n a s R s . 1 0 .0 0 . P a st p e rfo rm a n c em a y o r m a y n o t b e s u s ta in e d in fu tu re . 3 1 -D e c -20 0 5 w a s a n o n b u s in e s s d a y.
P ruICICI G ilt Fund P F O p tion
P ortfolio - Treas ury P F
Comp any /Is s uer R ating Mk t V alue % to N A V(R s . L a k h )
G ov ernment S ec urities 2 ,0 6 4 .7 7 5 3 .1 1 %
1 3 .0 5 % G O I 20 0 7 S o v e re ig n 1 ,5 6 6 .7 7 4 0 .3 0 %
6 .7 2% G O I 20 1 2 S o v e re ig n 4 9 8.0 0 1 2.81 %
Cas h , Call, CB L O & R ev ers e R ep o 2 ,3 1 8 .4 0 5 9 .6 3 %
O th er Current A s s ets (4 9 5 .0 1 ) - 1 2 .7 4 %
Total N et A s s ets 3 ,8 8 8 .1 6 1 0 0 .0 0 %
S ty le B ox
A b s o lu te – G ilt T re a s u ry P F o p tio n : 4 .1 7 % ; B e n c h m a rk : 4 .5 1 %P a s t p e rfo rm a n c e m a y o r m a y n o t b e s u s ta in e d in fu tu re .
P ortfolio - Inv es tment P F
Comp any /Is s uer R ating Mk t V alue % to N A V(R s . L a k h )
G ov ernment S ec urities 4 ,6 0 1 .5 5 8 4 .9 0 %
6 .20 % G O I 20 1 0 S o v e re ig n 2,820 .0 0 5 2.0 3 %
6 .6 5 % G O I 20 0 9 S o v e re ig n 9 83 .0 0 1 8.1 4 %
7 .5 5 % G O I 20 1 0 S o v e re ig n 4 9 9 .7 5 9 .22%
6 .7 2% G O I 20 1 2 S o v e re ig n 29 8.80 5 .5 1 %
Cas h , Call, CB L O & R ev ers e R ep o 7 5 8 .2 4 1 3 .9 9 %
O th er Current A s s ets 6 0 .2 4 1 .1 1 %
Total N et A s s ets 5 ,4 2 0 .0 3 1 0 0 .0 0 %
S nap s h ot: Inv es tment P lan P F op tion
Fund Managers : Rahul GoswamiIndic ativ e Inv estm ent H o riz o n: 1 y e ar & ab ov eInc ep t io n date: 1 9 -N ov -0 3Fund S iz e: Rs. 5 4 .2 0 c rore sN A V (A s o n 3 0 -June-0 6 ): : G ro w t h o p t io n: Rs. 1 0 .9 6 5 3* * E x p ense R atio fo r t h e m o nth o f Jun'0 6 : 1 .1 0 %
* * T his is a c lose ap p rox imation of the n umb e r.
S ty le B ox
A b s o lu te – G ilt In v e s tm e n t P F o p tio n : 3 .5 9 % ; B e n c h m a rk : 0 .81 %P a s t p e rfo rm a n c e m a y o r m a y n o t b e s u s ta in e d in fu tu re .
R e tu r n s > = 1 Y e a r a re C A G R , < Y e a r a re A b s o lu te . B e n c h m a rk is I-S e c L i B e x In d e x .F o r c o m p u ta tio n o f re tu rn s th e a llo tm e n t N A V h a s b e e n ta k e n a s R s . 1 0 .0 0 . P a st p e rfo rm a n c em a y o r m a y n o t b e s u s ta in e d in fu tu re . 3 1 -D e c -20 0 5 w a s a n o n b u s in e s s d a y.
Figures as on 3 0 -June, 2 0 0 6
R s 1 1 0 2 1 .8 0
R s 1 1 1 0 8 .7 9
9,950
1 0 ,1 50
1 0 ,350
1 0 ,550
1 0 ,7 50
1 0 ,950
1 1 ,1 50
1 1 ,350
Feb-
04
Apr
-04
Jun-
04
Aug
-04
Oct
-04
Dec
-04
Feb-
05
Apr
-05
Jun-
05
Aug
-05
Oct
-05
Dec
-05
Feb-
06
Apr
-06
Jun-
06
P ru IC IC I G ilt T re a s u ry -P F I S e c S i B e x
R s 1 0 965.30
R s 1 0 2 1 3.36
9,2 359,4 359,6359,8 35
1 0 ,0 351 0 ,2 35
1 0 ,4 351 0 ,6351 0 ,8 351 1 ,0 351 1 ,2 35
Nov
-03
Jan-
04
Mar
-04
May
-04
Jul-
04
Sep-
04
Nov
-04
Jan-
05
Mar
-05
May
-05
Jul-
05
Sep-
05
Nov
-05
Jan-
06
Mar
-06
May
-06
P ru IC IC I G ilt F u n d -P F I S e c L i-B e x
2 .33%
4 .54 %4 .1 7 %
2 .4 7 %
4 .96%4 .51 %
0 .0 0 %
1 .0 0 %
2 .0 0 %
3.0 0 %
4 .0 0 %
5.0 0 %
6.0 0 %
L a s t 6 M o n th s L a s t 1 y e a rs S in c e In c e p tio n
P ru IC IC I G ilt T re a s u ry -P F I S e c S i B e x
0 .96%
3.0 5%3.59%
-3.30 %
-0 .2 2 %
0 .8 1 %
-4 .0 0 %
-3.0 0 %
-2 .0 0 %
-1 .0 0 %
0 .0 0 %
1 .0 0 %
2 .0 0 %
3.0 0 %
4 .0 0 %
L a s t 6 M o n th s L a s t 1 y e a rs S in c e In c e p tio n
P ru IC IC I G ilt F u n d -P F I S e c L i-B e x
61 .2 5%
2 3.65%
1 3.99%
1 .1 1 %
0 .0 0 % 2 0 .0 0 % 4 0 .0 0 % 60 .0 0 % 8 0 .0 0 %
3-5 y e a rs
1 -3 y e a rs
< 1 8 2 d a y s
O th e r C u rre n t A s s e ts

29
Quantitative Indicators: Treasury Plan
A v e ra g e M a tu rity : 1 .3 4 y e a rsY ie ld T o M a tu rity : 7 .3 2%M o d ifie d D u ra tio n : 1 .20 y e a rs% U n lis te d B o n d s : 0 .0 0 %
F und M anag er C om m ent
T h e �a p p e a rin g a w a y fro m th e re d p o rtio n in d ic a te s a c h a n g e in th e p o rtfo lio s ty le . M a tu rity
is re d u c e d o n a c c o u n t o f a u c tio n s u p p ly c o n c e rn s a n d h ig h o il p ric e s
Quantitative Indicators: Investm ent Plan
A v e ra g e M a tu rity : 3 .5 8 y e a rsY ie ld T o M a tu rity : 7 .8 7 %M o d ifie d D u ra tio n : 3 .0 5 y e a rs% U n lis te d B o n d s : 0 .0 0 %
M aturity Profile:M aturity Profile:
Perform ance R ecord* - G row th O p tion (Treasury Plan)
R s. 1 0 0 0 0 invested at incep tion* : G ilt -Treasury V s I S ec S i B ex
W H Y S H O U L D O N E IN V E S T?Treasury Plan: S h ort term dep loym ent of funds in a p ortfolio of G -S ecs w ith low volatility
Investm ent Plan: M edium term investm ent in a p ortfolio of G -S ecs for steady returns w ith m ark et volatility
* R e tu r n s > = 1 Y e a r a re C A G R , < 1 Y e a r a re A b s o lu te . B e n c h m a rk is I S e c S i B e x . B e n c h -m a rk s ta rt d a te : 3 1 -0 3 -20 0 2. F o r c o m p u ta tio n o f re tu rn s th e a llo tm e n t N A V h a s b e e nta k e n a s R s . 1 0 .0 0 . P a s t p e rfo rm a n c e m a y o r m a y n o t b e s u s ta in e d in fu tu re . 3 0 -Ju n -20 0 1a n d 3 1 -D e c -20 0 5 w e re n o n b u s in e s s d a y s .
PruIC IC I G ilt F und
* B e n c h m a rk s ta rt d a te : 3 1 -0 3 -20 0 2. C A G R – G ilt - T re a s u ry : 5 .95 % ; B e n c h m a rk : 5 .93 %P a s t p e rfo rm a n c e m a y o r m a y n o t b e s u s ta in e d in fu tu re .
S tyle B ox S nap sh ot: Investm ent Plan
Fund Managers : Rahul Goswami
Indic ativ e Inv estm ent H o riz o n: 1 y e ar & ab ov eInc ep tio n date: 1 9 -0 8 -1 9 9 9Fund S iz e: Rs. 8 5 .2 6 c rore sN A V (A s o n 3 0 -June-0 6 ): G ro w th o p tio n: Rs. 2 0 .9 4 0 1
D iv idend o p tio n: Rs. 1 0 .2 7 7 1
* * E x p ense R atio fo r t h e m o nth o f Jun'0 6 : 1 .1 5 %
* * T his is a c lose ap p rox imation of the n umb e r.
S nap sh ot: Treasury Plan
Fund Managers : Rahul Goswami
Indic ativ e Inv estm ent H o riz o n: 3 -6 mon thsInc ep tio n date: 1 9 -0 8 -1 9 9 9Fund S iz e: Rs. 8 6 .6 2 c rore sN A V (A s o n 3 0 -June-0 6 ): G ro w th o p tio n: Rs. 1 7 .3 0 0 4
D iv idend o p tio n: Rs. 1 0 .4 5 3 3
* * E x p ense R atio fo r t h e m o nth o f Jun'0 6 : 1 .1 0 %
* * T his is a c lose ap p rox imation of the n umb e r.
R s. 1 0 0 0 0 invested at incep tion: G ilt - Investm ent V s I-S ec I B ex
C A G R – G ilt - In v e s tm e n t: 1 1 .3 6 % ; B e n c h m a rk : 1 1 .5 7 %P a s t p e rfo rm a n c e m a y o r m a y n o t b e s u s ta in e d in fu tu re .
Perform ance R ecord* - G row th O p tion (Investm ent Plan)
* R e tu rn s > = 1 Y e a r a re C A G R , < 1 Y e a r a re A b s o lu te . B e n c h m a rk is I B e x . F o r c o m p u ta tio no f re tu rn s th e a llo tm e n t N A V h a s b e e n ta k e n a s R s . 1 0 .0 0 . P a s t p e rfo rm a n c e m a y o r m a yn o t b e s u s ta in e d in fu tu re . 3 0 -Ju n -20 0 1 a n d 3 1 -D e c -20 0 5 w e re n o n b u s in e s s d a y s .
S tyle B ox
Portfolio - Treasury Plan
C om p any/ Issuer R ating M k t V alue % to N A V(R s . L a k h )
G overnm ent S ecurities 7 ,7 5 1 .9 0 8 9 .5 0 %• 6 .7 2% G O I 20 1 2 S o v e re ig n 2,1 91 .20 25 .3 0 %• 1 2.1 5 % G O I 20 0 8 S o v e re ig n 2,0 3 1 .3 3 23 .4 5 %• 1 3 .0 5 % G O I 20 0 7 S o v e re ig n 1 ,5 6 6 .7 7 1 8 .0 9%• 9.5 0 % G O I 20 0 8 S o v e re ig n 1 ,0 3 3 .8 6 1 1 .94 %• 6 .6 5 % G O I 20 0 9 S o v e re ig n 4 91 .5 0 5 .6 7 %
1 2.5 0 % G O I 20 0 8 S o v e re ig n 4 3 7 .24 5 .0 5 %Treasury B ills 8 7 .2 2 1 .0 1 %3 6 4 D a y T B ill (M D 21 /0 7 /20 0 6 ) S o v e re ig n 8 7 .22 1 .0 1 %C ash , C all, C B L O & R everse R ep o 6 2 2 .8 1 7 .1 9 %O th er C urrent A ssets 2 0 0 .0 8 2 .3 0 %Total N et A ssets 8 ,6 6 2 .0 1 1 0 0 .0 0 %
• T o p F iv e H o ld in g s
Portfolio - Investm ent Plan
C om p any/Issuer R ating M k t V alue % to N A V(R s . L a k h )
G overnm ent S ecurities 7 ,7 2 8 .2 5 9 0 .6 4 %
6 .20 % G O I 20 1 0 S o v e re ig n 4 ,23 0 .0 0 4 9.6 1 %
7 .5 5 % G O I 20 1 0 S o v e re ig n 3 ,4 98 .25 4 1 .0 3 %
C ash , C all, C B L O & R everse R ep o 3 1 5 .5 5 3 .7 0 %
O th er C urrent A ssets 4 8 2 .7 0 5 .6 6 %
Total N et A ssets 8 ,5 2 6 .5 0 1 0 0 .0 0 %
F ig ures as on 3 0 -June, 2 0 0 6
0.22%2.1 1 %
2.9 6 %
9 .5 0%
1 1 .3 6 %
-1 .25 %
1 .6 4 %3 .1 4 %
9 .7 9 %
1 1 .5 7 %
-2.00%
0.00%
2.00%
4 .00%
6 .00%
8 .00%
1 0.00%
1 2.00%
1 4 .00%
L a s t 6M o n th s
L a s t 1y e a rs
L a s t 3y e a rs
L a s t 5y e a rs
S in c eIn c e p tio n
P ru IC IC I G ilt In v e s tm e n t I S e c I-B e x
2.8 3 %
5 .04 % 4 .9 7 %
6 .7 1 %
8 .3 1 %
2.4 7 %
4 .9 6 % 4 .8 8 %
0.00%1 .00%2.00%3 .00%4 .00%5 .00%6 .00%7 .00%8 .00%9 .00%
L a s t 6M o n th s
L a s t 1 y e a rs L a s t 3 y e a rs L a s t 5 y e a rs S in c eIn c e p tio n
P ru IC IC I G ilt T re a s u ry I S e c S i B e x
R s 209 4 0.1 0
R s 21 21 6 .1 3
9 ,9 3 1
1 1 ,9 3 1
1 3 ,9 3 1
1 5 ,9 3 1
1 7 ,9 3 1
1 9 ,9 3 1
21 ,9 3 1
23 ,9 3 1
Aug
-99
Jan-
00
Jun-
00
Nov
-00
Apr
-01
Sep-
01
Feb-
02
Jul-
02
Dec
-02
May
-03
Oct
-03
Mar
-04
Aug
-04
Jan-
05
Jun-
05
Nov
-05
Apr
-06
P ru IC IC I G ilt In v e s tm e n t I S e c I-B e x
R s 1 27 8 3 .9 6
R s 1 27 7 1 .9 1
9 ,7 8 0
1 0,28 0
1 0,7 8 0
1 1 ,28 0
1 1 ,7 8 0
1 2,28 0
1 2,7 8 0
1 3 ,28 0
Apr
-02
Jul-
02
Oct
-02
Jan-
03
Apr
-03
Jul-
03
Oct
-03
Jan-
04
Apr
-04
Jul-
04
Oct
-04
Jan-
05
Apr
-05
Jul-
05
Oct
-05
Jan-
06
Apr
-06
P ru IC IC I G ilt T re a s u ry I S e c S i B e x
7 1 .4 1 %
1 8 .09 %
8 .20%
2.3 1 %
0.00% 20.00% 4 0.00% 6 0.00% 8 0.00%
1 -3 y e a rs
1 8 2 d a y s - 1 y e a r
< 1 8 2 d a y s
O th e r C u rre n t A s s e ts
9 0.6 4 %
5 .6 6 %
3 .7 0%
0.00% 20.00% 4 0.00% 6 0.00% 8 0.00% 1 00.00%
3 -5 y e a rs
O th e r C u rre n t
A s s e ts
< 1 8 2 d a y s

30
93.24%
6 .7 6 %
0 .0 0 % 20 .0 0 % 40 .0 0 % 6 0 .0 0 % 8 0 .0 0 % 1 0 0 .0 0 %
< 1 8 2 d a y s
> 1 8 2 d a y s
Rating Profile
Maturity Profile:
Q uan titativ e In d ic ators :
Average Maturity : 37.14 daysY ield T o Maturity : 7.15 %Mo dified D uratio n : 32 .5 4 days% F lo atin g R ate Assets : 2 0 .5 3%Average days to reset : 2 2 .9 0 daysAverage m aturity o f fix ed rate c o m p o n en t : 2 2 .77 daysW eigh ted average m aturity : 2 2 .8 0 days% U n listed B o n ds : 6 .6 9 %
Perform an c e R ec ord * - G row th O p tion – In s titution al Plus Plan
R s . 1 0 0 0 0 in v es ted at in c ep tion * : L iq uid Plan In s t. Plus V s C ris il L iq uid F un d In d ex
PS U /PF I B on d s 5 2 ,1 4 8 .8 2 3 .7 7 %In dustrial D evelo p m en t B an k o f In dia AA+ 2 3,9 37.2 5 1.73%H o usin g & U rb an D evelo p m en t C o rp o f In dia P 1+ 7,5 0 0 .0 0 0 .5 4%N ab ard AAA 7,48 2 .14 0 .5 4%In dian O il C o rp o ratio n L td AAA 6 ,0 0 2 .74 0 .44%B h arat H eavy E lec tric als L td AAA 3,0 17.5 7 0 .2 2 %In dian R ailw ay F in an c e C o rp o ratio n AAA 2 ,40 5 .10 0 .17%E x p o rt Im p o rt B an k o f In dia L td AAA 1,0 0 0 .9 7 0 .0 7%P o w ergrid C o rp o ratio n L td AAA 5 0 0 .12 0 .0 4%K o n k an R ailw ay C o rp o ratio n L td AAA 30 2 .9 3 0 .0 2 %Priv ate C orp orate S ec urities 2 2 2 ,5 7 5 .1 1 1 6 .1 3 %G lo b al T rade F in an c e L td P 1+ 2 2 ,70 0 .0 0 1.6 5 %T G S In vestm en t & T rade P vt. L td. A1+ 2 2 ,5 0 0 .0 0 1.6 3%P T C T ata In dustries S tan C h art In vtt & L o an A1+ (S O ) 15 ,0 2 7.8 9 1.0 9 %P T C G E C ap ital S ervic es In dia L td AAA 14,2 0 1.75 1.0 3%K o tak S ec urities L td P 1+ 10 ,0 0 0 .0 0 0 .72 %P T C T ata Mo to rs AAA(S O ) 8 ,5 78 .8 5 0 .6 2 %P T C C iti F leet T rust C itib an k AAA(S O ) 7,5 9 0 .9 8 0 .5 5 %P T C B H P C T ata Mo to rs AAA(S O ) 7,6 31.35 0 .5 5 %P T C R ab o In dia F in an c e AAA(S O ) 7,42 0 .74 0 .5 4%P T C H D F C B an k AAA(S O ) 7,2 15 .5 4 0 .5 2 %P T C S h riram T ran sp o rt F in an c e H S B C AAA(S O ) 6 ,76 2 .78 0 .49 %B irla G lo b al F in an c e L td A1+ 6 ,5 0 0 .0 0 0 .47%P T C U B L T rust In dusIn d B an k AAA(S O ) 6 ,437.2 7 0 .47%P T C IB L T rust In dusIn d B an k AAA(S O ) 5 ,8 2 2 .2 2 0 .42 %O sc ar In vestm en ts L td U n rated 5 ,5 0 0 .0 0 0 .40 %C itiF in an c ial C o n sum er F in an c e In dia L td AAA 5 ,38 7.43 0 .39 %H D F C L td AAA 5 ,0 0 1.2 7 0 .36 %B alram p ur C h in i Mills L td A1+ 5 ,0 0 0 .0 0 0 .36 %S un daram F in an c e L td AAA 5 ,0 0 0 .0 0 0 .36 %Mah in dra & Mah in dra F in an c ial S ervic es L td AA+ 4,49 0 .71 0 .33%R elian c e In dustries L td AAA 4,40 3.2 5 0 .32 %R aym o n d L td P 1+ 4,30 0 .0 0 0 .31%K o tak Mah in dra P rim us L td AA+ 3,9 5 1.6 1 0 .2 9 %R ab o In dia F in an c e L td AAA 2 ,5 0 0 .0 0 0 .18 %H in dalc o In dustries L td AAA 2 ,5 0 0 .8 3 0 .18 %S un daram F in an c e L td AA+ 2 ,5 0 0 .0 0 0 .18 %G E C ap ital S ervic es In dia L td AAA 2 ,5 0 0 .0 0 0 .18 %G ujarat G lass L td U n rated 2 ,5 0 0 .0 0 0 .18 %L ease P lan In dia L td AA+ 2 ,49 0 .40 0 .18 %IC IC I B an k L td AAA 2 ,0 0 4.2 2 0 .15 %K o tak Mah in dra In vestm en t L td A1+ 1,9 9 8 .2 4 0 .14%P T C Ash o k L eylan d F in an c e AAA(S O ) 1,8 6 8 .6 4 0 .14%AB N Am ro B an k L td AAA 1,8 31.18 0 .13%P T C T V S F in an c e AAA(S O ) 1,743.0 9 0 .13%Asso c iated C em en t C o m p an ies L td AA+ 1,5 0 0 .2 3 0 .11%D C M S h riram C o n so lidated L td P 1+ 1,5 0 0 .0 0 0 .11%P T C B irla H o m e F in an c e G E C S I AA(S O ) 1,5 0 0 .0 0 0 .11%P T C C h o lam an dalam In vestm en t & F in an c e C o . L td AAA(S O ) 8 6 7.2 1 0 .0 6 %P T C R T L T rust C en turio n B an k AAA(S O ) 6 5 1.11 0 .0 5 %C itic o rp Maruti F in an c e L td AAA 49 5 .9 5 0 .0 4%P T C C itic o rp F in an c e (In dia) L td AAA(S O ) 2 0 0 .37 0 .0 1%C Ps an d C D s 1 1 9 ,3 1 2 .6 2 8 .6 5 %H D F C B an k L td - C P P 1+ 19 ,434.2 8 1.41%H D F C B an k - C D P 1+ 19 ,38 1.6 8 1.40 %IN G V ysya B an k - C D P 1+ 18 ,8 8 8 .8 3 1.37%U C O B an k - C D P 1+ 18 ,311.19 1.33%K o tak Mah in dra B an k L td - C D P 1+ 13,8 0 9 .45 1.0 0 %H D F C L td - C P P 1+ 9 ,9 6 4.41 0 .72 %Tata Mo to rs L td - C P P 1+ 4,9 8 5 .45 0 .36 %Am eric an E x p ress B an k L td - C D P 1+ 3,8 6 3.2 3 0 .2 8 %G E C ap ital S ervic es In dia L td - C P P 1+ 2 ,35 3.16 0 .17%Y es B an k L td - C D P 1+ 2 ,344.9 2 0 .17%S tan dard C h artered In vestm en t & L o an (In dia) L td - C P P 1+ 1,9 5 3.14 0 .14%S tate B an k o f B ik an er & Jaip ur - C D P 1+ 1,9 18 .8 1 0 .14%In dustrial D evelo p m en t B an k o f In dia L td - C D P 1+ 1,39 0 .46 0 .10 %R edin gto n In dia L td - C P P 1+ 48 8 .38 0 .0 4%S tate B an k o f S aurash tra L td - C D P 1+ 140 .79 0 .0 1%S tate B an k o f In do re L td - C D P 1+ 8 4.44 0 .0 1%T erm D ep os its 8 7 6 ,1 0 0 .0 0 6 3 .5 0 %
• IC IC I B an k 2 5 1,10 0 .0 0 18 .2 0 %• P un jab N atio n al B an k 18 5 ,0 0 0 .0 0 13.41%• C an ara B an k 9 8 ,5 0 0 .0 0 7.14%• S tate B an k o f P atiala 8 0 ,30 0 .0 0 5 .8 2 %• C itib an k 70 ,0 0 0 .0 0 5 .0 7%
S tate B an k o f H yderab ad 6 9 ,6 0 0 .0 0 5 .0 4%S tate B an k o f B ik an er & Jaip ur 40 ,0 0 0 .0 0 2 .9 0 %C en tral B an k o f In dia 2 7,2 0 0 .0 0 1.9 7%U T I B an k 19 ,6 0 0 .0 0 1.42 %ID B I B an k 15 ,0 0 0 .0 0 1.0 9 %S tate B an k O f S aurash tra 12 ,5 0 0 .0 0 0 .9 1%Y es B an k 7,30 0 .0 0 0 .5 3%C as h , C all, C B L O & R ev ers e R ep o 9 8 ,6 9 9 .4 3 7 .1 5 %O th er C urren t A s s ets 1 0 ,9 7 4 .7 4 0 .8 0 %
T otal N et A s s ets 1 ,3 7 9 ,8 1 0 .7 2 1 0 0 .0 0 %
• T o p F ive H o ldin gs
S n ap s h ot:
Fund Managers : Chaitanya PandeIndic ativ e Inv estm ent H o riz o n: U p to 1 m o nthInc ep t io n date:
G ro w th O p tio n: 2 4 -0 6 -1 9 9 8Institutio nal O p tio n: 0 3 -0 4 -2 0 0 3Institutio nal P lus O p tio n: 2 8 -0 9 -2 0 0 3S up er Institutio nal P lus O p t io n: 1 7 -1 1 -2 0 0 5
Fund S iz e: R s . 1 3 ,7 9 8 .1 1 c ro resN A V (A s o n 3 0 -June-0 6 ):
G ro w t h o p t io n : R s . 1 7 .4 3 2 4Institutio nal G ro w t h o p t io n : R s . 1 7 .5 8 3 1Institutio nal P lus G ro w t h o p t io n : R s . 1 7 .6 3 4 0S up er Institutio nal P lus G ro w t h o p t io n : R s . 1 0 .3 8 7 4
* * E x p ense R atio fo r t h e m o nth o f Jun'0 6 :L iq u id Plan: 0 .9 0 %Ins t. Plan: 0 .6 0 %Ins t. Plu s Plan: 0 .5 5 %S u p er Ins t. Plu s Plan: 0 .4 5 %F II Plan : 0 .3 0 %
* * T his is a c lo s e ap p ro x im atio n o f the nu m b er.
W H Y S H O U L D O N E IN V E S T ?T em p orary p ark in g of fun d s w ith h ig h liq uid ity
S tyle B ox
PruIC IC I L iq uid Plan
* B en c h m ark start date : 31-0 3-2 0 0 2C AG R – L iq uid P lan : 5 .35 % ; B en c h m ark : 4.6 0 %P ast p erfo rm an c e m ay o r m ay n o t b e sustain ed in future.
Portfolio
C om p an y/Is s uer R atin g Mk t V alue (R s. L ak h ) % to N A V
* R eturn s > = 1 Y ear are C AG R , < 1 Y ear are S im p le An n ualised. B en c h m ark isC risil L iq uid F un d In dex . F o r c o m p utatio n o f return s th e allo tm en t N AV h as b eentak en as R s. 10 .0 0 . P ast p erfo rm an c e m ay o r m ay n o t b e sustain ed in future.31-D ec -2 0 0 5 w as a n o n b usin ess day.
F ig ures as on 3 0 -Jun e, 2 0 0 6
Rs 11544.13
Rs 11319 .0 7
9 ,9 50
10 ,150
10 ,35010 ,550
10 ,7 50
10 ,9 50
11,15011,350
11,550
11,7 50
Sep-
03
Nov
-03
Jan-
04
Mar
-04
May
-04
Jul-
04
Sep-
04
Nov
-04
Jan-
05
Mar
-05
May
-05
Jul-
05
Sep-
05
Nov
-05
Jan-
06
Mar
-06
May
-06
P ru IC IC I In stitu tio n a l P lu s P la n C risil L iq u id F u n d In d e x
6 .48 % 6 .37 % 6 .2 8 %5.9 9 %
5.35%4.55% 4.6 3%
5.9 7 %5.32 %
4.6 0 %
0 .0 0 %
1.0 0 %
2 .0 0 %
3.0 0 %
4.0 0 %
5.0 0 %
6 .0 0 %
7 .0 0 %
L a st 15d a y s
L a st 30d a y s
L a st 6M o n th s
L a st 1y e a rs
S in c eIn c e p tio n
P ru IC IC I In stitu tio n a l P lu s P la n C risil L iq u id F u n d In d e x
AAA and E q u iv ale nt2 5 .0 4 %
C all,C u rre ntAs s e ts ,B ankD e p o s its and R e v e rs e R e p o s
7 1 .4 5 %
AA and E q u iv ale nt
2 .9 3 %
U nrate d0 .5 8 %

31
87.81%
12 .19 %
0 .0 0 % 2 0 .0 0 % 4 0 .0 0 % 6 0 .0 0 % 80 .0 0 % 10 0 .0 0 %
< 182 d a y s
> 182 d a y s
A v e ra g e M a tu rity : 7 7 .4 1 D a y s
Y ie ld T o M a tu rity : 7 .0 2 %
M o d ifie d D u ra tio n : 6 8 .16 D a y s
% F lo a tin g R a te A s s e ts : 4 0 .7 8 %
A v e ra g e d a y s to re s e t : 7 .5 4 D a y s
A v e ra g e m a tu rity o f fix e d ra te c o m p o n e n t : 6 .0 5 D a y s
W e ig h te d a v e ra g e m a tu rity : 6 .6 6 D a y s
% U n lis te d B o n d s : 5 .4 1%
Quantitative Indicators:
M aturity P rofile
P erform ance R ecord * - C um ulative O p tion – P lan B
R s. 1 0 0 0 0 invested at incep tion: F loating R ate P lan B V s C risil L iq uid F und Index
R ating P rofile
S nap sh ot:
Fund Managers : Chaitanya PandeIndic ativ e Inv estm ent H o riz o n: 1 - 3 m o nthsInc ep tio n date: 2 8 -0 3 -2 0 0 3Fund S iz e: R s . 2 ,8 6 2 .5 5 c ro resN A V (A s o n 3 0 -June-0 6 ):
Plan A - Cu m u lativ e: R s . 1 1 .0 4 5 3Plan B - Cu m u lativ e: R s . 1 1 .8 3 2 6Plan C - Cu m u lativ e: R s . 1 1 .1 1 9 2Plan D - Cu m u lativ e: R s . 1 0 .3 9 4 1
* * E x p ense R atio fo r t h e m o nth o f Jun0 6 :Plan A - 1 .0 0 % , Plan B - 0 .7 5 % , Plan C - 0 .6 5 % , Plan D - 0 .5 0 %
* * T his is a c lo s e ap p ro x im atio n o f the nu m b er.
W H Y S H O U L D O N E IN V E S T ?
S h ort term dep loy m ent of funds
* R e tu rn s > = 1 Y e a r a re C A G R , < 1 Y e a r a re S im p le A n n u a lis e d . B e n c h m a rk isC ris il L iq u id F u n d In d e x . F o r c o m p u ta tio n o f re tu rn s th e a llo tm e n t N A V h a s b e e nta k e n a s R s .10 .0 0 . P a s t p e rfo rm a n c e m a y o r m a y n o t b e s u s ta in e d in fu tu re .31-D e c -2 0 0 5 w a s a n o n b u s in e s s d a y.
P ruIC IC I F loating R ate P lan
C A G R – F lo a tin g R a te P la n - P la n B : 5 .30 % ; B e n c h m a rk : 4 .6 2 %P a s t p e rfo rm a n c e m a y o r m a y n o t b e s u s ta in e d in fu tu re .
P S U / P F I B onds 2 0 ,1 4 6 .3 4 7 .0 5 %
In d u s tria l D e v e lo p m e n t B a n k o f In d ia A A + 9 ,6 4 5 .5 9 3.37 %
In d ia n O il C o rp o ra tio n L td A A A 7 ,0 0 3.2 0 2 .4 5 %
N a b a rd A A A 2 ,4 9 4 .0 5 0 .8 7 %
E x p o rt Im p o rt B a n k o f In d ia L td A A A 5 0 1.8 1 0 .18 %
In fra s tru c tu re D e v e lo p m e n t F in a n c e C o rp o ra tio n A A A 5 0 1.6 9 0 .18 %
P rivate C orp orate S ecurities 5 5 ,4 1 3 .2 2 1 9 .3 6 %
R a b o In d ia F in a n c e L td A A A 11,0 0 0 .0 0 3.8 4 %
H D F C L td A A A 10 ,0 0 0 .0 0 3.4 9 %
P T C C iti F le e t T ru s t C itib a n k A A A (S O ) 5 ,7 10 .8 8 2 .0 0 %
P T C H D F C B a n k A A A (S O ) 5 ,12 3.34 1.7 9 %
P T C T a ta In d u s trie s S ta n C h a rt In v tt & L o a n A 1+ (S O ) 5 ,0 0 9 .30 1.7 5 %
P T C G E C a p ita l S e rv ic e s In d ia L td A 1+ (S O ) 5 ,0 0 0 .0 0 1.7 5 %
H e ro H o n d a F in le a s e L td P 1+ 2 ,5 0 0 .0 0 0 .8 7 %
P T C B irla H o m e F in a n c e G E C S I A A (S O ) 2 ,0 0 0 .0 0 0 .7 0 %
O s c a r In v e s tm e n ts L td U n ra te d 2 ,0 0 0 .0 0 0 .7 0 %
M a h in d ra & M a h in d ra F in a n c ia l S e rv ic e s L td A A + 2 ,0 0 0 .0 0 0 .7 0 %
A s s o c ia te d C e m e n t C o m p a n ie s L td A A + 1,9 9 7 .6 0 0 .7 0 %
P T C H e ro M o to rs L td A 1+ (S O ) 1,7 0 0 .0 0 0 .5 9 %
P T C C itic o rp F in a n c e (In d ia ) L td A A A (S O ) 1,0 2 3.7 6 0 .36 %
P T C In d u s In d B a n k A A A (S O ) 34 8 .34 0 .12 %
C P s and C D s 2 5 ,0 5 1 .2 9 8 .7 6 %
H D F C B a n k - C D P 1+ 12 ,9 0 8 .4 8 4 .5 1%
K o ta k M a h in d ra B a n k L td - C D P 1+ 3,0 9 5 .2 3 1.0 8 %
IN G V y s y a B a n k - C D P 1+ 2 ,9 4 4 .5 1 1.0 3%
A m e ric a n E x p re s s B a n k L td - C D P 1+ 2 ,9 19 .8 8 1.0 2 %
U C O B a n k - C D P 1+ 2 ,19 5 .5 6 0 .7 7 %
S ta te B a n k o f In d o re L td - C D P 1+ 9 8 7 .6 3 0 .35 %
T erm D ep osits 1 8 0 ,4 0 0 .0 0 6 3 .0 2 %
• IC IC I B a n k 5 4 ,5 0 0 .0 0 19 .0 4 %
• C itib a n k 4 6 ,5 0 0 .0 0 16 .2 4 %
• Ja m m u & K a s h m ir B a n k 2 9 ,4 0 0 .0 0 10 .2 7 %
• S ta te B a n k o f H y d e ra b a d 15 ,0 0 0 .0 0 5 .2 4 %
• S ta te B a n k o f B ik a n e r & Ja ip u r 15 ,0 0 0 .0 0 5 .2 4 %
S ta te B a n k o f P a tia la 10 ,0 0 0 .0 0 3.4 9 %
S ta te B a n k O f S a u ra s h tra 5 ,0 0 0 .0 0 1.7 5 %
C a n a ra B a n k 5 ,0 0 0 .0 0 1.7 5 %
C ash , C all, C B L O & R everse R ep o 2 ,9 1 6 .3 2 1 .0 2 %
O th er C urrent A ssets 2 ,3 2 7 .7 5 0 .7 9 %
T otal N et A ssets 2 8 6 ,2 5 4 .9 2 1 0 0 .0 0 %
• T o p F iv e H o ld in g s
P ortfolio
C om p any /Issuer R ating M k t V alue (R s . L a k h ) % to N A VS ty le B ox
F ig ures as on 3 0 -June, 2 0 0 6
R s 1183 2 .6
R s 115 85 .0 3
9 ,9 5 010 ,15 010 ,3 5 010 ,5 5 010 ,75 010 ,9 5 011,15 011,3 5 011,5 5 011,75 011,9 5 0
Mar
-03
May
-03
Jul-
03
Sep-
03
Nov
-03
Jan-
04
Mar
-04
May
-04
Jul-
04
Sep-
04
Nov
-04
Jan-
05
Mar
-05
May
-05
Jul-
05
Sep-
05
Nov
-05
Jan-
06
Mar
-06
May
-06
P ru IC IC I F lo a tin g R a te P la n C ris il L iq u id F u n d In d e x
6 .19 % 6 .13 % 6 .2 4 % 5 .9 4 %5 .3 0 %
4 .5 5 % 4 .6 3 %
5 .9 7%5 .3 2 %
4 .6 2 %
0 .0 0 %
1.0 0 %
2 .0 0 %
3 .0 0 %
4 .0 0 %
5 .0 0 %
6 .0 0 %
7.0 0 %
L a s t 15d a y s
L a s t 3 0d a y s
L a s t 6M o n th s
L a s t 1y e a rs
S in c eIn c e p tio n
P ru IC IC I F lo a tin g R a te P la n C ris il L iq u id F u n d In d e x
Unrated0 .7 0 %
A A and E q u iv alent
5 .4 6 %
C all,C u rrentA s s ets ,B ankD ep o s its and R ev ers e R ep o s
6 4 .8 6 %
A A A and E q u iv alent2 8 .9 8 %
0

32
70.61%
11.5 6%
10.4 6%
7.3 7%
0.00% 2 0.00% 4 0.00% 60.00% 8 0.00%
< 18 2 d a y s
18 2 d a y s - 1 y e a r
O th e r C u rre n t A s s e ts
1-3 y e a rs
Fund Manager Comment
T h e �a p p e a rin g a w a y fro m th e re d p o rtio n in d ic a te s a c h a n g e in th e p o rtfo lio s ty le . M a tu rity is re d u c e d
o n a c c o u n t o f a u c tio n s u p p ly c o n c e rn s a n d h ig h o il p ric e s
Maturity P rofile Q uantitativ e Indic ators :
A v e ra g e M a tu rity : 0 .4 1 Y e a r
Y ie ld T o M a tu rity : 7 .6 9 %
M o d ifie d D u ra tio n : 0 .25 Y e a r
% F lo a tin g R a te A s s e ts : 26 .0 8 %
A v e ra g e d a y s to re s e t : 0 .1 9 Y e a r
A v e ra g e m a tu rity o f fix e d ra te c o m p o n e n t : 0 .1 9 Y e a r
W e ig h te d a v e ra g e m a tu rity : 0 .1 9 Y e a r
% U n lis te d B o n d s : 7 .1 4 %
R s . 1 0 0 0 0 inv es ted at incep tion* : S T P V s Cris il S h ort T erm B ond Fund Index
R ating P rofile
P S U / P FI B onds 7 ,2 4 4 .8 7 1 3 .0 0 %
• In d u s tria l D e v e lo p m e n t B a n k o f In d ia A A + 3,4 9 4 .4 3 6 .27 %
P o w e rg rid C o rp o ra tio n L td A A A 2,25 0 .7 7 4 .0 4 %
E x p o rt Im p o rt B a n k o f In d ia L td A A A 1 ,4 9 9 .6 7 2.6 9 %
P riv ate Corp orate S ec urities 1 9 ,7 5 1 .3 4 3 5 .4 5 %
• C itiF in a n c ia l C o n s u m e r F in a n c e In d ia L td A A A 2,9 9 0 .5 1 5 .37 %
P T C C iti F le e t T ru s t C itib a n k A A A (S O ) 2,7 4 2.8 8 4 .9 2%
P T C G E C a p ita l S e rv ic e s In d ia L td A 1 + (S O ) 2,6 5 3.9 7 4 .7 6 %
P T C D A S T ru s t S ta n d a rd C h a rte re d B a n k F 1 + S O 2,5 4 4 .1 9 4 .5 7 %
G ra s im In d u s trie s L td A A A 2,0 1 3.8 3 3.6 1 %
P T C R T L T ru s t C e n tu rio n B a n k A A A (S O ) 1 ,7 7 5 .6 0 3.1 9 %
P T C U B L T ru s t In d u s In d B a n k A A A (S O ) 1 ,5 9 0 .1 2 2.8 5 %
P T C D L F G E C a p ita l S e rv ic e s In d ia L td A A A (S O ) 1 ,39 1 .5 6 2.5 0 %
K o ta k M a h in d ra P rim u s L td A A + 9 8 7 .9 0 1 .7 7 %
P T C T V S F in a n c e A A A (S O ) 9 0 6 .32 1 .6 3%
P T C V E T ru s t M M F S L A A A (S O ) 1 5 4 .4 6 0 .28 %
T erm D ep os its 2 2 ,0 0 0 .0 0 3 9 .5 0 %
• IC IC I B a n k 1 2,0 0 0 .0 0 21 .5 4 %
• C itib a n k 5 ,0 0 0 .0 0 8 .9 8 %
• S ta te B a n k o f H y d e ra b a d 5 ,0 0 0 .0 0 8 .9 8 %
Cas h , Call, CB L O & R ev ers e R ep o 8 8 4 .5 8 1 .5 9 %
O th er Current A s s ets 5 ,8 2 8 .8 9 1 0 .4 6 %
T otal N et A s s ets 5 5 ,7 0 9 .6 8 1 0 0 .0 0 %
• T o p F iv e H o ld in g s
W H Y S H O U L D O N E IN V E S T ?S h ort term dep loy ment of funds w ith low v olatilityP ruICICI S h ort T erm P lan
* B e n c h m a rk s ta rt d a te : 31 -0 3-20 0 2C A G R – S h o rt T e rm P la n : 6 .38 % ; B e n c h m a rk : 5 .22%P a s t p e rfo rm a n c e m a y o r m a y n o t b e s u s ta in e d in fu tu re .
P ortfolio
Comp any /Is s uer R ating Mk t V alue (R s . L a k h ) % to N A VS ty le B ox
P erformanc e R ec ord* - Cumulativ e O p tion
* R e tu rn s > = 1 Y e a r a re C A G R , < 1 Y e a r a re A b s o lu te . B e n c h m a rk is C risil S h o rtTe rm B o n d F u n d In d e x . S ta rt d a te : 31 -0 3-20 0 2. F o r c o m p u ta tio n o f re tu rn s th ea llo tm e n t N A V h a s b e e n ta k e n a s R s . 1 0 .0 0 . P a s t p e rfo rm a n c e m a y o r m a yn o t b e s u s ta in e d in fu tu re . 31 -D e c -20 0 5 w a s a n o n b u s in e s s d a y.
Figures as on 3 0 -June, 2 0 0 6
S nap s h ot:Fund Managers : Chaitanya PandeIndic ativ e Inv estm ent H o riz o n: 3 - 6 m o nthsInc ep t io n C um ulativ e O p tio n: 2 5 -1 0 -2 0 0 1date Institutio nal O p tio n : 0 3 -0 4 -2 0 0 3Fund S iz e: R s . 5 5 7 .1 0 c ro resN A V (A s o n 3 0 -June-0 6 ):
C um ulativ e O p t io n : R s . 1 3 .5 2 5 1Institutio nal O p t io n : R s . 1 3 .6 2 9 4
* * E x p ense R atio fo r t h e m o nth o f Jun'0 6 :S ho rt T erm Plan : 1 .1 0 %Ins t. Plan : 0 .8 0 %
* * T his is a c lo s e ap p ro x im atio n o f the nu m b er.
}
R s 13 006.78
R s 12 4 14 .18
9 ,9 5 0
10,4 5 0
10,9 5 0
11,4 5 0
11,9 5 0
12 ,4 5 0
12 ,9 5 0
13 ,4 5 0
Apr
-02
Jul-
02
Oct
-02
Jan-
03
Apr
-03
Jul-
03
Oct
-03
Jan-
04
Apr
-04
Jul-
04
Oct
-04
Jan-
05
Apr
-05
Jul-
05
Oct
-05
Jan-
06
Apr
-06
P ru IC IC I S h o rt T e rm P la n C ris il S h o rt T e rm B o n d F u n d In d e x
3 .2 0%
5 .78 % 5 .64 %
6.66%
2 .4 2 %
4 .3 0% 4 .2 4 %
0.00%
1.00%
2 .00%
3 .00%
4 .00%
5 .00%
6.00%
7.00%
L a s t 6 M o n th s L a s t 1 y e a rs L a s t 3 y e a rs S in c e In c e p tio n
P ru IC IC I S h o rt T e rm P la n C ris il S h o rt T e rm B o n d F u n d In d e x
AA and E q u iv ale nt
8 .0 5 %
C all,C u rre ntAs s e ts ,B ankD e p o s its and R e v e rs e R e p o s
5 1 .5 4 %
AAA and E q u iv ale nt4 0 .4 1 %

33
Rs. 10000 invested at inception: L ong Term F loating Rate P lan-B V s C risil L iq u id F u nd Index
CAGR – Long Term Floating Rate Plan: 5.74%; Benchmark : 4.96%Past p erformance may or may not b e s u s tained in fu tu re.
Rating P rofile
Av erage M atu rity : 0 .8 1 Y ear
Y ield To M atu rity : 7.43 %
M od ified D u ration : 0 .67 Y ear
% Floating Rate As sets : 42 .0 1 %
Av erage d ay s to reset : 0 .1 4 Y ear
Av erage matu rity of fix ed rate comp onent : 0 .0 7 Y ear
W eighted Av erage M atu rity : 0 .1 0 Y ear
% U nlis ted Bond s : 5.54%
Q u antitative Indicators:
M atu rity P rofile
P erfor m ance Record * - C u m u lative O ption
S napsh ot:
Fund Managers : Chaitanya PandeIndic ativ e Inv estm ent H o riz o n: 6 -1 2 m o nthsInc ep t io n date: 1 5 -S ep -0 4Fund S iz e: R s . 4 5 1 .5 8 c ro resN A V (A s o n 3 0 -June-0 6 ):
Plan A - Cu m u lativ e: R s . 1 0 .9 6 5 1Plan B - Cu m u lativ e: R s . 1 1 .0 4 9 4
* * E x p ense R atio fo r t h e m o nth o f Jun'0 6 :Plan A - 1 .2 5 %Plan B - 0 .8 5 %
* * T his is a c lo s e ap p ro x im atio n o f the nu m b er.
* Retu rns > = 1 Y ear are CAGR, < 1 Y ear are Ab solu te. Benchmark is Cris ilLiq u id Fu nd Ind ex . For comp u tation of retu rns the allotment N AV has b eentaken as Rs . 1 0 .0 0 . Pas t p erformance may or may not b e s u s tained in fu tu re.3 1 -D ec-2 0 0 5 w as a non b u s ines s d ay.
P r u IC IC I L ong T erm F loating Rate P lan
P S U / P F I B onds 5 ,8 15 .2 7 12 .8 8 %
• Bharat H eav y E lectricals Ltd AAA 2 ,8 1 6.40 6.2 4%
Ind ian O il Corp oration Ltd AAA 1 ,0 0 0 .46 2 .2 2 %
Ind u s trial D ev elop ment Bank of Ind ia AA+ 998 .41 2 .2 1 %
U nion Bank of Ind ia AA 1 ,0 0 0 .0 0 2 .2 1 %
P r ivate C orporate S ecu r ities 16 ,02 6 .8 2 3 5 .4 8 %
• GE Cou ntry w id e Finacial S erv ices Ltd AAA 2 ,50 0 .0 0 5.54%
Rab o Ind ia Finance Ltd AAA 2 ,50 0 .0 0 5.54%
PTC U BL Tru s t Ind u s Ind Bank AAA(S O ) 1 ,590 .1 2 3 .52 %
H D FC Ltd AAA 1 ,50 3 .8 3 3 .3 3 %
M ahind ra & M ahind ra Financial S erv ices Ltd AA+ 1 ,50 0 .0 0 3 .3 2 %
PTC Birla H ome Finance GE CS I AA(S O ) 1 ,50 0 .0 0 3 .3 2 %
PTC H ero M otors Ltd A1 + (S O ) 1 ,50 0 .0 0 3 .3 2 %
PTC D LF GE Cap ital S erv ices Ind ia Ltd AAA(S O ) 1 ,2 1 0 .0 6 2 .68 %
LIC H ou s ing Finance Ltd AAA 1 ,0 0 0 .0 0 2 .2 1 %
PTC Citi Fleet Tru s t Citib ank AAA(S O ) 72 4.2 1 1 .60 %
ICICI Bank Ltd AAA 498 .60 1 .1 0 %
T er m D eposits 17 ,5 00.00 3 8 .7 5 %
• ICICI Bank 7,50 0 .0 0 1 6.61 %
• Central Bank of Ind ia 5,0 0 0 .0 0 1 1 .0 7%
• S tate Bank of Patiala 5,0 0 0 .0 0 1 1 .0 7%
C ash , C all, C B L O & Reverse Repo 17 9 .6 1 0.4 0%
O th er C u r rent A ssets 5 ,6 3 6 .4 0 12 .4 9 %
T otal N et A ssets 4 5 ,15 8 .10 100.00%
• Top Fiv e H old ings
P ortfolio
C om pany /Issu er Rating M k t V alu e (Rs . Lakh) % to N A VS ty le B ox
W H Y S H O U L D O N E IN V E S T ?
G enerate m ark et rate of retu rns w ith low volatility
F ig u res as on 3 0-J u ne, 2 006
Rs 11049.40
Rs 10903 .95
9,95 0
10,15 0
10,3 5 0
10,5 5 0
10,7 5 0
10,95 0
11,15 0
Sep-
04O
ct-0
4
Nov
-04
Dec
-04
Jan-
05
Feb-
05M
ar-0
5A
pr-0
5M
ay-0
5
Jun-
05Ju
l-05
Aug
-05
Sep-
05O
ct-0
5N
ov-0
5D
ec-0
5
Jan-
06Fe
b-06
Mar
-06
Apr
-06
May
-06
Jun-
06
P ru IC IC I L o n g T e rm F lo a tin g Ra te P la n C risil L iq u id F u n d In d e x
3 .01%
5 .8 7 % 5 .7 4%
2 .98 %
5 .3 2 %4.96 %
0.00%
1.00%
2 .00%
3 .00%
4.00%
5 .00%
6 .00%
7 .00%
L a st 6 M o n th s L a st 1 y e a rs S in c e In c e p tio n
P ru IC IC I L o n g T e rm F lo a tin g Ra te P la n C risil L iq u id F u n d In d e x
AA and E q u iv ale nt1 1 .0 7 %
C all,C u rre ntAs s e ts ,B ankD e p o s its and R e v e rs e R e p o s
5 1 .6 3 %
AAA and E q u iv ale nt3 7 .3 0 %
5 1.42 %
2 3 .7 1%
12 .48 %
6 .8 5 %
3 .3 2 %
2 .2 1%
0.00% 2 0.00% 40.00% 6 0.00%
< 18 2 d a y s
O th e r C u rre n t A sse ts
3 -5 y e a rs

34
100%
0.00% 4 0.00% 8 0.00% 12 0.00%
< 18 2 d a y s
Rating Profile
M atu rity Profile:
Q u antitativ e Ind ic ators :
A v e ra g e M a tu rity : 6 .33 D a y sY ie ld T o M a tu rity : 7 .1 0 %M o d ifie d D u ra tio n : 6 .0 6 D a y s% F lo a tin g R a te A s s e ts : 5 6 .44%A v e ra g e d a y s to re s e t : 3.9 2 D a y sA v e ra g e m a tu rity o f fix e d ra te c o m p o n e n t : 3.6 5 D a y sW e ig h te d a v e ra g e m a tu rity : 3.8 0 D a y s% U n lis te d B o n d s : 6 .9 5 %
Perform anc e* Rec ord - C as h O p tion - G row th
PS U /PF I B ond s 1 ,0 0 0 .4 6 2 .7 8 %
In d ia n O il C o rp o ra tio n L td A A A 1 ,0 0 0 .46 2 .7 8 %
Priv ate C orp orate S ec u rities 2 ,5 0 0 .0 0 6 .9 5 %
• G E C a p ita l S e rv ic e s In d ia L td A A A 2 ,5 0 0 .0 0 6 .9 5 %
C Ps and C D s 1 ,6 8 1 .4 2 4 .6 7 %
H D F C B a n k - C D P 1 + 6 9 7 .0 7 1 .9 4%
P u n ja b N a tio n a l B a n k - C D P 1 + 49 3.2 0 1 .37 %
S ta te B a n k o f B ik a n e r & Ja ip u r - C D P 1 + 49 1 .1 5 1 .36 %
T erm D ep os its 2 1 ,5 0 0 .0 0 5 9 .7 4 %
• C itib a n k 7 ,5 0 0 .0 0 2 0 .8 4%
• IC IC I B a n k 6 ,5 0 0 .0 0 1 8 .0 6 %
• C e n tra l B a n k o f In d ia 5 ,0 0 0 .0 0 1 3.8 9 %
• S ta te B a n k o f P a tia la 2 ,5 0 0 .0 0 6 .9 5 %
C as h , C all, C B L O & Rev ers e Rep o 6 ,9 9 9 .8 8 1 9 .4 5 %
O th er C u rrent A s s ets 2 ,3 1 4 .3 3 6 .4 1 %
T otal N et A s s ets 3 5 ,9 9 6 .0 9 1 0 0 .0 0 %
• T o p F iv e H o ld in g s
S nap s h ot:
Fund Managers : Chaitanya PandeIndic ativ e Inv estm ent H o riz o n: O ne day to o ne w eekInc ep t io n date:
G ro w th O p tio n: 0 6 -0 3 -2 0 0 2G ro w th C ash O p tio n: 0 9 -0 3 -2 0 0 6
Fund S iz e: R s . 3 5 9 .9 6 c ro resN A V (A s o n 3 0 -June-0 6 ):
G ro w t h o p t io n : R s . 1 2 .0 6 0 4C ash O p t io n G ro w t h : R s . 1 0 .2 0 6 5
* * E x p ense R atio fo r t h e m o nth o f Jun'0 6 :G ro w th o p tio n: 1 .0 0 %Cash O p tio n G ro w th: 0 .3 5 %
* * T his is a c lo s e ap p ro x im atio n o f the nu m b er.
W H Y S H O U L D O N E IN V E S T ?T em p orary p ark ing of fu nd s w ith h igh liq u id ity
S ty le B ox
Pru IC IC I S w eep PlanPortfolio
C om p any /Is s u er M k t V alu e (R s . L a k h ) % to N A V
* R e tu rn s > = 1 Y e a r a re C A G R , < 1 Y e a r a re S im p le A n n u a lis e d . B e n c h m a rk isC ris il L iq u id F u n d In d e x . F o r c o m p u ta tio n o f re tu rn s th e a llo tm e n t N A V h a s b e e nta k e n a s R s . 1 0 .0 0 . P a s t p e rfo rm a n c e m a y o r m a y n o t b e s u s ta in e d in fu tu re .
F igu res as on 3 0 -J u ne, 2 0 0 6
6 .6 3 % 6 .5 8 % 6 .6 1%
4 .5 6 % 4 .6 2 %
6 .15 %
0.00%
1.00%
2 .00%
3 .00%
4 .00%
5 .00%
6 .00%
7 .00%
L a s t 15 d a y s L a s t 3 0 d a y s S in c e in c e p tio n
P ru IC IC I S w e e p C ris il L iq u id F u n d In d e x
Call,CurrentA s s ets ,B ankD ep o s its and R ev ers e R ep o s
8 5 .6 0 %
A A A and E q uiv alent1 4 .4 0 %

35
WHY SHOULD ONE INVEST?C u s t o m is e d in v e s t m e n t s o lu t io n s t o m a t c h r is k r e t u r n p ro f ile .P ru IC IC I A d v is o r Se r ie s
P o r t f o lio - C a u t io u s P la n
C o m p a n y / Is s u e r M k t . Va lu e % t o NA V(R s . L a k h )
P ru IC IC I S h o rt te rm P la n 2 4 7 .30 4 0 .7 3%
P ru IC IC I F lo a tin g R a te P la n 2 0 6 .0 7 33.9 4 %
P ru IC IC I L iq u id P la n 1 2 3.52 2 0 .34 %
P ru IC IC I F le x ib le In c o m e P la n 8 2 .4 3 1 3.58 %
P ru IC IC I G ro w th P la n 6 4 .9 0 1 0 .6 9 %
P ru IC IC I D y n a m ic P la n 6 4 .2 1 1 0 .57 %
P ru IC IC I E m e rg in g S .T .A .R 4 2 .2 3 6 .9 5%
Oth e r C u r r e n t A s s e t s ( 2 2 3 .4 6 ) - 3 6 .8 0 %
To t a l Ne t A s s e t s 6 0 7 .2 0 1 0 0 .0 0 %
F ig u r e s a s o n 3 0 -J u n e , 2 0 0 6
Fund Managers : Pankaj Kaji
P o r t f o lio - Ve r y A g g r e s s iv e P la n
C o m p a n y / Is s u e r M k t . Va lu e % t o NA V(R s . L a k h )
P ru IC IC I G ro w th P la n 32 5.6 9 38 .8 5%
P ru IC IC I P o w e r P la n 32 2 .7 8 38 .50 %
P ru IC IC I D y n a m ic P la n 8 0 .54 9 .6 1 %
P ru IC IC I L iq u id P la n 7 7 .2 3 9 .2 1 %
Oth e r C u r r e n t A s s e t s 3 2 .1 8 3 .8 3 %
To t a l Ne t A s s e t s 8 3 8 .4 2 1 0 0 .0 0 %
P o r t f o lio - M o d e r a t e P la n
C o m p a n y / Is s u e r M k t . Va lu e % t o NA V(R s . L a k h )
P ru IC IC I D y n a m ic P la n 1 50 .0 4 1 5.55%
P ru IC IC I F lo a tin g R a te P la n 1 4 4 .4 7 1 4 .9 7 %
P ru IC IC I S h o rt te rm P la n 9 6 .32 9 .9 8 %
P ru IC IC I F le x ib le In c o m e P la n 9 6 .31 9 .9 8 %
P ru IC IC I L iq u id P la n 1 9 2 .59 1 9 .9 5%
P ru IC IC I G ro w th P la n 1 51 .6 9 1 5.7 2 %
P ru IC IC I P o w e r P la n 1 50 .34 1 5.58 %
Oth e r C u r r e n t A s s e t s ( 1 6 .5 7 ) - 1 .7 3 %
To t a l Ne t A s s e t s 9 6 5 .1 9 1 0 0 .0 0 %
P o r t f o lio - Ve r y C a u t io u s P la n
C o m p a n y / Is s u e r M k t . Va lu e % t o NA V(R s . L a k h )
P ru IC IC I L iq u id P la n 2 9 9 .58 50 .0 9 %
P ru IC IC I F lo a tin g R a te P la n 1 59 .8 1 2 6 .7 2 %
P ru IC IC I S h o rt te rm P la n 1 54 .8 2 2 5.8 9 %
Oth e r C u r r e n t A s s e t s (1 6 .1 5 ) -2 .7 0 %
To t a l Ne t A s s e t s 5 9 8 .0 6 1 0 0 .0 0 %
F u n d Siz e R s . 3 8 .0 0 C r o r e s
P e r f o r m a n c e R e c o r d s *
Sc h e m e Na m e Da t e P e r io d NA V NA V R e t u r n s(R s ) a s o f F u n d B e n c h m a r k
3 0 -J u n -0 6 In d e x
V e ry C a u tio u s 30 -D e c -0 5 L a s t 6 M o n th s 1 1 .0 1 7 3 1 1 .334 4 2 .8 8 % 2 .8 1 %
V e ry C a u tio u s 30 -Ju n -0 5 L a s t 1 y e a rs 1 0 .7 4 9 4 1 1 .334 4 5.4 4 % 5.0 1 %
V e ry C a u tio u s 1 8 -D e c -0 3 S in c e In c e p tio n 1 0 1 1 .334 4 5.0 7 % 4 .4 3%
C a u tio u s 30 -D e c -0 5 L a s t 6 M o n th s 1 1 .8 0 55 1 2 .34 7 5 4 .59 % 3.9 5%
C a u tio u s 30 -Ju n -0 5 L a s t 1 y e a rs 1 0 .9 58 1 2 .34 7 5 1 2 .6 8 % 1 2 .4 3%
C a u tio u s 1 8 -D e c -0 3 S in c e In c e p tio n 1 0 1 2 .34 7 5 8 .6 8 % 8 .1 1 %
M o d e ra te 30 -D e c -0 5 L a s t 6 M o n th s 1 3.8 0 0 5 1 4 .8 6 9 6 7 .7 5% 6 .8 9 %
M o d e ra te 30 -Ju n -0 5 L a s t 1 y e a rs 1 1 .6 0 53 1 4 .8 6 9 6 2 8 .1 3% 2 4 .1 5%
M o d e ra te 1 8 -D e c -0 3 S in c e In c e p tio n 1 0 1 4 .8 6 9 6 1 6 .9 5% 1 5.2 3%
A g g re s s iv e 30 -D e c -0 5 L a s t 6 M o n th s 1 5.7 2 0 6 1 7 .2 1 0 4 9 .4 8 % 8 .8 8 %
A g g re s s iv e 30 -Ju n -0 5 L a s t 1 y e a rs 1 2 .4 8 1 8 1 7 .2 1 0 4 37 .8 8 % 33.7 1 %
A g g re s s iv e 1 8 -D e c -0 3 S in c e In c e p tio n 1 0 1 7 .2 1 0 4 2 3.8 9 % 2 1 .0 5%
V e ry A g g re s s iv e 30 -D e c -0 5 L a s t 6 M o n th s 1 7 .7 2 4 2 1 9 .7 2 51 1 1 .2 9 % 9 .9 6 %
V e ry A g g re s s iv e 30 -Ju n -0 5 L a s t 1 y e a rs 1 3.1 8 6 4 1 9 .7 2 51 4 9 .59 % 38 .9 1 %
V e ry A g g re s s iv e 1 8 -D e c -0 3 S in c e In c e p tio n 1 0 1 9 .7 2 51 30 .7 4 % 2 4 .39 %
V e ry C a u tio u s :- C ris il L iq u id fu n d In d e x - 7 0 % , C ris il S h o rt T e rm B o n d F u n d -30 %
C a u tio u s :- N ifty -1 5% , C ris il C o m p o s ite B o n d F u n d In d e x - 7 0 % , C ris il L iq u idF u n d In d e x -1 5%
M o d e ra te :- N ifty -4 0 % , C ris il C o m p o s ite B o n d F u n d In d e x - 4 0 % , C ris il L iq u idF u n d In d e x -2 0 %
A g g re s s iv e :- N ifty -7 0 % , C ris il C o m p o s ite B o n d F u n d In d e x - 2 5% , C ris il L iq u idF u n d In d e x -5%
V e ry A g g re s s iv e :- N ifty -9 0 % , C ris il L iq u id F u n d In d e x - 1 0 %
* R e tu rn s < 1 Y e a r : A b s o lu te , > = 1 Y e a r : C A G RN o te : F o r c o m p u ta tio n o f re tu r n s th e a llo tm e n t N A V h a s b e e n ta k e n a s R s .1 0 .0 0P a s t P e rfo rm a n c e m a y o r m a y n o t b e s u s ta in e d in th e fu tu re . 31 -D e c -2 0 0 5 w a s a n o nb u s in e s s d a y.
P o r t f o lio - A g g r e s s iv e P la n
C o m p a n y / Is s u e r M k t . Va lu e % t o NA V(R s . L a k h )
P ru IC IC I G ro w th P la n 2 4 3.9 8 30 .8 4 %
P ru IC IC I P o w e r P la n 1 6 1 .1 9 2 0 .37 %
P ru IC IC I L iq u id P la n 1 54 .2 4 1 9 .4 9 %
P ru IC IC I D y n a m ic P la n 1 2 0 .6 5 1 5.2 5%
P ru IC IC I F le x ib le In c o m e P la n 7 7 .4 4 9 .7 9 %
P ru IC IC I S h o rt te rm P la n 38 .7 3 4 .8 9 %
Oth e r C u r r e n t A s s e t s (5 .0 1 ) - 0 .6 3 %
To t a l Ne t A s s e t s 7 9 1 .2 2 1 0 0 .0 0 %
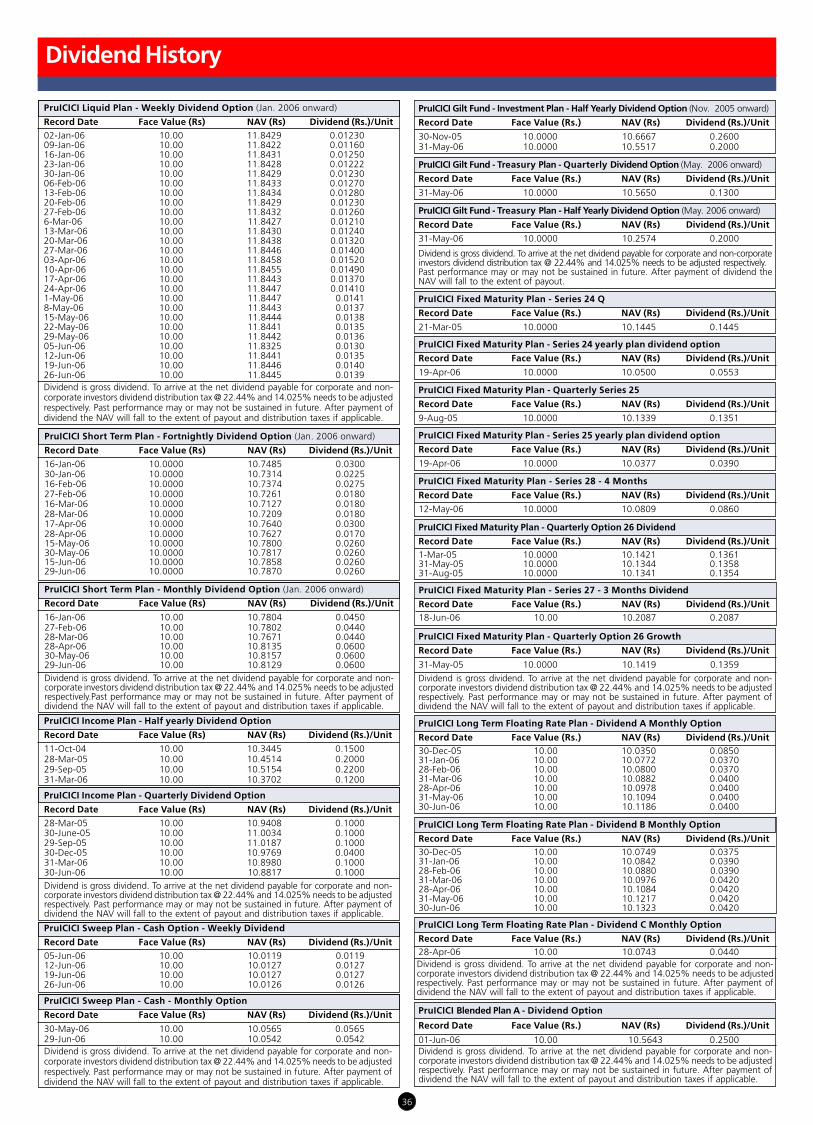
36
Dividend History
P ru IC IC I G ilt F u nd - Investm ent P la n - Ha lf Y ea rly Dividend O p tion (N o v . 2 0 0 5 o n w a rd )
R ec ord Da te F a c e V a lu e (R s.) N A V (R s) Dividend (R s.)/ U nit
30 -N o v -0 5 1 0 .0 0 0 0 1 0 .6667 0 .2 60 031 -M a y -0 6 1 0 .0 0 0 0 1 0 .5 5 1 7 0 .2 0 0 0
P ru IC IC I F ix ed M a tu rity P la n - Q u a rterly O p tion 2 6 Dividend
R ec ord Da te F a c e V a lu e (R s.) N A V (R s) Dividend (R s.)/ U nit
1 -M a r-0 5 1 0 .0 0 0 0 1 0 .1 4 2 1 0 .1 36131 -M a y -0 5 1 0 .0 0 0 0 1 0 .1 34 4 0 .1 35 831 -A u g -0 5 1 0 .0 0 0 0 1 0 .1 34 1 0 .1 35 4
P ru IC IC I Inc om e P la n - Q u a rterly Dividend O p tion
R ec ord Da te F a c e V a lu e (R s) N A V (R s) Dividend (R s.)/ U nit
2 8 -M a r-0 5 1 0 .0 0 1 0 .9 4 0 8 0 .1 0 0 030 -Ju n e -0 5 1 0 .0 0 1 1 .0 0 34 0 .1 0 0 02 9 -S e p -0 5 1 0 .0 0 1 1 .0 1 8 7 0 .1 0 0 030 -D e c -0 5 1 0 .0 0 1 0 .9 7 69 0 .0 4 0 031 -M a r-0 6 1 0 .0 0 1 0 .8 9 8 0 0 .1 0 0 030 -Ju n -0 6 1 0 .0 0 1 0 .8 8 1 7 0 .1 0 0 0
D iv id e n d is g ro s s d iv id e n d . T o a rriv e a t th e n e t d iv id e n d p a y a b le fo r c o rp o ra te a n d n o n -c o rp o ra te in v e s to rs d iv id e n d d is trib u tio n ta x @ 2 2 .4 4 % a n d 1 4 .0 2 5 % n e e d s to b e a d ju s te dre s p e c tiv e ly. P a s t p e rfo rm a n c e m a y o r m a y n o t b e s u s ta in e d in fu tu re . A fte r p a y m e n t o fd iv id e n d th e N A V w ill fa ll to th e e x te n t o f p a y o u t a n d d is trib u tio n ta x e s if a p p lic a b le .
P ru IC IC I Inc om e P la n - Ha lf yea rly Dividend O p tion
R ec ord Da te F a c e V a lu e (R s) N A V (R s) Dividend (R s.)/ U nit
1 1 -O c t-0 4 1 0 .0 0 1 0 .34 4 5 0 .1 5 0 02 8 -M a r-0 5 1 0 .0 0 1 0 .4 5 1 4 0 .2 0 0 02 9 -S e p -0 5 1 0 .0 0 1 0 .5 1 5 4 0 .2 2 0 031 -M a r-0 6 1 0 .0 0 1 0 .37 0 2 0 .1 2 0 0
P ru IC IC I S h ort T erm P la n - M onth ly Dividend O p tion (Ja n . 2 0 0 6 o n w a rd )
R ec ord Da te F a c e V a lu e (R s) N A V (R s) Dividend (R s.)/ U nit
1 6-Ja n -0 6 1 0 .0 0 1 0 .7 8 0 4 0 .0 4 5 02 7 -F e b -0 6 1 0 .0 0 1 0 .7 8 0 2 0 .0 4 4 02 8 -M a r-0 6 1 0 .0 0 1 0 .7 67 1 0 .0 4 4 02 8 -A p r-0 6 1 0 .0 0 1 0 .8 1 35 0 .0 60 030 -M a y -0 6 1 0 .0 0 1 0 .8 1 5 7 0 .0 60 02 9 -Ju n -0 6 1 0 .0 0 1 0 .8 1 2 9 0 .0 60 0
D iv id e n d is g ro s s d iv id e n d . T o a rriv e a t th e n e t d iv id e n d p a y a b le fo r c o rp o ra te a n d n o n -c o rp o ra te in v e s to rs d iv id e n d d is trib u tio n ta x @ 2 2 .4 4 % a n d 1 4 .0 2 5 % n e e d s to b e a d ju s te dre s p e c tiv e ly.P a s t p e rfo rm a n c e m a y o r m a y n o t b e s u s ta in e d in fu tu re . A fte r p a y m e n t o fd iv id e n d th e N A V w ill fa ll to th e e x te n t o f p a y o u t a n d d is trib u tio n ta x e s if a p p lic a b le .
P ru IC IC I L ong T erm F loa ting R a te P la n - Dividend A M onth ly O p tion
R ec ord Da te F a c e V a lu e (R s.) N A V (R s) Dividend (R s.)/ U nit
30 -D e c -0 5 1 0 .0 0 1 0 .0 35 0 0 .0 8 5 031 -Ja n -0 6 1 0 .0 0 1 0 .0 7 7 2 0 .0 37 02 8 -F e b -0 6 1 0 .0 0 1 0 .0 8 0 0 0 .0 37 031 -M a r-0 6 1 0 .0 0 1 0 .0 8 8 2 0 .0 4 0 02 8 -A p r-0 6 1 0 .0 0 1 0 .0 9 7 8 0 .0 4 0 031 -M a y -0 6 1 0 .0 0 1 0 .1 0 9 4 0 .0 4 0 030 -Ju n -0 6 1 0 .0 0 1 0 .1 1 8 6 0 .0 4 0 0
P ru IC IC I S h ort T erm P la n - F ortnig h tly Dividend O p tion (Ja n . 2 0 0 6 o n w a rd )
R ec ord Da te F a c e V a lu e (R s) N A V (R s) Dividend (R s.)/ U nit
1 6-Ja n -0 6 1 0 .0 0 0 0 1 0 .7 4 8 5 0 .0 30 030 -Ja n -0 6 1 0 .0 0 0 0 1 0 .7 31 4 0 .0 2 2 51 6-F e b -0 6 1 0 .0 0 0 0 1 0 .7 37 4 0 .0 2 7 52 7 -F e b -0 6 1 0 .0 0 0 0 1 0 .7 2 61 0 .0 1 8 01 6-M a r-0 6 1 0 .0 0 0 0 1 0 .7 1 2 7 0 .0 1 8 02 8 -M a r-0 6 1 0 .0 0 0 0 1 0 .7 2 0 9 0 .0 1 8 01 7 -A p r-0 6 1 0 .0 0 0 0 1 0 .7 64 0 0 .0 30 02 8 -A p r-0 6 1 0 .0 0 0 0 1 0 .7 62 7 0 .0 1 7 01 5 -M a y -0 6 1 0 .0 0 0 0 1 0 .7 8 0 0 0 .0 2 6030 -M a y -0 6 1 0 .0 0 0 0 1 0 .7 8 1 7 0 .0 2 601 5 -Ju n -0 6 1 0 .0 0 0 0 1 0 .7 8 5 8 0 .0 2 602 9 -Ju n -0 6 1 0 .0 0 0 0 1 0 .7 8 7 0 0 .0 2 60
D iv id e n d is g ro s s d iv id e n d . T o a rriv e a t th e n e t d iv id e n d p a y a b le fo r c o rp o ra te a n d n o n -c o rp o ra te in v e s to rs d iv id e n d d is trib u tio n ta x @ 2 2 .4 4 % a n d 1 4 .0 2 5 % n e e d s to b e a d ju s te dre s p e c tiv e ly. P a s t p e rfo rm a n c e m a y o r m a y n o t b e s u s ta in e d in fu tu re . A fte r p a y m e n t o fd iv id e n d th e N A V w ill fa ll to th e e x te n t o f p a y o u t a n d d is trib u tio n ta x e s if a p p lic a b le .
P ru IC IC I L ong T erm F loa ting R a te P la n - Dividend C M onth ly O p tion
R ec ord Da te F a c e V a lu e (R s.) N A V (R s) Dividend (R s.)/ U nit
2 8 -A p r-0 6 1 0 .0 0 1 0 .0 7 4 3 0 .0 4 4 0
P ru IC IC I L ong T erm F loa ting R a te P la n - Dividend B M onth ly O p tion
R ec ord Da te F a c e V a lu e (R s.) N A V (R s) Dividend (R s.)/ U nit
30 -D e c -0 5 1 0 .0 0 1 0 .0 7 4 9 0 .0 37 531 -Ja n -0 6 1 0 .0 0 1 0 .0 8 4 2 0 .0 39 02 8 -F e b -0 6 1 0 .0 0 1 0 .0 8 8 0 0 .0 39 031 -M a r-0 6 1 0 .0 0 1 0 .0 9 7 6 0 .0 4 2 02 8 -A p r-0 6 1 0 .0 0 1 0 .1 0 8 4 0 .0 4 2 031 -M a y -0 6 1 0 .0 0 1 0 .1 2 1 7 0 .0 4 2 030 -Ju n -0 6 1 0 .0 0 1 0 .1 32 3 0 .0 4 2 0
P ru IC IC I L iq u id P la n - W eek ly Dividend O p tion (Ja n . 2 0 0 6 o n w a rd )
R ec ord Da te F a c e V a lu e (R s) N A V (R s) Dividend (R s.)/ U nit
0 2 -Ja n -0 6 1 0 .0 0 1 1 .8 4 2 9 0 .0 1 2 300 9 -Ja n -0 6 1 0 .0 0 1 1 .8 4 2 2 0 .0 1 1 601 6-Ja n -0 6 1 0 .0 0 1 1 .8 4 31 0 .0 1 2 5 02 3-Ja n -0 6 1 0 .0 0 1 1 .8 4 2 8 0 .0 1 2 2 230 -Ja n -0 6 1 0 .0 0 1 1 .8 4 2 9 0 .0 1 2 300 6-F e b -0 6 1 0 .0 0 1 1 .8 4 33 0 .0 1 2 7 01 3-F e b -0 6 1 0 .0 0 1 1 .8 4 34 0 .0 1 2 8 02 0 -F e b -0 6 1 0 .0 0 1 1 .8 4 2 9 0 .0 1 2 302 7 -F e b -0 6 1 0 .0 0 1 1 .8 4 32 0 .0 1 2 606-M a r-0 6 1 0 .0 0 1 1 .8 4 2 7 0 .0 1 2 1 01 3-M a r-0 6 1 0 .0 0 1 1 .8 4 30 0 .0 1 2 4 02 0 -M a r-0 6 1 0 .0 0 1 1 .8 4 38 0 .0 1 32 02 7 -M a r-0 6 1 0 .0 0 1 1 .8 4 4 6 0 .0 1 4 0 00 3-A p r-0 6 1 0 .0 0 1 1 .8 4 5 8 0 .0 1 5 2 01 0 -A p r-0 6 1 0 .0 0 1 1 .8 4 5 5 0 .0 1 4 9 01 7 -A p r-0 6 1 0 .0 0 1 1 .8 4 4 3 0 .0 1 37 02 4 -A p r-0 6 1 0 .0 0 1 1 .8 4 4 7 0 .0 1 4 1 01 -M a y -0 6 1 0 .0 0 1 1 .8 4 4 7 0 .0 1 4 18 -M a y -0 6 1 0 .0 0 1 1 .8 4 4 3 0 .0 1 371 5 -M a y -0 6 1 0 .0 0 1 1 .8 4 4 4 0 .0 1 382 2 -M a y -0 6 1 0 .0 0 1 1 .8 4 4 1 0 .0 1 352 9 -M a y -0 6 1 0 .0 0 1 1 .8 4 4 2 0 .0 1 360 5 -Ju n -0 6 1 0 .0 0 1 1 .8 32 5 0 .0 1 301 2 -Ju n -0 6 1 0 .0 0 1 1 .8 4 4 1 0 .0 1 351 9 -Ju n -0 6 1 0 .0 0 1 1 .8 4 4 6 0 .0 1 4 02 6-Ju n -0 6 1 0 .0 0 1 1 .8 4 4 5 0 .0 1 39
D iv id e n d is g ro s s d iv id e n d . T o a rriv e a t th e n e t d iv id e n d p a y a b le fo r c o rp o ra te a n d n o n -c o rp o ra te in v e s to rs d iv id e n d d is trib u tio n ta x @ 2 2 .4 4 % a n d 1 4 .0 2 5 % n e e d s to b e a d ju s te dre s p e c tiv e ly. P a s t p e rfo rm a n c e m a y o r m a y n o t b e s u s ta in e d in fu tu re . A fte r p a y m e n t o fd iv id e n d th e N A V w ill fa ll to th e e x te n t o f p a y o u t a n d d is trib u tio n ta x e s if a p p lic a b le .
P ru IC IC I B lended P la n A - Dividend O p tion
R ec ord Da te F a c e V a lu e (R s.) N A V (R s) Dividend (R s.)/ U nit
0 1 -Ju n -0 6 1 0 .0 0 1 0 .5 64 3 0 .2 5 0 0D iv id e n d is g ro s s d iv id e n d . T o a rriv e a t th e n e t d iv id e n d p a y a b le fo r c o rp o ra te a n d n o n -c o rp o ra te in v e s to rs d iv id e n d d is trib u tio n ta x @ 2 2 .4 4 % a n d 1 4 .0 2 5 % n e e d s to b e a d ju s te dre s p e c tiv e ly. P a s t p e rfo rm a n c e m a y o r m a y n o t b e s u s ta in e d in fu tu re . A fte r p a y m e n t o fd iv id e n d th e N A V w ill fa ll to th e e x te n t o f p a y o u t a n d d is trib u tio n ta x e s if a p p lic a b le .
P ru IC IC I F ix ed M a tu rity P la n - S eries 2 4 Q
R ec ord Da te F a c e V a lu e (R s.) N A V (R s) Dividend (R s.)/ U nit
2 1 -M a r-0 5 1 0 .0 0 0 0 1 0 .1 4 4 5 0 .1 4 4 5
P ru IC IC I F ix ed M a tu rity P la n - Q u a rterly S eries 2 5
R ec ord Da te F a c e V a lu e (R s.) N A V (R s) Dividend (R s.)/ U nit
9 -A u g -0 5 1 0 .0 0 0 0 1 0 .1 339 0 .1 35 1
P ru IC IC I F ix ed M a tu rity P la n - S eries 2 8 - 4 M onth s
R ec ord Da te F a c e V a lu e (R s.) N A V (R s) Dividend (R s.)/ U nit
1 2 -M a y -0 6 1 0 .0 0 0 0 1 0 .0 8 0 9 0 .0 8 60
P ru IC IC I F ix ed M a tu rity P la n - S eries 2 4 yea rly p la n dividend op tion
R ec ord Da te F a c e V a lu e (R s.) N A V (R s) Dividend (R s.)/ U nit
1 9 -A p r-0 6 1 0 .0 0 0 0 1 0 .0 5 0 0 0 .0 5 5 3
P ru IC IC I F ix ed M a tu rity P la n - S eries 2 5 yea rly p la n dividend op tion
R ec ord Da te F a c e V a lu e (R s.) N A V (R s) Dividend (R s.)/ U nit
1 9 -A p r-0 6 1 0 .0 0 0 0 1 0 .0 37 7 0 .0 39 0
P ru IC IC I F ix ed M a tu rity P la n - Q u a rterly O p tion 2 6 G row th
R ec ord Da te F a c e V a lu e (R s.) N A V (R s) Dividend (R s.)/ U nit
31 -M a y -0 5 1 0 .0 0 0 0 1 0 .1 4 1 9 0 .1 35 9
D iv id e n d is g ro s s d iv id e n d . T o a rriv e a t th e n e t d iv id e n d p a y a b le fo r c o rp o ra te a n d n o n -c o rp o ra te in v e s to rs d iv id e n d d is trib u tio n ta x @ 2 2 .4 4 % a n d 1 4 .0 2 5 % n e e d s to b e a d ju s te dre s p e c tiv e ly. P a s t p e rfo rm a n c e m a y o r m a y n o t b e s u s ta in e d in fu tu re . A fte r p a y m e n t o fd iv id e n d th e N A V w ill fa ll to th e e x te n t o f p a y o u t a n d d is trib u tio n ta x e s if a p p lic a b le .
P ru IC IC I G ilt F u nd - T rea su ry P la n - Q u a rterly Dividend O p tion (M a y . 2 0 0 6 o n w a rd )
R ec ord Da te F a c e V a lu e (R s.) N A V (R s) Dividend (R s.)/ U nit
31 -M a y -0 6 1 0 .0 0 0 0 1 0 .5 65 0 0 .1 30 0
P ru IC IC I G ilt F u nd - T rea su ry P la n - Ha lf Y ea rly Dividend O p tion (M a y . 2 0 0 6 o n w a rd )
R ec ord Da te F a c e V a lu e (R s.) N A V (R s) Dividend (R s.)/ U nit
31 -M a y -0 6 1 0 .0 0 0 0 1 0 .2 5 7 4 0 .2 0 0 0
D iv id e n d is g ro ss d iv id e n d . T o a rriv e a t th e n e t d iv id e n d p a y a b le fo r c o rp o ra te a n d n o n -c o rp o ra tein v e sto rs d iv id e n d d istrib u tio n ta x @ 2 2 .4 4 % a n d 1 4 .0 2 5 % n e e d s to b e a d ju ste d re sp e c tiv e ly.P a s t p e rfo rm a n c e m a y o r m a y n o t b e s u s ta in e d in fu tu re . A fte r p a y m e n t o f d iv id e n d th eN A V w ill fa ll to th e e x te n t o f p a y o u t.
P ru IC IC I S w eep P la n - C a sh O p tion - W eek ly Dividend
R ec ord Da te F a c e V a lu e (R s) N A V (R s) Dividend (R s.)/ U nit
0 5 -Ju n -0 6 1 0 .0 0 1 0 .0 1 1 9 0 .0 1 1 91 2 -Ju n -0 6 1 0 .0 0 1 0 .0 1 2 7 0 .0 1 2 71 9 -Ju n -0 6 1 0 .0 0 1 0 .0 1 2 7 0 .0 1 2 72 6-Ju n -0 6 1 0 .0 0 1 0 .0 1 2 6 0 .0 1 2 6
P ru IC IC I S w eep P la n - C a sh - M onth ly O p tion
R ec ord Da te F a c e V a lu e (R s) N A V (R s) Dividend (R s.)/ U nit
30 -M a y -0 6 1 0 .0 0 1 0 .0 5 65 0 .0 5 652 9 -Ju n -0 6 1 0 .0 0 1 0 .0 5 4 2 0 .0 5 4 2
D iv id e n d is g ro s s d iv id e n d . T o a rriv e a t th e n e t d iv id e n d p a y a b le fo r c o rp o ra te a n d n o n -c o rp o ra te in v e s to rs d iv id e n d d is trib u tio n ta x @ 2 2 .4 4 % a n d 1 4 .0 2 5 % n e e d s to b e a d ju s te dre s p e c tiv e ly. P a s t p e rfo rm a n c e m a y o r m a y n o t b e s u s ta in e d in fu tu re . A fte r p a y m e n t o fd iv id e n d th e N A V w ill fa ll to th e e x te n t o f p a y o u t a n d d is trib u tio n ta x e s if a p p lic a b le .
P ru IC IC I F ix ed M a tu rity P la n - S eries 2 7 - 3 M onth s Dividend
R ec ord Da te F a c e V a lu e (R s.) N A V (R s) Dividend (R s.)/ U nit
1 8 -Ju n -0 6 1 0 .0 0 1 0 .2 0 8 7 0 .2 0 8 7

37
Dividend History
P ru IC IC I M onth ly Inc om e P la n* * - Q u a rterly Dividend O p tion (Feb. 2 0 0 5 o n w a rd )
Record Date F ace V alu e (Rs .) N A V (Rs ) Div iden d (Rs .)/ U n it
2 8 -Feb-0 6 1 0 .0 0 0 0 1 1 .7 5 7 2 0 .3 0 0 03 1 -M a y -0 6 1 0 .0 0 0 0 1 1 .7 6 4 9 0 .2 0 0 0
P ru IC IC I M on th ly In com e P lan * * - H alf Y early Div iden d O p tion (S ep t.2 0 0 5 o n w a rd )
Record Date F ace V alu e (Rs .) N A V (Rs ) Div iden d (Rs .)/ U n it
1 -S ep -0 5 1 0 .0 0 0 0 1 1 .7 1 5 6 0 .4 5 0 02 8 -Feb-0 6 1 0 .0 0 0 0 1 1 .8 4 6 3 0 .5 0 0 0
D iv id en d is g ro ss d iv id en d . T o a rriv e a t th e n et d iv id en d p a y a ble fo r c o rp o ra te a n d n o n -c o rp o ra tein v esto rs d iv id en d d istribu tio n ta x @ 2 2 .4 4 % a n d 1 4 .0 2 5 % n eed s to be a d ju sted resp ec tiv ely.P a st p erfo rm a n c e m a y o r m a y n o t be su sta in ed in fu tu re. A fter p a y m en t o f d iv id en d th e N A V w illfa ll to th e ex ten t o f p a y o u t a n d d istribu tio n ta x es if a p p lic a ble. * * A n o p en -en d ed fu n d . M o n th lyin c o m e is n o t a ssu red a n d is su bjec t to th e a v a ila bility o f d istribu ta ble su rp lu s. P ru IC IC I Dis cov ery F u n d - Div iden d O p tion
Record Date F ace V alu e (Rs .) N A V (Rs ) Div iden d (Rs .)/ U n it
1 1 -O c t-0 5 1 0 .0 0 1 7 .9 9 1 .5 02 3 -M a r-0 6 1 0 .0 0 2 0 .3 0 2 .0 0
P a s t p erfo rm a n c e m a y o r m a y n o t be s u s ta in ed in fu tu re. A fter p a y m en t o f d iv id en d th eN A V w ill fa ll to th e ex ten t o f p a y o u t a n d d is tribu tio n ta x es if a p p lic a ble.
P ru IC IC I F lex ib le In com e P lan - H alf Y early Div iden d O p tion (M a y 2 0 0 6 o n w a rd )
Record Date F ace V alu e (Rs .) N A V (Rs ) Div iden d (Rs .)/ U n it
3 1 -M a y -0 6 1 0 .0 0 0 0 1 0 .6 6 6 4 0 .2 5 0 0
D iv id en d is g ro s s d iv id en d . T o a rriv e a t th e n et d iv id en d p a y a ble fo r c o rp o ra te a n d n o n -c o rp o ra te in v es to rs d iv id en d d is tribu tio n ta x @ 2 2 .4 4 % a n d 1 4 .0 2 5 % n eed s to be a d ju s tedres p ec tiv ely. P a s t p erfo rm a n c e m a y o r m a y n o t be s u s ta in ed in fu tu re. A fter p a y m en t o fd iv id en d th e N A V w ill fa ll to th e ex ten t o f p a y o u t a n d d is tribu tio n ta x es if a p p lic a ble.
P ru IC IC I M on th ly In com e P lan * * - M on th ly Div iden d O p tion (Feb. 2 0 0 6 o n w a rd )
Record Date F ace V alu e (Rs .) N A V (Rs ) Div iden d (Rs .)/ U n it
2 8 -Feb-0 6 1 0 .0 0 0 0 1 1 .4 2 2 6 0 .0 8 0 03 1 -M a r-0 6 1 0 .0 0 0 0 1 1 .6 4 0 8 0 .1 0 0 02 8 -A p r-0 6 1 0 .0 0 0 0 1 1 .7 2 9 6 0 .1 0 0 03 1 -M a y -0 6 1 0 .0 0 0 0 1 1 .4 4 7 5 0 .0 8 0 03 0 -Ju n -0 6 1 0 .0 0 0 0 1 1 .3 0 8 8 0 .0 6 0 0
P ru IC IC I F loatin g Rate P lan - P lan A - F ortn ig h tly Div iden d O p tion (Ja n . 2 0 0 6 o n w a rd )
Record Date F ace V alu e (Rs .) N A V (Rs ) Div iden d (Rs .)/ U n it
1 6 -Ja n -0 6 1 0 .0 0 1 0 .0 2 7 9 0 .0 2 6 63 0 -Ja n -0 6 1 0 .0 0 1 0 .0 2 2 7 0 .0 2 1 41 6 -Feb-0 6 1 0 .0 0 1 0 .0 2 7 7 0 .0 2 6 02 7 -Feb-0 6 1 0 .0 0 1 0 .0 1 9 0 0 .0 1 7 31 6 -M a r-0 6 1 0 .0 0 1 0 .0 2 8 2 0 .0 2 6 52 8 -M a r-0 6 1 0 .0 0 1 0 .0 2 4 0 0 .0 2 2 31 7 -A p r-0 6 1 0 .0 0 1 0 .0 3 5 9 0 .0 3 4 22 8 -A p r-0 6 1 0 .0 0 1 0 .0 2 0 1 0 .0 1 8 41 5 -M a y -0 6 1 0 .0 0 1 0 .0 3 0 0 0 .0 2 8 33 0 -M a y -0 6 1 0 .0 0 1 0 .0 2 6 5 0 .0 2 4 81 5 -Ju n -0 6 1 0 .0 0 1 0 .0 2 7 2 0 .0 2 5 52 9 -Ju n -0 6 1 0 .0 0 1 0 .0 2 4 4 0 .0 2 2 7
P ru IC IC I F loatin g Rate P lan - P lan B - F ortn ig h tly Div iden d O p tion (Ja n .2 0 0 6 o n w a rd )
Record Date F ace V alu e (Rs .) N A V (Rs ) Div iden d (Rs .)/ U n it
1 6 -Ja n -0 6 1 0 .0 0 1 0 .0 6 5 9 0 .0 2 7 93 0 -Ja n -0 6 1 0 .0 0 1 0 .0 6 0 5 0 .0 2 2 51 6 -Feb-0 6 1 0 .0 0 1 0 .0 6 5 6 0 .0 2 7 32 7 -Feb-0 6 1 0 .0 0 1 0 .0 5 6 4 0 .0 1 8 11 6 -M a r-0 6 1 0 .0 0 1 0 .0 6 6 1 0 .0 2 7 82 8 -M a r-0 6 1 0 .0 0 1 0 .0 6 1 4 0 .0 2 3 11 7 -A p r-0 6 1 0 .0 0 1 0 .0 7 4 0 0 .0 3 5 72 8 -A p r-0 6 1 0 .0 0 1 0 .0 5 7 5 0 .0 1 9 21 5 -M a y -0 6 1 0 .0 0 1 0 .0 6 7 8 0 .0 2 9 53 0 -M a y -0 6 1 0 .0 0 1 0 .0 6 4 2 0 .0 2 5 91 5 -Ju n -0 6 1 0 .0 0 1 0 .0 6 4 9 0 .0 2 6 62 9 -Ju n -0 6 1 0 .0 0 1 0 .0 6 2 1 0 .0 2 3 8
P ru IC IC I F loatin g Rate P lan - P lan C - F ortn ig h tly Div iden d O p tion (Ja n .2 0 0 6 o n w a rd s )
Record Date F ace V alu e (Rs .) N A V (Rs ) Div iden d (Rs .)/ U n it
1 6 -Ja n -0 6 1 0 .0 0 1 0 .0 2 9 4 0 .0 2 8 33 0 -Ja n -0 6 1 0 .0 0 1 0 .0 2 3 8 0 .0 2 2 71 6 -Feb-0 6 1 0 .0 0 1 0 .0 2 9 1 0 .0 2 7 72 7 -Feb-0 6 1 0 .0 0 1 0 .0 1 9 7 0 .0 1 8 31 6 -M a r-0 6 1 0 .0 0 1 0 .0 2 9 7 0 .0 2 8 32 8 -M a r-0 6 1 0 .0 0 1 0 .0 2 4 8 0 .0 2 3 41 7 -A p r-0 6 1 0 .0 0 1 0 .0 3 7 5 0 .0 3 6 12 8 -A p r-0 6 1 0 .0 0 1 0 .0 2 0 8 0 .0 1 9 41 5 -M a y -0 6 1 0 .0 0 1 0 .0 3 1 3 0 .0 2 9 93 0 -M a y -0 6 1 0 .0 0 1 0 .0 2 7 7 0 .0 2 6 31 5 -Ju n -0 6 1 0 .0 0 1 0 .0 2 8 4 0 .0 2 7 02 9 -Ju n -0 6 1 0 .0 0 1 0 .0 2 5 4 0 .0 2 4 0
P ru IC IC I G row th P lan - Div iden d O p tion
Record Date F ace V alu e (Rs .) N A V (Rs ) Div iden d (Rs .)/ U n it
1 6 -M a r-0 0 1 0 .0 0 3 0 .0 5 1 0 .0 00 1 -M a r-0 1 1 0 .0 0 1 2 .5 4 1 .2 01 5 -M a r-0 2 1 0 .0 0 1 0 .8 3 0 .8 02 4 -Ju l-0 3 1 0 .0 0 1 1 .0 9 0 .8 00 6 -N o v -0 3 1 0 .0 0 1 4 .7 6 2 .5 02 5 -M a r-0 4 1 0 .0 0 1 3 .1 5 2 .0 01 7 -M a r-0 5 1 0 .0 0 1 4 .6 8 1 .0 02 3 -M a r-0 6 1 0 .0 0 2 3 .0 3 2 .0 0
P a s t p erfo rm a n c e m a y o r m a y n o t be s u s ta in ed in fu tu re. A fter p a y m en t o f d iv id en d th eN A V w ill fa ll to th e ex ten t o f p a y o u t a n d d is tribu tio n ta x es if a p p lic a ble.
P ru IC IC I P ow er - Div iden d O p tion
Record Date F ace V alu e (Rs .) N A V (Rs ) Div iden d (Rs .)/ U n it
1 7 -Feb-0 3 1 0 .0 0 1 3 .6 2 2 .7 02 4 -Ju l-0 3 1 0 .0 0 1 4 .0 7 2 .0 02 3 -O c t-0 3 1 0 .0 0 1 8 .6 2 3 .0 02 4 -D ec -0 3 1 0 .0 0 1 6 .2 2 3 .0 02 5 -M a r-0 4 1 0 .0 0 1 2 .6 8 1 .5 02 4 -M a r-0 5 1 0 .0 0 1 4 .7 2 2 .5 02 6 -D ec -0 5 1 0 .0 0 1 7 .7 7 2 .0 0
P a s t p erfo rm a n c e m a y o r m a y n o t be s u s ta in ed in fu tu re. A fter p a y m en t o f d iv id en d th eN A V w ill fa ll to th e ex ten t o f p a y o u t a n d d is tribu tio n ta x es if a p p lic a ble.
P ru IC IC I F M C G F u n d - Div iden d O p tion
Record Date F ace V alu e (Rs .) N A V (Rs ) Div iden d (Rs .)/ U n it
1 6 -M a r-0 0 R s . 1 0 .0 0 1 1 .4 5 1 .0 02 3 -M a r-0 6 R s . 1 0 .0 0 3 4 .4 7 3 .0 0
P a s t p erfo rm a n c e m a y o r m a y n o t be s u s ta in ed in fu tu re. A fter p a y m en t o f d iv id en d th eN A V w ill fa ll to th e ex ten t o f p a y o u t a n d d is tribu tio n ta x es if a p p lic a ble.
P ru IC IC I T ax P lan - Div iden d O p tion
Record Date F ace V alu e (Rs .) N A V (Rs ) Div iden d (Rs .)/ U n it
1 6 -M a r-0 0 1 0 .0 0 2 2 .0 6 6 .0 02 4 -Ju l-0 3 1 0 .0 0 1 2 .3 8 1 .2 02 5 -M a r-0 4 1 0 .0 0 1 6 .0 9 4 .5 02 8 -D ec -0 4 1 0 .0 0 2 0 .6 1 2 .5 02 3 -A u g -0 5 1 0 .0 0 2 6 .9 8 4 1 2 .5 02 0 -M a r-0 6 1 0 .0 0 3 1 .5 1 5 .0 0
P a s t p erfo rm a n c e m a y o r m a y n o t be s u s ta in ed in fu tu re. A fter p a y m en t o f d iv id en d th eN A V w ill fa ll to th e ex ten t o f p a y o u t a n d d is tribu tio n ta x es if a p p lic a ble.
P ru IC IC I E m erg in g S .T .A .R. F u n d - Div iden d O p tion
Record Date F ace V alu e (Rs .) N A V (Rs ) Div iden d (Rs .)/ U n it
1 8 -M a y -0 6 1 0 .0 0 2 3 .9 3 0 0 3 .0 0 0 0
P a s t p erfo rm a n c e m a y o r m a y n o t be s u s ta in ed in fu tu re. A fter p a y m en t o f d iv id en d th eN A V w ill fa ll to th e ex ten t o f p a y o u t a n d d is tribu tio n ta x es if a p p lic a ble.
P ru IC IC I In com e M u ltip lier F u n d - Div iden d O p tion (M a r. 2 0 0 6 o n w a rd )
Record Date F ace V alu e (Rs .) N A V (Rs ) Div iden d (Rs .)/ U n it
2 3 -M a r-0 6 1 0 .0 0 1 2 .4 2 2 5 1 .0 0 0 0
P ru IC IC I L on g T erm P lan - Div iden d O p tion
Record Date F ace V alu e (Rs .) N A V (Rs ) Div iden d (Rs .)/ U n it
2 8 -A p r-0 6 1 0 .0 0 1 0 .4 5 8 0 0 .0 5 0 03 1 -M a y -0 6 1 0 .0 0 1 0 .4 7 8 3 0 .0 5 0 03 0 -Ju n -0 6 1 0 .0 0 1 0 .4 8 7 1 0 .0 5 0 0
D iv id en d is g ro s s d iv id en d . T o a rriv e a t th e n et d iv id en d p a y a ble fo r c o rp o ra te a n d n o n -c o rp o ra te in v es to rs d iv id en d d is tribu tio n ta x @ 2 2 .4 4 % a n d 1 4 .0 2 5 % n eed s to be a d ju s tedres p ec tiv ely. P a s t p erfo rm a n c e m a y o r m a y n o t be s u s ta in ed in fu tu re. A fter p a y m en t o fd iv id en d th e N A V w ill fa ll to th e ex ten t o f p a y o u t a n d d is tribu tio n ta x es if a p p lic a ble.
P ru IC IC I Dy n am ic F u n d - Div iden d O p tion
Record Date F ace V alu e (Rs .) N A V (Rs ) Div iden d (Rs .)/ U n it
2 1 -S ep -0 5 1 0 .0 0 1 6 .5 7 5 7 2 .0 02 7 -A p r-0 6 1 0 .0 0 2 1 .6 9 9 8 2 .0 0
P a s t p erfo rm a n c e m a y o r m a y n o t be s u s ta in ed in fu tu re. A fter p a y m en t o f d iv id en d th eN A V w ill fa ll to th e ex ten t o f p a y o u t a n d d is tribu tio n ta x es if a p p lic a ble.
P ru IC IC I F lex ib le In com e P lan - Q u arterly Div iden d O p tion (M a y 2 0 0 6 o n w a rd )
Record Date F ace V alu e (Rs .) N A V (Rs ) Div iden d (Rs .)/ U n it
3 1 -M a y -0 6 1 0 .0 0 0 0 1 0 .5 4 0 1 0 .1 0 0 0
P ru IC IC I B len ded P lan B - Div iden d O p tion
Record Date F ace V alu e (Rs .) N A V (Rs ) Div iden d (Rs .)/ U n it
0 1 -Ju n -0 6 1 0 .0 0 1 0 .4 4 8 5 0 .4 0 0 0
D iv id en d is g ro s s d iv id en d . T o a rriv e a t th e n et d iv id en d p a y a ble fo r c o rp o ra te a n d n o n -c o rp o ra te in v es to rs d iv id en d d is tribu tio n ta x @ 2 2 .4 4 % a n d 1 4 .0 2 5 % n eed s to be a d ju s tedres p ec tiv ely. P a s t p erfo rm a n c e m a y o r m a y n o t be s u s ta in ed in fu tu re. A fter p a y m en t o fd iv id en d th e N A V w ill fa ll to th e ex ten t o f p a y o u t a n d d is tribu tio n ta x es if a p p lic a ble.
P ru IC IC I F loatin g Rate P lan - P lan D - F ortn ig h tly Div iden d O p tion (M a y . 2 0 0 6 o n w a rd )
Record Date F ace V alu e (Rs .) N A V (Rs ) Div iden d (Rs .)/ U n it
1 5 -M a y -0 6 1 0 .0 0 1 0 .0 3 0 9 0 .0 3 0 53 0 -M a y -0 6 1 0 .0 0 1 0 .0 2 7 2 0 .0 2 6 81 5 -Ju n -0 6 1 0 .0 0 1 0 .0 2 8 1 0 .0 2 7 72 9 -Ju n -0 6 1 0 .0 0 1 0 .0 2 5 1 0 .0 2 4 7
D iv id en d is g ro ss d iv id en d . T o a rriv e a t th e n et d iv id en d p a y a ble fo r c o rp o ra te a n d n o n -c o rp o ra tein v esto rs d iv id en d d istribu tio n ta x @ 2 2 .4 4 % a n d 1 4 .0 2 5 % n eed s to be a d ju sted resp ec tiv ely.P a s t p erfo rm a n c e m a y o r m a y n o t be s u s ta in ed in fu tu re. A fter p a y m en t o f d iv id en d th eN A V w ill fa ll to th e ex ten t o f p a y o u t a n d d is tribu tio n ta x es if a p p lic a ble.
P ru IC IC I B alan ced F u n d - Div iden d O p tion
Record Date F ace V alu e (Rs .) N A V (Rs ) Div iden d (Rs .)/ U n it
1 6 -M a r-0 0 1 0 .0 0 1 4 .1 7 1 .0 0 P er u n it3 0 -O c t-0 3 1 0 .0 0 1 2 .9 3 2 .0 0 P er u n it2 4 -M a r-0 5 1 0 .0 0 1 5 .3 6 3 .5 0 P er u n it2 6 -D ec -0 5 1 0 .0 0 1 5 .7 6 1 .2 0 P er u n it
P a s t p erfo rm a n c e m a y o r m a y n o t be s u s ta in ed in fu tu re. A fter p a y m en t o f d iv id en d th eN A V w ill fa ll to th e ex ten t o f p a y o u t a n d d is tribu tio n ta x es if a p p lic a ble.
P ru IC IC I In fras tru ctu re f u n d - Div iden d
Record Date F ace V alu e (Rs .) N A V (Rs ) Div iden d (Rs .)/ U n it
2 0 -M a r-0 6 1 0 .0 0 1 4 .3 7 1 .0 0

38
Key Features
T yp e
In v estm en t P attern(U n d e r n o rm a lc irc u m s ta n c e s )
O p tio n s
D efault O p tio n
A p p lic atio n A m o un t ###
M in . A d d l. In v estm en t ###
E n try L o ad *
E x it L o ad *$$$
R ed em p tio n C h eq uesIssued # #
M in . R ed em p tio n A m t.
C ut o f f tim e:P u rc h a s e /S w itc h inR e d e m p tio n /S w itc h o u t $
S ystem atic In v estm en tP lan (S IP )
S ystem atic W ith d raw alP lan (S W P )
S ystem atic T ran sfer P lan(S T P ) $$
R ec urrin g E x p en ses* *In v e s tm e n t M a n g m t. E x p .O th e r re c u rrin g e x p e n s e sT o tal
Funds at a glanceL iq uid P lan
O p e n -e n d e d L iq u id In c o m e F u n d
M o n e y M a rk e t u p to 8 0 % & D e b tIn s tru m e n ts u p to 2 0 %
1. Growth O p tion2 . D iv id e n d O p tion
a ) D iv id e n d P a y ou tQ u a rte rly & H a lf Y e a rly
b ) D iv . R e in v e s tm e n ti) D a ily , W e e k ly & M o n th lyii) Q u a rte rly & H a lf Y e a rly
D iv id e n d R e in v e s tm e n t w ithw e e k ly fre q u e n c y .
a ) G ro w th o p tio n : R s .1 5 ,0 0 0b ) D iv id e n d o p tio n : R s . 1 la c(p lu s in m u ltip le s o f R e .1 )
R s . 5 ,0 0 0 & in m u ltip le s th e re o f
N il
N il
G e n e ra lly w ith in 1 B u s in e s s D a yfo r s p e c ifie d R B I lo c a tio n s a n da d d itio n a l 3 B u s in e s s D a y s fo rN o n -R B I lo c a tio n s . S a m e D a yR e d e m p tio n F a c ility (re fe r toK e y In fo rm a tio n M e m o ra n d u m )
R s . 5 ,0 0 0
1 .0 0 p .m .1 0 .0 0 a .m .
N .A .
N .A .
A v a ila b le
0 .7 0 %0 .3 0 %1.0 0 %
In c o m e P lan
O p e n -e n d e d D e b t F u n d
D e b t S e c u ritie s u p to 7 5 % & M o n e yM a rk e t & C a s h u p to 2 5 %
1. Growth2 . Growth-A E P (A p p re c ia tio n &
R e g u la r)3 . D iv id e n d ^ (Q u a rte rly & H a lf
Y e a rly )
D iv id e n d R e in v e s tm e n t w ithH a lf Y e a rly fre q u e n c y .
R s . 5 ,0 0 0 (p lu s in m u ltip le s o f R e . 1 )R s .2 5 ,0 0 0 fo r A E P
R s . 5 0 0 & in m u ltip le s th e re o f
N il
F o r in v e s tm e n t o f le s s th a n o r u p toR s .1 0 la k h s : 0 .5 % if in v e s tm e n th e ld fo r le s s th a n o r e q u a l to ap e rio d o f 6 m o n th s F o r in v e s tm e n to f a b o v e R s .1 0 la k h s : N il
G e n e ra lly w ith in 1 B u s in e s s D a y fo rs p e c if ie d R B I lo c a t io n s a n da d d itio n a l 3 B u s in e s s D a y s fo r N o n -R B I lo c a tio n s
R s . 5 0 0
3 .0 0 p .m .3 .0 0 p .m .
M on thly : M in im u m R s . 1 ,0 0 0 + 5p o s t-d a te d c h e q u e s fo r a m in im u mo f R s . 1 ,0 0 0 e a c h .
* * * * *
M in im u m o f R s . 5 0 0 a n d in m u ltip le so f R e . 1 /-
A v a ila b le
1 .2 5 %0 .7 5 %
2 .0 0 %
S hort T e rm P la n
O p e n -e n d e d In c o m e F u n d
D e b t S e c u ritie s u p to 1 0 0 % & M o n e yM a rk e t & C a s h u p to 5 0 %
1 . C u m u la tiv e2 . D iv id e n d R e in v e s tm e n t
(F o rtn ig h tly & M o n th ly )
D iv id e n d R e in v e s tm e n t w ithF o rtn ig h tly fre q u e n c y .
R s .5 ,0 0 0 (p lu s in m u ltip le s o f R e . 1 )R s .2 5 ,0 0 0 fo r In s titu tio n a l o p tio n(p lu s in m u ltip le s o f R e .1 )
R s . 5 0 0 & in m u ltip le s th e re o f
N il
N il
G e n e ra lly w ith in 1 B u s in e s s D a y fo rs p e c if ie d R B I lo c a t io n s a n da d d itio n a l 3 B u s in e s s D a y s fo r N o n -R B I lo c a tio n s
R s . 5 0 0
3 .0 0 p .m .3 .0 0 p .m .
N o t A v a ila b le
N o t A v a ila b le
A v a ila b le
1 .2 5 %1 .0 0 %
2 .2 5 %
F loa tin g R a te P la n
O p e n -e n d e d In c o m e F u n d
6 5 -1 0 0 % = F lo a tin g R a te D e b tIn s tru m e n ts . 0 -3 5 % = F ix e d ra ted e b t in s tru m e n ts w ith m a tu rity le s sth a n 1 y e a r.
1. C u m u la tiv e2 . D iv . R e in v e s tm e n t
(F o rtn ig h tly & D a ilyfre q u e n c ie s )
O p tion : P la n AS u b op tion : C u m u la tiv e
a ) P la n -A : R s 1 0 ,0 0 0 /-b ) P la n -B : R s .1 0 la c sc ) P la n -C : R s .3 c ro re sd ) P la n -D : R s .5 c ro re s(p lu s in m u ltip le s o f R e .1 )
P la n s A & B : R s.1 0 0 0 p lu s in m u ltip le so f R e .1P la n C : T h e m in im u m a d d itio n a lin v e s tm e n t a m o u n t c a n b e a n ya m o u n t p ro v id e d th e m in im u mb a la n c e in th e in v e s to rs a c c o u n t a tth e tim e o f a d d itio n a l s u b s c rip tio nin c lu d in g th e a m o u n t p ro p o s e d to b ein v e s t e d , is n o t b e lo w R s . 5C ro re * * * * .
P la n -A , B , C & D : N il
P la n -A : F o r in v e s tm e n t o f le s s th a nR s .1 0 la k h s : 0 .5 0 % o f a p p lic a b leN A V in c a s e th e a m o u n t s o u g h t tob e re d e e m e d is n o t b e in g in v e s te du n d e r th e o p tio n fo r a m in im u mp e rio d o f s e v e n d a y s .P la n B , P la n C & P la n D : N il
G e n e ra lly W ith in 1 b u s in e s s d a y fo rS p e c if ie d R B I lo c a t io n s a n da d d itio n a l 3 B u s in e s s D a y s fo r N o n -R B I lo c a tio n s .
R s . 5 0 0 /- a n d m u ltip le s th e re o f
1 .0 0 p .m .1 0 .0 0 a .m .
N o t A v a ila b le
N o t A v a ila b le
A v a ila b le
P la n A P la n B P la n C
1.0 0 % 0 .7 5 % 0 .6 5 %
L on g T e rm F loa tin gR a te P la n
O p e n -e n d e d In c o m e F u n d
6 5 -1 0 0 % = F lo a tin g R a te D e b tIn s tru m e n ts . 0 -3 5 % = F ix e d ra ted e b t in s tru m e n ts
1. C u m u la tiv e2 . D iv . R e in v e s tm e n t
(Q u a rte rly )
O p tion : P la n AS u b op tion : C u m u la tiv eD iv id e n d : A u to m a tic
R e in v e s tm e n t
a ) P la n -A : R s 2 5 ,0 0 0 /-b ) P la n -B : R s .1 c ro rec ) P la n -C : R s .5 c ro re s(p lu s in m u ltip le s o f R e .1 )
P la n s A & B : R s .1 0 0 0 (p lu s inm u ltip le s o f R e 1 )P la n C : T h e m in im u m a d d itio n a lin v e s tm e n t a m o u n t c a n b e a n ya m o u n t p ro v id e d th e m in im u mb a la n c e in th e in v e s to rs a c c o u n t a tth e tim e o f a d d itio n a l s u b s c rip tio nin c lu d in g th e a m o u n t p ro p o s e d to b ein v e s t e d , is n o t b e lo w R s . 5C ro re * * * * .
P la n -A , B & C : N il
P la n -A : 0 .5 0 % fo r in v e s tm e n ts o fle s s th a n o r e q u a l to R s . 1 C ro rea n d re d e m p tio n is m a d e o n o rb e f o r e t h e c o m p le t io n o f s ixm o n th s fro m th e d a te o f a llo tm e n to f u n its .P la n B & P la n C : N il
G e n e ra lly W ith in 1 b u s in e s s d a y fo rS p e c if ie d R B I lo c a t io n s a n da d d itio n a l 3 B u s in e s s D a y s fo r N o n -R B I lo c a tio n s .
R s . 5 ,0 0 0 /- a n d in m u ltip le s th e re o f;p ro v id e d th a t m in im u m b a la n c eu n d e r a p a rtic u la r fo lio s h o u ld n o tf a ll b e lo w t h e m in u m u ma p p lic a tio n a m o u n t. T h is w ill n o tb e a p p lic a b le f o r c lo s in g t h ea c c o u n t.
3 .0 0 p .m .3 .0 0 p .m .
N o t A v a ila b le
N o t A v a ila b le
A v a ila b le
P la n A P la n B P la n C0 .7 5 % 0 .6 0 % 0 .5 0 %0 .5 0 % 0 .3 0 % 0 .2 5 %
1.7 5 % 0 .9 0 % 0 .7 5 %

39
Key Features
Type
Investment Pattern(Under normalcircumstances)
Options
Default Option
Application Amount ###
Min. Addl. Investment ###
Entry Load*
Exit Load*$$$
Redemption ChequesIssued ##
Min. Redemption Amt.
Cut off time:Purchase/Switch inRedemption/Switch out $
Systematic InvestmentPlan (SIP)
Systematic WithdrawalPlan (SWP)
Systematic Transfer Plan(STP) $$
Recurring Expenses**Investment Mangmt. Exp.Other recurring expensesTotal
Funds at a glance
* T he T rustees reserves the right to change/modify the load structure at a later date for the Schemes. * * Investors are req uested to read the section on “ F ees and A nnual Recurringexpenses” in the Offer D ocuments of the respective schemes. T he recurring expenses indicated ab ove may change sub ject to ceilings under the Regulations. * * * Entry load of 2 .2 5 % ofthe applicab le N A V will b e charged on the SIP/ST P investment under this Scheme. Exit L oad on the SIP/ST P Invesment under this Scheme is N il. * * * * * F or SIP/ST P investment under thisScheme: Entry L oad – N il, Exit L oad – N il. Exceptions: F or all SIP and ST P investments registered under Prudential IC IC I Power and Prudential IC IC I D iscovery F und from June 2 1 , 2 0 0 6 toJuly 31 , 2 0 0 6 : (i) If redemptions are made from June 2 1 , 2 0 0 6 to July 5 , 2 0 0 6 no exit load shall b e charged; (ii) If redemptions are made after July 5 , 2 0 0 6 b ut on or b efore the end of sixmonths from the date of investment of each installment of SIP/ST P investment, an exit load of 0 .5 % shall b e charged. ^ Under the D ividend Option, the Unit-holder may choose b etweenD ividend Pay out and Reinvestment Option. If not chosen, D efault Option would b e D ividend Pay out. $ F or all web -b ased transactions under the schemes of Prudential IC IC I Mutual F und,entered through the web site of the fund viz . www.pruicici.com there would b e a cooling off period of 30 minutes b efore the respective cut-off times of the relevant schemes. ### In caseof all purchase transactions including additional purchase req uests under all schemes except Prudential IC IC I L iq uid Plan, the A MC reserves the right to reject/reverse the transaction, if anamount of Rs. 1 L ak h and ab ove is received b y way of MIC R cheq ues at the centers where high value clearing is availab le. In case of Prudential IC IC I Index F und, all the transaction for F resh/A dditional purchases for a consideration of Rs.One lak h and ab ove will b e accepted only through H igh V alue C heq ues/D emand D rafts received b efore the cut-off time of 1 0 .0 0 a.m. forclearing of H igh V alue Instruments or through T ransfer C heq ues received b efore 1 .0 0 p.m. Æ F or dividend of Rs.5 0 0 or less the D ividend will b e A utomatic C ompulsory Reinvestment(irrespective of the option selected b y the Unitholder) & for D ividend of more than Rs.5 0 0 will either b e paid out or reinvested as opted b y the Unitholders, If not selected the default optionwould b e dividend reinvestment. # # A s per the Regulations, the F und shall dispatch redemption proceeds within 1 0 B usiness day s of receiving the redemption req uest. Investors are advisedto refer to the sections titled “ Suspension of sale and redemption of units” and “ Right to limit Redemption” . T he default option for pay ment of redemption/dividend proceeds would b e D irectC redit into their b ank account (in case the investor has provided his b ank mandate as one of the b ank s participating in direct credit arrangement and if he fails to specify the mode ofpay ment). * * * * Minimum additional application amount shall b e applicab le for investments b y an investor b y itself or for investments along with any of its group companies. L ater on evenif the net asset value under the folio falls b elow Rs. 5 crores, the investment can continue under the Option C . $ $ $ W here as a result of a redemption / switch arising out of excess holdingb y an investor b ey ond 2 5 % of the net assets of the scheme in the manner envisaged under specified SEB I circulars, such redemption / switch will not b e sub ject to exit load. $ $ T heminimum amount that can b e transferred from one scheme to another is Rs. 1 0 0 0 /- for a minimum of 6 installments. T he unitholder can avail the ST P facility for a maximum period of1 0 y ears.
Flexib le Income Plan
Open-ended Income Fund
10 to 100% - Money market andDebentures with residual maturityof less than 1 year. 0 to 9 0% -Debt instruments with maturitymore than 1 year
1. Cumulative2. DividendÆ (Quarterly & Half
Yearly)
Dividend Reinvestment withHalf Yearly frequency.
Rs.5,000 (plus in multiples of Re. 1)
Rs. 500 & in multiples thereof
Nil
Nil
Generally within 1 Business Day forspecified RBI locations andadditional 3 Business Days for Non-RBI locations
Rs. 500
3.00 p.m.3.00 p.m.
Monthly: Minimum Rs. 1,000 + 5post-dated cheques for a minimumof Rs. 1,000 each
*****
Minimum of Rs. 500 and multiplesof Re. 1/-
Available
1.00%0.50%
1.50%
G ilt - Treasury
Open-ended short-term Gilt Fund
Gilt Securities (incl. Treasury Bills).Average Maturity normally not toexceed 3 years.
1. Growth2. Growth-AEP3. Dividend (Quarterly & Half
Yearly)
Dividend Reinvestment withQuarterly frequency.
Rs.25,000 (plus in multiples of Re. 1)
Rs. 5,000 & in multiples thereof
Nil
Nil
Generally within 1 Business Day forspecified RBI locations andadditional 3 Business Days for Non-RBI locations
Rs. 5,000
3.00 p.m.3.00 p.m.
Not Available
Not Available
Available
0.75%0.35%
1.10%
G ilt - Investment
Open-ended medium-term Gilt Fund
Gilt Securities (incl. Treasury Bills).Average Maturity normally not toexceed 8 years.
1. Growth2. Growth-AEP3. DividendÆ (Half Yearly)
Dividend Reinvestment withHalf Yearly frequency.
Rs.25,000 (plus in multiples of Re. 1)
Rs. 5,000 & in multiples thereof
Nil
Nil
Generally within 1 Business Day forspecified RBI locations andadditional 3 Business Days for Non-RBI locations
Rs. 5,000
3.00 p.m.3.00 p.m.
Not Available
Not Available
Available
0.75%0.4 0%
1.15%
G ilt - TreasuryPF Option
Open-ended Gilt Fund
Gilt Securities (incl. Treasury Bills).Average Maturity normally not toexceed 3 years.
1. Growth2. Growth-AEP (Monthly,
Quarterly, Half Yearly & Yearly)
Cumulative option
Rs.25,000 (plus in multiples of Re. 1)
Rs. 5,000 & in multiples thereof
Nil
0.80% of applicable NAV in case theamount sought to be redeemed is notbeing invested under the Plan for aminimum period of 365 days. ExitLoad is NIL if the amount is investedfor more than 365 days.
Generally within 1 Business Day forspecified RBI locations andadditional 3 Business Days for Non-RBI locations
Rs. 5,000
3.00 p.m.3.00 p.m.
Not Available
Not Available
Not Available
2.25%
G ilt - InvestmentPF Option
Open-ended Gilt Fund
Gilt Securities (incl. Treasury Bills).Average Maturity normally not toexceed 8 years.
1. Growth2. Growth-AEP (Monthly,
Quarterly, Half Yearly & Yearly)
Cumulative option
Rs.25,000 (plus in multiples of Re. 1)
Rs. 5,000 & in multiples thereof
Nil
0.60% of applicable NAV in case theamount sought to be redeemed is notbeing invested under the Plan for aminimum period of 365 days.
Generally within 1 Business Day forspecified RBI locations andadditional 3 Business Days for Non-RBI locations
Rs. 5,000
3.00 p.m.3.00 p.m.
Not Available
Not Available
Not Available
1.10%

40
Key Features
Type
Investment Pattern(Under normal circumstances)
Options
Default Option
Application Amount ###
Min. Addl. Investment ###
Entry Load*
Ex it Load*$$$
Redemption Cheq ues Issued # #
Min. Redemption Amt.
Cut off time:Purchase/Switch inRedemption/Switch out $
Systematic Investment Plan(SIP)
Systematic W ithdrawal Plan (SW P)
Systematic Transfer Plan (STP)
Recurring Ex penses**Investment Mangmt. Exp.Other recurring expensesTotal
Long Term Plan
Open-ended Income Fund
Debt Instruments - 0% to 100% & MoneyMarket instruments including money atcall- 0% to 10%
Cumulative & Dividend
Dividend Reinvestment
Rs. 5,000 (plus in multiples of Re.1)
Rs. 500/-
Nil
Nil
Generally within 1 Business Day forspecified RBI locations and additional 3Business Days for Non-RBI locations.
Rs. 500/- provided that minimum balanceunder a particular folio should not fall be-low Rs. 5,000
3.00 p.m.3.00 p.m.
Monthly: Minimum Rs. 1,000 + 5 post-datedcheques for a minimum of Rs. 1,000 each.
*****
Minimum of Rs. 500 and in multiples of Re. 1/-Not Available
2.00%
Income Multiplier Fund –Regular Plan
An open-ended debt fund which investsupto 30% in equity.
Equity & Equity Related Securities0-30%, Debt instruments 65-100%, Cash &money market instruments 0-5%.
1. Cumulative2. Dividend
Dividend Reinvestment
Rs.5,000
Rs.500 & in multiples thereof
Nil
(i) 1% - For investments of less than Rs. 5crores and if the investments are held forless than a period of 12 months; (ii) No ExitLoad for investments of Rs. 5 crores andabove.
Generally within 3 Business Days forspecified RBI locations and additional 3Business Days for Non-RBI locations
Rs.500
3.00 p.m.3.00 p.m.
Monthly: Minimum Rs. 1,000 + 5 post-datedcheques for a minimum of Rs. 1,000 each.
*****
Minimum of Rs.500 and multiples of Re. 1/-
Available $ $
1.00%1.25%
2.25%
Monthly Income Plan
An open-ended fund. Monthly income isnot assured and is subject to the availabilityof distributable surplus.
Debt securities, money market instru-ments, securitised debt & Cash upto 85%,Equity & Equity related securities upto 15%
1. Cumulative2. AEP (Appreciation & Regular)3. Dividend (Monthly, Quarterly & Half
Yearly)
Dividend Reinvestment (Monthly)
a) Cumulative : Rs.5,000b) Dividend & AEP : Rs. 25,000(plus multiples of Re 1)
Rs.500 & in multiples thereof under eachoption
Nil
For investment of less than or upto Rs.10lakhs: 0.5% if investment held for less thanor equal to a period of 6 months Forinvestment of above Rs.10 lakhs: Nil
Generally within 1 Business Day forspecified RBI locations and additional 3Business Days for Non-RBI locations
Rs.500
3.00 p.m.3.00 p.m.
Dividend & AEP Option – Monthly andCumulative (without AEP) Option –Monthly: Min. Rs. 1,000 + 5 post-dtd.cheques for a minimum of Rs. 1,000 each.
*****
Minimum of Rs.500 and multiples of Re. 1/-
Available $ $
1.25%1.00%
2.25%
Child Care Plan - Study
Open-ended fund (Study Plan)
Equity and Equity related securities 0-15%,Debt Securities, Money MarketInstruments, Securitised Debt and Cash(including money at call) 85-100%
Cumulative Option
Cumulative Option
Rs. 5,000/-, additional in multiples of Re.1
Rs. 1,000/-
1.50%
1.00% if investment is redeemed within 3years.Nil if investment is redeemed after 3years but before the Beneficiary Childattains the age of 18.
Normally Within 3 business days
Rs. 1,000
3.00 p.m.3.00 p.m.
Monthy : Minimum Rs 1000 + 5 post datedcheques for a min of Rs. 1,000/- each.Entry Load: 1.50% of applicable NAVEx it Load: 1.00% of applicale NAV ifinvestment is redeemed within 3 years fromthe date of allotment, Nil thereafter.
Minimum of Rs.500 and multiples of Re. 1/-
Available
1.25%1.00%
2.25%
Funds at a glance
Key FeaturesType
Investment Pattern(Under normal circumstances)
Options
Default Option
Application Amount ###
Min. Addl. Investment ###
Max . Amount Investment per application
Entry Load*
Ex it Load*$$$
Redemption Cheq ues Issued # #
Min. Redemption Amt.
Cut off time:Purchase/Switch inRedemption/Switch out $
Systematic Investment Plan (SIP)
Systematic Withdrawal Plan (SWP)
Systematic Transfer Plan (STP) $$
Recurring Ex penses**Investment Mangmt. Exp.Other recurring expensesTotal
Child Care Plan - GiftOpen-ended fund (Gift Plan)
Equity & Equity related securities65% to 80%, Debt Securities, MoneyMarket Instruments, Securitised Debt &Cash (including money at call) 20%-35%.
Cumulative Option
Cumulative Option
Rs. 5,000/-, additional in multiples of Re.1
Rs.1,000/-
Not Available
1.50%
1.00% if investment is redeemed within 3years.Nil if investment is redeemed after 3years but before the Beneficiary Childattains the age of 18.
Normally Within 3 business days
Rs.1,000
3.00 p.m.3.00 p.m.
Monthy : Minimum Rs 1000 + 5 post datedcheques for a min of Rs. 1,000/- each.Entry Load: 1.50% of applicable NAVEx it Load: 1.00% of applicale NAV ifinvestment is redeemed within 3 years fromthe date of allotment, Nil thereafter.
Minimum of Rs.500 and multiples of Re. 1/-
Available
1.25%1.25%
2.50%
Balanced FundOpen-ended Balanced Fund
Equity and Equity related instruments –65% to 80% & Debt, Money Market andCash – 20% to 35%.
Growth & Dividend
Dividend Reinvestment
Rs. 5,000 (plus in multiples of Re. 1)
Rs. 500 & in multiples thereof
Not Available
(i) For investment of less than Rs.5Crores: 2.25% of applicable NAV;
(ii) For investment of Rs.5 Crores &above: NIL
Nil
Generally within 3 Business Days forspecified RBI locations and an additionalof 3 Business Days for Non RBI locations
Rs. 500
3.00 p.m.3.00 p.m.
Monthly: Minimum Rs. 1,000 + 5 post-datedcheques for a minimum of Rs. 1000 each
***
Minimum of Rs.500 and multiples of Re. 1/-
Available
1.25%1.25%
2.50%
Blended Plan - A @ @Open ended fund investing in a blend ofequity, derivatives, debt and money marketinstruments.
Equity and Equity Related securities – 65%-80%; Derivative including Index Futures,Stock Futures, Index Options and StockOptions etc. – 0%-80%; Money Market,Debt instruments, securitised debt and callmoney – 20%-35%.
Growth & Dividend
Option - GrowthSub-option - Reinvestment
Rs. 5,000 (plus in multiples of Re. 1)
Rs. 1,000 & in multiples of Re.1/-
Rs. 10 Crores per application
Nil
0.50%, if the investment is redeemedwithin a period of 30 days from the date ofallotment. Nil, if the investment is redeemedafter 30 days from the date of allotment.
Generally within 3 Business Days forspecified RBI locations and an additionalof 3 Business Days for Non RBI locations
Rs. 500 and in multiples of Re.1/-
3.00 p.m.3.00 p.m.
Not available
Not available
Not available
1.25%1.25%
2.50%
Blended Plan - B @ @Open ended fund investing in a blend ofequity, derivatives, debt and money marketinstruments.
Equity and Equity Related securities – 0%-49%; Derivative including Index Futures,Stock Futures, Index Options and StockOptions etc. – 0%-49%; Money Market,Debt instruments, securitised debt and callmoney – 51%-100%.
Growth & Dividend
Option - GrowthSub-option - Reinvestment
Rs. 5,000 (plus in multiples of Re. 1)
Rs. 1,000 & in multiples of Re.1/-
Not Available
Nil
0.50%, if the investment is redeemed withina period of 30 days from the date ofallotment. Nil, if the investment is redeemedafter 30 days from the date of allotment.
Generally within 2 Business Days forspecified RBI locations and an additional of3 Business Days for Non RBI locations
Rs. 500 and in multiples of Re.1/-
3.00 p.m.3.00 p.m.
Not available
Not available
Not available
1.00%1.25%
2.25%
@ @ Default option for PruICICI Blended Plan is Plan B.

41
Funds at a glance
Key Features
Type
Investment Pattern(Under normalcircumstances)
Options
Default Option
Application Amount ###
Min. Addl. Investment ###
Entry Load*
Exit Load* $$$
Redemption ChequesIssued ##
Min. Redemption Amt.
Cut off time:Purchase/Switch inRedemption/Switchout $
Systematic Invest-ment Plan (SIP)
Systematic With-drawal Plan (SWP)
Systematic TransferPlan (STP) $$
Recurring Expenses**Investment Mangmt. Exp.Other recurring expensesTotal
FMCG Fund
Open-ended FMCG Sectoral Fund
Equity and Equity relatedinstruments in FMCGCompanies upto 90% in &Debt, Money Market and Cashupto 10%
Growth & Dividend
Dividend Reinvestment
Rs. 5,000 (plus in multiples ofRe.1)
Rs. 500 & in multiples thereof
(i) For investment of lessthan Rs.5 Crores : 2.25% ofapplicable NAV;(ii) For investment of Rs.5Crores & above: NIL
Nil
Generally within 3 BusinessDays for specified RBIlocations and an additional of3 Business Days for Non RBIlocations
Rs. 500
3.00 p.m.3.00 p.m.
Monthly: Minimum Rs. 1,000+ 5 post-dated cheques for aminimum of Rs. 1000 each
***
Minimum of Rs.500 andmultiples of Re. 1/-
Available
1.25%1.25%
2.50%
Technology Fund
Open-ended Equity Fund
Equity and Equity relatedinstruments 90 to 95% &Debt, Money Market andCash 5 to 10%
Growth & Dividend
Dividend Reinvestment
Rs. 5,000 (plus in multiples ofRe.1)
Rs. 500 & in multiples thereof
(i) For investment of lessthan Rs.5 Crores : 2.25% ofapplicable NAV;(ii) For investment of Rs.5Crores & above: NIL
Nil
Generally within 3 BusinessDays for specified RBIlocations and an additionalof 3 Business Days for NonRBI locations
Rs. 500
3.00 p.m.3.00 p.m.
Monthly: Minimum Rs. 1,000+ 5 post-dated cheques for aminimum of Rs. 1000 each
***
Minimum of Rs.500 andmultiples of Re. 1/-
Available
1.25%1.25%
2.50%
Dynamic Plan
Open-ended Equity Fund
Equity and Equity relatedinstruments 0 to 100% &Debt, Money Market andCash 0 to 100%
Cumulative & Dividend
Dividend Reinvestment
Rs. 5,000 (plus in multiples ofRe.1)
Rs. 500 & in multiples thereof
(i) For investment of lessthan Rs.5 Crores: 2.25% ofapplicable NAV;(ii) For investment of Rs.5Crores & above: NIL
Nil
Generally within 3 BusinessDays for specified RBIlocations and an additionalof 3 Business Days for NonRBI locations
Rs. 500 and in multiplesthereof
3.00 p.m.3.00 p.m.
Monthly: Minimum Rs. 1,000+ 5 post-dated cheques for aminimum of Rs. 1000 each
***
Minimum of Rs.500 andmultiples of Re. 1/-
Available
1.00%1.50%
2.50%
Power
Open-ended Growth Fund
Equity and Equity relatedsecurities including nonconvertible portion ofconvertible debentures -Upto 95% and at least 5% inDebt and Money Marketsecurities.
Cumulative & Dividend
Dividend Reinvestment
Rs. 5,000 (plus in multiples ofRe.1)
Rs. 500 & in multiples thereof
(i) For investment of lessthan Rs.5 Crores: 2.25% ofapplicable NAV;(ii) For investment of Rs.5Crores & above: NIL
Nil
Generally within 3 BusinessDays for specified RBIlocations and an additionalof 3 Business Days for NonRBI locations
Rs. 500 and in multiplesthereof
3.00 p.m.3.00 p.m.
Monthly: Minimum Rs. 1,000+ 5 post-dated cheques for aminimum of Rs. 1000 each
***
Minimum of Rs.500 andmultiples of Re. 1/-
Available
1.25%1.25%
2.50%
Growth Plan
Open-ended Equity Fund
Equity and Equity relatedinstruments upto 95% & Debt,Money Market and Cash upto5%
Growth & Dividend
Dividend Reinvestment
Rs. 5,000 (plus in multiples ofRe.1)
Rs. 500 & in multiples thereof
(i) For investment of lessthan Rs.5 Crores: 2.25% ofapplicable NAV;(ii) For investment of Rs.5Crores & above: NIL
Nil
Generally within 3 BusinessDays for specified RBIlocations and an additional of3 Business Days for Non RBIlocations
Rs. 500
3.00 p.m.3.00 p.m.
Monthly: Minimum Rs. 1,000+ 5 post-dated cheques for aminimum of Rs. 1000 each
***
Minimum of Rs.500 andmultiples of Re. 1/-
Available
1.25%1.25%
2.50%
Tax Plan
Open-ended EquityLinked Saving Scheme
Equity and Equity relatedinstruments upto 90% & Debt,Money Market and Cash upto10%
Growth & Dividend
Dividend Reinvestment
Rs. 500 (plus in multiples ofRe. 1)
Rs. 500 & in multiples thereof
(i) For investment of lessthan Rs.5 Crores : 2.25% ofapplicable NAV;(ii) For investment of Rs.5Crores & above: NIL
Nil
Generally within 3 BusinessDays for specified RBIlocations and an additional of3 Business Days for Non RBIlocations after lock-in periodof 3 yrs.
Rs. 500
3.00 p.m.3.00 p.m.
Monthly: Minimum of Rs. 500or multiples thereof & 5 post-dated cheques for a minimum ofRs. 500 for a block of 5 months inadvance.
***
Not available
Available
1.25%1.25%
2.50%

42
Key Features
Type
Investment Pattern(Under normalcircumstances)
Options
Default Option
Application Amount ###
Min. Addl. Investment ###
Entry Load*
Exit Load* $$$
Redemption ChequesIssued ##
Min. Redemption Amt.
Cut off time:Purchase/Switch inRedemption/Switch out $
Systematic InvestmentPlan (SIP)
Systematic WithdrawalPlan (SWP)
Systematic TransferPlan (STP) $$
Recurring Expenses**Investment Mangmt. Exp.Other recurring expensesTotal
SPIcE
An open-ended,exchange listed, indexlinked growth scheme
Securities comprisingthe SENSEX upto 100%& Upto 10% in Moneymarket instruments,convertible bonds &other securitiesincluding cash & call
–
–
One Unit (One unit =SENSEX /100)
One Unit (One unit =SENSEX /100)
Nil
NIL (In case there areno quotes on the BSE/DSE for five tradingdays consecutively, aninvestor can selldirectly to the fund atan exit load of 2.5% ofNAV)
Within 3 buisness days
One Unit (One unit =SENSEX /100)
3.00 p.m. during StockExchange WorkingHours
Not Available
Not Available
Not Available
1.00%
Index Fund
Open-ended Index LinkedGrowth Scheme
Equity stocks drawn from thecomponents of the S&P CNXNifty and the exchangetraded derivatives on the S&PCNX Nifty – upto 100%.Money Market instruments– upto 10%
N ifty
–
Rs.5,000 (plus multiples of Rs1000)
Rs.1000/-
Nil
0.50% -for purchase trans-action upto Rs.5 lac if theinvestment is redeemed be-fore 1 year and Nil -for allpurchase transactions overRs. 5 lac
Within 5 Business Days
Rs.1000
3.00 p.m.3.00 p.m.
Monthly/Quarterly: Mini-mum Rs.1,000/- + 5 post-datedcheques of Rs. 1,000/- each.Entry Load: Nil; Exit Load:0.5% of the applicable NAV,if the investment is redeemedwithin 1 year from the dateof allotment, Nil thereafter.
Minimum of Rs.1000 andmultiples of Re. 1/-
Not Available
0.70%0.55%
1.25%
Discovery Fund
Open-ended EquityFund
Equity and Equity relatedsecurities - 80% to 100%and Cash & Money Mar-ket instruments - 0% to20%
Growth & Dividend
DividendReinvestment
Rs. 5,000 (plus inmultiples of Re.1)
Rs. 500 & in multiplesthereof
(1) For investment ofless than Rs. 5 Crores:Entry load at 2.25% ofapplicable Net Asset Value(NAV);(2) For investment ofRs.5 Crores and above:Entry load is Nil.
Nil
Within 3 Business Daysfor specified RBI loca-tions and an additional of3 Business Days for Non-RBI locations.
Rs.500
3.00 p.m.3.00 p.m.
Monthly: MinimumRs.1,000 + 5 post-datedcheques of Rs. 1,000each
***
Minimum of Rs.500 andmultiples of Re. 1/-
Available
1.25%1.25%
2.50%
Emerging S.T.A.R. (Stock sTargeted At Returns)
Fund
Open-ended Equity Fund
Equity and Equity Linked Instruments -90% to 100% and Debt Securities, Cash& Money Market instruments - 0% to10%
Growth & Dividend
Dividend Reinvestment
Rs. 5,000 (plus in multiples of Re.1)
Rs. 500 & in multiples thereof
(1) For investment of less than Rs. 5Crores: Entry load at 2.25% of applicableNet Asset Value (NAV);(2) For investment of Rs.5 Crores andabove: Entry load is Nil.
The exit load structure for fresh andadditional purchases for amounts lessthan Rs. 5 crores (including switch-insfrom open ended debt schemes) madeby unitholders during the period May 1,2006 to May 31, 2006 will be – (i) 0.5%of the applicable NAV, if the amountsought to be redeemed or switched outis invested for a period of six months orless than six months from the date ofallotment; (ii) Nil, if the amount soughtto be redeemed or switched out isinvested for a period of more than sixmonths from the date of allotment. Thisload structure will be applicable onlyfor the purchases (including switch-insfrom open ended debt schemes) madeduring the period May 1, 2006 to May31, 2006. For all other purchases madeeither before May 1, 2006 or after May31, 2006 no exit load will be charged onthe redemptions or switch-outs made.
Within 2 Business Days from the dateof acceptance of Redemption requestat any of the Customer ServiceCentres.
Rs.500
3.00 p.m.3.00 p.m.
Monthly: Minimum Rs. 1,000 + 5 post-dated cheques of Rs. 1,000 each
***
Minimum of Rs.500 and multiples ofRe. 1/-
Available
2.50%
Infrastructure Fund
Open-ended Equity Fund
Equity and Equity relatedinstruments in Infrastructuresector 70% to 100% & debt,money market instrument andcall money 0% to 30%
Growth & Dividend
Dividend Reinvestment
Rs. 5,000 (plus in multiples ofRe.1)
Rs. 500 & in multiples thereof
(i) For all purchases of lessthan Rs. 5 Crore perTransaction: 2.25% ofapplicable NAV;(ii) For purchases of Rs.5Crore & above per Transaction: NIL
1) For investment madebefore 28 -N ov-05:A) 1% of applicable N AV if
i) Amount originallyinvested per transactionis less than Rs.5 croresand Redemption madebefore completion of 6months from the date ofallotment of units.
B) N il – if i) Originalinvestment is 5 crores ormore per transaction.Or ii) RedemptionRequest made on/after 6months from date ofallotment irrespective oforiginal investment.
2) N il for investments madeon or after 28 -N ov-05.
Generally within 3 Business Daysfor specified RBI locations andan additional of 3 Business Daysfor Non-RBI locations
Rs. 500
3.00 p.m.3.00 p.m.
Monthly: Minimum Rs. 1,000 +5 post-dated cheques for aminimum of Rs. 1000 each
***
Minimum of Rs.500 and multiplesof Re. 1/-
Available
1.25%1.25%2.50%
Services IndustriesFund
Open-ended Equity Fund
Equity and equity relatedinstruments in services sector70% to 100% & debt, moneymarket instruments and callmoney 0% to 30%
Growth & Dividend payout &Dividend Reinvestment
Dividend Reinvestment
Rs. 5000 per application and inmultiples of Re.1 thereafter
Rs. 500 per application and inmultiples of Re.1 thereafter
(i) For all purchases of lessthan Rs. 5 crore pertransaction:2.25% of applicableNAV;(ii) For all purchases of morethan Rs. 5 crore & above pertransaction:NIL
For investment made duringN ew Fund Offer (N FO) Period:(i) 1% of applicable NAV ifamount originally invested pertransaction is less than Rs. 5crores and redemption madebefore completion of 6 monthsfrom the date of allotment.(ii) Nil if (a) Original investmentis 5 crores or more pertransaction and the redemptionrequest is made within 6 monthsor beyond; or (b) RedemptionRequest is made on/after 6months from the date ofallotment irrespective of anyamount invested.For investment made afterN FO Period: Nil
Generally within 3 business daysfor specified RBI locations andan additional 3 Business days forNon-RBI locations
Rs 500 and in multiples thereof
3.00 p.m.3.00 p.m.
Monthly:Minimum Rs. 1000 + 5Installment for a minimum of Rs.1000 each and in multiples of Re.1 thereafter
***
Available
Available
1.25%1.25%
2.50%

Statutory Details: Prudential ICICI Mutual Fund (The Fund) has been set up as a Trust sponsored by Prudential plc (through its wholly owned subsidiary Prudential Corporation Holdings Limited) and ICICI Bank Limited.Prudential ICICI Trust Limited is the Trustee to the Fund and Prudential ICICI Asset Management Company Limited is the Investment Manager to the Fund. Risk Factors: Mutual Funds and securities investments are subjectto market risks and there is no assurance or guarantee that the objectives of the Schemes will be achieved • As with any securities investment, the NAV of the Units issued under the Schemes can go up or down, dependingon the factors and forces affecting the capital markets • Past performance of the Sponsors, AMC/Fund does not indicate the future performance of the Schemes of the Fund • The Sponsors are not responsible or liablefor any loss resulting from the operation of the Schemes beyond the contribution of an amount of Rs. 22.2 lacs, collectively made by them towards setting up the Fund and such other accretions and additions to the corpusset up by the Sponsors • Prudential ICICI Growth Plan^ (An open-ended equity fund. Objective is to generate long term capital appreciation), Entry Load: **, Exit Load: Nil; Prudential ICICI Income Plan (An open-ended Debt Fund. Objective is to generate income through investments in debt securities), Entry Load: Nil, Exit Load: For investment of less than or upto Rs. 10 Lakhs : 0.50% of applicable Net Asset Value (NAV) if theinvestment held for less than or equal to a period of 6 months; For investment of above Rs. 10 Lakhs: Nil; Prudential ICICI Liquid Plan (An open-ended Liquid Income Fund. Objective is to generate reasonable returnswhile providing high levels of liquidity), Entry Load: Nil, Exit Load: Nil; Prudential ICICI FMCG Fund^ (An open-ended FMCG Sectoral Fund. Objective is to generate long term capital appreciation through investmentsprimarily in FMCG sector), Entry Load: **, Exit Load: Nil; Prudential ICICI Tax Plan^ (An open-ended Equity Linked Saving Scheme. Objective is to generate long term capital appreciation), Entry Load: **, Exit Load:Nil; Prudential ICICI Gilt Fund - Treasury Plan (An open-ended short-term Gilt Fund. Objective is to generate regular returns through investments made in gilts), Entry Load: Nil, Exit Load: Nil; Prudential ICICIGilt Fund - Investment Plan (An open-ended medium-term Gilt Fund. Objective is to generate regular returns through investments made in gilts), Entry Load: Nil, Exit Load: Nil; Prudential ICICI Balanced Fund^(An open-ended Balanced Fund. Objective is to generate long term capital appreciation and current income), Entry Load: **, Exit Load: Nil; Prudential ICICI Technology Fund^ (An open-ended Equity Fund. Objectiveis to generate long term capital appreciation), Entry Load: **, Exit Load: Nil; Prudential ICICI Monthly Income Plan (An open ended fund. Monthly income is not assured and is subject to the availableof distributable surplus) (Objective is to generate regular income through investments in fixed income securities), Entry Load: Nil, Exit Load: For investment of less than or upto Rs. 10 Lakhs : 0.50% of applicable NetAsset Value (NAV) if the investment held for less than or equal to a period of 6 months; For investment of above Rs. 10 Lakhs : Nil; Prudential ICICI Fixed Maturity Plan - Y early Series 5, Series 12 (A close-endedFund to generate regular returns by investing in a portfolio of fixed income securities/ debt instruments normally maturing in line with the time profile of the Plan), Entry Load: Nil, Exit Load: Nil for redemption on SpecifiedRedemption Date and 1.5%, on the amount sought to be redeemed by the unitholders for the redemption made on such Business Days (other than on Specified Redemption Date) under Series 5 & Series 12; PrudentialICICI Fixed Maturity Plan – Series 25 (A close-ended Debt Fund. Objective is to generate regular returns) Entry Load : Nil and Exit Load :0.50% under Quarterly Plan, 2.00% under 15 Months Plan & 1% under YearlyPlan on the amount sought to be redeemed by the Unitholders under the Plan for the redemptions made on such Business Days (other than on Specified Redemption Dates); Prudential ICICI Fixed Maturity Plan – Series28 - 16 months Plan (A close-ended Debt Fund. Objecitve is to seek to generate regular returns by investing in a portfolio of fixed income securities/debt instruments normally maturing in line with the time profileof the Plan), Entry Load: Nil, Exit Load: Nil - for redemptions made on Maturity, 1% of the applicable NAV for redemptions made during repurchase facility period; Prudential ICICI Fixed Maturity Plan – Series 28- 13 months Plan (A close-ended Debt Fund. Objective of the Plan is to seek to generate regular returns by investing in a portfolio of fixed income securities/ debt instruments normally maturing in line with the timeprofile of the Plan), Entry Load: Nil, Exit Load: Nil - for redemptions made on Maturity, 1% of the applicable NAV for redemptions made during repurchase facility period; Prudential ICICI Fixed Maturity Plan – Series32 - 3 months Plan A (A close-ended Debt Fund. Objective of the Plan under the Scheme is seeking to generate regular returns by investing in a portfolio of fixed income securities/ debt instruments normally maturingin line with the time profile of the Plan), Entry Load: Nil, Exit Load: Nil - for redemptions made on Maturity, 1% of the applicable NAV for redemptions made during repurchase facility period; Prudential ICICI FixedMaturity Plan – Series 31 - 4 months Plan (A close-ended Debt Fund. Objective is to seek to generate regular returns by investing in a portfolio of fixed income securities/ debt instruments normally maturing in linewith the time profile of the Scheme), Entry Load: Nil, Exit Load: Nil - for redemptions made on Maturity, 1% of the applicable NAV for redemptions made during repurchase facility period; Prudential ICICI Child CarePlan (Study Plan: An open-ended fund. Objective is to generate income by creating a portfolio that is invested in debt, money market instruments and equity and equity related securities. Gift Plan: An open-ended Fund.Objective is to generate capital appreciation by creating a portfolio that is invested in equity and equity related securities and debt and money market instruments), Entry Load for both the plans are 1.50%. The Exit Loadfor both the Plans are 1%, if investment is redeemed within 3 years. (2) Nil, if investment is redeemed after 3 years but before the Unitholder attains the age of 18; Prudential ICICI Power^ (An open-ended GrowthFund. Objective is to generate long term capital appreciation through investments in core sectors & associated feeder industries), Entry Load: **, Exit Load: Nil; Prudential ICICI Short Term Plan (An open-endedIncome Fund. Objective is to generate Income through investments in debt securities) Entry Load: Nil, Exit Load: Nil; Prudential ICICI Long Term Plan (An open-ended Income Fund. Objective is to generate incomethrough investment in range of debt and money market instruments while maintaining optimum balance of yield, safety and liquidity), Entry Load: Nil, Exit Load: 0.75% if the investment is redeemed within 12 months;Prudential ICICI Sweep Plan (An open-ended Liquid Fund. Objective is to provide reasonable returns, commensurate with low risk while providing a high level of liquidity, through investments made primarily in moneymarket and debt securities), Entry Load: Nil, Exit Load: Nil; Prudential ICICI Index Fund (An open-ended index linked Growth Scheme. Objective is track the returns of S&P CNX Nifty Index through investment instocks drawn from constituents of Nifty), Entry Load: Nil, Exit Load: 0.50% for purchase transactions upto Rs.5 lacs, if the investment is redeemed within 1 year of investments and NIL for purchase transactions overRs. 5 lacs; Prudential ICICI Flexible Income Plan (An open-ended Income Fund. Objective is to generate income through investments in a range of debt instruments and money market instruments of various maturitieswith a view to maximising income while maintaining the optimum balance of yield, safety and liquidity) Entry Load: Nil, Exit Load: Nil; Prudential ICICI Dynamic Plan^ (An open-ended Equity Fund. Objective is togenerate capital appreciation by actively investing in equity and equity related securities and for defensive consideration in debt / money market instruments), Entry Load: **, Exit Load: Nil; SENSEX Prudential ICICIExchange Traded Fund (“ SPIcE” ) (An open-ended exchange listed, index linked growth scheme. Objective is to provide the investment returns that closely corresponds to the total return of securities as representedby the SENSEX). Entry Load: Nil, Exit Load: 2.5% of applicable NAV in case of no quotes on the BSE for five trading days consecutively and an investor redeeming directly from the Fund; Prudential ICICI Floating RatePlan – Option A, B & C (An open-ended income fund. Objective is to generate income consistent with the prudent risk from a portfolio comprising substantially of floating rate debt instruments, fixed rate debt instrumentsswapped for floating rate return, and also fixed rate instruments and money market instruments) Entry Load : Nil, Exit Load : Nil for Options B and C and for Option A - For investments of less than Rs. 10 Lakhs Exit load@ 0.50% of applicable NAV in case the amount sought to be redeemed is not being invested under the Option A for a minimum period of seven days; Prudential ICICI Advisor Series (An open-ended asset allocationfund, which is of the nature of Fund of Funds, comprising there under five investment Plans, with a primary objective to generate returns through investment in underlying schemes of Prudential ICICI Mutual Fund) EntryLoad: For Prudential ICICI Very Cautious Plan and Prudential ICICI Cautious Plan is Nil and for Prudential ICICI Moderate Plan, Prudential ICICI Aggressive Plan and Prudential ICICI Very Aggressive Plan, the Entry Loadis 1%, 1.50% and 1.75% respectively, Exit Load: Nil, Further, for investments by the Fund of Funds scheme, in underlying schemes of Prudential ICICI Mutual Fund, there would not be any entry load / exit load. PrudentialICICI Gilt Fund Investment Plan - PF Option (An open-ended Medium Term Gilt Fund. Objective is to generate income through investments in Gilts of various maturities) Entry Load: Nil, Exit load : 0.60% of a NAVin case the amount sought to be redeemed is not being invested under the Plan for a minimum period of 365 days, Prudential ICICI Gilt Fund Treasury - PF Option (An open-ended Gilt Fund. Objective is to generateincome through investments in Gilts of various maturities) Entry Load: Nil, Exit load: 0.80% of a NAV in case the amount sought to be redeemed is not being invested under the Plan for a minimum period of 365 day;Prudential ICICI Income Multiplier Fund (An open-ended debt fund which invests upto 30% in equity. Objective is to generate long-term capital appreciation from a portfolio that is invested predominantly in debtand money market securities and the balance in equity and equity related securities) Entry Load: Nil, Exit Load: (i) 1% - For investments of less than Rs. 5 crores and if the investments are held for less than a period of12 months; (ii) No Exit Load for investments of Rs. 5 crores and above; Prudential ICICI Discovery Fund^ (An open-ended Equity Fund. Objective is to generate returns through a combination of dividend income andcapital appreciation by investing primarily in a well-diversified portfolio of value stocks) Entry Load: **, Exit Load: Nil; Prudential ICICI Long Term Floating Rate Plan – Option A, B & C (An open-ended IncomeFund. Objective is to generate income through investments in a range of debt and money market instruments of various maturities with a view to maximiz ing income while maintaining the optimum balance of yield, safetyand liquidity) Entry Load : Nil, Exit Load : Nil for Options B and C and for Option A - 0.50% for investments of less than or equal to Rs. 1 Crore and redemption is made on or before the completion of six months from thedate of allotment of units; Prudential ICICI Emerging S.T.A.R. (Stocks Targeted At Returns) Fund^ (An open-ended Equity Fund. Primary objective is to generate capital appreciation by actively investing indiversified mid cap stocks. The scheme will invest primarily in companies that have a market capitalisation between 100 crores and 2000 crores.) Entry Load: **, Exit Load: The exit load structure for fresh and additionalpurchases for amounts less than Rs. 5 crores (including switch-ins from open ended debt schemes) made by unitholders during the period May 1, 2006 to May 31, 2006 will be – (i) 0.5% of the applicable NAV, if the amountsought to be redeemed or switched out is invested for a period of six months or less than six months from the date of allotment; (ii) Nil, if the amount sought to be redeemed or switched out is invested for a period ofmore than six months from the date of allotment. This load structure will be applicable only for the purchases (including switch-ins from open ended debt schemes) made during the period May 1, 2006 to May 31, 2006.For all other purchases made either before May 1, 2006 or after May 31, 2006 no exit load will be charged on the redemptions or switch-outs made; Prudential ICICI Blended Plan (An open ended fund investing ina blend of equity, derivatives, debt and money market instruments under two Plans viz . Plan A and Plan B. Objective of Plan A under the scheme is to provide capital appreciation and income distribution to unitholdersby investing in equity & equity related securities including derivatives and the balance portion in debt securities. Objective of Plan B under the scheme is to provide capital appreciation and income distribution to unitholdersby investing predominantly in debt securities and the balance portion in equity & equity related securities including derivatives. Entry Load: Nil. Exit Load: Under both the Plans viz ., Plan A and Plan B, in case the amountsought to be redeemed is not invested by the investor for a period of 30 days from the date of allotment, an exit load @ 0.50% of applicable NAV will be imposed.); Prudential ICICI Infrastructure Fund^ (An open-ended equity scheme. Objective is to generate capital appreciation and income distribution to unitholders by investing predominantly in equity/equity related securities of the companies belonging to the infrastructureindustries and balance in debt securities and money market instruments including call money), Entry Load: For all purchases of less than Rs.5 crore per transaction - 2.25% of applicable NAV, For Purchases of Rs.5 croresand above per transaction - Nil, Exit Load: For Investments made before November 28, 2005 - (i) If the amount originally invested per transaction is less than Rs. 5 crores and the redemption request is made before completionof 6 months from the date of allotment of units - 1.00%, (ii) If the amount originally invested per transaction is Rs. 5 crores or more and whether the redemption is sought within 6 months or beyond; or Any amount invested,for which the redemption request is made on or after the completion of 6 months from the date of allotment of units - No exit load; For investments made from November 28, 2005 onwards: No exit load will be chargedfor investments made under the Scheme on or after November 28, 2005 irrespective of the amount invested; Prudential ICICI Services Industries Fund (PISIF)^ (An open-ended equity Scheme. Objective: to generatecapital appreciation and income distribution to unitholders by investing predominantly in equity/equity related securities of the companies belonging to the service industry and balance in debt securities and money marketinstruments including call money), Entry Load: For all purchases of less than Rs.5 crore per transaction - 2.25% of applicable NAV, For Purchases of Rs. 5 crores and above per transaction - Nil; Exit Load: For Investmentsmade during the New Fund Offering period: (i) 1% - If the amount originally invested per transaction is less than Rs. 5 crores and the redemption request is made before completion of 6 months from the date of allotmentof units. (ii) Nil - If the amount originally invested per transaction is Rs. 5 crores or more and whether the redemption is sought within 6 months or beyond; or Any amount invested, for which the redemption request ismade on or after the completion of 6 months from the date of allotment of units. For investments made after New Fund Offer: Nil; Prudential ICICI Fusion Fund (A close-ended diversified equity scheme, with a maturityperiod of 5 years, that seeks to generate long-term capital appreciation by investing predominantly in equity and equity related instruments of companies across large, mid and small market capitaliz ation. Entry Load:Nil, Exit Load: For the redemptions made before the maturity date of the Scheme i.e. redemptions made during the repurchase facility period, the following exit load structure will be applicable: (i) 5% of the applicableNAV, if the amount sought to be redeemed is invested for a period of one year or less than one year from the date of allotment; (ii) 4% of the applicable NAV, if the amount sought to be redeemed is invested for a periodmore than one year but less than or equal to two years from the date of allotment; (iii) 3% of the applicable NAV, if the amount sought to be redeemed is invested for a period of more than two years but less than orequal to three years from the date of allotment; (iv) 2% of the applicable NAV, if the amount sought to be redeemed is invested for a period of more than three years but less than or equal to four years from the dateof allotment; (v) 1% of the applicable NAV, if the amount sought to be redeemed is invested for a period of more than four years from the date of allotment but redeemed before the date of maturity of the Scheme. Theseare the names of the Schemes and do not in any manner indicate either the quality of the Schemes or their future prospects and returns.** Entry Load for all the Equity Funds: (i) For investment of less than Rs.5 crores is 2.25% of applicable NAV; (ii) For investment of Rs.5 crores and above is Nil. No entry load will be payable in respect of switchtransaction from one equity scheme of Prudential ICICI to another equity scheme of Prudential ICICI. Further, for investments by a Fund of Funds Scheme(s) in various schemes of Prudential ICICI Mutual Fund, there wouldnot be any entry load / exit load charged by the underlying schemes.^ For SIP & STP Investments: Entry load of 2.25% of the applicable NAV will be charged on the amount invested under the scheme(s). Exit Load: Nil.Exceptions: For all SIP and STP investments registered under Prudential ICICI Power and Prudential ICICI Discovery Fund from June 21, 2006 to July 31, 2006: (i) If redemptions are made from June21, 2006 to July 5, 2006 no exit load shall be charged; (ii) If redemptions are made after July 5, 2006 but on or before the end of six months from the date of investment of each installment of SIP/STP investment, an exitload of 0.5% shall be charged.Load Structure on SIP & STP investments under the following schemes are as follows: • Prudential ICICI Child Care Plan (Gift Plan & Study Plan) – Entry Load: 1.50% of applicable NAV. Exit Load:1.00% of Applicable NAV if the investment is redeemed within 3 years from the date of allotment, Nil thereafter • Prudential ICICI Moderate Plan – Entry Load: 1% of applicable NAV; Exit Load: Nil • PrudentialICICI Aggressive Plan – Entry Load: 1% of applicable NAV; Exit Load: 0.5% of the applicable NAV, if the units are redeemed before completion of 2 years from the date of allotment • Prudential ICICI VeryAggressive Plan – Entry Load: 1% of applicable NAV; Exit Load: 0.75% of the applicable NAV, if the units are redeemed before completion of 2 years from the date of allotment • Prudential ICICI Index Fund– Entry Load: Nil; Exit Load: 0.5% of the applicable NAV, if the investment is redeemed within 1 year from the date of allotment, Nil thereafter • No entry or exit load will be charged on the SIP investments underPrudential ICICI Flexible Income Plan, Prudential ICICI Long Term Plan, Prudential ICICI Income Plan, Prudential ICICI Monthly Income Plan, Prudential ICICI Income Multiplier Fund, Prudential ICICI Very Cautious Plan andPrudential ICICI Cautious Plan.
Prudential ICICI Mutual Fund Corporate Office
Peninsula Tower, 8th Floor, Peninsula Corporate Park, Ganpatrao Kadam Marg, Off. Senapati Bapat Marg,
Lower Parel, Mumbai – 400 013. Telephone No.: 022-24997 000 Fax No.: 022-2499 7 029
Website: www.pruicici.com E-mail: enquiry@ pruicici.com