Discretionary thrift at the bottom of the pyramid John Nkosi
105
i Discretionary thrift at the bottom of the pyramid John Nkosi Student No.: 10675923 A research project submitted to the Gordon Institute of Business Science, University Pretoria, in partial fulfilment of the requirements for the degree of Masters of Business Administration. 9 th November 2011 Copyright © 2012, University of Pretoria. All rights reserved. The copyright in this work vests in the University of Pretoria. No part of this work may be reproduced or transmitted in any form or by any means, without the prior written permission of the University of Pretoria.
-
Upload
khangminh22 -
Category
Documents
-
view
2 -
download
0
Transcript of Discretionary thrift at the bottom of the pyramid John Nkosi

i
Discretionary thrift at the bottom of the pyramid
John Nkosi
Student No.: 10675923
A research project submitted to the Gordon Institute of Business Science,
University Pretoria, in partial fulfilment of the requirements for the degree of
Masters of Business Administration.
9th November 2011
Copyright © 2012, University of Pretoria. All rights reserved. The copyright in this work vests in the University of Pretoria. No part of this work may be reproduced or transmitted in any form or by any means, without the prior written permission of the University of Pretoria.

ii
ABSTRACT
The purpose of this research is to investigate the concept of discretionary thrift
amongst low income consumers. Flatters and Willmott (2009) identified
discretionary thrift as an advancing trend amongst affluent developed nation
consumers. These consumers temper their spending habits depending on
product or occasion; there are certain products for which consumers are willing
to pay a premium (behaviour associated with materialism) and there are others
that consumers are looking to save money on (behaviour associated with
frugality). Thrift for low income consumers, especially in emerging market
settings, is not considered discretionary; rather, it is portrayed as ‘necessary’ to
ensure survival.
This study followed a descriptive, quantitative design and surveyed 154
individuals considered to be at the bottom of South Africa’s income pyramid.
There is sufficient evidence from this research to support the proposition of
discretionary thrift amongst low income consumers. Low income consumers
were found to save money by paying as little as possible (behaviour associated
with frugality) for fast moving consumer goods with low functional and status
risk and were found to willingly pay the required premium (behaviour associated
with materialism) for socially visible aspirational brands of clothing and fast
moving consumer goods. The level of frugality and materialism expressed with
respect to these products was not influenced by age or level of education.
However, the level of frugality expressed with respect to these products was
affected by an individual’s gross and disposable income.

iii
KEYWORDS
Frugality
Materialism
Discretionary thrift
Bottom of the pyramid

iv
DECLARATION
I declare that this research project is my own work. It is submitted in partial
fulfilment of the requirements for the degree of Master of Business
Administration at the Gordon Institute of Business Science, University of
Pretoria. It has not been submitted before for any degree or examination in any
other University. I further declare that I have obtained the necessary
authorisation and consent to carry out this research.
John Nkosi
9th November 2011

v
ACKNOWLEDGEMENTS
The completion of this project would not have been possible without the help of
certain individuals. To my parents and siblings, thank you for your continued
encouragement. I am blessed to have you in my life. To my wife Zizile, thank
you for holding down the fort during the MBA. Your support and understanding
made the busy weekends and late nights tolerable. To my baby boys Yankho
and Ulemu, I hope my continued education will one day inspire you to work
hard in school. Remember, never stop learning. To my supervisor Kerry Chipp,
thank you for your time and assistance. Your input was always constructive and
helped bring focus to this project. Finally, to my classmates, thank you for your
friendship and insights. You made the MBA journey memorable.

vi
TABLE OF CONTENTS 1. INTRODUCTION TO THE RESEARCH PROBLEM .............................................................................. 1 1.1 INTRODUCTION .................................................................................................................................. 1 1.2 RESEARCH MOTIVATION .................................................................................................................... 1 1.3 RESEARCH RELEVANCE .................................................................................................................... 3 2. LITERATURE REVIEW ........................................................................................................................... 4 2.1 INTRODUCTION .................................................................................................................................. 4 2.2 FRUGALITY ........................................................................................................................................ 5 2.3 MATERIALISM ................................................................................................................................... 10 2.4 DISCRETIONARY THRIFT ................................................................................................................. 11 2.5 THE BOTTOM OF THE INCOME PYRAMID ......................................................................................... 13 2.6 CONSUMER BEHAVIOUR AT BOP .................................................................................................... 17 2.6.1 Common misconceptions of consumers at BOP .............................................................. 17
2.6.2 Consumer motivations at BOP ........................................................................................... 21
2.7 FACTORS THAT MAY INFLUENCE DISCRETIONARY THRIFT AT BOP................................................ 29 2.7.1 Level of Income ..................................................................................................................... 30
2.7.2 Age .......................................................................................................................................... 31
2.7.3 Level of Education ................................................................................................................ 32
2.7.4 Relative Deprivation ............................................................................................................. 33
2.8 CONCLUSION ON LITERATURE REVIEW ........................................................................................... 35 3.0 STATEMENT OF RESEARCH PROPOSITION ...................................................................................... 37 4.0 METHODOLOGY ......................................................................................................................... 39 4.1 INTRODUCTION ................................................................................................................................ 39 4.2 RESEARCH DESIGN .................................................................................................................. 39 4.3 POPULATION AND SAMPLING .......................................................................................................... 40 4.4 SURVEY QUESTIONNAIRE ............................................................................................................... 41 4.5 DATA COLLECTION ........................................................................................................................... 45 4.6 DATA ANALYSIS ............................................................................................................................... 46 4.8 LIMITATIONS OF RESEARCH DESIGN ............................................................................................... 47 5.0 RESULTS .......................................................................................................................................... 48 5.1 INTRODUCTION ................................................................................................................................ 48 5.2 DEMOGRAPHICS OF RESPONDENTS ................................................................................................ 48 5.3 DATA ANALYSIS AND RELIABILITY .................................................................................................... 50 5.4 RESULTS TO RESEARCH QUESTIONS .............................................................................................. 54 5.4.1 There is discretionary thrift at bottom of the income pyramid. Low income consumers exhibit frugality or materialism depending on product being considered. ............................... 54 5.4.2 Materialism and frugality (discretionary thrift) may be affected by an individual’s
income level (gross income and/or disposable income) at the bottom of the pyramid. ........ 62 5.4.3 Materialism and frugality may be affected by an individual’s age at the bottom of the pyramid. ........................................................................................................................................... 66 5.4.4 Materialism and frugality may be affected by an individual’s level of education at the bottom of the pyramid. ................................................................................................................... 69
5.5 CONCLUSION OF RESULTS .............................................................................................................. 71 6.0 DISCUSSION OF RESULTS ................................................................................................................ 72 6.1 INTRODUCTION ................................................................................................................................ 72 6.2 DISCUSSION OF RESULTS FROM RESEARCH PROPOSITION 1......................................................... 72 6.2.1 There is discretionary thrift at bottom of the income pyramid. Low income consumers exhibit frugality or materialism depending on product being considered. ............................... 72 6.2.2 Frugality and materialism may be affected by an individual’s income level (gross income and/or disposable income) at the bottom of the pyramid. ........................................... 77
6.2.3 Materialism and frugality may be affected by an individual’s age at the bottom of the pyramid. ........................................................................................................................................... 79 6.2.4 Materialism and frugality may be affected by an individual’s level of education at the bottom of the pyramid. ................................................................................................................... 80
7.0 CONCLUSION ................................................................................................................................... 82

vii
7.1 FUTURE RESEARCH ......................................................................................................................... 84 REFERENCES ........................................................................................................................................ 85 APPENDIX ........................................................................................................................................... 92

viii
LIST OF FIGURES Figure 1: Schematic of unidimensional frugality scale. ................................................. 6
Figure 2: Motivation values circumplex (Pepper et al., 2009, p.128) ............................. 8
Figure 3: The Economic Pyramid. Source: Prahalad (2009, p.28). ..............................14
Figure 4: South Africa’s population and income pyramid. Chipp and Corder (2009, p.18). ....................................................................................................................16
Figure 5: Reasons for poverty (Hamilton and Catterall (2005, p.630) ..........................20
Figure 6: Example of multidimensional view of frugality. .............................................36
Figure 7: Products and brands presented to survey respondents. ...............................43
LIST OF TABLES
Table 1: The South African LSM
®. Chipp and Corder (2009, p.18). .............................16
Table 2: Household expenditure. Jacob and Smit (2010, p.17). ..................................22
Table 3: Short form LSM questionnaire and scoring matrix. Chipp and Corder (2010). .............................................................................................................................41
Table 4: MVS adapted from Ponchio and Aranha (2008), Jacobs and Smit (2010). ....44
Table 5: Frugality Scale adapted from Lastovicka et al. (1999). ..................................45
Table 6: BOP brand categories (Rimmell, 2008). ........................................................46
Table 7: Demographic composition of respondents .....................................................49
Table 8: Summary of frugality scores and reliability ....................................................50
Table 9: Summary of materialism scores and reliability ...............................................51
Table 10: Summary of materialism subscale scores. ..................................................53
Table 11: Mean aggregated materialism scores. .........................................................54
Table 12: Frugality and consumer behaviour...............................................................55
Table 13: Test for linear association. ...........................................................................56
Table 14: Product or brand bought when saving money. .............................................57
Table 15: Observed versus expected selections of product/brand groups. ..................58
Table 16: Chi-Square test for frugality product/brand groups. .....................................59
Table 17: Products/brands bought using money intentionally saved from other purchases. ...........................................................................................................60
Table 18: Observed versus expected selections of product/brand groups. ..................61
Table 19: Chi-Square test for frugality product/brand groups. .....................................61
Table 20: Mean levels of frugality with gross income. .................................................62
Table 21: ANOVA – Differences in mean levels of frugality with gross income. ..........63
Table 22: Mean levels of frugality with disposable income. .........................................63
Table 23: ANOVA – Differences in mean levels of frugality with disposable income. ..64
Table 24: Mean levels of materialism with gross income. ............................................64
Table 25: ANOVA – Differences in mean levels of materialism with gross income. .....65
Table 26: Mean levels of materialism with disposable income. ....................................65
Table 27: ANOVA – Differences in mean levels of materialism with disposable income. .............................................................................................................................66
Table 28: Mean levels of frugality with age ..................................................................67
Table 29: ANOVA – Differences in mean levels of frugality with age. ..........................67
Table 30: Mean levels of materialism with age. ...........................................................68
Table 31: ANOVA – Differences in mean levels of materialism with age. ....................68
Table 32: Mean levels of frugality with education. .......................................................69
Table 33: ANOVA – Differences in mean levels of frugality with education. ................70
Table 34: Mean levels of materialism with education. ..................................................70
Table 35: ANOVA – Differences in mean levels of materialism with education............70
Table 36: Brands most associated with frugality..........................................................74

ix
Table 37: Brands most associated with materialism. ...................................................76

1
1. INTRODUCTION TO THE RESEARCH PROBLEM
1.1 INTRODUCTION
This research intends to investigate the concept of discretionary thrift amongst
low income consumers in an emerging market setting characterised by high
social mobility. The research seeks to provide insights into factors that may
influence the expression of frugality and materialism amongst low income
consumers. As such, the research is built on theories developed in the
disciplines of psychology and sociology, and aims to contribute to the growing
body of literature on low income consumer behaviour.
1.2 RESEARCH MOTIVATION
The recent global financial crisis has sparked a flurry of academic research into
its potential long term impacts on consumer behaviour. Indeed, evidence from
the United States of America and Europe suggests that a new type of shopper
focused on gaining superior value from purchases has emerged from the
recession (Piercy, Cravens & Lane, 2010). Piercy et al. (2010) report that
consumers in developed nations have adopted a thriftiness or frugality based
on quality and value. A recent review by Flatters and Willmott (2009) identified
discretionary thrift – a desire to economise, as an advancing trend amongst
developed nation consumers. Consumer tastes formed in times of prosperity
have evolved in line with changing economic realities (Wiggins and Berchall,
2008). These consumers temper their spending habits depending on product
or occasion; there are certain products for which consumers are still willing to

2
pay a premium and there are others that consumers are looking to save money
on. Piercy et al. (2010) states that marketing strategies in these developed
economies will require a better understanding of the new priorities and buying
processes of the post-recession consumer.
Surprisingly, little is mentioned in the way of discretionary thrift amongst low
resource consumers with reference to the recession or otherwise. Barki and
Parente (2010) and Martinez and Carbonell (2007) have noted findings on
research that shows that low income consumers often exhibit similar behaviour
to high income consumers.
In an earlier study on frugality, Lastovicka, Bettencourt, Hughner and Kutzner
(1999) concluded that lower income levels do not necessarily lead to frugality.
The authors described this as “counterintuitive” (Lastovicka et al. 1999, p. 96)
and called for further research to be undertaken on the subject. Poor people, it
seems, are expected to be frugal at all times to ensure survival; Pepper,
Jackson and Uzell (2009) report that low income is a strong predictor for
thriftiness. While this may be the case in the context of a developed, static
society like the United Kingdom where prominent studies on frugality were
conducted, Jacob and Smit (2010) suggest that transitional economies
characterised by new freedom to acquire goods are often associated with high
levels of materialism. Barki and Parente (2010) report that there are segments
of the low income population in emerging markets who are not driven by prices.
Given their limited resources, it may be reasonable to posit that discretionary
thrift may also be expressed by low income consumers; these consumers may

3
exhibit behaviour associated with frugality in one instance, and exhibit
materialism in another. To this end, research is required to ascertain whether
the concept of discretionary thrift exists amongst low income consumers more
so in societies typified by high social mobility.
1.3 RESEARCH RELEVANCE
This research is not only relevant to South Africa and other emerging
economies; low income consumers in both developing and developed world
contexts are often misunderstood. Companies wishing to offer their goods and
services to low income consumers need a firm understanding of the motivations
of these individuals in order to respond with the appropriate business
positioning.

4
2. LITERATURE REVIEW
2.1 INTRODUCTION
The literature reviewed in this section defines the theory of frugality as
understood from its origins in psychology and sociology. The concept of
discretionary thrift is introduced after critical analysis of frugality constructs in
the context of low income emerging market societies typically characterised by
high social mobility. It is argued that thrift observed here is not always
‘necessary for survival’ as put forward by several researchers; similar to affluent
consumers in developed markets, low income individuals will temper their
spending habits, that is express frugality and materialism, based on occasion or
circumstance.
The literature review then proceeds to discuss the concept of ‘bottom of the
pyramid’ and the common misconceptions regarding low income consumers.
The review then delves into the motivations that influence consumer choices at
the bottom of the pyramid and how these may fuel simultaneous expression of
frugality and materialism. Finally, the literature review concludes by offering a
compelling argument as to how a study of discretionary thrift at the bottom of
the pyramid will contribute to the existing discussions on low income consumer
behaviour.

5
2.2 FRUGALITY
Restraint associated with frugality is deeply rooted in our past (Lastovicka et
al., 1999). All major religions discourage excess in acquisition and encourage
moderation (Lastovicka et al., 1999). Frugality prescribes delayed economic
gratification (Lastovicka et al., 1999); it calls for disciplined allocation of
resources (time and money) on hand to acquire a valued goal (Lastovicka et al.,
1999). From a sociological perspective, frugality is not deprivation but the
sacrificing of a series of whims for the sake of obtaining a more worthy goal
(Lastovicka et al., 1999); it is a lifestyle and includes practices such as buying in
bulk or re-using items on hand rather than acquiring more (Lastovicka et al.,
1999). The psychological perspective defines frugality as a careful use of
resources and avoidance of waste; it may be motivated by personality traits or
concern for the environment (ecocentrism) (Lastovicka et al., 1999). Drawing
from all these points of view, Lastovicka et al., (1999, p. 88) propose the
following definition for frugality:
“Frugality is a unidimensional consumer lifestyle trait characterised by the
degree to which consumers are both restrained in acquiring and in resourcefully
using economic goods and services to achieve longer-term goals”.
Richins and Dawson (1990) report that unidimensional personality traits are
typically formed at an early age, remain unchanged over time and are
impervious to environmental stimuli. The unidimensional approach thus implies
that frugality is absolute and can be measured on a single number line (Figure
1). It is rigid, you are either less frugal or more frugal than your peers; by

6
extension, for this measurement to apply, people within any given society
should express frugality in a similar manner. However, Immekus and Imbrie
(2008) state that social or psychological constructs are typically characterised
as multidimensional. That is, the measured trait is specified in terms of a set of
related domains (Immekus and Imbrie, 2008). Regardless, Lastovicka et al.
(1999) developed a unidimensional scale to measure frugality and
recommended that future researchers possibly consider frugality as a
dependent variable.
Figure 1: Schematic of unidimensional frugality scale.
Motivation rather than behaviour, it seems, may lie at the heart of frugality.
Rick, Cryder and Loewenstein (2007) draw an important distinction between
frugal individuals and tightwads. Tightwads spend less than they would ideally
like to spend because of an anticipatory pain of paying. That is, their affective
reaction to spending may lead them to spend less than their deliberative selves
would prefer (Rick et al., 2007). Tightwads and the highly frugal may behave
the same in terms of spending, but the highly frugal spend conservatively
because they enjoy saving, not because the prospect of spending pains them
(Rick et al., 2007). Indeed, Rose, Smith and Segrist (2010) claim that frugal
Frugality Scale
Low High *
An individual’s measured frugality. It is rigid and is not influenced by time or circumstance.

7
consumers are non-compulsive, value- and price-conscious and find it
pleasurable to save money. Here again, tightwads and the frugal are portrayed
as individuals who are averse to spending money regardless of the situation or
circumstance in agreement with the unidimensional perspective put forward by
Lastovicka et al. (1999).
Insights into the possible motivations for frugality and perhaps its
multidimensionality can be found in research by Pepper, Jackson and Uzzell
(2009). The research was prompted by the emergence of an ethically conscious
lifestyle choice termed ‘voluntary simplicity’ in the United Kingdom. Nash (2000)
championed that frugality in developed nations may be indistinct from non-
materialism adopted in protest to excessive or unfair consumption and
production. Voluntary simplicity is characterised by reduced material
consumption (adoption of frugal ways) and the removal of clutter from one’s life
(Ballantine and Creery, 2010). Pepper et al. (2009) set out to test assertions by
Nash (2000) and determine whether there was a difference in behaviour
observed amongst people who are inherently frugal as per Lastovicka et al.
(1999) and those, like voluntary simplifiers, who exhibit frugal behaviour as an
intentional moral challenge to consumerism. Drawing on Shalom Scwhartz’s
1992 work on values that motivate human behaviour, Pepper et al. (2009)
developed a circumplex of value types (Figure 2); value types whose pursuit is
compatible appear adjacent in the circumplex whereas conflicting values
appear opposite each other. Thus, the polarities of the axes of the circumplex
denote four value types. (1) Openness to change (consists of self- direction,
stimulation and hedonism) vs. (3) conservation (security, conformation and

8
tradition) relates to the conflict between motivation to follow one’s own interests
and the motivation to preserve the status quo and the certainty it provides in
relationships with others (Pepper et al., 2009). (2) Self-enhancement (power,
achievement, hedonism) vs. (4) self-transcendence (universalism and
benevolence) represent the extent to which people enhance their own interests
even at the expense of others as opposed to transcending them and promoting
the welfare of others (Pepper et al., 2009).
Figure 2: Motivation values circumplex (Pepper et al., 2009, p.128)
Pepper et al. (2009) note that in developed world settings, it is possible to
distinguish frugal behaviour borne out of a personality trait to that explained by
social or ecological ideals (self-transcendence values). Frugality not motivated
by ethical ideals is however strongly linked to low income; people with low
income, they observe, have a lack of desire for prestige or improving social
status (Pepper et al. 2009). The frugal “ascribe minimal importance to the
ownership and acquisition of material goods in achieving major life goals or
desired states” (Pepper et al. 2009, p. 128). People who value the
1 2
3 4

9
enhancement of self (power and achievement) are therefore less likely to
consume frugally as frugality is about restraint not self-promotion (Pepper et al.
2009). Rose et al. (2010) and Lastovicka et al. (1999) state that frugality is
always negatively correlated with materialism; individuals who express high
levels of frugality tend to exhibit low levels of materialism regardless of
circumstance. The frugal are less subject to interpersonal influence and more
oriented toward long-term outcomes (Rose et al., 2010). These findings
(Pepper et al. 2009, Lastovicka et al. 1999, Rose et al., 2010) may only be
applicable to the developed world societies in which the research was
conducted. Developed countries have already gone through a consumer cycle
of materialism and it may be that people with low income do not harbour
ambitions for self-enhancement or that people who exhibit frugality constantly
place minimal importance to the pursuit of material goods. Alternatively, this
could be an indication of a general lack of understanding of low income
individuals and/or the psychology and sociology of frugality. Recent studies by
Martinez and Carbonell (2007), Ponchio and Aranha (2008), Barki and Parente
(2010), Van Kempen (2004) and Jacob and Smit (2010) on low income
consumer behaviour in emerging markets where there is a lot of social mobility
indicate that these consumers readily aspire to products that are considered the
domain of the middle class and are willing to purchase them; engaging in this
kind of activity is seen as a differentiator, showing other low income consumers
one’s improving social standing (Barki and Parente, 2010). Thus, frugality and
materialism exercised here could be motivated by self-enhancement values
(Figure 2) as individuals signal power and achievement to their peers. Low
income consumers may therefore penny-pinch (exhibit behaviour associated

10
with frugality) on certain products or occasions and voluntarily pay a premium
(exhibit behaviour associated with materialism) on others. The frugality
expressed may not be as rigid as that introduced by Lastovicka et al. (1999); it
may be fluid, changing depending on occasion or circumstance. Sawady and
Tescher (2008) observe that purchasing behaviours amongst the poor are not
always motivated by price; they are often based on whether the acquisition will
appease their sense of belonging to society.
2.3 MATERIALISM
Materialism speaks to the relationship that individuals have with material
possessions (Jacob and Smit, 2010). According to Ponchio and Aranha (2008),
the most common definitions for materialism within the context of consumer
behaviour were suggested by Belk (1984) and Richins and Dawson (1992).
Belk (1984) states that materialism is the importance we place on material
goods. Highly materialistic people see possessions as a benchmark for success
(Richins and Dawson, 1992); they believe that the number and quality of
possessions accumulated determines their value or standing in society (Jacob
and Smit, 2010). Individuals low in materialism generally choose to lead a
simple life with few material possessions. Belk (1984) and Richins and Dawson
(1992) developed scales to measure materialism levels. The Belk (1984)
materialism scale is based on personality traits such as possessiveness, non-
generosity and envy, thought to be closely related to materialism. Belk (1984)
however viewed materialism as unidimensional; in contrast, Richins and
Dawson (1990) argue that materialistic tendencies are more situational and
evolve with time. “Materialism is a multidimensional concept which includes not

11
only traits, but attitudinal, behavioural and value components as well” (Richins
and Dawson, 1990, p. 169). They suggested that materialism be viewed as an
attribute that changes with social condition and age; Richins and Dawson
(1992) proposed a material value scale (MVS) based on a) acquisition centrality
– materialists place possessions and their acquisition at the centre of their lives,
b) acquisition as the pursuit of happiness – materialists view possessions and
their acquisition as essential to their well-being in life, and c) possession
defined success – materialists judge their own and others’ success by the
possessions accumulated.
Early research on materialism was concentrated in developed nations. Jacob
and Smit (2010) report that in the 1990s researchers began to observe that
materialistic tendencies which arose in developed economies were being
emulated in the third world; “ultimately, the consistent finding was that
developing/less affluent economies were often more materialistic than
developed economies, clearly suggesting that materialistic values are pervasive
in developing economy environment” (Jacob and Smit, 2010, p. 15). Following
extensive testing, Richins (2004) introduced a 9-items MVS which has enjoyed
wide usage across cultural divides.
2.4 DISCRETIONARY THRIFT
The terms discretionary thrift, voluntary frugality and pragmatic spending are
used interchangeably in literature to describe consumers who have purposely
curbed their spending but are capable financially to revert to their past spending
patterns (“Understanding the post-recession consumer”, 2010). Discretionary

12
thrift is described as a developed world phenomenon brought about by the
global recession (Piercy et al., 2010). Once the recession ends, consumers are
expected to revert to previous spending habits. It is apparent that frugality
observed here is considered a choice (discretionary); affluent consumers
choose to pay a premium on certain products and save money on others. On
the other hand, thrift amongst the poor, especially in emerging markets, is
expected and obligatory for survival (Flatters and Willmott, 2009). Karnani
(2006) states that poor people spend 80% of their income on food, clothing and
fuel, as a result not much is left over for luxuries. Although Martinez and
Carbonell (2007) and Prahalad (2004) dispute this notion, low income is
frequently synonymous with necessary thrift. An example of this can be found in
an article by Garette and Karnani (2010). The researchers explain that 94% of
poor cellular phone users in Bangladesh reduce their cellular phone costs by
sending and receiving “missed calls” that is calling a number deliberately and
hanging up before the other person picks up the call. A missed call can be used
to send a pre-negotiated message such as “come and pick me up” or a
relational sign such as “I miss you” or a request for a call back. Depending on
the number of rings, different messages can be conveyed. Garette and Karnani
(2010) state that this practise is growing rapidly throughout the developing
world and is simply due to the fact that the poor have no money. The authors
do not consider that this practice could be borne out of voluntary frugality or a
myriad of other non-monetary factors. Garette and Karnani (2010) conclude
that the biggest difference between bottom of the income pyramid and affluent
markets is the obvious but under emphasised fact that the poor have very little
purchasing power (Garette and Karnani, 2010).

13
By contrast, Subrahmanyan and Gomez-Arias (2008) state that the poor often
seek items that may be considered luxury or non-essential. These purchases
could be infrequent or inspired by festivals, traditions or peer-pressure and are
often financed by reducing consumption of certain items, paying in instalments
or taking loans (Subrahmanyan and Gomez-Arias, 2008). Van Kempen (2004)
states that consumer activity for low income consumers is not only a matter
need but also one of embellishing social status. Status-minded consumers
overspend on goods that can be viewed in public space relative to those that
are not readily visible (Van Kempen, 2004). These observations lend credence
to the hypothesis that low income consumers, in emerging markets at least,
despite meagre resources, do exercise discretionary thrift. In line with the self-
enhancement value motive, the poor are subject to social influences and as a
result exercise varying degrees of materialism and frugality; there are certain
circumstances under which low income consumers intentionally exercise
restraint in order to pursue materialistic endeavours. The proceeding sections
offer further insights into the characteristics of low income consumer markets,
the spending behaviours observed, and the possible motivations for frugality
and materialism therein.
2.5 THE BOTTOM OF THE INCOME PYRAMID
The term Bottom of the Pyramid (BOP), used to describe the world’s poor, has
not been precisely defined. Several authors use different definitions. Martinez
and Carbonell (2007) define it as people who live on less than $2,000 per year,
considering purchasing power parity (PPP). Barki and Parente (2010) report

14
that most of the research and case studies at BOP consider a broader definition
that includes people living on less than $8 per day PPP or approximately
$3,000 per annum PPP. Prahalad (2009) classifies the world economically into
5 tiers (see Figure 3). Tiers 4 and 5 form the base of the pyramid and are said
to consist of more than 4 billion people globally that live on no more than
$1,500 per year (PPP). However, Karnani (2006) argues that the number of
people at BOP and their purchasing power is grossly overestimated. He quotes
other researchers in the field and asserts that there are in fact less than 2.7
billion people at BOP. Nonetheless, income is widely used to define BOP, after
all, it is a popular tool in group segmentation. The Gini index, which measures
the degree of income or wealth inequality in a given country, is based on
income levels (Barki and Parente, 2010). But is a monetary measure as
prescribed by Prahalad (2009) and others sufficient to adequately describe this
vast and geographically sparse group of people?
Figure 3: The Economic Pyramid. Source: Prahalad (2009, p.28).

15
Chipp and Corder (2009) provide an alternative view. They contend that BOP
consumers are usually dependent on the group and as such, identifying these
individuals by per capita income is possibly ineffective. Chipp and Corder
(2009) suggest that a household standard is a better measure and would
provide a far superior benchmark as it is free of monetary currency concerns
over time. South Africa has had “an empirically derived definition of all social
strata based on household variables since 1989; it is termed the Living
Standards Measure (LSM®) and it is widely used by marketing practitioners”
(Chipp and Corder 2009, p. 3). A short list of 7 questions has been developed
to help researchers and marketers identify the pyramid location of urban
dwellers. Table 2 and Figure 4 below depict the constituents of South Africa’s
income pyramid. Globally, the need for a non-monetary measure to classify low
income consumers is echoed by Amine and Smith (2009); they state that the
poor should not be described by a single demographic, low income. In reality,
this so-called segment includes people who are not all the same in terms of
living conditions, possessions and preference (Amine and Smith, 2009).

16
Table 1: The South African LSM®. Chipp and Corder (2009, p.18).
TOTAL
The South African Pyramid ‘000 %
Population (‘000) 31,305 100 The Apex of the Pyramid (Group A - LSM
®s 9
&10.) 4,463 14.3
The Buttress of the Pyramid (Group B - LSM
®s 7 & 8)
5,105 16.3
The Core of the Pyramid (Group C - LSM®s 5
& 6) 10,534 33.6
The Foundation of the Pyramid (Group F - LSM
®s 1-4)
11,194 35.8
Figure 4: South Africa’s population and income pyramid. Chipp and Corder (2009, p.18).
Foundation, 36
Core, 34
Buttress, 16
Apex, 14
0%
10%
20%
30%
40%
50%
60%
70%
80%
90%
100%
SA Pyramid

17
2.6 CONSUMER BEHAVIOUR AT BOP
Literature on BOP suggests that companies can serve the poor and make a
profit (Seelos and Mair, 2007). The BOP proposition can be summarised as
follows (Karnani, 2006):
• There is much untapped purchasing power at BOP. Private companies can
make significant profits by selling to the poor.
• By selling to the poor, private companies can bring prosperity to the poor,
and thus can help eradicate poverty.
• Large multinational companies should play the leading role in this process of
selling to the poor.
2.6.1 Common misconceptions of consumers at BOP
Discussions around strategies (Seelos and Mair, 2007), and risk and misfortune
(Karnani, 2006) in doing business at BOP have dominated academic literature
over the last 10 years. Barki and Parente (2010) state that there is a lack of
comprehensive studies that analyse differences in consumption behaviour at
BOP. Martinez and Carbonell (2007) call attention to the need for businesses to
learn how to do business with the poor as opposed to getting business from the
poor. Martinez and Carbonell (2007) highlight that the most common
misconceptions worldwide around low income consumers are (Martinez and
Carbonell, 2007):
• The poor have no money. This is misleading. Although each member of a
family may earn very little, the joint purchasing power of poor families and
communities is large.

18
• Spending by the poor is restricted to basic goods. On the contrary, the
poor buy luxury items such as televisions and radios.
• The poor only buy cheap things. Poor consumers often pay much higher
prices than middle class consumers for the same goods as they cannot
obtain bulk discounts.
These erroneous beliefs were largely exposed by Hamilton and Catterall (2005)
who conducted extensive research amongst the United Kingdom’s poor. Barki
and Parente (2010) report that low income segments everywhere only begun to
be considered as potentially profitable post 1998. Since then, it must be said,
marketers have made great strides towards ensuring that the poor are offered
products in the right form, in the right place and at the right time. However, this
is not always done as advised by marketing textbooks or BOP researchers.
Hamilton and Catterall (2005) state that the exchange relationship between
marketers and low income consumers in first world societies is sometimes
imbalanced in favour of the marketers. Working on the assumption that low
income consumers are a business risk, marketers do not pay sufficient
attention to them. As a result, low income consumers are often unable to
access the range of offerings available to more affluent individuals for reasons
other than a lack of affordability or desire to consume; indeed, the poor
frequently spend more to acquire goods and services through travel expenses
as these goods are not always available near low income communities
(Hamilton and Catterall, 2005). Anderson et al. (2010) report similar findings in
emerging markets of Nigeria and Kenya. Zain (Pty) LTD, Nigeria’s second
largest mobile network operator, conducted research in low income

19
communities to determine factors that affect mobile phone usage (Anderson et
al, 2010). They found that the poor were eager to use cellular technology and
services such as text messaging and picture messaging but uptake was
hampered not by lack of income, but by poor distribution of top-up vouchers,
unreliable network coverage, language barriers and inadequate understanding
of the company’s products and services (Anderson et al., 2010).
A long standing stereotype in developing and developed societies is that the
poor are lazy, criminal and responsible for their circumstances (Martinez and
Carbonell (2007), Hamilton and Catterall (2005)). However, there are many
reasons for poverty or transition into poverty (Figure 5) and not all of them are
due to individual characteristics. Macroeconomic factors such as recessions,
political factors such as corruption or poor governance and social barriers such
as education, language and attitudes, particularly in the third world, can all
accentuate poverty. The grand standing by Pepper et al. (2009) that the poor in
developed nations do not harbour self enhancement values may yet be another
misnomer. Hamilton and Catterall (2005) report that many low income
consumers adopt coping mechanisms to regulate emotional stress associated
with poverty; these include fantasising about a better future or reformulating
needs in ways that differ from social expectations (Hamilton and Catterall,
2005). Certainly, low income individuals are people too and express their needs
and wants in similar ways to more affluent consumers. In Brazil, BOP
individuals were found to demonstrate a high concern about maintaining their
self-respect and being treated with dignity (Barki and Parente, 2010); they were
found to frequent retailers that offered high quality customer service and

20
respect for patrons and shun those that offer “a shopping experience that
reminds them of their poverty status” (Barki and parente, 2010, p. 17). Rashid
and Rahman (2009) and Subrahmanyan and Gomez-Arias (2008) agree that
there is a need for a better grasp of and sensitivity towards the socio-economic
contexts of low income individuals. The supposition that discretionary thrift is a
first world phenomenon which only applies to affluent consumers in those
countries shows that further research is needed to gain a better awareness of
the long-term poor in developing and developed economies; this study
therefore has wide ranging implications as it seeks to add to the body of
knowledge on low income consumer behaviour.
Figure 5: Reasons for poverty (Hamilton and Catterall (2005, p.630)

21
2.6.2 Consumer motivations at BOP
What motivates consumer behaviour, and therefore the expression of frugality
and materialism amongst low income consumers? Flatters and Willmott (2009)
and Garette and Karnani (2010) suggest that frugal practices observed at BOP
are borne out of necessity. Low income consumers have to be frugal in order to
have sufficient funds to cover basic living expenses. Subrahmanyan and
Gomez-Arias (2008) examined low income consumer spending habits using
Maslow’s hierarchy of needs. According to Maslow, there are five core human
needs that are satisfied in a hierarchical manner (Sirgy, 1986). These are:
• physiological
• safety and security
• belonging
• self-esteem; and
• self-actualization
Maslow’s theory stipulates that unless lower order needs are satisfied (bare
necessities), higher-level needs remain dormant (Subrahmanyan and Gomez-
Arias, 2008). With the majority of BOP spend on food (Karnani, 2006), at first
glance, it may seem BOP motivations are to fulfil basic needs. However, as
indicated by Martinez and Carbonell (2007), BOP consumers purchase for
more than mere survival. In fact, the highest increase in BOP spend over the
last decade has been in the category of communications and technology, a
higher order need (Subrahmanyan and Gomez-Arias, 2008). A prime example
of this is the household expenditure for low income consumers in South Africa
(Table 2). After food, the next biggest category of expenditure is “other”. This

22
includes luxury items such as branded clothing, cellular phones and other
socially visible goods (Jacob and Smit, 2010).
Table 2: Household expenditure. Jacob and Smit (2010, p.17).
Household Expenditure
Sector South African (%)
Food 43.0 Housing 11.0 Water 1.3 Energy 6.4
Household goods 11.2 Health 1.4
Transportation 5.6 Information and communication
technology 1.8
Education 2.2 Other 16.1 Total 100
Hamilton and Catterall (2008) report that low income consumers counter
feelings of alienation from consumer culture by embracing actions that primarily
reduce financial disadvantage and social exclusion. This is a different and
perhaps more powerful argument against the ‘low achievement’ motivation
findings amongst developed world poor of Pepper et al. (2009). Frugal practices
such as maintaining a stringent budget, engaging in price comparisons, turning
to the alternative sector (buying second hand items), and using brands and
products in unexpected and creative ways are methods used to overcome the
financial disadvantage faced by low income consumers worldwide, helping to
ensure that limited resources are able to fulfil a wide variety of needs (Hamilton
and Catterall, 2008). Thus, without devaluing the importance of satisfying lower

23
order needs, it seems mere survival is not always the driving force behind frugal
behaviour at BOP.
Another way that poor consumers reduce their financial disadvantage is
through social capital. Social capital refers to the norms and networks that
enable people to act collectively; networks such as a person’s family, friends
and associates are an important asset and can be called on in a crisis
(Subrahmanyan and Gomez-Arias, 2008). In India, communities with diverse
stock of social capital are considered to be in a stronger position to confront
poverty; individuals can rely on an extended kinship for both material and non-
material support (Subrahmanyan and Gomez-Arias, 2008). Aggregated funds
obtained from this social support system (household or communal income) give
BOP consumers the opportunity to purchase goods that may not otherwise be
within their financial reach.
There is school of thought from the developed world that suggests that low
income consumers often confine their purchases of both food and non-foods to
outlets within their neighbourhoods. This so-called confined buying behaviour
occurs when a group of consumers does not spread its purchases evenly
among available stores and instead, concentrates purchases among a subset
of the stores (Goldman, 1978). Although Hamilton and Catterall (2005) assert
that low spatial mobility is largely responsible for confined consumption,
Goldman (1978) advises that the allure of credit may also constrain low income
consumers to certain stores. In other words, confined consumption is the
consequence of a desire to consume. Evidence of this in emerging markets can
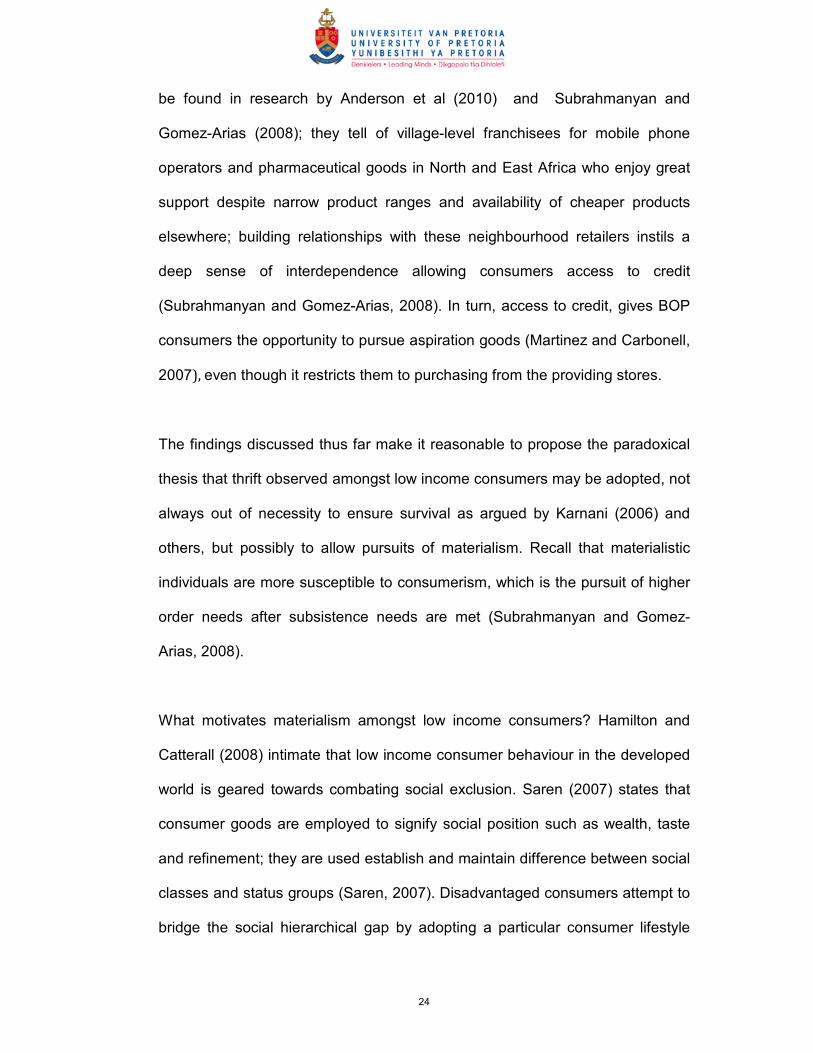
24
be found in research by Anderson et al (2010) and Subrahmanyan and
Gomez-Arias (2008); they tell of village-level franchisees for mobile phone
operators and pharmaceutical goods in North and East Africa who enjoy great
support despite narrow product ranges and availability of cheaper products
elsewhere; building relationships with these neighbourhood retailers instils a
deep sense of interdependence allowing consumers access to credit
(Subrahmanyan and Gomez-Arias, 2008). In turn, access to credit, gives BOP
consumers the opportunity to pursue aspiration goods (Martinez and Carbonell,
2007), even though it restricts them to purchasing from the providing stores.
The findings discussed thus far make it reasonable to propose the paradoxical
thesis that thrift observed amongst low income consumers may be adopted, not
always out of necessity to ensure survival as argued by Karnani (2006) and
others, but possibly to allow pursuits of materialism. Recall that materialistic
individuals are more susceptible to consumerism, which is the pursuit of higher
order needs after subsistence needs are met (Subrahmanyan and Gomez-
Arias, 2008).
What motivates materialism amongst low income consumers? Hamilton and
Catterall (2008) intimate that low income consumer behaviour in the developed
world is geared towards combating social exclusion. Saren (2007) states that
consumer goods are employed to signify social position such as wealth, taste
and refinement; they are used establish and maintain difference between social
classes and status groups (Saren, 2007). Disadvantaged consumers attempt to
bridge the social hierarchical gap by adopting a particular consumer lifestyle

25
and constructing a ‘better’ image of self through the products and services
associated with more affluent groups (Saren, 2007). At the same time, low
income consumers also engage in downward comparisons. Hamilton and
Catterall (2006) state that downward comparisons are another way of
enhancing self-identity. The knowledge that there are people in more severe
financial difficulties and that there are others that are further down the income
ladder reduces dissatisfaction with their own situations (Hamilton and Catterall,
2006). Although Saren (2007) Hamilton and Catterall (2006) operated in the
developed world, comparable observations have been reported in emerging
markets. Barki and Parente (2010) report the results of a study conducted by
Van Kempen (2004) that showed that a substantial proportion of the urban poor
in developing countries are willing to pay a premium for designer branded
clothing. They claimed that there are two main reasons for this (Barki and
Parente, 2010):
• Designer labels are a symbol of status and integration in society. They help
combat social exclusion by helping the poor portray an image that minimises
visible signs of social difference from loftier classes.
• As per Hamilton and Catterall (2006), for downward comparison purposes, it
is a kind of differentiation from extremely poor people, who cannot afford
these products.
Van Kempen (2004) however states that it is not known whether social identity
for the developing country poor is ultimately gained by differentiating oneself
from other poor people through the consumption of expensive status symbols
or by integrating with the non-poor through signalling a modern middle-class

26
lifestyle. Recently, marketers have sought to profit from this need for social
inclusion; advertising for products and services directed at the upper class
consumer stress the idea of ‘exclusivity’ and ‘differentiation’ from the middle
class masses; marketing communications to the low income class highlight the
idea of ‘inclusivity’ - that is, suggesting an access to a ‘middle class’ standard of
living (Barki and Parente, 2010).
Closely linked to the concept of social inclusion, is compensatory consumption.
According to this concept, individuals who cannot fulfil their primary needs,
especially regarding self-esteem or self-actualization, compensate for its lack
by the purchase of material status symbols (Subrahmanyan and Gomez-Arias,
2008). This phenomenon has been observed in first and third world societies.
Hamilton (2009, p.543) reports that there are low income consumers in the
United Kingdom whose financial resources result in them being unable to
obtain goods and services for an “adequate” and “socially acceptable” standard
of living. Excluded from consumer culture, low income consumers become
socially and materially deprived which ultimately provokes stigmatisation. To
combat this stigma, low income consumers disguise or mask poverty. Hamilton
(2009, p.549) discusses “brand simulation” strategies where low income
consumers disguise their favoured top brand with a more economically
acceptable alternative, such as a generic. The generic brand is reworked and
passed off as the genuine article; a common example involves refilling the
packaging of an expensive brand with a low price generic (Hamilton, 2009).
These products are then prominently displayed in the household fulfilling
materialistic leanings that cannot be satisfied due to a lack of income. Van

27
Kempen (2007) reports of low income households in Bolivia who spend their
hard earned income on socially visible goods and who also use their creativity
to create the illusion that they are better off than they really are. He notes that
one can only gain social position if consumption is externally verifiable (Van
Kempen, 2007); the status-intensity of a product thus increases with its degree
of social visibility.
Status signalling may therefore engender materialism among low income
consumers. Compensatory consumers are expected to pay more (act in a
materialistic manner) for socially visible goods such as cosmetics, clothing, cars
or food items that have prestigious brand names and act frugal with respect to
goods with low social visibility (discretionary thrift). Van Kempen (2007) found
that compensatory consumers also tend to replace socially visible goods
(durables) relatively quickly for newer high-end models.
Another possible motive for materialism displayed by low income consumers is
the need to minimise functional risk (Van Kempen, 2004). Barki and Parente
(2010) state that poor people tend to be more loyal to branded products
because they cannot afford to make mistakes. A brand name serves as an
extrinsic cue that positively affects consumers’ perception of product quality
(Van Kempen, 2004). If a product does not deliver the expected value, poor
consumers may not be able to buy another new product. The financial risk is
simply too high and the poor may have to use the defective product until the
end. Rimell (2008) showed that low income consumers have great affinity for
products that may be considered beyond their monetary reach. Store brands

28
aimed at the poor are often viewed with suspicion (Rimell, 2008). So, buying
aspiration brands is rational as it assures that expected performance is
delivered. Frugality and materialism observed here may be discretionary; poor
consumers may be extremely materialistic towards goods with a high functional
risk. Rimell (2008) reports of low income households who pay a considerable
premium for a particular detergent brand because, compared to cheaper
brands, it is more effective at removing stains and does not damage clothes
with repeated use. As a result clothes are cleaner and last longer. These same
consumers however may be frugal towards goods with low functional risk; they
may save money for instance by buying brown sugar instead of more expensive
white sugar.
In summary, it is undoubted that the poor have a limited budget. The frugal
behaviour exhibited at times may be purposefully chosen as it allows the poor
consumers to gather enough resources to purchase goods that may be
regarded as luxury items for the middle or upper class. This apparent
materialism may be motivated by the need to overcome social costs or
functional risk and does not particularly indicate ‘necessary’ thrift to ensure
survival. In fact, it suggests the opposite; that is, there are factors which may
influence low income consumers to spend rather than save. For this reason, a
study on discretionary thrift amongst low income earners is all the more
relevant; the question remains, what guides choice?

29
2.7 FACTORS THAT MAY INFLUENCE DISCRETIONARY THRIFT AT BOP
Having established reasons that may motivate frugality and materialism
amongst low income consumers, it is important to consider external factors that
may accentuate the expression of frugality or materialism. As postulated,
frugality may not be one-dimensional as defined by Lastovicka et al., 1999; like
materialism, it may be multi-dimensional. One-dimensional constructs are
relatively unchanged over time and are relatively impervious to environmental
stimuli; discretionary thrift on the other hand implies that consumers are frugal
in certain circumstances and willing to pay a premium in others. There may be
certain types of products or brands for which thrift or materialism is more
prominent. Observations by Barki and Parente (2010), Van Kempen (2004) and
Subrahmanyan and Gomez-Arias (2008) show that BOP consumers in
developing countries are prepared to pay a premium for certain products, not
because they are perceived as being of higher quality but for symbolic reasons.
Van Kempen (2004) states that subjects who are unable to gain status because
of their poor background place great emphasis on owning designer brands.
This compensatory spending makes up for one’s low status in society
(Subrahmanyan and Gomez-Arias (2008)). As reported, compensatory
consumers are expected to pay more for socially visible goods that have
prestigious brand names. Low income consumers are therefore expected to
exhibit materialistic tendencies when considering these goods. Accordingly,
there are other variables that may affect frugality or materialism expressed by
low income consumers towards products or brands. These are:
• Level of income.
• Age of low income consumer.

30
• Level of education of low income consumer.
• Relative deprivation.
2.7.1 Level of Income
Gross income is widely used as a dependent variable in research on
materialism. Van Kempen (2004) reports that there is a threshold level of
income below which individuals can hardly afford to spend resources on
symbolic products. Those who earn an income above this level, although still
poor, have the opportunity to distinguish themselves from the poorer group by
consuming aspiration products (Van Kempen, 2004). However, research by
Ponchio and Aranha (2008) disputes this finding. The authors conducted a
study to determine if there was a relationship between materialism and level of
income (gross income from work, pension or social security programs) in poor
communities of Sao Paulo. Ponchio and Aranha (2008) found that there is no
association between income level amongst the poor and materialism. With
respect to frugality, Pepper et al (2008) state that income is a strong predictor
for frugal tendencies. The lower the income, the more likely an individual will
exhibit frugal behaviour. Further investigation is therefore required to determine
the impact of gross income levels on the propensity to spend on certain
products or brands in low income societies. This notwithstanding, disposable
income may be a more suitable variable in measuring frugality and materialism
as gross income does not take into account an individual’s level of
indebtedness. There may be low income earners that have the same or more
disposable income as middle income earners. Therefore the frugality or

31
materialism expressed may be better correlated to disposable income than
gross income. Further, measuring the impact of disposable income on frugality
and materialism has wider implications as the results can be extrapolated
beyond BOP.
2.7.2 Age
Life stage is an important factor that has to be taken into account when
observing consumption choices (Salm, 2010). Ponchio and Aranha (2008)
report that the level of materialism exhibited by low income consumers is
affected by age. In various studies listed by the authors, older consumers
(consumers over 50 years old) consistently showed the lowest levels of
materialism (Ponchio and Aranha, 2008). It may be that these consumers have
little interest in socially visible consumption or that younger consumers have a
higher compensatory urge for material goods (Van Kempen, 2007). It may also
be that older consumers are more collectivist and less influenced by peer
pressure or the media and its desire creation activity. Indeed, Rimmell (2008)
writes of young (under 30 years old) BOP consumers who put great emphasis
on appearance; they are compelled to spend money on aspiration brands in
order to look and feel good (Rimmell, 2008). Van Kempen (2007) argues that
age has a negative relationship with the consumption of socially visible durable
goods. According to developmental psychology, older consumers are more
aware of their mortality and tend to divest goods rather than invest in them.
Older members of society are also likely to have acquired their durables earlier
in time than their younger cohorts and therefore do not have the same desire to
consume (Van Kempen, 2007).

32
2.7.3 Level of Education
According to Van Kempen (2004), the more formal schooling a low income
consumer has received, the lower the premium he or she places on aspiration
brands. Van Kempen (2004) describes this as unexpected since schools in
developing countries are often an important institution through which modern
middle class values are instilled. Designer clothing and other aspiration goods
are a symbolic expression of the middle class; as such, one would expect the
willingness to buy these goods increase with an increase in levels of education
(Van Kempen, 2004). In line with the compensatory consumption hypothesis
described by Subrahmanyan and Gomez-Arias (2008), Van Kempen (2004)
found that respondents with an intermediate level of education (secondary
school) showed a slight tendency to pay a premium for aspiration brands than
cohorts with high level of education (tertiary education); unambiguous support
for the hypothesis was found in low education groups (no formal education
beyond primary schooling) where these individuals showed a strong propensity
to pay a premium for symbolic goods than their more educated counterparts
(Van Kempen, 2004). It stands to reason that this correlation between status-
seeking behaviour and education level could be identical to that between
incidents of discretionary thrift and levels of income. Stated differently,
individuals with low levels of education could be expected to be more frugal in
their purchases of certain items in order for them to afford the premium required
for aspiration goods. Manzi (2007) states that, in developing countries,
autonomy is largely dependent on education levels. The most obvious
implication of low education attainment is the persistence of low income earning

33
capability, which results in material deprivation (Manzi, 2007) and may in turn
spur the need for compensatory consumption.
2.7.4 Relative Deprivation
Relative deprivation is a theoretical concept that has been used to analyse
contexts of perceived injustice and inequality (Manzi, 2007). Social psychology
states that people do not suffer in an absolute way; rather they compare their
lot with that of others (Lopéz Turley, 2002 in Manzi , 2007 ). A person will feel
relatively deprived if (1) he or she lacks an object, (2) desires it, (3) sees some
other person(s) with it and (4) thinks it is feasible to obtain that object (Lopéz
Turley, 2002 in Manzi, 2007). Relative deprivation is a universal concept and
may be brought about by past events. Lopéz Turley (2002) in Manzi (2007)
states that relatively deprived people often exhibit a sense of entitlement; they
feel that they deserve the circumstances that have been denied to them but
granted to others.
South Africa, a vibrant emerging market economy with high social mobility, has
a recent tragic political history that presents the sort of environment that may
encourage relative deprivation amongst groups of people who were previously
denied opportunities, heightening their expression of materialism and possibly
frugality. A study conducted by Manzi (2007) found that relative deprivation
exists amongst newly affluent black South Africans. It is generally accepted that
consumer behaviour is heavily influenced by reference groups; a reference
group is “any person or group that serves as a point of comparison or reference
for an individual consumer” (Jacob and Smit 2010, p. 16). Manzi (2007, p. 112)

34
reports that the relative deprivation felt by socially mobile blacks is “egoistic” in
nature as individuals continuously compare their material possessions to those
in their business and social networks. Affluent black South Africans tend to
pursue extravagant lifestyles as they attempt acquire things that were denied to
them with the aim of “catching up” to those more prosperous inside and outside
their race group (Manzi, 2007). This notion of non-racial reference groups is
disputed by Jacob and Smit (2010) who state that the role models for the
majority of black Africans have changed from white or western men to the new
black elite – politicians, entertainers, entrepreneurs and young black
professionals. Nonetheless, even as black South Africans are making the
transition from poor to middle class in impressive numbers, the vast majority
remain poor; the education they were deprived of during apartheid may mean
they cannot take advantage of opportunities in the new South Africa. Therefore
how does the consumerism of black socio-economic climbers, fuelled by
relative deprivation, affect those low income consumers who are not in a
position to take advantage of newly availed opportunities? Simply put, by virtue
of being role models, the materialism of newly affluent blacks will shape the
desires, aspirations and behaviours at BOP and may cause an increase in
status signalling. The poor may express frugality when considering certain
items in order to overcome financial disadvantage, helping them ensure that
limited resources are sufficient to acquire goods that bestow social reverence.
Similar observations may be encountered in other parts of the globe where
relative deprivation is prevalent.

35
2.8 CONCLUSION ON LITERATURE REVIEW
Academic literature presents frugality as one-dimensional. Low income is
described as a strong predictor for frugality. It is stated that the frugal tend to be
less materialistic, less aspirational, less subject to interpersonal influence, and
more oriented toward long-term outcomes. These findings however, may only
be applicable to the developed world societies where early research on frugality
was conducted; these developed countries have already gone through a cycle
of consumerism and frugality may truly be associated with low income
individuals and people with low materialistic and aspirational leanings (for
example voluntary simplicity). Alternatively there may be a general lack of
understanding of the long term poor or the nature of frugality; the status
signalling behaviour adopted to combat feelings of social exclusion in these
settings implies that the developed world poor may yet harbour strong
materialistic and self-enhancement tendencies.
There are several researchers who claim that frugality in low income
communities in emerging markets is borne out of necessity for survival.
However, this may also be as a result of a poor understanding of low income
consumers. These settings are still gripped in a cycle of materialism and there
is great desire and opportunity for social mobility. Consumer behaviour
observed amongst the poor here is heavily influences by status signalling.
Frugality expressed may not be to ensure survival; it may be at the discretion of
the consumer, to ensure sufficient funds are available for materialistic pursuits
(purchasing of socially visible goods). Hence, the one-dimensional views of
frugality may not apply here either. There may be circumstances in which the
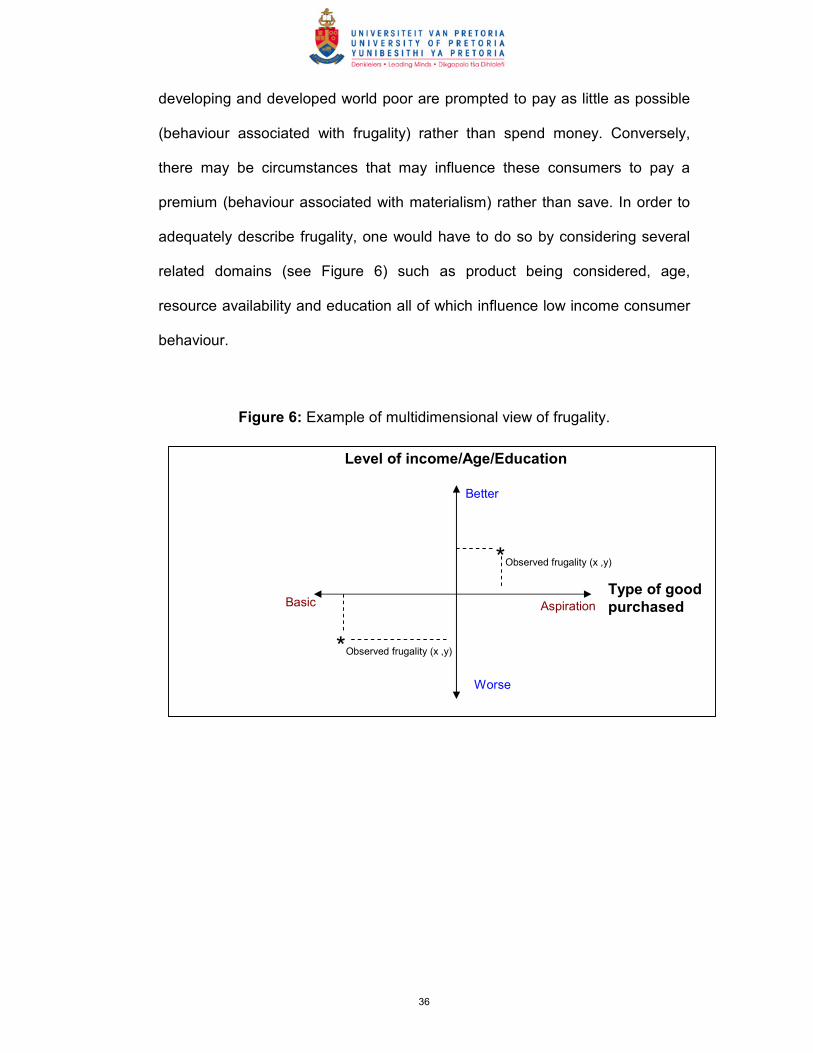
36
developing and developed world poor are prompted to pay as little as possible
(behaviour associated with frugality) rather than spend money. Conversely,
there may be circumstances that may influence these consumers to pay a
premium (behaviour associated with materialism) rather than save. In order to
adequately describe frugality, one would have to do so by considering several
related domains (see Figure 6) such as product being considered, age,
resource availability and education all of which influence low income consumer
behaviour.
Figure 6: Example of multidimensional view of frugality.
Aspiration Basic
Better
Worse
Level of income/Age/Education
Type of good
purchased
*Observed frugality (x ,y)
*Observed frugality (x ,y)

37
3.0 STATEMENT OF RESEARCH PROPOSITION
The preceding chapter has shown that, like materialism, frugality may be
multidimensional; its expression may be influenced by socio-economic
circumstances. Discretionary thrift is a term commonly associated with affluent
consumers in developed countries. These consumers, we learn, moderate their
spending depending on circumstance. They are willing to pay a premium on
certain items (behaviour consistent with materialism) or withhold spending on
others (behaviour consistent with frugality). Low income consumers on the
other hand are expected to be prudent to ensure survival; they are reluctant
spenders regardless of product or occasion.
This research intends to investigate discretionary thrift amongst low income
consumers in South Africa. The research also seeks to describe factors that
may influence the discretionary thrift expressed by low income consumers. The
propositions that will be addressed are:
1. Proposition 1: There is discretionary thrift at bottom of the income pyramid.
Low income consumers exhibit frugality or materialism depending on
product being considered.
• Frugality - There are certain products with which low income
consumers intentionally exercise restraint in order to use money for
other purposes.
• Materialism - Low income consumers intentionally save money on
certain products in order to pay the required premium on others.

38
2. Proposition 2: Discretionary thrift may be affected by an individual’s
income level (gross income and/or disposable income) at the bottom of the
pyramid.
• Frugality expressed with respect to a particular product is affected by
an individual’s income level at the bottom of the pyramid.
• Materialism expressed with respect to a particular product is affected
by an individual’s income level at the bottom of the pyramid.
3. Proposition 3: Discretionary thrift may be affected by an individual’s age.
• Frugality expressed with respect to a particular product is affected by
an individual’s age at the bottom of the pyramid.
• Materialism expressed with respect to a particular product is affected
by an individual’s age at the bottom of the pyramid.
4. Proposition 4: Discretionary thrift may be affected by an individual’s level of
education.
• Frugality expressed with respect to a particular product is affected by
level of education at the bottom of the pyramid.
• Materialism expressed with respect to a particular product is affected
by level of education at the bottom of the pyramid.

39
4.0 METHODOLOGY
4.1 INTRODUCTION
This chapter presents the methodology employed to study discretionary thrift at
the bottom of South Africa’s income pyramid. With the theoretical basis
(Chapter 2) and objectives (Chapter 3) of this research established, the
methods of data collection and analysis are discussed and possible limitations
of the approach are highlighted.
4.2 RESEARCH DESIGN
This research took the form of a descriptive, quantitative design. Blumberg et
al. (2008) states that descriptive studies try to provide an answer to questions
like who, what, when, where and sometimes, how. In descriptive studies, the
reasearcher attempts to describe, or define a subject often by creating a profile
of a group of problems, people or events. Descriptive studies however cannot
explain why an event has occurred or why variables interact the way that they
do (Blumberg et al, 2008). Quantitative studies rely on quantitative information
to study a phenomenon (Blumberg et al, 2008).
This study did not attempt to explain why BOP consumers exhibit the behaviour
that they do. Its aim was to describe, using structured quantitative information,
discretionary thrift at BOP. The research instrument for the study was a survey.
Zikmund (2003) defines surveys as research conducted by gathering
information from a sample of people by use of a questionnaire or interview.

40
Summated rating attitudinal scales (Likert) were used to gather information
from BOP consumers. The Likert scale was chosen as it is the most frequently
used variation of the summated rating scale and can be used to measure
attitudes (Blumberg et al., 2008). The Likert scale contains statements that
express either a favourable or unfavourable attitude towards an object of
interest (Blumberg et al., 2008).
4.3 POPULATION AND SAMPLING
The population of relevance for this study was South Africans in the LSM® 1-4
range as per BOP definition by Chipp and Corder (2009). This is in contrast to
Jacob and Smit (2010) who defined the population of relevance for their
research into materialism amongst South Africa’s low income consumers as
individuals earning less than R7, 000 per month.
The sample for this study was obtained from Motsoaledi squatter camp, an
informal settlement in Soweto, Johannesburg. The squatter camp is
characterised by makeshift housing or shacks furnished from wood, cardboard
and scrap metal; some of the shacks are electrified, however, there is minimal
indoor plumbing or sewage piping. The sample was a convenience sample,
based on access to individuals in LSM® 1-4. Probability sampling was not used
as it requires a controlled procedure to ensure that each population element is
given a known non-zero chance of selection (Blumberg et al, 2008). The unit of
analysis was spending behaviour of the individual at BOP. Similar to the study
by Jacob and Smit (2010), a sample size of 120 respondents was calculated to

41
provide estimates of materialism and frugality at a precision of 0.25 and at a
95% confidence level.
4.4 SURVEY QUESTIONNAIRE
This study required that only individuals within a relevant population group be
surveyed. As such, respondents were required to supply information which was
measured against metrics from SAARF’s Living Standard Measure (Table 3,
Chipp and Corder (2010)).
Table 3: Short form LSM questionnaire and scoring matrix. Chipp and Corder (2010).
ATTRIBUTE/ QUESTION YES NO
Have hot running water in home 10 0
Have a working microwave oven 10 0
Have a flush toilet in home or on plot 10 0
Have a working vacuum cleaner or floor polisher 10 0
Have a working computer/laptop in home 10 0
Have a working electric stove in home* 10 0
Have 1 or more working motor vehicles in home 10 0
Totals of each column
TOTAL SCORE

42
Having established that individuals were in the LSM® 1-4 group (total score less
than or equal to 10 in Table 3), respondents were asked to identify from a list of
aspiration, conventional and low cost brands and products (Figure 7) those
items for which they put money aside in order to afford. In relation to these
products/brands, they were asked to identify the one they valued the most; a
blank line was provided and their level of materialism relating to this product
was then determined.
LSM 1 – 4 Less than 0 -10 BOP/FOUNDATION
LSM 5 – 6: Core 11 30 CORE
LSM 7 – 8: Buttress 31 50 BUTTRESS
LSM 9 – 10: Apex 51 + APEX
*A hot plate was not considered an electric stove.

43
Figure 7: Products and brands presented to survey respondents.
To measure materialism, the study used a version of Richins (2004) 9-item
shortened materials value scale (MVS) employed by Ponchio and Aranha
(2008) and Jacobs and Smit (2010) in their research on materialism at BOP. In
reliability tests, these studies yielded Cronbach’s alphas of 0.73 and 0.82
respectively. Similar to the above research, nine statements corresponding to
the 9-item MVS were listed in the questionnaire (Table 4), with each statement
needing to be ranked on a 5 point scale ranging from 1 = “I strongly disagree”
to 5 = “I strongly agree”. Where required, the statements were adapted to
context and product set (see upper case text in Table 4).

44
Table 4: MVS adapted from Ponchio and Aranha (2008), Jacobs and Smit (2010).
To determine frugality, respondents were asked to identify from the said list of
49 brands and products those items they routinely and intentionally buy in order
to save money for other purposes. In relation to these products/brands, they
were asked to identify the one they usually buy when they are saving money; a
blank line was provided and their level of frugality with respect to this product
was then determined using the 8-item frugality scale developed by Lastovicka
et al. (1999). In reliability testing, Lastovicka et al. (1999) reported a Cronbach’s
alpha of 0.80 for their 6-point Likert scale (6 = “I strongly agree”, 1 = “I strongly
disagree”). To avoid confusion and maintain consistency throughout the
questionnaire, a decision was made in this study to use a 5-point Likert scale;
respondents were asked to rank each statement on a 5 point scale ranging
from 1 = “I strongly disagree” to 5 = “I strongly agree” (Table 5). Frugality
questions from Lastovicka et al. (1999) were adapted to context and product
set (see upper case text in Table 5).

45
Table 5: Frugality Scale adapted from Lastovicka et al. (1999).
To evaluate whether the discretionary thrift exhibited at BOP is affected by age,
education or income, respondents were asked to list basic demographic
information such as age, education and monthly income (gross and
disposable). A copy of the questionnaire used in the research is provided the
Appendix.
4.5 DATA COLLECTION
A third party was hired to administer the survey; where necessary, assistance
was provided to respondents in completing the survey. Language and level of
education of the target audience was carefully considered in designing the
survey questionnaire. To this end, the questionnaire was pretested with a group
of LSM® 1-4 individuals before it was finalised. The purpose of the pretesting
was to ensure that the instructions were easy to understand and that the scales
and statements were clear and unambiguous.

46
4.6 DATA ANALYSIS
Brands and products listed by respondents in the survey with respect to
frugality and materialism were arranged into 6 categories. These 6 categories
(Table 6) are in line with those defined by Rimmell (2008) in her research on
brand relationships at BOP. Frequency tables were then plotted and categories
which featured most with respect to frugality and materialism were noted for
further discussion.
Table 6: BOP brand categories (Rimmell, 2008).
Brand Categories
Fast Moving Consumer
Goods
Discount Clothing
Chains
Telecommunications
Restaurant Chains Premium Branded
Clothing
Supermarket Chains
As an initial analysis of the materialism and frugality scale responses, the
measured response to each construct were analysed using the basic
descriptive statistics of range, median, mean and standard deviation. Similar to
other research conducted with these scales (Ponchio and Aranha (2008),
Jacobs and Smit (2010) and Lastovicka et al. (1999)) Cronbach’s alpha tests
were performed to determine reliability. In line with the research propositions,
mean frugality and materialism scores of participants sampled were subjected
to the ANOVA test to see if they vary in a statistically significant manner with
changes to age, income level or education.

47
4.8 LIMITATIONS OF RESEARCH DESIGN
The researcher is aware that there are various limitations that apply to this
research. This study follows a descriptive design and therefore cannot explain
why an event has occurred or why variables interact the way that they do. A
non-probability sample is used in this study; this sample does not give a true
cross-section representation of the population, and as a result, the attitudes
expressed may not reflect the entire population (Blumberg et. al., 2008).
Consequently, results from this study cannot be generalised to all BOP
consumers. Further, frugality and materialism may be viewed as socially
sensitive subjects by respondents and some may be tempted to to self-report in
a socially desirable manner introducing bias into the study (Lastovicka et al.
(1999)). Sources of error commonly associated with survey-type research may
also introduce bias to this study. These may include (Blumberg et. al., 2008):
• Leniency – This occurs when a participant is either ‘an easy rater’ or a ‘hard
rater’. The extreme ratings given may distort the findings of the study.
• Central tendency – Participants may not understand the object being rated
and consistently may give ‘neutral’ ratings.
Finally, the constructs used to measure frugality and materialism in other
research (Lastovicka et al. (1999), Ponchio and Aranha (2008), Jacobs and
Smit (2010)) have been adapted for this study. Thus, there is scope for
researcher error, including possible issues of criterion and construct error.

48
5.0 RESULTS
5.1 INTRODUCTION
This section presents a descriptive analysis of the sample used in the study.
The results of the questionnaire responses received are summarised and
tested against the propositions put forward in Chapter 3 to demonstrate
whether discretionary thrift exists at BOP and to determine whether it is
influenced by income, age and education.
5.2 DEMOGRAPHICS OF RESPONDENTS
The response sample initially consisted of 162 individuals. However, only 154
respondents were found to be in the LSM® 1-4 group; this is well above the
suitable sample size of 120 respondents required for this study. Of the 154
respondents, 26 did not list their monthly disposable income. Therefore, all later
analysis concerning disposable income will be performed on a sample
consisting of 128 respondents.
A few respondents in the survey answered ‘yes’ to the question in the LSM®
questionnaire pertaining to ownership of an electric stove (Table 3). These
respondents in fact own hot plates; hot plates were not considered stove
equivalents and these responses were not considered in the LSM® group
calculation.
The majority of respondents to this study were male (57%). This is inconsistent
with the gender split of low income consumers in South Africa which is reported

49
as 51% female and 49% male (Jacob and Smit, 2010). The respondents were
mostly above the age of 35 years old (62%) and were without a high school
qualification (60%); all the respondents in the survey earned a gross monthly
income less than R4000. Of the 128 respondents who volunteered their
disposable income, the majority (44%) had a disposable income less than
R3000 per month. The demographic composition of individuals surveyed is
summarised in Table 7.
Table 7: Demographic composition of respondents
Age Frequency %
Between 20 and 34 59 38
Older than 35 95 62
Gender
Male 88 57
Female 66 43
Education
No Matric 94 61
Completed Matric 56 37
Other 4 2
Gross Income
R100 – R1000 37 24
More than R1001 117 76
Disposable Income
R100 to R500 33 26
R501 to R1000 39 30
More than R1001 but
less than R2500
56 44
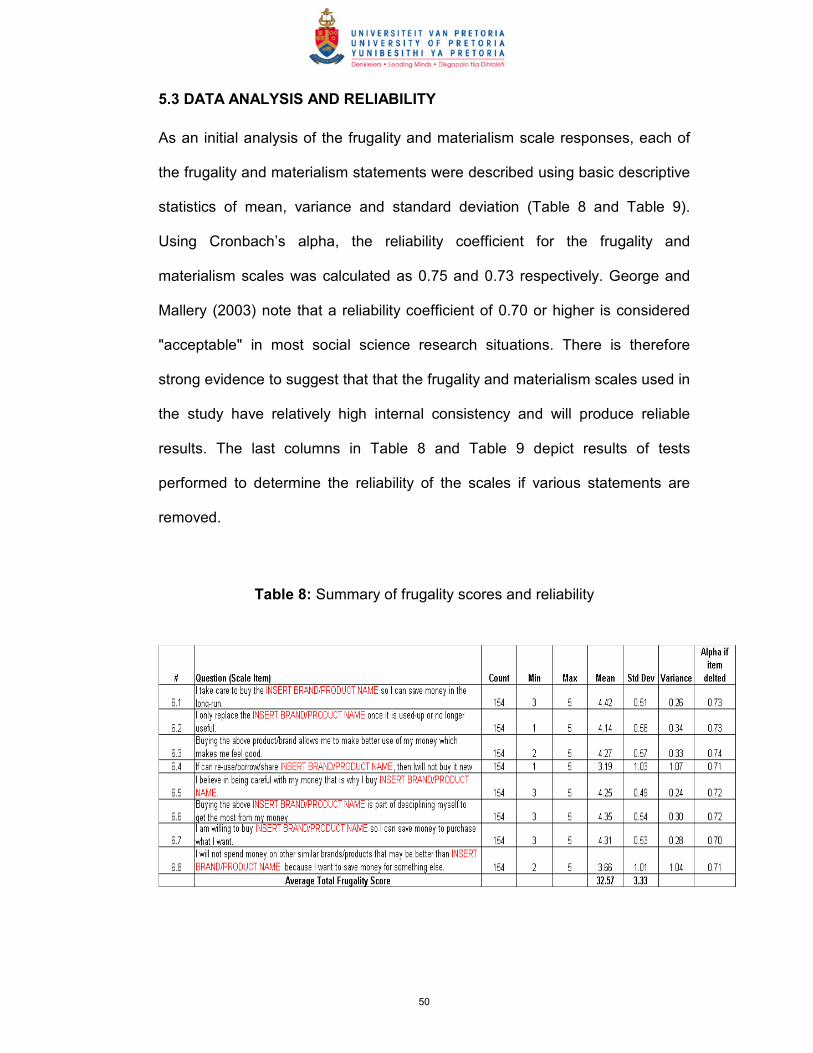
50
5.3 DATA ANALYSIS AND RELIABILITY
As an initial analysis of the frugality and materialism scale responses, each of
the frugality and materialism statements were described using basic descriptive
statistics of mean, variance and standard deviation (Table 8 and Table 9).
Using Cronbach’s alpha, the reliability coefficient for the frugality and
materialism scales was calculated as 0.75 and 0.73 respectively. George and
Mallery (2003) note that a reliability coefficient of 0.70 or higher is considered
"acceptable" in most social science research situations. There is therefore
strong evidence to suggest that that the frugality and materialism scales used in
the study have relatively high internal consistency and will produce reliable
results. The last columns in Table 8 and Table 9 depict results of tests
performed to determine the reliability of the scales if various statements are
removed.
Table 8: Summary of frugality scores and reliability

51
Table 9: Summary of materialism scores and reliability
Based on the results presented in Table 8, the following observations regarding
mean frugality scores and standard deviations are made:
• All statements in the frugality scale achieved a mean score greater than 3.
Respondents therefore tended to agree with the statements made and
displayed strong characteristics associated with frugality when regarding
certain brands/products.
• The lowest scoring statement was item 6.4. This may be because not all the
products/brands in the survey can be re-used/shared/borrowed. This was
important when it came to product set choice.
• Statement 6.1 had the highest mean score indicating the strong desire for
low income individuals to save money when making their purchases.
• The highest standard deviation was recorded for item 6.4. Again, this may
be because the products/brands identified in the survey cannot all be re-
used/shared/borrowed.

52
• Statement 6.5 had the lowest standard deviation, suggesting that
respondents consistently agreed with this statement.
• Analysis of the Cronbach’s alphas in the frugality questionnaire shows that
the inclusion of all 8 items improved the reliability of the survey.
Based on the results presented in Table 9, the following observations regarding
mean materialism scores and standard deviations are made:
• All statements in the materialism scale achieved a mean score greater than
3. Respondents therefore tended to agree with the statements made and
displayed strong characteristics associated with materialism when regarding
certain brands/products.
• The lowest scoring statement was item 8.7. This was the only question on
the MVS that was not directed at the selected product/brand. Examination of
the variation caused by exclusion of this item shows the highest Cronbach’s
alpha (0.77). Therefore the scale would have been more reliable had this
statement not been included. Perhaps the open-ended nature of the
question made it difficult for respondents to accurately put their sentiments
on a scale and they defaulted to neutral or lower ratings.
• Statement 8.4 had the highest mean score. This indicates that respondents
particularly enjoy spending money on their chosen product/brand.
• The statement with the widest ranging views (highest standard deviation)
was item 8.7, again perhaps due to its non-specific nature.
• Statement 8.8 had the lowest standard deviation, suggesting that
respondents consistently agreed that being in a position to afford a certain
brand or product brought them a strong measure of happiness.

53
Table 10 shows the summated mean scores for each of the MVS subscales.
The subscales are aligned to Richins and Dawson’s (1992) value motivations
for materialistic behaviour, namely – possession defined success, acquisition
centrality and acquisition as the pursuit of happiness. Ranked from lowest to
highest score, the table shows success to be the least important materialistic
value for this sample. Using a t-test, it is possible to conclude that that the
difference between the means of the materialism subscale scores are not
significant at the 5% level. Low income consumers sampled are equally likely to
view the acquisition or possession of their chosen brand/product “to judge the
success of others and oneself”, “as playing a central role in their lives” or “being
essential to their satisfaction and wellbeing” (Richins, 2004, p. 210).
Table 10: Summary of materialism subscale scores.
Description Count Mean Std. Dev.
Success (S) 154 12.17 1.75 Centrality (C ) 154 12.39 1.50 Happiness (H) 154 12.53 1.46

54
5.4 RESULTS TO RESEARCH QUESTIONS
5.4.1 There is discretionary thrift at bottom of the income pyramid. Low
income consumers exhibit frugality or materialism depending on product
being considered.
As highlighted above, the mean scores for all the statements in both the
materialism and frugality scales were greater than 3 indicating that low income
individuals express frugality or materialism depending on product being
considered. This data is in the expected direction of discretionary thrift. In the
previous chapter, it is highlighted that the survey statements used to measure
frugality and materialism are similar to those used by Lastovicka et al. (1999)
and Jacob and Smit (2010) and Ponchio and Aranha (2008). Table 11
compares the mean aggregated materialism scores obtained in this study to
those reported by Jacob and Smit (2010) and Ponchio and Aranha (2008)
amongst South Africa and Brazil’s low income consumers respectively.
Table 11: Mean aggregated materialism scores.
Study
Mean Std. Dev.
Nkosi (2011) 37.09 3.87 Ponchio and Aranha (2008) 23.81 7.03 Jacob and Smit (2010) 29.93 6.86
Following t-tests (t = 11.969, df = 369, p<0.0001 and t = 22.273, df = 588,
p<0.0001), the materialism expressed in this study is significantly higher than
that reported by Jacob and Smit (2010) and Ponchio and Aranha (2008). It may
be that the respondents here were highly materialistic or that the adaptations
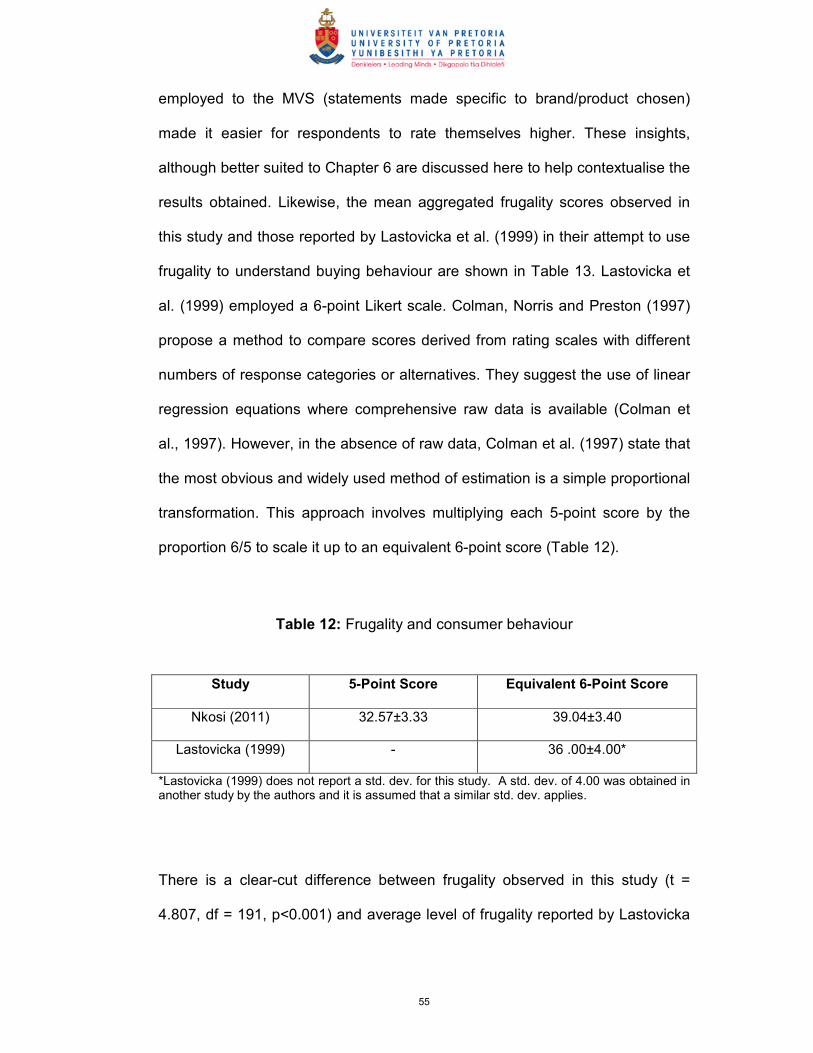
55
employed to the MVS (statements made specific to brand/product chosen)
made it easier for respondents to rate themselves higher. These insights,
although better suited to Chapter 6 are discussed here to help contextualise the
results obtained. Likewise, the mean aggregated frugality scores observed in
this study and those reported by Lastovicka et al. (1999) in their attempt to use
frugality to understand buying behaviour are shown in Table 13. Lastovicka et
al. (1999) employed a 6-point Likert scale. Colman, Norris and Preston (1997)
propose a method to compare scores derived from rating scales with different
numbers of response categories or alternatives. They suggest the use of linear
regression equations where comprehensive raw data is available (Colman et
al., 1997). However, in the absence of raw data, Colman et al. (1997) state that
the most obvious and widely used method of estimation is a simple proportional
transformation. This approach involves multiplying each 5-point score by the
proportion 6/5 to scale it up to an equivalent 6-point score (Table 12).
Table 12: Frugality and consumer behaviour
Study 5-Point Score Equivalent 6-Point Score
Nkosi (2011) 32.57±3.33 39.04±3.40
Lastovicka (1999) - 36 .00±4.00*
*Lastovicka (1999) does not report a std. dev. for this study. A std. dev. of 4.00 was obtained in another study by the authors and it is assumed that a similar std. dev. applies.
There is a clear-cut difference between frugality observed in this study (t =
4.807, df = 191, p<0.001) and average level of frugality reported by Lastovicka
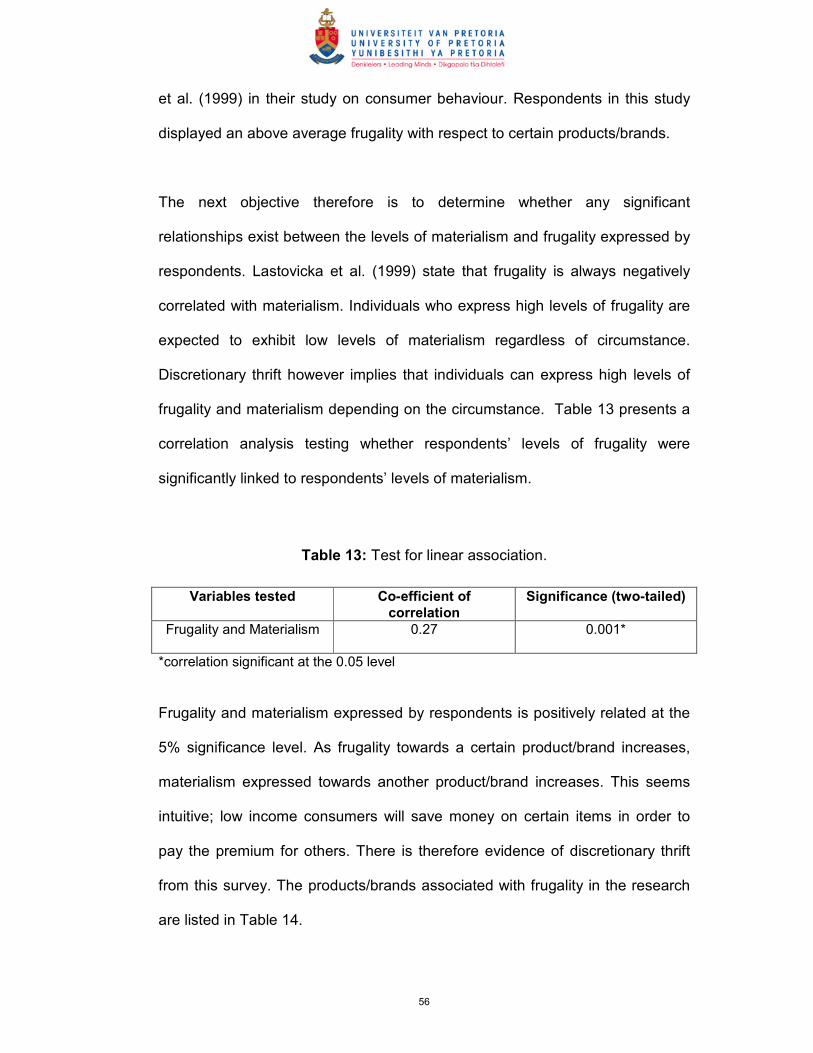
56
et al. (1999) in their study on consumer behaviour. Respondents in this study
displayed an above average frugality with respect to certain products/brands.
The next objective therefore is to determine whether any significant
relationships exist between the levels of materialism and frugality expressed by
respondents. Lastovicka et al. (1999) state that frugality is always negatively
correlated with materialism. Individuals who express high levels of frugality are
expected to exhibit low levels of materialism regardless of circumstance.
Discretionary thrift however implies that individuals can express high levels of
frugality and materialism depending on the circumstance. Table 13 presents a
correlation analysis testing whether respondents’ levels of frugality were
significantly linked to respondents’ levels of materialism.
Table 13: Test for linear association.
Variables tested Co-efficient of
correlation
Significance (two-tailed)
Frugality and Materialism 0.27 0.001*
*correlation significant at the 0.05 level
Frugality and materialism expressed by respondents is positively related at the
5% significance level. As frugality towards a certain product/brand increases,
materialism expressed towards another product/brand increases. This seems
intuitive; low income consumers will save money on certain items in order to
pay the premium for others. There is therefore evidence of discretionary thrift
from this survey. The products/brands associated with frugality in the research
are listed in Table 14.

57
Table 14: Product or brand bought when saving money.
Frequency Percent Valid Percent Cumulative Percent
Valid Trinco 3 1.9 1.9 1.9
Joko 1 .6 .6 2.6
Freshpak Rooibos 1 .6 .6 3.2
Frisco 2 1.3 1.3 4.5
Omo 1 .6 .6 5.2
Surf 1 .6 .6 5.8
Sunlight 6 3.9 3.9 9.7
Dove 2 1.3 1.3 11.0
Lux 1 .6 .6 11.7
Drink o pop 2 1.3 1.3 13.0
Kellogg's 1 .6 .6 13.6
Morvite 6 3.9 3.9 17.5
Mabela 2 1.3 1.3 18.8
Iw isa 17 11.0 11.0 29.9
White Star 12 7.8 7.8 37.7
Pride 10 6.5 6.5 44.2
Tastic 6 3.9 3.9 48.1
All Star 2 1.3 1.3 49.4
Soviet 1 .6 .6 50.0
Mageu 1 .6 .6 50.6
Vaseline 1 .6 .6 51.3
Woolw orths 2 1.3 1.3 52.6
Mr Price 3 1.9 1.9 54.5
PEP 8 5.2 5.2 59.7
Boxer Superstore 5 3.2 3.2 63.0
Luck Star 12 7.8 7.8 70.8
KFC 3 1.9 1.9 72.7
Chicken Licken 1 .6 .6 73.4
Selati Brow n Sugar 12 7.8 7.8 81.2
Rainbow Chicken 1 .6 .6 81.8
Sunbake Bread 8 5.2 5.2 87.0
Inkomazi 8 5.2 5.2 92.2
Dickies 2 1.3 1.3 93.5
Shoprite 10 6.5 6.5 100.0
Total 154 100.0 100.0

58
There are 34 products/brands in total. To ascertain whether the selection of
these items was purely random, a chi-square goodness of fit test was
performed. This test compared the observed choices to those expected based
on the proportion of brands/products in the different groups (Table 15). The
results of the Chi-square test are shown in Table 16; they show that the
product/brand distribution observed differs significantly (p<0.0001) from that
expected if the selection was random. Therefore, the most frequently identified
products with respect to frugality in the survey belong to the fast moving
consumer goods group.
Table 15: Observed versus expected selections of product/brand groups.
Category Observed (%) Expected (%) Residual
Fast Moving Consumer Goods 76 68 8
Restaurant Chains 7 4 -3
Premium Branded Clothing 3 15 -12
Discount Clothing Chains 3 6 -3
Supermarket Chains 11 7 4
*Telecommunications is not shown as it was not selected by respondents.

59
Table 16: Chi-Square test for frugality product/brand groups.
Category
Chi-Square 16.577
Df 4
Asymp. Sig. .002
The products/brands most associated with materialism are listed in Table 17.
There are 28 products/brands in total. Again, a chi-square goodness of fit test
was performed to compare the observed choices and to those expected if the
selections were purely random (Table 18). The results of the chi-square test are
shown in Table 19. These results show that the product/brand distribution
observed differs significantly (p = 0.002) from that expected if the selection was
random. Therefore, the most frequently identified products in the survey with
respect to materialism belong to the premium branded clothing group.

60
Table 17: Products/brands bought using money intentionally saved from other
purchases.
Frequency Percent Valid Percent Cumulative Percent
Valid Ricoffy 1 .6 .6 .6
Freshpak Rooibos 2 1.3 1.3 1.9
Nike 17 11.0 11.0 13.0
Adidas 8 5.2 5.2 18.2
Pumas 10 6.5 6.5 24.7
Dove 1 .6 .6 25.3
Lux 1 .6 .6 26.0
Kellogg's 2 1.3 1.3 27.3
Iwisa 2 1.3 1.3 28.6
Tastic 9 5.8 5.8 34.4
All Star 6 3.9 3.9 38.3
Soviet 4 2.6 2.6 40.9
Levis 9 5.8 5.8 46.8
Heineken 14 9.1 9.1 55.8
Black Label 6 3.9 3.9 59.7
Mageu 1 .6 .6 60.4
Pond's 4 2.6 2.6 63.0
Woolworths 9 5.8 5.8 68.8
Mr Price 1 .6 .6 69.5
Nando's 4 2.6 2.6 72.1
KFC 8 5.2 5.2 77.3
Chicken Licken 5 3.2 3.2 80.5
Selati Brown Sugar 1 .6 .6 81.2
Baby Soft Toilet Paper 5 3.2 3.2 84.4
Vodacom Airtime 8 5.2 5.2 89.6
MTN Airtime 8 5.2 5.2 94.8
Rainbow Chicken 3 1.9 1.9 96.8
Shoprite 5 3.2 3.2 100.0
Total 154 100.0 100.0

61
Table 18: Observed versus expected selections of product/brand groups.
Category Observed (%) Expected (%) Residual
1. Fast Moving Consumer Goods 33 66 -33
2. Restaurant Chains 2 4 -2
3. Premium Branded Clothing 35 14 21
4. Discount Clothing Chains 11 6 5
5. Telecommunications 10 6 4
6. Supermarket Chains 9 6 3
Table 19: Chi-Square test for frugality product/brand groups.
Category
Chi-Square 62.28
Df 5
Asymp. Sig. .00
Conclusion to proposition: Proposition supported. There are indications of
discretionary thrift in the sample surveyed. Low income consumers seem to
exhibit frugality or materialism depending on product being considered.

62
5.4.2 Materialism and frugality (discretionary thrift) may be affected by an
individual’s income level (gross income and/or disposable income) at the
bottom of the pyramid.
Mean levels of frugality (Table 20 and Table 22) across different gross and
disposable income levels were compared using ANOVA testing. The survey
questionnaire had 6 gross income groups (see Appendix). However, these were
compressed to two gross income categories, ‘R100 to R1000 per month’ and
‘more than R1001 per month’ to ensure compliance with the central limit theory.
For disposable income, three categories, namely ‘R100 to R500 per month’,
‘R501 to R1000 per month’ and ‘more than R1001 per month but less than
R2500’ were identified.
In terms of frugality, ANOVA testing showed that at a 5% significance level,
there was a statistically significant difference in mean levels of frugality with
varying gross and disposable income (Table 21 and Table 23).
Table 20: Mean levels of frugality with gross
income.
Respondent's gross
income Mean N Std. Deviation
R100 to R1000 31.54 37 3.05
More than R1001 32.90 117 3.36
Total 32.57 154 3.33

63
Table 21: ANOVA – Differences in mean levels of frugality with gross income.
Sum of
Squares Df Mean Square F Sig.
Between Groups 51.76 1 51.76 4.79 .030
Within Groups 1643.96 152 10.82
Total 1695.71 153
Table 22: Mean levels of frugality with disposable income.
Respondent’s
disposable income Mean N Std. Deviation
R100 to R500 30.40 33 1.68
R501 to R1000 31.85 39 2.29
more than R1001 33.18 56 2.78
Total 32.05 128 2.63

64
Table 23: ANOVA – Differences in mean levels of frugality with disposable
income.
(I) Respondent’s
disposable
income
(J) Respondent’s
disposable
income
Mean
Difference
(I-J)
Std.
Error Sig.
95% Confidence Interval
Lower
Bound
Upper
Bound
R100 to R500 R501 to R1000 -1.45* .56 .03 -2.82 -.08
more than
R1001
-2.78* .52 .00 -4.06 -1.51
R501 to R1000 R100 to R500 1.45* .56 .03 .08 2.82
more than
R1001
-1.33* .50 .03 -2.54 -.12
more than
R1001
R100 to R500 2.78* .52 .00 1.51 4.06
R501 to R1000 1.33* .50 .03 .12 2.54
*. The mean difference is significant at the 0.05 level.
Mean levels of materialism with gross income and disposable income are
shown in Table 24 and Table 26. There was however no statistically significant
difference in the mean levels of materialism across gross (Table 26) and
disposable income groups (Table 27.
Table 24: Mean levels of materialism with gross income.
Respondent's gross
income Mean N Std. Deviation
R100 to R1000 36.24 37 3.06
More than R1001 37.36 117 4.06
Total 37.09 154 3.87

65
Table 25: ANOVA – Differences in mean levels of materialism with gross
income.
Sum of
Squares Df Mean Square F Sig.
Between Groups 34.99 1 34.99 2.36 .13
Within Groups 2251.73 152 14.81
Total 2286.73 153
Table 26: Mean levels of materialism with disposable income.
Respondents
disposable income Mean N Std. Deviation
R100 to R500 36.27 33 3.56
R501 to R1000 37.41 39 3.63
more than R1001 37.91 56 3.45
Total 37.34 128 3.57

66
Table 27: ANOVA – Differences in mean levels of materialism with disposable
income.
(I) Respondent’s
disposable
income
(J) Respondent’s
disposable
income
Mean
Difference
(I-J)
Std.
Error Sig.
95% Confidence Interval
Lower
Bound
Upper
Bound
R100 to R500 R501 to R1000 -1.14 .84 .53 -3.16 .89
more than R1001 -1.64 .77 .11 -3.52 .24
R501 to R1000 R100 to R500 1.14 .84 .53 -.89 3.16
more than R1001 -.50 .74 1.00 -2.29 1.29
more than R1001 R100 to R500 1.64 .77 .11 -.24 3.52
R501 to R1000 .50 .74 1.00 -1.29 2.29
Conclusion to proposition: Proposition not supported with respect to
materialism. Proposition supported with respect to frugality – frugality amongst
low income consumers surveyed appears to be affected by income levels.
5.4.3 Materialism and frugality may be affected by an individual’s age at
the bottom of the pyramid.
The survey questionnaire included 3 age categories, namely ‘between 20 and
34’, ‘between 35 and 49’ and ‘over 50’ (see Appendix). There were 59
respondents in the ‘between 20 and 34’ category, 69 respondents in the
‘between 35 and 49’ category and 26 respondents in the ’over 50’ category.
The means obtained with respect to frugality and materialism are displayed in
Table 28 and Table 30. At the 5% significance level, there was no statistically

67
significant difference in mean levels of frugality and materialism with varying
age groups (Table 29 and Table 31).
Table 28: Mean levels of frugality with age
Respondent's Age Mean Std. Deviation
Between 20 and 34 32.37 2.72
Between 35 and 49 31.62 2.58
Over 50 32.40 2.46
Total 32.03 2.62
Table 29: ANOVA – Differences in mean levels of frugality with age.
(I) Respondent's Age (J) Respondent's Age
Mean
Difference (I-J) Std. Error Sig.
95% Confidence Interval
Lower Bound Upper Bound
Between 20 and 34 Between 35 and 49 .75 .51 .43 -.49 1.98
Over 50 -.035 .69 1.00 -1.72 1.65
Between 35 and 49 Between 20 and 34 -.75 .51 .43 -1.98 .49
Over 50 -.78 .68 .76 -2.43 .87
Over 50 Between 20 and 34 .03 .69 1.00 -1.65 1.72
Between 35 and 49 .78 .68 .76 -.87 2.43

68
Table 30: Mean levels of materialism with age.
Respondent's Age Mean Std. Deviation
Between 20 and 34 37.24 3.53
Between 35 and 49 36.91 3.78
Over 50 38.55 2.72
Total 37.30 3.55
Table 31: ANOVA – Differences in mean levels of materialism with age.
Conclusion to proposition: Proposition that frugality and materialism may be
affected by an individual’s age at the bottom of the pyramid is not supported by
this survey.
(I) Respondent's Age (J) Respondent's Age
Mean
Difference (I-J) Std. Error Sig.
95% Confidence Interval
Lower Bound Upper Bound
Between 20 and 34 Between 35 and 49 .33 .69 1.00 -1.34 1.99
Over 50 -1.31 .94 .50 -3.58 .97
Between 35 and 49 Between 20 and 34 -.33 .69 1.00 -1.99 1.34
Over 50 -1.64 .92 .23 -3.86 .59
Over 50 Between 20 and 34 1.31 .94 .50 -.97 3.58
Between 35 and 49 1.64 .92 .23 -.59 3.86

69
5.4.4 Materialism and frugality may be affected by an individual’s level of
education at the bottom of the pyramid.
The 4 education categories in the survey questionnaire (‘I did not finish matric’,
‘I finished matric’, ‘I have a post matric qualification’ and ‘other’) did not all meet
the central limit theory. The ‘I have a post matric qualification’ and ‘other’
categories yielded 15 and 4 respondents respectively. Data from the ‘I have a
post matric qualification’ category was combined with that from the ‘I finished
matric’ group. Data from the ‘other’ category was discarded. The means
obtained with respect to frugality and materialism are displayed in Table 32 and
Table 34. At the 5% significance level, there was no statistically significant
difference in mean levels of frugality and materialism with education (Table 33
and Table 35).
Table 32: Mean levels of frugality with education.
Respondent's Education Mean N Std. Deviation
I did not finish matric 32.43 92 3.06
I finished matric 32.77 58 3.71
Total 32.57 150 3.33

70
Table 33: ANOVA – Differences in mean levels of frugality with education.
Sum of
Squares Df Mean Square F Sig.
Between Groups 4.23 1 4.27 .38 .54
Within Groups 1691.45 152 11.13
Total 1695.71 153
Table 34: Mean levels of materialism with education.
Respondent's Education Mean N Std. Deviation
I did not finish matric 36.98 92 3.51
I finished matric 37.26 58 4.37
Total 37.09 150 3.87
Table 35: ANOVA – Differences in mean levels of materialism with education.
Sum of
Squares Df Mean Square F Sig.
Between Groups 2.90 1 2.90 .19 .66
Within Groups 2283.83 152 15.03
Total 2286.73 153
Conclusion to proposition: Proposition that frugality and materialism may be
affected by the measured levels of education at the bottom of the pyramid is not
supported by this survey.

71
5.5 CONCLUSION OF RESULTS
The results show some evidence of discretionary thrift at BOP. Low income
consumers express frugality and materialism depending on the product/brand
being considered. The extent of frugality observed is affected by income (gross
income and disposable income). Materialism however, is not correlated with
income. As for the other demographic variables considered, there was no
statistically significant relationship between respondent’s frugality and
materialism with age or measured level of education.

72
6.0 DISCUSSION OF RESULTS
6.1 INTRODUCTION
The results in Chapter 5 have addressed the propositions put forward in the
research. To tease out important insights, the results are discussed here with
reference to the literature in Chapter 2. Using the format of the research
propositions in Chapter 3, the literature is either confirmed or alternative views
proposed with respect to frugality and materialism amongst low income
consumers.
6.2 DISCUSSION OF RESULTS FROM RESEARCH PROPOSITIONS
6.2.1 There is discretionary thrift at bottom of the income pyramid. Low
income consumers exhibit frugality or materialism depending on product
being considered.
As discussed in Chapter 2, discretionary thrift, the behaviour of exhibiting
frugality and materialism depending on occasion or product being considered,
is described as a first world phenomenon. Given that Flatters and Willmott
(2009) and Garette and Karnani (2010) deem frugal practices amongst the poor
as necessary to ensure survival, this proposition looked to investigate whether,
akin to affluent consumers, there are certain products which low income
consumers intentionally purchase in an attempt to save money (behaviour
associated with frugality) to pay the required premium on others (behaviour
associated with materialism).

73
The statistical tests carried out on materialism and frugality constructs in
Chapter 5 seem to indicate that the respondents sampled displayed
characteristics associated with frugality and materialism depending on the
product considered. Contrary to observations by Rose et al. (2010) and
Lastovicka et al. (1999) who state that the frugal tend not to have materialistic
leanings, the materialism and frugality scores obtained in this research indicate
a statistically significant, positive relationship. The expression of frugality, it
seems, may have some multi-dimensional facets. Richins and Dawson (1992)
argue that multi-dimensional constructs are more situational and evolve with
time. As borne out of the survey, the respondents appear to express above
average frugality with regards to particular brands/products and relatively high
levels of materialism with others. If frugality was truly unidimensional as defined
by Lastovicka et al. (1999), and by implication unchanging regardless of
circumstance, one would have expected a negative correlation with
materialism. Table 36 overleaf shows the top 3 products/brands (in terms of
percentage occurrence) that respondents associated with frugality in the
survey. It is interesting to note that these brands/products are fast moving
consumer goods with low functional and status risk. Hamilton and Catterall
(2008) report that low income individuals counter feelings of alienation from
consumer culture by embracing actions that primarily reduce financial
disadvantage; this often includes the use of brands in unexpected and creative
ways (Hamilton and Catterall, 2008). Saving money on maize meal, tinned fish
and brown sugar is a creative way of meeting needs at relatively low cost.
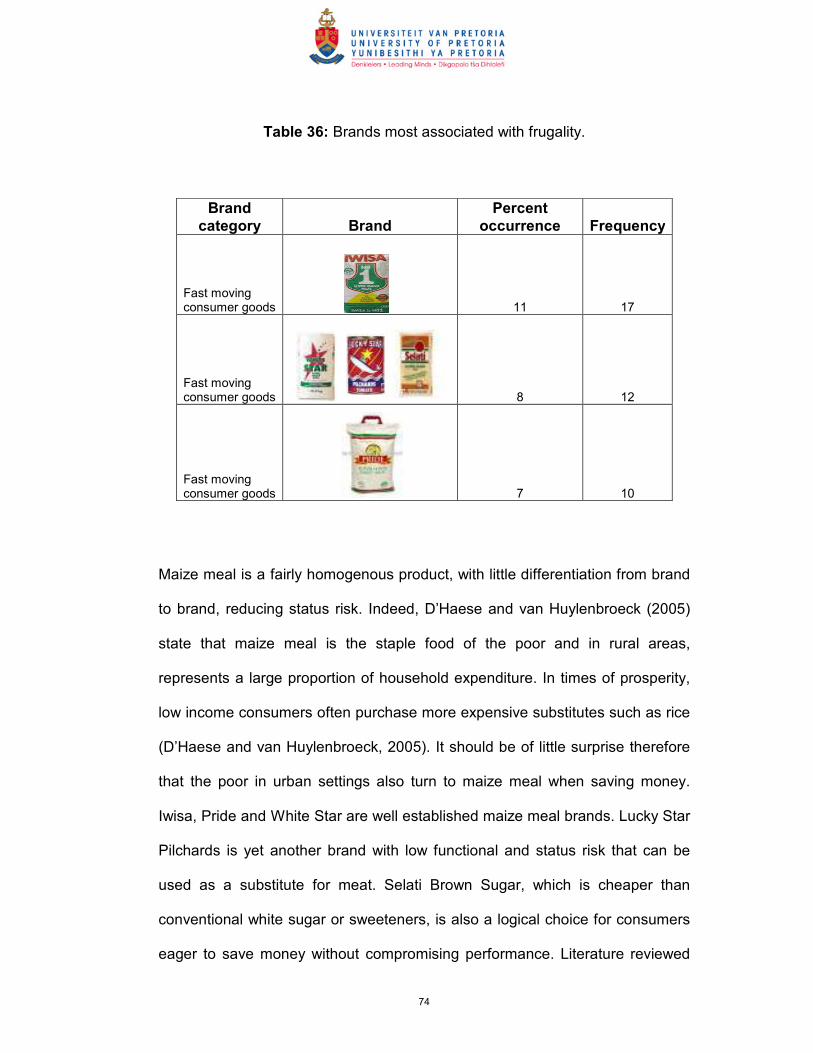
74
Table 36: Brands most associated with frugality.
Brand
category Brand
Percent
occurrence Frequency
Fast moving consumer goods
11 17
Fast moving consumer goods
8 12
Fast moving consumer goods
7 10
Maize meal is a fairly homogenous product, with little differentiation from brand
to brand, reducing status risk. Indeed, D’Haese and van Huylenbroeck (2005)
state that maize meal is the staple food of the poor and in rural areas,
represents a large proportion of household expenditure. In times of prosperity,
low income consumers often purchase more expensive substitutes such as rice
(D’Haese and van Huylenbroeck, 2005). It should be of little surprise therefore
that the poor in urban settings also turn to maize meal when saving money.
Iwisa, Pride and White Star are well established maize meal brands. Lucky Star
Pilchards is yet another brand with low functional and status risk that can be
used as a substitute for meat. Selati Brown Sugar, which is cheaper than
conventional white sugar or sweeteners, is also a logical choice for consumers
eager to save money without compromising performance. Literature reviewed

75
on the internal motivations of people who exhibit frugal behaviour states that
these individuals are less likely to be driven by self enhancement or self-
promotion values (Pepper et al., 2009); they are less materialistic, less subject
to interpersonal influence, and more oriented toward long-term outcomes (Rose
et al., 2010). Table 37 shows the top 3 brands associated with materialism in
the survey. These are all premium brands with high social visibility and hint to
respondents’ desire for self-promotion. Analysis conducted on Richins (1994)
MVS and its subscale shows that respondents expressed relatively high levels
of materialism and were equally motivated by acquisition centrality, acquisition
as the pursuit of happiness and possession defined success. Jacob and Smit
(2010) offer compelling perspective on why materialism may form an important
part of a low income individual’s outlook. When a lack of money is seen as the
root cause of unhappiness in one’s household, it is quite conceivable that being
able to afford and possess certain aspiration brands/products would play a
major role in life (Jacob and Smit, 2004). Consequently, the respondents view
the possession or acquisition of these socially visible goods as an important
part of their lives, a source of happiness and as a sign of social status. This is
remarkable given that these very same individuals also produced fairly high
frugality scores, lending credence to the thesis that frugality and materialism
may be fluid, changing depending on circumstance.

76
Table 37: Brands most associated with materialism.
It may be argued that social and self enhancement factors may not be the only
motivating factors behind the observed product/brand selection. What of
functional risk? Although this cannot be ruled out, it is quite unlikely; the
prominence of brands with high social visibility (Nike and Puma are popular
premium brands; Heineken is a premium beer frequently consumed in social
settings) indicates elements of status signalling (Saren, 2007) and potentially
compensatory consumption (van Kempen, 2004). If functional risk was indeed
the primary motivator behind the selection of materialism items, other less
socially visible premium brands such as Kellogg’s, Freshpack Rooibos Tea or
Baby Soft Toilet paper would have enjoyed higher selection frequencies.
In conclusion, low income consumers surveyed seem to display behaviour
associated with discretionary thrift. They opt to pay as little as possible on fast
moving goods with low functional and status risk in order to ensure that

77
sufficient funds are available for the purchase of socially visible premium
brands/products.
6.2.2 Frugality and materialism may be affected by an individual’s income
level (gross income and/or disposable income) at the bottom of the
pyramid.
Van Kempen (2004) argues that the poor have the opportunity to distinguish
themselves from poorer groups by consuming aspiration productions. Manzi
(2007) reports that individuals with a new freedom to acquire compare their
material possessions to those in their social networks that are more prosperous
with the aim to “catch up to” or surpass them. Using gross income and
disposable income as a proxy for “ability to acquire”, this proposition looked to
test whether materialism and frugality expressed by low income consumers is
heightened by an increasing ability to acquire.
The gross income categories from the survey (see Appendix) were severely
truncated for compliance with the central limit theory thus introducing potential
for type 2 error. Further, it was found that disposable income amounts for the
LSM 1-4 sample were extremely close to each other which could also
contribute to type 2 error. On reviewing the results in Section 5.4.2 there is a
small but significant increase in the levels of frugality expressed with respect to
certain products/brand as gross income and disposable income increases. A
likely explanation for this is that as gross income and disposable income levels
increase, savings attained from frugal practises, when combined with income
in-hand, may give low income consumers the ability to afford aspiration goods
78
or allow access to credit for the purchase of said goods. Indeed, Jacob and
Smit (2010) report a positive, significant relationship between gross income and
level of indebtedness. Intuitively then, it is expected that an increase in income
should also lead to an increase materialism. However, Van Kempen (2004)
states that there is a threshold level of income below which individuals can
hardly afford to spend resources on symbolic products; here, the incentive for
frugality may be survival. This could be the reason why there was an increase
in frugality aimed at saving money for material pursuits with increasing gross
and disposable income above R1000 per month and R500 per month
respectively.
There was an increase in materialism with increasing gross and disposable
income. This increase however, was not significant at the 5% level. Again, the
variance in levels of income of respondents in the survey may have been too
small to allow appreciable differentiation in materialism. Ponchio and Arahna
(2008) and Jacob and Smit (2010) encountered a similar phenomenon in their
research into materialism amongst the poor. The level of materialism observed
by these researchers was however significantly lower as reported in Chapter 5.
In summary, respondents’ frugality with respect to certain brands/ products
seems to increase with increasing gross and disposable income. Materialism
expressed, though relatively high compared to other studies, does not appear
to be affected by increasing levels of gross and disposable income.

79
6.2.3 Materialism and frugality may be affected by an individual’s age at
the bottom of the pyramid.
The literature reviewed (Van Kempen (2007), Ponchio and Aranha (2008),
Rimmell (2008)) indicates that materialism decreases with age and frugality
increases with age. In these studies, older consumers, specifically those over
the age of 50 consistently showed frugal tendencies and little interest
materialistic pursuits. Salm (2010) reports that consumption choice, in terms of
brands/products purchased, is heavily influenced by age; Van Kempen, (2007)
states that older consumers hardly partake in socially visible consumption.
This proposition aimed to examine whether the expression of materialism and
frugality with respect to particular brand or product was similarly influenced by
age. The results presented in Section 5.4.3 show that age had no significant
impact on the frugality and materialism expressed towards certain
brands/products. This inconsistency with previous studies may be due to the
nature of the sample. Compared to other research, the sample here had far
fewer respondents in the ‘over 50 category’ (26 out of 154 individuals). This
may have compromised the statistical comparisons with ‘younger’ age groups
(possible violation of the central limit theory) introducing type 2 error. Perhaps,
given that the materialism observed had strong social influences, a larger
proportion of ‘over 50’ respondents would have produced results in line with
literature.

80
6.2.4 Materialism and frugality may be affected by an individual’s level of
education at the bottom of the pyramid.
This proposition sought to investigate whether, as postulated by Van Kempen
(2004), the education level of low income consumers influences the importance
that he or she places on aspiration brands. In line with the compensatory
consumption hypothesis described by Subrahmanyan and Gomez-Arias (2008),
Van Kempen (2004) found that respondents with a high school education
showed higher levels of materialism (willingness to pay a premium) for
aspiration goods than their more educated counterparts. Similarly, it was
expected in this study that the inkling to save money on certain products
(frugality) in order to purchase aspiration goods would increase with decreasing
levels of education. The respondents to the survey formed two broad
categories, namely people who had completed high school and obtained further
qualifications and those that had not attended school or had some schooling
but did not complete high school.
There was no statistically significant difference in the willingness to save for
material goods (frugality) and willingness to acquire material goods
(materialism) across the measured education levels. Both groups were equally
willing to save for and spend on material goods. It should be noted however
that this research has a limited distribution of education categories to allow the
researcher to state with any authority how education may impact materialism
and frugality. Categories such as ‘no education’, ‘some primary’, ‘primary’,
‘some high school’, ‘high school’ and so on would have to be considered in
order to draw a more informed conclusion. What is clear however, is that the

81
urge for compensatory consumption, whether exacerbated by relative
deprivation or not, is felt at the education levels examined here. Jacob and Smit
(2010, p.27) state that the transition from apartheid to democracy, and the
resulting, often rapid, social mobility of black individuals has led to increased
spending and fostered a desire to satisfy “acquisition fantasies” in people still
striving to improve their economic situations. It appears that those, like the
respondents in this survey that are unable to fully partake in the consumption
culture do exhibit a strong propensity for socially visible goods.

82
7.0 CONCLUSION
The purpose of this research was to investigate the concept of discretionary
thrift amongst low income consumers in an emerging market setting
characterised by high social mobility. Flatters and Willmott (2009) identified
discretionary thrift as an advancing trend amongst affluent developed nation
consumers. These consumers temper their spending habits depending on
product or occasion; there are certain products for which consumers are willing
to pay a premium (behaviour associated with materialism) and there are others
that consumers are looking to save money on (behaviour associated with
frugality). Thrift of low income consumers, especially in emerging markets, is
not considered discretionary; rather, it is portrayed as ‘necessary’ for survival.
There is sufficient evidence from this research to support the proposition that
there is discretionary thrift amongst the low income consumers surveyed. The
statistical tests carried out on materialism and frugality constructs seem to
indicate that respondents displayed characteristics associated with frugality and
materialism depending on the product considered. Low income consumers
were found to save money by paying as little as possible for fast moving
consumer goods with low functional and status risk. Frugality expressed with
respect to these products was found to be above average as defined by
Lastovicka et al. (1999). The goods most frequently associated with materialism
were found to be premium socially visible brands of clothing and fast moving
consumer goods. The materialism expressed with respect to these products
was significantly higher than that measured by Jacob and Smit (2010) and
Ponchio and Aranha (2008) in other low income communities.

83
The existence of discretionary thrift lends support to the thesis that frugality
may not be unidimensional, and by implication, unchanging regardless of time
or circumstance. Individuals may choose to express frugality depending on
product being considered. Other observations reported in academic literature
that those who express frugality are not materialistic and are less subject to
interpersonal influence (Pepper et al. (2009), Rose et al. (2010), Lastovicka et
al. (1999)) do not seem to apply to the respondents to this survey. This may be
because South Africa is characterised by high social mobility and the above
observations were recorded in static developed world societies. Alternatively it
could be an indication of the general lack of understanding of the poor or of the
concept of frugality.
The research presented here also sought to provide insights into factors that
may accentuate the expression of frugality and materialism towards a particular
product/brand amongst low income consumers. There is insufficient evidence
to support the proposition that age and measured level of education have an
effect on the level of materialism and frugality expressed with respect to a
certain brand or product. There is insufficient evidence to support the
proposition that level of income, gross or disposable, has an effect on the level
of materialism expressed with respect to a certain brand or product. There is
however sufficient evidence to support the proposition that level of income,
gross or disposable, has an effect on the level of frugality expressed with
respect to a certain brand or product.

84
7.1 FUTURE RESEARCH
The following areas could form the basis of future research:
The effects of income, gross and disposable, and education on materialism and
frugality in this study are not exhaustive. Research could be conducted with a
wider sample variance in income. Similarly, a sample of comprising of
individuals with ‘no education’, ‘some primary’, ‘primary’, ‘some high school’,
‘high school’, ‘some tertiary’, ‘tertiary’ and ‘post graduate’ education could be
obtained and their materialism and frugality pertaining to certain products
measured.
One intriguing debate in materialism studies, and in consumer research, is the
role that culture plays in influencing behaviour. Research could be conducted to
ascertain whether people within a particular LSM® band but from different
cultural backgrounds (for example black and white South Africans) express
frugality and materialism in the same way and whether they exhibit similar
product set choices with respect to discretionary thrift.

85
REFERENCES
� Amine, L. S., & Smith, J. (2009). Challenges to Modem Consumer
Segmentation in a Changing World: The Need for a Second Step.
Multinational Business Review, 17(3), 71-99.
� Anderson, J, Kupp, M and Vandermerwe, S (2010). Good business makes
poor customers good customers. Business Strategy Review, (4), 46-51.
� Andrew, M. C., Norris, C. E., & Preston, C. C. (1997). Comparing Rating
Scales of Different Lengths: Equivalence of Scores from 5-Point and 7 Point
Scales. Psychological Reports, 80, 355-362. Retrieved from
http://www.le.ac.uk/psychology/amc/comprati.pdf.
� Ballantine, P. W., & Creery, S. (2010). The consumption and disposition
behaviour of voluntary simplifiers. Journal of Consumer Behaviour, 9(1), 45-
56.
� Barki, E., & Parente, J. (2010). Consumer Behaviour of the Base of the
Pyramid Market in Brazil. Greener Management International, (56), 11-23.
� Belk R.W. (1984). Three scales to measure construct related to materialism:
reliability, validity, and relationships to measures of happiness. Advances in
Consumer Research (11), 291-297.
� Blumberg, B., Cooper D.R., & Schindler P. S. (2008), Business Research
Methods. 2nd Edition. McGraw-Hill Higher education
� Chipp, K, Corder, C. (2009). Where practice meets theory: Defining and
reviewing the bottom of the pyramid for South African marketers.
86
International Base of the Pyramid Conference, Gordon Institute of Business
Science, Johannesburg.
� Chipp, K, Corder, C. (2010). Where practice meets theory: turning dollars
into measurable variables at the bottom of the pyramid in an emerging
market in South Africa. IIMA Conference, Gordon Institute of Business
Science, Johannesburg.
� Colman, A.M, Norris C.E, and Preston C.C. (1997). Comparing rating
scales of different lengths: Equivalence of scores from 5-point and 7-point
scales. Psychological Reports, (80), 355-362. Retrieved from
http://www.le.ac.uk/psychology/amc/comprati.pdf.
� Clapovitz, D. (1967). The poor pay more: Consumer Practices of Low
Income Families. Macmillan, London, UK.
� D’Haese, M., Van Huylenbroeck, G., (2005). The rise of supermarkets and
the changing expenditure patterns of poor rural households case study in
the Transkei area, South Africa. Food Policy, 30(1), 97-113
� Flatters, P., Willmott, M. (2009) “Understanding the Post Recession
Consumer”. Harvard Business Review, July-August, 106-112.
� Garrette, B., & Karnani, A. (2010). Challenges in Marketing Socially Useful
Goods to the Poor. California Management Review, 52(4), 29-47.
� George, D., & Mallery, P. (2003). SPSS for Windows step by step: A simple guide
and reference. 11.0 update (4th ed.). Boston: Allyn & Bacon.

87
� Goldman, A. (1978). Confined shopping behaviour among low income
consumers: An empirical test. JMR, Journal of Marketing Research (Pre-
1986), 15(000001), 11-11.
� Hamilton, K. 2009, “Low-income families: experiences and responses to
consumer exclusion”. The International Journal of Sociology and Social
Policy, 29 (9/10), 543-557.
� Hamilton, K., & Catterall, M. (2005). Towards A Better Understanding of the
Low-Income Consumer. Advances in Consumer Research, 32(1), 627-632.
� Hamilton, K., & Catterall, M. (2006). Transitions into Poverty: An Exploratory
Study into How Families Cope When Faced With Income Reduction and
Limited Consumption Opportunities. Marketing Review, 6(2), 123-136.
� Immekus, J. C., & Imbrie, P. K. (2008). Dimensionality Assessment Using
the Full-Information Item Bifactor Analysis for Graded Response Data: An
Illustration with the State Metacognitive Inventory. Educational &
Psychological Measurement, 68(4), 695-709.
� Jacob, G., Smit, E.v.d. (2010). Materialism and indebtedness of low income
consumers: Evidence from South Africa's largest credit granting catalogue
retailer. South African Journal of Business Management, 41(4), 11-33.
� Karnani, A. (2006). Misfortune at the Bottom of the Pyramid. Greener
Management International, (51), 99-110.
� Lastovicka, J. L., Bettencourt, L. A., Hughner, R. S., & Kuntze, R. J. (1999).
Lifestyle of the tight and frugal: Theory and measurement. Journal of
Consumer Research, 26(1), 85-98.

88
� Lopéz Turley, R. (2002). Is relative deprivation beneficial? The effects of
richer and poorer neighbors on children’s outcomes. In Manzi, T (2007). The
link between relative depravation and lifestyle choices of affluent black
South Africans. MBA, University of Pretoria.
� Louw, I.L (2008). Redefining BOP: In pursuit of sustainable Opportunity at
the Base of the Pyramid. MBA, University of Pretoria.
� Manzi, T (2007). The link between relative depravation and lifestyle choices
of affluent black South Africans. MBA, University of Pretoria.
� Martinez, J., & Carbonell, M. (2007). Value at the bottom of the pyramid.
Business Strategy Review, 18(3), 50-55.
� Nash J.A. (2000). Towards the revival and reform of the subversive virtue:
Frugality. In Pepper, M., Jackson, T., & Uzzell, D. (2009). An examination of
the values that motivate socially conscious and frugal consumer behaviours.
International Journal of Consumer Studies, 33(2), 126-136.
� Pepper, M., Jackson, T., & Uzzell, D. (2009). An examination of the values
that motivate socially conscious and frugal consumer behaviours.
International Journal of Consumer Studies, 33(2), 126-136.
� Piercy, N. F., Cravens, D. W., & Lane, N. (2010). Marketing out of the
recession: recovery is coming, but things will never be the same again.
Marketing Review, 10(1), 3-23.
� Ponchio, M., & Aranha, F. (2008). Materialism as a predictor variable of low
income consumer behaviour when entering into instalment plan
agreements. Journal of Consumer Behaviour, 7(1), 21-34.

89
� Prahalad, C.K. (2004). The Fortune at the Bottom of the Pyramid:
Eradicating Poverty through Profits. New Jersey, Wharton School
Publishing.
� Prahalad, C.K. (2009). The Fortune at the Bottom of the Pyramid:
Eradicating Poverty through Profits. 5th Edition. New Jersey, Wharton
School Publishing.
� Rashid, A. T., & Rahman, M. (2009). Making profit to solve development
problems: the case of Telenor AS and the Village Phone Programme in
Bangladesh. Journal of Marketing Management, 25(9/10), 1049-1060.
� Richins, M. L. (2004). The Material Values Scale: Measurement Properties
and Development of a Short Form. Journal of Consumer Research, 31(1),
209-219.
� Richins, M. L., & Dawson, S. (1990). Measuring Material Values: A
Preliminary Reports of Scale Development. Advances in Consumer
Research, 17(1), 169-175.
� Richins, M. L., & Dawson, S. (1992). A Consumer Values Orientation for
Materialism and Its Measurement: Scale Development and Validation.
Journal of Consumer Research, 19(3), 303-316.
� Rick, S. I., Cryder, C. E., & Loewenstein, G. (2008). Tightwads and
Spendthrifts. Journal of Consumer Research, 34(6), 767-782.
� Rimell, S. (2008), The consumer-brand relationship amongst low income
consumers. MBA, University of Pretoria.
� Rose, P, Smith S. T, Segrist D.J (2010), “Too cheap to chug: frugality as a
buffer against college student drinking”, Journal of Consumer Behaviour, 9
(3), 228-238.

90
� Salm, M. (2010). Subjective mortality expectations and consumption and
saving behaviours among the elderly. Canadian Journal of Economics,
43(3), 1040-1057.
� Saren, M. (2007). To have is to be? A critique of self-creation through
consumption. Marketing Review, 7(4), 343-354.
� Sawady, E.R., Teschner, J. (2008). Financial decision-making processes of
low-income individuals. In Retsinas, N.P. & Belsky, E.S. (Eds.). Borrowing to
live: Consumer and mortgage credit revisited: The Brookings Institution,
p.p.92-109.
� Seelos, C., & Mair, J. (2007). Profitable Business Models and Market
Creation in the Context of Deep Poverty: A Strategic View. Academy of
Management Perspectives, 21(4), 49-63.
� Schwartz, S.H. (1992) Universals in the content and structure of values:
theoretical advances and empirical tests in 20 countries. In Pepper, M.,
Jackson, T., & Uzzell, D. (2009). An examination of the values that motivate
socially conscious and frugal consumer behaviours. International Journal of
Consumer Studies, 33(2), 126-136.
� Sirgy, M.J (1986), A quality of life theory derived from Maslow’s
development perspective: quality is related to progressive satisfaction of
hierarchy of needs, lower order and higher. American Journal of Economics
and Sociology, 45 (3), 329-342.
� Subrahmanyan, S., & Gomez-Arias, J. (2008). Integrated approach to
understanding consumer behaviour at bottom of pyramid. Journal of
Consumer Marketing, 25(7), 402-412.

91
� Understanding the post-recession consumer (2010). Journal of Financial
Planning, 23(4), 12.
� van Kempen, L. (2004). Are the poor willing to pay a premium for designer
labels? A field experiment in Bolivia. Oxford Development Studies, 32(2),
205-224.
� van Kempen, L. (2007). Status consumption and ethnicity in Bolivia:
evidence from durables ownership. International Journal of Consumer
Studies, 31(1), 76-89.
� Wiggins, J. and Birchall, J. (2008), Global Consumers Forced to Rethink
Buying Patterns, Financial Times, October 10, p. 24.
� Zikmund, W.G. (2003), Exploring Marketing Research. 8th Edition. USA.
Thompson Learning Ohio.

92
APPENDIX
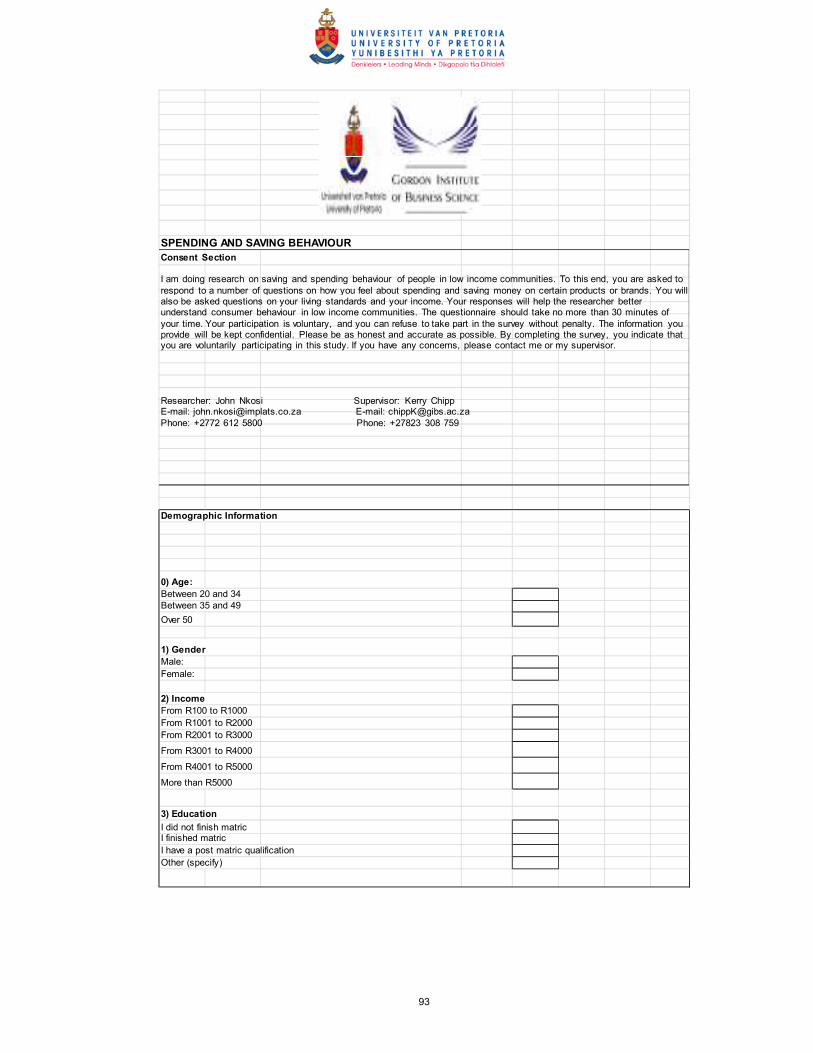
93
SPENDING AND SAVING BEHAVIOUR
Demographic Information
0) Age:
Between 20 and 34Between 35 and 49
Over 50
1) Gender
Male:
Female:
2) Income
From R100 to R1000
From R1001 to R2000
From R2001 to R3000
From R3001 to R4000
From R4001 to R5000
More than R5000
3) Education
I did not finish matricI finished matric
I have a post matric qualification
Other (specify)
Consent Section
I am doing research on saving and spending behaviour of people in low income communities. To this end, you are asked to respond to a number of questions on how you feel about spending and saving money on certain products or brands. You will also be asked questions on your living standards and your income. Your responses will help the researcher better understand consumer behaviour in low income communities. The questionnaire should take no more than 30 minutes of your time. Your participation is voluntary, and you can refuse to take part in the survey without penalty. The information you provide will be kept confidential. Please be as honest and accurate as possible. By completing the survey, you indicate that you are voluntarily participating in this study. If you have any concerns, please contact me or my supervisor.
Researcher: John Nkosi Supervisor: Kerry ChippE-mail: [email protected] E-mail: [email protected]: +2772 612 5800 Phone: +27823 308 759

94
SAARF LSM measure criteria
Yes No
Have PC Desktop/Laptop
Have motor vehicle in household
Have vacuum cleaner/polisher in house
Have electric stove in household
Attribute/Question
Have hot running water in home
Have microwave in household
Have flush toilet in or outside the house
Thrift
5) I buy the following brands/products when I want to save money for something else. (Please indicate with an 'X')
5.1 5.8 5.15 5.22 5.29 5.36 5.43
5.44
5.2 5.9 5.16 5.23 5.30 5.37
5.3 5.10 5.17 5.24 5.31 5.38 5.45
5.4 5.11 5.18 5.25 5.32 5.39
5.46
5.5 5.12 5.19 5.26 5.33 5.40 5.47
5.41
5.6 5.13 5.20 5.27 5.34 5.48
5.7 5.14 5.21 5.28 5.35 5.42 5.49

95
In relation to the products/brands listed above, please think of the one you usually buy when you are saving money
Which one is it (WRITE NAME)?
Now thinking of that product, I am going to ask you a few questions about it
Frugality Scale adapted from Lastovicka et al. (1999)
# S.DisagreeDisagree Neutral Agree S.Agree
6.1
6.2
6.3
6.4
6.5
6.6
6.7
6.8
I will not spend money on other similar brands/products that may be better than INSERT
BRAND/PRODUCT NAME because I want to save money for something else.
If can re-use/borrow/share INSERT BRAND/PRODUCT NAME, then Iwill not buy it new.
I believe in being careful with my money that is why I buy INSERT BRAND/PRODUCT
NAME. Buying the above INSERT BRAND/PRODUCT NAME is part of desciplining myself to
get the most from my money.I am willing to buy INSERT BRAND/PRODUCT NAME so I can save money to purchase
what I want.
Question (Scale Item)
I take care to buy the INSERT BRAND/PRODUCT NAME so I can save money in the
long-run.I only replace the INSERT BRAND/PRODUCT NAME once it is used-up or no longer
useful.
Buying the above product/brand allows me to make better use of my money which
makes me feel good.
Materialism
7) I save money so that I can afford these brands or products: (Please indicate with an 'X')
7.1 7.8 7.15 7.22 7.29 7.36 7.43
7.44
7.2 7.9 7.16 7.23 7.30 7.37
7.3 7.10 7.17 7.24 7.31 7.38 7.45
7.4 7.11 7.18 7.25 7.32 7.39
7.46
7.5 7.12 7.19 7.26 7.33 7.40 7.47
7.41
7.6 7.13 7.20 7.27 7.34 7.48
7.7 7.14 7.21 7.28 7.35 7.42 7.49

96
In relation to the products/brands listed above, please think of the one you value the most
Which one is it (WRITE NAME)?
Now thinking of that product, I am going to ask you a few questions about it
Material Value Scale adapted from Ponchio and Aranha (2008), Jacobs and Smit (2010
# S.Disagree Disagree Neutral Agree S.Agree
8.1
8.2
8.3
8.4
8.5
8.6
8.7
8.8
8.9
(S) Success subscale
(C ) Centrality
(H) Happiness
Question (Scale Item)
I admire people who own/use the INSERT PRODUCT/BRAND SELECTED
FROM PREVIOUS QUESTION. (S)
I like spending money on the INSERT NAME OF PRODUCT/BRAND. (C)
I like a lot of luxury in my life. (C)
It bothers me that I can't always afford to buy the INSERT PRODUCT/BRAND
NAME. (H)
Some of the most important achievements in life include being able to afford
INSERT PRODUCT/BRAND NAME. (S)
My life would be better if I was able to always purchase the INSERT
PRODUCT/BRAND NAME. (H)
Buying theINSERT PRODUCT/BRAND NAME gives me a lot of pleasure. (C)
I'd be happier if I could afford to buy the INSERT PRODUCT/BRAND NAME more
often. (H)
The INSERT PRODUCT/BRAND NAME impresses people. (S)