ICICI Securities Ltd. | Retail Equity Research
17
ICICI Securities Ltd. | Retail Equity Research December 12, 2013 MotoGaze - December, 2013 End of festive season ends short-term relief… Festive cheers end as November fails to sustain October momentum! With the festive season ending early in November this year, the positive momentum seen last month has cooled off with retail sales largely lagging wholesales. The two-wheeler segment has again managed to keep its head over water even as all other segments have shown a YoY decline with last years’ festive season ending later. On an MoM basis, the decline in numbers was expected. For November, overall industry volumes grew 1.6% YoY to ~1.78 million units. Growth was led by the two-wheeler industry (6.8% YoY growth), aided by continued growth in HMSI as production got ramped up (~44% YoY increase) and HMCL also continued to grow ~7% after a strong October. The scooter segment continued to outperform the entire industry and grew ~24% YoY while the motorcycle segment growth slowed down to 3.7% YoY. Domestic car sales continued to stay under pressure and declined ~8% YoY, even as top market leader’s domestic sales dropped only 4% YoY. The downslide for the M&HCV segment continued and the segment de-grew ~31% YoY. The LCV segment also declined ~24% YoY as industrial activity slowdown has percolated to the last mile segment. Tractor volumes have continued to remain robust due to higher MSPs and expectation of a good Rabi crop with growth returning to non-performing markets as well. Even on the exports front, there has been ~6% YoY growth in November volumes for the overall industry with the two-wheeler (2-W) segment growing ~17%. Summing up the festive season! Comparing the October-November festive season in totality over last year, overall volumes have grown 7.2% largely led by the 2-W segment, which grew 12.5%. The share of scooter volumes in the 2-W segment grew 210 bps YoY. Utility vehicles saw ~7% YoY growth in volumes largely due to newer product launches. Passenger cars, however, struggled and saw ~7% volume decline with market leader MSIL de-growing 2.5% YoY. The CV segment remained largely insulated from the festive demand and saw a continued decline in volumes. Growth largely rural centric till now; new launches to create demand now With growth till now remaining largely rural centric and the festive season largely over, the key trigger for growth is likely to be product launches. As shown by new launches this year e.g. Ecosport, Amaze and Grande i10, newer launches have helped beat the demand slowdown. With a slew of launches planned by most OEs, we expect urban demand to also pick up. However, although we remain sceptical on the immediate-term growth prospects for the passenger/commercial vehicle segments, we expect overall volumes to pick up, albeit gradually in the coming quarters. With general elections approaching, we believe the auto industry is likely to witness some relief as seen in the previous two general election years. Industry outlook With the end of the festive season, the focus will shift to new product launches. The Auto Expo in February will give an indication of the immediate product pipeline for major OEs. On a longer term basis, we remain positive on the growth prospects of the industry with a rise in incomes augmenting auto penetration levels in the country. On the basis of index performance, for November, the BSE Auto index (up 2.0%) has outperformed the BSE Sensex (down 1.7%). Among our I-direct auto-coverage, we remain bullish on frontline OEM stocks like Tata Motors DVR and Eicher Motors. Sector View Equalweight Volume performance… Company Gr. YoY(%) Hero Motocorp 5.6% Bajaj Auto -16.6% TVS Motors -9.4% Maruti Suzuki -10.7% Tata Motors -38.6% Mahindra and Mahindra -18.5% Ashok Leyland -30.5% Key players & industry volume growth -Nov’13 (%) -18.5 -30.5 -38.6 -16.6 5.6 -9.4 43.0 -10.7 -10.9 1.4 -21.0 0.0 -15.2 -19.4 -8.6 -15.1 -12.3 -20.9 -22.4 -1.1 Industry HMCL BAL TVS HMSI Maruti TML M&M Hyundai ALL YoY gr MoM gr Source: Siam Key players & industry volume growth YTD (%) -9.5 -4.7 29.3 0.9 -27.6 -2.7 3.0 3.1 -22.1 -10.2 Industry HMCL BAL TVS HMSI Maruti TML M&M Hyundai ALL Source: Siam Analyst’s name Nishant Vass [email protected] Venil Shah venil.shah@icicisecurities.com
-
Upload
independent -
Category
Documents
-
view
1 -
download
0
Transcript of ICICI Securities Ltd. | Retail Equity Research

ICICI Securities Ltd. | Retail Equity Research
December 12, 2013
MotoGaze - December, 2013
End of festive season ends short-term relief… Festive cheers end as November fails to sustain October momentum! With the festive season ending early in November this year, the positive momentum seen last month has cooled off with retail sales largely lagging wholesales. The two-wheeler segment has again managed to keep its head over water even as all other segments have shown a YoY decline with last years’ festive season ending later. On an MoM basis, the decline in numbers was expected. For November, overall industry volumes grew 1.6% YoY to ~1.78 million units. Growth was led by the two-wheeler industry (6.8% YoY growth), aided by continued growth in HMSI as production got ramped up (~44% YoY increase) and HMCL also continued to grow ~7% after a strong October. The scooter segment continued to outperform the entire industry and grew ~24% YoY while the motorcycle segment growth slowed down to 3.7% YoY. Domestic car sales continued to stay under pressure and declined ~8% YoY, even as top market leader’s domestic sales dropped only 4% YoY. The downslide for the M&HCV segment continued and the segment de-grew ~31% YoY. The LCV segment also declined ~24% YoY as industrial activity slowdown has percolated to the last mile segment. Tractor volumes have continued to remain robust due to higher MSPs and expectation of a good Rabi crop with growth returning to non-performing markets as well. Even on the exports front, there has been ~6% YoY growth in November volumes for the overall industry with the two-wheeler (2-W) segment growing ~17%.
Summing up the festive season! Comparing the October-November festive season in totality over last year, overall volumes have grown 7.2% largely led by the 2-W segment, which grew 12.5%. The share of scooter volumes in the 2-W segment grew 210 bps YoY. Utility vehicles saw ~7% YoY growth in volumes largely due to newer product launches. Passenger cars, however, struggled and saw ~7% volume decline with market leader MSIL de-growing 2.5% YoY. The CV segment remained largely insulated from the festive demand and saw a continued decline in volumes. Growth largely rural centric till now; new launches to create demand now With growth till now remaining largely rural centric and the festive season largely over, the key trigger for growth is likely to be product launches. As shown by new launches this year e.g. Ecosport, Amaze and Grande i10, newer launches have helped beat the demand slowdown. With a slew of launches planned by most OEs, we expect urban demand to also pick up. However, although we remain sceptical on the immediate-term growth prospects for the passenger/commercial vehicle segments, we expect overall volumes to pick up, albeit gradually in the coming quarters. With general elections approaching, we believe the auto industry is likely to witness some relief as seen in the previous two general election years.
Industry outlook
With the end of the festive season, the focus will shift to new product launches. The Auto Expo in February will give an indication of the immediate product pipeline for major OEs. On a longer term basis, we remain positive on the growth prospects of the industry with a rise in incomes augmenting auto penetration levels in the country. On the basis of index performance, for November, the BSE Auto index (up 2.0%) has outperformed the BSE Sensex (down 1.7%). Among our I-direct auto-coverage, we remain bullish on frontline OEM stocks like Tata Motors DVR and Eicher Motors.
Sector View
Equalweight
Volume performance… Company Gr. YoY(%)Hero Motocorp 5.6%Bajaj Auto -16.6%TVS Motors -9.4%Maruti Suzuki -10.7%Tata Motors -38.6%Mahindra and Mahindra -18.5%Ashok Leyland -30.5%
Key players & industry volume growth -Nov’13 (%)
-18.5
-30.5
-38.6
-16.6
5.6
-9.4
43.0
-10.7
-10.9
1.4
-21.0
0.0
-15.2
-19.4
-8.6
-15.1
-12.3
-20.9
-22.4
-1.1
Industry
HMCL
BAL
TVS
HMSI
Maruti
TML
M&M
Hyundai
ALL
YoY gr
MoM gr
Source: Siam
Key players & industry volume growth YTD (%)
-9.5
-4.7
29.3
0.9
-27.6
-2.7
3.0
3.1
-22.1
-10.2
Industry
HMCL
BAL
TVS
HMSI
Maruti
TML
M&M
Hyundai
ALL
Source: Siam Analyst’s name
Nishant Vass [email protected] Venil Shah [email protected]

ICICI Securities Ltd. | Retail Equity Research
Page 2
Two & three wheeler industry The two-wheeler industry saw handsome growth in November, with industry volumes growing 6.8% to ~1.4 million units. The motorcycle and scooter segments saw growth of 3.7% YoY and 24.2% YoY, respectively. Share of scooters in the two-wheeler segment has continued to grow and stands at 21.2% YTD, ~220 bps higher over last year. Among MNC players, HMSI has continued to grow aggressively with increased capacity expansion helping reduce waiting periods leading to loss of market share for domestic players like HMCL, TVS and BAL. The three-wheeler industry at 65,017 units has de-grown ~19% YoY as market leader BAL saw ~30% YoY drop in both domestic and export markets for the month.
Market share movement According to data released by the Society of Indian Automobile Manufacturers (Siam), the domestic market share of two and three-wheeler players is as below for November 2013.
Exhibit 1: Domestic market share movement in two-wheelers
18.5
42.2
13.0
18.8
7.6
15.3
41.3
11.9
22.9
8.6
15.0
41.4
11.8
23.1
8.7
0
5
10
15
20
25
30
35
40
45
Bajaj Auto Hero Motocorp TVS motor HMSI Others
(%)
Nov-12 Oct-13 Nov-13
Source: Siam, Data used is YTD
The 2-W segment has seen a bit of a turnaround in
fortunes with the festive season showing good growth.
Segment leader HMCL has shown good growth even as
aggressive competitor HMSI has gained market share with
enhanced production capacity ensuring lower waiting
periods

ICICI Securities Ltd. | Retail Equity Research
Page 3
Exhibit 2: Domestic market share movement in three-wheelers
41.0
34.7
12.6
11.8
40.6
35.0
12.3
12.2
39.9
35.2
12.5
12.4
0 5 10 15 20 25 30 35 40 45
Bajaj Auto
Piaggio
M&M
Others
(%)
Nov-12 Oct-13 Nov-13
Source: Siam, Data used is YTD
Exhibit 3: Domestic market share movement in motorcycles
25.2
52.5
5.5
11.5
21.4
51.2
5.8
15.1
21.0
51.4
5.7
15.2
0
10
20
30
40
50
60
Bajaj Auto Hero Motocorp TVS motor Honda
(%)
Nov-12 Oct-13 Nov-13
Source: Company, ICICIdirect.com Research
The domestic three-wheeler market has not been doing
well since the last quarter. Even the festive season saw
muted volumes for the segment as the overall demand
scenario remains muted
Hero MotoCorp continues to be the market leader in the
executive and economy segments. High fuel prices and an
overall reduction in discretionary spending have started to
hit this segment. The market seems to be moving in favour
of MNC OEMs like HMSI, Suzuki and Yamaha that have
shifted the focus to the economy segment

ICICI Securities Ltd. | Retail Equity Research
Page 4
Exhibit 4: Domestic market share movement in scooters/scooterettes
17.315.5
49.2
17.919.6
12.4
51.3
16.619.4
12.4
51.6
16.6
-5
5
15
25
35
45
55
Hero Motocorp TVS Motors Honda Others
(%)
Nov-12 Oct-13 Nov-13
Source: Siam, Data used is YTD
Exhibit 5: Market share movement in executive motorcycle segment*
31.624.7
61.154.7
7.3 6.312.414.3
0
10
20
30
40
50
60
70
80
90
Nov
-11
Dec-
11
Jan-
12
Feb-
12
Mar
-12
Apr-1
2
May
-12
Jun-
12
Jul-1
2
Aug-
12
Sep-
12
Oct-1
2
Nov
-12
Dec-
12
Jan-
13
Feb-
13
Mar
-13
Apr-1
3
May
-13
Jun-
13
Jul-1
3
Aug-
13
Sep-
13
Oct-1
3
(%)
Bajaj Auto Hero Motocorp TVS HMSI
Source: Siam * only top 4 two-wheeler OEMs Note: From April 2012, executive segment includes 125 cc sales
Exhibit 6: Market share movement in greater than 125 cc segment
72.9 72.3
15.913.611.2 14.1
0
10
20
30
40
50
60
70
80
90
Nov
-11
Dec-
11
Jan-
12
Feb-
12
Mar
-12
Apr-1
2
May
-12
Jun-
12
Jul-1
2
Aug-
12
Sep-
12
Oct-1
2
Nov
-12
Dec-
12
Jan-
13
Feb-
13
Mar
-13
Apr-1
3
May
-13
Jun-
13
Jul-1
3
Aug-
13
Sep-
13
Oct-1
3
(%)
Bajaj Auto (LHS) Hero Motocorp (RHS) TVS
Source: Siam *only top three vehicle two-wheeler OEMs
HMSI continues to be the clear leader in the scooter
segment. The scooter segment remains one of the fastest
growing segments in the entire automobile industry. HMCL
has continued to gain market share in the scooter segment
while TVS has continuously lost market share
The executive motorcycle segment continues to be
dominated by Hero MotoCorp. HMCL, BAL and TVS have
lost market share while HMSI has gained share handsomely

ICICI Securities Ltd. | Retail Equity Research
Page 5
Hero MotoCorp (HERHON) • After posting its highest ever monthly sales at 6.25 lakh units in
October, Hero MotoCorp’s November sales failed to carry forward the strong momentum and saw only ~6% YoY growth for the month led by the continued strength in scooter volumes
• In the motorcycle segment, overall volumes grew merely 3.7% as
the entry-level (<= 125 cc) segment has grown only 4.4% YoY for HMCL while the >125 cc segment has de-grown ~11% YoY. The scooter segment has, however, continued to perform well and registered sales of ~57,000 units, a rise of ~24% YoY
• Exports have de-grown ~32% YoY to ~10,093 units and have not
performed well this year
Exhibit 7: Volume performance (in units) Segment Nov-13 Nov-12 %chg Oct-13 %chg YTD'14 YTD'13 %chg
Motorcycles 473,265 456,179 3.7 564,565 -16.2 3,675,478 3,656,616 0.5Scooters 57,265 46,126 24.1 60,855 -5.9 455,965 350,001 30.3Total Sales 530,530 502,305 5.6 625,420 -15.2 4,131,443 4,006,617 3.1Exports(inc. above) 10,093 14,800 -31.8 11,296 -10.6 85,775 107,619 -20.3Exports (% of sales) 1.9 2.9 - 1.8 - 2.1 2.7 -Source: Company, Siam
Bajaj Auto (BAAUTO)
• Bajaj Auto’s volume performance has continued to remain under pressure as its mainly urban centric bike portfolio has continued to witness a demand slowdown. The motorcycle segment saw volumes of ~278,000 units, a decline of ~15% YoY and ~20% MoM
• The three-wheeler (3-W) segment has also seen weakness with
~30% YoY decline in volumes. Export volumes have especially seen a sharp decline as a shipment of ~7000 units was delayed due to a strike at the JNPT port, Mumbai
• The contribution of exports in volume terms stands at 36.3% YTD,
compared to 34.2% last year
Exhibit 8: Volume performance (in units)
Segment Nov-13 Nov-12 %chg Oct-13 %chg YTD'14 YTD'13 %chgMotorcycles 278,703 326,727 -14.7 348,323 -20.0 2,336,467 2,599,060 -10.13-wheelers 31,888 45,566 -30.0 37,000 -13.8 300,052 312,914 -4.1Total 2&3 wheelers 310,591 372,293 -16.6 385,323 -19.4 2,636,519 2,911,974 -9.5Exports(incl. in above) 133,731 124,115 7.7 138,022 -3.1 1,018,978 1,056,136 -3.5Exports as % of sales 43.1 33.3 35.8 - 36.3 34.2 -Source: Company, Siam
Hero MotoCorp: Sales volumes
456
484
503
447
414
442 50
245
043
140
440
956
547
3
46
5854 57 56
5357 56
60 61 58
5554
0
100
200
300
400
500
600
Nov
'12
Jan'
13
Mar
'13
May
'13
Jul'1
3
Sep'
13
Nov
'13
('000
s)
0
10
20
30
40
50
60
70
('000
s)
Motorcycles Scooters
Source: Siam, ICICIdirect.com Research Bajaj Auto: Sales volumes
327
298
301
291
267 30
130
525
524
7 279 32
4 348
279
46 46 4641
34
43
35
41
34 34
44
37
32
0
50
100
150
200
250
300
350
400
Nov
'12
Jan'
13
Mar
'13
May
'13
Jul'1
3
Sep'
13
Nov
'13
('000
s)
0
5
10
15
20
25
30
35
40
45
50
('000
s)
Two-Wheelers Three-Wheelers
Source: Siam, ICICIdirect.com Research

ICICI Securities Ltd. | Retail Equity Research
Page 6
TVS Motors (TVSSUZ) • Overall sales at ~1.6 lakh units de-grew ~9% YoY, as the moped
segment continued to witness pressure and declined ~12% YoY. Motorcycle volumes, however, declined after a good performance in the festive month and de-grew ~25% MoM while scooter sales saw a dip of ~9% MoM
• After a significant decline in volumes in October, which saw ~30%
YoY drop, the moped segment recovered slightly and grew ~21% MoM. However, this is still ~13% YoY decline
• Export markets have continued to do well for TVS with the
segment growing ~25% YTD. Three-wheeler exports at ~5000 units have been doing well and have driven the sharp growth in 3-W volumes this year
Exhibit 9: Volume performance (in units)
Segment Nov-13 Nov-12 %chg Oct-13 %chg YTD'14 YTD'13 %chgMotorcycles 61,471 65,494 -6.1 82,352 -25.4 539,535 502,415 7.4Scooters 38,331 37,470 2.3 42,124 -9.0 299,157 313,418 -4.6Mopeds 55,802 63,819 -12.6 45,797 21.8 449,133 521,388 -13.9Total 2-W Sales 155,604 171,837 -9.4 170,273 -8.6 1,287,825 1,350,992 -4.73-Wheelers 6,304 5,054 24.7 7,926 -20.5 53,393 30,058 77.6Total Sales 161,908 176,891 -8.5 178,199 -9.1 1,341,218 1,381,050 -2.9Exports(incl. in above) 25,338 20,080 26.2 18,563 36.5 197,202 157,514 25.2Exports as % of sales 16.3 11.7 10.9 - 15.3 11.7
Source: Company, Siam Honda Motorcycles and Scooters India (HMSI)
• Overall sales grew ~43% YoY as the impact of capacity ramp-up has begun taking effect. Peak capacity is still a few months away and volumes can get ramped up to ~4 million units annually in existing facilities
• Both the motorcycle and scooter segments saw strong growth but
volumes obviously fell from last month’s peak. Still, HMSI has continued to outperform the industry with strong growth momentum
• Export markets have also done well but with HMSI’s focus more
firm on the domestic markets and in a bid to reduce waiting time, the share of the export segment has remained largely steady YTD
Exhibit 10: Volume performance (in units)
Segment Nov-13 Nov-12 %chg Oct-13 %chg YTD'14 YTD'13 %chgMotorcycles 150,995 108,439 39.2 182,683 -17.3 1,136,333 837,536 35.7Scooters 168,085 114,677 46.6 193,058 -12.9 1,224,242 988,070 23.9Total Sales 319,080 223,116 43.0 375,741 -15.1 2,360,575 1,825,606 29.3Exports(incl.above) 15,500 13,723 12.9 15,659 -1.0 105,749 89,748 17.8Exports as % of sales 4.9 6.2 -129 bps 4.2 -417 bps 4.5 4.9 -44 bps
Source: Company, Siam
TVS Motors : Scooter sales volumes
65 60 65 61 62 68 67 59 58 61
83 82
61
37
30 38 31 29 30 34 39 37 36
43 42
38
64
66
69
69 71 63 59 60 52 51
63
46
56
020406080
100120140160180200
Nov
'12
Jan'
13
Mar
'13
May
'13
Jul'1
3
Sep'
13
Nov
'13
(%)
Motorcycles Scooters Mopeds
Source: Siam, ICICIdirect.com Research
HMSI: Motorcycles scooter sales volumes
122
108
106
119
109
121
123
91 121 14
8
157
163 183
129
115
111 112
120 13
2
136
138 13
1 140 15
2 166 19
3
0
50
100
150
200
250
300
350
400
Oct '
12
Dec
'12
Feb
'13
Apr '
13
Jun'
13
Aug'
13
Oct'1
3
('000
s)
Motorcycles Scooters
Source: Siam, ICICIdirect.com Research

ICICI Securities Ltd. | Retail Equity Research
Page 7
Exhibit 11: Volume trends in executive segment
80
130
180
230
280
330
380
430
May
-11
Jul-1
1
Sep-
11
Nov
-11
Jan-
12
Mar
-12
May
-12
Jul-1
2
Sep-
12
Nov
-12
Jan-
13
Mar
-13
May
-13
Jul-1
3
Sep-
13
Nov
-13
(000
's)
80
130
180
230
280
(000
's)
Bajaj Auto (LHS) Hero Motocorp (RHS)
Source: Siam volumes have been calculated with April 2009 as base with 100 Note: From April 2012, the executive segment includes 125 cc sales
Exhibit 12: Volume trends in premium segment
020406080
100120140160180200
May
-11
Jul-1
1
Sep-
11
Nov
-11
Jan-
12
Mar
-12
May
-12
Jul-1
2
Sep-
12
Nov
-12
Jan-
13
Mar
-13
May
-13
Jul-1
3
Sep-
13
Nov
-13
(000
's)
020406080100120140160180200
(000
's)
Bajaj Auto (LHS) Hero Motocorp (RHS)
Source: Siam volumes have been rebased with April 2009 as base as base with 100 Note: From April 2012, premium segment excludes 125 cc sales

ICICI Securities Ltd. | Retail Equity Research
Page 8
Four-wheeler industry
The passenger vehicles segment at 246,480 units has dropped ~11% YoY as expectations from the festive season have not materialised with even last month witnessing flattish growth. The passenger car segment de-grew ~11% YoY in October with domestic car sales at 142,849 units declining ~10% YoY. Overall exports for the PV segment at ~44,960 units de-grew ~14% YoY. The utility vehicle (UV) segment has been under pressure in the past few months, especially the older models. However, Ecosport and Duster have continued to show good traction and continued to register smart volumes. In November, the domestic segment has shown a decline of 3.4% YoY. Commercial vehicles continued to remain under pressure as a result of the decline in industrial activity. The decline was ~31% for the M&HCV segment (13.120 units). The LCV segment at 36,748 units witnessed a decline of ~24% YoY.
October saw Alto, Swift and Dzire continue to remain in
the top-3. Newly launched Nissan Terrano made it to the
top-20, even as Honda Amaze, Ford Ecosport, Hyundai Grand i10 continue to stay in the top-20 list
Exhibit 13: Top 20 passenger vehicles models Current Position Model Volume
Market Share Sep'13 2013
1 Maruti Alto 23,024 11.7 1 1
2 Maruti Swift 15,734 8.0 2 3
3 Maruti DZire 15,286 7.8 3 2
4 Maruti Wagon R 12,815 6.5 4 4
5 Hyundai Grand i10 11,007 5.6 5 22
6 Mahindra Bolero 8,474 4.3 6 5
7 Honda Amaze 7,598 3.9 7 13
8 Hyundai Eon 6,340 3.2 9 6
9 Maruti Ertiga 5,840 3.0 8 10
10 Maruti Omni 5,477 2.8 10 12
11 Hyundai i20 4,643 2.4 12 8
12 Tata Indica/Vista 4,510 2.3 13 11
13 Toyota Innova 4,412 2.2 11 9
14 Ford Ecosport 4,392 2.2 15 24
15 Hyundai i10 4,094 2.1 18 7
16 Hyundai Santro 3,842 2.0 23 17
17 Renault Duster 3,624 1.8 16 14
18 Mahindra Scorpio 3,594 1.8 14 16
19 Hyundai Verna 3,219 1.6 17 15
20 Nissan Terrano 2,865 1.5 22 51
Source: Company,www.bestsellingcarsblog.com, Team BHP, ICICIdirect.com Research

ICICI Securities Ltd. | Retail Equity Research
Page 9
Market share movement According to Siam, the domestic market share for passenger vehicles (PV) and commercial vehicles (CV) in November 2013 has been as follows: Exhibit 14: Domestic market share movement in passenger vehicles
38.1
14.7
12.9
11.7
3.3
19.4
40.5
15.0
8.9
10.5
3.6
21.6
40.7
15.2
8.7
10.3
3.5
21.6
0 5 10 15 20 25 30 35 40 45
Maruti
Hyundai
Tata motors
M&M
GM
Others
(%)
Nov-12 Oct-13 Nov-13
Source: Siam, Data used is YTD * passenger vehicles as per Siam include Vans like Gio, Maxximo, Eeco, Ace
Exhibit 15: Market share movement in A2 segment
35.637.8 38.8
57.154.9 55.1
0
10
20
30
40
50
60
70
Nov
-11
Dec-
11
Jan-
12
Feb-
12
Mar
-12
Apr-1
2
May
-12
Jun-
12
Jul-1
2
Aug-
12
Sep-
12
Oct-1
2
Nov
-12
Dec-
12
Jan-
13
Feb-
13
Mar
-13
Apr-1
3
May
-13
Jun-
13
Jul-1
3
Aug-
13
Sep-
13
Oct-1
3
Nov
-13
(%)
Hyundai Maruti
Source: Siam, Top two PV OEMs considered
The market share for Maruti has begun improving after the
plant lockout situation came to an end. We feel Maruti will
approach its long-term share of 40% in the market with the
addition of new diesel capacity and outperformance of its
petrol portfolio as diesel-petrol price rationalisation
happens
The A2 segment is the bread and butter category of the
passenger car segment. The segment had seen a drop in
volumes owing to a lack of options among diesel variants.
As discretionary consumption spending increases, the
segment will see a definitive improvement in volumes

ICICI Securities Ltd. | Retail Equity Research
Page 10
Exhibit 16: Domestic market share movement in commercial vehicles
13.0
19.5
56.3
11.312.1
23.7
52.2
12.012.0
24.0
52.1
11.9
0
10
20
30
40
50
60
ALL M&M Tata Motors Others
(%)
Nov-12 Oct-13 Nov-13
Source: Siam Data used is YTD
Exhibit 17: Segmental share in CVs
26.826.330.3
73.2 73.771.6
0
10
20
30
40
50
60
70
80
Dec-
11
Jan-
12
Feb-
12
Mar
-12
Apr-1
2
May
-12
Jun-
12
Jul-1
2
Aug-
12
Sep-
12
Oct-1
2
Nov
-12
Dec-
12
Jan-
13
Feb-
13
Mar
-13
Apr-1
3
May
-13
Jun-
13
Jul-1
3
Aug-
13
Sep-
13
Oct-1
3
Nov
-13
(%)
M&HCV LCV
Source: Siam
Despite a slowdown in the M&HCV segment, LCVs had
continued to buck the trend and managed to grow.
However, in the past two or three months, LCVs have also
witnessed a drop in volumes as the overall economic
scenario has shown little signs of improvement
The outperformance of the LCV segment in the past year,
coupled with a decline in the M&HCV segment has enabled
the LCV/MHCV ratio to quickly reach the 70:30 mark that is the norm in most countries

ICICI Securities Ltd. | Retail Equity Research
Page 11
Maruti Suzuki India (MARUTI)
• Maruti Suzuki reported a decline in overall volumes of ~11% YoY and ~12% MoM. Domestic demand slowdown has continued unabated with even the festive season failing to bring much cheer. Exports have also seen a sharp decline and failed to lift volumes
• Sales of Alto, Swift and Dzire have managed to hold on to top-3 positions in the domestic PV segment despite the increase in competitive intensity on new product launches. Ertiga also saw sales coming off after a strong display in October
• Exports declined ~46% YoY, ~27% sequentially to ~6,600 units
Exhibit 18: Volume performance (in units)
Segment Nov-13 Nov-12 %chg Oct-13 %chg YTD'14 YTD'13 %chgM800* 1,754 1,101 59.3 2,087 -16.0 13,261 11,107 19.4Omni, Eeco,Versa 8,021 8,650 -7.3 9,786 -18.0 64,774 76,607 -15.4Alto, Wagon-R, Zen, Swift,Ritz 54,408 59,427 -8.4 59,480 -8.5 420,600 411,753 2.1SX4, Swift Dzire 15,486 14,194 9.1 17,473 -11.4 130,364 105,289 23.8Kizashi 1 71 -98.6 0 NA 1 129 -99.2Total Passengers 79,670 83,443 -4.5 88,826 -10.3 629,000 604,885 4.0Gypsy, Vitara,Ertiga 5,840 7,439 -21.5 7,236 -19.3 39,480 55,205 -28.5Total Domestic 85,510 90,882 -5.9 96,062 -11.0 668,480 660,090 1.3Exports 6,630 12,318 -46.2 9,025 -26.5 70,767 72,478 -2.4Total Sales 92,140 103,200 -10.7 105,087 -12.3 739,247 732,568 0.9Exports as % of sales 7.2 11.9 8.6 9.6 9.9 SoSource: Company, Siam. * estimates
Tata Motors (TELCO)
• Tata Motors’ domestic volumes have gone from bad to worse with total sales of merely 40,863 units, ~38% YoY and ~21% MoM decline. Jaguar Land Rover’s performance, however, has been consistently good with growth coming from major markets like North America and China
• In the domestic business, the CV segment declined ~37% YoY, echoing the poor demand scenario. The PV segment has also been struggling and saw a decline of ~42% YoY, with both passenger cars and UVs failing to arrest the demand decline. Response to new product launches holds the key for Tata Motors in this segment
• Jaguar Land Rover has continued to post strong numbers with growth coming from both the Jaguar as well as Land Rover segments. The numbers for November will be released sometime in the next few days
Exhibit 19: Volume performance (in units) Segment Nov-13 Nov-12 %chg Oct-13 %chg YTD'14 YTD'13 %chgDomestic MHCV sales 7,601 10,344 -26.5 8,934 -14.9 79,914 104,838 -23.8Domestic LCV Sales 22,477 37,716 -40.4 28,047 -19.9 217,613 264,730 -17.8Domestic Pass.Car Sales 8,264 13,892 -40.5 11,398 -27.5 77,983 139,589 -44.1Domestic UV Sales 2,521 4,548 -44.6 3,259 -22.7 21,646 34,705 -37.6Exports 3,671 4,146 -11.5 4,712 -22.1 33,418 36,189 -7.7Total Sales 40,863 66,500 -38.6 51,638 -20.9 397,179 548,802 -27.6Jaguar Sales 6,511 6,260 4.0 7,006 -7.1 50,928 24,945 104.2Landrover Sales 32,113 28,289 13.5 29,151 10.2 216,404 163,846 32.1Total JLR Sales 38,624 34,549 11.8 36,157 6.8 267,332 188,791 41.6Source: Company, Siam *JLR data is as per estimates
Maruti Suzuki India: sales volumes
9511
411
0 120
9785 84 83 87
105
105
92
103
11.9
13.7
9.810.610.0
7.08.1
8.89.8
12.913.9
8.67.2
0
20
40
60
80
100
120
140
Nov
'12
Jan'
13
Mar
'13
May
'13
Jul'1
3
Sep'
13
Nov
'13
('000
s)
0
2
4
6
8
10
12
14
16
(%)
Total Sales Export %
Source: Siam, ICICIdirect.com Research
Tata Motors: CVs sales volume
48.1
50.9
46.0 50.8 59
.7
38.8
37.4
40.4
39.9
37.0
37.0
37.0
30.1
18.4
14.6
15.7 11.2 13
.0
12.4
11.9 12.3
11.5
12.6
13.4
14.7
10.8
0
10
20
30
40
50
60
70
80
Nov
'12
Jan'
13
Mar
'13
May
'13
Jul'1
3
Sep'
13
Nov
'13
(000
's)
CV Sales PV Sales
Jaguar Land Rover sales volume
38.2
28.9 31
.2
27.9
34.5
32.3 35
.542
.7
30.5 35
.230
.9 35.9
36.2
0
20
40
60
80
100
Oct'1
2N
ov'1
2De
c'12
Jan'
13Fe
b'13
Mar
'13
Apr'1
3M
ay'1
3Ju
n'13
Jul'1
3Au
g'13
Sep'
13Oc
t'13
(% s
hare
of t
otal
vol
umes
)
10
15
20
25
30
35
40
45
50
(000
's)
% Jaguar % LR JLR total volumes(RHS)
Source: Company, ICICIdirect.com Research:

ICICI Securities Ltd. | Retail Equity Research
Page 12
Mahindra and Mahindra (MAHMAH)
• Overall automotive volumes of M&M have been disappointing with the UV segment declining ~32% YoY, as competition from Duster and Ecosport coupled with low demand hurt volumes. Inclusive of pickups, the decline came at 22.7% YoY
• Old warhorses Bolero and Scorpio have continued to remain the volume drivers for M&M as newer products have struggled to maintain their run rates. The Verito family has seen a continued slump in volumes despite the launch of Verito Vibe. Automotive exports, however, grew ~115% on a low base of last year
• The farm equipment segment has been doing well for M&M and tractor sales have grown ~13% YoY in the domestic market on good monsoons and expectations of a good rabi crop. Tractor exports have also continued to grow with ~7% YoY increase
Ashok Leyland (ASHLEY)
• Ashok Leyland (ALL) witnessed an overall ~32% de-growth in volumes. The M&HCV segment (~44% YoY drop) saw a sharp fall in volumes while the LCV segment (~28% YoY decline) was also unable to sustain initial volumes that were seen at the launch
• With the launch of the Stile, ALL has entered the segment and will be looking to incremental volumes from products targeted towards commercial usage
• Exports have done well in the month, across segments and grown only ~3% YoY on a low base
Exhibit 20: Volume performance (in units) Segment Nov-13 Nov-12 %chg Oct-13 %chg YTD'14 YTD'13 %chgUV’s (inclusive of pick ups) 29,157 37,722 -22.7 39,396 -26.0 258,821 283,719 -8.8M & HCV 443 931 -52.4 502 -11.8 5,291 7,904 -33.1Verito+Verito Vibe 800 1,235 -35.2 890 -10.1 7,103 10,575 -32.8Total 4wheeler 30,400 39,888 -23.8 40,788 -25.5 271,215 302,198 -10.33wheeler (Champion, Alfa) 5,861 6,867 -14.6 6,999 -16.3 41,269 44,930 -8.1Total Domestic 36,261 46,755 -22.4 47,787 -24.1 312,484 347,131 -10.0
Exports 2,994 1,388 115.7 2,771 8.0 18,595 21,700 -14.3
Total Sales 39,255 48,143 -18.5 50,558 -22.4 331,079 368,831 -10.2
Exports as % of sales 7.6 2.9 5.5 5.6 5.9
Tractors - Domestic 22,343 19,757 13.1 37,532 -40.5 188,501 151,987 24.0
- Exports 776 719 7.9 731 6.2 6,722 7,472 -10.0
Total Tractors 23,119 20,476 12.9 38,263 -39.6 195,223 159,459 22.4Exports as % of tractor sales 3.4 3.5 1.9 3.4 4.7 Source: Company, Siam
Exhibit 21: Volume performance (in units) Segment Nov-13 Nov-12 %chg Oct-13 %chg YTD'14 YTD'13 %chgM&HCV Passenger 1,000 1,502 -33.4 1,169 -14.5 13,801 14,947 -7.7M&HCV Goods 1,715 3,357 -48.9 2,924 -41.3 23,787 35,271 -32.6LCV 2,260 3,138 -28.0 2,310 -2.2 18,591 22,927 -18.9Passenger Vehicles 400 0 NA 400 0.0 800 - NATotal Sales 5,375 7,997 -32.8 6,803 -21.0 56,979 73,145 -22.1Exports 672 531 26.5 640 5.0 5,745 6,212 -7.5Exports as % of sales 12.5 6.6 9.4 - 10.1 8.5Source: Company, Siam
Mahindra and Mahindra: Sales volume
48.1
45.3 49
.547
.8 51.9
41.4 43
.538
.137
.137
.9 43.3
50.6
39.3
152025303540455055
Nov
'12
Dec'
12Ja
n'13
Feb'
13M
ar'1
3Ap
r'13
May
'13
Jun'
13Ju
l'13
Aug'
13Se
p'13
Oct'1
3N
ov'1
3
(000
's)
Source: SIAM, ICICIdirect.com Research Mahindra and Mahindra: Tractor sales
20.5
14.8 19
.4
14.9 17
.3
23.2
23.6 27
.7
18.5
14.2
26.6
38.3
23.1
05
10152025303540
Nov
'12
Dec'1
2
Jan'
13
Feb'
13
Mar
'13
Apr'1
3
May
'13
Jun'
13
Jul'1
3
Aug'
13
Sep'
13
Oct'1
3
Nov
'13
(000
's)
Source: SIAM, ICICIdirect.com Research
Ashok Leyland: Total sales
7.7
7.3
10.6
10.0
14.0
7.5
7.3
7.0
8.7
7.1
7.2
6.8
5.4
0
2
4
6
8
10
12
14
16
Nov
'12
Dec'1
2
Jan'
13
Feb'
13
Mar
'13
Apr'1
3
May
'13
Jun'
13
Jul'1
3
Aug'
13
Sep'
13
Oct'1
3
Nov
'13
(000
's)
Source: Siam, ICICIdirect.com Research

ICICI Securities Ltd. | Retail Equity Research
Page 13
News & views • Honda has unveiled the fourth generation of Honda City in India,
with a diesel variant also available. The sedan will be available from January 2014. The refreshed model has an enlarged interior space, despite the length being exactly similar to the previous generation City and will compete with segment leader Verna
• The major launches and product pipelines of OEs will also be
showcased during the Auto Expo to be held in February
• Hero MotoCorp is likely to launch ~10 new products/refreshes in the next three months as it seeks to arrest the loss of market share to HMSI
• Eicher Motors has unveiled the Pro Series of trucks and buses:
comprising products in the 5-49 tonne range. There will be 11 new products in total in this Pro series. VECV, the JV with Volvo AB, will be investing ~| 700 crore in the manufacturing facility in addition to the | 1800 crore invested already in the past five years

ICICI Securities Ltd. | Retail Equity Research
Page 14
ICICIdirect.com Research Universe (Auto & Auto ancillary)
CMP M Cap(|) TP(|) Rating (| Cr) FY13E FY14E FY15E FY13E FY14E FY15E FY13E FY14E FY15E FY13E FY14E FY15E FY13E FY14E FY15E
Amara Raja (AMARAJ) 357 380 Hold 6,099 16.8 22.6 27.1 21.3 15.8 13.2 11.2 9.0 7.0 33.6 36.4 35.3 27.1 28.1 26.5Apollo Tyre (APOTYR) 83 76 Hold 4,181 12.2 16.5 15.8 6.8 5.0 5.2 3.8 3.2 2.9 18.7 19.1 17.8 18.0 19.9 16.1Ashok Leyland (ASHLEY) 17 16 Hold 4,524 1.6 0.1 1.4 10.4 176.0 12.4 9.4 19.6 6.9 6.2 0.4 9.5 9.7 0.6 8.1Bajaj Auto (BAAUTO) 1,998 2,450 Buy 57,803 103.8 124.2 153.1 19.2 16.1 13.0 15.8 16.0 12.0 58.2 43.5 43.0 49.7 36.7 36.3Balkrishna Ind. (BALIND) 292 244 Sell 2,822 37.6 43.0 34.9 7.4 6.4 7.9 6.6 5.7 6.1 16.2 16.0 11.7 25.5 16.2 16.0Bharat Forge (BHAFOR) 312 281 Hold 7,261 10.6 15.6 23.2 29.3 20.0 13.4 10.5 8.5 6.5 9.1 11.9 14.6 11.0 14.2 18.0Eicher Motors (EICMOT)` 4,855 5,400 Buy 13,114 148.7 227.7 305.5 32.6 21.3 15.9 19.0 9.4 6.4 19.4 23.8 26.3 19.2 23.4 24.5Escorts (ESCORT)* 128 85 Sell 1,522 14.1 15.5 17.1 6.8 6.2 5.6 3.5 3.1 2.5 9.9 11.2 10.8 9.4 9.6 9.7Exide Industries (EXIIND) 117 123 Hold 9,979 6.1 6.8 8.2 19.1 17.3 14.3 13.0 10.5 8.8 19.6 21.0 21.9 15.3 15.1 16.2Hero Mototcorp (HERHON) 2,163 2,100 Hold 43,190 106.1 111.4 144.8 20.4 19.4 14.9 11.5 12.6 11.0 42.8 45.8 53.3 42.3 38.9 42.9JK Tyre & Ind (JKIND) 165 131 Hold 677 44.9 66.2 87.2 3.7 2.5 1.9 4.5 2.9 3.0 14.5 20.3 19.3 22.4 24.3 24.5M&M (MAHMAH) 950 1,033 Hold 56,074 51.2 58.2 61.3 18.6 16.3 15.5 11.3 10.3 9.2 22.4 20.5 19.3 22.9 21.6 19.4Maruti Suzuki (MARUTI) 1,753 1,663 Hold 52,976 79.2 97.8 118.8 22.1 17.9 14.8 9.7 7.2 5.9 11.9 14.1 15.3 12.9 13.9 14.7Motherson (MOTSUM) 279 266 Hold 16,382 11.3 12.2 20.1 24.6 22.9 13.8 12.9 7.4 5.3 11.3 23.6 29.7 19.4 26.0 33.1Tata Motors (TELCO) 378 475 Buy 111,640 31.0 47.0 60.6 12.4 8.2 6.3 5.2 3.7 3.2 23.2 24.8 25.6 26.3 27.5 28.3Bosch (MICO) 8,907 9,360 Hold 27,968 319.6 350.7 437.1 27.6 25.1 20.2 17.3 15.7 12.6 15.8 15.3 16.6 16.2 15.2 16.9
Sector / CompanyRoE (%)EPS (|) P/E (x) EV/EBITDA (x) RoCE (%)
Source: ICICIdirect.com Research *Year ending September

ICICI Securities Ltd. | Retail Equity Research
Page 15
Exhibit 22: Auto raw material index
190.3
210.0
80
100
120
140
160
180
200
220
240
Feb-
09
Jun-
09
Oct-0
9
Feb-
10
Jun-
10
Oct-1
0
Feb-
11
Jun-
11
Oct-1
1
Feb-
12
Jun-
12
Oct-1
2
Feb-
13
Jun-
13
Oct-1
3
Source: Bloomberg, Reuters, Company, ICICIdirect.com Research
Exhibit 23: Currency movements
80
90
100
110
120
130
140
150
160
Mar
-10
May
-10
Jul-1
0
Sep-
10
Nov
-10
Jan-
11
Mar
-11
May
-11
Jul-1
1
Sep-
11
Nov
-11
Jan-
12
Mar
-12
May
-12
Jul-1
2
Sep-
12
Nov
-12
Jan-
13
Mar
-13
May
-13
Jul-1
3
Sep-
13
Nov
-13
USDINR USDJPY USDEUR
Source: Company, ICICIdirect.com Research
The in-house raw material index reflects the combination of
various input materials (steel, rubber, aluminium, plastics)
for OEMs, which have February 2009 as base year at 100.
The chart shows a declining trend in raw material prices,
which is a positive for the industry. The recent move in the
currency has offset the impact of reduced RM prices
unless the currency appreciates. RM prices are likely to go
up for auto companies
ICICI Securities Ltd. | Retail Equity Research
Page 16
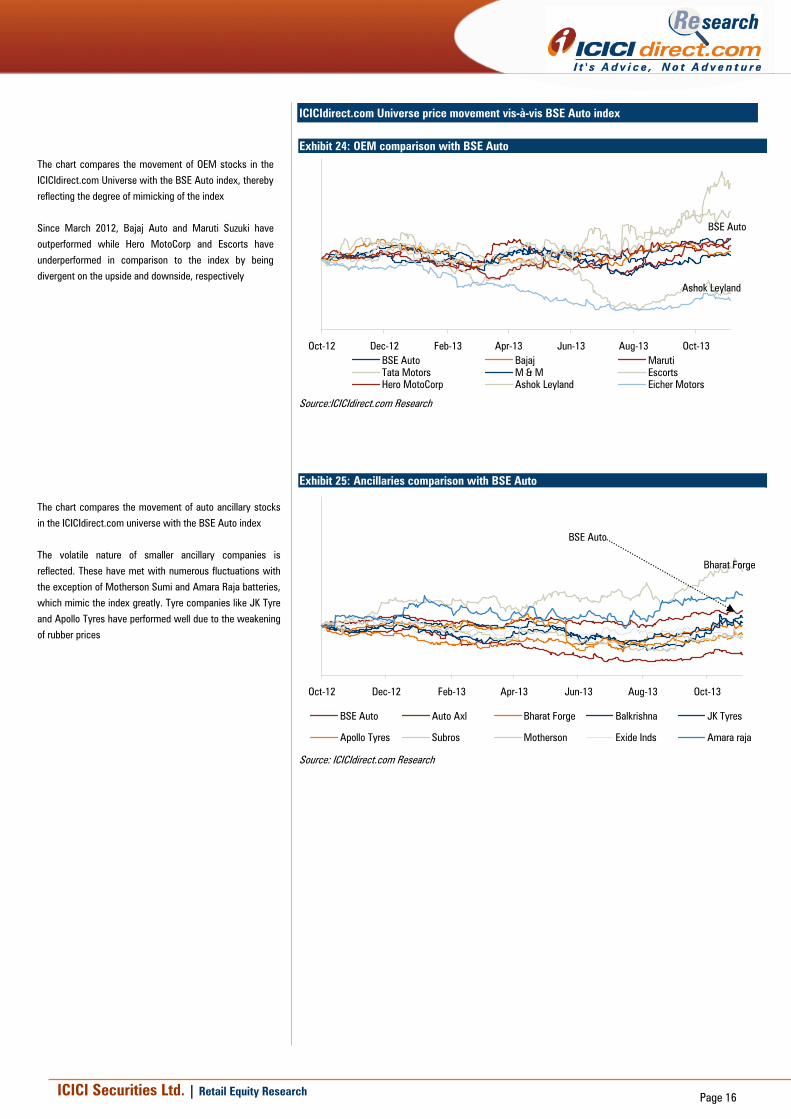
ICICIdirect.com Universe price movement vis-à-vis BSE Auto index
Exhibit 24: OEM comparison with BSE Auto
BSE Auto
Ashok Leyland
Oct-12 Dec-12 Feb-13 Apr-13 Jun-13 Aug-13 Oct-13BSE Auto Bajaj MarutiTata Motors M & M EscortsHero MotoCorp Ashok Leyland Eicher Motors
Source:ICICIdirect.com Research Exhibit 25: Ancillaries comparison with BSE Auto
BSE Auto
Bharat Forge
Oct-12 Dec-12 Feb-13 Apr-13 Jun-13 Aug-13 Oct-13
BSE Auto Auto Axl Bharat Forge Balkrishna JK Tyres
Apollo Tyres Subros Motherson Exide Inds Amara raja
Source: ICICIdirect.com Research
The chart compares the movement of OEM stocks in the
ICICIdirect.com Universe with the BSE Auto index, thereby
reflecting the degree of mimicking of the index
Since March 2012, Bajaj Auto and Maruti Suzuki have
outperformed while Hero MotoCorp and Escorts have
underperformed in comparison to the index by being
divergent on the upside and downside, respectively
The chart compares the movement of auto ancillary stocks
in the ICICIdirect.com universe with the BSE Auto index
The volatile nature of smaller ancillary companies is
reflected. These have met with numerous fluctuations with
the exception of Motherson Sumi and Amara Raja batteries,
which mimic the index greatly. Tyre companies like JK Tyre
and Apollo Tyres have performed well due to the weakening
of rubber prices

ICICI Securities Ltd. | Retail Equity Research
Page 17
RATING RATIONALE ICICIdirect.com endeavours to provide objective opinions and recommendations. ICICIdirect.com assigns ratings to its stocks according to their notional target price vs. current market price and then categorises them as Strong Buy, Buy, Hold and Sell. The performance horizon is two years unless specified and the notional target price is defined as the analysts' valuation for a stock. Sector view: Over weight compared to index Equal weight compared to index Under weight compared to index Index here refers to BSE 500
Pankaj Pandey Head – Research [email protected]
ICICIdirect.com Research Desk, ICICI Securities Limited, 1st Floor, Akruti Trade Centre, Road No 7, MIDC, Andheri (East) Mumbai – 400 093
ANALYST CERTIFICATION We /I, Nishant Vass MBA (FINANCE) Venil Shah MBA research analysts, authors and the names subscribed to this report, hereby certify that all of the views expressed in this research report accurately reflect our personal views about any and all of the subject issuer(s) or securities. We also certify that no part of our compensation was, is, or will be directly or indirectly related to the specific recommendation(s) or view(s) in this report. Analysts aren't registered as research analysts by FINRA and might not be an associated person of the ICICI Securities Inc.
Disclosures: ICICI Securities Limited (ICICI Securities) and its affiliates are a full-service, integrated investment banking, investment management and brokerage and financing group. We along with affiliates are leading underwriter of securities and participate in virtually all securities trading markets in India. We and our affiliates have investment banking and other business relationship with a significant percentage of companies covered by our Investment Research Department. Our research professionals provide important input into our investment banking and other business selection processes. ICICI Securities generally prohibits its analysts, persons reporting to analysts and their dependent family members from maintaining a financial interest in the securities or derivatives of any companies that the analysts cover.
The information and opinions in this report have been prepared by ICICI Securities and are subject to change without any notice. The report and information contained herein is strictly confidential and meant solely for the selected recipient and may not be altered in any way, transmitted to, copied or distributed, in part or in whole, to any other person or to the media or reproduced in any form, without prior written consent of ICICI Securities. While we would endeavour to update the information herein on reasonable basis, ICICI Securities, its subsidiaries and associated companies, their directors and employees (“ICICI Securities and affiliates”) are under no obligation to update or keep the information current. Also, there may be regulatory, compliance or other reasons that may prevent ICICI Securities from doing so. Non-rated securities indicate that rating on a particular security has been suspended temporarily and such suspension is in compliance with applicable regulations and/or ICICI Securities policies, in circumstances where ICICI Securities is acting in an advisory capacity to this company, or in certain other circumstances.
This report is based on information obtained from public sources and sources believed to be reliable, but no independent verification has been made nor is its accuracy or completeness guaranteed. This report and information herein is solely for informational purpose and may not be used or considered as an offer document or solicitation of offer to buy or sell or subscribe for securities or other financial instruments. Though disseminated to all the customers simultaneously, not all customers may receive this report at the same time. ICICI Securities will not treat recipients as customers by virtue of their receiving this report. Nothing in this report constitutes investment, legal, accounting and tax advice or a representation that any investment or strategy is suitable or appropriate to your specific circumstances. The securities discussed and opinions expressed in this report may not be suitable for all investors, who must make their own investment decisions, based on their own investment objectives, financial positions and needs of specific recipient. This may not be taken in substitution for the exercise of independent judgment by any recipient. The recipient should independently evaluate the investment risks. The value and return of investment may vary because of changes in interest rates, foreign exchange rates or any other reason. ICICI Securities and affiliates accept no liabilities for any loss or damage of any kind arising out of the use of this report. Past performance is not necessarily a guide to future performance. Investors are advised to see Risk Disclosure Document to understand the risks associated before investing in the securities markets. Actual results may differ materially from those set forth in projections. Forward-looking statements are not predictions and may be subject to change without notice.
ICICI Securities and its affiliates might have managed or co-managed a public offering for the subject company in the preceding twelve months. ICICI Securities and affiliates might have received compensation from the companies mentioned in the report during the period preceding twelve months from the date of this report for services in respect of public offerings, corporate finance, investment banking or other advisory services in a merger or specific transaction. It is confirmed that Nishant Vass MBA (FINANCE) Venil Shah MBA research analysts and the authors of this report have not received any compensation from the companies mentioned in the report in the preceding twelve months. Our research professionals are paid in part based on the profitability of ICICI Securities, which include earnings from Investment Banking and other business.
ICICI Securities or its subsidiaries collectively do not own 1% or more of the equity securities of the Company mentioned in the report as of the last day of the month preceding the publication of the research report.
It is confirmed that Nishant Vass MBA (FINANCE) Venil Shah MBA research analysts and the authors of this report or any of their family members does not serve as an officer, director or advisory board member of the companies mentioned in the report.
ICICI Securities may have issued other reports that are inconsistent with and reach different conclusion from the information presented in this report. ICICI Securities and affiliates may act upon or make use of information contained in the report prior to the publication thereof.
This report is not directed or intended for distribution to, or use by, any person or entity who is a citizen or resident of or located in any locality, state, country or other jurisdiction, where such distribution, publication, availability or use would be contrary to law, regulation or which would subject ICICI Securities and affiliates to any registration or licensing requirement within such jurisdiction. The securities described herein may or may not be eligible for sale in all jurisdictions or to certain category of investors. Persons in whose possession this document may come are required to inform themselves of and to observe such restriction.