CCL Products Ltd. - HDFC securities
21
Initiating Coverage CCL Products Ltd. 27-May-2021
-
Upload
khangminh22 -
Category
Documents
-
view
3 -
download
0
Transcript of CCL Products Ltd. - HDFC securities
CCL Products Ltd.
1
Lorem ipsum dolor sit amet, consectetuer adipiscing elit, sed diam nonummy nibh euismod tincidunt ut laoreet dolore magna aliquam erat volutpat. Ut wisi enim ad minim veniam, quis nostrud exerci tation ullamcorper suscipit lobortis nisl ut aliquip ex ea commodo consequat. Duis autem vel eum iriure dolor in hendrerit in vulputate velit esse molestie consequat, vel illum dolore eu feugiat nulla
Lorem ipsum dolor sit amet, consectetuer adipiscing elit, sed diam nonummy
nibh euismod tincidunt ut laoreet dolore magna aliquam erat volutpat. Ut wisi enim ad minim veniam,
quis nostrud exerci tation ullamcorper suscipit lobortis nisl ut aliquip ex ea commodo consequat. Duis autem vel eum iriure dolor in hendrerit in vulputate velit esse molestie consequat,
vel illum dolore eu feugiat nulla facilisis at vero eros et accumsan et iusto odio dignissim qui blandit praesent luptatum zzril delenit augue duis dolore te feugait nulla facilisi. et iusto odio dignissim qui blandit praesent luptatum zzril delenit
Initiating Coverage
CCL Products Ltd.
27-May-2021

CCL Products Ltd.
2
Industry LTP Recommendation Base Case Fair Value Bull Case Fair Value Time Horizon
Coffee Rs. 340 Buy at LTP and add on dips to Rs 289 - 295 band Rs. 376 Rs. 405 2 quarters
Our take CCL Products Ltd (CCL) is in the business of converting raw coffee beans into instant coffee granules/powder. The company is not only India’s largest coffee processor, but it has the world’s largest single location plant and has top private label instant coffee manufacturers across the globe as its clients. While prima facie it looks like a commodity conversion business, unlike tea or other commodities, coffee processing is a specialist job as the flavour and consistency has to be maintained batch after batch irrespective of the input quality or grade. Not many companies have been successful in doing this and hence, globally, coffee business has very little competition and high profitability. Worldwide CCL’s coffee is being consumed at the rate of 1,000 cups per second. CCL exports its processed coffee to more than 90 countries and supports more than 250 brands with sustainable supplies — both quality and quantity. CCL has on offer more than 1000 recipes for the clients to choose from. It has a combined state-of-the-art manufacturing capacity of 35,000 MTPA, which is spread over Duggirala (Guntur District of AP), Kuvvakolli (Chittoor District, AP), Switzerland, and Vietnam. Having succeeded in placing their coffee on the world markets, CCL launched its ‘Continental Coffee’ brand for the Indian market, which should act as a major growth catalyst, going ahead. With the help of its rich experience in the international markets, it has developed 250+ blends, claiming they are superior to its competitors’ blends. Valuation and recommendation CCL is amongst the largest green coffee bean processors globally. It is India’s largest exporter of instant coffee (38% market share) and world’s leading supplier to private labels (~10% market share). Over the past two decades, it has increased its capacity by 10x without diluting equity and has also managed to keep its debt in check. Its business model is strong and robust, by virtue of it being a sticky business; it has the best-in-class technology, superior economies of scale and resilient margins. The company posted the highest-ever EBITDA margin in FY20 (~25, fell marginally to 24% in FY21); we believe this would sustain with increasing contribution of freeze-dried coffee, small packs, and focus on B2C business. The ongoing capacity expansions in Vietnam and India are slated to be completed by Q2FY22. The company is already planning to add further capacities in Vietnam to the tune of ~10,000 MT in the near term which is aligned with its long term goal of attaining capacity level of 50,000-55,000 MT by FY24. With enhanced revenue growth visibility, the stock is likely to rerate if the company continues to maintain a strong margin profile. Free cash flow generation is likely to be steady and return
HDFC Scrip Code CCLROEQNR
BSE Code 519600
NSE Code CCL
Bloomberg CCL IN
CMP May 26, 2021 340
Equity Capital (cr) 26.6
Face Value (Rs) 2
Eq- Share O/S(cr) 13.3
Market Cap (Rscr) 4524
Book Value (Rs) 82
Avg.52 Wk Volume 325442
52 Week High 360
52 Week Low 174
Share holding Pattern % (Mar 31, 2021)
Promoters 46.19
Institutions 26.62
Non Institutions 27.19
Total 100.0
Fundamental Research Analyst Harsh Sheth [email protected]

CCL Products Ltd.
3
ratios are bound to improve with higher profitability and better utilisation. The promoters have increased their stake in the company from 45.28% in Sept 2019 to 46.19% in Sept 2020 by creeping acquisition. We recommend a BUY on the stock at LTP and add further on dips to 289-295 band for a base case target of Rs. 376 (20xFY23E EPS) and a bull case target of Rs. 405 (21.5xFY23E EPS).
Financial Summary (Rs Cr)
Particulars (Rs cr) Q4FY21 Q4FY20 YoY-% Q3FY21 QoQ-% FY19 FY20 FY21 FY22E FY23E
Net Revenues 332 265 25.28 300 10.67 1081 1139 1242 1379 1502
EBITDA 85 71 19.71 72 18.06 245 286 298 359 397
APAT 49 42 16.67 47 4.26 155 166 182 223 250
Diluted EPS (Rs) 3.70 3.17 16.71 3.54 4.52 11.6 12.5 13.7 16.8 18.8
P/E (x) 29.2 27.3 24.8 20.3 18.1
EV/EBITDA 19.7 17.1 16.4 13.2 11.6
RoE-% 19.6 18.8 18.1 19.1 18.5 (Source: Company, HDFC sec)
Q4-FY21 Result Update In Q4FY21, CCL witnessed topline growth of 25.3% Y-o-Y to Rs. 332 Cr while PAT expanded by 16.4% to Rs 49 Cr. Gross margin contracted 11bps to 58.7% on lower contribution of freeze-dried coffee (FDC) while EBITDA margin stood at 25.69% with decline of 104 Bps Y-o-Y due to higher packing costs. The capacity utilisation at the Vietnam plant, India FDC and Duggirala was 95%, 60-62% and 70-75% in FY21. The performance of FDC which was impacted in FY21 is likely to revive in FY22 with Russia and other export markets showing significant recovery. The capacity addition of 3,500MT at the Vietnam spray-dried unit is slightly delayed due to pandemic and production is expected to commence by Jul’21. The entire capacity of the agglomeration facility of 5,000MT in India is also expected to get operational by Aug’21. Long-term triggers Coffee industry: spreading the aroma Coffee is more than popular: it's ubiquitous. With over 2.25 billion cups of coffee being consumed in the world daily, it is not incorrect to say that it is the most revered beverage across the globe. There are two major types of coffee: Arabica and Robusta. The former is generally considered superior to the latter. Coffee is usually produced in developing countries and imported by developed countries.
CCL Products Ltd.
4
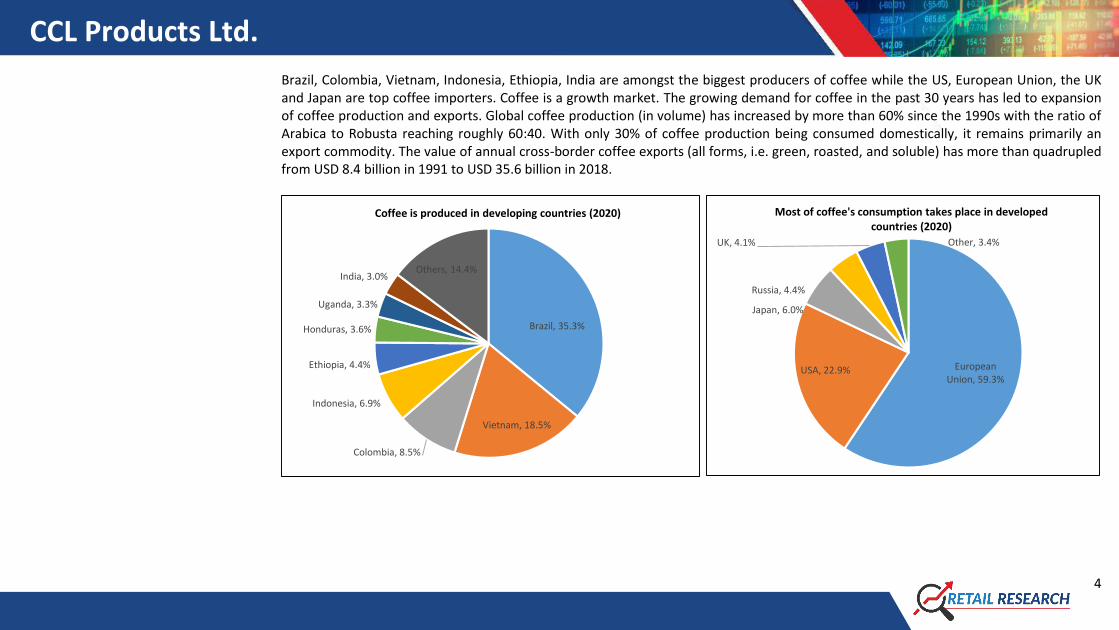
Brazil, Colombia, Vietnam, Indonesia, Ethiopia, India are amongst the biggest producers of coffee while the US, European Union, the UK and Japan are top coffee importers. Coffee is a growth market. The growing demand for coffee in the past 30 years has led to expansion of coffee production and exports. Global coffee production (in volume) has increased by more than 60% since the 1990s with the ratio of Arabica to Robusta reaching roughly 60:40. With only 30% of coffee production being consumed domestically, it remains primarily an export commodity. The value of annual cross-border coffee exports (all forms, i.e. green, roasted, and soluble) has more than quadrupled from USD 8.4 billion in 1991 to USD 35.6 billion in 2018.
Brazil, 35.3%
Vietnam, 18.5%
Colombia, 8.5%
Indonesia, 6.9%
Ethiopia, 4.4%
Honduras, 3.6%
Uganda, 3.3%
India, 3.0%Others, 14.4%
Coffee is produced in developing countries (2020)
European Union, 59.3%
USA, 22.9%
Japan, 6.0%
Russia, 4.4%
UK, 4.1% Other, 3.4%
Most of coffee's consumption takes place in developed countries (2020)

CCL Products Ltd.
5
Value chain of the coffee industry
According to Euromonitor, the size of the global instant coffee market was ~9,50,000 MTPA in 2020. Nestle and Kraft Foods together account for >50% of the market. Nestle dominates the market with 30% of the world’s total instant coffee volumes. However, there is a growing segment comprising private label instant coffees sold by other retail brand owners and supermarkets with the size of ~3,50,000 MTPA, which is also CCL’s addressable market. CCL, having ~10% global market share, is a major player in the private label instant coffee market along with Olam International, DEK, Cacique, Tata Coffee, etc. Instant coffee has become increasingly popular all over the world. Over the past decade, the share of instant coffee in total coffee consumption has increased from ~25% to ~35% whereas the share of fresh coffee (ground and roasted) has declined from ~75% to ~65%. The European Union is the largest consumer of instant coffee, followed by Russia, US, UK, Japan, etc. While the consumption has increased in low single digits in the developed countries, it has grown at >10% CAGR in the south-east Asian countries in the past decade.

CCL Products Ltd.
6
Resilient business model: a strong ‘moat’ Being focused on research and development, the company has created and commercialised unique products in the market. Right blending is crucial in the coffee processing business. Coffee manufacturing requires expertise as one has to cater to varied tastes across regions and cultures. CCL offers 250+ blends that are customized as per clients’ needs across 90 countries. This has created customer stickiness as clients like to maintain consistency in quality and taste of their products. It is the only company in the world which is offering all types of instant coffee from one location. This means customers end up saving on logistical costs while eliminating the hassle of sourcing from multiple locations/vendors. Further, CCL also has built an inhouse packaging facility, offering multiple packaging solutions which have given it a greater competitive edge. CCL has established itself by building contacts and credibility over time. Establishing a presence has not been an easy achievement and any incumbents would usually take longer in the presence of these entry barriers. Superior economies of scale: Over the past two decades, CCL has expanded its combined capacity by over 10x to 35000MT to meet the increasing demand for instant coffee globally. The company has instant coffee manufacturing capacity of 25,000MT and 10,000MT in India and Vietnam respectively. In addition to this, it has agglomeration capacity of 5,500MT/3,000MT/3,000MT in Vietnam/India/Switzerland respectively. In India, CCL had a modest capacity of 3,600 MT in FY03, which expanded over the years (to
9.6
7.26.7
6.15.5 5.4 5.3 5.2 4.9 4.8
4.3 4.2 3.9 3.8 3.7 3.7 3.6 3.4 3.4 3.3 3.2 3.1 3.1 3.1 3
Top 25 countries in per capita consumption (in Kgs)

CCL Products Ltd.
7
25,000 MT currently). Being one of the largest instant coffee producers in the world, the company enjoys cost and efficiency advantages. It also claims to hold a superior technological know-how, having sourced its equipment from Brazil, which has allowed it to use low grades of green coffee beans to produce high quality instant coffee, thus giving an edge in terms of production cost. Utilization levels over the years have improved, resulting in the company generating superior EBITDA/kg on account of positive operating leverage. The management has guided EBITDA/kg of Rs 130-135 by FY24 from ~Rs 110 in FY21 on the account of higher contribution from value added products.
Long-standing relationships: CCL is primarily a contract manufacturer for global instant coffee brand retailers or private label marketers and it has already established its longstanding presence in the international markets. The majority of CCL’s customers have been with the company for >15-20 years, many of whom entered the business only after partnering with CCL, thus demonstrating the quality of their relationship with it. Brand owners drive revenue share contributing to 50% of total revenue. The top 15 clients contribute to 60% of the revenue with Strauss Coffee being the biggest client (10% revenue share). Jacobs Douwe Egberts (JDE, second largest coffee player), LMZ Soluble Coffee, and Extrakt Caffee are some of the other big clients. The above factors (such as being the single source supplier of all forms of instant coffee) and the reducing dependency of retailers globally on Brazilian players should drive growth.
0
5000
10000
15000
20000
25000
30000
35000
40000
FY03 FY04 FY05 FY06 FY07 FY08 FY09 FY10 FY11 FY12 FY13 FY14 FY15 FY16 FY17 FY18 FY19 FY20
(in
MTP
A)
CCL has expanded its capacity by 10x over last 2 decades
364502
651 717881 932 976
1138 1081 11391242
FY11 FY12 FY13 FY14 FY15 FY16 FY17 FY18 FY19 FY20 FY21
(in
Rs.
Cr.
)
Sales have grown at ~13% CAGR since FY11

CCL Products Ltd.
8
Shielded from volatility in raw material prices: CCL follows the process of procuring raw material only after it has received its orders; hence, its margins remain stable. According to the company’s procurement policy, it places the orders for green coffee beans at spot prices and simultaneously price the contracts to clients, thus safeguarding it from any volatility in coffee prices. Given that the company operates on cost-plus model, the EBITDA in percentage terms will look amplified when prices of coffee are lower due to the ‘low-base’ effect.
Vietnam expansion: an unbeatable advantage Vietnam is the second largest producer and exporter of coffee globally. It is the largest producer of Robusta coffee. CCL was the largest importer of coffee from Vietnam for over one and half decade and so the government of Vietnam offered the company to set up a plant there. The Vietnam plant offers the following advantages: Proximity to markets: Important markets like China, Japan, Korea, etc. are in close proximity to Vietnam. Also, Vietnam enjoys the most favoured nation (MFN) status to trade with ASEAN countries with ‘nil’ or reduced duty structure. Access to raw material: With Vietnam being the largest producer, supply of raw materials is assured. CCL’s plant is located in the Dak Lak province, which is also regarded as the ‘Robusta Capital of the World’, further assuring perennial availability, low inventory requirements, and low logistics costs.
42.5%
33.4%
40.9% 40.7% 38.2%41.2% 43.4%
39.3%44.8%
50.9% 52.5%
0.0%
20.0%
40.0%
60.0%
0
50
100
150
200
250
FY11 FY12 FY13 FY14 FY15 FY16 FY17 FY18 FY19 FY20 FY21
CCL's Gross Margins have improved despite volatility in coffee prices
ICO Composite = LHS Gross Margin = RHS
CCL Products Ltd.
9
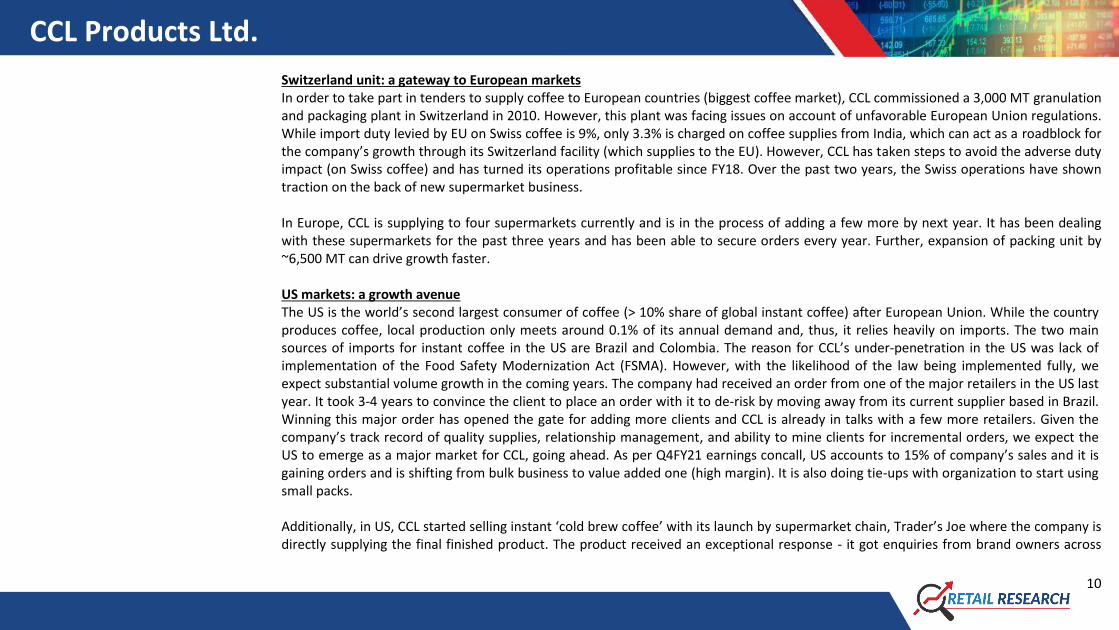
Tax breaks: When CCL commenced its operations in Vietnam, it was granted a tax break (0% tax) for five years until the end of FY18 and, post that, a tax exemption of 50% for the following nine years. However, this has now been converted to “no tax” for the entire lifetime of the company as long as it meets stipulated conditions of minimum employment, environmental governance, etc. Vietnam contributes ~25% towards the company’s topline. With further expansion set to take place, this number would only get bigger.
0
5,000
10,000
15,000
20,000
25,000
30,000
35,000
1999-00 2001-02 2003-04 2005-06 2007-08 2009-10 2011-12 2013-14 2015-16 2017-18
(in
'000
60
Kg
bag
)
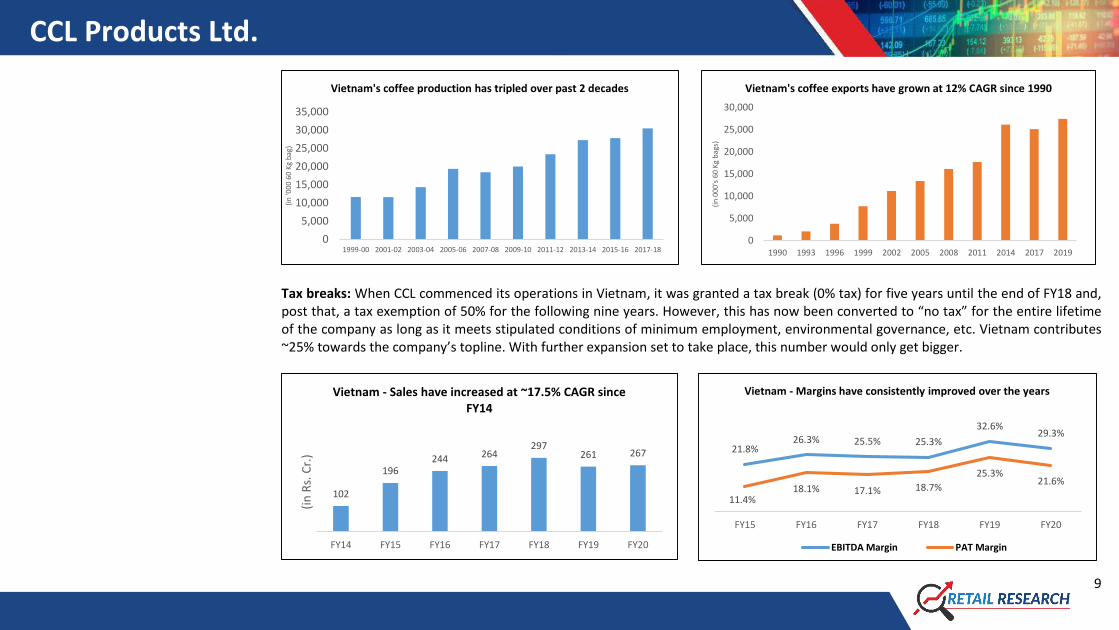
Vietnam's coffee production has tripled over past 2 decades
0
5,000
10,000
15,000
20,000
25,000
30,000
1990 1993 1996 1999 2002 2005 2008 2011 2014 2017 2019
(in
000
's 6
0 K
g b
ags)
Vietnam's coffee exports have grown at 12% CAGR since 1990
102
196244 264
297261 267
FY14 FY15 FY16 FY17 FY18 FY19 FY20
(in
Rs.
Cr.
)
Vietnam - Sales have increased at ~17.5% CAGR since FY14
21.8%26.3% 25.5% 25.3%
32.6%29.3%
11.4%18.1% 17.1% 18.7%
25.3%21.6%
FY15 FY16 FY17 FY18 FY19 FY20
Vietnam - Margins have consistently improved over the years
EBITDA Margin PAT Margin
CCL Products Ltd.
10
Switzerland unit: a gateway to European markets In order to take part in tenders to supply coffee to European countries (biggest coffee market), CCL commissioned a 3,000 MT granulation and packaging plant in Switzerland in 2010. However, this plant was facing issues on account of unfavorable European Union regulations. While import duty levied by EU on Swiss coffee is 9%, only 3.3% is charged on coffee supplies from India, which can act as a roadblock for the company’s growth through its Switzerland facility (which supplies to the EU). However, CCL has taken steps to avoid the adverse duty impact (on Swiss coffee) and has turned its operations profitable since FY18. Over the past two years, the Swiss operations have shown traction on the back of new supermarket business. In Europe, CCL is supplying to four supermarkets currently and is in the process of adding a few more by next year. It has been dealing with these supermarkets for the past three years and has been able to secure orders every year. Further, expansion of packing unit by ~6,500 MT can drive growth faster. US markets: a growth avenue The US is the world’s second largest consumer of coffee (> 10% share of global instant coffee) after European Union. While the country produces coffee, local production only meets around 0.1% of its annual demand and, thus, it relies heavily on imports. The two main sources of imports for instant coffee in the US are Brazil and Colombia. The reason for CCL’s under-penetration in the US was lack of implementation of the Food Safety Modernization Act (FSMA). However, with the likelihood of the law being implemented fully, we expect substantial volume growth in the coming years. The company had received an order from one of the major retailers in the US last year. It took 3-4 years to convince the client to place an order with it to de-risk by moving away from its current supplier based in Brazil. Winning this major order has opened the gate for adding more clients and CCL is already in talks with a few more retailers. Given the company’s track record of quality supplies, relationship management, and ability to mine clients for incremental orders, we expect the US to emerge as a major market for CCL, going ahead. As per Q4FY21 earnings concall, US accounts to 15% of company’s sales and it is gaining orders and is shifting from bulk business to value added one (high margin). It is also doing tie-ups with organization to start using small packs. Additionally, in US, CCL started selling instant ‘cold brew coffee’ with its launch by supermarket chain, Trader’s Joe where the company is directly supplying the final finished product. The product received an exceptional response - it got enquiries from brand owners across
CCL Products Ltd.
11
the world while the company received incremental orders. CCL enjoys the first mover advantage in the product as competitors could take 3-5 years to develop this product which requires substantial investments. B2C business, a lucrative opportunity CCL has always been identified as a global B2B player; however, over the past few years, the company has been increasingly focusing on its B2C play in India, given the robust growth opportunities and lucrative margins. CCL had ventured into domestic market in 2014 with the launch of Continental brand in Andhra Pradesh and Telangana. Post its successful launch, the product was rolled out in other states. Showcasing the management’s willingness to make it big in India’s instant coffee market, in 2016, Continental Coffee Private Limited, a 100% subsidiary, was setup for domestic marketing and brand building. The company has roped in professionals from top FMCG companies for this brand creation. India’s coffee industry: India has largely been a tea-drinking nation since time immemorial. However, coffee has become an increasingly popular drink since the turn of the twentieth century. India accounts for 3.14% (2019-20) of the global coffee production and is the third-largest producer and exporter of coffee in Asia, and the sixth-largest producer and fifth-largest exporter of coffee in the world. However, the production is skewed towards the southern states of Karnataka, Kerala, Tamil Nadu and Andhra Pradesh, which contribute to 99.7% (of 2,98,000 MT production in FY19-20) of India’s total produce. Likewise, southern India accounts for over 70% of domestic consumption. India’s instant coffee market is valued at ~Rs. 2,500 Cr and is growing at approximately 8% CAGR. The per capita consumption of coffee in India stands below 0.3kg, which is way below the Asian per capita consumption of over 2 kg, offering immense scope for double-digit growth, going ahead. A positive change in consumer lifestyle (specifically driven by western culture), higher disposable incomes, and the growing number of young professionals are some of the important factors that promote growth of coffee consumption in India. Additionally, increased access to coffee machines in offices and institutions triggered interest in coffee among consumers, which indirectly drove sales in households, as people began to acquire a taste and in turn started consuming coffee at home as well. The instant coffee market in India is currently duopolistic with Nestle (Nescafe & Sunrise) and HUL (Bru) competing neck to neck. Together, they both hold over 93% market share with CCL Products at No.3 position. CCL holds 3% overall and 5% market share in south India.

CCL Products Ltd.
12
Focused brand building and product innovation: CCL has stepped up its brand-building activities in order to increase the brand’s visibility. The company had spent ~Rs. 30 cr in 2020 and has guided to spend Rs.15-20 Cr in FY22 on advertisements. It has a direct reach of
95,000 outlets and aims to increase it to 1.5 lakh outlets in FY22. The company’s R&D team is constantly working on developing new products. Given the youth’s readiness to experiment with specialty coffees, it had launched 3-in-1 premixes in various flavors like Hazelnut, Cappuccino, Mocha, Caramel etc., under the brand name “THIS”. It also launched freeze-dried coffee in different flavors like coconut, spice, lemon and hazelnut to give varied options to customers in the premium segment. Continental Decaf was also launched under specialty coffees to cater to the niche market segment that prefers decaffeinated coffee.
Karnataka, 68.3%
Kerala, 22.1%
Tamil Nadu, 5.8%
Andhra Pradesh, 3.5%
Others, 0.3%
South India accounts for ~99% of India's coffee production (2020)
Karnataka, 15%
Kerala, 3%
Tamil Nadu, 36%
Andhra Pradesh, 6%
Others, 40%
South India leads the coffee consumption with 60% share (2020)

CCL Products Ltd.
13
CCL sells its products under brands ‘Continental XTRA’, ‘Continental Speciale‘, Continental Malgudi’ and ‘ Continental THIS’
Product Comparison: CCL, HUL and Nestle Type Company Brand Rs/ 100 gm
Premium Nestle Nescafe Gold 360
CCL Continental ‘Black’ 329
Pure Coffee Nestle Nescafe Classic 239
HUL Bru Gold 200
CCL Continental Speciale 200
Chicory Blended Nestle Nescafe Sunrise 149
HUL Bru Instant 145
CCL Continental XTRA 125
Filter Coffee HUL Bru Green Label 31
CCL Continental Malgudi 50
The road ahead: The domestic business of CCL contributed Rs. 150 Cr (vs Rs 90 Cr in FY20) to the topline out of which B2C business contributed ~Rs. 100 Cr in FY21 (vs Rs. 55 Cr in FY20). Further, the company sells to private label marketers such as DMart, Spencer, Big Bazaar, Reliance Retail, D’aromas, etc in addition to participating in tenders for bulk supplies to railways and army. These businesses contribute the remaining ~33% to the domestic revenues. The B2C business has grown 6x over past 4 years with contribution increasing from Rs. 8.5 Cr to Rs. 100 Cr and we expect robust growth to continue on the account of smaller base and dedicated efforts undertaken by the management. With branded business commanding superior margins, the profitability will further enhance, going ahead.
CCL Products Ltd.
14
Short-term triggers Vietnam expansion to drive the growth CCL’s capex in Vietnam is on track and the new planned capacity (3,500 MT) will commercialize by end of June 2021 which will take the total capacity in Vietnam to 13,500 MT. The growth momentum is likely to continue with a strong order book from the US and likelihood of adding a few more retailers in Europe. Despite the ongoing expansion, the company would be in a position to double its capacity from 13,500 MT within 8-10 months at lower incremental cost, given that only machinery imports and assembling need to be undertaken. Given the historical growth trend and recent headwinds, we believe company can add capacities in next 2-3 years which will essentially result in doubling of volumes. In Q4FY21 earnings concall, management has already guided to add additional 10,000 MT capacity post ongoing expansion in near term.
Branded business on growth trajectory The COVID-19 pandemic unveiled the opportunity in premix and functional coffee segments due to increase in inhouse consumption of specialty coffees. The demand for premium coffee has grown as the focus shifts to consumption of high-quality coffee. CCL, with its strong portfolio, is able to serve to the diversified needs of consumers. Also, being the manufacturer of instant coffee domestically, it has a price advantage and can be competitive in pricing vis-à-vis competing brands which have to import coffee by paying substantial duties. In FY21, the domestic business achieved revenue of Rs. 150 cr, including B2C business of Rs. 100 cr (vs Rs. 55 cr in FY20). Management has guided that, over the next 3-4 years, the focus would be to gain reasonable market share, for which it will continue its aggressive brand building. The management expects to break even in FY22 and become profitable, going ahead; however, we believe it will take a few more years before we see a meaningful contribution to the bottomline.
Lack of clarity on MEIS benefits CCL in the past has enjoyed MEIS benefits (Rs. 33 cr in FY20). Now, the government of India is replacing the existing system and from Jan 2021 onwards, a new scheme ROTDP will apply. For FY21, it has arrears of Rs. 28 Cr for 9 months (Apr’20-Dec’20) which it expects to receive in FY22. Given the company has an EOU unit as well as SEZ unit, it has applied for additional benefits. However, there is no clarity on the same or on the new scheme as the government has not formally made an announcement.
Higher margins to be sustainable CCL reported its highest-ever EBITDA margin of 25% in FY20. Though, the margins took a slight hit (104 Bps) in pandemic-struck FY21 which can be attributed to lower offtake of FDC, logistical issues/costs in Q3 and Q4 and rise in packing/transportation costs, the

CCL Products Ltd.
15
management is confident of maintaining the margin levels, going forward, facilitated by the expansion of packaging and agglomeration unit and increasing volumes from freeze drying plant (freeze dried coffee fetches 60‐70% higher realization than spray dried coffee). Further, breakeven in B2C business will enhance profitability. Additionally, we expect revenue to grow at ~10% CAGR over FY21-FY23E. Given CCL is an export-oriented company, deriving ~93% of its revenues from exports, the resurgence of COVID-19 in India is unlikely to have any major impact.
Key risks Currency volatility CCL derives ~90% of its revenue through exports, thus being exposed to currency fluctuations. However, ~75% of its raw material is also imported and hence it creates a natural hedge for all transactions taking place in US dollars.
Duty changes across operating countries CCL supplies coffee to over 90 countries from India and Vietnam. Any unfavorable change in import or export duty rates in any country or imposition of non-tariff barriers could impact the competitiveness of supply from Vietnam and/or India.
Slower ramp-up in branded business The company is cautiously expanding its Continental brand in the domestic market. Although it has been well-received so far, any adverse customer response could impact the growth prospects and financials.
717881 932 976
1138 1081 11391242
13791502
FY14 FY15 FY16 FY17 FY18 FY19 FY20 FY21 FY22E FY23E
Revenue Growth
9.0%10.7%
13.1% 13.8% 13.0% 14.3% 14.6% 14.7% 16.2% 16.7%
20.0% 19.4%22.0%
23.8%21.0%
22.7%25.1% 24.0%
26.0% 26.4%
FY14 FY15 FY16 FY17 FY18 FY19 FY20 FY21 FY22E FY23E
EBITDA and PAT Margin
PAT Margin EBITDA Margin
CCL Products Ltd.
16
Credit risk With ~95% of CCL’s business being B2B in nature, the company is exposed to credit risks. However, most of the business is repetitive and through established clientele. The company does not have record of any major bad debts in its history.
Supply chain disruptions In a year of high uncertainty in the macro environment and geopolitical relations, disruptions in the supply chain are an important risk to monitor.
Changes in export subsidies in India could affect margins The government of India has replaced the existing MEIS system from Jan 2021 onwards with a new scheme ROTDP. There is lack of clarity in terms of the impact of this change on the subsidies receivable and also on arrears for FY21. New announced scheme has not mentioned EOUs and SEZs for incentives going ahead.
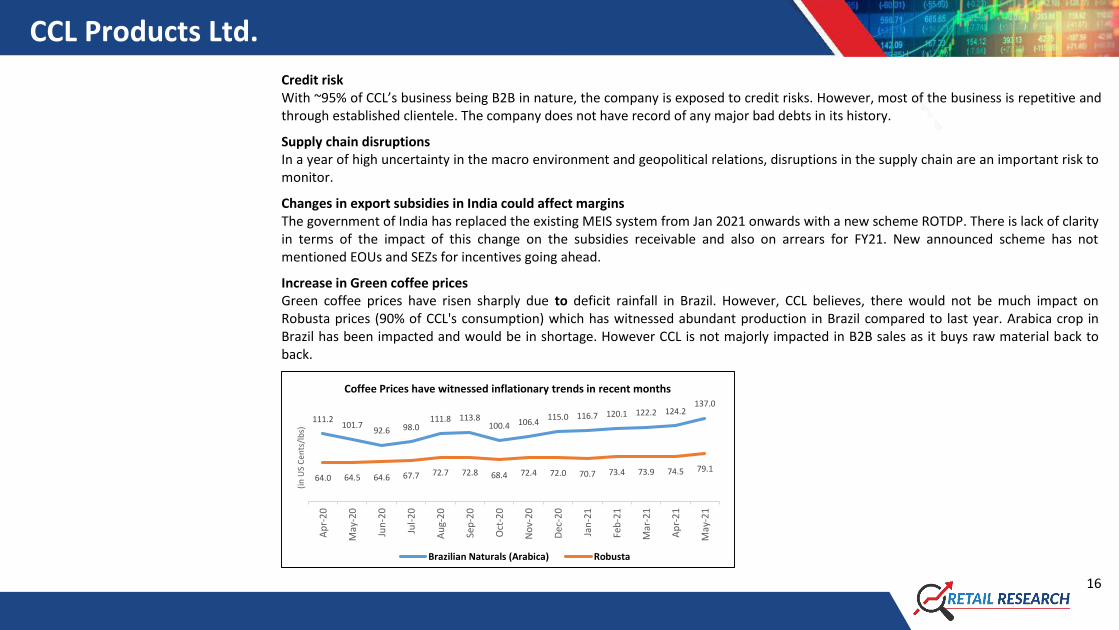
Increase in Green coffee prices Green coffee prices have risen sharply due to deficit rainfall in Brazil. However, CCL believes, there would not be much impact on Robusta prices (90% of CCL's consumption) which has witnessed abundant production in Brazil compared to last year. Arabica crop in Brazil has been impacted and would be in shortage. However CCL is not majorly impacted in B2B sales as it buys raw material back to back.
111.2101.7
92.6 98.0111.8 113.8
100.4 106.4115.0 116.7 120.1 122.2 124.2
137.0
64.0 64.5 64.6 67.7 72.7 72.8 68.4 72.4 72.0 70.7 73.4 73.9 74.5 79.1
Ap
r-2
0
May
-20
Jun
-20
Jul-
20
Au
g-2
0
Sep
-20
Oct
-20
No
v-2
0
Dec
-20
Jan
-21
Feb
-21
Mar
-21
Ap
r-2
1
May
-21
(in
US
Cen
ts/l
bs)
Coffee Prices have witnessed inflationary trends in recent months
Brazilian Naturals (Arabica) Robusta
CCL Products Ltd.
17
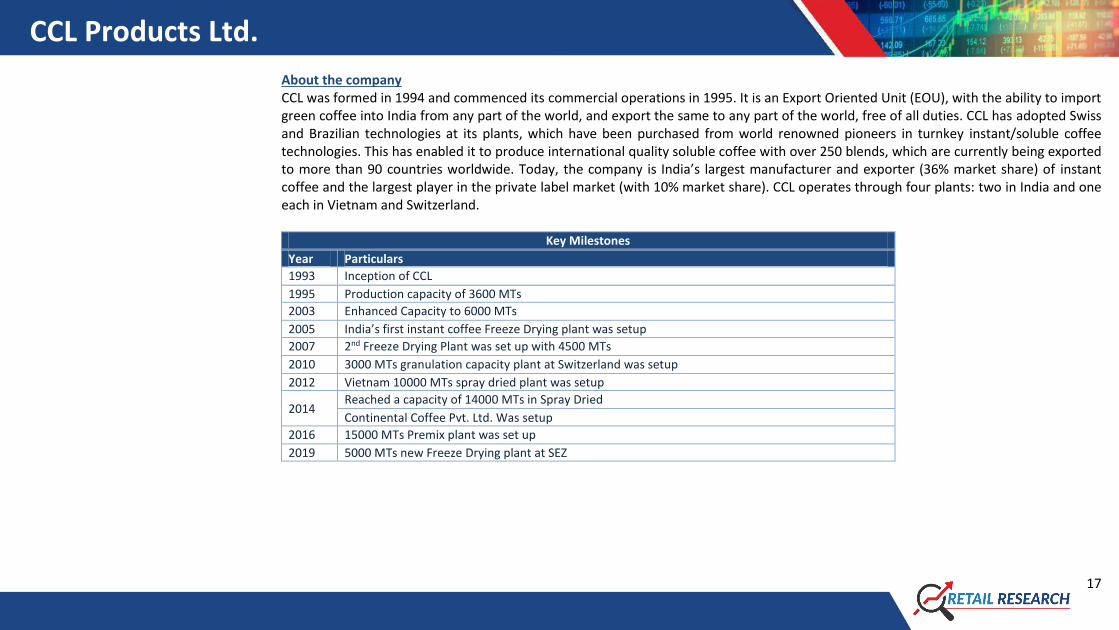
About the company CCL was formed in 1994 and commenced its commercial operations in 1995. It is an Export Oriented Unit (EOU), with the ability to import green coffee into India from any part of the world, and export the same to any part of the world, free of all duties. CCL has adopted Swiss and Brazilian technologies at its plants, which have been purchased from world renowned pioneers in turnkey instant/soluble coffee technologies. This has enabled it to produce international quality soluble coffee with over 250 blends, which are currently being exported to more than 90 countries worldwide. Today, the company is India’s largest manufacturer and exporter (36% market share) of instant coffee and the largest player in the private label market (with 10% market share). CCL operates through four plants: two in India and one each in Vietnam and Switzerland.
Key Milestones
Year Particulars
1993 Inception of CCL
1995 Production capacity of 3600 MTs
2003 Enhanced Capacity to 6000 MTs
2005 India’s first instant coffee Freeze Drying plant was setup
2007 2nd Freeze Drying Plant was set up with 4500 MTs
2010 3000 MTs granulation capacity plant at Switzerland was setup
2012 Vietnam 10000 MTs spray dried plant was setup
2014 Reached a capacity of 14000 MTs in Spray Dried
Continental Coffee Pvt. Ltd. Was setup
2016 15000 MTs Premix plant was set up
2019 5000 MTs new Freeze Drying plant at SEZ
CCL Products Ltd.
18
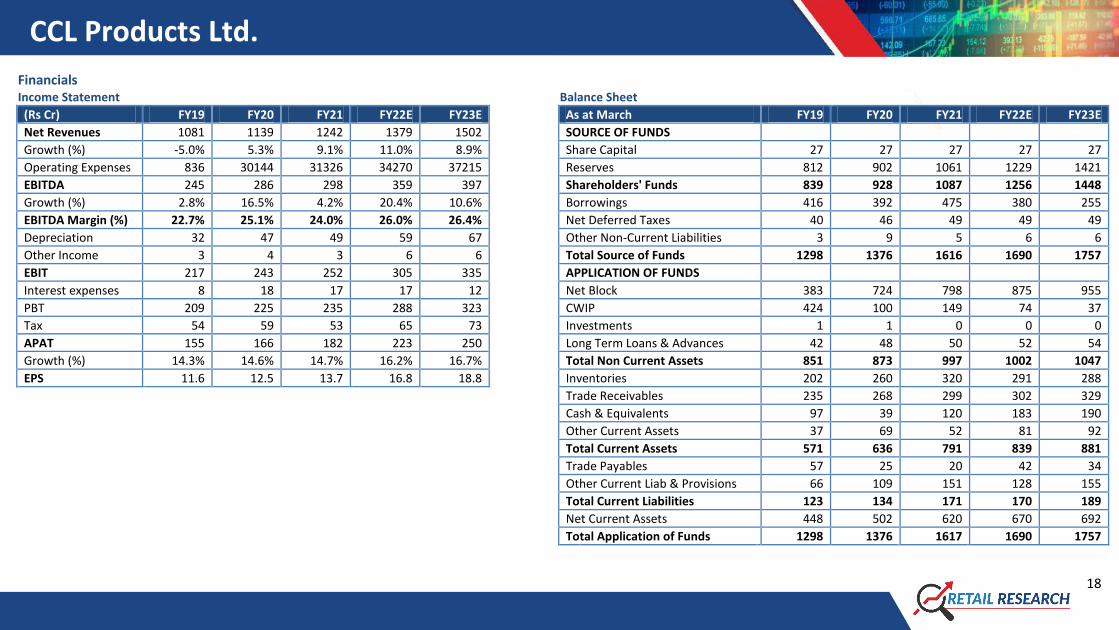
Financials Income Statement
Balance Sheet (Rs Cr) FY19 FY20 FY21 FY22E FY23E
As at March FY19 FY20 FY21 FY22E FY23E
Net Revenues 1081 1139 1242 1379 1502
SOURCE OF FUNDS
Growth (%) -5.0% 5.3% 9.1% 11.0% 8.9%
Share Capital 27 27 27 27 27
Operating Expenses 836 30144 31326 34270 37215
Reserves 812 902 1061 1229 1421
EBITDA 245 286 298 359 397
Shareholders' Funds 839 928 1087 1256 1448
Growth (%) 2.8% 16.5% 4.2% 20.4% 10.6%
Borrowings 416 392 475 380 255
EBITDA Margin (%) 22.7% 25.1% 24.0% 26.0% 26.4%
Net Deferred Taxes 40 46 49 49 49
Depreciation 32 47 49 59 67
Other Non-Current Liabilities 3 9 5 6 6
Other Income 3 4 3 6 6
Total Source of Funds 1298 1376 1616 1690 1757
EBIT 217 243 252 305 335
APPLICATION OF FUNDS
Interest expenses 8 18 17 17 12
Net Block 383 724 798 875 955
PBT 209 225 235 288 323
CWIP 424 100 149 74 37
Tax 54 59 53 65 73
Investments 1 1 0 0 0
APAT 155 166 182 223 250
Long Term Loans & Advances 42 48 50 52 54
Growth (%) 14.3% 14.6% 14.7% 16.2% 16.7%
Total Non Current Assets 851 873 997 1002 1047
EPS 11.6 12.5 13.7 16.8 18.8
Inventories 202 260 320 291 288
Trade Receivables 235 268 299 302 329
Cash & Equivalents 97 39 120 183 190
Other Current Assets 37 69 52 81 92
Total Current Assets 571 636 791 839 881
Trade Payables 57 25 20 42 34
Other Current Liab & Provisions 66 109 151 128 155
Total Current Liabilities 123 134 171 170 189
Net Current Assets 448 502 620 670 692
Total Application of Funds 1298 1376 1617 1690 1757

CCL Products Ltd.
19
Cash Flow Statement Key Ratios
(Rs Cr) FY19 FY20 FY21 FY22E FY23E
(Rs Cr) FY19 FY20 FY21 FY22E FY23E
Reported PBT 208.6 225.3 234.8 288.0 323.0
EBITDA Margin 22.7 25.1 24.0 26.0 26.4
Interest Expenses 31.7 47.1 49.4 59.4 67.1
EBIT Margin 20.1 21.4 20.3 22.1 22.3
Depreciation 45.8 65.6 53.5 74.1 78.3
APAT Margin 14.3 14.6 14.7 16.2 16.7
Working Capital Change -35.9 -147.1 -91.5 11.5 -15.7
RoE 19.6 18.8 18.1 19.1 18.5
Tax Paid -57.1 -53.5 -25.9 -64.8 -72.7
RoCE 18.8 18.9 17.5 19.1 20.1
OPERATING CASH FLOW ( a ) 161.5 90.3 170.9 308.8 312.9
Solvency Ratio
Capex -241.3 -63.8 -154.6 -80.0 -110.0
Net Debt/EBITDA (x) 1.3 1.2 1.2 0.5 0.2
Free Cash Flow -79.9 26.5 16.3 228.8 202.9
Net D/E 0.4 0.4 0.3 0.2 0.0
Investments and Others 58.0 -24.8 1.8 0.0 0.0
INVESTING CASH FLOW ( b ) -174.8 -88.4 -152.8 -80.0 -110.0
EPS 11.6 12.5 13.7 16.8 18.8
Debt Issuance / (Repaid) 105.4 52.6 90.3 -95.0 -125.0
CEPS 14.0 16.0 17.4 21.2 23.9
Interest Expenses 56.8 -40.8 155.0 -25.0 -55.0
BV 63.1 69.8 81.7 94.4 108.8
Share Capital Issuance 0.0 0.0 0.0 0.0 0.0
Dividend 3.5 4.5 2.0 4.1 4.4
Dividend -56.5 -89.8 -26.6 -54.5 -58.5
Cash Conversion Cycle (days) 142.6 186.8 203.6 169.2 163.9
Others -6.8 0.0 0.0 0.0 0.0
Debtor days 79.4 85.9 87.7 80.0 80.0
FINANCING CASH FLOW ( c ) 42.1 -37.2 63.7 -166.2 -195.9
Inventory days 88.2 111.4 123.5 104.1 95.1
NET CASH FLOW (a+b+c) 28.7 -35.3 81.8 62.6 7.0
Creditors days 24.9 10.5 7.7 14.9 11.2
VALUATION
P/E 29.2 27.3 24.8 20.3 18.1
P/BV 5.4 4.9 4.2 3.6 3.1
EV/EBITDA 19.7 17.1 16.4 13.2 11.6
EV / Revenues 4.5 4.3 3.9 3.4 3.1
Dividend Yield (%) 1.0% 1.3% 0.6% 1.2% 1.3% (Source: Company, HDFC Sec)
CCL Products Ltd.
20
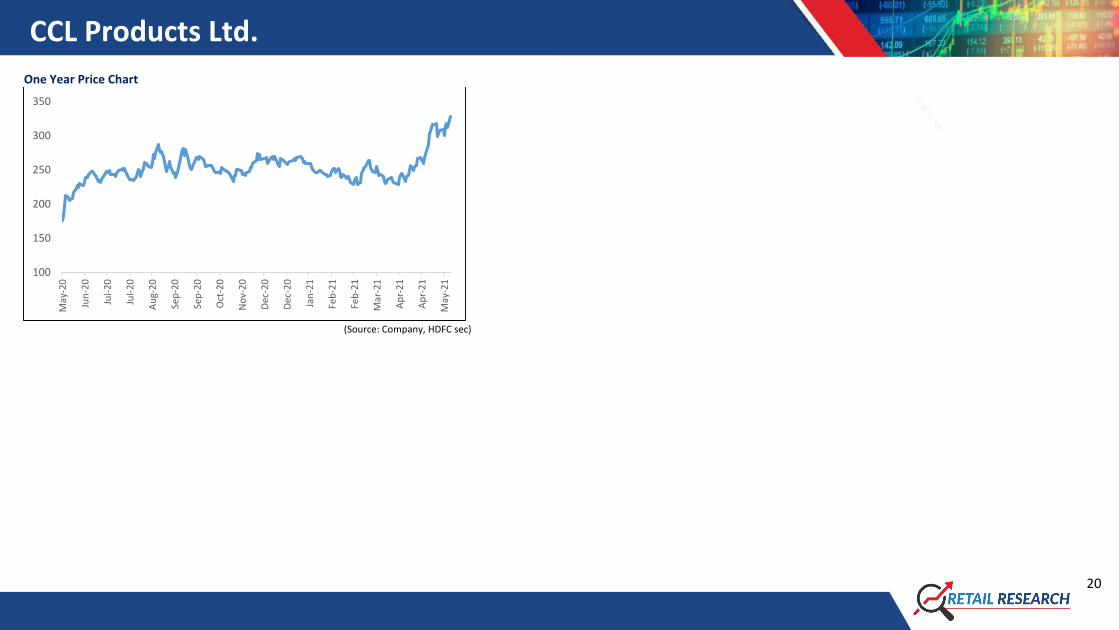
One Year Price Chart
(Source: Company, HDFC sec)
100
150
200
250
300
350
May
-20
Jun
-20
Jul-
20
Jul-
20
Au
g-2
0
Sep
-20
Sep
-20
Oct
-20
No
v-2
0
Dec
-20
Dec
-20
Jan
-21
Feb
-21
Feb
-21
Mar
-21
Ap
r-2
1
Ap
r-2
1
May
-21

CCL Products Ltd.
21
Disclosure:
I, Harsh Sheth, MCom, author and the names subscribed to this report, hereby certify that all of the views expressed in this research report accurately reflect our views about the subject issuer(s) or securities. HSL has no material adverse disciplinary history as on the date of publication of this report. We also
certify that no part of our compensation was, is, or will be directly or indirectly related to the specific recommendation(s) or view(s) in this report.
Research Analyst or his relative or HDFC Securities Ltd. does not have any financial interest in the subject company. Also Research Analyst or his relative or HDFC Securities Ltd. or its Associate may have beneficial ownership of 1% or more in the subject company at the end of the month immediately
preceding the date of publication of the Research Report. Further Research Analyst or his relative or HDFC Securities Ltd. or its associate does not have any material conflict of interest.
Any holding in stock –No
HDFC Securities Limited (HSL) is a SEBI Registered Research Analyst having registration no. INH000002475.
Disclaimer: This report has been prepared by HDFC Securities Ltd and is meant for sole use by the recipient and not for circulation. The information and opinions contained herein have been compiled or arrived at, based upon information obtained in good faith from sources believed to be reliable. Such information has not been independently verified and no guaranty, representation of warranty, express or implied, is made as to its accuracy, completeness or correctness. All such information and opinions are subject to change without notice. This document is for information purposes only. Descriptions of any company or companies or their securities mentioned herein are not intended to be complete and this document is not, and should not be construed as an offer or solicitation of an offer, to buy or sell any securities or other financial instruments. This report is not directed to, or intended for display, downloading, printing, reproducing or for distribution to or use by, any person or entity who is a citizen or resident or located in any locality, state, country or other jurisdiction where such distribution, publication, reproduction, availability or use would be contrary to law or regulation or what would subject HSL or its affiliates to any registration or licensing requirement within such jurisdiction. If this report is inadvertently sent or has reached any person in such country, especially, United States of America, the same should be ignored and brought to the attention of the sender. This document may not be reproduced, distributed or published in whole or in part, directly or indirectly, for any purposes or in any manner. Foreign currencies denominated securities, wherever mentioned, are subject to exchange rate fluctuations, which could have an adverse effect on their value or price, or the income derived from them. In addition, investors in securities such as ADRs, the values of which are influenced by foreign currencies effectively assume currency risk. It should not be considered to be taken as an offer to sell or a solicitation to buy any security. HSL may from time to time solicit from, or perform broking, or other services for, any company mentioned in this mail and/or its attachments. HSL and its affiliated company(ies), their directors and employees may; (a) from time to time, have a long or short position in, and buy or sell the securities of the company(ies) mentioned herein or (b) be engaged in any other transaction involving such securities and earn brokerage or other compensation or act as a market maker in the financial instruments of the company(ies) discussed herein or act as an advisor or lender/borrower to such company(ies) or may have any other potential conflict of interests with respect to any recommendation and other related information and opinions. HSL, its directors, analysts or employees do not take any responsibility, financial or otherwise, of the losses or the damages sustained due to the investments made or any action taken on basis of this report, including but not restricted to, fluctuation in the prices of shares and bonds, changes in the currency rates, diminution in the NAVs, reduction in the dividend or income, etc. HSL and other group companies, its directors, associates, employees may have various positions in any of the stocks, securities and financial instruments dealt in the report, or may make sell or purchase or other deals in these securities from time to time or may deal in other securities of the companies / organizations described in this report. HSL or its associates might have managed or co-managed public offering of securities for the subject company or might have been mandated by the subject company for any other assignment in the past twelve months. HSL or its associates might have received any compensation from the companies mentioned in the report during the period preceding twelve months from t date of this report for services in respect of managing or co-managing public offerings, corporate finance, investment banking or merchant banking, brokerage services or other advisory service in a merger or specific transaction in the normal course of business. HSL or its analysts did not receive any compensation or other benefits from the companies mentioned in the report or third party in connection with preparation of the research report. Accordingly, neither HSL nor Research Analysts have any material conflict of interest at the time of publication of this report. Compensation of our Research Analysts is not based on any specific merchant banking, investment banking or brokerage service transactions. HSL may have issued other reports that are inconsistent with and reach different conclusion from the information presented in this report. Research entity has not been engaged in market making activity for the subject company. Research analyst has not served as an officer, director or employee of the subject company. We have not received any compensation/benefits from the subject company or third party in connection with the Research Report. HDFC securities Limited, I Think Techno Campus, Building - B, "Alpha", Office Floor 8, Near Kanjurmarg Station, Opp. Crompton Greaves, Kanjurmarg (East), Mumbai 400 042 Phone: (022) 3075 3400 Fax: (022) 2496 5066 Compliance Officer: Binkle R. Oza Email: [email protected] Phone: (022) 3045 3600 HDFC Securities Limited, SEBI Reg. No.: NSE, BSE, MSEI, MCX: INZ000186937; AMFI Reg. No. ARN: 13549; PFRDA Reg. No. POP: 11092018; IRDA Corporate Agent License No.: CA0062; SEBI Research Analyst Reg. No.: INH000002475; SEBI Investment Adviser Reg. No.: INA000011538; CIN - U67120MH2000PLC152193 Mutual Funds Investments are subject to market risk. Please read the offer and scheme related documents carefully before investing.