ITC Limited - HDFC securities
17
1 ITC Ltd. Stock Update ITC Limited November 24, 2021
-
Upload
khangminh22 -
Category
Documents
-
view
1 -
download
0
Transcript of ITC Limited - HDFC securities

1
ITC Ltd.
Stock Update
ITC Limited
November 24, 2021
2
ITC Ltd.
Our Take: ITC Ltd: A True Indian Conglomerate ITC has a diversified presence in cigarettes, FMCG, hotels, packaging, paperboards & specialty papers and agri-business. Apart from having a near monopoly in its traditional business of cigarettes, ITC is the country's leading FMCG marketer, a clear market leader in the Indian paperboard and packaging industry, a globally acknowledged pioneer in farmer empowerment through its wide-reaching agribusiness and a pre-eminent hotelier in India - a trailblazer in 'Responsible Luxury' chain of hotels. ITC's wholly-owned subsidiary, ITC Infotech, is a specialized global digital solutions provider. Over the past decade, the company’s relatively new consumer goods business has established a vibrant portfolio of many world-class Indian brands that create and retain value. ITC's world class FMCG brands, including Aashirvaad, Sunfeast, Yippee, Bingo, B Natural, ITC Master Chef, Fabelle, Sunbean, Fiama, Engage, Vivel, Savlon, Classmate, Paperkraft, Mangaldeep and, Aim and others have garnered encouraging consumer franchise within a short span of time. While many of these brands are market leaders in their respective segments, other brands from ITC stable are making appreciable progress. The competitiveness of ITC's diverse businesses rests on the strong foundations of institutional strength derived from its deep consumer insights, cutting-edge research & development, differentiated product development capacity, brand-building capability, world-class manufacturing infrastructure, extensive rural linkages, efficient trade marketing and distribution network and dedicated human resources. The company’s ability to leverage internal synergies across its diverse businesses lends it a unique type of competitive advantage. On May 17, 2021, we had initiated coverage on the stock (Link) with a recommendation to ‘Buy at LTP and add on dips to Rs 189-195 band’ for base case fair value of Rs 228 and bull case fair value of Rs 250. The stock had achieved our base case target on September 17 and bull case target on October 13, 2021. Valuation & Recommendation: ITC stock has underperformed the sector and benchmarks over past few years due to concerns, including (1) environment social and governance (ESG) norms (leading to outflow of FPI money), (2) regulatory/competitive challenges in the core cigarette business, and (3) concerns over capital allocation. Doing a deep-dive into financials, we found that ~60% of ITC’s cashflows have been paid as dividends, while only 15% has been utilized to scale up capacities across segments, with majority deployed in the promising FMCG business, followed by hotels and paper & packaging business. The remaining portion is held as non-core investments. Paper/agri businesses are generating healthy ROCE and are capable of self-funding capex needs but hotel segment is playing a spoilsport. However, the company has developed a sizeable
Industry LTP Recommendation Base Case Fair Value Bull Case Fair Value Time Horizon
FMCG Rs.231.6 Buy in Rs 229-234 band and add more on dips in Rs 204-209 band Rs. 257 Rs. 272 2 quarters
HDFC Scrip Code ITCLTDEQNR
BSE Code 500875
NSE Code ITC
Bloomberg ITC:IN
CMP (Nov 23, 2021) 231.6
Equity Capital (Rs Cr) 1230.5
Face Value (Rs) 1
Equity Share O/S (Cr) 1230.5
Market Cap (Rs Cr) 285338
Book Value (Rs) 48.8
Avg. 52 Wk Volumes (in ‘000s) 175709
52 Week High 265
52 Week Low 188
Share holding Pattern % (Sept, 2021)
Promoters 0
Institutions 54.53
Non Institutions 45.47
Total 100.0
* Refer at the end for explanation on Risk Ratings
Fundamental Research Analyst Harsh Sheth

3
ITC Ltd.
footprint in hotels and the management has noted that it will henceforth go asset light for hotels, where the focus would now be on managed properties. In FMCG business, with significant front-end investment already done to build capacities, we expect a material decline in annual organic capex here. Financial re-engineering (apart from a recent increase in dividend payout ratio to 80-85%) can unlock value: (1) de-merger of capital guzzling and low-return-generating hotels business - since incremental expansion is expected to happen through management contract route and hence may not require cash infusion from parents, and (2) listing of ITC InfoTech - revenue of Rs 2445 Cr in FY21 – since it is completely unrelated to core cigarettes business. Cross synergies and ITC’s big ambitions for FMCG may restrict any demergers here but the scaling up of the FMCG business could provide another strong FCF generating business. Strong recovery in cigarettes business, focus on profitable growth in FMCG business – With resumption of normalcy and higher mobility, we expect demand trends to improve to achieve cigarette recovery. A gradual FMCG business turnaround with improving profitability remains another important catalyst for stock outperformance over the medium term. At 14.3x Sept’23 EPS, ITC trades at a steep discount to the FMCG sector. At these valuations, there is limited downside risk, and the risk-reward ratio in the current market scenario is favorable for ITC. We feel investors can buy the stock in Rs 229-234 band (14.3x Sept’FY23E EPS) and add more on dips in Rs 204-209 band with a base case target of Rs.257 (18x Sept’FY23E EPS) and a bull case target of Rs.272 (19x Sept’23E EPS). Financial Summary
Particulars (Rs Cr) Q2FY22 Q2FY21 YoY-% Q1FY22 QoQ-% FY21 FY22E FY23E FY24E
Net Revenues 13554 11977 13.2 12959 4.6 49273 54569 59027 63573
EBITDA 4615 4061 13.7 3923 17.7 17003 20068 21508 23096
APAT 3697 3232 14.4 3014 22.7 13383 15555 16935 18206
Diluted EPS (Rs) 3.0 2.6 14.4 2.4 22.7 10.9 12.6 13.8 14.8
P/E (x) 21.3 18.3 16.8 15.7
EV/EBITDA 15.0 12.6 11.7 10.8
RoCE-% 37.7 44.3 47.6 50.8 (Source: Company, HDFC sec)
Q2FY22 Result Update ITC delivered an in-line revenue growth, with a few positives in key segments. Revenue was up 12% YoY with cigarettes/FMCG/hotels/agri/paper growing 11/3/254/-7/25% YoY. Cigarette revenue growth was 10%, with volume growth of 9.5%. Given the positive growth rate for cigarette volumes and potential for price hikes, we expect a sustainable cigarette recovery in H2FY22. Cigarette EBIT growth was at 10%. FMCG business registered steady 6% growth and clocked 11% two-year CAGR. FMCG EBITDA margin was at 10%
4
ITC Ltd.
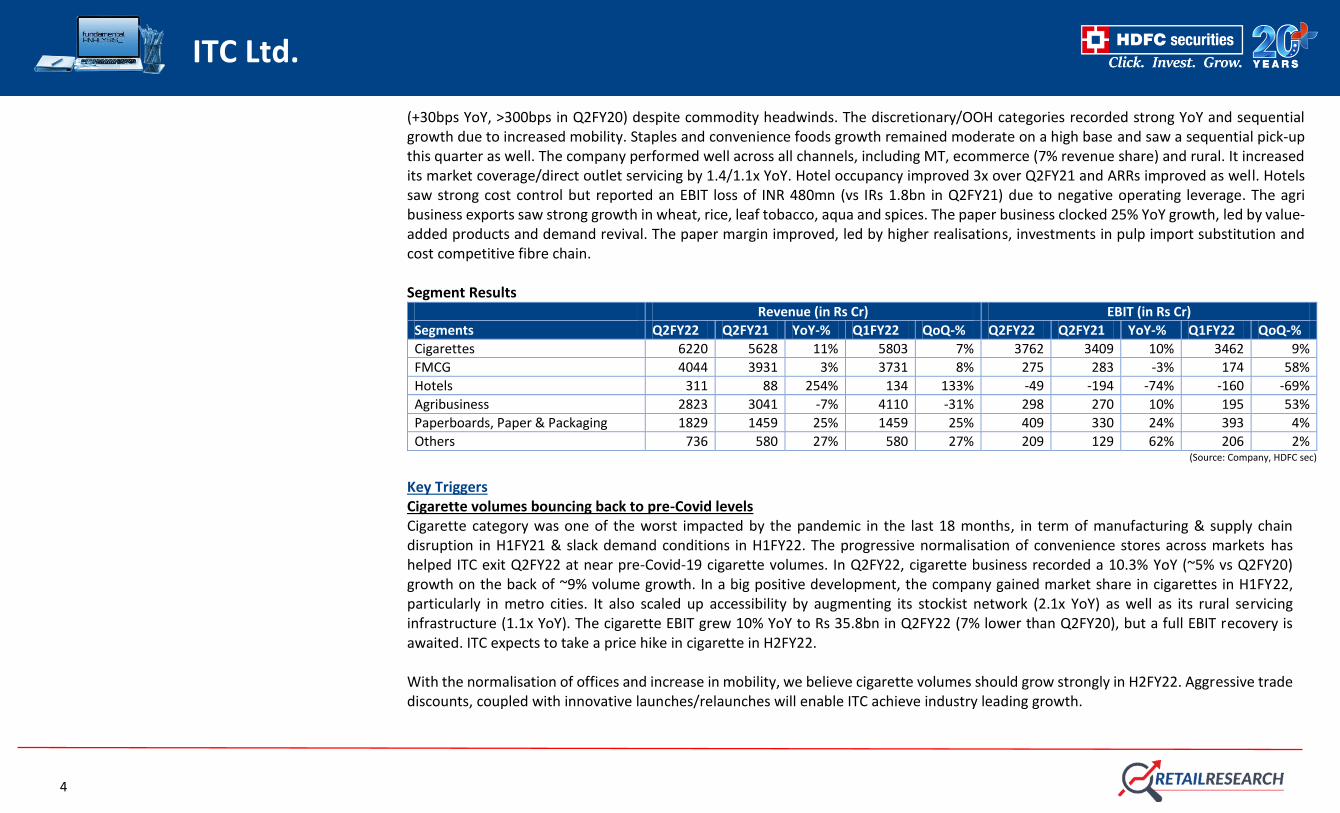
(+30bps YoY, >300bps in Q2FY20) despite commodity headwinds. The discretionary/OOH categories recorded strong YoY and sequential growth due to increased mobility. Staples and convenience foods growth remained moderate on a high base and saw a sequential pick-up this quarter as well. The company performed well across all channels, including MT, ecommerce (7% revenue share) and rural. It increased its market coverage/direct outlet servicing by 1.4/1.1x YoY. Hotel occupancy improved 3x over Q2FY21 and ARRs improved as well. Hotels saw strong cost control but reported an EBIT loss of INR 480mn (vs IRs 1.8bn in Q2FY21) due to negative operating leverage. The agri business exports saw strong growth in wheat, rice, leaf tobacco, aqua and spices. The paper business clocked 25% YoY growth, led by value-added products and demand revival. The paper margin improved, led by higher realisations, investments in pulp import substitution and cost competitive fibre chain. Segment Results
Revenue (in Rs Cr) EBIT (in Rs Cr)
Segments Q2FY22 Q2FY21 YoY-% Q1FY22 QoQ-% Q2FY22 Q2FY21 YoY-% Q1FY22 QoQ-%
Cigarettes 6220 5628 11% 5803 7% 3762 3409 10% 3462 9%
FMCG 4044 3931 3% 3731 8% 275 283 -3% 174 58%
Hotels 311 88 254% 134 133% -49 -194 -74% -160 -69%
Agribusiness 2823 3041 -7% 4110 -31% 298 270 10% 195 53%
Paperboards, Paper & Packaging 1829 1459 25% 1459 25% 409 330 24% 393 4%
Others 736 580 27% 580 27% 209 129 62% 206 2% (Source: Company, HDFC sec)
Key Triggers Cigarette volumes bouncing back to pre-Covid levels Cigarette category was one of the worst impacted by the pandemic in the last 18 months, in term of manufacturing & supply chain disruption in H1FY21 & slack demand conditions in H1FY22. The progressive normalisation of convenience stores across markets has helped ITC exit Q2FY22 at near pre-Covid-19 cigarette volumes. In Q2FY22, cigarette business recorded a 10.3% YoY (~5% vs Q2FY20) growth on the back of ~9% volume growth. In a big positive development, the company gained market share in cigarettes in H1FY22, particularly in metro cities. It also scaled up accessibility by augmenting its stockist network (2.1x YoY) as well as its rural servicing infrastructure (1.1x YoY). The cigarette EBIT grew 10% YoY to Rs 35.8bn in Q2FY22 (7% lower than Q2FY20), but a full EBIT recovery is awaited. ITC expects to take a price hike in cigarette in H2FY22. With the normalisation of offices and increase in mobility, we believe cigarette volumes should grow strongly in H2FY22. Aggressive trade discounts, coupled with innovative launches/relaunches will enable ITC achieve industry leading growth.

5
ITC Ltd.
(Source: Company, HDFC sec)
Sharp increase in cigarette taxation remains unlikely The cigarettes category remains heavily impacted by punitive and discriminatory taxation. It constitutes 9% of tobacco consumption but its contribution towards duties & taxes is 80% of the total tobacco products. On the other hand, other tobacco products (bidis, non-smoke tobacco products) contribute 91% to volumes and only 20% to duties & taxes. In the period between 2011- 12 and 2017-18, taxes on cigarettes almost trebled (on a comparable basis). In July 2017, the industry was further impacted by a sharp increase of 13% in tax incidence under the GST regime. The short period of relative stability in taxes was halted in February 2020, with a sharp increase of 13% in tax. Cigarette taxes have hit the threshold of diminishing returns, as amply demonstrated over the past decade. Whilst the Central Excise Duty rates increased by a CAGR of 15.7% between 2012-13 and 2016-17, tax revenue from cigarettes grew at merely 4.7% CAGR during the same period. The government took cognizance of the same and did not raise taxes in Budget 2021. The punitive taxes on the cigarette industry have also led to an alarming rise in illicit cigarette trade in the country. Euromonitor International ranks India as the fourth-largest illicit cigarette market globally. It is estimated that on account of illegal cigarettes alone, the revenue loss to the government is almost Rs. 15,000 Cr per annum. While legal cigarette industry volumes have declined by about 20% between 2010-11 and 2019-20, the illicit duty-evaded cigarette segment has grown 36% during the same period, accounting for about one-fourth of the domestic industry and making India one of the fastest growing illicit cigarette markets in the world.
1% 3% 4%
-1% -1%
1%
-6% -4% -3%
1%6% 8% 9%
4% 3% 2%
-10%
-35%
-12%-7%
8%
31%
10%
-40%
-30%
-20%
-10%
0%
10%
20%
30%
40%
Mar-16 Jun-16 Sep-16 Dec-16 Mar-17 Jun-17 Sep-17 Dec-17 Mar-18 Jun-18 Sep-18 Dec-18 Mar-19 Jun-19 Sep-19 Dec-19 Mar-20 Jun-20 Sep-20 Dec-20 Mar-21 Jun-21 Sep-21
Cigarette volume growth (YoY)
Cigarette business has witnessed a good recovery over past few quarters
6
ITC Ltd.
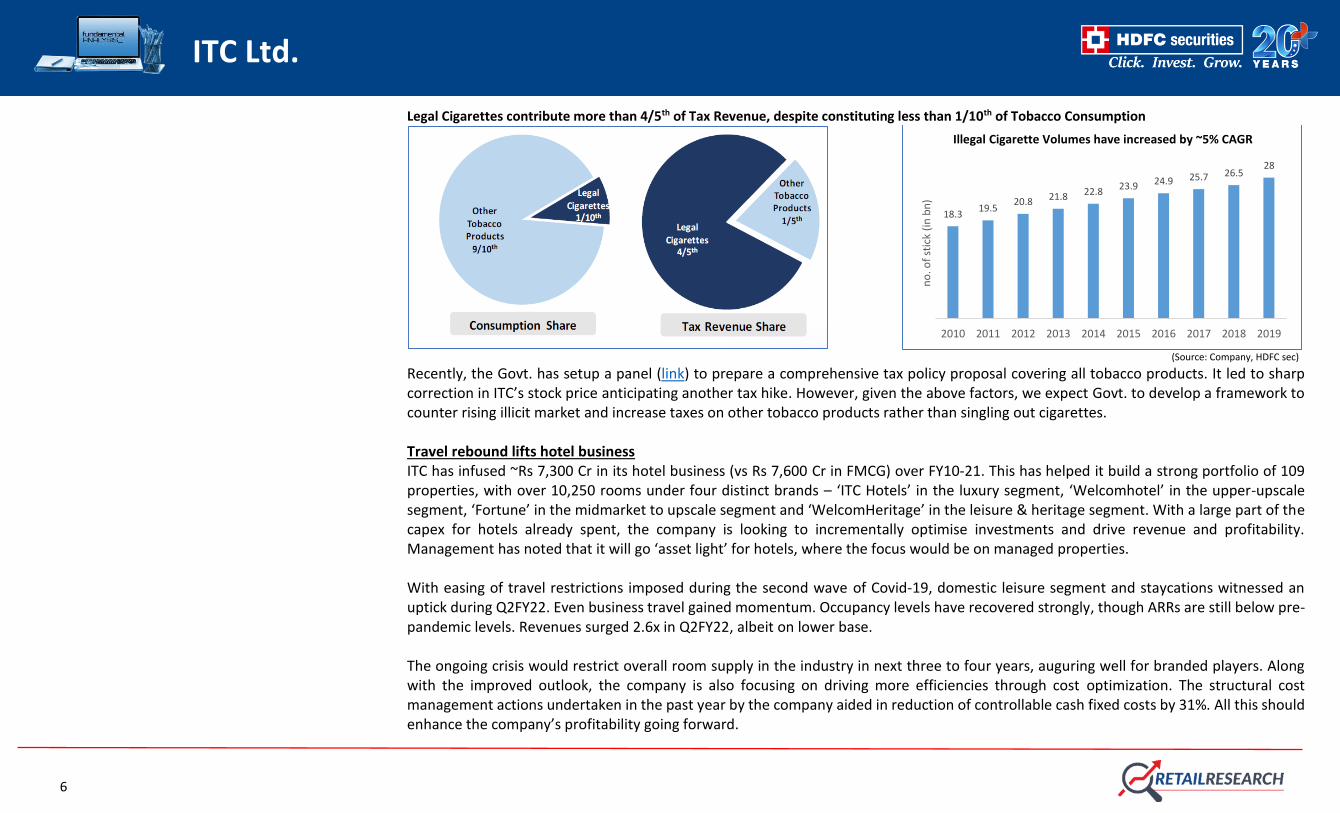
Legal Cigarettes contribute more than 4/5th of Tax Revenue, despite constituting less than 1/10th of Tobacco Consumption
(Source: Company, HDFC sec)
Recently, the Govt. has setup a panel (link) to prepare a comprehensive tax policy proposal covering all tobacco products. It led to sharp correction in ITC’s stock price anticipating another tax hike. However, given the above factors, we expect Govt. to develop a framework to counter rising illicit market and increase taxes on other tobacco products rather than singling out cigarettes. Travel rebound lifts hotel business ITC has infused ~Rs 7,300 Cr in its hotel business (vs Rs 7,600 Cr in FMCG) over FY10-21. This has helped it build a strong portfolio of 109 properties, with over 10,250 rooms under four distinct brands – ‘ITC Hotels’ in the luxury segment, ‘Welcomhotel’ in the upper-upscale segment, ‘Fortune’ in the midmarket to upscale segment and ‘WelcomHeritage’ in the leisure & heritage segment. With a large part of the capex for hotels already spent, the company is looking to incrementally optimise investments and drive revenue and profitability. Management has noted that it will go ‘asset light’ for hotels, where the focus would be on managed properties. With easing of travel restrictions imposed during the second wave of Covid-19, domestic leisure segment and staycations witnessed an uptick during Q2FY22. Even business travel gained momentum. Occupancy levels have recovered strongly, though ARRs are still below pre-pandemic levels. Revenues surged 2.6x in Q2FY22, albeit on lower base. The ongoing crisis would restrict overall room supply in the industry in next three to four years, auguring well for branded players. Along with the improved outlook, the company is also focusing on driving more efficiencies through cost optimization. The structural cost management actions undertaken in the past year by the company aided in reduction of controllable cash fixed costs by 31%. All this should enhance the company’s profitability going forward.
18.319.5
20.8 21.8 22.823.9 24.9 25.7 26.5
28
2010 2011 2012 2013 2014 2015 2016 2017 2018 2019
no
. of
stic
k (i
n b
n)
Illegal Cigarette Volumes have increased by ~5% CAGR
7
ITC Ltd.
FMCG Business - firmly on path for a profitable scale-up Over the past 20 years ITC has aggressively invested in the FMCG business (packaged food, personal care, stationery, incense sticks, safety matches) as its growth avenues for the future. Since its diversification out of cigarettes in 2001-02, ITC has expanded to have a portfolio of 25 Mother brands in various consumption categories with a total consumer spend of Rs 22,000 Cr, making it the third-largest F&B company by revenue. Of these 25 Mother brands, 9 are among the top 3 in their respective categories. The company continues to scale up this business by expanding in adjacencies, innovation, and premiumising the portfolio with value-added products. As discussed at length in our initiating coverage report (Link), ITC’s addressable market offers a 13x opportunity headroom. The management has set an ambitious target of Rs. 1,00,000 Cr revenue in FMCG business (ex-cigarettes) by 2030, which is nearly 8X its current sales (Rs. 14,757 Cr). In its latest bid to expand its FMCG business, ITC has recently forayed into fast-growing Rs 10,000 Cr breakfast category with a ready-to-cook and ready-to-mix range and staples under the household brand "Aashirvaad". ITC has also made some inorganic acquisitions to scale up the portfolio, including the Savlon brand (acquired from Johnson & Johnson group in F15 (brand size at Rs10bn in FY21 vs. Rs3bn in FY15) and more recently spice maker Sunrise Foods (FY20). The majority of the business, however, has grown organically. Significant front-end investments made in building capacities: Seeing the potential opportunity in organised foods and beverages, ITC has been aggressive over the last couple of decades in setting up capacity across this vertical. Since FY10, ITC’s FMCG business has invested ~Rs 7,600 Cr in capex, while the business only turned EBITDA positive from FY13. ITC has added nine integrated consumer goods manufacturing and logistics (ICML) facilities and is in process of setting up two more. These large facilities were built to augment ITC’s manufacturing and sourcing footprint across categories with a view to provide structural advantages, including ensuring product freshness, improving market responsiveness, reducing the cost of servicing proximal markets and providing a heightened focus on product hygiene, safety and quality. Asset turnover to improve going ahead: Once the two new ICML are completed, we expect a material decline in annual organic capex needs for the FMCG business. Along with the faster scale up of the FMCG business, this should help a recovery in asset turnover for the company. Focus on profitable growth: From a business perspective, aggressive top-line expansion with no focus on profitability seems to be a flawed strategy. However, from the perspective of ITC, we believe diversifying revenue streams was the right strategy as management has already identified emerging headwinds for its core business of cigarettes. ITC has leveraged cash from its core business to fund capacity in the FMCG business. With capacity, distribution infrastructure, brand strength and scalability in place, we think the FMCG business is perfectly positioned to drive profitability.
8
ITC Ltd.
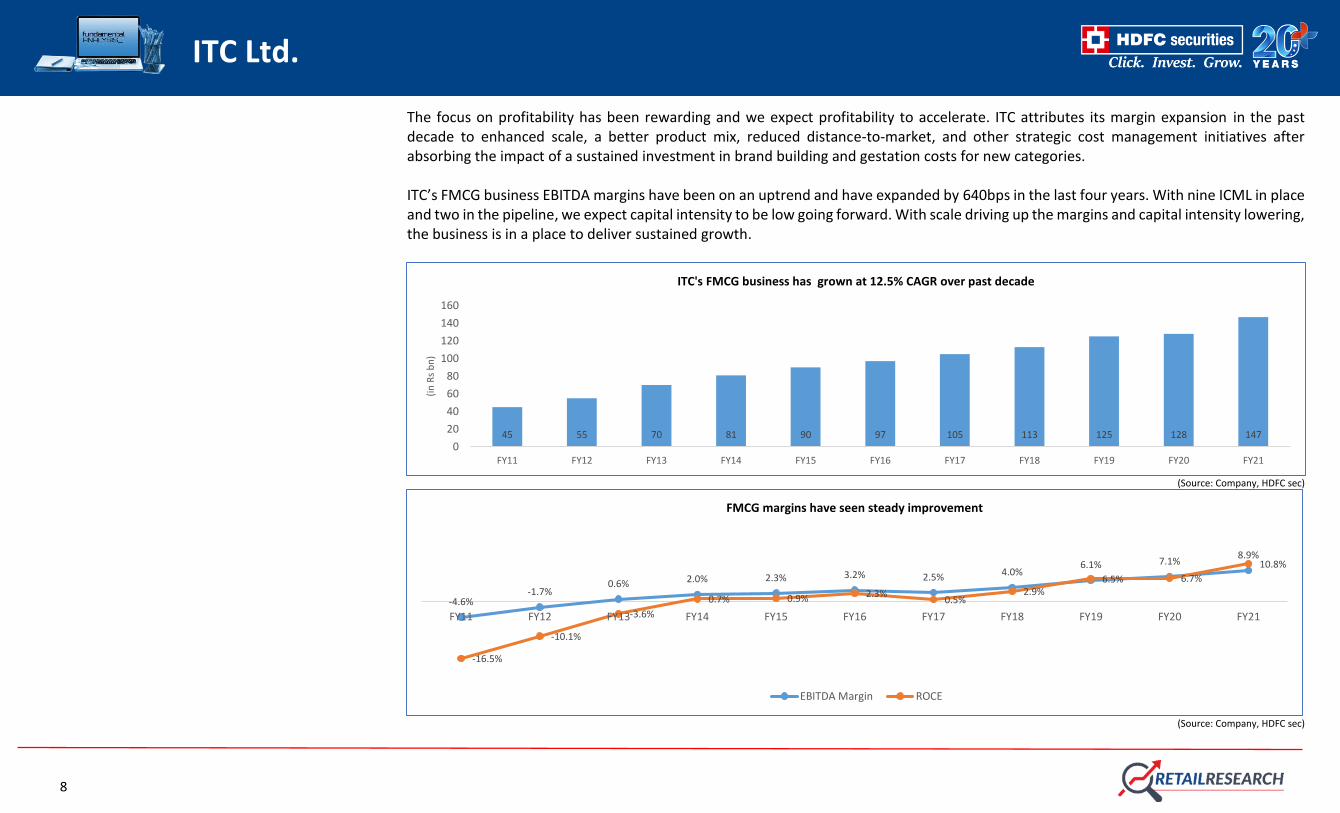
The focus on profitability has been rewarding and we expect profitability to accelerate. ITC attributes its margin expansion in the past decade to enhanced scale, a better product mix, reduced distance-to-market, and other strategic cost management initiatives after absorbing the impact of a sustained investment in brand building and gestation costs for new categories. ITC’s FMCG business EBITDA margins have been on an uptrend and have expanded by 640bps in the last four years. With nine ICML in place and two in the pipeline, we expect capital intensity to be low going forward. With scale driving up the margins and capital intensity lowering, the business is in a place to deliver sustained growth.
(Source: Company, HDFC sec)
(Source: Company, HDFC sec)
45 55 70 81 90 97 105 113 125 128 1470
20
40
60
80
100
120
140
160
FY11 FY12 FY13 FY14 FY15 FY16 FY17 FY18 FY19 FY20 FY21
(in
Rs
bn
)
ITC's FMCG business has grown at 12.5% CAGR over past decade
-4.6%-1.7%
0.6% 2.0% 2.3% 3.2% 2.5% 4.0%6.1% 7.1%
8.9%
-16.5%
-10.1%
-3.6%
0.7% 0.9% 2.3%0.5%
2.9%6.5% 6.7%
10.8%
FY11 FY12 FY13 FY14 FY15 FY16 FY17 FY18 FY19 FY20 FY21
FMCG margins have seen steady improvement
EBITDA Margin ROCE
9
ITC Ltd.
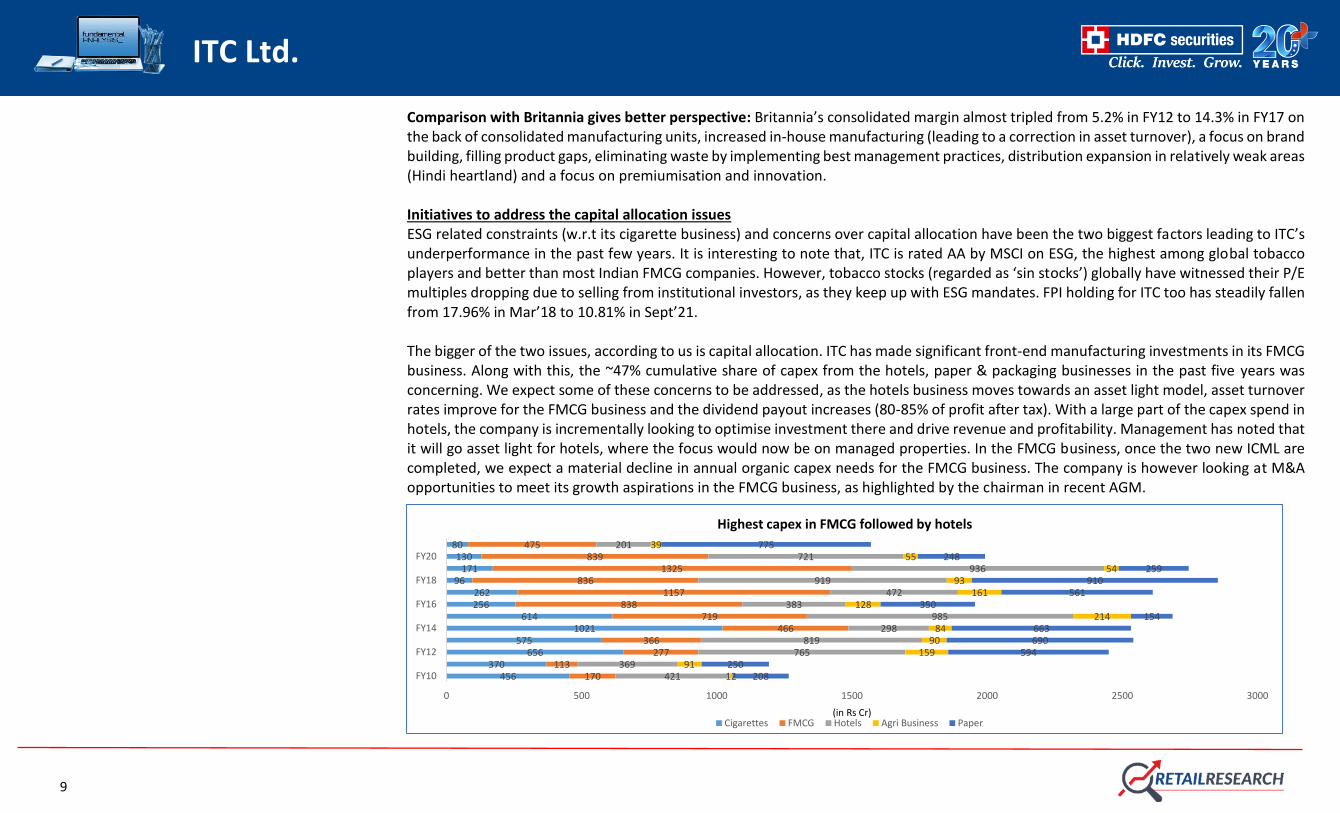
Comparison with Britannia gives better perspective: Britannia’s consolidated margin almost tripled from 5.2% in FY12 to 14.3% in FY17 on the back of consolidated manufacturing units, increased in-house manufacturing (leading to a correction in asset turnover), a focus on brand building, filling product gaps, eliminating waste by implementing best management practices, distribution expansion in relatively weak areas (Hindi heartland) and a focus on premiumisation and innovation. Initiatives to address the capital allocation issues ESG related constraints (w.r.t its cigarette business) and concerns over capital allocation have been the two biggest factors leading to ITC’s underperformance in the past few years. It is interesting to note that, ITC is rated AA by MSCI on ESG, the highest among global tobacco players and better than most Indian FMCG companies. However, tobacco stocks (regarded as ‘sin stocks’) globally have witnessed their P/E multiples dropping due to selling from institutional investors, as they keep up with ESG mandates. FPI holding for ITC too has steadily fallen from 17.96% in Mar’18 to 10.81% in Sept’21. The bigger of the two issues, according to us is capital allocation. ITC has made significant front-end manufacturing investments in its FMCG business. Along with this, the ~47% cumulative share of capex from the hotels, paper & packaging businesses in the past five years was concerning. We expect some of these concerns to be addressed, as the hotels business moves towards an asset light model, asset turnover rates improve for the FMCG business and the dividend payout increases (80-85% of profit after tax). With a large part of the capex spend in hotels, the company is incrementally looking to optimise investment there and drive revenue and profitability. Management has noted that it will go asset light for hotels, where the focus would now be on managed properties. In the FMCG business, once the two new ICML are completed, we expect a material decline in annual organic capex needs for the FMCG business. The company is however looking at M&A opportunities to meet its growth aspirations in the FMCG business, as highlighted by the chairman in recent AGM.
456370
656575
1021614
256262
96171
13080
170113
277366
466719
8381157
8361325
839475
421369
765819
298985
383472
919936
721201
1291
15990
84214
128161
9354
5539
208250
594690663
154350
561910
259248
775
0 500 1000 1500 2000 2500 3000
FY10
FY12
FY14
FY16
FY18
FY20
(in Rs Cr)
Highest capex in FMCG followed by hotels
Cigarettes FMCG Hotels Agri Business Paper
10
ITC Ltd.
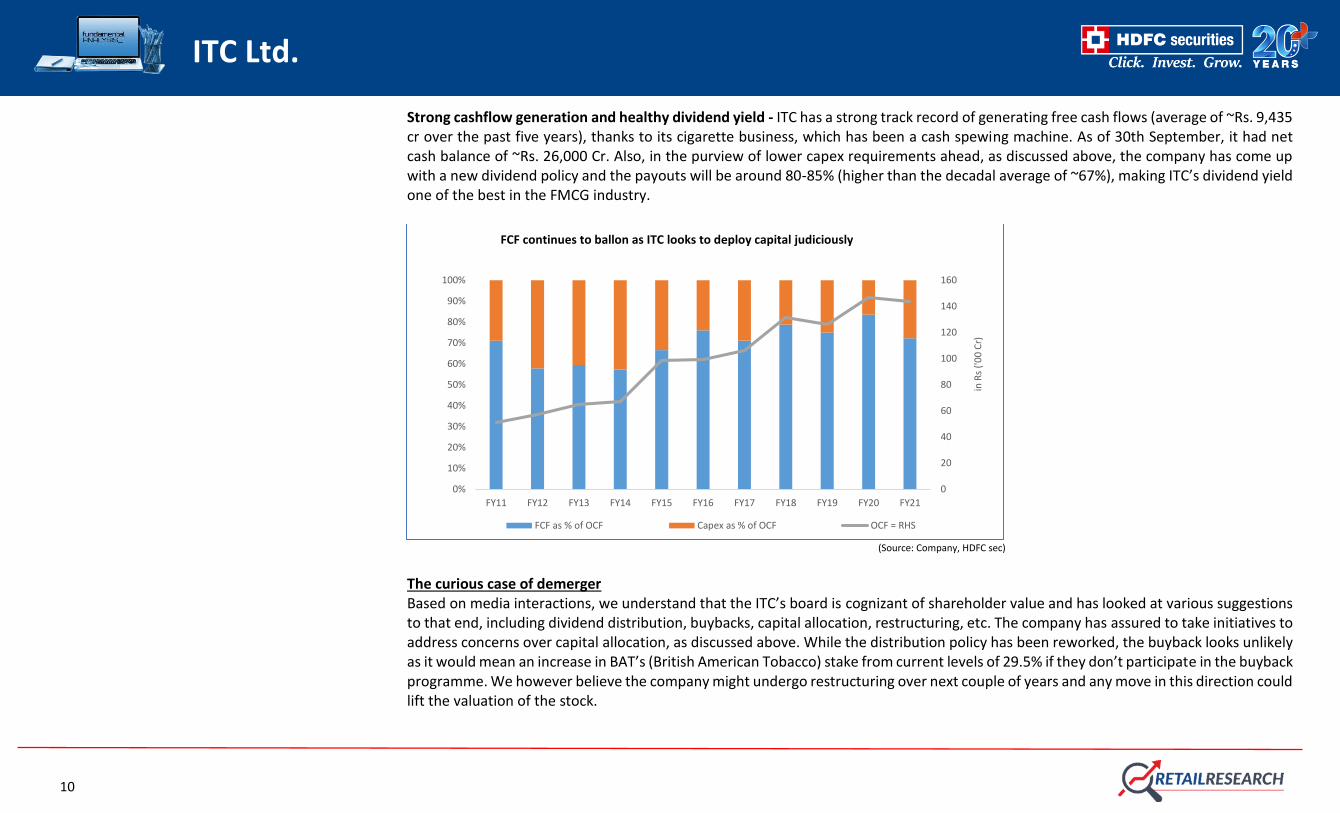
Strong cashflow generation and healthy dividend yield - ITC has a strong track record of generating free cash flows (average of ~Rs. 9,435 cr over the past five years), thanks to its cigarette business, which has been a cash spewing machine. As of 30th September, it had net cash balance of ~Rs. 26,000 Cr. Also, in the purview of lower capex requirements ahead, as discussed above, the company has come up with a new dividend policy and the payouts will be around 80-85% (higher than the decadal average of ~67%), making ITC’s dividend yield one of the best in the FMCG industry.
(Source: Company, HDFC sec)
The curious case of demerger Based on media interactions, we understand that the ITC’s board is cognizant of shareholder value and has looked at various suggestions to that end, including dividend distribution, buybacks, capital allocation, restructuring, etc. The company has assured to take initiatives to address concerns over capital allocation, as discussed above. While the distribution policy has been reworked, the buyback looks unlikely as it would mean an increase in BAT’s (British American Tobacco) stake from current levels of 29.5% if they don’t participate in the buyback programme. We however believe the company might undergo restructuring over next couple of years and any move in this direction could lift the valuation of the stock.
0
20
40
60
80
100
120
140
160
0%
10%
20%
30%
40%
50%
60%
70%
80%
90%
100%
FY11 FY12 FY13 FY14 FY15 FY16 FY17 FY18 FY19 FY20 FY21
in R
s ('
00
Cr)
FCF continues to ballon as ITC looks to deploy capital judiciously
FCF as % of OCF Capex as % of OCF OCF = RHS
11
ITC Ltd.
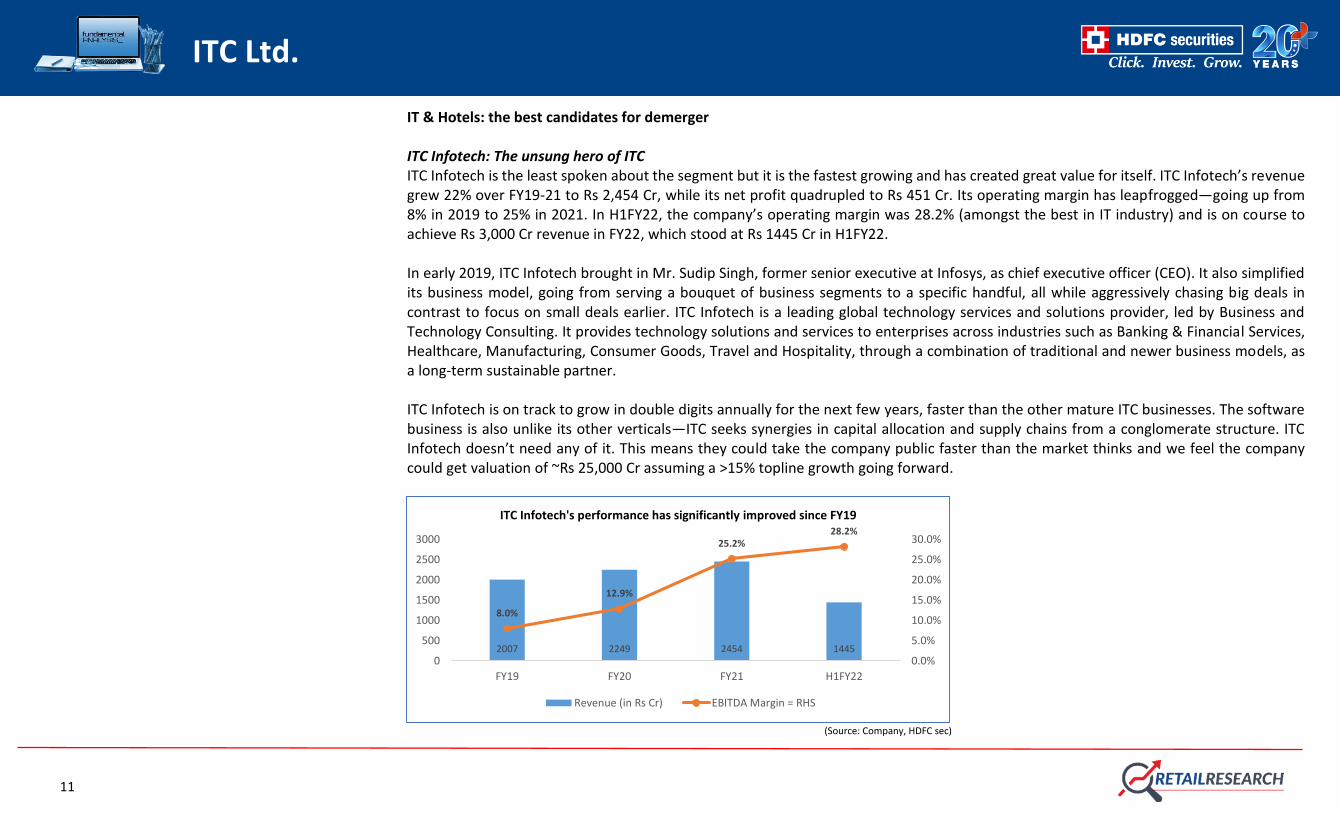
IT & Hotels: the best candidates for demerger ITC Infotech: The unsung hero of ITC ITC Infotech is the least spoken about the segment but it is the fastest growing and has created great value for itself. ITC Infotech’s revenue grew 22% over FY19-21 to Rs 2,454 Cr, while its net profit quadrupled to Rs 451 Cr. Its operating margin has leapfrogged—going up from 8% in 2019 to 25% in 2021. In H1FY22, the company’s operating margin was 28.2% (amongst the best in IT industry) and is on course to achieve Rs 3,000 Cr revenue in FY22, which stood at Rs 1445 Cr in H1FY22. In early 2019, ITC Infotech brought in Mr. Sudip Singh, former senior executive at Infosys, as chief executive officer (CEO). It also simplified its business model, going from serving a bouquet of business segments to a specific handful, all while aggressively chasing big deals in contrast to focus on small deals earlier. ITC Infotech is a leading global technology services and solutions provider, led by Business and Technology Consulting. It provides technology solutions and services to enterprises across industries such as Banking & Financial Services, Healthcare, Manufacturing, Consumer Goods, Travel and Hospitality, through a combination of traditional and newer business models, as a long-term sustainable partner. ITC Infotech is on track to grow in double digits annually for the next few years, faster than the other mature ITC businesses. The software business is also unlike its other verticals—ITC seeks synergies in capital allocation and supply chains from a conglomerate structure. ITC Infotech doesn’t need any of it. This means they could take the company public faster than the market thinks and we feel the company could get valuation of ~Rs 25,000 Cr assuming a >15% topline growth going forward.
(Source: Company, HDFC sec)
2007 2249 2454 1445
8.0%
12.9%
25.2%28.2%
0.0%
5.0%
10.0%
15.0%
20.0%
25.0%
30.0%
0
500
1000
1500
2000
2500
3000
FY19 FY20 FY21 H1FY22
ITC Infotech's performance has significantly improved since FY19
Revenue (in Rs Cr) EBITDA Margin = RHS
12
ITC Ltd.
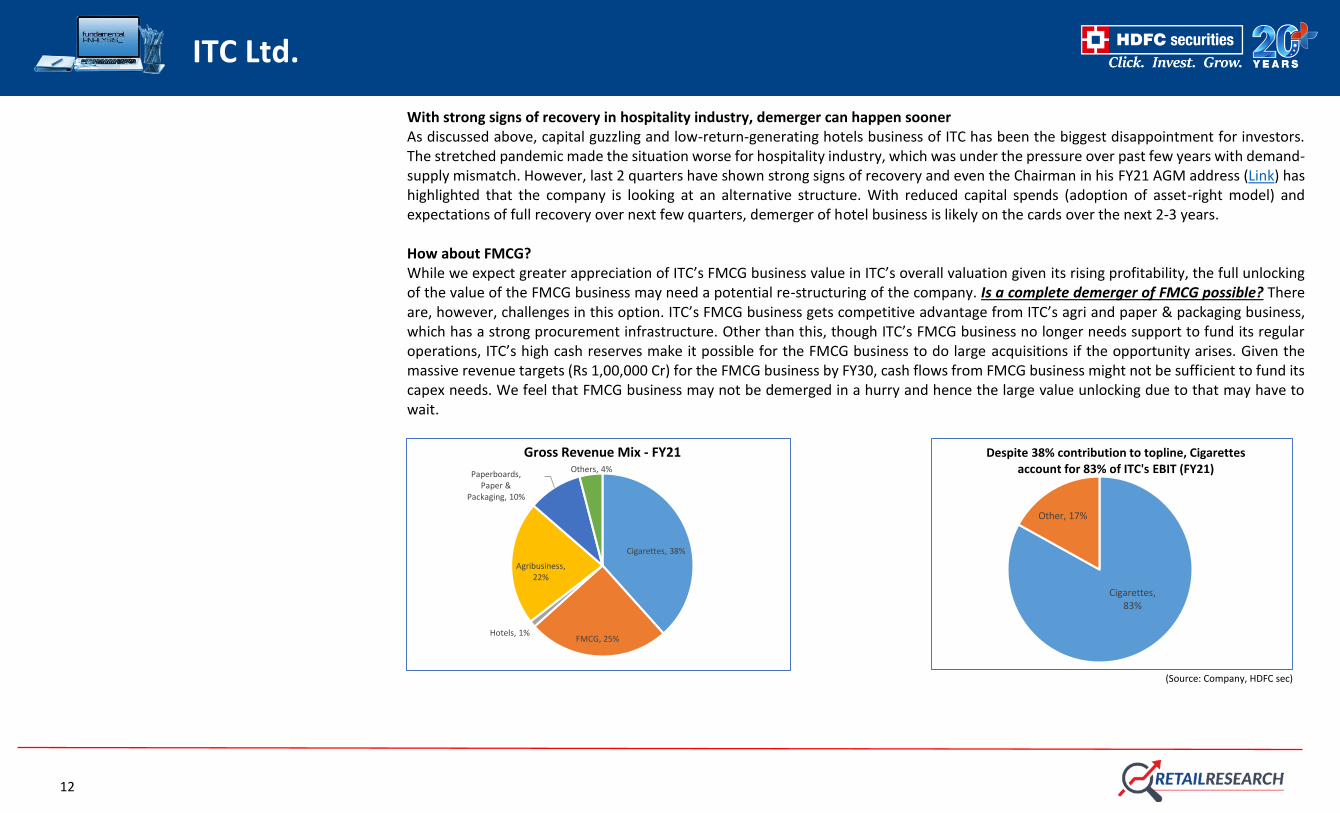
With strong signs of recovery in hospitality industry, demerger can happen sooner As discussed above, capital guzzling and low-return-generating hotels business of ITC has been the biggest disappointment for investors. The stretched pandemic made the situation worse for hospitality industry, which was under the pressure over past few years with demand-supply mismatch. However, last 2 quarters have shown strong signs of recovery and even the Chairman in his FY21 AGM address (Link) has highlighted that the company is looking at an alternative structure. With reduced capital spends (adoption of asset-right model) and expectations of full recovery over next few quarters, demerger of hotel business is likely on the cards over the next 2-3 years. How about FMCG? While we expect greater appreciation of ITC’s FMCG business value in ITC’s overall valuation given its rising profitability, the full unlocking of the value of the FMCG business may need a potential re-structuring of the company. Is a complete demerger of FMCG possible? There are, however, challenges in this option. ITC’s FMCG business gets competitive advantage from ITC’s agri and paper & packaging business, which has a strong procurement infrastructure. Other than this, though ITC’s FMCG business no longer needs support to fund its regular operations, ITC’s high cash reserves make it possible for the FMCG business to do large acquisitions if the opportunity arises. Given the massive revenue targets (Rs 1,00,000 Cr) for the FMCG business by FY30, cash flows from FMCG business might not be sufficient to fund its capex needs. We feel that FMCG business may not be demerged in a hurry and hence the large value unlocking due to that may have to wait.
(Source: Company, HDFC sec)
Cigarettes, 38%
FMCG, 25%Hotels, 1%
Agribusiness, 22%
Paperboards, Paper &
Packaging, 10%
Others, 4%
Gross Revenue Mix - FY21
Cigarettes, 83%
Other, 17%
Despite 38% contribution to topline, Cigarettes account for 83% of ITC's EBIT (FY21)
13
ITC Ltd.
Key Risks Profitability and cash generation are heavily skewed towards the cigarettes business. Any further Covid waves and subsequent
lockdowns can significantly affect profitability.
Punitive taxation by the government on the cigarettes business could increase the illegal sales of the product and impact growth rates for ITC.
Investors that emphasize on strong ESG values tend to avoid ITC because of the nature of its business, even though the company is one of the highest rated ESG companies in the world. If ESG acceptance becomes more widespread, it could result in further shrinkage in valuations.
Poor capital allocation in the future can lead to lower returns for the company.
Potential sale of the 7.93% government stake in ITC held by SUUTI.
Potential change in smoker behaviour (especially fringe smokers) post the lockdown period.
In case of rural slowdown due to weather or other reasons, ITC’s FMCG sales growth can be impacted more, as there could be more down trading where ITC has a limited presence.
Company Background ITC is India's largest cigarette manufacturer, with presence in cigarettes for over 100 years and 77% market share. Its key brands include Gold Flake, Classic, American Club, Navy Cut, Players, Scissors, Capstan, Berkeley, Bristol, Flake, Silk Cut, Duke & Royal, etc. Over the years, the company has diversified across various businesses – paperboard, paper & packaging, hospitality, agri business, lifestyle retailing (scaled down in F19), information technology, branded packaged food, education/stationary products and agarbattis & safety matches, and personal care. The company continues to scale up the FMCG business by entering newer product categories. There are some synergy benefits across the different segments. Paper & packaging and the agri business segments support the packaging and commodity sourcing requirements for cigarettes and the FMCG business. As of FY21, cigarettes and FMCG were the two largest revenue contributors, contributing 38% and 25% of revenues, respectively.

14
ITC Ltd.
Segmental Contribution
Gross Revenue (in Rs Cr)
Segment FY15 FY16 FY17 FY18 FY19 FY20 FY21
Cigarettes 31856 34063 35878 24848 22913 23679 22557
FMCG 9054 9751 10537 11357 12535 12875 14757
Hotels 1256 1359 1414 1495 1747 1912 664
Agri Business 8380 7457 8385 8155 9565 5913 12883
Paperboards Paper and Packaging 5181 5328 5363 5249 5860 4499 5619
Others 1750 1849 1514 1603 1967 2122 2394
EBIT (in Rs Cr)
Cigarettes 11637 12348 13204 14128 15412 15838 13498
FMCG 31 57 26 170 396 425 838
Hotels 52 61 117 145 186 154 -564
Agri Business 904 934 926 841 793 830 918
Paperboards, Paper and Packaging 921 908 966 1042 1239 1305 1099
Others 232 166 103 127 172 291 559 (Source: Company, HDFC sec)

15
ITC Ltd.
Financials
Income Statement Balance Sheet
(Rs Cr) FY19 FY20 FY21 FY22E FY23E FY24E As at March FY19 FY20 FY21 FY22E FY23E FY24E
Net Revenues 48353 49404 49273 54569 59027 63573 SOURCE OF FUNDS
Growth (%) 11.3 2.2 -0.3 10.7 8.2 7.7 Share Capital 1226 1229 1231 1231 1231 1231
Operating Expenses 29946 30144 32270 34501 37519 40476 Reserves 57915 64044 58779 60486 62343 64239
EBITDA 18406 19260 17003 20068 21508 23096 Shareholders' Funds 59141 65273 60010 61717 63574 65470
Growth (%) 11.7 4.6 -11.7 18.0 7.2 7.4 Long Term Debt 8 6 6 6 6 6
EBITDA Margin (%) 38.1 39.0 34.5 36.8 36.4 36.3 Short Term Debt 2 1 4 4 5 5
Depreciation 1397 1645 1646 1769 1859 1971 Net Deferred Taxes 1993 1571 1678 1777 1884 1999
EBIT 17010 17615 15357 18299 19649 21125 Other Non-current Liabilities 242 523 694 694 694 694
Other Income 2174 2598 2633 2547 3044 3270 Minority Interest 343 377 347 355 364 374
Interest expenses 45 55 45 48 50 52 Total Source of Funds 61729 67752 62738 64552 66525 68548
PBT 19138 20026 17945 20797 22643 24344 APPLICATION OF FUNDS
Tax 6314 4442 4555 5235 5699 6127 Net Block 19182 21516 22903 23804 24615 25314
APAT 12786 14888 13383 15555 16935 18206 CWIP 4563 3700 4453 3652 3011 2499
Growth (%) 14.0 16.4 -10.1 16.2 8.9 7.5 Goodwill 203 203 403 403 403 403
EPS 10.4 12.1 10.9 12.6 13.8 14.8 Other Non-Current Assets 4319 1634 1405 1540 1687 1850
Total Non-Current Assets 28267 27052 29163 29398 29716 30066
Inventories 7944 8966 10397 10807 11566 12457
Trade Receivables 4035 2562 2502 2771 2997 3228
Cash & Equivalents 29196 35941 29338 31303 32961 34577
Other Current Assets 2297 2790 2164 2273 2386 2506
Total Current Assets 43472 50259 44402 47154 49911 52767
Trade Payables 3510 3630 4319 4849 5246 5650
Other Current Liab & Provisions 6501 5929 6509 7150 7857 8636
Total Current Liabilities 10010 9558 10827 12000 13103 14285
Net Current Assets 33462 40700 33574 35154 36808 38482
Total Application of Funds 61729 67752 62738 64552 66525 68548
16
ITC Ltd.
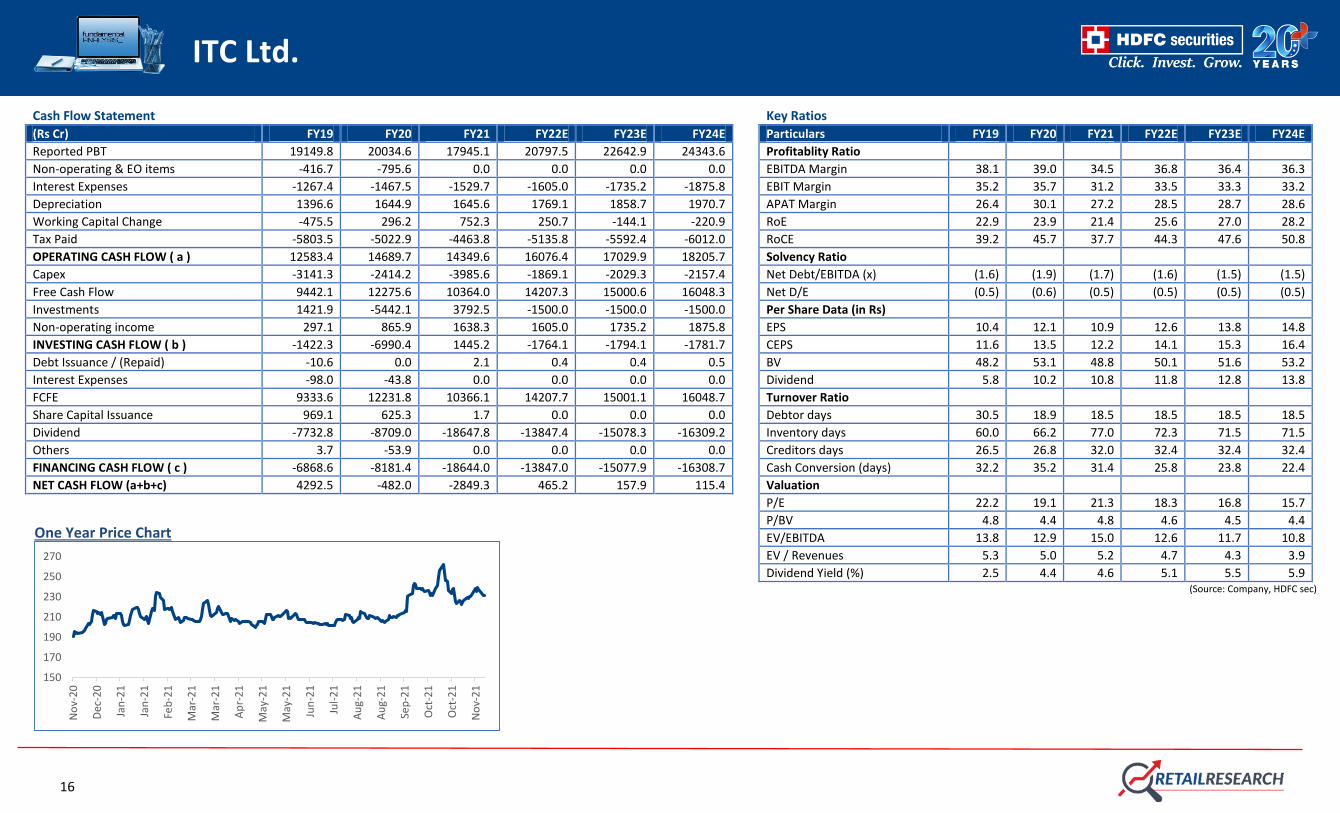
Cash Flow Statement Key Ratios
(Rs Cr) FY19 FY20 FY21 FY22E FY23E FY24E Particulars FY19 FY20 FY21 FY22E FY23E FY24E
Reported PBT 19149.8 20034.6 17945.1 20797.5 22642.9 24343.6 Profitablity Ratio
Non-operating & EO items -416.7 -795.6 0.0 0.0 0.0 0.0 EBITDA Margin 38.1 39.0 34.5 36.8 36.4 36.3
Interest Expenses -1267.4 -1467.5 -1529.7 -1605.0 -1735.2 -1875.8 EBIT Margin 35.2 35.7 31.2 33.5 33.3 33.2
Depreciation 1396.6 1644.9 1645.6 1769.1 1858.7 1970.7 APAT Margin 26.4 30.1 27.2 28.5 28.7 28.6
Working Capital Change -475.5 296.2 752.3 250.7 -144.1 -220.9 RoE 22.9 23.9 21.4 25.6 27.0 28.2
Tax Paid -5803.5 -5022.9 -4463.8 -5135.8 -5592.4 -6012.0 RoCE 39.2 45.7 37.7 44.3 47.6 50.8
OPERATING CASH FLOW ( a ) 12583.4 14689.7 14349.6 16076.4 17029.9 18205.7 Solvency Ratio
Capex -3141.3 -2414.2 -3985.6 -1869.1 -2029.3 -2157.4 Net Debt/EBITDA (x) (1.6) (1.9) (1.7) (1.6) (1.5) (1.5)
Free Cash Flow 9442.1 12275.6 10364.0 14207.3 15000.6 16048.3 Net D/E (0.5) (0.6) (0.5) (0.5) (0.5) (0.5)
Investments 1421.9 -5442.1 3792.5 -1500.0 -1500.0 -1500.0 Per Share Data (in Rs)
Non-operating income 297.1 865.9 1638.3 1605.0 1735.2 1875.8 EPS 10.4 12.1 10.9 12.6 13.8 14.8
INVESTING CASH FLOW ( b ) -1422.3 -6990.4 1445.2 -1764.1 -1794.1 -1781.7 CEPS 11.6 13.5 12.2 14.1 15.3 16.4
Debt Issuance / (Repaid) -10.6 0.0 2.1 0.4 0.4 0.5 BV 48.2 53.1 48.8 50.1 51.6 53.2
Interest Expenses -98.0 -43.8 0.0 0.0 0.0 0.0 Dividend 5.8 10.2 10.8 11.8 12.8 13.8
FCFE 9333.6 12231.8 10366.1 14207.7 15001.1 16048.7 Turnover Ratio
Share Capital Issuance 969.1 625.3 1.7 0.0 0.0 0.0 Debtor days 30.5 18.9 18.5 18.5 18.5 18.5
Dividend -7732.8 -8709.0 -18647.8 -13847.4 -15078.3 -16309.2 Inventory days 60.0 66.2 77.0 72.3 71.5 71.5
Others 3.7 -53.9 0.0 0.0 0.0 0.0 Creditors days 26.5 26.8 32.0 32.4 32.4 32.4
FINANCING CASH FLOW ( c ) -6868.6 -8181.4 -18644.0 -13847.0 -15077.9 -16308.7 Cash Conversion (days) 32.2 35.2 31.4 25.8 23.8 22.4
NET CASH FLOW (a+b+c) 4292.5 -482.0 -2849.3 465.2 157.9 115.4 Valuation
P/E 22.2 19.1 21.3 18.3 16.8 15.7
P/BV 4.8 4.4 4.8 4.6 4.5 4.4
EV/EBITDA 13.8 12.9 15.0 12.6 11.7 10.8
EV / Revenues 5.3 5.0 5.2 4.7 4.3 3.9
Dividend Yield (%) 2.5 4.4 4.6 5.1 5.5 5.9 (Source: Company, HDFC sec)
One Year Price Chart
150
170
190
210
230
250
270
No
v-2
0
Dec
-20
Jan
-21
Jan
-21
Feb
-21
Mar
-21
Mar
-21
Ap
r-2
1
May
-21
May
-21
Jun
-21
Jul-
21
Au
g-2
1
Au
g-2
1
Sep
-21
Oct
-21
Oct
-21
No
v-2
1

17
ITC Ltd.
HDFC Sec Retail Research Rating description Green Rating stocks This rating is given to stocks that represent large and established business having track record of decades and good reputation in the industry. They are industry leaders or have significant market share. They have multiple streams of cash flows and/or strong balance sheet to withstand downturn in
economic cycle. These stocks offer moderate returns and at the same time are unlikely to suffer severe drawdown in their stock prices. These stocks can be kept as a part of long term portfolio holding, if so desired. This stocks offer low risk and lower reward and are suitable for beginners. They offer
stability to the portfolio.
Yellow Rating stocks This rating is given to stocks that have strong balance sheet and are from relatively stable industries which are likely to remain relevant for long time and unlikely to be affected much by economic or technological disruptions. These stocks have emerged stronger over time but are yet to reach the level
of green rating stocks. They offer medium risk, medium return opportunities. Some of these have the potential to attain green rating over time.
Red Rating stocks This rating is given to emerging companies which are riskier than their established peers. Their share price tends to be volatile though they offer high growth potential. They are susceptible to severe downturn in their industry or in overall economy. Management of these companies need to prove their
mettle in handling cyclicality of their business. If they are successful in navigating challenges, the market rewards their shareholders with handsome gains; otherwise their stock prices can take a severe beating. Overall these stocks offer high risk high return opportunities. Disclosure: I, Harsh Sheth, MCom, authors and the names subscribed to this report, hereby certify that all of the views expressed in this research report accurately reflect our views about the subject issuer(s) or securities. HSL has no material adverse disciplinary history as on the date of publication of this report. We also certify that no part of our compensation
was, is, or will be directly or indirectly related to the specific recommendation(s) or view(s) in this report.
Research Analyst or her relative or HDFC Securities Ltd. does not have any financial interest in the subject company. Also Research Analyst or his relative or HDFC Securities Ltd. or its Associate may have beneficial ownership of 1% or more in the subject company at the end of the month immediately preceding the date of publication of the
Research Report. Further Research Analyst or her relative or HDFC Securities Ltd. or its associate does not have any material conflict of interest.
Any holding in stock – No
HDFC Securities Limited (HSL) is a SEBI Registered Research Analyst having registration no. INH000002475.
Disclaimer:
This report has been prepared by HDFC Securities Ltd and is meant for sole use by the recipient and not for circulation. The information and opinions contained herein have been compiled or arrived at, based upon information obtained in good faith from sources believed to be reliable. Such information has not been independently verified and
no guaranty, representation of warranty, express or implied, is made as to its accuracy, completeness or correctness. All such information and opinions are subject to change without notice. This document is for information purposes only. Descriptions of any company or companies or their securities mentioned herein are not intended to be
complete and this document is not, and should not be construed as an offer or solicitation of an offer, to buy or sell any securities or other financial instruments.
This report is not directed to, or intended for display, downloading, printing, reproducing or for distribution to or use by, any person or entity who is a citizen or resident or located in any locality, state, country or other jurisdiction where such distribution, publication, reproduction, availability or use would be contrary to law or regulation or what
would subject HSL or its affiliates to any registration or licensing requirement within such jurisdiction.
If this report is inadvertently sent or has reached any person in such country, especially, United States of America, the same should be ignored and brought to the attention of the sender. This document may not be reproduced, distributed or published in whole or in part, directly or indirectly, for any purposes or in any manner.
Foreign currencies denominated securities, wherever mentioned, are subject to exchange rate fluctuations, which could have an adverse effect on their value or price, or the income derived from them. In addition, investors in securities such as ADRs, the values of which are influenced by foreign currencies effectively assume currency risk.
It should not be considered to be taken as an offer to sell or a solicitation to buy any security. HSL may from time to time solicit from, or perform broking, or other services for, any company mentioned in this mail and/or its attachments.
HSL and its affiliated company(ies), their directors and employees may; (a) from time to time, have a long or short position in, and buy or sell the securities of the company(ies) mentioned herein or (b) be engaged in any other transaction involving such securities and earn brokerage or other compensation or act as a market maker in the financial
instruments of the company(ies) discussed herein or act as an advisor or lender/borrower to such company(ies) or may have any other potential conflict of interests with respect to any recommendation and other related information and opinions.
HSL, its directors, analysts or employees do not take any responsibility, financial or otherwise, of the losses or the damages sustained due to the investments made or any action taken on basis of this report, including but not restricted to, fluctuation in the prices of shares and bonds, changes in the currency rates, diminution in the NAVs, reduction
in the dividend or income, etc.
HSL and other group companies, its directors, associates, employees may have various positions in any of the stocks, securities and financial instruments dealt in the report, or may make sell or purchase or other deals in these securities from time to time or may deal in other securities of the companies / organizations described in this report.
HSL or its associates might have managed or co-managed public offering of securities for the subject company or might have been mandated by the subject company for any other assignment in the past twelve months.
HSL or its associates might have received any compensation from the companies mentioned in the report during the period preceding twelve months from t date of this report for services in respect of managing or co-managing public offerings, corporate finance, investment banking or merchant banking, brokerage services or other advisory
service in a merger or specific transaction in the normal course of business.
HSL or its analysts did not receive any compensation or other benefits from the companies mentioned in the report or third party in connection with preparation of the research report. Accordingly, neither HSL nor Research Analysts have any material conflict of interest at the time of publication of this report. Compensation of our Research
Analysts is not based on any specific merchant banking, investment banking or brokerage service transactions. HSL may have issued other reports that are inconsistent with and reach different conclusion from the information presented in this report.
Research entity has not been engaged in market making activity for the subject company. Research analyst has not served as an officer, director or employee of the subject company. We have not received any compensation/benefits from the subject company or third party in connection with the Research Report.
HDFC securities Limited, I Think Techno Campus, Building - B, "Alpha", Office Floor 8, Near Kanjurmarg Station, Opp. Crompton Greaves, Kanjurmarg (East), Mumbai 400 042 Phone: (022) 3075 3400 Fax: (022) 2496 5066
Compliance Officer: Binkle R. Oza Email: [email protected] Phone: (022) 3045 3600
HDFC Securities Limited, SEBI Reg. No.: NSE, BSE, MSEI, MCX: INZ000186937; AMFI Reg. No. ARN: 13549; PFRDA Reg. No. POP: 11092018; IRDA Corporate Agent License No.: CA0062; SEBI Research Analyst Reg. No.: INH000002475; SEBI Investment Adviser Reg. No.: INA000011538; CIN - U67120MH2000PLC152193
Mutual Funds Investments are subject to market risk. Please read the offer and scheme related documents carefully before investing.