HDFC BANK LTD. - Ashika Group
84
Market Overview Prominent Headlines September 2019 Q&A with CIO Mutual Fund Overview Stock Picks Monthly Insight Performance Valuation at a Glance Crude oil update Sector - Automobile Economy Review Economy Chart Book Management Meet Note Technical View Market Diary Commodity monthly round-up Book Review World Economic Calendar IN SIGHT October 2019 HDFC BANK LTD. | SIEMENS INDIA LTD. | INDIAN HOTELS COMPANY LTD. Q&A WITH Mr. Sachin Relekar, Chief Investment Officer - Equity, LIC Mutual Fund ReforMS galore
-
Upload
khangminh22 -
Category
Documents
-
view
1 -
download
0
Transcript of HDFC BANK LTD. - Ashika Group

Market OverviewProminent Headlines September 2019Q&A with CIOMutual Fund OverviewStock Picks
Monthly Insight PerformanceValuation at a GlanceCrude oil updateSector - Automobile
Economy ReviewEconomy Chart BookManagement Meet NoteTechnical View
Market DiaryCommodity monthly round-upBook ReviewWorld Economic Calendar
INSIGHTOctober 2019
HDFC BANK LTD. | SIEMENS INDIA LTD. | INDIAN HOTELS COMPANY LTD.
Q&A WITH Mr. Sachin Relekar,
Chief Investment Officer - Equity, LIC Mutual Fund
ReforMS galore
Marketoverview1 41 Economy
review
6 Q&A Mr. Sachin Relekar, Chief Investment Officer - Equity, LIC Mutual Fund
59 Managementmeet note• Prataap Snacks Ltd.
15 Stockpicks• HDFC Bank Ltd.• Siemens India Ltd.• Indian Hotels Company
Ltd.
28 Valuationat a glance
70 Marketdiary
74 Book review - Subscribed by Tien Tzuo
Economychart book 48
Mutualfund overview 10 Technical
view 63
Monthlyinsight performance 24
Crude oil update 30
Commoditymonthly
round-up 71
Worldeconomic calendar 78
Sector -Automobile 34
Prominent headlines September 2019 4PROMINENT
HEADLINES
INSIDE THIS ISSUE
MarketOVERVIEW
1 October 2019INSIGHT
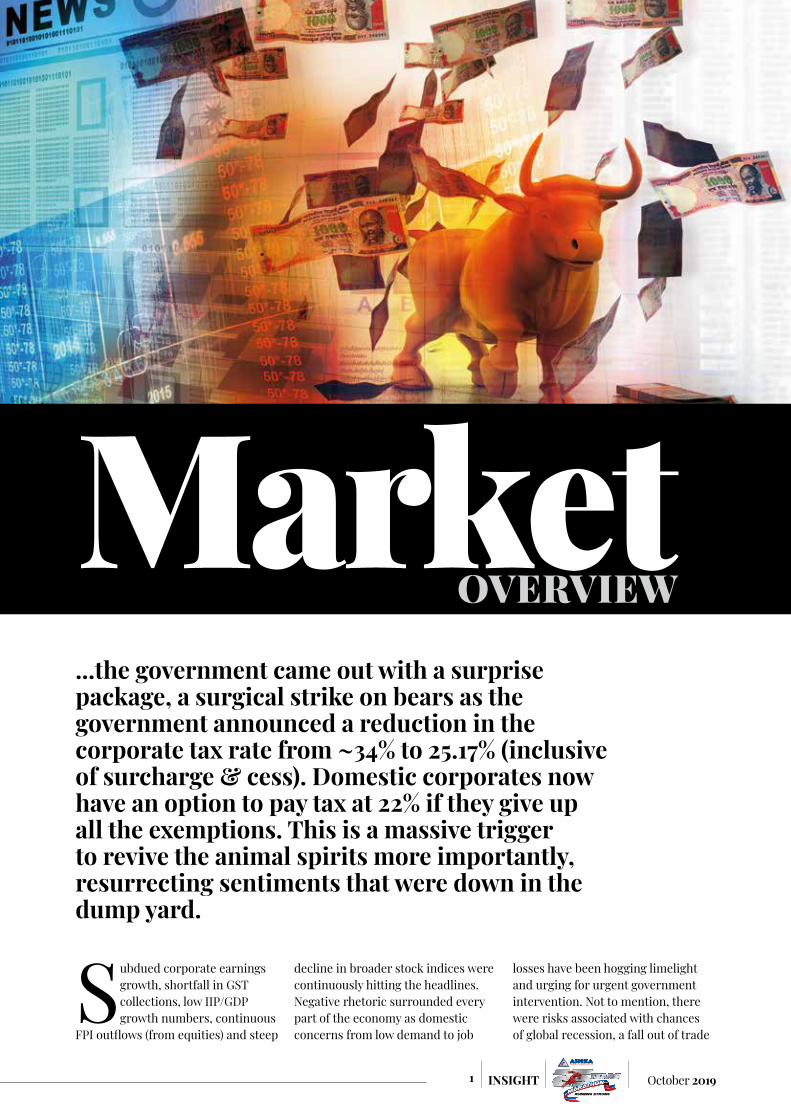
...the government came out with a surprise package, a surgical strike on bears as the government announced a reduction in the corporate tax rate from ~34% to 25.17% (inclusive of surcharge & cess). Domestic corporates now have an option to pay tax at 22% if they give up all the exemptions. This is a massive trigger to revive the animal spirits more importantly, resurrecting sentiments that were down in the dump yard.
Subdued corporate earnings growth, shortfall in GST collections, low IIP/GDP growth numbers, continuous
FPI outflows (from equities) and steep
decline in broader stock indices were continuously hitting the headlines. Negative rhetoric surrounded every part of the economy as domestic concerns from low demand to job
losses have been hogging limelight and urging for urgent government intervention. Not to mention, there were risks associated with chances of global recession, a fall out of trade

2October 2019 INSIGHT
wars. Taking chances on the soft sensitive situation (over job losses), industries like auto & FMCG have been urging the government to reduce GST rates. However, reduction of GST, in the face of already diminishing GST collections, would have implied drastic divergence from fiscal consolidation, fearing rating downgrade. Besides, it was quite evident, that if the government went forward with GST reduction in one industry, others will follow suit, thus the government needed to find a solution which would be impartial and universal thus benefitting all. This is after economists and experts have constantly blamed the government for demonetization and following it up with implementation of GST and failing to create adequate employment. The final nail in the coffin came in the form of liquidity crisis engulfing the NBFC sector and thus slowing down consumption particularly for the auto and consumer durables sector. The government was taking baby steps with a series of announcements made by Finance minister (FM) every week to address the issues plaguing the economy. For the last month or so, the FM announced withdrawal of surcharge on capital gains on super rich & FPIs, an upfront Rs.70,000 crore equity infusion into public sector banks (PSBs) to boost lending,
sops for export sector and Rs 20,000 crore fund for housing sector, mega merger of PSBs. However, these steps although important, but failed to make any significant boost to the sentiments as well to the corporate earnings. Prompting to come out something big, the government came out with a surprise package, a surgical strike on bears as the government announced a reduction in the corporate tax rate from ~34% to 25.17% (inclusive of surcharge & cess). Domestic corporates now have an option to pay tax at 22% if they give up all the exemptions. This is a massive trigger to revive the animal spirits more importantly, resurrecting sentiments that were down in the dump yard. To provide fillip to private investment and government’s ‘Make in India’ initiative, another new provision has been inserted in the Income Tax Act with effect from FY20, which allows any new domestic company incorporated on or after October 1, 2019 to make fresh investment in manufacturing, an option to pay income tax at 15%. This benefit is available to companies that do not avail any exemption/incentive and commences their production on or before March 31, 2023. The effective tax rate for these companies shall be 17.01% inclusive of surcharge & cess. This is a master stroke from the government being impartial to all
industries and all major shortcoming haunting the economic growth has been addressed with a single move. According to CRISIL, the reduction in tax rate could help the top 1000 listed companies save Rs 37,000 crore this fiscal year. Thus, there is a straightaway gain at the bottomline, resulting in improving their return on equities (ROE) of all companies. This incremental cashflows to the corporate is at the discretion of the management if they want to pass it on to customers or channelize to debt reduction or put into incremental investments to increase capacity. Other announcements included removal of FPI surcharge on derivatives, removal of 20% tax on buybacks for listed companies for announcements were made before July 15, 2019. For those continuing to opt for exemptions, Minimum Alternative Tax (MAT) has been reduced to 15% from existing 18.5%. Based on the government estimates, the revenue shortfall for the government could be ~Rs 1.45tn, that needs to be filled up by divestment, most probably. Thus, the fiscal stimulus pegged at ~0.8% of GDP is well thought of to address multiple issues. After the tax cut, India has come at one of the lowest taxed nation (22%) and certainly lowest for new companies (15%).
How Corporate India will be taxed (in %)
How Corporate India will be taxed (in %)
New mfg cos.
Existing companies Min. Alternate Tax
Without exemptions & deductions at
new rates
With exemptions and deductions at existing rates
Cos. with turnover <Rs 400 crores in FY17-18
Others New rate Old rate
Corporate tax rate 15.00 22.00 25.00 30.00 15.00 18.50
After surcharge
Total income Rs 1-10 core16.50 24.20
26.75 32.10 16.05 19.80
Total income> Rs 10 crore 28.00 33.60 16.80 20.72
After health & education cess
Total income< Rs 1 crore
17.16 25.17
26.00 31.20 15.60 19.24
Total income Rs 1-10 core 27.82 33.38 16.69 20.59
Total income> Rs 10 crore 29.12 34.94 17.47 21.55Source: Hindubusinessline, rates are applicable for domestic companies

3 October 2019INSIGHT
With just one stroke, the government has (a) upgraded earnings for corporates (b) given impetus to private capex (c) made India globally attractive, with the lowest taxed nation (for new investments) which will attract FDI (d) a fillip to ‘Make in India’ initiative by the government. However, the move will not result in immediate demand revival, for that to happen, government needed to lower personal income taxes or may be a GST cut (considering that it is fully passed on by manufacturers). However, research shows that consumption backed by investment growth is a lot more sustainable than consumption fueled by credit amid falling investment & savings. Essentially, during the last five to six years, India’s consumption was driven by credit, and this jinx was broken after the liquidity crisis hit prominent NBFCs. Thus, the revival of consumption will be a long-drawn process however will be sustainable if backed by higher capex, higher job generation and thus translating into higher demand. This is where the government needs to keep on improving the ease of doing business in India with reforms on
land & labour apart from land and labour reform, agricultural reforms, infrastructure reforms, direct tax code (DTC), financial sector reforms and the simplification of GST will be clear agendas for Modi 2.0. In an recent International event Modi has wooed investors and promised for further tax and market reforms to make India even more competitive. The low interest environment will also help fuel demand for project loans, thus the credit growth has every chance of improvement from here on. This is where the whole focus will shift towards the next monetary policy by RBI. So far, the RBI has already done its part and cut rates four times this year, by a cumulative 110 basis points, to spur growth. However, the big stimulus by the government also comes with added risks of fiscal slippage, which might push the bond yields higher. Rupee might well come under pressure after the exuberance in the stock markets dies down. However, if FPIs make a comeback, this could very well result in some appreciation. The RBI might very well wait on the sideline and watch out how the rates are transmitted by the banks after RBI’s strong mandate to
the banks to link floating rate loans to external benchmarks. Besides, there will be some clarity from the government until next monetary policy meet, with regards to the fiscal position or the counter moves to address the shortfall together with the bond yields & INR. The government might very well cut down on public expenditure to consolidate its fiscal balances which again will be growth inhibitive. For instance, the fiscal boost in 2008–09 proved to be quite effective in lifting aggregate demand. It was led by both tax cuts together with expenditure ramp-up; backed by massive monetary easing which was also concurrent with global fiscal stimulus which lifted capital inflows. We could be very well moving to period of easy global liquidity as US central bank has reduced rates twice this year, European central bank has lowered interest rates to their lowest ever level of -0.5% and announced stimulus of €20 billion of bonds every month from November onwards. Meanwhile inversion in yields is a common phenomenon now in developed economies which leaves the policymakers much to ponder over.
Paras BothraPresident - Equity ResearchEmail - [email protected]: 022 6611 1704 / 1786Mobile: 98203 97061
Country-wise effective corporate tax rate for 2019 (%)India (New Companies) * 15%Hong Kong SAR 17%Singapore 17%Switzerland 18%UK 19%Russia 20%Taiwan 20%Thailand 20%Vietnam 20%Sweden 21%India* 22%Malaysia 24%China 25%Indonesia 25%South Korea 25%US 27%Germany 30%Japan 31%France 31%Brazil 34%
Source: Media articles, KPMG

If you want to invest in a market where there is scale, come
to India. If you want to invest in a market where the latest trends and features are appre-ciated, come to India. If you want to invest in start-ups with a huge market, come to India. If you want to invest in one of the world’s largest infrastructure ecosystem, come to India - Narendra Modi, Prime Minister
To make the econ-omy stronger, the government
has taken all measures and I want to say that the fundamentals of the country’s economy are strong. We are not in any crisis. Some reactions from non-banking financial companies (NBFCs) are there. But we are addressing all issues - Prakash Javadekar, Union Minister
We are looking at 100 billion dollar investment
by Saudi Arabia in the infrastructure sector - Amit Kumar Ghosh, Joint Secretary for Highways
Huge export potential exists in chemical and
allied sector and it should make a combined effort to set higher goals and aspire for extraordinary results - Piyush Goyal, Commerce and Industry Minister
We need to think what kind of innovation we
need to undertake to attain a high trajectory growth. The government is active, the fundamen-tals of Indian economy is intact and we will continue to do whatever it required to take India back to high trajectory growth rate - Amitabh Kant, Niti Aagoy CEO
From a valuation point of view, market is reason-
ably cheap in small and mid-caps, fairly valued in large caps and expensive in super-large caps. However, the confidence on earnings growth is not coming through because of variety of issues - Nilesh Shah, managing director at Kotak Mahin-dra Asset Management Company
In spectrum auctions, for sub-1GHz, it is possible that someone
might want to pick up some spectrum for 4G but 5G pricing is still the main challenge. Our members have indicated that at the current prices, it does not make sense to invest this kind of money - Rajan Mathews, Cellular Oper-ators’ Association of India (COAI) Director-General
In the digital sphere itself, we are keen to make India a $1 trillion
economy. India is emerg-ing as a big center for electronic manufacturing. From just two mobile fac-tories in 2014, India now has 269 mobile factories in 2019 - Ravi Shankar Prasad, Union minister
Indicators are suggest-ing that stocks have bottomed out, partic-
ularly midcaps, and this is a good time to invest. We have a much better monsoon this year. Banks are flushed with funds. Bank credit will grow by 15% and we have come out of NPA cycles. We are seeing the beginning of a turnaround, but it will be slow - Rakesh Jhunjhun-wala, ACE investor
We are most bullish on the Indian market
because of the Modi reform, but also because of the incredible growth potential of over a billion people being lifted out of poverty. The consumer market in India will be growing rapidly and drive economic growth in years to come - Mark Mobius, founder of Mobius Capital Partners LLP
India’s move to cut corporate tax rate will push growth to higher
levels. It is going to give a boost to companies in India and also companies that want to invest in India. This will definitely attract capital but more importantly I believe it will boost the economic growth in the country because with more investments, you are going to get more growth - Mark Mobius, founder, Mobius Capital Partners
PROMINENT HEADLINES SEPTEMBER 2019
4October 2019 INSIGHT

We are not a member of the Nuclear
Suppliers Group and due to this we dont really have the ability to get the necessary fuel supply for producing nuclear energy and if India gets a solu-tion on this front, then the country could be a model in this area for the rest of the world - Naren-dra Modi, Prime Minister
It is a very bold measure, and it is a highly positive
step. India’s corporate tax now becomes very competitive compared to other emerging market economies in ASEAN and other parts of Asia. So far as international investors are concerned, so far as FDI is concerned, I think India stands definitely in a very competitive posi-tion, and would be able to attract higher invest-ments - Shaktikanta Das, RBI Governor
From the latest eco-nomic numbers, we can see the growth
is slowing down. India has many other attributes but the primary thing that attracts foreign money is growth - Mark Matthews, MD, Julius Baer
There are no plans to revise the fiscal deficit target for
the current fiscal at the moment and a decision in this regard will be taken before the annual Budget - Nirmala Sitharaman, Finance Minister
The Rs 1.45-lakh crore tax giveaway is unlikely to widen
the fiscal deficit much, as the shortfall will be met through increased tax collections due to higher growth. Direct and indirect tax revenues are expected to go up with growth picking up after these tax cuts - Rajiv Kumar, Niti Aayog Vice Chairman
When you don’t understand the #GRAVITY of
the economic slowdown, the words stumble and reasoning becomes feeble. If someone thinks that maths doesn’t help understanding gravity and economics, then it’s a sign that you are hiding the actual statistical data. Newton must be smiling - Raghuram Rajan, former RBI governor
Midcap and smallcaps have turned attractive
on a standalone basis and even if you were to drastically reduce your assumptions on growth there are good number of pockets of mid and small-caps that are reflecting value and that is what the market is starting to realise - Taher Badshah, chief investment officer for equities at Invesco Mutual Fund
The credit from banks must grow by 12 per cent every year to meet the Centre’s target to achieve a $5-trillion economy within the next five years and the step taken for mergers of the PSBs is in the right direction to meet the goal - Dinesh Kumar Khara, SBI MD
The move to reduce the corporate tax rate a “big revolutionary step” for investment, and was called as a historic move by businesses. This is just the beginning, there’s more to come. It’s a golden opportunity to partner India … The government of India respects wealth creation - Narendra Modi, Prime Minister of India
5 October 2019INSIGHT
6October 2019 INSIGHT
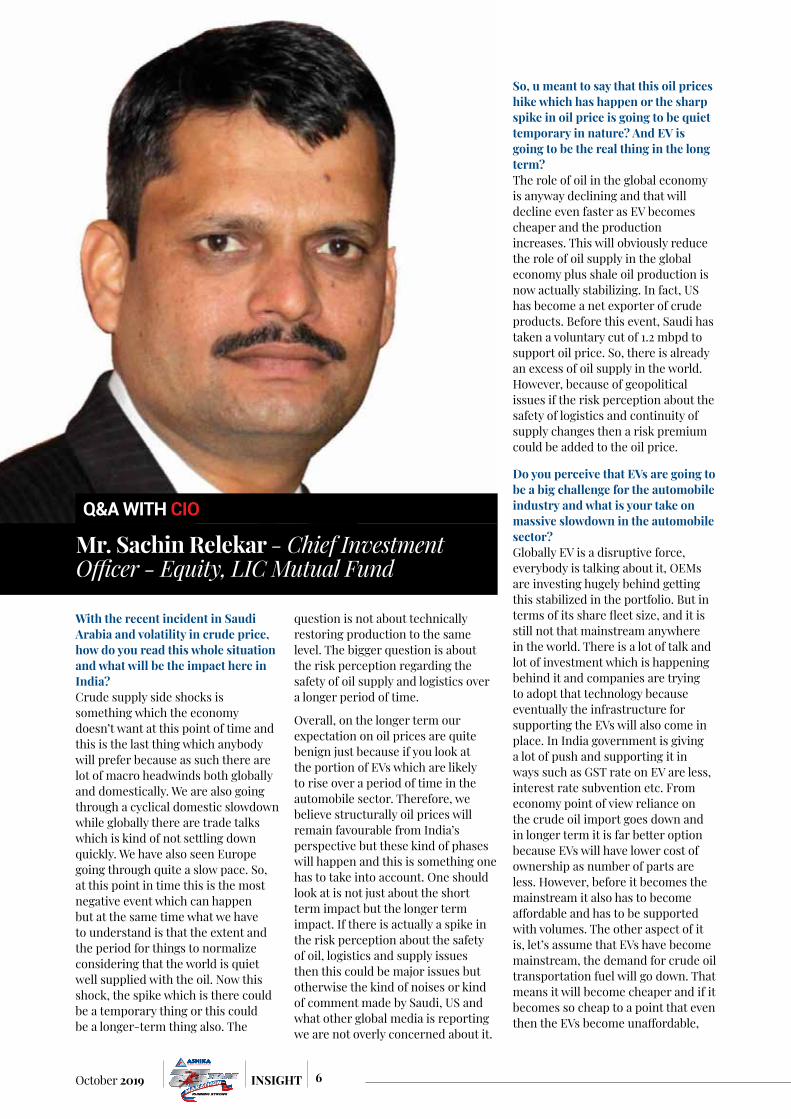
With the recent incident in Saudi Arabia and volatility in crude price, how do you read this whole situation and what will be the impact here in India? Crude supply side shocks is something which the economy doesn’t want at this point of time and this is the last thing which anybody will prefer because as such there are lot of macro headwinds both globally and domestically. We are also going through a cyclical domestic slowdown while globally there are trade talks which is kind of not settling down quickly. We have also seen Europe going through quite a slow pace. So, at this point in time this is the most negative event which can happen but at the same time what we have to understand is that the extent and the period for things to normalize considering that the world is quiet well supplied with the oil. Now this shock, the spike which is there could be a temporary thing or this could be a longer-term thing also. The
question is not about technically restoring production to the same level. The bigger question is about the risk perception regarding the safety of oil supply and logistics over a longer period of time.
Overall, on the longer term our expectation on oil prices are quite benign just because if you look at the portion of EVs which are likely to rise over a period of time in the automobile sector. Therefore, we believe structurally oil prices will remain favourable from India’s perspective but these kind of phases will happen and this is something one has to take into account. One should look at is not just about the short term impact but the longer term impact. If there is actually a spike in the risk perception about the safety of oil, logistics and supply issues then this could be major issues but otherwise the kind of noises or kind of comment made by Saudi, US and what other global media is reporting we are not overly concerned about it.
So, u meant to say that this oil prices hike which has happen or the sharp spike in oil price is going to be quiet temporary in nature? And EV is going to be the real thing in the long term?The role of oil in the global economy is anyway declining and that will decline even faster as EV becomes cheaper and the production increases. This will obviously reduce the role of oil supply in the global economy plus shale oil production is now actually stabilizing. In fact, US has become a net exporter of crude products. Before this event, Saudi has taken a voluntary cut of 1.2 mbpd to support oil price. So, there is already an excess of oil supply in the world. However, because of geopolitical issues if the risk perception about the safety of logistics and continuity of supply changes then a risk premium could be added to the oil price.
Do you perceive that EVs are going to be a big challenge for the automobile industry and what is your take on massive slowdown in the automobile sector? Globally EV is a disruptive force, everybody is talking about it, OEMs are investing hugely behind getting this stabilized in the portfolio. But in terms of its share fleet size, and it is still not that mainstream anywhere in the world. There is a lot of talk and lot of investment which is happening behind it and companies are trying to adopt that technology because eventually the infrastructure for supporting the EVs will also come in place. In India government is giving a lot of push and supporting it in ways such as GST rate on EV are less, interest rate subvention etc. From economy point of view reliance on the crude oil import goes down and in longer term it is far better option because EVs will have lower cost of ownership as number of parts are less. However, before it becomes the mainstream it also has to become affordable and has to be supported with volumes. The other aspect of it is, let’s assume that EVs have become mainstream, the demand for crude oil transportation fuel will go down. That means it will become cheaper and if it becomes so cheap to a point that even then the EVs become unaffordable,
Q&A WITH CIO
Mr. Sachin Relekar - Chief Investment Officer - Equity, LIC Mutual Fund
7 October 2019INSIGHT
so there is always a competition between the two. Some of the global analyst reports saying that the sales of EVs will take over the sales of IC engine vehicle maybe somewhere in between 2024-25. These are only blue paper as of now which have been made some long-term projection. So, we are quite far away from that point as of now and companies will get time in adopting the new technology. But one thing is very clear, the investment requirement to adopt to EV or migrate to EV platform is going to be huge and therefore the players with scale i.e. companies having larger balance sheet and with investment capability will be able to adopt to the transition phase better. The smaller or marginal players will have bigger challenges in migrating to that. I think in terms of two wheelers, and scooters that the transition will be much faster because already we are seeing prototype concepts are working very fine and as prices come down adoption will also be faster. For passenger vehicles India might take a little longer because our infrastructure will also take time to come into place but as it becomes a mass phenomenon then adoption will become faster. But this is all subject to lot of other variables and factors which should be play out. It’s not that EVs has been invented now. Even in early 1920s there was the concept of EV, however it was not being adopted because the infrastructure for IC in terms of fuel availability came up, infrastructure for EV didn’t came up. But the technology now is much more refined, prices are falling so convenience level has improved but one must be watchful about it.
Crude oil prices also plays a major role in EV taking off, so you have any understanding about the fact that what is the crude oil range likely to be, taking into account the availability of shell gas?In case of shale gas / oil a marginal cost of production is important. What in the initial phases the shale gas production was on a lower scale so marginal cost of production was higher. However, gradually marginal cost of production has come down as the technology improved. In case of EVs also it’s too early to say that. EVs technology is becoming competitive
gradually. It is improving as not only the cost of battery is coming down but also the range (Km travelled per charge) has been improving. The technology is improving rapidly. Therefore, the breakeven point at which EV becomes competitive for a crude oil price would be shifting downward much faster.
So, it is all going to be a match of crude oil prices coming down and EV volume rising.Like I said at the beginning, some of the global analysts and blue papers suggested that incremental sales from EVs taking over IC engine sales globally will come somewhere in 2024-25 though IC engines will be in play and it will not go away completely because there will be some vehicle which will be more affordable in IC engine range v/s EV, both can co-exist.
Do you think the traditional Indian automobile companies are well equipped to transition themselves or realign their business model?We are talking more of PVs and 2 wheelers; CVs is a different ball game it will take little longer also for the OEMs. All PV players as such has some investment into the EVs and there is enough time for them for transition and they will transition that won’t be a challenge, the question is how much investment you would require and will that be making sense from a return on capital point of view for a longer period of time.
RBI has slashed interest rates by 110 bps this year and probably there are one or two more in the anvil, however the transmission didn’t happen as smoothly. How do you see and interpret the recent mandate to link floating rates to external benchmarks in this regard? Transmission has already happened for few segments, for instance, home loans are available cheaper at around 8%, probably the lowest in last 10 years. Housing loan has large shares of retail loans and is the most significant. However, unsecured loans will not get cheaper due to inherent risks involved as the risk premium takes care of the asset quality issues. In terms of transmission, the real concern would be the velocity or the
credit offtake and not just about the rates. Now, credit offtake is slower because of slower investment cycle. That’s, a real concern. For a good quality borrower decent interest rates are available. As of now, interest rates are more reflected into capital market asset prices, wherein some of these are at very high premium compared to historic levels.
However, low interest rates are not benefitting the economy because of the slowness of the investment cycle. We have gone through lot of transition in the last 2-3 years which cannot be ignored such as the demonetization, followed by GST. It had their impact on the broader economy. As these effects fade off, then the momentum will gradually come back. As the GST compliance improves, the GST revenues will also improve, aiding government finances and driving investment cycle and that’s where the impact of low interest regime will be pronounced as this will drive government capex. As government finances improve, they will have more funds to implement projects on a larger scale and the private capex will eventually come in to play. Low interest rates alone will be less effective if the fiscal position is tight. The impact will also be evident in the form of weaker currency. Therefore, the in direct tax buoyancy needs to pick up to make the fiscal position strong. However, the GST system is still young with lot of things getting implemented like that of the E-way bill and a lot of compliance work is going on. GST is a technology led platform. Besides, there is always a part for technology enablement and making the system more transparent in terms of refunds, timelines etc.
Coming back to interest rate transmission, interest rates for all segments cannot come down altogether since risk premium is dependent on consumer to consumer. For instance, microfinance rates won’t come down drastically, this is a high-risk segment and so these loans will be priced higher because of the risks involved. Credit card interest rates, two-wheeler loans, these products are designed in such a way that the rates will not come down to very low levels considering risk.
8October 2019 INSIGHT
However, for corporates with strong credit rating, they will be beneficiary of lower interest rates. Till now, banks were reluctant to lower deposit rates but it is now coming down, thus transmission will now happen however it is also dependent on the risk premium.
Although the general feeling is that NPAs have peaked out, however new NPAs crop up every now and then for the corporate facing banks. How do you see the NPA cycle now?There is no new wave of NPAs. Large ticket size NPAs are either in NCLT or undergoing through resolution stage. Besides, large ticket size NPAs happened in two or three sectors - metals & mining, power and road & construction. Some of these are all identified and stressed loans for banks actually peaked out in 2018-19 and these have been recognized and provided for, thus resulting in losses for banks. The entire pain went for eight quarters. Post which we are going through a slower kind of economic phase so there are these NPAs which are cropping up. However, incremental issues in loans are not very large, and these are taken care of in the provisions for banks. Some credit costs are part of business of banks and it will not come down to zero. At the same time, some of the mid-corporate entities which are slipping as NPAs, the quantum is certainly not very large and they are either having problems to dispose of assets or going through a cash crunch because of the slow state of the economy. However, it depends on the size of the bank, for a small bank these NPAs as a percentage could still have a major impact but for a large bank, this not very concerning. Also, some of this is seasonal in nature (agri loans) and will get addressed as we move on.
Post Altico incident, how do you see the NBFC space panning out. Is asset/liability mismatch issue still haunting the NBFC space/housing finance companies (HFC)?Asset liability mismatch is one thing. Bigger problem is if your loan becomes non performing. If you are building a long-term asset book based on short term funding (like CPs), the mismatch is in the public domain.
However, that adjustment is going on particularly for those HFCs/NBFCs which have access to the capital markets. Some of them who were not able to rebalance their books had to run down their asset book. However, it could impact asset quality itself.
The residential housing products which are priced reasonably there is decent demand for it. The issue is with the premium products in relation to specific micro markets. On the other hand, commercial real estate is doing relatively better. Post RERA and GST, there is a migration towards brands and some of the companies which are listed, better corporate houses have witnessed an increase in sales volumes. Some of the builders or developers who were not able to attract buyers on their own are getting into joint development agreement with better established brands. There is a formalization and consolidation of the market which is good from the longer-term point of view as this will bring in more transparency. So, the NBFC problem especially, asset-liability mismatch problems have been recognized. However, there could be incremental challenges ahead but any issues of large scale are unlikely to recur.
So, you say that whole of the NBFC issue is in public domain and nothing major is going to come up?Surprises will happen, I mean good thing is like we have gone through huge kind of churn in this but it has not led to a contagion which says a lot about the stability and the sturdiness about our regulation also. Besides, the way the entire exposure has been fixed so we have seen very large companies running down the entire book but we didn’t see the shocks spreading massively into the system which is actually a good thing to happen otherwise that could have been a different kind of problem altogether.
Coming down to the income level of the people and the consumption now has sharply slowed down so how do you see this consumption basket, the income level of the people and the unemployment talks?Unemployment is a very different subject. Consumption constitutes a
very large ~70% of GDP. Obviously, when there is economic slowdown the discretionary consumption will get affected. However, I am not too much worried from longer time frame because I believe that consumption will sort itself out. Consumer discretionary is also a very mixed picture. It’s basically a case to case where we are witnessing some consumer durable companies are growing with double digit volume. AC sales are up 40% in last quarter. There are categories which are under penetrated which are doing very well, and there are categories which are saturated like automobiles. Modern retail business in growing fast. FMCG is growing at slower pace which is also to do with the base effect they grew very fast after demonetization and the benefit of GST which came through. Personal income level is a matter of concern because there is inequality, also some section is actually going better and some are falling behind but that needs to be seen in terms of way the technology is playing role in this new economy which is lot more subject to disruption, lot more subject to so called mixed economy, that is something of a long term phenomena. India is a very young demography, will remain young for around 2040, so there will be a propensity for consumption and saving. Our income levels will keep growing higher, our productivity will improve once as some of the larger things like fiscal deficit starts improving , public infrastructure will get built up, technology will play a much bigger role , efficiency in the system will go up and the efficiency will lead to higher disposal income. For longer term our per capita GDP will actually improve, so once it crosses the threshold of $2000 per capita income which we are very close to then the demand for discretionary will actually pick up faster.
The upcoming festive season needs to be watched closely because if this consumption slowdown is a cyclical kind of thing it will compensate in the upcoming festive season.Possibly. Except auto or the large ticket size kind of consumption otherwise things are expected to stabilize. There are certain categories
9 October 2019INSIGHT
which are in the right side of disruption, certain companies which are adopting the technology faster they are actually getting the market share and are growing much faster.
Media reports highlighted that Amazon and Flipkart are saying there is no recession kind of thing and there are not sign of any slowdown?E-commerce or modern trade is where the value migration is happening and consumers are finding convenience. So overall consumption is growing at slower pace, but these e-commerce companies are growing at much higher pace, logistics for consumer companies is growing very fast. We are seeing food delivery aggregators are growing at a very fast pace as technology is on their side. Opportunity are more in the micro than the macro.
When we say that structurally consumption is going to be the key theme over the next many years then do you see that valuation premium which many of the companies enjoy will sustain?It differs from company to company. If for your company whose competitive advantage period comes to an end, we will see derating. We have seen some of the very prime companies in consumption space getting de-rated very sharply when growth came down. For each company, each business needs to be looked at separately and there is a framework for looking at it. We are very clear that we will not get into the company having corporate governance and sustainability issues. We are are looking to buy companies having capital efficiency, competitive advantage and scalability. We are basically aligning our portfolio towards that. We look to pay reasonable price for that.
While we are saying that consumption is a very big opportunity in India we also need a company which is properly aligned to that and capable in terms of executing that with the proper competitive advantage. Otherwise we could have company in a big industry without any
competitive advantage or very sub optimal kind of capital efficiency. It might not able to create wealth.
Some of the categories for the future which you think will grow?Services, is going to be a big profit pool creation. Within that if globally you look at which are the sectors where profit pools are much higher compared to in India, some of the sectors which are at the nascent stage and probably there the profit pool will be much higher.
So, two things which we are focusing on is one is the GST compliance driving formalization and technology. There you will find value migration from unorganized to organized which is a large thing. Technology is playing big role in all the businesses, business which are adopting to that will gain. Consumer and financial services will benefit from this. Govt. services will also be a big winner. Globally if you look at in the developed market, there profit pool from these sectors are very large and is disproportionately high. Within financial services, capital market intermediaries has very large relevance in terms of profit pool.
How do you see the midcap & small cap story panning out from here on? What would be the strategy?Investment approach doesn’t change, it be a large cap or a midcap or a small cap. There is a five-point framework which is very well articulated. There are risk parameters which are clearly identified with corporate governance as well as the management quality being one of the top filters. Second is the business sustainability for instance if you are in a business which is subjected to a technology risk or to environmental risk or any sort of regulation & all which kind of blurs the visibility beyond three years, we will not take exposure to those businesses. Having screened out companies based on these parameters; the first thing we look out for companies with optimal capital efficiency so that they can fund their growth. Second is competitive advantage and third is scalability of the business. These parameters don’t change with the
size of the company. We need to be certain about these aspects so as to stay invested in these companies and see them moving to higher market capitalization. Business might go through difficult times and cycles, however companies qualifying these parameters would see through the difficult times and would come out strong over a longer period of time.
What is the advice you want to give to retail investors, how should they position themselves in the current market situation?Our advice for retail is consistent. Retail investors should focus on asset allocation. Mutual funds are enablers for long term financial goals. There should be clarity with regards to financial goal or investment horizon. If the same is longer term in nature of 5-7 years. Historical data shows that the probability is near zero to lose the money in equities. If you have a long-term investment horizon of 5 years and above, one should allocate more to equity as an asset class. Thus, it depends on the asset allocation and being realistic about return expectations. It is advisable to have conservative expectations somewhere around the nominal GDP growth over longer period of time.
What’s your take on the recent massive corporate tax cuts by the government? We believe this is a very big reform. It is very simple idea of a single tax rate and there have not been any caveats put in and lot of people will migrate to it. The quality companies which have a competitive advantage will be benefited in terms of higher earnings and higher capital efficiency. Secondly, the industries which have significant share of unorganized and non-compliant competition, market consolidation will happen towards organized and compliant players. These are the two near term impacts which will likely play out in next one year or so. In the medium to long term, deep reforms will also be followed up with some other regulatory improvements like land & labour reforms, which will eventually lead to pick up in the investment cycle.
Disclaimer: Mutual Fund investments are subject to market risks, read all scheme related documents carefully.

10October 2019 INSIGHT
Investment ObjectiveThe scheme aspires to generate long term capital appre-ciation by investing substantially in a portfolio of equity and equity linked instruments of large cap and midcap companies. Suitable for investors with moderate risk appetite and investment horizon of more than 3 years.
Investment StrategyThe Fund is focused to generate long-term capital appreciation by investing mainly in equity and equity related instruments of Large & Mid-cap companies. It may also invest a certain portion of its corpus in debt and money market securities. Mid-size companies offer attractive long-term growth opportunities than relatively large-cap companies. while they tend to be more volatile and less liquid than large-cap companies in general.
Investment framework of the fund is based on 5 parameters
Strong & sustainable earnings growth in the long term
Scalability of business
Quality management & governance
Capital efficiency
Competitive advantage
As per SEBI mandate, large & mid cap schemes must invest a minimum 35 per cent of their corpus in large cap companies, and another 35 per cent in mid cap companies. The large and mid-cap category makes sense because of the strict investment mandate imposed by SEBI for
every mutual fund category. Since a large and mid-cap fund invests in both large and mid-cap stocks, it can give higher returns than purely large cap funds and less risky than pure small cap schemes.
The scheme has registered an impressive performance over the recent years. The scheme has outperformed its benchmark during both the short and long term periods. It is a relatively aggressive scheme which holds more of sectors, like banking and finance, the growth of which is dependent on the economic growth of the country. It is the right scheme for investors who wish to earn potentially high returns for relatively high-risk levels.
Mutual Fund Overview LIC MF LARGE & MID CAP FUND
Important Information
NAV (G) (Rs.) 15.4
NAV (D) (Rs.) 13.6
Inception Date February 25, 2015
Fund size (Rs. Cr.) 509.4
Fund Manager Sachin Relekar
Entry load N.A
Exit Load For units in excess of 12% of the investment,1% will be charged for
redemption within 365 days
Benchmark NIFTY Large Midcap 250 TRI
Min Investment (Rs.) 5000
Min SIP Investment (Rs.) 1000Note: All data are as on August 31, 2019; NAV are as on September 24, 2019Source: Factsheet, Value Research

11 October 2019INSIGHT
Key RatiosBeta (x) 0.99Standard deviation (%) 14.62Sharpe Ratio 0.25Alpha (%) 0.80R Squared 0.79Expense ratio (%) 2.77Portfolio Turnover ratio (%) 134.00Avg Market cap (Rs. Cr.) 59,568
Month of Recom
Fund Name Benchmark NAV as on 23.08.2019
1 Year Return
(%)
3 Year Return (%)
5 Year Return
(%)
Aug-18 Franklin India Equity Saving Fund S&P BSE Small Cap 10.0 -- -- --
Sep-18 Sundaram Services Fund S&P BSE 200 10.6 -- -- --
Oct-18 Reliance Balanced Advantage Fund CRISIL Hybrid 35+65 Aggressive 88.7 0.5 8.4 8.1
Nov-18 Kotak Emerging Equity Scheme NIFTY Midcap 100 35.2 -11.0 4.6 11.9
Jan-19 Tata Hybrid Equity Fund CRISIL Hybrid 25+75 Aggressive 203.4 -4.27 3.41 7.75
Feb-19 Invesco India Contra Fund S&P BSE 500 43.8 -12.13 8.78 10.94
Mar-19 Mirae Asset Large Cap Fund NIFTY 200 48.13 -4.4 10.02 11.26
Apr-19 SBI Focused Equity Fund S&P BSE 500 133.31 -4.12 8.85 11.13
May-19 Invesco India Small Cap Fund S&P BSE 250 SmallCap TRI 9.24 - - -
Jun-19 ICICI Prudential Multi Asset Fund Nifty 50 Total Return (70) 255.19 -1.28 7.36 7.97
Jul-19 ICICI Prudential Asset Allocator Fund CRISIL Hybrid 50+50 Moderate Index
55.19 5.03 9.49 9.37
Aug-19 Reliance MultiCap Fund S&P BSE 500 86.62 -9.4 4.95 6.7
Note: All data are as on August 31, 2019; NAV are as on September 24, 2019Source: Factsheet, Value Research
Ashika Mutual Fund Recommendation Alpha Generation
Performance of the Fund alongwith Benchmark (as on Sep 20, 2019) 1 month 3 months 6 months 1 year 3 Years 5 Years Since Inception
Fund (%) 4.12 0.72 2.77 1.80 9.61 9.30Benchmark (%) 3.19 -3.39 -0.97 -0.78 9.32
Asset Allocation
Equity Debt Cash
85.59% 0.00% 14.41%
37.6
9.4
7.6
6.7
6.6
5.1
3.7
2.7
2.0
2.0
0 10 20 30 40
Financial
Chemicals
Services
Technology
FMCG
Healthcare
Automobile
Energy
Construction
Cons Durable
% SECTOR ALLOCATION
Portfolio as on Aug 31, 2019Stocks % of Net assetsBajaj Finance 5.9HDFC Bank 5.3City Union Bank 4.8ICICI Bank 4.7HDFC 3.9Cholamandalam Invest. & 3.6Tata Consultancy Services 3.5Bajaj Finserv 3.4Avenue Supermarts 3.3Infosys 3.2

12October 2019 INSIGHT
NAV AUM (Rs Cr)
30 Day
3 M 6 M 1 Yr 3 Yr 5 Yr Since Inception
Return
Sharpe Ratio
Exp. Ratio
SBI - Contra Fund Reg (G) 103.52 1309 9.74 (2.77) (4.62) (2.03) 2.04 5.84 17.46 -0.31 2.36
HDFC - Capital Builder Value Fund (G)
281.66 4257 7.97 (2.26) (5.06) (2.75) 7.27 9.43 13.89 0.05 1.96
Reliance - Value Fund (G) 73.58 2902 10.09 (0.68) 1.16 6.10 7.59 9.94 14.96 0.01 2.02
Kotak - India EQ Contra Fund (G) 53.11 819 7.42 0.70 2.15 5.22 11.18 10.51 12.51 0.32 2.58
Invesco - India Contra Fund (G) 47.17 3992 7.82 (1.13) (1.19) 2.14 10.45 11.67 13.26 0.26 2.01
Value Fund
NAV AUM (Rs Cr)
30 Day
3 M 6 M 1 Yr 3 Yr 5 Yr Since Inception
Return
Sharpe Ratio
Exp. Ratio
Axis - Focused 25 (G) 29.43 7841 9.41 4.44 10.31 8.68 13.69 13.67 15.96 0.39 2.03
Mirae - Asset Focused Fund Reg (G) 11.18 1381 9.56 5.41 0.00 0.00 0.00 0.00 30.32 - 2.08
SBI - Focused Equity Fund Reg (G) 144.68 5127 8.53 1.68 5.30 10.58 10.67 12.36 19.38 0.24 2.11
HDFC - Focused 30 Fund (G) 77 454 11.25 (2.31) (0.53) 2.69 5.22 6.47 14.58 -0.16 2.55
Sundaram - Select Focus Reg (G) 184.31 973 6.53 0.67 4.36 8.07 11.89 8.95 18.47 0.37 2.48
Focus Fund
NAV AUM (Rs Cr)
30 Day
3 M 6 M 1 Yr 3 Yr 5 Yr Since Inception
Return
Sharpe Ratio
Exp. Ratio
Mirae - Asset Tax Saver Fund Reg (G)
18.03 2306 7.79 1.10 3.90 9.11 14.05 0.00 17.06 0.54 1.9
Kotak - Tax Saver Scheme (G) 44.72 896 7.70 (0.47) 3.74 8.84 8.79 11.34 11.42 0.12 2.4
Invesco - India Tax Plan (G) 51.26 859 8.12 0.75 1.73 3.53 9.12 10.60 13.70 0.16 2.42
Sundaram - Diversified Equity (G) 99.58 2439 8.42 (1.97) (0.16) 2.22 5.25 8.87 12.27 -0.09 2.13
SBI - M Tax Gain Reg (G) 139.08 6683 7.68 (1.64) (2.11) 1.79 4.24 6.57 15.31 -0.18 1.99
ELSS Fund
ALL DATA BELONGS TO 9/24/2019
NAV AUM (Rs Cr)
30 Day
3 M 6 M 1 Yr 3 Yr 5 Yr Since Inception
Return
Sharpe Ratio
Exp. Ratio
SBI - Large & Midcap Fund Reg (G) 221.98 2493 9.48 0.78 1.84 5.96 7.49 10.68 13.83 0.02 2.25
Mirae - Asset Emerging Bluechip Fund Reg (G)
54.29 7759 7.62 1.23 3.62 10.90 12.82 16.99 19.85 0.41 1.88
ICICI Pru - Large & Mid Cap Fund Reg (G)
320.62 3457 7.34 (1.57) 0.44 1.01 5.59 7.11 17.75 -0.09 1.99
LIC - Large & Mid Cap Fund - Reg (G)
15.44 509 8.97 4.47 6.28 8.35 10.08 0.00 9.95 0.25 2.77
Sundaram - Large and Mid Cap Fund (G
35.28 721 9.72 1.99 4.21 8.20 11.98 12.12 10.56 0.30 2.65
Large & Mid Cap Fund
13 October 2019INSIGHT
NAV AUM (Rs Cr)
30 Day
3 M 6 M 1 Yr 3 Yr 5 Yr Since Inception
Return
Sharpe Ratio
Exp. Ratio
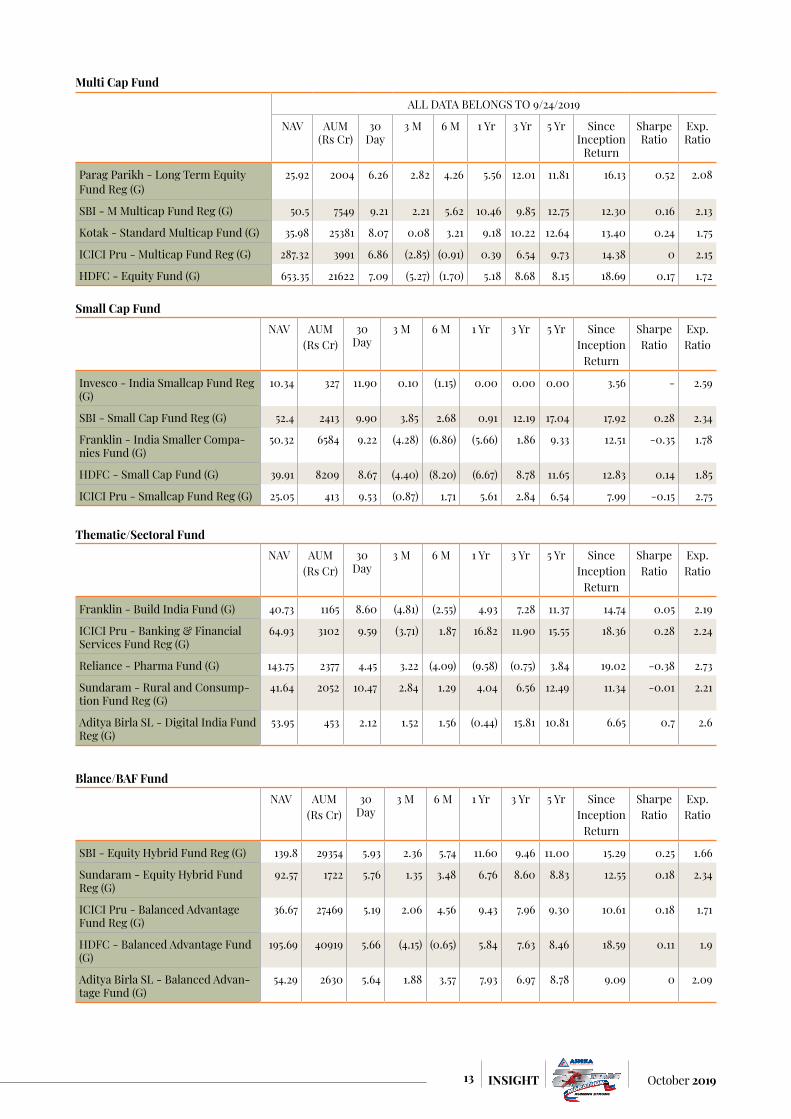
Invesco - India Smallcap Fund Reg (G)
10.34 327 11.90 0.10 (1.15) 0.00 0.00 0.00 3.56 - 2.59
SBI - Small Cap Fund Reg (G) 52.4 2413 9.90 3.85 2.68 0.91 12.19 17.04 17.92 0.28 2.34
Franklin - India Smaller Compa-nies Fund (G)
50.32 6584 9.22 (4.28) (6.86) (5.66) 1.86 9.33 12.51 -0.35 1.78
HDFC - Small Cap Fund (G) 39.91 8209 8.67 (4.40) (8.20) (6.67) 8.78 11.65 12.83 0.14 1.85
ICICI Pru - Smallcap Fund Reg (G) 25.05 413 9.53 (0.87) 1.71 5.61 2.84 6.54 7.99 -0.15 2.75
Small Cap Fund
NAV AUM (Rs Cr)
30 Day
3 M 6 M 1 Yr 3 Yr 5 Yr Since Inception
Return
Sharpe Ratio
Exp. Ratio
Franklin - Build India Fund (G) 40.73 1165 8.60 (4.81) (2.55) 4.93 7.28 11.37 14.74 0.05 2.19
ICICI Pru - Banking & Financial Services Fund Reg (G)
64.93 3102 9.59 (3.71) 1.87 16.82 11.90 15.55 18.36 0.28 2.24
Reliance - Pharma Fund (G) 143.75 2377 4.45 3.22 (4.09) (9.58) (0.75) 3.84 19.02 -0.38 2.73
Sundaram - Rural and Consump-tion Fund Reg (G)
41.64 2052 10.47 2.84 1.29 4.04 6.56 12.49 11.34 -0.01 2.21
Aditya Birla SL - Digital India Fund Reg (G)
53.95 453 2.12 1.52 1.56 (0.44) 15.81 10.81 6.65 0.7 2.6
Thematic/Sectoral Fund
NAV AUM (Rs Cr)
30 Day
3 M 6 M 1 Yr 3 Yr 5 Yr Since Inception
Return
Sharpe Ratio
Exp. Ratio
SBI - Equity Hybrid Fund Reg (G) 139.8 29354 5.93 2.36 5.74 11.60 9.46 11.00 15.29 0.25 1.66
Sundaram - Equity Hybrid Fund Reg (G)
92.57 1722 5.76 1.35 3.48 6.76 8.60 8.83 12.55 0.18 2.34
ICICI Pru - Balanced Advantage Fund Reg (G)
36.67 27469 5.19 2.06 4.56 9.43 7.96 9.30 10.61 0.18 1.71
HDFC - Balanced Advantage Fund (G)
195.69 40919 5.66 (4.15) (0.65) 5.84 7.63 8.46 18.59 0.11 1.9
Aditya Birla SL - Balanced Advan-tage Fund (G)
54.29 2630 5.64 1.88 3.57 7.93 6.97 8.78 9.09 0 2.09
Blance/BAF Fund
ALL DATA BELONGS TO 9/24/2019
NAV AUM (Rs Cr)
30 Day
3 M 6 M 1 Yr 3 Yr 5 Yr Since Inception
Return
Sharpe Ratio
Exp. Ratio
Parag Parikh - Long Term Equity Fund Reg (G)
25.92 2004 6.26 2.82 4.26 5.56 12.01 11.81 16.13 0.52 2.08
SBI - M Multicap Fund Reg (G) 50.5 7549 9.21 2.21 5.62 10.46 9.85 12.75 12.30 0.16 2.13
Kotak - Standard Multicap Fund (G) 35.98 25381 8.07 0.08 3.21 9.18 10.22 12.64 13.40 0.24 1.75
ICICI Pru - Multicap Fund Reg (G) 287.32 3991 6.86 (2.85) (0.91) 0.39 6.54 9.73 14.38 0 2.15
HDFC - Equity Fund (G) 653.35 21622 7.09 (5.27) (1.70) 5.18 8.68 8.15 18.69 0.17 1.72
Multi Cap Fund

14October 2019 INSIGHT
Disclaimer: Mutual Fund investments are subject to market risks, read all scheme related documents carefully.
NAV AUM (Rs Cr)
30 Day
3 M 6 M 1 Yr 3 Yr 5 Yr Since Inception
Return
Sharpe Ratio
Exp. Ratio
Aditya Birla SL - Equity Savings Fund Reg (G)
13.63 843 3.41 4.85 0.96 3.57 5.09 4.74 6.56 -0.21 2.34
HDFC - Equity Savings Fund (G) 36.93 4910 1.59 2.77 (0.71) 1.11 4.36 6.92 9.10 0.14 1.93
ICICI Pru - Equity Savings Fund (G)
14.19 1617 1.43 2.53 1.43 3.73 8.40 6.82 7.61 0.39 1.36
Kotak - Equity Savings Fund Reg (G)
14.52 2003 2.09 2.60 1.28 2.91 5.79 7.31 7.70 0.24 2.16
Reliance - Equity Savings Fund Reg (G)
11.97 1124 (1.23) (0.20) (4.99) (5.93) (4.76) 2.94 4.24 -0.41 2.19
SBI - Equity Savings Fund Reg (G) 13.29 1759 2.95 4.28 1.96 3.74 6.68 5.41 6.72 -0.23 1.69
Equity Savings
NAV AUM (Rs Cr)
30 Day
3 M 6 M 1 Yr 3 Yr 5 Yr Since Inception
Return
Sharpe Ratio
Exp. Ratio
Aditya Birla SL - Arbitrage Fund Reg (G)
19.53 4308 0.11 0.32 1.45 3.35 6.38 6.04 6.80 0.01 0.84
HDFC - Arbitrage Fund WP (G) 22.61 4825 0.08 0.28 1.38 3.15 6.10 5.78 7.08 -0.46 0.75
ICICI Pru - Equity Arbitrage Fund Reg (G)
25.15 12243 0.05 0.27 1.38 3.25 6.24 6.03 7.51 0.07 0.95
Kotak - Equity Arbitrage Fund (G) 27.2 15629 0.09 0.30 1.41 3.28 6.31 6.18 7.42 0.35 0.97
Reliance - Arbitrage Fund (G) 19.53 8937 0.07 0.25 1.39 3.27 6.35 6.27 7.71 0.47 1.04
SBI - Arbitrage Opp Fund Reg (G) 24.8 4237 0.07 0.27 1.46 3.43 6.36 6.05 7.30 0.02 0.88
Arbitrage Fund
ALL DATA BELONGS TO 9/24/2019
NAV AUM (Rs Cr)
30 Day
3 M 6 M 1 Yr 3 Yr 5 Yr Since Inception
Return
Sharpe Ratio
Exp. Ratio
Invesco - India Dynamic Equity Fund (G)
29.49 908 0.16
26.45 (26/10/2018)
0.00% 0.89 3.22 5.51 2.55 0.09 2.22
ICICI Pru - Asset Allocator Fund (G)
57.02 3041 1.10
52.2208 (09/10/2018)
0.00% 1.74 4.20 8.77 8.17 0.66 1.41
ICICI Pru - Multi-Asset Fund (G)
265.98 10942 0.37
243.8023 (14/02/2019)
0.00% (1.55) 0.47 2.71 4.96 0.17 1.93
SBI - Dynamic Asset Alloca-tion Fund (G)
13.43 683 0.08
12.7887 (26/10/2018)
0.00% 0.49 0.96 2.48 5.46 0.06 2.19
Dynamic/ Multi Assets
NAV AUM (Rs Cr)
30 Day
3 M 6 M 1 Yr 3 Yr 5 Yr Since Inception
Return
Sharpe Ratio
Exp. Ratio
ICICI Pru - Retirement Fund Pure Debt Plan (G)
10.65 196 - 10 (27/02/2019)
3.16% 2.38 5.68 0.00 0.00 - 2.02
Aditya Birla SL - Retirement Fund 30s Plan (G)
9.94 93 - 9.061 (22/08/2019)
0.00% 0.79 (0.80) 0.00 0.00 - 2.68
HDFC - Retirement Savings Fund Hybrid Equity Reg (G)
16.8 313 - 15.077 (26/10/2018)
0.00% (0.34) 1.30 6.96 5.69 - 2.44
Aditya Birla SL - Bal Bhav-ishya Yojna Wealth Plan (G)
10.33 161 - 9.45 (22/08/2019)
0.00% 0.78 (0.96) 0.00 0.00 - 2.64
ICICI Pru - Child Care Gift Plan Reg
138.37 612 (0.15)
126.8 (26/10/2018)
0.00% (2.54) (1.76) 2.64 5.29 -0.08 2.55
Solution Fund

15 October 2019INSIGHT
HDFC Bank Ltd.
STOCK PICKS
CMP: Rs 1230 Rating: BUY Target: Rs 1395
Investment RationaleDominant market positionHDFC Bank is the fastest growing large bank, accounting for 7% of market share among all banks and 27% among private sector banks (as of Dec 2018) with strong customer base of over 49 million. It is a comprehensive bank with a balanced presence across retail, SME and corporate segments through significant reach (more than 5000 branches pan India), brand value
and wide range of product offering. HDFC Bank has a balanced presence (branches) in metro, urban, semi-urban and rural areas at 28%, 19%, 31% and 22% respectively, as of March 2019. The bank started 5 to 6 years back in expanding its presence in semi urban and rural regions and now accounts for 53% of branches. In the private banking space, HDFC bank is the largest and most profitable bank, with total asset of Rs 12.4 trillion and net profit of Rs 210
billion as of FY19. It has continued its dominance in both retail and wholesale with ratio of 54:46 for its loan book. Over the years, HDFC bank has built one of the strongest liability franchise, aided by wide presence, superior technology offerings and comprehensive product packages in transaction banking. HDFC Bank is also the market leader in credit cards driven by cross selling to existing customers (~65% of credit card portfolio) while existing customers
Company InformationBSE Code 500180NSE Code HDFCBANKBloomberg Code HDFCB INISIN INE040A01034Market Cap (Rs. Cr) 678211Outstanding shares(Cr) 546.652-wk Hi/Lo (Rs.) 1282.7 / 942.5Avg. daily volume (1yr. on NSE) 3439586Face Value(Rs.) 1Book Value (Rs) 273.9
Promoter 26.3%
DII 17.1%
FII 38.6%
Share holding pattern as on June 2019
Others 18.0%

16October 2019 INSIGHT
account for ~50% of the personal loan segment. Expansion in rural regions will enable the bank to earn strong fee income thus supporting robust other income growth (which accounts ~27% of net revenues in FY19). Its dominance in private banking space, deep reach to customers and wide range of financial products make HDFC bank different from other financial institutions. .
Low funding costs entail healthy marginsHDFC bank is amongst the lowest deposit costs bank in the industry. In past 3-4 years, the bank witnessed decline in its cost of deposits from 5.91% in FY16 to 4.82% in FY18, due to demonetization drive by government. Cost of deposits has only slightly inched up to 5.03% in FY19, despite tight liquidity environment. Low cost deposit is due to bank’s healthy proportion of CASA deposits which has been in the range of 43% to 48% in last 3-4 years. Low cost funds coupled with stable interest rate cycle helped the bank to maintain healthy NIMs over the years. For the last 3 years, bank has maintained average NIMs of 4.3-4.4%. Higher yield from assets on account of higher proportion & product mix of retail loans also supported its stable NIMs. Rising competition and intent on higher profitability led to shift from corporate to retail segment with
contribution increasing from 47% in FY15 to 53% in FY19. Besides, within the retail, high yielding unsecured book (personal loans & credit cards) has increased from ~24% in FY15 to ~33% in FY19, thus fueled better than industry advances growth of 22% during the same period for the bank. The bank’s strong ability to maintain healthy proportion of CASA deposits together with focus on high yield retail loan would keep its NIMs stable over the years.
Strong asset quality & robust return on assetsOver the years, HDFC bank is one of the best banks in maintaining healthy asset quality in the industry. As of FY19, bank has maintained a very high specific provision cover at 71% of NPAs with total coverage ratio (including general & floating provisions) at 117%. Focus on high yielding retail loan (accounting for 54% of loan portfolio) and being very selective in project finance, is the primary factor behind superior asset quality performance since existence. Management has always maintained that capacity utilization above 80% will be the indication for beginning of investment cycle (currently capacity utilization ~76%) which looks to be a few quarters away. The pickup in the investment cycle is required for large ticket project finance. For last 3 years the bank has maintained
average gross NPA and net NPA of 1.24% and 0.37% respectively, which is commendable in the industry. Although, in last 3 years asset quality has marginally deteriorated on account of cyclical trends in its agriculture loan portfolio due to the volatile monsoon season and frequent farm loan waivers announced by various state governments. The crisis in NBFC and HFCs sector has also not deterred its portfolio. The bank management has reviewed its existing NBFC portfolio and believes that the portfolio is well-positioned, and it does not see an immediate concern on any exposure as the bank has always lent to high-rated NBFCs based on an internal risk assessment. One of the key strengths of the bank has been its ability to reduce operating expenses and thus compensated for higher provisioning expenses. There has been consistent decline in cost to income (C/I) ratio every year after peaking at 49.7% in FY12. For the last three years, C/I declined from 43.4% in FY17 to 39.7% in FY19 and the management has targeted for further reduction. HDFC bank’s strong operating efficiencies and stable asset quality led to steady rise in return on assets (RoA). The management has maintained RoA between 1.9% to 2% since FY13. The most notable thing is that strong RoA growth has come without compromising on asset quality and margins. It is expected that improvement in RoA over the next 3 years should be driven more by operating synergies coming out of digital banking initiatives and lower branch additions and recruits, thereby boosting productivity ratios.
Recent updates On business: During Q1FY20, HDFC
Bank showed a mild moderation in business growth as well as on asset quality. Credit growth came in lower at 17% while provisions was higher due to increased rate of provisions on agri book & on unsecured book and auto loans. Given the heavy reliance of the unsecured loans (~18% of loan book) and auto (11% of loan book), a rise in credit costs is inevitable, however a lot of this is cyclical in nature, besides the management
HDFC Bank Ltd. Price Chart
0 2,000 4,000 6,000 8,000 10,000 12,000 14,000 16,000 18,000 20,000
500
600
700
800
900
1000
1100
1200
1300
Sep-
16
Dec
-16
Mar
-17
Jun-
17
Sep-
17
Dec
-17
Mar
-18
Jun-
18
Sep-
18
Dec
-18
Mar
-19
Jun-
19
Sep-
19
Volume (000's) (RHS) HDFC Bank

17 October 2019INSIGHT
opines that it is still not even close to budgeted credit cost in any product segment. The bank expects to sustain credit cost within 80–100bps. Upbeat on festive season: HDFC
Bank still sees good prospects ahead of festive season in the next couple of months driven by aggressive marketing campaigns and tie-ups with brands and partners and therefore in a position to offer cashbacks and discounts. The bank wants to leverage its unparalleled distribution network and sense a good opportunity to capture market share at the expense of competitors. Cost optimization: Management
has guided to reduce cost to income ratio over next three years to 35% from ~40% currently as digitalization scales up. Five-pronged strategy for growth:
(a) The bank plans to expand its branch network, adding another 600-700 branches per year, and it plans to double its new customer acquisition to 6mn customers in FY20. (b) It will leverage on the 600k CSCs (common service centres) to scale up business and expects 100k feet-on-street by June 2020 (c) Use VRMs (virtual relationship managers) to cater to 6m customers and eventually to ensure that profitability per customer from this segment matches profitability per customer from 3mn customers who have dedicated RMs (generating 50% of retail earnings) (d) Despite being loss making, HDFC Bank wants to increase merchant acquisition from 1mn in FY19 to 4mn by FY21. This would also aid in cross-selling of asset & liability products (e) The bank will leverage on digital banking and use its API-based platform more actively and integrate it well with
e-commerce players. In the process it will bring down its cost to income ratio too. On Fund raising: The recent
relaxation in risk-weights (RW) for retail book pushed up Tier1 by 90bps to 15.8%. HDFC Bank doesn’t see any fund raise in coming few quarters unless the credit demand requires additional capital. As of 1QFY20, total CAR stood at 16.9% On separate listing of HDB
Financial services: HDFC Bank may consider separate listing of its subsidiary to raise fund, when credit environment revives. As of 1QFY20, HDB financial services has total loan book of Rs 56,287 crore and the Bank held 95.5% stake. Repo rate linked loans – not much
impact on margins: HDFC Bank’s retail loans are largely fixed rate in nature and doesn’t see any short-term impact on the NIMs. Currently SA rate is 3.5% and TD rates are at 7.1% and the bank has slashed the TD rates recently. Nevertheless, the management is confident to maintain the NIMs in the range of 4.1%-4.4%. Corporate tax cut: The Government
has announced downward revision in corporate tax rate from existing 30% to 22% from FY20 onwards, which would lower effective tax rate to 25.17% at higher end from the current level of 34.95%. HDFC bank’s effective tax rate stood at 34.5% for FY19 and is expected to provide a jump of ~14% to the bottomline in FY20.
Key Risks Higher inflation may prompt RBI
to hike the interest rate, which could result in higher cost of funds and lower margins for bank Slowdown in economy and higher
unemployment could increase NPA for the bank as weak economic growth would hurt the earnings of corporate and individuals
ValuationHDFC Bank has built a robust retail franchisee over the years and has been growing consistently thus gaining market share across retail products. On account of a strong CASA franchisee, it has been able to earn consistently strong NIMs of 4.3% and being a retail bank hasn’t been subjected to asset quality hiccups and has maintained adequate capitalization levels and healthy return ratios. It’s expansion into the rural & semi-urban areas and cross-selling to existing customers ensures plenty of room to grow and thus generating healthy interest income as well as fee income. We believe HDFC Bank will sustain its best in class track record on asset quality despite minor blemishes given its focus on internal customers, strict adherence to strong cash flow based lending and firm focus on risk management. HDFC bank has formulated a five-pronged strategy to drive the next leg of growth driven by digitization initiatives. In the process, the management expects to reduce cost to income ratio over next three years to 35% from ~40%. Despite minor hiccups on asset quality over the last three years, The management has maintained its ROA driven by operating leverage and remains one of the best compounding machines in the sector. Thus, we recommend our investors to BUY the scrip with target of Rs 1395, from 12 to 18 months investment perspective. Currently, the bank is valued at P/BV of 3.36x on FY21E BVPS of Rs 369.3.
Particulars (in Rs Cr) FY18 FY19 FY20E FY21E
Net interest Income 40,095 48,243 58,209 69,329
NIM (%) 4.4% 4.4% 4.3% 4.2%
Operating Profit 32,625 39,750 48,326 57,938
PAT 17,487 21,078 29,042 36,232
EPS (Rs) 33.69 38.70 53.14 66.29
BV (Rs) 204.8 273.9 315.8 369.3
GNPA (%) 1.3% 1.4% 1.7% 1.7%Source: Ace equity & Ashika Research

18October 2019 INSIGHT
Siemens India Ltd.CMP: Rs 1515 Rating: BUY Target: Rs 1700
Company overviewSiemens India Ltd. (SIL) is a 75% subsidiary of Siemens AG, Germany, which has presence in more than 200 countries. SIEM offers diverse products and services solutions in power generation, transmission and distribution, automation and
drives, industrial and digital solution. Siemens has 22 factories located across the country, 8 Centres of Competence, 11 R&D centres and a nationwide sales and service network. The factories in India mainly aim at manufacturing steam turbines, motors, switchgears,
generators, transformers, relay and smart grid systems etc. The strategic business unit in India can be divided into divisions namely: Power and Gas, Energy Management, Building Technologies, Mobility, Digital Factory, Process Industries and Drives. Siemens has its associations
Company InformationBSE Code 500550NSE Code SIEMENSBloomberg Code SIEM INISIN INE003A01024Market Cap (Rs. Cr) 51370Outstanding shares(Cr) 35.652-wk Hi/Lo (Rs.) 1493.8 / 850.25Avg. daily volume (1yr. on NSE) 563,519Face Value(Rs.) 2Book Value 240.1
Promoter 75.0%
DII 11.8%
FII 2.1%
Share holding pattern as on June 2019
Others 11.1%
STOCK PICKS
19 October 2019INSIGHT
with the Indian Railways for more than six decades and has been a preferred technology and customized solution provider since then.
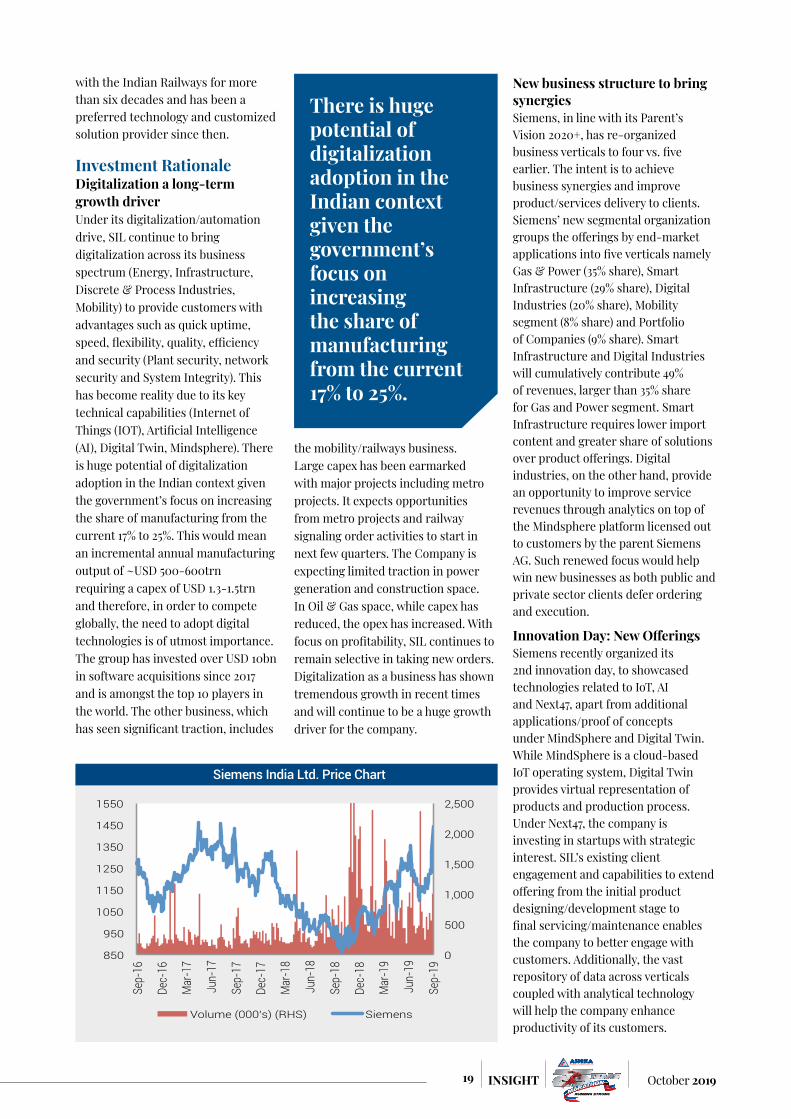
Investment RationaleDigitalization a long-term growth driverUnder its digitalization/automation drive, SIL continue to bring digitalization across its business spectrum (Energy, Infrastructure, Discrete & Process Industries, Mobility) to provide customers with advantages such as quick uptime, speed, flexibility, quality, efficiency and security (Plant security, network security and System Integrity). This has become reality due to its key technical capabilities (Internet of Things (IOT), Artificial Intelligence (AI), Digital Twin, Mindsphere). There is huge potential of digitalization adoption in the Indian context given the government’s focus on increasing the share of manufacturing from the current 17% to 25%. This would mean an incremental annual manufacturing output of ~USD 500-600trn requiring a capex of USD 1.3-1.5trn and therefore, in order to compete globally, the need to adopt digital technologies is of utmost importance. The group has invested over USD 10bn in software acquisitions since 2017 and is amongst the top 10 players in the world. The other business, which has seen significant traction, includes
the mobility/railways business. Large capex has been earmarked with major projects including metro projects. It expects opportunities from metro projects and railway signaling order activities to start in next few quarters. The Company is expecting limited traction in power generation and construction space. In Oil & Gas space, while capex has reduced, the opex has increased. With focus on profitability, SIL continues to remain selective in taking new orders. Digitalization as a business has shown tremendous growth in recent times and will continue to be a huge growth driver for the company.
New business structure to bring synergiesSiemens, in line with its Parent’s Vision 2020+, has re-organized business verticals to four vs. five earlier. The intent is to achieve business synergies and improve product/services delivery to clients. Siemens’ new segmental organization groups the offerings by end-market applications into five verticals namely Gas & Power (35% share), Smart Infrastructure (29% share), Digital Industries (20% share), Mobility segment (8% share) and Portfolio of Companies (9% share). Smart Infrastructure and Digital Industries will cumulatively contribute 49% of revenues, larger than 35% share for Gas and Power segment. Smart Infrastructure requires lower import content and greater share of solutions over product offerings. Digital industries, on the other hand, provide an opportunity to improve service revenues through analytics on top of the Mindsphere platform licensed out to customers by the parent Siemens AG. Such renewed focus would help win new businesses as both public and private sector clients defer ordering and execution.
Innovation Day: New OfferingsSiemens recently organized its 2nd innovation day, to showcased technologies related to IoT, AI and Next47, apart from additional applications/proof of concepts under MindSphere and Digital Twin. While MindSphere is a cloud-based IoT operating system, Digital Twin provides virtual representation of products and production process. Under Next47, the company is investing in startups with strategic interest. SIL’s existing client engagement and capabilities to extend offering from the initial product designing/development stage to final servicing/maintenance enables the company to better engage with customers. Additionally, the vast repository of data across verticals coupled with analytical technology will help the company enhance productivity of its customers.
Siemens India Ltd. Price Chart
0
500
1,000
1,500
2,000
2,500
850
950
1050
1150
1250
1350
1450
1550
Sep-
16
Dec-
16
Mar
-17
Jun-
17
Sep-
17
Dec-
17
Mar
-18
Jun-
18
Sep-
18
Dec-
18
Mar
-19
Jun-
19
Sep-
19
Volume (000's) (RHS) Siemens
There is huge potential of digitalization adoption in the Indian context given the government’s focus on increasing the share of manufacturing from the current 17% to 25%.
20October 2019 INSIGHT
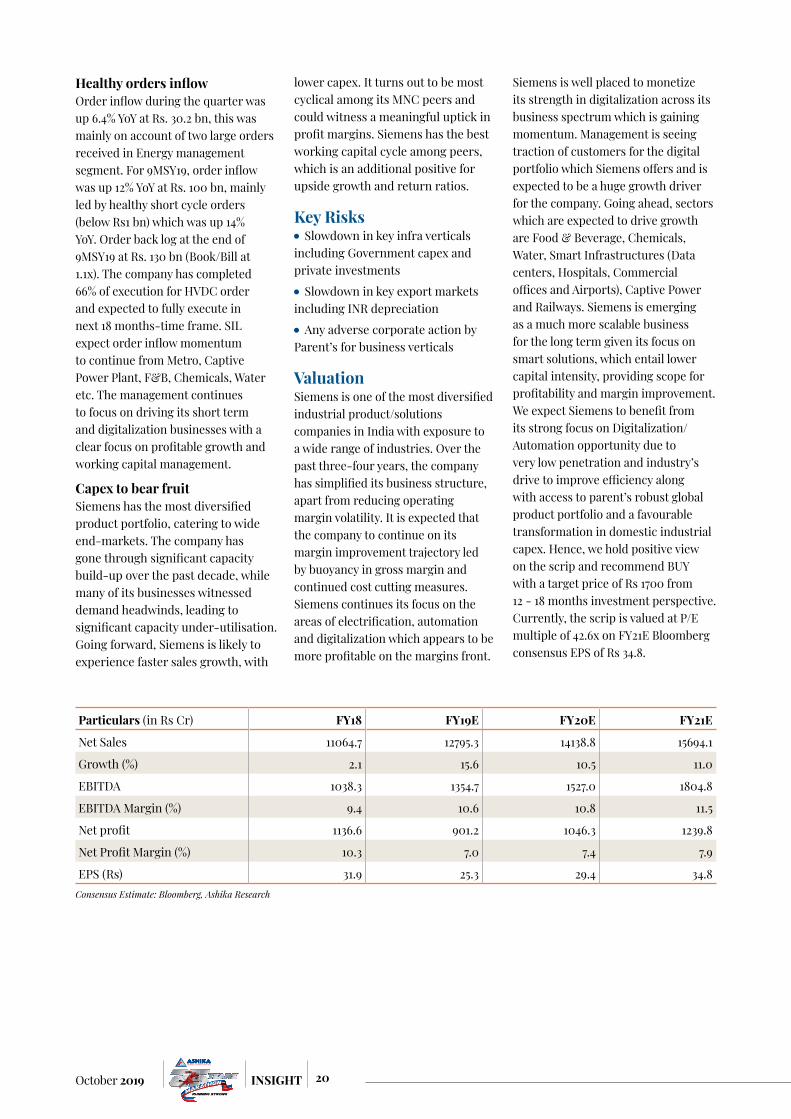
Healthy orders inflowOrder inflow during the quarter was up 6.4% YoY at Rs. 30.2 bn, this was mainly on account of two large orders received in Energy management segment. For 9MSY19, order inflow was up 12% YoY at Rs. 100 bn, mainly led by healthy short cycle orders (below Rs1 bn) which was up 14% YoY. Order back log at the end of 9MSY19 at Rs. 130 bn (Book/Bill at 1.1x). The company has completed 66% of execution for HVDC order and expected to fully execute in next 18 months-time frame. SIL expect order inflow momentum to continue from Metro, Captive Power Plant, F&B, Chemicals, Water etc. The management continues to focus on driving its short term and digitalization businesses with a clear focus on profitable growth and working capital management.
Capex to bear fruit Siemens has the most diversified product portfolio, catering to wide end-markets. The company has gone through significant capacity build-up over the past decade, while many of its businesses witnessed demand headwinds, leading to significant capacity under-utilisation. Going forward, Siemens is likely to experience faster sales growth, with
lower capex. It turns out to be most cyclical among its MNC peers and could witness a meaningful uptick in profit margins. Siemens has the best working capital cycle among peers, which is an additional positive for upside growth and return ratios.
Key Risks Slowdown in key infra verticals
including Government capex and private investments
Slowdown in key export markets including INR depreciation
Any adverse corporate action by Parent’s for business verticals
ValuationSiemens is one of the most diversified industrial product/solutions companies in India with exposure to a wide range of industries. Over the past three-four years, the company has simplified its business structure, apart from reducing operating margin volatility. It is expected that the company to continue on its margin improvement trajectory led by buoyancy in gross margin and continued cost cutting measures. Siemens continues its focus on the areas of electrification, automation and digitalization which appears to be more profitable on the margins front.
Siemens is well placed to monetize its strength in digitalization across its business spectrum which is gaining momentum. Management is seeing traction of customers for the digital portfolio which Siemens offers and is expected to be a huge growth driver for the company. Going ahead, sectors which are expected to drive growth are Food & Beverage, Chemicals, Water, Smart Infrastructures (Data centers, Hospitals, Commercial offices and Airports), Captive Power and Railways. Siemens is emerging as a much more scalable business for the long term given its focus on smart solutions, which entail lower capital intensity, providing scope for profitability and margin improvement. We expect Siemens to benefit from its strong focus on Digitalization/Automation opportunity due to very low penetration and industry’s drive to improve efficiency along with access to parent’s robust global product portfolio and a favourable transformation in domestic industrial capex. Hence, we hold positive view on the scrip and recommend BUY with a target price of Rs 1700 from 12 - 18 months investment perspective. Currently, the scrip is valued at P/E multiple of 42.6x on FY21E Bloomberg consensus EPS of Rs 34.8.
Particulars (in Rs Cr) FY18 FY19E FY20E FY21E
Net Sales 11064.7 12795.3 14138.8 15694.1
Growth (%) 2.1 15.6 10.5 11.0
EBITDA 1038.3 1354.7 1527.0 1804.8
EBITDA Margin (%) 9.4 10.6 10.8 11.5
Net profit 1136.6 901.2 1046.3 1239.8
Net Profit Margin (%) 10.3 7.0 7.4 7.9
EPS (Rs) 31.9 25.3 29.4 34.8Consensus Estimate: Bloomberg, Ashika Research

21 October 2019INSIGHT
Indian Hotels Company Ltd.
CMP: Rs 159 Rating: BUY Target: Rs 185
Company overviewIndian Hotel Company ltd. (IHCL), a Tata Group company is South Asia’s largest hospitality company. Incorporated in 1899, IHCL has increased its total number of hotels
to 151 with 18,217 rooms inventory, including international properties in US, UK and Middle East countries. Apart from hotel, it also offers ancillary services like restaurants, spas, catering services and clubs.
With ‘Aspiration 2022’, company intent to achieve higher scale and sustain profitability. In order to expand its operation and stay ahead of competition, management is committed to add 15 new properties
Company InformationBSE Code 500850NSE Code INDHOTELBloomberg Code IH INISIN INE053A01029Market Cap (Rs. Cr) 18,992.5 Outstanding shares (Cr) 118.93 52-wk Hi/Lo (Rs.) 164.3/110.0Avg. daily volume (1yr. on NSE) 1,080,860 Face Value (Rs.) 1Book Value (Rs) 37.9
Promoter 39.1%
Others 19.8%
DII 41.1%
Share holding pattern as on June 2019
STOCK PICKS
22October 2019 INSIGHT
every year. Further, corporate tax rate cut and reduction of GST rate on room tariff are the two positive triggers for Indian hotel industry.
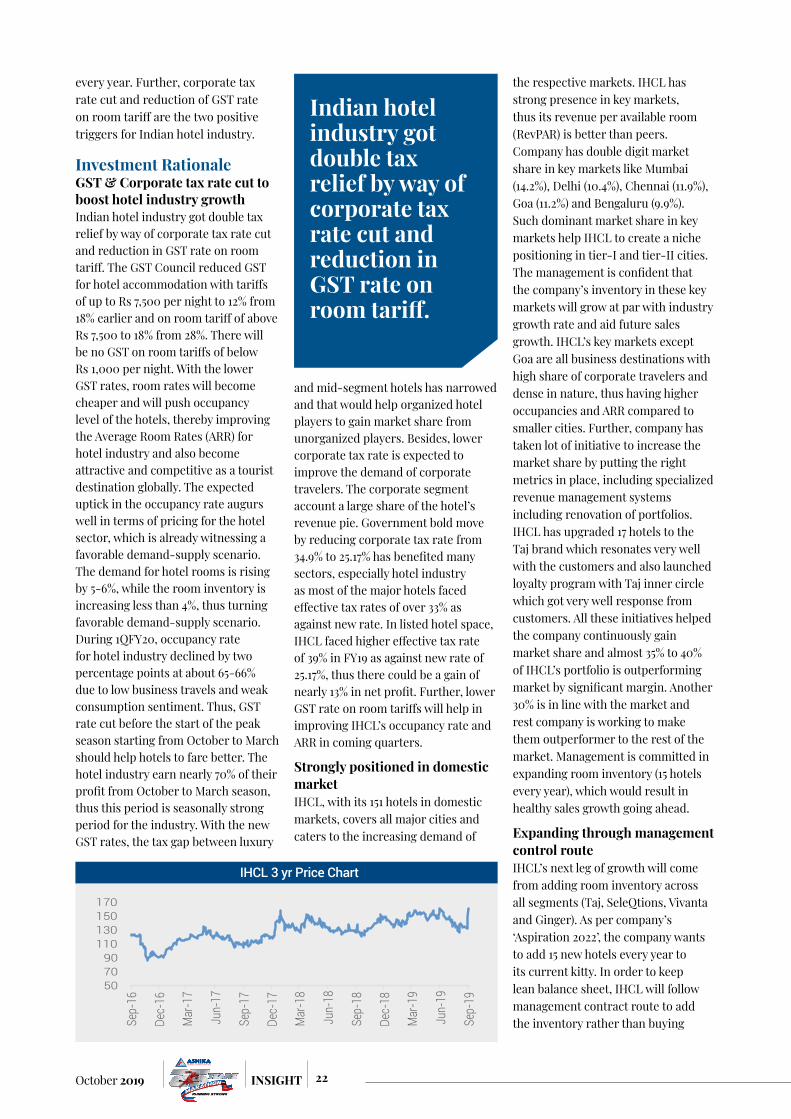
Investment RationaleGST & Corporate tax rate cut to boost hotel industry growthIndian hotel industry got double tax relief by way of corporate tax rate cut and reduction in GST rate on room tariff. The GST Council reduced GST for hotel accommodation with tariffs of up to Rs 7,500 per night to 12% from 18% earlier and on room tariff of above Rs 7,500 to 18% from 28%. There will be no GST on room tariffs of below Rs 1,000 per night. With the lower GST rates, room rates will become cheaper and will push occupancy level of the hotels, thereby improving the Average Room Rates (ARR) for hotel industry and also become attractive and competitive as a tourist destination globally. The expected uptick in the occupancy rate augurs well in terms of pricing for the hotel sector, which is already witnessing a favorable demand-supply scenario. The demand for hotel rooms is rising by 5-6%, while the room inventory is increasing less than 4%, thus turning favorable demand-supply scenario. During 1QFY20, occupancy rate for hotel industry declined by two percentage points at about 65-66% due to low business travels and weak consumption sentiment. Thus, GST rate cut before the start of the peak season starting from October to March should help hotels to fare better. The hotel industry earn nearly 70% of their profit from October to March season, thus this period is seasonally strong period for the industry. With the new GST rates, the tax gap between luxury
and mid-segment hotels has narrowed and that would help organized hotel players to gain market share from unorganized players. Besides, lower corporate tax rate is expected to improve the demand of corporate travelers. The corporate segment account a large share of the hotel’s revenue pie. Government bold move by reducing corporate tax rate from 34.9% to 25.17% has benefited many sectors, especially hotel industry as most of the major hotels faced effective tax rates of over 33% as against new rate. In listed hotel space, IHCL faced higher effective tax rate of 39% in FY19 as against new rate of 25.17%, thus there could be a gain of nearly 13% in net profit. Further, lower GST rate on room tariffs will help in improving IHCL’s occupancy rate and ARR in coming quarters.
Strongly positioned in domestic marketIHCL, with its 151 hotels in domestic markets, covers all major cities and caters to the increasing demand of
the respective markets. IHCL has strong presence in key markets, thus its revenue per available room (RevPAR) is better than peers. Company has double digit market share in key markets like Mumbai (14.2%), Delhi (10.4%), Chennai (11.9%), Goa (11.2%) and Bengaluru (9.9%). Such dominant market share in key markets help IHCL to create a niche positioning in tier-I and tier-II cities. The management is confident that the company’s inventory in these key markets will grow at par with industry growth rate and aid future sales growth. IHCL’s key markets except Goa are all business destinations with high share of corporate travelers and dense in nature, thus having higher occupancies and ARR compared to smaller cities. Further, company has taken lot of initiative to increase the market share by putting the right metrics in place, including specialized revenue management systems including renovation of portfolios. IHCL has upgraded 17 hotels to the Taj brand which resonates very well with the customers and also launched loyalty program with Taj inner circle which got very well response from customers. All these initiatives helped the company continuously gain market share and almost 35% to 40% of IHCL’s portfolio is outperforming market by significant margin. Another 30% is in line with the market and rest company is working to make them outperformer to the rest of the market. Management is committed in expanding room inventory (15 hotels every year), which would result in healthy sales growth going ahead.
Expanding through management control routeIHCL’s next leg of growth will come from adding room inventory across all segments (Taj, SeleQtions, Vivanta and Ginger). As per company’s ‘Aspiration 2022’, the company wants to add 15 new hotels every year to its current kitty. In order to keep lean balance sheet, IHCL will follow management contract route to add the inventory rather than buying
IHCL 3 yr Price Chart
50 70 90
110 130 150 170
Sep-
16
Dec-
16
Mar
-17
Jun-
17
Sep-
17
Dec-
17
Mar
-18
Jun-
18
Sep-
18
Dec-
18
Mar
-19
Jun-
19
Sep-
19
Indian hotel industry got double tax relief by way of corporate tax rate cut and reduction in GST rate on room tariff.
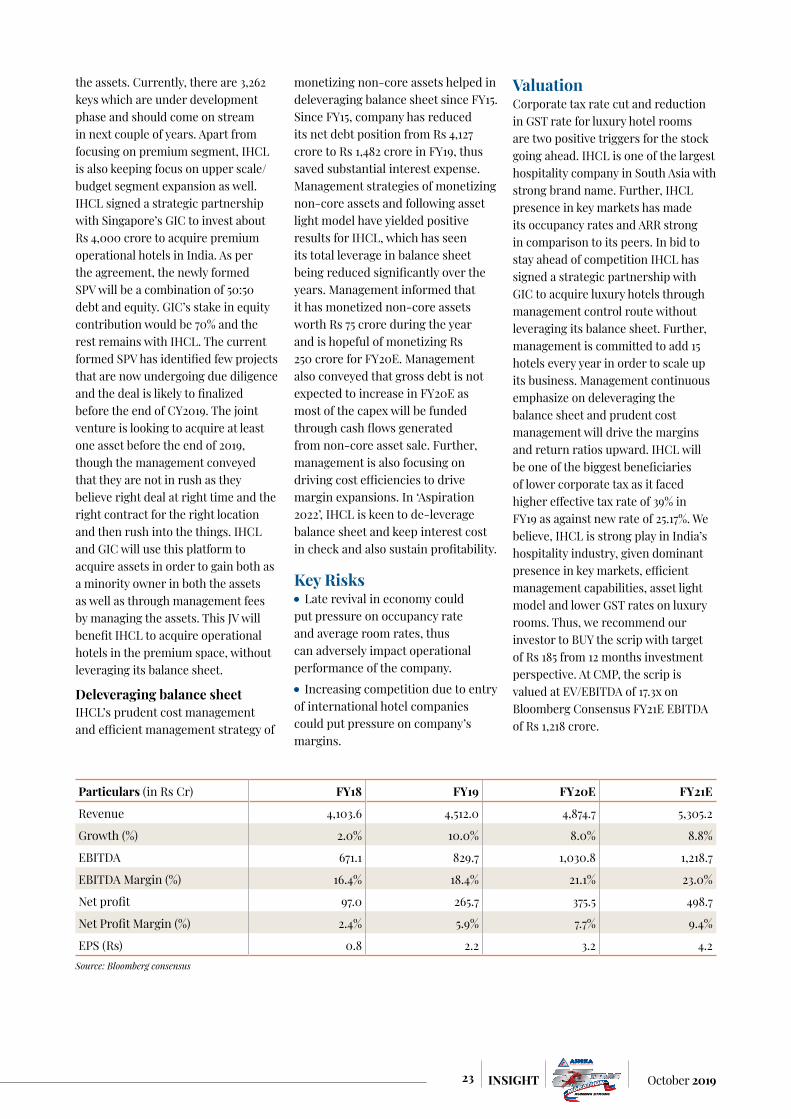
23 October 2019INSIGHT
the assets. Currently, there are 3,262 keys which are under development phase and should come on stream in next couple of years. Apart from focusing on premium segment, IHCL is also keeping focus on upper scale/budget segment expansion as well. IHCL signed a strategic partnership with Singapore’s GIC to invest about Rs 4,000 crore to acquire premium operational hotels in India. As per the agreement, the newly formed SPV will be a combination of 50:50 debt and equity. GIC’s stake in equity contribution would be 70% and the rest remains with IHCL. The current formed SPV has identified few projects that are now undergoing due diligence and the deal is likely to finalized before the end of CY2019. The joint venture is looking to acquire at least one asset before the end of 2019, though the management conveyed that they are not in rush as they believe right deal at right time and the right contract for the right location and then rush into the things. IHCL and GIC will use this platform to acquire assets in order to gain both as a minority owner in both the assets as well as through management fees by managing the assets. This JV will benefit IHCL to acquire operational hotels in the premium space, without leveraging its balance sheet.
Deleveraging balance sheet IHCL’s prudent cost management and efficient management strategy of
monetizing non-core assets helped in deleveraging balance sheet since FY15. Since FY15, company has reduced its net debt position from Rs 4,127 crore to Rs 1,482 crore in FY19, thus saved substantial interest expense. Management strategies of monetizing non-core assets and following asset light model have yielded positive results for IHCL, which has seen its total leverage in balance sheet being reduced significantly over the years. Management informed that it has monetized non-core assets worth Rs 75 crore during the year and is hopeful of monetizing Rs 250 crore for FY20E. Management also conveyed that gross debt is not expected to increase in FY20E as most of the capex will be funded through cash flows generated from non-core asset sale. Further, management is also focusing on driving cost efficiencies to drive margin expansions. In ‘Aspiration 2022’, IHCL is keen to de-leverage balance sheet and keep interest cost in check and also sustain profitability.
Key Risks Late revival in economy could
put pressure on occupancy rate and average room rates, thus can adversely impact operational performance of the company.
Increasing competition due to entry of international hotel companies could put pressure on company’s margins.
ValuationCorporate tax rate cut and reduction in GST rate for luxury hotel rooms are two positive triggers for the stock going ahead. IHCL is one of the largest hospitality company in South Asia with strong brand name. Further, IHCL presence in key markets has made its occupancy rates and ARR strong in comparison to its peers. In bid to stay ahead of competition IHCL has signed a strategic partnership with GIC to acquire luxury hotels through management control route without leveraging its balance sheet. Further, management is committed to add 15 hotels every year in order to scale up its business. Management continuous emphasize on deleveraging the balance sheet and prudent cost management will drive the margins and return ratios upward. IHCL will be one of the biggest beneficiaries of lower corporate tax as it faced higher effective tax rate of 39% in FY19 as against new rate of 25.17%. We believe, IHCL is strong play in India’s hospitality industry, given dominant presence in key markets, efficient management capabilities, asset light model and lower GST rates on luxury rooms. Thus, we recommend our investor to BUY the scrip with target of Rs 185 from 12 months investment perspective. At CMP, the scrip is valued at EV/EBITDA of 17.3x on Bloomberg Consensus FY21E EBITDA of Rs 1,218 crore.
Particulars (in Rs Cr) FY18 FY19 FY20E FY21E
Revenue 4,103.6 4,512.0 4,874.7 5,305.2
Growth (%) 2.0% 10.0% 8.0% 8.8%
EBITDA 671.1 829.7 1,030.8 1,218.7
EBITDA Margin (%) 16.4% 18.4% 21.1% 23.0%
Net profit 97.0 265.7 375.5 498.7
Net Profit Margin (%) 2.4% 5.9% 7.7% 9.4%
EPS (Rs) 0.8 2.2 3.2 4.2 Source: Bloomberg consensus

24October 2019 INSIGHT
Monthly Insight Recommendation Performance Sheet
Total Call: 283
Target Achieved 83% Calls Open 7%Booked 10% More than 100% Return 51% - 143 stocks
50-25% Return 12% - 34 stocks100-50% Return 16% - 46 stocks
Less than 25% Return 21% - 60 stocks
Success Rate Return Classification

25 October 2019INSIGHT
Our recommendation includes stocks across the sectors that are generating alpha return for our investors. For the last 10 years we have been consistent in generating superior return for our clients through our prestigious
monthly insight recommendations. Since January 2012 we have recom-mended 283 stocks out of which 234 has achieved target. Success ratio stands at 83%. Out of these 143 stocks have given a return of more than 100%.
We have selected stocks across large cap and mid cap companies and across variety of sectors. For the period analyzed, the stocks recommended by us have outperformed their respective sectoral indices.
TimePeriod
Script Sector RecoPrice
TargetPrice
TargetReturn
High afterReco
Returnfrom High
CMP (as on 25/09/2019)
Status
Oct-19 HDFC Bank Banking 1230 1395 13.4%
Siemens Capital Goods 1515 1700 12.2%
Indian Hotels Hotels 159 185 16.4%
Sep-19 Hindustan Unilever FMCG 1830 1975 7.9% 2100.7 14.8% 2051.5 Target Achieved
Gujarat Gas Oil & Gas 177 200 13.0% 185.0 4.5% 175.6
Aug-19 ICICI Bank Banking 424 473 11.6% 450.0 6.1% 434.2
Divi’s Lab Pharma 1590 1750 10.1% 1683.5 5.9% 1633.5
Jul-19 City Union Bank Banking 205 254 23.9% 227.0 10.7% 222.4
Reliance Nippon Life Finance 221 265 19.9% 289.0 30.8% 263.2 Target Achieved
Sanofi India Pharma 5743 6775 18.0% 6393.0 11.3% 5856.9
Jun-19 Axis Bank Banking 808 905 12.0% 827.8 2.4% 695.0
Asian Paints Paints 1365 1560 14.3% 1820.0 33.3% 1751.8 Target Achieved
Honeywell Automation Electrical Equip. 25905 30195 16.6% 29495.0 13.9% 27908.6
May-19 TCS IT 2256 2490 10.4% 2296.2 1.8% 2088.5
MCX Finance 858 1005 17.1% 1030.0 20.0% 984.5 Target Achieved
Apr-19 Page Industries FMCG 24766 29080 17.4% 25850.0 4.4% 22255.4 Booked
Crompton Greaves Cons. Consumar Durables 215 256 19.1% 276.5 28.6% 260.1 Target Achieved
Equitas Holdings Banking & Finance 134 191 42.5% 143.7 7.2% 101.8
Mar-19 ITC FMCG 275 319 16.0% 310.0 12.7% 256.0
Tech Mahindra IT 825 960 16.4% 846.5 2.6% 705.9
Feb-19 HDFC Bank Banking 1045 1204 15.2% 1282.7 22.7% 1253.8 Target Achieved
Pfizer Pharma 3039 3490 14.8% 3488.0 14.8% 3321.5 Target Achieved
Jan-19 United Spirits FMCG 640 735 14.8% 689.8 7.8% 650.8
Abbott India Pharma 7480 8580 14.7% 10988.8 46.9% 10629.7 Target Achieved
Indraprastha Gas Oil & Gas 262 315 20.2% 372.4 42.1% 348.7 Target Achieved
Dec-18 Berger Paints Paints 319 369 15.7% 437.7 37.2% 423.9 Target Achieved
Cummins India Capital Goods 776 889 14.6% 884.2 13.9% 592.7 Target Achieved
Nov-18 Nestlé India FMCG 9680 11370 17.5% 14117.2 45.8% 13458.5 Target Achieved
Dabur India FMCG 385 470 22.1% 469.2 21.9% 445.6 Target Achieved
Oct-18 Godrej Consumer FMCG 768 910 18.5% 849.9 10.7% 671.4
Dr. Lal PathLabs Pharma 954 1125 17.9% 1474.0 54.5% 1390.4 Target Achieved
Sep-18 Bharat Forge Auto 665 752 13.1% 693.9 4.3% 442.3 Booked
ABB India Electrical Equip. 1322 1510 14.2% 1670.0 26.3% 1539.6 Target Achieved
Whirlpool of India Consumar Durables 1795 2033 13.3% 1954.7 8.9% 1838.9
Aug-18 Cipla Pharma 625 715 14.4% 678.5 8.6% 434.6
Marico FMCG 351 408 16.2% 404.0 15.1% 392.0 Target Achieved
Jul-18 Procter & Gamble Hygiene FMCG 9900 11100 12.1% 12097.9 22.2% 11579.0 Target Achieved
Dishman Carbogen Pharma 261 307 17.6% 314.8 20.6% 172.2 Target Achieved
Jun-18 Nestle India FMCG 9519 10900 14.5% 14117.2 48.3% 13458.5 Target Achieved
CESC Power 802 1020 27.2% 851.7 6.2% 772.0
Bata India Footware 764 890 16.5% 1782.0 133.2% 1706.0 Target Achieved
May-18 ITC FMCG 280 324 15.7% 323.0 15.3% 256.0 Target Achieved
Tata Chemical Chemicals 762 890 16.8% 787.5 3.3% 601.2
Apr-18 Voltas Consumar Durables 620 720 16.1% 705.0 13.7% 668.8
Recommended Stocks
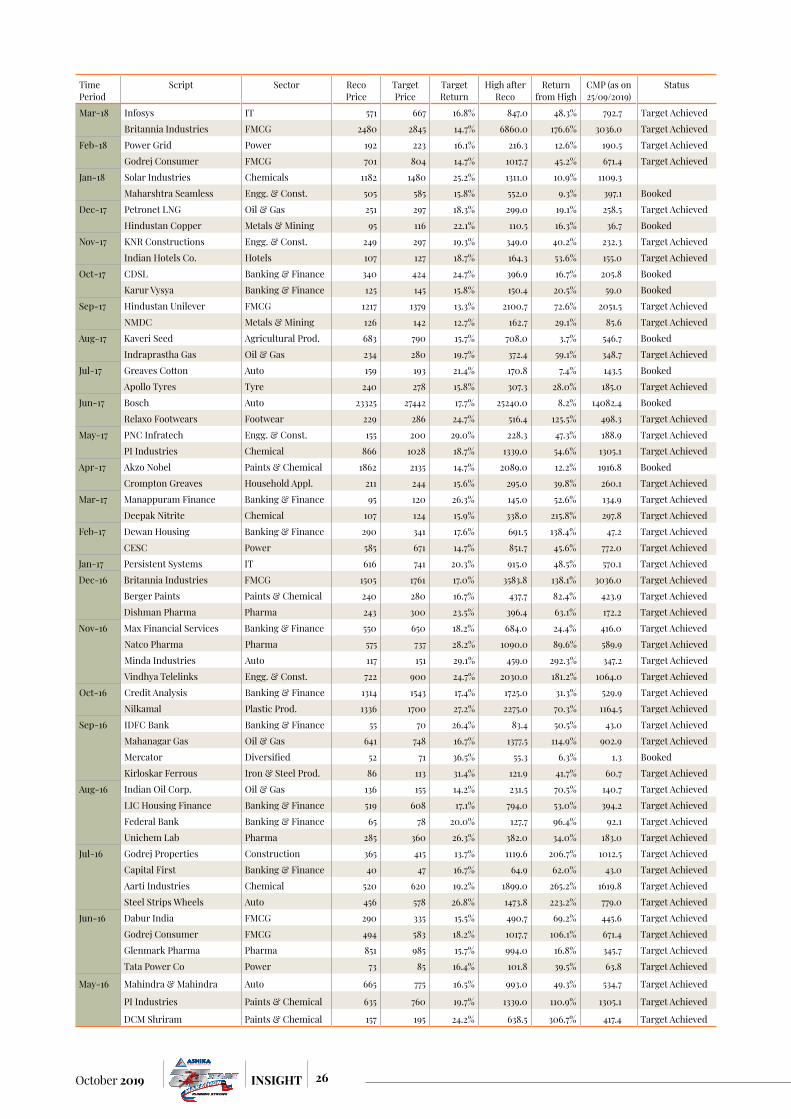
26October 2019 INSIGHT
TimePeriod
Script Sector RecoPrice
TargetPrice
TargetReturn
High afterReco
Returnfrom High
CMP (as on 25/09/2019)
Status
Mar-18 Infosys IT 571 667 16.8% 847.0 48.3% 792.7 Target AchievedBritannia Industries FMCG 2480 2845 14.7% 6860.0 176.6% 3036.0 Target Achieved
Feb-18 Power Grid Power 192 223 16.1% 216.3 12.6% 190.5 Target AchievedGodrej Consumer FMCG 701 804 14.7% 1017.7 45.2% 671.4 Target Achieved
Jan-18 Solar Industries Chemicals 1182 1480 25.2% 1311.0 10.9% 1109.3 Maharshtra Seamless Engg. & Const. 505 585 15.8% 552.0 9.3% 397.1 Booked
Dec-17 Petronet LNG Oil & Gas 251 297 18.3% 299.0 19.1% 258.5 Target AchievedHindustan Copper Metals & Mining 95 116 22.1% 110.5 16.3% 36.7 Booked
Nov-17 KNR Constructions Engg. & Const. 249 297 19.3% 349.0 40.2% 232.3 Target AchievedIndian Hotels Co. Hotels 107 127 18.7% 164.3 53.6% 155.0 Target Achieved
Oct-17 CDSL Banking & Finance 340 424 24.7% 396.9 16.7% 205.8 BookedKarur Vysya Banking & Finance 125 145 15.8% 150.4 20.5% 59.0 Booked
Sep-17 Hindustan Unilever FMCG 1217 1379 13.3% 2100.7 72.6% 2051.5 Target AchievedNMDC Metals & Mining 126 142 12.7% 162.7 29.1% 85.6 Target Achieved
Aug-17 Kaveri Seed Agricultural Prod. 683 790 15.7% 708.0 3.7% 546.7 BookedIndraprastha Gas Oil & Gas 234 280 19.7% 372.4 59.1% 348.7 Target Achieved
Jul-17 Greaves Cotton Auto 159 193 21.4% 170.8 7.4% 143.5 BookedApollo Tyres Tyre 240 278 15.8% 307.3 28.0% 185.0 Target Achieved
Jun-17 Bosch Auto 23325 27442 17.7% 25240.0 8.2% 14082.4 BookedRelaxo Footwears Footwear 229 286 24.7% 516.4 125.5% 498.3 Target Achieved
May-17 PNC Infratech Engg. & Const. 155 200 29.0% 228.3 47.3% 188.9 Target AchievedPI Industries Chemical 866 1028 18.7% 1339.0 54.6% 1305.1 Target Achieved
Apr-17 Akzo Nobel Paints & Chemical 1862 2135 14.7% 2089.0 12.2% 1916.8 BookedCrompton Greaves Household Appl. 211 244 15.6% 295.0 39.8% 260.1 Target Achieved
Mar-17 Manappuram Finance Banking & Finance 95 120 26.3% 145.0 52.6% 134.9 Target AchievedDeepak Nitrite Chemical 107 124 15.9% 338.0 215.8% 297.8 Target Achieved
Feb-17 Dewan Housing Banking & Finance 290 341 17.6% 691.5 138.4% 47.2 Target AchievedCESC Power 585 671 14.7% 851.7 45.6% 772.0 Target Achieved
Jan-17 Persistent Systems IT 616 741 20.3% 915.0 48.5% 570.1 Target AchievedDec-16 Britannia Industries FMCG 1505 1761 17.0% 3583.8 138.1% 3036.0 Target Achieved
Berger Paints Paints & Chemical 240 280 16.7% 437.7 82.4% 423.9 Target AchievedDishman Pharma Pharma 243 300 23.5% 396.4 63.1% 172.2 Target Achieved
Nov-16 Max Financial Services Banking & Finance 550 650 18.2% 684.0 24.4% 416.0 Target AchievedNatco Pharma Pharma 575 737 28.2% 1090.0 89.6% 589.9 Target AchievedMinda Industries Auto 117 151 29.1% 459.0 292.3% 347.2 Target AchievedVindhya Telelinks Engg. & Const. 722 900 24.7% 2030.0 181.2% 1064.0 Target Achieved
Oct-16 Credit Analysis Banking & Finance 1314 1543 17.4% 1725.0 31.3% 529.9 Target AchievedNilkamal Plastic Prod. 1336 1700 27.2% 2275.0 70.3% 1164.5 Target Achieved
Sep-16 IDFC Bank Banking & Finance 55 70 26.4% 83.4 50.5% 43.0 Target AchievedMahanagar Gas Oil & Gas 641 748 16.7% 1377.5 114.9% 902.9 Target AchievedMercator Diversified 52 71 36.5% 55.3 6.3% 1.3 BookedKirloskar Ferrous Iron & Steel Prod. 86 113 31.4% 121.9 41.7% 60.7 Target Achieved
Aug-16 Indian Oil Corp. Oil & Gas 136 155 14.2% 231.5 70.5% 140.7 Target AchievedLIC Housing Finance Banking & Finance 519 608 17.1% 794.0 53.0% 394.2 Target AchievedFederal Bank Banking & Finance 65 78 20.0% 127.7 96.4% 92.1 Target AchievedUnichem Lab Pharma 285 360 26.3% 382.0 34.0% 183.0 Target Achieved
Jul-16 Godrej Properties Construction 365 415 13.7% 1119.6 206.7% 1012.5 Target AchievedCapital First Banking & Finance 40 47 16.7% 64.9 62.0% 43.0 Target AchievedAarti Industries Chemical 520 620 19.2% 1899.0 265.2% 1619.8 Target AchievedSteel Strips Wheels Auto 456 578 26.8% 1473.8 223.2% 779.0 Target Achieved
Jun-16 Dabur India FMCG 290 335 15.5% 490.7 69.2% 445.6 Target AchievedGodrej Consumer FMCG 494 583 18.2% 1017.7 106.1% 671.4 Target AchievedGlenmark Pharma Pharma 851 985 15.7% 994.0 16.8% 345.7 Target AchievedTata Power Co Power 73 85 16.4% 101.8 39.5% 63.8 Target Achieved
May-16 Mahindra & Mahindra Auto 665 775 16.5% 993.0 49.3% 534.7 Target Achieved
PI Industries Paints & Chemical 635 760 19.7% 1339.0 110.9% 1305.1 Target Achieved
DCM Shriram Paints & Chemical 157 195 24.2% 638.5 306.7% 417.4 Target Achieved
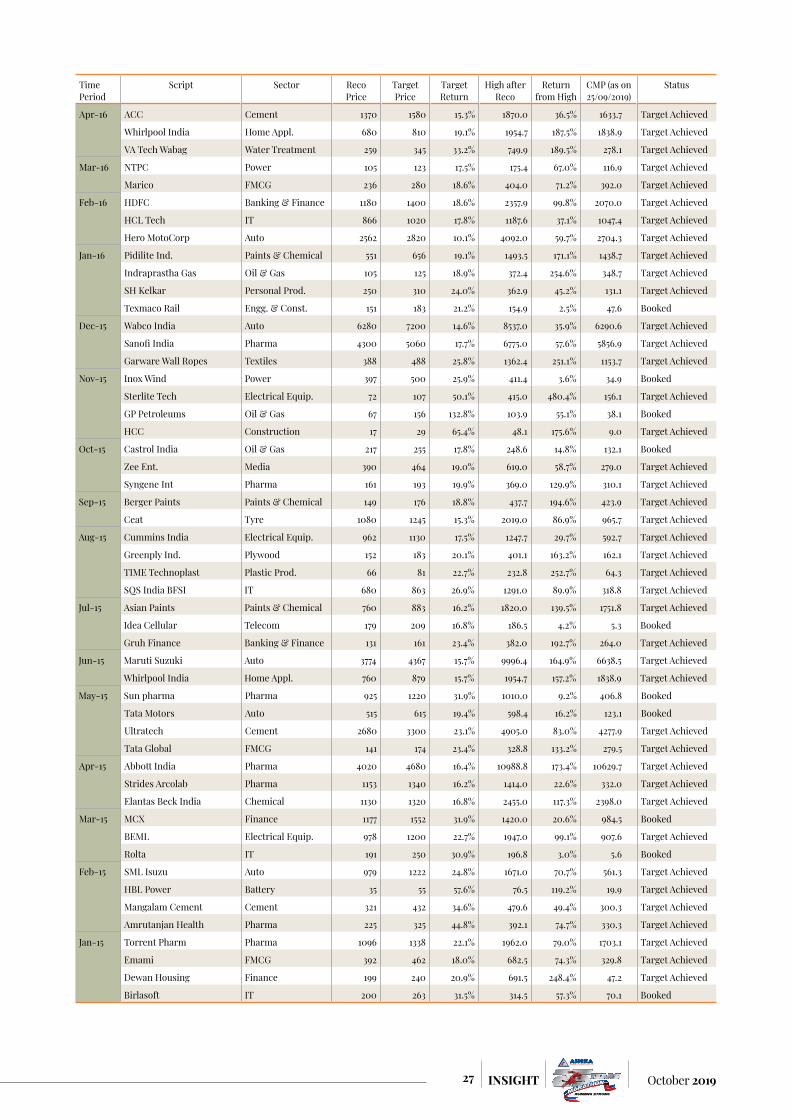
27 October 2019INSIGHT
TimePeriod
Script Sector RecoPrice
TargetPrice
TargetReturn
High afterReco
Returnfrom High
CMP (as on 25/09/2019)
Status
Apr-16 ACC Cement 1370 1580 15.3% 1870.0 36.5% 1633.7 Target Achieved
Whirlpool India Home Appl. 680 810 19.1% 1954.7 187.5% 1838.9 Target Achieved
VA Tech Wabag Water Treatment 259 345 33.2% 749.9 189.5% 278.1 Target Achieved
Mar-16 NTPC Power 105 123 17.5% 175.4 67.0% 116.9 Target Achieved
Marico FMCG 236 280 18.6% 404.0 71.2% 392.0 Target Achieved
Feb-16 HDFC Banking & Finance 1180 1400 18.6% 2357.9 99.8% 2070.0 Target Achieved
HCL Tech IT 866 1020 17.8% 1187.6 37.1% 1047.4 Target Achieved
Hero MotoCorp Auto 2562 2820 10.1% 4092.0 59.7% 2704.3 Target Achieved
Jan-16 Pidilite Ind. Paints & Chemical 551 656 19.1% 1493.5 171.1% 1438.7 Target Achieved
Indraprastha Gas Oil & Gas 105 125 18.9% 372.4 254.6% 348.7 Target Achieved
SH Kelkar Personal Prod. 250 310 24.0% 362.9 45.2% 131.1 Target Achieved
Texmaco Rail Engg. & Const. 151 183 21.2% 154.9 2.5% 47.6 Booked
Dec-15 Wabco India Auto 6280 7200 14.6% 8537.0 35.9% 6290.6 Target Achieved
Sanofi India Pharma 4300 5060 17.7% 6775.0 57.6% 5856.9 Target Achieved
Garware Wall Ropes Textiles 388 488 25.8% 1362.4 251.1% 1153.7 Target Achieved
Nov-15 Inox Wind Power 397 500 25.9% 411.4 3.6% 34.9 Booked
Sterlite Tech Electrical Equip. 72 107 50.1% 415.0 480.4% 156.1 Target Achieved
GP Petroleums Oil & Gas 67 156 132.8% 103.9 55.1% 38.1 Booked
HCC Construction 17 29 65.4% 48.1 175.6% 9.0 Target Achieved
Oct-15 Castrol India Oil & Gas 217 255 17.8% 248.6 14.8% 132.1 Booked
Zee Ent. Media 390 464 19.0% 619.0 58.7% 279.0 Target Achieved
Syngene Int Pharma 161 193 19.9% 369.0 129.9% 310.1 Target Achieved
Sep-15 Berger Paints Paints & Chemical 149 176 18.8% 437.7 194.6% 423.9 Target Achieved
Ceat Tyre 1080 1245 15.3% 2019.0 86.9% 965.7 Target Achieved
Aug-15 Cummins India Electrical Equip. 962 1130 17.5% 1247.7 29.7% 592.7 Target Achieved
Greenply Ind. Plywood 152 183 20.1% 401.1 163.2% 162.1 Target Achieved
TIME Technoplast Plastic Prod. 66 81 22.7% 232.8 252.7% 64.3 Target Achieved
SQS India BFSI IT 680 863 26.9% 1291.0 89.9% 318.8 Target Achieved
Jul-15 Asian Paints Paints & Chemical 760 883 16.2% 1820.0 139.5% 1751.8 Target Achieved
Idea Cellular Telecom 179 209 16.8% 186.5 4.2% 5.3 Booked
Gruh Finance Banking & Finance 131 161 23.4% 382.0 192.7% 264.0 Target Achieved
Jun-15 Maruti Suzuki Auto 3774 4367 15.7% 9996.4 164.9% 6638.5 Target Achieved
Whirlpool India Home Appl. 760 879 15.7% 1954.7 157.2% 1838.9 Target Achieved
May-15 Sun pharma Pharma 925 1220 31.9% 1010.0 9.2% 406.8 Booked
Tata Motors Auto 515 615 19.4% 598.4 16.2% 123.1 Booked
Ultratech Cement 2680 3300 23.1% 4905.0 83.0% 4277.9 Target Achieved
Tata Global FMCG 141 174 23.4% 328.8 133.2% 279.5 Target Achieved
Apr-15 Abbott India Pharma 4020 4680 16.4% 10988.8 173.4% 10629.7 Target Achieved
Strides Arcolab Pharma 1153 1340 16.2% 1414.0 22.6% 332.0 Target Achieved
Elantas Beck India Chemical 1130 1320 16.8% 2455.0 117.3% 2398.0 Target Achieved
Mar-15 MCX Finance 1177 1552 31.9% 1420.0 20.6% 984.5 Booked
BEML Electrical Equip. 978 1200 22.7% 1947.0 99.1% 907.6 Target Achieved
Rolta IT 191 250 30.9% 196.8 3.0% 5.6 Booked
Feb-15 SML Isuzu Auto 979 1222 24.8% 1671.0 70.7% 561.3 Target Achieved
HBL Power Battery 35 55 57.6% 76.5 119.2% 19.9 Target Achieved
Mangalam Cement Cement 321 432 34.6% 479.6 49.4% 300.3 Target Achieved
Amrutanjan Health Pharma 225 325 44.8% 392.1 74.7% 330.3 Target Achieved
Jan-15 Torrent Pharm Pharma 1096 1338 22.1% 1962.0 79.0% 1703.1 Target Achieved
Emami FMCG 392 462 18.0% 682.5 74.3% 329.8 Target Achieved
Dewan Housing Finance 199 240 20.9% 691.5 248.4% 47.2 Target Achieved
Birlasoft IT 200 263 31.5% 314.5 57.3% 70.1 Booked

28October 2019 INSIGHT
Valuation at a glanceSl. Company Name CMP
(Rs.)Mkt Cap (Rs. Cr.)
Est. P/E FY20
Est. P/E FY21
Est. P/B FY20
Est. ROE FY20
Est. ROE FY21
Median PE 5
Years
Net Profit 5 yr
CAGR
Dividend Payout
5 yr Average
Market Cap 5 yr CAGR
1 ABB India 1539.6 32625.4 81.4 58.1 8.1 13.4 11.6 107.3 23.6 25.0 4.9
2 ACC 1633.7 30677.8 21.5 19.5 2.9 15.3 12.1 31.0 6.8 45.6 1.7
3 Adani Ports 414.8 85903.1 18.9 16.0 3.5 17.6 17.7 21.5 18.1 7.4 7.4
4 Ambuja Cements 210.1 41718.4 21.4 19.4 1.9 10.1 8.6 29.5 11.2 43.4 5.3
5 Ashok Leyland 70.8 20768.9 9.1 8.8 2.4 25.7 20.9 27.5 LP 49.5 18.2
6 Asian Paints 1751.8 168032.3 61.3 51.7 17.7 24.1 27.3 57.4 12.1 44.3 18.8
7 Aurobindo Pharma 602.2 35285.2 12.3 10.6 2.5 18.5 17.5 20.3 15.1 7.1 9.4
8 Avenue Supermarts 1902.2 118713.4 96.0 74.2 21.2 17.6 20.9 118.1 41.1 0.0 NA
9 Axis Bank 695.0 182093.1 20.5 13.8 2.6 7.6 16.2 17.5 -4.4 12.9 15.1
10 Bajaj Auto 2941.0 85102.8 18.0 16.3 3.7 22.6 18.6 20.0 7.6 40.5 3.7
11 Bajaj Finance 3930.9 227935.9 41.9 31.9 11.5 22.5 23.9 41.8 40.9 9.8 76.0
12 Bajaj Finserv 8255.6 131376.4 30.5 27.2 5.5 14.5 18.0 22.2 15.8 1.3 50.5
13 Bajaj Holdings 3501.8 38972.2 N/A N/A 1.4 11.7 N/A 9.1 8.9 15.4 20.7
14 Bandhan Bank 489.6 58414.7 24.1 19.9 5.2 19.0 21.6 41.5 NA 6.8 NA
15 Bank of Baroda 93.5 35966.9 16.1 6.3 0.4 2.2 7.4 8.9 -26.1 6.7 3.4
16 Bharti Airtel 341.7 175333.5 N/A N/A 1.9 -3.2 -0.2 38.4 -22.0 52.3 -17.3
17 Bharti Infratel 257.4 47599.7 17.3 16.1 3.7 18.1 22.0 27.9 14.8 37.0 12.4
18 BHEL 50.2 17462.5 13.0 12.6 0.6 3.2 6.8 42.0 -32.9 98.2 4.5
19 Biocon 218.3 26190.0 26.7 20.2 3.7 8.2 16.8 24.5 10.4 90.5 -1.0
20 Bosch 14082.4 41534.1 103.2 27.5 4.6 16.7 16.1 47.1 17.0 14.2 23.1
21 BPCL 465.2 100911.8 11.8 10.1 2.6 20.7 19.9 12.1 12.6 21.6 1.2
22 Britannia Ind. 3036.0 72960.6 55.6 47.4 17.2 30.3 28.4 49.8 24.0 29.6 39.2
23 Cadila Healthcare 249.1 25501.4 16.4 14.6 2.5 19.3 13.8 28.5 18.1 20.0 1.6
24 Cipla 434.6 35026.8 19.9 16.7 2.3 10.4 11.9 36.1 1.9 14.9 3.7
25 Coal India 192.6 118694.1 6.8 6.5 4.5 74.9 57.1 15.9 2.9 108.3 -11.2
26 Colgate Palmolive (I) 1487.0 40442.9 53.6 48.0 28.0 52.2 59.0 45.9 4.5 63.4 6.8
27 Container Corp. 600.2 36569.8 28.7 25.8 3.5 12.5 12.8 32.6 5.3 31.0 5.2
28 Dabur India 445.6 78731.2 47.7 41.3 14.0 25.4 26.6 43.3 9.6 45.3 17.0
29 Divis Lab 1633.5 43363.0 29.7 24.8 6.2 21.0 20.2 29.5 11.8 28.9 17.0
30 DLF 155.8 38553.0 18.7 15.3 1.0 3.8 5.5 43.7 15.3 51.4 3.1
31 Dr. Reddy's Lab. 2773.4 46054.3 20.3 18.4 3.3 14.1 14.6 27.2 -0.1 21.7 -1.5
32 Eicher Motors 17600.1 48028.6 23.0 20.6 5.4 27.6 20.7 51.0 41.1 17.9 15.0
33 GAIL (India) 136.5 61540.9 8.8 8.7 1.3 14.9 13.7 16.1 6.5 37.6 2.4
34 General Insuranc 197.2 34596.8 N/A N/A 1.4 11.1 N/A 39.8 4.1 26.7 NA
35 Godrej Consumer 671.4 68632.8 41.2 36.0 9.4 34.6 22.9 50.1 25.2 42.3 17.5
36 Grasim Inds 724.2 47625.4 10.7 9.1 0.9 3.1 9.0 16.4 -3.1 10.1 13.6
37 Havells India 730.4 45708.6 50.8 41.2 10.8 19.8 21.5 44.1 12.0 39.0 23.1
38 HCL Technologies 1053.9 142940.3 13.9 12.4 3.4 24.8 22.2 16.3 9.2 33.5 4.9
39 HDFC 2070.0 357352.4 25.3 23.7 4.3 15.9 15.8 19.8 21.1 39.7 NA
40 HDFC AMC 2866.0 60934.0 50.1 44.1 19.8 35.0 36.9 43.2 20.6 18.5 25.2
41 HDFC Bank 1239.7 678210.6 27.7 23.4 4.4 17.0 15.8 25.1 NA 24.3 NA
42 HDFC Life 557.9 112554.9 77.2 65.6 19.9 24.6 18.6 71.3 7.8 49.0 -0.7
43 Hero MotoCorp 2704.3 54011.1 17.0 16.6 4.1 27.5 22.5 20.8 20.4 -6.1 2.7
44 Hindalco Industries 189.9 42650.1 8.8 8.0 0.7 9.8 8.4 16.8 44.0 40.4 27.0
45 Hindustan Unilever 2051.5 444111.2 61.8 52.0 56.4 79.9 72.7 45.4 6.8 80.2 21.7
46 Hindustan Zinc 201.7 85203.6 10.3 9.6 2.5 22.9 24.6 10.9 -0.5 91.7 6.0
47 HPCL 285.4 43489.9 7.5 6.6 1.4 23.9 18.6 15.3 13.1 25.9 17.8
48 ICICI Bank 434.2 280398.3 20.8 14.7 2.4 3.8 16.0 15.8 -19.1 18.8 8.8
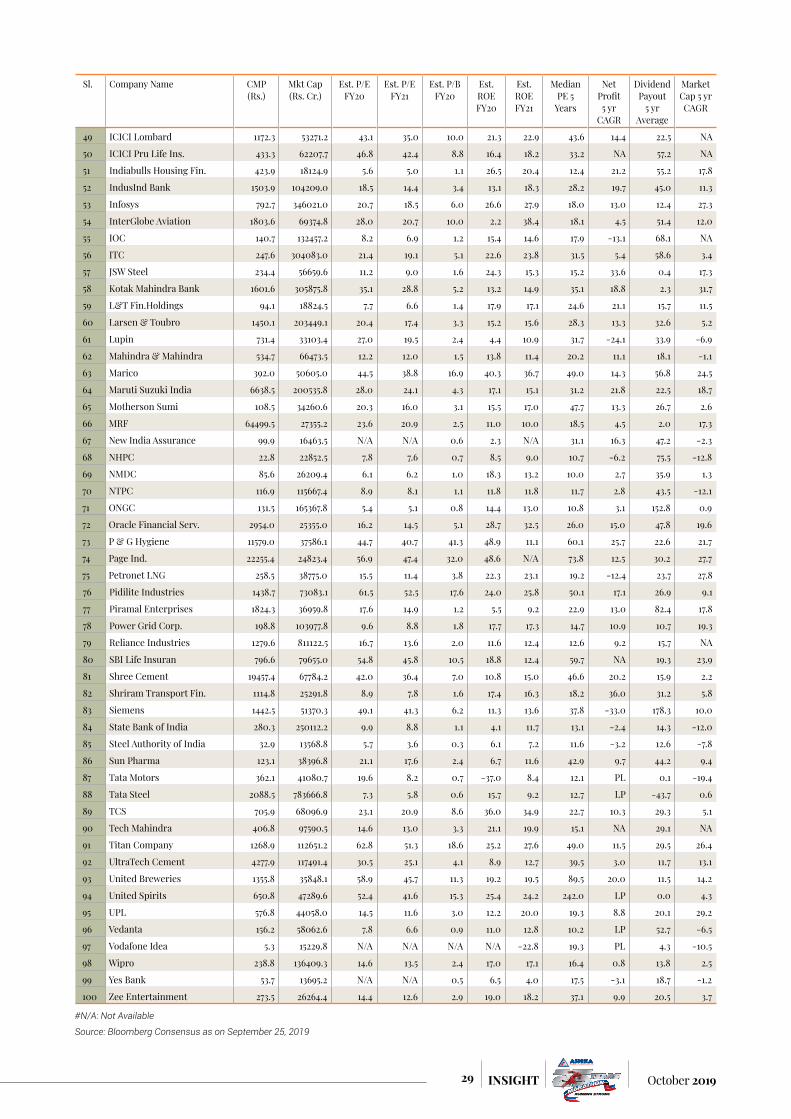
29 October 2019INSIGHT
Sl. Company Name CMP (Rs.)
Mkt Cap (Rs. Cr.)
Est. P/E FY20
Est. P/E FY21
Est. P/B FY20
Est. ROE FY20
Est. ROE FY21
Median PE 5
Years
Net Profit 5 yr
CAGR
Dividend Payout
5 yr Average
Market Cap 5 yr CAGR
49 ICICI Lombard 1172.3 53271.2 43.1 35.0 10.0 21.3 22.9 43.6 14.4 22.5 NA
50 ICICI Pru Life Ins. 433.3 62207.7 46.8 42.4 8.8 16.4 18.2 33.2 NA 57.2 NA
51 Indiabulls Housing Fin. 423.9 18124.9 5.6 5.0 1.1 26.5 20.4 12.4 21.2 55.2 17.8
52 IndusInd Bank 1503.9 104209.0 18.5 14.4 3.4 13.1 18.3 28.2 19.7 45.0 11.3
53 Infosys 792.7 346021.0 20.7 18.5 6.0 26.6 27.9 18.0 13.0 12.4 27.3
54 InterGlobe Aviation 1803.6 69374.8 28.0 20.7 10.0 2.2 38.4 18.1 4.5 51.4 12.0
55 IOC 140.7 132457.2 8.2 6.9 1.2 15.4 14.6 17.9 -13.1 68.1 NA
56 ITC 247.6 304083.0 21.4 19.1 5.1 22.6 23.8 31.5 5.4 58.6 3.4
57 JSW Steel 234.4 56659.6 11.2 9.0 1.6 24.3 15.3 15.2 33.6 0.4 17.3
58 Kotak Mahindra Bank 1601.6 305875.8 35.1 28.8 5.2 13.2 14.9 35.1 18.8 2.3 31.7
59 L&T Fin.Holdings 94.1 18824.5 7.7 6.6 1.4 17.9 17.1 24.6 21.1 15.7 11.5
60 Larsen & Toubro 1450.1 203449.1 20.4 17.4 3.3 15.2 15.6 28.3 13.3 32.6 5.2
61 Lupin 731.4 33103.4 27.0 19.5 2.4 4.4 10.9 31.7 -24.1 33.9 -6.9
62 Mahindra & Mahindra 534.7 66473.5 12.2 12.0 1.5 13.8 11.4 20.2 11.1 18.1 -1.1
63 Marico 392.0 50605.0 44.5 38.8 16.9 40.3 36.7 49.0 14.3 56.8 24.5
64 Maruti Suzuki India 6638.5 200535.8 28.0 24.1 4.3 17.1 15.1 31.2 21.8 22.5 18.7
65 Motherson Sumi 108.5 34260.6 20.3 16.0 3.1 15.5 17.0 47.7 13.3 26.7 2.6
66 MRF 64499.5 27355.2 23.6 20.9 2.5 11.0 10.0 18.5 4.5 2.0 17.3
67 New India Assurance 99.9 16463.5 N/A N/A 0.6 2.3 N/A 31.1 16.3 47.2 -2.3
68 NHPC 22.8 22852.5 7.8 7.6 0.7 8.5 9.0 10.7 -6.2 75.5 -12.8
69 NMDC 85.6 26209.4 6.1 6.2 1.0 18.3 13.2 10.0 2.7 35.9 1.3
70 NTPC 116.9 115667.4 8.9 8.1 1.1 11.8 11.8 11.7 2.8 43.5 -12.1
71 ONGC 131.5 165367.8 5.4 5.1 0.8 14.4 13.0 10.8 3.1 152.8 0.9
72 Oracle Financial Serv. 2954.0 25355.0 16.2 14.5 5.1 28.7 32.5 26.0 15.0 47.8 19.6
73 P & G Hygiene 11579.0 37586.1 44.7 40.7 41.3 48.9 11.1 60.1 25.7 22.6 21.7
74 Page Ind. 22255.4 24823.4 56.9 47.4 32.0 48.6 N/A 73.8 12.5 30.2 27.7
75 Petronet LNG 258.5 38775.0 15.5 11.4 3.8 22.3 23.1 19.2 -12.4 23.7 27.8
76 Pidilite Industries 1438.7 73083.1 61.5 52.5 17.6 24.0 25.8 50.1 17.1 26.9 9.1
77 Piramal Enterprises 1824.3 36959.8 17.6 14.9 1.2 5.5 9.2 22.9 13.0 82.4 17.8
78 Power Grid Corp. 198.8 103977.8 9.6 8.8 1.8 17.7 17.3 14.7 10.9 10.7 19.3
79 Reliance Industries 1279.6 811122.5 16.7 13.6 2.0 11.6 12.4 12.6 9.2 15.7 NA
80 SBI Life Insuran 796.6 79655.0 54.8 45.8 10.5 18.8 12.4 59.7 NA 19.3 23.9
81 Shree Cement 19457.4 67784.2 42.0 36.4 7.0 10.8 15.0 46.6 20.2 15.9 2.2
82 Shriram Transport Fin. 1114.8 25291.8 8.9 7.8 1.6 17.4 16.3 18.2 36.0 31.2 5.8
83 Siemens 1442.5 51370.3 49.1 41.3 6.2 11.3 13.6 37.8 -33.0 178.3 10.0
84 State Bank of India 280.3 250112.2 9.9 8.8 1.1 4.1 11.7 13.1 -2.4 14.3 -12.0
85 Steel Authority of India 32.9 13568.8 5.7 3.6 0.3 6.1 7.2 11.6 -3.2 12.6 -7.8
86 Sun Pharma 123.1 38396.8 21.1 17.6 2.4 6.7 11.6 42.9 9.7 44.2 9.4
87 Tata Motors 362.1 41080.7 19.6 8.2 0.7 -37.0 8.4 12.1 PL 0.1 -19.4
88 Tata Steel 2088.5 783666.8 7.3 5.8 0.6 15.7 9.2 12.7 LP -43.7 0.6
89 TCS 705.9 68096.9 23.1 20.9 8.6 36.0 34.9 22.7 10.3 29.3 5.1
90 Tech Mahindra 406.8 97590.5 14.6 13.0 3.3 21.1 19.9 15.1 NA 29.1 NA
91 Titan Company 1268.9 112651.2 62.8 51.3 18.6 25.2 27.6 49.0 11.5 29.5 26.4
92 UltraTech Cement 4277.9 117491.4 30.5 25.1 4.1 8.9 12.7 39.5 3.0 11.7 13.1
93 United Breweries 1355.8 35848.1 58.9 45.7 11.3 19.2 19.5 89.5 20.0 11.5 14.2
94 United Spirits 650.8 47289.6 52.4 41.6 15.3 25.4 24.2 242.0 LP 0.0 4.3
95 UPL 576.8 44058.0 14.5 11.6 3.0 12.2 20.0 19.3 8.8 20.1 29.2
96 Vedanta 156.2 58062.6 7.8 6.6 0.9 11.0 12.8 10.2 LP 52.7 -6.5
97 Vodafone Idea 5.3 15229.8 N/A N/A N/A N/A -22.8 19.3 PL 4.3 -10.5
98 Wipro 238.8 136409.3 14.6 13.5 2.4 17.0 17.1 16.4 0.8 13.8 2.5
99 Yes Bank 53.7 13695.2 N/A N/A 0.5 6.5 4.0 17.5 -3.1 18.7 -1.2
100 Zee Entertainment 273.5 26264.4 14.4 12.6 2.9 19.0 18.2 37.1 9.9 20.5 3.7
#N/A: Not Available
Source: Bloomberg Consensus as on September 25, 2019

30October 2019 INSIGHT
India’s plan for economic recovery was threatened after the heart of Saudi Arabia’s oil industry was targeted in a deadly drone attack as India imports a large quantity of oil from Saudi Arabia and a spike in the rates could derail India path to economic recovery amid growth slowdown. On September 14, 2019, the Houthis, a rebel Shia group of Yemen that is backed by Iran, bombed the Abqaiq plant as well as the Khurais oil field in Saudi Arabia. The attack, executed by drones, meant that Saudi Aramco, the state-owned oil company, had to not only suspend the
production of 5.7 million barrels per day (mbpd) (about 5% of global oil supply) but also restrict the use of 2 mbpd of spare capacity. This is the largest-ever disruption in crude oil production in Saudi Arabia since the 1991 Gulf war.
For oil markets, it’s the single worst sudden disruption ever, surpassing the loss of Kuwaiti and Iraqi petroleum supply in August 1990, when Saddam Hussein invaded his neighbour. It also exceeds the loss of Iranian oil output in 1979 during the Islamic Revolution, according to the International Energy Agency.
The risk premium of crude oil has evaporated and the market focus is back to the demand side of the equation.
Crude oilupdate

31 October 2019INSIGHT
Repairs and RestorationSaudi Arabia initially expected to re-start most lost oil output within days of the attack, but that early optimism was tempered after evaluation of the damage. Energy Minister Prince Abdulaziz bin Salman and Saudi Aramco CEO Amin Nasser still painted a positive picture of the kingdom’s ability to restore oil production and exports after the attack at a briefing on 17 September. Here’s a summary of the key takeaways from the briefing: Production from the Khurais field restarted 24 hours
after the attack, with output running at about 360,000 barrels a day. Abqaiq facility was processing 2 million barrels a day -
41% of its pre-attack throughput - and “its entire output is expected to be restored to prior rates by the end of September.” Saudi Arabia’s oil production capacity will be restored to
11 million barrels a day by the end of September and to 12 million by the end of November. Oil production will reach 9.8 million barrels a day in
October, in line with the volume the country has been pumping in recent months. There will be zero reduction in flows of crude to
customers.
However, market have been less optimistic. According to consultant FGE, repair of the Abqaiq facility is unlikely to be completed by end-September as planned and will instead take months, with production likely to average 8 million barrels a day this month. Full restoration of pre-attack capacity at Abqaiq will only be completed by end of the year.
Global oil rates surged most since 1991 Gulf warGlobal oil prices spiked the most since the 1991 Gulf war, sparking worries of an extended spell of market volatility hitting consumer sentiment by pushing up fuel prices and posing fresh challenges to the government’s recent efforts to revive the pace of economic growth. Global benchmark Brent crude rose 19% to almost $72 per barrel as the mar-ket opened for the first time after the drone strike at the heart of Saudi Arabia’s oil industry. The attack knocked out half of the OPEC (Organization of the Petroleum Exporting Countries) lynchpin’s production, or roughly 5% of daily global supply.
Brent crude oil which is mostly effected by any geopo-litical tensions especially in middle east because major gulf countries export Brent crude oil whereas WTI crude oil is traded in US and does not have direct impact amid middle east tensions. Brent WTI crude oil spread recently widened from $4 to above 6.5 on heightened tensions in Middle East. Rising Brent WTI spread is generally consid-ered positive for global crude oil prices. This spread can widen towards $8.5-9 in near term.
Crude oil prices react to a variety of geopolitical and economic events
Source: Bloomberg
MCX Crude Oil (Rs. / Barrel)
Source: Bloomberg
3000
3500
4000
4500
5000
5500
6000
Sep-
17
Nov-
17
Jan-
18
Mar
-18
May
-18
Jul-1
8
Sep-
18
Nov-
18
Jan-
19
Mar
-19
May
-19
Jul-1
9
Sep-
19
Brent WTI Spread
Source: Bloomberg
0
2
4
6
8
10
12
14
Sep-
17
Nov-
17
Jan-
18
Mar-1
8
May-
18
Jul-1
8
Sep-
18
Nov-
18
Jan-
19
Mar-1
9
May-
19
Jul-1
9
Sep-
19
Historical Oil Supply Loss (mbpd)
Source: IEA
5.7 5.6
4.3 4.3 4.1
2.6 2.3 2.1 2.0 2.0 1.8
0.5
0.0
1.0
2.0
3.0
4.0
5.0
6.0 Sa
udi D
rone
stri
ke
Sep-
2019
Irani
an R
evol
utio
n 19
78-1
979
Arab
-Isr
aeli
war
, oil
emba
rgo
1973
-197
4
Iraqi
inva
sion
of K
uwai
t 19
90-1
991
Iran
-Ira
q w
ar
1980
-198
1
Vene
zuel
a st
rike
2002
-200
3
Iraq
war
20
03
Iran
sanc
tions
Ap
r 201
8 - P
rese
nt
Suez
Cris
is
1956
-195
7
Six-
Day
War
19
67
OPE
C+ c
ut
Dec
201
6 - P
rese
nt
Vene
zeul
a pr
oduc
tion
May
201
8 - P
rese
nt
Brent Crude Vs. WTI Crude Oil Price (USD per Barrel)
Source: Bloomberg
40 45 50 55 60 65 70 75 80 85 90
Sep-
17
Nov-
17
Jan-
18
Mar-1
8
May-
18
Jul-1
8
Sep-
18
Nov-
18
Jan-
19
Mar-1
9
May-
19
Jul-1
9
Sep-
19
Brent Crude WTI Crude

32October 2019 INSIGHT
Global oil demand-supply balance2012 2013 2014 2015 2016 2017 2018 2019E
Demand (mn b/d)
Total demand 90.7 91.7 93 95.3 96.4 98 99.3 100.3
Yoy growth 1.2 1.1 1.2 2.3 1.1 1.5 1.3 1.1
Supply (mn b/d)
Non-OPEC 52.5 54.5 57 59.8 59.1 59.9 62.9 64.8
Yoy growth -0.4 2.1 2.4 2.9 -0.7 0.8 3 1.9
OPEC
Crude 32.1 30.6 30.5 31.4 32.4 32 31.9 30
NGLs 6.4 6.2 6.3 5.2 5.4 5.5 5.5 5.6
Total OPEC 38.4 36.8 36.8 36.6 37.8 37.5 37.4 35.6
Total supply 90.9 91.3 93.7 96.4 96.9 97.4 100.3 100.4
Total stock change 0.2 -0.5 0.7 1.1 0.5 -0.6 1.1 0
OPEC crude capacity 35.8 35.2 35.2 35.2 35.9 34.9 34.9 32.5
Implied spare capacity 3.9 4.1 5.5 4.9 4 2.3 4.1 2.6Source: IEA
Recent updateThe risk premium of crude oil has evaporated and the market focus is back to the demand side of the equation. A number of factors are impacting:
As per news articles, Saudi oil output has rebounded to more than 8 million barrels per day (bpd). While some news article say it has crossed the 11.3 mbpd mark and restored production back to pre attack levels earlier than anticipated.
Iranian President Hassan Rouhani claimed that the U.S. offered to remove all sanctions on Iran in exchange for negotiations. President Donald Trump and the State Department later denied those claims.
Saudi Arabia has agreed to a partial ceasefire in Yemen. The UAE, an active partner in the war against Houthis had already signalled that it intends to scale back its presence.
Crude markets also deepened their latest losses after the Energy Infor mation Administration reported a 2.4m barrel build in the US crude oil inventories for the week to September 20.
Concerns about the growing China-US trade spat also continues to weigh on the markets. Oil prices slid, after the US President Donald Trump while speaking to the UN General Assembly, criticized China on a number of issues.
US has imposed sanctions on 5 Chinese nationals and six entities which were suspected to be involved in buying Iranian crude oil despite sanctions. China criticizes US sanctions mentioning its cooperation with Iran is legiti-mate and legal.
India’s crude oil dependencyIndia imports 80 per cent of the oil it consumes, which means there are multiple ways in which the country will be impacted by this disruption.
The first issue is supply. India is already trying to make up for the loss of supply from Iran after US-imposed sanc-tions. An extended period of high oil prices is likely to hurt India’s economic growth. Saudi is the second-biggest oil supplier after Iraq. It sold 40.33 million tonnes of crude oil to India in 2018-19 fiscal, when the country had imported 207.3 million tonnes of oil. Although Saudi Arabia has assured that there will be no loss of supply, if the process of restoration takes more time than anticipated, India would have to look for alternatives. This may not be easy since the global supply has been fairly volatile because of disruptions in some of the other big suppliers such as Venezuela, Libya and Nigeria.
A hit on prices may then follow. According to Care Ratings, India is expected to import 1.6 billion barrels of crude oil in the current financial year. So, an increase in oil prices by just one dollar essentially means an increase of $1.6 billion in the import bill.
As such, rising oil prices will worsen the Indian govern-ment’s fiscal balance. Moreover, higher crude oil prices would also lead to higher domestic oil prices, which, in turn, will further depress the demand for all things, espe-cially those that use oil as the primary input — say, cars. This dip in consumption demand, which is already under strain as the recent growth slowdown has shown, would likely mean lower economic activity and consequently lower revenues for the government.

33 October 2019INSIGHT
The rise in crude prices may hit hard as the Indian economy is already facing a slowdown and will worsen the Indian government’s fiscal balance. The economy expanded 5% in Q1FY20, the slowest pace since March 2013. Moreover, higher crude oil prices would also lead to higher domestic oil prices, which, in turn, will further depress the demand for all things, especially those that use oil as the primary input. This dip in consumption demand, which is already under strain as the recent growth slowdown has shown, would likely mean lower economic activity and consequently lower revenues for the government.
Oil minister Dharmendra Pradhan stated that “we are confident that there would not be any supply disruption” as the situation is “closely monitored”. However, market experts expect that an extended period of high oil prices could hurt India’s economic growth as it imports 80% of its crude requirement.
Global Crude Oil Supply SourceMBPD % to Total
Global Supply
Saudi Arabia 9.8 9.9
Middle East 24.7 24.9
OPEC 30.5 30.8
US 12.4 12.5
Non-OPEC 68.6 69.2
Total world oil supply
99.1 100.0
Source: News Article
India Crude Oil Supply SourceMn Tn % of Total
Import
Iraq 46.6 20.6
Saudi Arabia 40.3 17.8
Iran 23.9 10.6
UAE 17.4 7.7
Venezuela 17.3 7.6
Nigeria 16.8 7.4
Kuwait 10.9 4.8
Mexico 10.3 4.5
USA 6.4 2.8
Others 36.7 16.2
Total Import 226.6 100.0Source: Bloomberg
Source: IOCL
60
65
70
75
80
85
90
Sep-
18
Oct-
18
Nov-
18
Dec-
18
Jan-
19
Feb-
19
Mar
-19
Apr-
19
May
-19
Jun-
19
Jul-1
9
Aug-
19
Sep-
19
Petrol Price (Rs. / Ltr.) Diesel Price (Rs. / Ltr.)

34October 2019 INSIGHT
AutomobileIn the midst of a slowdown
SECTOR OUTLOOKSECTOR OUTLOOK
The slowdown blues in Indian auto sector could challenge government’s ambitious target of making India a USD 5 trillion economy within a period of five years. To achieve the target, Indian
economy need to grow at a pace of around 8% annually in real terms till 2024-25, which will be challenging given current economic slowdown and sluggish industrial activities. India is, currently, a USD 2.8 trillion economy to reach the USD 5 trillion mark by 2024, the economy would require nominal growth in dollar terms of over 12% a year. Indian automobile industry which act as the backbone for an economy and industrialization & development of manufacturing sector, contributing nearly 7.1% of GDP and employing around 3.7 crore people directly and indirectly
is in the midst of a slowdown. Since, 1999, Indian auto industry witnessed 4 down cycle with average cycle persisting for 1.5-2 years. In contrast, historically upcycle or the positive demand trend for Indian auto sector lasts for 4-6 years. The longest downcycle period for Passenger Vehicle (PV) segment was from 2QFY01 to 1QFY03, before it recovered to clock 11% YoY growth during 2QFY03. In tractor segment, the longest slack period had been from 4QFY00 to 1QFY04, nearly 14 quarters. Medium & Heavy Commercial Vehicle (M&HCV) segment witnessed longest downcycle between 1QFY13 to 1QFY15, period of 9 quarters. Slowdowns in 2 Wheelers (2W) have been generally shorter and shallower (4 to 5 quarters) than in PV and M&HCV given lower reliance on financing in 2W
In response to economic slowdown and to uplift the investments, government has unleashed mas-sive reform by slashing corporate tax rate from effective 34.9% to 25.17%. As per the government, the revenue loss will be to the tune of Rs 1.45 lakh crore per year. Such massive corporate tax rate cut will augur well for domestic manufacturing companies including Auto OEMS and Auto ancil-lary companies.

35 October 2019INSIGHT
compared to other segments. As auto sales numbers is a lead economic indicator, the performance of the sector revealed the state of the economy, thus whenever the sec-tor witnessed slowdown, it dragged down India’s real GDP growth. Over the last 20 years, Indian auto sector has gone through 4 downcycles and it has been noticed that macro factors like the pace of change in liquidity, slow GDP growth and weak industrial production have consistently impacted the auto sales across slowdowns and subsequent recoveries. Based on empirical data, it can be said that currently the auto industry is in the middle of downcycle which has started from 2QFY19. The current slowdown is driven by domestic factors rather than global events, such as lower access to credit as lenders are reluctant in lending and rising cost of vehicle ownership due to regulatory changes like new emission and safety norms. In addition, the advent of electric vehicles has also made customers concerned about the future of vehicles run-ning on internal combustion engines. However, industry experts believed that such slowdown is the consequence of back to back roll out of demonetization and GST, which created acute liquidity crisis in the system. In response to economic slowdown and to uplift the investments, government has unleashed massive reform by slashing corporate tax rate from effective 34.9% to 25.17%. Such massive corporate tax rate cut will augur well for domes-tic manufacturing companies including Auto OEMS and Auto ancillary companies.
Historical slowdown phasesSince 1999, Indian auto sector faced 4 down cycles with average period of cycle 1.5-2 years. Based on sector’s volume data over the past 2 decades suggest that current slowdown in auto sector is more of cyclical in nature. Historically, the upcycle or the positive demand trend for Indian auto makers lasts for 4-6 years, and the downcycle persists for 1.5-2 years. However, slowdown phases had been different for the four sub segments like PV, M&HCV, Tractor and 2W. The longest downcycle period for Passenger Vehicle (PV) segment was from 2QFY01 to 1QFY03, before it recovered to clock 11% YoY growth during 2QFY03. In tractor segment, the longest slack period had been from 4QFY00 to 1QFY04, nearly 14 quarters. Medium & Heavy Commercial Vehicle (M&HCV) segment witnessed longest downcycle between 1QFY13 to 1QFY15, period of 9 quarters. In 2W, the slowdown had always been shorter and shallower than the other seg-ments which generally lasts for 4 to 5 quarters. It has been noticed that since 1999, there has been strong correlation between M1 (money supply) & Real GDP growth and Auto
sales. During 3QFY01 to 1QFY03, all the segments except 2W witnessed slowdown which converged with weak GDP growth and flat M1 growth. After growing at a pace of 7%, GDP growth had cooled down to 5.5% during 3Q & 4Q of FY99, whereas M1 growth during the period had been stable. 2W, Tractor and M&HCV segments faced shorter period of down cycle during FY08. While the sales of PV during the tenure remained healthy owing to huge Pay revision for government employees during that time which led the PV sales growth. However, the deceleration in GDP growth had been steeper during that period with GDP growth came down to below 3% after growing at average pace of more than 8% from FY03-FY08. Indian economic growth plunged to 1.5% in 3QFY09 and even steeper to 0.2% in 4QFY09. The situation was further aggravated with M1 growth came down to 9% in FY09 after registering average growth of 18% during FY03-FY08. PV and M&HCV segments had gone through slowdown during Q4FY13 to Q1FY15 and same slowdown has been reflected in GDP growth. During that tenure (1QFY13 to 4QFY13), GDP grew at sub 5% rate before it revived to 6.4% from 1QFY14. Indian economy got new lease of life after NDA government came into power in 2014 general elec-tion in an intention to steer back the economy into growth track. PV, 2W & M&HCV segments witnessed longest streak of up cycle from 2QFY15 to 1QFY19, where industry got support from government reforms and surge in ride hailing companies like OLA, UBER, TAXI for Sure, etc. The current slowdown in auto sales has started from 2QFY19 and is expected to persist maximum 3 to 4 quarters. The current down cycle is driven by domestic factors like acute liquidity crisis, slow economic growth and rising car ownership cost due to regulatory changes. GDP growth during 1QFY20 declined to 5% which sent an alarming bell for the government. Thus, in order to arrest the falling growth, government has announced big bang reform of slashing corporate tax rate for domestic manufacturing companies from 30% to 22% (effective tax rate from 34% to 25.17%). This step is expected to add on around 10% growth in big domestic companies’ bottom line. The entire auto sector would be benefited from this move especially auto OEMs like Eicher Motors, Maruti Suzuki, Hero Moto corp, Ashok Leyland, as their current effective tax rate is above 31% on average. Besides, government has instructed PSU banks to go deeper into rural areas and provide credit support to MSME & SME segment with adequate risk framework in place. This will address the liquidity issue and will support the rural growth which in turn drive 2W, PV & Tractor sales in coming quarters.
Vehicles sales volume growth trend (%)
Source: SIAM & Company’s reports
Real GDP growth (%)
Source: RBI.org
-90%
-40%
10%
60%
110%
1QFY
99
3QFY
99
1QFY
00
3QFY
00
1QFY
01
3QFY
01
1QFY
02
3QFY
02
1QFY
03
3QFY
03
1QFY
04
3QFY
04
1QFY
05
3QFY
05
1QFY
06
3QFY
06
1QFY
07
3QFY
07
1QFY
08
3QFY
08
1QFY
09
3QFY
09
1QFY
10
3QFY
10
1QFY
11
3QFY
11
1QFY
12
3QFY
12
1QFY
13
3QFY
13
1QFY
14
3QFY
14
1QFY
15
3QFY
15
1QFY
16
3QFY
16
1QFY
17
3QFY
17
1QFY
18
3QFY
18
1QFY
19
3QFY
19
1QFY
20
PV volume growth (%) 2W volume growth (%) Tractor volume growth (%)
M&HCV Volume growth (%) LCV Volume grwoth (%) 0.0%
2.0%
4.0%
6.0%
8.0%
10.0%
12.0%
14.0%
1QFY
99
3QFY
99
1QFY
00
3QFY
00
1QFY
01
3QFY
01
1QFY
02
3QFY
02
1QFY
03
3QFY
03
1QFY
04
3QFY
04
1QFY
05
3QFY
05
1QFY
06
3QFY
06
1QFY
07
3QFY
07
1QFY
08
3QFY
08
1QFY
09
3QFY
09
1QFY
10
3QFY
10
1QFY
11
3QFY
11
1QFY
12
3QFY
12
1QFY
13
3QFY
13
1QFY
14
3QFY
14
1QFY
15
3QFY
15
1QFY
16
3QFY
16
1QFY
17
3QFY
17
1QFY
18
3QFY
18
1QFY
19
3QFY
19
1QFY
20 9 0
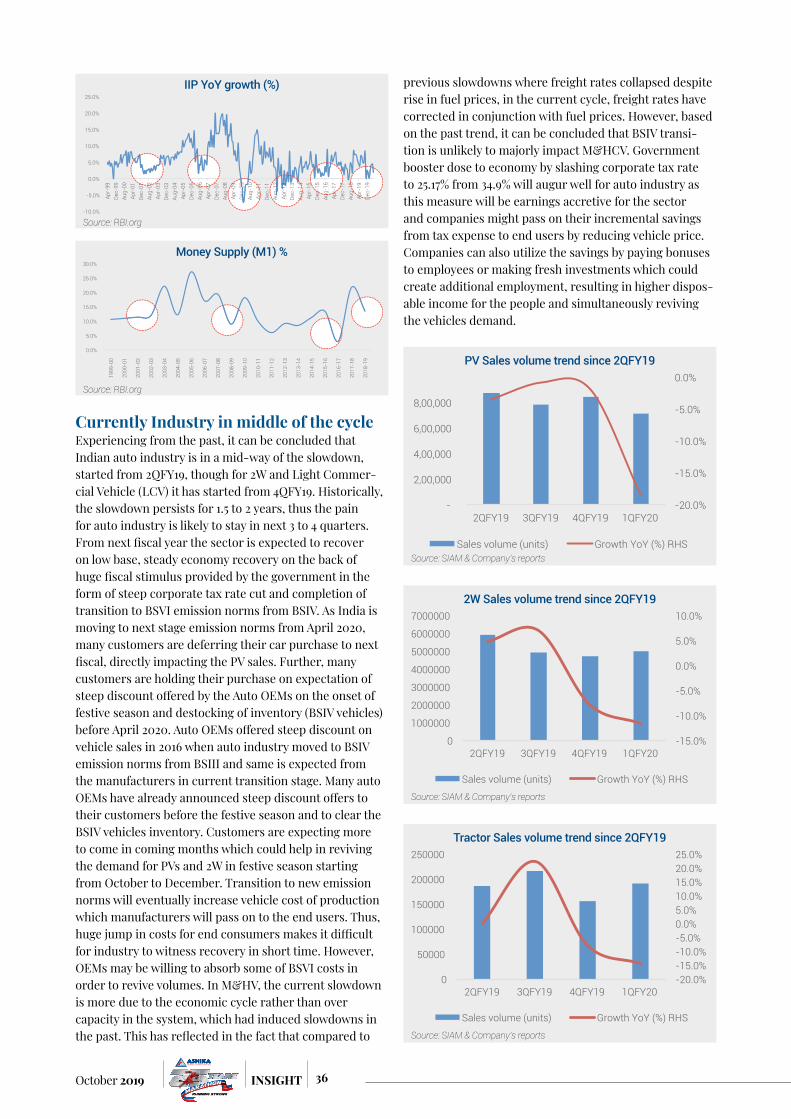
36October 2019 INSIGHT
Currently Industry in middle of the cycleExperiencing from the past, it can be concluded that Indian auto industry is in a mid-way of the slowdown, started from 2QFY19, though for 2W and Light Commer-cial Vehicle (LCV) it has started from 4QFY19. Historically, the slowdown persists for 1.5 to 2 years, thus the pain for auto industry is likely to stay in next 3 to 4 quarters. From next fiscal year the sector is expected to recover on low base, steady economy recovery on the back of huge fiscal stimulus provided by the government in the form of steep corporate tax rate cut and completion of transition to BSVI emission norms from BSIV. As India is moving to next stage emission norms from April 2020, many customers are deferring their car purchase to next fiscal, directly impacting the PV sales. Further, many customers are holding their purchase on expectation of steep discount offered by the Auto OEMs on the onset of festive season and destocking of inventory (BSIV vehicles) before April 2020. Auto OEMs offered steep discount on vehicle sales in 2016 when auto industry moved to BSIV emission norms from BSIII and same is expected from the manufacturers in current transition stage. Many auto OEMs have already announced steep discount offers to their customers before the festive season and to clear the BSIV vehicles inventory. Customers are expecting more to come in coming months which could help in reviving the demand for PVs and 2W in festive season starting from October to December. Transition to new emission norms will eventually increase vehicle cost of production which manufacturers will pass on to the end users. Thus, huge jump in costs for end consumers makes it difficult for industry to witness recovery in short time. However, OEMs may be willing to absorb some of BSVI costs in order to revive volumes. In M&HV, the current slowdown is more due to the economic cycle rather than over capacity in the system, which had induced slowdowns in the past. This has reflected in the fact that compared to
previous slowdowns where freight rates collapsed despite rise in fuel prices, in the current cycle, freight rates have corrected in conjunction with fuel prices. However, based on the past trend, it can be concluded that BSIV transi-tion is unlikely to majorly impact M&HCV. Government booster dose to economy by slashing corporate tax rate to 25.17% from 34.9% will augur well for auto industry as this measure will be earnings accretive for the sector and companies might pass on their incremental savings from tax expense to end users by reducing vehicle price. Companies can also utilize the savings by paying bonuses to employees or making fresh investments which could create additional employment, resulting in higher dispos-able income for the people and simultaneously reviving the vehicles demand.
IIP YoY growth (%)
Source: RBI.org-10.0%
-5.0%
0.0%
5.0%
10.0%
15.0%
20.0%
25.0% Ap
r-99
D
ec-9
9 Au
g-00
Ap
r-01
D
ec-0
1 Au
g-02
Ap
r-03
D
ec-0
3 Au
g-04
Ap
r-05
D
ec-0
5 Au
g-06
Ap
r-07
D
ec-0
7 Au
g-08
Ap
r-09
D
ec-0
9 Au
g-10
Ap
r-11
D
ec-1
1 Au
g-12
Ap
r-13
D
ec-1
3 Au
g-14
Ap
r-15
D
ec-1
5 Au
g-16
Ap
r-17
D
ec-1
7 Au
g-18
Ap
r-19
D
ec-1
9 1 2 5 06 07 7
Apr-
09D
ec-0
9D
ec-0
9Au
g-100
Apr-
11
Aug-
12ug
12Ap
r-13-1
3D
ec-1
3Au
g-14
c-15
ug-1
6pr
-17 17
g-18
Apr-
19D
ec-1
9
Money Supply (M1) %
Source: RBI.org
0.0%
5.0%
10.0%
15.0%
20.0%
25.0%
30.0%
1999
-00
2000
-01
2001
-02
2002
-03
2003
-04
2004
-05
2005
-06
2006
-07
2007
-08
2008
-09
2009
-10
2010
-11
2011
-12
2012
-13
2013
-14
2014
-15
2015
-16
2016
-17
2017
-18
2018
-19
PV Sales volume trend since 2QFY19
Source: SIAM & Company’s reports
-20.0%
-15.0%
-10.0%
-5.0%
0.0%
-
2,00,000
4,00,000
6,00,000
8,00,000
2QFY19 3QFY19 4QFY19 1QFY20
Sales volume (units) Growth YoY (%) RHS
Tractor Sales volume trend since 2QFY19
Source: SIAM & Company’s reports
-20.0% -15.0% -10.0% -5.0% 0.0% 5.0% 10.0% 15.0% 20.0% 25.0%
0
50000
100000
150000
200000
250000
2QFY19 3QFY19 4QFY19 1QFY20
Sales volume (units) Growth YoY (%) RHS
2W Sales volume trend since 2QFY19
Source: SIAM & Company’s reports
-15.0%
-10.0%
-5.0%
0.0%
5.0%
10.0%
0
1000000
2000000
3000000
4000000
5000000
6000000
7000000
2QFY19 3QFY19 4QFY19 1QFY20
Sales volume (units) Growth YoY (%) RHS

37 October 2019INSIGHT
Slowdown driven by domestic factorsThe current auto sales slowdown is driven by host of domestic factors, rather than global events including NBFC crisis, sharp jump in vehicle cost due to regulations, rising competition from pre-owned vehicle market and government proposing a deadline of converting some vehicle categories to electric from present internal combustion engine (ICE) technology. Slowing income growth and NBFC crisis are the primary reasons for the current slowdown compared to earlier cycles which had been triggered by global events like Asian crisis, Dotcom bubble, global financial crisis, etc. NBFCs crisis triggered in September 2018 with IL&FS group defaulted with their debt payments and gradually it spread to other NBFCs, forming an acute liquidity crisis in the economy. The NBFC crisis had a twin effect on demand 1) it curtailed the financing to new vehicle 2) NBFC were financing those customers who were not preferred for financing by banks. Hence, revival of lending by NBFC is critical for demand revival. It has been estimated that vehicle price to rise in between 5-30% over FY19-21 due to various safety, insurance and emission norms related compliance costs. The hike in road tax along with increased cost manufac-turing to adhere to the BSVI norms, resulted in increase in on-road prices by an average 14-15%. In some states, where road tax increase was higher, the on-road price has gone up by more than 20%. This has primarily impacted the entry-level segment which is very price conscious. A 1% hike in price also impacts the vehicle sales. The general price hike over the previous decade was 1-2% p.a. as compared to sharp price increase over FY19-21 can restrict recovery. However, the ability of consumers to
absorb the same will depend on the availability of finance for purchasing the vehicle. Over the past 5 years, the size of pre-owned market has expanded significantly, with higher share of organized players. In PV segment, the significant rise in pre-owned cars over the past 2 years is a reflection of rising consumer interest in this segment. Thus, customers rising interest in pre-owned car segment also negatively impacted the new car sales. Also, potential financing opportunities in the pre-owned market are higher compared to new vehicles given the extremely low penetration in the former. For instance, in PV, share of financing in pre-owned cars is ~17% compared to ~80% in case of new vehicles, thus entailing huge untapped potential. Further, government has been considering a proposal to ban all ICE-driven 2Ws under 150 cc in the next 6 years and all 3Ws within 4 years. More than three in four vehicles sold in India currently would be impacted if this proposal were to be implemented and would have negative implications on 2W manufacturers. On the emission transition, the deadline is April 1, 2020 and this too is a major pain point for vehicle makers. However, government has been striving to address the current issues of auto sector by lowering GST in Electric vehicles, mandating government agencies and departments to replace old vehicles, increasing depreciation rate on new vehicles for commercial fleet service providers, urging banks to make automobile loans cheaper and increase credit availability to non-banking finance companies. Even government has assured that vehicles compliant with Bharat Stage IV emission norms registered before March 31, 2020, will be able to run for the entire registration period or the life of the vehicle. Definitely, these measures taken by the government will go well for the auto sector and could revive the sales in quarters to come.
M&HCV volume trend since 2QFY19
Source: SIAM & Company’s reports
-20.0%
-10.0%
0.0%
10.0%
20.0%
30.0%
0
20000
40000
60000
80000
100000
120000
2QFY19 3QFY19 4QFY19 1QFY20
Sales volume (units) Growth YoY (%) RHS
In 2W & PV Value vs Volume 10 yr CAGR growth (FY08-FY18)
Source: Industry reports
10.8%
8.0%
14.4% 12.6%
2W PV Volume Value
Pre-owned car market is booming (units ‘000’)
Source: Industry reports
1760
2368
2976
3584
4192
FY12 FY18
Used car sales (PVs) New car sales
LCV volume trend since 2QFY19
Source: SIAM & Company’s reports
-10.0% -5.0% 0.0% 5.0% 10.0% 15.0% 20.0% 25.0% 30.0%
0
50000
100000
150000
200000
2QFY19 3QFY19 4QFY19 1QFY20
Sales volume (units) Growth YoY (%) RHS

38October 2019 INSIGHT
Government support to turnaround the ailing sectorIn order to steer back the sector into growth path, government has proposed slew of measures. These measures will help in improving the demand sentiments. These measures will act as a growth catalyst and will help in stimulating the demand. Notable measures government have taken are 1) deferral of increase in registration fee (to June 2020) in order to keep the rising cost of ownership under check, 2) removing the ban (imposed in 2014) on purchase of new vehicles by government departments, 3) higher rate of depreciation to 30% (existing rate 15%) for vehicles bought from now till March 31, 2020, 4) expedite recapitalizing of PSU banks to improve liquidity and 5) instructing banks to link auto loans to repo rate for seamless transmission of interest rates decline to auto loan customers. The proposed higher rate of depreciation is aimed at business enterprises and will help the commercial vehicle segment. Government also clarified that BS-IV vehicles purchased up to March 2020 will be operational till their period of registration (~15 years). Such assurance from government has cleared the customer ambiguity over purchase of BS-IV vehicles. Government is also working on the scrappage policy, with the current impetus on creating necessary infrastructure. In order to provide a fillip to EVs, government is focusing on setting up infrastructure for manufacturing compo-nents for electric vehicles including batteries (sunrise sector) for exports. To improve system liquidity, govern-ment will expedite recapitalization of PSU banks by ~Rs 70,000 crore and also instructed banks to link auto loans to repo rate for smooth transmission of interest rates decline to auto loans customers. Muted demand resulted in inventory levels for many dealers which inched to higher level of around 45 days or higher. Higher inventory blocked the working capital of the dealers and the dealers were finding hard to finance the working capital due to shortage of liquidity and banks’ reluctance of lending money to dealers amid sharp slowdown in auto sales. Thus, infusing additional liquidity in the system through recapitalization would ease funding issue of auto dealers. However, big bang reforms came from government by way of slashing corporate rate tax from effective 34.94% to 25.17% for larger domestic companies. Further, those companies getting incorporated in October 2019 and start production before March 31, 2023 would get a reduction in effective corporate tax from 29.12% to 17.01%. These measures are expected to boost investments and manu-facturing under the Make in India initiative. Indian Auto OEMs and auto ancillary companies are one of the biggest beneficiaries of tax rate cut as most of the large auto makers paid higher tax rate of above 30%. A reduction of nearly 10% in tax rate would directly boost up the earnings growth by nearly 10-13% on an average and would improve
the return ratios. After this tax rate cut, base corporate tax rate in India has become competitive with other countries and should help to boost investments. At time, when US and China the world two hemisphere are in trade spat, government move of slashing corporate tax rate would help in shifting manufacturing base of global companies from China to India, thus improving the overall investment scenario in India and employing large scale of people. The reduction of corporate tax rates to globally competitive levels will incentivize OEMs and their vendors to increase localization, which augurs well for the auto industry. Post the corporate tax rate cut, the revised tax structure is now in line with other emerging markets, thus would attract more FDI in Indian manufacturing sector. In US,
when President Donald Trump administration initiated massive tax rate cut, then the loss in revenue was set off by growth which has increased substantially. The same cycle is expected to replicate in India as well. However, the benefit from tax rate cut is unlikely to pass on to customers through vehicle price cut as indicated by Auto OEMs. But reduction in tax rate will help the Auto OEMs to absorb the higher raw material prices and improve its margins and return ratios.
Large companies are major beneficiary of Corporate Tax rate cutTurnover < Rs 400 cr Effective
tax rate before
(%)
Effective rate now
(%)
Tax cut in % points
Taxable income < Rs 1 crore 26 22.9 3.1
Taxable income > Rs 1 crore 27.8 24.5 3.3
Turnover > Rs 400 cr 23.9 10.6
Taxable income < Rs 1 crore 31.2 22.9 8.3
Taxable income Rs 1-100 crore
33.4 24.5 8.9
Taxable income > Rs 100 crore
34.9 25.6 9.3
Source: news article
Corporate Tax rate in India becomes Attractive
Source: news article
30%
30%
28%
25%
25%
25%
25%
24%
23%
22%
20%
20%
20%
20%
17%
Indi
a (o
ld)
Phili
ppin
es
Srila
nka
Bang
lade
sh
Chin
a
Indo
nesi
a
Sout
h Ko
rea
Mal
aysi
a
Japa
n
Indi
a (N
ew)
Cam
bodi
a
Taiw
an
Thai
land
Viet
nam
Sing
apor
e
Indian Auto OEMs and auto ancillary companies are one of the biggest beneficiaries of tax rate cut as most of the large auto makers paid higher tax rate of above 30%.

39 October 2019INSIGHT
Sales Volume Trend for Large Auto OEMs since July 2018
Valuation at record lowNifty Auto Index valuation corrected significantly from September 2016 level. The correction has been steep for the Index, correcting nearly by 43% from September 2016 level of 38x to 22x amid declining sales volume which started from 2QFY19. Most of the Auto OEMs have witnessed steep fall in their P/E multiple and currently trading at their historical low levels. Among the major Auto OEMs, M&M Ltd & Eicher Motors witnessed 52% steep fall in P/E multiple since September 2016. Maruti Suzuki, the leader in PV segment also witnessed 24% fall in its P/E multiple in same period. P/E multiple of Hero Motocorp, the leader in 2W sector corrected by nearly 27% from September 2016. In comparison to Hero Motocorp & Eicher motors, Bajaj Auto witnessed less pressure in its valuation (corrected by 13% since September 2016). Dismal auto sales and weak economic sentiment weigh on the stock prices of Auto OEMs with Nifty Auto Index under-performed Nifty 50 since January 2018 by correcting nearly 34%, while benchmark Nifty appreciated by 11% during same period. As the domestic auto sector is still lingering, its hard to determine the bottom of the multiple. However, government sops to revive the industry growth would definitely provide a cushion to their valuations.
Maruti Montly Sales Trend since July 2018
-40% -30% -20% -10% 0% 10%
0 50000
100000 150000 200000
Jul-1
8 Au
g-18
Se
p-18
O
ct-1
8 N
ov-1
8 D
ec-1
8 Ja
n-19
Fe
b-19
M
ar-1
9 Ap
r-19
M
ay-1
9 Ju
n-19
Ju
l-19
Aug-
19
Sales Volume (in Units) YoY growth % RHS
Tata Motors (exclude JLR) Montly Sales Trend since July 2018
-60% -40% -20% 0% 20% 40%
0
20000
40000
60000
80000
Jul-1
8
Aug
-18
Sep-
18
Oct
-18
Nov
-18
Dec
-18
Jan-
19
Feb-
19
Mar
-19
Apr
-19
May
-19
Jun-
19
Jul-1
9
Aug
-19
Sales Volume (in Units) YoY growth % RHS
M&M Ltd Montly Sales Trend since July 2018
-30% -20% -10% 0% 10% 20%
0 20000 40000 60000 80000
100000 120000
Jul-1
8
Aug
-18
Sep-
18
Oct
-18
Nov
-18
Dec
-18
Jan-
19
Feb-
19
Mar
-19
Apr
-19
May
-19
Jun-
19
Jul-1
9
Aug
-19
Sales Volume (in Units) YoY growth % RHS
Bajaj Auto Montly Sales Trend since July 2018
-20% -10% 0% 10% 20% 30% 40%
0 100000 200000 300000 400000 500000 600000
Jul-1
8 Au
g-18
Se
p-18
O
ct-1
8 N
ov-1
8 D
ec-1
8 Ja
n-19
Fe
b-19
M
ar-1
9 Ap
r-19
M
ay-1
9 Ju
n-19
Ju
l-19
Aug-
19
Sales Volume (in Units) YoY growth % RHS
TVS Motor Montly Sales Trend since July 2018
Source: filings in BSE
-20% -10% 0% 10% 20% 30% 40%
0
100000
200000
300000
400000
500000
Jul-1
8 Au
g-18
Se
p-18
O
ct-1
8 N
ov-1
8 D
ec-1
8 Ja
n-19
Fe
b-19
M
ar-1
9 Ap
r-19
M
ay-1
9 Ju
n-19
Ju
l-19
Aug-
19
Sales Volume (in Units) YoY growth % RHS
Ashok Leyland Montly Sales Trend since July 2018
-60%
-40%
-20%
0%
20%
40%
0
5000
10000
15000
20000
25000
Jul-1
8 Au
g-18
Se
p-18
O
ct-1
8 N
ov-1
8 D
ec-1
8 Ja
n-19
Fe
b-19
M
ar-1
9 Ap
r-19
M
ay-1
9 Ju
n-19
Ju
l-19
Aug-
19
Sales Volume (in Units) YoY growth % RHS
Eicher Motors Montly Sales Trend since July 2018
Source: news article
-30% -25% -20% -15% -10% -5% 0% 5% 10%
0
20000
40000
60000
80000
Jul-1
8 Au
g-18
Se
p-18
O
ct-1
8 N
ov-1
8 D
ec-1
8 Ja
n-19
Fe
b-19
M
ar-1
9 Ap
r-19
M
ay-1
9 Ju
n-19
Ju
l-19
Aug-
19
Sales Volume (in Units) YoY growth % RHS
Hero Motocorp Montly Sales Trend since July 2018
Source: news article
-30%
-20%
-10%
0%
10%
20%
0
200000
400000
600000
800000
1000000
Jul-1
8 Au
g-18
Se
p-18
O
ct-1
8 N
ov-1
8 D
ec-1
8 Ja
n-19
Fe
b-19
M
ar-1
9 Ap
r-19
M
ay-1
9 Ju
n-19
Ju
l-19
Aug-
19
Sales Volume (in Units) YoY growth % RHS
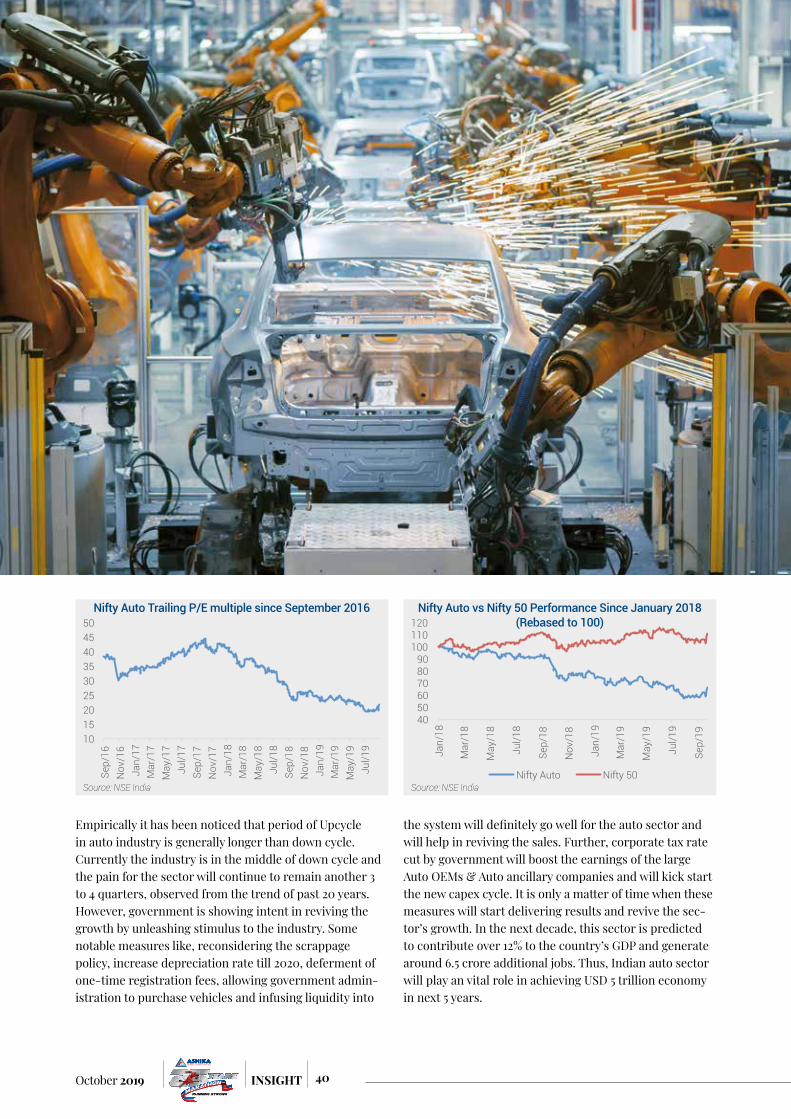
40October 2019 INSIGHT
Empirically it has been noticed that period of Upcycle in auto industry is generally longer than down cycle. Currently the industry is in the middle of down cycle and the pain for the sector will continue to remain another 3 to 4 quarters, observed from the trend of past 20 years. However, government is showing intent in reviving the growth by unleashing stimulus to the industry. Some notable measures like, reconsidering the scrappage policy, increase depreciation rate till 2020, deferment of one-time registration fees, allowing government admin-istration to purchase vehicles and infusing liquidity into
the system will definitely go well for the auto sector and will help in reviving the sales. Further, corporate tax rate cut by government will boost the earnings of the large Auto OEMs & Auto ancillary companies and will kick start the new capex cycle. It is only a matter of time when these measures will start delivering results and revive the sec-tor’s growth. In the next decade, this sector is predicted to contribute over 12% to the country’s GDP and generate around 6.5 crore additional jobs. Thus, Indian auto sector will play an vital role in achieving USD 5 trillion economy in next 5 years.
Nifty Auto Trailing P/E multiple since September 2016
Source: NSE India
10 15 20 25 30 35 40 45 50
Sep/
16
Nov
/16
Jan/
17
Mar
/17
May
/17
Jul/1
7 Se
p/17
N
ov/1
7 Ja
n/18
M
ar/1
8 M
ay/1
8 Ju
l/18
Sep/
18
Nov
/18
Jan/
19
Mar
/19
May
/19
Jul/1
9
Nifty Auto vs Nifty 50 Performance Since January 2018 (Rebased to 100)
Source: NSE India
40 50 60 70 80 90
100 110 120
Jan/
18
Mar
/18
May
/18
Jul/1
8
Sep/
18
Nov
/18
Jan/
19
Mar
/19
May
/19
Jul/1
9
Sep/
19
Nifty Auto Nifty 50

41 October 2019INSIGHT
...the government announced a reduction in the corporate tax rate from ~34% to 25.17% (inclusive of surcharge & cess). This is a massive trigger to revive the animal spirits more importantly, resurrecting sentiments that were down in the dump yard.
Economy review
While the slowdown in the economy is clearly evident with the decline in GDP numbers now conforming, the deepest impact has been on account of a decline in demand.
There are many signs which are here to confirm the same on account of a decline in income levels, also significantly driven by ineffectiveness of the government to create jobs. One even doesn’t need a host of data to get a grip on the real problems which are plaguing the economy. Decline in economic growth together with high inflation (like that of 2012-2013) is structural in nature, however, decline in economic growth accompanied by benign inflation (like what is prevailing now) is most of the times on account of lack of demand. It is clearly no rocket science to understand that the decline in income has led to decline in demand and the situation has aggravated severely on
the rural side, which is clearly captured by the decline in rural wages. Another indicator of the rural distress has been captured by the wide disparity between the urban and rural inflation. Rural inflation in August at 2.18% is almost half of that of the urban retail inflation (at 4.49%). Although, the baskets of both price indices are composed of varying articles with variable weights, however a widening divergence in the recent period certainly cannot be attributed to the same reason. A Hindubusinessline article has highlighted that there has been wide disparity in prices in articles such as food & beverages and clothing & footwear across CPI rural & urban indices. Food and beverages (F&B), which constitute 54.18% of the rural basket, inched up by a meagre 0.91%, while its urban counterpart saw a 6.42% spike in August (F&B constitutes 36.29% of the urban basket). There has been wide disparity

42October 2019 INSIGHT
in prices of fruits, vegetables and eggs across Urban & Rural indices. While August 2019 numbers for rural CPI indicate deflation in these items, urban numbers indi-cated a rise of 3%-20%. The article states that economists have highlighted two factors which have contributed to the lackluster rural numbers: (a) a supply glut in rural regions on account of lack of infrastructure for storage and hence transportation to urban areas (b) the recent floods in different states have just complicated the matters further in terms of transportation of goods from rural to urban. Thus, the muted price levels for agricultural produce have resulted in lower income for rural popu-lation and thus lower demand, which can be observed from the items like clothing and footwear in the CPI rural index (weight of 7.36%) which is witnessing deflation of 0.13% while that of urban indices (with a weight of 5.57%) exhibits price inflation of 3.40%. This stark difference between urban & rural portfolio over the same bundle of commodities captures the abysmally low demand situation
in rural India. Thus, the CPI inflation for whole of India has actually been benign on account of depressed price levels across rural India, which is doing more harm than good for the economy as a whole.
Since various data points reflect muted demand scenario, economists like Soumya Kanti Ghosh of SBI have argued that tackling the economic slowdown through monetary policy in isolation will not be successful. In fact, only a counter- cyclical fiscal response might address the core of the current problem. Mr. Ghosh is of the opinion that monetary policy plays a signifi-cant part, however limited to certain extent. An era of low interest rate for a decade doesn’t boost aggre-gate demand but rather increases household debt. For instance, in US, it increased from $12.5 trillion in Q1FY08 to $13.9 trillion in Q2 2019. This trend has also caught up in India in the recent period and could be understood from the 58% jump in financial liabilities of households in FY18 from 22% yoy jump in FY17. Such is the effect that the net financial savings (gross financial savings minus financial liabilities) as % of GNDI (Gross National Disposable Income)
has largely been flat at 6.5% in FY18 against 6.2% in FY17, although gross financial savings as % of GNDI improved to 10.8% from 9.2% during the same periods. Mr. Ghosh stated that while household leverage has jumped 2 times
in the last 5 years, disposable income has jumped by only 1.5 times, thereby putting pressure on savings. Thus, considering such a large jump in the household leverage, the monetary pol-icy is probably ineffective and count-er-cyclical fiscal response is what Mr. Ghosh favoured which might address the core of the current problem. He strongly advocated for (a) abolition of capital gains tax, to boost household financial savings, (b) increase in Section 80C/ PPF limit, which will incentivize household savings (c) front loading expenditure through PM-KI-SAN and MGNREGA schemes to arrest demand weakness (d) continuing with capital expenditure in face of declin-ing private investment.
Divergence between Urban & Rural CPI
Source: RBI
0
2
4
6
8
10
JAN
-201
4 AP
R-20
14
JUL-
2014
O
CT-2
014
JAN
-201
5 AP
R-20
15
JUL-
2015
O
CT-2
015
JAN
-201
6 AP
R-20
16
JUL-
2016
O
CT-2
016
JAN
-201
7 AP
R-20
17
JUL-
2017
O
CT-2
017
JAN
-201
8 AP
R-20
18
JUL-
2018
O
CT-2
018
JAN
-201
9 AP
R-20
19
JUL-
2019
CPI-Rural (%) CPI- Urban (%)
CPI inflation- August (Y-o-Y) (%)
Major HeadsRural Urban
Weights Inflation Weights InflationFood & beverages 54.18 0.91 36.29 6.42Pan, tobacco and intoxicants 3.26 5.56 1.36 3.58Clothing & footwear 7.36 -0.13 5.57 3.4Housing - - 21.67 4.84Fuel & light 7.94 -0.88 5.58 -3.31Miscellaneous 27.26 6.08 29.53 3.28General Index (all groups) 100.00 2.18 100.00 4.49
Source: RBI
An era of low interest rate for a decade doesn’t boost aggregate demand but rather increases household debt. For instance, in US, it increased from $12.5 trillion in Q1FY08 to $13.9 trillion in Q2 2019.

43 October 2019INSIGHT
Although, other economists like Mr. Himanshu, assis-tant professor at Jawaharlal Nehru university have also suggested for fiscal reforms instead of tackling sectoral issues. In a live mint article, he strongly advocated for public expenditure-led demand injection, even if it comes at the cost of fiscal consolidation. However, not all economists have reacted in the same tone and some of the experts have actually advised the government against that. Even in the case of manufacturers, majority of auto and FMCG players have requested the government to reduce Goods & Service tax (GST) to spur demand. Although, one needs to keep in mind that a change in GST rate will hardly induce demand for a rupees five pack of biscuits. A grim revenue situation has prompted key states to express reservations over a cut in GST rate for the auto sector from 28% to 18%. Prominent states like Bihar, West Bengal, Kerala, and Punjab are of the view that the slowdown in the auto sector is not because of the GST rate but struc-tural issues in the economy. The fitment committee in its early September meeting had stated a potential revenue loss of around Rs 50,000 crore annually in case the GST rate was reduced by 10% and thus practically ruling it out. Kerala Finance Minister Thomas Isaac probably best summed up the situation and tweeted “To all votaries of abolishing 28 per cent slab in GST: You are hooting to make Indian tax system one of the most iniquitous. Average rate on consumer durables in pre GST period was around 35 per cent. You want to reduce it to 18 per cent. A cardinal principle of taxation is equity. Refer to Dalton.” While it is true that a cut in GST rates would have spurred demand if the same is passed on in full, however, given the dwindling GST collections, the proposition wasn’t just, given the fact that the government was already battling lower collections in FY19 by Rs 50,000 crore. Meanwhile, Bajaj Auto’s Managing Director Rajiv Bajaj believes the ongoing slump in the auto industry is mainly due to overproduction and there is no need for a tax cut at this juncture. Mr. Bajaj feels the problem will be sorted by November as the automobile sector is now correcting the stock levels for Bharat Stage-VI emission norms. Indeed, the industry is passing through a change in emission norms, which has postponed purchases and those episode needed further study before jumping to conclusions.
In other data it can be showed that the consumption in recent periods was fueled by easy availability of credit (personal loans). As corporate credit demand waned, banks and NBFCs aggressively pushed retail credit, result-ing in India’s retail credit-to-GDP ratio rising from 11.7% in FY12 to 15.7% in FY19, while overall bank credit declined. However, research has shown that for consumption to sustain, it needs to be supported by meaningful and sustained investment growth, which has faltered.
There’s also altogether another explanation for the present slowdown at hand and experts believe that there’s more to this than meets the eye. Indian economy could very well be passing through a structural transformation as experts have now realized. The moves taken by the Narendra Modi government like demonetization and simultaneous digitization followed by implementation of GST, although could be painful in the short term and has been slowing down the economy, but again, any change of that scale is bound to be painful in the short term and beneficial in the long term. Experts like V Kumaraswamy (author of Making Growth Happen in India) are of the opinion that both formalization and digitization have been the key reasons for slowdown as experts now expect the formal sector to rise to 70-75% in a span of next five years
Household sector financial savings(in Rs billion) FY12 FY13 FY14 FY15 FY16 FY17 FY18
Gross financial saving 9327 10640 11908 12572 14962 14384 18696
Financial liabilities 2901 3304 3587 3768 3854 4686 7406
Net Financial Savings 6426 7336 8321 8804 11108 9697 11290
GNDI 89644 101773 114896 127257 140252 155654 173159Source: RBI, Ashika Research
(as % of GNDI) FY12 FY13 FY14 FY15 FY16 FY17 FY18
Gross financial saving 10.4% 10.5% 10.4% 9.9% 10.7% 9.2% 10.8%
Financial liabilities 3.2% 3.2% 3.1% 3.0% 2.7% 3.0% 4.3%
Net Financial Savings 7.2% 7.2% 7.2% 6.9% 7.9% 6.2% 6.5%Source: RBI, Ashika Research
Divergent trends in total credit vs retail
Source: RBI, Ace Equity, Ashika Research, Retail credit comprises of Bank+listed NBFCs
44%
45%
46%
47%
48%
49%
50%
10%
11%
12%
13%
14%
15%
16%
17%
FY12 FY13 FY14 FY15 FY16 FY17 FY18 FY19 Retail credit to GDP Total credit to GDP-RHS

44October 2019 INSIGHT
from 45-50% now. The author explains Formalisation as a process to bring more of the unorganised sector into the formal fold by means of GST, making it uneconomical for others to deal with it, and ensuring registration under laws governing manufacturing and income tax. While the move on digitization by linking most of its subsidies to bank accounts, opening Jan Dhan accounts, and pushing for more digitised payments across all sections, has resulted in shrinkage of the economy, but at the same time it reduces incentives for tax evasion, provide a level-playing field for tax-compliant entities, expand the tax base and hence tax-GDP ratio. Mr. Kumaraswamy explained the process in greater detail. Before GST, our economy was predominantly informal or unorganized and these so called “informal” sector was profitable and cost competitive due to rampant tax evasion at various levels. With the introduction of GST, most of them have become uncompetitive. However, some of them which manages capital & labour efficiently will still be profitable even after paying taxes. However, due to this formalization, the cost structure of these informal units has gone up thus shifting the supply curve up. Tax collection of the gov-ernment will rise (as previous informal units which have survived are now paying taxes) while market prices will go up and volumes adjust downwards due to rise in prices. While profitability of the previous tax compliant entities is expected to go up, that of the newly tax compliant entities (which were earlier informal) will turn worse. While it is also possible that a large number of informal units become unviable on account of new taxes, to supply at the market clearing prices.
Now in the case of inelastic products (like food and essential items), Mr. Kumaraswamy argues that people will reallocate from other expenditure lines and there will not be much of a decline in volume. However, for dis-cretionary items (like that of cars & houses), people may not substitute but postpone or downgrade the quality of purchase. The real impact of demand decline will however be dependent on the elasticity of demand of various products. While nominal incomes may shrink or expand depending upon whether the price effect overwhelms vol-ume reduction, in real terms there will be a shrinkage due to both price increase and volume reduction. Moreover, companies for which distribution channel is non-existent
will be less impacted by the slowdown. Companies like that of paints sector, DMart, Trent, Westlife Development, Jubilant Food works have not experienced any slowdown. Similarly, commentaries from Amazon & Flipkart also suggest no hint of slowdown as both players prepares for their sale events with wider consumer choices and larger financing options. Thus, a deeper study of the effect of GST at various levels (i.e. consumer, dealer, distributor, manufacturer) needs to be undertaken before jumping to conclusions. As for taxes, they don’t necessarily result in economic shrinkage, opined Mr. Kumaraswamy. In most cases, they are transfers from one pocket to another, the government in this case. According to him, governments are more compulsive spenders and that often ends up boosting the economy also. An increase in direct taxes may not result in significant change in volumes or price, however will reduce post tax returns on capital employed (ROCE) and without a similar reduction in cost of capital, investment demand will be impacted directly. In case of indirect taxes, the taxes so collected if spent well, there would be no overall impact on the economy and the shrinkage in one sector will be made up by expansion in areas where the government spends. The formalization drive by the government has certainly led to shrinkage of the private sector, however the government has not responded to the shrinkage by spending whatever it gar-ners from this formalization drive. On the contrary, the government has been reducing expenditure to adhere to the fiscal consolidation target. As a consequence of both private & government expenditure shrinking, the overall economy was bound to contract.
The government might have also studied the issues plaguing the economy and after hue and cry from various industries for stimulus package, the government came up with a booster dose which was pending for a long time. In a surprise move the government announced a reduction in the corporate tax rate from ~34% to 25.17% (inclusive of surcharge & cess). This is a massive trigger to revive the animal spirits more importantly, resurrecting sentiments that were down in the dump yard. To provide fillip to private investment and government’s ‘Make in India’ initiative, another new provision has been inserted in the Income Tax Act with effect from FY20, which allows any new domestic company incorporated on or after October 1, 2019 to make fresh investment in manufacturing, an option to pay income tax at 15%. This benefit is available to companies that do not avail any exemption/incentive and commences their production on or before March 31, 2023. The effective tax rate for these companies shall be 17.01% inclusive of surcharge & cess. This is a master stroke from the government being impartial to all industries and all major shortcoming haunting the economic growth has been addressed with a single move. According to CRISIL, the reduction in tax rate could help the top 1000 listed companies save Rs 37,000 crore this fiscal year. Thus, there is a straightaway gain at the bottomline, resulting in improving their return on equities (ROE) of all companies. This incremental cashflows to the corporate is at the discretion of the management if they want to pass it on to customers or channelize to debt reduction or put into
Compliance hurts
Source: Hindubusinessline, V Kumaraswamy “Formalisation is shrinking the economy”

45 October 2019INSIGHT
incremental investments to increase capacity. Based on the government estimates, the revenue shortfall for the government could be ~Rs 1.45tn, that needs to be filled up by divestment, most probably. Thus, the fiscal stimulus pegged at ~0.8% of GDP is well thought of to address multiple issues. After the tax cut, India has come at one of the lowest taxed nation (22%) and certainly lowest for new companies (15%). This is strong move to make India globally competitive and thus will attract FDI in manufacturing to give fillip to ‘Make in India’ initiative. However, does it address the consumption slowdown in
the economy? Not directly, however, if the manufacturers pass on the lower tax to consumers, that will help in revival of demand. However, it will not be material for all industries, for instance for auto, even if the whole tax cut is passed on it would only bring down prices by 0.5%, which is unlikely to spur demand. However, if the same is directed towards building new capacities, it will create more employment and eventually trickle down into higher consumption. Although, time taking, this is the rational way to start virtuous cycle of growth.
How Corporate India will be taxed (in %)
How Corporate India will be taxed (in %)
New mfg cos.
Existing companies Min. Alternate TaxWithout
exemptions & deductions at
new rates
With exemptions and deductions at existing rates
Cos. with turnover <Rs 400 crores in FY17-18
Others New rate Old rate
Corporate tax rate 15.00 22.00 25.00 30.00 15.00 18.50After surchargeTotal income Rs 1-10 core
16.50 24.2026.75 32.10 16.05 19.80
Total income> Rs 10 crore 28.00 33.60 16.80 20.72After health & education cessTotal income< Rs 1 crore
17.16 25.1726.00 31.20 15.60 19.24
Total income Rs 1-10 core 27.82 33.38 16.69 20.59Total income> Rs 10 crore 29.12 34.94 17.47 21.55
Source: Hindubusinessline, rates are applicable for domestic companies
Country-wise effective corporate tax rate for 2019 (%)India (New Companies) * 15%Hong Kong SAR 17%Singapore 17%Switzerland 18%UK 19%Russia 20%Taiwan 20%Thailand 20%Vietnam 20%Sweden 21%India* 22%Malaysia 24%China 25%Indonesia 25%South Korea 25%US 27%Germany 30%Japan 31%France 31%Brazil 34%
Source: Media articles, KPMG

46October 2019 INSIGHT
External Sector (% YoY) FY12 FY13 FY14 FY15 FY16 FY17 FY18 FY19 FY20Exports (USD Bn.) 309.8 306.6 318.6 316.5 266.4 280.1 309.0 337.2 133.5% YoY 20.9% -1.0% 3.9% -0.6% -15.9% 5.2% 10.3% 10.3%Imports (USD Bn.) 499.5 502.2 466.2 461.5 396.4 392.6 469.0 517.5 206.4%YoY 30.3% 0.5% -7.2% -1.0% -14.1% -1.0% 19.5% 19.5%Trade Deficit (USD Bn.) -189.8 -195.7 -147.6 -144.9 -130.1 -112.4 -160.0 -180.3 -72.9Invisibles (USD Bn.) 111.6 107.5 115.3 118.1 107.9 98.0 111.3 123.0Current Account Deficit (USD Bn.) -78.2 -88.2 -32.3 -26.9 -22.2 -14.4 -48.7 -57.3% of GDP -4.2% -4.8% -1.7% -1.3% -1.1% -0.6% -1.9% -2.1%Capital Account (USD Bn.) 67.8 89.3 48.8 89.3 41.1 36.4 91.4 53.9% of GDP 2.8% 3.0% 1.9% 3.8% 2.0% 2.2% 2.4% 2.0%Forex Reserve (incl Gold) (USD Bn.) 294.4 292.0 304.2 341.6 360.2 370.0 424.5 420.1 429.0Months of imports 7.1 7.0 7.8 8.9 10.9 11.3 10.9 14.8 5.8External Debt (USD Bn.) 360.8 409.4 446.2 474.7 484.8 471.3 529.3 543.0Short Term Debt (USD Bn.) 78.2 96.7 91.7 85.5 83.5 88.1 102.2 108.4FDI Inflows (USD Bn.) 35.1 22.4 24.3 30.9 40.0 43.5 44.9 33.5ECB (USD Bn.) 35.4 32.0 33.2 28.4 24.4 22.0 28.9 41.9Exchange Rate USD/INR (Avg.) 51.2 60.1 54.4 62.6 66.3 67.1 64.5 69.9 70.0% Depreciation 17.5% -9.5% 15.1% 6.0% 1.1% -3.9% 8.4% 0.1%Precious Metals Gold - Mumbai (Rs. per 10gms.) 25722 30164 29190 27415 26534 29665 29300 31193 34229.0Gold - London (USD per troy oz.) 1645 1654 1327 1247 1147 1258 1285 1263 1388Silver - Mumbai (Rs. per Kg.) 57316 57602 46637 40558 36318 42748 39072 38404 39779Silver - NewYork (USD per troy oz.) 3546 3051 2145 1814 1526 1779 1687 1539 1588Crude Oil Yearly Avg. (USD per Barrel) 114.1 110.2 107.6 86.6 48.7 49.9 57.9 70.7 65.4Industry Growth IIP 3.3% 3.3% 4.0% 3.3% 4.6% 3.7% 3.6% 3.3%Mining -5.3% -0.1% -1.4% 4.3% 5.3% 2.9% 2.9% 3.4%Manufacturing 4.8% 3.6% 3.8% 2.8% 4.4% 3.8% 3.5% 2.8%Electricity 4.0% 6.1% 14.8% 5.7% 5.8% 5.1% 5.2% 6.6%Primary Goods 0.5% 2.3% 3.8% 5.0% 4.9% 3.5% 3.5% 2.7%Capital Goods 0.3% -3.7% -1.1% 3.0% 3.2% 2.7% 2.8% -4.3%Consumer Durables 4.9% 5.6% 4.0% 3.4% 2.9% -1.1% 5.3% -2.7%Core Sector Growth Eight Core Industries 3.8% 2.6% 4.9% 3.0% 4.8% 4.3% 4.3% 3.0%Coal Production (Mn. Tn.) 552 569 575 621 651 672 689 739.4 220.9Coal Growth (%) 3.2% 1.0% 8.0% 4.8% 3.2% 2.6% 7.3% 1.8%Crude Oil Production (Mn Tn) 38 38 38 37 37 36 36 34.2 11.0Crude Oil Growth (%) -0.6% -0.2% -0.9% -1.4% -2.5% -0.9% -4.1% -6.2%Natural Gas Production (BCUM) 46 40 35 33 31 31 32 32.1 10.4Natural Gas Growth (%) -14.4% -12.9% -5.3% -4.7% -1.0% 2.9% 0.8% -0.8%Petroleum Refinery Products Prodn (Mn Tn) 203 218 221 221 232 243 254 262.4 86.0Petroleum Refinery Products Growth (%) 7.2% 1.4% 0.2% 4.9% 4.9% 4.6% 3.1% -2.0%Fertilizers Production of (Mn Tn) 39 37 38 39 41 41 41 41.5 13.4Fertilizers Growth (%) -3.3% 1.5% 1.3% 7.0% 0.2% 0.0% 0.3% -0.4%Steel Production (Mn Tn) 76 82 88 92 91 101 106 111.3 39.5Steel Growth (%) 7.9% 7.3% 5.1% -1.3% 10.7% 5.6% 4.7% 10.9%Cement Production (Mn Tn) 230 247 256 271 283 280 298 337.3 114.1Cement Growth (%) 7.5% 3.7% 5.9% 4.6% -1.2% 6.3% 13.3% 2.7%Electricity Generation (Bn KWH) 877 912 967 1110 1174 1242 1308 1374.9 498.0Electricity Growth (%) 4.0% 6.1% 14.8% 5.7% 5.8% 5.3% 5.1% 6.4%Railways Traffic Freight Traffic (Mn Tonne) 969.8 1009.7 1053.6 1097.6 1101.5 1106.6 1159.6 1221.4 406.0Freight Traffic Revenue (Rs Bn) 696.7 858.7 934.7 1053.1 1090.0 1043.1 1170.3 1272.1 413.7Airport Traffic Total Freight (Mt in Mn) 2.3 2.2 2.3 2.5 2.7 3.0 3.4 3.6 1.135Total Passenger (in Mn) 162.3 159.4 168.9 190.1 224.0 265.0 308.8 344.7 113.44Automobile Sales (in mn) Passenger Vehicles 2.6 3.2 3.1 3.2 3.4 3.8 4.0 4.1 Commercial Vehicles 0.8 0.9 0.7 0.7 0.8 0.8 1.0 1.1Three Wheelers 0.5 0.8 0.8 0.9 0.9 0.8 1.0 1.3Two Wheelers 13.4 15.8 16.9 18.4 18.9 19.9 23.0 24.5Grand Total 17.4 20.7 21.5 23.3 24.1 25.3 29.0 30.9FII Investments (Rs Bn) Equity 437.4 1400.3 797.1 1113.3 -141.7 557.0 256.3 -16.3 -36.1Debt 499.9 283.3 -280.6 1661.3 -40.0 -72.9 1190.4 -429.5 -177.23Total 937.3 1683.7 516.5 2774.6 -181.8 484.1 1446.8 -410.7 -93.93DII Investments (Rs Bn) Equity -37.9 -669.4 -540.7 -192.6 786.9 299.3 1146.0 724.1 575.5Monetary Indicators (% YoY)Money supply 15.9% 13.5% 13.6% 11.9% 10.7% 9.3% 7.8% 10.2% 10.2%Inflation – WPI (Avg.) 9.0% 6.9% 5.2% 1.2% -3.7% 1.7% 3.0% 4.3% 2.3%CPI (Avg.) 8.6% 10.1% 9.3% 5.9% 4.9% 4.5% 3.6% 3.4% 3.1%10 Yr Gsec (%) 8.6% 8.0% 8.7% 7.8% 7.5% 6.7% 7.4% 7.7% 6.7%364 day T-Bill (%) 8.4% 7.8% 8.7% 7.7% 7.1% 6.1% 6.5% 7.0% 5.6%India AAA Corp 10 year (%) 9.5% 8.9% 9.6% 8.4% 8.4% 7.8% 8.2% 8.6% 7.4%Bank Deposit (Rs. Bn.) 59091 67505 77056 85333 93273 107577 114260 125738 127802Deposit growth (%) 13.5% 14.2% 14.1% 10.7% 9.3% 15.3% 6.2% 10.0% 9.7%Bank Credit (Rs. Bn.) 46119 52605 59941 65364 72496 78415 86254 97717 96807Bank credit growth (%) 17.0% 14.1% 13.9% 9.0% 10.9% 8.2% 10.0% 13.3% 10.3%
Fiscal Year to 31 March

47 October 2019INSIGHT
FY12 FY13 FY14 FY15 FY16 FY17 FY18 FY19 (RE)
National Income Indicators
Nominal GDP (Rs. Bn.) 87363 99440 112335 124680 137640 152537 167731 188407
Nominal GDP (USD Bn.) 1708 1655 2065 1992 2075 2274 2603 2696
Per Capita GDP (Rs) 71609 80518 89796 98405 107341 118263 129901 141447
Real GDP growth – at 2011-12 prices (%) 5.5% 6.4% 7.4% 8.2% 7.1% 6.7% 7.2%
By Demand (%YoY) at Market Prices (At Current Prices)
Consumption 13.6% 14.3% 12.0% 11.3% 12.1% 10.8% 11.5%
Pvt Consumption 14.3% 15.3% 11.9% 11.6% 11.3% 10.1% 10.9%
Public Consumption 9.7% 8.9% 12.6% 9.7% 16.5% 14.7% 13.7%
Gross Fixed Capital Formation (GFCF) 10.9% 5.7% 6.7% 4.5% 11.1% 9.8% 14.7%
GFCF at Market prices (Rs. Bn.) 29977 33250 35156 37504 39182 43525 47789 54827
Cons; Invst, Savings * (%GDP)
Consumption 67.3% 67.1% 67.9% 68.6% 69.2% 69.9% 70.5% 70.9%
Gross Fixed Capital Formation 34.3% 33.4% 31.3% 30.1% 28.5% 28.5% 28.5% 29.1%
By Activity (%YoY)
GVA 5.4% 6.1% 7.2% 8.1% 7.1% 6.5% 7.0%
Agriculture growth 1.5% 5.6% -0.2% 0.6% 6.3% 3.4% 3.8%
Industry growth 4.5% 4.2% 8.1% 12.1% 8.7% 5.5% 7.5%
Services growth 6.5% 7.0% 8.9% 8.5% 6.6% 7.6% 7.5%
Combined deficit (Centre+State)
Gross fiscal deficit (Rs Bn) 6850 6844 7497 8366 9524 10647 11004 10998
As % of GDP 7.8% 6.9% 6.7% 6.7% 6.9% 7.0% 6.6% 5.9%
Gross primary deficit (Rs Bn) 2850 2301 2155 2520 3043 3403 2838 2146
As % of GDP 3.2% 2.3% 1.9% 2.0% 2.2% 2.2% 1.7% 1.1%
Revenue deficit (Rs Bn) 3704 3440 3676 4112 3481 3569 5000 3868
As % of GDP 4.1% 3.5% 3.3% 3.3% 2.5% 2.3% 3.0% 2.1%
Fiscal Indicators (% GDP)
Centre's fiscal deficit 5.9% 4.9% 4.5% 4.1% 3.9% 3.5% 3.5% 3.4%
State fiscal deficit 1.9% 2.0% 2.2% 2.6% 3.1% 3.5% 3.1% 2.6%
Combined deficit (Centre+State) 7.8% 6.9% 6.7% 6.7% 6.9% 7.0% 6.6% 5.9%
Subsidies (Rs. Bn.)
Central Subsidies 2113.2 2474.9 2447.2 2490.2 2418.3 2040.3 1912.1 2662.2
As % of GDP 2.4% 2.5% 2.2% 2.0% 1.8% 1.3% 1.1% 1.4%
Gross Tax Revenue (Rs. Bn.)
Corporation Tax 3232 3563 3947 4289 4532 4849 5712 6710
Income Tax 1708 2018 2429 2657 2876 3496 4308 5290
Customs Duties 1493 1658 1721 1880 2103 2260 1290 1300
Excise Duties 1456 1759 1702 1900 2881 3811 2594 2596
Service Tax 974 1325 1548 1680 2114 2546 812 93
GST 0 0 0 0 0 0 4426 6439
Other Taxes 8 8 41 43 50 299 48 53
Direct Taxes 4940 5570 6385 6957 7419 8356 10020 12000
Indirect Taxes 3917 4742 4971 5491 7149 8816 9170 10482
Gross tax revenue 8849 10334 11387 12449 14569 17172 19190 22482
Devolvement to States 2554 2915 3229 3378 5062 6080 6730 7615
Tax revenue (Net) 6295 7419 8159 9071 9507 11092 12460 14844
Gross tax revenue % of GDP 7.2% 7.5% 7.3% 7.3% 6.9% 7.3% 7.4% 7.9%
Domestic savings sectorwise (Rs Bn)
Financial Savings 6426 7336 8321 8804 11108 9697 11290
Physical Savings 14230 15017 14532 15587 13641 16532 18092
Total Household Sector 20656 22353 22853 24391 24749 26229 29382
Private Corporate Sector 8268 9940 12072 14571 16383 17701 19863
Public Sector 2927 2988 2894 2990 3305 3767 4540
Gross Domestic Savings 31851 35281 37819 41952 44437 47698 53786
Net Domestic Savings 30268 33692 36082 40200 42823 46484 52160
Fiscal Year to 31 March

48October 2019 INSIGHT
Economy chart bookMonetary Policy Rates and Indicators (Liquidity & Monetary)
2
4
6
8
10
27-A
pr-0
1 28
-Mar
-02
03-M
ar-0
3 31
-Mar
-04
24-J
an-0
6 31
-Jan
-07
30-J
ul-0
8 05
-Jan
-09
20-A
pr-1
0 02
-Nov
-10
16-J
un-1
1 17
-Apr
-12
20-S
ep-1
3 03
-Mar
-15
04-O
ct-1
6 01
-Aug
-18
07-A
ug-1
9
Repo Rate (%)
Repo & Rev. Repo (%)
6.5
7.0
7.5
8.0
8.5
9.0
9.5
Sep
-16
Dec
-16
Mar
-17
Jun
-17
Sep
-17
Dec
-17
Mar
-18
Jun
-18
Sep
-18
Dec
-18
Mar
-19
Jun
-19
Sep
-19
1 Years 5 Years 10 Years
India’s AAA Corporate Bond Yield (%)
0.0
0.2
0.4
0.6
0.8
1.0
1.2
1.4
1.6
Sep
-16
Dec
-16
Mar
-17
Jun
-17
Sep
-17
Dec
-17
Mar
-18
Jun
-18
Sep
-18
Dec
-18
Mar
-19
Jun
-19
Sep
-19
India GSec & AAA Bond Yield Spread (%)
5.5 6.0 6.5 7.0 7.5 8.0 8.5 9.0 9.5
Sep-
16
Dec
-16
Mar
-17
Jun-
17
Sep-
17
Dec
-17
Mar
-18
Jun-
18
Sep-
18
Dec
-18
Mar
-19
Jun-
19
Sep-
19
1 Month 3 Month 12 Month
Commercial Paper Rate (%)
3.5
4.0
4.5
5.0
5.5
6.0
Sep
-16
Dec
-16
Mar
-17
Jun-
17
Sep
-17
Dec
-17
Mar
-18
Jun-
18
Sep
-18
Dec
-18
Mar
-19
Jun-
19
Sep
-19
US GSec & India GSec Bond Yield Spread (%)
5
6
7
8
9
10
11
03-M
ay-1
1 26
-Jul
-11
25-O
ct-1
1 29
-Jan
-13
03-M
ay-1
3 20
-Sep
-13
29-O
ct-1
3 15
-Jan
-15
02-J
un-1
5 05
-Apr
-16
06-A
pr-1
7 06
-Jun
-18
07-F
eb-1
9 06
-Jun
-19
Marginal Standing Facility (%)
3
4
5
6
7
8
9
10
08-A
pr-0
0 29
-Jul
-00
24-F
eb-0
1 19
-May
-01
29-D
ec-0
1 16
-Nov
-02
18-S
ep-0
4 23
-Dec
-06
17-F
eb-0
7 14
-Apr
-07
04-A
ug-0
7 26
-Apr
-08
24-M
ay-0
8 19
-Jul
-08
11-O
ct-0
8 08
-Nov
-08
13-F
eb-1
0 24
-Apr
-10
10-M
ar-1
2 03
-Nov
-12
Cash Reserve Ratio (CRR) (%)
5
6
7
8
9
10
11
02-A
pr-0
0 17
-Feb
-01
23-O
ct-0
1 29
-Apr
-03
17-A
pr-1
2 19
-Mar
-13
15-J
ul-1
3 07
-Oct
-13
28-J
an-1
4 04
-Mar
-15
29-S
ep-1
5 04
-Oct
-16
02-A
ug-1
7 01
-Aug
-18
06-A
pr-1
9 07
-Aug
-19
Bank Rate (%)
18
19
20
21
22
23
24
25
26
25-O
ct-9
7 08
-Nov
-08
07-N
ov-0
9 18
-Dec
-10
11-A
ug-1
2 14
-Jun
-14
09-A
ug-1
4 07
-Feb
-15
02-A
pr-1
6 09
-Jul
-16
01-O
ct-1
6 07
-Jan
-17
24-J
un-1
7 14
-Oct
-17
05-J
an-1
9 06
-Apr
-19
06-J
un-1
9
Statutory Liquidity Ratio (%)
7.0
7.5
8.0
8.5
9.0
9.5
10.0
10.5
Ju
l-1
0
Jan
-11
Ap
r-11
Ju
l-11
Sep
-12
Sep
-13
Ap
r-1
5
Oct
-15
Ap
r-1
7
Oct
-17
Ap
r-1
8
Oct
-18
Ap
r-1
9
SBI Base Rate (%)
5.5
6.0
6.5
7.0
7.5
8.0
8.5
Sep
-16
Dec
-16
Mar
-17
Jun-
17
Sep
-17
Dec
-17
Mar
-18
Jun-
18
Sep
-18
Dec
-18
Mar
-19
Jun-
19
Sep
-19
1 Years 5 Years 10 Years
India’s Government Bond Yield (%)
5.0
5.5
6.0
6.5
7.0
7.5
8.0
Sep
-16
Dec
-16
Mar
-17
Jun-
17
Sep
-17
Dec
-17
Mar
-18
Jun-
18
Sep
-18
Dec
-18
Mar
-19
Jun-
19
Sep
-19
30 Days 91 Days 364 Days
India’s Government 364-Day T-Bill (%)

49 October 2019INSIGHT
Economy chart book
Inflation
Industrial Activities
5.4 5.4 5.3 5.6 5.6
6.4
6.7
7.2
5.0
5.5
6.0
6.5
7.0
7.5
Cal
l Rat
e
T-B
ill 1
Mos
T-B
ill 3
Mos
T-B
ill 1
2 M
os
G-S
ec 1
Yrs
G-S
ec 5
Yrs
G-S
ec 1
0 Y
rs
G-S
ec 3
0 Y
rs
Yield (%)
0
5
10
15
20
25
0
20,000
40,000
60,000
80,000
1,00,000
1,20,000
1,40,000
Jul-
09
Jul-
10
Jul-
11
Jul-
12
Jul-
13
Jul-
14
Jul-
15
Jul-
16
Jul-
17
Jul-
18
Jul-
19
Deposits Growth (%) (RHS)
All Scheduled Commercial Banks - Aggregate deposits (Rs. Bn.)
0
5
10
15
20
25
30
0
20,000
40,000
60,000
80,000
1,00,000
1,20,000
Jul-
09
Jul-
10
Jul-
11
Jul-
12
Jul-
13
Jul-
14
Jul-
15
Jul-
16
Jul-
17
Jul-
18
Jul-
19
Credit Growth (%) (RHS)
All Scheduled Commercial Banks - Bank Cedit (Rs. Bn.)
0
1
2
3
4
5
6
Aug
-16
Nov
-16
Feb-
17
May
-17
Aug
-17
Nov
-17
Feb-
18
May
-18
Aug
-18
Nov
-18
Feb-
19
May
-19
Aug
-19
CPI Inflation (%)
-4 -3 -2 -1 0 1 2 3 4 5 6 7
Aug
-16
Nov
-16
Feb-
17
May
-17
Aug
-17
Nov
-17
Feb-
18
May
-18
Aug
-18
Nov
-18
Feb-
19
May
-19
Aug
-19
CFPI Inflation (%)
0
1
2
3
4
5
6
Jul-
16
Oct
-16
Jan-
17
Apr
-17
Jul-
17
Oct
-17
Jan-
18
Apr
-18
Jul-
18
Oct
-18
Jan-
19
Apr
-19
Jul-
19
WPI Inflation (%)
0
2
4
6
8
10
Jul-
17
Sep
-17
Nov
-17
Jan-
18
Mar
-18
May
-18
Jul-
18
Sep
-18
Nov
-18
Jan-
19
Mar
-19
May
-19
Jul-
19
IIP (YoY %)
-5
0
5
10
15
Jul-
17
Sep-
17
Nov
-17
Jan-
18
Mar
-18
May
-18
Jul-
18
Sep-
18
Nov
-18
Jan-
19
Mar
-19
May
-19
Jul-
19
Mining Manufacturing Electricity General
Sectoral IIP (YoY %)
-10
40
Jul-
17
Sep
-17
Nov
-17
Jan-
18
Mar
-18
May
-18
Jul-
18
Sep
-18
Nov
-18
Jan-
19
Mar
-19
May
-19
Jul-
19
Primary Goods Capital Goods Infra Goods Consumer Durables
Use Base IIP (YoY %)
49
50
51
52
53
54
55
Aug
-17
Oct
-17
Dec
-17
Feb-
18
Apr
-18
Jun-
18
Aug
-18
Oct
-18
Dec
-18
Feb-
19
Apr
-19
Jun-
19
Aug
-19
Nikkei India Manufacturing PMI
0 1 2 3 4 5 6 7 8 9
Jul-
17
Sep
-17
Nov
-17
Jan-
18
Mar
-18
May
-18
Jul-
18
Sep
-18
Nov
-18
Jan-
19
Mar
-19
May
-19
Jul-
19
Eight Core Industries Growth (%)
-5
0
5
10
15
20
40
50
60
70
80
90
100
Jul-
17
Sep
-17
Nov
-17
Jan-
18
Mar
-18
May
-18
Jul-
18
Sep
-18
Nov
-18
Jan-
19
Mar
-19
May
-19
Jul-
19
Production (Mn. Tn.) Growth (%) (RHS)
Coal

50October 2019 INSIGHT
Economy chart book
-6
-4
-2
0
2
4
6
8
2,300
2,400
2,500
2,600
2,700
2,800
2,900
Jul-
17
Sep
-17
Nov
-17
Jan-
18
Mar
-18
May
-18
Jul-
18
Sep
-18
Nov
-18
Jan-
19
Mar
-19
May
-19
Jul-
19
Production (MCUM) Growth (%) (RHS)
Natural Gas
-5
0
5
10
15
20
25
20,000
22,000
24,000
26,000
28,000
30,000
32,000
34,000
Jul-
17
Sep
-17
Nov
-17
Jan-
18
Mar
-18
May
-18
Jul-
18
Sep
-18
Nov
-18
Jan-
19
Mar
-19
May
-19
Jul-
19
Production ('000 Tn) Growth (%) (RHS)
Cement
-5
0
5
10
15
20
8,000
8,500
9,000
9,500
10,000
10,500
11,000
Jul-
17
Sep
-17
Nov
-17
Jan-
18
Mar
-18
May
-18
Jul-
18
Sep
-18
Nov
-18
Jan-
19
Mar
-19
May
-19
Jul-
19
Production ('000 Tn) Growth (%) (RHS)
Steel
-15
-10
-5
0
5
10
15
18,000
19,000
20,000
21,000
22,000
23,000
24,000
Jul-
17
Sep
-17
Nov
-17
Jan-
18
Mar
-18
May
-18
Jul-
18
Sep
-18
Nov
-18
Jan-
19
Mar
-19
May
-19
Jul-
19
Production ('000 Tn) Growth (%) (RHS)
Petroleum Refinery Products
-15
-10
-5
0
5
10
15
2,800
3,000
3,200
3,400
3,600
3,800
4,000
Jul-
17
Sep-
17
Nov
-17
Jan-
18
Mar
-18
May
-18
Jul-
18
Sep-
18
Nov
-18
Jan-
19
Mar
-19
May
-19
Jul-
19
Production of ('000 Tn) Growth (%) (RHS)
Fertilizers
0.0
2.0
4.0
6.0
8.0
10.0
12.0
95,000
1,05,000
1,15,000
1,25,000
1,35,000
Jul-
17
Sep
-17
Nov
-17
Jan-
18
Mar
-18
May
-18
Jul-
18
Sep
-18
Nov
-18
Jan-
19
Mar
-19
May
-19
Jul-
19
Generation (Mn KWH) Growth (%) (RHS)
Electricity
55
60
65
70
75
80
85
90
95
Sep
-09
Sep
-10
Sep
-11
Sep
-12
Sep
-13
Sep
-14
Sep
-15
Sep
-16
Sep
-17
Sep
-18
Sep
-19
EUR-INR
40
45
50
55
60
65
70
75
80
Sep
-09
Sep
-10
Sep
-11
Sep
-12
Sep
-13
Sep
-14
Sep
-15
Sep
-16
Sep
-17
Sep
-18
Sep
-19
USD-INR
60
70
80
90
100
110
Sep
-09
Sep
-10
Sep
-11
Sep
-12
Sep
-13
Sep
-14
Sep
-15
Sep
-16
Sep
-17
Sep
-18
Sep
-19
GBP-INR
Currencies
45
50
55
60
65
70
75
Sep
-09
Sep
-10
Sep
-11
Sep
-12
Sep
-13
Sep
-14
Sep
-15
Sep
-16
Sep
-17
Sep
-18
Sep
-19
JPY-INR
6
7
8
9
10
11
12
Sep
-09
Sep
-10
Sep
-11
Sep
-12
Sep
-13
Sep
-14
Sep
-15
Sep
-16
Sep
-17
Sep
-18
Sep
-19
CNY-INR
70
75
80
85
90
95
100
105
Sep
-09
Sep
-10
Sep
-11
Sep
-12
Sep
-13
Sep
-14
Sep
-15
Sep
-16
Sep
-17
Sep
-18
Sep
-19
Dollar Index
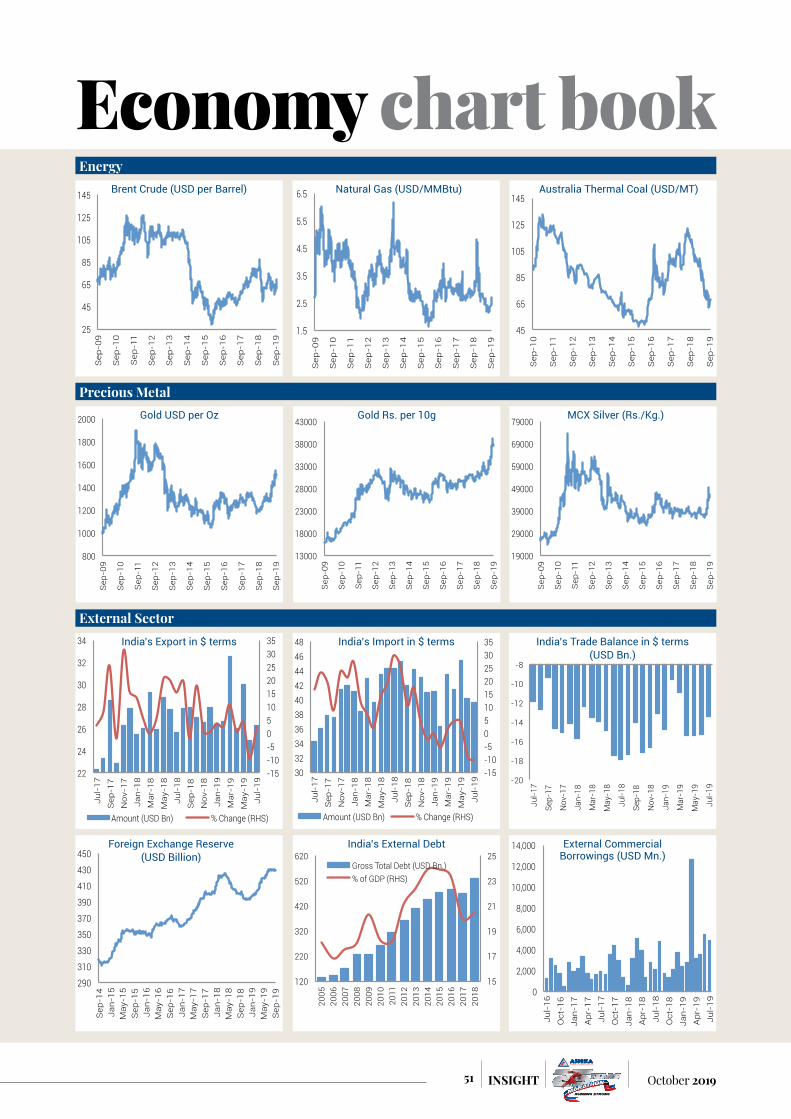
51 October 2019INSIGHT
Economy chart book
45
65
85
105
125
145
Sep
-10
Sep
-11
Sep
-12
Sep
-13
Sep
-14
Sep
-15
Sep
-16
Sep
-17
Sep
-18
Sep
-19
Australia Thermal Coal (USD/MT)
25
45
65
85
105
125
145
Sep
-09
Sep
-10
Sep
-11
Sep
-12
Sep
-13
Sep
-14
Sep
-15
Sep
-16
Sep
-17
Sep
-18
Sep
-19
Brent Crude (USD per Barrel)
1.5
2.5
3.5
4.5
5.5
6.5
Sep
-09
Sep
-10
Sep
-11
Sep
-12
Sep
-13
Sep
-14
Sep
-15
Sep
-16
Sep
-17
Sep
-18
Sep
-19
Natural Gas (USD/MMBtu)
Energy
Precious Metal
800
1000
1200
1400
1600
1800
2000
Sep
-09
Sep
-10
Sep
-11
Sep
-12
Sep
-13
Sep
-14
Sep
-15
Sep
-16
Sep
-17
Sep
-18
Sep
-19
Gold USD per Oz
13000
18000
23000
28000
33000
38000
43000
Sep
-09
Sep
-10
Sep
-11
Sep
-12
Sep
-13
Sep
-14
Sep
-15
Sep
-16
Sep
-17
Sep
-18
Sep
-19
Gold Rs. per 10g
19000
29000
39000
49000
59000
69000
79000
Sep
-09
Sep
-10
Sep
-11
Sep
-12
Sep
-13
Sep
-14
Sep
-15
Sep
-16
Sep
-17
Sep
-18
Sep
-19
MCX Silver (Rs./Kg.)
-15 -10 -5 0 5 10 15 20 25 30 35
22
24
26
28
30
32
34
Jul-
17
Sep
-17
Nov
-17
Jan-
18
Mar
-18
May
-18
Jul-
18
Sep
-18
Nov
-18
Jan-
19
Mar
-19
May
-19
Jul-
19
Amount (USD Bn) % Change (RHS)
India’s Export in $ terms
-15 -10 -5 0 5 10 15 20 25 30 35
30 32 34 36 38 40 42 44 46 48
Jul-
17
Sep
-17
Nov
-17
Jan-
18
Mar
-18
May
-18
Jul-
18
Sep
-18
Nov
-18
Jan-
19
Mar
-19
May
-19
Jul-
19
Amount (USD Bn) % Change (RHS)
India’s Import in $ terms
-20
-18
-16
-14
-12
-10
-8
Jul-1
7
Sep-
17
Nov
-17
Jan-
18
Mar
-18
May
-18
Jul-1
8
Sep-
18
Nov
-18
Jan-
19
Mar
-19
May
-19
Jul-1
9
India’s Trade Balance in $ terms (USD Bn.)
External Sector
290
310
330
350
370
390
410
430
450
Sep
-14
Jan-
15
May
-15
Sep
-15
Jan-
16
May
-16
Sep
-16
Jan-
17
May
-17
Sep
-17
Jan-
18
May
-18
Sep
-18
Jan-
19
May
-19
Sep
-19
Foreign Exchange Reserve (USD Billion)
15
17
19
21
23
25
120
220
320
420
520
620
2005
20
06
2007
20
08
2009
20
10
2011
20
12
2013
20
14
2015
20
16
2017
20
18
Gross Total Debt (USD Bn.) % of GDP (RHS)
India’s External Debt
0
2,000
4,000
6,000
8,000
10,000
12,000
14,000
Jul-
16
Oct
-16
Jan-
17
Apr
-17
Jul-
17
Oct
-17
Jan-
18
Apr
-18
Jul-
18
Oct
-18
Jan-
19
Apr
-19
Jul-
19
External Commercial Borrowings (USD Mn.)

52October 2019 INSIGHT
Economy chart bookFund Flow – FII DII and MF
-10,000 -5,000
0 5,000
10,000 15,000 20,000 25,000 30,000
Sep
-16
Dec
-16
Mar
-17
Jun-
17
Sep
-17
Dec
-17
Mar
-18
Jun-
18
Sep
-18
Dec
-18
Mar
-19
Jun-
19
Sep
-19
**23-Sep-2019
Mutual Fund Equity Investments (Rs. Cr.)
-30,000
-20,000
-10,000
0
10,000
20,000
30,000
Sep
-16
Dec
-16
Mar
-17
Jun-
17
Sep
-17
Dec
-17
Mar
-18
Jun-
18
Sep
-18
Dec
-18
Mar
-19
Jun-
19
Sep
-19
**23-Sep-2019
FII Debt Investments (Rs. Cr.)
3500
4500
5500
6500
7500
8500
9500
Aug
-17
Oct
-17
Dec
-17
Feb-
18
Apr
-18
Jun-
18
Aug
-18
Oct
-18
Dec
-18
Feb-
19
Apr
-19
Jun-
19
Aug
-19
SIP (Rs. Crore)
-40,000 -30,000 -20,000 -10,000
0 10,000 20,000 30,000 40,000
Sep
-16
Dec
-16
Mar
-17
Jun-
17
Sep
-17
Dec
-17
Mar
-18
Jun-
18
Sep
-18
Dec
-18
Mar
-19
Jun-
19
Sep
-19
**23-Sep-2019
FII Equity Investments (Rs. Cr.)
-40,000 -30,000 -20,000 -10,000
0 10,000 20,000 30,000 40,000
Sep
-18
Oct
-18
Nov
-18
Dec
-18
Jan-
19
Feb-
19
Mar
-19
Apr
-19
May
-19
Jun-
19
Jul-
19
Aug
-19
Sep
-19
DII Investments Equity FII Investments Equity **23-Sep-2019
FII DII Equity Investments (Rs. Cr.)
-20,000 -10,000
0 10,000 20,000 30,000 40,000 50,000 60,000 70,000 80,000
Sep
-16
Dec
-16
Mar
-17
Jun-
17
Sep
-17
Dec
-17
Mar
-18
Jun-
18
Sep
-18
Dec
-18
Mar
-19
Jun-
19
Sep
-19
**23-Sep-2019
Mutual Fund Debt Investments (Rs. Cr.)
-20,000 -15,000 -10,000
-5,000 0
5,000 10,000 15,000 20,000 25,000 30,000
Sep
-16
Dec
-16
Mar
-17
Jun-
17
Sep
-17
Dec
-17
Mar
-18
Jun-
18
Sep
-18
Dec
-18
Mar
-19
Jun-
19
Sep
-19
**23-Sep-2019
DII Equity Investments (Rs. Cr.)
-40,000 -30,000 -20,000 -10,000
0 10,000 20,000 30,000 40,000
Sep
-18
Oct
-18
Nov
-18
Dec
-18
Jan-
19
Feb-
19
Mar
-19
Apr
-19
May
-19
Jun-
19
Jul-
19
Aug
-19
Sep
-19
FII Investments Equity MF Investments Equity **23-Sep-2019
FII MF Equity Investments (Rs. Cr.)
16
18
20
22
24
26
28
Aug
-17
Oct
-17
Dec
-17
Feb-
18
Apr
-18
Jun-
18
Aug
-18
Oct
-18
Dec
-18
Feb-
19
Apr
-19
Jun-
19
Aug
-19
AUM (Rs. Trillion)
0
50
100
150
FY13
FY14
FY15
FY16
FY17
FY18
FY19
NSDL CDSL Mutual Fund
Demat a/c & Mutual Fund folios (In Mn)
3.0
4.0
5.0
6.0
7.0
8.0
9.0
Jun-
15
Dec
-15
Jun-
16
Dec
-16
Jun-
17
Dec
-17
Jun-
18
Dec
-18
Jun-
19
No. of MF Folios (in Cr.)
30%
35%
40%
45%
50%
55%
3000
5000
7000
9000
11000
13000
Jun-
16
Sep
-16
Dec
-16
Mar
-17
Jun-
17
Sep
-17
Dec
-17
Mar
-18
Jun-
18
Sep
-18
Dec
-18
Mar
-19
Jun-
19
Equity AUM (Rs. Bn.) % of Total AUM
Equity AUM

53 October 2019INSIGHT
Economy chart bookGDP
4
5
6
7
8
9
10
Q1 Q3 Q1 Q3 Q1 Q3 Q1 Q3 Q1 Q3 Q1
FY15 FY16 FY17 FY18 FY19 FY20
Quarterly Real GDP (%)
7
8
9
10
11
12
13
14
15
Q1 Q3 Q1 Q3 Q1 Q3 Q1 Q3 Q1 Q3 Q1
FY15 FY16 FY17 FY18 FY20 FY19
Quarterly Nominal GDP (%)
27.0
27.5
28.0
28.5
29.0
29.5
30.0
30.5
Q1 Q2 Q3 Q4 Q1 Q2 Q3 Q4 Q1 Q2 Q3 Q4 Q1 Q2 Q3 Q4 Q1
FY16 FY17 FY18 FY19 FY20
GFCF % of GDPmp
320 340 360 380 400 420 440 460 480
13000
14000
15000
16000
17000
18000
2011
-12
2012
-13
2013
-14
2014
-15
2015
-16
2016
-17
2017
-18
Physical assets Gold & Silver
Physical Savings (Rs. Bn.)
0 5000
10000 15000 20000 25000 30000 35000
2011
-12
2012
-13
2013
-14
2014
-15
2015
-16
2016
-17
2017
-18
Financial Savings Physical Savings
Household Sector Savings (Rs. Bn.)
0%
20%
40%
60%
80%
100%
2011
-12
2012
-13
2013
-14
2014
-15
2015
-16
2016
-17
2017
-18
Financial Savings Physical Savings
% of Household Sector Savings
0
20000
40000
60000
2011
-12
2012
-13
2013
-14
2014
-15
2015
-16
2016
-17
2017
-18
Public Sector Private Corporate Sector
Household Sector
Gross Domestic Savings (Rs. Bn.)
0%
50%
100%
2011
-12
2012
-13
2013
-14
2014
-15
2015
-16
2016
-17
2017
-18
Public Sector Private Corporate Sector Household Sector
% of Gross Domestic Savings
28% 29% 30% 31% 32% 33% 34% 35% 36% 37%
2011
-12
2012
-13
2013
-14
2014
-15
2015
-16
2016
-17
2017
-18
Gross Domestic Savings as % of GDP
Sector-Wise Domestic Savings
0
2
4
6
8
10
12
2000
-01
2001
-02
2002
-03
2003
-04
2004
-05
2005
-06
2006
-07
2007
-08
2008
-09
2009
-10
2010
-11
2011
-12
2012
-13
2013
-14
2014
-15
2015
-16
2016
-17
2017
-18
2018
-19
Central Govt. State Govt. Combined
Gross Fiscal Deficit (As % to GDP) (%)
-2 -1 0 1 2 3 4 5 6 7 8
2000
-01
2001
-02
2002
-03
2003
-04
2004
-05
2005
-06
2006
-07
2007
-08
2008
-09
2009
-10
2010
-11
2011
-12
2012
-13
2013
-14
2014
-15
2015
-16
2016
-17
2017
-18
2018
-19
Gross primary deficit Revenue deficit
Combined Deficits Of Central and State Governments (%)
0.0
0.5
1.0
1.5
2.0
2.5
3.0
1989
-90
1991
-92
1993
-94
1995
-96
1997
-98
1999
-00
2001
-02
2003
-04
2005
-06
2007
-08
2009
-10
2011
-12
2013
-14
2015
-16
2017
-18
2019
-20B
E
Subsidies - as % of GDP
Public Finance Indicators

54October 2019 INSIGHT
Economy chart book
-6%
-4%
-2%
0%
2%
4%
6%
630
650
670
690
710
730
750
Jul-
17
Sep
-17
Nov
-17
Jan-
18
Mar
-18
May
-18
Jul-
18
Sep
-18
Nov
-18
Jan-
19
Mar
-19
May
-19
Jul-
19
Number (Mn) Growth (%) (RHS)
Indian Rail Passengers
-10% -5% 0% 5% 10% 15% 20% 25% 30%
20
22
24
26
28
30
32
Jul-
17
Sep
-17
Nov
-17
Jan-
18
Mar
-18
May
-18
Jul-
18
Sep
-18
Nov
-18
Jan-
19
Mar
-19
May
-19
Jul-
19
Passengers (in Mn) Growth (%) (RHS)
Passenger Handled at Airport
-10%
0%
10%
20%
30%
40%
50%
60%
7000
9000
11000
13000
15000
17000
19000
21000
Jul-
17
Sep
-17
Nov
-17
Jan-
18
Mar
-18
May
-18
Jul-
18
Sep
-18
Nov
-18
Jan-
19
Mar
-19
May
-19
Jul-
19
Earnings (Rs. Cr.) Growth (%) (RHS)
Indian Rail Freight Earnings
-10%
-5%
0%
5%
10%
15%
20%
25%
2,20,000
2,40,000
2,60,000
2,80,000
3,00,000
3,20,000
3,40,000
Jul-
17
Oct
-17
Jan-
18
Apr
-18
Jul-
18
Oct
-18
Jan-
19
Apr
-19
Jul-
19
Freight (in tonnes) Growth (%) (RHS)
Cargo Handled at Airport
0%
2%
4%
6%
8%
10%
12%
90
95
100
105
110
115
120
125
Jul-
17
Sep
-17
Nov
-17
Jan-
18
Mar
-18
May
-18
Jul-
18
Sep
-18
Nov
-18
Jan-
19
Mar
-19
May
-19
Jul-
19
Tonnage (Mn Ton) Growth (%) (RHS)
Indian Rail Freight Traffic
-4% -2% 0% 2% 4% 6% 8% 10% 12% 14%
3600
3800
4000
4200
4400
4600
4800
5000
Jul-
17
Sep
-17
Nov
-17
Jan-
18
Mar
-18
May
-18
Jul-
18
Sep
-18
Nov
-18
Jan-
19
Mar
-19
May
-19
Jul-
19
Earnings (Rs. Cr.) Growth (%) (RHS)
Indian Rail Passengers Earnings
Services Trend
Auto Sales
10,00,000
11,00,000
12,00,000
13,00,000
14,00,000
15,00,000
16,00,000
17,00,000
18,00,000
Aug
-17
Nov
-17
Feb-
18
May
-18
Aug
-18
Nov
-18
Feb-
19
May
-19
Aug
-19
Two Wheelers
1,00,000
1,20,000
1,40,000
1,60,000
1,80,000
2,00,000
2,20,000
Aug
-17
Nov
-17
Feb-
18
May
-18
Aug
-18
Nov
-18
Feb-
19
May
-19
Aug
-19
Passenger Vehicles
70,000
90,000
1,10,000
1,30,000
1,50,000
1,70,000
1,90,000
2,10,000
Aug
-17
Nov
-17
Feb-
18
May
-18
Aug
-18
Nov
-18
Feb-
19
May
-19
Aug
-19
Commercial Vehicles
13,00,000
14,00,000
15,00,000
16,00,000
17,00,000
18,00,000
19,00,000
20,00,000
21,00,000
22,00,000
Aug-
17
Nov
-17
Feb-
18
May
-18
Aug-
18
Nov
-18
Feb-
19
May
-19
Aug-
19
Total Sales (Domestic + Exports)
10,00,000
11,00,000
12,00,000
13,00,000
14,00,000
15,00,000
16,00,000
17,00,000
18,00,000
19,00,000
Aug
-17
Nov
-17
Feb-
18
May
-18
Aug
-18
Nov
-18
Feb-
19
May
-19
Aug
-19
Domestic Sales
1,80,000
2,00,000
2,20,000
2,40,000
2,60,000
2,80,000
3,00,000
Aug
-17
Nov
-17
Feb-
18
May
-18
Aug
-18
Nov
-18
Feb-
19
May
-19
Aug
-19
Export Sales

55 October 2019INSIGHT
Economy chart bookValuations
10
15
20
25
30
35
200
250
300
350
400
450
Sep
-09
Sep
-10
Sep
-11
Sep
-12
Sep
-13
Sep
-14
Sep
-15
Sep
-16
Sep
-17
Sep
-18
Sep
-19
EPS (Rs.) PE Ratio (x) (RHS)
Nifty
10
15
20
25
30
35
700
900
1100
1300
1500
1700
Sep
-09
Sep
-10
Sep
-11
Sep
-12
Sep
-13
Sep
-14
Sep
-15
Sep
-16
Sep
-17
Sep
-18
Sep
-19
EPS (Rs.) PE Ratio (x) (RHS)
Sensex
20
25
30
35
40
260
270
280
290
300
310
320
Sep-
15
Jan-
16
May
-16
Sep-
16
Jan-
17
May
-17
Sep-
17
Jan-
18
May
-18
Sep-
18
Jan-
19
May
-19
Sep-
19
EPS (Rs.) PE Ratio (x) (RHS)
Nifty 500
0.4
0.5
0.5
0.6
0.6
0.7
0.7
0.8
0.8
0.9
Sep-
09
Sep-
10
Sep-
11
Sep-
12
Sep-
13
Sep-
14
Sep-
15
Sep-
16
Sep-
17
Sep-
18
Sep-
19
Earning Yield / Bond Yield
10
30
50
70
90
110
130
40
90
140
190
240
Sep
-15
Dec
-15
Mar
-16
Jun-
16
Sep
-16
Dec
-16
Mar
-17
Jun-
17
Sep
-17
Dec
-17
Mar
-18
Jun-
18
Sep
-18
Dec
-18
Mar
-19
Jun-
19
Sep
-19
EPS (Rs.) PE Ratio (x) (RHS)
Nifty Midcap 50
2.0
2.5
3.0
3.5
4.0
4.5
Au
g-0
9
Au
g-1
0
Au
g-1
1
Au
g-1
2
Au
g-1
3
Au
g-1
4
Au
g-1
5
Au
g-1
6
Au
g-1
7
Au
g-1
8
Au
g-1
9
Nifty PB Ratio (x)
400
500
600
700
800
900
1000
Apr
-18
Jun-
18
Aug
-18
Oct
-18
Dec
-18
Feb-
19
Apr
-19
Jun-
19
Aug
-19
China Iron Ore 62% Fe Fines (CNY/MT)
30
50
70
90
110
130
Sep-
14
Jan-
15
May
-15
Sep-
15
Jan-
16
May
-16
Sep-
16
Jan-
17
May
-17
Sep-
17
Jan-
18
May
-18
Sep-
18
Jan-
19
May
-19
Sep-
19
China Iron Ore Australian Fine (USD/dmt)
1500
2000
2500
3000
3500
4000
4500
5000
Sep
-14
Feb-
15
Jul-
15
Dec
-15
May
-16
Oct
-16
Mar
-17
Aug
-17
Jan-
18
Jun-
18
Nov
-18
Apr
-19
Sep
-19
China Domestic Hot Rolled Steel (CNY/MT)
Ferrous Metal
2000
2500
3000
3500
4000
4500
5000
5500
Sep-
14
Feb-
15
Jul-
15
Dec
-15
May
-16
Oct
-16
Mar
-17
Aug
-17
Jan-
18
Jun-
18
Nov
-18
Apr
-19
Sep-
19
China Domestic Cold Rolled Steel (CNY/MT)
800
1300
1800
2300
2800
3300
Sep
-14
Feb-
15
Jul-
15
Dec
-15
May
-16
Oct
-16
Mar
-17
Aug
-17
Jan-
18
Jun-
18
Nov
-18
Apr
-19
Sep
-19
China Heavy Steel Scrap (CNY/MT)
1500
2000
2500
3000
3500
4000
4500
5000
5500
Sep
-14
Feb-
15
Jul-
15
Dec
-15
May
-16
Oct
-16
Mar
-17
Aug
-17
Jan-
18
Jun-
18
Nov
-18
Apr
-19
Sep
-19
China Domestic Steel Rebar (CNY/MT)

56October 2019 INSIGHT
Economy chart book
500
700
900
1100
1300
1500
Sep
-14
Feb-
15
Jul-
15
Dec
-15
May
-16
Oct
-16
Mar
-17
Aug
-17
Jan-
18
Jun-
18
Nov
-18
Apr
-19
Sep
-19
Europe Ferro-manganese 75% (EUR/MT)
800
1000
1200
1400
1600
1800
Sep
-14
Feb-
15
Dec
-15
May
-16
Oct
-16
Mar
-17
Aug
-17
Jan-
18
Jun-
18
Nov
-18
Apr
-19
Sep
-19
Europe Ferro-silicon 75% (EUR/MT)
200 250 300 350 400 450 500 550 600 650
Sep
-14
Feb-
15
Dec
-15
May
-16
Oct
-16
Mar
-17
Aug
-17
Jan-
18
Jun-
18
Nov
-18
Apr
-19
Sep
-19
China Steel Wire Rod (USD/MT)
4000
4500
5000
5500
6000
6500
7000
7500
Sep
-14
Feb-
15
Jul-
15
Dec
-15
May
-16
Oct
-16
Mar
-17
Aug
-17
Jan-
18
Jun-
18
Nov
-18
Apr
-19
Sep
-19
LME Copper (USD/MT)
1000
1500
2000
2500
3000
3500
Sep
-14
Feb-
15
Jul-
15
Dec
-15
May
-16
Oct
-16
Mar
-17
Aug
-17
Jan-
18
Jun-
18
Nov
-18
Apr
-19
Sep
-19
China Domestic Pig Iron (CNY/MT)
30
50
70
90
110
130
150
Sep
-14
Feb-
15
Jul-
15
Dec
-15
May
-16
Oct
-16
Mar
-17
Aug
-17
Jan-
18
Jun-
18
Nov
-18
Apr
-19
Sep
-19
Iron Ore Lump 62% (USD/MT)
40
60
80
100
120
140
160
180
Sep
-14
Feb-
15
Jul-
15
Dec
-15
May
-16
Oct
-16
Mar
-17
Aug
-17
Jan-
18
Jun-
18
Nov
-18
Apr
-19
Sep
-19
Iron Ore Pellet 65% (USD/MT)
Non Ferrous Metal
1300
1800
2300
2800
3300
3800
Sep
-14
Jan-
15
May
-15
Sep
-15
Jan-
16
May
-16
Sep
-16
Jan-
17
May
-17
Sep
-17
Jan-
18
May
-18
Sep
-18
Jan-
19
May
-19
Sep
-19
LME Zinc (USD/MT)
7000
9000
11000
13000
15000
17000
19000
21000
Sep
-14
Jan-
15
May
-15
Sep
-15
Jan-
16
May
-16
Sep
-16
Jan-
17
May
-17
Sep
-17
Jan-
18
May
-18
Sep
-18
Jan-
19
May
-19
Sep
-19
LME Nickel (USD/MT)
90
110
130
150
170
190
210
230
250
Sep
-14
Feb-
15
Jul-
15
Dec
-15
May
-16
Oct
-16
Mar
-17
Aug
-17
Jan-
18
Jun-
18
Nov
-18
Apr
-19
Sep
-19
MCX Zinc (Rs./Kg.)
1500
1700
1900
2100
2300
2500
2700
2900
Sep
-14
Feb-
15
Jul-
15
Dec
-15
May
-16
Oct
-16
Mar
-17
Aug
-17
Jan-
18
Jun-
18
Nov
-18
Apr
-19
Sep
-19
LME Lead (USD/MT)
100
110
120
130
140
150
160
170
180
Sep
-14
Feb-
15
Jul-
15
Dec
-15
May
-16
Oct
-16
Mar
-17
Aug
-17
Jan-
18
Jun-
18
Nov
-18
Apr
-19
Sep
-19
MCX Lead (Rs./Kg.)
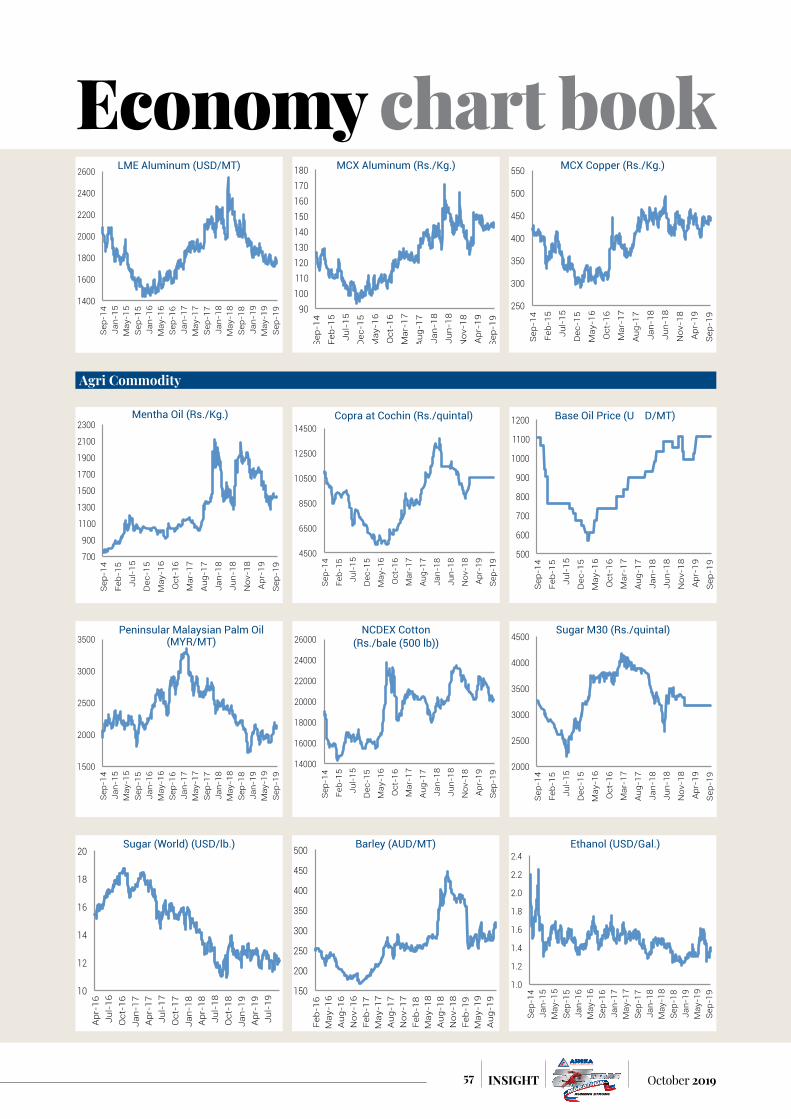
57 October 2019INSIGHT
Economy chart book
250
300
350
400
450
500
550
Sep
-14
Feb-
15
Jul-
15
Dec
-15
May
-16
Oct
-16
Mar
-17
Aug
-17
Jan-
18
Jun-
18
Nov
-18
Apr
-19
Sep
-19
MCX Copper (Rs./Kg.)
700
900
1100
1300
1500
1700
1900
2100
2300
Sep
-14
Feb-
15
Jul-
15
Dec
-15
May
-16
Oct
-16
Mar
-17
Aug
-17
Jan-
18
Jun-
18
Nov
-18
Apr
-19
Sep
-19
Mentha Oil (Rs./Kg.)
1400
1600
1800
2000
2200
2400
2600
Sep
-14
Jan-
15
May
-15
Sep
-15
Jan-
16
May
-16
Sep
-16
Jan-
17
May
-17
Sep
-17
Jan-
18
May
-18
Sep
-18
Jan-
19
May
-19
Sep
-19
LME Aluminum (USD/MT)
90 100 110 120 130 140 150 160 170 180
Sep
-14
Feb-
15
Jul-
15
Dec
-15
May
-16
Oct
-16
Mar
-17
Aug
-17
Jan-
18
Jun-
18
Nov
-18
Apr
-19
Sep
-19
MCX Aluminum (Rs./Kg.)
4500
6500
8500
10500
12500
14500
Sep-
14
Feb-
15
Jul-
15
Dec
-15
May
-16
Oct
-16
Mar
-17
Aug
-17
Jan-
18
Jun-
18
Nov
-18
Apr
-19
Sep-
19
Copra at Cochin (Rs./quintal)
500
600
700
800
900
1000
1100
1200
Sep
-14
Feb-
15
Jul-
15
Dec
-15
May
-16
Oct
-16
Mar
-17
Aug
-17
Jan-
18
Jun-
18
Nov
-18
Apr
-19
Sep
-19
Base Oil Price (USD/MT)
Agri Commodity
14000
16000
18000
20000
22000
24000
26000
Sep
-14
Feb-
15
Jul-
15
Dec
-15
May
-16
Oct
-16
Mar
-17
Aug
-17
Jan-
18
Jun-
18
Nov
-18
Apr
-19
Sep
-19
NCDEX Cotton (Rs./bale (500 lb))
2000
2500
3000
3500
4000
4500
Sep
-14
Feb-
15
Jul-
15
Dec
-15
May
-16
Oct
-16
Mar
-17
Aug
-17
Jan-
18
Jun-
18
Nov
-18
Apr
-19
Sep
-19
Sugar M30 (Rs./quintal)
1500
2000
2500
3000
3500
Sep
-14
Jan-
15
May
-15
Sep
-15
Jan-
16
May
-16
Sep
-16
Jan-
17
May
-17
Sep
-17
Jan-
18
May
-18
Sep
-18
Jan-
19
May
-19
Sep
-19
Peninsular Malaysian Palm Oil (MYR/MT)
10
12
14
16
18
20
Apr
-16
Jul-
16
Oct
-16
Jan-
17
Apr
-17
Jul-
17
Oct
-17
Jan-
18
Apr
-18
Jul-
18
Oct
-18
Jan-
19
Apr
-19
Jul-
19
Sugar (World) (USD/lb.)
150
200
250
300
350
400
450
500
Feb-
16
May
-16
Aug
-16
Nov
-16
Feb-
17
May
-17
Aug
-17
Nov
-17
Feb-
18
May
-18
Aug
-18
Nov
-18
Feb-
19
May
-19
Aug
-19
Barley (AUD/MT)
1.0
1.2
1.4
1.6
1.8
2.0
2.2
2.4
Sep-
14
Jan-
15
May
-15
Sep-
15
Jan-
16
May
-16
Sep-
16
Jan-
17
May
-17
Sep-
17
Jan-
18
May
-18
Sep-
18
Jan-
19
May
-19
Sep-
19
Ethanol (USD/Gal.)
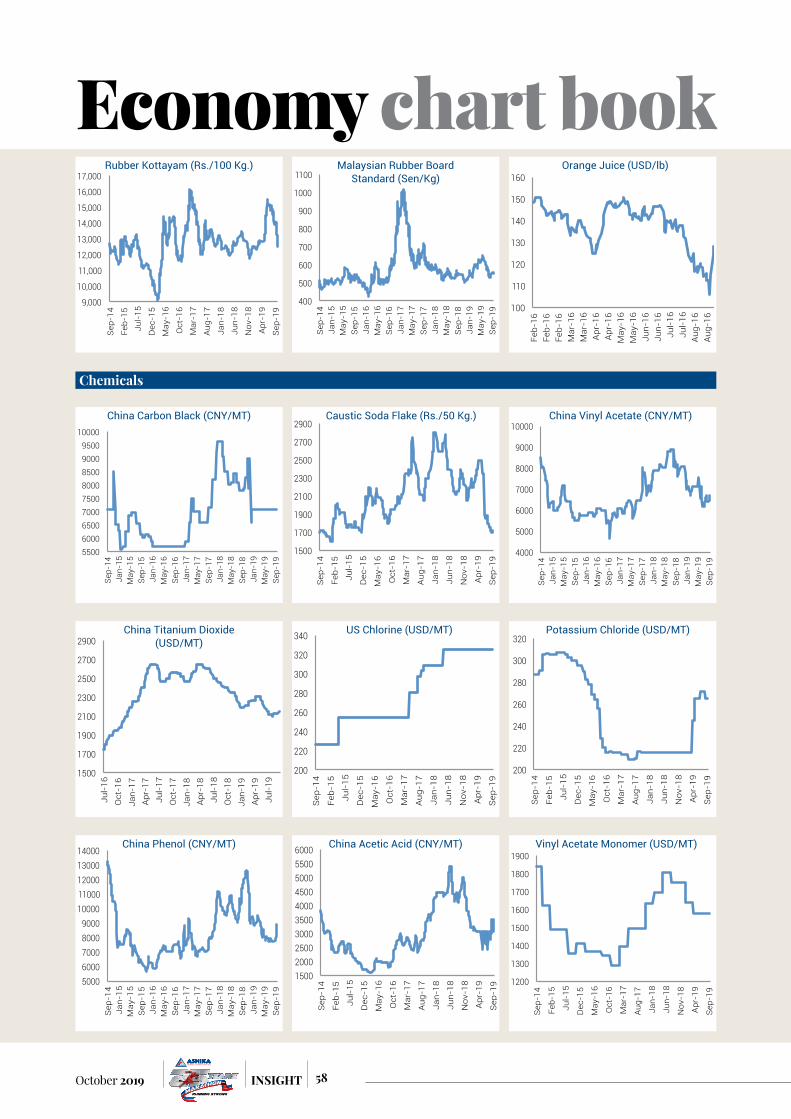
58October 2019 INSIGHT
Economy chart book
9,000
10,000
11,000
12,000
13,000
14,000
15,000
16,000
17,000
Sep-
14
Feb-
15
Jul-
15
Dec
-15
May
-16
Oct
-16
Mar
-17
Aug
-17
Jan-
18
Jun-
18
Nov
-18
Apr
-19
Sep-
19
Rubber Kottayam (Rs./100 Kg.)
400
500
600
700
800
900
1000
1100
Sep
-14
Jan-
15
May
-15
Sep
-15
Jan-
16
May
-16
Sep
-16
Jan-
17
May
-17
Sep
-17
Jan-
18
May
-18
Sep
-18
Jan-
19
May
-19
Sep
-19
Malaysian Rubber Board Standard (Sen/Kg)
5500 6000 6500 7000 7500 8000 8500 9000 9500
10000
Sep-
14
Jan-
15
May
-15
Sep-
15
Jan-
16
May
-16
Sep-
16
Jan-
17
May
-17
Sep-
17
Jan-
18
May
-18
Sep-
18
Jan-
19
May
-19
Sep-
19
China Carbon Black (CNY/MT)
1500
1700
1900
2100
2300
2500
2700
2900
Sep
-14
Feb-
15
Jul-
15
Dec
-15
May
-16
Oct
-16
Mar
-17
Aug
-17
Jan-
18
Jun-
18
Nov
-18
Apr
-19
Sep
-19
Caustic Soda Flake (Rs./50 Kg.)
100
110
120
130
140
150
160
Feb-
16
Feb-
16
Feb-
16
Mar
-16
Mar
-16
Apr-
16
Apr-
16
May
-16
May
-16
Jun-
16
Jun-
16
Jul-
16
Jul-
16
Aug-
16
Aug-
16
Orange Juice (USD/lb)
Chemicals
4000
5000
6000
7000
8000
9000
10000
Sep-
14
Jan-
15
May
-15
Sep-
15
Jan-
16
May
-16
Sep-
16
Jan-
17
May
-17
Sep-
17
Jan-
18
May
-18
Sep-
18
Jan-
19
May
-19
Sep-
19
China Vinyl Acetate (CNY/MT)
1500
1700
1900
2100
2300
2500
2700
2900
Jul-
16
Oct
-16
Jan-
17
Apr
-17
Jul-
17
Oct
-17
Jan-
18
Apr
-18
Jul-
18
Oct
-18
Jan-
19
Apr
-19
Jul-
19
China Titanium Dioxide (USD/MT)
200
220
240
260
280
300
320
340
Sep
-14
Feb-
15
Jul-
15
Dec
-15
May
-16
Oct
-16
Mar
-17
Aug
-17
Jan-
18
Jun-
18
Nov
-18
Apr
-19
Sep
-19
US Chlorine (USD/MT)
200
220
240
260
280
300
320
Sep
-14
Feb-
15
Jul-
15
Dec
-15
May
-16
Oct
-16
Mar
-17
Aug
-17
Jan-
18
Jun-
18
Nov
-18
Apr
-19
Sep
-19
Potassium Chloride (USD/MT)
5000 6000 7000 8000 9000
10000 11000 12000 13000 14000
Sep
-14
Jan-
15
May
-15
Sep
-15
Jan-
16
May
-16
Sep
-16
Jan-
17
May
-17
Sep
-17
Jan-
18
May
-18
Sep
-18
Jan-
19
May
-19
Sep
-19
China Phenol (CNY/MT)
1500 2000 2500 3000 3500 4000 4500 5000 5500 6000
Sep
-14
Feb-
15
Jul-
15
Dec
-15
May
-16
Oct
-16
Mar
-17
Aug
-17
Jan-
18
Jun-
18
Nov
-18
Apr
-19
Sep
-19
China Acetic Acid (CNY/MT)
1200
1300
1400
1500
1600
1700
1800
1900
Sep-
14
Feb-
15
Jul-
15
Dec
-15
May
-16
Oct
-16
Mar
-17
Aug-
17
Jan-
18
Jun-
18
Nov
-18
Apr-
19
Sep-
19
Vinyl Acetate Monomer (USD/MT)
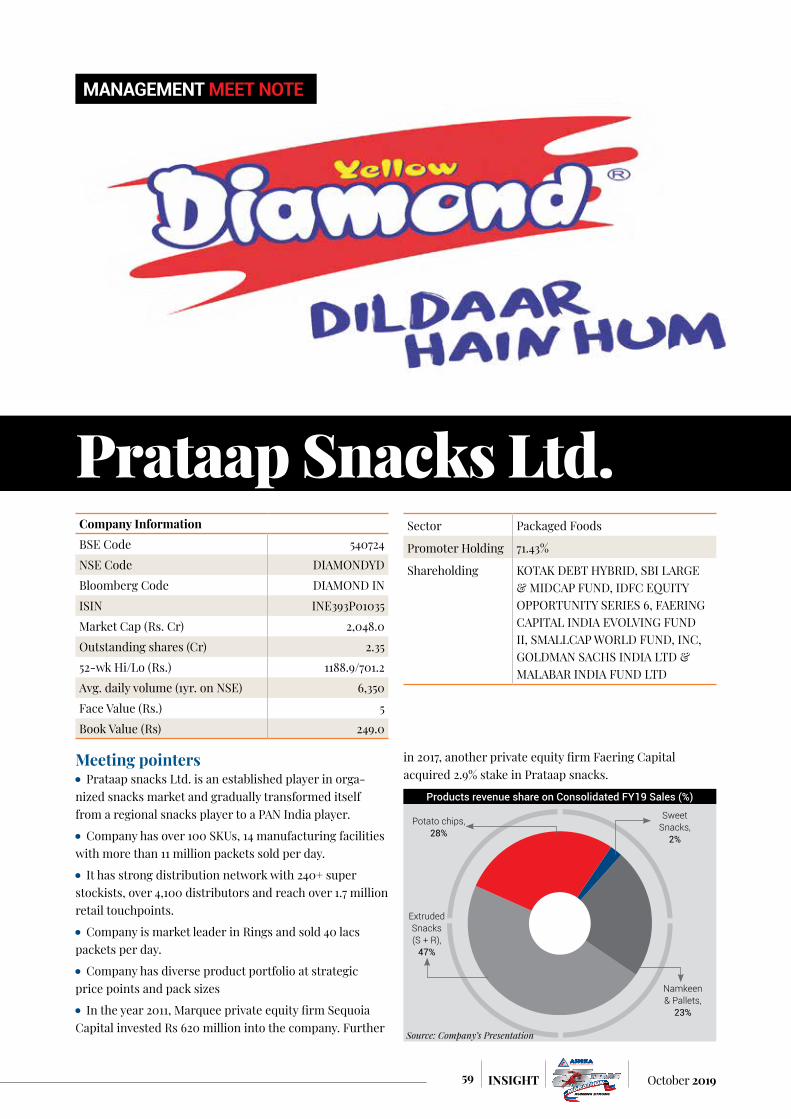
59 October 2019INSIGHT
Prataap Snacks Ltd.
MANAGEMENT MEET NOTE
Sector Packaged Foods
Promoter Holding 71.43%
Shareholding KOTAK DEBT HYBRID, SBI LARGE & MIDCAP FUND, IDFC EQUITY OPPORTUNITY SERIES 6, FAERING CAPITAL INDIA EVOLVING FUND II, SMALLCAP WORLD FUND, INC, GOLDMAN SACHS INDIA LTD & MALABAR INDIA FUND LTD
Company InformationBSE Code 540724NSE Code DIAMONDYDBloomberg Code DIAMOND INISIN INE393P01035Market Cap (Rs. Cr) 2,048.0 Outstanding shares (Cr) 2.35 52-wk Hi/Lo (Rs.) 1188.9/701.2Avg. daily volume (1yr. on NSE) 6,350 Face Value (Rs.) 5Book Value (Rs) 249.0
Meeting pointers Prataap snacks Ltd. is an established player in orga-
nized snacks market and gradually transformed itself from a regional snacks player to a PAN India player.
Company has over 100 SKUs, 14 manufacturing facilities with more than 11 million packets sold per day.
It has strong distribution network with 240+ super stockists, over 4,100 distributors and reach over 1.7 million retail touchpoints.
Company is market leader in Rings and sold 40 lacs packets per day.
Company has diverse product portfolio at strategic price points and pack sizes
In the year 2011, Marquee private equity firm Sequoia Capital invested Rs 620 million into the company. Further
in 2017, another private equity firm Faering Capital acquired 2.9% stake in Prataap snacks.
Products revenue share on Consolidated FY19 Sales (%)
Potato chips, 28%
Sweet Snacks,
2%
Namkeen & Pallets,
23%
Extruded Snacks (S + R),
47%
Source: Company’s Presentation

60October 2019 INSIGHT
Important Highlights Company’s manufacturing facilities are closer to the
market thus reduces channel and freight cost and makes the pricing of the product competitive in the market.
Region No. of States / UT
No. of Super Stockists
North 7 53East 12 39South 5 18West 5 135
Initially company has started operation from Indore and Guwahati but because of cost advantage and more specifically logistics cost in Salty Snacks, it has migrated to pan India with manufacturing facilities in 14 locations and also adopted third party manufacturing. Recently, company start focusing on Sweet Snacks and 3
months back company launched Cup Cake which is doing well. Management aim to further strengthen their sweet snacks line by launching layered cake this year. Currently sweet snacks line contributes to 2% of the business but the management estimates it to become 10% of the top-line in the next 3-5 years. Management expects sweet snacks category to become
profitable and decent size category. Sweet snacks orga-nized market is estimated at around Rs 2,000 crore to Rs 2,500 crore and Britannia is the leader in the space. Sweet snacks is highly under penetrated category and
growing at fast pace. There are very limited national players in sweet snacks segment as there is entry barrier because of the requirement of higher expertise. In FY15 & FY17, raw material cost went high (potato,
palm oil and packaging) impacting the profitability. Post that, management undergone through business process engineering in terms of procurement, stocking, creditor days. In FY19, despite of elevated raw material cost, com-pany was insulated because of these processes adopted earlier.
In FY19, net profitability got impacted because of Avadh acquisition and also due to other reasons.Ø Avadh acquisition resulted in higher DepreciationØ In order to take price advantage on Packaging mate-rial, company made the early payments to creditors and increase level of inventory, which resulted in higher working capital cycle and lower cash conversion ratio, which is a one-off case.Ø Net Profitability was impacted because of amortization
Working Capital Cycle
-45 -39 -42 -53 -38
9 9 6 8 10
52 48 46 48 53
16 18 10 3
25
FY 15 FY 16 FY 17 FY 18 FY 19
Payable days Receivable days
Inventories days Net days Source: Company’s Presentation
Cash Conversion Ratio332%
158% 152%
190%
24%
FY 15 FY 16 FY 17 FY 18 FY 19 Source: Company’s Presentation
POTATO CHIPS
Potato based snack
SKUs: 7 flavors
Target group: Youth & Children
CHULBULERice grit & Corn grit based snackSKUs: 8 flavoursTarget group: Youth & Children
RINGS, KURVES &
PUFFCorn grit based snackMarket leader in RingsSKUs: 8 flavoursTarget group: Children
NAMKEENGram basedSKUs: 22 varietiesTarget group: Children
PELLET SNACKS
Wheat basedSKUs: 4 flavoursTarget group: Children
YUM CAKE, CUP CAKE,
COOKIE CAKECake variations with Chocolate fillingsSKUs: 4 flavourTarget group: Children and Youth
NAMKEEN & FRYUMS
Namkeen and Fryums catering to local tastesSKUs: 55 varietiesTarget group: All
Source: Company’s Presentation
Diverse product portfolio
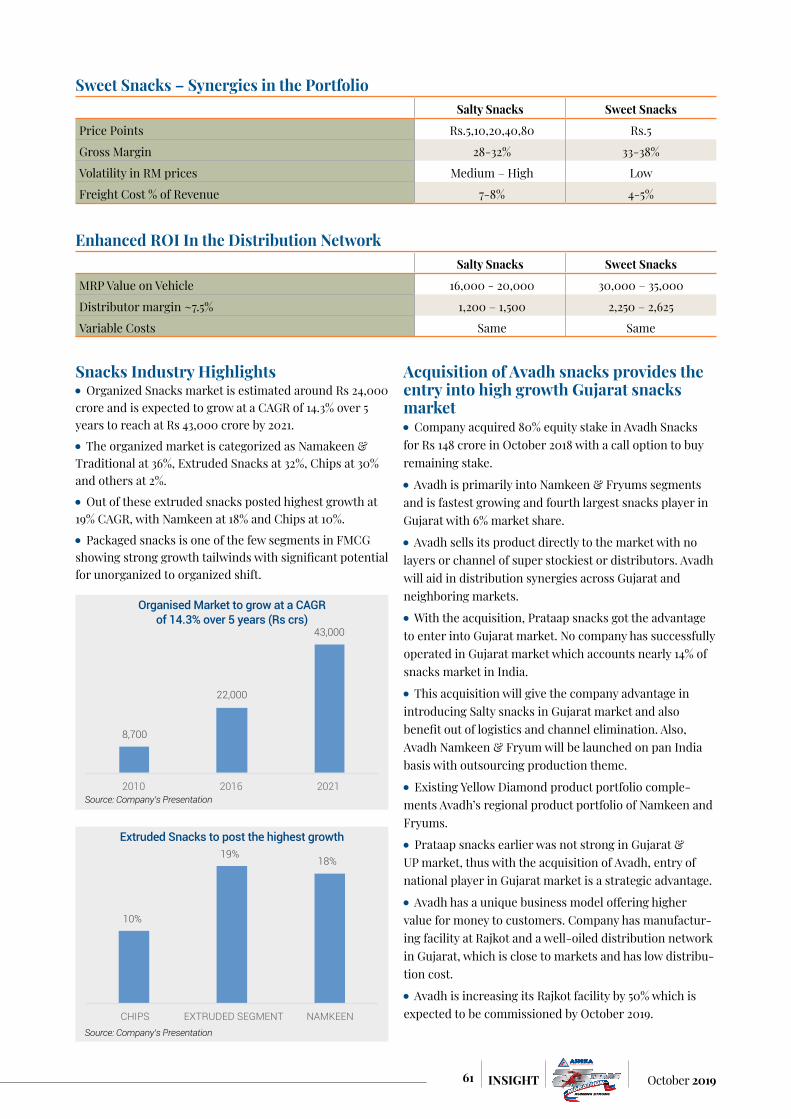
61 October 2019INSIGHT
Snacks Industry Highlights Organized Snacks market is estimated around Rs 24,000
crore and is expected to grow at a CAGR of 14.3% over 5 years to reach at Rs 43,000 crore by 2021.
The organized market is categorized as Namakeen & Traditional at 36%, Extruded Snacks at 32%, Chips at 30% and others at 2%.
Out of these extruded snacks posted highest growth at 19% CAGR, with Namkeen at 18% and Chips at 10%.
Packaged snacks is one of the few segments in FMCG showing strong growth tailwinds with significant potential for unorganized to organized shift.
Acquisition of Avadh snacks provides the entry into high growth Gujarat snacks market Company acquired 80% equity stake in Avadh Snacks
for Rs 148 crore in October 2018 with a call option to buy remaining stake.
Avadh is primarily into Namkeen & Fryums segments and is fastest growing and fourth largest snacks player in Gujarat with 6% market share.
Avadh sells its product directly to the market with no layers or channel of super stockiest or distributors. Avadh will aid in distribution synergies across Gujarat and neighboring markets.
With the acquisition, Prataap snacks got the advantage to enter into Gujarat market. No company has successfully operated in Gujarat market which accounts nearly 14% of snacks market in India.
This acquisition will give the company advantage in introducing Salty snacks in Gujarat market and also benefit out of logistics and channel elimination. Also, Avadh Namkeen & Fryum will be launched on pan India basis with outsourcing production theme.
Existing Yellow Diamond product portfolio comple-ments Avadh’s regional product portfolio of Namkeen and Fryums.
Prataap snacks earlier was not strong in Gujarat & UP market, thus with the acquisition of Avadh, entry of national player in Gujarat market is a strategic advantage.
Avadh has a unique business model offering higher value for money to customers. Company has manufactur-ing facility at Rajkot and a well-oiled distribution network in Gujarat, which is close to markets and has low distribu-tion cost.
Avadh is increasing its Rajkot facility by 50% which is expected to be commissioned by October 2019.
Sweet Snacks – Synergies in the PortfolioSalty Snacks Sweet Snacks
Price Points Rs.5,10,20,40,80 Rs.5
Gross Margin 28-32% 33-38%
Volatility in RM prices Medium – High Low
Freight Cost % of Revenue 7-8% 4-5%
Enhanced ROI In the Distribution NetworkSalty Snacks Sweet Snacks
MRP Value on Vehicle 16,000 - 20,000 30,000 – 35,000
Distributor margin ~7.5% 1,200 – 1,500 2,250 – 2,625
Variable Costs Same Same
Organised Market to grow at a CAGR of 14.3% over 5 years (Rs crs)
8,700
22,000
43,000
2010 2016 2021 Source: Company’s Presentation
Extruded Snacks to post the highest growth
10%
19% 18%
CHIPS EXTRUDED SEGMENT NAMKEEN Source: Company’s Presentation

62October 2019 INSIGHT
Avadh financials for FY19Sales Rs 152 Cr
EBIDTA Margin (%) 7%
PAT Margin (%) 4% to 5%*(Sales & Distribution cost & logistics cost low)
Creating Shareholders valueCreation of shareholders value will depend on 4 growth pillars1. Continued growth in Salty Snacks through following initiatives: Deeper penetration in existing markets & territories
Entering new markets and territories
Addressing white spaces in pan-India presence
Wider penetration of retail touch points
Addressing regional tastes and preference to enhance recall and repeat purchases
2. Growth in Avadh Portfolio Improving penetration and touch points in Gujarat and
in neighboring markets
Avadh plant capacity to be increased by 100% of which phase I of 50% capacity expansion to be completed by October 2019.
3. Synergy for Yellow Diamond & Avadh Avadh Snacks expertise in Gujarat enables Prataap
Snacks to accelerate growth and deepen its presence in Gujarat, where it is keen to build a strong presence.
Best-selling and popular Yellow Diamond products to leverage Avadh network to cover Gujarat market.
Product portfolio of both companies are complemen-tary, with a blend of regional and national flavors and variants across categories.
Combined offering reverberates strongly with custom-ers as well as trade partners.
Avadh’s extensive range of pellet-based snacks to leverage Yellow Diamond manufacturing and distribution infra and be introduced pan-India
4. Increase in products & Capacity for Sweet Snacks Sweet Snacks product range to be taken across entire
distribution network
Recently commissioned two additional lines for Cup Cakes and Layer Cakes
Cup Cakes launched in test markets have received positive feedback.
Will launch Tiffin Cakes and Layer Cakes in H2FY20
Increasing sweet snacks portfolio has significant advantage because of attractive gross margin profile, lower freight costs, less volatile raw material cost, product diversity and enhanced RoI to the distribution network.
Management Growth strategies Company claims that Rs 5 price point strategy to stay,
because in hinterland India still Rs 2 price point packets are relevant and sold, which will migrate to the above over the years.
Also Unorganized (50% of the market at present) to organized shift takes at the cheapest price point and hence widening of the market in Rs 5 price point.
Pratap Snacks is the largest snacks company in Rs 5 price point and is the leader. About 80% of the business comes at this price point for the company.
Company expects that ROCE in next 5 years to improve to 15% to 20%. It expects, pellets, namkeen and sweet snacks to grow faster.
Last year add spend was low in Rings and it did not do well, and hence recently strategy has been changed which is yielding results.
Last year reverse logistics also got affected because of economic slowdown and more specifically auto company sales slowing down.
In packaging, 100% is recycled and laminated will be used by year end.
Company also claims to bring down the logistics cost by number of km by being closer to market and 3P manufac-turing facility (3rd Party manufacturing facilities).
Levers for Margin ImprovementCompany expects the following levers of margin expan-sion by almost 300 bps in coming years to 9.5% to 10%.
Raw Material cost management which accounts 60% of sales
Long term contract on palm oil and packaging
Potato Storage facilities
Leveraging benefits of scale
Changing product mix
Rationalizing operation and distribution cost
Other cost management initiatives
Transforming into Asset light model (at present 76% owned & 24% 3P facilities). Some of the notable benefits of 3P facilities are lower capital cost, improved asset turn-over & efficiency, located close to key markets and lower transportation costs.

63 October 2019INSIGHT
Technical view Key takeaways from September 2019 Eight core sectors growth slows to 2.1% in July
Nikkei Manufacturing Purchasing Managers’ Index, declined to 51.4 in August from July’s 52.5
India’s August exports decline 6% to $26 bn; trade deficit narrows to $13.4 bn
IIP grew 4.3% in July from a downward-revised 1.2% a month ago
India’s retail inflation climbed up to a 10-month high of 3.21% in August
WPI inflation dips to 1.08% in August
GDP growth falls to 6-yr low in June quarter at 5%
Finance Minister proposed to slash corporate tax for domestic companies and new domestic manufacturing companies
US central bank lowered the target range for its key interest rates by 25 basis points to between 1.75% and 2%
ECB reduced the deposit rate to minus 0.5% from minus 0.4%, and said to buy debt from Nov. 1 at a pace of 20 billion euros a month
Indian equity market witnessed rebound past month after witnessing decline for three consecutive month in row. During the month Nifty logged the biggest one day gain in 10 years propelled by tax cut. Bulls took charge after the government slashed corporate tax rates for companies by almost 10% points to 25.17% to bring them at par with Asian rivals such as China and South Korea. FIIs may now have a good reason to come back and stimulate consump-tion and ignite capex cycle. On the global front extended Sino-US trade war, drone strike on a Saudi Arabian oil facility and deteriorating global economic health has been impacting the investors’ confidence.
Market Breadth AnalysisBenchmark Index witnessed rebound after three con-secutive month of decline. Nifty gained by 652 points or 5.95% to end the month at 11600.2. The market breadth, indicating the overall health of the market, was positive. Market turnover too were on a diminishing trend as is evident from the chart below. Turnover in the market has been consistently drying up for the past three consecu-tive month in a row, here in the month of September a

64October 2019 INSIGHT
turnaround can be seen where a sudden spike in volume is evident. A Broad based rally in the market was seen were advance outpaced the decline by a huge margin.
No. of Stocks above 50 & 200 dmaThe market breadth has improved sharply where no. of stocks above the 200dma has increased and the same is noticed in 50dma as well in comparison to previous month which is a sign of strength in the short term as well as long term perspective.
FII actionsInvestments by domestic institutional investors failed to match up to disinvestments by foreign institutional inves-tors (FIIs). Recent data shows FII were net sellers with a net outflow of Rs.5507 Cr whereas the DIIs were net buyers to the tune of Rs.11477 Cr in the month of September 2019. Finance Minister Nirmala Sitharaman slashed tax rate for corporates by almost 10% points to 25.17% to bring them at par with Asian rivals such as China and South Korea. FIIs may now have a good reason to come back and stimulate consumption and ignite capex cycle.
Sectoral PerformanceAs the bumpy rise continues, Nifty and Sensex recovered and were up by 5.95% and 5.45% respectively. The Smallcap and Midcap Indices too recovered and were up 11% and 10% respectively. Sectorally, Capital Goods Index gained the most with more than 17% gain followed by Consumer Durable with 15% gain and Bankex with 13.5% gain. While on the other hand IT index was down by 5% and Telecom, Energy and Healthcare underperformed the benchmark ending with a gain of 1%, 2% and 4% respectively.
Classical Technical analysisChannel formationSince Oct’15 onward Nifty has been trading amidst the rising channel formation, by joining the swing lows of 6825 (March 2016), 7893(Dec’16) and 10004(October’18). The
*As on 23rd Sept 2019
0.50 0.60 0.70 0.80 0.90 1.00 1.10 1.20 1.30 1.40
Oct-
18
Nov-
18
Dec-
18
Jan-
19
Feb-
19
Mar
-19
Apr-
19
May
-19
Jun-
19
Jul-1
9
Aug-
19
Sep-
19
10 Week average A/D Ratio
0 0.1 0.2 0.3 0.4 0.5 0.6 0.7 0.8 0.9
Dec-18
Jan-19
Feb-19
Mar-19
Apr-19
May-19
Jun-19
Jul-19
Aug-19
Milli
ons
BSE Cash NSE Cash Total *As on 23rd Sept 2019
NSE BSE Turnover
*As on 23rd Sept 2019
0
50
100
150
200
250
300
Jan-19
Feb-19
Mar-19
Apr-19
May-19
Jun-19
Jul-19
Aug-19
Sep-19
NIFTY100 NIFTY200 NIFTY500
No. of Stocks above 200dma
0 50
100 150 200 250 300 350 400 450
Jan-19
Feb-19
Mar-19
Apr-19
May-19
Jun-19
Jul-19
Aug-19
Sep-19
NIFTY100 NIFTY200 NIFTY500 *As on 23rd Sept 2019
No. of Stocks above 50dma
-40000
-30000
-20000
-10000
0
10000
20000
30000
40000
Dec-
17
Feb-
18
Apr-
18
Jun-
18
Aug-
18
Oct-
18
Dec-
18
Feb-
19
Apr-
19
Jun-
19
Aug-
19
* as on 23.09.2019
FII
*As on 23rd Sept 2019
-10.00%
-5.00%
0.00%
5.00%
10.00%
15.00%
20.00%
IT
Tele
com
En
ergy
H
ealth
care
In
fra
FMCG
M
idca
p PS
U Re
alty
M
etal
Au
to
Smal
lcap
Fi
nanc
e Oil
Bank
ex
Cons
umer
Dur
able
s Ca
pita
l Goo
ds
Sector & Industry

65 October 2019INSIGHT
elevated support level emanating from the trendline now stands around 11000. Presently it seems that 4th leg of the pattern is in the making which predicts upside target of 12500-12600 and maximum downside seems limited till the recent swing low of 10637.
Inverse Head & ShoulderNifty faced stiff resistance at higher levels for major part of the month but eventually was able to cross the all important resistance level of 11200 and in the process initiated breakout from of the neckline of the bullish Inverse Head and Shoulder formation. Nifty had been consolidating since past few trading days though market breadth remains slightly positive with relatively smaller candle which are the formal characteristics of a classical reversal pattern. According to the present chart structure there will be supports around 10,850 and 10,800 level, which is likely to act as a cushion on the lower side in case of any decline while the bullish structure projects an upside potential of 12000 (considering difference of the high and low of pattern from breakout level).
Oscillator StudyOn the oscillator front the daily RSI has shot up and is comfortably trading above the bullish zone of 60 in the daily time frame, in the weekly time frame though it has
turned positive with bullish crossover but continues to remain below the 50 level mark. A sustainable move above the 60 level mark in daily time frame will result in with a change in outlook from consolidation to positive and could target higher upper area of 70-75 level in the near term. This anticipated move would further fuel the market to head higher. The RSI is also moving with higher lows and higher high fashion in both the time frame further validating the strength in the market. Bullish outlook is visible through ADX as well, where +DI seems to have crossed the -DI from below though ADX line remain subdued at 26.
Moving AveragesThe recent spike in Index has pulled the benchmark Index to trade above all crucial short term and medium term averages and as averages define the trend in Technical parlance it can determined that the present trend in Nifty might have changed from sideways consolidation to positive. However interestingly the 50dma has crossed the 200sma last month. Such formation in technical parlance is termed as death cross which has a bearish implication. Important to note that the slope of the average which determines the intensity of the trend seems to connate a different picture altogether. The slope of 200dma has been gradually rising which might eventually result into form a
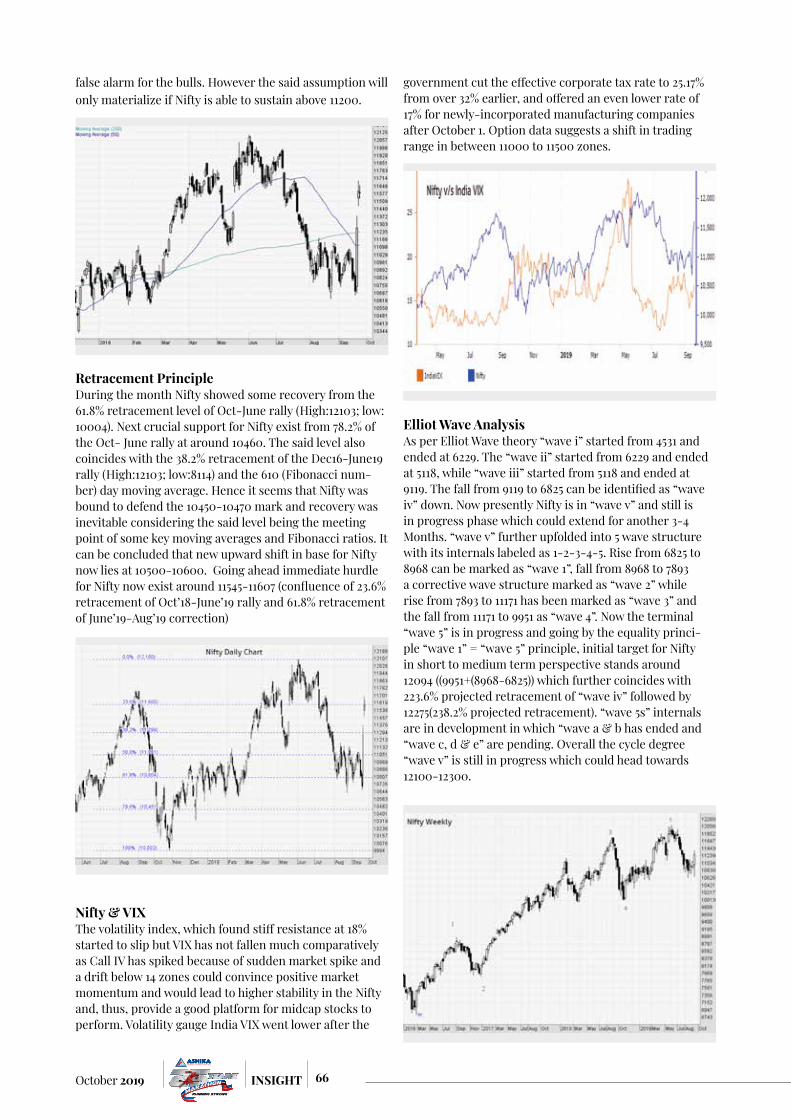
66October 2019 INSIGHT
false alarm for the bulls. However the said assumption will only materialize if Nifty is able to sustain above 11200.
Retracement PrincipleDuring the month Nifty showed some recovery from the 61.8% retracement level of Oct-June rally (High:12103; low: 10004). Next crucial support for Nifty exist from 78.2% of the Oct- June rally at around 10460. The said level also coincides with the 38.2% retracement of the Dec16-June19 rally (High:12103; low:8114) and the 610 (Fibonacci num-ber) day moving average. Hence it seems that Nifty was bound to defend the 10450-10470 mark and recovery was inevitable considering the said level being the meeting point of some key moving averages and Fibonacci ratios. It can be concluded that new upward shift in base for Nifty now lies at 10500-10600. Going ahead immediate hurdle for Nifty now exist around 11545-11607 (confluence of 23.6% retracement of Oct’18-June’19 rally and 61.8% retracement of June’19-Aug’19 correction)
Nifty & VIXThe volatility index, which found stiff resistance at 18% started to slip but VIX has not fallen much comparatively as Call IV has spiked because of sudden market spike and a drift below 14 zones could convince positive market momentum and would lead to higher stability in the Nifty and, thus, provide a good platform for midcap stocks to perform. Volatility gauge India VIX went lower after the
government cut the effective corporate tax rate to 25.17% from over 32% earlier, and offered an even lower rate of 17% for newly-incorporated manufacturing companies after October 1. Option data suggests a shift in trading range in between 11000 to 11500 zones.
Elliot Wave AnalysisAs per Elliot Wave theory “wave i” started from 4531 and ended at 6229. The “wave ii” started from 6229 and ended at 5118, while “wave iii” started from 5118 and ended at 9119. The fall from 9119 to 6825 can be identified as “wave iv” down. Now presently Nifty is in “wave v” and still is in progress phase which could extend for another 3-4 Months. “wave v” further upfolded into 5 wave structure with its internals labeled as 1-2-3-4-5. Rise from 6825 to 8968 can be marked as “wave 1”, fall from 8968 to 7893 a corrective wave structure marked as “wave 2” while rise from 7893 to 11171 has been marked as “wave 3” and the fall from 11171 to 9951 as “wave 4”. Now the terminal “wave 5” is in progress and going by the equality princi-ple “wave 1” = “wave 5” principle, initial target for Nifty in short to medium term perspective stands around 12094 ((9951+(8968-6825)) which further coincides with 223.6% projected retracement of “wave iv” followed by 12275(238.2% projected retracement). “wave 5s” internals are in development in which “wave a & b has ended and “wave c, d & e” are pending. Overall the cycle degree “wave v” is still in progress which could head towards 12100-12300.

67 October 2019INSIGHT
Another possibility being that if the recent high in Nifty 12103 if considered as the end of Impulse ‘wave 5’ and corrective decline is in progression. From 12103, a new falling leg has begun which could push the index down to quite an extent. Two possibilities can develop first, Nifty has completed “wave iv” at 11181 and are heading lower towards 10650 (wave i =wave v). Secondly, “wave iv” could form as a symmetrical triangle and trade amidst the nar-row range of 11181-10780 before turning negative. Hence as long as index stays below 11181, negative outlook towards 10650 followed by 10200 can be maintained. However, in the interim, counter trend bounces could occur.
Interesting Chart pattern to watch in Sectoral IndicesBank Nifty (61.8% retracement & trendline)In the daily chart the Index has taken support at 61.8% retracement level (High: 31783; Low: 23605) at 26600. Sus-taining above the said support level is crucial as sessions of consolidation will make the index healthy and might provide a fresh entry opportunity
Nifty IT (Trendline support)The Index has been on a continuous rising spree with consecutive higher high formation. The elevated support from the rising trendline since 2018 onward now exist at 15400-15450, sustaining above which would maintain a positive biasness in the Index.
Nifty Energy (Flag formation)Bearish Flag formation in the Index can be seen in daily time frame which is a continuation pattern, such patterns are formed when there is a sharp price movement fol-lowed by a sideways price movement. Break down below 13840 would confirm the said pattern and would initiate another sharp price movement lower.
Nifty Auto (Strong Support)Strong support from Feb’16 low of 6900 is expected to provide pause to the existing downtrend due to a concen-tration of demand. The said support level is strong enough to stop the Index from falling any further.

68October 2019 INSIGHT
Nifty Metal (Downward sloping Channel)The Index since had been trading amidst the downward sloping channel since Dec’17 onward i.e. moving between two parallel trendlines. The lower panel of the channel support exist at 2250-2260 sustaining above indicates of a further rally in the price.
Nifty Infra (rising trendline)The Index in daily timeframe signals a consolidation pattern in the last few weeks. The sector is on a crucial bottom reversal pattern since the rising trendline Feb’16 has an elevated support at 2900. The formation signals an emergence of buying interest from the lows.
Nifty FMCG (Positive divergence)The Index has been decreasing gradually however the same is not reflected through oscillators which has
witnessed consistent rise which signals of a potential reversal point. This bullish divergences can ignite short-term pullback.
Other correlated asset classesUnited States (Dow Jones Industrial Average)On the upside DJIA possess major challenge from the all time highs around 27400 and the ascending trendline marked by the highs from January 2018, October 2018 and July 2019 highs is likely to offer resistance. The elevated resistance exist around 27400-27500. If the said level materializes on technical parlance then upwards biasness could take a hold. The main trend is up according to the daily swing chart. However there is room for a 50% cor-rection till 26300 coinciding with the ascending trendline adjoining the low of Dec 2018 and August 2019. Tensions in the Middle East have been running high leading to end the DJIAs continuous winning streak. Saudi Arabia says Iran was “unquestionably” behind the strike on its oil facilities and President Trump said he’ll substantially increase sanctions on Iran. In the all important FOMC meet US Federal Reserve cut interest rates by a quarter of a percentage point for the second time this year but is divided on further action this year.
Gold (Comex)The commodity in technical parlance have been gaining negative traction and losing positive momentum for the last couple of days, supporting prospects for further depreciating move amid risk-on mood. Gold has now retreated back to challenge 100 day SMA which is acting as neck-line support of a bearish head & shoulders chart pattern formation. Hence decisive close below $1470 can drag Gold prices towards $1450 (38.2% retracement & previous swing high) followed by $1415 (50% retracement). It seems that buying the dip in gold could turn out to be the wise investment decision considering an unprece-dented $17 trillion in negative-yielding bonds worldwide to heightened geopolitical threats—that might boost investors’ appetite for the metal, which has a history of holding its value in times of crisis

69 October 2019INSIGHT
Crude Oil (Brent)Crude oil price had been struggling to clear $63.00, the prices did provided the necessary breakout with a breakaway gap and spiked to $71.95 after a strike on a Saudi Arabian oil facility removed about 5% of global supplies, an attack the US has blamed on Iran. However Crude oil prices soon sink as quick Saudi output recovery is expected. On the technical parlance along with the breakout RSI has rose sharply reflecting a fresh and strong uptrend momentum. On the flip-side, a break below $62.5 could drag the price towards the vicinity of $59-60.
USDINRDomestic currency reversed from 61.8% Fibonacci retracement of October 2018 to July 2019 rally. The currency now taking support from the 50-day SMA level of 70.70 and targeting towards 70.09, including 100-day SMA, during further declines. The structure is well supported by bearish signal from the 12-bar moving average con-vergence and divergence (MACD) indicator. Investors holding short positions can sit comfortably as long as the pair trades below the 71.5 zone. Indian Rupee witnessed
a roller coaster ride this month. Surge of oil prices due to drone attacks on Saudi’s oil facilities lifted the risk premium higher in the currency. Later Saudi’s efforts to deliver optimistic comments on restoration of oil supplies faded the geo-political risk sentiments. Rupee further caught the positive sentiment after RBI governor spoke about policy easing in the October policy. The US Federal Reserve cut interest rate by 25 basis points which seems to be factored in. The currency market will also take cues from developments from the US-China trade talks going forward.
Summing it UpNifty started the month on a negative note, extended its decline to move marginally below the key support level of 10740 as a bear trap. After completing its last leg of decline bulls came charging back with a record gain and ended the month with a handsome gain of 5.95%. The Index has been on a consolidation mode after a prolonged negative sentiment seems to have ended after the announcement of cut in corporate tax rate. With sizeable bull candle for the two consecutive day indicates of a continuation of positive momentum in the index and favors the bulls. Breakout of H&S pattern, close above 200 Day EMA and positively placed momentum indicators and oscillators all suggests the upmove could continue further, an upside breakout of the consolidation range signal of a sharp upside reversal in the market as per larger timeframe i.e. weekly. Hence here onward one can expect lower band of the bullish gap area of 11274 to act as important support and reverse its role going forward. There may be a throwback fall to 11200 – 11100 range which could be used as buying opportunity. Index below 10950 should be anchored as threat. While on the upside the negative gap recorded on July 8 (11798-11772) coinciding with the 78.2% retracement level would act as immediate resistance followed by major challenge from the all time highs of 12103.
62
64
66
68
70
72
74
76
Jan-
18
Mar
-18
May
-18
Jul-1
8
Sep-
18
Nov
-18
Jan-
19
Mar
-19
May
-19
Jul-1
9
Sep-
19
USD-INR
800
1000
1200
1400
1600
1800
2000
Sep-
09
Sep-
10
Sep-
11
Sep-
12
Sep-
13
Sep-
14
Sep-
15
Sep-
16
Sep-
17
Sep-
18
Sep-
19
Gold USD per Oz
50
55
60
65
70
75
80
Jan-
19
Jan-
19
Feb-
19
Mar
-19
Mar
-19
Apr-
19
May
-19
May
-19
Jun-
19
Jul-1
9
Jul-1
9
Aug-
19
Sep-
19
Brent Crude (USD per Barrel)

70October 2019 INSIGHT
Market diaryBEST PERFORMERS FOR THE MONTH (NIFTY 100)
Sl No.
Co. Name Cl. Price26.08.2019
Cl. Price24.09.2019
Cl. Price Var (%)
1 Bharat Petroleum Corporation Ltd.
335.4 461.3 37.5%
2 HDFC Asset Manage-ment Company Ltd.
2243.1 2930.0 30.6%
3 Page Industries Ltd. 18160.0 23359.0 28.6%4 Colgate-Palmolive
(India) Ltd.1201.4 1518.4 26.4%
5 Avenue Supermarts Ltd.
1531.1 1880.3 22.8%
6 Siemens Ltd. 1172.2 1435.3 22.4%7 Britannia Industries
Ltd.2533.9 3080.2 21.6%
8 Bajaj Finance Ltd. 3324.3 3961.8 19.2%9 Ashok Leyland Ltd. 63.2 75.2 19.0%10 Container Corporation
Of India Ltd.489.8 581.1 18.7%
11 Procter & Gamble Hygiene & Health Care Ltd.
9944.3 11790.7 18.6%
12 Eicher Motors Ltd. 15548.2 18434.3 18.6%13 Vedanta Ltd. 135.1 160.0 18.4%14 Tata Motors Ltd. 110.6 130.9 18.4%15 Motherson Sumi
Systems Ltd.97.8 115.6 18.1%
16 Titan Company Ltd. 1102.5 1292.7 17.3%17 Havells India Ltd. 652.8 757.0 16.0%18 Cadila Healthcare Ltd. 219.5 254.0 15.7%19 General Insurance
Corporation of India Ltd.
171.1 197.4 15.4%
20 Tata Motors - DVR Ordinary
52.2 59.9 14.8%
Source: NSE
WORST PERFORMERS FOR THE MONTH (NIFTY 100)Sl No.
Co. Name Cl. Price26.08.2019
Cl. Price24.09.2019
Cl. Price Var (%)
1 Zee Entertainment Enterprises Ltd.
364.9 279.0 -23.5%
2 Yes Bank Ltd. 62.9 56.1 -10.9%
3 Indiabulls Housing Finance Ltd.
487.8 435.0 -10.8%
4 Tata Consultancy Services Ltd.
2276.3 2044.7 -10.2%
5 Power Grid Corpora-tion Of India Ltd.
202.9 190.5 -6.1%
6 HCL Technologies Ltd. 1092.9 1047.4 -4.2%
7 NTPC Ltd. 120.1 115.2 -4.1%
8 SBI Life Insurance Company Ltd.
827.1 795.2 -3.9%
9 Cipla Ltd. 466.6 450.3 -3.5%
10 Wipro Ltd. 249.1 240.7 -3.4%
11 Bharti Airtel Ltd. 360.7 348.7 -3.3%
12 Oracle Financial Services Software Ltd.
3013.4 2939.8 -2.4%
13 Sun Pharmaceutical Industries Ltd.
419.4 409.7 -2.3%
14 The New India Assur-ance Co. Ltd.
108.2 106.0 -2.0%
15 Piramal Enterprises Ltd.
1881.4 1848.9 -1.7%
16 Lupin Ltd. 747.2 739.3 -1.1%
17 Infosys Ltd. 802.6 794.1 -1.1%
18 Housing Development Finance Corporation Ltd.
2148.4 2130.0 -0.9%
19 NHPC Ltd. 23.3 23.2 -0.4%
Indices Performance 26.08.2019 –24.09.2019Sector Indices - Monthly Return (%)
Source: BSE
-4.0
%
0.3%
3.6%
4.1%
5.3%
6.0%
6.6%
8.0%
8.0%
8.7%
10.2
%
10.3
%
10.5
%
11.8
%
-6.0% -4.0% -2.0% 0.0% 2.0% 4.0% 6.0% 8.0%
10.0% 12.0% 14.0%
IT
Telec
om
Heal
thca
re
Ener
gy
Infra
Real
ty
Fina
nce
Bank
ex
Mid
cap
FMCG
Auto
Met
al
Oil
Capi
talG
oods

71 October 2019INSIGHT
Commodity monthly round-upCOPPERThe price of copper dropped amid intensifying worries about China’s economic slowdown, especially in manufacturing, vital to overall demand for the red metal. Trade wor-ries have dogged copper price bulls for the better part of the year, but more recently weak data from China (and the US and Germany, the world’s top three consumers of industrial metals), has intensified the selloff. Chinese manufacturing data for August was nothing short of dismal with the National Bureau of Statistics outlining a 4.4% rise in factory output which was well below forecasts and the lowest reading since February 2002. The CEO of the world’s number
one producer of copper, Codelco, did not provide any solace to copper bulls, telling local media that prices will remain depressed through 2020, Reuters reports. Now the situation is more jolted after impeachment proposal brought up by House of Democrats against President Trump. The uncertain political scenario and chance of vacuum of US leadership may give more pain in the coming days.
From the supply side, as per the International Copper Study Group global refined copper market ended the first half of 2019 with a supply deficit of about 220,000 mt. Factoring in changes to unreported, bonded stocks in China, the deficit likely
totaled 190,000 mt, the Lisbon-based research group said. World mine production declined about 1.4% in H1 to nearly 9.92 million mt, with concentrate production declining 1% and solvent extraction-electro win-ning by 3.5%. Reduced output in two major producing countries, Chile and Indonesia, more than offset growth in other countries, ICSG analysts said.
Production in Chile, the world’s larg-est copper producer, declined 2.5% mainly because of lower copper head grades, while concentrate production in Indonesia dropped 55% as a result of the transition of two major mines to different ore zones.
“ The world is the great gymnasium where we come to make ourselves strong” - Swami Vivekananda
1st half 2019, Copper Demand Supply Data (Credit ICSG)World Refined Copper Usage and Supply TrendsThousand metric tonnes, copper
2016 2017 2018 Jan-Jun 20192018 2019 Mar Apr May Jun
World Mine Production 20,386 20,097 20,557 10,058 9,919 1,691 1,631 1,735 1,679World Mine Capacity 23,481 23,993 24,082 12,324 12,368 2,114 2,054 2,130 2,068Mine Capacity Utilization (%) 86.8 83.8 85.4 81.6 80.2 80.0 79.4 81.5 81.2Primary Refined Production 19,490 19,495 20,061 9,855 9,708 1,661 1,622 1,660 1,636Secondary Refined Production 3,866 4,053 4,043 2,016 2,032 346 334 344 333World Refined Production (Secondary+Primary) 23,357 23,548 24,104 11,871 11,740 2,007 1,957 2,004 1,969World Refinery Capacity 26,853 27,375 27,710 13,707 14,108 2,413 2,341 2,426 2,354Refineries Capacity Utilization (%) 87.0 86.0 87.0 86.6 83.2 83.2 83.6 82.6 83.7World Refined Usage 2/ 23,512 23,732 24,511 12,047 11,960 2,009 2,080 2,074 1,991World Refined Stocks End of Period 1,365 1,375 1,227 1,571 1,244 1,312 1,323 1,265 1,244Period Stock Change -140 10 -148 196 17 47 10 -58 -20Refined Balance 3/ -156 -183 -407 -177 -220 -3 -123 -70 -21Seasonally Adjusted Refined Balance4/ -95 -146 -21 -21 -23 11Refined Balance Adjusted forChinese bonded stock change 5/
-143 -181 -467 -174 -193 47 -118 -117 -89
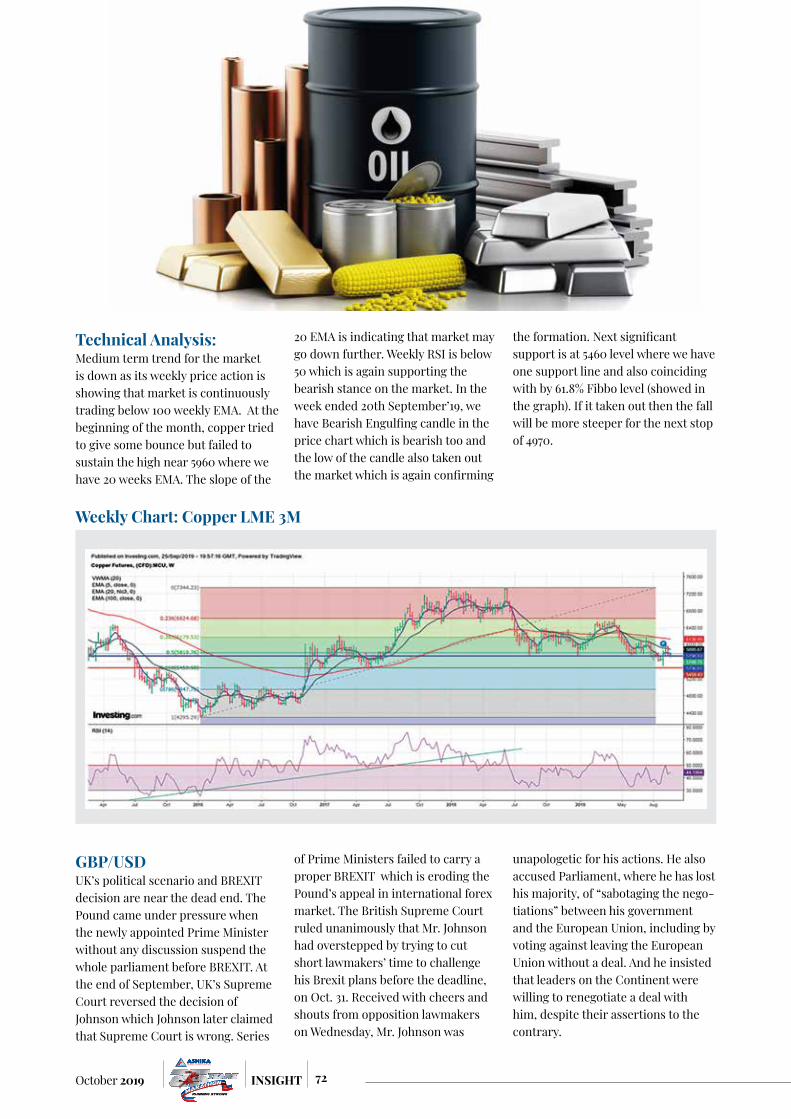
72October 2019 INSIGHT
GBP/USDUK’s political scenario and BREXIT decision are near the dead end. The Pound came under pressure when the newly appointed Prime Minister without any discussion suspend the whole parliament before BREXIT. At the end of September, UK’s Supreme Court reversed the decision of Johnson which Johnson later claimed that Supreme Court is wrong. Series
of Prime Ministers failed to carry a proper BREXIT which is eroding the Pound’s appeal in international forex market. The British Supreme Court ruled unanimously that Mr. Johnson had overstepped by trying to cut short lawmakers’ time to challenge his Brexit plans before the deadline, on Oct. 31. Received with cheers and shouts from opposition lawmakers on Wednesday, Mr. Johnson was
unapologetic for his actions. He also accused Parliament, where he has lost his majority, of “sabotaging the nego-tiations” between his government and the European Union, including by voting against leaving the European Union without a deal. And he insisted that leaders on the Continent were willing to renegotiate a deal with him, despite their assertions to the contrary.
Technical Analysis: Medium term trend for the market is down as its weekly price action is showing that market is continuously trading below 100 weekly EMA. At the beginning of the month, copper tried to give some bounce but failed to sustain the high near 5960 where we have 20 weeks EMA. The slope of the
20 EMA is indicating that market may go down further. Weekly RSI is below 50 which is again supporting the bearish stance on the market. In the week ended 20th September’19, we have Bearish Engulfing candle in the price chart which is bearish too and the low of the candle also taken out the market which is again confirming
the formation. Next significant support is at 5460 level where we have one support line and also coinciding with by 61.8% Fibbo level (showed in the graph). If it taken out then the fall will be more steeper for the next stop of 4970.
Weekly Chart: Copper LME 3M
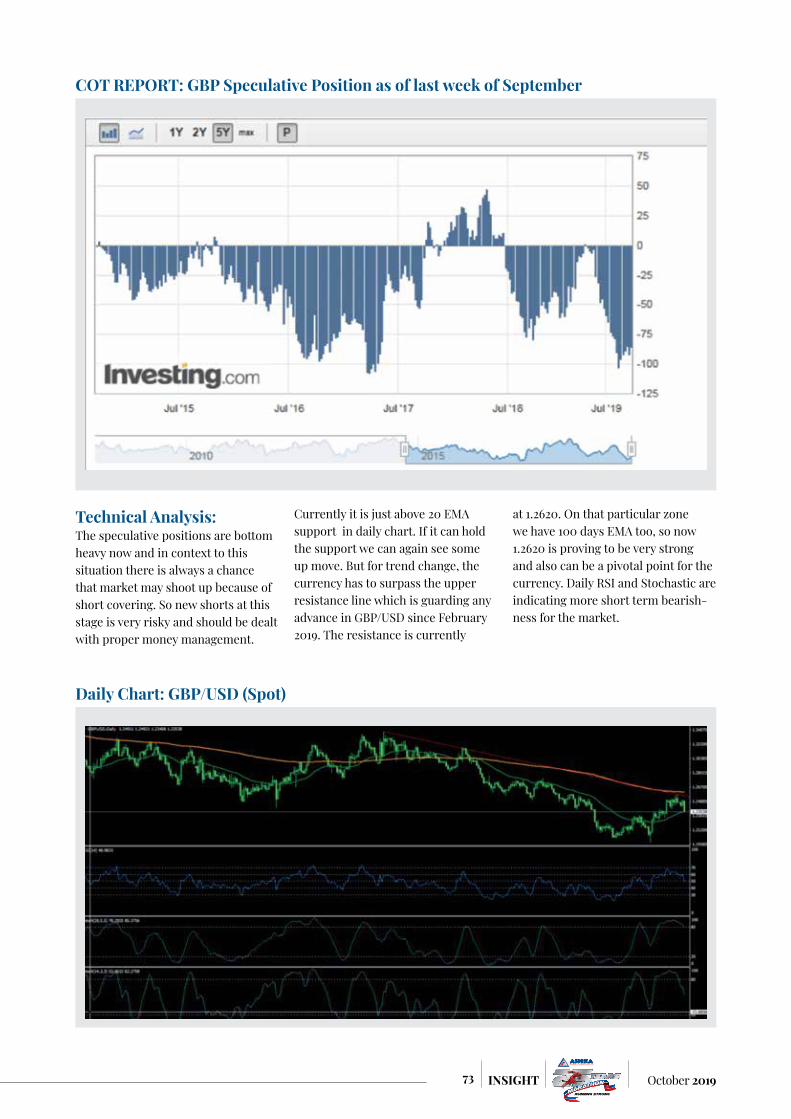
73 October 2019INSIGHT
COT REPORT: GBP Speculative Position as of last week of September
Technical Analysis: The speculative positions are bottom heavy now and in context to this situation there is always a chance that market may shoot up because of short covering. So new shorts at this stage is very risky and should be dealt with proper money management.
Currently it is just above 20 EMA support in daily chart. If it can hold the support we can again see some up move. But for trend change, the currency has to surpass the upper resistance line which is guarding any advance in GBP/USD since February 2019. The resistance is currently
at 1.2620. On that particular zone we have 100 days EMA too, so now 1.2620 is proving to be very strong and also can be a pivotal point for the currency. Daily RSI and Stochastic are indicating more short term bearish-ness for the market.
Daily Chart: GBP/USD (Spot)
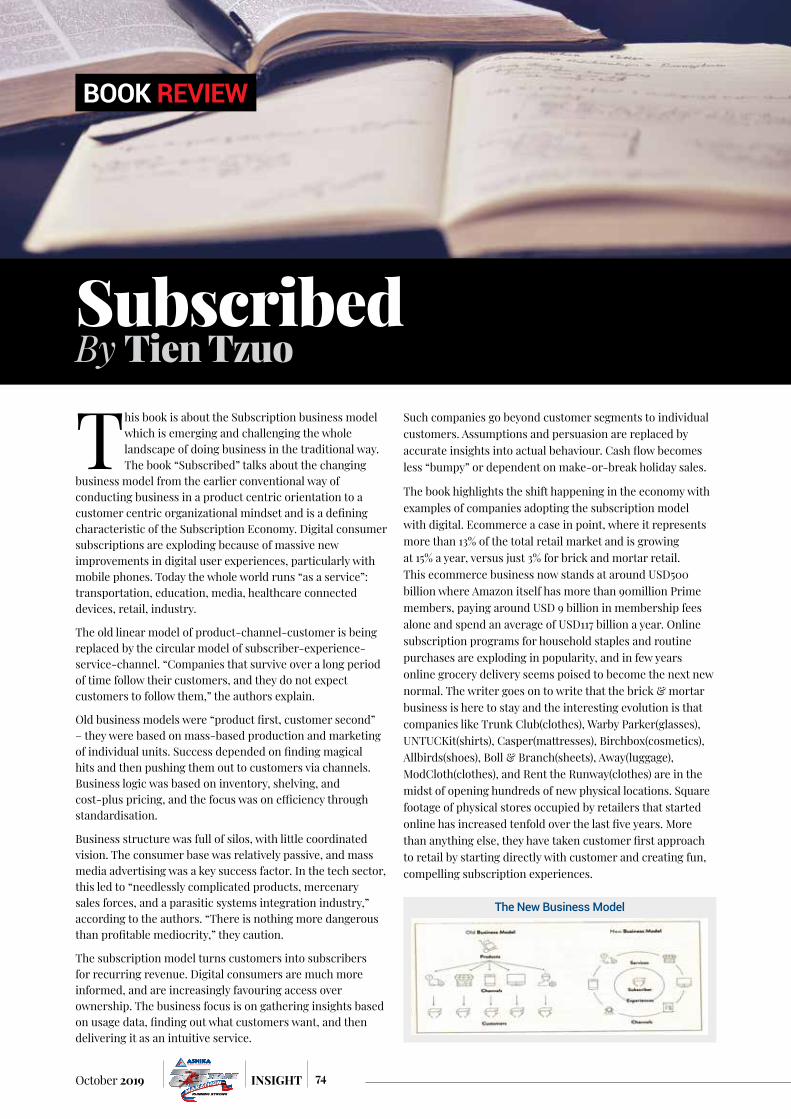
74October 2019 INSIGHT
SubscribedBy Tien Tzuo
BOOK REVIEW
This book is about the Subscription business model which is emerging and challenging the whole landscape of doing business in the traditional way. The book “Subscribed” talks about the changing
business model from the earlier conventional way of conducting business in a product centric orientation to a customer centric organizational mindset and is a defining characteristic of the Subscription Economy. Digital consumer subscriptions are exploding because of massive new improvements in digital user experiences, particularly with mobile phones. Today the whole world runs “as a service”: transportation, education, media, healthcare connected devices, retail, industry.
The old linear model of product-channel-customer is being replaced by the circular model of subscriber-experience-service-channel. “Companies that survive over a long period of time follow their customers, and they do not expect customers to follow them,” the authors explain.
Old business models were “product first, customer second” – they were based on mass-based production and marketing of individual units. Success depended on finding magical hits and then pushing them out to customers via channels. Business logic was based on inventory, shelving, and cost-plus pricing, and the focus was on efficiency through standardisation.
Business structure was full of silos, with little coordinated vision. The consumer base was relatively passive, and mass media advertising was a key success factor. In the tech sector, this led to “needlessly complicated products, mercenary sales forces, and a parasitic systems integration industry,” according to the authors. “There is nothing more dangerous than profitable mediocrity,” they caution.
The subscription model turns customers into subscribers for recurring revenue. Digital consumers are much more informed, and are increasingly favouring access over ownership. The business focus is on gathering insights based on usage data, finding out what customers want, and then delivering it as an intuitive service.
Such companies go beyond customer segments to individual customers. Assumptions and persuasion are replaced by accurate insights into actual behaviour. Cash flow becomes less “bumpy” or dependent on make-or-break holiday sales.
The book highlights the shift happening in the economy with examples of companies adopting the subscription model with digital. Ecommerce a case in point, where it represents more than 13% of the total retail market and is growing at 15% a year, versus just 3% for brick and mortar retail. This ecommerce business now stands at around USD500 billion where Amazon itself has more than 90million Prime members, paying around USD 9 billion in membership fees alone and spend an average of USD117 billion a year. Online subscription programs for household staples and routine purchases are exploding in popularity, and in few years online grocery delivery seems poised to become the next new normal. The writer goes on to write that the brick & mortar business is here to stay and the interesting evolution is that companies like Trunk Club(clothes), Warby Parker(glasses), UNTUCKit(shirts), Casper(mattresses), Birchbox(cosmetics), Allbirds(shoes), Boll & Branch(sheets), Away(luggage), ModCloth(clothes), and Rent the Runway(clothes) are in the midst of opening hundreds of new physical locations. Square footage of physical stores occupied by retailers that started online has increased tenfold over the last five years. More than anything else, they have taken customer first approach to retail by starting directly with customer and creating fun, compelling subscription experiences.
The New Business Model

75 October 2019INSIGHT
Amazon versus Walmart battle has been framed as ecommerce versus retail, but that’s always been a false dichotomy. It’s about starting with the customer instead of the product. It’s about establishing ongoing relationships. It’s about flipping the script- starting with the digital experience, and then building the store. Amazon says “put the customer first. Invent. And be patient. Whereas Walmart uptill this time was busy dispensing inventory.
Other examples where businesses are evolving and reinventing as a service and subscription business with everything evolving around the customers and his ID. Apple also is transitioning from its smartphone battleground from selling unit volume as product to user monetization and we will see the full force in years to come. Apple’s service revenue is growing at a scorching pace and is neutralizing its ebb & flow of the hardware business. It looks that with each passing year Apple would care less and less about how many IPhones it ships, and more about its revenue per Apple ID, lifetime value per Apple ID, and efficiency metrics toward growing the base and value of those Apple IDs. Case in point, Apple subscription plan that covered everything from network provider charges, automatic hardware upgrades, add-on option for extra devices, music, video content, specialty content, games etc., Apple as a Service in nutshell.
Another example of shifting gears from selling products to subscription model based on services is Fender the largest guitar selling company in the world. With falling sells every year, it reinvented itself by launching a new subscription-based online video teaching service called Fender Play. So, business from a static product with re-sellers and unit sale focus, it shifted to subscriber base and engagement rates. It is not about owing guitar but about being a guitar player and a music lover for life.
The New Golden Age of Media:The paid subscription is the predominant format in the market which customers are gravitating towards. The media industry is managing three transitions at the same time: from physical to digital, PC to mobile, and download to streaming. Netflix, which started streaming movies in 2007, went from zero to 100 million streaming subscribers in ten years, Spotify, founded almost ten years later, went from zero to more than 50 million paying subscribers in less than nine years, and today is responsible for more than 20% of global music industry revenues. Netflix now spends USD 8 billion a year on original content. SVOD, streaming video on demand is USD 14 billion industry which was zero ten years ago. In future “Neflix of Sports” will be another theme to emerge. Remember, those customers aren’t going anywhere-they are just demanding different digital services. So, a shift in cable subscribers (watch only 9% of what is available anyway), SVOD, content on demand, subscription- pay and watch etc. are changing the business model in media space with the emergence of broadband, digital, smartphones etc.
Planes, Trains, and Automobiles:You don’t buy Hyundai’s new hybrid car the Ioniq- you subscribe to it, for USD 275 a month. It is like picking a cell phone plan: pick your model online, choose between a twenty-four or thirty-six-month plan, select your upgrades,
then walk into a dealership to pick up your vehicle. Unlike lease, which binds you to a specific vehicle, it is an emergence of a subscription model which potentially offer you access to a range of vehicles, simply flip between vehicles via the app as your needs change. You are signing up with the company, not the car. Registration, insurance, maintenance simply goes away. Subscription on a month on month basis is also in the offering. Volvo expect that one out of every five of the company’s vehicle will be delivered via subscription by 2023, and the company is working on its own ridesharing network that will allow users to loan or rent its cars for profit. Millennials think that the car ownership is expensive and hence the emergence of a massive disruptive trend i.e., the Uber, Ola, Lyft of the world. 60 million rider use Uber & Lyft of the world. They have ushered in a completely new set of consumer priorities. Transportation seems to be toeing the path of electricity and internet access. Rideshare though doesn’t look like a subscriber model, but in reality, it is a digital subscription model, as it has your ID and all your payment particulars, and it employ usage-based pricing so that you pay for only what you use. It knows your usage history and uses that information to customize its service for you. Though the monthly usage plan also seems to be around the corner. Uber literally is going after your commute as the Amazon Prime hooked you with free shipping and now you have got music, movies and all other sorts of services.
Cell Phones on Wheels:Today the accepted Silicon Valley wisdom is that as cars turn into cell phones on wheels, software will inevitably trump hardware just as Microsoft trumped IBM. As lithium batteries replace combustion engines, automobile hardware will become commodified and the new growth market will be in information services. Digital diagnostics, infotainment channels, and enhanced navigation systems are expected to constitute a USD 270 billion industry. At some point the data and services associated with a vehicle may be worth more than the vehicle itself (much like a cell phone). A lot of legacy car companies look a lot like IBM did in 1985. Without control over platform, PC hardware is nothing more than a commodity, with negligible margins, intense competition and an inability to control destiny. IBM lost the war by giving the user experience over to Microsoft, and the same thing is going to happen to legacy car companies when they inevitably hand over their dashboard intelligence to Apple, Google and Facebook. Car manufacturer need to come out of their manufacturing mindset to transportation solutions. They are sensing that automation is coming. They get that in the future they will probably be doing more fleet management and fewer individual vehicle sales, i.e., mobility as a service and they are also sensing the threat from all these new ridesharing services who will take the massive income out of them by just reinventing the business as a service. Ford’s & GM’s of the world and others are observant to it, and winners of tomorrow will be a difficult guess to make at this moment, but seismic shift is for sure and this throws a whole new plethora of opportunities.
All you can Fly:Flying is an awful experience, and more so for frequent business fliers, boarding a plane is never a pleasant

76October 2019 INSIGHT
experience. To this a company called Surf Air has emerged, which is often called the “Netflix of Aviation” or the “Uber of the Skies”. Its members get access to limitless flights for a flat monthly fee. This has emerged, starting with the customer’s wants and needs, attacking pain points and thereby acquiring loyal subscriber base in the process and that too app based. Airline industry is ripe for disruption. There are more than 200 million frequent fliers worldwide, and as customer preferences shift, every one of them is up for grabs. The product mindset of airline industry which prioritizes add-ons and revenue extraction and devalue customers is going to collapse under its own weight. The new model with flying experience and synchronizing your flights arrival time with your car and also a service like Clear can speed you through security lines. All these services wrapped up in a flat annual frequent-flier membership plan.
Transportation is seamlessly going to be embedded daily lives intuitively and seemingly.
Companies formerly known as Newspapers:Digital subscriptions are transforming the broader publishing industry in profound ways. It also has a realization about the fact that customer subscribe to the services because of good (content) journalism at the core and not paying for advertisement unnecessarily imposed with the news. Hence thousands of readers use add blocking software as majority of advertisement have no relevance whatsoever. Readers & Publishers alike are starting to appreciate the dividends of direct reader relationships. Earlier advertisement and classified income business models were very much driven by myopic product mindset which took a real toll on readers. Today there is a whole new generation of consumers who are comfortable subscribing for services- Spotify, Netflix, food boxes, productivity apps- as long as they stay timely, relevant, and focused. Though advertisement is never going to go away but making advertising a secondary- though still vital revenue source is the most important strategic goal for most news publishers. Digital will give edge on knowing customer preferences, legitimate reader engagements and thereby dynamic pricing strategy rather than any kind of reverse engineering an editorial product for the benefit of advertisers. The New York Times, FT, The Economist & Motor Trend are successfully transition their business model to digital subscription and reader engagement and better content and journalism at the core.
Swallowing the Big Fish: Lessons from the rebirth of the Tech:In 2011, Adobe is a classic case of taking a pragmatic step to move to a subscription driven business model. The transition was a successful case history which though had financial pain in the immediate future but eventually led to significant growth in business and its stock price. They realized that subscription is the dominant business model for the technology industry. They stopped selling (though it went parallelly for some time so as the customers get reasonable time to switch over and properly communicating the change) their enormously profitable Creative Suite software in boxes and move to a digital subscription model. It led to the revenue curve temporarily dipping below the operating expense curve
before climbing back upward and is called the “swallowing the fish” for the transition period. The business model simply pushed the revenue into the future as recurring in nature i.e., per unit sale-based model shifted gears to Annual recurring revenue (ARR) metrics. Today the company has completely transitioned itself to a 100% subscription based business model with better growth prospect year over year.
Same was the case with CISCO which successfully moved from its relatively flat hardware business to a software and services business, thereby selling boxes to selling outcomes in its new subscription model. Cisco’s latest set of Catalyst hardware comes embedded with machine learning and an analytics software platform that helps companies solve huge inefficiencies by reducing network provisioning times, preventing security breaches and minimizing operating expenses.
Today’s innovative companies are increasingly pursuing recurring revenue- based business models and re relegating their ERP systems to a commodity general ledger in the process. The old cumbersome “one size fits all” ERP model is incrementally becoming redundant. THE plug and play SaaS providers which performs a specific core function really well is more effective than a massive product-based installation.
IOT and the fall and rise of manufacturing:With the sweeping shift from products to services in retail, transportation, media and technology, as well the transformation in manufacturing is inevitable. The internet of things IOT is going to be massive in increasing the global productivity, output and growth. According to various predictions, by 2020 we are expected to have more than a billion smart meters, 100 million connected lightbulbs, more than 150 million 4G connected cards, 200 million smart home units, several billion smart clothing units, more than 90 million wearables. And what do these sensors allow these products to do? Collect and transmit data-lots of it. All these products will be beaming information back into centralized servers, so companies can start using analytic platforms to look for patterns and ways to improve things. This entire eco-system is the Internet of Things. The digitalization of the physical world through sensors and connectivity. The physical device is just and enabler. Your value lies in your IP, the usage data from your customer base, and your ability to trade information across multiple markets. When raw data generated by all these millions of digital devices and interpret that data with analytic software, then you can sell that new intelligence as a service that can become as valuable as having electricity, Wi-Fi or running water in your house. Another
So, a fish

77 October 2019INSIGHT
word of these kind of analytic service is artificial intelligence AI. Everything we formally electrified we will now cognitize.
Schnedier Electric tracks and monitors elevator usage patterns so that elevators can default to busier floors, saving people waiting time. Tracking wear and tear, so that maintenance can be scheduled. Also working with farms where waste usage can be tracked down to liter, as well weather patterns and favorable spot electricity pricing. Symmons Industries builds smart shower systems for hotels that let management teams monitor usage data like temperature, duration, and water volume in order to optimize their utility bills. Honeywell is working with Intel to let logistics package be tracked and also with sensitive electronic equipment, their health can also be measured with location, shock and tilt, light, humidity, temperature and potential tampering. Apple watch gets approval for EKG sensor which will help push health care towards remote monitoring rather than periodic testing, potentially saving billions of dollars in health care cost. Whirlpool’s new ovens know how to scan recipes and cook meals accordingly. Sensor in Johnnie Walker Blue Label whisky bottles let people know if the bottle has been tampered with and where it sits in the supply chain. Chrono Therapeutics helps patients administer medication through skin patches that automatically handle dosage and timing issues. Thync is a subscription-based wearable that uses safe, low-level electrical stimulation to help you relax, improve your mood, sleep better without chemicals. FloorIn Motion from France delivers connected floors that monitor human traffic patterns in order to manage building energy usage. The physical world is starting to “wake up”.
What happened to the technology sector is going to happen to the manufacturing sector. Because IoT allows you to rediscover your customers. The only competitive advantage is your relationship with and knowledge of your customers. Earlier the competitor comes up with a product in the market. The other one buys it in the open market and sends it to the R&D lab, which than dismantles it, benchmark it, and reverse-engineer it in a thousand different ways. But in the new ear the competitors can’t do that with the collective intelligence of your customer base. This is an incredibly powerful advantage.
The Twentieth-Century organization resembled a sequence of stovepipes. Siloed functions. Marketing did the research and passed it off to the product group, which took the specs and made it happen. They passed it off to the sales team, which pitched it like crazy. Finance counted the beans. IT got called when someone forgot their password. This made sense when everything was about scale, consistency and any color as long as it is black. This is the product-based approach. The focus has been on efficiency through standardization: How do I lower my inventory? How do I shorten my supply chains? How do I get a product from point A to point B faster and cheaper, thereby lowering my per unit cost, in order to give my company a competitive advantage? How do I maintain a consistent system of record? Everyone installed fancy ERP systems to help manage their supply chains. The goal was standardization across systems of record. But what happens when your IT infrastructure is based around customer, not units of sale? The golden era of postwar corporate
dominance, when this original product-based management structure was created, was enabled by a relatively passive consumer base.
This is clearly is not the case anymore. In this new world with the customer at the center, the silos must come down. How can you create a new subscriber experience that delivers outcomes if everyone has their heads down? How can you deliver business model innovation, make the right choices across how you innovate, how you go to the market, how you approach your fundamental business model i.e., the new subscription model?
The new subscription economy Average recurring revenue:
ARR-Chrun+ACV= Net ARRACV: Annual contract value
Subscription + Legacy it Architecture = Chaos
New CRM:
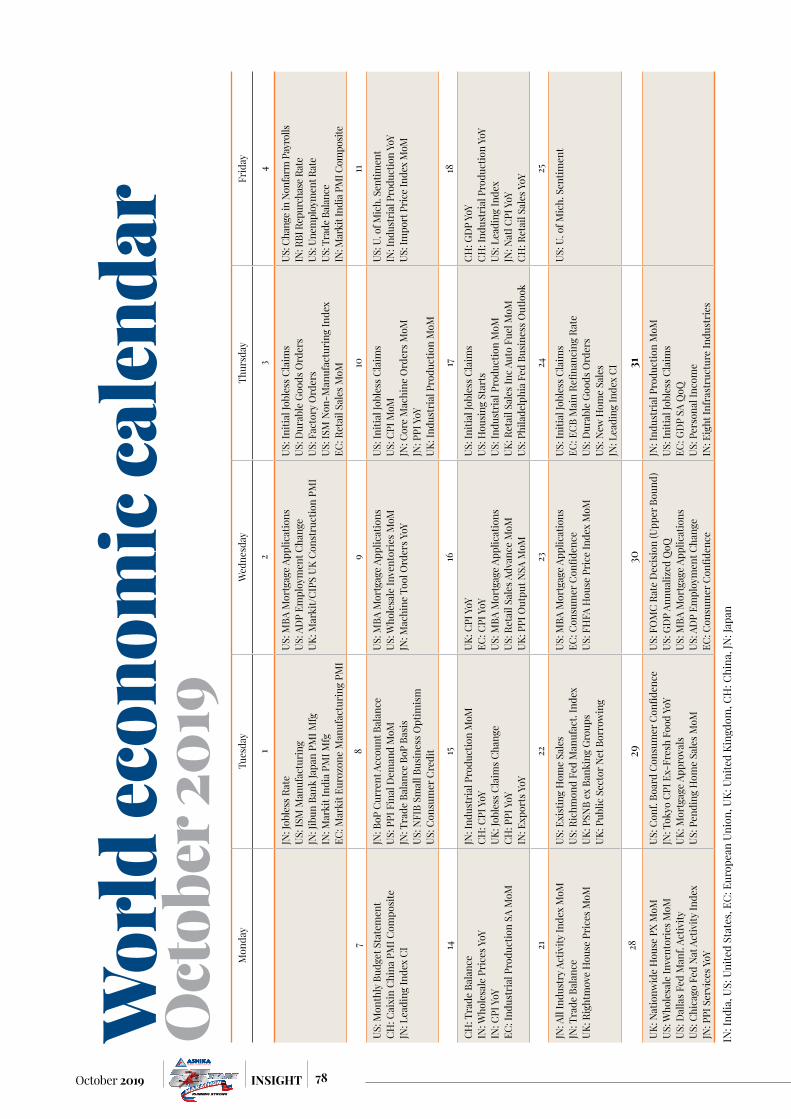
78October 2019 INSIGHT
Mon
day
Tues
day
Wed
nesd
ayTh
ursd
ayFr
iday
12
34
JN: J
oble
ss R
ate
US: I
SM M
anuf
actu
ring
JN: J
ibun
Ban
k Ja
pan
PMI M
fgIN
: Mar
kit I
ndia
PM
I Mfg
EC: M
arki
t Eur
ozon
e M
anuf
actu
ring
PM
I
US: M
BA M
ortg
age
Appl
icat
ions
US: A
DP
Empl
oym
ent C
hang
eUK
: Mar
kit/
CIPS
UK
Cons
truc
tion
PMI
US: I
nitia
l Job
less
Cla
ims
US: D
urab
le G
oods
Ord
ers
US: F
acto
ry O
rder
sUS
: ISM
Non
-Man
ufac
turi
ng In
dex
EC: R
etai
l Sal
es M
oM
US: C
hang
e in
Non
farm
Pay
rolls
IN: R
BI R
epur
chas
e Ra
teUS
: Une
mpl
oym
ent R
ate
US: T
rade
Bal
ance
IN: M
arki
t Ind
ia P
MI C
ompo
site
78
910
11
US: M
onth
ly B
udge
t Sta
tem
ent
CH: C
aixi
n Ch
ina
PMI C
ompo
site
JN: L
eadi
ng In
dex
CI
JN: B
oP C
urre
nt A
ccou
nt B
alan
ceUS
: PPI
Fin
al D
eman
d M
oMJN
: Tra
de B
alan
ce B
oP B
asis
US: N
FIB
Smal
l Bus
ines
s Opt
imis
mUS
: Con
sum
er C
redi
t
US: M
BA M
ortg
age
Appl
icat
ions
US: W
hole
sale
Inve
ntor
ies M
oMJN
: Mac
hine
Too
l Ord
ers Y
oY
US: I
nitia
l Job
less
Cla
ims
US: C
PI M
oMJN
: Cor
e M
achi
ne O
rder
s MoM
JN: P
PI Y
oYUK
: Ind
ustr
ial P
rodu
ctio
n M
oM
US: U
. of M
ich.
Sen
timen
tIN
: Ind
ustr
ial P
rodu
ctio
n Yo
YUS
: Im
port
Pri
ce In
dex
MoM
1415
1617
18
CH: T
rade
Bal
ance
IN: W
hole
sale
Pri
ces Y
oYIN
: CPI
YoY
EC: I
ndus
tria
l Pro
duct
ion
SA M
oM
JN: I
ndus
tria
l Pro
duct
ion
MoM
CH: C
PI Y
oYUK
: Job
less
Cla
ims C
hang
eCH
: PPI
YoY
IN: E
xpor
ts Y
oY
UK: C
PI Y
oYEC
: CPI
YoY
US: M
BA M
ortg
age
Appl
icat
ions
US: R
etai
l Sal
es A
dvan
ce M
oMUK
: PPI
Out
put N
SA M
oM
US: I
nitia
l Job
less
Cla
ims
US: H
ousi
ng S
tart
sUS
: Ind
ustr
ial P
rodu
ctio
n M
oMUK
: Ret
ail S
ales
Inc
Auto
Fue
l MoM
US: P
hila
delp
hia
Fed
Busi
ness
Out
look
CH: G
DP
YoY
CH: I
ndus
tria
l Pro
duct
ion
YoY
US: L
eadi
ng In
dex
JN: N
atl C
PI Y
oYCH
: Ret
ail S
ales
YoY
2122
2324
25
JN: A
ll In
dust
ry A
ctiv
ity In
dex
MoM
JN: T
rade
Bal
ance
UK: R
ight
mov
e H
ouse
Pri
ces M
oM
US: E
xist
ing
Hom
e Sa
les
US: R
ichm
ond
Fed
Man
ufac
t. In
dex
UK: P
SNB
ex B
anki
ng G
roup
sUK
: Pub
lic S
ecto
r Net
Bor
row
ing
US: M
BA M
ortg
age
Appl
icat
ions
EC: C
onsu
mer
Con
fiden
ceUS
: FH
FA H
ouse
Pri
ce In
dex
MoM
US: I
nitia
l Job
less
Cla
ims
EC: E
CB M
ain
Refin
anci
ng R
ate
US: D
urab
le G
oods
Ord
ers
US: N
ew H
ome
Sale
sJN
: Lea
ding
Inde
x CI
US: U
. of M
ich.
Sen
timen
t
2829
3031
UK: N
atio
nwid
e H
ouse
PX
MoM
US: W
hole
sale
Inve
ntor
ies M
oMUS
: Dal
las F
ed M
anf.
Activ
ityUS
: Chi
cago
Fed
Nat
Act
ivity
Inde
xJN
: PPI
Ser
vice
s YoY
US: C
onf.
Boar
d Co
nsum
er C
onfid
ence
JN: T
okyo
CPI
Ex-
Fres
h Fo
od Y
oYUK
: Mor
tgag
e Ap
prov
als
US: P
endi
ng H
ome
Sale
s MoM
US: F
OM
C Ra
te D
ecis
ion
(Upp
er B
ound
)US
: GD
P An
nual
ized
QoQ
US: M
BA M
ortg
age
Appl
icat
ions
US: A
DP
Empl
oym
ent C
hang
eEC
: Con
sum
er C
onfid
ence
JN: I
ndus
tria
l Pro
duct
ion
MoM
US: I
nitia
l Job
less
Cla
ims
EC: G
DP
SA Q
oQUS
: Per
sona
l Inc
ome
IN: E
ight
Infr
astr
uctu
re In
dust
ries
IN: I
ndia
, US:
Uni
ted
Stat
es, E
C: E
urop
ean
Unio
n, U
K: U
nite
d Ki
ngdo
m, C
H: C
hina
, JN
: Jap
an
Wor
ld ec
onom
ic ca
lend
ar
Oct
ober
201
9

79 October 2019INSIGHT
Capital Markets Fund Raising Advisory
• Issue Management • IPO / FPO • Right Issue • Qualified Institutional Placement
• Open Offer • Takeover • Buyback • Delisting
• Overseaslisting
• Underwriting
• Private Equity• Venture / Growth Capital • Pipe
• Debt Syndication• Project Finance • Team Loan • Working Capital Loan • Acquisition Funding • Construction Finance
• M &A• Merger / Acquisition / Disposal• Management Buy-outs / Buy-ins• Leveraged Buy-outs • Joint Ventures • Strategic Partnership • Spin-Offs• Divestment
• Corporate restructuring• Capital Restructuring • Finance Restructuring
• Business Valuation• ESPO Valuation • Fairness Opinion
For Debt Fund raising / Mergers & Acquisition / Business OpportunityIf you have any queries or questions, please mail us at [email protected]
Services at Ashika Capital Limited
Ashika Group presents FutureBets - first ever un-conference of the season. FutureBets is first of its kind salon and performance art piece to understand how future will disrupt public markets. The event features world class speakers in the field of finance,
healthcare, investment and more along with the first ever stock market of the future simulation game. More details on the event on www.makefuturebets.com
Ashika Group presents FutureBets

80October 2019 INSIGHT
AWARDS
NSE Market Achievers Award 2018REGEIONAL RETAIL MEMBER OF THE YEAR 2018 -
EASTERN INDIA
Helping Clients Reach for Better Via SIP – National from Franklin Templeton Investments, 2018NSDL STAR PERFORMANCE AWARD 2018
NSE Market Achievers Award 2017REGEIONAL RETAIL MEMBER OF THE YEAR 2017 -
EASTERN INDIA
BTVI Emerging Company of the Year 2019
BTVI Young Business Leader of the Year 2019
81 October 2019INSIGHT
Ashika Stock Broking Ltd.Ashika Stock Broking Limited (“ASBL”) started its journey in the year 1994 and is presently offering a wide bouquet of services to its valued clients including broking services, depository services and distributorship of financial prod-ucts (Mutual funds, IPO & Bonds). It became a “Research Entity” under SEBI (Research Analyst) Regulations 2014 in the year of 2015 (Reg No. INH000000206).
ASBL is a wholly owned subsidiary of Ashika Global Securities (P) Ltd., a RBI registered non-deposit taking NBFC Company. ASHIKA GROUP (details enumerated on our website www.ashikagroup.com) is an integrated financial service provider inter alia engaged in the business of Investment Banking, Corporate Lending, Com-modity Broking, Debt Syndication & Other Advisory Services.
There were no significant and mate-rial disciplinary actions against ASBL taken by any regulatory authority during last three years except routine matters.
DISCLOSUREResearch reports are being prepared and distributed by ASBL in the sole capacity of being a Research Analyst under SEBI (Research Analyst) Regu-lations 2014. The following disclosures and disclaimer are an essential part of any Research Report so being distributed.
1) ASBL or its associates, its Research
Analysts (including their relatives) may have financial interest in the subject company(ies). And, the said financial interest is not limited to having an open stock market position in /acting as advisor to /having a loan transaction with the subject com-pany(ies) apart from registration as clients.
2) ASBL or its Research Analysts (including their relatives) do not have any actual / beneficial ownership of 1% or more of securities of the subject company(ies) at the end of the month immediately preceding the date of publication of the source research report or date of the concerned public appearance. However, ASBL’s associates may have actual / beneficial ownership of 1% or more of securities of the subject company(ies).
3) ASBL or its Research Analysts (including their relatives) do not have any other material conflict of interest at the time of publication of the source research report or date of the concerned public appearance. However, ASBL’s associates might have an actual / potential conflict of interest (other than ownership).
4) ASBL or its associates may have received compensation for investment banking, merchant banking, broker-age services and for other products and services from the subject compa-nies during the preceding 12 months. However, ASBL or its associates or its
Research analysts (forming part of Research Desk) have not received any compensation or other benefits from the subject companies or third parties in connection with the research report/ research recommendation. Moreover, Research Analysts have not received any compensation from the companies mentioned in the research report/ recommendation in the past twelve months.
5) The subject companies in the research report/ recommendation may be a client of or may have been a client of ASBL during the twelve months preceding the date of con-cerned public appearance for invest-ment banking/ merchant banking / brokerage services.
6) ASBL or their Research Analysts have not managed or co–managed public offering of securities for the subject company(ies) in the past twelve months. However, ASBL’s associates may have managed or co–managed public offering of securities for the subject company(ies) in the past twelve months.
7) Research Analysts have not served as an officer, director or employee of the companies mentioned in the report/ recommendation.
8) Neither ASBL nor its Research Analysts have been engaged in market making activity for the companies mentioned in the report / recommendation.
DISCLAIMERThe research recommendations and information are solely for the personal information of the authorized recipient and does not con-strue to be an offer document or any investment, legal or taxation advice or solicitation of any action based upon it. This report is not for public distribution or use by any person or entity, where such distribution, publication, availability or use would be contrary to law, regulation or subject to any registration or licensing requirement. We will not treat recipients as customer by virtue of their receiving this report. The report is based upon the information obtained from public sources that we consider reliable, but we do not guarantee its accuracy or completeness. ASBL shall not be in anyways responsible for any loss or damage that may arise to any such person from any inadvertent error in the information contained in this report. The recipients of this report should rely on their own investigations.

A
PR
OD
UCT
| in
fo@
tris
ysco
m.c
omRegistered OfficeTrinity226/1, A.J.C. Bose Road7th Floor, Kolkata-700020Phone: 033-4010 2500Fax No: 033-4010 2543
Corporate Office1008, Raheja Centre,214, Nariman Point, 10th FloorMumbai-400021Phone: 022-6611 1700Fax No: 022-6611 1710
Group CompaniesAshika Credit Capital Ltd.
(RBI Registered NBFC)
CIN No. L67120WB1994PLC062159
Ashika Global Securities Pvt. Ltd.(RBI Registered NBFC)
CIN No. U65929WB1995PTC069046
Ashika Capital Ltd.(SEBI Authorised Merchant Banker)
CIN No. U30009WB2000PLC091674
Ashika Investment Managers Pvt. Ltd.CIN number – U65929MH2017PTC297291
Ashika Stock Broking Ltd.(Member : NSE, BSE, MSE, MCX, ICEX Depository participant of CDSL / NSDL, AMFI Mutual Fund Advisor, Research Analyst)CIN No. U65921WB1994PL217071SEBI Registration No : INZ000169130SEBI Regsitration No : INH00000006 (RA)
Ashika Commodities & Derivatives Pvt. Ltd.(Member : NCDEX, MCX)CIN No. U51909WB2003PTC096985SEBI Regsitartion No :- INZ000063835
Ashika Wealth Advisors Pvt Ltd.CIN number – U65999WB2018PTC227019SEBI Registered Investment AdviserSEBI Registration number – INA300013759
www.ashikagroup.com