KONKA GROUP CO., LTD. ANNUAL REPORT 2019
333
Konka Group Co., Ltd. Annual Report 2019 1 KONKA GROUP CO., LTD. ANNUAL REPORT 2019 2020-30 April 2020
-
Upload
khangminh22 -
Category
Documents
-
view
1 -
download
0
Transcript of KONKA GROUP CO., LTD. ANNUAL REPORT 2019

Konka Group Co., Ltd. Annual Report 2019
1
KONKAGROUPCO., LTD.
ANNUALREPORT 2019
2020-30
April 2020
Konka Group Co., Ltd. Annual Report 2019
2
Part I Important Notes, Table of Contents and Definitions
The Board of Directors (or the “Board”), the Supervisory Committee as well as the directors,supervisors and senior management of Konka Group Co., Ltd. (hereinafter referred to as the“Company”) hereby guarantee the factuality, accuracy and completeness of the contents ofthis Report and its summary, and shall be jointly and severally liable for anymisrepresentations, misleading statements or material omissions therein.
Liu Fengxi, the Company’s legal representative, Li Chunlei, the Company’s Chief FinancialOfficer (CFO), and Feng Junxiu, head of the Company’s financial department (equivalent tofinancial manager) hereby guarantee that the Financial Statements carried in this Report arefactual, accurate and complete.
All the Company’s directors have attended the Board meeting for the review of this Reportand its summary.
Any plans for the future or other forward-looking statements mentioned in this Report and itssummary shall NOT be considered as absolute promises of the Company to investors.Therefore, investors are reminded to exercise caution when making investment decisions.
The Board has approved a final dividend plan as follows: based on the 2,407,945,408 shares, acash dividend of RMB0.5 (tax inclusive) per 10 shares is to be distributed to the shareholders,with no bonus issue from either profit or capital reserves.
This Report and its summary have been prepared in both Chinese and English. Should therebe any discrepancies or misunderstandings between the two versions, the Chinese versionsshall prevail.
Konka Group Co., Ltd. Annual Report 2019
3
Table of Contents
Part I Important Notes, Table of Contents and Definitions........................................................... 2
Part II Corporate Information and Key Financial Information................................................... 9
Part III Business Summary............................................................................................................. 14
Part IV Operating Performance Discussion andAnalysis............................................................17
Part V Significant Events.................................................................................................................45
Part VI Share Changes and Shareholder Information................................................................. 88
Part VII Preferred Shares................................................................................................................94
Part VIII Convertible Corporate Bonds........................................................................................ 95
Part IX Directors, Supervisors, Senior Management and Staff...................................................96
Part X Corporate Governance...................................................................................................... 107
Part XI Corporate Bonds...............................................................................................................117
Part XII Financial Statements.......................................................................................................122
Part XIII Documents Available for Reference............................................................................. 333
Konka Group Co., Ltd. Annual Report 2019
4
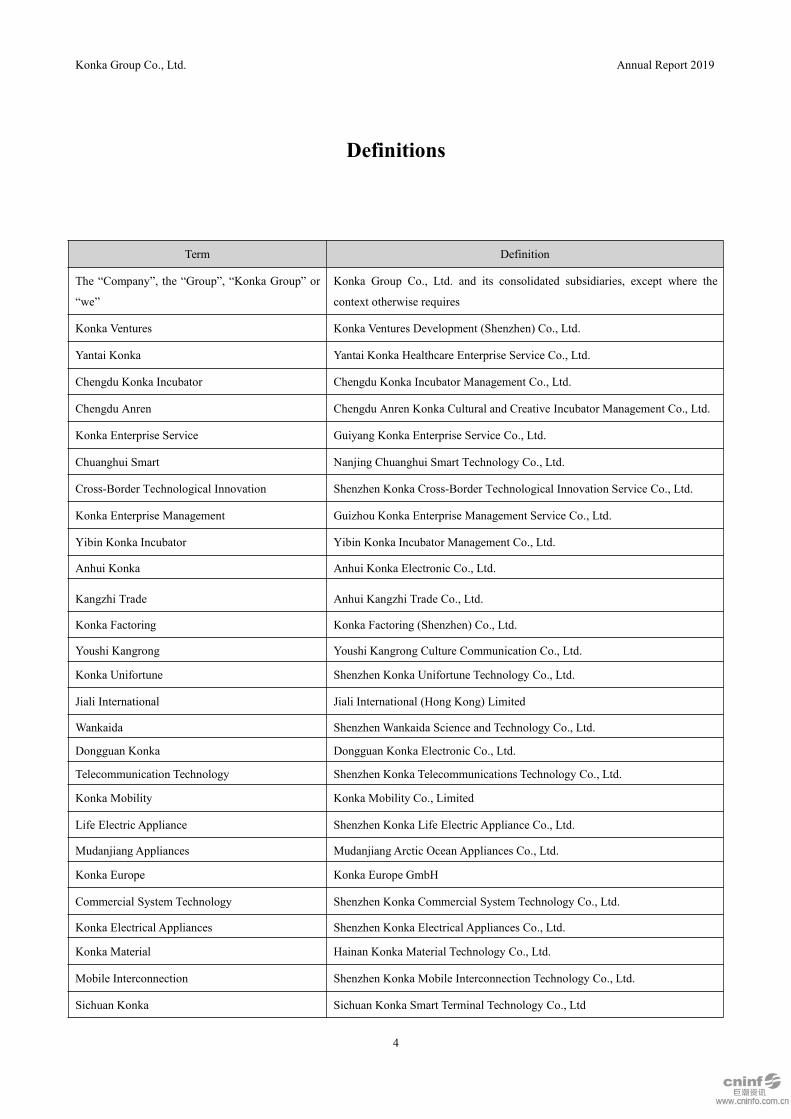
Definitions
Term Definition
The “Company”, the “Group”, “Konka Group” or
“we”
Konka Group Co., Ltd. and its consolidated subsidiaries, except where the
context otherwise requires
Konka Ventures Konka Ventures Development (Shenzhen) Co., Ltd.
Yantai Konka Yantai Konka Healthcare Enterprise Service Co., Ltd.
Chengdu Konka Incubator Chengdu Konka Incubator Management Co., Ltd.
Chengdu Anren Chengdu Anren Konka Cultural and Creative Incubator Management Co., Ltd.
Konka Enterprise Service Guiyang Konka Enterprise Service Co., Ltd.
Chuanghui Smart Nanjing Chuanghui Smart Technology Co., Ltd.
Cross-Border Technological Innovation Shenzhen Konka Cross-Border Technological Innovation Service Co., Ltd.
Konka Enterprise Management Guizhou Konka Enterprise Management Service Co., Ltd.
Yibin Konka Incubator Yibin Konka Incubator Management Co., Ltd.
Anhui Konka Anhui Konka Electronic Co., Ltd.
Kangzhi Trade Anhui Kangzhi Trade Co., Ltd.
Konka Factoring Konka Factoring (Shenzhen) Co., Ltd.
Youshi Kangrong Youshi Kangrong Culture Communication Co., Ltd.
Konka Unifortune Shenzhen Konka Unifortune Technology Co., Ltd.
Jiali International Jiali International (Hong Kong) Limited
Wankaida Shenzhen Wankaida Science and Technology Co., Ltd.
Dongguan Konka Dongguan Konka Electronic Co., Ltd.
Telecommunication Technology Shenzhen Konka Telecommunications Technology Co., Ltd.
Konka Mobility Konka Mobility Co., Limited
Life Electric Appliance Shenzhen Konka Life Electric Appliance Co., Ltd.
Mudanjiang Appliances Mudanjiang Arctic Ocean Appliances Co., Ltd.
Konka Europe Konka Europe GmbH
Commercial System Technology Shenzhen Konka Commercial System Technology Co., Ltd.
Konka Electrical Appliances Shenzhen Konka Electrical Appliances Co., Ltd.
Konka Material Hainan Konka Material Technology Co., Ltd.
Mobile Interconnection Shenzhen Konka Mobile Interconnection Technology Co., Ltd.
Sichuan Konka Sichuan Konka Smart Terminal Technology Co., Ltd

Konka Group Co., Ltd. Annual Report 2019
5
Yibin Smart Yibin Konka Smart Technology Co., Ltd.
Anhui Tongchuang Anhui Konka Tongchuang Electrical Appliances Co., Ltd.
Anhui Electrical Appliance Anhui Konka Electrical Appliance Technology Co., Ltd.
Frestec Refrigeration Henan Frestec Refrigeration Appliance Co., Ltd.
Frestec Smart Henan Frestec Smart Eco Electrical Appliances Co., Ltd.
Frestec Electrical Appliances Henan Frestec Electrical Appliances Co., Ltd.
Frestec Household Appliances Henan Frestec Household Appliances Co., Ltd.
Pengrun Technology Shenzhen Konka Pengrun Technology & Industry Co., Ltd.
Jiaxin Technology Jiaxin Technology Co., Ltd.
E3info E3info (Hainan) Technology Co., Ltd.
Yifang Technology Shenzhen Konka Yifang Technology Co., Ltd.
Dongguan Packing Dongguan Konka Packing Materials Co., Ltd.
E2info Shenzhen E2info Network Technology Co., Ltd.
E2info (Hainan) E2info (Hainan) Network Technology Co., Ltd.
Beijing Konka Electronic Beijing Konka Electronic Co., Ltd.
Konka Leasing Konka Financial Leasing (Tianjin) Co., Ltd.
Fittings Technology Shenzhen Konka Electronic Fittings Technology Co., Ltd.
Boluo Konka Precision Boluo Konka Precision Technology Co., Ltd.
Xiamen Dalong Xiamen Dalong Trading Co., Ltd.
Boluo Konka Boluo Konka PCB Co., Ltd.
Hong Kong Konka Hong Kong Konka Limited
Konka Electrical Appliances Investment Konka Electrical Appliances Investment & Development Co., Ltd.
Chain Kingdom Memory Technologies Chain Kingdom Memory Technologies Co., Limited
Chain Kingdom Memory Technologies
(Shenzhen)Chain Kingdom Memory Technologies (Shenzhen) Co., Ltd.
Hefei KONSEMI Hefei KONSEMI Storage Technology Co., Ltd.
Konka SmartTech Konka SmartTech Limited
Kangjietong Kangjietong (Hong Kong) Limited
Konka Electrical Appliances International Trading Konka Electrical Appliances International Trading Co., Ltd.
Kanghao Technology Kanghao Technology Co., Ltd.
Yuekang Semiconductor Yuekang Semiconductor Technology (Yantai) Co., Ltd.
Konka North America Konka North America LLC
Konka Investment Shenzhen Konka Investment Holding Co., Ltd.
Yibin Konka Technology Park Yibin Konka Technology Park Operation Co., Ltd.
Industrial New Town Sichuan Konka Industrial New Town Development Co., Ltd.
Konka Capital Shenzhen Konka Capital Equity Investment Management Co., Ltd.
Konka Group Co., Ltd. Annual Report 2019
6
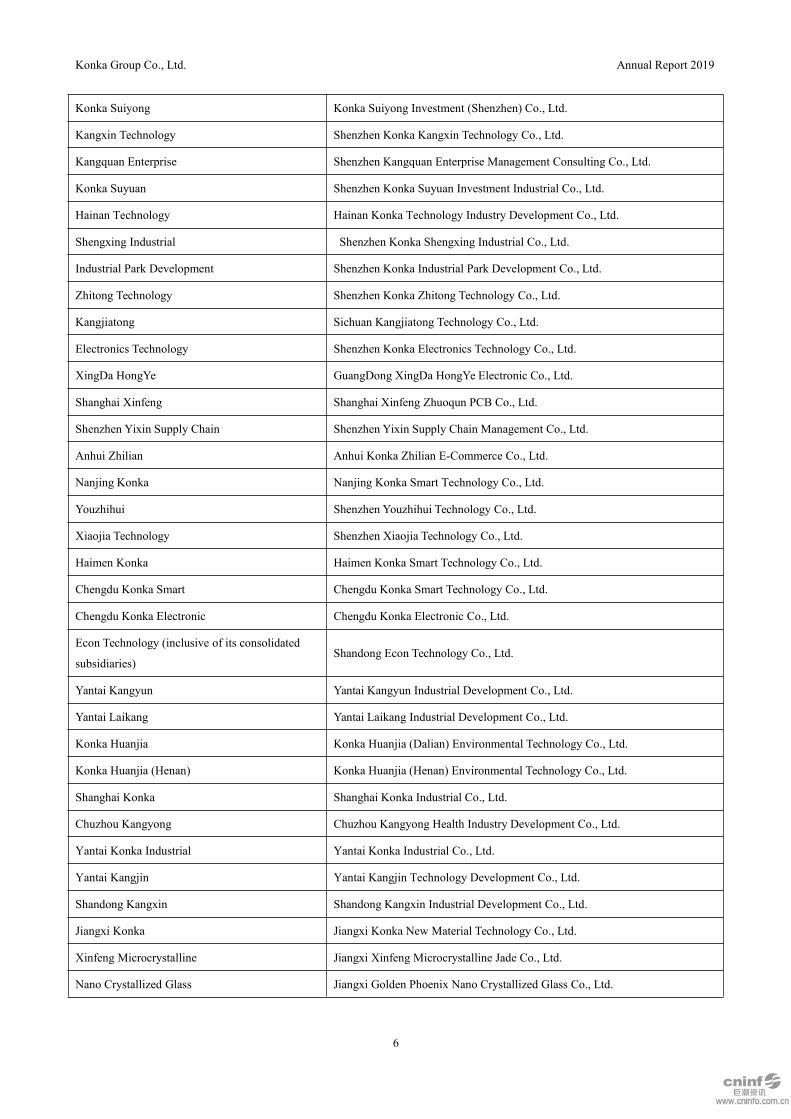
Konka Suiyong Konka Suiyong Investment (Shenzhen) Co., Ltd.
Kangxin Technology Shenzhen Konka Kangxin Technology Co., Ltd.
Kangquan Enterprise Shenzhen Kangquan Enterprise Management Consulting Co., Ltd.
Konka Suyuan Shenzhen Konka Suyuan Investment Industrial Co., Ltd.
Hainan Technology Hainan Konka Technology Industry Development Co., Ltd.
Shengxing Industrial Shenzhen Konka Shengxing Industrial Co., Ltd.
Industrial Park Development Shenzhen Konka Industrial Park Development Co., Ltd.
Zhitong Technology Shenzhen Konka Zhitong Technology Co., Ltd.
Kangjiatong Sichuan Kangjiatong Technology Co., Ltd.
Electronics Technology Shenzhen Konka Electronics Technology Co., Ltd.
XingDa HongYe GuangDong XingDa HongYe Electronic Co., Ltd.
Shanghai Xinfeng Shanghai Xinfeng Zhuoqun PCB Co., Ltd.
Shenzhen Yixin Supply Chain Shenzhen Yixin Supply Chain Management Co., Ltd.
Anhui Zhilian Anhui Konka Zhilian E-Commerce Co., Ltd.
Nanjing Konka Nanjing Konka Smart Technology Co., Ltd.
Youzhihui Shenzhen Youzhihui Technology Co., Ltd.
Xiaojia Technology Shenzhen Xiaojia Technology Co., Ltd.
Haimen Konka Haimen Konka Smart Technology Co., Ltd.
Chengdu Konka Smart Chengdu Konka Smart Technology Co., Ltd.
Chengdu Konka Electronic Chengdu Konka Electronic Co., Ltd.
Econ Technology (inclusive of its consolidated
subsidiaries)Shandong Econ Technology Co., Ltd.
Yantai Kangyun Yantai Kangyun Industrial Development Co., Ltd.
Yantai Laikang Yantai Laikang Industrial Development Co., Ltd.
Konka Huanjia Konka Huanjia (Dalian) Environmental Technology Co., Ltd.
Konka Huanjia (Henan) Konka Huanjia (Henan) Environmental Technology Co., Ltd.
Shanghai Konka Shanghai Konka Industrial Co., Ltd.
Chuzhou Kangyong Chuzhou Kangyong Health Industry Development Co., Ltd.
Yantai Konka Industrial Yantai Konka Industrial Co., Ltd.
Yantai Kangjin Yantai Kangjin Technology Development Co., Ltd.
Shandong Kangxin Shandong Kangxin Industrial Development Co., Ltd.
Jiangxi Konka Jiangxi Konka New Material Technology Co., Ltd.
Xinfeng Microcrystalline Jiangxi Xinfeng Microcrystalline Jade Co., Ltd.
Nano Crystallized Glass Jiangxi Golden Phoenix Nano Crystallized Glass Co., Ltd.

Konka Group Co., Ltd. Annual Report 2019
7
Shenzhen Nianhua Shenzhen Nianhua Enterprise Management Co., Ltd.
Shenzhen KONSEMI Shenzhen KONSEMI Co., Ltd.
Shenzhen Meixin Shenzhen Meixin Semiconductor Technology Co., Ltd.
Zhengmao Semiconductor Chongqing Zhengmao Semiconductor Co., Ltd.
Hefei KONSEMI Hefei KONSEMI Storage Technology Co., Ltd.
Yihe Electronic Hefei Yihe Electronic Co., Ltd.
Chongqing Konka Chongqing Konka Technology Development Co., Ltd.
Shenzhen Huiying Technology Shenzhen Konka Huiying Technology Co., Ltd.
Chongqing Huiying Technology Chongqing Konka Huiying Technology Co., Ltd.
Konka Eco-Development Shenzhen Konka Eco-Development Investment Co., Ltd.
Suining Konka Industrial Park Suining Konka Industrial Park Development Co., Ltd.
Konka Ronghe Konka Ronghe Industrial Technology (Foshan) Co., Ltd.
Suining Electronic Technological Innovation Suining Konka Electronic Technological Innovation Co., Ltd.
Dongguan Konka Investment Dongguan Konka Investment Co., Ltd.
Shenzhen Chuangzhi Electrical Appliances Shenzhen Konka Chuangzhi Electrical Appliances Co., Ltd.
Kanghong (Yantai) Environmental Kanghong (Yantai) Environmental Technology Co., Ltd.
Kanghong (Yantai) Environmental Technology
ParkKanghong (Yantai) Environmental Technology Park Co., Ltd.
Chongqing Kangxingrui Chongqing Kangxingrui Environmental Technology Co., Ltd.
Chongqing Optoelectronic Technology Research
InstituteChongqing Konka Optoelectronic Technology Research Institute Co., Ltd.
Xinying Semiconductor Konka Xinying Semiconductor Technology (Shenzhen) Co., Ltd.
Jiangkang (Shanghai) Technology Jiangkang (Shanghai) Technology Co., Ltd.
Chongqing Property Development Chongqing Konka Property Development Co., Ltd.
Chongqing Xingyi Property Development Chongqing Konka Xingyi Property Development Co., Ltd.
Chongqing Fuze Property Chongqing Konka Fuze Property Co., Ltd.
Ningbo Kanghanrui Electrical Appliances Ningbo Kanghanrui Electrical Appliances Co., Ltd.
Konka Intelligent Manufacturing Shenzhen Konka Intelligent Manufacturing Technology Co., Ltd.
Debao New Material Anhui Konka Debao New Material Technology Co., Ltd.
Suining Jiarun Property Suining Jiarun Property Co., Ltd.
Chuzhou Kangxin Health Industry Chuzhou Kangxin Health Industry Development Co., Ltd.
Kangxinlong Environmental Protection Hubei Kangxinlong Environmental Protection Co., Ltd.
CSRC The China Securities Regulatory Commission
SZSE The Shenzhen Stock Exchange
CSRC Shenzhen The Shenzhen Bureau of the China Securities Regulatory Commission
Konka Group Co., Ltd. Annual Report 2019
8
RMB, RMB’0,000, RMB’00,000,000Expressed in the Chinese currency of Renminbi, expressed in tens of thousands
of Renminbi, expressed in hundreds of millions of Renminbi
Konka Group Co., Ltd. Annual Report 2019
9
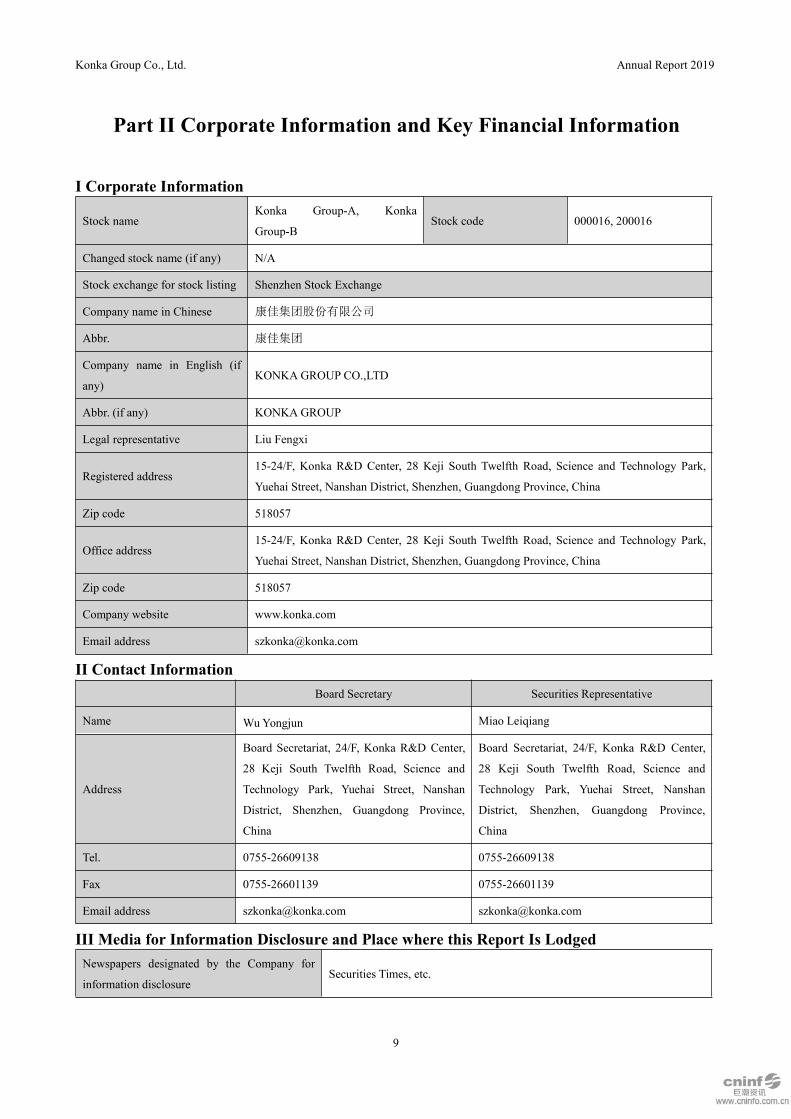
Part II Corporate Information and Key Financial Information
I Corporate Information
Stock nameKonka Group-A, Konka
Group-BStock code 000016, 200016
Changed stock name (if any) N/A
Stock exchange for stock listing Shenzhen Stock Exchange
Company name in Chinese 康佳集团股份有限公司
Abbr. 康佳集团
Company name in English (if
any)KONKAGROUP CO.,LTD
Abbr. (if any) KONKAGROUP
Legal representative Liu Fengxi
Registered address15-24/F, Konka R&D Center, 28 Keji South Twelfth Road, Science and Technology Park,
Yuehai Street, Nanshan District, Shenzhen, Guangdong Province, China
Zip code 518057
Office address15-24/F, Konka R&D Center, 28 Keji South Twelfth Road, Science and Technology Park,
Yuehai Street, Nanshan District, Shenzhen, Guangdong Province, China
Zip code 518057
Company website www.konka.com
Email address [email protected]
II Contact InformationBoard Secretary Securities Representative
Name WuYongjun Miao Leiqiang
Address
Board Secretariat, 24/F, Konka R&D Center,
28 Keji South Twelfth Road, Science and
Technology Park, Yuehai Street, Nanshan
District, Shenzhen, Guangdong Province,
China
Board Secretariat, 24/F, Konka R&D Center,
28 Keji South Twelfth Road, Science and
Technology Park, Yuehai Street, Nanshan
District, Shenzhen, Guangdong Province,
China
Tel. 0755-26609138 0755-26609138
Fax 0755-26601139 0755-26601139
Email address [email protected] [email protected]
III Media for Information Disclosure and Place where this Report Is LodgedNewspapers designated by the Company for
information disclosureSecurities Times, etc.
Konka Group Co., Ltd. Annual Report 2019
10
Website designated by CSRC for publication of
this Reporthttp://www.cninfo.com.cn/new/index
Place where this Report is lodged
Board Secretariat, 24/F, Konka R&D Center, 28 Keji South Twelfth Road,
Science and Technology Park, Yuehai Street, Nanshan District, Shenzhen,
Guangdong Province, China
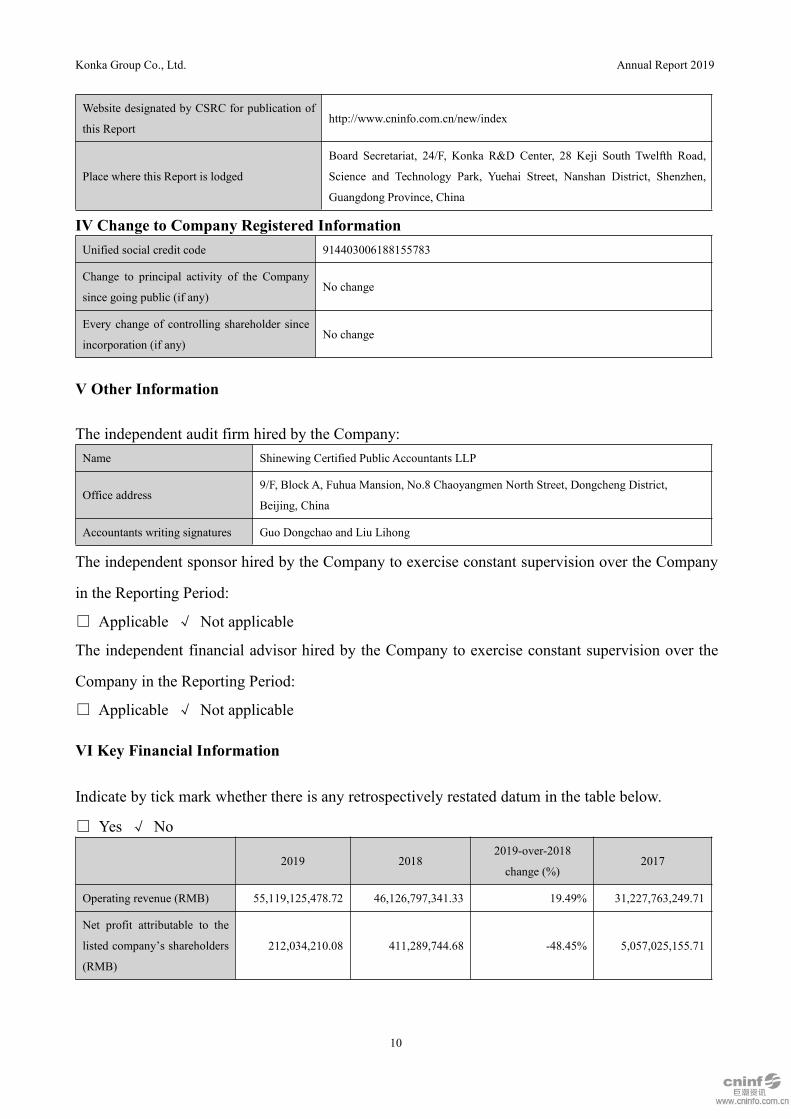
IV Change to Company Registered InformationUnified social credit code 914403006188155783
Change to principal activity of the Company
since going public (if any)No change
Every change of controlling shareholder since
incorporation (if any)No change
V Other Information
The independent audit firm hired by the Company:Name Shinewing Certified Public Accountants LLP
Office address9/F, Block A, Fuhua Mansion, No.8 Chaoyangmen North Street, Dongcheng District,
Beijing, China
Accountants writing signatures Guo Dongchao and Liu Lihong
The independent sponsor hired by the Company to exercise constant supervision over the Company
in the Reporting Period:
□ Applicable √ Not applicable
The independent financial advisor hired by the Company to exercise constant supervision over the
Company in the Reporting Period:
□ Applicable √ Not applicable
VI Key Financial Information
Indicate by tick mark whether there is any retrospectively restated datum in the table below.
□ Yes √ No
2019 20182019-over-2018
change (%)2017
Operating revenue (RMB) 55,119,125,478.72 46,126,797,341.33 19.49% 31,227,763,249.71
Net profit attributable to the
listed company’s shareholders
(RMB)
212,034,210.08 411,289,744.68 -48.45% 5,057,025,155.71
Konka Group Co., Ltd. Annual Report 2019
11
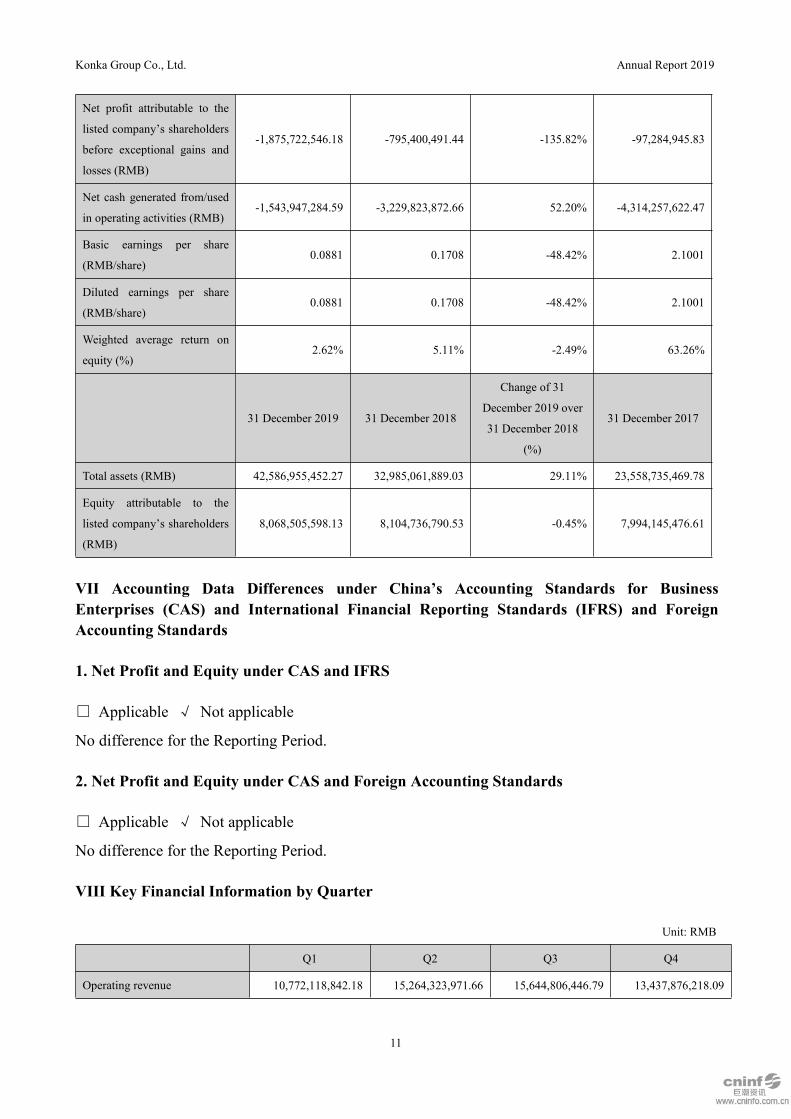
Net profit attributable to the
listed company’s shareholders
before exceptional gains and
losses (RMB)
-1,875,722,546.18 -795,400,491.44 -135.82% -97,284,945.83
Net cash generated from/used
in operating activities (RMB)-1,543,947,284.59 -3,229,823,872.66 52.20% -4,314,257,622.47
Basic earnings per share
(RMB/share)0.0881 0.1708 -48.42% 2.1001
Diluted earnings per share
(RMB/share)0.0881 0.1708 -48.42% 2.1001
Weighted average return on
equity (%)2.62% 5.11% -2.49% 63.26%
31 December 2019 31 December 2018
Change of 31
December 2019 over
31 December 2018
(%)
31 December 2017
Total assets (RMB) 42,586,955,452.27 32,985,061,889.03 29.11% 23,558,735,469.78
Equity attributable to the
listed company’s shareholders
(RMB)
8,068,505,598.13 8,104,736,790.53 -0.45% 7,994,145,476.61
VII Accounting Data Differences under China’s Accounting Standards for BusinessEnterprises (CAS) and International Financial Reporting Standards (IFRS) and ForeignAccounting Standards
1. Net Profit and Equity under CAS and IFRS
□ Applicable √ Not applicable
No difference for the Reporting Period.
2. Net Profit and Equity under CAS and Foreign Accounting Standards
□ Applicable √ Not applicable
No difference for the Reporting Period.
VIII Key Financial Information by Quarter
Unit: RMB
Q1 Q2 Q3 Q4
Operating revenue 10,772,118,842.18 15,264,323,971.66 15,644,806,446.79 13,437,876,218.09

Konka Group Co., Ltd. Annual Report 2019
12
Net profit attributable to the
listed company’s shareholders85,566,720.43 267,200,300.30 97,725,667.63 -238,458,478.28
Net profit attributable to the
listed company’s shareholders
before exceptional gains and
losses
-418,684,690.19 -204,226,943.38 -423,396,028.22 -829,414,884.39
Net cash generated from/used in
operating activities-540,740,144.72 -1,502,216,027.05 -529,623,670.17 1,028,632,557.35
Indicate by tick mark whether any of the quarterly financial data in the table above or their
summations differs materially from what have been disclosed in the Company’ s quarterly or
interim reports.
□ Yes √ No
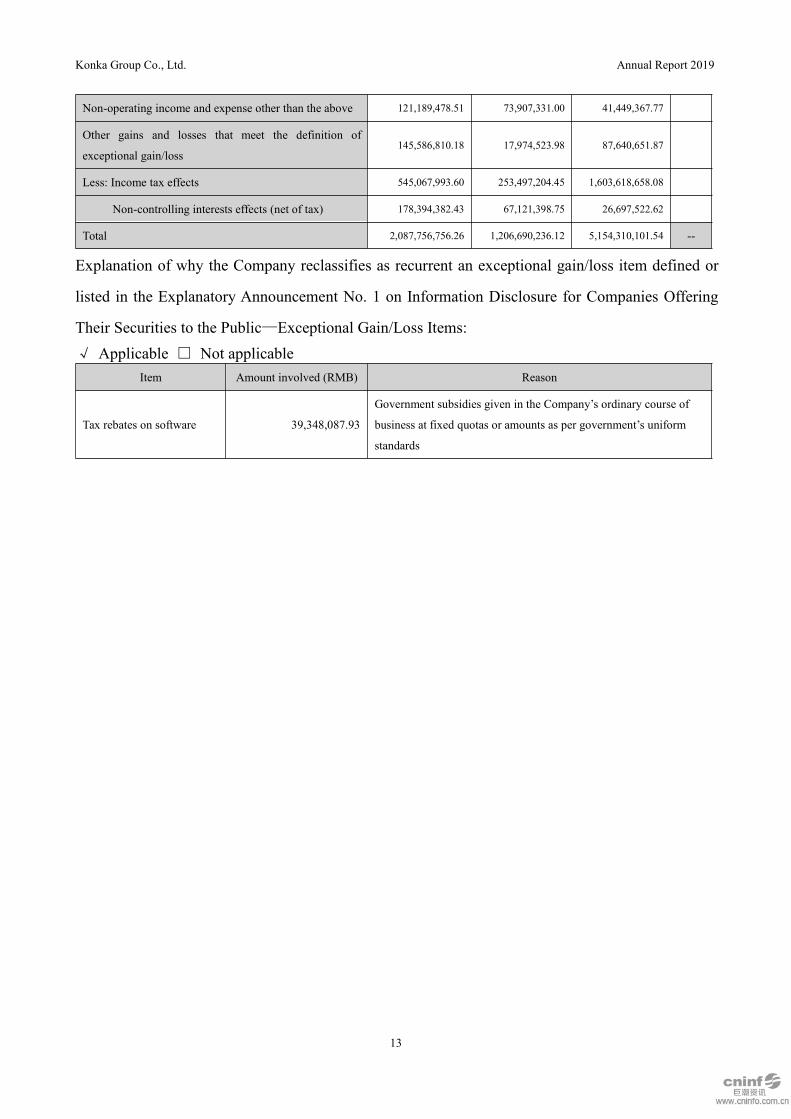
IX Exceptional Gains and Losses
√ Applicable □ Not applicable
Unit: RMB
Item 2019 2018 2017 Note
Gain or loss on disposal of non-current assets (inclusive
of impairment allowance write-offs)1,202,401,420.41 732,818,574.90 6,470,215,253.82
Government subsidies charged to current profit or loss
(exclusive of government subsidies given in the
Company’s ordinary course of business at fixed quotas
or amounts as per the government’s uniform standards)
1,204,519,346.40 259,609,022.27 178,372,701.34
Gain equal to the amount by which investment costs for
the Company to obtain subsidiaries, associates and joint
ventures are lower than the Company’ s enjoyable fair
value of identifiable net assets of investees when making
investments
0.00 220,045,229.63
Gain or loss on assets entrusted to other entities for
investment or management71,541,978.85 182,022,653.32 70,070,846.08
Gain or loss on debt restructuring 14,515,006.57
Gain or loss on fair-value changes in held-for-trading and
derivative financial assets and liabilities & income from
disposal of held-for-trading and derivative financial
assets and liabilities and other investments in debt
obligations (exclusive of the effective portion of hedges
that arise in the Company’s ordinary course of business)
49,472,415.17 39,542,461.74 -63,931,276.14
Gain or loss on loan entrustments 1,992,676.20 1,389,042.48 808,737.50
Konka Group Co., Ltd. Annual Report 2019
13
Non-operating income and expense other than the above 121,189,478.51 73,907,331.00 41,449,367.77
Other gains and losses that meet the definition of
exceptional gain/loss145,586,810.18 17,974,523.98 87,640,651.87
Less: Income tax effects 545,067,993.60 253,497,204.45 1,603,618,658.08
Non-controlling interests effects (net of tax) 178,394,382.43 67,121,398.75 26,697,522.62
Total 2,087,756,756.26 1,206,690,236.12 5,154,310,101.54 --
Explanation of why the Company reclassifies as recurrent an exceptional gain/loss item defined or
listed in the Explanatory Announcement No. 1 on Information Disclosure for Companies Offering
Their Securities to the Public—Exceptional Gain/Loss Items:√ Applicable □ Not applicable
Item Amount involved (RMB) Reason
Tax rebates on software 39,348,087.93
Government subsidies given in the Company’s ordinary course of
business at fixed quotas or amounts as per government’s uniform
standards
Konka Group Co., Ltd. Annual Report 2019
14
Part III Business Summary
I Principal Activity of the Company in the Reporting Period
(I) The Consumer Electronic DivisionThis division primarily comprises the multimedia sub-division, the white goods sub-division andthe mobile phone sub-division, with details as follows:1. The Multimedia Sub-DivisionThe Company provides multimedia products and services, including colour TVs and Internet TVservices, for both domestic and overseas markets.The domestic sales of the Company’s colour TVs are realized mainly through B2B(Business-to-Business) and B2C (Business-to-Consumer), with its branch companies, businessdepartments and after-sales maintenance points operating across the country. And the Companyprofits from the margins between the costs and the selling prices of its colour TVs.As for selling its colour TVs abroad, the Company mainly relies on B2B. Its colour TVs are sold toAsia Pacific, Middle East, Central & South America, East Europe, etc. And operating profit sourceis also the differences between the costs and the selling prices of its colour TVs.Internet business is based on the intelligent TV terminals sold by our company. It mainly carries outthree aspects of business. Firstly, it works with other Internet companies to provide end users with,among other content, video, educational, music, medical and game content to generate earnings.Secondly, it analyses user behaviours and offer certain free, interactive services to increaseattractiveness to users, promote its brand and stimulate desire for its hardware products. Finally, it istrying to build an Internet TV platform with tens of millions of users, on which it will profit throughcommercial and application distribution. This Internet TV business is key to the Company’sInternet-oriented transformation and upgrade to a development model of “hardware + software” and“smart TV + end users”.2. The White Goods Sub-Division
The white goods produced by the Company mainly include refrigerators, washing machines, air conditioners,
freezers, etc., which are sold through B2B and B2C mainly to the domestic market. And the Company profits from
the margins between the costs and the selling prices of its white goods.
3. The Mobile Phone Sub-DivisionThe mobile phones of the Company are sold to both the domestic and overseas markets. Theoverseas sales mainly rely on B2B and the profit comes from the margins between the costs and theselling prices of the mobile phones. As for the domestic sales of its mobile phones, the Companyrelies on B2B and B2C, and profits mainly from the costs and the selling prices of its products and

Konka Group Co., Ltd. Annual Report 2019
15
slightly from the related value added services.(II) The Industry Trade BusinessIn the industry trade business, the Company benefits from purchasing and processing IC chips, LCD screens, etc., which are raw materials in its traditional core business, from upstream suppliers andselling them to downstream customers. The industry trade business can help the Company establishgood relationships with its upstream suppliers and downstream customers, and keep it informed ofprices of the materials used in its production for better cost control over its existing products.(III) The Environmental Protection DivisionCurrently, this business focuses on water treatment, recycling of renewable resources and the newmaterial of glass ceramic. Water engineering PPP (Public-Private Partnership) projects areundertaken under BOT (Build-Operate-Transfer) or EPC (Energy Performance Contracting) models.Renewable resources are collected, sorted, processed, distributed and sold. And glass ceramicproducts are developed, produced and marketed.(IV) The Semi-Conductor DivisionCurrently, the Company is engaged in storage, optoelectronics, etc. with respect to thesemi-conductor business. In storage, the Company primarily designs and markets master storagechips, and intends to engage in packaging and testing of storage products. In optoelectronics, theCompany primarily develops Micro LED-related products.
II Significant Changes in Major Assets
1. Significant Changes in Major Assets
Major
assetsMain reason for significant changes
Equity
assets
Up 31.38% as at 31 December 2019 compared to 31 December 2018, primarily driven by the reclassification of
equity interests in formerly consolidated subsidiary to a long-term equity investment measured at fair value due to
loss of control, and new investments in equity interests in associates.
Fixed assets No significant change
Intangible
assets
Up 64.45% as at 31 December 2019 compared to 31 December 2018, primarily driven by the RMB450 million of
land use rights purchased by the Smart factory business in 2019
Constructio
n in
progress
Up 97.14% as at 31 December 2019 compared to 31 December 2018, primarily driven by the commencement of
construction of certain PPP projects in 2019 in the environmental protection business
2. Major Assets Overseas
□ Applicable √ Not applicable

Konka Group Co., Ltd. Annual Report 2019
16
III Core Competitiveness Analysis
The Company’s core competitiveness lies in its R&D ability, brand, marketing network and humanresources. It has developed a three-level R&D system of “Konka Research Institute-MultimediaR&D Centre-specialized design institutes”, with close to 100 core technologies and approximately1,500 R&D personnel. Meanwhile, it has introduced approximately 100 technological professionalsfor its two programs of Micro LED and master storage chips. It also boasts a strong brand presenceamong consumers, as well as among banks and other financing channels. Additionally, its domesticmarketing and service network, including more than 60 branch companies, over 200 offices andabout 3,000 after-sales service stations across the country, directly connect to around 3,000 retailterminals, along with a well-established overseas marketing network. Meanwhile, it has high-levelpersonnel with years of rich management and industry experience, as well as a high-quality teamwith strong execution capabilities.
Konka Group Co., Ltd. Annual Report 2019
17
Part IV Operating Performance Discussion and Analysis
I Overview
In 2019, the Company carried on with its long-term development strategy of “Technology +Industry + Park”. It strengthened the capability of independent innovation, deepened thedevelopment of core technologies, vigorously promoted emerging businesses, as well as devoteditself to business restructuring and transformation. These efforts have produced good results. Thecolor TV business of the Company reported a loss due to rising costs, fiercer competition, etc. For2019, the Company recorded operating revenue of RMB55.119 billion, up 19.49% year-on-year.Net profit attributable to the Company as the parent stood at RMB212 million, representing ayear-on-year drop of 48.45%. What the Company has accomplished in 2019 is summarized asfollows:(I) Continuously Increase the R&D Investment and Boost the Technical InnovationIn 2019, the Company invested RMB501 million in R&D, up 26.27% year-on-year. As a result, theCompany made the following R&D achievements: the National Second Prize for Progress inScience and Technology was awarded to the Company’s programme the Digital TV BroadcastSystem and the Domestication of Core Chips; the programme led by the Company the Research andIndustrialization of the Next-generation Internet Intelligent Terminal Key Technology won theGuangdong Provincial Second Prize for Progress in Science and Technology; the programmeindependently completed by the Company the Research and Industrialization of Key QualityManagement Technologies for Food in Refrigerators won the Third Prize for Progress in Scienceand Technology of the China Light Industry Council; the 8K Equipment End-to-End SignalConnection Key Technology and R&D of Terminal Display Products was included in the Key R&DProgrammes of Guangdong Province; the Company cooperatively completed the programmeNon-point River Basin Pollution Cause Analysis and Control Key Technology and won the NationalSecond Prize for the Environmental Protection. In order to promote industry-university-researchcooperation, introduce and gather high-level talents, and enhance independent innovation and corecompetitiveness, in the report period the Company established the Academician Workstationtogether with Academician Li Jiachun.(II) Continue the Brand ConstructionIn 2019, the Company aimed at building its international and technology-based corporate image andmaking its brand more attractive to young and high-end oriented. In order to revitalize the Konkabrand, the Company applied various strategies, initiated the CCTV National Brand Plan, signed acooperation contract with Lu Han, a top star, and boosted its brand upgrading by launching the
Konka Group Co., Ltd. Annual Report 2019
18
sub-brand Aphaea and reshaping the Frestech Electric brand. Throughout the year, the Companyinvested approximately RMB460 million in branding, up 31.57% year-on-year, and madeunremitting effort to build its new image--an international high-end brand more attractive to youngthrough scientific and technological innovations.(III) Various Industrial Park Projects were Implemented.In 2019, various industrial park projects of the Company were implemented to facilitate andguarantee its strategic transformation and upgrading and expansion of emerging industries,including Konka (Chuzhou) Smart Appliances and Equipment Industrial Park, Yibin Konka SmartTerminal High-Tech Park, Dongguan Konka Smart Industrial Park, Chongqing KonkaSemi-conductor Optoelectronics Industrial Park, Suining Konka Electronic Technology IndustrialPark, Konka Chuzhou Technological Innovation Centre, Yantai Great Health Accelerator IndustrialPark, and Haimen Headquarter for Eastern China etc..(IV) Promote the Core Competitiveness through the Micro LED Layout.In June 2019, the Company entered a cooperation agreement with Chongqing Bishan DistrictPeople’s Government with the proposal of building Chongqing Konka Semi-conductorOptoelectronics Industrial Park; in September 2019, the Company formally established its holdingsubsidiary Chongqing Konka Optoelectric Technology Institute Co., Ltd. specialized in the R&D,design and production of Micro LED. Nowadays, in the field of Micro LED, the Company areapplying 99 patents, and its independently-developed Micro LED Display Screen and Micro LEDlight-emitting chip have been successfully illuminated in the laboratory.(V) Business Operation Highlights1. Industrial Product Division(1) The Multimedia Sub-divisionIn 2019, the Company’s multimedia business launched its high-end sub-brand Aphaea. Besides, theCompany vigorously expanded the overseas operation of its self-owned brand, and established ajoint venture company in Egypt to realize the localized operation. The Company also set up amarketing company in the U.S.A, laying a good foundation for its global layout.(2) The White Goods Sub-divisionAfter the acquisition of Frestec Electrical Appliances, the Company internally optimized the R&D,purchasing, production, sales and after-sales service of the white goods. Externally, the Companyintegrated various channel resources, realized the reuse of channels owned by upstream suppliersand downstream suppliers between Frestec Electric and Konka, continuously improved the productmarketing structure, strengthened the online channel management and enhanced the managementquality. In the year, the Company’s white goods business achieved operating revenue of RMB3.829billion, up 79.97% year-on-year.(3) The Environmental Protection Technology Sub-division

Konka Group Co., Ltd. Annual Report 2019
19
In 2019, in terms of the water treatment business, the Company won 14 bids with the bid-winningcontract amount exceeding RMB10 billion. As the Company always highlights the scientific andtechnological R&D and investment into the environmental protection business, it successfully setup the academician workstation and jointly established laboratories with various colleges anduniversities including Harbin Institute of Technology. In addition, the Company cooperativelycompleted the programme Non-point River Basin Pollution Cause Analysis and Control KeyTechnology and won the National Second Prize for the Environmental Protection.(4) The Semiconductor Technology Sub-divisionIn 2019, the Company developed its semi-conductor technology business step by step. On one hand,the Company established its holding subsidiary Chongqing Konka Optoelectric TechnologyInstitute Co., Ltd. in charge of the Micro LED business, and its independently-developed MicroLED Display Screen and Micro LED light-emitting chip have been successfully illuminated in thelaboratory; on the other hand, the storage main control chips independently developed by theCompany’s holding subsidiary Hefei Konsemi were put into volume production. The first batch ofchips (100,000) were sold out in December 2019. In addition, the company's memory chip testingbase has completed the preliminary planning, is expected to be in trial production at the end of2020.(5) The Mobile Internet Sub-divisionIn 2019, by means of the strategic analysis and operational adjustment, the Company’s mobileInternet business recorded a year-on-year growth of 16.97% in operating revenue, and graduallytransformed from the manufacturing and sales of mobile phones into a provider of multipleintelligent terminal solutions.(6) The PCB Sub-divisionIn May 2019, the Company established the PCB Business Division. By means of the industrialstructure establishment, the resources integration, the industrial park upgrading and the overalllayout, the Company increased the product scale and propelled its high-end orientation.2. Technology Park DivisionIn 2019, the Company vigorously promoted the strategy of “Technology+Industry+Park”,continuously developed new projects and accelerated the construction of various projects. Forexample, the lands for the construction of Konka (Chuzhou) Smart Appliances and EquipmentIndustrial Park and Yibin Konka Smart Terminal High-Tech Park were obtained, and the workshopbuilding was capped; as the lands for the construction of Dongguan Konka Smart Industrial Park,Chongqing Konka Semi-conductor Optoelectronics Industrial Park, Yancheng SemiconductorPackaging and Testing Base, Suining Konka Electronic Technology Industrial Park were obtained,they are now under construction. Meanwhile, great effort is also made to positively implement otherindustrial park projects including the transformed Wankang Town and Guxian Environmental

Konka Group Co., Ltd. Annual Report 2019
20
Protection Technology Town etc..3. Platform Service Division(1) The Industry Trade BusinessIn 2019, the company's industrial and trade business will further expand to the processing link:through cooperation with leading enterprises in the industry, the company established Anhuikangjiadebao New Material Technology Co., Ltd. in 2019, which plans to face the home appliance,automobile, office equipment, plastic packaging market, carry out the production and sales ofmodified plastics, and gradually explore the field of high-end modified plastics to improve productsCard value.(2) The Internet Sub-divisionIn 2019, through positively adjusting the strategies and optimizing the business structure, theCompany successfully sought various channels for acquiring traffics, and achieved revenue ofRMB590 million with a gross profit of RMB230 million in its Internet business.4. Financial Investment Division(1) The Investment Sub-divisionIn 2019, the Company emphasized the layout of key fields including semiconductors,environmental protection and new materials, and vigorously promoted the application of industrialfunds. In the same year, Orient Konka Industrial M&A Funds invested by the Company achieves atotal investment of RMB600 million, and the Company is also preparing other funds projects.However, the Company’s wholly-owned subsidiary Konka Capital has obtained correspondingqualification as the private equity and venture capital fund manager.(2) The Venture Capital Investment Sub-divisionUp to the end of 2019, the Company respectively set up 11 scientific innovation centers inShenzhen, Yantai, Nanjing, Guiyang, Chengdu, Yibin, Dayi and Kunming, and established 7 officesin Chicago and Silicon Valley etc.. At present, the Company has successively built 15 incubators forits scientific innovation business and 82 enterprises are incubating.
II Core Business Analysis
(I) Overview
See “I Overview” above.
(II) Revenue and Cost Analysis
1. Breakdown of Operating Revenue
Unit: RMB

Konka Group Co., Ltd. Annual Report 2019
21
2019 2018
Change (%)Operating revenue
As % of total
operating revenue (%)Operating revenue
As % of total
operating revenue (%)
Total 55,119,125,478.72 100% 46,126,797,341.33 100% 19.49%
By operating division
Electronics 14,746,927,518.74 26.75% 13,170,227,703.47 28.55% 11.97%
The Industry Trade B
usiness32,744,925,411.86 59.41% 28,348,817,442.89 61.46% 15.51%
Environmental
protection7,079,397,665.91 12.84% 3,020,514,260.13 6.55% 134.38%
Other 547,874,882.21 0.99% 1,587,237,934.84 3.44% -65.48%
By product category
Colour TVs 8,765,607,417.92 15.90% 9,892,486,636.93 21.45% -11.39%
Mobile phones 387,519,655.81 0.70% 331,298,592.29 0.72% 16.97%
White goods 3,829,318,820.56 6.95% 2,127,731,143.29 4.61% 79.97%
The Industry Trade B
usiness32,744,925,411.86 59.41% 28,348,817,442.89 61.46% 15.51%
Environmental
protection7,079,397,665.91 12.84% 3,020,514,260.13 6.55% 134.38%
Other 2,312,356,506.66 4.20% 2,405,949,265.80 5.22% -3.89%
By operating segment
Domestic 20,324,715,174.80 36.87% 16,868,143,462.93 36.57% 20.49%
Overseas 34,794,410,303.92 63.13% 29,258,653,878.40 63.43% 18.92%
2. Operating Division, Product Category or Operating Segment Contributing over 10% ofOperating Revenue or Operating Profit
√ Applicable □ Not applicable
Unit: RMB
Operating
revenueCost of sales
Gross profit
margin
YoY change in
operating revenue
(%)
YoY change in
cost of sales (%)
YoY change in
gross profit
margin (%)
By operating division
Electronics 14,746,927,518.74 13,118,800,956.63 11.04% 11.97% 16.52% -3.48%
The Industry Trad
e Business32,744,925,411.86 32,376,857,384.01 1.12% 15.51% 15.35% 0.13%

Konka Group Co., Ltd. Annual Report 2019
22
Environmental
protection7,079,397,665.91 6,379,216,880.51 9.89% 134.38% 142.14% -2.89%
By product category
Colour TVs 8,765,607,417.92 8,005,508,211.90 8.67% -11.39% -7.87% -3.49%
Supply chain
management32,744,925,411.86 32,376,857,384.01 1.12% 15.51% 15.35% 0.13%
Environmental
protection7,079,397,665.91 6,379,216,880.51 9.89% 134.38% 142.14% -2.89%
By operating segment
Domestic 20,324,715,174.80 17,807,235,103.96 12.39% 20.49% 21.60% -0.80%
Overseas 34,794,410,303.92 34,330,963,397.07 1.33% 18.92% 20.11% -0.98%
Core business data of the prior year restated according to the changed statistical caliber for theReporting Period:□ Applicable √ Not applicable3. Whether Revenue from Physical Sales Is Higher than Service Revenue√ Yes □ NoOperating division Item Unit 2019 2018 Change (%)
Electronics
Unit sales 0,000 units 1,434 1,232 16.40%
Output 0,000 units 1,523 1,063 15.05%
Inventory 0,000 units 105 129 -18.60%
Any over 30% YoYmovements in the data above and why:□ Applicable √ Not applicable4. Execution Progress of Major Signed Sales Contracts in the Reporting Period□Applicable √ Not applicable5. Breakdown of Cost of SalesBy product category
Unit: RMB
Product
categoryItem
2019 2018
Change
(%)Cost of salesAs % of total
cost of sales (%)Cost of sales
As % of total
cost of sales
(%)
Color TVs Color TVs 8,005,508,211.90 15.35% 8,689,731,404.20 20.10% -7.87%
Mobile phonesMobile
phones365,230,272.39 0.70% 327,425,343.91 0.76% 11.55%
White goods White goods 3,299,314,084.65 6.33% 1,767,282,597.98 4.09% 86.69%
Konka Group Co., Ltd. Annual Report 2019
23
The Industry Tr
ade Business
Supply chain
services32,376,857,384.01 62.10% 28,068,819,224.05 64.93% 15.35%
Environmental
protection
Environment
al protection6,379,216,880.51 12.24% 2,634,491,782.63 6.09% 142.14%
Other Other 1,712,071,667.58 3.28% 1,739,863,561.68 4.02% -1.60%
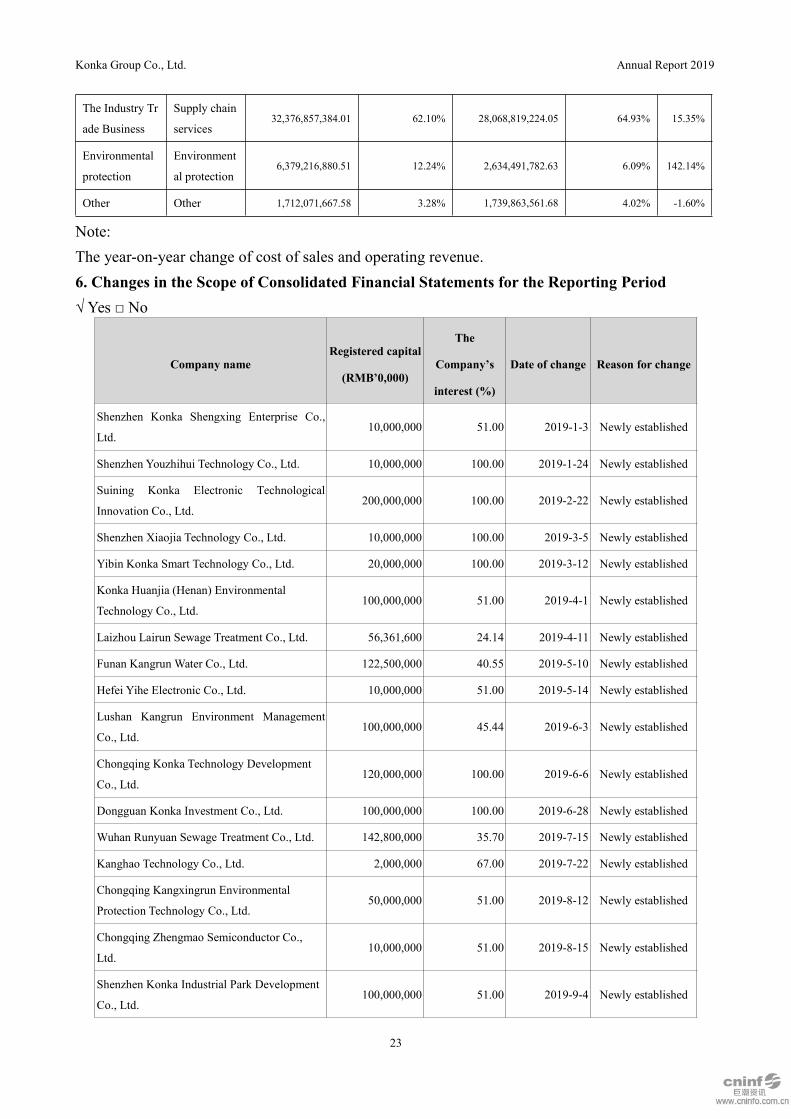
Note:The year-on-year change of cost of sales and operating revenue.6. Changes in the Scope of Consolidated Financial Statements for the Reporting Period√ Yes □ No
Company nameRegistered capital
(RMB’0,000)
The
Company’s
interest (%)
Date of change Reason for change
Shenzhen Konka Shengxing Enterprise Co.,
Ltd.10,000,000 51.00 2019-1-3 Newly established
Shenzhen Youzhihui Technology Co., Ltd. 10,000,000 100.00 2019-1-24 Newly established
Suining Konka Electronic Technological
Innovation Co., Ltd.200,000,000 100.00 2019-2-22 Newly established
Shenzhen Xiaojia Technology Co., Ltd. 10,000,000 100.00 2019-3-5 Newly established
Yibin Konka Smart Technology Co., Ltd. 20,000,000 100.00 2019-3-12 Newly established
Konka Huanjia (Henan) Environmental
Technology Co., Ltd.100,000,000 51.00 2019-4-1 Newly established
Laizhou Lairun Sewage Treatment Co., Ltd. 56,361,600 24.14 2019-4-11 Newly established
Funan Kangrun Water Co., Ltd. 122,500,000 40.55 2019-5-10 Newly established
Hefei Yihe Electronic Co., Ltd. 10,000,000 51.00 2019-5-14 Newly established
Lushan Kangrun Environment Management
Co., Ltd.100,000,000 45.44 2019-6-3 Newly established
Chongqing Konka Technology Development
Co., Ltd.120,000,000 100.00 2019-6-6 Newly established
Dongguan Konka Investment Co., Ltd. 100,000,000 100.00 2019-6-28 Newly established
Wuhan Runyuan Sewage Treatment Co., Ltd. 142,800,000 35.70 2019-7-15 Newly established
Kanghao Technology Co., Ltd. 2,000,000 67.00 2019-7-22 Newly established
Chongqing Kangxingrun Environmental
Protection Technology Co., Ltd.50,000,000 51.00 2019-8-12 Newly established
Chongqing Zhengmao Semiconductor Co.,
Ltd.10,000,000 51.00 2019-8-15 Newly established
Shenzhen Konka Industrial Park Development
Co., Ltd.100,000,000 51.00 2019-9-4 Newly established

Konka Group Co., Ltd. Annual Report 2019
24
Shenzhen Konka Chuangzhi Electric
Appliance Co., Ltd.10,000,000 100.00 2019-9-5 Newly established
Kanghong (Yantai) Environmental Protection
Technology Co., Ltd.30,000,000 51.00 2019-9-5 Newly established
Tongchuan Kangrun Honghui Environment
Management Co., Ltd.76,000,000 45.39 2019-9-10 Newly established
Konka North America LLC 1,000,000 100.00 2019-9-13 Newly established
Haimen Konka Smart Technology Co., Ltd 50,000,000 100.00 2019-9-29 Newly established
Boxing County Xingkang Environmental
Protection Technology Co., Ltd.100,000,000 35.70 2019-9-30 Newly established
Shenzhen Konka Huiying Technology Co.,
Ltd.50,000,000 51.00 2019-9-30 Newly established
Chongqing Konka Photoelectric Technology
Research Institute Co., Ltd.2,000,000,000 75.00 2019-9-30 Newly established
Shenzhen Konka Zhitong Technology Co., Ltd. 10,000,000 51.00 2019-10-9 Newly established
Konka Xinying Semiconductor Technology
(Shenzhen) Co., Ltd.100,000,000 56.00 2019-10-29 Newly established
Chongqing Konka Huiying Technology Co.,
Ltd.30,000,000 51.00 2019-10-30 Newly established
Jiangkang (Shanghai) Technology Co., Ltd. 20,000,000 51.00 2019-11-1 Newly established
E2info (Hainan) Network Technology Co., Ltd. 3,000,000 95.78 2019-11-6 Newly established
Chongqing Konka Properties Development
Co., Ltd.50,000,000 51.00 2019-11-7 Newly established
Kanghong (Yantai) Environmental Protection
Technology Industrial Park Co., Ltd.10,000,000 51.00 2019-11-18 Newly established
Chongqing Konka Xingyi Properties Co., Ltd. 50,000,000 51.00 2019-11-18 Newly established
Shenzhen Konka Kangxin Technology Co.,
Ltd.10,000,000 51.00 2019-11-21 Newly established
Chongqing Konka Fuze Properties Co., Ltd. 50,000,000 51.00 2019-11-21 Newly established
Suining Jiarun Properties Co., Ltd. 10,000,000 100.00 2019-11-26 Newly established
Shenzhen Konka Zhizao Technology Co., Ltd. 20,000,000 51.00 2019-11-29 Newly established
Anhui Konka Jiadebao New Material
Technology Co., Ltd.50,000,000 60.00 2019-11-29 Newly established
Yuekang Semiconductor Technology (Yantai)
Co., Ltd.100,000,000 100.00 2019-12-5 Newly established
Ningbo Kanghanrui Electrical Appliances Co.,
Ltd.150,000,000 60.00 2019-12-10 Newly established

Konka Group Co., Ltd. Annual Report 2019
25
Henan Frestec Smart Ecological Electrical
Appliance Co., Ltd.10,000,000 51.00 2019-12-11 Newly established
Hefei Chain Kingdom Memory Technologies
Co., Ltd.5,000,000 51.00 2019-12-18 Newly established
Chengdu Konka Smart Technology Co., Ltd. 50,000,000 100.00 2019-12-20 Newly established
Chengdu Konka Electronics Co., Ltd. 50,000,000 100.00 2019-12-20 Newly established
Hubei Kangxinlong Environmental Protection
Co., Ltd.30,000,000 51.00 2019-12-23 Newly established
Tingyuan Environmental Protection
Technology (Shanghai) Co., Ltd.50,000,000 51.00 2019-12-24 Newly established
Chuzhou Kangxin Health Industry
Development Co., Ltd.30,000,000 100.00 2019-12-25 Newly established
Yantai Kangyun Industrial Development Co.,
Ltd.30,000,000 51.00 2019-12-30 Newly established
Yantai Laikang Industrial Development Co.,
Ltd.10,000,000 51.00 2019-12-30 Newly established
Chuzhou Konka Technology Industry
Development Co., Ltd.40,000,000 49.00 2019-6-21
Equity transfer
Shenzhen Konka E-display Co., Ltd.2,000,000 100.00 2019-6-21
Losing control
power
Chuzhou Kangjin Health Industry
Development Co., Ltd.30,000,000 49.00 2019-9-25
Equity transfer
Shenzhen Kangyue Enterprise Co., Ltd. 20,000,000 49.00 2019-12-26 Equity transfer
Haimen Kangjian Technology Industrial Park
Operations Management Co., Ltd.100,000,000 30.00 2019-8-12
Equity transfer
Yantai Kangyue Investment Co., Ltd.20,000,000 49.00 2019-12-26
Losing control
power
7. Major Changes to the Business Scope or Product or Service Range in the Reporting Period□Applicable √ Not applicable8. Major Customers and SuppliersMajor customers:Total sales to top five customers (RMB) 17,388,591,156.50
Total sales to top five customers as % of total sales of the
Reporting Period (%)31.55%
Total sales to related parties among top five customers as %
of total sales of the Reporting Period (%)0.00%
Top five customers:

Konka Group Co., Ltd. Annual Report 2019
26
No. Customer
Sales revenue contributed
for the Reporting Period
(RMB)
As % of total sales revenue (%)
1 Customer A 7,331,759,302.16 13.30%
2 Customer B 5,865,449,956.62 10.64%
3 Customer C 1,874,539,856.30 3.40%
4 Customer D 1,410,894,148.68 2.56%
5 Customer E 905,947,892.74 1.64%
Total -- 17,388,591,156.50 31.55%
Other information about major customers:
√ Applicable □ Not applicableNone of the top five customers were related parties of the Company. And none of the Company’sdirectors, supervisors, executive officers, core technicians, over 5% shareholders, actual controlleror any other related parties held equity interests in the major customers, directly or indirectly.Major suppliers:Total purchases from top five suppliers (RMB) 19,691,061,479.97
Total purchases from top five suppliers as % of total purchases
of the Reporting Period (%)38.48%
Total purchases from related parties among top five suppliers
as % of total purchases of the Reporting Period (%)0.00%
Top five suppliers:
No. SupplierPurchase in the Reporting
Period (RMB)As % of total purchases (%)
1 Supplier 1 8,557,141,283.65 16.72%
2 Supplier 2 5,033,534,194.87 9.84%
3 Supplier 3 2,626,139,417.84 5.13%
4 Supplier 4 1,773,307,908.59 3.47%
5 Supplier 5 1,700,938,675.01 3.32%
Total -- 19,691,061,479.97 38.48%
Other information about major suppliers:√ Applicable □ Not applicableNone of the top five customers were related parties of the Company. And none of the Company’sdirectors, supervisors, executive officers, core technicians, over 5% shareholders, actual controlleror any other related parties held equity interests in the major customers, directly or indirectly.3. Expense
Unit: RMB
Konka Group Co., Ltd. Annual Report 2019
27
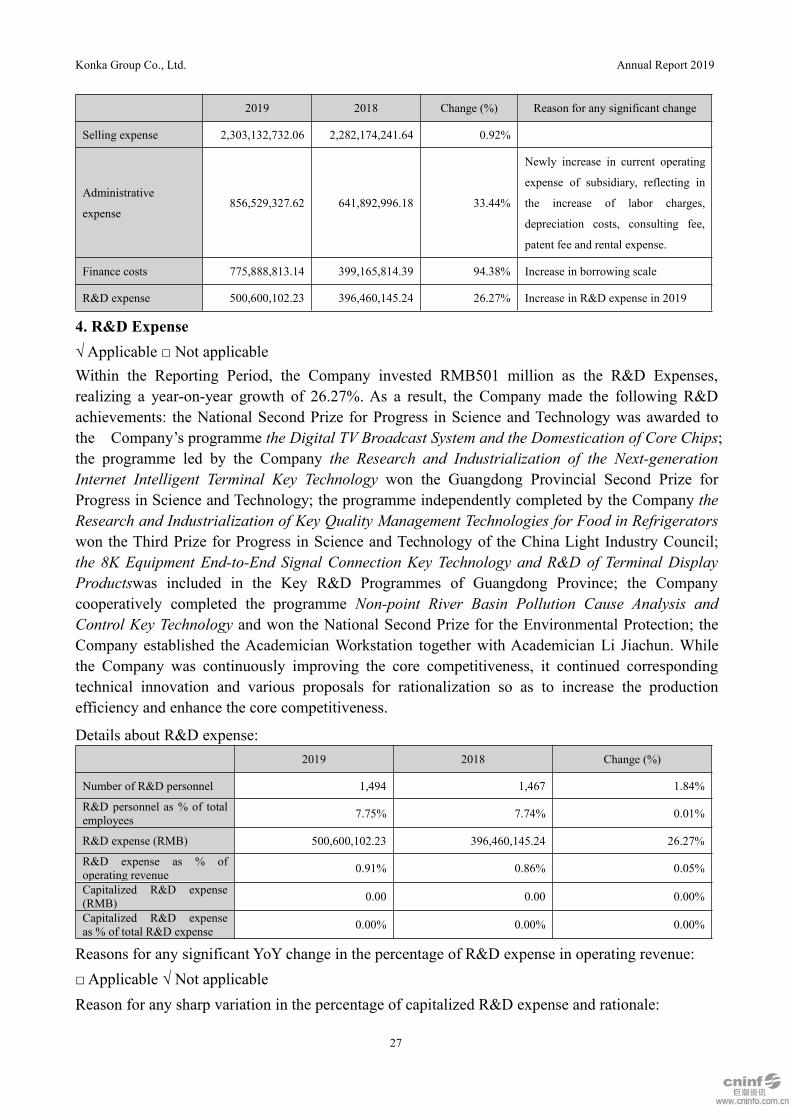
2019 2018 Change (%) Reason for any significant change
Selling expense 2,303,132,732.06 2,282,174,241.64 0.92%
Administrative
expense856,529,327.62 641,892,996.18 33.44%
Newly increase in current operating
expense of subsidiary, reflecting in
the increase of labor charges,
depreciation costs, consulting fee,
patent fee and rental expense.
Finance costs 775,888,813.14 399,165,814.39 94.38% Increase in borrowing scale
R&D expense 500,600,102.23 396,460,145.24 26.27% Increase in R&D expense in 2019
4. R&D Expense√ Applicable □ Not applicableWithin the Reporting Period, the Company invested RMB501 million as the R&D Expenses,realizing a year-on-year growth of 26.27%. As a result, the Company made the following R&Dachievements: the National Second Prize for Progress in Science and Technology was awarded tothe Company’s programme the Digital TV Broadcast System and the Domestication of Core Chips;the programme led by the Company the Research and Industrialization of the Next-generationInternet Intelligent Terminal Key Technology won the Guangdong Provincial Second Prize forProgress in Science and Technology; the programme independently completed by the Company theResearch and Industrialization of Key Quality Management Technologies for Food in Refrigeratorswon the Third Prize for Progress in Science and Technology of the China Light Industry Council;the 8K Equipment End-to-End Signal Connection Key Technology and R&D of Terminal DisplayProductswas included in the Key R&D Programmes of Guangdong Province; the Companycooperatively completed the programme Non-point River Basin Pollution Cause Analysis andControl Key Technology and won the National Second Prize for the Environmental Protection; theCompany established the Academician Workstation together with Academician Li Jiachun. Whilethe Company was continuously improving the core competitiveness, it continued correspondingtechnical innovation and various proposals for rationalization so as to increase the productionefficiency and enhance the core competitiveness.
Details about R&D expense:2019 2018 Change (%)
Number of R&D personnel 1,494 1,467 1.84%
R&D personnel as % of totalemployees 7.75% 7.74% 0.01%
R&D expense (RMB) 500,600,102.23 396,460,145.24 26.27%
R&D expense as % ofoperating revenue 0.91% 0.86% 0.05%
Capitalized R&D expense(RMB) 0.00 0.00 0.00%
Capitalized R&D expenseas % of total R&D expense 0.00% 0.00% 0.00%
Reasons for any significant YoY change in the percentage of R&D expense in operating revenue:□ Applicable √ Not applicableReason for any sharp variation in the percentage of capitalized R&D expense and rationale:
Konka Group Co., Ltd. Annual Report 2019
28
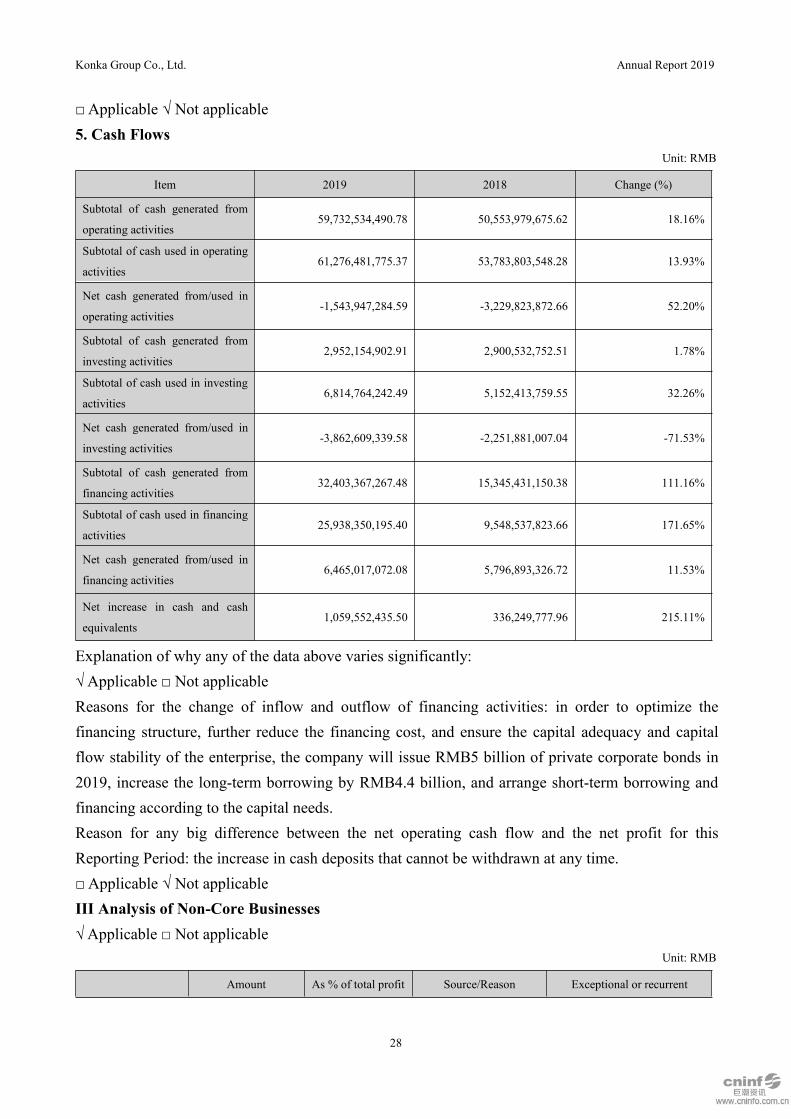
□Applicable √ Not applicable5. Cash Flows
Unit: RMB
Item 2019 2018 Change (%)
Subtotal of cash generated from
operating activities59,732,534,490.78 50,553,979,675.62 18.16%
Subtotal of cash used in operating
activities61,276,481,775.37 53,783,803,548.28 13.93%
Net cash generated from/used in
operating activities-1,543,947,284.59 -3,229,823,872.66 52.20%
Subtotal of cash generated from
investing activities2,952,154,902.91 2,900,532,752.51 1.78%
Subtotal of cash used in investing
activities6,814,764,242.49 5,152,413,759.55 32.26%
Net cash generated from/used in
investing activities-3,862,609,339.58 -2,251,881,007.04 -71.53%
Subtotal of cash generated from
financing activities32,403,367,267.48 15,345,431,150.38 111.16%
Subtotal of cash used in financing
activities25,938,350,195.40 9,548,537,823.66 171.65%
Net cash generated from/used in
financing activities6,465,017,072.08 5,796,893,326.72 11.53%
Net increase in cash and cash
equivalents1,059,552,435.50 336,249,777.96 215.11%
Explanation of why any of the data above varies significantly:√ Applicable □ Not applicableReasons for the change of inflow and outflow of financing activities: in order to optimize thefinancing structure, further reduce the financing cost, and ensure the capital adequacy and capitalflow stability of the enterprise, the company will issue RMB5 billion of private corporate bonds in2019, increase the long-term borrowing by RMB4.4 billion, and arrange short-term borrowing andfinancing according to the capital needs.Reason for any big difference between the net operating cash flow and the net profit for thisReporting Period: the increase in cash deposits that cannot be withdrawn at any time.□ Applicable √ Not applicableIII Analysis of Non-Core Businesses√ Applicable □ Not applicable
Unit: RMB
Amount As % of total profit Source/Reason Exceptional or recurrent

Konka Group Co., Ltd. Annual Report 2019
29
Investment income 1,183,381,090.39 262.64%Dividends from
subsidiariesExceptional
Gain/loss on
changes in fair
value
-3,005,381.67 -0.67% Exceptional
Asset impairments -303,035,915.82 -67.26%Impairment of
receivablesExceptional
Non-operating
income165,843,388.94 36.81%
Tax rebates of software is
recurrent and others are
uncertain
Non-operating
expense18,533,352.41 4.11% Exceptional
IV Analysis of Assets and Liabilities1. Significant Changes in Asset CompositionAdjustments to the Financial Statements at the Beginning of the First Execution Year of any NewStandard Governing Financial Instruments, Revenue or Leases in 2019√ Applicable □ Not applicable
Unit: RMB
31 December 2019 31 December 2018 Change
in
percent
age (%)
Reason for any significant changeAmount
As % of
total assetsAmount
As % of
total assets
Monetary
capital
6,599,360,05
1.6115.50%
4,348,144,12
9.5313.18% 2.32%
Accounts
receivable
4,416,179,65
7.8710.37%
4,457,458,90
4.3213.51% -3.14%
Inventories5,318,503,04
4.6912.49%
5,487,605,22
7.0516.64% -4.15%
Investment
property
400,197,374.
070.94%
210,824,355.
720.64% 0.30%
Long-term
equity
investments
3,465,541,19
6.898.14%
2,637,780,82
5.538.00% 0.14%
Fixed assets2,561,254,19
1.556.01%
2,410,226,49
5.817.31% -1.30%
Construction in
progress
4,291,544,36
8.5210.08%
2,176,871,53
0.806.60% 3.48%
Konka Group Co., Ltd. Annual Report 2019
30
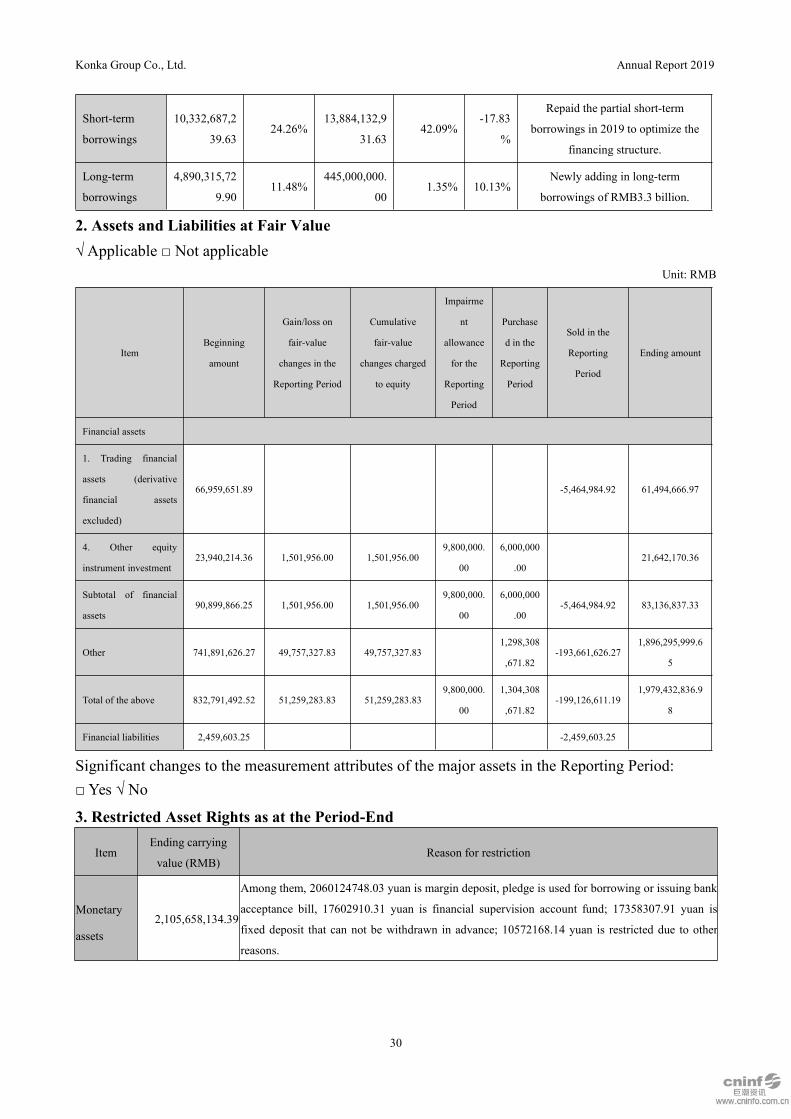
Short-term
borrowings
10,332,687,2
39.6324.26%
13,884,132,9
31.6342.09%
-17.83
%
Repaid the partial short-term
borrowings in 2019 to optimize the
financing structure.
Long-term
borrowings
4,890,315,72
9.9011.48%
445,000,000.
001.35% 10.13%
Newly adding in long-term
borrowings of RMB3.3 billion.
2. Assets and Liabilities at Fair Value√ Applicable □ Not applicable
Unit: RMB
ItemBeginning
amount
Gain/loss on
fair-value
changes in the
Reporting Period
Cumulative
fair-value
changes charged
to equity
Impairme
nt
allowance
for the
Reporting
Period
Purchase
d in the
Reporting
Period
Sold in the
Reporting
Period
Ending amount
Financial assets
1. Trading financial
assets (derivative
financial assets
excluded)
66,959,651.89 -5,464,984.92 61,494,666.97
4. Other equity
instrument investment23,940,214.36 1,501,956.00 1,501,956.00
9,800,000.
00
6,000,000
.0021,642,170.36
Subtotal of financial
assets90,899,866.25 1,501,956.00 1,501,956.00
9,800,000.
00
6,000,000
.00-5,464,984.92 83,136,837.33
Other 741,891,626.27 49,757,327.83 49,757,327.831,298,308
,671.82-193,661,626.27
1,896,295,999.6
5
Total of the above 832,791,492.52 51,259,283.83 51,259,283.839,800,000.
00
1,304,308
,671.82-199,126,611.19
1,979,432,836.9
8
Financial liabilities 2,459,603.25 -2,459,603.25
Significant changes to the measurement attributes of the major assets in the Reporting Period:□ Yes √ No
3. Restricted Asset Rights as at the Period-End
ItemEnding carrying
value (RMB)Reason for restriction
Monetary
assets2,105,658,134.39
Among them, 2060124748.03 yuan is margin deposit, pledge is used for borrowing or issuing bank
acceptance bill, 17602910.31 yuan is financial supervision account fund; 17358307.91 yuan is
fixed deposit that can not be withdrawn in advance; 10572168.14 yuan is restricted due to other
reasons.
Konka Group Co., Ltd. Annual Report 2019
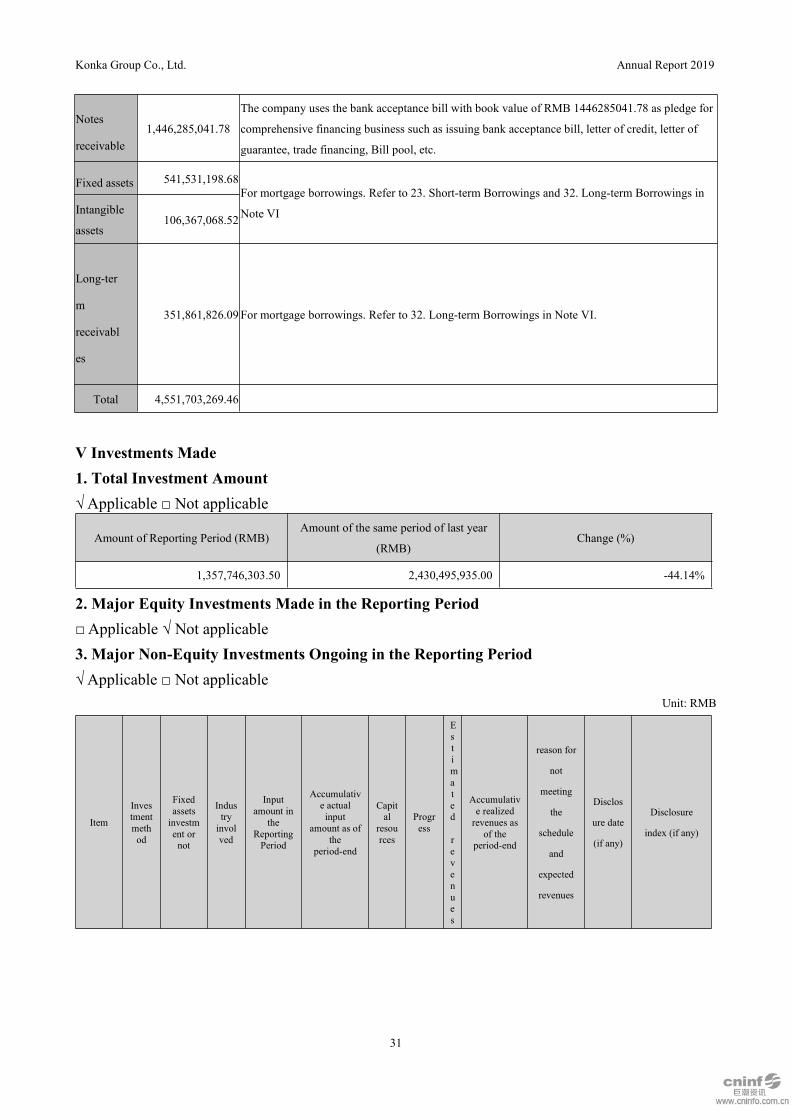
31
Notes
receivable1,446,285,041.78
The company uses the bank acceptance bill with book value of RMB 1446285041.78 as pledge for
comprehensive financing business such as issuing bank acceptance bill, letter of credit, letter of
guarantee, trade financing, Bill pool, etc.
Fixed assets 541,531,198.68For mortgage borrowings. Refer to 23. Short-term Borrowings and 32. Long-term Borrowings in
Note VIIntangible
assets106,367,068.52
Long-ter
m
receivabl
es
351,861,826.09 For mortgage borrowings. Refer to 32. Long-term Borrowings in Note VI.
Total 4,551,703,269.46
V Investments Made1. Total Investment Amount√ Applicable □ Not applicable
Amount of Reporting Period (RMB)Amount of the same period of last year
(RMB)Change (%)
1,357,746,303.50 2,430,495,935.00 -44.14%
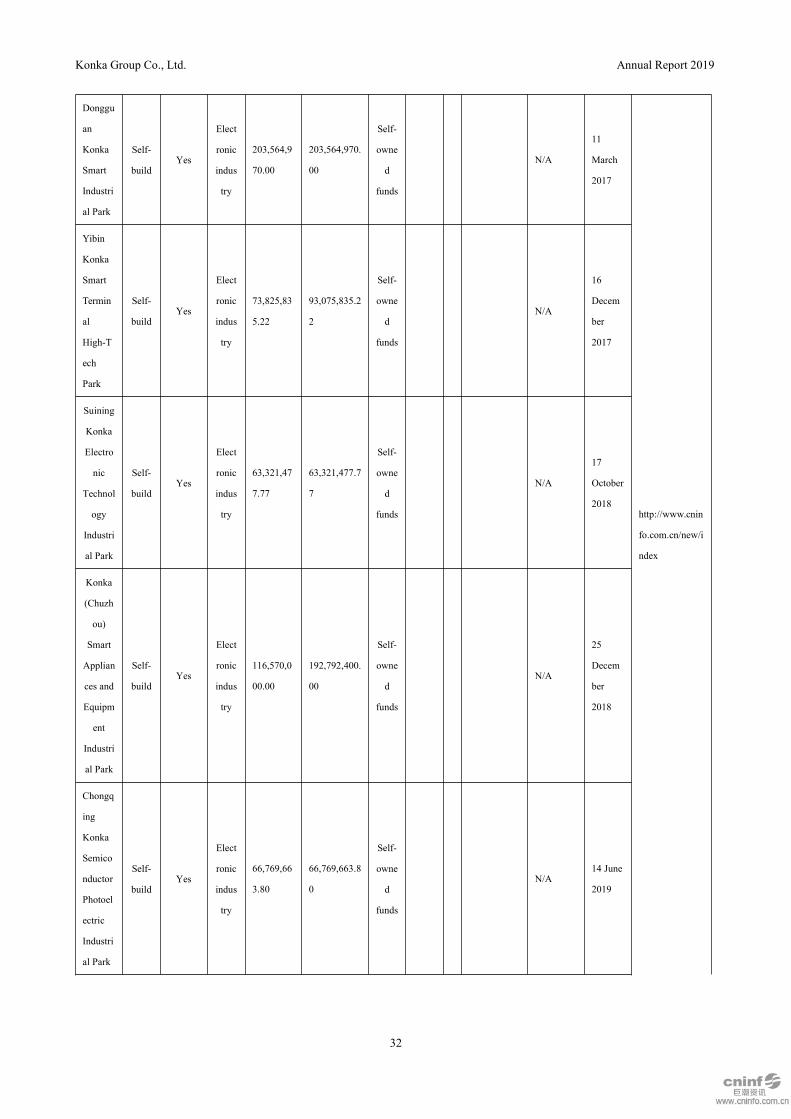
2. Major Equity Investments Made in the Reporting Period□Applicable √ Not applicable3. Major Non-Equity Investments Ongoing in the Reporting Period√ Applicable □ Not applicable
Unit: RMB
Item
Investmentmethod
Fixedassetsinvestment ornot
Industryinvolved
Inputamount in
theReportingPeriod
Accumulative actualinput
amount as ofthe
period-end
Capital
resources
Progress
Estimated
revenues
Accumulative realizedrevenues as
of theperiod-end
reason for
not
meeting
the
schedule
and
expected
revenues
Disclos
ure date
(if any)
Disclosure
index (if any)
Konka Group Co., Ltd. Annual Report 2019
32
Donggu
an
Konka
Smart
Industri
al Park
Self-
buildYes
Elect
ronic
indus
try
203,564,9
70.00
203,564,970.
00
Self-
owne
d
funds
N/A
11
March
2017
http://www.cnin
fo.com.cn/new/i
ndex
Yibin
Konka
Smart
Termin
al
High-T
ech
Park
Self-
buildYes
Elect
ronic
indus
try
73,825,83
5.22
93,075,835.2
2
Self-
owne
d
funds
N/A
16
Decem
ber
2017
Suining
Konka
Electro
nic
Technol
ogy
Industri
al Park
Self-
buildYes
Elect
ronic
indus
try
63,321,47
7.77
63,321,477.7
7
Self-
owne
d
funds
N/A
17
October
2018
Konka
(Chuzh
ou)
Smart
Applian
ces and
Equipm
ent
Industri
al Park
Self-
buildYes
Elect
ronic
indus
try
116,570,0
00.00
192,792,400.
00
Self-
owne
d
funds
N/A
25
Decem
ber
2018
Chongq
ing
Konka
Semico
nductor
Photoel
ectric
Industri
al Park
Self-
buildYes
Elect
ronic
indus
try
66,769,66
3.80
66,769,663.8
0
Self-
owne
d
funds
N/A14 June
2019
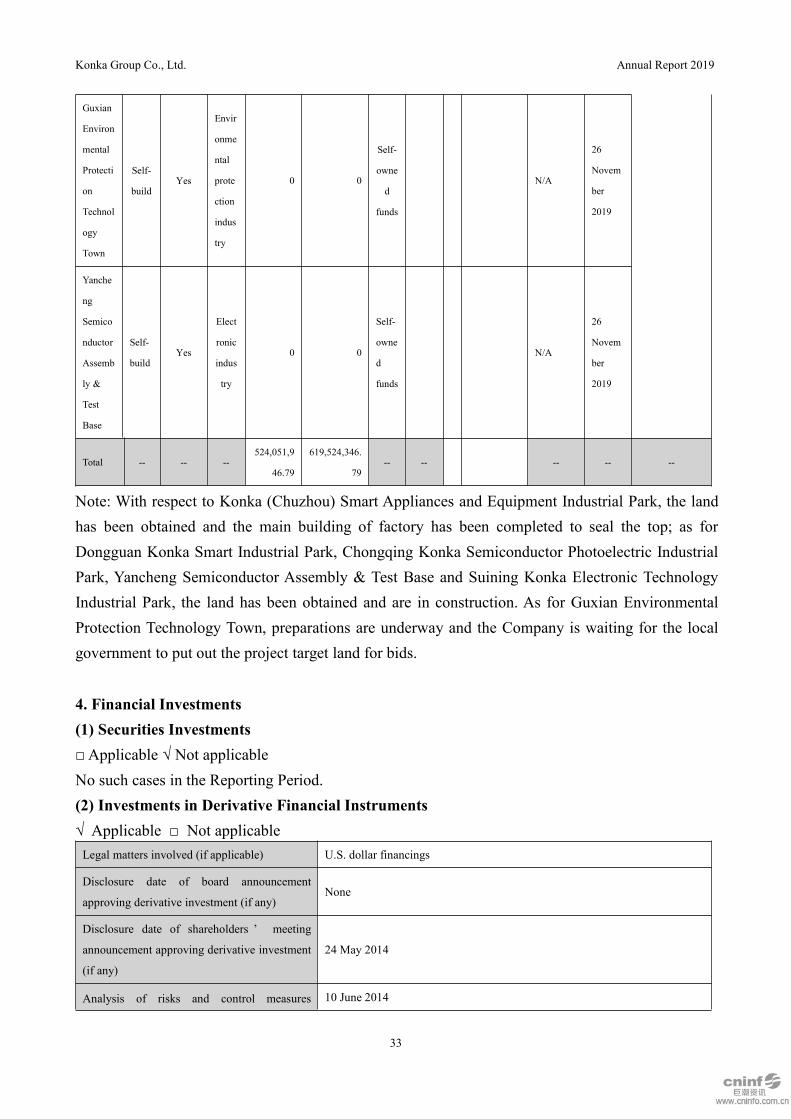
Konka Group Co., Ltd. Annual Report 2019
33
Guxian
Environ
mental
Protecti
on
Technol
ogy
Town
Self-
buildYes
Envir
onme
ntal
prote
ction
indus
try
0 0
Self-
owne
d
funds
N/A
26
Novem
ber
2019
Yanche
ng
Semico
nductor
Assemb
ly &
Test
Base
Self-
buildYes
Elect
ronic
indus
try
0 0
Self-
owne
d
funds
N/A
26
Novem
ber
2019
Total -- -- --524,051,9
46.79
619,524,346.
79-- -- -- -- --
Note: With respect to Konka (Chuzhou) Smart Appliances and Equipment Industrial Park, the landhas been obtained and the main building of factory has been completed to seal the top; as forDongguan Konka Smart Industrial Park, Chongqing Konka Semiconductor Photoelectric IndustrialPark, Yancheng Semiconductor Assembly & Test Base and Suining Konka Electronic TechnologyIndustrial Park, the land has been obtained and are in construction. As for Guxian EnvironmentalProtection Technology Town, preparations are underway and the Company is waiting for the localgovernment to put out the project target land for bids.
4. Financial Investments(1) Securities Investments□Applicable √ Not applicableNo such cases in the Reporting Period.(2) Investments in Derivative Financial Instruments√ Applicable □ Not applicableLegal matters involved (if applicable) U.S. dollar financings
Disclosure date of board announcement
approving derivative investment (if any)None
Disclosure date of shareholders ’ meeting
announcement approving derivative investment
(if any)
24 May 2014
Analysis of risks and control measures 10 June 2014
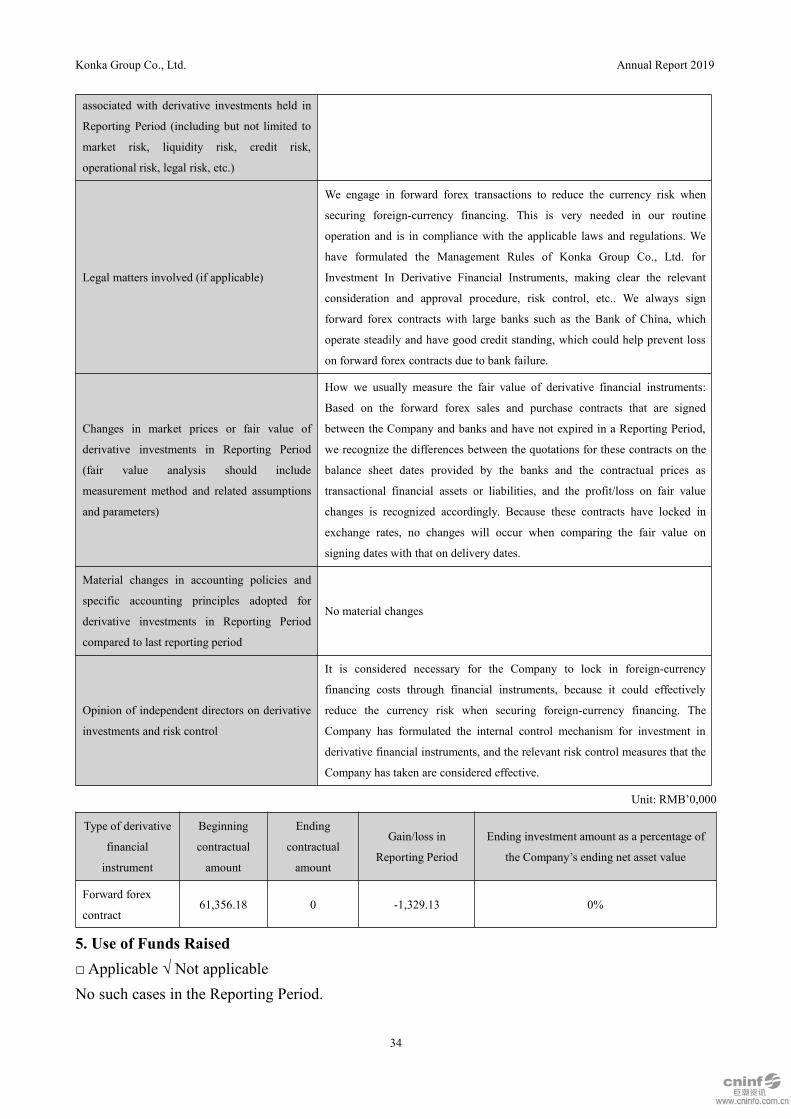
Konka Group Co., Ltd. Annual Report 2019
34
associated with derivative investments held in
Reporting Period (including but not limited to
market risk, liquidity risk, credit risk,
operational risk, legal risk, etc.)
Legal matters involved (if applicable)
We engage in forward forex transactions to reduce the currency risk when
securing foreign-currency financing. This is very needed in our routine
operation and is in compliance with the applicable laws and regulations. We
have formulated the Management Rules of Konka Group Co., Ltd. for
Investment In Derivative Financial Instruments, making clear the relevant
consideration and approval procedure, risk control, etc.. We always sign
forward forex contracts with large banks such as the Bank of China, which
operate steadily and have good credit standing, which could help prevent loss
on forward forex contracts due to bank failure.
Changes in market prices or fair value of
derivative investments in Reporting Period
(fair value analysis should include
measurement method and related assumptions
and parameters)
How we usually measure the fair value of derivative financial instruments:
Based on the forward forex sales and purchase contracts that are signed
between the Company and banks and have not expired in a Reporting Period,
we recognize the differences between the quotations for these contracts on the
balance sheet dates provided by the banks and the contractual prices as
transactional financial assets or liabilities, and the profit/loss on fair value
changes is recognized accordingly. Because these contracts have locked in
exchange rates, no changes will occur when comparing the fair value on
signing dates with that on delivery dates.
Material changes in accounting policies and
specific accounting principles adopted for
derivative investments in Reporting Period
compared to last reporting period
No material changes
Opinion of independent directors on derivative
investments and risk control
It is considered necessary for the Company to lock in foreign-currency
financing costs through financial instruments, because it could effectively
reduce the currency risk when securing foreign-currency financing. The
Company has formulated the internal control mechanism for investment in
derivative financial instruments, and the relevant risk control measures that the
Company has taken are considered effective.
Unit: RMB’0,000
Type of derivative
financial
instrument
Beginning
contractual
amount
Ending
contractual
amount
Gain/loss in
Reporting Period
Ending investment amount as a percentage of
the Company’s ending net asset value
Forward forex
contract61,356.18 0 -1,329.13 0%
5. Use of Funds Raised□Applicable √ Not applicableNo such cases in the Reporting Period.
Konka Group Co., Ltd. Annual Report 2019
35
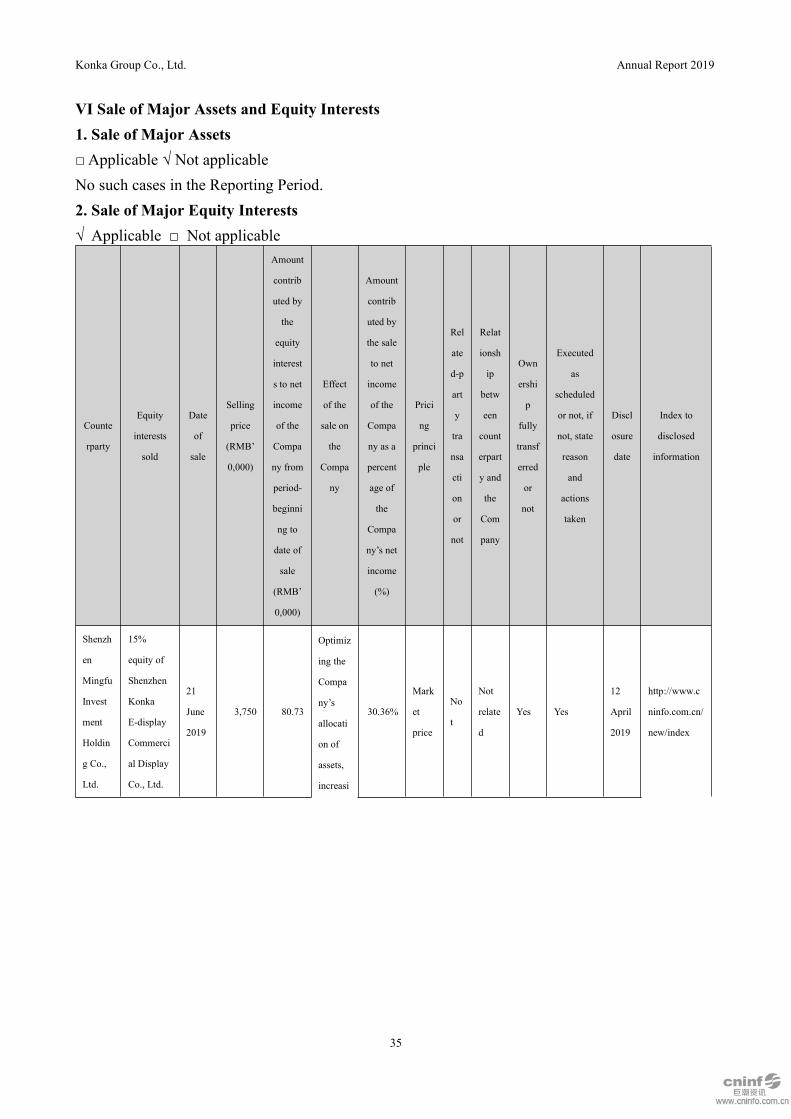
VI Sale of Major Assets and Equity Interests1. Sale of Major Assets□Applicable √ Not applicableNo such cases in the Reporting Period.2. Sale of Major Equity Interests√ Applicable □ Not applicable
Counte
rparty
Equity
interests
sold
Date
of
sale
Selling
price
(RMB’
0,000)
Amount
contrib
uted by
the
equity
interest
s to net
income
of the
Compa
ny from
period-
beginni
ng to
date of
sale
(RMB’
0,000)
Effect
of the
sale on
the
Compa
ny
Amount
contrib
uted by
the sale
to net
income
of the
Compa
ny as a
percent
age of
the
Compa
ny’s net
income
(%)
Prici
ng
princi
ple
Rel
ate
d-p
art
y
tra
nsa
cti
on
or
not
Relat
ionsh
ip
betw
een
count
erpart
y and
the
Com
pany
Own
ershi
p
fully
transf
erred
or
not
Executed
as
scheduled
or not, if
not, state
reason
and
actions
taken
Discl
osure
date
Index to
disclosed
information
Shenzh
en
Mingfu
Invest
ment
Holdin
g Co.,
Ltd.
15%
equity of
Shenzhen
Konka
E-display
Commerci
al Display
Co., Ltd.
21
June
2019
3,750 80.73
Optimiz
ing the
Compa
ny’s
allocati
on of
assets,
increasi
30.36%
Mark
et
price
No
t
Not
relate
d
Yes Yes
12
April
2019
http://www.c
ninfo.com.cn/
new/index

Konka Group Co., Ltd. Annual Report 2019
36
ng
assets’
liquidit
y
Shenzh
en
Overse
as
Chines
e Town
Capital
Invest
ment
Manag
ement
Co., Lt
51%
equity of
Chuzhou
Konka
Technolo
gy
Industri
al
Developm
ent Co.,
Ltd.
21
June
2019
6352.05 -124.49 26.66%
Not
lower
than
asses
sed
value
Ye
s
The
same
actua
l
contr
oller
Yes Yes
11
June
2019
Shangh
ai OCT
Invest
ment
Develo
pment
Co.,
Ltd.
51%
equity of
Chuzhou
Konka
Kangjin
Health
Industry
Developm
ent Co.,
Ltd.
25
Septe
mber
2019
12,225.
43-192.26 62.68%
Not
lower
than
asses
sed
value
Ye
s
The
same
actua
l
contr
oller
Yes Yes
18
Septe
mber
2019
Haime
n
Rongh
ui
Propert
ies Co.,
Ltd.
40%
equity of
Haimen
Kangjian
Technolog
y
Industrial
Parl
Operation
Managem
ent Co.,
Ltd.
18
Dece
mber
2019
20,000 -519.78 78.29%
Mark
et
price
No
t
Not
relate
d
Yes Yes
23
Octo
ber
2019
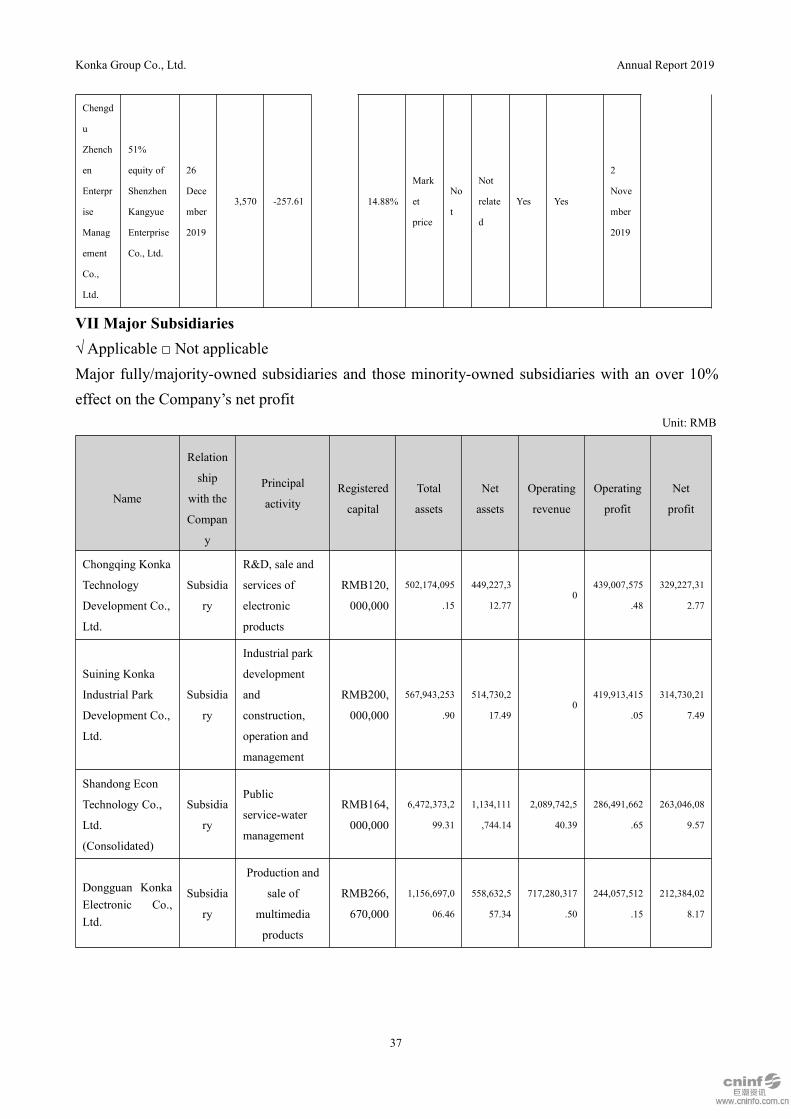
Konka Group Co., Ltd. Annual Report 2019
37
Chengd
u
Zhench
en
Enterpr
ise
Manag
ement
Co.,
Ltd.
51%
equity of
Shenzhen
Kangyue
Enterprise
Co., Ltd.
26
Dece
mber
2019
3,570 -257.61 14.88%
Mark
et
price
No
t
Not
relate
d
Yes Yes
2
Nove
mber
2019
VII Major Subsidiaries√ Applicable □ Not applicableMajor fully/majority-owned subsidiaries and those minority-owned subsidiaries with an over 10%effect on the Company’s net profit
Unit: RMB
Name
Relation
ship
with the
Compan
y
Principal
activityRegistered
capital
Total
assets
Net
assets
Operating
revenue
Operating
profit
Net
profit
Chongqing Konka
Technology
Development Co.,
Ltd.
Subsidia
ry
R&D, sale and
services of
electronic
products
RMB120,
000,000
502,174,095
.15
449,227,3
12.770
439,007,575
.48
329,227,31
2.77
Suining Konka
Industrial Park
Development Co.,
Ltd.
Subsidia
ry
Industrial park
development
and
construction,
operation and
management
RMB200,
000,000
567,943,253
.90
514,730,2
17.490
419,913,415
.05
314,730,21
7.49
Shandong Econ
Technology Co.,
Ltd.
(Consolidated)
Subsidia
ry
Public
service-water
management
RMB164,
000,000
6,472,373,2
99.31
1,134,111
,744.14
2,089,742,5
40.39
286,491,662
.65
263,046,08
9.57
Dongguan KonkaElectronic Co.,Ltd.
Subsidia
ry
Production and
sale of
multimedia
products
RMB266,
670,000
1,156,697,0
06.46
558,632,5
57.34
717,280,317
.50
244,057,512
.15
212,384,02
8.17

Konka Group Co., Ltd. Annual Report 2019
38
Anhui Konka
Electronic Co.,
Ltd.
Subsidia
ry
Production and
sale of
multimedia
products
RMB140,
000,000
1,894,880,1
39.35
604,187,6
72.32
2,563,263,2
61.84
189,970,888
.01
207,921,82
9.24
Hong Kong
Konka Co., Ltd.
Subsidia
ry
Export & import
of
electromechanic
al and
electronics
HKD500,
000
3,043,803,3
66.53
179,971,5
19.97
5,545,451,6
49.18
157,314,952
.82
169,787,50
1.57
Konka Electrical
Appliances
Investment &
Development Co.,
Ltd.
Subsidia
ry
Investment
platform
HKD500,
000
469,276,938
.82
103,260,1
22.510.00
98,230,082.
63
90,482,643
.64
ShenzhenWankaida Scienceand TechnologyCo., Ltd.
Subsidia
ry
Production and
sale of
multimedia
products
RMB10,0
00,000
148,665,698
.26
136,692,6
37.94
102,998,520
.00
99,966,098.
28
85,881,709
.46
E2infoSubsidia
ry
Internet and
related services
RMB20,1
74,070.81
341,930,825
.08
191,539,6
50.62
291,410,136
.24
91,318,044.
28
79,018,550
.58
Chain Kingdom
Memory
Technologies Co.,
Limited
Subsidia
ry
The Industry Tr
ade Business
USD1,500
,000
1,589,937,5
48.58
104,326,3
03.70
7,255,440,6
15.91
68,566,540.
30
57,623,214
.42
Konka ElectricalAppliancesInternationalTrading Co., Ltd.
Subsidia
ry
Export & import
of
electromechanic
al and
electronics
HKD500,
000
1,220,213,0
65.54
-155,129,
693.33
1,429,811,3
63.50
48,291,790.
04
48,291,790
.04
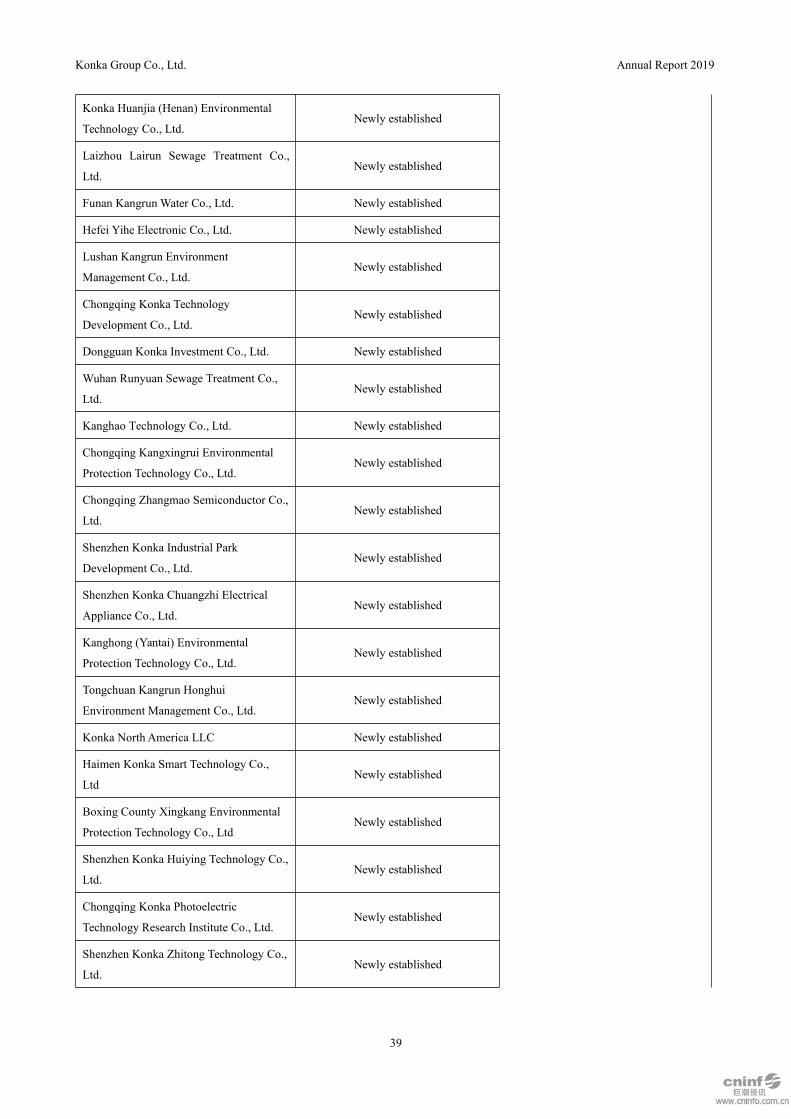
Subsidiaries obtained or disposed in the Reporting Period:√ Applicable □ Not applicable
SubsidiaryHow subsidiary was obtained or
disposed in the Reporting Period
Effects on overall operations and
operating performance
Shenzhen Konka Shengxing Enterprise
Co., Ltd.Newly established
Beneficial to the development of the
Company’s relevant business
Shenzhen Youzhihui Technology Co., Ltd. Newly established
Suining Konka Electronic Technological
Innovation Co., Ltd.Newly established
Shenzhen Xiaojia Technology Co., Ltd. Newly established
Yibin Konka Smart Technology Co., Ltd. Newly established
Konka Group Co., Ltd. Annual Report 2019
39
Konka Huanjia (Henan) Environmental
Technology Co., Ltd.Newly established
Laizhou Lairun Sewage Treatment Co.,
Ltd.Newly established
Funan Kangrun Water Co., Ltd. Newly established
Hefei Yihe Electronic Co., Ltd. Newly established
Lushan Kangrun Environment
Management Co., Ltd.Newly established
Chongqing Konka Technology
Development Co., Ltd.Newly established
Dongguan Konka Investment Co., Ltd. Newly established
Wuhan Runyuan Sewage Treatment Co.,
Ltd.Newly established
Kanghao Technology Co., Ltd. Newly established
Chongqing Kangxingrui Environmental
Protection Technology Co., Ltd.Newly established
Chongqing Zhangmao Semiconductor Co.,
Ltd.Newly established
Shenzhen Konka Industrial Park
Development Co., Ltd.Newly established
Shenzhen Konka Chuangzhi Electrical
Appliance Co., Ltd.Newly established
Kanghong (Yantai) Environmental
Protection Technology Co., Ltd.Newly established
Tongchuan Kangrun Honghui
Environment Management Co., Ltd.Newly established
Konka North America LLC Newly established
Haimen Konka Smart Technology Co.,
LtdNewly established
Boxing County Xingkang Environmental
Protection Technology Co., LtdNewly established
Shenzhen Konka Huiying Technology Co.,
Ltd.Newly established
Chongqing Konka Photoelectric
Technology Research Institute Co., Ltd.Newly established
Shenzhen Konka Zhitong Technology Co.,
Ltd.Newly established
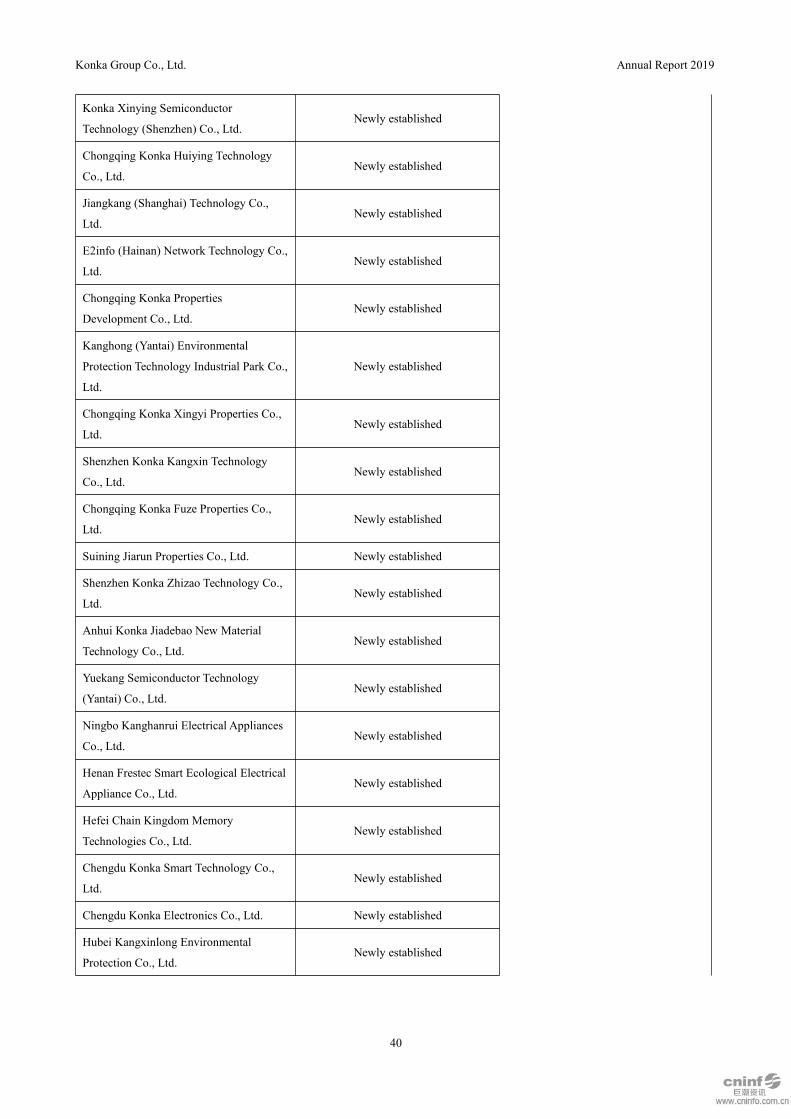
Konka Group Co., Ltd. Annual Report 2019
40
Konka Xinying Semiconductor
Technology (Shenzhen) Co., Ltd.Newly established
Chongqing Konka Huiying Technology
Co., Ltd.Newly established
Jiangkang (Shanghai) Technology Co.,
Ltd.Newly established
E2info (Hainan) Network Technology Co.,
Ltd.Newly established
Chongqing Konka Properties
Development Co., Ltd.Newly established
Kanghong (Yantai) Environmental
Protection Technology Industrial Park Co.,
Ltd.
Newly established
Chongqing Konka Xingyi Properties Co.,
Ltd.Newly established
Shenzhen Konka Kangxin Technology
Co., Ltd.Newly established
Chongqing Konka Fuze Properties Co.,
Ltd.Newly established
Suining Jiarun Properties Co., Ltd. Newly established
Shenzhen Konka Zhizao Technology Co.,
Ltd.Newly established
Anhui Konka Jiadebao New Material
Technology Co., Ltd.Newly established
Yuekang Semiconductor Technology
(Yantai) Co., Ltd.Newly established
Ningbo Kanghanrui Electrical Appliances
Co., Ltd.Newly established
Henan Frestec Smart Ecological Electrical
Appliance Co., Ltd.Newly established
Hefei Chain Kingdom Memory
Technologies Co., Ltd.Newly established
Chengdu Konka Smart Technology Co.,
Ltd.Newly established
Chengdu Konka Electronics Co., Ltd. Newly established
Hubei Kangxinlong Environmental
Protection Co., Ltd.Newly established
Konka Group Co., Ltd. Annual Report 2019
41
Tingyuan Environmental Protection
Technology (Shanghai) Co., Ltd.Newly established
Chuzhou Kangxin Health Industry
Development Co., Ltd.Newly established
Yantai Kangyun Industrial Development
Co., Ltd.Newly established
Yantai Laikang Industrial Development
Co., Ltd.Newly established
Chuzhou Konka Technology Industry
Development Co., Ltd.Transfer partial equity
Bring about gains with large amount
Shenzhen Konka E-display Commercial
Display Co., Ltd.Transfer partial equity
Chuzhou Kangjin Health Industry
Development Co., Ltd.Transfer partial equity
Shenzhen Kangyue Enterprise Co., Ltd. Transfer partial equity
Haimen Kangjian Technology Industrial
Park Operations Management Co., Ltd.Transfer partial equity
Yantai Kangyue Investment Co., Ltd. Transfer partial equity
Information about major majority- and minority-owned subsidiaries:NoneVIII Structured Bodies Controlled by the Company□Applicable √ Not applicableIX. Prospect of the Company’s Future DevelopmentIn 2020, as combing the operation system and enhancing the management foundation, along thetarget to be a platform company driven by innovation, the Company strengthened the risk controlwith the guidance of the development strategy of reform, transformation and upgrading, taking thehigh-quality sustainable development as the main line to accelerate the revitalization of Konka.The Company’s work plan for 2020 is as follows:(I) Advocate the Gathering-type Synergy of Existing BusinessesIn 2020, the Company will rely on a core to promote the synergetic development of four majorbusiness groups, and the core involves the following content:The first is the semiconductor. As the semiconductor business can be applied to the intelligentterminal product business and expanded to the industrial park business, it is crucial for theCompany to develop its core technology and core competitiveness.The second is the new consumer electronics. The Company will continuously develop the consumerelectronics business and enrich its connotation, expand to other related business and product fieldsand form the new consumer electronics business system and industrial ecology.
Konka Group Co., Ltd. Annual Report 2019
42
The third is the technology park. The technology park business, as an operation and feeding mode,serves as a carrier to promote the growth of new consumer electronics, semiconductor and otherindustries.Guided by the strategy of “Technology + Industry + Park”, the Company will focus as the core“Semiconductor + New Consumer Electronics + Technology Park” to drive the synergeticdevelopment of four business groups and realize the gathering-type synergetic development.(II) Strengthen the Growth of Existing BusinessIn 2020, the Company will highlight and strengthen the growth of existing business. Firstly, theCompany will enhance its core competitiveness and makes the scientific and technologicalinnovation be its core competitiveness; secondly, the Company will continuously enhance its capitalstrength and efficiency; thirdly, the Company will promote the talent team construction, and rely onits outstanding business team and R&D team to drive the high-quality development of variousbusinesses.(III) Transform from Konka Electronics to Konka TechnologyIn 2020, the Company will emphasize and expand its businesses to the industry’s upstream corefields. On one hand, the Company will strengthen the product R&D and the core technicalinnovation and positively propel the new technology’s industrial transformation to energize theindustry; on the other hand, the Company will also make breakthrough in its core fields, key linksand original technologies, focus on Micro LED, semiconductors and other key links to conduct thetechnology R&D, and urge the transformation of Konka Electronics into the innovation-driven newindustrial operation platform-Konka Technology.(IV) Main Works of Various Business Divisions1. Industrial Product Business GroupThe Multimedia Sub-division: in 2020, the multimedia sub-division will continue driving thereform and innovation of sales in domestic market, increase the investment into the export sales andthe online domestic sales, urge the capacity building and organization reform by optimizing theproduct structure and the cost structure and continuously improve its business performance.The White Goods Sub-division: in 2020, the white good dub-division will not only broaden theproduct category to cover all product categories including air conditioners, refrigerators, freezers,washing machines, cold chains and kitchen appliances, but also optimize the product structure andproduce high-end products to create its first-class brand image and capacity. In addition, based onthe Konka + Frestec Electric dual brand operation, it will form the full-chain and full-channelsystem operation capacity covering refrigerators, washing machines and air conditioners.The Environmental Protection Division: in terms of the renewable resources, the Company willaccelerate its transformation into the disposal of scrapped cars; in light of the water treatment, theCompany will vigorously drive the existing project’s efficient operation, and by means of the
Konka Group Co., Ltd. Annual Report 2019
43
continuous innovation, it will accelerate the integration, datamation and intellectualization processof sewage treatment and river control, and further realize the efficient implementation of operationmanagement; in terms of the new materials sub-division, the Company will further enhance itsability in selling products and continuously develop new product application scenarios.The Semiconductor Sub-division: the Company will strengthen its business development in storage,photoelectricity and semiconductor application and service. Meanwhile, the Micro LEDSub-division will break through the technical bottleneck and realize the technical transformationand output; the storage main control chips sub-division will research and develop thenew-generation products while vigorously selling existing products.Mobile Internet Sub-division: the mobile Internet Sub-division will focus on main products,continuously enlarge its scare and propel the Intelligent Community and 5G router business byseizing various opportunities posed by the 5G commercial network and Internet of Things.The PCB Sub-division: the PCB Sub-division will positively promote the existing division’slarge-scale reorganization and integration, realize the continuous growth of the businessperformance, and lay a firm foundation for the PCB Sub-division’s capitalized operation.2. The Technology Park DivisionIn 2020, the technology park division will highlight the innovation of business mode and speed upits national layout. Firstly, the diversified business forms will be applied to gather the industrialchain’s upstream and downstream partners to accelerate the development and implementation ofnew projects including the industrial park, headquarters economy, logistics park, industrial townand new industrial city etc.; secondly, emphasis will be placed on improving the technology park’sconstruction and management level, further perfecting the communication mechanism with thedesign institute, the construction contractor and the supervisor, establishing the constructionprojects’ safety organization structure and responsibility system and enhancing the technologypark’s construction and management level; thirdly, special attention will be paid to strengthen thebusiness team’s business development ability and customer resources acquisition ability.3. The Platform Service DivisionIndustry and trade business: first, the industry and trade business will continue to promote the closecombination of existing business and entrusted processing business to form a business model ofindustry and trade integration; second, the industry and trade business will further improve andimprove the risk control model, upgrade the risk control model of the original business, promote theestablishment of risk control construction of R & D, production and sales system, and prevent andcontrol industry in combination with the transformation of chip business and plastic businessBusiness risk.The Internet Sub-division: in 2020, the Internet Sub-division will make the users more diversified,and seek new resources from various aspects including 5G+UHD and AI+IoT etc. so as to promote
Konka Group Co., Ltd. Annual Report 2019
44
the development of the family Internet value-added services and complete the layout of Internet ofThings and Smart Home business.4. The Financial Investment DivisionThe Investment Sub-division: in 2020, on the premise that possible investment risks are strictlycontrolled, the investment division will emphasize the layout of the semiconductor, 5G, advancedmanufacturing and electronic information industrial chain upstream and downstream, upgrade andoptimize the Company’s existing industry by means of industrial M&A, strategic joint venture,equity investment and industry funds and assist the Company to realize the goal of high-qualitydevelopment heart and soul.The Venture Capital Investment Sub-division: in 2020, while the venture capital investmentsub-division is vigorously operating the established innovation center, it will focus on theinnovation of business mode, especially the profit-making mode, and continue incubating variousenterprises.X Communications with the Investment Community such as Researches, Inquiries andInterviews1. During the Reporting Period√ Applicable □ Not applicable
Date Way of communicationType of communication
party
Index to main information
communicated
7 May 2019 One-on-one meeting Institution
http://www.cninfo.com.cn/new/in
dex
27 May 2019 One-on-one meeting Institution
6 June 2019 One-on-one meeting Institution
28 June 2019 One-on-one meeting Institution
3 July 2019 One-on-one meeting Institution
17 July 2019 One-on-one meeting Institution
20 August 2019 One-on-one meeting Institution
11 September 2019 One-on-one meeting Institution
26 December 2019 One-on-one meeting Institution
Times of communications 9
Number of institutions communicated with 19
Number of individuals communicated with 0
Number of other communication parties 0
Tip-offs or leakages of substantial
supposedly-confidential information during
communications
None
Konka Group Co., Ltd. Annual Report 2019
45
Part V Significant Events
I Profit Distributions to Ordinary Shareholders (in the Form of Cash and/or Stock)How the profit distribution policy, especially the cash dividend policy, for ordinary shareholderswas formulated, executed or revised in the Reporting Period:√ Applicable □ Not applicable
The cash dividend policy of the Company was clearly stated in its Articles of Association, withspecific and clear dividend standards and ratios. The relevant decision-making procedure andmechanism were sound; the independent directors faithfully performed their duties and played theirdue role; and the non-controlling interests were able to fully express their opinion and desire andtheir legal rights and interests were fully protected. The Company strictly followed the cashdividend policy in its Articles of Association, and the cash dividend payout of the Company was inline with its Articles of Association and the relevant resolution of the Shareholders’Meeting.
According to the requirements of the Listed Company Supervision Guideline No. 3-ListedCompanies’ Cash Dividend issued by the CSRC, the Company has revised the dividend payoutpolicy in its Articles of Association, further clarifying the priority and proportion of cash dividendin dividend payouts. In order to further normalize its shareholder return mechanism, push forwardthe establishment of a scientific, sustained and stable shareholder return mechanism, enhance thetransparency and operability of decision-making for its dividend payout policy, and effectivelyprotect the legal rights and interests of public investors, the Company strictly followed theShareholder Return Planning for Subsequent Three Years (2019-2021), which was formulated in2019.
Special statement about the cash dividend policy
In compliance with the Company’s Articles of Association and resolution of general
meetingYes
Specific and clear dividend standard and ratio Yes
Complete decision-making procedure and mechanism Yes
Independent directors faithfully performed their duties and played their due role Yes
Non-controlling interests are able to fully express their opinion and desire and their legal
rights and interests are fully protectedYes
In case of adjusting or changing the cash dividend policy, the conditions and procedures
involved are in compliance with applicable regulations and transparentYes
The profit distributions to ordinary shareholders, either in the form of cash or stock, in the past threeyears (including the Reporting Period) are summarized as follows:1. Dividend Payout Plan for 2019

Konka Group Co., Ltd. Annual Report 2019
46
Based on the total shares of 2,407,945,408 as of the end of 2019, a cash dividend of RMB0.5 (taxinclusive) per 10 shares was planned to be distributed to all the shareholders, with the total dividendpayout reaching RMB120,397,270.40. And the retained earnings should carry forward for futurepayout without bonus issue from capital reserves and profit.
2. Dividend Payout Plan for 2018Based on the total shares of 2,407,945,408 as of the end of 2018, a cash dividend of RMB1.00 (taxinclusive) per 10 shares was planned to be distributed to all the shareholders, with the total dividendpayout reaching RMB240,794,540.80. And the retained earnings should carry forward for futurepayout without bonus issue from capital reserves and profit.3. Dividend Payout Plan for 2017
Based on the total shares of 2,407,945,408 as of the end of 2017, a cash dividend of RMB1.62 (taxinclusive) per 10 shares was distributed to all the shareholders, with the total dividend payoutreaching RMB390,087,156.10. And the retained earnings should carry forward for future payoutwithout bonus issue from capital reserves and profit.Cash dividend for ordinary shareholders in the past three years (including the Reporting Period)
Unit: RMB
Year
Cash
dividend
s (tax
inclusive
) (A)
Net profit
attributable
to ordinary
shareholders
of the listed
company in
consolidated
statements
for the year
(B)
A as % of B (%)
Cashdividendsin otherforms(such asshare
repurchase) (C)
C as % of B
(%)
Total
cash
dividend
s
(includin
g those
in other
forms)
(D)
D as % of B
(%)
2019120,397,27
0.40212,034,210.08 56.78% 0 0.00%
120,397,2
70.4056.78%
2018240,794,54
0.80411,289,744.68 58.55% 0 0.00%
240,794,5
40.8058.55%
2017390,087,15
6.10
5,057,025,155.7
17.71% 0 0.00%
390,087,1
56.107.71%
Indicate by tick mark whether the Company fails to put forward a cash dividend proposal for theordinary shareholders despite the facts that the Company has made profits in the Reporting Periodand the profits of the Company as the parent distributable to the ordinary shareholders are positive.□ Applicable √ Not applicableII Final Dividend Plan for the Reporting Period√Applicable □ Not applicable
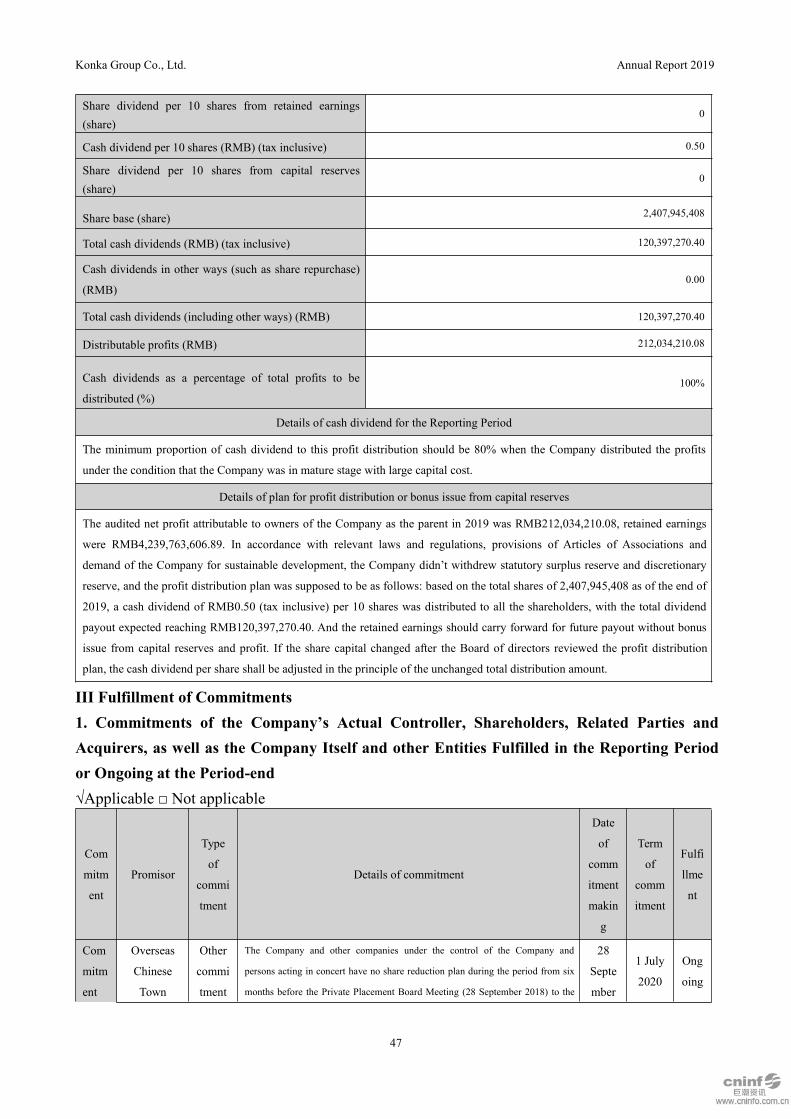
Konka Group Co., Ltd. Annual Report 2019
47
Share dividend per 10 shares from retained earnings(share)
0
Cash dividend per 10 shares (RMB) (tax inclusive) 0.50
Share dividend per 10 shares from capital reserves(share)
0
Share base (share) 2,407,945,408
Total cash dividends (RMB) (tax inclusive) 120,397,270.40
Cash dividends in other ways (such as share repurchase)
(RMB)0.00
Total cash dividends (including other ways) (RMB) 120,397,270.40
Distributable profits (RMB) 212,034,210.08
Cash dividends as a percentage of total profits to be
distributed (%)100%
Details of cash dividend for the Reporting Period
The minimum proportion of cash dividend to this profit distribution should be 80% when the Company distributed the profits
under the condition that the Company was in mature stage with large capital cost.
Details of plan for profit distribution or bonus issue from capital reserves
The audited net profit attributable to owners of the Company as the parent in 2019 was RMB212,034,210.08, retained earnings
were RMB4,239,763,606.89. In accordance with relevant laws and regulations, provisions of Articles of Associations and
demand of the Company for sustainable development, the Company didn’t withdrew statutory surplus reserve and discretionary
reserve, and the profit distribution plan was supposed to be as follows: based on the total shares of 2,407,945,408 as of the end of
2019, a cash dividend of RMB0.50 (tax inclusive) per 10 shares was distributed to all the shareholders, with the total dividend
payout expected reaching RMB120,397,270.40. And the retained earnings should carry forward for future payout without bonus
issue from capital reserves and profit. If the share capital changed after the Board of directors reviewed the profit distribution
plan, the cash dividend per share shall be adjusted in the principle of the unchanged total distribution amount.
III Fulfillment of Commitments1. Commitments of the Company’s Actual Controller, Shareholders, Related Parties andAcquirers, as well as the Company Itself and other Entities Fulfilled in the Reporting Periodor Ongoing at the Period-end√Applicable □ Not applicable
Com
mitm
ent
Promisor
Type
of
commi
tment
Details of commitment
Date
of
comm
itment
makin
g
Term
of
comm
itment
Fulfi
llme
nt
Com
mitm
ent
Overseas
Chinese
Town
Other
commi
tment
The Company and other companies under the control of the Company and
persons acting in concert have no share reduction plan during the period from six
months before the Private Placement Board Meeting (28 September 2018) to the
28
Septe
mber
1 July
2020
Ong
oing

Konka Group Co., Ltd. Annual Report 2019
48
made
in
IPO
or
refin
ancin
g
Enterprises
Co.
issuance date of the commitment. To avoid the short-swing trading stipulated in
the Securities Law, the Company and other companies under the control of the
Company and persons acting in concert don’t reduce the shares of Konka
directly or indirectly during the period from six months before the Private
Placement Board Meeting (28 September 2018) to six months after the
completion of share issue.
2018
Overseas
Chinese
Town
Enterprises
Co.
Other
commi
tment
If Konka Group and its majority-owned subsidiaries are subject to any
administrative punishment or investigated due to any real estate-related illegal
acts within the Reporting Period including the undisclosed idle land, the land
speculation, the property hoarding and the housing price gouging etc., which has
caused any losses to the listed company or the investor, the Company will burden
corresponding liabilities for compensation according to relevant laws, regulations
and provisions issued by the securities market supervision department.
13
May
2019
31
Dece
mber
9999
Ong
oing
Overseas
Chinese
Town
Enterprises
Co.
Comm
itment
s on
horizo
ntal
compe
tition,
related
-party
transac
tion
and
capital
occupa
tion
1. Companies excluding Konka Group and various subsidiaries under the
Company’s control (hereinafter referred to as “Other Companies”) will
maximally reduce and avoid any related transaction with the Konka Group, and
shall neither take advantage of its status as Konka Group’s controlling
shareholder to seek any improper privilege and illegitimate right superior than
any third party on the market in the aspect of business cooperation with Konka
Group, nor to obtain the priority in concluding any transaction with Konka
Group. 2. If any necessary transaction cannot be avoided, the Company and other
companies under the Company’s control will legally sign corresponding
agreement with Konka Group according to such principles as fairness,
objectiveness and valuable compensation, fulfill various legal procedures and
perform their obligation in information disclosure and relevant internal decision
making and approval procedures according to applicable laws, regulations and the
Articles of Association so as to guarantee the fairness of the related transaction
price. However, they shall not take advantage of such transaction to take any act
which will damage the legitimate interests of Konka Group and the group’s other
shareholders. 3. The Company will fulfill its due obligations as Konka Group’s
controlling shareholder based on good faith, fully respect Konka Group’s status
of an independent legal person and guarantee its independent management and
decision making. Meanwhile, the Company guarantees that, it will attend the
General Meeting according to the Articles of Association, equally exercise
various rights and burden due obligations, and restrain itself from seeking any
illegitimate interests in the name of the Group’s controlling shareholder and
illegally transferring any capital and profit of Konka Group and its controlled
subsidiaries by taking advantage of any related transaction. In addition, the
Company commits not to damage any legitimate rights and interests of Konka
Group and other shareholders. 4. If the Company breaks the above-mentioned
promise and guarantee, it shall compensate any losses suffered by Konka Group
and its investors for this reason.
28
March
2019
31
Dece
mber
9999
Ong
oing
Overseas
ChineseComm
itment
1. As of the issuance date of the letter of commitment, the Company neitherdirectly or indirectly involves in any business competing with Konka Group’smain business, nor directly or indirectly carry on any business competing with
28
March
31
Dece
Ong
oing
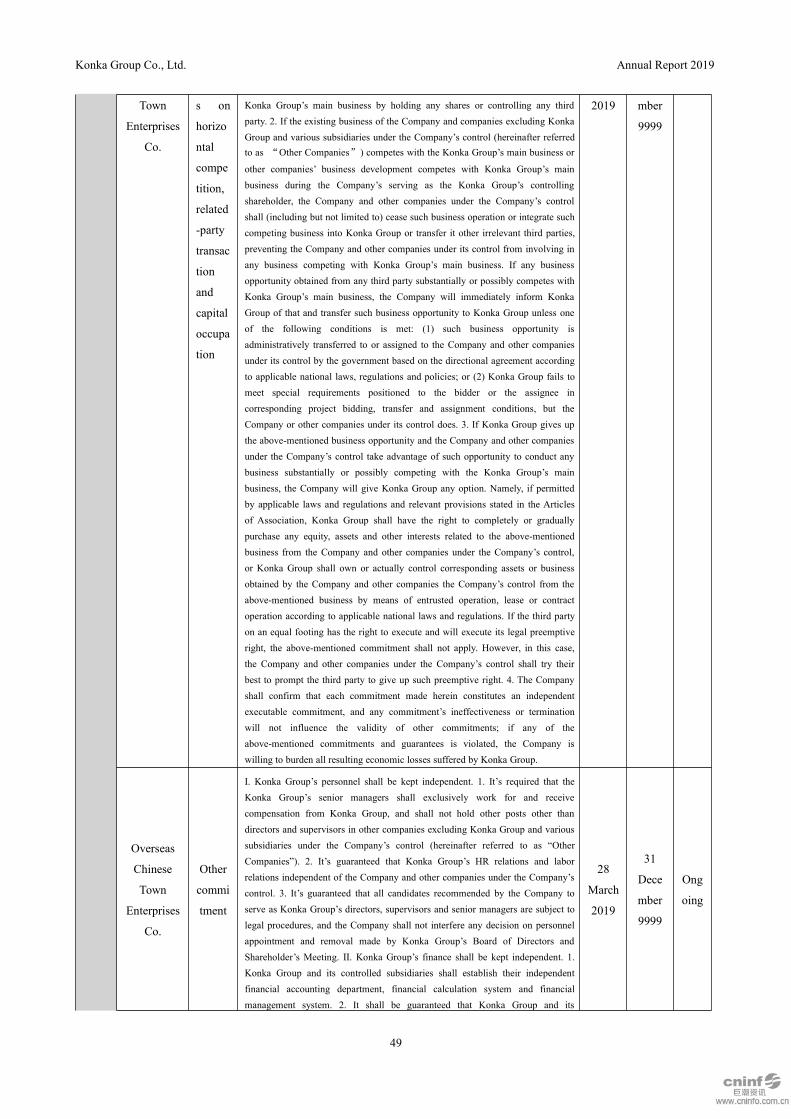
Konka Group Co., Ltd. Annual Report 2019
49
Town
Enterprises
Co.
s on
horizo
ntal
compe
tition,
related
-party
transac
tion
and
capital
occupa
tion
Konka Group’s main business by holding any shares or controlling any thirdparty. 2. If the existing business of the Company and companies excluding KonkaGroup and various subsidiaries under the Company’s control (hereinafter referredto as “Other Companies”) competes with the Konka Group’s main business or
other companies’ business development competes with Konka Group’s mainbusiness during the Company’s serving as the Konka Group’s controllingshareholder, the Company and other companies under the Company’s controlshall (including but not limited to) cease such business operation or integrate suchcompeting business into Konka Group or transfer it other irrelevant third parties,preventing the Company and other companies under its control from involving inany business competing with Konka Group’s main business. If any businessopportunity obtained from any third party substantially or possibly competes withKonka Group’s main business, the Company will immediately inform KonkaGroup of that and transfer such business opportunity to Konka Group unless oneof the following conditions is met: (1) such business opportunity isadministratively transferred to or assigned to the Company and other companiesunder its control by the government based on the directional agreement accordingto applicable national laws, regulations and policies; or (2) Konka Group fails tomeet special requirements positioned to the bidder or the assignee incorresponding project bidding, transfer and assignment conditions, but theCompany or other companies under its control does. 3. If Konka Group gives upthe above-mentioned business opportunity and the Company and other companiesunder the Company’s control take advantage of such opportunity to conduct anybusiness substantially or possibly competing with the Konka Group’s mainbusiness, the Company will give Konka Group any option. Namely, if permittedby applicable laws and regulations and relevant provisions stated in the Articlesof Association, Konka Group shall have the right to completely or graduallypurchase any equity, assets and other interests related to the above-mentionedbusiness from the Company and other companies under the Company’s control,or Konka Group shall own or actually control corresponding assets or businessobtained by the Company and other companies the Company’s control from theabove-mentioned business by means of entrusted operation, lease or contractoperation according to applicable national laws and regulations. If the third partyon an equal footing has the right to execute and will execute its legal preemptiveright, the above-mentioned commitment shall not apply. However, in this case,the Company and other companies under the Company’s control shall try theirbest to prompt the third party to give up such preemptive right. 4. The Companyshall confirm that each commitment made herein constitutes an independentexecutable commitment, and any commitment’s ineffectiveness or terminationwill not influence the validity of other commitments; if any of theabove-mentioned commitments and guarantees is violated, the Company iswilling to burden all resulting economic losses suffered by Konka Group.
2019 mber
9999
Overseas
Chinese
Town
Enterprises
Co.
Other
commi
tment
I. Konka Group’s personnel shall be kept independent. 1. It’s required that theKonka Group’s senior managers shall exclusively work for and receivecompensation from Konka Group, and shall not hold other posts other thandirectors and supervisors in other companies excluding Konka Group and varioussubsidiaries under the Company’s control (hereinafter referred to as “OtherCompanies”). 2. It’s guaranteed that Konka Group’s HR relations and laborrelations independent of the Company and other companies under the Company’scontrol. 3. It’s guaranteed that all candidates recommended by the Company toserve as Konka Group’s directors, supervisors and senior managers are subject tolegal procedures, and the Company shall not interfere any decision on personnelappointment and removal made by Konka Group’s Board of Directors andShareholder’s Meeting. II. Konka Group’s finance shall be kept independent. 1.Konka Group and its controlled subsidiaries shall establish their independentfinancial accounting department, financial calculation system and financialmanagement system. 2. It shall be guaranteed that Konka Group and its
28
March
2019
31
Dece
mber
9999
Ong
oing

Konka Group Co., Ltd. Annual Report 2019
50
subsidiaries could make independent financial decisions and would not interfereKonka Group’s use of funds. The capital of Konka Group and its subsidiariesshall not be occupied by the Company and other companies under the Company’scontrol by means of borrowing, debt repayment, advance payment or in otherways with their rights and interests not seriously damaged by the Company andother companies under the Company’s control. 3. The Konka Group and itssubsidiaries shall independently open their accounts in the bank, and shall notshare the same bank account with the Company and other companies under theCompany’s control. 4. Konka Group and its subsidiaries shall legally andindependently pay taxes. III. The Konka Group’s institutional independence shallbe kept. 1. The Konka Group and its subsidiaries shall legally establish andperfect their corporate governance structure, set up their independent andcomplete institutional framework, and completely separate from the Companyand other companies under the Company’s control. Namely, the Konka Groupand its subsidiaries and the Company and other companies under the Company’scontrol shall respectively establish their own offices and business operation sites.2. It’s guaranteed that the Konka Group and its subsidiaries could operateindependently, and the Company would not bypass the Shareholder’s Meeting todirectly or indirectly interfere Konka Group’s decision making and businessoperation. IV. Konka Group shall keep its assets independent and complete. 1.Konka Group and its subsidiaries shall possess complete operating assets. 2. It’sguaranteed that the capital, assets and other resources of Konka Group and itssubsidiaries would not be illegally occupied. V. The Konka Group shall guaranteeits business independence. 1. After this issue, Konka Group shall possesscorresponding assets, personnel and qualification for independently carry outbusiness operations and the ability of independent management based on themarket without relying on the Company and other companies under theCompany’s control. 2. The Company and other companies under the Company’scontrol shall avoid any horizontal competition with Konka Group’s mainbusiness. 3. Various related transactions shall be strictly controlled, andcorresponding continuous related transaction must be reduced between the KonkaGroup and its subsidiaries and the Company and its affiliated companies. It’s notallowed to illegally occupy the Company’s assets and funds. However, anyunavoidable related transactions will be priced based on such principles asFairness, Justice and Openness. Meanwhile, for any significant relatedtransaction, it’s required to fulfill corresponding information disclosureobligation, complete relevant approval procedures and disclose relatedinformation according to Konka Group’s Articles of Association and applicablelaws and regulations. 4. It is not allowed to interfere any major decision made bythe Konka Group and affect the independence of Konka Group’s assets,personnel, finance, institution and business via independent operation or act inconcert in any way other than the execution of shareholder’s right.
Overseas
Chinese
Town
Enterprises
Co.
Other
commi
tment
1. It’s not allowed to interfere the operation and management activities of theCompany excessively; 2. It’s not allowed to encroach the interest of theCompany; 3. During the period from the issuance date of the commitment to thecompletion, if China Securities Regulatory Commission (hereinafter referred to as“CSRC”) publishes any new regulatory provisions on such compensation andreward measures and the above-mentioned commitments are not in conformitywith such provisions, the Company will make a supplementary commitment thenaccording to the latest provisions issued by CSRC. 4. The Company earnestlypromises to adhere to various compensations and reward policies established bythe Company and make corresponding promises; if the Company breaks suchpromises and cause any losses to the Company or the investor, the Company iswilling to legally compensate any losses suffered by the Company or the investordue to the violation against such commitment.
28
March
2019
31
Dece
mber
2020
Ong
oing
Shenzhen
Overseas
Other
commi
1. The restricted stock trade period of Konka Group subscribed by the Company
is 36 months. Namely, the stock subscribed by the Company shall not be
28
Febru
31
Dece
Ong
oing

Konka Group Co., Ltd. Annual Report 2019
51
Chinese
Town
Capital
Investment
Manageme
nt Co., Ltd.
tment transferred within 36 months from the end of the day of this issue (calculating
from the day when the additional issue of stocks obtained is registered in the
name of the Company and the same below); all stocks derived from any stocks
obtained by the Company during this issue (including new stocks obtained by
distributing stock dividends and adding the capital reserve into the capital stock)
shall also be subject to the above-mentioned lock-up arrangement. After the
above-mentioned lock-up period expires, the transfer and transaction of
corresponding stocks shall be performed according to the then effective laws,
regulations and various rules, provisions and requirements put forward by China
Securities Regulatory Commission (hereinafter referred to as “CSRC”) and
Shenzhen Stock Exchange (hereinafter referred to as “SSE”). 2. Before this issue,
all stocks held by the Company and the persons acting in concert from Konka
Group shall be locked up for 12 months from the end of the day of this issue.
Stocks held by the Company and the persons acting in concert from Konka Group
before this issue correspond to additional stocks held in Konka Group due to the
distribution of dividends and the conversion into share capital, which shall also be
subject to the above-mentioned agreement.
ary
2019
mber
2022
Shenzhen
Overseas
Chinese
Town
Capital
Investment
Manageme
nt Co., Ltd.
Other
commi
tment
I. The Company is legally established and exists validly according to applicable
Chinese laws and regulations with full capacity for civil rights and civil conduct,
possesses corresponding qualification for subscribing stocks issued by Konka
Group as stipulated in Chinese laws, administrative laws and regulations,
departmental regulations and normative documents, and has obtained all due
internal approvals or licenses for subscribing this issue of stocks. II. The
Company shall not involve in any of the following situations: 1. the Company
damages the legitimate rights and interests of Konka Group and its shareholders
during the subscription of stocks from Konka Group; 2. the Company is
encumbered with a relatively large amount of outstanding debts;3. the Company
has any severe unlawful act or is a suspect of any severe unlawful act in the
recent 3 years; 4. the Company has any severe dishonest conduct on the stock
market in the recent 3 years; 5. any situation under which the subscription of the
listed company’s stocks is not allowed according to applicable laws,
administrative regulations and various provisions issued by CSRC.III. The
Company, the Company’s directors, supervisors and senior managers (or key
personnel) are not subject to any administrative punishment (except those
obviously irrelevant to the stock market), criminal punishment or any major civil
action related to any economic disputes in the recent 5 years, and any major civil
arbitration related to any economic disputes in the recent 5 years is concluded. IV.
After this subscription, any business conducted by the Company shall not
compete with or potentially compete with that of Konka Group. V. Within 24
months before Konka Group’s disclosure of this stock issue plan, all major
transactions between the Company and Konka Group shall be subject to all
necessary decision-making procedures according to various provisions geared to
the related transaction, and corresponding information is disclosed. Such related
transaction is conducted for the need of normal business development of Konka
28
March
2019
31
Dece
mber
2022
Ong
oing
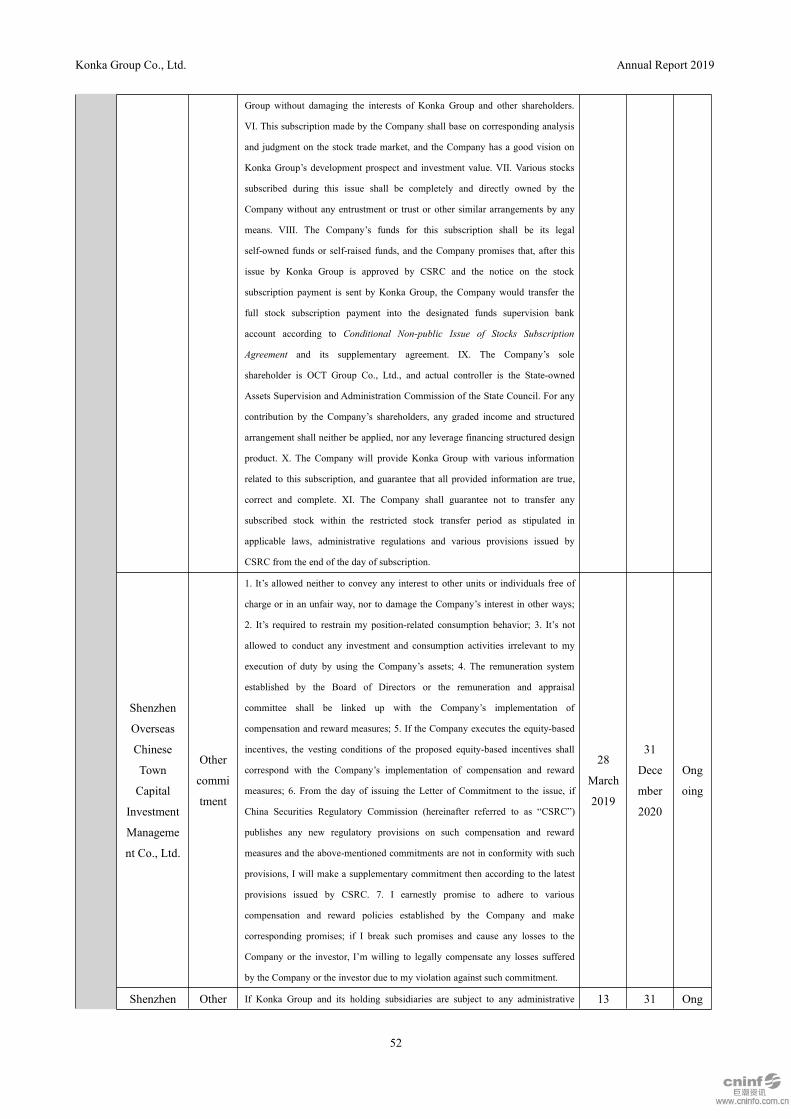
Konka Group Co., Ltd. Annual Report 2019
52
Group without damaging the interests of Konka Group and other shareholders.
VI. This subscription made by the Company shall base on corresponding analysis
and judgment on the stock trade market, and the Company has a good vision on
Konka Group’s development prospect and investment value. VII. Various stocks
subscribed during this issue shall be completely and directly owned by the
Company without any entrustment or trust or other similar arrangements by any
means. VIII. The Company’s funds for this subscription shall be its legal
self-owned funds or self-raised funds, and the Company promises that, after this
issue by Konka Group is approved by CSRC and the notice on the stock
subscription payment is sent by Konka Group, the Company would transfer the
full stock subscription payment into the designated funds supervision bank
account according to Conditional Non-public Issue of Stocks Subscription
Agreement and its supplementary agreement. IX. The Company’s sole
shareholder is OCT Group Co., Ltd., and actual controller is the State-owned
Assets Supervision and Administration Commission of the State Council. For any
contribution by the Company’s shareholders, any graded income and structured
arrangement shall neither be applied, nor any leverage financing structured design
product. X. The Company will provide Konka Group with various information
related to this subscription, and guarantee that all provided information are true,
correct and complete. XI. The Company shall guarantee not to transfer any
subscribed stock within the restricted stock transfer period as stipulated in
applicable laws, administrative regulations and various provisions issued by
CSRC from the end of the day of subscription.
Shenzhen
Overseas
Chinese
Town
Capital
Investment
Manageme
nt Co., Ltd.
Other
commi
tment
1. It’s allowed neither to convey any interest to other units or individuals free of
charge or in an unfair way, nor to damage the Company’s interest in other ways;
2. It’s required to restrain my position-related consumption behavior; 3. It’s not
allowed to conduct any investment and consumption activities irrelevant to my
execution of duty by using the Company’s assets; 4. The remuneration system
established by the Board of Directors or the remuneration and appraisal
committee shall be linked up with the Company’s implementation of
compensation and reward measures; 5. If the Company executes the equity-based
incentives, the vesting conditions of the proposed equity-based incentives shall
correspond with the Company’s implementation of compensation and reward
measures; 6. From the day of issuing the Letter of Commitment to the issue, if
China Securities Regulatory Commission (hereinafter referred to as “CSRC”)
publishes any new regulatory provisions on such compensation and reward
measures and the above-mentioned commitments are not in conformity with such
provisions, I will make a supplementary commitment then according to the latest
provisions issued by CSRC. 7. I earnestly promise to adhere to various
compensation and reward policies established by the Company and make
corresponding promises; if I break such promises and cause any losses to the
Company or the investor, I’m willing to legally compensate any losses suffered
by the Company or the investor due to my violation against such commitment.
28
March
2019
31
Dece
mber
2020
Ong
oing
Shenzhen Other If Konka Group and its holding subsidiaries are subject to any administrative 13 31 Ong

Konka Group Co., Ltd. Annual Report 2019
53
Overseas
Chinese
Town
Capital
Investment
Manageme
nt Co., Ltd.
commi
tment
punishment or investigated due to any real estate-related illegal acts within the
Reporting Period including the undisclosed idle land, the land speculation, the
property hoarding and the housing price gouging etc., which has caused any
losses to the listed company or the investor, the Company will burden
corresponding liabilities for compensation according to relevant laws, regulations
and provisions issued by the securities market supervision department.
May
2019
Dece
mber
9999
oing
The
directors,
supervisors
and senior
managers
of Konka
Group Co.,
Ltd.
Other
commi
tment
1. It’s allowed neither to convey any interest to other units or individuals free of
charge or in an unfair way, nor to damage the Company’s interest in other ways;
2. It’s required to restrain my position-related consumption behavior; 3. It’s not
allowed to conduct any investment and consumption activities irrelevant to my
execution of duty by using the Company’s assets; 4. The remuneration system
established by the Board of Directors or the remuneration and appraisal
committee shall be linked up with the Company’s implementation of
compensation and reward measures; 5. If the Company executes the equity-based
incentives, the vesting conditions of the proposed equity-based incentives shall
correspond with the Company’s implementation of compensation and reward
measures; 6. From the day of issuing the Letter of Commitment to the issue, if
China Securities Regulatory Commission (hereinafter referred to as “CSRC”)
publishes any new regulatory provisions on such compensation and reward
measures and the above-mentioned commitments are not in conformity with such
provisions, I will make a supplementary commitment then according to the latest
provisions issued by CSRC. 7. I earnestly promise to adhere to various
compensation and reward policies established by the Company and make
corresponding promises; if I break such promises and cause any losses to the
Company or the investor, I’m willing to legally compensate any losses suffered
by the Company or the investor due to my violation against such commitment.
28
March
2019
31
Dece
mber
2020
Ong
oing
The
directors
and senior
managers
of Konka
Group Co.,
Ltd.
Other
commi
tment
If Konka Group and its holding subsidiaries are subject to any administrative
punishment or investigated due to any real estate-related illegal acts within the
Reporting Period including the undisclosed idle land, the land speculation, the
property hoarding and the housing price gouging etc., which has caused any
losses to the listed company or the investor, the Company will burden
corresponding liabilities for compensation according to relevant laws, regulations
and provisions issued by the securities market supervision department.
13
May
2019
31
Dece
mber
9999
Ong
oing
Fulfill on time or not Yes
Specific reasons for failing to fulfill commitments on time and plans for next step (if any) None
2. Where there had an earnings forecast for an asset or project and the Reporting Period wasstill within the forecast period, explain why the forecast has been reached for the ReportingPeriod.□Applicable √ Not applicable

Konka Group Co., Ltd. Annual Report 2019
54
IV Occupation of the Company’s Capital by the Controlling Shareholder or Its RelatedParties for Non-Operating Purposes□Applicable √ Not applicableNo such cases in the Reporting Period.V Explanations Given by the Board of Directors, the Supervisory Board and the IndependentDirectors (if any) Regarding the Independent Auditor's “Modified Opinion” on the FinancialStatements of the Reporting Period□Applicable √ Not applicableVI YoY Changes to Accounting Policies, Estimates and Methods√Applicable □ Not applicable
In 2017, the Ministry of Finance revised and released the accounting standards related to financialinstruments, including ASBE No. 22-Recognition and Measurement of Financial Instruments,ASBE No. 23-Transfer of Financial Assets, ASBE No. 24-Hedge Accounting and ASBENo.37-Presentation of Financial Instruments. The above four financial instruments (collectivelyreferred to as “New Financial Instruments Standards”) require to be implemented by various listedcompanies in China from 1 January 2019 on. In addition, the Ministry of Finance issued the Noticeon Printing and Distributing the 2018 Annual Financial Statements of General Enterprises on 15June 2018 (CK [2018] No. 15), indicating that various enterprises implementing ASBE need toprepare their financial statements in accordance with these standards. After this change, theCompany will implement the new financial instrument criteria and the new financial statementformat published by the Ministry of Finance. For other unchanged parts except theabove-mentioned accounting policy change, the Company will continue implementing theAccounting Standards for Business Enterprises and various specific accounting standards, ASBEApplication Guide, ASBE Interpretation Announcement and other relevant provisions previouslypublished by the Ministry of Finance. According to the new financial instrument standards, theCompany will regard the “Business Mode” of the financial assets held by the enterprise and the“financial assets contract cash flow features” as the judgment basis to classify and measure thefinancial instrument (including the depreciation), revise the financial assets depreciation accountingtreatment from “the incurred loss method” to “the expected loss method”. The difference betweenthe original book value of financial instruments and the new book value on the day of implementingthe standards shall be included in the Retained Income or other Comprehensive Income at thebeginning of 2019 without any significant influence on the Company’s financial condition, businessperformance and cash flow.
VII Retrospective Restatements due to Correction of Material Accounting Errors in theReporting Period□Applicable √ Not applicable
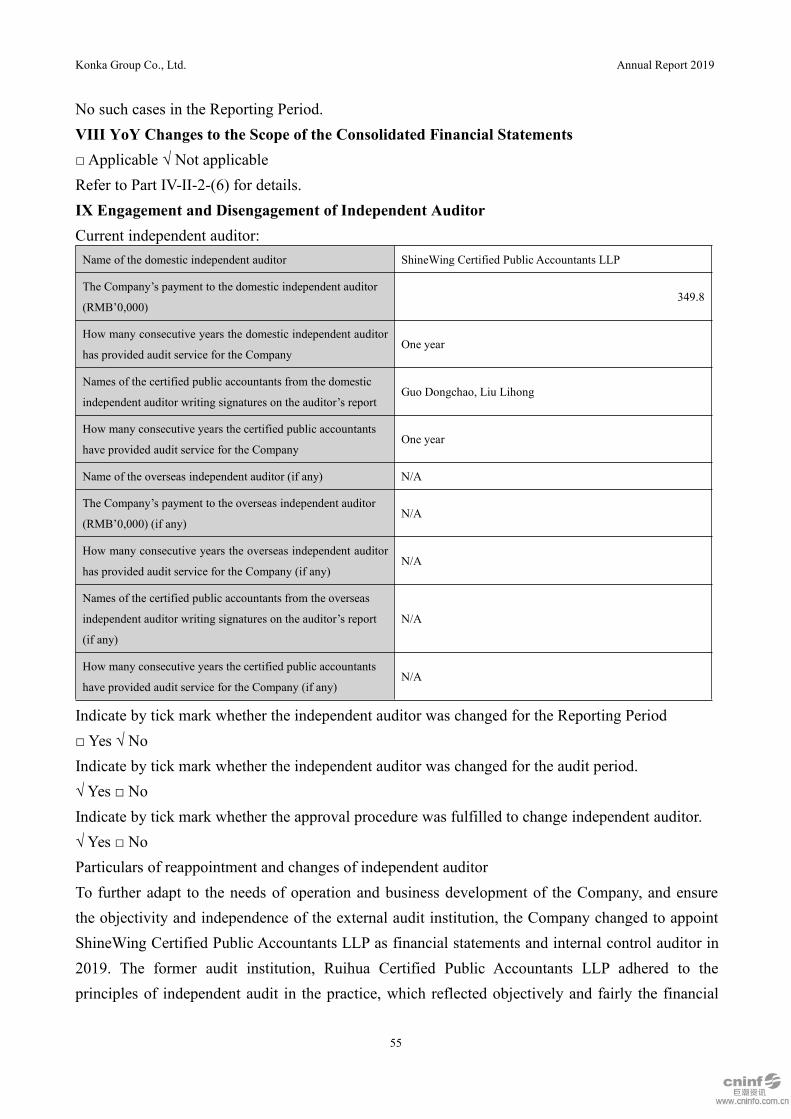
Konka Group Co., Ltd. Annual Report 2019
55
No such cases in the Reporting Period.VIII YoY Changes to the Scope of the Consolidated Financial Statements□Applicable √ Not applicableRefer to Part IV-II-2-(6) for details.IX Engagement and Disengagement of Independent AuditorCurrent independent auditor:Name of the domestic independent auditor ShineWing Certified Public Accountants LLP
The Company’s payment to the domestic independent auditor
(RMB’0,000)349.8
How many consecutive years the domestic independent auditor
has provided audit service for the CompanyOne year
Names of the certified public accountants from the domestic
independent auditor writing signatures on the auditor’s reportGuo Dongchao, Liu Lihong
How many consecutive years the certified public accountants
have provided audit service for the CompanyOne year
Name of the overseas independent auditor (if any) N/A
The Company’s payment to the overseas independent auditor
(RMB’0,000) (if any)N/A
How many consecutive years the overseas independent auditor
has provided audit service for the Company (if any)N/A
Names of the certified public accountants from the overseas
independent auditor writing signatures on the auditor’s report
(if any)
N/A
How many consecutive years the certified public accountants
have provided audit service for the Company (if any)N/A
Indicate by tick mark whether the independent auditor was changed for the Reporting Period□ Yes √ NoIndicate by tick mark whether the independent auditor was changed for the audit period.√ Yes □ NoIndicate by tick mark whether the approval procedure was fulfilled to change independent auditor.√ Yes □ NoParticulars of reappointment and changes of independent auditorTo further adapt to the needs of operation and business development of the Company, and ensurethe objectivity and independence of the external audit institution, the Company changed to appointShineWing Certified Public Accountants LLP as financial statements and internal control auditor in2019. The former audit institution, Ruihua Certified Public Accountants LLP adhered to theprinciples of independent audit in the practice, which reflected objectively and fairly the financial

Konka Group Co., Ltd. Annual Report 2019
56
situation of the Company, fulfilling reliably the obligations as the audit institution and preservingthe legitimate interest of the Company and all shareholders from a professional perspective. In viewof Ruihua Certified Public Accountants LLP offering audit services for consecutive years, and nowin order to further adapt to the needs of operation and business development of the Company, andensure the objectivity and independence of the external audit institution, the Company changed toappoint ShineWing Certified Public Accountants LLP as financial statements ad internal controlauditor in 2019. ShineWing Certified Public Accountants LLP has possessed the qualifications oflicense to engage in securities and futures business, and the experience and ability to offer auditservices for listed companies, which can provide fair audit services to the Company, meeting therequirements of auditing work in 2019. There was no harm to the interest of the Company andshareholders by changing the auditing firm.Independent auditor, financial advisor or sponsor engaged for the audit of internal controls:√ Applicable □ Not applicableThe Company appointed ShineWing Certified Public Accountants LLP as the internal controlauditor in 2019 with RMB0.6 million of payment for the internal control audit.
X Possibility of Listing Suspension or Termination after Disclosure of this Report□Applicable √ Not applicableXI Insolvency and Reorganization□Applicable √ Not applicableNo such cases in the Reporting Period.XII Major Legal Matters√ Applicable □ Not applicable
General information
Involv
ed
amoun
t
(RMB
’0,000
)
Prov
isionProgress
Decisions and
effects
Execution of
decisions
Discl
osur
e
date
Ind
ex
to
disc
lose
d
info
rma
tion

Konka Group Co., Ltd. Annual Report 2019
57
As matured notes were failed to be
accepted, the Company has filed a
lawsuit with the court to request China
Energy Electric Fuel Co., Ltd., China
Energy (Shanghai) Enterprise Co., Ltd..,
Shanghai Nengping industrial Co., Ltd.,
and Shenzhen Qianhai Baoying Factoring
Co., Ltd. to pay the bill and the
corresponding interest to the Company.
5,000 Not
The
Company
has won the
case and the
judgment
was in
effect.
The Company
won the case. At
present, it is in
the execution
stage. Based on
the principle of
prudence, the
Company has
withdrawn
relevant
impairment
provision
according to
accounting
policies.
The court has
adopted
property
preservation,
which are
currently in
the
implementatio
n stage. The
Company has
applied for the
corresponding
shareholder to
be the
additional
respondent.
25
June
2019
http
://w
ww
.cni
nfo.
co
m.c
n/n
ew/
ind
exAs matured notes were failed to be
accepted, the Company has filed a
lawsuit with the court to request
Shanghai Huaxin International Group
Co., Ltd. and Tianjin International Trade
Petrochemical Co., Ltd. to pay the bill
and the corresponding interest to the
Company.
5,000 Not
The first
trial is in
session, and
awaiting
judgment.
The court
has adopted
property
preservation
measures.
The case is
awaiting
judgment. Based
on the principle
of prudence, the
Company has
withdrawn
relevant
impairment
provision
according to
accounting
policies.
Pending for
judgment

Konka Group Co., Ltd. Annual Report 2019
58
As matured notes were failed to be
accepted, the Company has filed a
lawsuit with the court to request
Shanghai Huaxin International Group
Co., Ltd. Qingdao Bonded Zhongshe
International Trading Co., Ltd. and
Shenzhen Qianhai Benniu Agricultural
Technology Co., Ltd. to pay the bill and
the corresponding interest to the
Company.
15,000 Not
The
Company
has won the
case and the
judgment
was in
effect.
The Company
won the case. At
present, it is in
the execution
stage. Based on
the principle of
prudence, the
Company has
withdrawn
relevant
impairment
provision
according to
accounting
policies.
The court has
adopted
property
preservation,
which are
currently in
the
implementatio
n stage.
As matured notes were failed to be
accepted, Konka Factoring has filed a
lawsuit with the court to request Tahoe
Group Co., Ltd., Fuzhou Taijia Enterprise
Co., Ltd., and Xiamen Lianchuang
Microelectronics Co., Ltd. to pay the bill
and the corresponding interest to Konka
Factoring.
5,067.
67Not
The court
has adopted
property
preservation.
The case is
at trial.
The case is
awaiting
judgment. Based
on the principle
of prudence, the
Company has
withdrawn
relevant
impairment
provision
according to
accounting
policies.
Pending for
judgment
As matured notes were failed to be
accepted, Konka Factoring has filed a
lawsuit with the court to request CCCC
First Harbor Engineering Co., Ltd.,
Tianjin Galaxy Trading Co., Ltd.,
Shenzhen Gujinhong Trading Co., Ltd.,
Shanghai Tianwei International Trading
Co., Ltd., and Shanghai Runlin
International Trading Co., Ltd. to pay the
bill and the corresponding interest to
Konka Factoring.
3,620 Not
The court
judged to
dismiss the
suit.
The court judged
to dismiss the
suit. The
Company has
withdrawn
relevant
impairment
provision
according to
accounting
policies.

Konka Group Co., Ltd. Annual Report 2019
59
As matured notes were failed to be
accepted, Konka Factoring has filed a
lawsuit with the court to request CCCC
First Harbor Engineering Co., Ltd.,
Tianjin Galaxy Trading Co., Ltd.,
Dongguan Jufang Trading Co., Ltd., and
Wuhan Jialian Agricultural Technology
Development Co., Ltd., to pay the bill
and the corresponding interest to Konka
Factoring.
1,000 Not
The court
has adopted
property
preservation.
The case is
at trial.
The case is
awaiting
judgment. Based
on the principle
of prudence, the
Company has
withdrawn
relevant
impairment
provision
according to
accounting
policies.
Pending for
judgment
As matured notes were failed to be
accepted, the Company has filed a
lawsuit with the court to request Hefei
Huajun Trading Co., Ltd. and Wuhan
Jialian Agricultural Technology
Development Co., Ltd. to pay the bill and
the corresponding interest to the
Company.
8,000 Not
The case is
awaiting
trial. The
court has
adopted
property
preservation.
The case is
awaiting trial.
Based on the
principle of
prudence, the
Company has
withdrawn
relevant
impairment
provision
according to
accounting
policies.
Pending for
trial
The customer of Hong Kong Konka,
H-BUSTER SAO PAULO
INDUSTRIAE COMERCIO S.A (Brazil)
was insolvent, and obtained the approval
of the judicial reorganization application
of Cotia Third Civil Court of the Court of
Sao Paulo, Brazil in May 2013. As the
creditor of H-BUSTER, Hong Kong
Konka filed the debt declaration
documents, and in August 2014, the
amount confirmed of debt was USD2.78
million.
1,939.
38Not
The
restructuring
plan was
rejected by
the creditors'
meeting and
the case is
still
pending.
The case is
awaiting
judgment. Based
on the principle
of prudence, the
Company has
withdrawn
relevant
impairment
provision
according to
accounting
policies.
Suit pending

Konka Group Co., Ltd. Annual Report 2019
60
Due to the Jiangxi Xinxin Jian’an
Engineering Co., Ltd. (hereinafter
referred to as the “Jiangxi Xinxin”),
Jiangxi Shanshi Technology
Development Co., Ltd. (hereinafter
referred to as the “Jiangxi Shanshi”),
Jiangxi Zhongyi Decoration Materials
Co., Ltd. (hereinafter referred to as the
“Jiangxi Zhongyi”) failed to repay the
loan and its interest of China Great Wall
AMC Jiangxi Branch (hereinafter
referred to as the “Great Wall Jiangxi
Branch”), the Great Wall Jiangxi Branch
sued to the court, and required Jiangxi
Xinxin, Jiangxi Shanshi, Jiangxi Zhongyi
to repay RMB300 million with
RMB108,000 liquidated damages, and
RMB13.65 million of interest.
Meanwhile, 9 guarantors including
Jiangxi Konka, Xinfeng Microcrystalline
and Nanocrystal are required to
undertake joint liability guaranty. The
judgment of first instance was required
Jiangxi Xinxin, Jiangxi Zhongyi and
Jiangxi Shanshi shall repay the principal,
interest and liquidated damages to Great
Wall Jiangxi Branch and the guarantors
bear the joint liability for satisfaction to
the debts. The defendants have appealed
against the first instance judgment. So
far, the case has not yet been heard in
court.
31,375
.8Yes
The case is
awaiting the
second trial
The case is
awaiting the
second trial. The
corresponding
liability of risk
assumed by the
Company's
controlled
companies
involved in the
case is
controllable.
Other defendants
exclusive of the
controlled
companies of the
Company are
solvent, and at
the same time,
the Company has
outstanding
payments to the
other defendants
in this case. The
above amount
can be offset
against the
Company’s debt
obligations in the
future. Based on
the principle of
prudence, the
Company has
withdrawn
relevant
impairment
provision
according to
accounting
policies.
Suit pending

Konka Group Co., Ltd. Annual Report 2019
61
Due to the dispute of the right to use of
the patent, Via Licensing Corporation
submitted the arbitration to the Hong
Kong International Arbitration Center
and required Hong Kong Konka and the
Company to pay USD18.69 million for
the patent license fee, and USD40.3875
million for subsequent modification of
the patent license fee. With the approval
of the arbitration tribunal, the application
for arbitration procedure was cancelled
and the two parties have reached a
settlement.
28,175
.13Not
The
arbitration
procedure
was
terminated
and the two
parties have
reached a
settlement.
The arbitration
procedure was
terminated and
the two parties
have reached a
settlement. No
significant effect
to the profit of
the Company.
The
arbitration
procedure was
terminated
and the two
parties have
reached a
settlement.
Due to the dispute of sales contract,
Wumart Chain Co., Ltd. sued the Beijing
Branch of Wumart to the court of
Shijingshan District of Beijing, and
requested the Beijing Branch to return the
prepayment of goods.
1,073.
67Not
The case has
been heard
in court and
pending for
judgment.
The case is
awaiting
trial/judgment.
Based on the
principle of
prudence, the
Company has
withdrawn
relevant
impairment
provision
according to
accounting
policies.
Suit pending
XIII Punishments and Rectifications□Applicable √ Not applicableNo such cases in the Reporting Period.XIV Credit Quality of the Company as well as Its Controlling Shareholder and ActualController□Applicable √ Not applicableXV Equity Incentive Plans, Employee Stock Ownership Plans or Other Incentive Measuresfor Employees□Applicable √ Not applicableNo such cases in the Reporting Period.XVI Major Related-Party Transactions1. Continuing Related-Party Transactions√ Applicable □ Not applicable

Konka Group Co., Ltd. Annual Report 2019
62
Related
party
Relatio
nship
with the
Compa
ny
Type of
transact
ion
Specific
transact
ion
Prici
ng
princi
ple
Trans
actio
n
price
Total
value
(RMB’
0,000)
As % of
total
value of
all
same-ty
pe
transact
ions
Approv
ed
transact
ion line
(RMB’
0,000)
Over
the
appro
ved
line
or
not
Meth
od of
settle
ment
Obtai
nable
mark
et
price
for
same
-type
trans
actio
ns
Disclos
ure date
Index to
disclosed
informati
on
OCT
Enterprises
Co., Ltd and
its
subsidiaries
Under
the
same
actual
controll
er
Purchas
e of
commo
dities
and
services
Purchas
e of
material
s
Nego
tiated
price
Mark
et
price
1,902.1
00.20% 2,000 Not Cash N/A
30
March
2019 http://w
ww.cninf
o.com.cn
/new/ind
ex
OCT
Enterprises
Co., Ltd and
its
subsidiaries
Under
the
same
actual
controll
er
Sales of
goods
and
services
Sales of
LCD
Nego
tiated
price
Mark
et
price
3,159.9
10.36% 3,000 Not Cash N/A
30
March
2019
Total -- --5,062.0
1-- 5,000
4,91
2.08-- -- -- --
Large-amount sales return in detail N/A
Give the actual situation in the Reporting
Period (if any) where an estimate had been
made for the total value of continuing
related-party transactions by type to occur in
the Reporting Period
The Company has published the Forecasting Public Notice on Routine Related-party Transaction for
Y2018 on Securities Times, Shanghai Securities News, China Securities Journal and Hong Kong Ta
Kung Pao as well as the Internet website designated by CSRC
http://http://www.cninfo.com.cn/new/index on 30 March 2019. In the Reporting Period, the basis for
pricing, transaction price, transaction amount and settlement methods of raw materials purchased by
the Company were basically in accordance with the forecast. The total amount was RMB49.1208
million.
Reason for any significant difference between
the transaction price and the market reference
price
N/A
2. Related-Party Transactions Regarding Purchase or Sales of Assets or Equity Interests√Applicable □ Not applicableRefer to XVI -5 for details.3. Related Transactions Regarding Joint Investments in Third Parties□Applicable √ Not applicableNo such cases in the Reporting Period.。
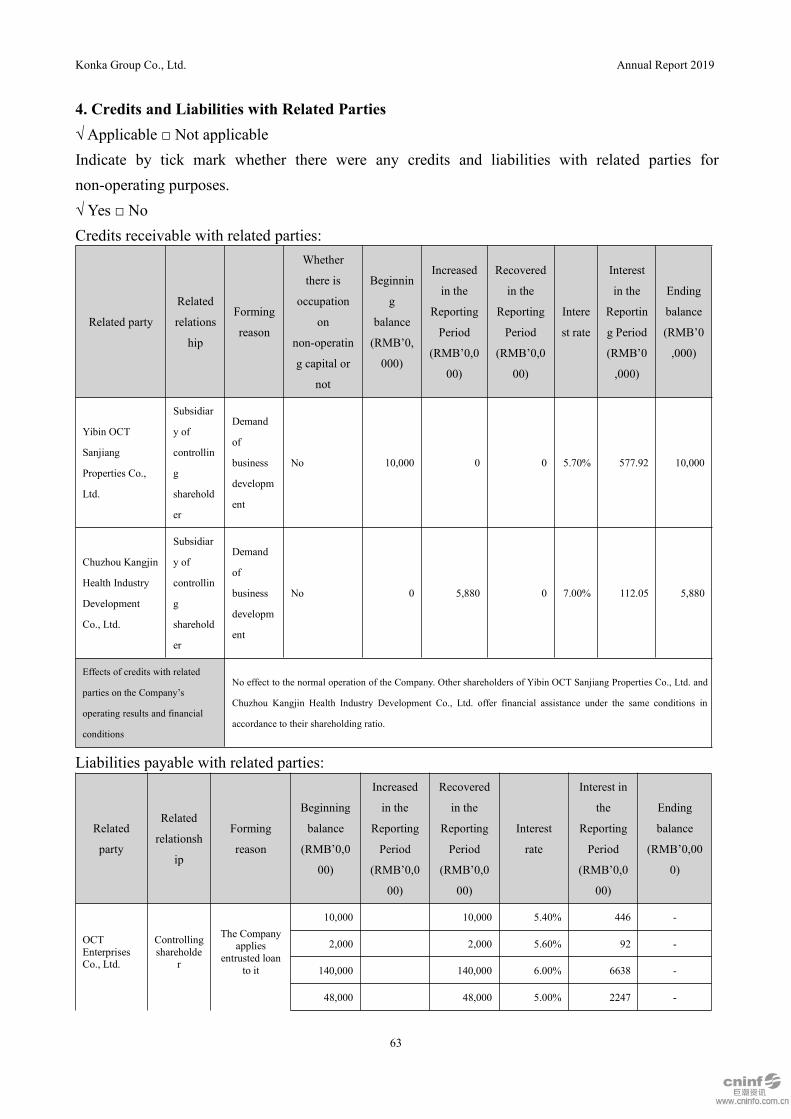
Konka Group Co., Ltd. Annual Report 2019
63
4. Credits and Liabilities with Related Parties√ Applicable □ Not applicableIndicate by tick mark whether there were any credits and liabilities with related parties fornon-operating purposes.√ Yes □ NoCredits receivable with related parties:
Related party
Related
relations
hip
Forming
reason
Whether
there is
occupation
on
non-operatin
g capital or
not
Beginnin
g
balance
(RMB’0,
000)
Increased
in the
Reporting
Period
(RMB’0,0
00)
Recovered
in the
Reporting
Period
(RMB’0,0
00)
Intere
st rate
Interest
in the
Reportin
g Period
(RMB’0
,000)
Ending
balance
(RMB’0
,000)
Yibin OCT
Sanjiang
Properties Co.,
Ltd.
Subsidiar
y of
controllin
g
sharehold
er
Demand
of
business
developm
ent
No 10,000 0 0 5.70% 577.92 10,000
Chuzhou Kangjin
Health Industry
Development
Co., Ltd.
Subsidiar
y of
controllin
g
sharehold
er
Demand
of
business
developm
ent
No 0 5,880 0 7.00% 112.05 5,880
Effects of credits with related
parties on the Company’s
operating results and financial
conditions
No effect to the normal operation of the Company. Other shareholders of Yibin OCT Sanjiang Properties Co., Ltd. and
Chuzhou Kangjin Health Industry Development Co., Ltd. offer financial assistance under the same conditions in
accordance to their shareholding ratio.
Liabilities payable with related parties:
Related
party
Related
relationsh
ip
Forming
reason
Beginning
balance
(RMB’0,0
00)
Increased
in the
Reporting
Period
(RMB’0,0
00)
Recovered
in the
Reporting
Period
(RMB’0,0
00)
Interest
rate
Interest in
the
Reporting
Period
(RMB’0,0
00)
Ending
balance
(RMB’0,00
0)
OCTEnterprisesCo., Ltd.
Controllingshareholde
r
The Companyapplies
entrusted loanto it
10,000 10,000 5.40% 446 -
2,000 2,000 5.60% 92 -
140,000 140,000 6.00% 6638 -
48,000 48,000 5.00% 2247 -

Konka Group Co., Ltd. Annual Report 2019
64
100,000 100,000 6.00% 5526 -
27,656 27,656 5.00% 791 -
50,000 50,000 5.00% 826 -
50,000 50,000 5.00% 2063 -
22,192 22,192 5.00% 740 -
150,000 4.06% 1150 150,000
150,000 56,594 4.14% 773 93,406
38,464 38,464 5.00% 422
90,000 3.93% 206 90,000
Effects of liabilities with
related parties on the
Company’s operating
results and financial
conditions
The Company applies entrusted loan from OCT Enterprises Co., Ltd. which meets the needs of the
company's existing business development and reduces the financing cost.
5. Other Major Related-Party Transactions√ Applicable □ Not applicable(1) Transfer of 51% of equity interests of Chuzhou Konka TID: The 11thMeeting of the 9th Board ofDirectors of the Company held on 6 June 2019 reviewed and approved the Proposal on Transfer of51% of Equity Interests of Chuzhou Konka Technology & Industry Development Co., Ltd. and theCompany decided to transfer 51% equity interests of Chuzhou Konka Technology & IndustryDevelopment Co., Ltd. to Shenzhen OCT Capital Investment Management Co., Ltd. via agreementwith the price of RMB63.5205 million. At present, the Company has received the share transferpayment and the registration changing procedures of Chuzhou Konka Technology & IndustryDevelopment Co., Ltd. has been completed.(2) Transfer of 51% of equity interests of Chuzhou Kangjin Health Industrial Development Co.,Ltd.: The 15th Meeting of the 9th Board of Directors of the Company held on 16 September 2019reviewed and approved the Proposal on Transfer of 51% of Equity Interests of Chuzhou KangjinHealth Industrial Development Co., Ltd. and the Company decided to transfer 51% equity interestsof Chuzhou Kangjin Health Industrial Development Co., Ltd. to Shanghai OCT InvestmentDevelopment Co., Ltd. with the price of RMB122.2543 million. At present, the Company hasreceived the transfer payment and the registration changing procedures of Chuzhou Kangjin HealthIndustrial Development Co., Ltd. has been completed.(3) Launched the financial leasing business: The 17th Meeting of the 9th Board of Directors of theCompany held on 22 October 2019 reviewed and approved the Proposal on Launching the FinancialLeasing Business with OCT Financial Leasing Co., Ltd. and the Company decided to launch thefinancial leasing business with OCT Financial Leasing Co., Ltd. via the Company and the

Konka Group Co., Ltd. Annual Report 2019
65
wholly-owned subsidiary Dongguan Konka respectively with financing amount of RMB50 millionnot exceeded respectively. The financing maturity is not over 50 years with the annual interest rateof 5.45%.(4) Provided advertising service: The 19th Meeting of the 9th Board of Directors of the Companyheld on 25 November 2019 reviewed and approved the Proposal on Provision of AdvertisingService to Overseas Chinese Town Enterprises Co., and the Company decided to provide theintelligent terminal advertising service to Overseas Chinese Town Enterprises Co. with servicetransaction price of RMB95 million.Index to the public announcements about the said related-party transactions disclosed
Title of public announcement Disclosure date Disclosure website
Announcement on Transfer of 51% of Equity Interests of Chuzhou Konka
Technology & Industry Development Co., Ltd. and the Related-party Transaction11 June 2019
http://www.cninfo.com.cn
/new/index
Announcement on Transfer of 51% of Equity Interests of Chuzhou Konka
Technology & Industry Development Co., Ltd. and Completion of Registration
Changing Procedures
25 June 2019
Announcement on Transfer of 51% of Equity Interests of Chuzhou Kangjin Health
Industry Development Co., Ltd. and the Related-party Transaction18 September 2019
Announcement on Transfer of 51% of Equity Interests of Chuzhou Kangjin Health
Industry Development Co., Ltd. and Completion of Registration Changing
Procedures
27 September 2019
Announcement on Launching the Financial Leasing Business and the
Related-party Transaction23 October 2019
Proposal on Provision of Advertising Service to Overseas Chinese Town
Enterprises Co. and the Related-party Transaction26 November 2019
XVII Major Contracts and Execution thereof1. Entrustment, Contracting and Leases(1) Entrustment□Applicable √ Not applicableNo such cases in the Reporting Period.(2) Contracting□Applicable √ Not applicableNo such cases in the Reporting Period.(3) Leases√ Applicable □ Not applicableNote to leasesNo significant leases in the Reporting Period.
The rent of Konka Development Building has received RMB80.94 million in the Reporting Period.

Konka Group Co., Ltd. Annual Report 2019
66
The project bringing about gains or losses as over 10% of total profit in the Reporting Period□ Applicable √ Not applicableNo such cases in the Reporting Period.2. Major Guarantees√ Applicable □ Not applicable(1) Guarantees
Unit: RMB'0,000
Guarantees provided by the Company and its subsidiaries for external parties (exclusive of those for subsidiaries)
Obligor
Disclosure date of
the guarantee line
announcement
Line of
guarantee
Actual occurrence
date
Actual
guarantee
amount
Type of
guarante
e
Ter
m of
guar
ante
e
Havi
ng
expi
red
or
not
Guar
antee
for a
relate
d
party
or not
Jiangxi Xinxin
Jian’an
Engineering Co.,
Ltd.
10,000 12 December 2016 10,000Joint-liab
ility
Two
year
s
Not Not
Jiangxi Zhongyi
Decoration
Materials Co.,
Ltd.
10,000 12 December 2016 10,000Joint-liab
ility
Two
year
s
Not Not
Jiangxi Shanshi
Technological
Development
Co., Ltd.
10,000 12 December 2016 10,000Joint-liab
ility
Two
year
s
Not Not
Kunshan
Kangsheng
Investment
Development
Co., Ltd.
19 September 2018 24,500 23 September 2019 24,500Joint-liab
ility
Thre
e
year
s
Not Yes
Yibin OCT
Sanjiang
Properties Co.,
Ltd.
19 September 2018 40,000 29 September 2019 14,000Joint-liab
ility
Thre
e
year
s
Not Yes
Total approved line for such guarantees in the
Reporting Period (A1)1,281
Total actual amount of such guarantees in the
Reporting Period (A2)38,500
Total approved line for such guarantees at the
end of the Reporting Period (A3)208,781
Total actual balance of such guarantees at the
end of the Reporting Period (A4)68,500
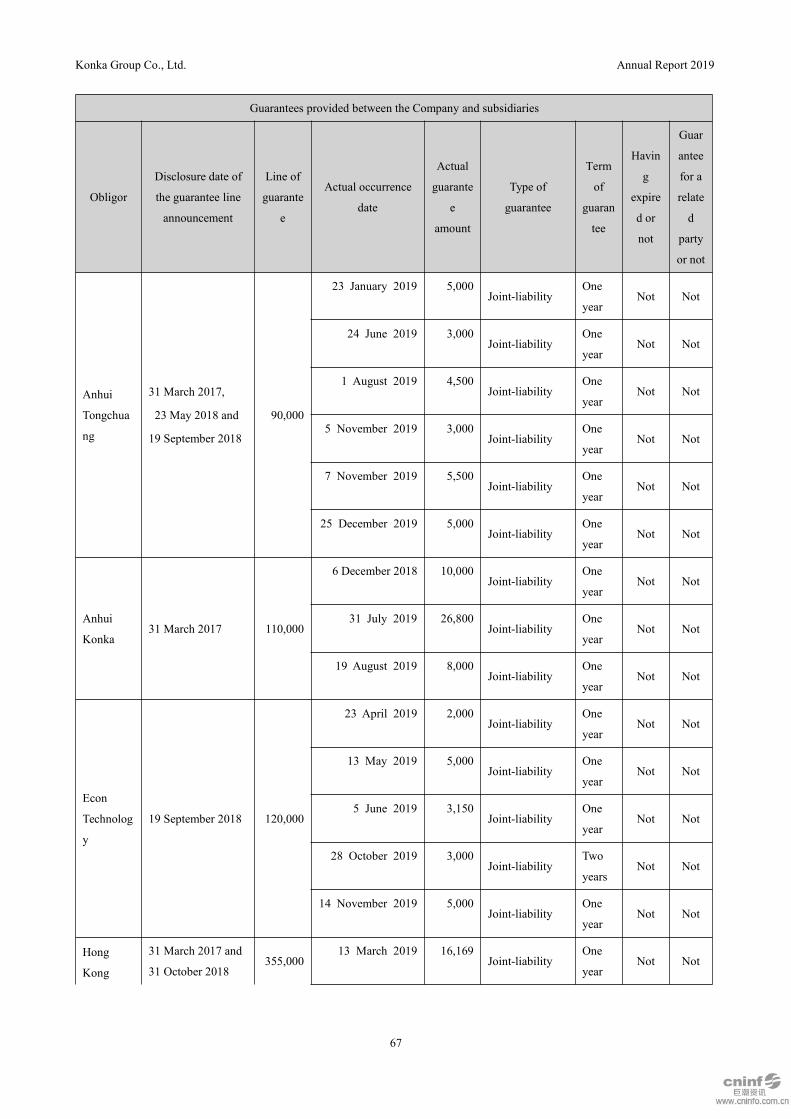
Konka Group Co., Ltd. Annual Report 2019
67
Guarantees provided between the Company and subsidiaries
Obligor
Disclosure date of
the guarantee line
announcement
Line of
guarante
e
Actual occurrence
date
Actual
guarante
e
amount
Type of
guarantee
Term
of
guaran
tee
Havin
g
expire
d or
not
Guar
antee
for a
relate
d
party
or not
Anhui
Tongchua
ng
31 March 2017,
23 May 2018 and
19 September 2018
90,000
23 January 2019 5,000Joint-liability
One
yearNot Not
24 June 2019 3,000Joint-liability
One
yearNot Not
1 August 2019 4,500Joint-liability
One
yearNot Not
5 November 2019 3,000Joint-liability
One
yearNot Not
7 November 2019 5,500Joint-liability
One
yearNot Not
25 December 2019 5,000Joint-liability
One
yearNot Not
Anhui
Konka31 March 2017 110,000
6 December 2018 10,000Joint-liability
One
yearNot Not
31 July 2019 26,800Joint-liability
One
yearNot Not
19 August 2019 8,000Joint-liability
One
yearNot Not
Econ
Technolog
y
19 September 2018 120,000
23 April 2019 2,000Joint-liability
One
yearNot Not
13 May 2019 5,000Joint-liability
One
yearNot Not
5 June 2019 3,150Joint-liability
One
yearNot Not
28 October 2019 3,000Joint-liability
Two
yearsNot Not
14 November 2019 5,000Joint-liability
One
yearNot Not
Hong
Kong
31 March 2017 and
31 October 2018355,000
13 March 2019 16,169Joint-liability
One
yearNot Not

Konka Group Co., Ltd. Annual Report 2019
68
Konka 18 July 2019 9,490Joint-liability
One
yearNot Not
7 August 2019 10,545Joint-liability
One
yearNot Not
15 November 2019 9,455Joint-liability
One
yearNot Not
Jiangxi
Konka31 October 2018 60,000
4 December 2018 10,000Joint-liability
Two
yearsNot Not
7 December 2018 10,000Joint-liability
Two
yearsNot Not
18 March 2019 11,961Joint-liability
Two
yearsNot Not
28 February 2019 10,000Joint-liability
One
yearNot Not
26 June 2019 5,500Joint-liability
Three
yearsNot Not
27 June 2019 6,000Joint-liability
One
yearNot Not
30 October 2019 6,500Joint-liability
Three
yearsNot Not
XingDa
HongYe
19 September 2018
and 30 March 201920,000
21 November 2018 5,800Joint-liability
Two
yearsNot Not
19 April 2019 4,000Joint-liability
One
yearNot Not
20 May 2019 1,000Joint-liability
One
yearNot Not
9 December 2019 2,500
Joint-liability
Two
and a
half
years
Not Not
Electronic
s
Technolog
y
19 September 2018 350,000
18 April 2019 58,000Joint-liability
One
yearNot Not
20 June 2019 5,000Joint-liability
One
yearNot Not
2 December 2019 50,000Joint-liability
One
yearNot Not
Anhui
Electrical
Appliance
19 September 2018
30,000 2 February 2019 13,000
Joint-liability
Five
years Not Not
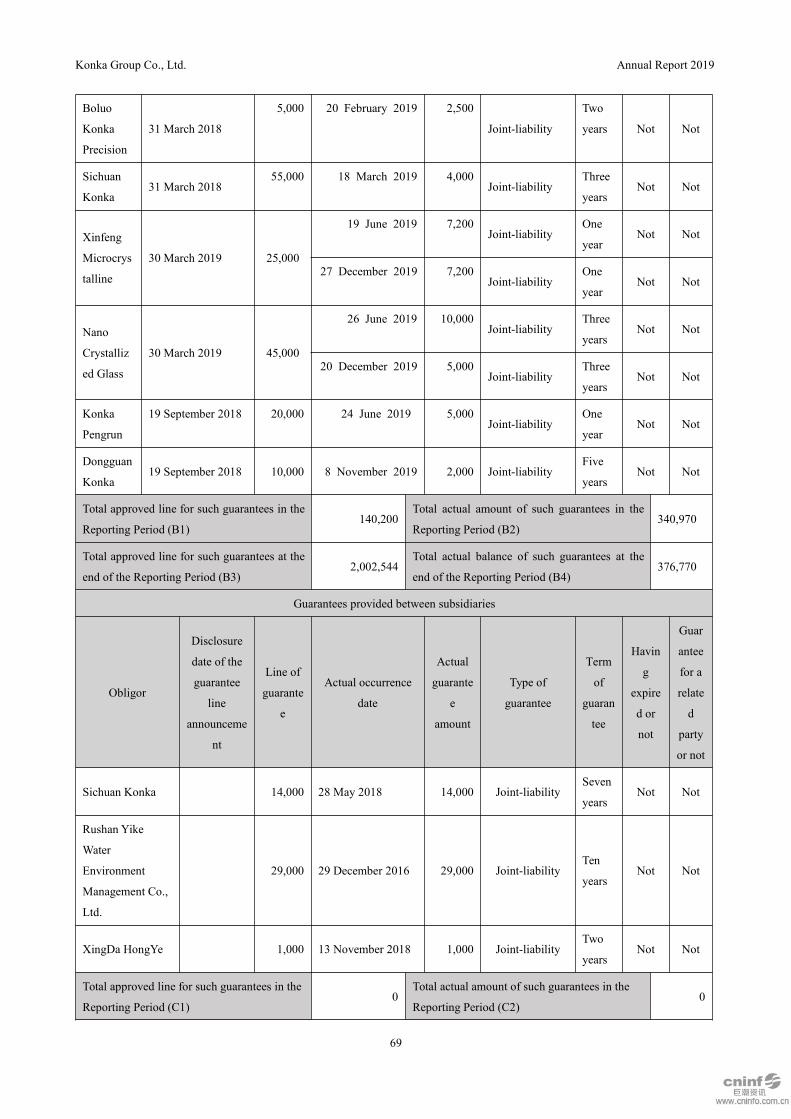
Konka Group Co., Ltd. Annual Report 2019
69
Boluo
Konka
Precision
31 March 2018
5,000 20 February 2019 2,500
Joint-liability
Two
years Not Not
Sichuan
Konka31 March 2018
55,000 18 March 2019 4,000Joint-liability
Three
yearsNot Not
Xinfeng
Microcrys
talline
30 March 2019 25,000
19 June 2019 7,200Joint-liability
One
yearNot Not
27 December 2019 7,200Joint-liability
One
yearNot Not
Nano
Crystalliz
ed Glass
30 March 2019 45,000
26 June 2019 10,000Joint-liability
Three
yearsNot Not
20 December 2019 5,000Joint-liability
Three
yearsNot Not
Konka
Pengrun
19 September 2018 20,000 24 June 2019 5,000Joint-liability
One
yearNot Not
Dongguan
Konka19 September 2018 10,000 8 November 2019 2,000 Joint-liability
Five
yearsNot Not
Total approved line for such guarantees in the
Reporting Period (B1)140,200
Total actual amount of such guarantees in the
Reporting Period (B2)340,970
Total approved line for such guarantees at the
end of the Reporting Period (B3)2,002,544
Total actual balance of such guarantees at the
end of the Reporting Period (B4)376,770
Guarantees provided between subsidiaries
Obligor
Disclosure
date of the
guarantee
line
announceme
nt
Line of
guarante
e
Actual occurrence
date
Actual
guarante
e
amount
Type of
guarantee
Term
of
guaran
tee
Havin
g
expire
d or
not
Guar
antee
for a
relate
d
party
or not
Sichuan Konka 14,000 28 May 2018 14,000 Joint-liabilitySeven
yearsNot Not
Rushan Yike
Water
Environment
Management Co.,
Ltd.
29,000 29 December 2016 29,000 Joint-liabilityTen
yearsNot Not
XingDa HongYe 1,000 13 November 2018 1,000 Joint-liabilityTwo
yearsNot Not
Total approved line for such guarantees in the
Reporting Period (C1)0
Total actual amount of such guarantees in the
Reporting Period (C2)0
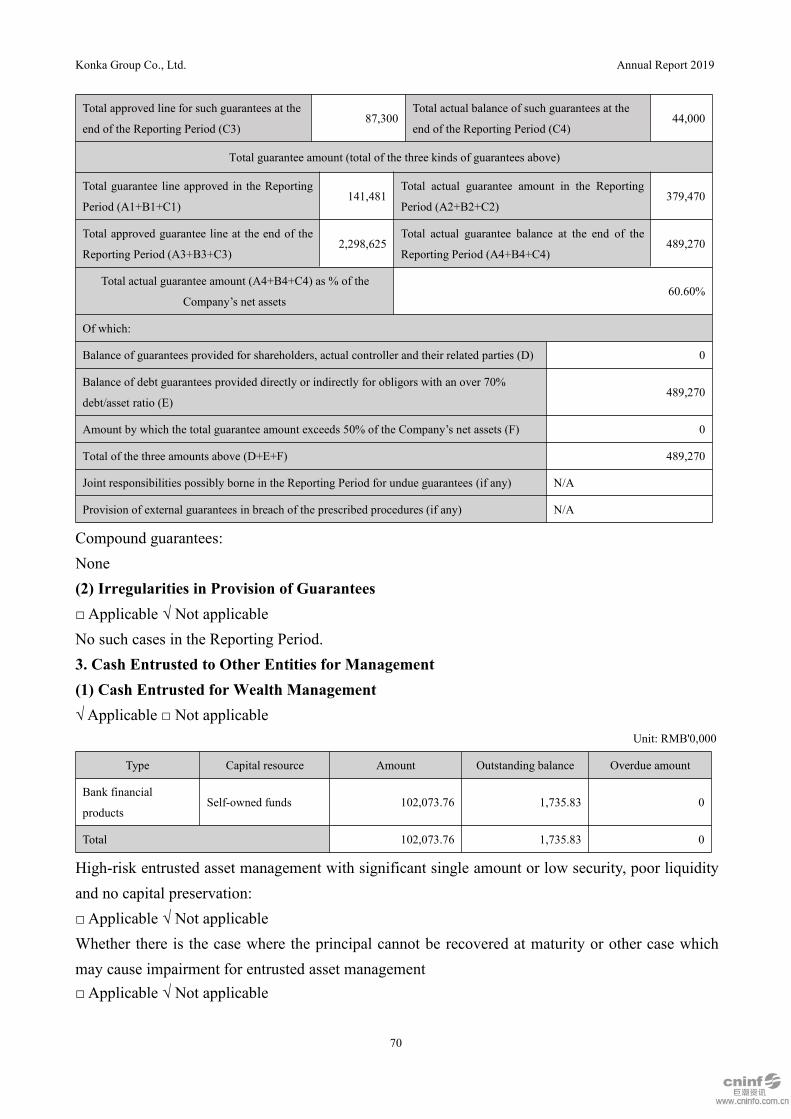
Konka Group Co., Ltd. Annual Report 2019
70
Total approved line for such guarantees at the
end of the Reporting Period (C3)87,300
Total actual balance of such guarantees at the
end of the Reporting Period (C4)44,000
Total guarantee amount (total of the three kinds of guarantees above)
Total guarantee line approved in the Reporting
Period (A1+B1+C1)141,481
Total actual guarantee amount in the Reporting
Period (A2+B2+C2)379,470
Total approved guarantee line at the end of the
Reporting Period (A3+B3+C3)2,298,625
Total actual guarantee balance at the end of the
Reporting Period (A4+B4+C4)489,270
Total actual guarantee amount (A4+B4+C4) as % of the
Company’s net assets60.60%
Of which:
Balance of guarantees provided for shareholders, actual controller and their related parties (D) 0
Balance of debt guarantees provided directly or indirectly for obligors with an over 70%
debt/asset ratio (E)489,270
Amount by which the total guarantee amount exceeds 50% of the Company’s net assets (F) 0
Total of the three amounts above (D+E+F) 489,270
Joint responsibilities possibly borne in the Reporting Period for undue guarantees (if any) N/A
Provision of external guarantees in breach of the prescribed procedures (if any) N/A
Compound guarantees:None(2) Irregularities in Provision of Guarantees□Applicable √ Not applicableNo such cases in the Reporting Period.3. Cash Entrusted to Other Entities for Management(1) Cash Entrusted for Wealth Management√ Applicable □ Not applicable
Unit: RMB'0,000
Type Capital resource Amount Outstanding balance Overdue amount
Bank financial
productsSelf-owned funds 102,073.76 1,735.83 0
Total 102,073.76 1,735.83 0
High-risk entrusted asset management with significant single amount or low security, poor liquidityand no capital preservation:□ Applicable √ Not applicableWhether there is the case where the principal cannot be recovered at maturity or other case whichmay cause impairment for entrusted asset management□ Applicable √ Not applicable
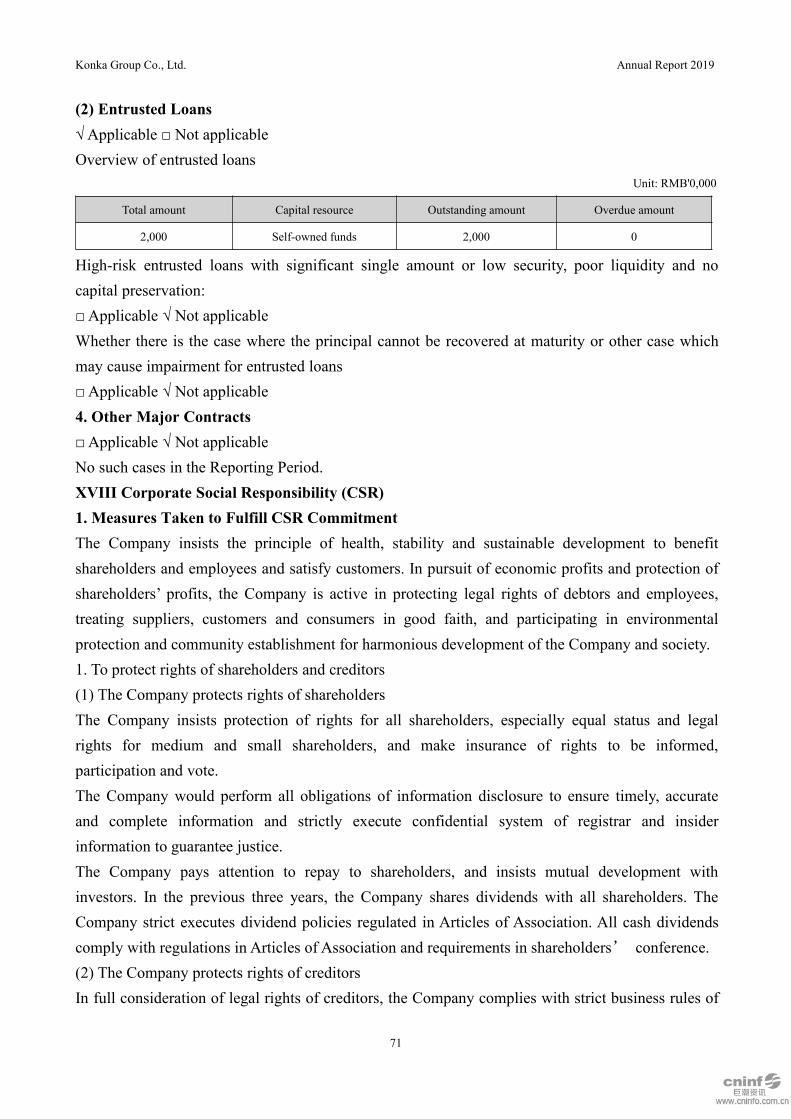
Konka Group Co., Ltd. Annual Report 2019
71
(2) Entrusted Loans√ Applicable □ Not applicableOverview of entrusted loans
Unit: RMB'0,000
Total amount Capital resource Outstanding amount Overdue amount
2,000 Self-owned funds 2,000 0
High-risk entrusted loans with significant single amount or low security, poor liquidity and nocapital preservation:□ Applicable √ Not applicableWhether there is the case where the principal cannot be recovered at maturity or other case whichmay cause impairment for entrusted loans□ Applicable √ Not applicable4. Other Major Contracts□Applicable √ Not applicableNo such cases in the Reporting Period.XVIII Corporate Social Responsibility (CSR)1. Measures Taken to Fulfill CSR CommitmentThe Company insists the principle of health, stability and sustainable development to benefitshareholders and employees and satisfy customers. In pursuit of economic profits and protection ofshareholders’ profits, the Company is active in protecting legal rights of debtors and employees,treating suppliers, customers and consumers in good faith, and participating in environmentalprotection and community establishment for harmonious development of the Company and society.1. To protect rights of shareholders and creditors(1) The Company protects rights of shareholdersThe Company insists protection of rights for all shareholders, especially equal status and legalrights for medium and small shareholders, and make insurance of rights to be informed,participation and vote.The Company would perform all obligations of information disclosure to ensure timely, accurateand complete information and strictly execute confidential system of registrar and insiderinformation to guarantee justice.The Company pays attention to repay to shareholders, and insists mutual development withinvestors. In the previous three years, the Company shares dividends with all shareholders. TheCompany strict executes dividend policies regulated in Articles of Association. All cash dividendscomply with regulations in Articles of Association and requirements in shareholders’ conference.(2) The Company protects rights of creditorsIn full consideration of legal rights of creditors, the Company complies with strict business rules of
Konka Group Co., Ltd. Annual Report 2019
72
credit cooperation to guarantee legal rights of creditors. No damages upon rights of creditorshappened.2. The Company performs responsibilities to suppliers and customers(1) It is devoted to improve customer service quality.The Company is insisting philosophy of customer orientation to strengthen customer servicemanagement, service consciousness for employees, service levels and to protect rights forcustomers. Through customer service hot-line, field visit and follow-up service, the Company hasset a good corporate image for customers.(2) Be honest to suppliersFollowing the principle of integrity and mutually beneficial cooperation, the Company keeps goodcooperative relations with suppliers at each level. The corporate principle is open, fair and impartialto standardize procurement, protect suppliers’ legal rights and lay solid foundation for furthercooperation.3. Be enthusiastic to social and public welfare undertakingsBased on the principle of appreciating and repaying the society, the Company has participated in allkinds of activities for public welfare, cooperated with society, undertaken social responsibilitiesactively and promoted harmonious development between enterprise and society.4. Be responsible for employeesThe Company insists the principle of people orientation to improve working environment, promoteoccupational skills, provide opportunity and platform for development and growth and encourageself upgradation and realization for employees. Mutual improvement for employees and enterprisecould be achieved.(1) Be honest and law-abiding to protect legal rights for employeesThe Company would strictly comply with laws and regulations in Labor Law and Labor ContractLaw to sign labor contract with employees with fair treatment in employment, payment, promotion,training, demission and retirement. Also, the Company would pay all kinds of insurances andhousing fund for employees. Regular physical examination would be organized for each year. Anyproblems found would require re-examination and consultation from a doctor.The Company would improve living quality; enhance cohesive force and sense of belongingsthrough a series of safeguard measures.(2) To protect occupational health for employeesThe Company would establish and perfect training, safety assessment by security system toguarantee the safety and occupational health for employees. On the other hand, by promotion of theimportance of safety, safety awareness would be rooted in the heart to make all employees abide bysafety standards and fully play subjective initiative in protecting self-occupational safety andproduction safety.

Konka Group Co., Ltd. Annual Report 2019
73
(3) To promote occupational skills by diversified professional trainingThe Company has always paid great attention on diversified training for employees. On the onehand, the Company would be meticulous in training of regular business and occupational skills andcarry out all requirements positively to improve professional levels by normal training management.On the other hand, the Company would establish methods of self-training platform, traininginstructor, theme training and lectures to provide colorful training activities. Besides the work,professional and comprehensive quality would be fully promoted.5. Be responsible for environmentThe Company concerns about environmental changes and close relationships with environment bycreating low carbon economy in technical innovation, from green manufacturing, green products togreen industry circular economy. The Company would provide efforts in protecting globalecological environment. In June 2012, subsidized products catalogue had been released jointly byNational Development and Reform Commission, Ministry of Industry and Information and Ministryof Finance.In the new year, the Company would undertake all social responsibilities by improving strategicmanagement, sustainable development and enterprise economic efficiency. It would reattribute allshareholders and would protect legal rights for creditors and employees. To be honest to suppliersand customers, the Company would serve local economic development and participate in socialpublic welfare activities and environment protection. It would undertake all responsibilities in manyfields and make attributions to social, economic, and environmental sustainable development for asocialism harmonious society.2. Measures Taken for Targeted Poverty Alleviation(1) PlansIn accordance with the guiding principles of the state on the development of precision povertyalleviation, the Company has proactively carried out critical work on poverty alleviation andengaged in the targeted support in Sansui County and Tianzhu County in Guizhou Province.(2) Summary of the Related Work Done in the Reporting PeriodIn 2019, the Company donated office supplies of approximately RMB0.3 million, includingtelevision sets and books to Sansui County and Tianzhu County, together with the work on publicbrand establishment of no more than RMB0.378 million which will be used for the packageplanning and advertisement promotion of Sansui ducks of Sansui County.(3) Results of Targeted Poverty Alleviation
IndexUnit of
measurementAmount/implementation
I. Overall situation —— ——
Of which: 2. Materials converted to cash RMB’0,000 67.8

Konka Group Co., Ltd. Annual Report 2019
74
II. Itemized investment —— ——
9. Other plans —— ——
9.2 Investment amount RMB’0,000 67.8
(4) Subsequent PlansTo fully perform its duties of targeted poverty alleviation, in 2020, the Company plans tocontinuously conduct the targeted poverty alleviation affairs for Tianzhu and Sansui two counties ofGuizhou Province.3. Issues Related to Environmental ProtectionIndicate by tick mark whether the Company or any of its subsidiaries is identified as a majorpolluter by the environmental protection authorities.Yes
Name of
polluter
Name of
major
pollutants
Way
of
discha
rge
Number
of
dischar
ge
outlets
Distributi
on of
discharge
outlets
Discharge
concentration
Discharge standards
implemented
Total
disch
arge
Approved total
discharge
Excess
ive
discha
rge
XingDa
HongYe
Pollution
sources of
waste water:
PH、copper、
COD、
ammonia nitr
ogen、total
nitrogen、tota
l phosphorus
Discha
rge of
station
ary
polluti
on
source
s
1
Main
discharge
outlet of
the waste
water
station
PH6-9;copper
≤0.5mg/L;
COD≤80mg/L;
ammonia nitrogen≤
15mg/L;total
nitrogen
≤20mg/L; total
phosphorus
≤1mg/L
Electroplating water
pollutant discharge
standard
DB44/1597-2015
Table 1
0.448
milli
on
tons/
year
Total discharge
448,500
tons/year;
pollutant COD
24.891 tons/year;
ammonia nitroge
n 3.982
tons/year; total
nitrogen 9.373
tons/year; total
phosphorus
0.439 tons/year
None
waste
gas pollutants
: sulfuric acid
fume,
hydrogen
chloride,
formaldehyde
,hydrogen
cyanide,
nitrogen
oxide,
ammonia, b
enzene,
Discha
rge of
station
ary
polluti
on
source
s
14
Three on
the roof of
one plant ,
ten on the
roof of
two plants
and one
on the
roof of the
canteen
sulfuric acid
fume≤30mg/m3;
nitrogen
oxide≤200mg/m3;
hydrogen
chloride≤30mg/m3
;
TVOC≤90mg/m3;
benzene≤12mg/m3
;
methylbenzen≤40m
g/m3;
dimethylbenzene≤7
Emission Standard for
Electroplating
Pollutants
GB21900-2008 Air
Emission Limits
Table 5, Guangdong
Air Pollutant
Emission Standard
DB44/27-2001 the
Second Level
Standard in the
Second Period,
Emission standard for
2,986
,560,
000
stand
ard
cube/
year
2,986,560,000
standard
cube/year (note:
the total
discharge is not
stated in the
latest version of
national
discharge permit
in 2018; two
exhaust towers
were added in
2018; calculated
None
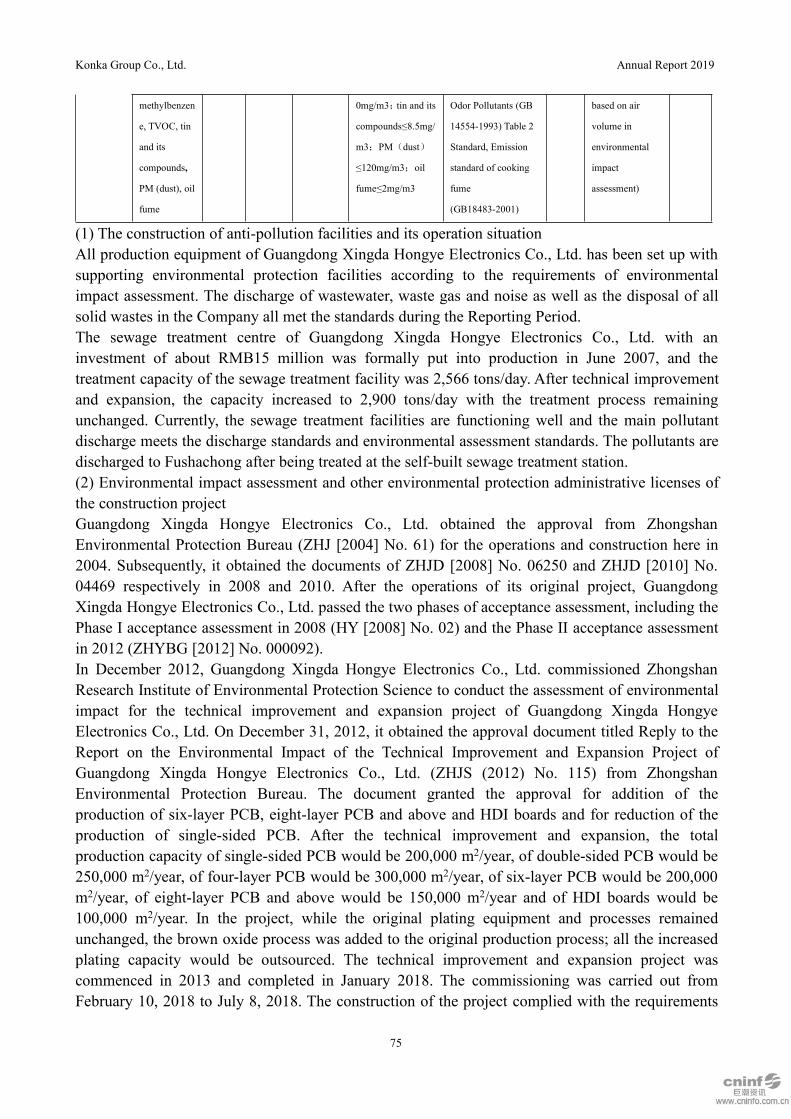
Konka Group Co., Ltd. Annual Report 2019
75
methylbenzen
e, TVOC, tin
and its
compounds,
PM (dust), oil
fume
0mg/m3;tin and its
compounds≤8.5mg/
m3;PM(dust)
≤120mg/m3;oil
fume≤2mg/m3
Odor Pollutants (GB
14554-1993) Table 2
Standard, Emission
standard of cooking
fume
(GB18483-2001)
based on air
volume in
environmental
impact
assessment)
(1) The construction of anti-pollution facilities and its operation situationAll production equipment of Guangdong Xingda Hongye Electronics Co., Ltd. has been set up withsupporting environmental protection facilities according to the requirements of environmentalimpact assessment. The discharge of wastewater, waste gas and noise as well as the disposal of allsolid wastes in the Company all met the standards during the Reporting Period.The sewage treatment centre of Guangdong Xingda Hongye Electronics Co., Ltd. with aninvestment of about RMB15 million was formally put into production in June 2007, and thetreatment capacity of the sewage treatment facility was 2,566 tons/day. After technical improvementand expansion, the capacity increased to 2,900 tons/day with the treatment process remainingunchanged. Currently, the sewage treatment facilities are functioning well and the main pollutantdischarge meets the discharge standards and environmental assessment standards. The pollutants aredischarged to Fushachong after being treated at the self-built sewage treatment station.(2) Environmental impact assessment and other environmental protection administrative licenses ofthe construction projectGuangdong Xingda Hongye Electronics Co., Ltd. obtained the approval from ZhongshanEnvironmental Protection Bureau (ZHJ [2004] No. 61) for the operations and construction here in2004. Subsequently, it obtained the documents of ZHJD [2008] No. 06250 and ZHJD [2010] No.04469 respectively in 2008 and 2010. After the operations of its original project, GuangdongXingda Hongye Electronics Co., Ltd. passed the two phases of acceptance assessment, including thePhase I acceptance assessment in 2008 (HY [2008] No. 02) and the Phase II acceptance assessmentin 2012 (ZHYBG [2012] No. 000092).In December 2012, Guangdong Xingda Hongye Electronics Co., Ltd. commissioned ZhongshanResearch Institute of Environmental Protection Science to conduct the assessment of environmentalimpact for the technical improvement and expansion project of Guangdong Xingda HongyeElectronics Co., Ltd. On December 31, 2012, it obtained the approval document titled Reply to theReport on the Environmental Impact of the Technical Improvement and Expansion Project ofGuangdong Xingda Hongye Electronics Co., Ltd. (ZHJS (2012) No. 115) from ZhongshanEnvironmental Protection Bureau. The document granted the approval for addition of theproduction of six-layer PCB, eight-layer PCB and above and HDI boards and for reduction of theproduction of single-sided PCB. After the technical improvement and expansion, the totalproduction capacity of single-sided PCB would be 200,000 m2/year, of double-sided PCB would be250,000 m2/year, of four-layer PCB would be 300,000 m2/year, of six-layer PCB would be 200,000m2/year, of eight-layer PCB and above would be 150,000 m2/year and of HDI boards would be100,000 m2/year. In the project, while the original plating equipment and processes remainedunchanged, the brown oxide process was added to the original production process; all the increasedplating capacity would be outsourced. The technical improvement and expansion project wascommenced in 2013 and completed in January 2018. The commissioning was carried out fromFebruary 10, 2018 to July 8, 2018. The construction of the project complied with the requirements

Konka Group Co., Ltd. Annual Report 2019
76
for environmental impact assessment and met the criteria for the acceptance of environmentalprotection for the completion of construction projects. In 2018, the Company obtained the statesewage permit, certificate No.: 91442000768405216J001P.(3) Contingency plan for emergent environmental incidentIn strict accordance with requirements of laws, regulations and relevant documents, such as Law ofthe People’s Republic of China on Emergency Response and Interim Measures on EnvironmentalEmergency Response Plan, Guangdong Xingda Hongye Electronics Co., Ltd. has established riskprevention measures and emergency response plans, kept its emergency equipment in a normal state,formulated the Contingency Plan for Emergent Environmental Incident, and put on records atZhongshan Environmental Protection Bureau, Guangdong Province, record No.: 4420002017044M.In addition, the Company conducts a drill of major environmental pollution incident on its factoryto enhance its emergency response capabilities for emergent environmental pollution incidents.Furthermore, Guangdong Xingda Hongye Electronics Co., Ltd. has built an emergency pool (whichis the comprehensive water tank in the sewage treatment station covering an area of 800m3) and setup a fire pool (500m3 and located on Floor 1 of Factory Building No. 2), which serve as temporarystorage pools for exterior drainage or fire drainage to eradicate accidental discharge of wastewaterin the case of failed operation of the sewage transmission pipeline or fire accident due to outage orother special circumstances. The sewage transmission pipeline has been equipped withanti-corrosion and cathodic protection using anti-corrosion pipes and carbon steel pipes. Pursuant tothe new discharge standards, the related discharge pipeline has been modified and the productiondepartment has been required to discharge strictly in accordance with discharge standards to cut thecosts of wastewater treatment. Different types of wastewater are normally and properly treatedthrough fine shunting. Personnel have been specially arranged to manage the chemical liquidwarehouse and exert reasonable control and requirements over the liquid discharge by the plant andtimely transportation of the liquid by suppliers; emergency tools such as protective masks, bootsand immiscible pumps have been equipped;(4) Environmental self-monitoring planAccording to the requirements of the Environmental Protection Administration, Guangdong XingdaHongye Electronics Co., Ltd. attaches great importance to environmental monitoring management.Thus, pursuant to the Measures for Self-Monitoring and Information Disclosure of National KeyMonitored Enterprises, the Report on the Environmental Impact of the Technical Improvement andExpansion Project of Guangdong Xingda Hongye Electronics Co., Ltd. and the reply opinions forenvironmental impact assessment, the Company has formulated the Environmental Self-MonitoringPlan and reported to the municipal environmental protection bureau for approval and record. Itimplements online monitoring for the PH, COD and ammonia nitrogen pollutants discharged inwastewater through real-time monitoring and an automatic frequency of every two hours, entruststhe qualified third-party online monitoring equipment operation and maintenance institute to carryout periodic maintenance on automatic monitoring equipment and monitoring data networkingequipment, and entrusts the qualified third-party monitoring unit to carry out the “three wastes”project monitoring. All self-monitoring plan results will be reported and disclosed on publicplatforms on a periodic basis.In the case of normal production, the results will be updated on a daily basis, with onlinemonitoring data disclosed in real time and manual monitoring data disclosed on the next day aftercompletion. In the case of public holidays, the operation monitoring data for the holiday period will

Konka Group Co., Ltd. Annual Report 2019
77
be disclosed on the first working day after the holiday. Items monitored on a monthly basis will bedisclosed by the 25th day of the month. Items inspected on a quarterly basis will be disclosed by the25th day of the last month of the quarter. The annual self-monitoring report for the previous yearwill be disclosed at the end of January each year. In the case of shutdown with days off, the numberof days off will be indicated in the information bar and related proofs will be submitted to themonitoring center of the municipal environmental bureau for record.The results are disclosed on Guangdong Province Key Pollution Source Regulatory InformationPlatform and on National Pollution Source Monitoring Information Management and SharingPlatform for public monitoring.(5) Other environmental information that should be disclosedThe environmental protection investment of Guangdong Xingda Hongye Electronics Co., Ltd. for2019 was approximately RMB19 million, mainly used as the environmental engineering investment(approximately RMB1.5 million) and the operation of environmental protection equipment(approximately RMB6.25 million).(6) Other Environmental InformationAccording to the examination by the Company, the Company and its other holding subsidiaries arenot key pollutant units. All have faithfully implemented the laws and regulations related toenvironmental protection, such as Environmental Protection Law of the People's Republic of China,Water Pollution Prevention and Control Law of the People's Republic of China, Law of the People'sRepublic of China on the Prevention and Control of Atmospheric Pollution, Law of the People'sRepublic of China on Prevention and Control of Pollution From Environmental Noise, Law of thePeople's Republic of China on the Prevention and Control of Environmental Pollution by SolidWaste in the daily production and operation, without being punished for violations of laws andregulations during the Reporting Period.XIX Other Significant Events√ Applicable □ Not applicable(I) Private placement of corporate bonds, asset securitization of commercial factoring and assetsecuritization of accounts receivable: Currently, the private placement of corporate bonds of RMB5billion has been issued, matters with other private placement of corporate bonds of RMB0.6 billionare in moving forward; the asset securitization of commercial factoring and asset securitization ofaccounts receivable are in moving forward.(II) The Company’s application for a private A-share placement was accepted for processing by theCSRC on 20 May 2019, and the Company has disclosed its reply to the CSRC’s questions regardingthe application. At present, this issue is under the approval of CSRC and it’s uncertain whether it isapproved.(III) Disclosure index of significant information
AnnouncementNo.
Date Title Page on newspaper
Linkon
http://www.cninf

Konka Group Co., Ltd. Annual Report 2019
78
o.com.cn
2019-014 January2019
Announcement on the Progress ofOffering Guarantees to theMajority-owned Subsidiary
Securities TimesB29, Shanghai SecuritiesNews 64 etc.
http://
www.c
ninfo.c
om.cn/
new/in
dex
2019-0215 January
2019
Announcement on the Progress ofOffering Guarantees to thewholly-owned subsidiary
Securities TimesB13, Shanghai SecuritiesNews 48 etc.
2019-0316 January
2019
Announcement on the Result of PrivatePlacement of Corporate Bonds in 2019(Phase I)
Securities TimesB32, Shanghai SecuritiesNews 33 etc.
2019-0418 January
2019
Announcement on the Progress ofOffering Guarantees to theMajority-owned Subsidiary
Securities TimesB36, Shanghai SecuritiesNews 76 etc.
2019-0525 January
2019
Announcement on the Progress ofOffering Guarantees to thewholly-owned subsidiary
Securities TimesB29, Shanghai SecuritiesNews 36 etc.
2019-0626 January
2019Announcement on the 2018 EarningsForecasts
Securities TimesB20, Shanghai SecuritiesNews 32 etc.
2019-072 February2019
Announcement on the Resolution ofthe 4th Meeting of the 9th Board ofDirectors
Securities TimesB36, Shanghai SecuritiesNews 33 etc.
2019-082 February
2019Notice on Convening the 1st
Extraordinary General Meeting of 2019Securities TimesB36, Shanghai Securities
News 33 etc.
2019-092 February
2019
Announcement on External FinancialAids Generated from Planned Transferof Partial Equity of Subsidiaries
Securities TimesB36, Shanghai SecuritiesNews 33 etc.
2019-1012 February
2019
Announcement on the Progress ofOffering Guarantees to theMajority-owned Subsidiary
Securities TimesB25, Shanghai SecuritiesNews 85 etc.
2019-1115 February
2019Announcement on Accumulative NewBorrowings
Securities TimesB12, Shanghai SecuritiesNews 76 etc.
2019-1221 February
2019
Announcement on the Resolution ofthe 1st Extraordinary General Meetingof 2019
Securities TimesB42, Shanghai SecuritiesNews 40 etc.
2019-1314 March2019
Announcement on the Progress ofOffering Guarantees to theMajority-owned Subsidiary
Securities TimesB28, Shanghai SecuritiesNews 56 etc.

Konka Group Co., Ltd. Annual Report 2019
79
2019-1419 March2019
Announcement on the Progress ofOffering Guarantees to theMajority-owned Subsidiary
Securities TimesB92, Shanghai SecuritiesNews 92 etc.
2019-1519 March2019
Announcement on VolunteerInformation Disclosure of Pre-winningthe Bid for Project
Securities TimesB92, Shanghai SecuritiesNews 92 etc.
2019-1619 March2019
Announcement on Abnormal Volatilityof Stock Trading
Securities TimesB116, Shanghai SecuritiesNews 40 etc.
2019-1719 March2019
Indicative Announcement on Planningof Private Placement of Shares
Securities TimesB116, Shanghai SecuritiesNews 40 etc.
2019-1821 March2019
Announcement on Offering OverseasLoan under Domestic Guarantee toForeign Wholly-owned Subsidiary
Securities TimesB29, Shanghai SecuritiesNews 48 etc.
2019-1928 March2019
Announcement on VolunteerInformation Disclosure of Pre-winningthe Bid for Project
Securities TimesB33, Shanghai SecuritiesNews 40 etc.
2019-2029 March2019
Announcement on InformationDisclosure of Voluntariness ofReceiving Letter of Acceptance
Securities TimesB128, Shanghai SecuritiesNews 428 etc.
2019-2130 March2019
Announcement on the Abstract of the2018 Annual Report
Securities TimesB41, Shanghai SecuritiesNews 529 etc.
2019-2230 March2019
Announcement on the 2018 AnnualReport
2019-2330 March2019
Announcement on the Resolution ofthe 7th Meeting of the 9th Board ofDirectors
Securities TimesB41, Shanghai SecuritiesNews 529 etc.
2019-2430 March2019
Announcement on the Resolution ofthe 2nd Meeting of the 9th SupervisoryCommittee
Securities TimesB41, Shanghai SecuritiesNews 529 etc.
2019-2530 March2019
Announcement on External GuaranteesSecurities TimesB42, Shanghai Securities
News 529 etc.
2019-2630 March2019
Announcement on the Changes of Partof Accounting Policies
Securities TimesB42, Shanghai SecuritiesNews 530 etc.
2019-2730 March2019
Announcement on the Expectation ofthe 2019 Routine Related Transaction
Securities TimesB43, Shanghai SecuritiesNews 530 etc.
2019-2830 March2019
Announcement on Involving Numberof Subscriptors after Penetration ofSubscriptors for Private Placement ofA-shares
Securities TimesB42, Shanghai SecuritiesNews 530 etc.
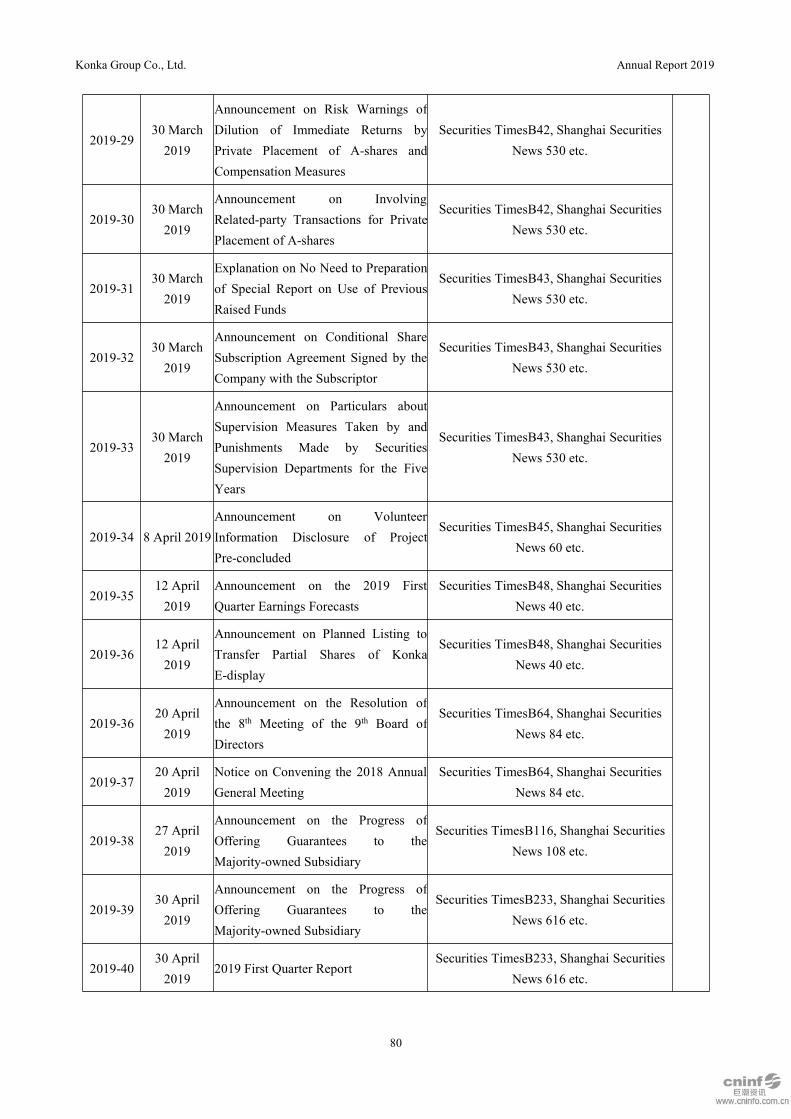
Konka Group Co., Ltd. Annual Report 2019
80
2019-2930 March2019
Announcement on Risk Warnings ofDilution of Immediate Returns byPrivate Placement of A-shares andCompensation Measures
Securities TimesB42, Shanghai SecuritiesNews 530 etc.
2019-3030 March2019
Announcement on InvolvingRelated-party Transactions for PrivatePlacement of A-shares
Securities TimesB42, Shanghai SecuritiesNews 530 etc.
2019-3130 March2019
Explanation on No Need to Preparationof Special Report on Use of PreviousRaised Funds
Securities TimesB43, Shanghai SecuritiesNews 530 etc.
2019-3230 March2019
Announcement on Conditional ShareSubscription Agreement Signed by theCompany with the Subscriptor
Securities TimesB43, Shanghai SecuritiesNews 530 etc.
2019-3330 March2019
Announcement on Particulars aboutSupervision Measures Taken by andPunishments Made by SecuritiesSupervision Departments for the FiveYears
Securities TimesB43, Shanghai SecuritiesNews 530 etc.
2019-34 8 April 2019Announcement on VolunteerInformation Disclosure of ProjectPre-concluded
Securities TimesB45, Shanghai SecuritiesNews 60 etc.
2019-3512 April2019
Announcement on the 2019 FirstQuarter Earnings Forecasts
Securities TimesB48, Shanghai SecuritiesNews 40 etc.
2019-3612 April2019
Announcement on Planned Listing toTransfer Partial Shares of KonkaE-display
Securities TimesB48, Shanghai SecuritiesNews 40 etc.
2019-3620 April2019
Announcement on the Resolution ofthe 8th Meeting of the 9th Board ofDirectors
Securities TimesB64, Shanghai SecuritiesNews 84 etc.
2019-3720 April2019
Notice on Convening the 2018 AnnualGeneral Meeting
Securities TimesB64, Shanghai SecuritiesNews 84 etc.
2019-3827 April2019
Announcement on the Progress ofOffering Guarantees to theMajority-owned Subsidiary
Securities TimesB116, Shanghai SecuritiesNews 108 etc.
2019-3930 April2019
Announcement on the Progress ofOffering Guarantees to theMajority-owned Subsidiary
Securities TimesB233, Shanghai SecuritiesNews 616 etc.
2019-4030 April2019
2019 First Quarter ReportSecurities TimesB233, Shanghai Securities
News 616 etc.
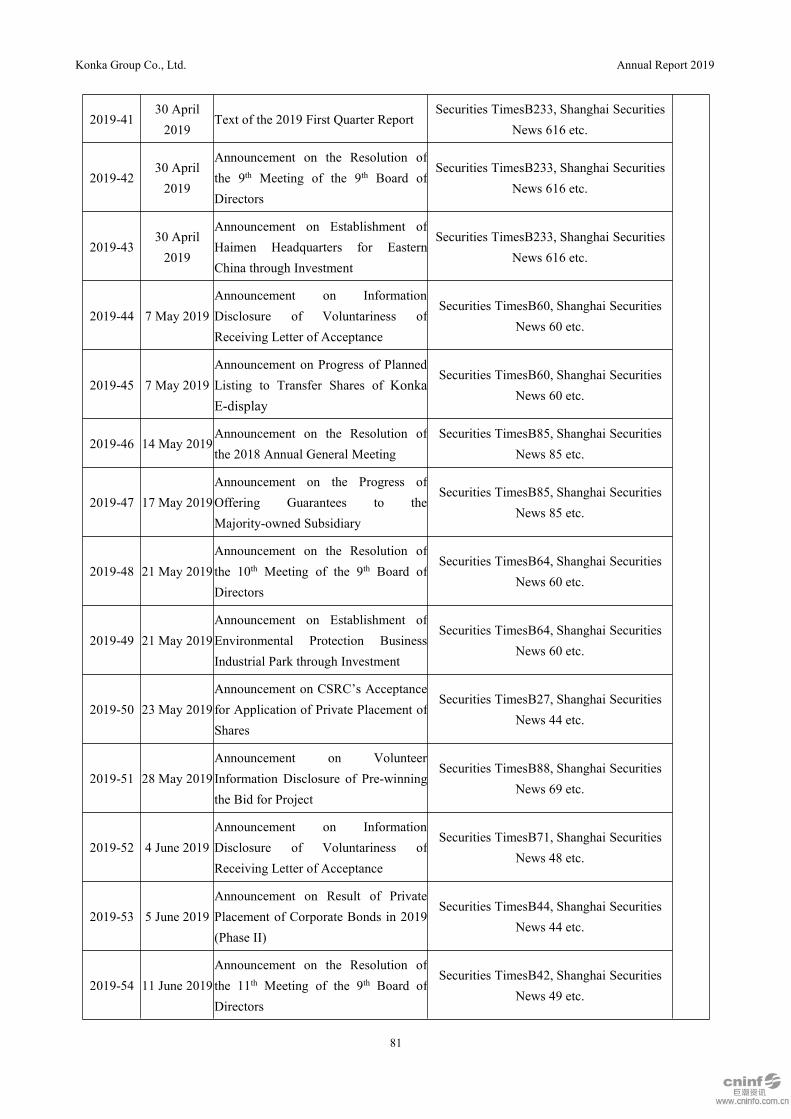
Konka Group Co., Ltd. Annual Report 2019
81
2019-4130 April2019
Text of the 2019 First Quarter ReportSecurities TimesB233, Shanghai Securities
News 616 etc.
2019-4230 April2019
Announcement on the Resolution ofthe 9th Meeting of the 9th Board ofDirectors
Securities TimesB233, Shanghai SecuritiesNews 616 etc.
2019-4330 April2019
Announcement on Establishment ofHaimen Headquarters for EasternChina through Investment
Securities TimesB233, Shanghai SecuritiesNews 616 etc.
2019-44 7 May 2019Announcement on InformationDisclosure of Voluntariness ofReceiving Letter of Acceptance
Securities TimesB60, Shanghai SecuritiesNews 60 etc.
2019-45 7 May 2019Announcement on Progress of PlannedListing to Transfer Shares of KonkaE-display
Securities TimesB60, Shanghai SecuritiesNews 60 etc.
2019-46 14 May 2019Announcement on the Resolution ofthe 2018 Annual General Meeting
Securities TimesB85, Shanghai SecuritiesNews 85 etc.
2019-47 17 May 2019Announcement on the Progress ofOffering Guarantees to theMajority-owned Subsidiary
Securities TimesB85, Shanghai SecuritiesNews 85 etc.
2019-48 21 May 2019Announcement on the Resolution ofthe 10th Meeting of the 9th Board ofDirectors
Securities TimesB64, Shanghai SecuritiesNews 60 etc.
2019-49 21 May 2019Announcement on Establishment ofEnvironmental Protection BusinessIndustrial Park through Investment
Securities TimesB64, Shanghai SecuritiesNews 60 etc.
2019-50 23 May 2019Announcement on CSRC’s Acceptancefor Application of Private Placement ofShares
Securities TimesB27, Shanghai SecuritiesNews 44 etc.
2019-51 28 May 2019Announcement on VolunteerInformation Disclosure of Pre-winningthe Bid for Project
Securities TimesB88, Shanghai SecuritiesNews 69 etc.
2019-52 4 June 2019Announcement on InformationDisclosure of Voluntariness ofReceiving Letter of Acceptance
Securities TimesB71, Shanghai SecuritiesNews 48 etc.
2019-53 5 June 2019Announcement on Result of PrivatePlacement of Corporate Bonds in 2019(Phase II)
Securities TimesB44, Shanghai SecuritiesNews 44 etc.
2019-54 11 June 2019Announcement on the Resolution ofthe 11th Meeting of the 9th Board ofDirectors
Securities TimesB42, Shanghai SecuritiesNews 49 etc.
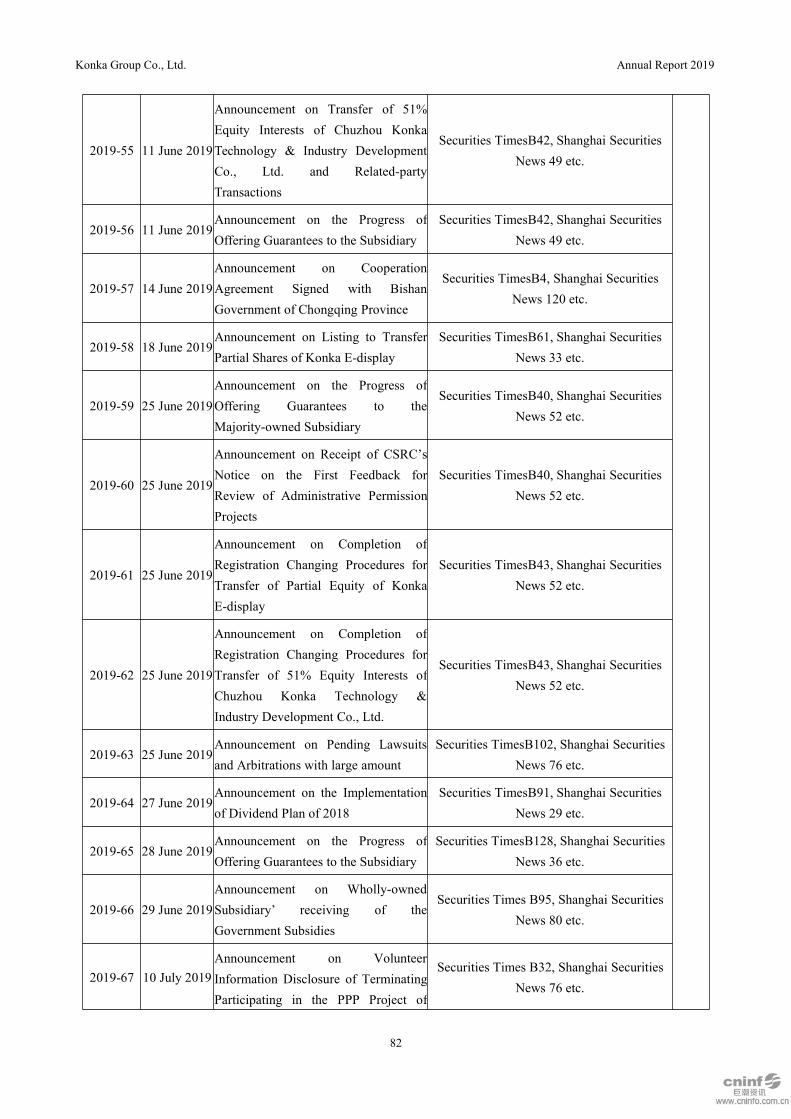
Konka Group Co., Ltd. Annual Report 2019
82
2019-55 11 June 2019
Announcement on Transfer of 51%Equity Interests of Chuzhou KonkaTechnology & Industry DevelopmentCo., Ltd. and Related-partyTransactions
Securities TimesB42, Shanghai SecuritiesNews 49 etc.
2019-56 11 June 2019Announcement on the Progress ofOffering Guarantees to the Subsidiary
Securities TimesB42, Shanghai SecuritiesNews 49 etc.
2019-57 14 June 2019Announcement on CooperationAgreement Signed with BishanGovernment of Chongqing Province
Securities TimesB4, Shanghai SecuritiesNews 120 etc.
2019-58 18 June 2019Announcement on Listing to TransferPartial Shares of Konka E-display
Securities TimesB61, Shanghai SecuritiesNews 33 etc.
2019-59 25 June 2019Announcement on the Progress ofOffering Guarantees to theMajority-owned Subsidiary
Securities TimesB40, Shanghai SecuritiesNews 52 etc.
2019-60 25 June 2019
Announcement on Receipt of CSRC’sNotice on the First Feedback forReview of Administrative PermissionProjects
Securities TimesB40, Shanghai SecuritiesNews 52 etc.
2019-61 25 June 2019
Announcement on Completion ofRegistration Changing Procedures forTransfer of Partial Equity of KonkaE-display
Securities TimesB43, Shanghai SecuritiesNews 52 etc.
2019-62 25 June 2019
Announcement on Completion ofRegistration Changing Procedures forTransfer of 51% Equity Interests ofChuzhou Konka Technology &Industry Development Co., Ltd.
Securities TimesB43, Shanghai SecuritiesNews 52 etc.
2019-63 25 June 2019Announcement on Pending Lawsuitsand Arbitrations with large amount
Securities TimesB102, Shanghai SecuritiesNews 76 etc.
2019-64 27 June 2019Announcement on the Implementationof Dividend Plan of 2018
Securities TimesB91, Shanghai SecuritiesNews 29 etc.
2019-65 28 June 2019Announcement on the Progress ofOffering Guarantees to the Subsidiary
Securities TimesB128, Shanghai SecuritiesNews 36 etc.
2019-66 29 June 2019Announcement on Wholly-ownedSubsidiary’ receiving of theGovernment Subsidies
Securities Times B95, Shanghai SecuritiesNews 80 etc.
2019-67 10 July 2019Announcement on VolunteerInformation Disclosure of TerminatingParticipating in the PPP Project of
Securities Times B32, Shanghai SecuritiesNews 76 etc.

Konka Group Co., Ltd. Annual Report 2019
83
Taicheng Water EcologicalEnvironment Management
2019-68 10 July 2019Announcement on the Progress ofOffering Guarantees to theMajority-owned Subsidiary
Securities Times B32, Shanghai SecuritiesNews 76 etc.
2019-69 19 July 2019Announcement on the Progress ofOffering Guarantees to the Subsidiary
Securities Times B49, Shanghai SecuritiesNews 272 etc.
2019-70 24 July 2019Announcement on the Issuance Resultof the Private Placement of CorporateBonds (Phase III) in 2019
Securities Times B31, Shanghai SecuritiesNews 40 etc.
2019-71 27 July 2019Announcement on Offering OverseasLoan under Domestic Guarantee toForeign Wholly-owned Subsidiary
Securities Times B12, Shanghai SecuritiesNews 44 etc.
2019-72 30 July 2019
Announcement on Receiving theNotice on Suspending the Review ofthe Application for AdministrationPermission of China SecuritiesRegulatory Commission
Securities Times B21, Shanghai SecuritiesNews 52 etc.
2019-731 August2019
Announcement on Applying forResuming Review of Private Placementof A-stock to China SecuritiesRegulatory Commission
Securities Times B32, Shanghai SecuritiesNews 41 etc.
2019-741 August2019
Announcement on the Progress ofOffering Guarantees to theWholly-owned Subsidiary
Securities Times B32, Shanghai SecuritiesNews 41 etc.
2019-757 August2019
Announcement on the Abstract of the2019 Interim Report
Securities Times B62, Shanghai SecuritiesNews 28 etc.
2019-767 August2019
Announcement on the 2019 InterimReport
2019-777 August2019
Announcement on Resolutions of the14th Meeting of the 9th Board ofDirectors
Securities Times B62, Shanghai SecuritiesNews 28 etc.
2019-7810 August2019
Announcement on the Progress ofOffering Guarantees to theMajority-owned Subsidiary
Securities Times B44, Shanghai SecuritiesNews 24 etc.
2019-7927 August2019
Announcement on the Progress ofOffering Guarantees to theMajority-owned Subsidiary
Securities Times B70, Shanghai SecuritiesNews 501 etc.

Konka Group Co., Ltd. Annual Report 2019
84
2019-8030 August2019
Announcement on Participating in the2019 Online Collective Reception Dayfor Investors of Shenzhen ListedCompanies in 2019
Securities Times B107, Shanghai SecuritiesNews 104 etc.
2019-8110
September2019
Announcement on Receiving theNotice on Resuming Review ofApplication for AdministrationPermission of China SecuritiesRegulatory Commission
Securities Times B39, Shanghai SecuritiesNews 60 etc.
2019-8218
September2019
Announcement on Resolutions of the15th Meeting of the 9th Board ofDirectors
Securities Times B62, Shanghai SecuritiesNews 33 etc.
2019-8318
September2019
Announcement on Transfer of 51% ofEquity in Chuzhou Kangjin HealthIndustry Development Co., Ltd. andRelated-party Transactions
Securities Times B62, Shanghai SecuritiesNews 33 etc.
2019-8418
September2019
Announcement on Offering FinancialAid for Chuzhou Kangjin CompanyBased on the Shareholding Ratio andRelated-party Transactions
Securities Times B62, Shanghai SecuritiesNews 33 etc.
2019-8518
September2019
Announcement on Offering FinancialAid for K-Star Company Based on theShareholding Ratio
Securities Times B62, Shanghai SecuritiesNews 33 etc.
2019-8618
September2019
Announcement on the Project ofBuilding the Konka SemiconductorOptoelectronics Research Institutethrough investment in Chongqing City
Securities Times B62, Shanghai SecuritiesNews 33 etc.
2019-8718
September2019
Announcement on the PrivatePlacement of Corporate BondProgramming by the Company
Securities Times B62, Shanghai SecuritiesNews 33 etc.
2019-8818
September2019
Notice on Convening the 2nd
Extraordinary General Meeting of 2019Securities Times B62, Shanghai Securities
News 33 etc.
2019-8927
September2019
Announcement on Completing theIndustrial and Commercial Registrationof Changes for Transfer of 51% ofEquity in Chuzhou Kangjin HealthIndustry Development Co., Ltd.
Securities Times B27, Shanghai SecuritiesNews 77 etc.
2019-908 October2019
Announcement on ReceivingGovernment Subsidies by theWholly-owned Subsidiary
Securities Times B73, Shanghai SecuritiesNews 116 etc.
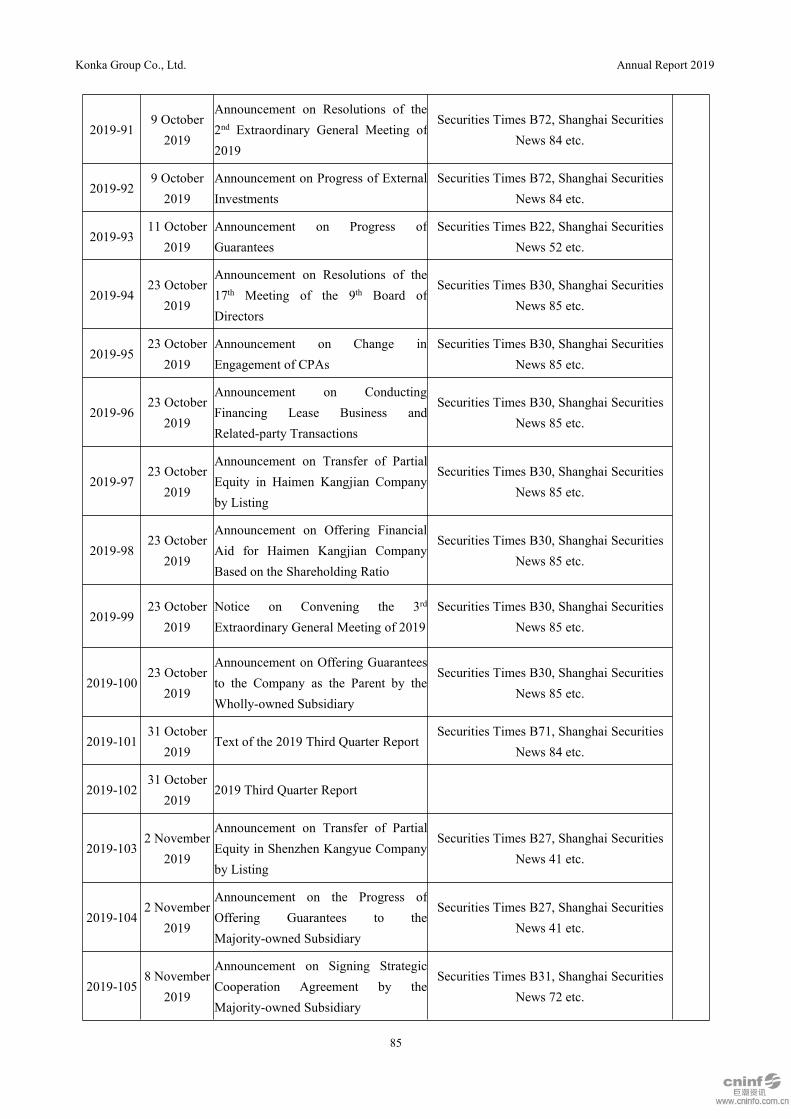
Konka Group Co., Ltd. Annual Report 2019
85
2019-919 October2019
Announcement on Resolutions of the2nd Extraordinary General Meeting of2019
Securities Times B72, Shanghai SecuritiesNews 84 etc.
2019-929 October2019
Announcement on Progress of ExternalInvestments
Securities Times B72, Shanghai SecuritiesNews 84 etc.
2019-9311 October
2019Announcement on Progress ofGuarantees
Securities Times B22, Shanghai SecuritiesNews 52 etc.
2019-9423 October
2019
Announcement on Resolutions of the17th Meeting of the 9th Board ofDirectors
Securities Times B30, Shanghai SecuritiesNews 85 etc.
2019-9523 October
2019Announcement on Change inEngagement of CPAs
Securities Times B30, Shanghai SecuritiesNews 85 etc.
2019-9623 October
2019
Announcement on ConductingFinancing Lease Business andRelated-party Transactions
Securities Times B30, Shanghai SecuritiesNews 85 etc.
2019-9723 October
2019
Announcement on Transfer of PartialEquity in Haimen Kangjian Companyby Listing
Securities Times B30, Shanghai SecuritiesNews 85 etc.
2019-9823 October
2019
Announcement on Offering FinancialAid for Haimen Kangjian CompanyBased on the Shareholding Ratio
Securities Times B30, Shanghai SecuritiesNews 85 etc.
2019-9923 October
2019Notice on Convening the 3rd
Extraordinary General Meeting of 2019Securities Times B30, Shanghai Securities
News 85 etc.
2019-10023 October
2019
Announcement on Offering Guaranteesto the Company as the Parent by theWholly-owned Subsidiary
Securities Times B30, Shanghai SecuritiesNews 85 etc.
2019-10131 October
2019Text of the 2019 Third Quarter Report
Securities Times B71, Shanghai SecuritiesNews 84 etc.
2019-10231 October
20192019 Third Quarter Report
2019-1032 November
2019
Announcement on Transfer of PartialEquity in Shenzhen Kangyue Companyby Listing
Securities Times B27, Shanghai SecuritiesNews 41 etc.
2019-1042 November
2019
Announcement on the Progress ofOffering Guarantees to theMajority-owned Subsidiary
Securities Times B27, Shanghai SecuritiesNews 41 etc.
2019-1058 November
2019
Announcement on Signing StrategicCooperation Agreement by theMajority-owned Subsidiary
Securities Times B31, Shanghai SecuritiesNews 72 etc.

Konka Group Co., Ltd. Annual Report 2019
86
2019-1068 November
2019
Announcement on Resolutions of the3rd Extraordinary General Meeting of2019
Securities Times B31, Shanghai SecuritiesNews 72 etc.
2019-10721
November2019
Announcement on the Progress ofOffering Guarantees to theMajority-owned Subsidiary
Securities Times B26, Shanghai SecuritiesNews 65 etc.
2019-10826
November2019
Announcement on Offering FinancialAid for Yantai Kangyue CompanyBased on the Shareholding Ratio
Securities Times B58, Shanghai SecuritiesNews 100 etc.
2019-10926
November2019
Announcement on Changes of SomeAccounting Policies
Securities Times B58, Shanghai SecuritiesNews 100 etc.
2019-11026
November2019
Announcement on OfferingAdvertizing Services for OCT Groupand Related-party Transactions
Securities Times B58, Shanghai SecuritiesNews 100 etc.
2019-11126
November2019
Announcement on the Project ofBuilding an Environmental TechnologyTown through Investment in YantaiCity
Securities Times B58, Shanghai SecuritiesNews 100 etc.
2019-11226
November2019
Notice on Convening the 4th
Extraordinary General Meeting of 2019Securities Times B58, Shanghai Securities
News 100 etc.
2019-11326
November2019
Announcement on Resolutions of the19th Meeting of the 9th Board ofDirectors
Securities Times B58, Shanghai SecuritiesNews 100 etc.
2019-11426
November2019
Announcement on Investment in theProject of Closed Beta of MemoryChips
Securities Times B63, Shanghai SecuritiesNews 100 etc.
2019-11527
November2019
Supplementary Notice on Conveningthe 4th Extraordinary General Meetingof 2019
Securities Times B57, Shanghai SecuritiesNews 63 etc.
2019-11628
November2019
Announcement on Offering OverseasLoan under Domestic Guarantee toForeign Wholly-owned Subsidiary
Securities Times B32, Shanghai SecuritiesNews 52 etc.
2019-1173 December
2019
Announcement on the Progress ofOffering Guarantees to theMajority-owned Subsidiary
Securities Times B100, Shanghai SecuritiesNews 80 etc.
2019-11812
December2019
Announcement on the Progress ofOffering Guarantees to theWholly-owned Subsidiary
Securities Times B26, Shanghai SecuritiesNews 84 etc.

Konka Group Co., Ltd. Annual Report 2019
87
2019-11917
December2019
Announcement on Resolutions of the4th Extraordinary General Meeting of2019
Securities Times B58, Shanghai SecuritiesNews 96 etc.
2019-12019
December2019
Announcement on Progress of Transferof Partial Equity in Haimen KangjianCompany by Listing
Securities Times B46, Shanghai SecuritiesNews 92 etc.
2019-12126
December2019
Announcement on the Progress ofOffering Guarantees to theMajority-owned Subsidiary
Securities Times B46, Shanghai SecuritiesNews 29 etc.
2019-12227
December2019
Announcement on ReceivingGovernment Subsidies by theMajority-owned Subsidiary
Securities Times B43, Shanghai SecuritiesNews 52 etc.
2019-12327
December2019
Announcement on Progress of Transferof Partial Equity in Shenzhen KangqueCompany by Listing
Securities Times B43, Shanghai SecuritiesNews 52 etc.
XX Significant Events of Subsidiaries□Applicable √ Not applicable
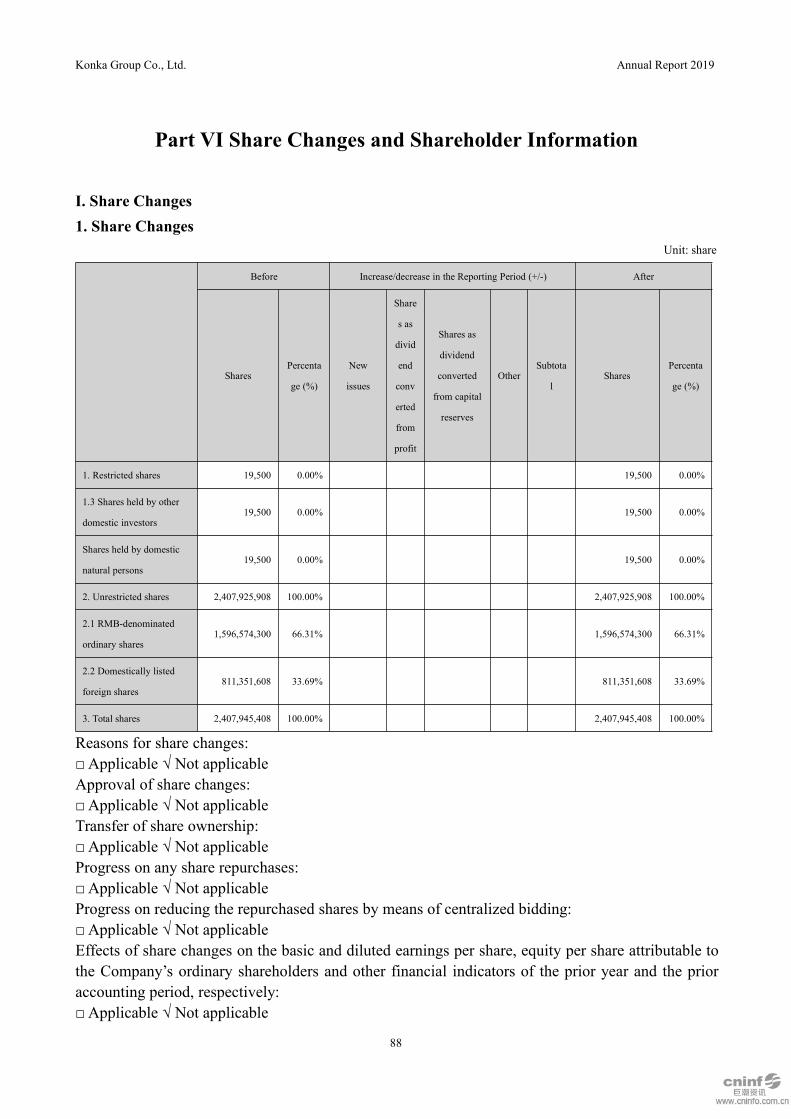
Konka Group Co., Ltd. Annual Report 2019
88
Part VI Share Changes and Shareholder Information
I. Share Changes1. Share Changes
Unit: share
Before Increase/decrease in the Reporting Period (+/-) After
SharesPercenta
ge (%)
New
issues
Share
s as
divid
end
conv
erted
from
profit
Shares as
dividend
converted
from capital
reserves
OtherSubtota
lShares
Percenta
ge (%)
1. Restricted shares 19,500 0.00% 19,500 0.00%
1.3 Shares held by other
domestic investors19,500 0.00% 19,500 0.00%
Shares held by domestic
natural persons19,500 0.00% 19,500 0.00%
2. Unrestricted shares 2,407,925,908 100.00% 2,407,925,908 100.00%
2.1 RMB-denominated
ordinary shares1,596,574,300 66.31% 1,596,574,300 66.31%
2.2 Domestically listed
foreign shares811,351,608 33.69% 811,351,608 33.69%
3. Total shares 2,407,945,408 100.00% 2,407,945,408 100.00%
Reasons for share changes:□ Applicable √ Not applicableApproval of share changes:□ Applicable √ Not applicableTransfer of share ownership:□ Applicable √ Not applicableProgress on any share repurchases:□ Applicable √ Not applicableProgress on reducing the repurchased shares by means of centralized bidding:□ Applicable √ Not applicableEffects of share changes on the basic and diluted earnings per share, equity per share attributable tothe Company’s ordinary shareholders and other financial indicators of the prior year and the prioraccounting period, respectively:□ Applicable √ Not applicable
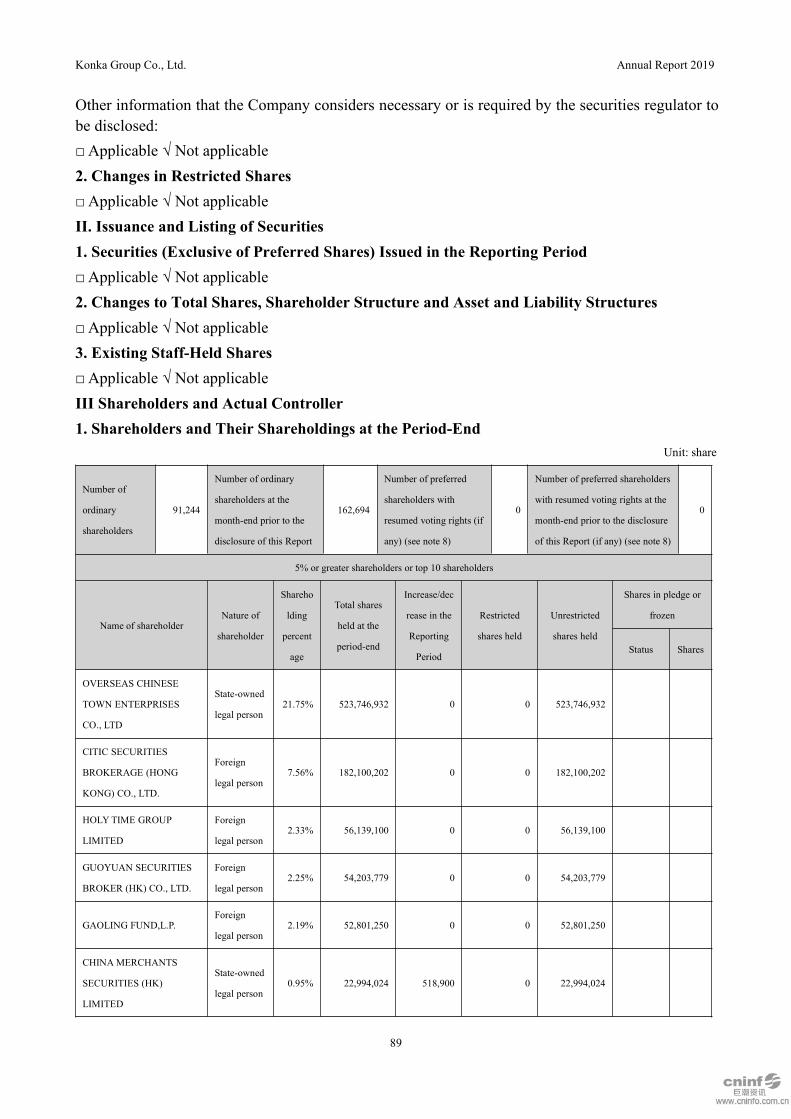
Konka Group Co., Ltd. Annual Report 2019
89
Other information that the Company considers necessary or is required by the securities regulator tobe disclosed:□ Applicable √ Not applicable2. Changes in Restricted Shares□Applicable √ Not applicableII. Issuance and Listing of Securities1. Securities (Exclusive of Preferred Shares) Issued in the Reporting Period□Applicable √ Not applicable2. Changes to Total Shares, Shareholder Structure and Asset and Liability Structures□Applicable √ Not applicable3. Existing Staff-Held Shares□Applicable √ Not applicableIII Shareholders and Actual Controller1. Shareholders and Their Shareholdings at the Period-End
Unit: share
Number of
ordinary
shareholders
91,244
Number of ordinary
shareholders at the
month-end prior to the
disclosure of this Report
162,694
Number of preferred
shareholders with
resumed voting rights (if
any) (see note 8)
0
Number of preferred shareholders
with resumed voting rights at the
month-end prior to the disclosure
of this Report (if any) (see note 8)
0
5% or greater shareholders or top 10 shareholders
Name of shareholderNature of
shareholder
Shareho
lding
percent
age
Total shares
held at the
period-end
Increase/dec
rease in the
Reporting
Period
Restricted
shares held
Unrestricted
shares held
Shares in pledge or
frozen
Status Shares
OVERSEAS CHINESE
TOWN ENTERPRISES
CO., LTD
State-owned
legal person21.75% 523,746,932 0 0 523,746,932
CITIC SECURITIES
BROKERAGE (HONG
KONG) CO., LTD.
Foreign
legal person7.56% 182,100,202 0 0 182,100,202
HOLYTIME GROUP
LIMITED
Foreign
legal person2.33% 56,139,100 0 0 56,139,100
GUOYUAN SECURITIES
BROKER (HK) CO., LTD.
Foreign
legal person2.25% 54,203,779 0 0 54,203,779
GAOLING FUND,L.P.Foreign
legal person2.19% 52,801,250 0 0 52,801,250
CHINAMERCHANTS
SECURITIES (HK)
LIMITED
State-owned
legal person0.95% 22,994,024 518,900 0 22,994,024
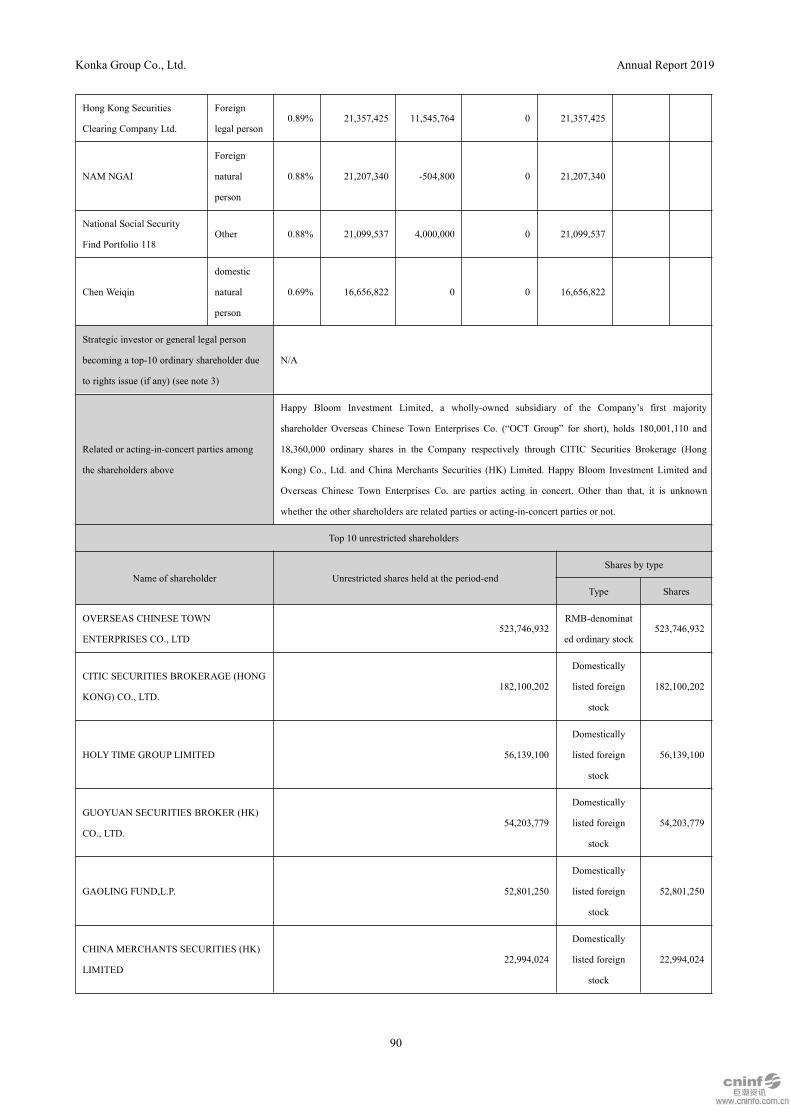
Konka Group Co., Ltd. Annual Report 2019
90
Hong Kong Securities
Clearing Company Ltd.
Foreign
legal person0.89% 21,357,425 11,545,764 0 21,357,425
NAM NGAI
Foreign
natural
person
0.88% 21,207,340 -504,800 0 21,207,340
National Social Security
Find Portfolio 118Other 0.88% 21,099,537 4,000,000 0 21,099,537
Chen Weiqin
domestic
natural
person
0.69% 16,656,822 0 0 16,656,822
Strategic investor or general legal person
becoming a top-10 ordinary shareholder due
to rights issue (if any) (see note 3)
N/A
Related or acting-in-concert parties among
the shareholders above
Happy Bloom Investment Limited, a wholly-owned subsidiary of the Company’s first majority
shareholder Overseas Chinese Town Enterprises Co. (“OCT Group” for short), holds 180,001,110 and
18,360,000 ordinary shares in the Company respectively through CITIC Securities Brokerage (Hong
Kong) Co., Ltd. and China Merchants Securities (HK) Limited. Happy Bloom Investment Limited and
Overseas Chinese Town Enterprises Co. are parties acting in concert. Other than that, it is unknown
whether the other shareholders are related parties or acting-in-concert parties or not.
Top 10 unrestricted shareholders
Name of shareholder Unrestricted shares held at the period-endShares by type
Type Shares
OVERSEAS CHINESE TOWN
ENTERPRISES CO., LTD523,746,932
RMB-denominat
ed ordinary stock523,746,932
CITIC SECURITIES BROKERAGE (HONG
KONG) CO., LTD.182,100,202
Domestically
listed foreign
stock
182,100,202
HOLYTIME GROUP LIMITED 56,139,100
Domestically
listed foreign
stock
56,139,100
GUOYUAN SECURITIES BROKER (HK)
CO., LTD.54,203,779
Domestically
listed foreign
stock
54,203,779
GAOLING FUND,L.P. 52,801,250
Domestically
listed foreign
stock
52,801,250
CHINAMERCHANTS SECURITIES (HK)
LIMITED22,994,024
Domestically
listed foreign
stock
22,994,024

Konka Group Co., Ltd. Annual Report 2019
91
Hong Kong Securities Clearing Company
Ltd.21,357,425
RMB-denominat
ed ordinary stock21,357,425
NAM NGAI 21,207,340
Domestically
listed foreign
stock
21,207,340
National Social Security Find Portfolio 118 21,099,537RMB-denominat
ed ordinary stock21,099,537
Chen Weiqin 16,656,822RMB-denominat
ed ordinary stock16,656,822
Related or acting-in-concert parties among
top 10 unrestricted public shareholders, as
well as between top 10 unrestricted public
shareholders and top 10 shareholders
Happy Bloom Investment Limited, a wholly-owned subsidiary of the Company’s first majority
shareholder Overseas Chinese Town Enterprises Co. (“OCT Group” for short), holds 180,001,110 and
18,360,000 common shares in the Company respectively through CITIC Securities Brokerage (Hong
Kong) Co., Ltd. and China Merchants Securities (HK) Limited. Happy Bloom Investment Limited and
Overseas Chinese Town Enterprises Co. are parties acting in concert. Other than that, it is unknown
whether the other shareholders are related parties or acting-in-concert parties or not.
Top 10 ordinary shareholders involved in
securities margin trading (if any) (see note 4)
Chen Weiqin holds 16,656,822 A-shares in the Company through his securities account for customer
credit trading guarantee in CITIC Securities Company Limited.
Indicate by tick mark whether any of the top 10 ordinary shareholders or the top 10 unrestrictedordinary shareholders of the Company conducted any promissory repo during the Reporting Period.□ Yes √ NoNo such cases in the Reporting Period.2. Controlling ShareholderNature of the controlling shareholder: Controlled by a central state-owned legal person
Type of the controlling shareholder: legal person
Name of
actual
controller
Legal
representative
/person in
charge
Date of
establish
ment
Unified
social
credit
code
Principal activity
Overseas
Chinese
Town
Enterprises
Co.
Duan
Xiannian
11
Novemb
er 1985
91440300
19034617
5T
Export of textile, light industrial products, etc; import of self-used
goods in Shenzhen, mechanical equipment, light industrial products,
etc. as approved by the relevant authorities of Shenzhen (under
Government Document JMB [92] WJMGTSZZ No. A19024);
compensation trade; investment in tourism and relevant cultural
industry (including art performance, entertainment and their services,
etc), industry, real estate, commerce & trade, packaging, decoration
and investment in printing industry. The convert of export commodities
into domestic sale and the domestic sales of import commodities.
Travelling, rental of warehouses, culture and art, bonded warehouse of
car donation, convention and exhibition services (the projects involved
in license management can be operated after getting the relevant
license first ); sales of automobile (sedan car included)

Konka Group Co., Ltd. Annual Report 2019
92
Controlling
shareholder’s
holdings in other
listed companies at
home or abroad in the
Reporting Period
As of 31 December 2019, Overseas Chinese Town Enterprises Co. held 47.01% equity of Shenzhen
Overseas Chinese Town Co., Ltd. (a company listed on the main Board of Shenzhen Stock Exchange,
SZ. 000069). Meanwhile, Shenzhen Overseas Chinese Town Co., Ltd. indirectly held 70.94% equity of
OCT (Asia) Holdings Ltd. (a company listed on the main Board of Hong Kong Stock Exchange,
3366.HK). Overseas Chinese Town Enterprises Co. directly held 18.14% equity of Yunnan Tourism
Co., Ltd. (a company listed on the SME Board of Shenzhen Stock Exchange, SZ.002059) and indirectly
held 35.74% equity of Yunnan Tourism Co., Ltd through increasing capital to Yunnan Expo Tourism
Group Holdings., Ltd. Overseas Chinese Town Enterprises Co. held 8% equity of China Everbright
Bank Company Limited (a company listed on the main Board of Shanghai Stock Exchange
(SH.601818) and the main Board of Hong Kong Stock Exchange (6818.HK). Overseas Chinese Town
Enterprises Co. indirectly held 2.85% equity of Zhejiang Century Huatong Group Co., Ltd. (a company
listed on the main Board of Shenzhen Stock Exchange, SZ.002602) through its subsidiary Shenzhen
OCT Capital Investment Management Co., Ltd. Overseas Chinese Town Enterprises Co. indirectly held
35.60% equity of OCT Top-Sight Cultural Group Co., Ltd.(a company listed on National Equities
Exchange and Quotations, 834548.OC) through its subsidiary Shenzhen OCT Cultural Group Co., Ltd.
Overseas Chinese Town Enterprises Co. indirectly held 80.00% equity of Jianmenguan Oct Tourism
Development Co., Ltd (a company listed on National Equities Exchange and Quotations, 871381.OC)
though its subsidiary OCTWest Investment Co., Ltd.
Change of the controlling shareholder in the Reporting Period:□ Applicable √ Not applicableNo such cases in the Reporting Period.3. Actual Controller and Its Acting-in-Concert PartiesNature of the actual controller: Central institution for state-owned assets management
Type of the actual controller: legal person
Name of actual controller
Legal
representative/person in
charge
Date of establishmentUnified social
credit code
Principal
activity
State-owned Assets Supervision and
Administration Commission of the
State Council
Hao Peng Not applicable Not applicable
Actual controller’s holdings in other listed companies at home or
abroad in the Reporting PeriodNot applicable
Change of the actual controller during the Reporting Period:□ Applicable √ Not applicableNo such cases in the Reporting Period.Ownership and control relations between the actual controller and the Company:

Konka Group Co., Ltd. Annual Report 2019
93
Indicate by tick mark whether the actual controller controls the Company via trust or other ways ofasset management.□ Applicable √ Not applicable4. Other 10% or Greater Corporate Shareholders□Applicable √ Not applicable5. Limitations on Shareholding Decrease by the Company’s Controlling Shareholder, ActualController, Reorganizer and Other Commitment Makers□Applicable √ Not applicable

Konka Group Co., Ltd. Annual Report 2019
94
Part VII Preferred Shares
□ Applicable √ Not applicable
No preferred shares in the Reporting Period.

Konka Group Co., Ltd. Annual Report 2019
95
Part VIII Convertible Corporate Bonds
□Applicable √ Not applicableNo convertible corporate bonds in the Reporting Period.

Konka Group Co., Ltd. Annual Report 2019
96
Part IX Directors, Supervisors, Senior Management and Staff
I Change in Shareholdings of Directors, Supervisors and Senior Management
Name Office title
Incu
mbe
nt/Fo
rmer
Ge
nd
er
Ag
eStart of tenure End of tenure
Begi
nnin
g
share
holdi
ng
Incre
ase
in
the
Repo
rting
Perio
d
Decr
ease
in
the
Repo
rting
Perio
d
Othe
r
incre
ase/d
ecrea
se
Endin
g
shareh
olding
Liu
Fengxi
Director,
Chairman of the
Board
Incu
mbe
nt
M
ale48 3 December 2018 3 December 2021 0 0 0 0 0
He
HaibinDirector
Incu
mbe
nt
M
ale46 3 December 2018 3 December 2021 0 0 0 0 0
Zhang
JingDirector
Incu
mbe
nt
M
ale38 3 December 2018 3 December 2021 0 0 0 0 0
Zhou
BinDirector
Incu
mbe
nt
M
ale41 3 December 2018 3 December 2021 0 0 0 0 0
Sun
Shengd
ian
Independent
director
Incu
mbe
nt
M
ale65 3 December 2018 3 December 2021 0 0 0 0 0
Wang
Shugua
ng
Independent
director
Incu
mbe
nt
M
ale49 3 December 2018 3 December 2021 0 0 0 0 0
Deng
Chunh
ua
Independent
director
Incu
mbe
nt
Fe
ma
le
57 3 December 2018 3 December 2021 0 0 0 0 0
Wang
Youlai
Supervisor,
chairman of the
Supervisory
Committee
Incu
mbe
nt
M
ale59 3 December 2018 3 December 2021 0 0 0 0 0
Yang
GuobinSupervisor
Incu
mbe
nt
M
ale51 3 December 2018 3 December 2021 0 0 0 0 0
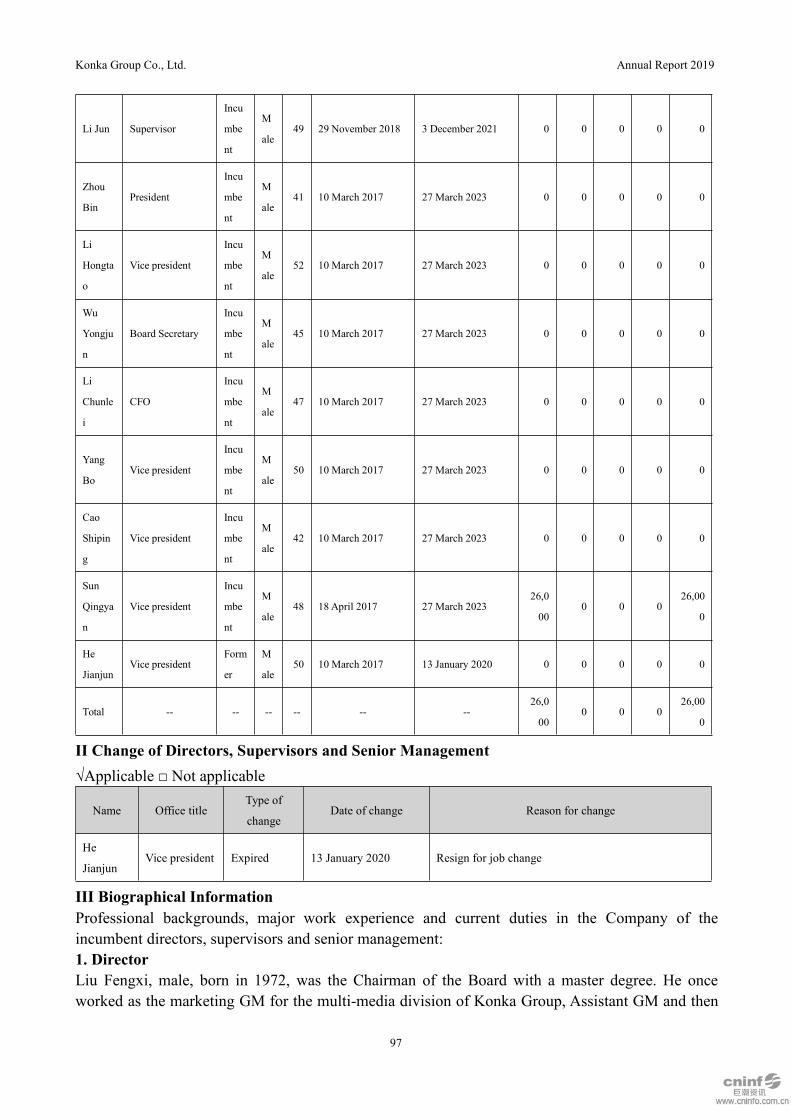
Konka Group Co., Ltd. Annual Report 2019
97
Li Jun Supervisor
Incu
mbe
nt
M
ale49 29 November 2018 3 December 2021 0 0 0 0 0
Zhou
BinPresident
Incu
mbe
nt
M
ale41 10 March 2017 27 March 2023 0 0 0 0 0
Li
Hongta
o
Vice president
Incu
mbe
nt
M
ale52 10 March 2017 27 March 2023 0 0 0 0 0
Wu
Yongju
n
Board Secretary
Incu
mbe
nt
M
ale45 10 March 2017 27 March 2023 0 0 0 0 0
Li
Chunle
i
CFO
Incu
mbe
nt
M
ale47 10 March 2017 27 March 2023 0 0 0 0 0
Yang
BoVice president
Incu
mbe
nt
M
ale50 10 March 2017 27 March 2023 0 0 0 0 0
Cao
Shipin
g
Vice president
Incu
mbe
nt
M
ale42 10 March 2017 27 March 2023 0 0 0 0 0
Sun
Qingya
n
Vice president
Incu
mbe
nt
M
ale48 18 April 2017 27 March 2023
26,0
000 0 0
26,00
0
He
JianjunVice president
Form
er
M
ale50 10 March 2017 13 January 2020 0 0 0 0 0
Total -- -- -- -- -- --26,0
000 0 0
26,00
0
II Change of Directors, Supervisors and Senior Management√Applicable □ Not applicable
Name Office titleType of
changeDate of change Reason for change
He
JianjunVice president Expired 13 January 2020 Resign for job change
III Biographical InformationProfessional backgrounds, major work experience and current duties in the Company of theincumbent directors, supervisors and senior management:1. DirectorLiu Fengxi, male, born in 1972, was the Chairman of the Board with a master degree. He onceworked as the marketing GM for the multi-media division of Konka Group, Assistant GM and then
Konka Group Co., Ltd. Annual Report 2019
98
Vice GM of Shenzhen Konka Telecommunications Technology Co., Ltd., Chief of the OperationManagement Center of Konka Group, Assistant to President and Vice President of Konka Group,etc. And now he is acting as the member of the Standing Committee and Deputy GM of OCT Group,Director and GM of Shenzhen Konka Holding Group Co., Ltd. as well as the Board Chairman andCEO of Konka Group.
He Haibin, male, born in 1974, a senior accountant, was a director of the Company with a masterdegree. He once worked as the Chief of Audit Department and Financial Department in OverseasChinese Town Group Corporation, as Principal of Finance in Planning Department of the CrownePlaza Shenzhen, as CFO in Shenzhen OCT Seaview Hotel Co., Ltd., as CFO in InterContinentalShenzhen, as Vice CFO in Overseas Chinese Town Group Corporation and as CFO in OverseasChinese Town Hong Kong Limited, GM of OCT Capital Investment Management Co., Ltd., theChief Accountant of Shenzhen OCT Co., Ltd., and Chief of Business Management Division inOverseas Chinese Town Enterprises Co. etc. Now he serves as the Standing Committee and BoardSecretary the Chief Accountant of Oversees Chinese Town Group Corporation, and the Chairman ofthe Board of Shenzhen OCT Capital Investment Management Co., Ltd, director of OCT (Yunnan)Investment Co., Ltd, Executive Director of Overseas Chinese City (Asia) Holding Co., Ltd., thesupervisor in Wuhan OCT Industrial Development Co., Ltd., Shenzhen OCT Culture Group Co.,Ltd., OCT East China Investment Co., Ltd. and OCTWest Investment Co., Ltd. as well as a directorof Konka Group.
Zhang Jing, Director, male, was born in 1982, MBA. He served as Manager of the CEO’s Office inOCT Group, Senior Manager of the Strategic Development Department in Shenzhen OCT Co., Ltd.,a member of the Preparatory Work Group of Qingdao OCT, Director of the AdministrationDepartment (Deputy Director of the Party Committee Office) in Shenzhen OCT Properties Co., Ltd.,Deputy Director and Director of the Strategic Development Department in Shenzhen OCT Co., Ltd.,General Manager of the Strategic Planning Department in OCT Group, General Manager of theCorporate Management Department in OCT Group, and Director of the Corporate ManagementDepartment in Shenzhen OCT Co., Ltd.. Currently, he serves as Executive Deputy General Managerof OCT West Investment Co., Ltd., Chairman and General Manager of Xi’an OCT Industry Co.,Ltd., Chairman and General Manager of Xi’an Qujiang OCT Investment Development Co., Ltd.,General Manager of Xi’an OCT Land Co., Ltd., General Manager of Xi’an Fengdong OCTDevelopment Co., Ltd., Director of OCT (HK) Co., Ltd., Non-Executive Director of OCT (Asia),Chairman of OCT (Beijing) Business Management Co., Ltd., Vice Chairman of Huawan HealthyIndustry Development Co., Ltd., Director of OCT (Yunnan) Investment Co., Ltd. Director YunnanExpoTourism Holding Group Co., Ltd., Executive Director & GM of Xi’an Kangxing Real EstateCo., Ltd. and Director of Konka Group.
Zhou Bin, male, born in 1979, was the director and president of the Company with a bachelordegree. He once served as the director assistant, deputy director and director in OperatingManagement Center in Konka Group, assistant of the president in the Board of Directors & Directorin Operating Management Center in Konka Group and President of Konka Group. Now, he acts asthe director and president in Konka Group, director in Shenzhen Konka Holding Group Co., Ltd.
Konka Group Co., Ltd. Annual Report 2019
99
2. Independent DirectorSun Shengdian, a male senior economist, born in 1955, was the independent director of theCompany with a doctor degree in engineering. Formerly vice GM, deputy secretary of the Partycommittee, GM and president of Shenzhen SEG, Hitachi Color Display Devices Co., Ltd., president,secretary of Party Committee of Shenzhen SEG Group Co., Ltd. director of Shenzhen China StarOptoelectronics Technology Co., Ltd., independent director of Skyworth Holding Ltd., the vicepresident of Shenzhen Huakong SEG Co., Ltd., and the head of Shenzhen Electronics IndustriesAssociation. Now, he serves as the director of China Vanke Co., Ltd, and independent director ofKonka Group.
Wang Shuguang, Independent Director, male, was born in 1971, PhD in economics, professor anddoctoral supervisor. He served as Independent Director of Yantai Rural Commercial Bank, JinanRural Commercial Bank, Ningbo Yuyao Rural Commercial Bank and SDIC Zhonglu, and ExternalSupervisor and Convener of the Board of Supervisors of Industrial Bank Co., Ltd. Currently, heserves as Professor and Doctoral Supervisor in the School of Economics of Peking University,Executive Deputy Director of the Institute for Cultural Industries, Peking University andIndependent Director of Konka Group.
Deng Chunhua, Independent Director, female, ethnic group of Han, born in 1963, MBA, professorand master’s supervisor of accounting, Certified Public Accountant in China (non-practicingmember). She served as Chief Accountant and Project Manager of WUYIGE Certified PublicAccounts LLP, Zhongnan University of Economics and Law, Member of the Fifth Session of theCorporate Special Committee of the Chinese Association of Quantitative Economics and Memberof the Professional Jury Committee of Hubei Administration of Sport. From July 1984 till now, shehas been teaching in the School of Accounting of Zhongnan University of Economics and Law asAssistant Lecturer, Lecturer, Associate Professor and Professor. Currently, she serves asIndependent Director of Jiangsu Pomlead Co., Ltd, Independent Director of Zhejiang GoldenseaEnvironment Technology Co., Ltd and Independent Director of Konka Group.
3. SupervisorWang Youlai, a male engineer, born in 1961, was the chairman of the Supervisory Committee of theCompany with a doctor degree. He formerly worked as the business manager of the QualityDepartment in Konka Group, assistant GM, vice GM, and vice president of Konka Group, DeputyDirector and Director of the Administration Department of Overseas Chinese Town Enterprise Co.,and joint party secretary of General Headquarters. He is currently the leader of the first inspectionteam of the OCT Group Co., Ltd., director of Shenzhen Bright Group Co., Ltd., director of OCT(Hainan) Group Co., Ltd., and supervisor of Konka Group.
Yang Guobin, Supervisor, male, was born in 1969, Bachelor’s Degree, Certified Public Accountant.He served as Deputy Director of the Finance Department of OCT Group, CFO of Konka Group andDeputy Director of the Corporate Management Department of OCT Group. Currently, he serves as afull-time Director in OCT Group, Director of Shenzhen Guangming Group and Supervisor ofKonka Group.
Konka Group Co., Ltd. Annual Report 2019
100
Li Jun, male, born in 1971, member of Communist Party, was an employee supervisor of theCompany with a bachelor degree. Formerly worked as the financial manager of Nanchang Branchof Telecommunications Technology Co., Ltd., Senior Manager of the Financial Department inTelecommunications Technology Co., Ltd., the Senior Manager and assistant to the chief anddeputy director of Auditing and Legal Affairs Department in Konka Group, leader of disciplineinspection commission of Konka Group, and employee supervisor of the 8th Supervisory Committeeof Konka Group. Presently working as the full-time deputy secretary of discipline inspectioncommission of Konka Group, the director of Discipline inspection and Supervision Center, Chief ofthe Auditing and Legal Affairs Department, GM of the Internal Control and Risk ManagementDepartment.
4. Senior ExecutiveZhou Bin, male, born in 1979, was the director and president of the Company with a bachelordegree. He once served as the director assistant, deputy director and director in OperatingManagement Center in Konka Group, assistant of the president in the Board of Directors & Directorin Operating Management Center in Konka Group and president of Konka Group. He is currently adirector of Shenzhen Konka Holdings Group Co., Ltd., a director and president of Konka Group.
Li Hongtao, male, Han nationality, born in 1968, was the vice president of the Company with abachelor degree. He successively took the post such as Assistant to GM, GM, Chairman of theBoard and GM of Shenzhen Konka Telecommunication Technology Co., Ltd and Assistant toPresident and vice president of Konka Group etc. He now is acting as Vice President of KonkaGroup.
Wu Yongjun, male, Han nationality, born in 1975, was the Board Secretary with a master degree.Formerly he worked as the senior manager of Secretariat, assistant to the chief, vice chief, chief,Securities Affairs representative and Board Secretary in Konka Group. Presently he is working asthe secretary of the board of directors of Konka Group.
Li Chunlei, male, Han nationality, born in 1973, was the CFO of the Company with a master degree.Once served as the director in Real Estate Business Division in Konka Group, vice GM and GM inKunshan Kangsheng Investment Development Co., Ltd., deputy director (preside the work) anddirector in Strategic Development Center, GM in Financial Center and GM in Asset SettlementCenter and CFO of Konka Group. now he acts as the CFO in Konka Group.
Yang Bo, male, Han nationality, born in 1970, was the vice president of the Company with a masterdegree. Once served as the director in Shenzhen Cable Television Education Financial Channel,director in the market sales and support region of US Tailiyang Communications Company, GM inProgram Operating Department in Shenzhen Topway Video Communication Co., Ltd., director andGM in Shenzhen Tianhua Century Media Co., Ltd., GM in Market Sales Center in ShenzhenTopway Video Communication Co., Ltd. and vice president of Konka Group. Now he acts as thevice president in Konka Group.
Cao Shiping, male, Han nationality, born in 1978, was the vice president of the Company with a
Konka Group Co., Ltd. Annual Report 2019
101
master degree. Once served as the GM in Jinzhou Branch and Tianjin Branch of Konka GroupMulti-media, GM in Multi-media Business Division Customer Cooperation Department, vice GMin Multi-media Marketing Business Division, vice GM in Multi-media Business Division and GMin Marketing Center, GM in Multi-media Business Division, GM in Internet Business Division andvice president of Konka Group. Now he acts as the vice president in Konka Group.
Sun Qingyan, a male senior economist, Han nationality, born in 1972, was the vice president of theCompany with a doctor degree. Once served as the tutor in Northeast University of Finance andEconomies, vice GM in Shenzhen Huaixin Enterprise Investment Consulting Co., Ltd., CEO inShenzhen Xinheng Lida Capital Management Co., Ltd., vice GM in Shanying InvestmentManagement Co., Ltd., GM in Shenzhen Shenwo Asset Management Co., Ltd. and vice president ofKonka Group. He now acts as the vice president of Konka Group.
Offices held concurrently in shareholding entities:√Applicable □Not applicable
Name Shareholding entityOffice held in the
shareholding entityStart of tenure
End of
tenure
Remuneratio
n or
allowance
from the
shareholding
entity
Liu
Fengxi
OCT Enterprises Co.Party Committee Standing
Committee and vice GM22 February 2016 Yes
Shenzhen Konka Holding Group
Co., Ltd.Director and GM 14 April 2020
He Haibin
OCT Enterprises Co.
Party Committee Standing
Committee, Board
Secretary, and chief
accountant
30 January 2018 Yes
Shenzhen OCT Capital Investment
Management Co., LtdChairman of the Board 8 February 2018
OCT (Yunnan) Investment Co.,
LtdDirector 18 December 2018
Overseas Chinese City (Asia)
Holding Co., Ltd.Executive director 4 May 2017
Wuhan OCT Industrial
Development Co., Ltd.Supervisor 27 December 2018
Shenzhen OCT Culture Group Co.,
Ltd.Supervisor 11 August 2016
OCT East China Investment Co.,
Ltd.Supervisor 20 January 2017
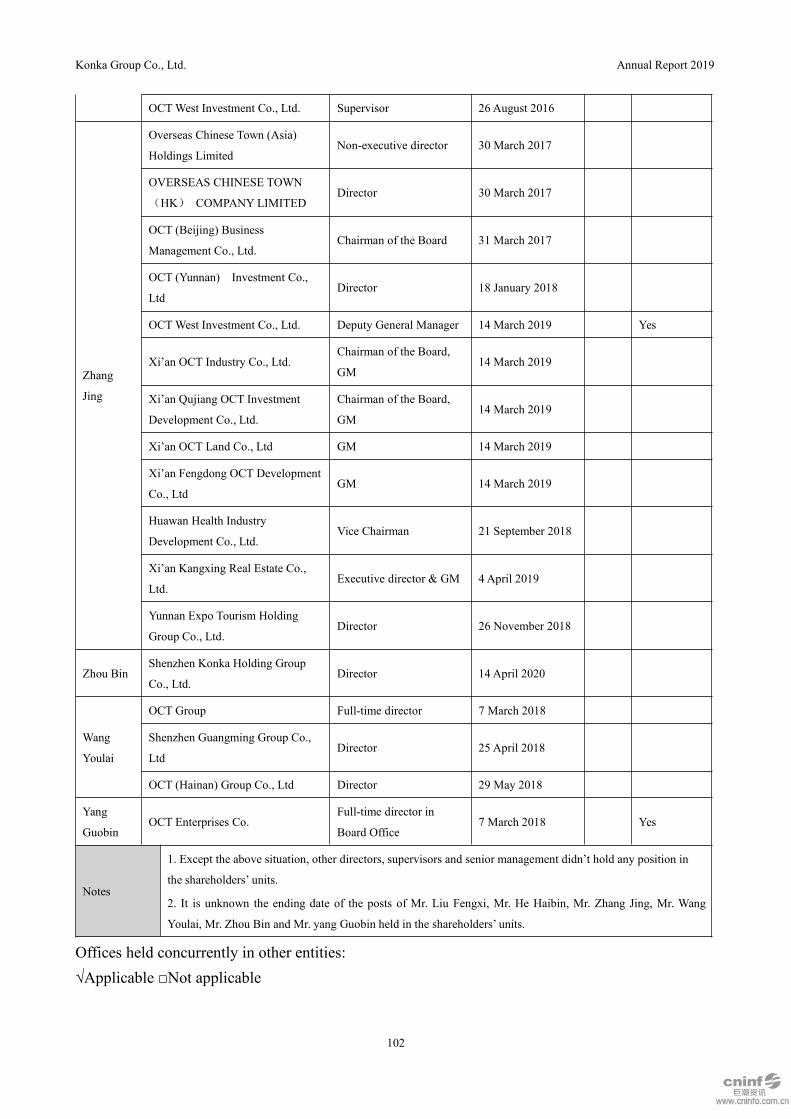
Konka Group Co., Ltd. Annual Report 2019
102
OCTWest Investment Co., Ltd. Supervisor 26 August 2016
Zhang
Jing
Overseas Chinese Town (Asia)
Holdings LimitedNon-executive director 30 March 2017
OVERSEAS CHINESE TOWN
(HK) COMPANY LIMITEDDirector 30 March 2017
OCT (Beijing) Business
Management Co., Ltd.Chairman of the Board 31 March 2017
OCT (Yunnan) Investment Co.,
LtdDirector 18 January 2018
OCTWest Investment Co., Ltd. Deputy General Manager 14 March 2019 Yes
Xi’an OCT Industry Co., Ltd.Chairman of the Board,
GM14 March 2019
Xi’an Qujiang OCT Investment
Development Co., Ltd.
Chairman of the Board,
GM14 March 2019
Xi’an OCT Land Co., Ltd GM 14 March 2019
Xi’an Fengdong OCT Development
Co., LtdGM 14 March 2019
Huawan Health Industry
Development Co., Ltd.Vice Chairman 21 September 2018
Xi’an Kangxing Real Estate Co.,
Ltd.Executive director & GM 4April 2019
Yunnan Expo Tourism Holding
Group Co., Ltd.Director 26 November 2018
Zhou BinShenzhen Konka Holding Group
Co., Ltd.Director 14 April 2020
Wang
Youlai
OCT Group Full-time director 7 March 2018
Shenzhen Guangming Group Co.,
LtdDirector 25 April 2018
OCT (Hainan) Group Co., Ltd Director 29 May 2018
Yang
GuobinOCT Enterprises Co.
Full-time director in
Board Office7 March 2018 Yes
Notes
1. Except the above situation, other directors, supervisors and senior management didn’t hold any position in
the shareholders’ units.
2. It is unknown the ending date of the posts of Mr. Liu Fengxi, Mr. He Haibin, Mr. Zhang Jing, Mr. Wang
Youlai, Mr. Zhou Bin and Mr. yang Guobin held in the shareholders’ units.
Offices held concurrently in other entities:√Applicable □Not applicable

Konka Group Co., Ltd. Annual Report 2019
103
Name Other entityOffice held
in the entity
Start of
tenureEnd of tenure
Remuneration
or allowance
from the entity
Sun
ShengdianChina Vanke Co., Ltd Director 30 June 2017 Yes
Wang
Shuguang
School of Economics of Peking
UniversityProfessor Yes
Wang
Shuguang
Institute for Cultural Industries of Peking
University
Deputy
director
Deng
Chunhua
Zhongnan University of Economics and
LawProfessor Yes
Deng
ChunhuaJiangsu Pomlead Co., Ltd
Independen
t director
Deng
Chunhua
Zhejiang Goldensea Environment
Technology Co.,Ltd
Independen
t director15 May 2019
Punishments imposed in the recent three years by the securities regulator on the incumbent directors,supervisors and senior management as well as those who left in the Reporting Period:□ Applicable √ Not applicableIV Remuneration of Directors, Supervisors and Senior ManagementDecision-making procedure, determination basis and actual payments of remuneration for directors,supervisors and senior management:The salary of directors and supervisors of the Company should be submitted to the shareholdersmeeting for review after the approval and consent by the Board of directors. Referred to the salarylevel of the Directors and Supervisor of the domestic listed companies of same industry, the salaryproposal of the Director and Supervisors of the Company which approved and reviewed by the 2nd
Extraordinary General Meeting of 2015 were as follows: (1) the basic annual salary standard of theBoard Chairman was of RMB1.2 million, the subsidy standard of other Directors (excluding theDirectors serving in the Company) was of RMB0.3 million per person per year and the subsidystandard of the Supervisors (excluding the Employee Supervisors) was of RMB0.2 million perperson per year; which was executed since June 2015. (2) the above standards were all pre-taxstandard with the individual income tax burdened in person as well as the Company withheld andremitted tax.Other treatment for independent directors: travel expense when they went to attend the Boardsessions, Supervisory sessions or Shareholders’ General Meetings and the expenses when they wereperforming their duties as stipulated in the relevant regulations and the Articles of Association andother relevant systems, all these could be reported for deletion.The Board of Directors determined the remuneration of senior management staffs referring to thefollowing factors: a. scope of jobs and responsibility shouldered; b. actual profit of the Company; c.
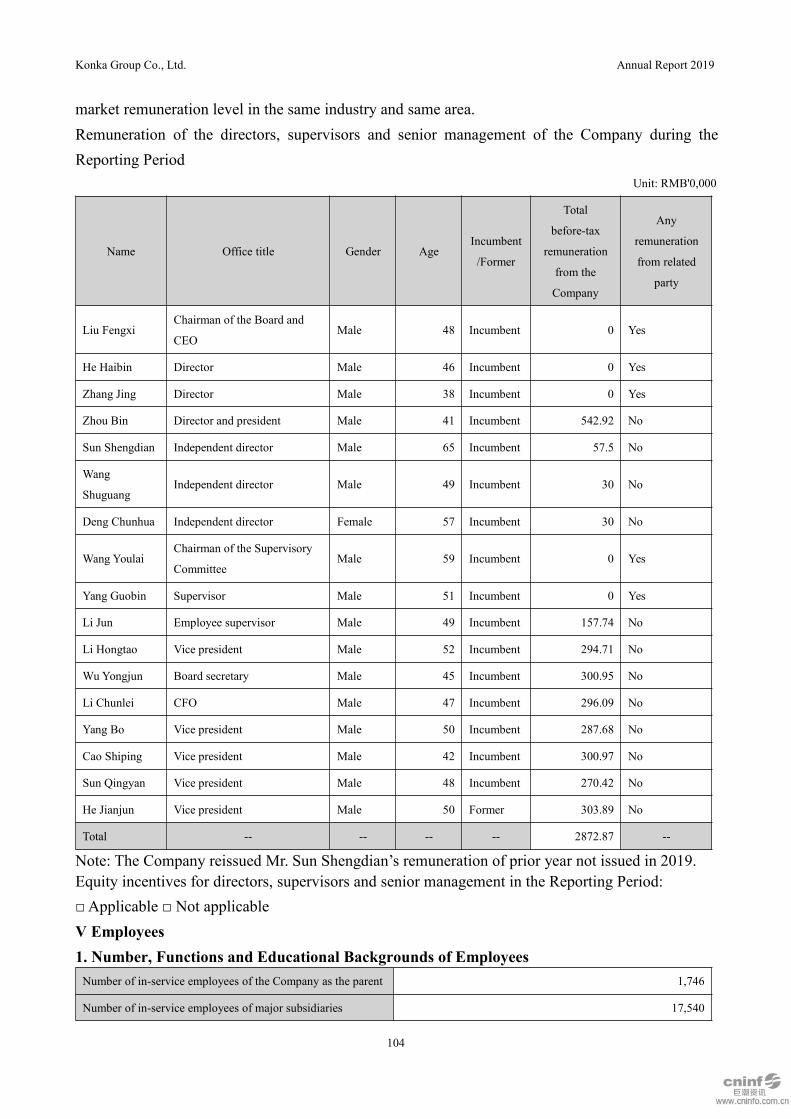
Konka Group Co., Ltd. Annual Report 2019
104
market remuneration level in the same industry and same area.Remuneration of the directors, supervisors and senior management of the Company during theReporting Period
Unit: RMB'0,000
Name Office title Gender AgeIncumbent
/Former
Total
before-tax
remuneration
from the
Company
Any
remuneration
from related
party
Liu FengxiChairman of the Board and
CEOMale 48 Incumbent 0 Yes
He Haibin Director Male 46 Incumbent 0 Yes
Zhang Jing Director Male 38 Incumbent 0 Yes
Zhou Bin Director and president Male 41 Incumbent 542.92 No
Sun Shengdian Independent director Male 65 Incumbent 57.5 No
Wang
ShuguangIndependent director Male 49 Incumbent 30 No
Deng Chunhua Independent director Female 57 Incumbent 30 No
Wang YoulaiChairman of the Supervisory
CommitteeMale 59 Incumbent 0 Yes
Yang Guobin Supervisor Male 51 Incumbent 0 Yes
Li Jun Employee supervisor Male 49 Incumbent 157.74 No
Li Hongtao Vice president Male 52 Incumbent 294.71 No
Wu Yongjun Board secretary Male 45 Incumbent 300.95 No
Li Chunlei CFO Male 47 Incumbent 296.09 No
Yang Bo Vice president Male 50 Incumbent 287.68 No
Cao Shiping Vice president Male 42 Incumbent 300.97 No
Sun Qingyan Vice president Male 48 Incumbent 270.42 No
He Jianjun Vice president Male 50 Former 303.89 No
Total -- -- -- -- 2872.87 --
Note: The Company reissued Mr. Sun Shengdian’s remuneration of prior year not issued in 2019.Equity incentives for directors, supervisors and senior management in the Reporting Period:□ Applicable □ Not applicableV Employees1. Number, Functions and Educational Backgrounds of EmployeesNumber of in-service employees of the Company as the parent 1,746
Number of in-service employees of major subsidiaries 17,540

Konka Group Co., Ltd. Annual Report 2019
105
Total number of in-service employees 19,286
Total number of paid employees in the Reporting Period 19,286
Number of retirees to whom the Company as the parent or its
major subsidiaries need to pay retirement pensions0
Functions
Function Employees
Production 9,753
Sales 5,912
Technical 1,494
Financial 692
Administrative 1,435
Total 19,286
Educational backgrounds
Educational background Employees
Master and above 203
Bachelor 2,714
Junior college 6,744
High school and below 9,625
Total 19,286
2. Employee Remuneration PolicyThe Company promulgated its remuneration system with the operating strategy of serving for theenterprise development and enhancement, and the principle of deciding the remuneration accordingto the post, business performance and capabilities, as well as the market competitiveness andinternal fairness. And it decided the employee’s remuneration level according to its businessearnings, the posts and fulfillment of the business performance of the employee.3. Employee Training PlansThe Company adhered to the people-oriented and paid special attention to cultivate the talents.Surrounded by the business development and the construction of talent team, the Company activelyorganized and carried out various training activities, and continuously perfected its talentscultivation system, as well as further enhanced the employee’s professional skills and overall quality,so as to strengthen the construction of management talents, professional talents and technical talentsteams.In 2019, guided by closing to the business needs, the Company centralized the superior resources topromote the cultivation of key talents. And it organized and carried out the open class project for allthe employees, and organized and carried out the new employee’s training & cultivation projects

Konka Group Co., Ltd. Annual Report 2019
106
respectively for the graduates from campus recruiting and personnel from social recruitment.Meanwhile, it centralized to organize the pointed the training projects of general management skillsand post professional knowledge, etc for the personnel from marketing, R&D, manufacturing,financial and human resources systems, so as to better complete its annual training plan.4. Labor Outsourcing□Applicable √ Not applicable

Konka Group Co., Ltd. Annual Report 2019
107
Part X Corporate Governance
I General Information of Corporate GovernanceIn the Reporting Period, strictly in accordance with the Company Law, Securities Law of the PRC,Code of Corporate Governance for Listed Companies, Share Listing Rules of Shenzhen StockExchange and the relevant rules and regulations of the CSRC, the Company timely amended theinternal control systems such as the Articles of Association and Administrative Method on Provisionof External Financial Aids as well as Management System on Investors Relationship, continuouslyperfected the corporate governance structure and standardized the Company’s operation. By the endof the Reporting Period, the actual conditions of corporate governance basically met therequirements of the regulatory documents in respect of corporate governance structure of listedcompanies issued by CSRC.(I) Shareholders and the Shareholders’ General MeetingThe Company drew up Articles of Association and Rules for Procedure of Shareholders’ GeneralMeeting, ensured that all shareholders, in particular medium and minor shareholders, enjoy legalrights and equal standard. In the Reporting Period, the Company was able to publish announcementon Shareholders’ General Meetings in advance, convened Shareholders’ General Meeting withstrictly accordance to relevant requirements, so as to enable the shareholders have their rights ofinformation to the Company’s material issues and the participation rights. In 2019, the Companyconvened five Shareholders’ General Meeting in total. The Company seriously did well theregistration, arrangement and organization work for the Shareholders’ General Meeting before thecircular on convening the Shareholders’ General Meeting being published at the designated media.The Company convened the Shareholders’ General Meeting at the office address of the Companystrictly in line with relevant stipulations, which was convenient in traffic, and the shareholderscould attend the session in accordance with their actual situation. The Company’s directors,supervisors and senior management staffs made explanations and description for the shareholders’questions and advices at the session.(II) Controlling shareholder and the CompanyIn the Reporting Period, the controlling shareholders and actual controllers strictly regulated itsbehavior and complied with laws in exercising their rights and obligations, not bypassed theShareholders’ General Meeting to intervene in the Company’s decisions and operations directly orindirectly. The Company was separated from the controlling shareholders and actual controllers inaspects of its business, personnel, assets, organ and finance, the Board of Directors, SupervisoryCommittee and the internal departments of the Company functioned independently.(III) Directors and the Board of Directors

Konka Group Co., Ltd. Annual Report 2019
108
The number and structure of the Board Bureau of the Company were in compliance with laws andregulations. The Company drew up Rules for Procedures of the Board Bureau, so as to ensure ahigh efficient operation and scientific decision-making of the Board Bureau; the Company has setup Independent Director System and engaged three independent directors. In the Reporting Period,the number of directors and composition of the Board of Directors of the Company as well as theprocedure of selection was in accordance with the requirements of the rules and laws as well asArticles of Association. The Company set up four special committees, which were Financial AuditCommittee, Nomination Committee, Remuneration & Appraisal Committee, Strategy Committee toprovide profession opinion for the decision of the Board of Directors. All the directors carried outtheir work, fulfilled their duties and scrupulously attended the Board sessions in accordance withRules of Procedure for the Board of Directors, Rules for Independent Directors, etc. 19 Boardsessions were convened by the Company during the Reporting Period, which brought thedecision-making mechanism of the Board of Directors into full play.(IV) Supervisors and supervisory committeeThe Company has established Rules for Procedures of the Supervisory Committee, persons andstructure of the Supervisory Committee was in line with relevant laws and statutes, supervisors canearnestly perform their responsibilities, independently and efficiently executed supervision andcheck responsibilities with a spirit of being responsible to shareholders. In the Reporting Period, thenumber of supervisors and composition of the Supervisory Committee of the Company as well astheir selecting procedure complied with the laws, regulations. In accordance with the requirement ofthe Rules of Procedure for Supervisory Committee, the supervisors performed their duties in anearnest and responsible manner, and exercised their functions of supervision on the decision-makingprocedure of the Board of Directors, resolutions and the Company’s operation by law, and tookeffective supervision over the Company’s significant events, related transactions, financial position,as well as the legality and compliance on duty performance by the directors, president and othersenior management members.(V) Performance Appraisal and Incentive & Restrictive MechanismThe senior management staffs of the Company were recruited on an open basis and in compliancewith the laws and regulations. The Company has established and gradually improved theperformance appraisal standards and incentive & restrictive mechanism for senior managementstaffs, so as to attract qualified personnel, and ensure the stability of senior management staffs.(VI) Interested partiesDuring the Reporting Period, the Company fully respected and maintained the legal rights of theinterested parties, and realized the balance of interest among the parties such as society,shareholders and employees, etc. Meanwhile, the Company protected the rights of the employees,promoted the environmental protection, and actively joined in the social benefit and charitable
Konka Group Co., Ltd. Annual Report 2019
109
cause so as to jointly promote sustainable and healthy development.(VII) Information disclosure and transparencyThe Company formulated the Management System for Investor Relations and the ManagementSystem for Information Disclosure and the Rules on Implementation for Information DisclosureCommittee. And the Company designated specially-assigned person to take charge of theinformation disclosure, and designated specialized department to be responsible for the reception ofshareholders and consultation, actively carrying out the work for investor relations management toensure equal access to information for all shareholders. The Company strictly complied with therequirements of the laws, regulations and the Articles of Association to disclose its information asrequired by the relevant regulations on an timely, honest, complete and accurate basis, to ensure theaccurate and timely information disclosure, while ensure equal access to information for allshareholders.(VIII) Non-standard governance1. Type of non-standard governance matter existedThere was a situation that the Company disclosed undisclosed information.2. Types and cycle of undisclosed information provided to the principal shareholderThe Company provided monthly financial data to the principal shareholder.3. Reasons for the related non-standard governance existedThe Company submitted the undisclosed information such as monthly financial data to thesubstantial shareholder directly administrated by the State-owned Assets Supervision andAdministration Commission of State Council in accordance with the managerial demand ofSASAC.4. Impact on Company independenceAfter the self-inspection, the Company kept strictly to the requirements of “Notice on Strengtheningthe Supervision of Listed Company’s Provision of Non-public Information to SubstantialShareholders and Actual Controllers”, and “Supplementary Notice Concerning Strengthening theSupervision of the Non-standard Governance Behavior of Listed Company's Provision ofNon-public Information to Substantial Shareholders and Actual Controllers”, while stringentlyperformed the necessary procedures. There existed no circumstances of substantial shareholder’sabuse of control and disclosure of undisclosed information for insider trading, and hence, it has noimpact on the independence of the Company.(IX) Development of company’s special governance activity, formulation and implementationof registration and management system for the insider of inside information1. Establishment and perfection of management system for the insider of inside informationTo further standardize the company’s inside information management behavior, strengthen thecompany’s inside information confidential work, and maintain the fair principle of information
Konka Group Co., Ltd. Annual Report 2019
110
disclosure, the Company established Inside Information and Insider Management System in KonkaGroup Co., Ltd. The Company strictly implements the system in the information disclosure work,meanwhile, carefully implements the Company’s inside information and insider registration andmanagement method, registers the insider of inside information, and report to Shenzhen StockExchange and Shenzhen Security Regulatory Bureau according to the provision.The Company conducted the special inspection on the inside information management during theoccurrence of major event in 2019 and the annual report in 2019. After the inspection, the Companyactually realized that the insider of inside information strictly kept the confidential provision, didnot disclose, divulge and spread the Company’s inside information to the outside, the insider ofinside information did not buy and sell the Company’s share with the inside information beforedisclosing the major sensitive information influencing the Company’s share price, there was noinvestigation and rectification from the regulatory department during the editing, review anddisclosure of regular report and major event. Management Rules for Inside Information and InsiderManagement System was implemented in place and controlled effectively.2. Establishment and implementation of external information user’s management systemTo strengthen the management on the reporting of Company’s inside information, the Companyestablishes Inside Information Reporting Management System, and prescribes the insideinformation reporting range, reporting procedure, responsibility division and other mattersaccording to Security Law in People’s Republic of China, Information Disclosure ManagementMethod in Listed Company, Inside Information and Insider Management System in Konka GroupCo., Ltd. and other related provisions in the laws, regulations and regulatory documents.The Company conducted the special inspection on the inside information reporting status during theoccurrence of major event in 2019 and the annual report in 2019. After the inspection, theCompany’s inside information reporting status complies with the requirements in InsideInformation Reporting Management System. Inside Information Reporting Management Systemwas implemented in place and controlled effectively.Indicate by tick market whether there is any material incompliance with the regulatory documents
issued by the CSRC governing the governance of listed companies.
□ Yes √ No
No such cases in the Reporting Period.II The Company’s Independence from Its Controlling Shareholder in Business, Personnel,Asset, Organization and Financial AffairsDuring the Reporting Period, the company was fully separated from the controlling shareholders interms of business, staff, assets, organs, and finance, which owned independent legal representativeand main status in market competition and had independent accounting, as well as possessedcomplete business and the ability of independent operation to face the market.
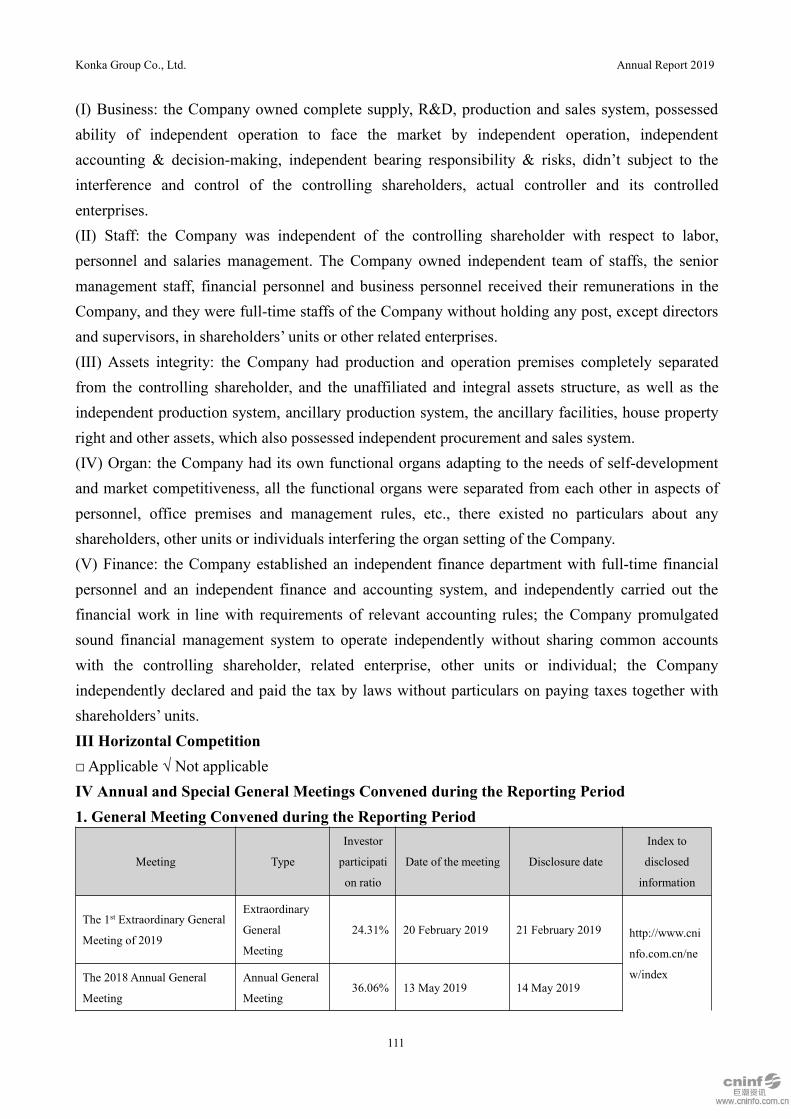
Konka Group Co., Ltd. Annual Report 2019
111
(I) Business: the Company owned complete supply, R&D, production and sales system, possessedability of independent operation to face the market by independent operation, independentaccounting & decision-making, independent bearing responsibility & risks, didn’t subject to theinterference and control of the controlling shareholders, actual controller and its controlledenterprises.(II) Staff: the Company was independent of the controlling shareholder with respect to labor,personnel and salaries management. The Company owned independent team of staffs, the seniormanagement staff, financial personnel and business personnel received their remunerations in theCompany, and they were full-time staffs of the Company without holding any post, except directorsand supervisors, in shareholders’ units or other related enterprises.(III) Assets integrity: the Company had production and operation premises completely separatedfrom the controlling shareholder, and the unaffiliated and integral assets structure, as well as theindependent production system, ancillary production system, the ancillary facilities, house propertyright and other assets, which also possessed independent procurement and sales system.(IV) Organ: the Company had its own functional organs adapting to the needs of self-developmentand market competitiveness, all the functional organs were separated from each other in aspects ofpersonnel, office premises and management rules, etc., there existed no particulars about anyshareholders, other units or individuals interfering the organ setting of the Company.(V) Finance: the Company established an independent finance department with full-time financialpersonnel and an independent finance and accounting system, and independently carried out thefinancial work in line with requirements of relevant accounting rules; the Company promulgatedsound financial management system to operate independently without sharing common accountswith the controlling shareholder, related enterprise, other units or individual; the Companyindependently declared and paid the tax by laws without particulars on paying taxes together withshareholders’ units.III Horizontal Competition□Applicable √ Not applicableIV Annual and Special General Meetings Convened during the Reporting Period1. General Meeting Convened during the Reporting Period
Meeting Type
Investor
participati
on ratio
Date of the meeting Disclosure date
Index to
disclosed
information
The 1st Extraordinary General
Meeting of 2019
Extraordinary
General
Meeting
24.31% 20 February 2019 21 February 2019 http://www.cni
nfo.com.cn/ne
w/indexThe 2018 Annual General
Meeting
Annual General
Meeting36.06% 13 May 2019 14 May 2019

Konka Group Co., Ltd. Annual Report 2019
112
The 2nd Extraordinary General
Meeting of 2019
Extraordinary
General
Meeting
24.32% 8 October 2019 9 October 2019
The 3rd Extraordinary General
Meeting of 2019
Extraordinary
General
Meeting
24.29% 7 November 2019 8 November 2019
The 4th Extraordinary General
Meeting of 2019
Extraordinary
General
Meeting
24.29% 16 December 2019 17 December 2019
2. Special General Meetings Convened at the Request of Preferred Shareholders withResumed Voting Rights□Applicable √ Not applicableV Performance of Duty by Independent Directors in the Reporting Period1. Attendance of Independent Directors at Board Meetings and General Meetings
Attendance of independent directors at board meetings and general meetings
Independe
nt director
Total number of
board meetings the
independent
director was
eligible to attend
Board
meetings
attended on
site
Board meetings
attended by way of
telecommunication
Board
meetings
attended
through a
proxy
Board
meetings the
independent
director failed
to attend
The independent
director failed to
attend two
consecutive board
meetings (yes/no)
General
meetings
attended
Sun
Shengdian19 4 15 0 0
No1
Wang
Shuguang19 3 15 1 0
No0
Deng
Chunhua19 4 15 0 0
No1
Why any independent director failed to attend two consecutive board meetings:Not applicable.2. Objections Raised by Independent Directors on Matters of the CompanyIndicate by tick mark whether any independent directors raised any objections on any matter of theCompany.□ Yes √ NoNo such cases in the Reporting Period.3. Other Information about the Performance of Duty by Independent DirectorsIndicate by tick mark whether any suggestions from independent directors were adopted by theCompany.□ Yes √ NoSuggestions from independent directors adopted or not adopted by the Company:During the Reporting Period, the Independent Directors of the Company vigorously attended therelevant meetings, carefully reviewed each proposal, objectively stated their own views andopinions, knew of the R&D progress and the operating situation of the Company, the executionsituation of the internal control construction and the resolutions of the meetings of the Board of
Konka Group Co., Ltd. Annual Report 2019
113
Directors and as well as the Annual General Meeting.As the expert of the involved each field, the Independent Directors put forward the constructiveadvices by use of their own professional knowledge towards the internal management, including: toactively promote the establishment and implementation of the Company’s development strategyplan, provide advices on the expansion of new businesses, focus on risk control matters such as cashflow and accounts receivable management. The Company carefully adopted the advices from theIndependent Directors and constantly improved and enhanced the management level of theCompany.VI Performance of Duties by Specialized Committees under the Board during this ReportingPeriod(I) Summary Report on the Performance of the Audit Committee Subject to the Board of DirectorsThe Company had constituted the Work Rules for the Financial Audit Committee under the Boardwhich was revised in 2019 and illustrated the exact personnel, obligations and rights and workingprocess of annual report of the Financial Audit Committee under the Board. In 2019, based on theprinciple of faithfulness, the major execution situations of the Financial Audit Committee under theBoard were as follows:1. Reviewed financial statements of Annual Report 2018, First Quarter Report 2019, Interim Report2019, and the Third Quarter Report 2019, and had no objection to the aforesaid financial statements.2. Submitted the Proposal on Hiring CPA in 2019 to the Board on 28 March 2019 in whichproposing to continue to hire Ruihua CPA as the audit institution of financial statements of theCompany in 2019.3. Submitted the Proposal on Change of CPA to the Board on 11 October 2019 in which proposingto hire Shine Wing Certified Public Accountants not Ruihua CPA as the audit institution of financialstatements of the Company in 2019.4. During the preparation of Annual Report 2018 of the Company, it fulfilled the following duties:(1) Issued the Notes of the Events such as the Audit Work Arrangement of the Financial AuditCommittee and approved the arrangement for 2019 annual auditing of the Company;(2) Issued Audit Opinion of the Financial Audit Committee on Financial Accounting StatementsPrepared by the Company before CPAs’ entry of Audit;(3) Communicated and exchanged ideas with the CPAs responsible for annual auditing on theproblems occurring during the auditing;(4) Issued Audit Opinion on Financial Accounting Statements of the Company after CPAs Issuedthe Preliminary Audit Opinion;(5) Supervised and urged CPAs in writing to submit he audit report within the agreed time periodfor many times.(6) Issued Summary Report on 2019 Annual Auditing by Ruihua Certified Public Accountants;(7) Submitted the Resolution of the 2019 Annual Financial Statement of the Company to the Board;
Konka Group Co., Ltd. Annual Report 2019
114
(8) Submitted the Proposal on Engagement of the CPAs in 2020 to the Board;5. In 2019, according to the authorization of the Board of Directors, the Financial Audit Committeeaccepted the report on the work of the Company’s Internal Auditing Department and carried outmanagement over the Internal Auditing Department of the Company and its work.(II) Summary Report on the Performance of the Remuneration and Appraisal CommitteeSubject to the Board of DirectorsThe Company had constituted the Work Rules for the Remuneration and Appraisal Committeeunder the Board which illustrated the exact personnel, obligations and rights of the Remunerationand Appraisal Committee under the Board. In 2019, based on the principle of faithfulness, the majorexecution situations of the Remuneration and Appraisal Committee under the Board were asfollows:1. On 5 August 2019, the Remuneration and Appraisal Committee subject to the Board of Directorssubmitted the Audit Opinion on the Reward Planning for the Management of the Company in 2018to the Board.2. During the preparation of Annual Report 2019, the Remuneration and Appraisal Committeesubject to the Board of Directors issued the Audit Opinion on the Disclosed Remuneration Situationof the Directors, Supervisors and Senior Executives of the Company, which considered thecondition of the remuneration of the Directors, Supervisors and Senior Executives of the Companydisclosed in the 2019 Annual Report was verified. The disclosed remuneration situation of theDirectors, Supervisors and Senior Executives of the Company met with the remunerationmanagement system without any situation that violated the remuneration management system of theCompany.VII Performance of Duty by the Supervisory CommitteeIndicate by tick mark whether the Supervisory Committee found any risk to the Company during itssupervision in the Reporting Period.□ Yes √ NoThe Supervisory Committee raised no objections in the Reporting Period.VIII Appraisal of and Incentive for Senior ManagementIn order to enable the senior management staffs of the Company give better performance of theirduties, and clarify their rights and obligations, the Company established and improved a fair,transparent and efficient Performance Appraisal Standard and Incentive & Restraint Mechanism forthe senior management staffs. The Company assessed the duty performance and completion ofbusiness of senior management staffs in terms of professional skills, management level and jobperformance; took the salary plus bonus as a main incentive way, to improve the incentive of seniormanagement. The senior management staff was appraised by the Board of Directors, which wassupervised by the Supervisory Committee.

Konka Group Co., Ltd. Annual Report 2019
115
IX Internal Control1. Material Internal Control Weaknesses Identified for the Reporting Period□ Yes √ No2. Internal Control Self-Evaluation ReportDisclosure date of the internal control
self-evaluation report20 April 2020
Index to the disclosed internal control
self-evaluation reporthttp://www.cninfo.com.cn/new/index
Evaluated entities’ combined assets as %
of consolidated total assets90.00%
Evaluated entities’ combined operating
revenue as % of consolidated operating
revenue
90.00%
Identification standards for internal control weaknesses
Type Weaknesses in internal control over financial reportingWeaknesses in internal control not related to
financial reporting
Nature
standa
rd
Those with the following characteristics should be recognized as
great defect: (1) found out there were malpractices of the Directors,
Supervisors and Senior Executives of the Company that formed
significant influences on the financial report; (2) the Company
revised the published financial report and revised the great
misstatements caused by the malpractices or the mistakes; (3) CPA
found out there was great misstatement of the current financial report
while didn’t found during the operating process of the internal
control; (4) the supervision of the internal control by the Finance
Audit Committee and the internal audit institution of the Company
was invalid; (5) not yet revised the great defect after the reasonable
period as which was discovered among the internal control
assessment; (6) the significant business lacked of systematic control
or the systematic control was invalid.. Those with the following
characteristics should be recognized as significant defect: (1) not yet
chosen or applied the accounting polices according to the generally
accepted accounting standards; (2) not yet constructed the anti-spam
process or control measures; (3) as for the accounts disposal of the
unconventional or special transactions, there was no corresponding
control mechanism or execution or the existence of the corresponding
supplement control; (4) there was one or multiple defects during the
control of the compile of the financial report at the period-end and
could not reasonable guarantee the statement of the compiled
financial report reach the real and accurate target; (5) not yet revised
the significant defect after the reasonable period as which was
The following signs indicated there may exist
great defect among the internal control of the
non-financial report; (1) the operating
activities of the enterprises seriously violated
the national laws and regulations; (2) negative
news frequently disclosed by the media which
caused significant harm to the Company’s
reputation; (3) the core management team left
their positions one after another or the outflow
of the key position personnel was serious; (4)
significant business lacked of systematic
control of the system was invalid; (5) great
defect discovered among the internal control
assessment not yet be revised in time. The
following signs indicated there may exist
significant defect among the internal control of
the non-financial report: (1) negative news
occurred rather frequently which caused rather
big harm to the Company’s reputation; (2) the
outflow of the key position personnel was
rather serious; (3) there was obvious defect
among the control system of the significant
business; (4) the significant defect found
among the internal control assessment not yet
be revised in time. 3. Other defects from the

Konka Group Co., Ltd. Annual Report 2019
116
discovered among the internal control assessment. 3. Other defects
from the internal control hadn’t reached the recognition standards of
the great defect or significant defect should be recognized as general
defect.
internal control hadn’t reached the recognition
standards of the great defect or significant
defect, should be recognized as general defect.
Quanti
tative
standa
rd
Great defect: potential misstatement amount≥1% of the gross profit
margin of the 2019 consolidated financial report of the Company;
significant defect: 0.5% of the gross profit margin of the 2019
consolidated financial report of the Company ≤potential
misstatement amount< 1% of the gross profit margin of the 2019
consolidated financial report of the Company; general defect:
potential misstatement amount<0.5% of the gross profit margin of
the 2019 consolidated financial report of the Company.
Implement in accordance with the quantitative
criteria of internal control defect evaluation in
financial statements
Number of material weaknesses in internal control over financial reporting 0
Number of material weaknesses in internal control not related to financial
reporting0
Number of serious weaknesses in internal control over financial reporting 0
Number of serious weaknesses in internal control not related to financial
reporting0
X Independent Auditor’s Report on Internal Control√ Applicable □ Not applicable
Opinion paragraph in the independent auditor’s report on internal control
We considered that, in all the significant aspects, Konka Group maintained efficient internal control of the financial report
according to the C-SOX and the relevant regulations on 31 December 2019
Independent auditor’s report on
internal control disclosed or notDisclosed
Disclosure date 22 April 2020
Index to such report disclosed http://www.cninfo.com.cn/new/index
Type of the auditor’s opinion Unmodified unqualified opinion
Material weaknesses in internal
control not related to financial
reporting
None
Indicate by tick mark whether any modified opinion is expressed in the independent auditor’s reporton the Company’s internal control.□ Yes √ NoIndicate by tick mark whether the independent auditor’s report on the Company’s internal control isconsistent with the internal control self-evaluation report issued by the Company’s Board.√ Yes □ No
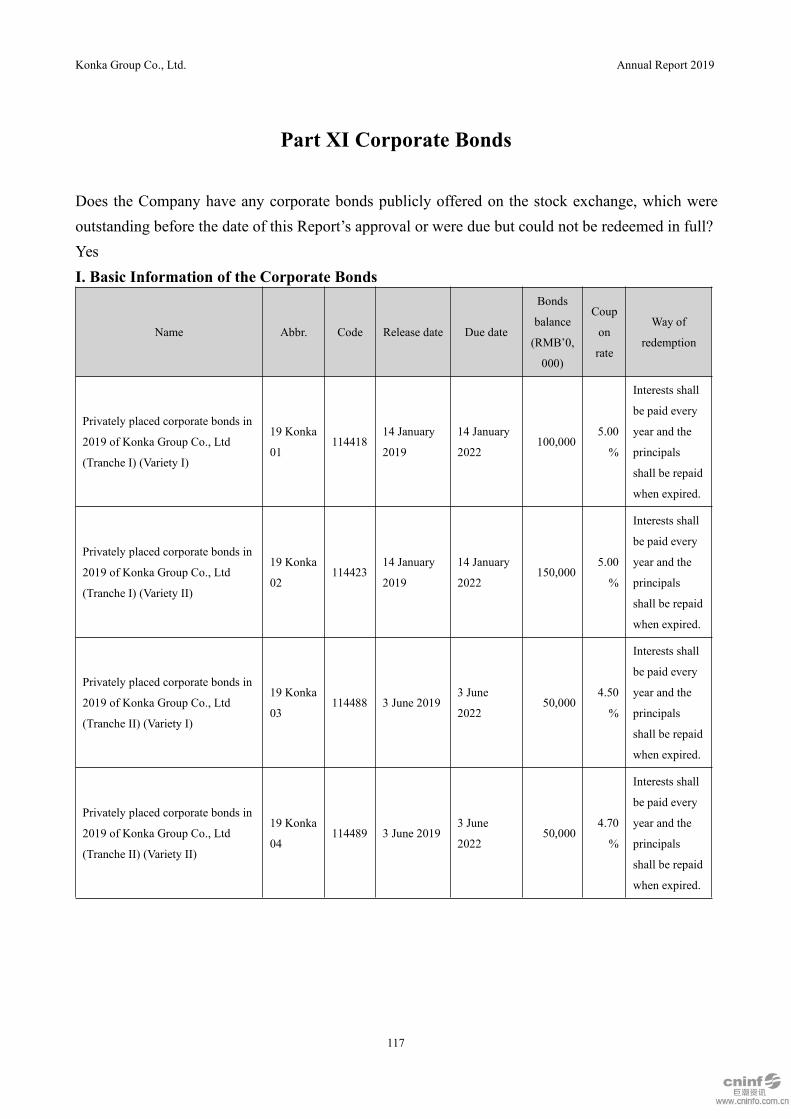
Konka Group Co., Ltd. Annual Report 2019
117
Part XI Corporate Bonds
Does the Company have any corporate bonds publicly offered on the stock exchange, which wereoutstanding before the date of this Report’s approval or were due but could not be redeemed in full?YesI. Basic Information of the Corporate Bonds
Name Abbr. Code Release date Due date
Bonds
balance
(RMB’0,
000)
Coup
on
rate
Way of
redemption
Privately placed corporate bonds in
2019 of Konka Group Co., Ltd
(Tranche I) (Variety I)
19 Konka
01114418
14 January
2019
14 January
2022100,000
5.00
%
Interests shall
be paid every
year and the
principals
shall be repaid
when expired.
Privately placed corporate bonds in
2019 of Konka Group Co., Ltd
(Tranche I) (Variety II)
19 Konka
02114423
14 January
2019
14 January
2022150,000
5.00
%
Interests shall
be paid every
year and the
principals
shall be repaid
when expired.
Privately placed corporate bonds in
2019 of Konka Group Co., Ltd
(Tranche II) (Variety I)
19 Konka
03114488 3 June 2019
3 June
202250,000
4.50
%
Interests shall
be paid every
year and the
principals
shall be repaid
when expired.
Privately placed corporate bonds in
2019 of Konka Group Co., Ltd
(Tranche II) (Variety II)
19 Konka
04114489 3 June 2019
3 June
202250,000
4.70
%
Interests shall
be paid every
year and the
principals
shall be repaid
when expired.
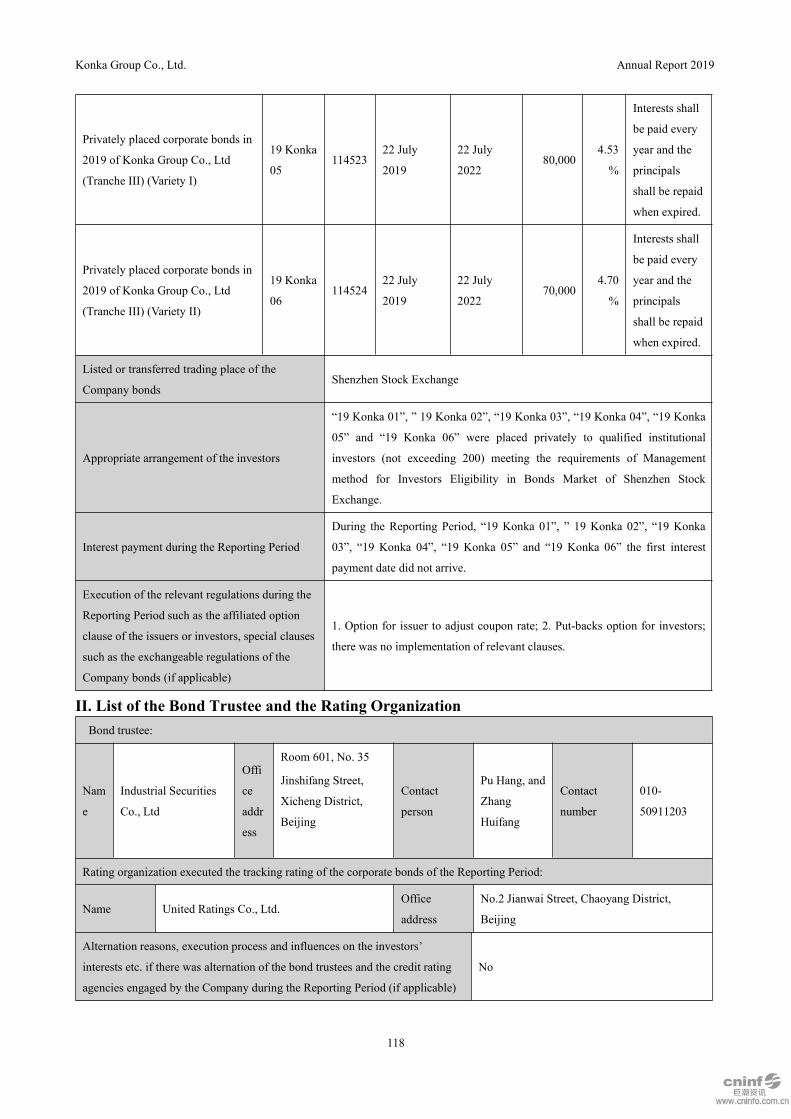
Konka Group Co., Ltd. Annual Report 2019
118
Privately placed corporate bonds in
2019 of Konka Group Co., Ltd
(Tranche III) (Variety I)
19 Konka
05114523
22 July
2019
22 July
202280,000
4.53
%
Interests shall
be paid every
year and the
principals
shall be repaid
when expired.
Privately placed corporate bonds in
2019 of Konka Group Co., Ltd
(Tranche III) (Variety II)
19 Konka
06114524
22 July
2019
22 July
202270,000
4.70
%
Interests shall
be paid every
year and the
principals
shall be repaid
when expired.
Listed or transferred trading place of the
Company bondsShenzhen Stock Exchange
Appropriate arrangement of the investors
“19 Konka 01”, ” 19 Konka 02”, “19 Konka 03”, “19 Konka 04”, “19 Konka
05” and “19 Konka 06” were placed privately to qualified institutional
investors (not exceeding 200) meeting the requirements of Management
method for Investors Eligibility in Bonds Market of Shenzhen Stock
Exchange.
Interest payment during the Reporting Period
During the Reporting Period, “19 Konka 01”, ” 19 Konka 02”, “19 Konka
03”, “19 Konka 04”, “19 Konka 05” and “19 Konka 06” the first interest
payment date did not arrive.
Execution of the relevant regulations during the
Reporting Period such as the affiliated option
clause of the issuers or investors, special clauses
such as the exchangeable regulations of the
Company bonds (if applicable)
1. Option for issuer to adjust coupon rate; 2. Put-backs option for investors;
there was no implementation of relevant clauses.
II. List of the Bond Trustee and the Rating OrganizationBond trustee:
Nam
e
Industrial Securities
Co., Ltd
Offi
ce
addr
ess
Room 601, No. 35
Jinshifang Street,
Xicheng District,
Beijing
Contact
person
Pu Hang, and
Zhang
Huifang
Contact
number
010-
50911203
Rating organization executed the tracking rating of the corporate bonds of the Reporting Period:
Name United Ratings Co., Ltd.Office
address
No.2 Jianwai Street, Chaoyang District,
Beijing
Alternation reasons, execution process and influences on the investors’
interests etc. if there was alternation of the bond trustees and the credit rating
agencies engaged by the Company during the Reporting Period (if applicable)
No
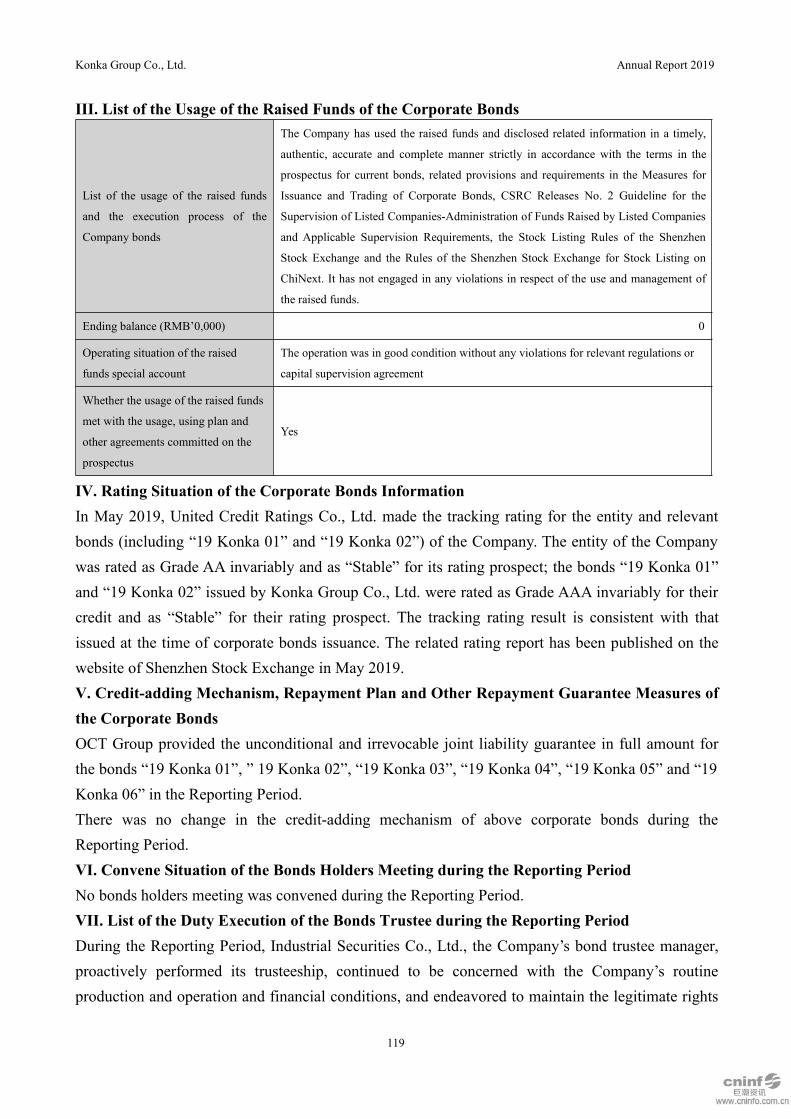
Konka Group Co., Ltd. Annual Report 2019
119
III. List of the Usage of the Raised Funds of the Corporate Bonds
List of the usage of the raised funds
and the execution process of the
Company bonds
The Company has used the raised funds and disclosed related information in a timely,
authentic, accurate and complete manner strictly in accordance with the terms in the
prospectus for current bonds, related provisions and requirements in the Measures for
Issuance and Trading of Corporate Bonds, CSRC Releases No. 2 Guideline for the
Supervision of Listed Companies-Administration of Funds Raised by Listed Companies
and Applicable Supervision Requirements, the Stock Listing Rules of the Shenzhen
Stock Exchange and the Rules of the Shenzhen Stock Exchange for Stock Listing on
ChiNext. It has not engaged in any violations in respect of the use and management of
the raised funds.
Ending balance (RMB’0,000) 0
Operating situation of the raised
funds special account
The operation was in good condition without any violations for relevant regulations or
capital supervision agreement
Whether the usage of the raised funds
met with the usage, using plan and
other agreements committed on the
prospectus
Yes
IV. Rating Situation of the Corporate Bonds InformationIn May 2019, United Credit Ratings Co., Ltd. made the tracking rating for the entity and relevantbonds (including “19 Konka 01” and “19 Konka 02”) of the Company. The entity of the Companywas rated as Grade AA invariably and as “Stable” for its rating prospect; the bonds “19 Konka 01”and “19 Konka 02” issued by Konka Group Co., Ltd. were rated as Grade AAA invariably for theircredit and as “Stable” for their rating prospect. The tracking rating result is consistent with thatissued at the time of corporate bonds issuance. The related rating report has been published on thewebsite of Shenzhen Stock Exchange in May 2019.V. Credit-adding Mechanism, Repayment Plan and Other Repayment Guarantee Measures ofthe Corporate BondsOCT Group provided the unconditional and irrevocable joint liability guarantee in full amount forthe bonds “19 Konka 01”, ” 19 Konka 02”, “19 Konka 03”, “19 Konka 04”, “19 Konka 05” and “19Konka 06” in the Reporting Period.There was no change in the credit-adding mechanism of above corporate bonds during theReporting Period.VI. Convene Situation of the Bonds Holders Meeting during the Reporting PeriodNo bonds holders meeting was convened during the Reporting Period.VII. List of the Duty Execution of the Bonds Trustee during the Reporting PeriodDuring the Reporting Period, Industrial Securities Co., Ltd., the Company’s bond trustee manager,proactively performed its trusteeship, continued to be concerned with the Company’s routineproduction and operation and financial conditions, and endeavored to maintain the legitimate rights
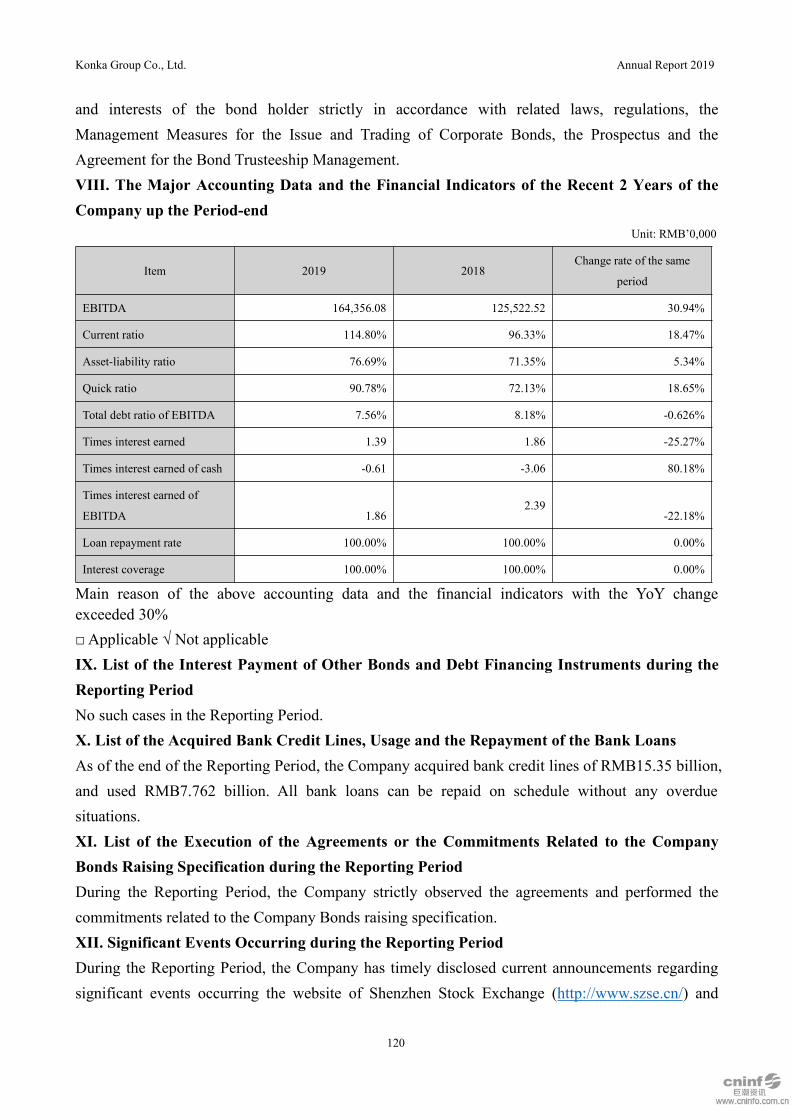
Konka Group Co., Ltd. Annual Report 2019
120
and interests of the bond holder strictly in accordance with related laws, regulations, theManagement Measures for the Issue and Trading of Corporate Bonds, the Prospectus and theAgreement for the Bond Trusteeship Management.VIII. The Major Accounting Data and the Financial Indicators of the Recent 2 Years of theCompany up the Period-end
Unit: RMB’0,000
Item 2019 2018Change rate of the same
period
EBITDA 164,356.08 125,522.52 30.94%
Current ratio 114.80% 96.33% 18.47%
Asset-liability ratio 76.69% 71.35% 5.34%
Quick ratio 90.78% 72.13% 18.65%
Total debt ratio of EBITDA 7.56% 8.18% -0.626%
Times interest earned 1.39 1.86 -25.27%
Times interest earned of cash -0.61 -3.06 80.18%
Times interest earned of
EBITDA 1.862.39
-22.18%
Loan repayment rate 100.00% 100.00% 0.00%
Interest coverage 100.00% 100.00% 0.00%
Main reason of the above accounting data and the financial indicators with the YoY changeexceeded 30%□Applicable √ Not applicableIX. List of the Interest Payment of Other Bonds and Debt Financing Instruments during theReporting PeriodNo such cases in the Reporting Period.X. List of the Acquired Bank Credit Lines, Usage and the Repayment of the Bank LoansAs of the end of the Reporting Period, the Company acquired bank credit lines of RMB15.35 billion,and used RMB7.762 billion. All bank loans can be repaid on schedule without any overduesituations.XI. List of the Execution of the Agreements or the Commitments Related to the CompanyBonds Raising Specification during the Reporting PeriodDuring the Reporting Period, the Company strictly observed the agreements and performed thecommitments related to the Company Bonds raising specification.XII. Significant Events Occurring during the Reporting PeriodDuring the Reporting Period, the Company has timely disclosed current announcements regardingsignificant events occurring the website of Shenzhen Stock Exchange (http://www.szse.cn/) and

Konka Group Co., Ltd. Annual Report 2019
121
cninfo (http://www.cninfo.com.cn/new/index). As of the disclosure date of this Report, relatedsignificant events have no subsequent progress yet.XIII. Whether there Was Guarantor of the Corporate Bonds√ Yes □ No
Whether the guarantor of the corporate bonds was legal person or other organizations√ Yes □ NoWhether separately disclose the financial statements (including Balance Sheet, Income Statement,Cash Flow Statement, and Changes in owners’ (shareholders’) Equity, and notes for FinancialStatements) of guarantor in the Reporting Period within 4 months from the ending date of everyaccounting year
□ Yes √ No

Konka Group Co., Ltd. Annual Report 2019
122
Part XII Financial Statements
I Independent Auditor’s ReportType of the independent auditor’s opinion Unmodified unqualified opinion
Date of signing this report 20 April 2020
Name of the independent auditorShineWing Certified Public Accountants (Special General
Partnership)
Reference number of audit report XYZH/2020GZA50009
Name of the certified public accountants Guo Dongchao, Liu Lihong
Independent Auditor’s ReportXYZH/2020GZA50009
All shareholders of Konka Group Co., Ltd.
I. Opinion
We have audited the accompanying financial statements of Konka Group Co., Ltd. (the “Company”), whichcomprise the Company’s and consolidated balance sheets of the parent company as at 31 December 2019, theCompany’s and consolidated income statements of the parent company, the Company’s and consolidatedcash flow statements of the parent company, the Company’s and consolidated statements of changes inshareholders’ equity of the parent company for the year then ended, as well as the notes to the financialstatements.In our opinion, the financial statements attached were prepared in line with the regulations of AccountingStandards for Business Enterprises in all significant aspects which gave a true and fair view of theconsolidated and parent financial position of the Company as at 31 December 2019 and the consolidated andparent business performance and cash flow of the Company for 2019.II. Basis for OpinionWe conducted our audit in accordance with Standards on Auditing for Certified Public Accountants. Ourresponsibilities under those standards are further described in the Auditor’s Responsibilities for the Audit ofthe Financial Statements section of our report. In accordance with professional ethics for certified publicaccountants, we are independent with Foshan Huaxin Packing Co., Ltd. and we have fulfilled our otherethical responsibilities. We believe that the audit evidence we have obtained is sufficient and appropriate toprovide a basis for our opinion.III. Key Audit MattersKey audit matters are those matters that, in our professional judgment, were of most significance in our auditof the financial statements of the Current Period. These matters were addressed in the context of our audit ofthe financial statements as a whole, and in forming our opinion thereon, and we do not provide a separateopinion on these matters.

Konka Group Co., Ltd. Annual Report 2019
123
1. Recognition of operating revenues
Key audit matters Countermeasures of audit
Please refer to the notes to the financial
statements "six, notes to the consolidated
financial statements" 43.In 2019,Konka
Group's consolidated financial statements
confirmed operating income of RMB
55,119,125,478.72, the mainly revenue
comes from the electronic business, trading
business,and environmental protection
business, environmental protection business,
etc. Due to the importance of revenue to the
financial statements as a whole, and the
inherent misstatement risk of management's
manipulation of revenue recognition in order
to achieve specific goals or expectations, we
make revenue recognition a key audit matter.
(1) Evaluate and test income to confirm the effectiveness of key internal control
design and operation;
(2) Select samples to check supporting documents such as sales contracts,
construction contracts, sales support documents, orders, invoices, delivery receipts,
cargo rights transfer vouchers, bank transfer vouchers, invoices, customs declarations,
etc. Accounting policies identify contract terms and conditions related to risks and
reward transfers in commodity ownership, check whether the company is the main
responsible person or agent in the sales business, and evaluate whether the company's
revenue confirms that the accounting policies meet the requirements of the enterprise
accounting standards;
(3) Perform analytical procedures on revenue and costs, analyze the fluctuations and
causes of sales prices this year, and evaluate the rationality of sales gross profit
margin changes;
(4) According to the characteristics and nature of the customer's transaction, select
important customers to implement the letter and letter procedure for the transaction
amount and the balance of the transaction, and strictly control the letter and letter
procedure;
(5) For environmental protection projects, check the estimated total cost of the project
and review the calculation process of the percentage of completion of the project,
assess the management ’s significant judgment and reasonableness of the estimated
total cost; obtain engineering measurement payment certificates and other documents
to confirm the completion amount and progress Check whether the progress of the
project and the amount of completion have been signed and sealed by the contractor
and the supervisor; for major projects, check the progress of the image on the spot;
check whether the actual completion of the project is consistent with the completion
progress confirmed by the company.
(6) Select samples of important customers and suppliers to check industrial and
commercial information and background, and evaluate the commercial rationality of
transactions with customers; entrust lawyers to check whether there is an association
between important overseas customers and suppliers. Evaluate the professional
competence and independence of lawyers and the availability of lawyers' work; visit
customers and suppliers with large amounts on the spot, understand the background of
the transaction and the basic situation of the counterparty, check whether there is
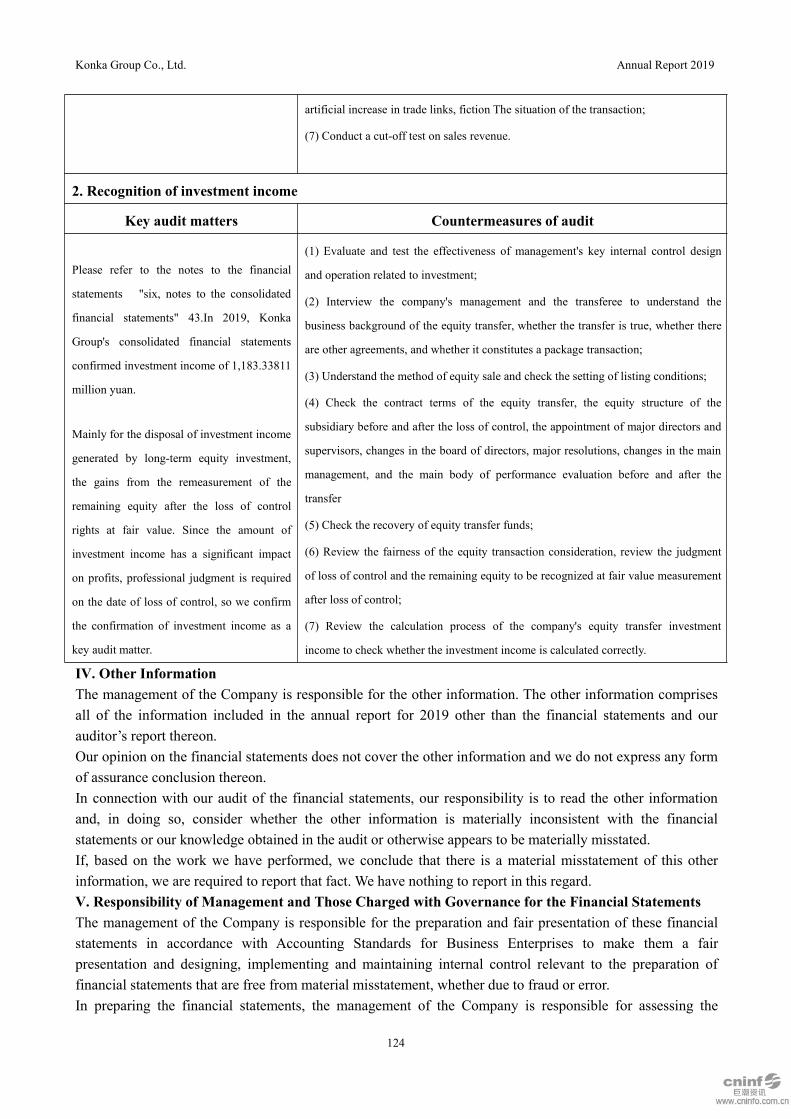
Konka Group Co., Ltd. Annual Report 2019
124
artificial increase in trade links, fiction The situation of the transaction;
(7) Conduct a cut-off test on sales revenue.
2. Recognition of investment income
Key audit matters Countermeasures of audit
Please refer to the notes to the financial
statements "six, notes to the consolidated
financial statements" 43.In 2019, Konka
Group's consolidated financial statements
confirmed investment income of 1,183.33811
million yuan.
Mainly for the disposal of investment income
generated by long-term equity investment,
the gains from the remeasurement of the
remaining equity after the loss of control
rights at fair value. Since the amount of
investment income has a significant impact
on profits, professional judgment is required
on the date of loss of control, so we confirm
the confirmation of investment income as a
key audit matter.
(1) Evaluate and test the effectiveness of management's key internal control design
and operation related to investment;
(2) Interview the company's management and the transferee to understand the
business background of the equity transfer, whether the transfer is true, whether there
are other agreements, and whether it constitutes a package transaction;
(3) Understand the method of equity sale and check the setting of listing conditions;
(4) Check the contract terms of the equity transfer, the equity structure of the
subsidiary before and after the loss of control, the appointment of major directors and
supervisors, changes in the board of directors, major resolutions, changes in the main
management, and the main body of performance evaluation before and after the
transfer
(5) Check the recovery of equity transfer funds;
(6) Review the fairness of the equity transaction consideration, review the judgment
of loss of control and the remaining equity to be recognized at fair value measurement
after loss of control;
(7) Review the calculation process of the company's equity transfer investment
income to check whether the investment income is calculated correctly.
IV. Other InformationThe management of the Company is responsible for the other information. The other information comprisesall of the information included in the annual report for 2019 other than the financial statements and ourauditor’s report thereon.Our opinion on the financial statements does not cover the other information and we do not express any formof assurance conclusion thereon.In connection with our audit of the financial statements, our responsibility is to read the other informationand, in doing so, consider whether the other information is materially inconsistent with the financialstatements or our knowledge obtained in the audit or otherwise appears to be materially misstated.If, based on the work we have performed, we conclude that there is a material misstatement of this otherinformation, we are required to report that fact. We have nothing to report in this regard.V. Responsibility of Management and Those Charged with Governance for the Financial StatementsThe management of the Company is responsible for the preparation and fair presentation of these financialstatements in accordance with Accounting Standards for Business Enterprises to make them a fairpresentation and designing, implementing and maintaining internal control relevant to the preparation offinancial statements that are free from material misstatement, whether due to fraud or error.In preparing the financial statements, the management of the Company is responsible for assessing the
Konka Group Co., Ltd. Annual Report 2019
125
Company’s ability to continue as a going concern, disclosing, if applicable, matters related to going concernand using the going concern basis of accounting unless the management either intends to liquidate theCompany or to cease operations, or has no realistic alternative but to do so.Those charged with governance are responsible for overseeing the Company’s financial reporting process.VI. CPA’s Responsibility for the Audit of the Financial StatementsOur objectives are to obtain reasonable assurance about whether the financial statements as a whole are freefrom material misstatement, whether due to fraud or error, and to issue an auditor’s report that includes ouropinion. We report our opinion solely to you, as a body, and for no other purpose. We do not assumeresponsibility towards or accept liability to any other person for the contents of this report. Reasonableassurance is a high level of assurance, but is not a guarantee that an audit conducted in accordance withauditing standards will always detect a material misstatement when it exists. Misstatements can arise fromfraud or error and are considered material if, individually or in the aggregate, they could reasonably beexpected to influence the economic decisions of users taken on the basis of these financial statements.As part of an audit in accordance with auditing standards, we exercise professional judgment and maintainprofessional skepticism throughout the audit. We also:(1) Identify and assess the risks of major misstatement of financial statements due to fraud or errors, designand implement audit procedures to deal with these risks, and obtain sufficient and appropriate audit evidenceas the basis for issuing audit opinions. Since fraud may involve collusion, forgery, intentional omissions,misrepresentation, or overriding internal control, the risk of failing to detect a major misstatement due tofraud is higher than the risk of failing to detect a major misstatement due to error.(2) Understand the internal control related to auditing in order to design appropriate auditing procedures.(3) Evaluate the appropriateness of management's selection of accounting policies and the rationality ofaccounting estimates and related disclosures.(4) To draw conclusions on the appropriateness of the management's use of continuous operationassumptions. At the same time, based on the audit evidence obtained, a conclusion can be drawn on whetherthere is a material uncertainty that may cause significant doubts about Konka Group's ability to continueoperations. If we conclude that there are significant uncertainties, the auditing standards require us to drawthe attention of the users of the statements to the relevant disclosures in the financial statements in the auditreport; if the disclosures are insufficient, we should issue a non-reserved opinion. Our conclusion is based onthe information available as of the date of the audit report. However, future events or circumstances mayprevent Konka Group from continuing its operations.(5) Evaluate the overall presentation, structure, and content of the financial statements, and evaluate whetherthe financial statements fairly reflect related transactions and events.(6) Obtain sufficient and appropriate audit evidence on the financial information of the entities or businessactivities in Konka Group to express audit opinions on the financial statements. We are responsible forguiding, supervising and executing group audits, and assume full responsibility for audit opinions.We communicate with those charged with governance regarding, among other matters, the planned scope andtiming of the audit and significant audit findings, including any significant deficiencies in internal controlthat we identify during our audit.We also provide those charged with governance with a statement that we have complied with relevant ethicalrequirements regarding independence, and to communicate with them all relationships and other matters thatmay reasonably be thought to bear on our independence, and related safeguards (if applicable).From the matters communicated with those charged with governance, we determine those matters that wereof most significance in the audit of the financial statements of the Current Period and are therefore the key
Konka Group Co., Ltd. Annual Report 2019
126
audit matters. We describe these matters in our auditor’s report unless law or regulation precludes publicdisclosure about the matter or when, in extremely rare circumstances, we determine that a matter should notbe communicated in our report because the adverse consequences of doing so would reasonably be expectedto outweigh the public interest benefits of such communication.
ShineWing Certified Public Accountants
(Special General Partnership)
CPA (Engagement Partner):
CPA:
Beijing·China 20 April 2020
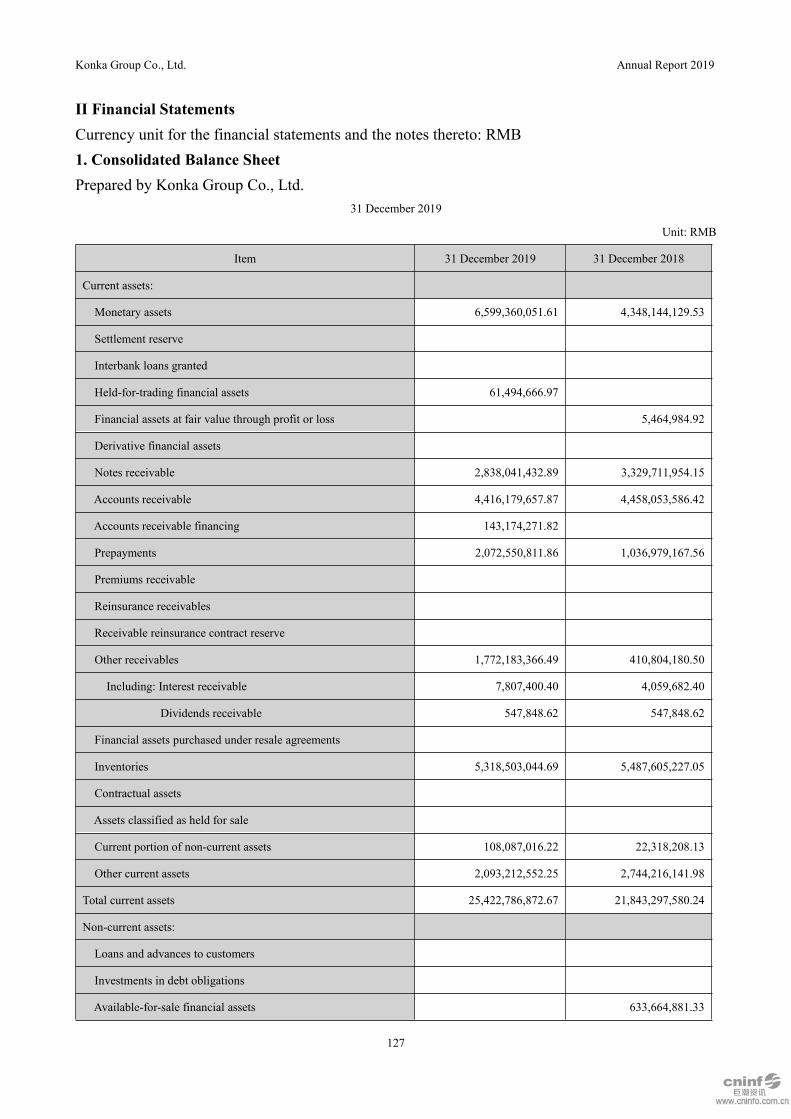
Konka Group Co., Ltd. Annual Report 2019
127
II Financial StatementsCurrency unit for the financial statements and the notes thereto: RMB1. Consolidated Balance SheetPrepared by Konka Group Co., Ltd.
31 December 2019
Unit: RMB
Item 31 December 2019 31 December 2018
Current assets:
Monetary assets 6,599,360,051.61 4,348,144,129.53
Settlement reserve
Interbank loans granted
Held-for-trading financial assets 61,494,666.97
Financial assets at fair value through profit or loss 5,464,984.92
Derivative financial assets
Notes receivable 2,838,041,432.89 3,329,711,954.15
Accounts receivable 4,416,179,657.87 4,458,053,586.42
Accounts receivable financing 143,174,271.82
Prepayments 2,072,550,811.86 1,036,979,167.56
Premiums receivable
Reinsurance receivables
Receivable reinsurance contract reserve
Other receivables 1,772,183,366.49 410,804,180.50
Including: Interest receivable 7,807,400.40 4,059,682.40
Dividends receivable 547,848.62 547,848.62
Financial assets purchased under resale agreements
Inventories 5,318,503,044.69 5,487,605,227.05
Contractual assets
Assets classified as held for sale
Current portion of non-current assets 108,087,016.22 22,318,208.13
Other current assets 2,093,212,552.25 2,744,216,141.98
Total current assets 25,422,786,872.67 21,843,297,580.24
Non-current assets:
Loans and advances to customers
Investments in debt obligations
Available-for-sale financial assets 633,664,881.33
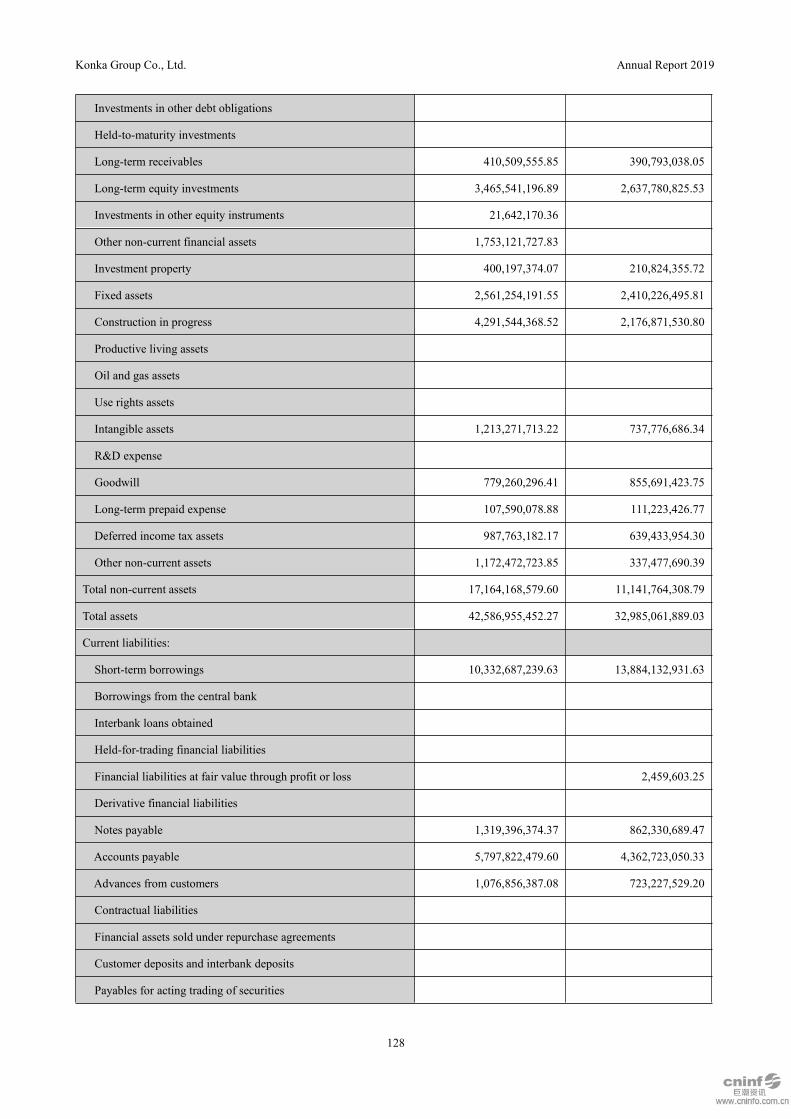
Konka Group Co., Ltd. Annual Report 2019
128
Investments in other debt obligations
Held-to-maturity investments
Long-term receivables 410,509,555.85 390,793,038.05
Long-term equity investments 3,465,541,196.89 2,637,780,825.53
Investments in other equity instruments 21,642,170.36
Other non-current financial assets 1,753,121,727.83
Investment property 400,197,374.07 210,824,355.72
Fixed assets 2,561,254,191.55 2,410,226,495.81
Construction in progress 4,291,544,368.52 2,176,871,530.80
Productive living assets
Oil and gas assets
Use rights assets
Intangible assets 1,213,271,713.22 737,776,686.34
R&D expense
Goodwill 779,260,296.41 855,691,423.75
Long-term prepaid expense 107,590,078.88 111,223,426.77
Deferred income tax assets 987,763,182.17 639,433,954.30
Other non-current assets 1,172,472,723.85 337,477,690.39
Total non-current assets 17,164,168,579.60 11,141,764,308.79
Total assets 42,586,955,452.27 32,985,061,889.03
Current liabilities:
Short-term borrowings 10,332,687,239.63 13,884,132,931.63
Borrowings from the central bank
Interbank loans obtained
Held-for-trading financial liabilities
Financial liabilities at fair value through profit or loss 2,459,603.25
Derivative financial liabilities
Notes payable 1,319,396,374.37 862,330,689.47
Accounts payable 5,797,822,479.60 4,362,723,050.33
Advances from customers 1,076,856,387.08 723,227,529.20
Contractual liabilities
Financial assets sold under repurchase agreements
Customer deposits and interbank deposits
Payables for acting trading of securities

Konka Group Co., Ltd. Annual Report 2019
129
Payables for underwriting of securities
Payroll payable 426,870,498.58 376,506,567.71
Taxes payable 607,845,294.99 288,004,192.44
Other payables 2,374,287,243.20 2,024,657,277.74
Including: Interest payable 227,831,108.53 27,230,631.41
Dividends payable
Handling charges and commissions payable
Reinsurance payables
Liabilities directly associated with assets classified as held for
sale
Current portion of non-current liabilities 210,066,077.13 151,792,404.13
Other current liabilities
Total current liabilities 22,145,831,594.58 22,675,834,245.90
Non-current liabilities:
Insurance contract reserve
Long-term borrowings 4,890,315,729.90 445,000,000.00
Bonds payable 4,987,709,643.64
Including: Preferred shares
Perpetual bonds
Lease liabilities
Long-term payables 383,287,104.62 128,374,597.41
Long-term payroll payable 5,565,646.72 8,792,614.98
Provisions 206,591.51 21,772,898.37
Deferred income 151,874,258.45 112,899,128.24
Deferred income tax liabilities 95,467,096.05 141,020,093.34
Other non-current liabilities
Total non-current liabilities 10,514,426,070.89 857,859,332.34
Total liabilities 32,660,257,665.47 23,533,693,578.24
Owners’ equity:
Share capital 2,407,945,408.00 2,407,945,408.00
Other equity instruments
Including: Preferred shares
Perpetual bonds
Capital reserves 230,368,577.09 208,356,624.21

Konka Group Co., Ltd. Annual Report 2019
130
Less: Treasury stock
Other comprehensive income -21,293,103.52 -10,538,219.08
Specific reserve
Surplus reserves 1,211,721,109.67 1,227,564,785.19
General reserve
Retained earnings 4,239,763,606.89 4,271,408,192.21
Total equity attributable to owners of the Company as the parent 8,068,505,598.13 8,104,736,790.53
Non-controlling interests 1,858,192,188.67 1,346,631,520.26
Total owners’ equity 9,926,697,786.80 9,451,368,310.79
Total liabilities and owners’ equity 42,586,955,452.27 32,985,061,889.03
Legal representative: Liu Fengxi CFO: Li ChunleiHead of the financial department: Feng Junxiu2. Balance Sheet of the Company as the Parent
Unit: RMB
Item 31 December 2019 31 December 2018
Current assets:
Monetary assets 2,498,077,198.12 2,124,335,536.69
Held-for-trading financial assets 61,494,666.97
Financial assets at fair value through profit or loss 5,464,984.92
Derivative financial assets
Notes receivable 2,148,312,821.38 2,181,466,683.90
Accounts receivable 9,564,720,940.39 7,427,246,429.42
Accounts receivable financing 66,002,903.68
Prepayments 911,315,168.95 1,019,335,571.49
Other receivables 10,552,820,915.47 6,667,463,126.57
Including: Interest receivable 7,431,353.86 5,769,663.24
Dividends receivable 518,580,871.02
Inventories 218,644,308.47 254,225,716.41
Contractual assets
Assets classified as held for sale
Current portion of non-current assets
Other current assets 1,096,689,897.40 77,249,216.99
Total current assets 27,118,078,820.83 19,756,787,266.39
Non-current assets:
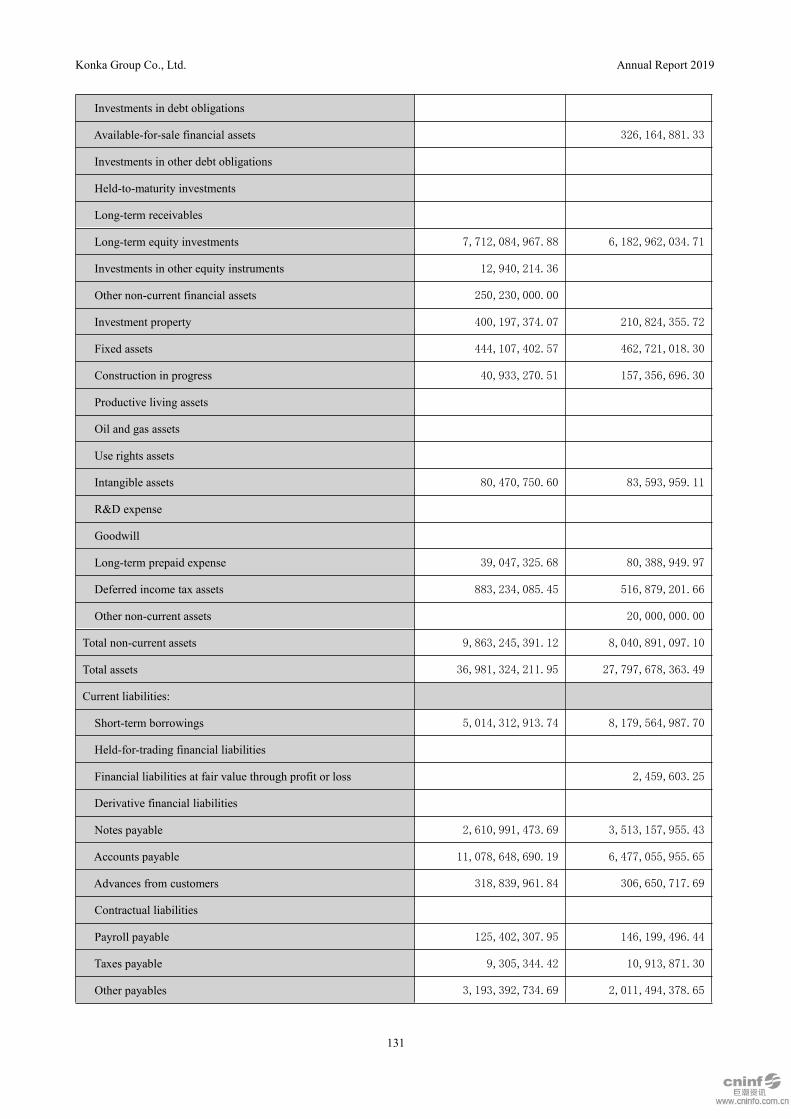
Konka Group Co., Ltd. Annual Report 2019
131
Investments in debt obligations
Available-for-sale financial assets 326,164,881.33
Investments in other debt obligations
Held-to-maturity investments
Long-term receivables
Long-term equity investments 7,712,084,967.88 6,182,962,034.71
Investments in other equity instruments 12,940,214.36
Other non-current financial assets 250,230,000.00
Investment property 400,197,374.07 210,824,355.72
Fixed assets 444,107,402.57 462,721,018.30
Construction in progress 40,933,270.51 157,356,696.30
Productive living assets
Oil and gas assets
Use rights assets
Intangible assets 80,470,750.60 83,593,959.11
R&D expense
Goodwill
Long-term prepaid expense 39,047,325.68 80,388,949.97
Deferred income tax assets 883,234,085.45 516,879,201.66
Other non-current assets 20,000,000.00
Total non-current assets 9,863,245,391.12 8,040,891,097.10
Total assets 36,981,324,211.95 27,797,678,363.49
Current liabilities:
Short-term borrowings 5,014,312,913.74 8,179,564,987.70
Held-for-trading financial liabilities
Financial liabilities at fair value through profit or loss 2,459,603.25
Derivative financial liabilities
Notes payable 2,610,991,473.69 3,513,157,955.43
Accounts payable 11,078,648,690.19 6,477,055,955.65
Advances from customers 318,839,961.84 306,650,717.69
Contractual liabilities
Payroll payable 125,402,307.95 146,199,496.44
Taxes payable 9,305,344.42 10,913,871.30
Other payables 3,193,392,734.69 2,011,494,378.65

Konka Group Co., Ltd. Annual Report 2019
132
Including: Interest payable 223,847,860.57 24,158,666.48
Dividends payable
Liabilities directly associated with assets classified as held for
sale
Current portion of non-current liabilities 130,512,375.00 40,000,000.00
Other current liabilities
Total current liabilities 22,481,405,801.52 20,687,496,966.11
Non-current liabilities:
Long-term borrowings 3,438,055,729.90 245,000,000.00
Bonds payable 4,987,709,643.64
Including: Preferred shares
Perpetual bonds
Lease liabilities
Long-term payables 21,855,688.19
Long-term payroll payable
Provisions 206,591.51 206,591.51
Deferred income 59,545,839.30 75,705,476.93
Deferred income tax liabilities 751,345.42
Other non-current liabilities
Total non-current liabilities 8,507,373,492.54 321,663,413.86
Total liabilities 30,988,779,294.06 21,009,160,379.97
Owners’ equity:
Share capital 2,407,945,408.00 2,407,945,408.00
Other equity instruments
Including: Preferred shares
Perpetual bonds
Capital reserves 114,018,066.79 114,018,066.79
Less: Treasury stock
Other comprehensive income -2,682,217.31 -1,182,217.31
Specific reserve
Surplus reserves 1,227,564,785.19 1,227,564,785.19
Retained earnings 2,245,698,875.22 3,040,171,940.85
Total owners’ equity 5,992,544,917.89 6,788,517,983.52
Total liabilities and owners’ equity 36,981,324,211.95 27,797,678,363.49

Konka Group Co., Ltd. Annual Report 2019
133
3. Consolidated Income StatementUnit: RMB
Item 2019 2018
1. Revenue 55,119,125,478.72 46,126,797,341.33
Including: Operating revenue 55,119,125,478.72 46,126,797,341.33
Interest income
Premium income
Handling charge and commission income
2. Costs and expenses 56,684,201,307.20 47,036,996,977.83
Including: Cost of sales 52,138,198,501.04 43,227,613,914.45
Interest expense
Handling charge and commission expense
Surrenders
Net claims paid
Net amount provided as insurance contract reserve
Expenditure on policy dividends
Reinsurance premium expense
Taxes and surcharges 109,851,831.11 89,689,865.93
Selling expense 2,303,132,732.06 2,282,174,241.64
Administrative expense 856,529,327.62 641,892,996.18
R&D expense 500,600,102.23 396,460,145.24
Finance costs 775,888,813.14 399,165,814.39
Including: Interest expense 1,031,068,425.69 566,070,556.21
Interest income 247,559,600.76 43,630,012.41
Add: Other income 1,229,174,834.33 294,265,632.23
Return on investment (“-” for loss) 1,183,381,090.39 927,414,370.96
Including: Share of profit or loss of joint ventures and associates 141,264,035.96 19,139,381.20
Income from the derecognition of financial assets at amortized
cost (“-” for loss)
Foreign exchange gain (“-” for loss)
Net gain on exposure hedges (“-” for loss)
Gain on changes in fair value (“-” for loss) -3,005,381.67 50,191,052.64
Credit impairment loss (“-” for loss) -531,879,268.76
Asset impairment loss (“-” for loss) -303,035,915.82 -226,869,220.67
Asset disposal income (“-” for loss) 293,706,640.64 -563,894.74
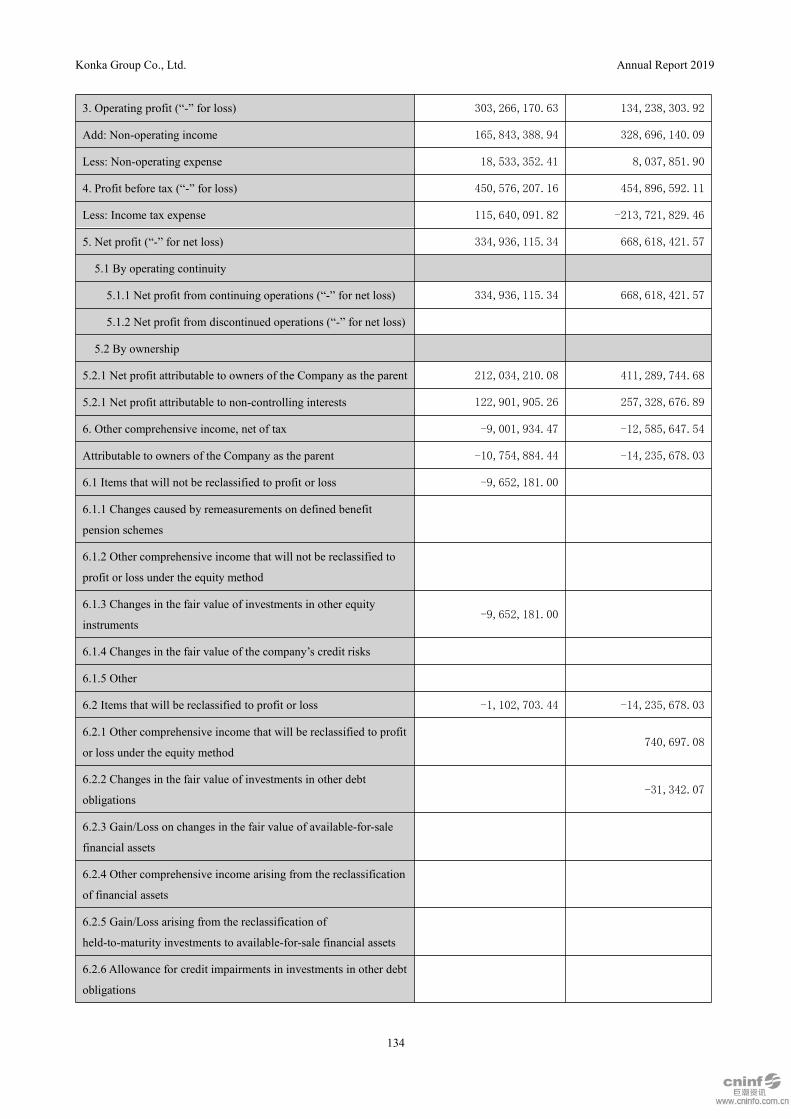
Konka Group Co., Ltd. Annual Report 2019
134
3. Operating profit (“-” for loss) 303,266,170.63 134,238,303.92
Add: Non-operating income 165,843,388.94 328,696,140.09
Less: Non-operating expense 18,533,352.41 8,037,851.90
4. Profit before tax (“-” for loss) 450,576,207.16 454,896,592.11
Less: Income tax expense 115,640,091.82 -213,721,829.46
5. Net profit (“-” for net loss) 334,936,115.34 668,618,421.57
5.1 By operating continuity
5.1.1 Net profit from continuing operations (“-” for net loss) 334,936,115.34 668,618,421.57
5.1.2 Net profit from discontinued operations (“-” for net loss)
5.2 By ownership
5.2.1 Net profit attributable to owners of the Company as the parent 212,034,210.08 411,289,744.68
5.2.1 Net profit attributable to non-controlling interests 122,901,905.26 257,328,676.89
6. Other comprehensive income, net of tax -9,001,934.47 -12,585,647.54
Attributable to owners of the Company as the parent -10,754,884.44 -14,235,678.03
6.1 Items that will not be reclassified to profit or loss -9,652,181.00
6.1.1 Changes caused by remeasurements on defined benefit
pension schemes
6.1.2 Other comprehensive income that will not be reclassified to
profit or loss under the equity method
6.1.3 Changes in the fair value of investments in other equity
instruments-9,652,181.00
6.1.4 Changes in the fair value of the company’s credit risks
6.1.5 Other
6.2 Items that will be reclassified to profit or loss -1,102,703.44 -14,235,678.03
6.2.1 Other comprehensive income that will be reclassified to profit
or loss under the equity method740,697.08
6.2.2 Changes in the fair value of investments in other debt
obligations-31,342.07
6.2.3 Gain/Loss on changes in the fair value of available-for-sale
financial assets
6.2.4 Other comprehensive income arising from the reclassification
of financial assets
6.2.5 Gain/Loss arising from the reclassification of
held-to-maturity investments to available-for-sale financial assets
6.2.6 Allowance for credit impairments in investments in other debt
obligations

Konka Group Co., Ltd. Annual Report 2019
135
6.2.7 Reserve for cash flow hedges
6.2.8 Differences arising from the translation of foreign
currency-denominated financial statements-1,102,703.44 -14,945,033.04
6.2.9 Other
Attributable to non-controlling interests 1,752,949.97 1,650,030.49
7. Total comprehensive income 325,934,180.87 656,032,774.03
Attributable to owners of the Company as the parent 201,279,325.64 397,054,066.65
Attributable to non-controlling interests 124,654,855.23 258,978,707.38
8. Earnings per share
8.1 Basic earnings per share 0.0881 0.1708
8.2 Diluted earnings per share 0.0881 0.1708
Legal representative: Liu Fengxi CFO: Li ChunleiHead of the financial department: Feng Junxiu4. Income Statement of the Company as the Parent
Unit: RMB
Item 2019 2018
1. Operating revenue 5,686,102,146.98 13,377,681,886.45
Less: Cost of sales 5,413,631,784.77 12,572,129,164.32
Taxes and surcharges 14,547,750.43 25,843,072.39
Selling expense 1,210,476,107.74 1,511,526,663.59
Administrative expense 387,778,068.98 349,794,611.61
R&D expense 47,127,013.11 148,115,964.90
Finance costs 414,932,824.70 263,729,410.33
Including: Interest expense 1,553,039,361.28 566,070,556.21
Interest income 782,721,658.41 43,630,012.41
Add: Other income 51,226,732.61 73,925,099.14
Return on investment (“-” for loss) 999,198,310.44 1,247,079,039.64
Including: Share of profit or loss of joint ventures and associates 5,132,712.27 33,783,935.14
Income from the derecognition of financial assets at amortized
cost (“-” for loss)
Net gain on exposure hedges (“-” for loss)
Gain on changes in fair value (“-” for loss) -3,005,381.67 50,191,052.64
Credit impairment loss (“-” for loss) -170,077,622.68
Asset impairment loss (“-” for loss) -16,347,540.36 -64,312,750.93
Asset disposal income (“-” for loss) 1,000.00 -2,560.75
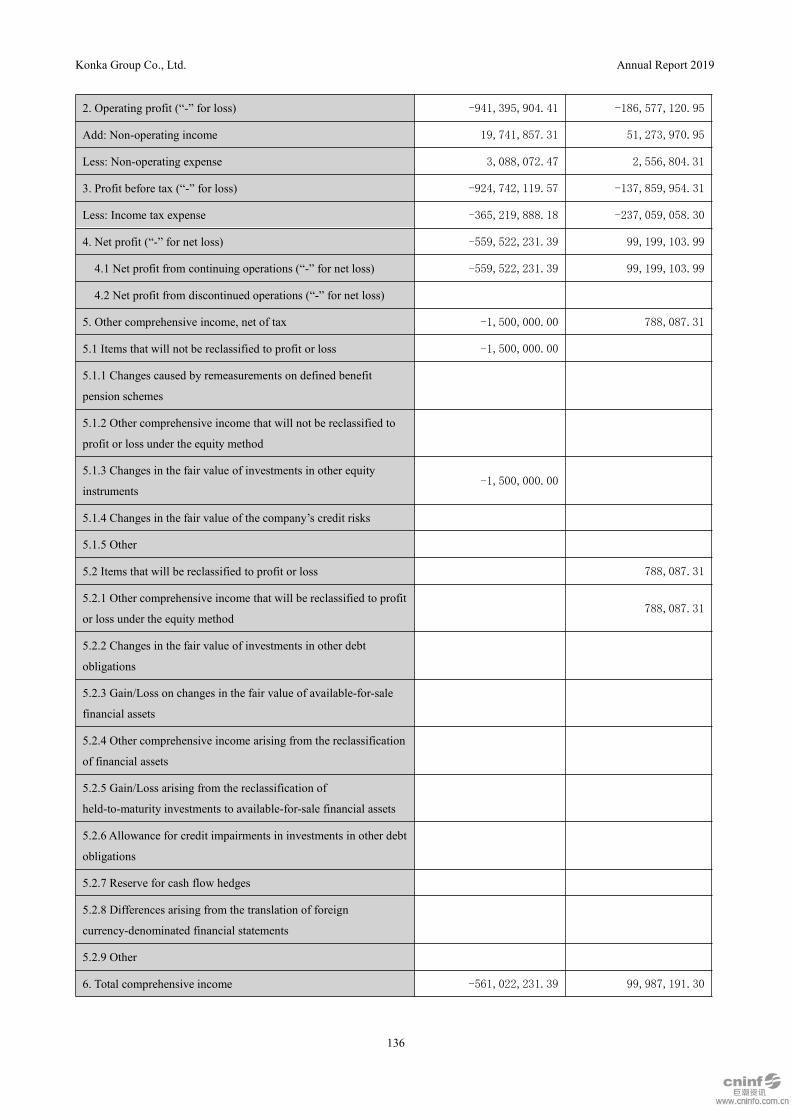
Konka Group Co., Ltd. Annual Report 2019
136
2. Operating profit (“-” for loss) -941,395,904.41 -186,577,120.95
Add: Non-operating income 19,741,857.31 51,273,970.95
Less: Non-operating expense 3,088,072.47 2,556,804.31
3. Profit before tax (“-” for loss) -924,742,119.57 -137,859,954.31
Less: Income tax expense -365,219,888.18 -237,059,058.30
4. Net profit (“-” for net loss) -559,522,231.39 99,199,103.99
4.1 Net profit from continuing operations (“-” for net loss) -559,522,231.39 99,199,103.99
4.2 Net profit from discontinued operations (“-” for net loss)
5. Other comprehensive income, net of tax -1,500,000.00 788,087.31
5.1 Items that will not be reclassified to profit or loss -1,500,000.00
5.1.1 Changes caused by remeasurements on defined benefit
pension schemes
5.1.2 Other comprehensive income that will not be reclassified to
profit or loss under the equity method
5.1.3 Changes in the fair value of investments in other equity
instruments-1,500,000.00
5.1.4 Changes in the fair value of the company’s credit risks
5.1.5 Other
5.2 Items that will be reclassified to profit or loss 788,087.31
5.2.1 Other comprehensive income that will be reclassified to profit
or loss under the equity method788,087.31
5.2.2 Changes in the fair value of investments in other debt
obligations
5.2.3 Gain/Loss on changes in the fair value of available-for-sale
financial assets
5.2.4 Other comprehensive income arising from the reclassification
of financial assets
5.2.5 Gain/Loss arising from the reclassification of
held-to-maturity investments to available-for-sale financial assets
5.2.6 Allowance for credit impairments in investments in other debt
obligations
5.2.7 Reserve for cash flow hedges
5.2.8 Differences arising from the translation of foreign
currency-denominated financial statements
5.2.9 Other
6. Total comprehensive income -561,022,231.39 99,987,191.30

Konka Group Co., Ltd. Annual Report 2019
137
7. Earnings per share
7.1 Basic earnings per share
7.2 Diluted earnings per share
5. Consolidated Cash Flow StatementUnit: RMB
Item 2019 2018
1. Cash flows from operating activities:
Proceeds from sale of commodities and rendering of services 55,023,730,960.29 46,363,698,743.08
Net increase in customer deposits and interbank deposits
Net increase in borrowings from the central bank
Net increase in loans from other financial institutions
Premiums received on original insurance contracts
Net proceeds from reinsurance
Net increase in deposits and investments of policy holders
Interest, handling charges and commissions received
Net increase in interbank loans obtained
Net increase in proceeds from repurchase transactions
Net proceeds from acting trading of securities
Tax rebates 697,787,485.21 475,610,439.41
Cash generated from other operating activities 4,011,016,045.28 3,714,670,493.13
Subtotal of cash generated from operating activities 59,732,534,490.78 50,553,979,675.62
Payments for commodities and services 54,686,521,084.34 45,867,095,178.07
Net increase in loans and advances to customers
Net increase in deposits in the central bank and in interbank
loans granted
Payments for claims on original insurance contracts
Net increase in interbank loans granted
Interest, handling charges and commissions paid
Policy dividends paid
Cash paid to and for employees 1,808,972,838.78 1,659,612,131.21
Taxes paid 842,402,228.64 1,648,013,358.42
Cash used in other operating activities 3,938,585,623.61 4,609,082,880.58
Subtotal of cash used in operating activities 61,276,481,775.37 53,783,803,548.28
Net cash generated from/used in operating activities -1,543,947,284.59 -3,229,823,872.66

Konka Group Co., Ltd. Annual Report 2019
138
2. Cash flows from investing activities:
Proceeds from disinvestment 224,405,975.50 106,597,820.94
Return on investment 168,681,375.93 146,065,795.48
Net proceeds from the disposal of fixed assets, intangible assets
and other long-lived assets202,577,149.61 2,372,418.53
Net proceeds from the disposal of subsidiaries and other business
units270,821,233.18 252,468,488.60
Cash generated from other investing activities 2,085,669,168.69 2,393,028,228.96
Subtotal of cash generated from investing activities 2,952,154,902.91 2,900,532,752.51
Payments for the acquisition of fixed assets, intangible assets and
other long-lived assets3,928,377,181.52 486,058,229.18
Payments for investments 1,357,746,303.50 597,975,935.00
Net increase in pledged loans granted
Net payments for the acquisition of subsidiaries and other
business units1,118,860,395.37
Cash used in other investing activities 1,528,640,757.47 2,949,519,200.00
Subtotal of cash used in investing activities 6,814,764,242.49 5,152,413,759.55
Net cash generated from/used in investing activities -3,862,609,339.58 -2,251,881,007.04
3. Cash flows from financing activities:
Capital contributions received 508,363,013.03 332,513,927.94
Including: Capital contributions by non-controlling interests to
subsidiaries508,363,013.03 203,580,594.60
Borrowings obtained 30,069,405,522.31 14,681,965,477.02
Cash generated from other financing activities 1,825,598,732.14 330,951,745.42
Subtotal of cash generated from financing activities 32,403,367,267.48 15,345,431,150.38
Repayments of borrowings 23,540,444,424.43 8,081,422,372.12
Payments for interest and dividends 774,763,008.11 709,581,026.62
Including: Dividends paid by subsidiaries to non-controlling
interests32,480,813.33 960,052.07
Cash used in other financing activities 1,623,142,762.86 757,534,424.92
Subtotal of cash used in financing activities 25,938,350,195.40 9,548,537,823.66
Net cash generated from/used in financing activities 6,465,017,072.08 5,796,893,326.72
4. Effect of foreign exchange rate changes on cash and cash
equivalents1,091,987.59 21,061,330.94
5. Net increase in cash and cash equivalents 1,059,552,435.50 336,249,777.96
Add: Cash and cash equivalents, beginning of the period 3,434,149,481.72 3,097,899,703.76
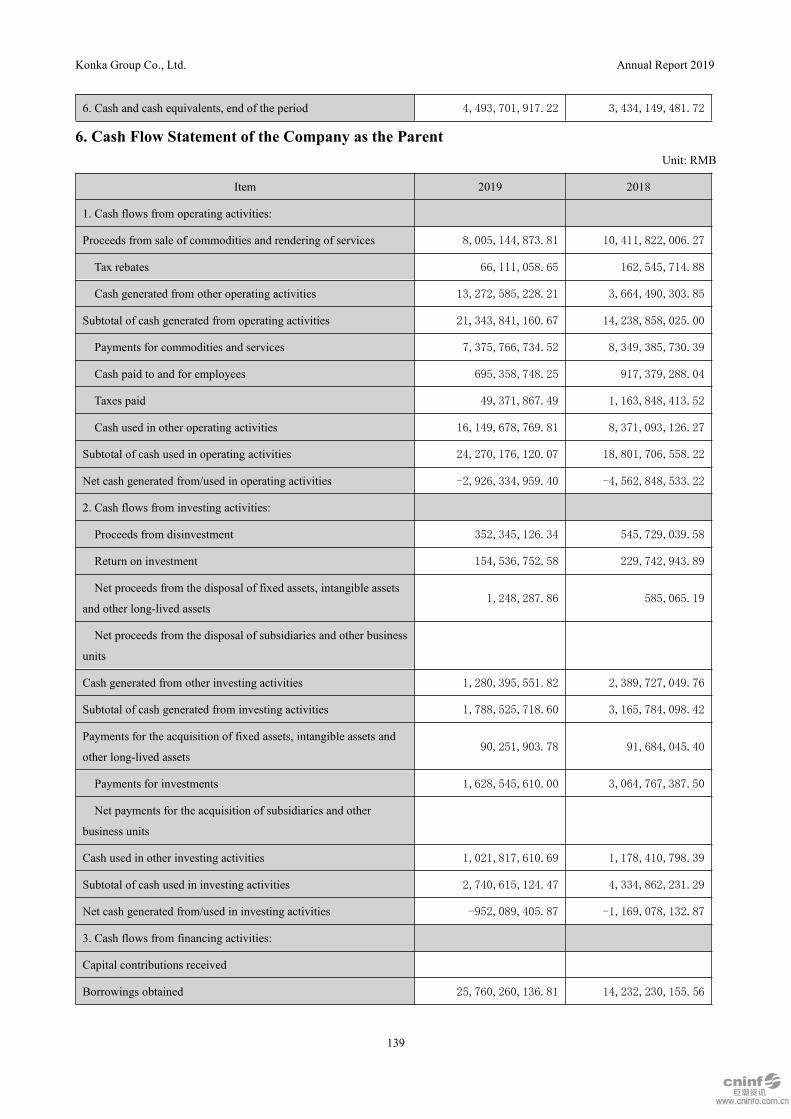
Konka Group Co., Ltd. Annual Report 2019
139
6. Cash and cash equivalents, end of the period 4,493,701,917.22 3,434,149,481.72
6. Cash Flow Statement of the Company as the ParentUnit: RMB
Item 2019 2018
1. Cash flows from operating activities:
Proceeds from sale of commodities and rendering of services 8,005,144,873.81 10,411,822,006.27
Tax rebates 66,111,058.65 162,545,714.88
Cash generated from other operating activities 13,272,585,228.21 3,664,490,303.85
Subtotal of cash generated from operating activities 21,343,841,160.67 14,238,858,025.00
Payments for commodities and services 7,375,766,734.52 8,349,385,730.39
Cash paid to and for employees 695,358,748.25 917,379,288.04
Taxes paid 49,371,867.49 1,163,848,413.52
Cash used in other operating activities 16,149,678,769.81 8,371,093,126.27
Subtotal of cash used in operating activities 24,270,176,120.07 18,801,706,558.22
Net cash generated from/used in operating activities -2,926,334,959.40 -4,562,848,533.22
2. Cash flows from investing activities:
Proceeds from disinvestment 352,345,126.34 545,729,039.58
Return on investment 154,536,752.58 229,742,943.89
Net proceeds from the disposal of fixed assets, intangible assets
and other long-lived assets1,248,287.86 585,065.19
Net proceeds from the disposal of subsidiaries and other business
units
Cash generated from other investing activities 1,280,395,551.82 2,389,727,049.76
Subtotal of cash generated from investing activities 1,788,525,718.60 3,165,784,098.42
Payments for the acquisition of fixed assets, intangible assets and
other long-lived assets90,251,903.78 91,684,045.40
Payments for investments 1,628,545,610.00 3,064,767,387.50
Net payments for the acquisition of subsidiaries and other
business units
Cash used in other investing activities 1,021,817,610.69 1,178,410,798.39
Subtotal of cash used in investing activities 2,740,615,124.47 4,334,862,231.29
Net cash generated from/used in investing activities -952,089,405.87 -1,169,078,132.87
3. Cash flows from financing activities:
Capital contributions received
Borrowings obtained 25,760,260,136.81 14,232,230,155.56
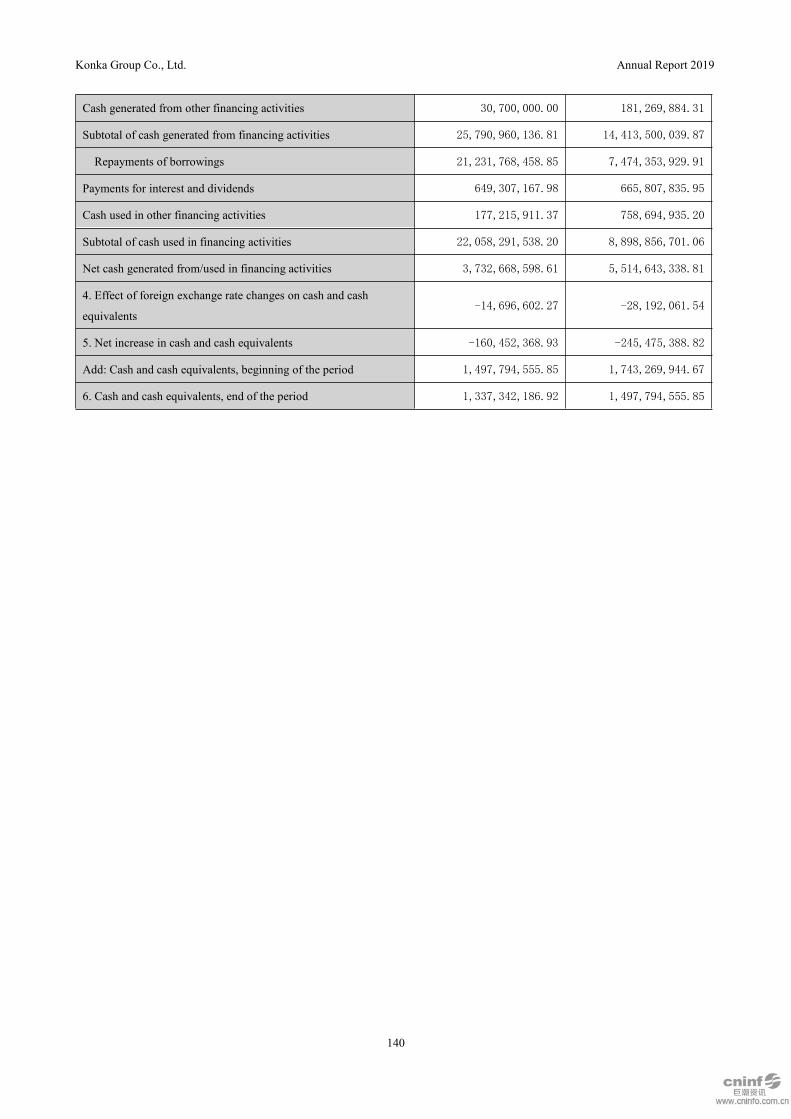
Konka Group Co., Ltd. Annual Report 2019
140
Cash generated from other financing activities 30,700,000.00 181,269,884.31
Subtotal of cash generated from financing activities 25,790,960,136.81 14,413,500,039.87
Repayments of borrowings 21,231,768,458.85 7,474,353,929.91
Payments for interest and dividends 649,307,167.98 665,807,835.95
Cash used in other financing activities 177,215,911.37 758,694,935.20
Subtotal of cash used in financing activities 22,058,291,538.20 8,898,856,701.06
Net cash generated from/used in financing activities 3,732,668,598.61 5,514,643,338.81
4. Effect of foreign exchange rate changes on cash and cash
equivalents-14,696,602.27 -28,192,061.54
5. Net increase in cash and cash equivalents -160,452,368.93 -245,475,388.82
Add: Cash and cash equivalents, beginning of the period 1,497,794,555.85 1,743,269,944.67
6. Cash and cash equivalents, end of the period 1,337,342,186.92 1,497,794,555.85
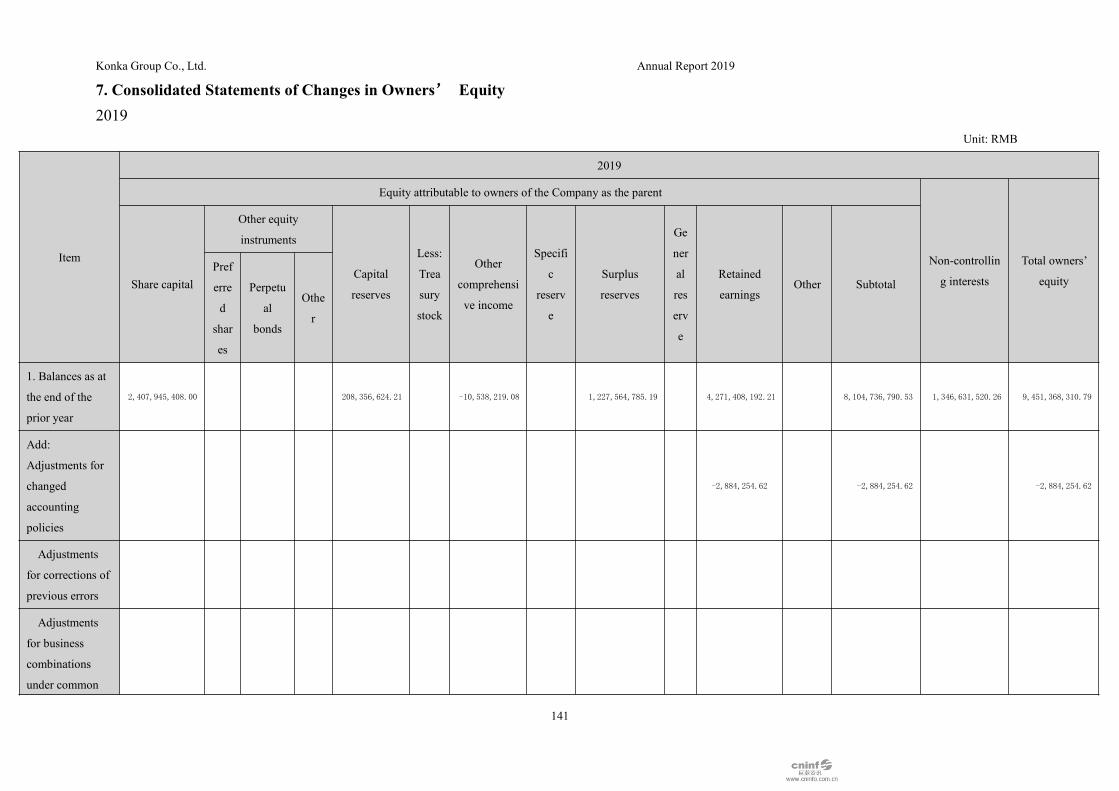
Konka Group Co., Ltd. Annual Report 2019
141
7. Consolidated Statements of Changes in Owners’ Equity2019
Unit: RMB
Item
2019
Equity attributable to owners of the Company as the parent
Non-controllin
g interests
Total owners’
equityShare capital
Other equity
instruments
Capital
reserves
Less:
Trea
sury
stock
Other
comprehensi
ve income
Specifi
c
reserv
e
Surplus
reserves
Ge
ner
al
res
erv
e
Retained
earningsOther Subtotal
Pref
erre
d
shar
es
Perpetu
al
bonds
Othe
r
1. Balances as at
the end of the
prior year
2,407,945,408.00 208,356,624.21 -10,538,219.08 1,227,564,785.19 4,271,408,192.21 8,104,736,790.53 1,346,631,520.26 9,451,368,310.79
Add:
Adjustments for
changed
accounting
policies
-2,884,254.62 -2,884,254.62 -2,884,254.62
Adjustments
for corrections of
previous errors
Adjustments
for business
combinations
under common
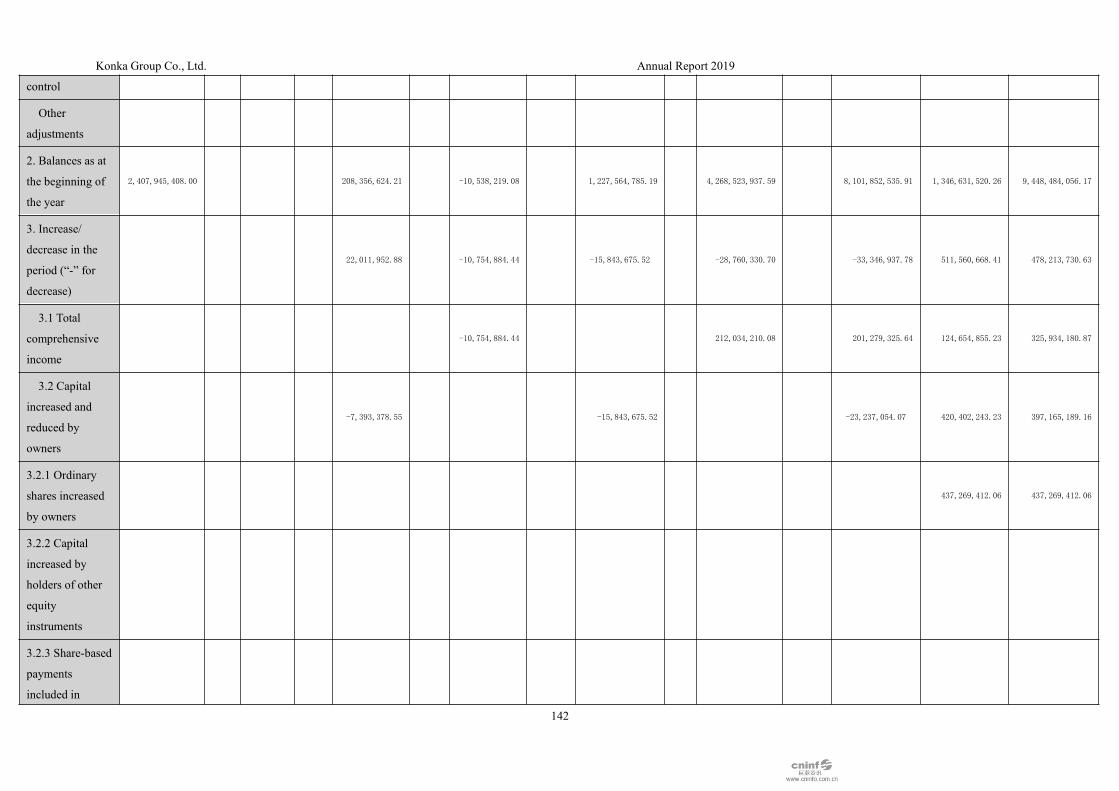
Konka Group Co., Ltd. Annual Report 2019
142
control
Other
adjustments
2. Balances as at
the beginning of
the year
2,407,945,408.00 208,356,624.21 -10,538,219.08 1,227,564,785.19 4,268,523,937.59 8,101,852,535.91 1,346,631,520.26 9,448,484,056.17
3. Increase/
decrease in the
period (“-” for
decrease)
22,011,952.88 -10,754,884.44 -15,843,675.52 -28,760,330.70 -33,346,937.78 511,560,668.41 478,213,730.63
3.1 Total
comprehensive
income
-10,754,884.44 212,034,210.08 201,279,325.64 124,654,855.23 325,934,180.87
3.2 Capital
increased and
reduced by
owners
-7,393,378.55 -15,843,675.52 -23,237,054.07 420,402,243.23 397,165,189.16
3.2.1 Ordinary
shares increased
by owners
437,269,412.06 437,269,412.06
3.2.2 Capital
increased by
holders of other
equity
instruments
3.2.3 Share-based
payments
included in
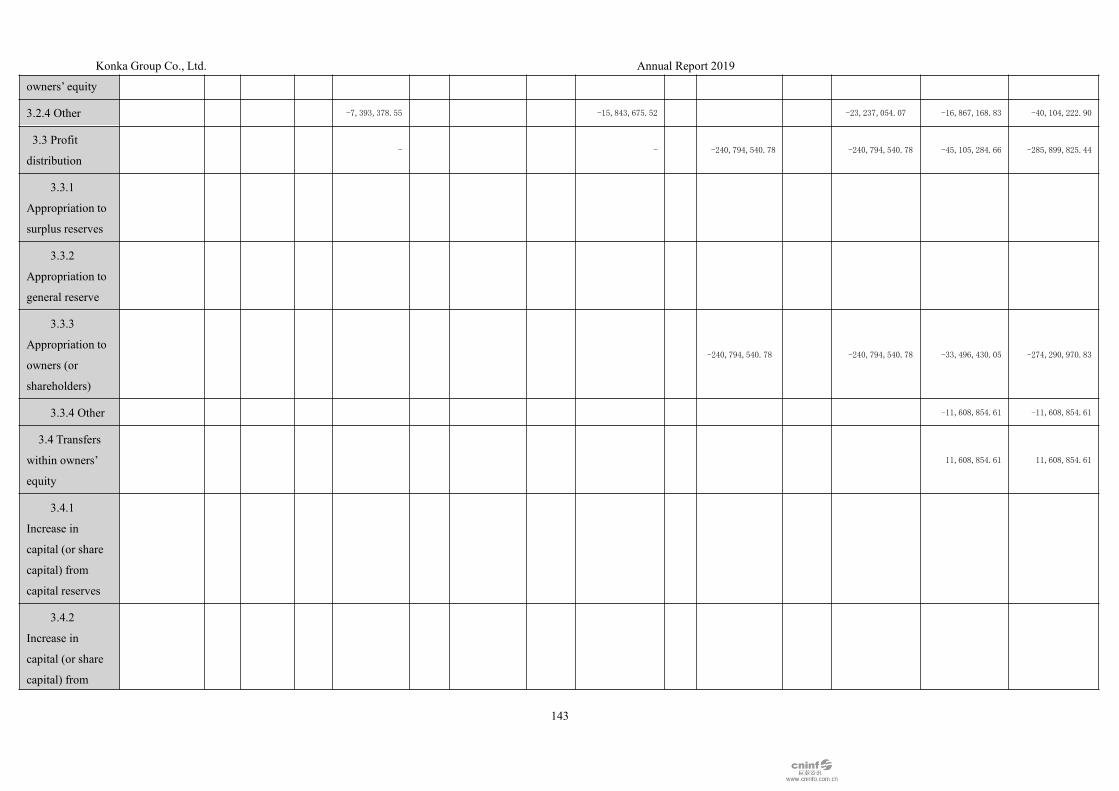
Konka Group Co., Ltd. Annual Report 2019
143
owners’ equity
3.2.4 Other -7,393,378.55 -15,843,675.52 -23,237,054.07 -16,867,168.83 -40,104,222.90
3.3 Profit
distribution- - -240,794,540.78 -240,794,540.78 -45,105,284.66 -285,899,825.44
3.3.1
Appropriation to
surplus reserves
3.3.2
Appropriation to
general reserve
3.3.3
Appropriation to
owners (or
shareholders)
-240,794,540.78 -240,794,540.78 -33,496,430.05 -274,290,970.83
3.3.4 Other -11,608,854.61 -11,608,854.61
3.4 Transfers
within owners’
equity
11,608,854.61 11,608,854.61
3.4.1
Increase in
capital (or share
capital) from
capital reserves
3.4.2
Increase in
capital (or share
capital) from
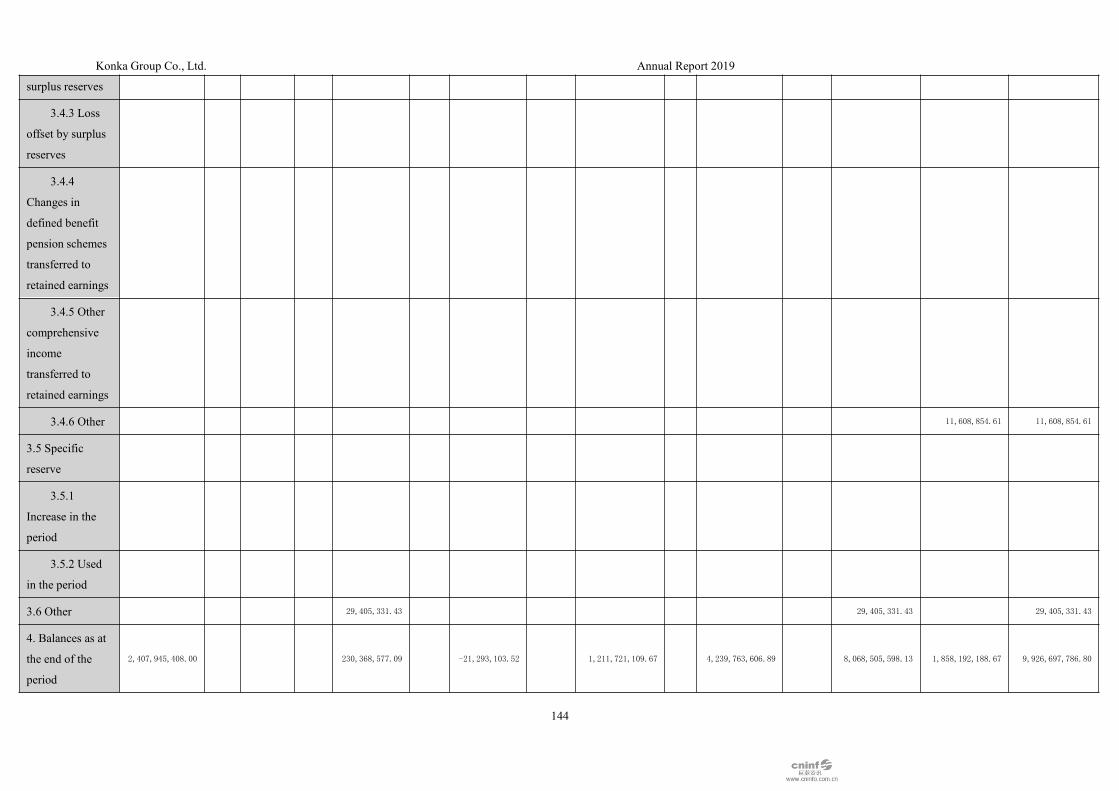
Konka Group Co., Ltd. Annual Report 2019
144
surplus reserves
3.4.3 Loss
offset by surplus
reserves
3.4.4
Changes in
defined benefit
pension schemes
transferred to
retained earnings
3.4.5 Other
comprehensive
income
transferred to
retained earnings
3.4.6 Other 11,608,854.61 11,608,854.61
3.5 Specific
reserve
3.5.1
Increase in the
period
3.5.2 Used
in the period
3.6 Other 29,405,331.43 29,405,331.43 29,405,331.43
4. Balances as at
the end of the
period
2,407,945,408.00 230,368,577.09 -21,293,103.52 1,211,721,109.67 4,239,763,606.89 8,068,505,598.13 1,858,192,188.67 9,926,697,786.80
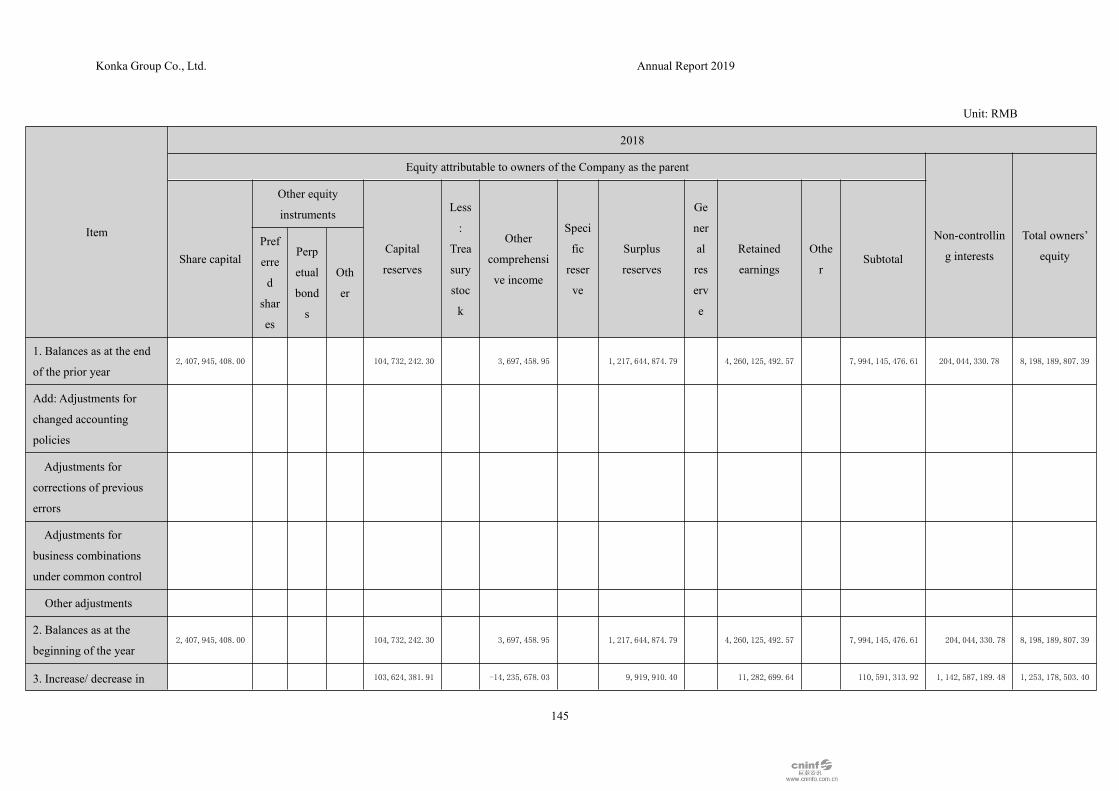
Konka Group Co., Ltd. Annual Report 2019
145
Unit: RMB
Item
2018
Equity attributable to owners of the Company as the parent
Non-controllin
g interests
Total owners’
equityShare capital
Other equity
instruments
Capital
reserves
Less
:
Trea
sury
stoc
k
Other
comprehensi
ve income
Speci
fic
reser
ve
Surplus
reserves
Ge
ner
al
res
erv
e
Retained
earnings
Othe
rSubtotal
Pref
erre
d
shar
es
Perp
etual
bond
s
Oth
er
1. Balances as at the end
of the prior year2,407,945,408.00 104,732,242.30 3,697,458.95 1,217,644,874.79 4,260,125,492.57 7,994,145,476.61 204,044,330.78 8,198,189,807.39
Add: Adjustments for
changed accounting
policies
Adjustments for
corrections of previous
errors
Adjustments for
business combinations
under common control
Other adjustments
2. Balances as at the
beginning of the year2,407,945,408.00 104,732,242.30 3,697,458.95 1,217,644,874.79 4,260,125,492.57 7,994,145,476.61 204,044,330.78 8,198,189,807.39
3. Increase/ decrease in 103,624,381.91 -14,235,678.03 9,919,910.40 11,282,699.64 110,591,313.92 1,142,587,189.48 1,253,178,503.40

Konka Group Co., Ltd. Annual Report 2019
146
the period (“-” for
decrease)
3.1 Total
comprehensive income-14,235,678.03 411,289,744.68 397,054,066.65 258,978,707.38 656,032,774.03
3.2 Capital increased
and reduced by owners884,568,534.17 884,568,534.17
3.2.1 Ordinary shares
increased by owners204,255,406.70 204,255,406.70
3.2.2 Capital increased by
holders of other equity
instruments
3.2.3 Share-based
payments included in
owners’ equity
3.2.4 Other 680,313,127.47 680,313,127.47
3.3 Profit distribution 9,919,910.40 -400,007,045.04 -390,087,134.64 -960,052.07 -391,047,186.71
3.3.1 Appropriation
to surplus reserves9,919,910.40 -9,919,910.40
3.3.2 Appropriation
to general reserve
3.3.3 Appropriation
to owners (or
shareholders)
-390,087,134.64 -390,087,134.64 -960,052.07 -391,047,186.71
3.3.4 Other
3.4 Transfers within
owners’ equity
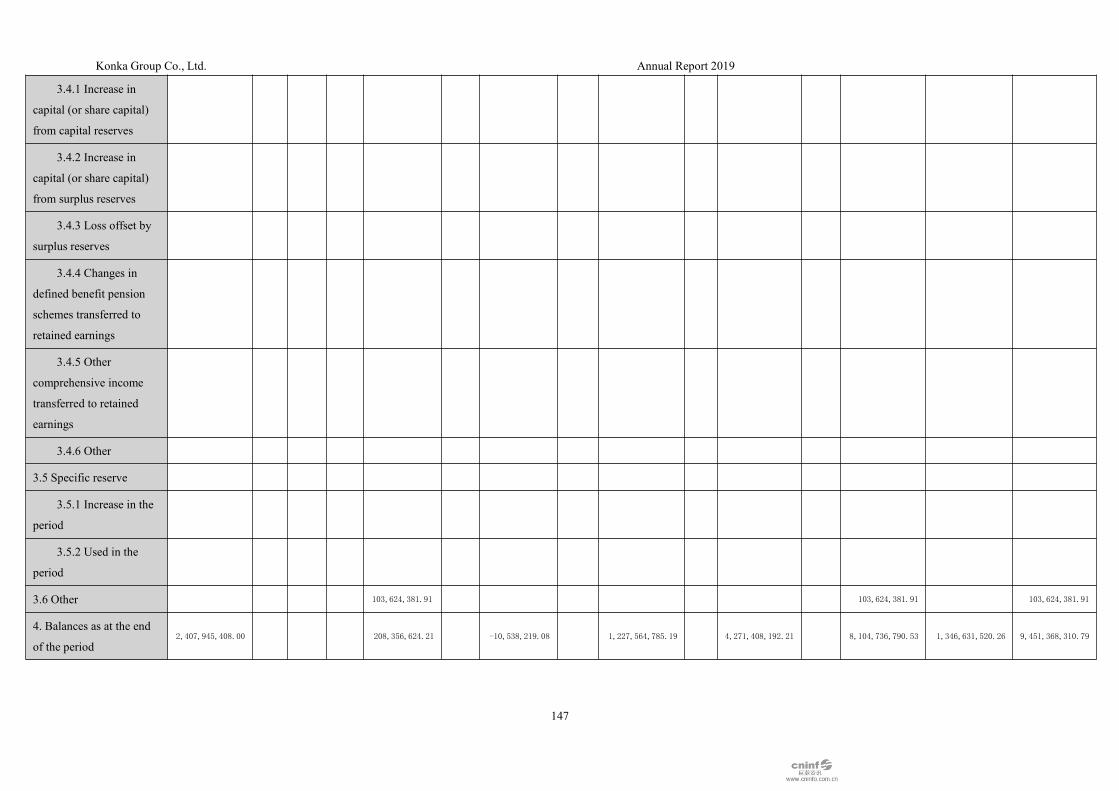
Konka Group Co., Ltd. Annual Report 2019
147
3.4.1 Increase in
capital (or share capital)
from capital reserves
3.4.2 Increase in
capital (or share capital)
from surplus reserves
3.4.3 Loss offset by
surplus reserves
3.4.4 Changes in
defined benefit pension
schemes transferred to
retained earnings
3.4.5 Other
comprehensive income
transferred to retained
earnings
3.4.6 Other
3.5 Specific reserve
3.5.1 Increase in the
period
3.5.2 Used in the
period
3.6 Other 103,624,381.91 103,624,381.91 103,624,381.91
4. Balances as at the end
of the period2,407,945,408.00 208,356,624.21 -10,538,219.08 1,227,564,785.19 4,271,408,192.21 8,104,736,790.53 1,346,631,520.26 9,451,368,310.79
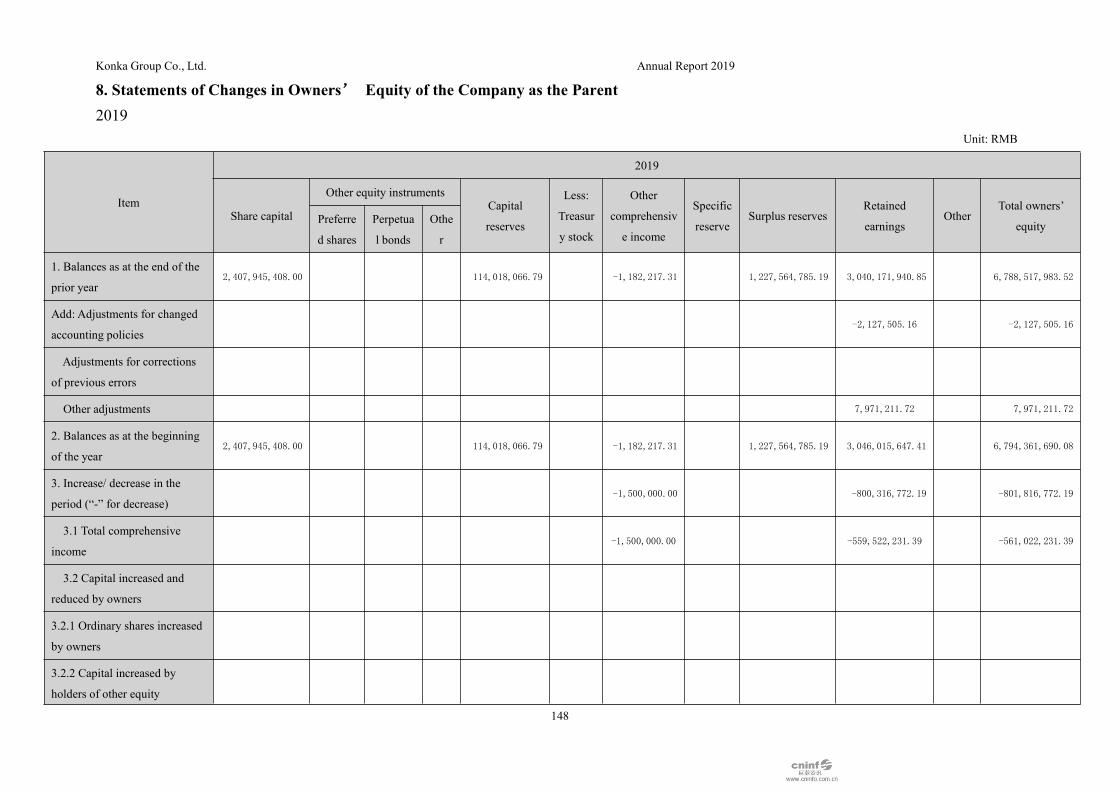
Konka Group Co., Ltd. Annual Report 2019
148
8. Statements of Changes in Owners’ Equity of the Company as the Parent2019
Unit: RMB
Item
2019
Share capital
Other equity instrumentsCapital
reserves
Less:
Treasur
y stock
Other
comprehensiv
e income
Specific
reserveSurplus reserves
Retained
earningsOther
Total owners’
equityPreferre
d shares
Perpetua
l bonds
Othe
r
1. Balances as at the end of the
prior year2,407,945,408.00 114,018,066.79 -1,182,217.31 1,227,564,785.19 3,040,171,940.85 6,788,517,983.52
Add: Adjustments for changed
accounting policies-2,127,505.16 -2,127,505.16
Adjustments for corrections
of previous errors
Other adjustments 7,971,211.72 7,971,211.72
2. Balances as at the beginning
of the year2,407,945,408.00 114,018,066.79 -1,182,217.31 1,227,564,785.19 3,046,015,647.41 6,794,361,690.08
3. Increase/ decrease in the
period (“-” for decrease)-1,500,000.00 -800,316,772.19 -801,816,772.19
3.1 Total comprehensive
income-1,500,000.00 -559,522,231.39 -561,022,231.39
3.2 Capital increased and
reduced by owners
3.2.1 Ordinary shares increased
by owners
3.2.2 Capital increased by
holders of other equity

Konka Group Co., Ltd. Annual Report 2019
149
instruments
3.2.3 Share-based payments
included in owners’ equity
3.2.4 Other
3.3 Profit distribution -240,794,540.80 -240,794,540.80
3.3.1 Appropriation to
surplus reserves
3.3.2 Appropriation to
owners (or shareholders)-240,794,540.80 -240,794,540.80
3.3.3 Other
3.4 Transfers within owners’
equity
3.4.1 Increase in capital
(or share capital) from capital
reserves
3.4.2 Increase in capital
(or share capital) from surplus
reserves
3.4.3 Loss offset by
surplus reserves
3.4.4 Changes in defined
benefit pension schemes
transferred to retained earnings
3.4.5 Other comprehensive
income transferred to retained
earnings
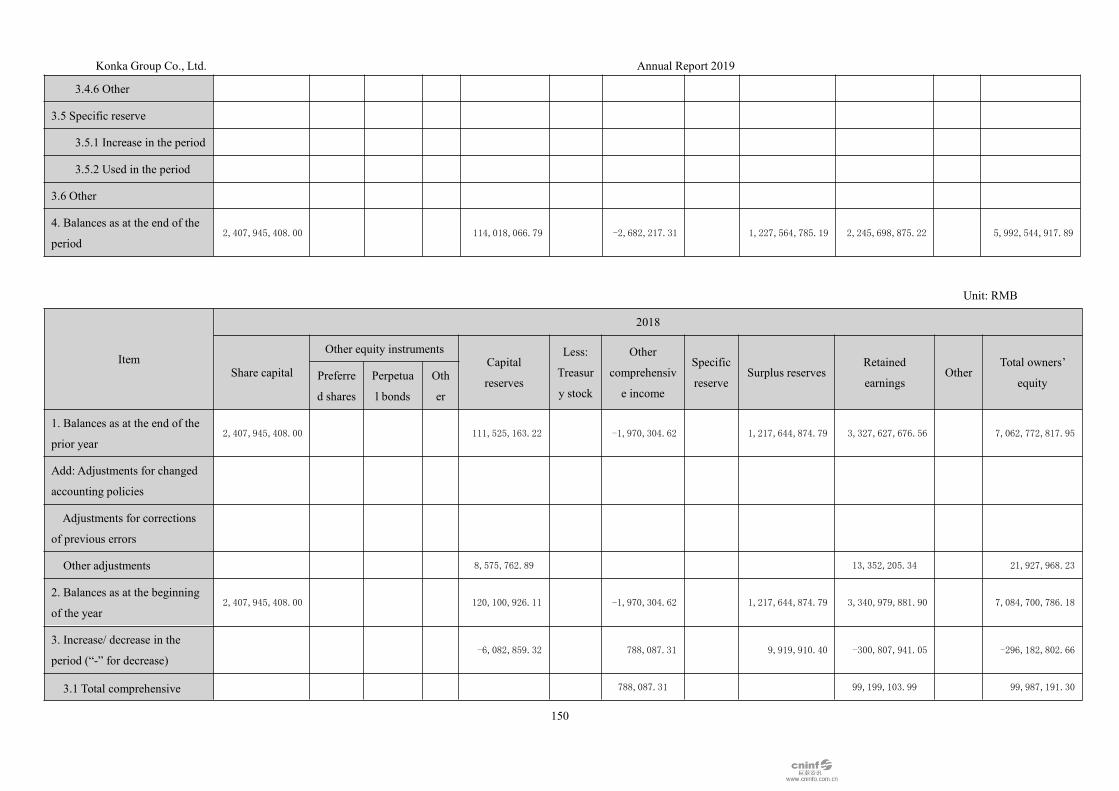
Konka Group Co., Ltd. Annual Report 2019
150
3.4.6 Other
3.5 Specific reserve
3.5.1 Increase in the period
3.5.2 Used in the period
3.6 Other
4. Balances as at the end of the
period2,407,945,408.00 114,018,066.79 -2,682,217.31 1,227,564,785.19 2,245,698,875.22 5,992,544,917.89
Unit: RMB
Item
2018
Share capital
Other equity instrumentsCapital
reserves
Less:
Treasur
y stock
Other
comprehensiv
e income
Specific
reserveSurplus reserves
Retained
earningsOther
Total owners’
equityPreferre
d shares
Perpetua
l bonds
Oth
er
1. Balances as at the end of the
prior year2,407,945,408.00 111,525,163.22 -1,970,304.62 1,217,644,874.79 3,327,627,676.56 7,062,772,817.95
Add: Adjustments for changed
accounting policies
Adjustments for corrections
of previous errors
Other adjustments 8,575,762.89 13,352,205.34 21,927,968.23
2. Balances as at the beginning
of the year2,407,945,408.00 120,100,926.11 -1,970,304.62 1,217,644,874.79 3,340,979,881.90 7,084,700,786.18
3. Increase/ decrease in the
period (“-” for decrease)-6,082,859.32 788,087.31 9,919,910.40 -300,807,941.05 -296,182,802.66
3.1 Total comprehensive 788,087.31 99,199,103.99 99,987,191.30

Konka Group Co., Ltd. Annual Report 2019
151
income
3.2 Capital increased and
reduced by owners
3.2.1 Ordinary shares increased
by owners
3.2.2 Capital increased by
holders of other equity
instruments
3.2.3 Share-based payments
included in owners’ equity
3.2.4 Other
3.3 Profit distribution 9,919,910.40 -400,007,045.04 -390,087,134.64
3.3.1 Appropriation to
surplus reserves9,919,910.40 -9,919,910.40
3.3.2 Appropriation to
owners (or shareholders)-390,087,134.64 -390,087,134.64
3.3.3 Other
3.4 Transfers within owners’
equity
3.4.1 Increase in capital (or
share capital) from capital
reserves
3.4.2 Increase in capital (or
share capital) from surplus
reserves
3.4.3 Loss offset by

Konka Group Co., Ltd. Annual Report 2019
152
surplus reserves
3.4.4 Changes in defined
benefit pension schemes
transferred to retained earnings
3.4.5 Other comprehensive
income transferred to retained
earnings
3.4.6 Other
3.5 Specific reserve
3.5.1 Increase in the period
3.5.2 Used in the period
3.6 Other -6,082,859.32 -6,082,859.32
4. Balances as at the end of the
period2,407,945,408.00 114,018,066.79 -1,182,217.31 1,227,564,785.19 3,040,171,940.85 6,788,517,983.52

Konka Group Co., Ltd. Annual Report 2019
153
Konka Group Co., Ltd.Notes to Financial Statements 2019
(All amounts are expressed, unless otherwise stated, in Renminbi (RMB).)I. Company Profile1. EstablishmentKonka Group Co., Ltd. (hereinafter referred to as “Company” or “the Company”), is a joint-stocklimited company reorganized from the former Shenzhen Konka Electronic Co., Ltd. in August 1991upon approval of the People’s Government of Shenzhen Municipality, and has its ordinary shares(A-share and B-share) listed on Shenzhen Stock Exchange with prior consent from the People’sBank of China Shenzhen Special Economic Zone Branch. On 29 August 1995, the Company wasrenamed to “Konka Group Co., Ltd.” (Credibility code: 914403006188155783) with its mainbusiness electronic industry. And now the headquarters locates in No. 28 of No. 12 of Keji SouthRd., Science & Technology Park, Yuehai Street, Nanshan District, Shenzhen, Guangdong Province.2. Share capitalAfter the distribution of bonus shares, allotments, increased share capital and new shares issued overthe years, as of December 31, 2019, the company has issued a total of 2,407,945,408.00 shares(denomination of 1 yuan per share) with a registered capital of 2,407,945,408.00 yuan.3. The nature of the company's business and main operating activitiesThe Company and its subsidiaries are mainly engaged in the production and sales of colour TVs,white goods, mobile phones, etc.; trade business, environmental protection, etc.4. The financial statements contained herein have been approved for issue by the Board of Directorsof the Company on 20 April 2020.
II. Consolidation scope1. As of December 31, 2019, the company has a total of 146 subsidiaries included in theconsolidation scope. For details, please refer to Note 8 "Equity in Other Entities". The consolidationscope of the company this year increased by 56 households and decreased by 18 householdscompared to the previous year. For details, please refer to Note 7 “Changes in the consolidationscope”.
Corporate name Abbreviation
Konka Ventures Development (Shenzhen) Co., Ltd. Konka Ventures
Yantai Konka Healthcare Enterprise Service Co., Ltd. Yantai Konka
Chengdu Konka Incubator Management Co., Ltd. Chengdu Konka Incubator
Chengdu Anren Konka Cultural and Creative IncubatorManagement Co., Ltd. Chengdu Anren
Guiyang Konka Enterprise Service Co., Ltd. Konka Enterprise Service
Nanjing Chuanghui Smart Technology Co., Ltd. Chuanghui Smart
Shenzhen Konka Cross-Border Technological Innovation ServiceCo., Ltd. Cross-Border Technological Innovation
Guizhou Konka Enterprise Management Service Co., Ltd. Konka Enterprise Management
Yibin Konka Incubator Management Co., Ltd. Yibin Konka Incubator
Anhui Konka Electronic Co., Ltd. Anhui Konka
Anhui Kangzhi Trade Co., Ltd. Kangzhi Trade
Konka Factoring (Shenzhen) Co., Ltd. Konka Factoring
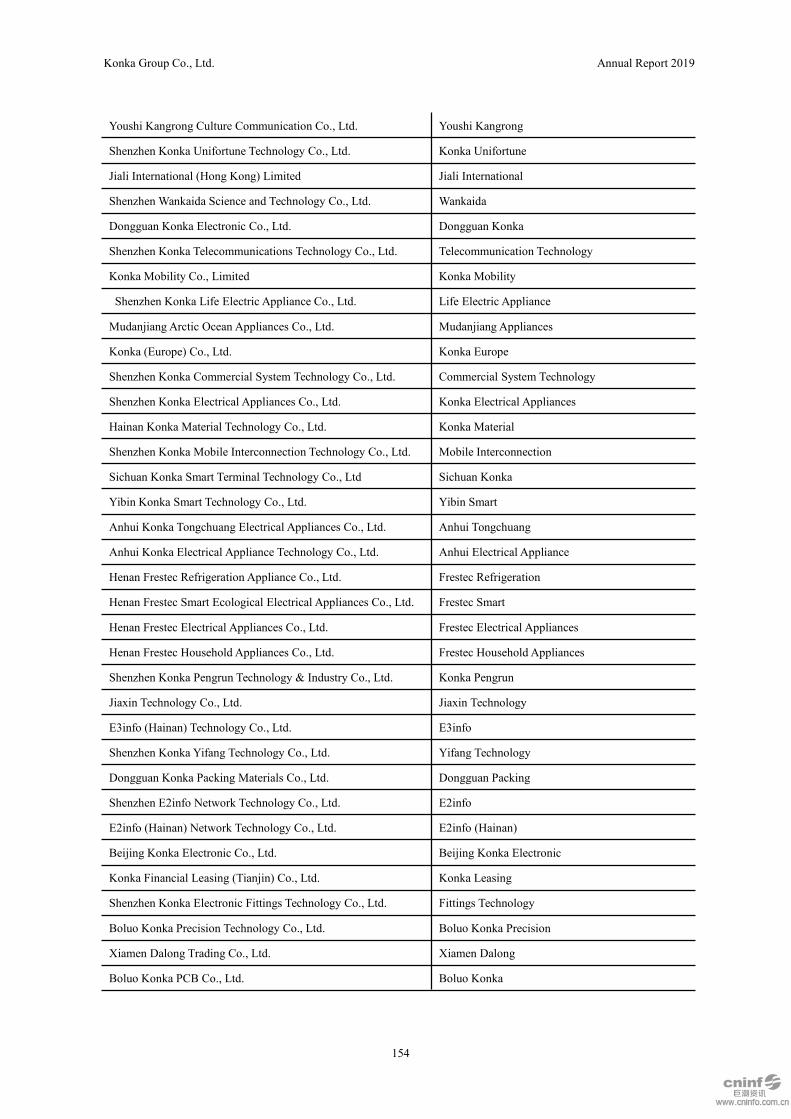
Konka Group Co., Ltd. Annual Report 2019
154
Youshi Kangrong Culture Communication Co., Ltd. Youshi Kangrong
Shenzhen Konka Unifortune Technology Co., Ltd. Konka Unifortune
Jiali International (Hong Kong) Limited Jiali International
Shenzhen Wankaida Science and Technology Co., Ltd. Wankaida
Dongguan Konka Electronic Co., Ltd. Dongguan Konka
Shenzhen Konka Telecommunications Technology Co., Ltd. Telecommunication Technology
Konka Mobility Co., Limited Konka Mobility
Shenzhen Konka Life Electric Appliance Co., Ltd. Life Electric Appliance
Mudanjiang Arctic Ocean Appliances Co., Ltd. Mudanjiang Appliances
Konka (Europe) Co., Ltd. Konka Europe
Shenzhen Konka Commercial System Technology Co., Ltd. Commercial System Technology
Shenzhen Konka Electrical Appliances Co., Ltd. Konka Electrical Appliances
Hainan Konka Material Technology Co., Ltd. Konka Material
Shenzhen Konka Mobile Interconnection Technology Co., Ltd. Mobile Interconnection
Sichuan Konka Smart Terminal Technology Co., Ltd Sichuan Konka
Yibin Konka Smart Technology Co., Ltd. Yibin Smart
Anhui Konka Tongchuang Electrical Appliances Co., Ltd. Anhui Tongchuang
Anhui Konka Electrical Appliance Technology Co., Ltd. Anhui Electrical Appliance
Henan Frestec Refrigeration Appliance Co., Ltd. Frestec Refrigeration
Henan Frestec Smart Ecological Electrical Appliances Co., Ltd. Frestec Smart
Henan Frestec Electrical Appliances Co., Ltd. Frestec Electrical Appliances
Henan Frestec Household Appliances Co., Ltd. Frestec Household Appliances
Shenzhen Konka Pengrun Technology & Industry Co., Ltd. Konka Pengrun
Jiaxin Technology Co., Ltd. Jiaxin Technology
E3info (Hainan) Technology Co., Ltd. E3info
Shenzhen Konka Yifang Technology Co., Ltd. Yifang Technology
Dongguan Konka Packing Materials Co., Ltd. Dongguan Packing
Shenzhen E2info Network Technology Co., Ltd. E2info
E2info (Hainan) Network Technology Co., Ltd. E2info (Hainan)
Beijing Konka Electronic Co., Ltd. Beijing Konka Electronic
Konka Financial Leasing (Tianjin) Co., Ltd. Konka Leasing
Shenzhen Konka Electronic Fittings Technology Co., Ltd. Fittings Technology
Boluo Konka Precision Technology Co., Ltd. Boluo Konka Precision
Xiamen Dalong Trading Co., Ltd. Xiamen Dalong
Boluo Konka PCB Co., Ltd. Boluo Konka

Konka Group Co., Ltd. Annual Report 2019
155
Hong Kong Konka Limited Hong Kong Konka
Konka Electrical Appliances Investment & Development Co.,Ltd. Konka Electrical Appliances Investment
Chain Kingdom Memory Technologies Co., Limited Chain Kingdom Memory Technologies
Chain Kingdom Memory Technologies (Shenzhen) Co., Ltd. Chain Kingdom Memory Technologies (Shenzhen)
Hefei Chain Kingdom Memory Technologies Co., Ltd. Hefei Chain Kingdom Memory Technologies
Konka SmartTech Limited Konka SmartTech
Kangjietong (Hong Kong) Limited Kangjietong
Konka Electrical Appliances International Trading Co., Ltd. Konka Electrical Appliances International Trading
Kanghao Technology Co., Ltd. Kanghao Technology
Yuekang Semiconductor Technology (Yantai) Co., Ltd. Yuekang Semiconductor
Konka North America LLC Konka North America
Shenzhen Konka Investment Holding Co., Ltd. Konka Investment
Yibin Konka Technology Park Operation Co., Ltd. Yibin Konka Technology Park
Sichuan Konka Industrial New Town Development Co., Ltd. Industrial New Town
Shenzhen Konka Capital Equity Investment Management Co.,Ltd. Konka Capital
Konka Suiyong Investment (Shenzhen) Co., Ltd. Konka Suiyong
Shenzhen Konka Kangxin Technology Co., Ltd. Kangxin Technology
Shenzhen Kangquan Enterprise Management Consulting Co.,Ltd. Kangquan Enterprise
Shenzhen Konka Suyuan Investment Industrial Co., Ltd. Konka Suyuan
Hainan Konka Technology Industry Development Co., Ltd. Hainan Technology
Shenzhen Konka Shengxing Industrial Co., Ltd. Shengxing Industrial
Shenzhen Konka Industrial Park Development Co., Ltd. Industrial Park Development
Shenzhen Konka Zhitong Technology Co., Ltd. Zhitong Technology
Sichuan Kangjiatong Technology Co., Ltd. Kangjiatong
Shenzhen Konka Electronics Technology Co., Ltd. Electronics Technology
GuangDong XingDa HongYe Electronic Co., Ltd. XingDa HongYe
Shanghai Xinfeng Zhuoqun PCB Co., Ltd. Shanghai Xinfeng
Anhui Konka Zhilian E-Commerce Co., Ltd. Anhui Zhilian
Nanjing Konka Smart Technology Co., Ltd. Nanjing Konka
Shenzhen Youzhihui Technology Co., Ltd. Youzhihui
Shenzhen Xiaojia Technology Co., Ltd. Xiaojia Technology
Haimen Konka Smart Technology Co., Ltd. Haimen Konka
Chengdu Konka Smart Technology Co., Ltd. Chengdu Konka Smart
Chengdu Konka Electronics Co., Ltd. Chengdu Konka Electronics
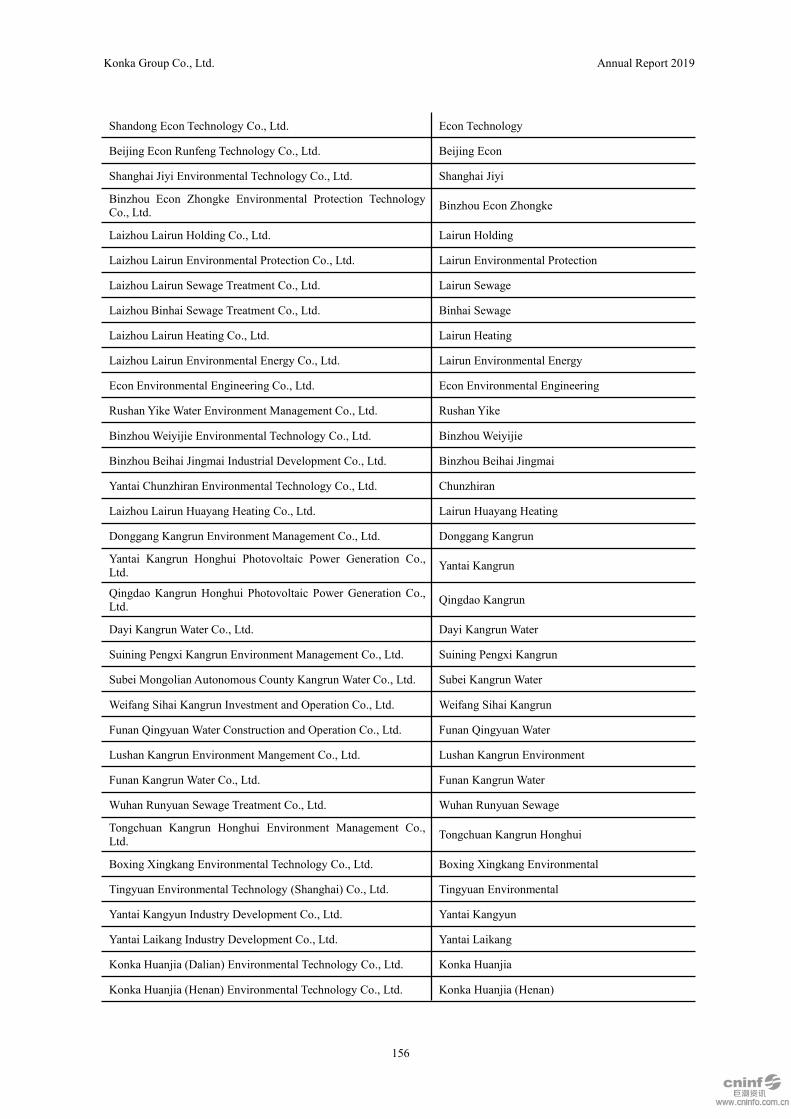
Konka Group Co., Ltd. Annual Report 2019
156
Shandong Econ Technology Co., Ltd. Econ Technology
Beijing Econ Runfeng Technology Co., Ltd. Beijing Econ
Shanghai Jiyi Environmental Technology Co., Ltd. Shanghai Jiyi
Binzhou Econ Zhongke Environmental Protection TechnologyCo., Ltd. Binzhou Econ Zhongke
Laizhou Lairun Holding Co., Ltd. Lairun Holding
Laizhou Lairun Environmental Protection Co., Ltd. Lairun Environmental Protection
Laizhou Lairun Sewage Treatment Co., Ltd. Lairun Sewage
Laizhou Binhai Sewage Treatment Co., Ltd. Binhai Sewage
Laizhou Lairun Heating Co., Ltd. Lairun Heating
Laizhou Lairun Environmental Energy Co., Ltd. Lairun Environmental Energy
Econ Environmental Engineering Co., Ltd. Econ Environmental Engineering
Rushan Yike Water Environment Management Co., Ltd. Rushan Yike
Binzhou Weiyijie Environmental Technology Co., Ltd. Binzhou Weiyijie
Binzhou Beihai Jingmai Industrial Development Co., Ltd. Binzhou Beihai Jingmai
Yantai Chunzhiran Environmental Technology Co., Ltd. Chunzhiran
Laizhou Lairun Huayang Heating Co., Ltd. Lairun Huayang Heating
Donggang Kangrun Environment Management Co., Ltd. Donggang Kangrun
Yantai Kangrun Honghui Photovoltaic Power Generation Co.,Ltd. Yantai Kangrun
Qingdao Kangrun Honghui Photovoltaic Power Generation Co.,Ltd. Qingdao Kangrun
Dayi Kangrun Water Co., Ltd. Dayi Kangrun Water
Suining Pengxi Kangrun Environment Management Co., Ltd. Suining Pengxi Kangrun
Subei Mongolian Autonomous County Kangrun Water Co., Ltd. Subei Kangrun Water
Weifang Sihai Kangrun Investment and Operation Co., Ltd. Weifang Sihai Kangrun
Funan Qingyuan Water Construction and Operation Co., Ltd. Funan Qingyuan Water
Lushan Kangrun Environment Mangement Co., Ltd. Lushan Kangrun Environment
Funan Kangrun Water Co., Ltd. Funan Kangrun Water
Wuhan Runyuan Sewage Treatment Co., Ltd. Wuhan Runyuan Sewage
Tongchuan Kangrun Honghui Environment Management Co.,Ltd. Tongchuan Kangrun Honghui
Boxing Xingkang Environmental Technology Co., Ltd. Boxing Xingkang Environmental
Tingyuan Environmental Technology (Shanghai) Co., Ltd. Tingyuan Environmental
Yantai Kangyun Industry Development Co., Ltd. Yantai Kangyun
Yantai Laikang Industry Development Co., Ltd. Yantai Laikang
Konka Huanjia (Dalian) Environmental Technology Co., Ltd. Konka Huanjia
Konka Huanjia (Henan) Environmental Technology Co., Ltd. Konka Huanjia (Henan)

Konka Group Co., Ltd. Annual Report 2019
157
Shanghai Konka Industrial Co., Ltd. Shanghai Konka
Chuzhou Kangyong Health Industry Development Co., Ltd. Chuzhou Kangyong
Yantai Konka Industrial Co., Ltd. Yantai Konka Industrial
Yantai Kangjin Technology Development Co., Ltd. Yantai Kangjin
Shandong Kangxin Industrial Development Co., Ltd. Shandong Kangxin
Jiangxi Konka New Material Technology Co., Ltd. Jiangxi Konka
Jiangxi Xinfeng Microcrystalline Jade Co., Ltd. Xinfeng Microcrystalline
Jiangxi Golden Phoenix Nano Crystallized Glass Co., Ltd. Nano Crystallized Glass
Shenzhen Nianhua Enterprise Management Co., Ltd. Shenzhen Nianhua
Shenzhen KONSEMI Co., Ltd. Shenzhen KONSEMI
Shenzhen Meixin Semiconductor Technology Co., Ltd. Shenzhen Meixin
Chongqing Zhengmao Semiconductor Co., Ltd. Zhengmao Semiconductor
Hefei KONSEMI Storage Technology Co., Ltd. Hefei KONSEMI
Hefei Yihe Electronic Co., Ltd. Yihe Electronic
Chongqing Konka Technology Development Co., Ltd. Chongqing Konka
Shenzhen Konka Huiying Technology Co., Ltd. Shenzhen Huiying Technology
Chongqing Konka Huiying Technology Co., Ltd. Chongqing Huiying Technology
Shenzhen Konka Eco-Development Investment Co., Ltd. Konka Eco-Development
Suining Konka Industrial Park Development Co., Ltd. Suining Konka Industrial Park
Konka Ronghe Industrial Technology (Foshan) Co., Ltd. Konka Ronghe
Suining Konka Electronic Technological Innovation Co., Ltd. Suining Electronic Technological Innovation
Dongguan Konka Investment Co., Ltd. Dongguan Konka Investment
Shenzhen Konka Chuangzhi Electrical Appliances Co., Ltd. Shenzhen Chuangzhi Electrical Appliances
Kanghong (Yantai) Environmental Protection Technology Co.,Ltd. Kanghong (Yantai) Environmental Protection
Kanghong (Yantai) Environmental Protection TechnologyIndustrial Park Co., Ltd.
Kanghong (Yantai) Environmental ProtectionIndustrial Park
Chongqing Kangxingrui Environmental Protection TechnologyCo., Ltd. Chongqing Kangxingrui
Chongqing Konka Optoelectronic Technology Institute Co., Ltd. Chongqing Optoelectronic Institute
Konka Xinying Semiconductor Technology (Shenzhen) Co., Ltd. Xinying Semiconductor
Jiangkang (Shanghai) Technology Co., Ltd. Jiangkang (Shanghai) Technology
Chongqing Konka Real Estate Development Co., Ltd. Chongqing Real Estate Development
Chongqing Konka Xingyi Real Estate Co., Ltd. Chongqing Xingyi Real Estate
Chongqing Konka Fuze Real Estate Co., Ltd. Chongqing Fuze Real Estate
Ningbo Kanghanrui Electrical Appliances Co., Ltd. Ningbo Kanghanrui Electrical Appliances
Shenzhen Konka Zhizao Technology Co., Ltd. Konka Zhizao

Konka Group Co., Ltd. Annual Report 2019
158
2. A check list of corporate names and their abbreviations mentioned in this Report
III. Basis for the Preparation of Financial Statements1. Basic for the preparationWith the going-concern assumption as the basis and based on transactions and other events thatactually occurred, the Company prepared financial statements in accordance with The AccountingStandards for Business Enterprises issued by the Ministry of Finance and other regulations as well asthe accounting policies and estimations stipulated in the Note IV “Significant Accounting Policiesand Estimations”.2. Going-concernThe Company has the operation history with profits and financial support. Thus, it is reasonable toprepare the financial statements based on going-concern.
IV. Important Accounting Policies and EstimationsThe specific accounting policies and accounting estimates formulated by the company based on theactual production and operation characteristics include the recognition and measurement of bad debtprovision for receivables, the measurement of issued inventories, the classification of fixed assetsand depreciation methods, amortization of intangible assets, revenue recognition and measurement,etc.
1. Statement of Compliance with the Accounting Standards for Business EnterprisesThe financial statements prepared by the Company are in compliance with in compliance with theAccounting Standards for Business Enterprises, which factually and completely present theCompany’s financial positions, business results and cash flows, and other relevant information.
2. Fiscal PeriodThe Company’s fiscal year starts on January 1 and ends on December 31 of every year according tothe Gregorian calendar.
3. Operating CycleAn operating cycle for the Company is 12 months, which is also the classification criterion for theliquidity of its assets and liabilities.
4. Recording CurrencyThe Company adopted Renminbi as the bookkeeping base currency.
5. Accounting Treatment Methods for Business Combinations under the Same Control or not underthe Same ControlAs the combining party, the assets and liabilities obtained by the Company in a business combinationunder the same control shall be measured on the basis of their carrying value in the final controllingparty on the combining date. As for the balance between the carrying value of the net assets obtainedand the carrying value of the consideration paid by it, the capital reserve shall be adjusted. If thecapital reserve is not sufficient to be offset, the retained earnings shall be adjusted. The direct costs
Anhui Konka Debao New Material Technology Co., Ltd. Debao New Material Technology
Suining Jiarun Real Estate Co., Ltd. Suining Jiarun Real Estate
Chuzhou Kangxin Health Industry Development Co., Ltd. Chuzhou Kangxin Health Industry
Hubei Kangxinglong Environmental Protection Co., Ltd. Kangxinglong Environmental Protection
Rushan Econ Shell Technology Incubator Co., Ltd. Rushan Econ Shell
Yantai Huanhai Xinze Enterprise Management Co., Ltd. Yantai Huanhai Xinze

Konka Group Co., Ltd. Annual Report 2019
159
incurred by the merging party for the business combination shall be included in the current profit andloss when incurred.The identifiable assets, liabilities and contingent liabilities of the acquiree acquired in the businesscombination under different control shall be measured at fair value on the acquisition date. Themerger cost is the sum of the fair value of cash or non-cash assets, liabilities issued or assumed,equity securities issued, etc. paid by the Company on the purchase date to gain control over thepurchased party and all directly related expenses incurred in the business combination (The mergecost of business combination realized step by step through multiple transactions is the sum of everysingle transaction’s cost). The balance that the combined cost greater than the fair value share of theidentifiable net assets of the purchased party obtained in the combination shall be recognized asgoodwill; When the merger cost is less than the fair value share of the identifiable net assets of theacquiree acquired in the merger, the fair value of all identifiable assets, liabilities and contingentliabilities acquired in the merger, and non-cash assets of the merger consideration or equity securitiesissued, etc. shall be reviewed first. After review, if the merger cost is still less than the fair valueshare of the identifiable net assets of the acquiree acquired in the merger, the difference shall beincluded in the non-operating income of the merger period. Intermediary expenses such as auditing,legal services, evaluation and consulting and other management expenses incurred for a businesscombination are included in the current profit and loss when incurred.
6. Methods for Preparing Consolidated Financial StatementsThe scope of consolidation includes the Company and its all subsidiaries.The financial statements of subsidiaries are adjusted in accordance with the accounting policies andaccounting period of the Group during the preparation of the consolidated financial statements,where the accounting policies and the accounting periods are inconsistent between the Group andsubsidiaries.All significant internal transactions, current balances and unrealized profits within the scope ofconsolidation shall be offset when preparing the consolidated statement. The shares of thesubsidiary's owner's equity that do not belong to the parent company and the shares of minorityshareholders' equity in current net profit and loss, other comprehensive income and totalcomprehensive income shall be respectively listed in the consolidated financial statement "Minorityshareholders' equity, minority shareholders' profit and loss, other comprehensive income that belongsto minority shareholders and total comprehensive income that belongs to minority shareholders".For subsidiaries acquired through merger of enterprises under the same control, their operatingresults and cash flows are included in the consolidated financial statements from the beginning of thecurrent merger period. When preparing the comparative consolidated financial statements, therelevant items in the financial statements of the previous year shall be adjusted as if the consolidatedreporting entity had existed since the final controlling party began to control it.At the occasion of the equity of the investee under the same control is acquired step by step throughmultiple transactions, and finally form the business combination, when preparing the consolidatedstatement, it shall be deemed as the adjustment is made in the current state when the final controllingparty starts to control. And when compiling the comparative report, the assets and liabilities of themerged party shall be merged into the comparative statement of the consolidated financial statementsof the consolidated Company without any earlier than the time when the Company and the mergedparty are under the control of the ultimate controlling party, and the combined net increased assetsshall be adjusted to the relevant items under owners' equity in the comparative statements. In order toavoid the re-calculation of the net assets value of the merged party, the long-term equity investmentheld by the Company before the merger, the confirmed relevant profit and loss on the same partywith the Company and the merged party on the date of acquisition of the original equity from thefinal control date to the merger date, and changes of other comprehensive income and other netassets shall offset the beginning retained earnings and current profits and losses of the comparativestatement period respectively.For subsidiaries acquired through business combination under the different control, the operatingresults and cash flow shall be included in the consolidated financial statements from the date when
Konka Group Co., Ltd. Annual Report 2019
160
the Company obtains the control right. When preparing the consolidated financial statements, thefinancial statements of the subsidiaries shall be adjusted on the basis of the fair value of theidentifiable assets, liabilities and contingent liabilities determined on the acquisition date.At the occasion of the equity of the investee under different control is acquired step by step throughmultiple transactions and eventually form the business combination, when preparing the consolidatedstatement, the equity of the investee held before the purchase date is re-measured according to thefair value of the equity on the purchase date, and the difference between the fair value and its bookvalue is included in the current investment income. The equity of the acquiree held before therelevant purchase date involves other comprehensive income under the equity method and otherchanges in owner's equity other than net profit and loss, other comprehensive income and profitdistribution, which are converted into investment profit and loss in the current period of the purchasedate, except for other comprehensive income arising from the remeasurement of defined benefitplans's net liabilities or changes in net assets by the investee.The Company partially disposes of long-term equity investments in subsidiaries without losingcontrol, when preparing the consolidated financial statements, the difference between the disposalprice and the share of net assets that the subsidiaries have continuously calculated since the date ofpurchase or the date of consolidation is corresponding to the disposal of long-term equityinvestments. The capital premium or equity premium is adjusted. If the capital reserve is insufficientto offset, the retained earnings are adjusted.If the Company loses control over the investee due to the disposal of some equity investments andother reasons, the remaining equity shall be re-measured at its fair value on the date of loss of controlwhen preparing the consolidated financial statements. The difference between the sum of theconsideration obtained from the disposal of equity and the fair value of the remaining equity, minusthe share of the net assets of the original subsidiary calculated on the basis of the originalshareholding ratio and continuously calculated from the date of purchase or merger, is included inthe investment profit and loss of the current period when the control right is lost, and goodwill isoffset. Other comprehensive income related to the original subsidiary's equity investment, etc., willbe transferred to the current investment profit and loss when the control right is lost.If the Company disposes of the equity investment in a subsidiary company step by step throughmultiple transactions until the loss of control right, if the transactions of the disposal of the equityinvestment in a subsidiary company until the loss of control right belong to a package transaction,the transactions shall be treated as transactions of the disposal of the subsidiary company and the lossof control right for accounting. However, the difference between the disposal price and the share ofthe subsidiary's net assets corresponding to the disposal investment before the loss of control right isrecognized as other comprehensive income in the consolidated financial statements, and istransferred to the investment profit and loss of the current period when the control right is lost.
7. Classification of Joint Arrangements and Accounting Treatment of Joint OperationsThe Company classifies joint arrangements into joint operations and joint ventures. For a jointoperation, the Company, as a joint operator, recognizes the assets and liabilities that it holds andbears in the joint operation, and recognizes the jointly-held assets and jointly-borne liabilitiesaccording to the Company’s stake in the joint operation; recognizes relevant income and expenseaccording to the Company’s stake in the joint operation. When the Company purchases or sells theassets not constituting business with the joint operation, the Company only recognizeds the share ofthe other jont operators in the gains and losses arising from the transaction.
8. Cash and Cash EquivalentsIn the Company’s understanding, the cash in the cash flow statement includes cash on hand anddeposits that can be used for cover, the cash equivalents in the cash flow statement include highcirculating investments held within three months which are easily convertible into known amount ofcash and whose risks in change of value are minimal.
Konka Group Co., Ltd. Annual Report 2019
161
9. Foreign Currency Businesses and Translation of Foreign Currency Financial Statements(1) Conversion method for foreign currency transactionsThe foreign currency transactions that occurred in the company are converted into the amount of thebookkeeping standard currency according to the exchange rate at the beginning of the transactionday (usually refer to the middle price of the foreign exchange price of the day announced by thePeople's Bank of China), but the company's foreign currency exchange business occurs Ortransactions involving foreign currency exchange shall be converted into the amount of the recordingcurrency in accordance with the exchange rate actually adopted.(2) Conversion method for foreign currency monetary items and foreign currency non-monetaryitemsOn the balance sheet date, foreign currency monetary items are converted at the spot exchange rateon the balance sheet date. The resulting exchange differences, except for: ① The exchangedifferences arising from foreign currency special borrowings related to the acquisition andconstruction of assets that meet the capitalization requirements are based on The principle ofcapitalization of borrowing costs; ② Exchange difference of hedging instruments used for effectivehedge of net investment in overseas operations (the difference is included in other comprehensiveincome, and it is not recognized as current profit or loss until the net investment is disposed of); and③ Foreign currency monetary items for sale, except for amortized costs, the exchange differencesarising from changes in other book balances are included in other comprehensive income, and areincluded in the current profit and loss.If the preparation of consolidated financial statements involves overseas operations, if there is aforeign currency monetary item that substantially constitutes a net investment in overseas operations,the exchange difference due to exchange rate changes is included in other comprehensive income;when disposing of overseas operations, it is transferred to the current profit and loss. .Non-monetary items denominated in foreign currencies that are measured at historical cost are stillmeasured using the amount of the recording currency converted at the spot exchange rate on thetransaction date. Foreign currency non-monetary items measured at fair value are translated at thespot exchange rate on the date when the fair value is determined, and the difference between theamount of the recording standard currency after conversion and the amount of the original recordingstandard currency is treated as a change in fair value (including exchange rate changes) , Included inthe current profit or loss or recognized as other comprehensive income.(3) Conversion method of foreign currency financial statementsIf the preparation of consolidated financial statements involves overseas operations, if there is aforeign currency monetary item that substantially constitutes a net investment in overseas operations,the exchange difference arising from changes in exchange rates is recognized as "foreign currencystatement translation difference" as other comprehensive income; disposal of overseas operations Atthe time, it is included in the current profit and loss of disposal.Foreign currency financial statements for overseas operations are converted into RMB statements inthe following ways: Assets and liabilities items in the balance sheet are converted at the spotexchange rate on the balance sheet date; shareholders ’equity items other than“ undistributedprofits ”items Use the spot exchange rate at the time of conversion. The income and expense items inthe profit statement are translated at the current average exchange rate on the transaction date. Theundistributed profit at the beginning of the period is the undistributed profit at the end of the periodafter the previous year's conversion; the undistributed profit at the end of the period is calculated andpresented according to the converted profit distribution items; the total difference between the assetsand liabilities and shareholders' equity items after conversion , As a translation difference in foreigncurrency statements, is recognized as other comprehensive income. When disposing of overseasoperations and losing control, the translation differences of foreign currency statements related to theoverseas operations listed in the shareholders ’equity items in the balance sheet shall be transferredto the current profit or loss in full or in proportion to the disposal of the overseas operations.Foreign currency cash flows and cash flows of overseas subsidiaries are translated at the current

Konka Group Co., Ltd. Annual Report 2019
162
average exchange rate on the cash flow date. The impact of exchange rate changes on cash is used asan adjustment item and is presented separately in the cash flow statement.The opening amount and the actual number of the previous period are listed based on the amountconverted from the financial statements of the previous period.When disposing of all the owner's equity of the company's overseas operations or losing control ofoverseas operations due to the disposal of part of the equity investment or other reasons, theshareholders' equity items listed in the balance sheet, related to the overseas operations, are attributedto the mother. The foreign currency statement translation differences of the company's owner's equityare all transferred to the current profit and loss disposal.When the disposal of part of the equity investment or other reasons leads to a reduction in theproportion of overseas operating equity held but without loss of control over overseas operations, theforeign currency statement translation difference related to the overseas operating disposal portionwill be vested in minority shareholders ’equity and not transferred to current profit or loss. Whendisposing of part of the equity of an overseas operation as an associate or joint venture, the foreigncurrency statement translation difference related to the overseas operation is transferred to thecurrent profit or loss in proportion to the disposal of the overseas operation.
10. Financial Assets and Financial LiabilitiesThe Company recognizes a financial asset or liability when it becomes a party of the relevantfinancial instrument contract.(1) Financial assets1) Classification, recognition and measurement of financial assetsThe Company classifies the financial assets into financial assets measured at amortized cost, financialassets measured by the fair value and the changes recorded in other comprehensive income andfinancial assets at fair value through profit or loss based on the business model for financial assetsmanagement and characteristics of contractual cash flow of financial assetsThe Company classified the financial assets meeting the following consitions at the same time asfinancial assets at amortized cost: ①The business mode of the Company to manage the financialassets targets at collecting the contractual cash flow. ②The contract of the financial assets stipulatesthat the cash flow generated in the specific date is the payment of the interest based on the principaland outstanding principal amount. These financial assets initially measured at fair value and relevanttransaction cost shall be included into the initial recognized amount and subsequently measured atamortized cost. Except for those designated to be hedge items, the difference between the initialrecognized amont and the amount due shall be amortized at actual interest rate and their amortization,impairment and exchange gain and loss as well as gains or losses arising from derecognition shall berecorded into the current profit or loss.The Company classified the financial assets meeting the following consitions at the same time asfinancial assets at fair value through other comprehensive income: ①The Business mode formanaging financial assets of the Company takes contract cash flow collected as target and selling astarget. ②The contract of the financial assets stipulates that the cash flow generated in the specificdate is the payment of the interest based on the principal and outstanding principal amount. Thesefinancial assets initially measured at fair value and relevant transaction cost shall be included into theinitial recognized amount. Except for those designated as hedged items, as for these financial assets,except for gains or losses on credit impairment, exchange gain and loss and interest of financialassets measured at actual interst rate, other gains or losses generated shall be recorded into othercomprehensive income. When derecognized, the accumulated gains and losses originally recordedinto other comprehensive income shall be transferred out into the current profit or loss.The Company recognizes interest income according to the effective interest rate method. Interestincome is calculated and determined according to the book balance of the financial asset multipliedby the actual interest rate, except for the following circumstances: ① For the financial asset withcredit impairment that has been purchased or originated, from the initial recognition, the interestincome is calculated and determined according to the amortized cost of the financial asset and the
Konka Group Co., Ltd. Annual Report 2019
163
actual interest rate adjusted by credit. ② For financial assets purchased or originated that have notsuffered credit impairment but have suffered credit impairment in subsequent periods, the interestincome shall be calculated and determined according to the amortized cost and actual interest rate ofthe financial assets in subsequent periods.The Company designates non-transactional investment in equity instruments as financial assets atfair value through other comprehensive income. Those designated non-transactional investment inequity instruments by the Company is initially measured at fair value and relevant transaction costshall be recorded into the initial recognized amount. Except for dividends (excluding those belongingto recovery of investment cost) which shall be recorded into the current profit or loss, other relevantgains and losses (including exchange gains and losses) shall be recorded into other comprehensiveincome and cannot be transferred into the current profit or loss subsequently. When derecognized,the accumulated gains or losses originally recorded into other comprehensive income shall betransferred out into retained earnings.The Company classifies financial assets not belonging to above two as financial assets at fair valuethrough profit or loss which shall be initially measured at fair value and relevant transaction costshall be directly recorded into the current profit or loss. Gains or losses arising from these financialassets shall be recorded into the current profit or loss.The contingent consideration recognized by the Company in the business combination not under thesame control which constitutes a financial asset shall be classified as the financial asset at fair valuethrough profit or loss.2) Recognition and measurement of financial assets transferThe Company derecognizes a financial asset when one of the following conditions is met:1) the rights to receive cash flows from the asset have expired; 2) the enterprise has transferred itsrights to receive cash flows from the asset to a third party under a pass-through arrangement; or 3)the enterprise has transferred its rights to receive cash flows from the asset and either (a) hastransferred substantially all the risks and rewards of the asset, or (b) has neither transferred norretained substantially all the risks and rewards of the asset, but has transferred control of the asset.If the overall transfer of financial assets fulfills the requirements for derecognition, the difference betweenthe book value of the transferred financial assets and the sum of the consideration received due to thetransfer and the corresponding derecognition part of the accumulated amount of fair value changesoriginally directly included in other comprehensive income (the contract terms involving the transferredfinancial assets stipulate that the cash flow generated on a specific date is only the payment of theprincipal and interest based on the unpaid principal amount) shall be included in the current profits andlosses.If the partial transfer of financial assets satisfies the conditions for termination confirmation, theentire book value of the transferred financial assets will be apportioned between the terminationconfirmation portion and the non-termination confirmation portion according to their relative fairvalues, and the consideration received for the transfer And the amount corresponding to thetermination of the recognition of the cumulative amount of changes in fair value originally includedin other comprehensive income that should be apportioned to the derecognition part And thepayment of interest based on the outstanding principal amount), and the difference between the totalbook value of the aforesaid financial assets allocated is included in the current profit and loss.(2) Finanical liabilities1) Classification, recognition and measurement of financial liabilitiesThe Company’s financial liabilities are, on initial recognition, classified into financial liabilities atfair value through profit or loss and other financial liabilities.Financial liabilities at fair value through profit or loss include held-for-trading financial liabilitiesand financial liabilities designated at the initial recognition to be measured by the fair value and theirchanges are recorded in the current profit or loss (the relevant classification basis shall be disclosedreferring to the classification basis for financial assets). The subsequent measurement shall be at fairvalue and gains or losses arising from changes in fair value and the dividends and interest expenserelated to the financial liability shall be the current profit or loss.Other financial liabilities (disclose relevant details based on actual situation) shall be subsequently

Konka Group Co., Ltd. Annual Report 2019
164
measured at amortized cost with actual interest rate. The Company classifies financial liabilitiesexcept for the following items as financial liabilities at amortized cost: ①Financial liabilities at fairvalue through profit or loss including held-for-trading financial liabilities (including the derivativeinstruments belonging to financial liabilities) and designated financial liabilities at fair value throughprofit or loss. ②Financial liabilities arising from the transfer of financial assets not meeting thederecognition conditions or continuous involvement in the transferred financial assets. ③Financialguarantee contract not belonging to cases of above ① or ② and loan commitments at interest ratelower than the market rate not belonging to the case in①.The Company treats the financial liability arising from contingent consideration recognized as thepurchase party in the business combination not under the same control at fair value and changesthereof shall be recorded into the current profit or loss.2) Derecognition of financial liabilitiesIn case of current obligation of financial liabilities (or partial financial liabilities) being terminated,derecognition of such financial liabilities (or partial financial liabilities) is conducted by theCompany. If the Company (borrower) concludes an agreement with the lender to replace existingfinancial liabilities with new ones and contact terms of new financial liabilities are different fromthose of existing financial liabilities, derecognition of existing financial liabilities and recognition ofnew financial liabilities shall be conducted. In case of material alteration of contract terms of existingfinancial liabilities (partial financial liabilities) by the Company, derecognition of existing financialliabilities and recognition of new financial liabilities as per modified terms shall be conducted. Incase of derecognition of financial liabilities (partial financial liabilities), the Company includes thebalance between its carrying value and payment consideration into the current profit or loss.(3) Determination of financial assets and liabilities’ fair valueFair value is the amount for which an asset could be exchanged, or a liability settled, betweenknowledgeable, willing parties in an arm’s length transaction. For a financial instrument which hasan active market, the Company uses quoted price in the active market to establish its fair value. Thequoted price in the active market refers to the price that can be regularly obtained from exchangemarket, agencies, industry associations, pricing authorities; it represents the fair market trading pricein the actual transaction. For a financial instrument which does not have an active market, theCompany establishes fair value by using a valuation technique. Valuation techniques include usingrecent arm’s length market transactions between knowledgeable, willing parties, reference to thecurrent fair value of another instrument that is substantially the same, discounted cash flow analysisand option pricing models. The Company measures initially and subsequently the fair value of aninterest rate swap at the value of a competitor’s interest rate swap quoted by a recognized financialinstitution as at the Company’s balance sheet date in accordance with the principle of consistency. Invaluation, the Company adopts applicable valuation techniques supported by sufficient utilizabledata and other information in current circumstances, selects input values consistent with asset orliability characteristics considered in relevant asset or liability transactions of market participatorsand prioritizes the applying relevant observable input values. Unobservable input values shall not beapplied unless relevant observable input values are not accessible or feasible.An equity instrument is any contract that evidences a residual interest in the assets of the Companyafter deducting all of its liabilities. The consideration received from issuing equity instruments, net oftransaction costs, are added to shareholders’ equity. All types of distribution (excluding stockdividends) made by the Company to holders of equity instruments are deducted from shareholders’equity. The Company does not recognize any changes in the fair value of equity instruments.An equity instrument distributing dividends during the period of continued existence (including the“interest” generated from those classified as equity instrument) shall be treated as profit distribution.(4) Offsetting financial assets and financial liabilities

Konka Group Co., Ltd. Annual Report 2019
165
The Company’s financial assets and liabilities shall be separately presented in the balance sheet andnot set off each other. But when meeting the following conditions at the same time, the net amountafter offset shall be presented in the balance sheet: (1) The Company has the statutory right to set offrecognized amount which is currently executable; (2) The Company plans to setlle with the netamount or realize the financial asset and pay off the financial liability simultaneously.(5) The Distinction Between Financial Liabilities and Equity Instruments and Related TreatmentMethodsThe Company distinguishes the financial liabilities and equity instruments according to the followingprinciples: (1) If the Company cannot unconditionally avoid performing a contractual obligation bydelivering cash or other financial assets, the contractual obligation meets the definition of financialliabilities. Although some financial instruments do not explicitly include the terms and conditions ofthe obligation to deliver cash or other financial assets, they may indirectly form contractualobligations through other terms and conditions. (2) If a financial instrument must be settled with orcan be settled with the Company's own equity instrument, it is necessary to consider whether theCompany's own equity instrument used to settle the instrument is used as a substitute for cash orother financial assets, or to enable the holder of the instrument to enjoy the residual equity in theassets of the issuer after deducting all liabilities. If it belongs to the former condition, the instrumentis the financial liability of the issuer; if it belong to the latter condition, the instrument is the equityinstrument of the issuer. In some cases, a financial instrument contract requires the Company to useor use its own equity instrument to settle the financial instrument, in which the amount of contractualrights or contractual obligations is equal to the number of its own equity instruments available or tobe delivered multiplied by its fair value at the time of settlement, regardless of whether the amountof contractual rights or obligations is fixed, whether it is entirely or partially based on changes invariables other than the market price of the Company's own equity instruments, the contract shall beclassified as a financial liability.In classifying financial instruments (or their components) in the consolidated statement, theCompany has taken into account all terms and conditions reached between the Company membersand the holders of financial instruments. If the Company as a whole undertakes the obligation todeliver cash, other financial assets or settle accounts in other ways that cause the instrument tobecome a financial liability due to the instrument, the instrument shall be classified as a financialliability.If financial instruments or their components are financial liabilities, the Company will includeinterest, dividends (or dividends), gains or losses, and gains or losses arising from redemption orrefinancing, etc. in the current profits and losses.If financial instruments or their components are equity instruments, when they are issued (includingrefinancing), repurchased, sold or cancelled, the Company will treat them as changes in equity andwill not recognize changes in the fair value of equity instruments.
11. Impairment of Financial AssetsThe Company needs to confirm that the financial assets subject to the impairment loss are thefinancial assets measured based on the amortized cost, the debt instrument investment measuredbased on the fair value with its variations included into other comprehensive incomes and the leaseoutlay receivable, mainly including notes receivable, account receivable, other receivables,investment on creditor’s rights, other investments on creditor’s rights and long-term receivables etc.Besides, in respect of the contract assets and partial financial guarantee contract, correspondingimpairment provisions shall be calculated and withdrawn and corresponding credit impairment lossesrecognized according to various accounting policies mentioned in this part.(1) Methods for the Recognition of Impairment ProvisionsFor all mentioned items above, the Company shall calculate and withdraw corresponding impairmentprovisions and recognize corresponding credit impairment losses according to applicable expectedcredit loss measurement methods (general methods or simplified methods) with the expected creditloss as the basis.Credit loss refers to the difference between all receivable contract cash flows and all expected cash
Konka Group Co., Ltd. Annual Report 2019
166
flows that are discounted to the present value based on the original actual interest rate -- the presentvalue of all cash shortfall. However, for the purchased or original financial assets subject to the creditimpairment, the Company shall realize the discounting based on the actual interest rate subject to thecredit adjustment.General methods applied to measure the expected credit loss can be described as: the Company shallevaluate whether the credit risk of the financial assets (including the contract assets and otherapplicable items; the same below) increases remarkably after the initial recognition on the balancesheet day; if the credit risk increases remarkably after the initial recognition, the Company shallmeasure the provision for loss based on the specific expected credit loss amount during the entireperiod of existence; if not, the Company shall measure the provision for loss based on the specificexpected credit loss amount in the following 12 months. While evaluating the expected credit loss,the Company shall take all reasonable and well-founded information into consideration, includingthe forward-looking information.For the financial instrument of lower credit risk on the balance sheet day, the Company shall assumethat its credit risk does not increase remarkably after the initial recognition, and correspondingprovision for loss shall be measured according to the expected credit loss in the following 12 months.(2) Standards for Judging Whether the Credit Risk Increases Remarkably after the InitialRecognitionIf any financial assets’ probability of default within the expected period of existence determined onthe balance sheet day is obviously higher than that within the expected period of existencedetermined during the initial recognition, it shall indicate the remarkable increase of the financialassets’ credit risk. Unless it is under special circumstances, the Company shall adopt variousvariations in the default risk in the following 12 months as the reasonable basis for estimatingcorresponding variations in the default risk within the entire period of existence and determiningwhether the credit risk increases remarkably after the initial recognition.(3) Combined Method for Evaluating the Expected Credit Risk based on CorrespondingCombinationFor the financial assets with remarkably different credit risk, the Company shall separately evaluateits credit risk, including the receivables from related parties, receivables involved in any dispute withthe other party or any lawsuit and arbitration, and receivables with obvious evidence showing thatthe debtor cannot fulfill the due payment obligation etc.Except for the financial assets whose credit risk shall be separately evaluated, the Company shalldivide these financial assets into different combinations based on the specific risk features, on whichbasis, corresponding credit risks can be evaluated.(4) Accounting Treatment Methods Applied to the Impairment of Financial AssetsAt the end of the period, the Company shall calculate the expected credit losses of various financialassets. If the expected credit loss is higher than the carrying amount of its current impairmentprovision, the difference shall be recognized as the impairment loss; if lower, the difference shall berecognized as the gain from the impairment.(5) Methods for Determining the Credit Loss of Various Financial Assets① Notes ReceivablesFor notes receivable, the Company shall measure the provision for loss based on the specificexpected credit loss during the entire period of existence. According to the credit risk characteristicsthereof, except those with separate evaluation of credit risk, notes receivable can be divided intodifferent combinations:
Item Basis
Bank AcceptanceThe Accepter shall be the bank with high credit
level and low risks
Trade AcceptanceClassified by credit risk of acceptors (the sameas accounts receivable)
Konka Group Co., Ltd. Annual Report 2019
167
②Account Receivable and Contract AssetsFor account receivable and contract assets excluding significant financing composition, theCompany shall measure the provision for loss according to the specific expected credit loss amountwithin the entire period of existence.For account receivable, contract assets and lease payment receivable including significant financingcomposition, the Company shall always measure the provision for loss according to the specificexpected credit loss amount within the period of existence.Except the account receivable and contract assets whose credit risks shall be separately evaluated,the Company shall divide them into different combinations based on the specific credit risks:
Item Basis
Aging CombinationThis portfolio is accounts receivable with aging
as the credit risk feature.
Project Funds Combination This portfolio is the project-related receivables.
Related party combinationThe accounts receivable within the scope of
consolidation③Other ReceivablesBy determining whether the credit risk of other receivables increases remarkably after the initialrecognition, the Company shall measure the impairment loss based on the specific expected creditloss in the following 12 months or during the entire period of existence. Except other receivableswhose credit risks shall be separately evaluated, the Company shall divide them into differentcombinations based on the specific credit risk features:
Item Basis
Aging CombinationThis portfolio is accounts receivable with aging
as the credit risk feature.
Low Risk Combination
This combination shall regard other receivables
of extremely low risk (including the revolving
fund, the cash deposit and the guarantee
deposit) as the credit risk feature.
Related party combinationOther receivables within the scope of
consolidation.④ Long-term Receivables (except the account receivable and the lease payment receivable includingthe significant financing composition)By determining whether the credit risk of long-term account receivables increases remarkably afterthe initial recognition, the Company shall measure the impairment loss based on the specificexpected credit loss in the following 12 months or during the entire period of existence. Exceptlong-term account receivables whose credit risks shall be separately evaluated, the Company shalldivide them into different combinations based on the specific credit risk features:
Item Basis
Financing Lease Combination Regarding the long-term receivables related to

Konka Group Co., Ltd. Annual Report 2019
168
the financing lease as the credit riskcharacteristics
Franchise Combination Regarding the long-term receivables related tothe PPP Project as the credit risk characteristics
12. Inventory(1) ClassificationThe Company’s inventories mainly include raw materials, goods in process; merchandise on hand,goods delivered, circulating materials, consigned processing materials and property inventories(development product, and development cost), and finished but unsettled assets of constructioncontract.① Development product refers to the finished and held-for-sale property.② Development costs refers to the unfinished property with the development purpose for sale.③ The finished but unsettled assets of construction contract refers to the excess amount of the sumof accumulatively incurred costs and recognized gross margin (loss) of contract in process over thesettled amount.(2) Pricing method for outgoing inventories Pricing method of common inventoriesThe inventories shall be measured in light of their cost when obtained. The cost of inventory consistsof purchase costs, processing costs and other costs. Inventory is accounted by weight averagemethod upon receiving and giving. For merchandise on hand shall be accounted by planned cost, ifthe difference between planned cost of and actual cost of raw materials is accounted through the costvariance item, and the planned cost is adjusted to the actual cost according to the cost differencewhich the carryover and given-out inventory should shoulder in the period. Pricing method of property inventoriesThe property inventories are initially measured at the costs, and inventories mainly include materialsin stock, development product in process (development costs), finished development product, anddevelopment product intended to sell but rent temporarily, and etc. The costs of the developmentproduct include the land premium, expenditures for supporting infrastructures, expenditures forconstruction and installation projects, the borrowing costs before the completion of the developedproject and other expenses occurred during the development process. When the inventories aredelivered, its actual costs shall be recognized by weighted average method. Pricing method of construction contractThe construction contracts shall be measured at actual cost, including all direct and indirect costsrelated to the execution of the contract from the time signing the contract to completing the contract.The expenses such as travel expenses and bidding fees incurred for the purpose of signing thecontract, which can be separately and reliably measured and the contract is likely to be concluded,are included in the contract cost when the contract is obtained; if the above conditions are not met,they are included in the current profit and loss.The accumulated costs incurred in the contract in progress, the accumulated recognized gross profit(loss) and the settled price are stated in the balance sheet as net offset. The part of the sum of theaccumulated costs incurred in the contract in progress and the accumulated recognized gross profit(loss) that exceeds the settled price is stated as the inventory; the part of the settlement costs of thecontract in progress that exceeds the sum of the accumulated costs incurred and the accumulatedrecognized gross profit (loss) are stated as account collected in advance.(3) Recognition basis of net realizable value and withdrawal method of depreciation reserves forinventoriesThe net realizable value refers, in the ordinary course of business, to the account after deducting theestimated cost of completion, estimated sale expense and relevant taxes from the estimated sale priceof inventories. The net realizable value of inventories shall be fixed on the basis of valid evidence aswell as under consideration of purpose of inventories and the effect of events after
Konka Group Co., Ltd. Annual Report 2019
169
balance-sheet-date.On the balance sheet date, the inventories shall be measured according to the cost or the netrealizable value, whichever is lower. If the net realizable value is lower than the cost, it shallwithdraw the depreciation reserves for inventories, which was withdrawn in accordance with thebalance that the cost of individual inventory item exceeding the net realizable value. The inventorieswith various numbers and low unit price shall be made provisions for depreciation reserves ofinventories according to the category of inventories. For inventories that are produced and sold in thesame region with same or similar end use or purposes, and hard to be measured separately from otheritems, it shall be made merger provisions for falling price of inventories.After withdrawing the depreciation reserves for inventories, if the factors, which cause anywrite-down of the inventories, have disappeared, causing the net realizable value of inventories ishigher than its carrying amount; the amount of write-down shall be reversed from the originalamount of depreciation reserve for inventories. The reversed amount shall be included in the profitsand losses of the current period.(4) The perpetual inventory system is maintained for stock system.(5) Amortization method of the low-value consumption goods and packing articlesThe low-value consumption goods should be amortized by one time amortization when acquiringand the packing articles are amortized by one time amortization when acquiring.
13. Long-term Equity InvestmentsSome of the long-term equity investments referred to by the Company are mainly for subsidiaries.They refer to the long-term equity investments and joint ventures that the Company has control, jointcontrol or significant influence over the invested, affiliated enterprises. For long-term equityinvestments that the company does not have control, joint control or significant influence on theinvested units, they are accounted for as available-for-sale financial assets or financial assetsmeasured at fair value and whose changes are included in the profits and losses of the current periodfrom January 1, 2019. if they are non-tradable, the company may choose to designate them asfinancial assets measured at fair value and whose changes are included in other comprehensiveincome during initial recognition. please refer to notes 4 and 10 "financial assets and financialliabilities" for accounting policies.Joint control refers to the common control of the company over an arrangement according to relevantagreements, and the relevant activities of the arrangement can only be decided after the participantssharing the control rights have agreed unanimously. Significant influence refers to the fact that thecompany has the power to participate in the decision-making of the financial and operating policiesof the invested entity, but cannot control or jointly control the formulation of these policies withother parties.(1)Determination of investment costFor the long-term equity investment obtained from the merger of enterprises under the same control,the initial investment cost of the long-term equity investment shall be based on the share of the bookvalue of the shareholders' equity of the merged party in the consolidated financial statements of thefinal controlling party on the merger date. The difference between the initial investment cost oflong-term equity investment and the cash paid, the non-cash assets transferred and the book value ofthe debts undertaken, and the adjustment of capital reserve; If the capital reserve is insufficient tooffset, the retained earnings shall be adjusted. If equity securities are issued as mergerconsideration, the capital reserve shall be adjusted on the merger date according to the share of thebook value of the merged party's owner's equity in the final controlling party's consolidated financialstatements as the initial investment cost of the long-term equity investment, and according to thetotal nominal value of the issued shares as equity, and the difference between the initial investmentcost of the long-term equity investment and the total nominal value of the issued shares. If thecapital reserve is insufficient to offset, the retained earnings shall be adjusted.For the long-term equity investment obtained from the merger of enterprises not under the samecontrol, the initial investment cost of the long-term equity investment shall be taken as the merger
Konka Group Co., Ltd. Annual Report 2019
170
cost on the purchase date. The merger cost includes the sum of the assets paid by the purchaser, theliabilities incurred or assumed, and the fair value of the equity securities issued.Intermediary expenses such as auditing, legal services, evaluation and consultation and other relatedmanagement expenses incurred by the merging party or the purchaser for the enterprise merger shallbe included in the current profits and losses when incurred.Other equity investments other than the long-term equity investments formed by the merger ofenterprises are initially measured according to the cost, which is determined according to the actualcash purchase price paid by the company, the fair value of equity securities issued by the company,the value agreed in investment contracts or agreements, the fair value or original book value of assetsexchanged in non-monetary asset exchange transactions, and the fair value of the long-term equityinvestments themselves, depending on the way the long-term equity investments are obtained.Expenses, taxes and other necessary expenses directly related to obtaining long-term equityinvestment are also included in the investment cost.(2) Subsequent Measurement and Profit and Loss Recognition MethodsFor long-term equity investments that are jointly controlled by the invested units (except those thatconstitute joint operators) or have significant impact, the equity method shall be adopted foraccounting. In addition, the company's financial statements use the cost method to account forlong-term equity investments that can control the invested units.①long-term equity investment accounted for by cost methodWhen the cost method is used for accounting, the long-term equity investment is priced according tothe initial investment cost, and the cost of the long-term equity investment is adjusted by adding orrecovering the investment. In addition to the actual price paid at the time of obtaining theinvestment or the declared but undistributed cash dividends or profits included in the consideration,the current investment income shall be recognized according to the cash dividends or profits declaredand distributed by the invested entity.② long-term equity investment accounted for by equity methodIf the initial investment cost of the long-term equity investment is greater than the fair value share ofthe identifiable net assets of the invested entity when the equity method is used for accounting, theinitial investment cost of the long-term equity investment shall not be adjusted; If the initialinvestment cost is less than the fair value share of the identifiable net assets of the investee, thedifference shall be included in the current profits and losses, and the cost of long-term equityinvestment shall be adjusted at the same time.When the equity method is used for accounting, the investment income and other comprehensiveincome shall be recognized respectively according to the share of the net profit and loss and othercomprehensive income realized by the invested entity that should be enjoyed or shared, and the bookvalue of long-term equity investment shall be adjusted at the same time. The book value oflong-term equity investment shall be reduced correspondingly according to the portion of profits orcash dividends declared and distributed by the invested entity. The book value of long-term equityinvestment shall be adjusted and included in the capital reserve for other changes in the owner'sequity of the invested entity other than net profit and loss, other comprehensive income and profitdistribution. When confirming the share of the net profit and loss of the investee, the net profit ofthe investee shall be confirmed after adjustment based on the fair value of the identifiable assets ofthe investee at the time of obtaining the investment. If the accounting policies and accountingperiods adopted by the invested entity are inconsistent with the Company, the financial statements ofthe invested entity shall be adjusted in accordance with the Company's accounting policies andaccounting periods, and the investment income and other comprehensive income shall be recognizedaccordingly. For transactions between the Company, associated enterprises and joint ventures, ifthe assets invested or sold do not constitute business, the unrealized gains and losses on internaltransactions shall be offset by the portion attributable to the Company according to the proportionenjoyed, and the investment gains and losses shall be recognized on this basis. However, theunrealized internal transaction losses between the Company and the investee shall not be offset ifthey are impairment losses of the transferred assets.

Konka Group Co., Ltd. Annual Report 2019
171
When the net loss of the investee is confirmed to be shared, the book value of the long-term equityinvestment and other long-term interests that substantially constitute the net investment of theinvestee shall be reduced to zero. In addition, if the company has the obligation to bear additionallosses to the investee, the estimated liabilities shall be recognized according to the estimatedobligations and included in the current investment losses. If the invested entity realizes net profit inthe following period, the company will resume the recognition of the profit sharing amount after theprofit sharing amount makes up for the unrecognized loss sharing amount.③Acquisition of minority sharesIn the preparation of consolidated financial statements, if the capital reserve (equity premium) isadjusted due to the difference between the long-term equity investment added by the purchase ofminority equity and the net asset share that the subsidiary company is entitled to continuouslycalculate from the date of purchase (or the date of consolidation) according to the addedshareholding ratio, and the capital reserve (equity premium) is insufficient to offset, the retainedearnings shall be adjusted.④ disposal of long-term equity investmentIn the consolidated financial statements, the parent company partially disposes of the long-termequity investment in the subsidiary company without losing control. The difference between thedisposal price and the net assets of the subsidiary company corresponding to the disposal of thelong-term equity investment is included in the shareholders' equity. If the parent company partiallydisposes of the long-term equity investment in the subsidiary company, resulting in the loss ofcontrol over the subsidiary company, it shall be handled according to the relevant accounting policiesmentioned in notes 4 and 6 "methods for preparing consolidated financial statements".For the disposal of long-term equity investment under other circumstances, the difference betweenthe book value of the disposed equity and the actual purchase price shall be included in the currentprofits and losses.For long-term equity investments that are accounted for by the equity method and the remainingequity after disposal are still accounted for by the equity method, other comprehensive incomeoriginally included in shareholders' equity shall be accounted for on the same basis as the directdisposal of relevant assets or liabilities by the invested entity according to the correspondingproportion. Owners' equity recognized due to changes in owners' equity other than net profit andloss, other comprehensive income and profit distribution of the investee shall be transferred to thecurrent profit and loss in proportion.For long-term equity investments that are accounted for by the cost method and the remaining equityis still accounted for by the cost method after disposal, other comprehensive income recognized bythe equity method accounting or financial instrument recognition and measurement standardsaccounting before obtaining control over the invested entity shall be accounted for on the same basisas the direct disposal of related assets or liabilities by the invested entity, and shall be carried forwardto the current profits and losses in proportion. Changes in other owner's equity other than net profitand loss, other comprehensive income and profit distribution in the net assets of the invested entityrecognized by the equity method are carried forward to the current profit and loss in proportion.14. Investment PropertyThe term “investment property” refers to the real estate held for generating rent and/or capitalappreciation. Investment property of the Company include the right to use any land which hasalready been rented; the right to use any land which is held and prepared for transfer afterappreciation; and the right to use any building which has already been rented.The initial measurement of the investment property shall be made at its cost. Subsequentexpenditures incurred for an investment property is included in the cost of the investment propertywhen it is probable that economic benefits associated with the investment property will flow to theCompany and the cost can be reliably measured, otherwise the expenditure is recognized in profit orloss in the period in which they are incurred.The Company shall make a follow-up measurement to the investment property by employing thecost pattern on the date of the balance sheet. An accrual depreciation or amortization shall be madefor the investment property in the light of the accounting policies of the use right of buildings or
Konka Group Co., Ltd. Annual Report 2019
172
lands.For details of impairment test method and withdrawal method of impairment provision of investmentproperty, please refer to Note IV. 20. “Long-term assets impairment”.When owner-occupied real estate or inventories are changed into investment property or investmentproperty is changed into owner-occupied real estate, of which book value prior to the change shall bethe entry value after the change.When an investment property is changed to an owner-occupied real estate, it would be transferred tofixed assets or intangible assets at the date of such change. When an owner-occupied real estate ischanged to be held to earn rental or for capital appreciation, the fixed asset or intangible asset istransferred to investment property at the date of such change. If the fixed asset or intangible asset ischanged into investment property measured by adopting the cost pattern, whose book value prior tothe change shall be the entry value after the change; if the fixed asset or intangible asset is changedinto investment property measured by adopting the fair value pattern, whose fair value on the date ofsuch change shall be the entry value after the changeAn investment property is derecognized on disposal or when the investment property is permanentlywithdrawn from use and no future economic benefits are expected from its disposal. The amount ofproceeds on sale, transfer, retirement or damage of an investment property less its carrying amountand related taxes and expenses is recognized in profit or loss in the period in which it is incurred.
15. Fixed Assets(1) Conditions for recognition of fixed assetsFixed assets refer to tangible assets held for the production of commodities, the provision of services,leasing or operation and management, whose service life exceeds one accounting year. Fixed assetsare recognized only when the economic benefits associated with them are likely to flow into thecompany and their costs can be reliably measured. Fixed assets are initially measured at cost, takinginto account the impact of expected abandonment costs.(2) Depreciation methods of each fixed assetThe fixed assets should be withdrawn and depreciation by straight-line depreciation within the usefullife since the next month when the fixed assets reach the estimated available state. The useful life,estimated net salvage and the yearly discounted rate of each fixed asset are as follows:
Category of fixed
assetsMethod
Useful life
(Year)
Expected net
salvage value
(%)
Annual
deprecation (%)
Housing and
building
Straight-line
depreciation20-40 5-10.00 2.25-4.75
Machinery
equipment
Straight-line
depreciation5-10 5-10.00 9.00-19.00
Electronic
equipment
Straight-line
depreciation3-5 5-10.00 18.00-31.67
Transportation
vehicle
Straight-line
depreciation3-5 5-10.00 18.00-31.67
Other equipmentStraight-line
depreciation5 5-10.00 18.00-19.00
The “expected net salvage value” refers to the expected amount that the Company may obtain from
Konka Group Co., Ltd. Annual Report 2019
173
the current disposal of a fixed asset after deducting the expected disposal expenses at the expirationof its expected useful life.(3) Testing method of impairment and withdrawal method of provision for impairment on fixedassetsFor details of the testing method of impairment and withdraw method of impairment provision forimpairment on fixed assets, please refer to Note IV. 20 “Long-term assets impairment”.(4) Recognition basis, pricing and depreciation method of fixed assets by finance leaseThe “finance lease” shall refer to a lease that has transferred in substance all the risks and rewardsrelated to the ownership of an asset. Its ownership may or may not eventually be transferred. Thefixed assets by finance lease shall adopt the same depreciation policy for self-owned fixed assets. Ifit is reasonable to be certain that the lessee will obtain the ownership of the leased asset when thelease term expires, the leased asset shall be fully depreciated over its useful life. If it is notreasonable to be certain that the lessee will obtain the ownership of the leased asset at the expiry ofthe lease term, the leased asset shall be fully depreciated over the shorter one of the lease term or itsuseful life.(5) Other explanationsThe follow-up expenses related to a fixed asset, if the economic benefits pertinent to this fixed assetare likely to flow into the enterprise and its cost can be reliably measured, shall be recorded into costof fixed assets and ultimately recognized as the carrying value of the replaced part; otherwise, theyshall be included in the current profits and losses.Terminate to recognize the fixed assets when the fixed assets under the disposing state or beestimated that could not occur any economy benefits through using or disposing. When the Companysells, transfers or discards any fixed assets, or when any fixed assets of the Company is damaged ordestroyed, the Company shall deduct the carrying value of the fixed assets as well as the relevanttaxes from the disposal income, and include the amount in the current profits and losses.The Company shall check the useful life, expected net salvage value and depreciation method of thefixed assets at the end of the year at least, if there is any change, it shall be regarded as a change ofthe accounting estimates.
16. Construction in ProgressConstruction in process is measured at actual cost. Actual cost comprises construction costs,borrowing costs that are eligible for capitalization before the fixed assets being ready for theirintended us and other relevant costs. Construction in process is transferred to fixed assets when theassets are ready for their intended use.For details of the testing method of impairment and withdraw method of impairment provision onconstruction in progress, please refer to Note IV. 20 “Long-term assets impairment”.
17. Borrowing CostsFor incurred borrowing costs, which can be directly attributed to fixed assets, investment real estateand inventory that need more than one year of purchasing, construction or production activities toreach the preset usable or sellable status, shall be capitalized when the asset expenditure has occurred,the borrowing costs have occurred, and the purchasing, construction or production activitiesnecessary for the asset to reach the preset usable or sellable status have begun; When the acquisition,construction or production of assets that meet the capitalization conditions reach the intended usableor sellable status, capitalization is stopped, and the borrowing costs incurred thereafter are includedin the profits and losses of the current period. If there is an abnormal interruption in the acquisition,construction or production of assets that meet the capitalization conditions and the interruption lastsfor more than 3 consecutive months, the capitalization of borrowing costs will be suspended until theacquisition, construction or production of assets starts again.The to-be-capitalized amount of interests shall be determined in light of the actual interests incurredof the specially borrowed loan at the present period minus the income of interests earned on theunused borrowing loans as a deposit in the bank or as a temporary investment; the enterprise shallcalculate and determine the to-be-capitalized amount on the general borrowing by multiplying the

Konka Group Co., Ltd. Annual Report 2019
174
weighted average asset disbursement of the part of the accumulative asset disbursements minus thegeneral borrowing by the capitalization rate of the general borrowing used. The capitalization rateshall be calculated and determined in light of the weighted average interest rate of the generalborrowing.During the capitalization period, the exchange differences of foreign currency special loans are fullycapitalized; the exchange differences of foreign currency general loans are included in the currentprofit and loss.
18. Intangible Assets(1) Intangible assetsThe term “intangible asset” refers to the identifiable non-monetary assets possessed or controlled byenterprises which have no physical shape.The intangible assets shall be initially measured according to its cost. The costs related with theintangible assets, if the economic benefits related to intangible assets are likely to flow into theenterprise and the cost of intangible assets can be measured reliably, shall be recorded into the costsof intangible assets; otherwise, it shall be recorded into current profits and losses upon theoccurrence.The use right of land gained is usually measured as intangible assets. For the self-developed andconstructed factories and other constructions, the related expenditures on use right of land andconstruction costs shall be respectively measured as intangible assets and fixed assets. For thepurchased houses and buildings, the related payment shall be distributed into the payment for useright of land and the payment for buildings, if it is difficult to be distributed, the whole payment shallbe treated as fixed assets.For intangible assets with a finite service life, from the time when it is available for use, the cost afterdeducting the sum of the expected salvage value and the accumulated impairment provision shall beamortized by straight line method during the service life. While the intangible assets without certainservice life shall not be amortized.At the end of period, the Company shall check the service life and amortization method of intangibleassets with finite service life, if there is any change, it shall be regarded as a change of theaccounting estimates. Besides, the Company shall check the service life of intangible assets withoutcertain service life, if there is any evidence showing that the period of intangible assets to bring theeconomic benefits to the enterprise can be prospected, it shall be estimated the service life andamortized in accordance with the amortization policies for intangible assets with finite service life.(2) R & D expensesThe expenditures for internal research and development projects of an enterprise shall be classifiedinto research expenditures and development expenditures.The research expenditures shall be recorded into the profit or loss for the current period.The development expenditures shall be confirmed as intangible assets when they satisfy thefollowing conditions simultaneously, and shall be recorded into profit or loss for the current periodwhen they don’t satisfy the following conditions.① It is feasible technically to finish intangible assets for use or sale;② It is intended to finish and use or sell the intangible assets;③ The usefulness of methods for intangible assets to generate economic benefits shall be proved,including being able to prove that there is a potential market for the products manufactured byapplying the intangible assets or there is a potential market for the intangible assets itself or theintangible assets will be used internally;④ It is able to finish the development of the intangible assets, and able to use or sell the intangibleassets, with the support of sufficient technologies, financial resources and other resources;⑤ The development expenditures of the intangible assets can be reliably measured.As for expenses that can’t be identified as research expenditures or development expenditures, theoccurred R & D expenses shall be all included in current profits and losses.(3) Testing method of impairment and withdraw method of impairment provision of intangible assets
Konka Group Co., Ltd. Annual Report 2019
175
For details of the testing method of impairment and withdraw method of impairment provision onintangible assets, see Notes IV. 20 “Long-term assets impairment”.
19. Long-term Deferred ExpensesLong-term deferred expenses refer to general expenses with the apportioned period over one year(one year excluded) that have occurred but attributable to the current and future periods. Long-termdeferred expenses shall be amortized averagely within benefit period.
20. Impairment of Long-termAssetsFor non-current financial Assets of fixed Assets, projects under construction, intangible Assets withlimited service life, investing real estate with cost model, long-term equity investment of subsidiaries,cooperative enterprises and joint ventures, the Company should judge whether decrease in valueexists on the date of balance sheet. Recoverable amounts should be tested for decrease in value if itexists. Other intangible Assets of reputation and uncertain service life and other non-accessibleintangible assets should be tested for decrease in value no matter whether it exists.If the recoverable amount is less than carrying value in impairment test results, the provision forimpairment of differences should include in impairment loss. Recoverable amounts would be thehigher of net value of asset fair value deducting disposal charges or present value of predicted cashflow. Asset fair value should be determined according to negotiated sales price of fair trade. If nosales agreement exists but with asset active market, fair value should be determined according to theBuyer’s price of the asset. If no sales agreement or asset active market exists, asset fair value couldbe acquired on the basis of best information available. Disposal expenses include legal fees, taxes,cartage or other direct expenses of merchantable Assets related to asset disposal. Present value ofpredicted asset cash flow should be determined by the proper discount rate according to Assets inservice and predicted cash flow of final disposal. Asset depreciation reserves should be calculated onthe basis of single Assets. If it is difficult to predict the recoverable amounts for single Assets,recoverable amounts should be determined according to the belonging asset group. Asset group is theminimum asset combination producing cash flow independently.In impairment test, carrying value of the business reputation in financial report should be shared tobeneficial asset group and asset group combination in collaboration of business merger. It is shownin the test that if recoverable amounts of shared business reputation asset group or asset groupcombination are lower than book value, it should determine the impairment loss. Impairment lossamount should firstly be deducted and shared to the carrying value of business reputation of assetgroup or asset group combination, then deduct carrying value of all assets according to proportionsof other carrying value of above assets in asset group or asset group combination except businessreputation.After the asset impairment loss is determined, recoverable value amounts would not be returned infuture.
21. Employee CompensationEmployee compensation of the Company mainly includes short-term employee compensation,departure benefits, demission benefits and other long-term employee compensation. Of which:Short-term compensation mainly including salary, bonus, allowances and subsidies, employeeservices and benefits, medical insurance premiums, birth insurance premium, industrial injuryinsurance premium, housing fund, labour union expenditure and personnel education fund,non-monetary benefits etc. The short-term compensation actually happened during the accountingperiod when the active staff offering the service for the Company should be recognized as liabilitiesand is included in the current gains and losses or relevant assets cost. Of which the non-monetarybenefits should be measured according to the fair value.Welfare after demission mainly includes setting drawing plan. Defined contribution plans includebasic endowment insurance, unemployment insurance and annuity. Deposited amounts are chargedto relevant asset costs or current profits and losses during the period in which they are incurred.Defined benefit plan of the Company is internal early retirement plan. According to anticipated
Konka Group Co., Ltd. Annual Report 2019
176
accumulative welfare unit, the Company makes estimates by unbiased and consistent actuarialassumption for the demographic variables and financial variables, measures the obligations producedin defined benefit plans, and determines the vesting period. On balance sheet date, the Company willlist all obligations in defined benefit plans as present value and include current service costs intocurrent profits and losses.When terminating labour relations before expiration of contract, or layoffs with compensations, andthe Company cannot terminate the labour relations unilaterally or reduce the demission welfare,remuneration and liabilities produced from the demission welfare should be determined and includedin current profits and losses when determining the costs of demission welfare and recombination.However, demission welfare not fully paid within 12 months after annual Reporting Period should behandled the same as other long-term employees’ payrolls.The inside employee retirement plan is treated by adopting the same principle with the above dismission welfare. The Company would recorded the salary and the social security insurance fees paid andso on from the employee’s service termination date to normal retirement date into current profits andlosses (dismission welfare) under the condition that they meet the recognition conditions ofestimated liabilities.The other long-term welfare that the Company offers to the staffs, if met with the setting drawingplan, should be accounting disposed according to the setting drawing plan, while the rest should bedisposed according to the setting revenue plan.
22. ProvisionsThe Company should recognize the related obligation as a provision for liability when the obligationmeets the following conditions: (1) That obligation is a present obligation of the enterprise; (2) It isprobable that an outflow of economic benefits from the enterprise will be required to settle theobligation; (3) A reliable estimate can be made of the amount of the obligation.On the balance sheet date, an enterprise shall take into full consideration of the risks, uncertainty,time value of money, and other factors pertinent to the Contingencies to measure the provisions inaccordance with the best estimate of the necessary expenses for the performance of the currentobligation.When all or some of the expenses necessary for the liquidation of an provisions of an enterprise isexpected to be compensated by a third party, the compensation should be separately recognized as anasset only when it is virtually certain that the reimbursement will be obtained. Besides, the amountrecognized for the reimbursement should not exceed the carrying value of the estimated liabilities.
23. Recognition and Measurement of revenue(1) Revenue from selling goodsNo revenue from selling goods may be recognized unless the following conditions are metsimultaneously: the significant risks and rewards of ownership of the goods have been transferred tothe buyer by the enterprise; the enterprise retains neither continuous management right that usuallykeeps relation with the ownership nor effective control over the sold goods; the relevant amount ofrevenue can be measured in a reliable way; the relevant economic benefits may flow into theenterprise; and the relevant costs incurred or to be incurred can be measured in a reliable way.The recognition of revenue from commodities for the home market when shipping the goods ortransferring property in goods; for goods exported, the revenue shall be recognized once the goodsare cleared through customs and delivered to the carrier designated by the purchaser; for goodsdirectly traded in overseas, the revenue shall be recognized when customers pick up the goods or thegoods are delivered to the assigned place by customers.(2) Providing labour servicesIf the Company can reliably estimate the outcome of a transaction concerning the labour services itprovides, it shall recognize the revenue from providing services employing thepercentage-of-completion method on the date of the balance sheet. The completed proportion of atransaction concerning the providing of labour services shall be decided by the proportion of thelabour service already provided to the total labour service to provide.

Konka Group Co., Ltd. Annual Report 2019
177
The outcome of a transaction concerning the providing of labour services can be measured in areliable way, means that the following conditions shall be met simultaneously: ① The amount ofrevenue can be measured in a reliable way; ② The relevant economic benefits are likely to flow intothe enterprise; ③ The schedule of completion under the transaction can be confirmed in a reliableway; and④ The costs incurred or to be incurred in the transaction can be measured in a reliable way.If the outcome of a transaction concerning the providing of labour services cannot be measured in areliable way, the revenue from the providing of labour services shall be recognized in accordancewith the amount of the cost of labour services incurred and expected to be compensated, and makethe cost of labour services incurred as the current expenses. If it is predicted that the cost of labourservices incurred couldn’t be compensated, thus no revenue shall be recognized.Where a contract or agreement signed between Company and other enterprises concerns sellinggoods and providing of labour services, if the part of sale of goods and the part of providing labourservices can be distinguished from each other and can be measured respectively, the part of sale ofgoods and the part of providing labour services shall be treated respectively. If the part of sellinggoods and the part of providing labour services cannot be distinguished from each other, or if the partof sale of goods and the part of providing labour services can be distinguished from each other butcannot be measured respectively, both parts shall be conducted as selling goods.(3) Construction contract incomeUnder circumstance of that the outcome of the construction contract can be reliably estimated, thecontract income and costs are confirmed on the balance sheet date in accordance with the percentageof completion method. The completion of the contract is determined by the proportion of theincurred labor costs to the estimated total costs.That the result of the construction contract can be reliably estimated refers to that: ① the totalincome of the contract can be reliably measured; ②the economic benefits related to the contract arelikely to flow into the enterprise;③The actual contract costs can be clearly differentiated and reliablymeasured; ④ the completion of the contract and the costs needed to complete the contract can bereliably determined.If the result of the construction contract cannot be reliably estimated, but the contract cost can berecovered, the contract income can be confirmed according to the actual contract cost that can berecovered, and the contract cost is confirmed as the contract expense in the current occurring period;for the contract cost that cannot be recovered, it is immediately confirmed as the contract cost but notthe contract income when it occurs. If the uncertainties that make the results of the constructioncontract cannot be reliably estimated are no longer in existence, the income and expenses related tothe construction contract are determined according to the percentage of completion method.If the estimated total cost of the contract exceeds the total contract income, the estimated loss isconfirmed as the current expense.The accumulated costs incurred in the contract in progress, the accumulated recognized gross profit(loss) and the settled price are stated in the balance sheet as net offset. The part of the sum of theaccumulated costs incurred in the contract in progress and the accumulated recognized gross profit(loss) that exceeds the settled price is stated as the inventory; the part of the settlement costs of thecontract in progress that exceeds the sum of the accumulated costs incurred and the accumulatedrecognized gross profit (loss) are stated as account collected in advance.(4) Business income of BOT and PPPThe Company participates in the construction of public infrastructure by means of BOT and PPP.During the construction period, the Company recognizes the relevant revenue and expenses fromproviding services in accordance with ASBE No. 15 - Construction Contracts. After the completionof infrastructure, the Company recognizes the revenue from related to follow-up services inaccordance with ASBE No. 14 - Revenue.Revenue from construction contracts is measured at the fair value of collected consideration orconsideration receivable (generally the amount of construction contracts), and financial assets orintangible assets are recognized, in the recognition of revenue, in the following circumstances:

Konka Group Co., Ltd. Annual Report 2019
178
① The contract stipulates that within a certain period after the completion of infrastructure, thecompany undertaken the project may unconditionally collect money or other financial assets of afixed amount from the party awarding the contract; or, where the services fee charged by thecompany undertaken the project is lower than a specified amount, and the party awarding thecontract is responsible for compensating the relevant price difference to the company undertaken theproject in accordance with the contract, in the recognition of revenue, financial assets are recognizedand treated in accordance with the provisions of ASBE No. 22 - Recognition and Measurement ofFinancial Instruments.② The contract stipulates that the Company has the right to collect fees from the party receivingservices within a certain period of time after the completion of relevant infrastructure. However, ifthe amount of fees is uncertain, this right does not constitute an unconditional right to collect cash.The Company undertaken the project shall recognize intangible assets in the recognition of revenue.In case that interest on borrowing occurs in the construction process, it shall be treated in accordancewith the provisions of ASBE No. 17 - Borrowing Costs.In case that the project company fails to provide actual construction services and contracts theinfrastructure construction to other parties, there will be no recognition of revenue from constructionservices, and the project price paid in the construction process is recognized as financial assets orintangible assets in accordance with the contract.(5) Interest revenueThe amount of interest revenue should be measured and confirmed in accordance with the length oftime for which the Company’s monetary fund is used by others and the agreed interest rate.(6) Property leasing revenueFor the recognition method of the property leasing revenue, please refer to Notes IV. 26.(7) Factoring business revenueTake the paid-in factoring payment as the fair value to carry out initial measurement. Subsequentmeasurement shall be carried out as per the effective interest method according to the amortized cost.Take the balance between the fair value initially confirmed and transferred amount of accountsreceivable or face value of notes receivable as the interest income by effective interests method andamortized costs during the financing period or the rest credit period; interest income shall berecognized by straight-line method if it is due within 1 year. The profits and losses from terminationof recognition, impairment, and amortization shall be included into the current profits and losses.(8) Finance lease incomeAs a financial lessor, the Company recognizes, on the beginning date of the lease term, the sum ofthe minimum rental receivables on the lease start date and the initial direct costs as the entry value offinancial lease receivable, and records the unguaranteed residential value. The difference between thesum of minimum rental receivables plus the unguaranteed residential value and the present value isrecognized as unrealized financing revenue.Unrealized financing revenue is measured using the real interest rate method during the lease termand recognized as current financing lease revenue. Contingent rents are included in current profitsand losses when they actually occur.
24. Government Grants(1) Types of government grantsGovernment grants refer to monetary or non-monetary assets obtained by the company from thegovernment for free (but excluding the capital invested by the government as the owner), which aremainly divided into government grants related to assets and government grants related to income . Ifthe government grants is a monetary asset, it shall be measured according to the amount received orreceivable. If the government grants is a non-monetary asset, it shall be measured at its fair value; ifits fair value cannot be obtained reliably, it shall be measured at its nominal amount. Governmentgrants measured in nominal amounts are directly included in the current profit and loss.(2) Accounting treatment method of government grantsThe government grants related to assets refer to the government grants obtained by the company for
Konka Group Co., Ltd. Annual Report 2019
179
the purchase or construction or other forms of long-term assets. The company's asset-relatedgovernment grants, offsetting the book value of related assets or recognized as deferred income, andrecognized as deferred income, shall be included in the current profit and loss in installmentsaccording to a reasonable and systematic method within the useful life of the relevant assets;government grants related to income refer to government grants obtained by the company in additionto government grants related to assets. The company's government grants related to income used tocompensate the company's related costs or losses in subsequent periods are recognized as deferredincome, and during the period when the related costs or losses are recognized, they are included inthe current profit or loss or offset related Cost expense or loss; if it is used to compensate the relevantcost expense or loss incurred by the company, it is directly included in the current profit and loss oroffset the relevant cost expense or loss.(3) Confirmation timing of government grantsgovernment grants measured in accordance with the amount receivable are confirmed when there issolid evidence at the end of the period that they can meet the relevant conditions stipulated by thefinancial support policy and it is expected that the financial support funds can be received.Except for government grants measured in accordance with the receivable amount, the company willrecognize the subsidies when they actually receive the subsidies.
25. Deferred Income TaxAssets/Deferred Income Tax Liabilities(1) Income tax of the current periodOn the balance sheet date, for the current income tax liabilities (or assets) of the current period aswell as the part formed during the previous period, should be measured by the income tax of theestimated payable (returnable) amount which be calculated according to the regulations of the taxlaw.(2) Deferred income tax assets and deferred income tax liabilitiesThe difference between the carrying value of certain assets and liabilities and their tax assessmentbasis, as well as the temporary difference occurs from the difference between the carrying value ofthe items which not be recognized as assets and liabilities but could confirm their tax assessmentbasis according to the regulations of the tax law, the deferred income tax assets and the deferredincome tax liabilities should be recognized by adopting liabilities law of the balance sheet.No deferred tax liability is recognized for a temporary difference arising from the initial recognitionof goodwill, the initial recognition of assets or liabilities due to a transaction other than a businesscombination, which affects neither accounting profit nor taxable profit (or deductible loss). Besides,no deferred tax assets is recognized for the taxable temporary differences related to the investmentsof subsidiary companies, associated enterprises and joint enterprises, and the investing enterprise cancontrol the time of the reverse of temporary differences as well as the temporary differences areunlikely to be reversed in the excepted future. Otherwise, the Company should recognize thedeferred income tax liabilities arising from other taxable temporary difference.No deferred taxable assets should be recognized for the deductible temporary difference of initialrecognition of assets and liabilities arising from the transaction which is not business combination,the accounting profits will not be affected, nor will the taxable amount or deductible loss be affectedat the time of transaction. Besides, no deferred taxable assets should be recognized for the deductibletemporary difference related to the investments of the subsidiary companies, associated enterprisesand joint enterprises, which are not likely to be reversed in the expected future or is not likely toacquire any amount of taxable income tax that may be used for making up such deductible temporarydifferences. Otherwise, the Company shall recognize the deferred income tax assets arising from adeductible temporary difference basing on the extent of the amount of the taxable income that islikely to be acquired to make up such deductible temporary differencesFor any deductible loss or tax deduction that can be carried forward to the next year, thecorresponding deferred income tax asset shall be determined to the extent that the amount of futuretaxable income to be offset by the deductible loss or tax deduction to be likely obtained.On the balance sheet date, the deferred income tax assets and the deferred income tax liabilities shallbe measured at the tax rate applicable to the period during which the assets are expected to be
Konka Group Co., Ltd. Annual Report 2019
180
recovered or the liabilities are expected to be settled.The carrying value of deferred income tax assets shall be reviewed at each balance sheet date. If it isunlikely to obtain sufficient taxable income to offset against the benefit of the deferred income taxasset, the carrying value of the deferred income tax assets shall be written down. Any suchwrite-down should be subsequently reversed where it becomes probable that sufficient taxableincome will be available.(3) Income tax expensesIncome tax expenses include current income tax and deferred income tax.The rest current income tax and the deferred income tax expenses or revenue should be included intocurrent gains and losses except for the current income tax and the deferred income tax related to thetransaction and events that be confirmed as other comprehensive income or be directly included inthe shareholders’ equity which should be included in other comprehensive income or shareholders’equity as well as the carrying value for adjusting the goodwill of the deferred income tax occurs fromthe business combination.(4) Offset of income taxThe current income tax assets and liabilities of the Company should be listed by the written-off netamount which intend to executes the net amount settlement as well as the assets acquiring andliabilities liquidation at the same time while owns the legal rights of settling the net amount.The deferred income tax assets and liabilities of the Company should be listed as written-off netamount when having the legal rights of settling the current income tax assets and liabilities by netamount and the deferred income tax and liabilities is relevant to the income tax which be collectedfrom the same taxpaying bodies by the same tax collection and administration department or isrelevant to the different taxpaying bodies but during each period which there is significant reverse ofthe deferred income assets and liabilities in the future and among which the involved taxpayingbodies intend to settle the current income tax and liabilities by net amount or are at the same timeacquire the asset as well as liquidate the liabilities.
26. LeasingFinancing leasing virtually transferred the whole risks and leasing of the compensation related to theassets ownership and their ownership may eventually be transferred or maybe not. Other leasingexcept for the financing leasing is operating leasing.(1) Business of operating leases recorded by the Company as the lesseeThe rent expenses from operating leases shall be recorded by the lessee in the relevant asset costs orthe profits and losses of the current period by using the straight-line method over each period of thelease term. The initial direct costs shall be recognized as the profits and losses of the current period.The contingent rents shall be recorded into the profits and losses of the current period in which theyactually arise.(2) Business of operating leases recorded by the Company as the lessorThe rent incomes from operating leases shall be recognized as the profits and losses of the currentperiod by using the straight-line method over each period of the lease term. The initial direct costs ofgreat amount shall be capitalized when incurred, and be recorded into current profits and losses inaccordance with the same basis for recognition of rent incomes over the whole lease term. The initialdirect costs of small amount shall be recorded into current profits and losses when incurred. Thecontingent rents shall be recorded into the profits and losses of the current period in which theyactually arise.(3) Business of finance leases recorded by the Company as the lesseeOn the lease beginning date, the Company shall record the lower one of the fair value of the leasedasset and the present value of the minimum lease payments on the lease beginning date as theentering value in an account, recognize the amount of the minimum lease payments as the enteringvalue in an account of long-term account payable, and treat the balance between the recorded amountof the leased asset and the long-term account payable as unrecognized financing charges. Besides,the initial direct costs directly attributable to the leased item incurred during the process of leasenegotiating and signing the leasing agreement shall be recorded in the asset value of the current
Konka Group Co., Ltd. Annual Report 2019
181
period. The balance through deducting unrecognized financing charges from the minimum leasepayments shall be respectively stated in long-term liabilities and long-term liabilities due within 1year.Unrecognized financing charges shall be adopted by the effective interest rate method in the leaseterm, so as to calculate and recognize current financing charges. The contingent rents shall berecorded into the profits and losses of the current period in which they actually arise.(4) Business of finance leases recorded by the Company as the lessorOn the beginning date of the lease term, the Company shall recognize the sum of the minimum leasereceipts on the lease beginning date and the initial direct costs as the entering value in an account ofthe financing lease values receivable, and record the unguaranteed residual value at the same time.The balance between the sum of the minimum lease receipts, the initial direct costs and theunguaranteed residual value and the sum of their present values shall be recognized as unrealizedfinancing income. The balance through deducting unrealized financing incomes from the financelease accounts receivable shall be respectively stated in long-term claims and long-term claims duewithin 1 year.Unrecognized financing incomes shall be adopted by the effective interest rate method in the leaseterm, so as to calculate and recognize current financing revenues. The contingent rents shall berecorded into the profits and losses of the current period in which they actually arise.
27. Other Main Accounting Policies and Estimates(1)Termination of operationTermination of operation refers to a separately identifiable constituent part that satisfies one of thefollowing conditions that has been disposed of by the Company or is classified as held-for-sale:This constituent part represents an independent main business or a separate main business area; This constituent part is part of an associated plan that is intended to be disposed of in an independentmain business or a separate major business area; This constituent part is a subsidiary that isspecifically acquired for resale.(2) Hedging AccountingTo avoid certain risks, the Company carries out hedging of some financial instruments as hedgingtools. The Company treats hedging that meets specified conditions using hedging accounting method.The Company's hedging is fair -value hedging, and treats the hedging of foreign exchange risk withdefinite undertaking at fair value. At the beginning of hedging, the Company records the relationshipbetween hedging tools and hedged items, risk management objectives and strategies for differenthedging transactions. In addition, at the beginning and after the hedging, the Company conductscontinuous evaluation of the effectiveness of hedging to check whether the hedging is highlyeffective during the accounting period in which the hedging relationship is designated.Fair value hedging is a qualified derivative instrument designated for fair value hedging, and thegains or losses resulting from its changes in fair value are included in the current profits and losses.The gains or losses of the hedged items due to hedged risks are also included in the current profitsand losses, and the carrying value of the hedged items is also adjusted. When the Company cancelsthe designation of hedging relationship, the hedging instrument expires or is sold, the contract isterminated or exercised, or the conditions are no longer satisfied, the use of hedging accounting isterminated.
28. Changes in Main Accounting Policies and Estimates(1) Changes of accounting policies1) Changes of accounting policies due to implementing the new standards governing financialinstrumentsThe Ministry of Finance issued the Accounting Standards for Business EnterprisesNo.22-Recognition and Measurement of Financial Instruments (revised in 2017) (CK [2017]No.7),Accounting Standards for Business Enterprises No.23-Transfer of Financial Assets (revised in 2017)(CK[2017]No.8), and Accounting Standards for Business Enterprises No.24-Hedge Accounting(revised in 2017) (CK[2017]No.9) on 31 March 2017, and issued the Accounting Standards for
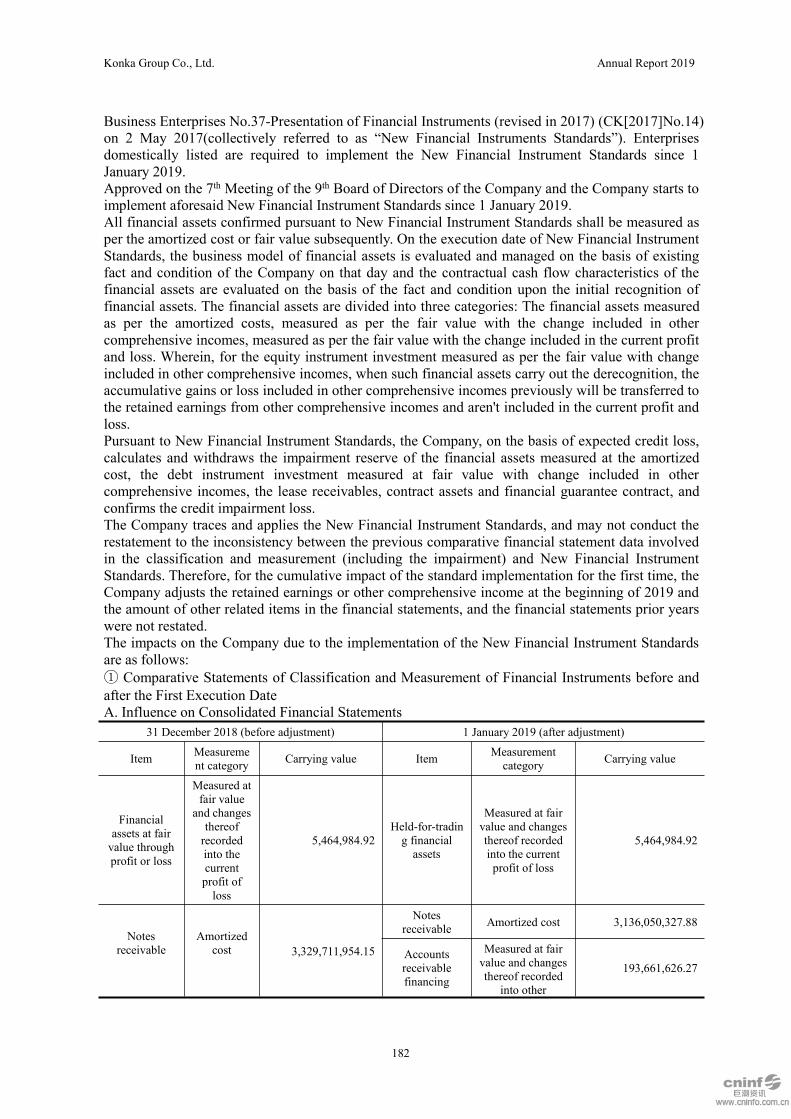
Konka Group Co., Ltd. Annual Report 2019
182
Business Enterprises No.37-Presentation of Financial Instruments (revised in 2017) (CK[2017]No.14)on 2 May 2017(collectively referred to as “New Financial Instruments Standards”). Enterprisesdomestically listed are required to implement the New Financial Instrument Standards since 1January 2019.Approved on the 7th Meeting of the 9th Board of Directors of the Company and the Company starts toimplement aforesaid New Financial Instrument Standards since 1 January 2019.All financial assets confirmed pursuant to New Financial Instrument Standards shall be measured asper the amortized cost or fair value subsequently. On the execution date of New Financial InstrumentStandards, the business model of financial assets is evaluated and managed on the basis of existingfact and condition of the Company on that day and the contractual cash flow characteristics of thefinancial assets are evaluated on the basis of the fact and condition upon the initial recognition offinancial assets. The financial assets are divided into three categories: The financial assets measuredas per the amortized costs, measured as per the fair value with the change included in othercomprehensive incomes, measured as per the fair value with the change included in the current profitand loss. Wherein, for the equity instrument investment measured as per the fair value with changeincluded in other comprehensive incomes, when such financial assets carry out the derecognition, theaccumulative gains or loss included in other comprehensive incomes previously will be transferred tothe retained earnings from other comprehensive incomes and aren't included in the current profit andloss.Pursuant to New Financial Instrument Standards, the Company, on the basis of expected credit loss,calculates and withdraws the impairment reserve of the financial assets measured at the amortizedcost, the debt instrument investment measured at fair value with change included in othercomprehensive incomes, the lease receivables, contract assets and financial guarantee contract, andconfirms the credit impairment loss.The Company traces and applies the New Financial Instrument Standards, and may not conduct therestatement to the inconsistency between the previous comparative financial statement data involvedin the classification and measurement (including the impairment) and New Financial InstrumentStandards. Therefore, for the cumulative impact of the standard implementation for the first time, theCompany adjusts the retained earnings or other comprehensive income at the beginning of 2019 andthe amount of other related items in the financial statements, and the financial statements prior yearswere not restated.The impacts on the Company due to the implementation of the New Financial Instrument Standardsare as follows:① Comparative Statements of Classification and Measurement of Financial Instruments before andafter the First Execution DateA. Influence on Consolidated Financial Statements
31 December 2018 (before adjustment) 1 January 2019 (after adjustment)
Item Measurement category Carrying value Item Measurement
category Carrying value
Financialassets at fairvalue throughprofit or loss
Measured atfair valueand changesthereofrecordedinto thecurrentprofit ofloss
5,464,984.92Held-for-trading financialassets
Measured at fairvalue and changesthereof recordedinto the currentprofit of loss
5,464,984.92
Notesreceivable
Amortizedcost 3,329,711,954.15
Notesreceivable Amortized cost 3,136,050,327.88
Accountsreceivablefinancing
Measured at fairvalue and changesthereof recorded
into other
193,661,626.27
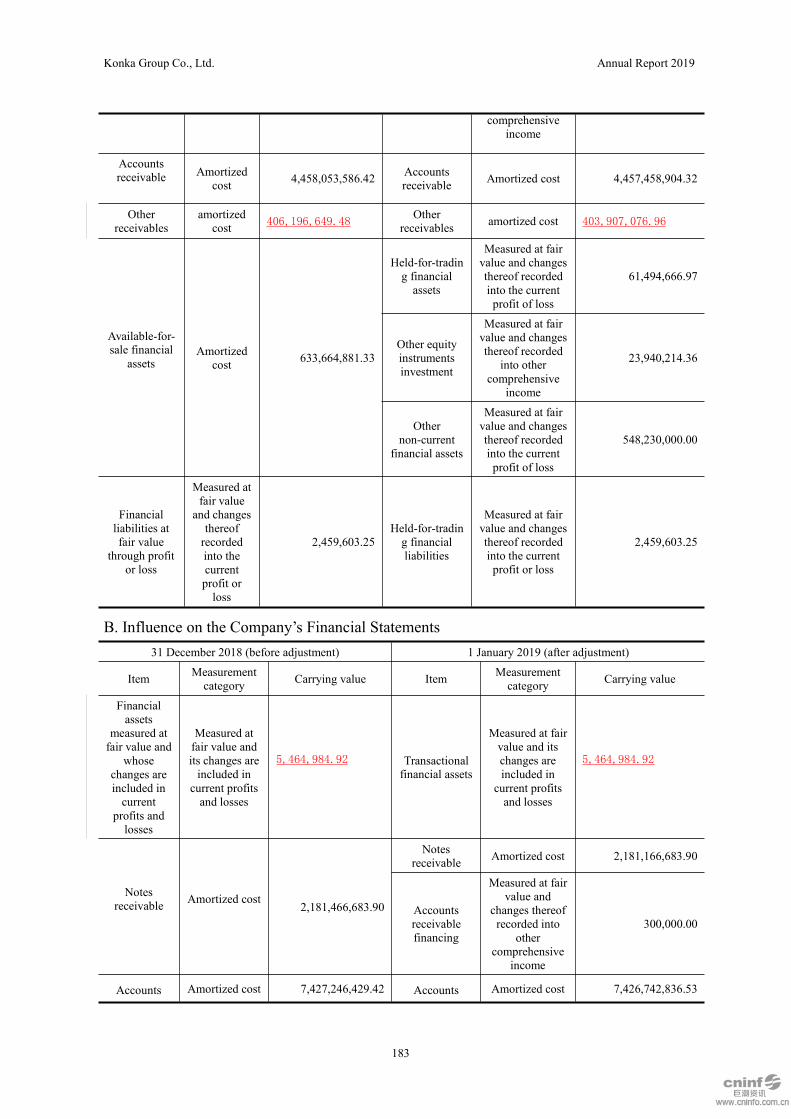
Konka Group Co., Ltd. Annual Report 2019
183
comprehensiveincome
Accountsreceivable Amortized
cost 4,458,053,586.42 Accountsreceivable Amortized cost 4,457,458,904.32
Otherreceivables
amortizedcost 406,196,649.48
Otherreceivables amortized cost 403,907,076.96
Available-for-sale financial
assetsAmortized
cost 633,664,881.33
Held-for-trading financialassets
Measured at fairvalue and changesthereof recordedinto the currentprofit of loss
61,494,666.97
Other equityinstrumentsinvestment
Measured at fairvalue and changesthereof recorded
into othercomprehensive
income
23,940,214.36
Othernon-current
financial assets
Measured at fairvalue and changesthereof recordedinto the currentprofit of loss
548,230,000.00
Financialliabilities atfair value
through profitor loss
Measured atfair valueand changesthereofrecordedinto thecurrentprofit orloss
2,459,603.25Held-for-trading financialliabilities
Measured at fairvalue and changesthereof recordedinto the currentprofit or loss
2,459,603.25
B. Influence on the Company’s Financial Statements31 December 2018 (before adjustment) 1 January 2019 (after adjustment)
Item Measurementcategory Carrying value Item Measurement
category Carrying value
Financialassets
measured atfair value and
whosechanges areincluded incurrent
profits andlosses
Measured atfair value andits changes areincluded in
current profitsand losses
5,464,984.92 Transactionalfinancial assets
Measured at fairvalue and itschanges areincluded in
current profitsand losses
5,464,984.92
Notesreceivable Amortized cost
2,181,466,683.90
Notesreceivable Amortized cost 2,181,166,683.90
Accountsreceivablefinancing
Measured at fairvalue and
changes thereofrecorded into
othercomprehensive
income
300,000.00
Accounts Amortized cost 7,427,246,429.42 Accounts Amortized cost 7,426,742,836.53

Konka Group Co., Ltd. Annual Report 2019
184
receivable receivable
Otherreceivables amortized cost 6,661,693,463.33
Otherreceivables amortized cost 6,660,069,55
Available-for-sale
financialassets
Amortized cost 326,164,881.33
Held-for-trading financialassets
Measured at fairvalue and
changes thereofrecorded intothe currentprofit of loss
61,494,666.97
Other equityinstrumentsinvestment
Measured at fairvalue and
changes thereofrecorded into
othercomprehensive
income
14,440,214.36
Othernon-current
financial assets
Measured at fairvalue and
changes thereofrecorded intothe currentprofit of loss
250,230,000.00
Financialliabilities atfair valuethrough
profit or loss
Measured atfair value andchanges thereofrecorded intothe currentprofit or loss
2,459,603.25Held-for-trading financialliabilities
Measured at fairvalue and
changes thereofrecorded intothe currentprofit or loss
2,459,603.25
②Reconciliation Statements on Adjustment of Carrying Value of Original Financial Instruments tothat of New Financial Instruments Classified and Measured in Accordance with New FinancialInstruments Standards on the First Execution DateA. Influence on Consolidated Financial Statements
Item 31 December 2018(before adjustment)
Reclassified Remeasured 1 January 2019 (afteradjustment)
Amortized cost:
Notes receivable 3,329,711,954.15 - - -Less: transferred toaccounts receivablefinancing
- 193,661,626.27 - -
Remeasurement:provisions for expectedcredit loss
- - - -
Balance presentedaccording to newfinancial instrumentsstandards
- - - 3,136,050,327.88
Accounts receivable 4,458,053,586.42 - - -Less: transferred toaccounts receivablefinancing
- - - -
Remeasurement:provision for expectedcredit losses
- - 594,682.10 -
Balance presentedaccording to newfinancial instrumentsstandards
- - - 4,457,458,904.32

Konka Group Co., Ltd. Annual Report 2019
185
Item 31 December 2018(before adjustment)
Reclassified Remeasured 1 January 2019 (afteradjustment)
Other receivables 406,196,649.48 - - -Remeasurement:provision for expectedcredit losses
- - 2,289,572.52 -
Balance presentedaccording to newfinancial instrumentsstandards
- - - 403,907,076.96
At fair value throughprofit or loss:Held-for-tradingfinancial assets - - - -
Add: transferred fromfinancial assets at fairvalue through profit orloss (classifiedaccording to originalstandards)
- 5,464,984.92 - -
Add: transferred fromavailable-for-salefinancial assets(orginal standards)
- 61,494,666.97 - -
Balance presentedaccording to newfinancial instrumentsstandards
- - - 66,959,651.89
Available-for-salefinancial assets 633,664,881.33 - - -
Less: held-for-tradingfinancial assets - 61,494,666.97 - -
Less: other equityinstrument investments - 23,940,214.36 - -
Less: other non-currentfinancial assets - 548,230,000.00 - -
Remeasurement:provisions for expectedcredit loss
- - - -
Balance presentedaccording to newfinancial instrumentsstandards
- - - -
Other non-currentfinancial assets - - - -
Transferred fromavailable-for-salefinancial assets
- 548,230,000.00 - -
Balance presentedaccording to newfinancial instrumentsstandards
- - - 548,230,000.00
Held-for-tradingfinancial liabilities - -
Add: transferred fromfinancial liabilities atfair value throughprofit or loss(classified according to
- 2,459,603.25 -
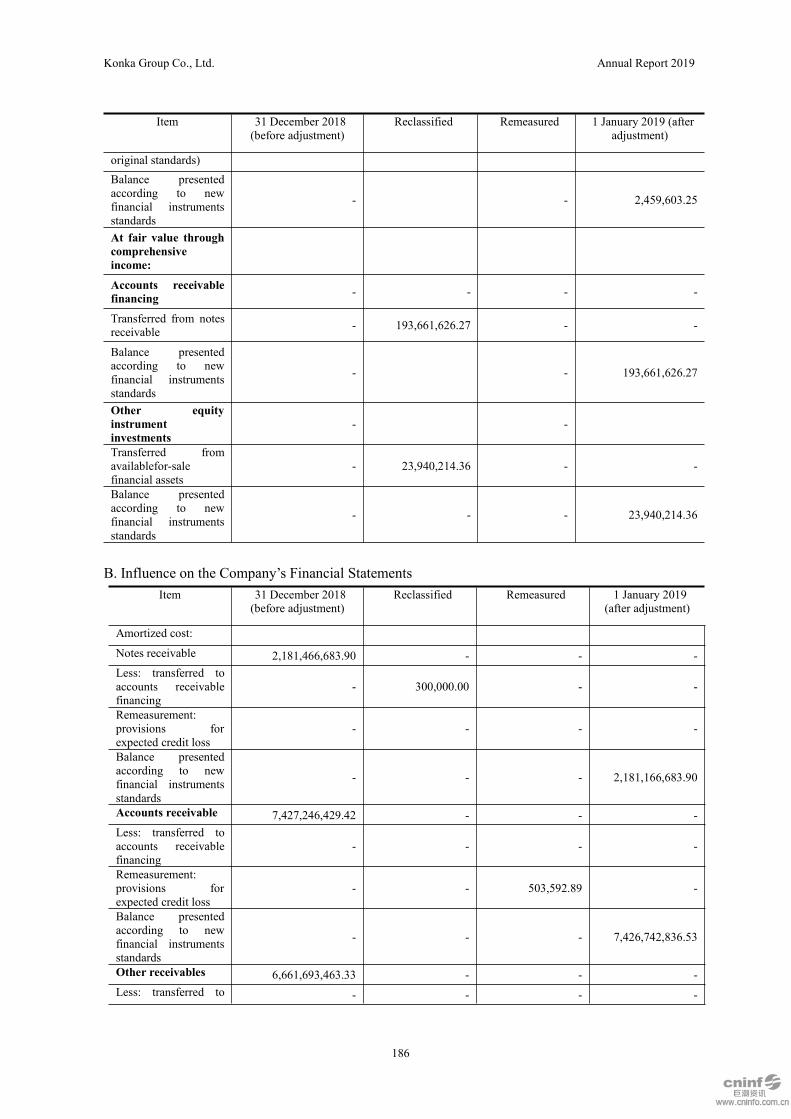
Konka Group Co., Ltd. Annual Report 2019
186
Item 31 December 2018(before adjustment)
Reclassified Remeasured 1 January 2019 (afteradjustment)
original standards)Balance presentedaccording to newfinancial instrumentsstandards
- - 2,459,603.25
At fair value throughcomprehensiveincome:
Accounts receivablefinancing - - - -
Transferred from notesreceivable - 193,661,626.27 - -
Balance presentedaccording to newfinancial instrumentsstandards
- - 193,661,626.27
Other equityinstrumentinvestments
- -
Transferred fromavailablefor-salefinancial assets
- 23,940,214.36 - -
Balance presentedaccording to newfinancial instrumentsstandards
- - - 23,940,214.36
B. Influence on the Company’s Financial StatementsItem 31 December 2018
(before adjustment)Reclassified Remeasured 1 January 2019
(after adjustment)
Amortized cost:
Notes receivable 2,181,466,683.90 - - -Less: transferred toaccounts receivablefinancing
- 300,000.00 - -
Remeasurement:provisions forexpected credit loss
- - - -
Balance presentedaccording to newfinancial instrumentsstandards
- - - 2,181,166,683.90
Accounts receivable 7,427,246,429.42 - - -Less: transferred toaccounts receivablefinancing
- - - -
Remeasurement:provisions forexpected credit loss
- - 503,592.89 -
Balance presentedaccording to newfinancial instrumentsstandards
- - - 7,426,742,836.53
Other receivables 6,661,693,463.33 - - -Less: transferred to - - - -

Konka Group Co., Ltd. Annual Report 2019
187
Item 31 December 2018(before adjustment)
Reclassified Remeasured 1 January 2019(after adjustment)
accounts receivablefinancingRemeasurement:provision for expectedcredit losses
- - 1,623,912.27 -
Balance presentedaccording to newfinancial instrumentsstandards
- - - 6,660,069,551.06
At fair valuethrough profit orloss:Helf-for-tradingfinancial assets - - - -
Add: transferred fromfinancial assets at fairvalue through profitor loss (classifiedaccording to originalstandards)
- 5,464,984.92 - -
Add: transferred fromavailable-for-salefinancial assets(original standards)
- 61,494,666.97 - -
Balance presentedaccording to newfinancial instrumentsstandards
- - - 66,959,651.89
Available-for-salefinancial assets 326,164,881.33 - - -
Less: held-for-tradingfinancial assets - 61,494,666.97 - -
Less: other equityinstrumentinvestments
- 14,440,214.36 - -
Less: othernon-current financialassets
- 250,230,000.00 - -
Remeasurement:provisions forexpected credit loss
- - - -
Balance presentedaccording to newfinancial instrumentsstandards
- - - -
Other non-currentfinancial assets - - -
Transferred fromavailable-for-salefinancial assets
- 250,230,000.00 - -
Balance presentedaccording to newfinancial instrumentsstandards
- - - 250,230,000.00
Held-for-tradingfinancial liabilities - - -
Add: transferred fromfinancial liabilities atfair value through
- 2,459,603.25 - -

Konka Group Co., Ltd. Annual Report 2019
188
Item 31 December 2018(before adjustment)
Reclassified Remeasured 1 January 2019(after adjustment)
profit or loss(classified accordingto original standards)Balance presentedaccording to newfinancial instrumentsstandards
- - - 2,459,603.25
At fair valuethroughcomprehensiveincome:Accounts receivablefinancing - - - -
Transferred fromnotes receivable - 300,000.00 -
Transferred fromaccounts receivable - - - -
Remeasurement: atfair value - - - -
Remeasurement:provisions forexpected credit loss
- - - -
Balance presentedaccording to newfinancial instrumentsstandards
- - - 300,000.00
Other equityinstrumentinvestments
- - - -
Transferred fromavailable-for-salefinancial assets
- 14,440,214.36 - -
Balance presentedaccording to newfinancial instrumentsstandards
- - 14,440,214.36
③Reconciliation Statements on Provision for Financial Assets Impairment on the First ExecutionDateA. Influence on Consolidated Financial Statements
Measurement category 31 December 2018(before adjustment)
Reclassified Remeasured 1 January 2019(after adjustment)
Amortized cost:Provision forimpairment of notesreceivable
- - - -
Provision forimpairment of accountsreceivable
414,925,927.88 - 594,682.10 415,520,609.98
Provision forimpairment of otherreceivables
213,129,067.76 - 2,289,572.52 215,418,640.28
Provision forimpairment ofavailable-for-salefinancial assets
10,747,785.64 -10,747,785.64 - -
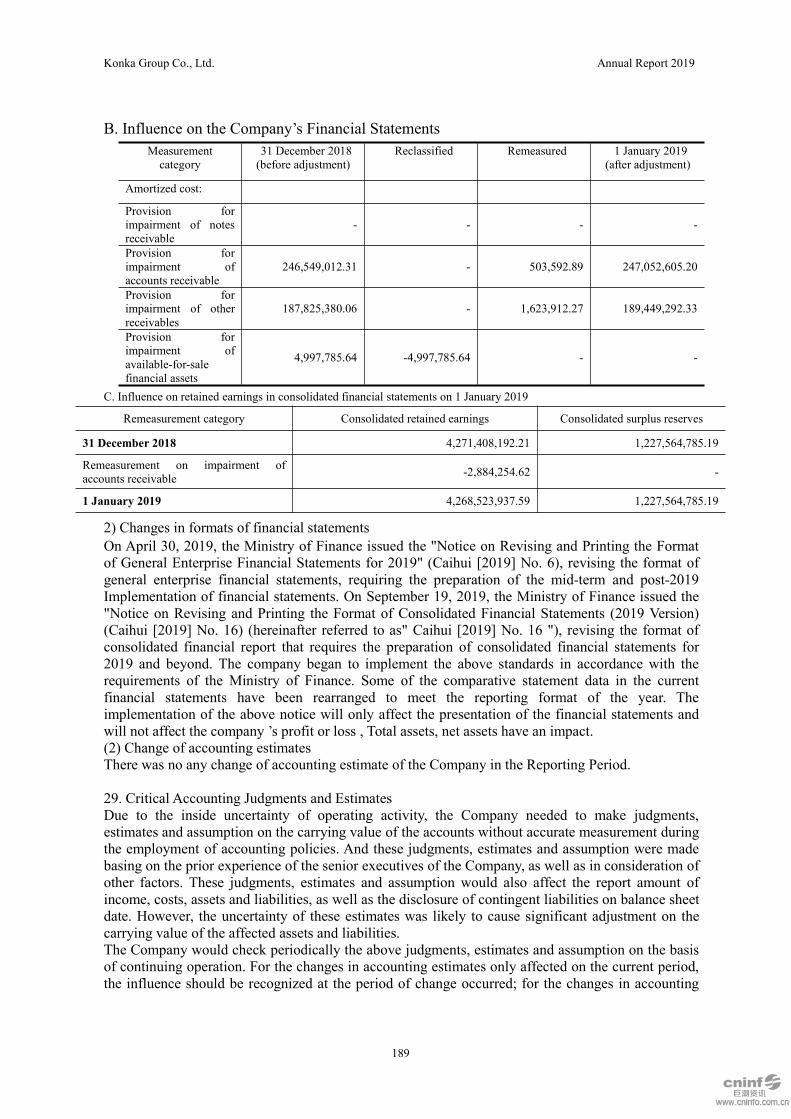
Konka Group Co., Ltd. Annual Report 2019
189
B. Influence on the Company’s Financial StatementsMeasurementcategory
31 December 2018(before adjustment)
Reclassified Remeasured 1 January 2019(after adjustment)
Amortized cost:
Provision forimpairment of notesreceivable
- - - -
Provision forimpairment ofaccounts receivable
246,549,012.31 - 503,592.89 247,052,605.20
Provision forimpairment of otherreceivables
187,825,380.06 - 1,623,912.27 189,449,292.33
Provision forimpairment ofavailable-for-salefinancial assets
4,997,785.64 -4,997,785.64 - -
C. Influence on retained earnings in consolidated financial statements on 1 January 2019
Remeasurement category Consolidated retained earnings Consolidated surplus reserves
31 December 2018 4,271,408,192.21 1,227,564,785.19
Remeasurement on impairment ofaccounts receivable -2,884,254.62 -
1 January 2019 4,268,523,937.59 1,227,564,785.19
2) Changes in formats of financial statementsOn April 30, 2019, the Ministry of Finance issued the "Notice on Revising and Printing the Formatof General Enterprise Financial Statements for 2019" (Caihui [2019] No. 6), revising the format ofgeneral enterprise financial statements, requiring the preparation of the mid-term and post-2019Implementation of financial statements. On September 19, 2019, the Ministry of Finance issued the"Notice on Revising and Printing the Format of Consolidated Financial Statements (2019 Version)(Caihui [2019] No. 16) (hereinafter referred to as" Caihui [2019] No. 16 "), revising the format ofconsolidated financial report that requires the preparation of consolidated financial statements for2019 and beyond. The company began to implement the above standards in accordance with therequirements of the Ministry of Finance. Some of the comparative statement data in the currentfinancial statements have been rearranged to meet the reporting format of the year. Theimplementation of the above notice will only affect the presentation of the financial statements andwill not affect the company ’s profit or loss , Total assets, net assets have an impact.(2) Change of accounting estimatesThere was no any change of accounting estimate of the Company in the Reporting Period.
29. Critical Accounting Judgments and EstimatesDue to the inside uncertainty of operating activity, the Company needed to make judgments,estimates and assumption on the carrying value of the accounts without accurate measurement duringthe employment of accounting policies. And these judgments, estimates and assumption were madebasing on the prior experience of the senior executives of the Company, as well as in consideration ofother factors. These judgments, estimates and assumption would also affect the report amount ofincome, costs, assets and liabilities, as well as the disclosure of contingent liabilities on balance sheetdate. However, the uncertainty of these estimates was likely to cause significant adjustment on thecarrying value of the affected assets and liabilities.The Company would check periodically the above judgments, estimates and assumption on the basisof continuing operation. For the changes in accounting estimates only affected on the current period,the influence should be recognized at the period of change occurred; for the changes in accounting
Konka Group Co., Ltd. Annual Report 2019
190
estimates affected the current period and also the future period, the influence should be recognized atthe period of change occurred and future period.On the balance sheet date, the Company needed to make judgments, estimates and assumption on theaccounts in the following important items:(1) Revenue Recognition - Construction ContractIf the construction contract results can be reliably estimated, the Company adopts the method ofcompletion percentage to confirm the contract income on the balance sheet date. The percentage ofcontract completion is confirmed in accordance with the method described in Note IV, 233, Revenue,and is cumulatively calculated in each fiscal year in which each construction contract is executed.Significant judgment is required in determining the percentage of completion, contract costs incurred,estimated total contract income and total cost, and contract recyclability, and the project managementpersonnel usually make judgments mainly based on past experience and work. The estimated totalcontract income and total cost, as well as estimated changes in contract execution results, may havean impact on operating income, operating costs, and profit or loss for the current or subsequentperiod of the change, and may have a significant impact.(2) Categorization of leasingIn accordance with Accounting Standards for Enterprises No. 21 – Leasing, the Companycategorized the leasing into operating lease and finance lease. During the categorization, themanagement level needed to make analysis and judgment on whether all the risk and compensationrelated with the leased assets had been transferred to the leasee, or whether the Company had alreadyundertaken all the risk and compensation related with the leased assets.(3) Financial assets impairmentIf the Company adopts the expected credit loss model to evaluate financial instrument impairment,it's necessary to make significant judgments and estimates on the expected credit loss model, and allreasonable and well-founded information needs to be taken into account, including forward-lookinginformation. When such judgments and estimates are made, the expected changes in the debtor'scredit risk are inferred based on historical data in combination with economic policies,macroeconomic indicators, industry risks, external market conditions, technological environment,and changes in customer circumstances.(4) Provision for falling price of inventoriesIn accordance with the accounting policies of inventories, for the inventories that the costs weremore than the net realizable value as well as out-of-date and dull-sale inventories, the Companywithdrawn the provision for falling price of inventories on the lower one between costs and netrealizable value. Evaluating the falling price of inventories needed the management level gain thevalid evidence and take full consideration of the purpose of inventories, influence of events afterbalance sheet date and other factors, and then made relevant judgments and estimates. The actualamount and the difference of previous estimates would affect the carrying value of inventories andthe withdrawal and reversal on provision for bad debts of inventories during the period of estimatesbeing changed.(5) The fair value of financial instrumentFor the financial instruments without active market, the Company recognized the fair value byvarious methods. These evaluation methods included discounted cash flow mode analysis, etc. TheCompany needed to estimate the future cash flow, credit risk, fluctuation rate of market and relativityand other factors, as well as choose the property discount rate. Due to the uncertainty of relevantassumptions, so their changes would affect the fair value of financial instrument.For equity instrument investment or contracts with public offers, the cost will not be taken as theoptimal estimation of the fair value by the Company since 1 January 2019.(6) Provision for impairment of long-term assetsThe Company made a judgment on the non-current assets other than financial assets whether theyhad any indication of impairment on the balance sheet date. For the intangible assets without finiteservice life, other than the annual impairment test, they should be subject to the impairment testwhen there was any indication of impairment. For other non-current non-financial assets, whichshould be subjected to impairment test when there was indication of impairment indicated that the
Konka Group Co., Ltd. Annual Report 2019
191
carrying value can’t be recoverable.When the carrying value of the assets or assets portfolio was more than the recoverable amount,which was the higher one between the net amount of fair value after deducting the disposal expensesand the discounted amount of the estimated future cash flow, it means impairment incurred.The net amount of fair value after deducting the disposal expenses should be fixed the price in thesale agreement for similar assets in the fair transaction minus the increased costs directly attributableto the assets disposal.When estimated the discounted value of future cash flow, the Company needed to make importantjudgment on the output, selling price, relevant costs and the discount rate for calculating thediscounted amount, etc. When estimated the recoverable amount, the Company would adopt all theavailable documents, including the prediction for relevant output, selling price and relevant operatingcosts arising from reasonable and supportive assumptions.The Company made the impairment test on goodwill at least one time per year, which required topredict the discounted amount of the future cash flow of the assets or assets portfolio with thedistributed good will, for which, the Company needed to predict the future cash flow of the assets orassets portfolio, and adopt the property discounted rate to decide the discounted amount of futurecash flow.(7) Depreciation and amortizationFor the investment real estate, fixed assets and intangible assets, the Company withdrew thedepreciation and amortization by adopting the straight-line method during the service life after fullconsideration of the salvage value. The Company checked the service life periodically so as to decidethe amount of depreciation and amortization at each Reporting Period. The service life was fixed bythe Company in accordance with the previous experience of the similar assets and the expectedtechnical update. If there was any significant change on the previous estimates, the depreciation andamortization expenses should be adjusted.(8) Deferred income tax assetsWithin the limit that it was likely to have sufficient taxable profits to offset the losses, the Companyrecognized the deferred income tax assets by all the unused tax losses, which needed themanagement level of the Company to estimate time and amount of the future taxable profits incurredwith many judgments, as well as integrate strategy of tax payment, to decide the amount of deferredincome tax assets which should be recognized.(9) Income taxDuring the routine operating activities, there were some uncertainty in the ultimate tax treatment andcalculation for parts of transactions. Some accounts of such transaction could be listed as pre-taxexpenditures only after the approval of taxation authorities. If there were any differences between theultimate result of recognition for these taxation maters and their initial estimates, the differenceswould affect the current income tax and deferred income tax at the period of ultimate recognition.(10) Internal early retirement welfare and supplementary retirement welfareAmounts of expenditures and liabilities of internal early retirement welfare and supplementaryretirement welfare should be determined according to assumption terms. Assumption terms includediscount rate, average growth rate of medical costs, growth rate of subsidies for early retirementemployees and retirees and other factors. The differences of actual results and assumption should beconfirmed immediately and included into costs of current year. Although the management haveadopted reasonable assumption terms, changes of actual experience value and assumption terms mayaffect the internal early retirement welfare, supplementary retirement benefits and balance ofliabilities.(11) ProvisionsThe Company made the estimation on product quality guarantee, predicted loss of contract and thefine for delayed delivery etc. and withdrew the relevant provision for provisions in accordance theprovisions of contract, current knowledge and experience. Under the condition that the contingentevent has formed a current duty and fulfilling the duty is likely to cause the economical interestoutflow the Company, the Company measures the provisions in accordance with the best estimate ofthe necessary expenses for the performance of the current duty. The recognition and measurement of
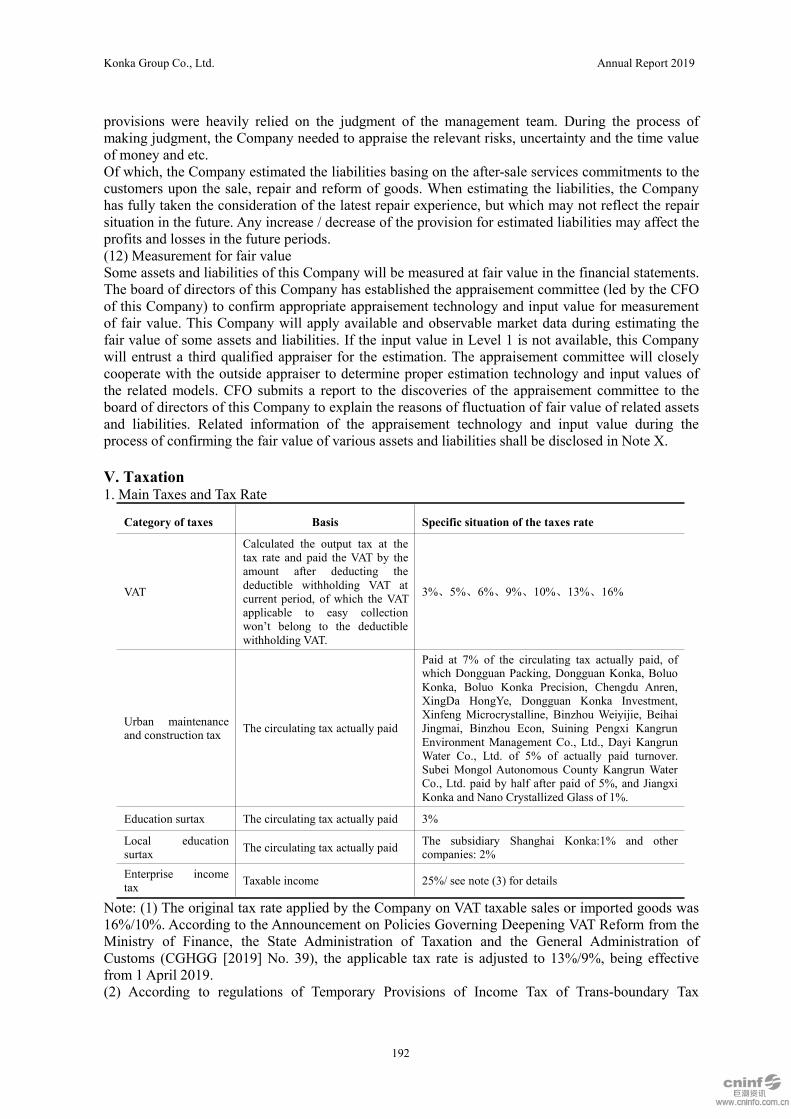
Konka Group Co., Ltd. Annual Report 2019
192
provisions were heavily relied on the judgment of the management team. During the process ofmaking judgment, the Company needed to appraise the relevant risks, uncertainty and the time valueof money and etc.Of which, the Company estimated the liabilities basing on the after-sale services commitments to thecustomers upon the sale, repair and reform of goods. When estimating the liabilities, the Companyhas fully taken the consideration of the latest repair experience, but which may not reflect the repairsituation in the future. Any increase / decrease of the provision for estimated liabilities may affect theprofits and losses in the future periods.(12) Measurement for fair valueSome assets and liabilities of this Company will be measured at fair value in the financial statements.The board of directors of this Company has established the appraisement committee (led by the CFOof this Company) to confirm appropriate appraisement technology and input value for measurementof fair value. This Company will apply available and observable market data during estimating thefair value of some assets and liabilities. If the input value in Level 1 is not available, this Companywill entrust a third qualified appraiser for the estimation. The appraisement committee will closelycooperate with the outside appraiser to determine proper estimation technology and input values ofthe related models. CFO submits a report to the discoveries of the appraisement committee to theboard of directors of this Company to explain the reasons of fluctuation of fair value of related assetsand liabilities. Related information of the appraisement technology and input value during theprocess of confirming the fair value of various assets and liabilities shall be disclosed in Note X.
V. Taxation1. Main Taxes and Tax Rate
Category of taxes Basis Specific situation of the taxes rate
VAT
Calculated the output tax at thetax rate and paid the VAT by theamount after deducting thedeductible withholding VAT atcurrent period, of which the VATapplicable to easy collectionwon’t belong to the deductiblewithholding VAT.
3%、5%、6%、9%、10%、13%、16%
Urban maintenanceand construction tax The circulating tax actually paid
Paid at 7% of the circulating tax actually paid, ofwhich Dongguan Packing, Dongguan Konka, BoluoKonka, Boluo Konka Precision, Chengdu Anren,XingDa HongYe, Dongguan Konka Investment,Xinfeng Microcrystalline, Binzhou Weiyijie, BeihaiJingmai, Binzhou Econ, Suining Pengxi KangrunEnvironment Management Co., Ltd., Dayi KangrunWater Co., Ltd. of 5% of actually paid turnover.Subei Mongol Autonomous County Kangrun WaterCo., Ltd. paid by half after paid of 5%, and JiangxiKonka and Nano Crystallized Glass of 1%.
Education surtax The circulating tax actually paid 3%
Local educationsurtax The circulating tax actually paid The subsidiary Shanghai Konka:1% and other
companies: 2%Enterprise incometax Taxable income 25%/ see note (3) for details
Note: (1) The original tax rate applied by the Company on VAT taxable sales or imported goods was16%/10%. According to the Announcement on Policies Governing Deepening VAT Reform from theMinistry of Finance, the State Administration of Taxation and the General Administration ofCustoms (CGHGG [2019] No. 39), the applicable tax rate is adjusted to 13%/9%, being effectivefrom 1 April 2019.(2) According to regulations of Temporary Provisions of Income Tax of Trans-boundary Tax
Konka Group Co., Ltd. Annual Report 2019
193
Payment Enterprises by State Administration of Taxation, resident enterprises without businessestablishment or places of legal persons should be tax payment enterprises with the administrativemeasures of income tax of “unified computing, level-to-level administration, local prepayment,liquidation summary, and finance transfer”. It came into force from 1 January 2008. According to theabove methods, the Company’s sales branch companies in each area will hand in the corporateincome taxes in advance from 1 January 2008 and will be final settled uniformly by the Company atthe year-end.(3) The main taxpayers of different corporate income tax rates are explained as follows:Name of entity Income tax rateElectronics Technology, Anhui Konka, Dongguan Konka,Econ Technology, XingDa HongYe, Wankaida, E2info,Jiangxi Konka, Xinfeng Microcrystalline, Nano CrystallizedGlass, Telecommunication Technology, Sichuan Konka,Boluo Konka Precision
15%
Hong Kong Konka, Konka Electrical AppliancesInternational Trading, Jiali International, Kangjietong, JiaxinTechnology, Jiaxin Technology, Konka Electrical AppliancesInvestment, Konka SmartTech, Konka Mobility
16.5%
Chain Kingdom Memory Technologies 8.25%/16.5%
Konka Europe 16.8%
Kanghao Technology 22.5%
2. Tax Preference and Approved Documents(1) According to Caishui [2019] No. 13: Notice on the implementation of the inclusive tax reductionand exemption policy for small and micro enterprises, from January 1, 2019 to December 31, 2021,the annual taxable income of small and profitable enterprises is not The portion exceeding 1 millionyuan will be reduced to 25% of the taxable income, and the corporate income tax will be paid at therate of 20%; the portion of the annual taxable income exceeding 1 million yuan but not exceeding 3million yuan will be reduced by 50% Include the taxable income and pay corporate income tax at arate of 20%.(2) On November 30, 2016, Bokang Precision, a subsidiary of the company, obtained the high-techenterprise certificate jointly issued by the Guangdong Provincial Department of Science andTechnology, the Guangdong Provincial Department of Finance, the Guangdong State TaxationBureau, and the Guangdong Local Taxation Bureau. The certificate number is GR201644001388,valid for three years, according to relevant tax regulations, Bokang Precision has enjoyed relevantpreferential tax policies for high-tech enterprises for three consecutive years from 2016 to 2018, andis subject to corporate income tax at a preferential tax rate of 15%.On February 19, 2020, Bokang Precision was listed in the reply letter (Guokehuozi [2020] No. 54) ofthe third batch of high-tech enterprises in Guangdong Province, which was announced by the Officeof the National Leading Group for High-tech Enterprise Certification and Management Thecertificate number is GR201944007820. The company estimates that there are no obstacles in thehigh-tech review, and collects and pays corporate income tax at a preferential tax rate of 15%.(3) On 15 August 2017, Shenzhen Konka Telecommunications Technology Co., Ltd., the subsidiaryof this Company obtained the high-tech enterprise certificate (certificate No.: GR201744201722)jointly issued by Shenzhen Technology Innovation Committee, Finance Commission of ShenzhenMunicipality, Shenzhen Municipal Office, SAT, Shenzhen Local Taxation Bureau, with a validperiod of three years. According to related taxation regulations, Shenzhen KonkaTelecommunications Technology Co., Ltd. enjoys related taxation preferential policies as a high-techenterprise from 2017 to 2019 and pays the enterprise income tax as per the preferential tax rate of15%.(4) On 23 August 2017, Jiangxi Konka New Material Technology Co., Ltd., the subsidiary of this

Konka Group Co., Ltd. Annual Report 2019
194
Company obtained the High-tech Enterprise Certificate (certificate No.: GR201736000497) jointlyissued by Department of Science and Technology of Jiangxi Province, Department of Finance ofJiangxi Province, Jiangxi Provincial Office, SAT, Jiangxi Local Taxation Bureau with a valid periodof three years. According to related taxation regulations, the company enjoys related taxationpreferential policies as a high-tech enterprise from 2017 to 2019 and pays the enterprise income taxas per the preferential tax rate of 15%.(5) On 23 August 2017, Jiangxi Golden Phoenix Nano Crystallized Glass Co., Ltd., the subsidiary ofthe Company obtained the High-tech Enterprise Certificate (certificate No.: GR201736000110)jointly issued by Department of Science and Technology of Jiangxi Province, Department of Financeof Jiangxi Province, Jiangxi Provincial Office, SAT, Jiangxi Local Taxation Bureau with a validperiod of three years. According to related taxation regulations, the company enjoys related taxationpreferential policies as a high-tech enterprise from 2017 to 2019 and pays the enterprise income taxas per the preferential tax rate of 15%.(6) On 31 October 2017, Wankaida, the subsidiary of this Company obtained the High-techEnterprise Certificate (certificate No.: GR201744204716) joint issued by Shenzhen TechnologyInnovation Committee, Finance Committee of Shenzhen Municipality, Shenzhen Municipal Office,SAT and Shenzhen Local Taxation Bureau with a valid period of three years. According to relatedtaxation regulations, Wankaida enjoys related taxation preferential policies as a high-tech enterprisefrom 2017 to 2019 and pays the enterprise income tax as per the referential tax rate of 15%.(7) On 9 November 2017, Dongguan Konka Electronic Co., Ltd., the subsidiary of this Companyobtained the High-tech Enterprise Certificate (certificate No.: GR201744003812) jointly issued byDepartment of Science and Technology of Guangdong Province, Department of Finance ofGuangdong Province, Guangdong Provincial Office, SAT, Guangdong Local Taxation Bureau with avalid period of three years. According to related taxation regulations, the company enjoys relatedtaxation preferential policies as a high-tech enterprise from 2017 to 2019 and pays the enterpriseincome tax as per the preferential tax rate of 15%.(8) On 28 December 2017, Econ Technology, a subsidiary of the Company, obtained the High-techEnterprise Certificate (certificate No.: GR201737001495) jointly issued by Department of Scienceand Technology of Shangdong Province, Department of Finance of Shangdong Province, ShangdongProvincial Office, SAT, Shangdong Local Taxation Bureau with a valid period of three years.According to the relevant tax regulations, the company enjoys related tax incentives for high-techcompanies for three consecutive years from 2017 to 2019, and is subject to corporate income tax at apreferential rate of 15%.(9) On 16 October 2018, Shenzhen E2info Network Technology Co., Ltd., the subsidiary of thisCompany obtained the high-tech enterprise certificate (certificate No.: GR201844201969) jointlyissued by Shenzhen Technology Innovation Committee, Finance Committee of ShenzhenMunicipality, Shenzhen Taxation Bureau of SAT with a valid period of three years. According torelated taxation regulations, the company enjoys related taxation preferential policies as a high-techenterprise from 2018 to 2020 and pays the enterprise income tax as per the preferential tax rate of15%.(10) On 28 November 2018, the Company’s subsidiary XingDa HongYe received the High-techEnterprise Certificate (No.GR201844008446 with the 3-year period of validity) jointly issued byDepartment of Science and Technology of Guangdong Province, Department of Finance ofGuangdong Province and State Administration of Taxation (Guangdong Provincial Tax Service).According to relevant tax regulations, from 2018 to 2020, the enterprise shall be eligible for enjoyingrelevant preferential tax policies as a new high-tech enterprise and corresponding corporate incometax shall be paid based on the preferential tax rate of 15%.(11) On September 9, 2019, Anhui Konka, the subsidiary of the Company, obtained a certificate ofhigh-tech enterprise jointly issued by Anhui Science and Technology Department, Anhui ProvincialDepartment of Finance and Anhui Provincial Tax Bureau of the State Administration of Taxation.The certificate number is GR201934000966 and is valid for three years. According to relevant taxregulations, Anhui Konka shall enjoy relevant preferential tax policies for high-tech enterprises forthree consecutive years from 2019 to 2021 and pay the enterprise income tax at a preferential tax rate
Konka Group Co., Ltd. Annual Report 2019
195
of 15%.(12) On September 16, 2019, Xinfeng Microcrystalline, the subsidiary of the Company, obtained ahigh-tech enterprise certificate jointly issued by Jiangxi Science and Technology Department, JiangxiProvincial Department of Finance and Jiangxi Provincial Tax Bureau of the State Administration ofTaxation. The certificate number is GR201936000744 and is valid for three years. According torelevant tax regulations, Xinfeng Microcrystalline shalll enjoy relevant preferential tax policies forhigh-tech enterprises for three consecutive years from 2019 to 2021 and pay the enterprise incometax at a preferential tax rate of 15%.(13) On November 28, 2019, Sichuan Konka, a subsidiary of the Company, obtained a certificate ofhigh-tech enterprise jointly issued by Sichuan Science and Technology Department, SichuanProvincial Department of Finance and Sichuan Provincial Tax Bureau of the State Administration ofTaxation. The certificate number is GR201951002096 and is valid for three years. According torelevant tax regulations, Sichuan Konka shall enjoy relevant preferential tax policies for high-techenterprises for three consecutive years from 2019 to 2021 and pay the enterprise income tax at apreferential tax rate of 15%.(14) On December 9, 2019, Electronics Technology, the subsidiary of the Company, obtained aCertificate Of High-tech Enterprise jointly issued by Shenzhen Science and Technology Department,Shenzhen Provincial Department of Finance and Shenzhen Provincial Tax Bureau of the StateAdministration of Taxation. The certificate number is GR201944204287 and is valid for three years.According to relevant tax regulations, Electronics Technology shall enjoy relevant preferential taxpolicies for high-tech enterprises for three consecutive years from 2019 to 2021 and pay theenterprise income tax at a preferential tax rate of 15%.(15) According to the Notice on Issues Concerning the Promotion of Energy-Saving Service IndustryDevelopment VAT Business Tax and Corporate Income Tax Policy Issued by the Ministry of Financeand the State Administration of Taxation (Caishui [2010] No. 110) For the income, the enterpriseenjoys the "three exemptions and three halves" preferential treatment of corporate income tax sincethe tax year in which the first production and operation income of the project is obtained. BinhaiSewage and Lairun Holdings, subsidiaries of the company, enjoy this tax incentive. Coastal sewagewill be exempt from corporate income tax from March 1, 2017 to February 29, 2020, and corporateincome tax will be levied at half the 25% legal tax rate from March 1, 2020 to February 28, 2023;Run Holdings is exempt from corporate income tax from September 1, 2017 to August 31, 2020.From September 1, 2020 to August 31, 2023, corporate income tax is levied in half at the legal taxrate of 25%.(16) According to the fiscal and taxation document [2011] No. 100 published by the Ministry ofFinance and the State Administration of Taxation, for the VAT general taxpayers who sell theirself-developed and produced software products, the VAT shall be levied at the rate of 13%, and thenthe part that the actual tax burden on their VAT exceeds 3 will be implemented with the policy ofimmediate withdrawal. The Company’s subsidiaries, Wankaida Technology and ElectronicsTechnology all enjoy this preferential policy.(17) According to the regulations of the Special Catalogue of VAT Concessions for Products andLabors with Comprehensive Utilization of Resources issued by the Ministry of Finance and the StateAdministration of Taxation (Finance and Taxation [2015] No. 78), the wastewater treatment businessoperated by Lairun Holdings, a subsidiary of the Company, belongs to the this catalogue. Then afterit has been levied the VAT at a rate of 16 %, the actual tax burden on the wastewater treatmentincome tax will be refunded in accordance with the 70% of the actual tax burden, and the actual taxburden on the renewable water income VAT will be refunded immediately at 50%.(18) According to the document Caishui [2013] No.37 issued by the Ministry of Finance and theState Administration of Taxation, the general taxpayers among the pilot taxpayers approved by thePeople's Bank of China, the CBRC and the Ministry of Commerce to operate financial leasingbusiness shall provide tangible movable property financial leasing services, and the VAT refundpolicy shall be applied to the part where the actual VAT tax burden exceeds 3%. Konka Leasing, thesubsidiary of the Company, shall be qualified to enjoyed the tax concession.
Konka Group Co., Ltd. Annual Report 2019
196
VI. Notes on Major Items in Consolidated Financial Statements of the CompanyUnless otherwise noted, the following annotation project (including the main projects,annotation ofthe financial statement of the Company), the period-begin refers to 1 January 2019, the period-endrefers to 31 December 2019, this period refers to Y2019 and the last period refers to the period from1 January 2018 to 31 December 2018. The monetary unit is renminbi.
1. Monetary Assets
Item Ending balance Beginning balance
Cash on hand 18,699.99 130,105.31
Bank deposits 4,493,683,217.23 3,434,019,376.41
Other monetary assets 2,105,658,134.39 913,994,647.81
Total 6,599,360,051.61 4,348,144,129.53
Of which: total amount deposited in
overseas378,330,661.32 518,005,414.06
Notes: The ending balance of other monetary assets was the deposits of each margin deposit not
withdrawn at any time. Refer to NoteVI-60 Assets with restricted ownership or use right for details.
As of 31 December 2019, the monetary assets deposited in overseas by the Company was
RMB378,330,661.32 (RMB518,005,414.06 on 31 December 2018)
2. Held-for-trading Financial Assets
Item Ending balance Beginning balance
Financial assets at fair value through profit or lossIncluding: debt instrument investment
Equity instrument investment 61,494,666.97 61,494,666.97Other 5,464,984.92
Total 61,494,666.97 66,959,651.89
3. Notes Receivable
(1) Notes Receivable Listed by Category
Item Ending balance Beginning balance
Bank acceptance bill 2,638,629,011.87 2,313,409,006.75
Commercial acceptance bill 199,412,421.02 822,641,321.13
Total 2,838,041,432.89 3,136,050,327.88
(2) Notes Receivable Pledged by the Company at the Period-end

Konka Group Co., Ltd. Annual Report 2019
197
Item Amount
Bank acceptance bill 1,446,285,041.78
Total 1,446,285,041.78
(3) Notes Receivable which Had Endorsed by the Company or had Discounted and had not Due on
the Balance Sheet Date at the Period-end
Item Amount of recognitiontermination at the period-end
Amount of not terminatedrecognition at the period-end
Bank acceptance bill 1,090,403,349.36
Commercial acceptance bill 3,103,650.87
Total 1,093,507,000.23
(4) Notes Transferred to Accounts Receivable because Drawer of the Notes Failed to Execute the
Contract or Agreement
Item Amount of the notes transferred to accountsreceivable at the period-end
Bank acceptance bill 200,000,000.00
Commercial acceptance bill 744,149,880.08
Total 944,149,880.08
Note: At the end of the year, the bills transferred to the accounts receivable due to the issuer's failure
to perform were the overdue bills of the company's factoring business.
(5) Listed by Withdrawal Methods for Bad Debt Provision
Category
Ending balance
Carrying amount Bad debt provision Carrying value
Amount Proportion (%) Amount
Withdrawal
proportion (%)
Notes receivable withsignificant individual amount andmake independent provision forexpected credit loss
Notes receivable withdrawnexpected credit loss according tocredit risks characteristics
2,842,347,510.24 100.00 4,306,077.35 0.15 2,838,041,432.89
Of which: Bank acceptance bill 2,638,629,011.87 92.83 2,638,629,011.87
Commercial acceptance bill 203,718,498.37 7.17 4,306,077.35 2.11 199,412,421.02
Notes receivable with
Konka Group Co., Ltd. Annual Report 2019
198
Category
Ending balance
Carrying amount Bad debt provision Carrying value
Amount Proportion (%) Amount
Withdrawal
proportion (%)
insignificant single amount forwhich expected credit lossprovision separately accrued
Total 2,842,347,510.24 100.00 4,306,077.35 0.15 2,838,041,432.89
(Continued)
Category
Beginning balance
Carrying amount Bad debt provision
Carrying valueAmount Proportio
n (%) Amount
Withdrawal
proportion (%)
Notes receivable with significantindividual amount and makeindependent provision forexpected credit loss
Notes receivable withdrawnexpected credit loss according tocredit risks characteristics
3,136,050,327.88 100.00 3,136,050,327.88
Of which: Bank acceptance bill 2,313,409,006.75 73.77 2,313,409,006.75
Commercial acceptance bill 822,641,321.13 26.23 822,641,321.13
Notes receivable with insignificantsingle amount for which expectedcredit loss provision separatelyaccrued
Total 3,136,050,327.88 100.00 3,136,050,327.88
(6) Bad debt provision for notes receivable withdrawn, collected or reversed during the Reporting
Period
CategoryBeginning
balance
Changed amount
Ending balanceWithdrawn Collected or
reversed
Write-off or
verified
Commercialacceptance bill — 4,306,077.35 4,306,077.35
Total — 4,306,077.35 4,306,077.35
4. Accounts Receivable
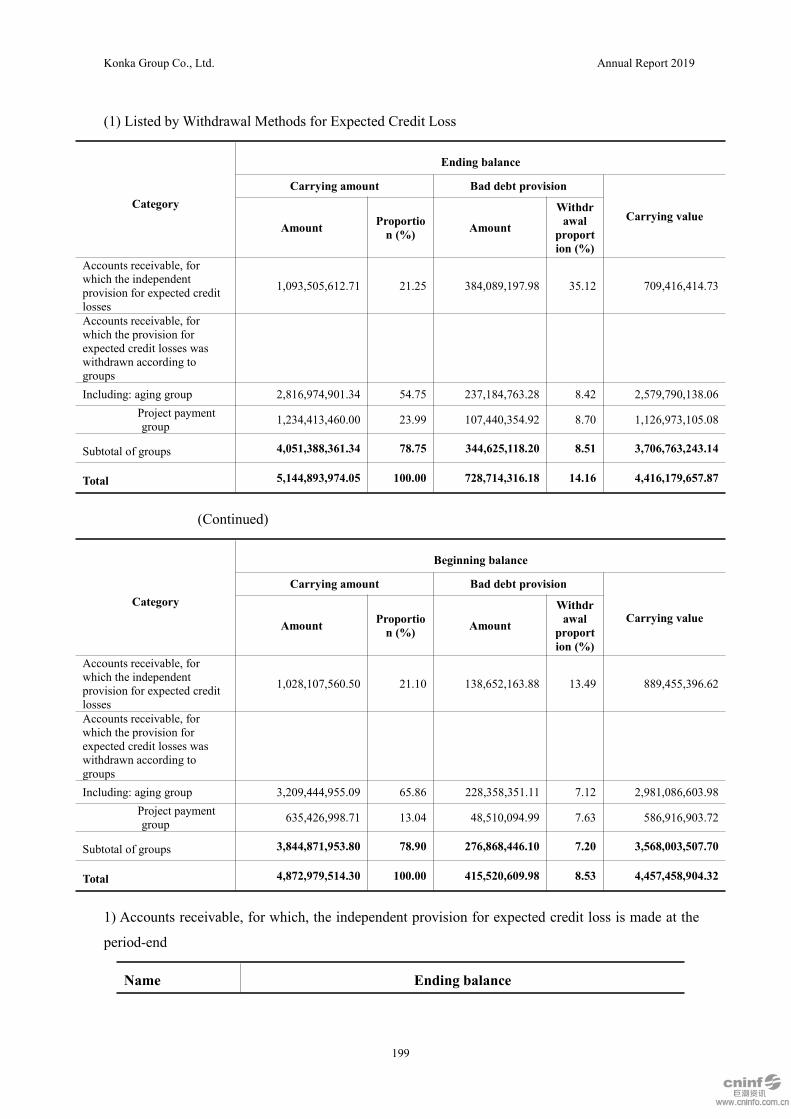
Konka Group Co., Ltd. Annual Report 2019
199
(1) Listed by Withdrawal Methods for Expected Credit Loss
Category
Ending balance
Carrying amount Bad debt provision
Carrying valueAmount Proportio
n (%) Amount
Withdrawal
proportion (%)
Accounts receivable, forwhich the independentprovision for expected creditlosses
1,093,505,612.71 21.25 384,089,197.98 35.12 709,416,414.73
Accounts receivable, forwhich the provision forexpected credit losses waswithdrawn according togroupsIncluding: aging group 2,816,974,901.34 54.75 237,184,763.28 8.42 2,579,790,138.06
Project paymentgroup 1,234,413,460.00 23.99 107,440,354.92 8.70 1,126,973,105.08
Subtotal of groups 4,051,388,361.34 78.75 344,625,118.20 8.51 3,706,763,243.14
Total 5,144,893,974.05 100.00 728,714,316.18 14.16 4,416,179,657.87
(Continued)
Category
Beginning balance
Carrying amount Bad debt provision
Carrying valueAmount Proportion (%) Amount
Withdrawal
proportion (%)
Accounts receivable, forwhich the independentprovision for expected creditlosses
1,028,107,560.50 21.10 138,652,163.88 13.49 889,455,396.62
Accounts receivable, forwhich the provision forexpected credit losses waswithdrawn according togroupsIncluding: aging group 3,209,444,955.09 65.86 228,358,351.11 7.12 2,981,086,603.98
Project paymentgroup 635,426,998.71 13.04 48,510,094.99 7.63 586,916,903.72
Subtotal of groups 3,844,871,953.80 78.90 276,868,446.10 7.20 3,568,003,507.70
Total 4,872,979,514.30 100.00 415,520,609.98 8.53 4,457,458,904.32
1) Accounts receivable, for which, the independent provision for expected credit loss is made at the
period-end
Name Ending balance
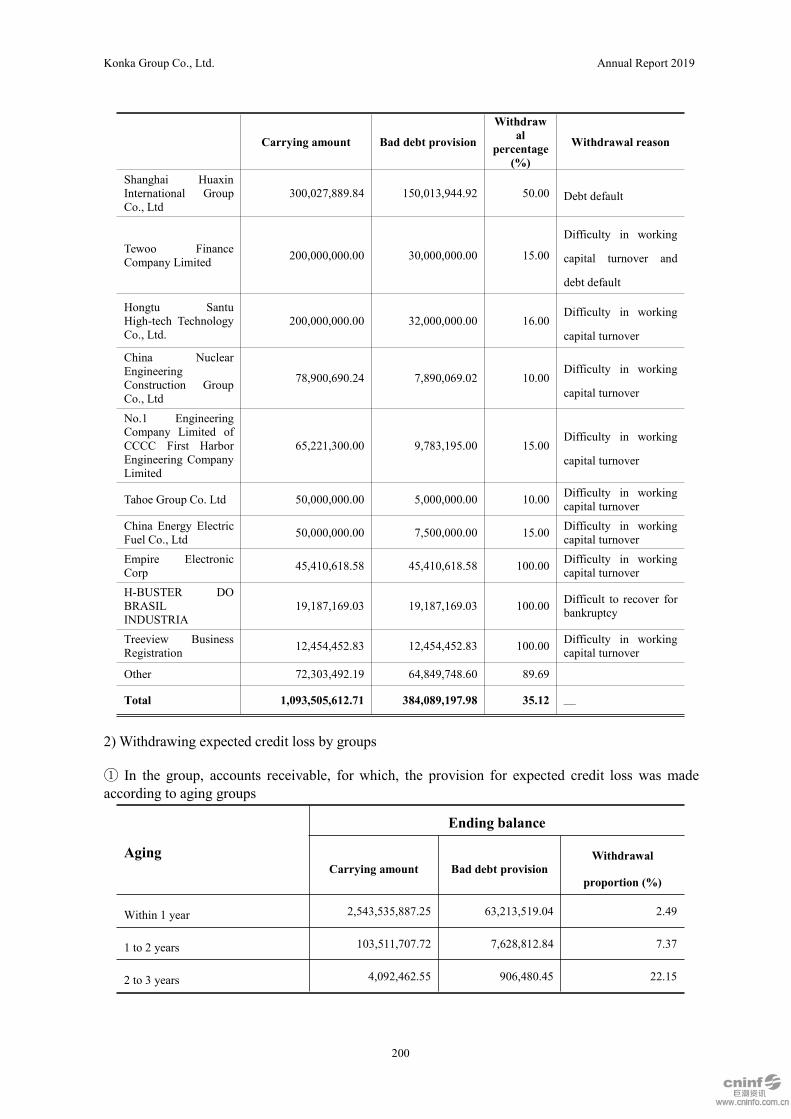
Konka Group Co., Ltd. Annual Report 2019
200
Carrying amount Bad debt provision
Withdrawal
percentage(%)
Withdrawal reason
Shanghai HuaxinInternational GroupCo., Ltd
300,027,889.84 150,013,944.92 50.00 Debt default
Tewoo FinanceCompany Limited 200,000,000.00 30,000,000.00 15.00
Difficulty in working
capital turnover and
debt default
Hongtu SantuHigh-tech TechnologyCo., Ltd.
200,000,000.00 32,000,000.00 16.00Difficulty in working
capital turnover
China NuclearEngineeringConstruction GroupCo., Ltd
78,900,690.24 7,890,069.02 10.00Difficulty in working
capital turnover
No.1 EngineeringCompany Limited ofCCCC First HarborEngineering CompanyLimited
65,221,300.00 9,783,195.00 15.00Difficulty in working
capital turnover
Tahoe Group Co. Ltd 50,000,000.00 5,000,000.00 10.00 Difficulty in workingcapital turnover
China Energy ElectricFuel Co., Ltd 50,000,000.00 7,500,000.00 15.00 Difficulty in working
capital turnoverEmpire ElectronicCorp 45,410,618.58 45,410,618.58 100.00 Difficulty in working
capital turnoverH-BUSTER DOBRASILINDUSTRIA
19,187,169.03 19,187,169.03 100.00 Difficult to recover forbankruptcy
Treeview BusinessRegistration 12,454,452.83 12,454,452.83 100.00 Difficulty in working
capital turnover
Other 72,303,492.19 64,849,748.60 89.69
Total 1,093,505,612.71 384,089,197.98 35.12 —
2) Withdrawing expected credit loss by groups
① In the group, accounts receivable, for which, the provision for expected credit loss was madeaccording to aging groups
Aging
Ending balance
Carrying amount Bad debt provisionWithdrawal
proportion (%)
Within 1 year 2,543,535,887.25 63,213,519.04 2.49
1 to 2 years 103,511,707.72 7,628,812.84 7.37
2 to 3 years 4,092,462.55 906,480.45 22.15
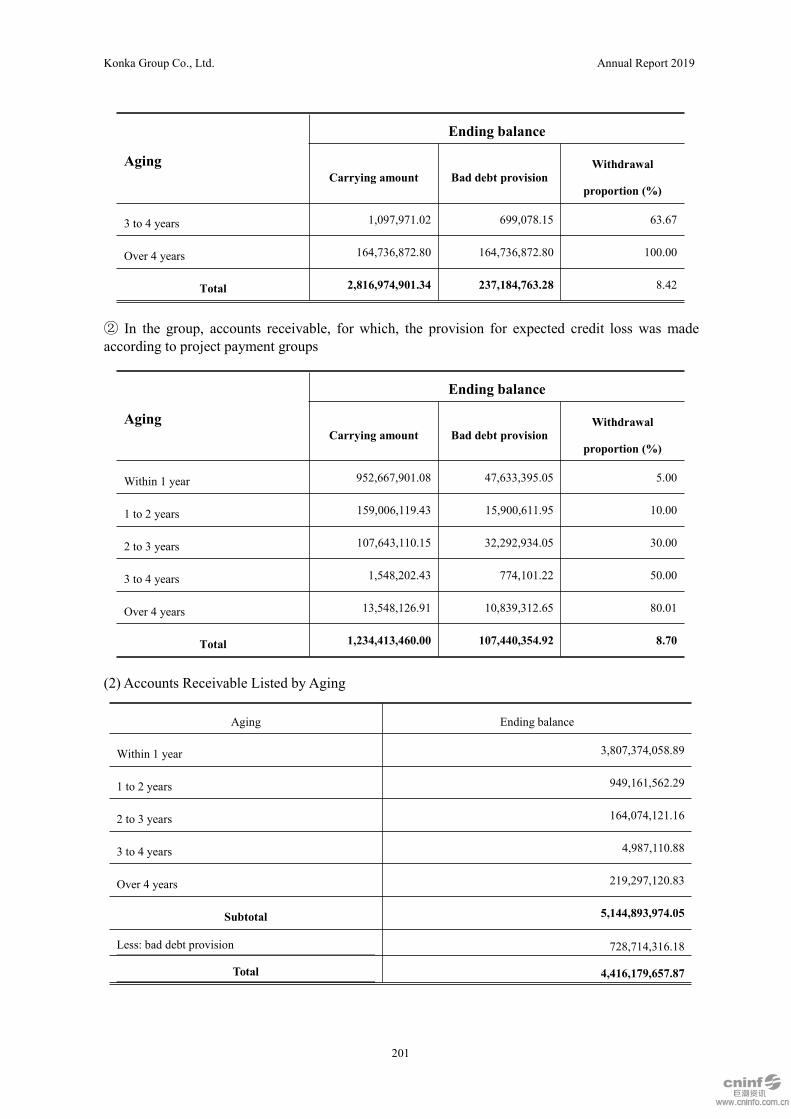
Konka Group Co., Ltd. Annual Report 2019
201
Aging
Ending balance
Carrying amount Bad debt provisionWithdrawal
proportion (%)
3 to 4 years 1,097,971.02 699,078.15 63.67
Over 4 years 164,736,872.80 164,736,872.80 100.00
Total 2,816,974,901.34 237,184,763.28 8.42
② In the group, accounts receivable, for which, the provision for expected credit loss was madeaccording to project payment groups
Aging
Ending balance
Carrying amount Bad debt provisionWithdrawal
proportion (%)
Within 1 year 952,667,901.08 47,633,395.05 5.00
1 to 2 years 159,006,119.43 15,900,611.95 10.00
2 to 3 years 107,643,110.15 32,292,934.05 30.00
3 to 4 years 1,548,202.43 774,101.22 50.00
Over 4 years 13,548,126.91 10,839,312.65 80.01
Total 1,234,413,460.00 107,440,354.92 8.70
(2) Accounts Receivable Listed by Aging
Aging Ending balance
Within 1 year 3,807,374,058.89
1 to 2 years 949,161,562.29
2 to 3 years 164,074,121.16
3 to 4 years 4,987,110.88
Over 4 years 219,297,120.83
Subtotal 5,144,893,974.05
Less: bad debt provision 728,714,316.18
Total 4,416,179,657.87

Konka Group Co., Ltd. Annual Report 2019
202
3) Bad debt provision for accounts receivable during the Reporting Period
In this year, the actual provision for bad debts amounted to RMB 339,398,520.50, the amount for
bad debt write-offs was RMB 24,926,223.99, the amount of bad debts increased by RMB
2,460,005.29 due to exchange rate fluctuations, and the amount of bad debts was reduced by RMB
3,738,595.60 due to loss of control.
(4) Accounts receivable actually verified during the Reporting Period
Item Verified amount
DSCHOLDINGSLIMITED 24,823,474.04
Other 102,749.95
Total 24,926,223.99
(5) Top 5 of the Ending Balance of the Accounts Receivable Collected according to the Arrears Party
The total amount of top five of account receivable of ending balance collected by arrears party was
RMB1,282,258,307.10, accounting for 24.92% of total closing balance of account receivable, the
relevant ending balance of bad debt provision withdrawn was RMB241,125,465.78.
(6) There was no accounts receivable derecognized for transfer of financial assets.
(7) There is no amount of assets and liabilities formed due to the transfer of accounts receivable and
continued involvement in this year.
5. Accounts Receivable Financing
Item
Ending amount Beginning balance
CostChange in
fair value
Fair value at
period-endCost
Change in
fair value
Fair value at
period-end
Notes
receiv
able
143,174,271.82 - 143,174,271.82 193,661,626.27 - 193,661,626.27
Total 143,174,271.82 - 143,174,271.82 193,661,626.27 - 193,661,626.27
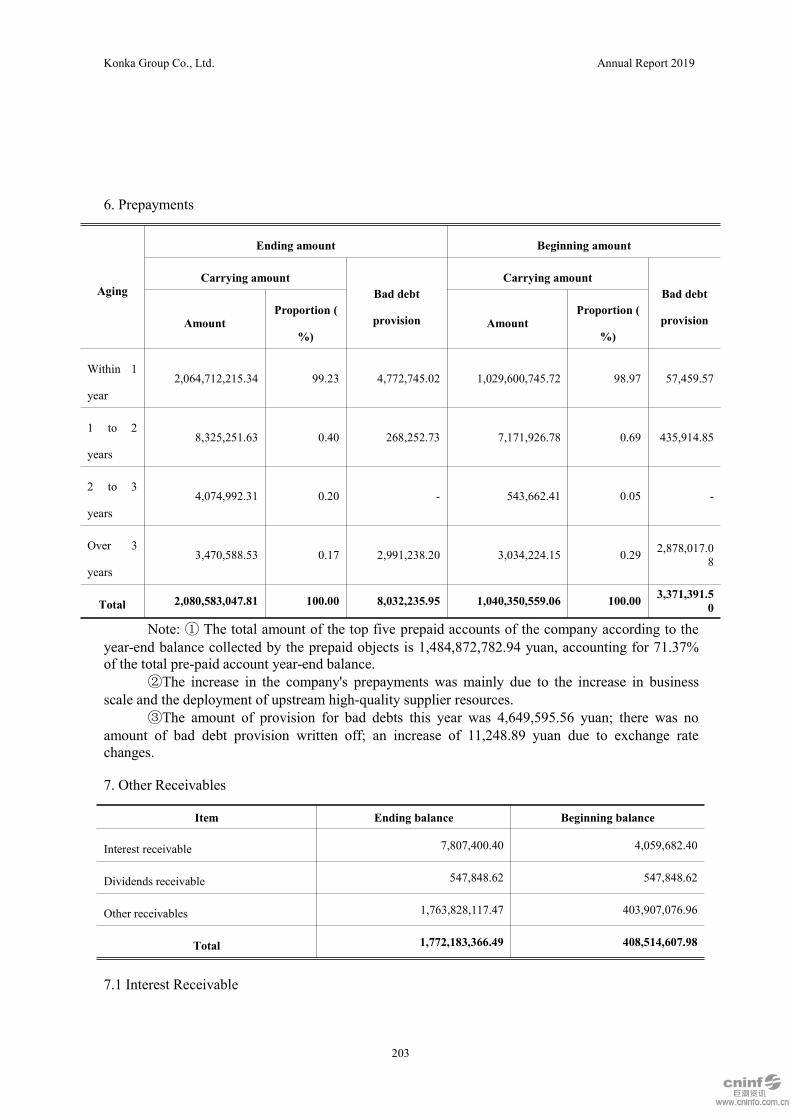
Konka Group Co., Ltd. Annual Report 2019
203
6. Prepayments
Aging
Ending amount Beginning amount
Carrying amountBad debt
provision
Carrying amountBad debt
provisionAmountProportion (
%)Amount
Proportion (
%)
Within 1
year2,064,712,215.34 99.23 4,772,745.02 1,029,600,745.72 98.97 57,459.57
1 to 2
years8,325,251.63 0.40 268,252.73 7,171,926.78 0.69 435,914.85
2 to 3
years4,074,992.31 0.20 - 543,662.41 0.05 -
Over 3
years3,470,588.53 0.17 2,991,238.20 3,034,224.15 0.29 2,878,017.0
8
Total 2,080,583,047.81 100.00 8,032,235.95 1,040,350,559.06 100.00 3,371,391.50
Note: ① The total amount of the top five prepaid accounts of the company according to theyear-end balance collected by the prepaid objects is 1,484,872,782.94 yuan, accounting for 71.37%of the total pre-paid account year-end balance.
②The increase in the company's prepayments was mainly due to the increase in businessscale and the deployment of upstream high-quality supplier resources.
③The amount of provision for bad debts this year was 4,649,595.56 yuan; there was noamount of bad debt provision written off; an increase of 11,248.89 yuan due to exchange ratechanges.
7. Other Receivables
Item Ending balance Beginning balance
Interest receivable 7,807,400.40 4,059,682.40
Dividends receivable 547,848.62 547,848.62
Other receivables 1,763,828,117.47 403,907,076.96
Total 1,772,183,366.49 408,514,607.98
7.1 Interest Receivable
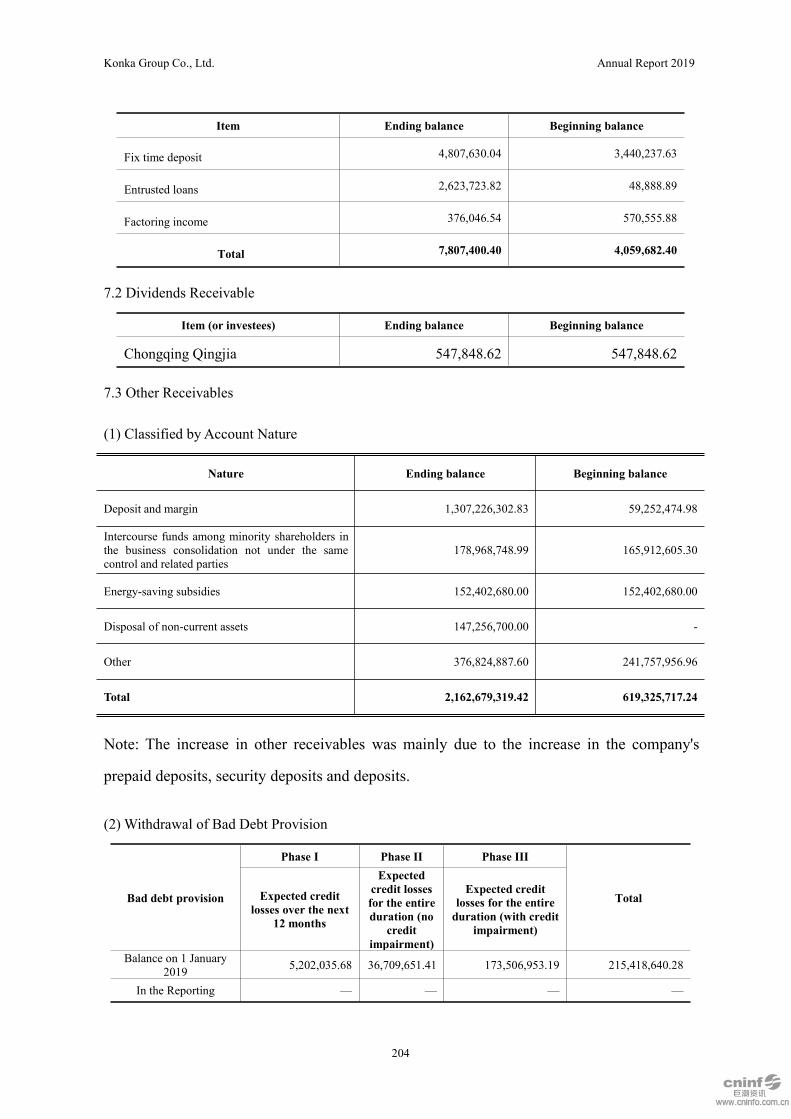
Konka Group Co., Ltd. Annual Report 2019
204
Item Ending balance Beginning balance
Fix time deposit 4,807,630.04 3,440,237.63
Entrusted loans 2,623,723.82 48,888.89
Factoring income 376,046.54 570,555.88
Total 7,807,400.40 4,059,682.40
7.2 Dividends Receivable
Item (or investees) Ending balance Beginning balance
Chongqing Qingjia 547,848.62 547,848.62
7.3 Other Receivables
(1) Classified by Account Nature
Nature Ending balance Beginning balance
Deposit and margin 1,307,226,302.83 59,252,474.98
Intercourse funds among minority shareholders inthe business consolidation not under the samecontrol and related parties
178,968,748.99 165,912,605.30
Energy-saving subsidies 152,402,680.00 152,402,680.00
Disposal of non-current assets 147,256,700.00 -
Other 376,824,887.60 241,757,956.96
Total 2,162,679,319.42 619,325,717.24
Note: The increase in other receivables was mainly due to the increase in the company's
prepaid deposits, security deposits and deposits.
(2) Withdrawal of Bad Debt Provision
Bad debt provision
Phase I Phase II Phase III
TotalExpected creditlosses over the next
12 months
Expectedcredit lossesfor the entireduration (no
creditimpairment)
Expected creditlosses for the entireduration (with credit
impairment)
Balance on 1 January2019 5,202,035.68 36,709,651.41 173,506,953.19 215,418,640.28
In the Reporting — — — —
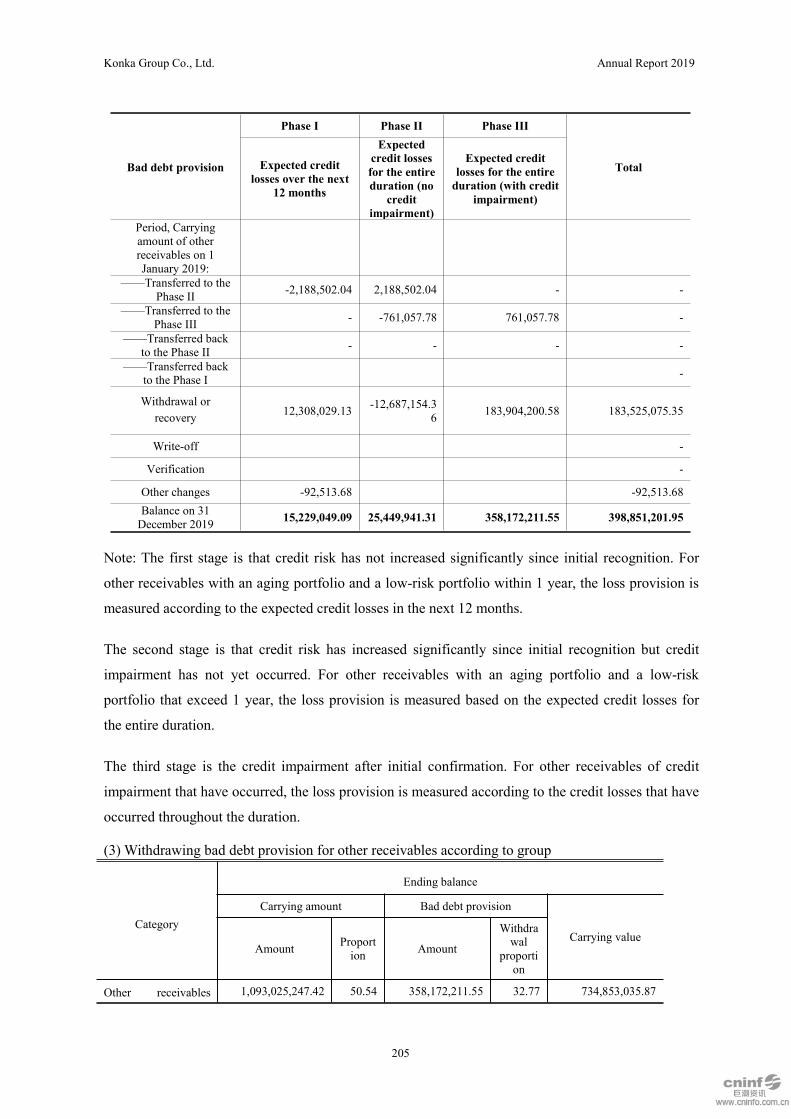
Konka Group Co., Ltd. Annual Report 2019
205
Bad debt provision
Phase I Phase II Phase III
TotalExpected creditlosses over the next
12 months
Expectedcredit lossesfor the entireduration (no
creditimpairment)
Expected creditlosses for the entireduration (with credit
impairment)
Period, Carryingamount of otherreceivables on 1January 2019:
——Transferred to thePhase II -2,188,502.04 2,188,502.04 - -
——Transferred to thePhase III - -761,057.78 761,057.78 -
——Transferred backto the Phase II - - - -
——Transferred backto the Phase I -
Withdrawal orrecovery 12,308,029.13 -12,687,154.3
6 183,904,200.58 183,525,075.35
Write-off -
Verification -
Other changes -92,513.68 -92,513.68Balance on 31December 2019 15,229,049.09 25,449,941.31 358,172,211.55 398,851,201.95
Note: The first stage is that credit risk has not increased significantly since initial recognition. For
other receivables with an aging portfolio and a low-risk portfolio within 1 year, the loss provision is
measured according to the expected credit losses in the next 12 months.
The second stage is that credit risk has increased significantly since initial recognition but credit
impairment has not yet occurred. For other receivables with an aging portfolio and a low-risk
portfolio that exceed 1 year, the loss provision is measured based on the expected credit losses for
the entire duration.
The third stage is the credit impairment after initial confirmation. For other receivables of credit
impairment that have occurred, the loss provision is measured according to the credit losses that have
occurred throughout the duration.
(3) Withdrawing bad debt provision for other receivables according to group
Category
Ending balance
Carrying amount Bad debt provision
Carrying valueAmount Proport
ion Amount
Withdrawal
proportion
Other receivables 1,093,025,247.42 50.54 358,172,211.55 32.77 734,853,035.87
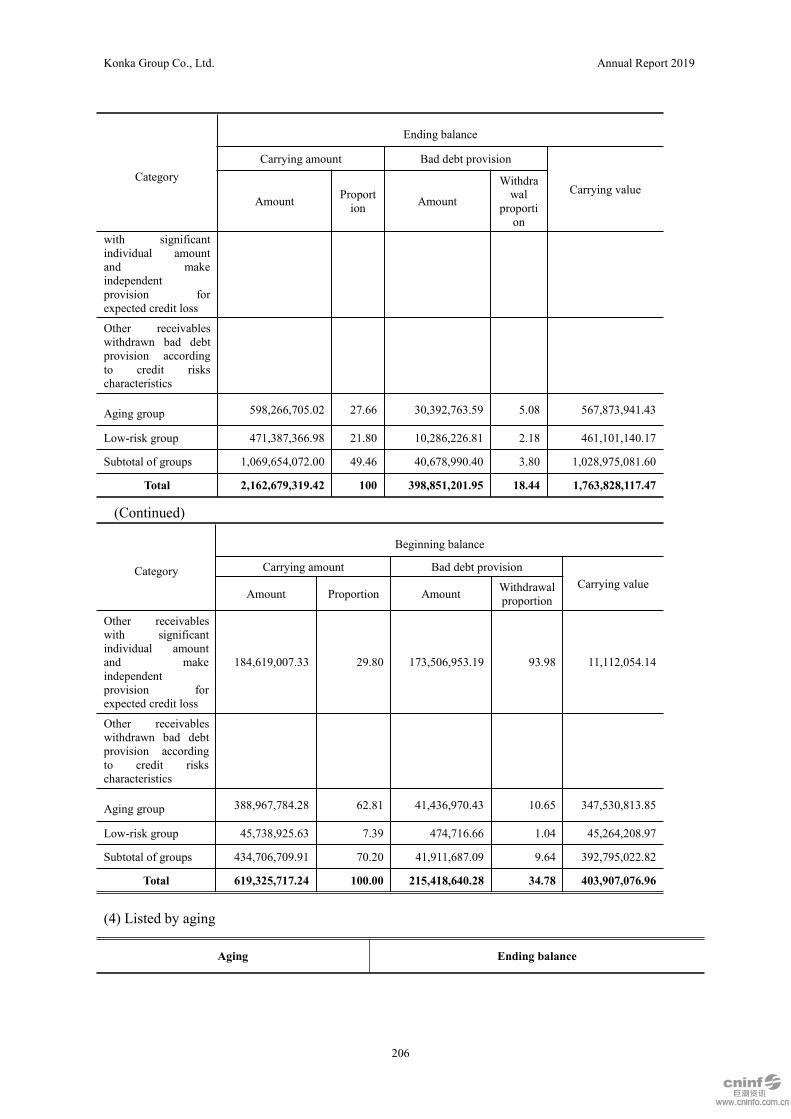
Konka Group Co., Ltd. Annual Report 2019
206
Category
Ending balance
Carrying amount Bad debt provision
Carrying valueAmount Proport
ion Amount
Withdrawal
proportion
with significantindividual amountand makeindependentprovision forexpected credit loss
Other receivableswithdrawn bad debtprovision accordingto credit riskscharacteristics
Aging group 598,266,705.02 27.66 30,392,763.59 5.08 567,873,941.43
Low-risk group 471,387,366.98 21.80 10,286,226.81 2.18 461,101,140.17
Subtotal of groups 1,069,654,072.00 49.46 40,678,990.40 3.80 1,028,975,081.60
Total 2,162,679,319.42 100 398,851,201.95 18.44 1,763,828,117.47
(Continued)
Category
Beginning balance
Carrying amount Bad debt provisionCarrying value
Amount Proportion Amount Withdrawalproportion
Other receivableswith significantindividual amountand makeindependentprovision forexpected credit loss
184,619,007.33 29.80 173,506,953.19 93.98 11,112,054.14
Other receivableswithdrawn bad debtprovision accordingto credit riskscharacteristics
Aging group 388,967,784.28 62.81 41,436,970.43 10.65 347,530,813.85
Low-risk group 45,738,925.63 7.39 474,716.66 1.04 45,264,208.97
Subtotal of groups 434,706,709.91 70.20 41,911,687.09 9.64 392,795,022.82
Total 619,325,717.24 100.00 215,418,640.28 34.78 403,907,076.96
(4) Listed by aging
Aging Ending balance
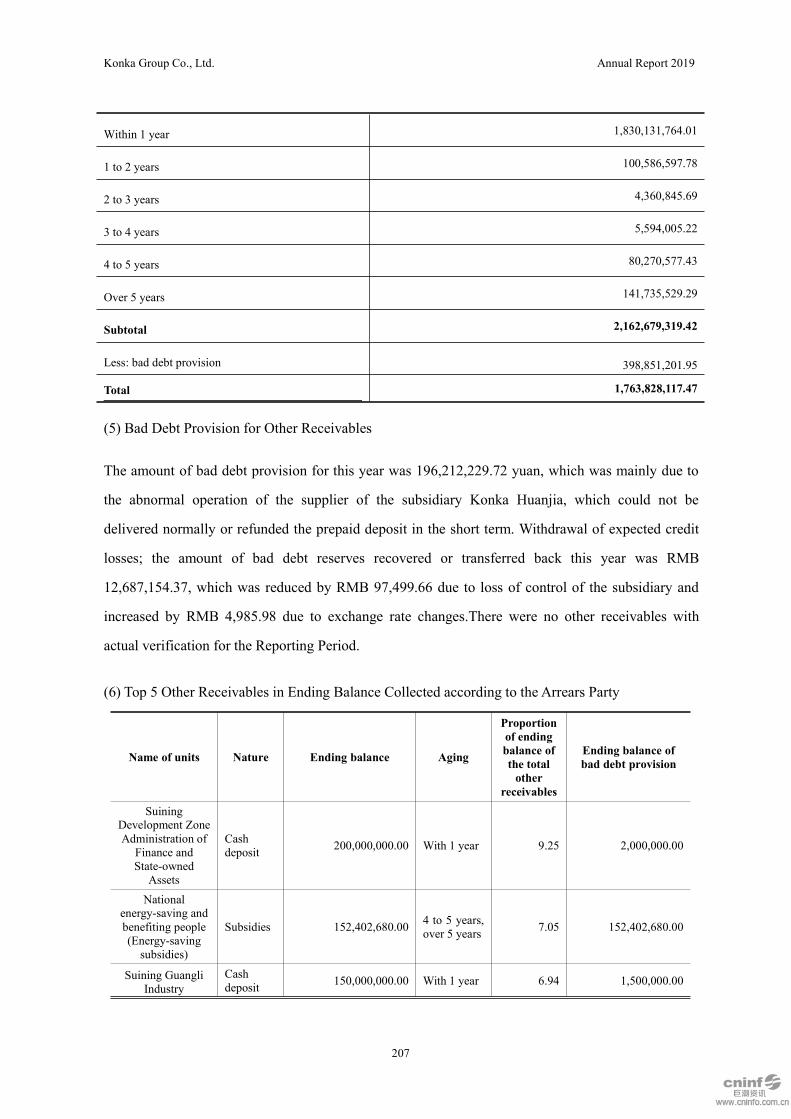
Konka Group Co., Ltd. Annual Report 2019
207
Within 1 year 1,830,131,764.01
1 to 2 years 100,586,597.78
2 to 3 years 4,360,845.69
3 to 4 years 5,594,005.22
4 to 5 years 80,270,577.43
Over 5 years 141,735,529.29
Subtotal 2,162,679,319.42
Less: bad debt provision 398,851,201.95
Total 1,763,828,117.47
(5) Bad Debt Provision for Other Receivables
The amount of bad debt provision for this year was 196,212,229.72 yuan, which was mainly due to
the abnormal operation of the supplier of the subsidiary Konka Huanjia, which could not be
delivered normally or refunded the prepaid deposit in the short term. Withdrawal of expected credit
losses; the amount of bad debt reserves recovered or transferred back this year was RMB
12,687,154.37, which was reduced by RMB 97,499.66 due to loss of control of the subsidiary and
increased by RMB 4,985.98 due to exchange rate changes.There were no other receivables with
actual verification for the Reporting Period.
(6) Top 5 Other Receivables in Ending Balance Collected according to the Arrears Party
Name of units Nature Ending balance Aging
Proportionof endingbalance ofthe totalother
receivables
Ending balance ofbad debt provision
SuiningDevelopment ZoneAdministration of
Finance andState-owned
Assets
Cashdeposit 200,000,000.00 With 1 year 9.25 2,000,000.00
Nationalenergy-saving andbenefiting people(Energy-savingsubsidies)
Subsidies 152,402,680.00 4 to 5 years,over 5 years 7.05 152,402,680.00
Suining GuangliIndustry
Cashdeposit 150,000,000.00 With 1 year 6.94 1,500,000.00

Konka Group Co., Ltd. Annual Report 2019
208
Name of units Nature Ending balance Aging
Proportionof endingbalance ofthe totalother
receivables
Ending balance ofbad debt provision
DevelopmentCo.,Ltd.
AdministrativeCommittee ofChuzhou
Development Zone
Assetdisposalmoney
147,256,700.00 With 1 year 6.81 3,254,373.07
Haimen RonghuiReal EstateCo.,Ltd.
Equitytransfermoney
100,000,000.00 With 1 year 4.62 2,210,000.00
Total — 749,659,380.00 — 34.66 161,367,053.07
(7) There were no other receivables derecognized due to transfer of financial assets during the
Reporting Period.
(8) There were no assets and liabilities formed by transferring other receivables and continuing to be
involved in this period.
8. Inventory
(1) Category of Inventory
Item
Ending balance
Carrying amount
Of which: the
capitalized
amount of the
borrowings
Falling pricereserves Carrying value
Development projects of
the property:
Development cost - - - -
Land intended to develop - - - -
Subtotal - - - -
Non-developmentprojects of the property:
Raw materials 1,275,228,321.83 - 27,122,457.46 1,248,105,864.37
Consigned processingmaterials 3,117,408.28 - - 3,117,408.28
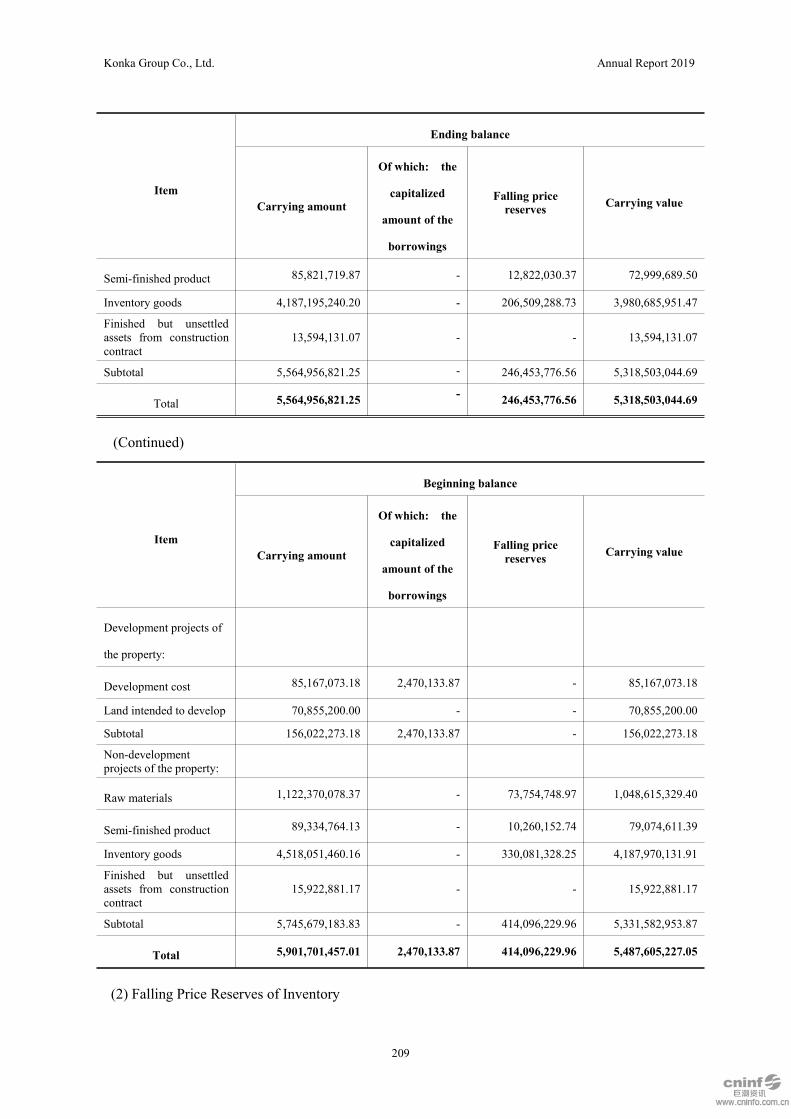
Konka Group Co., Ltd. Annual Report 2019
209
Item
Ending balance
Carrying amount
Of which: the
capitalized
amount of the
borrowings
Falling pricereserves Carrying value
Semi-finished product 85,821,719.87 - 12,822,030.37 72,999,689.50
Inventory goods 4,187,195,240.20 - 206,509,288.73 3,980,685,951.47
Finished but unsettledassets from constructioncontract
13,594,131.07 - - 13,594,131.07
Subtotal 5,564,956,821.25 - 246,453,776.56 5,318,503,044.69
Total 5,564,956,821.25 - 246,453,776.56 5,318,503,044.69
(Continued)
Item
Beginning balance
Carrying amount
Of which: the
capitalized
amount of the
borrowings
Falling pricereserves Carrying value
Development projects of
the property:
Development cost 85,167,073.18 2,470,133.87 - 85,167,073.18
Land intended to develop 70,855,200.00 - - 70,855,200.00
Subtotal 156,022,273.18 2,470,133.87 - 156,022,273.18
Non-developmentprojects of the property:
Raw materials 1,122,370,078.37 - 73,754,748.97 1,048,615,329.40
Semi-finished product 89,334,764.13 - 10,260,152.74 79,074,611.39
Inventory goods 4,518,051,460.16 - 330,081,328.25 4,187,970,131.91
Finished but unsettledassets from constructioncontract
15,922,881.17 - - 15,922,881.17
Subtotal 5,745,679,183.83 - 414,096,229.96 5,331,582,953.87
Total 5,901,701,457.01 2,470,133.87 414,096,229.96 5,487,605,227.05
(2) Falling Price Reserves of Inventory
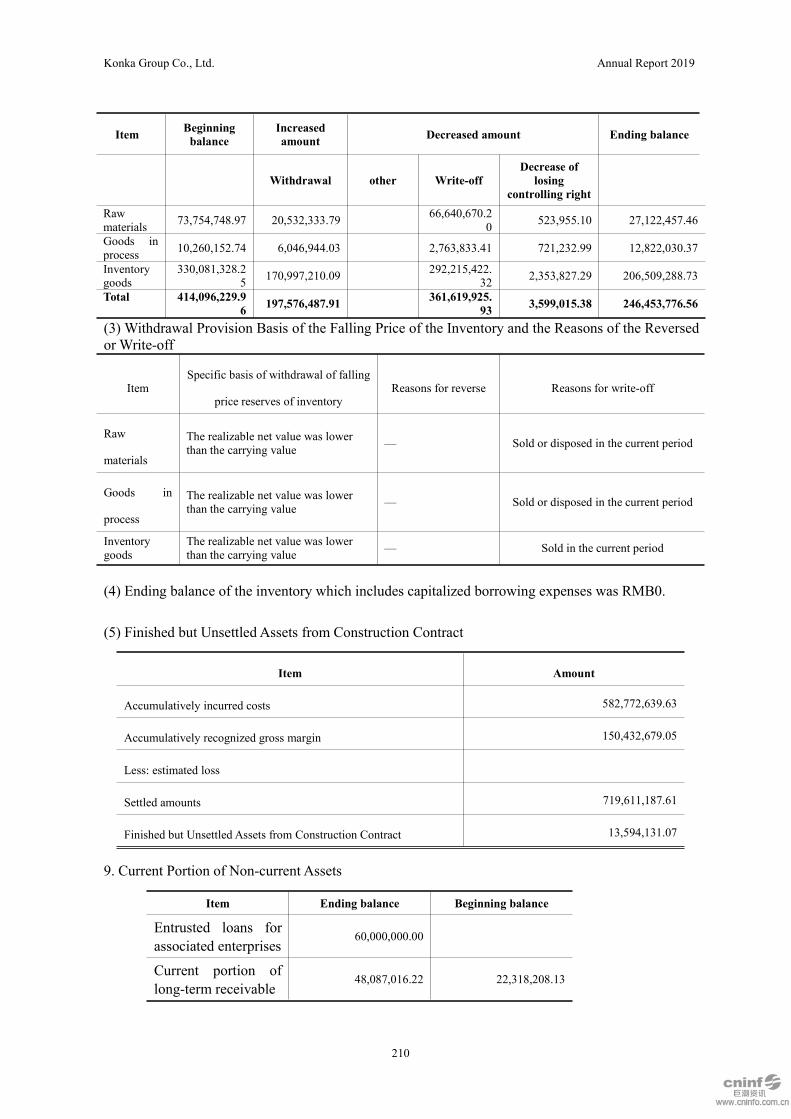
Konka Group Co., Ltd. Annual Report 2019
210
Item Beginningbalance
Increasedamount Decreased amount Ending balance
Withdrawal other Write-offDecrease of
losingcontrolling right
Rawmaterials 73,754,748.97 20,532,333.79 66,640,670.2
0 523,955.10 27,122,457.46
Goods inprocess 10,260,152.74 6,046,944.03 2,763,833.41 721,232.99 12,822,030.37
Inventorygoods
330,081,328.25 170,997,210.09 292,215,422.
32 2,353,827.29 206,509,288.73
Total 414,096,229.96 197,576,487.91 361,619,925.
93 3,599,015.38 246,453,776.56
(3) Withdrawal Provision Basis of the Falling Price of the Inventory and the Reasons of the Reversedor Write-off
ItemSpecific basis of withdrawal of falling
price reserves of inventoryReasons for reverse Reasons for write-off
Raw
materials
The realizable net value was lowerthan the carrying value — Sold or disposed in the current period
Goods in
process
The realizable net value was lowerthan the carrying value — Sold or disposed in the current period
Inventorygoods
The realizable net value was lowerthan the carrying value — Sold in the current period
(4) Ending balance of the inventory which includes capitalized borrowing expenses was RMB0.
(5) Finished but Unsettled Assets from Construction Contract
9. Current Portion of Non-current Assets
Item Ending balance Beginning balance
Entrusted loans forassociated enterprises
60,000,000.00
Current portion oflong-term receivable
48,087,016.22 22,318,208.13
Item Amount
Accumulatively incurred costs 582,772,639.63
Accumulatively recognized gross margin 150,432,679.05
Less: estimated loss
Settled amounts 719,611,187.61
Finished but Unsettled Assets from Construction Contract 13,594,131.07

Konka Group Co., Ltd. Annual Report 2019
211
Item Ending balance Beginning balance
Total 108,087,016.22 22,318,208.13
10. Other Current Assets
Item Ending balance Beginning balance
Principal and interest of entrusted loans to joint ventures 1,323,295,500.40 1,824,523,111.11
Prepayments and deductible taxes, and refund of tax for exportreceivable 598,034,887.02 794,991,256.00
Temporary difference of input tax 134,571,124.94
Prepayment of land purchase 75,450,000.00
Trust investment 18,331,817.52 30,000,000.00
Others 18,979,222.37 19,251,774.87
Total 2,093,212,552.25 2,744,216,141.98

Konka Group Co., Ltd. Annual Report 2019
212
11. Long-term Receivables
(1) List of Long-term Receivables
Item
Ending balance Beginning balanceInterval of
discount rateCarrying amount Bad debtprovision Carrying value Carrying amount Bad debt
provision Carrying value
Finance leasing amount 77,783,250.17 - 77,783,250.17 55,893,266.81 - 55,893,266.81 4.35%-8.78%
Of which: unrealized financingincome 9,635,891.82 - 9,635,891.82 4,975,887.40 - 4,975,887.40 4.35%-8.78%
Cash deposits of long-termreceivables 28,951,495.81 - 28,951,495.81 7,801,495.81 - 7,801,495.81
Long-term receivables ofprojects with franchise tights 351,861,826.09 - 351,861,826.09 349,416,483.56 - 349,416,483.56
Less: Current portion oflong-term receivables (fordetails, see Note VI. 9)
48,087,016.22 - 48,087,016.22 22,318,208.13 - 22,318,208.13
Total 410,509,555.85 - 410,509,555.85 390,793,038.05 - 390,793,038.05 —
(2) List of Projects with Franchise Rights
Item Type Project scale Franchise right Date of contract Operation
PPP Project of water supply and sewageRushan Silver Beach PPP 452,802,100.00 Right of charge for se
wage disposal July 2016 Partial trialoperation
(3) Changes in Long-term Receivables of Projects with Franchise Rights
Item Initial investedamount Beginning balance Increase Decrease Ending balance
Of which: reclassifiedinto current portion oflong-term receivables
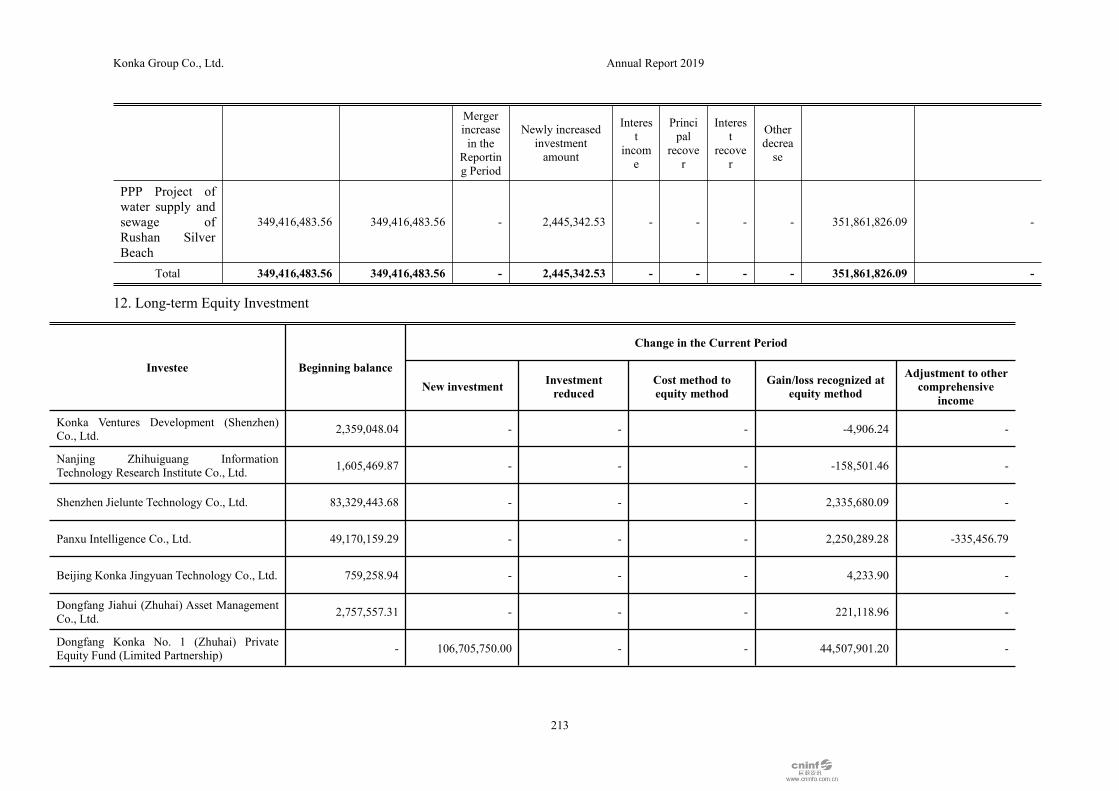
Konka Group Co., Ltd. Annual Report 2019
213
Mergerincreasein the
Reporting Period
Newly increasedinvestmentamount
Interest
income
Principal
recover
Interest
recover
Otherdecrease
PPP Project ofwater supply andsewage ofRushan SilverBeach
349,416,483.56 349,416,483.56 - 2,445,342.53 - - - - 351,861,826.09 -
Total 349,416,483.56 349,416,483.56 - 2,445,342.53 - - - - 351,861,826.09 -
12. Long-term Equity Investment
Investee Beginning balance
Change in the Current Period
New investment Investmentreduced
Cost method toequity method
Gain/loss recognized atequity method
Adjustment to othercomprehensive
income
Konka Ventures Development (Shenzhen)Co., Ltd. 2,359,048.04 - - - -4,906.24 -
Nanjing Zhihuiguang InformationTechnology Research Institute Co., Ltd. 1,605,469.87 - - - -158,501.46 -
Shenzhen Jielunte Technology Co., Ltd. 83,329,443.68 - - - 2,335,680.09 -
Panxu Intelligence Co., Ltd. 49,170,159.29 - - - 2,250,289.28 -335,456.79
Beijing Konka Jingyuan Technology Co., Ltd. 759,258.94 - - - 4,233.90 -
Dongfang Jiahui (Zhuhai) Asset ManagementCo., Ltd. 2,757,557.31 - - - 221,118.96 -
Dongfang Konka No. 1 (Zhuhai) PrivateEquity Fund (Limited Partnership) - 106,705,750.00 - - 44,507,901.20 -

Konka Group Co., Ltd. Annual Report 2019
214
Investee Beginning balance
Change in the Current Period
New investment Investmentreduced
Cost method toequity method
Gain/loss recognized atequity method
Adjustment to othercomprehensive
income
Shenzhen Xiaorui Technology Co., Ltd. 100,277,552.55 - - - -3,600,730.72 -
Guoguang Ruilian (Shenzhen) NetworkTechnology Co., Ltd. 777,956.58 - - - -585,633.38 -
Puchuang Jiakang Technology Co., Ltd. - 400,000.00 - - -400,000.00 -
Weihai Water Environmental ProtectionTechnology Co., Ltd. 2,440,433.26 - - - 52,778.70 -
Weihai Yiheng Environmental TechnologyCo., Ltd. 4,571,472.70 - - - 96,820.19 -
Huoqiu Kangrun Kaitian WaterEnvironmental Protection Co., Ltd. - 32,434,987.50 - - - -
Huarun Environmental Protection WaterTreatment Co., Ltd. - 15,819,210.00 - - 199,660.31 -
Binzhou Beihai Weiqiao Solid WasteTreatment Co., Ltd. 59,671,933.63 - - - 98,461,156.32 -
Shandong Bishuiyuan EnvironmentalTechnology Co., Ltd. 24,745,069.48 - - - 1,429,552.18 -
Shandong Konka Zhijia Electrical AppliancesCo., Ltd. - 4,000,000.00 - - 52,660.23 -
Henan Konka Zhijia Electrical AppliancesCo., Ltd. - 1,600,000.00 - - -890,365.18 -
Anhui Kaikaishijie E-commerce Co., Ltd. 436,685,064.57 - - - -11,834,755.90 -
Kunshan Konka Electronic Co., Ltd. 200,694,466.80 - - - -18,280,700.29 -

Konka Group Co., Ltd. Annual Report 2019
215
Investee Beginning balance
Change in the Current Period
New investment Investmentreduced
Cost method toequity method
Gain/loss recognized atequity method
Adjustment to othercomprehensive
income
Kunshan Kangsheng InvestmentDevelopment Co., Ltd. 269,673,264.00 - - - - -
Chutianlong Co., Ltd. 624,845,604.93 - - - 22,304,031.77 -
Heilongjiang Longkang Zhijia TechnologyCo., Ltd. 6,400,480.52 - - - -1,550,082.49 -
Konka Green, Konka Technology 78,409,903.14 - - - -1,067,483.78 -
Shaanxi Silu Yunqi Smart Technology Co.,Ltd. 4,522,509.33 12,350,000.00 - - 329,806.10 -
Shenzhen Konka Information Network Co.,Ltd. 26,656,667.58 - - - -13,996,444.85 -
Shenzhen Zhongbing Konka Technology Co.,Ltd. 10,617,873.79 - - - -3,344,645.38 -
Shenzhen Konka Smart Electrical ApplianceTechnology Co., Ltd. 2,287,478.52 - - - 594,671.20 -
Zhuhai Jinsu Plastic Co., Ltd. 11,040,246.82 - - - 1,196,157.32 -
Shenzhen Qiaochenghui Network TechnologyCo., Ltd. 3,592,514.06 - 3,592,514.06 - - -
Shenzhen Fusheng New Material Co., Ltd. 79,859,338.44 - - - -1,038,480.46 -
Shenzhen Yaode Technology Co., Ltd. 222,210,835.18 - - - 7,529,410.29 -
Wuhan Tianyuan Environmental ProtectionCo., Ltd. 252,270,255.47 - - - 23,307,076.74 -

Konka Group Co., Ltd. Annual Report 2019
216
Investee Beginning balance
Change in the Current Period
New investment Investmentreduced
Cost method toequity method
Gain/loss recognized atequity method
Adjustment to othercomprehensive
income
Shenzhen Konka Yishijie CommercialDisplay Co., Ltd. - - - 86,760,000.00 40,425.67 -
Chuzhou Konka Technology IndustryDevelopment Co., Ltd. - - - 61,029,500.00 - -
Chuzhou Kangjin Healthcare IndustryDevelopment Co., Ltd. - - - 117,460,056.00 - -
Haimen Kangjian Technology Industrial ParkOperation and Management Co., Ltd. - - - 131,273,550.00 - -
Shenzhen Kangyue Industrial Co., Ltd. - - - 33,856,942.00 - -
Feide Technology (Shenzhen) Co., Ltd. 4,868,798.36 12,000,000.00 - - -2,554,176.68 -
Chongqing Qingjia Electronic Co., Ltd. 19,750,739.24 - - - -582,038.16 -
Nanjing Kangxing Technology IndustrialPark Operation and Management Co., Ltd. 50,929,429.45 - 17,000,000.00 - -1,623,757.77 -
Total 2,637,780,825.53 185,309,947.50 20,592,514.06 430,380,048.00 143,400,727.72 -335,456.79
(Continued)
Investee
Change in the Current PeriodEnding balance
(carrying amount)
Balance of assetimpairmentallowanceOther equity
changes
Cash dividend orprofit distribution
declared
Impairmentallowance Other
Konka Ventures Development (Shenzhen)Co., Ltd. - - - - 2,354,141.80 -

Konka Group Co., Ltd. Annual Report 2019
217
Nanjing Zhihuiguang InformationTechnology Research Institute Co., Ltd. - - - - 1,446,968.41 -
Shenzhen Jielunte Technology Co., Ltd. - - - - 85,665,123.77 -
Panxu Intelligence Co., Ltd. - - - - 51,084,991.78 -
Beijing Konka Jingyuan Technology Co., Ltd. - - - - 763,492.84 -
Dongfang Jiahui (Zhuhai) Asset ManagementCo., Ltd. - - - - 2,978,676.27 -
Dongfang Konka No. 1 (Zhuhai) PrivateEquity Fund (Limited Partnership) - - - 158,810,750.31 310,024,401.51 -
Shenzhen Xiaorui Technology Co., Ltd. - - 8,676,821.83 - 88,000,000.00 8,676,821.83
Guoguang Ruilian (Shenzhen) NetworkTechnology Co., Ltd. - - - - 192,323.20 -
Puchuang Jiakang Technology Co., Ltd. - - - - - -
Weihai Water Environmental ProtectionTechnology Co., Ltd. - - - - 2,493,211.96 -
Weihai Yiheng Environmental TechnologyCo., Ltd. - - - - 4,668,292.89 -
Huoqiu Kangrun Kaitian WaterEnvironmental Protection Co., Ltd. - - - - 32,434,987.50 -
Huarun Environmental Protection WaterTreatment Co., Ltd. - - - - 16,018,870.31 -
Binzhou Beihai Weiqiao Solid WasteTreatment Co., Ltd. - 24,500,000.00 - - 133,633,089.95 -
Shandong Bishuiyuan EnvironmentalTechnology Co., Ltd. - - - - 26,174,621.66 -
Shandong Konka Zhijia Electrical AppliancesCo., Ltd. - - - - 4,052,660.23 -
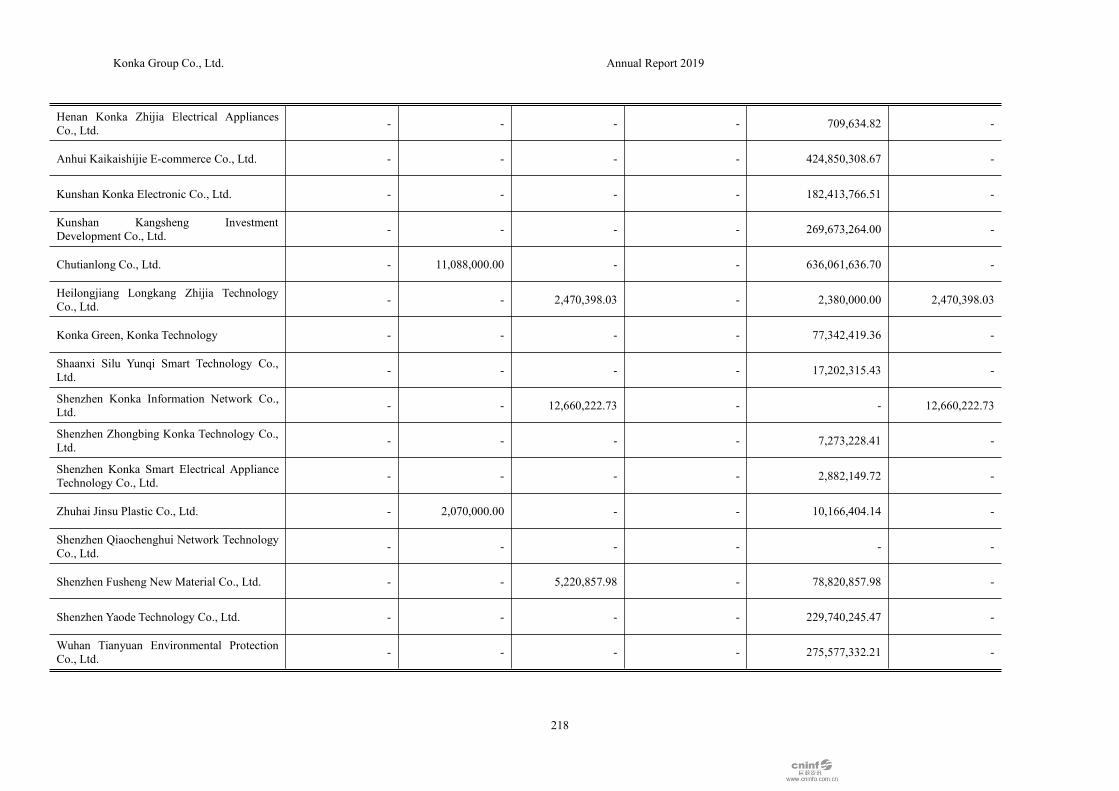
Konka Group Co., Ltd. Annual Report 2019
218
Henan Konka Zhijia Electrical AppliancesCo., Ltd. - - - - 709,634.82 -
Anhui Kaikaishijie E-commerce Co., Ltd. - - - - 424,850,308.67 -
Kunshan Konka Electronic Co., Ltd. - - - - 182,413,766.51 -
Kunshan Kangsheng InvestmentDevelopment Co., Ltd. - - - - 269,673,264.00 -
Chutianlong Co., Ltd. - 11,088,000.00 - - 636,061,636.70 -
Heilongjiang Longkang Zhijia TechnologyCo., Ltd. - - 2,470,398.03 - 2,380,000.00 2,470,398.03
Konka Green, Konka Technology - - - - 77,342,419.36 -
Shaanxi Silu Yunqi Smart Technology Co.,Ltd. - - - - 17,202,315.43 -
Shenzhen Konka Information Network Co.,Ltd. - - 12,660,222.73 - - 12,660,222.73
Shenzhen Zhongbing Konka Technology Co.,Ltd. - - - - 7,273,228.41 -
Shenzhen Konka Smart Electrical ApplianceTechnology Co., Ltd. - - - - 2,882,149.72 -
Zhuhai Jinsu Plastic Co., Ltd. - 2,070,000.00 - - 10,166,404.14 -
Shenzhen Qiaochenghui Network TechnologyCo., Ltd. - - - - - -
Shenzhen Fusheng New Material Co., Ltd. - - 5,220,857.98 - 78,820,857.98 -
Shenzhen Yaode Technology Co., Ltd. - - - - 229,740,245.47 -
Wuhan Tianyuan Environmental ProtectionCo., Ltd. - - - - 275,577,332.21 -

Konka Group Co., Ltd. Annual Report 2019
219
Shenzhen Konka Yishijie CommercialDisplay Co., Ltd. - 2,526,830.75 - - 84,273,594.93 -
Chuzhou Konka Technology IndustryDevelopment Co., Ltd. - - - - 61,029,500.00 -
Chuzhou Kangjin Healthcare IndustryDevelopment Co., Ltd. - - - - 117,460,056.00 -
Haimen Kangjian Technology Industrial ParkOperation and Management Co., Ltd. - - - - 131,273,550.00 -
Shenzhen Kangyue Industrial Co., Ltd. - - - - 33,856,942.00 -
Feide Technology (Shenzhen) Co., Ltd. - - - - 14,314,621.68 -
Chongqing Qingjia Electronic Co., Ltd. - - - - 19,168,701.08 -
Nanjing Kangxing Technology IndustrialPark Operation and Management Co., Ltd. - - - - 32,305,671.68 -
Total - 40,184,830.75 29,028,300.57 158,810,750.31 3,465,541,196.89 29,028,300.57

220
13. Other Equity Instrument Investment
(1) Investment in non-trading equity instruments
Item Ending balance Beginning balance
Shenzhen Tianyilian Science & Technology Co., Ltd. - 4,800,000.00
Shenzhen Adopt Network Co., Ltd. - -
Beijing Konka Technology Co., Ltd. 1,200,000.00 4,700,000.00
AVO 6,000,000.00 -
Shaoyang Haishang Ecological AgriculturalTechnology Co., Ltd. 1,501,956.00 -
Feihong Electronics Co., Ltd. - -
ZAEFI - -
Shenzhen Chuangce Investment Development Co.,Ltd. - -
Shanlian Information Technology Engineering Center 1,860,809.20 3,360,809.20
Shenzhen CIU Science & Technology Co., Ltd. 953,000.00 953,000.00
Shenzhen Digital TV National EngineeringLaboratory Co., Ltd. 7,726,405.16 7,726,405.16
Shanghai National Engineering Research Center ofDigital TV Co., Ltd. 2,400,000.00 2,400,000.00
Total 21,642,170.36 23,940,214.36
(2) Non-transactional Equity Instrument Investment
Item
Dividendincome
recognized inthe currentperiod
Accumulativegain
Accumulativeloss
Amount ofretainedearnings
transferred fromother
comprehensiveincome
Reason for beingdesignated to be
measured at fair valueof which recorded inother comprehensive
income
Reason forretainedearnings
transferredfrom other
comprehensive income
ShenzhenTianyilianScience &Technology Co.,Ltd.
- - 4,800,000.00 - Long-term holding basedon strategic purpose
-
Shenzhen AdoptNetwork Co., Ltd. - - 5,750,000.00 - Long-term holding based
on strategic purpose-
Beijing KonkaTechnology Co.,Ltd.
- - 3,500,000.00 - Long-term holding basedon strategic purpose
-
AVO - - - - Long-term holding basedon strategic purpose
-
ShaoyangHaishangEcologicalAgriculturalTechnology Co.,Ltd.
- - - - Long-term holding basedon strategic purpose
-
Feihong - - 1,300,000.00 - Long-term holding basedon strategic purpose
-

221
Item
Dividendincome
recognized inthe currentperiod
Accumulativegain
Accumulativeloss
Amount ofretainedearnings
transferred fromother
comprehensiveincome
Reason for beingdesignated to be
measured at fair valueof which recorded inother comprehensive
income
Reason forretainedearnings
transferredfrom other
comprehensive income
Electronics Co.,
Ltd.
ZAEFI - - 100,000.00 - Long-term holding basedon strategic purpose
-
ShenzhenChuangceInvestmentDevelopment Co.,Ltd.
- - 485,000.00 - Long-term holding basedon strategic purpose -
ShanlianInformationTechnologyEngineeringCenter
- - 3,139,190.80 - Long-term holding basedon strategic purpose -
Shenzhen CIUScience &Technology Co.,Ltd.
- - 200,000.00 - Long-term holding basedon strategic purpose -
Shenzhen DigitalTV NationalEngineeringLaboratory Co.,Ltd.
- - 1,273,594.84 - Long-term holding basedon strategic purpose -
ShanghaiNationalEngineeringResearch Centerof Digital TV Co.,Ltd.
- - - - Long-term holding basedon strategic purpose -
Total - - 20,547,785.64 - - -
14. Other Non-current Financial Assets
Item Ending balance Beginning balance
Equity investments 540,230,000.00 450,230,000.00
Investments in debt obligations 1,212,891,727.83 98,000,000.00
Total 1,753,121,727.83 548,230,000.00
Note: The debt investment at the end of the year was mainly the company’s debt fund of
1,049,891,727.83 yuan invested in Chuzhou Huike Intelligent Home Appliances Industry
Investment Partnership (Limited Partnership).
15. Investment Property
Item Houses and buildings
I. Original carrying value
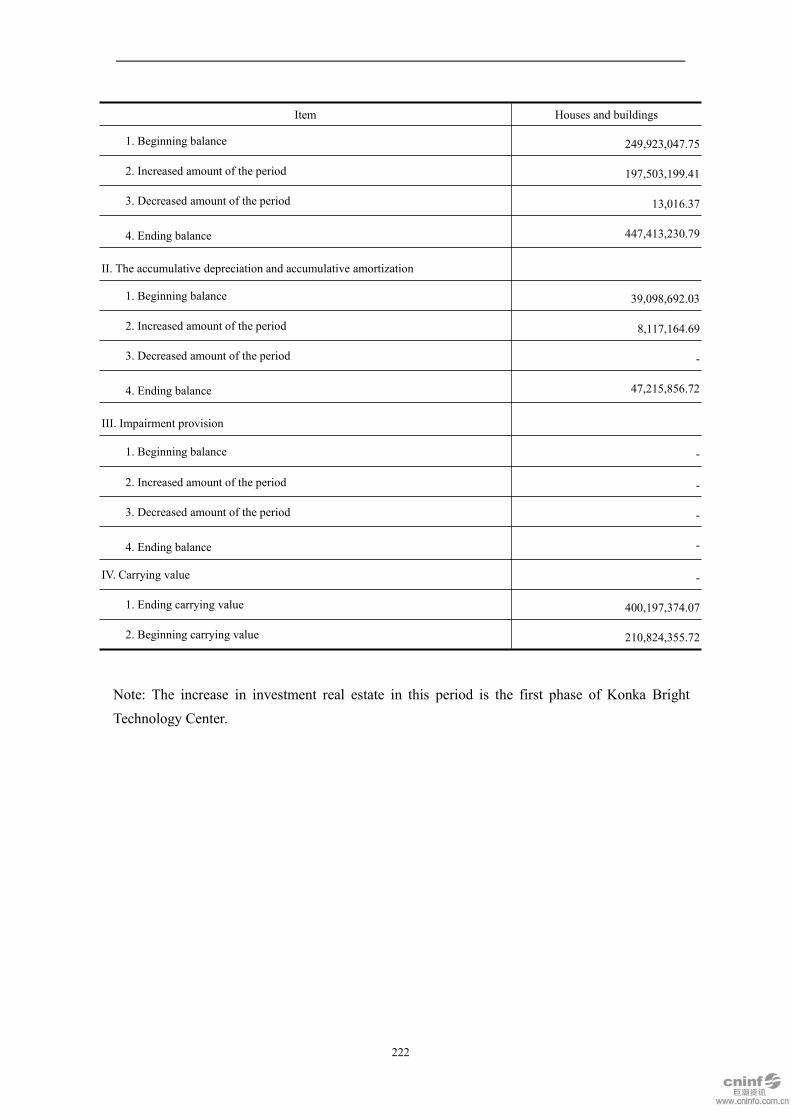
222
Item Houses and buildings
1. Beginning balance 249,923,047.75
2. Increased amount of the period 197,503,199.41
3. Decreased amount of the period 13,016.37
4. Ending balance 447,413,230.79
II. The accumulative depreciation and accumulative amortization
1. Beginning balance 39,098,692.03
2. Increased amount of the period 8,117,164.69
3. Decreased amount of the period -
4. Ending balance 47,215,856.72
III. Impairment provision
1. Beginning balance -
2. Increased amount of the period -
3. Decreased amount of the period -
4. Ending balance -
IV. Carrying value -
1. Ending carrying value 400,197,374.07
2. Beginning carrying value 210,824,355.72
Note: The increase in investment real estate in this period is the first phase of Konka BrightTechnology Center.
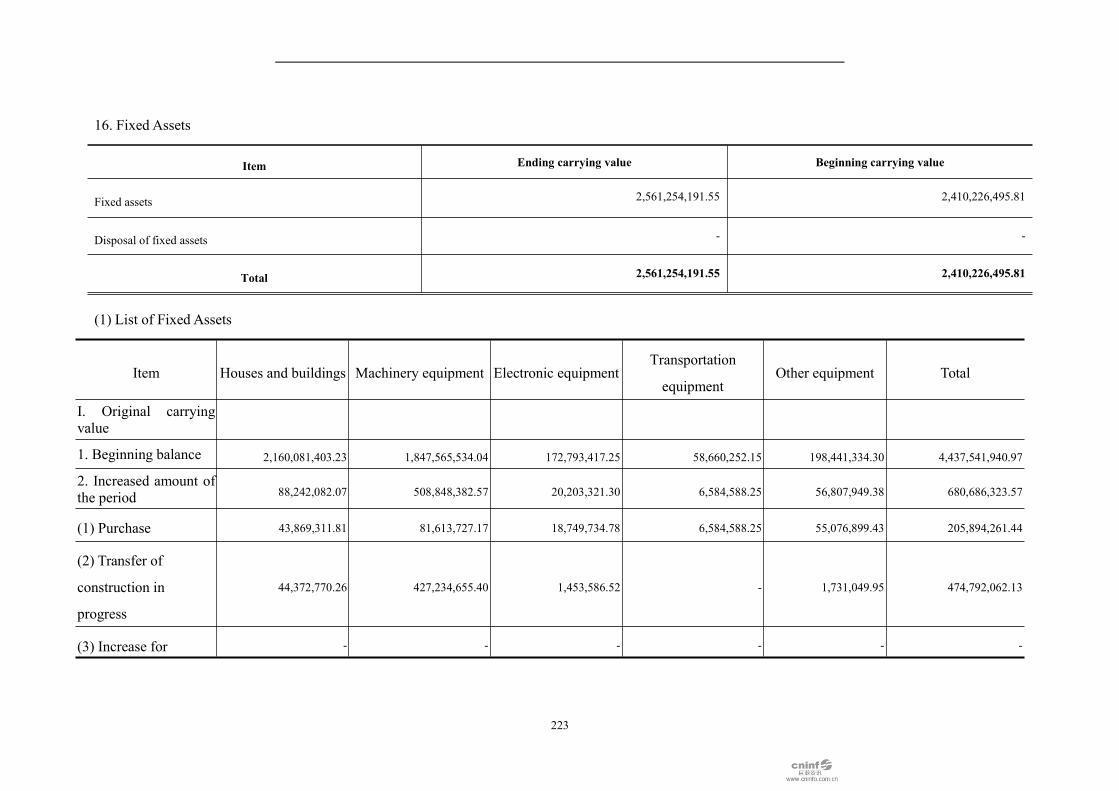
223
16. Fixed Assets
Item Ending carrying value Beginning carrying value
Fixed assets 2,561,254,191.55 2,410,226,495.81
Disposal of fixed assets - -
Total 2,561,254,191.55 2,410,226,495.81
(1) List of Fixed Assets
Item Houses and buildings Machinery equipment Electronic equipmentTransportation
equipmentOther equipment Total
I. Original carryingvalue
1. Beginning balance 2,160,081,403.23 1,847,565,534.04 172,793,417.25 58,660,252.15 198,441,334.30 4,437,541,940.97
2. Increased amount ofthe period 88,242,082.07 508,848,382.57 20,203,321.30 6,584,588.25 56,807,949.38 680,686,323.57
(1) Purchase 43,869,311.81 81,613,727.17 18,749,734.78 6,584,588.25 55,076,899.43 205,894,261.44
(2) Transfer of
construction in
progress
44,372,770.26 427,234,655.40 1,453,586.52 - 1,731,049.95 474,792,062.13
(3) Increase for - - - - - -

224
Item Houses and buildings Machinery equipment Electronic equipmentTransportation
equipmentOther equipment Total
business combination
3. Decreased amount
of the period213,105,378.31 339,265,571.20 8,932,082.70 7,180,972.77 13,635,422.35 582,119,427.33
(1) Disposal or Scrap 213,105,378.31 151,570,971.76 8,812,826.05 6,829,654.19 11,760,674.01 392,079,504.32
(2) Decrease for loss of
controlling right- 5,273,753.80 119,256.65 351,318.58 1,874,748.34 7,619,077.37
(3) Decrease for other
reasons- 182,420,845.64 - - - 182,420,845.64
4. Ending balance 2,035,218,106.99 2,017,148,345.41 184,064,655.85 58,063,867.63 241,613,861.33 4,536,108,837.21
II. Accumulative
depreciation
1. Beginning balance 634,795,930.27 1,001,329,043.28 135,908,033.93 40,186,544.94 141,731,721.09 1,953,951,273.51
2. Increased amount ofthe period 67,969,604.47 149,634,296.46 11,145,490.75 5,133,774.40 22,774,219.28 256,657,385.35
(1) Withdrawal 67,969,604.47 149,634,296.46 11,145,490.75 5,133,774.40 22,774,219.28 256,657,385.35
(2) Increase for
business merger- - - - - -

225
Item Houses and buildings Machinery equipment Electronic equipmentTransportation
equipmentOther equipment Total
3. Decreased amount
of the period68,920,961.75 211,807,236.79 7,073,727.55 5,445,916.17 11,119,928.64 304,367,770.90
(1) Disposal or Scrap 68,920,961.75 117,776,230.87 6,989,970.96 5,430,106.83 10,086,249.00 209,203,519.41
(2) Decrease for loss of
controlling right- 2,423,669.35 83,756.59 15,809.34 1,033,679.64 3,556,914.92
(3) Decrease for other
reasons- 91,607,336.57 - - - 91,607,336.57
4. Ending balance 633,844,572.99 939,156,102.95 139,979,797.13 39,874,403.17 153,386,011.73 1,906,240,887.96
III. Depreciation
reserves
1. Beginning balance 1,247,805.91 68,610,152.04 1,215,451.65 820,215.24 1,470,546.81 73,364,171.65
2. Increased amount ofthe period - - - - - -
(1) Withdrawal - - - - - -
(2) Increase for
business merger- - - - - -
3. Decreased amount - 4,586,246.47 58,874.37 - 105,293.11 4,750,413.95
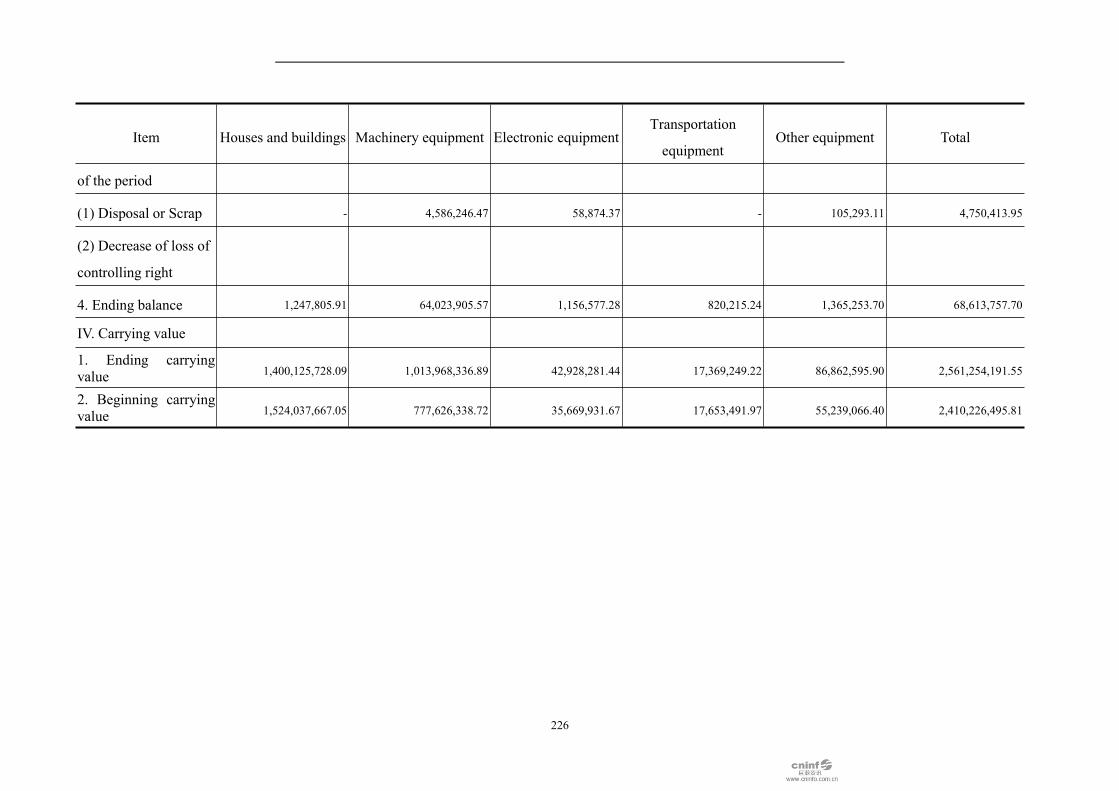
226
Item Houses and buildings Machinery equipment Electronic equipmentTransportation
equipmentOther equipment Total
of the period
(1) Disposal or Scrap - 4,586,246.47 58,874.37 - 105,293.11 4,750,413.95
(2) Decrease of loss of
controlling right
4. Ending balance 1,247,805.91 64,023,905.57 1,156,577.28 820,215.24 1,365,253.70 68,613,757.70
IV. Carrying value
1. Ending carryingvalue 1,400,125,728.09 1,013,968,336.89 42,928,281.44 17,369,249.22 86,862,595.90 2,561,254,191.55
2. Beginning carryingvalue 1,524,037,667.05 777,626,338.72 35,669,931.67 17,653,491.97 55,239,066.40 2,410,226,495.81
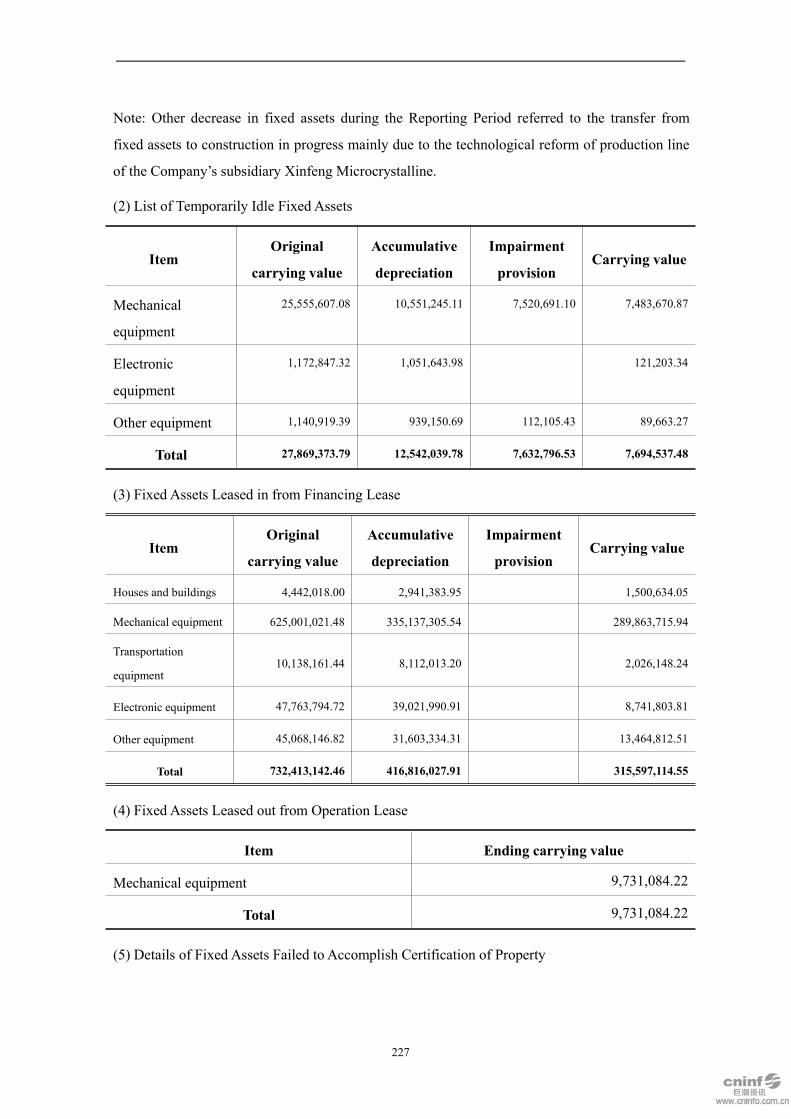
227
Note: Other decrease in fixed assets during the Reporting Period referred to the transfer from
fixed assets to construction in progress mainly due to the technological reform of production line
of the Company’s subsidiary Xinfeng Microcrystalline.
(2) List of Temporarily Idle Fixed Assets
ItemOriginal
carrying value
Accumulative
depreciation
Impairment
provisionCarrying value
Mechanical
equipment
25,555,607.08 10,551,245.11 7,520,691.10 7,483,670.87
Electronic
equipment
1,172,847.32 1,051,643.98 121,203.34
Other equipment 1,140,919.39 939,150.69 112,105.43 89,663.27
Total 27,869,373.79 12,542,039.78 7,632,796.53 7,694,537.48
(3) Fixed Assets Leased in from Financing Lease
ItemOriginal
carrying value
Accumulative
depreciation
Impairment
provisionCarrying value
Houses and buildings 4,442,018.00 2,941,383.95 1,500,634.05
Mechanical equipment 625,001,021.48 335,137,305.54 289,863,715.94
Transportation
equipment10,138,161.44 8,112,013.20 2,026,148.24
Electronic equipment 47,763,794.72 39,021,990.91 8,741,803.81
Other equipment 45,068,146.82 31,603,334.31 13,464,812.51
Total 732,413,142.46 416,816,027.91 315,597,114.55
(4) Fixed Assets Leased out from Operation Lease
Item Ending carrying value
Mechanical equipment 9,731,084.22
Total 9,731,084.22
(5) Details of Fixed Assets Failed to Accomplish Certification of Property
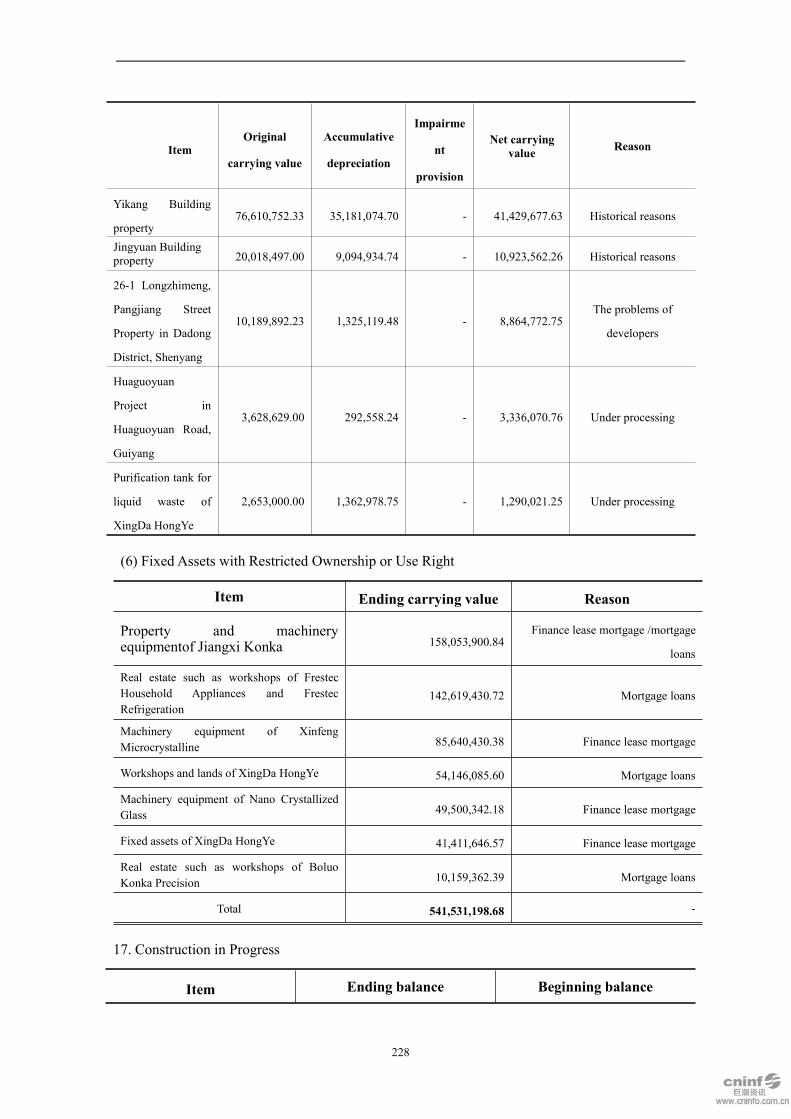
228
ItemOriginal
carrying value
Accumulative
depreciation
Impairme
nt
provision
Net carryingvalue Reason
Yikang Building
property76,610,752.33 35,181,074.70 - 41,429,677.63 Historical reasons
Jingyuan Buildingproperty 20,018,497.00 9,094,934.74 - 10,923,562.26 Historical reasons
26-1 Longzhimeng,
Pangjiang Street
Property in Dadong
District, Shenyang
10,189,892.23 1,325,119.48 - 8,864,772.75The problems of
developers
Huaguoyuan
Project in
Huaguoyuan Road,
Guiyang
3,628,629.00 292,558.24 - 3,336,070.76 Under processing
Purification tank for
liquid waste of
XingDa HongYe
2,653,000.00 1,362,978.75 - 1,290,021.25 Under processing
(6) Fixed Assets with Restricted Ownership or Use Right
Item Ending carrying value Reason
Property and machineryequipmentof Jiangxi Konka 158,053,900.84
Finance lease mortgage /mortgage
loans
Real estate such as workshops of FrestecHousehold Appliances and FrestecRefrigeration
142,619,430.72 Mortgage loans
Machinery equipment of XinfengMicrocrystalline 85,640,430.38 Finance lease mortgage
Workshops and lands of XingDa HongYe 54,146,085.60 Mortgage loans
Machinery equipment of Nano CrystallizedGlass 49,500,342.18 Finance lease mortgage
Fixed assets of XingDa HongYe 41,411,646.57 Finance lease mortgage
Real estate such as workshops of BoluoKonka Precision 10,159,362.39 Mortgage loans
Total 541,531,198.68 -
17. Construction in Progress
Item Ending balance Beginning balance
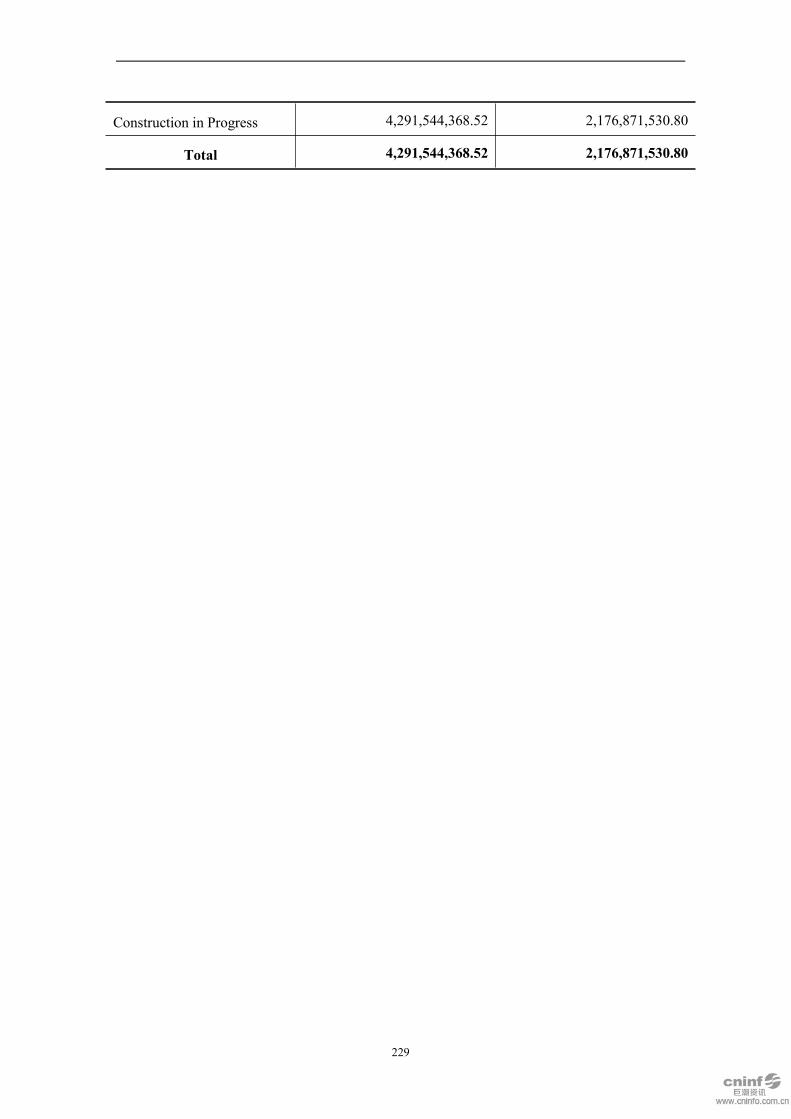
229
Construction in Progress 4,291,544,368.52 2,176,871,530.80
Total 4,291,544,368.52 2,176,871,530.80

230
(1) List of Construction in Progress
Item
Ending balance Beginning balance
Carrying amountImpairmen
tprovision
Carrying value Carrying amountImpairmen
tprovision
Carrying value
Comprehensive improvement engineering project of drainagebasins in the city of Donggang 715,838,346.63 715,838,346.63 451,789,427.70 451,789,427.70
PPP Project of Funan Sewage Treatment592,295,248.19 592,295,248.19
Water supply engineering project in Mazongshan Town, SubeiMongol Autonomous County, Gansu Province 571,112,712.15 571,112,712.15 552,055,516.50 552,055,516.50
PPP Project of Lushan Shahe Ecological Rehabilitation andImprovement (Phase I) 511,792,398.90 511,792,398.90
Integrated PPP Project of Huangpi Sewage Treatment385,214,225.65 385,214,225.65
The second line of Jiangxi Nano Crystallized Glass336,485,492.44 336,485,492.44 303,533,244.21 303,533,244.21
Central City Comprehensive accelerated programs inEconomic and Technological Development Zone ofBinhai, Weifang
329,745,585.38 329,745,585.38 261,826,586.30 261,826,586.30
Ankang Smart Plant143,320,357.80 143,320,357.80
Tongchuan Project99,720,949.28 99,720,949.28
The second sewage plant of Laizhou90,971,785.34 90,971,785.34
Yibin Konka Hi-Tech Industrial Park86,183,539.65 86,183,539.65
Dayi Project79,258,722.98 79,258,722.98 400,000.00 400,000.00
Guangming Project39,753,607.36 39,753,607.36 153,577,240.57 153,577,240.57
The second line of Xinfeng Microcrystalline Jade39,066,165.62 39,066,165.62 365,069,872.84 365,069,872.84
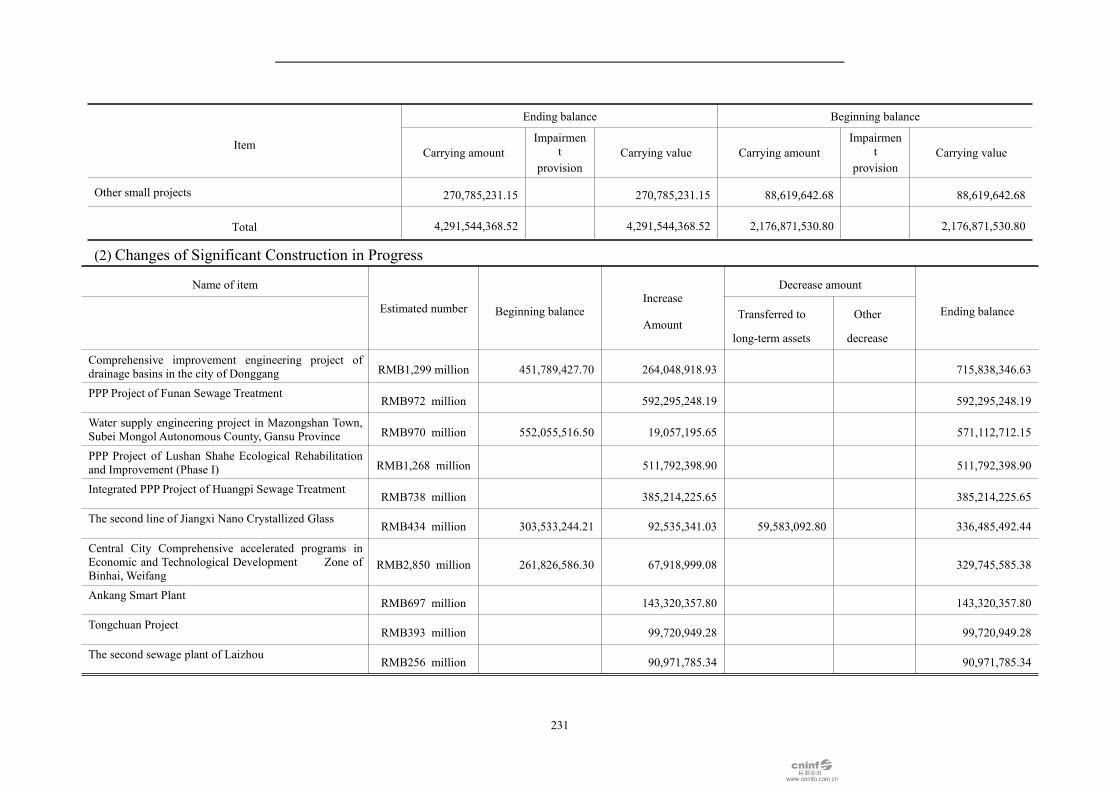
231
Item
Ending balance Beginning balance
Carrying amountImpairmen
tprovision
Carrying value Carrying amountImpairmen
tprovision
Carrying value
Other small projects 270,785,231.15 270,785,231.15 88,619,642.68 88,619,642.68
Total 4,291,544,368.52 4,291,544,368.52 2,176,871,530.80 2,176,871,530.80
(2) Changes of Significant Construction in Progress
Name of item
Estimated number Beginning balanceIncrease
Amount
Decrease amount
Ending balanceTransferred to
long-term assets
Other
decrease
Comprehensive improvement engineering project ofdrainage basins in the city of Donggang RMB1,299 million 451,789,427.70 264,048,918.93 715,838,346.63
PPP Project of Funan Sewage TreatmentRMB972 million 592,295,248.19 592,295,248.19
Water supply engineering project in Mazongshan Town,Subei Mongol Autonomous County, Gansu Province RMB970 million 552,055,516.50 19,057,195.65 571,112,712.15
PPP Project of Lushan Shahe Ecological Rehabilitationand Improvement (Phase I) RMB1,268 million 511,792,398.90 511,792,398.90
Integrated PPP Project of Huangpi Sewage TreatmentRMB738 million 385,214,225.65 385,214,225.65
The second line of Jiangxi Nano Crystallized GlassRMB434 million 303,533,244.21 92,535,341.03 59,583,092.80 336,485,492.44
Central City Comprehensive accelerated programs inEconomic and Technological Development Zone ofBinhai, Weifang
RMB2,850 million 261,826,586.30 67,918,999.08 329,745,585.38
Ankang Smart PlantRMB697 million 143,320,357.80 143,320,357.80
Tongchuan ProjectRMB393 million 99,720,949.28 99,720,949.28
The second sewage plant of LaizhouRMB256 million 90,971,785.34 90,971,785.34
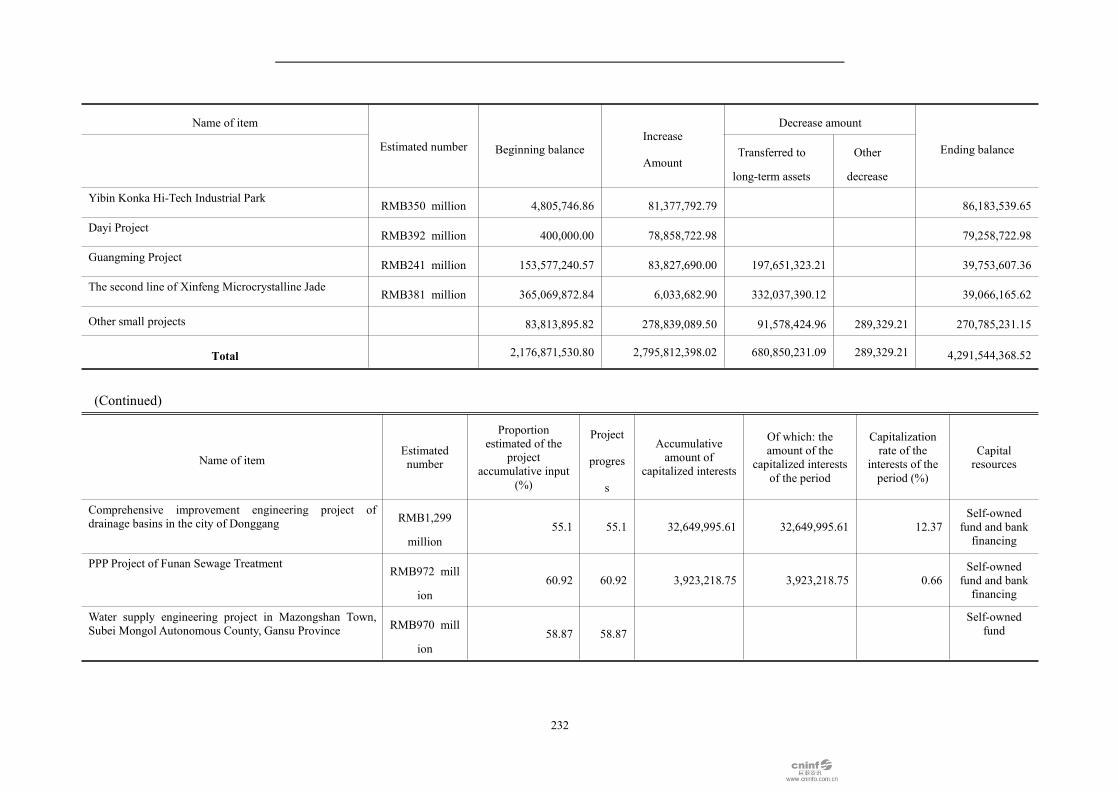
232
Name of item
Estimated number Beginning balanceIncrease
Amount
Decrease amount
Ending balanceTransferred to
long-term assets
Other
decrease
Yibin Konka Hi-Tech Industrial ParkRMB350 million 4,805,746.86 81,377,792.79 86,183,539.65
Dayi ProjectRMB392 million 400,000.00 78,858,722.98 79,258,722.98
Guangming ProjectRMB241 million 153,577,240.57 83,827,690.00 197,651,323.21 39,753,607.36
The second line of Xinfeng Microcrystalline JadeRMB381 million 365,069,872.84 6,033,682.90 332,037,390.12 39,066,165.62
Other small projects 83,813,895.82 278,839,089.50 91,578,424.96 289,329.21 270,785,231.15
Total 2,176,871,530.80 2,795,812,398.02 680,850,231.09 289,329.21 4,291,544,368.52
(Continued)
Name of itemEstimatednumber
Proportionestimated of the
projectaccumulative input
(%)
Project
progres
s
Accumulativeamount of
capitalized interests
Of which: theamount of the
capitalized interestsof the period
Capitalizationrate of the
interests of theperiod (%)
Capitalresources
Comprehensive improvement engineering project ofdrainage basins in the city of Donggang RMB1,299
million55.1 55.1 32,649,995.61 32,649,995.61 12.37
Self-ownedfund and bankfinancing
PPP Project of Funan Sewage TreatmentRMB972 mill
ion60.92 60.92 3,923,218.75 3,923,218.75 0.66
Self-ownedfund and bankfinancing
Water supply engineering project in Mazongshan Town,Subei Mongol Autonomous County, Gansu Province RMB970 mill
ion58.87 58.87
Self-ownedfund

233
Name of itemEstimatednumber
Proportionestimated of the
projectaccumulative input
(%)
Project
progres
s
Accumulativeamount of
capitalized interests
Of which: theamount of the
capitalized interestsof the period
Capitalizationrate of the
interests of theperiod (%)
Capitalresources
PPP Project of Lushan Shahe Ecological Rehabilitation andImprovement (Phase I) RMB1,268 m
illion40.37 40.37
Self-ownedfund
Integrated PPP Project of Huangpi Sewage TreatmentRMB738 mill
ion52.17 52.17
Self-ownedfund
The second line of Jiangxi Nano Crystallized GlassRMB434 mill
ion77.53 77.53 32,249,994.16 5,403,293.13 5.84
Self-ownedfund and
finance leasing
Central City Comprehensive accelerated programs inEconomic and Technological Development Zone ofBinhai, Weifang
RMB2,850 m
illion11.39 11.39 5,685,669.94 5,685,669.94 8.37
Self-ownedfund and bankfinancing
Ankang Smart PlantRMB697 mill
ion20.56 20.56 - - -
Self-ownedfund
Tongchuan ProjectRMB393 mill
ion25.37 25.37 - - -
Self-ownedfund
The second sewage plant of LaizhouRMB256 mill
ion35.49 35.49 - - -
Self-ownedfund
Yibin Konka Hi-Tech Industrial ParkRMB350 mill
ion24.62 24.62 - - -
Self-ownedfund
Dayi ProjectRMB392 mill
ion20.21 20.21 - - -
Self-ownedfund
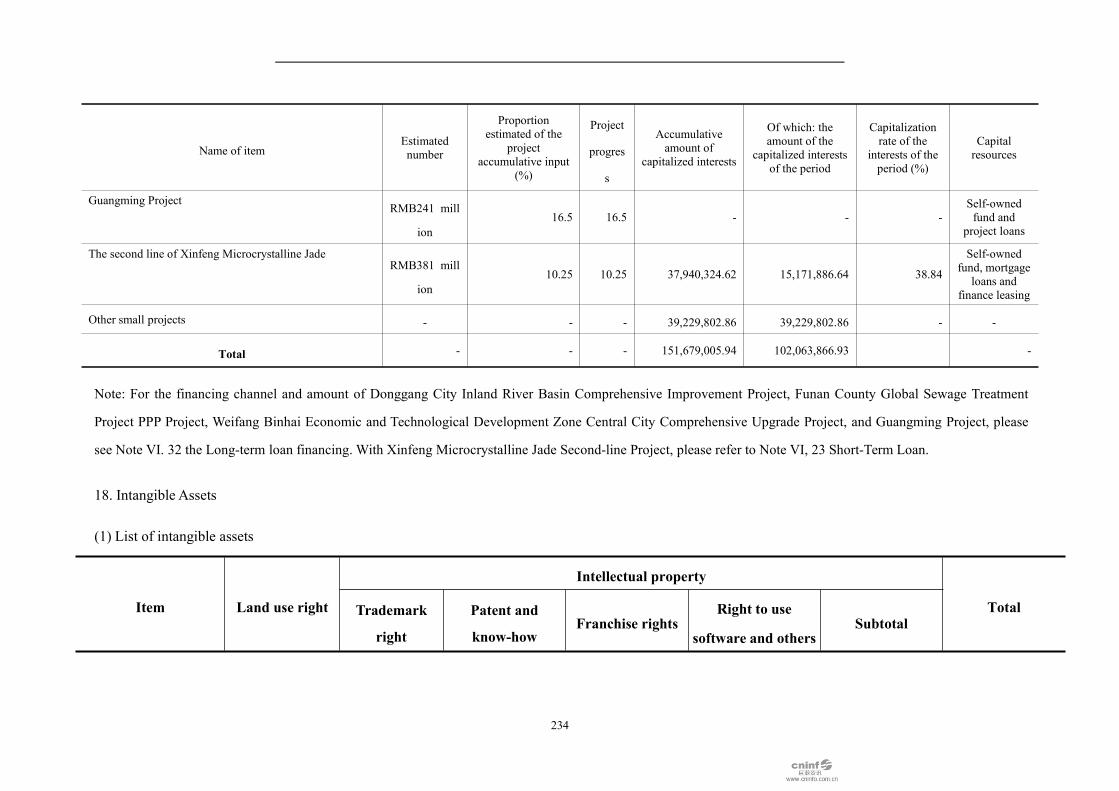
234
Name of itemEstimatednumber
Proportionestimated of the
projectaccumulative input
(%)
Project
progres
s
Accumulativeamount of
capitalized interests
Of which: theamount of the
capitalized interestsof the period
Capitalizationrate of the
interests of theperiod (%)
Capitalresources
Guangming ProjectRMB241 mill
ion16.5 16.5 - - -
Self-ownedfund and
project loans
The second line of Xinfeng Microcrystalline JadeRMB381 mill
ion10.25 10.25 37,940,324.62 15,171,886.64 38.84
Self-ownedfund, mortgage
loans andfinance leasing
Other small projects - - - 39,229,802.86 39,229,802.86 - -
Total - - - 151,679,005.94 102,063,866.93 -
Note: For the financing channel and amount of Donggang City Inland River Basin Comprehensive Improvement Project, Funan County Global Sewage Treatment
Project PPP Project, Weifang Binhai Economic and Technological Development Zone Central City Comprehensive Upgrade Project, and Guangming Project, please
see Note VI. 32 the Long-term loan financing. With Xinfeng Microcrystalline Jade Second-line Project, please refer to Note VI, 23 Short-Term Loan.
18. Intangible Assets
(1) List of intangible assets
Item Land use right
Intellectual property
TotalTrademark
right
Patent and
know-howFranchise rights
Right to use
software and othersSubtotal

235
Item Land use right
Intellectual property
TotalTrademark
right
Patent and
know-howFranchise rights
Right to use
software and othersSubtotal
I. Original carryingvalue1. Beginning balance 548,540,757.52 47,490,161.70 87,491,851.74 111,050,625.01 80,373,189.03 326,405,827.48 874,946,585.00
2. Increased amount ofthe period 485,250,292.69 28,084,905.75 15,040,566.04 19,498,611.74 62,624,083.53 547,874,376.22
(1) Purchase 449,220,316.79 28,084,905.75 15,040,566.04 13,221,185.35 56,346,657.14 505,566,973.93
(2) Transfer of
construction in progress6,277,426.39 6,277,426.39 6,277,426.39
(3) Increase for business
combination(4) Increase for otherreasons 36,029,975.90 36,029,975.90
3. Decreased amount of
the period7,367,983.02 92,450.02 4,479,280.91 181,795.53 4,753,526.46 12,121,509.48
(1) Disposal 7,367,983.02 92,450.02 181,795.53 274,245.55 7,642,228.57
(2) Decrease for losing
controlling right
(3) Decrease for other 4,479,280.91 4,479,280.91 4,479,280.91

236
Item Land use right
Intellectual property
TotalTrademark
right
Patent and
know-howFranchise rights
Right to use
software and othersSubtotal
reasons
4. Ending balance 1,026,423,067.19 75,482,617.43 102,532,417.78 106,571,344.10 99,690,005.24 384,276,384.55 1,410,699,451.74
II. Accumulated
amortization
1. Beginning balance 40,662,235.55 5,364,671.49 46,294,309.44 6,663,037.50 35,284,562.07 93,606,580.50 134,268,816.05
2. Increased amount ofthe period 41,340,908.53 10,123,516.22 4,442,025.00 7,871,162.33 22,436,703.55 63,777,612.08
(1) Withdrawal 41,340,908.53 10,123,516.22 4,442,025.00 7,871,162.33 22,436,703.55 63,777,612.08
(2) Increase for business
combination
3. Decreased amount of
the period3,245,526.66 92,450.02 181,795.53 274,245.55 3,519,772.21
(1) Disposal 3,245,526.66 92,450.02 181,795.53 274,245.55 3,519,772.21
(2) Decrease for losing
controlling right
4. Ending balance 78,757,617.42 5,272,221.47 56,417,825.66 11,105,062.50 42,973,928.87 115,769,038.50 194,526,655.91
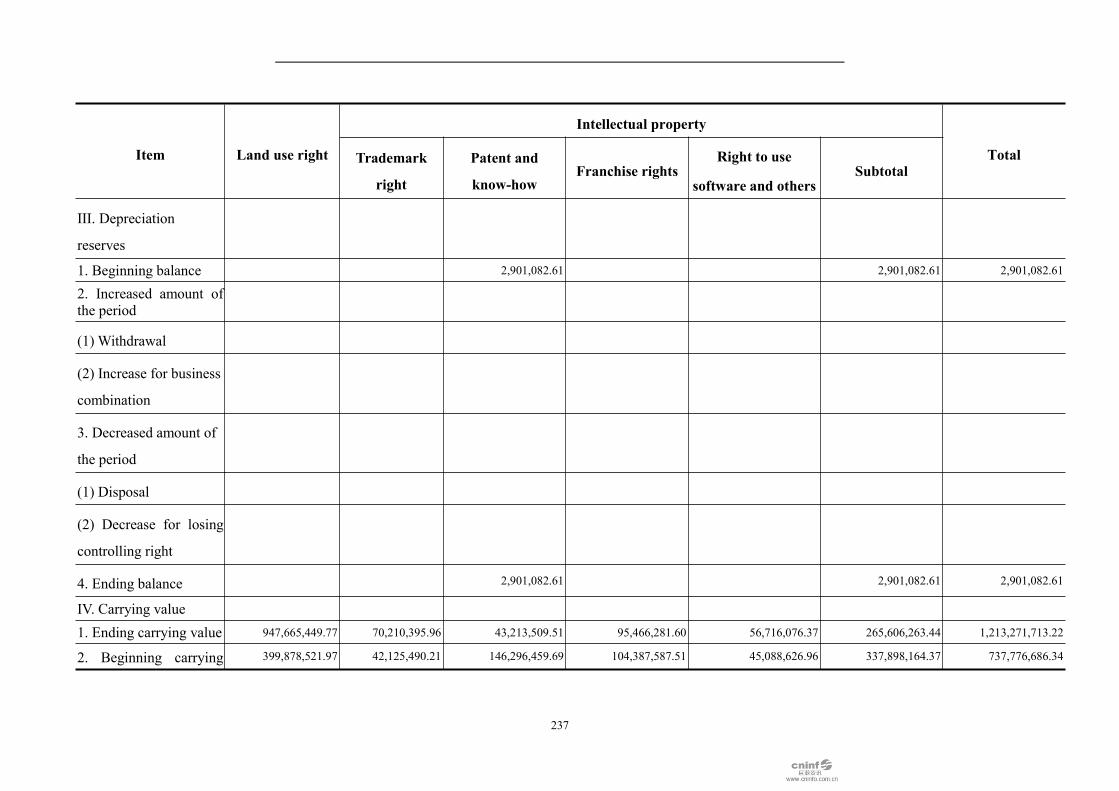
237
Item Land use right
Intellectual property
TotalTrademark
right
Patent and
know-howFranchise rights
Right to use
software and othersSubtotal
III. Depreciation
reserves
1. Beginning balance 2,901,082.61 2,901,082.61 2,901,082.61
2. Increased amount ofthe period
(1) Withdrawal
(2) Increase for business
combination
3. Decreased amount of
the period
(1) Disposal
(2) Decrease for losing
controlling right
4. Ending balance 2,901,082.61 2,901,082.61 2,901,082.61
IV. Carrying value1. Ending carrying value 947,665,449.77 70,210,395.96 43,213,509.51 95,466,281.60 56,716,076.37 265,606,263.44 1,213,271,713.22
2. Beginning carrying 399,878,521.97 42,125,490.21 146,296,459.69 104,387,587.51 45,088,626.96 337,898,164.37 737,776,686.34
238
Item Land use right
Intellectual property
TotalTrademark
right
Patent and
know-howFranchise rights
Right to use
software and othersSubtotal
value
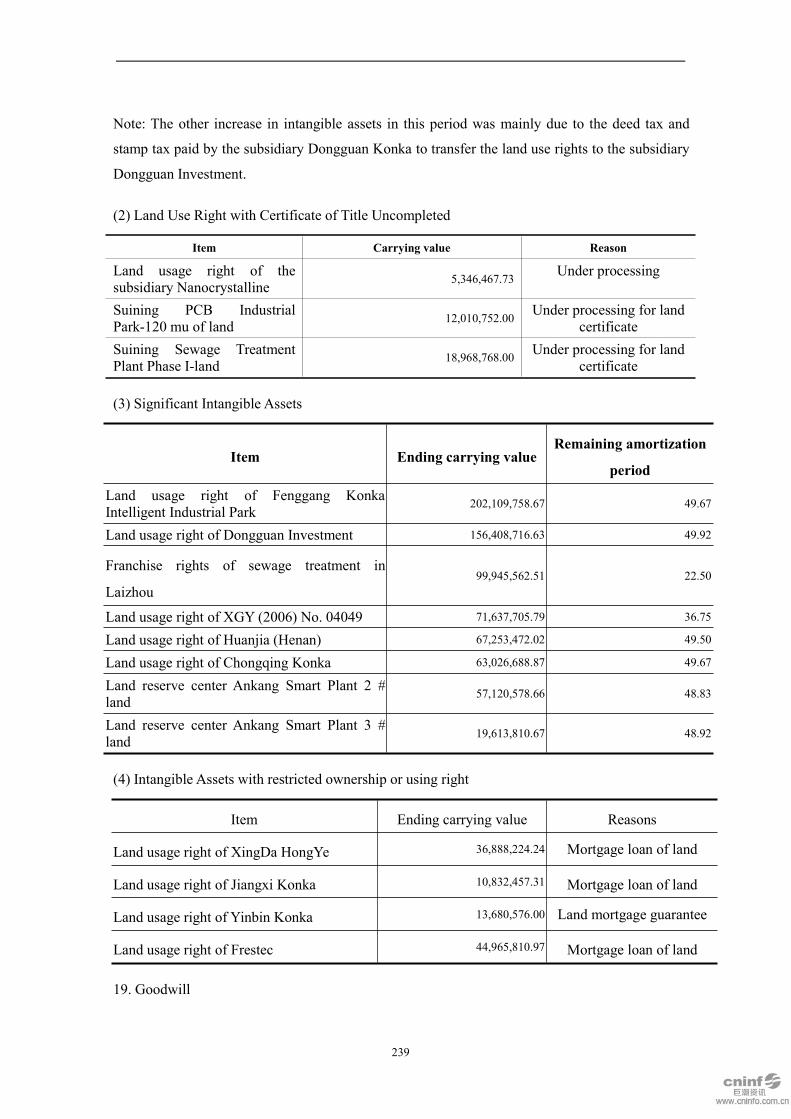
239
Note: The other increase in intangible assets in this period was mainly due to the deed tax and
stamp tax paid by the subsidiary Dongguan Konka to transfer the land use rights to the subsidiary
Dongguan Investment.
(2) Land Use Right with Certificate of Title Uncompleted
Item Carrying value Reason
Land usage right of thesubsidiary Nanocrystalline 5,346,467.73 Under processing
Suining PCB IndustrialPark-120 mu of land 12,010,752.00 Under processing for land
certificateSuining Sewage TreatmentPlant Phase I-land 18,968,768.00 Under processing for land
certificate
(3) Significant Intangible Assets
Item Ending carrying valueRemaining amortization
period
Land usage right of Fenggang KonkaIntelligent Industrial Park 202,109,758.67 49.67
Land usage right of Dongguan Investment 156,408,716.63 49.92
Franchise rights of sewage treatment in
Laizhou99,945,562.51 22.50
Land usage right of XGY (2006) No. 04049 71,637,705.79 36.75
Land usage right of Huanjia (Henan) 67,253,472.02 49.50
Land usage right of Chongqing Konka 63,026,688.87 49.67
Land reserve center Ankang Smart Plant 2 #land 57,120,578.66 48.83
Land reserve center Ankang Smart Plant 3 #land 19,613,810.67 48.92
(4) Intangible Assets with restricted ownership or using right
Item Ending carrying value Reasons
Land usage right of XingDa HongYe 36,888,224.24 Mortgage loan of land
Land usage right of Jiangxi Konka 10,832,457.31 Mortgage loan of land
Land usage right of Yinbin Konka 13,680,576.00 Land mortgage guarantee
Land usage right of Frestec 44,965,810.97 Mortgage loan of land
19. Goodwill
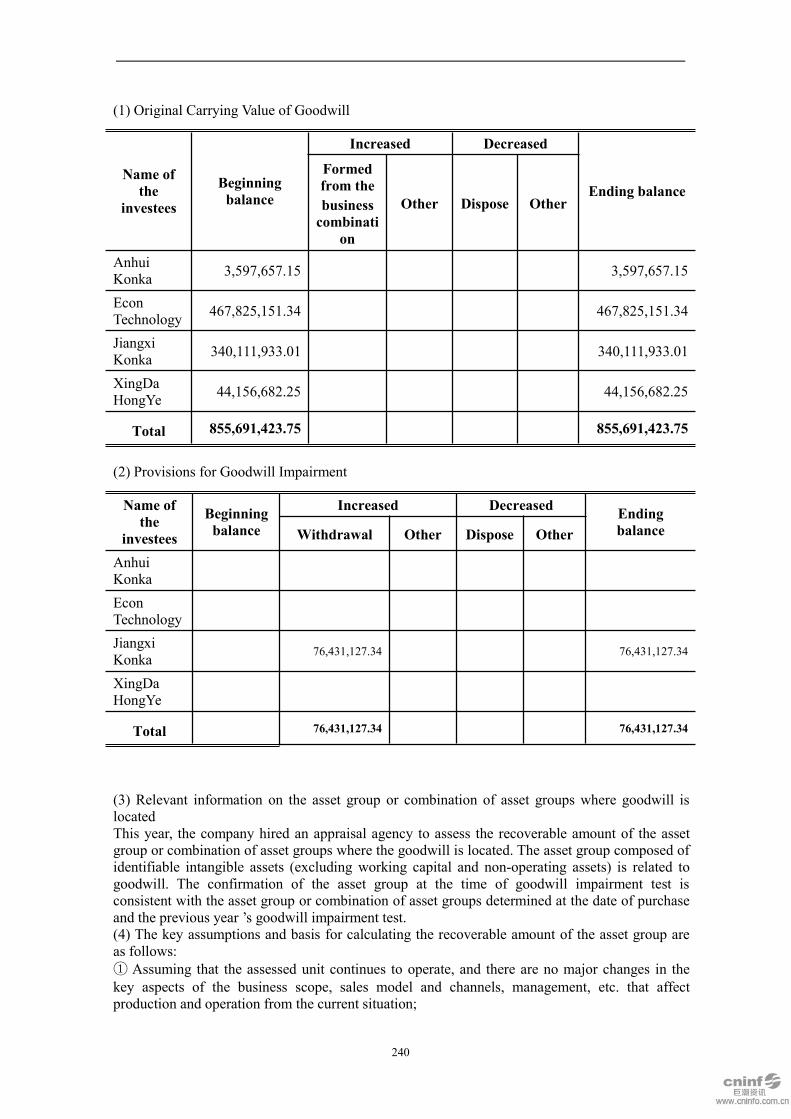
240
(1) Original Carrying Value of Goodwill
Name ofthe
investees
Beginningbalance
Increased Decreased
Ending balanceFormedfrom thebusinesscombinati
on
Other Dispose Other
AnhuiKonka 3,597,657.15 3,597,657.15
EconTechnology 467,825,151.34 467,825,151.34
JiangxiKonka 340,111,933.01 340,111,933.01
XingDaHongYe 44,156,682.25 44,156,682.25
Total 855,691,423.75 855,691,423.75
(2) Provisions for Goodwill Impairment
Name ofthe
investees
Beginningbalance
Increased Decreased EndingbalanceWithdrawal Other Dispose Other
AnhuiKonkaEconTechnologyJiangxiKonka 76,431,127.34 76,431,127.34
XingDaHongYe
Total 76,431,127.34 76,431,127.34
(3) Relevant information on the asset group or combination of asset groups where goodwill islocatedThis year, the company hired an appraisal agency to assess the recoverable amount of the assetgroup or combination of asset groups where the goodwill is located. The asset group composed ofidentifiable intangible assets (excluding working capital and non-operating assets) is related togoodwill. The confirmation of the asset group at the time of goodwill impairment test isconsistent with the asset group or combination of asset groups determined at the date of purchaseand the previous year ’s goodwill impairment test.(4) The key assumptions and basis for calculating the recoverable amount of the asset group areas follows:① Assuming that the assessed unit continues to operate, and there are no major changes in thekey aspects of the business scope, sales model and channels, management, etc. that affectproduction and operation from the current situation;
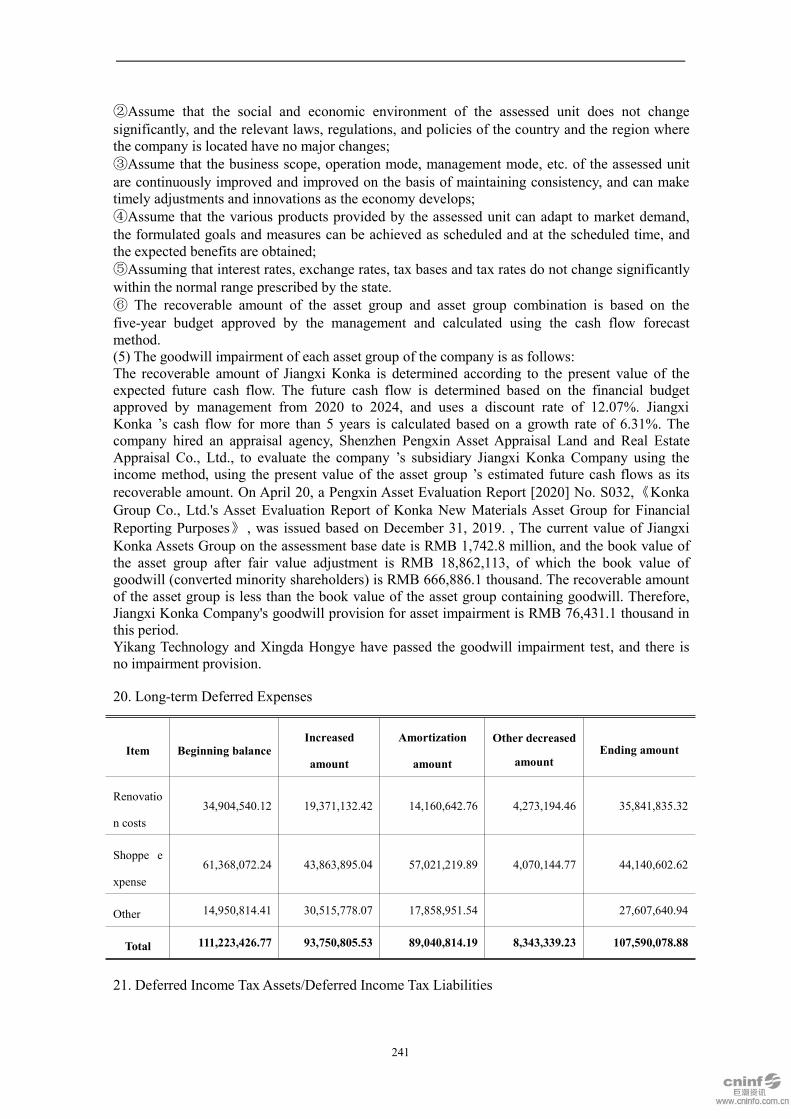
241
②Assume that the social and economic environment of the assessed unit does not changesignificantly, and the relevant laws, regulations, and policies of the country and the region wherethe company is located have no major changes;③Assume that the business scope, operation mode, management mode, etc. of the assessed unitare continuously improved and improved on the basis of maintaining consistency, and can maketimely adjustments and innovations as the economy develops;④Assume that the various products provided by the assessed unit can adapt to market demand,the formulated goals and measures can be achieved as scheduled and at the scheduled time, andthe expected benefits are obtained;⑤Assuming that interest rates, exchange rates, tax bases and tax rates do not change significantlywithin the normal range prescribed by the state.⑥ The recoverable amount of the asset group and asset group combination is based on thefive-year budget approved by the management and calculated using the cash flow forecastmethod.(5) The goodwill impairment of each asset group of the company is as follows:The recoverable amount of Jiangxi Konka is determined according to the present value of theexpected future cash flow. The future cash flow is determined based on the financial budgetapproved by management from 2020 to 2024, and uses a discount rate of 12.07%. JiangxiKonka ’s cash flow for more than 5 years is calculated based on a growth rate of 6.31%. Thecompany hired an appraisal agency, Shenzhen Pengxin Asset Appraisal Land and Real EstateAppraisal Co., Ltd., to evaluate the company ’s subsidiary Jiangxi Konka Company using theincome method, using the present value of the asset group ’s estimated future cash flows as itsrecoverable amount. On April 20, a Pengxin Asset Evaluation Report [2020] No. S032,《KonkaGroup Co., Ltd.'s Asset Evaluation Report of Konka New Materials Asset Group for FinancialReporting Purposes》 , was issued based on December 31, 2019. , The current value of JiangxiKonka Assets Group on the assessment base date is RMB 1,742.8 million, and the book value ofthe asset group after fair value adjustment is RMB 18,862,113, of which the book value ofgoodwill (converted minority shareholders) is RMB 666,886.1 thousand. The recoverable amountof the asset group is less than the book value of the asset group containing goodwill. Therefore,Jiangxi Konka Company's goodwill provision for asset impairment is RMB 76,431.1 thousand inthis period.Yikang Technology and Xingda Hongye have passed the goodwill impairment test, and there isno impairment provision.
20. Long-term Deferred Expenses
Item Beginning balanceIncreased
amount
Amortization
amount
Other decreased
amountEnding amount
Renovatio
n costs34,904,540.12 19,371,132.42 14,160,642.76 4,273,194.46 35,841,835.32
Shoppe e
xpense61,368,072.24 43,863,895.04 57,021,219.89 4,070,144.77 44,140,602.62
Other 14,950,814.41 30,515,778.07 17,858,951.54 27,607,640.94
Total 111,223,426.77 93,750,805.53 89,040,814.19 8,343,339.23 107,590,078.88
21. Deferred Income Tax Assets/Deferred Income Tax Liabilities
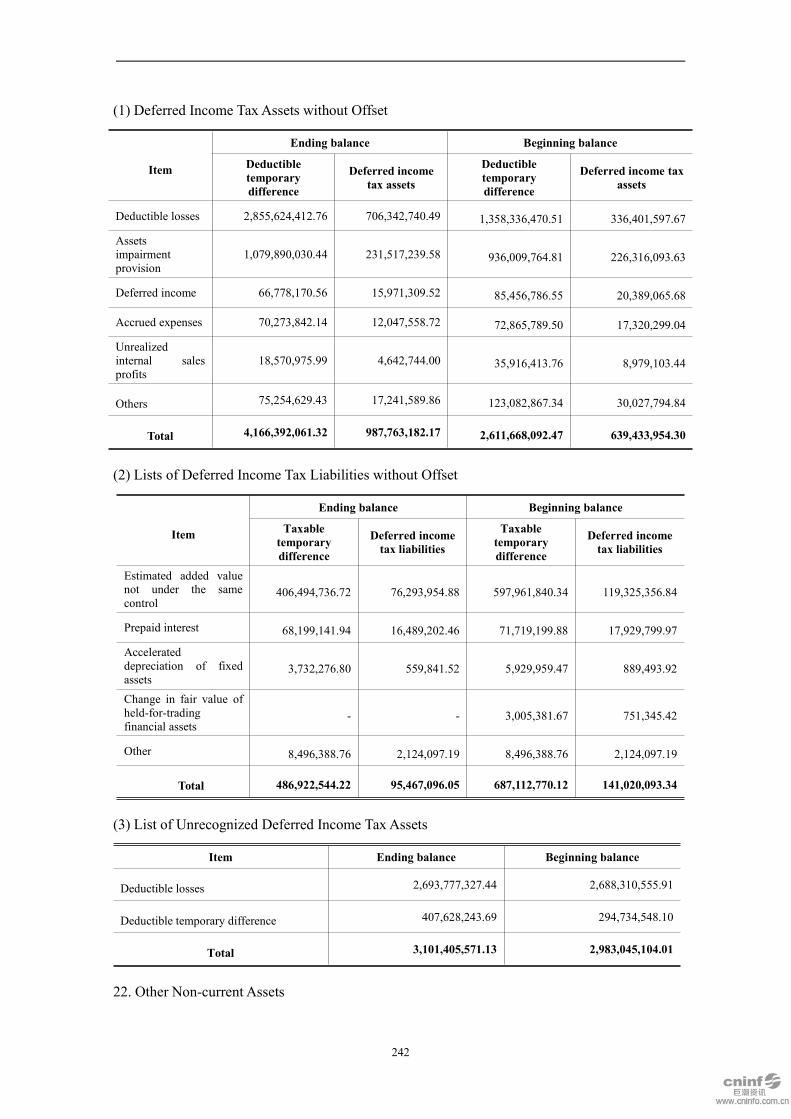
242
(1) Deferred Income Tax Assets without Offset
Item
Ending balance Beginning balance
Deductibletemporarydifference
Deferred incometax assets
Deductibletemporarydifference
Deferred income taxassets
Deductible losses 2,855,624,412.76 706,342,740.49 1,358,336,470.51 336,401,597.67
Assetsimpairmentprovision
1,079,890,030.44 231,517,239.58 936,009,764.81 226,316,093.63
Deferred income 66,778,170.56 15,971,309.52 85,456,786.55 20,389,065.68
Accrued expenses 70,273,842.14 12,047,558.72 72,865,789.50 17,320,299.04
Unrealizedinternal salesprofits
18,570,975.99 4,642,744.00 35,916,413.76 8,979,103.44
Others 75,254,629.43 17,241,589.86 123,082,867.34 30,027,794.84
Total 4,166,392,061.32 987,763,182.17 2,611,668,092.47 639,433,954.30
(2) Lists of Deferred Income Tax Liabilities without Offset
Item
Ending balance Beginning balance
Taxabletemporarydifference
Deferred incometax liabilities
Taxabletemporarydifference
Deferred incometax liabilities
Estimated added valuenot under the samecontrol
406,494,736.72 76,293,954.88 597,961,840.34 119,325,356.84
Prepaid interest 68,199,141.94 16,489,202.46 71,719,199.88 17,929,799.97
Accelerateddepreciation of fixedassets
3,732,276.80 559,841.52 5,929,959.47 889,493.92
Change in fair value ofheld-for-tradingfinancial assets
- - 3,005,381.67 751,345.42
Other 8,496,388.76 2,124,097.19 8,496,388.76 2,124,097.19
Total 486,922,544.22 95,467,096.05 687,112,770.12 141,020,093.34
(3) List of Unrecognized Deferred Income Tax Assets
Item Ending balance Beginning balance
Deductible losses 2,693,777,327.44 2,688,310,555.91
Deductible temporary difference 407,628,243.69 294,734,548.10
Total 3,101,405,571.13 2,983,045,104.01
22. Other Non-current Assets
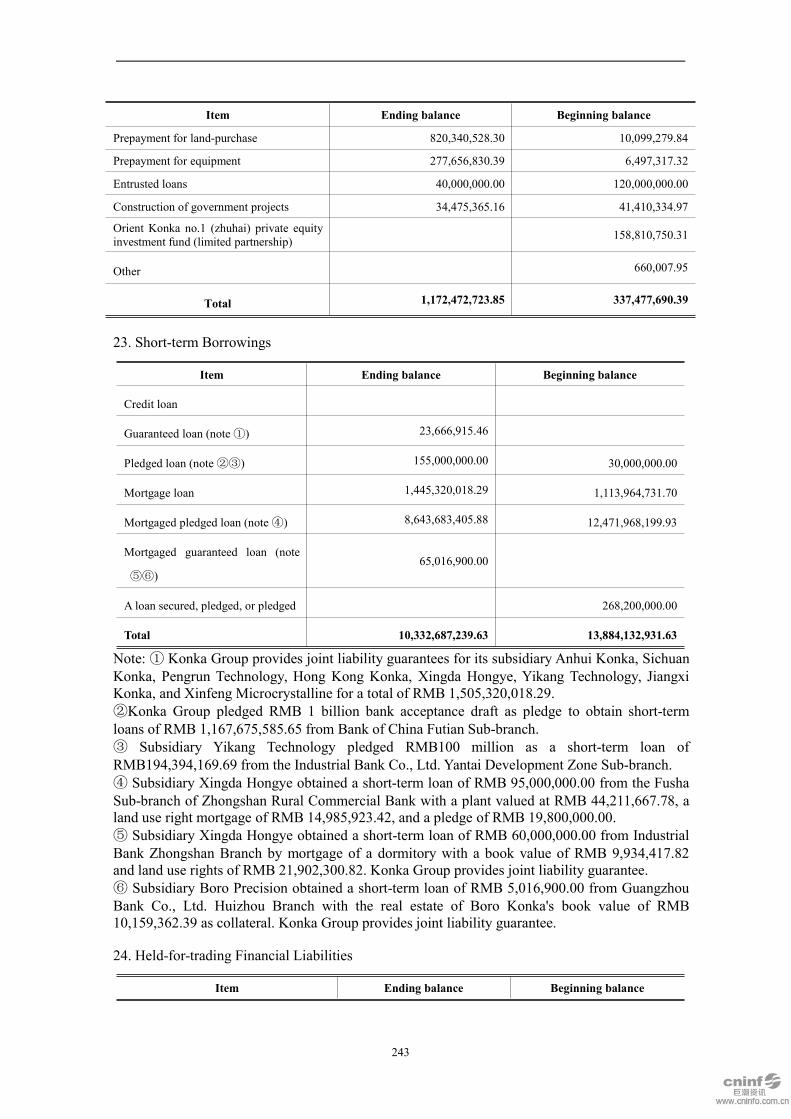
243
Item Ending balance Beginning balance
Prepayment for land-purchase 820,340,528.30 10,099,279.84
Prepayment for equipment 277,656,830.39 6,497,317.32
Entrusted loans 40,000,000.00 120,000,000.00
Construction of government projects 34,475,365.16 41,410,334.97
Orient Konka no.1 (zhuhai) private equityinvestment fund (limited partnership) 158,810,750.31
Other 660,007.95
Total 1,172,472,723.85 337,477,690.39
23. Short-term Borrowings
Item Ending balance Beginning balance
Credit loan
Guaranteed loan (note①) 23,666,915.46
Pledged loan (note②③) 155,000,000.00 30,000,000.00
Mortgage loan 1,445,320,018.29 1,113,964,731.70
Mortgaged pledged loan (note④) 8,643,683,405.88 12,471,968,199.93
Mortgaged guaranteed loan (note
⑤⑥)65,016,900.00
A loan secured, pledged, or pledged 268,200,000.00
Total 10,332,687,239.63 13,884,132,931.63
Note:① Konka Group provides joint liability guarantees for its subsidiary Anhui Konka, SichuanKonka, Pengrun Technology, Hong Kong Konka, Xingda Hongye, Yikang Technology, JiangxiKonka, and Xinfeng Microcrystalline for a total of RMB 1,505,320,018.29.②Konka Group pledged RMB 1 billion bank acceptance draft as pledge to obtain short-termloans of RMB 1,167,675,585.65 from Bank of China Futian Sub-branch.③ Subsidiary Yikang Technology pledged RMB100 million as a short-term loan ofRMB194,394,169.69 from the Industrial Bank Co., Ltd. Yantai Development Zone Sub-branch.④ Subsidiary Xingda Hongye obtained a short-term loan of RMB 95,000,000.00 from the FushaSub-branch of Zhongshan Rural Commercial Bank with a plant valued at RMB 44,211,667.78, aland use right mortgage of RMB 14,985,923.42, and a pledge of RMB 19,800,000.00.⑤ Subsidiary Xingda Hongye obtained a short-term loan of RMB 60,000,000.00 from IndustrialBank Zhongshan Branch by mortgage of a dormitory with a book value of RMB 9,934,417.82and land use rights of RMB 21,902,300.82. Konka Group provides joint liability guarantee.⑥ Subsidiary Boro Precision obtained a short-term loan of RMB 5,016,900.00 from GuangzhouBank Co., Ltd. Huizhou Branch with the real estate of Boro Konka's book value of RMB10,159,362.39 as collateral. Konka Group provides joint liability guarantee.
24. Held-for-trading Financial Liabilities
Item Ending balance Beginning balance
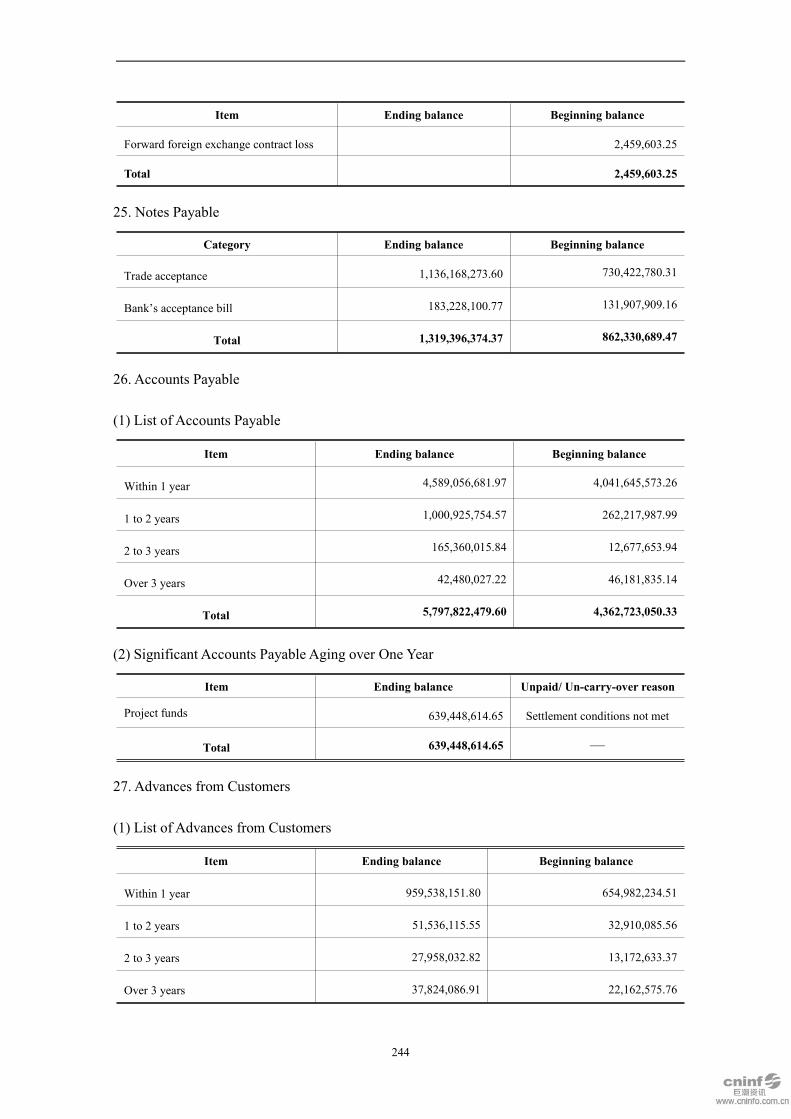
244
Item Ending balance Beginning balance
Forward foreign exchange contract loss 2,459,603.25
Total 2,459,603.25
25. Notes Payable
Category Ending balance Beginning balance
Trade acceptance 1,136,168,273.60 730,422,780.31
Bank’s acceptance bill 183,228,100.77 131,907,909.16
Total 1,319,396,374.37 862,330,689.47
26. Accounts Payable
(1) List of Accounts Payable
Item Ending balance Beginning balance
Within 1 year 4,589,056,681.97 4,041,645,573.26
1 to 2 years 1,000,925,754.57 262,217,987.99
2 to 3 years 165,360,015.84 12,677,653.94
Over 3 years 42,480,027.22 46,181,835.14
Total 5,797,822,479.60 4,362,723,050.33
(2) Significant Accounts Payable Aging over One Year
Item Ending balance Unpaid/ Un-carry-over reason
Project funds 639,448,614.65 Settlement conditions not met
Total 639,448,614.65 —
27. Advances from Customers
(1) List of Advances from Customers
Item Ending balance Beginning balance
Within 1 year 959,538,151.80 654,982,234.51
1 to 2 years 51,536,115.55 32,910,085.56
2 to 3 years 27,958,032.82 13,172,633.37
Over 3 years 37,824,086.91 22,162,575.76
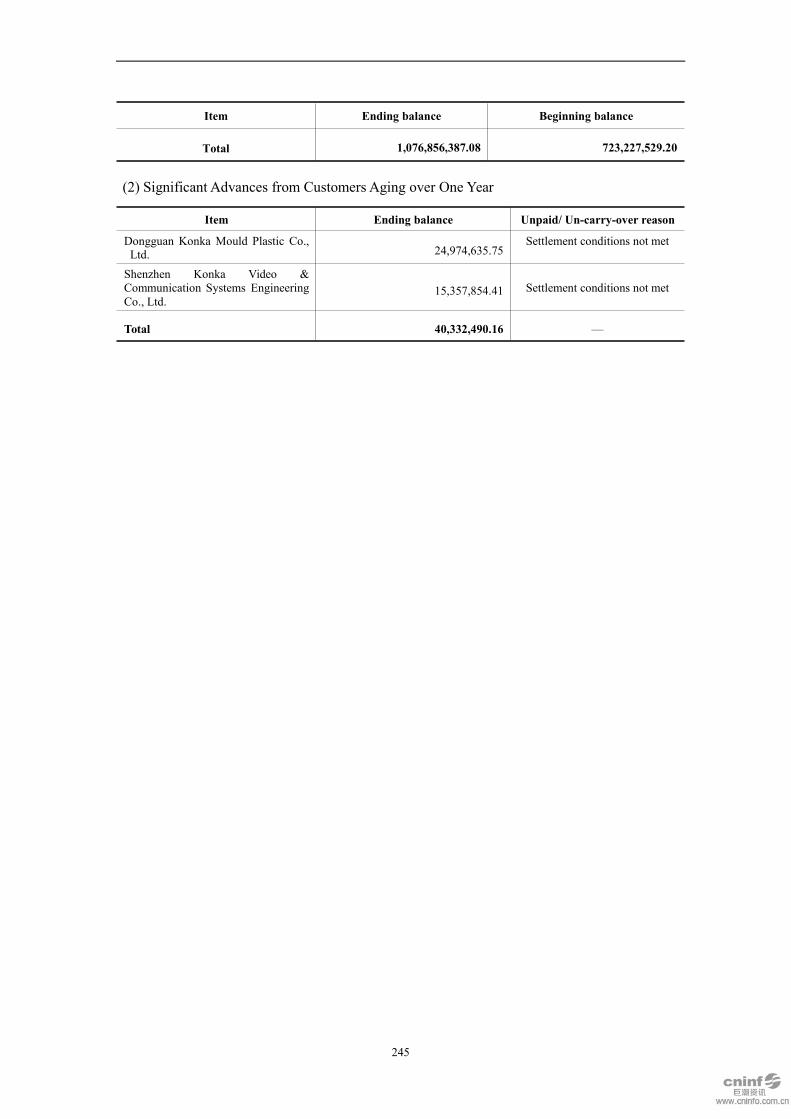
245
Item Ending balance Beginning balance
Total 1,076,856,387.08 723,227,529.20
(2) Significant Advances from Customers Aging over One Year
Item Ending balance Unpaid/ Un-carry-over reason
Dongguan Konka Mould Plastic Co.,Ltd. 24,974,635.75
Settlement conditions not met
Shenzhen Konka Video &Communication Systems EngineeringCo., Ltd.
15,357,854.41 Settlement conditions not met
Total 40,332,490.16 —

246
28. Payroll Payable
(1) List of Payroll Payable
Item Beginning balance IncreaseIncrease by merger Decrease Decrease by losing
controlling rightEnding balance
I. Short-term salary 375,284,193.12 1,751,113,773.38 1,698,595,354.78 5,441,418.52 422,361,193.20
II. Post-employment benefit-defined
contribution plans1,222,374.59 136,728,868.13 134,511,511.85 31,692.30 3,408,038.57
III. Termination benefits 29,671,275.91 28,570,009.11 1,101,266.80
IV. Current portion of other benefits
Total 376,506,567.71 1,917,513,917.42 1,861,676,875.74 5,473,110.82 426,870,498.57
(2) List of Short-term Salary
Item Beginning balance IncreaseIncrease by merger Decrease Decrease by losing
controlling rightEnding balance
1.Salary, bonus, allowance,subsidy 359,657,745.92 1,548,674,817.36 1,495,852,780.27 5,144,280.24 407,335,502.77
2. Employee welfare 5,620,738.67 65,176,408.54 65,444,848.61 205,004.94 5,147,293.66
3. Social insurance 3,138,171.50 60,192,530.93 60,100,091.86 19,191.28 3,211,419.29
Of which: Medical insurance 768,410.84 51,091,568.40 51,557,119.89 13,173.87 289,685.48

247
Item Beginning balance IncreaseIncrease by merger Decrease Decrease by losing
controlling rightEnding balance
premiums
Work-related injury
insurance160,343.82 3,405,513.23 3,521,509.27 4,356.05 39,991.73
Maternity insurance 2,209,416.84 5,695,449.30 5,021,462.70 1,661.36 2,881,742.08
4. Housing fund 545,498.50 49,405,469.08 49,294,935.18 51,945.00 604,087.40
5.Labor union budget andemployee education budget 5,581,101.82 11,173,765.03 11,496,461.91 20,997.06 5,237,407.88
6.Short-term absence with
payment
7. Short-term profit sharing plan 1,849.46 1,849.46
8. Other 740,936.71 16,488,932.98 16,404,387.49 825,482.20
Total 375,284,193.12 1,751,113,773.38 1,698,595,354.78 5,441,418.52 422,361,193.20
(3) List of Defined Contribution Plan
Item Beginning balance IncreaseIncrease by merger Decrease Decrease by losing
controlling rightEnding balance
1. Basic pension benefits 1,147,799.70 132,937,160.79 130,701,248.42 30,242.03 3,353,470.04
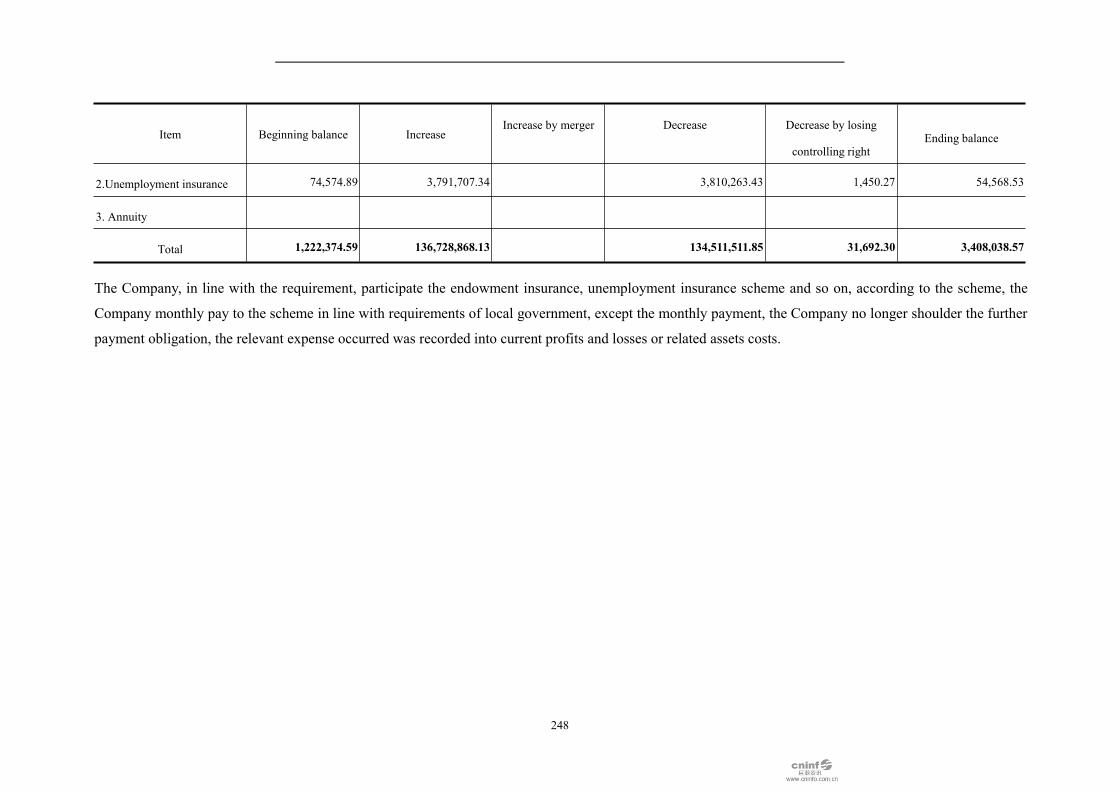
248
Item Beginning balance IncreaseIncrease by merger Decrease Decrease by losing
controlling rightEnding balance
2.Unemployment insurance 74,574.89 3,791,707.34 3,810,263.43 1,450.27 54,568.53
3. Annuity
Total 1,222,374.59 136,728,868.13 134,511,511.85 31,692.30 3,408,038.57
The Company, in line with the requirement, participate the endowment insurance, unemployment insurance scheme and so on, according to the scheme, the
Company monthly pay to the scheme in line with requirements of local government, except the monthly payment, the Company no longer shoulder the further
payment obligation, the relevant expense occurred was recorded into current profits and losses or related assets costs.
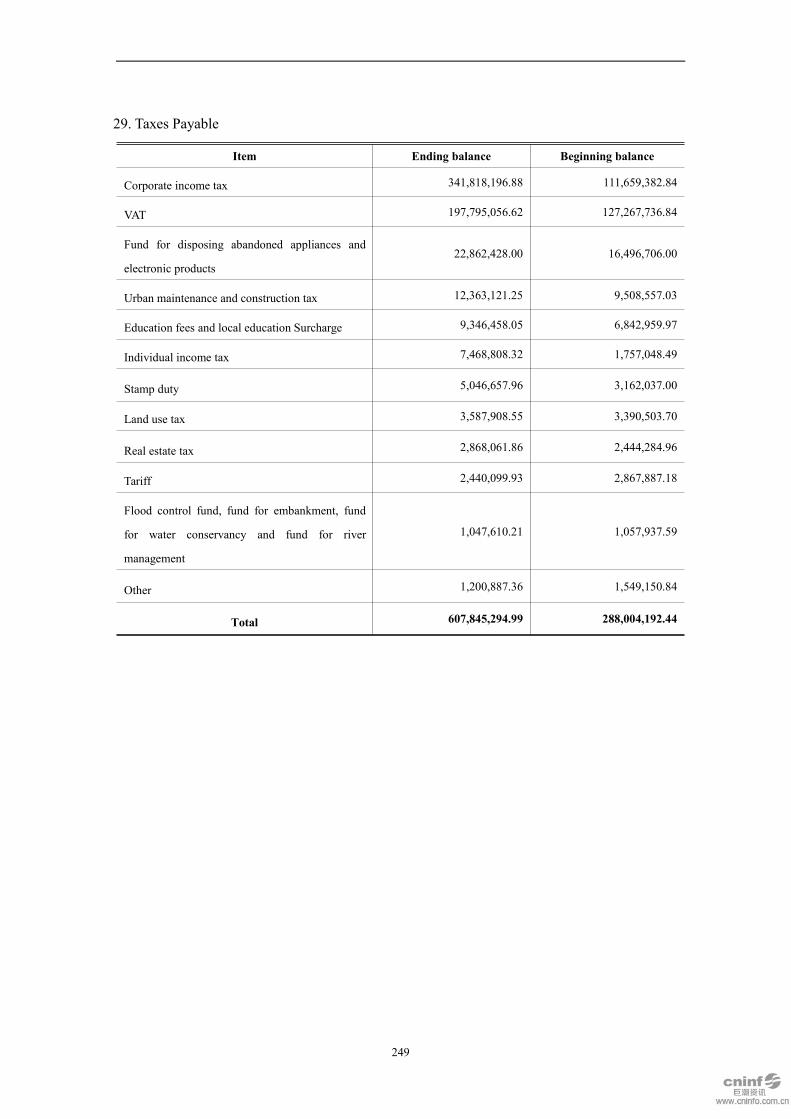
249
29. Taxes Payable
Item Ending balance Beginning balance
Corporate income tax 341,818,196.88 111,659,382.84
VAT 197,795,056.62 127,267,736.84
Fund for disposing abandoned appliances and
electronic products22,862,428.00 16,496,706.00
Urban maintenance and construction tax 12,363,121.25 9,508,557.03
Education fees and local education Surcharge 9,346,458.05 6,842,959.97
Individual income tax 7,468,808.32 1,757,048.49
Stamp duty 5,046,657.96 3,162,037.00
Land use tax 3,587,908.55 3,390,503.70
Real estate tax 2,868,061.86 2,444,284.96
Tariff 2,440,099.93 2,867,887.18
Flood control fund, fund for embankment, fund
for water conservancy and fund for river
management
1,047,610.21 1,057,937.59
Other 1,200,887.36 1,549,150.84
Total 607,845,294.99 288,004,192.44
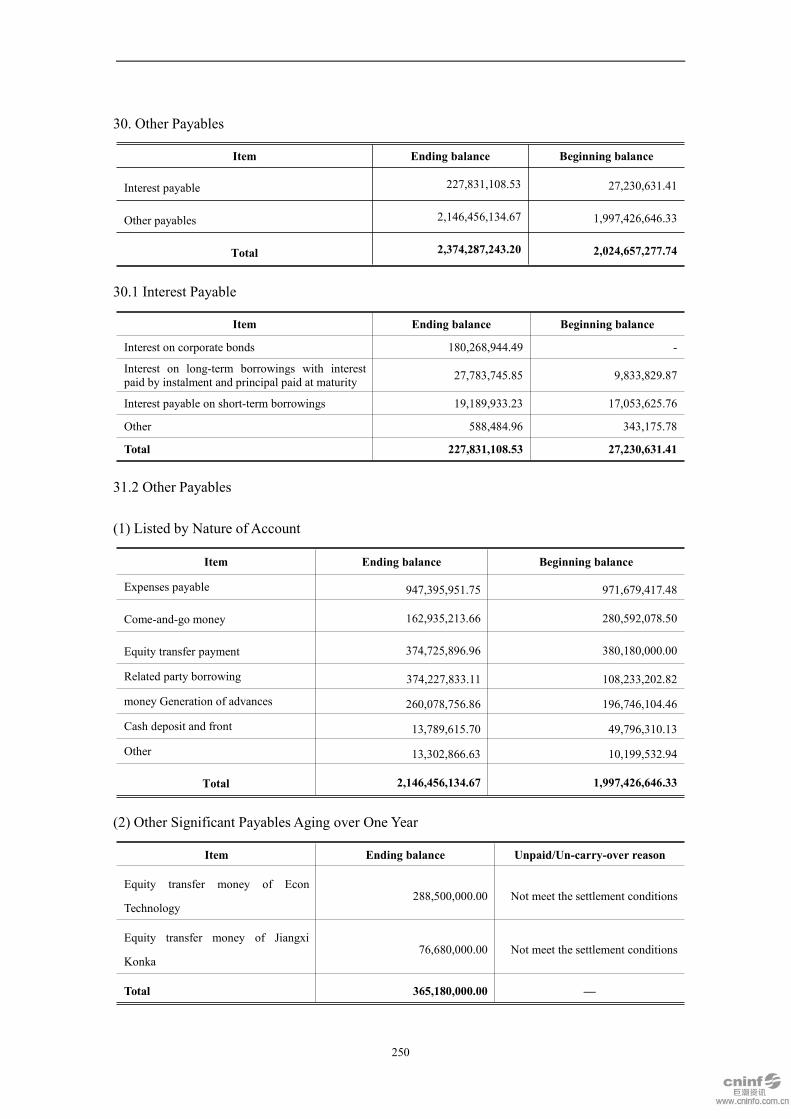
250
30. Other Payables
Item Ending balance Beginning balance
Interest payable 227,831,108.53 27,230,631.41
Other payables 2,146,456,134.67 1,997,426,646.33
Total 2,374,287,243.20 2,024,657,277.74
30.1 Interest Payable
Item Ending balance Beginning balance
Interest on corporate bonds 180,268,944.49 -
Interest on long-term borrowings with interestpaid by instalment and principal paid at maturity 27,783,745.85 9,833,829.87
Interest payable on short-term borrowings 19,189,933.23 17,053,625.76
Other 588,484.96 343,175.78
Total 227,831,108.53 27,230,631.41
31.2 Other Payables
(1) Listed by Nature of Account
Item Ending balance Beginning balance
Expenses payable 947,395,951.75 971,679,417.48
Come-and-go money 162,935,213.66 280,592,078.50
Equity transfer payment 374,725,896.96 380,180,000.00
Related party borrowing 374,227,833.11 108,233,202.82
money Generation of advances 260,078,756.86 196,746,104.46
Cash deposit and front 13,789,615.70 49,796,310.13
Other 13,302,866.63 10,199,532.94
Total 2,146,456,134.67 1,997,426,646.33
(2) Other Significant Payables Aging over One Year
Item Ending balance Unpaid/Un-carry-over reason
Equity transfer money of Econ
Technology288,500,000.00 Not meet the settlement conditions
Equity transfer money of Jiangxi
Konka76,680,000.00 Not meet the settlement conditions
Total 365,180,000.00 —
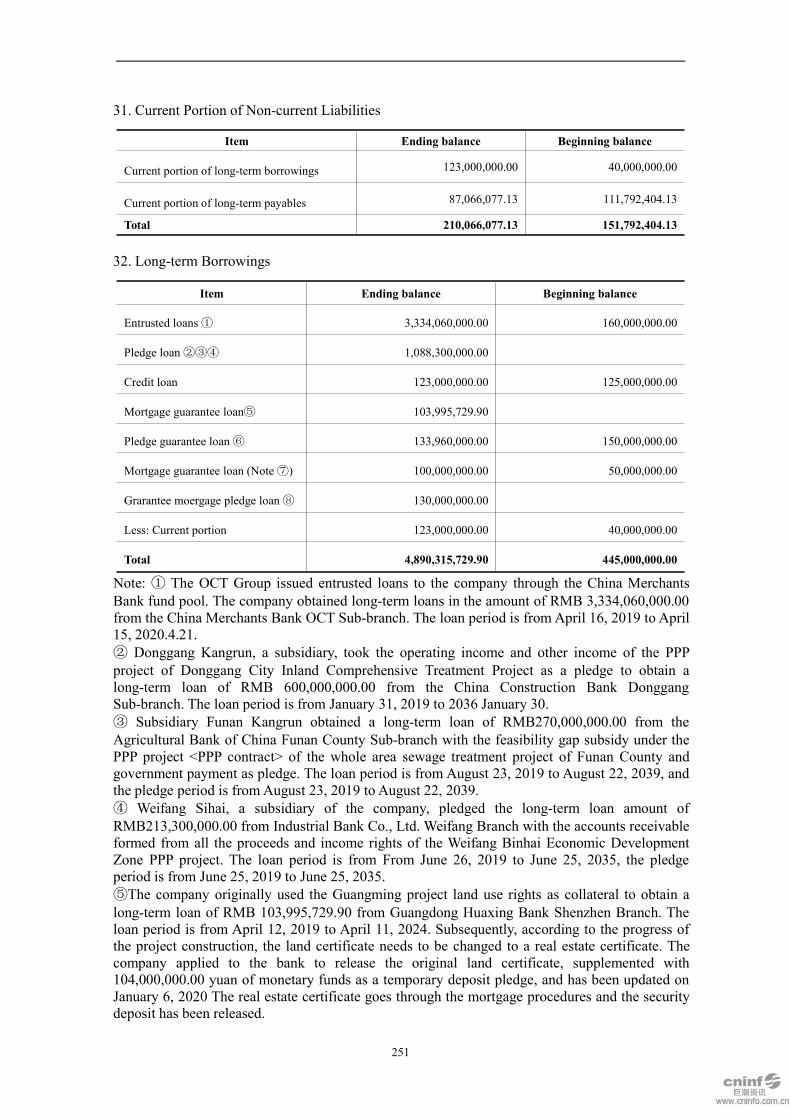
251
31. Current Portion of Non-current Liabilities
Item Ending balance Beginning balance
Current portion of long-term borrowings 123,000,000.00 40,000,000.00
Current portion of long-term payables 87,066,077.13 111,792,404.13
Total 210,066,077.13 151,792,404.13
32. Long-term Borrowings
Item Ending balance Beginning balance
Entrusted loans① 3,334,060,000.00 160,000,000.00
Pledge loan②③④ 1,088,300,000.00
Credit loan 123,000,000.00 125,000,000.00
Mortgage guarantee loan⑤ 103,995,729.90
Pledge guarantee loan⑥ 133,960,000.00 150,000,000.00
Mortgage guarantee loan (Note⑦) 100,000,000.00 50,000,000.00
Grarantee moergage pledge loan⑧ 130,000,000.00
Less: Current portion 123,000,000.00 40,000,000.00
Total 4,890,315,729.90 445,000,000.00
Note: ① The OCT Group issued entrusted loans to the company through the China MerchantsBank fund pool. The company obtained long-term loans in the amount of RMB 3,334,060,000.00from the China Merchants Bank OCT Sub-branch. The loan period is from April 16, 2019 to April15, 2020.4.21.② Donggang Kangrun, a subsidiary, took the operating income and other income of the PPPproject of Donggang City Inland Comprehensive Treatment Project as a pledge to obtain along-term loan of RMB 600,000,000.00 from the China Construction Bank DonggangSub-branch. The loan period is from January 31, 2019 to 2036 January 30.③ Subsidiary Funan Kangrun obtained a long-term loan of RMB270,000,000.00 from theAgricultural Bank of China Funan County Sub-branch with the feasibility gap subsidy under thePPP project <PPP contract> of the whole area sewage treatment project of Funan County andgovernment payment as pledge. The loan period is from August 23, 2019 to August 22, 2039, andthe pledge period is fromAugust 23, 2019 to August 22, 2039.④ Weifang Sihai, a subsidiary of the company, pledged the long-term loan amount ofRMB213,300,000.00 from Industrial Bank Co., Ltd. Weifang Branch with the accounts receivableformed from all the proceeds and income rights of the Weifang Binhai Economic DevelopmentZone PPP project. The loan period is from From June 26, 2019 to June 25, 2035, the pledgeperiod is from June 25, 2019 to June 25, 2035.⑤The company originally used the Guangming project land use rights as collateral to obtain along-term loan of RMB 103,995,729.90 from Guangdong Huaxing Bank Shenzhen Branch. Theloan period is from April 12, 2019 to April 11, 2024. Subsequently, according to the progress ofthe project construction, the land certificate needs to be changed to a real estate certificate. Thecompany applied to the bank to release the original land certificate, supplemented with104,000,000.00 yuan of monetary funds as a temporary deposit pledge, and has been updated onJanuary 6, 2020 The real estate certificate goes through the mortgage procedures and the securitydeposit has been released.
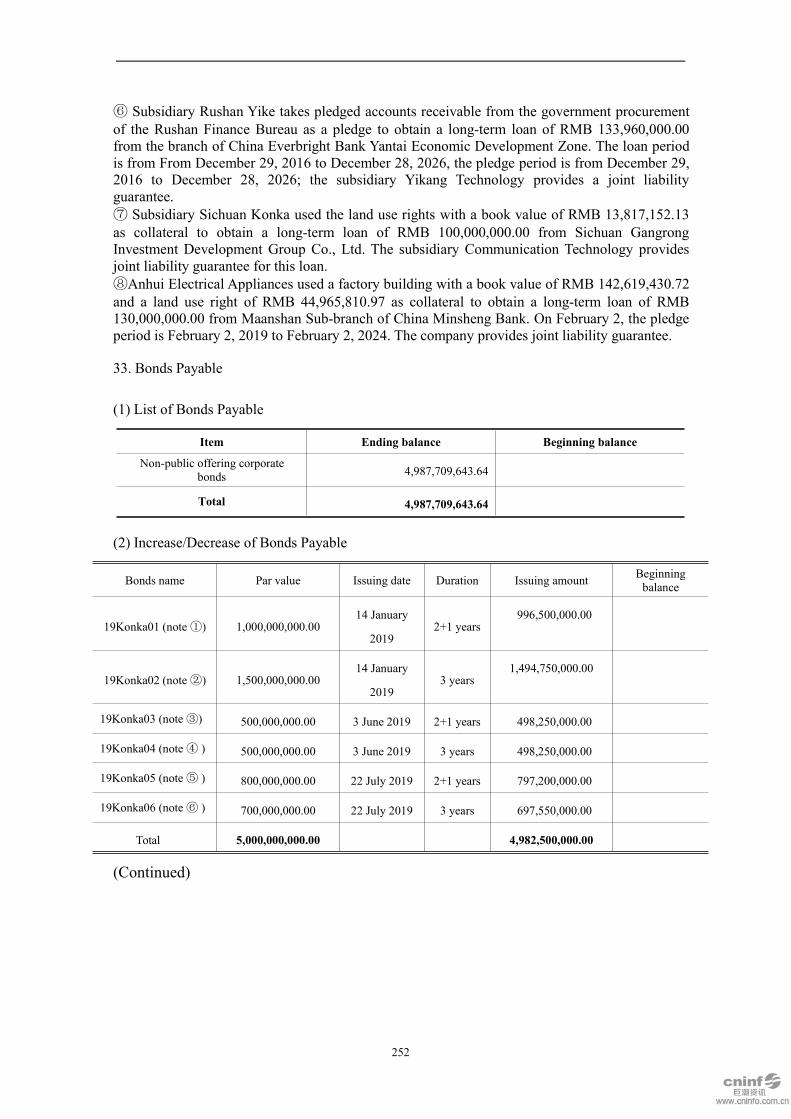
252
⑥ Subsidiary Rushan Yike takes pledged accounts receivable from the government procurementof the Rushan Finance Bureau as a pledge to obtain a long-term loan of RMB 133,960,000.00from the branch of China Everbright Bank Yantai Economic Development Zone. The loan periodis from From December 29, 2016 to December 28, 2026, the pledge period is from December 29,2016 to December 28, 2026; the subsidiary Yikang Technology provides a joint liabilityguarantee.⑦ Subsidiary Sichuan Konka used the land use rights with a book value of RMB 13,817,152.13as collateral to obtain a long-term loan of RMB 100,000,000.00 from Sichuan GangrongInvestment Development Group Co., Ltd. The subsidiary Communication Technology providesjoint liability guarantee for this loan.⑧Anhui Electrical Appliances used a factory building with a book value of RMB 142,619,430.72and a land use right of RMB 44,965,810.97 as collateral to obtain a long-term loan of RMB130,000,000.00 from Maanshan Sub-branch of China Minsheng Bank. On February 2, the pledgeperiod is February 2, 2019 to February 2, 2024. The company provides joint liability guarantee.
33. Bonds Payable
(1) List of Bonds Payable
Item Ending balance Beginning balance
Non-public offering corporatebonds 4,987,709,643.64
Total 4,987,709,643.64
(2) Increase/Decrease of Bonds Payable
Bonds name Par value Issuing date Duration Issuing amount Beginningbalance
19Konka01 (note①) 1,000,000,000.0014 January
20192+1 years
996,500,000.00
19Konka02 (note②) 1,500,000,000.0014 January
20193 years
1,494,750,000.00
19Konka03 (note③) 500,000,000.00 3 June 2019 2+1 years 498,250,000.00
19Konka04 (note④ ) 500,000,000.00 3 June 2019 3 years 498,250,000.00
19Konka05 (note⑤ ) 800,000,000.00 22 July 2019 2+1 years 797,200,000.00
19Konka06 (note⑥ ) 700,000,000.00 22 July 2019 3 years 697,550,000.00
Total 5,000,000,000.00 4,982,500,000.00
(Continued)

253
Bonds name
Increased
through
merger
Issued during the
Reporting Period
Withdraw interest
at face value
Amortization of
premium and
discount
Repay
during
the
Report
ing
Period
Ending balance
19Konka01 (note①) — 996,500,000.00 48,750,000.04 1,298,742.17 — 997,798,742.17
19Konka02 (note②) — 1,494,750,000.00 73,124,999.98 1,948,113.21 — 1,496,698,113.21
19Konka03 (note③) — 498,250,000.00 13,250,000.00 420,073.37 — 498,670,073.37
19Konka04 (note④ ) — 498,250,000.00 13,838,888.88 420,073.37 — 498,670,073.37
19Konka05 (note⑤ ) — 797,200,000.00 16,408,666.68 598,742.14 — 797,798,742.14
19Konka06 (note⑥ ) — 697,550,000.00 14,896,388.91 523,899.38 — 698,073,899.38
Total 4,982,500,000.00 180,268,944.49 5,209,643.64 — 4,987,709,643.64
Note: ① On 14 January 2019, RMB1 billion of private placement corporate bonds was issued
with the duration of two plus one years, the annual interest rate of 5.00% and the due date of 14
January 2021.
② On 14 January 2019, RMB1.5 billion of private placement corporate bonds was issued with
the duration of three years, the annual interest rate of 5.00% and the due date of 14 January 2022.
③ On 3 June 2019, RMB0.5 billion of private placement corporate bonds was issued with the
duration of two plus one years, the annual interest rate of 4.50% and the due date of 3 June 2021.
④ On 15 January 2019, RMB0.5 billion of private placement corporate bonds was issued with
the duration of three years, the annual interest rate of 4.70% and the due date of 3 June 2022.
⑤ On 22 July 2019, RMB0.8 billion of private placement corporate bonds was issued with the
duration of two plus one years, the annual interest rate of 4.53% and the due date of 22 July 2021.
⑥ On 22 July 2019, RMB0.7 billion of private placement corporate bonds was issued with the
duration of three years, the annual interest rate of 4.70% and the due date of 22 July 2022.
34. Long-term Payables
Item Ending balance Beginning balanceAccrued financing lease outlay 519,416,941.74 240,167,001.54
Including: unrecognized financing expense 49,063,759.99 -
Less: Current portion 87,066,077.13 111,792,404.13
Total 383,287,104.62 128,374,597.41
35. Long-term Payroll Payable

254
Item Ending balance Beginning balance
I. Termination benefits-net liabilities of defined contribution
plans
5,565,646.72 8,792,614.98
II. Termination benefits-
III. Other long-term welfare- -
Total5,565,646.72 8,792,614.98
(2) Changes in Defined Benefit Plans
①Obligation present value of defined benefit plans:Item Reporting period Same period of last year
I. Beginning balance8,792,614.98 13,361,821.86
II. Defined benefit cost recorded into current profits and
losses
- -
1. Current service cost- -
2. Previous service cost- -
3. Settlement gains (“-” for loss)- -
4. Net interest- -
III. The cost of defined benefit recorded into other
comprehensive income
- -
1. Actuarial gains (“-” for loss)- -
IV. Other changes3,226,968.26 4,569,206.88
1. Consideration paid when settled- -
2.Welfare paid3,226,968.26 4,569,206.88
V. Ending balance5,565,646.72 8,792,614.98
② Notes to the influence of the content and related risk of defined benefit pension
schemes to the future cash flows, time and uncertainty of the Company:
Due to upgrading and reconstruction of current work sites of the subsidiary,
Telecommunication Technology, it is to adjust the labor relations according to
Implementation Measures for Accompanying Employees in manufacturing system of
Shenzhen Konka Telecommunication Technology Co., Ltd. On the premise to balance the
Company’ and employees’ benefits and voluntary selection, Telecommunication
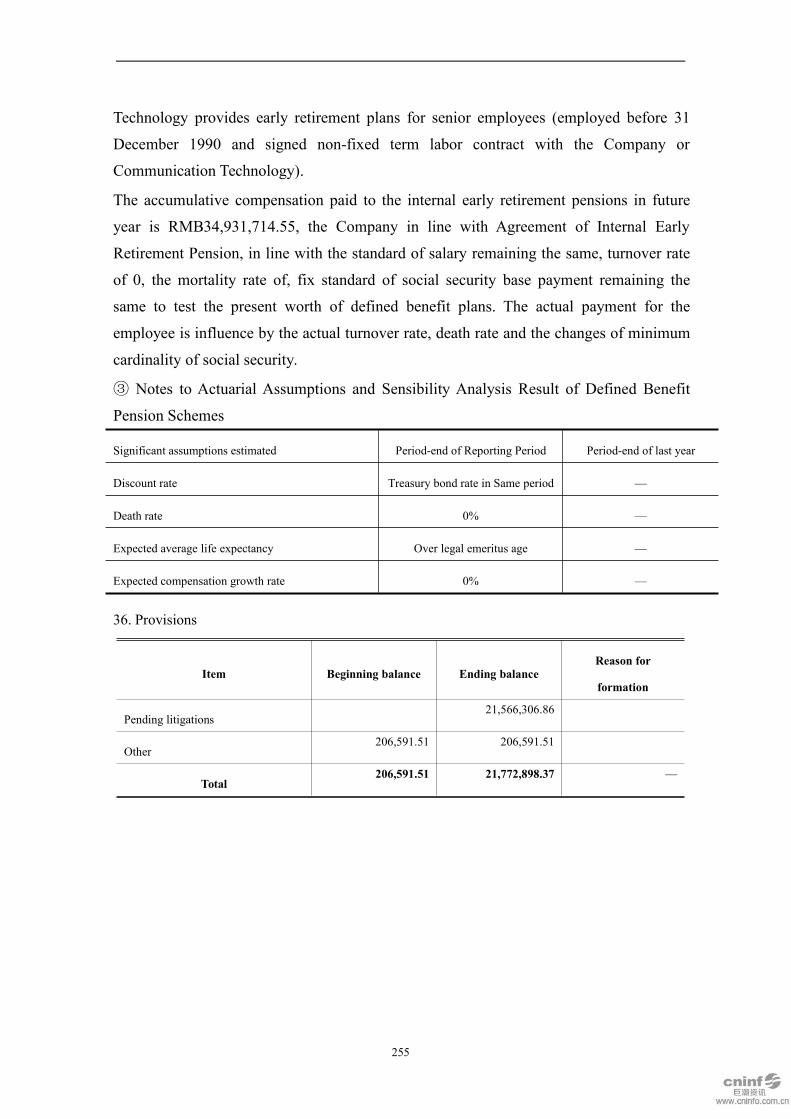
255
Technology provides early retirement plans for senior employees (employed before 31
December 1990 and signed non-fixed term labor contract with the Company or
Communication Technology).
The accumulative compensation paid to the internal early retirement pensions in future
year is RMB34,931,714.55, the Company in line with Agreement of Internal Early
Retirement Pension, in line with the standard of salary remaining the same, turnover rate
of 0, the mortality rate of, fix standard of social security base payment remaining the
same to test the present worth of defined benefit plans. The actual payment for the
employee is influence by the actual turnover rate, death rate and the changes of minimum
cardinality of social security.
③ Notes to Actuarial Assumptions and Sensibility Analysis Result of Defined Benefit
Pension Schemes
Significant assumptions estimated Period-end of Reporting Period Period-end of last year
Discount rate Treasury bond rate in Same period —
Death rate 0% —
Expected average life expectancy Over legal emeritus age —
Expected compensation growth rate 0% —
36. Provisions
Item Beginning balance Ending balanceReason for
formation
Pending litigations21,566,306.86
Other206,591.51 206,591.51
Total206,591.51 21,772,898.37 —

256
37. Deferred Income
(1) Category of Deferred Income
Item Beginning balance Increase Decrease Ending balance Reason for formation
Government subsidies 112,899,128.24 70,351,404.14 31,376,273.93 151,874,258.45 Related to assets/related to income
Total 112,899,128.24 70,351,404.14 31,376,273.93 151,874,258.45 —
(2) List of Government Subsidy
Government subsidy Beginningbalance
New amount inthe period
Amountcharged tonon-operating incomein theperiod
Amount charged to
other income in the
period
Amountoffsetting
cost/expensein the period
Otherchanges Ending balance
Asset/income
-related
Subsidy for construction of Yibinfactory of Yibin Konka IndustrialPark
56,943,815.54 56,943,815.54 Asset-related
Subsidy for Dual HDR OLEDSmart TV R&D andindustrialization project
13,300,000.00 13,300,000.00 Asset-related
Subsidy for the smart TV industrialchain project of Konka Group Co.,Ltd.
15,354,500.00 4,494,000.00 10,860,500.00 Asset-related
Operating subsidy for Konka ZhifuLife Science Innovation Centerproject
8,500,000.06 1,999,999.92 6,500,000.14 Asset-related
Subsidy for Konka YibinIntelligent Terminal InnovationCenter Incubation Project
6,000,000.00 6,000,000.00 Asset-related
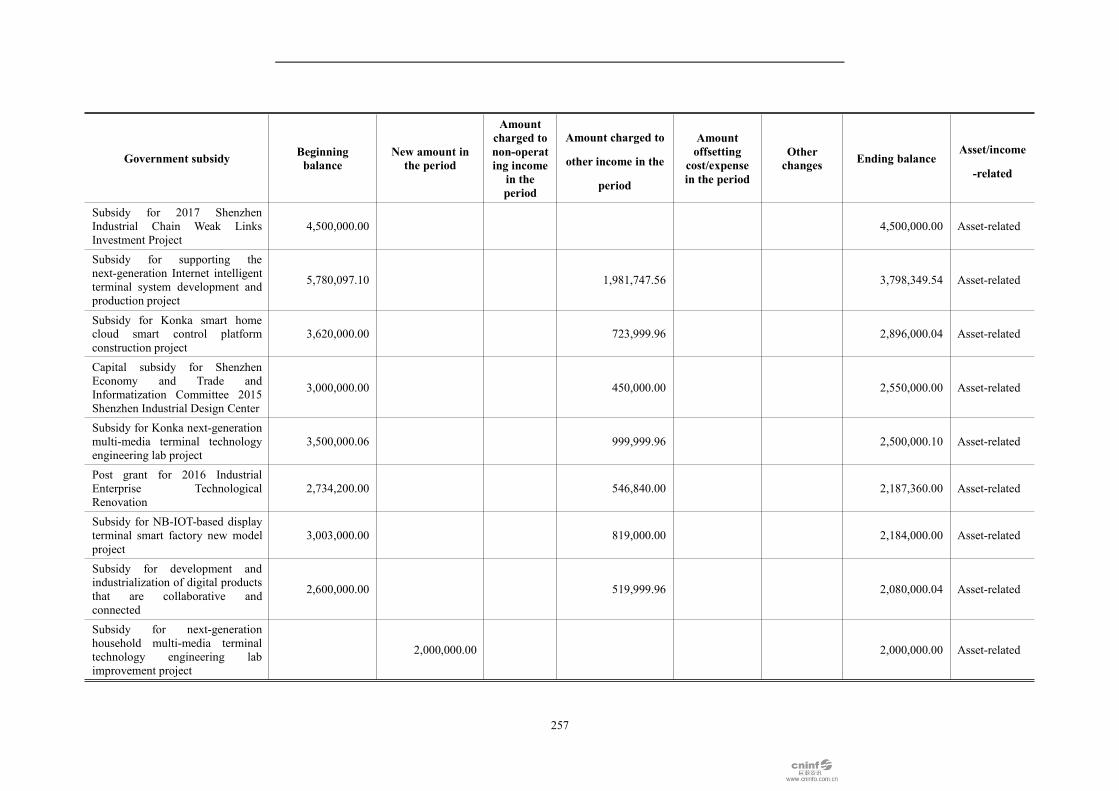
257
Government subsidy Beginningbalance
New amount inthe period
Amountcharged tonon-operating incomein theperiod
Amount charged to
other income in the
period
Amountoffsetting
cost/expensein the period
Otherchanges Ending balance
Asset/income
-related
Subsidy for 2017 ShenzhenIndustrial Chain Weak LinksInvestment Project
4,500,000.00 4,500,000.00 Asset-related
Subsidy for supporting thenext-generation Internet intelligentterminal system development andproduction project
5,780,097.10 1,981,747.56 3,798,349.54 Asset-related
Subsidy for Konka smart homecloud smart control platformconstruction project
3,620,000.00 723,999.96 2,896,000.04 Asset-related
Capital subsidy for ShenzhenEconomy and Trade andInformatization Committee 2015Shenzhen Industrial Design Center
3,000,000.00 450,000.00 2,550,000.00 Asset-related
Subsidy for Konka next-generationmulti-media terminal technologyengineering lab project
3,500,000.06 999,999.96 2,500,000.10 Asset-related
Post grant for 2016 IndustrialEnterprise TechnologicalRenovation
2,734,200.00 546,840.00 2,187,360.00 Asset-related
Subsidy for NB-IOT-based displayterminal smart factory new modelproject
3,003,000.00 819,000.00 2,184,000.00 Asset-related
Subsidy for development andindustrialization of digital productsthat are collaborative andconnected
2,600,000.00 519,999.96 2,080,000.04 Asset-related
Subsidy for next-generationhousehold multi-media terminaltechnology engineering labimprovement project
2,000,000.00 2,000,000.00 Asset-related
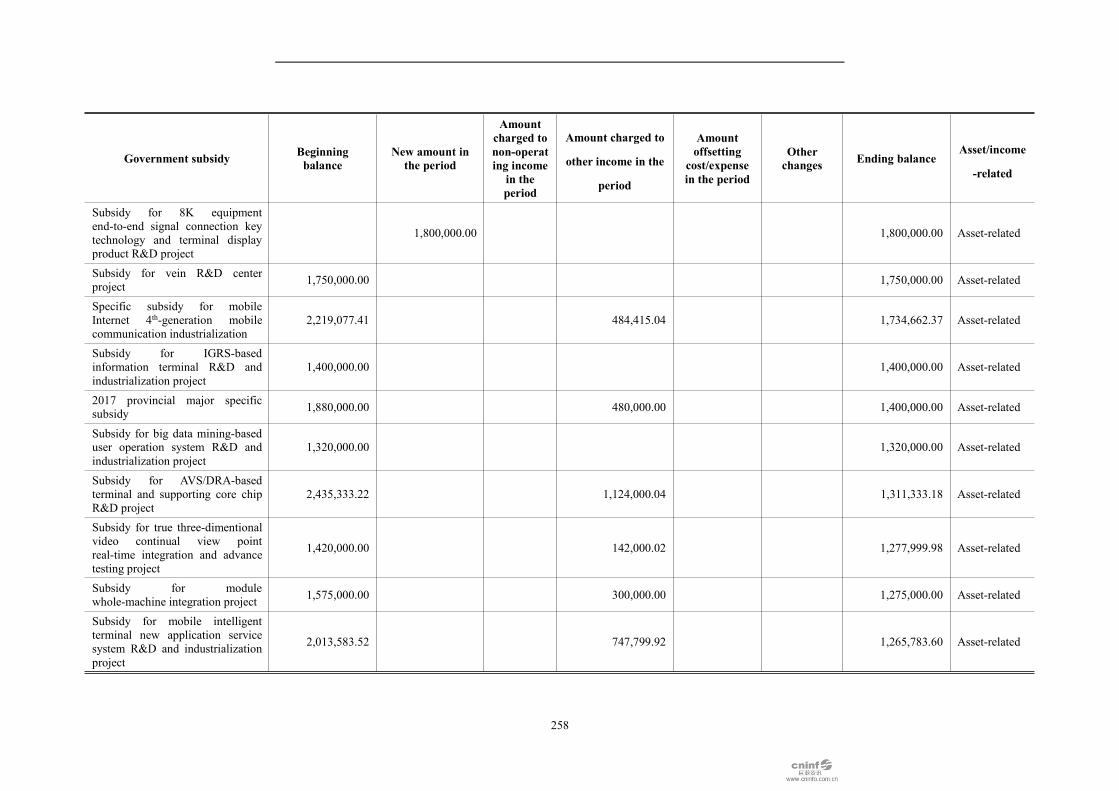
258
Government subsidy Beginningbalance
New amount inthe period
Amountcharged tonon-operating incomein theperiod
Amount charged to
other income in the
period
Amountoffsetting
cost/expensein the period
Otherchanges Ending balance
Asset/income
-related
Subsidy for 8K equipmentend-to-end signal connection keytechnology and terminal displayproduct R&D project
1,800,000.00 1,800,000.00 Asset-related
Subsidy for vein R&D centerproject 1,750,000.00 1,750,000.00 Asset-related
Specific subsidy for mobileInternet 4th-generation mobilecommunication industrialization
2,219,077.41 484,415.04 1,734,662.37 Asset-related
Subsidy for IGRS-basedinformation terminal R&D andindustrialization project
1,400,000.00 1,400,000.00 Asset-related
2017 provincial major specificsubsidy 1,880,000.00 480,000.00 1,400,000.00 Asset-related
Subsidy for big data mining-baseduser operation system R&D andindustrialization project
1,320,000.00 1,320,000.00 Asset-related
Subsidy for AVS/DRA-basedterminal and supporting core chipR&D project
2,435,333.22 1,124,000.04 1,311,333.18 Asset-related
Subsidy for true three-dimentionalvideo continual view pointreal-time integration and advancetesting project
1,420,000.00 142,000.02 1,277,999.98 Asset-related
Subsidy for modulewhole-machine integration project 1,575,000.00 300,000.00 1,275,000.00 Asset-related
Subsidy for mobile intelligentterminal new application servicesystem R&D and industrializationproject
2,013,583.52 747,799.92 1,265,783.60 Asset-related
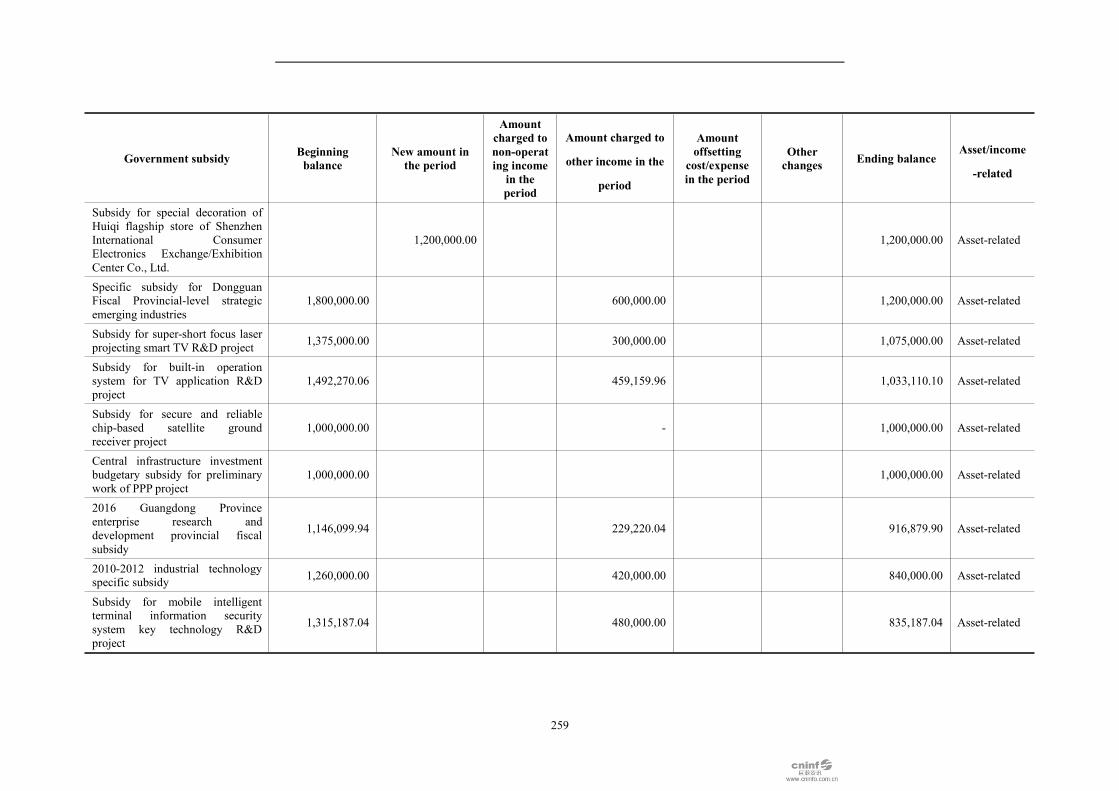
259
Government subsidy Beginningbalance
New amount inthe period
Amountcharged tonon-operating incomein theperiod
Amount charged to
other income in the
period
Amountoffsetting
cost/expensein the period
Otherchanges Ending balance
Asset/income
-related
Subsidy for special decoration ofHuiqi flagship store of ShenzhenInternational ConsumerElectronics Exchange/ExhibitionCenter Co., Ltd.
1,200,000.00 1,200,000.00 Asset-related
Specific subsidy for DongguanFiscal Provincial-level strategicemerging industries
1,800,000.00 600,000.00 1,200,000.00 Asset-related
Subsidy for super-short focus laserprojecting smart TV R&D project 1,375,000.00 300,000.00 1,075,000.00 Asset-related
Subsidy for built-in operationsystem for TV application R&Dproject
1,492,270.06 459,159.96 1,033,110.10 Asset-related
Subsidy for secure and reliablechip-based satellite groundreceiver project
1,000,000.00 - 1,000,000.00 Asset-related
Central infrastructure investmentbudgetary subsidy for preliminarywork of PPP project
1,000,000.00 1,000,000.00 Asset-related
2016 Guangdong Provinceenterprise research anddevelopment provincial fiscalsubsidy
1,146,099.94 229,220.04 916,879.90 Asset-related
2010-2012 industrial technologyspecific subsidy 1,260,000.00 420,000.00 840,000.00 Asset-related
Subsidy for mobile intelligentterminal information securitysystem key technology R&Dproject
1,315,187.04 480,000.00 835,187.04 Asset-related
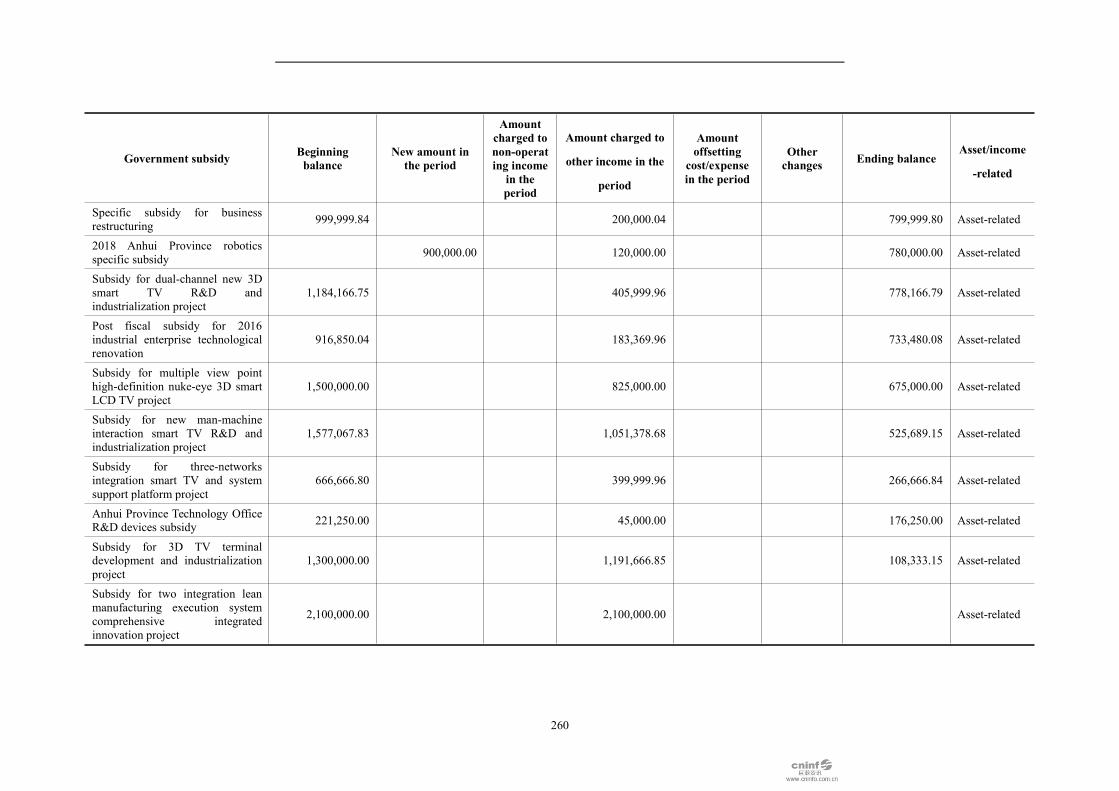
260
Government subsidy Beginningbalance
New amount inthe period
Amountcharged tonon-operating incomein theperiod
Amount charged to
other income in the
period
Amountoffsetting
cost/expensein the period
Otherchanges Ending balance
Asset/income
-related
Specific subsidy for businessrestructuring 999,999.84 200,000.04 799,999.80 Asset-related
2018 Anhui Province roboticsspecific subsidy 900,000.00 120,000.00 780,000.00 Asset-related
Subsidy for dual-channel new 3Dsmart TV R&D andindustrialization project
1,184,166.75 405,999.96 778,166.79 Asset-related
Post fiscal subsidy for 2016industrial enterprise technologicalrenovation
916,850.04 183,369.96 733,480.08 Asset-related
Subsidy for multiple view pointhigh-definition nuke-eye 3D smartLCD TV project
1,500,000.00 825,000.00 675,000.00 Asset-related
Subsidy for new man-machineinteraction smart TV R&D andindustrialization project
1,577,067.83 1,051,378.68 525,689.15 Asset-related
Subsidy for three-networksintegration smart TV and systemsupport platform project
666,666.80 399,999.96 266,666.84 Asset-related
Anhui Province Technology OfficeR&D devices subsidy 221,250.00 45,000.00 176,250.00 Asset-related
Subsidy for 3D TV terminaldevelopment and industrializationproject
1,300,000.00 1,191,666.85 108,333.15 Asset-related
Subsidy for two integration leanmanufacturing execution systemcomprehensive integratedinnovation project
2,100,000.00 2,100,000.00 Asset-related
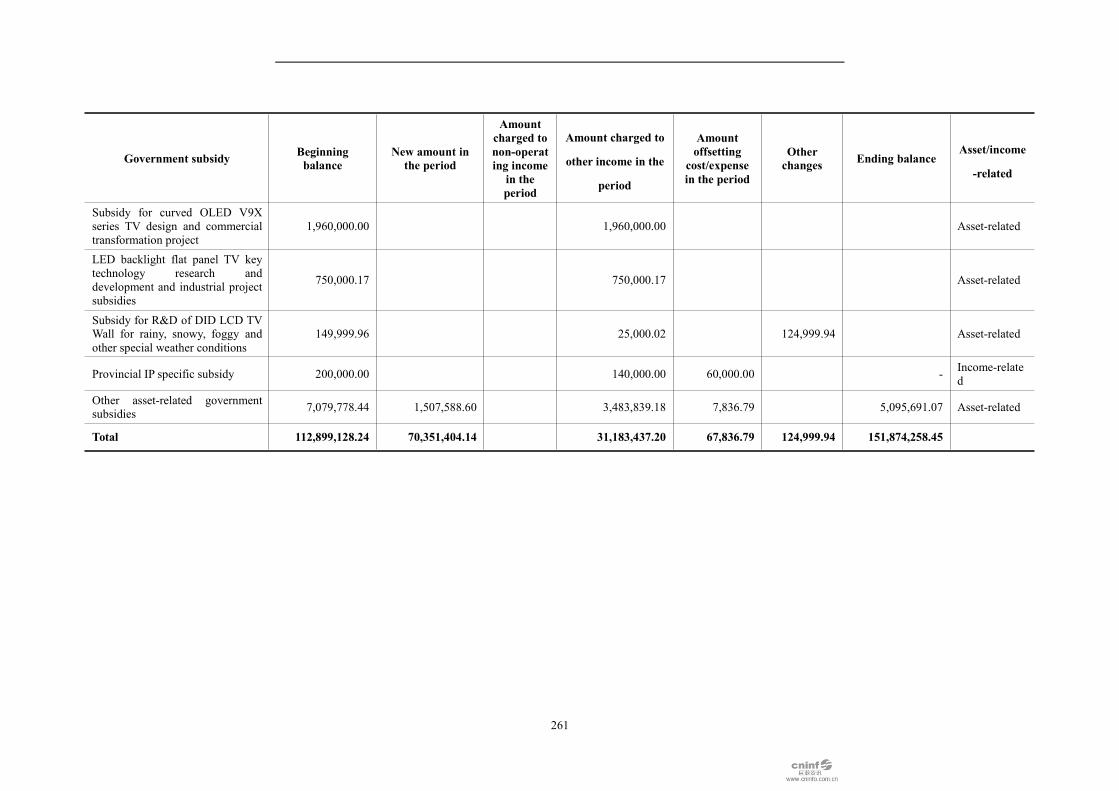
261
Government subsidy Beginningbalance
New amount inthe period
Amountcharged tonon-operating incomein theperiod
Amount charged to
other income in the
period
Amountoffsetting
cost/expensein the period
Otherchanges Ending balance
Asset/income
-related
Subsidy for curved OLED V9Xseries TV design and commercialtransformation project
1,960,000.00 1,960,000.00 Asset-related
LED backlight flat panel TV keytechnology research anddevelopment and industrial projectsubsidies
750,000.17 750,000.17 Asset-related
Subsidy for R&D of DID LCD TVWall for rainy, snowy, foggy andother special weather conditions
149,999.96 25,000.02 124,999.94 Asset-related
Provincial IP specific subsidy 200,000.00 140,000.00 60,000.00 - Income-related
Other asset-related governmentsubsidies 7,079,778.44 1,507,588.60 3,483,839.18 7,836.79 5,095,691.07 Asset-related
Total 112,899,128.24 70,351,404.14 31,183,437.20 67,836.79 124,999.94 151,874,258.45

262
38. Share Capital
Item Beginning balance
Increase/decrease (+/-)
Ending balanceNewsharesissued
Bonusshares
Bonusissuefromprofit
Other Subtotal
The sum of
shares2,407,945,408.00 2,407,945,408.00
39. Capital Reserves
Item Beginning balance Increase Decrease Ending balance
Capital premium 7,393,378.55 7,393,378.55
Other capitalreserves 200,963,245.66 29,405,331.43 23,237,054.07 207,131,523.02
Total 208,356,624.21 29,405,331.43 23,237,054.07 214,524,901.57
Note: Other capital reserve increased by 29405331.43 Yuan due to capital increase of minority
shareholders of e-square of the company; capital reserve (share premium) decreased by
7393378.55 Yuan due to repurchase of minority shareholders' equity of subsidiary mobile Internet,
and surplus reserve decreased by 15843675.52 Yuan due to insufficient offset of capital reserve
(share premium).

263
40. Other Comprehensive Income
Item Beginning balance
Reporting Period
Ending balanceIncome beforetaxation in theCurrent Period
Less: Recordedin other
comprehensiveincome in priorperiod and
transferred inprofit or loss inthe CurrentPeriod
Less: Recordedin other
comprehensiveincome in priorperiod and
transferred inretained earningsin the Current
Period
Less:Incometax
expense
Attributable toowners of the
Company as theparent after tax
Attributable tonon-controllinginterests after tax
I. Items that will not bereclassified to profit or loss -9,652,181.00 -9,652,181.00
Changes in fair value ofother equity instrumentinvestment
-9,652,181.00 -9,652,181.00
II. Items that will bereclassified to profit or loss -10,538,219.08 650,246.53 -1,102,703.44 1,752,949.97 -11,640,922.52
Of which: Othercomprehensive income thatwill be reclassified to profitor loss under the equitymethod
-2,397,350.96 -2,397,350.96
Gains and losses onchanges in fair value ofavailable-for-sale financialassetsDifferences arising from thetranslation of foreigncurrency denominatedfinancial statements
-8,140,868.12 650,246.53 -1,102,703.44 1,752,949.97 -9,243,571.56
Total -10,538,219.08 -9,001,934.47 -1,102,703.44 1,752,949.97 -21,293,103.52
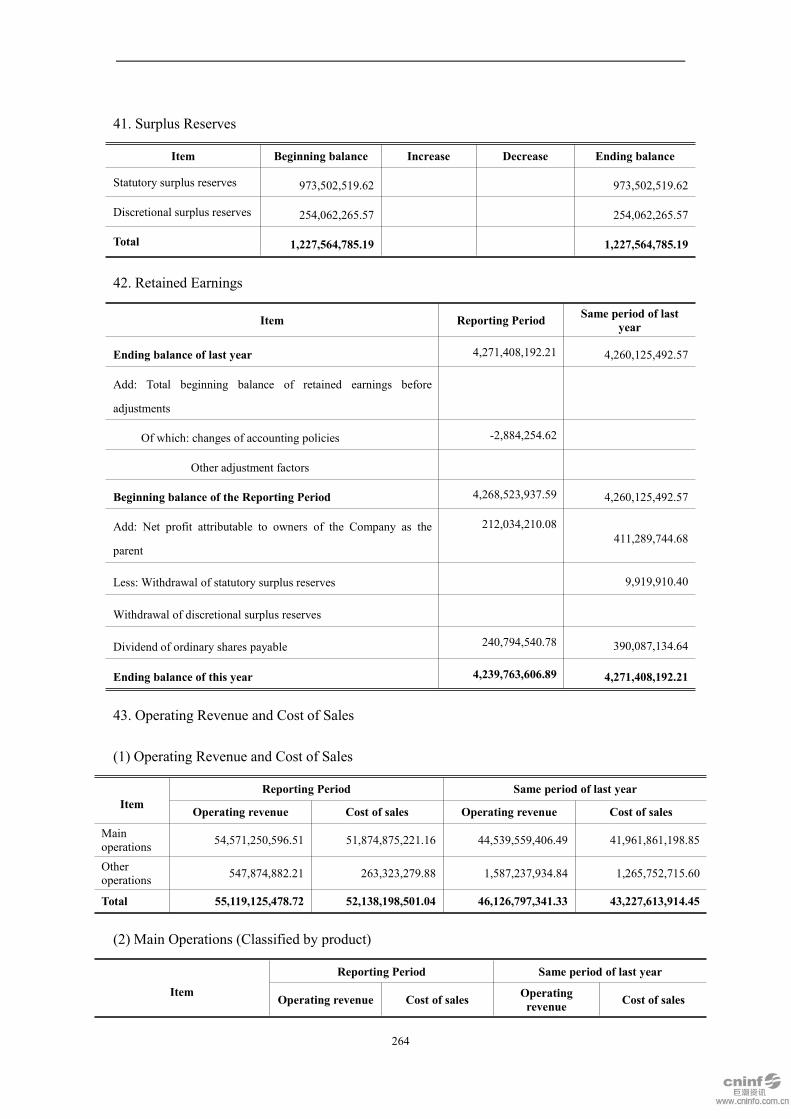
264
41. Surplus Reserves
Item Beginning balance Increase Decrease Ending balance
Statutory surplus reserves 973,502,519.62 973,502,519.62
Discretional surplus reserves 254,062,265.57 254,062,265.57
Total 1,227,564,785.19 1,227,564,785.19
42. Retained Earnings
Item Reporting Period Same period of lastyear
Ending balance of last year 4,271,408,192.21 4,260,125,492.57
Add: Total beginning balance of retained earnings before
adjustments
Of which: changes of accounting policies -2,884,254.62
Other adjustment factors
Beginning balance of the Reporting Period 4,268,523,937.59 4,260,125,492.57
Add: Net profit attributable to owners of the Company as the
parent
212,034,210.08411,289,744.68
Less: Withdrawal of statutory surplus reserves 9,919,910.40
Withdrawal of discretional surplus reserves
Dividend of ordinary shares payable 240,794,540.78 390,087,134.64
Ending balance of this year 4,239,763,606.89 4,271,408,192.21
43. Operating Revenue and Cost of Sales
(1) Operating Revenue and Cost of Sales
ItemReporting Period Same period of last year
Operating revenue Cost of sales Operating revenue Cost of sales
Mainoperations 54,571,250,596.51 51,874,875,221.16 44,539,559,406.49 41,961,861,198.85
Otheroperations 547,874,882.21 263,323,279.88 1,587,237,934.84 1,265,752,715.60
Total 55,119,125,478.72 52,138,198,501.04 46,126,797,341.33 43,227,613,914.45
(2) Main Operations (Classified by product)
Item
Reporting Period Same period of last year
Operating revenue Cost of sales Operatingrevenue Cost of sales
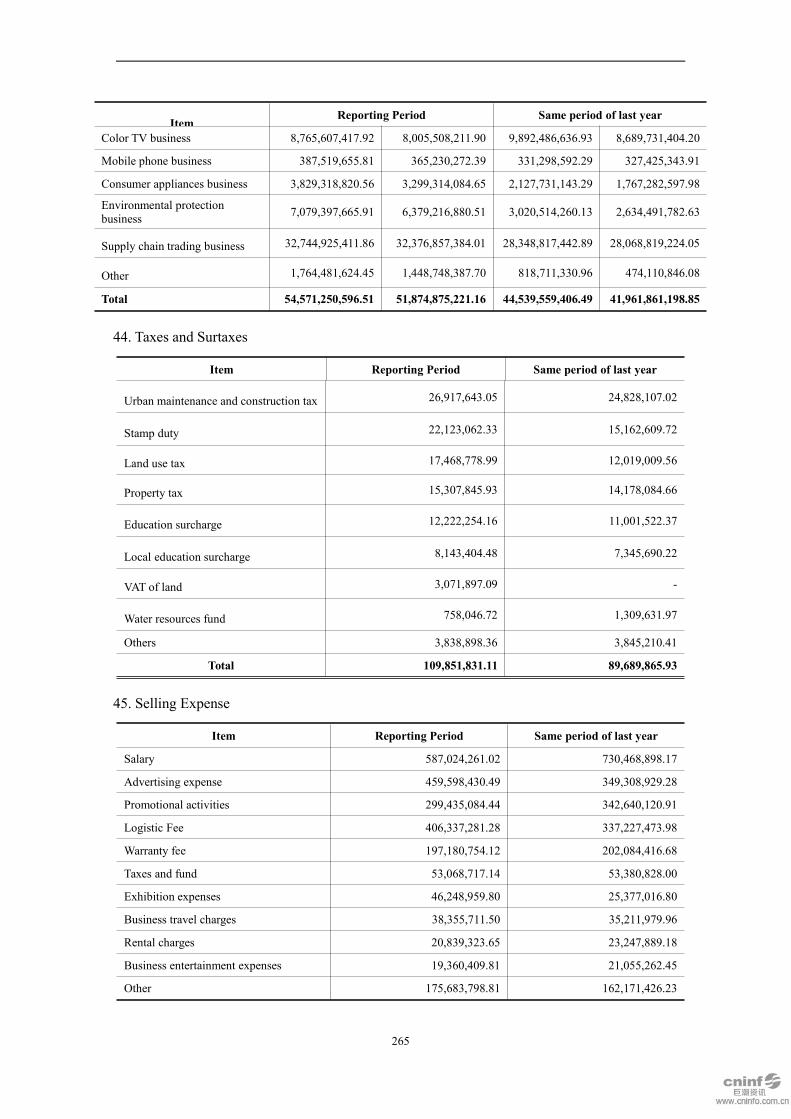
265
ItemReporting Period Same period of last year
Color TV business 8,765,607,417.92 8,005,508,211.90 9,892,486,636.93 8,689,731,404.20
Mobile phone business 387,519,655.81 365,230,272.39 331,298,592.29 327,425,343.91
Consumer appliances business 3,829,318,820.56 3,299,314,084.65 2,127,731,143.29 1,767,282,597.98
Environmental protectionbusiness 7,079,397,665.91 6,379,216,880.51 3,020,514,260.13 2,634,491,782.63
Supply chain trading business 32,744,925,411.86 32,376,857,384.01 28,348,817,442.89 28,068,819,224.05
Other 1,764,481,624.45 1,448,748,387.70 818,711,330.96 474,110,846.08
Total 54,571,250,596.51 51,874,875,221.16 44,539,559,406.49 41,961,861,198.85
44. Taxes and Surtaxes
Item Reporting Period Same period of last year
Urban maintenance and construction tax 26,917,643.05 24,828,107.02
Stamp duty 22,123,062.33 15,162,609.72
Land use tax 17,468,778.99 12,019,009.56
Property tax 15,307,845.93 14,178,084.66
Education surcharge 12,222,254.16 11,001,522.37
Local education surcharge 8,143,404.48 7,345,690.22
VAT of land 3,071,897.09 -
Water resources fund 758,046.72 1,309,631.97
Others 3,838,898.36 3,845,210.41
Total 109,851,831.11 89,689,865.93
45. Selling Expense
Item Reporting Period Same period of last year
Salary 587,024,261.02 730,468,898.17
Advertising expense 459,598,430.49 349,308,929.28
Promotional activities 299,435,084.44 342,640,120.91
Logistic Fee 406,337,281.28 337,227,473.98
Warranty fee 197,180,754.12 202,084,416.68
Taxes and fund 53,068,717.14 53,380,828.00
Exhibition expenses 46,248,959.80 25,377,016.80
Business travel charges 38,355,711.50 35,211,979.96
Rental charges 20,839,323.65 23,247,889.18
Business entertainment expenses 19,360,409.81 21,055,262.45
Other 175,683,798.81 162,171,426.23

266
Item Reporting Period Same period of last year
Total 2,303,132,732.06 2,282,174,241.64
46. Administrative Expense
Item Reporting Period Same period of last year
Salary 419,423,921.56 278,758,343.19
Depreciation charge 101,216,934.52 71,547,932.45
Consulting fees 45,022,285.82 42,016,562.62
Social securities expense 31,652,888.41 22,483,701.61
Business travel charges 21,665,580.27 22,475,469.34
Patent fee 16,457,657.10 22,609,874.52
Wealfare for employees 16,807,653.85 15,390,406.89
Loss on scraping of inventories 11,955,696.11 11,658,004.88
Water & electricity fees 12,761,543.31 10,237,943.20
Labor union expenditure 4,777,836.99 5,597,428.25
Other 174,787,329.68 139,117,329.23
Total 856,529,327.62 641,892,996.18
47. R&D Expense
Item Reporting Period Same period of last year
Salary 197,406,785.63 176,668,069.66
Material drawing out 104,755,285.94 47,815,656.03
Expenses on trial production of newproducts 88,111,358.93 112,453,347.32
Commission service charge 41,462,134.39
Depreciation and amortization 12,437,250.53 11,820,275.57
Information charges 11,747,617.21 10,466,824.02
Testing fees 5,812,646.23 11,555,165.21
Water & electricity fees 3,025,199.91 5,399,670.34
Business travel charges 3,657,172.93 3,309,558.94
Other 32,184,650.53 16,971,578.15
Total 500,600,102.23 396,460,145.24
48. Finance Costs
Item Reporting Period Same period of last year
Interest expense 1,031,068,425.69 566,070,556.21

267
Item Reporting Period Same period of last year
Less: Interest income 247,559,600.76 43,630,012.41
Foreign exchange profit or loss -67,740,367.81 -174,702,042.10
Other 60,120,356.02 51,427,312.69
Total 775,888,813.14 399,165,814.39
49. Other Income
Item Reporting Period Same period of last year
Support fund 967,721,870.00 18,108,788.00
Rewards and subsidies 156,190,460.00 173,850,805.31
Software tax rebates 39,348,087.93 64,656,609.96
Transfer of deferred income 31,183,437.20 29,357,262.38
Post subsidies 19,185,216.90 1,796,103.67
Land tax rebates 10,906,489.80 2,248,900.00
L/C export subsidy 3,560,576.00 3,821,338.00
Other 1,078,696.50 425,824.91
Total 1,229,174,834.33 294,265,632.23
Note: The increase in other income was mainly due to the increase in industry support funds
received in this period.
50. Investment Income
Item Reporting Period Same period of lastyear
Long-term equity investment income measured by equity
method141,264,035.96 19,139,381.20
Investment income from disposal of long-term equity
investment569,444,481.69 185,587,193.61
Investment income from holding of held-for-tradingfinancial assets 2,330,000.00
Investment income from disposal of held-for-tradingfinancial assets -10,285,883.02 -45,928,989.49
Dividend income from holding of other equity instrumentinvestmentsInvestment income from holding of held-to-maturityinvestmentsInvestment income from disposal of held-to-maturityinvestmentsInvestment income from holding of available-for-salefinancial assets 17,920,000.00
Investment income from disposal of available-for-salefinancial assets 17,360,398.59

268
Item Reporting Period Same period of lastyear
Income from remeasurement of residual stock rights at fairvalue after losing control power 342,337,346.63 551,089,548.47
Income from purchase of financial products and entrustloans 73,534,655.05 183,411,695.80
Investment income adjusted due to unrealized profitsgenerated from upstream transactions 4,322,774.22 -1,164,857.22
Interest income from holding of debt instrument
investments60,433,679.86
Total 1,183,381,090.39 927,414,370.96
51. Gain on Changes in Fair Value
Sources Reporting Period Same period of lastyear
Trading financial assets 5,168,185.39
Of which: gain on changes in fair value of derivative financial
instruments
5,168,185.39
Trading financial liabilities -3,005,381.67.67
Investment property at fair value 45,022,867.25
Of which: gain on changes in fair value of derivative financial
instruments
45,022,867.25
Total -3,005,381.67 50,191,052.64
52. Credit Impairment Loss
Item Reporting Period Same period of last year
Impairment loss on notes receivable -4,306,077.35
Impairment loss on accounts receivable -339,398,520.50
Impairment loss on other receivables -183,525,075.35
Bad debt loss of prepayment -4,649,595.56
Total -531,879,268.76
53. Asset Impairment Loss
Item Reporting Period Same period of last year
Bad debt loss -86,898,151.31
Inventory falling price loss -197,576,487.91 -139,421,841.21
Impairment loss on fixed assets -549,228.15
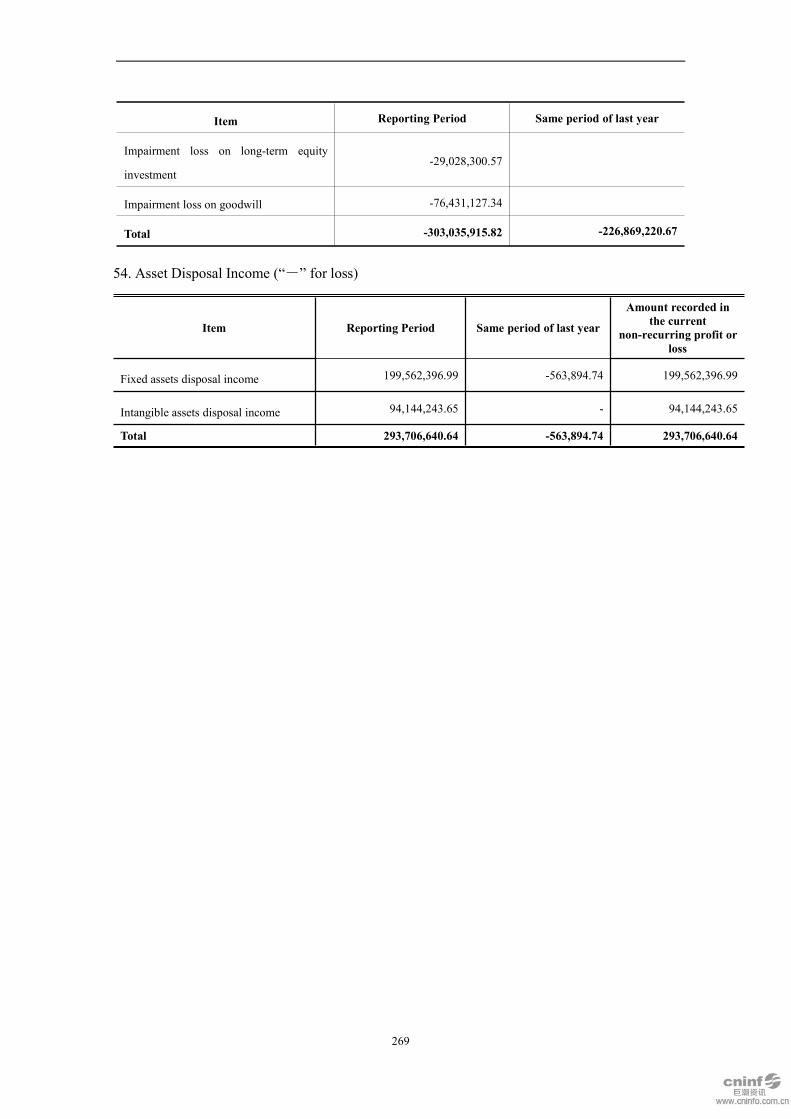
269
Item Reporting Period Same period of last year
Impairment loss on long-term equity
investment-29,028,300.57
Impairment loss on goodwill -76,431,127.34
Total -303,035,915.82 -226,869,220.67
54. Asset Disposal Income (“-” for loss)
Item Reporting Period Same period of last year
Amount recorded inthe current
non-recurring profit orloss
Fixed assets disposal income 199,562,396.99 -563,894.74 199,562,396.99
Intangible assets disposal income 94,144,243.65 - 94,144,243.65
Total 293,706,640.64 -563,894.74 293,706,640.64
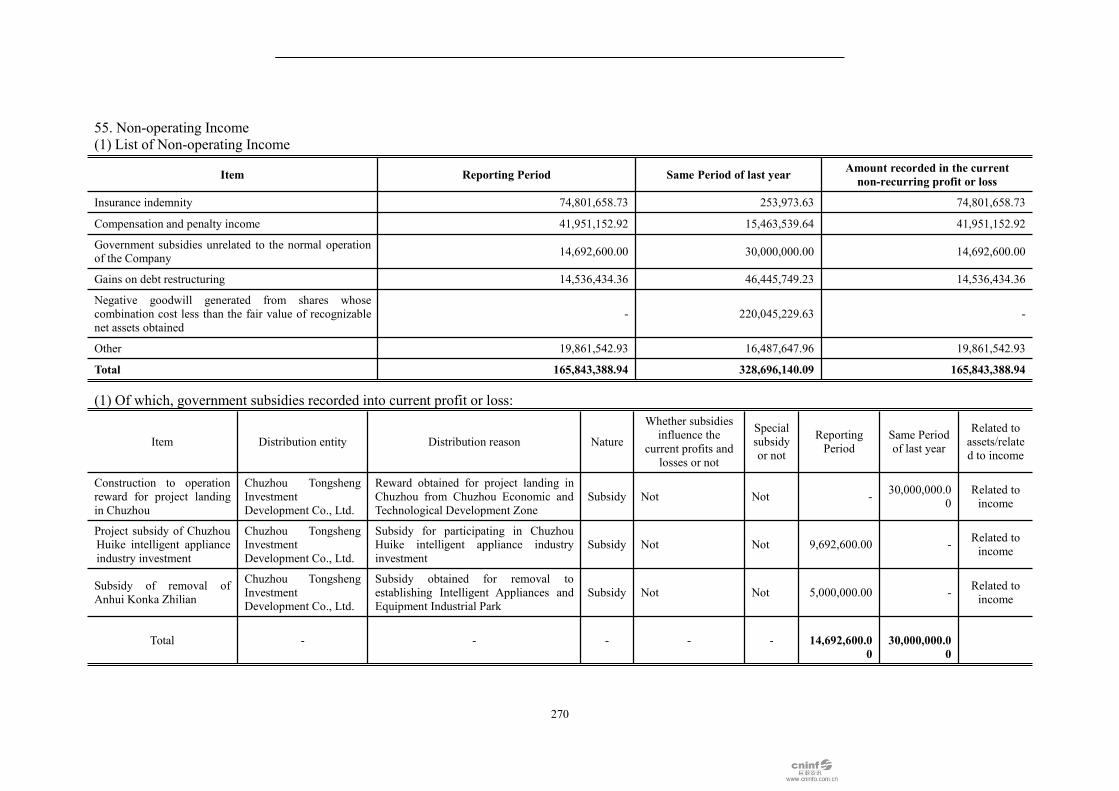
270
55. Non-operating Income(1) List of Non-operating Income
Item Reporting Period Same Period of last year Amount recorded in the currentnon-recurring profit or loss
Insurance indemnity 74,801,658.73 253,973.63 74,801,658.73
Compensation and penalty income 41,951,152.92 15,463,539.64 41,951,152.92
Government subsidies unrelated to the normal operationof the Company 14,692,600.00 30,000,000.00 14,692,600.00
Gains on debt restructuring 14,536,434.36 46,445,749.23 14,536,434.36
Negative goodwill generated from shares whosecombination cost less than the fair value of recognizablenet assets obtained
- 220,045,229.63 -
Other 19,861,542.93 16,487,647.96 19,861,542.93
Total 165,843,388.94 328,696,140.09 165,843,388.94
(1) Of which, government subsidies recorded into current profit or loss:
Item Distribution entity Distribution reason Nature
Whether subsidiesinfluence the
current profits andlosses or not
Specialsubsidyor not
ReportingPeriod
Same Periodof last year
Related toassets/related to income
Construction to operationreward for project landingin Chuzhou
Chuzhou TongshengInvestmentDevelopment Co., Ltd.
Reward obtained for project landing inChuzhou from Chuzhou Economic andTechnological Development Zone
Subsidy Not Not - 30,000,000.00
Related toincome
Project subsidy of ChuzhouHuike intelligent applianceindustry investment
Chuzhou TongshengInvestmentDevelopment Co., Ltd.
Subsidy for participating in ChuzhouHuike intelligent appliance industryinvestment
Subsidy Not Not 9,692,600.00 - Related toincome
Subsidy of removal ofAnhui Konka Zhilian
Chuzhou TongshengInvestmentDevelopment Co., Ltd.
Subsidy obtained for removal toestablishing Intelligent Appliances andEquipment Industrial Park
Subsidy Not Not 5,000,000.00 - Related toincome
Total - - - - - 14,692,600.00
30,000,000.00

271
56. Non-operating Expense
Item Reporting Period Same Period of last year
Amount recordedinto the current
non-recurring profitor loss
Losses on damage and scraping of
non-current assets4,445,790.35 3,503,737.74 4,445,790.35
Compensation expense 9,631,943.32 2,846,395.24 9,631,943.32
Donations 1,139,372.59 177,601.00 1,139,372.59
Other 4,455,618.74 1,687,718.92 4,455,618.74
Total 18,533,352.41 8,037,851.90 18,533,352.41
57. Income Tax Expense
(1) Lists of Income Tax Expense
Item Reporting Period Same period oflast year
Current income tax expense 514,367,217.82 145,391,357.02
Deferred income tax expense -398,727,126.00 -359,113,186.48
Total 115,640,091.82 -213,721,829.46
(2) Adjustment Process of Accounting Profit and Income Tax Expense
Item Reporting Period
Profit before taxation 450,576,207.16
Current income tax expense accounted at statutory/applicabletax rate 112,644,051.79
Influence of applying different tax rates by subsidiaries -104,749,193.99
Influence of income tax before adjustment 17,951,051.11
Influence of non-taxable income -88,184,072.05
Influence of not deductable costs, expenses and losses 61,005,370.46
Influence of deductable loss of unrecognized deferred incometax assets in prior period -42,012,707.36
Influence of deductable temporary difference or deductablelosses of unrecognized deferred income tax in the ReportingPeriod
132,050,201.09
Changes in the balance of deferred income tax assets/ liabilitiesin previous period due to adjustment of tax rate 9,140,086.86
Other 17,795,303.91
Income tax expense 115,640,091.82

272
58. Other Comprehensive Income
Refer to “Note VI-40. Other Comprehensive Income” for details.
59. Cash Flow Statement
(1) Cash Generated from/Used in Other Operating/Investing/Financing Activities
1) Cash Generated from Other Operating Activities
Item Reporting Period Same Period of last year
Commercial factoring accounts received 1,350,090,436.53 3,046,250,433.88
Intercourse funds 88,274,570.49 48,357,936.24
Income from government subsidy 1,253,240,751.45 240,968,351.06
Front money and guarantee deposit 1,164,255,729.60 150,767,666.31
Interest income from bank deposits 31,706,637.33 21,754,813.26
Compensation of suppliers 24,896,023.45 27,704,625.75
Other 98,551,896.43 178,866,666.63
Total 4,011,016,045.28 3,714,670,493.13
2) Cash Used in Other Operating Activities
Item Reporting Period Same Period of last year
The commercial factoring payment (Note) 972,659,093.50 2,925,211,901.01
Expense for cash payment 1,529,577,152.08 1,150,343,818.19
Payment made on behalf 30,691,357.02 51,369,090.01
Payment for guarantee deposit, cash deposit 1,019,583,946.33 344,427,373.48
Expense for bank handling charges 37,748,563.79 31,199,551.45
Energy conversation subsidy returned 89,960,000.00
Other 258,365,510.89 106,531,146.44
Total 3,938,585,623.61 4,609,082,880.58
3) Cash Generated from Other Investing Activities
Item Reporting Period Same Period of last year
Recovery of financial products 454,850,000.00 2,145,785,000.00
Recovery of entrusted loans 1,268,950,000.00 17,600,000.00
Other 361,869,168.69 229,643,228.96
Total 2,085,669,168.69 2,393,028,228.96
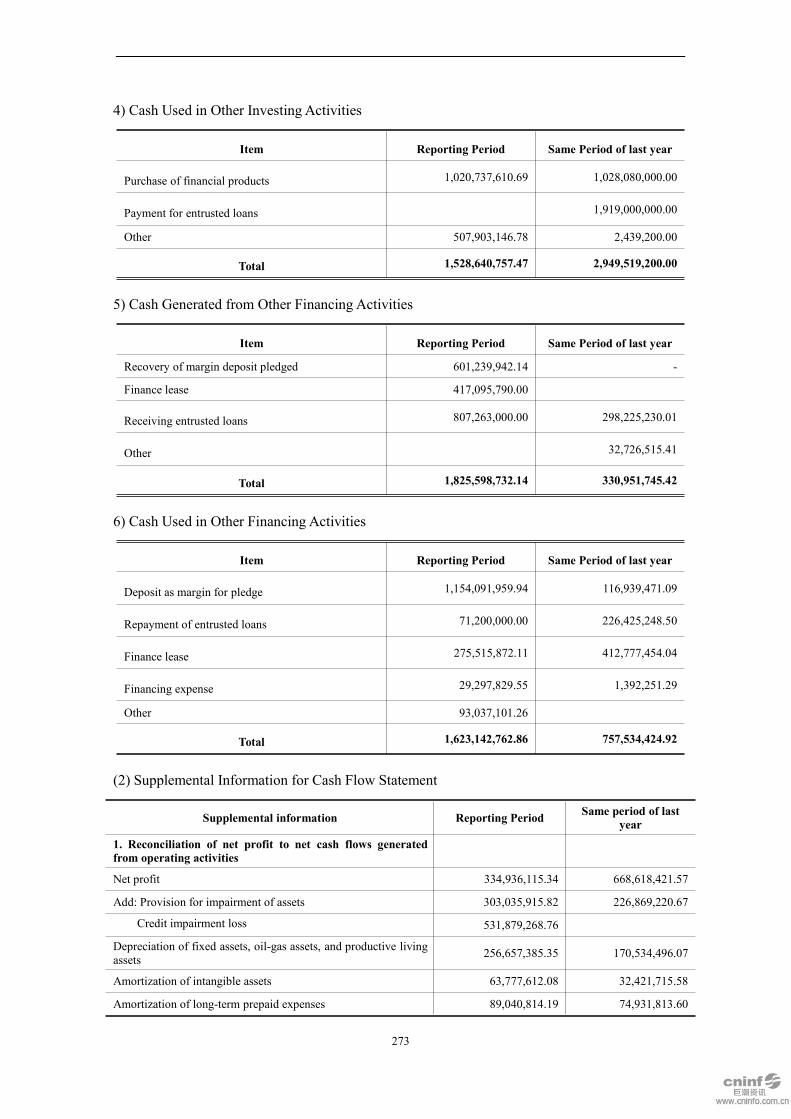
273
4) Cash Used in Other Investing Activities
Item Reporting Period Same Period of last year
Purchase of financial products 1,020,737,610.69 1,028,080,000.00
Payment for entrusted loans 1,919,000,000.00
Other 507,903,146.78 2,439,200.00
Total 1,528,640,757.47 2,949,519,200.00
5) Cash Generated from Other Financing Activities
Item Reporting Period Same Period of last year
Recovery of margin deposit pledged 601,239,942.14 -
Finance lease 417,095,790.00
Receiving entrusted loans 807,263,000.00 298,225,230.01
Other 32,726,515.41
Total 1,825,598,732.14 330,951,745.42
6) Cash Used in Other Financing Activities
Item Reporting Period Same Period of last year
Deposit as margin for pledge 1,154,091,959.94 116,939,471.09
Repayment of entrusted loans 71,200,000.00 226,425,248.50
Finance lease 275,515,872.11 412,777,454.04
Financing expense 29,297,829.55 1,392,251.29
Other 93,037,101.26
Total 1,623,142,762.86 757,534,424.92
(2) Supplemental Information for Cash Flow Statement
Supplemental information Reporting Period Same period of lastyear
1. Reconciliation of net profit to net cash flows generatedfrom operating activities
Net profit 334,936,115.34 668,618,421.57
Add: Provision for impairment of assets 303,035,915.82 226,869,220.67
Credit impairment loss 531,879,268.76
Depreciation of fixed assets, oil-gas assets, and productive livingassets 256,657,385.35 170,534,496.07
Amortization of intangible assets 63,777,612.08 32,421,715.58
Amortization of long-term prepaid expenses 89,040,814.19 74,931,813.60
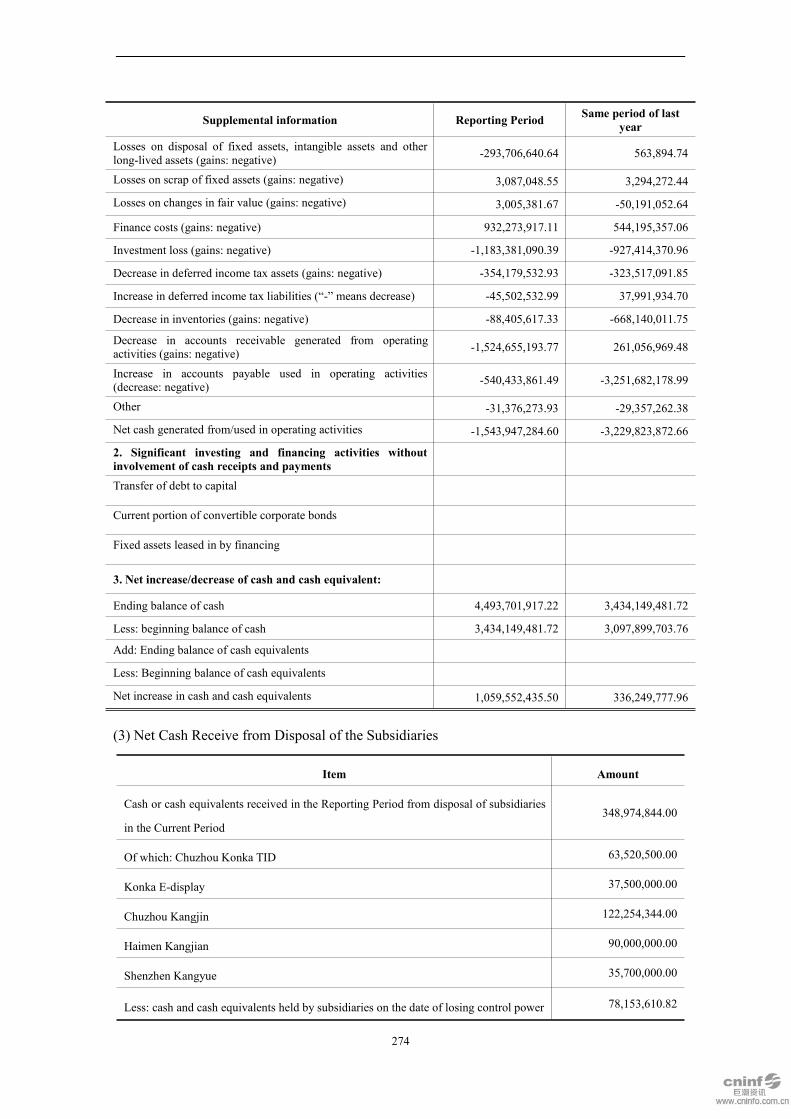
274
Supplemental information Reporting Period Same period of lastyear
Losses on disposal of fixed assets, intangible assets and otherlong-lived assets (gains: negative) -293,706,640.64 563,894.74
Losses on scrap of fixed assets (gains: negative) 3,087,048.55 3,294,272.44
Losses on changes in fair value (gains: negative) 3,005,381.67 -50,191,052.64
Finance costs (gains: negative) 932,273,917.11 544,195,357.06
Investment loss (gains: negative) -1,183,381,090.39 -927,414,370.96
Decrease in deferred income tax assets (gains: negative) -354,179,532.93 -323,517,091.85
Increase in deferred income tax liabilities (“-” means decrease) -45,502,532.99 37,991,934.70
Decrease in inventories (gains: negative) -88,405,617.33 -668,140,011.75
Decrease in accounts receivable generated from operatingactivities (gains: negative) -1,524,655,193.77 261,056,969.48
Increase in accounts payable used in operating activities(decrease: negative) -540,433,861.49 -3,251,682,178.99
Other -31,376,273.93 -29,357,262.38
Net cash generated from/used in operating activities -1,543,947,284.60 -3,229,823,872.66
2. Significant investing and financing activities withoutinvolvement of cash receipts and paymentsTransfer of debt to capital
Current portion of convertible corporate bonds
Fixed assets leased in by financing
3. Net increase/decrease of cash and cash equivalent:
Ending balance of cash 4,493,701,917.22 3,434,149,481.72
Less: beginning balance of cash 3,434,149,481.72 3,097,899,703.76
Add: Ending balance of cash equivalents
Less: Beginning balance of cash equivalents
Net increase in cash and cash equivalents 1,059,552,435.50 336,249,777.96
(3) Net Cash Receive from Disposal of the Subsidiaries
Item Amount
Cash or cash equivalents received in the Reporting Period from disposal of subsidiaries
in the Current Period348,974,844.00
Of which: Chuzhou Konka TID 63,520,500.00
Konka E-display 37,500,000.00
Chuzhou Kangjin 122,254,344.00
Haimen Kangjian 90,000,000.00
Shenzhen Kangyue 35,700,000.00
Less: cash and cash equivalents held by subsidiaries on the date of losing control power 78,153,610.82
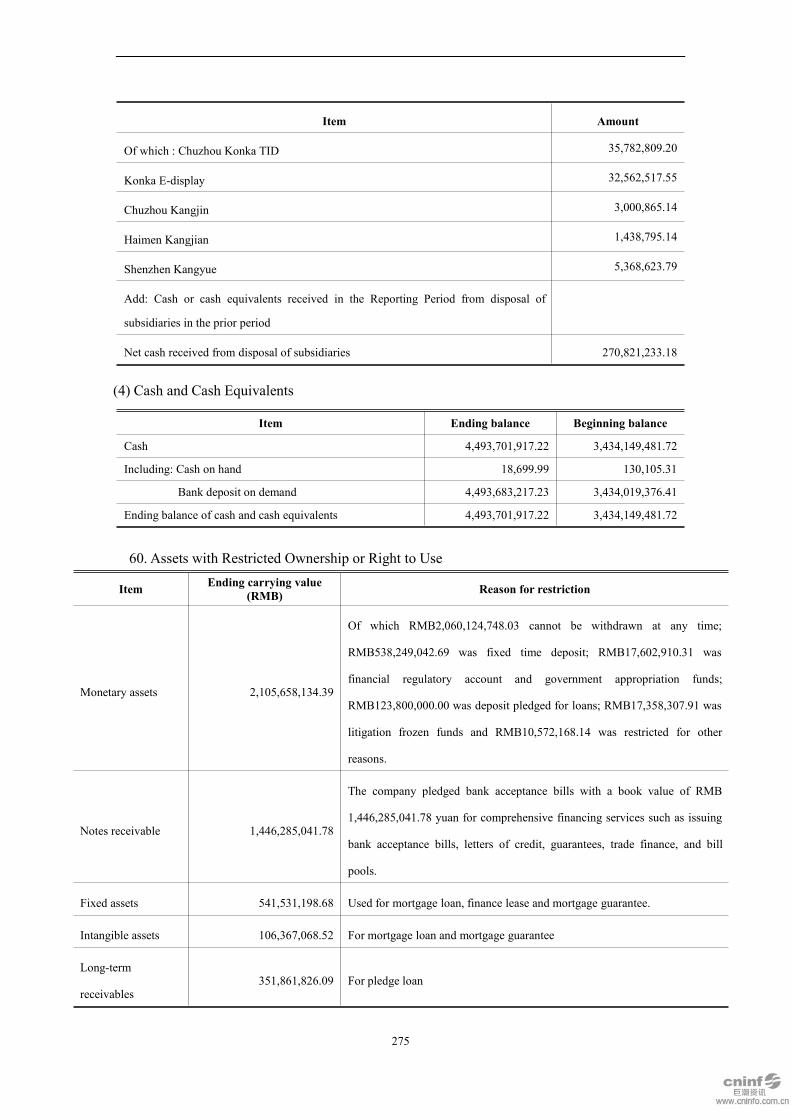
275
Item Amount
Of which : Chuzhou Konka TID 35,782,809.20
Konka E-display 32,562,517.55
Chuzhou Kangjin 3,000,865.14
Haimen Kangjian 1,438,795.14
Shenzhen Kangyue 5,368,623.79
Add: Cash or cash equivalents received in the Reporting Period from disposal of
subsidiaries in the prior period
Net cash received from disposal of subsidiaries 270,821,233.18
(4) Cash and Cash Equivalents
Item Ending balance Beginning balance
Cash 4,493,701,917.22 3,434,149,481.72
Including: Cash on hand 18,699.99 130,105.31
Bank deposit on demand 4,493,683,217.23 3,434,019,376.41
Ending balance of cash and cash equivalents 4,493,701,917.22 3,434,149,481.72
60. Assets with Restricted Ownership or Right to Use
Item Ending carrying value(RMB) Reason for restriction
Monetary assets 2,105,658,134.39
Of which RMB2,060,124,748.03 cannot be withdrawn at any time;
RMB538,249,042.69 was fixed time deposit; RMB17,602,910.31 was
financial regulatory account and government appropriation funds;
RMB123,800,000.00 was deposit pledged for loans; RMB17,358,307.91 was
litigation frozen funds and RMB10,572,168.14 was restricted for other
reasons.
Notes receivable 1,446,285,041.78
The company pledged bank acceptance bills with a book value of RMB
1,446,285,041.78 yuan for comprehensive financing services such as issuing
bank acceptance bills, letters of credit, guarantees, trade finance, and bill
pools.
Fixed assets 541,531,198.68 Used for mortgage loan, finance lease and mortgage guarantee.
Intangible assets 106,367,068.52 For mortgage loan and mortgage guarantee
Long-term
receivables351,861,826.09 For pledge loan
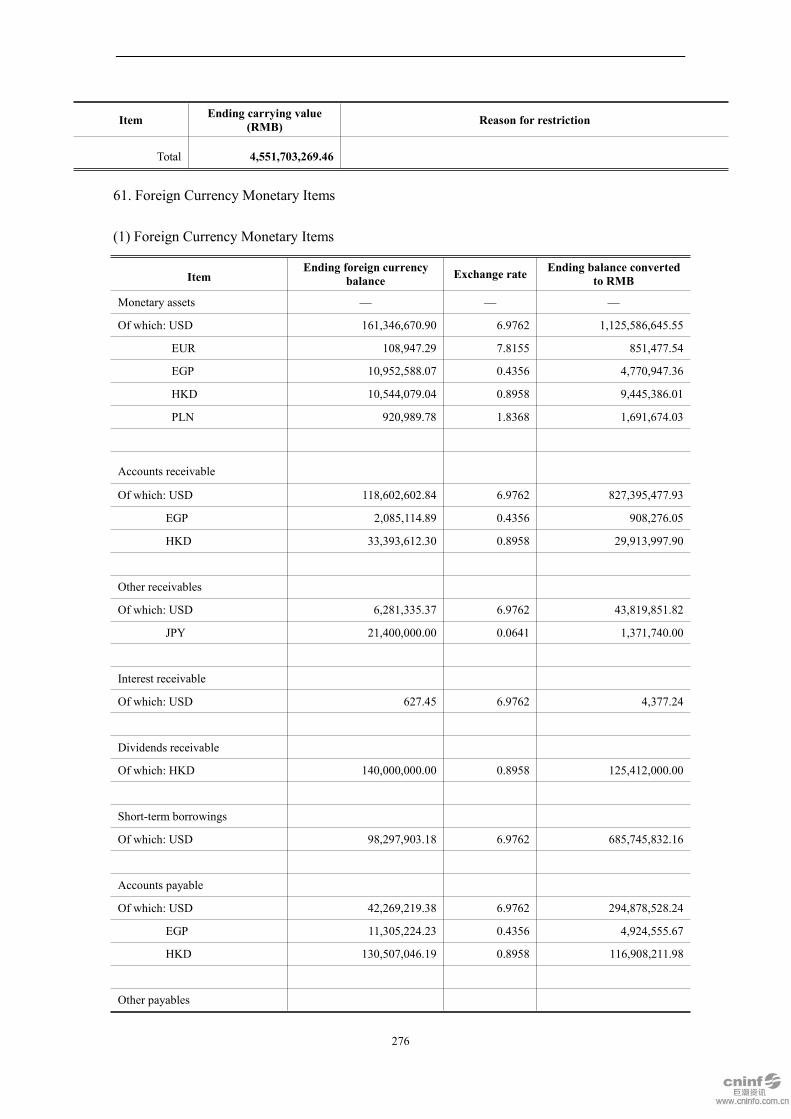
276
Item Ending carrying value(RMB) Reason for restriction
Total 4,551,703,269.46
61. Foreign Currency Monetary Items
(1) Foreign Currency Monetary Items
ItemEnding foreign currency
balance Exchange rate Ending balance convertedto RMB
Monetary assets — — —
Of which: USD 161,346,670.90 6.9762 1,125,586,645.55
EUR 108,947.29 7.8155 851,477.54
EGP 10,952,588.07 0.4356 4,770,947.36
HKD 10,544,079.04 0.8958 9,445,386.01
PLN 920,989.78 1.8368 1,691,674.03
Accounts receivable
Of which: USD 118,602,602.84 6.9762 827,395,477.93
EGP 2,085,114.89 0.4356 908,276.05
HKD 33,393,612.30 0.8958 29,913,997.90
Other receivables
Of which: USD 6,281,335.37 6.9762 43,819,851.82
JPY 21,400,000.00 0.0641 1,371,740.00
Interest receivable
Of which: USD 627.45 6.9762 4,377.24
Dividends receivable
Of which: HKD 140,000,000.00 0.8958 125,412,000.00
Short-term borrowings
Of which: USD 98,297,903.18 6.9762 685,745,832.16
Accounts payable
Of which: USD 42,269,219.38 6.9762 294,878,528.24
EGP 11,305,224.23 0.4356 4,924,555.67
HKD 130,507,046.19 0.8958 116,908,211.98
Other payables
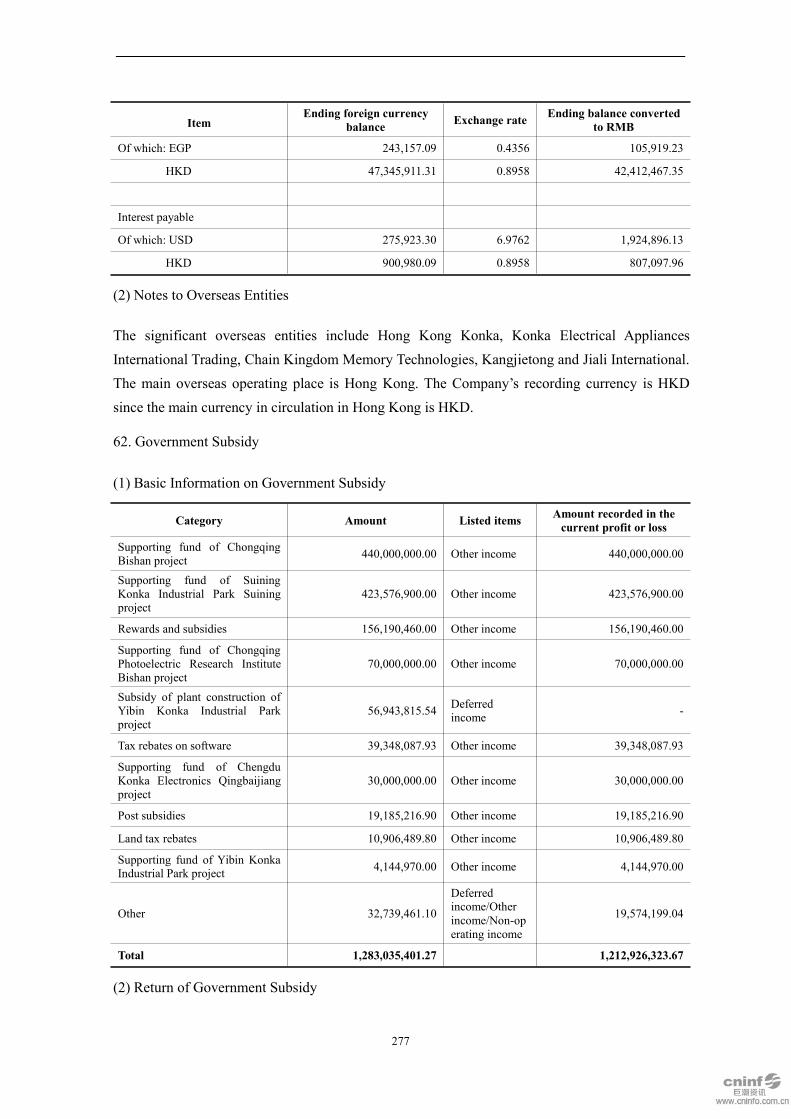
277
ItemEnding foreign currency
balance Exchange rate Ending balance convertedto RMB
Of which: EGP 243,157.09 0.4356 105,919.23
HKD 47,345,911.31 0.8958 42,412,467.35
Interest payable
Of which: USD 275,923.30 6.9762 1,924,896.13
HKD 900,980.09 0.8958 807,097.96
(2) Notes to Overseas Entities
The significant overseas entities include Hong Kong Konka, Konka Electrical AppliancesInternational Trading, Chain Kingdom Memory Technologies, Kangjietong and Jiali International.The main overseas operating place is Hong Kong. The Company’s recording currency is HKDsince the main currency in circulation in Hong Kong is HKD.
62. Government Subsidy
(1) Basic Information on Government Subsidy
Category Amount Listed items Amount recorded in thecurrent profit or loss
Supporting fund of ChongqingBishan project 440,000,000.00 Other income 440,000,000.00
Supporting fund of SuiningKonka Industrial Park Suiningproject
423,576,900.00 Other income 423,576,900.00
Rewards and subsidies 156,190,460.00 Other income 156,190,460.00
Supporting fund of ChongqingPhotoelectric Research InstituteBishan project
70,000,000.00 Other income 70,000,000.00
Subsidy of plant construction ofYibin Konka Industrial Parkproject
56,943,815.54 Deferredincome -
Tax rebates on software 39,348,087.93 Other income 39,348,087.93
Supporting fund of ChengduKonka Electronics Qingbaijiangproject
30,000,000.00 Other income 30,000,000.00
Post subsidies 19,185,216.90 Other income 19,185,216.90
Land tax rebates 10,906,489.80 Other income 10,906,489.80
Supporting fund of Yibin KonkaIndustrial Park project 4,144,970.00 Other income 4,144,970.00
Other 32,739,461.10
Deferredincome/Otherincome/Non-operating income
19,574,199.04
Total 1,283,035,401.27 1,212,926,323.67
(2) Return of Government Subsidy
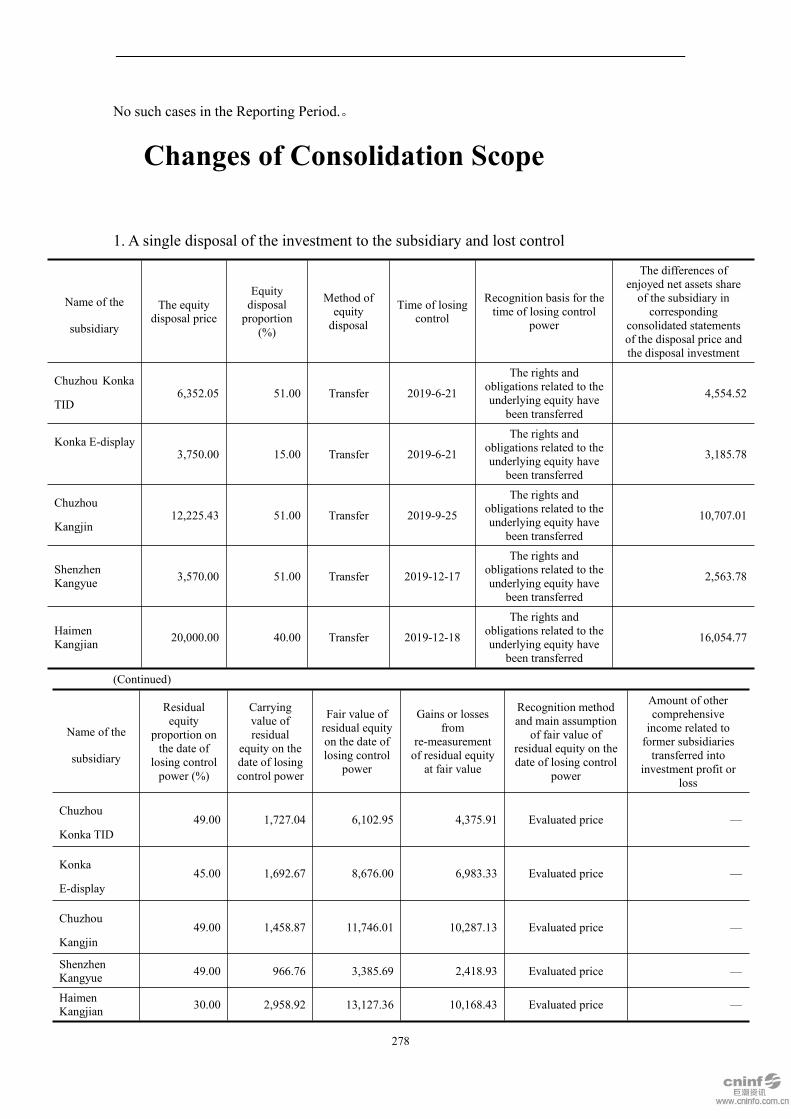
278
No such cases in the Reporting Period.。
Changes of Consolidation Scope
1. A single disposal of the investment to the subsidiary and lost control
Name of the
subsidiary
The equitydisposal price
Equitydisposalproportion
(%)
Method ofequitydisposal
Time of losingcontrol
Recognition basis for thetime of losing control
power
The differences ofenjoyed net assets shareof the subsidiary incorresponding
consolidated statementsof the disposal price andthe disposal investment
Chuzhou Konka
TID6,352.05 51.00 Transfer 2019-6-21
The rights andobligations related to theunderlying equity have
been transferred
4,554.52
Konka E-display3,750.00 15.00 Transfer 2019-6-21
The rights andobligations related to theunderlying equity have
been transferred
3,185.78
Chuzhou
Kangjin12,225.43 51.00 Transfer 2019-9-25
The rights andobligations related to theunderlying equity have
been transferred
10,707.01
ShenzhenKangyue 3,570.00 51.00 Transfer 2019-12-17
The rights andobligations related to theunderlying equity have
been transferred
2,563.78
HaimenKangjian 20,000.00 40.00 Transfer 2019-12-18
The rights andobligations related to theunderlying equity have
been transferred
16,054.77
(Continued)
Name of the
subsidiary
Residualequity
proportion onthe date of
losing controlpower (%)
Carryingvalue ofresidual
equity on thedate of losingcontrol power
Fair value ofresidual equityon the date oflosing control
power
Gains or lossesfrom
re-measurementof residual equityat fair value
Recognition methodand main assumption
of fair value ofresidual equity on thedate of losing control
power
Amount of othercomprehensiveincome related toformer subsidiariestransferred into
investment profit orloss
Chuzhou
Konka TID49.00 1,727.04 6,102.95 4,375.91 Evaluated price —
Konka
E-display45.00 1,692.67 8,676.00 6,983.33 Evaluated price —
Chuzhou
Kangjin49.00 1,458.87 11,746.01 10,287.13 Evaluated price —
ShenzhenKangyue 49.00 966.76 3,385.69 2,418.93 Evaluated price —
HaimenKangjian 30.00 2,958.92 13,127.36 10,168.43 Evaluated price —
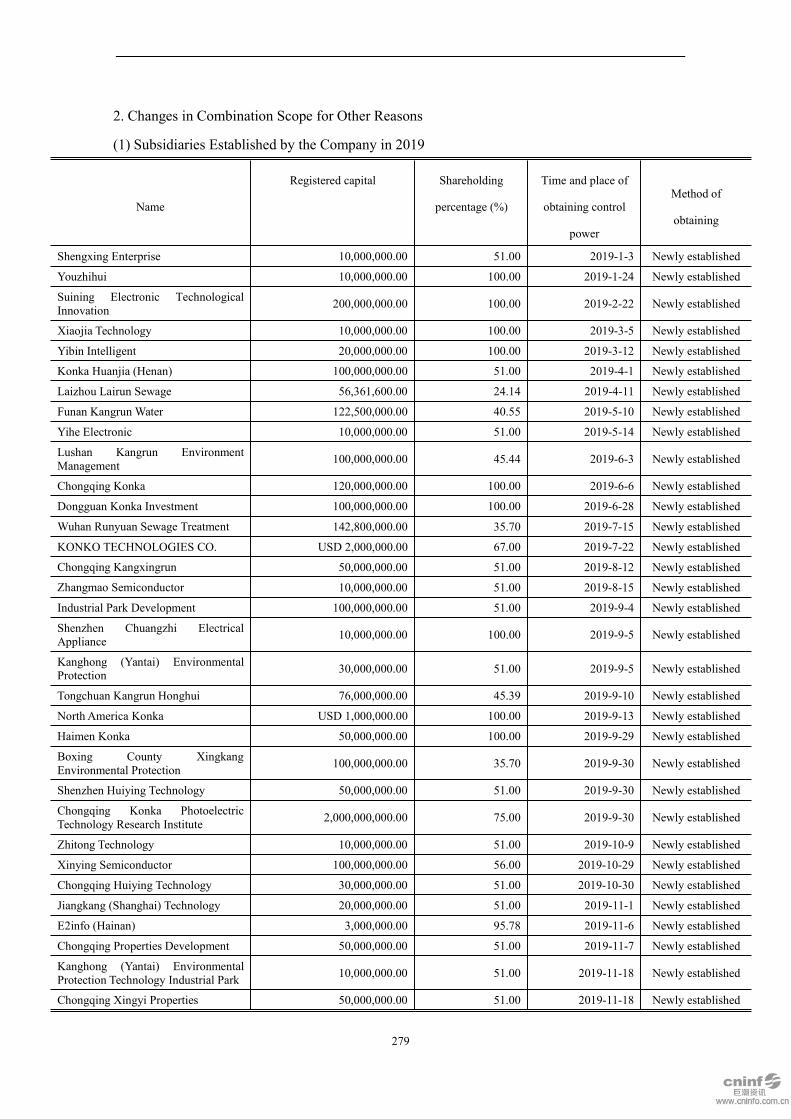
279
2. Changes in Combination Scope for Other Reasons
(1) Subsidiaries Established by the Company in 2019
Name
Registered capital Shareholding
percentage (%)
Time and place of
obtaining control
power
Method of
obtaining
Shengxing Enterprise 10,000,000.00 51.00 2019-1-3 Newly established
Youzhihui 10,000,000.00 100.00 2019-1-24 Newly established
Suining Electronic TechnologicalInnovation 200,000,000.00 100.00 2019-2-22 Newly established
Xiaojia Technology 10,000,000.00 100.00 2019-3-5 Newly established
Yibin Intelligent 20,000,000.00 100.00 2019-3-12 Newly established
Konka Huanjia (Henan) 100,000,000.00 51.00 2019-4-1 Newly established
Laizhou Lairun Sewage 56,361,600.00 24.14 2019-4-11 Newly established
Funan Kangrun Water 122,500,000.00 40.55 2019-5-10 Newly established
Yihe Electronic 10,000,000.00 51.00 2019-5-14 Newly established
Lushan Kangrun EnvironmentManagement 100,000,000.00 45.44 2019-6-3 Newly established
Chongqing Konka 120,000,000.00 100.00 2019-6-6 Newly established
Dongguan Konka Investment 100,000,000.00 100.00 2019-6-28 Newly established
Wuhan Runyuan Sewage Treatment 142,800,000.00 35.70 2019-7-15 Newly established
KONKO TECHNOLOGIES CO. USD 2,000,000.00 67.00 2019-7-22 Newly established
Chongqing Kangxingrun 50,000,000.00 51.00 2019-8-12 Newly established
Zhangmao Semiconductor 10,000,000.00 51.00 2019-8-15 Newly established
Industrial Park Development 100,000,000.00 51.00 2019-9-4 Newly established
Shenzhen Chuangzhi ElectricalAppliance 10,000,000.00 100.00 2019-9-5 Newly established
Kanghong (Yantai) EnvironmentalProtection 30,000,000.00 51.00 2019-9-5 Newly established
Tongchuan Kangrun Honghui 76,000,000.00 45.39 2019-9-10 Newly established
North America Konka USD 1,000,000.00 100.00 2019-9-13 Newly established
Haimen Konka 50,000,000.00 100.00 2019-9-29 Newly established
Boxing County XingkangEnvironmental Protection 100,000,000.00 35.70 2019-9-30 Newly established
Shenzhen Huiying Technology 50,000,000.00 51.00 2019-9-30 Newly established
Chongqing Konka PhotoelectricTechnology Research Institute 2,000,000,000.00 75.00 2019-9-30 Newly established
Zhitong Technology 10,000,000.00 51.00 2019-10-9 Newly established
Xinying Semiconductor 100,000,000.00 56.00 2019-10-29 Newly established
Chongqing Huiying Technology 30,000,000.00 51.00 2019-10-30 Newly established
Jiangkang (Shanghai) Technology 20,000,000.00 51.00 2019-11-1 Newly established
E2info (Hainan) 3,000,000.00 95.78 2019-11-6 Newly established
Chongqing Properties Development 50,000,000.00 51.00 2019-11-7 Newly established
Kanghong (Yantai) EnvironmentalProtection Technology Industrial Park 10,000,000.00 51.00 2019-11-18 Newly established
Chongqing Xingyi Properties 50,000,000.00 51.00 2019-11-18 Newly established

280
Name
Registered capital Shareholding
percentage (%)
Time and place of
obtaining control
power
Method of
obtaining
Kangxin Technology 10,000,000.00 51.00 2019-11-21 Newly established
Chongqing Fuze Properties 50,000,000.00 51.00 2019-11-21 Newly established
Suining Jiarun Properties 10,000,000.00 100.00 2019-11-26 Newly established
Konka Zhizao 20,000,000.00 51.00 2019-11-29 Newly established
debao New Material 50,000,000.00 60.00 2019-11-29 Newly established
Yuekang Semiconductor 100,000,000.00 100.00 2019-12-5 Newly established
Ningbo Kanghanrui ElectricalAppliances 150,000,000.00 60.00 2019-12-10 Newly established
Frestec Intelligent 10,000,000.00 51.00 2019-12-11 Newly established
Chain Kingdom Memory Technology 5,000,000.00 51.00 2019-12-18 Newly established
Chengdu Konka IntelligentTechnology 50,000,000.00 100.00 2019-12-20 Newly established
Chengdu Konka Electronics 50,000,000.00 100.00 2019-12-20 Newly established
Kangxinlong EnvironmentalProtection 30,000,000.00 51.00 2019-12-23 Newly established
Tingyuan Environmental Protection 50,000,000.00 51.00 2019-12-24 Newly established
Chuzhou Kangxin Health Industry 30,000,000.00 100.00 2019-12-25 Newly established
Yantai Kangyun 30,000,000.00 51.00 2019-12-30 Newly established
Yantai Laikang 10,000,000.00 51.00 2019-12-30 Newly established
(2) Changes in Combination Scope for Other Reasons
The subsidiary of the Company, Mudanjiang Appliances liquidated in the Reporting Period and
distributed the residual assets.
VIII.Equity in Other Entities
1. Equity in Subsidiary
(1) Subsidiaries
NameMain
operatingplace
Registrationplace Nature of business
Holding percentage(%) Way of
gainingDirectly Indirectly
Konka Ventures Shenzhen,Guangdong
Shenzhen,Guangdong
Other organization andmanagement service 51.00 - Establishment
or investment
Yantai Konka Yantai,Shandong
Yantai,Shandong
Other professionalconsultancy andinvestigation
- 51.00 Establishmentor investment
Chengdu Konka Chengdu,Sichuan
Chengdu,Sichuan Commercial service - 51.00 Establishment
or investment
Chengdu Anren Chengdu,Sichuan
Chengdu,Sichuan Commercial service - 51.00 Establishment
or investment

281
NameMain
operatingplace
Registrationplace Nature of business
Holding percentage(%) Way of
gainingDirectly Indirectly
Konka EnterpriseService
Guiyang,Guizhou
Guiyang,Guizhou
Headquartersmanagement - 51.00 Establishment
or investment
ChuanghuiIntelligent
Nanjing,Jiangsu
Nanjing,Jiangsu
Entrepreneurial spaceservice - 40.80 Establishment
or investment
Cross-borderKechuang
Shenzhen,Guangdong
Shenzhen,Guangdong
Other IT service industrynot listed clearly - 26.01 Establishment
or investment
Konka EnterpriseManagement
Guiyang,Guizhou
Guiyang,Guizhou
Other Commercial servicenot listed clearly - 51.00 Establishment
or investment
Yibin KonkaIncubator
Yibin,Sichuan
Yibin,Sichuan Commercial service - 51.00 Establishment
or investment
Anhui Konka Chuzhou,Anhui
Chuzhou,Anhui Manufacturing industry 78.00 - Establishment
or investment
Kangzhi TradeChuzhou,Anhui
Chuzhou,Anhui Wholesale industry - 78.00 Establishment
or investment
Konka Factoring Shenzhen,Guangdong
Shenzhen,Guangdong
Insurance agents(non-bank finance) 100.00 - Establishment
or investment
Youshi Kangrong Tianjin Tianjin Advertisement - 70.00 Establishmentor investment
Konka Unifortune Shenzhen,Guangdong
Shenzhen,Guangdong Retail industry 51.00 - Establishment
or investment
Jiali International Hong Kong,China
Hong Kong,China Retail industry - 51.00 Establishment
or investment
Wankaida Shenzhen,Guangdong
Shenzhen,Guangdong Software development 100.00 - Establishment
or investment
Dongguan Konka Dongguan,Guangdong
Dongguan,Guangdong Manufacturing industry 75.00 25.00 Establishment
or investment
Telecommunication
TechnologyShenzhen,Guangdong
Shenzhen,Guangdong Manufacturing industry 75.00 25.00 Establishment
or investment
XiangkangTelecommunication
Hong Kong,China
Hong Kong,China Manufacturing industry - 100.00 Establishment
or investment
Electrical
AppliancesShenzhen,Guangdong
Shenzhen,Guangdong Manufacturing industry 75.00 25.00 Establishment
or investment
Konka Europe Frankfurt,Germany
Frankfurt,Germany International Trading 100.00 - Establishment
or investment
Commercial System
TechnologyShenzhen,Guangdong
Shenzhen,Guangdong Commerce 81.00 - Establishment
or investment
Konka ElectricalAppliances
Shenzhen,Guangdong
Shenzhen,Guangdong
Manufacturing industry,commerce 100.00 - Establishment
or investment
Konka Materials Haikou,Hainan
Haikou,Hainan Commercial service - 51.00 Establishment
or investment
Mobile
InterconnectionShenzhen,Guangdong
Shenzhen,Guangdong Commerce 100.00 - Establishment
or investment
Sichuan Konka Yibin,Sichuan
Yibin,Sichuan Manufacturing industry - 100.00 Establishment
or investment
Yibin Intelligent Yibin,Sichuan
Yibin,Sichuan Information service 100.00 Establishment
or investment
Anhui Tongchuang Chuzhou, Chuzhou, Manufacturing industry 100.00 - Establishment

282
NameMain
operatingplace
Registrationplace Nature of business
Holding percentage(%) Way of
gainingDirectly Indirectly
Anhui Anhui or investment
Electrical ApplianceTechnology
Chuzhou,Anhui
Chuzhou,Anhui Manufacturing industry - 51.00 Establishment
or investment
FrestecRefrigeration
Xinxiang,Henan
Xinxiang,Henan Manufacturing industry - 51.00 Establishment
or investment
Frestec Intelligent Xinxiang,Henan
Xinxiang,Henan Manufacturing industry 51.00 Establishment
or investment
Frestec ElectricalAppliances
Xinxiang,Henan
Xinxiang,Henan Manufacturing industry - 51.00 Establishment
or investment
Frestec HouseholdAppliances
Xinxiang,Henan
Xinxiang,Henan Manufacturing industry - 51.00 Establishment
or investment
PengrunTechnology
Shenzhen,Guangdong
Shenzhen,Guangdong Retail industry 51.00 - Establishment
or investment
Jiaxin Technology Hong Kong,China
Hong Kong,China Retail industry - 51.00 Establishment
or investment
E3info Haikou,Hainan
Haikou,Hainan
Network platformdevelopment 60.00 - Establishment
or investment
Yifang Technology Shenzhen,Guangdong
Shenzhen,Guangdong
Network platformdevelopment - 60.00 Establishment
or investment
Dongguan Packing Dongguan,Guangdong
Dongguan,Guangdong Manufacturing industry 75.00 25.00 Establishment
or investment
E2info Shenzhen,Guangdong
Shenzhen,Guangdong Information service 95.78 - Establishment
or investment
E2info (Hainan) Haikou,Hainan
Haikou,Hainan Information service 95.78 Establishment
or investment
Beijing Konka
Electronic Beijing Beijing Sale of home appliance 100.00 - Establishmentor investment
Konka LeasingTianjin PilotFree TradeZone
Tianjin PilotFree TradeZone
Leasing industry - 100.00 Establishmentor investment
Fittings Technology Shenzhen,Guangdong
Shenzhen,Guangdong Investment holding 75.00 25.00 Establishment
or investment
Boluo Konka
PrecisionBoluo,Guangdong
Boluo,Guangdong Manufacturing industry - 100.00 Establishment
or investment
Xiamen Dalong Xiamen,Fujian
Xiamen,Fujian Commerce - 69.23 Establishment
or investment
Boluo Konka Boluo,Guangdong
Boluo,Guangdong Manufacturing industry - 100.00 Establishment
or investment
Hong Kong Konka Hong Kong,China
Hong Kong,China International trading 100.00 - Establishment
or investment
Konka Household
Appliances
Investment
Hong Kong,China
Hong Kong,China Investment holding - 100.00 Establishment
or investment
Chain Kingdom Hong Kong,China
Hong Kong,China International trading - 51.00 Establishment
or investment
Chain KingdomShenzhen
Shenzhen,Guangdong
Shenzhen,Guangdong Wholesale industry - 51.00 Establishment
or investment
Hefei Chain Hefei, Anhui Hefei, Anhui Information service 51.00 Establishment
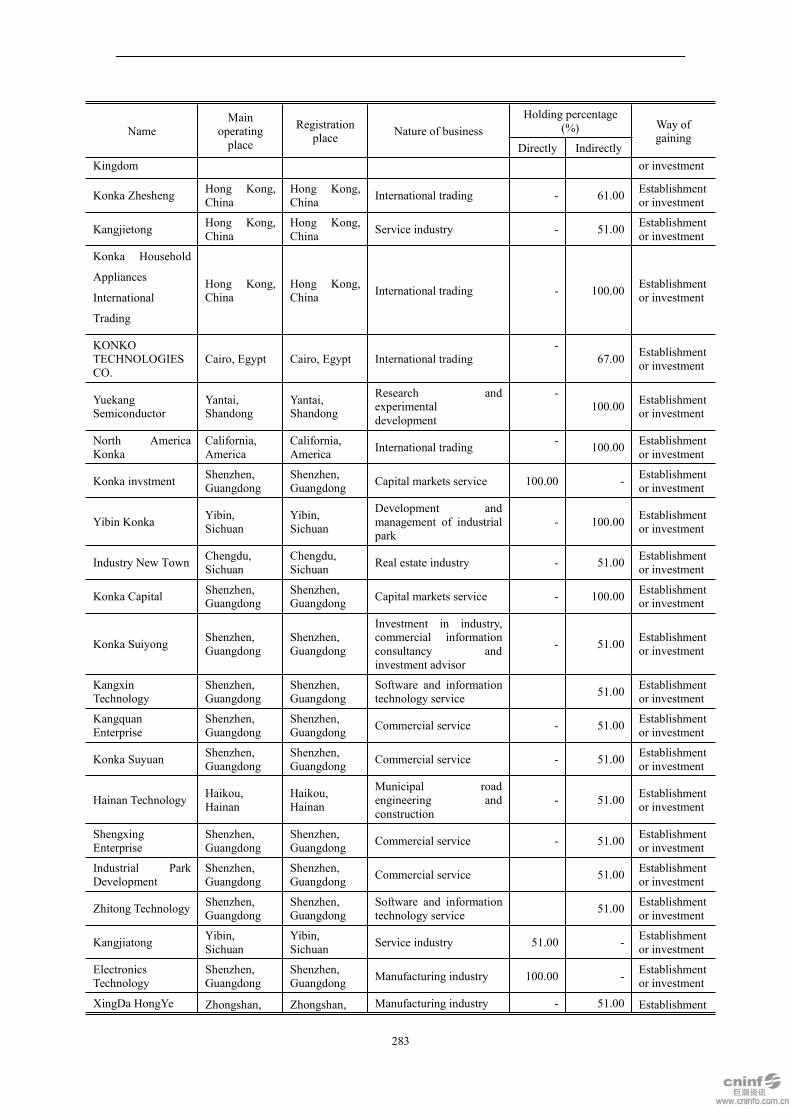
283
NameMain
operatingplace
Registrationplace Nature of business
Holding percentage(%) Way of
gainingDirectly Indirectly
Kingdom or investment
Konka Zhesheng Hong Kong,China
Hong Kong,China International trading - 61.00 Establishment
or investment
Kangjietong Hong Kong,China
Hong Kong,China Service industry - 51.00 Establishment
or investment
Konka Household
Appliances
International
Trading
Hong Kong,China
Hong Kong,China International trading - 100.00 Establishment
or investment
KONKOTECHNOLOGIESCO.
Cairo, Egypt Cairo, Egypt International trading-
67.00 Establishmentor investment
YuekangSemiconductor
Yantai,Shandong
Yantai,Shandong
Research andexperimentaldevelopment
-100.00 Establishment
or investment
North AmericaKonka
California,America
California,America International trading - 100.00 Establishment
or investment
Konka invstment Shenzhen,Guangdong
Shenzhen,Guangdong Capital markets service 100.00 - Establishment
or investment
Yibin Konka Yibin,Sichuan
Yibin,Sichuan
Development andmanagement of industrialpark
- 100.00 Establishmentor investment
Industry New Town Chengdu,Sichuan
Chengdu,Sichuan Real estate industry - 51.00 Establishment
or investment
Konka Capital Shenzhen,Guangdong
Shenzhen,Guangdong Capital markets service - 100.00 Establishment
or investment
Konka Suiyong Shenzhen,Guangdong
Shenzhen,Guangdong
Investment in industry,commercial informationconsultancy andinvestment advisor
- 51.00 Establishmentor investment
KangxinTechnology
Shenzhen,Guangdong
Shenzhen,Guangdong
Software and informationtechnology service 51.00 Establishment
or investment
KangquanEnterprise
Shenzhen,Guangdong
Shenzhen,Guangdong Commercial service - 51.00 Establishment
or investment
Konka Suyuan Shenzhen,Guangdong
Shenzhen,Guangdong Commercial service - 51.00 Establishment
or investment
Hainan Technology Haikou,Hainan
Haikou,Hainan
Municipal roadengineering andconstruction
- 51.00 Establishmentor investment
ShengxingEnterprise
Shenzhen,Guangdong
Shenzhen,Guangdong Commercial service - 51.00 Establishment
or investment
Industrial ParkDevelopment
Shenzhen,Guangdong
Shenzhen,Guangdong Commercial service 51.00 Establishment
or investment
Zhitong Technology Shenzhen,Guangdong
Shenzhen,Guangdong
Software and informationtechnology service 51.00 Establishment
or investment
Kangjiatong Yibin,Sichuan
Yibin,Sichuan Service industry 51.00 - Establishment
or investment
ElectronicsTechnology
Shenzhen,Guangdong
Shenzhen,Guangdong Manufacturing industry 100.00 - Establishment
or investment
XingDa HongYe Zhongshan, Zhongshan, Manufacturing industry - 51.00 Establishment

284
NameMain
operatingplace
Registrationplace Nature of business
Holding percentage(%) Way of
gainingDirectly Indirectly
Guangdong Guangdong or investment
Shanghai Xinfeng Shanghai Shanghai Commerce - 51.00 Establishmentor investment
Anhui Zhilian Chuzhou,Anhui
Chuzhou,Anhui Electronic commerce - 100.00 Establishment
or investment
Nanjing Konka Nanjing,Jiangsu
Nanjing,Jiangsu Wholesale industry - 100.00 Establishment
or investment
Youzhihui Shenzhen,Guangdong
Shenzhen,Guangdong
Software and informationtechnology serviceindustry
- 100.00 Establishmentor investment
Xiaojia Technology Shenzhen,Guangdong
Shenzhen,Guangdong Retail industry - 100.00 Establishment
or investment
Haimen Konka Nantong,Jiangsu
Nantong,Jiangsu
Wholesale and retailindustry 100.00 Establishment
or investment
Chengdu KonkaIntelligent
Chengdu,Sichuan
Chengdu,Sichuan
Wholesale and retailindustry 100.00 Establishment
or investment
Chengdu KonkaElectronic
Chengdu,Sichuan
Chengdu,Sichuan Manufacturing industry 100.00 Establishment
or investment
Econ Technology Yantai,Shandong
Yantai,Shandong
Environmentaltechnology serviceindustry
51.00 - Establishmentor investment
Beijing Kangyi Beijing BeijingEnvironmentaltechnology serviceindustry
- 51.00 Establishmentor investment
Shanghai Jiyi Shanghai ShanghaiEnvironmentaltechnology serviceindustry
- 51.00 Establishmentor investment
Binzhou Econ Binzhou,Shandong
Binzhou,Shandong
Environmentaltechnology serviceindustry
- 51.00 Establishmentor investment
Lairun Holdings Yantai,Shandong
Yantai,Shandong
Environmentaltechnology serviceindustry
- 30.60 Establishmentor investment
LairunEnvironmentalProtection
Yantai,Shandong
Yantai,Shandong
Environmentaltechnology serviceindustry
- 27.54 Establishmentor investment
Laizhou LairunSewage Treatment
Yantai,Shandong
Yantai,Shandong
Environmenal protectionand environmentmanagement
- 24.14 Establishmentor investment
Binhai SewageTreatment
Yantai,Shandong
Yantai,Shandong
Environmentaltechnology serviceindustry
- 30.60 Establishmentor investment
EconEnvironmentalEngineering
Chengdu,Sichuan
Chengdu,Sichuan
Environmentaltechnology serviceindustry
- 51.00 Establishmentor investment
Yantai Kangrun Yantai,Shandong
Qingdao,Shandong
Environmentaltechnology serviceindustry
- 51.00 Establishmentor investment
Rushan Yike Weihai,Shandong
Weihai,Shandong
Environmentaltechnology serviceindustry
- 44.37 Establishmentor investment
Binzhou Weiyijie Binzhou,Shandong
Binzhou,Shandong
Environmentaltechnology service
- 35.70 Establishmentor investment
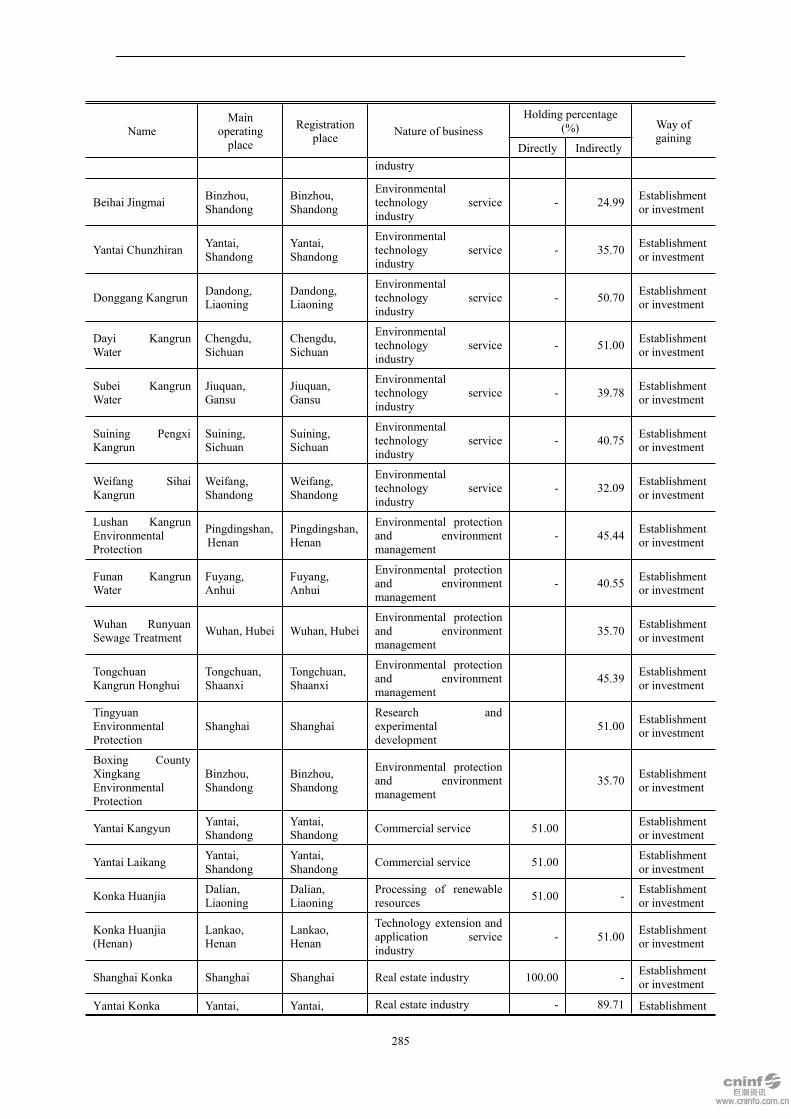
285
NameMain
operatingplace
Registrationplace Nature of business
Holding percentage(%) Way of
gainingDirectly Indirectly
industry
Beihai Jingmai Binzhou,Shandong
Binzhou,Shandong
Environmentaltechnology serviceindustry
- 24.99 Establishmentor investment
Yantai Chunzhiran Yantai,Shandong
Yantai,Shandong
Environmentaltechnology serviceindustry
- 35.70 Establishmentor investment
Donggang Kangrun Dandong,Liaoning
Dandong,Liaoning
Environmentaltechnology serviceindustry
- 50.70 Establishmentor investment
Dayi KangrunWater
Chengdu,Sichuan
Chengdu,Sichuan
Environmentaltechnology serviceindustry
- 51.00 Establishmentor investment
Subei KangrunWater
Jiuquan,Gansu
Jiuquan,Gansu
Environmentaltechnology serviceindustry
- 39.78 Establishmentor investment
Suining PengxiKangrun
Suining,Sichuan
Suining,Sichuan
Environmentaltechnology serviceindustry
- 40.75 Establishmentor investment
Weifang SihaiKangrun
Weifang,Shandong
Weifang,Shandong
Environmentaltechnology serviceindustry
- 32.09 Establishmentor investment
Lushan KangrunEnvironmentalProtection
Pingdingshan,Henan
Pingdingshan,Henan
Environmental protectionand environmentmanagement
- 45.44 Establishmentor investment
Funan KangrunWater
Fuyang,Anhui
Fuyang,Anhui
Environmental protectionand environmentmanagement
- 40.55 Establishmentor investment
Wuhan RunyuanSewage Treatment Wuhan, Hubei Wuhan, Hubei
Environmental protectionand environmentmanagement
35.70 Establishmentor investment
TongchuanKangrun Honghui
Tongchuan,Shaanxi
Tongchuan,Shaanxi
Environmental protectionand environmentmanagement
45.39 Establishmentor investment
TingyuanEnvironmentalProtection
Shanghai ShanghaiResearch andexperimentaldevelopment
51.00 Establishmentor investment
Boxing CountyXingkangEnvironmentalProtection
Binzhou,Shandong
Binzhou,Shandong
Environmental protectionand environmentmanagement
35.70 Establishmentor investment
Yantai Kangyun Yantai,Shandong
Yantai,Shandong Commercial service 51.00 Establishment
or investment
Yantai Laikang Yantai,Shandong
Yantai,Shandong Commercial service 51.00 Establishment
or investment
Konka Huanjia Dalian,Liaoning
Dalian,Liaoning
Processing of renewableresources 51.00 - Establishment
or investment
Konka Huanjia(Henan)
Lankao,Henan
Lankao,Henan
Technology extension andapplication serviceindustry
- 51.00 Establishmentor investment
Shanghai Konka Shanghai Shanghai Real estate industry 100.00 - Establishmentor investment
Yantai Konka Yantai, Yantai, Real estate industry - 89.71 Establishment
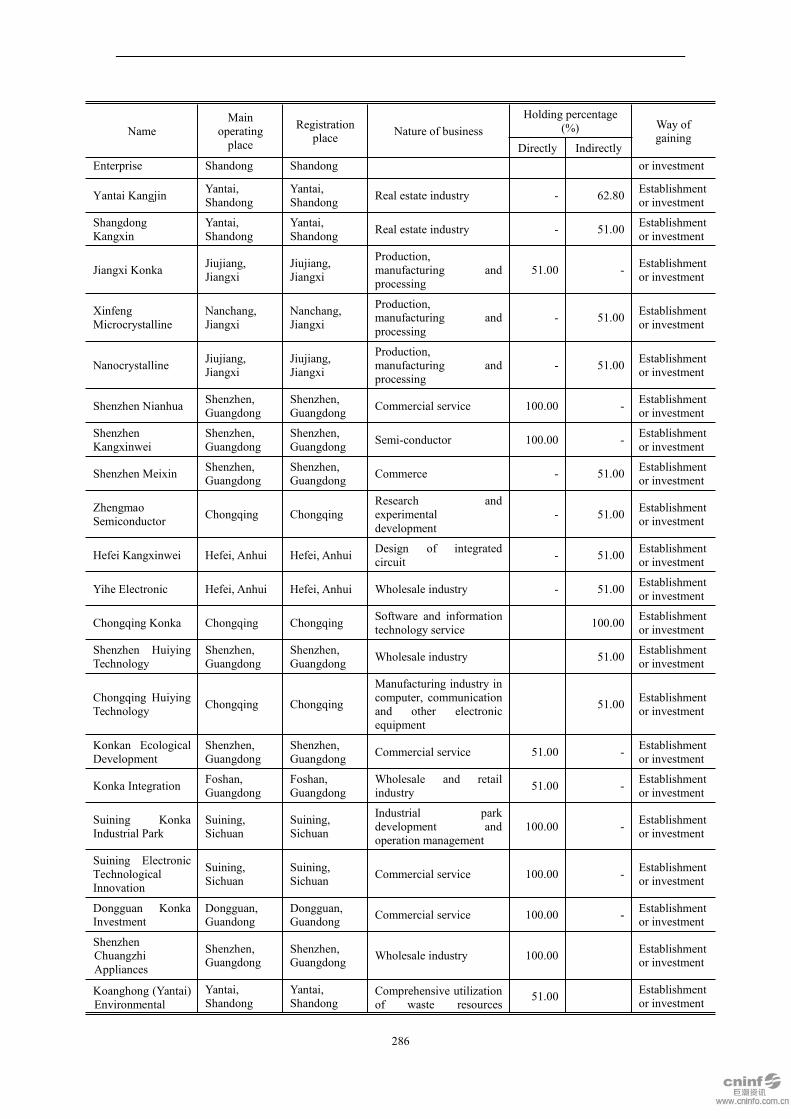
286
NameMain
operatingplace
Registrationplace Nature of business
Holding percentage(%) Way of
gainingDirectly Indirectly
Enterprise Shandong Shandong or investment
Yantai Kangjin Yantai,Shandong
Yantai,Shandong Real estate industry - 62.80 Establishment
or investment
ShangdongKangxin
Yantai,Shandong
Yantai,Shandong Real estate industry - 51.00 Establishment
or investment
Jiangxi Konka Jiujiang,Jiangxi
Jiujiang,Jiangxi
Production,manufacturing andprocessing
51.00 - Establishmentor investment
XinfengMicrocrystalline
Nanchang,Jiangxi
Nanchang,Jiangxi
Production,manufacturing andprocessing
- 51.00 Establishmentor investment
Nanocrystalline Jiujiang,Jiangxi
Jiujiang,Jiangxi
Production,manufacturing andprocessing
- 51.00 Establishmentor investment
Shenzhen Nianhua Shenzhen,Guangdong
Shenzhen,Guangdong Commercial service 100.00 - Establishment
or investment
ShenzhenKangxinwei
Shenzhen,Guangdong
Shenzhen,Guangdong Semi-conductor 100.00 - Establishment
or investment
Shenzhen Meixin Shenzhen,Guangdong
Shenzhen,Guangdong Commerce - 51.00 Establishment
or investment
ZhengmaoSemiconductor Chongqing Chongqing
Research andexperimentaldevelopment
- 51.00 Establishmentor investment
Hefei Kangxinwei Hefei, Anhui Hefei, Anhui Design of integratedcircuit - 51.00 Establishment
or investment
Yihe Electronic Hefei, Anhui Hefei, Anhui Wholesale industry - 51.00 Establishmentor investment
Chongqing Konka Chongqing Chongqing Software and informationtechnology service 100.00 Establishment
or investment
Shenzhen HuiyingTechnology
Shenzhen,Guangdong
Shenzhen,Guangdong Wholesale industry 51.00 Establishment
or investment
Chongqing HuiyingTechnology Chongqing Chongqing
Manufacturing industry incomputer, communicationand other electronicequipment
51.00 Establishmentor investment
Konkan EcologicalDevelopment
Shenzhen,Guangdong
Shenzhen,Guangdong Commercial service 51.00 - Establishment
or investment
Konka Integration Foshan,Guangdong
Foshan,Guangdong
Wholesale and retailindustry 51.00 - Establishment
or investment
Suining KonkaIndustrial Park
Suining,Sichuan
Suining,Sichuan
Industrial parkdevelopment andoperation management
100.00 - Establishmentor investment
Suining ElectronicTechnologicalInnovation
Suining,Sichuan
Suining,Sichuan Commercial service 100.00 - Establishment
or investment
Dongguan KonkaInvestment
Dongguan,Guandong
Dongguan,Guandong Commercial service 100.00 - Establishment
or investment
ShenzhenChuangzhiAppliances
Shenzhen,Guangdong
Shenzhen,Guangdong Wholesale industry 100.00 Establishment
or investment
Koanghong (Yantai)Environmental
Yantai,Shandong
Yantai,Shandong
Comprehensive utilizationof waste resources
51.00 Establishmentor investment
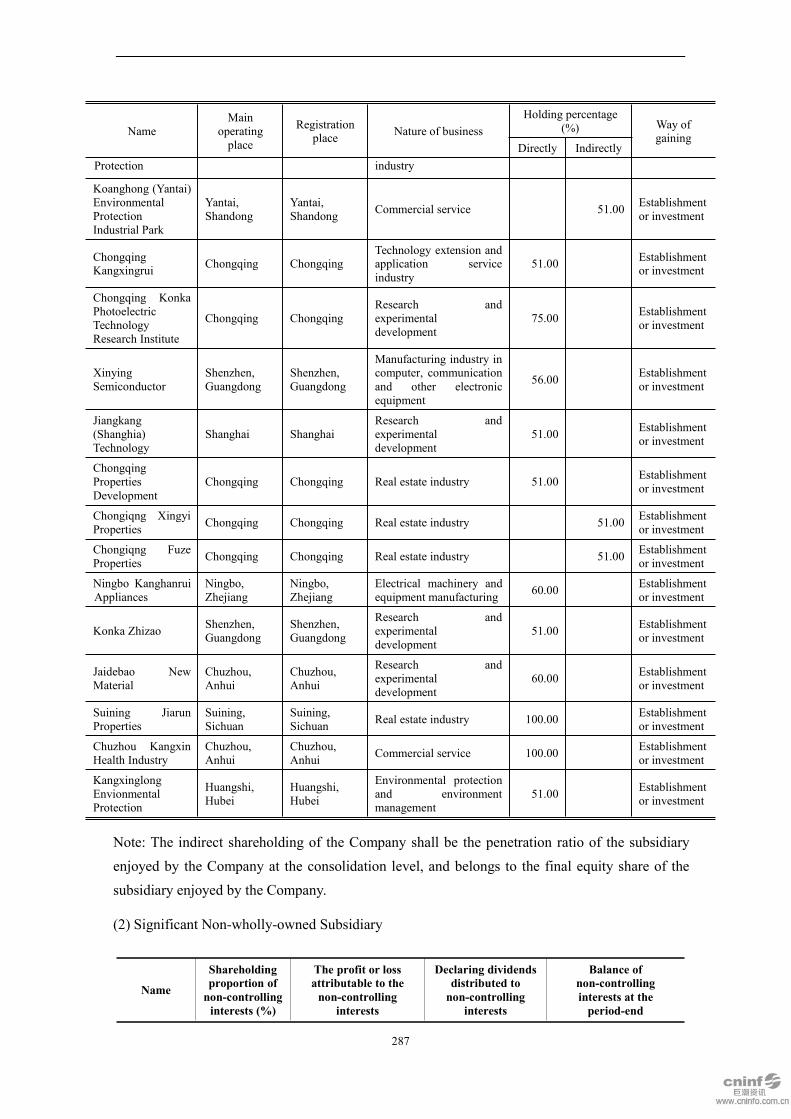
287
NameMain
operatingplace
Registrationplace Nature of business
Holding percentage(%) Way of
gainingDirectly Indirectly
Protection industry
Koanghong (Yantai)EnvironmentalProtectionIndustrial Park
Yantai,Shandong
Yantai,Shandong Commercial service 51.00 Establishment
or investment
ChongqingKangxingrui Chongqing Chongqing
Technology extension andapplication serviceindustry
51.00 Establishmentor investment
Chongqing KonkaPhotoelectricTechnologyResearch Institute
Chongqing ChongqingResearch andexperimentaldevelopment
75.00 Establishmentor investment
XinyingSemiconductor
Shenzhen,Guangdong
Shenzhen,Guangdong
Manufacturing industry incomputer, communicationand other electronicequipment
56.00 Establishmentor investment
Jiangkang(Shanghia)Technology
Shanghai ShanghaiResearch andexperimentaldevelopment
51.00 Establishmentor investment
ChongqingPropertiesDevelopment
Chongqing Chongqing Real estate industry 51.00 Establishmentor investment
Chongiqng XingyiProperties Chongqing Chongqing Real estate industry 51.00 Establishment
or investment
Chongiqng FuzeProperties Chongqing Chongqing Real estate industry 51.00 Establishment
or investment
Ningbo KanghanruiAppliances
Ningbo,Zhejiang
Ningbo,Zhejiang
Electrical machinery andequipment manufacturing 60.00 Establishment
or investment
Konka Zhizao Shenzhen,Guangdong
Shenzhen,Guangdong
Research andexperimentaldevelopment
51.00 Establishmentor investment
Jaidebao NewMaterial
Chuzhou,Anhui
Chuzhou,Anhui
Research andexperimentaldevelopment
60.00 Establishmentor investment
Suining JiarunProperties
Suining,Sichuan
Suining,Sichuan Real estate industry 100.00 Establishment
or investment
Chuzhou KangxinHealth Industry
Chuzhou,Anhui
Chuzhou,Anhui Commercial service 100.00 Establishment
or investment
KangxinglongEnvionmentalProtection
Huangshi,Hubei
Huangshi,Hubei
Environmental protectionand environmentmanagement
51.00 Establishmentor investment
Note: The indirect shareholding of the Company shall be the penetration ratio of the subsidiaryenjoyed by the Company at the consolidation level, and belongs to the final equity share of thesubsidiary enjoyed by the Company.
(2) Significant Non-wholly-owned Subsidiary
Name
Shareholdingproportion ofnon-controllinginterests (%)
The profit or lossattributable to thenon-controlling
interests
Declaring dividendsdistributed tonon-controlling
interests
Balance ofnon-controllinginterests at theperiod-end
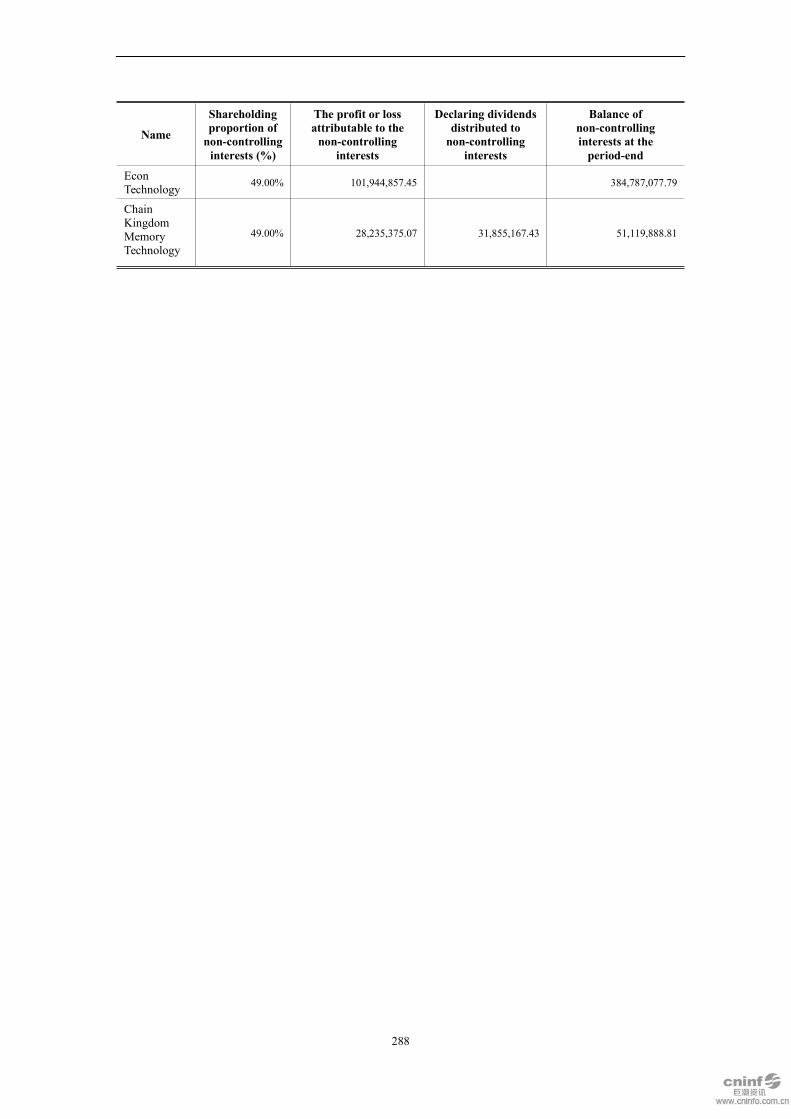
288
Name
Shareholdingproportion ofnon-controllinginterests (%)
The profit or lossattributable to thenon-controlling
interests
Declaring dividendsdistributed tonon-controlling
interests
Balance ofnon-controllinginterests at theperiod-end
EconTechnology 49.00% 101,944,857.45 384,787,077.79
ChainKingdomMemoryTechnology
49.00% 28,235,375.07 31,855,167.43 51,119,888.81
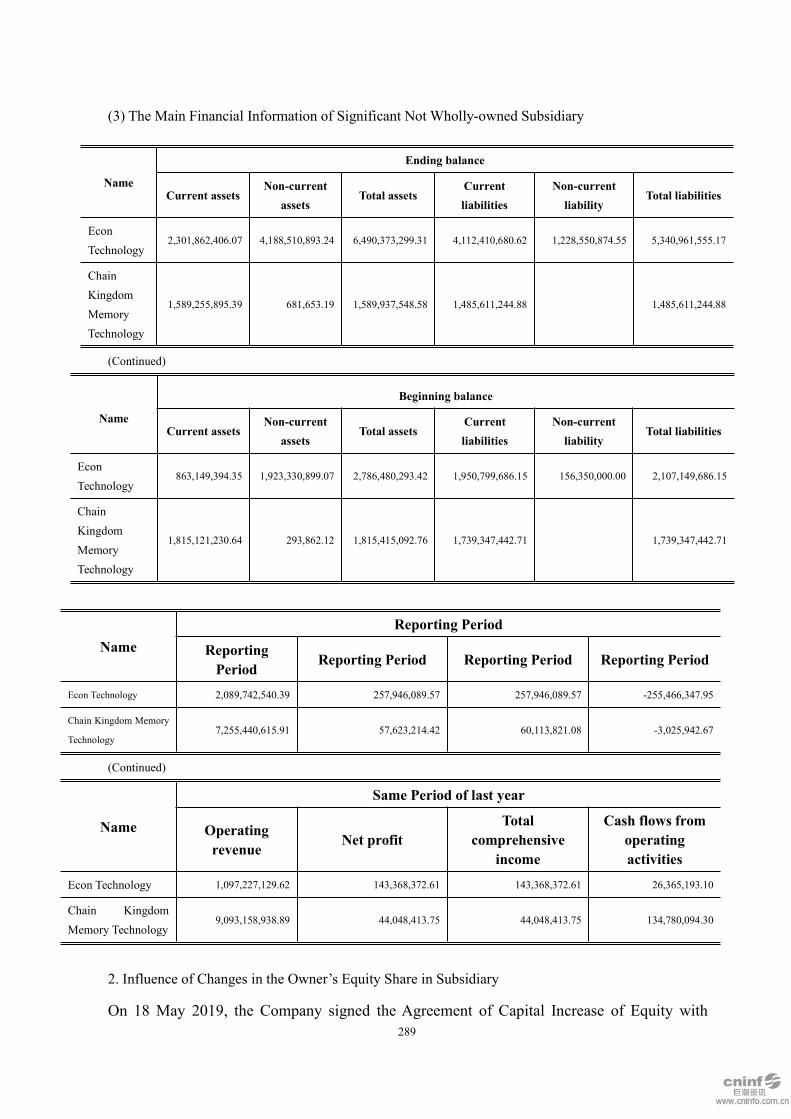
289
(3) The Main Financial Information of Significant Not Wholly-owned Subsidiary
Name
Ending balance
Current assetsNon-current
assetsTotal assets
Currentliabilities
Non-currentliability
Total liabilities
EconTechnology
2,301,862,406.07 4,188,510,893.24 6,490,373,299.31 4,112,410,680.62 1,228,550,874.55 5,340,961,555.17
ChainKingdomMemoryTechnology
1,589,255,895.39 681,653.19 1,589,937,548.58 1,485,611,244.88 1,485,611,244.88
(Continued)
Name
Beginning balance
Current assetsNon-current
assetsTotal assets
Currentliabilities
Non-currentliability
Total liabilities
EconTechnology
863,149,394.35 1,923,330,899.07 2,786,480,293.42 1,950,799,686.15 156,350,000.00 2,107,149,686.15
ChainKingdomMemoryTechnology
1,815,121,230.64 293,862.12 1,815,415,092.76 1,739,347,442.71 1,739,347,442.71
NameReporting Period
ReportingPeriod
Reporting Period Reporting Period Reporting Period
Econ Technology 2,089,742,540.39 257,946,089.57 257,946,089.57 -255,466,347.95
Chain Kingdom Memory
Technology7,255,440,615.91 57,623,214.42 60,113,821.08 -3,025,942.67
(Continued)
Name
Same Period of last year
Operatingrevenue
Net profitTotal
comprehensiveincome
Cash flows fromoperatingactivities
Econ Technology 1,097,227,129.62 143,368,372.61 143,368,372.61 26,365,193.10
Chain KingdomMemory Technology
9,093,158,938.89 44,048,413.75 44,048,413.75 134,780,094.30
2. Influence of Changes in the Owner’s Equity Share in Subsidiary
On 18 May 2019, the Company signed the Agreement of Capital Increase of Equity with

290
Alibaba, which RMB31,666,666.66 of Alibaba as consideration to subscribe the newly
increased registered capital of E2info with RMB174,070.81, and the retained capital of
RMB31,492,595.85 was accounted into capital reserve of E2info, while the Company didn’t
increase capital synchronously. After the completion of the above capital increase, the
Company’s shareholding ratio in E2info was 95.7766% and it still be controlled by the
Company and is still included in the scope of consolidation.
Item E2info
Cash 31,666,666.66
Fair value of non-monetary assets -
-
Total of disposal consideration 31,666,666.66
Less: Share of net assets accounted by percentage of stock
rights disposed
174,070.81
Difference 31,492,595.85
Of which: Adjustment of capital reserves 31,492,595.85
Adjustment of surplus reserve -
Adjustment of retained earnings -
3. Equity in Joint Ventures or Associated Enterprises
(1) Significant Joint Ventures or Associated Enterprises
NameMain
operating place
Registrationplace
Nature ofbusiness
Holdingpercentage (%)
Accounting
treatmentof the
investment to joint
Directly
Indirectly
Dongfang Konka No.1(Zhuhai) Private EquityInvestment Fund (LP)
Zhuhai ZhuhaiInvestmentmanagement
49.95 -Equitymethod

291
Binzhou Beihai WeiqiaoSolid Waste Disposal Co.,Ltd.
Binzhou Binzhou
Environmentalprotection andenvironmentalmanagement
49.00 -Equitymethod
(2) Main Financial Information of Significant Associated Enterprise
Item
Ending balance/Reporting Period
Dongfang Konka No.1 (Zhuhai)Private Equity Investment Fund
(LP)
Binzhou Beihai Weiqiao SolidWaste Disposal Co., Ltd.
Current assets 632,869,229.53 168,736,029.14
Non-current assets 182,046,220.08
Total assets 632,869,229.53 350,782,249.22
Current liabilities 44,259,288.94 72,613,343.21
Non-current liability - -
Total liabilities 44,259,288.94 72,613,343.21
Equity of non-controlling interests
Equity attributable to shareholders of the
Company as the parent588,609,940.59 278,168,906.01
Share of net assets accounted by
shareholding percentage294,010,665.32 136,302,763.94
Carrying value of equity investment to
associated enterprises294,010,665.32 136,302,763.94
Operating revenue - 291,745,561.77
Finance costs -12,631.40 420,534.06
Income tax expense 344,172.57 -
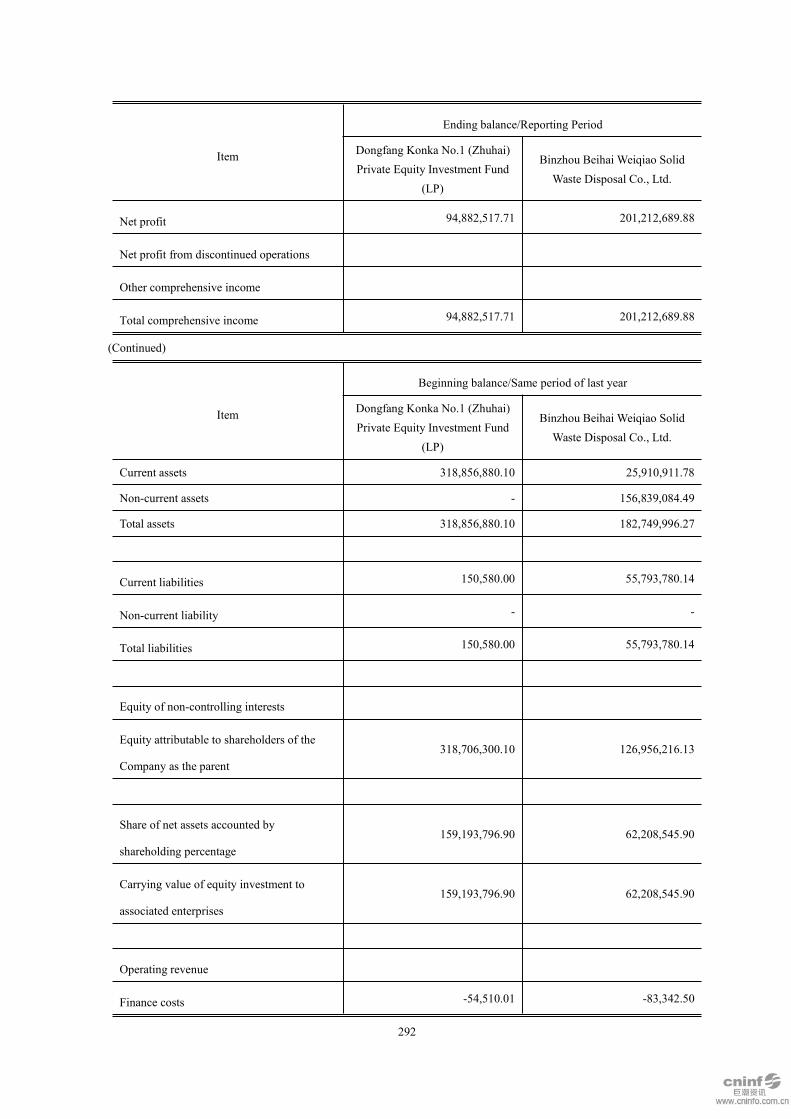
292
Item
Ending balance/Reporting Period
Dongfang Konka No.1 (Zhuhai)Private Equity Investment Fund
(LP)
Binzhou Beihai Weiqiao SolidWaste Disposal Co., Ltd.
Net profit 94,882,517.71 201,212,689.88
Net profit from discontinued operations
Other comprehensive income
Total comprehensive income 94,882,517.71 201,212,689.88
(Continued)
Item
Beginning balance/Same period of last year
Dongfang Konka No.1 (Zhuhai)Private Equity Investment Fund
(LP)
Binzhou Beihai Weiqiao SolidWaste Disposal Co., Ltd.
Current assets 318,856,880.10 25,910,911.78
Non-current assets - 156,839,084.49
Total assets 318,856,880.10 182,749,996.27
Current liabilities 150,580.00 55,793,780.14
Non-current liability - -
Total liabilities 150,580.00 55,793,780.14
Equity of non-controlling interests
Equity attributable to shareholders of the
Company as the parent318,706,300.10 126,956,216.13
Share of net assets accounted by
shareholding percentage159,193,796.90 62,208,545.90
Carrying value of equity investment to
associated enterprises159,193,796.90 62,208,545.90
Operating revenue
Finance costs -54,510.01 -83,342.50

293
Item
Beginning balance/Same period of last year
Dongfang Konka No.1 (Zhuhai)Private Equity Investment Fund
(LP)
Binzhou Beihai Weiqiao SolidWaste Disposal Co., Ltd.
Income tax expense
Net profit -1,446,259.90 -10,621,176.06
Net profit from discontinued operations
Other comprehensive income
Total comprehensive income -1,446,259.90 -10,621,176.06
(3) Summary Financial Information of Insignificant Joint Ventures or Associated Enterprises
ItemEnding
balance/ReportingPeriod
Beginningbalance/The sameperiod of last year
Associated enterprise:
Total carrying value of investment 3,249,236,533.91 901,074,598.59
The total of following items according to the shareholdingproportions
--Net profit 431,670.21 -24,999,046.40
--Other comprehensive income -335,456.79 740,697.08
--Total comprehensive income 96,213.42 -24,258,349.32
IX. The Risk Related to Financial Instruments
The Company’s main financial instruments include borrowings, accounts receivable, accounts
payable, trading financial assets and liabilities, etc. Details of the various financial instruments are
shown in the relevant notes to Annotation VI. Risks related to these financial instruments, and risk
management policies the Company has adopted to reduce these risks are described as follows. The
Company management manages and monitors the risk exposure in order to ensure the above risks to
be controlled in a limited scope.
The goals of the Company engaged in the risk management is to achieve the proper balance between
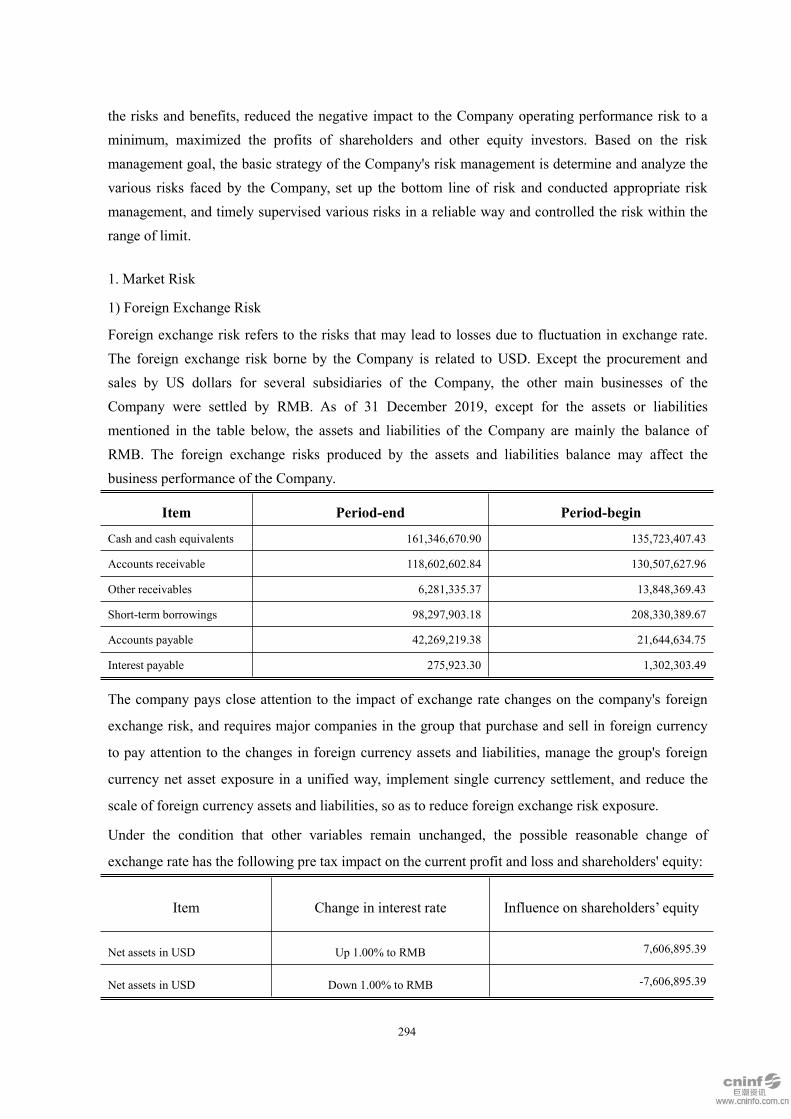
294
the risks and benefits, reduced the negative impact to the Company operating performance risk to aminimum, maximized the profits of shareholders and other equity investors. Based on the riskmanagement goal, the basic strategy of the Company's risk management is determine and analyze thevarious risks faced by the Company, set up the bottom line of risk and conducted appropriate riskmanagement, and timely supervised various risks in a reliable way and controlled the risk within therange of limit.
1. Market Risk
1) Foreign Exchange Risk
Foreign exchange risk refers to the risks that may lead to losses due to fluctuation in exchange rate.The foreign exchange risk borne by the Company is related to USD. Except the procurement andsales by US dollars for several subsidiaries of the Company, the other main businesses of theCompany were settled by RMB. As of 31 December 2019, except for the assets or liabilitiesmentioned in the table below, the assets and liabilities of the Company are mainly the balance ofRMB. The foreign exchange risks produced by the assets and liabilities balance may affect thebusiness performance of the Company.
Item Period-end Period-begin
Cash and cash equivalents 161,346,670.90 135,723,407.43
Accounts receivable 118,602,602.84 130,507,627.96
Other receivables 6,281,335.37 13,848,369.43
Short-term borrowings 98,297,903.18 208,330,389.67
Accounts payable 42,269,219.38 21,644,634.75
Interest payable 275,923.30 1,302,303.49
The company pays close attention to the impact of exchange rate changes on the company's foreign
exchange risk, and requires major companies in the group that purchase and sell in foreign currency
to pay attention to the changes in foreign currency assets and liabilities, manage the group's foreign
currency net asset exposure in a unified way, implement single currency settlement, and reduce the
scale of foreign currency assets and liabilities, so as to reduce foreign exchange risk exposure.
Under the condition that other variables remain unchanged, the possible reasonable change of
exchange rate has the following pre tax impact on the current profit and loss and shareholders' equity:
Item Change in interest rate Influence on shareholders’ equity
Net assets in USD Up 1.00% to RMB 7,606,895.39
Net assets in USD Down 1.00% to RMB -7,606,895.39

295
2) Interest Rate Risk- Cash Flow Change Risk
The company bears interest rate risk due to interest rate changes of interest bearing financial assets
and liabilities. The company's interest bearing financial assets are mainly bank deposits, of which the
variable interest rate is mostly short-term, while the interest bearing financial liabilities are mainly
bank loans and corporate bonds. On December 31, 2019, the company's long-term bank borrowings
and corporate bonds are fixed interest rates. Therefore, it is considered that the risk caused by the
change of interest rate is mainly related to the short-term bank borrowings. On December 31, 2019,
the balance of such short-term borrowings is 10332687239.63 yuan. On December 31, 2019, if the
interest rate of short-term borrowings of such scale rises or falls by 50 basis points while other factors
remain unchanged, the group's net profit will decrease or increase by about 51663436.20 yuan. On
December 31, 2019, the company's bank borrowings are fixed interest rates, so any change in interest
rates is not considered to have a significant impact on the company's performance.
2. Credit Risk
Credit risk refers to the risk of financial loss incurred by the group due to the failure of customers or
counterparties of financial instruments to fulfill their contractual responsibilities. The relevant risks
mainly come from bank balances, receivables and other receivables, as well as financial instruments.
The company's working capital is deposited in banks with high credit rating, so the credit risk of
working capital is low.
For financial instruments measured at fair value, the book value reflects their risk exposure, but not
the maximum risk exposure, and the maximum risk exposure will change with the change of future
fair value.
In order to reduce credit risk, the company has set up a group to determine the credit limit, conduct
credit approval, and implement other monitoring procedures to ensure that necessary measures are
taken to recover overdue claims. In addition, the company reviews the recovery of each single
receivable on each balance sheet date to ensure that sufficient bad debt provision is made for the
unrecoverable amount. Therefore, the company's management believes that the company's credit risk
has been greatly reduced.
(1) At the end of the period, there are no overdue financial assets that have not been impaired.
(2) See note VI, 4, accounts receivable and note VI, 7, other receivables for details of financial assets
with single impairment
3. Liquidity RiskIn terms of management of liquidity risk, the company monitors and maintains the cash and cashequivalents at a level deemed sufficient by the management to provide funds for the company's

296
operation and mitigate the impact of short-term fluctuations in cash flow. The financial department ofthe company is responsible for balancing the continuity and flexibility of funds through the use ofbank credit to meet the needs of the company's working capital.In order to mitigate the liquidity risk, the management of the company has carried out a detailedinspection on the liquidity of the company, including the maturity of accounts payable and otherpayables, bank credit line and bond financing. The conclusion is that the company has sufficientfunds to meet the needs of the group's short-term debt and capital expenditure.
X.The Disclosure of Fair Value
1. Ending Fair Value of Assets and Liabilities at Fair Value
Item
Ending fair value
Fair valuemeasurementitems at level 1
Fair valuemeasurementitems at level 2
Fair valuemeasurementitems at level 3
Total
I. Consistent fair value measurement — — — —
(I) Trading financial assets 61,494,666.97 61,494,666.97
1. Financial assets at fair value throughprofit or loss
61,494,666.97 61,494,666.97
(1) Debt instrument investment
(2) Equity instrument investment 61,494,666.97 61,494,666.97
(3) Derivative financial assets
(4) Other
(II) Accounts receivable financing 143,174,271.82 143,174,271.82
(III) Investment in other debtobligations
(IV) Other equity instrumentinvestment
21,642,170.36 21,642,170.36
(V) Other non-current financial assets 1,753,121,727.83 1,753,121,727.83
Total assets of consistent fair valuemeasurement
204,668,938.79 1,774,763,898.19 1,979,432,836.98
9Total liabilities of consistent fair valuemeasurement(II) Inconsistent fair valuemeasurement
- - - -
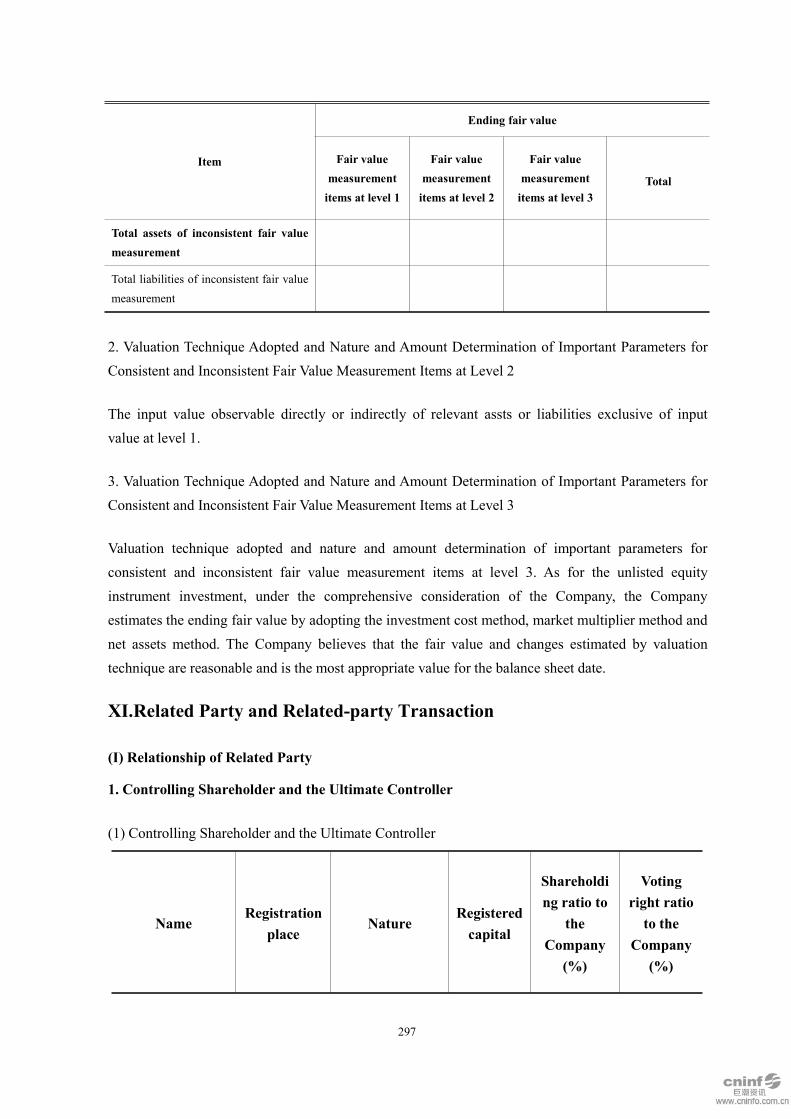
297
Item
Ending fair value
Fair valuemeasurementitems at level 1
Fair valuemeasurementitems at level 2
Fair valuemeasurementitems at level 3
Total
Total assets of inconsistent fair valuemeasurement
Total liabilities of inconsistent fair valuemeasurement
2. Valuation Technique Adopted and Nature and Amount Determination of Important Parameters forConsistent and Inconsistent Fair Value Measurement Items at Level 2
The input value observable directly or indirectly of relevant assts or liabilities exclusive of inputvalue at level 1.
3. Valuation Technique Adopted and Nature and Amount Determination of Important Parameters forConsistent and Inconsistent Fair Value Measurement Items at Level 3
Valuation technique adopted and nature and amount determination of important parameters forconsistent and inconsistent fair value measurement items at level 3. As for the unlisted equityinstrument investment, under the comprehensive consideration of the Company, the Companyestimates the ending fair value by adopting the investment cost method, market multiplier method andnet assets method. The Company believes that the fair value and changes estimated by valuationtechnique are reasonable and is the most appropriate value for the balance sheet date.
XI.Related Party and Related-party Transaction
(I) Relationship of Related Party
1. Controlling Shareholder and the Ultimate Controller
(1) Controlling Shareholder and the Ultimate Controller
NameRegistration
placeNature
Registeredcapital
Shareholding ratio to
theCompany
(%)
Votingright ratioto the
Company(%)

298
NameRegistration
placeNature
Registeredcapital
Shareholding ratio to
theCompany
(%)
Votingright ratioto the
Company(%)
OCT Group Co., Ltd. ShenzhenTourism, real estate,electronics industry
RMB12billion
29.999997 29.999997
The ultimate controller of the Company is State-owned Assets Supervisor Commission of the StateCouncil.
2. Subsidiary
Refer to note VIII-1(1) Subsidiaries for the information of subsidiaries.
3. Associated Enterprises and Joint Ventures
Refer to Note VIII-3. (1) Significant Associated Enterprises for details of significant associatedenterprises of the Company. Information on other joint ventures or associated enterprises occurringconnected transactions with the Company in Reporting Period, or forming balance due to connectedtransactions made in previous period:
Name Relationship with the Company
Shenzhen Yaode Technology Co., Ltd. Associated enterprise
Shenzhen Jielunte Technology Co., Ltd. Associated enterprise
Shenzhen Konka E-display Commercial Display Co.,Ltd.
Associated enterprise
Shenzhen Konka Information Network Co., Ltd. Associated enterprise
Kunshan Konka Electronics Co. Ltd. Associated enterprise
Anhui Kaikai Sihjie E-commerce Co., Ltd. Associated enterprise
Puchuang Jiakang Technology Co, Ltd. Associated enterprise
Feidi Technology (Shenzhen) Co., Ltd. Associated enterprise
Shenzhen Xiaorui Technology Co., Ltd Associated enterprise
Shandong Konka Smart Electrical Appliance Co., Ltd. Associated enterprise
Henan Konka Smart Electrical Appliance Co., Ltd. Associated enterpriseHeilongjiang Longkang Smart Electrical Appliance Co.,Ltd.
Associated enterprise
4. Information on Other Related Parties
Name Relationship with the Company
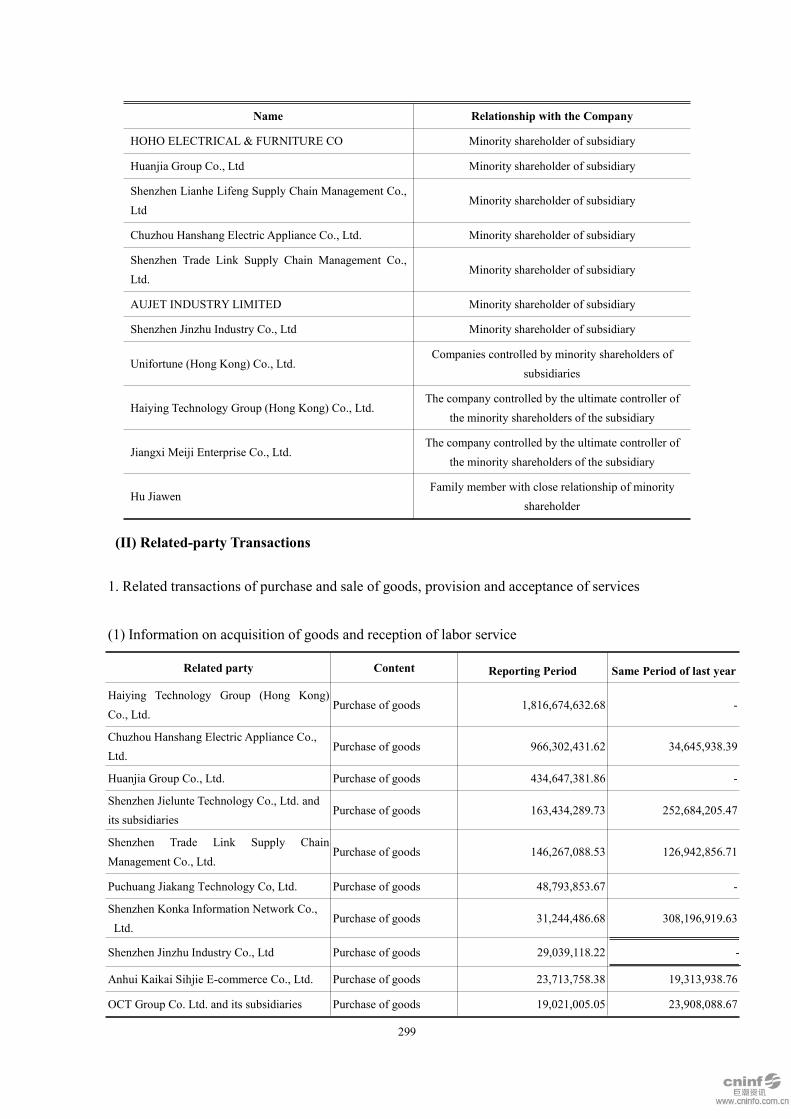
299
Name Relationship with the Company
HOHO ELECTRICAL & FURNITURE CO Minority shareholder of subsidiary
Huanjia Group Co., Ltd Minority shareholder of subsidiary
Shenzhen Lianhe Lifeng Supply Chain Management Co.,Ltd
Minority shareholder of subsidiary
Chuzhou Hanshang Electric Appliance Co., Ltd. Minority shareholder of subsidiary
Shenzhen Trade Link Supply Chain Management Co.,Ltd.
Minority shareholder of subsidiary
AUJET INDUSTRY LIMITED Minority shareholder of subsidiary
Shenzhen Jinzhu Industry Co., Ltd Minority shareholder of subsidiary
Unifortune (Hong Kong) Co., Ltd.Companies controlled by minority shareholders of
subsidiaries
Haiying Technology Group (Hong Kong) Co., Ltd.The company controlled by the ultimate controller of
the minority shareholders of the subsidiary
Jiangxi Meiji Enterprise Co., Ltd.The company controlled by the ultimate controller of
the minority shareholders of the subsidiary
Hu JiawenFamily member with close relationship of minority
shareholder
(II) Related-party Transactions
1. Related transactions of purchase and sale of goods, provision and acceptance of services
(1) Information on acquisition of goods and reception of labor service
Related party Content Reporting Period Same Period of last year
Haiying Technology Group (Hong Kong)Co., Ltd.
Purchase of goods 1,816,674,632.68 -
Chuzhou Hanshang Electric Appliance Co.,Ltd.
Purchase of goods 966,302,431.62 34,645,938.39
Huanjia Group Co., Ltd. Purchase of goods 434,647,381.86 -
Shenzhen Jielunte Technology Co., Ltd. andits subsidiaries
Purchase of goods 163,434,289.73 252,684,205.47
Shenzhen Trade Link Supply ChainManagement Co., Ltd.
Purchase of goods 146,267,088.53 126,942,856.71
Puchuang Jiakang Technology Co, Ltd. Purchase of goods 48,793,853.67 -
Shenzhen Konka Information Network Co.,Ltd.
Purchase of goods 31,244,486.68 308,196,919.63
Shenzhen Jinzhu Industry Co., Ltd Purchase of goods 29,039,118.22 -
Anhui Kaikai Sihjie E-commerce Co., Ltd. Purchase of goods 23,713,758.38 19,313,938.76
OCT Group Co. Ltd. and its subsidiaries Purchase of goods 19,021,005.05 23,908,088.67
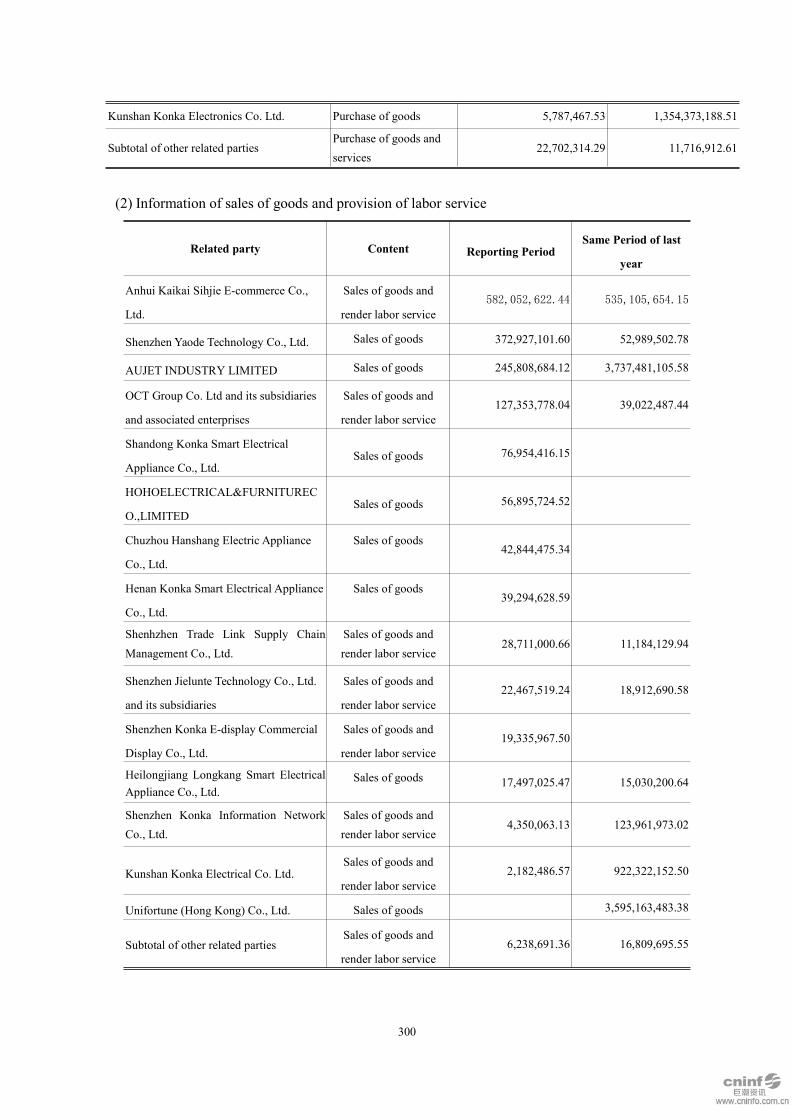
300
Kunshan Konka Electronics Co. Ltd. Purchase of goods 5,787,467.53 1,354,373,188.51
Subtotal of other related partiesPurchase of goods andservices
22,702,314.29 11,716,912.61
(2) Information of sales of goods and provision of labor service
Related party Content Reporting PeriodSame Period of last
year
Anhui Kaikai Sihjie E-commerce Co.,
Ltd.
Sales of goods and
render labor service582,052,622.44 535,105,654.15
Shenzhen Yaode Technology Co., Ltd. Sales of goods 372,927,101.60 52,989,502.78
AUJET INDUSTRY LIMITED Sales of goods 245,808,684.12 3,737,481,105.58
OCT Group Co. Ltd and its subsidiaries
and associated enterprises
Sales of goods and
render labor service127,353,778.04 39,022,487.44
Shandong Konka Smart Electrical
Appliance Co., Ltd.Sales of goods 76,954,416.15
HOHOELECTRICAL&FURNITUREC
O.,LIMITEDSales of goods 56,895,724.52
Chuzhou Hanshang Electric Appliance
Co., Ltd.
Sales of goods42,844,475.34
Henan Konka Smart Electrical Appliance
Co., Ltd.
Sales of goods39,294,628.59
Shenhzhen Trade Link Supply ChainManagement Co., Ltd.
Sales of goods andrender labor service
28,711,000.66 11,184,129.94
Shenzhen Jielunte Technology Co., Ltd.
and its subsidiaries
Sales of goods and
render labor service22,467,519.24 18,912,690.58
Shenzhen Konka E-display Commercial
Display Co., Ltd.
Sales of goods and
render labor service19,335,967.50
Heilongjiang Longkang Smart ElectricalAppliance Co., Ltd.
Sales of goods 17,497,025.47 15,030,200.64
Shenzhen Konka Information NetworkCo., Ltd.
Sales of goods andrender labor service
4,350,063.13 123,961,973.02
Kunshan Konka Electrical Co. Ltd.Sales of goods and
render labor service2,182,486.57 922,322,152.50
Unifortune (Hong Kong) Co., Ltd. Sales of goods 3,595,163,483.38
Subtotal of other related partiesSales of goods and
render labor service6,238,691.36 16,809,695.55

301
2. Information on Related-party Lease
Leasee Category
The lease feeconfirmed in
theReporting
The lease feeconfirmed in thesame period of
last yearOCT Group Co. Ltd. And itssubsidiaries
Commercialresidential buildingsand office buildings
1,640,143.78 1,541,573.44
3. Information on Related-party Guarantee
(1) The Company was guarantor
Secured partyGuarantee amount(RMB’0,000)
Currency
Start date End dateExecutionaccomplished or not
Anhui Tongchuang 3,200.00 CNY 2019-8-1 2020-8-1 Not
Anhui Tongchuang 5,000.00 CNY 2019-11-7 2020-10-9 Not
Anhui Tongchuang 3,330.00 CNY 2019-12-25 2020-12-25 Not
Anhui Tongchuang 2,964.50 CNY 2019-1-23 2020-1-23 Not
Anhui Tongchuang 2,376.00 CNY 2019-6-24 2020-6-24 Not
Anhui Tongchuang 1,200.00 CNY 2019-11-5 2020-11-4 Not
Anhui Konka 10,000.00 CNY 2018-12-6 2020-6-2 Not
Anhui Konka 21,788.00 CNY 2019-7-31 2020-7-31 Not
Anhui Konka 8,000.00 CNY 2019-8-19 2020-7-29 Not
Hong Kong Konka 2,300.00 USD 2019-3-13 2020-3-13 Not
Hong Kong Konka 1,500.00 USD 2019-8-7 2020-8-7 Not
Hong Kong Konka 1,350.00 USD 2019-7-18 2020-8-3 Not
Hong Kong Konka 1,345.00 USD 2019-11-15 2020-12-5 Not
Boluo Konka Precision 1,674.75 CNY 2019-2-20 2021-2-20 Not
Sichuan Konka 4,000.00 CNY 2019-3-18 2022-3-17 Not
Sichuan Konka 10,000.00 CNY 2018-5-28 2025-5-24 Not
Electronics Technology 39,863.95 CNY 2019-4-18 2020-4-18 Not

302
Secured partyGuarantee amount(RMB’0,000)
Currency
Start date End dateExecutionaccomplished or not
Electronics Technology 3,954.13 CNY 2019-6-20 2020-5-17 Not
Dongguan Konka 2,000.00 CNY 2019-11-8 2024-11-10 Not
Anhui Electrical Appliance 13,000.00 CNY 2019-2-2 2024-2-2 Not
XingDa HongYe 5,800.00 CNY 2018-11-21 2020-11-21 Not
XingDa HongYe 4,000.00 CNY 2019-4-19 2020-4-18 Not
XingDa HongYe 1,000.00 CNY 2019-5-20 2020-5-19 Not
XingDa HongYe 2,500.00 CNY 2019-12-9 2022-6-9 Not
XingDa HongYe 950.00 CNY 2018-11-13 2020/11/13 Not
Econ Technology 2,000.00 CNY 2019-4-23 2020-4-22 Not
Econ Technology 5,000.00 CNY 2019-5-13 2020-5-12 Not
Econ Technology 3,000.00 CNY 2019-6-5 2020-6-5 Not
Econ Technology 3,000.00 CNY 2019-10-28 2020-10-27 Not
Yibin OCT Sanjiang Properties Co.,Ltd.
58.00 CNY 2019-9-29 2022-9-28 Not
Jiangxi Konka 10,000.00 CNY 2018-12-4 2020-12-23 Not
Jiangxi Konka 5,000.00 CNY 2018-12-7 2020-4-17 Not
Jiangxi Konka 5,000.00 CNY 2018-12-7 2020-12-4 Not
Jiangxi Konka 11,900.00 CNY 2019-3-18 2021-9-18 Not
Jiangxi Konka 10,000.00 CNY 2019-2-28 2020-2-28 Not
Jiangxi Konka 5,000.00 CNY 2019-6-27 2020-6-24 Not
Jiangxi Konka 6,500.00 CNY 2019-10-30 2022-10-30 Not
Jiangxi Konka 5,500.00 CNY 2019-6-26 2022-6-25 Not
Rusha Yike 13,396.00 CNY 2016-12-29 2026-12-28 Not
Nano Crystallized Glass 10,000.00 CNY 2019-6-26 2022-6-25 Not
Nano Crystallized Glass 5,000.00 CNY 2019-12-20 2022-12-20 Not
Xinfeng Microcrystalline 6,000.00 CNY 2019-6-19 2020-6-18 Not
Pengrun Technology 1,500.00 CNY 2019-8-21 2020-8-20 Not
(2) The Company was secured party
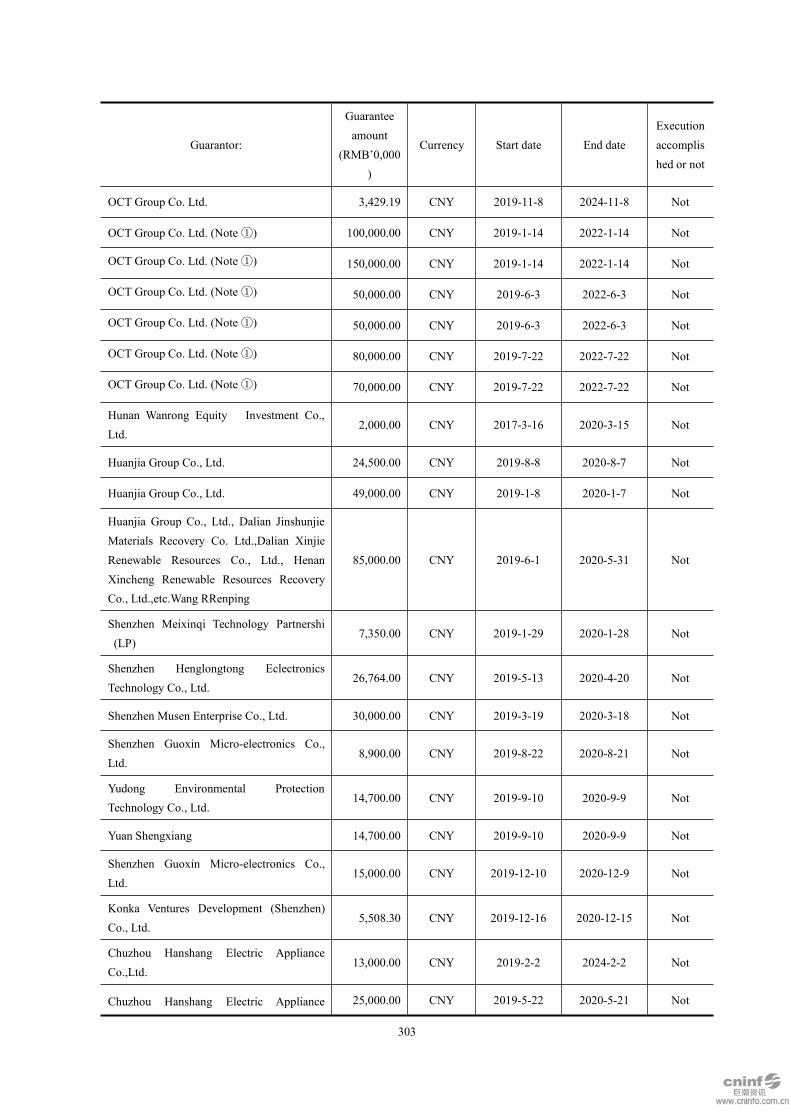
303
Guarantor:
Guaranteeamount
(RMB’0,000)
Currency Start date End dateExecutionaccomplished or not
OCT Group Co. Ltd. 3,429.19 CNY 2019-11-8 2024-11-8 Not
OCT Group Co. Ltd. (Note①) 100,000.00 CNY 2019-1-14 2022-1-14 Not
OCT Group Co. Ltd. (Note①) 150,000.00 CNY 2019-1-14 2022-1-14 Not
OCT Group Co. Ltd. (Note①) 50,000.00 CNY 2019-6-3 2022-6-3 Not
OCT Group Co. Ltd. (Note①) 50,000.00 CNY 2019-6-3 2022-6-3 Not
OCT Group Co. Ltd. (Note①) 80,000.00 CNY 2019-7-22 2022-7-22 Not
OCT Group Co. Ltd. (Note①) 70,000.00 CNY 2019-7-22 2022-7-22 Not
Hunan Wanrong Equity Investment Co.,Ltd.
2,000.00 CNY 2017-3-16 2020-3-15 Not
Huanjia Group Co., Ltd. 24,500.00 CNY 2019-8-8 2020-8-7 Not
Huanjia Group Co., Ltd. 49,000.00 CNY 2019-1-8 2020-1-7 Not
Huanjia Group Co., Ltd., Dalian JinshunjieMaterials Recovery Co. Ltd.,Dalian XinjieRenewable Resources Co., Ltd., HenanXincheng Renewable Resources RecoveryCo., Ltd.,etc.Wang RRenping
85,000.00 CNY 2019-6-1 2020-5-31 Not
Shenzhen Meixinqi Technology Partnershi(LP)
7,350.00 CNY 2019-1-29 2020-1-28 Not
Shenzhen Henglongtong EclectronicsTechnology Co., Ltd.
26,764.00 CNY 2019-5-13 2020-4-20 Not
Shenzhen Musen Enterprise Co., Ltd. 30,000.00 CNY 2019-3-19 2020-3-18 Not
Shenzhen Guoxin Micro-electronics Co.,Ltd.
8,900.00 CNY 2019-8-22 2020-8-21 Not
Yudong Environmental ProtectionTechnology Co., Ltd.
14,700.00 CNY 2019-9-10 2020-9-9 Not
Yuan Shengxiang 14,700.00 CNY 2019-9-10 2020-9-9 Not
Shenzhen Guoxin Micro-electronics Co.,Ltd.
15,000.00 CNY 2019-12-10 2020-12-9 Not
Konka Ventures Development (Shenzhen)Co., Ltd.
5,508.30 CNY 2019-12-16 2020-12-15 Not
Chuzhou Hanshang Electric ApplianceCo.,Ltd.
13,000.00 CNY 2019-2-2 2024-2-2 Not
Chuzhou Hanshang Electric Appliance 25,000.00 CNY 2019-5-22 2020-5-21 Not

304
Guarantor:
Guaranteeamount
(RMB’0,000)
Currency Start date End dateExecutionaccomplished or not
Co.,Ltd.
Guizhou Huajinrun Technology Co. Ltd. 26,764.00 CNY 2019-5-13 2020-4-20 Not
Chuzhou State-owned Assets ManagementCo. Ltd.
2,200.00 CNY 2019-12-2 2020-6-2 Not
Yantai Baijiangyuan Business ManagementCenter (LP)
15,697.17 CNY 2019-4-23 2020-12-19 Not
Yantai Fengqingtai Investment Center (LP) 6,980.55 CNY 2019-4-23 2020-12-19 Not
Yantai Qingjiangchuan BusinessManagement Center (LP)
446.08 CNY 2019-4-23 2020-12-19 Not
Yantai Qingrunyuan Business ManagementCenter (LP)
6,413.89 CNY 2019-4-23 2020-12-19 Not
Chuzhou State-owned Assets ManagementCo., Ltd.
2,200.00 CNY 2019-12-2 2020-6-2 Not
Hu Zehong 9,467.38 CNY 2018-7-1 2021-6-30 Not
Hu Zehong 129.38 CNY 2018-7-1 2021-6-30 Not
Li Chunsehng 129.38 CNY 2018-7-1 2021-6-30 Not
Dai Yaojin 129.38 CNY 2018-7-1 2021-6-30 Not
Liang RuIling 129.38 CNY 2018-7-1 2021-6-30 Not
Hu Zehong 2,450.00 CNY 2019-4-22 2020-4-21 Not
Hu Zehong 1,470.00 CNY 2019-11-8 2020-11-7 Not
Hu Zehong 465.20 CNY 2018-11-13 2020-11-13 Not
Hu Zehong 1,225.00 CNY 2019-12-9 2022-6-9 Not
Jiangxi Xinzixin Real Estate Co., Ltd. 2,940.00 CNY 2019-6-19 2020-6-18 Not
Jiangxi Xinzixin Real Estate Co., Ltd. 2,450.00 CNY 2019-6-27 2020-6-24 Not
Jiangxi Xinzixin Real Estate Co., Ltd. 5,860.69 CNY 2019-3-18 2021-9-18 Not
Jiangxi Xinzixin Real Estate Co., Ltd. 4,900.00 CNY 2019-2-28 2020-2-28 Not
Jiangxi Xinzixin Real Estate Co., Ltd. 5,880.00 CNY 2019-8-27 2022-10-30 Not
Zhu Xinming 19,600.00 CNY 2019-10-15 2020-10-14 Not
Zhu Xinming 4,900.00 CNY 2018-12-4 2020-12-23 Not

305
Guarantor:
Guaranteeamount
(RMB’0,000)
Currency Start date End dateExecutionaccomplished or not
Zhu Xinming 4,900.00 CNY 2018-12-7 2020-12-5 Not
Zhu Xinming 2,450.00 CNY 2019-12-20 2022-12-20 Not
4,900.00 CNY 2018-12-4 2020-12-23
Jiangxi Xinzixin Real Estate Co., Ltd. 4,900.00 CNY 2018-12-7 2020-12-5 Not
Jiangxi Xinzixin Real Estate Co., Ltd. 2,450.00 CNY 2019-12-20 2022-12-20 Not
Jiangxi Xinzixin Real Estate Co., Ltd. 4,900.00 CNY 2019-7-7 2020-7-1
Jiangxi Xinzixin Real Estate Co., Ltd.,ZhuQingming, Xiong Muzhi, ZengXiaohong, Zhu Chengfu
7,350.00 USD 2018-5-17 2020-10-31 Not
AUJET INDUSTRY LIMITED 4,900.00 USD 2018-9-27 2020-10-31 Not
Shenzhen Trade Link Supply ChainManagement Co. Ltd.
15,000.00 USD 2018-8-21 2022-12-31 Not
Wu Guoren and Xiao Yongsong 3,000.00 USD 2019-1-1 2022-12-31 Not
Wu Guoren and Xiao Yongsong 1,715.00 USD 2018-1-1 2022-4-20 Not
Guizhou Huajinrun Technology Co. Ltd. 2,940.00 USD 2018-1-1 2023-6-30 Not
Shenzhen Unifortune Supply ChainManagement Co., Ltd.
1,470.00 USD 2018-9-19 2023-6-30 Not
Shenzhen Unifortune Supply ChainManagement Co., Ltd.
15,000.00 CNY 2019-9-26 2020-9-25 Not
Electronics Technology 50,000.00 CNY 2019-9-27 2020-9-26 Not
Electronics Technology 50,000.00 CNY 2019-9-27 2020-9-26 Not
Note: ① The Company has issued private corporate bonds with face value of RMB5,000,000,000.00,
and the principle and interest of the above bonds were joint liability provided by OCT Group Co.,
Ltd.
Note: The Company was provided with counter guarantee regarding entrusted loans from the
Company to controlled subsidiaries by minority shareholders of aforesaid controlled subsidiaries.
4. Borrowings of Funds
NameAmount
(RMB’0,000)Start date Due date Duration Interest

306
Borrowing
OCT Group Co. Ltd. 150,000.00 2019-10-25 2022-10-23 2019-10-25至 2022-10-23 4.06%
OCT Group Co. Ltd. 93,406.00 2019-11-13 2022-11-6 2019-11-13至 2022-11-6 4.14%
OCT Group Co. Ltd. 90,000.00 2019-12-11 2022-12-9 2019-12-11至 2022-12-9 3.93%
Shenzhen RenjianhuahaiEnvironmental Protection TourTechnology Development Co., Ltd.
27,979.00 2019-11-25 2020-11-24 2019-11-25至 2020-11-24 8.00%
Chuzhou Hanshang ElectricAppliance Co., Ltd.
4,025.00 2019-10-17 2020-10-16 2019-10-17至 2020-10-16 7.00%
Chuzhou Hanshang ElectricAppliance Co., Ltd.
3,000.00 2019-2-20 2020-2-19 2019-2-20至 2020-2-19 7.00%
Chuzhou Hanshang ElectricAppliance Co., Ltd.
1,000.00 2019-8-15 2020-8-14 2019-8-15至 2020-8-14 7.00%
Lending
Haimen Kangjian TechnologyIndustrial Park Operation andManagement Co. Ltd.
17,850.00 2019-8-30 2020-8-29 2019-8-30至 2020-8-29 8.00%
Haimen Kangjian TechnologyIndustrial Park Operation andManagement Co. Ltd.
1,610.00 2019-9-29 2020-8-29 2019-8-30至 2020-8-29 8.00%
Haimen Kangjian TechnologyIndustrial Park Operation andManagement Co. Ltd.
540.00 2019-12-2 2020-8-29 2019-12-2至 2020-8-29 8.00%
Haimen Kangjian TechnologyIndustrial Park Operation andManagement Co. Ltd.
18,200.00 2019-12-2 2020-8-29 2019-12-2至 2020-8-29 8.00%
Haimen Kangjian TechnologyIndustrial Park Operation andManagement Co. Ltd.
4,900.00 2019-12-3 2020-6-2 2019-12-3至 2020-6-2 8.00%
Haimen Kangjian TechnologyIndustrial Park Operation andManagement Co. Ltd.
1,000.00 2019-10-1 2020-8-29 2019-10-1至 2020-8-29 8.00%
Yantai Kangyue Investment Co. Ltd. 12,852.70 2019-12/16 2020/12/15 2019-12-16至 2020-12-15 8.00%
Chongqing Qingjia Electronic Co.,Ltd.
890.00 2018-4-12 2020-4-12 2018-4-12至 2020-4-12 8.00%
Chuzhou Kangjin Health Industry 5,880.00 2019-9-25 2020-3-15 2019-9-25至 2020-3-15 7.00%
Nanjing Kangxing TechnologyIndustrial Park Operation andManagement Co. Ltd.
14,493.00 2019-10-21 2020-10-21 2018-10-22至 2020-4-21 8.00%
Nanjing Kangxing TechnologyIndustrial Park Operation and
41,600.00 2019-5-20 2020-4-21 2018-10-22至 2020-4-21 8.00%

307
NameAmount
(RMB’0,000)Start date Due date Duration Interest
Borrowing
Management Co. Ltd.
Yibin OCT Sanjiang Properties CoLtd.
6,000.00 2018-10-25 2020-4-24 2018-10-25至 2020-4-24 5.70%
Yibin OCT Sanjiang Properties CoLtd.
4,000.00 2018-10-25 2021-10-24 2018-10-25至 2021-10-24 5.70%
Hunan Wanrong Technology Co. Ltd. 2,000.00 2017-3-16 2020-3-15 2017-3-16至 2020-3-15 11.00%
Note: The interest expenses generated by the borrowing funds from the above-mentioned related
parties are respectively: 219204406.33 yuan from overseas Chinese City Group Co., Ltd., 894117.77
yuan from Shenzhen Renjian Huahai eco technology tourism development Co., Ltd. and 5497012.52
yuan from Chuzhou hanshang Electric Appliance Co., Ltd.; the interest income or investment income
generated by the borrowing funds from the above-mentioned related parties are respectively: 1244
yuan from Chongqing Qingjia Electronic Co., Ltd, 022.19 yuan, Nanjing Kangxing Technology
Industrial Park Operation Management Co., Ltd. 92177204.40 yuan, Yibin overseas Chinese town
Sanjiang Real Estate Co., Ltd. 5779166.67 yuan and Hunan Wanrong Technology Co., Ltd.
2108888.86 yuan.
5. Assets Transfer and Debt Restructuring of Related Party
Equity transfer Proportion Time Acquiree Price
Chuzhou TID 51.00% 2019-6-21
Shenzhen OCTCapital InvestmentManagement Co.,
Ltd.
63,520,500.00
CChuzhou Kangjin 51.00% 2019-9-25
Shanghai OCTCapital InvestmentDevelopment Co.,
Ltd.
122,254,344.00
SShenzhen OCT LIFE 33.00% 2019-3-21
Shenzhen OCTProperty CommerceDevelopment Co.,
Ltd.
4,538,210.00
6. Information on Remuneration for Key Management Personnel
ItemReporting Period (RMB’0,000) Same Period of last year
(RMB’0,000)

308
ItemReporting Period (RMB’0,000) Same Period of last year
(RMB’0,000)
Total remuneration 2,872.87 2,132.92
(III) Intercourse Balance of Related Party
1. Accounts Receivable
Item
Related party Ending balance
Carrying amountBad debtprovision
Carrying amount Bad debt provision
Accounts receivable:
Shenzhen YaodeTechnology Co., Ltd.
119,160,752.64 2,426,038.42 38,691,654.09 773,833.08
HOHO ELECTRICAL &FURNITURE CO
112,180,062.15 2,277,255.26
Shenzhen JielunteTechnology Co., Ltd. andits subsidiaries
75,330,999.32 1,645,079.86 13,445,059.89 268,901.19
Shenzhen KonkaE-display CommercialDisplay Co., Ltd.
63,110,212.25 1,281,137.31
Shenzhen KonkaInformation NetworkCo., Ltd.
38,384,430.47 1,536,141.16 35,556,676.56 711,133.53
OCT Group Co. Ltd. Andits subsidiaries
21,207,204.72 430,506.25 13,413,924.15 502,591.00
Anhui Kaikai ShijieE-commerce Co., Ltd.
19,822,544.45 402,397.65 144,976,103.92 2,899,522.08
Kunshan KonkaElectronics Co., Ltd.
235,078.99 4,772.10 25,051,883.94 501,037.68
Subtotal of other relatedparties
13,829,893.57 1,940,210.75 12,547,196.74 433,850.67
Total 463,261,178.56 11,943,538.76 283,682,499.29 6,090,869.23
Notes receivable:
Anhui Kaikai ShijieE-commerce Co., Ltd.
37,000,000.00 240,100,000.00
Subtotal of other relatedparties
6,739,171.02
Total 43,739,171.02 240,100,000.00
Other receivables:

309
Item
Related party Ending balance
Carrying amountBad debtprovision
Carrying amount Bad debt provision
Jiangxi Meiji EnterpriseCo., Ltd.
93,612,640.31 2,068,839.35 74,788,640.31 1,495,772.81
Equity transfer of DaiRongxing and otherintercourse funds
85,104,483.48 4,161,412.98 81,450,139.05 2,309,283.85
OCT Group Co., Ltd. andits subsidiaries,
29,609,699.81 8,794,143.64 21,310,694.38 8,717,383.79
Huanjia Group Co., Ltd. 23,065,103.20 4,613,020.64
Equity transfer of HuJiawen and otherintercourse funds
251,625.20 12,300.31 240,692.62 4,813.85
Subtotal of other relatedparties
84,194.95 6,951.75 9,437,581.32 192,866.67
Total 231,727,746.95 19,656,668.67 187,227,747.68 12,720,120.97
Prepayment:
Haiying TechnologyGroup (Hong Kong) Co.,
439,434,346.00
Shenzhen KonkaInformation Network Co.,
40,983,577.99 4,341,793.16
Puchuang JiakangTechnology Co, Ltd.
39,920,926.00
Shenzhen UnifortuneSupply Chain
28,623,157.08 28,623,157.08
Shenzhen JielunteTechnology Co., Ltd. and
13,763,739.19 29,647,649.73
Chuzhou HanshangElectric Appliance Co.,Ltd.
24,076,497.42
Other related parties 883,108.32 1,140,698.44
Total 563,608,854.58 87,829,795.83
Long-term receivables:
Feidi Technology(Shenzhen) Co., Ltd.
69,808,144.01 43,476,841.21
Other related parties 7,295,892.00 14,086,876.64
Total 77,104,036.01 57,563,717.85
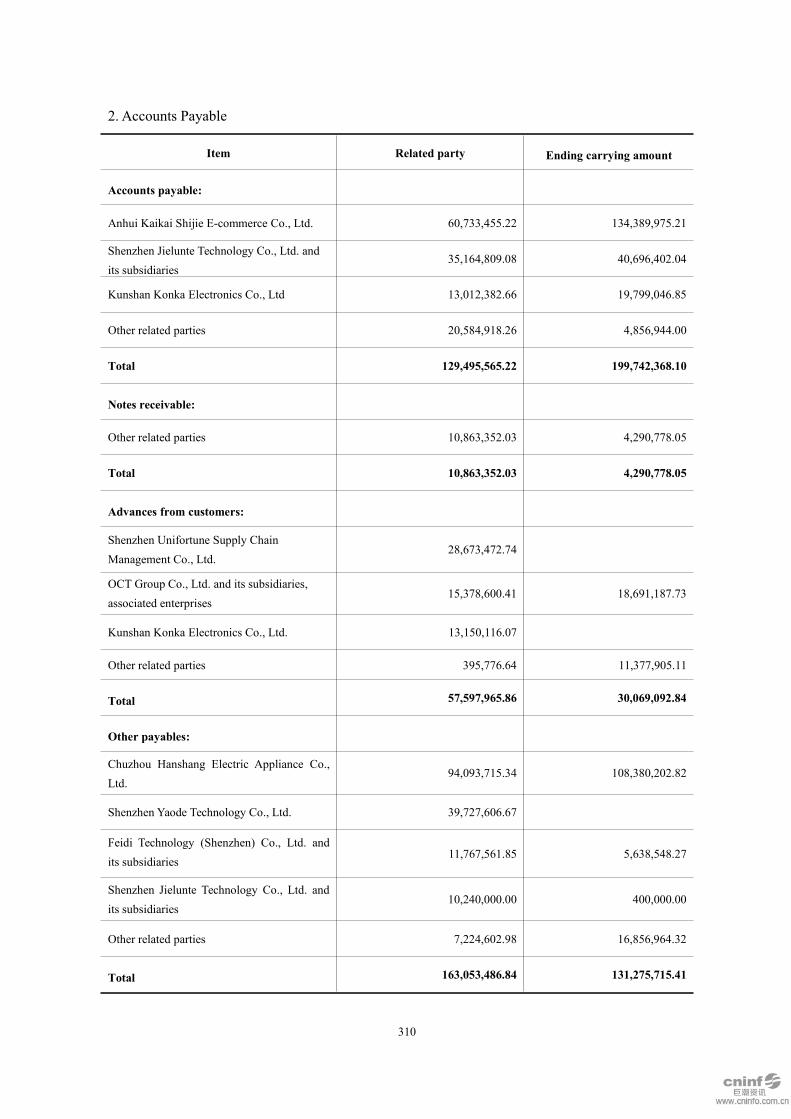
310
2. Accounts Payable
Item Related party Ending carrying amount
Accounts payable:
Anhui Kaikai Shijie E-commerce Co., Ltd. 60,733,455.22 134,389,975.21
Shenzhen Jielunte Technology Co., Ltd. andits subsidiaries
35,164,809.08 40,696,402.04
Kunshan Konka Electronics Co., Ltd 13,012,382.66 19,799,046.85
Other related parties 20,584,918.26 4,856,944.00
Total 129,495,565.22 199,742,368.10
Notes receivable:
Other related parties 10,863,352.03 4,290,778.05
Total 10,863,352.03 4,290,778.05
Advances from customers:
Shenzhen Unifortune Supply ChainManagement Co., Ltd.
28,673,472.74
OCT Group Co., Ltd. and its subsidiaries,associated enterprises
15,378,600.41 18,691,187.73
Kunshan Konka Electronics Co., Ltd. 13,150,116.07
Other related parties 395,776.64 11,377,905.11
Total 57,597,965.86 30,069,092.84
Other payables:
Chuzhou Hanshang Electric Appliance Co.,Ltd.
94,093,715.34 108,380,202.82
Shenzhen Yaode Technology Co., Ltd. 39,727,606.67
Feidi Technology (Shenzhen) Co., Ltd. andits subsidiaries
11,767,561.85 5,638,548.27
Shenzhen Jielunte Technology Co., Ltd. andits subsidiaries
10,240,000.00 400,000.00
Other related parties 7,224,602.98 16,856,964.32
Total 163,053,486.84 131,275,715.41

311
Item Related party Ending carrying amount
Long-term payables:
OCT Group Co., Ltd. and its subsidiaries 48,946,771.98 -
Total 48,946,771.98 -
XII.Commitment and Contingency
(I) Commitments
1. Capital Commitments
Item Ending balance Beginning balance
Commitments signed but hasn’t been recognized in
financial statements
—Commitment on construction and purchase of
long-lived assets
—Contract with large amount 3,889,900,964.09 1,127,089,984.26
—Foreign investment commitments 103,090,000.00
Total 3,992,990,964.09 1,127,089,984.26
2. Operating Lease Commitments
As of the balance sheet date, the irrevocable operating lease commitments that the Company signedwere as followed:
Item Ending balance Beginning balance
Minimum lease payments of irrevocable operating lease
1 year after balance date 29,370,366.16 21,432,789.82
2 years after balance date 29,016,143.76 10,038,667.42
3 years after balance date 17,502,940.47 3,662,167.92
Following years 5,349,676.50 3,938,998.40
Total 81,239,126.89 39,072,623.56

312
3. Other Commitments
As of 31 December 2019, there were no other significant commitments for the Company to disclose.
(II) Contingency
(1) The dispute in bill recourse right among the Company, Jiangsu Hongtu Sanbao High-Tech
Technology Co., Ltd., Jiangsu Hongtu High-Tech Technology Co., Ltd., Nanjing Jiongjiong
Electroincs Technology Co., Ltd. and Shenzhen Qianhai Benniu Agricultural Technology Co., Ltd.,
has involved with the underlying amount of RMB200 million and relevant interest. In July 2019, the
Company filed a lawsuit to the court. Now the case is hearing in the Nanjing Municipal Intermediate
People’s Court, and the Company has applied for property preservation to the court. As of the
issuance date of this report, the case has not been held a court hearing.
(2) The Company held commercial acceptance bills of Shanghai Huaxin International Group Co.,
Ltd., while the acceptor failed to accept the matured bills. The company, as the plaintiff, filed a
lawsuit with the court on the matured bill with a total amount of 300027889.84 yuan, requiring the
bill acceptor Shanghai Huaxin company and the front hand of the bill involved to bear joint and
several liability for clearing the bill amount and default interest. As of the date of this report, the cases
involving 150 million yuan have been in the stage of compulsory execution, and other cases are still
under trial. The above commercial acceptance bill has not been cashed.
(3)Because the Company holds the commercial acceptance bill accepted by China Nuclear
Engineering Construction Group Co., Ltd., the acceptor fails to honour the bill after the bill is due.
The Company, as the plaintiff, files a lawsuit to the court on the bill of RMB78,900,690.24, requiring
the acceptor to assume joint and several liabilities for the bill amount and default interest. As of the
date of this report, the case is still on trial and the above commercial acceptance bill has not been
honored.
(4) As Kangjia commercial factoring, a subsidiary of the company, holds the commercial acceptance
bill accepted by CCCC First Engineering Co., Ltd. and the acceptor fails to honor the bill when it is
due, the company, as the plaintiff, brings a lawsuit to the court for the bill due to 65221300.00 yuan
and demands that CCCC and the front hand of the bill involved bear joint and several liabilities for
the bill amount and default interest. As of the date of this report, the case is still under trial, and the
above-mentioned commercial acceptance bill has not been cashed.
(5)The dispute between the Company and China Energy Electric Fuel Co., Ltd., China Energy

313
(Shanghai) Enterprise Co., Ltd., Shanghai Nengping Enterprise Co., Ltd. and Shenzhen Qianhai
Baoying Commercial Factoring Co., Ltd. over the right of recourse for bills involves the amount of
the subject matter of the lawsuit to be RMB50 million and the corresponding interest. In September
2018, the Company filed a lawsuit with Shenzhen Intermediate People’s Court, which has preserved
the defendant's corresponding property. The judgment of this case has come into effect. In the court's
judgment, defendants such as China Energy Electric Fuel Co., Ltd. shall pay the bill amount of
RMB50 million and the relevant interest to the Company. As of the issuance date of this report, the
case was in the execution stage and has applied to the court for additional shareholders to be the
executor.
(6) The dispute in bill recourse among the subsidiary of the Company, Konka Factoring (Shenzhen)
Co., Ltd., Tahoe Group Co., Ltd., Fuzhou Taijia Enterprise Co., Ltd. and Xiamen Lian
Micro-electronics Co., Ltd., has involved with the underlying amount of RMB50 million and relevant
interest. In January 2019, the Company filed a lawsuit to Xiamen Municipal Intermediate People’s
Court, and the Company has applied for property preservation to the court. As of the issuance date of
this report, the case has not given judgment.
(7) Loan contract disputes related to the Company’s subsidiary Jiangxi Konka and its subsidiary
Xinfeng Microcrystaline, Nanocrystalline, China Great Wall AMC Jiangxi Branch, Zhu Xinming,
Leng Sumin, Jiangxi Xinzixin, Jiangxi Xinxin Jian’an Engineering, Jiangxi Zhongyi Decorative
Material, Jiangxi Shanshi Science and Technology and etc. Due to the affiliated parties of Jiangxi
Konka’s original shareholder, i.e. Jiangxi Xinxin Jian’an Engineering, Jiangxi Zhongyi Decorative
Material, Jiangxi Shanshi Technology, failed to repay the loan on schedule. Therefore, China Great
Wall AMC Jiangxi Branch filed a lawsuit and demanded Jiangxi Xinxin Jian’an Engineering, Jiangxi
Zhongyi Decorative Material, Jiangxi Shanshi Science and Technology to repay the loan principal of
RMB300 million, liquidated damages of RMB108,000 and interest of RMB13.65 million. Guarantors
Jiangxi Konka, Zhu Xinming, Leng Sumin, Nano Crystallized Glass and Xinfeng Microcrystaline
were required to bear joint liability for the above debts.
On 31 October 2019, the Jiangxi Provincial Superior People’s Court ruled in first instance that Jiangxi
Xinxin Jian’an Engineering, Jiangxi Zhongyi Decorative Material, Jiangxi Shanshi Technology would
repay the loan principal of RMB300 million, interest and liquidated damages to China Great Wall
AMC Jiangxi Branch within 10 days from the effective date of the judgment respectively. Jiangxi
Konka, Zhu Xinming, Leng Sumin, Nano Crystallized Glass and Xinfeng Microcrystaline shall bear

314
joint and several liabilities for all debts determined by the above judgment. The defendants refused to
accept the judgment of the first instance and launched appeal. The second instance of the case has not
yet started.
The actual controller of Konka New Materials, Zhu Xinming, and his spouse, Leng Sumin, as
guarantors, provided a total of about RMB143 million of real estate mortgage guarantee to Great Wall
AMC for the above loans. Zhu Xinming and Leng Sumin also provided joint and several liability
guarantee. In order to avoid the adverse impact of this case on the Company, the Company has agreed
in the acquisition agreement of Jiangxi Konka, Xinfeng Microcrystalline and nanometer
microcrystalline that all contingent debts incurred by Jiangxi Konka by the original shareholders of
Konka new material in the form of joint and several liability. Jiangxi Xinzixin real estate co., ltd. has
held a total of about RMB243 million of real estate assets as the case of the anti-guarantee mortgage
to Konka group and went through the mortgage registration procedures. As of the date of this report,
the case is still on trial and the above commercial acceptance bill has not been honored.
XIII.Events after Balance Sheet Date
1. Significant Non-adjusted Events
No significant non-adjusted events
2. Influence of Implementation of NewAccounting Standards since 1 January 2020
The Ministry of Finance issued the Notes of Revising and Printing Accounting Standards for BusinessEnterprises No. 14-Revenue (CK [2017] No.22) on 5 July 2017. The amendment of AccountingStandards for Business Enterprises No. 14-Revenue mainly includes: two current standards ofrevenue and construction contract are included in consolidated revenue recognition model; thetransfer of risk premium is replaced by the transfer of control as judgment basis of time and place ofrecognizing revenue; each single fulfillment obligation included in contracts shall be identified and berecognized the revenue respectively when fulfilling; more definite guidelines will be provided to theaccounting treatment of contracts containing multiple transaction arrangement; the explicit stipulationis provided to the recognization and measurement of revenue of certain specific transactions (ormatters).
Domestic listed companies shall implement the new standards from 1 January 2020 according to therelevant regulations of the abovementioned document. The Company adjusted the relevant content ofaccounting policy and started to implement the new standards from 1 January 2020.
3. Since the outbreak of the epidemic situation of COVID-19 (“epidemic of COVID-19”) in Chinasince January 2020, the Company has actively responded to and strictly implemented the provisions

315
and requirements of the party and the government at all levels on the prevention and control of thevirus epidemic, and supported the national war epidemic through multiple measures including supplysecurity, social responsibility and internal management. The Company expects that this new outbreakand the prevention and control measures will cause a certain temporary impact on the production andoperation of the Company’s domestic and overseas subsidiaries. The impact depends on the progressof the epidemic prevention and control, the duration and the implementation of prevention andcontrol policies in different regions. The Company will continue to pay close attention to thedevelopment of the epidemic of COVID-19, and actively respond to its impact on the Company’sfinancial situation, operating results and other aspects.
4. No other significant events after balance sheet date of the Company other than above disclosedmatters.
XIV.Other Significant Events
No Other significant transactions and events.
XV.Notes of Main Items in the Financial Statements of the Company as the
Parent
1. Accounts Receivable
(1) Listed by Withdrawal Method of Expected Credit Loss
Category
Ending balance
Carrying amount Bad debt provision
Carrying valueAmount
Proportio
n (%)Amount
Withdrawal
proportion
(%)
Accounts receivable for
which expected credit loss
withdrawn separately
851,581,146.54 8.53 243,095,956.82 28.55 608,485,189.72
Accounts receivable for
which expected credit loss
withdrawn by group
Of which: Aging group 546,689,702.44 5.48 176,154,824.04 32.22 370,534,878.40
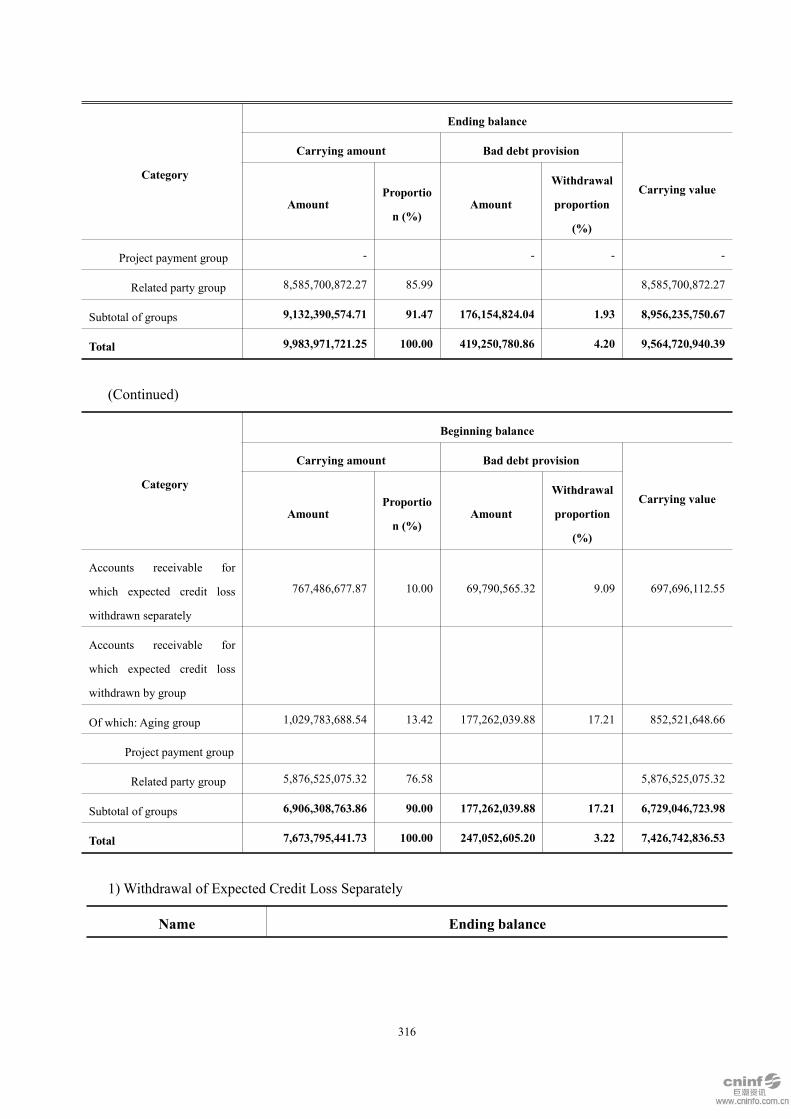
316
Category
Ending balance
Carrying amount Bad debt provision
Carrying valueAmount
Proportio
n (%)Amount
Withdrawal
proportion
(%)
Project payment group - - - -
Related party group 8,585,700,872.27 85.99 8,585,700,872.27
Subtotal of groups 9,132,390,574.71 91.47 176,154,824.04 1.93 8,956,235,750.67
Total 9,983,971,721.25 100.00 419,250,780.86 4.20 9,564,720,940.39
(Continued)
Category
Beginning balance
Carrying amount Bad debt provision
Carrying valueAmount
Proportio
n (%)Amount
Withdrawal
proportion
(%)
Accounts receivable for
which expected credit loss
withdrawn separately
767,486,677.87 10.00 69,790,565.32 9.09 697,696,112.55
Accounts receivable for
which expected credit loss
withdrawn by group
Of which: Aging group 1,029,783,688.54 13.42 177,262,039.88 17.21 852,521,648.66
Project payment group
Related party group 5,876,525,075.32 76.58 5,876,525,075.32
Subtotal of groups 6,906,308,763.86 90.00 177,262,039.88 17.21 6,729,046,723.98
Total 7,673,795,441.73 100.00 247,052,605.20 3.22 7,426,742,836.53
1) Withdrawal of Expected Credit Loss Separately
Name Ending balance
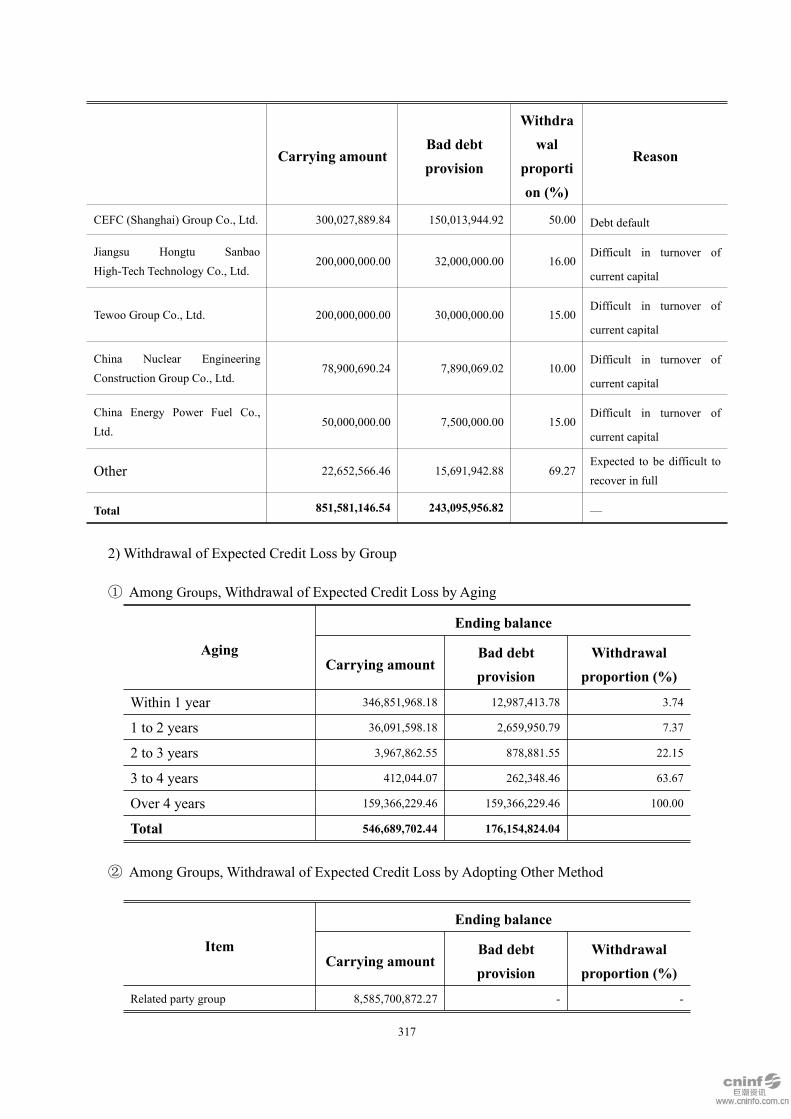
317
Carrying amountBad debtprovision
Withdrawal
proportion (%)
Reason
CEFC (Shanghai) Group Co., Ltd. 300,027,889.84 150,013,944.92 50.00 Debt default
Jiangsu Hongtu SanbaoHigh-Tech Technology Co., Ltd.
200,000,000.00 32,000,000.00 16.00Difficult in turnover of
current capital
Tewoo Group Co., Ltd. 200,000,000.00 30,000,000.00 15.00Difficult in turnover of
current capital
China Nuclear EngineeringConstruction Group Co., Ltd.
78,900,690.24 7,890,069.02 10.00Difficult in turnover of
current capital
China Energy Power Fuel Co.,Ltd.
50,000,000.00 7,500,000.00 15.00Difficult in turnover of
current capital
Other 22,652,566.46 15,691,942.88 69.27Expected to be difficult torecover in full
Total 851,581,146.54 243,095,956.82 —
2) Withdrawal of Expected Credit Loss by Group
① Among Groups, Withdrawal of Expected Credit Loss by Aging
Aging
Ending balance
Carrying amountBad debtprovision
Withdrawalproportion (%)
Within 1 year 346,851,968.18 12,987,413.78 3.74
1 to 2 years 36,091,598.18 2,659,950.79 7.37
2 to 3 years 3,967,862.55 878,881.55 22.15
3 to 4 years 412,044.07 262,348.46 63.67
Over 4 years 159,366,229.46 159,366,229.46 100.00
Total 546,689,702.44 176,154,824.04
② Among Groups, Withdrawal of Expected Credit Loss by Adopting Other Method
Item
Ending balance
Carrying amountBad debtprovision
Withdrawalproportion (%)
Related party group 8,585,700,872.27 - -

318
Item
Ending balance
Carrying amountBad debtprovision
Withdrawalproportion (%)
Total 8,585,700,872.27 - -
2) Listed by aging group
Aging Ending balance
Within 1 year 8,597,211,385.57
1 to 2 years 878,535,145.09
2 to 3 years 336,766,315.77
3 to 4 years 2,232,813.62
Over 4 years 169,226,061.20
Subtotal 9,983,971,721.25
Less: Bad debt provision 419,250,780.86
Total 9,564,720,940.39
(3) Information of Bad Debt Provision in the Reporting Period
The amount of actual withdrawal of bad debt provision is RMB172,198,175.66.
(4) Actual Verification of Accounts Receivable
No actual verified accounts receivable in the Reporting Period.
(5) Top 5 of the Ending Balance of the Accounts Receivable Collected according to Arrears Party
Total amount of Top 5 of ending balance of accounts receivable collected according to arrears party
was RMB9,189,000,915.15 accounting for 92.04% of total ending balance of accounts receivable.
Total ending balance of bad debt provision withdrawn was RMB212,013,944.92.
(6) There Was No Account Receivable Terminated the Recognition owning to the Transfer of the
Financial Assets.
(7) There Was No Asset and Liability Formed due to the Transfer of Accounts Receivable andContinued Involvement in the Reporting Period.
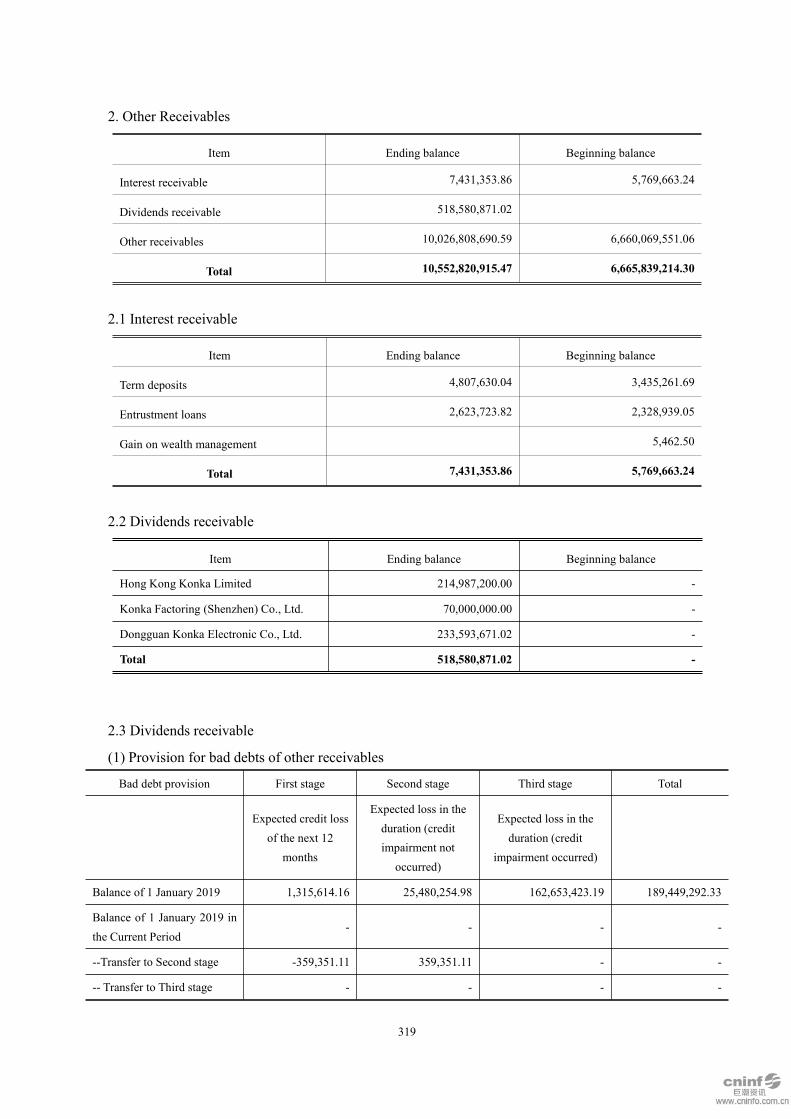
319
2. Other Receivables
Item Ending balance Beginning balance
Interest receivable 7,431,353.86 5,769,663.24
Dividends receivable 518,580,871.02
Other receivables 10,026,808,690.59 6,660,069,551.06
Total 10,552,820,915.47 6,665,839,214.30
2.1 Interest receivable
Item Ending balance Beginning balance
Term deposits 4,807,630.04 3,435,261.69
Entrustment loans 2,623,723.82 2,328,939.05
Gain on wealth management 5,462.50
Total 7,431,353.86 5,769,663.24
2.2 Dividends receivable
Item Ending balance Beginning balance
Hong Kong Konka Limited 214,987,200.00 -
Konka Factoring (Shenzhen) Co., Ltd. 70,000,000.00 -
Dongguan Konka Electronic Co., Ltd. 233,593,671.02 -
Total 518,580,871.02 -
2.3 Dividends receivable
(1) Provision for bad debts of other receivables
Bad debt provision First stage Second stage Third stage Total
Expected credit lossof the next 12
months
Expected loss in theduration (creditimpairment not
occurred)
Expected loss in theduration (credit
impairment occurred)
Balance of 1 January 2019 1,315,614.16 25,480,254.98 162,653,423.19 189,449,292.33
Balance of 1 January 2019 inthe Current Period
- - - -
--Transfer to Second stage -359,351.11 359,351.11 - -
-- Transfer to Third stage - - - -

320
-- Reverse to Second stage - - - -
-- Reverse to First stage - - - -
Withdrawal of the CurrentPeriod
6,340,067.68 6,340,067.68
Reversal of the CurrentPeriod
8,435,026.70 192,053.96 8,627,080.66
Write-offs of the CurrentPeriod
-
Verification of the CurrentPeriod
-
Other changes -
Balance of 31 December2019
7,296,330.73 17,404,579.39 162,461,369.23 187,162,279.35
Note: The first stage is that credit risk has not increased significantly since initial recognition. Forother receivables with an aging portfolio and a low-risk portfolio within 1 year, the loss provision ismeasured according to the expected credit losses in the next 12 months.The second stage is that credit risk has increased significantly since initial recognition but creditimpairment has not yet occurred. For other receivables with an aging portfolio and a low-riskportfolio that exceed 1 year, the loss provision is measured based on the expected credit losses for theentire duration.The third stage is the credit impairment after initial confirmation. For other receivables of creditimpairment that have occurred, the loss provision is measured according to the credit losses that haveoccurred throughout the duration.(2) Other Receivables Withdrawn Bad Debt Provision by Group
Category
Ending balance
Carrying amount Bad debt provision
Carrying valueAmount
Proportion(%)
AmountWithdrawalproportion
(%)
Other receivablesfor whichwithdrawn expectedcredit lossseparately:
173,092,959.33 1.69 162,461,369.23 93.86 10,631,590.10
Other receivablesfor whichwithdrawn bad debtprovision by creditrisk features group:
- - - - -
Aging group 196,772,672.55 1.93 16,787,423.23 8.53 179,985,249.32
Low risk group 390,582,659.31 3.82 7,913,486.89 2.03 382,669,172.42
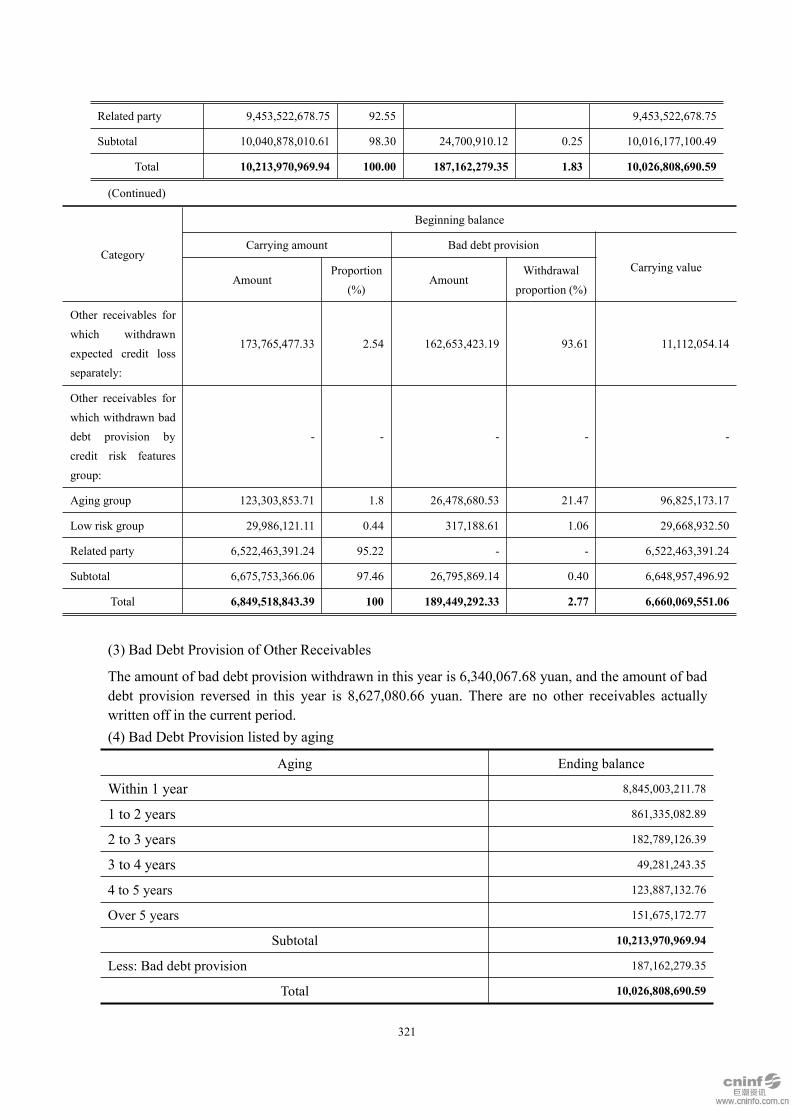
321
Related party 9,453,522,678.75 92.55 9,453,522,678.75
Subtotal 10,040,878,010.61 98.30 24,700,910.12 0.25 10,016,177,100.49
Total 10,213,970,969.94 100.00 187,162,279.35 1.83 10,026,808,690.59
(Continued)
Category
Beginning balance
Carrying amount Bad debt provision
Carrying valueAmount
Proportion(%)
AmountWithdrawal
proportion (%)
Other receivables forwhich withdrawnexpected credit lossseparately:
173,765,477.33 2.54 162,653,423.19 93.61 11,112,054.14
Other receivables forwhich withdrawn baddebt provision bycredit risk featuresgroup:
- - - - -
Aging group 123,303,853.71 1.8 26,478,680.53 21.47 96,825,173.17
Low risk group 29,986,121.11 0.44 317,188.61 1.06 29,668,932.50
Related party 6,522,463,391.24 95.22 - - 6,522,463,391.24
Subtotal 6,675,753,366.06 97.46 26,795,869.14 0.40 6,648,957,496.92
Total 6,849,518,843.39 100 189,449,292.33 2.77 6,660,069,551.06
(3) Bad Debt Provision of Other Receivables
The amount of bad debt provision withdrawn in this year is 6,340,067.68 yuan, and the amount of baddebt provision reversed in this year is 8,627,080.66 yuan. There are no other receivables actuallywritten off in the current period.(4) Bad Debt Provision listed by aging
Aging Ending balance
Within 1 year 8,845,003,211.78
1 to 2 years 861,335,082.89
2 to 3 years 182,789,126.39
3 to 4 years 49,281,243.35
4 to 5 years 123,887,132.76
Over 5 years 151,675,172.77
Subtotal 10,213,970,969.94
Less: Bad debt provision 187,162,279.35
Total 10,026,808,690.59
322
(5) Other receivables with top five ending balances collected by debtors.
In this year, the total amount of the top five other receivables collected by debtors at the end of the
year is 6,237,722,020.34 yuan, accounting for 61.07% of the total amount of other receivables at the
end of the year, and the total amount of the corresponding accrued bad debt reserves at the end of the
year is 0.00 yuan.
(6) There Was No Other Receivables Terminated the Recognition owning to the Transfer of the
Financial Assets.
(7) There Was No Asset and Liability Formed by the Transfer and the Continues Involvement of
Other Receivables
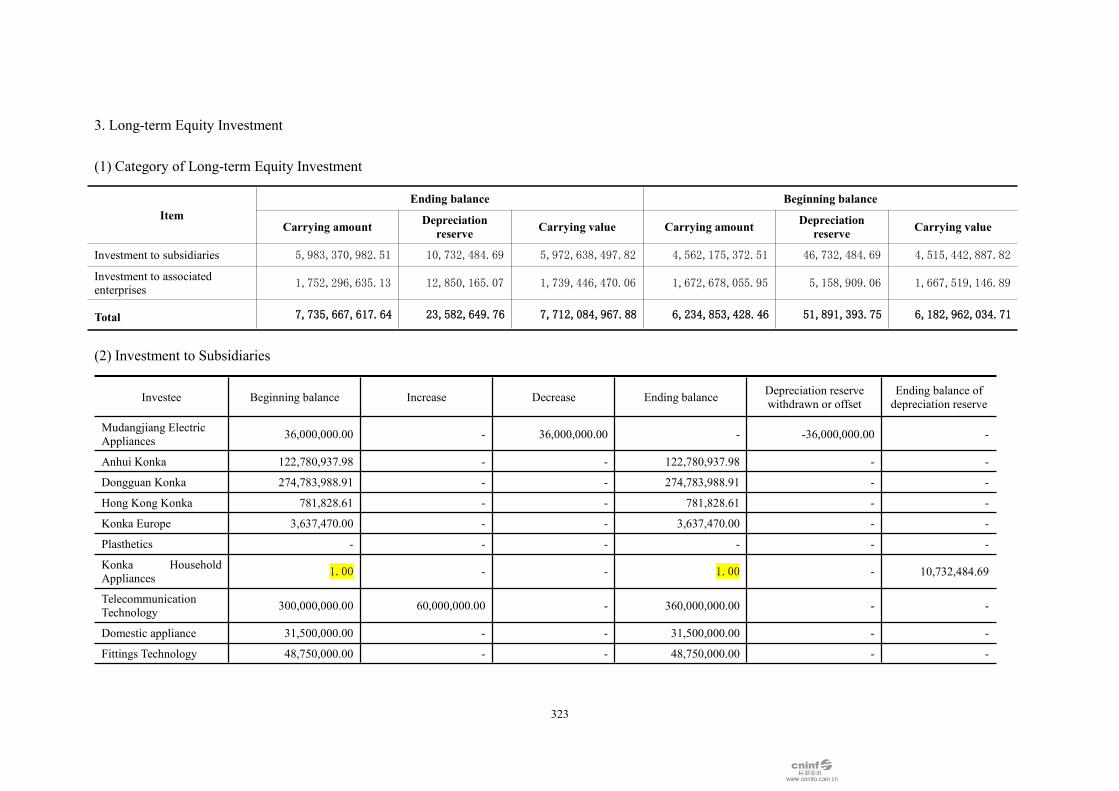
323
3. Long-term Equity Investment
(1) Category of Long-term Equity Investment
ItemEnding balance Beginning balance
Carrying amount Depreciationreserve Carrying value Carrying amount Depreciation
reserve Carrying value
Investment to subsidiaries 5,983,370,982.51 10,732,484.69 5,972,638,497.82 4,562,175,372.51 46,732,484.69 4,515,442,887.82
Investment to associatedenterprises 1,752,296,635.13 12,850,165.07 1,739,446,470.06 1,672,678,055.95 5,158,909.06 1,667,519,146.89
Total 7,735,667,617.64 23,582,649.76 7,712,084,967.88 6,234,853,428.46 51,891,393.75 6,182,962,034.71
(2) Investment to Subsidiaries
Investee Beginning balance Increase Decrease Ending balance Depreciation reservewithdrawn or offset
Ending balance ofdepreciation reserve
Mudangjiang ElectricAppliances 36,000,000.00 - 36,000,000.00 - -36,000,000.00 -
Anhui Konka 122,780,937.98 - - 122,780,937.98 - -
Dongguan Konka 274,783,988.91 - - 274,783,988.91 - -
Hong Kong Konka 781,828.61 - - 781,828.61 - -
Konka Europe 3,637,470.00 - - 3,637,470.00 - -
Plasthetics - - - - - -
Konka HouseholdAppliances 1.00 - - 1.00 - 10,732,484.69
TelecommunicationTechnology 300,000,000.00 60,000,000.00 - 360,000,000.00 - -
Domestic appliance 31,500,000.00 - - 31,500,000.00 - -
Fittings Technology 48,750,000.00 - - 48,750,000.00 - -

324
Investee Beginning balance Increase Decrease Ending balance Depreciation reservewithdrawn or offset
Ending balance ofdepreciation reserve
Konka Factoring 300,000,000.00 - - 300,000,000.00 - -
Wankaida 10,000,000.00 - - 10,000,000.00 - -
Anhui Tongchuang 481,702,612.22 - - 481,702,612.22 - -
Beijing Konka 200,000,000.00 - - 200,000,000.00 - -
Konka E-display 7,200,000.00 - 7,200,000.00 - - -
Commercial Technology 5,832,000.00 - - 5,832,000.00 - -
Mobile Internet 10,200,000.00 9,800,000.00 - 20,000,000.00 - -
E2info 19,322,040.00 - - 19,322,040.00 - -
E3info 12,000,000.00 - - 12,000,000.00 - -
Dongguan Packing 8,602,009.10 - - 8,602,009.10 - -
Chuzhou Konka TID 40,000,000.00 - 40,000,000.00 - - -
Konka Ventures 2,550,000.00 - - 2,550,000.00 - -
Konka Pengrun 25,500,000.00 - - 25,500,000.00 - -
Konka Unifortune 15,300,000.00 - - 15,300,000.00 - -
Konka Investment 40,000,000.00 437,000,000.00 - 477,000,000.00 - -
Jiangxi Konka 689,680,000.00 - - 689,680,000.00 - -
Electronics Technology 1,000,000,000.00 - - 1,000,000,000.00 - -
Sichuan Kangjiatong 1,020,000.00 14,280,000.00 - 15,300,000.00 - -
Econ Technology 688,500,000.00 - - 688,500,000.00 - -
Konka Huanjia 91,800,000.00 - - 91,800,000.00 - -
Shenzhen Nianhua 30,000,000.00 - - 30,000,000.00 - -
Shanghai Konka 40,000,000.00 - - 40,000,000.00 - -
Shenzhen Kangxinwei 14,000,000.00 86,000,000.00 - 100,000,000.00 - -
Konka EcologicalDevelopment - 50,000.00 - 50,000.00 - -
Konka Integration - 5,100,000.00 - 5,100,000.00 - -

325
Investee Beginning balance Increase Decrease Ending balance Depreciation reservewithdrawn or offset
Ending balance ofdepreciation reserve
Suining KonkaIndustrial Park - 200,000,000.00 - 200,000,000.00 - -
Suining ElectronicTechnology - 200,000,000.00 - 200,000,000.00 - -
Dongguan KonkaInvestment - 44,400,000.00 - 44,400,000.00 - -
Shenzhen ChuangzhiElectrical Appliances - 10,000,000.00 - 10,000,000.00 - -
Konka (Yantai)EnvironmentalProtection
- 5,100.00 - 5,100.00 - -
Chongqing Kangxingrui - 25,500,000.00 - 25,500,000.00 - -
Chongqing PhotoelectricResearch Institute - 350,000,000.00 - 350,000,000.00 - -
Xinying Semiconductor - 14,000,000.00 - 14,000,000.00 - -
Chongqing PropertiesDevelopment - 25,500,000.00 - 25,500,000.00 - -
Ningbo KanghanruiElectrical Appliances - 9,000,000.00 - 9,000,000.00 - -
Konka Zhizao - 510.00 - 510.00 - -
Jiadebao New Material - 3,750,000.00 - 3,750,000.00 - -
Suining JiarunProperties - 10,000,000.00 - 10,000,000.00 - -
KangxinlongEnvironmentalProtection
- 10,000.00 - 10,000.00 - -
Chuzhou Kangjin - 30,000,000.00 30,000,000.00 - - -
Haimen Kangjian - 70,000,000.00 70,000,000.00 - - -
Shenzhen Kangyue - 11,800,000.00 11,800,000.00 - - -
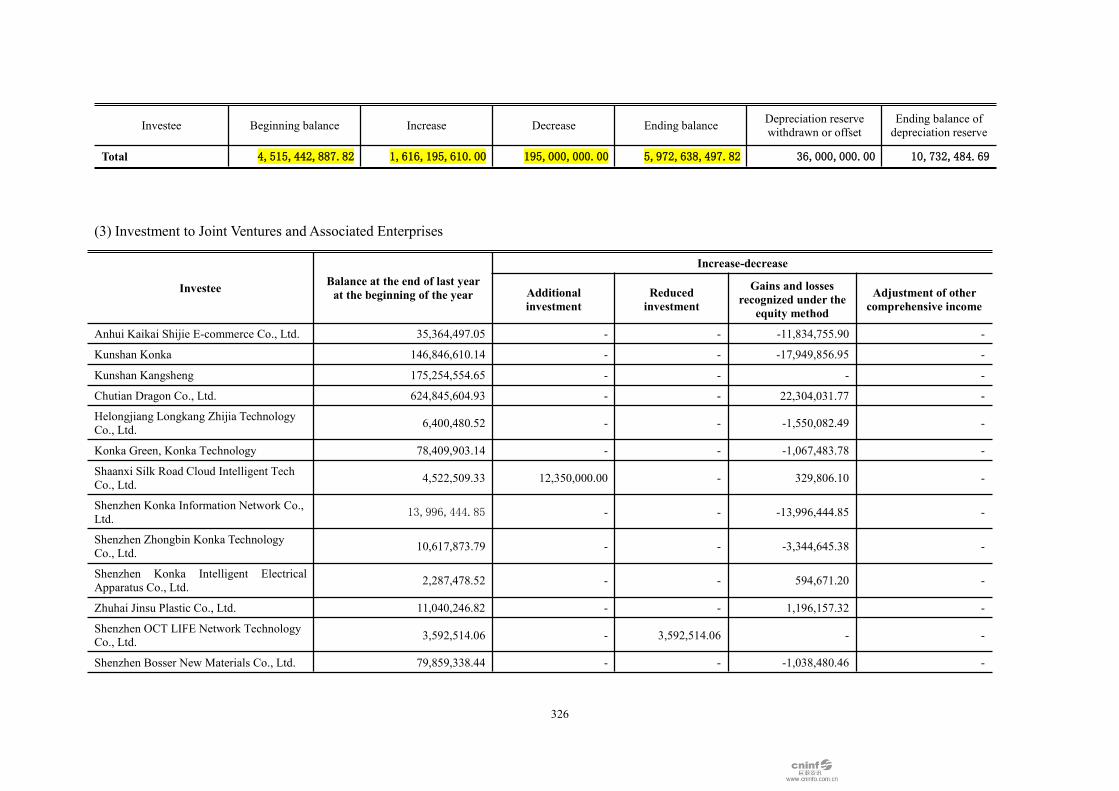
326
Investee Beginning balance Increase Decrease Ending balance Depreciation reservewithdrawn or offset
Ending balance ofdepreciation reserve
Total 4,515,442,887.82 1,616,195,610.00 195,000,000.00 5,972,638,497.82 36,000,000.00 10,732,484.69
(3) Investment to Joint Ventures and Associated Enterprises
Investee Balance at the end of last yearat the beginning of the year
Increase-decrease
Additionalinvestment
Reducedinvestment
Gains and lossesrecognized under the
equity method
Adjustment of othercomprehensive income
Anhui Kaikai Shijie E-commerce Co., Ltd. 35,364,497.05 - - -11,834,755.90 -
Kunshan Konka 146,846,610.14 - - -17,949,856.95 -
Kunshan Kangsheng 175,254,554.65 - - - -
Chutian Dragon Co., Ltd. 624,845,604.93 - - 22,304,031.77 -
Helongjiang Longkang Zhijia TechnologyCo., Ltd. 6,400,480.52 - - -1,550,082.49 -
Konka Green, Konka Technology 78,409,903.14 - - -1,067,483.78 -
Shaanxi Silk Road Cloud Intelligent TechCo., Ltd. 4,522,509.33 12,350,000.00 - 329,806.10 -
Shenzhen Konka Information Network Co.,Ltd. 13,996,444.85 - - -13,996,444.85 -
Shenzhen Zhongbin Konka TechnologyCo., Ltd. 10,617,873.79 - - -3,344,645.38 -
Shenzhen Konka Intelligent ElectricalApparatus Co., Ltd. 2,287,478.52 - - 594,671.20 -
Zhuhai Jinsu Plastic Co., Ltd. 11,040,246.82 - - 1,196,157.32 -
Shenzhen OCT LIFE Network TechnologyCo., Ltd. 3,592,514.06 - 3,592,514.06 - -
Shenzhen Bosser New Materials Co., Ltd. 79,859,338.44 - - -1,038,480.46 -

327
Investee Balance at the end of last yearat the beginning of the year
Increase-decrease
Additionalinvestment
Reducedinvestment
Gains and lossesrecognized under the
equity method
Adjustment of othercomprehensive income
Shenzhen Yaode Technology Co., Ltd. 222,210,835.18 - - 7,529,410.29 -
Wuhan Tianyuan Environmental ProtectionCo., Ltd. 252,270,255.47 - - 23,307,076.74 -
Konka E-display - 16,926,689.50 - - -
Chuzhou Konka Technology IndustryDevelopment Co., Ltd. - 17,270,427.37 - - -
Chuzhou Kangjin Health IndustrialDevelopment Co., Ltd. - 14,588,741.64 - - -
Haimen Kangjian Technology IndustrialPark Operations and Management Co., Ltd. - 29,589,201.10 - - -
Shenzhen Kangyue Enterprise Co., Ltd. - 3,691,460.77 - - -
Total 1,667,519,146.89 94,416,520.38 3,592,514.06 4,479,403.61 -
(Continued)
Investee
Increase-decrease
Ending balanceEnding balanceof depreciation
reserveOther equitychanges
Cash bonus orprofits announced
to issue
Withdrawal ofimpairmentprovision
Other
Anhui Kaikai Shijie E-commerce Co., Ltd. - - - - 23,529,741.15 -
Kunshan Konka - - - - 128,896,753.19 -
Kunshan Kangsheng - - - - 175,254,554.65 -
Chutian Dragon Co., Ltd. - 11,088,000.00 - - 636,061,636.70 -
Helongjiang Longkang Zhijia TechnologyCo., Ltd. - - 2,470,398.03 - 2,380,000.00 2,470,398.03
Konka Green, Konka Technology - - - - 77,342,419.36 -
Shaanxi Silk Road Cloud Intelligent TechCo., Ltd. - - - - 17,202,315.43 -
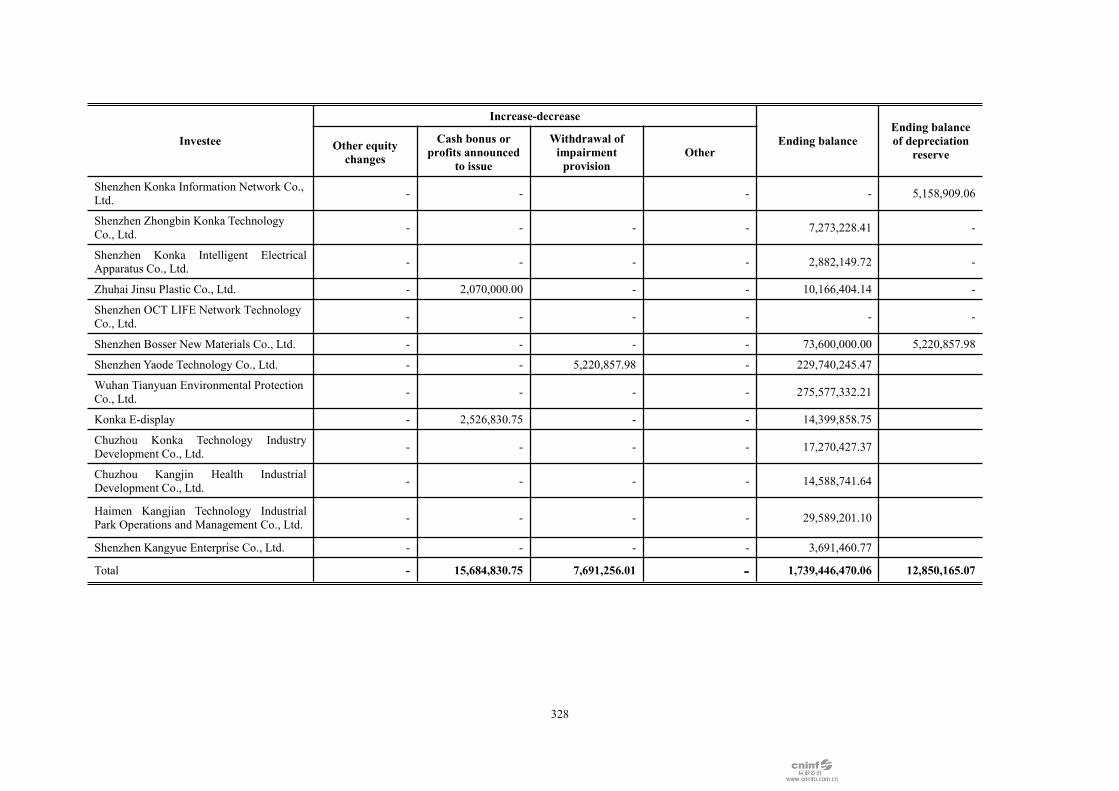
328
Investee
Increase-decrease
Ending balanceEnding balanceof depreciation
reserveOther equitychanges
Cash bonus orprofits announced
to issue
Withdrawal ofimpairmentprovision
Other
Shenzhen Konka Information Network Co.,Ltd. - - - - 5,158,909.06
Shenzhen Zhongbin Konka TechnologyCo., Ltd. - - - - 7,273,228.41 -
Shenzhen Konka Intelligent ElectricalApparatus Co., Ltd. - - - - 2,882,149.72 -
Zhuhai Jinsu Plastic Co., Ltd. - 2,070,000.00 - - 10,166,404.14 -
Shenzhen OCT LIFE Network TechnologyCo., Ltd. - - - - - -
Shenzhen Bosser New Materials Co., Ltd. - - - - 73,600,000.00 5,220,857.98
Shenzhen Yaode Technology Co., Ltd. - - 5,220,857.98 - 229,740,245.47
Wuhan Tianyuan Environmental ProtectionCo., Ltd. - - - - 275,577,332.21
Konka E-display - 2,526,830.75 - - 14,399,858.75
Chuzhou Konka Technology IndustryDevelopment Co., Ltd. - - - - 17,270,427.37
Chuzhou Kangjin Health IndustrialDevelopment Co., Ltd. - - - - 14,588,741.64
Haimen Kangjian Technology IndustrialPark Operations and Management Co., Ltd. - - - - 29,589,201.10
Shenzhen Kangyue Enterprise Co., Ltd. - - - - 3,691,460.77
Total - 15,684,830.75 7,691,256.01 - 1,739,446,470.06 12,850,165.07
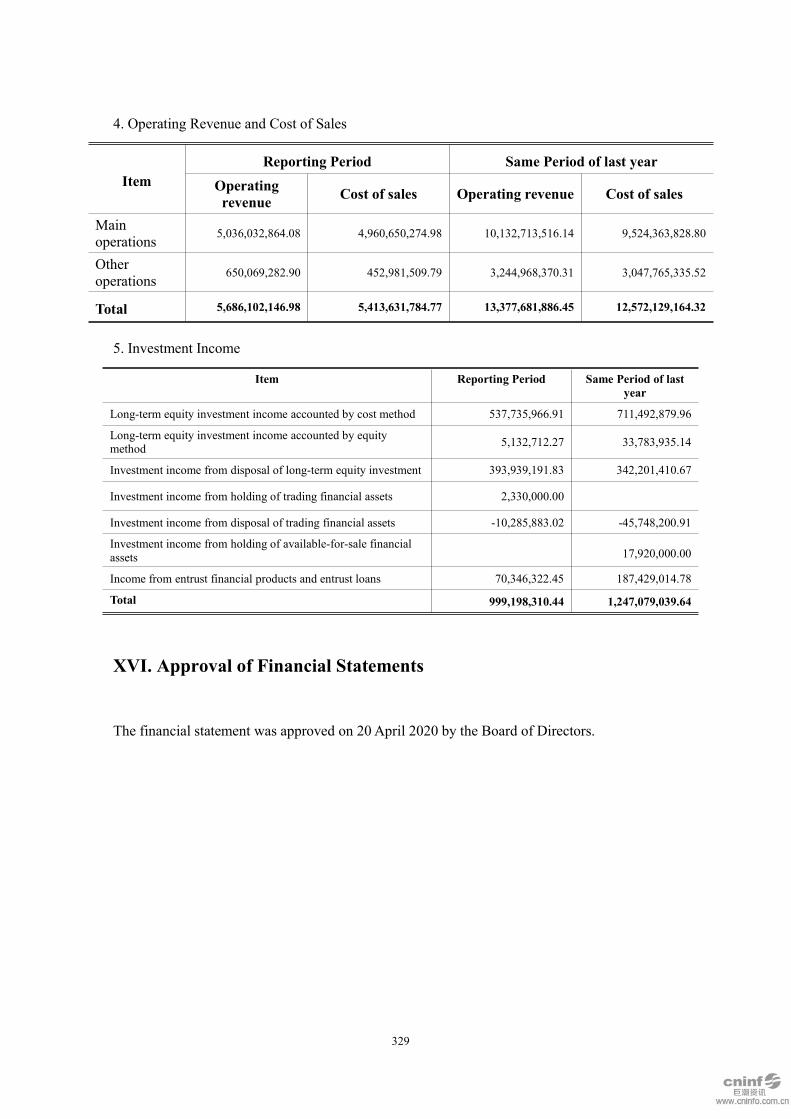
329
4. Operating Revenue and Cost of Sales
ItemReporting Period Same Period of last year
Operatingrevenue Cost of sales Operating revenue Cost of sales
Mainoperations 5,036,032,864.08 4,960,650,274.98 10,132,713,516.14 9,524,363,828.80
Otheroperations 650,069,282.90 452,981,509.79 3,244,968,370.31 3,047,765,335.52
Total 5,686,102,146.98 5,413,631,784.77 13,377,681,886.45 12,572,129,164.32
5. Investment Income
Item Reporting Period Same Period of lastyear
Long-term equity investment income accounted by cost method 537,735,966.91 711,492,879.96
Long-term equity investment income accounted by equitymethod 5,132,712.27 33,783,935.14
Investment income from disposal of long-term equity investment 393,939,191.83 342,201,410.67
Investment income from holding of trading financial assets 2,330,000.00
Investment income from disposal of trading financial assets -10,285,883.02 -45,748,200.91
Investment income from holding of available-for-sale financialassets 17,920,000.00
Income from entrust financial products and entrust loans 70,346,322.45 187,429,014.78
Total 999,198,310.44 1,247,079,039.64
XVI. Approval of Financial Statements
The financial statement was approved on 20 April 2020 by the Board of Directors.
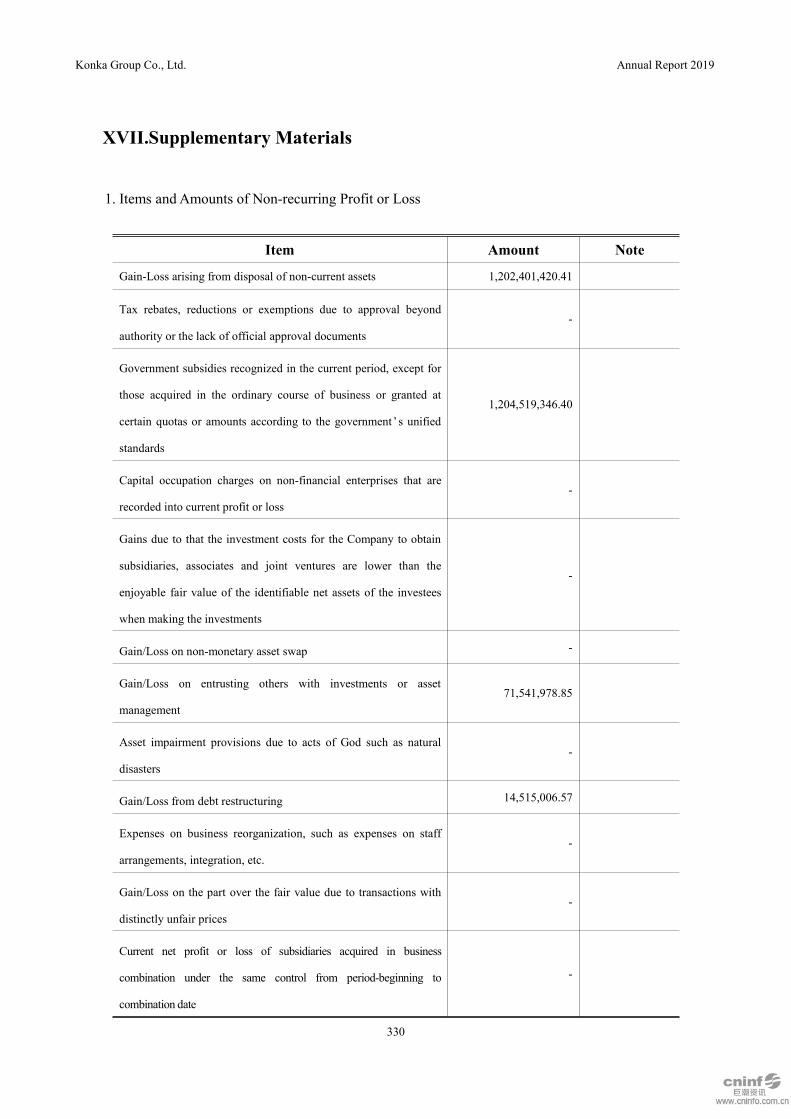
Konka Group Co., Ltd. Annual Report 2019
330
XVII.Supplementary Materials
1. Items and Amounts of Non-recurring Profit or Loss
Item Amount Note
Gain-Loss arising from disposal of non-current assets 1,202,401,420.41
Tax rebates, reductions or exemptions due to approval beyond
authority or the lack of official approval documents-
Government subsidies recognized in the current period, except for
those acquired in the ordinary course of business or granted at
certain quotas or amounts according to the government ’s unified
standards
1,204,519,346.40
Capital occupation charges on non-financial enterprises that are
recorded into current profit or loss-
Gains due to that the investment costs for the Company to obtain
subsidiaries, associates and joint ventures are lower than the
enjoyable fair value of the identifiable net assets of the investees
when making the investments
-
Gain/Loss on non-monetary asset swap -
Gain/Loss on entrusting others with investments or asset
management71,541,978.85
Asset impairment provisions due to acts of God such as natural
disasters-
Gain/Loss from debt restructuring 14,515,006.57
Expenses on business reorganization, such as expenses on staff
arrangements, integration, etc.-
Gain/Loss on the part over the fair value due to transactions with
distinctly unfair prices-
Current net profit or loss of subsidiaries acquired in business
combination under the same control from period-beginning to
combination date
-

Konka Group Co., Ltd. Annual Report 2019
331
Item Amount Note
Gain/Loss incurred from contingency unrelated to the Company’s
normal operating businesses.-
Gain/loss from change of fair value of trading financial assets and
liabilities, and derivative financial assets and liabilities, and
investment gains from disposal of trading financial assets and
liabilities, and derivative financial assets and liabilities, and
investment in other obligatory rights, other than valid hedging
related to the Company’s common businesses
49,472,415.17
Reverse of bad debt provision of accounts receivable individually
conducting impairment test-
Gain/loss on entrustment loans 1,992,676.20
Gain/loss on change in fair value of investment property of which
the subsequent measurement is carried out adopting fair value
method
-
Effect on current profit or loss when a one-off adjustment is made
to current profit or loss according to requirements of taxation,
accounting and other relevant laws and regulations
-
Custody fee income when entrusted with operation -
Other non-operating income and expense other than the above 121,189,478.51
Project confirmed with the definition of non-recurring gains and
losses145,586,810.18
Subtotal 2,811,219,132.29
Income tax effects 545,067,993.60
Non-controlling interests effects (after tax) 178,394,382.43
Total 2,087,756,756.26 —
The explanation of the Company to “Project confirmed with the definition of non-recurring gains and losses”
and define non-recurring gains and losses as recurring gains and losses according to the nature and features
of normal business operations of company.
Item Amount Reason
Software tax 39,348,087.93 Government grants recognized in the current period, and acquired
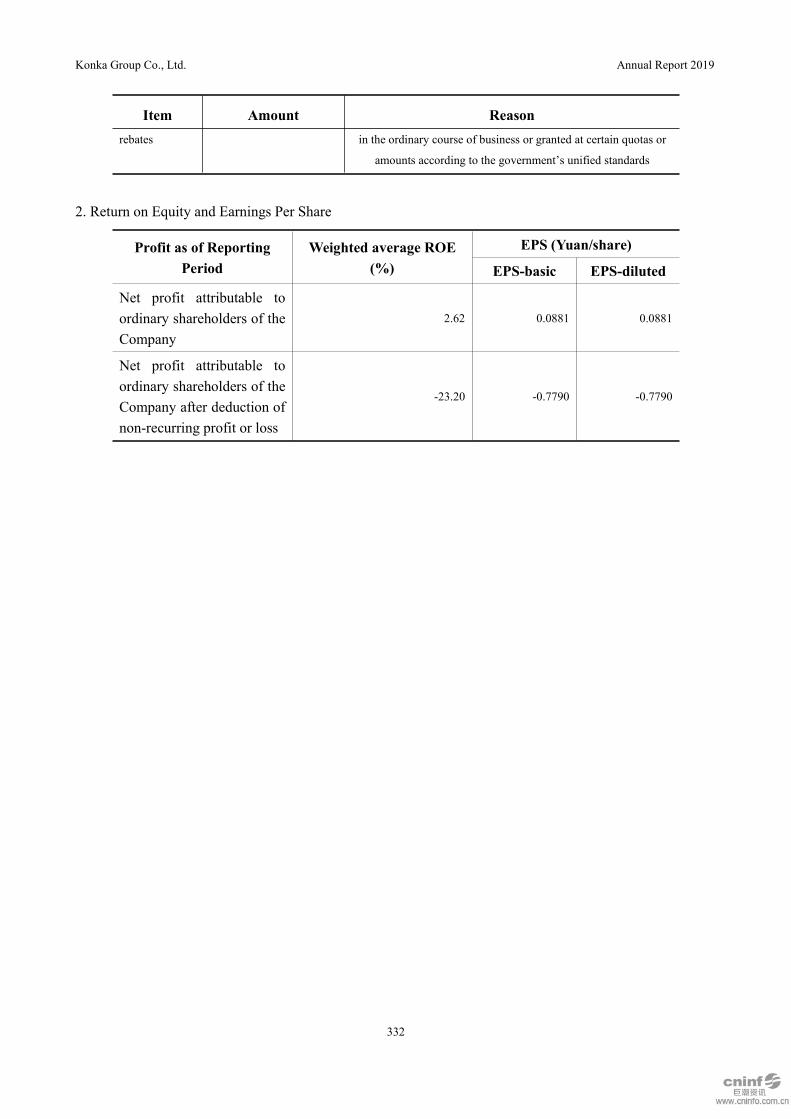
Konka Group Co., Ltd. Annual Report 2019
332
Item Amount Reasonrebates in the ordinary course of business or granted at certain quotas or
amounts according to the government’s unified standards
2. Return on Equity and Earnings Per Share
Profit as of ReportingPeriod
Weighted average ROE(%)
EPS (Yuan/share)
EPS-basic EPS-diluted
Net profit attributable toordinary shareholders of theCompany
2.62 0.0881 0.0881
Net profit attributable toordinary shareholders of theCompany after deduction ofnon-recurring profit or loss
-23.20 -0.7790 -0.7790

Konka Group Co., Ltd. Annual Report 2019
333
Part XIII Documents Available for Reference
I. The financial statements with the signatures and seals of the Company’s legal representative,Chief Financial Officer and head of the financial department;II. The original copy of the Independent Auditor’s Report with the seal of the CPA firm and thesignatures & seals of the certified public accountants;III. The originals of all the Company’s documents and announcements disclosed to the public vianewspapers designated by the CSRC in the Reporting Period; andIV. Other relevant materials.
The Board of Directors
Konka Group Co., Ltd.
21 April 2020