Yadea Group Holdings Ltd
27
www.jpmorganmarkets.com Asia Pacific Equity Research 23 June 2016 Yadea Group Holdings Ltd Initiation Neutral 1585.HK, 1585 HK Riding into the future - initiate with Neutral Price: HK$1.30 Price Target: HK$1.50 China Head of Asia Auto Research Nick Lai AC (852) 2800 8543 [email protected] Bloomberg JPMA LAI <GO> Rebecca Y Wen (852) 2800-8505 [email protected] J.P. Morgan Securities (Asia Pacific) Limited Yadea Group Holdings Ltd (Reuters: 1585.HK, Bloomberg: 1585 HK) Rmb in mn, year-end Dec FY14A FY15A FY16E FY17E FY18E Revenue (Rmb mn) 5,824 6,429 7,478 8,693 9,440 EBIT (Rmb mn) 306 491 511 763 845 Net Profit (Rmb mn) 223 375 390 583 646 EPS (Rmb) - 0.13 0.13 0.19 0.22 DPS (Rmb) 0.00 0.00 0.00 0.00 0.00 Revenue growth (%) 15.1% 10.4% 16.3% 16.2% 8.6% EPS growth (%) - - 3.9% 49.4% 10.8% ROE 39.1% 57.8% 27.1% 24.4% 21.5% P/E (x) - 8.8 8.5 5.7 5.1 P/BV (x) - 4.2 1.6 1.2 1.0 Dividend Yield 0.0% 0.0% 0.0% 0.0% 0.0% Source: Company data, Bloomberg, J.P. Morgan estimates. Company Data 52-week Range (HK$) 1.85-1.25 Shares O/S (mn) 3,000 Market Cap (Rmb mn) 3,313 Market Cap ($ mn) 503 Price (HK$) 1.30 Date Of Price 22 Jun 16 Free Float(%) 27.9% 3M - Avg daily vol (mn) - 3M - Avg daily val ($ mn) - HSI 2,0668.44 Exchange Rate 7.76 Price Target End Date 31-Dec-16 See page 24 for analyst certification and important disclosures, including non-US analyst disclosures. J.P. Morgan does and seeks to do business with companies covered in its research reports. As a result, investors should be aware that the firm may have a conflict of interest that could affect the objectivity of this report. Investors should consider this report as only a single factor in making their investment decision. 0.8 1.0 1.2 1.4 1.6 1.8 HK$ Jun-15 Sep-15 Dec-15 Mar-16 Jun-16 Price Performance 1585.HK share price (HK$) HSI (rebased) We initiate coverage on Yadea with a Neutral rating and Dec-16 PT of HK$1.5. Yadea is the largest electric-scooter and second-largest electric- bicycle manufacturer in China under its own brand (Yadea), with 10.5% market share by revenue in 2015 (source Frost & Sullivan). Positive investment drivers: 1) Steady industry growth and market share gains: China’s electric two-wheeler market is expected to grow at mid-single digits p.a. over the next couple of years. Yadea expanded its market share from ~8% in 2013 to ~10% in 2015, and we expect further market share gains. 2) Restrictions on motorbikes to benefit e-scooters/bikes: To curb air pollution, many cities in China (currently ~200) have banned the use of motorcycles. This has directly benefited electric two-wheelers, which have gained share at the expense of traditional motorcycles. 3) Solid balance sheet and financial position: Yadea has a significant negative working capital business model as it receives payments from customers (i.e. dealers) promptly but pays suppliers several months later. The result is a net cash position (40% of assets is cash) and positive free cash flow, which creates potential dividend upside. 4) Penetration into high end e-motorcycles: Yadea has entered into a strategic co-operation agreement with Lightning Motors, a US-based high-end electric motorcycle producer, and plans to launch an advanced lithium battery powered e-scooter in China in the future. Key investment risks: 1) Price competition: Intense competition caused Yadea's ASP to slip by ~4% in 2015 as a result of higher rebates to dealers to retain market share. 2) Regulatory risk of prohibiting the use of electric two-wheelers. 3) Consumption upgrade to four-wheelers. Valuation, risks: Our Dec-16 PT of HK$1.5 is based on 10x PER. Risks: worse than expected sales volume or pricing. Completed 22 Jun 2016 10:58 PM HKT Disseminated 23 Jun 2016 12:15 AM HKT
-
Upload
khangminh22 -
Category
Documents
-
view
0 -
download
0
Transcript of Yadea Group Holdings Ltd

www.jpmorganmarkets.com
Asia Pacific Equity Research23 June 2016
Yadea Group Holdings Ltd
Initiation
Neutral1585.HK, 1585 HK
Riding into the future - initiate with NeutralPrice: HK$1.30
Price Target: HK$1.50
China
Head of Asia Auto Research
Nick Lai AC
(852) 2800 8543
Bloomberg JPMA LAI <GO>
Rebecca Y Wen
(852) 2800-8505
J.P. Morgan Securities (Asia Pacific) Limited
Yadea Group Holdings Ltd (Reuters: 1585.HK, Bloomberg: 1585 HK)
Rmb in mn, year-end Dec FY14A FY15A FY16E FY17E FY18ERevenue (Rmb mn) 5,824 6,429 7,478 8,693 9,440EBIT (Rmb mn) 306 491 511 763 845Net Profit (Rmb mn) 223 375 390 583 646EPS (Rmb) - 0.13 0.13 0.19 0.22DPS (Rmb) 0.00 0.00 0.00 0.00 0.00Revenue growth (%) 15.1% 10.4% 16.3% 16.2% 8.6%EPS growth (%) - - 3.9% 49.4% 10.8%ROE 39.1% 57.8% 27.1% 24.4% 21.5%P/E (x) - 8.8 8.5 5.7 5.1P/BV (x) - 4.2 1.6 1.2 1.0Dividend Yield 0.0% 0.0% 0.0% 0.0% 0.0%Source: Company data, Bloomberg, J.P. Morgan estimates.
Company Data52-week Range (HK$) 1.85-1.25Shares O/S (mn) 3,000Market Cap (Rmb mn) 3,313Market Cap ($ mn) 503Price (HK$) 1.30Date Of Price 22 Jun 16Free Float(%) 27.9%3M - Avg daily vol (mn) -3M - Avg daily val ($ mn) -HSI 2,0668.44Exchange Rate 7.76Price Target End Date 31-Dec-16
See page 24 for analyst certification and important disclosures, including non-US analyst disclosures.J.P. Morgan does and seeks to do business with companies covered in its research reports. As a result, investors should be aware that the firm may have a conflict of interest that could affect the objectivity of this report. Investors should consider this report as only a single factor in making their investment decision.
0.8
1.0
1.2
1.4
1.6
1.8
HK$
Jun-15 Sep-15 Dec-15 Mar-16 Jun-16
Price Performance
1585.HK share price (HK$)
HSI (rebased)
We initiate coverage on Yadea with a Neutral rating and Dec-16 PT of HK$1.5. Yadea is the largest electric-scooter and second-largest electric-bicycle manufacturer in China under its own brand (Yadea), with 10.5% market share by revenue in 2015 (source Frost & Sullivan).
Positive investment drivers:
1) Steady industry growth and market share gains: China’s electric two-wheeler market is expected to grow at mid-single digits p.a. overthe next couple of years. Yadea expanded its market share from ~8% in 2013 to ~10% in 2015, and we expect further market share gains.
2) Restrictions on motorbikes to benefit e-scooters/bikes: To curb air pollution, many cities in China (currently ~200) have banned the use of motorcycles. This has directly benefited electric two-wheelers,which have gained share at the expense of traditional motorcycles.
3) Solid balance sheet and financial position: Yadea has a significant negative working capital business model as it receives payments from customers (i.e. dealers) promptly but pays suppliers several months later. The result is a net cash position (40% of assets is cash) and positive free cash flow, which creates potential dividend upside.
4) Penetration into high end e-motorcycles: Yadea has entered into a strategic co-operation agreement with Lightning Motors, a US-based high-end electric motorcycle producer, and plans to launch an advanced lithium battery powered e-scooter in China in the future.
Key investment risks: 1) Price competition: Intense competition caused Yadea's ASP to slip by ~4% in 2015 as a result of higher rebates to dealers to retain market share. 2) Regulatory risk of prohibiting the use of electric two-wheelers. 3) Consumption upgrade to four-wheelers.
Valuation, risks: Our Dec-16 PT of HK$1.5 is based on 10x PER. Risks:worse than expected sales volume or pricing.
Completed 22 Jun 2016 10:58 PM HKTDisseminated 23 Jun 2016 12:15 AM HKT
2
Asia Pacific Equity Research23 June 2016
Nick Lai(852) 2800 [email protected]
Valuation summary (Please refer to Valuation references section for more comps and analysis)Price (LC) Mkt cap P/E (x) P/B (x) ROE Div. yield
Company Code Rec June-22 (US$ M) 16E 17E 16E 17E 16E 17E 16E 17EYadea 1585 HK N 1.3 503 8.5 5.7 1.6 1.2 27% 24% 0.0% 0.0%Brilliance 1114 HK OW 7.9 5,136 9.6 8.0 1.5 1.3 16% 17% 1.3% 1.4%ZhengTong Auto 1728 HK N 2.9 835 7.8 6.9 0.6 0.6 8% 9% 3.4% 3.9%DongFeng Motor 489 HK N 8.4 9,319 4.9 4.7 0.6 0.6 14% 13% 2.8% 2.9%Great Wall Motor-H 2333 HK N 6.5 10,577 6.0 6.2 1.1 1.0 20% 17% 7.9% 5.0%Geely 175 HK OW 4.2 4,777 9.5 7.6 1.4 1.2 16% 17% 0.9% 1.3%GAC-H 2238 HK OW 9.5 16,730 7.5 6.7 1.2 1.0 17% 17% 2.6% 4.3%Minth Group 425 HK OW 24.0 3,465 13.2 10.8 2.2 1.8 18% 18% 2.3% 3.0%Baoxin Auto 1293 HK N 4.2 1,398 19.8 18.1 1.7 1.6 9% 9% 0.0% 0.5%Zhongsheng 881 HK UW 4.2 1,162 13.2 12.4 0.7 0.6 5% 5% 1.2% 1.5%Sinotruk 3808 HK N 3.4 1,224 22.6 20.3 0.4 0.4 2% 2% 0.9% 1.4%Nexteer 1316 HK OW 7.5 2,412 10.1 8.5 2.4 1.8 26% 24% 1.3% 1.7%SAIC Motor 600104 CH N 20.4 34,160 7.2 6.8 1.2 1.1 17% 17% 6.7% 7.0%Fuyao-H 3606 HK OW 18.0 5,468 12.6 11.2 2.2 2.0 18% 19% 4.9% 5.4%BAIC Motor 1958 HK UW 5.5 5,346 10.6 9.1 0.9 0.9 9% 10% 3.2% 3.2%Yutong Bus 600066 CH OW 20.0 6,728 11.2 10.5 3.3 2.9 30% 29% 7.5% 5.3%Huayu Automotive 600741 CH N 15.4 7,368 9.2 8.6 1.6 1.4 18% 18% 5.3% 4.8%Weichai Power (1) 2338 HK OW 8.3 4,647 14.1 11.4 0.9 0.8 6% 7% 2.8% 3.5%BYD 1211 HK OW 46.4 19,917 22.2 17.5 2.6 2.2 12% 14% 0.0% 0.0%Average 9.9 9.1 1.4 1.3 15% 15% 3.1% 3.1%Average exclude BYD 8.9 8.2 1.3 1.2 15% 15% 3.2% 3.3%
Source: J.P. Morgan estimates, Bloomberg. Notes: (1) Weichai Power is covered by Karen Li. (2) Average P/E is calculated as aggregated sector market cap divided by FY16/17E aggregated sector
earnings; averages of P/B, ROE and dividend yield are simple average of the companies listed above.
Key catalysts for the stock price: Upside risks to our view: Downside risks to our view:
Launch of high-end Lib models More cities putting restrictions on gasoline-powered
two wheelers
Better than expected sales volume or pricing Worse than expected sales volume or pricing
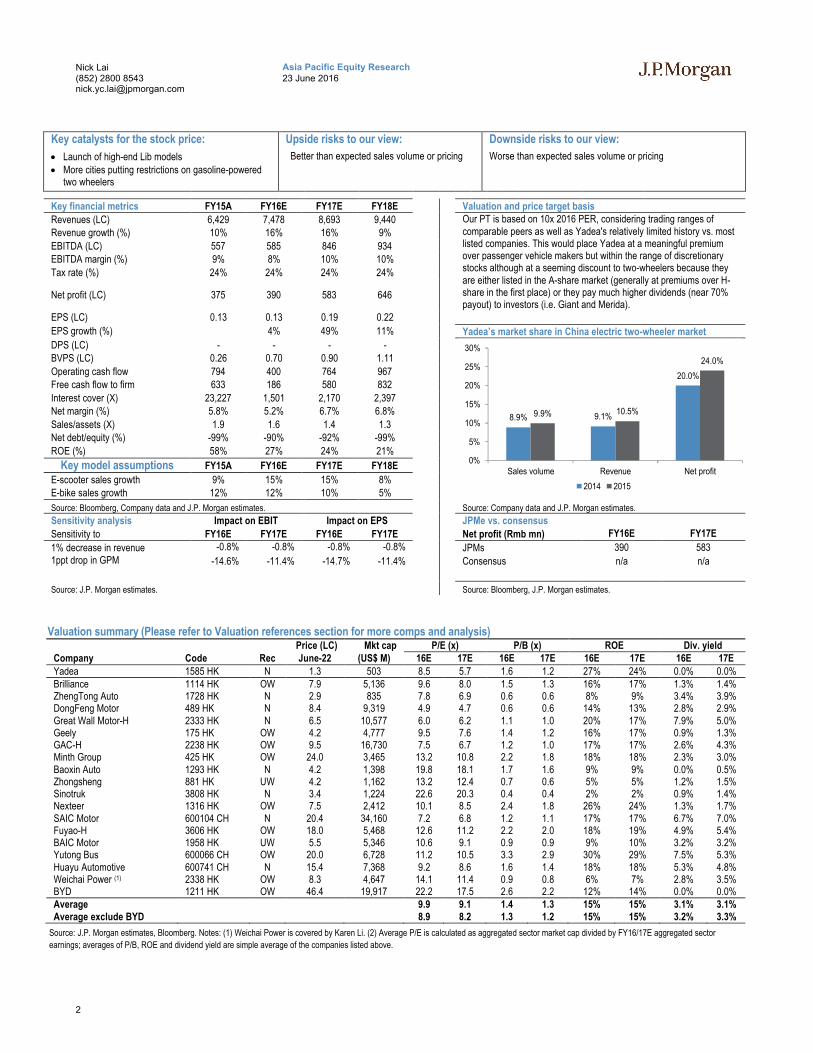
Key financial metrics FY15A FY16E FY17E FY18E Valuation and price target basis
Revenues (LC) 6,429 7,478 8,693 9,440 Our PT is based on 10x 2016 PER, considering trading ranges of comparable peers as well as Yadea's relatively limited history vs. most listed companies. This would place Yadea at a meaningful premium over passenger vehicle makers but within the range of discretionary stocks although at a seeming discount to two-wheelers because they are either listed in the A-share market (generally at premiums over H-share in the first place) or they pay much higher dividends (near 70% payout) to investors (i.e. Giant and Merida).
Revenue growth (%) 10% 16% 16% 9%
EBITDA (LC) 557 585 846 934EBITDA margin (%) 9% 8% 10% 10%
Tax rate (%) 24% 24% 24% 24%
Net profit (LC) 375 390 583 646
EPS (LC) 0.13 0.13 0.19 0.22
EPS growth (%) 4% 49% 11% Yadea’s market share in China electric two-wheeler market
DPS (LC) - - - -BVPS (LC) 0.26 0.70 0.90 1.11
Operating cash flow 794 400 764 967Free cash flow to firm 633 186 580 832
Interest cover (X) 23,227 1,501 2,170 2,397Net margin (%) 5.8% 5.2% 6.7% 6.8%
Sales/assets (X) 1.9 1.6 1.4 1.3Net debt/equity (%) -99% -90% -92% -99%
ROE (%) 58% 27% 24% 21%
Key model assumptions FY15A FY16E FY17E FY18E
E-scooter sales growth 9% 15% 15% 8%E-bike sales growth 12% 12% 10% 5%
Source: Bloomberg, Company data and J.P. Morgan estimates. Source: Company data and J.P. Morgan estimates.
Sensitivity analysis Impact on EBIT Impact on EPS JPMe vs. consensus
Sensitivity to FY16E FY17E FY16E FY17E Net profit (Rmb mn) FY16E FY17E
1% decrease in revenue -0.8% -0.8% -0.8% -0.8% JPMs 390 5831ppt drop in GPM -14.6% -11.4% -14.7% -11.4% Consensus n/a n/a
Source: J.P. Morgan estimates. Source: Bloomberg, J.P. Morgan estimates.
8.9% 9.1%
20.0%
9.9% 10.5%
24.0%
0%
5%
10%
15%
20%
25%
30%
Sales volume Revenue Net profit
2014 2015

3
Asia Pacific Equity Research23 June 2016
Nick Lai(852) 2800 [email protected]
Table of contentsInvestment positives ................................................................4
Positive 1: Superior profitability and healthy balance sheet ......................................4
Positive 2: Resilient industry growth and market share gains....................................6
Positive 3: Restriction on motorcycle an opportunity for e-scooter ...........................7
Positive 4: Penetration into high-end LiB e-scooter ..................................................7
Key investment risks................................................................8
Risk 1: Pricing competition .....................................................................................8
Risk 2: Consumption upgrade might be a threat to two-wheeler demand...................9
Risk 3: Regulatory risk on prohibiting electric two-wheelers..................................10
Risk 4: Pending litigations and non-compliance incidents ......................................10
Valuation references ..............................................................11
Company analysis ..................................................................13
SWOT analysis........................................................................16
Industry analysis ....................................................................17
Financial analysis...................................................................19
Profit & loss..........................................................................................................19
Balance sheet ........................................................................................................21
Cash flow..............................................................................................................21
Investment Thesis, Valuation and Risks ..............................22

4
Asia Pacific Equity Research23 June 2016
Nick Lai(852) 2800 [email protected]
Investment positives
Positive 1: Superior profitability and healthy balance sheet
Superior profitability
Yadea’s profitability measured by gross margin has improved meaningfully from 13% in 2013 to 17% in 2014 and 19% in 2015 vs. average of China’s listed two-wheelers at 13-14% in 2014-15. While we acknowledge the fact that it may not be an apples-to-apples comparison between Yadea and other listed two-wheelers that derive their revenue not only from electric two-wheelers but also (and possibly mainly) traditional bicycles or fuel powered motorcycles, these are perhaps the best comparable peers as there are no listed pure electric two-wheeler companies in China. In the pure electric two-wheeler industry, we think Yadea’s superior profitability can be gauged through its 24% market share by net profit (FY15) vs. only ~10% share in sales volume or revenue, according to Frost & Sullivan.
Table 1: Margin comparison - Yadea vs. China listed two-wheelers Rmb mn, %
Company Local name Ticker Revenue Net profit Gross margin Net margin
2015 2015 2014 2015 2014 2015
Yadea 雅迪 1585 HK 6,429 375 17% 19% 4% 6%
Loncin Motor C-A 隆鑫通用 603766 CH 7,009 770 19% 20% 9% 11%
Chongqing Zong-A 宗申动力 001696 CH 4,660 381 20% 21% 8% 8%
Zhejiang Qian -A 钱江摩托 000913 CH 2,090 (130) 14% 17% -8% -6%
Chongqing Jian-B 建摩 200054 CH 1,326 241 11% 6% -8% 18%
China Jialing-A 中国嘉陵 600877 CH 1,040 (160) 10% 9% 1% -15%
Zhonglu Co Ltd-A 中路股份 600818 CH 654 52 12% 17% 1% 8%
Jinshan Develo-A 金山开发 600679 CH 459 4 14% 14% 6% 1%
Linhai Co Ltd-A 林海股份 600099 CH 356 2 13% 13% 1% 1%
Shenz China Bi-A 深中华 000017 CH 171 (0) 6% 7% 2% 0%
Average of China listed two-wheelers 13% 14% 1% 3%
Source: Company, Bloomberg. Note: averages are simple average and excludes outliers
Figure 1: Gross margin comparison
Source: Company, J.P. Morgan estimates, Bloomberg. Note: averages are simple average and
excludes outliers
Figure 2: Yadea’s market share by volume, revenue and profit in China’s electric two-wheeler market (2014-2015)
Source: Company, Frost & Sullivan
12.9%
16.6%
18.9%
12.7%13.2% 13.7%
10.0%11.0%12.0%13.0%14.0%15.0%16.0%17.0%18.0%19.0%20.0%
2013 2014 2015
Yadea China listed two-wheelers avg
8.9% 9.1%
20.0%
9.9% 10.5%
24.0%
0%
5%
10%
15%
20%
25%
30%
Sales volume Revenue Net profit
2014 2015
Yadea’s profitability measured by gross margin was substantially higher than average of China listed two-wheelers in 2014/2015 Yadea has 24% market share by net
profit in electric two-wheelers vs. 9.9% in sales volume and 10.5% in revenue due to higher margins

5
Asia Pacific Equity Research23 June 2016
Nick Lai(852) 2800 [email protected]
Cash-rich balance sheet and negative working capital
Besides superior profitability, Yadea also has a very healthy balance sheet measured by ROE, net cash/equity, working capital or cash conversion cycle. For instance, Yadea’s ROE was 39% in 2014 and 58% in 2015, well above most peers highlighted in the following table. Yadea has been in a net cash position consistently since 2013 and its net cash to equity stood at -225% in 2014 or -199% in 2015 vs. industry average of -12%, based on our analysis. Furthermore, Yadea’s cash conversion cycle is exceptionally strong at -116 days in 2014 and -156 days in 2015 vs. other peers at best -30 days, as the company receives payment from customers (i.e. dealers) rather quickly and then pays suppliers several months later.
Yadea’s negative working capital and free cash flow position allows potential dividend upside, in our view (which we discuss further in “Financial Analysis” section of this report). At the moment, we have not factored any dividend in our forecasts.
Table 2: Key balance sheet metric comparison - Yadea vs. China listed two-wheelers
Company Local name Ticker ROE Net debt (cash) to equity Cash conversion cycle (days)
2014 2015 2014 2015 2014 2015
Yadea 雅迪 1585 HK 39% 58% -225% -199% -116 -156
Loncin Motor C-A 隆鑫通用 603766 CH 16% 17% -25% -19% 20 22
Chongqing Zong-A 宗申动力 001696 CH 12% 11% -15% 14% 105 92
Zhejiang Qian -A 钱江摩托 000913 CH -9% -6% 9% 5% 235 221
Chongqing Jian-B 建摩 200054 CH -159% 176% 7832% 342% 6 31
China Jialing-A 中国嘉陵 600877 CH 6% -160% 466% n/a -9 -30
Zhonglu Co Ltd-A 中路股份 600818 CH 2% 12% 10% -1% 36 48
Jinshan Develo-A 金山开发 600679 CH 6% 0% -12% -12% 18 37
Linhai Co Ltd-A 林海股份 600099 CH 1% 1% -42% -41% 74 88
Shenz China Bi-A 深中华 000017 CH 52% -1% -224% -200% 5 10
Average of China listed two-wheelers 5% 6% -13% -9% 55 58
Source: Company, Bloomberg. Note: 1) Averages are simple average and excludes outliers. 2) Net debt is calculated as interest-bearing borrowings - cash and cash equivalent and pledged bank
deposits.
Figure 3: ROE comparison
Source: Company, J.P. Morgan estimates, Bloomberg. Note: averages are simple average and
excludes outliers
Figure 4: Net debt (cash) to equity comparison
Source: Company, J.P. Morgan estimates, Bloomberg. Note: 1) Averages are simple average
and excludes outliers. 2) Net debt is calculated as interest-bearing borrowings - cash and cash
equivalent and pledged bank deposits
32%
39%
58%
5% 5% 6%
0%
10%
20%
30%
40%
50%
60%
70%
2013 2014 2015
Yadea China listed two-wheelers avg
-112%
-225%-199%
-14% -13% -9%
-250%
-200%
-150%
-100%
-50%
0%2013 2014 2015
Yadea China listed two-wheelers avg
6
Asia Pacific Equity Research23 June 2016
Nick Lai(852) 2800 [email protected]
Positive 2: Resilient industry growth and market share gains
Resilient industry growth
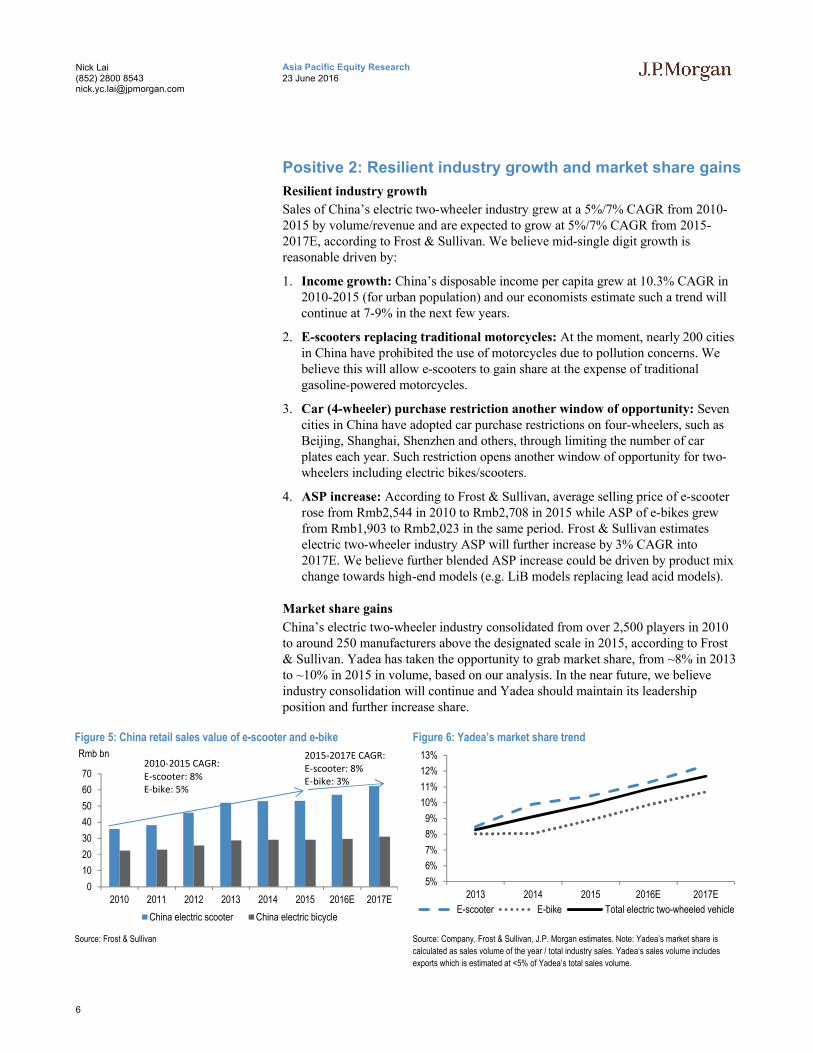
Sales of China’s electric two-wheeler industry grew at a 5%/7% CAGR from 2010-2015 by volume/revenue and are expected to grow at 5%/7% CAGR from 2015-2017E, according to Frost & Sullivan. We believe mid-single digit growth is reasonable driven by:
1. Income growth: China’s disposable income per capita grew at 10.3% CAGR in 2010-2015 (for urban population) and our economists estimate such a trend will continue at 7-9% in the next few years.
2. E-scooters replacing traditional motorcycles: At the moment, nearly 200 cities in China have prohibited the use of motorcycles due to pollution concerns. We believe this will allow e-scooters to gain share at the expense of traditional gasoline-powered motorcycles.
3. Car (4-wheeler) purchase restriction another window of opportunity: Sevencities in China have adopted car purchase restrictions on four-wheelers, such as Beijing, Shanghai, Shenzhen and others, through limiting the number of car plates each year. Such restriction opens another window of opportunity for two-wheelers including electric bikes/scooters.
4. ASP increase: According to Frost & Sullivan, average selling price of e-scooter rose from Rmb2,544 in 2010 to Rmb2,708 in 2015 while ASP of e-bikes grew from Rmb1,903 to Rmb2,023 in the same period. Frost & Sullivan estimates electric two-wheeler industry ASP will further increase by 3% CAGR into 2017E. We believe further blended ASP increase could be driven by product mix change towards high-end models (e.g. LiB models replacing lead acid models).
Market share gains
China’s electric two-wheeler industry consolidated from over 2,500 players in 2010 to around 250 manufacturers above the designated scale in 2015, according to Frost & Sullivan. Yadea has taken the opportunity to grab market share, from ~8% in 2013 to ~10% in 2015 in volume, based on our analysis. In the near future, we believe industry consolidation will continue and Yadea should maintain its leadership position and further increase share.
Figure 5: China retail sales value of e-scooter and e-bike
Source: Frost & Sullivan
Figure 6: Yadea’s market share trend
Source: Company, Frost & Sullivan, J.P. Morgan estimates. Note: Yadea’s market share is
calculated as sales volume of the year / total industry sales. Yadea‘s sales volume includes
exports which is estimated at <5% of Yadea’s total sales volume.
0
10
20
30
40
50
60
70
2010 2011 2012 2013 2014 2015 2016E 2017E
Rmb bn
China electric scooter China electric bicycle
2010-2015 CAGR:E-scooter: 8%E-bike: 5%
2015-2017E CAGR:E-scooter: 8%E-bike: 3%
5%
6%
7%
8%
9%
10%
11%
12%
13%
2013 2014 2015 2016E 2017E
E-scooter E-bike Total electric two-wheeled vehicle

7
Asia Pacific Equity Research23 June 2016
Nick Lai(852) 2800 [email protected]
Positive 3: Restriction on motorcycle an opportunity for e-scooter
To curb air pollution, nearly 200 cities in China had prohibited or restricted the use of motorcycle as of 2013, according to China Association of Automobile Manufacturers. All tier-one cities including Beijing, Shanghai, Guangzhou and Shenzhen are in the list, as well as major tier-two cities such as Tianjin, Nanjing, Hangzhou, Chengdu and others. Restrictions vary by city but can be categorized as:
1. Prohibiting the use of motorcycles for entire city
2. Restricting the use of motorcycles in certain districts or time frame
3. Limiting the number of motorcycle plate issuance per year
Besides a few cities that also prohibit the use of e-scooter/e-bikes (i.e. Shenzhen), restrictions on motorcycles open an opportunity for electric two-wheelers. As a result of regulatory restrictions on the use of motorcycles, domestic motorcycle sales (mainly gasoline powered motorcycle) declined at a CAGR of 9% between 2010-2015 whilst electric two-wheelers (i.e. electric bike, electric moped and electric motorcycle) grew by 5%.
Figure 7: Domestic sales of motorcycle vs. electric two-wheeler
Source: Frost & Sullivan, CAAM. Note: Motorcycle sales here include traditional motorcycle and
electric motorcycle and include a minor portion of three-wheeled motorcycle. Electric two
wheelers include electric bikes, electric mopeds and electric motorcycle.
Figure 8: Sales growth (yoy%) of motorcycle vs. electric two-wheeler
Source: Frost & Sullivan, CAAM. Note: Motorcycle sales here include traditional motorcycle and
electric motorcycle and include a minor portion of three-wheeled motorcycle. Electric two
wheelers include electric bikes, electric mopeds and electric motorcycle.
Positive 4: Penetration into high-end LiB e-scooter
Lightning Motors is a US based company established in 2006 and specializes in R&D of advanced electric two-wheeler vehicles. In June 2015, Yadea entered into a strategic cooperation agreement with Lightning Motors to jointly research, develop and produce products as well as sharing international customer base. Yadea will be Lightning’s exclusive worldwide electric two-wheeler vehicle partner and can exclusively use its relevant intellectual property rights for electric two-wheeler vehicles. In Dec-2015, Yadea also acquired 11.1% of Lightning Motors with total consideration of USD1.3mn.
Yadea plans to launch high-end lithium battery powered electric scooters under the “Lightning” brand, which will be sold exclusively through Yadea’s online platform. We expect the newly developed LiB e-scooter to be priced at Rmb10k-20k vs. Yadea’s current e-scooters MSRP at Rmb2,165-3,920 (excluding batteries and
-
5
10
15
20
25
30
35
40
2010 2011 2012 2013 2014 2015
Million units
China domestic motorcycle sales Electric two wheeler sales
2010-2015 CAGR:Motorcycle: -9% , Electric two-wheelers: 5%
-15%
-10%
-5%
0%
5%
10%
15%
20%
2010 2011 2012 2013 2014 2015
China domestic motorcycle sales Electric two wheeler sales
China’s domestic motorcycle sales have been dropping every year since 2010 while electric two-wheelers saw consistent positive growth

8
Asia Pacific Equity Research23 June 2016
Nick Lai(852) 2800 [email protected]
chargers). We believe currently there’s no such high-end e-scooter models in the price range of >Rmb10k in the market and hence the new product launch offers potential business opportunity for the company.
Figure 9: Example of Lightning's existing product: LS-218 (retail price starts at US$38,888)
Source: Company
Key investment risks
Risk 1: Pricing competition
Whilst China’s electric two-wheeler industry has consolidated from over 2,500 players in 2010 to around 250 manufacturers above designated scale in 2015, the industry remains fragmented as top 5 players accounted for only ~33% of total revenue in 2015. In such a highly competitive and fragmented industry, a sudden slowdown in demand could lead to aggressive price competition.
Indeed, when industry sales volume decelerated to 0.2% growth in 2014 (from 8% in 2013 or 15% in 2012), Yadea’s e-scooter and e-bike ASP dropped as a result of higher discounts offered to dealers as part of sales promotions, which lasted from 2H14 to 3Q15. Blended ASP in 2015 further declined by 4% vs. 2014.
Our sensitivity analysis indicates that a 1% drop in e-scooter and e-bike blended ASP could lead to a ~4% drop in 2016E gross profit, or ~10% change in net profit, assuming all other assumptions are held constant (i.e. no change in sales volume and same opex assumptions).
Table 3: Sensitivity on gross and net profit – assuming Yadea’s e-scooter and e-bike blended ASP declines by 1%
Rmb mn, % 2013 2014 2015 2016E 2017EGross profit - actual/ base case 655 968 1,217 1,422 1,738Gross profit - ASP decline by 1% 616 922 1,168 1,364 1,671Difference -6% -5% -4% -4% -4%Net profit - actual/ base case 174 223 375 390 583Net profit - ASP decline by 1% 147 194 342 350 538Difference -16% -13% -9% -10% -8%
Source: Company, J.P. Morgan estimates. Note: assuming all other assumptions held constant.
Specs of LS-218 (Lightning’s existing model):
Retail price starts at US$38,888
Battery options: o 380V 12 kwh battery pack
(Range of 100-120 miles per charge)o 380V 15 kwh battery pack
(Range of 120-150 miles per charge)o 380V 20 kwh battery pack
(Range of 160-180 miles per charge)
Horsepower: 200HP
Yadea plans to jointly develop new high-end LiB model with Lightning;expected MSRP at Rmb10-20k.

9
Asia Pacific Equity Research23 June 2016
Nick Lai(852) 2800 [email protected]
Risk 2: Consumption upgrade might be a threat to two-wheeler demand
Private transportation on the road ranges from bicycle, scooter/ motorcycle, three-wheeler to automobile (sedan, SUV, van, pickup truck and so on). When it comes to choosing between the different means of transportation, affordability plays a crucial role besides other factors such as convenience, comfort, regulation and personal preference. Indeed, one can argue that two-wheelers can sometimes be more convenient and easier to travel within cities especially during traffic or when it becomes difficult to locate parking spaces; four-wheelers also have irreplaceable advantages such as higher speed, more comfort, longer travel distance and greater load/passenger capacity, etc.
While we acknowledge that the starting price of entry-level four-wheelers (mini/low speed EVs/ compact cars) is ~10-15x of two-wheelers (e-scooters/ motorcycles), two factors could continue to drive consumption upgrade:
1. China's passenger vehicle (four-wheeler) price has been declining at 4% CAGR in the past decade.
2. In the same period, average disposable income per capita rose at 11% CAGR.
We believe both trends could carry on with average car price declining at 3-4%/year while income rising at 7-9% p.a. in the near future. Historical data show that during 2010-2015, sales growth of mini EV and compact PV (≤1.6L) has been consistently considerably higher than the growth of motorcycle/ e-scooter.
Figure 10: Sales growth comparison (yoy%)
Source: Frost & Sullivan, CAAM, Tianneng Power. Note: compact PV refers to passenger
vehicles with engine capacity below or equal 1.6L
Figure 11: China passenger vehicle price index (Jan-2004 = 100)
Source: CEIC
-10%0%
10%20%30%40%50%60%70%80%90%
2010 2011 2012 2013 2014 2015
Motorcycle/ E-scooter Mini EV Compact PV
62
50556065707580859095
100 China passenger vehicle price declined at a CAGR of 4% in 2004-2015 while disposable income per capita rose at 11.5% CAGR in the same period.
Sales growth of mini EV and compact PV have been consistently considerably higher than the growth of motorcycle/ e-scooter in 2010-2015
10
Asia Pacific Equity Research23 June 2016
Nick Lai(852) 2800 [email protected]
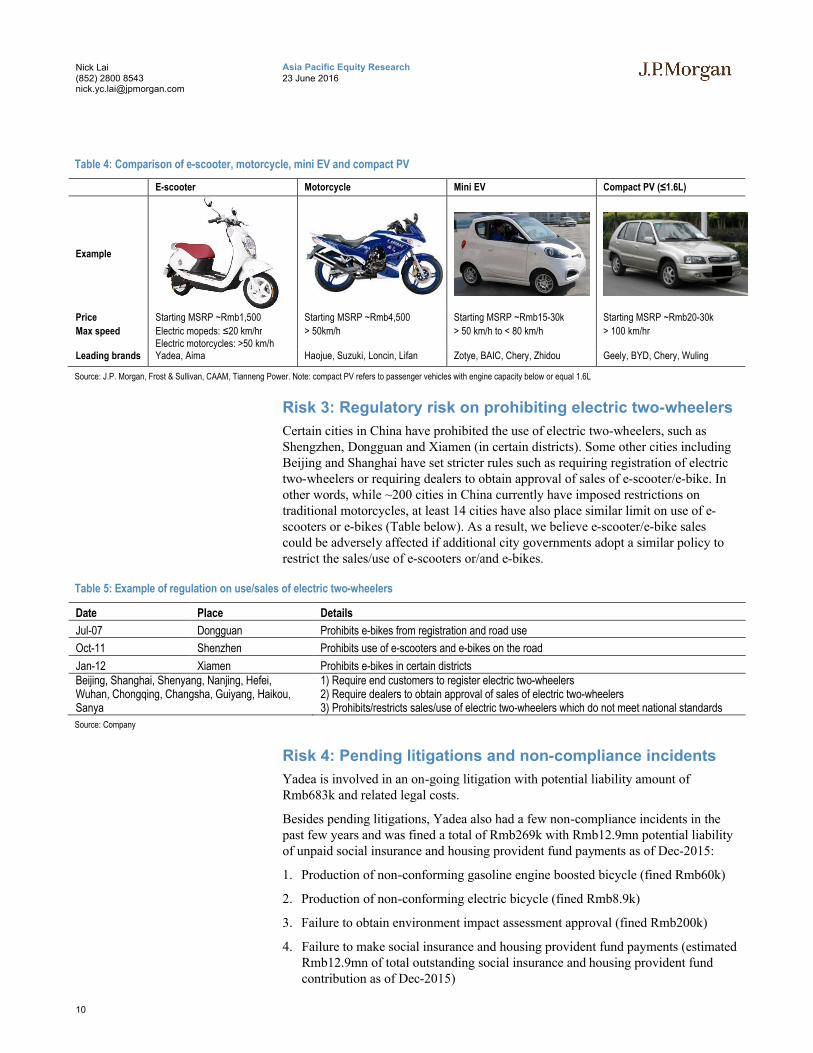
Table 4: Comparison of e-scooter, motorcycle, mini EV and compact PV
E-scooter Motorcycle Mini EV Compact PV (≤1.6L)
Example
Price Starting MSRP ~Rmb1,500 Starting MSRP ~Rmb4,500 Starting MSRP ~Rmb15-30k Starting MSRP ~Rmb20-30k
Max speed Electric mopeds: ≤20 km/hrElectric motorcycles: >50 km/h
> 50km/h > 50 km/h to < 80 km/h > 100 km/hr
Leading brands Yadea, Aima Haojue, Suzuki, Loncin, Lifan Zotye, BAIC, Chery, Zhidou Geely, BYD, Chery, Wuling
Source: J.P. Morgan, Frost & Sullivan, CAAM, Tianneng Power. Note: compact PV refers to passenger vehicles with engine capacity below or equal 1.6L
Risk 3: Regulatory risk on prohibiting electric two-wheelers
Certain cities in China have prohibited the use of electric two-wheelers, such as Shengzhen, Dongguan and Xiamen (in certain districts). Some other cities including Beijing and Shanghai have set stricter rules such as requiring registration of electric two-wheelers or requiring dealers to obtain approval of sales of e-scooter/e-bike. In other words, while ~200 cities in China currently have imposed restrictions on traditional motorcycles, at least 14 cities have also place similar limit on use of e-scooters or e-bikes (Table below). As a result, we believe e-scooter/e-bike sales could be adversely affected if additional city governments adopt a similar policy to restrict the sales/use of e-scooters or/and e-bikes.
Table 5: Example of regulation on use/sales of electric two-wheelers
Date Place Details
Jul-07 Dongguan Prohibits e-bikes from registration and road use
Oct-11 Shenzhen Prohibits use of e-scooters and e-bikes on the road
Jan-12 Xiamen Prohibits e-bikes in certain districtsBeijing, Shanghai, Shenyang, Nanjing, Hefei, Wuhan, Chongqing, Changsha, Guiyang, Haikou, Sanya
1) Require end customers to register electric two-wheelers 2) Require dealers to obtain approval of sales of electric two-wheelers3) Prohibits/restricts sales/use of electric two-wheelers which do not meet national standards
Source: Company
Risk 4: Pending litigations and non-compliance incidents
Yadea is involved in an on-going litigation with potential liability amount of Rmb683k and related legal costs.
Besides pending litigations, Yadea also had a few non-compliance incidents in the past few years and was fined a total of Rmb269k with Rmb12.9mn potential liability of unpaid social insurance and housing provident fund payments as of Dec-2015:
1. Production of non-conforming gasoline engine boosted bicycle (fined Rmb60k)
2. Production of non-conforming electric bicycle (fined Rmb8.9k)
3. Failure to obtain environment impact assessment approval (fined Rmb200k)
4. Failure to make social insurance and housing provident fund payments (estimated Rmb12.9mn of total outstanding social insurance and housing provident fund contribution as of Dec-2015)
11
Asia Pacific Equity Research23 June 2016
Nick Lai(852) 2800 [email protected]
Valuation references
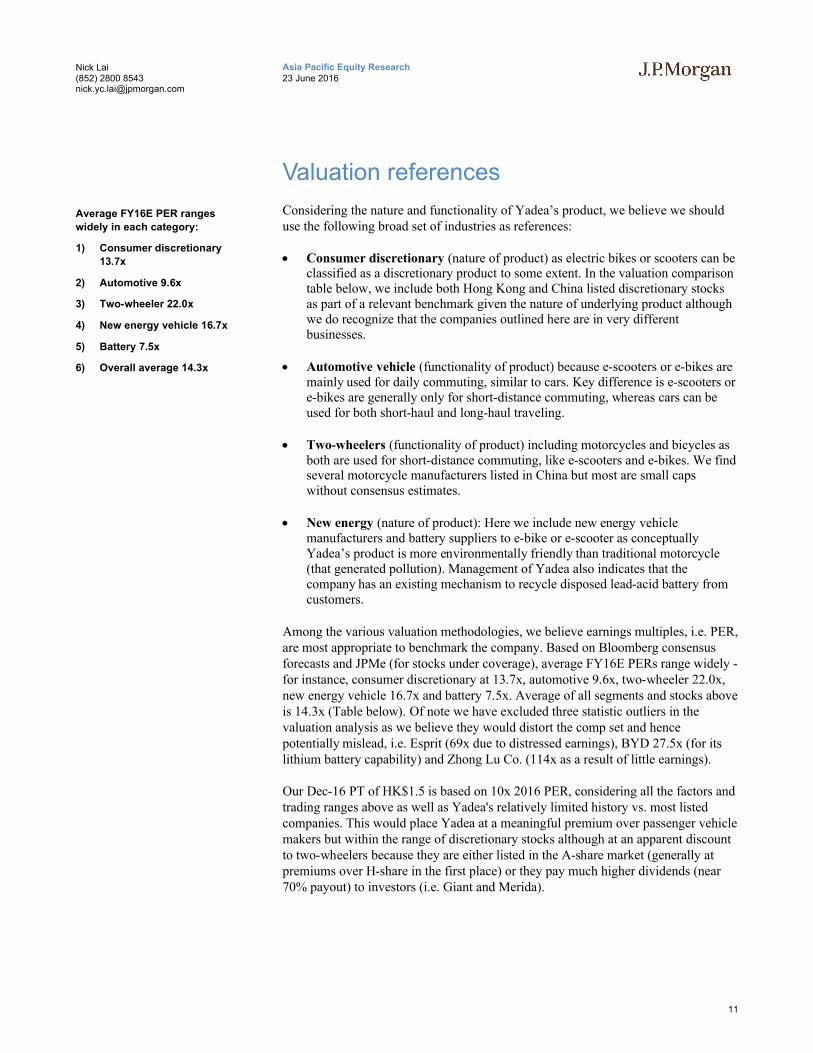
Considering the nature and functionality of Yadea’s product, we believe we should use the following broad set of industries as references:
Consumer discretionary (nature of product) as electric bikes or scooters can be classified as a discretionary product to some extent. In the valuation comparison table below, we include both Hong Kong and China listed discretionary stocks as part of a relevant benchmark given the nature of underlying product although we do recognize that the companies outlined here are in very different businesses.
Automotive vehicle (functionality of product) because e-scooters or e-bikes are mainly used for daily commuting, similar to cars. Key difference is e-scooters or e-bikes are generally only for short-distance commuting, whereas cars can be used for both short-haul and long-haul traveling.
Two-wheelers (functionality of product) including motorcycles and bicycles as both are used for short-distance commuting, like e-scooters and e-bikes. We find several motorcycle manufacturers listed in China but most are small caps without consensus estimates.
New energy (nature of product): Here we include new energy vehicle manufacturers and battery suppliers to e-bike or e-scooter as conceptually Yadea’s product is more environmentally friendly than traditional motorcycle (that generated pollution). Management of Yadea also indicates that the company has an existing mechanism to recycle disposed lead-acid battery from customers.
Among the various valuation methodologies, we believe earnings multiples, i.e. PER, are most appropriate to benchmark the company. Based on Bloomberg consensus forecasts and JPMe (for stocks under coverage), average FY16E PERs range widely -for instance, consumer discretionary at 13.7x, automotive 9.6x, two-wheeler 22.0x, new energy vehicle 16.7x and battery 7.5x. Average of all segments and stocks above is 14.3x (Table below). Of note we have excluded three statistic outliers in the valuation analysis as we believe they would distort the comp set and hence potentially mislead, i.e. Esprit (69x due to distressed earnings), BYD 27.5x (for its lithium battery capability) and Zhong Lu Co. (114x as a result of little earnings).
Our Dec-16 PT of HK$1.5 is based on 10x 2016 PER, considering all the factors and trading ranges above as well as Yadea's relatively limited history vs. most listed companies. This would place Yadea at a meaningful premium over passenger vehicle makers but within the range of discretionary stocks although at an apparent discount to two-wheelers because they are either listed in the A-share market (generally at premiums over H-share in the first place) or they pay much higher dividends (near 70% payout) to investors (i.e. Giant and Merida).
Average FY16E PER ranges
widely in each category:
1) Consumer discretionary
13.7x
2) Automotive 9.6x
3) Two-wheeler 22.0x
4) New energy vehicle 16.7x
5) Battery 7.5x
6) Overall average 14.3x

12
Asia Pacific Equity Research23 June 2016
Nick Lai(852) 2800 [email protected]
Table 6: Valuation summary
Ticker Company NameLocalname
JPManalyst
Country RecPrice (LC)Mkt Cap P/E P/ BV ROE Div yield
Jun-22 (US$ M) 16E 17E 16E 17E 16E 17E 16E 17E
1585 HK Yadea 雅迪 Nick Lai China N 1.3 503 8.5 5.7 1.6 1.2 27% 24% 0.0% 0.0%
Consumer discretionary 13.7 12.1 1.9 1.8 14% 15% 4.0% 4.7%2020 HK Anta Sports Prod 安踏体育 Shen Li, CFA China N 14.2 4,591 12.4 10.6 3.1 2.8 26% 28% 5.5% 6.5%
1880 HK Belle Intl 百丽 Ebru Sener Kurumlu China N 4.3 4,708 10.2 8.2 1.2 1.1 15% 14% 6.1% 7.3%
1234 HK China Lilang Ltd 中国利郎 Shen Li, CFA China OW 4.8 753 7.0 6.6 1.5 1.4 23% 22% 9.3% 9.8%
3308 HK Golden Eagle Ret 金鹰商贸集团 Ebru Sener Kurumlu China N 8.4 1,823 14.7 13.2 2.2 2.0 15% 16% 3.1% 3.4%
1169 HK Haier Electronic 海尔电器 Shen Li, CFA China OW 11.4 4,112 10.5 9.6 1.6 1.4 16% 16% 0.9% 1.0%
2331 HK Li Ning Co Ltd 李宁 Shen Li, CFA China N 3.4 831 13.3 10.6 1.4 1.3 12% 13% 1.7% 4.8%
891 HK Trinity Ltd 利邦 Shen Li, CFA Hong Kong N 0.6 133 9.7 7.4 0.3 0.3 3% 4% 6.8% 8.5%
1368 HK Xtep Intl 特步国际 Shen Li, CFA Hong Kong N 4.2 1,205 10.9 9.8 1.5 1.4 14% 15% 5.6% 6.1%
330 HK Esprit Hldgs 思捷环球 Ebru Sener Kurumlu Hong Kong N 6.0 1,496 60.1 48.3 0.7 0.7 -2% 1% 0.0% 1.2%
709 HK Giordano Intl 佐丹奴国际 Shen Li, CFA Hong Kong N 3.5 709 12.6 12.4 2.0 2.0 16% 16% 7.4% 7.4%
494 HK Li & Fung Ltd 利丰 Ebru Sener Kurumlu Hong Kong N 3.6 3,938 11.2 10.2 1.3 1.2 10% 11% 5.4% 5.9%
1212 HK Lifestyle Intl 利福国际 Ebru Sener Kurumlu Hong Kong OW 12.3 2,545 9.2 8.7 1.5 1.3 17% 16% 4.9% 5.2%
973 HK L'Occitane Intl 欧舒丹 Shen Li, CFA Hong Kong OW 16.8 3,199 20.2 17.6 3.0 2.7 16% 16% 1.9% 2.2%
178 HK Sa Sa Intl Hldgs 莎莎国际 Shen Li, CFA Hong Kong N 2.7 1,010 21.8 18.1 3.4 3.2 16% 18% 3.3% 4.1%
1910 HK Samsonite Intl 新秀丽 Shen Li, CFA Luxembourg N 23.1 4,191 19.3 17.3 2.7 2.5 15% 16% 2.5% 2.7%
600315 CH Shanghai Jahwa-A 上海家化 Ebru Sener Kurumlu China N 27.1 2,780 22.4 20.9 3.0 2.8 14% 14% 2.0% 2.1%
600690 CH Qingdao Haier-A 青岛海尔 Shen Li, CFA China OW 8.9 8,237 13.0 12.4 2.1 1.9 17% 16% 1.9% 2.1%Automotive 9.6 8.6 1.1 1.0 13% 13% 3.0% 3.1%600104 CH Saic Motor-A 上汽集团 Nick Lai China N 20.4 34,159 7.2 6.8 1.2 1.1 17% 17% 6.7% 7.0%
1114 HK Brilliance China 华晨中国 Nick Lai China OW 7.9 5,136 9.6 8.0 1.5 1.3 16% 17% 1.3% 1.4%
1958 HK Baic Motor-H 北京汽车 Nick Lai China UW 5.5 5,346 10.6 9.1 0.9 0.9 9% 10% 3.2% 3.2%
489 HK Dongfeng Motor-H 东风集团 Nick Lai China N 8.4 9,319 4.9 4.7 0.6 0.6 14% 13% 2.8% 2.9%
175 HK Geely Automobile 吉利汽车 Nick Lai China OW 4.2 4,777 9.5 7.6 1.4 1.2 16% 17% 0.9% 1.3%
2333 HK Great Wall Mot-H 长城汽车 Nick Lai China N 6.5 10,577 6.0 6.2 1.1 1.0 20% 17% 7.9% 5.0%
2238 HK Guangzhou Auto-H 广汽集团 Nick Lai China OW 9.5 16,729 7.5 6.7 1.2 1.0 17% 17% 2.6% 4.3%
881 HK Zhongsheng Group 中升控股 Nick Lai China UW 4.2 1,162 13.2 12.4 0.7 0.6 5% 5% 1.2% 1.5%
1293 HK Baoxin Auto Grou 宝信汽车 Nick Lai China N 4.2 1,398 19.8 18.1 1.7 1.6 9% 9% 0.0% 0.5%
1728 HK China Zhengtong 正通汽车 Nick Lai China N 2.9 835 7.8 6.9 0.6 0.6 8% 9% 3.4% 3.9%New energy vehicle 16.7 14.0 2.9 2.6 21% 21% 3.7% 2.7%1211 HK Byd Co Ltd-H 比亚迪 Nick Lai China OW 46.4 19,916 22.2 17.5 2.6 2.2 12% 14% 0.0% 0.0%
600066 CH Zhengzhou Yut-A 宇通客车 Nick Lai China OW 20.0 6,728 11.2 10.5 3.3 2.9 30% 29% 7.5% 5.3%
729 HK Fdg Evehicles 五龙电动车 N/A Hong Kong NC 0.4 1,260 n/a n/a n/a n/a -5% -50% n/a n/aTwo-wheelers 22.0 18.9 3.2 2.9 18% 18% 3.1% 3.3%9921 TT Giant Manufactur 巨大 Dan Lu, CFA Taiwan N 205.0 2,389 23.0 21.0 3.6 3.4 16% 17% 3.0% 3.2%
9914 TT Merida Industry 美利达 Dan Lu, CFA Taiwan N 140.5 1,305 14.7 13.9 3.1 2.9 22% 21% 4.8% 5.0%
2206 TT Sanyang Motor Co 三阳工业 N/A Taiwan NC 21.0 574 24.4 n/a n/a n/a n/a n/a n/a n/a
1599 TT Aeon Motor Co Lt 宏佳腾 N/A Taiwan NC 55.5 78 n/a n/a n/a n/a n/a n/a n/a n/a
8937 TT Her Chee Industr 合骐工业 N/A Taiwan NC 11.3 25 n/a n/a n/a n/a n/a n/a n/a n/a
601777 CH Lifan Industry-A 力帆股份 N/A China NC 11.6 2,222 23.8 18.2 n/a n/a n/a n/a n/a n/a
600818 CH Zhonglu Co Ltd-A 中路股份 N/A China NC 30.7 1,292 88.8 92.9 20.9 15.7 18% 17% 0.1% 0.0%
603766 CH Loncin Motor C-A 隆鑫通用 N/A China NC 19.4 2,467 19.0 16.3 2.9 2.5 16% 16% 1.4% 1.6%
001696 CH Chongqing Zong-A 宗申动力 N/A China NC 11.0 1,909 27.4 24.9 n/a n/a n/a n/a n/a n/a
600877 CH China Jialing-A 中国嘉陵 N/A China NC n/a n/a n/a n/a n/a n/a n/a n/a n/a n/a
000017 CH Shenz China Bi-A 深中华 N/A China NC 10.3 630 n/a n/a n/a n/a n/a n/a n/a n/a
600679 CH Jinshan Develo-A 金山开发 N/A China NC 14.5 662 n/a n/a n/a n/a n/a n/a n/a n/a
000913 CH Zhejiang Qian -A 钱江摩托 N/A China NC 12.2 841 n/a n/a n/a n/a n/a n/a n/a n/a
600099 CH Linhai Co Ltd-A 林海股份 N/A China NC 11.6 385 n/a n/a n/a n/a n/a n/a n/a n/a
200054 CH Chongqing Jian-B 建摩 N/A China NC 13.8 212 n/a n/a n/a n/a n/a n/a n/a n/a
422 HK Vietnam Manufact 越南制造加工 N/A Hong Kong NC 0.4 47 n/a n/a n/a n/a n/a n/a n/a n/aBattery for electric two-wheelers 7.5 6.2 1.4 1.2 19% 20% 4.6% 5.9%819 HK Tianneng Power 天能动力 N/A China NC 5.5 804 6.4 5.2 1.3 1.1 22% 23% 5.5% 6.8%
951 HK Chaowei Power 超威动力 N/A China NC 4.9 648 8.5 7.1 1.5 1.3 15% 16% 3.7% 5.0%
002684 CH Guangdong Dyna-A 猛狮科技 N/A China NC 33.6 1,677 43.0 23.6 11.3 7.6 27% 33% n/a n/a
Average (1) 14.3 12.0 2.6 2.2 15% 14% 3.6% 4.0%Source: Bloomberg, J.P. Morgan estimates. Estimates are based on Bloomberg consensus for companies not under J.P. Morgan coverage. Note: (1) Average PER excludes outliers (>100x or
negative PER) and BYD whose PER is due to battery capability.

13
Asia Pacific Equity Research23 June 2016
Nick Lai(852) 2800 [email protected]
Company analysis
Market leader in electric two-wheeler vehicle industry
Yadea was established in 2001 and is the largest player in the electric scooter segment in China by revenue in 2015, accounting for 11.2% of the market. In the electric bicycle market, Yadea is the second-largest player with 9.2% market share by revenue in 2015. Adding e-scooter and e-bike together, Yadea accounted for 9.9% of the market’s total sales volume in 2015, 10.5% of total revenue and 24% of total net profit (source: Frost & Sullivan) thanks to the company’s higher efficiency and profitability.
Figure 12: China electric two-wheeler vehicle market share by revenue (2015)
Source: Frost & Sullivan
Figure 13: China electric scooter market share by revenue (2015)
Source: Frost & Sullivan
Figure 14: China electric bicycle market share by revenue (2015)
Source: Frost & Sullivan
Figure 15: Yadea’s market share in China electric two-wheeler market (2014 and 2015)
Source: Company, Frost & Sullivan, J.P. Morgan
Shareholding structure and milestones
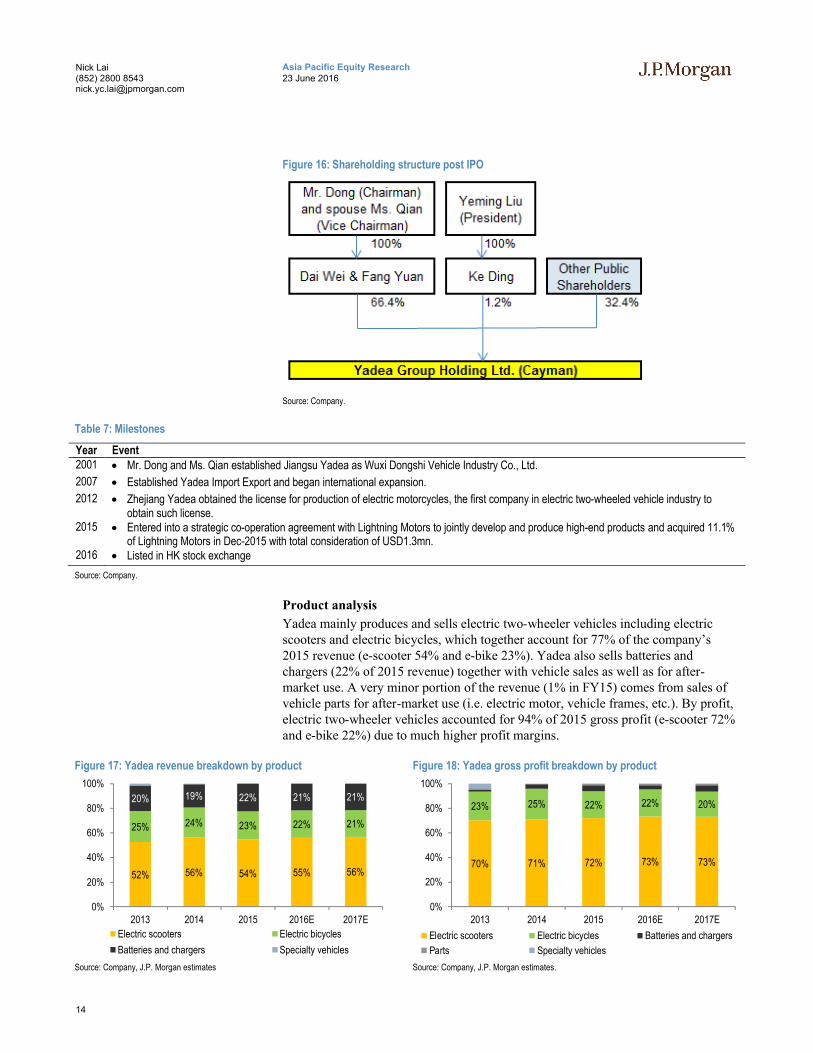
Yadea’s founder and Chairman, Mr. Dong and his spouse Ms. Qian together hold 66.4% of the company’s total shares post IPO. The President Mr. Yeming Liu holds 1.2% of total shares. Please refer to below chart for Yadea’s current shareholding structure.
Yadea, 10.5%
Aima, 8.8%
Luyuan, 5.0%
Sunra, 4.8%
Tailg, 4.3%Others, 66.7%
Yadea, 11.2%
Aima, 6.6%
Luyuan, 5.3%
Sunra, 4.4%
Tailg, 4.2%Others, 68.3%
Aima, 12.9%
Yadea, 9.2%
Sunra, 5.4%
Tailg, 4.5%
Luyuan, 4.3%
Others, 63.7%8.9% 9.1%
20.0%
9.9% 10.5%
24.0%
0%
5%
10%
15%
20%
25%
30%
Sales volume Revenue Net profit
2014 2015
14
Asia Pacific Equity Research23 June 2016
Nick Lai(852) 2800 [email protected]
Figure 16: Shareholding structure post IPO
Source: Company.
Table 7: Milestones
Year Event2001 Mr. Dong and Ms. Qian established Jiangsu Yadea as Wuxi Dongshi Vehicle Industry Co., Ltd.
2007 Established Yadea Import Export and began international expansion.
2012 Zhejiang Yadea obtained the license for production of electric motorcycles, the first company in electric two-wheeled vehicle industry to obtain such license.
2015 Entered into a strategic co-operation agreement with Lightning Motors to jointly develop and produce high-end products and acquired 11.1% of Lightning Motors in Dec-2015 with total consideration of USD1.3mn.
2016 Listed in HK stock exchange
Source: Company.
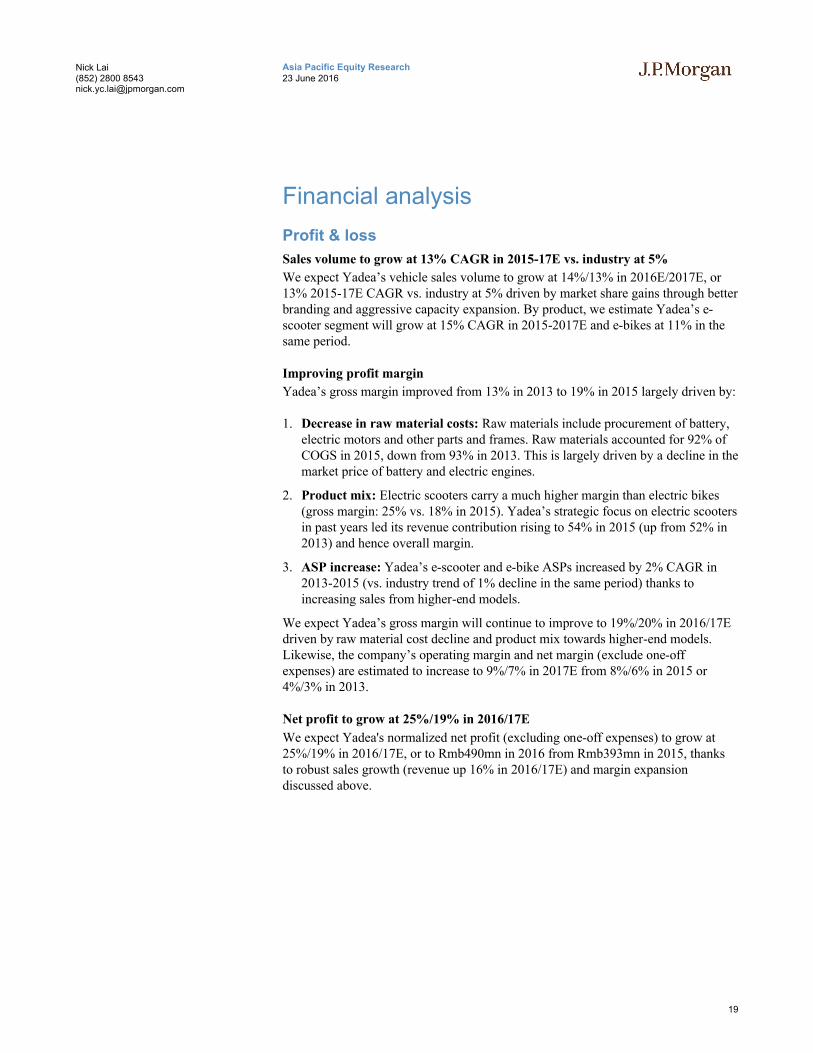
Product analysis
Yadea mainly produces and sells electric two-wheeler vehicles including electric scooters and electric bicycles, which together account for 77% of the company’s 2015 revenue (e-scooter 54% and e-bike 23%). Yadea also sells batteries and chargers (22% of 2015 revenue) together with vehicle sales as well as for after-market use. A very minor portion of the revenue (1% in FY15) comes from sales of vehicle parts for after-market use (i.e. electric motor, vehicle frames, etc.). By profit, electric two-wheeler vehicles accounted for 94% of 2015 gross profit (e-scooter 72% and e-bike 22%) due to much higher profit margins.
Figure 17: Yadea revenue breakdown by product
Source: Company, J.P. Morgan estimates
Figure 18: Yadea gross profit breakdown by product
Source: Company, J.P. Morgan estimates.
52% 56% 54% 55% 56%
25% 24% 23% 22% 21%
20% 19% 22% 21% 21%
0%
20%
40%
60%
80%
100%
2013 2014 2015 2016E 2017E
Electric scooters Electric bicycles
Batteries and chargers Specialty vehicles
70% 71% 72% 73% 73%
23% 25% 22% 22% 20%
0%
20%
40%
60%
80%
100%
2013 2014 2015 2016E 2017E
Electric scooters Electric bicycles Batteries and chargers
Parts Specialty vehicles

15
Asia Pacific Equity Research23 June 2016
Nick Lai(852) 2800 [email protected]
Production and capacity expansion plans
As of end-2015, Yadea had annual electric two-wheeler production capacity of 5.0 million units from its four production plants – Tianjin, Wuxi, Cixi and Dongguan. By product, Yadea’s production capacity for electric scooters and electric bicycles was2.5mn units each. Capacity at Tianjin plant was expanded to 2.5mn units (vs. 1.3mn units in end-14) in April-2015 and Yadea plans to expand its production capacity at Wuxi plant to 1.3mn units by end-16 (from 0.7mn units as of end-15). Dongguan plant is also expected to expand to 1.2mn units’ capacity by end-2017. Upon completion of expansion at Wuxi and Dongguan plants, Yadea will have a total of 6.4mn units’ production capacity by end-2017, based on our analysis.
Figure 19: Yadea production capacity expansion plansMillion units
Source: Company, J.P. Morgan estimates
Figure 20: Yadea production capacity expansion plans by plantMillion units
Source: Company, J.P. Morgan estimates
0.0
1.0
2.0
3.0
4.0
5.0
6.0
7.0
2013 2014 2015 2016E 2017E
Total electric scooters Total electric bicycles
0
1
2
3
4
5
6
7
2013 2014 2015 2016E 2017E
Tianjin (e-bike) Wuxi (e-scooter)
Cixi (e-scooter) Dongguan (e-scooter)

16
Asia Pacific Equity Research23 June 2016
Nick Lai(852) 2800 [email protected]
SWOT analysis
Strengths
Superior profitability: Yadea’s profitability measured by gross margin has improved meaningfully from 13% in 2013 to 17% in 2014 and 19% in 2015 vs. average of China’s listed two-wheelers at ~13% in 2014. In the pure electric two-wheeler industry, Yadea’s superior profitability can be gauged through its 24% market share by net profit (FY15) vs. only ~10% share in sales volume or revenue.
Healthy balance sheet and cash flow position: Yadea’s ROE was 39% in 2014 and 58% in 2015, well above most industry peers. Yadea has been net cash position consistently since 2013 and its net cash to equity stood at 225% in 2014 and 199% in 2015 vs. industry average of 12%. Furthermore, Yadea’s cash conversion cycle is exceptionally strong at -116/-156 days in 2014/2015 vs. other peers at best -9 days, as the company receives payment from customers (i.e. dealers) rather quickly and then pays suppliers several months later. The company’s negative working capital and free cash flow position allows for potential dividend upside, in our view.
Weaknesses
Pricing competition: The electric two-wheeler industry is highly fragmented as top 5 players accounted for only 33% of total revenue in 2015. In such a highly competitive industry, a sudden slowdown in demand could lead to aggressive price competition.
Indeed, when industry sales volume decelerated to 0.2% growth in 2014 (from 8% in 2013 and 15% in 2012), Yadea’s e-scooter and e-bike ASP dropped a result of higher discounts offered to dealers as part of sales promotion which lasted from 2H14 to 3Q15. Blended ASP in 2015 further declined by 4% vs. 2014.
Our sensitivity analysis indicates that a 1% drop in e-scooter and e-bike blended ASP could lead to ~4% drop in 2015/16E gross profit, or ~10% change in net profit, assuming all other assumptions held constant (i.e. no change in sales volume and same opex assumptions).
Opportunities
Industry resilient growth: Sales of China’s electric two-wheeled vehicle industry have recorded 5%/7% CAGR between 2010-2015 by volume/revenue and are expected to grow at 5%/7% CAGR between 2015-2017E, according to Frost & Sullivan.
Market share gain: Yadea’s market share grew from ~8% in 2013 to ~10% in 2015 based on our analysis. In the near future, we believe industry consolidation will continue and Yadea should retain its leadership position and further increase share.
Restriction on motorcycle an opportunity for e-scooters: As a result of regulatory restrictions on the use of motorcycles, domestic motorcycle sales (mainly gasoline powered motorcycles) declined at a CAGR of 9% between 2010-2015 whilst electric two wheelers (i.e. electric bike, electric moped and electric motorcycle) grew by 5% in the same period.
Penetration into high-end LiB e-scooter: Yadea plans to jointly develop new high-end LiB model with Lightning; expected MSRP at Rmb10-20k.
Threats
Consumption upgrade might be a threat to two-wheeler demand: While we acknowledge that the starting price of entry-level four-wheelers (mini EVs/ compact cars) is ~10-15x of two-wheelers, two factors could continue to drive consumption upgrade: 1) China's passenger vehicle price has been declining at 4% CAGR in the past decade. 2) At the same period, average disposable income per capita rose at 11% CAGR.
We believe both trends could carry on with average car prices declining at 3-4%/year while income rising at 7-9% in the near future. Historical data shows that during the period of 2010-2015, sales growth of mini EV and compact PV (≤1.6L) have been consistently and considerably higher than the growth of motorcycle/ e-scooter.
Regulatory risk on prohibiting electric two-wheelers:Certain cities in China have prohibited the use of electric two-wheelers, such as Shengzhen, Dongguan and Xiamen. We believe industry sales could be adversely affected if additional city governments adopt similar policy to restrict the sales/use of e-scooter or e-bikes.

17
Asia Pacific Equity Research23 June 2016
Nick Lai(852) 2800 [email protected]
Industry analysis
5% CAGR growth expected in China in 2015-2017E
Global retail sales volume of two-wheeler electric vehicles grew at 5% CAGR during 2010-2015 to 39 million units in 2015 and is estimated to grow at 4% CAGR (2015-2017E) to 42 million units in 2017E, according to Frost & Sullivan. China accounted for 86% of global sales in 2015 with 5% CAGR in 2010-2015 to 34 million units in 2015. China electric two-wheeler vehicle sales volume will grow at 5% CAGR to 37 million units in 2017E, according to Frost & Sullivan.
Disposable income growth to continue to drive industry sales
China’s disposable income per capita grew at 10.3% CAGR in 2010-2015 (for urban population) and our economists estimate this trend will continue at 7-9% in the next few years. We expect China’s rising disposable income to continue to drive consumption demand for electric two-wheeler vehicles in the near future.
ASP increase to further drive revenue growth
Retail sales value of China electric two-wheeler vehicles grew at a moderately higher rate compared to sales volume due to continuing rising ASP. According to Frost & Sullivan, average selling price of e-scooters rose from Rmb2,544 in 2010 to Rmb2,708 in 2015 while ASP of e-bikes grew from Rmb1,903 to Rmb2,023 in the same period. Frost & Sullivan estimates electric two-wheeler vehicle industry ASP will further grow at 3% CAGR into 2017E, resulting in sales value CAGR of 7% vs. volume of only 5% in 2015-17E, driven by rising living standards and higher contribution from high-end products.
E-scooters to enjoy superior growth over e-bikes
Sales volume and value of electric scooters in China grew at 7%/8% CAGR in 2010-2015 vs. electric bicycles at 4%/5% in the same period. E-scooters enjoy better growth over e-bikes partially due to consumption upgrade or substitution effect from e-bikes to e-scooters. It is estimated that electric scooters will grow at 6%/8% CAGR in volume/value in 2015-17E vs. e-bikes at 1%/3%.
Market consolidation and competitive landscape
China’s electric two-wheeler industry consolidated from over 2,500 brands in 2010 to around 250 manufacturers above designated scale in 2015. The industry remains pretty fragmented as top 5 players in the industry accounted for only 33% of revenue in 2015. Yadea ranks as No. 1 in electric two-wheeler industry with 10.5% market share by sales value.

18
Asia Pacific Equity Research23 June 2016
Nick Lai(852) 2800 [email protected]
Figure 21: Retail sales volume of electric two-wheeler vehicles
Source: Frost & Sullivan
Figure 22: China retail sales value of electric two-wheeler vehicles
Source: Frost & Sullivan
Figure 23: China disposable income per capita by region (urban population)
Source: CEIC, J.P. Morgan estimates
Figure 24: China e-scooter and e-bike ASP trend
Source: Frost & Sullivan
Figure 25: China retail sales volume of e-scooter and e-bike
Source: Frost & Sullivan
Figure 26: China retail sales value of e-scooter and e-bike
Source: Frost & Sullivan
0
10
20
30
40
50
2010 2011 2012 2013 2014 2015 2016E 2017E
Million units
Global China
2010-2015 CAGR: Global/China: 5%
2015-2017E CAGR: Global/China: 4%/5%
0
20
40
60
80
100
2010 2011 2012 2013 2014 2015 2016E 2017E
Retail sales value (Rmb bn)
2010-2015 CAGR: 7%
2015-2017E CAGR: 7%
Northern
Northeastern
Eastern
Central
Southern
WesternNorthwestern
-
5,000
10,000
15,000
20,000
25,000
30,000
35,000
40,000
1992
1994
1996
1998
2000
2002
2004
2006
2008
2010
2012
2014
2016
E
Rmb
China disposable income (urban) CAGR 2009-2014: 11%CAGR 2014-2016E: 9%
Average 4-5 years gap between the wealthiest and the poorest region.
1,000
1,500
2,000
2,500
3,000
2010 2011 2012 2013 2014 2015 2016E 2017E
Rmb
China electric scooter China electric bicycle
2010-2015 CAGR:E-scooter: 1%E-bike: 1%
2015-2017E CAGR:E-scooter: 3%E-bike: 2%
0
5
10
15
20
25
2010 2011 2012 2013 2014 2015 2016E 2017E
Million units
China electric scooter China electric bicycle
2010-2015 CAGR:E-scooter: 7%E-bike: 4%
2015-2017E CAGR:E-scooter: 6%E-bike: 1%
0
10
20
30
40
50
60
70
2010 2011 2012 2013 2014 2015 2016E 2017E
Rmb bn
China electric scooter China electric bicycle
2010-2015 CAGR:E-scooter: 8%E-bike: 5%
2015-2017E CAGR:E-scooter: 8%E-bike: 3%
19
Asia Pacific Equity Research23 June 2016
Nick Lai(852) 2800 [email protected]
Financial analysis
Profit & loss
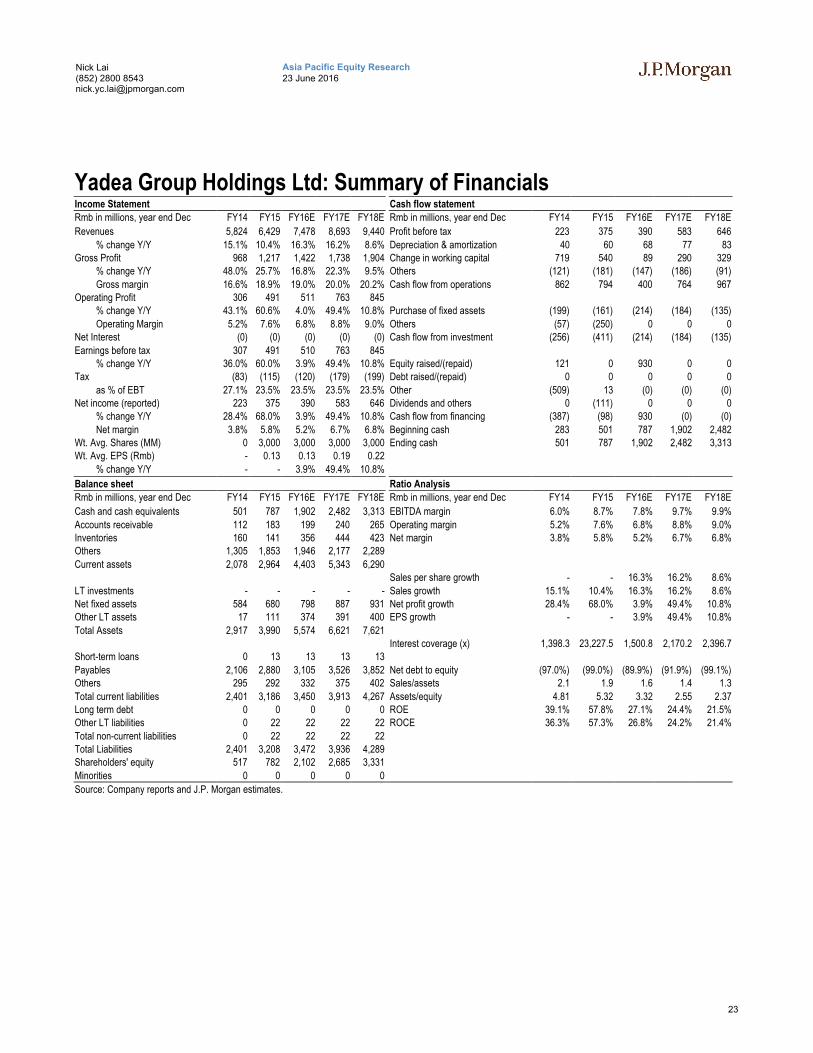
Sales volume to grow at 13% CAGR in 2015-17E vs. industry at 5%
We expect Yadea’s vehicle sales volume to grow at 14%/13% in 2016E/2017E, or 13% 2015-17E CAGR vs. industry at 5% driven by market share gains through better branding and aggressive capacity expansion. By product, we estimate Yadea’s e-scooter segment will grow at 15% CAGR in 2015-2017E and e-bikes at 11% in the same period.
Improving profit margin
Yadea’s gross margin improved from 13% in 2013 to 19% in 2015 largely driven by:
1. Decrease in raw material costs: Raw materials include procurement of battery, electric motors and other parts and frames. Raw materials accounted for 92% of COGS in 2015, down from 93% in 2013. This is largely driven by a decline in the market price of battery and electric engines.
2. Product mix: Electric scooters carry a much higher margin than electric bikes (gross margin: 25% vs. 18% in 2015). Yadea’s strategic focus on electric scooters in past years led its revenue contribution rising to 54% in 2015 (up from 52% in 2013) and hence overall margin.
3. ASP increase: Yadea’s e-scooter and e-bike ASPs increased by 2% CAGR in 2013-2015 (vs. industry trend of 1% decline in the same period) thanks to increasing sales from higher-end models.
We expect Yadea’s gross margin will continue to improve to 19%/20% in 2016/17E driven by raw material cost decline and product mix towards higher-end models. Likewise, the company’s operating margin and net margin (exclude one-off expenses) are estimated to increase to 9%/7% in 2017E from 8%/6% in 2015 or4%/3% in 2013.
Net profit to grow at 25%/19% in 2016/17E
We expect Yadea's normalized net profit (excluding one-off expenses) to grow at 25%/19% in 2016/17E, or to Rmb490mn in 2016 from Rmb393mn in 2015, thanks to robust sales growth (revenue up 16% in 2016/17E) and margin expansion discussed above.

20
Asia Pacific Equity Research23 June 2016
Nick Lai(852) 2800 [email protected]
Figure 27: Yadea’s sales volume and forecast
Source: Company, J.P. Morgan estimates
Figure 28: Yadea’s profit margin trends
Source: Company, J.P. Morgan estimates
Figure 29: Yadea’s raw material cost as % of COGS
Source: Company, J.P. Morgan estimates
Figure 30: Price trends of battery and electric motor (Rmb)
Source: Frost & Sullivan
Table 8: P&L analysis
RMB mn, % 2013 2014 2015 2016E 2017E
Revenue 5,059 5,824 6,429 7,478 8,693
Sales growth (yoy%) 51% 15% 10% 16% 16%
Gross profit 655 968 1,217 1,422 1,738
Gross margin (%) 13% 17% 19% 19% 20%
Operating profit 214 306 491 508 763
Operating margin (%) 4.2% 5.2% 7.6% 6.8% 8.8%
Pre-tax profit 225 307 491 510 763
Tax rate (%) 23% 27% 24% 24% 24%
Net profit 174 223 375 390 583
Net margin (%) 3.4% 3.8% 5.8% 5.2% 6.7%
Net profit growth (yoy%) 71% 28% 68% 4% 49%
Normalized NP (excl one-off) 175 306 393 490 583
Net margin (%) 3.4% 5.3% 6.1% 6.6% 6.7%
Net profit growth (%) 72% 75% 29% 25% 19%
Source: Company, J.P. Morgan estimates.
45%
10%10% 14% 13%
0%
10%
20%
30%
40%
50%
-
500,000
1,000,000
1,500,000
2,000,000
2,500,000
3,000,000
2013 2014 2015 2016E 2017E
Unit
Electric scooters Electric bicycles Series3
13%
17%19% 19%
20%
4% 5%8% 7%
9%
3% 4%6% 5% 7%
0%
5%
10%
15%
20%
25%
2013 2014 2015 2016E 2017E
Gross margin Operating margin Net margin
93%
92%
92%
91%
91%
92%
92%
93%
93%
94%
2013 2014 2015

21
Asia Pacific Equity Research23 June 2016
Nick Lai(852) 2800 [email protected]
Balance sheet
DuPont analysis – ROE estimated at 27% in 2016E
We expect Yadea’s ROE 27%/24% in 2016/17E vs. 58% in 2015 as a result of enlarged equity base (and hence lower equity multiplier) as well as deleverage, highlighted in the DuPont analysis below. On the other hand, we believe Yadea’s profitability in terms of net margin will improve to 7% from 6% over this period.
Net cash position since 2013
Yadea has been in a net cash position consistently for the period 2013-2015 as the company barely has any interest-bearing debt (only Rmb13mn as of 2015). We believe Yadea will stay in a net cash position for 2016/17E.
Very strong cash conversion cycle
Yadea has a very healthy cash conversion cycle of -156 days in 2015 as its account receivables turnover was merely 8 days (Yadea usually receives payments before distribution of goods and only selected dealers with good credit history are granted with short-term credit term) and inventory turnover was also healthy at 11 days while accounts payable turnover was 175 days long. We believe Yadea will keep a negative CCC position in 2016/17E.
Table 9: Du Pont analysis
2013 2014 2015 2016E 2017E
Net margin 3% 4% 6% 5% 7%
Asset turnover (x) 2.3 2.1 1.9 1.6 1.4
Equity multiplier (x) 4.0 4.8 5.3 3.3 2.5
ROE 32% 39% 58% 27% 24%
Source: Company, J.P. Morgan estimates
Table 10: Balance sheet analysis
2013 2014 2015 2016E 2017E
Net debt (cash) / equity -124% -225% -199% -134% -134%
AR days 5 5 8 9 9
Inventory days 31 20 11 15 21
AP days 112 140 175 180 174
Cash conversion cycle (days) -76 -115 -156 -156 -144
Current ratio 87% 87% 93% 128% 137%
Quick ratio 69% 80% 89% 117% 125%
Source: Company, J.P. Morgan estimates. Note: net debt is calculated as interest-bearing borrowings - cash and cash equivalent and
pledged bank deposits.
Cash flow
Consistent free cash flow since 2013
Yadea has delivered consistent positive free cash flow since 2013 and we expect the company to maintain its strong cash position in 2016/17E with total cash at year end standing at Rmb1.9bn/2.4bn. At the moment, we have not factored any dividend forecast in our model but believe there is potential upside to this assumption considering the company’s solid financial position as discussed above. In 2015 though, the company declared it would distribute altogether Rmb154mn dividend(paid in Jan-2015), in recognition of existing shareholders’ contribution.

22
Asia Pacific Equity Research23 June 2016
Nick Lai(852) 2800 [email protected]
In terms of working capital, we estimate it might turn from negative position (-Rmb222mn) in 2015 to positive Rmb953mn in 2016, mainly as a result of increased cash. Although we forecast its working capital will turn positive in 2016/17E, cash conversion cycle is expected to remain strong.
Table 11: Cash flow analysis
Rmb mn 2013 2014 2015 2016E 2017E
Working capital (249) (323) (222) 953 1,429
Operating cash flow 444 862 794 400 764
Capex (187) (199) (161) (214) (184)
Free cash flow 257 662 633 186 580
Total cash at period end 283 501 787 1,902 2,482
Source: Company, J.P. Morgan estimates. Note: Free cash flow is calculated as operating cash flow – capex. Working capital is
calculated as current asset – current liability. Capex includes 1) purchase of property, plant and equipment, 2) additions to prepaid land
lease payments and 3) additions of intangible assets.
Investment Thesis, Valuation and Risks
Yadea Group Holdings Ltd (Neutral; Price Target: HK$1.50)
Investment Thesis
Positive investment thesis includes 1) superior profitability and healthy balance sheet, 2) resilient industry growth and market share gains, 3) restrictions on gasoline-powered motorcycle an opportunity for e-scooters, 4) penetration into high-end Lib e-scooter through Lightning.
Investment risks include 1) pricing competition in the industry, 2) consumption upgrade to four-wheelers a threat to two-wheelers demand, 3) regulatory risks on prohibiting electric two-wheelers.
Valuation
Our Dec-16 PT of HK$1.5 is based on 10x 2016 PER, considering trading ranges of comparable peers as well as Yadea's relatively limited history vs. most listed companies. This would place Yadea at a meaningful premium over passenger vehiclemakers but within the range of discretionary stocks, although at an apparent discount to two-wheelers because they are either listed in the A-share market (generally at premiums over H-share in the first place) or pay much higher dividends (near 70% payout) to investors (i.e. Giant and Merida).
Risks to Rating and Price Target
Downside risks: 1) Worse than expected sales or pricing environment. 2) More cities placing restrictions or bans on the use of electric two-wheelers. Upside risk: Better than expected sales volume or pricing.
23
Asia Pacific Equity Research23 June 2016
Nick Lai(852) 2800 [email protected]
Yadea Group Holdings Ltd: Summary of FinancialsIncome Statement Cash flow statement
Rmb in millions, year end Dec FY14 FY15 FY16E FY17E FY18E Rmb in millions, year end Dec FY14 FY15 FY16E FY17E FY18E
Revenues 5,824 6,429 7,478 8,693 9,440 Profit before tax 223 375 390 583 646
% change Y/Y 15.1% 10.4% 16.3% 16.2% 8.6% Depreciation & amortization 40 60 68 77 83Gross Profit 968 1,217 1,422 1,738 1,904 Change in working capital 719 540 89 290 329
% change Y/Y 48.0% 25.7% 16.8% 22.3% 9.5% Others (121) (181) (147) (186) (91)
Gross margin 16.6% 18.9% 19.0% 20.0% 20.2% Cash flow from operations 862 794 400 764 967Operating Profit 306 491 511 763 845
% change Y/Y 43.1% 60.6% 4.0% 49.4% 10.8% Purchase of fixed assets (199) (161) (214) (184) (135)
Operating Margin 5.2% 7.6% 6.8% 8.8% 9.0% Others (57) (250) 0 0 0Net Interest (0) (0) (0) (0) (0) Cash flow from investment (256) (411) (214) (184) (135)
Earnings before tax 307 491 510 763 845% change Y/Y 36.0% 60.0% 3.9% 49.4% 10.8% Equity raised/(repaid) 121 0 930 0 0
Tax (83) (115) (120) (179) (199) Debt raised/(repaid) 0 0 0 0 0
as % of EBT 27.1% 23.5% 23.5% 23.5% 23.5% Other (509) 13 (0) (0) (0)Net income (reported) 223 375 390 583 646 Dividends and others 0 (111) 0 0 0
% change Y/Y 28.4% 68.0% 3.9% 49.4% 10.8% Cash flow from financing (387) (98) 930 (0) (0)
Net margin 3.8% 5.8% 5.2% 6.7% 6.8% Beginning cash 283 501 787 1,902 2,482Wt. Avg. Shares (MM) 0 3,000 3,000 3,000 3,000 Ending cash 501 787 1,902 2,482 3,313Wt. Avg. EPS (Rmb) - 0.13 0.13 0.19 0.22
% change Y/Y - - 3.9% 49.4% 10.8%
Balance sheet Ratio Analysis
Rmb in millions, year end Dec FY14 FY15 FY16E FY17E FY18E Rmb in millions, year end Dec FY14 FY15 FY16E FY17E FY18E
Cash and cash equivalents 501 787 1,902 2,482 3,313 EBITDA margin 6.0% 8.7% 7.8% 9.7% 9.9%
Accounts receivable 112 183 199 240 265 Operating margin 5.2% 7.6% 6.8% 8.8% 9.0%Inventories 160 141 356 444 423 Net margin 3.8% 5.8% 5.2% 6.7% 6.8%Others 1,305 1,853 1,946 2,177 2,289
Current assets 2,078 2,964 4,403 5,343 6,290Sales per share growth - - 16.3% 16.2% 8.6%
LT investments - - - - - Sales growth 15.1% 10.4% 16.3% 16.2% 8.6%Net fixed assets 584 680 798 887 931 Net profit growth 28.4% 68.0% 3.9% 49.4% 10.8%Other LT assets 17 111 374 391 400 EPS growth - - 3.9% 49.4% 10.8%
Total Assets 2,917 3,990 5,574 6,621 7,621Interest coverage (x) 1,398.3 23,227.5 1,500.8 2,170.2 2,396.7
Short-term loans 0 13 13 13 13
Payables 2,106 2,880 3,105 3,526 3,852 Net debt to equity (97.0%) (99.0%) (89.9%) (91.9%) (99.1%)Others 295 292 332 375 402 Sales/assets 2.1 1.9 1.6 1.4 1.3
Total current liabilities 2,401 3,186 3,450 3,913 4,267 Assets/equity 4.81 5.32 3.32 2.55 2.37Long term debt 0 0 0 0 0 ROE 39.1% 57.8% 27.1% 24.4% 21.5%Other LT liabilities 0 22 22 22 22 ROCE 36.3% 57.3% 26.8% 24.2% 21.4%
Total non-current liabilities 0 22 22 22 22Total Liabilities 2,401 3,208 3,472 3,936 4,289Shareholders' equity 517 782 2,102 2,685 3,331
Minorities 0 0 0 0 0
Source: Company reports and J.P. Morgan estimates.

24
Asia Pacific Equity Research23 June 2016
Nick Lai(852) 2800 [email protected]
Analyst Certification: The research analyst(s) denoted by an “AC” on the cover of this report certifies (or, where multiple research analysts are primarily responsible for this report, the research analyst denoted by an “AC” on the cover or within the document individually certifies, with respect to each security or issuer that the research analyst covers in this research) that: (1) all of the views expressed in this report accurately reflect his or her personal views about any and all of the subject securities or issuers; and (2) no part of any of the research analyst's compensation was, is, or will be directly or indirectly related to the specific recommendations or views expressed by the research analyst(s) in this report. For all Korea-based research analysts listed on the front cover, they also certify, as per KOFIA requirements, that their analysis was made in good faith and that the views reflect their own opinion, without undue influence or intervention.
Important Disclosures
Market Maker/ Liquidity Provider: J.P. Morgan Securities plc and/or an affiliate is a market maker and/or liquidity provider in securities issued by Yadea Group Holdings Ltd.
Lead or Co-manager: J.P. Morgan acted as lead or co-manager in a public offering of equity and/or debt securities for Yadea Group Holdings Ltd within the past 12 months.
Client: J.P. Morgan currently has, or had within the past 12 months, the following entity(ies) as clients: Yadea Group Holdings Ltd.
Client/Investment Banking: J.P. Morgan currently has, or had within the past 12 months, the following entity(ies) as investment banking clients: Yadea Group Holdings Ltd.
Investment Banking (past 12 months): J.P. Morgan received in the past 12 months compensation for investment banking services from Yadea Group Holdings Ltd.
Investment Banking (next 3 months): J.P. Morgan expects to receive, or intends to seek, compensation for investment banking services in the next three months from Yadea Group Holdings Ltd.
Other Significant Financial Interests: J.P. Morgan owns a position of 1 million USD or more in the debt securities of Yadea Group Holdings Ltd.
Company-Specific Disclosures: Important disclosures, including price charts and credit opinion history tables, are available for compendium reports and all J.P. Morgan–covered companies by visiting https://jpmm.com/research/disclosures, calling 1-800-477-0406, or e-mailing [email protected] with your request. J.P. Morgan’s Strategy, Technical, and Quantitative Research teams may screen companies not covered by J.P. Morgan. For important disclosures for these companies, please call 1-800-477-0406 or e-mail [email protected].
Explanation of Equity Research Ratings, Designations and Analyst(s) Coverage Universe: J.P. Morgan uses the following rating system: Overweight [Over the next six to twelve months, we expect this stock will outperform the average total return of the stocks in the analyst’s (or the analyst’s team’s) coverage universe.] Neutral [Over the next six to twelve months, we expect this stock will perform in line with the average total return of the stocks in the analyst’s (or the analyst’s team’s) coverage universe.] Underweight [Over the next six to twelve months, we expect this stock will underperform the average total return of the stocks in the analyst’s (or the analyst’s team’s) coverage universe.] Not Rated (NR): J.P. Morgan has removed the rating and, if applicable, the price target, for this stock because of either a lack of a sufficient fundamental basis or for legal, regulatory or policy reasons. The previous rating and, if applicable, the price target, no longer should be relied upon. An NR designation is not a recommendation or a rating. In our Asia (ex-Australia) and U.K. small- and mid-cap equity research, each stock’s expected total return is compared to the expected total return of a benchmark country market index, not to those analysts’ coverage universe. If it does not appear in the Important Disclosures section of this report, the certifying analyst’s coverage universe can be found on J.P. Morgan’s research website, www.jpmorganmarkets.com.
Coverage Universe: Lai, Nick YC: BAIC Motor Corp LTD (1958.HK), BYD Company Limited - A (002594.SZ), BYD Company Limited - H (1211.HK), Baoxin Auto Group Limited (1293.HK), Brilliance China Automotive (1114.HK), China Resources Cement (1313.HK), China ZhengTong Auto Service Holding Limited (1728.HK), DongFeng Motor Co., Ltd. (0489.HK), Fuyao Glass Industry Group - A (600660.SS), Fuyao Glass Industry Group - H (3606.HK), Geely Automobile Holdings Ltd. (0175.HK), Great Wall Motor - A (601633.SS), Great Wall Motor - H (2333.HK), Guangzhou Automobile Group - A (601238.SS), Guangzhou Automobile Group - H (2238.HK), Huayu Automotive Systems - A (600741.SS), Minth Group (0425.HK), Nexteer Automotive Group Limited (1316.HK), SAIC Motor Corp - A (600104.SS), Sinotruk (3808.HK), Zhengzhou Yutong Bus - A (600066.SS), Zhongsheng Group Holdings (0881.HK)

25
Asia Pacific Equity Research23 June 2016
Nick Lai(852) 2800 [email protected]
J.P. Morgan Equity Research Ratings Distribution, as of April 1, 2016
Overweight(buy)
Neutral(hold)
Underweight(sell)
J.P. Morgan Global Equity Research Coverage 44% 44% 12%IB clients* 53% 49% 34%
JPMS Equity Research Coverage 43% 48% 9%IB clients* 71% 63% 49%
*Percentage of investment banking clients in each rating category.For purposes only of FINRA/NYSE ratings distribution rules, our Overweight rating falls into a buy rating category; our Neutral rating falls into a hold rating category; and our Underweight rating falls into a sell rating category. Please note that stocks with an NR designation are not included in the table above.
Equity Valuation and Risks: For valuation methodology and risks associated with covered companies or price targets for covered companies, please see the most recent company-specific research report at http://www.jpmorganmarkets.com, contact the primary analyst or your J.P. Morgan representative, or email [email protected].
Equity Analysts' Compensation: The equity research analysts responsible for the preparation of this report receive compensation based upon various factors, including the quality and accuracy of research, client feedback, competitive factors, and overall firm revenues.
Registration of non-US Analysts: Unless otherwise noted, the non-US analysts listed on the front of this report are employees of non-US affiliates of JPMS, are not registered/qualified as research analysts under NASD/NYSE rules, may not be associated persons of JPMS, and may not be subject to FINRA Rule 2711 and NYSE Rule 472 restrictions on communications with covered companies, public appearances, and trading securities held by a research analyst account.
Other Disclosures
J.P. Morgan ("JPM") is the global brand name for J.P. Morgan Securities LLC ("JPMS") and its affiliates worldwide. J.P. Morgan Cazenove is a marketing name for the U.K. investment banking businesses and EMEA cash equities and equity research businesses of JPMorgan Chase & Co. and its subsidiaries.
All research reports made available to clients are simultaneously available on our client website, J.P. Morgan Markets. Not all research content is redistributed, e-mailed or made available to third-party aggregators. For all research reports available on a particular stock, please contact your sales representative.
Options related research: If the information contained herein regards options related research, such information is available only to persons who have received the proper option risk disclosure documents. For a copy of the Option Clearing Corporation's Characteristics and Risks of Standardized Options, please contact your J.P. Morgan Representative or visit the OCC's website at http://www.optionsclearing.com/publications/risks/riskstoc.pdf
Legal Entities Disclosures U.S.: JPMS is a member of NYSE, FINRA, SIPC and the NFA. JPMorgan Chase Bank, N.A. is a member of FDIC. U.K.: JPMorgan Chase N.A., London Branch, is authorised by the Prudential Regulation Authority and is subject to regulation by the Financial Conduct Authority and to limited regulation by the Prudential Regulation Authority. Details about the extent of our regulation by the Prudential Regulation Authority are available from J.P. Morgan on request. J.P. Morgan Securities plc (JPMS plc) is a member of the London Stock Exchange and is authorised by the Prudential Regulation Authority and regulated by the Financial Conduct Authority and the Prudential Regulation Authority. Registered in England & Wales No. 2711006. Registered Office 25 Bank Street, London, E14 5JP. South Africa: J.P. Morgan Equities South Africa Proprietary Limited is a member of the Johannesburg Securities Exchange and is regulated by the Financial Services Board. Hong Kong: J.P. Morgan Securities (Asia Pacific) Limited (CE number AAJ321) is regulated by the Hong Kong Monetary Authority and the Securities and Futures Commission in Hong Kong and/or J.P. Morgan Broking (Hong Kong) Limited (CE number AAB027) is regulated by the Securities and Futures Commission in Hong Kong. Korea: This material is issued and distributed in Korea by or through J.P. Morgan Securities (Far East) Limited, Seoul Branch, which is a member of the Korea Exchange(KRX) and is regulated by the Financial Services Commission (FSC) and the Financial Supervisory Service (FSS). Australia: J.P. Morgan Australia Limited (JPMAL) (ABN 52 002 888 011/AFS Licence No: 238188) is regulated by ASIC and J.P. Morgan Securities Australia Limited (JPMSAL) (ABN 61 003 245 234/AFS Licence No: 238066) is regulated by ASIC and is a Market, Clearing and Settlement Participant of ASX Limited and CHI-X. Taiwan: J.P.Morgan Securities (Taiwan) Limited is a participant of the Taiwan Stock Exchange (company-type) and regulated by the Taiwan Securities and Futures Bureau. India: J.P. Morgan India Private Limited (Corporate Identity Number - U67120MH1992FTC068724), having its registered office at J.P. Morgan Tower, Off. C.S.T. Road, Kalina, Santacruz - East, Mumbai – 400098, is registered with Securities and Exchange Board of India (SEBI) as a ‘Research Analyst’ having registration number INH000001873. J.P. Morgan India Private Limited is also registered with SEBI as a member of the National Stock Exchange of India Limited (SEBI Registration Number - INB 230675231/INF 230675231/INE 230675231) and Bombay Stock Exchange Limited (SEBI Registration Number - INB 010675237/INF 010675237). Telephone: 91-22-6157 3000, Facsimile: 91-22-6157 3990 and Website: www.jpmipl.com. For non local research reports, this material is not distributed in India by J.P. Morgan India Private Limited. Thailand: This material is issued and distributed in Thailand by JPMorgan Securities (Thailand) Ltd., which is a member of the Stock Exchange of Thailand and is regulated by the Ministry of Finance and the Securities and Exchange Commission and its registered address is 3rd Floor, 20 North Sathorn Road, Silom, Bangrak, Bangkok 10500. Indonesia: PT J.P. Morgan Securities Indonesia is a member of the Indonesia Stock Exchange and is regulated by the OJK a.k.a. BAPEPAM LK. Philippines: J.P. Morgan Securities Philippines Inc. is a Trading Participant of the Philippine Stock Exchange and a member of the Securities Clearing Corporation of the Philippines and the Securities Investor Protection Fund. It is regulated by the Securities and Exchange Commission. Brazil: Banco J.P. Morgan S.A. is regulated by the Comissao de Valores Mobiliarios (CVM) and by the Central Bank of Brazil. Mexico: J.P. Morgan Casa de Bolsa, S.A. de C.V., J.P. Morgan Grupo Financiero is a member of the Mexican Stock Exchange and authorized to act as a broker dealer by the National Banking and Securities Exchange

26
Asia Pacific Equity Research23 June 2016
Nick Lai(852) 2800 [email protected]
Commission. Singapore: This material is issued and distributed in Singapore by or through J.P. Morgan Securities Singapore Private Limited (JPMSS) [MCI (P) 193/03/2016 and Co. Reg. No.: 199405335R], which is a member of the Singapore Exchange Securities Trading Limited and/or JPMorgan Chase Bank, N.A., Singapore branch (JPMCB Singapore), both of which are regulated by the Monetary Authority of Singapore. This material is issued and distributed in Singapore only to accredited investors, expert investors and institutional investors, as defined in Section 4A of the Securities and Futures Act, Cap. 289 (SFA). This material is not intended to be issued or distributed to any retail investors or any other investors that do not fall into the classes of “accredited investors,” “expert investors” or “institutional investors,” as defined under Section 4A of the SFA. Recipients of this document are to contact JPMSS or JPMCB Singapore in respect of any matters arising from, or in connection with, the document. Japan: JPMorgan Securities Japan Co., Ltd. and JPMorgan Chase Bank, N.A., Tokyo Branch are regulated by the Financial Services Agency in Japan. Malaysia: This material is issued and distributed in Malaysia by JPMorgan Securities (Malaysia) Sdn Bhd (18146-X) which is a Participating Organization of Bursa Malaysia Berhad and a holder of Capital Markets Services License issued by the Securities Commission in Malaysia. Pakistan: J. P. Morgan Pakistan Broking (Pvt.) Ltd is a member of the Karachi Stock Exchange and regulated by the Securities and Exchange Commission of Pakistan. Saudi Arabia: J.P. Morgan Saudi Arabia Ltd. is authorized by the Capital Market Authority of the Kingdom of Saudi Arabia (CMA) to carry out dealing as an agent, arranging, advising and custody, with respect to securities business under licence number 35-07079 and its registered address is at 8th Floor, Al-Faisaliyah Tower, King Fahad Road, P.O. Box 51907, Riyadh 11553, Kingdom of Saudi Arabia. Dubai: JPMorgan Chase Bank, N.A., Dubai Branch is regulated by the Dubai Financial Services Authority (DFSA) and its registered address is Dubai International Financial Centre - Building 3, Level 7, PO Box 506551, Dubai, UAE.
Country and Region Specific Disclosures U.K. and European Economic Area (EEA): Unless specified to the contrary, issued and approved for distribution in the U.K. and the EEA by JPMS plc. Investment research issued by JPMS plc has been prepared in accordance with JPMS plc's policies for managing conflicts of interest arising as a result of publication and distribution of investment research. Many European regulators require a firm to establish, implement and maintain such a policy. This report has been issued in the U.K. only to persons of a kind described in Article 19 (5), 38, 47 and 49 of the Financial Services and Markets Act 2000 (Financial Promotion) Order 2005 (all such persons being referred to as "relevant persons"). This document must not be acted on or relied on by persons who are not relevant persons. Any investment or investment activity to which this document relates is only available to relevant persons and will be engaged in only with relevant persons. In other EEA countries, the report has been issued to persons regarded as professional investors (or equivalent) in their home jurisdiction. Australia: This material is issued and distributed by JPMSAL in Australia to "wholesale clients" only. This material does not take into account the specific investment objectives, financial situation or particular needs of the recipient. The recipient of this material must not distribute it to any third party or outside Australia without the prior written consent of JPMSAL. For the purposes of this paragraph the term "wholesale client" has the meaning given in section 761G of the Corporations Act 2001. Germany: This material is distributed in Germany by J.P. Morgan Securities plc, Frankfurt Branch and J.P.Morgan Chase Bank, N.A., Frankfurt Branch which are regulated by the Bundesanstalt für Finanzdienstleistungsaufsicht. Hong Kong: The 1% ownership disclosure as of the previous month end satisfies the requirements under Paragraph 16.5(a) of the Hong Kong Code of Conduct for Persons Licensed by or Registered with the Securities and Futures Commission. (For research published within the first ten days of the month, the disclosure may be based on the month end data from two months prior.) J.P. Morgan Broking (Hong Kong) Limited is the liquidity provider/market maker for derivative warrants, callable bull bear contracts and stock options listed on the Stock Exchange of Hong Kong Limited. An updated list can be found on HKEx website: http://www.hkex.com.hk. Japan: There is a risk that a loss may occur due to a change in the price of the shares in the case of share trading, and that a loss may occur due to the exchange rate in the case of foreign share trading. In the case of share trading, JPMorgan Securities Japan Co., Ltd., will be receiving a brokerage fee and consumption tax (shouhizei) calculated by multiplying the executed price by the commission rate which was individually agreed between JPMorgan Securities Japan Co., Ltd., and the customer in advance. Financial Instruments Firms: JPMorgan Securities Japan Co., Ltd., Kanto Local Finance Bureau (kinsho) No. 82 Participating Association / Japan Securities Dealers Association, The Financial Futures Association of Japan, Type II Financial Instruments Firms Association and Japan Investment Advisers Association. Korea: This report may have been edited or contributed to from time to time by affiliates of J.P. Morgan Securities (Far East) Limited, Seoul Branch. Singapore: As at the date of this report, JPMSS is a designated market maker for certain structured warrants listed on the Singapore Exchange where the underlying securities may be the securities discussed in this report. Arising from its role as designated market maker for such structured warrants, JPMSS may conduct hedging activities in respect of such underlying securities and hold or have an interest in such underlying securities as a result. The updated list of structured warrants for which JPMSS acts as designated market maker may be found on the website of the Singapore Exchange Limited: http://www.sgx.com.sg. In addition, JPMSS and/or its affiliates may also have an interest or holding in any of the securities discussed in this report – please see the Important Disclosures section above. For securities where the holding is 1% or greater, the holding may be found in the Important Disclosures section above. For all other securities mentioned in this report, JPMSS and/or its affiliates may have a holding of less than 1% in such securities and may trade them in ways different from those discussed in this report. Employees of JPMSS and/or its affiliates not involved in the preparation of this report may have investments in the securities (or derivatives of such securities) mentioned in this report and may trade them in ways different from those discussed in this report. Taiwan: This material is issued and distributed in Taiwan by J.P. Morgan Securities (Taiwan) Limited. India: For private circulation only, not for sale. Pakistan: For private circulation only, not for sale. New Zealand: This material is issued and distributed by JPMSAL in New Zealand only to persons whose principal business is the investment of money or who, in the course of and for the purposes of their business, habitually invest money. JPMSAL does not issue or distribute this material to members of "the public" as determined in accordance with section 3 of the Securities Act 1978. The recipient of this material must not distribute it to any third party or outside New Zealand without the prior written consent of JPMSAL. Canada: The information contained herein is not, and under no circumstances is to be construed as, a prospectus, an advertisement, a public offering, an offer to sell securities described herein, or solicitation of an offer to buy securities described herein, in Canada or any province or territory thereof. Any offer or sale of the securities described herein in Canada will be made only under an exemption from the requirements to file a prospectus with the relevant Canadian securities regulators and only by a dealer properly registered under applicable securities laws or, alternatively, pursuant to an exemption from the dealer registration requirement in the relevant province or territory of Canada in which such offer or sale is made. The information contained herein is under no circumstances to be construed as investment advice in any province or territory of Canada and is not tailored to the needs of the recipient. To the extent that the information contained herein references securities of an issuer incorporated, formed or created under the laws of Canada or a province or territory of Canada, any trades in such securities must be conducted through a dealer registered in Canada. No securities commission or similar regulatory authority in Canada has reviewed or in any way passed judgment upon these materials, the information contained herein or the merits of the securities described herein, and any representation to the contrary is an offence. Dubai: This report has been issued to persons regarded as professional clients as defined under the DFSA rules. Brazil: Ombudsman J.P. Morgan: 0800-7700847 / [email protected].
General: Additional information is available upon request. Information has been obtained from sources believed to be reliable but JPMorgan Chase & Co. or its affiliates and/or subsidiaries (collectively J.P. Morgan) do not warrant its completeness or accuracy except with respect to any disclosures relative to

27
Asia Pacific Equity Research23 June 2016
Nick Lai(852) 2800 [email protected]
JPMS and/or its affiliates and the analyst's involvement with the issuer that is the subject of the research. All pricing is as of the close of market for the securities discussed, unless otherwise stated. Opinions and estimates constitute our judgment as of the date of this material and are subject to change without notice. Past performance is not indicative of future results. This material is not intended as an offer or solicitation for the purchase or sale of any financial instrument. The opinions and recommendations herein do not take into account individual client circumstances, objectives, or needs and are not intended as recommendations of particular securities, financial instruments or strategies to particular clients. The recipient of this report must make its own independent decisions regarding any securities or financial instruments mentioned herein. JPMS distributes in the U.S. research published by non-U.S. affiliates and accepts responsibility for its contents. Periodic updates may be provided on companies/industries based on company specific developments or announcements, market conditions or any other publicly available information. Clients should contact analysts and execute transactions through a J.P. Morgan subsidiary or affiliate in their home jurisdiction unless governing law permits otherwise.
"Other Disclosures" last revised June 18, 2016.
Copyright 2016 JPMorgan Chase & Co. All rights reserved. This report or any portion hereof may not be reprinted, sold or redistributed without the written consent of J.P. Morgan. #$J&098$#*P