Haier Electronics Group Co., Ltd. - :: HKEX :: HKEXnews ::
210
ANNUAL REPORT 01169 Stock Code : Haier Electronics Group Co., Ltd. 海爾電器集團有限公司 * 2018 *
-
Upload
khangminh22 -
Category
Documents
-
view
0 -
download
0
Transcript of Haier Electronics Group Co., Ltd. - :: HKEX :: HKEXnews ::

www.haier.hk
This annual report is printed on environmental friendly paper
ANNUAL REPORT
01169Stock Code :
Haier Electronics Group Co., Ltd.海爾電器集團有限公司*
2018*
Haier E
lectronics Group
Co., Ltd
. A
nnual Rep
ort 2018

2 Corporate Profile
3 Simplified Business Structure
4 Corporate Information
6 Chairman’s Letter
10 Directors And Senior Management
16 Business Review
28 Financial Review
38 Corporate Governance Report
56 Report of The Directors
73 Independent Auditor’s Report
79 Consolidated Statement of Profit or Loss
80 Consolidated Statement of Comprehensive Income
81 Consolidated Statement of Financial Position
83 Consolidated Statement of Changes in Equity
85 Consolidated Statement of Cash Flows
88 Notes to Financial Statements
208 Five Year Financial Summary
CONTE
NTS

2 Haier Electronics Group Co., Ltd. Annual Report 2018
CORPORATE PROFILE
Haier Electronics Group Co., Ltd. (Stock code: 01169) (the “Company”), a subsidiary of Haier Group Corporation (“Haier Corp”), is listed on the Main Board of The Stock Exchange of Hong Kong Limited. The Company and its subsidiaries (the “Group”) are principally engaged in: the research, development, manufacture and wholesale of washing machines and water heaters under Haier Corp brands (“Haier”, “Casarte” and “Leader”); the distribution of electronics products of Haier Corp in the People’s Republic of China (“PRC”) and logistics services under the name of “Gooday” in the PRC for large-format items, including but not limited to home appliances, furniture and fitness equipment.
Founded in 1984, Haier Corp is headquartered in Qingdao, Shandong Province, the PRC and is one of the world’s leading white goods home appliance manufacturers engaging in the research, development, production and sale of a wide variety of household appliances (including the white goods) and consumer electronic goods in the PRC today. The products of Haier Corp are now sold in over 100 countries. According to the data published by Euromonitor International in January 2019, Haier has once again been named as the number one major appliances brand in the world. This is the tenth consecutive year that Haier Corp has received the accolade.

3Haier Electronics Group Co., Ltd. Annual Report 2018
SIMPLIFIED BUSINESS STRUCTURE
White Goods Manufacturing
and Sales
Washing MachineWater HeaterChannel ServicesLogistics
Haier Electronics Group Co., Ltd.
4 Haier Electronics Group Co., Ltd. Annual Report 2018
CORPORATE INFORMATION
BOARD OF DIRECTORSExecutive DirectorsMr. ZHOU Yun Jie (Chairman) Mr. XIE Ju Zhi (Chief Executive Officer) (appointed with effect from 27 March 2019) Mr. LI Hua Gang (appointed with effect from 27 March 2019) Mr. SUN Jing Yan (retired with effect from 27 March 2019)
Non-executive DirectorsMr. LIANG Hai Shan Ms. TAN Li Xia (retired with effect from 27 March 2019) Dr. WANG Han Hua Mr. YANG Guang (appointed with effect from 11 May 2018) Mr. YIN Jing (retired with effect from 11 May 2018)
Independent Non-executive DirectorsMr. YU Hon To, David Mrs. Eva CHENG LI Kam Fun Mr. GONG Shao Lin (appointed with effect from 26 June 2018) Ms. TSOU Kai-Lien, Rose (retired with effect from 1 July 2018)
PRINCIPAL BOARD COMMITTEESAudit CommitteeMr. YU Hon To, David (Committee Chairman) Mrs. Eva CHENG LI Kam Fun Ms. TAN Li Xia (retired with effect from 27 March 2019) Mr. GONG Shao Lin (appointed with effect from 27 March 2019)
Remuneration CommitteeMrs. Eva CHENG LI Kam Fun (Committee Chairman) Mr. YU Hon To, David Mr. ZHOU Yun Jie Dr. WANG Han Hua (Observer)
Nomination CommitteeMr. YU Hon To, David (Committee Chairman) Mrs. Eva CHENG LI Kam Fun Mr. ZHOU Yun Jie
Strategic CommitteeMr. ZHOU Yun Jie (Committee Chairman) Mr. YANG Guang (appointed with effect from 11 May 2018) Mr. GONG Shao Lin (appointed with effect from 26 June 2018) Ms. TSOU Kai-Lien, Rose (ceased to act with effect from 1 July 2018) Mr. YIN Jing (ceased to act with effect from 11 May 2018) Dr. WANG Han Hua (Observer)
COMPANY SECRETARYMr. NG Chi Yin
LEGAL ADVISORSAs to Hong Kong Law DLA Piper Hong Kong Jeffrey Mak Law Firm
As to Bermuda LawConyers Dill & Pearman
PRINCIPAL BANKER IN HONG KONGIndustrial and Commercial Bank of China (Asia) Limited
PRINCIPAL BANKER IN THE PRCChina Construction Bank Corporation
AUDITORSErnst & Young
FINANCIAL CALENDARSix-month interim period end : 30 June Financial year end : 31 December
5Haier Electronics Group Co., Ltd. Annual Report 2018
Corporate Information
REGISTERED OFFICEClarendon House 2 Church Street Hamilton HM 11 Bermuda
HEAD OFFICE AND PRINCIPAL PLACE OF BUSINESS IN HONG KONGUnit 3513 35/F., The Center 99 Queen’s Road Central Hong Kong
PRINCIPAL PLACE OF BUSINESS IN THE PRCHaier Industrial Park No. 1, Haier Road Qingdao, the PRC
PRINCIPAL SHARE REGISTRAR AND TRANSFER OFFICEConyers Corporate Services (Bermuda) Limited Clarendon House 2 Church Street Hamilton HM 11 Bermuda
BRANCH SHARE REGISTRAR AND TRANSFER OFFICE IN HONG KONGTricor Tengis Limited Level 22 Hopewell Centre 183 Queen’s Road East Hong Kong
TELEPHONE NUMBER+852 2169 0000
FAX NUMBER+852 2169 0880
STOCK CODEThe Stock Exchange of Hong Kong Limited: 01169
WEBSITEwww.haier.hk
INVESTOR RELATIONS CONTACTStrategic Financial Relations Limited 24/F, Admiralty Centre I 18 Harcourt Road Hong Kong Telephone Number : (852) 2111 8468 Fax Number : (852) 2527 1186 E-mail Address : [email protected]

6 Haier Electronics Group Co., Ltd. Annual Report 2018
CHAIRMAN’S LETTER
In 2018, Haier Electronics Group’s revenue has increased by 8.3%, and the net profit attributable to the owners of the Company has increased by 13.7%. We achieved overall increases in market shares in each of our product lines. According to the statistics from Euromonitor International, the Haier brand has topped the global white goods brand rankings for the tenth consecutive years.
We would like to thank our investors for your trust, which have enabled us to see beyond small gains and small losses, and stay focused on the planning of long-term strategies that create values for our shareholders. We would like to thank our consumers for your support, it is a great honor and a huge responsibility. From the moment you selected our products, we bear the responsibility to provide you with even better experience. We would like to thank each and every employee on our team for your dedication, who have created countless touching moments while fulfilling the job responsibilities.
We are facing an uncertain macro environment; whether it is the pressure from the economic downturn, or challenges from the trade frictions, different enterprises would have different visions. In my opinion, for a well-developed and ever-growing company, challenges are our opportunities, which can further drive high-quality development through innovations. “Anything can be a success if it is well-prepared in advance, or it can be a failure if not well prepared.” It is gratifying to note that in past few years, in response to these uncertainties, we have made adjustments and deployments in respect of corporate strategies, organizational structure and incentive mechanisms. Although we cannot avoid uncertainties, we have the confidence and capability to manage them. What is the most valuable asset of an enterprise? The answer is not about factory buildings, not about equipment, but about people. People are the essence of an enterprise. Only by fully unleashing the creativity of each employee can we create more user value, and in turn maximize our shareholder value. At present, our company has already developed an innovative system centered on human values. Our employees are confident in our development strategies and are passionate about the innovative platform we have built up. The company is fully prepared for the challenges we may face in 2019. We will embrace change and uncertainties with a positive attitude.

7Haier Electronics Group Co., Ltd. Annual Report 2018
Chairman’s Letter
Over the past three years, we have stayed customer-centric and innovative. We have reconstructed our corporate value chain and established a business model with high entry barriers.
Our diverse brand portfolio and product mix provide personalized solutions for consumers with different needs. Through our globalized branding strategies, Haier Group now owns seven major home appliance brands, including Haier, Casarte, Leader, America’s GE Appliances, New Zealand’s Fisher&Paykel, Japan’s AQUA, and Italy’s Candy. Together they form a “Worldwide Cluster of Home Appliance Brands”. Our Group’s product line development can leverage Haier Group’s abundant global R&D resources to produce a rich portfolio of product solutions, thus reaching a wide spectrum of customer needs covering different regions and at different levels.
To give an example, with the integration of the Fisher&Paykel’s direct drive motor technology, Haier Washing Machine has become the only company in the Chinese market that can produce large-drum size direct drive variable-frequency front-load washing machines. Leveraging on our global R&D resources, we launched the Casarte’s steam cleaning technology in China market to solve the long-standing users’ problem of fiber damage of delicate fabrics (e.g. fur and silk) caused by traditional washing solutions. In 2018, we offered steam cleaning experience to consumers for almost 100 million times.
Our smart home solutions transform home appliances into platforms that interact with users. In the next decade, the Internet of Things (IoT) will refine people’s lifestyle. The explosive growth of IoT is likely to kickoff from smart home. The prevalence and application of smart home solution does not only lie in its technological feasibility, but also in its application in live life scenarios. Haier’s smart home solutions are enabled by our self-developed U+ system. The design concepts also integrate with applications of user

8 Haier Electronics Group Co., Ltd. Annual Report 2018
Chairman’s Letter
needs and user experience, and innovate from consumption scenarios. With reference to users’ living scenarios, and based on the four physical spaces of smart living room, smart kitchen, smart bathroom and smart bedroom, we launched seven whole-house solutions such as whole-house water using and wash & care, etc., as well as a variety of smart living scenarios. Haier has already developed a cumulative total of over 1,000 smart home scenarios, covering first- and second-tier cities across China. Besides, these smart home scenarios can be customized, and the experience can be enhanced.
We established an industrial internet platform that shifted large-scale manufacturing to customization. All of our Group’s recent constructed factories have adopted COSMOPlat, an industrial internet platform independently innovated by the Haier Group. COSMOPlat is built upon a differentiated model of user-centered large-scale customization to establish a whole-process, total-factor and full-cycle complete ecosystem. It has been appointed to take the lead in the formulation of international standards for mass customization by the world’s three major organizations on standardization — IEEE, ISO and IEC. Users can customize their own products on this platform, which innovates the end-to-end interconnected value chain model. This resulted in 71% of build-to-order products on the production line, which can skip the warehousing stage and be directly delivered to users’ homes.
We formed a network that integrated online and offline touchpoints. In the future retail market, whoever owns the touchpoint network that can deeply interact with users, will be well positioned to take lead in the competition. In terms of offline channels, we developed touchpoint networks in a more flexible way by proactively expanding our offline stores and touchpoints, and integrating them with the mobile internet. Our goal is to develop a contact network that can cover all users’ scene of consumption. Meanwhile, our brick-and-mortar stores transformed from the conventional model of in-store marketing, to a model that focused on community interactions. In terms of online channels, we promoted personalized customization and set product solutions, evolving from the sales of products to the sales of solutions, from placing advertisements to self-propagating marketing, from buying traffic to offering a consistent omni-channel consumer-centric experience. Finally, we leveraged on the social network of the “Shunguang” platform to achieve online and offline integration, forming communities through the interactions between micro-store owners and users, which enabled us to accurately grasp user needs, and to match users in the communities with suitable household products and solutions.
By expanding from product manufacturing to the wider product-linked ecosystem of consumption scenarios, we generated ecosystem revenue that extended beyond traditional hardware sales. We have already established leading positions for our washing machine and water heater businesses in the industry, but our future is far beyond that. We are building and upgrading the IoT ecosystem based on the experience of user lifestyles. We collaborate with stakeholders in the ecosystem to share the value enhancements. For instance, Haier’s smart washing machine can recognize garment through RFID technology. It can intelligently apply detergent and adjust washing programs according to the textile and the perceived water quality. We have integrated smart washing machines, apparel manufacturers, fabric manufacturers and detergent manufacturers on the same platform, so as to provide apparel companies with full-life-cycle solutions for clothing, hence bringing users wonderful whole-process experience of washing, caring, storing, dressing and purchasing. Meanwhile, the ecosystem also generates derived income for Haier Washing Machine, which includes commissions from the distribution of clothing and detergents.
We are planning for the new field of water business. We have announced in the second half of 2018 the plan to merge the water purification business into our Group. I would like to express our gratitude to all shareholders for your supportive votes. This asset swap transaction will bring us better opportunities to offer environmental-friendly, safe and healthy water using experience to consumers in China, covering residential

9Haier Electronics Group Co., Ltd. Annual Report 2018
Chairman’s Letter
apartment and houses, as well as commercial scenarios. We will construct a production base for household water appliances in China, and will connect and share the resources of water purifiers, water heaters and washing machines in the aspects of our product design, purchasing, supply chain and channel services, so as to provide our users with whole-process, integrated water usage solutions. We will relentlessly explore upstream and downstream development opportunities in the water industry, investing our capital and resources in relevant new growth opportunities, so as to enhance our cash efficiency and shareholder values.
We also actively fulfill our corporate citizenship responsibilities. The concept of “Green Development” has permeated the entire process of our business operations from R&D, design, manufacturing, logistics, etc. We evaluate our raw materials utilization rate and prioritize the use of green raw materials. Through ongoing innovations, we strive to conserve energy and reduce emissions. For instance, we have implemented a full-life-cycle electronic waste management system within the company, sorting and storing electronic waste generated during our production and circulation processes by partnering with certified suppliers.
We are devoted in charities, and are committed to giving back to the society through sincere donations. The Haier Group has built, and Haier Electronics also participated in, a cumulative total of 286 “Hope Schools” to improve the education conditions in deprived areas, covering 26 provinces, province-level municipalities and autonomous regions in China. We believe kinship and warmth can be passed on to one another. Through our touchpoint networks including the Haier’s specialty stores and the Shunguang communities, we organized charitable activities like the “Hug Daddy” campaign, which supported the reunions of stay-at-home children with their parents and relatives in different areas. The campaign has involved 59 of our regional centers and radiated to 118 cities.
Once again, we would like to express our heartfelt gratitude for your support. We look forward to sharing the joy of success from our innovations with you in 2019.

10 Haier Electronics Group Co., Ltd. Annual Report 2018
DIRECTORS AND SENIOR MANAGEMENT
The Directors and senior management of the Group during the year are as follows:
EXECUTIVE DIRECTORS
Mr. ZHOU Yun Jie (“Mr. Zhou”), aged 52, has been serving as an Executive Director and general manager of the Company since 12 November 2009. He has also been appointed as the chairman of the Company with effect from 25 June 2013. He is also a member of the remuneration committee and nomination committee of the Company, and is the chairman of the strategic committee of the Company. Mr. Zhou was the chief executive officer of the Company from 18 March 2013 to 25 August 2017. Mr. Zhou graduated from the Huazhong University of Science and Technology, the People’s Republic of China (the “PRC”) with a Bachelor’s degree in Engineering in 1988. He has a Master’s degree in corporate management from the Ocean University of China, the PRC and has completed his Doctoral courses with a diploma in Management from the Xi’an Jiaotong University, the PRC. He joined the Haier Group Corporation (“Haier Group”) in 1988 and has had over 20 years of experience in the areas of sales management, enterprise management and international business. Currently, he is the President and Deputy Chairman of the board of Haier Group, and also he is a deputy to the 13th National People’s Congress of China. He also serves as a non-executive director of Bank of Qingdao Co., Ltd., a company listed on the Hong Kong Stock Exchange and Shenzhen Stock Exchange.
Mr. Zhou is also a director of the following Group’s subsidiaries: Goodaymart (Shanghai) Investment Co., Ltd., Qingdao Goodaymart Logistics Co., Ltd. and its certain subsidiaries, and Qingdao Gooday Chuang Zhi Investment Management Co., Ltd..
Mr. SUN Jing Yan (“Mr. Sun”), aged 48, has served as an Executive Director of the Company since 28 April 2017. Mr. Sun joined the Haier Group in 1993 and has since then held a number of senior positions in the Electrothermal Appliance Department of the Haier Group. Mr. Sun retired as an Executive Director of the Company with effect from 27 March 2019. He has been the General Manager of the Water Heater Division of the Group till the end of year 2018. He is also the General Manager of Kitchen and Sanitary Wares Business of Haier Group, and serves concurrently as the Vice President of Haier Group. Mr. Sun graduated from Shandong Institute of Light Industry, the PRC in 1993 with a Bachelor in Engineering in Machine Design and Manufacture. He has over 20 years of extensive experience in water heater business.
Mr. Sun is a director of the following Group’s subsidiaries: Haier Electrical Appliances Fourth Holdings (BVI) Limited, Haier Water Heaters Holdings (BVI) Limited, Qingdao Economy and Technology Development Zone Haier Water Heater Co., Ltd., Wuhan Haier Water Heater Co., Ltd., Chongqing Haier Water Heater Co., Ltd., Qingdao Haier New Energy Electronics Co., Ltd., Qingdao Lejia Electric Appliances Co., Ltd. and Goodaymart (HK) Limited.

11Haier Electronics Group Co., Ltd. Annual Report 2018
Directors and Senior Management
NON-EXECUTIVE DIRECTORS
Mr. LIANG Hai Shan (“Mr. Liang”), aged 52, has served as an Executive Director of the Company since December 2001 and has been re-designated as a Non-executive Director with effect from 12 November 2009. Mr. Liang was previously mainly responsible for strategic procurement and overall quality control of products of the Group. He is current ly responsible for ident i fy ing market opportunities and white goods business strategies formulation of the Company. He received a Bachelor’s degree of Industry from the Xi’an Jiaotong University, the PRC and has over 20 years of experience in the manufacture of household electrical appliances, particularly in raw material procurement function and white goods business. He is also the Executive President and the Deputy Chairman of the board of Haier Group, the General Manager and Chairman of Qingdao Haier Co., Ltd. (a company listed on the Shanghai Stock Exchange and China Europe International Exchange (CEINEX)).
Ms. TAN Li Xia (“Ms. Tan”), aged 48, has served as a Non-executive Director of the Company since 18 November 2013. She is also a member of the audit committee of the Company. Ms. Tan retired as a Non-executive Director and a member of the audit committee of the Company with effect from 27 March 2019. Ms. Tan graduated from Central University of Finance and Economics, the PRC and has a master degree in Business Administration from the China Europe International Business School upon completion of the EMBA program. She is a Fellow of the Chartered Institute of Management Accountants and has been designated as a Chartered Global Management Accountant (CGMA). She joined Haier Group in 1992 and had held the positions as the Head o f Depar tment o f Overseas Marke t Development of Haier Group, Head of Department of Financial Management of Haier Group and Chief Financial Officer of Haier Group. Currently, she is the Executive Vice President of Haier Group. Ms. Tan also holds positions of Deputy Chairman of the Board of directors of Qingdao Haier Co., Ltd. (a
company listed on the Shanghai Stock Exchange and China Europe International Exchange (CEINEX)), non-executive director of Bank of Qingdao Co., Ltd. (a company listed on the Hong Kong Stock Exchange and Shenzhen Stock Exchange), and director of Fisher & Paykel Appliances Holdings Limited. Ms. Tan was awarded titles such as Model Worker of Shandong Province (山東省勞動模範), National Outstanding Entrepreneur (全國優秀企業家), the China CFO of the Year (中國總會計師年度人物) and China Top Ten Women in Economic Area (中國十大經濟女性年度人物). Ms. Tan is also a member of the 12th executive committee of the All-China Women’s Federation, Deputy Chairman of China Association of Women Entrepreneurs.
Dr. WANG Han Hua (“Dr. Wang”), aged 54, has served as a Non-executive Director of the Company since 1 June 2013. He is also the observer of the remuneration committee and strategic committee of the Company. Dr. Wang obtained his Doctor of Philosophy degree from the University of Nebraska of the United States in 1994. He was the China Managing Director of Sonos Inc, an US based world leading wireless HIFi producer from April 2014 to May 2018. Prior to this, he took position as the chief executive off icer of Al lyes Information Technology (Shanghai) Co. Ltd. (好耶信息技術(上海)有限公司), an internet company providing full digital marketing solutions of data, technology and product to its customers, in December 2012. Prior to this, Dr. Wang had been the president of Amazon (China) Holding Company Limited from May 2005 until November 2012 and was responsible for the sale, marketing, cooperation and the construction of B2C E-commerce ecological chain of Amazon in China. Prior to joining Amazon (China) Holding Company Limited, Dr. Wang served a number of positions with Motorola Mobility Technologies (China) Company Limited Beijing branch company (摩托羅拉移動技術(中國)有限公司北京分公司) between 1998 and 2005 including as marketing director, director of strategy and corporate planning, vice president of the Asia Pacific region and general manager of the mobile telephone operations of China.

12 Haier Electronics Group Co., Ltd. Annual Report 2018
Directors and Senior Management
Management specialized in Global Supply Chain Management from Portland State University. He was a member of Institute of Electrical and Electronics Engineer (IEEE). He also had served as the Vice President of Program and the Advisory Council member of the Council of Supply Chain Management Professionals (CSCMP).
INDEPENDENT NON-EXECUTIVE DIRECTORS
Mr. YU Hon To, David (“Mr. Yu”), aged 71, was appointed as an Independent Non-executive Director of the Company on 21 June 2007. He is also the chairman of the audit committee and nomination committee of the Company and a member of the remuneration committee of the Company. Mr. Yu is a fellow of the Institute of Chartered Accountants in England and Wales and an associate of the Hong Kong Institute of Certified Public Accountants. He was formerly a partner of an international accounting firm with extensive experience in corporate finance. He serves as an independent non-executive director of several other companies listed on the Stock Exchange of Hong Kong, namely China Renewable Energy Investment L imited, Media Chinese International Limited, One Media Group Limited, Playmates Holdings Limited, China Resources Gas Group Limited, Keck Seng Investments (Hong Kong) Limited, New Century Asset Management Limited (the manager of New Century Real Estate Investment Trust) and MS Group Holdings Limited.
Mrs. Eva CHENG Li Kam Fun (“Mrs. Cheng”), aged 66, was appointed as an Independent Non-executive Director of the Company on 1 June 2013. She is also a member of the audit committee and nomination committee of the Company and the chairman of the remuneration committee of the Company. Mrs. Cheng graduated from the University of Hong Kong with Bachelor of Arts (Hons) and Master of Business Administration degrees. She was conferred with the degree of Doctor of Business Administration, honoris causa, from the Open University of Hong Kong in 2014.
NON-EXECUTIVE DIRECTORS (continued)
Mr. YANG Guang (“Mr. Yang”), aged 41, was appointed as a Non-executive Director of the Company on 11 May 2018. He is also a member of the strategic committee of the Company. Mr. Yang graduated from Jilin University, China, majoring in biological pharmacy. He joined Alibaba Group in September 2007. He is currently the general manager of the department of supply chain innovation of Alibaba Group and is responsible for innovative product and business in supply chain and logistics services in Taobao.com. Mr. Yang has extensive experience in the internet industry and the lottery industry. Before the current position, Mr. Yang led the operation team of consumer electronics product in Taobao.com. Mr. Yang was one of the core members of the team responsible for the establishment of Tmall.com and Taobao Travel. From 2012 to 2015, Mr. Yang was responsible for Taobao.com’s innovative business including Taobao Lottery. Currently, Mr. Yang is also a non-executive Director of AGTech Holdings Limited, a company listed on the GEM of the Hong Kong Stock Exchange, and a non-executive Director of SUNING.COM Co., Ltd. (a company listed on the Shenzhen Stock Exchange).
Mr. YIN Jing (“Mr. Yin”), aged 36, has served as a Non-Executive Director of the Company since 21 June 2017. He is also a member of the strategic committee of the Company. Mr. Yin retired as a Non-executive Director and a member of the strategic committee of the Company with effect from 11 May 2018. Mr. Yin serves as the Assistant to CEO of Alibaba Group since March 2018, where he is responsible for the global initiatives. Prior to his current position, Mr. Yin was the President of Tmall Home Business Group of Alibaba Group. Mr. Yin joined Alibaba Group in 2013 and prior to that, he served as Head of Supply Chain of Amazon Web Services (AWS), the Amazon.com cloud computing business unit based in Seattle, Washington State of USA. Mr. Yin received his bachelor’s degree in Electrical Engineering from George Fox University and holds a master’s degree in International

13Haier Electronics Group Co., Ltd. Annual Report 2018
Directors and Senior Management
Mr. GONG Shao Lin (“Mr. Gong”), aged 63, was appointed as an Independent Non-executive Director and a member of the strategic committee of the Company on 26 June 2018. He has also been appointed as a member of the Company’s audit committee with effect from 27 March 2019. He graduated from the Central Institute of Finance and Economics, the PRC (中央財政金融學院) with a Bachelor’s degree in Finance, and obtained his Doc to r ’ s deg ree i n Econom ics f r om the Southwestern University of Finance and Economics, the PRC (西南財經大學) in June 1999. Mr. Gong has an extensive experience in the securities and finance sectors. He was the board chairman of China Merchants Securities Co., Ltd. during the period from November 2001 to May 2017. He retired from this position in May 2017 and thereafter serves as senior advisor of China Merchants Securities Co., Ltd till May 2018. He was the Vice-President of China Merchants Bank during the period from 1997 to 2001. Prior to this, he had held a number of senior positions in the People’s Bank of China between 1982 and 1997.
Ms. TSOU Kai-Lien, Rose (“Ms. Tsou”), aged 53, has been appointed as an Independent Non- executive Director of the Company since 7 June 2014. She is also a member of the strategic committee of the Company. Ms. Tsou retired as a Independent Non-executive Director and a member of the strategic committee of the Company with effect from 1 July 2018. Ms. Tsou currently is Head of Oath APAC business, where she is responsible for managing Oath’s businesses in Japan, Hong Kong, Taiwan, Southeast Asia and India as well as chairing the board at the Oath’s joint venture operations in Australia and New Zealand. Ms. Tsou joined Oath through its acquisition of Yahoo where she served as Managing Director and Senior Vice President of Yahoo APAC, she was responsible for revenue growth in users services, advertising business and e-commerce. Ms. Tsou served as managing director of Yahoo Taiwan for 7 years. During her tenure, she successfully grew the e-commerce business and established Yahoo as a brand synonymous with the internet in Taiwan. Ms. Tsou holds an MBA from J.L. Kellogg School of Management, Northwestern University, as wel l as a Master’s of Mass Communication from Boston University.
INDEPENDENT NON-EXECUTIVE DIRECTORS (continued)
Mrs. Cheng is currently Executive Director of Our Hong Kong Foundation. She serves on the Boards of multiple publicly listed companies as Independent Non-executive Director. These companies include Nestle S.A. on the SIX Swiss Exchange, Trinity Limited on the Main Board of the Hong Kong Stock Exchange, and Amcor Limited on the Australian Securities Exchange. Prior to joining the Our Hong Kong Foundation, Mrs. Cheng had a distinguished career that spanned 34 years with Amway Corporation. When she retired in 2011, she held the concurrent positions of Executive Vice President of Amway Corporation and Executive Chairman of Amway China Co. Ltd. responsible for Amway Greater China & Southeast Asia Region.
Mrs. Cheng’s leadership was well recognized in the business community. She was twice named the “World’s 100 Most Powerful Women” by Forbes Magazine in 2008 and 2009. CNBC awarded Mrs. Cheng with the “China Talent Management Award” in its 2007 China Business Leaders Awards. In the areas of public and community service, Mrs. Cheng is a director of China Children and Teenagers Foundation, council member of the Hong Kong Academy for Performing Arts, court member of the Open University of Hong Kong, advisor of the All-China Women’s Federation Hong Kong Delegates Association, honorary president of the Hong Kong Federation of Women, and permanent honorary director of The Chinese General Chamber of Commerce.

14 Haier Electronics Group Co., Ltd. Annual Report 2018
Directors and Senior Management
Yantai Goodaymart Electric Appliance Co., Ltd., Hefei Goodaymart Electric Appliance Co., Ltd., Jiangsu Subei Goodaymart Electric Appliance Co., Ltd., Wuhan Goodaymart Electric Appliance Co., Ltd., Shanxi Goodaymart Electric Appliance Co., Ltd., Qingdao Haier Electronics Sales Service Co., Ltd., Haier Washing Machines Holdings (BVI) Limited, 365 Goodaymart (CM) Limited, 365 Goodaymart (HK) Limited, Haier Group E-commerce Co., Ltd., Qingdao Gooday Information Technology Co., Ltd., Guanmei (Shanghai) Enterprise Management Co., Ltd., and Ningzhen (Shanghai) Enterprise Management Co., Ltd..
SENIOR MANAGEMENT
Mr. XIE Ju Zhi (“Mr. Xie”), aged 53, graduated from Shandong University of Finance and Economics in July 1989 with a bachelor’s degree, and joined Haier Group in the same year. Mr. Xie has experience in whole-process product management, product-wide services and product-wide marketing. He has held senior positions in Electrothermal Division and East China Marketing and Promotion Division of the Haier Group, and served as the Corporate General Manager of the Customer Services of the Haier Group since August 2002. Since July 2012, he has been the Vice President of Haier Group, and he has undertaken Haier Group’s integration of community sales services of first and second-tier cities, and developing the online and offline sales of new household products. Since December 2015 to date, he has been managing the newly developing business segments of Haier Group, including water purification, logistics, Haier home and Gooday services. He is also in charge of the water heater business since 2019. Mr. Xie was awarded honorary titles including the Gold Award of Outstanding Contribution Award of China’s Home Appliance Services Industry* (中國家電服務行業突出貢獻獎金獎) and Outstanding Entrepreneur of Shandong Province* (山東省優秀企業家).
Mr. Xie has been appointed as an executive Director of the Company and the Chief Executive Officer of the Company with effect from 27 March 2019.
CHIEF EXECUTIVE OFFICER
Mr. LI Hua Gang (“Mr. Li”), aged 49, has been appointed as the Chief Executive Officer of the Company with effect from 25 August 2017. Mr. Li graduated from the Huazhong University of Science and Technology, the PRC in 1991 with a Bachelor’s degree in Economics, and graduated from China Europe International Business School in 2014 with a Master’s degree in EMBA. Mr. Li currently serves as the Vice President of Haier Group. Mr. Li has relinquished his role as the Chief Executive Officer of the Company and he has been appointed as an executive Director of the Company with effect from 27 March 2019. He joined Haier Group in 1991 and has since then held a number of senior positions in the sales and marketing functions of Haier Group with his expertise in the sales management of the PRC market. Mr. Li has served as the Chief Operating Officer of the Company from 2009 to 2014 and has been re-designated as the China Chief Marketing Officer of Haier Group after that. Mr. Li was the alternate Director to Mr. LIANG Hai Shan from 7 June 2014 to 24 August 2017. Serving as the China Chief Marketing Officer of Haier Group, Mr. Li vigorously promoted brand upgrade and channel optimization strategy, leading to the growths of revenue for online business and offline domestic business of Haier Group. Mr. Li is a manager with broad vision and rich business experience. Since 2015, in the transformation process of creating value for customers while realizing employees’ own value, Mr. Li undertook challenges and participated in the frontline operation of the market, which enhanced the brand image of Haier Group and strengthened the strategic collaboration of online and offline channels. With his outstanding performance and excellent leadership, Mr. Li has won the trust from the management and staff of the Group.
Mr. Li is also a director of the following Group’s subs id ia r i es : Chongq ing New Goodaymar t Electronics Sales Co., Ltd., Fujian Goodaymart Electric Appliance Co., Ltd., Goodaymart (Shanghai) Investment Co., Ltd., Haier Electronics Sales (Hefei) Co., Ltd., Haier Electronics Sales (HK) Co., Ltd.,

15Haier Electronics Group Co., Ltd. Annual Report 2018
Directors and Senior Management
Mr. SHU Hai (“Mr. Shu”), aged 52, has served as the General Manager of washing machine product division of the Company since June 2009. Mr. Shu has a Master’s degree in International Trade from Ocean University of China, the PRC. He joined the Haier Group in 1995 and has since held a number of senior positions in the washing machine business. He is currently responsible for the sales, research and development and production management of the washing machine business of the Group.
COMPANY SECRETARY
Mr. NG Chi Yin (“Mr. Ng”), aged 53, joined the Company on 18 March 2009 as Company Secretary. Mr. Ng graduated from the Faculty of Business Administration of the Chinese University of Hong Kong with a Bachelor’s degree in business administration. He is also a fellow member of the Association of Chartered Certified Accountants, and a member of the Hong Kong Institute of Certified Public Accountants and the Institute of Chartered Accountants in England and Wales. He has over 20 years of experience in auditing, finance and company secretarial matters.
SENIOR MANAGEMENT (continued)
Mr. HUANG Xiao Wu (“Mr. Huang”), aged 41, was appointed as Deputy General Manager of the Company in November 2009. Mr. Huang holds a Master’s degree in Business Administration from the University of Hong Kong and a Bachelor’s degree in Engineering from the University of Chong Qing. Mr. Huang is responsible for assisting the Chairman and Chief Executive Officer in implementing the Group’s corporate development strategy. Mr. Huang has 20 years of extensive experience in banking, investment and corporate finance. Prior to joining the Group, he had worked with a commercial bank and several investment banking firms.
Mr. ZHAN Bo (“Mr. Zhan”), aged 38, has served as the Chief Financial Officer of the Company since 12 November 2013. Mr. Zhan holds an Executive Master’s degree in Business Administration from University of International Business and Economics and a Bachelor’s degree in Economics from Tianjin University of Finance and Economics. He is a Fellow of the Chartered Inst i tute of Management Accountants (FCMA) and has been designated as a Chartered Global Management Accountant (CGMA). He joined the Haier Group in 2002, and has since held a number of senior financial positions in Haier Group finance department, Haier Europe trading company, Haier Group telecommunication business and Haier Global Marketing department. He has extensive experience in financial management.

16 Haier Electronics Group Co., Ltd. Annual Report 2018
BUSINESS REVIEW
BUSINESS REVIEW
Industry Analysis
According to the National Bureau of Statistics (NBS) of China, the total retail sales of consumer goods in 2018 reached RMB38 trillion, representing a year-on-year increase of 9%. Consumption has further become a significant force in driving economic growth. However, due to the uncertainty of the US-China trade war and a weak real estate market in the PRC, the 2018 home appliances industry was impacted to a certain degree, especially in segments that are correlated with the real estate sector. The bullish sentiment in the market from the previous year gradually eased, with the high growth rate at the beginning of the year declined as the year progressed. According to All View Cloud (AVC) online and offline channels’ data summary, the annual total sales of home appliances amounted to RMB832.7 billion with a year-on-year growth rate of 1.5%, which was a decrease of 10.3 percentage points compared to that of 2017. The growth rates of washing machine and electric water heater products were 3.7% and –0.8% respectively, whereas water purifier products recorded a growth rate of 17.4%. Although the overall market condition was sluggish, due to the rapid changes in consumers’ spending behaviors as well as the deepening of channel transformation, the home appliances market still managed to achieve distinguished performance in some brands and segments with the following characteristics:
Consumption upgrade continued with strong wil l ingness to buy high-end brands. As consumers’ purchase behaviors leaned towards brand and quality products, coupled with a continued increase in per capita disposable income, the trend of consumption upgrade gave rise to home appliance products positioned in the mid- to high-end market, and drove the growth of large-capacity, smart, and energy-efficient novel products. AVC offline data showed that the sales value of high-end products1) in 2018 accounted for 35.4% in the washing machine segment, 39.4% in the electric water heater segment, and 43.1% in the gas water heater segment, representing year-on-year increases of 8, 2.4 and 4.1 percentage points respectively. In the washing machine segment, despite a mere overall market growth rate of 3.7%, Haier’s premium brand Casarte recorded a growth rate of over 50% in annual sales value, surpassing that of other major washing machine brands.
Leading brands’ further increase in market concentration. According to data from China Market Monitor Co., Ltd. (CMM), market shares further concentrated towards leading brands. The overall market share of the top three leading companies in the washing machine and water heater segments amounted to 71% and 57.1% respectively, representing an increase of 3.0 and 1.0 percentage points from that of 2017. Consumers’ brand awareness of standard home appliances continued t o r i s e , s i g n i f i c a n t l y s t r e n g t h e n i n g t h e competitiveness of leading brands.
1) High-end products refer to top-load washing machine priced over RMB3,000 or front-load washing machine priced over RMB5,000, as well as electric water heater priced over RMB3,000 and gas water heater priced over RMB4,000.

17Haier Electronics Group Co., Ltd. Annual Report 2018
Business Review
BUSINESS REVIEW (continued)
Industry Analysis (continued)
Encouraging growth in lifestyle appliances, vast potential in development of set products. Due to the existing high penetration rate per household, the market for fridge and washer products has gradually saturated. In contrast, some wellness and lifestyle appliances with lower market penetration, such as dishwashers, dryers and water purifiers, showed prosperous performance. As estimated by AVC omni-channel data, they achieved rapid growth rates of 27.6%, 34%, and 17.4% respectively in 2018. The prosperity of these products brought great potential for the development of product bundles with complementary functions. For instance, the two-in-one washer-dryer combo had an offline growth that reached 37.6%. Moreover, a water heater equipped with whole house multilayer filter and softener system can effectively prevent scale buildup in water heaters, and offer users a superior wash and care experience.
Scenario-based consumption on the rise with booming set sales. Consumers were placing increasing importance on scenario-based experience and preferred integrated solutions rather than products with a single function. This made set sales one of the current directions in promotion. In addition, product sets purchase by consumers in the home furnishing or HVAC market offers convenience and consistency in the style of home furnishing. Using Haier as an example, product bundles purchase witnessed a strong growth in 2018, with total sales volume surpassed 2.1 million.
New retail model integrating online and offline channels bolstered business growth. In 2018, the country’s online retail sales of physical goods recorded a year-on-year increase of 25.4%, online channels continued to outperform offline retails; yet, the growth of online channels slowed down and the cost of customer acquisition gradually rose. A new retail model integrating online and offline channels became an prospective path of development. This meant leveraging the data-analyzing power of online channels to capture users’ profiles, utilizing the
convenience of online order and payment, while taking advantage of the offline brick-and-mortar space to showcase products and create scenario experiences, thus enriching customer touchpoints, raising overall conversion rates. The new retail model has effectively increased sales efficiency and reduced offline inventory cost.
Large-format logistics business. According to the National Postal Management Conference, China’s express delivery business volume in 2018 totaled to 50.5 billion pieces of items, marking an increase of 25.8% year-on-year. The amount is projected to increase by 20% in 2019 to 60 billion pieces. In face of a daily volume of over 160 million pieces of items, the use of technologies such as IoT applications, big data analysis and artificial intelligence may herald a new era of digitalization in the express delivery industry. Furthermore, large-format item logistics in 2018 was fueled by the increase in the proportion of online shopping of large-format products such as furniture and home appliances, making it the new battleground of the sector. Deppon Logistics Co. Ltd changed its name to Deppon Express and began heavily advertising ‘next-day’ delivery service of large-format items. Meanwhile, logistics companies such as ZTO Express, SF Express and Yunda Express quickly established express logistics business to break into the market of large-format item delivery. A high-quality end-to-end service is essential due to the existence of many pain points in large-format logistics, including delivery of non-standard commodities, fragility of items during transportat ion, di f f iculty in del ivery through staircases, and the need to provide professional assembly services. This required large-format item logistics players to commit a higher capital investment, thus improving their information technology level and high-tech distribution tools. They also needed to face a rise in labor and transportation costs in spite of the downward price pressure from customers’ orders.

18 Haier Electronics Group Co., Ltd. Annual Report 2018
Business Review
BUSINESS REVIEW (continued)
In 2018, the Group recorded a revenue of RMB85,250,041,000, a year-on-year increase of 8.3%, and a net profit attributable to parent company of RMB3,789,679,000, a year-on-year increase of 13.7%. Benefiting from our high-performance innovations which have been continuously creating value to users, our white goods business, channel services business and logistics business have all achieved growth against a downward economic trend. Seizing the trend of consumption upgrades, the white goods sector continued to upgrade products with enhanced qualities, achieving an increase in sales revenue and gross profit margin. Our channel services business underwent a transformation with continued expansion of customer touchpoint network, and improved conversion rate of stores through interactive marketing. Riding on the steady growth of the e-commerce business, the logistics business vigorously developed its third-party business and overseas business to drive growth momentum. By building ecosystems of Internet of Clothing, Smart bathroom etc., the Group improves users living scenario with IoT technology and enhances users’ loyalty to Haier’s brand and services. In 2018, total revenue increased from participants and their interested parties of the ecosystem achieved more than RMB2 billion.
The breakdown of segment revenue and business performance for 2018 is set out below:
Proportion of segment revenue to revenue before
consolidated eliminations
Proportion of segment profit to profit before
consolidated eliminations
Channel services
Logistics
Washing machine
Water heater
64%
9%
20%
7%
Channel services
Logistics
Washing machine
Water heater
28% 9%
44%
19%

19Haier Electronics Group Co., Ltd. Annual Report 2018
Business Review
BUSINESS REVIEW (continued)
The above pie charts are prepared based on the amounts of segment revenue and the entire business performance, without taking into account any inter-segment eliminations of revenue and business performance. Inter-segment eliminations refer to the revenue generated from sales of washing machines and water heaters to the Group’s internal distribution channels, service fee revenue generated from after-sales installation and repair services for washing machines and water heaters of the channel services segment, and revenue under logistics segment generated from warehousing and transportation services for washing machine, water heater and distribution businesses. In 2018, the inter-segment eliminations of washing machine, water heater, channel services and logistics businesses are as follows:
Product or service receiver
Product or service provider
Business segments Washing machine Water heater Channel services Logistics
Washing machine N/A RMB14.58 billion N/A
Water heater N/A RMB5.57 billion N/A
Channel services RMB0.29 billion N/A RMB0.01 billion
Logistics RMB1.07 billion RMB0.02 billion N/A
Washing Machine Business
In 2018, our Group’s washing machine business maintained steady development despite the overall sluggish performance in the washing machine industry. We recorded a total revenue of RMB21.49 billion with a year-on-year increase of 10%. According to the market statistics from Euromonitor International, sales volume of Haier’s washing machines accounted for 14.9% of global market share in 2018, ranking top in the world for the tenth consecutive year. According to a market research report published by CMM, the Group’s washing machine business in 2018 continued to reap the largest market share on offline channels in terms of sales value in PRC. Our overall market share witnessed a further growth, accounting for 33.6% and 34.4% on offline and online channels respectively, representing year-on-year increases of 3.7 and 6.5 percentage points. In particular, our “Casarte” brand maintained a over 50% annual growth rate, its share of sales further rose to more than 10%. The “Leader” brand achieved a around 50% annual revenue growth, with its share of sales increased to more than 6%. Our three major brands achieved coordinated development while each focusing on different market segments and target customers.
Washing machine segment has witnessed prosperous trend of consumption upgrade. For front-load models priced over RMB6,000 among the entire industry, the market share of Haier’s products grew to 46%, which was 30 percentage points higher than that of the second-ranked brand. Besides, product models in the dimensions of washer-dryer combo, large-capacity, smart, and variable-frequency all witnessed significant growths in market shares.
As a frontrunner in the laundry industry in China, Haier’s washing machine business is committed to continuous product innovation and technological iteration. We strive to address users’ pain points and to provide users with superior wash and care experience. Since the launch of Air Wash in 2017 to cater for certain high-end fabrics that were not easy to wash, the product continued to upgrade, adding fabric and washing procedure options. The “Crystal” series products using direct drive technology continued to breakthrough with increasing drum diameters.

20 Haier Electronics Group Co., Ltd. Annual Report 2018
Business Review
In terms of experienced-based social marketing, the washing machine business continued to promote the “Air Wash” washing mode through offering users free on-site laundry service at 15,000 offline stores. These on-the-spot demonstrat ions provided comparisons of the before and after washing conditions of down jackets, mink fur coats and even luxury handbags, giving users an vivid understanding of the “Air Wash” function in Haier’s washing machines, and have greatly aroused enthusiasm among consumers.
In terms of overseas exports, the Group’s washing machines focus on driving brand awareness for oversea market. In 2018, our overseas export recorded a revenue increase of 15% year-on-year, export business accounted for 9% of washing machine segment’s overall sales value. Among the global export market, growths in the European and South Asian markets were substantial. In the South Asian market, projects on fully-automatic and front-load washing machine products drove a rapid rise in end market sales this year with a growth rate reaching 54%. In the European market, led by the continual iterations of direct drive motor technology, coupled with the effects from new customer development through differentiated products such as Twin Tasker and Fiber Care, market sales skyrocketed with a year-on-year increase of 70%.
The washing machine business continued to expand its production capacity during this year. As of 2018, we have reached a production capacity of 22.5 million units. Currently our washing machine segment continues to increase production lines to expand production capacity. We expect to increase the production capacity in 2019, so as to effectively cater to the user demand forecast. Meanwhile, the Group has strengthened its control on product costs during the year. Facing the risks of rising cost in raw materials, we reduced overall production costs through modular procurement and front-end design, while enhancing product positioning towards middle to high-end, thus effectively maintaining products’ gross profit margins at a steady level.
BUSINESS REVIEW (continued)
Washing Machine Business (continued)
The Group’s washing machine industry has been actively building an Internet of Clothing ecosystem, so as to expand product awareness, and to explore cross-sector partnerships. In August 2018, Haier took the lead in setting up the world’s first Clothing related ecosystem platform, attracting more than 100 large and medium-sized apparel enterprises to join. Through collaboration with Haier, apparel companies attached RFID chips to their clothes during production process, enabling digital management of the entire life cycle of the clothes from warehouse, delivery, sales to after sales. Apparel retail stores could track the sales data throughout the whole process, and could even customize featured styles and promote popular items according to purchase demand of users in the region. On the other hand, Haier’s washing machines could identify clothes with RFID chips and adjust washing mode automatically, bringing a truly smart and convenient laundry experience for users. In addition, data collected could be shared by both parties, making joint development of products possible in the future.
While setting up the ecosystem partnerships, our washing machine business continued to create cross-selling opportunities and conduct community-based marketing. Leveraging on the collaborations with apparel brands, Haier set up washing machine stores within apparel stores, offering users on-site demonst ra t ion to showcase the exce l l en t performance of Haier’s washing machines which greatly promoted cross-selling. One example was the collaboration between Haier’s washing machines and the reputable children’s clothing brand YEEHOO in displaying washers with baby care laundry functions in YEEHOO’s stores. Haier also collaborated with a high-end silk clothing brand to showcase products dedicated for silk wear with air wash function in their stores. Besides working with apparel brands, the Clothing ecosystem also partnered with detergent brands for win-win relationships between the Group and brand owners.
21Haier Electronics Group Co., Ltd. Annual Report 2018
Business Review
In 2018, revenue generated from sales of Haier’s electric water heaters increased by more than 7%, accounting for around 66.3% of the Group’s total sales of water heaters. Based on CMM’s retail monitoring data, Haier’s electric heater products gained a market share of 26.72% in terms of sales volume, once again confirming our leading position in China’s electric heater market. The market share in terms of sales value was 28.51%, which had an increase of 0.78 percentage points over the same period last year.
The success of electric water heaters stems from our continual product innovation and ongoing investment in research and development of new technologies. Electric water heater has the merit of stable water temperature, but traditional electric water heater requires lengthy heat up time, takes up large space, and is susceptible to bacteria and water scale. Following relentless attempts and endeavours, the Group’s electric water heater team has launched the Casarte’s Tianmu (天沐) series and the Haier’s Jingxiang (淨享) series, aiming at solving users’ pain points on electric water heaters. Through the use of 3D instantaneous heat technology, a 15-minute bathing time merely requires a 5-minute heat up time. This has addressed users’ complaints on long water heat up waiting time. Besides, the thickness of water heater was reduced to 278mm, which greatly decreased the space occupied by the heater. In order to provide a healthy bathing experience to users, we released the dual-effect scale inhibition technology to effectively prevent the formation of scale in water heaters, together with the three-stage purification technology which could remove harmful substances such as sediment, rust, residual chlorine and bacteria from water. By installing an additional smart module, water heaters could automatically record and analyze users’ water using habits, and provide the function of auto heating up of water in advance, enabling energy saving and increasing user comfort . Our product innovat ion has been recognized internationally, with the Jingxiang (淨享) Plus9 series winning the CES China Innovation Award in U.S. and the China AWE Award in 2018.
BUSINESS REVIEW (continued)
Washing Machine Business (continued)
The Haier’s front-load washer connected factory constructed in Huangdao, Qingdao in 2018 is the eleventh connected factories of Haier. It was also the world’s leading factory for mass customization of IoT ecosystem brands. With a construction area of approximately 100,000 square meters and an annual production capacity of 3 million units, the factory was equipped with 12 pieces of global leading technologies in related fields. The Group proactively builds smart factories that connect with users: from gathering user needs and experience from the front end, visualizing the whole process on the production end, to efficient delivery and distribution of goods. The process realized our transformation from mass production to mass customization. So far, around 50% of products manufactured on the production lines of our interconnected factories has been customized by franchise stores, whereas around 20% has been customized products directly ordered by end consumers, resulting in an overall build-to-order rate of 71%. The Group’s washing machine business provided continuous boost to the industrial innovation of mass customization manufacturing.
Water heater business
The Group’s water heater business has developed a broad range of products, which primarily include four types of water heaters: electric, gas, solar energy and air energy heat pump, providing consumers with comfortable bathing solutions. In 2018, the Group’s water heater business continued to grow, recording a revenue of RMB7.12 billion, representing a year-on-year increase of 10.7%. The increase in revenue was mainly derived from the rise in market share driven by product innovation, as well as the rapid growth of gas and air energy heat pump products.
According to offline statistics published by CMM, the Group’s water heater sustained its leading position in the industry with a 19.27% market share in terms of sales volume, representing an increase of 0.5 percentage points year-on-year; market share in terms of sales value was 18.11%, with a year-on-year increase of 1.2 percentage points.

22 Haier Electronics Group Co., Ltd. Annual Report 2018
Business Review
by the Group combines solar collectors with heat storage, eliminating the need for external water tanks so as to save space. Following our 2017 acquisition of Austria’s GREENoneTEC Solarindustrie GmbH, the world’s largest flat plate collector manufacturer, we have localized their technologies to launch a direct heating flat plate technology that doubles the heating speed of traditional solar energy products.
Air source heat pump water heater uses energy generated by air compression to heat up water, and is the most energy-efficient and safest water heater. Air source water heater has the advantage of large water output capacity and can provide hot water at a low cost for 24 hours a day, but the ordinary air source water heater has limitations on the working environment and output water temperature. The new generation “Tianmu Power” air source water heater launched by the Group can automatically match the ambient temperature with optimal frequency. It can heat up to a high water temperature of 80ºC solely with the heat pump, achieving an energy efficiency ratio COP value of up to 6.0, far exceeding the national grade 1 energy efficiency standard for 9 levels. The heater model has won the 2018 AWE Environmental Award.
While focusing on our products, the water heater department also pays attention to the build-up of the ecosystem. We have partnered with a number of sanitary ware brands and smart bathroom hardware product suppliers to build smart IoT solutions for bathroom spaces.
Haier’s water heater has upgraded its production capacity towards smart manufacturing, with a total capacity reaching 11 million units. This year we started the construction of a mass customization factory for electric water heaters in the Qingdao Sino-German EcoPark, and planned to build a factory with gas heater production lines and air source heat pump production lines in Zhengzhou, they are expected to correspondingly increase our annual production capacity by 1 million, 3 million and 500,000 units respectively upon full operations.
BUSINESS REVIEW (continued)
Water heater business (continued)
Gas water heaters have maintained rapid growth in recent years. In 2018, the sales value of Haier’s gas water heaters has grown by close to 19%. According to data from the CMM’s offline statistics, our market share in terms of sales volume reached 9.61%, ranking among the top five in the industry with a year-on-year increase of 1.32 percentage points. Market share in terms of sales value was 9.6%, representing a growth of 1.6 percentage points year-on-year. Compared to electric water heater, gas water heater has a lower cost of usage, higher thermal efficiency, and can provide instant hot water. However, it has high technical barriers and stringent safety requirements. Through collaborations with China’s first-class scientific research institutions in recent years, we quickly formulated unique differentiated technologies to create a series of products featuring the patented rich-oxygen blue flame, NOCO and carbon monoxide safety system, ensuring safety protection in the use of gas in users’ home environment. Besides, we continued to enhance users’ bathing experience with the feature of zero-cold-water through precise thermostat control, and waterfal l washing through turbocharging technologies. In 2018, Casarte’s gas water heater CH3 became the first domestic product in China to pass the European standard of “3 Stars Class” accreditation for the highest comfort level in hot water usage.
The retail volume and revenue of the Group’s solar energy products continued to lead the domestic market, with market shares reaching 30.37% and 28.29% respectively according to CMM’s offline statistics. Solar water heaters harness solar energy as main heat source, while some also use electricity as backup energy source. They are more environmental-friendly than electric and gas water heaters. Traditional solar water heaters adopt heat exchange technology, which require long heat up time, external water tanks, and complicated pipelines that take up space. The ALL-IN-ONE series launched

23Haier Electronics Group Co., Ltd. Annual Report 2018
Business Review
Channel services segment’s revenue from Haier franchise stores recorded sales revenue of RMB48.59 billion with a year-on-year increase close to 7%. We continued to optimize the product mix of our own channels, and our inventory turnover ratio also significantly improved.
Since the end of 2015, the Group has accelerated the promotion of premium brands while deepening its transformation on the management of retailers. In 2018, the Group continued to intensify its reform efforts, cultivating for the continuous expansion of market share and improvement in channels efficiency.
First of all, we continued the expansion of our touchpoints network, proactively acquiring customers to drive purchase demand.
In the fourth quarter of 2018, the Group launched the Core Business Districts’ Stores project, which performed data analysis and channels planning in major business districts of the country. The project proposed to build integrated home furnishing stores in markets of home decor companies, household building materials and HVAC, offering users integrated solutions on water heaters, water purifiers, central air conditioners, and kitchen appliances before they began their home renovations. For rural areas, the Group targeted 803 counties from villages and towns for development towards market dominance. In addition, the Group continued to uphold the “small but smart” principle and set up smart cloud stores in various premises, penetrating communities, home decor companies, household building materials markets, shopping centers, and kiosks in counties and towns. In 2018, more than 8,300 “smart cloud stores”1 were built, recording a strong growth compared to last year.
1 Smart cloud stores refer to offline stores that display and sell products through interactive screens and do not own physical inventories.
BUSINESS REVIEW (continued)
Water heater business (continued)
The Group has already issued an announcement on the plan to merge Haier Group’s water purification business into our Group after its asset swap transaction is completed. Haier’s water purification currently provides household and commercial solutions including point-of-use and whole-house water purification. The merger of our water purification and water heater businesses will create synergies in the dimensions of sales network, supplier resources, research and development capabilities, installation and after-sales services. The integration of our water purification business is conducive to the clear positioning of the Group’s smart household water-using platform. Our group will offer a full range of household water appliances which include water purifiers, water heaters and washing machines. This will form a whole-process service that comprises design, installation and adjustment, providing users with the best experience in smart whole-house water heating, using, purifying and softening. According to CMM’s monitoring data, Haier’s water purification had online and offline market shares of 12.2% and 4.6% respectively in 2018, representing year-on-year increases of 2.1 and 1.4 percentage points. Haier’s water purification has planned to invest in a factory construction in 2019 for the production of whole-house and point-of-use products, providing consumers with superior products in whole-house water treatment.
Channel Services Business
Channel services business achieved an annual sales revenue of RMB68.04 billion in 2018 with a year-on-year increase of 7.0%. Sales revenue from online channels amounted to RMB17.15 billion, accounting for 25.2% of the channel services segment revenue, with a year-on-year increase of 17%. During the period of Double 11 Shopping Festival from 1 November 2018 to 11 November 2018, the Group’s overall home appliances online retail share reached 18.5%, with a year-on-year growth of 0.3 percentage points.

24 Haier Electronics Group Co., Ltd. Annual Report 2018
Business Review
Thirdly, we integrated the four networks on marketing, services, logistics and internet through the use of information tools. In the fourth quarter of 2018, the Group launched a network-wide strategy, reinforcing our dedication in providing customer-oriented and user-centric whole process shopping experience, thereby creating a unified marketing and pricing control model throughout the entire network. Customers would receive same product prices and information across all online platforms such as JD, Suning, Gome and specialty stores in the same region, removing the need for them to compare prices which might result in a loss of enthusiasm in consumption. In addition, the linking of logistics and internet supported user tracking from purchase to distribution as well as throughout the entire product life cycle. This enabled us to offer superior pre-sales, sales and after-sales services. Inevitably, the integration of these four networks is closely related to the continuous development, iteration and application of information tools. At present, the Group’s store management system, Jushanghui, achieved a 100% coverage of all our direct-sale customers, whereas Yilihuo covered 100% of all our customers in vi l lages and towns. Channels’ management staff could perform real-time monitoring of distributors on order placements, sales, inventory levels and after-sales without in-person supervision.
BUSINESS REVIEW (continued)
Channel Services Business (continued)
While we were expanding our touchpoints network, we proactively reached out to customers instead of passively waiting for them to show up. The Group strengthened our Love To Home (愛到家) and One-Stop Home-based (一站駐家) services. In the Love To Home service, salespersons would visit well-developed communities, offering home appliances cleaning and free laundry services to gain users’ trust, thus incentivizing their intention to trade their old appliances in for new products. In the One-Stop Home-based service, salespersons would proactively reach out to customers by visiting unrenovated new communities, so as to provide users with bundled solutions on home improvements. Both services heightened the interactions between users and our salespersons, impressing customers with proactive and heartfelt services, which developed their trust in Haier’s products.
Secondly, the Group enhanced scenario- and experience-based consumption, improving per square meter sales. Combining our strengths of diverse brand composition and comprehensive range of products, we continued to reform stores within our channels, turning traditional spatial arrangements by product categories into real-life scenarios that featured complete sets of product solutions. This enabled us to fully explore and customize to users’ needs, and effectively facilitate them in making purchase decisions. We have gradually formulated the foundation of product bundles development to cater for various needs in users’ everyday lives, currently this comprised 4 room scenarios such as smart kitchen and smart living room, and 7 whole-house solutions such as whole-house air and whole-house water purification. Building on our in-depth understanding of customers’ demand and solid experience in product sales, the Group was offering trainings to our stores’ sales teams on “product bundles immersive sales masters”. The trainings aimed at improving salespersons’ ski l ls on conversations and empathy with the goal of driving sales growth.
25Haier Electronics Group Co., Ltd. Annual Report 2018
Business Review
customers reduce the number of deposited goods in warehouse, Gooday Logistics optimized our routing, consolidating 30 e-commerce central warehouses in the country into 7 central warehouses, while increasing the number of contract truck (車小微) from 80,000 to 100,000, effectively reducing delivery time from 2.3 days to 1.9 days. Gooday Logistics extended its services towards the back-end to allow sorting and repackaging in warehouses, providing customers with a broader chain of services. Our user reputation (DSR) in 2018 reached 4.91, surpassing the industry average of 4.84 and that of its competitors. During the 618 and Double 11 e-commerce shopping festivals, Gooday Logistics achieved on-time delivery rates of 99% and 98.5% respectively, which were higher than industry average levels of 97.5% and 97% respectively.
The Group continues to plan for expansion in the large-format furniture market, striving to provide omni-channel logistics services to customers. Leveraging on our favorable reputation and edges in the field of large-format home appliances, our offline household business has increased by 12%. In addition, we further reinforced our cooperation with major customers such as Sleemon and DeRUCCI. After two years of effort, our household segment has realized front-end pick-up services in 10 household industry clusters, established 3 Cainiao management systems and integrated 117 line-haul transportation resources for delivery to 2,200 regions across the country. We also continued to improve delivery and assembly capacities, and widen our network coverage.
Gooday Logistics continued to accelerate the development of new business segments. In the third-party home appliances business sector, we achieved a revenue growth of around 40% in 2018, and became the main carrier of Xiaomi’s large-format household appliances. In the automobile sector, we provided delivery, installation, maintenance and battery recycling services for enterprises such as Yadea and Xinri.
BUSINESS REVIEW (continued)
Channel Services Business (continued)
Lastly, our online and offline channels worked in synergy, cultivating the integration of our “4-in-1” shopping model. The Group has been vigorously promoting the development of Shunguang, which removed the boundaries between our offline brick-and-mortar stores and online shops, connecting Shunguang, WeChat mini programs, Haier’s specialty stores and ehaier into a “4-in-1” integrated store. Shunguang’s micro-stores not only become an interface in accelerating the sales of Haier’s own products, but also help to build a cross-boarder ecosystem by introducing third-party brands. Shunguang strives to introduce consumer brands that promote joyful home living, expanding the variety of products with carefully selected SKUs. By leveraging the platform’s abundant resources of micro-store merchants, it facilitates communication among communities and increases sales of third-party brands. At the same time, third-party products enr iches users’ consumpt ion scenar ios on Shunguang, which evolves from lower-frequency purchases of home appl iances to everyday consumptions, forming strong complementary relat ionships with exist ing home appl iances consumptions. At present, the platform has gathered around 400 third-party brands, each with SKUs above 2,000 units, bringing Shunguang an increase in GMV of about RMB150 million.
Logistics services business
In 2018, the revenue of Gooday Logistics has increased by 12.7% year-on-year to RMB10.14 billion. The increase was mainly attributable to the growth of offline business in the home appliances and large-format furniture businesses, as well as the expansion in new business areas such as cross-border freight forwarding.
Gooday Logistics continued to strengthen its collaboration with major e-commerce platform, providing superior regional distribution and last-mile delivery services of large-format home appliances for the Tmall platform. In order to help e-commerce

26 Haier Electronics Group Co., Ltd. Annual Report 2018
Business Review
The uncertainties in international trade policies have posed risks to the Group’s export business. Since the beginning of 2018, the United States has imposed a protective tariff on imported washing machines at 50% tax rate for a period of 3 years. Impacted by the US-China trade negotiations, there is the possibility for the United States to continue imposing higher tariffs on a wider range of home appliances from China, which in turn will affect the Group’s revenue. In 2018, the Group’s revenue gained through exports to the United States accounted for around 0.1% of our total revenue. The Group will continue to diversify the risk by actively expanding our overseas markets in various regions so as to avoid sole reliance on the market in a single country.
The durable home appliances industry is related to property purchase or home renovation. Due to the influence from the recent policies and regulations imposed by Chinese government on real estate, according to the National Bureau of Statistics of China, the growth rate of commercial housing sales area in China dipped from 5.3% in 2017 to 2.2% in 2018, resulting in a slowdown in the overall growth of the washing machine and water heater industries, which thereby brought pressure to the Group’s continual growth. In order to maintain steady growth, our Group has to ceaselessly upgrade our products according to user needs, enhance products’ added-value, and launch new products and services related to water ecosphere.
Volatility of raw material prices is an important factor a f f ec t i ng the g ross p ro f i t marg in o f the manufacturing industry. The prices of raw materials which mainly included steel plates, hot-dip galvanized sheets, copper and plastic PP materials, and parts accounted for more than 90% of the manufacturing costs of washing machines and water heaters, our gross profit margin will be under pressure if raw material prices rise in the future. We will reduce the impact of rising raw material prices through ongoing improvement in our production processes and optimization of our product mix.
BUSINESS REVIEW (continued)
Logistics services business (continued)
Gooday Logistics also proactively optimized its asset portfolio. On one hand, we explored new business areas, expanding our international freight forwarding business through our acquisition of Peiji Logistics and achieved a revenue of RMB670 million during this year; on the other hand, in view of the unfavourable competitive environment faced by the less-than-truck-load business, Gooday Logistics signed an equity transfer agreement with the founding shareholders of Sheng Feng Logistics, whom we jointly invested in Sheng Feng Logistics, to transfer 50.37% equity shares we held in the company for cash consideration in 2018.
Gooday Logistics continued to strengthen its platform network this year, actively building smart and automated warehouses to set the benchmark for the large-format logistics industry. As of the end of 2018, the total area of warehouses managed by the Group amounted to 4.7 million square meters, of which approximately 26% were self-built warehouses. The Group has set up smart unmanned warehouses in Hangzhou and Qingdao, with a total area of 5,000 square meters, implementing a model of whole-process smart management. In particular, the Qingdao smart warehouse adopted an unmanned driving system to improve the efficiency of stock-in, sorting and stock-out of goods, which increased the competitiveness of Gooday Logistics in the field of smart warehouse management.
Principal risks and uncertainties faced by the Company
The Group is subject to various risks, including, among others, external risk, strategic risk, financial risk and operational risk.

27Haier Electronics Group Co., Ltd. Annual Report 2018
Business Review
Our logist ics business belongs to a highly fragmented industry. Fierce competition poses risks to the Group in terms of downward price pressure and loss of customers. We will reduce costs through continual capital investment and leveraging our network advantages and economies of scale; we will also develop value-added services, providing differentiated services to avoid price competition.
The Group insists on the adoption of a strategy of branding in our overseas markets. Nevertheless, Haier is yet to be the mainstream brand in some overseas markets. Haier’s competitiveness in terms of sales channel and service network in some of these markets are also not as mature as that in the Chinese market. Besides, our strategies on overseas market expansion are facing instabilities of local political and economic climates, major reforms in legal and regulatory regimes, and the risk of exchange rate fluctuations, which in turn trigger uncertainties on the Group’s future export revenue and gross margin. At present, our export business mainly involves the Group’s washing machine business, in which export revenue accounted for 2% of the Group’s total revenue in 2018. The Group will persist in conducting research and tracking of the international market, performing credit investigation on companies we trade with, and flexibly selecting settlement terms, so as to reduce risks.
BUSINESS REVIEW (continued)
Principal risks and uncertainties faced by the Company (continued)
In terms of sales volume, the Group’s market share of washing machine and water heater products ranked first in the PRC domestic market in 2018. The Group always believes R&D innovation is the path for enterprises to relentlessly surpass themselves and sustain long-term development. As a critical part of R&D innovation, the Group owns unique patents for high-end product components, which serve as technical barriers. However, competitors in the industry could imitate our technology, and may even do so quickly by luring our talents with higher salaries and copying our technical information. In order to maintain the competitive advantages of our products, we established a regime of continual innovation based on user needs, offered high-quality products and services to create positive brand images, and ensured adequate systems were in place for patents application and protection.
Sales channels of home appliances in China were experiencing a decline in growth among online channels as well as the process of online and offline channels integration. Sales growth from online channels used to be one of the Group’s growth drivers. The overall drop in growth of online channels has intensified the competition in our online franchisees; meanwhile, some of our off l ine franchisees were also subject to the risk of failure in adapting to new competitions. In this regard, the Group has adopted numerous measures to optimize our omni-channel management: we established an integrated online and offline management team, promoted the integration of online and offline sales channels through the “four-store-in-one” plan, developed the Shunguang platform to support offline distributors in building their online presence, and developed the Jushanghui platform to enhance distributors’ operational efficiency and technological management.

28 Haier Electronics Group Co., Ltd. Annual Report 2018
FINANCIAL REVIEW
In 2018, the Group’s revenue amounted to RMB85,250,041,000, representing an increase of 8.3% from RMB78,740,680,000 (restated) in 2017. The profit attributable to owners of the Company was RMB3,789,679,000, representing an increase of 13.7% from RMB3,331,904,000 (restated) in 2017. The basic earnings per share attributable to ordinary equity holders of the Company was RMB1.36, representing an increase of 13.3% from RMB1.20 (restated) in 2017.
1. ANALYSIS OF REVENUE AND PROFIT
2018 2017 ChangeItems RMB’000 RMB’000 %
(Restated)
RevenueWashing machine business 21,489,429 19,535,555 +10.0%Water heater business 7,120,244 6,430,815 +10.7%Channel services business 68,035,076 63,605,786 +7.0%Logistics business 10,144,305 9,000,435 +12.7%Inter-segment elimination (21,539,013) (19,831,911) +8.6%
Consolidated revenue 85,250,041 78,740,680 +8.3%Adjusted operating profit* 4,057,616 3,636,310 +11.6%Profit attributable to owners of
the Company 3,789,679 3,331,904 +13.7%Earnings per share attributable to
ordinary equity holders of the CompanyBasic RMB1.36 RMB1.20 +13.3%
Diluted RMB1.35 RMB1.19 +13.4%
* Adjusted operating profit was defined as profit before tax, net of interest income and expenses, investment gains and losses (including dividend income from equity instruments at fair value through other comprehensive income, investment income from other financial assets, gains/(losses) on disposal of subsidiaries, associates, businesses and available-for-sale investments), gains/(losses) on liquidations of subsidiaries and government grants.
The revenue of the Group for 2018 was RMB85,250,041,000, representing an increase of 8.3% as compared to RMB78,740,680,000 (restated) in 2017. The increase of revenue was mainly attributable to the stable growth of Haier home appliances business and the growth of logistics business.
The revenue from the washing machine business amounted to RMB21,489,429,000 in 2018, representing an increase of 10.0% as compared to RMB19,535,555,000 (restated) in 2017. This was mainly attributable to the continuous innovation of washing machine products and continuous marketing upgrade such as scenario-based marketing and community marketing. In terms of driving factors, the increase in average selling price and sales volume of washing machines was mainly attributable to the enhancement of product mix and increase in market share. In terms of product mix, sales of front-loading washing machines increased by 20%, and Casarte washing machines even recorded an increase of over 50%, indicating the continuous improvement of product mix.

29Haier Electronics Group Co., Ltd. Annual Report 2018
Financial Review
large-format furniture businesses, as well as the expansion in new business areas such as cross-border freight forwarding.
Profit attributable to owners of the Company
In 2018, the profit attributable to owners of the Company was RMB3,789,679,000, representing an increase of 13.7% from RMB3,331,904,000 (restated) in 2017. The basic earnings per share attributable to ordinary equity holders of the Company was RMB1.36 in 2018, representing an increase of 13.3% from RMB1.20 (restated) in 2017.
Adjusted Operating Profit
Adjusted operating profit was defined as profit before tax, net of interest income and expenses, investment gains and losses (including dividend income from equity instruments at fair value through other comprehensive income, investment income from other financial assets, gains/(losses) on d isposa l o f subs id iar ies , assoc iates, b u s i n e s s e s a n d a v a i l a b l e - f o r - s a l e investments), gains/(losses) on liquidations of subsidiaries and government grants. By excluding these items, it is easier for management and investors to compare the Group’s financial results over multiple periods and analyze trends in its operations.
Adjusted operating profit is used as a non-IFRS measure to evaluate the Group’s results of operations. This measure provides investors with a valuable information of the Group’s ongoing operation performance because it reveals its business trends that may be obscured by the net effect of realized capital gains and losses, fair value changes on derivative financial instruments, gains and losses on disposition of operations and adjustments for other signif icant non-recurring or unusual items.
1. ANALYSIS OF REVENUE AND PROFIT (continued)
The revenue from the water heater business amounted to RMB7,120,244,000 in 2018, representing an increase of 10.7% as compared to RMB6,430,815,000 (restated) in 2017. This was mainly attributable to the continuous investment in technological innovation and product upgrade, expansion of household building materials and home f u rn i sh i ng s to r es ne two rk and t he enhancement of online operations. In terms of driving factors, there was an increase in average selling price and sales volume of water heaters. In terms of product mix, the placement of products became more balanced. Among which, the revenue of gas and new energy heat pump water heaters recorded growth of almost 20%, together representing 30% of the revenue from water heaters.
The revenue from the channel services business amounted to RMB68,035,076,000 in 2018, representing an increase of 7.0% as compared to RMB63,605,786,000 (restated) in 2017. This was mainly attributable to the continuous promotion of retail transformation strategy of the Group. For offline distributing channel, the Group strengthened the arrangement for commercial zones and township-level networks, and increased the number of network points, which provided better consumption scenarios and more convenient service experience for users. For online distributing channel, the Group enhanced user experience through upgrading and strengthening the operating ability on every e-commerce platform.
The revenue from the logistics business amounted to RMB10,144,305,000 in 2018, representing an increase of 12.7% as compared to RMB9,000,435,000 in 2017. This was mainly attributable to the growth of offline business in the home appliances and

30 Haier Electronics Group Co., Ltd. Annual Report 2018
Financial Review
the proportion of one-stop products and high-end products brought by the retail transformation strategy.
The gross profit margin of the logistics business was 7.1%, representing a decrease of 3 percentage points from 10.1% in 2017. Such decrease was mainly due to the increase in storage and transportation costs.
Selling and Distribution Expenses
The ratio of selling and distribution expenses of the washing machine and water heater businesses to its segment revenue increased by 0.4 percentage points from 16.2% in 2017 to 16.6% in 2018, which was mainly due to the increase in end distribution personnel and investment in scenario-based marketing of the Group.
The ratio of selling and distribution expenses of the channel services business to its segment revenue was 7.8%, which was the same as 7.8% (restated) in 2017.
The ratio of selling and distribution expenses of the logistics business to its segment revenue increased by 0.1 percentage point from 1.0% in 2017 to 1.1% in 2018, which was mainly due to the new acquisitions by Gooday Logistics.
Administrative Expenses
The ratio of administrative expenses of the washing machine business decreased by 0.1 percentage point from 4.3% in 2017 to 4.2% in 2018. In 2018, in order to maintain the leading position in product innovation, increased investment was made into research and development for washing machine business, which increased the ratio of administrative expenses. However, the overall ratio of administrative expenses decreased by 0.1 percentage point as a result of the gains on foreign exchange brought by the dep rec i a t i on o f RMB i n 2018 and enhancement of management efficiency.
1. ANALYSIS OF REVENUE AND PROFIT (continued)
Adjusted Operating Profit (continued)
In 2018, the adjusted operating profit of the Group was RMB4,057,616,000, representing an increase of 11.6% as compared to RMB3,636,310,000 (restated) in 2017. The increase in the adjusted operating profit was mainly contributed by the steady growth of i ncome as we l l as the con t i nuous improvement in the operational efficiency of the Group.
Gross Profit Margins
In 2018, the overall gross profit margin of the Group was 17.8%, representing an increase of 0.3 percentage points from 17.5% in 2017. The increase in the overall gross profit margin was mainly attributable to the increase in the proportion of high-end products.
The gross profit margin of the washing machine business was 28.1%, representing an increase of 0.3 percentage points from 27.8% (restated) in 2017. The increase in gross profit margin of the washing machine business was mainly attributable to the continuous optimization of product mix brought by the steady and strong growth of high-end products such as Casarte.
The gross profit margin of the water heater business was 36.9%, representing an increase of 0.3 percentage points from 36.6% in 2017. The increase in gross profit margin of the water heater business was mainly due to the increase in the proportion of high-end products.
The gross profit margin of the channel services business was 10.7%, representing an increase of 0.2 percentage points from 10.5% (restated) in 2017. The increase in gross profit margin of the channel services business was mainly due to the increase in

31Haier Electronics Group Co., Ltd. Annual Report 2018
Financial Review
1. ANALYSIS OF REVENUE AND PROFIT (continued)
Administrative Expenses (continued)
The ratio of administrative expenses of the water heater business was 5.2%, which was the same as that of 2017.
The ratio of administrative expenses of the channel services business increased by 0.1 percentage point from 0.9% in 2017 to 1.0%, which was mainly due to the enhancement of technological investment as a result of the promotion of retail transformation and integration of “four networks” by the Group.
The ratio of administrative expenses of the logistics business decreased by 0.2 percentage points from 5.3% in 2017 to 5.1%, which was mainly due to the increase in investment in information technology and the enhancement of operational efficiency of the logistics business.
2. FINANCIAL POSITION
2018 2017Items RMB’000 RMB’000
(Restated)
Non-current assets 10,417,406 8,871,765Current assets 36,539,987 34,783,158Current liabilities 18,732,980 18,978,003Non-current liabilities 2,476,129 1,646,469Net assets 25,748,284 23,030,451
Cash and Cash Equivalents and Wealth Management Products from Other Financial Assets
In 2018, the Group’s total balance of cash and cash equivalents and wealth management products from other financial assets increased by 13.8% from RMB17,015,439,000 (restated) as at 31 December 2017 to RMB19,370,248,000 as at 31 December 2018. The increase was mainly attributable to profit contribution for the year.
2018 2017
Items RMB’000 RMB’000(Restated)
Cash and cash equivalents 14,660,708 15,040,624Wealth management products from other financial
assets— Current portion 4,382,181 1,974,815— Non-current portion 327,359 —
Total 19,370,248 17,015,439

32 Haier Electronics Group Co., Ltd. Annual Report 2018
Financial Review
Inventory Turnover DaysAs at the end of 2018, the inventory turnover days of the washing machine and water heater businesses was 32 days, increased by 8 days as compared to the end of 2017, which was mainly attributable to the increase in inventory to ensure adequate supply for peak sales during Chinese New Year.
As at the end of 2018, the inventory turnover days of the channel services business was 46 days, representing a decrease of 4 days as compared to the end of 2017. This was mainly attributable to the enhancement of retai l transformation and eff iciency of inventory management.
Trade Payables Turnover DaysThe trade payables turnover days of the Group’s washing machine and water heater businesses was 36 days as at the end of 2018, representing a decrease of 21 days as compared to the end of 2017. This was mainly due to the significant increase in raw materials procurement in December 2017, while balance payable for procurement of materials significantly decreased year-on-year at the end of 2018 due to the relatively balanced production schedule throughout the year.
The trade payables turnover days of the channel services business was 8 days as at the end of 2018, representing an increase of 4 days as compared to the end of 2017.
The trade payables turnover days of the logistics business was 92 days as at the end of 2018, representing a decrease of 21 days as compared to the end of 2017, which was mainly due to the enhancement of Gooday Logistics’ efficiency in settlement with supp l i e rs resu l t i ng f rom in fo rmat ion technology improvement.
2. FINANCIAL POSITION (continued)
Net assets
The Group’s net assets increased by 11.8% from RMB23,030,451,000 (restated) as at 31 December 2017 to RMB25,748,284,000 as at 31 December 2018. The increase in net assets was mainly attributable to profit contribution for the year.
Working Capital
Trade and Bills Receivables Turnover DaysThe bills receivable turnover days of the Group’s washing machine and water heater businesses was 20 days as at the end of 2018, representing a decrease of 15 days as compared to the end of 2017, which was mainly attributable to the increase in use of bills for settlement.
As at the end of 2018, the trade receivables turnover days of the Group’s washing machine and water heater businesses was 18 days, representing an increase of 4 days as compared to the end of 2017.
In the Group’s channel services business, the majority of customers of Haier brand in the 3rd and 4th-tier markets are relatively small scale customers, and the sales are generally settled with payment in advance of delivery. The trade receivables turnover days as at the end of 2018 was 2 days, which was the same as that of the end of 2017.
As at the end of 2018, the trade receivables turnover days of the Group’s logistics business was 63 days, representing a decrease of 13 days from the end of 2017, which was mainly due to the strengthened payment management of trade receivables.

33Haier Electronics Group Co., Ltd. Annual Report 2018
Financial Review
3. CASH FLOW ANALYSIS
2018 2017Items Note(s) RMB’000 RMB’000
(Restated)
Cash and cash equivalents as stated in the statement of cash flows at the beginning of the year 15,040,624 12,704,974
Net cash flow from operating activities 4,246,455 4,166,254Net cash flow used in investing activities (a) (4,130,419) (2,537,602)Net cash flow (used in)/from financing activities (b) (554,990) 772,060Effect of foreign exchange rate changes, net 59,355 (65,062)
Cash and cash equivalents as stated in the statement of cash flows at the end of the year 14,661,025 15,040,624
Less: cash and cash equivalents of a disposal group held for sale 317 —
Cash and cash equivalents as stated in the statement of financial position at the end of the year 14,660,708 15,040,624
In 2018, net cash inflow of operating activities increased by 1.9% to RMB4,246,455,000 as compared with 2017, which was mainly due to profit contribution for the year.
(a) In 2018, net cash outflow of investing activities was RMB4,130,419,000, representing an increase of 63% as compared to 2017, with details as follows:
2018 2017
Items RMB’000 RMB’000(Restated)
Capital expenditure (2,338,703) (1,287,883)Purchase of wealth management products (2,706,364) (1,514,366)Acquisition of subsidiaries (103,834) (49,332)Cash from disposal of subsidiaries, associates,
an available-for-sale investment, an asset held for sale and a business 658,476 212,017
Cash from disposal of fixed assets and leasehold land 159,179 13,072
Dividend from Sinopec Sales Company Limited (after tax) 94,341 36,860
Interest received from wealth management products 90,655 43,550
Net cash inflow of other investing activities 15,831 8,480
Net cash flow used in investing activities (4,130,419) (2,537,602)

34 Haier Electronics Group Co., Ltd. Annual Report 2018
Financial Review
3. CASH FLOW ANALYSIS (continued)
(b) In 2018, net cash outflow of financing activities was RMB554,990,000, with details as follows:
2018 2017
Items RMB’000 RMB’000(Restated)
Capital contributions from minority shareholders of subsidiaries 616,528 1,264,485
Issuance of new shares 10,835 60,768Dividend distribution to shareholders and
minority shareholders (878,566) (427,437)Repurchase of shares (100,467) (12,039)Net repayment of borrowings (125,100) (60,849)Deemed distribution for business combinations
under common control (50,000) (36,093)Cash paid for acquisition of equity from
minority shareholders of subsidiaries (31,541) —
Net cash inflow/(outflow) of other financing activities 3,321 (16,775)
Net cash flow (used in)/from financing activities (554,990) 772,060
LIQUIDITY AND FINANCIAL RESOURCES
The Group focuses on cash flow management and has been able to maintain a healthy financial and liquidity position. As at 31 December 2018, the Group had a current ratio of 195.1%, representing an increase of 11.8 percentage points as compared to 183.3% (restated) as at 31 December 2017.
2018 2017Items RMB’000 RMB’000
(Restated)
Cash and cash equivalents 14,660,708 15,040,624Wealth management products from other financial assets 4,709,540 1,974,815
19,370,248 17,015,439Less:Interest-bearing borrowings 92,374 192,624
Net balance of cash and cash equivalents and wealth management products from other financial assets 19,277,874 16,822,815

35Haier Electronics Group Co., Ltd. Annual Report 2018
Financial Review
LIQUIDITY AND FINANCIAL RESOURCES (continued)
As at 31 December 2018, wealth management products from other f inancial assets was RMB4,709,540,000 (31 December 2017: RMB1,974,815,000).
As at 31 December 2018, net balance of cash and cash equivalent and wealth management products f r o m o t h e r f i n a n c i a l a s s e t s w a s RMB19,277,874,000 (31 December 2017: RMB16,822,815,000 (restated)), representing an increase of 14.6% as compared to 2017.
The Group will continue to maintain stable liquidity in its operations in 2019 to ensure the meeting of its working capital requirements for the next year, to construct connected factories and e-commerce platform, as well as to maintain financial flexibility for future strategic investment opportunities.
CAPITAL EXPENDITURE
The Company assesses its capital expenditure and investments in washing machine, water heater and logistics businesses from time to time. The capital e x p e n d i t u r e d u r i n g t h e y e a r w a s RMB2,353,671,000 (2017: RMB1,332,150,000 (restated)), in which RMB627,463,000 (2017: RMB563,865,000) was used in the construction of warehouses for logistics business, and in which RMB1,244,753,000 and RMB412,469,000 (2017: RMB645,789,000 and RMB116,529,000) were used in the construction of factory and equipment upgrade for washing machine and water heater businesses respectively.
GEARING RATIO
As at 31 December 2018, the Group’s gearing ratio (defined as total borrowings, including interest-bearing borrowings, over net assets) was 0.4% (31 December 2017: 0.8% (restated)).
TREASURY POLICIES
The Group adopts a prudent approach in its cash management and risk control. Most of the Group’s revenues and expenses are denominated in Renminbi. Cash is generally placed in deposits denominated either in Renminbi, Hong Kong dollars or United States Dollars. Foreign currency risk is largely, though not fully, mitigated, as liabilities in Renminbi will be substantially offset by the Group’s revenue, most of which are derived from domestic sales in China and denominated in Renminbi. Only approximately 3.1% of the Group’s revenue is derived from export sales and is denominated in other currencies. The Group does not have any significant interest rate risk as it has an overall net cash balance. The Group does not have any financial instrument for hedging purposes.
CAPITAL COMMITMENT
The Group’s capital commitments contracted but n o t y e t p r o v i d e d f o r a m o u n t e d t o RMB1,306,208,000 as at 31 December 2018 (31 December 2017: RMB735,691,000), which were mainly related to the construction of connected factories as well as warehouses for the logistics business.
CHARGE OF ASSETS
As at 31 December 2018, certain of the Group’s buildings and leasehold land with a net carrying value of RMB45,853,000 (31 December 2017: RMB117,952,000), freehold land with a net carrying value of RMB9,464,000 (31 December 2017: RMB9,367,000) and trade receivables with a net carrying value of RMB14,231,000 (31 December 2017: RMB53,670,000) were pledged to secure certain of the Group’s bank loans.
In addition, as at 31 December 2017, the Group’s other short-term loans were secured by the pledge of the Group’s trade receivables amounting to RMB3,533,000 in total.

36 Haier Electronics Group Co., Ltd. Annual Report 2018
Financial Review
The Group’s trading terms with customers of washing machines, water heaters and logistics businesses are mainly on credit, except for new customers, where payment in advance is normally required. The credit period is generally ranging from 30 to 90 days. Each customer has a maximum credit l imit . The Group’s trade receivables relate to a large number of diversified customers, and therefore there is no significant concentration of credit risk.
In the Group’s channel services business, the majority of customers in the 3rd and 4th-tier markets are relatively small scale customers, and the sales are generally settled with cash before delivery. The business model aims at achieving rapid sales.
The Group is dedicated to establish a mechanism to achieve success and to share with the supplier partners and to realize fair competition among themselves. The supplier partners can interact directly through various channels including a cloud manufacturing platform (COSMO). The suppliers can participate in front-end design through online platform of module resources. The Group’s platform of research and development resources can introduce the top-notch resources from around the world for research and development, design and supply chain, with the aim of securing the availabil ity of resources for the best user experience.
The Group has also adopted and implemented whole-process online-tendering mechanisms such as online tendering, online bidding, online bid invitation and online bid-evaluation etc., which can ensure the compliance and efficiency of the tendering mechanism and assure fair competition.
CHARGE OF ASSETS (continued)
Furthermore, as at 31 December 2018, certain of the Group’s bills payable were secured by the pledge of the Group’s bank deposits amounting to R M B 5 7 , 8 5 3 , 0 0 0 ( 3 1 D e c e m b e r 2 0 1 7 : RMB112,365,000) and the Group’s bills receivable amounting to RMB35,108,000 (31 December 2017: RMB14,235,000).
CONTINGENT LIABILITIES
At the end of the reporting period, neither the Group nor the Company had any significant contingent liabilities.
RELATIONSHIP WITH EMPLOYEES AND REMUNERATION POLICY
The Group is dedicated to offer employees a competitive remuneration mechanism (including short-, medium- and long-term incentives), all-rounded benefit plans, work-life balance and employee caring scheme. Under the management approach of “Integrating Order with Personnel”, it encourages every employee to integrate his/her personal deve lopment into the long-term development of the Company, for achieving a healthy development and progress between the Company and employees and thus creates a win-win situation.
The total number of employees of the Group increased by approximately 10% to 16,759 as at 31 December 2018 from 15,241 as at 31 December 2017.
RELATIONSHIP WITH CUSTOMERS AND SUPPLIERS
The Group values its customers and suppliers as major partners and stakeholders. A healthy and competitive partnership network is fundamental to the Group’s success.

37Haier Electronics Group Co., Ltd. Annual Report 2018
Financial Review
The Group acquired an additional 36% equity in te rest in Q ingdao Jushanghu i Network Technology Co., Ltd. (青島巨商匯網絡科技有限公司 ) ( “Jushanghui” ) a t a cons iderat ion of RMB56,300,000. After the completion of the acquisition, the Group holds 60% equity interest in Jushanghui. Jushanghui principally engages in providing technical consultancy services for companies under the Group through platforms such as Yilihuo and smart cloud stores, and carrying out platform selling service business via the platform of Jushanghui.
DIVIDENDS
The Board has proposed a final dividend of HK38 cents per share in cash to shareholders whose names appear on the register of members of the Company on Monday, 8 July 2019 for the year ended 31 December 2018. All the dividends will be paid upon approval by shareholders at the Company’s forthcoming annual general meeting. The final dividend will be paid on around Friday, 9 August 2019.
This dividend represented approximately 25% of the profit attributable to the owners of the Company for the year, and will be distributed out of the retained earnings of the Company. The Group shall retain sufficient cash for maintaining a strong financial position for capturing strategic investments when opportunities arise.
MATERIAL ACQUISITIONS
In 2018, the Group and Haier Electric International Co., Ltd. (“Haier International”) entered into an asset swap agreement, pursuant to which, Guanmei (Shanghai) Enterprise Management Co., Ltd. (“Guanmei”), a wholly-owned subsidiary of the Company, has agreed to acquire and Haier International has agreed to sell the equity interest in Qingdao Haishi Water Equipment Co., Ltd. ( “Qingdao Haish i” ) at a cons iderat ion of RMB1,074,000,000, which shall be satisfied by Guanmei by way of transfer of 55% of the equity interest in Bingji (Shanghai) Enterprise Management Co., Ltd., a wholly-owned subsidiary of Guanmei, from Guanmei to Haier International at the same consideration. As at the date of this report, such transaction was approved by shareholders in a special general meeting held on 21 November 2018 and is pending approval or consent by the relevant government authorities in PRC.
In 2018, in order to optimize the layout of cross-border logistics, Gooday Logistics, an important subsidiary of the Group, acquired 60% equity interest of Guizhou Peiji Logistics Co., Ltd. (貴州沛吉物流有限公司) (“Peiji Logistics”), a leading international freight forwarding company, at a considerat ion of RMB163,145,000. Gooday Logistics also granted put options to the remaining 40% non-controlling shareholders of Peiji Logistics to sell their respective interests to Gooday Logistics at a price to be determined based on agreed formula, and they are carried at fair value amount ing to RMB148,960,000 as at 31 December 2018.

38 Haier Electronics Group Co., Ltd. Annual Report 2018
CORPORATE GOVERNANCE REPORT
CORPORATE GOVERNANCE PRACTICES
The board (the “Board”) of directors (the “Directors”) and the management (the “Management”) of Haier Electronics Group Co., Ltd. (the “Company”) recognise that sound corporate practices are crucial to the efficient operation of the Company and its subsidiaries (collectively the “Group”) and the safeguarding of our shareholders’ interests. In this regard, the Board gives high priority to enhance the Company’s corporate governance standards with emphasis on transparency, accountability and independence in order to enhance the long-term value of our shareholders.
The Company has complied with the applicable code provisions (the “Code Provision(s)”) and principles under the Corporate Governance Code (the “Code”) as set out in Appendix 14 to the Rules Governing the Listing of Securities (the “Listing Rules”) on The Stock Exchange of Hong Kong Limited (the “Hong Kong Stock Exchange”) during the year ended 31 December 2018 except for certain deviations as described below. The Board shall review its code from time to time to ensure its continuous compliance with the Code. This report describes the Company’s corporate governance practices, explains its applications of and deviations from the Code, together with considered reasons for such deviations.
BOARD OF DIRECTORS
Composition
During the year ended 31 December 2018, the Board comprised two Executive Directors, four Non-executive Directors and three Independent Non-executive Directors (the “INED(s)”).
The Board has at least one-third in number of its members comprising INEDs throughout the year. The Company has also fulfilled the requirements of the composition of the Company’s audit committee, remuneration committee and the nomination committee under the Listing Rules.
At least one of the INEDs possesses appropriate professional qualifications or accounting or related financial management expertise under Rule 3.10 of the Listing Rules. The Directors are well-versed in respective areas such as accounting and finance, business management and industry knowledge and the Board as a whole has achieved an appropriate balance of skills and experience. The chairman of the Board and the nomination committee will review the composition of the board from time to time so as to enhance it for meeting the strategic objectives of the Company. The Directors’ biographical details are set out on pages 10 to 13 of this annual report.
To the best of the Company’s knowledge, there is no financial or family relationship among the Board members. All of them are free to exercise their independent judgment on all matters concerning the Company.
Under Code Provision A.4.1, non-executive directors should be appointed for specific terms, subject to re- election. Currently, all Non-executive Directors of the Company are not appointed for a specific term but are subject to retirement by rotation and re-election at the annual general meeting of the Company (the “AGM”) in accordance with the Company’s Bye-laws (the “Bye-laws”), and their appointment will be reviewed by the nomination committee and the Board when they are due for re-election.
The Bye-laws have stated clearly the procedures for the appointment of new directors, re-election and removal of directors. Under the Bye-laws, the Board may from time to time appoint a director either to fill a casual vacancy or as an addition to the Board. Any such new director shall hold office until the next following general meeting of the Company or until the next following AGM and shall then be eligible for re-election at the same general meeting.

39Haier Electronics Group Co., Ltd. Annual Report 2018
Corporate Governance Report
BOARD OF DIRECTORS (continued)
Board diversity policy
The Company has adopted the board diversity policy since the year 2013. The Company recognizes the benefits of having a diverse Board to enhance the quality of its performance and as an essential element in maintaining sustainable development and achieving strategic objectives. The Company continues to review and enhance the level of board diversity. All Board appointment will be based on merits against objective criteria and with due regards for benefits and balance of diversity on the Board. Board diversity would be considered in terms of, among other things, age, gender, educational and cultural background, expertise, industry experience and independence, in order to complement and extend the skills, know-how and experience of the Board.
Delegation by the Board
The Directors are collectively responsible for setting the Group’s strategies, providing leadership and guidance to put them into effect, reviewing and monitoring the performance of the Group and are accountable to the Company’s shareholders. To maximise the effectiveness of the Group’s operations, the Board has delegated management and administration of the Group’s daily operations to the Executive Directors, chief executive officer (“CEO”) and the Management while reserved several important matters for its approval. To this end, the Board has adopted written guidelines (the “Guidelines”) laying down the division of functions between the Board and the Management (including the Executive Directors and the CEO).
Pursuant to the Guidelines, the major functions of the Board and the Management are summarized as follows:
The Board is principally responsible for:
1. determining the overall strategy;
2. reviewing all significant policies of the Group;
3. monitoring the performance of the Management to ensure that the business operations of the Group are properly planned and conducted;
4. approving interim and annual results of the Group based on recommendations made by the audit committee of the Company;
5. approving material contracts and transactions for which the Management is required to obtain the Board’s prior approval; and
6. subject to the requirements of the Listing Rules, approving transactions in which connected person(s) (as defined in the Listing Rules) of the Company is/are considered having a material conflict of interests.

40 Haier Electronics Group Co., Ltd. Annual Report 2018
Corporate Governance Report
BOARD OF DIRECTORS (continued)
Delegation by the Board (continued)
The Management is principally responsible for:
1. exercising all such other powers and performing all such other acts as may be exercised and performed by the Directors, save and except for those that may specifically be reserved by the Board and/or the committees set up by the Board for decision and implementation; or those that may only be exercised by the Board pursuant to The Companies Act of Bermuda, the Bye-laws, the Listing Rules and/or the Hong Kong Codes on Takeovers and Mergers and Share Buy-backs;
2. formulating and implementing policies for business activities, internal controls and administration of the Company;
3. planning and deciding the Company’s strategies on its business activities;
4. monitoring the executions of the continuing connected transactions with connected person(s) (as defined in the Listing Rules) of the Company to ensure their compliance with the relevant rules and regulation; and
5. keeping proper written records of its decisions made which may be inspected by any member of the Board or the Board committees upon request.
The Board reviews those arrangements and the Guidelines on a periodic basis to ensure that they remain appropriate to the needs of the Group.
Chairman and Chief Executive Officer (“CEO”)
The roles of chairman and chief executive officer (“CEO”) of the Company are separated and are performed by the different persons. During the year ended 31 December 2018, Mr. Zhou Yun Jie, an Executive Director, had served as the chairman of the Company, while Mr. Li Hua Gang has served as the CEO of the Company.
INEDs
The INEDs have the same duties of care and skill and fiduciary duties as the Executive Directors. They are expressly identified as such in all corporate communications that disclose the names of the Directors.
The INEDs are experienced professionals with expertise in areas of accounting and finance, and business management. With their professional knowledge and experience, the INEDs advise the Company on its operation and management; provide independent opinion on the Company’s connected/continuing connected transactions; participate in the Company’s audit committee meetings, remuneration committee meetings, nomination committee meetings and strategic committee meetings. The INEDs also contribute to provide adequate checks and balances so as to protect the interests of the Company, to enable the interests of the Company’s shareholders as a whole are adequately and fairly represented, and to promote the development of the Company.
The Company has received an annual confirmation of independence from each of the INEDs pursuant to Rule 3.13 of the Listing Rules and considers all INEDs independent as at the date of this report.
41Haier Electronics Group Co., Ltd. Annual Report 2018
Corporate Governance Report
BOARD OF DIRECTORS (continued)
Supply of and access to information
Newly appointed Directors will receive induction packages relating to the duties and responsibilities of directors under the Listing Rules and other applicable rules and regulations.
All the Directors are briefed and updated from time to time on the latest legislative and regulatory developments, and they receive, in a timely manner, adequate information which is accurate, clear, complete and reliable to ensure that they are fully aware of their responsibilities under the Listing Rules, applicable legal and regulatory requirements.
In order to ensure that their duties can be properly discharged, the Directors are entitled to seek advice from independent professional advisers whenever deemed necessary by them at the Company’s expense.
Professional development
The Directors paid significant attention to enhance their knowledge and expertise so as to discharge their duties and responsibilities more effectively. The Company would organize in-house training sessions for newly appointed directors which are conducted by professional relating to the duties and responsibilities of directors under the Listing Rules and other applicable rules and regulations.
During the year, all Directors have fully observed the Code Provision A.6.5 and have attended various relevant training programmes which include:
(i) participation and/or as speakers in relevant conferences and seminars organized by various external organizations relevant to the business or directors’ duties, for update on corporate governance, and for enhancing their business expertise; and
(ii) private study of materials relevant to the director’s duties and responsibilities.
During the year, all Directors received regular updates on the Group’s business, operations, risk management, corporate governance matters, and changes on relevant laws and regulations applicable to the Group.
The Company Secretary of the Company, who is a full-time employee of the Company, has taken no less than 15 hours of relevant professional training.
Board meetings
During the year ended 31 December 2018, apart from the adhoc meetings and consents obtained by means of written resolutions of all the Board members, the Board held four scheduled meetings at approximately quarterly intervals to review and approve, among other things, the 2017 annual results and 2018 interim results, the overall Group’s strategy, discloseable and connected transactions of the Group. The Company’s board meetings (the “Board Meeting(s)”) are permitted to be held by means of telephone or other means of electronic communication under the Bye-laws.

42 Haier Electronics Group Co., Ltd. Annual Report 2018
Corporate Governance Report
BOARD OF DIRECTORS (continued)
Board meetings (Continued)
Sufficient notices are served and comprehensive information is provided to the Board members in advance of all the Board Meetings in order to enable them to make informed decisions on all matters transacted at the Board Meetings.
The proceedings of the Board Meetings are conducted by the Chairman of the Board or another Executive Director who ensures that sufficient time is allowed for discussion among the Directors and equal opportunities are being given to the Directors to express their views and share their concerns.
The chairman has met the non-executive directors (including INEDs) at least once without the presence of the Executive Director(s).
The Company Secretary attends the Board Meetings to advise Directors on corporate governance practices, and statutory compliance, accounting and financial issues whenever deemed necessary by the Board.
The Company Secretary is responsible for preparing minutes recording all matters transacted and resolved at the Board Meetings. All the Board minutes are kept by the Company Secretary and are open for inspection by the Directors.
The following table shows the attendance of the Directors at the scheduled Board Meetings during the year ended 31 December 2018:
No. of the scheduled
Board Meetings attended/held
Executive Directors:Mr. Zhou Yun Jie (Chairman) 4/4Mr. Sun Jing Yan 3/4
Non-executive Directors:Mr. Liang Hai Shan 3/4Ms. Tan Li Xia 1/4Dr. Wang Han Hua 4/4Mr. Yang Guang (appointed with effect from 11 May 2018) 3/3Mr. Yin Jing (retired with effect from 11 May 2018) 1/1
INEDs:Mr. Yu Hon To, David 4/4Mrs. Eva Cheng Li Kam Fun 4/4Mr. Gong Shao Lin (appointed with effect from 26 June 2018) 3/3Ms. Tsou Kai-Lien, Rose (retired with effect from 1July 2018) 2/2

43Haier Electronics Group Co., Ltd. Annual Report 2018
Corporate Governance Report
BOARD OF DIRECTORS (continued)
Board meetings (Continued)
It is challenging to arrange the Board Meeting that fits in with the tight and busy schedules of all the Directors. Certain of the Directors devoted considerable time and efforts to the management of the Group’s business, they were only able to attend some of the Board Meetings in person and their attendance rate at the Board Meetings were relatively low during the year. To enable all the Directors to keep abreast of the Group’s latest development and to discharge their duties properly, the Company Secretary briefed the Directors on those matters transacted at the Board Meetings that they were unable to attend. In addition, draft and final versions of the Board minutes were sent to all Directors for their comments and records. Also, the minutes of Board Meetings as well as meetings of Board committees are recorded in sufficient details of the matters considered and decisions made, including concerns raised by the Directors or dissenting views expressed.
Model Code for Securities Transactions by Directors
The Company has adopted a Model Code for Securities Transactions by Directors (the “Haier Electronics Model Code”) on no less exacting terms than the Model Code for Securities Transactions by Directors of Listed Issuers set out in Appendix 10 to the Listing Rules. Upon enquiry by the Company, all Directors of the Company have confirmed that they have complied with the required standards as set out in the Haier Electronics Model Code throughout the year ended 31 December 2018.
In addition, the Board has adopted written guidelines (the “Employees’ Guidelines for Securities Transactions”) for securities transactions by employees (the “Relevant Employees”) who are likely to be in possession of unpublished price sensitive information of the Company on no less exacting terms than the Haier Electronics Model Code. Having made specific enquiries of all the Relevant Employees, the Company confirmed that all the Relevant Employees had complied with the required standards as set out in the Employees’ Guidelines for Securities Transactions throughout the year ended 31 December 2018.
Board Committees
The Board has established an Audit Committee (the “Audit Committee”), a Remuneration Committee (the “Remuneration Committee”), a Nomination Committee (the “Nomination Committee”) and a Strategic Committee (the “Strategic Committee”) (collectively the “Committees”) to oversee specific aspects of the Company’s affairs. The Committees report to the Board regularly, and have been provided with sufficient resources to discharge their respective duties. To reinforce independence, the chairman of the Committees other than the Strategic Committee is an INED. Each of the Committees has adopted specific terms of reference covering its duties, powers and functions which will be reviewed by the Board from time to time. The Company Secretary also acts as secretary of the Committees. The Committees adopt as far as practicable, the procedures and arrangement of the Board Meeting in relation to the conduct of meetings, notice of meetings and recording of minutes. Further particulars of each of the Committees are set out below:
(1) Audit CommitteeDuring the year ended 31 December 2018, the Audit Committee comprised one Non-executive Director, namely Ms. Tan Li Xia, and two INEDs (Mr. Yu Hon To, David and Mrs. Eva Cheng Li Kam Fun), and was chaired by Mr. Yu Hon To, David. Mr. Yu is a professional accountant and was formerly a partner of an international accounting firm. The terms of reference of the Audit Committee (as revised) are available on the respective websites of the Company and the Hong Kong Stock Exchange.

44 Haier Electronics Group Co., Ltd. Annual Report 2018
Corporate Governance Report
BOARD OF DIRECTORS (continued)
Board Committees (continued)
(1) Audit Committee (continued)The primary duties of the Audit Committee are to ensure the objectivity and credibility of financial reporting, to make recommendations to the Board on the appointment, reappointment and removal of the Group’s external auditors and review of the Company’s financial controls, internal control and risk management systems. Each member of the Audit Committee has unrestricted access to the Group’s external auditor and the Management.
During the year ended 31 December 2018, the Audit Committee held three meetings to review the management and accounting principles and practices adopted by the Group and to discuss financial reporting matters including the review of 2017 annual results and 2018 interim results of the Group, review the adequacy of resources, accounting staff qualifications and experience, training programmes and budget of the Company’s accounting and financial reporting functions, review of the internal control procedures and the connected transactions, review the reappointment of external auditors and other related issues.
There is no disagreement between the Board and the Audit Committee regarding the selection, appointment, resignation or dismissal of external auditor. The Audit Committee also met the external auditor at least twice without the presence of the Executive Directors and the Management.
The annual results for the year ended 31 December 2018 were also reviewed by the Audit Committee.
The Board also has adopted the arrangement for employees of the Company to raise genuine concerns, in confidence, about possible improprieties in financial reporting, internal control or other matters in the Company and its subsidiaries. The Audit Committee monitors the execution of this arrangement.
The following table shows the attendance of members of the Audit Committee during the year ended 31 December 2018:
No. of Audit Committee meetings
attended/held
Non-executive Director:Ms. Tan Li Xia 3/3
INEDs:Mr. Yu Hon To, David 3/3Mrs. Eva Cheng Li Kam Fun 3/3
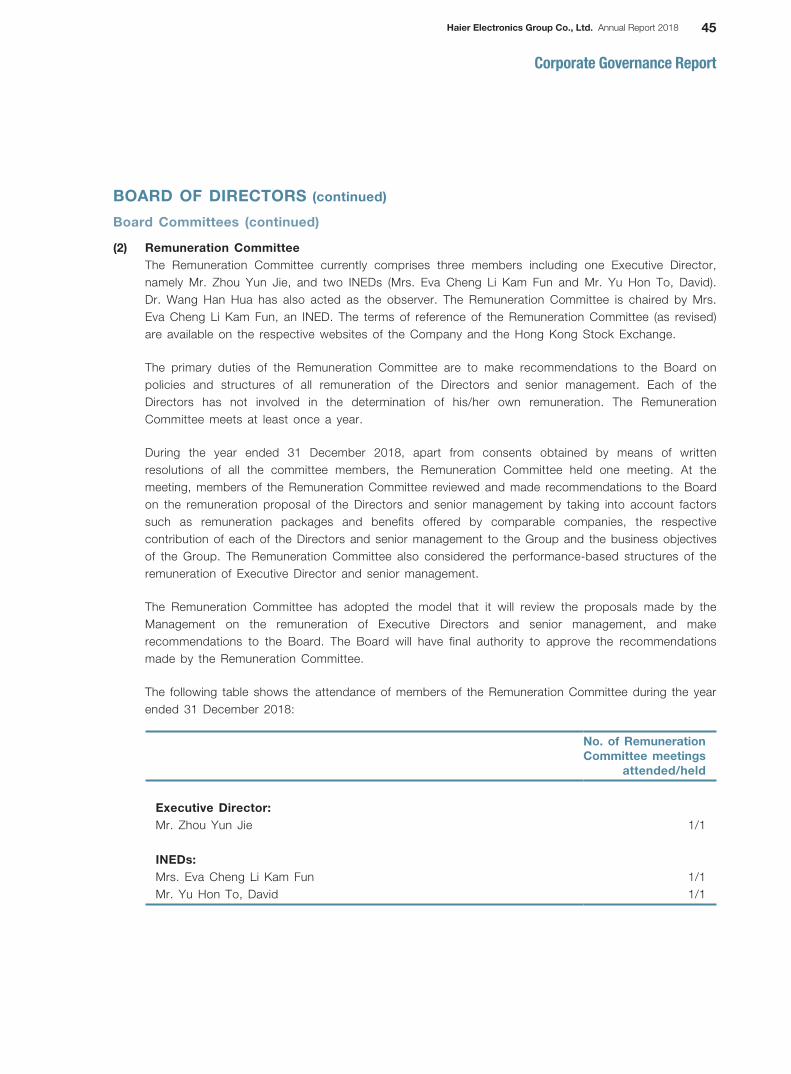
45Haier Electronics Group Co., Ltd. Annual Report 2018
Corporate Governance Report
BOARD OF DIRECTORS (continued)
Board Committees (continued)
(2) Remuneration CommitteeThe Remuneration Committee currently comprises three members including one Executive Director, namely Mr. Zhou Yun Jie, and two INEDs (Mrs. Eva Cheng Li Kam Fun and Mr. Yu Hon To, David). Dr. Wang Han Hua has also acted as the observer. The Remuneration Committee is chaired by Mrs. Eva Cheng Li Kam Fun, an INED. The terms of reference of the Remuneration Committee (as revised) are available on the respective websites of the Company and the Hong Kong Stock Exchange.
The primary duties of the Remuneration Committee are to make recommendations to the Board on policies and structures of all remuneration of the Directors and senior management. Each of the Directors has not involved in the determination of his/her own remuneration. The Remuneration Committee meets at least once a year.
During the year ended 31 December 2018, apart from consents obtained by means of written resolutions of all the committee members, the Remuneration Committee held one meeting. At the meeting, members of the Remuneration Committee reviewed and made recommendations to the Board on the remuneration proposal of the Directors and senior management by taking into account factors such as remuneration packages and benefits offered by comparable companies, the respective contribution of each of the Directors and senior management to the Group and the business objectives of the Group. The Remuneration Committee also considered the performance-based structures of the remuneration of Executive Director and senior management.
The Remuneration Committee has adopted the model that it will review the proposals made by the Management on the remuneration of Executive Directors and senior management, and make recommendations to the Board. The Board will have final authority to approve the recommendations made by the Remuneration Committee.
The following table shows the attendance of members of the Remuneration Committee during the year ended 31 December 2018:
No. of Remuneration Committee meetings
attended/held
Executive Director:Mr. Zhou Yun Jie 1/1
INEDs:Mrs. Eva Cheng Li Kam Fun 1/1Mr. Yu Hon To, David 1/1

46 Haier Electronics Group Co., Ltd. Annual Report 2018
Corporate Governance Report
BOARD OF DIRECTORS (continued)
Board Committees (continued)
(3) Nomination CommitteeThe Nomination Committee was formed on 19 September 2008 and currently comprises three members including one Executive Director, namely, Mr. Zhou Yun Jie, and two INEDs (Mr. Yu Hon To, David and Mrs. Eva Cheng Li Kam Fun). The Nomination Committee is chaired by Mr. Yu Hon To David, an INED. The Nomination Committee meets at least once a year. The terms of reference of the Nomination Committee (as revised) are available on the respective websites of the Company and the Hong Kong Stock Exchange.
The Nomination Committee is responsible for formulating nomination policy and making recommendations to the Board on nomination and appointment of Directors and Board succession. It also develops selection procedures of candidates for nomination, reviews the structure, size and composition of the Board and assesses the independence of the INEDs. The Company has provided the Nomination Committee sufficient resources to perform its duties.
Nomination procedures include identification and acknowledgement of qualified individuals by the Nomination Committee and review and approval of such nomination by the Board. The selection criteria for Directors are that the candidates must have substantial experience in business relevant to the Company, or in corporate management, or in relevant profession and must be able to contribute effectively to the objectives of the Company. In identifying suitable candidates for appointment to the Board, the Nomination Committee will consider candidates on merit against objective criteria (such as professional expertise, relevant experience, personal ethics etc.) and with due regard for the benefits of diversity on the Board. Any committee member may propose suitable candidates for directorship for discussion and approval by the Nomination Committee, after which the Board will consider and, if proper, approve such nomination. Directors thus selected is subject to re-election by the Company’s shareholders in the next general meeting or next annual general meeting, as appropriate, according to the Bye-laws of the Company. The Nomination Committee also advises the Board in considering the suitability of the re-election of the Directors who are subject to the retirement by rotation at the AGM in accordance with the Bye-laws.
The Nomination Committee monitors the execution of the Board diversity policy of the Company. Selection will be based on a range of diversity perspectives, including but not limited to, professional experience, business experience and insight, skills, know-how, gender, age, cultural and educational background, ethnic and length of services. It will review the Board diversity policy as appropriate and recommend any revisions to the policy to the Board for consideration and approval if necessary.
During the year ended 31 December 2018, apart from consents obtained by means of written resolutions of all the committee members, the Nomination Committee held one meeting. At the meeting, members of the Nomination Committee have identified and recommended qualified individuals to the Board for the appointment of directors, reviewed the composition of the Board and diversity of the Board, and advised the Board on the suitability of the retirement and re-election of the Directors at the annual general meeting.

47Haier Electronics Group Co., Ltd. Annual Report 2018
Corporate Governance Report
BOARD OF DIRECTORS (continued)
Board Committees (continued)
(3) Nomination Committee (continued)The following table shows the attendance of members of the Nomination Committee during the year ended 31 December 2018:
No. of Nomination Committee meetings
attended/held
Executive Director:Mr. Zhou Yun Jie 1/1
INEDs:Mr. Yu Hon To, David 1/1Mrs. Eva Cheng Li Kam Fun 1/1
(4) Strategic CommitteeThe Strategic Committee was formed on 18 October 2011 and currently comprises three members including one Executive Director, namely, Mr. Zhou Yun Jie, one INED, namely, Mr. Gong Shao Lin and one Non-executive Director namely, Mr. Yang Guang. Dr. Wang Han Hua has also acted as the observer. The Strategic Committee is chaired by Mr. Zhou Yun Jie. The Strategic Committee shall meet four times a year.
The purpose of the Strategic Committee shall be to prepare recommendations for the Board in fulfilling its responsibilities relating to (a) the development, articulation, and execution of the Company’s long term strategic plan, and (b) the review, evaluation, and approval of certain strategic transactions, including but not limited to acquisitions, mergers, divestitures, financings, capital structure and joint ventures.
The primary duties of the Strategic Committee are to review the major long term strategic proposals of the Group, review the issue, offer or sale of shares or other equity securities of the Company for the purposes of funding acquisitions or investments made or new businesses undertaken by the Group, review the proposed initial or follow-on equity investment by the Company through the establishment of a new business or venture or other means, review and comment on the annual budgets of the Group taken as a whole, and thereafter recommend to the Board for its consideration and approval.
During the year ended 31 December 2018, the Strategic Committee held four meetings. At the meetings, members of the Strategic Committee have discussed the strategies and the development plans of the channel services business, logistic business and water purifying business and made recommendations to the Board. The strategic transactions, such as the mergers and acquisitions, were reviewed.

48 Haier Electronics Group Co., Ltd. Annual Report 2018
Corporate Governance Report
BOARD OF DIRECTORS (continued)
Board Committees (continued)
(4) Strategic Committee (continued)The following table shows the attendance of members of the Strategic Committee during the year ended 31 December 2018:
No. of Strategic Committee meetings
attended/held
Executive Director:Mr. Zhou Yun Jie 4/4
Non-executive Directors:Mr. Yang Guang (appointed with effect from 11 May 2018) 3/3Mr. Yin Jing (retired with effect from 11 May 2018) 1/1
INED:Mr. Gong Shao Lin (appointed with effect from 26 June 2018) 3/3Ms. Tsou Kai-Lien, Rose (retired with effect from 1 July 2018) 2/2
Corporate Governance Function
In fulfilling the requirements of the Listing Rules which became effective on 1 April 2012, the Board delegated the corporate governance duties to the Audit Committee and Nomination Committee.
The primary corporate governance duties are to develop and review the Company’s policies and practices on corporate governance and make recommendations to the Board; to review and monitor the training and continuous professional development of Directors and senior management; to review and monitor the Company’s policies and practices on compliance with legal and regulatory requirements; to develop, review and monitor the code of conduct and compliance manual (if any) applicable to employees and Directors; and to review the Company’s compliance with the code and disclosure in the Corporate Governance Report.
During the year, the Board and the Committees have developed and reviewed the Company’s corporate governance practices, including the review of the recent changes of regulatory requirements, and the review of the process in upgrading the internal controls and risk management.

49Haier Electronics Group Co., Ltd. Annual Report 2018
Corporate Governance Report
COMMUNICATION WITH SHAREHOLDERS AND INVESTOR RELATIONS
A shareholders’ communication policy was established in March 2012. The Company has maintained different communication channels with its shareholders through the publication of annual and interim reports, circulars and announcements. Such information is also available on the websites of the Hong Kong Stock Exchange and the Company.
It is the Company’s practice to provide an explanation to shareholders of the details of the voting by poll procedures in the general meetings in accordance with the Bye-laws and the Listing Rules. The poll results of the general meetings are also published on the websites of the Hong Kong Stock Exchange and the Company. The Board regards general meetings as one of the principal channels of communication with our shareholders and the Directors provide detailed and complete answers to questions raised by the shareholders in the general meetings.
During the year ended 31 December 2018, the Company held three general meetings, including the annual general meeting and two special general meetings, in which various resolutions were passed.
The following table shows the attendance of the Directors at the general meeting held during the year ended 31 December 2018:
No. of the General meetings attended/
held
Executive Directors:Mr. Zhou Yun Jie 1/3Mr. Sun Jing Yan 0/3
Non-executive Directors:Mr. Liang Hai Shan 0/3Ms. Tan Li Xia 0/3Dr. Wang Han Hua 2/3Mr. Yang Guang (appointed with effect from 11 May 2018) 2/3Mr. Yin Jing (retired with effect from 11 May 2018) 0/0
INEDs:Mr. Yu Hon To, David 3/3Mrs. Eva Cheng Li Kam Fun 3/3Mr. Gong Shao Lin (appointed with effect from 26 June 2018) 2/2Ms. Tsou Kai-Lien, Rose (retired with effect from 1 July 2018) 1/1
During the year ended 31 December 2018, amendments be made to the relevant provisions of the Company’s bye-laws to enable the Company to send or supply corporate communication to the shareholders of the Company using electronic means or by making them available on the Company’s website in satisfaction of the Company’s obligation to send a printed copy thereof to the shareholders to the extent permitted under the Listing Rules and the Company’s constitutional documents. Apart from above, there have been no other significant changes in the Company’s constitutional documents.
50 Haier Electronics Group Co., Ltd. Annual Report 2018
Corporate Governance Report
SHAREHOLDERS’ RIGHTS
Procedures by which Shareholders may convene a special general meeting
Pursuant to Section 74(1) of the Bermuda Companies Act and the bye-law 62 of the Bye-laws of the Company, the shareholder(s) of the Company holding at the date of the deposit of the requisition not less than one-tenth of the paid-up capital of the Company as at the date of the deposit carries the right of voting at general meetings of the Company may request the Board to convene a special general meeting.
The requisition must state the purposes of the meeting, and must be signed by the requisitionists and deposited at the registered office of the Company at Clarendon House, 2 Church Street, Hamilton HM 11, Bermuda and the head office and principal place of business of the Company in Hong Kong at Unit 3513, 35/F., The Center, 99 Queen’s Road Central, Hong Kong, for the attention of the Company Secretary and may consist of several documents in like form each signed by one or more requisitionists.
If the Directors do not within twenty-one days from the date of the deposit of the requisition proceed duly to convene a meeting, the requisitionists, or any of them representing more than one half of the total voting rights of all of them, may themselves convene a meeting, but any meeting so convened shall not be held after the expiration of three months from the said date.
Procedures by which enquiries may be put to the Board
Shareholders may put forward enquiries to the Board through the Company Secretary who will direct the enquiries to the Board for handling. Such enquiries can be made by the following means:
Mail: Company Secretary Haier Electronics Group Co., Ltd. Unit 3513, 35/F., The Center, 99 Queen’s Road Central, Hong Kong
E-mail: [email protected]
Procedures for putting forward proposals at a Shareholders’ meeting
On the requisition in writing of (i) either any number of Shareholders representing not less than one-twentieth of the total voting rights of all the Shareholders having at the date of the requisition a right to vote at the meeting to which the requisition relates, or (ii) not less than 100 Shareholders, the Company shall be under a duty to:
(a) give to Shareholders entitled to receive notice of the next AGM notice of any resolution which may properly be moved and is intended to be moved at that meeting; and
(b) circulate to Shareholders entitled to have notice of any general meeting sent to them any statement of not more than 1,000 words with respect to the matter referred to in any proposed resolution or the business to be dealt with at that meeting.

51Haier Electronics Group Co., Ltd. Annual Report 2018
Corporate Governance Report
SHAREHOLDERS’ RIGHTS (continued)
Procedures for putting forward proposals at a Shareholders’ meeting (continued)
The written request/statements must be signed by the shareholder(s) concerned and deposited at the Company’s registered office in Bermuda at Clarendon House, 2 Church Street, Hamilton HM11, Bermuda and head office and principal place of business of the Company in Hong Kong at Unit 3513, 35/F., The Center, 99 Queen’s Road Central, Hong Kong, for the attention of the Company Secretary, not less than six weeks before the AGM in the case of a requisition requiring notice of a resolution and not less than one week before the general meeting in the case of any other requisition.
If the written request is in order, the Company Secretary will ask the Board (i) to include the resolution in the agenda for the AGM; or (ii) to circulate the statement for the general meeting, provided that the shareholder(s) concerned have deposited a sum of money reasonably determined by the Board sufficient to meet the Company’s expenses in serving the notice of the resolution and/or circulating the statement submitted by the shareholder(s) concerned in accordance with the statutory requirements to all the registered shareholders. On the contrary, if the requisition is invalid or the shareholder(s) concerned have failed to deposit sufficient money to meet the Company’s expenses for the said purposes, the shareholder(s) concerned will be advised of this outcome and accordingly, the proposed resolution will not be included in the agenda for the AGM; or the statement will not be circulated for the general meeting.
Procedures for Shareholders to propose a person for election as a Director
If a Shareholder wishes to nominate a person to stand for election as a Director at a general meeting, notice in writing of his intention to propose such person for election as a Director and the notice in writing executed by the nominee of his willingness to be elected must be validly served at the principal place of business in Hong Kong of the Company. The minimum length of the period during which such notices are given shall be at least 7 days and the period for lodgement of such notices shall commence no earlier than the day after the dispatch of the notice of the general meeting appointed for such election and end no later than 7 days prior to the date of such general meeting.
To enable shareholders to make an informed decision on their election at a general meeting, the names of all candidates submitted for election or re-election as a Director together with his/her biographical details as set out in Rule 13.51(2) of the Listing Rules (including other directorships held in listed public companies in the past 3 years and other major appointments) are to be set out in a circular or supplementary circular to be sent to shareholders prior to the meeting in accordance with the Listing Rules.
INSURANCE
The Group has arranged appropriate directors’ and officers’ liability insurance to indemnify the Directors and senior staff of the Group for their potential liabilities incurred by them in discharging their duties. The Group reviews the insurance coverage for the Directors and the Group’s senior staff on an annual basis.

52 Haier Electronics Group Co., Ltd. Annual Report 2018
Corporate Governance Report
ACCOUNTABILITY AND AUDIT
The Directors acknowledge their responsibility for preparing financial statements of the Group in accordance with relevant statutory requirements and generally accepted accounting principles in Hong Kong and ensuring that the financial statements give a true and fair view of the Group’s financial position. In preparing the financial statements of the Group for the year ended 31 December 2018, the Directors have adopted suitable accounting policies and applied them consistently; made judgments and estimates that are prudent and reasonable; and prepared the financial statements on a going concern basis.
The responsibilities of the external auditor with respect to the financial reporting are set out in the Independent Auditor’s Report of this Annual Report.
The Board aims to present a comprehensive, balanced and understandable assessment of the Group’s development and prospects in all corporate communications, including but not limited to annual and interim reports, any price sensitive announcements and financial disclosures required under the Listing Rules, any reports to regulators as well as to information required to be disclosed pursuant to other statutory requirements.
RISK MANAGEMENT AND INTERNAL CONTROL
The Group is committed to implementing and maintaining effective risk management and internal controls procedures to identify and manage the risks faced by the Group, as well as to safeguard the interests of the Group and our shareholders as a whole. The Board would ensure that adequate resources and management attention will be devoted to strengthen its internal controls and risk management procedures.
The Board is responsible for overseeing adequate internal controls and risk management procedures in the Group, reviewing their effectiveness on an on-going basis, and ensuring the Management has clearly defined the authorities and key responsibilities of each business and operational unit for adequate checks and balances. The Board has delegated to the Management the design, implementation and monitoring of the Group’s risk management and internal control systems covering all material aspects, including financial, operational, risk management functions and in compliance with all relevant regulations. Such systems are designed to manage the risk of failure to achieve business objectives, and provide reasonable, but not absolute assurance against material misstatement or loss.
The Board is also responsible for ensuring that the Management has discharged its duty to have an effective internal control system in terms of the adequacy of resources, qualification and experience of staff of the Company’s finance and internal audit functions, and their training programme and budget.
Control Environment
— The control framework is consistent with that promoted by The COSO (Committee of Sponsoring Organizations of the Treadway Commission) standards;
— Risk awareness and control responsibility are built into the company culture and are regarded as the foundation of risk management and internal control systems;
— An effective internal audit function is maintained which is independent from operational management;
— Whistleblowing Guideline of the Company is in place.

53Haier Electronics Group Co., Ltd. Annual Report 2018
Corporate Governance Report
RISK MANAGEMENT AND INTERNAL CONTROL (continued)
Internal Auditing Function
In response to the broadening of the Group’s scope of business activities and the increase in geographical locations in which it operates, to face the challenges of the fast growing trend of new business and the related increased financial and operational risks, the Group has continuously strengthened the functions of its Internal Audit Department which provides independent and objective assurance and consulting activity designed to add value and improve Company’s operations. It helps the Group in accomplishing its objectives by bringing a systematic, disciplined approach to evaluate and improve the effectiveness of risk management, control, and governance processes.
Internal auditing is a catalyst for improving Company’s governance, risk management and management controls by providing insight and recommendations based on analyses and assessments of data and business processes. With commitment to integrity and accountability, Internal Audit provides value to governing bodies and senior management as an objective source of independent advice.
The Internal Audit Department also provides independent and reasonably assurance that the internal controls system is effective and efficient. In order to carry out its functions, the Internal Audit Department is given unrestricted access to all business operations and personnel, all business files and accounting records. The head of the Department reports directly and regularly to the Audit Committee and CEO respectively on the findings of audit matters. The work schedule of the Internal Audit Department is based on an annual audit program reviewed and approved by the Audit Committee.
Risk Management
An enterprise-wide risk assessment with the Management and key-process owners had been institutionalised to identify major risks of all levels and to review the effectiveness of the key controls and mechanisms in place. It is intended that the risk management framework would be able to raise risk-awareness within senior management such that a safeguarding culture of the Group’s business and assets is to be developed and implemented.
A Risk Management Committee has been set up comprising the CEO and senior managers of major business units to review and analyse weekly the key risks associated with achieving the objectives of the Group as well as the individual departments, activities and businesses to provide reasonable assurance that internal controls are both embedded and effective within their areas of accountability. Such assessment has been implemented throughout the year to evaluate all major risks associated with the business operations of the forthcoming years. Relevant measures have been adopted to deal with and to mitigate the risks to controllable range.
The Internal Audit Department of the Company plays a significant role in the risk management execution. Major risks of all levels facing the Group are identified and evaluated, and the Risk Management Committee ultimately reviewed the identification and evaluation of these risks. Based on these measures, mitigation strategies and plans with respect to each key risk identified are developed and implemented, which include establishing or enhancing internal controls, with regular review and update. The process of the work performed are reported regularly to the Audit Committee and the Board.

54 Haier Electronics Group Co., Ltd. Annual Report 2018
Corporate Governance Report
RISK MANAGEMENT AND INTERNAL CONTROL (continued)
Control Process
The Company recognizes that the assessment of the internal control system is an on-going process which will require applications of underlying principles to the different objective categories in the changing business and operating environments. In particular, management enhancements are required to address deficiencies in internal controls over operations, compliance and financial and non-financial reporting.
There is a clearly-defined management structure with specified authority limits and segregated responsibilities to achieve business control objectives and safeguard of assets. Guidelines and approval limits for operating and capital expenditures are set clearly and in advance, and, with division of operations and financial personnel responsible for the different approval processes. An internal budget system as well as expense system have been used to enhance the controls and effectiveness embedded in the approval process. Detective controls are also in place as safeguards for the business and operational processes.
The Internal Audit Department establishes an annual internal control review plan for major internal control systems covering areas including operational control, financial control and compliance control (including review of controls on continuing connected transactions). The review tasks on various internal controls are prioritized in accordance with the risk level assessed or where significant changes have been taken place. During the year ended 31 December 2018, the Internal Audit Department has conducted a review of the effectiveness of Group’s internal control system’s procedures on the major business and operational processes, particularly on those divisions and businesses which were newly set up, such as the newly acquired logistics joint ventures and new businesses. Recommendations for further improvements have been reported to the Audit Committee as well as Board, together with its findings. Such recommendations have been or are being implemented by the Management with regular review.
Review of Control Effectiveness
The Audit Committee reviewed the effectiveness of the risk management and internal control systems by reviewing the work of the Internal Audit Department. The Board has, through the Audit Committee, reviewed and considered that for the year ended 31 December 2018: (i) the Group’s risk management and internal control systems were effective and adequate, with reference to the COSO (Committee of Sponsoring Organizations of the Treadway Commission) standards; (ii) the Group had adopted the necessary control mechanisms to monitor and rectify any non-compliance of regulations.
Inside InformationThe Company has adopted the following procedures and internal controls for the handling and dissemination of inside information:
(i) the Company keeps updated on the obligations under the Securities and Futures Ordinance, the applicable Listing Rules and other statutory regulations with regard to the timely and proper disclosure of inside information and authorizes the disclosure through the publication of announcements as required;
(ii) the Company implemented an Inside Information Disclosure Policy which the Company’s spokespersons have to strictly follow in communicating with the public;

55Haier Electronics Group Co., Ltd. Annual Report 2018
Corporate Governance Report
RISK MANAGEMENT AND INTERNAL CONTROL (continued)
Review of Control Effectiveness (continued)
Inside Information (continued)(iii) the Company adopted a Model Code for securities transactions by Directors, and by employees who
are likely to be in possession of unpublished inside information of the Company on no less exacting terms than that for the Directors; and
(iv) the Company included in the employee conduct code that unauthorised uses of confidential and inside information are strictly prohibited.
REMUNERATION OF EXTERNAL AUDITORS
The Group’s independent external auditors are Ernst & Young, Certified Public Accountants (“Ernst & Young”). During the year ended 31 December 2018, the annual audit fees and non-audit fees payable/paid by the Group to Ernst & Young were RMB7,365,000 and RMB1,978,000, respectively. The non-audit services mainly included the performance of agreed-upon procedures in respect of the Group’s quarterly and interim financial information (RMB1,450,000), review of the continuing connected transactions (RMB160,000), taxation consultation services (RMB308,000) and other services fee (RMB60,000).
27 March 2019

56 Haier Electronics Group Co., Ltd. Annual Report 2018
REPORT OF THE DIRECTORS
The Directors present their report and the audited financial statements of the Group for the year ended 31 December 2018.
PRINCIPAL ACTIVITIES
The principal activity of the Company is investment holding.
During the year, the Group’s subsidiaries continued to be engaged in the manufacture and sale of washing machines and water heaters, sale and distribution of home appliances and other products, providing after- sale services and other value-added consumer services, and providing logistics services. There were no significant changes in the nature of the Group’s principal activities during the year. Further discussion and analysis of these activities as required by Schedule 5 to the Companies Ordinance, including a discussion of the principal risks and uncertainties faced by the Group and an indication of the Group’s likely future developments, can be found in the Chairman’s letter and Business Review and Financial Review set out on pages 6 to 9 and 16 to 37 of this Annual Report. Such information forms part of the Report of The Directors.
RESULTS AND DIVIDENDS
The Group’s profit for the year ended 31 December 2018 and the Group’s financial position as at that date are set out in the financial statements on pages 79 to 207.
The Directors of the Company recommend the payment of a final dividend for the year ended 31 December 2018 of HK38 cents per share (2017: HK29 cents per share).
SUMMARY FINANCIAL INFORMATION
A summary of the published results and assets, liabilities and non-controlling interests of the Group for the last five financial years, as extracted from the audited financial statements and restated/reclassified as appropriate, is set out on page 208. This summary does not form part of the audited financial statements.
PROPERTY, PLANT AND EQUIPMENT AND INVESTMENT PROPERTIES
Details of movements in the property, plant and equipment, and investment properties of the Group during the year ended 31 December 2018 are set out in notes 14 and 15 to the financial statements, respectively.
SHARE CAPITAL AND SHARE OPTIONS
Details of movements in the Company’s share capital and share options during the year ended 31 December 2018 are set out in notes 35 and 37 to the financial statements.
PRE-EMPTIVE RIGHTS
There are no provisions for pre-emptive rights under the Company’s Bye-laws or the laws of Bermuda which would oblige the Company to offer new shares on a pro rata basis to existing shareholders.

57Haier Electronics Group Co., Ltd. Annual Report 2018
Report of The Directors
PURCHASE, REDEMPTION OR SALE OF LISTED SECURITIES OF THE COMPANY
During the year, the Company purchased certain of its ordinary shares (the “Shares”) on The Stock Exchange of Hong Kong Limited (the “Stock Exchange”) and these Shares were subsequently cancelled by the Company. The summary details of those transactions are as follows:
Number of shares
repurchased Price per share TotalMonth Highest Lowest price paid
HK$ HK$ HK$’000
September 2018 3,290,000 19.70 18.42 63,379October 2018 1,480,000 19.30 16.08 26,761November 2018 440,000 17.44 17.02 7,624
5,210,000 97,764
The issued capital of the Company was reduced by the par value thereof. The premium paid on the purchase of the Company’s shares of HK$97,243,000 (2017: nil) has been charged to the share premium account of the Company. The purchased shares were cancelled during the year. The purchase of the Company’s shares during the year was effected by the directors, pursuant to the mandate from shareholders received at the last annual general meeting.
During the year, there were also purchases of 1,565,158 shares of the Company for an aggregate consideration of HK$32,092,000 pursuant to a restricted share award scheme (the “Restricted Share Award Scheme”) as announced by the Company on 15 April 2014, and the receipt of 2,615,288 shares of the Company from the Directors and employees as substitution of their individual income tax for exercising awarded shares which amounted to HK$64,451,000.
Saved as disclosed above, neither the Company, nor any of its subsidiaries purchased, redeemed or sold any of the Company’s listed securities during the year ended 31 December 2018.
RESERVES
Details of movements in the reserves of the Company and the Group during the year are set out in note 50 to the financial statements and in the consolidated statement of changes in equity, respectively.
DISTRIBUTABLE RESERVES
At 31 December 2018, the Company’s reserves available for distribution, calculated in accordance with the provisions of the Companies Act 1981 of Bermuda (as amended), amounted to RMB3,687,779,000, of which HK$1,065,167,000 (equivalent to RMB935,958,000) has been proposed as a final dividend for the year. In addition, RMB2,366,571,000 in the Company’s share premium account may be capitalised and distributed to members in the form of fully paid bonus shares.
58 Haier Electronics Group Co., Ltd. Annual Report 2018
Report of The Directors
ENVIRONMENTAL POLICIES AND PERFORMANCE
The Group recognizes the importance of environmental sustainability against modern ecological challenges, and has introduced the environmental protection concept and elements into the various aspects of operations. The Group continues to deepen the transformation of the green service platform and has the “green development” strategy implemented in product design, production processes, logistics and transportation, and daily operations. The Group takes the “green” economy as a new path for corporate development and adheres to the principle of high technology content, low resource consumption, and low environmental pollution throughout the entire process of supply, production, sales, distribution, and service.
The Group has increased investment in R&D and innovation of core products and services, and supported innovation as the lifeline of the Company. Through technical means, the Group has built with suppliers and distribution partners innovative alliances centered on sharing and collaboration. On the basis of promoting smart logistics and intelligent warehousing, The Group has integrated global user resources and global supply chain resources to build and develop an environmental friendly, socially harmonious green industrial chain.
Further discussions of these activities are in the Environmental, Social and Governance Report which will be issued separately within the period as required by the Listing Rules.
COMPLIANCE WITH LAWS AND REGULATIONS
The Board is responsible for reviewing and monitoring the Group’s policies and practices on compliance with legal and regulatory requirements, with the assistance of the Internal Audit Department, the Legal Department and the Company Secretarial Department of the Company. The Company has in place compliance procedures to ensure adherence to the laws and regulations that are relevant to the Group.
Apart from the laws and rules applicable to the Company as a listed company, laws and regulations in other jurisdictions also apply to and have a significant impact on the non-Hong Kong operations of the Group, such as those relevant to the manufacturing process, product specification and design, labour, and environmental protection in respect of the Group’s manufacture of products, channel services and logistic services operations in China.
The Group’s staff are regularly briefed and updated from time to time on the relevant changes in laws and regulations so as to enhance their awareness of compliance obligations.
During the year ended 31 December 2018, the Group has complied with the relevant laws and regulations that have a significant impact on the operations of the Group.
MAJOR CUSTOMERS AND SUPPLIERS
In the year under review, sales to the Group’s five largest customers accounted for less than 20% of the total sales for the year. Purchases from the Group’s five largest suppliers accounted for 80% of the total purchases for the year and purchases from the largest supplier included therein amounted to 48%.
During the year ended 31 December 2018, Haier Group Corporation (“Haier Corp”), the substantial shareholders of the Company, had beneficial interests in one of the Group’s five largest customers and all of the Group’s five largest suppliers.
Save as disclosed above, none of the Directors or any of their close associates or any shareholders of the Company which, to the best knowledge of the Directors, owns more than 5% of the Company’s issued share capital had any beneficial interest in the Group’s five largest customers or suppliers.

59Haier Electronics Group Co., Ltd. Annual Report 2018
Report of The Directors
DIRECTORS
The Directors of the Company during the year were:
Executive directors:Mr. Zhou Yun JieMr. Sun Jing Yan
Non-executive directors:Mr. Liang Hai ShanMs. Tan Li XiaDr. Wang Han HuaMr. Yang Guang
(appointed with effect from 11 May 2018)Mr. Yin Jing
(retired with effect from 11 May 2018)
Independent non-executive directors:Mr. Yu Hon To, DavidMrs. Eva Cheng Li Kam FunMr. Gong Shao Lin
(appointed with effect from 26 June 2018)Ms. Tsou Kai-Lien, Rose
(retired with effect from 1 July 2018)
Mr. Yin Jing retired as a Non-executive Director of the Company retired with effect from 11 May 2018, and Ms. Tsou Kai-Lien, Rose retired as an Independent non-executive Director of the Company with effect from 1 July 2018. Mr. Yin and Ms. Tsou had taken this decision due to their other personal commitments and business objectives.
Subsequent to the year end date, on 27 March 2019, Mr. Li Hua Gang and Mr. Xie Ju Zhi were appointed as executive Directors of the Company. Ms. Tan Li Xia retired as a non-executive Director of the Company, and Mr. Sun Jing Yan retired as an executive Director of the Company with effect from 27 March 2019. Ms. Tan had taken this decision due to commitments on her other business within Haier Group. Mr. Sun had taken this decision due to re-designation of duties within the Haier Group.
In accordance with the Bye-laws, Mr. Liang Hai Shan, Dr. Wang Han Hua are subject to retirement by rotation at the forthcoming AGM. Mr. Li Hua Gang and Mr. Xie Ju Zhi will hold office until the forthcoming AGM. All these Directors are eligible for re-election at the AGM.
The INEDs are not appointed for any specific terms and are subject to retirement by rotation and re-election at the AGM in accordance with the Bye-laws.
The Company has received an annual confirmation of independence from each of Mr. Yu Hon To, David, Mrs. Eva Cheng Li Kam Fun and Mr. Gong Shao Lin, and, as at the date of this report, the Board still considers them independent on the basis of such confirmations.
DIRECTORS’ AND SENIOR MANAGEMENT’S BIOGRAPHIES
Biographical details of the Directors of the Company and the senior management of the Group are set out on pages 10 to 15 of the annual report.

60 Haier Electronics Group Co., Ltd. Annual Report 2018
Report of The Directors
CHANGES OF INFORMATION OF DIRECTORS
Below are the changes of Directors’ information required to be disclosed pursuant to Rule 13.51B(1) of the Listing Rules since the report date of the Company’s interim report for the period ended 30 June 2018:
Up to the date of this report, Mr. Zhou Yun Jie has resigned as director of Haier International Business Corporation Limited, a subsidiary of the Group. Mr. Li Hua Gang has ceased to be a director of Hunan Goodaymart Electric Appliance Co., Ltd, a subsidiary of the Group.
DIRECTORS’ SERVICE CONTRACTS
During the year, no Director had a service contract with the Company or any of its subsidiaries which is not determinable by the Company within one year without payment of compensation, other than statutory compensation.
PERMITTED INDEMNITY
Under the Bye-laws, every director or other officer of the Company acting in relation to any of the affairs of the Company shall be entitled to be indemnified out of the assets of the Company against all costs, charges, expenses, losses or liabilities which he may sustain or incur in or about the execution of the duties of his office or otherwise in relation thereto. A Directors’ and Officers’ Liability Insurance is in place to protect the Directors and officers of the Group against any potential liability arising from the Group’s activities which such directors and officers may be held liable.
DIRECTORS’ REMUNERATION
The Directors’ fees are subject to shareholders’ approval at general meetings. Other emoluments are determined by the Company’s Board with reference to Directors’ duties, responsibilities and performance and the results of the Group.
DIRECTORS’ INTERESTS IN TRANSACTIONS, ARRANGEMENTS OR CONTRACTS
Except executive positions and related interests in the Haier Group, no director nor a connected entity of a director had a material interest, either directly or indirectly, in any transactions, arrangements or contracts of significance to the business of the Group to which the Company, the holding companies of the Company or any of the Company’s subsidiaries or fellow subsidiaries was a party during the year.
DIRECTORS’ INTERESTS IN COMPETING BUSINESS
Except executive positions and related interests in the Haier Group, none of the Directors is interested in any businesses which compete or are likely to compete, either directly or indirectly, with the businesses of the Group.
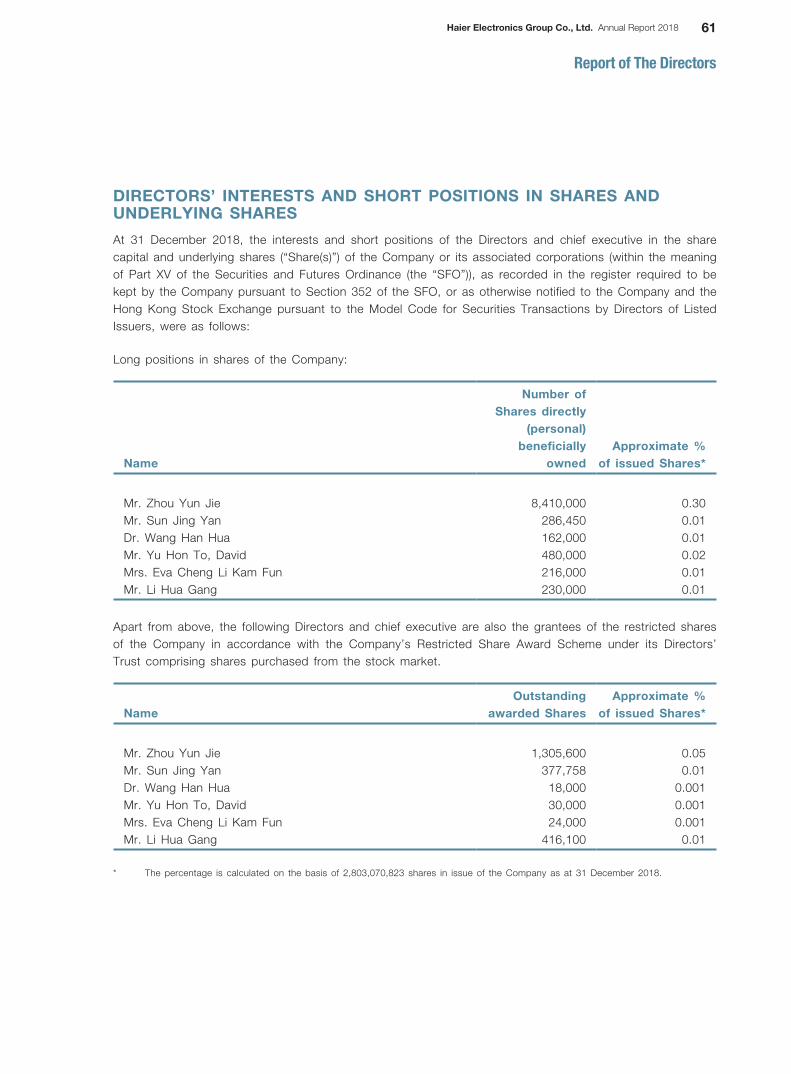
61Haier Electronics Group Co., Ltd. Annual Report 2018
Report of The Directors
DIRECTORS’ INTERESTS AND SHORT POSITIONS IN SHARES AND UNDERLYING SHARES
At 31 December 2018, the interests and short positions of the Directors and chief executive in the share capital and underlying shares (“Share(s)”) of the Company or its associated corporations (within the meaning of Part XV of the Securities and Futures Ordinance (the “SFO”)), as recorded in the register required to be kept by the Company pursuant to Section 352 of the SFO, or as otherwise notified to the Company and the Hong Kong Stock Exchange pursuant to the Model Code for Securities Transactions by Directors of Listed Issuers, were as follows:
Long positions in shares of the Company:
Name
Number ofShares directly
(personal)beneficially
ownedApproximate %
of issued Shares*
Mr. Zhou Yun Jie 8,410,000 0.30Mr. Sun Jing Yan 286,450 0.01Dr. Wang Han Hua 162,000 0.01Mr. Yu Hon To, David 480,000 0.02Mrs. Eva Cheng Li Kam Fun 216,000 0.01Mr. Li Hua Gang 230,000 0.01
Apart from above, the following Directors and chief executive are also the grantees of the restricted shares of the Company in accordance with the Company’s Restricted Share Award Scheme under its Directors’ Trust comprising shares purchased from the stock market.
NameOutstanding
awarded SharesApproximate %
of issued Shares*
Mr. Zhou Yun Jie 1,305,600 0.05Mr. Sun Jing Yan 377,758 0.01Dr. Wang Han Hua 18,000 0.001Mr. Yu Hon To, David 30,000 0.001Mrs. Eva Cheng Li Kam Fun 24,000 0.001Mr. Li Hua Gang 416,100 0.01
* The percentage is calculated on the basis of 2,803,070,823 shares in issue of the Company as at 31 December 2018.

62 Haier Electronics Group Co., Ltd. Annual Report 2018
Report of The Directors
DIRECTORS’ INTERESTS AND SHORT POSITIONS IN SHARES AND UNDERLYING SHARES (continued)
NameDate of grant
of share options
Number ofshare options
granted andnot yet exercised*
Approximate %of issued sharesupon exercise of
share options#
Mr. Sun Jing Yan 11/09/2015 84,000 0.003Mr. Li Hua Gang 11/09/2015 108,000 0.004
Note:
* The exercise price of each of the above share options is HK$12.84 for subscription of one share. The exercisable period is from 10 May 2016 to 10 May 2020.
# The percentage is calculated on the basis of 2,803,070,823 shares in issue of the Company as at 31 December 2018.
Long positions in shares and underlying shares of Qingdao Haier Co., Ltd (“Qingdao Haier”), the Company’s shareholder:
NameNumber of
shares held
Approximate%of total registered
share capital Capacity and interest
Mr. Liang Hai Shan 12,859,062 0.20 Directly (personal) beneficially ownedMs. Tan Li Xia 6,836,737 0.11 Directly (personal) beneficially ownedMr. Zhou Yun Jie 196,596 0.003 Directly (personal) beneficially ownedMr. Li Hua Gang 482,214 0.01 Directly (personal) beneficially owned
Save as disclosed above, as at 31 December 2018, none of the Directors and chief executive had any interests or short positions in the shares or underlying shares of the Company or its associated corporation (within the meaning of Part XV of the SFO), as recorded in the register required to be kept by the Company pursuant to Section 352 of the SFO, or as otherwise notified to the Company and the Hong Kong Stock Exchange pursuant to the Model Code for Securities Transactions by Directors of Listed Issuers.
DIRECTORS’ RIGHTS TO ACQUIRE SHARES IN OR DEBENTURES OF THE COMPANY
Share Option Scheme
The Company operates a share option scheme (the “Share Option Scheme”) for the purpose of providing incentives and reward to eligible participants who contribute to the success of the Group’s operations. Further details of the Share Option Scheme are disclosed in note 37 to the financial statements.

63Haier Electronics Group Co., Ltd. Annual Report 2018
Report of The Directors
DIRECTORS’ RIGHTS TO ACQUIRE SHARES IN OR DEBENTURES OF THE COMPANY (continued)
Share Option Scheme (continued)
The following table discloses movements in the Company’s share options outstanding during the year:
Number of share options
Date ofgrant of
share options (note 1)
Exercise periodof share options
Exerciseprice of
share optionsper share
(note 2)
Name or category of participants
At1 January
2018
Grantedduring
the year
Exercisedduring
the year
Cancelledduring
the year
Lapsedduring
the year
At31 December
2018HK$
Executive directorMr. Sun Jing Yan 84,000 — — — — 84,000 11/09/2015 10/05/2016–10/05/2020 12.84
Chief executiveMr. Li Hua Gang 108,000 — — — — 108,000 11/09/2015 10/05/2016–10/05/2020 12.84
Other employeesIn aggregate 3,303,200 — 1,040,345 — — 2,262,855 11/09/2015 10/05/2016–10/05/2020 12.84
3,495,200 — 1,040,345 — — 2,454,855
Notes:
1. For share options granted on 11 September 2015, 40% and 60% of the total share options granted were to be vested on vesting dates of 10 May 2016 and 10 May 2017, respectively. The vesting period of the share options is from the date of grant until the respective vesting dates.
2. The exercise price of the share options is subject to adjustment(s) in the case of rights or bonus share issues, or other similar changes in the share capital of the Company.
3. The weighted average closing price of the Company’s shares immediately before the exercise dates of the share options was HK$25.42 per share.
4. The total share options that could be granted under the then available scheme mandate limit as at 31 December 2018 were in respect of 153,890,890 shares which represented 5.5% of the issued shares of the Company as at 31 December 2018.
As at 31 December 2018, the Company had 2,454,855 share options outstanding under the Share Option Scheme. Should the share options be fully exercised, the Company will receive approximately HK$31,520,000 (before issue expenses). The fair value of these unexercised options measured in accordance with the Group’s accounting policy (note 2.4 to the financial statements) amounted to HK$8,272,000.
The particulars regarding dilution effect of the share options are set out in note 12 to the financial statements.
Restricted Share Award Scheme
The Company operates a Restricted Share Award Scheme, which aims at providing incentives to employees and optimising the remuneration structure of the Group. According to the Restricted Share Award Scheme, the Company may purchase the scheme shares in the open market and hold the purchased shares in the Share Award Scheme Trust for the relevant selected employees until such shares vest or issue and allot new scheme shares to the trustee. The Board has discretion to decide whether the awarded shares are to be purchased or subscribed. Further details of this scheme are disclosed in note 36 to the financial statements.

64 Haier Electronics Group Co., Ltd. Annual Report 2018
Report of The Directors
DIRECTORS’ RIGHTS TO ACQUIRE SHARES IN OR DEBENTURES OF THE COMPANY (continued)
Restricted Share Award Scheme (continued)
The following table discloses movements in the Company’s awarded shares under the Company’s Restricted Share Award Scheme during the year:
Number of awarded shares
Exercise/vesting periodof awarded shares
(note 2)
Exerciseprice of
awardedshares per
share(note 1)
Name of participants
At1 January
2018
Grantedduring
the year(note 2)
Exercisedduring
the year
Cancelledduring
the year
Lapsed during
the year
At31
December2018
Date ofgrant ofawarded
sharesHK$
Executive directorsMr. Zhou Yun Jie
696,000 — 696,000 — — — 17/10/2016 17/10/2016–01/07/2018 —960,000 — 384,000 — — 576,000 29/05/2017 29/05/2017–01/07/2019 —
— 605,000 — — — 605,000 05/07/2018 05/07/2018–01/07/2020 —— 124,600 — — — 124,600 17/09/2018 17/09/2018–01/07/2020 —
1,656,000 729,600 1,080,000 — — 1,305,600
Mr. Sun Jing Yan 214,800 — 182,580 — — 32,220 08/07/2016 08/07/2016–01/07/2019 (note 3)
—
272,000 — 93,262 — — 178,738 03/03/2017 03/03/2017–01/07/2019 —— 138,300 — — — 138,300 05/07/2018 05/07/2018–01/07/2020 —— 28,500 — — — 28,500 17/09/2018 17/09/2018–01/07/2020 —
486,800 166,800 275,842 — — 377,758
2,142,800 896,400 1,355,842 — — 1,683,358
Non-executive directorDr. Wang Han Hua 30,000 — 12,000 — — 18,000 29/05/2017 29/05/2017–01/07/2019 —
Independent Non-executive directors
Mr. Yu Hon To, David 50,000 — 20,000 — — 30,000 29/05/2017 29/05/2017–01/07/2019 —Mrs. Eva Cheng Li Kam
Fun 40,000 — 16,000 — — 24,000 29/05/2017 29/05/2017–01/07/2019 —Ms. Tsou Kai-Lien, Rose 30,000 — 15,000 — 15,000 — 29/05/2017 29/05/2017–01/07/2019 —
120,000 — 51,000 — 15,000 54,000
Chief executiveMr. Li Hua Gang 44,000 — — — — 44,000 08/07/2016 08/07/2016–07/07/2020 6.42
— 172,800 — — — 172,800 05/07/2018 05/07/2018–01/07/2020 —— 135,800 — — — 135,800 12/07/2018 12/07/2018–01/07/2020 —— 63,500 — — — 63,500 17/09/2018 17/09/2018–01/07/2020 —
44,000 372,100 — — — 416,100
Other employeesIn aggregate 560,400 — — — 560,400 — 15/04/2014 15/04/2014–14/04/2018 9.685In aggregate 104,400 — — — — 104,400 08/07/2016 08/07/2016–07/07/2020 6.42In aggregate 8,794,325 — 7,980,304 337,081 — 476,940 08/07/2016 08/07/2016–01/07/2019
(note 3)—
In aggregate 10,818,000 — 3,945,658 — — 6,872,342 03/03/2017 03/03/2017–01/07/2019 —In aggregate — 10,381,400 — — — 10,381,400 17/09/2018 17/09/2018–01/07/2020 —
20,277,125 10,381,400 11,925,962 337,081 560,400 17,835,082
22,613,925 11,649,900 13,344,804 337,081 575,400 20,006,540
65Haier Electronics Group Co., Ltd. Annual Report 2018
Report of The Directors
DIRECTORS’ RIGHTS TO ACQUIRE SHARES IN OR DEBENTURES OF THE COMPANY (continued)
Restricted Share Award Scheme (continued)
Notes:
1. The exercise price of the awarded shares is subject to adjustment(s) in the case of rights or bonus issues, or other similar changes in the Company’s share capital.
2. The restricted shares will become exercisable once they are vested.
3. The remaining awarded shares remain exercisable until 1 July 2019.
4. The closing price of the Company’s share immediately before the grant dates of the awarded shares were HK$24.35, HK$24.15 and HK$19.62 per share.
As at 31 December 2018, the number of ordinary shares held for the Restricted Share Awarded Scheme was 7,590,843 (31 December 2017: 11,855,130) with an aggregate carrying amount of RMB97,391,000 (31 December 2017: RMB158,583,000).
The fair values of the awarded shares granted during the year were approximately HK$21,574,000, HK$3,178,000, and HK$199,741,000 (HK$23.55, HK$23.40 and HK$18.85 each), of which the Group recognised a restricted share expense of HK$54,686,000 during the year.
At the date of approval of these financial statements, the Company had 20,006,540 awarded shares outstanding under the Restricted Share Award Scheme, which represented approximately 0.71% of the Company’s shares in issue as at that date.
The particulars regarding dilution effect of the awarded shares under the Restricted Share Award Scheme are set out in note 12 to the financial statements.
Save as the options and restricted shares granted to the Directors, at no time during the year ended 31 December 2018 were rights to acquire benefits by means of the acquisition of shares in or debentures of the Company granted to any Directors or their respective spouses or minor children, or were any such rights exercised by them; or was the Company, its holding company, or any of its subsidiaries or fellow subsidiaries a party to any arrangement to enable the Directors to acquire such rights in any other body corporate.
CONTRACT OF SIGNIFICANCE
The Group has contracts with Haier Corp and their subsidiaries and/or associates (collectively referred to as “Haier Affiliates”) for the purchase of products and materials. Further details of the transactions undertaken in connection with these contracts during the year are included in the section “CONNECTED TRANSACTIONS”.
EQUITY-LINKED AGREEMENT
The Company has not engaged in any equity-linked agreement during the year ended 31 December 2018.

66 Haier Electronics Group Co., Ltd. Annual Report 2018
Report of The Directors
SUBSTANTIAL SHAREHOLDERS’ INTERESTS IN SHARES AND UNDERLYING SHARES
At 31 December 2018, the following shareholders who have interest in 5% or more of the issued share capital and share options of the Company were recorded in the register of substantial shareholders as required to be kept by the Company pursuant to section 336 of the SFO:
Long positions:
Name of shareholders NotesNumber of shares
interested
Approximate percentage of the Company’s issued
share capital*
Haier Corp 1 1,596,778,592 56.97Qingdao Haier 2 1,596,778,592 56.97Haier Shareholdings (Hong Kong) Limited
(“Hong Kong Haier”) 2 867,501,110 30.95Haier (HK) Investment Co., Limited (“Haier (HK)
Investment”) 3 336,600,000 12.01HCH (HK) Investment Management Co., Limited
(“HCH (HK)”). 3 336,600,000 12.01
Short positions:
Name of shareholders NotesNumber of shares
interested
Approximate percentage of the Company’s issued
share capital*
Haier Corp 1, 4 242,424,242 8.65Qingdao Haier 2, 4 242,424,242 8.65Hong Kong Haier 2, 4 242,424,242 8.65
* The percentage is calculated on the basis of 2,803,070,823 shares in issue of the Company as at 31 December 2018.

67Haier Electronics Group Co., Ltd. Annual Report 2018
Report of The Directors
SUBSTANTIAL SHAREHOLDERS’ INTERESTS IN SHARES AND UNDERLYING SHARES (continued)
Notes:
1. As Qingdao Haier is a non-wholly-owned subsidiary of Haier Corp, Haier Corp was deemed to be interested in 1,260,178,592 shares held by Qingdao Haier pursuant to the SFO, and also deemed to have short positions in 242,424,242 shares held by Hong Kong Haier, a wholly-owned subsidiary of Qingdao Haier, pursuant to SFO.
Haier Corp was also deemed to be interested in 336,600,000 shares held by its subsidiary, HCH (HK).
Mr. Zhou Yun Jie, an Executive Director of the Company, Mr. Liang Hai Shan and Ms. Tan Li Xia, Non-executive Directors of the Company, are also the members of the management committee of Haier Corp.
2. Qingdao Haier held 392,677,482 shares as beneficial owner. Moreover, Qingdao Haier was deemed to be interested in 867,501,110 shares held by its wholly-owned subsidiary, Hong Kong Haier, and deemed to have short positions in 242,424,242 shares held by Hong Kong Haier, pursuant to the SFO.
Furthermore, HCH (HK) has appointed Qingdao Haier to exercise voting in respect of their holding of 336,600,000 shares.
3. HCH (HK) is wholly controlled by Haier (HK) Investment, and Haier (HK) Investment was deemed to be interested in 336,600,000 shares held by HCH (HK) pursuant to the SFO.
4. Exchangeable bonds exchangeable into fully paid ordinary shares of the Company were issued by a subsidiary of Qingdao Haier on 21 November 2017. The underlying shares of the above exchangeable bonds are 242,424,242 shares of the Company currently owned by Hong Kong Haier.
Save as disclosed above, as at 31 December 2018, no person, other than the Directors of the Company, whose interests are set out in the section “Directors’ interests and short positions in shares and underlying shares” above, had registered an interest or short position in the shares or underlying shares of the Company that was required to be recorded pursuant to section 336 of the SFO.

68 Haier Electronics Group Co., Ltd. Annual Report 2018
Report of The Directors
CONNECTED TRANSACTIONS
During the year ended 31 December 2018, the Group had the following connected transactions and continuing connected transactions, certain details of which are disclosed in compliance with the requirements of Chapter 14A of the Listing Rules.
Connected transactions
i) On 30 August 2018, the Group and Haier Electric International Co., Ltd. (“Haier International”), a subsidiary of Haier Corp., entered into an asset swap agreement, pursuant to which Guanmei (Shanghai) Enterprise Management Co., Ltd. (“Guanmei”), an indirect wholly-owned subsidiary of the Company, agreed to acquire and Haier International agreed to sell 51% of the equity interest in Qingdao Haishi Water Equipment Co., Ltd. (“Qingdao Haishi”) at a consideration of RMB1,074,000,000, to be satisfied by Guanmei by way of transfer of 55% of the equity interest in Bingji (Shanghai) Enterprise Management Co., Ltd., a wholly-owned subsidiary of Guanmei, from Guanmei to Haier International at the same consideration.
Haier International is also a subsidiary of Haier Corp. Haier International is therefore a connected person of the Company under the Listing Rules. Such transaction was approved by shareholders of the Company in a special general meeting held on 21 November 2018 and is pending approval or consent by the relevant government authorities in the PRC.
ii) On 21 December 2018, the Group entered into acquisition agreements to acquire 6.33%, 0.08% and 0.08% (totally 6.49%) of the equity interests in Qingdao Haier Washing Machine Co., Ltd., an indirect non-wholly-owned subsidiary of the Company, from subsidiaries of Haier Corp., namely Qingdao Haier New Economics Consulting Limited, Qingdao Haier Components Procurement Limited, and Qingdao Haier International Trading Limited, respectively, for the cash consideration of RMB81,666,857, RMB1,032,125 and RMB1,032,125, respectively.
Each of the above vendor is an associate of Haier Corp and, therefore, a connected person of the Company. 93.51% of the equity interest of Qingdao Haier Washing Machine Co., Ltd. is already owned by the Group, and therefore upon the completion, the Company will, through its subsidiaries, own an aggregate of 100.00% of the equity interest in Qingdao Haier Washing Machine Co., Ltd.
Continuing connected transactions
On 24 September 2018, the Company on the one part and the Haier Group and its relevant members on the other, have entered into ten continuing connected transaction agreements to renew the existing continuing connected transaction agreements entered into on 20 July 2015. The existing continuing connected transaction agreements shall remain in force until 31 December 2018. The ten continuing connected transaction agreements include Internal Sales Agreement, Logistics Services Agreement, After-sale Services Agreement, Products Procurement Agreement, Materials Procurement Agreement, Production and Experimental Equipment Procurement Agreement, Export Agreement, Promotion Agreement, Product R&D Agreement and Services Agreement.
On 24 September 2018, a new Financial Services Agreement was entered into between the Company, Haier Group Finance Co., Ltd. (“Haier Finance”) and Haier Corp, pursuant to which the previous financial services agreement entered into by the Company, Haier Finance and Haier Corp on 11 December 2015 was terminated and replaced. Under the new Financial Services Agreement, Haier Finance agreed to provide the Financial Services (including the Provision of Deposit Services, Provision of Loan Services and other Financial Services) to the Group at a fair and reasonable price and on normal commercial terms. Haier Finance is a company ultimately controlled by Haier Corp and is a connected person of the Company.
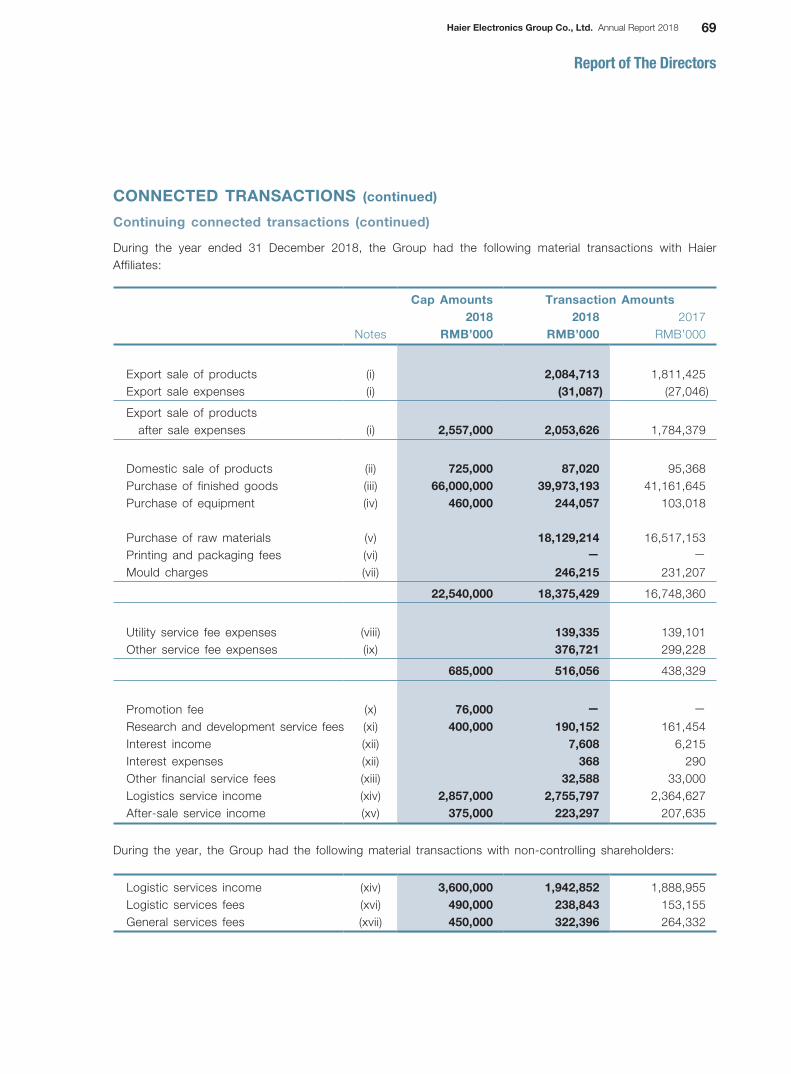
69Haier Electronics Group Co., Ltd. Annual Report 2018
Report of The Directors
CONNECTED TRANSACTIONS (continued)
Continuing connected transactions (continued)
During the year ended 31 December 2018, the Group had the following material transactions with Haier Affiliates:
Cap Amounts Transaction Amounts
2018 2018 2017Notes RMB’000 RMB’000 RMB’000
Export sale of products (i) 2,084,713 1,811,425Export sale expenses (i) (31,087) (27,046)
Export sale of products after sale expenses (i) 2,557,000 2,053,626 1,784,379
Domestic sale of products (ii) 725,000 87,020 95,368Purchase of finished goods (iii) 66,000,000 39,973,193 41,161,645Purchase of equipment (iv) 460,000 244,057 103,018
Purchase of raw materials (v) 18,129,214 16,517,153Printing and packaging fees (vi) — —
Mould charges (vii) 246,215 231,207
22,540,000 18,375,429 16,748,360
Utility service fee expenses (viii) 139,335 139,101Other service fee expenses (ix) 376,721 299,228
685,000 516,056 438,329
Promotion fee (x) 76,000 — —
Research and development service fees (xi) 400,000 190,152 161,454Interest income (xii) 7,608 6,215Interest expenses (xii) 368 290Other financial service fees (xiii) 32,588 33,000Logistics service income (xiv) 2,857,000 2,755,797 2,364,627After-sale service income (xv) 375,000 223,297 207,635
During the year, the Group had the following material transactions with non-controlling shareholders:
Logistic services income (xiv) 3,600,000 1,942,852 1,888,955Logistic services fees (xvi) 490,000 238,843 153,155General services fees (xvii) 450,000 322,396 264,332

70 Haier Electronics Group Co., Ltd. Annual Report 2018
Report of The Directors
CONNECTED TRANSACTIONS (continued)
Continuing connected transactions (continued)
Notes:
(i) The export sale of products were made at prices representing the selling prices of these products for export less a fixed service fee margin for the selling expenses of Haier Overseas Electric Appliances Co., Ltd. which are 1.5% of the selling prices of products.
(ii) The domestic sale of products were made at prices no less favorable than those prevailing in the domestic market for the products of the same type and quality and those offered by the Group to independent third parties.
(iii) The purchase of finished goods was charged at prices no less favorable than those prevailing in the domestic market for the products of the same type and quality and those offered by Haier Affiliates to independent third parties.
(iv) The purchase of equipment was charged at prices (i) used or idled by members of the Haier Affiliates for a consideration calculated based on their net asset values; (ii) tailor-made by members of the Haier Affiliates for a consideration calculated based on the reasonable costs plus reasonable profits, with reference to the market tender and biding price, and shall be no less favourable than terms offered by independent third parties to the Group; (iii) the imported production and experimental equipment through Haier Affiliates was charged at the purchase price from suppliers plus a commission fee from 1.3% to 3% according to relevant operational and administrative expenses.
It is envisaged that there will be expected changes in the business plan of the Group with respect to its general factory construction projects, and thus the maximum aggregate annual value of continuing connected transactions in relation to the Production and Experimental Equipment Procurement for the financial year ended 31 December 2018 has been revised to RMB460 million, as stated in the Company’s announcement dated 24 September 2018.
(v) The purchase of raw materials was charged at prices not higher than the consolidated and integrated tender and bidding price of the raw materials plus a commission fee of 1.25%.
(vi) The printing and packaging fees were charged on terms no less favorable than those offered by independent third parties.
(vii) The moulds were charged at a price, being the reasonable costs of Haier Affiliates plus reasonable profits, with reference to the market tender and bidding price, on terms no less favourable than those offered at the same time by independent third parties.
(viii) The utility service fee was charged based on the state-prescribed prices plus actual administrative costs.
(ix) The other service fees were charged with reference to the actual costs incurred and/or on terms no less favourable than those offered by independent third parties to the Group.
(x) The promotion fee was charged based on the actual costs incurred and shall not be more than 0.6% of the domestic and export sales of the products of the Group.
(xi) The research and development service fees were charged at actual costs incurred in the research and development activities. For the single project related to the intellectual property with the amount of more than RMB20,000,000, the independent valuation professional firm shall be involved to determine the price.
(xii) The interest income and expenses were determined with reference to the standard rates published by the People’s Bank of China, and on terms no less favourable than those of the best offered by other listed and national/major independent commercial banks. The maximum balance of bank deposits placed with and the maximum loan balance drawn down from Haier Group Finance Co., Ltd. related to the above interest income and expenses during the year were RMB2,096,492,000 (Cap Amount: RMB2,100,000,000) and RMB40,000,000 respectively.
(xiii) The other financial service fees were charged at a rate determined by reference to the benchmark rates published by the People’s Bank of China, and on terms no less favorable than those offered by independent commercial banks.
(xiv) The logistics service income was charged on terms no less favorable than those prevailing in the domestic market for services of similar kinds and quality and those charged by the Group on independent third parties.
(xv) The after-sale service income was charged on terms no less favorable than those prevailing in the domestic market for services of similar nature and scale.

71Haier Electronics Group Co., Ltd. Annual Report 2018
Report of The Directors
CONNECTED TRANSACTIONS (continued)
Continuing connected transactions (continued)
Notes: (continued)
(xvi) The logistic services fees shall be fair and reasonable and no less favourable than terms offered by independent third parties in respect of the same or similar services.
(xvii) The general service fees were charged at prices no less favorable than those prices and terms obtained by independent third parties
in respect of the same or similar services.
The INEDs have reviewed the continuing connected transactions set out above and have confirmed that these continuing connected transactions were entered into:
(i) in the ordinary and usual course of business of the Group;
(ii) on normal commercial terms or on terms no less favorable to the Group than terms available to or from independent third parties; and
(iii) in accordance with the relevant agreements governing them on terms that are fair and reasonable and in the interests of the shareholders of the Company as a whole.
The amounts of the continuing connected transactions have not exceeded the cap disclosed in previous announcements made by the Company.
Ernst & Young, the Company’s auditors, were engaged to report on the Group’s continuing connected transactions in accordance with Hong Kong Standard on Assurance Engagements 3000 Assurance Engagements Other Than Audits or Reviews of Historical Financial Information and with reference to Practice Note 740 Auditor’s Letter on Continuing Connected Transactions under the Hong Kong Listing Rules issued by the Hong Kong Institute of Certified Public Accountants. Ernst & Young have issued their unqualified letter containing their findings and conclusions in respect of the continuing connected transactions disclosed above by the Group in accordance with Rule 14A.56 of the Listing Rules. A copy of the auditor’s letter will be provided by the Company to the Hong Kong Stock Exchange in April 2019.
MANAGEMENT CONTRACTS
No contracts concerning the management and/or administration of the whole or any substantial part of the business of the Company were entered into or existed during the year.
SUFFICIENCY OF PUBLIC FLOAT
Based on information that is publicly available to the Company and within the knowledge of the Directors as at the date of this report, at least 25% of the Company’s total issued share capital was held by the public.
EVENTS AFTER THE REPORTING PERIOD
Details of the significant events of the Group after the reporting period are set out in note 49 to the financial statements.

72 Haier Electronics Group Co., Ltd. Annual Report 2018
Report of The Directors
AUDITORS
Ernst & Young will retire, and a resolution for their reappointment as the auditor of the Company will be proposed at the forthcoming annual general meeting.
On behalf of the Board
Zhou Yun JieChairman
Hong Kong27 March 2019

73Haier Electronics Group Co., Ltd. Annual Report 2018
INDEPENDENT AUDITOR’S REPORT
To the shareholders of Haier Electronics Group Co., Ltd.(Incorporated in Bermuda with limited liability)
OPINION
We have audited the consolidated financial statements of Haier Electronics Group Co., Ltd. (the “Company”) and its subsidiaries (the “Group”) set out on pages 79 to 207, which comprise the consolidated statement of financial position as at 31 December 2018, and the consolidated statement of profit or loss, the consolidated statement of comprehensive income, the consolidated statement of changes in equity and the consolidated statement of cash flows for the year then ended, and notes to the consolidated financial statements, including a summary of significant accounting policies.
In our opinion, the consolidated financial statements give a true and fair view of the consolidated financial position of the Group as at 31 December 2018, and of its consolidated financial performance and its consolidated cash flows for the year then ended in accordance with International Financial Reporting Standards (“IFRSs”) issued by the International Accounting Standards Board (“IASB”) and have been properly prepared in compliance with the disclosure requirements of the Hong Kong Companies Ordinance.
BASIS FOR OPINION
We conducted our audit in accordance with Hong Kong Standards on Auditing (“HKSAs”) issued by the Hong Kong Institute of Certified Public Accountants (“HKICPA”). Our responsibilities under those standards are further described in the Auditor’s responsibilities for the audit of the consolidated financial statements section of our report. We are independent of the Group in accordance with the HKICPA’s Code of Ethics for Professional Accountants (the “Code”), and we have fulfilled our other ethical responsibilities in accordance with the Code. We believe that the audit evidence we have obtained is sufficient and appropriate to provide a basis for our opinion.
KEY AUDIT MATTERS
Key audit matters are those matters that, in our professional judgement, were of most significance in our audit of the consolidated financial statements of the current period. These matters were addressed in the context of our audit of the consolidated financial statements as a whole, and in forming our opinion thereon, and we do not provide a separate opinion on these matters. For each matter below, our description of how our audit addressed the matter is provided in that context.
We have fulfilled the responsibilities described in the Auditor’s responsibilities for the audit of the consolidated financial statements section of our report, including in relation to these matters. Accordingly, our audit included the performance of procedures designed to respond to our assessment of the risks of material misstatement of the consolidated financial statements. The results of our audit procedures, including the procedures performed to address the matters below, provide the basis for our audit opinion on the accompanying consolidated financial statements.

74 Haier Electronics Group Co., Ltd. Annual Report 2018
Independent Auditor’s Report
KEY AUDIT MATTERS (continued)
Key audit matter How our audit addressed the key audit matter
Impairment testing of goodwill
The management performs impairment test annually for goodwill. This requires an estimation of the recoverable amount of the cash-generating unit (the “CGU”) to which the goodwill was allocated. The calculation of the CGU’s recoverable amount is complex and involves significant management judgements and estimates, such as budgeted gross margin, revenue growth rates and discount rates, which were sensitive to the expected future market conditions and the CGU’s actual performance.
Relevant disclosures are included in notes 3 and 17 to the financial statements.
Our audit procedures included the assessment of key assumptions, including those related to revenue growth rates, budgeted gross margins and discount rates which were assessed by us with the assistance from our internal valuation specialists by benchmarking against independent data from the industry index. We compared the forecasted figures with the historical financial performance of the corresponding CGU.
Recoverability of trade receivables
Trade receivables as at 31 December 2018 were material to the financial statements of the Group. When determining the expected losses (“ECL”) of the trade receivable, significant management judgements and estimates are involved to consider the ageing of the balance, existence of disputes, recent historical payment patterns and other available information concerning the forecast economic conditions.
Relevant disclosures are included in notes 3 and 23 to the financial statements.
Our audit procedures included the assessment of the key internal controls which govern credit control and debt collection. We assessed the management’s ECL allowance by examining the information used by management to form such judgement and estimates, including checking the accuracy of the historical default information, evaluating the adjustments made on the historical loss rates based on the current economic conditions and forward-looking information. We also evaluated the Group’s provision for impairment of trade receivables by reference to the Group’s subsequent collection of the trade receivables.

75Haier Electronics Group Co., Ltd. Annual Report 2018
Independent Auditor’s Report
KEY AUDIT MATTERS (continued)
Key audit matter How our audit addressed the key audit matter
Provision for inventories
As at 31 December 2018, the Group’s inventories were exposed to inventory obsolete and excess risks as a result of the fast technology innovation and macroeconomic challenges. The determination of the provision amount is complex and involves significant judgements and estimates because it depends on the net realisable value of inventories.
Relevant disclosures are included in notes 3 and 22 to the financial statements.
Our audit procedures included the evaluation of the inventory provisioning policy through inquiry with the management and checking to the relevant assessment documentation. We checked to the underlying data, such as the selling prices, subsequent sales, and the estimated selling expenses to assess the net realisable value of inventories on a sample basis. We reviewed the inventories’ ageing report and performed analysis on the number of turnover days. We reviewed subsequent sales of finished goods and subsequent usage of raw materials.
Product warranty provisions
Product warranty provisions are made with reference to the sales volume and the expected unit costs for warranties services. The assessment of the provision amount involves management assumptions, judgements and estimates. Changes in the assumptions could have a significant impact on the provision amount.
Relevant disclosures are included in notes 3 and 33 to the financial statements.
Our audit procedures included the review of the provision estimation process, the examination of the underlying data of the provision estimation process as well as the review of the computation of the provision amount based on the management’s methodology at year end.

76 Haier Electronics Group Co., Ltd. Annual Report 2018
Independent Auditor’s Report
OTHER INFORMATION INCLUDED IN THE ANNUAL REPORT
The directors of the Company are responsible for the other information. The other information comprises the information included in the Annual Report, other than the consolidated financial statements and our auditor’s report thereon.
Our opinion on the consolidated financial statements does not cover the other information and we do not express any form of assurance conclusion thereon.
In connection with our audit of the consolidated financial statements, our responsibility is to read the other information and, in doing so, consider whether the other information is materially inconsistent with the consolidated financial statements or our knowledge obtained in the audit or otherwise appears to be materially misstated. If, based on the work we have performed, we conclude that there is a material misstatement of this other information, we are required to report that fact. We have nothing to report in this regard.
RESPONSIBILITIES OF THE DIRECTORS FOR THE CONSOLIDATED FINANCIAL STATEMENTS
The directors of the Company are responsible for the preparation of the consolidated financial statements that give a true and fair view in accordance with IFRSs issued by the IASB and the disclosure requirements of the Hong Kong Companies Ordinance, and for such internal control as the directors determine is necessary to enable the preparation of consolidated financial statements that are free from material misstatement, whether due to fraud or error.
In preparing the consolidated financial statements, the directors of the Company are responsible for assessing the Group’s ability to continue as a going concern, disclosing, as applicable, matters related to going concern and using the going concern basis of accounting unless the directors of the Company either intend to liquidate the Group or to cease operations or have no realistic alternative but to do so.
The directors of the Company are assisted by the Audit Committee in discharging their responsibilities for overseeing the Group’s financial reporting process.
AUDITOR’S RESPONSIBILITIES FOR THE AUDIT OF THE CONSOLIDATED FINANCIAL STATEMENTS
Our objectives are to obtain reasonable assurance about whether the consolidated financial statements as a whole are free from material misstatement, whether due to fraud or error, and to issue an auditor’s report that includes our opinion. Our report is made solely to you, as a body, in accordance with section 90 of the Bermuda Companies Act 1981, and for no other purpose. We do not assume responsibility towards or accept liability to any other person for the contents of this report.
Reasonable assurance is a high level of assurance, but is not a guarantee that an audit conducted in accordance with HKSAs will always detect a material misstatement when it exists. Misstatements can arise from fraud or error and are considered material if, individually or in the aggregate, they could reasonably be expected to influence the economic decisions of users taken on the basis of these consolidated financial statements.

77Haier Electronics Group Co., Ltd. Annual Report 2018
Independent Auditor’s Report
AUDITOR’S RESPONSIBILITIES FOR THE AUDIT OF THE CONSOLIDATED FINANCIAL STATEMENTS (continued)
As part of an audit in accordance with HKSAs, we exercise professional judgement and maintain professional scepticism throughout the audit. We also:
• Identify and assess the risks of material misstatement of the consolidated financial statements, whether due to fraud or error, design and perform audit procedures responsive to those risks, and obtain audit evidence that is sufficient and appropriate to provide a basis for our opinion. The risk of not detecting a material misstatement resulting from fraud is higher than for one resulting from error, as fraud may involve collusion, forgery, intentional omissions, misrepresentations, or the override of internal control.
• Obtain an understanding of internal control relevant to the audit in order to design audit procedures that are appropriate in the circumstances, but not for the purpose of expressing an opinion on the effectiveness of the Group’s internal control.
• Evaluate the appropriateness of accounting policies used and the reasonableness of accounting estimates and related disclosures made by the directors.
• Conclude on the appropriateness of the directors’ use of the going concern basis of accounting and, based on the audit evidence obtained, whether a material uncertainty exists related to events or conditions that may cast significant doubt on the Group’s ability to continue as a going concern. If we conclude that a material uncertainty exists, we are required to draw attention in our auditor’s report to the related disclosures in the consolidated financial statements or, if such disclosures are inadequate, to modify our opinion. Our conclusions are based on the audit evidence obtained up to the date of our auditor’s report. However, future events or conditions may cause the Group to cease to continue as a going concern.
• Evaluate the overall presentation, structure and content of the consolidated financial statements, including the disclosures, and whether the consolidated financial statements represent the underlying transactions and events in a manner that achieves fair presentation.
• Obtain sufficient appropriate audit evidence regarding the financial information of the entities or business activities within the Group to express an opinion on the consolidated financial statements. We are responsible for the direction, supervision and performance of the group audit. We remain solely responsible for our audit opinion.
We communicate with the Audit Committee regarding, among other matters, the planned scope and timing of the audit and significant audit findings, including any significant deficiencies in internal control that we identify during our audit.
We also provide the Audit Committee with a statement that we have complied with relevant ethical requirements regarding independence and to communicate with them all relationships and other matters that may reasonably be thought to bear on our independence, and where applicable, related safeguards.

78 Haier Electronics Group Co., Ltd. Annual Report 2018
Independent Auditor’s Report
AUDITOR’S RESPONSIBILITIES FOR THE AUDIT OF THE CONSOLIDATED FINANCIAL STATEMENTS (continued)
From the matters communicated with the Audit Committee, we determine those matters that were of most significance in the audit of the consolidated financial statements of the current period and are therefore the key audit matters. We describe these matters in our auditor’s report unless law or regulation precludes public disclosure about the matter or when, in extremely rare circumstances, we determine that a matter should not be communicated in our report because the adverse consequences of doing so would reasonably be expected to outweigh the public interest benefits of such communication.
The engagement partner on the audit resulting in this independent auditor’s report is Ng Siu Ki Ricky.
Ernst & YoungCertified Public Accountants22/F, CITIC Tower1 Tim Mei AvenueCentral, Hong Kong
27 March 2019

79Haier Electronics Group Co., Ltd. Annual Report 2018
CONSOLIDATED STATEMENT OF PROFIT OR LOSSYear ended 31 December 2018
2018 2017Notes RMB’000 RMB’000
(Restated)
REVENUE 5 85,250,041 78,740,680Cost of sales (70,067,466) (64,930,515)
Gross profit 15,182,575 13,810,165Other income and gains 5 1,135,817 815,219Selling and distribution expenses (8,827,562) (7,890,007)Administrative expenses (2,607,194) (2,361,319)Other expenses and losses (8,301) (51,977)Finance costs 7 (10,908) (11,121)Share of profits and losses of associates (346) 4,141
PROFIT BEFORE TAX 6 4,864,081 4,315,101Income tax expense 10 (873,976) (820,463)
PROFIT FOR THE YEAR 3,990,105 3,494,638
Attributable to:Owners of the Company 3,789,679 3,331,904Non-controlling interests 200,426 162,734
3,990,105 3,494,638
EARNINGS PER SHARE ATTRIBUTABLE TO ORDINARY EQUITY HOLDERS OF THE COMPANY 12
Basic RMB1.36 RMB1.20
Diluted RMB1.35 RMB1.19

80 Haier Electronics Group Co., Ltd. Annual Report 2018
CONSOLIDATED STATEMENT OF COMPREHENSIVE INCOMEYear ended 31 December 2018
2018 2017RMB’000 RMB’000
(Restated)
PROFIT FOR THE YEAR 3,990,105 3,494,638
OTHER COMPREHENSIVE INCOME/(LOSS)Other comprehensive income/(loss) that may be reclassified
to profit or loss in subsequent periods:Exchange differences:
Exchange differences on translation of financial statements of group companies 226,385 (114,594)
Reclassification adjustments for a foreign operation liquidated during the year — (1,118)
Net other comprehensive income/(loss) that may be reclassified to profit or loss in subsequent periods 226,385 (115,712)
Other comprehensive income/(loss) that will not be reclassified to profit or loss in subsequent periods:Equity investments designated at fair value through other
comprehensive income:Changes in fair value (20,918) —
Income tax effect 2,092 —
(18,826) —
Share of other comprehensive income of an associate 18,013 —
Net other comprehensive loss that will not be reclassified to profit or loss in subsequent periods (813) —
OTHER COMPREHENSIVE INCOME/(LOSS) FOR THE YEAR, NET OF TAX 225,572 (115,712)
TOTAL COMPREHENSIVE INCOME FOR THE YEAR 4,215,677 3,378,926
Attributable to:Owners of the Company 4,015,251 3,215,118Non-controlling interests 200,426 163,808
4,215,677 3,378,926

81Haier Electronics Group Co., Ltd. Annual Report 2018
CONSOLIDATED STATEMENT OF FINANCIAL POSITION31 December 2018
31 December 2018
31 December 2017
1 January 2017
Notes RMB’000 RMB’000 RMB’000(Restated) (Restated)
NON-CURRENT ASSETSProperty, plant and equipment 14 5,373,818 4,087,863 3,294,330Investment properties 15 28,449 29,415 33,142Prepaid land lease payments 16 1,142,478 1,161,400 1,061,516Goodwill 17 267,992 424,863 392,485Other intangible assets 18 101,917 88,859 131,156Investments in associates 19 178,073 247,147 292,603Equity investments designated at fair value
through other comprehensive income 20 1,261,664 — —Available-for-sale investments 20 — 1,283,082 1,401,396Other non-current financial assets 21 422,878 45,742 37,515Long-term prepayments 24 760,351 485,005 329,665Deferred tax assets 34 879,786 1,018,389 724,181
Total non-current assets 10,417,406 8,871,765 7,697,989
CURRENT ASSETSInventories 22 8,654,478 8,414,473 5,185,075Trade and bills receivables 23 5,205,997 5,816,848 5,700,897Prepayments, other receivables and other
assets 24 3,403,008 3,416,533 4,617,398Other financial assets 25 4,382,181 1,974,815 460,449Pledged deposits 26 89,524 119,865 71,272Cash and cash equivalents 26 14,660,708 15,040,624 12,704,974
36,395,896 34,783,158 28,740,065
Asset and disposal group held for sale 27 144,091 — —
Total current assets 36,539,987 34,783,158 28,740,065
CURRENT LIABILITIESTrade and bills payables 28 5,780,722 6,090,435 4,592,151Other payables and accruals 29 7,212,667 7,077,673 5,811,848Contract liabilities 30 4,183,758 4,132,209 4,697,322Interest-bearing borrowings 31 68,799 162,082 73,000Finance lease payables — — 9,338Due to a non-controlling shareholder — — 27,883Tax payable 780,261 841,207 613,080Put option liabilities — — 15,700Convertible and exchangeable bonds — — 1,223,220Provisions 33 674,411 674,397 545,717
18,700,618 18,978,003 17,609,259

82 Haier Electronics Group Co., Ltd. Annual Report 2018
Consolidated Statement of Financial Position31 December 2018
31 December 2018
31 December 2017
1 January 2017
Notes RMB’000 RMB’000 RMB’000(Restated) (Restated)
Liabilities directly associated with the assets classified as held for sale 27 32,362 — —
Total current liabilities 18,732,980 18,978,003 17,609,259
NET CURRENT ASSETS 17,807,007 15,805,155 11,130,806
TOTAL ASSETS LESS CURRENT LIABILITIES 28,224,413 24,676,920 18,828,795
NON-CURRENT LIABILITIESInterest-bearing borrowings 31 23,575 30,542 —Finance lease payables — — 7,534Deferred income 192,596 160,743 88,883Deferred tax liabilities 34 98,611 178,385 53,708Put option liabilities 32 1,792,322 916,938 —Provisions 33 363,320 354,476 312,505Other non-current liabilities 5,705 5,385 —
Total non-current liabilities 2,476,129 1,646,469 462,630
Net assets 25,748,284 23,030,451 18,366,165
EQUITYEquity attributable to owners of the
Company Issued equity 35 2,922,364 2,995,491 2,876,892Shares held for the Restricted Share
Award Scheme 36 (97,391) (158,583) (152,984)Equity component of convertible and
exchangeable bonds — — 54,838Reserves 38 20,947,640 17,969,518 14,737,835
23,772,613 20,806,426 17,516,581Non-controlling interests 1,975,671 2,224,025 849,584
Total equity 25,748,284 23,030,451 18,366,165
Zhou Yun Jie Xie Ju ZhiDirector Director

83Haier Electronics Group Co., Ltd. Annual Report 2018
CONSOLIDATED STATEMENT OF CHANGES IN EQUITYYear ended 31 December 2018
Attribu
table t
o the
owner
s of th
e Com
pany
Reser
ves
Issued
equ
ity
Share
s hel
d for
the Re
stricte
d Sh
are Aw
ard
Schem
e
Equity
com
ponent
of
conver
tible and
exchan
geable
bon
ds
Capita
l red
uction
res
erve
Capita
l res
erve
Capita
l red
emptio
n res
erve
Share
opt
ion
reserv
e
Award
ed sha
re res
erve
Put o
ption
reserv
eRe
serve
funds
Retain
ed pro
fits
Exchan
ge fluc
tuation
res
erve
Other
reserv
esTot
al res
erves
Total
Non-
contro
lling
interes
tsTot
al equ
ityNo
tesRM
B’000
RMB’0
00RM
B’000
RMB’0
00RM
B’000
RMB’0
00RM
B’000
RMB’0
00RM
B’000
RMB’0
00RM
B’000
RMB’0
00RM
B’000
RMB’0
00RM
B’000
RMB’0
00RM
B’000
At 31
Decem
ber 20
16As
previo
usly r
eporte
d2,8
76,892
(152,9
84)54,
838(1,7
58,526
)1,9
76,819
42589,
37651,
743(21
0,331)
830,45
715,
012,84
954,
957(1,2
61,833
)14,
785,93
617,
564,68
2833
,288
18,397
,970
Effect
of bu
siness
comb
ination
under
com
mon c
ontrol
2.1—
——
——
——
——
—(36
,764)
—45,
7188,9
548,9
5416,
29625,
250Eff
ect of
adopt
ion of
IFRS
152.2
——
——
——
——
——
(57,05
5)—
—(57
,055)
(57,05
5)—
(57,05
5)
As res
tated
2,876,
892(15
2,984)
54,838
(1,758,
526)
1,976,
819425
89,376
51,743
(210,3
31)830
,457
14,919
,030
54,957
(1,216,
115)
14,737
,835
17,516
,581
849,58
418,
366,16
5Pro
fit for
the y
ear (re
stated
)—
——
——
——
——
—3,3
31,904
——
3,331,
9043,3
31,904
162,73
43,4
94,638
Exchan
ge diff
erence
s on t
ransla
tion of
fina
ncial s
tatem
ents o
f grou
p com
panies
——
——
——
——
——
—(11
5,668)
—(11
5,668)
(115,6
68)1,0
74(11
4,594)
Recla
ssifica
tion ad
justme
nts fo
r a fo
reign
operat
ion di
sposed
of du
ring th
e year
——
——
——
——
——
—(1,1
18)—
(1,118)
(1,118)
—(1,1
18)
Total c
ompre
hensiv
e incom
e/(loss
) for th
e year
——
——
——
——
——
3,331,
904(11
6,786)
—3,2
15,118
3,215,
118163
,808
3,378,
926Iss
ue of
shares
35123
,435
——
——
—(17
,457)
(45,21
0)—
——
——
(62,66
7)60,
768—
60,768
Exchan
ge of
conver
tible a
nd exc
hangea
ble bo
nds—
—(54
,838)
——
——
——
——
126,66
8474
,880
601,54
8546
,710
676,51
01,2
23,220
Share
s purc
hased/
receiv
ed for
the R
estrict
ed Sh
are Aw
ard Sc
heme
—(30
,531)
——
——
——
——
——
——
(30,53
1)—
(30,53
1)Sh
ares t
ransfe
rred t
o part
icipant
s from
the S
hare
Award
Schem
e Trus
t35
(4,836)
24,932
——
——
—(16
,525)
——
——
—(16
,525)
3,571
—3,5
71Div
idend
incom
e of s
hares
under
the—
Restri
cted S
hare A
ward
Schem
e—
——
——
——
——
——
—1,7
311,7
311,7
31—
1,731
Equity
-settle
d shar
e optio
n arra
ngeme
nts37
——
——
——
(27,24
3)—
——
——
—(27
,243)
(27,24
3)—
(27,24
3)Re
stricte
d Shar
e Awa
rd Sc
heme a
rrange
ments
36—
——
——
——
154,50
1—
——
——
154,50
1154
,501
—154
,501
Share
-based
paym
ent ex
pense
——
——
——
—8,5
00—
——
——
8,500
8,500
5,399
13,899
Transf
er of
share
option
reser
ve upo
n the
expiry
of sha
re opt
ions
——
——
——
(38,65
6)—
——
38,656
——
——
——
Chang
es in
fair va
lue of
put o
ption l
iabilitie
s—
——
——
——
—24,
906—
——
—24,
90624,
906(2,3
23)22,
583Ac
quisiti
on of
subsid
iaries
——
——
——
——
7,426
——
——
7,426
7,426
2,115
9,541
Dispos
al of s
ubsidia
ries41
——
——
——
——
——
——
——
—(12
,077)
(12,07
7)Liq
uidatio
n of a
subsi
diary
——
——
——
——
——
——
——
—1,5
651,5
65Tra
nsfer
of put
option
reser
ve upo
n the
forfeit
ure
or exp
iry of
incent
ive ag
reeme
nts w
ith non
-contr
olling
shareh
olders
——
——
——
——
216,60
8—
——
(216,6
08)—
——
—Dis
posal o
f an a
ssocia
te—
——
——
——
——
——
—(20
,988)
(20,98
8)(20
,988)
—(20
,988)
Deem
ed dis
tributio
ns for
busin
ess co
mbina
tion
under
commo
n cont
rol—
——
——
——
——
——
—(33
,532)
(33,53
2)(33
,532)
(2,561)
(36,09
3)Ca
pital co
ntribu
tions f
rom no
n-cont
rolling
sha
rehold
ers of
subsi
diaries
——
——
(95,91
0)—
——
(442,6
46)—
——
372,16
0(16
6,396)
(166,3
96)568
,082
401,68
6Ac
quisiti
on fro
m non
-contr
olling
shareh
olders
of
subsid
iaries
——
——
——
——
——
——
(39,67
7)(39
,677)
(39,67
7)8,4
77(31
,200)
Divide
nds pa
id to
non-co
ntrolli
ng sha
rehold
ers—
——
——
——
——
——
——
——
(34,55
4)(34
,554)
Transf
er to
reserv
e fund
s—
——
——
——
——
88,871
(88,87
1)—
——
——
—Fin
al 2016
divid
end—
——
—(41
5,019)
——
——
——
——
(415,0
19)(41
5,019)
—(41
5,019)
2,995,
491(15
8,583)
—(1,7
58,526
)1,4
65,890
4256,0
20153
,009
(404,0
37)919
,328
18,200
,719
64,839
(678,1
49)17,
969,51
820,
806,42
62,2
24,025
23,030
,451

84 Haier Electronics Group Co., Ltd. Annual Report 2018
Consolidated Statement of Changes in EquityYear ended 31 December 2018
Attrib
utable
to th
e own
ers of
the C
ompa
ny
Reser
ves
Issue
d eq
uity
Share
s he
ld for
the
Restr
icted
Sh
are Aw
ard
Sche
me
Capit
al red
uctio
n res
erve
Capit
al res
erve
Capit
al red
empti
on
reserv
e
Share
op
tion
reserv
e
Award
ed
share
reserv
ePu
t opti
on
reserv
eRe
serve
funds
Retai
ned
profits
Exch
ange
flu
ctuati
on
reserv
e
Other
comp
rehen
sive
reserv
eOth
er res
erves
Total
res
erves
Total
Non-
contr
olling
int
erests
Total
eq
uity
Notes
RMB’0
00RM
B’000
RMB’0
00RM
B’000
RMB’0
00RM
B’000
RMB’0
00RM
B’000
RMB’0
00RM
B’000
RMB’0
00RM
B’000
RMB’0
00RM
B’000
RMB’0
00RM
B’000
RMB’0
00
At 31
Decem
ber 20
17As
previo
usly r
eporte
d2,9
95,491
(158,5
83)(1,7
58,526
)1,4
65,890
4256,0
20153
,009
(404,0
37)919
,328
18,320
,931
64,839
—(72
3,867)
18,044
,012
20,880
,920
2,211,
67323,
092,59
3Eff
ect of
busin
ess co
mbina
tion un
der co
mmon
contro
l2.1
——
——
——
——
—(39
,361)
——
45,718
6,357
6,357
12,352
18,709
Effect
of ad
option
of IF
RS 15
2.2—
——
——
——
——
(80,85
1)—
——
(80,85
1)(80
,851)
—(80
,851)
As res
tated
2,995,
491(15
8,583)
(1,758,
526)
1,465,
890425
6,020
153,00
9(40
4,037)
919,32
818,
200,71
964,
839—
(678,1
49)17,
969,51
820,
806,42
62,2
24,025
23,030
,451
Profit
for th
e year
——
——
——
——
—3,7
89,679
——
—3,7
89,679
3,789,
679200
,426
3,990,
105Oth
er com
prehen
sive in
come f
or the
year:
Exchan
ge diff
erence
s on t
ransla
tion of
financ
ial sta
tement
s of g
roup c
ompan
ies—
——
——
——
——
—226
,385
——
226,38
5226
,385
—226
,385
Chang
e in fa
ir valu
e of e
quity
instru
ments
at fa
ir val
ue thr
ough o
ther c
ompre
hensiv
e incom
e, net
of
tax—
——
——
——
——
——
(18,82
6)—
(18,82
6)(18
,826)
—(18
,826)
Share
of ot
her co
mpreh
ensive
incom
e of
an ass
ociate
——
——
——
——
——
—18,
013—
18,013
18,013
—18,
013
Total c
ompre
hensiv
e incom
e/(loss
) for th
e year
——
——
——
——
—3,7
89,679
226,38
5(81
3)—
4,015,
2514,0
15,251
200,42
64,2
15,677
Issue
of sha
res35
66,158
——
——
(2,843)
(52,48
0)—
——
——
—(55
,323)
10,835
—10,
835Sh
ares p
urchas
ed for
the R
estrict
ed Sh
are
Award
Schem
e—
(82,31
2)—
——
——
——
——
——
—(82
,312)
—(82
,312)
Share
s tran
sferre
d to p
articip
ants f
rom th
e Sh
are Aw
ard Sc
heme T
rust
35(53
,060)
143,50
4—
——
—(90
,444)
——
——
——
(90,44
4)—
——
Divide
nd inc
ome o
f shar
es und
er the
Restri
cted
Share
Award
Schem
e—
——
——
——
——
——
—3,0
803,0
803,0
80—
3,080
Restri
cted s
hare a
ward
schem
e arra
ngeme
nts36
——
——
——
125,09
0—
——
——
—125
,090
125,09
0—
125,09
0Sh
are-ba
sed pa
yment
s expe
nse—
——
——
—6,2
05—
——
——
—6,2
056,2
054,4
4810,
653Tra
nsfer
of aw
arded
share
reserv
e upon
the e
xpiry
of aw
arded
shares
——
——
——
(4,336)
——
4,336
——
——
——
—Sh
ares r
epurch
ased
35(86
,225)
——
—(42
5)—
——
—425
——
——
(86,22
5)—
(86,22
5)Ch
anges
in fair
value
of pu
t optio
n liab
ilities
——
——
——
—(91
,861)
——
——
—(91
,861)
(91,86
1)(45
,702)
(137,5
63)Pu
t optio
ns gra
nted t
o non-
contro
lling
shareh
olders
——
——
——
—(77
,125)
——
——
—(77
,125)
(77,12
5)(71
,835)
(148,9
60)Ac
quisiti
on of
subsid
iaries
40—
——
——
——
——
——
——
——
(1,163)
(1,163)
Dispos
al of s
ubsidia
ries41
——
——
——
——
——
——
——
—(28
7,808)
(287,8
08)De
emed
dispos
al of a
n asso
ciate
——
——
——
——
——
——
685685
685—
685De
emed
distrib
utions
for bu
siness
comb
ination
und
er com
mon c
ontrol
——
——
——
——
——
——
(50,00
0)(50
,000)
(50,00
0)—
(50,00
0)Ca
pital co
ntribu
tions f
rom no
n-cont
rolling
sha
rehold
ers of
subsi
diaries
——
——
——
—(27
6,735)
——
——
179,46
8(97
,267)
(97,26
7)136
,705
39,438
Acqui
sition
from
non-co
ntrolli
ng sha
rehold
ers of
sub
sidiari
es—
——
——
——
——
——
—(24
,764)
(24,76
4)(24
,764)
(6,777)
(31,54
1)Div
idends
paid
to non
-contr
olling
shareh
olders
——
——
——
——
——
——
——
—(17
6,648)
(176,6
48)Tra
nsfer
to res
erve f
unds
——
——
——
——
286,79
7(28
6,797)
——
——
——
—Fin
al 2017
divid
end—
——
(685,4
05)—
——
——
——
——
(685,4
05)(68
5,405)
—(68
5,405)
2,922,
364(97
,391)
(1,758,
526)
780,48
5—
3,177
137,04
4(84
9,758)
1,206,
12521,
708,36
2291
,224
(813)
(569,6
80)20,
947,64
023,
772,61
31,9
75,671
25,748
,284

85Haier Electronics Group Co., Ltd. Annual Report 2018
CONSOLIDATED STATEMENT OF CASH FLOWSYear ended 31 December 2018
2018 2017Notes RMB’000 RMB’000
(Restated)
CASH FLOWS FROM OPERATING ACTIVITIESProfit before tax 4,864,081 4,315,101Adjustments for:
Finance costs 7 10,908 11,121Share of profits and losses of associates 346 (4,141)Bank interest income 5 (305,468) (229,086)Return on investments in other financial assets 5 (111,053) (45,853)Dividend income from an equity investment designated at
fair value through other comprehensive income 5 (104,823) (41,053)Loss/(gain) on disposal of subsidiaries, net 5,6 (79,275) 1,480Gain on disposal of a business 5 — (23,585)Gain on disposal of associates and an available-for-sale
investment 5 — (133,519)Gain on liquidations of subsidiaries 5 — (14)Gain on a bargain purchase of an associate 5 (185) —Loss/(gain) on disposal/write-off of items of property,
plant and equipment and prepaid land lease payments, net 5,6 (165,380) 6,818
Loss on disposal/write-off of intangible assets 6 — 34,467Loss on impairment of intangible assets 6 — 9,966Depreciation of property, plant and equipment 6 314,810 319,509Depreciation of investment properties 6 2,063 2,134Recognition of prepaid land lease payments 6 27,316 28,454Amortisation of intangible assets 6 11,768 12,170Amortisation of long-term prepayments 6 4,500 1,877Provision for obsolete and slow-moving inventories, net 6 231,400 171,879Impairment of trade receivables, net 6 3,262 3,533Impairment of prepayments and other assets, net 6 5,039 (4,287)Share-based payment expense 6 10,653 13,899Equity-settled share option credit, net 6 — (27,243)Equity-settled Restricted Share Award Scheme expense,
net 6 125,090 154,501
4,845,052 4,578,128

86 Haier Electronics Group Co., Ltd. Annual Report 2018
Consolidated Statement of Cash FlowsYear ended 31 December 2018
2018 2017Notes RMB’000 RMB’000
(Restated)
Increase in inventories (510,353) (3,403,797)Decrease/(increase) in trade and bills receivables 609,534 (127,004)Decrease in prepayments, other receivables and
other assets 245,554 1,311,548Increase/(decrease) in trade and bills payables (476,211) 1,499,626Increase/(decrease) in other payables and accruals (84,357) 1,272,478Increase/(decrease) in contract liabilities 48,626 (565,113)Increase in provisions 8,858 166,451Decrease in deferred income related to government grants (17,315) (23,481)Effect of foreign exchange rate changes, net 186,627 44,536
Cash generated from operations 4,856,015 4,753,372Interest received 266,876 169,200Hong Kong profits tax paid (20,136) (38,663)Mainland China corporate income tax paid, net of tax
refund (856,300) (717,655)
Net cash flows from operating activities 4,246,455 4,166,254
CASH FLOWS FROM INVESTING ACTIVITIESPurchases of items of property, plant and equipment (1,862,142) (939,080)Receipt of government grants for property, plant and
equipment 62,061 89,770Proceeds from disposal of items of property, plant and
equipment and prepaid land lease payments 159,179 13,072Additions to prepaid land lease payments (170,719) (162,984)Additions to intangible assets (17,858) (4,159)Acquisition of subsidiaries 40 (103,834) (49,332)Disposal of subsidiaries 41 632,466 23,619Liquidation of subsidiaries — (13)Disposal of a business — 23,585Acquisition of non-controlling interests — (3,040)Investment in an associate (2,450) —Disposal of associates — 150,413Dividends from an associate 400 360Dividends from an equity investment designated at fair
value through other comprehensive income 104,823 40,956Mainland China corporate income tax paid on investing
activities (25,553) (4,096)Disposal of an available-for-sale investment — 14,400Purchases of other non-current assets (59,250) (30,000)Purchases of other financial assets, net (2,706,364) (1,514,366)Interest received from other financial assets 90,655 43,550Increase in long-term prepayments (287,984) (181,660)Deposits received for disposal of an asset held for sale 26,010 —Decrease/(increase) in pledged deposits 30,141 (48,597)
Net cash flows used in investing activities (4,130,419) (2,537,602)

87Haier Electronics Group Co., Ltd. Annual Report 2018
Consolidated Statement of Cash FlowsYear ended 31 December 2018
2018 2017Notes RMB’000 RMB’000
(Restated)
CASH FLOWS FROM FINANCING ACTIVITIESProceeds from issue of shares 35 10,835 60,768Proceeds from transfer of shares to participants from the
Share Award Scheme Trust — 3,571Dividend income of shares under the Restricted Share
Award 3,080 —Shares purchased for the Restricted Share Award Scheme (14,242) (12,039)Repurchase of shares 35 (86,225) —Contributions to share-based incentive arrangements of
subsidiaries 11,322 7,544Capital contributions from non-controlling shareholders 616,528 1,264,485New borrowings 133,532 496,506Repayment of borrowings (258,632) (557,355)Dividends paid to shareholders (706,465) (415,019)Dividends paid to non-controlling shareholders (172,101) (12,418)Deemed distributions for business combinations under
common control (50,000) (36,093)Capital element of finance lease rental payments — (16,800)Interest element of finance lease rental payments — (464)Interest paid for borrowings (11,081) (10,626)Acquisition of non-controlling interests (31,541) —
Net cash flows from/(used in) financing activities (554,990) 772,060
NET INCREASE/(DECREASE) IN CASH AND CASH EQUIVALENTS (438,954) 2,400,712
Cash and cash equivalents at beginning of year 15,040,624 12,704,974Effect of foreign exchange rate changes, net 59,355 (65,062)
CASH AND CASH EQUIVALENTS AT END OF YEAR 14,661,025 15,040,624
ANALYSIS OF BALANCES OF CASH AND CASH EQUIVALENTS
Non-pledged cash and bank balances 3,456,286 4,232,099Time deposits 26 11,204,422 10,808,525
Cash and cash equivalents as stated in the statement of financial position 26 14,660,708 15,040,624
Cash and cash equivalents of a disposal group classified as held for sale 317 —
Cash and cash equivalents as stated in the statement of cash flows 14,661,025 15,040,624

88 Haier Electronics Group Co., Ltd. Annual Report 2018
NOTES TO FINANCIAL STATEMENTS31 December 2018
1. CORPORATE AND GROUP INFORMATION
Haier Electronics Group Co., Ltd. is a limited liability company incorporated in Bermuda. The registered office of the Company is located at Clarendon House, 2 Church Street, Hamilton HM11, Bermuda.
In the opinion of the directors, as at 31 December 2018, the holding company of the Company is Qingdao Haier Co., Ltd. (“Qingdao Haier”), established in the People’s Republic of China (the “PRC”), and the ultimate holding company of the Company is Haier Group Corporation (“Haier Corp”), established in the PRC.
During the year, the Group was involved in the following principal activities:
• manufacture and sale of washing machines
• manufacture and sale of water heaters
• sale and distribution of home appliances and other products as well as the provision of after-sales and other value-added consumer services
• provision of logistics services
Information about subsidiaries
Particulars of the Company’s principal subsidiaries are as follows:
Name
Place of incorporation/ registration and business
Issued ordinary/ registered
share capital
Percentage of equity
attributable to the Company Principal activities
Direct Indirect
Qingdao Haier Washing Machine Co., Ltd.**
PRC/Mainland China RMB238,610,000 — 94 Manufacture and sale of washing machines
Foshan Shunde Haier Electric Co., Ltd.**
PRC/Mainland China RMB48,800,000 — 60 Manufacture and sale of washing machines
Hefei Haier Washing Machine Co., Ltd.**
PRC/Mainland China RMB92,000,000 — 99 Manufacture and sale of washing machines
Qingdao Jiaonan Haier Washing Machine Co., Ltd.**
PRC/Mainland China RMB10,000,000 — 95 Manufacture and sale of washing machines
Chongqing Haier Washing Machine Co., Ltd.*
PRC/Mainland China RMB25,000,000 25 74 Manufacture and sale of washing machines

89Haier Electronics Group Co., Ltd. Annual Report 2018
Notes to Financial Statements31 December 2018
1. CORPORATE AND GROUP INFORMATION (continued)
Information about subsidiaries (continued)
Name
Place of incorporation/ registration and business
Issued ordinary/ registered
share capital
Percentage of equity
attributable to the Company Principal activities
Direct Indirect
Qingdao Haier Drum Washing Machine Co., Ltd.**
PRC/Mainland China RMB99,345,600 — 100 Manufacture and sale of washing machines
Chongqing Haier Drum Washing Machine Co., Ltd.**
PRC/Mainland China RMB250,000,000 — 99 Manufacture and sale of washing machines
Foshan Haier Drum Washing Machine Co., Ltd.**
PRC/Mainland China RMB150,000,000 — 99 Manufacture and sale of washing machines
Qingdao Haier Washing Electric Appliance Co., Ltd.**
PRC/Mainland China RMB300,000,000 — 100 Sale of washing machines
Tianjin Ririxin Assets Management Co., Ltd.**
PRC/Mainland China RMB300,000,000 — 94 Construction of production facilities for washing machines
Foshan Shunde Haier Intelligent Electronics Co., Ltd.*
PRC/Mainland China RMB20,000,000 25 74 Manufacture and sale of accessories for electrical appliances
Chongqing Haier Water Heater Co., Ltd.**
PRC/Mainland China RMB120,000,000 — 100 Manufacture and sale of water heaters
Qingdao Economy and Technology Development Zone Haier Water Heater Co., Ltd.**
PRC/Mainland China RMB120,000,000 — 100 Manufacture and sale of water heaters
Wuhan Haier Water Heater Co., Ltd.**
PRC/Mainland China RMB120,000,000 — 100 Manufacture and sale of water heaters
Qingdao Haier New Energy Electronics Co., Ltd.**
PRC/Mainland China RMB150,000,000 — 100 Manufacture and sale of water heaters

90 Haier Electronics Group Co., Ltd. Annual Report 2018
Notes to Financial Statements31 December 2018
1. CORPORATE AND GROUP INFORMATION (continued)
Information about subsidiaries (continued)
Name
Place of incorporation/ registration and business
Issued ordinary/ registered
share capital
Percentage of equity
attributable to the Company Principal activities
Direct Indirect
Qingdao Lejia Electronics Co., Ltd.**
PRC/Mainland China RMB10,000,000 — 97 Sale of home electric appliances
Chongqing New Goodaymart Electronics Sales Co., Ltd.**
PRC/Mainland China RMB5,000,000 — 100 Sale of home electric appliances
Haier Electronics Sales (Hefei) Co., Ltd.**
PRC/Mainland China RMB5,000,000 — 100 Sale of home electric appliances
Qingdao Haier Electronics Sales Service Co., Ltd.**
PRC/Mainland China RMB5,000,000 — 100 Sale of home electric appliances
Haier International Business Corporation Limited
Hong Kong HK$10,000,000 — 100 Export sale of home electric appliances
Haier Group E-commerce Co., Ltd.**
PRC/Mainland China RMB37,500,000 — 100 Online sale of Haier brand home electric appliances
Shanghai Boyol New Brothers Supply Chain Management Co., Ltd.**
PRC/Mainland China RMB42,400,000 — 34# Provision of logistics services
Guangdong Goodaymart Supply Chain Co., Ltd.**
PRC/Mainland China RMB230,000,000 — 56 Provision of logistics services
Shenyang Goodaymart Supply Chain Co., Ltd.**
PRC/Mainland China RMB150,000,000 — 56 Provision of logistics services
Luoyang Goodaymart Logistics Co., Ltd.**
PRC/Mainland China RMB75,000,000 — 56 Provision of logistics services
Qingdao Goodaymart Household Service Co., Ltd.**
PRC/Mainland China RMB9,000,000 — 56 Provision of logistics services

91Haier Electronics Group Co., Ltd. Annual Report 2018
Notes to Financial Statements31 December 2018
1. CORPORATE AND GROUP INFORMATION (continued)
Information about subsidiaries (continued)
Name
Place of incorporation/ registration and business
Issued ordinary/ registered
share capital
Percentage of equity
attributable to the Company Principal activities
Direct Indirect
Qingdao Goodaymart Wuhan Logistics Co., Ltd.**
PRC/Mainland China RMB270,000,000 — 56 Provision of logistics services
Qingdao Gooday Logistics Co., Ltd.*
PRC/Mainland China USD91,641,415 — 56 Provision of logistics services
Qingdao Goodaymart Supply Chains Co., Ltd.**
PRC/Mainland China RMB10,000,000 — 56 Provision of logistics services
Qingdao Goodaymart Electronics Service Co., Ltd.**
PRC/Mainland China RMB20,000,000 — 100 Provision of after-sales services
Qingdao Goodaymart Lexinyun Technology Co., Ltd.**
PRC/Mainland China RMB20,000,000 — 78 Provision of after-sales services
Qingdao Goodaymart Chuangzhi Investment Management Co., Ltd.**
PRC/Mainland China RMB199,199,900 — 100 Investment holding
* Registered as Sino-foreign equity joint venture enterprises under PRC law
** Registered as domestic limited liability companies under PRC law
*** Registered as wholly-foreign-owned enterprises under PRC law
# Shanghai Boyol New Brothers Supply Chain Management Co., Ltd. is a subsidiary of non-wholly-owned subsidiaries of the Company and accordingly, is accounted for as a subsidiary by virtue of the Company’s control over its holding companies.
The above table lists the subsidiaries of the Company which, in the opinion of the directors, principally affected the results for the year or formed a substantial portion of the net assets of the Group. To give details of other subsidiaries would, in the opinion of the directors, result in particulars of excessive length.

92 Haier Electronics Group Co., Ltd. Annual Report 2018
Notes to Financial Statements31 December 2018
2.1 BASIS OF PREPARATION
These financial statements have been prepared in accordance with International Financial Reporting Standards (“IFRSs”) (which include all International Financial Reporting Standards, International Accounting Standards (“IASs”) and Interpretations) issued by the International Accounting Standards Board (the “IASB”), accounting principles generally accepted in Hong Kong and the disclosure requirements of the Hong Kong Companies Ordinance. They have been prepared under the historical cost convention, except for bills receivable, certain other financial assets (current and non-current), equity investments designated at fair value through other comprehensive income, put option liabilities and other non-current liabilities which have been measured at fair value. These financial statements are presented in Renminbi (“RMB”) and all values are rounded to the nearest thousand except when otherwise indicated.
Merger accounting for business combinations under common control
During the year, the Group, through its wholly-owned subsidiary namely, Qingdao Goodaymart Chuangzhi Investment Management Co., Ltd. (“Qingdao Chuangzhi”), acquired an additional 25% equity interest in Qingdao Jushanghui Network Technology Co., Ltd. (“Jushanghui”) at a cash consideration of RMB50,000,000 (the “Acquisition”), which has been fully paid during the year, and the Group’s equity interest in Jushanghui has increased to 49% after the Acquisition. Jushanghui was an indirect non-wholly-owned subsidiary of Haier Corp and is currently principally engaged in the provision of channel services. Notwithstanding that the Group’s equity interest in Jushanghui was no more than 50% immediately after the completion of the Acquisition, it is accounted for as a subsidiary to the Group by virtue of an agreement pursuant to which a shareholder holding 11% equity interest in Jushanghui agreed to follow the Group’s actions and votes in the shareholders’ meetings of Jushanghui.
Pursuant to the Acquisition, the Company became an indirect holding company of Jushanghui. Since the Company and Jushanghui were ultimately controlled by Haier Corp both before and after the completion of the Acquisition, the Acquisition was accounted for using the principles of merger accounting.
The consolidated statements of profit or loss, the consolidated statements of comprehensive income, the consolidated statements of changes in equity and the consolidated statements of cash flows of the Group for the years ended 31 December 2018 and 2017 include the results, changes in equity and cash flows of all companies then comprising the Group and Jushanghui, as if the corporate structure of the Group immediately after the completion of the Acquisition had been in existence throughout the years ended 31 December 2018 and 2017, or since their respective dates of acquisition, incorporation or registration, where this is a shorter period. The consolidated statement of financial position of the Group as at 31 December 2017 has been prepared to present the state of affairs of the Group and Jushanghui as if the corporate structure of the Group immediately after the completion of the Acquisition had been in existence and in accordance with the respective equity interests and/or the power to exercise control over the individual companies attributable to the Company as at 31 December 2017.
Further details of the restatement of the Group’s operating results and financial positions in prior periods to include Jushanghui are set out in note 2.2 to the financial statements.

93Haier Electronics Group Co., Ltd. Annual Report 2018
Notes to Financial Statements31 December 2018
2.1 BASIS OF PREPARATION (continued)
Basis of consolidation
The consolidated financial statements include the financial statements of the Company and its subsidiaries (collectively referred to as the “Group”) for the year ended 31 December 2018. A subsidiary is an entity (including a structured entity), directly or indirectly, controlled by the Company. Control is achieved when the Group is exposed, or has rights, to variable returns from its involvement with the investee and has the ability to affect those returns through its power over the investee (i.e., existing rights that give the Group the current ability to direct the relevant activities of the investee).
When the Company has, directly or indirectly, less than a majority of the voting or similar rights of an investee, the Group considers all relevant facts and circumstances in assessing whether it has power over an investee, including:
(a) the contractual arrangement with the other vote holders of the investee;
(b) rights arising from other contractual arrangements; and
(c) the Group’s voting rights and potential voting rights.
The financial statements of the subsidiaries are prepared for the same reporting period as the Company, using consistent accounting policies. The results of subsidiaries are consolidated from the date on which the Group obtains control, and continue to be consolidated until the date that such control ceases.
Profit or loss and each component of other comprehensive income are attributed to the owners of the parent of the Group and to the non-controlling interests, even if this results in the non-controlling interests having a deficit balance. All intra-group assets and liabilities, equity, income, expenses and cash flows relating to transactions between members of the Group are eliminated in full on consolidation.
The Group reassesses whether or not it controls an investee if facts and circumstances indicate that there are changes to one or more of the three elements of control described above. A change in the ownership interest of a subsidiary, without a loss of control, is accounted for as an equity transaction.
If the Group loses control over a subsidiary, it derecognises (i) the assets (including goodwill) and liabilities of the subsidiary, (ii) the carrying amount of any non-controlling interest and (iii) the cumulative translation differences recorded in equity; and recognises (i) the fair value of the consideration received, (ii) the fair value of any investment retained and (iii) any resulting surplus or deficit in profit or loss. The Group’s share of components previously recognised in other comprehensive income is reclassified to profit or loss or retained profits, as appropriate, on the same basis as would be required if the Group had directly disposed of the related assets or liabilities.

94 Haier Electronics Group Co., Ltd. Annual Report 2018
Notes to Financial Statements31 December 2018
2.2 CHANGES IN ACCOUNTING POLICIES AND DISCLOSURES
The Group has adopted the following new and revised IFRSs for the first time for the current year’s financial statements.
Amendments to IFRS 2 Classification and Measurement of Share-based Payment Transactions
Amendments to IFRS 4 Applying IFRS 9 Financial Instruments with IFRS 4 Insurance Contracts
IFRS 9 Financial InstrumentsIFRS 15 Revenue from Contracts with CustomersAmendments to IFRS 15 Clarifications to IFRS 15 Revenue from Contracts with customersAmendments to IAS 40 Transfers of Investment PropertyIFRIC 22 Foreign Currency Transactions and Advance ConsiderationAnnual Improvements
2014–2016 CycleAmendments to IFRS 1 and IAS 28
Except for the amendments to IFRS 4 and Annual Improvements 2014–2016 Cycle , which are not relevant to the preparation of the Group’s financial statements, the nature and the impact of the new and revised IFRSs are described below:
(a) Amendments to IFRS 2 address three main areas: the effects of vesting conditions on the measurement of a cash-settled share-based payment transaction; the classification of a share- based payment transaction with net settlement features for withholding a certain amount in order to meet an employee’s tax obligation associated with the share-based payment; and accounting where a modification to the terms and conditions of a share-based payment transaction changes its classification from cash-settled to equity-settled. The amendments clarify that the approach used to account for vesting conditions when measuring equity-settled share-based payments also applies to cash-settled share-based payments. The amendments introduce an exception so that a share-based payment transaction with net share settlement features for withholding a certain amount in order to meet the employee’s tax obligation is classified in its entirety as an equity-settled share-based payment transaction when certain conditions are met. Furthermore, the amendments clarify that if the terms and conditions of a cash-settled share-based payment transaction are modified, with the result that it becomes an equity-settled share-based payment transaction, the transaction is accounted for as an equity-settled transaction from the date of the modification. The amendments have had no impact on the financial position or performance of the Group.
(b) IFRS 9 Financial Instruments replaces IAS 39 Financial Instruments: Recognition and Measurement for annual periods beginning on or after 1 January 2018, bringing together all three aspects of the accounting for financial instruments: classification and measurement, impairment and hedge accounting.
The Group has recognised the transition adjustments against the applicable opening balances in equity at 1 January 2018. Therefore, the comparative information was not restated and continues to be reported under IAS 39.

95Haier Electronics Group Co., Ltd. Annual Report 2018
Notes to Financial Statements31 December 2018
2.2 CHANGES IN ACCOUNTING POLICIES AND DISCLOSURES (continued)
(b) (continued)
Classification and measurement
The following information sets out the impacts of adopting IFRS 9 on the statement of financial position. A reconciliation between the carrying amounts under IAS 39 and the balances reported under IFRS 9 as at 1 January 2018 is as follows:
Notes
Original measurement category under IAS 39
New measurement category under IFRS 9
Original carrying amount
under IAS 39
New carrying amount
under IFRS 9
Financial assetsAvailable-for-sale
investments (note 20)(i) Available-for-sale
financial assetsFinancial assets at
FVOCI11,283,082 1,283,082
Other non-current financial assets (note 21)
Financial assets at FVPL2
Financial assets at FVPL
45,742 45,742
Trade receivables (note 23)
(ii) Loans and receivables Financial assets at amortised cost
3,273,403 3,273,403
Bills receivable (note 23) (iii) Loans and receivables Financial assets at FVOCI
2,543,445 2,543,445
Other receivables (note 24)
Loans and receivables Financial assets at amortised cost
1,783,978 1,783,978
Other financial assets (note 25)
Loans and receivables Financial assets at amortised cost
779,265 779,265
Other financial assets (note 25)
(iv) Available-for-sale financial assets
Financial assets at FVPL
1,195,550 1,195,550
Pledged deposits (note 26)
Loans and receivables Financial assets at amortised cost
119,865 119,865
Cash and cash equivalents (note 26)
Loans and receivables Financial assets at amortised cost
15,040,624 15,040,624
1 FVOCI: Financial assets at fair value through other comprehensive income.
2 FVPL: Financial assets at fair value through profit or loss.

96 Haier Electronics Group Co., Ltd. Annual Report 2018
Notes to Financial Statements31 December 2018
2.2 CHANGES IN ACCOUNTING POLICIES AND DISCLOSURES (continued)
(b) (continued)
Classification and measurement (continued)
Notes:
(i) The Group has elected the option to irrevocably designate certain of its previous available-for-sale equity investments as equity investments at fair value through other comprehensive income. As the carrying amount of the available-for-sale investments amounting to RMB1,283,082,000 as at 31 December 2017 was approximate to the fair value as at 1 January 2018, no transition adjustment to the financial asset and equity at 1 January 2018 was recognised.
(ii) The gross carrying amount of the trade receivables represents the amount after adjustments for the adoption of IFRS 15. Further details of the adjustments for the adoption of IFRS 15 are included in note 2.2(c) to the financial statements.
(iii) The Group’s bills receivable are managed with a business model under which bills receivable are held to collect contractual cash flows or endorsed to suppliers prior to their expiry date. Accordingly, these bills receivable are reclassified as financial assets at fair value through other comprehensive income upon adoption of IFRS 9.
(iv) The Group has classified certain of its wealth management products previously classified as available-for-sale investments as financial assets measured at fair value through profit or loss because these wealth management products were with floating returns and did not pass the contractual cash flow characteristics test in IFRS 9.
There was no change in classification and carrying amounts of financial liabilities at 1 January 2018.
Impairment
The Group has remeasured the impairment allowances of financial assets as at 31 December 2017 using the expected credit losses (“ECLs”) under IFRS 9, which is approximate to the impairment allowances under IAS 39. Accordingly, no transition adjustment to the financial assets and equity at 1 January 2018 was recognised.
(c) IFRS 15 and its amendments replace IAS 11 Construction Contracts , IAS 18 Revenue and related interpretations and it applies, with limited exceptions, to all revenue arising from contracts with customers. The new standard establishes a five-step model to account for revenue arising from contracts with customers. Under IFRS 15, revenue is recognised at an amount that reflects the consideration to which an entity expects to be entitled in exchange for transferring goods or services to a customer. The standard also introduces extensive qualitative and quantitative disclosure requirements, including disaggregation of total revenue, information about performance obligations, changes in contract asset and liability account balances between periods and key judgements and estimates. As a result of the application of IFRS 15, the Group has changed the accounting policy with respect to revenue recognition.

97Haier Electronics Group Co., Ltd. Annual Report 2018
Notes to Financial Statements31 December 2018
2.2 CHANGES IN ACCOUNTING POLICIES AND DISCLOSURES (continued)
(c) (continued)
The Group adopted IFRS 15 using the full retrospective method of adoption. The effect of the transition on the current year has not been disclosed as the standard provides an optional practical expedient. The Group did not apply any of the other available optional practical expedients.
The effect of adopting IFRS 15 is as follows:
Statement of profit or loss Adjustment 2017RMB’000
Revenue (i) (74,027)Cost of sales (i) 45,267Income tax expenses (i) 4,964
Profit for the year and attributable to owners of the Company (23,796)
Earnings per share attributable to ordinary equity holders of the Company
Basic (RMB0.01)
Diluted (RMB0.01)

98 Haier Electronics Group Co., Ltd. Annual Report 2018
Notes to Financial Statements31 December 2018
2.2 CHANGES IN ACCOUNTING POLICIES AND DISCLOSURES (continued)
(c) (continued)
Statement of financial position Adjustments31 December
20171 January
2017RMB’000 RMB’000
NON-CURRENT ASSETSDeferred tax assets (i) 16,850 11,886
Total non-current assets 16,850 11,886
CURRENT ASSETSPrepayments, other receivables and
other assets (i) 166,681 121,413
Total current assets 166,681 121,413
Total assets 183,531 133,299
CURRENT LIABILITIESOther payable and accruals (i), (ii) (3,867,827) (4,506,968)Contract liabilities (ii) 4,132,209 4,697,322
Total current liabilities (i) 264,382 190,354
Total liabilities 264,382 190,354
Net assets (80,851) (57,055)
EQUITYRetained profits (80,851) (57,055)
Total equity (80,851) (57,055)
99Haier Electronics Group Co., Ltd. Annual Report 2018
Notes to Financial Statements31 December 2018
2.2 CHANGES IN ACCOUNTING POLICIES AND DISCLOSURES (continued)
(c) (continued)
The nature of the adjustments as at 31 December 2017 and 1 January 2017 and the reasons for the changes in the statement of financial position as at 31 December 2017 and 1 January 2017 and the statement of profit or loss for the year ended 31 December 2017 are described below:
(i) Sale of goods
Some contracts for the sale of goods provide customers with a right of return and volume rebates. Before adopting IFRS 15, the Group recognised revenue from the sale of goods measured at the fair value of the consideration received or receivable, net of returns and volume rebates. Under IFRS 15, rights of return and volume rebates give rise to variable consideration which is determined using the expected value method or the most likely amount method.
Rights of returnFor a contract that provides a customer with a right to return the defective goods within a specified period, the Group previously estimated expected returns based on the average historical return rate. Upon adoption of IFRS 15, the Group recognised right-of-return assets which are included in prepayments, other receivables and other assets and are measured at the former carrying amounts of the goods to be returned less any expected costs to recover the goods, including any potential decreases in the value of the returned goods. In addition, refund liabilities were recognised based on the amounts that the Group expects to return to the customers using the expected value method.
Accordingly, the adoption of IFRS 15 resulted in an increase in prepayments, other receivables and other assets by RMB166,681,000 and RMB121,413,000, an increase in deferred tax assets by RMB16,850,000 and RMB11,886,000, and an increase in other payables and accruals by RMB264,382,000 and RMB190,354,000 in the statement of financial position as at 31 December 2017 and 1 January 2017 respectively. The statement of profit or loss for the year ended 31 December 2017 was also restated, resulting in decrease in revenue, cost of sales and income tax expense of RMB74,027,000, RMB45,267,000 and RMB4,964,000, respectively.
Volume rebatesThe Group calculated the volume rebates in accordance with the terms stipulated in the rebate agreements. Upon the adoption of IFRS 15, the Group has reclassified the accruals for rebates to refund liabilities amounting to RMB1,332,152,000 and RMB1,073,735,000, both of which are included in other payables and accruals in the statements of financial position, as at 31 December 2017 and 1 January 2017, respectively.

100 Haier Electronics Group Co., Ltd. Annual Report 2018
Notes to Financial Statements31 December 2018
2.2 CHANGES IN ACCOUNTING POLICIES AND DISCLOSURES (continued)
(c) (continued)
(ii) Consideration received from customers in advance
Before the adoption of IFRS 15, the Group recognised consideration received from customers as receipt in advance included in other payables and accruals. Under IFRS 15, the amount is classified as contract liabilities.
Therefore, upon adoption of IFRS 15, the Group reclassified RMB4,132,209,000 and RMB4,697,322,000 from receipt in advance to contract liabilities in the statement of financial position as at 31 December 2017 and 1 January 2017, respectively.
(d) Amendments to IAS 40, clarify when an entity should transfer property, including property under construction or development, into or out of investment property. The amendments state that a change in use occurs when the property meets, or ceases to meet, the definition of investment property and there is evidence of the change in use. A mere change in management’s intentions for the use of a property does not provide evidence of a change in use. The amendments have had no impact on the financial position or performance of the Group.
(e) IFRIC 22, provides guidance on how to determine the date of the transaction when applying IAS 21 to the situation where an entity receives or pays advance consideration in a foreign currency and recognises a non-monetary asset or liability. The interpretation clarifies that the date of the transaction for the purpose of determining the exchange rate to use on initial recognition of the related asset, expense or income (or part of it) is the date on which an entity initially recognises the non-monetary asset (such as a prepayment) or non-monetary liability (such as deferred income) arising from the payment or receipt of the advance consideration. If there are multiple payments or receipts in advance of recognising the related item, the entity must determine the transaction date for each payment or receipt of the advance consideration. The interpretation has had no impact on the Group’s financial statements as the Group’s accounting policy for the determination of the exchange rate applied for initial recognition of non-monetary assets or non-monetary liabilities is consistent with the guidance provided in the interpretation.

101Haier Electronics Group Co., Ltd. Annual Report 2018
Notes to Financial Statements31 December 2018
2.2 CHANGES IN ACCOUNTING POLICIES AND DISCLOSURES (continued)
Restatement of operating results and financial positions of the Group
The operating results previously reported by the Group for the year ended 31 December 2017 have been restated as a result of the adoption of IFRS 15 and the application of merger accounting (note 2.1) to include the operating results of Jushanghui as set out below:
The Group
(as previously Adoption of IFRS 15
Merger accounting The Group (restated)
reported) Jushanghui EliminationRMB’000 RMB’000 RMB’000 RMB’000 RMB’000
Revenue 78,798,324 (74,027) 16,383 — 78,740,680Profit/(loss) before tax 4,350,402 (28,760) (7,735) 1,194 4,315,101Profit/(loss) for the year and
attributable to owners of the Company 3,524,975 (23,796) (7,735) 1,194 3,494,638
Earnings per share attributable to ordinary equity holders of the Company
Basic RMB1.21 (RMB0.01) — — RMB1.20
Diluted RMB1.20 (RMB0.01) — — RMB1.19

102 Haier Electronics Group Co., Ltd. Annual Report 2018
Notes to Financial Statements31 December 2018
2.2 CHANGES IN ACCOUNTING POLICIES AND DISCLOSURES (continued)
Restatement of operating results and financial positions of the Group (continued)
The financial positions previously reported by the Group at 31 December 2017 and 1 January 2017 have been restated to include the impact of the adoption of IFRS 15 and the assets and liabilities of Jushanghui as set out below:
31 December 2017
The Group (as previously Adoption of
IFRS 15
Merger accounting The Group (restated)reported) Jushanghui Elimination
RMB’000 RMB’000 RMB’000 RMB’000 RMB’000
Non-current assets 8,860,055 16,850 372 (5,512) 8,871,765Current assets 34,581,341 166,681 37,586 (2,450) 34,783,158Current liabilities 18,702,334 264,382 13,737 (2,450) 18,978,003Non-current liabilities 1,646,469 — — — 1,646,469Total equity 23,092,593 (80,851) 24,221 (5,512) 23,030,451
1 January 2017
The Group (as previously Adoption of
IFRS 15
Merger accounting The Group (restated)reported) Jushanghui Elimination
RMB’000 RMB’000 RMB’000 RMB’000 RMB’000
Non-current assets 7,692,438 11,886 370 (6,705) 7,697,989Current assets 28,575,328 121,413 45,774 (2,450) 28,740,065Current liabilities 17,407,166 190,354 14,189 (2,450) 17,609,259Non-current liabilities 462,630 — — — 462,630Total equity 18,397,970 (57,055) 31,955 (6,705) 18,366,165
103Haier Electronics Group Co., Ltd. Annual Report 2018
Notes to Financial Statements31 December 2018
2.3 ISSUED BUT NOT YET EFFECTIVE INTERNATIONAL FINANCIAL REPORTING STANDARDS
The Group has not applied the following new and revised IFRSs, that have been issued but are not yet effective, in these financial statements.
Amendments to IFRS 3 Definition of a Business2
Amendments to IFRS 9 Prepayment Features with Negative Compensation1
Amendments to IFRS 10 and IAS 28
Sale or Contribution of Assets between an Investor and its Associate or Joint Venture4
IFRS 16 Leases1
IFRS 17 Insurance Contracts3
Amendments to IAS 1 and IAS 8
Definition of Material2
Amendments to IAS 19 Plan Amendment, Curtailment or Settlement1
Amendments to IAS 28 Long-term Interests in Associates and Joint Ventures1
IFRIC 23 Uncertainty over Income Tax Treatments1
Annual Improvements 2015–2017 Cycle
Amendments to IFRS 3, IFRS 11, IAS 12 and IAS 231
1 Effective for annual periods beginning on or after 1 January 20192 Effective for annual periods beginning on or after 1 January 20203 Effective for annual periods beginning on or after 1 January 20214 No mandatory effective date yet determined but available for adoption
Further information about those IFRSs that are expected to be applicable to the Group is described below.
Amendments to IFRS 3 clarify and provide additional guidance on the definition of a business. The amendments clarify that for an integrated set of activities and assets to be considered a business, it must include, at a minimum, an input and a substantive process that together significantly contribute to the ability to create output. A business can exist without including all of the inputs and processes needed to create outputs. The amendments remove the assessment of whether market participants are capable of acquiring the business and continue to produce outputs. Instead, the focus is on whether acquired inputs and acquired substantive processes together significantly contribute to the ability to create outputs. The amendments have also narrowed the definition of outputs to focus on goods or services provided to customers, investment income or other income from ordinary activities. Furthermore, the amendments provide guidance to assess whether an acquired process is substantive and introduce an optional fair value concentration test to permit a simplified assessment of whether an acquired set of activities and assets is not a business. The Group expects to adopt the amendments prospectively from 1 January 2020.

104 Haier Electronics Group Co., Ltd. Annual Report 2018
Notes to Financial Statements31 December 2018
2.3 ISSUED BUT NOT YET EFFECTIVE INTERNATIONAL FINANCIAL REPORTING STANDARDS (continued)
Amendments to IFRS 10 and IAS 28 address an inconsistency between the requirements in IFRS 10 and in IAS 28 in dealing with the sale or contribution of assets between an investor and its associate or joint venture. The amendments require a full recognition of a gain or loss when the sale or contribution of assets between an investor and its associate or joint venture constitutes a business. For a transaction involving assets that do not constitute a business, a gain or loss resulting from the transaction is recognised in the investor’s profit or loss only to the extent of the unrelated investor’s interest in that associate or joint venture. The amendments are to be applied prospectively. The previous mandatory effective date of amendments to IFRS 10 and IAS 28 was removed by the IASB in December 2015 and a new mandatory effective date will be determined after the completion of a broader review of accounting for associates and joint ventures. However, the amendments are available for adoption now.
IFRS 16, replaces IAS 17 Leases , IFRIC 4 Determining whether an Arrangement contains a Lease , SIC 15 Operating Leases — Incentives and SIC 27 Evaluating the Substance of Transactions Involving the Legal Form of a Lease . The standard sets out the principles for the recognition, measurement, presentation and disclosure of leases and requires lessees to recognise assets and liabilities for most leases. The standard includes two elective recognition exemptions for lessees — leases of low-value assets and short-term leases. At the commencement date of a lease, a lessee will recognise a liability to make lease payments (i.e., the lease liability) and an asset representing the right to use the underlying asset during the lease term (i.e., the right-of-use asset). Lessees can choose to apply the standard using either a full retrospective or a modified retrospective approach.
The Group will adopt IFRS 16 from 1 January 2019. The Group plans to adopt the transitional provisions in IFRS 16 to recognise the cumulative effect of initial adoption as an adjustment to the opening balance of retained earnings at 1 January 2019 and will not restate the comparatives. In addition, the Group plans to apply the new requirements to contracts that were previously identified as leases applying IAS 17 and measure the lease liability at the present value of the remaining lease payments, discounted using the Group’s incremental borrowing rate at the date of initial application. The right-of-use asset will be measured at the amount of the lease liability, adjusted by the amount of any prepaid or accrued lease payments relating to the lease recognised in the statement of financial position immediately before the date of initial application. The Group plans to use the exemptions allowed by the standard on lease contracts whose lease terms end within 12 months as of the date of initial application. During the year, the Group has performed a detailed assessment on the impact of adoption of IFRS 16. The Group has estimated that, when it adopts IFRS 16, right-of-use assets and lease liabilities will be presented separately in the consolidated statement of financial position, the corresponding adjustment amount is yet to be finalised.

105Haier Electronics Group Co., Ltd. Annual Report 2018
Notes to Financial Statements31 December 2018
2.3 ISSUED BUT NOT YET EFFECTIVE INTERNATIONAL FINANCIAL REPORTING STANDARDS (continued)
Amendments to IAS 1 and IAS 8 provide a new definition of material. The new definition states that information is material if omitting, misstating or obscuring it could reasonably be expected to influence decisions that the primary users of general purpose financial statements make on the basis of those financial statements. The amendments clarify that materiality will depend on the nature or magnitude of information. A misstatement of information is material if it could reasonably be expected to influence decisions made by the primary users. The Group expects to adopt the amendments prospectively from 1 January 2020. The amendments are not expected to have any significant impact on the Group’s financial statements.
Amendments to IAS 28 clarify that the scope exclusion of IFRS 9 only includes interests in an associate or joint venture to which the equity method is applied and does not include long-term interests that in substance form part of the net investment in the associate or joint venture, to which the equity method has not been applied. Therefore, an entity applies IFRS 9, rather than IAS 28, including the impairment requirements under IFRS 9, in accounting for such long-term interests. IAS 28 is then applied to the net investment, which includes the long-term interests, only in the context of recognising losses of an associate or joint venture and impairment of the net investment in the associate or joint venture. The Group expects to adopt the amendments on 1 January 2019 and will assess its business model for such long-term interests based on the facts and circumstances that exist on 1 January 2019 using the transitional requirements in the amendments. The Group also intends to apply the relief from restating comparative information for prior periods upon adoption of the amendments.
IFRIC 23 addresses the accounting for income taxes (current and deferred) when tax treatments involve uncertainty that affects the application of IAS 12 (often referred to as “uncertain tax positions”). The interpretation does not apply to taxes or levies outside the scope of IAS 12, nor does it specifically include requirements relating to interest and penalties associated with uncertain tax treatments. The interpretation specifically addresses (i) whether an entity considers uncertain tax treatments separately; (ii) the assumptions an entity makes about the examination of tax treatments by taxation authorities; (iii) how an entity determines taxable profits or tax losses, tax bases, unused tax losses, unused tax credits and tax rates; and (iv) how an entity considers changes in facts and circumstances. The interpretation is to be applied retrospectively, either fully retrospectively without the use of hindsight or retrospectively with the cumulative effect of application as an adjustment to the opening equity at the date of initial application, without the restatement of comparative information. The Group expects to adopt the interpretation from 1 January 2019. The interpretation is not expected to have any significant impact on the Group’s financial statements.

106 Haier Electronics Group Co., Ltd. Annual Report 2018
Notes to Financial Statements31 December 2018
2.4 SUMMARY OF SIGNIFICANT ACCOUNTING POLICIES
Investments in associates and joint ventures
An associate is an entity in which the Group has a long term interest of generally not less than 20% of the equity voting rights and over which it is in a position to exercise significant influence. Significant influence is the power to participate in the financial and operating policy decisions of the investee, but is not control or joint control over those policies.
A joint venture is a type of joint arrangement whereby the parties that have joint control of the arrangement have rights to the net assets of the joint venture. Joint control is the contractually agreed sharing of control of an arrangement, which exists only when decisions about the relevant activities require the unanimous consent of the parties sharing control.
The Group’s investments in associates are stated in the consolidated statement of financial position at the Group’s share of net assets under the equity method of accounting, less any impairment losses. Adjustments are made to bring into line any dissimilar accounting policies that may exist.
The Group’s share of the post-acquisition results and other comprehensive income of associates and joint ventures is included in the consolidated statement of profit or loss and consolidated statement of comprehensive income, respectively. In addition, when there has been a change recognised directly in the equity of the associate or joint venture, the Group recognises its share of any changes, when applicable, in the consolidated statement of changes in equity. Unrealised gains and losses resulting from transactions between the Group and its associates or joint ventures are eliminated to the extent of the Group’s investments in the associates or joint ventures, except where unrealised losses provide evidence of an impairment of the assets transferred. Goodwill arising from the acquisition of associates or joint ventures is included as part of the Group’s investments in associates or joint ventures.
If an investment in an associate becomes an investment in a joint venture or vice versa, the retained interest is not remeasured. Instead, the investment continues to be accounted for under the equity method. In all other cases, upon loss of significant influence over the associate or joint control over the joint venture, the Group measures and recognises any retained investment at its fair value. Any difference between the carrying amount of the associate or joint venture upon loss of significant influence or joint control and the fair value of the retained investment and proceeds from disposal is recognised in profit or loss.
Business combinations and goodwill
As explained in note 2.1 above, the acquisition of subsidiaries under common control has been accounted for using the merger method of accounting. The acquisition method of accounting is used to account for business combinations not under common control.
Under the merger method of accounting, the net assets of the combining entities or businesses are combined using their existing book values from the controlling parties’ perspective. No amount is recognised in respect of goodwill or excess of the acquirers’ interest in the net fair value of acquires’ identifiable assets, liabilities and contingent liabilities over the cost of investment at the time of common control combination. The consolidated statement of profit or loss include the results of each of the combining entities or businesses first came under common control, where this is a shorter period, regardless of the date of the common control combination.
107Haier Electronics Group Co., Ltd. Annual Report 2018
Notes to Financial Statements31 December 2018
2.4 SUMMARY OF SIGNIFICANT ACCOUNTING POLICIES (continued)
Business combinations and goodwill (continued)
Business combinations not under common controlUnder the acquisition method of accounting, the consideration transferred is measured at the acquisition date fair value which is the sum of the acquisition date fair values of assets transferred by the Group, liabilities assumed by the Group to the former owners of the acquiree and the equity interests issued by the Group in exchange for control of the acquiree. For each business combination, the Group elects whether to measure the non-controlling interests in the acquiree that are present ownership interests and entitle their holders to a proportionate share of net assets in the event of liquidation at fair value or at the proportionate share of the acquiree’s identifiable net assets. All other components of non-controlling interests are measured at fair value. Acquisition-related costs are expensed as incurred.
When the Group acquires a business, it assesses the financial assets and liabilities assumed for appropriate classification and designation in accordance with the contractual terms, economic circumstances and pertinent conditions as at the acquisition date. This includes the separation of embedded derivatives in host contracts of the acquiree.
If the business combination is achieved in stages, the previously held equity interest is remeasured at its acquisition date fair value and any resulting gain or loss is recognised in profit or loss.
Any contingent consideration to be transferred by the acquirer is recognised at fair value at the acquisition date. Contingent consideration classified as an asset or liability is measured at fair value with changes in fair value recognised in profit or loss. Contingent consideration that is classified as equity is not measured and subsequent settlement is accounted for within equity.
Goodwill is initially measured at cost, being the excess of the aggregate of the consideration transferred, the amount recognised for non-controlling interests and any fair value of the Group’s previously held equity interests in the acquiree over the identifiable net assets acquired and liabilities assumed. If the sum of this consideration and other items is lower than the fair value of the net assets acquired, the difference is, after reassessment, recognised in profit or loss as a gain on bargain purchase.
After initial recognition, goodwill is measured at cost less any accumulated impairment losses. Goodwill is tested for impairment annually or more frequently if events or changes in circumstances indicate that the carrying value may be impaired. The Group performs its annual impairment test of goodwill as at 31 December. For the purpose of impairment testing, goodwill acquired in a business combination is, from the acquisition date, allocated to each of the Group’s cash-generating units, or groups of cash-generating units, that are expected to benefit from the synergies of the combination, irrespective of whether other assets or liabilities of the Group are assigned to those units or groups of units.

108 Haier Electronics Group Co., Ltd. Annual Report 2018
Notes to Financial Statements31 December 2018
2.4 SUMMARY OF SIGNIFICANT ACCOUNTING POLICIES (continued)
Business combinations and goodwill (continued)
Business combinations not under common control (continued)Impairment is determined by assessing the recoverable amount of the cash-generating unit (group of cash-generating units) to which the goodwill relates. Where the recoverable amount of the cash-generating unit (group of cash-generating units) is less than the carrying amount, an impairment loss is recognised. An impairment loss recognised for goodwill is not reversed in a subsequent period.
Where goodwill has been allocated to a cash-generating unit (or group of cash-generating units) and part of the operation within that unit is disposed of, the goodwill associated with the operation disposed of is included in the carrying amount of the operation when determining the gain or loss on the disposal. Goodwill disposed of in these circumstances is measured based on the relative value of the operation disposed of and the portion of the cash-generating unit retained.
Fair value measurement
The Group measures its bills receivable, certain other financial assets (current and non-current), equity investments designated at fair value through other comprehensive income, put option liabilities and other non-current liabilities at fair value at the end of each reporting period. Fair value is the price that would be received to sell an asset or paid to transfer a liability in an orderly transaction between market participants at the measurement date. The fair value measurement is based on the presumption that the transaction to sell the asset or transfer the liability takes place either in the principal market for the asset or liability, or in the absence of a principal market, in the most advantageous market for the asset or liability. The principal or the most advantageous market must be accessible by the Group. The fair value of an asset or a liability is measured using the assumptions that market participants would use when pricing the asset or liability, assuming that market participants act in their economic best interest.
A fair value measurement of a non-financial asset takes into account a market participant’s ability to generate economic benefits by using the asset in its highest and best use or by selling it to another market participant that would use the asset in its highest and best use.
The Group uses valuation techniques that are appropriate in the circumstances and for which sufficient data are available to measure fair value, maximising the use of relevant observable inputs and minimising the use of unobservable inputs.
All assets and liabilities for which fair value is measured or disclosed in the financial statements are categorised within the fair value hierarchy, described as follows, based on the lowest level input that is significant to the fair value measurement as a whole:
Level 1 — based on quoted prices (unadjusted) in active markets for identical assets or liabilities
Level 2 — based on valuation techniques for which the lowest level input that is significant to the fair value measurement is observable, either directly or indirectly
Level 3 — based on valuation techniques for which the lowest level input that is significant to the fair value measurement is unobservable

109Haier Electronics Group Co., Ltd. Annual Report 2018
Notes to Financial Statements31 December 2018
2.4 SUMMARY OF SIGNIFICANT ACCOUNTING POLICIES (continued)
Fair value measurement (continued)
For assets and liabilities that are recognised in the financial statements on a recurring basis, the Group determines whether transfers have occurred between levels in the hierarchy by reassessing categorisation (based on the lowest level input that is significant to the fair value measurement as a whole) at the end of each reporting period.
Impairment of non-financial assets
Where an indication of impairment exists, or when annual impairment testing for an asset is required (other than inventories, financial assets and asset and disposal group held for sale), the asset’s recoverable amount is estimated. An asset’s recoverable amount is the higher of the asset’s or cash-generating unit’s value in use and its fair value less costs of disposal, and is determined for an individual asset, unless the asset does not generate cash inflows that are largely independent of those from other assets or groups of assets, in which case the recoverable amount is determined for the cash-generating unit to which the asset belongs.
An impairment loss is recognised only if the carrying amount of an asset exceeds its recoverable amount. In assessing value in use, the estimated future cash flows are discounted to their present value using a pre-tax discount rate that reflects current market assessments of the time value of money and the risks specific to the asset. An impairment loss is charged to the statement of profit or loss in the period in which it arises in those expense categories consistent with the function of the impaired asset.
An assessment is made at the end of each reporting period as to whether there is an indication that previously recognised impairment losses may no longer exist or may have decreased. If such an indication exists, the recoverable amount is estimated. A previously recognised impairment loss of an asset other than goodwill is reversed only if there has been a change in the estimates used to determine the recoverable amount of that asset, but not to an amount higher than the carrying amount that would have been determined (net of any depreciation/amortisation) had no impairment loss been recognised for the asset in prior years. A reversal of such an impairment loss is credited to the statement of profit or loss in the period in which it arises.

110 Haier Electronics Group Co., Ltd. Annual Report 2018
Notes to Financial Statements31 December 2018
2.4 SUMMARY OF SIGNIFICANT ACCOUNTING POLICIES (continued)
Related parties
A party is considered to be related to the Group if:
(a) the party is a person or a close member of that person’s family and that person
(i) has control or joint control over the Group;
(ii) has significant influence over the Group; or
(iii) is a member of the key management personnel of the Group or of a parent of the Group;
or
(b) the party is an entity where any of the following conditions applies:
(i) the entity and the Group are members of the same group;
(ii) one entity is an associate or joint venture of the other entity (or of a parent, subsidiary or fellow subsidiary of the other entity);
(iii) the entity and the Group are joint ventures of the same third party;
(iv) one entity is a joint venture of a third entity and the other entity is an associate of the third entity;
(v) the entity is a post-employment benefit plan for the benefit of employees of either the Group or an entity related to the Group;
(vi) the entity is controlled or jointly controlled by a person identified in (a);
(vii) a person identified in (a)(i) has significant influence over the entity or is a member of the key management personnel of the entity (or of a parent of the entity); and
(viii) the entity, or any member of a group of which it is a part, provides key management personnel services to the Group or to the parent of the Group.

111Haier Electronics Group Co., Ltd. Annual Report 2018
Notes to Financial Statements31 December 2018
2.4 SUMMARY OF SIGNIFICANT ACCOUNTING POLICIES (continued)
Property, plant and equipment and depreciation
Property, plant and equipment, other than freehold land and construction in progress, are stated at cost less accumulated depreciation and any impairment losses. The cost of an item of property, plant and equipment comprises its purchase price and any directly attributable costs of bringing the asset to its working condition and location for its intended use.
Expenditure incurred after items of property, plant and equipment have been put into operation, such as repairs and maintenance, is normally charged to the statement of profit or loss in the period in which it is incurred. In situations where the recognition criteria are satisfied, the expenditure for a major inspection is capitalised in the carrying amount of the asset as a replacement. Where significant parts of property, plant and equipment are required to be replaced at intervals, the Group recognises such parts as individual assets with specific useful lives and depreciates them accordingly.
Depreciation is calculated on the straight-line basis to write off the cost of each item of property, plant and equipment to its residual value over its estimated useful life. The principal annual rates used for this purpose are as follows:
Freehold land Not depreciatedBuildings 2% to 19%Leasehold improvements 10% to 50%Plant and machinery 5% to 33%Tools, furniture and fixtures 10% to 33%Motor vehicles 9% to 33%
Where parts of an item of property, plant and equipment have different useful lives, the cost of that item is allocated on a reasonable basis among the parts and each part is depreciated separately. Residual values, useful lives and the depreciation method are reviewed, and adjusted if appropriate, at least at each financial year end.
An item of property, plant and equipment including any significant part initially recognised is derecognised upon disposal or when no future economic benefits are expected from its use or disposal. Any gain or loss on disposal or retirement recognised in the statement of profit or loss in the year the asset is derecognised is the difference between the net sales proceeds and the carrying amount of the relevant asset.
Construction in progress is stated at cost less any impairment losses, and is not depreciated. Construction in progress is reclassified to the appropriate category of the property, plant and equipment when completed and ready for use.

112 Haier Electronics Group Co., Ltd. Annual Report 2018
Notes to Financial Statements31 December 2018
2.4 SUMMARY OF SIGNIFICANT ACCOUNTING POLICIES (continued)
Investment properties
Investment properties are interests in buildings (including the leasehold interest under an operating lease for a property which would otherwise meet the definition of an investment property) held to earn rental income and/or for capital appreciation, rather than for use in the production or supply of goods or services or for administrative purposes; or for sale in the ordinary course of business. Such properties are measured initially at cost, including transaction costs. Subsequent to initial recognition, investment properties are stated at cost less accumulated depreciation and any impairment losses. Depreciation is calculated on the straight-line method to write off the cost of each investment property over its estimated useful life. The principal annual rates used for this purpose range from 4% to 5%.
Any gains or losses on the retirement or disposal of an investment property are recognised in the statement of profit or loss in the year of the retirement or disposal.
Non-current assets and disposal groups held for sale
Non-current assets and disposal groups are classified as held for sale if their carrying amounts will be recovered principally through a sales transaction rather than through continuing use. For this to be the case, the asset or disposal group must be available for immediate sale in its present condition subject only to terms that are usual and customary for the sale of such assets or disposal groups and its sale must be highly probable. All assets and liabilities of a subsidiary classified as a disposal group are reclassified as held for sale regardless of whether the Group retains a non-controlling interest in its former subsidiary after the sale.
Non-current assets and disposal groups (other than investment properties and financial assets) classified as held for sale are measured at the lower of their carrying amounts and fair values less costs to sell. Property, plant and equipment and intangible assets classified as held for sale are not depreciated or amortised.
Intangible assets (other than goodwill)
Intangible assets acquired separately are measured on initial recognition at cost. The cost of intangible assets acquired in a business combination is the fair value at the date of acquisition. The useful lives of intangible assets are assessed to be either finite or indefinite. Intangible assets with finite lives are subsequently amortised over the useful economic life and assessed for impairment whenever there is an indication that the intangible asset may be impaired. The amortisation period and the amortisation method for an intangible asset with a finite useful life are reviewed at least at each financial year end.
Intangible assets with indefinite useful lives are tested for impairment annually either individually or at the cash-generating unit level. Such intangible assets are not amortised. The useful life of an intangible asset with an indefinite life is reviewed annually to determine whether the indefinite life assessment continues to be supportable. If not, the change in the useful life assessment from indefinite to finite is accounted for on a prospective basis.

113Haier Electronics Group Co., Ltd. Annual Report 2018
Notes to Financial Statements31 December 2018
2.4 SUMMARY OF SIGNIFICANT ACCOUNTING POLICIES (continued)
Intangible assets (other than goodwill) (continued)
Patents, licences and softwarePurchased patents, licences and software are stated at cost less any impairment losses and software acquired through business combinations is initially stated at fair value. They are amortised on the straight-line basis over their estimated useful lives of not exceeding 10 years.
Management service arrangementsManagement service arrangements are initially stated at fair value and subsequently amortised on the straight-line basis over the tenure of management service arrangements of 20 years.
Customer relationshipsCustomer relationships acquired through business combinations are initially stated at fair value and subsequently amortised on the straight-line basis over their estimated useful lives of not exceeding 10 years.
TrademarksTrademarks have indefinite useful lives and are stated at cost, less any impairment losses.
Research and development costsAll research costs are charged to the statement of profit or loss as incurred.
Expenditure incurred on projects to develop new products is capitalised and deferred only when the Group can demonstrate the technical feasibility of completing the intangible asset so that it will be available for use or sale, its intention to complete and its ability to use or sell the asset, how the asset will generate future economic benefits, the availability of resources to complete the project and the ability to measure reliably the expenditure during the development. Product development expenditure which does not meet these criteria is expensed when incurred.
Deferred development costs are stated at cost less any impairment losses and are amortised using the straight-line basis over the commercial lives of the underlying products, commencing from the date when the products are put into commercial production.
Leases
Leases where substantially all the rewards and risks of ownership of assets remain with the lessor are accounted for as operating leases. Where the Group is the lessor, assets leased by the Group under operating leases are included in non-current assets, and rentals receivable under the operating leases are credited to the statement of profit or loss on the straight-line basis over the lease terms. Where the Group is the lessee, rentals payable under operating leases net of any incentives received from the lessor are charged to the statement of profit or loss on the straight-line basis over the lease terms.
Prepaid land lease payments under operating leases are initially stated at cost and subsequently recognised on the straight-line basis over the lease terms.

114 Haier Electronics Group Co., Ltd. Annual Report 2018
Notes to Financial Statements31 December 2018
2.4 SUMMARY OF SIGNIFICANT ACCOUNTING POLICIES (continued)
Investments and other financial assets (policies under IFRS 9 applicable from 1 January 2018)
Initial recognition and measurementFinancial assets are classified, at initial recognition, as subsequently measured at amortised cost, fair value through other comprehensive income, and fair value through profit or loss.
The classification of financial assets at initial recognition depends on the financial asset’s contractual cash flow characteristics and the Group’s business model for managing them. With the exception of trade receivables that do not contain a significant financing component or for which the Group has applied the practical expedient of not adjusting the effect of a significant financing component, the Group initially measures a financial asset at its fair value, plus in the case of a financial asset not at fair value through profit or loss, transaction costs. Trade receivables that do not contain a significant financing component or for which the Group has applied the practical expedient are measured at the transaction price determined under IFRS 15 in accordance with the policies set out for “Revenue recognition (applicable from 1 January 2018)” below.
In order for a financial asset to be classified and measured at amortised cost or fair value through other comprehensive income, it needs to give rise to cash flows that are solely payments of principal and interest (“SPPI”) on the principal amount outstanding.
The Group’s business model for managing financial assets refers to how it manages its financial assets in order to generate cash flows. The business model determines whether cash flows will result from collecting contractual cash flows, selling the financial assets, or both.
All regular way purchases and sales of financial assets are recognised on the trade date, that is, the date that the Group commits to purchase or sell the asset. Regular way purchases or sales are purchases or sales of financial assets that require delivery of assets within the period generally established by regulation or convention in the marketplace.
Subsequent measurementThe subsequent measurement of financial assets depends on their classification as follows:
Financial assets at amortised cost (debt instruments)The Group measures financial assets at amortised cost if both of the following conditions are met:
• The financial asset is held within a business model with the objective to hold financial assets in order to collect contractual cash flows.
• The contractual terms of the financial asset give rise on specified dates to cash flows that are solely payments of principal and interest on the principal amount outstanding.
Financial assets at amortised cost are subsequently measured using the effective interest method and are subject to impairment. Gains and losses are recognised in the statement of profit or loss when the asset is derecognised, modified or impaired.

115Haier Electronics Group Co., Ltd. Annual Report 2018
Notes to Financial Statements31 December 2018
2.4 SUMMARY OF SIGNIFICANT ACCOUNTING POLICIES (continued)
Investments and other financial assets (policies under IFRS 9 applicable from 1 January 2018) (continued)
Financial assets at fair value through other comprehensive income (debt instruments)The Group measures debt investments at fair value through other comprehensive income if both of the following conditions are met:
• The financial asset is held within a business model with the objective of both holding to collect contractual cash flows and selling.
• The contractual terms of the financial asset give rise on specified dates to cash flows that are solely payments of principal and interest on the principal amount outstanding.
For debt investments at fair value through other comprehensive income, interest income, foreign exchange revaluation and impairment losses or reversals are recognised in the statement of profit or loss and computed in the same manner as for financial assets measured at amortised cost. The remaining fair value changes are recognised in other comprehensive income. Upon derecognition, the cumulative fair value change recognised in other comprehensive income is recycled to the statement of profit or loss.
Financial assets designated at fair value through other comprehensive income (equity investments) Upon initial recognition, the Group can elect to classify irrevocably its equity investments as equity investments designated at fair value through other comprehensive income when they meet the definition of equity under IAS 32 Financial Instruments: Presentation and are not held for trading. The classification is determined on an instrument-by-instrument basis.
Gains and losses on these financial assets are never recycled to the statement of profit or loss. Dividends are recognised as other income in the statement of profit or loss when the right of payment has been established, it is probable that the economic benefits associated with the dividend will flow to the Group and the amount of the dividend can be measured reliably, except when the Group benefits from such proceeds as a recovery of part of the cost of the financial asset, in which case, such gains are recorded in other comprehensive income. Equity investments designated at fair value through other comprehensive income are not subject to impairment assessment.
Financial assets at fair value through profit or lossFinancial assets at fair value through profit or loss include financial assets held for trading, financial assets designated upon initial recognition at fair value through profit or loss, or financial assets mandatorily required to be measured at fair value. Financial assets are classified as held for trading if they are acquired for the purpose of selling or repurchasing in the near term. Derivatives, including separated embedded derivatives, are also classified as held for trading unless they are designated as effective hedging instruments. Financial assets with cash flows that are not solely payments of principal and interest are classified and measured at fair value through profit or loss, irrespective of the business model. Notwithstanding the criteria for debt instruments to be classified at amortised cost or at fair value through other comprehensive income, as described above, debt instruments may be designated at fair value through profit or loss on initial recognition if doing so eliminates, or significantly reduces, an accounting mismatch.

116 Haier Electronics Group Co., Ltd. Annual Report 2018
Notes to Financial Statements31 December 2018
2.4 SUMMARY OF SIGNIFICANT ACCOUNTING POLICIES (continued)
Investments and other financial assets (policies under IFRS 9 applicable from 1 January 2018) (continued)
Financial assets at fair value through profit or loss (continued)Financial assets at fair value through profit or loss are carried in the statement of financial position at fair value with net changes in fair value recognised in the statement of profit or loss.
This category includes derivative instruments and equity investments which the Group had not irrevocably elected to classify at fair value through other comprehensive income. Dividends on equity investments classified as financial assets at fair value through profit or loss are also recognised as other income in the statement of profit or loss when the right of payment has been established, it is probable that the economic benefits associated with the dividend will flow to the Group and the amount of the dividend can be measured reliably.
A derivative embedded in a hybrid contract, with a financial liability or non-financial host, is separated from the host and accounted for as a separate derivative if the economic characteristics and risks are not closely related to the host; a separate instrument with the same terms as the embedded derivative would meet the definition of a derivative; and the hybrid contract is not measured at fair value through profit or loss. Embedded derivatives are measured at fair value with changes in fair value recognised in the statement of profit or loss. Reassessment only occurs if there is either a change in the terms of the contract that significantly modifies the cash flows that would otherwise be required or a reclassification of a financial asset out of the fair value through profit or loss category.
A derivative embedded within a hybrid contract containing a financial asset host is not accounted for separately. The financial asset host together with the embedded derivative is required to be classified in its entirety as a financial asset at fair value through profit or loss.
Investments and other financial assets (policies under IAS 39 applicable before 1 January 2018)
Initial recognition and measurementFinancial assets are classified, at initial recognition, as financial assets at fair value through profit or loss, loans and receivables and available-for-sale financial investments, or as derivatives designated as hedging instruments in an effective hedge, as appropriate. When financial assets are recognised initially, they are measured at fair value plus transaction costs that are attributable to the acquisition of the financial assets, except in the case of financial assets recorded at fair value through profit or loss.
All regular way purchases and sales of financial assets are recognised on the trade date, that is, the date that the Group commits to purchase or sell the asset. Regular way purchases or sales are purchases or sales of financial assets that require delivery of assets within the period generally established by regulation or convention in the marketplace.
Subsequent measurementThe subsequent measurement of financial assets depends on their classification as follows:
117Haier Electronics Group Co., Ltd. Annual Report 2018
Notes to Financial Statements31 December 2018
2.4 SUMMARY OF SIGNIFICANT ACCOUNTING POLICIES (continued)
Investments and other financial assets (policies under IAS 39 applicable before 1 January 2018) (continued)
Financial assets at fair value through profit or lossFinancial assets at fair value through profit or loss include financial assets held for trading and financial assets designated upon initial recognition as at fair value through profit or loss. Financial assets are classified as held for trading if they are acquired for the purpose of sale in the near term. Derivatives, including separated embedded derivatives, are also classified as held for trading unless they are designated as effective hedging instruments as defined by IAS 39.
Financial assets at fair value through profit or loss are carried in the statement of financial position at fair value with net positive or negative changes in fair value presented as other income and gains or other expenses and losses in the statement of profit or loss. These net fair value changes do not include any dividends or interest earned on these financial assets, which are recognised in accordance with the policies set out for “Revenue recognition (applicable before 1 January 2018)” below.
Financial assets designated upon initial recognition as at fair value through profit or loss are designated at the date of initial recognition and only if the criteria in IAS 39 are satisfied.
Derivatives embedded in host contracts are accounted for as separate derivatives and recorded at fair value if their economic characteristics and risks are not closely related to those of the host contracts and the host contracts are not held for trading or designated as at fair value through profit or loss. These embedded derivatives are measured at fair value with changes in fair value recognised in the statement of profit or loss. Reassessment only occurs if there is either a change in the terms of the contract that significantly modifies the cash flows that would otherwise be required or a reclassification of a financial asset out of the fair value through profit or loss category.
Loans and receivablesLoans and receivables are non-derivative financial assets with fixed or determinable payments that are not quoted in an active market. After initial measurement, such assets are subsequently measured at amortised cost using the effective interest rate method less any allowance for impairment. Amortised cost is calculated by taking into account any discount or premium on acquisition and includes fees or costs that are an integral part of the effective interest rate. The effective interest rate amortisation is included in other income and gains in the statement of profit or loss. The loss arising from impairment is recognised in the statement of profit or loss in other expenses and losses.
Available-for-sale financial investmentsAvailable-for-sale financial investments are non-derivative financial assets in listed and unlisted equity investments and debt securities. Equity investments classified as available for sale are those which are neither classified as held for trading nor designated as at fair value through profit or loss. Debt securities in this category are those which are intended to be held for an indefinite period of time and which may be sold in response to needs for liquidity or in response to changes in market conditions.

118 Haier Electronics Group Co., Ltd. Annual Report 2018
Notes to Financial Statements31 December 2018
2.4 SUMMARY OF SIGNIFICANT ACCOUNTING POLICIES (continued)
Investments and other financial assets (policies under IAS 39 applicable before 1 January 2018) (continued)
Available-for-sale financial investments (continued)After initial recognition, available-for-sale financial investments are subsequently measured at fair value, with unrealised gains or losses recognised as other comprehensive income in the available-for-sale investment revaluation reserve until the investment is derecognised, at which time the cumulative gain or loss is recognised in the statement of profit or loss in other income, or until the investment is determined to be impaired, when the cumulative gain or loss is reclassified from the available-for-sale investment revaluation reserve to the statement of profit or loss in other gains or losses. Interest and dividends earned whilst holding the available-for-sale financial investments are reported as interest income and dividend income, respectively and are recognised in the statement of profit or loss as other income in accordance with the policies set out for “Revenue recognition” below.
When the fair value of unlisted equity investments cannot be reliably measured because (a) the variability in the range of reasonable fair value estimates is significant for that investment or (b) the probabilities of the various estimates within the range cannot be reasonably assessed and used in estimating fair value, such investments are stated at cost less any impairment losses.
The Group evaluates whether the ability and intention to sell its available-for-sale financial assets in the near term are still appropriate. When, in rare circumstances, the Group is unable to trade these financial assets due to inactive markets, the Group may elect to reclassify these financial assets if management has the ability and intention to hold the assets for the foreseeable future or until maturity.
For a financial asset reclassified from the available-for-sale category, the fair value carrying amount at the date of reclassification becomes its new amortised cost and any previous gain or loss on that asset that has been recognised in equity is amortised to profit or loss over the remaining life of the investment using the effective interest rate. Any difference between the new amortised cost and the maturity amount is also amortised over the remaining life of the asset using the effective interest rate. If the asset is subsequently determined to be impaired, then the amount recorded in equity is reclassified to the statement of profit or loss.
Derecognition of financial assets (policies under IFRS 9 applicable from 1 January 2018 and policies under IAS 39 applicable before 1 January 2018)
A financial asset (or, where applicable, a part of a financial asset or part of a group of similar financial assets) is primarily derecognised (i.e., removed from the Group’s consolidated statement of financial position) when:
• the rights to receive cash flows from the asset have expired; or
• the Group has transferred its rights to receive cash flows from the asset or has assumed an obligation to pay the received cash flows in full without material delay to a third party under a “pass-through” arrangement; and either (a) the Group has transferred substantially all the risks and rewards of the asset, or (b) the Group has neither transferred nor retained substantially all the risks and rewards of the asset, but has transferred control of the asset.

119Haier Electronics Group Co., Ltd. Annual Report 2018
Notes to Financial Statements31 December 2018
2.4 SUMMARY OF SIGNIFICANT ACCOUNTING POLICIES (continued)
Derecognition of financial assets (policies under IFRS 9 applicable from 1 January 2018 and policies under IAS 39 applicable before 1 January 2018) (continued)
When the Group has transferred its rights to receive cash flows from an asset or has entered into a pass-through arrangement, it evaluates if, and to what extent, it has retained the risk and rewards of ownership of the asset. When it has neither transferred nor retained substantially all the risks and rewards of the asset nor transferred control of the asset, the Group continues to recognise the transferred asset to the extent of the Group’s continuing involvement. In that case, the Group also recognises an associated liability. The transferred asset and the associated liability are measured on a basis that reflects the rights and obligations that the Group has retained.
Continuing involvement that takes the form of a guarantee over the transferred assets is measured at the lower of the original carrying amount of the asset and the maximum amount of consideration that the Group could be required to repay.
Impairment of financial assets (policies under IFRS 9 applicable from 1 January 2018)
The Group recognises an allowance for ECLs for all debt instruments not held at fair value through profit or loss. ECLs are based on the difference between the contractual cash flows due in accordance with the contract and all the cash flows that the Group expects to receive, discounted at an approximation of the original effective interest rate. The expected cash flows will include cash flows from the sale of collateral held or other credit enhancements that are integral to the contractual terms.
General approachECLs are recognised in two stages. For credit exposures for which there has not been a significant increase in credit risk since initial recognition, ECLs are provided for credit losses that result from default events that are possible within the next 12 months (a 12-month ECL). For those credit exposures for which there has been a significant increase in credit risk since initial recognition, a loss allowance is required for credit losses expected over the remaining life of the exposure, irrespective of the timing of the default (a lifetime ECL).
At each reporting date, the Group assesses whether the credit risk on a financial instrument has increased significantly since initial recognition. When making the assessment, the Group compares the risk of a default occurring on the financial instrument as at the reporting date with the risk of a default occurring on the financial instrument as at the date of initial recognition and considers reasonable and supportable information that is available without undue cost or effort, including historical and forward-looking information.
For debt investments at fair value through other comprehensive income, the Group applies the low credit risk simplification. At each reporting date, the Group evaluates whether the debt investments are considered to have low credit risk using all reasonable and supportable information that is available without undue cost or effort. In making that evaluation, the Group reassesses the external credit ratings of the debt investments. In addition, the Group considers that there has been a significant increase in credit risk when contractual payments are more than six months past due.
120 Haier Electronics Group Co., Ltd. Annual Report 2018
Notes to Financial Statements31 December 2018
2.4 SUMMARY OF SIGNIFICANT ACCOUNTING POLICIES (continued)
Impairment of financial assets (policies under IFRS 9 applicable from 1 January 2018) (continued)
General approach (continued)The Group considers a financial asset in default when contractual payments are one year past due. However, in certain cases, the Group may also consider a financial asset to be in default when internal or external information indicates that the Group is unlikely to receive the outstanding contractual amounts in full before taking into account any credit enhancements held by the Group. A financial asset is written off when there is no reasonable expectation of recovering the contractual cash flows.
Debt investments at fair value through other comprehensive income and financial assets at amortised cost are subject to impairment under the general approach and they are classified within the following stages for measurement of ECLs except for trade receivables and contract assets which apply the simplified approach as detailed below.
Stage 1 — Financial instruments for which credit risk has not increased significantly since initial recognition and for which the loss allowance is measured at an amount equal to 12-month ECLs
Stage 2 — Financial instruments for which credit risk has increased significantly since initial recognition but that are not credit-impaired financial assets and for which the loss allowance is measured at an amount equal to lifetime ECLs
Stage 3 — Financial assets that are credit-impaired at the reporting date (but that are not purchased or originated credit-impaired) and for which the loss allowance is measured at an amount equal to lifetime ECLs
Simplified approachFor trade receivables and contract assets that do not contain a significant financing component or when the Group applies the practical expedient of not adjusting the effect of a significant financing component, the Group applies the simplified approach in calculating ECLs. Under the simplified approach, the Group does not track changes in credit risk, but instead recognises a loss allowance based on lifetime ECLs at each reporting date. The Group has established a provision matrix that is based on its historical credit loss experience, adjusted for forward-looking factors specific to the debtors and the economic environment.
For trade receivables and contract assets that contain a significant financing component and lease receivables, the Group chooses as its accounting policy to adopt the simplified approach in calculating ECLs with policies as described above.
121Haier Electronics Group Co., Ltd. Annual Report 2018
Notes to Financial Statements31 December 2018
2.4 SUMMARY OF SIGNIFICANT ACCOUNTING POLICIES (continued)
Impairment of financial assets (policies under IAS 39 applicable before 1 January 2018)
The Group assesses at the end of each reporting period whether there is objective evidence that a financial asset or a group of financial assets is impaired. An impairment exists if one or more events that occurred after the initial recognition of the asset have an impact on the estimated future cash flows of the financial asset or the group of financial assets that can be reliably estimated. Evidence of impairment may include indications that a debtor or a group of debtors is experiencing significant financial difficulty, default or delinquency in interest or principal payments, the probability that they will enter bankruptcy or other financial reorganisation and observable data indicating that there is a measurable decrease in the estimated future cash flows, such as changes in arrears or economic conditions that correlate with defaults.
Financial assets carried at amortised costFor financial assets carried at amortised cost, the Group first assesses whether impairment exists individually for financial assets that are individually significant, or collectively for financial assets that are not individually significant. If the Group determines that no objective evidence of impairment exists for an individually assessed financial asset, whether significant or not, it includes the asset in a group of financial assets with similar credit risk characteristics and collectively assesses them for impairment. Assets that are individually assessed for impairment and for which an impairment loss is, or continues to be, recognised are not included in a collective assessment of impairment.
The amount of any impairment loss identified is measured as the difference between the asset’s carrying amount and the present value of estimated future cash flows (excluding future credit losses that have not yet been incurred). The present value of the estimated future cash flows is discounted at the financial asset’s original effective interest rate (i.e., the effective interest rate computed at initial recognition).
The carrying amount of the asset is reduced through the use of an allowance account and the loss is recognised in the statement of profit or loss. Interest income continues to be accrued on the reduced carrying amount using the rate of interest used to discount the future cash flows for the purpose of measuring the impairment loss. Loans and receivables together with any associated allowance are written off when there is no realistic prospect of future recovery and all collateral has been realised or has been transferred to the Group.
If, in a subsequent period, the amount of the estimated impairment loss increases or decreases because of an event occurring after the impairment was recognised, the previously recognised impairment loss is increased or reduced by adjusting the allowance account. If a write-off is later recovered, the recovery is credited to the statement of profit or loss.
122 Haier Electronics Group Co., Ltd. Annual Report 2018
Notes to Financial Statements31 December 2018
2.4 SUMMARY OF SIGNIFICANT ACCOUNTING POLICIES (continued)
Impairment of financial assets (policies under IAS 39 applicable before 1 January 2018) (continued)
Assets carried at costIf there is objective evidence that an impairment loss has been incurred on an unquoted equity instrument that is not carried at fair value because its fair value cannot be reliably measured, or on a derivative asset that is linked to and must be settled by delivery of such an unquoted equity instrument, the amount of the loss is measured as the difference between the asset’s carrying amount and the present value of estimated future cash flows discounted at the current market rate of return for a similar financial asset. Impairment losses on these assets are not reversed.
Available-for-sale financial investmentsFor available-for-sale financial investments, the Group assesses at the end of each reporting period whether there is objective evidence that an investment or a group of investments is impaired.
If an available-for-sale asset is impaired, an amount comprising the difference between its cost (net of any principal payment and amortisation) and its current fair value, less any impairment loss previously recognised in the statement of profit or loss, is removed from other comprehensive income and recognised in the statement of profit or loss.
In the case of equity investments classified as available for sale, objective evidence would include a significant or prolonged decline in the fair value of an investment below its cost. “Significant” is evaluated against the original cost of the investment and “prolonged” against the period in which the fair value has been below its original cost. Where there is evidence of impairment, the cumulative loss — measured as the difference between the acquisition cost and the current fair value, less any impairment loss on that investment previously recognised in the statement of profit or loss — is removed from other comprehensive income and recognised in the statement of profit or loss. Impairment losses on equity instruments classified as available for sale are not reversed through the statement of profit or loss. Increases in their fair value after impairment are recognised directly in other comprehensive income.
The determination of what is “significant” or “prolonged” requires judgement. In making this judgement, the Group evaluates, among other factors, the duration or extent to which the fair value of an investment is less than its cost.
In the case of debt instruments classified as available for sale, impairment is assessed based on the same criteria as financial assets carried at amortised cost. However, the amount recorded for impairment is the cumulative loss measured as the difference between the amortised cost and the current fair value, less any impairment loss on that investment previously recognised in the statement of profit or loss. Future interest income continues to be accrued based on the reduced carrying amount of the asset using the rate of interest used to discount the future cash flows for the purpose of measuring the impairment loss. The interest income is recorded as part of finance income. Impairment losses on debt instruments are reversed through the statement of profit or loss if the subsequent increase in fair value of the instruments can be objectively related to an event occurring after the impairment loss was recognised in the statement of profit or loss.

123Haier Electronics Group Co., Ltd. Annual Report 2018
Notes to Financial Statements31 December 2018
2.4 SUMMARY OF SIGNIFICANT ACCOUNTING POLICIES (continued)
Financial liabilities (policies under IFRS 9 applicable from 1 January 2018 and IAS 39 applicable before 1 January 2018)
Initial recognition and measurementFinancial liabilities are classified, at initial recognition, as financial liabilities at fair value through profit or loss, loans and borrowings, payables, or as derivatives designated as hedging instruments in an effective hedge, as appropriate.
All financial liabilities are recognised initially at fair value and, in the case of loans and borrowings and payables, net of directly attributable transaction costs.
Subsequent measurementThe subsequent measurement of financial liabilities depends on their classification as follows:
Financial liabilities at fair value through profit or loss (policies under IFRS 9 applicable from 1 January 2018)Financial liabilities at fair value through profit or loss include financial liabilities held for trading and financial liabilities designated upon initial recognition as at fair value through profit or loss.
Financial liabilities are classified as held for trading if they are incurred for the purpose of repurchasing in the near term. This category also includes derivative financial instruments entered into by the Group that are not designated as hedging instruments in hedge relationships as defined by IFRS 9. Separated embedded derivatives are also classified as held for trading unless they are designated as effective hedging instruments. Gains or losses on liabilities held for trading are recognised in the statement of profit or loss. The net fair value gain or loss recognised in the statement of profit or loss does not include any interest charged on these financial liabilities.
Financial liabilities designated upon initial recognition as at fair value through profit or loss are designated at the initial date of recognition, and only if the criteria in IFRS 9 are satisfied. Gains or losses on liabilities designated at fair value through profit or loss are recognised in the statement of profit or loss, except for the gains or losses arising from the Group’s own credit risk which are presented in other comprehensive income with no subsequent reclassification to the statement of profit or loss. The net fair value gain or loss recognised in the statement of profit or loss does not include any interest charged on these financial liabilities.
Financial liabilities at fair value through profit or loss (policies under IAS 39 applicable before 1 January 2018)Financial liabilities at fair value through profit or loss include financial liabilities held for trading and financial liabilities designated upon initial recognition as at fair value through profit or loss.

124 Haier Electronics Group Co., Ltd. Annual Report 2018
Notes to Financial Statements31 December 2018
2.4 SUMMARY OF SIGNIFICANT ACCOUNTING POLICIES (continued)
Financial liabilities (policies under IFRS 9 applicable from 1 January 2018 and IAS 39 applicable before 1 January 2018) (continued)
Financial liabilities at fair value through profit or loss (policies under IAS 39 applicable before 1 January 2018) (continued)Financial liabilities are classified as held for trading if they are acquired for the purpose of repurchasing in the near term. This category includes derivative financial instruments entered into by the Group that are not designated as hedging instruments in hedge relationships as defined by IAS 39. Separated embedded derivatives are also classified as held for trading unless they are designated as effective hedging instruments. Gains or losses on liabilities held for trading are recognised in the statement of profit or loss. The net fair value gain or loss recognised in the statement of profit or loss does not include any interest charged on these financial liabilities.
Financial liabilities designated upon initial recognition as at fair value through profit or loss are designated at the date of initial recognition and only if the criteria in IAS 39 are satisfied.
Loans and borrowingsAfter initial recognition, interest-bearing loans and borrowings are subsequently measured at amortised cost, using the effective interest rate method unless the effect of discounting would be immaterial, in which case they are stated at cost. Gains and losses are recognised in the statement of profit or loss when the liabilities are derecognised as well as through the effective interest rate amortisation process.
Amortised cost is calculated by taking into account any discount or premium on acquisition and fees or costs that are an integral part of the effective interest rate. The effective interest rate amortisation is included in finance costs in the statement of profit or loss.
Derecognition of financial liabilities (policies under IFRS 9 applicable from 1 January 2018 and IAS 39 applicable before 1 January 2018)
A financial liability is derecognised when the obligation under the liability is discharged or cancelled, or expires.
When an existing financial liability is replaced by another from the same lender on substantially different terms, or the terms of an existing liability are substantially modified, such an exchange or modification is treated as a derecognition of the original liability and the recognition of a new liability, and the difference between the respective carrying amounts is recognised in the statement of profit or loss.
Offsetting of financial instruments (policies under IFRS 9 applicable from 1 January 2018 and IAS 39 applicable before 1 January 2018)
Financial assets and financial liabilities are offset and the net amount is reported in the statement of financial position if there is a currently enforceable legal right to offset the recognised amounts and there is an intention to settle on a net basis, or to realise the assets and settle the liabilities simultaneously.

125Haier Electronics Group Co., Ltd. Annual Report 2018
Notes to Financial Statements31 December 2018
2.4 SUMMARY OF SIGNIFICANT ACCOUNTING POLICIES (continued)
Treasury shares
Own equity instruments which are reacquired and held by the Company or the Group (treasury shares) are recognised directly in equity at cost. No gain or loss is recognised in the statement of profit or loss on the purchase, sale, issue or cancellation of the Group’s own equity instruments.
Inventories
Inventories are stated at the lower of cost and net realisable value. Cost is determined on the weighted average basis and, in the case of work in progress and finished goods, comprises direct materials, direct labour and an appropriate proportion of overheads. Net realisable value is based on the estimated selling prices less any estimated costs to be incurred to completion and disposal.
Cash and cash equivalents
For the purpose of the consolidated statement of cash flows, cash and cash equivalents comprise cash on hand and demand deposits, and short term highly liquid investments that are readily convertible into known amounts of cash, are subject to an insignificant risk of changes in value, less bank overdrafts which are repayable on demand and form an integral part of the Group’s cash management.
For the purpose of the consolidated statement of financial position, cash and cash equivalents comprise cash on hand and at banks and other financial institutions, including term deposits, and assets similar in nature to cash, which are not restricted as to use.
Provisions
A provision is recognised when a present obligation (legal or constructive) has arisen as a result of a past event and it is probable that a future outflow of resources will be required to settle the obligation, provided that a reliable estimate can be made of the amount of the obligation.
When the effect of discounting is material, the amount recognised for a provision is the present value at the end of the reporting period of the future expenditures expected to be required to settle the obligation. The increase in the discounted present value amount arising from the passage of time is included in finance costs in the statement of profit or loss.
The Group provides for warranties in relation to the sale of certain washing machines and water heaters for general repairs of defects occurring during the warranty period. Provisions for these assurance-type warranties granted by the Group on certain products are recognised based on sales volume and past experience of the level of repairs or returns, discounted to their present values as appropriate.
A contingent liability recognised in a business combination is initially measured at its fair value. Subsequently, it is measured at the higher of (i) the amount that would be recognised in accordance with the general guidance for provisions above; and (ii) the amount initially recognised less, when appropriate, the cumulative amount of income recognised in accordance with the guidance for revenue recognition.

126 Haier Electronics Group Co., Ltd. Annual Report 2018
Notes to Financial Statements31 December 2018
2.4 SUMMARY OF SIGNIFICANT ACCOUNTING POLICIES (continued)
Income tax
Income tax comprises current and deferred tax. Income tax relating to items recognised outside profit or loss is recognised outside profit or loss, either in other comprehensive income or directly in equity.
Current tax assets and liabilities are measured at the amount expected to be recovered from or paid to the taxation authorities, based on tax rates (and tax laws) that have been enacted or substantively enacted by the end of the reporting period, taking into consideration interpretations and practices prevailing in the countries in which the Group operates.
Deferred tax is provided, using the liability method, on all temporary differences at the end of the reporting period between the tax bases of assets and liabilities and their carrying amounts for financial reporting purposes.
Deferred tax liabilities are recognised for all taxable temporary differences, except:
• when the deferred tax liability arises from the initial recognition of goodwill or an asset or liability in a transaction that is not a business combination and, at the time of the transaction, affects neither the accounting profit nor taxable profit or loss; and
• in respect of taxable temporary differences associated with investments in subsidiaries and associates, when the timing of the reversal of the temporary differences can be controlled and it is probable that the temporary differences will not reverse in the foreseeable future.
Deferred tax assets are recognised for all deductible temporary differences, the carryforward of unused tax credits and any unused tax losses. Deferred tax assets are recognised, to the extent that it is probable that taxable profit will be available against which the deductible temporary differences, the carryforward of unused tax credits and unused tax losses can be utilised, except:
• when the deferred tax asset relating to the deductible temporary differences arises from the initial recognition of an asset or liability in a transaction that is not a business combination and, at the time of the transaction, affects neither the accounting profit nor taxable profit or loss; and
• in respect of deductible temporary differences associated with investments in subsidiaries and associates, deferred tax assets are only recognised to the extent that it is probable that the temporary differences will reverse in the foreseeable future and taxable profit will be available against which the temporary differences can be utilised.
The carrying amount of deferred tax assets is reviewed at the end of each reporting period and reduced to the extent that it is no longer probable that sufficient taxable profit will be available to allow all or part of the deferred tax asset to be utilised. Unrecognised deferred tax assets are reassessed at the end of each reporting period and are recognised to the extent that it has become probable that sufficient taxable profit will be available to allow all or part of the deferred tax asset to be recovered.

127Haier Electronics Group Co., Ltd. Annual Report 2018
Notes to Financial Statements31 December 2018
2.4 SUMMARY OF SIGNIFICANT ACCOUNTING POLICIES (continued)
Income tax (continued)
Deferred tax assets and liabilities are measured at the tax rates that are expected to apply to the period when the asset is realised or the liability is settled, based on tax rates (and tax laws) that have been enacted or substantively enacted by the end of the reporting period.
Deferred tax assets and deferred tax liabilities are offset if and only if the Group has a legally enforceable right to set off current tax assets and current tax liabilities and the deferred tax assets and deferred tax liabilities relate to income taxes levied by the same taxation authority on either the same taxable entity or different taxable entities which intend either to settle current tax liabilities and assets on a net basis, or to realise the assets and settle the liabilities simultaneously, in each future period in which significant amounts of deferred tax liabilities or assets are expected to be settled or recovered.
Government grants
Government grants are recognised at their fair value where there is reasonable assurance that the grant will be received and all attaching conditions will be complied with. When the grant relates to an expense item, it is recognised as income on a systematic basis over the periods that the costs, which it is intended to compensate, are expensed.
Where the grant relates to an asset, the fair value is credited to a deferred income account and is released to the statement of profit or loss over the expected useful life of the relevant asset by equal annual instalments or deducted from the carrying amount of the asset and released to the statement of profit or loss by way of a reduced depreciation charge.
Revenue recognition
Revenue from contracts with customersRevenue from contracts with customers is recognised when control of goods or services is transferred to the customers at an amount that reflects the consideration to which the Group expects to be entitled in exchange for those goods or services.
When the consideration in a contract includes a variable amount, the amount of consideration is estimated to which the Group will be entitled in exchange for transferring the goods or services to the customer. The variable consideration is estimated at contract inception and constrained until it is highly probable that a significant revenue reversal in the amount of cumulative revenue recognised will not occur when the associated uncertainty with the variable consideration is subsequently resolved.

128 Haier Electronics Group Co., Ltd. Annual Report 2018
Notes to Financial Statements31 December 2018
2.4 SUMMARY OF SIGNIFICANT ACCOUNTING POLICIES (continued)
Revenue recognition (continued)
Revenue from contracts with customers (continued)When the contract contains a financing component which provides the customer a significant benefit of financing the transfer of goods or services to the customer for more than one year, revenue is measured at the present value of the amount receivable, discounted using the discount rate that would be reflected in a separate financing transaction between the Group and the customer at contract inception. When the contract contains a financing component which provides the Group a significant financial benefit for more than one year, revenue recognised under the contract includes the interest expense accreted on the contract liability under the effective interest method. For a contract where the period between the payment by the customer and the transfer of the promised goods or services is one year or less, the transaction price is not adjusted for the effects of a significant financing component, using the practical expedient in IFRS 15.
(a) Sale of goodsRevenue from the sale of goods is recognised at the point in time when control of the asset is transferred to the customer, generally on delivery of goods.
Some contracts for the sale of goods provide customers with rights of return and volume rebates. The rights of return and volume rebates give rise to variable consideration.
(i) Rights of returnFor contracts which provide a customer with a right to return the goods within a specified period, the expected value method is used to estimate the goods that will not be returned because this method best predicts the amount of variable consideration to which the Group will be entitled. The requirements in IFRS 15 on constraining estimates of variable consideration are applied in order to determine the amount of variable consideration that can be included in the transaction price. For goods that are expected to be returned, instead of revenue, a refund liability is recognised. A right-of-return asset (and the corresponding adjustment to cost of sales) is also recognised for the right to recover products from a customer.
(ii) Volume rebatesRetrospective volume rebates may be provided to certain customers once the quantity of products purchased during the period exceeds a threshold specified in the contract. Rebates are offset against amounts payable by the customer. To estimate the variable consideration for the expected future rebates, the most likely amount method is used for contracts with a single-volume threshold and the expected value method for contracts with more than one volume threshold. The selected method that best predicts the amount of variable consideration is primarily driven by the number of volume thresholds contained in the contract. The requirements on constraining estimates of variable consideration are applied and a refund liability for the expected future rebates is recognised.

129Haier Electronics Group Co., Ltd. Annual Report 2018
Notes to Financial Statements31 December 2018
2.4 SUMMARY OF SIGNIFICANT ACCOUNTING POLICIES (continued)
Revenue recognition (continued)
Revenue from contracts with customers (continued) (b) Rendering of services
Revenue from the provision of services is recognised over time, using an output method to measure progress towards complete satisfaction of the service, because the customer simultaneously receives and consumes the benefits provided by the Group.
Other incomeRental income is recognised on a time proportion basis over the lease terms.
Interest income is recognised on an accrual basis using the effective interest method by applying the rate that exactly discounts the estimated future cash receipts over the expected life of the financial instrument or a shorter period, when appropriate, to the net carrying amount of the financial asset.
Dividend income is recognised when the shareholders’ right to receive payment has been established, it is probable that the economic benefits associated with the dividend will flow to the Group and the amount of the dividend can be measured reliably.
Contract liabilities
A contract liability is the obligation to transfer goods or services to a customer for which the Group has received a consideration (or an amount of consideration that is due) from the customer. If a customer pays the consideration before the Group transfers goods or services to the customer, a contract liability is recognised when the payment is made or the payment is due (whichever is earlier). Contract liabilities are recognised as revenue when the Group performs under the contract.
Right-of-return assets
A right-of-return asset represents the Group’s right to recover the goods expected to be returned by customers. The asset is measured at the former carrying amount of the goods to be returned, less any expected costs to recover the goods, including any potential decreases in the value of the returned goods. The Group updates the measurement of the asset recorded for any revisions to its expected level of returns, as well as any additional decreases in the value of the returned goods.
Refund liabilities
A refund liability is the obligation to refund some or all of the consideration received (or receivable) from the customer and is measured at the amount the Group ultimately expects it will have to return to the customer. The Group updates its estimates of refund liabilities (and the corresponding change in the transaction price) at the end of each reporting period.

130 Haier Electronics Group Co., Ltd. Annual Report 2018
Notes to Financial Statements31 December 2018
2.4 SUMMARY OF SIGNIFICANT ACCOUNTING POLICIES (continued)
Put option liabilities
A put option liability is the obligation for the Group or Group’s subsidiaries to purchase certain subsidiaries equity instruments for cash or another financial asset gives rise to a financial liability carried at the present value of the redemption amount as at the end of the reporting period. The Group recognises the non-controlling interests that are granted put options, including the share of profits and losses, up to the end of the reporting period or the exercise date of the put options, whichever is earlier. Then, at the end of each reporting period, the Group de-recognises the non-controlling interests and recognises the put option financial liability with the difference recognised in equity as if the non-controlling interests are acquired at the end of reporting period.
Employee benefits
Share-based paymentsThe Company operates a restricted share award scheme (note 36) and a share option scheme (note 37) for the purpose of providing incentives and rewards to eligible participants who contribute to the success of the Group’s operations. Employees (including directors) of the Group receive remuneration in the form of share-based payments, whereby employees render services as consideration for equity instruments (“equity-settled transactions”).
The cost of equity-settled transactions is measured by reference to the fair value at the date at which they are granted. The fair value is determined by an external valuer using a binomial model or with reference to the share price at the date of grant, adjusted by the present value of the dividend expected to be received during the vesting period.
The cost of equity-settled transactions is recognised in employee benefit expense, together with a corresponding increase in equity, over the period in which the performance and/or service conditions are fulfilled. The cumulative expense recognised for equity-settled transactions at the end of each reporting period until the vesting date reflects the extent to which the vesting period has expired and the Group’s best estimate of the number of equity instruments that will ultimately vest. The charge or credit to the statement of profit or loss for a period represents the movement in the cumulative expense recognised as at the beginning and end of that period.
Service and non-market performance conditions are not taken into account when determining the grant date fair value of awards, but the likelihood of the conditions being met is assessed as part of the Group’s best estimate of the number of equity instruments that will ultimately vest. Market performance conditions are reflected within the grant date fair value. Any other conditions attached to an award, but without an associated service requirement, are considered to be non-vesting conditions. Non-vesting conditions are reflected in the fair value of an award and lead to an immediate expensing of an award unless there are also service and/or performance conditions.
For awards that do not ultimately vest because non-market performance and/or service conditions have not been met, no expense is recognised. Where awards include a market or non-vesting condition, the transactions are treated as vesting irrespective of whether the market or non-vesting condition is satisfied, provided that all other performance and/or service conditions are satisfied.

131Haier Electronics Group Co., Ltd. Annual Report 2018
Notes to Financial Statements31 December 2018
2.4 SUMMARY OF SIGNIFICANT ACCOUNTING POLICIES (continued)
Employee benefits (continued)
Share-based payments (continued)Where the terms of an equity-settled award are modified, as a minimum an expense is recognised as if the terms had not been modified, if the original terms of the award are met. In addition, an expense is recognised for any modification that increases the total fair value of the share-based payments, or is otherwise beneficial to the employee as measured at the date of modification.
Where an equity-settled award is cancelled, it is treated as if it had vested on the date of cancellation, and any expense not yet recognised for the award is recognised immediately. This includes any award where non-vesting conditions within the control of either the Group or the employee are not met. However, if a new award is substituted for the cancelled award, and is designated as a replacement award on the date that it is granted, the cancelled and new awards are treated as if they were a modification of the original award, as described in the previous paragraph.
The dilutive effect of outstanding options is reflected as additional share dilution in the computation of earnings per share.
Pension schemesThe Group operates a defined contribution Mandatory Provident Fund retirement benefit scheme (the “MPF Scheme”) under the Mandatory Provident Fund Schemes Ordinance for those employees who are eligible to participate in the MPF Scheme. Contributions are made based on a percentage of the employees’ basic salaries and are charged to the statement of profit or loss as they become payable in accordance with the rules of the MPF Scheme. The assets of the MPF Scheme are held separately from those of the Group in an independently administrated fund. The Group’s employer contributions vest fully with the employees when contributed into the MPF Scheme.
The employees of the Group’s subsidiaries which operate in Mainland China are required to participate in central pension schemes operated by the local municipal governments. These subsidiaries are required to contribute a certain percentage of their payroll costs to the central pension schemes. The contributions are charged to the statement of profit or loss as they become payable in accordance with the rules of the central pension schemes.
Dividends
Final dividends are recognised as a liability when they are approved by the shareholders in a general meeting. Proposed final dividends are disclosed in the notes to the financial statements.
Interim dividends are simultaneously proposed and declared, because the Company’s Bye-Laws grant the directors the authority to declare interim dividends. Consequently, interim dividends are recognised immediately as a liability when they are proposed and declared.

132 Haier Electronics Group Co., Ltd. Annual Report 2018
Notes to Financial Statements31 December 2018
2.4 SUMMARY OF SIGNIFICANT ACCOUNTING POLICIES (continued)
Foreign currencies
These financial statements are presented in RMB, which is the Group’s presentation currency. The functional currency of the Company is Hong Kong dollar while the RMB is used as the presentation currency of the financial statements of the Company for the purpose of aligning with the presentation currency of the Group. Each entity in the Group determines its own functional currency and items included in the financial statements of each entity are measured using that functional currency. Foreign currency transactions recorded by the entities in the Group are initially recorded using their respective functional currency rates prevailing at the dates of the transactions. Monetary assets and liabilities denominated in foreign currencies are translated at the functional currency rates of exchange ruling at the end of the reporting period. Differences arising on settlement or translation of monetary items are recognised in the statement of profit or loss.
Non-monetary items that are measured in terms of historical cost in a foreign currency are translated using the exchange rates at the dates of the initial transactions. Non-monetary items measured at fair value in a foreign currency are translated using the exchange rates at the date when the fair value was measured. The gain or loss arising on translation of a non-monetary item measured at fair value is treated in line with the recognition of the gain or loss on change in fair value of the item (i.e., translation difference on the item whose fair value gain or loss is recognised in other comprehensive income or profit or loss is also recognised in other comprehensive income or profit or loss, respectively).
In determining the exchange rate on initial recognition of the related asset, expense or income on the derecognition of a non-monetary asset or non-monetary liability relating to an advance consideration, the date of initial transaction is the date on which the Group initially recognises the non-monetary asset or non-monetary liability arising from the advance consideration. If there are multiple payments or receipts in advance, the Group determines the transaction date for each payment or receipt of the advance consideration.
The functional currencies of certain subsidiaries not established in the PRC are currencies other than the RMB. As at the end of the reporting period, the assets and liabilities of these entities are translated into RMB at exchange rates prevailing at the end of the reporting period and their statements of profit or loss are translated into RMB at the weighted average exchange rates for the year.
The resulting exchange differences are recognised in other comprehensive income and accumulated in the exchange fluctuation reserve. On disposal or liquidation of a foreign operation, the component of other comprehensive income relating to that particular foreign operation is recognised in the statement of profit or loss.
For the purpose of the consolidated statement of cash flows, the cash flows of the subsidiaries not established in the PRC are translated into RMB at the exchange rates ruling at the dates of the cash flows. Frequently recurring cash flows of these subsidiaries which arise throughout the year are translated into RMB at the weighted average exchange rates for the year.

133Haier Electronics Group Co., Ltd. Annual Report 2018
Notes to Financial Statements31 December 2018
3. SIGNIFICANT ACCOUNTING JUDGEMENTS AND ESTIMATES
The preparation of the Group’s financial statements requires management to make judgements, estimates and assumptions that affect the reported amounts of revenue, expenses, assets and liabilities, and their accompanying disclosures, and the disclosure of contingent liabilities. Uncertainty about these assumptions and estimates could result in outcomes that could require a material adjustment to the carrying amounts of the assets or liabilities affected in the future.
Judgements
In the process of applying the Group’s accounting policies, management has made the following judgements, apart from those involving estimations, which have the most significant effect on the amounts recognised in the financial statements:
Determining the method to estimate variable consideration and assessing the constraint for the sale of goodsCertain contracts for the sale of goods include a right of return and volume rebates that give rise to variable consideration. In estimating the variable consideration, the Group is required to use either the expected value method or the most likely amount method based on which method better predicts the amount of consideration to which it will be entitled.
The Group determined that the expected value method is the appropriate method to use in estimating the variable consideration for the sale of goods with rights of return, given the large number of customer contracts that have similar characteristics. In estimating the variable consideration for the sale of goods with volume rebates, the Group determined that using a combination of the most likely amount method and the expected value method is appropriate. The selected method that better predicts the amount of variable consideration related to volume rebates is primarily driven by the number of volume thresholds contained in the contract. The most likely amount method is used for those contracts with a single volume threshold, while the expected value method is used for contracts with more than one volume threshold.
Before including any amount of variable consideration in the transaction price, the Group considers whether the amount of variable consideration is constrained. The Group determined that the estimates of variable consideration are not constrained based on its historical experience, business forecast and the current economic conditions. In addition, the uncertainty on the variable consideration will be resolved within a short time frame.
Estimation uncertainty
The key assumptions concerning the future and other key sources of estimation uncertainty at the end of the reporting period, that have a significant risk of causing a material adjustment to the carrying amounts of assets and liabilities within the next financial year, are described below.

134 Haier Electronics Group Co., Ltd. Annual Report 2018
Notes to Financial Statements31 December 2018
3. SIGNIFICANT ACCOUNTING JUDGEMENTS AND ESTIMATES (continued)
Estimation uncertainty (continued)
Impairment of goodwillThe Group determines whether goodwill is impaired at least on an annual basis. This requires an estimation of the value-in-use or fair value less cost of disposal of the cash-generating units to which the goodwill is allocated. Estimating the value-in-use or fair value less cost of disposal requires the Group to make an estimate of the expected future cash flows from the cash-generating units and also to choose a suitable discount rate in order to calculate the present value of those cash flows. The carrying amount of goodwill at 31 December 2018 was RMB267,992,000 (2017: RMB424,863,000). Further details are given in note 17.
Provision for expected credit losses on trade receivablesThe Group uses a provision matrix to calculate ECLs for trade receivables. The provision rates are based on days past due for groupings of various customer segments that have similar loss patterns (i.e. by customer type).
The provision matrix is initially based on the Group’s historical observed default rates. The Group will calibrate the matrix to adjust the historical credit loss experience with forward-looking information. For instance, if forecast economic conditions (i.e., gross domestic products) are expected to deteriorate over the next year which can lead to an increased number of defaults, the historical default rates are adjusted. At each reporting date, the historical observed default rates are updated and changes in the forward-looking estimates are analysed.
The assessment of the correlation among historical observed default rates, forecast economic conditions and ECLs is a significant estimate. The amount of ECLs is sensitive to changes in circumstances and forecast economic conditions. The Group’s historical credit loss experience and forecast of economic conditions may also not be representative of customer’s actual default in the future. The information about the ECLs on the Group’s trade receivables is disclosed in note 23 to the financial statements.
Fair value of unlisted equity investmentsThe unlisted equity investments have been valued based on a market-based valuation technique as detailed in note 47 to the financial statements. The valuation requires the Group to determine the comparable public companies (peers) and select the price multiple. In addition, the Group makes estimates about the discount for illiquidity and size differences. The Group classifies the fair value of these investments as Level 3. The fair value of the unlisted equity investments at 31 December 2018 was RMB1,261,664,000 (2017: RMB1,283,082,000). Further details are included in note 20 to the financial statements.
Provision of inventoriesWrite-down of inventories to net realisable value is made based on the ageing and estimated net realisable value of inventories. The assessment of the write-down amount involves management’s judgements and estimates. Where the actual outcome or expectation in future is different from the original estimate, such differences will impact the carrying value of the inventories and the write-down charge/reversal in the period in which such estimate has been changed. At 31 December 2018, the carrying amount of inventories was RMB8,654,478,000 (2017: RMB8,414,473,000).

135Haier Electronics Group Co., Ltd. Annual Report 2018
Notes to Financial Statements31 December 2018
3. SIGNIFICANT ACCOUNTING JUDGEMENTS AND ESTIMATES (continued)
Estimation uncertainty (continued)
Product warranty provisionsProduct warranty provisions are made with reference to the sales volume and the expected unit cost for warranties. The assessment of the provision amount involves management’s judgements and estimates. Where the actual outcome or expectation in future is different from the original estimate, such differences will impact the carrying amount of the product warranty provisions and the provision amount charged/reversed in the period in which such estimate has been changed. At 31 December 2018, the product warranty provisions amounted to RMB696,739,000 (2017: RMB715,060,000). Further details are included in note 33 to the financial statements.
Impairment of non-financial assets (other than goodwill)The Group assesses whether there are any indicators of impairment for all non-financial assets at the end of each reporting period. Indefinite life intangible assets are tested for impairment annually and at other times when such an indicator exists. Other non-financial assets are tested for impairment when there are indicators that the carrying amounts may not be recoverable. An impairment exists when the carrying value of an asset or a cash-generating unit exceeds its recoverable amount, which is the higher of its fair value less costs of disposal and its value-in-use. The calculation of the fair value less costs of disposal is based on available data from binding sales transactions in an arm’s length transaction of similar assets or observable market prices less incremental costs for disposing of the asset. When value-in-use calculations are undertaken, management must estimate the expected future cash flows from the asset or cash-generating unit and choose a suitable discount rate in order to calculate the present value of those cash flows.
Useful lives of items of property, plant and equipmentManagement determines the estimated useful lives and related depreciation for the Group’s property, plant and equipment. This estimate is based on the historical experience of the actual useful lives of items of property, plant and equipment of similar nature and functions. It could change significantly as a result of technical innovations and competitor actions in response to industry cycles. The depreciation charge will increase when the useful lives are less than the previously estimated useful lives, or management will write off or write down obsolete or non-strategic assets that have been abandoned or sold. At 31 December 2018, the carrying amount of the property, plant and equipment was RMB5,373,818,000 (2017: RMB4,087,863,000 (restated)).
Deferred tax assetsDeferred tax assets are recognised for deductible temporary differences, carryforward of unused tax credits and unused tax losses, to the extent that it is probable that taxable profit will be available against which the deductible temporary differences, and the carryforward of unused tax credits and unused tax losses can be utilised. Significant management judgement is required to determine the amount of deferred tax assets that can be recognised, based upon the likely timing and level of future taxable profits together with future tax planning strategies. The carrying value of deferred tax assets at 31 December 2018 was RMB879,786,000 (2017: RMB1,018,389,000 (restated)).

136 Haier Electronics Group Co., Ltd. Annual Report 2018
Notes to Financial Statements31 December 2018
4. OPERATING SEGMENT INFORMATION
For management purposes, the Group is organized into business units based on their products and services and has four reportable segments as follows:
(a) the washing machine business segment manufactures and sells washing machines;
(b) the water heater business segment manufactures and sells water heaters;
(c) the channel service business segment sells and distributes home appliances and other products as well as provides after-sales and other value-added consumer services; and
(d) the logistics business segment provides logistics services.
Management monitors the results of the Group’s operating segments separately for the purpose of making decisions about resource allocation and performance assessment. Segment performance is evaluated based on reportable segment profit, which is a measure of adjusted profit before tax. The adjusted profit before tax is measured consistently with the Group’s profit before tax except that treasury and investment income, corporate and other unallocated income and gains, corporate and other unallocated expenses and losses as well as finance costs are excluded from such measurement.
Segment assets exclude equity investments designated at fair value through other comprehensive income/available-for-sale investments, deferred tax assets, wealth management products included in other financial assets, pledged deposits, cash and cash equivalents, asset and disposal group held for sale and corporate and other unallocated assets as these assets are managed on a group basis.
Segment liabilities exclude deferred tax liabilities, tax payable, interest-bearing borrowings, liabilities directly associated with the assets classified as held for sale corporate and other unallocated liabilities as these liabilities are managed on a group basis.
Intersegment sales of the washing machine and water heater businesses represent the sales of washing machines and water heaters through the Group’s channel service business. Intersegment sales of logistics business represent the logistics services provided to customers of the washing machine, water heater as well as channel service businesses, while intersegment sales of the channel service business represent the after-sales services provided to customers of the washing machine, water heater and logistics businesses. Such intersegment sales and transfers are transacted in accordance with the terms and conditions mutually agreed by the parties involved.

137Haier Electronics Group Co., Ltd. Annual Report 2018
Notes to Financial Statements31 December 2018
4. OPERATING SEGMENT INFORMATION (continued)
Washing machine business Water heater business Channel service business Logistics business Consolidated2018 2017 2018 2017 2018 2017 2018 2017 2018 2017
RMB’000 RMB’000 RMB’000 RMB’000 RMB’000 RMB’000 RMB’000 RMB’000 RMB’000 RMB’000(Restated) (Restated) (Restated) (Restated)
Segment revenue (note 5)Sales to external customers
Sales of goods 6,908,466 6,454,132 1,552,634 1,063,686 67,479,221 63,073,995 — — 75,940,321 70,591,813Rendering of services — — — — 258,154 256,856 9,051,566 7,892,011 9,309,720 8,148,867
6,908,466 6,454,132 1,552,634 1,063,686 67,737,375 63,330,851 9,051,566 7,892,011 85,250,041 78,740,680Intersegment sales 14,580,963 13,081,423 5,567,610 5,367,129 297,701 274,935 1,092,739 1,108,424 21,539,013 19,831,911
Total 21,489,429 19,535,555 7,120,244 6,430,815 68,035,076 63,605,786 10,144,305 9,000,435 106,789,054 98,572,591
Reconciliation:Elimination of intersegment sales (21,539,013) (19,831,911)
Segment revenue 85,250,041 78,740,680Segment other income and gains 180,841 184,600 94,492 64,618 30,169 34,882 308,203 82,144 613,705 366,244
Total segment revenue and other income and gains 85,863,746 79,106,924
Segment results 2,048,033 1,861,700 884,493 784,111 1,322,745 1,122,156 396,849 432,651 4,652,120 4,200,618Reconciliation:Elimination of intersegment results (140,745) (174,405)Treasury and investment income
(note 5) 521,344 315,992Corporate and other unallocated
income and gains 230 135,649Corporate and other unallocated
expenses and losses (157,960) (151,632)Finance costs (note 7) (10,908) (11,121)
Profit before tax 4,864,081 4,315,101

138 Haier Electronics Group Co., Ltd. Annual Report 2018
Notes to Financial Statements31 December 2018
4. OPERATING SEGMENT INFORMATION (continued)
Washing machine business
Water heater business
Channel service business
Logistics business Consolidated
2018 2017 2018 2017 2018 2017 2018 2017 2018 2017RMB’000 RMB’000 RMB’000 RMB’000 RMB’000 RMB’000 RMB’000 RMB’000 RMB’000 RMB’000
(Restated) (Restated) (Restated) (Restated)
Segment assets 7,337,829 5,952,202 2,151,191 1,511,056 10,808,616 11,132,749 5,897,806 6,079,775 26,195,442 24,675,782Reconciliation:Elimination of intersegment
receivables (5,620,600) (5,379,228)Deferred tax assets 879,786 1,018,389Wealth management products
included in other financial assets (note 25) 4,709,540 1,974,815
Pledged deposits 89,524 119,865Cash and cash equivalents 14,660,708 15,040,624Equity investments designated at
fair value through other comprehensive income (note 20) 1,261,664 —
Available-for-sale investments (note 20) — 1,283,082
Asset and disposal group held for sale (note 27) 144,091 —
Corporate and other unallocated assets 4,637,238 4,921,594
Total assets 46,957,393 43,654,923
Segment liabilities 3,410,380 3,942,744 1,627,813 1,837,034 13,279,290 12,818,315 3,550,926 3,436,952 21,868,409 22,035,045Reconciliation:Elimination of intersegment
payables (5,620,600) (5,379,228)Deferred tax liabilities 98,611 178,385Tax payable 780,261 841,207Interest-bearing borrowings 92,374 192,624Liabilities directly associated with
the assets classified as held for sale (note 27) 32,362 —
Corporate and other unallocated liabilities 3,957,692 2,756,439
Total liabilities 21,209,109 20,624,472

139Haier Electronics Group Co., Ltd. Annual Report 2018
Notes to Financial Statements31 December 2018
4. OPERATING SEGMENT INFORMATION (continued)
Washing machine business
Water heater business
Channel service business
Logistics business Consolidated
2018 2017 2018 2017 2018 2017 2018 2017 2018 2017RMB’000 RMB’000 RMB’000 RMB’000 RMB’000 RMB’000 RMB’000 RMB’000 RMB’000 RMB’000
(Restated) (Restated)
Other segment information:Investments in associates — — — — — — 791 93,344 791 93,344Corporate and other unallocated
amounts 177,282 153,803
178,073 247,147
Share of profits and losses of associates — — — — — — 192 1,475 192 1,475
Corporate and other unallocated amounts (538) 2,666
(346) 4,141
Product warranty and installation provisions 596,344 548,485 462,662 451,665 — — — — 1,059,006 1,000,150
Provision for obsolete and slow-moving inventories 85,067 71,889 21,138 14,757 125,195 85,233 — — 231,400 171,879
Impairment of trade receivables, net 8,866 766 (3,168) 2,266 (3,728) 96 1,292 405 3,262 3,533Impairment of prepayments and other
receivables and other assets, net — 74 — 14 4,975 (6,510) 64 2,135 5,039 (4,287)Loss/(gain) on disposal/write-off of items
of property, plant and equipment and prepaid land lease payments, net (2,470) 4,304 (1,446) 2,241 452 (4) (161,920) 277 (165,384) 6,818
Corporate and other unallocated amounts 4 —
(165,380) 6,818
Loss on disposal/write-off of intangible assets — — — — — 34,467 — — — 34,467
Loss on impairment of intangible assets — — — — — 9,966 — — — 9,966Depreciation and amortisation 129,455 116,407 78,731 76,020 14,354 13,968 136,719 156,507 359,259 362,902Corporate and other unallocated
amounts 1,198 1,242
360,457 364,144
Capital expenditure* 1,244,753 645,789 412,469 116,529 68,986 5,967 627,463 563,865 2,353,671 1,332,150
* Capital expenditure consists of additions to property, plant and equipment, long-term prepayments, prepaid land lease payments, and intangible assets through cash payment of RMB2,338,703,000 (2017: RMB1,287,883,000 (restated)) and endorsement of bills receivable of RMB14,968,000 (2017: RMB44,267,000).

140 Haier Electronics Group Co., Ltd. Annual Report 2018
Notes to Financial Statements31 December 2018
4. OPERATING SEGMENT INFORMATION (continued)
Geographical information
(a) Revenue from external customers
2018 2017RMB’000 RMB’000
(Restated)
Mainland China 82,582,696 75,532,216Other countries/regions 2,667,345 3,208,464
85,250,041 78,740,680
(b) Non-current assets
2018 2017RMB’000 RMB’000
(Restated)
Segment non-current assetsMainland China 7,699,314 6,362,944Other countries/regions 153,764 161,608
7,853,078 6,524,552
Equity investments designated at fair value through other comprehensive income 1,261,664 —
Available-for-sale investments — 1,283,082Other non-current financial assets 422,878 45,742Deferred tax assets 879,786 1,018,389
Total 10,417,406 8,871,765
Information about major customers
During the year, there was no revenue from a single customer (2017: Nil) which individually accounted for 10% or more of the Group’s revenue.

141Haier Electronics Group Co., Ltd. Annual Report 2018
Notes to Financial Statements31 December 2018
5. REVENUE, OTHER INCOME AND GAINS
An analysis of revenue from contracts with customers is as follows:
2018 2017RMB’000 RMB’000
(Restated)
Sale of goods 75,940,321 70,591,813Rendering of services 9,309,720 8,148,867
85,250,041 78,740,680
Information about the Group’s performance obligations is summarised below:
Sale of goods
The performance obligation is satisfied upon delivery of goods and payment is generally due within 30 to 90 days from delivery, except for new customers, where payment in advance is normally required. Some contracts provide customers with a right of return and volume rebates which give rise to variable consideration subject to constraint.
Rendering of services
The performance obligation is satisfied over time as services are rendered and payment is generally due within 30 to 90 days from rendering the services. Service contracts are for periods of one year or less, or are billed based on the time incurred.

142 Haier Electronics Group Co., Ltd. Annual Report 2018
Notes to Financial Statements31 December 2018
5. REVENUE, OTHER INCOME AND GAINS (continued)
An analysis of other income and gains is as follows:
2018 2017RMB’000 RMB’000
(Restated)
Treasury and investment income:Bank interest income 305,468 229,086Return on investments in other financial assets# 111,053 45,853Dividend income from an equity investment designated
at fair value through other comprehensive income 104,823 —
Dividend income from available-for-sale investments — 41,053
521,344 315,992
Government grants* 216,569 218,282Compensation received from suppliers 114,123 91,556Gross rental income 2,137 2,352
Disposal gains:Items of property, plant and equipment and prepaid land
lease payments, net 165,380 —
Subsidiaries 79,275 —
Business — 23,585Associates and available-for-sale investment — 133,519
244,655 157,104
Gain on liquidation of subsidiaries — 14Gain on bargain purchase of an associate 185 —
Others 36,804 29,919
1,135,817 815,219
* Various government grants have been received for investments in certain regions in Mainland China in which the Company’s subsidiaries operate as well as for the Group’s technology advancements. There are no unfulfilled conditions or contingencies relating to these grants.
# The amount represents investment income in other financial assets of RMB102,355,000 (2017: RMB45,853,000) and their fair value changes of RMB8,698,000 (2017: nil).

143Haier Electronics Group Co., Ltd. Annual Report 2018
Notes to Financial Statements31 December 2018
6. PROFIT BEFORE TAX
The Group’s profit before tax is arrived at after charging/(crediting):
2018 2017
Notes RMB’000 RMB’000(Restated)
Cost of inventories sold 60,844,417 57,232,418Cost of services provided 8,535,333 7,217,462Depreciation of property, plant and equipment 14 314,810 319,509Depreciation of investment properties 15 2,063 2,134Recognition of prepaid land lease payments 16 27,316 28,454Amortisation of intangible assets* 18 11,768 12,170Amortisation of long-term prepayments 4,500 1,877Research and development costs** 783,345 626,466Auditor’s remuneration 7,365 8,200
Employee benefit expense: (including directors’ and chief executive’s remuneration — note 8):Wages and salaries 4,483,806 3,668,015Welfare 86,310 61,117Pension scheme contributions 410,331 361,848Share-based payment expense*** 10,653 13,899Equity-settled share option credit, net 37 — (27,243)Equity-settled Restricted Share Award Scheme
expense, net 36 125,090 154,501
5,116,190 4,232,137
Minimum lease payments under operating leases in respect of land and buildings 202,425 155,332
Product warranty and installation provisions 33 1,059,006 1,000,150Provision for obsolete and slow-moving inventories# 231,400 171,879Impairment of financial assets, net:
Impairment of trade receivables, net## 23 3,262 3,533Impairment of prepayments, other receivables and
other assets, net## 24 5,039 (4,287)Loss on disposal/write-off of items of property, plant
and equipment, net## — 6,818Loss on disposal/write-off of intangible assets## — 34,467Loss on impairment of intangible assets## 18 — 9,966Loss on disposal of subsidiaries, net## 41 — 1,480Foreign exchange differences, net (40,270) 26,075

144 Haier Electronics Group Co., Ltd. Annual Report 2018
Notes to Financial Statements31 December 2018
6. PROFIT BEFORE TAX (continued)
* The amortisation of intangible assets for the year is included in “Administrative expenses” in the consolidated statement of profit or loss.
** The research and development costs included mould charges of RMB456,316,000 (2017: RMB308,756,000) which are included in “Cost of sales” in the consolidated statement of profit or loss.
*** The management of certain subsidiaries of the Group has been granted equity interests in the respective subsidiaries under certain vesting conditions. The share-based payment expense is measured by reference to the fair value of the equity interests at the date of grant and is recognised over the period in which the performance and/or service conditions are fulfilled.
# The provision for obsolete and slow-moving inventories for the year is included in “Cost of sales” in the consolidated statement of profit or loss.
## These items are included in “Other expenses and losses” in the consolidated statement of profit or loss.
7. FINANCE COSTS
An analysis of finance costs is as follows:
2018 2017RMB’000 RMB’000
Interest on borrowings 10,908 10,657Interest on finance leases — 464
10,908 11,121
8. DIRECTORS’ AND CHIEF EXECUTIVE’S REMUNERATION
Directors’ and chief executive’s remuneration for the year, disclosed pursuant to the Rules Governing the Listing of Securities on the Hong Kong Stock Exchange (the “Listing Rules”), section 383(1)(a), (b), (c) and (f) of the Hong Kong Companies Ordinance and Part 2 of the Companies (Disclosure of Information about Benefits of Directors) Regulation, is as follows:
2018 2017RMB’000 RMB’000
Fees 1,605 1,516
Other emoluments:Salaries, allowances and benefits in kind 2,113 1,746Performance related bonuses 2,186 1,343Equity-settled share option credit, net — (3,363)Equity-settled Restricted Share Award Scheme expense 19,994 16,954Pension scheme contributions 165 124
24,458 16,804
26,063 18,320

145Haier Electronics Group Co., Ltd. Annual Report 2018
Notes to Financial Statements31 December 2018
8. DIRECTORS’ AND CHIEF EXECUTIVE’S REMUNERATION (continued)
(a) Independent non-executive directors
The remuneration of independent non-executive directors during the year is as follows:
Fees
Salaries, allowances benefits in
kind
Equity-settled share option
expense
Equity-settled Restricted Share
Award Scheme expense Total
RMB’000 RMB’000 RMB’000 RMB’000 RMB’000
2018Mr. Yu Hon To, David 279 18 — 381 678Mrs. Eva Cheng Li Kam Fun 279 18 — 304 601Ms. Tsou Kai-Lien, Rose* 116 5 — 227 348Mr. Gong Shao Lin** 120 8 — — 128
794 49 — 912 1,755
2017Mr. Yu Hon To, David 287 18 96 325 726Mrs. Eva Cheng Li Kam Fun 287 18 87 260 652Ms. Tsou Kai-Lien, Rose 239 6 66 195 506
813 42 249 780 1,884
* Ms. Tsou Kai-Lien, Rose resigned from an independence non-executive director of the Company with effect from 1 July 2018.
** Mr. Gong Shao Lin was appointed as an independence non-executive director of the Company with effect from 26 June 2018.
There were no other emoluments payable to the independent non-executive directors during the year (2017: Nil).

146 Haier Electronics Group Co., Ltd. Annual Report 2018
Notes to Financial Statements31 December 2018
8. DIRECTORS’ AND CHIEF EXECUTIVE’S REMUNERATION (continued)
(b) Executive directors, non-executive directors and the chief executive
Fees
Salaries,
allowances
and benefits
in kind
Performance-
related
bonuses
Equity-
settled
Restricted
Share Award
Scheme
expense
Pension
scheme
contributions Total
RMB’000 RMB’000 RMB’000 RMB’000 RMB’000 RMB’000
2018Executive directors:
Mr. Zhou Yun Jie 218 742 940 13,603 55 15,558
Mr. Sun Jing Yan 150 510 480 2,900 55 4,095
368 1,252 1,420 16,503 110 19,653
Non-executive directors:Mr. Liang Hai Shan — 142 — — — 142
Dr. Wang Han Hua 233 9 — 228 — 470
Ms. Tan Li Xia — 142 — — — 142
Mr. Yin Jing* 22 2 — — — 24
Mr. Yang Guang** 38 7 — — — 45
293 302 — 228 — 823
Chief executive:Mr. Li Hua Gang 150 510 766 2,351 55 3,832
811 2,064 2,186 19,082 165 24,308
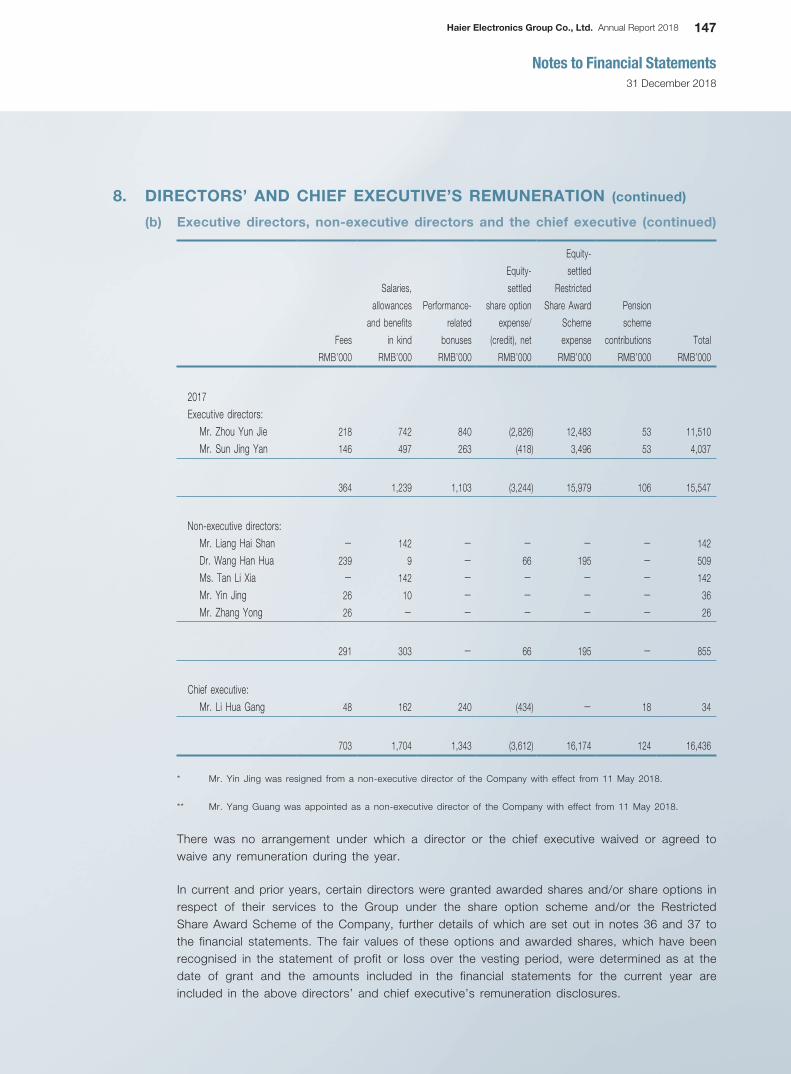
147Haier Electronics Group Co., Ltd. Annual Report 2018
Notes to Financial Statements31 December 2018
8. DIRECTORS’ AND CHIEF EXECUTIVE’S REMUNERATION (continued)
(b) Executive directors, non-executive directors and the chief executive (continued)
Fees
Salaries,
allowances
and benefits
in kind
Performance-
related
bonuses
Equity-
settled
share option
expense/
(credit), net
Equity-
settled
Restricted
Share Award
Scheme
expense
Pension
scheme
contributions Total
RMB’000 RMB’000 RMB’000 RMB’000 RMB’000 RMB’000 RMB’000
2017Executive directors:
Mr. Zhou Yun Jie 218 742 840 (2,826) 12,483 53 11,510
Mr. Sun Jing Yan 146 497 263 (418) 3,496 53 4,037
364 1,239 1,103 (3,244) 15,979 106 15,547
Non-executive directors:Mr. Liang Hai Shan — 142 — — — — 142
Dr. Wang Han Hua 239 9 — 66 195 — 509
Ms. Tan Li Xia — 142 — — — — 142
Mr. Yin Jing 26 10 — — — — 36
Mr. Zhang Yong 26 — — — — — 26
291 303 — 66 195 — 855
Chief executive:Mr. Li Hua Gang 48 162 240 (434) — 18 34
703 1,704 1,343 (3,612) 16,174 124 16,436
* Mr. Yin Jing was resigned from a non-executive director of the Company with effect from 11 May 2018.
** Mr. Yang Guang was appointed as a non-executive director of the Company with effect from 11 May 2018.
There was no arrangement under which a director or the chief executive waived or agreed to waive any remuneration during the year.
In current and prior years, certain directors were granted awarded shares and/or share options in respect of their services to the Group under the share option scheme and/or the Restricted Share Award Scheme of the Company, further details of which are set out in notes 36 and 37 to the financial statements. The fair values of these options and awarded shares, which have been recognised in the statement of profit or loss over the vesting period, were determined as at the date of grant and the amounts included in the financial statements for the current year are included in the above directors’ and chief executive’s remuneration disclosures.

148 Haier Electronics Group Co., Ltd. Annual Report 2018
Notes to Financial Statements31 December 2018
9. FIVE HIGHEST PAID EMPLOYEES
The five highest paid employees during the year included two directors (2017: two directors) and one chief executive (2017: nil), details of whose remuneration are set out in note 8 above. Details of the remuneration for the year of the remaining two (2017: three) highest paid non-director employees who are neither a director nor chief executive of the Company are as follows:
2018 2017RMB’000 RMB’000
Salaries, allowances and benefits in kind 1,708 1,842Equity-settled share option credit, net — (1,253)Equity-settled Restricted Share Award Scheme expense 4,776 8,918Pension scheme contributions 70 159
6,554 9,666
The number of non-director and non-chief executive highest paid employees whose remuneration fell within the following bands is as follows:
Number of employees2018 2017
HK$3,000,001 to HK$3,500,000 — 1HK$3,500,001 to HK$4,000,000 1 1HK$4,000,001 to HK$4,500,000 1 1
Total 2 3
In current and prior years, awarded shares and/or share options were granted to these non-director and non-chief executive highest paid employees in respect of their services to the Group under the share option scheme and the Restricted Share Award Scheme of the Company, further details of which are set out in notes 36 and 37 to the financial statements. The fair values of these options and awarded shares, which have been recognised in the statement of profit or loss over the vesting period, were determined as at the date of grant and the amounts included in the financial statements for the current year are included in the above non-director and non-chief executive highest paid employees’ remuneration disclosures.

149Haier Electronics Group Co., Ltd. Annual Report 2018
Notes to Financial Statements31 December 2018
10. INCOME TAX
Hong Kong profits tax has been provided at the rate of 16.5% (2017: 16.5%) on the estimated assessable profits arising in Hong Kong during the year. Tax on profits assessable in Mainland China has been calculated at the applicable PRC corporate income tax (“CIT”) rate. Certain subsidiaries of the Group are entitled to a preferential tax treatment of reduction in the CIT rate to 15%.
2018 2017RMB’000 RMB’000
(Restated)
CurrentCharge for the year 832,133 1,007,626Overprovision in prior years (4,869) (11,679)
Deferred (note 34) 46,712 (175,484)
Total tax charge for the year 873,976 820,463
A reconciliation of the tax expense applicable to profit before tax at the statutory rates for the jurisdictions in which the Company and the majority of its subsidiaries are domiciled to the tax expense at the effective tax rates is as follows:
2018 2017RMB’000 RMB’000
(Restated)
Profit before tax 4,864,081 4,315,101
Tax at the statutory tax rate 1,210,935 1,078,121Lower tax rates enacted by local authorities (374,427) (315,216)Effect of withholding tax on the distributable profits of the
Group’s PRC subsidiaries 65,500 123,748Effect on opening deferred tax of decrease in rates 6,011 1,811Adjustments in respect of current tax of previous periods (4,869) (11,679)Adjustments in respect of deferred tax of previous periods — (26,835)Profits and losses attributable to associates 87 (197)Income not subject to tax (12,005) (954)Expenses not deductible for tax 33,871 34,494Tax losses not recognised 51,550 18,748Tax losses utilised from previous periods (37,650) (93,151)Deductible temporary differences not recognised (23,922) 11,573Additional deduction allowance for research and
development costs (41,105) —
Tax charge at the Group’s effective rate 873,976 820,463
The share of tax attributable to associates amounting to RMB92,000 (2017: RMB147,000) is included in “Share of profits and losses of associates” in the consolidated statement of profit or loss.
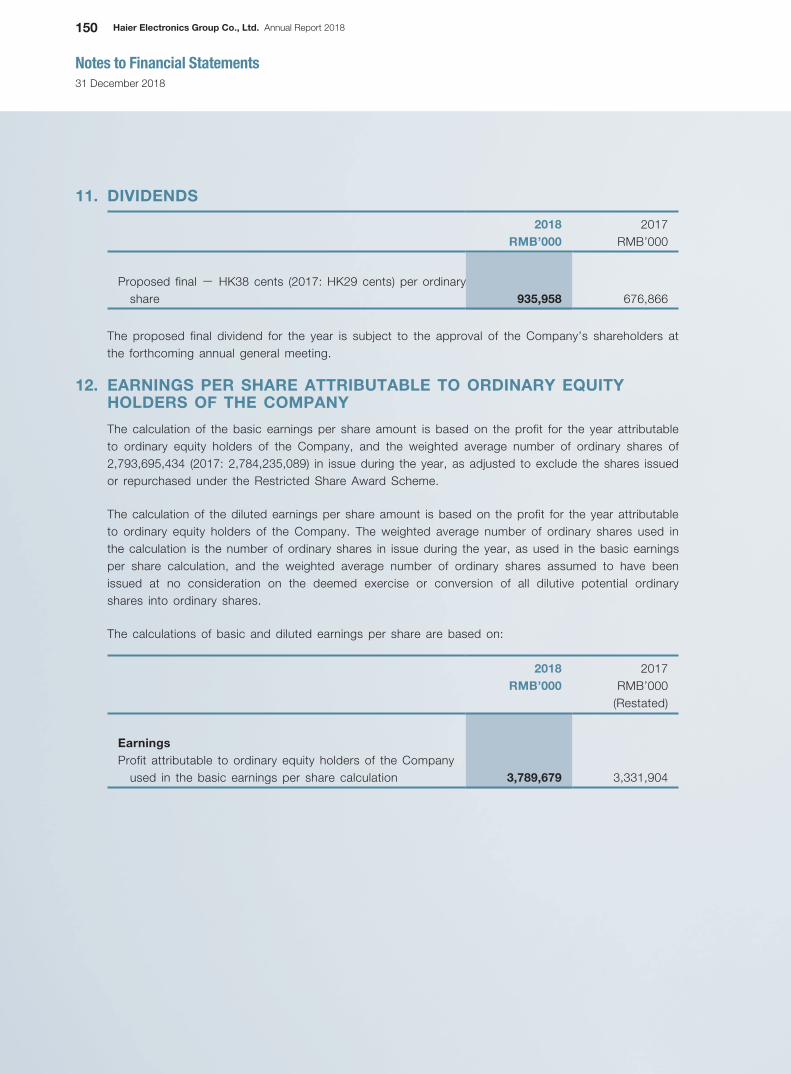
150 Haier Electronics Group Co., Ltd. Annual Report 2018
Notes to Financial Statements31 December 2018
11. DIVIDENDS
2018 2017RMB’000 RMB’000
Proposed final — HK38 cents (2017: HK29 cents) per ordinary share 935,958 676,866
The proposed final dividend for the year is subject to the approval of the Company’s shareholders at the forthcoming annual general meeting.
12. EARNINGS PER SHARE ATTRIBUTABLE TO ORDINARY EQUITY HOLDERS OF THE COMPANY
The calculation of the basic earnings per share amount is based on the profit for the year attributable to ordinary equity holders of the Company, and the weighted average number of ordinary shares of 2,793,695,434 (2017: 2,784,235,089) in issue during the year, as adjusted to exclude the shares issued or repurchased under the Restricted Share Award Scheme.
The calculation of the diluted earnings per share amount is based on the profit for the year attributable to ordinary equity holders of the Company. The weighted average number of ordinary shares used in the calculation is the number of ordinary shares in issue during the year, as used in the basic earnings per share calculation, and the weighted average number of ordinary shares assumed to have been issued at no consideration on the deemed exercise or conversion of all dilutive potential ordinary shares into ordinary shares.
The calculations of basic and diluted earnings per share are based on:
2018 2017RMB’000 RMB’000
(Restated)
EarningsProfit attributable to ordinary equity holders of the Company
used in the basic earnings per share calculation 3,789,679 3,331,904

151Haier Electronics Group Co., Ltd. Annual Report 2018
Notes to Financial Statements31 December 2018
12. EARNINGS PER SHARE ATTRIBUTABLE TO ORDINARY EQUITY HOLDERS OF THE COMPANY (continued)
Number of shares2018 2017
SharesWeighted average number of ordinary shares in issue during
the year used in the basic earnings per share calculation 2,793,695,434 2,784,235,089
Effect of dilution — weighted average number of ordinary shares:
Share options 1,204,791 3,414,062Restricted share award 17,908,344 16,942,647
19,113,135 20,356,709
Total 2,812,808,569 2,804,591,798
13. RELATED PARTY TRANSACTIONS
(a) During the year, in addition to the transactions detailed elsewhere in these financial statements, the Group had the following material transactions with Haier Corp and its subsidiaries and/or associates (collectively referred to as “Haier Affiliates”) and non-controlling shareholders (and their affiliates):
2018 2017RMB’000 RMB’000
Haier Affiliates:Export sale of products 2,084,713 1,811,425Export sale expenses (31,087) (27,046)Export sale of products after sale expenses 2,053,626 1,784,379Domestic sale of products 87,020 95,368Purchase of finished goods 39,973,193 41,161,645Purchase of raw materials 18,129,214 16,517,153Purchase of equipment 244,057 103,018Mould charges 246,215 231,207Utility service fee expenses 139,335 139,101Research and development service fees 190,152 161,454Other service fee expenses 376,721 299,228Interest income 7,608 6,215Interest expenses 368 290Other financial service fees 32,588 33,000Logistics service income 2,755,797 2,364,627After-sales service income 223,297 207,635
Non-controlling shareholders:Logistics service income 1,942,852 1,888,955Logistics service fees 238,843 153,155General service fees 322,396 264,332

152 Haier Electronics Group Co., Ltd. Annual Report 2018
Notes to Financial Statements31 December 2018
13. RELATED PARTY TRANSACTIONS (continued)
(a) (continued)
The above transactions were conducted in accordance with the terms and conditions mutually agreed by the parties involved.
The transactions with Haier Affiliates and non-controlling shareholders (and their affiliates) also constitute continuing connected transactions as defined in Chapter 14A of the Listing Rules.
(b) Other transactions with related parties:
(i) During the year, the Group acquired an additional 25% equity interest in Jushanghui from a fellow subsidiary of the Group at a cash consideration of RMB50,000,000, further details of which are set in note 2.1 to the financial statements.
(ii) During the year, as a result of the undertakings issued to the Group as detailed in note 14 to the financial statements, the Group reached an agreement with a Haier affiliate which agreed to compensate the Group for the expenses and/or losses arising from the relocation of two factories in Qingdao, the PRC. The compensation amount is RMB99,278,000, of which RMB30,000,000 has been paid to the Group during the year.
(iii) On 30 August 2018, the Group and Haier Electric International Co., Ltd. (“Haier International”), a subsidiary of Haier Corp, entered into an asset swap agreement, pursuant to which Guanmei (Shanghai) Enterprise Management Co., Ltd. (“Guanmei”), an indirect wholly-owned subsidiary of the Company, agreed to acquire and Haier International agreed to sell 51% of the equity interest in Qingdao Haishi Water Equipment Co., Ltd. (“Qingdao Haishi”) at a consideration of RMB1,074,000,000 to be satisfied by Guanmei by way of transfer of 55% of the equity interest in Bingji (Shanghai) Enterprise Management Co., Ltd. (“Bingji”), a wholly-owned subsidiary of Guanmei, from Guanmei to Haier International at the same consideration. Qingdao Haishi is principally engaged in the research and development and sale of household water purifying solutions, and Bingji is an investment holding company that indirectly controls Qingdao Gooday Logistics Co., Ltd. (“Gooday Logistics”), which is principally engaged in the business of providing logistics services in the PRC and primarily represents the logistics segment of the Group.
The above transaction was approved by shareholders of the Company in a special general meeting of the Company held on 21 November 2018 and is still pending approval or consent by the relevant government authorities in the PRC on the date of approval of the financial statements.
(iv) On 21 December 2018, the Group entered into acquisition agreements to acquire 6.33%, 0.08% and 0.08% (totally 6.49%) of the equity interests in Qingdao Haier Washing Machine Co., Ltd., an indirect non-wholly-owned subsidiary of the Company, from certain subsidiaries of Haier Corp, namely Qingdao Haier New Economics Consulting Limited, Qingdao Haier Components Procurement Limited, and Qingdao Haier International Trading Limited, respectively, for the cash consideration of RMB81,666,857, RMB1,032,125 and RMB1,032,125, respectively. The acquisition was completed on 30 January 2019.

153Haier Electronics Group Co., Ltd. Annual Report 2018
Notes to Financial Statements31 December 2018
13. RELATED PARTY TRANSACTIONS (continued)
(c) Compensation of key management personnel (including the directors and chief executive of the Company) of the Group:
2018 2017RMB’000 RMB’000
Short term employee benefits 9,597 8,182Post-employment benefits 360 315Equity-settled share option credit, net — (5,178)Equity-settled Restricted Share Award Scheme expense 30,180 29,714
Total compensation paid to key management personnel 40,137 33,033
Further details of directors’ and chief executive’s emoluments are included in note 8 to the financial statements.
The number of non-director and non-chief executive key management personnel whose remuneration fell within the following bands is as follows:
2018 2017
HK$2,000,001 to HK$2,500,000 1 —HK$2,500,001 to HK$3,000,000 — 1HK$3,000,001 to HK$3,500,000 2 2HK$3,500,001 to HK$4,000,000 1 1HK$4,000,001 to HK$4,500,000 1 1
5 5

154 Haier Electronics Group Co., Ltd. Annual Report 2018
Notes to Financial Statements31 December 2018
14. PROPERTY, PLANT AND EQUIPMENT
Freehold land Buildings
Leasehold improve-
mentsPlant and
machinery
Tools, furniture
and fixtures
Motor vehicles
Construction in progress Total
RMB’000 RMB’000 RMB’000 RMB’000 RMB’000 RMB’000 RMB’000 RMB’000
31 December 2018At 1 January 2018 (as
restated):Cost 19,853 2,817,898 68,613 1,633,777 150,193 198,022 737,682 5,626,038Accumulated depreciation
and impairment — (671,384) (24,030) (680,369) (70,787) (91,605) — (1,538,175)
Net carrying amount 19,853 2,146,514 44,583 953,408 79,406 106,417 737,682 4,087,863
Cost at 1 January 2018, net of accumulated depreciation and impairment 19,853 2,146,514 44,583 953,408 79,406 106,417 737,682 4,087,863
Additions — 23 3,666 8,209 2,766 16,054 1,995,842 2,026,560Acquisition of subsidiaries
(note 40) — — — — 1,829 1,709 — 3,538Disposal of subsidiaries
(note 41) — (151,372) (12,347) (10,065) (8,685) (84,442) (7,015) (273,926)Disposals/write-off — (133,781) — (18,911) (1,485) (3,119) — (157,296)Assets classified as held for
sale — — — — (29) (27) — (56)Depreciation provided during
the year — (124,845) (6,935) (145,179) (19,513) (18,338) — (314,810)Transfers — 287,593 — 459,627 42,768 23,820 (813,808) —
Exchange realignment 156 1,058 — 60 614 38 19 1,945
Cost at 31 December 2018, net of accumulated depreciation and impairment 20,009 2,025,190 28,967 1,247,149 97,671 42,112 1,912,720 5,373,818
At 31 December 2018:Cost 20,009 2,793,380 59,932 1,934,786 176,855 127,719 1,912,720 7,025,401Accumulated depreciation
and impairment — (768,190) (30,965) (687,637) (79,184) (85,607) — (1,651,583)
Net carrying amount 20,009 2,025,190 28,967 1,247,149 97,671 42,112 1,912,720 5,373,818
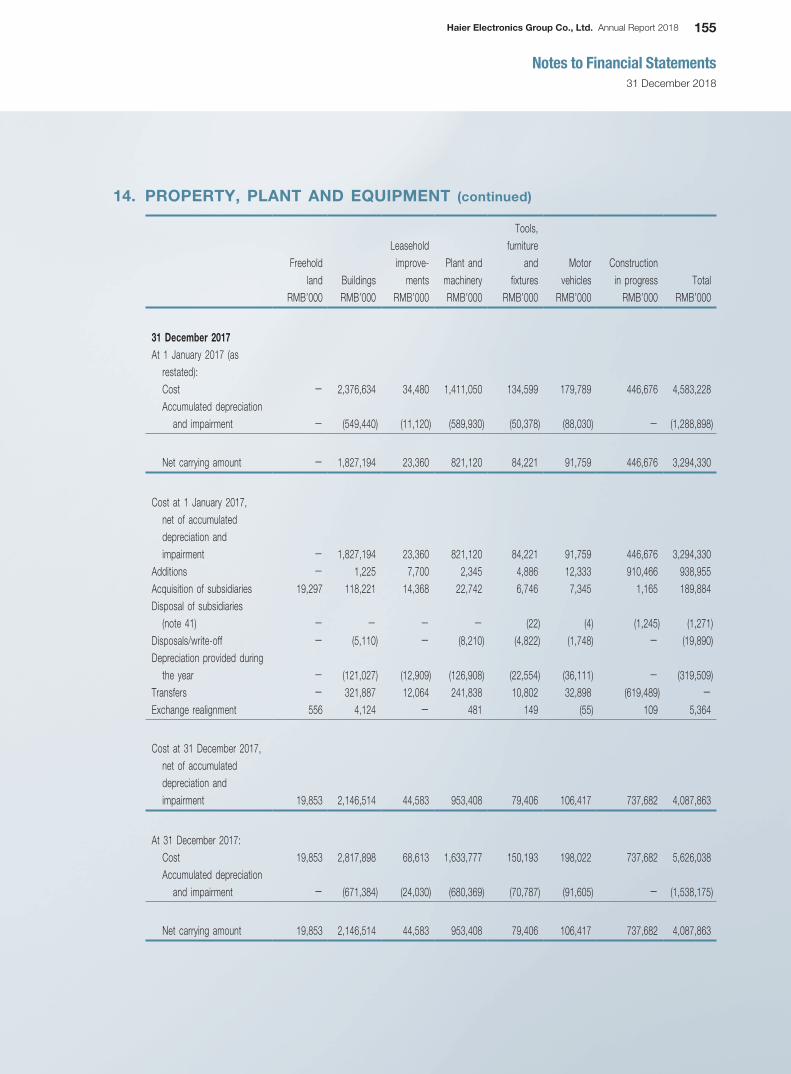
155Haier Electronics Group Co., Ltd. Annual Report 2018
Notes to Financial Statements31 December 2018
14. PROPERTY, PLANT AND EQUIPMENT (continued)
Freehold land Buildings
Leasehold improve-
mentsPlant and machinery
Tools, furniture
and fixtures
Motor vehicles
Construction in progress Total
RMB’000 RMB’000 RMB’000 RMB’000 RMB’000 RMB’000 RMB’000 RMB’000
31 December 2017At 1 January 2017 (as
restated):Cost — 2,376,634 34,480 1,411,050 134,599 179,789 446,676 4,583,228Accumulated depreciation
and impairment — (549,440) (11,120) (589,930) (50,378) (88,030) — (1,288,898)
Net carrying amount — 1,827,194 23,360 821,120 84,221 91,759 446,676 3,294,330
Cost at 1 January 2017, net of accumulated depreciation and impairment — 1,827,194 23,360 821,120 84,221 91,759 446,676 3,294,330
Additions — 1,225 7,700 2,345 4,886 12,333 910,466 938,955Acquisition of subsidiaries 19,297 118,221 14,368 22,742 6,746 7,345 1,165 189,884Disposal of subsidiaries
(note 41) — — — — (22) (4) (1,245) (1,271)Disposals/write-off — (5,110) — (8,210) (4,822) (1,748) — (19,890)Depreciation provided during
the year — (121,027) (12,909) (126,908) (22,554) (36,111) — (319,509)Transfers — 321,887 12,064 241,838 10,802 32,898 (619,489) —
Exchange realignment 556 4,124 — 481 149 (55) 109 5,364
Cost at 31 December 2017, net of accumulated depreciation and impairment 19,853 2,146,514 44,583 953,408 79,406 106,417 737,682 4,087,863
At 31 December 2017:Cost 19,853 2,817,898 68,613 1,633,777 150,193 198,022 737,682 5,626,038Accumulated depreciation
and impairment — (671,384) (24,030) (680,369) (70,787) (91,605) — (1,538,175)
Net carrying amount 19,853 2,146,514 44,583 953,408 79,406 106,417 737,682 4,087,863

156 Haier Electronics Group Co., Ltd. Annual Report 2018
Notes to Financial Statements31 December 2018
14. PROPERTY, PLANT AND EQUIPMENT (continued)
As at 31 December 2018, certain of the Group’s buildings with an aggregate net book value of approximately RMB530,906,000 (2017: RMB873,811,000) did not have building ownership certificates registered under the names of the respective subsidiaries of the Company.
With respect to the above properties, the Group’s investment properties and prepaid land lease payments, Haier Corp issued to the Group in prior years three undertakings pursuant to which Haier Corp agreed to provide other suitable properties to the Group to ensure that the operations of certain subsidiaries of the Company are not disrupted and/or indemnify the Group against the related losses. The aggregate net book value of the Group’s buildings indemnified by Haier Corp as at 31 December 2018 amounted to approximately RMB113,787,000 (2017: RMB116,782,000).
In the opinion of the directors, the Group is entitled to lawfully and validly occupy and/or use the buildings and investment properties for its daily operations, notwithstanding the fact that the related building ownership certificates have not yet been obtained.
At 31 December 2018, certain of the Group’s buildings with an aggregate carrying amount of approximately RMB45,853,000 (2017: RMB112,555,000) and certain parcels of the Group’s freehold land with an aggregate net carrying amount of approximately RMB9,464,000 (2017: RMB9,367,000) were pledged to secure bank loans granted to the Group (note 31).
15. INVESTMENT PROPERTIES
2018 2017RMB’000 RMB’000
Cost at 1 January, net of accumulated depreciation 29,415 33,142Depreciation provided during the year (2,063) (2,134)Exchange realignment 1,097 (1,593)
Cost at 31 December, net of accumulated depreciation 28,449 29,415
At 31 December:Cost 42,749 41,505Accumulated depreciation (14,300) (12,090)
Net carrying amount 28,449 29,415
The Group’s investment properties consist of one commercial property in Hong Kong and one industrial property in Mainland China.
In the opinion of the directors, the fair values of the Group’s investment properties erected on land in Hong Kong and Mainland China were approximately RMB27,365,000 (2017: RMB22,273,000) and RMB10,450,000 (2017: RMB11,946,000), respectively, as at 31 December 2018.
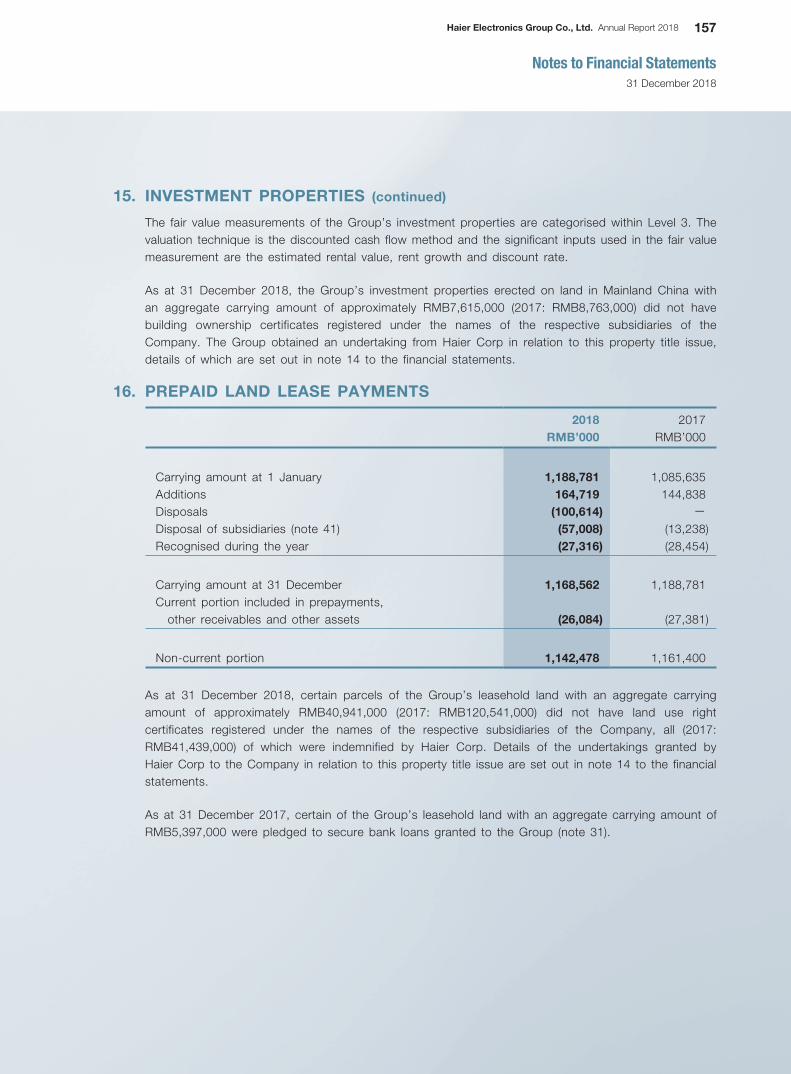
157Haier Electronics Group Co., Ltd. Annual Report 2018
Notes to Financial Statements31 December 2018
15. INVESTMENT PROPERTIES (continued)
The fair value measurements of the Group’s investment properties are categorised within Level 3. The valuation technique is the discounted cash flow method and the significant inputs used in the fair value measurement are the estimated rental value, rent growth and discount rate.
As at 31 December 2018, the Group’s investment properties erected on land in Mainland China with an aggregate carrying amount of approximately RMB7,615,000 (2017: RMB8,763,000) did not have building ownership certificates registered under the names of the respective subsidiaries of the Company. The Group obtained an undertaking from Haier Corp in relation to this property title issue, details of which are set out in note 14 to the financial statements.
16. PREPAID LAND LEASE PAYMENTS
2018 2017RMB’000 RMB’000
Carrying amount at 1 January 1,188,781 1,085,635Additions 164,719 144,838Disposals (100,614) —
Disposal of subsidiaries (note 41) (57,008) (13,238)Recognised during the year (27,316) (28,454)
Carrying amount at 31 December 1,168,562 1,188,781Current portion included in prepayments,
other receivables and other assets (26,084) (27,381)
Non-current portion 1,142,478 1,161,400
As at 31 December 2018, certain parcels of the Group’s leasehold land with an aggregate carrying amount of approximately RMB40,941,000 (2017: RMB120,541,000) did not have land use right certificates registered under the names of the respective subsidiaries of the Company, all (2017: RMB41,439,000) of which were indemnified by Haier Corp. Details of the undertakings granted by Haier Corp to the Company in relation to this property title issue are set out in note 14 to the financial statements.
As at 31 December 2017, certain of the Group’s leasehold land with an aggregate carrying amount of RMB5,397,000 were pledged to secure bank loans granted to the Group (note 31).

158 Haier Electronics Group Co., Ltd. Annual Report 2018
Notes to Financial Statements31 December 2018
17. GOODWILL
2018 2017RMB’000 RMB’000
Cost at 1 January 424,863 392,485Acquisition of a subsidiary (note 40) 161,084 32,378Disposal of subsidiaries (note 41) (317,955) —
Cost at 31 December 267,992 424,863
At 31 December:Cost 267,992 424,863Accumulated impairment — —
Net carrying amount 267,992 424,863
Goodwill acquired through business combinations are allocated to the following cash-generating units for impairment testing, all of which are under the logistics business segment, except for GREENoneTEC Solarindustrie GmbH which is under the water heater segment:
• Qingdao Goodaymart Wisdom Union Co, Ltd. (“Qingdao Furnishing Service”);
• Shanghai Boyol New Brothers Supply Chain Management Co., Ltd. (“Shanghai Beiye Supply Chain”);
• GREENoneTEC Solarindustrie GmbH. (“GoT”);
• Peiji Logistics Group Co., Ltd. (“Peiji Logistics”);
• Shanghai Grand Logistics Co., Ltd. (“Grand Logistics”); and
• Shengfeng Logistics Co., Ltd. (“Shengfeng Logistics”).

159Haier Electronics Group Co., Ltd. Annual Report 2018
Notes to Financial Statements31 December 2018
17. GOODWILL (continued)
The carrying amount of goodwill allocated to each of the cash-generating units is as follows:
2018 2017Notes RMB’000 RMB’000
Qingdao Furnishing Service (i) 6,123 6,123Shanghai Beiye Supply Chain (i) 68,407 68,407GoT (i) 3,299 3,299Peiji Logistics (i) 161,084 —
Grand Logistics (ii) 29,079 29,079Shengfeng Logistics (note 41) (iii) — 317,955
Net carrying amount 267,992 424,863
Notes:
(i) The recoverable amounts of Qingdao Furnishing Service, Shanghai Beiye Supply Chain, GoT and Peiji Logistics have been determined based on value in use calculations using cash flow projections based on financial budgets covering a five-year period approved by senior management and discount rates of 17.2%, 17.1%, 15.7% and 16.4% (2017: 17.2%, 18.5%, 15.7% and nil), respectively. The growth rate used to extrapolate the cash flows beyond the five-year period is 3% (2017: 3%).
Assumptions were used in the value in use calculation of the above cash-generating units for 31 December 2018. The following describes each key assumption on which management has based its cash flow projections to undertake impairment testing of goodwill:
Revenue growth rate — The basis used to determine the revenue growth rate is the average growth rate achieved in the years immediately before the budget year, increased for expected market development.
Budgeted gross margins — The basis used to determine the value assigned to the budgeted gross margins is the actual gross margin achieved in the year immediately before the budget year and expected market development.
Discount rates — The discount rates used are before tax and reflect specific risks relating to the relevant units.
(ii) The recoverable amount of Grand Logistics has been determined based on its fair value less cost of disposal categorised in Level 3 using cash flow projections based on a financial budget covering a ten-year period approved by senior management and a discount rate of 15.6% (2017: 15.8%). The growth rate used to extrapolate the cash flows beyond the ten-year period is 3% (2017: 3%).
Assumptions were used in the fair value calculation for 31 December 2018. The following describes each key assumption on which management has based its cash flow projections to determine the fair value:
Revenue growth rate — The basis used to determine the revenue growth rate is the average growth rate achieved in the years immediately before the budget year, increased for expected market development.
Budgeted gross margins — The basis used to determine the value assigned to the budgeted gross margins is the average gross margin in the years immediately before the budget year, increased for expected efficiency improvement and market development.
Discount rates — The discount rate used is before tax and reflect specific risks relating to the units.
(iii) The recoverable amount of Shengfeng Logistics was determined based on its fair value less cost of disposal categorised in Level 3 using cash flow projections based on financial budgets covering a ten-year period approved by senior management. The discount rate applied to the cash flow projections was 14.7% in 2017. The growth rate used to extrapolate the cash flows beyond the ten-year period was 3% in 2017.

160 Haier Electronics Group Co., Ltd. Annual Report 2018
Notes to Financial Statements31 December 2018
18. OTHER INTANGIBLE ASSETS
Software
Patents and
licencesCustomer
relationships Trademarks TotalRMB’000 RMB’000 RMB’000 RMB’000 RMB’000
(note)
31 December 2018
At 1 January 2018: (as restated)Cost 66,265 10,638 22,619 45,000 144,522Accumulated amortisation and
impairment (37,204) (7,090) (11,369) — (55,663)
Net carrying amount 29,061 3,548 11,250 45,000 88,859
Cost at 1 January 2018, net of accumulated amortisation and impairment 29,061 3,548 11,250 45,000 88,859
Additions 27,018 282 — — 27,300Acquisition of a subsidiary (note 40) 16 — — — 16Amortisation provided during the year (9,128) (1,238) (1,402) — (11,768)Disposal of subsidiaries (note 41) (2,437) — — — (2,437)Assets classified as held for sale (75) — — — (75)Exchange realignment (2) 24 — — 22
Cost at 31 December 2018, net of accumulated amortisation and impairment 44,453 2,616 9,848 45,000 101,917
At 31 December 2018:Cost 90,117 10,919 22,619 45,000 168,655Accumulated amortisation and
impairment (45,664) (8,303) (12,771) — (66,738)
Net carrying amount 44,453 2,616 9,848 45,000 101,917

161Haier Electronics Group Co., Ltd. Annual Report 2018
Notes to Financial Statements31 December 2018
18. OTHER INTANGIBLE ASSETS (continued)
Software
Patents and
licences
Management service
arrangementsCustomer
relationships Trademarks TotalRMB’000 RMB’000 RMB’000 RMB’000 RMB’000 RMB’000
(note)
31 December 2017
At 1 January 2017: (as restated)Cost 54,483 2,429 70,000 18,967 45,000 190,879Accumulated amortisation and impairment (29,269) (2,429) (19,250) (8,775) — (59,723)
Net carrying amount 25,214 — 50,750 10,192 45,000 131,156
Cost at 1 January 2017, net of accumulated amortisation and impairment 25,214 — 50,750 10,192 45,000 131,156
Additions 17,644 — — — — 17,644Acquisition of subsidiaries 1,471 4,178 — 3,652 — 9,301Amortisation provided during the year (5,305) (771) (3,500) (2,594) — (12,170)Disposals of subsidiaries (note 41) — — (47,250) — — (47,250)Impairment during the year (9,966) — — — — (9,966)Exchange realignment 3 141 — — — 144
Cost at 31 December 2017, net of accumulated amortisation and impairment 29,061 3,548 — 11,250 45,000 88,859
At 31 December 2017:Cost 66,265 10,638 — 22,619 45,000 144,522Accumulated amortisation and impairment (37,204) (7,090) — (11,369) — (55,663)
Net carrying amount 29,061 3,548 — 11,250 45,000 88,859
Note:
The trademarks are attributable to the cash-generating unit of Shanghai Beiye Supply Chain.

162 Haier Electronics Group Co., Ltd. Annual Report 2018
Notes to Financial Statements31 December 2018
19. INVESTMENTS IN ASSOCIATES
2018 2017RMB’000 RMB’000
(Restated)
Share of net assets 178,073 247,147
The associates of the Group are not individually material, and the aggregate financial information of the associates is illustrated in the following table:
2018 2017RMB’000 RMB’000
(Restated)
Share of the associates’ profits/(losses) for the year (346) 4,141Aggregate carrying amount of the Group’s investments
in the associates 178,073 247,147
The unrecognised share of losses of the above investments in associates accumulatively as at 31 December 2018 amounted to RMB6,836,000 (2017: RMB12,828,000).
20. EQUITY INVESTMENTS DESIGNATED AT FAIR VALUE THROUGH OTHER COMPREHENSIVE INCOME/AVAILABLE-FOR-SALE INVESTMENTS
2018 2017RMB’000 RMB’000
Equity investments designated at fair value through other comprehensive income
Unlisted equity investments, at fair value Sinopec Sales Co., Ltd. 1,261,664 —
Available-for-sale investmentsUnlisted equity investments, at cost — 1,283,107Impairment — (25)
— 1,283,082
The above equity investments were irrevocably designated at fair value through other comprehensive income as the Group considers these investments to be strategic in nature.
During the year ended 31 December 2018, the Group received dividends in the amount of RMB104,823,000 from the above investments.

163Haier Electronics Group Co., Ltd. Annual Report 2018
Notes to Financial Statements31 December 2018
21. OTHER NON-CURRENT FINANCIAL ASSETS
2018 2017RMB’000 RMB’000
Derivative financial instruments 95,519 45,742Non-current portion of wealth management products
(note 25) 327,359 —
422,878 45,742
The derivative financial instruments arose from acquisition of investee companies and they are measured at fair value and are categorised in Level 2 or Level 3 of the fair value measurement.
Details of wealth management products are set out in note 25 to the financial statements.
22. INVENTORIES
2018 2017RMB’000 RMB’000
Raw materials 72,352 133,534Work in progress 56,844 56,072Finished goods 8,525,282 8,224,867
8,654,478 8,414,473

164 Haier Electronics Group Co., Ltd. Annual Report 2018
Notes to Financial Statements31 December 2018
23. TRADE AND BILLS RECEIVABLES
2018 2017RMB’000 RMB’000
(Restated)
Trade receivables 3,636,122 3,331,162Impairment (61,318) (57,759)
Trade receivables, net 3,574,804 3,273,403Bills receivable 1,631,193 2,543,445
5,205,997 5,816,848
The Group’s trading terms with its customers are mainly on credit, except for new customers, where payment in advance is normally required. The credit period is generally ranging from 30 to 90 days. Each customer has a maximum credit limit. The Group seeks to maintain strict control over its outstanding receivables to minimise credit risk. Overdue balances are reviewed regularly by senior management. In view of the aforementioned and the fact that the Group’s trade receivables relate to a large number of diversified customers, there is no significant concentration of credit risk. The Group does not hold any collateral or other credit enhancements over its trade receivable balances. Trade receivables are non-interest-bearing.
An ageing analysis of the trade receivables as at the end of the reporting period, based on the invoice date and net of loss allowance, is as follows:
2018 2017RMB’000 RMB’000
(Restated)
Within 1 month 2,878,569 2,580,0331 to 2 months 477,963 408,1062 to 3 months 69,917 101,091Over 3 months 148,355 184,173
3,574,804 3,273,403

165Haier Electronics Group Co., Ltd. Annual Report 2018
Notes to Financial Statements31 December 2018
23. TRADE AND BILLS RECEIVABLES (continued)
The movements in the loss allowance for impairment of trade receivables are as follows:
2018 2017RMB’000 RMB’000
At beginning of year 57,759 60,109Impairment losses, net (note 6) 3,262 3,533Amount written off as uncollectible (8,300) (7,165)Acquisition of subsidiaries (note 40) 16,381 2,458Disposal of subsidiaries (7,610) (1,176)Amount classified as held for sale (174) —
At end of year 61,318 57,759
Impairment under IFRS 9 for the year ended 31 December 2018
An impairment analysis is performed at each reporting date using a provision matrix to measure expected credit losses. The provision rates are based on days past due for groupings of various customer segments with similar loss patterns (i.e., by customer type). The calculation reflects the probability-weighted outcome, the time value of money and reasonable and supportable information that is available at the reporting date about past events, current conditions and forecasts of future economic conditions. Generally, trade receivables are written off if past due for more than one year and are not subject to enforcement activity.
Set out below is the information about the credit risk exposure on the Group’s trade receivables using a provision matrix:
As at 31 December 2018
Past due
CurrentLess than
1 year1 to 2years
Over2 years Total
Expected credit loss rate 0.08% 7.26% 19.86% 92.51% 1.69%Gross carrying amount
(RMB’000) 3,446,806 101,285 41,811 46,220 3,636,122Expected credit losses
(RMB’000) 2,901 7,357 8,302 42,758 61,318

166 Haier Electronics Group Co., Ltd. Annual Report 2018
Notes to Financial Statements31 December 2018
23. TRADE AND BILLS RECEIVABLES (continued)
Impairment under IAS 39 for the year ended 31 December 2017
Included in the above provision for impairment of trade receivables, which was measured based on incurred credit losses under IAS 39, as at 31 December 2017 was a provision for individually impaired trade receivables of RMB57,759,000 with a carrying amount before provision of RMB128,868,000.
The individually impaired trade receivables as at 31 December 2017 related to customers that were in financial difficulties or in default in interest and/or principal payments and only a portion of the receivables is expected to be recovered.
The ageing analysis of the trade receivables as at 31 December 2017 that were not individually nor collectively considered to be impaired under IAS 39 is as follows:
2017RMB’000
(Restated)
Not past due 3,132,696Less than 1 year past due 62,2111 to 2 years past due 7,387
3,202,294
Receivables that were neither past due nor impaired related to customers for whom there was no recent history of default.
Receivables that were past due but not impaired related to a number of customers that had a good track record with the Group. Based on past experience, the directors of the Company were of the opinion that no provision for impairment under IAS 39 was necessary in respect of these balances as there had not been a significant change in credit quality and the balances were still considered fully recoverable.
Included in the Group’s trade and bills receivables are amounts due from Haier Affiliates of RMB1,823,604,000 (2017: RMB1,591,400,000) and amounts due from non-controlling shareholders (and their affiliates) of RMB456,107,000 (2017: RMB476,742,000), respectively, which are repayable on credit terms similar to those offered to the major customers of the Group. Further details of the sales to these related parties are set out in note 13 to the financial statements.
At 31 December 2018, certain of the Group’s bills receivable of approximately RMB35,108,000 (2017: RMB14,235,000) were pledged to secure certain of the Group’s bills payable (note 28).
At 31 December 2018, certain of the Group’s trade receivables of approximately RMB14,231,000 (2017: RMB57,203,000) were pledged to secure loans granted to the Group (note 31).

167Haier Electronics Group Co., Ltd. Annual Report 2018
Notes to Financial Statements31 December 2018
24. PREPAYMENTS, OTHER RECEIVABLES AND OTHER ASSETS
2018 2017RMB’000 RMB’000
(Restated)
CurrentPrepayments (note a) 1,226,831 1,505,176Other receivables (note a) 1,969,983 1,786,912Right-of-return assets 255,384 166,681
3,452,198 3,458,769Impairment allowance (49,190) (42,236)
3,403,008 3,416,533
Non-currentLong-term prepayments (note b) 760,351 485,005
4,163,359 3,901,538
The movements in provision for impairment of prepayments and other receivables are as follows:
2018 2017RMB’000 RMB’000
At 1 January 42,236 47,898Impairment losses, net (note 6) 5,039 (4,287)Amount written off as uncollectible (2,445) (2,170)Acquisition of subsidiaries (note 40) 4,660 795Amount classified as held for sale (300) —
At 31 December 49,190 42,236
Notes:
(a) Included in the Group’s prepayments and other receivables are amounts due from Haier Affiliates of RMB1,428,178,000 (2017: RMB1,474,373,000) and amounts due from non-controlling shareholders (and their affiliates) of RMB46,097,000 (2017: RMB48,540,000), respectively, which are unsecured, interest-free and repayable on demand.
Prepayments and other receivables mainly represent prepayments and the deposits with suppliers and other parties. The expected credit losses are estimated by applying a loss rate approach with reference to the historical loss record of the Group and is adjusted to reflect the current conditions and forecasts of future economic conditions, as appropriate. The loss rate applied as at 31 December 2018 was 1.54%. The credit quality of the financial assets included in prepayments and other receivables is considered to be normal because they are not past due and there is no information indicating that the financial assets had a significant increase in credit risk.
(b) Included in the Group’s long-term prepayments are advances made to Haier Affiliates relating to the acquisition of property, plant and equipment and prepaid land lease payments with an aggregate amount of RMB218,215,000 (2017: RMB229,672,000).

168 Haier Electronics Group Co., Ltd. Annual Report 2018
Notes to Financial Statements31 December 2018
25. OTHER FINANCIAL ASSETS
2018 2017RMB’000 RMB’000
Wealth management products 4,709,540 1,974,815Portion classified as non-current (note 21) (327,359) —
Current portion 4,382,181 1,974,815
As at the end of the reporting period, included in the Group’s wealth management products were products with floating returns amounting to RMB1,895,008,000 (2017: RMB1,195,550,000) which were measured at fair value through profit and loss; and products with fixed returns amounting to RMB2,814,532,000 (2017: RMB779,265,000) which were stated at amortised cost. All wealth management products are principal protected, except for a wealth management product of RMB350,000,000 included in current assets as at 31 December 2018. The expected credit losses for the assets measured at amortised cost are immaterial to the Group.
26. CASH AND CASH EQUIVALENTS AND PLEDGED DEPOSITS
2018 2017RMB’000 RMB’000
(Restated)
Cash and bank balances 3,545,810 4,351,964Time deposits 11,204,422 10,808,525
14,750,232 15,160,489Less: cash and bank balances pledged for:
bills payable (note 28) (57,853) (112,365)bank guarantees (31,671) (7,500)
(89,524) (119,865)
Cash and cash equivalents 14,660,708 15,040,624
At the end of the reporting period, the cash and bank balances and time deposits of the Group denominated in RMB amounted to RMB12,695,487,000 (2017: RMB13,954,307,000 (restated)). The RMB is not freely convertible into other currencies, however, under Mainland China’s Foreign Exchange Control Regulations and Administration of Settlement, Sale and Payment of Foreign Exchange Regulations, the Group is permitted to exchange RMB for other currencies through banks authorised to conduct foreign exchange business.

169Haier Electronics Group Co., Ltd. Annual Report 2018
Notes to Financial Statements31 December 2018
26. CASH AND CASH EQUIVALENTS AND PLEDGED DEPOSITS (continued)
Cash at banks earns interest at floating rates based on daily bank deposit rates. Time deposits are made for varying periods depending on the immediate cash requirements of the Group, and earn interest at the deposit rates of the respective periods. The bank balances and pledged deposits are deposited with creditworthy banks or financial institutions with no recent history of default. The Group expects no significant credit risk associated and that there would not be any significant losses due to non-performance by these counterparties.
Included in the Group’s cash and cash equivalents are deposits of approximately RMB1,926,953,000 (2017: RMB1,218,378,000 (restated)) placed with Haier Corp Finance Co., Ltd. (“Haier Finance”), which is a fellow subsidiary of the Group and is a financial institution approved by the People’s Bank of China. The interest rate on these deposits ranges from 0.30% to 3.20% per annum. Further details of the interest income attributable to the deposits placed with Haier Finance are set out in note 13 to the financial statements.
27. ASSET AND DISPOSAL GROUP HELD FOR SALE AND ASSOCIATED LIABILITIES
Asset heldfor sale
Disposal groupheld for sale and
associated liabilities Total
RMB’000 RMB’000 RMB’000(note a) (note b)
Assets 106,010 38,081 144,091Liabilities — 32,362 32,362
Notes:
(a) During the year, the Group agreed to sell its entire 58.08% equity interest in Shengfeng Logistics to its non-controlling shareholders for RMB798,354,000, of which 50.37% equity interest has been disposed of in 2018, while the remaining 7.71% equity interest is scheduled to be disposed of in 2019 and is carried at fair value of RMB106,010,000 as at 31 December 2018.
(b) During the year, the Group agreed to sell its entire 67.45% equity interest in Shanghai Guangfulai Co., Ltd., an indirect subsidiary, to its non-controlling shareholders for RMB5,059,000, and the transaction is scheduled to be completed in 2019.

170 Haier Electronics Group Co., Ltd. Annual Report 2018
Notes to Financial Statements31 December 2018
28. TRADE AND BILLS PAYABLES
2018 2017RMB’000 RMB’000
(Restated)
Trade payables 5,695,114 5,984,030Bills payable 85,608 106,405
5,780,722 6,090,435
An ageing analysis of the trade payables as at the end of the reporting period, based on the invoice date, is as follows:
2018 2017RMB’000 RMB’000
(Restated)
Within 1 month 4,884,971 5,293,4301 to 2 months 384,171 396,3692 to 3 months 65,848 71,930Over 3 months 360,124 222,301
5,695,114 5,984,030
The trade and bills payables are non-interest-bearing and are normally settled on credit terms ranging from 30 to 180 days.
Included in the Group’s trade payables are amounts due to Haier Affiliates of RMB3,009,446,000 (2017:RMB3,244,965,000 (restated)), which are repayable on credit terms similar to those offered by other similar suppliers of the Group. Further details of the purchases from these related parties are set out in note 13 to the financial statements.
At 31 December 2018, certain of the Group’s bills payable are secured by the pledge of the Group’s bank deposits amounting to RMB57,853,000 (2017: RMB112,365,000) (note 26) and the Group’s bills receivable amounting to RMB35,108,000 (2017: RMB14,235,000) (note 23).

171Haier Electronics Group Co., Ltd. Annual Report 2018
Notes to Financial Statements31 December 2018
29. OTHER PAYABLES AND ACCRUALS
2018 2017RMB’000 RMB’000
(Restated)
Other payables and accruals 5,468,287 5,467,552Refund liabilities:
Volume rebate 1,357,260 1,332,152Sales return 371,724 264,382
Deferred revenue 15,396 13,587
7,212,667 7,077,673
Other payables are non-interest-bearing and repayable on demand.
Included in the Group’s other payables and accruals are amounts due to Haier Affiliates of RMB566,525,000 (2017: RMB758,377,000) and amounts due to non-controlling shareholders (and their affiliates) of RMB1,811,000 (2017: RMB9,236,000), respectively, which are unsecured, interest-free and repayable on demand.
30. CONTRACT LIABILITIES
Contract liabilities mainly include short-term advances received from customers for sales of products and provision of logistics, after-sales and other value-added customer services.
2018 2017RMB’000 RMB’000
(Restated)
Sale of goods 4,114,270 4,017,371Rendering of services 69,488 114,838
4,183,758 4,132,209
There were contract liabilities of RMB4,017,371,000 and RMB56,704,000 brought forward from the prior year and recognised during the year as revenue from sales of goods and rendering of services, respectively.

172 Haier Electronics Group Co., Ltd. Annual Report 2018
Notes to Financial Statements31 December 2018
31. INTEREST-BEARING BORROWINGS
2018 2017Effective
interest rate (%) Maturity RMB’000
Effective interest rate
(%) Maturity RMB’000
CurrentBank loans — unsecured 3.88–4.75 2019 20,254 2.73 2018 287Bank loans — secured 0.09–2.50 2019 48,545 0.50–12.00 2018 158,262Other loans — secured — 10.00 2018 3,533
68,799 162,082
Non-currentBank loans — secured 2.50–3.00 2020–2024 23,575 2.50–3.00 2020–2024 30,542
92,374 192,624
Analysed into:Bank loans repayable:
Within one year or on demand 68,799 158,549
In the second to fifth years, inclusive 23,081 24,935
Beyond five years 494 5,607
92,374 189,091
Other borrowings repayable:Within one year or on
demand — 3,533
92,374 192,624
Certain of the Group’s bank loans are secured by:
(i) mortgages over the Group’s buildings, which had an aggregate carrying amount at the end of the reporting period of approximately RMB45,853,000 (2017: RMB112,555,000), and certain parcels of the Group’s freehold land with an aggregate net carrying amount of approximately RMB9,464,000 (2017: RMB9,367,000); and
(ii) pledge of the Group’s trade receivables totaling approximately RMB14,231,000 (2017: RMB53,670,000).

173Haier Electronics Group Co., Ltd. Annual Report 2018
Notes to Financial Statements31 December 2018
31. INTEREST-BEARING BORROWINGS (continued)
As at 31 December 2017, certain of the Group’s bank loans were also secured by mortgages over the Group’s leasehold land with an aggregate carrying amount of RMB5,397,000.
As at 31 December 2017, the Group’s other loans are secured by the pledge of the Group’s trade receivables totaling approximately of RMB3,533,000.
At the end of the reporting period, the Group’s interest-bearing borrowings were denominated in the following currencies:
2018 2017RMB’000 RMB’000
Renminbi 20,000 102,362Euro 72,120 89,975United States dollar 254 287
92,374 192,624
32. PUT OPTION LIABILITIES
The put option liabilities arose from the put options granted to non-controlling shareholders of the Group’s subsidiaries namely, GoT, Gooday Logistics and Peiji Logistics, to sell their respective interests in those entities to the Group at prices to be determined based on agreed formulas, and they are carried at fair values amounting to RMB55,959,000, RMB1,587,403,000 and RMB148,960,000 (2017: RMB55,510,000, RMB861,428,000, nil), respectively, as at 31 December 2018. Other than the put option liability attributable to Gooday Logistics which is categorised in Level 2 of the fair value measurement, all the put option liabilities are categorised in Level 3 of the fair value measurement.
33. PROVISIONS
2018 2017RMB’000 RMB’000
Product warranties 696,739 715,060Installation 340,992 313,813
1,037,731 1,028,873Portion classified as current liabilities (674,411) (674,397)
Non-current portion 363,320 354,476

174 Haier Electronics Group Co., Ltd. Annual Report 2018
Notes to Financial Statements31 December 2018
33. PROVISIONS (continued)
The movements in provisions are as follows:
2018 2017RMB’000 RMB’000
At 1 January 1,028,873 858,222Additional provision (note 6) 1,059,006 1,000,150Amounts utilised during the year (1,050,148) (833,699)Acquisition of subsidiaries — 4,200
At 31 December 1,037,731 1,028,873
The Group provides installation services and warranties of three to eight years to its customers for washing machines and water heaters, under which faulty products are repaired or replaced. The amount of the provision for the warranties is estimated based on sales volume and past experience of the level of installation services rendered, repairs and returns. The estimation basis is reviewed on an ongoing basis and revised where appropriate.
34. DEFERRED TAX
The movements in deferred tax assets and deferred tax liabilities during the year are as follows:
Deferred tax assets
2018Accruedexpense Provisions
Unrealised profits
Refund liabilities Others Total
RMB’000 RMB’000 RMB’000 RMB’000 RMB’000 RMB’000
At 1 January (as restated) 403,566 113,547 157,431 204,482 139,363 1,018,389Deferred tax credited/(charged) to the
statement of profit or loss during the year, net (note 10) (168,726) 2,804 49,093 258 (13,436) (130,007)
Deferred tax credited to the statement of other comprehensive income during the year — — — — 2,092 2,092
Acquisition of subsidiaries (note 40) — — — — 4,957 4,957
Disposal of subsidiaries (note 41) — — — — (15,645) (15,645)
At 31 December 234,840 116,351 206,524 204,740 117,331 879,786

175Haier Electronics Group Co., Ltd. Annual Report 2018
Notes to Financial Statements31 December 2018
34. DEFERRED TAX (continued)
Deferred tax assets (continued)
2017Accrued expense Provisions
Unrealised profits
Refund liabilities Others Total
RMB’000 RMB’000 RMB’000 RMB’000 RMB’000 RMB’000
At 1 January (as restated) 267,127 91,312 114,447 172,531 78,764 724,181Deferred tax credited to the
statement of profit or loss during the year, net (note 10) 136,439 22,235 42,984 31,951 58,929 292,538
Acquisition of subsidiaries — — — — 1,696 1,696Disposal of subsidiaries (note 41) — — — — (50) (50)Exchange differences — — — — 24 24
At 31 December 403,566 113,547 157,431 204,482 139,363 1,018,389
Deferred tax liabilities
2018Fair value
adjustments arising from
acquisition of subsidiaries
Withholding taxes Others Total
RMB’000 RMB’000 RMB’000 RMB’000
At 1 January 14,809 161,690 1,886 178,385Deferred tax charged/(credited) to the
statement of profit or loss during the year, net (note 10) (760) (84,500) 1,965 (83,295)
Deferred tax credited to the statement of other comprehensive income during the year — — 6,004 6,004
Disposal of subsidiaries (note 41) (2,483) — — (2,483)
At 31 December 11,566 77,190 9,855 98,611

176 Haier Electronics Group Co., Ltd. Annual Report 2018
Notes to Financial Statements31 December 2018
34. DEFERRED TAX (continued)
Deferred tax liabilities (continued)
2017Fair value
adjustments arising from
acquisition of subsidiaries
Withholding taxes Others Total
RMB’000 RMB’000 RMB’000 RMB’000
At 1 January 7,421 38,630 7,657 53,708Acquisition of subsidiaries 8,311 — — 8,311Deferred tax charged/(credited) to the
statement of profit or loss during the year, net (note 10) (923) 123,748 (5,771) 117,054
Exchange differences — (688) — (688)
At 31 December 14,809 161,690 1,886 178,385
The Group has tax losses arising in Hong Kong of RMB34,276,000 (2017: RMB31,261,000) that are available indefinitely for offsetting against future taxable profits of the companies in which the losses arose. The Group also has tax losses arising in Mainland China and deductible temporary differences of RMB549,231,000 and RMB150,223,000, respectively (2017: RMB512,601,000 and RMB234,681,000, respectively), that will expire in one to five years for offsetting against future taxable profits. Deferred tax assets have not been recognised in respect of these losses as they have arisen in the Company and subsidiaries that have been loss-making for some time and it is not considered probable that taxable profits will be available against which the tax losses can be utilised.
Pursuant to the PRC CIT Law, a 5% or 10% withholding tax is levied on dividends declared to foreign investors from the foreign investment enterprises established in Mainland China. The requirement is effective from 1 January 2008 and applies to earnings after 31 December 2007. A lower withholding tax rate may be applied if there is a tax treaty between Mainland China and the jurisdiction of the foreign investors. For the Group, the applicable rate is 5% or 10%. The Group is therefore liable for withholding taxes on dividends distributed by those subsidiaries established in Mainland China in respect of earnings generated from 1 January 2008.
As at 31 December 2018, The Group has recognised deferred tax liabilities of RMB77,190,000 (2017: RMB161,690,000) in relation to withholding taxes for the earnings of the PRC subsidiaries to be remitted in the foreseeable future. The aggregate amount of temporary differences associated with investments in subsidiaries in Mainland China for which deferred tax liabilities have not been recognised total led approximately RMB18,207,639,000 at 31 December 2018 (2017: RMB15,657,668,000 (restated)). In the opinion of the directors, it is not probable that such earnings will be distributed in the foreseeable future.
There are no income tax consequences attaching to the payment of dividends by the Company to its shareholders.

177Haier Electronics Group Co., Ltd. Annual Report 2018
Notes to Financial Statements31 December 2018
35. ISSUED EQUITY
Issued equityRMB’000
At 1 January 2017 2,876,892Exercise of share options 78,225Exercise of awarded shares 45,210Shares transferred to participants from the Share Award Scheme Trust (4,836)
At 31 December 2017 and 1 January 2018 2,995,491Exercise of share options 13,678Exercise of awarded shares 52,480Shares transferred to participants from the Share Award Scheme Trust (53,060)Shares repurchased (86,225)
At 31 December 2018 2,922,364
Shares
Company
2018 2017
HK$’000 HK$’000
Authorised: 30,000,000,000 shares of HK$0.1 each 3,000,000 3,000,000
2018 2017
HK$’000 RMB’000 HK$’000 RMB’000equivalent equivalent
Issued and fully paid: 2,803,070,823 (2017: 2,802,340,407) shares of HK$0.1 each 280,307 276,084 280,234 276,034

178 Haier Electronics Group Co., Ltd. Annual Report 2018
Notes to Financial Statements31 December 2018
35. ISSUED EQUITY (continued)
The movements of the Company’s issued share capital and share premium account during the year are as follows:
Number of shares in
issue
Issued share
capital
Share premium account Total
RMB’000 RMB’000 RMB’000
At 1 January 2017 2,792,076,768 275,153 2,322,030 2,597,183Exercise of share options 5,588,000 478 77,747 78,225Exercise of awarded shares 4,675,639 403 44,807 45,210Shares transferred to participants
from the Share Award Scheme Trust — — (4,836) (4,836)
At 31 December 2017 and 1 January 2018 2,802,340,407 276,034 2,439,748 2,715,782
Exercise of share options (note i) 1,040,345 84 13,594 13,678Exercise of awarded shares
(note ii) 4,900,071 426 52,054 52,480Shares transferred to participants
from the Share Award Scheme Trust (note iii) — — (53,060) (53,060)
Shares repurchased (note iv) (5,210,000) (460) (85,765) (86,225)
At 31 December 2018 2,803,070,823 276,084 2,366,571 2,642,655
Notes:
(i) The subscription rights attaching to 1,040,345 share options were exercised during the year, resulting in the issue of 1,040,345 shares of HK$0.1 each for a total cash consideration of HK$13,358,000 (equivalent to RMB10,835,000). An amount of RMB2,843,000 was transferred from the share option reserve to the share premium account upon the exercise of the share options.
(ii) The subscription rights attaching to 4,900,071 awarded shares were exercised during the year, resulting in the issue of 4,900,071 shares of HK$0.1 each at nil consideration. An amount of RMB52,480,000 was transferred from the awarded share reserve to the share premium account upon the exercise of the awarded shares.
(iii) During the year, the Company transferred 8,444,733 shares which were held by the Share Award Scheme Trust to participants with no cash consideration under the Restricted Share Award Scheme. An amount of RMB90,444,000 was transferred from the awarded share reserve to the share premium account, and an amount of RMB143,504,000 was credited to shares held for the Restricted Share Award Scheme from share premium account.
(iv) All of the repurchased shares were cancelled during the year and the issued shares of the Company were reduced by the par value thereof. The premium paid on the repurchases of the Company’s shares of HK$97,243,000 (equivalent to RMB85,765,000) has been charged to the share premium account of the Company.

179Haier Electronics Group Co., Ltd. Annual Report 2018
Notes to Financial Statements31 December 2018
35. ISSUED EQUITY (continued)
Share options
Details of the Company’s share option scheme and the share options issued under the scheme are included in note 37 to the financial statements.
36. SHARES HELD FOR THE RESTRICTED SHARE AWARD SCHEME
The Group operates a restricted share award scheme (the “Restricted Share Award Scheme”), which aims at providing incentives to employees and optimising the remuneration structure of the Group. According to the Restricted Share Award Scheme, the Company may purchase the scheme shares in the open market and hold the purchased shares in the Share Award Scheme Trust for the relevant selected employees until such shares vest or are issued and new scheme shares are allotted to the trustee. The board of the Company has the discretion to decide whether the awarded shares are to be purchased or subscribed.
As at 31 December 2018, the number of ordinary shares held for the Restricted Share Award Scheme was 7,590,843 (2017: 11,855,130) with an aggregate carrying amount of RMB97,391,000 (2017: RMB158,583,000).
The following awarded shares were outstanding under the Restricted Share Award Scheme during the year:
2018 2017
Weighted average exercise
price per share
Number of awarded
shares
Weighted average exercise
price per share
Number of awarded
sharesHK$ HK$
At 1 January 0.28 22,613,925 0.60 17,732,400Granted during the year 0.00 11,649,900 0.00 12,200,000Forfeited/lapsed during the year 5.95 (912,481) 0.00 (596,940)Exercised during the year 0.00 (13,344,804) 0.63 (6,721,535)
At 31 December 0.05 20,006,540 0.28 22,613,925
The weighted average share price at the dates of exercise for awarded shares exercised during the year was HK$24.92 (2017: HK$20.11) per share.

180 Haier Electronics Group Co., Ltd. Annual Report 2018
Notes to Financial Statements31 December 2018
36. SHARES HELD FOR THE RESTRICTED SHARE AWARD SCHEME (continued)
The exercise prices and exercise periods/vesting periods of the awarded shares outstanding as at the end of the reporting period are as follows:
2018 2017 Number
of awarded shares
Exercise price*
Exercise period
Number of awarded
sharesExercise
price*Exercise
periodHK$
per shareHK$
per share
15/04/2015 15/04/2015— 9.685 –14/04/2018 560,400 9.685 –14/04/2018
08/07/2016 08/07/2016148,400 6.42 –07/07/2020 148,400 6.42 –07/07/2020
148,400 708,800
2018 2017 Number
of awarded shares
Exerciseprice*
Vestingperiod#
Number of awarded
sharesExercise
price*Vestingperiod#
HK$ per share
HK$ per share
509,160 — 08/07/2016–01/07/2019 9,705,125 — 08/07/2016–01/07/20197,051,080 — 03/03/2017–01/07/2019 11,090,000 — 03/03/2017–01/07/2019
648,000 — 29/05/2017–01/07/2019 1,110,000 — 29/05/2017–01/07/2019916,100 — 05/07/2018–01/07/2020 — — —
135,800 — 12/07/2018–01/07/2020 — — —
10,598,000 — 17/09/2018–01/07/2020 — — —
19,858,140 21,905,125
* The exercise price of the awarded shares is subject to adjustment in the case of rights or bonus issues, or other similar changes in the Company’s share capital.
# The restricted shares will become exercisable once they are vested.

181Haier Electronics Group Co., Ltd. Annual Report 2018
Notes to Financial Statements31 December 2018
36. SHARES HELD FOR THE RESTRICTED SHARE AWARD SCHEME (continued)
The fair values of the awarded shares granted during the year were approximately RMB18,712,000, RMB2,757,000 and RMB175,443,000 (RMB20.43, RMB20.30 and RMB16.55 each) (2017: RMB140,056,000 and RMB18,666,000, RMB12.63 and RMB16.82 each), of which the Group recognised a Restricted Share Award Scheme expense of RMB48,047,000 (2017: RMB71,125,000) during the year ended 31 December 2018.
In respect of the awarded shares granted in the prior years, a Restricted Share Award Scheme expense of RMB77,043,000 (2017: RMB83,376,000) was recognised during the year ended 31 December 2018.
The fair value of equity-settled awarded shares granted during the year was estimated with reference to the share price at the date of grant, adjusted by the present value of the dividend expected to be received during the vesting period.
The following table lists the inputs to the model used:
2018 2017
Dividend yield (%) 1.21–1.51 0.62–0.83Risk-free interest rate (%) 1.670–2.012 0.583–1.217Contractual life of awarded shares (year) 0.79–1.97 1.09–2.33Closing price of a share on the date of grant (HK$ per share) 19.24–24.00 14.50–19.44
No other feature of the awarded shares granted was incorporated into the measurement of fair value.
During the year, the Company transferred 8,444,733 (2017: 2,045,896) shares which were held by the Share Award Scheme Trust to participants with no cash consideration (2017: HK$4,264,000, equivalent to RMB3,571,000) under the Restricted Share Award Scheme, and the subscription rights attaching to 4,900,071 (2017: 4,675,639) awarded shares were exercised, resulting in the issue of 4,900,071 (2017: 4,675,639) shares of HK$0.1 each at nil consideration, as further detailed in note 35 to the financial statements.

182 Haier Electronics Group Co., Ltd. Annual Report 2018
Notes to Financial Statements31 December 2018
37. SHARE OPTION SCHEME
The Company operates a share option scheme for the purpose of providing incentives and rewards to the eligible participants who contribute to the success of the operations of the Group. Eligible participants of the share option scheme include any employee, executive or officer of the Group (including executive, non-executive and independent non-executive directors of the Company) and any suppliers, consultants, agents, advisers, shareholders, customers, partners or business associates who, in the opinion of the board of directors of the Company (the “Board”), have contributed to the Group. The Company’s current share option scheme became effective on 8 June 2011 and, unless otherwise cancelled or amended, will remain in force for 10 years from that date. As at the date of this report, the share option scheme had a remaining life of around two years.
The maximum number of shares in respect of which options may be granted under the share option scheme is such number of shares, when aggregated with shares subject to any other share option scheme(s) of the Company, must not exceed 10% of the issued share capital of the Company as at the date of adoption of the share option scheme. The maximum number of shares issuable upon exercise of the options granted under the share option scheme and any other share option scheme(s) of the Company (including exercised, cancelled and outstanding options) to each eligible participant in any 12-month period is limited to 1% of the shares of the Company in issue as at the date of grant. Any further grant of share options in excess of this 1% limit shall be subject to the issue of a circular by the Company (and if required, the holding company) and the shareholders’ approval of the Company (and if required, the approval of the shareholders of the holding company) in a general meeting.
Share options granted to a director, chief executive or substantial shareholder of the Company, or to any of their respective associates, are subject to the approval in advance by the independent non-executive directors of the Company (and if required, the independent non-executive directors of the holding company), excluding the independent non-executive director(s) of the Company and the holding company who is/are the grantee(s) of the options. In addition, any share option granted to a substantial shareholder or an independent non-executive director of the Company, or to any of their respective associates, in excess of 0.1% of the shares of the Company in issue as at the date of grant and with an aggregate value (based on the closing price of the shares of the Company as at the date of grant) in excess of HK$5,000,000, within any 12-month period, is subject to the issue of a circular by the Company (and if required, the holding company) and the shareholders’ approval of the Company (and if required, the approval of the shareholders of the holding company) in advance in a general meeting.
The offer of a grant of share options may be accepted within 28 days from the date of the offer, upon payment of a nominal consideration of RMB1 or HK$1 in total by the grantee. The exercise period of the share options granted is determinable by the board of directors, and commences on a specified date and ends on a date which is not later than 10 years from the date of grant of the share options or the expiry date of the share option scheme, whichever is earlier.
The exercise price of the share options is determinable by the board of directors, but may not be less than the highest of (i) the closing price of the shares of the Company as stated in the daily quotation sheet of the Hong Kong Stock Exchange on the date of grant, which must be a trading day; (ii) the average of the closing prices of the shares of the Company as stated in the Hong Kong Stock Exchange’s daily quotation sheets for the five trading days immediately preceding the date of grant; and (iii) the nominal value of the shares of the Company.

183Haier Electronics Group Co., Ltd. Annual Report 2018
Notes to Financial Statements31 December 2018
37. SHARE OPTION SCHEME (continued)
Share options do not confer rights on the holders to dividends or to vote at shareholders’ meetings.
The following share options were outstanding under the share option scheme during the year:
2018 2017
Weighted average exercise
priceNumber
of options
Weighted average exercise
priceNumber
of optionsHK$
per shareHK$
per share
At 1 January 12.84 3,495,200 14.63 31,302,800Forfeited during the year — — 12.84 (13,224,000)Lapsed during the year — — 19.12 (8,995,600)Exercised during the year 12.84 (1,040,345) 12.72 (5,588,000)
At 31 December 12.84 2,454,855 12.84 3,495,200
The weighted average share price at the date of exercise for share options exercised during the year was HK$26.13 (2017: HK$20.30) per share.
The exercise prices and exercise periods of the share options outstanding as at the end of the reporting period are as follows:
2018 2017 Number
of optionsExercise
price* Exercise periodNumber
of optionsExercise
price* Exercise periodHK$
per shareHK$
per share
2,454,855 12.84 10/05/2016–10/05/2020 3,495,200 12.84 10/05/2016–10/05/2020
* The exercise price of the share options is subject to adjustment in the case of rights or bonus issues, or other similar changes in the Company’s share capital.
No share option expense (2017: share option credit of RMB27,243,000) was recognised during the year ended 31 December 2018 in respect of the share options granted.

184 Haier Electronics Group Co., Ltd. Annual Report 2018
Notes to Financial Statements31 December 2018
37. SHARE OPTION SCHEME (continued)
The 1,040,345 share options exercised during the year resulted in the issue of 1,040,345 ordinary shares of the Company and new share capital of HK$13,358,000 (equivalent to RMB10,835,000) (before issue expense), as further detailed in note 35 to the financial statements. An amount of RMB2,843,000 was transferred from the share option reserve to issue equity upon the exercise of the share options.
At the end of the reporting period, the Company had 2,454,855 share options outstanding under the share option scheme. The exercise in full of the outstanding share options would, under the present capital structure of the Company, result in the issue of 2,454,855 additional ordinary shares of the Company and additional share capital of HK$245,000 (equivalent to RMB215,000) and share premium of HK$31,275,000 (equivalent to RMB27,439,000) (before issue expenses).
Subsequent to the end of the reporting period, a total of 220,455 share options with the exercise price of HK$12.84 per share were exercised. At the date of approval of these financial statements, the Company had 2,234,400 share options outstanding under the share option scheme, which represented approximately 0.08% of the Company’s shares in issue as at that date.
38. RESERVES
The amounts of the Group’s reserves and the movements therein for the current and prior years are presented in the consolidated statement of changes in equity on pages 83 to 84 of the annual report.
The Group’s capital reduction reserve arose from the reduction in the nominal value of each of the issued shares of the Company from HK$0.10 to HK$0.01 by the cancellation of paid-up capital of HK$0.09 for each of the issued shares of the Company effective from 8 March 2007.
The Group’s capital reserve originally represented the difference between the credit arising from the capital reduction of HK$1,657,866,000 (equivalent to RMB1,758,526,000) and the amount transferred to el iminate the accumulated losses of the Group of HK$1,196,370,000 (equivalent to RMB1,186,521,000).
The share option reserve comprises the fair value of share options granted which are yet to be exercised, as further explained in the accounting policy for share-based payments in note 2.4 to the financial statements. The amount will either be transferred to the share premium account when the related options are exercised, or transferred to retained profits should the related options expire.
The awarded share reserve comprises the fair value of the awarded shares granted under the Restricted Share Award Scheme as well as the fair value of equity interests of certain subsidiaries of the Group granted to their employees, which are yet to be exercised, as further explained in the accounting policy for share-based payments in note 2.4 to the financial statements.
The put option reserve arose from the Group’s incentive agreements with non-controlling shareholders of certain subsidiaries, as further detailed in note 32 to the financial statements.

185Haier Electronics Group Co., Ltd. Annual Report 2018
Notes to Financial Statements31 December 2018
38. RESERVES (continued)
Other reserves mainly represent reserves arising from acquisitions under common control and disposals of subsidiaries without loss of control, deemed disposal of associates, exercise of convertible and exchangeable bonds, put option reserve for the forfeiture or expiry of incentive agreements with non-controlling shareholder, capital contribution from non-controlling interest as well as dividend income from shares under the Restricted Share Award Scheme.
Pursuant to the relevant PRC laws and regulations, certain of the Group’s subsidiaries registered in the PRC are required to transfer a portion of their profits to reserve funds. These funds are non-distributable in the form of cash dividends. When determining the appropriations to these funds, the net profits of these subsidiaries are determined in accordance with the applicable financial rules and regulations of the PRC.
39. PARTLY-OWNED SUBSIDIARIES WITH MATERIAL NON-CONTROLLING INTERESTS
The following table illustrates the summarised financial information of Gooday Logistics, a 70.08%-owned (2017: 68.41%) subsidiary of the Group, and its subsidiaries (“Gooday Logistics Group”) (note). The amounts disclosed are before any inter-company eliminations other than those within Gooday Logistics Group:
2018 2017
RMB’000 RMB’000
Profit for the year allocated to non-controlling interests of Gooday Logistics Group 160,668 125,143
Dividends paid to non-controlling interests of Gooday Logistics Group 5,156 4,539
Accumulated balance of non-controlling interests at the reporting date of Gooday Logistics Group 1,815,386 1,917,983
The net cash flows from/(used in) the operating activities, investing activities and financing activities are as follows, other financial information of Gooday Logistics Group is included in the logistics business segment as detailed in note 4 to the financial statements.
2018 2017
RMB’000 RMB’000
Net cash flows from/(used in):Operating activities 114,019 427,261Investing activities (1,658,652) (835,031)Financing activities 406,868 1,930,164
Note: The voting right of Gooday Logistics is 56.40% (2017: 59.55%) because the Group granted put options to non-controlling shareholders holding 13.68% (2017: 8.86%) equity interest in Gooday Logistics, which are classified as liabilities (note 32) rather than as non-controlling interests included in equity.

186 Haier Electronics Group Co., Ltd. Annual Report 2018
Notes to Financial Statements31 December 2018
40. BUSINESS COMBINATIONS
On 6 July 2018, the Group acquired a 60% equity interest in Peiji Logistics, which is engaged in the freight forwarding business at a cash consideration of RMB163,145,000, of which RMB114,534,000 has been paid during the year and RMB48,611,000 remained unsettled as at 31 December 2018. The acquisition was made as part of the Group’s strategy to further develop its logistics business.
The Group has elected to measure the non-controlling interests in Peiji Logistics at the non-controlling interest’s proportionate share of Peiji Logistics’s identifiable net assets.
The fair values of the identifiable assets and liabilities of Peiji Logistics as at the date of acquisition were as follows:
Fair value
recognised on acquisition
Notes RMB’000
Property, plant and equipment 14 3,538Other intangible assets 18 16Long term prepayments 2,460Deferred tax assets 34 4,957Inventories 23,062Trade and bills receivables 448,854Prepayments, other receivables and other assets 87,832Cash and cash equivalents 10,700Trade and bills payables (314,992)Other payables and accruals (80,544)Contract liabilities (5,670)Interest-bearing borrowings (165,000)Tax payable (14,315)
Total identifiable net assets at fair value 898Non-controlling interests 1,163
2,061Goodwill on acquisition 17 161,084
163,145
Satisfied by:Cash 114,534Other payables 48,611
163,145
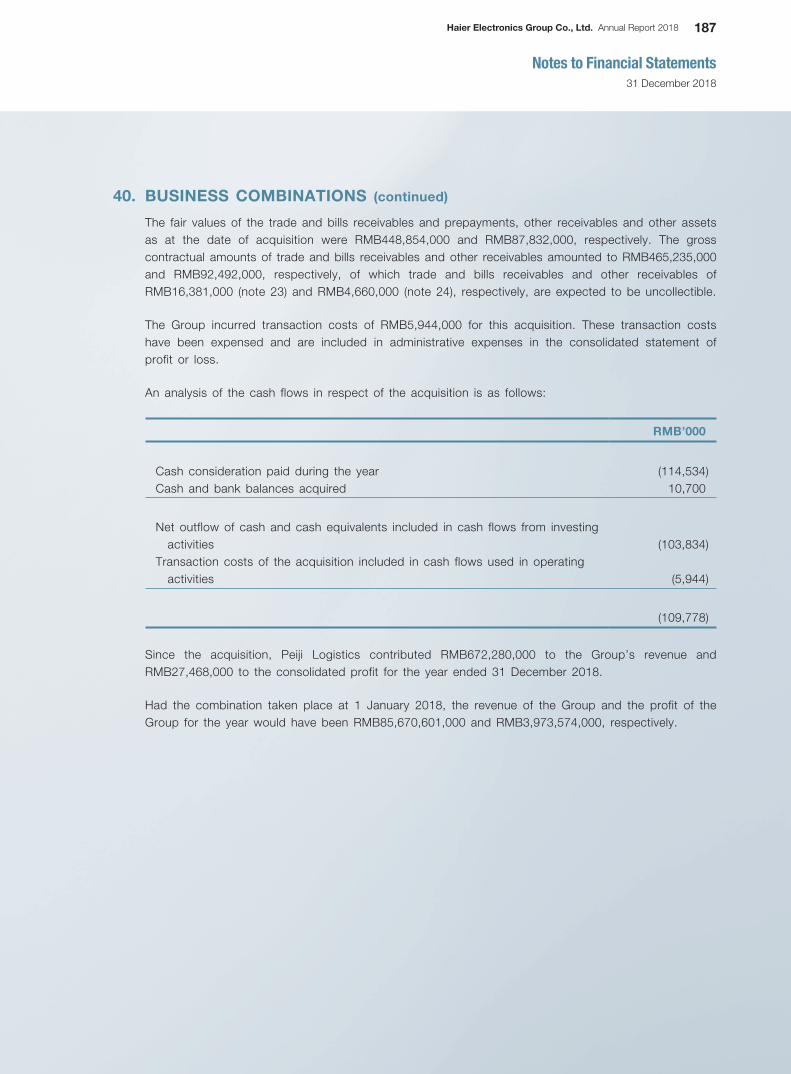
187Haier Electronics Group Co., Ltd. Annual Report 2018
Notes to Financial Statements31 December 2018
40. BUSINESS COMBINATIONS (continued)
The fair values of the trade and bills receivables and prepayments, other receivables and other assets as at the date of acquisition were RMB448,854,000 and RMB87,832,000, respectively. The gross contractual amounts of trade and bills receivables and other receivables amounted to RMB465,235,000 and RMB92,492,000, respectively, of which trade and bills receivables and other receivables of RMB16,381,000 (note 23) and RMB4,660,000 (note 24), respectively, are expected to be uncollectible.
The Group incurred transaction costs of RMB5,944,000 for this acquisition. These transaction costs have been expensed and are included in administrative expenses in the consolidated statement of profit or loss.
An analysis of the cash flows in respect of the acquisition is as follows:
RMB’000
Cash consideration paid during the year (114,534)Cash and bank balances acquired 10,700
Net outflow of cash and cash equivalents included in cash flows from investing activities (103,834)
Transaction costs of the acquisition included in cash flows used in operating activities (5,944)
(109,778)
Since the acquisition, Peiji Logistics contributed RMB672,280,000 to the Group’s revenue and RMB27,468,000 to the consolidated profit for the year ended 31 December 2018.
Had the combination taken place at 1 January 2018, the revenue of the Group and the profit of the Group for the year would have been RMB85,670,601,000 and RMB3,973,574,000, respectively.

188 Haier Electronics Group Co., Ltd. Annual Report 2018
Notes to Financial Statements31 December 2018
41. DISPOSAL OF SUBSIDIARIES
2018 2017Notes RMB’000 RMB’000
Net assets disposed of:Property, plant and equipment 14 273,926 1,271Prepaid land lease payments 16 57,008 13,238Goodwill 17 317,955 —
Other intangible assets 18 2,437 —
Investments in associates 93,216 —
Long-term prepayments 10,302 35Deferred tax assets 34 15,645 50Inventories 56,688 31,896Trade and bills receivables 400,306 36,963Prepayments, other receivables and other assets 158,190 36,052Pledged deposits 200 4Cash and cash equivalents 70,644 11,156Trade and bills payables (138,730) (18,472)Other payables and accruals (71,742) (39,414)Contract liabilities (58,553) (14,270)Interest-bearing borrowings (130,000) —
Tax payable (4,581) (8,059)Deferred income (11,083) —
Deferred tax liabilities 34 (2,483) —
Exchange fluctuation reserve 405 (1,118)Non-controlling interests (287,808) (12,077)
751,942 37,255Gain/(loss) on disposal of subsidiaries, net 5,6 79,275 (1,480)
831,217 35,775
Satisfied by:Cash 703,110 34,775Other receivables 22,097 1,000Asset classified as held for sale 106,010 —
831,217 35,775

189Haier Electronics Group Co., Ltd. Annual Report 2018
Notes to Financial Statements31 December 2018
41. DISPOSAL OF SUBSIDIARIES (continued)
An analysis of the net inflow of cash and cash equivalents in respect of the disposal of subsidiaries is as follows:
2018 2017
RMB’000 RMB’000
Cash consideration received 703,110 34,775Cash and bank balances disposed of (70,644) (11,156)
Net inflow of cash and cash equivalents in respect of the disposal of subsidiaries 632,466 23,619
42. NOTES TO THE CONSOLIDATED STATEMENT OF CASH FLOWS
(a) Major non-cash transactions
During the year, the Group purchased property, plant and equipment by endorsing bills receivable with an aggregate carrying amount of RMB14,968,000 (2017: RMB44,267,000).
(b) Changes in liabilities arising from financing activities
Other payables Interest-bearingand accruals borrowings
RMB’000 RMB’000
At 1 January 2018 44,359 192,624Changes from financing cash flows (183,182) (125,100)Foreign exchange movement — 956Acquisition of subsidiaries 14,970 165,000Shares purchased for the Restricted Share Award
Scheme (18,492) —
Interest expense 10,908 —
Disposal of subsidiaries (3,095) (130,000)Reclassified as held for sale — (11,106)Dividends payable to non-controlling shareholders
settled by offsetting against trade receivables (6,859) —
Dividends payable to non-controlling shareholders 176,648 —
At 31 December 2018 35,257 92,374

190 Haier Electronics Group Co., Ltd. Annual Report 2018
Notes to Financial Statements31 December 2018
42. NOTES TO THE CONSOLIDATED STATEMENT OF CASH FLOWS (continued)
(b) Changes in liabilities arising from financing activities (continued)
Otherpayables
andaccruals
Interest-bearing
borrowings
Financelease
payables
Due to anon-
controllingshareholder
RMB’000 RMB’000 RMB’000 RMB’000
At 1 January 2017 97,396 73,000 16,872 27,883Changes from financing cash flows (103,517) 31,014 (17,264) (3,846)Foreign exchange movement — (1,857) — (1,775)Exempt from a non-controlling
shareholder — — — (22,262)Acquisition of subsidiaries — 90,467 — —
Shares purchased/received for the Restricted Share Award Scheme 18,492 — — —
Interest expense 10,657 — 464 —
Taxes from finance leases — — (72) —
Disposal of subsidiaries (13,223) — — —
Dividends payable to non-controlling shareholders 34,554 — — —
At 31 December 2017 44,359 192,624 — —

191Haier Electronics Group Co., Ltd. Annual Report 2018
Notes to Financial Statements31 December 2018
43. CONTINGENT LIABILITIES
At the end of the reporting period, the Group did not have any significant contingent liabilities.
44. OPERATING LEASE ARRANGEMENTS
(a) As lessor
The Group leases its investment properties (note 15 to the financial statements) under operating lease arrangements, with leases negotiated for terms ranging from one to five years.
At the end of the reporting period, the Group had total future minimum lease receivables under non-cancellable operating leases with its tenants falling due as follows:
2018 2017
RMB’000 RMB’000
Within one year 14,533 13,183In the second to fifth years, inclusive 17,641 10,739
32,174 23,922
(b) As lessee
The Group leases certain properties under operating lease arrangements. Leases for the properties are negotiated for terms ranging from one to twelve years.
At the end of the reporting period, the Group had total future minimum lease payments under non-cancellable operating leases falling due as follows:
2018 2017
RMB’000 RMB’000
Within one year 763,749 421,229In the second to fifth years, inclusive 756,703 427,348After five years 94,916 124,607
1,615,368 973,184

192 Haier Electronics Group Co., Ltd. Annual Report 2018
Notes to Financial Statements31 December 2018
45. COMMITMENTS
In addition to the operating lease commitments detailed in note 44(b) above, the Group had the following commitments at the end of the reporting period:
2018 2017
RMB’000 RMB’000
Contracted, but not provided for:Property, plant and equipment 1,306,208 735,691
Included in the Group’s commitment are contracts entered with Haier Affiliates of RMB21,212,000 (2017: RMB19,082,000).
46. FINANCIAL INSTRUMENTS BY CATEGORY
The carrying amounts of each of the categories of financial instruments as at the end of the reporting period are as follows:
Financial assets
31 December 2018
Financial assets
at fair value
through profit
or loss —
designated as
such upon initial
recognition
Financial assets at fair
value through other
comprehensive incomeFinancial
assets at
amortised
cost Total
Debt
investments
Equity
investments
RMB’000 RMB’000 RMB’000 RMB’000 RMB’000
Equity investments designated at
fair value through other
comprehensive income — — 1,261,664 — 1,261,664
Other non-current financial assets 422,878 — — — 422,878
Trade receivables (note 23) — — — 3,574,804 3,574,804
Bills receivable (note 23) — 1,631,193 — — 1,631,193
Other receivables — — — 1,959,024 1,959,024
Other financial assets 1,567,649 — — 2,814,532 4,382,181
Pledged deposits — — — 89,524 89,524
Cash and cash equivalents — — — 14,660,708 14,660,708
1,990,527 1,631,193 1,261,664 23,098,592 27,981,976

193Haier Electronics Group Co., Ltd. Annual Report 2018
Notes to Financial Statements31 December 2018
46. FINANCIAL INSTRUMENTS BY CATEGORY (continued)
Financial assets (continued)
31 December 2017
Financial assets at fair value through
profit or loss — designated as
such upon initial
recognitionLoans and receivables
Available- for-sale financial
assets TotalRMB’000 RMB’000 RMB’000 RMB’000
(Restated) (Restated)
Available-for-sale investments — — 1,283,082 1,283,082Other non-current financial assets 45,742 — — 45,742Trade and bills receivables — 5,816,848 — 5,816,848Other receivables — 1,783,978 — 1,783,978Other financial assets — 779,265 1,195,550 1,974,815Pledged deposits — 119,865 — 119,865Cash and cash equivalents — 15,040,624 — 15,040,624
45,742 23,540,580 2,478,632 26,064,954
Financial liabilities
31 December 2018
Financial liabilities
at fair value
Financial liabilities
at amortised cost Total
RMB’000 RMB’000 RMB’000
Trade and bills payables — 5,780,722 5,780,722Other payables and accruals (note 29) — 5,468,287 5,468,287Interest-bearing borrowings — 92,374 92,374Put option liabilities 1,792,322 — 1,792,322Other non-current liabilities 5,705 — 5,705
1,798,027 11,341,383 13,139,410

194 Haier Electronics Group Co., Ltd. Annual Report 2018
Notes to Financial Statements31 December 2018
46. FINANCIAL INSTRUMENTS BY CATEGORY (continued)
Financial liabilities (continued)
31 December 2017
Financial liabilities
at fair value
Financial liabilities
at amortised cost Total
RMB’000 RMB’000 RMB’000(Restated) (Restated)
Trade and bills payables — 6,090,435 6,090,435Other payables and accruals (note 29) — 5,467,552 5,467,552Interest-bearing borrowings — 192,624 192,624Put option liabilities 916,938 — 916,938Other non-current liabilities 5,385 — 5,385
922,323 11,750,611 12,672,934
47. FAIR VALUE AND FAIR VALUE HIERARCHY OF FINANCIAL INSTRUMENTSThe carrying amounts and fair values of the Group’s financial instruments, other than those with carrying amounts that reasonably approximate to fair values, are as follows:
Carrying amounts Fair values
2018 2017 2018 2017RMB’000 RMB’000 RMB’000 RMB’000
Financial assetsEquity investments
designated at fair value through other comprehensive income 1,261,664 — 1,261,664 —
Other non-current financial assets 422,878 45,742 422,878 45,742
Bills receivable* 1,631,193 — 1,631,193 —Other financial assets 1,567,649 1,195,550 1,567,649 1,195,550
4,883,384 1,241,292 4,883,384 1,241,292
Financial liabilitiesPut option liabilities 1,792,322 916,938 1,792,322 916,938Interest-bearing borrowings 92,374 192,624 92,247 192,458Other non-current liabilities 5,705 5,385 5,705 5,385
1,890,401 1,114,947 1,890,274 1,114,781
* Bills receivable as at 31 December 2017 amounting to RMB2,543,445,000 were classified as financial assets measured at
amortised cost under IAS 39.

195Haier Electronics Group Co., Ltd. Annual Report 2018
Notes to Financial Statements31 December 2018
47. FAIR VALUE AND FAIR VALUE HIERARCHY OF FINANCIAL INSTRUMENTS (continued)
Management has assessed that the fair values of cash and cash equivalents, pledged deposits, certain other financial assets measured at amortised cost, trade receivables, other receivables, trade and bills payables and other payables and accruals approximate to their carrying amounts largely due to the short term maturities of these instruments.
The Group’s management is responsible for determining the policies and procedures for the fair value measurement of financial instruments. At each reporting date, management analyses the movements in the values of financial instruments and determines the major inputs applied in the valuation. The valuation process and results are discussed with the audit committee twice a year for interim and annual financial reporting.
The fair values of the financial assets and liabilities are included at the amount at which the instrument could be exchanged in a current transaction between willing parties, other than in a forced or liquidation sale. The following methods and assumptions were used to estimate the fair values:
(a) The fair values of unlisted equity investments designated at fair value through other comprehensive income, which were previously classified as available-for-sale equity investments, have been estimated using a market-based valuation technique based on assumptions that are not supported by observable market prices or rates. The valuation requires the management to determine comparable public companies (peers) based on industry, size, leverage and strategy, and calculates an appropriate price multiple, such as enterprise value to earnings before interest, taxes, depreciation and amortisation (“EV/EBITDA”) multiple and price to earnings (“P/E”) multiple, for each comparable company identified. The multiple is calculated by dividing the enterprise value of the comparable company by an earnings measure. The trading multiple is then discounted for considerations such as illiquidity and size differences between the comparable companies based on company-specific facts and circumstances. The discounted multiple is applied to the corresponding earnings measure of the unlisted equity investments to measure the fair value. The management believe that the estimated fair values resulting from the valuation technique, which are recorded in the consolidated statement of financial position, and the related changes in fair values, which are recorded in other comprehensive income, are reasonable, and that they were the most appropriate values at the end of the reporting period.
196 Haier Electronics Group Co., Ltd. Annual Report 2018
Notes to Financial Statements31 December 2018
47. FAIR VALUE AND FAIR VALUE HIERARCHY OF FINANCIAL INSTRUMENTS (continued)
(b) The fair values of derivative financial investments included in other non-current financial assets have been estimated using the Black-Scholes model, and discounted cash flow valuation model, based on assumptions that are not supported by observable market prices or rates. The valuation requires the management to make estimates about the expected future cash flows including expected future dividends and proceeds on subsequent disposal of equity interests. The management believe that the estimated fair values resulting from the valuation technique, which are recorded in the consolidated statement of financial position, and the related changes in fair values, which are recorded in consolidated statement of profit or loss, are reasonable, and that they were the most appropriate values at the end of the reporting period. The fair values of the remaining other non-current financial assets are determined with reference to their respective latest available transaction prices.
(c) The fair values of put option liabilities have been measured by discounting the expected future cash flows using rates currently available for instruments with similar terms, credit risk and remaining maturities, or the discounted cash flow model and the Monte Carlo Simulation model, based on assumptions that are not supported by observable market prices or rates.
The Group invests in unlisted investments, which represent wealth management products included in other financial assets issued by banks in Mainland China and Hong Kong. The Group has estimated the fair value of these unlisted investments by using a discounted cash flow valuation model based on the market interest rates of instruments with similar terms and risks.
The fair values of bills receivable, and interest-bearing borrowings have been calculated by discounting the expected future cash flows using rates currently available for instruments with similar terms, credit risk and remaining maturities. The Group’s own non-performance risk for interest-bearing borrowings as at 31 December 2018 was assessed to be insignificant.

197Haier Electronics Group Co., Ltd. Annual Report 2018
Notes to Financial Statements31 December 2018
47. FAIR VALUE AND FAIR VALUE HIERARCHY OF FINANCIAL INSTRUMENTS (continued)
Below is a summary of significant unobservable inputs to the valuation of financial instruments together with a quantitative sensitivity analysis as at 31 December 2018 and 2017:
Valuation technique
Significant unobservable input Range
Sensitivity of fair value to the input
(a) Unlisted equity investments
Valuation multiples
Average P/E multiple of peers
2018: 15.61 to 15.92 1% increase (decrease) in multiple would result in increase (decrease) in fair value by RMB12,615,000 (RMB12,615,000)
Discount for lack of marketability
2018: 14% to 16% 1% increase (decrease) in the risk-free interest rate would result in decrease (increase) in fair value by RMB14,841,000 (RMB14,841,000)
(b) Other non-current financial assets
Black-Scholes Median volatility of comparable companies
2018: 32.54% to 52.54% (2017: 33.27% to 53.27%)
10% (2017: 10%) increase (decrease) in the median volatility of comparable companies would result in increase (decrease) in fair value by RMB11,425,000 (RMB8,370,000) (2017: RMB9,856,000 (RMB6,588,000))
Risk-free interest rate 2018: 2.97% to 4.97% (2017: 2.83% to 4.83%)
1% (2017: 1%) increase (decrease) in the risk-free interest rate would result in decrease (increase) in fair value by RMB24,000 (RMB28,000) (2017: RMB308,000 (RMB394,000))
(c) Put option liabilities
Monte Carlo Simulation
Risk-free interest rate 2018: 0.47% to 1.47% (2017: 0.34% to 2.34%)
0.5% (2017: 1%) increase (decrease) in the risk-free interest rate would result in decrease (increase) in fair value by RMB285,000 (RMB288,000) (2017: RMB780,000 (RMB343,000))
(c) Put option liabilities
Monte Carlo Simulation
Median volatility of comparable companies
2018: 14.14% to 16.14% 1% increase (decrease) in the median volatility of comparable companies would result in increase (decrease) in fair value by RMB7,113,000 (RMB7,991,000)
Weighted average cost of capital (WACC)
2018: 12.11% to 14.11% 1% increase (decrease) in WACC would result in decrease (increase) in fair value by RMB9,131,000 (RMB9,868,000)
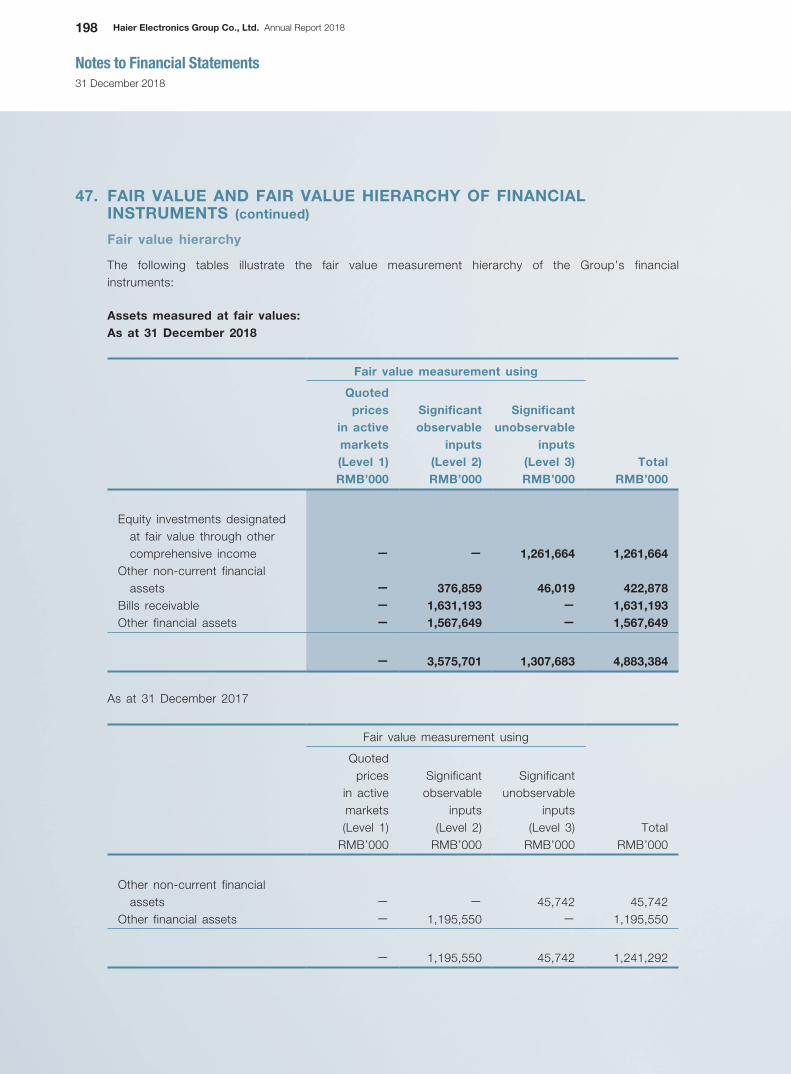
198 Haier Electronics Group Co., Ltd. Annual Report 2018
Notes to Financial Statements31 December 2018
47. FAIR VALUE AND FAIR VALUE HIERARCHY OF FINANCIAL INSTRUMENTS (continued)
Fair value hierarchy
The following tables illustrate the fair value measurement hierarchy of the Group’s financial instruments:
Assets measured at fair values:As at 31 December 2018
Fair value measurement using Quoted
prices in active markets
Significant observable
inputs
Significant unobservable
inputs(Level 1) (Level 2) (Level 3) TotalRMB’000 RMB’000 RMB’000 RMB’000
Equity investments designated at fair value through other comprehensive income — — 1,261,664 1,261,664
Other non-current financial assets — 376,859 46,019 422,878
Bills receivable — 1,631,193 — 1,631,193Other financial assets — 1,567,649 — 1,567,649
— 3,575,701 1,307,683 4,883,384
As at 31 December 2017
Fair value measurement using
Quoted prices
in active markets
Significant observable
inputs
Significant unobservable
inputs(Level 1) (Level 2) (Level 3) Total
RMB’000 RMB’000 RMB’000 RMB’000
Other non-current financial assets — — 45,742 45,742
Other financial assets — 1,195,550 — 1,195,550
— 1,195,550 45,742 1,241,292

199Haier Electronics Group Co., Ltd. Annual Report 2018
Notes to Financial Statements31 December 2018
47. FAIR VALUE AND FAIR VALUE HIERARCHY OF FINANCIAL INSTRUMENTS (continued)
Fair value hierarchy (continued)
Liabilities measured at fair values:As at 31 December 2018
Fair value measurement using Quoted
prices in active markets
Significant observable
inputs
Significant unobservable
inputs(Level 1) (Level 2) (Level 3) TotalRMB’000 RMB’000 RMB’000 RMB’000
Put option liabilities — 1,587,403 204,919 1,792,322Other non-current liabilities — — 5,705 5,705
— 1,587,403 210,624 1,798,027
As at 31 December 2017
Fair value measurement using
Quoted prices
in active markets
Significant observable
inputs
Significant unobservable
inputs(Level 1) (Level 2) (Level 3) Total
RMB’000 RMB’000 RMB’000 RMB’000
Put option liabilities — 861,428 55,510 916,938Other non-current liabilities — — 5,385 5,385
— 861,428 60,895 922,323
During the year, there were no transfers of fair value measurements between Level 1 and Level 2 and no transfers into or out of Level 3 (2017: nil).

200 Haier Electronics Group Co., Ltd. Annual Report 2018
Notes to Financial Statements31 December 2018
47. FAIR VALUE AND FAIR VALUE HIERARCHY OF FINANCIAL INSTRUMENTS (continued)
Fair value hierarchy (continued)
Liabilities for which fair values are disclosed:As at 31 December 2018
Fair value measurement using Quoted
prices in active markets
Significant observable
inputs
Significant unobservable
inputs(Level 1) (Level 2) (Level 3) TotalRMB’000 RMB’000 RMB’000 RMB’000
Interest-bearing borrowings — 92,247 — 92,247
As at 31 December 2017
Fair value measurement using
Quoted prices
in active markets
Significant observable
inputs
Significant unobservable
inputs(Level 1) (Level 2) (Level 3) Total
RMB’000 RMB’000 RMB’000 RMB’000
Interest-bearing borrowings — 192,458 — 192,458
48. FINANCIAL RISK MANAGEMENT OBJECTIVES AND POLICIES
The Group’s principal financial instruments comprise interest-bearing borrowings and cash and short term deposits. The main purpose of these financial instruments is to raise finance for the Group’s operations. The Group has various other financial assets and liabilities such as trade and bills receivables and trade and bills payables, which arise directly from its operations.
The main risks arising from the Group’s financial instruments are foreign currency risk, credit risk and liquidity risk. The board of directors reviews and agrees policies for managing each of these risks and they are summarised below.

201Haier Electronics Group Co., Ltd. Annual Report 2018
Notes to Financial Statements31 December 2018
48. FINANCIAL RISK MANAGEMENT OBJECTIVES AND POLICIES (continued)
Foreign currency risk
The Group has transactional currency exposures. These exposures mainly arise from sales or purchases by the Group’s operating units in Mainland China and Hong Kong in currencies other than the units’ functional currencies (i.e., RMB or the Hong Kong dollar). The Group does not enter into any hedging transactions for reducing the Group’s exposure to foreign currency risk.
The following table demonstrates the sensitivity at the end of the reporting period to a reasonably possible change in the United States dollar exchange rates, with all other variables held constant, of the Group’s profit before tax (due to changes in the fair value of monetary assets and liabilities). There is no significant impact on other components of the Group’s equity.
Increase/(decrease) in exchange rates
Increase/(decrease) in profit before tax
% RMB’000
31 December 2018If RMB strengthens against the United States dollar 5 (20,373)If RMB weakens against the United States dollar (5) 20,373
31 December 2017If RMB strengthens against the United States dollar 5 (46,187)If RMB weakens against the United States dollar (5) 46,187
Credit risk
The carrying amounts of cash and cash equivalents, pledged deposits, trade and bills receivables, and financial assets included in prepayments, deposits and other receivables and other financial assets represent the Group’s maximum exposure to credit risk in relation to financial assets. Substantially all of the Group’s cash and cash equivalents and pledged deposits are held in major financial institutions located in Mainland China, which management believes are of high credit quality. The Group has policies to control the size of the deposits to be placed with various reputable financial institutions according to their market reputation, operating scale and financial background with a view to limiting the amount of credit exposure to any single financial institution.
The Group trades only with recognised and creditworthy third parties and Haier Affiliates. It is the Group’s policy that all customers who wish to trade on credit terms are subject to credit verification procedures. In addition, receivable balances are monitored on an ongoing basis and the Group’s exposure to bad debts is not significant.

202 Haier Electronics Group Co., Ltd. Annual Report 2018
Notes to Financial Statements31 December 2018
48. FINANCIAL RISK MANAGEMENT OBJECTIVES AND POLICIES (continued)
Credit risk (continued)
The credit risk of the Group’s financial assets, which comprise cash and cash equivalents, pledged deposits, wealth management products and other receivables, arises from default of the counterparty, with a maximum exposure equal to the carrying amounts of these instruments, and they were all classified within stage 1 as at 31 December 2018, which is mainly based on past due information unless other information is available without undue cost or effort.
Since the Group trades only with recognised and creditworthy third parties and Haier Affiliates, there is no requirement for collateral. Concentrations of credit risk are managed by customer/counterparty. There are no significant concentrations of credit risk within the Group as the customer bases of the Group’s trade receivables are widely dispersed in different sectors.
Further quantitative data in respect of the Group’s exposure to credit risk arising from trade and bills receivables and other receivables are respectively disclosed in notes 23 and 24 to the financial statements.
Liquidity risk
The Group monitors its risk to a shortage of funds using a recurring liquidity planning tool. This tool considers the maturity of both its financial instruments and financial assets (e.g., trade receivables) and projected cash flows from operations.
The Group’s objective is to maintain a balance between continuity of funding and flexibility through the use of interest-bearing borrowings. It is the Group’s policy to renew its loan agreements with Haier Finance or major local banks in Mainland China upon the maturity of the Group’s short and long term borrowings when funding is needed.
The maturity profile of the Group’s financial liabilities as at the end of the reporting period, based on the contractual undiscounted payments, is as follows:
31 December 2018
On demand or no fixed terms
of repaymentWithin
one yearOver
one year TotalRMB’000 RMB’000 RMB’000 RMB’000
Trade and bills payables — 5,780,722 — 5,780,722Other payables (note 29) 5,468,287 — — 5,468,287Interest-bearing borrowings — 75,328 19,093 94,421Put option liabilities — — 2,020,042 2,020,042Other non-current liabilities — — 7,297 7,297
5,468,287 5,856,050 2,046,432 13,370,769

203Haier Electronics Group Co., Ltd. Annual Report 2018
Notes to Financial Statements31 December 2018
48. FINANCIAL RISK MANAGEMENT OBJECTIVES AND POLICIES (continued)
Liquidity risk (continued)
31 December 2017
On demand or no fixed terms of
repaymentWithin
one yearOver
one year TotalRMB’000 RMB’000 RMB’000 RMB’000
(Restated) (Restated) (Restated)
Trade and bills payables — 6,090,435 — 6,090,435Other payables (note 29) 5,467,552 — — 5,467,552Interest-bearing borrowings — 169,424 24,251 193,675Put option liabilities — — 1,235,668 1,235,668Other non-current liabilities — — 6,888 6,888
5,467,552 6,259,859 1,266,807 12,994,218
Capital management
The primary objectives of the Group’s capital management are to safeguard the Group’s ability to continue as a going concern and to maintain healthy capital ratios in order to support its business and maximise shareholders’ value.
The Group manages its capital structure and makes adjustments to it in light of changes in economic conditions. To maintain or adjust the capital structure, the Group may adjust the dividend payment to shareholders, return capital to shareholders or issue new shares. The Group is not subject to any externally imposed capital requirements. No changes were made in the objectives, policies or processes for managing capital during the years ended 31 December 2018 and 31 December 2017.

204 Haier Electronics Group Co., Ltd. Annual Report 2018
Notes to Financial Statements31 December 2018
48. FINANCIAL RISK MANAGEMENT OBJECTIVES AND POLICIES (continued)
Capital management (continued)
The Group monitors working capital using a gearing ratio, which is total debt divided by total equity. The Group’s policy is to maintain the gearing ratio not exceeding 50%. Total debt includes interest-bearing borrowings. The gearing ratios as at the end of the reporting periods were as follows:
2018 2017RMB’000 RMB’000
(Restated)
Interest-bearing borrowings 92,374 192,624
Total debt 92,374 192,624
Total equity 25,748,284 23,030,451
Gearing ratio 0.4% 0.8%
49. EVENTS AFTER THE REPORTING PERIOD
Subsequent to the end of the reporting period, a total of 220,455 share options with the exercise price of HK$12.84 per share were exercised.

205Haier Electronics Group Co., Ltd. Annual Report 2018
Notes to Financial Statements31 December 2018
50. STATEMENT OF FINANCIAL POSITION OF THE COMPANY
Information about the statement of financial position of the Company at the end of the reporting period is as follows:
2018 2017RMB’000 RMB’000
NON-CURRENT ASSETSInvestments in subsidiaries 2,354,887 2,232,107Other non-current financial assets 327,359 —
Due from subsidiaries 1,716,747 1,608,557
Total non-current assets 4,398,993 3,840,664
CURRENT ASSETSPrepayments, other receivables and other assets 60,748 20,669Other financial assets 339,408 —
Cash and cash equivalents 1,823,965 251,004
Total current assets 2,224,121 271,673
CURRENT LIABILITIESOther payables and accruals 68,376 51,491
Total current liabilities 68,376 51,491
NET CURRENT ASSETS 2,155,745 220,182
TOTAL ASSETS LESS CURRENT LIABILITIES 6,554,738 4,060,846
NON-CURRENT LIABILITIESDue to subsidiaries 69,446 61,664
Total non-current liabilities 69,446 61,664
Net assets 6,485,292 3,999,182
EQUITYIssued capital 276,084 276,034Shares held for the Restricted Share Award Scheme (97,391) (158,583)Reserves (note) 6,306,599 3,881,731
Total equity 6,485,292 3,999,182
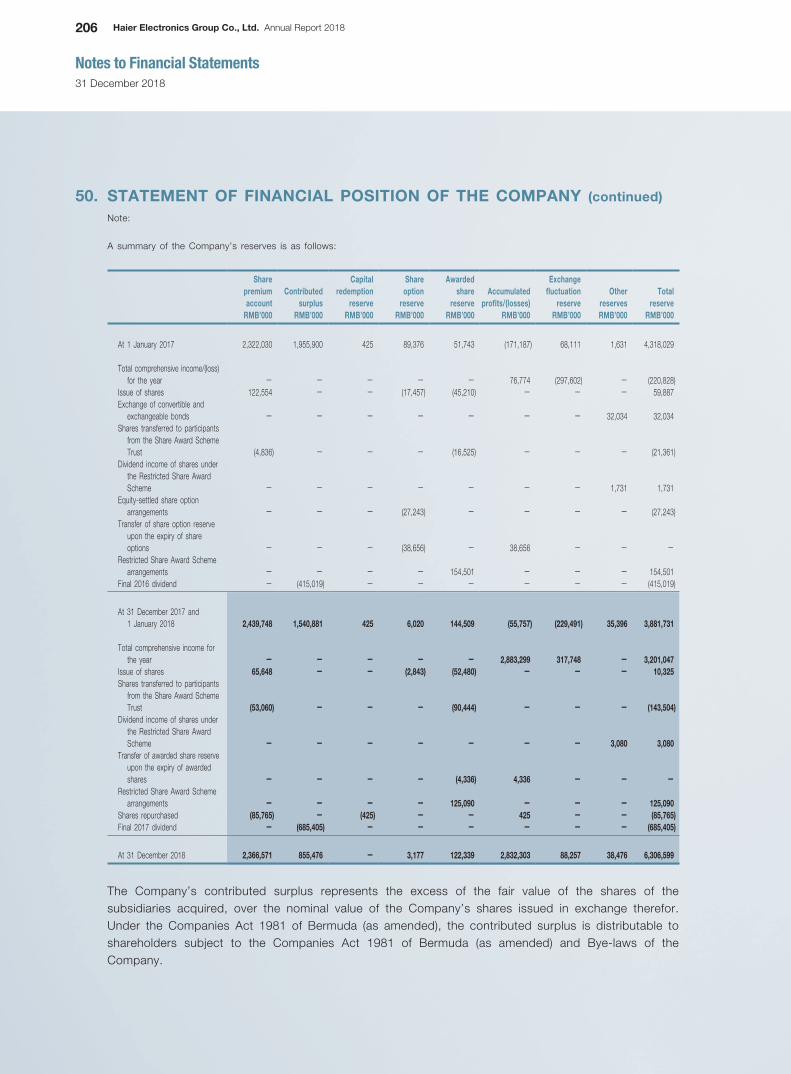
206 Haier Electronics Group Co., Ltd. Annual Report 2018
Notes to Financial Statements31 December 2018
50. STATEMENT OF FINANCIAL POSITION OF THE COMPANY (continued)
Note:
A summary of the Company’s reserves is as follows:
Share premium account
Contributed surplus
Capital redemption
reserve
Share option
reserve
Awarded share
reserveAccumulated
profits/(losses)
Exchange fluctuation
reserveOther
reservesTotal
reserveRMB’000 RMB’000 RMB’000 RMB’000 RMB’000 RMB’000 RMB’000 RMB’000 RMB’000
At 1 January 2017 2,322,030 1,955,900 425 89,376 51,743 (171,187) 68,111 1,631 4,318,029
Total comprehensive income/(loss) for the year — — — — — 76,774 (297,602) — (220,828)
Issue of shares 122,554 — — (17,457) (45,210) — — — 59,887Exchange of convertible and
exchangeable bonds — — — — — — — 32,034 32,034Shares transferred to participants
from the Share Award Scheme Trust (4,836) — — — (16,525) — — — (21,361)
Dividend income of shares under the Restricted Share Award Scheme — — — — — — — 1,731 1,731
Equity-settled share option arrangements — — — (27,243) — — — — (27,243)
Transfer of share option reserve upon the expiry of share options — — — (38,656) — 38,656 — — —
Restricted Share Award Scheme arrangements — — — — 154,501 — — — 154,501
Final 2016 dividend — (415,019) — — — — — — (415,019)
At 31 December 2017 and 1 January 2018 2,439,748 1,540,881 425 6,020 144,509 (55,757) (229,491) 35,396 3,881,731
Total comprehensive income for the year — — — — — 2,883,299 317,748 — 3,201,047
Issue of shares 65,648 — — (2,843) (52,480) — — — 10,325Shares transferred to participants
from the Share Award Scheme Trust (53,060) — — — (90,444) — — — (143,504)
Dividend income of shares under the Restricted Share Award Scheme — — — — — — — 3,080 3,080
Transfer of awarded share reserve upon the expiry of awarded shares — — — — (4,336) 4,336 — — —
Restricted Share Award Scheme arrangements — — — — 125,090 — — — 125,090
Shares repurchased (85,765) — (425) — — 425 — — (85,765)Final 2017 dividend — (685,405) — — — — — — (685,405)
At 31 December 2018 2,366,571 855,476 — 3,177 122,339 2,832,303 88,257 38,476 6,306,599
The Company’s contributed surplus represents the excess of the fair value of the shares of the subsidiaries acquired, over the nominal value of the Company’s shares issued in exchange therefor. Under the Companies Act 1981 of Bermuda (as amended), the contributed surplus is distributable to shareholders subject to the Companies Act 1981 of Bermuda (as amended) and Bye-laws of the Company.

207Haier Electronics Group Co., Ltd. Annual Report 2018
Notes to Financial Statements31 December 2018
51. COMPARATIVE AMOUNTS
As further explained in notes 2.1 and 2.2 to the financial statements, due to the application of merger accounting for business combinations under common control as well as the adoption of IFRS 15, the comparative amounts have been restated.
52. APPROVAL OF THE FINANCIAL STATEMENTS
The financial statements were approved and authorised for issue by the board of directors on 27 March 2019.

208 Haier Electronics Group Co., Ltd. Annual Report 2018
FIVE YEAR FINANCIAL SUMMARY
A summary of the results and of the assets, liabilities and non-controlling interests of the Group for the last five financial years is set out below.
Year ended 31 December2018 2017 2016 2015 2014
RMB’000 RMB’000 RMB’000 RMB’000 RMB’000(Restated) (Restated) (Restated) (Restated)
RESULTS
REVENUE 85,250,041 78,740,680 63,846,303 62,838,842 67,123,799Cost of sales (70,067,466) (64,930,515) (52,777,164) (52,847,181) (57,286,568)
Gross profit 15,182,575 13,810,165 11,069,139 9,991,661 9,837,231Other income and gains 1,135,817 815,219 675,493 802,729 390,766Selling and distribution expenses (8,827,562) (7,890,007) (6,102,781) (5,398,071) (4,704,728)Administrative expenses (2,607,194) (2,361,319) (2,039,406) (1,978,114) (2,246,187)Other expenses and losses (8,301) (51,977) (62,618) (71,692) (20,647)Finance costs (10,908) (11,121) (43,022) (70,527) (95,962)Share of profits and losses of
associates (346) 4,141 (27,323) 11,714 —
PROFIT BEFORE TAX 4,864,081 4,315,101 3,469,482 3,287,700 3,160,473Income tax expense (873,976) (820,463) (682,387) (609,201) (650,005)
PROFIT FOR THE YEAR 3,990,105 3,494,638 2,787,095 2,678,499 2,510,468
Attributable to:Owners of the Company 3,789,679 3,331,904 2,769,152 2,674,361 2,441,971Non-controlling interests 200,426 162,734 17,943 4,138 68,497
3,990,105 3,494,638 2,787,095 2,678,499 2,510,468
As at 31 December2018 2017 2016 2015 2014
RMB’000 RMB’000 RMB’000 RMB’000 RMB’000(Restated) (Restated) (Restated) (Restated)
ASSETS, LIABILITIES AND NON-CONTROLLING INTERESTS
TOTAL ASSETS 46,957,393 43,654,923 36,438,054 30,572,352 27,704,321TOTAL LIABILITIES (21,209,109) (20,624,472) (18,071,889) (14,808,334) (15,602,825)NON-CONTROLLING INTERESTS (1,975,671) (2,224,025) (849,584) (902,020) (611,610)
23,772,613 20,806,426 17,516,581 14,861,998 11,489,886

www.haier.hk
This annual report is printed on environmental friendly paper
ANNUAL REPORT
01169Stock Code :
Haier Electronics Group Co., Ltd.海爾電器集團有限公司*
2018*
Haier E
lectronics Group
Co., Ltd
. A
nnual Rep
ort 2018