2021060800311.pdf - :: HKEX :: HKEXnews ::
58
1 Hong Kong Exchanges and Clearing Limited and The Stock Exchange of Hong Kong Limited take no responsibility for the contents of this announcement, make no representation as to its accuracy or completeness and expressly disclaim any liability whatsoever for any loss howsoever arising from or in reliance upon the whole or any part of the contents of this announcement. (Incorporated in the Cayman Islands with limited liability) Stock Code: 1929 CHOW TAI FOOK JEWELLERY GROUP LIMITED 周 大福珠寶集團有限公司 ANNUAL RESULTS ANNOUNCEMENT FOR THE YEAR ENDED 31 MARCH 2021 AND THE UNAUDITED KEY OPERATIONAL DATA FROM 1 APRIL TO 31 MAY 2021 • The Group’s revenue was up by 23.6% in FY2021, driven by our retail expansion in Mainland China and a solid recovery there in 2HFY2021. Versus FY2019, revenue was up by 5.3% on a two- year basis. • Same Store Sales (1) (“SSS”) in Mainland China increased by 31.9% whereas Hong Kong and Macau recorded a decline of 41.3% during the year. • Core operating profit (2) increased by 51.7% year-on-year. Core operating profit margin (2) increased to 12.3%, thanks to our well contained SG&A and operating leverage. • Profit attributable to shareholders increased by 107.7% in FY2021, mainly benefitted from one- off rent concession, unrealised gain on gold loans plus foreign exchange gain, netting off impairment on assets and goodwill. • Retail network expanded to 4,591 POS as at 31 March 2021, with a net addition of 741 POS in FY2021. • With a solid foundation that has already been built through our “Smart+ 2020” strategic framework, we are pleased to move forward with our Dual-Force Strategy. Our Dual-Force Strategy will steer us towards the continual expansion of physical footprint and digital empowerment in order to continue delivering exceptional customer experience that creates long-term brand differentiation and loyalty. FINANCIAL HIGHLIGHTS 2021 2020 For the year ended 31 March HK$ million HK$ million YoY change Revenue 70,164 56,751 23.6% Gross profit 20,075 16,096 24.7% Gross profit margin 28.6% 28.4% Adjusted gross profit margin (3) 28.2% 29.6% Core operating profit (2) 8,630 5,687 51.7% Core operating profit margin (2) 12.3% 10.0% Profit attributable to shareholders of the Company 6,026 2,901 107.7% Earnings per share (HK$) 0.60 0.29 107.7% Dividend per share (4) (HK$) 0.40 0.24 (1) “Same Store Sales” for FY2021 is the Retail Sales Value (“RSV”) from the self-operated points of sale (“POS”) of CHOW TAI FOOK JEWELLERY existing as at 31 March 2021 and which have been opened prior to 1 April 2019. RSV from franchised POS and other channels are not included (2) Core operating profit and the corresponding margin, a non-IFRS measure, being the aggregate of adjusted gross profit and other income, less selling and distribution costs and general and administration expenses (“SG&A”), which the Company believes is useful in gaining a more complete understanding of its operational performance and the underlying trend of its businesses (3) Adjusted gross profit margin, a non-IFRS measure, eliminates the effect of unrealised loss (gain) on gold loans, which the Company believes is useful in gaining a more complete understanding of its operational performance and the underlying trend of its businesses (4) The proposed final dividend of HK$0.24 per share is subject to the approval of shareholders at the forthcoming annual general meeting. Dividend payout ratio for FY2021 is approximately 66.4% on a full year basis
-
Upload
khangminh22 -
Category
Documents
-
view
0 -
download
0
Transcript of 2021060800311.pdf - :: HKEX :: HKEXnews ::

1
Hong Kong Exchanges and Clearing Limited and The Stock Exchange of Hong Kong Limited take no responsibility for the contents of this announcement, make no representation as to its accuracy or completeness and expressly disclaim any liability whatsoever for any loss howsoever arising from or in reliance upon the whole or any part of the contents of this announcement.
(Incorporated in the Cayman Islands with limited liability)
Stock Code: 1929
CHOW TAI FOOK JEWELLERY GROUP LIMITED周大福珠寶集團有限公司
ANNUAL RESULTS ANNOUNCEMENT FOR THE YEAR ENDED 31 MARCH 2021AND
THE UNAUDITED KEY OPERATIONAL DATA FROM 1 APRIL TO 31 MAY 2021• TheGroup’s revenuewasupby23.6% inFY2021,drivenbyour retailexpansion inMainland
Chinaandasolidrecoverytherein2HFY2021.VersusFY2019,revenuewasupby5.3%onatwo-yearbasis.
• SameStoreSales(1)(“SSS”)inMainlandChinaincreasedby31.9%whereasHongKongandMacaurecordedadeclineof41.3%duringtheyear.
• Coreoperatingprofit(2)increasedby51.7%year-on-year.Coreoperatingprofitmargin(2)increasedto12.3%,thankstoourwellcontainedSG&Aandoperatingleverage.
• Profitattributabletoshareholders increasedby107.7% inFY2021,mainlybenefittedfromone-off rent concession,unrealisedgainongold loansplus foreignexchangegain, nettingoffimpairmentonassetsandgoodwill.
• Retailnetworkexpandedto4,591POSasat31March2021,withanetadditionof741POSinFY2021.• With a solid foundation thathas alreadybeenbuilt throughour “Smart+2020” strategic
framework,wearepleased tomove forwardwithourDual-ForceStrategy.OurDual-ForceStrategywill steer us towards the continual expansion of physical footprint and digitalempowerment inorder tocontinuedeliveringexceptional customerexperience thatcreateslong-termbranddifferentiationandloyalty.
FINANCIAL HIGHLIGHTS2021 2020
Fortheyearended31March HK$ million HK$ million YoYchange
Revenue 70,164 56,751 23.6%Grossprofit 20,075 16,096 24.7% Gross profit margin 28.6% 28.4% Adjusted gross profit margin(3) 28.2% 29.6%Coreoperatingprofit(2) 8,630 5,687 51.7% Core operating profit margin(2) 12.3% 10.0%Profitattributabletoshareholdersof theCompany
6,026 2,901 107.7%
Earningspershare(HK$) 0.60 0.29 107.7%Dividendpershare(4)(HK$) 0.40 0.24(1) “Same Store Sales” for FY2021 is the Retail Sales Value (“RSV”) from the self-operated points of sale (“POS”) of CHOW TAI FOOK
JEWELLERY existing as at 31 March 2021 and which have been opened prior to 1 April 2019. RSV from franchised POS and other channels are not included
(2) Core operating profit and the corresponding margin, a non-IFRS measure, being the aggregate of adjusted gross profit and other income, less selling and distribution costs and general and administration expenses (“SG&A”), which the Company believes is useful in gaining a more complete understanding of its operational performance and the underlying trend of its businesses
(3) Adjusted gross profit margin, a non-IFRS measure, eliminates the effect of unrealised loss (gain) on gold loans, which the Company believes is useful in gaining a more complete understanding of its operational performance and the underlying trend of its businesses
(4) The proposed final dividend of HK$0.24 per share is subject to the approval of shareholders at the forthcoming annual general meeting. Dividend payout ratio for FY2021 is approximately 66.4% on a full year basis

2
ANNUAL RESULTS FOR THE YEAR ENDED 31 MARCH 2021
Theboardofdirectors(the“Board”or“Directors”)ofChowTaiFookJewelleryGroupLimited(the“Company”,“we”or“ChowTaiFook”)ispleasedtoannouncetheauditedannualresultsof theCompanyand itssubsidiaries (collectively, the“Group”) fortheyearended31March2021 (“FY2021”), togetherwith comparative figures for theyearended31March2020(“FY2020”)asfollows:
CONSOLIDATED STATEMENT OF PROFIT OR LOSS AND OTHER COMPREHENSIVE INCOMEFor the year ended 31 March 2021
2021 2020Notes HK$ million HK$ million
Revenue 2 70,163.8 56,750.8Costofgoodssold (50,089.1) (40,654.6)
Gross profit 20,074.7 16,096.2Otherincome 3 691.7 436.6Sellinganddistributioncosts (8,634.9) (8,689.7)Generalandadministrativeexpenses (3,213.7) (2,867.1)Othergainsandlosses 4 430.8 (147.1)Otherexpenses 5 (664.1) (146.3)Shareofprofitsofanassociate 4.6 3.5Interestincome 81.5 78.0Financecosts (376.0) (559.6)
Profit before taxation 6 8,394.6 4,204.5Taxation 7 (2,218.5) (1,221.4)
Profit for the year 6,176.1 2,983.1

3
2021 2020Note HK$ million HK$ million
Other comprehensive income/(expense)Item that will not be reclassified to profit or loss: —remeasurementofdefinedbenefitscheme 18.1 (24.0)
Item that may be reclassified subsequently to profit or loss: —exchangedifferencesarisingontranslation offoreignoperations
1,235.1 (980.6)
Other comprehensive income/(expense) for the year
1,253.2 (1,004.6)
Total comprehensive income for the year 7,429.3 1,978.5
Profit for the year attributable to: ShareholdersoftheCompany 6,026.4 2,901.0 Non-controllinginterests 149.7 82.1
6,176.1 2,983.1
Total comprehensive income for the year attributable to: ShareholdersoftheCompany 7,223.8 1,937.2 Non-controllinginterests 205.5 41.3
7,429.3 1,978.5
Earnings per share — Basic and Diluted 8 HK60.3 cents HK29.0cents
CONSOLIDATED STATEMENT OF PROFIT OR LOSS AND OTHER COMPREHENSIVE INCOME (Continued)For the year ended 31 March 2021

4
CONSOLIDATED STATEMENT OF FINANCIAL POSITIONAt 31 March 2021
2021 2020Notes HK$ million HK$ million
Non-current assets Property,plantandequipment 4,614.6 4,641.3 Right-of-useassets 1,792.8 2,288.0 Investmentproperties 214.9 225.4 Goodwill – 231.5 Otherintangibleassets 158.0 207.6 Jewellerycollectibles 1,520.1 1,520.1 Prepaymentanddeposits 229.8 248.3 Financialassetsatfairvaluethrough profitorloss
22.0 21.0
Investmentsinassociates 23.8 11.7 Amountsduefromassociates 51.1 57.5 Loanreceivables 11.8 15.6 Deferredtaxassets 426.3 570.1
9,065.2 10,038.1
Current assets Inventories 10 43,011.4 42,538.4 Tradeandotherreceivables 11 6,180.4 5,340.8 Amountsduefromassociates 4.6 – Loanreceivables 8.9 7.9 Taxationrecoverable 5.8 99.0 Cashandcashequivalents 6,031.9 7,219.2
55,243.0 55,205.3
Current liabilities Tradeandotherpayables 12 17,240.0 12,430.0 Amountsduetonon-controlling shareholdersofsubsidiaries
66.0 97.9
Taxationpayable 721.8 388.6 Bankborrowings 4,619.0 10,533.0 Goldloans 5,725.4 11,280.4 Leaseliabilities 770.0 896.8
29,142.2 35,626.7
Net current assets 26,100.8 19,578.6
Total assets less current liabilities 35,166.0 29,616.7

5
2021 2020HK$ million HK$ million
Non-current liabilities Bankborrowings 1,798.9 897.5 Leaseliabilities 726.0 900.3 Retirementbenefitobligations 238.8 260.2 Deferredtaxliabilities 764.0 505.1 Otherliabilities 70.7 62.8
3,598.4 2,625.9
Net assets 31,567.6 26,990.8
Share capital 10,000.0 10,000.0Reserves 20,767.1 16,343.3
Equity attributable to shareholders of the Company
30,767.1 26,343.3
Non-controlling interests 800.5 647.5
31,567.6 26,990.8
CONSOLIDATED STATEMENT OF FINANCIAL POSITION (Continued)At 31 March 2021

6
NOTES TO THE CONSOLIDATED FINANCIAL STATEMENTSFor the year ended 31 March 2021
1. BASIS OF PREPARATION
New and amended standards adopted by the Group
TheGrouphasappliedthefollowingstandardsandamendmentswhicharefirsteffectivefortheirannualreportingperiodcommencing1April2020.
IFRS3(Amendments) DefinitionofaBusinessIAS1andIAS8(Amendments) DefinitionofMaterialConceptualFrameworkforFinancial Reporting2018
RevisedConceptualFrameworkforFinancialReporting
Theapplicationof theabovenewandamended IFRSs inthecurrentyearhashadnomaterial impactontheGroup’sfinancialperformanceandpositionsforthecurrentandprioryearsand/oronthedisclosuressetoutintheseconsolidatedfinancialstatements.
New standards and interpretations not yet adopted
Certainnewaccountingstandardsandinterpretationshavebeenpublishedthatarenotmandatoryfor31March2021reportingperiodandhavenotbeenearlyadoptedby theGroup.Thesestandardsarenotexpected tohaveamaterial impacton theentity in the currentor future reportingperiodsandonforeseeablefuturetransactions.
New standards, amendments and improvements to existing standards
AnnualImprovementsProject AnnualImprovementstoHKFRSs2018–20201
IFRS3,IAS16andIAS37(Amendments) Narrow-scopeamendments1
IAS1(Amendments) ClassificationofLiabilitiesasCurrentorNon-current2IFRS17 InsuranceContracts2IFRS10andIAS28(Amendments) SaleorcontributionofAssetsbetweenanInvestorandits
AssociateorJointVenture3
1 Effectiveforaccountingperiodsbeginningonorafter1January20222 Effectiveforaccountingperiodsbeginningonorafter1January20233 Effectiveforaccountingperiodsbeginningonorafteradatetobedetermined
2. REVENUE AND SEGMENT INFORMATION
Revenuerepresents thenetamountsreceivedandreceivable forgoodssoldandservicesprovided lessreturnsandnetoftradediscounts.
Forthepurposesof resourceallocationandperformanceassessment, informationreportedtothechiefoperatingdecisionmaker (the“CODM”),whichcomprisesexecutivedirectorsof theCompany,mainlyfocusesonthe locationofmanagement.Revenuederivedfromeach locationofmanagement is furtheranalysed into those from retail andwholesalemarketswhen reviewedby theCODM.TheGroup’sreportableandoperatingsegmentsfortheyearsended31March2021and2020includedtwosegments,namely(i)businessintheMainlandChinaand(ii)businessinHongKong,Macauandothermarkets.

7
2. REVENUE AND SEGMENT INFORMATION (Continued)
(a) Analysis of the Group’s revenue and results by reportable segment
For the year ended 31 March
Mainland ChinaHong Kong, Macau and
other markets Total2021 2020 2021 2020 2021 2020
HK$ million HK$ million HK$ million HK$ million HK$ million HK$ million
RevenueExternalsales—Retail 35,716.1 26,796.0 9,122.8 14,875.3 44,838.9 41,671.3—Wholesale(note i) 23,982.1 13,966.8 1,342.8 1,112.7 25,324.9 15,079.5
Segment/Grouprevenue 59,698.2 40,762.8 10,465.6 15,988.0 70,163.8 56,750.8Inter-segmentsales(note ii) – – 2,772.8 2,126.3 2,772.8 2,126.3
59,698.2 40,762.8 13,238.4 18,114.3 72,936.6 58,877.1
Adjustedgrossprofit (beforeelimination)
16,710.9 12,432.2 2,743.5 4,244.3 19,454.4 16,676.5
Inter-segmenteliminations – – 332.2 130.5 332.2 130.5
Adjustedgrossprofit 16,710.9 12,432.2 3,075.7 4,374.8 19,786.6 16,807.0Otherincome 425.6 279.4 266.1 157.2 691.7 436.6Sellinganddistributioncostsand generalandadministrativeexpenses
(8,910.3) (7,615.7) (2,938.3) (3,941.1) (11,848.6) (11,556.8)
Coreoperatingprofit(segmentresult) 8,226.2 5,095.9 403.5 590.9 8,629.7 5,686.8
Unrealisedgain/(loss)ongold(note iii) 288.1 (710.8)Others(note iv) (228.7) (289.9)Interestincome 81.5 78.0Financecosts (376.0) (559.6)
Profitbeforetaxation 8,394.6 4,204.5
Othersegmentinformationincluded inmeasurementofcoreoperating profit(segmentresult):Concessionairefees 1,990.5 1,583.3 0.3 1.4 1,990.8 1,584.7Operatingleaserentalsinrespect ofrentedpremises
145.9 135.6 155.7 116.0 301.6 251.6
Staffcosts 3,454.5 3,027.7 1,185.2 1,532.8 4,639.7 4,560.5Depreciationandamortisation 1,036.3 964.2 1,082.8 1,405.7 2,119.1 2,369.9

8
2. REVENUE AND SEGMENT INFORMATION (Continued)
(a) Analysis of the Group’s revenue and results by reportable segment (Continued)
Notes:
(i) Wholesale revenue represents revenue from jewellery trading, sales to franchiseesand retailersandprovisionofservicestofranchisees.
(ii) Inter-segmentsalesarechargedatapricemutuallyagreedbybothparties.
(iii) AfairvaluegainofHK$288.1million(2020:lossofHK$710.8million)hasnotyetbeenrealisedduetotimingdifferenceintherecognitionoftheimpactofchangesingoldpricebetweengoldloans(shortposition)andgoldinventories(longposition).
(iv) Othersrepresentothergainsandlosses,otherexpensesandshareofprofitsofanassociate.
Adjustedgrossprofitrepresentsthegrossprofitgeneratedfromeachsegmentwithoutallocationofunrealised (loss)/gainongold.Coreoperatingprofit represents theprofit generated fromeachsegmentwithoutallocationofunrealised(loss)/gainongold,othergainsandlosses,otherexpenses,shareofprofitsofanassociate, interest incomeandfinancecosts.ThisisthemeasurereportedtotheCODMforthepurposesofresourceallocationandperformanceassessment.
(b) Analysis of the Group’s assets and liabilities by reportable segment
As at 31 March
Segment assets
Mainland ChinaHong Kong, Macau and
other markets Total2021 2020 2021 2020 2021 2020
HK$ million HK$ million HK$ million HK$ million HK$ million HK$ million
Property,plantandequipment 3,603.0 3,437.8 1,011.6 1,203.5 4,614.6 4,641.3Right-of-useassets 634.2 589.5 1,158.6 1,698.5 1,792.8 2,288.0Investmentproperties 17.7 17.2 197.2 208.2 214.9 225.4Goodwill – 193.3 – 38.2 – 231.5Otherintangibleassets 111.8 142.8 37.3 47.6 149.1 190.4Jewellerycollectibles – – 1,520.1 1,520.1 1,520.1 1,520.1Prepaymentanddeposits 97.9 96.5 131.9 151.8 229.8 248.3Inventories 26,681.8 24,547.8 16,329.6 17,990.6 43,011.4 42,538.4Tradeandotherreceivables 5,538.7 4,698.2 641.7 642.6 6,180.4 5,340.8Taxationrecoverable – – 5.8 99.0 5.8 99.0
Total segment assets 36,685.1 33,723.1 21,033.8 23,600.1 57,718.9 57,323.2
Unallocated: Otherintangibleassets 8.9 17.2 Financialassetsatfairvalue throughprofitorloss
22.0 21.0
Investmentsinassociates andamountsduefrom associates
79.5 69.2
Loanreceivables 20.7 23.5 Deferredtaxassets 426.3 570.1 Cashandcashequivalents 6,031.9 7,219.2
Total assets 64,308.2 65,243.4

9
2. REVENUE AND SEGMENT INFORMATION (Continued)
(b) Analysis of the Group’s assets and liabilities by reportable segment (Continued)
As at 31 March
Segment liabilities
Mainland ChinaHong Kong, Macau and
other markets Total2021 2020 2021 2020 2021 2020
HK$ million HK$ million HK$ million HK$ million HK$ million HK$ million
Tradeandotherpayables (15,891.4) (11,338.5) (1,348.6) (1,091.5) (17,240.0) (12,430.0)Taxationpayables (554.6) (227.9) (167.2) (160.7) (721.8) (388.6)Leaseliabilities (500.4) (472.3) (995.6) (1,324.8) (1,496.0) (1,797.1)
Total segment liabilities (16,946.4) (12,038.7) (2,511.4) (2,577.0) (19,457.8) (14,615.7)
Unallocated: Amountduetonon-controlling shareholdersofsubsidiaries
(66.0) (97.9)
Bankborrowings (6,417.9) (11,430.5) Goldloans (5,725.4) (11,280.4) Retirementbenefitsobligations (238.8) (260.2) Deferredtaxliabilities (764.0) (505.1) Otherliabilities (70.7) (62.8)
Total liabilities (32,740.6) (38,252.6)
(c) Analysis of the Group’s assets by geographical area
TheGroup’snon-currentassets,excluding loanreceivables,deposits,amountsduefromassociates,financialassetsatfairvaluethroughprofitorlossanddeferredtaxassets,bygeographicalareasareasfollows:
As at 31 March
2021 2020HK$ million HK$ million
MainlandChina 4,843.8 4,853.9HongKong,Macauandothermarkets 3,528.8 4,331.4
8,372.6 9,185.3

10
2. REVENUE AND SEGMENT INFORMATION (Continued)
(d) Disaggregation of revenue
TheGroupderivesrevenuefromthetransferofgoodsandservicesatapointintimeandovertimeinthefollowingmajorproductcategories:
For the year ended 31 March
2021 2020HK$ million HK$ million
At a point in timeRetailsalesof—Gem-set,PlatinumandK-goldjewellery 11,213.9 11,596.8—Goldjewelleryandproducts 28,320.0 26,661.4—Watches 5,305.0 3,413.1
44,838.9 41,671.3
Wholesaletofranchisees/retailers 24,449.8 14,578.9Jewellerytrading 575.8 245.2
Over timeServiceincomefromfranchisees 299.3 255.4
70,163.8 56,750.8
Noindividualcustomercontributedover10%ofthetotalrevenueoftheGroupinbothyears.
3. OTHER INCOME
2021 2020HK$ million HK$ million
Commissionincome 69.2 111.9Governmentgrants(note) 353.7 81.0Otherincomefromfranchisees 109.5 67.3Rentalincome 34.6 35.3Interestincomefromtradereceivables 57.4 56.0Interestincomefromloanreceivables 2.3 4.8Others 65.0 80.3
691.7 436.6
Note: UnderAnti-EpidemicFundlaunchedbytheHongKongSARgovernment,wagesubsidiesofHK$159.6millionrelatedtotheEmploymentSupportSchemeandsubsidiesofHK$3.2millionrelatedtotheone-offRetailSectorSubsidySchemewererecognised intheyearended31March2021.OthergovernmentsubsidiesofHK$1.0million (2020:HK$0.6million)weregrantedtosubsidiariesinHongKong.
Government subsidiesofHK$185.3million (2020:HK$80.4million) granted to subsidiaries inMainlandChina andgovernmentsubsidiesofHK$4.6milliongrantedtosubsidiariesinotherjurisdictionswererecognisedintheyearended31March2021.

11
4. OTHER GAINS AND LOSSES
2021 2020HK$ million HK$ million
Netforeignexchangegain/(loss) 336.4 (234.0)Lossondisposalofproperty,plantandequipment (32.3) (37.7)Gainonsurrenderofright-of-useassets 1.8 78.8COVID-19-relatedrentconcession 127.6 16.2Gainonacquisitionofsubsidiaries – 18.0Others (2.7) 11.6
430.8 (147.1)
5. OTHER EXPENSES
2021 2020HK$ million HK$ million
Donation 11.3 20.1Amortisationofotherintangibleasset 39.8 36.3Impairmentofamountduefromanassociate – 0.2Impairmentofgoodwill 231.5 26.3Impairmentofproperty,plantandequipment 66.6 13.0Impairmentofright-of-useassets 314.9 50.4
664.1 146.3
6. PROFIT BEFORE TAXATION
2021 2020HK$ million HK$ million
Profitbeforetaxationhasbeenarrivedataftercharging/(crediting):Directors’remuneration 87.5 97.1Staff’sretirementbenefitsschemecontributions 497.1 606.2Staffcosts 4,055.1 3,857.2
4,639.7 4,560.5
Costofinventoriesrecognisedasexpenses 48,702.8 38,333.7Concessionairefees 1,990.8 1,584.7Operatingleaserentalsinrespectofrentedpremises 301.6 251.6Depreciationofproperty,plantandequipment 1,024.1 975.0Depreciationofright-of-useassets 1,033.5 1,337.5Depreciationofinvestmentproperties 11.9 11.3Amortisationofotherintangibleassets(note) 49.6 46.1Recognition/(utilisation)ofallowancesoninventories (includedincostofgoodssold)
21.5 (24.1)
Lossallowancerecognised/(writtenback)ontradeand otherreceivables
149.7 (3.2)
Fairvaluelossarisingfromgoldloans(includedincostofgoodssold) 168.4 2,803.8GainonacquisitionofENZO(includedinothergainsandlosses) – 18.0Donations(includedinotherexpenses) 11.3 20.1Auditors’remunerationfortheCompany’sauditor—auditandrelatedservices 6.3 6.2—non-auditservices 2.1 2.2Auditor’sremunerationforotherauditors—auditandrelatedservices 6.6 3.9
Note: AmortisationofHK$39.8million (2020:HK$36.3million) related toHEARTSONFIREwas included innote5 “OtherExpenses”andtheremainingamountwasincludedingeneralandadministrativeexpenses.

12
7. TAXATION
2021 2020HK$ million HK$ million
Thetaxationchargecomprises:
Currenttax: EnterpriseIncomeTax(“EIT”)inMainlandChina 1,314.5 789.9 HongKongProfitsTax 163.1 129.8 Macaucomplementarytax 5.0 31.6 Taxationinotherjurisdictions 3.6 3.3
1,486.2 954.6
Under/(over)provisioninprioryears: EITinMainlandChina 42.4 (6.8) HongKongProfitsTax 21.5 0.1 Taxationinotherjurisdictions 3.4 1.5
67.3 (5.2)
Deferredtaxcharge 526.4 149.3
Withholdingtax* 138.6 122.7
2,218.5 1,221.4
* Withholdingtaxmainlyrepresentswithholdingtaxon intra-group licence incomeand interest incomefromMainlandChinasubsidiaries.
HongKongProfitsTaxiscalculatedat16.5%oftheestimatedassessableprofitforbothyears.
Under theEnterprise IncomeTax Law (the“EIT Law”)of thePeople’sRepublicofChina (“PRC”)andImplementationRegulationoftheEITLaw,thetaxrateofthesubsidiaries inMainlandChina is25.0%forbothyears.
For certain subsidiariesof theCompany inMainlandChina, theyareentitled to the tax incentives inconnectionwiththedevelopmentofthewesternpartofMainlandChina.Theapplicabletaxrateis15.0%forbothyears.
Macaucomplementary tax is calculatedat themaximumprogressive rateof12.0%on theestimatedassessableprofitforbothyears.

13
8. EARNINGS PER SHARE
ThecalculationofthebasicearningspersharefortheyearisbasedontheconsolidatedprofitattributabletoshareholdersoftheCompanyfortheyearandonthenumberof10,000,000,000(2020:10,000,000,000)sharesinissueduringtheyear.
Dilutedearningspershareisthesameasbasicearningspershareastherewasnopotentialordinarysharedilutionduringbothyears.
9. DIVIDENDS
2021 2020HK cents
per share HK$ millionHK cents
per share HK$ million
Dividendspaidandrecognisedas distributionduringtheyearForcurrentyear:—Interimdividends 16.0 1,600.0 12.0 1,200.0Forprioryear:—Finaldividends 12.0 1,200.0 20.0 2,000.0—Specialdividends – – 30.0 3,000.0
2,800.0 6,200.0
Subsequenttotheendofthereportingperiod,a finaldividendofHK24.0cents (2020:HK12.0cents)pershare,totallingHK$2,400.0million(2020:HK$1,200.0million)inrespectoftheyearended31March2021havebeenproposedbythedirectorsof theCompanyandaresubject toapprovalbytheshareholders intheforthcomingannualgeneralmeeting.
10. INVENTORIES
2021 2020HK$ million HK$ million
Rawmaterialsfor: Gem-set,PlatinumandK-goldjewellery 7,627.5 7,252.3 Goldjewelleryandproducts 3,017.5 2,114.6
10,645.0 9,366.9
Finishedgoods: Gem-set,PlatinumandK-goldjewellery 16,004.1 16,374.2 Goldjewelleryandproducts 14,376.9 14,963.6 Watches 1,765.5 1,638.7
32,146.5 32,976.5
Packagingmaterials 219.9 195.0
43,011.4 42,538.4

14
11. TRADE AND OTHER RECEIVABLES
Included in tradeandother receivablesare tradereceivablesofHK$4,580.6million (2020:HK$2,744.8million)andtheagingbyinvoicedateisasfollows:
2021 2020HK$ million HK$ million
0to30days 4,380.6 2,206.831to90days 79.7 382.491to180days 22.2 54.2Over180days 98.1 101.4
4,580.6 2,744.8
12. TRADE AND OTHER PAYABLES
IncludedintradeandotherpayablesaretradepayablesofHK$819.4million(2020:HK$253.4million)andtheagingbyinvoicedateisasfollows:
2021 2020HK$ million HK$ million
0to30days 800.6 200.731to90days 12.0 36.991to180days 0.4 12.6Over180days 6.4 3.2
819.4 253.4

15
MANAGEMENT DISCUSSION AND ANALYSIS
PERFORMANCE REVIEW
Overview
ThebusinessenvironmentwaschallenginginFY2021amidthepandemicandmacroeconomicuncertainties.Yet, theGroup’sbusinessmaintainedasteadyandhealthygrowth,drivenbyourretailexpansion inMainlandChinawithnetopeningsof746POSandasolidrecoverytherebackedbyanimprovingconsumersentimentandsoftenedgoldpricein2HFY2021.Ourstrategic stepson smart retail alsohelpedusachievebetter customerengagementandboostedoure-commerceandonline-to-offline(“O2O”)relatedsalesinMainlandChinaduringthefinancialyear.Ontheotherhand,businessinHongKong,Macauandothermarketswasstagnantasmajorbordercrossingsremainedclosed.
TheGroup’sadjustedgrossprofitmarginwasbenefittedduring1HFY2021asgoldpricesurged,yet,sucheffect faded in2HFY2021.CoupledwithahighersalescontributionfromwholesalebusinessinMainlandChinaandalessfavourableproductmix,adjustedgrossprofitmargindeclinedyear-on-yearduring the financial year.Nevertheless, thanks toourwellcontainedSG&A,operating leverageandgovernment subsidiesand reliefsgranted, theGroup’scoreoperatingprofitincreasedby51.7%year-on-yearinFY2021.
WiththeCOVID-19relatedrentconcession,unrealisedgainongold loansaswellas foreignexchange gain, netting off impairment on assets and goodwill, profit attributable toshareholderswaselevatedby107.7%comparedtothe lowbase inFY2020whilecomparingtoFY2019,itroseby31.3%onatwo-yearbasis.
Revenue
Revenue by reportable segmentFortheyearended31March(HK$million)
0
10,000
20,000
30,000
40,000
50,000
60,000
80,000
70,000
2017
28.2%
71.8%
36.3%
63.7%
37.8%
62.2%
39.5%
60.5%
51,246
59,156
66,661
56,751
70,164
14.9%
85.1% 46.5%
2018 2019 2020 2021
23.6%
34.5%
YoY change
Mainland China
Hong Kong, Macau and other markets

16
Revenue (HK$ million) 1HFY2020 2HFY2020 1HFY2021 2HFY2021
1HFYYoY
change
2HFYYoY
change
MainlandChina 20,224 20,539 21,216 38,482 4.9% 87.4%HongKong,Macauand othermarkets
9,309 6,679 3,457 7,009 62.9% 4.9%
Overall 29,533 27,218 24,673 45,491 16.5% 67.1%
• TheGroup’srevenuewasupby23.6%toHK$70,164million inFY2021.VersusFY2019,revenuewasupby5.3%onatwo-yearbasis.
• RevenuefromMainlandChinajumped46.5%duringthefinancialyear,supportedbynewopenings, improvingconsumersentimentandasoftenedgoldpricein2HFY2021aswellasa lowbaseofcomparison. ItscontributiontotheGroup’srevenuewas85.1% inthefinancialyear.
• InHongKong,Macauandothermarkets, revenueshrank34.5%year-on-yearas thechallengingmacros, pandemic and closureofmajor border crossingsweighedonconsumerspending.
Revenue by product(1) (excluding jewellery trading and service income from franchisees)Fortheyearended31March(HK$million)
0
10,000
20,000
30,000
40,000
50,000
60,000
70,000
20175.7% 6.0% 5.5% 6.1%
68.2%
7.7%
24.1%
50,821
57,892
65,966
56,250
69,289
2018 2019 2020 2021
23.2%
8.4%
26.3%
55.4%
62.4%64.1%
66.1%66.5%
27.4%
28.3%
30.0%
31.8%
YoY change
Gem-set, Platinum and K-gold jewellery
Gold jewellery and products
Watches
% of Revenue 1HFY2020 2HFY2020 1HFY2021 2HFY2021
Gem-set,PlatinumandK-goldjewellery 29.1% 25.5% 30.1% 20.9%Goldjewelleryandproducts 64.5% 68.7% 60.9% 72.2%Watches 6.4% 5.7% 9.0% 6.9%
• Revenueof gold jewellery andproductswasupby26.3% in FY2021.Despite thatinternationalgoldpricehikedeterred retaildemandduring1HFY2021, salesof thisproductcategory reboundedandgrewat74.9% in2HFY2021. Its contribution to theGroup’s revenueexpanded170basispoints to68.2% in the financialyear.Within theproductcategory,contributionoffixedpricegoldproductswas9.1%(FY2020:10.9%).

17
• Watchesalso registereda strong revenuegrowthof55.4% in FY2021, fuelledbyabuoyantdomesticdemandinMainlandChinaamidtheinternationaltravelrestrictions.
(1) Starting from FY2021, we re-classify our products into 3 categories namely gem-set, platinum and k-gold jewellery, gold jewellery and products, and watches, which the Company believes is appropriate in reflecting its performance
Same Store Sales Growth (“SSSG”)
SSSG by major market
1Q 2Q 3Q 4Q 1Q 2Q 3Q 4Q
10.5%
-10.9%
-42.3% -35.0%
-65.0%-75.5%
-52.5%-31.0%
31.2%
-6.8%
2.3%
-11.2%
11.0%
141.2%
-49.5%
12.2%
FY2020 FY2021
Mainland China
Hong Kong and Macau
FY2020 FY2021
SSSG SSSGSSS volume
growth MainlandChina 15.1% 31.9% 8.2%HongKongandMacau 38.7% 41.3% 42.9%
• InMainlandChina,SSSrevivedandturnedpositivein2QFY2021amidaneasingpandemicsituation there.Coupledwith the resilientdemandandanexceptionally lowbaseofcomparison,SSSGacceleratedto141.2%in4QFY2021.Asaresult,SSSinMainlandChinaincreasedby31.9%duringFY2021.
• InHongKongandMacau,amutedcustomer traffic led toa41.3%drop inSSSduringFY2021.Yet,SSSrose31.2%in4QFY2021attributabletoarecoveryoflocalconsumption.

18
Profitability
Group Core operating profit(2) by reportable segmentFortheyearended31March Fortheyearended31March
(HK$million)
2019 2020 2021
27.9%
18.0%
10.5% 10.0%12.3%
20.4%
16.9%
29.6%28.2%
Adjusted gross pro�t margin(1)
Selling and distribution costs and general and administrative expenses(”SG&A”) as a % to revenue
Core operating pro�t margin(2)
2019
2H: 2,942
5,004
1,968
1H: 2,062 2H: 1,042
1H: 9260
2,000
4,000
6,000
8,000
10,000
2021
8,226
4042H: 376
1H: 28
2H: 4,176
1H: 4,050
2020
5,096
591
1H: 6852H: (94)
2H: 2,253
1H: 2,843
Mainland China (2HFY)
Mainland China (1HFY)
Hong Kong, Macau and other markets (2HFY)
Hong Kong, Macau and other markets (1HFY)
(1) Adjusted gross profit and the corresponding margin, a non-IFRS measure, eliminates the effect of unrealised loss (gain) on gold loans, which the Company believes is useful in gaining a more complete understanding of its operational performance and the underlying trend of its businesses
(2) Core operating profit and the corresponding margin, a non-IFRS measure, being the aggregate of adjusted gross profit and other income, less SG&A, which the Company believes is useful in gaining a more complete understanding of its operational performance and the underlying trend of its businesses
(HK$ million) 1HFY2020 2HFY2020 1HFY2021 2HFY20211HFY
YoY change2HFY
YoY change Revenue 29,533 27,218 24,673 45,491 16.5% 67.1%Adjustedgrossprofit 9,064 7,743 8,660 11,127 4.5% 43.7% Adjusted gross profit margin 30.7% 28.4% 35.1% 24.5% 4.4% pts 3.9% pts
Otherincome 213 224 347 345 62.7% 54.4%SG&A (5,750) (5,807) (4,928) (6,921) 14.3% 19.2% SG&A as a % to revenue 19.5% 21.3% 20.0% 15.2% 0.5% pts 6.1% pts
Coreoperatingprofit 3,527 2,160 4,078 4,552 15.6% 110.8% Core operating profit margin 11.9% 7.9% 16.5% 10.0% 4.6% pts 2.1% pts
• Adjustedgrossprofitmargindecreasedby140basispoints inFY2021,mainlyduetoahigher sales contribution fromwholesalebusiness,gold jewelleryandproductsandwatchesinretailbusinessascomparedwithFY2020.
• Nevertheless, coreoperatingprofitmargin increased to12.3%, thanks toourwellcontainedSG&Aandoperating leverage. InFY2021, theGroup’scoreoperatingprofitincreasedby51.7%year-on-year.
19
• Amongthetwosegments,MainlandChinacontinuedtobeourmainprofitcontributorandaccounted forover95%of theGroup’scoreoperatingprofit inFY2021. Its coreoperatingprofitrecordedarobustgrowthof61.4%duringthefinancialyear.
• On theotherhand, coreoperatingprofit ofHongKong,Macauandothermarketsregistereda31.7%decline inFY2021,yet ithasdemonstrateda recovery trendsince1HFY2021.
• Profitattributable toshareholders increasedby107.7% inFY2021,mainlybenefittedfromone-off rentconcession,unrealisedgainongold loansplus foreignexchangegain,nettingoffimpairmentonassetsandgoodwill.ComparingtoFY2019,itroseby31.3%onatwo-yearbasis.
Adjusted gross profit margin
• Weuseadjustedgrossprofitmargin,anon-IFRSmeasure,foranalysis,whichrepresentsgrossprofitmargingeneratedfromthebusinessaftereliminatingtheeffectofunrealisedloss (gain) on gold loans, because thismeasure better reflects the operationalperformanceof theGroupand isuseful forunderstanding theunderlying trendof itsbusinesses.
Unrealised loss (gain)
For the year ended 31 March 2019 2020 2021
Grossprofitmargin 27.9% 28.4% 28.6%Unrealisedloss(gain)ongoldloans 0.0% 1.2% (0.4)%Adjustedgrossprofitmargin 27.9% 29.6% 28.2%
• Weusegold loans (shortposition ingold) foreconomichedgepurposetomitigatethefinancialimpactofthegoldpricefluctuationsinourgoldinventories(longposition).Thelong-termeffectof longandshortpositions ingold isexpectedtonetouteachotherthroughthesalesofgold inventories.However,whenwetakeasnapshotposition,ashort-termtimingdifferencemayarise.Theunsettledgoldloancontractsarerevaluedatmarketpriceat theendof the reportingperiod,while thegold inventoriesarenotrevaluedas it ismeasuredatweightedaveragecost,unlessan impairment indicatorexists.
• Asat31March2021, therewasanunrealisedgainofHK$288millionarising fromsuchtimingdifference.

20
Movements in adjusted gross profit marginFortheyearended31March
25.0%
27.0%
29.0%
31.0%
33.0%
2020 2021
29.6%
1.0% 28.2%
1.8%
0.2%
0.8%
Changes in gross pro�t marginby product in retail business
Changes in product mixin retail business
Impact from wholesale business
Changes in Mainland China, Hong Kong, Macau and other markets mix
• Atgrouplevel,FY2021adjustedgrossprofitmargincontractedby140basispointsyear-on-year.
• Thehighercontribution fromourwholesalebusinessandgold jewelleryandproductsandwatches inretailbusiness ledtothecontractionofgrossprofitmarginwhichwaspartiallyoffsetbythefavourablemarketmixwithpromisinggrowthinMainlandChina.
London gold price
1,100
1,300
1,500
1,700
1,900
2,100
2,300
1.4.2019 1.4.2020 31.3.2021
(US$ per ounce)
London gold price
Average of T-180 days(1)
(1) Average of T-180 days refers to the average gold price of previous 180 days on rolling basis, being a proxy of the average price of our hedged inventories. Average of T-180 days was used for FY2020 and FY2021
Londongold price
FY2021 Closing price YoY change Average price YoY change
5.1% 24.6%

21
SG&A
SG&A by reportable segmentFortheyearended31March(HK$million)
0
2,000
4,000
6,000
8,000
10,000
12,000
14,000
17.0%
2.5%
25.4%37.7%
62.3%
12,025
34.1%
65.9%
11,557
24.8%
75.2%
11,849
2019 2020 2021
YoY change
Mainland China
Hong Kong, Macau and other markets
SG&A to revenue ratioFortheyearended31March(HK$million)
18.0%
16.9%
20.4%
8.0%
2.8%
2.7%
1.2%1.6%
1.0%
2.9%
11,55711,849
1.7%
25.6%
15.4%
6.5%15.4%
2.5%
1.1%
5.4%0
2,000
4,000
6,000
8,000
10,000
12,000
14,000
2020
6.9%
2.9%
2.3%
1.3%1.1%0.7%
2.9%
12,025
2019 2021
1.4%
1.9%
6.6%
2.8%
0.8%0.8%
2.5%
Staff costs and related expenses
Concessionaire fees
Rental expenses
Depreciation and amortisation (Right-of-use assets, “ROUA”)
Depreciation and amortisation (Property, plant and equipment)
Advertising and promotion expenses
Packaging materials
Other SG&A(1)
As a % of revenueYoY change
(1) Other SG&A mainly represented bank charges incurred for sales transactions settlement, royalty fees for the sales of licensed products, certificate expenses and utilities
• SG&Aexpenseswaswellmanagedtobeincreasedby2.5%toHK$11,849million.
• SG&Aratiocontractedby350basispoints to16.9%duetooperating leverageandoureffectivecostcontrol. Inparticular,advertisingandpromotionexpenseswasdownby15.4%andpackagingmaterialswasalmostflatduringtheyear.
• Analysesof themajorSG&Acomponents, includingstaffcostsandrelatedexpenses,concessionairefeesandlease-relatedexpensesareprovidedonp.25to26and35to36ofthisannouncement.

22
MAINLAND CHINA
Revenue
Revenue by operation modelFortheyearended31March(HK$million)
0
10,000
20,000
30,000
40,000
70,000
60,000
50,000
33.3%
46.5%
71.7%40.2%
59.8%
71.7%
28.3%
65.7%
34.3%
42,432 40,763
59,698
21.6%
78.4%
31,019
76.3%
23.7%
36,804
2017 2018 2019 2020 2021
Retail
Wholesale
YoY change
• InMainland China, our retail revenue represents sales from self-operated POS,e-commerceandotherdirectchannels,whilewholesalerevenuemainlyrepresentssalestofranchiseesandprovisionofservicestofranchisees.
• RevenueinMainlandChinaleaped46.5%toHK$59,698millioninFY2021.Onaconstantexchangeratebasis,revenueroseby44.5%inthefinancialyear.
• Wholesalerevenuesoared71.7%duringthefinancialyear,boostedbynewopenings inlowertierandcounty levelcities. Its revenuecontributionclimbed590basispoints to40.2%inthefinancialyear.ShareofwholesalerevenueinMainlandChinawas36.3%and42.3%in1HFY2021and2HFY2021,respectively.
• Asat31March2021,wehad2,659 franchisedCHOWTAIFOOK JEWELLERYPOS.Formajorityof thesePOS,we retain inventoryownershipuntil sales transactions arecompletedwithretailconsumers,uponwhichwholesalerevenue is recognised.ThesePOScontributedapproximately64.1%ofthewholesalerevenueinMainlandChina.

23
SSSG
SSSG of major products
1Q 2Q 3Q 4Q 1Q 2Q 3Q 4Q
14.7%
3.0%
-3.0%
0.9% -49.2%
-6.6%
2.5% -5.2%
79.6%
-11.7%
2.5%
-19.8%
6.7%
159.8%
-51.0%
12.7%
FY2020 FY2021
Same Store ASP FY2021
Gem-set jewellery
HK$
7,000(FY2020(1): HK$6,500)
Gold jewellery and products
(FY2020(1): HK$4,100)
HK$
5,000
Gold jewellery and products
Gem-set, Platinum and K-gold jewellery
FY2021
SSSGSSS volume
growth
Gem-set,PlatinumandK-goldjewellery 11.2% 0.4%Goldjewelleryandproducts 35.3% 11.3%Watches 76.0% 21.8%
Overall 31.9% 8.2%
(1) Same Store average selling price (“ASP”) on FY2021 Same Store basis
• InMainlandChina,SameStoreASPcontinuedanupwardtrendinallproductcategoriesduringFY2021.
• Retaildemandforgold jewelleryandproductswassluggish in1HFY2021.Yet,asgoldpricesoftenedcoupledwithafavourableimpactfromtheappreciationofRMB,demandpickedup in2HFY2021.This ledtoaSSSGof35.3%for fullyear.ASPofgold jewelleryandproductssurgedfromHK$4,100 inFY2020toHK$5,000 inFY2021,mainlythankstothecontinualstrengthinCTF•HUÁCollection.
• SSSofgem-set,platinumandk-gold jewellerygrew11.2%during the financial year. Gem-setjewelleryASPwentupfromHK$6,500inFY2020toHK$7,000inFY2021.
• Watcheswitnessedaverystrongyearanddelivereda76.0%SSSGinFY2021,supportedbyabuoyantdomesticdemand.

24
Profitability
Mainland ChinaFortheyearended31March
2019 2020 2021
28.8%
17.6%
11.8%
30.5%
18.7%
12.5%
28.0%
14.9%
13.8%
SG&A as a % to revenue
Core operating pro�t margin
Adjusted gross pro�t margin
(HK$ million) 1HFY2020 2HFY2020 1HFY2021 2HFY2021
1HFY YoY
change
2HFY YoY
change Revenue 20,224 20,539 21,216 38,482 4.9% 87.4%Adjustedgrossprofit 6,445 5,988 7,343 9,368 13.9% 56.4% Adjusted gross profit margin 31.9% 29.2% 34.6% 24.3% 2.7% pts 4.9% pts
Otherincome 121 158 197 228 62.4% 44.6%SG&A (3,724) (3,892) (3,491) (5,420) 6.2% 39.2% SG&A as a % to revenue 18.4% 19.0% 16.5% 14.1% 1.9% pts 4.9% pts
Coreoperatingprofit 2,843 2,253 4,050 4,176 42.5% 85.3% Core operating profit margin 14.1% 11.0% 19.1% 10.9% 5.0% pts 0.1% pts
• AdjustedgrossprofitmargininMainlandChinaexpandedby270basispointsto34.6%in1HFY2021as like-for-likegrossprofitmargin improved,especially ingold jewelleryandproducts.However, in2HFY2021,adjustedgrossprofitmargindecreasedby490basispoints to24.3%asa resultofhighercontributionofgold jewelleryandproductsandwatches inretailbusiness,decline ingrossprofitmargin ingold jewelleryandproductsandimpactfromwholesalebusiness.
• Yet,coreoperatingprofitmarginstayedatabout11%in2HFY2021,similarto2HFY2020level.
• Overall,adjustedgrossprofitmargincontractedby250basispointsto28.0%inFY2021asa resultofhigher sales contribution fromwholesalebusiness,gold jewelleryandproductsandwatchesinretailbusinessascomparedwithFY2020.
• SG&Aratiodecreasedby380basispointsto14.9%inFY2021,thankstoourcostsavings,reliefreceivedfromgovernmentonmajorexpenseitemandoperatingleverage.
• Full year coreoperatingprofitmarginexpandedby130basispoints year-on-year,demonstratingacontinuousimprovementacrossthepreviousthreefinancialyears.

25
SG&A
SG&A to revenue ratioFortheyearended31March(HK$million)
14.9%
18.7%
7.4%
3.9%
1.0%1.5%1.2%1.2%
2.4%
7,616
8,910
14.1%
25.7%
5.8%
3.3%
0.9%
0.8%1.1%
0.9%
2.1%
21.4%5.7%0.7%
17.0%
7.4%
29.9%
0
1,000
2,000
3,000
4,000
5,000
7,000
10,000
9,000
6,000
8,000
2020
6.7%
4.5%
0.8%1.3%1.0%0.9%
2.4%
7,487
2019 2021
17.6%
Staff costs and related expenses
Concessionaire fees
Rental expenses
Depreciation and amortisation (ROUA)
Depreciation and amortisation (Property, plant and equipment)
Advertising and promotion expenses
Packaging materials
Other SG&A
As a % of respective revenueYoY change
Staff costs and related expensesFortheyearended31March(HK$million)
20,290 2.8%
0
500
1,000
1,500
2,000
2,500
3,000
3,500
37.3%
59.1%
3.6%
37.3%
59.2%
3.5%
2,8523,028
7.4%
6.7%
5.8%
3,455
46.8%
49.8%
3.4% 12.9%
4.1%
43.0%
14.1%
20202019 2021
As a % of respective revenue
Variable staff costs
Fixed staff costs
Other staff related expenses(2)
Average number of employees(1)
YoY change
FY2021
YoY change
(1) Employees in production function excluded(2) Other staff related expenses mainly included staff messing, medical care, educational expenses, etc.
• Staffcostsandrelatedexpenseswereupby14.1%inFY2021.Incrementalexpensesweremainlyattributabletothe increase invariableperformancebasedportionwhichwas inlinewithbusinessgrowth.
• Fixedcostsdecreasedby4.1%duringthefinancialyearas therewasgovernmentreliefonthesocial insurancecontributionamountedtoapproximatelyHK$40millionduetotheCOVID-19situation.Inaddition,thecalculationbasisofemployercontributiononthesocialinsurancewasadjusteddownbythegovernmentascomparedtotheprioryear.

26
Concessionaire fees and lease-related expenses(1)
Fortheyearended31March(HK$million)
25.7%
20.0%15.8%
84.2%
22.0%
78.0%
2,031
21.3%
78.7%
2,528
0
500
3,000
2,500
2,000
1,500
1,000
20202019 2021
2,246
24.5%
4.8%
3.9% 4.1%
8.4%8.3%8.0%
Concessionaire fees
Lease-related expenses as a % of respective revenue
YoY change
Concessionaire fees as a % of respective revenue
Lease-related expenses(1)
• Concessionaire feesroseby25.7%asretail revenue increased.Theconcessionaire feesratiowasloweredto8.0%mainlyduetotheshiftofsalesmixtowardsgoldjewelleryandproductswhicharegenerallysubjecttolowerrates.
• Lease-relatedexpensesratioalsowentdownto4.1%asaresultofoperatingleverage.
(1) Under IFRS 16 — leases, depreciation and amortisation (ROUA) and finance costs on leases replace the majority of rental expenses and therefore we combined these three elements for the analysis of lease-related expenses
POS network
POS movement by store brand(1) — Mainland China
31.3.2019 31.3.2020 During FY2021 31.3.2021As at Total Total Addition Reduction Net Total CHOWTAIFOOKJEWELLERY(2) 2,807 3,429 833 (164) 669 4,098CTFWATCH 113 116 22 (10) 12 128HEARTSONFIRE 3 1 – – – 1ENZO – 59 25 (9) 16 75SOINLOVE 27 43 31 (8) 23 66MONOLOGUE 38 51 34 (8) 26 77
(1) Shop-in-Shop (“SIS”) and Counter-in-Shop (“CIS”) excluded(2) CTF WATCH POS excluded

27
RSV analysis
RSV by product
29.6%
65.1%
5.3%25.1%
68.4%
6.5%
RSV YoYchangeFY2020 FY2021
27.4%
57.7%84.0%
50.1%
Gold jewellery and productsWatches
Overall
Gem-set, Pla�num andK-gold jewellery
RSV by channel
89.2%
5.9%4.9%
88.5%
7.2%4.3%
RSV YoYchangeFY2020 FY2021
49.0%83.4%30.9%
50.1%
CHOW TAI FOOK JEWELLERYOther store brands(1)
E-commerce(2)
Overall
(1) CTF WATCH, HEARTS ON FIRE, ENZO, SOINLOVE and MONOLOGUE included(2) Major platforms included Chow Tai Fook eShop, Tmall, JD.com, Vipshop; O2O distribution (i.e. routing online orders to POS for delivery
service), CloudSales 365 and Cloud Kiosk excluded

28
The following analyses focus on CHOWTAI FOOK JEWELLERY POSwhichcontributedapproximately90%oftheRSVinMainlandChina:
CHOW TAI FOOK JEWELLERY POS
RSV and POS by tier of cities(1)
11.9%
42.4%22.0%
23.7%
17.0%
48.4%18.3%
16.4%
% of POS % of RSV
FY2021RSV YoY
changeNet POS
movement
47.3% 52.7%
45.4%
54.1%
268 156
77
168
Tier II ci�esTier III ci�es
Tier I ci�es
Tier IV ci�es and others
(1) As an initiative to better reflect the economic development and strategic significance of cities in Mainland China, we adopt the city-tier ranking published by Yicai Global. New first-tier cities were grouped under Tier II cities in our analysis. Please refer to the ranking released on 29 May 2020
• InFY2021,weopenedanetof669CHOWTAIFOOKJEWELLERYPOSinMainlandChinaunderthecontinuousexecutionofourexpansionstrategy.ApproximatelyhalfoftheseopeningswerelocatedinTierIII,IVandothercities.
• Tier III, IVandothercitiesachievedstrongerRSVgrowththanTier Iand IIcitiesduringthefinancialyear,mainlydrivenbynewopenings.
RSV and POS by operation model
35.1%
64.9%
51.5%
48.5%
FY2021RSV YoY
changeNet POS
movement
26.6% 54Self-operated78.8%Franchised
% of POS % of RSV
723
• Byoperationmodel,allnetopenings inFY2021were in franchised format.Asat31March2021,approximately65%ofourPOSinMainlandChinawereinfranchisedformat.
• FranchisedPOSoutpacedself-operatedPOS inRSVgrowthandshared51.5%ofRSV inMainlandChinaduringFY2021,underpinned largelybynewopeningsoverthepasttwoyears.GrowthoffranchisedPOScalculatedonsamestorebasiswas32.8%inFY2021.
• Salesperstoreof franchisedPOSwasgenerally lower thanthatof self-operatedPOSlocatedinthesamecitytierduringthefinancialyear.

29
RSV and POS by store format
40.3%40.6%
19.2%
43.1%44.4%
12.5%
FY2021RSV YoY
changeNet POS
movement
12131.0%Department store84.9% 247Others
62.8% 301Shopping mall
% of POS % of RSV
• InFY2021,storesatstreet levelandshoppingmallscontinuedtohaveastrongerRSVgrowththanPOSindepartmentstores.
Self-operated CHOW TAI FOOK JEWELLERY POS
RSV per store by store age
0.0%
80.0%
60.0%
40.0%
20.0%
100.0%
120.0%
140.0%
60.8%
69.0%
84.3%
98.7%
119.4%
Less than 2 years(1) 2–4 years 4–6 years 6–8 years 8 years or more Total
FY2021 RSV per same store:HK$22.7 million(2)
POS opening date 4/2019–3/2021 4/2017–3/2019 4/2015–3/2017 4/2013–3/2015 3/2013or before
POS 115 292 205 177 650 1,439 % of POS 8.0% 20.3% 14.2% 12.3% 45.2% 100.0%
Ratio of annual RSV per store to RSV per Same Store(1) For POS of age less than 1 year, RSV is adjusted on an annualised basis(2) Value-added tax (“VAT”) included

30
Average quarterly sales(HK$million)
1Q 2Q 3Q 4Q
4.8
26.6%
4.1
17.8%
4.5
24.6%
4.7
20.3%
5.2
28.5%
5.6
24.0%
3.7
8.8
37.9%
20.3%
FY2021 quarterly SSS contributionto annual SSS
FY2020 quarterly SSS contribution to annual SSS(1)
FY2021 average quarterly SSS
FY2020 average quarterly SSS(1)
(1) SSS on FY2021 Same Store basis
• Asbusiness in1HFY2021wasstill recovering fromtheCOVID-19pandemic,averageSSScontributionin2HFY2021reachedapproximately62%offullyearSSS,slightlyhigherthanourseasonalityundernormalcourseofbusiness.
• 4Q,beingourpeakseasonasdrivenbyfestiveoccasionssuchasChineseNewYearandValentine’sDay,usuallyaccount for thehighestquarterlySSScontribution.However,withthepandemic,theSSScontributionfor4QFY2020wasreducedto20.3%,resultinginanabnormalseasonalitypattern.
E-commerce(1) and O2O related business(2)
RSV by product
24.2%
75.3%
0.4%
18.1%
81.5%
0.4%
RSV YoYchangeFY2020 FY2021
43.0%
107.4%95.0%
91.8%
Gem-set, Pla�num andK-gold jewelleryGold jewellery and productsWatches
Overall
(1) Major platforms included Chow Tai Fook eShop, Tmall, JD.com, Vipshop(2) O2O distribution (i.e. routing online orders to POS for delivery service), CloudSales 365 and Cloud Kiosk included
31
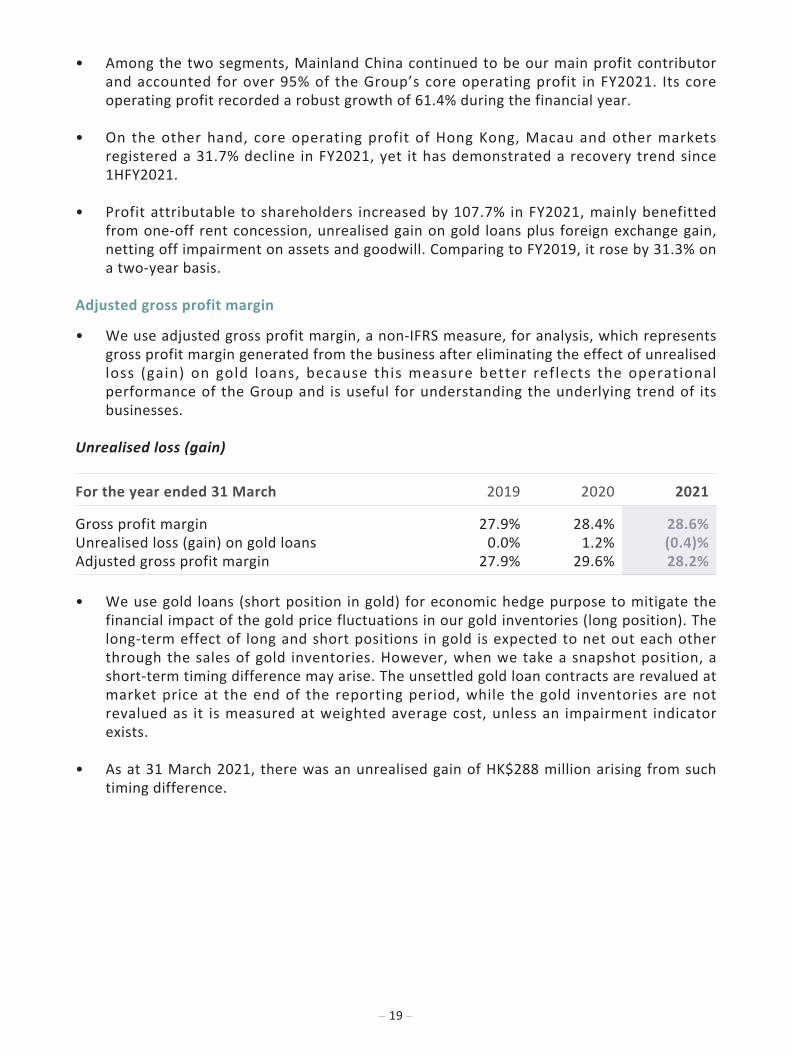
E-commerce and O2O related business performanceFY2021
4.2%E-commerce
2.9%O2O related business
RSV
YoY change
91.8% of respective retail sales volume
14.7%(FY2020: 14.8%)
of respective RSV
7.1%(FY2020: 5.6%)
ASP
2,800HK$
(FY2020: HK$1,400)
E-commerce
1,700HK$
O2O related business
4,900HK$
• RSVofoure-commerceandO2Orelatedbusinessgrewstronglyat91.8% inFY2021,mainlyattributabletooursalesonO2Oplatforms.
• E-commerceandO2Orelatedbusinesscontributed7.1%totheRSV inMainlandChinaduringthefinancialyear, thankstoourprivatedomainsmartretailapplications.ASPoftheseapplicationswasthreetimesthatofthee-commerceplatformsastheyenabledacloserconnectionandastrongertrustwithourcustomers.
• Intermsofretailsalesvolume,shareofthee-commerceandO2OrelatedbusinesstotheMainlandChina’soperationsstayedsimilartopreviousfinancialyear.

32
HONG KONG, MACAU AND OTHER MARKETS
Revenue
Revenue by operation modelFortheyearended31March(HK$million)
0
5,000
10,000
15,000
20,000
25,000
30,000
2017
4.6% 7.7% 4.8% 12.8%
87.2%
95.2%92.3%95.4%
20,22622,352
24,229
10,466
7.0%
93.0%
15,988
2018 2019 2020 2021
34.5%
38.7%
20.7%
YoY change
Retail
Wholesale
• InHongKong,Macauandothermarkets,ourretail revenuerepresentssalesfromself-operatedPOS,e-commerceandotherdirectchannels,whilewholesalerevenuerepresentssalestofranchisees,salestoretailersandsalesfromjewellerytrading.
• Retailrevenuedeclinedby38.7%inFY2021ascustomertrafficremainedsubdued.

33
SSSG
SSSG of major products
-11.6%
-15.2%
-47.8%
-37.1%-26.8%
-56.1%-66.8%
-82.9%
-65.7%
-64.5%
-37.0%
-50.7%
14.0%7.0%
62.8%
1Q 2Q 3Q 4Q 1Q 2Q 3Q 4Q
-66.2%
FY2020 FY2021
Same Store ASP FY2021
Gem-set jewellery
HK$
15,600(FY2020(1): HK$11,300)
Gold jewellery and products
(FY2020(1): HK$6,800)
HK$
5,500
Gold jewellery and products
Gem-set, Platinum and K-gold jewellery
FY2021
SSSG
SSS volume growth
Gem-set,PlatinumandK-goldjewellery 19.3% 38.7%Goldjewelleryandproducts 55.7% 45.0%Watches 7.6% 20.0% Overall 41.3% 42.9% (1) Same Store ASP on FY2021 Same Store basis
• SSSof gold jewelleryandproductswentdownbyabout56% inFY2021.ASPof theproductcategoryreducedfromHK$6,800 inFY2020toHK$5,500assalesmixof fixedpricegoldproductsincreased.
• Despite thechallengingbusinessenvironment,SSSGofgem-set,platinumandk-goldjewellerywasbacktoapositivelevelsince3QFY2021,thankstoourpromotionalefforts.Thissuccessfullyattractedbig ticket transactions, leadingto38.7% increase inASPofgem-setjewelleryduringthefinancialyear.

34
Profitability
Hong Kong, Macau and other marketsFortheyearended31March
26.3%
18.7%
8.1%
27.4%
24.7%
3.7%
29.4%
28.1%
3.9%
2019 2020 2021
SG&A as a % to revenue
Core operating pro�t margin
Adjusted gross pro�t margin
(HK$ million) 1HFY2020 2HFY2020 1HFY2021 2HFY20211HFY
YoY change2HFY
YoY change
Revenue 9,309 6,679 3,457 7,009 62.9% 4.9%Adjustedgrossprofit 2,619 1,756 1,316 1,760 49.7% 0.2% Adjusted gross profit margin 28.1% 26.3% 38.1% 25.1% 10.0% pts 1.2% pts
Otherincome 92 66 149 117 63.0% 78.0%SG&A (2,026) (1,915) (1,437) (1,501) 29.1% 21.6% SG&A as a % to revenue 21.8% 28.7% 41.6% 21.4% 19.8% pts 7.3% pts
Coreoperatingprofit 685 (94) 28 376 95.9% N/A Core operating profit margin 7.4% (1.4)% 0.8% 5.4% 6.6% pts N/A
• In1HFY2021,adjustedgrossprofitmarginimprovedsignificantlyby1,000basispointsto38.1%,drivenlargelybythesurgeingoldpriceandsomeimprovementingrossprofitmarginofourjewellerytradingbusiness.In2HFY2021,adjustedgrossprofitmargindecreasedfrom26.3%to25.1%duetoimpactfromwholesalebusinesswhichwaspartiallyoffsetbylike-for-likemarginimprovementandamorefavourableproductmixinretailbusiness.
• Asaresult,inFY2021,adjustedgrossprofitmarginexpandedby200basispointsto29.4%.
• SG&Aratioincreasedby340basispointsto28.1%inthefinancialyearduetooperatingdeleverageespecially in1HFY2021,yet thankstoeffectivecostcontrol,SG&Aratiowasbackto21.4%in2HFY2021.
• Coreoperatingprofitdroppedsignificantlyby31.7% inFY2021.Yet,acoreoperatingprofit ofHK$376millionwas recorded in 2HFY2021, demonstrating a sequentialimprovementfrom2HFY2020and1HFY2021.Itscorrespondingmarginwasslightlyupby20basispoints to3.9%during the financial year,benefitted from thegovernmentsubsidiesreceivedwhichwerecordedasotherincome.

35
SG&A
SG&A to revenue ratioFortheyearended31March(HK$million)
0
1,000
2,000
3,000
4,000
5,000
4.5%0.3%1.1%3.2%
7.6%
0.0%
11.3%
3.8%
0.3%1.1%1.2%
5.0%
0.1%
7.3%
4.2%0.4%1.4%1.9%
7.1%
0.0%
9.6%
4,538
2,938
3,941
2019 2020 2021
22.7%
78.6%
29.3%
8.0%49.2%
25.4%
47.5%30.4%
18.7%
28.1%24.7%
Depreciation and amortisation (ROUA)
Depreciation and amortisation (Property, plant and equipment)
Staff costs and related expenses
Concessionaire fees
Rental expenses
Packaging materials
Other SG&A
As a % of respective revenue
Advertising and promotion expenses
YoY change
Hong Kong and Macau
Staff costs and related expensesFortheyearended31March(HK$million)
3,050 5.3%9.2%
6.9%
11.8%
1,551
40.8%
52.4%
6.8%
34.8%
58.2%
7.0%
31.8%
61.3%
6.9%
1,328
1,048
16.9%
27.8%
21.1%
22.5%
20202019 20210
500
1,000
1,500
2,000
As a % of respective revenue
Other staff related expenses(2)
Fixed staff costs
Variable staff costs
Average number of employees(1)
YoY change
FY2021
YoY change
(1) Employees in production function excluded(2) Other staff related expenses mainly included staff messing, medical care, educational expenses, etc.
• Staffcostsandrelatedexpenseswasdownby21.1%.Thevariablestaffcostsshrankby27.8%year-on-yearinFY2021,largelyinlinewiththedropinrevenue.
• Fixedstaffcostsalsodeclinedby16.9%duetoattritionandreductiononcertainallowances.
• DuringFY2021,wereceivedHK$160million fromEmploymentSupportSchemewhichwasrecognisedinotherincome.

36
Lease-related expenses(3)
Fortheyearended31March(HK$million)
0
500
1,500
1,000
7.3%
4.9%
8.3%
3.3%
16.6%
80.1%
3.9%
8.5%
87.6%
31.2%
20202019 2021
1,146 1,126
774As a % of respective revenue
Finance costs on leases
Depreciation and amortisation (ROUA)
Rental expenses
YoY change
(3) Under IFRS 16 — leases, depreciation and amortisation (ROUA) and finance costs on leases replace the majority of rental expenses and therefore we combined these three elements for the analysis of lease-related expenses
• Lease-relatedexpensesfellby31.2%duetoconsolidationofPOSandrentalrenewalreduction.Yetitscorrespondingexpensesratioexpandedby100basispointsto8.3%inFY2021duetooperatingdeleverage.TheaveragereductiononleaserenewalduringFY2021relativetothelastleaseswasaround40%.
• DuringFY2021,COVID-19-relatedrentconcessionofHK$128millionwasrecognised inothergains.
POS networkPOS movement by store brand(1) — Hong Kong, Macau and other markets
31.3.2019 31.3.2020 During FY2021 31.3.2021As at Total Total Addition Reduction Net Total
CHOWTAIFOOKJEWELLERY 131 138 8 (12) (4) 134 HongKong,China 81 83 3 (7) (4) 79 Macau,China 19 18 1 (1) – 18 Othermarkets 31 37 4 (4) – 37HEARTSONFIRE 15 10 1 (3) (2) 8SOINLOVE – 1 – – – 1MONOLOGUE – 2 1 – 1 3
(1) SIS and CIS excluded

37
RSV analysis
Hong Kong, Macau and other markets
RSV by product
24.6%
61.5%
7.2%
28.8%
68.3%
9.7%
RSV YoYchangeFY2020 FY2021
21.0%
39.3%8.6%
32.6%
Gem-set, Pla�num andK-gold jewelleryGold jewellery and productsWatches
Overall
RSV and POS by geography
56.2%12.3%
31.5%
77.5%
13.9%
8.6%
% of POS % of RSV
FY2021RSV YoY
changeNet POS
movement
Hong Kong 30.9% 5Macau 47.7% –
9.6% –Other markets
• InFY2021,RSVrecordeda32.6%declineinHongKong,Macauandothermarketsasthepandemicsweighedoninternationaltravelandtouristrelatedconsumption.
• CustomertrafficatPOSinHongKongandMacaudroppedby40.3%year-on-yearduringthe financialyear.Whereas thepercentageofRSVsettledbyChinaUnionPay,Alipay,WeChatPayorRMBtothetotalRSVofHongKongandMacaumarketdroppedto18.2%inFY2021from36.9%inFY2020.
• InHongKong,weconsolidatedourretailnetworkandclosedanetof5POS inFY2021,mainlyintouristicareassuchasTsimShaTsuiandCausewayBay.
• Inothermarkets,weopened5dutyfreePOSinHainan,MainlandChinaandclosedanetof5POS inother locations.RSVdecline inothermarketswassofter thanthat inHongKongandMacau,thankstotherobustperformanceofdutyfreePOSinHainan.

38
Hong Kong and Macau
Average quarterly sales(HK$million)
11.4
16.0
28.0%
26.7 26.8
33.1%
45.7
33.1%
33.3
24.1%
19.8%
38.7
33.0%
20.4
14.7%
1Q 2Q 3Q 4Q
14.1%
FY2021 quarterly SSScontribution to annual SSS
FY2020 quarterly SSScontribution to annual SSS(1)
FY2021 average quarterly SSS
FY2020 average quarterly SSS(1)
(1) SSS on FY2021 Same Store basis
• 3Q,beingthepeakseasonfortheindustryasdrivenbyChristmas,usuallyaccountedforthehighestquarterlySSScontributionandaverageSSSforourHongKongandMacaumarket.
• Nevertheless,seasonalityinbothFY2021andFY2020deviatedfromthatunderournormalcourseofbusiness.The lingeringpandemicseverelyaffectedourbusiness in1HFY2021whereasourpromotionaleffortshelpedboostsalesin2HFY2021,liftingSSScontributionof2HFY2021to66.1%offullyearSSS.
• While the situation inHongKong since2QFY2020and theoutbreakofpandemic in4QFY2020heavilyweighedonourbusinessperformance,quarterlySSScontributionskewedtowardsthefirstquarterduringFY2020.
39
OTHER FINANCIAL REVIEW
Other income, other gains and losses and other expenses
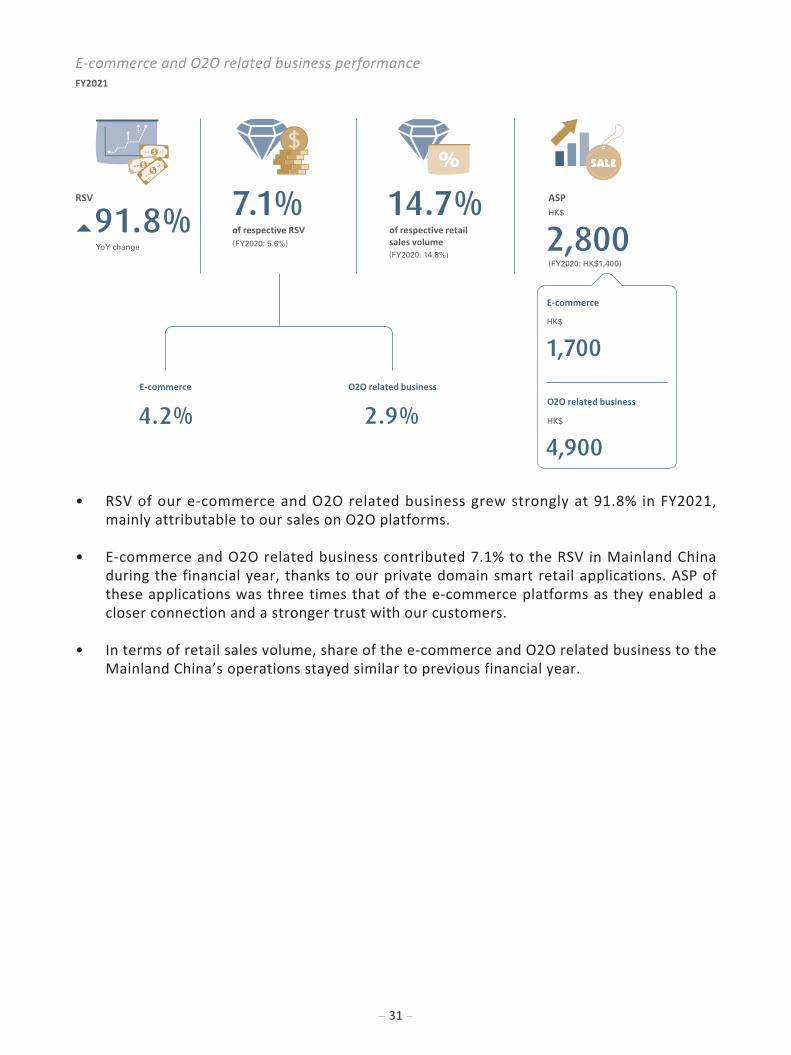
2019 2020 2021For the year ended 31 March HK$million HK$million HK$ million YoY change
Otherincome 396 437 692 58.4%Othergainsandlosses (276) (147) 431 N/AOtherexpenses (57) (146) (664) 353.9%
• OtherincomemainlyarosefromthegovernmentgrantsreceivedinMainlandChinaandHongKong, commission income,other income received from franchiseesandotherinterestincome.InFY2021,approximately34%ofotherincomewereone-offinnature.
• OthergainsandlossesmainlyrepresentedanetforeignexchangegainofHK$336million(FY2020: lossHK$234million)dueto theappreciationofRMB,COVID-19-relatedrentconcessionofHK$128million(FY2020:HK$16million)andgainonsurrenderofROUAofHK$2million(FY2020:HK$79million).
• Otherexpensesmainlyrepresentedtheassetsimpairment(includingproperty,plantandequipment and ROUA) of HK$382mill ion (FY2020: HK$63mill ion), the goodwillimpairmentofHK$232million (FY2020:HK$26million)andtheamortisationofotherintangibleassetsofapproximatelyHK$40million (FY2020:HK$36million)arising fromthe acquisition ofHeartsOn Fire Company, LLC several years ago.Wedecided arepositioningonHEARTSONFIREsoastomaintaintheidentityandheritageofthebrandwhilebetterservetheneedforustopenetrateintothehigh-endsegment.
Interest income, finance costs and taxation
2019 2020 2021For the year ended 31 March HK$million HK$million HK$ million YoY change
Interestincomefrombanks 83 78 82 4.5%Financecostsonbankborrowings (209) (284) (132) 53.7%Financecostsongoldloans (161) (207) (197) 4.6%Financecostsonleaseliabilities – (69) (48) 30.8%Taxation (1,668) (1,221) (2,219) 81.6%
• Financecostsonbankborrowingsdecreasedby53.7%,mainlyduetoarelatively loweraveragebankborrowinginterestrateandbankborrowingbalanceduringFY2021.
• Effectivetaxratedecreasedfrom29.0%inFY2020to26.4%inFY2021astheprofitabilityofHongKong,Macauandothermarketssegment,whichissubjecttorelativelylowertaxrates,improvedinFY2021.

40
Return on equity
• Weusereturnonequity (“ROE”) tomeasuretheefficiencyofgeneratingprofits fromeachunitofshareholderequity.
• Netprofitmarginincreasedto8.8%.ROEwasupby850basispointsto19.6%whiletheequitymultiplierdecreased.
Net profit
Revenue
Revenue
Total assets
Total assets
Total equity
ROE 19.6%Net profit
Total equity
8.5% pts(FY2020: 11.1%)
8.8%Net profit margin
(FY2020: 5.3%)
1.1 times 2.0 times
Assets turnover
(FY2020: 0.9 times)
Equity multiplier
(FY2020: 2.4 times)
Inventory balances and turnover period
Inventory balances by product(1)
Asat31March(HK$million)
0
10,000
5,000
15,000
20,000
25,000
30,000
35,000
40,000
45,000
1.9%
0.0%
7.7%
36.7%
4.3%
59.1%
39,327
3.9%
40.3%
55.8%
42,343
4.1%
40.6%
55.2%
42,792
2019 2020 2021
1.1%
YoY change
Gold jewellery and products
Watches
Gem-set, Platinum and K-gold jewellery
(1) Packaging materials excluded

41
Inventory turnover period by category(2)
Fortheyearended31March(Day)
0
100
50
150
200
250
300
350
400
450
60
239
299
84
297
381
78
234
312
2019 2020 2021
YoY change
69 days
63 days
6 days
Finished goods
Raw materials
(2) Being inventory balances, excluding packaging materials, at the end of the reporting period divided by cost of goods sold for the year, multiplied by 365 or 366
• Inventorybalances, excludingpackagingmaterials, increasedby1.1%and reachedHK$42,792millionasat31March2021.
• Inventoryturnoverperiodshortenedby69dayswhencomparedtothatofFY2020.
• Asat31March2021,approximatelyHK$7,280millionor16.9%ofour total inventorybalanceswereheldby franchisedPOS(31March2020:approximatelyHK$5,440millionor12.8%wereheldbyfranchisedPOS).
• Iftheinventorybalancesheldbyfranchiseeswereexcluded,inventoryturnoverperiodinFY2021wouldreduceto259days(FY2020:322days).

42
Capital structure
As at31.3.2020
HK$million%to
totalequity31.3.2021
HK$ million% to
total equity
Increase(decrease)
HK$ millionDenominated
currency(1)Interest rate
structure(1)
Non-currentassets 10,038 37.2% 9,065 28.7% (973) N/A N/A
Inventories 42,538 157.6% 43,011 136.3% 473 N/A N/A
Cashandcash equivalents(2)
7,219 26.7% 6,032 19.1% (1,187) MainlyHKD,RMBandUSD
Mainlyvariableinterest
rate
Totalborrowings(3) 22,711 84.1% 12,143 38.5% (10,568) Bankborrowings 11,431 42.3% 6,418 20.3% (5,013) HKD Variable
interestrate
Goldloans 11,280 41.8% 5,725 18.2% (5,555) RMBandUSD
Fixedinterest
rate
Netdebt(4) 15,492 57.4% 6,111 19.4% (9,381) N/A N/A
Workingcapital(5) 19,579 72.5% 26,101 82.7% 6,522 N/A N/A
Totalequity 26,991 100.0% 31,568 100.0% 4,577 N/A N/A
(1) Information about denominated currency and interest rate structure related to the condition as at 31 March 2021(2) Bank balances and cash included(3) As at 31 March 2021, bank borrowings amounted to HK$4,619 million and all the gold loans would be matured within 12 months while
bank borrowings amounted to HK$1,799 million would be matured in more than 1 year but not exceeding 2 years(4) Aggregate of bank borrowings, gold loans, net of cash and cash equivalents(5) Being net current assets
• Weprincipallymeetourworkingcapitalandother liquidity requirements throughacombinationof capital contributions, including cash flows fromoperations, bankborrowingsandgold loans.Gold loansarealsoused foreconomichedgepurpose tomitigatethefinancialimpactofthepricefluctuationsintheGroup’sgoldinventories.
• TheGroup’sdailyoperationwasmainlyfinancedbyoperatingcashflows,andmainlyreliedonshort-termborrowings to satisfy inventory financingneedsduringpeak seasons,workingcapital for futureexpansionplansandunexpectedneeds.TheGrouphasnotexperiencedanydifficultiesinrepayingitsborrowings.
• TheGroup’s incomeandexpenditureweremostlydenominated inHKDandRMB,whileitsassetsand liabilitiesweremostlydenominated inHKD,RMBandUSD.Nohedginginstrument is deployedagainstRMB fluctuation asmostof thedaily receipts andpayments forourMainlandoperationsarebothmade inRMB,whichdonotposeasubstantivecurrencyexposuretoourbusiness.

43
• It isour treasurypolicy tomaintainhigh liquidity in response to the requirementofoperating cash flows; and toupkeep financial prudencebynot engaging inhighlyleveragedorspeculativederivativeproducts.
Effect of RMB fluctuation
• AspartofourbusinessoperationisinMainlandChina,thefluctuationinRMBwouldpostsomeimpactonourperformance.
• TransactionsenteredbytheHongKongentitiesbutdenominated inRMB, includingtheinter-grouptransactionswiththeMainlandChinasubsidiaries,areconverted intoHKD,the functional currency of theGroup, initially using the spot rate at the date oftransactionandtheunsettledtransactionsareretranslatedatclosingexchangerateatthebalancesheetdate.Suchtranslationdifferencesbetweenthespotrateandclosingexchangeratearerecognisedinprofitorloss,negativelyaffectingourprofitfortheyearwhenRMBdepreciated.
• Exchangedifferencealsoariseswhen i) incomesandexpensesof theMainlandChinasegmentaretranslatedintoHKD,thepresentationcurrencyoftheGroup,attheaverageexchangerate,while thecorrespondingassetsand liabilitiesare translatedatclosingexchangerateandii)changeinclosingexchangeratesatthecurrentfinancialyearofthenetassetsoftheMainlandChinasegmentfromtheclosingratesatthepreviousfinancialyear.Suchdifferencesarerecognisedinthetranslationreserveinequity.
• The tablebelow illustrates the fluctuationofRMBand the impactonour financialperformance:
RMB to HKD
FY2021 Closing exchange rate YoY change Average exchange rate YoY change
8.1% 1.4%
2020 2021
For the year ended 31 March Asreported
Constantexchangeratebasis As reported
Constantexchangerate basis
RevenueYoYchange 14.9% 12.4% 23.6% 22.2%CoreoperatingprofitYoYchange 18.4% 15.5% 51.7% 49.8%Changesininventorybalances 7.7% 11.4% 1.1% 3.6%Changesincashandcashequivalents 5.5% 3.4% 16.4% 20.1%

44
Cash flows and others
Cash flows
2019 2020 2021For the year ended 31 March HK$million HK$million HK$ million
Operatingcashflowsbeforemovements inworkingcapital
7,774 9,912 11,572
Leasespaid(1) – (1,263) (1,182)Netcashusedininventories(2) (2,911) (3,427) (4,669)Netcashfromotheroperatingactivities 629 959 1,764Capitalexpenditure (1,392) (973) (839)
Pro forma free cash flows 4,100 5,208 6,646Netchangeinbankborrowings 2,133 1,362 (5,016)Dividendspaid (6,081) (6,243) (2,853)Othermovements (455) (749) 36
Net decrease in cash and cash equivalents (303) (422) (1,187)
Major cash flows items for FY2021(HK$million)
0
4,000
2,000
8,000
6,000
10,000
12,000
14,000
7,219
36
5,016
2,853
11,572
1,764
8394,669
1,182
6,032
20,000
18,000
16,000
6,646
Pro forma free cash �ows
Leases paid(1)
Operating cash �ows beforemovements in working capital
Net cash used in inventories(2)
Net cash from other operating activities
Capital expenditure
Net decrease in bank borrowings
Dividends paid
Other movementsAs at
31.3.2020As at
31.3.2021
(1) With adoption of IFRS 16, leases paid was included in financing activities(2) Net cash used in inventories included net change in inventories and repayment of gold loans
45
Capital expenditure
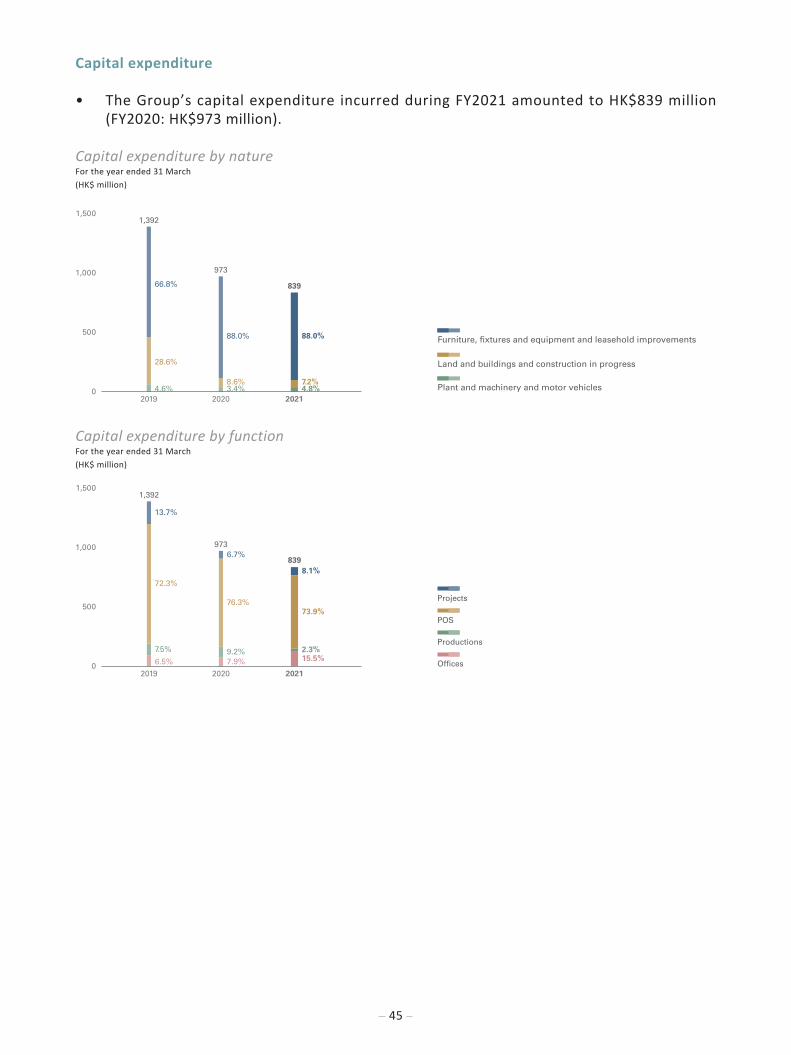
• TheGroup’scapitalexpenditure incurredduringFY2021amountedtoHK$839million(FY2020:HK$973million).
Capital expenditure by natureFortheyearended31March(HK$million)
0
500
1,000
1,500
3.4%8.6%
88.0%
4.6%
28.6%
66.8%
1,392
973
4.8%7.2%
88.0%
839
2019 2020 2021
Furniture, �xtures and equipment and leasehold improvements
Land and buildings and construction in progress
Plant and machinery and motor vehicles
Capital expenditure by functionFortheyearended31March(HK$million)
7.5%
6.5%
72.3%
13.7%
15.5%2.3%
73.9%
8.1%
7.9%9.2%
76.3%
6.7%
0
500
1,000
1,5001,392
973
839
2019 2020 2021
POS
Projects
Productions
Of�ces

46
CORPORATE STRATEGIESFY2021 isayearfullofunprecedentedchallengesaswellasunparalleledopportunities.TheoutbreakofCOVID-19acceleratedthepaceofdigitalisationatall levelsgloballyandalteredconsumers’buyinghabitsfundamentally.Webelievethatphysicalstoresandonlineplatformsshould still co-exist to create greater synergy for amore complete andmulti-facetedexperienceforcustomers.
Witha solid foundation thathasalreadybeenbuilt throughour“Smart+2020”strategicframework,which emphasised retail experience enhancement through technologicalinnovations,wearepleasedtomoveforwardwithourDual-ForceStrategy.OurDual-ForceStrategywill steerus towards the continualexpansionofphysical footprintanddigitalempowerment inordertocontinuedeliveringexceptionalcustomerexperiencethatcreateslong-termbranddifferentiationandloyalty.
MARKET REVIEW
Mainland China
• With theadoptionofeffectivepublichealthmeasures,China isoneof theearliestcountriestorecoverfromtheimpactsofCOVID-19.
• AccordingtotheNationalBureauofStatisticsofChina,thetotalretailsalesofconsumergoodsdecreasedby3.9%year-on-year in2020,whiletheretail salesofgold,silverandjewelleryalsodecreasedby4.7%.Yet, therehavebeensignsof improvement inthesecategories sinceAugust 2020. In the first 3monthsof 2021, a strong growthwasrecordedinbothretailsalesfiguresduetothelowbaselinefor2020.Anincrementwasalsorecordedascomparedtothesameperiodin2019.
• Againstthebackgroundof“dualcirculation”strategy,thedirectivesofthe14thFive-YearPlan,andinparticular,theguidanceof“stimulationofconsumptioninallsectors”intheFive-YearPlan,weexpectthatsalesintheconsumermarketinMainlandChinawillsurgerapidlyincomingyears.
• Developmentsinlowertiercitiesandruralareasareexpectedtopresenthugepotentialasgovernmentpoliciesandinfrastructureimprovementswillfavourtheirgrowth.
• Consumptionupgradeisthekeydriverofgrowth,andalternativeconsumptionpatternssuchas livestreamingandonlinesocialnetworkingareexpectedtogrowfast.Drivenbythenewduty-free retail strategy inChina,duty-freeshoppingwill also thrive in thecomingyears.
• With favourable fundamentals includingurbanisation, thegrowthofmiddleandupperclasses,andthesupportofgovernmentpolicies, theretailand jewellerymarketsareexpectedtocontinuetogrowinthecomingyears.
Hong Kong, Macau and other markets
• TheclosureofmajorbordercrossingshasaffectedtheretailenvironmentofHongKongandMacauinFY2021.Asshowninindustrydata,retailsalesperformanceofjewelleryindustryinHongKongrecordeda38.4%declineyear-on-yearfromApril2020toMarch2021.
• Webelievethatthedomesticmarkethasbottomedoutaswerecordedabetterbusinessperformancesince2QFY2021.Whenthemajorbordercrossingsreopen, thenumberofvisitsmadeandretailmarketwouldrecovergradually.

47
RETAIL EXPANSIONSTRATEGY
Expand the businessand get closer
to customers
擴 張 版 圖 , 貼 近 顧 客
實動力SMART RETAILSTRATEGY
Digital empowerment and experience upgrade
科 技 賦 能 , 體 驗 升 級
雲動力以顧
客為中心
Customer-centric
Deploy “Dual Forces” to develop a jewellery ecosystem雙力共構 開創珠寶新生態
• The travel retail business indifferentAsia-Pacific countrieshasalsobeenaffectedthroughouttheyearduetotheshutdownof international travel.However,webelievetherearegreatexpansionpotentials in the regionwith theRegionalComprehensiveEconomicPartnership (“RCEP”)betweenChinaandanumberofAsia-Pacificcountriessignedin2020;andtheHongKong-ASEANFreeTradeAgreement(“FTA”)andInvestmentAgreement (“IA”) came into full effect in February 2021.We shallmonitor thedevelopmentcloselyandtaketimelyactions.
DUAL-FORCE STRATEGY
Wewill focusmoreontheMainlandChinamarket.Ononehand,we implementourretailexpansionstrategytogetclosertoourcustomers.Tothatend,wecontinuetostrengthenourbrandsandproductofferings,andgrowthroughopeningPOSinMainlandChina.Ontheotherhand,wecarryoutour smart retail strategy. It centersondigital empowerment,allowingustocater tocustomers’needsaswecontinuetostreamlineourorder fulfilmentprocess.Wewillleveragesmartretailapplicationsandsmartmanufacturingtoofferservicesfromtheheartandspeedtocustomers.WehopethatourDual-ForceStrategywillensureourcustomerscanenjoyamorecomplete,multi-faceted,andseamlessshopping journeyandexperienceablissfulfulfilmentthroughjewellery.

48
POS NETWORK
Hong Kong and Macau
POS
100
POS97
Flagship Brand
Individual Brands
SOINLOVE
POS1MONOLOGUE
POS2
HEARTS ON FIRE
CHOW TAI FOOK JEWELLERY
SIS / CIS24
Other markets
POS
46
POS37
Flagship Brand
Individual BrandsHEARTS ON FIRE MONOLOGUE
POS POS8 1
CHOW TAI FOOK JEWELLERY
Mainland
China
POS
4,445
ENZO
POS75SOINLOVE
POS66MONOLOGUE
POS77
Individual BrandsHEARTS ON FIRE
POS1 SIS / CIS239
Flagship Brand
POS4,098CHOW TAI FOOK JEWELLERY CTF WATCH
POS128

49
MAINLAND CHINA
Retail expansion strategy
Brands and products
• AsMainlandChina’sjewellerymarkethasbeenreshapinginrecentyears,wecontinuetoexecutedifferentiationstrategytomakeinroadsintodiversecustomersegments.
• We offer curated retai l store exper iences under our f lagship brand, such as CTF JEWELRIA, CTFWATCHand experience stores, to cater to different shoppingenvironmentandconsumers’needs.Our individualbrands includingHEARTSONFIRE,ENZO,MONOLOGUEandSOINLOVE,serveourconsumerswithdifferent lifestylesandpersonalities.
• CTFJEWELRIA,oneofourinitiativesinenhancingstoreexperience,continuestorolloutmoreproductofferings fromselect internationaldesignersand jewellerybrandsontopof its signature collections to cater tomore sophisticated customers. In FY2021, CTF JEWELRIA accounted for 6.0%of theRSVof CHOWTAI FOOK JEWELLERY (1) inMainlandChina.Gem-set jewelleryASPwasaroundHK$10,000,whichwasaround40%higherthanoverallSameStoreASPofgem-setjewelleryinMainlandChina.
• Apartfromenhancingthequality,craftsmanshipandinnovationofourproducts,wealsostrivetopromoteproductcollectionsfeaturedwithappealingstories.
• CTF•HUÁCollectioncontributedto39.5%ofourgoldjewelleryandproductsRSVinFY2021.
• OurGuardianofLifeCollectionhelpedusgainmarketshareinthediamondengagementringsmarket.Itcontributedto8.7%ofourdiamondproductsRSVinFY2021.
• InFY2021,TMARKproductsaccountedfor24.7%of theRSVofourdiamondproductsandincreasedby60.7%inMainlandChina.WewilldistributemoreTMARKproducts inMainlandChinaforvaluedcustomerswhoembraceauthenticityandtechnology.
(1) CTF Watch excluded

50
Retail network
• We strive togainmarket share in theMainlandChinamarket.Hence,we focusonimplementingourtwo-prongedstrategy.
• Ourdiversifiedproductoffering laida foundation inexpandingour retailnetwork indifferentcities inMainlandChina.Keyelements includingcity’seconomic indicators,governmentpolicyandpeers’distributionnetworkareessential in implementingourretailexpansionstrategy.
• ForTierIandIIcities,wecontinuetooffercuratedretailexperiencesthroughupgradingourstoresandenhancingstoreexperiencesofour flagshipbrandto fulfil theneedsofmoresophisticatedcustomers.Wealsoexpandourindividualbrandsinlocationsthatfitthebrandimageforcustomerswhosharethesamepersonalitiesorvalues.
• For lower tierandcounty levelcities,wewouldpenetrate further into themarketbyleveragingourfranchisees’localknowledgeandaccess.
• InFY2021,therewere669netPOSopeningsofCHOWTAIFOOKJEWELLERY(1),ofwhich64netPOSopeningswereCTFJEWELRIA.
• Inviewoftheexcellentperformanceofourwatchbusiness,whichwassupportedbythestrongdomesticdemand,wewill continue to identifyopportunities toexpandournetworkinthehighpremiumwatchbusiness.
(1) CTF Watch excluded
Smart retail strategy
Everycustomerexpectsnothinglessthanbeingtreatedasthesinglemostimportantpersonbyus.Tothatend,ouromni-channelretailingaimtooffercustomerswiderarrayofchoicesandgreaterconvenience.Ourstaffprovidepeople-to-peopleengagementwithdigital toolsanddatatoengagecustomers,helpingthemenjoytheirseamlessshoppingexperience.
Wealsodoubledownon increasingpublicdomainvisibility.Morecontactpoints, togetherwithamorediversifiedsmart retailexperiencecouldbringnewcustomersandbusinessopportunitiestous.
Meanwhile,astreamlinedsupplychain iskeytooursmart retail strategy.Notonly that itimprovesourcustomisationcapabilitiesbutalsodriveshigheroperationalefficiency thatwoulddifferentiateusinthejewelleryindustry.
E-commerce
• Wecontinuedourclosecollaborationwithvariousrenownede-commerceplatforms inMainlandChina, suchasTmall, JD.comandVipshop, thusgainingmoreaccess toourcustomers.Whileoure-commercebusinessisgraduallygettingmorematureinMainlandChina’sretaillandscape,itservesasthemainportalforourpublicdomain.

51
• Werideoncurrent trends, suchasdirect salesvia livestreamingandshortvideos inthird-partymarketplaces, such as TikTok, in order to expand and enhance ourengagementwithcustomers.Thisallowsustobetterunderstandthecustomers’needsandpreferencesonourproductsaswellas theirspendingpattern,whichwillbeusefulforlaunchingmoresuccessfulproductsinthefuture.
• Weareactivelyexploringchangesinoursalesmodelstocopewiththeemergingtrendoflivestreaming. For example,we introduced jade finishedproducts and customisedproducts livestreaming on e-commerce platforms sinceDecember 2020 tomeetdiversifiedcustomerneeds.
Smart retail applications
• Leveragingbothouromni-channelcapabilitieswhichweactivelydeveloped inthepastand our extensive retail network,we continue to push forward our smart retailapplications.
• Ourstaffcementedtheirsuccesswithoursmartmobiletool,CloudSales365.InFY2021,morethan40,000staff inourself-operatedandfranchisedstoresusedCloudSales365 to reachmore than3.7million customers.Notonlydid it attract new customers, CloudSales365’sASPand sales conversation ratewereabout80%higher thanandaround10timesthee-commerceplatforms’performancerespectively.
• Asat31March2021,over40%ofourPOSinMainlandChinahaveinstalledCloudKiosks.Whileataphysicalstore,customerscanuseCloudKioskstoexploreor lookupawideproduct selectiononlineandshorter transaction time.Agamifiedexperience isalsoofferedattheKiosks.
• We introducedD-ONE,ourdigital jewellery customisationplatform, asoneofourConsumer toManufactory (“C2M”) initiatives tocater to thecustomerdemands forcustomisedproductsandexclusiveexperiences.
• WithD-ONE,most customisedproducts are ready for deliverywithin 24hours ascommitted.Incrediblefulfilmentspeedisthesignatureofthisplatform.
• Variousbrandsandproducts, suchasHEARTSONFIREandTMARK,were introduced toD-ONE in FY2021. In February 2021,we have also launched CHOWTAI FOOK TIANHUANGDILAOCollectiononD-ONE,featuringringsthattransformthereflectionoflightintopersonalisedmessages,thankstoouruseoftheinnovativelaserdiffractiontechnology.
• InFY2021,werecordedaRSVofHK$133millionthroughD-ONE.ItisencouragingtoseethattheASPofthesecustomisedproductswasmorethandoublethegem-setjewelleryASPatSameStorelevelinMainlandChina.
• Togetherwiththe initiativestoenhancetheautomation levelofoursupplychainandestablishvariousdigitalplatforms,westrivetodeliverunparalleledcustomerexperience.

52
Customer engagement
FY2021
29.4%Members’ repeat purchase as a % of respective RSV
Number of members
As at 31 March 2021
Mainland China
3,035,000
• Weunderstandthatcustomerrelationshipmanagement (“CRM”) isoneof thesuccessfactorsofourbusinesses.
• Notonlydidwe invest inbrandingand large-scaleproductpromotion,butwealsoleveragedthestrengthofsocialmediainfluencers–KeyOpinionLeaders(“KOL”)andKeyOpinionConsumers(“KOC”)toattractourtargetcustomers.
• Currently,CloudSales365isintegratedwithourCRMsystemsothatourfrontlinestaffarearmedwithtimelyinformationtooffermoretargetedservicestocustomersanytime,anywhere.
HONG KONG, MACAU AND OTHER MARKETS
Retail expansion strategy
Brands and products
• InHongKong,Macauandothermarkets,weshall focusonpromotingourservicesandproductsthroughourflagshipbrand.
• Wecontinue toofferproducts indifferent segmentsand to fulfil customers’needsthroughout their journey.Wealsobringexclusiveproductswith localised features inordertocreateproductdifferentiation.
• InFY2021,TMARKproductsaccountedfor31.6%of theRSVofourdiamondproductsanddroppedby13.8%inHongKongandMacau.

53
Retail network
• InFY2021,weclosedanetof6CHOWTAIFOOKJEWELLERYPOS intouristareas intheHongKongandMacaumarketsasthenumberoftouristsfromMainlandChinadeclined.FurtherPOSconsolidationwilldependonexpectedborder reopeningand the rentalmarketconditionof retail realestate.However,wecontinuetostrivetomaintainourleadership inbothmarkets.Forthisreason,weshallnothesitatetoexpand instrategiclocations.Forinstance,werecentlyopenedournewPOSintheCastleofMagicalDreamsinHongKongDisneyland.
• InFY2021,anetof4POSinAsia-Pacificareawereclosedasbusinesswasaffectedbythepandemic.However,wewillcontinueto identifyopportunities inAsia-Pacificandmaycontinueourexpansionwheninternationaltravelresumes.
• Fiveduty-freePOSwereopened inHainan,MainlandChinaduringthefinancialyear inordertoserveourtravelretailcustomerswhohavebeenaffectedbythesuspensionofinternational travel.Wewil l continue to expand in thismarket alongwith thedevelopmentofduty-freeshoppinginMainlandChina.
Smart retail strategy
• Wewillalsoadjusttheimplementationstrategyofsmartretailapplicationsaccordingtodifferentgeographicneeds.
• InHongKong,Macauandothermarkets, thechallengingbusinessenvironmenthaspromptedusto focusontransformingourcurrentbusinessmodel through innovationandtechnologyinordertoenhanceretailexperienceandimproveoperationalefficiency.
• Approximately22%ofourPOS inHongKongandMacau installedCloudKiosksasat31March2021.
• WearealsooptimisingsmarttoolsintheHongKongandMacaumarkets,hopingthatitwillhelpbuildingclosertiesbetweenourstaffandcustomers,and increasetrafficbothonlineandoffline.
• TobettercatertothelifestyleandshoppingpreferencesofcustomersinHongKongandMacau,weattemptedtoplacesmartvendingmachines indifferentshoppingmallsasapilot in FY2021 to create unique shopping scenarios and experiences,whichwassuccessfulinattractingdifferentgroupsofcustomers.
• InFY2021,wehavealsostartedpartnershipwithKDollar rewardsystemofNewWorldDevelopmenttobroadenourcustomerbaseandboostrecurringspending.
FY2021
44.1%Members’ repeat purchase as a % of respective RSV
Number of members
As at 31 March 2021
Hong Kong and Macau
1,225,000

54
SMART MANUFACTURING
Theobjectiveof smartmanufacturing is to increase theoperational speedof theoverallsupplychain.Tothisend,weimplementtheC2Minitiative,sothatproductioncanseamlesslybeconnectedwithcustomersand the frontline.Meanwhile,wealso focusonenhancingproductdevelopmentcapabilitytobettersupportourretailexpansionstrategyinthecomingyears.
C2M
• Weadopt the Industry4.0 framework to transformtheconventionalmanufacturingmodelintoC2MofwhichD-ONEisoneofourimplementationmeasures.
• Wemake full use of the Internet of Things (“IoT”) technology in our productionprocesses,suchthatequipment is interconnectedandminimumhuman involvement isrequired.Weconnectourhighlyautomatedproduction lineswithcustomersseamlesslyviaD-ONE,providingcustomersspeedyservicesthatcanfulfiltheirneedsforcustomisedproducts.
• Wealsoapply the“DigitalTwin”model toestablishadigitalvirtual factory throughaproduction simulation system for performing geometric simulations, and in turnidentifyingtheoptimumproductionarrangementandresourceallocation.At thesametime,weusesensors ineachprocessandequipment inphysical factories tocontrolactual production progress against s imulated estimates in real t ime, al lowingmanagementpersonneltodealwithabnormalsituationsimmediately.
Product development capability
• Wevalueourproductsandservices.Wearecommittedtopreservingandreinvigoratingtraditionalcraftsmanship.At thesametime,wecultivate theartisanal spirit throughpromotingcross-generationalcraftsmanship, innovationandnewtechnologies in theindustry.Withmorethan20yearsofresearchandproductionexperience,thecraftsmenof ChowTai Fook’sMaster Studio strive for product improvement by combiningtraditionalcraftsmanshipandinnovativetechnologies.
• C+CreativePark isdesigned for startupentrepreneurs tocreateanenvironment forbusiness incubation and to explore cooperation opportunities among investors,governmentandotherstakeholders.ThisincubationspaceestablishedatChowTaiFookJewelleryParkinWuhan,MainlandChina,istosupportstartupsinfourmajorindustries,namely,culturalandcreativedesign,e-commerce, innovativetechnologyandmaterials,andeducationand training. TheParkaims to facilitatedevelopmentof a jewelleryecosystemandcreatesynergywithinit,whichinturnwillbenefitthejewelleryindustry.Meanwhile,wecooperatedwithnumeroussuccessfulstartupstoadopttheir innovativetechnologyproductsinouroperations.

55
BUSINESS OUTLOOK AND STRATEGIES
InFY2021,despiteachallengingbusinessenvironmentbroughtaboutbythepandemic,ourMainlandChinabusinesscontinuedtodeliverstronggrowthperformance.
With theChinesegovernment’s “dual circulation” strategy,webelieved that jewelleryindustrycouldbenefitfromthegrowthindomesticconsumption.Asweareoptimisticaboutthemid-to long-termgrowth intheMainlandChinamarket,wewill focusonourMainlandChina’sbusinessdevelopmentinthecomingfuture.Ononehand,wewillcontinueourretailexpansionstrategythroughpenetratingintolowertiercitiesandleveragingfranchisees’localknowledge.Ontheotherhand,wewouldpush forwardoursmart retail strategy throughenhancingtheretailexperienceandfocusingonO2Ochannelintegrationstotakeadvantageofdigitaltransformation.
ThoughHongKongandMacaumarketsare facingmultiplechallengescurrently,webelievethatthedomesticmarkethasbottomedoutasthepandemicsituationisexpectedtobecomemorestable.Whenthemajorbordercrossingsreopen,thenumberofvisitsmadeandretailmarketwouldrecovergradually.
Forothermarkets,wewill focusoncountrieswithahigherdomestic consumption,andcontinueourexpansionstrategywheninternationaltravelresumes.
When itcomestosmartmanufacturing, inordertocopewithfuturedevelopmentandC2Minparticular,wewill furtherenhanceourautomation levels tomeettheproductneeds. Inthe future,wewillenhance thedevelopmentofourWuhancentre to support the rapiddevelopmentof the frontlineasWuhan’sadvantageousgeographical location canhelpacceleratetheoveralllogistics.
Wearedelightedtoreport thatwearemovingsteadily towardsour four long-termgoals,namely,(1)tostrengthenourmarketleaderpositionasweseekfurthermarketpenetration;(2) todevelop a comprehensive jewellery ecosystem; (3) tobe a tech-savvy jewellerycompanybyharnessinginnovationandtechnology;and(4)toimproveoperationalefficiencythroughdigitaltransformation.
Going forward,webelieve that ourDual-Force Strategywill enableour customers toexperienceablissfulfulfilmentthroughjewellery.

56
THE UNAUDITED KEY OPERATIONAL DATA FROM 1 APRIL TO 31 MAY 2021
From1Aprilto31May2021,theyear-on-yearchangesofRSVandSSSareasfollows:
(% change compared to the same period last year)
Group
RSVgrowth 77.0%
Mainland ChinaHong Kong, Macauand other markets
RSVgrowth 74.7% 98.5%ContributiontoGroupRSV 89.1% 10.9%
Mainland ChinaHong Kong and
Macau SSSG 49.3% 159.7%SSSvolumegrowth 32.2% 125.9%
SSSGbyproduct —Gem-set,PlatinumandK-goldjewellery 4.0% 110.8% —Goldjewelleryandproducts 73.6% 219.5%
Theunauditedkeyoperationaldatafrom1Aprilto31May2021waspreparedbasedonthelatestavailablemanagementaccountsandthe informationcurrentlyavailabletotheGroup.ThepositionremainstobereviewedbytheCompany’sauditor, itsauditcommitteeandtheBoard.
57
FINAL DIVIDEND AND ANNUAL GENERAL MEETING
TheBoardrecommendedthepaymentofa finaldividendofHK$0.24pershare forFY2021,amountingtoapproximatelyHK$2,400million(FY2020:afinaldividendofHK$0.12pershare,amountingtoapproximatelyHK$1,200million).Suchpaymentofdividendwillbesubject totheapprovalofshareholdersat theforthcomingannualgeneralmeetingof theCompanytobeheldonWednesday,28July2021andispayabletoshareholderswhosenamesappearontheregisterofmembersoftheCompanyatthecloseofbusinessonThursday,5August2021.It isexpectedthat theproposed finaldividendwillbepaidonoraboutFriday,20August2021.Noticeoftheannualgeneralmeetingwillbepublishedanddespatchedtoshareholdersof theCompany inthemannerrequiredbytheRulesGoverningtheListingofSecuritiesonTheStockExchangeofHongKongLimited(the“ListingRules”)induecourse.
REVIEW OF ANNUAL RESULTS
TheAuditCommitteeof theCompanyhasreviewedtheaccountingprinciplesandpracticesadoptedbytheGroupandtheconsolidatedfinancialstatementsoftheGroupforFY2021.
The figures in respect of theGroup’s consolidated statement of financial position,consolidatedstatementofprofitor lossandothercomprehensive incomeandtherelatednotestheretofortheyearended31March2021assetoutinthepreliminaryannouncementhavebeenagreedbytheGroup’sauditor,PricewaterhouseCoopers,totheamountssetoutintheGroup’sdraftconsolidated financial statements for theyear.TheworkperformedbyPricewaterhouseCoopers in this respectdidnot constituteanassuranceengagement inaccordancewithHong Kong Standards onAuditing,Hong Kong Standards onReviewEngagementsorHongKongStandardsonAssuranceEngagements issuedbytheHongKongInstituteofCertifiedPublicAccountantsandconsequentlynoassurancehasbeenexpressedbyPricewaterhouseCoopersonthepreliminaryannouncement.
CORPORATE GOVERNANCE PRACTICES
Duringtheyearended31March2021,theCompanywasinfullcompliancewithallapplicableprinciplesandcodeprovisionsof theCorporateGovernanceCodeassetout inAppendix14totheListingRules.
DIRECTORS’ SECURITIES TRANSACTIONS
TheCompanyhasadoptedacodeofconductregardingdirectors’securities transactionsontermsnolessexactingthantheModelCodeforSecuritiesTransactionsbyDirectorsofListedIssuers (the“ModelCode”)as setout inAppendix10 to theListingRules.HavingmadespecificenquiryofallDirectors, theDirectorsconfirmedthat theyhadcompliedwith the requiredstandardassetoutintheModelCodeandtheCompany’scodeofconductduringFY2021.

58
PURCHASE, SALE OR REDEMPTION OF LISTED SECURITIES
NeithertheCompanynoranyofitssubsidiarieshaspurchased,soldorredeemedanyoftheCompany’slistedsecuritiesduringtheyear.
CLOSURE OF REGISTER OF MEMBERS
Inorder toestablishentitlements toattendandvoteat the forthcomingannualgeneralmeetingoftheCompany,theregisterofmembersoftheCompanywillbeclosedfromFriday,23July2021toWednesday,28July2021,bothdaysinclusive,duringwhichperiodnotransferof share of the Companywill be registered. All transfers of shares of the Companyaccompaniedbytherelevantsharecertificatesandproperlycompletedtransfer formsmustbe lodgedwiththebranchshareregistrarandtransferofficeoftheCompany inHongKong,Tricor InvestorServicesLimitedofLevel54,HopewellCentre,183Queen’sRoadEast,HongKongforregistrationnolaterthan4:30p.m.onThursday,22July2021.
Inordertoestablishentitlementstotheproposedfinaldividend,theregisterofmembersoftheCompanywillbeclosedonThursday,5August2021andno transferof shareof theCompanywillberegisteredonthatday.AlltransfersofsharesoftheCompanyaccompaniedbytherelevantsharecertificatesandproperlycompletedtransferformsmustbelodgedwiththebranchshareregistrarandtransferofficeof theCompany inHongKong,Tricor InvestorServices Limitedof Level 54,Hopewell Centre, 183Queen’sRoadEast,HongKong forregistrationnolaterthan4:30p.m.onWednesday,4August2021.
ForandonbehalfoftheBoardDr. Cheng Kar-Shun, Henry
Chairman
HongKong,8June2021
As at the date of this announcement, the executive directors are Dr. Cheng Kar-Shun, Henry, M r . W o n g S i u - K e e , K e n t , M r . C h a n S a i - C h e o n g , D r . C h e n g C h i - K o n g , A d r i a n , Mr. Cheng Chi-Heng, Conroy, Ms. Cheng Chi-Man, Sonia, Mr. Cheng Kam-Biu, Wilson, Mr. Cheng Ping-Hei, Hamilton, Mr. Suen Chi-Keung, Peter and Mr. Liu Chun-Wai, Bobby; a n d t h e i n d e p e n d e n t n o n - e x e c u t i v e d i r e c t o r s a r e D r . F u n g K w o k - K i n g , V i c t o r , Dr. Or Ching-Fai, Raymond, Mr. Kwong Che-Keung, Gordon, Mr. Cheng Ming-Fun, Paul, Mr. Lam Kin-Fung, Jeffrey, Mr. Chia Pun-Kok, Herbert and Ms. Cheng Ka-Lai, Lily.