Annual Report - :: HKEX :: HKEXnews ::
270
-
Upload
khangminh22 -
Category
Documents
-
view
0 -
download
0
Transcript of Annual Report - :: HKEX :: HKEXnews ::


1China Molybdenum Co., Ltd.
CONTENTS
COMPANY PROFILE 2
CHAIRMAN’S LETTER 3
FINANCIAL HIGHLIGHTS 5
MARKET REVIEW AND PROSPECTS 11
BUSINESS REVIEW AND PROSPECTS 18
MANAGEMENT DISCUSSION AND ANALYSIS 22
RESOURCES AND RESERVES 31
MATERIAL EVENTS 35
MATERIAL EVENTS 35
HONOURS 35
DOMESTIC AND OVERSEAS INDUSTRY POLICIES 36
RISK WARNING 39
CORPORATE GOVERNANCE REPORT 42
REPORT OF THE BOARD OF DIRECTORS 57
REPORT OF THE SUPERVISORY COMMITTEE 81
PROFILES OF DIRECTORS, SUPERVISORS AND SENIOR MANAGEMENT 84
CORPORATE INFORMATION 87
AUDITOR’S REPORT 89
THIS ANNUAL REPORT INCLUDES FORWARD-LOOKING STATEMENTS. ALL STATEMENTS,
OTHER THAN STATEMENTS OF HISTORICAL FACTS, THAT ADDRESS BUSINESS ACTIVITIES,
EVENTS OR DEVELOPMENTS THAT THE COMPANY EXPECTS OR ANTICIPATES MAY OR
WILL OCCUR IN THE FUTURE (INCLUDING BUT NOT LIMITED TO PROJECTIONS, TARGETS,
ESTIMATES AND BUSINESS PLANS) ARE FORWARD-LOOKING STATEMENTS. THE COMPANY’S
ACTUAL RESULTS OR DEVELOPMENTS MAY DIFFER MATERIALLY FROM THOSE INDICATED
BY THESE FORWARD-LOOKING STATEMENTS AS A RESULT OF VARIOUS VARIABLES
AND UNCERTAINTIES. THE COMPANY MAKES THE FORWARD-LOOKING STATEMENTS IN
THE ANNUAL REPORT FOR THE YEAR REFERRED TO HEREIN AS AT 27 MARCH 2020 AND
UNDERTAKES NO OBLIGATION OR RESPONSIBILITY TO UPDATE THESE STATEMENTS, AND
DO NOT CONSTITUTE THE COMPANY’S SUBSTANTIVE UNDERTAKINGS TO INVESTORS.
INVESTORS ARE ADVISED TO PAY ATTENTION TO INVESTMENT RISKS.
Note: This annual report was prepared in both Chinese and English versions. Where there is discrepancy between the Chinese and English versions, the Chinese version shall prevail.

2 2019 Annual Report
COMPANY PROFILE
China Molybdenum Co., Ltd. (hereinafter referred to as “CMOC” or the “Company”, and together with its subsidiaries, the “Group”) is a joint stock company established in the People’s Republic of China (the “PRC” or “China”) on 25 August 2006. The Company was successfully listed on the Main Board of The Stock Exchange of Hong Kong Limited (the “Stock Exchange”) on 26 April 2007 and the Shanghai Stock Exchange (the “SSE”) on 9 October 2012.
The Company engages in non-ferrous metal industry, mainly the mining, beneficiation, smelting, refining and trading of base and rare metals. With its main business located in five continents: Asia, Africa, South America, Oceania and Europe, the Company is the largest tungsten producers, the second largest cobalt and niobium producer, one of the top five molybdenum producers and a leading copper producer in the world. It is also the second largest producer of phosphatic fertilizers in Brazil. In terms of trading business, the Company is among the third biggest base metals merchants in the world.
The Company’s vision is to become the most respected international resources company. It focuses on building a corporate culture that features meritocracy, cost control, continuous improvement, and achievement sharing. The corporate strategies include: reinforcing and maintaining the current competitiveness of the Company's business and strengthening competitive cost advantages of existing business through continuously identifying cost reduction opportunities and improving efficiency; optimizing business development fueled by organic growth of current production capacity and outward investment, based on the existing resource endowment, while continuously optimizing the Company's production capacity structure, appropriate external investment should be made to expand resource reserves and growth capacity; continuously managing and optimizing the balance sheet by rationalizing financing structure and reducing capital costs; creating synergy while ensuring stable domestic and overseas operations. Relying on its comprehensive competitive advantages in scale, industrial chain, technology, funds, market and management, and thanks to its diversified financing platform, the Company is stepping firmly towards its strategic goals.

3China Molybdenum Co., Ltd.
CHAIRMAN’S LETTER
To our shareholders,
CMOC’s vision commits us to growing into a respected world-class mining powerhouse no matter how long the journey is ahead. 2019 saw us striving to build capabilities on all fronts while staying vigilant as the world evolves rapidly. Step by step, we are forging ahead towards our purpose and destiny. I would like to express my gratitude to all shareholders for your continued trust and support, and present herewith the 2019 Annual Report on behalf of the Board of Directors.
Financial performance
In 2019, the Company reported a revenue of approximately RMB68.7 billion, including approximately RMB49.2 billion contributed from IXM following its consolidation at the end of July. EBITDA for the year was approximately RMB8.1 billion at 39% EBITDA margin for the mining segment, down from last year, mainly due to the fall of cobalt price and prolonged weakness of copper price. Net operating cash flow of the mining segment was approximately RMB6.2 billion. At the end of 2019, debt-to-asset ratio of the Company was 57.65% (51.36% excluding IXM) and net interest-bearing debt ratio stood at 25.34% (17.36% excluding IXM). With a reported approximately RMB1.857 billion of net profit attributable to shareholders, the Board of Directors proposes a dividend payment to shareholders totaling approximately RMB929 million (including tax) at a payout ratio of 50%.
Safety and ESG
Safety is our core corporate value and “zero harm” is our paramount target. In 2019, the Company achieved zero fatality and zero material environmental incident across our global operations and recorded a TRIR of 1.62, outperforming the global industry average published by ICMM. When COVID-19 pandemic first broke out in China, the Company responded immediately. A Coronavirus Prevention and Control Leadership Group was set up on January 26th, 2020, and subsequently Emergency Response Teams were assembled at all operations with emergency plans developed. Procedures on containment of coronavirus were established and strictly followed. Support to ensure stable operations was put in place and readily available.
In 2019, under the guidance of the Board and the Strategy and Sustainability Committee, we formed the cross-function Sustainable Development Executive Committee, which reviewed and enacted eight compliance and sustainability policies including Code of Business Conduct. By the definitions in Global Reporting Initiative, CMOC’s total “key economic contributions” worldwide reached over RMB26 billion.
Operations
We believe that the core competitiveness of a mining company stems from constant pursuit of performance improvement and cost excellences. In 2019, the Company realigned the management structure at TFM in the DRC and our Phoenix office in the US. These major changes delivered a streamlined management model with greater simplicity and higher efficiency. This major overhaul brought profound benefits to the whole group and set a solid foundation for our future growth. Our global operations rolled out major efficiency programs which recorded a total of approximately RMB1.47 billion cash cost savings over 2018, including approximately USD130 million at TFM through cost-control initiatives on several aspects, consisting of mining, processing, administration, supply chain and logistics.
In China, the molybdenum and tungsten business showed outstanding robustness under the ever-tightening and ever-changing regulatory environment and kept its leading cost competitiveness among industry peers. In Brazil, breakthroughs were made thanks to perseverance in advancing our processing technology. And in our Australian copper and gold operation, two major capex projects are progressing on time and on budget.
We accomplished a smooth consolidation of IXM and started to see benefits from the synergies between our mining and trading businesses. In 2019, IXM achieved 5.11 million tons of physical trade and approximately USD100 million of gross profit, a record high since it was founded in 2006, demonstrating the counter-cyclicality nature of its business model.
Li ChaochunChairman

4 2019 Annual Report
CHAIRMAN’S LETTER
We are committed to technological innovation. As a smart-mining pioneer in China, we are the first Chinese company applying 5G technology to mining, leading the industry by increasingly deploying autonomous electric mining vehicles.
Balance sheet management
The Company always holds to the principle of keeping a strong balance sheet with sufficient liquidity. COVID-19 pandemic will impact our operating cash flows. Our stress test evaluates not only declining prices at different levels, but also global business shutdowns for a certain period of time. The Company has already prepared for the potential challenges and, based on our assessment, will stand strong facing these extreme scenarios.
We are focused on managing and improving our balance sheet. In 2019, the Company closed USD1 billion financing via offshore bond issuance and syndication, as well as RMB4 billion financing via onshore SCP and corporate bond issuance. These financing initiatives further optimised our debt structure and financing cost. In 2019, we achieved average cost of financing at 4%, one of the top performers in the industry.
Portfolio
The Company has constructed a portfolio of commodities essential to improve people’s quality of life. Our portfolio presents a unique set of high-quality assets with long-life, low cost and great potential. We seek diversification centering around our core business segments. Our global expansion across products and value chain leads to the diversification of market and client base, and of revenue streams and cash flows. The Company also maintains a balanced asset and liability structure denominated in both RMB and USD. We are very excited about the long-term value and growth potential of our portfolio which enhances our capabilities to counter and mitigate risks of the future.
Business development
Based on our research of the tungsten market and positive view on its long-term prospect, the Company acquired 28,300 tons of APT. This alternative investment increased our tungsten reserves and further consolidated our leading position in the sector. The Company also invested in a nickel and cobalt hydrometallurgy project in Indonesia through minority equity participation. Upon its completion, the project will each year deliver at least 15,000 tons (in nickel content) products to the Company.
Looking ahead
The Company is in the process to develop our five-year corporate strategy. We will fully leverage the massive potential of our existing portfolio which presents very promising organic growth opportunities thanks to the exceptional quality of our mining assets. For instance, TFM, with its huge reserves, under appropriate conditions, has the great prospect to be developed into a world-class mine with annual production of over 400,000 tons copper and over 30,000 tons cobalt.
In the meantime, IXM is carrying out its mission, leveraging its advantage as a commodity trader, to facilitate the Group’s steady growth in the natural resources sector, and more importantly, to capture value adding synergistic opportunities across the Group’s mining, investment and financing activities.
The market’s recent volatility and downward trend reflected the growing concerns over another global economic recession, triggered by the spreading coronavirus. But where there is crisis, there is opportunity. While weathering through the storm, we will also strive to identify and seize the opportunities. Value creation, capital efficiency, shareholders return and sustainable development will always be our key considerations and criteria when making decisions over both organic and inorganic opportunities.
Sincere thanks
I would like to express my gratitude to all our shareholders, clients, vendors, partners, and communities for your continued trust and support which is critical and essential for our future growth. I also sincerely thank all our Board members, management teams and employees around the world for your hard work and contribution to the Company.
COVID-19 outbreak brought impacts unseen in a century across the world on many aspects, from social governance to economic activities, and from family behavior patterns to everyone’s mind and soul. Undoubtedly there will be profound effects. In the face of the rapid spread of the pandemic, the Company will unite and work with all stakeholders to overcome the unprecedented challenges. We believe that what does not defeat us makes us stronger.
Li ChaochuanChairman
Beijing, the PRC
27 March 2020

5China Molybdenum Co., Ltd.
FINANCIAL HIGHLIGHTS
I. SUMMARISED FINANCIAL INFORMATION
Unit: Yuan Currency: RMB
Major accounting information 2019 2018
Increase or decrease as compared to
last year 2017(%)
Operating revenue 68,676,565,008.79 25,962,862,773.77 164.52 24,147,557,764.10Net profit attributable to
shareholders of listed company 1,857,014,210.98 4,635,583,953.16 -59.94 2,727,796,169.73Net profit after deduction of non-
recurring profits or losses attributable to shareholders of listed company 746,685,213.05 4,560,178,551.23 -83.63 3,125,343,718.94
Net cash flow from operating activities 1,704,827,883.87 9,434,533,590.15 -81.93 8,428,811,927.59
EBITDA 8,075,199,693.12 12,615,392,379.22 -35.99 11,462,406,723.60Net assets attributable to the
shareholders of listed company 40,802,774,133.85 40,948,873,571.40 -0.36 38,157,183,127.02
Total assets 116,862,226,476.73 101,216,117,236.03 15.46 97,837,246,152.38
Gearing ratio57.65% 51.00%
Increased by 6.65 percentage points 53.08%
Net interest-bearing debt ratio25.34% 9.87%
Increased by 15.47percentage points 10.4%
II. MAJOR FINANCIAL INDICATORS
For the year ended 31 December
Increase or decrease as compared to
last year
For the year ended 31 December
2017Item 2019 2018 (%)
Basic earnings per share (“EPS”) (RMB Yuan per Share) 0.09 0.21 -57.14 0.14
Diluted EPS (RMB Yuan per Share) N/A N/A N/A N/A
Basic EPS after deduction of non-recurring profits or losses (RMB Yuan per Share) 0.03 0.21 -85.71 0.16
Weighted average return on net assets (%)
4.54 11.72
Decreased by 7.18
percentage points 9.89
Weighted average return on net assets after deduction of non-recurring profits or losses (%)
1.85 11.54
Decreased by 9.69
percentage points 11.25
6 2019 Annual Report
FINANCIAL HIGHLIGHTS
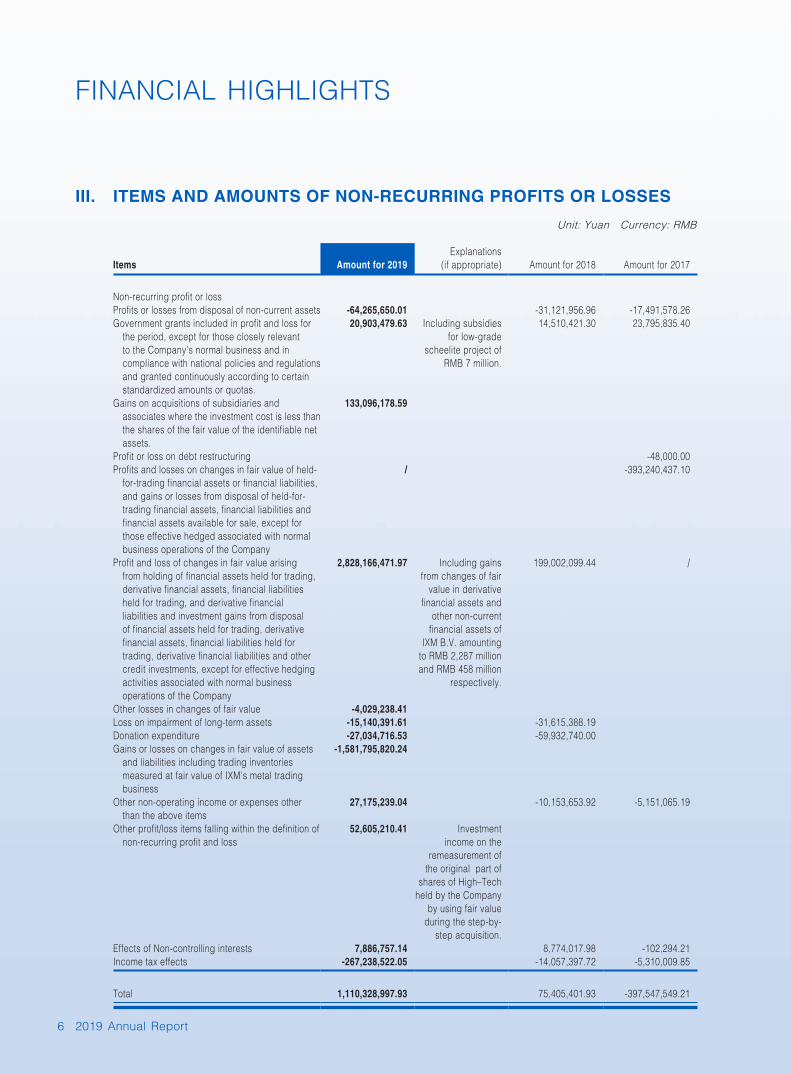
III. ITEMS AND AMOUNTS OF NON-RECURRING PROFITS OR LOSSES
Unit: Yuan Currency: RMB
Items Amount for 2019Explanations
(if appropriate) Amount for 2018 Amount for 2017
Non-recurring profit or lossProfits or losses from disposal of non-current assets -64,265,650.01 -31,121,956.96 -17,491,578.26Government grants included in profit and loss for
the period, except for those closely relevant to the Company’s normal business and in compliance with national policies and regulations and granted continuously according to certain standardized amounts or quotas.
20,903,479.63 Including subsidies for low-grade
scheelite project of RMB 7 million.
14,510,421.30 23,795,835.40
Gains on acquisitions of subsidiaries and associates where the investment cost is less than the shares of the fair value of the identifiable net assets.
133,096,178.59
Profit or loss on debt restructuring -48,000.00Profits and losses on changes in fair value of held-
for-trading financial assets or financial liabilities, and gains or losses from disposal of held-for-trading financial assets, financial liabilities and financial assets available for sale, except for those effective hedged associated with normal business operations of the Company
/ -393,240,437.10
Profit and loss of changes in fair value arising from holding of financial assets held for trading, derivative financial assets, financial liabilities held for trading, and derivative financial liabilities and investment gains from disposal of financial assets held for trading, derivative financial assets, financial liabilities held for trading, derivative financial liabilities and other credit investments, except for effective hedging activities associated with normal business operations of the Company
2,828,166,471.97 Including gains from changes of fair
value in derivative financial assets and
other non-current financial assets of
IXM B.V. amounting to RMB 2,287 million and RMB 458 million
respectively.
199,002,099.44 /
Other losses in changes of fair value -4,029,238.41Loss on impairment of long-term assets -15,140,391.61 -31,615,388.19Donation expenditure -27,034,716.53 -59,932,740.00Gains or losses on changes in fair value of assets
and liabilities including trading inventories measured at fair value of IXM’s metal trading business
-1,581,795,820.24
Other non-operating income or expenses other than the above items
27,175,239.04 -10,153,653.92 -5,151,065.19
Other profit/loss items falling within the definition of non-recurring profit and loss
52,605,210.41 Investment income on the
remeasurement of the original part of
shares of High–Tech held by the Company
by using fair value during the step-by-
step acquisition.Effects of Non-controlling interests 7,886,757.14 8,774,017.98 -102,294.21Income tax effects -267,238,522.05 -14,057,397.72 -5,310,009.85
Total 1,110,328,997.93 75,405,401.93 -397,547,549.21

7China Molybdenum Co., Ltd.
FINANCIAL HIGHLIGHTS
IV. CONSOLIDATED FINANCIAL STATEMENTS
(I) Consolidated Balance Sheet
Unit: Yuan Currency: RMB
For the year ended 31 DecemberItem 2019 2018 Increase (decrease)
Current assets:Cash and bank balances 15,647,900,059.61 26,647,644,058.81 -41.28%Held-for-trading financial assets 7,719,450,290.97 774,326,692.25 896.92%Derivative financial assets 2,178,322,223.39 0.00 100%Accounts receivable 1,510,508,440.50 860,999,687.88 75.44%Financing receivables 375,935,645.39 1,623,841,101.38 -76.85%Prepayments 1,065,494,520.83 151,004,234.22 605.61%Other receivables 1,119,039,260.19 1,040,048,708.23 7.59%Including: Interests receivable 198,921,505.19 226,186,602.19 -12.05%
Receivable dividends 2,235,286.10 0.00 100%Inventories 20,730,673,736.79 6,615,914,805.21 213.35%Other current assets 3,830,180,430.37 1,450,605,120.41 164.04%
Total current assets 54,177,504,608.04 39,164,384,408.39 38.33%
Non-current assets:Long-term equity investment 1,033,168,028.11 2,522,865,277.94 -59.05%Other investments in equity instruments 85,344,307.06 448,174,198.06 -80.96%Other non-current financial assets 4,356,783,464.12 3,906,621,612.87 11.52%Non-current derivative financial assets 7,620,425.07 3,179,157.60 139.70%Fixed assets 24,439,595,450.35 23,620,517,589.11 3.47%Construction in progress 2,386,791,478.58 1,893,822,308.19 26.03%Right-of-use assets 346,815,801.39 N/A N/AIntangible assets 20,446,930,377.08 20,931,052,279.34 -2.31%Long-term inventory 5,660,505,828.69 5,122,434,298.15 10.50%Goodwill 659,468,043.85 674,886,645.02 -2.28%Long-term prepaid expenses 136,987,188.97 129,022,870.55 6.17%Deferred tax assets 645,508,458.12 525,597,815.59 22.81%Other non-current assets 2,479,203,017.30 2,273,558,775.22 9.05%
Total non-current assets 62,684,721,868.69 62,051,732,827.64 1.02%
Total assets 116,862,226,476.73 101,216,117,236.03 15.46%
8 2019 Annual Report
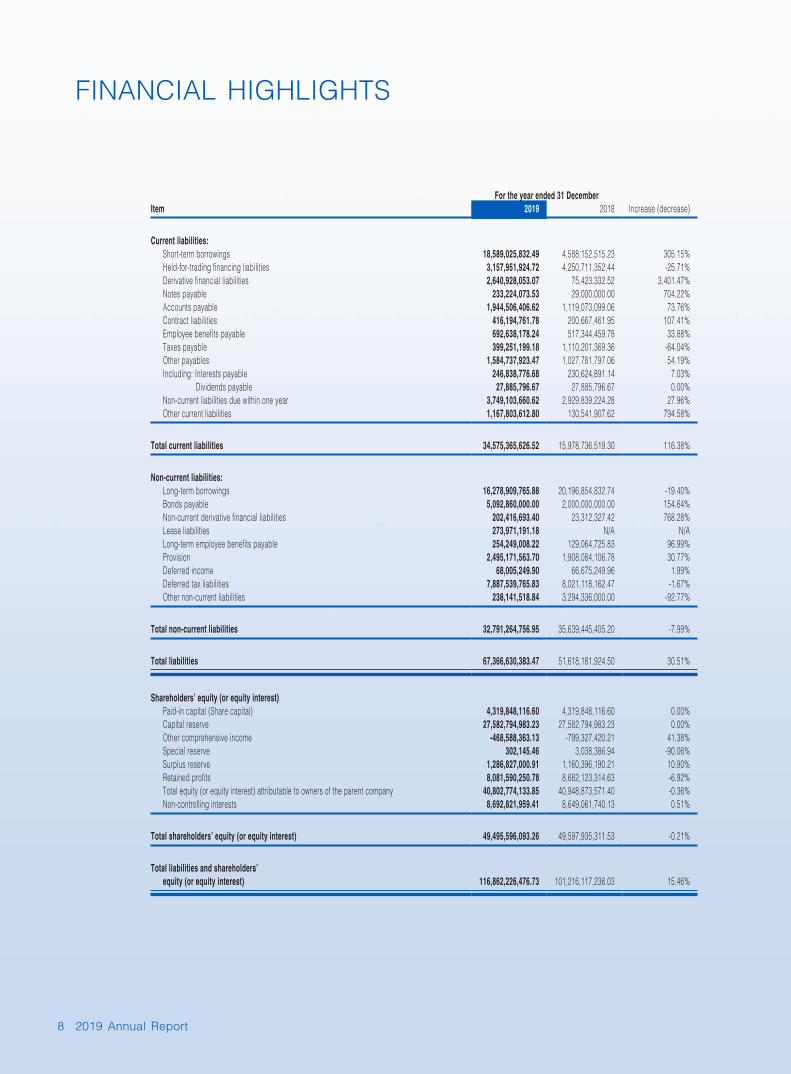
FINANCIAL HIGHLIGHTS
For the year ended 31 DecemberItem 2019 2018 Increase (decrease)
Current liabilities:Short-term borrowings 18,589,025,832.49 4,588,152,515.23 305.15%Held-for-trading financing liabilities 3,157,951,924.72 4,250,711,352.44 -25.71%Derivative financial liabilities 2,640,928,053.07 75,423,332.52 3,401.47%Notes payable 233,224,073.53 29,000,000.00 704.22%Accounts payable 1,944,506,406.62 1,119,073,099.06 73.76%Contract liabilities 416,194,761.78 200,667,461.95 107.41%Employee benefits payable 692,638,178.24 517,344,459.78 33.88%Taxes payable 399,251,199.18 1,110,201,369.36 -64.04%Other payables 1,584,737,923.47 1,027,781,797.06 54.19%Including: Interests payable 246,838,776.68 230,624,891.14 7.03% Dividends payable 27,885,796.67 27,885,796.67 0.00%Non-current liabilities due within one year 3,749,103,660.62 2,929,839,224.28 27.96%Other current liabilities 1,167,803,612.80 130,541,907.62 794.58%
Total current liabilities 34,575,365,626.52 15,978,736,519.30 116.38%
Non-current liabilities:Long-term borrowings 16,278,909,765.88 20,196,854,832.74 -19.40%Bonds payable 5,092,860,000.00 2,000,000,000.00 154.64%Non-current derivative financial liabilities 202,416,693.40 23,312,327.42 768.28%Lease liabilities 273,971,191.18 N/A N/ALong-term employee benefits payable 254,249,008.22 129,064,725.83 96.99%Provision 2,495,171,563.70 1,908,084,106.78 30.77%Deferred income 68,005,249.90 66,675,249.96 1.99%Deferred tax liabilities 7,887,539,765.83 8,021,118,162.47 -1.67%Other non-current liabilities 238,141,518.84 3,294,336,000.00 -92.77%
Total non-current liabilities 32,791,264,756.95 35,639,445,405.20 -7.99%
Total liabilities 67,366,630,383.47 51,618,181,924.50 30.51%
Shareholders’ equity (or equity interest)Paid-in capital (Share capital) 4,319,848,116.60 4,319,848,116.60 0.00%Capital reserve 27,582,794,983.23 27,582,794,983.23 0.00%Other comprehensive income -468,588,363.13 -799,327,420.21 41.38%Special reserve 302,145.46 3,038,386.94 -90.06%Surplus reserve 1,286,827,000.91 1,160,396,190.21 10.90%Retained profits 8,081,590,250.78 8,682,123,314.63 -6.92%Total equity (or equity interest) attributable to owners of the parent company 40,802,774,133.85 40,948,873,571.40 -0.36%Non-controlling interests 8,692,821,959.41 8,649,061,740.13 0.51%
Total shareholders’ equity (or equity interest) 49,495,596,093.26 49,597,935,311.53 -0.21%
Total liabilities and shareholders’ equity (or equity interest) 116,862,226,476.73 101,216,117,236.03 15.46%

9China Molybdenum Co., Ltd.
FINANCIAL HIGHLIGHTS
(II) Consolidated Income Statement
Unit: Yuan Currency: RMB
For the year ended 31 DecemberItem 2019 2018 Increase (decrease)
I. Total operating income 68,676,565,008.79 25,962,862,773.77 164.52%Including: Operating income 68,676,565,008.79 25,962,862,773.77 164.52%
II. Total operating costs 69,261,920,764.53 19,126,609,929.68 262.12%Including: Operating costs 65,605,691,676.40 16,180,247,120.46 305.47% Taxes and levies 812,716,202.17 1,018,793,135.61 -20.23% Selling expenses 90,657,673.80 96,821,993.66 -6.37% Administrative expenses 1,233,696,509.26 933,345,539.26 32.18% Re search and development expenses 268,320,900.73 254,356,012.27 5.49% Financial expenses 1,250,837,802.17 643,046,128.42 94.52% Including: Interest expenses 1,840,227,297.31 1,450,739,092.45 26.85% Interest income -929,942,890.97 -1,037,941,410.44 -10.41%Add: Other income 17,294,553.35 12,550,421.30 37.80% In vestment income (losses are indicated by “-”) 194,629,428.14 202,269,845.76 -3.78%Including: In come from investments in associates and joint ventures 21,744,539.34 69,110,578.55 -68.54% Ga ins from changes in fair value (losses are indicated by “-”) 2,703,857,555.18 122,407,995.85 2,108.89% Cr edit impairment gains (losses are indicated by “-”) -6,311,229.01 -17,792,652.00 -64.53% As set impairment gains (losses are indicated by “-”) -38,246,066.61 -66,582,688.49 -42.56% In come from the disposal of assets (losses are indicated by “-”) -64,265,650.01 -31,121,956.96 106.50%
III. Operating profit (losses are indicated by “-”) 2,221,602,835.30 7,057,983,809.55 -68.52%Add: Non-operating income 170,387,882.33 2,578,175.70 6,508.85%Less: Non-operating expenses 33,542,253.71 70,704,569.62 -52.56%
IV. Total profit (total losses are indicated by “-”) 2,358,448,463.92 6,989,857,415.63 -66.26%Less: Income tax expenses 592,600,086.07 1,839,815,909.39 -67.79%
V. Net profit (net losses are indicated by “-”)(1) Classified by business continuity 1,765,848,377.85 5,150,041,506.24 -65.71%
1. Net profit from continuing operations (losses are indicated by “-”) 1,765,848,377.85 5,150,041,506.24 -65.71%(2) Classified by ownership
1. Net profit attributable to owners of the parent company (losses are indicated by “-”) 1,857,014,210.98 4,635,583,953.16 -59.94%2. Non-controlling interest (losses are indicated by “-”) -91,165,833.13 514,457,553.08 -117.72%
VI. Other comprehensive income, net of tax 510,713,480.88 209,753,598.38 143.48%Other comprehensive income attributable to owners of the parent company, net of tax 375,539,057.08 -173,162,449.82 316.87%(I) Other comprehensive income cannot be reclassified into the profit or loss subsequently 60,440,773.28 -26,301,226.93 329.80%
1. Remeasurement of changes in defined benefit plans -8,303,640.00 0.00 100%2. Changes in fair value of other equity instrument investments 68,744,413.28 -26,301,226.93 361.37%
(II) Other comprehensive income that will be reclassified subsequently into the profit or loss 315,098,283.80 -146,861,222.89 314.56%1. Other comprehensive income to be reclassified into profit or loss under equity
method 20,822,262.48 -20,822,262.48 200.00%2. Cash flow hedge reserve (effective portion of gains or losses from cash flow hedge) -173,044,901.70 -17,113,194.35 911.18%3. Foreign exchange differences from translation of financial statements 467,320,923.02 -108,925,766.06 529.03%
Other comprehensive income, net of tax attributable to non-controlling shareholders 135,174,423.80 382,916,048.20 -64.70%
VII. Total comprehensive income 2,276,561,858.73 5,359,795,104.62 -57.53%Attributable to owners of the parent company 2,232,553,268.06 4,462,421,503.34 -49.97%Attributable to non-controlling interests 44,008,590.67 897,373,601.28 -95.10%
VIII. Earnings per share::(I) Basic earnings per share (RMB Yuan per Share) 0.09 0.21 -57.14%(II) Diluted earnings per share (RMB Yuan per Share) N/A N/A N/A

10 2019 Annual Report
FINANCIAL HIGHLIGHTS
(III) Consolidated Statement of Cash Flow
Unit: Yuan Currency: RMB
For the year ended 31 DecemberItem 2019 2018 Increase (decrease)
I. Cash flows from operating activities:Cash received from sales of goods and rendering services 71,786,252,657.57 29,243,394,765.11 145.48%Cash received related to other operating activities 4,753,257,983.02 1,136,280,555.91 318.32%Sub-total of cash inflows from operating activities 76,539,510,640.59 30,379,675,321.02 151.94%Cash paid for purchasing goods and receiving labour services 66,328,481,964.48 13,838,634,782.28 379.30%Cash paid to employees and paid for employees 2,307,952,972.59 2,058,337,557.31 12.13%Taxes and fees paid 4,168,334,672.22 3,876,805,514.67 7.52%Cash paid for other operating activities 2,029,913,147.43 1,171,363,876.61 73.29%Sub-total of cash outflow from operating activities 74,834,682,756.72 20,945,141,730.87 257.29%Net cash flow from operating activities 1,704,827,883.87 9,434,533,590.15 -81.93%
II. Cash flows from investing activities:Cash received from recovery of investment 4,784,176,788.82 6,076,815,575.34 -21.27%Cash received from investment income 1,632,774,545.59 207,156,988.46 688.18%Net cash received from disposals of fixed assets, intangible assets and other long term assets 24,417,189.84 43,630,402.62 -44.04%Cash received related to other investing activities 3,009,624,827.50 0.00 100%Sub-total of cash inflows from investment activities 9,450,993,351.75 6,327,602,966.42 49.36%Cash paid for acquiring or construction of fixed assets, intangible assets and other long-term assets 2,718,622,240.73 2,807,367,389.57 -3.16%Cash paid for investment 5,095,283,003.45 4,852,213,461.04 5.01%Net cash paid on acquisition of subsidiaries and other operating units 2,069,009,623.30 0.00 100.00%Cash paid for other investment activities 2,247,181,202.53 1,065,210,116.95 110.96%Sub-total of cash outflow from investment activities 12,130,096,070.01 8,724,790,967.56 39.03%Net cash flows from investment activities -2,679,102,718.26 -2,397,188,001.14 11.76%
III. Cash flows from financing activities:Cash received from borrowings 32,091,740,322.20 8,571,932,316.83 274.38%Cash received from other financing activities 2,903,278,100.00 3,013,968,920.00 -3.67%Sub-total of cash inflows from financing activities 34,995,018,422.20 11,585,901,236.83 202.05%Cash paid for debt repayment 31,372,194,483.49 9,999,663,814.94 213.73%Cash paid for distribution of dividends, profits or interest payment 4,203,154,203.48 2,646,126,449.90 58.84%Cash paid for other financing activities 9,667,041,045.09 2,786,560,371.98 246.92%Sub-total of cash outflow from financing activities 45,242,389,732.06 15,432,350,636.82 193.17%Net cash flow from financing activities -10,247,371,309.86 -3,846,449,399.99 -166.41%
IV. Effect of exchange rate changes on cash and cash equivalents 373,190,382.07 268,388,806.15 39.05%
V. Net increase in cash and cash equivalents -10,848,455,762.18 3,459,284,995.17 -413.60%Add: Balance of cash and cash equivalents at the beginning of year 23,240,703,274.03 19,781,418,278.86 17.49%
VI. Balance of cash and cash equivalents at the end of year 12,392,247,511.85 23,240,703,274.03 -46.68%
11China Molybdenum Co., Ltd.
MARKET REVIEW AND PROSPECTS
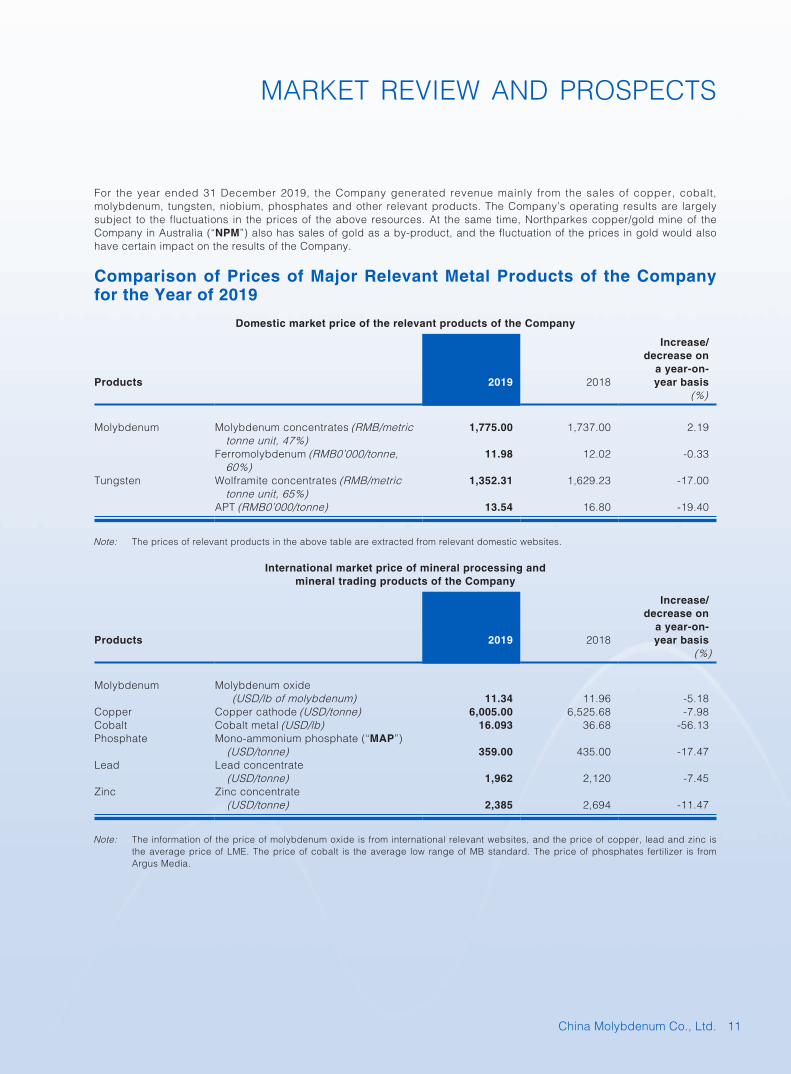
For the year ended 31 December 2019, the Company generated revenue mainly from the sales of copper, cobalt, molybdenum, tungsten, niobium, phosphates and other relevant products. The Company’s operating results are largely subject to the fluctuations in the prices of the above resources. At the same time, Northparkes copper/gold mine of the Company in Australia (“NPM”) also has sales of gold as a by-product, and the fluctuation of the prices in gold would also have certain impact on the results of the Company.
Comparison of Prices of Major Relevant Metal Products of the Company for the Year of 2019
Domestic market price of the relevant products of the Company
Products 2019 2018
Increase/decrease on
a year-on- year basis
(%)
Molybdenum Molybdenum concentrates (RMB/metric tonne unit, 47%)
1,775.00 1,737.00 2.19
Ferromolybdenum (RMB0’000/tonne, 60%)
11.98 12.02 -0.33
Tungsten Wolframite concentrates (RMB/metric tonne unit, 65%)
1,352.31 1,629.23 -17.00
APT (RMB0’000/tonne) 13.54 16.80 -19.40
Note: The prices of relevant products in the above table are extracted from relevant domestic websites.
International market price of mineral processing and mineral trading products of the Company
Products 2019 2018
Increase/decrease on
a year-on-year basis
(%)
Molybdenum Molybdenum oxide (USD/lb of molybdenum) 11.34 11.96 -5.18
Copper Copper cathode (USD/tonne) 6,005.00 6,525.68 -7.98Cobalt Cobalt metal (USD/lb) 16.093 36.68 -56.13Phosphate Mono-ammonium phosphate (“MAP”)
(USD/tonne) 359.00 435.00 -17.47Lead Lead concentrate
(USD/tonne) 1,962 2,120 -7.45Zinc Zinc concentrate
(USD/tonne) 2,385 2,694 -11.47
Note: The information of the price of molybdenum oxide is from international relevant websites, and the price of copper, lead and zinc is the average price of LME. The price of cobalt is the average low range of MB standard. The price of phosphates fertilizer is from Argus Media.

12 2019 Annual Report
MARKET REVIEW AND PROSPECTS
Molybdenum concentrate (RMB/metric tonne unit, 47%)
1,775.00 1,737.00
0
500
1,000
1,500
2,000
2019 2018
11.98 12.02
Ferromolybdenum(RMB'0000/tonne, 60%)
0
3
6
9
12
15
2019 2018
1,629.23
1,352.31
Wolframite concentrate (RMB/metric tonne unit, 65%)
0
500
1,000
1,500
2,000
2019 2018
13.54
16.80
APT (RMB'0000/tonne)
0
5
10
15
20
2019 2018
Molybdenum oxide (USD/lb of molybdenum)
11.9611.34
0
2
4
6
8
10
12
2019 2018
6,525.686,005.00
Copper cathode (USD/tonne)
0
1,400
2,800
4,200
5,600
7,000
2019 2018
Cobalt metal (USD/lb)
2019 2018
16.093
36.68
0
5
10
15
20
25
30
35
40 435.00359.00
MAP(USD/tonne)
0
100
200
300
400
500
2019 2018

13China Molybdenum Co., Ltd.
MARKET REVIEW AND PROSPECTS
MARKET REVIEW ON EACH METAL SEGMENT IN 2019
(1) Copper market
The Company mainly sells both copper concentrate and copper cathode to the international markets. According to the data of the UK's Commodity Research Unit (“CRU”), global copper consumption fell approximately 0.35% during 2019, led primarily by sluggish global auto sector and home appliances consumption, a slowdown in Chinese infrastructure investment, the impact on the global trade activities arising from Sino-US trade conflict, as well as increased political uncertainties caused by events such as the Brexit. Despite this, CRU estimated a continuing growth in Chinese demand on copper by 1.0%, though this marked a significant slowdown as compared with the growth of approximately 5.0% in 2018. Weak terminal consumption and market sentiment were perfectly evidenced by how the copper prices moved throughout 2019 – started on quite a bright note rallying towards the USD6,500/t in the first quarter before being dragged down to a range of around USD5,600/t to USD6,000/t between May and the end of November due to uncertainties of global trade in 2019. Since then, China and the USA reached the first-phase trade deal, which pushed the price of copper up by 3.36% to closing price at USD6,149/t. In addition, the domestic supply of copper scrap has shrunk to some extent as Chinese government has determined to cut foreign waste imports since 2017 by a complete ban on Category 7 scrap, approval and quota restrictions on Category 6 scrap imports, and tightened environmental control on domestic scrap generation. However, this has actually been a positive for off-grade copper cathodes consumption as some domestic semis fabricators had to seek alternatives. Meanwhile, driven by the quickly expanding smelting capacity of China and the tightened environment of international copper concentrate market, there has been a substantial decrease in the price of copper concentrates processing in 2019, which has brought much pressure to the operation of smelting industry.
(2) Cobalt market
The Company is the second largest producer of mined cobalt in the world. 2019 saw the back end of a large downside correction in the cobalt price from USD20/lb down to USD12.6/lb in August, where the market finally found a floor. The downward adjustment was primarily driven by a combination of two factors, firstly the demand side story, EV market not playing out rapidly as anticipated and secondly the build-up of high cost inventories largely due to significantly increased artisanal supplies in DRC that profited on skyrocketing cobalt price in the past two years and pushed the market into a surplus, and brought much pressure to the operation of smelting industry. However the lower price in the second half of 2019 did cause some cobalt supply to switch-off, most notably, Glencore announced to reduce 25,000t annual cobalt production, while part of the artisanal supply also suspended due to the low cobalt prices. As the cobalt market gradually balanced itself, the cobalt price in the second half of 2019 finally found a support with the Metal Bulletin ended the year increasing to just over USD15/lb for standard grade.
(3) Molybdenum market
The major molybdenum product of the Company is ferromolybdenum, which is sold mainly in the domestic market in China. Despite the effect of the supply side reform and the normalization of environmental protection supervision of the steel industry in China in 2019, the output of crude steel and stainless steel in China represented a year-on-year increase of 10.5% to 22,489,700 tonnes over the first three quarters, and the profitability of iron and steel enterprises still remained relatively high. The supply side of molybdenum raw materials recorded a year-on-year increase of 5.89%, lower than the expansion speed of the downstream demand side, which brought an increase of 2.19% to the average price of domestic molybdenum concentrate, causing a market trend of restraint after rise in the domestic molybdenum market.
In 2019, the average price of molybdenum concentrate was RMB1,775/metric tonne unit, representing a year-on-year increase of 2.19% and with the lowest price of RMB1,390/metric tonne unit and the highest price of RMB2,040/metric tonne unit. Throughout the year, the average price of ferromolybdenum was RMB119,800/tonne, representing a year-on-year decrease of 0.33%. The lowest price was RMB98,000/tonne, and the highest price was RMB140,000/tonne.
In 2019, the average price of molybdenum oxide of MW (a weekly magazine of metals in the US) was USD11.34/pound/Mo, representing a year-on-year decrease of 5.18%. The lowest price was USD8.2/pound/Mo, and the highest price was USD12.8/pound/Mo.

14 2019 Annual Report
MARKET REVIEW AND PROSPECTS
(4) Tungsten market
The major tungsten products of the Company are tungsten concentrate and ammonium paratungstate (APT), which are sold in the domestic market in China. In 2019, the overall tungsten market showed a trend of rise after restraint. In particular, the market price of tungsten remained stable in the first quarter. Affected by the Lunar New Year holiday, the supply of tungsten concentrate was slightly tight, but smelters progressively resumed production and increased procurement of tungsten after the festival. As a result, the market supply and demand were kept relatively balanced. The price of tungsten constantly declined in the second quarter. Due to concerns about the expected impact of the Pan-Asian auction on the market, APT price was rendered a rapid decline and thus triggering a stamping effect, accompanied by a weaker market demand of tungsten concentrate and subsequently sharp decline in the price of tungsten concentrate resulting from the production reduction and maintenance of certain APT enterprises due to price inversion. Affected by the cost support of tungsten concentrate and the events of auction of Pan Asian APT inventory in the third quarter, the price of tungsten concentrate was lower than the cost line of most mines. Hot monies entered the market to purchase tungsten concentrate, procuring the price to hit the bottom and remain stable. The domestic tungsten market operated with fluctuation in the fourth quarter. Upon the completion of Pan-Asian auction, the unfavorable expectation in the global tungsten market was eliminated, procuring price rebound, and the willingness of disposal of low-cost sources seized by hot monies in the early stage saw sudden enhancement after the stagflation of price, resulting in a reasonable bounce of market price. However, with the emergence of the downstream solid procurement demand, the market picked up steadily before the end of the year.
In 2019, the average domestic price of 65% black tungsten concentrates was RMB87,900/tonne, representing a year-on-year decrease of 17.00%. The lowest price was RMB71,000/tonne, and the highest price was RMB96,500/tonne. The average price of APT was RMB135,400/tonne, representing a year-on-year decrease of 19.40%. The lowest price was RMB108,000/tonne, and the highest price was RMB153,000/tonne.
According to the data of the UK's Metal Bulletin, the average price of APT in the European market in 2019 was USD230/metric tonne unit, representing a year-on-year decrease of 22.29%. The lowest price was USD175/metric tonne unit, and the highest price was USD271/metric tonne unit.
(5) Niobium market
The start of 2019 saw global demand for ferroniobium remaining strong as evidenced by a year-on-year increase of 19% in exports from Brazil. Ferroniobium prices increased during annual contract negotiations at the early period for the year 2019 and remained stable. However, due to the trade dispute between the US and the PRC, the price of niobium declined at the end of the year, which brought pressure to the confidence in industry. Demand for ferroniobium is expected to increase slightly during 2020 with the increase of PMIs in major economies.
(6) Phosphates market
In 2019, due to impact of heavy rains over plantation of corn and soybeans in the United States, lower application rates in the PRC and delays in the Monsoon Crop season in India, the demand of fertilizers in the international declined. Oversupply of phosphates, reduction in sulphur prices and currency depreciation in many producing countries also added pressure to prices. The standard price of the fertilizer market in Brazil (Brazil CFR MAP) in 2019 recorded a year-on-year decrease of 18%, and the second half of 2019 recorded a year-on-year decrease of 29%.
Even under the condition of falling prices and low profit margin, Moroccan and Saudi Arabian projects are ramping-up and high-cost Chinese producers also maintained relatively flat production. Total fertilizer deliveries in Brazil are expected to reach 36.6 Mt in 2019, representing an increase of approximately 1.1Mt as compared to 2018. As reported, grain production may create new records for this year and next, bringing favorable opportunities of the fertilizer industry.

15China Molybdenum Co., Ltd.
MARKET REVIEW AND PROSPECTS
(7) Mineral trading market
Copper concentrate: The 2019 Copper Concentrate market was characterized by a significant deficit which IXM was able to capitalize on. This enabled IXM to increase volume and profitability year on year resulting in the best annual results to date.
Zinc and lead concentrate: Despite of the adverse market conditions in 2019 characterized by oversupply of zinc and lead concentrate, weak investment, and in particular, an unprecedented high processing charges in recent two years rendering obstacles for most traders, IXM still maintained profitability, growth amid the upward trend in its sales and market shares.
Refined metal: The international copper cathode market was relatively stable during much of 2019. The layout of the market cost of copper cathode in China, insurance and freight charges was changed, further reducing the scale and liquidity of the market.
The zinc market offered certain favourable opportunities on the forward curve, but the captive nature of much of the market offers increasingly limited opportunities to trade for the time being.
The US aluminium market saw a significant decline in premiums towards the end of the year, leading to separation from fundamentals of the rest of the world The European and Asian markets presented better trading opportunities as well as warehousing-related trading strategies given the carry in the forward curve. Across all refined metals during the reporting period, IXM continued to focus on rationalising the trading operation away from small-volume retail business to instead focus on larger volume trading opportunities to achieve a more cost-efficient book and a lower overall cost per traded tonne.
Special metal: In 2019, upon completion of acquisition of IXM, according to the unified arrangement of the Company, IXM undertook to arrange niobium and cobalt markets. 2019 was the first year of trading for Specialty Metals. Despite our cobalt business having only started in Q3 2019, in that short amount of time we were able successfully establish IXM in the market.
MARKET PROSPECTS FOR EACH METAL SEGMENT FOR 2020
1. Copper market
Following the conclusion of the first-phase trade agreement between China and the United States, the performance of the global copper market is very bright at the beginning of the year. However, the outbreak of COVID-19 pandemic has significantly reversed market sentiment. Therefore, any judgment on the copper market in 2020 will largely depend on how the epidemic eventually develops. Owing to the extended public holiday in many areas of China and the adoption of strict isolation measures, for example, labourers cannot return to their work as scheduled after the holiday, industrial activities have been significantly slowed down and consumption in the first quarter has also been heavily hit. In this regard, it is reasonable to assume that, although some lost consumption may be covered later this year (with effective suppression of epidemic), some lost consumption is difficult to recover. Governments led by the United States have decided to provide further support to the economy by cutting taxes, giving green lights to large local government bonds, and encouraging infrastructure investment, then we would encounter this being turned in a recovery in domestic Chinese copper consumption and eventually a gradually rebound for copper price.
Moreover, there has been an expectation that a slight tightness in the copper concentrate market may feed through into the copper cathode market but again these statements are somewhat up in the air as a result of recent market events, especially new regulations issued by Chinese government on copper scrap imports following the re-classification of some copper scrap into renewable raw materials which should provide a slight improvement in scrap supply to the domestic Chinese market.
16 2019 Annual Report
MARKET REVIEW AND PROSPECTS
2. Cobalt market
We expect that in 2020, the cobalt market remains broadly balanced, and cobalt prices to be supported and even to break the ceiling of USD18/lb under the consumption of limited new supplies globally, no further subsidies cut for NEV in China, and sped-up development of EV sector in developed countries. Nevertheless, in 2020, we believe that the main driving force for price fluctuations is still from the supply side rather than the demand side, and the EV story will only really start to take hold from a turning point after 2022. In the short to medium term, the global supply and demand stay relatively stable thus there is unlikely a trend of significant increase in cobalt price, but in the long term the market is expected to have insufficient supply caused by strong market demand. Moreover, to address the serious violation of human rights problems which might be involved in the upstream supply chain of cobalt, more and more customers wished to regulate the supply sources and implement responsible procurement, further promoting sustainable development of industry chain of cobalt. The long-term price is anticipated to keep above USD18/lb. In 2020, the automobile industry has been severely affected since the outbreak of coronavirus, but the development trend was not altered. We see the cobalt price will fluctuate in a range of USD16/lb to USD18/lb unless any major shocks to the system.
3. Molybdenum market
In 2020, the domestic economy is expected to continue to maintain a stable operation, and the contribution to improving weakness in the construction of railway, highway and infrastructure aspects will continue to be strengthened. The large-scale infrastructure contribution and tax reduction measures proposed by China will bring new investment increments to the development of the real economy, and benefit overall iron and steel demand. From the demand side, crude steel output in the PRC has reached approximately 996 million tonnes in 2019, with an accumulated growth of 192 million tonnes over the past five years, representing an annual compound growth rate of 5.51%; the crude steel output of 21 mainstream stainless steel enterprises in China was 27.13 million tonnes, representing a year-on-year increase of 12.02%. Although the State banned on increasing iron and steel production capacity in 2020, the epidemic has a significant impact on demand for steel in the short term, but the supply-side structural reform and the upgrade of enterprise structure will continue to proceed. With effective suppression of the domestic epidemic, the resumption of work and production in various industries are in steady progress, and it is expected that the demand of alloy in the iron and steel industry will not be significantly affected. From the perspective of the supply side, the molybdenum market price is still relatively high in 2020, and it is expected that some of the suspended mines will be restarted, and some of the mines in production are expected to increase production capacity. The market supply will increase by approximately 15,000 tonnes, which is expected to increase by approximately 6.64%. The supply-side reform and environmental supervision will optimize the balance of supply and demand in the market. The steel industry and major molybdenum consumption market are both domestically located. After the stabilization in the domestic market, the effect of consumption end will be gradually weakened and the molybdenum market is expected to remain stable.
In the international market, emerging economies are still expected to continue to grow steadily, and the demand in molybdenum market is expected to maintain moderate growth. For international molybdenum supply, due to the decrease in production volume of molybdenum in mines such as Sierra Gorda and the slowdown in economic growth hindering the growth of copper resources demand, together with deterioration of the overseas epidemic, market demand within the near future will be significantly affected, it is expected that the volatility of the international supply market in 2020 will also become more severe.
4. Tungsten market
In 2020, with the continuous tightening of environmental protection supervision, the grade decline of tungsten ore sources, the reserve decline of large tungsten mine and the level-by-level strengthening of the safety entry threshold for regional small mines, the overall rised operation cost of mines, the rigidly increased cost of tungsten mining, and the overall trend of steady decline in domestic tungsten concentrate output will make more obvious presence, which would gradually consume the surplus output capacity of 2019 and facilitate the healthy operation of the price of primary tungsten products. In terms of domestic economic development trend, the State is expected to continuously promote the economic stimulus plans including tax reduction, and vigorously promote the upgrade of high-tech industry and equipment manufacturing industry. With the growth of emerging strategic industries and investment in the construction of infrastructure, the domestic demand of tungsten is expected to achieve rapid growth. However, the tungsten resources in the PRC are highly reliable on export. If the overseas epidemic fails to be contained in a timely manner, the export and overseas market demand of tungsten will be adversely affected, resulting in downturn of tungsten market in the near future.
17China Molybdenum Co., Ltd.
MARKET REVIEW AND PROSPECTS
5. Niobium market
Despite the negative impact by COVID-19, the domestic manufacturing activities declined sharply and the downstream consumption was also frozen in the first quarter, we expect various supportive measures that the government has launched including large liquidity being released to restore financial and market confidence as well as quicker approvals of local government bonds to be turned into a strong pick-up in the domestic infrastructure construction and manufacturing activities once the epidemic is contained later. This will contribute to more consumption of ferroniobium. In addition, due to the relatively balanced supply and demand in the niobium market, the price of niobium is mainly affected by the purchase of steel mills and price fluctuations in international ferro-vanadium market, while the supply of ferro-vanadium in the international market has been blocked recently, and the rise in ferro-vanadium prices has also provided a strong support for the ferroniobium market.
6. Phosphates market
Global phosphates demand is expected to rebound in 2020 and increase by approximately 1.5%, according to the International Fertilizer Association (IFA). It is expected that crops production in the United States will return to normal level, and Brazil and India will maintain a strong demand for fertilizers in order to reach grain production goals. Additionally, major global fertilizer producers have announced production cuts, and the market is expected to rebalance in 2020. For the long run, IFA forecasts an annual average demand growth of approximately 1.2%, based on robust drivers such as population growth, food per capita consumption improvement and limitations in resources for agriculture, such as water and fertile soils.
7. Mineral trade
Copper concentrate: 2020 has started off with considerably more uncertainty than characterized 2019. The spread of COVID-19 has resulted in temporary shutdowns in both the mining and smelting sectors for what are currently unknown periods of time. All of this has eclipsed some of the other fundamental issues that were driving the market such as continued smelting issues in India, political uncertainty in Chile, and projected ramping up of both mining and smelting capacity. This unsurprisingly all adds up to a far less certain picture for making trading decisions so IXM is proceeding cautiously.
Zinc and lead concentrate: 2020 carries a lot of uncertainties. From balance sheet perspective, 2020 looks less oversupplied vs 2019. With potential falling zinc prices impacting certain miners, there should be a natural cap on the TC. If this realizes, and net of any macro or similar negative impacts, the zinc concentrates TC should adjust to a lower side during this year.
Refined metal: For 2020 market situation, a predicted surplus in the aluminium market may present possible opportunities on premiums and carry strategies from time to time, while the ongoing changes to the scrap import regulations in China present an interesting dynamic for cathode import requirements and off-grade metal in particular. The zinc market still appears very tight on paper though it looks set to start to turn softer.
Specialty metals: IXM will consolidate and improve the market share of special metals trade.

18 2019 Annual Report
BUSINESS REVIEW AND PROSPECTS
2019 BUSINESS REVIEW ON ALL METAL SECTORS
1. Mineral exploration and processing
1. Copper and cobalt sector
During the reporting period, TFM Copper/Cobalt Mine achieved a production volume of 177,956 tonnes of copper metal, and 16,098 tonnes of cobalt metal.
2. Molybdenum and tungsten sector
During the reporting period, the Company realized a production volume of molybdenum metal of 14,918 tonnes, and tungsten metal of 10,722 tonnes (excluding Yulu Mining). Production volume of iron concentrate (65% content) reached 17,700 tonnes.
3. Niobium and phosphate sector
During the reporting period, Brazil achieved a production volume of phosphate fertilizers (high concentration fertilizer and low concentration fertilizer) of 1,097,623 tonnes and niobium metal of 7,489 tonnes.
4. Copper and gold sector
During the reporting period, where calculated based on 80% of equity interests, NPM achieved a production volume of copper metal of 28,591 tonnes and gold of 19,781 ounces.
2. Mineral trading
From the closing in July 2019 to the end of the reporting period, IXM achieved a physical trading volume (sales volume) of metal mineral of 1.062 million tonnes and 1.4219 million tonnes of refined metal minerals.
OPERATION REVIEW FOR THE YEAR OF 2019
1. Reinforcing the capability of control of advantageous assets while expanding the layout of the industrial chain with the appearance of layout of an internationalized resources company
A series of major overseas resource-related mergers and acquisitions have been completed since 2016. The company has grown into an international company integrating mining, trading business. The Company has become an international leading mineral exploration, processing and trading company. During the reporting period, the acquisitions of 24% non-controlling equity interests in TFM in the DRC and 100% equity interests of IXM by the Company were successfully completed, which not only increased the proportion of shareholding of the Company in advantageous mines but also added the mineral trading business into the Company, representing an important step for the development of the Company.
The advantageous mining resources acquired by the Company through counter-cyclical merger and acquisition movements have laid solid competitive advantages for the Company in the industry. The merger and acquisition of the world’s third largest metal trader extended the Company’s business to the field of mine trading business. The Company will achieve integration and improvement of its existing business based on the mature supply chain and market research advantages of the minerals trading sector in the future.

19China Molybdenum Co., Ltd.
BUSINESS REVIEW AND PROSPECTS
2. Significant achievements in adjustment to globally integrated management and control structure and accelerating integration of management and technology
Guided by the corporate culture of “meritocracy, cost control, continuous improvement and achievement sharing”, the Company built a globally integrated management and control structure, and improved its capabilities and standards of management and control of business of the Company while realized development in management, technology and cultural integration. The Company promoted its healthy development through the innovative management model, efficient management chain and execution. The Company strived for the integrated management objectives of simplified policies, detailed objectives, responsible personnel, clear duties, practicable system, reliable measurement, strict examination and well-executed improvement.
During the reporting period, the Company completed the adjustment to the management and control structure of TFM, made full use of the advantages of Chinese and western management system and achieved the in-depth integration of “high efficiency”, “low cost”, “fineness” of Chinese management and “platformization” and “informationization” of Western management. In addition, based on the technology advantages of beneficiation and smelting in the PRC, we are currently accelerating the projects of efficient use of TFM resources, and exploring its endogenous potential growth with an aim to achieve the growth in production capability and efficiency improvement with small amount capital investment.
During the reporting period, relying on the technical advantages accumulated by tungsten and molybdenum business to deal with refractory ores in the PRC, the Company proactively accelerated the technological renovation and optimization of niobium production business in Brazil, and dispatched excellent technical personnel and management teams from the PRC to support the production site in Brazil. A series of projects aiming to improve the production efficiency and reduce the cost of niobium business are in steady development and promising in the future.
3. Deepening management reform to boost cost reduction and efficiency enhancement, rapidly increasing organic growth potential
The Company pushed forward cost reduction and efficiency enhancement with great efforts through refined management and technological transformation and upgrade. During the reporting period, cash cost of the same caliber has seen a year-on-year decrease of approximately RMB1.469 billion. Among which, each of the Company’s mining units reduced cash cost of production and operation by approximately RMB1.288 billion, which included: the cash cost of production and operation of TFM recorded a year-on-year decrease of over USD130 million under the effort of the Chinese management team after taking over its management. The recovery rate of acid-soluble copper increased by 2.6 percentage points. The molybdenum-tungsten mines in the PRC used for the first time the operation of 40 units of pure electric mining trucks, reducing energy consumption and maintenance costs by more than 50% as compared with diesel-powered trucks with equivalent power. The Headquarters reduced management costs by approximately RMB33.90 million through business system reconstruction and management structure optimization, thereby reducing tax cost by approximately RMB147 million. Such cost reduction and efficiency enhancement measures will have a positive effect on the future operation of the Company, and will lead to continuous improvement in the operation of the Company.
4. Cont inuous ly promot ing the opt imiza t ion o f p roduct ion layout and technological innovation, and focusing on long-term development strategies to explore its endogenous growth and consolidate industry competitiveness
During the reporting period, the Company continued to optimize its industrial layout and launched a series of project development, technology upgrade, process research and transformation projects, guided by technological innovation and on the basis of quality mining assets and reserves of the Company, and focused on long-term development strategies.

20 2019 Annual Report
BUSINESS REVIEW AND PROSPECTS
Molybdenum and tungsten business in China: at the time of the preliminary achievement of improving capability of the beneficiation enhancement, Shangfanggou molybdenum iron mine was successfully relaunched after the industrial test and large-scale production of high talcum mine achieved satisfactory results, which effectively make up for the impact of grade decline of Sandaozhuang mine by making full use of the existing beneficiation business capacity. By recovering the associated iron resources of Shangfanggou molybdenum mine, the Company was able to cultivate new profit growth point in it. 5G technology was also applied to realize the remote drilling system and unmanned intelligent dispatching in Sandaozhuang molybdenum mine.
Copper and cobalt business in the DRC: the Company achieved optimization of the mining business by improving the ore extraction structure and reducing loss and dilution. Meanwhile, the Company proactively stabilized and improved the comprehensive recovery rate of copper and cobalt through technological modification and testing. The Company also applied existing technology advantages in China to promote efficient utilization of low-grade resources and accelerate the development and utilization of sulfide ores.
5. Fully leveraging on the advantages of supply chain in trade business to achieve efficient integration with the existing business
Relying on the perfect supply chain and customer system of IXM, the Company accelerated the business integration to realize the supply chain sharing and the supply chain cost reduction. Meanwhile, the Company integrated the existing sales business, deeply took advantage of the strength of global sales network and logistic warehousing system of IXM to achieve value-added sales of its original businesses.
By virtue of strong support of the Company, IXM continued its significant business expansion both geographically in Russia, Turkey, and South Africa, and expanded its precious metals raw materials business, including a large amount of anode copper, clay and gold concentrate, and continued its increasing in the trade volume in zinc and lead concentrates. IXM also significantly increased its market participation in the African copper belt, which provided support for TFM in the sales and logistics of copper cathode. IXM successfully integrated cobalt and niobium products into its original distribution business. As at the end of 2019, IXM significantly reduced its transaction operating costs through achievement of scale, greater efficiencies in operating systems, and synergies in logistics.
6. Promoting the concept of integrated sustainable development to address security, environment and anti-corruption issues with the highest standards
The realization of the concept of integrated sustainable development and the active implementation of social responsibilities have laid the foundation for healthy and sustainable development of the Company. As at the date of this report, the Company formulated and issued a series of sustainable development policies, including the Code of Business Conduct, Code of Conduct for Suppliers, Anti-corruption Policy, Export Control Policy, Economic Sanctions Policy, Human Rights Policy, Environmental Policy and Community Policy to regulate the operation of its global business.
With the goal of “zero harm” and “zero pollution”, the Company maintained high-pressure condition in terms of safety and environmental protection, and strengthened the management and control of major dangerous sources and management of emergencies to ensure normal operation and sustainable development of each business segment. The molybdenum and tungsten business in China have achieved zero death for four years and four months in a row, zero injuries for two years and three months in a row, and won “Safety Production Advanced Unit in Henan Province” for two consecutive years. The No. 2 Ore Processing Branch and the Tungsten Company passed the first batch of safety and double prevention benchmarking enterprises in Henan province; Zero pollution was achieved in terms of environmental protection throughout the year.
In the face of the outbreak of COVID-19 pandemic, the Company, while focusing on management and control of the epidemics, made equal efforts in production and operation, launched the emergency response plan with careful organization, implemented strict control and deployment, mobilized full staff to jointly fight against and respond to the impact of the epidemics, gave full play to the advantages of the global layout, opened up overseas procurement channels, purchased and donated materials for epidemics prevention to support prevention and control of epidemics in the country.

21China Molybdenum Co., Ltd.
BUSINESS REVIEW AND PROSPECTS
2020 BUSINESS PROSPECT
Based on future economic and market dynamics, the Company sets the following production budgets for main products of the Company for 2020:
1. Copper and cobalt business:
Copper metal output from 163,000 tonnes to 200,000 tonnes, and cobalt metal output from 14,000 tonnes to 17,000 tonnes.
2. Molybdenum and tungsten business:
Molybdenum metal output from 12,000 tonnes to 15,000 tonnes, and tungsten metal output from 7,000 tonnes to 9,000 tonnes (excluding Yulu Mining).
3. Copper and gold business (calculation on 80% equity):
NPM copper metal output from 24,000 tonnes to 29,000 tonnes, and gold output from 20,000 ounces to 25,000 ounces.
4. Niobium and phosphate business:
Niobium metal output from 10,000 tonnes to 12,000 tonnes, and phosphate fertilizer (high concentration fertilizer + low concentration fertilizer) output from 1.009 million tonnes to 1.234 million tonnes.
5. Mineral trade business:
Physical trade volume from 4.53 million tonnes to 5.54 million tonnes.
The above budgeted targets are based on the judgement of current economic environment and expected economic development trend. Whether it may realize or not depends on the macro-economic environment, industry development, market circumstance, efforts of the management team of the Company and other factors, which is subject to uncertainty. The Board decided to apply for the authorization at the general meeting of the Company to adjust the above budgeted targets as appropriate based on the market conditions and the business of the Company.
The above budgeted targets do not constitute substantive commitments to investors, and investors shall exercise caution about investment risk.

22 2019 Annual Report
MANAGEMENT DISCUSSION AND ANALYSIS
OVERVIEW
During the reporting period, the Company’s net profit decreased from approximately RMB5,150.04 million for the year ended 31 December 2018 to approximately RMB1,765.85 million, which decreased by approximately RMB3,384.19 million or 65.71%. Among others: net profit attributable to shareholders of the parent company amounted to approximately RMB1,857.01 million, representing a decrease of approximately RMB2,778.57 million or 59.94% from approximately RMB4,635.58 million for the year ended 31 December 2018. It was mainly due to the significant drop of the market prices of the Company’s principal products such as copper, cobalt and tungsten during the reporting period.
PRINCIPAL BUSINESSES BY INDUSTRY, PRODUCT AND REGION
Unit: Yuan Currency: RMB
Principal businesses by industry
By industry Operating revenue Operating cost Gross profit margin
Increase or decrease in operating revenue
as compared to last year
Increase or decrease in operating cost
as compared to last year
Increase or decrease in gross profit
margin as compared to last year
(%) (%) (%) (percentage points)
Mineral exploration and processing
19,259,047,326.71 14,733,965,816.80 23.50 -24.65 -7.47 Decreased by 14.19 percentage points
Mineral trading (note) 49,176,852,131.12 50,654,933,759.31 -3.01 / / /Others 38,038,481.08 22,148,702.94 41.77 -83.32 -74.41 Decreased by 20.27
percentage points
Principal businesses by product
By product Operating revenue Operating cost Gross profit margin
Increase or decrease in operating revenue
as compared to last year
Increase or decrease in operating cost
as compared to last year
Increase or decrease in gross profit
margin as compared to last year
(%) (%) (%) (percentage points)
Mineral exploration and processingMolybdenum and tungsten 4,505,451,936.38 2,127,804,615.84 52.77 -5.13 12.65 Decreased by 7.46
percentage pointsCopper and gold 1,322,524,050.21 1,030,953,199.21 22.05 -9.31 0.01 Decreased by 7.26
percentage pointsNiobium and phosphate 5,099,205,020.14 3,757,134,068.71 26.32 2.46 -1.96 Increased by 3.32
percentage pointsCopper and cobalt 8,331,866,319.98 7,818,073,933.04 6.17 -42.03 -14.76 Decreased by 30.02
percentage points
Mineral trading (note)Mineral metals 13,806,496,826.50 15,344,493,459.78 -11.14 / / /Refined metals 35,370,355,304.62 35,310,440,299.53 0.17 / / /
Others 38,038,481.08 22,148,702.94 41.77 -83.32 -74.41 Decreased by 20.27 percentage points

23China Molybdenum Co., Ltd.
MANAGEMENT DISCUSSION AND ANALYSIS
Principal businesses by region
By region Operating revenue Operating cost Gross profit margin
Increase or decrease in operating revenue
as compared to last year
Increase or decrease in operating cost
as compared to last year
Increase or decrease in gross profit
margin as compared to last year
(%) (%) (%) (percentage points)
Mineral exploration and processingChina 4,505,451,936.38 2,127,804,615.84 52.77 -5.13 12.65 Decreased by 7.46
percentage pointsAustralia 1,322,524,050.21 1,030,953,199.21 22.05 -9.31 0.01 Decreased by 7.26
percentage pointsBrazil 5,099,205,020.14 3,757,134,068.71 26.32 2.46 -1.96 Increased by 3.32
percentage pointsDRC 8,331,866,319.98 7,818,073,933.04 6.17 -42.03 -14.76 Decreased by 30.02
percentage pointsMineral trading (Note)
China 13,100,159,995.13 12,398,119,837.34 5.36 / / /Outside China 36,076,692,135.99 38,256,813,921.97 -6.04 / / /
OthersChina 38,038,481.08 22,148,702.94 41.77 -83.32 -74.41 Decreased by 20.27
percentage points
EXPLANATION TO PRINCIPAL BUSINESSES BY INDUSTRY, PRODUCT AND REGIONNote: IXM is engaged in the metal trading business which combines the futures and spot commodities. The Group only included the
corresponding cost of the spot commodities in accordance with the requirements of the Accounting Standards for Enterprises when accounting for the operating cost of the metal trade; the profit and loss related to the futures business is recognized in gains and losses in fair value change and investment income.
ANALYSIS OF PRODUCTION AND SALES VOLUME OF PRINCIPAL PRODUCTS
Principal products Unit
Production (procurement
volume) volume
Sales volume
Inventoryvolume
Increase or decrease of productionvolume as compared
to last year
Increase or decrease of
sales volume as compared
to last year
Increase or decrease of
inventory volume
as compared to last year
(%) (%) (%)
Mineral exploration and processingMolybdenum Tonnes 14,918 14,969 1,746 -3.01 -17.89 -6.23Tungsten Tonnes 10,722 10,743 1,305 -8.34 -3.73 -4.21Niobium Tonnes 7,489 7,453 2,676 -16.39 -17.64 53.00Phosphate fertilizer
(HA+LA)Tonnes 1,097,623 1,051,120 195,363 -1.68 2.76 28.64
Copper (TFM) Tonnes 177,956 159,116 32,120 5.73 -7.47 141.87Cobalt Tonnes 16,098 15,130 3,630 -14.13 -21.97 37.05Copper (80% equity
interest of NPM)Tonnes 28,591 29,191 1,507 -10.46 -7.80 70.09
Gold Ounces 19,781 20,095 / -21.89 -19.22 /
Mineral tradingMineral metals (Note 1) Tonnes 1,214,293 1,061,979 470,972 / / /Refined metals (Note 2) Tonnes 1,422,010 1,435,618 315,076 / / /
Note 1: the primary products of metal minerals, mainly are the concentrates.
Note 2: the smelting and processing products of metal minerals.

24 2019 Annual Report
MANAGEMENT DISCUSSION AND ANALYSIS
COMPONENT OF COST OF PRINCIPAL PRODUCTS
Unit: RMB’000By Industry
By industryComponent of cost
Amount for the current
year
Percentage over total cost for
the current yearAmount for
last year
Percentage over total cost for
last year
Percentage of changes in amount as
compared to last year
(%) (%) (%)
Mineral exploration and processing Materials 7,441,821 48.16 7,410,043 46.81 0.43
Labour 1,587,884 10.28 1,600,048 10.11 -0.76Depreciation 3,347,840 21.67 3,696,336 23.35 -9.43Energy 757,474 4.90 765,587 4.84 -1.06Manufacturing fees 2,317,077 15.00 2,356,862 14.89 -1.69
Mineral trading Purchase cost 51,847,507 100.00 / / /
By Product
By productComponent of cost
Amount for the current
year
Percentage over total cost for
the current yearAmount for
last year
Percentage over total cost of
last year
Percentage of changes in amount as
compared of last year
(%) (%) (%)
Mineral exploration and processing
Molybdenum and tungsten related products
Materials 667,142 36.50 596,810 35.07 11.78Labour 316,691 17.32 296,106 17.40 6.95Depreciation 152,266 8.33 157,581 9.26 -3.37Energy 237,253 12.98 227,576 13.37 4.25Manufacturing fees 454,615 24.87 423,537 24.89 7.34
Copper and gold related products
Materials 193,320 19.54 166,253 16.88 16.28Labour 143,671 14.52 141,875 14.41 1.27Depreciation 400,910 40.52 408,549 41.49 -1.87Energy 122,424 12.37 131,604 13.37 -6.98Manufacturing fees 129,043 13.04 136,381 13.85 -5.38
Niobium and phosphate related products
Materials 1,107,697 29.99 1,190,151 31.25 -6.93Labour 610,586 16.53 596,838 15.67 2.30Depreciation 560,436 15.17 587,819 15.43 -4.66Energy 185,146 5.01 205,660 5.40 -9.97Manufacturing fees 1,230,229 33.30 1,228,580 32.25 0.13
Copper and cobalt related products
Materials 5,473,662 61.22 5,456,829 58.46 0.31Labour 516,936 5.78 565,229 6.06 -8.54Depreciation 2,234,228 24.99 2,542,387 27.24 -12.12Energy 212,650 2.38 200,747 2.15 5.93Manufacturing fees 503,189 5.63 568,363 6.09 -11.47
Mineral tradingMineral metals Purchase cost 15,344,493 100.00 / / /Refined metals Purchase cost 36,503,014 100.00 / / /

25China Molybdenum Co., Ltd.
MANAGEMENT DISCUSSION AND ANALYSIS
ADMINISTRATIVE EXPENSES
For the year ended 31 December 2019, the administrative expenses of the Group amounted to approximately RMB1,233.70 million, representing an increase of approximately RMB300.35 million or 32.18% from approximately RMB933.35 million for the same period in 2018, mainly due to the completion of merger and acquisition of IXM on 24 July 2019 and the addition of fundamental metal trading business in the reporting period.
FINANCE EXPENSES
For the year ended 31 December 2019, the finance expenses of the Group amounted to approximately RMB1,250.84 million, representing an increase of approximately RMB607.79 million or 94.52% from approximately RMB643.05 million for the same period in 2018, mainly due to a year-on-year increase in net interest expenditure and a year-on-year decrease in exchange gains as a result of the completion of merger and acquisition of IXM on 24 July 2019.
GAINS ON CHANGES OF FAIR VALUE
For the year ended 31 December 2019, gains on changes of fair value of the Group amounted to approximately RMB2,703.86 million, representing an increase of approximately RMB2,581.45 million or 2,108.86% from approximately RMB122.41 million for the same period in 2018, mainly due to the completion of merger and acquisition of IXM on 24 July 2019 and the addition of fundamental metal trading business in the reporting period.
NON-OPERATING INCOME
For the year ended 31 December 2019, the non-operating income of the Group amounted to approximately RMB170.39 million, representing an increase of approximately RMB167.81 million or 6,504.26% from approximately RMB2.58 million for the same period in 2018, mainly due to the recognition of negative goodwill arising from the merger and acquisition of IXM in the reporting period.
INCOME TAX EXPENSES
For the year ended 31 December 2019, the income tax expenses of the Group amounted to approximately RMB592.60 million, representing a decrease of approximately RMB1,247.22 million or 67.79% from approximately RMB1,839.82 million for the same period in 2018, mainly due to a year-on-year decrease of the income tax expenses from copper and cobalt business in the reporting period.
FINANCIAL POSITION
As at 31 December 2019, the total assets of the Group amounted to approximately RMB116,862.23 million, comprising non-current assets of approximately RMB62,684.72 million and current assets of approximately RMB54,177.50 million. Equity attributable to shareholders of the parent company as at 31 December 2019 decreased by approximately RMB146.10 million or 0.36% to approximately RMB40,802.77 million from approximately RMB40,948.87 million as at 31 December 2018.
CURRENT ASSETS
As at 31 December 2019, the current assets of the Group increased by approximately RMB15,013.12 million or 38.33% to approximately RMB54,177.50 million from approximately RMB39,164.38 million as at 31 December 2018.
NON-CURRENT ASSETS
Non-current assets of the Group increased by approximately RMB632.99 mil l ion or 1.02% from approximately RMB62,051.73 million as at 31 December 2018 to approximately RMB62,684.72 million as at 31 December 2019.

26 2019 Annual Report
MANAGEMENT DISCUSSION AND ANALYSIS
SCOPE OF RESTRICTED ASSETS
As at the end of 2019, the bank acceptance bond deposits of the Group amounted to approximately RMB900.00 million (opening balance for the year: approximately RMB882.34 million), the loan guarantee deposits amounted to approximately RMB2,196.19 million (opening balance for the year: approximately RMB1,903.36 million), the special security deposits for the mine environment restoration and rehabilitation amounted to approximately RMB45.76 million (opening balance for the year: approximately RMB39.53 million), and other deposits amounted to approximately RMB0.5 million (opening balance for the year: approximately RMB0.5 million).
Save for the above, the Group has no other asset restriction, collateral or pledge.
CURRENT LIABILITIES
The current liabilities of the Group increased by approximately RMB18,596.63 million or 116.38% to approximately RMB34,575.37 million as at 31 December 2019 from approximately RMB15,978.74 million as at 31 December 2018.
NON-CURRENT LIABILITIES
The non-current liabilities of the Group decreased by approximately RMB2,848.19 million or 7.99% to approximately RMB32,791.26 million as at 31 December 2019 from approximately RMB35,639.45 million as at 31 December 2018.
EXPLANATION TO THE BALANCE SHEET ITEMS
Unit: RMB
Items
Balance as at the end of
the current period
Balance as at the end of
the current period as
a percentage of total assets
Balance as at the end of
the corresponding period of last year
Balance as at the end of the
corresponding period of
last year as a percentage
of total assets
Change in balance as
at the end of the current
period as compared
with balance as at the
end of the corresponding
period of last year Explanation
(%) (%) (%)
Cash and bank balances
15,647,900,059.61 13.39 26,647,644,058.81 26.28 -41.28 Payment of the consideration of equity acquisition, dividends and payments for auction bid of the APT of Kunming Fanya Metal Exchange Holdings Company Limited during the reporting period
Held-for-trading financial assets
7,719,450,290.97 6.61 774,326,692.25 0.76 896.92 Completion of merger and acquisition of IXM on 24 July 2019 and the addition of fundamental metal trading business in the reporting period
Derivative financial assets
2,178,322,223.39 1.86 0.00 0.00 100.00 Completion of merger and acquisition of IXM on 24 July 2019 and the addition of fundamental metal trading business in the reporting period

27China Molybdenum Co., Ltd.
MANAGEMENT DISCUSSION AND ANALYSIS
Items
Balance as at the end of
the current period
Balance as at the end of
the current period as
a percentage of total assets
Balance as at the end of
the corresponding period of last year
Balance as at the end of the
corresponding period of
last year as a percentage
of total assets
Change in balance as
at the end of the current
period as compared
with balance as at the
end of the corresponding
period of last year Explanation
(%) (%) (%)
Accounts receivable
1,510,508,440.50 1.29 860,999,687.88 0.85 75.44 Increase in accounts receivable of molybdenum and tungsten business during the reporting period
Financing receivable
375,935,645.39 0.32 1,623,841,101.38 1.60 -76.85 Receipt of bills receivable during the reporting period
Prepayments 1,065,494,520.83 0.91 151,004,234.22 0.15 605.61 Completion of merger and acquisition of IXM on 24 July and the addition of fundamental metal trading business in the reporting period
Inventories 20,730,673,736.79 17.74 6,615,914,805.21 6.53 213.35 Completion of merger and acquisition of IXM on 24 July and the addition of fundamental metal trading business for the reporting period
Other current assets
3,830,180,430.37 3.28 1,450,605,120.41 1.43 164.04 Completion of merger and acquisition of IXM on 24 July and the addition of fundamental metal trading business for the reporting period
Long-term equity investments
1,033,168,028.11 0.88 2,522,865,277.94 2.49 -59.05 NCCL Natural Resources Investment Fund LP, shares of which held by the Company, has completed the disposal of its investment in IXM and quitted the project for the reporting period
Short-term borrowings
18,589,025,832.49 15.91 4,588,152,515.23 4.53 305.15 Completion of merger and acquisition of IXM on 24 July and the addition of fundamental metal trading business for the reporting period

28 2019 Annual Report
MANAGEMENT DISCUSSION AND ANALYSIS
Items
Balance as at the end of
the current period
Balance as at the end of
the current period as
a percentage of total assets
Balance as at the end of
the corresponding period of last year
Balance as at the end of the
corresponding period of
last year as a percentage
of total assets
Change in balance as
at the end of the current
period as compared
with balance as at the
end of the corresponding
period of last year Explanation
(%) (%) (%)
Derivative financial liabilities
2,640,928,053.07 2.26 75,423,332.52 0.07 3,401.47 Completion of merger and acquisition of IXM on 24 July and the addition of fundamental metal trading business for the reporting period
Accounts payable 1,944,506,406.62 1.66 1,119,073,099.06 1.10 73.76 Increase in metal trade business payables for the period
Taxes payable 399,251,199.18 0.34 1,110,201,369.36 1.09 -64.04 Decrease in total taxes payable due as at the end of the reporting period arising from the decrease in profit
Other payables 1,584,737,923.47 1.36 1,027,781,797.06 1.01 54.19 Completion of merger and acquisition of IXM on 24 July and the addition of fundamental metal trading business for the reporting period
Other current liabilities
1,167,803,612.80 1.00 130,541,907.62 0.13 794.58 Issuance of ultra short-term financing bonds during the reporting period
Bonds payable 5,092,860,000.00 4.36 2,000,000,000.00 1.97 154.64 Issuance of corporate bonds and overseas USD-denominated bonds during the reporting period
Provision 2,495,171,563.70 2.14 1,908,084,106.78 1.88 30.77 Increase in reclamation and disposal costs of overseas mine during the reporting period
Other non-current liabilities
238,141,518.84 0.20 3,294,336,000.00 3.25 -92.77 Completion of acquisition of 24% equity interests in DRC during the reporting period.

29China Molybdenum Co., Ltd.
MANAGEMENT DISCUSSION AND ANALYSIS
CONTINGENCIES
(1) Pending litigation
Copper-Cobalt business of the Group in Congo (DRC)
At the end of 2015, TFM negotiated with SNEL to address the effectiveness, supply quality and quantity of electricity. In accordance with the amended items of the power agreement included in the dispute settlement plan, TFM agrees to pay the electricity at the price of USD0.0569 per kilowatt-hour from January 2016 (the previous electricity price was USD0.0350 per kilowatt-hour) and to pay USD10 million settlement compensation to get more continuous supply of electricity from SNEL. As at the date of this report, the two parties have not yet signed any formal agreement, and the negotiations are still in progress. In terms of this contingent liability, TFM has accrued USD10 million in expenditure in prior years.
The Group’s Copper-Cobalt business in Congo (DRC) may have some lawsuits, claims and liability claims in the daily business. The management considers that the results of such contingencies will not have a material adverse effect on the financial position, operating performance or cash flows of the business based on the information currently available.
The Group’s Niobium-Phosphorus business in Brazil
The Group’s Niobium-Phosphorus business in Brazil may face with various litigations and disputes in its daily business activities. The management determines the possibility of losing and consequent economic benefits outflow in accordance with the information available and the professional advice of external legal experts. If the possibility of economic benefits outflow were low, the management would determine as contingencies. The results of such contingencies will not have a material adverse effect on the financial position, operating performance or cash flows of the business based on the information currently available.
(2) Guarantees
As at 31 December 2019, the Group provides guarantees for the Australian Northparkes copper and gold mine business to Southwest Welsh government agencies of Australia, with guaranteed amount of AUD32,920,000 (equivalent to RMB160,790,000). The relevant business venture agrees to any liability of the business compulsory executed from this guarantee. As at 31 December 2019, no material guarantee responsibility was undertaken.
In 2019, IXM, a subsidiary of the Group, provided guarantee for a supplier located in China, assisting the supplier to get facility totaling USD50,000,000 from the bank. The maximum guarantee undertaken by IXM is limited to 5.0% of the unsettled principal and interest under the credit facility, while bearing no obligations on the remaining principle and interest of the facility. As at 31 December 2019, the Group’s guarantee obligation on the utilized facility amounted to USD2,500,000, equivalent to RMB17,440,000.
GEARING RATIO
Gearing ratio (total liabilities divided by total assets) of the Group increased to 57.65% as at 31 December 2019 from 51.00% as at 31 December 2018.
CASH FLOW
As at 31 December 2019, cash and cash equivalents of the Group decreased by approximately RMB10,848.45 million or 46.68% to approximately RMB12,392.25 million from approximately RMB23,240.70 million as at 31 December 2018. For the year ended 31 December 2019, net cash inflow generated from operating activities of the Group was approximately RMB1,704.83 million; net cash outflow from investment activities was approximately RMB2,679.10 million; and net cash outflow generated from financing activities was approximately RMB10,247.37 million.

30 2019 Annual Report
MANAGEMENT DISCUSSION AND ANALYSIS
The following table sets forth the cash flow position of the Group:
Unit: Yuan Currency: RMB
ItemAmount of
current yearAmount of
last year Change Explanation(%)
Cash receipts from sales of goods and rendering of services
71,786,252,657.57 29,243,394,765.11 145.48 Completion of merger and acquisition of IXM on 24 July and a year-on-year increase of metal trading business of bulk commodity for the current year
Cash receipts relating to other operating activities
4,753,257,983.02 1,136,280,555.91 318.32 Completion of merger and acquisition of IXM on 24 July and a year-on-year increase of metal trading business of bulk commodity for the current year
Cash payments for goods purchased and services received
66,328,481,964.48 13,838,634,782.28 379.30 Completion of merger and acquisition of IXM on 24 July and a year-on-year increase of metal trading business of bulk commodity for the current year, and the payment in September of the bid for the APT auction to Kunming Fanya Metal Exchange Inc.
Cash payments relating to other operating activities
2,029,913,147.43 1,171,363,876.61 73.29 Completion of merger and acquisition of IXM on 24 July and a year-on-year increase of metal trading business of bulk commodity for the current year
Cash receipts from investment income 1,632,774,545.59 207,156,988.46 688.18 Year-on-year increase in dividends from associates in the current year
Cash receipts relating to investing activities
3,009,624,827.50 0.00 100.00 Amount received from borrowings lent to external units during the current year
Net cash payments for acquisitions of subsidiaries and other business units
2,069,009,623.30 0.00 100.00 Year-on-year increase in expenses for acquisition of equity interest of subsidiaries for the current year
Other cash payments relating to investing activities
2,247,181,202.53 1,065,210,116.95 110.96 Year-on-year increase in the amount lent to the external units for the current year
Cash receipts from borrowings 32,091,740,322.20 8,571,932,316.83 274.38 Year-on-year increase in short-term borrowings obtained after the adjustment to financing structure for the current year
Cash repayments of borrowings 31,372,194,483.49 9,999,663,814.94 213.73 Year-on-year increase in repayment of long/short-term borrowings after the adjustment to financing structure for the current year
Cash payments for distribution of dividends or profits or settlement of interests
4,203,154,203.48 2,646,126,449.90 58.84 Year-on-year increase in distribution of dividends for the current year
Other cash payments relating to financing activities
9,667,041,045.09 2,786,560,371.98 246.92 Year-on-year increase in repayments of gold lease business due during the current year
CAPITAL STRUCTUREAs at 31 December 2019, the equity interests of shareholders of the Company amounted to approximately RMB49.5 billion, among which the equity attributable to shareholders of the parent company was approximately RMB40.8 billion. There was no change in the capital of the Company during 2019.
As at 31 December 2019, the Company issued 21,599,240,583 shares, comprising 17,665,772,583 A shares and 3,933,468,000 H shares.
FINANCIAL INSTRUMENTSThe Group’s major financial instruments include cash and bank balances, notes and accounts receivable, other receivables, other current assets, other equity instrument investment, other non-current financial assets, non-current derivative financial assets, other non-current assets, held-for-trading financial liabilities, derivative financial liabilities, notes and accounts payable, other payables, borrowings, other current liabilities, non-current liabilities due within one year, bonds payable, and other non-current liabilities, etc. Details of these financial instruments are disclosed in Note (V) of the Auditor’s Report set forth in this report.
Short-term BorrowingsDetails of the Group’s short-term borrowings are disclosed in Note (V). 22 of the Auditor’s Report set forth in this report.
Long-term BorrowingsDetails of the Group’s long-term borrowings are disclosed in Note (V). 33 of the Auditor’s Report set forth in this report.
Bonds payableDetails of the Group’s bonds payable are disclosed in Note (V). 34 of the Auditor’s Report set forth in this report.

31China Molybdenum Co., Ltd.
RESOURCE AND RESERVES
1. BASIC INFORMATION OF PROPRIETARY MINES
As at 31 December 2019, the information of the ore resources and reserves of the Company is as follows:
Name of mine Main category Resources GradeRecoverable
reserve Grade
Annual production
volume(4)
Remaining exploitable
years of resources(1)
Validityperiod of the
exploration right/License
(milliontonnes) (%)
(milliontonnes) (%)
(milliontonnes) (year) (year)
Sandaozhuang Molybdenum and Tungsten Mine
Molybdenum 438.96 0.101 220.47 0.105
19.91 11 1Sandaozhuang Molybdenum and Tungsten
MineTungsten 438.96 0.092 220.47 0.123
Shangfanggou Molybdenum Mine(2) Molybdenum 462.45 0.139 40.85 0.181
0.38 45 14Shangfanggou Molybdenum Mine Iron 26.47 17.50 1.35 31.19 Xinjiang Molybdenum Mine(3)(5) Molybdenum 441 0.115 141.58 0.139 0 38 25 NPM copper and gold mine in Australia Copper 616.33 0.55 132.83 0.55
6.42 21 9–17NPM copper and gold mine in Australia Gold 616.33 0.2 (g/t) 132.82 0.2 (g/t) TFM copper and cobalt mine in the DRC Copper 857.7 2.9 182.6 2.2
5.42 33 6–15TFM copper and cobalt mine in the DRC Cobalt 857.7 0.29 182.6 0.31 Brazil Mine area I Niobium 150.2 1.05 48.9 0.96 2.09 20 Same as service
term of the mine area
Brazil Mine area II Niobium 452.1 0.28 203.7 0.345.61 36
Same as service term of the mine
area Brazil Mine area II Phosphate 452.1 11.22 203.7 12.16
Notes:
(1) Calculation of remaining exploitable years of resources: calculated by dividing the recoverable reserve in the mine under exploration at the end of 2019 by the actual production scale (annual production volume) in 2019. Update on the reserves and changes in the actual production scale (due to technology, equipment, etc.) of the Company will affect the changes in the remaining exploitable years of resources of the Company. The remaining exploitable term of resources of Shangfanggou and Xinjiang Molybdenum Mine is the term of design and service.
(2) The Shangfanggou Molybdenum Mine is owned by Luoyang Fuchuan Mining Co., Ltd. (“Fuchuan Mining”), a joint venture of the Company. The Company has control over Fuchuan Mining through contract arrangements. As at the date of this report, Fuchuan Mining’s shareholding structure is as follows: a 10% equity interest of which is owned by Luanchuan Fukai Business and Trading Company Limited (欒川縣富凱商貿有限公司), a wholly-owned subsidiary of the Company and a 90% equity interest of which is owned by Xuzhou Huanyu Molybdenum Industry Co., Ltd. (徐州環宇鉬業有限公司) (“Xuzhou Huanyu”), a joint venture of the Company (the Company holds a 50% equity interest in Xuzhou Huanyu and Luoyang Guo’an Trade Co., Ltd. (洛陽國安商貿有限公司) holds a 50% equity interest in Xuzhou Huanyu).
(3) Resources and reserves of mines are measured under the standard of the Joint Ore Reserves Committee (聯合礦山儲量委員會), except for those of Xinjiang Molybdenum Mine measured under the PRC standard. The above ore resources, including reserves, have been confirmed by internal expert of the Company.
(4) The annual production volume mentioned in the table above was the actual ore consumption (processing volume) during the reporting period, excluding comprehensive utilization amount of tailings.
(5) During the reporting period, no mining activities were conducted in Xinjiang Molybdenum Mine.

32 2019 Annual Report
RESOURCE AND RESERVES
2. EXPLORATION, DEVELOPMENT AND MINING ACTIVITIES
(I) Exploration
(1) TFM Copper and Cobalt Mine in the DRC
During 2019, the exploration activities were carried out around the Dipeta Syncline and the Fungurume 88 deposit, mainly exploiting and developing the underground sulfide resources. Total amount of diamond drilling for the first half of 2019 was 28,627m of core drilling (including 11,257m in the Dipeta Syncline area, 4,289m in the Fungurume 88 high grade cobalt deposit and 2,740m in the Mofya limestone to support the increase of the reserves of quicklime plant). No drilling work was conducted in the second half of 2019. The exploration team worked on moving all historical core out of the base camp to the new storage area of LIP.
During the year, the exploration work of some greenfield areas was conducted in the Kamakonde, Pumpi and Musoko areas. No significant cobalt mineralization was found, and only minor copper mineralization showings were identified.
(2) Niobium and Phosphate Mine in Brazil
In 2019, drilling activities were conducted at Boa Vista Mine, Coqueiros Project and Chapadão Mine, respectively. The drilling work in the Boa Vista Mine in 2019 was commenced in January and finished in April, with 9 diamond drill holes totaling 3,394m using 2 drill rigs. The drilling work in the Coqueiros Project in 2019 started in May and finished in early June, with 26 diamond drill holes totaling 2,369m using 2 drill rigs. The drilling work in the Chapadão Mine in 2019 started in late June and finished in late December, with 32 diamond drill holes, totaling 7,193m using 2 drill rigs.
Regarding activities in the unexplored areas, the Company mainly submitted reports to Agencia National de Mineracao (“ANM”) (National Mining Agency), conducted geophysics surveys, and sought for new opportunities/projects and drilling targets. In terms of mineral rights, the Company has submitted four partial reports to ANM, requesting for additional 3 years of mineral research in Monjolos and Irai de Minas areas (Minas Gerais State) in the first half of 2019, and delivered three negative final reports of Goias State in the second half of 2019. Based on geophysical anomalies, CMOC was awarded by ANM 16 new unexplored areas in Britânia region (Goias State), and in the first half of 2019, obtained permission of mineral research and production of nine drilling targets (two drilling targets were drilled in 2019 with a total of 1,061m) in the next 3 years. Geological and structural mapping and sampling were conducted in other research areas (Monjolos and Irai de Minas) to examine the geological potential. Regarding new opportunities and projects, two new areas had been investigated to examine the potential for graphite and sound geographical potential of gold/copper areas (Pará State).
33China Molybdenum Co., Ltd.
RESOURCE AND RESERVES
(3) Mines in the PRC
Sandaozhuang Molybdenum and Tungsten Mine: production and exploration of mines were conducted in the northern mine area, with drilling work from the surface of the opencast mine, and the area of deploying mine exploration engineering was 36,000m2. The Company performed the construction of 22 holes drilling with reverse circulation SL400A drill rig, completing the drilling of 1,565m.
Shangfanggou Molybdenum Mine: exploration was carried out at the airspace level of around 1202, 1263, and 1274, while exploration and drill activities were conducted in Wangjiawa high-oxidation mining areas, in order to ensure production safety and mine oxidation rate in the review areas. The Company performed the exploration at the airspace level of 1,778.9m with reverse circulation drill rigs, and performed construction, production, exploration and drilling of 1,086.5m with down-the-hole drill rig.
Xinjiang Molybdenum Mine: during the reporting period, the Company did not conduct any exploration activities.
(4) NPM Copper and Gold Mine in Australia
Drilling activities (ML1247, ML1367, EL5800, EL5801, EL5323, EL8377) were conducted in mining and exploration areas, amounting to a total of 15,983m. The drilling activities consisted of 9,198m of surface diamond core, 3,913m of surface reverse circulation and 2,872m of air core drilling.
(II) Development
(1) TFM Copper and Cobalt Mine in the DRC:
60 hectares of clear and grub activities for waste dumping were completed at Fungurume 6, Kwatebala 6, Katuto 2 and southern Tenke. Activities for waste dumping relating to road construction for material transportation outside the pit of Katuto have been completed. Dewatering activity focused mainly on Tenke 3/5 pits, completing the construction of 4 dewatering wells, among which 1 dewatering well was located at Mofya. Sub-stations were built in Tenke and Mwadinkomba for the operation of dewatering pumps and cessation of the use of the diesel generators. Weep berms were built in the area of Katuto and Pumpi.
(2) Brazil Niobium and Phosphates Mine:
In order to collaborate with mining plan for quality control, the Company conducted drilling of 737 drill holes (totaling a drilled length of 21,916m) with one drill rig and reverse circulation in Boa Vista Mine. In the Chapadão Mine, the Company has made in aggregate 61 drill holes (totaling a drilled length of 2,967m) with one drill rig and reverse circulation.

34 2019 Annual Report
RESOURCE AND RESERVES
(3) Mines in the PRC:
Shangfanggou Molybdenum Mine: implementation of relocation project of 1# crushing station as well as construction of ore transportation roads and slag discharge and relocation of surrounding residents.
Sandaozhuang Molybdenum and Tungsten Mine and Xinjiang Molybdenum Mine: during the reporting period, the Company did not carry out any development activities.
(4) NPM Copper and Gold Mine in Australia:
In 2019, the Company continued underground development of the E26 L1N block cave, completing 3,689m during the year. The Company also completed underground development of the inclined ventilation shaft with additional 828m and E26 underground hole with 182.2m.
The Company completed the construction of new floating pool of phase II construction and commissioning of the tailings pond, which formed a part of the construction expansion engineering and earthwork project for establishing new crushing facilities.
(III) Exploration, Development and Mining Expenses of the Company
For the year ended 31 December 2019, the summary of the expenditures of exploration, development and mining activities of the Company is as follows:
(1) Domestic segment mining expenses:
Unit: RMB’0000
Project Exploration Development Mining
Sandaozhuang Molybdenum and Tungsten Mine 41.20 0.00 49,338.18
Shangfanggou Molybdenum Mine 47.22 13,653.66 1,313.20
Total 88.42 13,653.66 50,651.38
(2) Overseas segment mining expenses:
Unit: USD Million
Project Exploration Development Mining
Niobium Mine 0.695 1.499 22.407Phosphate Mine 1.641 0.355 11.602TFM Copper and Cobalt Mine 12.37 36.66 237.44NPM Copper and Gold Mine 4.51 25.90 33.55
Total 19.216 64.414 304.959

35China Molybdenum Co., Ltd.
MATERIAL EVENTS
I. MATERIAL EVENTS
(1) Acquisition of 100% equity interests of IXM
The Company and New Silk Road Commodities Limited (hereinafter referred to as “NSR”), a wholly-owned subsidiary of Natural Resources Investment Fund, entered into a share purchase agreement through CMOC Limited, a wholly-owned subsidiary of the Company in Hong Kong. Pursuant to such agreement, the Company purchased from NSR the 100% equity interests held by it in New Silk Road Commodities SA (hereinafter referred to as “NSRC”), which in turn indirectly holds the 100% equity interests of IXM through NSRC, with a consideration of USD495,000,000 plus the net profit of the target group in a certain period.
As at 24 July 2019, such acquisition has been completed after receiving relevant internal and external approvals and filing. The financial statement of IXM has been included in the consolidation scope of the Company after the date of completion.
For details, please refer to the relevant announcements published by the Company during the period from 4 December 2018 to 25 July 2019.
The acquisition of IXM will help the Company improve its international competitiveness, and its position and influence in the global resources market. IXM’s advanced metal procurement, mixing, transportation and trade service system will help the Company expand its business scope, develop new growth engines and follow the supply-demand adjustments in the industry, therefore extending the industry chain and creating synergies for existing businesses.
(2) Acquisition of 24% non-controlling equity interests in TFM in the DRC
On 14 April 2017, the Company convened the 2017 first extraordinary general meeting to consider and approve the “Resolution in relation to Seeking a Mandate from the Shareholders to Authorise the Board with Full Discretion to Deal with the Investment Cooperation between the Company, BHR and its Shareholders or the Shareholders of its Shareholders at the Tenke Fungurume Mining Area” (《關於提請股東大會授權董事會全權處理公司與BHR Newwood Investment Management Limited (hereinafter referred to as “BHR”)及其股東或上層投資人就Tenke Fungurume礦區投資進行的合作事宜的議案》). The general meeting of the Company authorized the Board with full discretion to deal with the investment cooperation at the Tenke Fungurume mining area.
On 18 January 2019, CMOC Limited and BHR entered into the Share Purchase Agreement. Pursuant to the agreement, CMOC Limited purchased 100% equity interests in BHR Newwood DRC Holdings Ltd. from BHR, with a consideration of USD1,135,993,578.71. After the transaction was completed, CMOC Limited currently holds 100% equity interests of TF Holdings Limited through BHR Newwood DRC Holdings Ltd. and CMOC International DRC Holdings Ltd., an indirect wholly-owned subsidiary of the Company, and will further control a total of 80% equity interests in TFM, which owns the Tenke Fungurume Mine.
As at 28 September 2019, such acquisition has been completed after receiving relevant internal and external approvals and filing.
For details, please refer to the relevant announcements published by the Company during the period from 20 June 2019 to 27 September 2019.
2. HONOURS(1). In February 2019, “High-efficiency green extraction technology and application of alkaline extraction of
complex, symbiotic and associated tungsten resources” (複雜共伴生鎢資源碱性萃取高效綠色提取技術及應用) of the Company was awarded the First Prize of Hunan Province Science and Technology Progress Award.
(2). In December 2019, the Company won the award of “Industry - University - Research Collaboration Innovation and Promotion of China (First Prize)” (中國產學研合作創新成果獎一等獎) with its “Development and Application of Energy Management System of Pure Electric Mineral Card for Intelligent Road Condition”(純電動礦卡智能路況能源管理系統開發與應用).
(3). In December 2019, the Company was awarded the “First Prize for Science and Technology Achievement in China’s Non-Ferrous Metal Industry”(中國有色金屬工業科學技術一等獎) with “Open-pit Mine Un-manned Mining Equipment and Key Technology of Intelligent Control Integration” (露天礦無人採礦裝備及智能管控一體化關鍵技術).

36 2019 Annual Report
MATERIAL EVENTS
3. DOMESTIC AND OVERSEAS INDUSTRY POLICIES
1. Within the PRC
Indicators for controlling the aggregate mining volume of tungsten mines
On 12 November 2019, the Ministry of Industry and Information Technology and the Ministry of Natural Resources jointly issued the “Indicators for Controlling the Aggregate Mining Volume of Rare Earth Mines and Tungsten Mines for the Year 2019” (《2019年度稀土鎢礦開採總量控制指標公佈》). The indicator for controlling the aggregate mining volume of tungsten concentrates (containing 65% tungsten trioxide) in China was 105,000 tonnes, including 78,150 tonnes of main indicators and 26,850 tonnes of indicators for comprehensive utilization.
Export qualification of tungsten
On 30 December 2019, the Company was approved with the export qualification of tungsten, which was the 15th enterprise with export qualification of tungsten in China.
Value-added tax
In order to implement the decisions and plans of the Party and the State Council and promote substantial VAT reduction, the Ministry of Finance, State Taxation Administration and General Administration of Customs announced that the new VAT policy was implemented from 1 April 2019. The details are as follows:
I. The tax rate of 16% and 10% originally applicable to the value-added tax taxable sale or import of goods of the general taxpayer (hereinafter referred to as the “taxpayer”) shall be adjusted to 13% and 9%, respectively.
II. The deduction rate of 10% originally applicable to taxpayer’s purchase of agricultural products shall be adjusted to 9%. The tax shall be calculated according to the deduction rate of 10% for taxpayer’s purchase of agricultural products for the production or commissioned processing of goods with a tax rate of 13%.
III. The export rebate rate on export goods originally applicable to the tax rate of 16% and the export rebate rate of 16% is adjusted to 13%; the export rebate rate on export goods and cross-border originally applicable to the tax rate of 10% and the export rebate rate of 10% is adjusted to 9%.
Others
Pursuant to the Special Administrative Measures (Negative List) for the Access of Foreign Investment (the 2019 Version) (《外商投資准入特別管理措施(負面清單)(2019年版本)》) promulgated by the National Development and Reform Commission and the Ministry of Commerce on 30 June 2019, the requirement on prohibiting foreign investment in exploration and exploitation of molybdenum was eliminated with effect from 30 July 2019.
37China Molybdenum Co., Ltd.
MATERIAL EVENTS
2. Overseas
Copper and cobalt business in the DRC
The Democratic Republic of the Congo (DRC) promulgated the Law No.18/001 (hereinafter referred to as the “New Mining Code”) on 28 March 2018 after multiple major modifications on the prior Mining Code No.007/2002 issued on 11 July 2002. The applicable regulations of the New Mining Code, namely the 2018 Mining Regulations (hereinafter referred to as the “Mining Regulations”), were adopted and promulgated by the Council of Ministers of the DRC government on 8 June 2018.
The New Mining Code made significant adjustments on the following tax policies:
Resources royalties (resources tax): the tax rate increased from 2% of net amount (sales less deductible costs) to 3.5% of gross sales income, while the tax rate of strategic resources increased to 10% of gross sales income. At this stage, cobalt was regarded as strategic resources in November 2018. The tax rate is 10%;
Super profit tax: when there is a particularly high growth in commodity prices, which exceeds 25% of the price in the feasibility report, super profit tax will be levied on profit growth. The tax rate on excess profit is 50%.
In addition, the New Mining Code made major adjustments to foreign investment in mining industry including entry of mining industry, equity transfer, foreign exchange administration, collection of tax and import and export, etc. The major changes are set out as below:
Foreign exchange policies: the proportion of remittance of the Company’s export income to domestic DRC during the outstanding payment period of shareholders’ loans in relation to the investment shall increase from 40% to 60%, and such export income shall only be used for its domestic expenses. Meanwhile, after the settlement of shareholders’ loans in relation to the investment, the export income shall be 100% remitted to DRC, and shall only be used for domestic expenses of DRC;
Equity transfer: the direct or indirect change in control of shares or equity of the Company with mining rights shall obtain prior national approval, and the transfer of stocks or shares of the Company with mining rights shall be levied upon based on the premium.
The tax policies adjusted by DRC according to the New Mining Code and Mining Regulations will increase the tax cost of the Company and have negative impact on the future profit of the Company.
In addition, the new Mining Code requires that the subcontracting business of mining enterprises shall be carried out in accordance with Law No. 17/001 (hereinafter referred to as the “Subcontractor Law”) issued by DRC on 8 February 2017. The new Mining Code further defines the subcontractor as a legal person established in accordance with the Laws of DRC and with participation of DRC, which provides materials, services or construction for the mining activities carried out by the holders of mining rights in accordance with their rights, including the construction of industrial, administrative management, social-cultural infrastructure and other services directly related to the mining project. According to the Subcontractor Law, subcontractors engaged in the private sector must be Congolese (DRC) with at least 51% interest. If a non-Congolese (DRC) controlled subcontractor lacks professional skills and experience and is not competent for the corresponding services, the contractor can enter into a contract with a foreign company for no more than six months, so that the foreign company can establish a compliant subcontractor enterprise in DRC within the limited time. It is worth noting that the Subcontractor Law does not limit the owner’s right to use foreign contractors.
On 24 May 2018, the DRC government issued government order No.18/018, setting up the Subcontractor Regulatory Agency to supervise the enforcement of Subcontractor Law. Government order No.18/018 stipulates that the subcontractor shall pay 5% of the subcontract amount to the subcontractor’s regulatory authority as the service fee.

38 2019 Annual Report
MATERIAL EVENTS
The DRC government and the business community are still very much divided on how to apply the Subcontractor Law to mining enterprises. At present, the position of the Subcontractor Regulatory Authority is that all the contracted service enterprises used by mining enterprises in this land need to meet the requirement that the citizens of the nation (excluding the legal persons actually controlled by foreign capital) actually hold at least 51% of the rights and interests. It is required that all enterprises engaged in the contracted services shall register with the Subcontractor Regulatory Authority and pay 5% of the contracted service contract amount to the Subcontractor Regulatory Authority as the service fee.
If the abovementioned is strictly carried out in accordance with the opinion of the Subcontractor Regulatory Authority, the scope of the Company’s selection of contractors will be greatly limited, and the Company will need to bear additional expenditure for the engagement of contractors, which will have a certain negative impact on the Company’s future profits. At present, mining enterprises in DRC generally refuse to implement the relevant laws in accordance with the understanding of the Subcontractor Regulatory Authority. The Company also did not require the contractor to register with the Subcontractor Regulatory Authority and pay the service fee.
Since the New Mining Code and Mining Regulations of DRC, the Subcontractor Law and government order No.18/018 were evidently in conflict with the Amended and Restated Mining Convention signed between the former TFM and the DRC government (hereinafter referred to as the “Mining Convention”) and Agreement of Government of the People’s Republic of China and the Government of the Democratic Republic of the Congo on Promotion and Protection of Investment (hereinafter referred to as the “PRC-DRC Agreement”), the Company will pay close attention to updates on circumstances for mining industry development in the DRC, seek solutions to protect rights of the Company to the greatest extent under the Mining Convention and the PRC-DRC Agreement through positive communication with the DRC government and meanwhile try to build a mutually beneficial and win-win harmonious relationship with the host government.
Niobium and phosphates in Brazil
In Brazil, the operations (mines and plants) are regulated by the National Mining Agency in Brazil (“Agência Nacional de Mineração”/“ANM”) together with labour, environmental and other agencies. The municipal, state and federal governments and the public prosecutor’s office are responsible for the enforcement of the relevant laws and regulations.
From the legal perspective, in the labor aspect, the impact of the new legislation has been positive for employers since the introduction of the law reforms. The new legislation gives employers more flexibility in handling labour disputes brought against them by employees and contractors, objectively reducing abuse of rights of action by the employees, as well as the number of labour cases in the courts, and also significantly reducing the number of labour lawsuits against the Company.
On the other hand, after the dam accidents in Mariana/MG and Brumandinho/MG, the government and the agencies have given much more attention to the legislation of the mineral sector. As a result, the House and Senate are considering several Bills of law to tighten mining legislation. For example, Normative Resolution no.4 and no.13 stipulated that the inspection and authorization shall be more severe in the process of dam construction and the criteria for approving the expansion of tailing dams shall be more stringent. In addition, the Prosecutor has been focusing on the mining sector and the lawsuits (Public Civil Action) against the segment have increased the industry pressure exponentially. The new norms and regulations have given very short deadlines for the Company, all relevant controls are in place and the operations are fully compliant with the relevant limits and regulations.
Copper & gold related products in Australia
Mining in the State of New South Wales (“NSW”) is mainly regulated by the Mining Act 1992, and administered by the Department of Trade and Investment. The NSW Government owns all mineral resources in NSW and all exploration and mining activities for minerals in NSW require a valid authorization and a mining lease. Under the Mining Act 1992, royalties are payable to the State of NSW on all publicly and privately owned minerals exploited by the holder of a mining licence.
The NSW Work Health and Safety (Mines and Petroleum Sites) Act 2013 and NSW Work Health and Safety (Mines and Petroleum Sites) Regulation 2014 align specific mine safety laws with general work health and safety laws. They also provide a single legislative framework for the regulation of safety in mines.

39China Molybdenum Co., Ltd.
RISK WARNING
1. EXPOSURE TO RISKS RELATED TO PRICE FLUCTUATIONS OF PRINCIPAL PRODUCTS
The revenue of the Company primarily generates from the sale of non-ferrous metals and phosphate products, including copper cathode, copper concentrates, cobalt hydroxide, ferromolybdenum, tungsten concentrates, ferroniobium, phosphate fertilizer and other related products. Its operating results are largely subject to fluctuations in the market prices thereof. The NPM copper and gold mine of the Company also has sales of gold as by-product. Accordingly, the price fluctuations in gold will also have an impact on the Company. Since the fluctuations in the costs of mining and smelting process are relatively insignificant, the Company’s profit and profit margin during the reporting period are closely related to the price trend of the commodities. Therefore, significant fluctuations in the prices of resource products and gold may cause instability of the operating results of the Company. Particularly, if the prices of resource products record sharp decrease, the operating results of the Company will fluctuate significantly.
Given that the product price fluctuations may have certain impact on the Company’s performance, the Company has formulated the CMOC Administrative Measures of Derivatives Trading Business, choosing the right opportunity to hedge the market risk with the appropriate derivatives trading business. At the same time, it regulates the behavior and provides risk prevention for derivatives trading of the Company.
2. EXPOSURE TO RISKS RELATED TO RELIANCE ON MINERAL RESOURCES
As the primary operation of the Company is mineral resource exploitation, the Company is highly dependent on mineral resources. The retained reserves and grade of mineral resources have a direct impact on the Company’s operation and development. The exploitation of mineral reserves with relatively low grade may be economically infeasible in case of cost of production rising due to fluctuations in the market price, decrease in the recovery rate, inflation and other factors, or due to restrictions caused by technical problems and natural conditions such as weather and natural disasters in the mining process. Therefore, full utilization of the retained reserves of the Company cannot be guaranteed and the production capacity of the Company might be affected.
Relevant internal technical staff of the Company will regularly review and update the reserve of resources and grade according to the development of resources, and optimize mining schemes and plans, thereby verifying resources of the Company and implementing the best mining plans.
3. EXPOSURE TO RISKS RELATED TO PRODUCTION SAFETY OR NATURAL DISASTERS
The Company engages in the mining business and mineral resources processing, and the Company has invested substantial resources in production safety to form a relatively complete system of production safety management, and continuously pushed forward the standardized safety management so as to establish a sound system for safe production management, risk prevention and supervision. However, safety incidents cannot be totally avoided. As an enterprise for mineral resource development, large amounts of waste rocks and tailings are produced in the production process. Inefficient management of slag discharge fields and tailing storage facilities may result in disaster in certain area. The Company uses explosives in the mining process. If there are defects in the process of storage and use of such materials, there may be risk of casualties. In addition, tailing storage facilities and slag discharge fields may be damaged if serious natural disaster occurs such as rainstorms or debris flows.
The Company will continue to prevent and control safety risks by formulating and improving safety system, in-tensifying accountability and assessment in relation to safety and environmental protection, continuously increase investment in production safety and environmental protection and promoting standardized safety management. The Company will improve the ability and level of prevention and control of natural disaster through the formulation and drills of natural disaster emergency plans such as “rainy season” emergency plan and issuance of the “Corporate Governance Standard for Tailings and Mineral Residue Management” and other measures applicable to global businesses.

40 2019 Annual Report
RISK WARNING
4. EXPOSURE TO RISKS RELATED TO THE COVID-19 OUTBREAK
Given the global spread of the COVID-19 since the beginning of 2020, currently speaking, the epidemic in China has seen further effective control while the epidemic overseas was exposed to further aggravation. As the epidemic has spread rapidly overseas, the World Health Organization has redefined it as “pandemic”, and if the epidemic cannot be contained in the short term, it will cause substantive impact on the global real economy. Shrinking demand, economic turmoil and market panic will bring risks of significant decrease in the prices of products, as well as new challenges and adverse impact on the supply of goods, logistics guarantee, and business travel of multinational companies. There will be increasing operating business pressure, epidemic prevention pressure and cost of the Company.
The Company will pay particular attention to the development of the epidemic, actively review the trend of the commodity market, and strengthen the prevention and control of the epidemic.
5. EXPOSURE TO RISKS RELATED TO EXCHANGE RATE
The Company's exposure to risks related to exchange rate is primarily arising from assets and liabilities held in foreign currencies other than the function currency and the international business commenced by IXM Group. Its assets and liabilities are denominated in functional currencies different from those of the entities and are therefore subject to changes in foreign exchange rates. The exchange rate risks exposed to the Company is mainly associated with USD, HK$, EUR, CAD, RMB, BRL, GBP, CDF and other currencies. All principal business operations of domestic subsidiaries are denominated and settled in RMB; the principal business operations of subsidiaries in Australia are mainly denominated and settled in AUD or USD; the niobium and phosphates businesses in Brazil are mainly denominated and settled in USD and BRL; and the copper and cobalt business in the DRC is mainly denominated and settled in USD and CDF. The function currency of IXM Group is USD. The Company manages its exchange rate risks with the principle of matching the currencies of assets/revenue with those of liabilities, so the exchange rate risks exposure arising from financing is insignificant.
Currency used to denominating revenue and cost may be different for certain parts of business, the fluctuation in the short-term exchange rates of all settlement currencies may have a certain effect on the operating results of the Company. The Company has paid close attention to the impact of the changes in exchange rates on the Group, and made use of financial instruments, such as forward foreign exchange contracts to hedge against foreign exchange rate risks in due course. For BRL with significant fluctuations in exchange rate, the Company has made certain hedging arrangements for daily operation and capital expenditure. IXM and its affiliates have all entered into contracts on foreign exchange derivatives to hedge the risks back into their own functional currencies.
6. EXPOSURE TO RISKS RELATED TO POLICY
The primary operation of the Company locates in various countries and regions including China, DRC, Brazil and Australia. As there are major discrepancies in state politics and economy development level among different countries and there are major risks relating to policy implementation and adjustments in developing countries and underdeveloped countries, such as state macroeconomic control policies, foreign exchange administration policies, industry policies and tax policies in operating countries, which may incur a certain impact on the operation of the Company.
In 2018, the DRC government introduced the new law for mining industry and its implementation rules, involving substantial changes on equity, financial tax policies and foreign exchange management policies. Even though the DRC government is willing to continue carrying out discussion and negotiation in respect of the above matters, failure of reaching consensus through negotiation will still incur significant impact on the operation of the Company in the future.
The Company maintains close communication with government authorities in each of its business operating areas and pays attention to changes in political and economic circumstances in relevant countries so as to improve its ability in preventing and responding to policy risks.

41China Molybdenum Co., Ltd.
RISK WARNING
7. EXPOSURE TO RISKS RELATED TO POLITICS
The operating assets of the Company are distributed in different countries and regions, of which copper and cobalt mine of TFM is located in the DRC, which is one of the underdeveloped countries in the world with critical social problems. If the political and security situation of the DRC deteriorates in the future, it will cause adverse effects on the production and operation of the Company. The overseas assets operational philosophy of the Company underlines the establishment of positive relations with local government, communities and social organizations. As the political ties between China and the DRC stabilize and draw ever closer, outbound investments into the DRC have been encouraged by the Chinese government and have become a trend. To further reduce potential economic losses of the Company incurred by relevant risks in operations, the Company has purchased overseas equity investment insurance for the DRC project from China Export & Credit Insurance Corporation. The insured investment includes: paid-up capital, retained profit and investment for equity acquisition. The insured risks include: foreign exchange restrictions, confiscation, war and political riots.
8. EXPOSURE TO RISKS RELATED TO OPERATIONS OF OVERSEAS ASSETS
The Company has a relatively extensive experience in operating and managing overseas assets. However, certain differences among different countries in terms of operation environment such as politics, economy, law and labor pose material challenges to the operation and management of assets by the Company in different regions. In addition, as the Company accelerates its pace of internationalization, it posts a big challenge to the reserve, cultivation and introduction of all kinds of professionals by the Company for international management. The operation and management of the Company may be subject to a shortage of professionals to a certain extent.
The Company actively implements the strategy of talent cultivation and introduction, independently introduces worldwide human resources with extensive industry operation experience and international management capabilities, explores and creates a management structure and control model applicable to the development of the Company and gives full play to the specialities of all kinds of talents, in order to achieve efficient governance of the Company’s global business and reduce operational risks.

42 2019 Annual Report
CORPORATE GOVERNANCE REPORT
The Board hereby presents this Corporate Governance Report in the Group’s report for the year ended 31 December 2019.
CORPORATE GOVERNANCE PRACTICES OF THE COMPANY
The Group has strived to uphold high standards of corporate governance to safeguard the interests of shareholders, to enhance corporate value and to implement accountability for the Group.
The Company has applied the principles and code provisions as set out in the Corporate Governance Code contained in Appendix 14 to the Rules Governing the Listing of Securities on The Stock Exchange of Hong Kong Limited (the “Hong Kong Listing Rules”).
In the opinion of the Board, the Company has adopted and complied with the code provisions as set out in the Corporate Governance Code throughout the year ended 31 December 2019, save as the deviation from the code provision E.1.2 of the Corporate Governance Code.
Pursuant to the code provision E.1.2 of the Corporate Governance Code, the chairman of the Board should invite the chairmen of its Board committees to attend the annual general meeting. In their absence, the chairman of the Board should invite another committee member (or his duly appointed delegate if such committee member is absent) to attend. All members of the Remuneration Committee were unable to attend the annual general meeting of the Company held on 14 June 2019 due to other business commitments. The members of the Audit and Risk Committee, the vice chairman of the Nomination and Governance Committee, the chairman of the Strategic and Sustainability Committee and the chairman of the Supervisory Board, the secretary to the Board and the chief financial officer have all attended such annual general meeting. The Company is of the view that their attendance was sufficient for (i) answering the questions raised by the shareholders who attended the annual general meeting and (ii) effectively communicating with shareholders who attended the annual general meeting. The Company will strive to optimize the planning and procedures of annual general meetings, give adequate time to all Directors to accommodate their work arrangement and provide all necessary support for their presence at and participation in the general meetings so that all Directors will be able to attend future annual general meetings of the Company.
The Company reviews its corporate governance practices regularly to ensure compliance with the Corporate Governance Code.
THE BOARD
During the year ended 31 December 2019, the Board held 11 Board meetings in total for reviewing and approving the financial affairs and usual course of business, considering and approving the annual budgets and the overall strategies and policies of the Company, and considering and approving relevant matters in relation to the acquisition of overseas businesses and issuance of corporate bonds by the Company.
RESPONSIBILITIES
The Board is responsible for the leadership and control of the Group, overseeing the Group’s businesses, strategic decisions and performances. The Group’s senior management is delegated the authority and responsibilities by the Board to manage the day-to-day management and operations of the Group. In addition, the Board has also established Board committees and has delegated to these Board committees’ various responsibilities (including corporate governance functions) set out in their terms of reference respectively.
Every Director carries out his duty in good faith and in compliance with the standards of applicable laws and regulations, and acts in the interests of the Company and its shareholders at all times.
The Company has arranged appropriate liability insurance which covers legal litigation arising from corporate activities against its Directors and senior management.

43China Molybdenum Co., Ltd.
CORPORATE GOVERNANCE REPORT
BOARD COMPOSITION
The Board currently comprises eight members, including two executive Directors, three non-executive Directors and three independent non-executive Directors.
The list of all Directors is set out under “Corporate Information” on page 87 and the independent non-executive Directors are expressly identified in all corporate communications pursuant to the Hong Kong Listing Rules.
As at the date of this report, the board of directors of the Company comprises the following Directors:
Executive Directors
Li Chaochun, ChairmanLi Faben, General Manager (also the chief executive within the meaning of the Corporate Governance Code)
Non-Executive Directors
Guo Yimin, Vice-Chairman (appointed as non-executive Director on 28 March 2019 and appointed as Vice-Chairman on 29 April 2019)Yuan HonglinCheng Yunlei
Independent Non-Executive Directors
Wang Gerry YouguiYan YeLi Shuhua
The list of Directors (by category) is also disclosed in all corporate communications issued by the Company from time to time pursuant to the Hong Kong Listing Rules. There is no relationship among members of the Board (including financial, business, family or other material or relevant relationship).
For the year ended 31 December 2019, the Board, at all times, met the requirements of the Hong Kong Listing Rules relating to the appointment of at least three independent non-executive Directors, and at least one-third of the Board with at least one independent non-executive Director possessing appropriate professional qualifications, or accounting or related financial management expertise.
The Company has received an annual confirmation from each independent non-executive Director of his/her independence pursuant to the requirements of the Hong Kong Listing Rules. The Company considers all independent non-executive Directors to be independent in accordance with the independence guidelines set out in Rule 3.13 of the Hong Kong Listing Rules.
Non-executive Directors (including independent non-executive Directors) bring a wide range of business and financial expertise, experience and independent judgment to the Board. Through active participation in Board meetings or meetings of Board committees, supervising management issues involving potential conflict of interests and serving on Board committees, all non-executive Directors (including independent non-executive Directors) make various contributions towards the direction of the Company.
CHAIRMAN AND GENERAL MANAGER
The roles and duties of the Chairman and the General Manager are carried out by different individuals and their respective responsibilities have been clearly specified in writing.
The Chairman, Mr. Li Chaochun, provides leadership for the Board and is also responsible for chairing the meetings, leading the operations of the Board and ensuring that all major and appropriate issues are discussed by the Board in a timely and constructive manner.
The General Manager, Mr. Li Faben, is responsible for running the Company’s business operations and implementing the Group’s strategic plans and business goals.

44 2019 Annual Report
CORPORATE GOVERNANCE REPORT
APPOINTMENT AND RE-ELECTION OF DIRECTORS
In accordance with the Company’s articles of association (the “Articles of Association”), all Directors of the Company (including non-executive Directors) are subject to retirement by rotation at least once every three years and any new Director appointed by the Board to fill a casual vacancy or as an addition to the Board shall submit himself/herself for election by shareholders at the first general meeting after appointment.
Each Director of the Company is appointed for a term commencing from the date on which the resolution regarding his/her appointment/re-election is passed until the conclusion of the annual general meeting of the Company held in 2018, at which meeting, they have retired and been re-elected. On 3 August 2018, the Company convened the 2018 first extraordinary general meeting to elect the next session of the Board. Mr. Li Chaochun and Mr. Li Faben served as executive Directors; Mr. Ma Hui, Mr. Yuan Honglin and Mr. Cheng Yunlei served as the non-executive Directors; and Mr. Wang Gerry Yougui, Ms. Yan Ye and Mr. Li Shuhua served as the independent non-executive Directors to form the fifth session of the Board. On 21 December 2018, Mr. Ma Hui, non-executive Director and vice chairman, resigned from his relevant positions in the Company due to adjustment of his work arrangements. On 26 December 2018, the first extraordinary general meeting of the fifth session of the Board of the Company considered and approved the resolution to nominate of Mr. Guo Yimin as a non-executive Director of the fifth session of the Board of the Company. The resolution has been considered and approved at the 2019 first extraordinary general meeting on 28 March 2019.
According to the Detailed Working Rules for Independent Directors adopted on 9 October 2012, the term of office for independent non-executive Directors shall be the same as that of other Directors of the Company, and they may stand for re-election upon expiry of their term, but the re-appointment shall not exceed six years. The Board proposed a special resolution at the annual general meeting held in 2015 regarding the amendment to the Articles of Association, fixing the number of the Board members at 7 to 11 so that the number and composition of the Board of Directors of the Company are in compliance with the requirements under the Company Law and the Hong Kong Listing Rules.
The Nomination and Governance Committee and the Board selected candidates of Directors with reference to major shareholders’ recommendations and certain criteria and procedures. The relevant criteria mainly include the candidate’s professional background, especially his or her experience in the industry where the Group operates, his or her financial and past track record with other similar companies and the recommendations from management and other knowledgeable individuals. The procedures and process of appointment, re-election and removal of Directors are laid down in the Articles of Association. The Nomination and Governance Committee of the Company is responsible for reviewing the Board composition, monitoring the appointment, nomination and succession plan of Directors and assessing the independence of independent non-executive Directors.
INDUCTION AND CONTINUING PROFESSIONAL DEVELOPMENT FOR DIRECTORS
Each newly appointed Director receives a comprehensive, formal and tailored induction on the first occasion of his/her appointment so as to ensure that he/she has an appropriate understanding of the business and operations of the Company and that he/she is fully aware of his/her responsibilities and obligations under the Hong Kong Listing Rules and relevant regulatory requirements.
The Directors are regularly updated with legal and regulatory developments as well as business and market changes to facilitate the discharge of their responsibilities. Briefings and continual professional development schemes for Directors will be arranged whenever necessary.

45China Molybdenum Co., Ltd.
CORPORATE GOVERNANCE REPORT
The Company encourages all Directors to participate in continuous professional development to develop and refresh their knowledge and skills in order to ensure that their contribution to the Board remains fully informed and relevant. For the year ended 31 December 2019, all Directors attended the training courses organized by the Company on corporate governance and regulatory development, and obtained and read relevant materials presented to them by the Office of the Board of the Company, including updates of laws and regulations. According to the details provided, the summary of the continuing professional development for Directors in 2019 is as follows:
Name of DirectorsLegal and Corporate
GovernanceBusiness
of the GroupRole, Function and
Duty of Directors
Executive DirectorsMr. Li Chaochun ✔ ✔ ✔
Mr. Li Faben ✔ ✔ ✔
Non-executive DirectorsMr. Guo Yimin(1) ✔ ✔ ✔
Mr. Yuan Honglin ✔ ✔ ✔
Mr. Cheng Yunlei ✔ ✔ ✔
Independent Non-Executive DirectorsMr. Wang Gerry Yougui ✔ ✔ ✔
Ms. Yan Ye ✔ ✔ ✔
Mr. Li Shuhua ✔ ✔ ✔
Note:
(1) Mr. Guo Yimin was appointed as a non-executive Director at the 2019 First Extraordinary General Meeting on 28 March 2019.
BOARD MEETINGS
Practices and Conduct of Board Meetings
Meeting schedules and draft agendas for each meeting are normally made available to Directors in advance.
Notices of regular Board meetings are served to all Directors at least 14 days before the meetings. For other Board and committee meetings, notice is generally given pursuant to the Articles of Association and the respective Terms of Reference and Detailed Working Rules of the committees.
The agenda of Board meeting and the accompanying Board papers are sent to all Directors at least three days before each Board meeting or committee meeting for their review and to keep the Directors apprised of the latest developments and financial position of the Company so as to enable them to make informed decisions. The Board and each Director also have separate and independent access to the senior management whenever necessary for inquiries or additional information.
The senior management will attend all regular Board meetings and when necessary, other Board and committee meetings to advise on business developments, operation, financial and accounting matters, statutory compliance, corporate governance and other major aspects of the Company.
The Articles of Association contains provisions requiring Directors to abstain from voting and not to be counted in the quorum at meetings for approving transactions where such Directors or any of their contact persons have a material interest.

46 2019 Annual Report
CORPORATE GOVERNANCE REPORT
Directors’ Attendance Records
During the year ended 31 December 2019, the Company convened a total of 11 Board meetings. The attendance records of each Director at the meetings of the Board, Remuneration Committee, Audit and Risk Committee, Nomination and Governance Committee and Strategic and Sustainability Committee and general meetings are set out below:
Number of Attendance in person/Number of Meetings Eligible to Attend
Name of Directors Board Meeting
Remuneration Committee
Meeting
Audit and Risk Committee
Meeting
Nomination and
Governance Committee
Meeting
Strategic and Sustainability
Committee Meeting
Annual General
Meeting (1)
Extraordinary General
Meeting and Class Meeting (2)
Mr. Li Chaochun 11/11 N/A N/A 1/1 1/1 1/1 6/6Mr. Li Faben 11/11 N/A N/A N/A 1/1 0/1 3/6Mr. Guo Yimin(3) 8/8 N/A N/A N/A N/A 1/1 3/3Mr. Yuan Honglin 11/11 1/1 5/5 N/A 1/1 0/1 3/6Mr. Cheng Yunlei 11/11 N/A N/A N/A N/A 1/1 6/6Mr. Wang Gerry
Yougui 10/11 1/1 N/A 1/1 1/1 0/1 3/6Ms. Yan Ye 11/11 N/A 5/5 1/1 N/A 1/1 3/6Mr. Li Shuhua 11/11 1/1 5/5 1/1 N/A 0/1 3/6
Notes:
(1) The Annual General Meeting was held on 14 June 2019.
(2) During the year ended 31 December 2019, the Company convened the 2019 First Extraordinary General Meeting on 28 March 2019 and the 2019 Second Extraordinary General Meeting on 27 December 2019.
(3) Mr. Guo Yimin was appointed as a non-executive Director at the 2019 First Extraordinary General Meeting on 28 March 2019.
JOINT COMPANY SECRETARIES
To maintain sound corporate governance and to comply with the Hong Kong Listing Rules and requirements of applicable Hong Kong laws, the Company appointed Ms. Ho Siu Pik from Tricor Services Limited (an external service provider) as the joint company secretary during the year ended 31 December 2019. Her primary contact person in the Company was Mr. Yue Yuanbin (“Mr. Yue”), the secretary to the Board. Both of the joint company secretaries have confirmed that each of them has undertaken no less than 15 hours of relevant professional training within the year.
On 10 January 2020, the Company convened the 11th extraordinary meeting of the fifth session of the Board in which a resolution was approved to appoint Ms. Ng Sau Mei (“Ms. Ng”) of TMF Hong Kong Limited as joint company secretary (together with Mr. Yue joint as joint company secretaries) with effect from 10 January 2020. Her primary contact person in the Company was Mr. Yue.
SECURITIES TRANSACTIONS MADE BY DIRECTORS, SUPERVISORS AND EMPLOYEES
The Company has adopted the Model Code for Securities Transactions by Directors of Listed Issuers (the “Model Code”) as set out in Appendix 10 to the Hong Kong Listing Rules in respect of dealings in the Company’s securities by the Directors and Supervisors. Specific enquiry has been made on all Directors and Supervisors and they have confirmed that the required standards set out in the Model Code have been complied with throughout the year ended 31 December 2019. The Company has also formulated written guidelines equally stringent as the Model Code (the “Employees Written Guidelines”) for securities transactions by employees of the Company who are likely to be in possession of unpublished inside information of the Company. No incident of non-compliance against the Employees Written Guidelines by the employees has been noted by the Company after making reasonable enquiry.

47China Molybdenum Co., Ltd.
CORPORATE GOVERNANCE REPORT
DELEGATION BY THE BOARD
The Board reserves its decisions for all major matters of the Company, including: the approval and monitoring of all policy matters, overall strategies and budgets, internal control and risk management systems, material transactions (in particular those that may involve conflict of interests), financial information, appointment of Directors and other significant financial and operational matters.
All Directors have full and timely access to all relevant information as well as the advice and services of the company secretaries, with a view to ensuring that Board procedures and all applicable rules and regulations are complied with. In appropriate circumstances, Directors may seek independent professional advice relating to such queries at the Company’s expense upon making such request to the Board.
The day-to-day management, administration and operations of the Company are delegated to the General Manager and the senior management. The delegated functions and work tasks are reviewed periodically. Prior to any significant transactions to be entered into by the abovementioned officers, approvals have to be obtained from the Board.
The Board has established a number of committees, including the Remuneration Committee, Audit and Risk Committee, Nomination and Governance Committee, Strategic and Sustainability Committee for overseeing particular aspects of the Company’s affairs. All Board committees of the Company were established with defined written terms of reference. Board committees are provided with sufficient resources to perform their duties. Upon reasonable requests, Board committees may seek independent professional advice in appropriate circumstances at the expense of the Company.
R E M U N E R A T I O N O F D I R E C T O R S, S U P E R V I S O R S A N D S E N I O R MANAGEMENT
The Company has established a formal and transparent procedure for formulating policies regarding remuneration of Directors, Supervisors and senior management of the Group. Details of the remuneration of the Directors, Supervisors and senior management of the Company for the year ended 31 December 2019 are set out in note (X).7 to the consolidated financial statements.
DISCLOSURES OF DIRECTORS AND SUPERVISORS PURSUANT TO RULE 13.51B(1) OF THE HONG KONG LISTING RULES
After having made all reasonable enquiries, except for the information disclosed in this annual report, the Company is not aware of any other information of the Directors and Supervisors which is required to be disclosed pursuant to Rule 13.51B(1) of the Hong Kong Listing Rules.
REMUNERATION COMMITTEE
The Company has established the Remuneration Committee and set out its specific Terms of Reference. As at the date of this report, the Remuneration Committee comprises two independent non-executive Directors, namely Mr. Wang Gerry Yougui and Mr. Li Shuhua and one non-executive Director, namely Mr. Yuan Honglin, with Mr. Wang Gerry Yougui acting as the chairman. The majority of members of the Remuneration Committee are independent non-executive Directors.
The roles and functions of the Remuneration Committee are set out in its Terms of Reference and Detailed Working Rules. Its primary functions include: to make recommendations to the Board on the remuneration policy and structure for all Directors and the senior management and to establish transparent procedures for developing such remuneration policy; to adopt the mode on remuneration determination to make recommendations to the Board on the remuneration packages of individual executive and non-executive Directors and the senior management; and to ensure that no Director or any of his/her contact persons will participate in deciding his/her own remuneration.
The primary aim of the Company’s remuneration policy on executive Directors’ packages is to enable the Company to retain and motivate executive Directors by linking their remuneration with performance and measured against corporate objectives. The remuneration policy of the Company for non-executive Directors is to ensure that they are sufficiently compensated for their efforts and time dedicated to the Company. In determining guidelines for each element of the remuneration package, the Company refers to the remuneration surveys conducted by independent external consultants on companies operating in similar businesses.

48 2019 Annual Report
CORPORATE GOVERNANCE REPORT
In order to motivate the senior management of the Company in an effective and reasonable way so that they can maximize the value for the shareholders and the Company, the Remuneration Committee has taken into account the market-oriented principles including the determination of remuneration based on the performance, responsibilities, faults and attitude, the enhancement of rewards and punishment, the comparison with similar overseas and domestic listed companies in the industry, and consideration of granting special awards regarding the special projects and contributions, as well as referring to the advice from the professional intermediaries.
The Remuneration Committee held one meeting during the year ended 31 December 2019, and the matters considered therein included confirmation of the adjustment of remuneration of the Directors and Supervisors, proposed to confirm on the remuneration of senior management and approval of the service contact of new Director. The attendance records are set out under “Directors’ Attendance Records” on page 46.
AUDIT AND RISK COMMITTEE
The Board resolved to change the name of the Audit Committee to Audit and Risk Committee on 4 August 2018, and has updated its Terms of Reference and Detailed Working Rules to better reflect its functions.
The Terms of Reference and Detailed Working Rules of the Audit and Risk Committee are based primarily on “A Guide for Effective Audit Committees” issued by the Hong Kong Institute of Certified Public Accountants. It is mainly responsible for assisting the Board in reviewing the financial information and reporting process, risk management and internal control systems, effectiveness of the internal audit function, scope of audit and appointment of external auditors, and arrangements to enable employees of the Company to raise concerns about possible improprieties in financial reporting, internal control or other matters of the Company.
The Audit and Risk Committee provides an important link between the Board and the Company’s auditors in matters falling within the Group’s scope of the audit.
The Audit and Risk Committee has reviewed the effectiveness of the external audit and internal controls, evaluated risks, and provided comments and advice to the Board. As at the date of this report, the Audit and Risk Committee comprises two independent non-executive Directors, namely Mr. Li Shuhua and Ms. Yan Ye, and one non-executive Director, namely Mr. Yuan Honglin, with Mr. Li Shuhua acting as the chairman of the committee. The Audit and Risk Committee has reviewed with the management and external auditors, the audited consolidated results of the Group for the year ended 31 December 2019, according to the accounting principles and practices adopted by the Group, and discussed auditing, internal controls and financial reporting matters.
The main duties of the Audit and Risk Committee are set out in its Terms of Reference, including the following:
(I) With respect to audit and financial supervision
• provide proposals to the Board of Directors on the appointment, re-appointment and removal of the external auditors, advise on the terms of remuneration and appointment of the external auditors, and deal with matters related to the resignation or dismissal of the auditors;
• review and supervise the independence and objectivity of the external auditors and give opinions in this regard;
• review and monitor the effectiveness of the audit procedures in accordance with applicable standards, discuss with the external auditors about the nature and scope of the audit and the relevant reporting obligations before the audit commences and express opinions in this regard;
• review the financial and accounting policies and practices of the Company, review the drafts of the annual reports, monitor the integrity of financial statements and annual report and accounts, half-year report and quarterly reports of the Company, and review significant financial reporting judgements contained therein and provide opinions in this regard;
• examine on a yearly basis the adequacy of the resources, the qualifications and experience of employees in connection with the Company’s financial accounting, financial reporting risk management and internal control functions, as well as the adequacy of the training courses received by employees and the related budgets;
• review arrangements under which employees may raise concerns about the possible inappropriate financial reporting, risk management, internal control or other matters under the condition of confidentiality.

49China Molybdenum Co., Ltd.
CORPORATE GOVERNANCE REPORT
(II) With respect to risk management and internal control
• review the Company’s financial control, and the risk management and internal control systems of the Company;
• discuss the risk management and internal control systems with the management to ensure that the management has discharged its duty to establish an effective system and to settle the procedural issues of serious internal control deficiencies;
• consider any findings of major investigations of risk management and internal control matters and the management’s response; and
• evaluate and enhance the risk management procedures and ensure the current and future rationality, effectiveness and feasibility thereof.
The Audit and Risk Committee supervises the risk management and internal control systems of the Company, reports to the Board on any material issues and makes recommendations to the Board.
The Audit and Risk Committee held five meetings during the year ended 31 December 2019 and reviewed matters including annual results for the year ended 31 December 2018, the results for the first quarter ended 31 March 2019, the results for the interim period ended 30 June 2019 and the results for the third quarter ended 30 September 2019. The Audit and Risk Committee also considered the financial reporting and compliance procedures, the report from the management on the review and processes of Company’s internal control and risk management systems and the re-appointment of the external auditors. The attendance records are set out under “Directors’ Attendance Records” on page 46.
During the year ended 31 December 2019, the Audit and Risk Committee also met the external auditors twice without the presence of the executive Directors.
NOMINATION AND GOVERNANCE COMMITTEE
The Board resolved to change the name of the Nomination Committee to Nomination and Governance Committee on 4 August 2018, and has updated its Terms of Reference and Detailed Working Rules to better reflect its functions.
As at the date of this report, the Nomination and Governance Committee comprises four Directors, including three independent non-executive Directors, namely Mr. Wang Gerry Yougui, Mr. Li Shuhua and Ms. Yan Ye, and one executive Director Mr. Li Chaochun. Mr. Wang Gerry Yougui and Mr. Li Chaochun act as the chairman and the vice chairman of the Nomination and Governance Committee respectively, and the independent non-executive Directors account for more than a half of members of the Nomination and Governance Committee.
The roles and functions of the Nomination Committee are set out in the Detailed Working Rules, and it is mainly responsible for (i) with respect to nomination: make suggestions to the Board as to the scale, structure, composition and any proposed change of the Board in light of the business activities, size of assets and shareholding structure of the Company, including reviewing the structure, number, composition and diversity of the members’ background of the Board (including but not limited to gender, age, cultural and educational background, professional experience, skills, knowledge and length of service) at least once a year or as needed; make recommendations to the Board on any proposed change to the Directors and the senior management; study the standards and procedures for the selection and appointment of Directors and senior management, and make recommendations to the Board; search and look for in a wide range of fields the candidates for qualified Directors and senior management, and examine and provide recommendations to the Board on this regard. The Board shall fully consider the Nomination and Governance Committee’s recommendations on the nomination of the candidates for Directors and senior management; make recommendations to the current Board on the candidates for Directors of the next session of the Board of Directors at the re-election of the Board of Directors; assess the independence of independent non-executive Directors and any elected independent non-executive Directors; make recommendations to the Board of Directors on the candidates for new Directors and senior management at the time when the term of office of the Directors and the senior management expires or they are unable to perform their duties for reasons; assess the performance of the Directors and the senior management and, when necessary, provide advice or make recommendations on the replacement of the Directors and the senior management on the assessment results; and review consecutively the needs for leadership and training development plans of the Company to ensure that the Company may continue to operate

50 2019 Annual Report
CORPORATE GOVERNANCE REPORT
efficiently and maintain international competitiveness, and to monitor the training and development of Directors. (ii) With respect to corporate governance: review and approve the Company’s vision, strategies, framework, principles and policies regarding corporate governance, and make recommendations to the Board of Directors; supervise the implementation of the corporate governance policies formulated by the Board of Directors and make relevant recommendations; review and consider the Company’s corporate governance policies and daily operations to ensure compliance with legal and regulatory provisions, and make recommendations to the Board of Directors; review and consider the Code of Conduct and Compliance Manual (if any) on corporate governance applicable to the Company’s Directors and employees; review and consider whether the Company complies with Appendix 14 (Corporate Governance Code) to the Hong Kong Listing Rules, the relevant disclosure provisions of the Corporate Governance Report and other relevant rules; review and assess the annual Corporate Governance Report for consideration and approval by the Board; examine, supervise and respond to the emerging corporate governance and, where appropriate, make recommendations to the Board of Directors to continuously improve the Company’s corporate governance performance; support the plans for corporate governance outside the Company (both local and overseas), where appropriate, to facilitate the continuous development of corporate governance; review and supervise the assessment procedures of the Board of Directors (including its committees and individual members), assess the Board of Directors on a regular basis, and submit assessment reports to the Board of Directors for consideration and approval; review and supervise the implementation of the shareholder communication policies to ensure its effective implementation and, where appropriate, make recommendations to the Board of Directors on strengthening the relationship between shareholders and the Company; and review and supervise the training and continuous professional development of the Directors, Supervisors and the senior management.
BOARD DIVERSITY POLICY
The Company adopted a board diversity policy. All appointments to the Board will be made on a merit basis.
The Nomination and Governance Committee reviews and evaluates the composition of the Board, makes recommendations to the Board in relation to the appointment of new Directors of the Company, as well as monitors the conduct of annual review on the effectiveness of the Board. When reviewing and evaluating the composition of the Board, the Nomination and Governance Committee will follow the board diversity policy to consider from a number of aspects the benefit of diversity, including but not limited to gender, age, cultural and educational background, ethnicity, professional experience, skills, knowledge and length of service, in order for the Board to maintain appropriate and balanced talent, skill, experience and background. In recommending candidates for appointment to the Board, the Nomination and Governance Committee will consider candidates on merit against objective criteria and with due regard for the benefit of diversity in the Board. In monitoring the effectiveness of the annual review of the Board, the Nomination and Governance Committee will consider the balance of talents, skills, experience, independence and knowledge on the Board and its diversity representation.
The Nomination and Governance Committee will discuss and agree on annually all measurable objectives, including but not limited to gender, age, cultural and educational background, race, professional experience, skills, knowledge and length of service, having due regard to the Company’s own business model and specific needs from time to time for implementing diversity on the Board and recommend them to the Board. The Company believes that the current Board possesses a balance of skills, experience, expertise and diversity of perspectives appropriate to the requirements of the Company’s business.
DIRECTOR NOMINATION POLICY
The Company has adopted a director nomination policy aiming at setting out the criteria and process in the nomination and appointment of Directors of the Company and ensuring the Board has a balance of skills, experiences and diversity of perspectives appropriate to the Company’s business as well as the Board continuity and appropriate leadership of the Board.
In assessing the suitability of a proposed candidate, the Nomination and Governance Committee would consider a number of factors including:
• character and integrity;
• qualifications, including cultural and educational background, professional qualifications, skills, knowledge and experience related to the Company’s business and strategy, and the diversity of factors referred to in the board diversity policy;

51China Molybdenum Co., Ltd.
CORPORATE GOVERNANCE REPORT
• the independence of a candidate proposed to be appointed as an independent non-executive Director, in particular by reference to the independence requirements under the Hong Kong Listing Rules;
• any potential contributions the candidate can bring to the Board in terms of diversified aspects, including professional qualifications, skills, professional experience, tenure of service, independence, race, gender and age;
• commitment in respect of available time and relevant contribution to discharge duties as a member of the Board and/or Board committees;
• the Company’s business activities, asset size and shareholding structure, as well as the Company’s corporate strategy; and
• such other perspectives that are appropriate to the Company’s business and the succession planning and where applicable, may be adopted and/or amended by the Board and/or the Nomination and Governance Committee from time to time for nomination of Directors and the succession planning.
The director nomination policy also sets out the procedures for the selection and appointment of new Directors and re-election of Directors at general meetings. In relation to the appointment of a new Director, the Nomination and Governance Committee will request the candidate to provide his/her biographical information and other information deemed necessary. The Nomination and Governance Committee will review and take reasonable steps to verify the information obtained from the candidate and seek clarification, where required. The Nomination and Governance Committee may, at its discretion, invite any candidate to meet with the Nomination and Governance Committee members to assist them in their consideration of the proposed nomination or recommendation. The Nomination and Governance Committee will then submit its nomination proposal to the Board for consideration and approval and then make recommendation to the shareholders of the Company for approval.
The Nomination and Governance Committee will conduct regular review on the structure, size and composition of the Board and the director nomination policy, and where appropriate, make recommendations on changes to the Board for consideration and approval to complement the Company’s corporate strategy and business needs to ensure its effectiveness.
The Nomination and Governance Committee held one meeting during the year ended 31 December 2019. The main topic considered was review on the Company's compliance with the corporate governance functions, including Directors’ profiles, board diversity policy, Directors’ professionals and sustainability. The attendance records are set out under “Directors’ Attendance Records” on page 46.
STRATEGIC AND SUSTAINABILITY COMMITTEE
The Board resolved to change the name of the Strategic Committee to Strategic and Sustainability Committee on 4 August 2018, and has updated its Terms of Reference and Detailed Working Rules to better reflect its functions.
The Strategic and Sustainability Committee is responsible for formulating the overall sustainable development plans and investment decision-making procedures of the Group. As at the date of this report, members of the Strategic and Sustainability Committee comprise two executive Directors, namely Mr. Li Chaochun and Mr. Li Faben, one independent non-executive Director, Mr. Wang Gerry Yougui, and one non-executive Director, Mr. Yuan Honglin, with Mr. Li Chaochun acting as the chairman of the committee.
During the year ended 31 December 2019, the Strategic and Sustainability Committee held one meeting; matters considered included assessment of the culture, management framework, affairs, risk management, capacity building and other matters in the fields of environment, social responsibility and sustainability of the Company, etc. The attendance records are set out under “Directors’ Attendance Records” on page 46.

52 2019 Annual Report
CORPORATE GOVERNANCE REPORT
CORPORATE GOVERNANCE FUNCTIONS
The Nomination and Governance Committee is responsible for performing the functions of corporate governance.
During the reporting period, the Nomination and Governance Committee has reviewed the Company’s corporate governance policies and practices, training and continuous professional development of Directors and senior management, the Company’s policies and practices on compliance with legal and regulatory requirements, the compliance of the Model Code and Employees Written Guidelines, and the Company’s compliance with the Corporate Governance Code and disclosure in Corporate Governance Report.
SUPERVISORY COMMITTEE
During the reporting period, the Supervisory Committee of the Company comprises three members, namely Ms. Kou Youmin (chairperson), Mr. Zhang Zhenhao and Ms. Wang Zhengyan. The Supervisory Committee is responsible for exercising supervision over the Board and its members and the senior management; and preventing them from abusing their power and authorities and jeopardizing the legal interests of the shareholders, the Company and its employees. During the year ended 31 December 2019, the Supervisory Committee held six meetings to review the financial positions and the internal control of the Company and adhered to the principle of good faith and proactively carried out various work.
The terms of office of Supervisors of the Company (including staff representative supervisor) commence from the date on which the resolutions in relation to appointment/re-election are passed until the conclusion of the annual general meeting of the Company to be convened in 2021 and are subject to retirement and re-election.
Pursuant to the Articles of Association, all Supervisors of the Company shall retire from office by rotation at least once every three years. The shareholder representative shall be elected at general meetings, and the employee representative shall be elected democratically by the employees of the Company. On 20 March 2018, Ms. Wang Zhengyan was elected as the employee representative Supervisor of the Company at the employee representatives’ meeting. On 3 August 2018, two shareholder representatives, Ms. Kou Youmin and Mr. Zhang Zhenhao, were elected at 2018 first extraordinary general meeting of the Company, together with Ms. Wang Zhengyan, to jointly form the fifth session of the Supervisory Committee of the Company.
ACCOUNTABILITY AND AUDIT
Directors’ Responsibilities for Financial Statements
The Directors acknowledged their responsibilities for preparing the consolidated financial statements of the Company for the year ended 31 December 2019.
The Board is responsible for presenting a balanced, clear and understandable assessment of annual and interim reports, inside information announcements and other disclosures required under the Hong Kong Listing Rules and other regulatory requirements.
The senior management provides explanations and information to the Board for approval so as to enable the Board to make an informed assessment and to consider and approve the financial information and position of the Company.
The statement of the independent auditors of the Company about their reporting responsibilities on the consolidated financial statements is set out in the Auditor’s Report on page 92.
INTERNAL CONTROL AND RISK MANAGEMENT
The Board has overall responsibility for maintaining the soundness and effectiveness of the internal control system and risk management procedures of the Group, including setting up a management structure and its terms of reference to ensure efficient and effective use of the Group’s resources to assist the Group in achieving its operation objectives, safeguarding the Group’s assets against any unauthorized use or disposal and ensuring an appropriate maintenance of relevant records.

53China Molybdenum Co., Ltd.
CORPORATE GOVERNANCE REPORT
The Board acknowledges that it is responsible for the risk management and internal control systems and reviewing the effectiveness of such systems. Such systems are designed to manage rather than eliminate the risk of failure to achieve business objectives, and can only provide reasonable and not absolute assurance against material misstatement or loss.
The Board maintains on-going supervision over the risk management and internal control systems of the Company through the Audit and Risk Committee, and has reviewed the effectiveness of such systems during 2019. The said review covered all material controls, including financial, operational and compliance controls.
The Board is of the opinion that the Company has adequate resources, staff qualifications, experience and training programmes as well as the relevant budget in terms of accounting, internal audit and financial reporting.
During 2019, the Audit and Risk Committee has reviewed the following matters:
• the changes, since the last annual review, in the nature and extent of significant risks, and the Company’s ability to respond to changes in its business and the external environment;
• the scope and quality of management’s ongoing monitoring of risks and the internal control systems, and the work of its internal audit function and other assurance providers;
• significant control failings or weaknesses that have been identified during the period, and the extent to which they have resulted in unforeseen outcomes or contingencies that have had, could have had, or may in the future have, a material impact on the Company’s financial performance or condition; and
• the effectiveness of the Company’s processes for financial reporting and compliance of the Hong Kong Listing Rules.
Deloitte Touche Tohmatsu Certified Public Accountants LLP (Special General Partnership) has been appointed to review the effectiveness of internal control in relation to the financial report of the Company for the year ended 31 December 2019 in accordance with relevant requirements under the Corporate Internal Control Audit Guidelines and the China Code of Ethics for Certified Public Accountants. Its responsibilities are to express an audit opinion on the effectiveness of internal control over the financial report after conducting an audit, and to disclose the material defects that have come to its attention in the internal control over non-financial reports. Deloitte Touche Tohmatsu Certified Public Accountants LLP (Special General Partnership) is of the view that the Company has maintained effective internal control over the financial report in all material aspects in the year ended 31 December 2019 in accordance with the Basic Rules for Corporate Internal Control and relevant requirements.
The Board evaluates the effectiveness of internal control system once a year. During the reporting period, the Company completed internal control self-assessment report for 2019. The Board has evaluated and validated the risk management and internal control system of the Group and has not found any violation of laws, regulations and rules or any significant deficiency in compliance monitoring and risk management or any major mistake. The Board considers the risk management and internal control systems of the Group are effective.
Details of the Audit Report on Internal Control issued by Deloitte Touche Tohmatsu Certified Public Accountants LLP (Special General Partnership) and the Internal Control Self-Assessment Report for 2019 of the Company had been published on the websites of the SSE, the Stock Exchange and the Company on 27 March 2020.
The Company has established an internal audit system. The internal control system of the Group is designed to facilitate effective and efficient operations, to ensure reliability of financial reporting and compliance with applicable laws and regulations, to identify and manage potential risks and to safeguard assets of the Group. The internal control system established by the Group for the purposes of risk management and control, together with internal audit and findings in the operation and management, and with reference to audit findings by external auditors, can be used to comprehensively recognize, evaluate and supervise material risks that the Group faces, including operation and decision-making risk, financial management and control risk and the risks resulted from the changes of operating environment. The internal auditors and senior management shall evaluate operational controls and risk management on a regular basis and report to the Audit and Risk Committee on any findings concerning internal control and risk management. The Audit and Risk Committee supervised the implementation of various rectification measures, and the rectification work was in line with expectations after subsequent tracking and checking.

54 2019 Annual Report
CORPORATE GOVERNANCE REPORT
DEALING WITH AND PUBLISHING INSIDE INFORMATION
The Company has formulated a policy regarding dealing with and publishing inside information, which specifies the procedures of and internal control over dealing with and publishing inside information to deal with and publish inside information in due course, without leading to place any person in a privileged position in security transactions. The inside information policy also provides guidance to the employees of the Group to ensure appropriate measures were put in place and prevent from contravening the disclosure requirements as stipulated in laws and Hong Kong Listing Rules by the Group. The Company establishes appropriate internal control and reporting system to identify and evaluate potential inside information. Pursuant to the requirements of Hong Kong Listing Rules, the Company publishes the relevant information relating to inside information on the websites of SSE, the Stock Exchange and the Company.
AUDITORS’ REMUNERATION
For the year ended 31 December 2019, the remuneration paid to the auditors of the Company, Deloitte Touche Tohmatsu Certified Public Accountants LLP (Special General Partnership) is set out below:
Types of servicesRemuneration
paid/to be paidRMB’000
Annual audit service 9,580Internal control audit 3,500
Note: Deloitte Touche Tohmatsu Certified Public Accountants LLP (Special General Partnership) provides auditing of financial statements of the parent company and the consolidated financial statements and reviews on the effectiveness of internal control for the Company. In 2019, annual financial auditing for the Company’s overseas businesses was conducted by Deloitte Touche Tohmatsu, Deloitte Touche Tohmatsu Certified Public and Deloitte SA, auditing fee of overseas businesses for the year amounted to approximately RMB5.862 million.
COMMUNICATIONS WITH SHAREHOLDERS AND INVESTOR RELATIONS
The general meetings of the Company provide a forum for communication between the shareholders and the Board. The Chairman as well as chairmen of the Audit and Risk Committee, Remuneration Committee, Nomination and Governance Committee and Strategic and Sustainability Committee shall attend the forthcoming annual general meeting to answer questions of the shareholders.
The Company will convene the annual general meeting (“AGM”) on 12 June 2020 and the notice of the AGM will be published and dispatched to the shareholders of the Company in accordance with the requirements of the Hong Kong Listing Rules and Articles of Association.
As at the end of the year, in accordance with the latest provisions of relevant laws, regulations, normative documents and the Article of Association, the Company formulated and revised the Articles of Association and prepared systems such as the Internal Reporting System for Major Issues of China Molybdenum Co., Ltd. (《洛陽鉬業重大事項內部報告制度》), the Information Dissemination and Promotion Guide of China Molybdenum Co., Ltd., the Detailed Working Rules of the Sustainability Committee, so as to enhance the level of internal control and management.
The Company is committed to disseminating important information regarding the Group to the public. To facilitate effective communication, the Company set up the website www.cmoc.com which sets out the information and updates relating to the Company’s business development and operation as well as financial information and other information available for public inspection.
SHAREHOLDERS’ RIGHTS
To safeguard the shareholders’ interests and rights, separate resolutions are proposed at shareholders’ meetings on each substantial issue (including the election of individual Directors).
All resolutions put forward at a general meeting will be taken by poll pursuant to the Hong Kong Listing Rules and the poll results will be posted on the websites of the Company, the Stock Exchange and the SSE after the general meeting.

55China Molybdenum Co., Ltd.
CORPORATE GOVERNANCE REPORT
CONVENING AN EXTRAORDINARY GENERAL MEETING BY SHAREHOLDERS
Shareholders either individually or collectively holding more than 10% of the shares of the Company may, through signing one or more copies of requisition(s) in the same form and content stating the topics to be discussed at the meeting, require the Board to convene an extraordinary general meeting or a class meeting. The Board shall, in accordance with the laws, administrative regulations and Articles of Association, furnish a written reply stating its agreement or disagreement to the convening of an extraordinary general meeting within ten days after receiving aforesaid written requisition(s).
In the event that the Board agrees to convene an extraordinary general meeting, the notice of the general meeting shall be issued within five days after the passing of the relevant resolution of the Board. Any change to the original proposal made in the notice requires prior approval of the shareholders concerned.
In the event that the Board does not agree to convene an extraordinary general meeting or does not furnish any reply within 10 days after receiving such requisition(s), shareholders individually or collectively holding 10% or more of the Company’s shares shall be entitled to propose to the supervisory committee to convene the extraordinary general meeting, provided that such proposal shall be made in writing.
In the event that the supervisory committee agrees to convene an extraordinary general meeting, the notice of the general meeting shall be issued within five days after receiving such proposal. Any changes to the original proposal made in the notice shall require prior approval of the shareholders concerned.
Failure of the supervisory committee to issue the notice of the general meeting within required time frame shall be deemed as failure of the supervisory committee to convene and preside over a general meeting, in which case, shareholders individually or collectively holding 10% or more of the Company’s shares for 90 consecutive days or more may convene and preside over the meeting on his/her/their own.
Where the supervisory committee or shareholders decide(s) to convene the general meeting by itself/themselves, it/they shall send out a written notice to the Board, and shall file with the dispatched office of the CSRC at the locality of the Company and the stock exchange. The shareholding of the convening shareholders shall not be lower than 10% prior to the announcement of the resolutions of the general meeting. The supervisory committee or the convening shareholders shall submit relevant evidence to the dispatched office of the CSRC at the locality of the Company and the stock exchange upon the issuance of the notice of general meeting and the announcement of the resolutions of the general meeting.
PUTTING FORWARD PROPOSALS AT GENERAL MEETINGS
When the Company convenes a general meeting, the Board, supervisory committee or the shareholders either individually or collectively holding 3% or more of the Company’s shares may put forward proposals to the Company.
Shareholders either individually or collectively holding 3% or more of the Company’s shares may submit their provisional motions to the convener 10 days before the date fixed for convening of the meeting. The convener shall issue a supplementary notice of the general meeting two days after the motions have been received and announce the name of the shareholder submitting the provisional motions, shareholding percentage and the contents of the motions.
Save for the circumstances referred to in the preceding paragraph, after the convener has issued the notice on the general meeting, no change shall be made to the motions listed in the notice of the meeting nor new motions shall be added.
The general meeting shall not vote on or resolve motions not listed in the notice of the general meeting or motions which do not meet the following requirements.
Content of proposals at the shareholders’ general meeting shall be matters falling within the functions and powers of general meeting. It shall have definite topics to discuss and specific matters to resolve and comply with the laws, administrative regulations and the requirements in the Articles of Association.

56 2019 Annual Report
CORPORATE GOVERNANCE REPORT
SHAREHOLDERS’ ENQUIRIES
Enquiries about Shareholdings
Shareholders should direct their enquiries about their shareholdings to the Office of the Board at the Company’s principal place of business in the PRC (for holders of A shares) or at the H share registrar of the Company, Computershare Hong Kong Investor Services Limited (for holders of H shares).
The address and contact details of the Company’s principal place of business in the PRC are as follows:
North of YiheHuamei Shan RoadChengdong New DistrictLuanchuan CountyLuoyang CityHenan ProvinceThe People’s Republic of ChinaTelephone No.:(+86) 379 6860 3993Facsimile No.:(+86) 379 6865 8017
The address and contact details of the H share registrar of the Company, Computershare Hong Kong Investor Services Limited, are as follows:
17M FloorHopewell Centre183 Queen’s Road EastWanchaiHong KongTelephone No.: (+852) 2862 8555Facsimile No.: (+852) 2865 0990/(+852) 2529 6087
ENQUIRIES ABOUT CORPORATE GOVERNANCE OR OTHER MATTERS TO BE PUT TO THE BOARD AND THE COMPANY
The Company will not normally deal with verbal or anonymous enquiries. Shareholders may send written enquiries to the Company, for the attention of the office of the Board, by email: [email protected], fax: (+86) 379 6865 8017, or mail to North of Yihe, Huamei Shan Road, Chengdong New District, Luanchuan County, Luoyang City, Henan Province, the People’s Republic of China (Attention: Mr. Yue Yuanbin). Shareholders may call the Company at (+86) 379 6860 3993 for any assistance.
Note: Shareholders’ information may be disclosed as required by law.
CONSTITUTIONAL DOCUMENTS
The Company approved the amendments to the Articles of Association at the extraordinary general meeting held on 28 March 2019. The latest Articles of Association of the Company are available on the websites of the SSE, the Stock Exchange and the Company.

57China Molybdenum Co., Ltd.
REPORT OF THE BOARD OF DIRECTORS
Dear Shareholders,
The Directors of the Company are pleased to present their 2019 annual report and the audited consolidated financial statements of the Company for the year ended 31 December 2019.
ESTABLISHMENT OF THE COMPANY
The Company was incorporated in the PRC on 25 August 2006 as a joint stock limited company in preparation for the listing of the Company’s shares on the Stock Exchange. Details are set out in the H share prospectus of the Company dated 13 April 2007.
On 26 April 2007, the Company completed its initial public offering of H shares and the H shares of the Company were successfully listed on the Stock Exchange.
On 24 September 2012, the Company completed its initial public offering of A shares. On 9 October 2012, the A shares of the Company were successfully listed on the SSE.
PRINCIPAL ACTIVITIES
(I) Principal Businesses
The Company engages in non-ferrous metal industry, mainly the mining, beneficiation, smelting, refining and trading of base and rare metals. With its main business located in five continents: Asia, Africa, South America, Oceania and Europe, the Company is the largest tungsten producers, the second largest cobalt and niobium producer, one of the top five molybdenum producers and a leading copper producer in the world. It is also the second largest producer of phosphatic fertilizers in Brazil. In terms of trading business, the Company is among the third biggest base metals merchants in the world.
The Company’s vision is to become the most respected international resources company. It focuses on building a corporate culture that features meritocracy, cost control, continuous improvement, and achievement sharing. The corporate strategies include: reinforcing and maintaining the current competitiveness of the Company's business and strengthening competitive cost advantages of existing business through continuously identifying cost reduction opportunities and improving efficiency; optimizing business development fueled by organic growth of current production capacity and outward investment, based on the existing resource endowment, while continuously optimizing the Company's production capacity structure, appropriate external investment should be made to expand resource reserves and growth capacity; continuously managing and optimizing the balance sheet by rationalizing financing structure and reducing capital costs; creating synergy while ensuring stable domestic and overseas operations. Relying on its comprehensive competitive advantages in scale, industrial chain, technology, funds, market and management, and thanks to its diversified financing platform, the Company is stepping firmly towards its strategic goals.
(II) Business Model of the Company
1. Mineral mining and processing business
The Company’ mining business adopts a model of centralized operation and level-to-level management. Besides, the Company has been seeking for investment, merge and acquisition opportunities on the projects of high-quality resources in a global scale.
(1) Procurement model
The Company adopts a tendering system for the procurement of materials in large quantities and for materials below the standards for tendering, the Company adopts centralized competitive bidding and separate hearings, resulting in a system that allows centralized procurement, division of responsibilities and a multi-layered supply chain. In particular, blasting equipment used in mining is a special commodity under governmental regulation, the trading of which is subject to a licensing system. Within the scope permitted by the laws and regulations, the Company could carry out designated procurement of this class of materials.

58 2019 Annual Report
REPORT OF THE BOARD OF DIRECTORS
(2) Production model
A large-scale, batch-based and continual production model is adopted. Moreover, the production plan is formulated and the best level of output is decided in line with the reserves of mines and the service life and on the basis of the market research.
(3) Sales model
Principal products of the Company include copper, cobalt, molybdenum, tungsten, niobium, and phosphate and other related products, wherein:
① The principal copper and cobalt products are copper cathode, copper concentrate and cobalt hydroxide. During the reporting period, copper cathode and copper concentrate are mainly sold to commodity traders (including Trafigura Beheer BV based in the Netherlands) and copper smelting plants, while cobalt hydroxide is mainly sold to the downstream cobalt smelting plants (including Umicore);
② The direct sales model of “manufacturer – consumer” has been mainly adopted in molybdenum, tungsten and related products, with the indirect sales model of “manufacturer – third party dealer – consumer” as the auxiliary;
③ Niobium products are ferroniobium. The Company has established an end user-oriented marketing strategy of direct selling aiming at different client bases from Europe, Asia and the North America. Meanwhile, domestic marketing team in the PRC has been promoting the sale of niobium to domestic niobium clients;
④ The major clients of its phosphate products are fertilizer mixers who mix the Company’s phosphate fertilizer with other auxiliary materials according to different formulas to produce mixed fertilizers and sell them to the end customers within Brazil.
2. Mineral Trading Business
Mineral trading of IXM makes profit mainly by seeking low-risk arbitrage opportunities in the value chain, and hedges the price change risks of spot positions through derivative financial instruments such as futures contracts, for example, arbitrage between different qualities and grades of the goods (quality spread), arbitrage between different locations or futures exchanges (location spread) and arbitrage based on different delivery periods (time spread). After discovering the above mismatch opportunities, IXM locked in profits by buying in the cheap market and selling in the expensive market, and simultaneously completed the conversion of commodity space, time and form.
(1) Concentrate metal trading
The gross profit of this business mainly comes from the difference between treatment charge/refining charge (TC/RC). IXM obtains profit from the difference between TC/RC agreed between the mine and the smelter through its deep understanding and prediction of market supply and demand, and the establishment of a strong cooperative relationship with mineral producers and smelters. It accounts for a large proportion of the gross profit of IXM’s concentrate business.
(2) Refined metal trading
The gross profit of this business mainly comes from the arbitrage of basis difference (the difference between the spot price and the futures price or the difference between the recent and forward futures contracts). With the layout of IXM in the entire value chain, the position-holding cost (including storage, insurance and financing costs, etc.) is kept at a low level. When the profits obtained through the basis difference can fully cover the corresponding the position-holding cost, IXM is able to lock profits with lower risks.

59China Molybdenum Co., Ltd.
REPORT OF THE BOARD OF DIRECTORS
(3) Sourcing, sales and risk control
IXM sourcing and sales strategy leverages on a network of commercial and logistic assets strategically located in key regions, an integrated supply chain, strategic mining investments for long term off-takes and downstream investments to secure captive flows. IXM dedicates considerable time and resources to analyzing market balances and seek possible trading opportunities through regular contact with IXM market research team and research institutes of this field.
IXM has built a diversified supplier & customer portfolio which includes integrated companies, smelters and refined metal retailers, etc, on the basis of the substantial network of contacts all along the supply and sale chains. As part of its strategy, IXM tend to work mostly with proven and performing counterparties.
While IXM conducts spot trading of non-ferrous metals, it also holds futures contracts of the same metal species that can be settled on a net basis. Taking advantage of the strong correlation between spot trading and future businesses, through the combined business model of futures business and spots trading, in the upswing cycle of the spot market, the profits of the spot trading side make up for the losses of the futures business; in the downward cycle of the spot market, the profits of the futures business make up for the losses of the spot trading side. This business model reduces the risks caused by industry cyclical and price fluctuations, creating stable and sustainable profits for enterprises.
IXM has a mature risk management and control system. After the risk prevention and control strategy is approved by the Company, it will be implemented by the risk management and macro strategy committee of IXM. IXM has set up a special risk management department to ensure that IXM’s risk control policies can be properly implemented through the supervision of daily positions and Var values.
(III) Industry Overview of Principal Products
The COVID-19 pandemic has brought greater uncertainty to the development of the industry, Although it has been effectively controlled in China and the industry resumed work and production began in an orderly manner, the epidemic has spread rapidly around the world, with huge impact on the global economic development, which superimposed on the price war between the two major oil giants, Saudi Arabia and Russia, resulting in a sharp drop in crude oil prices and a substantial drop in commodity prices. While the Federal Reserve urgently cut interest rates, entering the “0” rate era, and will also implement an unlimited quantitative easing program; China’s central bank is also making targeted cuts, releasing RMB550 billion worth of long-term capital; Various governments are taking various measures to cope with the situation. However, the huge uncertainty over the development of the pandemic has made it difficult to dismiss the pessimism. With commodities declining, the global economy is set to undergo a major test in the future and industry uncertainty intensifies.
1. Copper industry
The Company is a leading copper producer in the world and sells copper product (copper cathode and copper concentrates) to the international market. According to the data from Wood Mackenzie, global production volume of copper metal for the year 2019 was approximately 23.59 million tonnes, representing a year-on-year increase of 0.54%, production volume of copper metal by the Company for the year 2019 was approximately 206.5 thousand tonnes, representing 0.88% of the global production volume.
As one of the important raw materials of basic industries, copper with both industrial and financial traits is in-dispensable for industrial production and people’s daily lives. Among the non-ferrous materials, copper only lags behind aluminum in terms of consumption. From the view of major consumption areas, China, Europe and the United States are the three traditional consuming regions and maintain steady consumption levels.

60 2019 Annual Report
REPORT OF THE BOARD OF DIRECTORS
Since the second half of 2019, the signals of steady growth of domestic policies have been continuously released, including accelerated issuance of special bonds, central bank’s cut in required reserve ratio and easing of project capital ratio. Meanwhile, China and the United States have signed the phase one trade deal and the global economic recovery will be more sustainable, thus improving the demand expectation of copper. The acceleration of completion of domestic real estate gradually realizes the macroeconomic situation, also gradually pull the terminal consumption of household appliances such as air conditioning, washing machines rebound, stimulating the demand for copper. In respect of supply, affected by evens such as road blocking, riots and nationwide protests, main copper-produced countries in South America disturbance frequently occurred, making the supply of copper concentrate continuously tight. Therefore, price of copper increased steadily at the end of 2019. Copper prices has fallen sharply in early 2020 as logistics and supply chains were disrupted by the COVID-19 pandemic and uncertainty about global growth increased. With the epidemic under steady control in China, companies resuming production and work, and countries around the globe introducing policies for lowering interest rates, stabling growth and promoting consumption, the global economy is expected to recover gradually, which will support the future copper price rebound and gradually return to normal price trend.
2. Cobalt industry
The Company is the world’s second largest producer of cobalt and sells cobalt hydroxide to the international market. Pursuant to the data from Commodity Research Unit (CRU), global production volume of cobalt metal for the year 2019 was approximately 136 thousand tonnes, representing a year-on-year increase of 7.09%, production volume of cobalt metal by the Company for the year 2019 was approximately 16.1 thousand tonnes, representing 11.8% of the global production volume.
Since the 20th century, cobalt and its alloys have been widely used in industrial sectors such as motors, machinery, chemicals and aerospace and become an important strategic metal. In recent years, with the rapid development of consumer electronics and new energy vehicles, the consumption of cobalt is increasing year by year. Cobalt is one of the most common metal materials for lithium battery anodes. Currently, about 60% of total cobalt consumption is from battery materials. In respect of resources reserve, according to statistics in the “2020 Mineral Commodity Summaries” published by USGS in January 2020, global cobalt reserve as of the end of 2019 was approximately 7.00 million tonnes (the amount of metal). Among them, the DRC and Australia owns approximately 51% and 17% of the total global cobalt resources respectively.
The downstream distribution of global cobalt demand in 2019
Data Source: Antai, Haitong Securities Research Institute ( 海通證券研究所 )
Hardfacing material2.90%
Catalyst4.30%
Magnetic materials2.20%
Tire/Drier2.20%
Other2.10%
Ceramics4.00%
Batteries62.46%
Cemented carbide,diamond tools5.81%
High-temperature alloy13.41%
In the first half of 2019, affected factors such as growth in market supply, the price of cobalt products was significantly reduced. However, fundamentals of cobalt have gradually improved from the second half of 2019. From the perspective of supply, according to the annual report disclosure of 2019 of Glencore, its Mutanda mine suspended its production at the end of 2019. Cobalt production guidelines in 2020 is decreased by approximately 17 thousand tonnes as compared to the actual production volume in 2019. The impact of the COVID-19 outbreak on logistics and the resumption of work has further tightened the supply of cobalt. In terms of demand, update of consumer electronics products driven by 5G will pull the demand for cobalt in the short term. In addition, the improvement of EV penetration rate European automobile enterprises brought by the new carbon emission regulations in Europe and the hot sales of Tesla will further drive the medium and long-term demand for cobalt in the future. With the improvement of fundamentals and the gradual warming of market sentiment, cobalt consumption will usher in a new round of development, the price is expected to rise steadily.

61China Molybdenum Co., Ltd.
REPORT OF THE BOARD OF DIRECTORS
3. Molybdenum industry
The Company is one of the top five molybdenum producers in the world. Molybdenum products are mainly sold to domestic markets in the PRC. In accordance with the data from China Non-ferrous Metals Industry Association Molybdenum Branch, production volume of molybdenum metal in China for the year 2019 was approximately 100 thousand tonnes, representing a year-on-year increase of 7.76%, production volume of molybdenum metal by the Company for the year 2019 was approximately 14.9 thousand tonnes, representing 14.9% of the production volume in China.
China is the country with most abundant molybdenum resources in the world. Currently, its proven reserve of molybdenum is the No.1 in the world. Pursuant to the data published by USGS in 2020, global molybdenum reserve was approximately 18 million tonnes, nearly half of which was distributed in China. America, Peru and Chile totally owned 39% of global molybdenum resources and others are distributed in other countries. Among them, molybdenum reserve in China was 8.3 million tonnes, ranking No.1 in the world. The downstream of molybdenum has been widely used in different sectors such as iron and steel industry, machinery, electronics, mining, agriculture and pharmaceutical. Molybdenum has become a significant resource.
Global molybdenum primary product structure for 2018
Data Source: Yilanwang, Northeast Securities
Structural steel39%
Stainless steel23%
Chemical products13%
Cast iron8%
High-speed tool steel8%
Molybdenum metals6%
Nickel alloy3%
China is the main driver of global molybdenum consumption growth. From 2000 to 2018, China’s primary molybdenum demand increased to 93 thousand tonnes for the metal from 12 thousand tonnes for the metal, representing a CAGR of 11.9%. Since 2016, under the dual influences of the supply-side reform of molybdenum industry and conservative mining policies of the industry introduced by China, gross supply volume of molybdenum was effectively brought under control, domestic mining enterprises with high cost and low efficiency were shut down or urged to cut production. On top of that, tightening and normalized environmental inspection phased out the overcapacity on the supply side. Certain domestic steel plants have been upgrading their industrial structures, thus, the focus of production is shifting from ordinary steel to special steel; as such, demand of molybdenum showed steady and sound increase benefiting from the development of stainless steel products. Meanwhile, from 2019 to 2023 the CAGR of global demand for molybdenum metal is 2.6%, as predicted by CRU, while global principal production enterprises of molybdenum are faced with the impact of lowering grade. Thus, the capacity growth is expected to be restricted.

62 2019 Annual Report
REPORT OF THE BOARD OF DIRECTORS
4. Tungsten industry
The Company is the largest tungsten producer in the world and sells tungsten products to the domestic market in the PRC. In accordance with the data published by the United States Geological Survey in 2020, global tungsten reserve was approximately 3.2 million tonnes. In accordance with the data showed by China Nonferrous Metals Industry Association, production volume of tungsten metal in China for the year 2019 was approximately 95.1 thousand tonnes; production volume of tungsten metal by the Company for the year 2019 was 10.7 thousand tonnes, representing 11.25% of the production volume in China.
The Sandaozhuang Mine which is currently under mining is the largest uni-tungsten mine under operation in the world. China, as the largest producer of tungsten in the world, contributes to over 80% of the global supply. In recent years, the tungsten industry, has long been in the overcapacity with greater supply than demand and difficulty in destocking, and the tungsten market is hovering at low levels under the pressure of weak demand and difficulties in stock clearance. As the market price dived below the cost line, some mining enterprises stopped or downsized output, leading to a decline in the total capacity of the market. Since 2019, the production volume growth of major hard alloy was declined slightly, leading to a drop in tungsten demand. In September 2019, the Company won the auction for the 28,300 tonnes of APT inventory seized by the Kunming Pan Asian Nonferrous Metals Exchange, removing uncertainties that looms over the global tungsten market, and the relevant product price immediately recovered. As the depressed market downturn in the early stage inhibits the production capacity of enterprises and the impact of COVID-19 on road transportation and logistics, the supply of tungsten raw materials is relatively tight and supporting the stable tungsten price. In the future, with the recovery of the downstream demand for hard alloy, the price is expected to rise further.
5. Niobium industry
The Company is the world’s second largest producer of niobium, and sells niobium products to the international market. Production volume of niobium metal by the Company for the year 2019 was 7,489 tonnes.
The market of niobium is highly concentrated in the world. Companhia Brasileira de Metalurgia e Mineração (CBMM), occupying approximately 75% of the global output, has the absolute dominant position in the industry and has a strong influence on the price trend of niobium. Meanwhile, CBMM sets the pace of its output expansion for niobium products, so niobium price has kept relatively stable in history. Niobium’s major application product is ferroniobium, which mainly used to product structural steel with low alloy and high strength. In recent years, with structural adjustment and upgrading of the domestic steel industry, the consumption of ferroniobium in China has been increasing gradually. According to the data of Roskill, the CAGR of global niobium consumption reached 5% from 2010 to 2019, and the import growth of China's niobium products reached 30% year-on-year in both 2018 and 2019. With the official implementation of the new national standard for the domestic screw threaded steel, the trend of niobium replacing vanadium by steel manufacturers will further increase the niobium consumption.
63China Molybdenum Co., Ltd.
REPORT OF THE BOARD OF DIRECTORS
6. Phosphate industry
The Company is the second largest phosphate fertilizer producer in Brazil, selling phosphate fertilizer products to the Brazilian market. Brazil is one of the major producers and exporters of agricultural products in the world and the fourth largest fertilizer consumer in the world, and its annual consumption is far beyond its domestic output. MAP and Single superphosphate (“SSP”) are major high- and low-concentrated phosphate fertilizer products respectively in the Brazilian market.
Considering the rapid development of Brazil’s agriculture, there will be a steady growth in the demand for phosphate fertilizer in the next few years. As its phosphate ore reserves are not rich and such ores have relatively low contents of P2O5.Therefore, it needs to import a large amount of fertilizer products from Russia, the United States, China and other countries. The phosphates mine and chemical plants owned by the Company are located in the agricultural center of Brazil, the ores held have relatively high contents of P2O5 valid compound of phosphates mine is high. Meanwhile, due to the high cost of logistics in Brazil, the location with obvious geographical advantages, makes the Company one of the producers with the lowest production costs in these important areas.
BUSINESS REVIEW
According to the Schedule 5 of the Companies Ordinance of Hong Kong (Chapter 622 of The Laws of Hong Kong), discussion and analysis were made including the business review for the year ended 31 December 2019 and discussion on business development in the future which are described on the section headed “Business Review and Prospects” on page 18 to page 21 of this annual report, while description of principal risks and uncertainties facing by the Group can be found in different parts of this annual report, including the descriptions under the section headed “Risk Warning” on page 39 to page 41. Analysis using financial key performance indicators is described in the section headed “Management Discussion and Analysis” on page 22 to page 30 of this annual report. The above discussion forms part of the Report of the Board of Directors.
CORPORATE BONDS
During the year, basic information about issued corporate bonds is as follow:
Name of bonds Abbreviation Code Issue dateMature date
Balances of bonds
Interest rate
Payment method for principal and interest
Trading venues
(%)
US Dollar denominated bonds
CMOC CAP B2202 5722 2019/2/1 2022/2/1 USD0.3 billion
5.48 Full interest payment for half year
The Stock Exchange of Hong Kong Limited
Public issuance of 2019 Corporate Bonds (first tranche) of China Molybdenum Co., Ltd.*
19 CMOC 01 163043 2019/11/28 2022/11/28 RMB1 billion 4.28 Interest payment once a year, one-off payment of principal upon expiry
Shanghai Stock Exchange
1. Pursuant to “the proposal in respect of seeking authorization from the shareholders’ meeting of the Company to the board of directors of the Company for issue of debt financing instruments” considered and approved by the 2017 annual general meeting, the first extraordinary general meeting of the fifth session of the Board of the Company has determined to approve CMOC Capital Limited (being a wholly-owned subsidiary) to issue oversea bonds to qualified foreign institutional investor.
As at 1 February 2019, the Company issued USD0.3 billion bonds with the annual interest rate being 5.48%; and the interests paid semi-annually; the bond maturity date is 1 February 2022. The issuance of US dollar bonds was listed on The Stock Exchange of Hong Kong Limited on 4 February 2019.
Approximately USD297.5 million of net proceeds from the raised funds of issuance of USD bonds after deducting commissions and other estimated expenditures related to the issuance of overseas bonds will be used for the general operating needs of the Company, including but not limited to the repayment for existing obligations of the Company.

64 2019 Annual Report
REPORT OF THE BOARD OF DIRECTORS
2. Pursuant to “the proposal in respect of the Company compliance with the conditions for the issuance of bonds”, “the proposal in respect of the Company compliance with the conditions for the issuance of bonds” and “the proposal in respect of seeking authorization from the shareholders’ meeting of the Company to the board of directors of the Company to fully handle this public issuance of corporate bonds” were considered and approved by the 2016 annual general meeting, the Company has determined to approve the issuance of corporate bonds with a total nominal amount not exceeding RMB8 billion (inclusive) and with a term of no more than 8 years (inclusive), and the authorization to the board of directors to handle all matters related to this corporate bonds issue.
On 26 April 2019, upon the approval of Zheng Jian Xu Ke No. [2019] 840 published by CSRC, the Company was approved to issue corporate bonds to qualified investors with a total nominal amount not exceeding RMB8 billion. On 28 November 2019, the Company issued the first tranche of corporate bonds on the Shanghai Stock Exchange, with a scale of RMB1 billion and a final nominal rate of 4.28%. After deducting the issuing expenses from the principal and interest of the raised funds of current bonds of the Company, it is intended to improve the debt structure, repay the Company’s debts, and supplement the working capital and other purposes in compliance with the legal laws, regulations and relevant provisions.
P lease refer to the re levant announcements d isc losed by the Company on the websi tes of the SSE (www.sse.com.cn), the Stock Exchange (www.hkexnews.hk) and the Company (www.cmoc.com) for details.
ENVIRONMENTAL PROTECTION POLICIES AND PERFORMANCE
Regarding the collective environmental protection policy and performance, the Company maintains its high-quality services in the industry while adhering to the philosophy of “environmental protection goes first with green development”, in building itself into a resource-saving and eco-friendly company. It takes the harmonious development of energy business and environment as a critical responsibility of the Company and a priority in production and operation, and follows through the green mining concepts of resource saving, eco-friendliness and harmonious mining field in establishing its cultural system. It conscientiously implements the guidelines and policies of environmental protection, comprehensively builds up safe and eco-friendly environmental protection engineering and supporting facilities that are beneficial to water and soil conservation as well as recovery and management of mine ecosystem, tracks and supervises the construction of “simultaneous design, simultaneous construction and simultaneous commencement of usage” in environmental protection engineering, maintains strict control over construction, and ensures “not to commence operation without satisfactory acceptance”. Production and operation projects are comprehensively implemented with energy saving and emission reduction and pollution prevention measures to ensure long-term and stable operation in compliance with relevant standards. The Company insists on the development principle of “ecological development, scientific usage and cyclic economy”, actively adopts advanced technology, advanced process, advanced equipment, and endeavors to improve efficient use of resources and the level of discharge recycling and reuse. It promotes clean production, improves the system of energy saving and emission reduction, and practically steps up the reduction of pollutant emissions. It endeavors to promote its ability of environment management, and strives for the sustainable development of environmental protection.
The Company prepared the 2019 Environmental, Social and Governance Report of China Molybdenum Co., Ltd., i.e. the 2019 Social Responsibility Report (hereinafter referred to as the “Report”), pursuant to the Environmental, Social and Governance Reporting Guide issued by the Stock Exchange in December 2015, and the Environmental Information Disclosure Guide for Listed Companies issued by the SSE in May 2008, and disclosed it separately. The Report gives true information of the CMOC in terms of environmental, social and governance activities. All information in the Report are derived from the official documents and statistics reports of CMOC and the summary and statistics of its affiliated companies. The Report gives full disclosure of concerns of the major interested parties (including shareholders, customers, employees, suppliers and partners) of the Company:
• Environment
• Employees
• Community
• Products
Please refer to the 2019 Environmental, Social and Governance Report of China Molybdenum Co., Ltd., i.e. the 2019 Social Responsibility Report disclosed by the Company on the websites of the SSE (www.sse.com.cn), the Stock Exchange (www.hkexnews.hk) and the Company (www.cmoc.com) for details.

65China Molybdenum Co., Ltd.
REPORT OF THE BOARD OF DIRECTORS
COMPLIANCE WITH RELEVANT LAWS AND RULESThe Company devotes its efforts to strictly comply with regulated laws and rules in the jurisdictions where the Company is operating, and is also in compliance with applicable guidelines and rules issued by regulators. As far as the Directors know, the Company has complied with all laws and rules which have material effect on the Company during the reporting period. In addition, compliance with the relevant laws and regulations which have significant impacts on the Group has been disclosed in various parts of this annual report (especially in the Corporate Governance Report). Descriptions of key relationships between employees of the Company, major customers and suppliers are set out on page 74 to page 80 of the Report of the Board of Directors in the annual report.
CORE COMPETITIVENESS
(I) The Company implements and carries out advanced sustainable development policies to escort the Company’s long-term stable development.
There were no work-related accidents in the Company’s global business in 2019. The TRIR (Total Recordable Incident Rate) was 1.62; there were 14 cases of lost time injuries and the LTIR (Lost Time Injury Rate) per million work hours was 0.32, which is better than the global mining industry average published by ICMM.
The Company is fully aware of the importance of sustainability to its access to resources, markets and capital, and has nurtured and actively implemented it as our new core competitiveness. The Company engaged an internationally renowned law firm to review and update its compliance and sustainability policies applicable across the Company, which took reference from international best practice frameworks, including the Sustainability Principles of the International Council on Mining and Metals (ICMM), the IFC Environmental and Social Performance Standards, the International Labour Organization Conventions, the International Bill of Rights, etc., to continuously improve the Company’s governance framework on sustainability through continuous learning of international corporate good practice practices.
During the reporting period, the Company continued to engage external professional auditors for the review of the implementation of the top ten ICMM sustainability principles in the three international mining regions and the progress reported by the Company’s management headquarters. All of the Company’s mining zones are regularly reviewed by a third party to verify compliance with the requirements of the Environmental, Health and Safety Management Certification System, which includes ISO14001 and OSHAS18001 certification.
During the reporting period, the Company established a Sustainability Executive Committee, which is specifically responsible for promoting the implementation of the decisions of the Board, the Strategic and Sustainability Committee and the Company’s sustainability strategy at the executive level, reviewing and updating the Company-wide compliance and sustainability policies, including the Code of Business Conduct, the Supplier Code of Conduct, the Anti-Corruption Policy, the Export Control Policy, the Economic Sanctions Policy, the Human Rights Policy, the Environmental Policy, the Community Policy and the Health and Safety Environmental Policy, etc., to lay a solid policy foundation for future sustainable development.
(II) The Company possesses unique and scarce resource portfol io which effectively resist and reduce the impact of periodic fluctuation
Currently, the Company possesses a unique and scarce product portfolio including copper, cobalt, molybdenum, tungsten, niobium, phosphate and gold, and has industry-leading advantages for each resource variety. The resource varieties cover the basic, rare and precious metals, and enters into the market of agricultural applications with phosphorus resources.
Copper represents an important metal for consumption purpose, enjoying a broad prospect of application. Cobalt, as one of the major materials for new energy batteries currently, is very scarce for strategic purpose because of its low reserve in land resources. The periodical volatility of niobium metal is weaker than other non-ferrous metals, and therefore the price is relatively stable, and the risk of industry volatility is relatively low. Phosphorus is mainly applied in agricultural field. Brazil, where the Company’s business is operated, is bestowed with the vastest potential cultivable land in the world and represents the fourth largest consumer of fertilizer worldwide. Considering the shortage of local phosphates ore resources, phosphorus business of the Company in Brazil has obvious geographical advantages and develops steadily.
Product portfolio with unique and diversified natures enables the Company to effectively resist periodic fluctuation risks in resource sectors, enhance the ability to resist risks and fully enjoy the enormous benefits brought by the periodic changes in prices from various resources.
66 2019 Annual Report
REPORT OF THE BOARD OF DIRECTORS
(III) The Company has a vast reserve of distinctive resources with high quality
The Company is the second largest cobalt producer and the leading copper producer in the world. The TFM Copper and Cobalt Mine operated by the Company in the Congo (DRC) represents one of the largest reserve and highest grade copper-cobalt mines in the world, with a mining area that covers nearly 1,600 sq. km. As at 31 December 2019, the mining area contains 857.7 million tonnes of proven ore resources, with an average copper grade of 2.9%; an average cobalt grade of 0.29%. The Company operates a NPM copper and gold mine in Australia, which is the fourth largest operating copper and gold mine in Australia. As at 31 December 2019, proven ore resources reached 616.33 million tonnes, with an average copper grade of 0.55%; and an average gold grade of 0.2 (g/t).
The Company is the second largest niobium producer in the world and the second phosphate fertilizer producer in Brazil. The Company’s niobium/phosphate mining area in Brazil has rich reserves and bright prospect for exploration, with rich and high quality niobium resources and the highest grade P2O5 resources in Brazil. As at 31 December 2019, there were 452.1 million tonnes of proven phosphate ore resources, with an average grade of 11.22%; and 602.3 million tonnes of niobium ore resources with an average grade of 0.47%.
The Company is the largest tungsten producer and one of the top-five molybdenum producers in the world. The Company’s domestic resources in China include: the Luanchuan Sandaozhuang molybdenum/tungsten mine, a native molybdenum/tungsten mine large in scale, being a part of Luanchuan molybdenum mining field, the largest native molybdenum mining field in the world, and the largest scheelite operation tungsten mine of single unit. During the reporting period, the Luanchuan Shangfanggou molybdenum mine in close proximity to the Sandaozhuang molybdenum mine, which is owned by Luoyang Fuchuan Mining Co., Ltd., a joint venture of the Company, restarted mining and molybdenum ore supply was steadily improving, which was effectively alleviate the molybdenum production decline brought by the reduction of molybdenum grade of the Sandaozhuang mine of the Company. Meanwhile, abundant iron resources accompanied by the Sandaozhuang molybdenum mine have been efficient recovered. The Donggebi Molyubdenum Mine in Hami, Xinjiang, which is possessed by a subsidiary of the Company, has not yet been developed. As at 31 December 2019, domestic molybdenum ore resources owned by the Company aggregated to an amount of 1,342.41 million tonnes, with an average grade of 0.119%; the average grade of associated tungsten resource of Sandaozhuang Molybdenum and Tungsten Mine in Luanchuan was 0.092%, while the average iron grade of the byproducts of the Shangfanggou Molybdenum Mine was 17.50%.
All projects owned by the Company have particularly favorable prospect of resource exploration.
(IV) The Company possesses leading production technology and extremely strong cost competitiveness
Most mines owned by the Company are the mines with a portfolio of recoverable resources and the Company therefore proactively pushes forward the comprehensive recovery and utilization of resources. Within the PRC, the Sandaozhuang molybdenum/tungsten mine, a mine currently exploited and operated by the Company, recovers the by-product scheelite out of the molybdenum tailings, making the Company one of the largest tungsten producers. The successful industrialized recovery of by-products copper and iron created a new profit growth point for the Company. The comprehensive recovery of by-products fluorite and iron ore upon small scale industrialized production is being steadily promoted. Resource recovery of iron byproduct resources in the Shangfanggou Molybdenum Mine is already capable of large-scale production. Abroad, the TFM copper and cobalt mine operated in the Congo (DRC) recovers cobalt from copper tailings, with the high-efficient hydrometallurgy recycling and utilization technology of copper and cobalt resources, with the second-largest output of cobalt in the world. Part of the niobium output of the niobium business operating in Brazil comes from the comprehensive recovery of phosphate tailings. With advanced low-grade niobium ore resource efficient recovery and comprehensive utilization technology, phosphate ore resource processing and utilization, and development and production of high value-added products Technology, the Company’s niobium production ranks second in the world. There are still a variety of recyclable metals in mines located in Brazil which are yet to be researched and utilized by the Company. In the future, experience in production techniques and technology research and development can be shared by comprehensive recovery operation at home and aboard, so as to broaden the prospects of development.
The NPM copper and gold mine operated by the Company in Australia adopted advanced mining technology of block caving, and the automation level of its underground block caving mining has reached 100%. All of the mines (except for NPM) currently operated by the Company have adopted the effective open-pit mining. The Company strengthened the efficiency of ore mining and transport through automation procedures to achieve lower mining costs. The Company made use of by-products with value from comprehensively recycling associated and beneficial resources, strengthening the profitability of the mines operated and expanding the competitive edge in costs. Besides, the cash costs of all business sectors achieved by the Company stand at an internationally leading position in the industry, and enjoy relatively strong competitive edge in the industry.

67China Molybdenum Co., Ltd.
REPORT OF THE BOARD OF DIRECTORS
(V) The Company has advanced technical capabil it ies in the industry and industry-leading innovative technologies
The Company has a strong technological research and development team. The Company successfully implemented industrialization of its various scientific research results, leading industrial technology improvement and promoting the competitiveness of the Company.
The Company continuously invest in technological research, successfully passed the re-examination of high-tech enterprises of China in 2017 for the second time. “The integrated digital mining production management system in open pit mine” and “Technology and industrialization of recycling of low graded scheelite from molybdenum flotation tailings” obtained the award nomination in the “4th China Grand Award for Industry”. In December 2018, the project “Flotation Interface Assembly Technology and Application of Strategic Mineral Resources of Tungsten, Fluorine and Phosphorus and Calcium Minerals” (鎢氟磷含鈣戰略礦物資源浮選界面組裝技術及應用), collaborated by the Company, and Central South University and other units, was awarded the National Science Progress Award (Second Class). In January 2019, “Key technologies for comprehensive utilization and integrated collaborative mining of low grade ore and low grade associated resources of open pit mines” (露天礦貧礦與低品位伴生資源綜合利用及一體化協同開採技術) of the Company was awarded the Second Prize of Henan Province Science and Technology Progress Award. In February 2019, “High-efficiency green extraction technology and application of alkaline extraction of complex, symbiotic and associated tungsten resources” (複雜共伴生鎢資源堿性萃取高效綠色提取技術及應用) of the Company was awarded the First Prize of Hunan Province Science and Technology Progress Award. In December 2019, the Company won the award of “Industry-University-Research Collaboration Innovation and Promotion of China (First Prize)” (中國產學研合作創新成果獎一等獎) with its” Development and Application of Energy Management System of Pure Electric Mineral Card for Intelligent Road Condition”(純電動礦卡智能路況能源管理系統開發與應用), and the Company was awarded the “First Prize for Science and Technology Achievement in China’s Non-Ferrous Metal Industry”(中國有色金屬工業科學技術一等獎) with “Open-pit Mine Unmanned Mining Equipment and Key Technology of Intelligent Control Integration” (露天礦無人採礦裝備及智能管控一體化關鍵技術).
At the Mobile World Congress hosted by GSMA, the Company and its partners announced the first unmanned mining application in China, applying 5G technology to mine production, creating an unmanned mine through the application of unmanned mining equipment in a 5G environment, effectively saving costs while significantly enhancing the ability to guarantee safe production in the mine area and significantly improving production efficiency.
(VI) The Company has acquired a metals trading industry chain through merger and acquisition, which allows it to develop synergistically with its existing mine production businesses.
During the reporting period, the Company successfully acquired the world’s third largest metals trader, which achieves a high degree of synergy and complementarity in customer, sales, supply chain and logistics, risk control and other aspects of the existing businesses while extending the Company’s mine production industry chain. The Company will make full use of IXM’s existing global leading industry research and information advantages to grasp the fundamentals and trends of supply and demand, strengthen market trend research and the supply and demand relationship in the mining industry chain, optimize the resource allocation and strategic decisions of listed companies, enhance the Company’s global industry competitiveness and influence, and work together to form new business competitive advantages.

68 2019 Annual Report
REPORT OF THE BOARD OF DIRECTORS
(VII) The Company possesses a healthy balance sheet and long-term stable shareholder structure, safeguards the healthy development of the Company and values shareholder returns
The Company, as a pioneer and role model for the state-owned enterprises reform in China, had completed the mixed ownership reform of state-owned enterprises in 2014. Currently, a stable shareholder structure has been formed, which includes the investment allocation from private, state and large scale investment institutions, strategic and industrial investors. At present, all the operating businesses are mature in-production projects, with stable profitability and strong cash generating capacity of each business segment. Shareholders of all parties collectively foster the development of the Company and exercise shareholders’ rights in accordance with the combination of industry development and Company’s strategies. Stable business operation, proactive shareholder policies and stable equity structure are more beneficial to the Company in achieving a favorable development so as to steadily carry out the achievement of the strategic goals. The Company has stable and sound financial policies, committed to continuously building a healthy balance sheet.
As at the end of the reporting period, gearing ratio of the Company was 57.65% (51.36% excluding IXM), net interest-bearing debt ratio was 25.34% (17.36% excluding IXM), assets and liabilities structure has continued to remain stable and healthy. The monetary capital balance amounted to RMB15.6 billion as of the end of 2019, with over 50 domestic and foreign banks granting credit to the Company of over RMB110 billion, the large amount of unused credit and monetary capital balance provided the Company with sufficient liquidity.
The average dividend granted since 2015 is over 54%, the dividend policy is stable and dividend returns are substantial.
DIVIDEND
1. Cash dividend distribution policy
In accordance with Shareholders’ Return Plan in the Next Three Years(2019–2021)
(1) In the next three years, the Company adopts a proactive dividend distribution policy in the form of cash or shares, and implements such policy in accordance with the laws, regulations and regulatory requirements. Priority in profits distribution should be in cash rather than in shares. The Company shall distribute profits in the form of cash should such conditions are met. The Company may distribute interim cash dividends as and when appropriate.
(2) In accordance with the laws, regulations and other regulatory requirements in the period, the Company distributes dividend in cash if it records earnings with positive distributable profits and the cash flow of the Company can accommodate the needs of both its daily operation and sustainable development. If the Company distributes cash dividends, the proportion for cash dividends should also comply with the following requirements simultaneously: the profits distributed by the Company in the form of cash each year shall not be less than 30% of distributable profits recorded in the year, in accordance with laws, regulations and regulatory requirements in the period; where the Company is in a developed stage with no substantial capital expenditure arrangement, the dividend distributed in the form of cash shall not be less than 80% of the total profit distribution when distributing its profits; where the Company is in a developed stage with substantial capital expenditure arrangement, the dividend distributed in the form of cash shall not be less than 40% of the total profit distribution when distributing its profits; where the Company is in a developing stage with substantial capital expenditure arrangement, the dividend distributed in the form of cash shall not be less than 20% of the total profit distribution when distributing its profits;
The substantial capital expenditure arrangement mentioned above refers to matters that the total assets of transactions, including asset acquisitions and external investments, by the Company within a year account for more than 30% (inclusive) of the latest audited total assets of the Company. The Board of Directors of the Company shall propose a specific cash dividend distribution plan and submit it to the general meeting by differentiating the aforesaid circumstances after taking various factors into consideration, including its industry features, development stages, business model and profitability as well as whether it has any substantial capital expenditure arrangement.
(3) Where the Company records earnings with positive distributable profits for the year and the valuation on the shares of the Company is in a reasonable range, the Company may distribute dividend in the form of shares without prejudice to the scale of the share capital and the reasonable structure of shareholdings of the Company on the basis of considering rewarding and sharing corporate value with investors.

69China Molybdenum Co., Ltd.
REPORT OF THE BOARD OF DIRECTORS
2. Implementation of cash dividend distribution policy
The profit distribution plan for 2018 was considered and approved at the 2018 AGM of the Company held on 14 June 2019. The profit distribution was based on the Company’s total share capital of 21,599,240,583 shares before the implementation of the plan. The cash dividend per share was RMB0.110 (tax inclusive), and the total cash dividends of RMB2,375,916,464.13 (tax inclusive) were distributed. The dividend distribution was completed during the reporting period.
3. The Company's plans or proposals for the distribution of ordinary share dividends and the transferal of capital from capital reserve to equity for the last three years (including the reporting period)
Year of dividend distribution
Number of bonus shares for
every 10 shares
Amount of dividend for
every 10 shares
Amount increased for
every 10 sharesAmount of
cash dividend
Net profit attributable to
shareholders of ordinary shares of
listed companies in the consolidated
statement for the year of
dividend distribution
Percentage of net profit
attributable to shareholders of
ordinary shares of listed companies
in the consolidated statement
(share) (RMB)(tax inclusive) (share)(RMB thousand)
(tax inclusive) (RMB thousand) (%)
2019 0 0.43 0 928,767.35 1,857,014.21 50.0142018 0 1.10 0 2,375,916.46 4,635,583.95 51.252017 0 0.76 0 1,641,542.28 2,727,796.17 60.18
4. Proposal of dividend distribution:
A final cash dividend of RMB0.43 (tax inclusive) per 10 shares for the year ended 31 December 2019 was distributed to all shareholders based on the total share capital as at the date of registration of interests at the time of implementation of the profit distribution, which amounted to a total cash dividend of RMB928,767,345.07 (tax inclusive), representing 50.014% of the net profit attributable to the shareholders of the listed company for the year.
If the total share capital of the Company changes as a result of the conversion of convertible bonds, share repurchases, share repurchases granted under equity incentive, cancellation of share repurchases for major assets restructuring, etc. during the period from the date of disclosure of the announcement on the profit distribution plan to the date of registration of the implementation of equity distribution, the Company intends to maintain the total amount of distribution and adjust the distribution ratio per share accordingly.
The Company will dispatch to Shareholders a circular containing, among other things, the proposed distribution of final dividend and the AGM as soon as practicable.
In accordance with the “Enterprise Income Tax Law of the People’s Republic of China” (《中華人民共和國企業所得稅法》) and the “Rules for the Implementation of Enterprise Income Tax Law of the People’s Republic of China” (《中華人民共和國企業所得稅法實施條例》), both implemented on 1 January 2008 and the “Notice on Issues in Relation to the Withholding of Enterprise Income Tax on Dividends Paid by PRC Enterprises to Overseas Non-resident En-terprise Holders of H Shares” (Guo Shui Han [2008] No. 897) (《關於中國居民企業向境外H股非居民企業股東派發股息代扣代繳企業所得稅有關問題的通知》(國稅函[2008]897號)) promulgated on 6 November 2008, the Company is obliged to withhold and pay PRC enterprise income tax on behalf of non-resident enterprise Shareholders at a tax rate of 10%, when the Company distributes annual dividend to non-resident enterprise Shareholders whose names appear on the H shares register of members on the reference date. As such, any H Shares registered in the name of non-individual Shareholder, including shares registered in the name of HKSCC Nominees Limited, and other nominees, trustees, or other organizations and group, shall be deemed to be H Shares held by non-resident enterprise Shareholder(s), and the PRC enterprise income tax shall be withheld from any dividends payable thereon. Non-resident enterprise Shareholders may wish to apply for a tax refund (if any) in accordance with the relevant requirements, such as tax agreements (arrangements), upon receipt of any dividends.

70 2019 Annual Report
REPORT OF THE BOARD OF DIRECTORS
In accordance with the “Notice on Certain Issues Concerning the Policies of Individual Income Tax” (Cai Shui Zi [1994] No. 020) (《關於個人所得稅若干政策問題的通知》(財稅字[1994]020號)) promulgated by the PRC Ministry of Finance and the State Administration of Taxation on 13 May 1994, overseas individuals are exempted from the PRC individual income tax for dividends or bonuses received from foreign-invested enterprises. Furthermore, the competent tax authority of the Company confirmed that the relevant requirements under the “Notice on Certain Issues Concerning the Policies of Individual Income Tax” (Cai Shui Zi [1994] No. 020) (《關於個人所得稅若干政策問題的通知》(財稅字[1994]020號)) are applicable to the Company, the Company will not be required to withhold and pay any individual income tax on behalf of individual Shareholders when the Company distributes the final dividend to individual Shareholders whose names appear on the H shares register of members.
Pursuant to the “Notice on Relevant Taxation Policies Concerning the Pilot Inter-connected Mechanism for Trading on the Shanghai Stock Market and the Hong Kong Stock Market” (Cai Shui [2014] No. 81) (《關於滬港股票市場交易互聯互通機制試點有關稅收政策的通知》(財稅[2014]81號)) promulgated on 17 November 2014:
• For mainland individual investors who invest in the H shares via the Shanghai-Hong Kong Stock Connect, the Company will withhold individual income tax at the rate of 20% in the distribution of the 2019 final dividend. Individual investors may, by producing valid tax payment proofs, apply to the competent tax authority of China Securities Depository and Clearing Corporation Limited for tax credit relating to the withholding tax already paid abroad. For mainland securities investment funds that invest in the H Shares via the Shanghai-Hong Kong Stock Connect or Shenzhen-Hong Kong Stock Connect, the Company will withhold individual income tax in the distribution of the final dividend pursuant to the foregoing provisions; and
• For mainland corporate investors that invest in the H shares via the Shanghai-Hong Kong Stock Connect, the Company will not withhold the income tax in the distribution of the final dividend and the mainland corporate investors shall file the tax returns on their own.
Shareholders of H shares are recommended to consult their tax advisors regarding the relevant tax laws and regulations in the PRC, Hong Kong and other countries on the dividend payment by the Company and on the taxation implications of holding and dealing in the H shares.
FINANCIAL INFORMATION SUMMARY
The announced results, assets, and liabilities and minority interests of the Group for the last five financial years are as below:
Unit: RMB million
Items This year The previous year Three years ago Four years ago Five years ago
Operating revenue 68,677 25,963 24,148 6,950 4,197Total profit 2,358 6,990 5,382 1,190 683Income tax expenses 592 1,840 1,786 171 -20Net profit 1,766 5,150 3,596 1,019 703Net profit attributable to
owners of the parent Company 1,857 4,636 2,728 998 761
Profit or loss attributable to minority shareholders -91 514 868 21 -58
Total assets 116,862 101,216 97,837 87,924 30,880Total liabilities 67,366 51,618 51,928 53,587 13,064Total equity attributable
to shareholders of the parent Company 40,803 40,949 38,157 18,738 17,353
Total minority shareholders interests 8,693 8,649 7,752 15,599 463
The summary does not constitute part of the audited consolidated financial statements.

71China Molybdenum Co., Ltd.
REPORT OF THE BOARD OF DIRECTORS
PROPERTY, PLANT AND EQUIPMENT
Details of changes to the property, plant and equipment of the Company and the Group during the year are set out in note (V).14 and note (XIV).12 to the consolidated financial statements.
SHARE CAPITAL AND SHAREHOLDERS
1. Share Capital
Details of changes in the share capital of the Company during the year are set out in note (V).40 to the consolidated financial statements.
2. Shareholding structure of substantial shareholders
As at 31 December 2019, the shareholders of the Company amounted to 283,152, of which shareholders of H shares amounted to 8,743, and shareholders of A shares amounted to 274,409. By approximate percentage of shareholding in the registered capital, the shareholdings of the Company’s top ten shareholders were as follows:
Name of shareholders (Full name) Class of Share
Changes during the
reporting period
Closing number of
shares held Proportion(10,000 shares) (10,000 shares) (%)
Cathay Fortune Corporation (“CFC”)A share and H share 0 533,322.00 24.69
Luoyang Mining Group Co., Ltd. (“LMG”) A share 0 532,978.04 24.68
HKSCC NOMINEES LIMITED H share 92.49 358,751.88 16.61CCB Principal Asset Management –
ICBC – Shaanxi International Trust – Shaanxi International Trust•Jinyu No.6 targeted investment trust plan of assembled funds A share 0 77,748.69 3.60
China State-owned Enterprise Structure Adjustment Fund Co., Ltd. A share 0 73,970.68 3.42
Minsheng Royal Fund-Bank of Ningbo-Jiaxing Minliu Investment Partnership (limited partnership) A share 0 47,172.77 2.18
Ningbo Shanshan Venture Capital Co., Ltd. A share 47,120.42 47,120.42 2.18
Hong Kong Securities Clearing Company Ltd. A share 20,317.67 32,614.55 1.51
National Social Security Fund Package No. 108 A share 15,000.00 15,000.00 0.69
Henan Centaline Guquan Investment Management Co., Ltd. –Guquan Zhiyuan No.2 Private Security Investment Fund A share 11,764.71 11,764.71 0.54
Notes:
1. Percentage calculation is based on the Company’s total share capital of 21,599,240,583 shares.
2. HKSCC NOMINEES LIMITED held 3,587.5188 million H shares in the Company as a nominee, representing 16.61% of the Company’s shares in issue. HKSCC NOMINEES LIMITED is a member of the Central Clearing and Settlement System, which carries out securities registration and custodian business for customers.

72 2019 Annual Report
REPORT OF THE BOARD OF DIRECTORS
3. Substantial Shareholders’ interests in shares
To the best knowledge of all Directors and Supervisors, as at 31 December 2019, the persons or companies (other than Directors, the chief executives or Supervisors of the Company) who had interests or short positions in the shares and underlying shares of the Company which would fall to be disclosed under Divisions 2 and 3 of Part XV of the Securities and Futures Ordinance or who were deemed to be directly or indirectly interested in 5% or more of the nominal value of any class of share capital carrying rights to vote in all circumstances at general meetings of the Company were as follows:
NameNumber
of shares held Capacity Class of Share
Approximate percentage of
shareholding in relevant
class of shares
LMG 5,329,780,425 Beneficial owner A share 30.17%
Luoyang Guohong Investment Group Co., Ltd.
5,329,780,425 Interest in controlled corporation
A share 30.17%
CFC 5,030,220,000 Beneficial owner A share 28.47%
303,000,000(L) Interest in controlled corporation
H share 7.70%(L)
Cathay Fortune Investment Limited (“Cathay Hong Kong”)(1)
303,000,000(L) Beneficial owner H share 7.70%(L)
Yu Yong (2) 5,030,220,000 Interest in controlled corporation
A share 28.47%
303,000,000(L) Interest in controlled corporation
H share 7.70%(L)
BlackRock, Inc.(3) 203,342,885 (L) Interest in controlled corporation
H share 5.17% (L)
15,771,000 (S) 0.40% (S)
Citigroup Inc.(4) 420,933,279 (L) Interest in controlled corporation/Approved lending agent
H share 10.70% (L)
22,562,837 (S) 0.57% (S)402,487,336 (P) 10.23% (P)
GIC Private Limited 314,770,447 (L) Investment manager H share 8.00% (L)
JPMorgan Chase & Co.(5) 246,728,319 (L) Interest in controlled corporation/Investment manager/Approved lending agent
H share 6.27% (L)
56,564,899 (S) 1.44% (S)24,424,737 (P) 0.62% (P)
Notes: (L) – Long position, (S) – Short position, (P) –Lending pool
(1) Cathay Hong Kong is a wholly-owned subsidiary of CFC in Hong Kong.
73China Molybdenum Co., Ltd.
REPORT OF THE BOARD OF DIRECTORS
(2) Mr. Yu Yong holds 99% interest in CFC and was deemed to be interested in the 5,030,220,000 A shares of the Company directly through CFC. In addition, Mr. Yu Yong was deemed to be interested in the long position of 303,000,000 H shares of the Company. CFC, Cathay Fortune International Company Limited and Cathay Hong Kong, being the controlled corporations, directly or indirectly hold the shares of the Company.
(3) BlackRock, Inc. was deemed to hold a total of long position of 203,342,885 H shares and a short position of 15,771,000 H shares of the Company due to its control rights over a number of companies. Trident Merger, LLC, BlackRock Investment Management, LLC, BlackRock Holdco 2, Inc., BlackRock Financial Management, Inc., BlackRock Holdco 4, LLC, BlackRock Holdco 6, LLC, BlackRock Delaware Holdings Inc., BlackRock Institutional Trust Company, National Association, BlackRock Fund Advisors, BlackRock Capital Holdings, Inc., BlackRock Advisors, LLC, BlackRock International Holdings, Inc., BR Jersey International Holdings L.P., BlackRock Lux Finco S.à r.l.,, BlackRock Japan Holdings GK, BlackRock Japan Co., Ltd., BlackRock Holdco 3, LLC, BlackRock Canada Holdings LP, BlackRock Canada Holdings ULC, BlackRock Asset Management Canada Limited, BlackRock Australia Holdco Pty. Ltd., BlackRock Investment Management (Australia) Limited, BlackRock (Singapore) Holdco Pte. Ltd., BlackRock HK Holdco Limited, BlackRock Asset Management North Asia Limited, BlackRock Cayman 1 LP, BlackRock Cayman West Bay Finco Limited, BlackRock Cayman West Bay IV Limited, BlackRock Group Limited, BlackRock Finance Europe Limited, BlackRock (Netherlands) B.V., BlackRock Advisors (UK) Limited, BlackRock International Limited, BlackRock Group Limited-Luxembourg Branch, BlackRock Luxembourg Holdco S.à r.l., BlackRock Investment Management Ireland Holdings Limited, BlackRock Asset Management Ireland Limited, BLACKROCK (Luxembourg) S.A., BlackRock Investment Management (UK) Limited, BlackRock Fund Managers Limited, BlackRock Life Limited, BlackRock UK Holdco Limited and BlackRock Asset Management (Schweiz) AG, being the controlled corporations, directly or indirectly hold the shares of the Company.
(4) Citigroup Inc. was deemed to hold a total of long position of 420,933,279 H shares, a short position of 22,562,837 H shares and a lending pool of 402,487,336 H shares available for sale of the Company due to its control rights over a number of companies. Citicorp LLC, Citibank, N.A., Citigroup Global Markets Holdings Inc., Citigroup Financial Products Inc., Citigroup Global Markets Inc., Citigroup Global Markets Holdings Bahamas Limited and Citigroup Global Markets Limited, being the controlled corporations, directly or indirectly hold the shares of the Company.
(5) JPMorgan Chase & Co. was deemed to hold a total of long of 246,728,319 H shares, a short position of 56,564,899 H shares and a lending pool of 24,424,737 H shares of the Company due to its control rights over a number of companies. JPMorgan Asset Management (Taiwan) Limited, J.P. Morgan Bank Luxembourg S.A. – Amsterdam Branch, J.P. Morgan AG, J.P. Morgan Bank Luxembourg S.A. – Stockholm Bankfilial, J.P. Morgan Securities LLC, JPMORGAN CHASE BANK, N.A. – LONDON BRANCH, J.P. Morgan Investment Management Inc., J.P. Morgan Bank Luxembourg S.A. – Oslo Branch, JPMorgan Chase Bank, N.A. – Sydney Branch, J.P. Morgan Bank Luxembourg S.A., JPMorgan Chase Bank, N.A. – Hong Kong Branch, JPMorgan Chase Bank, National Association, JPMorgan Asset Management (Asia Pacific) Limited, J.P. MORGAN SECURITIES PLC, J.P. Morgan (Suisse) SA, JPMorgan Asset Management (Asia) Inc., JPMorgan Asset Management Holdings Inc., JPMorgan Chase Holdings LLC, J.P. Morgan International Finance Limited, J.P. Morgan Broker-Dealer Holdings Inc. and J.P. MORGAN CAPITAL HOLDINGS LIMITED, being the controlled corporations, directly or indirectly hold the shares of the Company.
Save as disclosed above, as at 31 December 2019, the Directors were not aware of any other persons (other than a Director, chief executive or Supervisor of the Company) who had interests or short positions in the shares and underlying shares of the Company as recorded in the register required to be kept by the Company under Section 336 of the SFO.
PRE-EMPTIVE RIGHTS
There are no provisions for pre-emptive rights under the Articles of Association and the laws of the PRC which would oblige the Company to offer new shares on a pro rata basis to existing shareholders.
BORROWINGS
Details of the borrowings of the Company and the Group are set out in notes (V).22, (V).33 and note (XIV).17 to the consolidated financial statements.
DISTRIBUTABLE RESERVE
The amount of the Company’s reserves available for distribution for the year ended 31 December 2019, calculated in accordance with the PRC rules and regulations, was RMB8,081.59 million.

74 2019 Annual Report
REPORT OF THE BOARD OF DIRECTORS
CHARITABLE DONATIONS
In 2019, the external donation expenses of the Group amounted to RMB27,034,716.52.
MAJOR CUSTOMERS AND SUPPLIERS
For the year ended 31 December 2019, the proportions of purchase and sales from the major suppliers and major customers of the Company to our total purchases and sales were as follows:
Purchases
The total purchases from our largest supplier was approximately 9.00% of our total purchase value.
The total purchases from our five largest suppliers was approximately 20.34% of our total purchase value.
Sales
The total sales to our largest customer was approximately 6.62% of our total sales value.
The total sales to our five largest customers was approximately 18.31% of our total sales value.
During the year, to the Directors’ knowledge, none of the Directors or Supervisors or their respective close associates or any shareholders who hold more than 5% of our shares, had any material interest or rights in our five largest customers and our five largest suppliers.
DIRECTORS, SUPERVISORS AND SENIOR MANAGEMENT
The Directors, Supervisors and senior management of the Company during the year and up to the date of this annual report are:
Executive Directors
Mr. Li ChaochunMr. Li Faben
Non-Executive Directors
Mr. Guo Yimin (appointed on 28 March 2019)Mr. Yuan HonglinMr. Cheng Yunlei
Independent Non-Executive Directors
Mr. Wang Gerry YouguiMs. Yan YeMr. Li Shuhua
Supervisors
Ms. Kou YouminMr. Zhang ZhenhaoMs. Wang Zhengyan

75China Molybdenum Co., Ltd.
REPORT OF THE BOARD OF DIRECTORS
Senior Management
Mr. Yue YuanbinMs. Wu YimingMr. Wang Chun (resigned as deputy general manager on 19 July 2019)
Pursuant to the Articles of Association, the term of office of all Directors and Supervisors is three years (expiry date of the tenure being the date of the annual general meeting to be held in 2021), and may stand for re-election upon expiry of the term.
The Company has received an annual confirmation from each of Mr. Wang Gerry Yougui, Mr. Li Shuhua and Ms. Yan Ye, all being the independent non-executive Directors, in respect of their independence and is of the opinion that they remained independent as at the date of this report.
DIRECTORS’, SUPERVISORS’ AND SENIOR MANAGEMENT’S PROFILES
Profile details of the Directors and Supervisors of the Company and the senior management of the Group are set out on pages 84 to 86 of the annual report.
D I R E C T O R S ’ , S U P E R V I S O R S ’ A N D S E N I O R M A N A G E M E N T ’ S REMUNERATION
The Directors’ and Supervisors’ fees are subject to shareholders’ approval at general meetings. Other emoluments are determined by the Board of Directors of the Company with reference to Directors’ and Supervisors’ duties, responsibilities and performance and the results of the Group. In compliance with the Corporate Governance Code, the Company has a remuneration committee to formulate remuneration policies. Details of the Directors’ and Supervisors’ remuneration are disclosed in note (X).7 to the consolidated financial statements.
The remuneration of the senior management for the year ended 31 December 2019 fell within the following bands (Note) :
Remuneration bandsNumber of
Individual(s)Year 2019
Above RMB1,500,000 1
Note: Directors and Supervisors of the Company and Mr. Yue Yuanbin were excluded; Ms. Ho Siu Pik, the former joint company secretary, was an external service provider, as such, she was not part of the Company’s senior management.
EMPLOYEES AND PENSION PLAN
As at 31 December 2019, the Group had approximately 11,183 full-time employees, classified as follows:
Professional CompositionCategory of professional composition Number of professionals
Production staff 7,671Sales staff 152Technical staff 973Financial staff 273Administrative staff 1,202Other supporting personnel 912
Total 11,183
Note: The Company completed the closing of the IXM merger and acquisition on 24 July 2019, resulting in the addition of IXM employees during the period.

76 2019 Annual Report
REPORT OF THE BOARD OF DIRECTORS
The remuneration policy for the employees of the Company principally consists of a salary point and performance remuneration system, based on employees’ positions and responsibilities and their quantified assessment results. The employees’ remuneration is evaluated in line with the Company’s operating results and personal performance in order to provide a consistent, fair and equitable remuneration system for all employees. The subsidiaries of the Company domiciled in China participate in the social insurance contribution plans introduced by China’s local governments. In accordance with the laws and regulations regarding the national and local labor and social welfares in China, the Company is required to pay on behalf of its employees a monthly social insurance premium covering pension insurance, health insurance, unemployment insurance, maternity insurance, work injury insurance and housing provident fund, etc. Pursuant to current applicable local regulations in China, the percentages of certain insurances are as follows: the pension insurance, health insurance, unemployment insurance, work injury insurance and the contribution to housing provident fund of our Chinese employees represent 16%, 7.5%, 0.7%, 0.2% to 0.95% and 5% to 12% of his or her total basic monthly salary respectively. In accordance with applicable PRC regulations, the Company currently participates in pension contribution plans organized by the governments. Such pension contribution plans are known as defined contribution plans, under which the Company is not allowed to reduce the current contribution level by using forfeited contributions.
The overseas employees of the Company are required to participate in pension and healthcare plans under the requirement of the laws in the countries where they reside.
ANALYSIS ON MAJOR SUBSIDIARIES
Basic information of major subsidiaries
Company name Principal products Registered capitalShareholding method
Shareholding proportion
CMOC Mining Pty Limited Copper and gold related products
USD346,000,000 Indirect 100%
CMOC International DRC Holdings Ltd.
Copper and cobalt related products
USD10,000 Indirect 100%
Luxembourg SPV Niobium and phosphates related products
USD20,000 Indirect 100%
IXM B.V. Mineral trading CHF32,290,000 Indirect 100%
Note: All subsidiaries of the Company located in the PRC listed in the Note to Financial Statements (VII) 1. are incorporated as companies with limited liabilities under PRC law, for details please refer to page 215 of this report.
FINANCIAL INDICATORS OF MAJOR SUBSIDIARIES DURING THE REPORTING PERIOD
Unit: RMB thousand
Company nameOperating
revenue Operating profit
Net profit attributable
to the parent company Total assets Net assets
CMOC Mining Pty Limited 1,333,781 191,215 143,401 5,955,976 3,011,206CMOC International DRC
Holdings Ltd. 9,322,081 -27,805 75,176 43,198,507 33,004,890Luxembourg SPV 5,038,197 496,726 332,528 14,878,696 4,432,526IXM B.V. 49,586,673 372,324 271,875 26,660,476 4,037,308

77China Molybdenum Co., Ltd.
REPORT OF THE BOARD OF DIRECTORS
DIRECTORS’ AND SUPERVISORS’ SERVICE CONTRACTS
All Directors and Supervisors of the Company have each entered into a service contract with the Company for a term of not more than three years until the annual general meeting of the Company to be held in 2021.
None of the Directors and Supervisors has a service contract with the Company which is not terminable within one year without payment of compensation, other than statutory compensation.
DIRECTORS’ AND SUPERVISORS’ INTERESTS IN TRANSACTIONS, ARRANGEMENTS OR CONTRACTS
None of the Directors and Supervisors or entities connected to the Directors and Supervisors had material interests, either directly or indirectly, in any transaction, arrangement or contract of significance to the business of the Group subsisting or entered into during or at the end of the year.
MATERIAL INVESTMENTS
The material investments held by the Group and the performance and prospects of such investments during the accounting year, are set out in note (V).10, 11 and 12, note (I).2, note (VII).2 to the consolidated financial statements and the section headed “Material Events”.
MANAGEMENT CONTRACTS
No contracts concerning the management and/or administration of the whole or any substantial part of the business of the Company were entered into or existed in 2019.
PERMITTED INDEMNITY
Except the liability insurance described below, the Company did not enter into any agreement with indemnity provisions with Directors or Supervisors of the Company to provide indemnity to Directors or Supervisors for legal liabilities caused to third parties or other types of legal liabilities.
The Company considered and passed the purchase of liability insurance for the risks of domestic and overseas litigations or regulatory investigations that the Directors, Supervisors and senior management of the Group may be exposed to when carrying out their duties in executing the business decisions and information disclosure, at the first extraordinary general meeting in 2019. The insurance covers management liabilities of the Directors, Supervisors and senior management, the Company’s equity securities claims and the Company’s inappropriate employment practices claims. The annual compensation limit per insurance item is up to USD100,000,000 per annum, at the total annual costs of premium not more than USD350,000 per annum.

78 2019 Annual Report
REPORT OF THE BOARD OF DIRECTORS
DIRECTORS’, CHIEF EXECUTIVES’ AND SUPERVISORS’ INTERESTS AND SHORT POSITIONS IN SECURITIES
As at 31 December 2019, the shareholding of A Shares of the current Directors, Supervisors and senior management of the Company was as follows:
NameNumber of shares
held Percentage in total
share capital (Shares) (%)
Li Chaochun 1,587,692 0.007Li Faben 1,064,400 0.005Yuan Honglin 1,050,600 0.005Zhang Zhenhao 1,063,500 0.005
Total 4,766,192 0.022
As of the disclosure date of this report, none of the undertakers has reduced his/her holdings in the Company’s shares.
Save as disclosed above, so far as was known to the Directors, as at 31 December 2019, none of the Directors, chief executives, senior management and Supervisors and their respective associates had interests or short positions in the shares, underlying shares and debentures of the Company or its associated corporations (within the meaning of Part XV of the SFO, which required the Company and Stock Exchange to be notified pursuant to Part XV of the SFO or which were required to be entered into the register required to be kept by the Company under Section 352 of the SFO or as otherwise notified to the Company and Stock Exchange pursuant to the Model Code.
CONNECTED TRANSACTIONS
For the year ended 31 December 2019, certain related party transactions set out in notes (X) and (XIV).36 to the consolidated financial statements have complied with applicable rules under Chapter 14A of the Hong Kong Listing Rules. The details of non-exempt connected transaction of the Group conducted during the year under Chapter 14A of the Hong Kong Listing Rules are as follows:
2019 Connected Transaction
BHR equity acquisition
On 18 January 2019, CMOC Limited and BHR entered into the BHR DRC Share Transfer Agreement, CMOC Limited purchased 100% equity interests in BHR Newwood DRC Holdings Ltd. from BHR with an amount of USD1,135,993,578.71. After arms’ length negotiation between the Company and the BHR Shareholders, CMOC Limited and BHR entered into the BHR DRC Termination Agreement on 19 June 2019, and the BHR DRC Share Transfer Agreement and the BHR DRC Equity Acquisition contemplated thereunder were terminated with immediate effect. On 19 June 2019, CMOC BHR Limited, an indirect wholly-owned subsidiary of the Company, as the Buyer, and the BHR Shareholders, as the Sellers, entered into the BHR Share Transfer Agreement. CMOC BHR Limited purchased all the issued and outstanding shares at the consideration of USD470,000,000(equivalent to approximately HK$3,678.2 million). At the same time, the Company will undertake an outstanding bank loan of BHR with a principal amount of USD690,000,000 (equivalent to approximately HK$5,399.9 million) and its accumulated interests expenses, a loan entered into by BHR for the acquisition of 24% interests in Tenke Mining in 2017. Before the above transaction, the Company and BHR held 70% and 30% equity interests in TF Holdings Limited (the “TFHL”), respectively. Hantang Iron Ore Investments Limited, one of the BHR shareholders, holding approximately 36.17% equity interests in BHR, is the controlling shareholder of BHR and a contact person of BHR under Chapter 14A of the Hong Kong Listing Rules. Therefore, Hantang Iron Ore Investments Limited is a connected person of the Company at the subsidiary level. The transaction constitutes a connected transaction of the Company under Chapter 14A of the Hong Kong Listing Rules.

79China Molybdenum Co., Ltd.
REPORT OF THE BOARD OF DIRECTORS
Upon the completion of the transaction, CMOC Limited held 100% equity interests of TFHL through BHR Newwood DRC Holdings Ltd. and CMOC International DRC Holdings Ltd., an indirect wholly-owned subsidiary of the Company, and further control a total of 80% equity interests in Tenke Fungurume Mining S.A., which owns the Tenke Fungurume Mining Complex. The above transaction will enhance the Group’s control and supervision over daily management and the mining operation of the Tenke Fungurume Mining Complex as well as boost the profitability and risk-resisting capability of the Group.
Details of the above connected transaction are set out in the announcements of the Company dated 18 January 2019, 19 June 2019, 18 September 2019 and 27 September 2019. Connected transaction above is in compliance with the disclosure requirements under Chapter 14A of the Hong Kong Listing Rules.
NON-COMPETITION AGREEMENTS
On 6 September 2006, non-compete agreements were entered into between the Company and each of CFC and LMG, respectively. CFC and LMG agreed not to compete with the Company in our businesses and granted the Company certain options and right of first refusal pursuant to the non-compete agreements. Details of the non-compete agreements had been disclosed in the prospectus of the Company dated 13 April 2007, under the section headed “Relationship with Controlling Shareholders – Non-Compete Agreements”. Each CFC and LMG had executed a Non-Competition Undertaking Letter with the Company on 30 January 2011 and 18 May 2011 respectively, pursuant to which each of them had undertaken not to compete with the Company in the businesses it operated or businesses to be further expanded. Details of the Non-competition Undertaking letters had been disclosed in “Peer Competition and Connected Transactions (同業競爭與關聯交易)” set out in Section VII to the prospectus of A Shares dated 8 October 2012. CFC (together with its parties acting in concert, Cathay Hong Kong) and Luoyang Guohong Investment Group Co., Ltd. had executed the Acquisition Report of China Molybdenum Co., Ltd.* on 23 January 2014 and 29 November 2013 respectively, pursuant to which each of them undertook not to compete with the Company in the businesses we operated. Details of the Acquisition Reports were disclosed in the announcements of the Company dated 23 January 2014 and 27 January 2014.
On 18 April 2017, the Company received from LMG the Notice on Gratuitous Transfer of State-Owned Shares by Luoyang Non-ferrous Mining Group Co., Ltd. (洛陽礦業集團有限公司), to transfer the 100% equity in Luoyang Guo’an Trade Co., Ltd. (“Guo’an Trade”) held by Luoyang Non-ferrous Mining Group Co., Ltd. (洛陽礦業集團有限公司) to LMG free of charge, as from which, LMG will perform the duty as the shareholder. Upon LMG’s acceptance of the transfer, in accordance with the Non-Competition Undertakings and to avoid actual competition between LMG and the Company upon actual commencement of production operation activities by Luoyang Fuchuan Mining Co., Ltd. (“Fuchuan Mining”), LMG made an undertaking to the Company on 18 April 2017, pursuant to which, LMG undertakes to the Company that, after LMG obtains the Luoyang Guo’an Interests (and indirectly holds the interests of Fuchuan Mining) and before Luoyang Fuchuan Mining Co., Ltd. commences production operations, LMG will procure the sale of the Luoyang Guo’an Interests, and the Company shall have the pre-emptive right to purchase Luoyang Guo’an Interests (the “Pre-Emptive Right”), or according to 《關於推動國有股東與所控股上市公司解決同業競爭規範關聯交易的指導意見》(the Guiding Opinions on Promoting the Resolution of Horizontal Competition and the Regulation of Affiliated Transactions by the State-owned Shareholders and the Listed Companies under Their Control*) jointly issued by 國務院國有資產監督管理委員會(the State-owned Assets Supervision and Administration Commission of the State Council*) and the China Securities Regulatory Commission, which indicated the comprehensive use of asset re-structuring, equity replacement, business adjustment and other similar methods to resolve the issue of competing business.
To further deal with the potential horizontal competition, the Company and Fuchuan Mining entered into an entrusted operation agreement in July 2019, in which Fuchuan Mining entrusts the Company to fully manage its overall business and take full responsibility for its production, operation and management for a term of three years, during which, the property right of Fuchuan Mining remain unchanged and the assets and profits belong to Fuchuan Mining according to law. Fuchuan Mining has resumed its production and operation activities since December 2019.
CONTROLLING SHAREHOLDERS’ INTERESTS IN CONTRACTS OF SIGNIFICANCE
No contracts of significance had been entered into between the Company or any of its subsidiaries and any controlling Shareholders or any of its subsidiaries in the reporting period.
No contracts of significance had been entered into by the controlling shareholder of the Company or any of its subsidiaries for provision of services to the Company or any of its subsidiaries in the reporting period.

80 2019 Annual Report
REPORT OF THE BOARD OF DIRECTORS
DIRECTORS’ INTERESTS IN COMPETING BUSINESS
Guo’an Trade, a wholly-owned subsidiary of LMG, the substantial shareholder of the Company, holds 50% equity of Xuzhou Huanyu, and Xuzhou Huanyu holds 90% equity of Fuchuan Mining. Fuchuan Mining is a joint venture of the Company, mainly engaged in the production of molybdenum, please refer to the “Resources and Reserve” and “Report of the Board of Directors” sections of this report for details of the production of Fuchuan Mining, The Company has control over Fuchuan Mining through contractual arrangements. The Company entered into a products purchase agreement with Fuchuan Mining in March 2020, pursuant to which, the Company purchases ore meeting the technical requirements of mineral processing from Fuchuan Mining. For details of the products purchase agreement, please refer to the announcements published by the Company dated 27 March 2020 and 6 April 2020.
Mr. Guo Yimin and Mr. Cheng Yunlei, as Directors of the Company, served as the chairman and director of LMG, respectively. Save as disclosed above, in 2019, none of the Directors had any interest in any business which competes or is likely to compete either directly or indirectly, with the business of the Group.
SUFFICIENCY OF PUBLIC FLOAT
Based on public information and to the knowledge of the Directors, at least 50.6% of the Company’s total issued share capital was held by the public as at the date of this report. The Company has been maintaining the public float required by the Hong Kong Listing Rules. In particular, the public float of H shares accounted for 16.8%.
DIRECTORS’ AND SUPERVISORS’ RIGHTS TO ACQUIRE SHARES OR DEBENTURES
At no time during the year was the Company, its holding company or any of its subsidiaries or fellow subsidiaries, a party to any arrangement to enable the Directors and Supervisors of the Company to acquire benefits by means of the acquisition of shares in, or debentures of, the Company or any other body corporate.
PURCHASE, SALE OR REDEMPTION OF THE COMPANY’S LISTED SECURITIES
During 2019, the Company or its subsidiary has not purchased, sold or redeemed any listed securities or related convertible securities, options, warrants or similar rights of the Company.
EQUITY-LINKED AGREEMENT
In 2019, the Company has not implemented any equity-linked agreement.
SHARE OPTION SCHEME
In 2019, the Company has not implemented any share option scheme.
AUDITOR
The consolidated financial statements of the Company for the year ended 31 December 2019 were audited by Deloitte Touche Tohmatsu Certified Public Accountants LLP. The financial report for the year 2019 prepared in accordance with the PRC Accounting Standards by the Company has been audited by Deloitte Touche Tohmatsu Certified Public Accountants LLP (Special General Partnership) and an auditor’s report with unqualified opinions has been issued. In the past three years, the Company has never changed the auditor.
The Company appointed Deloitte Touche Tohmatsu Certified Public Accountants LLP, as the auditor of the Company, with term of office until the conclusion of the next annual general meeting of the Company.
By order of the BoardLi Chaochun
Chairman
Luoyang City, Henan Province, the PRC27 March 2020

81China Molybdenum Co., Ltd.
REPORT OF THE SUPERVISORY COMMITTEE
Dear Shareholders,
In 2019, in strict compliance with the requirements of the Company Law, Securities Law, Articles of Association, Rules of Procedure for the Board of Supervisors and relevant laws and regulations, the supervisory committee conducted supervision and inspection over the Company’s operation and finance, implementation of resolutions passed at general meetings, the lawfulness and compliance of material decision-making procedures by the Board and the operational and management activities of the Company, and the performance of duties by the Board and the senior management, with a view to fostering standardized operation of the Company. For the sake of safeguarding the benefits of the Company and maximizing the interests of all the Shareholders, the supervisory committee performed its supervisory duty earnestly. We attended Board meetings in 2019 and considered that the Board, Directors and the senior management diligently and earnestly implemented all resolutions of the Company, without damaging the interests of the shareholders and the Company. The resolutions of the general meetings and the Board were in compliance with the requirements of Company Law, other relevant laws and regulations and the Articles of Association.
I. MEETINGS CONVENED
In 2019, the supervisory committee held six meetings. Apart from holding supervisory committee meetings, the supervisory committee also sat in and attended the meetings of the Company’s Board and general meetings and listened to and adopted important proposals and resolutions from the Company. We understood the process of how the Company’s material decisions were formed, had a grasp on the operational results of the Company, and simultaneously performed the supervisory committee’s functions of knowing facts, monitoring and investigation.
Meetings attended by the supervisory committee in 2019:
Number of Attendance in person/Number of MeetingsSupervisory
committee Board General meetings
Ms. Kou Youmin 6/6 11/11 6/7Mr. Zhang Zhenhao 6/6 11/11 7/7Ms. Wang Zhengyan 6/6 11/11 4/7
II. COMPLETION OF MAJOR DUTIES
In 2019, in strict compliance with the requirements of relevant laws and regulations and the Articles of Association, the supervisory committee prudently reviewed the compliant operations, finance and internal control, connected transactions and other issues of the Company. The supervisory committee also raised reasonable recommendations and opinions to the Board. It also effectively supervised as to whether the major and specific decisions made by the management of the Company were in compliance with the laws and regulations of the State and the Articles of Association, and whether they were made to safeguard the benefits of the shareholders.
1. Inspection of lawfulness of the Company’s operations
Pursuant to the relevant provisions of relevant laws and regulations of the State, Listing Rules in Mainland China and Hong Kong and Articles of Association, the supervisory committee conducted inspection and supervision over the procedures for convening general meetings and Board meetings of the Company, items to be resolved, implementation of resolutions passed at general meetings by the Board, the conduct codes of senior management of the Company and internal control system of the Company by attending the general meetings and the meetings of the Board of the Company. Upon inspection, the supervisory committee is of the view that the decision-making procedures on the general meetings and Board meetings of the Company are lawful, the resolutions of the general meetings and the Board can be effectively implemented and the internal control system of the Company is well established. The Directors and senior management are diligent and responsible. No violation of any laws, regulations, Listing Rules in Mainland China and Hong Kong and Articles of Association and no other circumstances which are harmful to interests of shareholders and the Company have been found in the performance of duties.

82 2019 Annual Report
REPORT OF THE SUPERVISORY COMMITTEE
2. Inspection of the Company’s financial status
In the reporting period, the supervisory committee conducted effective supervision and inspection over the performance of the Company’s financial system. Upon inspection, the supervisory committee is of the view that the financial operation of the Company was conducted in strict compliance with the financial management and the internal control system of the Company. Through the inspection over each auditing material (including the financial information) provided by the Company, the Company has built a sound financial internal control system, which could effectively guarantee the efficient operation of corporate funding and the safety and integrity of the Company’s properties. The Company has neither acted against the wishes of the shareholders nor violated the internal control system of the Company during the course of operation. The utilization of funds was in the interests of the shareholders and fitted the principle of maximizing the Company’s benefits. The financial position of the Company is solid with true financial information, and there is no false record, misrepresentations, or major omissions. There exists neither guarantee for violation of rules nor any guaranteed items which should be disclosed but have not been disclosed yet. Deloitte Touche Tohmatsu Certified Public Accountants LLP (Special General Partnership) audited the annual financial report and issued a standard and unqualified audit report.
3. Inspection of the implementation of the information disclosure systems
In the reporting period, the supervisory committee urged the Company’s relevant departments to be in strict compliance with the requirements of regulatory policies to perform its obligations of information disclosure, to seriously implement each information disclosure management system, to timely and fairly disclose information which is true, accurate and complete on the whole.
4. Review of the internal control evaluation report
After the careful review of the 2019 Internal Control Evaluation Report of the Company (《公司二零一九年度內部控制評價報告》), the supervisory committee is of the opinion that the compilation is in compliance with such requirements as the Basic Rules for Internal Control of Enterprise (《企業內部控制基本規範》) and the Internal Control Evaluation Guidelines of Enterprise (《企業內部控制評價指引》). By establishing efficient internal control system and management, the Company has improved its internal control system, which plays a better role in risk prevention and control during the Company’s production, operation and management to ensure an orderly development of various business activities of the Company and shareholders. The report objectively and accurately reflected the actual situation of the Company’s internal control, and no false records, misleading statements or major omissions have been found. The supervisory committee approved the 2019 Internal Control Evaluation Report of the Company.
5. Supervisions on connected transactions
During the course of conducting resolutions in relation to connected transactions by the Board of the Company, the approval procedures were in compliance with the laws and regulations, and were fair and reasonable without damaging the rights of minority shareholders.
6. The use of funds by related parties and external guarantee
In 2019, there was no non-operational use of the funds by the controlling shareholder; and there was no illegal external guarantee and guarantees provided in favour of the shareholders, controlling subsidiaries and subsidiary enterprises of the shareholders, and non-legal entities or individuals; and in the interests of the Company and the shareholders as a whole.
7. Trainings
In order to consistently increase professional knowledge and enhance the business level, to execute the supervisory function of the supervisory committee in a perfect way and to strictly comply with laws, regulations and the Articles of Association, relevant supervisors participated in the training courses according to requirements in respect of corporate governance and regulatory development organized by the Listed Companies Association of Henan or held by the Company, and received and read the relevant materials including updates of laws and rules sent by the Board Office of the Company.

83China Molybdenum Co., Ltd.
REPORT OF THE SUPERVISORY COMMITTEE
III. SUMMARY AND EVALUATION
The supervisory committee is of the view that the Board of Directors of the Company duly performed its operation in strict compliance with the requirements under the laws and regulations including the Companies Law, the Articles of Association and Hong Kong and Shanghai Stock Exchange Listing Rules. The Company kept the duly process of the production and operation, and ensured the stability of the production of the Company and the interests of the shareholders to the greatest extent. The major business decision-making procedures of the Company were legitimate and effective. The Directors and senior management of the Company duly performed its duties seriously, proactively and normatively conducted its work in accordance with the national laws, regulations, the Articles of Association and resolutions of the general meeting and the Board. The supervisory committee had not found any acts in breach of laws and regulations and the Articles of Association or against the interests of the shareholders and the Company by the Board and senior management of the Company during the course of performing their duties. The supervisory committee expressed its deep appreciation to the performance of the Board and management.
IV. WORKING PLAN
In 2020, the supervisory committee of the Company will be in strict compliance with the requirements of the Company Law, the Articles of Association, the Rules of Procedure for the Board of Supervisors, relevant laws and regulations and departmental rules, earnestly perform the supervisory function, and further enhance its supervision strength on the financial position, major issues, connected transactions and the compliance of the Directors and senior management personnel of the Company, thereby promoting continuous optimization of the internal control, standardization of operation and management of the Company, and safeguarding and guaranteeing the interests of the Company and investors.
By order of the Supervisory CommitteeKou YouminChairperson
Luoyang City, Henan province, the PRC27 March 2020

84 2019 Annual Report
PROFILES OF DIRECTORS, SUPERVISORS AND SENIOR MANAGEMENT
DIRECTORS
Executive Directors
Mr. Li Chaochun, born in February 1977, is an executive Director of the Company since January 2007, vice chairman of the Board of China Molybdenum from January 2007 to 14 January 2014 and chairman of the Board since January 2014. He is also the vice chairman of the Nomination and Governance Committee of the Company since 17 August 2012 and the chairman of our Strategic and Sustainability Committee since 14 January 2014. Mr. Li graduated from Shanghai Jiaotong University with a bachelor’s degree in law in July 1999. From July 1999 to December 1999, he was a staff accountant of the tax division of Arthur Andersen (Shanghai) Business Consulting Co., Ltd. He was with Arthur Andersen Hua Qiang CPA from January 2000 to March 2002, where his last position was a senior consultant of the tax division. From April 2002 to February 2003, he was a deputy manager of planning and strategy implementation of the general representative office of The Hong Kong and Shanghai Banking Corporation Limited. From July 2003 to January 2007, Mr. Li was an executive director of the investment department of Cathay Fortune Corporation.
Mr. Li Faben, born in January 1964, professor-level senior engineer, has been the executive Director of the Company since August 2006. He is also the general manager and a member of the Strategic and Sustainability Committee of the Company since October 2012. Mr. Li graduated from the Central South Mining & Metallurgical College (subsequently renamed as the Central South University of Technology, now known as the Central South University) with a bachelor’s degree in engineering in 1983 (major in mining engineering) and the Xi’an University of Architecture and Technology with a master’s degree in engineering in 2004 (specialized in mining engineering) and a doctor’s degree in Management Science and Engineering in January 2014. From August 1988 to January 1999, Mr. Li held various positions at Luoyang Luanchuan Molybdenum Company, in which he served as the deputy head and head of the technical division, quarry supervisor, head of the open-pit mining construction department and deputy manager of Luoyang Luanchuan Molybdenum Company. Mr. Li served as deputy general manager of Luoyang Luanchuan Molybdenum Group Co., Ltd. between January 1999 and November 2002. From November 2002 to August 2006, Mr. Li was the deputy general manager and vice chairman of Luoyang Luanchuan Molybdenum Group Co., Ltd. as well as a director of Luoyang Mining Group Co., Ltd. from July 2006 to November 2009. Mr. Li was the standing deputy general manager of CMOC from August 2006 to October 2012. Mr. Li was a director of China Molybdenum (Hong Kong) Company Limited from 16 August 2007 to May 2015.
Non-Executive Directors
Mr. Guo Yimin, born in October 1964, a senior economist, he has been the non-executive Director since March 2019 and the vice-chairman of the Company since April 2019. He graduated from Sichuan University with a bachelor’s degree in business administration in December 2005. From July 1983 to February 1995, he worked as planner and chief of planning department in Luoyang Glass Plant. Mr. Guo served as the assistant (deputy director level) of the director of investment committee of CLFG from February 1995 to July 1997, the financial vice-president of CLFG from July 1997 to July 2007, and the general manager of investment department, the assistant of chief financial officer, director, chief accountant of CLFG from July 2007 to August 2014. From August 2014 to November 2018, Mr. Guo served as the general manager of Luoyang Mining Group Co., Ltd. (洛陽礦業集團有限公司). He was also the director and general manager of Luoyang Guohong Investment Group Co., Ltd. (洛陽國宏投資集團有限公司) since August 2014, the chair-man of Luoyang Mining Group Co., Ltd. (洛陽礦業集團有限公司) since April 2015 and the vice chairman of Luoyang refinery Hongda industrial Co., Ltd. (洛陽煉化宏達實業有限責任公司) since September 2016.
Mr. Yuan Honglin, born in November 1967, has been our non-executive Director and a member of the Audit and Risk Committee, Remuneration Committee and Strategic and Sustainability Committee of the Company since November 2013. He has over 20 years of experience in the banking industry. Mr. Yuan graduated from Nanjing University in July 1990 with a bachelor’s degree in economics. In July 2004, Mr. Yuan obtained a MBA degree from Shanghai Jiaotong University. From August 1990 to May 2000, Mr. Yuan worked at Bank of China Limited, Nantong Branch where he held various positions including vice president of the Rudong sub-branch and manager of the credit management department of Nantong Branch. Between June 2000 and August 2007, Mr. Yuan worked at China Merchants Bank Limited, Shanghai Branch where he held various positions including president of Jiang Wan sub-branch and general manager of corporate banking department. From September 2007 to September 2012, Mr. Yuan worked at Ping An Bank Co., Ltd. where he held various positions including assistant to the president of the Shanghai Branch, vice president (responsible for the overall business operations) of the Shanghai Branch and general manager of the corporate banking department responsible for the northern region of China. From October 2012 to the present, Mr. Yuan has been the deputy general manager of Cathay Fortune Capital Limited.
Mr. Cheng Yunlei, born in September 1982, is an accountant and certified accountant. Mr. Cheng has been our non-executive Director since 26 June 2015. Mr. Cheng graduated from Henan University of Science and Technology and obtained a Bachelor’s degree in management in 2006. From July 2006 to October 2007, he worked in the No. 2 Audit Department of Luoyang Zhong Hua Certified Public Accountants Company Limited engaging in audit and financial consultancy work. He has served as the chief accountant and the person in charge of the finance and audit department of Luoyang Mining Group Co., Ltd. since November 2007. He served as the person in charge of the finance department of Luoyang Non-ferrous Mining Group Co., Ltd. (洛陽有色礦業集團有限公司) from September 2011 to June 2014, during which,

85China Molybdenum Co., Ltd.
PROFILES OF DIRECTORS, SUPERVISORS AND SENIOR MANAGEMENT
he concurrently served as a supervisor of Luoyang Non-ferrous Mining Group Co., Ltd., Luoyang Jinqiao Mining Co., Ltd. (洛陽錦橋礦業有限公司) and Luoning Jinlong Mining Co., Ltd. (洛寧金龍礦業有限公司). Since January 2015, Mr. Cheng has served as the general manager of the planning and finance department of Luoyang Guohong Investment Group Co., Ltd. He currently serves as the director and general manager of Luoyang Mining Group Co., Ltd. (洛陽礦業集團有限公司), the director of Luoyang Huaze Microcredit Co., Ltd. (洛陽華澤小額貸款有限公司), the general manager of Luoyang Guo’an Trade Co., Ltd. (洛陽國安商貿有限公司), and the supervisor of Henan Guoxin Investment Guarantee Co., Ltd. (河南國鑫投資擔保有限公司) and Luoyang Yu Meng Tong Industrial Co., Ltd. (洛陽豫孟通實業有限公司).
Independent Non-Executive Directors
Mr. Wang Gerry Yougui, born in May 1962, Hong Kong resident, Canadian citizen, has been the independent non-executive Director of the Company, the chairman of the Nomination and Governance Committee and Remuneration Committee, and a member of the Strategic and Sustainability Committee since August 2018. Mr. Wang received his Bachelor’s degree in Navigation from Shanghai Maritime University in 1983 and was awarded his Master’s degree in International Economics from the program sponsored by the United Nations Economic and Social Commission in 1986. In 1993, he obtained his Master of Science degree in Business Administration from the University of British Columbia in Canada. Mr. Wang was the Company Secretary & Business Development Deputy Manager at China Merchants Group from 1986 to 1989. He joined Seaspan Canada in 1990 and founded its containership business. In August 2005, Mr. Wang successfully took Seaspan’s containership business public, trading on the New York Stock Exchange as SSW. The offering was the largest shipping IPO in North America history. Mr. Wang worked as the Chief Executive Officer and Co-chairman for 12 years, making it the largest company of containership business in the world. Mr. Wang retired from Seaspan at the end of 2017 to turn his focus on developing new business ventures in Asia. Late on Mr. Wang founded the Tiger Gas Group (Tiger Clean Energy). Mr. Wang was named 2016 the Most Influential Person of Shipping in the world. Mr. Wang is serving as a consultant of Hong Kong and China region of the University of Pennsylvania in Asia. He is also an expert in shipping on BLOOMBERG TV & CNBC.
Ms. Yan Ye, born in May 1958, holds a degree of Master of Laws and is a registered lawyer. Ms. Yan has been the independent non-executive Director of the Company, and a member of the Audit and Risk Committee and Nomination and Governance Commit-tee since August 2018. Ms. Yan graduated from the faculty of law in Peking University in 1982 with a bachelor’s degree in law specialised in politics and law. She received a master’s degree in civil law from the faculty of law of Renmin University of China in 1984. She served as a lecturer and associate professor of the school of law of the Party School of the Central Committee of C.P.C. from 1984 to 1994. She served as a lawyer in Shaanxi Xiehui Law Firm from 1994 to 2003 and served as a lawyer in Shaanxi Win Law Firm from 2003 to 2008 and has served as a lawyer and a partner in Shaanxi Yanfeng Law Firm since 2008. Ms. Yan Ye concurrently serves as an independent director of Beijing Shenogen Pharma Group Ltd. (北京盛諾基醫藥科技有限公司).
Mr. Li Shuhua, born in 1971, has been the independent non-executive Director of the Company, the chairman of the Audit and Risk Committee and a member of the Nomination and Governance Committee and Remuneration Committee since August 2018. He obtained a bachelor’s degree in management majoring in auditing from Southwest University in 1993, a master’s degree in economics majoring in accounting from Xiamen University in 1996, and a doctor’s degree in management majoring in accounting from Shanghai University of Finance and Economics in 1999. During 2002 and 2004, he pursued his postdoctoral research in Finance and Law in Peking University, and obtained a Finance Executive Master of Business Administration (EMBA)’s degree from Shanghai Advanced Institute of Finance during 2013 and 2015. He served consecutively as director-level clerk of general office division, deputy division director of auditing division, deputy division director of general office division, division director of financial budgeting management division and division director of general office division of accounting department in CSRC during 1999 and 2010. During 2010 and 2018, he had worked for China Galaxy Securities Co., Ltd. and acted as Chief Risk Officer/Chief Compliance Officer and member of the Executive Committee. Since February 2018, he has been concurrently serving as a chair professor of practice at Xiamen National Accounting Institute and Renmin University of China. Mr. Li is currently the chairman of Changzhou Guangyang Bearing Co., Ltd. (常州光洋軸承股份有限公司), a director and the general manager of Changzhou Guangyang Holding Group Co.,Ltd. (常州光洋控股有限公司), an independent director of Bomesc Offshore Engineering Company Limited, Xi'an Shaangu Power Co., Ltd. and Guangzhou Hengyun Enterprises Holding Ltd., and the executive partner of the Merger and Acquisition Fund of Shenzhen Oriental Fortune Capital Investment Management Co., Ltd..
SUPERVISORSMs. Kou Youmin, born in August 1965, is a senior accountant. Ms. Kou has been the chairperson of our supervisory committee since 27 June 2015. Ms. Kou graduated from Henan Institute of Finance and Economics in 1999. She served as a technician at Luoyang Liming Plastic Plant (洛陽黎明塑料總廠) from August 1986 to January 1988; an accountant of Luoyang Changfeng Construction Material Store (洛陽長豐建材商店) from January 1988 to October 1992; an accountant of Luoyang Bearings Group Plastic Packing Manufacturing Plant (洛陽軸承集團塑料包裝製品廠) from October 1992 to September 1997; and the head of financial department of Luoyang Bearings Group Railway Bearings Co., Ltd. (洛陽軸承集團鐵路軸承有限公司) from September 1997 to March 2009. Ms. Kou has served as the head of financial department and the chief financial officer of Luoyang State-owned Assets Operation Company Limited (洛陽市國資國有資產經營有限公司) from March 2009 to March 2016. She also served as an assistant to general manager and the general manager of supervisory

86 2019 Annual Report
PROFILES OF DIRECTORS, SUPERVISORS AND SENIOR MANAGEMENT
and audit department of Luoyang Guohong Investment Group Co., Ltd. (洛陽國宏投資集團有限公司) from January to December 2015; and a deputy general manager of Luoyang Guohong Investment Group Co., Ltd. since December 2015. She currently serves as a supervisor of Luoyang Mining Group Co., Ltd (洛陽礦業集團有限公司).
Mr. Zhang Zhenhao, born in June 1973, obtained the CFA qualification from the CFA Institute. Mr. Zhang has been a Super-visor of the Company since August 2009. Mr. Zhang concurrently acts as a director of Cathay Fortune Corporation, a director of Cathay Fortune Investment Limited (鴻商投資有限公司), a director of Cathay Fortune International Company Limited (鴻商產業國際有限公司), a director of Cathay Fortune Singapore Pte. Ltd. (鴻商產業新加坡(私人)有限公司), a director of Shanghai CFC Puyuan Investment Management Co., Ltd (上海鴻商普源投資管理有限公司), a director of Shanghai CFC Datong Industrial Co., Ltd. (上海鴻商大通實業有限公司), a director of Shanghai Shanglue Trading Co., Ltd (上海商略貿易有限公司), a director of Beijing Huiqiao Investment Co., Ltd (北京匯橋投資有限公司) and a director of Cathay Fortune Capital Equity Investment Co., Ltd.* (鴻商資本股權投資有限公司). Mr. Zhang graduated from Tianjin Polytechnic University with a bachelor’s degree in textile engineering. Mr. Zhang also obtained a master degree in finance from the Graduate School of The Chinese Academy of Social Sciences. From 1993 to 1999, Mr. Zhang held positions at Tianjin Yarn-dyed Company (天津色織公司), Tianjin Weaving Materials Exchange, Hainan Zhongshang Futures Exchange* (海南中商期貨交易所). From May 1999 to December 2001, Mr. Zhang was employed by Zhongfu Securities Dealer Co. Ltd. as member of the preparatory division, general manager of the business management department and supervisor of the company. From January 2002 to May 2007, Mr. Zhang was employed by Zhongfu Securities Co. Ltd. as member of the preparatory division, general manager of the sales department of Haikou Securities, executive director of the sales management department, secretary to the board of directors of the company and general manager of the chief executive office and the human resources department. Since June 2007, Mr. Zhang has been the general manager of the finance department of Cathay Fortune Corporation.
Ms. Wang Zhengyan, born in June 1971, has been a supervisor of the Company since 19 January 2015. Ms. Wang graduated from the Department of Finance of Henan Agricultural University, the People’s Republic of China. From 1990 to January 2008, she worked at the property management department of China Luoyang Float Glass Group Co., Ltd., planning and development department and international engineering company. She joined the Company in January 2008, served as the deputy manager of China Molybdenum Metallic Material Company Ltd. from 2009 to 2011, and served as the deputy manager of Xinjiang Luomu Mining Co., Ltd. from 2011 to January 2013. Since then, she served as the head of investment engineering department. From January 2015 to January 2016, she served as the chairperson of the Company’s labour union.
JOINT COMPANY SECRETARYMr. Yue Yuanbin, born in 1973, has been the secretary to the Board of the Company since March 2017 and a joint company secretary since August 2018. Mr. Yue graduated with a bachelor’s degree in engineering from the department of materials engineering of the Shenyang Industrial College in July 1995. He then obtained a master’s degree in technology economics from the School of Economics and Management of Tongji University in March 1998. Mr. Yue served as a managing director of the corporate finance department of Guotai Junan Securities, a vice president in the investment banking division of China Fortune Securities and a vice president of New Margin Ventures.
Ms. Ng Sau Mei, born in Hong Kong, obtained a Master Degree in Laws from University of London in the UK. She is a fellow member of the Hong Kong Institute of Chartered Secretaries and Chartered Governance Institute (formerly the Institute of Chartered Secretaries and Administrators) in the UK, and an associate director of the Listing Services Department of TMF Hong Kong Limited. Ms. Ng has nearly 20 years of experience as a corporate secretary for providing corporate secretarial/joint company secretarial of related matters and compliance services to Hong Kong listed companies. Ms. Ng currently serves as company secretary/joint company secretary for a number of Hong Kong listed companies including Metallurgical Corporation of China Ltd. (中國冶金科工股份有限公司), Shandong Gold Mining Co., Ltd. (山東黃金礦業股份有限公司), The People’s Insurance Company (Group) of China Limited (中國人民保險集團股份有限公司), and China Blue Chemical Ltd. (中海石油化學股份有限公司).
SENIOR MANAGEMENTMs. Wu Yiming, born in 1975, is an economist. She has served as vice general manager of the Company since 31 January 2018. Ms. Wu graduated from Fudan University (復旦大學) in 1997 and obtained a master’s degree of management in Stanford University (美國斯坦福大學) in July 2008. She has rich experience in such fields as legal affairs management, financial management, assets management and corporate governance. Ms. Wu entered Baosteel Group (寶鋼集團) in July 1997 and served as senior legal executive, deputy director and director of Shanghai Baosteel International Trade Co., Ltd. (上海寶鋼國際貿易有限公司). She worked as the secretary of the board and director of the asset financial department of Baosteel Resources (寶鋼資源) from July 2008 to July 2010, and served as general manager assistant, the secretary of the board and director of the asset financial department of Baosteel Resources from July 2010 to July 2012. From September 2010 to July 2012, she held a concurrent position of general manager assistant of Baosteel Resources (International) (寶鋼資源(國際)). From July 2012 to March 2017, she worked as vice general manager of Baosteel Resources and Baosteel Resources (International). From February 2017 to January 2018, Ms. Wu served as the secretary of the board of Baoshan Iron & Steel Co., Ltd.

87China Molybdenum Co., Ltd.
CORPORATE INFORMATION
DIRECTORS
Executive Directors
Li Chaochun (Chairman)Li Faben (General Manager)
Non-Executive Directors
Guo Yimin (Vice chairman)Yuan HonglinCheng Yunlei
Independent Non-Executive Directors
Wang Gerry YouguiYan YeLi Shuhua
SUPERVISORS
Kou Youmin (Chairperson of the Supervisory Committee)Zhang ZhenhaoWang Zhengyan
BOARD COMMITTEES
Remuneration Committee
Wang Gerry Yougui (Chairman)Li ShuhuaYuan Honglin
AUDIT AND RISK COMMITTEE
Li Shuhua (Chairman)Yan YeYuan Honglin
STRATEGIC AND SUSTAINABILITY COMMITTEE
Li Chaochun (Chairman)Li FabenWang Gerry YouguiYuan Honglin
NOMINATION AND GOVERNANCE COMMITTEE
Wang Gerry Yougui (Chairman)Li Chaochun (Vice Chairman)Yan YeLi Shuhua
BOARD SECRETARY
Yue Yuanbin
JOINT COMPANY SECRETARIES
Yue YuanbinNg Sau Mei (FCS,FCIS)(appointed on 10 January 2020)
REGISTERED OFFICE IN THE PRC
North of Yihe, Huamei Shan RoadChengdong New District, Luanchuan CountyLuoyang City, Henan Province, the PRC
PRINCIPAL PLACE OF BUSINESS IN THE PRC
North of Yihe, Huamei Shan RoadChengdong New District, Luanchuan CountyLuoyang City, Henan Province, the PRC
PRINCIPAL PLACE OF BUSINESS IN HONG KONG
31/F, Tower Two, Times Square1 Matheson StreetCauseway Bay, Hong Kong (changed on 10 January 2020)
LEGAL REPRESENTATIVE
Li Chaochun
AUTHORIZED REPRESENTATIVES
Li ChaochunNg Sau Mei (appointed on 10 January 2020)
ENQUIRY DEPARTMENT OF THE COMPANY
Office of the Board of Directors

88 2019 Annual Report
CORPORATE INFORMATION
INFORMATION ENQUIRY TELEPHONE NO. OF THE COMPANY
(+86)379 6860 3993
SHANGHAI A SHARE REGISTRAR
China Securities Depository andClearing Corporation Limited, Shanghai Branch36/F, China Insurance BuildingNo. 166 Lujiazui Road EastPudong New AreaShanghai, the PRC
HONG KONG H SHARE REGISTRAR
Computershare Hong Kong Investor Services LimitedShops 1712–1716, 17th Floor, Hopewell Centre183 Queen’s Road East, Wanchai, Hong Kong
PLACES OF LISTING
Place of listing of A share – The Shanghai Stock ExchangePlace of listing of H share – The Stock Exchange of Hong Kong Limited
NAME OF THE STOCK
China Molybdenum Co., Ltd. (CMOC)
STOCK CODE
Stock code of A share: 603993 (Listed on 9 October 2012)Stock code of H share: 03993 (Listed on 26 April 2007)
PRINCIPAL BANKERS
1. Industrial and Commercial Bank of China Limited2. Agricultural Bank of China Limited3. China Construction Bank Corporation4. Bank of China Limited5. China Minsheng Banking Corp., Ltd.6. China CITIC Bank Corporation Limited7. China Development Bank Corporation8. Ping An Bank Co., Ltd.
AUDITOR
Deloitte Touche Tohmatsu Certified Public Accountants LLP
LEGAL ADVISORS
As to Hong Kong law:
Freshfields Bruckhaus Deringer55/F, One Island East, Taikoo PlaceQuarry Bay, Hong Kong
As to PRC law:
Llinks Law Offices19/F, One Lujiazui68 Yin Cheng Road MiddleShanghai, the PRC
WEBSITE
www.cmoc.com

89China Molybdenum Co., Ltd.
AUDITOR'S REPORT
De Shi Bao (Shen) Zi (20) No. P00816
To all shareholders of China Molybdenum Co., Ltd.:
I. OPINION
We have audited the financial statements of China Molybdenum Co., Ltd. ("CMOC", or "the Company"), which comprise the consolidated and the Company's balance sheets as at 31 December 2019, the consolidated and the Company's income statements, the consolidated and the Company's cash flow statements, and the consolidated and the Company's statements of changes in shareholders' equity for the year then ended, and the notes to the financial statements.
In our opinion, the accompanying financial statements of CMOC are prepared and present fairly, in all material respects, the consolidated and the Company's financial position as of 31 December 2019, and the consolidated and the Company's results of operations and cash flows for the year then ended in accordance with Accounting Standards for Business Enterprises.
II. BASIS FOR OPINION
We conducted our audit in accordance with China Standards on Auditing. Our responsibilities under those standards are further described in the Auditor's Responsibilities for the Audit of the Financial Statements section of our report. We are independent of CMOC in accordance with the Code of Ethics for Chinese Certified Public Accountants, and we have fulfilled our other ethical responsibilities in accordance with the Code. We believe that the audit evidences we have obtained are sufficient and appropriate to form our opinion.
III. KEY AUDIT MATTERS
The key audit matters are the most important matters that we consider to the audit of financial statements based on our professional judgment. The responses to these matters are based on the audit of the financial statements as a whole and the formation of an audit opinion. We do not express an opinion on these matters separately. We determine that the following matters are the key audit matters that need to be communicated in the auditor's report.
(I) Impairment of Mining Rights and Goodwill
Description
We identified the impairment of mining rights and goodwill as a key audit matter, mainly due to the management's significant estimates and judgments involved in determining the recoverable amounts of relevant cash-generating units. As at end of the reporting period, CMOC has several mining rights of molybdenum and tungsten, copper and gold, niobium and phosphorus, copper and cobalt, representing intangible assets – mining rights, and goodwill related to the acquisition of phosphorus business in Brazil in 2016.
In view of the significant carrying amounts of CMOC's mining rights and their high sensitivity to commodity prices in both domestic and foreign markets, the management evaluates if there exists any impairment indicators of these mining rights at each balance sheet date. The management shall perform impairment test for the mining rights with impairment indicators at each balance sheet date. For the goodwill arising from the acquisition, the management performs impairment test at the end of each year.
The above mentioned impairment review is related to the management's significant estimates and judgments, including ore reserves, discount rates, and cash flow forecasts based on future market supply and demand. Changes in the management's estimates and judgments may have significant financial impacts.

90 2019 Annual Report
AUDITOR'S REPORT
III. KEY AUDIT MATTERS (CONTINUED)
(I) Impairment of Mining Rights and Goodwill (continued)
Audit Response
The audit procedures we performed for the impairment evaluation of mining rights and goodwill include:
1. Reviewing the management's judgements and analyses for the impairment indicators of mining rights based on the operations of the related asset groups in the current period;
2. Evaluating the valuation models adopted by the management for goodwill and mining rights which have impairment indicators;
3. Based on our understanding of the industry, analyzing and reviewing the reasonableness of significant assumptions and judgements the management used in the forecast of future cash flows in the impairment test, including but not limited to determination of exploitable reserves and mining progress;
4. Analyzing and reviewing the discount rate the management used in the impairment test;
5. Checking the underlying data used in the calculation of the present value of the expected future cash flows with the historical data and other supporting evidence, and assessing the reasonableness.
(II) Revenue Recognition
Description
We identify the revenue recognition as a key audit matter, mainly because, as an A+H listed company, CMOC's revenue is generally considered to be a key business indicator. The CMOC's business segments include molybdenum-and-tungsten-related products, copper-and-gold-related products, niobium-and-phosphorus-related products, copper-and-cobalt-related products, metal trading and others. Based on the complexity of the revenue process and related internal controls, we identify the revenue recognition as a key audit matter.
Audit Response
The major audit procedures we performed for revenue recognition include:
1. Understanding and evaluating the internal controls related to revenue recognition in the sales and collection cycle of CMOC, and testing the effectiveness of their implementation;
2. Reviewing the sales contract on a sample basis, identifying the contract terms and conditions related to the transfer of control of the commodity, and evaluating whether the point of revenue recognition of CMOC complies with the Accounting Standards for Business Enterprises;
3. Performing analytical procedures according to the characteristics of the industry and the business of CMOC and combining with the commodity prices in open market to review the reasonableness of revenue recognition in current period;
4. Performing test of details on sales transactions to verify whether the revenue was recorded in the correct period and whether the revenue was overstated or understated.

91China Molybdenum Co., Ltd.
AUDITOR'S REPORT
III. KEY AUDIT MATTERS (CONTINUED)
(III) Significant business acquisition
Description
As described in Note I and Note VI to the financial statements, in the current year, CMOC has completed the acquisition of the metal trading platform business in Switzerland. Pursuant to Accounting Standard for Enterprises No. 20 – Business Combination, CMOC shall allocate the cost of acquisition at acquisition date, recognize the fair value of the identifiable assets and liabilities obtained from the acquiree which meet the recognition requirements at acquisition date, and calculate the goodwill or bargain purchase arising from the acquisition. Due to the significance of value, the complexity of valuation basis and methodology in determining the fair value of the acquired identifiable assets and liabilities, and significant estimates and judgments of the management, including the cash flow forecasts based on the future market supply and demand, and the discount rate. The selection of valuation basis and methodology, and changes in the management's estimates and judgments may have significant financial impacts. Therefore, we identify relevant accounting treatment of the significant business acquisition as a key audit matter.
Audit Response
The major audit procedures we performed for the above key audit matters include:
1. Reviewing the related acquisition agreements, and the management's judgment of the date of acquisition, understanding of the relevant contractual terms, and analysis of the impact of accounting treatments;
2. Understanding and reviewing the management's assertion and analysis of all identifiable assets and liabilities at the date of acquisition;
3. Conducting interviews with valuation experts employed by the management, evaluating their independence and competence, and understanding their valuation basis and methodology adopted in assessing the fair value of all identifiable assets and liabilities at the date of acquisition;
4. Based on our knowledge of the industry, and related source information and historical data, reviewing the reasonableness of basic assumptions, valuation basis and methodology and significant estimates and judgments the management and their valuation experts select in assessing the fair value of all identifiable assets and liabilities by using the work of our internal valuation experts;
5. Analyzing the reasonableness of the goodwill or bargain purchase arising from the business combination;
6. Reviewing the accounting treatments of such significant business acquisition.

92 2019 Annual Report
AUDITOR'S REPORT
IV. OTHER INFORMATION
The management of CMOC is responsible for preparation of the other information. The other information comprises the information included in the annual report, but does not include the financial statements and our auditor's report thereon.
Our opinion on the financial statements does not cover other information and we do not express any form of assurance opinion thereon.
In connection with our audit of the financial statements, our responsibility is to read the other information and, in doing so, consider whether the other information is materially inconsistent with the financial statements or our knowledge obtained in the audit or otherwise appears to be materially misstated.
If, based on the work we have performed, we conclude that there is a material misstatement of this other information, we are required to report that fact. In this respect, we have no matter to report.
V. RESPONSIBILITIES OF MANAGEMENT AND THOSE CHARGED WITH GOVERNANCE FOR THE FINANCIAL STATEMENTS
The management of CMOC is responsible for the preparation of the financial statements in accordance with Accounting Standards for Business Enterprises to achieve fair presentation of the financial statements, and for the design, implementation and maintenance of internal control which is necessary to enable the financial statements that are free from material misstatement, whether due to fraud or error.
In preparing the financial statements, the management is responsible for assessing CMOC's ability to continue as a going concern, disclosing, as applicable, matters related to going concern and using the going concern basis of accounting unless the management either intends to liquidate CMOC or to cease operations, or have no other realistic alternative but to do so.
Those charged with governance are responsible for overseeing CMOC's financial reporting process.
VI. AUDITOR'S RESPONSIBILITIES FOR THE AUDIT OF THE FINANCIAL STATEMENTS
Our objectives are to obtain reasonable assurance about whether the financial statements as a whole are free from material misstatement, whether due to fraud or error, and to issue an auditor's report that includes our opinion. Reasonable assurance is a high level of assurance, but is not a guarantee that an audit conducted in accordance with audit standards will always detect a material misstatement when it exists. Misstatements can arise from fraud or error and are considered material if, individually or in the aggregate, they could reasonably be expected to influence the economic decisions of users taken on the basis of these financial statements.
As part of an audit in accordance with audit standards, we exercise professional judgment and maintain professional skepticism throughout the audit. We also:
(1) Identify and assess the risks of material misstatement of the financial statements, whether due to fraud or error, design and perform audit procedures responsive to those risks, and obtain audit evidence that is sufficient and appropriate to provide a basis for our opinion. The risk of not detecting a material misstatement resulting from fraud is higher than for one resulting from error, as fraud may involve collusion, forgery, intentional omissions, misrepresentations, or the override of internal control.
(2) Obtain an understanding of internal control relevant to the audit in order to design audit procedures that are appropriate in the circumstances.
(3) Evaluate the appropriateness of accounting policies used and the reasonableness of accounting estimates and related disclosures made by the management.

93China Molybdenum Co., Ltd.
AUDITOR'S REPORT
VI. AUDITOR'S RESPONSIBILITIES FOR THE AUDIT OF THE FINANCIAL STATEMENTS (CONTINUED)
(4) Conclude on the appropriateness of the management's use of the going concern basis of accounting and, based on the audit evidence obtained, whether a material uncertainty exists related to events or conditions that may cast significant doubt on CMOC's ability to continue as a going concern. If we conclude that a material uncertainty exists, we are required to draw attention in our auditor's report to the related disclosures in the financial statements or, if such disclosures are inadequate, to modify our opinion. Our conclusions are based on the audit evidence obtained up to the date of our auditor's report. However, future events or conditions may cause CMOC to cease to continue as a going concern.
(5) Evaluate the overall presentation (including the disclosure), structure and content of the financial statements, and whether the financial statements represent the transactions and events in a manner that achieves fair presentation.
(6) Obtain sufficient and appropriate audit evidence regarding the financial information of the entities or business activities within CMOC to express an opinion on the financial statements. We are responsible for the direction, supervision and performance of the group audit. We remain solely responsible for our audit opinion.
We communicate with those charged with governance regarding, among other matters, the planned scope and timing of the audit and significant audit findings, including any significant deficiencies in internal control that we identify during our audit.
We also provide a statement to those charged with governance on compliance with the ethical requirements related to independence and communicate with those charged with governance of all relationships and other matters that may reasonably be considered to affect our independence, as well as related safeguards (if applicable).
Among the matters that are communicated with those charged with governance, we determine the matters that are most important to the current financial statement audit and thus constitute key audit matters. We describe these matters in the audit report unless the laws and regulations prohibit public disclosure of these matters or, in rare cases, if the negative consequences, upon reasonable expectation, of communicating the matters in the audit report outweigh the public interest benefits of such communication, we decide not to communicate these matters in the audit report.
Deloitte Touche TohmatsuCertified Public Accountants LLP
Chinese Certified Public Accountant: Hu Ke (Engagement Partner)
Shanghai, China
Chinese Certified Public Accountant: Shi Weicen
27 March 2020
The auditor's report and the accompanying financial statements are English translations of the Chinese auditor's report and statutory financial statements prepared under accounting principles and practices generally accepted in the People's Republic of China. These financial statements are not intended to present the financial position and results of operations and cash flows in accordance with accounting principles and practices generally accepted in other countries and jurisdictions. In case the English version does not conform to the Chinese version, the Chinese version prevails.

94 2019 Annual Report
CONSOLIDATED BALANCE SHEET31 DECEMBER 2019
Unit: RMB
ASSETS Notes 31 December 2019 31 December 2018
Current assets:Cash and bank balances (V) 1 15,647,900,059.61 26,647,644,058.81Held-for-trading financial assets (V) 2 7,719,450,290.97 774,326,692.25Derivative financial assets (V) 3 2,178,322,223.39 –Accounts receivable (V) 4 1,510,508,440.50 860,999,687.88Financing receivables (V) 5 375,935,645.39 1,623,841,101.38Prepayments (V) 6 1,065,494,520.83 151,004,234.22Other receivables (V) 7 1,119,039,260.19 1,040,048,708.23Inventories (V) 8 20,730,673,736.79 6,615,914,805.21Other current assets (V) 9 3,830,180,430.37 1,450,605,120.41
Total current assets 54,177,504,608.04 39,164,384,408.39
Non-current assets:Long-term equity investments (V) 10 1,033,168,028.11 2,522,865,277.94Other investments in equity instruments (V) 11 85,344,307.06 448,174,198.06Other non-current financial assets (V) 12 4,356,783,464.12 3,906,621,612.87Non-current derivative financial assets (V) 13 7,620,425.07 3,179,157.60Fixed assets (V) 14 24,439,595,450.35 23,620,517,589.11Construction in progress (V) 15 2,386,791,478.58 1,893,822,308.19Long-term inventories (V) 8 5,660,505,828.69 5,122,434,298.15Right-of-use assets (V) 16 346,815,801.39Intangible assets (V) 17 20,446,930,377.08 20,931,052,279.34Goodwill (V) 18 659,468,043.85 674,886,645.02Long-term prepaid expenses (V) 19 136,987,188.97 129,022,870.55Deferred tax assets (V) 20 645,508,458.12 525,597,815.59Other non-current assets (V) 21 2,479,203,017.30 2,273,558,775.22
Total non-current assets 62,684,721,868.69 62,051,732,827.64
Total assets 116,862,226,476.73 101,216,117,236.03
Current liabilities:Short-term borrowings (V) 22 18,589,025,832.49 4,588,152,515.23Held-for-trading financial liabilities (V) 23 3,157,951,924.72 4,250,711,352.44Derivative financial liabilities (V) 24 2,640,928,053.07 75,423,332.52Notes payable (V) 25 233,224,073.53 29,000,000.00Accounts payable (V) 26 1,944,506,406.62 1,119,073,099.06Contract liabilities (V) 27 416,194,761.78 200,667,461.95Employee benefits payable (V) 28 692,638,178.24 517,344,459.78Taxes payable (V) 29 399,251,199.18 1,110,201,369.36Other payables (V) 30 1,584,737,923.47 1,027,781,797.06Non-current liabilities due within one year (V) 31 3,749,103,660.62 2,929,839,224.28Other current liabilities (V) 32 1,167,803,612.80 130,541,907.62
Total current liabilities 34,575,365,626.52 15,978,736,519.30

95China Molybdenum Co., Ltd.
CONSOLIDATED BALANCE SHEET31 DECEMBER 2019
Unit: RMB
ASSETS Notes 31 December 2019 31 December 2018
Non-current liabilities:Non-current derivative financial liabilities (V) 13 202,416,693.40 23,312,327.42Long-term borrowings (V) 33 16,278,909,765.88 20,196,854,832.74Bonds payable (V) 34 5,092,860,000.00 2,000,000,000.00Lease liabilities (V) 35 273,971,191.18Long-term employee benefits payable (V) 36 254,249,008.22 129,064,725.83Provisions (V) 37 2,495,171,563.70 1,908,084,106.78Deferred income (V) 38 68,005,249.90 66,675,249.96Deferred tax liabilities (V) 20 7,887,539,765.83 8,021,118,162.47Other non-current liabilities (V) 39 238,141,518.84 3,294,336,000.00
Total non-current liabilities 32,791,264,756.95 35,639,445,405.20
Total liabilities 67,366,630,383.47 51,618,181,924.50 Shareholders' equity:
Paid-in capital (Share capital) (V) 40 4,319,848,116.60 4,319,848,116.60Capital reserve (V) 41 27,582,794,983.23 27,582,794,983.23Other comprehensive income (V) 42 (468,588,363.13) (799,327,420.21)Special reserve (V) 43 302,145.46 3,038,386.94Surplus reserve (V) 44 1,286,827,000.91 1,160,396,190.21Retained profits (V) 45 8,081,590,250.78 8,682,123,314.63Total equity attributable to the shareholders of the parent company 40,802,774,133.85 40,948,873,571.40Minority interests 8,692,821,959.41 8,649,061,740.13
Total shareholders' equity 49,495,596,093.26 49,597,935,311.53
Total liabilities and shareholders' equity 116,862,226,476.73 101,216,117,236.03

96 2019 Annual Report
BALANCE SHEET OF THE COMPANY31 DECEMBER 2019
Unit: RMB
ASSETS Notes 31 December 2019 31 December 2018
Current assets:Cash and bank balances (XIV) 1 3,979,403,901.95 14,766,503,386.80Held-for-trading financial assets (XIV) 2 1,014,194,897.26 –Accounts receivable (XIV) 3 69,757,554.20 178,457,336.22Financing receivables (XIV) 4 59,095,591.76 1,610,443,851.38Prepayments (XIV) 5 7,220,814.76 50,305,999.43Other receivables (XIV) 6 5,013,326,170.63 4,783,176,527.20Inventories (XIV) 7 140,962,874.49 142,318,149.08Other current assets 112,132,176.28 77,471,224.51
Total current assets 10,396,093,981.33 21,608,676,474.62
Non-current assets:Long-term equity investments (XIV) 8 29,912,001,876.46 23,164,431,184.76Other investments in equity instruments (XIV) 9 – 194,111,260.26Other non-current financial assets (XIV) 10 725,946,156.42 951,571,101.88Non-current derivative financial assets (XIV) 11 – 3,179,157.60Fixed assets (XIV) 12 1,343,692,135.81 1,338,742,434.52Construction in progress 185,186,824.85 171,760,810.63Intangible assets (XIV) 13 321,189,810.81 355,554,503.18Long-term prepaid expenses 146,894,703.40 145,047,198.03Deferred tax assets (XIV) 14 33,651,881.47 30,011,327.13Other non-current assets (XIV) 16 8,028,346.01 218,836,266.71
Total non-current assets 32,676,591,735.23 26,573,245,244.70
Total assets 43,072,685,716.56 48,181,921,719.32
Current liabilities:Short-term borrowings (XIV) 17 1,178,000,000.00 2,006,257,000.00Held-for-trading financial liabilities (XIV) 18 645,164,164.50 3,700,673,914.84Derivative financial liabilities (XIV) 19 – 70,753,781.72Notes payable 7,350,262.77 20,000,000.00Accounts payable (XIV) 20 236,918,656.25 134,109,971.43Contract liabilities 254,996,864.98 390,137,050.79Employee benefits payable 114,106,952.06 108,566,407.54Taxes payable (XIV) 21 22,913,488.49 117,362,547.14Other payables (XIV) 22 912,657,905.56 2,179,902,221.07Non-current liabilities due within one year – 696,387,501.74Other current liabilities (XIV) 23 1,150,711,291.46 174,999,888.99
Total current liabilities 4,522,819,586.07 9,599,150,285.26

97China Molybdenum Co., Ltd.
BALANCE SHEET OF THE COMPANY31 DECEMBER 2019
Unit: RMB
ASSETS Notes 31 December 2019 31 December 2018
Non-current liabilities:Non-current derivative financial liabilities (V) 13 202,416,693.40 23,312,327.42Bonds payable (V) 34 3,000,000,000.00 2,000,000,000.00Deferred income 18,787,996.10 18,787,996.10Deferred tax liabilities (XIV) 14 – –Provisions (XIV) 24 47,570,371.67 47,570,371.67Other non-current liabilities 204,093,366.89 307,006,153.71
Total non-current liabilities 3,472,868,428.06 2,396,676,848.90
Total liabilities 7,995,688,014.13 11,995,827,134.16
Shareholders' equity:Paid-in capital (Share capital) (V) 40 4,319,848,116.60 4,319,848,116.60Capital reserve (V) 41 27,636,530,888.88 27,636,530,888.88Other comprehensive income – (5,005,428.78)Special reserve 100,628.26 2,594,582.62Surplus reserve (V) 44 1,286,827,000.91 1,160,396,190.21Retained profits 1,833,691,067.78 3,071,730,235.63
Total shareholders' equity 35,076,997,702.43 36,186,094,585.16
Total liabilities and shareholders' equity 43,072,685,716.56 48,181,921,719.32
The financial statement is signed by the following persons-in-charge:
Legal representative: Person in charge of accounting: Person in charge of the accounting department:

98 2019 Annual Report
CONSOLIDATED INCOME STATEMENTFOR THE YEAR ENDED 31 DECEMBER 2019
Unit: RMB
Items Notes 2019 2018
I. Total operating income (V) 46 68,676,565,008.79 25,962,862,773.77Including: Operating income 68,676,565,008.79 25,962,862,773.77Less: Operating costs (V) 46 65,605,691,676.40 16,180,247,120.46
Taxes and levies (V) 47 812,716,202.17 1,018,793,135.61Selling expenses (V) 48 90,657,673.80 96,821,993.66Administrative expenses (V) 49 1,233,696,509.26 933,345,539.26Research and development expenses 268,320,900.73 254,356,012.27Financial expenses (V) 50 1,250,837,802.17 643,046,128.42Including: Interest expenses 1,840,227,297.31 1,450,739,092.45
Interest income (929,942,890.97) (1,037,941,410.44)Add: Other income (V) 51 17,294,553.35 12,550,421.30
Investment income (losses are indicated by "-") (V) 52 194,629,428.14 202,269,845.76
Including: Income from investments in associates and joint ventures 21,744,539.34 69,110,578.55
Gains from changes in fair value (losses are indicated by "-") (V) 53 2,703,857,555.18 122,407,995.85
Gains from credit impairment (losses are indicated by "-") (V) 54 (6,311,229.01) (17,792,652.00)
Gains from assets impairment (losses are indicated by "-") (V) 55 (38,246,066.61) (66,582,688.49)
Gains from disposal of assets (losses are indicated by "-") (64,265,650.01) (31,121,956.96)
II. Operating profit (loss is indicated by "-") 2,221,602,835.30 7,057,983,809.55Add: Non-operating income (V) 56 170,387,882.33 2,578,175.70Less: Non-operating expenses (V) 57 33,542,253.71 70,704,569.62
III. Total profit (loss is indicated by "-") 2,358,448,463.92 6,989,857,415.63Less: Income tax expenses (V) 58 592,600,086.07 1,839,815,909.39
IV. Net profit (loss is indicated by "-") 1,765,848,377.85 5,150,041,506.24(I) Classified by business continuity
1. Ne t profit from continuing operations (loss is indicated by "-") 1,765,848,377.85 5,150,041,506.24
2. Ne t profit from discontinued operations (loss is indicated by "-") – –
(II) Classified by ownership:1. Ne t profit attributable to minority interests (loss is
indicated by "-") (91,165,833.13) 514,457,553.082. Ne t profit attributable to owners of the parent
company (loss is indicated by "-") 1,857,014,210.98 4,635,583,953.16

99China Molybdenum Co., Ltd.
CONSOLIDATED INCOME STATEMENTFOR THE YEAR ENDED 31 DECEMBER 2019
Unit: RMB
Items Notes 2019 2018
V. Other comprehensive income, net of tax (V) 42 510,713,480.88 209,753,598.38Other comprehensive income attributable to owners of
the parent company, net of tax 375,539,057.08 (173,162,449.82)(I) Ot her comprehensive income that will not be
reclassified to profit or loss 60,440,773.28 (26,301,226.93)1. Ch anges in fair value of other investments in
equity instruments 68,744,413.28 (26,301,226.93)2. Re measurement of changes in defined benefit
plans (8,303,640.00) –(II) Ot her comprehensive income that may be
reclassified subsequently to profit or loss 315,098,283.80 (146,861,222.89)1. Ot her comprehensive income that may be
reclassified to profit or loss under equity method 20,822,262.48 (20,822,262.48)
2. Ca sh flow hedges reserve (Effective portion of profit or loss from cash flow hedges) (173,044,901.70) (17,113,194.35)
3. Fo reign exchange difference from translation of financial statements 467,320,923.02 (108,925,766.06)
Other comprehensive income attributable to minority interests, net of tax 135,174,423.80 382,916,048.20
VI. Total comprehensive income 2,276,561,858.73 5,359,795,104.62Total comprehensive income attributable to shareholders
of the parent company 2,232,553,268.06 4,462,421,503.34Total comprehensive income attributable to minority
interests 44,008,590.67 897,373,601.28
VII. Earnings per share: (V) 59(I) Basic earnings per share 0.09 0.21(II) Diluted earnings per share N/A N/A
The financial statement is signed by the following persons-in-charge:
Legal representative: Person in charge of accounting: Person in charge of the accounting department:

100 2019 Annual Report
INCOME STATEMENT OF THE COMPANYFOR THE YEAR ENDED 31 DECEMBER 2019
Unit: RMB
Item Notes 2019 2018
I. Operating revenue (XIV) 25 3,534,546,902.16 3,890,864,252.49Less: Operating costs (XIV) 25 1,454,050,191.48 1,258,578,899.96
Taxes and levies (XIV) 26 284,486,261.28 342,114,437.52Selling expenses 17,980.30 12,345.26Administrative expenses (XIV) 27 407,840,236.41 364,695,589.04R & D expenses 179,139,229.17 188,795,918.52Financial expenses (XIV) 28 (296,608,039.89) (527,911,495.37)Including: Interest expenses 246,584,700.66 272,439,763.32
Interest income (560,330,300.98) (803,909,376.38)Add: Other income 6,193,164.36 5,176,395.28
Investment income (losses are indicated by"-") (XIV) 29 121,943,376.80 109,613,041.05Including: Income from investments in
associates and joint ventures 68,939,691.70 62,379,726.43Gains from changes in fair value (losses are
indicated by"-") (218,236,080.59) (119,912,602.50)Gains from credit impairment(losses are
indicated by"-") (XIV) 30 5,881,152.41 (7,961,541.08)Gains from assets impairment(losses are
indicated by"-") (XIV) 31 (15,140,391.60) (1,945,548.70)Income from disposal of assets(losses are
indicated by"-") 7,097.16 (1,664,197.21)
II. Operating profit (losses are indicated by"-") 1,406,269,361.95 2,247,884,104.40Add: Non-operating income (XIV) 32 10,320,335.42 1,208,319.54Less: Non-operating expenses (XIV) 33 29,779,566.01 62,672,322.64
III. Total profit (loss is indicated by"-") 1,386,810,131.36 2,186,420,101.30Less: Income tax expenses (XIV) 34 146,302,024.38 264,365,160.17
IV. Net profit (loss is indicated by"-") 1,240,508,106.98 1,922,054,941.13(I) Ne t profit from continuing operations (loss is
indicated by"-") 1,240,508,106.98 1,922,054,941.13(II) Ne t profit from discontinued operations (loss is
indicated by"-") – –
V. Other comprehensive income 28,805,428.78 1,984,226.67(1) Ot her comprehensive income that will not be
reclassified to profit or loss 28,805,428.78 1,984,226.67Changes in fair value of other investments in equity
instruments 28,805,428.78 1,984,226.67
VI. Total comprehensive income 1,269,313,535.76 1,924,039,167.80
The financial statement is signed by the following persons-in-charge:
Legal representative: Person in charge of accounting: Person in charge of the accounting department:

101China Molybdenum Co., Ltd.
CONSOLIDATED CASH FLOW STATEMENTFOR THE YEAR ENDED 31 DECEMBER 2019
Unit: RMB
Item Notes(V) 2019 2018
I. Cash flows from operating activities:Cash receipts from the sale of goods and the rendering
of services 71,786,252,657.57 29,243,394,765.11Other cash receipts relating to operating activities 60(1) 4,753,257,983.02 1,136,280,555.91Sub-total of cash inflows from operating activities 76,539,510,640.59 30,379,675,321.02Cash payments for goods purchased and services
received 66,328,481,964.48 13,838,634,782.28Cash payments to and on behalf of employees 2,307,952,972.59 2,058,337,557.31Payments of various types of taxes 4,168,334,672.22 3,876,805,514.67Other cash payments relating to operating activities 60(2) 2,029,913,147.43 1,171,363,876.61Sub-total of cash outflows from operating activities 74,834,682,756.72 20,945,141,730.87Net cash flow from operating activities 1,704,827,883.87 9,434,533,590.15
II. Cash flows from investing activities:Cash receipts from disposals and recovery of
investments 60(3) 4,784,176,788.82 6,076,815,575.34Cash receipts from investment income 1,632,774,545.59 207,156,988.46Net cash receipts from disposals of fixed assets,
intangible assets and other long-term assets 24,417,189.84 43,630,402.62Other cash receipts relating to investing activities 60(4) 3,009,624,827.50 –Sub-total of cash inflows from investing activities 9,450,993,351.75 6,327,602,966.42Cash payments for acquisitions or disposals of
subsidiaries and other business units 60(5) 2,069,009,623.30 –Cash payments to acquire or construct fixed assets,
intangible assets and other long-term assets 2,718,622,240.73 2,807,367,389.57Cash payments to acquire investments 60(6) 5,095,283,003.45 4,852,213,461.04Other cash payments relating to investing activities 60(7) 2,247,181,202.53 1,065,210,116.95Sub-total of cash outflows from investing activities 12,130,096,070.01 8,724,790,967.56Net cash flow from investing activities (2,679,102,718.26) (2,397,188,001.14)
III. Cash flows from financing activities:Cash receipts from borrowings 32,091,740,322.20 8,571,932,316.83Other cash receipts relating to financing activities 60(8) 2,903,278,100.00 3,013,968,920.00Sub-total of cash inflows from financing activities 34,995,018,422.20 11,585,901,236.83Cash repayments of borrowings 31,372,194,483.49 9,999,663,814.94Cash payments for distribution of dividends or profits
and settlement of interests 4,203,154,203.48 2,646,126,449.90Including: dividends payments to minority shareholders
of subsidiaries – –Other cash payments relating to financing activities 60(9) 9,667,041,045.09 2,786,560,371.98Sub-total of cash outflows from financing activities 45,242,389,732.06 15,432,350,636.82Net cash flow from financing activities (10,247,371,309.86) (3,846,449,399.99)
IV. Ef fect of foreign exchange rate changes on cash and
cash equivalents 373,190,382.07 268,388,806.15
V. Net increase (decrease) in cash and cash equivalents (10,848,455,762.18) 3,459,284,995.17Add: Opening balance of cash and cash equivalents 61(2) 23,240,703,274.03 19,781,418,278.86
VI. Closing balance of cash and cash equivalents 61(2) 12,392,247,511.85 23,240,703,274.03
The financial statement is signed by the following persons-in-charge:
Legal representative: Person in charge of accounting: Person in charge of the accounting department:

102 2019 Annual Report
CASH FLOW STATEMENT OF PARENT COMPANYFOR THE YEAR ENDED 31 DECEMBER 2019
Unit: RMB
Item 2019 2018
I. Cash flows from operating activities:Cash receipts from the sale of goods and the rendering of services 4,973,376,414.40 5,173,039,718.89Other cash receipts relating to operating activities 536,775,179.82 1,370,840,899.34Sub-total of cash inflows from operating activities 5,510,151,594.22 6,543,880,618.23Cash payments for goods purchased and services received 557,062,660.59 984,463,629.34Cash payments to and on behalf of employees 423,785,740.90 335,262,080.46Payments of various types of taxes 872,744,557.49 1,052,056,440.51Other cash payments relating to operating activities 467,189,429.48 487,242,764.11Sub-total of cash outflows from operating activities 2,320,782,388.46 2,859,024,914.42Net cash flow from operating activities 3,189,369,205.76 3,684,855,703.81
II. Cash flows from investing activities:Cash receipts from disposals and recovery of investments 2,514,964,394.85 5,999,365,075.34Cash receipts from investment income 151,203,685.10 167,233,314.62Net cash receipts from disposals of fixed assets, intangible assets and
other long-term assets 17,983.76 277,411.47Other cash receipts relating to investing activities 4,883,422,180.08 2,754,687,696.63Sub-total of cash inflows from investing activities 7,549,608,243.79 8,921,563,498.06Cash payments to acquire or construct fixed assets, intangible assets
and other long-term assets 161,510,878.37 205,743,671.14Cash payments to acquire investments 7,956,791,852.15 5,190,867,591.23Other cash payments relating to investing activities 5,598,587,147.57 5,069,583,416.05Sub-total of cash outflows from investing activities 13,716,889,878.09 10,466,194,678.42Net cash flow from investing activities (6,167,281,634.30) (1,544,631,180.36)
III. Cash flows from financing activities:Cash receipts from capital contributions – –Cash receipts from borrowings 10,368,000,000.00 4,657,950,200.00Other cash receipts relating to financing activities 5,973,146,495.74 13,820,115,425.53Sub-total of cash inflows from financing activities 16,341,146,495.74 18,478,065,625.53Cash repayments of borrowings 9,995,253,131.46 5,644,130,200.00Cash payments for distribution of dividends or profits and
settlement of interests 2,559,090,284.13 1,947,058,038.49Other cash payments relating to financing activities 9,998,540,251.27 12,071,656,156.06Sub-total of cash outflows from financing activities 22,552,883,666.86 19,662,844,394.55Net cash flow from financing activities (6,211,737,171.12) (1,184,778,769.02)
IV. Ef fect of foreign exchange rate changes on cash and cash equivalents 93,748,554.77 9,245,509.42
V. Net increase (decrease) in cash and cash equivalents (9,095,901,044.89) 964,691,263.85Add: Opening balance of cash and cash equivalents 12,329,538,991.95 11,364,847,728.10
VI. Closing balance of cash and cash equivalents 3,233,637,947.06 12,329,538,991.95
The financial statement is signed by the following person-in-charge:
Legal representative: Person in charge of accounting: Person in charge of the accounting department:

103China Molybdenum Co., Ltd.
CONSOLIDATED STATEMENT OF CHANGES IN SHAREHOLDERS' EQUITY
FOR THE YEAR ENDED 31 DECEMBER 2019
Unit: RMB
For the current year Attributable to owners of the parent company
Minority interests
Total shareholders'
equity
ItemShare
capitalCapital reserve
Other comprehensive
incomeSpecial reserve
Surplus reserve
Retained profits
I. Balance at the end of 2018 4,319,848,116.60 27,582,794,983.23 (799,327,420.21) 3,038,386.94 1,160,396,190.21 8,682,123,314.63 8,649,061,740.13 49,597,935,311.53Add: Ch anges in accounting policies – – – – – – – –
II. Ba lance at the beginning of 2019 4,319,848,116.60 27,582,794,983.23 (799,327,420.21) 3,038,386.94 1,160,396,190.21 8,682,123,314.63 8,649,061,740.13 49,597,935,311.53III. Changes for the current year
(I) Tot al comprehensive income – – 375,539,057.08 – – 1,857,014,210.98 44,008,590.67 2,276,561,858.73
(II) Ca pital invested and reduced by shareholders
1. Business combination not involving enterprises under common control – – – – – – (15,585.72) (15,585.72)
(III) Profit distribution1. Tr ansfer to surplus reserve – – – – 126,430,810.70 (126,430,810.70) – –2. Di stributions to shareholders – – – – – (2,375,916,464.13) – (2,375,916,464.13)
(IV) Tr ansfers within the shareholders' equity – – – – – – – –
1. Ot her comprehensive income transferred to retained profits – – (44,800,000.00) – – 44,800,000.00 – –
(V) Special reserve1. Pr ovision in current
year – – – 163,424,044.33 – – 1,288,161.58 164,712,205.912. Am ount utilized in the year – – – (166,160,285.81) – – (1,520,947.25) (167,681,233.06)
IV. Balance at the end of 2019 4,319,848,116.60 27,582,794,983.23 (468,588,363.13) 302,145.46 1,286,827,000.91 8,081,590,250.78 8,692,821,959.41 49,495,596,093.26
For the previous year Attributable to owners of the parent company
Minority interests
Total shareholders'
equity
ItemShare
capitalCapital reserve
Other comprehensive
incomeSpecial reserve
Surplus reserve
Retained profits
I. Balance at the beginning of 2018 4,319,848,116.60 27,582,794,983.23 (626,164,970.39) 7,725,910.79 968,190,696.10 5,880,287,139.89 7,751,951,150.56 45,884,633,026.78
II. Changes for the current year(I) Total comprehensive income – – (173,162,449.82) – – 4,635,583,953.16 897,373,601.28 5,359,795,104.62(II) Ca pital invested and reduced by
shareholders – – – – – – – –(III) Profit distribution
1. Tr ansfer to surplus reserve – – – – 192,205,494.11 (192,205,494.11) – –2. Di stributions to shareholders – – – – – (1,641,542,284.31) – (1,641,542,284.31)
(IV) Tr ansfers within the shareholders' equity – – – – – – – –
(V) Special reserve1. Provision in current year – – – 133,704,462.03 – – 2,038,263.16 135,742,725.192. Am ount utilized in the year – – – (138,391,985.88) – – (2,301,274.87) (140,693,260.75)
III. Balance at the end of 2018 4,319,848,116.60 27,582,794,983.23 (799,327,420.21) 3,038,386.94 1,160,396,190.21 8,682,123,314.63 8,649,061,740.13 49,597,935,311.53
The financial statement is signed by the following persons-in-charge:
Legal representative: Person in charge of accounting: Person in charge of the accounting department:
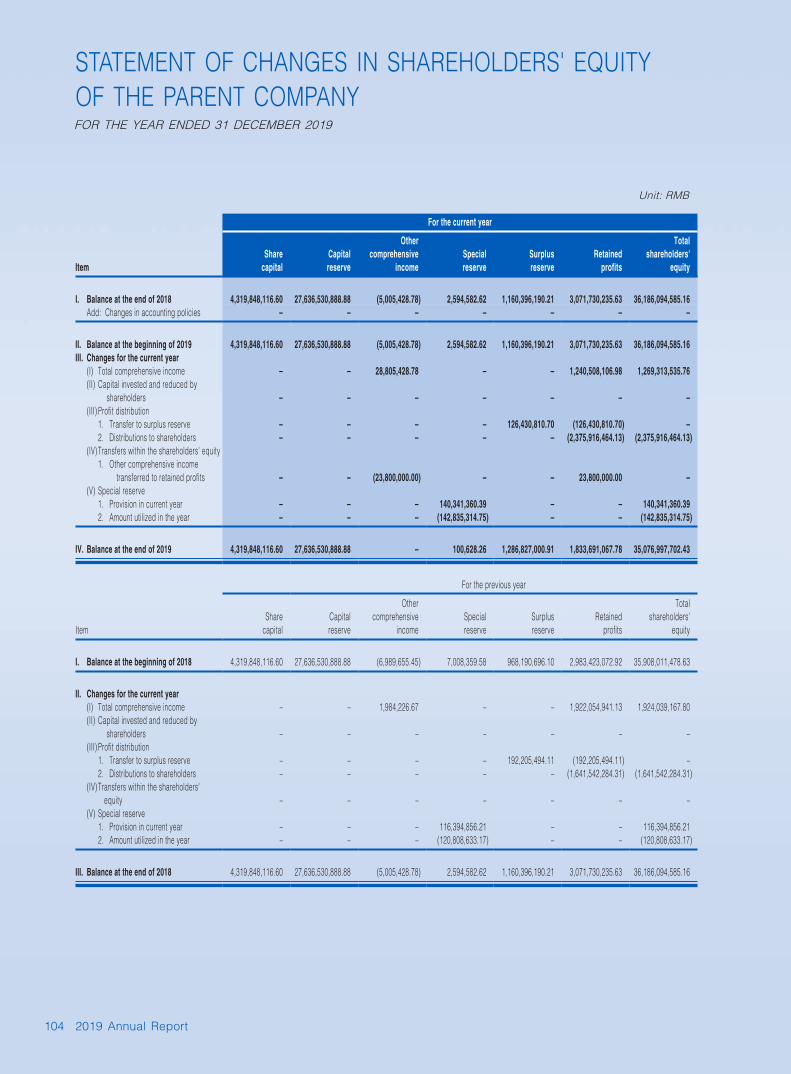
104 2019 Annual Report
STATEMENT OF CHANGES IN SHAREHOLDERS' EQUITY OF THE PARENT COMPANYFOR THE YEAR ENDED 31 DECEMBER 2019
Unit: RMB
For the current year
ItemShare
capitalCapital reserve
Other comprehensive
incomeSpecial reserve
Surplus reserve
Retained profits
Total shareholders'
equity
I. Balance at the end of 2018 4,319,848,116.60 27,636,530,888.88 (5,005,428.78) 2,594,582.62 1,160,396,190.21 3,071,730,235.63 36,186,094,585.16Add: Changes in accounting policies – – – – – – –
II. Balance at the beginning of 2019 4,319,848,116.60 27,636,530,888.88 (5,005,428.78) 2,594,582.62 1,160,396,190.21 3,071,730,235.63 36,186,094,585.16III. Changes for the current year
(I) Total comprehensive income – – 28,805,428.78 – – 1,240,508,106.98 1,269,313,535.76(II) Ca pital invested and reduced by
shareholders – – – – – – –(III) Profit distribution
1. Transfer to surplus reserve – – – – 126,430,810.70 (126,430,810.70) –2. Distributions to shareholders – – – – – (2,375,916,464.13) (2,375,916,464.13)
(IV) Transfers within the shareholders' equity1. Ot her comprehensive income
transferred to retained profits – – (23,800,000.00) – – 23,800,000.00 –(V) Special reserve
1. Provision in current year – – – 140,341,360.39 – – 140,341,360.392. Amount utilized in the year – – – (142,835,314.75) – – (142,835,314.75)
IV. Balance at the end of 2019 4,319,848,116.60 27,636,530,888.88 – 100,628.26 1,286,827,000.91 1,833,691,067.78 35,076,997,702.43
For the previous year
ItemShare
capitalCapital reserve
Other comprehensive
incomeSpecial reserve
Surplus reserve
Retained profits
Total shareholders'
equity
I. Balance at the beginning of 2018 4,319,848,116.60 27,636,530,888.88 (6,989,655.45) 7,008,359.58 968,190,696.10 2,983,423,072.92 35,908,011,478.63
II. Changes for the current year(I) Total comprehensive income – – 1,984,226.67 – – 1,922,054,941.13 1,924,039,167.80(II) Ca pital invested and reduced by
shareholders – – – – – – –(III) Profit distribution
1. Transfer to surplus reserve – – – – 192,205,494.11 (192,205,494.11) –2. Distributions to shareholders – – – – – (1,641,542,284.31) (1,641,542,284.31)
(IV) Tr ansfers within the shareholders' equity – – – – – – –
(V) Special reserve1. Provision in current year – – – 116,394,856.21 – – 116,394,856.212. Amount utilized in the year – – – (120,808,633.17) – – (120,808,633.17)
III. Balance at the end of 2018 4,319,848,116.60 27,636,530,888.88 (5,005,428.78) 2,594,582.62 1,160,396,190.21 3,071,730,235.63 36,186,094,585.16

105China Molybdenum Co., Ltd.
NOTES TO THE FINANCIAL STATEMENTSFOR THE YEAR ENDED 31 DECEMBER 2019
(I) BASIC INFORMATION ABOUT THE COMPANY
1. General Information of the Company
China Molybdenum Co., Ltd. (the "Company") was incorporated on 25 August 2006 as a joint-stock limited company on the basis of China Molybdenum Co., Ltd. by Luoyang Mining Group Co., Ltd. ("LMG") and Cathay Fortune Corporation ("CFC").
On 3 December 2006, according to the Extraordinary General Meeting resolutions of the Company and the China Securities Regulatory Commission Zheng Jian Guo He Zi [2007] No. 7 Document, it was approved to issue up to 1,246.1 million shares of overseas listed shares (including the over- allotment of 162.5 million shares), with a par value of Renminbi ("RMB") 0.2 each ordinary share. On 25 April 2007, the Company issued 1,083.6 million shares of overseas listed shares with a par value of RMB0.2 each ordinary share, which were listed on the Hong Kong Stock Exchange on 26 April 2007. After the issuing of H share on the Hong Kong Stock Exchange, the Company's share capital totaled up to 4,767.81 million shares.
On 4 May 2007, the Company issued 108.36 million shares of the over-allotment shares with a par value RMB0.2, after the over-allotment. After that, the Company's share capital totaled up to 4,876.17 million shares.
On 16 July 2012, according to Zheng Jian Xu Ke [2012] No. 942 "Official Reply for Approving the Initial Public Offering (IPO) of China Molybdenum Co., Ltd." issued by China Securities Regulatory Commission (the "CSRC"), the Company was approved to issue up to 542 million RMB ordinary shares (A share). Up to 26 September 2012, the Company had issued 200,000,000 shares of RMB ordinary shares (A share) with a par value of RMB0.20 per share. Those shares are listed on the Shanghai Stock Exchange from 9 October 2012. The Company's share capital totaled up to 5,076.17 million shares after the issuance of A shares.
On 24 November 2014, China Securities Regulatory Commission approved a total public offering of RMB4,900,000,000.00 of convertible bonds by the Company with Zheng Jian Xu Ke [2014] No. 1246 "Official Reply for Approving Public Offering of Convertible Company Bonds by China Molybdenum Co., Ltd.", and the Company completed issuance on 8 December 2014.
As the triggering conditions for the redemption option are satisfied, on 23 June 2015, the board of directors adopted the resolution that the Company exercised the redemption option after the closing on 9 July 2015. As of closing on 9 July 2015, convertible bonds with a par value of RMB4, 854,442,000 had been converted to equity, representing 99.07% of total convertible bond issued by the Company. After the conversion was completed, total equity of the company was increased to 5,629.07 million shares.
On 28 August 2015, the Company was approved in the second meeting of the fourth session of board of directors to transfer capital reserve into ordinary shares, 20 shares for every existing 10 shares to all shareholders. The transfer was completed on 12 November 2015. After the transfer was completed, the total equity of the Company was increased to 16,887,198,699 shares.
On 23 June 2017, the China Securities Regulatory Commission ("CSRC") approved the Company's non-public offering of not more than 5,769,230,769 shares of ordinary shares (A-share) through Zhen Jian Xu Ke [2017] No. 918 "Official Reply for Approving Non-public Offering of Shares by China Molybdenum Co., Ltd.". On 24 July 2017, the Company privately placed 4,712,041,884 shares of RMB ordinary shares (A-share) to specific objects at a price of RMB3.82 per share with a par value of RMB0.20, and the total amount of funds raised was RMB17,999,999,996.88; after deducting the issuance expenses, the net of raised funds amounted to RMB17,858,632,663.30. After the issuance, the share capital of the Company increased from 16,887,198,699 shares to 21,599,240,583 shares. The shares subscribed by the investors of this offering are not allowed to be transferred within 12 months from the date of the completion of this issuance. See Note V. 40 for the details of share capital.
The Company together with its subsidiaries (collectively as "the Group") are principally engaged in mining, smelting and deep processing of molybdenum tungsten series products, export of molybdenum tungsten series products and chemical products; mining and melting of copper, cobalt and niobium series products; mining and deep processing of phosphorus products; mining, processing and sale of gold and silver, and metal trading.

106 2019 Annual Report
NOTES TO THE FINANCIAL STATEMENTSFOR THE YEAR ENDED 31 DECEMBER 2019
(I) BASIC INFORMATION ABOUT THE COMPANY (CONTINUED)
2. Acquisition of Niobium and Phosphorus, Copper-Cobalt, and Metal trading Business
2.1 Acquisition of Niobium and Phosphorus businesses in Brazil
On 27 April 2016, the wholly-owned subsidiary of the Company, CMOC Limited entered into an acquisition agreement with, Ambras Holdings S.A.R.L., ANGLO AMERICAN LUXEMBOURG SÁRL ("AA Luxembourg"), Anglo American Marketing Limited ("AAML"), ANGLO AMERICAN CAPITAL PLC ("Capital PLC"), ANGLO AMERICAN CAPITAL LUXEMBOURG SÁRL ("Capital Luxembourg") and Anglo American Service (UK) Limited ("AASL"), subsidiaries of Anglo American PLC ("Anglo American"), to acquire the following companies at a consideration of US $1.5 billion:
(1) 100% shareholders' equity of American Fosfato Brasil Ltda. ("Copebras ", now renamed as Copebras Indústria Ltda.) and Anglo American Niobio Brasil Ltda. ("Niobras ", now renamed as Niobras Mineração Ltda.);
(2) AAML's Niobium sales division ("NMD");
(3) Creditor's rights over Copebras held by Capital PLC and Creditor's rights over Niobra held by Capital Luxembourg.
Under the acquisition agreement, the final acquisition consideration is subject to adjustment based on the book balance of cash and the net working capital at closing. The acquisition was approved by the Company's shareholders' meeting on 23 September 2016 and completed on 1 October 2016.
2.2 Acquisition of Copper-Cobalt business in DRC
On 9 May 2016, CMOC Limited and the Company (as the guarantor of CMOC Limited) entered into an acquisition agreement with Phelps Dodge Katanga Corporation ("PDK") and Freeport-McMoRan Inc. ("Freeport") (as the guarantor of PDK) to acquire 100% equity in Freeport-McMoRan DRC Holdings Ltd, ("FMDRC", now renamed as CMOC International DRC Holdings Limited) held by PDK at a consideration of US$2.65 billion. FMDRC holds 70% equity in TF Holdings Limited ("TFHL") established in Bermuda and TFHL holds 80% equity in Tenke Fungurume Mining S.A. ("TFM") established in the Democratic Republic of the Congo (DRC). Upon completion of the acquisition, the Company will indirectly hold 56% equity in TFM.
Under the acquisition agreement, in addition to the consideration price, the final consideration of acquisition also includes a contingent consideration and the cash balance adjustment at the closing. The acquisition was approved by the shareholders' meeting on 23 September 2016 and completed on 17 November 2016.
2.3 Acquisition of minority interests of Congo (DRC) copper and cobalt business
On 20 January 2017, the Group entered into a framework agreement with BHR Newwood Investment Management Limited ("BHR") and its investors, pursuant to which the Group obtained the control over BHR and its associated assets, and also committed to grant BHR investors a fixed annual exit returns over the corresponding period.
On 20 April 2017, BHR completed the acquisition of 30% of TFHL's equity, held by Lundin Mining Corporation, thereby BHR indirectly obtaining 24% of TFM's equity. Based on afore-said protocol control over BHR, the Group's indirect shareholding proportion in TFM increased from 56% to 80%.
On 19 June 2019, the Group signed an agreement with BHR investors to pay the final consideration to complete the exit of BHR investors. The Group's agreement control over BHR was thus changed to direct control, remaining the same proportion of indirect holding of TFM, which was completed on 27 September 2019.

107China Molybdenum Co., Ltd.
NOTES TO THE FINANCIAL STATEMENTSFOR THE YEAR ENDED 31 DECEMBER 2019
(I) BASIC INFORMATION ABOUT THE COMPANY (CONTINUED)
2. Acquisition of Niobium and Phosphorus, Copper-Cobalt, and Metal trading Business (Continued)
2.4 Acquisition of metal trading platform business in Switzerland
On 11 May 2018, Natural Resources Elite Investment ("NREIL"), 100% held by CMOC Limited invested NCCL Natural Resources Investment Fund ("Natural Resources Investment Fund") 45% held by Luoyang Molybdenum Holding as a limited partner to complete the 100% equity acquisition of IXM B.V (original name: Louis Dreyfus Company Metals B.V., hereinafter referred to as "IXM"). IXM which was a subsidiary of Louis Dreyfus Company B.V. ("LDC") is engaged in base metal and noble metal raw materials and metal trading platform business.
On 4 December 2018, CMOC Limited entered into an equity purchase agreement with New Silk Road Commodities Limited ("NSR"), the wholly-owned subsidiary of Natural Resources Investment Fund, thereby purchasing 100% issued and unissued shares of New Silk Road Commodities SA ("NSRC"), the wholly-owned subsidiary of NSR at a consideration of USD495 million and the net profit or loss of underlying assets for the period from 1 October 2018 to the closing date. The closing of this acquisition was completed on 24 July 2019. And the Company holds 100% equity of IXM indirectly through NSRC after the completion of this transaction.
3. Scope of the consolidated financial statements
The consolidated and the Company's financial statements have been approved by the board of directors of the Company on 27 March 2020.
See Note VII "INTERESTS IN OTHER ENTITIES" for details of subsidiaries within the scope of the consolidated financial statements for current year. The main change in the scope of the consolidated financial statements arises from the acquisition of subsidiaries. See Note VI "CHANGE OF CONSOLIDATION SCOPE" for details.
(II) PREPARATION BASIS OF THE FINANCIAL STATEMENTS
Preparation basis
The Group implements the Accounting Standards for Business Enterprises issued by the Ministry of Finance ("MoF") and the relevant regulations. The Group has adopted the Accounting Standards for Business Enterprises No. 21—Lease amended by the MoF in 2018 since 1 January 2019. The impact of the changes in relevant accounting policies are referred to Note III. 35. The Group also discloses related financial information in accordance with Preparation Rules for Information Disclosure by Companies Offering Securities to the Public No. 15 – General Provisions on Financial Reports (2014 Amendment). In addition, the financial statements also include the relevant disclosures required by the Hong Kong Companies Ordinance and the Listing Rules of the Hong Kong Stock Exchange.
Going concern
The Group performs evaluation on its ability to continue as a going concern for next 12 months from 31 December 2019, and no matters or conditions that may cast significant doubts on its ability to continue as a going concern are found. Therefore, the financial statements have been prepared on a going concern basis.
Basis of accounting and principle of measurement
The Group has adopted the accrual basis of accounting. Except for certain financial instruments which are measured at fair value, the Group adopts the historical cost as the principle of measurement in the financial statements. Where assets are impaired, provisions for asset impairment are made in accordance with relevant requirements.

108 2019 Annual Report
NOTES TO THE FINANCIAL STATEMENTSFOR THE YEAR ENDED 31 DECEMBER 2019
(II) PREPARATION BASIS OF THE FINANCIAL STATEMENTS (CONTINUED)
Basis of accounting and principle of measurement (Continued)
Where the historical cost is adopted as the measurement basis, assets are recorded at the amount of cash and cash equivalents paid or the fair value of the consideration given to acquire them at the time of their acquisition. Liabilities are recorded at the amount of proceeds or assets received or the contractual amounts for assuming the present obligation, or, at the amounts of cash and cash equivalents expected to be paid to settle the liabilities in the normal course of business.
Fair value is the price that would be received to sell an asset or paid to transfer a liability in an orderly transaction between market participants at the measurements date, regardless of whether that price is directly observable or estimated using valuation technique. Fair value measurement and disclosure in the financial statements are determined according to the above basis.
For non-financial assets measured at fair value, the capacity of market participants to realize the maximum profit of non-financial assets, or the capacity of other participants who acquired non-financial assets to realize the maximum profit will be considered when measuring fair values of such non-financial assets.
For financial assets with transaction prices as the fair value upon initial recognition and the valuation technique of unobservable inputs employed in the subsequent measurement at the fair value, the technique is adjusted during the valuation to match the initial recognition results determined with the transaction prices.
Fair value measurements are categorized into Level 1, 2 or 3 based on degree to which the inputs to the fair value measurements are observable and the significance of the inputs to the fair value measurement in its entirety, which are described as follows:
• Level 1 inputs are quoted prices (unadjusted) in active markets for identical assets or liabilities that the entity can access at the measurement date;
• Level 2 inputs are inputs, other than inputs within Level 1, that are observable for the asset or liability
• Level 3 inputs are unobservable inputs for the asset or liability.
(III) SIGNIFICANT ACCOUNTING POLICIES AND ACCOUNTING ESTIMATES
1. Declaration following Accounting Standards for Business Enterprises ("ASBE")
The financial statements of the Company have been prepared, in all material materials, in accordance with ASBE, and present fairly, the consolidated and parent company's financial position as of 31 December 2019, and the consolidated and parent company's results of operations and cash flows for the year then end.
2. Accounting period
The Group has adopted the calendar year as its accounting year i.e. from 1 January to 31 December.
3. Operating cycle
The operating cycle refers to the period from purchase of assets used for processing to realization of cash or cash equivalents. The Company's operating cycle is usually 12 months.

109China Molybdenum Co., Ltd.
NOTES TO THE FINANCIAL STATEMENTSFOR THE YEAR ENDED 31 DECEMBER 2019
(III) SIGNIFICANT ACCOUNTING POLICIES AND ACCOUNTING ESTIMATES (CONTINUED)
4. Functional currency
Renminbi ("RMB") is the currency of the primary economic environment in which the Company and its domestic subsidiaries operate. Therefore, the Company and its domestic subsidiaries choose RMB as their functional currency. The Company's foreign subsidiaries choose the currency of the main economic environment where the operating business is located as its functional currency. The Group adopts RMB to prepare the financial statements.
5. Accounting treatment of business combination under or not under the common control
Business combinations are classified into business combinations involving enterprises under common control and business combinations not involving enterprises under common control.
5.1 Business combinations involving enterprises under common control
A business combination involving enterprises under common control is a business combination in which all of the combining enterprises are ultimately controlled by the same party or parties both before and after the combination, and that control is not transitory.
Assets and liabilities obtained are measured at their respective carrying amounts as recorded by the combining entities at the date of the combination. The difference between the carrying amount of the net assets obtained and the carrying amount of the consideration paid for the combination is adjusted to the share premium in capital reserve. If the share premium is not sufficient to absorb the difference, any excess is adjusted against retained earnings.
Costs that are directly attributable to the combination are charged to profit or loss in the period in which they are incurred.
5.2 Business combinations involving enterprises not under common control and goodwill
A business combination involving enterprises not under common control is a business combination in which all of the combining enterprises are not ultimately controlled by the same party or parties before and after the combination.
The cost of combination is the aggregate of the fair values, at the acquisition date, of the assets given, liabilities incurred or assumed, and equity securities issued by the acquirer in exchange for control of the acquiree. Where a business combination not involving enterprises under common control is achieved in stages that involve multiple transactions, the cost of combination is the sum of the consideration paid at the acquisition date and the fair value at the acquisition date of the acquirer's previously held interest in the acquiree. The intermediary expenses incurred by the acquirer in respect of auditing, legal services, valuation and consultancy services, etc. and other associated administrative expenses attributable to the business combination are recognized in profit or loss when they are incurred.
The acquiree's identifiable assets, liabilities and contingent liabilities, acquired by the acquirer in a business combination, that meet the recognition criteria are measured at fair value at the acquisition date.

110 2019 Annual Report
NOTES TO THE FINANCIAL STATEMENTSFOR THE YEAR ENDED 31 DECEMBER 2019
(III) SIGNIFICANT ACCOUNTING POLICIES AND ACCOUNTING ESTIMATES (CONTINUED)
5. Accounting treatment of business combination under or not under the common control (Continued)
5.2 Business combinations involving enterprises not under common control and goodwill (Continued)
When the business combination contract provides that, upon the occurrence of multiple future contingencies, the acquirer shall pay an additional consideration for the combination, such contingent consideration as set out in the contract shall be recognized as a liability by the Group as a part of the aggregate consideration transferred in the business combination, and be included in the cost of combination at the fair value at the acquisition date. Within twelve months after the acquisition, if the contingent consideration needs to be adjusted as new or further evidences are obtained in respect of circumstances existed as of the acquisition date, the amount preciously included in the non-operating income shall be adjusted. A change in or adjustment to the contingent consideration under other circumstances shall be accounted for in the following way. Contingent consideration in the nature of a liability shall be measured in accordance with Accounting Standard for Business Enterprises No. 22 – Financial Recognition and Measurement of Financial Instruments and Accounting Standard for Business Enterprises No. 13 – Contingencies. Any change or adjustment is included in profit or loss for the current period.
Where the cost of combination exceeds the acquirer's interest in the fair value of the acquiree's identifiable net assets, the difference is treated as an asset and recognized as goodwill, which is measured at cost on initial recognition. Where the cost of combination is less than the acquirer's interest in the fair value of the acquiree's identifiable net assets, the acquirer firstly reassesses the measurement of the fair values of the acquiree's identifiable assets, liabilities and contingent liabilities and measurement of the cost of combination. If after that reassessment, the cost of combination is still less than the acquirer's interest in the fair value of the acquiree's identifiable net assets, the acquirer recognizes the remaining difference immediately in profit or loss for the current period.
If either the fair values of identifiable assets, liabilities and contingent liabilities acquired in a combination or the cost of business combination can be determined only provisionally by the end of the period in which the business combination was effected, the acquirer recognizes and measures the combination using those provisional values. Any adjustments to those provisional values within 12 months after the acquisition date are treated as if they had been recognized and measured on the acquisition date.
Goodwill arising on a business combination is measured at cost less accumulated impairment losses, and is presented separately in the consolidated financial statements.
6.1 Preparation of consolidated financial statement
The scope of consolidation in the consolidated financial statements is determined on the basis of control. Control exists when the investor has power over the investee; is exposed, or has rights, to variable returns from its involvement with the investee; and has the ability to use its power over the investee to affect its returns. The Group reassesses whether or not it controls an investee if facts and circumstances indicate that there are changes of the above elements of the definition of control.
Consolidation of a subsidiary begins when the Group obtains control over the subsidiary and ceases when the Group loses control of the subsidiary.
For a subsidiary disposed of by the Group, the operating results and cash flows before the date of disposal (the date when control is lost) are included in the consolidated income statement and consolidated statement of cash flows, as appropriate.

111China Molybdenum Co., Ltd.
NOTES TO THE FINANCIAL STATEMENTSFOR THE YEAR ENDED 31 DECEMBER 2019
(III) SIGNIFICANT ACCOUNTING POLICIES AND ACCOUNTING ESTIMATES (CONTINUED)
6. Preparation of consolidated financial statement (Continued)
6.1 Preparation of consolidated financial statement (Continued)
For a subsidiary acquired through a business combination involving enterprises not under common control, the operating results and cash flows from the acquisition date (the date when control is obtained) are included in the consolidated income statement and consolidated statement of cash flows, as appropriate.
No matter when the business combination occurs in the reporting period, subsidiaries acquired through a business combination involving enterprises under common control are included in the Group's scope of consolidation as if they had been included in the scope of consolidation from the date when they first came under the common control of the ultimate controlling party. Their operating results and cash flows from the beginning of the earliest reporting period or from the date when they first came under the common control of the ultimate controlling party are included in the consolidated income statement and consolidated statement of cash flows, as appropriate.
The significant accounting policies and accounting periods adopted by the subsidiaries are determined based on the uniform accounting policies and accounting periods set out by the Company.
The effects of all intra-group transactions on the consolidated financial statements are eliminated on consolidation.
The portion of subsidiaries' equity that is not attributable to the Company is treated as minority interests and presented as "minority interests" in the consolidated balance sheet within shareholders' equity. The portion of net profits or losses of subsidiaries for the period attributable to minority interests is presented as "minority interests" in the consolidated income statement below the "net profit" line item.
When the amount of loss for the period attributable to the minority shareholders of a subsidiary exceeds the minority shareholders' portion of the opening balance of owners' equity of the subsidiary, the excess amount are still allocated against minority interests.
Acquisition of minority interests or disposal of interest in a subsidiary that does not result in the loss of control over the subsidiary is accounted for as equity transactions. The carrying amounts of the Company's interests and minority interests are adjusted to reflect the changes in their relative interests in the subsidiary. The difference between the amount by which the minority interests are adjusted and the fair value of the consideration paid or received is adjusted to capital reserve under owners' equity. If the capital reserve is not sufficient to absorb the difference, the excess are adjusted against retained earnings.
Where equity interests in an acquiree are acquired in stages through multiple transactions ultimately constituting a business combination not involving entities under common control, the acquirer determines if these transactions are considered to be "a bundled transaction". If yes, these transactions are accounted for as a single transaction where control is obtained. If no, these transactions are accounted for as multiple transactions where control is obtained at the acquisition date; In this case, the acquirer remeasures its previously-held equity interests in the acquiree at their fair value on the acquisition date and recognizes any differences between such fair value and carrying amounts in profit or loss for the period. Where equity interests in an acquiree held before the acquisition date involve changes in other comprehensive income or changes in other owners' equity under equity method, they are transferred to income for the period that the acquisition date belongs to.

112 2019 Annual Report
NOTES TO THE FINANCIAL STATEMENTSFOR THE YEAR ENDED 31 DECEMBER 2019
(III) SIGNIFICANT ACCOUNTING POLICIES AND ACCOUNTING ESTIMATES (CONTINUED)
6. Preparation of consolidated financial statement (Continued)
6.1 Preparation of consolidated financial statement (Continued)
When the Group loses control over a subsidiary due to disposal of certain equity interest or other reasons, any retained interest is re-measured at its fair value at the date when control is lost. The difference between (i) the aggregate of the consideration received on disposal and the fair value of any retained interest and (ii) the share of the former subsidiary's net assets cumulatively calculated from the acquisition date according to the original proportion of ownership interest is recognized as investment income in the period in which control is lost, and at the same time adjusted against goodwill. Other comprehensive income associated with investment in the former subsidiary is reclassified to investment income in the period in which control is lost.
Multiple transactions involving disposal of equity investments in a subsidiary until loss of control are usually considered to be a bundled transaction when the conditions and economic impacts of these transactions satisfy with one or multiple following conditions: (1) these transactions are concluded simultaneously or concluded upon consideration of mutual influence; (2) these transactions, as a whole, can achieve a complete business results; (3) occurrence of a transaction depends the occurrence of at least one other transaction; (4) one transaction alone is not economical, but it is economical after consideration together with other transactions. Where multiple transactions involving disposal of equity investments in a subsidiary until loss of control are considered to be a bundled transaction, these multiple transactions are accounted for as a single transaction of disposing of the subsidiary and resulting in loss of control. The difference between the consideration received on each disposal and the corresponding proportion of the subsidiary's net assets calculated on a continuous basis since the acquisition date prior to the loss of control is recognized as other comprehensive income and transferred to profit or loss for the period when the control is eventually lost. Where multiple transactions involving disposal of equity investments in a subsidiary until loss of control are not considered to be a bundled transaction, these transactions are accounted for as independent transactions.
7. Classification of joint arrangements and accounting treatment for joint ventures
There are two types of joint arrangements – joint operations and joint ventures. The type of joint arrangements is determined based on the rights and obligations of joint operator to the joint arrangements by considering the factors, such as the structure, the legal form of the arrangements, and the contractual terms, etc. A joint operation is a joint arrangement whereby the joint operators have rights to the assets, and obligations for the liabilities, relating to the arrangement. A joint venture is a joint arrangement whereby the joint ventures have rights to the net assets of the arrangement.
The Group adopts the equity method to account the investment in joint ventures. Please specifically refer to Note III "14.3.2. Long-term equity investment accounted for using the equity method".
The Group as a joint operator recognizes the following items in relation to its interest in a joint operation: (1) its solely- held assets, including its share of any assets held jointly; (2) its solely-assumed liabilities, including its share of any liabilities incurred jointly; (3) its revenue from the sale of its share of the output arising from the joint operation; (4) its share of the revenue from the sale of the output by the joint operation; and (5) its solely-incurred expenses, including its share of any expenses incurred jointly. The Group accounts for the recognized assets, liabilities, revenues and expenses relating to its interest in a joint operation in accordance with the requirements applicable to the particular assets, liabilities, revenues and expenses.
8. Standards for determining cash and cash equivalent
Cash comprises cash on hand and deposits that can be readily withdrawn on demand. Cash equivalents are the Group's short-term, highly liquid investments that are readily convertible to known amounts of cash and which are subject to an insignificant risk of changes in value.

113China Molybdenum Co., Ltd.
NOTES TO THE FINANCIAL STATEMENTSFOR THE YEAR ENDED 31 DECEMBER 2019
(III) SIGNIFICANT ACCOUNTING POLICIES AND ACCOUNTING ESTIMATES (CONTINUED)
9. Translation of transactions and financial statements denominated in foreign currencies
9.1 Transactions denominated in foreign currencies
A foreign currency transaction is recorded, on initial recognition, by applying the spot exchange rate on the date of the transaction.
At the balance sheet date, foreign currency monetary items are translated into RMB using the spot exchange rates at the balance sheet date. Exchange differences arising from the differences between the spot exchange rates prevail ing at the balance sheet date and those on init ial recognition or at the previous balance sheet date are recognized in profit or loss for the period, except that (1) exchange differences related to a specific-purpose borrowing denominated in foreign currency that qualify for capitalization are capitalized as part of the cost of the qualifying asset during the capitalization period; (2) exchange differences related to hedging instruments for the purpose of hedging against foreign currency risks are accounted for using hedge accounting; (3) exchange differences arising from changes in the book balances (other than the amortized cost) of items that are reclassified at fair value through other comprehensive income are recognized as other comprehensive income.
When the consolidated financial statements include foreign operation(s), if there is foreign currency monetary item constituting a net investment in a foreign operation, exchange difference arising from changes in exchange rates are recognized as "exchange differences arising on translation of financial statements denominated in foreign currencies "in other comprehensive income, and in profit and loss for the period upon disposal of the foreign operation.
Foreign currency non-monetary items measured at historical cost are translated to the amounts in functional currency at the spot exchange rates on the dates of the transactions and the amounts in functional currency remain unchanged. Foreign currency non-monetary items measured at fair value are re-translated at the spot exchange rate on the date the fair value is determined. Difference between the re-translated functional currency amount and the original functional currency amount is treated as changes in fair value (including changes of exchange rate) and is recognized in profit and loss or as other comprehensive income.
9.2 Translation of financial statements denominated in foreign currencies
For the purpose of preparing the consolidated financial statements, financial statements of a foreign operation are translated from the foreign currency into RMB using the following method: assets and liabilities on the balance sheet are translated at the spot exchange rate prevailing at the balance sheet date; shareholders' equity items are translated at the spot exchange rates at the dates on which such items arose; all items in the income statement as well as items reflecting the distribution of profits are translated at exchange rates that approximate the actual spot exchange rates on the dates of the transactions; The difference between the translated assets and the aggregate of liabilities and shareholders' equity items is recognized as other comprehensive income and included in shareholders' equity.
Cash flows arising from a transaction in foreign currency and the cash flows of a foreign subsidiary are translated at an exchange rate which approximates the spot exchange rate on the date of the cash flows. The effect of exchange rate changes on cash and cash equivalents is regarded as a reconciling item and presented separately in the cash flow statement as "effect of exchange rate changes on cash and cash equivalents".
The opening balances and the comparative figures of previous year are presented at the translated amounts in the previous year's financial statements.

114 2019 Annual Report
NOTES TO THE FINANCIAL STATEMENTSFOR THE YEAR ENDED 31 DECEMBER 2019
(III) SIGNIFICANT ACCOUNTING POLICIES AND ACCOUNTING ESTIMATES (CONTINUED)
9. Translation of transactions and financial statements denominated in foreign currencies (Continued)
9.2 Translation of financial statements denominated in foreign currencies (Continued)
On disposal of the Group's entire interest in a foreign operation, or upon a loss of control over a foreign operation due to disposal of certain interest in it or other reasons, the Group transfers the accumulated exchange differences arising on translation of financial statements of this foreign operation attributable to the owners' equity of the parent company and presented under shareholders' equity, to profit or loss in the period in which the disposal occurs.
In case of a disposal or other reason that results in a reduction in the proportional interest held but does not result in the Group losing control over a foreign operation, the proportionate share of accumulated exchange differences arising on translation of financial statements are re-attributed to minority interests and are not recognized in profit and loss. For partial disposals of equity interests in foreign operations which are associates or joint ventures, the proportionate share of the accumulated exchange differences arising on translation of financial statements of foreign operations is reclassified to profit or loss.
10. Financial Instrument
Financial assets and financial liabilities are recognized when the Group becomes a party to the contractual provisions of the instrument.
For financial assets purchased or sold in a regular way, the Group recognizes assets acquired and liabilities assumed on a trade date basis, or derecognizes the assets sold on a trade date basis.
Financial assets and financial liabilities are initially measured at fair value. For financial assets and financial liabilities at fair value through profit or loss, transaction costs are immediately recognized in profit or loss. For other financial assets and financial liabilities, transaction costs are included in their initial recognized amounts. When conducting initial recognition of the accounts receivable that does not include significant financing components or the financing components in the contract no more than one year are not taken into consideration in accordance with Accounting Standard for Business Enterprises No. 14 – Revenue ("Revenue standard"), the Group makes the initial measurement at the transaction price specified in the revenue standard.
The effective interest method is a method of calculating the amortized cost of a financial asset or a financial liability and of allocating the interest income or interest expense over the relevant accounting period.
The effective interest rate is the rate that exactly discounts estimated future cash flows through the expected life of the financial asset or financial liability to the net carrying amount of the financial asset or financial liability. When calculating the effective interest rate, the Group estimates future cash flows considering all contractual terms of the financial assets or financial liabilities (such as repayment in advance, extension, call options or other similar options), without considering future credit losses.
The amortized cost of financial asset or financial liability is the initial recognition amount of the financial asset or the financial liability less the repaid amount of principal plus or less the accumulated amortized amount of the difference between the initial recognition amount and the amount of maturity with the effective interest rate method less the accumulated provisions for the losses (only applicable to the financial assets).
115China Molybdenum Co., Ltd.
NOTES TO THE FINANCIAL STATEMENTSFOR THE YEAR ENDED 31 DECEMBER 2019
(III) SIGNIFICANT ACCOUNTING POLICIES AND ACCOUNTING ESTIMATES (CONTINUED)
10. Financial Instrument (Continued)
10.1 Classification, recognition and measurement of financial assets
Subsequent to initial recognition, the Group's financial assets of various categories are subsequently measured at amortized cost, at fair value through other comprehensive income or at fair value through profit or loss.
If contractual terms of the financial asset give rise on specified dates to cash flows that are solely payments of principal and interest on the principal amount outstanding, and the financial asset is held within a business model whose objective is to hold financial assets in order to collect contractual cash flows, such asset is classified into financial asset measured at amortized cost. The financial assets classified as at amortized cost include cash and bank balances, notes receivable, accounts receivable, other receivables, other current assets, and other non-current assets, etc.
Financial assets that meet the following conditions are classified as at fair value through other comprehensive income ("FVTOCI"): 1) the financial asset is held within a business model whose objective is achieved by both collecting contractual cash flows and selling the financial assets; and 2) the contractual terms of the financial asset give rise on specified dates to cash flows that are solely payments of principal and interest on the principal amount outstanding. Such financial assets due over 1 year since acquisition are presented as other debt investments and those due within 1 year (inclusive) since balance sheet date are presented as other current assets due within one year; accounts receivable and notes receivable classified as at fair value through other comprehensive income ("FVTOCI") on acquisition are presented under financing receivables, and those due within 1 year (inclusive) since acquisition are presented under other current assets.
On the initial recognition, the Group may irrevocably designate non-trading equity instruments except for contingent consideration recognized in business combination not involving enterprises under common control as financial assets at fair value through other comprehensive income on an individual basis. Such financial assets are presented as other investments in equity instruments in financial statements.
Financial assets that meet one of the following requirements indicate that the purpose for the Group to hold the financial assets is for trading:
• It has been acquired principally for the purpose of selling in the near term;
• On initial recognition, relevant financial assets are part of a portfolio of the identifiable financial instruments that the Group manages on a collective basis and there is an objective evidence indicating that the Group has an actual pattern of short-term profit-taking recently; or
• Relevant financial assets are classified to derivative instruments, excluding derivatives that meet the definitions of financial guarantee contracts and are designated as effective hedging instruments.
Financial assets at FVTPL include financial assets classified as at fair value through profit or loss and those designated as at fair value through profit or loss:
• Financial assets that do not meet the requirements to be reclassified as financial assets at amortized cost or financial assets at fair value through other comprehensive income (FVTOCI) are classified as financial assets at fair value through profit or loss.
• Upon initial recognition, in order to eradicate or significantly reduce accounting mismatches, the Group can irrevocably designate financial assets as at fair value through profit or loss.
• Financial assets at FVTPL (other than derivative financial assets) are all presented under held-for-trading financial assets. Financial assets due over one year (or without fixed maturity) since the balance sheet date and expected to be held for over one year are presented under other non-current financial assets.

116 2019 Annual Report
NOTES TO THE FINANCIAL STATEMENTSFOR THE YEAR ENDED 31 DECEMBER 2019
(III) SIGNIFICANT ACCOUNTING POLICIES AND ACCOUNTING ESTIMATES (CONTINUED)
10. Financial Instrument (Continued)
10.1 Classification, recognition and measurement of financial assets (Continued)
10.1.1 Financial assets measured at amortized cost
Financial assets measured at amortized cost are measured subsequently at amortized cost by adopting the effective interest method, with gains or losses arising from the impairment or derecognition recorded to the profit or loss for the period.
Interest income from financial assets at amortized cost are recognized by the Group based on the effective interest method. Interest income is determined by applying an effective interest rate to the carrying amount of the financial asset except for the following situations:
• For the purchased or originated credit-impaired f inancial assets, the Group recognizes their interest income based on amortized cost and credit-adjusted effective interest rate of these financial assets since initial recognition.
• For the purchased or originated financial assets not-credit-impaired but subsequently becoming credit-impaired, the Group subsequently recognizes their interest income based on amortized cost and effective interest rate of these financial assets. If no credit exists due to improvement in credit risk of the financial instruments subsequently and such improvement is in relation to an event incurred subsequent to the application of above provisions, the Group will transfer to calculate and determine the interest income by applying an effective interest rate to the carrying amount of the financial asset.
10.1.2 Financial assets at fair value through other comprehensive income ("FVTOCI")
The impairment losses or gains relating to financial assets classified as at fair value through other comprehensive income, the interest income calculated by effective interest method, and the exchange gains or losses shall be included into the profit or loss over the current period, and the other financial assets shall be measured at fair value through other comprehensive income. The amount of the financial assets included into profit or loss of each period shall be regarded as equal as the amount measured at amortized cost through profit or loss over each period. When the financial assets are derecognized, the accumulated income or loss included in the other comprehensive income previously will be reclassified into the profit or loss over the current period from the other comprehensive income.
Fair value change of non-held-for-trading equity investment designated as at fair value through other comprehensive income ("FVTOCI"), is recognized in other comprehensive income. Upon derecognition of the financial asset, cumulative gains or losses previously recognized in other comprehensive income are transferred and included in retained earnings. During the period for which the Group holds the investments in the non-held-for-trading equity instruments, dividend income is recognized and included in profit or loss for the period when 1) the Group's right to collect dividend has been established; 2) it is probable that economic benefits associated with dividend will flow to the Group; and 3) the amount of dividend can be reliably measured.
10.1.3 Financial Assets at Fair Value through Profit or Loss ("FVTPL")
Financial assets at FVTPL are measured subsequently at fair value. Gains or losses from changes in fair value and dividends and interest income relevant to the financial assets are recognized in profit or loss for the current period.

117China Molybdenum Co., Ltd.
NOTES TO THE FINANCIAL STATEMENTSFOR THE YEAR ENDED 31 DECEMBER 2019
(III) SIGNIFICANT ACCOUNTING POLICIES AND ACCOUNTING ESTIMATES (CONTINUED)
10. Financial Instrument (Continued)
10.2 Impairment of financial assets
The Group accounts for impairment on financial assets at amortized cost, financial assets classified as FVTOCI and financial guarantee contracts that are not measured at fair value through profit or loss on the basis of ECL and recognizes relevant loss allowance.
The Group measures loss allowance based on the amount equal to the lifetime ECL for the accounts receivable arising from the transactions under revenue standards but not including significant financial elements or not considering the contract less than one year.
For other financial assets, except for the purchased or originated credit-impaired financial assets, at each balance sheet date, the Group assess changes in credit risk of relevant financial instruments since initial recognition. If the credit risk of the above financial instruments has increased significantly since initial recognition, the Group measures loss allowance based on the amount of full lifetime; if credit risk of the financial instrument has not increased significantly since initial recognition, the Group recognizes loss allowance based on 12-month ECL of the financial instrument. Increase in or reversal of credit loss allowance is included in profit or loss as loss/gain on impairment, except the financial assets classified as FVTOCI. The Group recognizes credit loss allowance for financial assets at FVOCI in other comprehensive income and recognizes loss or gain on impairment in profit or loss for the period, without reducing the carrying amount of the financial assets presented in the balance sheet.
The Group measured loss allowance at the full lifetime ECL of the financial instruments in the prior accounting period. However, as at the balance sheet date for the current period, for the above financial instruments, due to failure to qualify as significant increase in credit risk since initial recognition, the Group measures loss allowance for the financial instrument at 12-month ECL at the balance sheet date for the current period. Relevant reversal of loss allowance is included in profit or loss for the current period as gain on impairment.
10.2.1 Significant increase in credit risk
In assessing whether the credit risk has increased significantly since initial recognition, the Group compares the risk of a default occurring on the financial instrument as at the balance sheet date with the risk of a default occurring on the financial instrument as at the date of initial recognition with available reasonable and supportable forward-looking information. For financial guarantee contracts, the date that the Group becomes a party to the irrevocable commitment is considered to be the date of initial recognition in the application of criteria related to the financial instrument for impairment.
In particular, the following information is taken into account when assessing whether credit risk has increased significantly:
(1) Whether external market indicators of credit risk for the same financial instrument or financial instruments with shared expected life have changed significantly. Indicators include: credit spreads, credit default swap price for the borrower, length and extent of time when fair value of financial assets is less than amortized cost, other market information related to the borrower (including price changes in borrower's debt instruments or equity instruments);
(2) Whether external credit rating of the financial instrument has actually changed significantly or is expected to change significantly;
(3) Whether the debtor's internal credit rating is actually lowered or is expected to be lowered;

118 2019 Annual Report
NOTES TO THE FINANCIAL STATEMENTSFOR THE YEAR ENDED 31 DECEMBER 2019
(III) SIGNIFICANT ACCOUNTING POLICIES AND ACCOUNTING ESTIMATES (CONTINUED)
10. Financial Instrument (Continued)
10.2 Impairment of financial assets (Continued)
10.2.1 Significant increase in credit risk (Continued)
(4) Whether expected detr imental changes in business, f inancial and economic conditions of the debtor which will affect borrower's ability to perform repayment obligation have changed significantly, including significant reduction in the market shares of the debtor, sharp drop of the price of principal products, significant rise of the price of principal raw materials, critical shortage of working capital, and quality reduction of assets, etc.;
(5) Whether the actual or expected results of the debtor's operations have changed significantly, including the circumstance that an evident adverse change happens to the business indicators such as income and profit and is expected difficult to improve in a short term;
(6) Whether the credit risk of other financial instruments issued by the same debtor has increased significantly;
(7) Whether supervisory, economic or technical environment for the borrower has significant detrimental changes, including the circumstance whether the technological change, or the relevant pol icies proposed to introduce by the state or local government have significant adverse impact on the debtor;
(8) Whether the value of collateral for debt mortgage or the guarantee or credit enhancement quality provided by a third party has changed significantly, and these changes are expected to lower the economic motive of the debtor to repay within the time limit as specified by the contract or affect the probability of default;
(9) Whether the economic motive that will lower the borrower's repayment within the time limit as specified by the contract has changed significantly;
(10) Expected changes to loan contract, including the exemption or revision of contractual obligations, the granting of interest-free periods, the jump in interest rates, the requirement for additional collateral or guarantees, or other changes in the contractual framework for financial instruments that may result from the breach of contract;
(11) Whether the debtor's expected performance and repayment activities have changed significantly;
(12) Whether the Group's approach to credit management of financial instruments has changed.
Regardless of whether the credit risk has increased significantly after the above assessment, when the financial instrument contract payment has been overdue for more than 30 days (inclusive), it indicates that the credit risk of the financial instrument has increased significantly.
At the balance sheet date, the Group may assume that the credit risk on a financial instrument has not increased significantly since initial recognition if the financial instrument is determined to have low credit risk. If the default risk of financial instrument is relatively low, the borrower has a strong capability in performing its contract cash flow obligation in the short term, and the capability of the borrower to perform its contract cash obligation is not necessarily reduced even if adverse change exists in the economic situation and business environment in a relatively long time, the financial instrument is considered to be exposed to the credit risk at a relatively low level.

119China Molybdenum Co., Ltd.
NOTES TO THE FINANCIAL STATEMENTSFOR THE YEAR ENDED 31 DECEMBER 2019
(III) SIGNIFICANT ACCOUNTING POLICIES AND ACCOUNTING ESTIMATES (CONTINUED)
10. Financial Instrument (Continued)
10.2 Impairment of financial assets (Continued)
10.2.2 Credit-impaired financial assets
A financial asset is credit-impaired when one or more events that have a detrimental impact on the estimated future cash flows of that financial asset have occurred. Evidence that a financial asset is credit-impaired includes observable data about the following events:
(1) Significant financial difficulty of the issuer or the debtor;
(2) A breach of contract by the debtor, such as a default in interest or principal or past due event;
(3) The creditor(s) of the debtor, for economic or contractual reasons relating to the debtor's financial difficulty, having granted to the debtor a concession(s) that the creditor(s) would not otherwise consider; or
(4) It is becoming probable that the debtor will enter bankruptcy or other financial reorganization.
10.2.3 Recognition of expected credit loses
The Group recognizes the credit loss of other receivables and financial assets included in other non-current assets based on an individual asset basis, and recognizes credit loss of related financial instruments for accounts receivable on a collectively basis by using an impairment matrix. The Group classifies financial instruments into different groups based on shared risk characteristics, and the Group adopts the shared risk characteristics including: type of financial instruments, credit risk rating, initial recognition date, residual contractual term, industry of the debtor, geographic location of the debtor, and the value of collateral to the financial assets, etc.
ECL of relevant financial instruments is recognized based on the following methods:
• For a financial asset, credit loss is the present value of difference between the contractual cash flow receivable and the expected cash flow to be received.
• For a financial guarantee contract (Refer to Note III. 10.4.1.2.1 for detailed accounting policies), credit loss is the present value of difference between the expected payments to reimburse the holder for a credit loss that it incurs less any amounts that the Group expects to receive from the holder, the debtor or any other party.
• For credit-impaired financial assets other than the purchased or originated credit-impaired financial assets at the balance sheet date, credit loss is difference between the carrying amount of financial assets and the present value of expected future cash flows discounted at original effective interest rate.
The Group's measurement of ECL of financial instruments reflects factors including unbiased probability weighted average amount recognized by assessing a series of possible results, time value of money, reasonable and supportable information related to historical events, current condition and forecast of future economic position that is available without undue cost or effort at the balance date.
10.2.4 Write-down of financial assets
The Group shall directly write down the carrying amount of a financial asset when the Group has no reasonable expectations of recovering a financial asset in its entirety or a portion thereof. A write-down constitutes a derecognition of relevant financial assets.

120 2019 Annual Report
NOTES TO THE FINANCIAL STATEMENTSFOR THE YEAR ENDED 31 DECEMBER 2019
(III) SIGNIFICANT ACCOUNTING POLICIES AND ACCOUNTING ESTIMATES (CONTINUED)
10. Financial Instrument (Continued)
10.3 Transfer of financial assets
The Company derecognizes a financial asset if one of the following conditions is satisfied: (1) the contractual rights to the cash flows from the financial asset expire; or (2) the financial asset has been transferred and substantially all the risks and rewards of ownership of the financial asset is transferred to the transferee; or (3) although the financial asset has been transferred, the Company neither transfers nor retains substantially all the risks and rewards of ownership of the financial asset but has not retained control over the financial asset.
If the Company neither transfers nor retains substantially all the risks and rewards of ownership of a financial asset, and it retains control over the financial asset, it recognizes the financial asset to the extent of its continuing involvement in the transferred financial asset and recognizes an associated liability. The Group measures relevant liabilities by the following methods:
• If the financial assets transferred are measured at amortized cost, and the carrying amounts of relevant liabilities are equivalent to the carrying amounts of the transferred financial assets continuing in involvement less the amortized costs of the retained rights of the Group (if the Group retains associated rights for the transfer of financial assets) plus the amortized costs of the Group's obligations (if the Group bears associated obligations for the transfer of financial assets), relevant liabilities are not designated as financial liabilities at fair value through profit or loss.
• If financial assets transferred are measured at fair value, and the carrying amounts of relevant liabilities are equivalent to the carrying amounts of the transferred financial assets continuing in involvement less the fair value of the retained rights of the Group (if the Group retains associated rights for the transfer of financial assets) plus the Group's obligations (if the Group bears associated obligations for the transfer of financial assets), the fair value of the rights and obligations should be the fair value measured on an individual basis.
For a transfer of a financial asset in its entirety that satisfies the derecognition criteria, the difference between (1) the carrying amount of the financial asset transferred at the derecognition date; and (2) the sum of the consideration received from the transfer of financial assets and the corresponding amount of the derecognition part in the cumulative change that has been recognized in other comprehensive income, is recognized in profit or loss for the current period. If the financial assets transferred by the Group are the non-trading equity instrument investment designated as at FVTOCI, cumulative gains or losses previously recognized in other comprehensive income are reclassified in retained earnings from other comprehensive income.
If a part of the transferred financial asset qualifies for derecognition, the overall carrying amount of the financial asset prior to transfer is allocated between the part that continues to be recognized and the part that is derecognized, based on the respective fair values of those parts at the date of transfer. The difference between (1) the carrying amount allocated to the part derecognized on the date of derecognition; and (2) the sum of the consideration received for the part derecognized and any cumulative gain or loss allocated to the part derecognized which has been previously recognized in other comprehensive income, is recognized in profit or loss for the current period or retained earnings. If the financial assets transferred by the Group are the non-trading equity instrument investment designated as at FVTOCI, cumulative gains or losses previously recognized in other comprehensive income are reclassified in retained earnings from other comprehensive income.
For a transfer of a financial asset in its entirety that does not satisfy the derecognition criteria, the Group continues to recognize the transferred financial asset in its entirety. The consideration received from transfer of assets is recognized as a financial liability upon receipt.

121China Molybdenum Co., Ltd.
NOTES TO THE FINANCIAL STATEMENTSFOR THE YEAR ENDED 31 DECEMBER 2019
(III) SIGNIFICANT ACCOUNTING POLICIES AND ACCOUNTING ESTIMATES (CONTINUED)
10. Financial Instrument (Continued)
10.4 Classification of financial liabilities and equity instrument
Financial instruments issued by the Group are classified in accordance with the economic substance of the contractual arrangements instead of the legal form as well as the definitions of a financial liability and an equity instrument; on initial recognition, financial instruments or their component parts are classified as either financial liabilities or equity instruments.
10.4.1 Classification, recognition and measurement of financial liabilities
On initial recognition, financial liabilities are classified into financial liabilities at fair value through profit or loss and other financial liabilities.
10.4.1.1 Financial liabilities at FVTPL
Financial liabilities at FVTPL consist of financial liabilities held for trading (Including derivative instrument of financial liabilities) and those designated as at FVTPL, in which financial liabilities at FVTPL are presented as financial liabilities held for trading, except for derivative liabilities that are presented independently.
A financial liability is classified as held for trading if one of the following conditions is satisfied:
(1) It has been acquired principally for the purpose of repurchasing in the near term; or
(2) On initial recognition it is part of a portfolio of identified financial instruments that the Group manages together and there is objective evidence that the Group has a recent actual pattern of short-term profit-taking; or
(3) It is a derivative, except for a financial guarantee contract or a derivative that is a designated and effective hedging instrument.
A financial liability may be designated as at FVTPL upon initial recognition only when one of the following conditions is satisfied: (1) Such designation eliminates or significantly reduces accounting mismatch; (2) The financial liability forms part of a group of financial liabilities or a group of financial assets and financial liabilities, which is managed and its performance is evaluated on a fair value basis, in accordance with the Group's documented risk management or investment strategy, and information about the grouping is reported to key management personnel on that basis; or (3) it is a qualifying hybrid contract containing embedded derivatives.
Held-for-trading financial liabilities are subsequently measured at fair value. Any gains or losses arising from changes in the fair value or any dividend or interest expenses related to the financial liabilities are recognized in profit or loss.
For financial liability designated as at FVTPL, the amount of change in the fair value of such financial liability that is attributable to changes in the credit risk of that liability is presented in other comprehensive income, and other changes in the fair value are presented in profit or loss. Upon the derecognition of such financial liability, the accumulated amount of change in fair value that is attributable to changes in the credit risk of that liability, which is recognized in other comprehensive income, is transferred to retained earnings. Any dividend or interest income earned on the financial liabilities are recognized in profit or loss. If the impact of the change in credit risk of such financial liability dealt with in the above way would create or enlarge an accounting mismatch in profit or loss, the Group shall present all gains or losses on that liability (including the effects of changes in the credit risk of that liability) in profit or loss.

122 2019 Annual Report
NOTES TO THE FINANCIAL STATEMENTSFOR THE YEAR ENDED 31 DECEMBER 2019
(III) SIGNIFICANT ACCOUNTING POLICIES AND ACCOUNTING ESTIMATES (CONTINUED)
10. Financial Instrument (Continued)
10.4 Classification of financial liabilities and equity instrument (Continued)
10.4.1 Classification, recognition and measurement of financial liabilities (Continued)
10.4.1.1 Financial liabilities at FVTPL (Continued)
For financial liabilities arising from contingent consideration recognized by the Group as a purchaser in the business combination involving enterprises not under a common control, the Group measures such financial liabilities at fair value and the changes are recognized in profit or loss.
10.4.1.2 Other financial liabilities
Other financial liabilities outside of the financial guarantee contracts except those arising from transfer of financial assets that does not meet the requirements for derecognition or continuing involvement in the transferred financial asset are classified as at amortized cost and measured subsequently at amortized cost. Gains or losses arising from derecognition or amortization are recorded to profit or loss for the period.
10.4.1.2.1 Financial guarantee contracts
A financial guarantee contract is a contract that requires the issuer to make specified payments to reimburse the holder of the contract for a loss it incurs because a specified debtor fails to make payment when due in accordance with the original or modified terms of a debt instrument. Subsequent to initial recognition, financial guarantee contracts that are not designated as financial liabilities at fair value through profit or loss, or financial liabilities arising from transfer of financial assets does not satisfy derecognition criteria or continue involvement of transferred financial assets are measured at the higher of: (1) amount of loss provision; and (2) the amount initially recognized less cumulative amortization amount during the guarantee period.
10.4.2 Derecognition of financial liabilities
The Group derecognizes a financial liability (or part of it) only when the underlying present obligation (or part of it) is discharged. An agreement between the Group (an existing borrower) and an existing lender to replace the original financial liability with a new financial liability with substantially different terms is accounted for as an extinguishment of the original financial liability and the recognition of a new financial liability.
When the Group derecognizes a financial liability or a part of it, it recognizes the difference between the carrying amount of the financial liability (or part of the financial liability) derecognized and the consideration paid (including any non-cash assets transferred or new financial liabilities assumed) in profit or loss.
10.4.3 Equity instruments
An equity instrument is any contract that evidences a residual interest in the assets of the Group after deducting all of the liabilities. Equity instruments issued (including refinanced), repurchased, sold and cancelled by the Group are recognized as changes of equity. Transaction costs related to equity transactions are deducted from equity.
The Group recognizes the distribution to holders of the equity instruments as distribution of profits, and dividends paid do not affect total amount of shareholders equity.

123China Molybdenum Co., Ltd.
NOTES TO THE FINANCIAL STATEMENTSFOR THE YEAR ENDED 31 DECEMBER 2019
(III) SIGNIFICANT ACCOUNTING POLICIES AND ACCOUNTING ESTIMATES (CONTINUED)
10. Financial Instrument (Continued)
10.5 Derivatives and embedded derivatives
Derivative financial instruments include forward exchange contracts, commodity futures contracts, commodity forward contracts, currency swaps contracts, and interest rate swaps contracts and foreign exchange options contracts. Derivatives are initially measured at fair value at the date when the derivative contracts are entered into and are subsequently measured at fair value.
For the hybrid contract comprised of embedded derivatives and master contract, if the master contract belongs to financial assets, the Group shall apply the hybrid contract as a whole to the accounting standards on the classification of financial assets rather than split embedded derivatives from the hybrid contract.
An embedded derivative is separated from the hybrid instrument as a stand-alone derivative financial instrument, where the master contract included in the hybrid contract does not belong to financial assets and meet the following conditions.
(1) the economic characteristics and risks of the embedded derivative are not closely related to the economic characteristics and risks of the host contract;
(2) a separate instrument with the same terms as the embedded derivative would meet the definition of a derivative;
(3) the hybrid contract is not measured at fair value through profit or loss over the current period.
Where an embedded derivative is split from a hybrid contract, the Group performs accounting treatment for the master contract of the hybrid contract in accordance with applicable accounting standards. Where the Group is unable to measure the fair value of an embedded derivative reliably in accordance with the terms and conditions of the embedded derivative, the fair value of such embedded derivative is determined as the difference between the fair value of the hybrid contract and that of the master contract. Where the fair value of such embedded derivative on the acquisition date or the subsequent balance sheet dates is still unable to be measured separately, the Group designates the hybrid contract in a whole into the financial instrument at fair value through profit or loss over the current period.
10.6 Offsetting financial assets and financial liabilities
When the Group has a legal right that is currently enforceable to set off the recognized financial assets and financial liabilities, and intends either to settle on a net basis, or to realize the financial asset and settle the financial liability simultaneously, financial assets and financial liabilities are offset with the net amounts presented on the balance sheet. Otherwise, financial assets and financial liabilities are separately presented on the balance sheet without offsetting.
10.7 Compound instrument
Convertible bonds issued by the Group that contain both the liability and conversion option components are classified separately into respective items on initial recognition. Conversion option that is settled by the exchange of a fixed amount of cash or another financial asset for a fixed number of the Company's own equity instruments is an equity instrument.
On initial recognition, the fair value of the liability component is determined using the prevailing market interest of similar non-convertible debts. The difference between the gross proceeds of the issue of the convertible bonds and the fair value assigned to the liability component, representing the conversion option for the holder to convert the bonds into equity instrument, is included in equity instruments.

124 2019 Annual Report
NOTES TO THE FINANCIAL STATEMENTSFOR THE YEAR ENDED 31 DECEMBER 2019
(III) SIGNIFICANT ACCOUNTING POLICIES AND ACCOUNTING ESTIMATES (CONTINUED)
10. Financial Instrument (Continued)
10.7 Compound instrument (Continued)
In subsequent periods, the liability component of the convertible loan notes is carried at amortized cost using the effective interest method. The conversion option classified as equity remains in equity instruments. No gain or loss is recognized in profit or loss upon conversion or expiration of the option.
Transaction costs incurred for the issue of convertible loan notes are allocated to the liability component and equity component in proportion to their respective fair values. Transaction costs relating to the equity instruments component are charged directly to equity. Transaction costs relating to the liability component are included in the carrying amount of the liability component and amortized over the period of the convertible loan notes using the effective interest method.
11. Financing receivables
Notes receivable classified as at fair value through other comprehensive income ("FVTOCI") due within 1 year (inclusive) since acquisition are presented as financing receivables, and those due over 1 year since acquisition are presented as other debt investments. See Note 10.1, 10.2 and 10.3 for relevant accounting policies.
12. Inventory
12.1 Classification of inventories
The Group's inventories mainly include raw materials, work in progress, finished goods, goods on hand and trading inventories, etc. Inventories (excluding trading inventories outside the PRC) are initially measured at cost. Cost of inventories comprises all costs of purchase, costs of conversion and other expenditures incurred in bringing the inventories to their present location and condition.
The trading inventories are mainly from IXM, the subsidiaries of the Group. As a commodity trader, IXM measures the trading inventories at fair value less costs to sell in its financial statements prepared in accordance with international financial reporting standards, and recognizes changes in fair value in profit or loss.
Pursuant to Interpretation No.1 of the Enterprise Accounting Standards, for transactions or events occurred abroad to overseas subsidiaries of a domestic enterprise within China, if such transactions or events are not subject to the relevant laws and regulations of China or if such transactions are rare and if they are not covered by the accounting standards for enterprises, the accounting treatments made by the aforesaid overseas subsidiaries may be adjusted under the international standards on financial statements and then be consolidated into the relevant items of the consolidated financial statements of the parent company, provided that the principle of the Accounting Standards for Enterprises – Basic Standards is followed. Therefore, in the preparation of the financial statements, trading inventories outside the PRC of IXM are still measured according to the above-mentioned accounting policies.
12.2 Valuation methods of the inventory delivered
When the inventories (excluding trading inventories outside the PRC) are delivered, the actual costs of the delivered inventories are determined using the method of weighted average.

125China Molybdenum Co., Ltd.
NOTES TO THE FINANCIAL STATEMENTSFOR THE YEAR ENDED 31 DECEMBER 2019
(III) SIGNIFICANT ACCOUNTING POLICIES AND ACCOUNTING ESTIMATES (CONTINUED)
12. Inventory (Continued)
12.3 The basis of the net realizable value of the inventories
On the balance sheet date, the inventories (excluding trading inventories outside the PRC) shall be calculated by the lower of cost and net realized value. When the net realizable value is less than the cost, inventory provision is required.
The net realizable value represent the amount derived by deducting the potential cost, estimated sale cost and relative taxes to the completion date from the estimated selling price of the inventory in daily activities. The company determined net realizable value of inventories, made the obtained conclusive evidence as basis, and considered the purposes of holding inventories, events after the balance sheet date and other factors.
The provision for inventory shall be provided by the difference between the cost of the individual inventory and its net realized value.
In case the factors impacting the inventory provision is eliminated, making the net realizable value be higher than the book value, the write-down amount should be recovered from the previous write-down amount of inventory provision and the corresponding amount shall be reversed to current profit and loss.
12.4 The inventory system for inventory
The Group uses a perpetual inventory system.
12.5 Amortization method of low-value consumables and packaging materials
Packing materials and low-price easily-worn materials are amortized by the one-time writing-off method.
13. Held-for-sale assets
Non-current assets and disposal groups are classified as held for sale category when the Group recovers the book value through a sale (including an exchange of nonmonetary assets that has commercial substance) rather than continuing use.
Non-current assets or disposal groups classified as held for sale are required to satisfy the following conditions: (1) the asset or disposal group is available for immediate sale in its present condition subject only to terms that are usual and customary for sales of such asset or disposal group; (2) the sale is highly probable, i.e. the Group has made a resolution about selling plan and obtained a confirmed purchase commitment and the sale is expected to be completed within one year.
When there is loss of control over a subsidiary due to disposal of investments in the subsidiary, and the proposed disposal of investment in the subsidiary satisfies classification criteria of held-for-sale category, the investments in subsidiaries are classified as held-for-sale category as a whole in the company's separate financial statement, and all assets and liabilities of subsidiaries are classified as held-for-sale category in the consolidated financial statements regardless that part of the equity investments are remained after the sale.

126 2019 Annual Report
NOTES TO THE FINANCIAL STATEMENTSFOR THE YEAR ENDED 31 DECEMBER 2019
(III) SIGNIFICANT ACCOUNTING POLICIES AND ACCOUNTING ESTIMATES (CONTINUED)
13. Held-for-sale assets (Continued)
The Group measures the no-current assets or disposal groups classified as held for sale at the lower of their carrying amount and fair value less costs to sell. Where the carrying amount is higher than the net amount of fair value less costs to sell, carrying amount should be reduced to the net amount of fair value less costs to sell, and such reduction is recognized in impairment loss of assets and included in profit or loss for the period. Meanwhile, provision for impairment of held-for-sale assets are made. When there is increase in the net amount of fair value of non-current assets held for sale less costs to sell at the balance sheet date, the original deduction should be reversed in impairment loss of assets recognized after the classification of held-for-sale category, and the reverse amount is include in profit or loss for the period. The impairment loss of assets recognized before the classification of held-for-sale category will not be reversed.
Non-current assets classified as held-for-sale or disposal groups are not depreciated or amortized, interest and other costs of liabilities of disposal group classified as held for sale continue to be recognized.
All or part of equity investments in an associate or joint venture are classified as held-for-sale assets. For the part that is classified as held-for-sale, it is no longer accounted for using the equity method since the date of the classification.
14. Long-term equity investment
14.1 Basis for determining joint control and significant influence over the investee
Control exists when the investor has power over the investee; is exposed, or has rights, to variable returns from its involvement with the investee; and has the ability to use its power over the investee to affect its returns. Joint control is the contractually agreed sharing of control of an arrangement, which exists only when decisions about the relevant activities require the unanimous consent of the parties sharing control. Significant influence is the power to participate in the financial and operating policy decisions of the investee but is not control or joint control over those policies. When determining whether an investing enterprise is able to exercise control or significant influence over an investee, the effects of potential voting rights of the investee (for example, warrants and convertible debts) held by the investing enterprises or other parties that are currently exercisable or convertible have been considered.
14.2 Determination of investment cost
For a long-term equity investment acquired through a business combination involving enterprises under common control, the initial investment cost of the long-term equity investment is the attributable share of the carrying amount of the shareholders' equity of the acquiree at the date of combination in the consolidated financial statements of the ultimate controlling party. The difference between the initial investment cost and the carrying amount of cash paid, non-cash assets transferred and liabilities assumed is adjusted to capital reserve. If the balance of capital reserve is not sufficient, any excess is adjusted to retained earnings. If the consideration of the combination is satisfied by the issue of equity securities, the initial investment cost of the long-term equity investment is the attributable share of the carrying amount of the shareholders' equity of the acquiree in the consolidated financial statements of the ultimate controlling party. The aggregate face value of the shares issued is accounted for as share capital. The difference between the initial investment cost and the aggregate face value of the shares issued is adjusted to capital reserve. If the balance of capital reserve is not sufficient, any excess is adjusted to retained earnings.

127China Molybdenum Co., Ltd.
NOTES TO THE FINANCIAL STATEMENTSFOR THE YEAR ENDED 31 DECEMBER 2019
(III) SIGNIFICANT ACCOUNTING POLICIES AND ACCOUNTING ESTIMATES (CONTINUED)
14. Long-term equity investment (Continued)
14.2 Determination of investment cost (Continued)
For a long-term equity investment acquired through business combination not involving enterprises under common control, the initial investment cost of the long-term equity investment is the cost of acquisition at the date of combination. Where equity interests in an acquiree are acquired in stages through multiple transactions ultimately constituting a business combination not involving entities under common control, the acquirer determines if these transactions are considered to be "a bundled transaction". If yes, these transactions are accounted for as a single transaction where control is obtained. If no, the initial investment cost of the long-term equity investment is the aggregate of the carrying amount of the equity interest held in the acquiree prior to the acquisition date and the cost of the additional investment at the acquisition date. When the equity held was accounted for under equity method, relevant other comprehensive income is not accounted temporarily; when the equity held was accounted for other investments in equity instruments, the difference between the fair value and carrying amount, together with the cumulative changes in fair value recognized in other comprehensive income are included in retained earnings for the current period.
The intermediary fees incurred by the absorbing party or acquirer such as audit, legal, valuation and consulting fees, etc. and other related administrative expenses attributable to the business combination are recognized in profit or loss when they are incurred.
The long-term equity investment acquired otherwise than through a business combination is initially measured at its cost. When the entity is able to exercise significant influence or joint control (but not control) over an investee, the cost of long-term equity investments is the sum of the fair value of previously-held equity investments determined in accordance with Accounting Standard for Business Enterprises No. 22 – Financial Instruments: Recognition and Measurement (CAS 22) and the additional investment cost.
14.3 Subsequent measurement and recognition of profit or loss
14.3.1 Long-term equity investment accounted for using the cost method
Long-term equity investments in subsidiaries are accounted for using the cost method in the Company's separate financial statements. A subsidiary is an investee that is controlled by the Group.
Under the cost method, a long-term equity investment is measured at initial investment cost. When additional investment is made or the investment is recouped, the cost of the long-term equity investment is adjusted accordingly. Investment income is recognized in the period in accordance with the attributable share of cash dividends or profit distributions declared by the investee.
14.3.2 Long-term equity investment accounted for using the equity method
The Group accounts for investment in associates and joint ventures using the equity method. An associate is an entity over which the Group has significant influence; a joint venture is a joint arrangement whereby the Group has rights to the net assets of the arrangement.
Under the equity method, where the initial investment cost of a long-term equity investment exceeds the Group's share of the fair value of the investee's identifiable net assets at the time of acquisition, no adjustment is made to the initial investment cost. Where the initial investment cost is less than the Group's share of the fair value of the investee's identifiable net assets at the time of acquisition, the difference is recognized in profit or loss for the period, and the cost of the long-term equity investment is adjusted accordingly.

128 2019 Annual Report
NOTES TO THE FINANCIAL STATEMENTSFOR THE YEAR ENDED 31 DECEMBER 2019
(III) SIGNIFICANT ACCOUNTING POLICIES AND ACCOUNTING ESTIMATES (CONTINUED)
14. Long-term equity investment (Continued)
14.3 Subsequent measurement and recognition of profit or loss (Continued)
14.3.2 Long-term equity investment accounted for using the equity method (Continued)
Under the equity method, the Group recognizes its share of the net profit or loss and other comprehensive income made by the investee as investment income and other comprehensive income respectively, and adjust the carrying amount of the long-term equity investment accordingly; the carrying amount of the investment is reduced by the portion of any profit distributions or cash dividends declared by the investee that is distributed to the Group; the share of the changes in owners' equity of the investee other than those arising from net profit or loss, other comprehensive income and profit distribution are recognized in the capital reserve and the carrying amount of the long- term equity investment is adjusted accordingly. The Group recognizes its share of the investee's net profit or loss after making appropriate adjustments based on the fair value of the investee's individual separately identifiable assets, etc. at the acquisition date. Where the accounting policies and accounting period adopted by the investee are not consistent with those of the Group, the Group shall adjust the financial statements of the investee to conform to its own accounting policies and accounting period, and recognize investment income and other comprehensive income based on the adjusted financial statements. For the Group's transactions with its associates and joint ventures where assets contributed or sold does not constitute a business, unrealized intra-group profits or losses are recognized as investment income or loss to the extent that those attributable to the Group's proportionate share of interest are eliminated. However, unrealized losses resulting from the Group's transactions with its associates and joint ventures which represent impairment losses on the transferred assets are not eliminated.
The Group discontinues recognizing its share of net losses of the investee after the carrying amount of the long-term equity investment together with any long-term interests that in substance form part of its net investment in the investee is reduced to zero. If the Group has incurred obligations to assume additional losses of the investee, a provision is recognized according to the expected obligation, and recorded as investment loss for the period. Where net profits are subsequently made by the investee, the Group resumes recognizing its share of those profits only after its share of the profits exceeds the share of losses previously not recognized.
14.4 Disposal of long-term equity investments
On disposal of a long term equity investment, the difference between the proceeds actually received and the carrying amount is recognized in profit or loss for the period.
15. Fixed Assets
15.1 The conditions of recognition
Fixed assets are tangible assets that are held for use in the production or supply of goods or services, for rental to others, or for administrative purposes, and have useful lives of more than one accounting year. A fixed asset is recognized only when it is probable that economic benefits associated with the asset will flow to the Group and the cost of the asset can be measured reliably. Fixed assets are initially measured at cost and the effect of any expected costs of abandoning the asset at the end of its use is considered.
Subsequent expenditures incurred for the fixed asset are included in the cost of the fixed asset if it is probable that economic benefits associated with the asset will flow to the Group and the subsequent expenditures can be measured reliably. Meanwhile the carrying amount of the replaced part is derecognized. Other subsequent expenditures except for above expenditures that included in the cost of the fixed asset are recognized in profit or loss in the period in which they are incurred.

129China Molybdenum Co., Ltd.
NOTES TO THE FINANCIAL STATEMENTSFOR THE YEAR ENDED 31 DECEMBER 2019
(III) SIGNIFICANT ACCOUNTING POLICIES AND ACCOUNTING ESTIMATES (CONTINUED)
15. Fixed Assets (Continued)
15.2 Depreciation Method
A fixed asset is depreciated over its useful life using the straight-line method or the units of production method since the month subsequent to the one in which it is ready for intended use. The depreciation method useful life, estimated net residual value rate and annual depreciation rate of each category of fixed assets are as follows:
Resources-related subsidiaries of the Group situated in PRC
CategoryDepreciation method
Depreciation period
Residual value rate
Annual depreciation
rate(%) (%)
Land and building Straight-line method 8~45 0~5 2.1~12.5Mining projects Units of production
methodExpected life
of mines0 Unit of
productionMachine equipment Straight-line method 8~10 5 9.5~11.9Electronic equipment, appliances and furniture
Straight-line method 5 5 19.0
Transportation equipment Straight-line method 8 5 11.9
Resources-related subsidiaries of the Group situated in Australia
CategoryDepreciation method
Depreciation period
Residual value rate
Annual depreciation
rate(%) (%)
Buildings Straight-line method 8-45 0~5 2.1~12.5Mining projects Units of production
methodExpected life
of mines0 Unit of
productionMachineries and other equipment
Straight-line method 8-10 5 9.5~11.9
Resources-related subsidiaries of the Group situated in Brazil
CategoryDepreciation method
Depreciation period
Residual value rate
Annual depreciation
rate(%) (%)
Land ownership N/A Permanent – –Buildings Straight-line method 20-50 0~5 1.9~5Mining projects Units of production
methodExpected life
of mines0 Unit of
productionMachineries and other equipment
Straight-line method 5-20 0~5 5 ~20

130 2019 Annual Report
NOTES TO THE FINANCIAL STATEMENTSFOR THE YEAR ENDED 31 DECEMBER 2019
(III) SIGNIFICANT ACCOUNTING POLICIES AND ACCOUNTING ESTIMATES (CONTINUED)
15. Fixed Assets (Continued)
15.2 Depreciation Method (Continued)
Resources-related subsidiaries of the Group situated in DRC
CategoryDepreciation method
Depreciation period
Residual value rate
Annual depreciation
rate(%) (%)
Land ownership N/A Permanent – –Mining projects Units of production
methodExpected life
of mines0 Unit of
productionBuildings Straight-line method 5-33 0~5 2.88 ~20Machineries and other equipment
Straight-line method 3-20 0~5 5~33
Metal trading-related subsidiaries of the Group
CategoryDepreciation method
Depreciation period
Residual value rate
Annual depreciation
rate(%) (%)
Buildings Straight-line method 20 5 4.8Machine equipment Straight-line method 3 5 31.7Electronic equipment, appliances and furniture
Straight-line method 5 5 19.0
Estimated net residual value of a fixed asset is the estimated amount that the Group would currently obtain from disposal of the asset, after deducting the estimated costs of disposal, if the asset were already of the age and in the condition expected at the end of its useful life.
15.3 Others
If a fixed asset is upon disposal or no future economic benefits are expected to be generated from its use or disposal, the fixed asset is derecognized. When a fixed asset is sold, transferred, retired or damaged, the amount of any proceeds on disposal of the asset net of the carrying amount and related taxes is recognized in profit or loss for the period.
The Group reviews the useful l ife and estimated net residual value of a fixed asset and the depreciation method applied at least once at each financial year-end, and account for any change as a change in an accounting estimate.
16. Construction in progress
Construction in progress is measured at its actual costs. The actual costs include various construction expenditures during the construction period, borrowing costs capitalized before it is ready for intended use and other relevant costs. Construction in progress is not depreciated. Construction in progress is transferred to a fixed asset when it is ready for intended use.

131China Molybdenum Co., Ltd.
NOTES TO THE FINANCIAL STATEMENTSFOR THE YEAR ENDED 31 DECEMBER 2019
(III) SIGNIFICANT ACCOUNTING POLICIES AND ACCOUNTING ESTIMATES (CONTINUED)
17. Borrowing costsBorrowing costs directly attributable to the acquisition, construction or production of qualifying asset are capitalized when expenditures for such asset and borrowing costs are incurred and activities relating to the acquisition, construction or production of the asset that are necessary to prepare the asset for its intended use or sale have commenced. Capitalization of borrowing costs ceases when the qualifying asset being acquired, constructed or produced becomes ready for its intended use or sale.
Where funds are borrowed under a specific-purpose borrowing, the amount of interest to be capitalized is the actual interest expense incurred on that borrowing for the period less any bank interest earned from depositing the borrowed funds before being used on the asset or any investment income on the temporary investment of those funds. Where funds are borrowed under general-purpose borrowings, the Group determines the amount of interest to be capitalized on such borrowings by applying a capitalization rate to the weighted average of the excess of cumulative expenditures on the asset over the amounts of specific-purpose borrowings. The capitalization rate is the weighted average of the interest rates applicable to the general-purpose borrowings.
18. Biological assetsBiological assets of the Group are consumable biological assets
18.1 Consumable biological assets
Consumable biological assets are biological assets held for sale or to be harvested as agricultural produce in the future, including, for example, crops, vegetables and timber in plantation forests being grown and livestock being raised or held for sale. The consumable biological assets the Group owns are timbers.
Upon harvest or disposal of consumable biological assets, the Group uses the individual valuation method to carry out the cost by book value.
If there is an active market for consumable biological asset and the Company can obtain market prices and other relevant information regarding the same or similar type of consumable biological asset from the market so as to reasonably estimate the fair value of the related biological asset, the Company subsequently measures the consumable biological asset at fair value with changes of the fair value are recognized in profit or loss for the current period.
19. Intangible assets
19.1 Intangible assets
Intangible assets include land use rights and mining rights etc.
An intangible asset is measured initially at cost. When an intangible asset with a finite useful life is available for use, its original cost is amortized over its estimated useful life using the straight-line method or the units of production method. An intangible asset with an indefinite useful life is not amortized. Amortization method, useful life and estimate residual value rate of all intangible assets are as follows:
Category Amortization method Useful life Residual Value Rate (year) (%)
Land use rights Straight-line method 50 years 0%Mining rights Units of production method N/A 0%Copper supply concessions Units of purchase method N/A 0%Supplier relationship Straight-line method 15 years 0%
At the end of the year, the Group reviews the useful life and amortization method of intangible assets, and makes adjustments when necessary.
See Note III. "20. Impairment of long-term assets" for the details of impairment test of intangible assets.

132 2019 Annual Report
NOTES TO THE FINANCIAL STATEMENTSFOR THE YEAR ENDED 31 DECEMBER 2019
(III) SIGNIFICANT ACCOUNTING POLICIES AND ACCOUNTING ESTIMATES (CONTINUED)
19. Intangible assets (Continued)
19.2 Research and development expenditure for internal study
Expenditure during the research phase is recognized as an expense in the period in which it is incurred.
Expenditure during the development phase that meets all of the following conditions at the same time is recognized as intangible asset. Expenditure during development phase that does not meet the following conditions is recognized in profit or loss for the period:
(1) it is technically feasible to complete the intangible asset so that it will be available for use or sale;
(2) the Group has the intention to complete the intangible asset and use or sell it;
(3) the Group can demonstrate the ways in which the intangible asset will generate economic benefits, including the evidence of the existence of a market for the output of the intangible asset or the intangible asset itself or, if it is to be used internally, the usefulness of the intangible asset;
(4) the availability of adequate technical, f inancial and other resources to complete the development and the ability to use or sell the intangible asset; and
(5) the expenditure attributable to the intangible asset during its development phase can be reliably measured.
If the expenditures cannot be distinguished between the research phase and development phase, the Group recognizes all of them in profit or loss for the period.
20. Impairment of long-term assets
The Group reviews the Long-term equity investments, fixed assets, construction in progress, and intangible assets with finite useful life at each balance sheet date to determine whether there is any indication that they have suffered an impairment loss. If an impairment indication exists, the recoverable amount is estimated. Intangible assets with indefinite useful life and intangible assets not yet available for use are tested for impairment annually, irrespective of whether there is any indication that the assets may be impaired.
Recoverable amount is estimated on individual basis. If it is not practical to estimate the recoverable amount of an individual asset, the recoverable amount of the asset group to which the asset belongs will be estimated. The recoverable amount of an asset or asset group is the higher of its fair value less costs of disposal and the present value of the future cash flows expected to be derived from the asset or asset group.
If such recoverable amount is less than its carrying amount, a provision for impairment losses in respect of the deficit is recognized in profit or loss for the period.
Goodwill is tested for impairment at least at the end of each year. For the purpose of impairment testing, goodwill is considered together with the related assets groups, i.e., goodwill is reasonably allocated to the related assets group(s) or each of assets group(s) expected to benefit from the synergies of the combination. An impairment loss is recognized if the recoverable amount of the assets group or sets of assets groups (including goodwill) is less than its carrying amount. The impairment loss is firstly allocated to reduce the carrying amount of any goodwill allocated to such assets group or sets of assets groups, and then to the other assets of the group pro-rata on the basis of the carrying amount of each asset (other than goodwill) in the group.
Once an impairment loss is recognized for above mentioned assets, it will not be reversed in any subsequent period.

133China Molybdenum Co., Ltd.
NOTES TO THE FINANCIAL STATEMENTSFOR THE YEAR ENDED 31 DECEMBER 2019
(III) SIGNIFICANT ACCOUNTING POLICIES AND ACCOUNTING ESTIMATES (CONTINUED)
21. Long-term prepaid expenses
Long-term prepaid expenses represent expenses incurred that should be borne and amortized over the current and subsequent periods (together of more than one year). Long-term prepaid expenses are amortized using the straight-line method over the expected periods in which benefits are derived.
22. Contract liabilities
Contract liabilities refer to the Group's obligation to transfer goods or services to a customer for which the Group has received consideration from the customer. Contract assets and contract liabilities under the same contract are presented at net amount.
23. Employee benefits
23.1 Accounting treatment of short-term remuneration
Actually occurred short-term employee benefits are recognized as liabilities, with a corresponding charge to the profit or loss for the period or in the costs of relevant assets in the accounting period in which employees provide services to the Group. Staff welfare expenses incurred by the Group are recognized in profit or loss for the period or the costs of relevant assets based on the actually occurred amounts when it actually occurred. Non-monetary staff welfare expenses are measured at fair value.
Payment made by the Group of social security contributions for employees such as premiums or contributions on medical insurance, work injury insurance and maternity insurance, etc. and payments of housing funds, as well as union running costs and employee education costs provided in accordance with relevant requirements, are calculated according to prescribed bases and percentages in determining the amount of employee benefits and recognized as relevant liabilities, with a corresponding charge to the profit or loss for the period or the costs of relevant assets in the accounting period in which employees provide services.
23.2 Accounting treatment of post-employment benefits
Post-employment benefits are classified into defined contribution plans and defined benefit plans.
During the accounting period of rendering service to employees of the Group, amount which should be paid according to defined contribution plans is recognized as liabilities, and recognized in profit or loss or related costs of assets.
For defined benefit plans, the Group assigns the welfare obligation generated from the defined benefit plans to the period of rendering services using the formula determined by the projected unit credit method, and includes it in the current profit or loss or related asset costs. Employee benefit costs generated from the defined benefit plans are categorized as follows:
• Service cost (including current service cost, past service cost, as well as gains and losses on curtailments and settlements.);
• Net interest of net liabilities or net assets of defined benefit plans (including interest income of planned assets, interest expenses of defined benefit plan liabilities and effect of asset ceiling); and
• Remeasurement of changes in net liabilities or net assets of defined benefit plans.

134 2019 Annual Report
NOTES TO THE FINANCIAL STATEMENTSFOR THE YEAR ENDED 31 DECEMBER 2019
(III) SIGNIFICANT ACCOUNTING POLICIES AND ACCOUNTING ESTIMATES (CONTINUED)
23. Employee benefits (Continued)
23.2 Accounting treatment of post-employment benefits (Continued)
Service cost and net interest of net liabilities or net assets of defined benefit plans are included in the current profit or loss or related asset costs. Remeasurement of changes in net liabilities or net assets of defined benefit plans (including actuarial gains or losses, return on plan assets excluding the amount included in the net interest of net liabilities or net assets of defined benefit plans, and changes to the asset ceiling excluding the amount included in the net interest of net liabilities or net assets of defined benefit plans) is included in other comprehensive income.
Deficit or surplus generated from the present value of the obligation of defined benefit plan less the fair value of defined benefit plan asset is recognized as a net liability or a net asset of defined benefit plan. If there is a surplus in the defined benefit plan, the lower of the surplus of defined benefit plan and the asset ceiling is used to measure the net asset of the defined benefit plan.
23.3 Accounting treatment of termination benefits
When the Group provides termination benefits to employees, employee benefit liabilities are recognized for termination benefits, with a corresponding charge to the profit or loss for the period at the earlier of: (1) when the Group cannot unilaterally withdraw the offer of termination benefits because of the termination plan or a curtailment proposal; and (2) when the Group recognizes costs or expenses related to restructuring that involves the payment of termination benefits.
23.4 Accounting treatment of other long-term employee benefits
For other long-term employee benefits, where the definition of defined contribution plans is met, it is accounted for according to above-mentioned requirements of defined contribution plans. Otherwise, net liabilities or net assets of such other long-term employee benefits are recognized and measured according to related requirements of defined benefit plans. At the end of reporting period, the cost of employee benefits arising from other long-term employee benefits are recognized as service cost, and net interest of net liabilities or net assets of other long-term employee benefits, and changes arising from re-measurement of net liability or net assets of other long-term employee benefits. The total net amount of those items are either charged to profit or loss in the period, or included in cost of related assets.
24. Provisions
Provisions are recognized when the Group has a present obligation related to a contingency, it is probable that an outflow of economic benefits will be required to settle the obligation, and the amount of the obligation can be measured reliably.
The amount recognized as a provision is the best estimate of the consideration required to settle the present obligation at the balance sheet date, taking into account factors pertaining to a contingency such as the risks, uncertainties and time value of money. Where the effect of the time value of money is material, the amount of the provision is determined by discounting the related future cash outflows.
25. Share-based payment
A share-based payment is a transaction which the Group grants equity instruments, or incurs liabilities for amounts that are determined based on the price of equity instruments, in return for services rendered by employees. The Group's share-based payments are cash-settled share-based payments.
135China Molybdenum Co., Ltd.
NOTES TO THE FINANCIAL STATEMENTSFOR THE YEAR ENDED 31 DECEMBER 2019
(III) SIGNIFICANT ACCOUNTING POLICIES AND ACCOUNTING ESTIMATES (CONTINUED)
25. Share-based payment (Continued)
25.1 Cash-settled share-based payment
Cash-settled share-based payments are measured at the fair value of the liabilities incurred by the Group, which are determined based on the price of the share or other equity instruments. The Group recognizes the services for the period as related costs or expenses, with a corresponding increase in liability, at an amount equal to the fair value of the liability based on the best estimate of the outcome of vesting at each balance sheet date within the vesting period. Until the liability is settled, the Group re-measures the fair value of the liability at each balance sheet date and at the date of settlement, with any changes in fair value recognized in profit or loss for the period.
25.2 Accounting treatment related to implementation, modification and termination of share-based payment plan
In case the Group modifies a share-based payment arrangement, if the modification increases the fair value of the equity instruments granted, the Group will include the incremental fair value of the equity instruments granted in the measurement of the amount recognized for services received. If the modification increases the number of the equity instruments granted, the Group will include the fair value of additional equity instruments granted in the measurement of the amount recognized for services received. The increase in the fair value of the equity instruments granted is the difference between fair value of the equity instruments before and after the modification on the date of the modification. If the Group modifies the terms or conditions of the share-based payment arrangement in a manner that reduces the total fair value of the share-based payment arrangement, or is not otherwise beneficial to the employee, the Group will continue to account for the services received as if that modification had not occurred (other than a cancellation of some or all the equity instruments granted).
If cancellation of the equity instruments granted occurs during the vesting period, the Group will account for the cancellation of the equity instruments granted as an acceleration of vesting, and recognize immediately the amount that otherwise would have been recognized over the remainder of the vesting period in profit or loss for the period, with a corresponding recognition in capital reserve. When the employee or counterparty can choose whether to meet the non-vesting condition but the condition is not met during the vesting period, the Group treats it as a cancellation of the equity instruments granted.
26. Revenue
The revenue of the Group is mainly from:
(1) Sale of goods and metal trading:
The Group sells minerals including self-produced mineral products of molybdenum, tungsten, niobium, phosphorus, copper, cobalt and gold, etc. and commercial mineral products of copper, lead and zinc concentrates and copper, lead and zinc refined metal to the customers. Generally, the performance business only includes delivery of goods in the contract concerning sales of goods, so the consideration of sale is recognized according to the fixed price or temporary pricing arrangement as agreed in the sales contract. The Group recognizes the revenue at the time point when the control over the relevant goods are passed to the customers.
(2) Hotel services:
The Group provides services to the customers through its self-operated hotels and accordingly obtain revenue which is recognized over the period when the customers obtain and consume the relevant services.

136 2019 Annual Report
NOTES TO THE FINANCIAL STATEMENTSFOR THE YEAR ENDED 31 DECEMBER 2019
(III) SIGNIFICANT ACCOUNTING POLICIES AND ACCOUNTING ESTIMATES (CONTINUED)
26. Revenue (Continued)
(3) Others
The Group provides auxiliary services including sales of diesel and electric power to the customers and accordingly obtain revenue which is recognized over the period when the customers obtain and consume the relevant services.
The Group recognizes revenue based on the transaction price allocated to such performance obligation when a performance obligation is satisfied, i.e. when "control" of the goods or services underlying the particular performance obligation is transferred to the customer. A performance obligation represents the commitment that a good and service that is distinct shall be transferred by the Group to the customer. Transaction price refers to the consideration that the Group is expected to charge due to the transfer of goods or services to the customer, but it does not include payments received on behalf of third parties and amounts that the Group expects to return to the customer.
It is the performance obligation in a certain time when meeting one of the following conditions. The Group recognizes revenue within a certain period of time in accordance with the performance progress: (1) customers can obtain and exploit economic benefits brought by the Group's performance of obligations; (2) customers have the control over the goods under construction during the process of the Group's performance of obligations; (3) Goods from the process of the Group's performance of obligations are of irreplaceable purposes and the Group is entitled to charge collections for the completed performance of obligations to date within the entire term of contract. Otherwise, the Group recognizes revenue at the time-point when customers obtain the control rights over relevant goods or services.
The Group assesses whether it controls each specified good or service before that good or service is transferred to the customer to determine whether the Group is a principal or an agent. If the Group controls the specified good or service before that good or service is transferred to a customer, the Group is a principal and recognizes revenue in the gross amount of consideration received or receivable. Otherwise, the Group is an agent and recognizes revenue in the amount of any fee or commission to which it expects to be entitled. The fee or commission is the net amount of consideration that the Group retains after paying the other party the consideration received in exchange for the goods or services to be provided by that party.
When the Group collects amounts of sold goods or services in advance from the customer, the Group will firstly recognize the amounts as a liability and then transfer to revenue until satisfying relevant performance obligations. When the receipts in advance are non-refundable and the customer may give up all or part of contract right, and the Group is expected to be entitled to obtain amounts associated with contract rights given up by the customer, the above amounts shall be proportionally recognized as revenue in accordance with the model of exercising contract rights by the customer; otherwise, the Group will transfer the relevant balance of the above liability to revenue only when the probability is extremely low for the customer to satisfy remaining performance obligations.
27. Types and accounting treatment of government grants
Government grants are transfer of monetary assets and non-monetary assets from the government to the Group at no consideration. A government grant is recognized only when the Group can comply with the conditions attaching to the grant and the Group will receive the grant.
If a government grant is in the form of a transfer of a monetary asset, it is measured at the amount received or receivable

137China Molybdenum Co., Ltd.
NOTES TO THE FINANCIAL STATEMENTSFOR THE YEAR ENDED 31 DECEMBER 2019
(III) SIGNIFICANT ACCOUNTING POLICIES AND ACCOUNTING ESTIMATES (CONTINUED)
27. Types and accounting treatment of government grants (Continued)
27.1 Criterion and accounting treatment of government grants related to assets
The government grants of the Group mainly include grant for demonstration base project, etc. Due to direct relationship with investment and construction of fixed assets, such government grants are defined as the government grants related to assets.
A government grant related to an asset is recognized as deferred income, and evenly amortized to profit or loss over the useful life of the related asset.
27.2 Criterion and accounting treatment of government grants related to income
The government grants of the Group mainly include receipts of tax refunds, etc... Such government grants are defined as the government grants related to income.
For a government grant related to income, if the grant is a compensation for related cost expenses or losses to be incurred in subsequent periods, the grant is recognized as deferred income, and recognized in profit or loss over the periods in which the related costs or losses are recognized. If the grant is a compensation for related cost expenses or losses already incurred, the grant is recognized immediately in profit or loss for the period.
A government grant related to the Group's daily activities is recognized in other income based on the nature of economic activities; a government grant is not related to the Group's daily activities is recognized in non-operating income and expenses.
28. Deferred income tax assets/deferred income tax liabilities
The income tax expenses include current income tax and deferred income tax.
28.1 Current income taxes
At the balance sheet date, current income tax liabilities (or assets) for the current and prior periods are measured at the amount expected to be paid (or recovered) according to the requirements of tax laws.
28.2 Deferred tax assets and deferred tax liabilities
For temporary differences between the carrying amounts of certain assets or liabilities and their tax base, or between the nil carrying amount of those items that are not recognized as assets or liabilities and their tax base that can be determined according to tax laws, deferred tax assets and liabilities are recognized using the balance sheet liability method.
Deferred tax is generally recognized for all temporary differences. Deferred tax assets for deductible temporary differences are recognized to the extent that it is probable that taxable profits will be available against which the deductible temporary differences can be utilized. However, for temporary differences associated with the initial recognition of goodwill and the initial recognition of an asset or liability arising from a transaction (not a business combination) that affects neither the accounting profit nor taxable profits (or deductible losses) at the time of transaction, no deferred tax asset or liability is recognized.
For deductible losses and tax credits that can be carried forward, deferred tax assets are recognized to the extent that it is probable that future taxable profits will be available against which the deductible losses and tax credits can be utilized.

138 2019 Annual Report
NOTES TO THE FINANCIAL STATEMENTSFOR THE YEAR ENDED 31 DECEMBER 2019
(III) SIGNIFICANT ACCOUNTING POLICIES AND ACCOUNTING ESTIMATES (CONTINUED)
28. Deferred income tax assets/deferred income tax liabilities (Continued)
28.2 Deferred tax assets and deferred tax liabilities (Continued)
Deferred tax liabilities are recognized for taxable temporary differences associated with investments in subsidiaries and associates, and interests in joint ventures, except where the Group is able to control the timing of the reversal of the temporary difference and it is probable that the temporary difference will not reverse in the foreseeable future. Deferred tax assets arising from deductible temporary differences associated with such investments and interests are only recognized to the extent that it is probable that there will be taxable profits against which to utilize the benefits of the temporary differences and they are expected to reverse in the foreseeable future.
At the balance sheet date, deferred tax assets and liabilities are measured at the tax rates, according to tax laws, that are expected to apply in the period in which the asset is realized or the liability is settled.
Current and deferred tax expenses or income are recognized in profit or loss for the period, except when they arise from transactions or events that are directly recognized in other comprehensive income or in shareholders' equity, in which case they are recognized in other comprehensive income or in shareholders' equity; and when they arise from business combinations, in which case they adjust the carrying amount of goodwill.
At the balance sheet date, the carrying amount of deferred tax assets is reviewed and reduced if it is no longer probable that sufficient taxable profits will be available in the future to allow the benefit of deferred tax assets to be utilized. Such reduction in amount is reversed when it becomes probable that sufficient taxable profits will be available.
28.3 Offsetting of income taxes
When the Group has a legal right to settle on a net basis and intends either to settle on a net basis or to realize the assets and settle the liabilities simultaneously, current tax assets and current tax liabilities are offset and presented on a net basis.
When the Group has a legal right to settle current tax assets and liabilities on a net basis, and deferred tax assets and deferred tax liabilities relate to income taxes levied by the same taxation authority on either the same taxable entity or different taxable entities which intend either to settle current tax assets and liabilities on a net basis or to realize the assets and liabilities simultaneously, in each future period in which significant amounts of deferred tax assets or liabilities are expected to be reversed, deferred tax assets and deferred tax liabilities are offset and presented on a net basis.
29. Stripping costs
During mining operations, the Group may find that mineral wastes and surface cover to be removed before mining, and the removal activities for such wastes is called stripping. The stripping costs are usually capitalized in the mining development phase (before production). The capital expenditure is divided into cash outflows of investment activities.
After mining development phase can be ended for getting into the production phase, the waste removal activity is referred to as production stripping.

139China Molybdenum Co., Ltd.
NOTES TO THE FINANCIAL STATEMENTSFOR THE YEAR ENDED 31 DECEMBER 2019
(III) SIGNIFICANT ACCOUNTING POLICIES AND ACCOUNTING ESTIMATES (CONTINUED)
29. Stripping costs (Continued)
If the stripping activity is related to the current mining, the associated stripping costs are included in the statement of profit or loss for the current period as operating costs. If production stripping is associated with inventory production and improves the mining environment for subsequent years, the expenditure on the removal of wastes should be reasonably allocated between the two activities, and the portion that is beneficial to the mining environment for subsequent years shall be capitalized into the stripping and development capital expenditures. In some cases, where a large amount of wastes is removed or only a small volume of inventory is produced, the costs incurred by the stripping of wastes will be fully capitalized.
On the basis of the proven reserves of ore, all capitalized waste stripping costs are depreciated in accordance with the output method.
The impact on the waste stripping costs or on the remaining ore reserves arising from changes in mine life expectancy or mining plans will be treated as changes in accounting estimates.
30. Exploration, assessment and development expenditures
The costs of exploration and assessment are directly recognized in costs when they are incurred. When a mine is determined to be of economic value, all subsequent assessment expenditures, including expenditures incurred in early development phase, shall be capitalized into the cost of the underlying asset. The above capitalization terminates after the mine has reached the commercial production phase. The exploration assets generated from acquisitions are presented on the balance sheet at the cost less the accumulated impairment loss.
31. Leases (applicable from 1 January 2019)
A contract is, or contains, a lease if the contract conveys the right to control the use of an identical asset for a period of time in exchange for consideration.
For contracts entered into, the Group assesses whether the contract is, or contains, a lease at inception or modification date. Such contract will not be reassessed unless the terms and conditions of the contract are subsequently changed.
31.1 The Group as a lessee
31.1.1 Separating components of a contract
For a contract that contains a lease component and one or more additional lease or non-lease components, the Group allocates the consideration in the contract to each lease component on the basis of the relative stand-alone price of the lease component and the aggregate stand-alone price of the non-lease components.
31.1.2 Right-of-use assets
Except for short-term leases and leases of low-value assets, the Group recognizes a right-of-use asset at the commencement date of the lease. The commencement date of the lease is the date on which a lessor makes an underlying asset available for use. The right-of-use asset is measured at cost. The cost of the right-of-use asset shall include:
• the amount of the initial measurement of the lease liability;
• any lease payments made at or before the commencement date, less any lease incentives received;
• any initial direct costs incurred by the Group; and

140 2019 Annual Report
NOTES TO THE FINANCIAL STATEMENTSFOR THE YEAR ENDED 31 DECEMBER 2019
(III) SIGNIFICANT ACCOUNTING POLICIES AND ACCOUNTING ESTIMATES (CONTINUED)
31. Leases (applicable from 1 January 2019) (Continued)
31.1 The Group as a lessee (Continued)
31.1.2 Right-of-use assets (Continued)
• an estimate of costs to be incurred by the Group in dismantling and removing the underlying asset, restoring the site on which it is located or restoring the underlying asset to the condition required by the terms and conditions of the lease.
The Group makes provision for the depreciation of right-of-use assets in accordance with Accounting Standard for Business Enterprises No. 4–Fixed assets. Right-of-use assets in which the Group is reasonably certain to obtain ownership of the underlying leased assets at the end of the lease terms are depreciated from commencement date to the end of their useful lives. Otherwise, right-of-use assets are depreciated on a straight-line basis over the shorter of their estimated useful lives and the lease terms.
The Group assesses and determines whether the right-of-use asset is impaired and accounts for any impairment loss identified in accordance with Accounting Standard for Business Enterprises No. 8 – Impairment of Assets.
31.1.3 Lease liabilities
Except for short-term leases and leases of low-value assets, at the commencement date of a lease, the Group recognizes the lease liability at the present value of the lease payments that are not paid at that date. In calculating the present value of lease payments, the Group uses the incremental borrowing rate at the lease commencement date if the interest rate implicit in the lease is not readily determinable.
The lease payments are payments to the lessor for the right to use the underlying asset during the lease term made by the Group, including fixed payments and in-substance fixed payments, less any lease incentives receivable, if applicable.
After the commencement date, the Group recognizes interest expenses in each accounting periods during the lease, based on a constant periodic rate of interest on the remaining balance of the lease liabilities, and charges to profit or loss or the related costs of assets for the current period.
After the commencement date, the lease term has changed or there is a change in the assessment of exercise of a purchase option, in which case the related lease liability is remeasured by discounting the revised lease payments and the corresponding right-of-use asset is adjusted, if the carrying amount of right-of-use assets has been reduced to zero, but the lease liability still needs to be further reduced, the difference is recognized in the profit and loss for the current period.
31.1.4 Short-term leases and leases of low-value assets
The Group elects not to recognize right-of-use assets and lease liabilities for short-term leases of transportation devices and machinery equipment and leases of low-value assets. A short-term lease is a lease that at the commencement date, has a lease term of 12 months or less and does not contain any purchase options. A lease of a low-value asset, is a lease that the single underlying asset, when it is new, is of low value. The Group shall recognize the lease payments associated with short-term leases and leases of low-value assets as the cost of the related assets or profit or loss on a straight-line basis over the lease term.

141China Molybdenum Co., Ltd.
NOTES TO THE FINANCIAL STATEMENTSFOR THE YEAR ENDED 31 DECEMBER 2019
(III) SIGNIFICANT ACCOUNTING POLICIES AND ACCOUNTING ESTIMATES (CONTINUED)
31. Leases (applicable from 1 January 2019) (Continued)
31.1 The Group as a lessee (Continued)
31.1.5 Lease modifications
The Group accounts for a lease modification as a separate lease if:
• the modification increases the scope of the lease by adding the right to use one or more underlying assets; and
• the consideration for the leases increases by an amount commensurate with the stand-alone price for the increase in scope and any appropriate adjustments to that stand-alone price to reflect the circumstances of the particular contract.
For a lease modification that is not accounted for as a separate lease, the Group reallocates the consideration in the contract, and remeasures the lease liability based on the lease term of the modified lease by discounting the revised lease payments using a revised discount rate at the effective date of the modification.
For the decrease in scope of lease or the lease term arising from lease modification, the Group should decreases the carrying amount of right-of-use assets and recognizes the gains or losses relating to the partly or full derecognition of the lease into the profit or loss in current period. For remeasurement arising from lease modification, the Group should adjusts the corresponding carrying amount of right-of-use assets.
31.1.6 Deferred tax assets and deferred tax liabilities relating to leases
Where the Group recognizes right-of-use assets and lease l iabil i ty relating to lease transaction, the deferred income tax is recognized in accordance with the relevant regulations of Accounting Standard for Business Enterprises No.18—Income Tax regarding lease transaction in its entirety. The Group assesses the temporary difference on the basis of net amount of right-of-use assets and lease liability, and recognizes deferred tax assets and deferred tax liabilities.
31.2 The Group as a lessor
31.2.1 Separating components of a contract
For a contract that contains lease components and non-lease components, the Group applies Accounting Standards for Business Enterprises No. 14-Revenue to allocate consideration in a contract to lease and non-lease components. Non-lease components are separated from lease component on the basis of their relative stand-alone selling prices.
31.2.2 Classification of leases
A lease is classified as a finance lease if it transfers substantially all the risks and rewards incidental to ownership of an underlying asset. Other leases which are not finance leases are operating leases.
31.2.3 The Group as lessor under operating leases
Rental income from operating leases is recognized in profit or loss on a straight-line basis over the term of the relevant lease. Initial direct costs relating to operating leases are capitalized when incurred, amortized on the same basis as rental income recognition during the lease term, and recognized in profit or loss over the lease term.
The variable lease receipts obtained by the Group from operating lease but not included in the lease receivables are included in profit or loss when they are incurred.
142 2019 Annual Report
NOTES TO THE FINANCIAL STATEMENTSFOR THE YEAR ENDED 31 DECEMBER 2019
(III) SIGNIFICANT ACCOUNTING POLICIES AND ACCOUNTING ESTIMATES (CONTINUED)
32. Other significant accounting policies and accounting estimates
32.1 Safety production expenses
In accordance with Cai Qi [2012] No. 16 notice of printing and distributing the Administrative Measures for the Collection and Utilization of Enterprise Safety Production Expenses, the safety expenses for domestic mining enterprises are provided as per RMB5/ton for raw ore of surface mine, RMB10/ton for raw ore of downhole mine and RMB1/ton as for tailing pond.
In accordance with Cai Qi [2012] No. 16 notice of printing and distributing Administrative Measures for the Collection and Utilization of Enterprise Safety Production Expenses, safety expenses of the metallurgy enterprises of the group located in China will be provided as per actual operating revenue in last year. The safety expenses will the provided month by month based on the following standards with excessive and accumulative withdrawal method:
(I) Provided 3% if the operating revenue does not exceed RMB10 million;
(II) Provided 1.5% if the operating revenue is RMB10 million to RMB0.1 billion;
(III) Provided 0.5% if the operating revenue is RMB0.1 billion to RMB1 billion;
(IV) Provided 0.2% if the operating revenue is RMB1 billion to RMB5 billion;
(V) Provided 0.1% if the operating revenue is RMB5 billion to RMB10 billion;
(VI) Provided 0.05% if the operating revenue exceeds RMB10 billion.
When safety expenses of the enterprises is provided as per the standards, debit "manufacturing expenses" and credit "special reserve".
When the safety protection equipment and facilities are purchased with safety production reserve within specified limit, it should debit "construction in progress" and credit "bank deposit" based on the amount included into assets cost. The safe projects will be deemed as fixed assets upon completion and reaching the reserved serviceable condition; the special reserves will be written down as per the cost of fixed assets and the cumulative depreciation in the same amount will be confirmed; debit "special reserve" and credit "accumulated depreciation". The fixed asset will not withdraw depreciation later. But amount carried forward is within the limit of the balance of "special reserves" being offset to be zero.
When the safety production reserve is used to pay the expenses in safety production inspection, evaluating expenditure, safety skills training and emergency rescue drill, it should directly write down special reserves, debit "special reserves" and credit "bank deposit". The amount carried forward should be within the scope that the balance of "special reserve" is written down to zero.
32.2 Discontinued operations
A discontinued operation is a component of an entity that either has been disposed of or is classified as held for sale and can be distinguished separately in the operation and the preparation of financial statements:
– The component represents either a separate major line of business or a geographical area of operations;
– The component is part of a disposal plan to dispose of a separate major line of business or geographical area of operations;
– The component is a subsidiary acquired exclusively with a view to resale.

143China Molybdenum Co., Ltd.
NOTES TO THE FINANCIAL STATEMENTSFOR THE YEAR ENDED 31 DECEMBER 2019
(III) SIGNIFICANT ACCOUNTING POLICIES AND ACCOUNTING ESTIMATES (CONTINUED)
33. Hedge accounting
33.1 Basis of adopting hedge accounting and relevant accounting treatment
Some financial instruments are designated as hedging instruments by the Group for the purpose of managing risk exposure caused by specific risks such as interest rate risk, etc. The Group applies hedging accounting for a hedge that satisfies the prescribed conditions. Hedging activities of the Group include cash flow hedges.
At the inception of the hedge, the Group designates hedging instruments and hedged items formally, and prepares written documents of the nature of hedging instruments, hedged items and hedged risks as well as the effective assessment methods of hedge (including analysis on the causes for effective hedging and the method to determine the hedging ratio).
The Group will terminate the application of hedge accounting if one of the following conditions is met:
• the risk management objective is changed so that the hedging relationship no longer meets the risk management objective.
• the hedging instrument expires, or is sold, terminated or exercised.
• an economic relationship no longer exists between the hedged items and the hedging instruments, or the effect of credit risk starts to dominate in the changes in value arising from the economic relationship between the hedged items and the hedging instruments.
• the hedging relationship no longer meets other conditions for hedge accounting.
Cash flow hedges
The Group recognises the portion of the gain or loss on the hedging instrument that is determined to be an effective hedge in the other comprehensive income as cash flow hedges, and recognises the portion that is determined to be an ineffective hedge in current profit or loss. The cash flow hedging reserve shall be determined to be the lesser of (in absolute amounts) 1) the cumulative gain or loss on the hedging instrument from inception of the hedge; and 2) the cumulative change in present value of the expected future cash flows on the hedged item from inception of the hedge.
If a hedge of a forecast transaction subsequently results in the recognition of a non-financial asset or a non-financial liability, or the forecast transaction of a non-financial asset or a non-financial liability forms a firm commitment applicable to fair value hedge accounting, the Group will reclassify the cash flow hedging reserve originally recognized in the other comprehensive income into initial carrying amount of the asset or liability. For the cash flow hedges not under the above conditions, the Group will reclassify the cash flow hedging reserve originally recognized in the other comprehensive income into current profit or loss in the same period(s) during which the hedged expected cash flow affects profit or loss. If the cash flow hedging reserve recognized in the other comprehensive income is a loss all or a portion of which will not be recovered in future accounting periods, the Group shall reclassify into profit or loss the amount that is not expected to be recovered.
When the Group terminates the application of hedge accounting to cash flow hedge, if the hedged future cash flow is still expected to happen, the accumulated cash flow hedging reserve should be reserved and an accounting treatment should be made in the above manner; if the hedged future cash flow is expected not to happen, the accumulated cash flow hedging reserve will be reclassified from other comprehensive income into current profit or loss.

144 2019 Annual Report
NOTES TO THE FINANCIAL STATEMENTSFOR THE YEAR ENDED 31 DECEMBER 2019
(III) SIGNIFICANT ACCOUNTING POLICIES AND ACCOUNTING ESTIMATES (CONTINUED)
33. Hedge accounting (Continued)
33.2 Method for assessing effectiveness of hedging
The Group assesses whether the hedging relationship conforms to the hedge effectiveness requirements at the inception date of the hedge and the subsequent periods continuously. A hedge is regarded as conforming to the hedge effectiveness requirement if all of the following conditions are met:
• An economic relationship exists between the hedged items and the hedging instruments.
• The effect of credit risk is not dominant in the changes in value arising from the economic relationship between the hedged items and the hedging instruments.
• The hedge ratio of hedging relationship is equal to the ratio between the quantity of actual hedged items of the Group and the actual quantity of hedging instruments to hedge them.
Where the hedging relationship no longer conforms to the hedging effectiveness requirement due to hedge ratio, but the risk management objective for such set of hedging relationship designated by the Group stays unchanged, the Group will rebalance the hedging relationship and adjust the quantity of the hedged items or hedging instruments having existed in the hedging relationship to make the hedge ratio conform to the hedge effectiveness requirement again.
34. Key assumptions and uncertainties in the accounting estimates
In the application of the Group's accounting policies, which are described in Note III, the Group is required to make judgments, estimates and assumptions about the carrying amounts of items in the financial statements that cannot be measured accurately, due to the internal uncertainty of the operating activities. These judgments, estimates and assumptions are based on historical experiences of the Group's management as well as other factors that are considered to be relevant. Actual results may differ from these estimates.
The aforementioned judgments, estimates and assumptions are reviewed regularly on a going concern basis. The effect of a change in accounting estimate is recognized in the period of the change, if the change affects that period only; or recognized in the period of the change and future periods, if the change affects both.
The following are the key assumptions and uncertainties in accounting estimates at the balance sheet date that have a significant risk of causing a material adjustment to the carrying amounts of assets and liabilities in future periods:
Estimate of mineral reserve
The estimate of mineral reserve is determined based on the materials formulated by the industrial experts or other judicial authorities. Use the method to determine the mineral reserve and other minerals and calculate depreciation and amortization expenses, evaluate impairment indicators and useful life of mine, and forecast the payment time of rehabilitation cost for forecasting to be closed or rehabilitate mine.
When evaluating the useful life of mine for the purpose of accounting, calculate the mineral resources with mining value. The estimate of mineral reserve will involve multiple uncertainties. Estimate the currently effective assumptions and material changes in actual data. The changes in market prices, exchange rate, production cost or recovery may change the current economic situation of reserve and cause revaluation of the reserve in the end.

145China Molybdenum Co., Ltd.
NOTES TO THE FINANCIAL STATEMENTSFOR THE YEAR ENDED 31 DECEMBER 2019
(III) SIGNIFICANT ACCOUNTING POLICIES AND ACCOUNTING ESTIMATES (CONTINUED)
34. Key assumptions and uncertaint ies in the account ing est imates (Continued)
The useful life of fixed assets
The management should judge the estimated useful life of fixed assets and their depreciations. The estimate should base on the experience in actual useful life of fixed assets and assume the government will update upon expiration of mining rights. In the face of fierce industrial competition, the scientific innovation and competitors will produce significance on the estimate of useful life. Where the actual useful life is different from the estimated useful life, the management should adjust the depreciation amount.
Impairment of non-current assets other than financial assets
The Group assesses whether there are any indicators of impairment of all non-current assets other than financial assets at the balance sheet date. Non-current assets other than financial assets are tested for impairment when there are indicators that the carrying amounts may not be recoverable. For intangible assets with indefinite useful life and intangible assets not yet available for use are tested for impairment annually, irrespective of whether there is any indication that the assets may be impaired. Impairment exists if the carrying amount of an asset or asset group is higher than recoverable amount, the higher of its fair value less costs of disposal and the present value of the future cash flows expected to be derived from the asset or asset group. The calculation of the fair value less costs of disposal is based on available data from the observable market prices less incremental costs for disposing of the asset. The management must estimate the future cash flows of the asset or a set of asset group and determine a suitable discount rate to calculate the estimation of the present value of estimated future cash flows.
– Impairment of mining rights
At the impairment test of the Group's mining rights, including the mining rights of the Northparkes Copper-gold mine in Australia, Tenke Copper-Cobalt mine and CCC Niobium mine in Congo, the Molybdenum mine in East Gobi of Hami of Xinjiang, and the Cubitão Phosphorus mine and Catalão Niobium mine in Brazil, the management of the Group uses the long-term forecast data of Copper price and Molybdenum price from domestic and overseas authoritative research institutions as the sales price estimates of future Copper and Molybdenum products, and uses the latest estimates of the management's mining plan and future capital expenditures as a basis. The current risk-free rate of return, the average social rate of return, and assets-specific risks are taken into full consideration for the discount rate. The estimated future recoverable amount of the mining assets is largely determined by the above estimates of future commodity prices, mining plans, future capital expenditure plans and discount rates. Future commodity price forecasts do not represent actual sales prices that can be realized in the future, and mining plans, future capital expenditure plans and discount rates will also change. As at 31 December 2019, the management of the Group considered that there was no impairment of the mining assets held by the Group. If the above forecast and estimates change in the subsequent period, the estimated recoverable amount of the Group's mining assets may change or be lower than the carrying amount of the above assets.
– Impairment of goodwill
The Group tests at least annually whether the goodwill is impaired. This requires an estimate of the present value of future cash flows of an asset group or portfolio of asset groups for which the goodwill is allocated. For the forecast of the present value of future cash flows, the Group needs to forecast the cash flows generated by future asset groups or portfolio of asset groups and select the appropriate discount rate to determine the present value of future cash flows.

146 2019 Annual Report
NOTES TO THE FINANCIAL STATEMENTSFOR THE YEAR ENDED 31 DECEMBER 2019
(III) SIGNIFICANT ACCOUNTING POLICIES AND ACCOUNTING ESTIMATES (CONTINUED)
34. Key assumptions and uncertaint ies in the account ing est imates (Continued)
Provision for decline in value of inventories
As described in Note III. 12, inventories (excluding trading inventories outside the PRC) are measured at the lower of cost and net realizable value. Net realizable value is the estimated selling price in the ordinary course of business less the estimated costs of completion, the estimated costs necessary to make the sale and relevant taxes.
Operational procedures have been in place to monitor this risk as a significant proportion of the Group's working capital is devoted to inventories. The Group (1) ascertains whether obsolete and slow-moving inventories exist by stocktaking on a periodical basis and reviews whether these inventories are impaired; (2) reviews the impairment of aged inventories according to the inventory aging list on a periodical basis; (3) reviews the impairment of inventories according to volatility in market prices on a periodical basis. The review involves comparison of carrying amount of the obsolete and slow-moving inventories, the aged inventory items and inventories of which the market price has decreased significantly, with the respective net realizable value to determine whether allowance need to be made in respect of any obsolete, slow-moving and aged inventories in the financial statements. Based on the above procedures, the management of the Group believes that adequate provision for obsolete, slow-moving, aged inventories and inventories of which the market price has decreased significantly, has been made.
Provision for closure, restoration, rehabilitation and environmental costs
Provision for rehabilitation and environmental costs has been determined by the directors based on their best estimates. The directors estimated this liability for final reclamation and mine closure based upon detailed calculations of the amount and timing of future cash flows spending for a supplier to perform the required work, escalated for inflation, then discounted at a discount rate that reflects current market assessments of the time value of money and the risks specific to the liability, such that the provision reflects the present value of the expenditures expected to be required to settle the obligation. However, in so far as the effect on the land and the environment from current mining activities becomes apparent in future periods, the estimate of the associated costs may be subject to change in the future. The provision is reviewed regularly to verify that it properly reflects the present value of the obligation arising from the current and past mining activities.
Deferred tax assets
Deferred tax assets arise from the actual profits and temporary differences based on the actual tax rates utilized in the upcoming years. In cases where the actual future profits are less than the expected profits or the actual tax rates are lower than the expected tax rates, deferred tax assets recognized will be reversed and recognized in the consolidated profit and loss account for the period during which such reversals take place.
Deferred tax liabilities arising from acquisition of Brazil business
In the Group's acquisition of Brazil business not involving enterprises under common control in 2016, the identifiable net assets of the acquiree were measured at fair value on the acquisition date, and deferred tax liabilities were recognized according to the difference between the fair value of related assets at the date of acquisition and the tax base. According to the regulations of local tax law of Brazil, the taxable temporary differences can be reversed in the future if specific conditions are met. However, as the conditions are met with significant uncertainty, the management of the Group recognize the amount of deferred tax liabilities of RMB1,141,280,876.89 at 31 December 2019 (2018: RMB1,143,597,622.94). Once specific conditions are met in the future, the Group's deferred income tax liability might be reversed in the future to form benefit.

147China Molybdenum Co., Ltd.
NOTES TO THE FINANCIAL STATEMENTSFOR THE YEAR ENDED 31 DECEMBER 2019
(III) SIGNIFICANT ACCOUNTING POLICIES AND ACCOUNTING ESTIMATES (CONTINUED)
34. Key assumptions and uncertaint ies in the account ing est imates (Continued)
Enterprise income tax
Since the operating environment for subsidiaries of the Group situated in the Brazil and Congo (DRC) is special, and the final tax decisions on certain transactions made by local tax authorities have uncertainties, relevant subsidiaries use significant accounting estimates in the provision for the enterprise income tax during the reporting period, and make provision for liabilities on estimated enterprise income tax matters based on whether or not more income tax should be paid. As a result of the uncertainties in the calculation of the final income tax expense imposed by certain transactions, the enterprise income tax expense accrued by the relevant subsidiaries during the reporting period is an objective estimate based on existing tax laws and other relevant tax policies.
Contingent liabilities
The Group will face a wide range of legal disputes in the course of continuing operations, and the results of the relevant disputes are highly uncertain.
When the economic benefits related to a particular legal dispute are considered to be extremely likely to flow out and measurable, the management of the Group will make corresponding provisions according to the professional legal advice. Except those contingent liabilities which are considered to be of extremely low possibility to result in outflow of economic benefits, the contingent liabilities of the Group are disclosed in Note V, 37 and Note XI. The management uses judgment to determine whether a provision shall be made for the relevant legal dispute or whether the dispute shall be disclosed as a contingent liability.
Fair value measurement and valuation procedure
Part of the Group's book assets and liabilities is measured at fair value. In determining the fair value of the underlying assets and liabilities, the management of the Group will adopt the appropriate valuation method and the input value of the fair value measurement according to the nature of the underlying assets and liabilities. For the selection of input values, the Group will use observable market data wherever possible. The Group will sets up an internal valuation team or employs eligible appraisers from a third party to assess the part of financial instruments in respect of which the Level 1 inputs are not available. The financial department of the Group will cooperate with the valuation team or eligible external appraisers closely to determine suitable valuation technology and inputs of relevant model. For the relevant information relating to the valuation technology and input adopted in determining the fair value of assets and liabilities, refer to Note IX.
35. Changes in significant accounting policies and accounting estimates
Changes in significant accounting policies
New lease standard
Since 1 January 2019 ("the date of initial application"), the Group has adopted the "Accounting Standards for Business Enterprises No. 21 – Leases" revised by the MoF in 2018 (hereinafter referred to as the "new lease standard", the pre-revision lease standard is referred to as the "original lease standards"). The new lease standard improve the definition of lease; and the identification, allocation and combination are added to the new lease standard; the classification of operating lease and financial lease is cancelled; requires to recognize right-of-use assets and lease liabilities for all lease at the commencement date (except for short-term lease and leases of low-value assets) and recognize depreciation and interest expenses respectively. The new lease standard improve the leasee's subsequent measurement of lease, add the accounting treatment for the remeasurement of options and lease modifications, and add relevant disclosure requirements. The Group's amended accounting policies of leases for lessors and leasees are set out in Note III. 31.

148 2019 Annual Report
NOTES TO THE FINANCIAL STATEMENTSFOR THE YEAR ENDED 31 DECEMBER 2019
(III) SIGNIFICANT ACCOUNTING POLICIES AND ACCOUNTING ESTIMATES (CONTINUED)
35. Changes in significant accounting policies and accounting estimates (Continued)
Changes in significant accounting policies (Continued)
New lease standard (Continued)
For the lease contracts that already existed before the implementation of the standard, the Group chose not to reassess whether the contract was, or contained, a lease on the date of initial implementation.
The Group as a lessee
In accordance with the New Leases Standard, during the first implementation of the standard, the accumulative amounts impacted shall be adjusted in the opening balance of relevant items in the financial statements, with no impacts on comparative information.
Except for the leases of low-value assets, for all the leases classified as operating leases before the first implementation of the New Leases Standard, the Group chooses one or more of the following practical expedients:
• leases for which the lease term ends within 12 months of the date of initial implementation are accounted for in the same way as short-term leases;
• when measuring lease liabilities, leases with similar characteristics use the same discount rate;
• the measurement of right-of-use assets excludes any initial direct costs incurred;
• If the contract contains options to extend or terminate the lease, the Group determines the lease term based on the actual usage of the options before the date of initial implementation and hindsight.
On the initial application date, for the operating lease before the initial application date, the lease liabilities are recognized according to the present value of residual lease payments discounted by the incremental borrowing interest rate determined by the leasee on the initial application date. And the right-of-use assets is recognized according to the amount equal to the lease liabilities (adjusted by the lease prepayments if necessary).
On 1 January 2019, the Group recognized lease liabilities of RMB109,224,275.11 and right-of-use assets of RMB176,934,415.36. For the operating leases prior to the initial application date, the Group measures the lease liability using the present value after discounting the incremental borrowing rate on the initial implementation date. The weighted average amount of incremental borrowing rates is 7.61%.

149China Molybdenum Co., Ltd.
NOTES TO THE FINANCIAL STATEMENTSFOR THE YEAR ENDED 31 DECEMBER 2019
(III) SIGNIFICANT ACCOUNTING POLICIES AND ACCOUNTING ESTIMATES (CONTINUED)
35. Changes in significant accounting policies and accounting estimates (Continued)
Changes in significant accounting policies (Continued)
New lease standard (Continued)
The Group as a lessee (Continued)
The adjustment information of the Group's lease liabilities recognized on 1 January 2019 and the significant operating lease commitments disclosed in the 2018 financial statements are as follows:
Unit: RMB
Item Amount
I. Operating lease commitments at 31 December 2018 235,517,029.03 Lease liabilities discounted at relevant incremental borrowing rate on initial
application date 150,517,515.40 Add: Le ase without disclosing operating lease commitments due to the
insignificant amount 27,563,365.26Le ase liabilities related to original operating lease recognized by the new
lease standard 178,080,880.66II. Lease liabilities at 1 January 2019 178,080,880.66 Including: N on-current liabilities due within one year 68,856,605.55
Lease liabilities 109,224,275.11
The carrying amount of the right-of-use asset at 1 January 2019 was composed as follows:
Unit: RMB
Item 1 January 2019
Right-of-use assets: Right-of-use assets recognized for operating leases prior to the date of initial
application 178,080,880.66Reclassified prepaid rental (originally presented under other current liability) (1,146,465.30)
Total 176,934,415.36

150 2019 Annual Report
NOTES TO THE FINANCIAL STATEMENTSFOR THE YEAR ENDED 31 DECEMBER 2019
(III) SIGNIFICANT ACCOUNTING POLICIES AND ACCOUNTING ESTIMATES (CONTINUED)
35. Changes in significant accounting policies and accounting estimates (Continued)
Changes in significant accounting policies (Continued)
New lease standard (Continued)
The Group as a lessee (Continued)
The right-of-use asset on 1 January 2019 by category is as follows:
Unit: RMB
Item 1 January 2019
Buildings 145,106,766.07Machinery and equipment 31,827,649.29
Total 176,934,415.36
The Group as the lessor
There was no need to make any transitional adjustments according to transition requirements for leases that the Group act as the lessor. The Group made accounting treatments in accordance with the new lease standard starting from the date of initial application. The application of the new lease standard has no significant impact on the accounting treatment of the Group act as the lessor.
The impact of the adoption of the new lease standard on the related items in the Group's balance sheet on 1 January 2019 is listed as follows:
Unit: RMB
Item 31 December 2018 Adjustment 1 January 2019
Non-current Assets: Right-of-use assets 176,934,415.36 176,934,415.36
Current Liabilities: Non-current liabilities due within one year 2,929,839,224.28 68,856,605.55 2,998,695,829.83Other current liabilities 130,541,907.62 (1,146,465.30) 129,395,442.32
Non-current Liabilities: Lease liabilities 109,224,275.11 109,224,275.11
Financial statement presentation format
The Group has implemented the Notice of the Revised Format of 2019 Financial Statements for General Business Enterprise issued on April 30, 2019 by MoF (Cai Kuai [2019] No. 6, hereinafter referred to as "Cai Kuai No. 6 file") to the preparation of the 2019 financial statements. Cai Kuai No. 6 Document revised the listed items on the balance sheet and income statement; split the item "notes and accounts receivable" into "notes receivable" and "accounts receivable"; split the item " notes payable and accounts payable" into "notes payable" and "accounts payable"; specified or revised the listed content under "non-current assets due within one year", "deferred income", "other equity instruments", "research and development expenses", "interest income" under the item "interest income", "other income", "income from disposal of assets", "non-operating income", and "non-operating expenses". It also adjusted the presenting location of "impairment loss of assets" and specified the presenting contents of the line item "capital contributions from other equity holders". For the changes in the presented items above, the Group has re-presented the comparable data for the prior year.

151China Molybdenum Co., Ltd.
NOTES TO THE FINANCIAL STATEMENTSFOR THE YEAR ENDED 31 DECEMBER 2019
(IV) TAXATION
1. Major categories of taxes and tax rates
Category of tax Basis of tax assessment Tax rate
Chinese VAT The Company is a general taxpayer. Value-added Tax ("VAT") on sales is paid after deducting input VAT on purchases.
Note 1
Chinese city maintenance and construction tax
Actual turnover tax For c i ty urban area tax rate is 7%; For county town, tax rate is 5%; For others, tax rate is 1%.
Chinese resource tax Raw ore production or sales volume of concentrate 6.5%, 11% collection on ad valorem basis (note 2)
Chinese educational surtax and surcharge
Actual turnover tax 3%
Chinese regional educational surtax and surcharge
Actual turnover tax 2%
Australia goods and services tax ("GST")
Amount of the income from rendering of goods and services in Australia less the deductible purchase cost. It is not required to pay goods and services tax for export goods and the refund policy of goods and services tax is also applicable.
10% of the sales price of goods or services
Australia mining royalty Royalty of mineral resources can be levied by volume or by price. If levied by volume, the royalty will be levied per the unit of exploited minerals. If levied by price, it wil l be levied per 4% of the total value or the sales price of exploited minerals.
4% ex-mine value
Brazil social contribution tax and goods circulation tax
B raz i l l oca l soc ia l con t r i bu t i on t ax (P IS & CONFINS) and the goods circulation tax (ICMS) are applicable to Niobras and Copebras, of which the tax basis is the balance of income from rendering of goods and services in Brazil less the deductible costs. It is not required to pay social contribution tax and goods circulation tax for export goods.
The social contribution tax is 9.25% of the sales price of goods or services. The goods circulation tax is 4% -18% of the sales price of goods or services. The tax rates imposed by the local states of Brazil are different.
Congo (DRC) VAT VAT of the Democratic Republic of the Congo ("DRC") is applicable to TFM.
The output VAT is calculated at 16% of the sales amount calculated in accordance w i th the re levan t tax provisions.
Royalties of mining rights in Congo (DRC)
Sales of related products Note 3
Congo (DRC) exchange tax
The amount of foreign currency paid to or received from countries other than Congo (DRC).
0.2%
Enterprise income tax Taxable income: the amount of taxable income is computed on basis of adjusted pre-tax accounting profit of the period in accordance with the relevant provis ions of the tax law multiplying by the statutory tax rate.
Note 4

152 2019 Annual Report
NOTES TO THE FINANCIAL STATEMENTSFOR THE YEAR ENDED 31 DECEMBER 2019
(IV) TAXATION (CONTINUED)
1. Major categories of taxes and tax rates (Continued)Note1: According to the "Announcement on Policies Related to Deepening Value-Added Tax (VAT) Reform" (Announcement
No. 39 of 2019 by the Ministry of Finance, the State Administration of Taxation and the General Administration of Customs) issued by the Ministry of Finance, the State Administration of Taxation and the General Administration of Customs. Tax rates of taxpayers who engage in VAT taxable sales or imported goods have changed from 16% and 10 % to 13% and 9 % respectively from 1 April 2019.
In accordance with the Notice of the Ministry of Finance and the State Administration of Taxation on Adjusting Value-added Tax Rates (Cai Shui (2018) No. 32), the tax rates of 17% and 11% applicable to any taxpayers' VAT taxable sale or import of goods shall be adjusted to 16% and 10% respectively since 1 may 2018.
Note 2: Pursuant to the Notice on Implementation of the Reform of Resource Tax of Rare Earth, Tungsten and Molybdenum Featured by Price-based Tax Calculation and Collection (Cai Shui [2015] No. 52) issued by the Ministry of Finance and State Administration of Taxation, the implementation of calculation and collection of Molybdenum resources tax shall be changed from volume- based tax to price-based tax on and after 1 May 2015. The applicable rate of Tungsten resources tax is 6.5%. The applicable rate of Molybdenum resources tax is 11%.
Note3: In accordance with the mining act of Congo (DRC), the Group paid royalties of mining rights at 2% previously in respect of the revenue from sales of products relating to copper and cobalt business in Congo (DRC). At 1 July 2018, in accordance with the new mining act of Congo (DRC), such tax rate is increased to 3.5%. At 1 December 2018, the cobalt products are included in state strategic resources of Congo (DRC), thereby increasing the royalties of mining rights to 10% of revenue from the sale of cobalt products.
Note 4: Applicable income tax rate:
The applicable enterprise income tax rate for the Company and its domestic subsidiaries was 25%.
China Molybdenum (Hong Kong) Company Limited and CMOC Co., Ltd was incorporated in Hong Kong, thus was subject to Income Tax levied at a rate of 16.5%.
CMOC Mining Pty Limited ("CMOC Mining") and CMOC Mining Services Pty. Limited ("CMOC Mining Services") was incorporated in Australia, was subject to Income Tax levied at a rate of 30%.
CMOC UK Limited was incorporated in the United Kingdom, thus was subject to the applicable income tax rate of 19%.
Copebras, Niobras and CMOC BRASIL SERVICOS ADMINISTRATIVOS E PARTICIPACOES LTDA. (" CMOC BRASIL") are incorporated in Brazil, thus was subject to the income tax rate of 34%.
There's no enterprise income tax for the subsidiaries of the Group established in Bermuda and the British Cayman Islands.
TFM was incorporated in Congo (DRC) and was subject to the enterprise income tax rate of 30%.
IXM and its subsidiaries principally operate in Switzerland and China. Applicable income tax rate of its subsidiaries in Switzerland is 12%, which is changed to 13.99% since 2020.
2. Tax incentive and approvalOn 10 May 2015, the Decision of the State Council on Cancelling Non-Administrative Licensing Approval Items cancelled the recognition process of enterprise of comprehensive utilization of resources. However, the company sold powdered Tungsten (scheelite concentrates) is still within the scope of catalogue of income tax preferential program of enterprise of comprehensive utilization of resources. Therefore, the Company still recognized 90% of sales of powdered Tungsten (scheelite concentrates) to taxable income during the year 2018 and 2019.
On 6 December 2017, the Company received a "high-tech enterprise certificate", No. GR201741000176, which was jointly issued by the Henan Science and Technology Department, Henan Finance Department, the State Taxation Bureau of Henan Province and Local Taxation Bureau of Henan Province. The issuance of the high-tech enterprise certificate is a re-recognition after the expiration of the previous certificate, of which the validity is from 1 January 2017 to 31 December 2019, and the applicable enterprise income rate during above period is 15%.
On 29 June 2018, the People's Government of Tibet Autonomous Region published Several Provisions of Tibet's Preferential Policies for Attracting Foreign Investment (for Trial Implementation), and Article 6 provides that enterprises meeting certain conditions shall be exempted from local share of enterprise income tax from 1 January 2018 to 31 December 2021. In 2019, Schmocker (Tibet) International Trading Co., Ltd ("Tibet Schmoke"), the subsidiary of the Group, has employed 100% of permanent resident in Tibet, meeting the conditions for exemption from local share of enterprise income tax, so the applicable enterprise income rate during above period of Tibet Schmoke is 9%.

153China Molybdenum Co., Ltd.
NOTES TO THE FINANCIAL STATEMENTSFOR THE YEAR ENDED 31 DECEMBER 2019
(V) NOTES TO THE CONSOLIDATED FINANCIAL STATEMENTS
1. Cash and bank balances
Unit: RMB
31 December 2019 31 December 2018
ItemAmount in
foreign currency Exchange rate Amount in RMBAmount in foreign
currency Exchange rate Amount in RMB
Cash: 980,374.15 1,471,630.90Renminbi (refers to "RMB") 54,693.24 1.0000 54,693.24 277,816.35 1.0000 277,816.35US dollars (refers to "USD") 108,738.00 6.9762 758,578.04 107,375.62 6.8632 736,940.36Brazilian Reals (refers to "BRL") 26,517.33 1.7308 45,895.31 220,931.31 1.7712 391,322.30Australian dollars (refers to "AUD") 137.19 4.8877 670.55 74.77 4.8441 362.19Congolese francs (refers to "CDF") 28,687,500.00 0.0041 118,630.48 15,368,938.20 0.0042 64,219.24South African Rand (refers to "ZAR") 3,858.02 0.4942 1,906.53 2,030.85 0.4779 970.46
Bank balances: 12,391,267,137.70 23,239,231,643.13RMB 3,883,209,894.97 1.0000 3,883,209,894.97 13,525,878,899.19 1.0000 13,525,878,899.19USD 1,161,497,872.86 6.9762 8,102,878,492.15 1,300,922,655.86 6.8627 8,927,901,773.09Euro (refers to "EUR") 2,058,601.11 7.8254 16,109,437.55 10,785,578.05 7.9677 85,935,983.38Hong Kong dollars (refers to "HKD") 13,179,376.26 0.8977 11,831,468.02 9,995,847.10 0.8762 8,758,459.37Canadian dollars (refers to "CAD") 1,194,933.27 5.3462 6,388,301.67 1,178,505.21 5.0183 5,914,038.36AUD 15,664,351.45 4.8875 76,559,976.87 55,207,758.48 4.8440 267,428,957.58Brazilian Reals (refers to "BRL") 155,398,687.18 1.7308 268,958,821.44 227,800,236.39 1.7712 403,488,846.49Pounds (refers to "GBP") 825,472.86 9.1230 7,530,785.37 369,190.72 8.9401 3,300,603.82SGD 916,109.34 5.1833 4,748,432.15 5,654.31 4.9924 28,228.41CDF 68,782,610.50 0.0041 284,702.14 18,081,414.01 0.0042 75,590.87ZAR 16,598,074.09 0.4947 8,210,507.79 22,015,418.51 0.4779 10,520,262.57AED 37,846.48 1.8993 71,882.56 – – –CHF 157,488.00 7.2087 1,135,283.00 – – –CLP 15,542,861.55 0.0093 144,816.77 – – –MXP 2,002,612.58 0.3696 740,255.81 – – –NAD 129,478.20 0.4967 64,315.75 – – –VND 1,558,266,759.00 0.0003 470,454.00 – – –PEN 899,014.00 2.1032 1,890,774.42 – – –PLN 135,168.00 0.2822 38,143.63 – – –TRY 334.07 1.1723 391.64 – – –
Other cash and bank balances: 3,255,652,547.76 3,406,940,784.78RMB 1,746,433,385.39 1.0000 1,746,433,385.39 2,437,631,314.27 1.0000 2,437,631,314.27USD 216,338,287.66 6.9762 1,509,219,162.37 141,232,875.41 6.8632 969,309,470.51
Total 15,647,900,059.61 26,647,644,058.81Including: Total amount deposited abroad 3,906,802,139.54 5,475,868,110.21
Note: At the end of the current year, deposits for mines, deposits for loan interest, and pledged certificates of deposit for obtaining short-term borrowings, which were restricted, amounted to RMB45,757,948.05, RMB1,509,719,162.37, and RMB1,700,000,000.00 respectively (at the end of the prior year: RMB39,533,764.31, RMB1,684,309,470.51 and RMB997,430,000.00).

154 2019 Annual Report
NOTES TO THE FINANCIAL STATEMENTSFOR THE YEAR ENDED 31 DECEMBER 2019
(V) NOTES TO THE CONSOLIDATED FINANCIAL STATEMENTS (CONTINUED)
2. Held-for-trading financial assets
Unit: RMB
ItemFair value at the
end of the yearFair value at the
beginning of the year
Financial assets at fair value through profit or loss Including: Receivables (Note 1) 6,564,070,224.98 774,326,692.25
Structured deposits (Note 2) 1,014,194,897.26 –Fund products of financial institutions 133,225,678.32 –
Other 7,959,490.41 –
Total 7,719,450,290.97 774,326,692.25
Note 1: The major products of the Group are copper, lead and zinc concentrates and cobaltous hydroxide etc., selling price of which is provisonally determined according to the market price upon delivery. Generally, the price is finally determined according to the monthly average spot price quoted by the London Metals Exchange (LME) or other agreed pricing methods within a specified period or a period subsequent to the delivery. The Group classifies the accounts receivable generated from relevant business as financial assets at FVTPL.
As at 31 December 2019, held-for-trading financial assets with a book value of USD431,528,000.00 (equivalent to RMB3,010,425,633.60) were pledged to obtain short-term borrowings.
Note 2: They are the structured deposits of RMB purchased by the Group from domestic banks and financial institutions in the current year, the yield of which is linked to interest rates, exchange rates and other indicators. The Group classifies such deposits as financial assets at fair value through profit and loss.
3. Derivative financial assets
Unit: RMB
ItemFair value at the
end of the yearFair value at the
beginning of the year
Derivative financial instruments of which hedging relationship is not designated (Note)Forward commodity contracts 556,402,709.39 –Forward foreign exchange contracts 106,137,933.73 –Commodity futures contracts 1,465,849,014.44 –Commodity option contracts 38,349,607.25 –Foreign exchange option contracts 11,582,958.58 –
Total 2,178,322,223.39 –
Note: The Group uses commodity (copper, lead, zinc concentrates, refined metals etc.) futures contracts, forward commodity contracts and commodity option contracts to manage the risk of commodity purchases and future sales so as to avoid bearing the risk of significant changes in the price of relevant products arising from the fluctuation of the market price. Besides, the Group uses forward foreign exchange contracts and foreign exchange option contracts for risk management to avoid exchange rate risk.
The above forward commodity contracts, forward foreign exchange contracts, commodity futures contracts, commodity option contracts, and foreign exchange option contract are not designated as hedging instruments. The gains or losses arising from changes in fair value of these contracts shall be directly recorded into profit or loss. See Note V. 53.

155China Molybdenum Co., Ltd.
NOTES TO THE FINANCIAL STATEMENTSFOR THE YEAR ENDED 31 DECEMBER 2019
(V) NOTES TO THE CONSOLIDATED FINANCIAL STATEMENTS (CONTINUED)
4. Accounts receivable
(1) Disclosure by aging
Unit: RMB
Aging
31 December 2019
Accounts receivable Bad debt provision Proportion
(%)
Within 1 year 1,447,493,181.23 14,088,851.61 0.971-2 years 72,085,630.15 9,043,657.34 12.552-3 years 5,879,624.20 5,879,624.20 100.00Over 3 years 42,557,901.01 28,495,762.94 66.96
Total 1,568,016,336.59 57,507,896.09 3.67
(2) Credit risk of accounts receivable
As the Group has a long-term and stable transaction relationship with the customers with high credit rating in respect of the niobium business in Brazil, the management believes that the credit risk is low. As part of the credit risk management, the Group measures internal credit rating for the customers of tungsten and molybdenum business in China and phosphorus business in Brazil, and recognizes expected loss rate of accounts receivable in all ratings. At the balance sheet date, the Group recognizes the expected credit loss allowance for accounts receivables based on provision matrix.
Unit: RMB
Internal credit rating
31 December 2019 31 December 2018
Expected average loss rate
Provision for loss Book value Expected average loss rate Book balance Provision for loss Book value
Low risk 0.06% 1,074,863,215.71 689,873.46 1,074,173,342.25 0.05% 740,814,272.75 377,068.72 740,437,204.03Normal 2.26% 101,035,330.59 2,283,269.58 98,752,061.01 2.15% 53,227,340.03 1,142,190.59 52,085,149.44Attention 5.96% 358,314,896.82 21,359,397.94 336,955,498.88 6.28% 73,041,853.95 4,586,971.80 68,454,882.15Doubtful (impaired) 49.46% 1,241,641.83 614,103.47 627,538.36 40.31% 37,614.79 15,162.53 22,452.26Loss (impaired) 100.00% 32,561,251.64 32,561,251.64 – 100.00% 50,890,465.97 50,890,465.97 –
Total 1,568,016,336.59 57,507,896.09 1,510,508,440.50 918,011,547.49 57,011,859.61 860,999,687.88
The expected average loss rate is measured based on historical actual impairment rate with the current situation and prediction on future economy taken into consideration. There are no changes in evaluation approach and significant assumption in 2018 and 2019.

156 2019 Annual Report
NOTES TO THE FINANCIAL STATEMENTSFOR THE YEAR ENDED 31 DECEMBER 2019
(V) NOTES TO THE CONSOLIDATED FINANCIAL STATEMENTS (CONTINUED)
4. Accounts receivable (Continued)
(3) Changes in expected credit loss provision for accounts receivable
Unit: RMB
Lifetime ECL (not-credit-
impaired)Lifetime ECL
(credit-impaired) Total
1 January 2019 6,106,231.11 50,905,628.50 57,011,859.61Book balance of accounts receivable
at 1 January 2019 in the current period – – –
Transfer to credit-impaired – – –Transfer to not-credit-impaired 5,786,571.43 (5,786,571.43) –Provision of ECL for the period 11,425,691.36 – 11,425,691.36Reversal of ECL for the period (135,988.51) (6,676,814.29) (6,812,802.80)Write-off for the period (45,965.61) (5,266,887.67) (5,312,853.28)Changes in exchange rate 1,196,001.20 – 1,196,001.2031 December 2019 24,332,540.98 33,175,355.11 57,507,896.09
(4) Top five accounts receivable balances at the end of the report period based on debtors:
Unit: RMB
Name of entity
Relationship with the Company Amount
Proportion of the amount to the total
accounts receivableCredit
impairment loss(%)
31 December 2019Company A Third Party 699,100,000.02 46.28 743,690.47Company H Third Party 98,003,599.84 6.49 7,578,758.32Company C Third Party 41,602,694.13 2.75 –Company D Third Party 28,694,839.27 1.90 30,525.07Company E Third Party 27,104,903.82 1.79 13,042,765.75
Total 894,506,037.08 59.22 21,395,739.61

157China Molybdenum Co., Ltd.
NOTES TO THE FINANCIAL STATEMENTSFOR THE YEAR ENDED 31 DECEMBER 2019
(V) NOTES TO THE CONSOLIDATED FINANCIAL STATEMENTS (CONTINUED)
4. Accounts receivable (Continued)
(4) Top five accounts receivable balances at the end of the report period based on debtors:
Unit: RMB
Name of entity
Relationship with the Company Amount
Proportion of the amount to
the total accounts receivable
Credit impairment loss
(%)
31 December 2018Company H Third Party 100,308,115.62 10.93 3,407,201.80Company B Third Party 86,104,601.02 9.38 –Company AK Third Party 61,541,242.50 6.70 –Company AL Third Party 53,954,121.84 5.88 –Company AM Third Party 42,721,402.15 4.65 –
Total 344,629,483.13 37.54 3,407,201.80
5. Financing receivables
Unit: RMBCategory 31 December 2019 31 December 2018
Notes receivable 375,935,645.39 1,623,841,101.38Including: Bank acceptances 298,935,317.60 1,303,563,428.96
Commercial acceptances 77,000,327.79 320,277,672.42
Total 375,935,645.39 1,623,841,101.38
Part of notes receivable are endorsed or discounted by the Group in accordance with the daily fund requirement, and classified as financial assets at fair value through other comprehensive income.
(1) Credit risk of financing receivables:
The Group measures the ECL of financing receivables on the basis of the table of credit rating and loss given default ("LGD"). The ECL in financing receivables is as follows:
Unit: RMB
Internal credit rating
31 December 2019 31 December 2018
Expected average
loss rate Book valueExpected
credit loss
Expected average loss rate Book value
Expected credit loss
Lower risk (not-credit-impaired) 0.01% 329,948,077.60 29,700.00 0.02% 1,620,621,643.23 303,141.85Normal (not-credit-impaired) 2.27% 47,084,195.66 1,066,927.87 2.15% 3,600,000.00 77,400.00Loss (credit-impaired) 100.00% 12,650,000.00 12,650,000.00 100.00% 12,650,000.00 12,650,000.00
Total 389,682,273.26 13,746,627.87 1,636,871,643.23 13,030,541.85

158 2019 Annual Report
NOTES TO THE FINANCIAL STATEMENTSFOR THE YEAR ENDED 31 DECEMBER 2019
(V) NOTES TO THE CONSOLIDATED FINANCIAL STATEMENTS (CONTINUED)
5. Financing receivables (Continued)
(2) Endorsed or discounted financing receivables by the Group but still outstanding at balance sheet date at the end and beginning of the year respectively are as follows:
Unit: RMB
Category
Amount derecognized
as at the end of 2019
Amount derecognized
as at the end of 2018
Bank acceptances 1,509,138,489.45 324,130,239.49
Total 1,509,138,489.45 324,130,239.49
Note: Since major risks and reward including the interest rate risks related to such bank acceptance have been substantially transferred to the bank or another party, the Group ceased to recognize the discounted or endorsed bank acceptances.
(3) At the end and beginning of the year, the amount of financing receivables of the Group pledged to issue notes payable, is RMB220,266,943.78.
(4) At the end and beginning of the year, none of the Group's notes was transferred to accounts receivable due to the drawers' failure in performing the agreements.
6. Prepayments
(1) Aging analysis of prepayments is as follows
Unit: RMB
31 December 2019 31 December 2018
Aging Amount Proportion Amount Proportion(%) (%)
Within 1 year 1,058,923,660.46 99.38 129,129,737.09 85.511 to 2 years 5,619,915.06 0.53 20,526,003.36 13.592 to 3 years 87,984.55 0.01 578,364.87 0.38Over 3 years 862,960.76 0.08 770,128.90 0.52
Total 1,065,494,520.83 100.00 151,004,234.22 100.00

159China Molybdenum Co., Ltd.
NOTES TO THE FINANCIAL STATEMENTSFOR THE YEAR ENDED 31 DECEMBER 2019
(V) NOTES TO THE CONSOLIDATED FINANCIAL STATEMENTS (CONTINUED)
(2) Top five of prepayments balances at the end of year based on debtors
Unit: RMB
Name of entity
31 December 2019
Name of entity
31 December 2018
Relationship with the Company Amount
Proportion of the amount to the total
prepayments
Relationship with the Company Amount
Proportion of the amount to
the total prepayments
(%) (%)
Company J Third Party 250,553,097.33 23.52 Company O Third Party 32,665,478.98 21.63Company K Third Party 173,894,803.64 16.32 Company P Third Party 10,000,000.00 6.62Company L Third Party 100,834,790.51 9.46 Company Q Third Party 20,028,723.79 13.26Company M Third Party 29,514,692.23 2.77 Company R Third Party 8,000,000.00 5.30Company N Third Party 19,976,348.70 1.87 Company S Third Party 7,963,560.22 5.27
Total 574,773,732.41 53.94 Total 78,657,762.99 52.08
7. Other receivables
7.1 Summary of other receivables
Unit: RMB
Item 31 December 2019 31 December 2018
Interests receivable 198,921,505.19 226,186,602.19Dividends receivable 2,235,286.10 –Other receivables 917,882,468.90 813,862,106.04
Total 1,119,039,260.19 1,040,048,708.23
7.2 Interests receivable
Unit: RMB
Item 31 December 2019 31 December 2018
Interests receivable on bank deposits 196,689,674.82 213,222,472.86Interests receivable from the related parties (Note X. 6) 2,171,354.53 –Interests receivable from third parties (Note V. 9) 60,475.84 12,964,129.33
Total 198,921,505.19 226,186,602.19

160 2019 Annual Report
NOTES TO THE FINANCIAL STATEMENTSFOR THE YEAR ENDED 31 DECEMBER 2019
(V) NOTES TO THE CONSOLIDATED FINANCIAL STATEMENTS (CONTINUED)
7. Other receivables (Continued)
7.3 Other receivables
(1) Other receivables disclosed by nature
Unit: RMB
Nature of other receivables 31 December 2019 31 December 2018
Deductible Brazil social contribution tax (Note 1) 137,839,891.25 89,607,819.92Congo (DRC) VAT refunds receivable (Note 2) 514,634,483.07 594,520,342.69Deposits 64,143,499.66 8,607,209.96Refund of land-transferring fee receivable – 5,900,000.00Gains in close position (Note 3) 74,321,733.90 –Others 155,884,032.81 144,915,575.83
Total 946,823,640.69 843,550,948.40
Note 1: See Note V. 21 for details.
Note 2: The VAT refundable amount is generated from the export business of subsidiaries situated in the Congo (DRC). The entity has applied for tax refund from the government and is expected to receive the tax refund within one year.
Note 3: It is the closing position part of forward commodity contracts of the Group, and the gains of which will be received at the settlement after the period.
(2) Credit risk of other receivables
The Group had other receivables of which the loss provision was recognized on the basis of ECL as below:
Unit: RMB
31 December 2019 31 December 2018
Book balanceBad debt provision Book value Book balance
Bad debt provision Book value
Other receivables of which the loss provision was recognized on the basis of ECL 294,302,449.62 28,941,171.79 265,361,277.83 159,422,785.79 29,688,842.36 129,733,943.43
At 31 December 2019, the management of the Group believes that there's no ECL on other receivables except for the receivables amounting to RMB28,941,171.79 (31 December 2018: 29,688,842.36) that has credit-impaired and of which impairment has been provided fully.

161China Molybdenum Co., Ltd.
NOTES TO THE FINANCIAL STATEMENTSFOR THE YEAR ENDED 31 DECEMBER 2019
(V) NOTES TO THE CONSOLIDATED FINANCIAL STATEMENTS (CONTINUED)
7. Other receivables (Continued)
7.3 Other receivables (Continued)
(3) Changes in expected credit loss for other receivables
2019:
Unit: RMB
Item 1 January 2019 IncreaseDecrease 31 December
2019Reversal Write-off
Bad debt provision 29,688,842.36 4,833,183.25 5,580,853.82 – 28,941,171.79
2018:
Unit: RMB
Item 1 January 2018 IncreaseDecrease
31 December 2018Reversal Write-off
Bad debt provision 29,848,146.56 3,693,781.41 159,304.20 3,693,781.41 29,688,842.36
(4) Top five other receivables balances at the end of period/year based on debtors
Unit: RMB
Name of entityRelationship with the Company Amount Aging
Proportion of the amount to
the total other receivables
Closing balance
of bad debt provision
(%)
31 December 2019DRC government Local tax
authorities514,634,483.07 Within 2 years 54.35 –
Federal government of Brazil Local government 137,839,891.25 Within 2 years 14.56 –Company T Third Party 25,859,615.35 Within 1 year 2.73 –Company U Third Party 16,066,188.60 Within 1 year 1.7 –Company V Third Party 13,982,122.82 More than 3
years1.48 13,982,122.82
Total 708,382,301.09 74.82 13,982,122.82
31 December 2018DRC government Local tax authorities 594,520,342.69 Within 2 years 70.48 –Federal government of Brazil Local government 89,607,819.92 Within 2 years 10.62 –Company V Third Party 16,563,365.93 More than 3
years1.96 16,563,365.93
Company W Third Party 10,175,210.53 More than 3 years
1.21 –
Individual X Third Party 7,518,231.30 Within 2 years 0.89 –
Total 718,384,970.37 85.16 16,563,365.93
(5) There are no other receivables concerning government grants during the reporting period.

162 2019 Annual Report
NOTES TO THE FINANCIAL STATEMENTSFOR THE YEAR ENDED 31 DECEMBER 2019
(V) NOTES TO THE CONSOLIDATED FINANCIAL STATEMENTS (CONTINUED)
8. Inventories
Unit: RMB
Item31 December 2019 31 December 2018
Book value Book value
Inventories – measured at cost 15,046,524,453.39 11,695,442,526.86– measured at the fair value (Note) 11,344,655,112.09 42,906,576.50
Total 26,391,179,565.48 11,738,349,103.36
Note: As at 31 December 2019, the book value of the inventories measured at fair value, which is pledged by the Group to acquire short-term borrowings, is USD1,220,871,696.00, equivalent to RMB8,517,045,125.64.
The Group pledged warehouse receipts with book value of RMB184,078,875.24 to acquire forward trading quotas.
(1) Inventories measured at cost
(a) Categories of inventories
Unit: RMB
Item
31 December 2019 31 December 2018
Book balance
Provision for decline in value
of inventories Book value Book balance
Provision for decline in value
of inventories Book value
Current:Raw materials 2,630,110,933.86 8,998,848.83 2,621,112,085.03 2,510,471,739.65 8,042,411.49 2,502,429,328.16Work-in-progress 2,716,968,345.27 741,122.66 2,716,227,222.61 2,527,418,733.65 – 2,527,418,733.65Finished goods 2,850,015,357.86 2,580,328.76 2,847,435,029.10 1,587,776,172.60 1,709,429.20 1,586,066,743.40Trading inventories 1,247,146,512.38 – 1,247,146,512.38 – – –
Subtotal 9,444,241,149.37 12,320,300.25 9,431,920,849.12 6,625,666,645.90 9,751,840.69 6,615,914,805.21
Non-current:Raw materials (Note) 5,640,349,093.10 25,745,488.83 5,614,603,604.27 5,104,760,564.36 25,232,842.71 5,079,527,721.65
Subtotal 5,640,349,093.10 25,745,488.83 5,614,603,604.27 5,104,760,564.36 25,232,842.71 5,079,527,721.65
Total 15,084,590,242.47 38,065,789.08 15,046,524,453.39 11,730,427,210.26 34,984,683.40 11,695,442,526.86
Note: non-current raw materials are minerals reserved by the Group for future production or sales, including:
1. The sulfide ore exploited and reserved in Australian Northparkes Copper and gold business. According to the estimation of the management, it is expected that these ore material reserves will not be sold before the end of 2024, the mining period of E48 mine shaft. Therefore, the amount is presented as non-current assets.
2. Low-grade ores were produced from Tenke Copper-Cobalt mine in Congo, ore recovery process is further demanded in the future; the management estimates that these ores will not be ready for sales within one year, so it is presented as non-current assets.

163China Molybdenum Co., Ltd.
NOTES TO THE FINANCIAL STATEMENTSFOR THE YEAR ENDED 31 DECEMBER 2019
(V) NOTES TO THE CONSOLIDATED FINANCIAL STATEMENTS (CONTINUED)
8. Inventories (Continued)
(1) Inventories measured at cost (Continued)
(b) Provision for decline in value of inventories
Unit: RMB
Decrease in the current year Translation differences arising on translation
of financial statements denominated in
foreign currencies31 December
2019Categories of inventories
1 January 2019
Increase in the
current year Provision Reversal Write-off
Raw materials 8,042,411.49 8,499,661.39 252,078.83 6,423,493.23 (867,651.99) 8,998,848.83Work-in-progress – 1,451,147.35 175,442.54 534,582.15 – 741,122.66Finished goods 1,709,429.20 14,498,039.74 1,884,716.51 11,742,423.67 – 2,580,328.76
Subtotal 9,751,840.69 24,448,848.48 2,312,237.88 18,700,499.05 (867,651.99) 12,320,300.25
Non-current:Raw materials 25,232,842.71 969,064.40 – – (456,418.28) 25,745,488.83
Total 34,984,683.40 25,417,912.88 2,312,237.88 18,700,499.05 (1,324,070.27) 38,065,789.08
(2) Inventories measured at fair value
(a) Categories of inventories
Unit: RMB
Item31 December 2019 31 December 2018
Book value Book value
Current: Trading inventories outside the PRC 11,298,752,887.67 –Non-current: Consumable biological assets 45,902,224.42 42,906,576.50
Total 11,344,655,112.09 42,906,576.50
(b) Changes in consumable biological assets are set out below:
Unit: RMB
1 January 2019
Increase in the year Translation differences arising on translation
of financial statements denominated in
foreign currencies31 December
2019Item Quantity
Transferred from
construction in progress
Changes in fair value
Decrease in the
year Used
Euc alyptus forest in Brazil 2854 hectares 42,906,576.50 2,193,019.56 4,029,238.41 2,194,386.13 (1,032,223.92) 45,902,224.42

164 2019 Annual Report
NOTES TO THE FINANCIAL STATEMENTSFOR THE YEAR ENDED 31 DECEMBER 2019
(V) NOTES TO THE CONSOLIDATED FINANCIAL STATEMENTS (CONTINUED)
9. Other current assets
Unit: RMB
Item 31 December 2019 31 December 2018
Derivative financial instruments deposits (Note 1) 2,673,688,083.69 –VAT input to be deducted (Note 2) 480,126,517.62 –Prepayment of enterprise income tax 258,508,961.63 –Loans to suppliers (Note 3) 133,710,502.33 –Loans receivable from Société Nationale d'Electricité (Note 4) 95,419,322.85 96,207,236.95Prepaid insurance expenses (Note 5) 66,688,962.46 63,047,456.11Prepayment of VAT 43,949,283.60 42,292,777.66Prepayment of resources tax and mining right premium 31,711,396.53 –Loans receivable from a third party (Note 6) – 208,776,827.50Receivable from TFM minority shareholders (Note 7) – 43,096,220.58Loan receivable from NSR (Note 8) – 960,848,000.00Others 46,377,399.66 36,336,601.61
Total 3,830,180,430.37 1,450,605,120.41
The Group accounts the financial assets in the other current assets according to ECL model. At 31 December 2019, the management believes that the relevant financial assets have a low credit risk.
Note 1: It is the deposit paid by the Group to acquire derivative financial instruments.
Note 2: It is the VAT input to be deducted arising from the subsidiaries of the Group in China and the subsidiaries of IXM outside the PRC.
Note 3: The balance of loans to suppliers is USD10,000,000, equivalent to RMB69,762,000, representing a short-term loan to third party supplier with an annual interest rate of 12%; the remaining part represents a long-term loan to third-party supplier B that is due within one year. See Notes V. 21 for details.
Note 4: The loans receivable is due from Société Nationale d'Electricité ("SNEL") which is provided by the subsidiary of the Group in DRC. According to the agreement, the amount will be offset with electricity bill when the Company actually uses electricity. The current part is the portion expected to be offset in the next year. For the non-current part, see Note V. 21.
Note 5: It is the insurance expenses paid by the Group for the overseas business, which are amortized over the corresponding period of benefits.
Note 6: It is the Group's pledged loan due from a third party. The loan period is 1 year and the agreed interest rate is by reference to loan interest rates for the same period issued by the People's Bank of China. The loan is pledged with the equity interests held by the third party in unlisted company.
Note 7: It is Congo (DRC) subsidiary's receivable from Gécamines. According to the agreement, the current portion is the Company's deductible consulting fees due to Gécamines within 1 year. Refer to Note V. 21 for details of the non-current portion.
Note 8: It is the NREIL's loan receivable from NSR, and the loan period is 1 year according to the agreement. The Group makes a provision for interest receivable according to the agreed interest rate. The loan has been received in current year.

165China Molybdenum Co., Ltd.
NOTES TO THE FINANCIAL STATEMENTSFOR THE YEAR ENDED 31 DECEMBER 2019
(V) NOTES TO THE CONSOLIDATED FINANCIAL STATEMENTS (CONTINUED)
10. Long-term equity investments
Unit: RMB
Investee Notes 1 January 2019
Changes for the year
31 December
2019
Closing
balance of
provision for
impairment
Increase arising
from a business
combination
Additional
investment
Decreased
investment
Investment income
recognized under
equity method
Adjustment
to other
comprehensive
income Other decrease
Declare a cash
dividend or profit
distribution
Provision for
impairment
losses
Translation
difference
of financial
statements
denominated in
foreign currencies
I. Joint ventures
Luoyang High Tech Molybdenum &
Tungsten Materials Co., Ltd. ("High-Tech") Note 1 70,029,342.89 – – – (1,029,553.31) – (68,999,789.58) – – – – –
Xuzhou Huanyu Molybdenum Co., Ltd.
("Huan Yu") Note 2 909,103,386.78 – – – (61,228,247.67) – – – – – 847,875,139.11 –
Subtotal 979,132,729.67 – – – (62,257,800.98) – (68,999,789.58) – – – 847,875,139.11 –
II. Associates
Luoyang Yulu Mining Co., Ltd. ("Yulu Mining") Note 3 86,593,518.79 – – – 120,225,172.69 – – (98,200,000.00) – – 108,618,691.48 –
Caly Nanomoly Development, Inc.
("Nanomoly Development") Note 4 – – – – – – – – – – – –
Luoyang Shenyu Molybdenum Co., Ltd
("Luoyang Shenyu") Note 5 1,007,760.31 – – – 8,331.56 – – – – – 1,016,091.87 –
Natural Resources Investment Fund Note 6 1,456,131,269.17 – – – (33,049,846.78) 20,822,262.48 (1,455,389,362.35) – – 12,164,237.11 678,559.63 –
Zhejiang Youqing Trade Co., Ltd ("You Qing") Note 7 – – 1,500,000.00 – (1,500,000.00) – – – – – – –
Walvis Bay Cargo Terminal Pty. Ltd
("Walvis Bay") Note 8 – 3,526,533.88 – – (1,573,631.88) – – (2,463,537.75) – 2,348,641.20 1,838,005.45 –
PT.Huayue Nickel Cobalt
("Huayue Nickel Cobalt ") Note 9 – 73,538,850.00 – – (107,685.27) – – – – (289,624.16) 73,141,540.57 –
Subtotal 1,543,732,548.27 77,065,383.88 1,500,000.00 – 84,002,340.32 20,822,262.48 (1,455,389,362.35) (100,663,537.75) – 14,223,254.15 185,292,889.00 –
Total 2,522,865,277.94 77,065,383.88 1,500,000.00 – 21,744,539.34 20,822,262.48 (1,524,389,151.93) (100,663,537.75) – 14,223,254.15 1,033,168,028.11 –
Note 1: The Company held 50.25% equity in "High-Tech" and jointly control "High-Tech" with another shareholder according to the Articles of Association. On 27 December 2018, the Company signed an equity transfer agreement with another shareholder of High-Tech to acquire its 49.75% of equity in High-Tech, which was completed in May 2019, and High-Tech becomes a wholly-owned subsidiary of the Company.
Note 2 : Huan Yu, a joint venture of the Group, holds 90% of equity in Luoyang Fuchuan Mining Co., Ltd. ("Fu Chuan"). Meanwhile, the Group holds 10% of equity in Fu Chuan indirectly by its subsidiary, Fu Kai. Therefore, the Group holds directly and indirectly 55% of equity in Fu Chuan totally by Huan Yu.
According to the agreement with local government, the local government is entitled to 8% of the dividend rights of Fu Chuan. Thus, the Group actually holds 47% of the profit or loss of Fu Chuan under equity method.
Note 3: According to the resolution of Yulu Mining's 2007 annual general meeting of shareholders, both investors would share the net profit at the ratio of 1:1 since year 2008. Therefore, the Group holds 40% equity interest in Yulu Mining but recognizes investment income at 50% out of its net profit.
Note 4: The Group holds 40% of Nanomoly Development's equity and accounts investment therein based on equity method. In accordance with Articles of Association of Nanomoly Development, the Group does not assume any additional liabilities for additional loss. As at the end of the current year, the Group has written down its investment in Nanomoly Development to zero.

166 2019 Annual Report
NOTES TO THE FINANCIAL STATEMENTSFOR THE YEAR ENDED 31 DECEMBER 2019
(V) NOTES TO THE CONSOLIDATED FINANCIAL STATEMENTS (CONTINUED)
10. Long-term equity investments (Continued)
Note 5: On 7 April 2016, the Company entered into a collaboration agreement with a third party, and the Company invested RMB1.5 million by way of intangible assets and the counterparty invested RMB8.5 million of cash to incorporate Luoyang Shenyu. Meanwhile, the Company appointed a director and a supervisor to Luoyang Shenyu. Therefore, Luoyang Shenyu was accounted as an associate due to its significant influence.
Note 6: The Group held 45% shares of Natural Resources Investment Fund as a limited partner, and had significant influence on the operating decision of relevant investment entities. The relevant investment was accounted under equity method. Other decrease of the current year is the Group's recovery of certain capital contribution due to the acquisition of 100% equity in Natural Resources Investment Fund's wholly-owned subsidiary NSRC made by the Group's wholly-owned subsidiary Luoyang Molybdenum Holding on 24 July 2019.
Note 7: On 11 October 2019, the Company signed an equity transfer agreement with a third party, purchasing 30% of equity in You Qing held by a third party at a cash consideration price of RMB1.5 million, and assigning two directors and one supervisor. Therefore, it is accounted as a joint venture due to significant influence of the Group.
Note 8: Walvis Bay is an associate of NSRC, which is a wholly-owned subsidiary of the Company purchased in current year.
Note 9: In November 2019, the Group's wholly-owned subsidiary Luoyang Molybdenum Holding signed an equity transfer agreement with Newstride Limited, acquiring 100% of equity in W-Source Holding Limited ("W-Source Holding") at a consideration price of USD1,125.87, and indirectly acquiring 21% share of PT.Huayue Nickel Cobalt held by W-Source Holding. W-Source Holding assigns a director and a supervisor to PT.Huayue Nickel Cobalt. Therefore, it is accounted as an associate due to the significant influence of the Group.
There is no significant limits exist regarding cash transfer to the investees.
The entities invested by the Group are all unlisted entities.
11. Other investments in equity instruments
Unit: RMB
Item 1 January 2019 IncreaseChanges
in fair valueMaturity/disposal
Translation differences arising on translation
of financial statements denominated in
foreign currencies31 December
2019
Equity Y 388,222,520.52 – 67,777,479.48 (456,000,000.00) – –Equity Z 59,951,677.54 – 19,363,239.59 – – 79,314,917.13Equity AA – 5,795,576.24 – – – 5,795,576.24Equity AB – 425,592.24 – – (191,778.55) 233,813.69
Total 448,174,198.06 6,221,168.48 87,140,719.07 (456,000,000.00) (191,778.55) 85,344,307.06
Note: As the investments in equity instruments of the Group and its subsidiaries are the investments that the Group and its subsidiaries plan to hold for a long term, they are designated as financial assets at FVTOCI.
Due to the intention of Company Y to reduce its capital, a subsidiary of Company Y purchased all the shares of Company Y held by the Group at a consideration price of RMB456,000,000 in the current year. At the time of disposal, the fair value of the shares held by the Group in Company Y was RMB456,000,000.00, and the accumulated profits (net of tax) was RMB44,800,000.00, which was transferred from other comprehensive income to retained profits.

167China Molybdenum Co., Ltd.
NOTES TO THE FINANCIAL STATEMENTSFOR THE YEAR ENDED 31 DECEMBER 2019
(V) NOTES TO THE CONSOLIDATED FINANCIAL STATEMENTS (CONTINUED)
12. Other non-current financial assets
Unit: RMB
Item 1 January 2019 IncreaseChanges
in fair value Maturity/disposal
Translation differences arising on translation
of financial statements denominated in
foreign currencies31 December
2019
Entrusted wealth management products of non-banking financial institutions (Note 1) 951,566,173.88 – (575,422.18) (350,000,000.00) – 600,990,751.70
Entrusted wealth management products of banking financial institutions (Note 2 ) – 120,000,000.00 4,950,476.72 – – 124,950,476.72
AC Partnership shares (Note 3) 766,023,085.44 18,000,000.00 368,804,510.90 (144,480,682.75) – 1,008,346,913.59AD Partnership shares 257,473,530.99 – 50.15 – – 257,473,581.14AE Partnership shares 82,798,577.22 – 4,279,579.17 – 1,897,546.56 88,975,702.95AF Fund shares 142,295,687.69 32,063,218.63 33,973,424.27 – 4,292,385.26 212,624,715.85AG Fund shares – 207,591,000.00 4,006,506.30 – 1,727,713.50 213,325,219.80Target asset management plans 1,459,479,527.97 – 45,695,531.30 – 33,119,179.61 1,538,294,238.88AH Company equity 150,355,920.00 20,239,277.76 38,121,915.14 – 4,545,063.75 213,262,176.65AI Company equity 13,668,720.00 – 374,803.63 – 309,589.50 14,353,113.13AJ Company equity 82,955,461.68 – (620,721.05) – 1,846,905.08 84,181,645.71Others 4,928.00 – – – – 4,928.00
Total 3,906,621,612.87 397,893,496.39 499,010,654.35 (494,480,682.75) 47,738,383.26 4,356,783,464.12
Note 1: Other wealth management products of non-banking financial institutions are in relation to wealth management product plans provided by the non-banking financial institutions within China purchased by the Group, with expected yield of 5.4041%. The management of the Group believes that the interests in these wealth management product plans and the risk exposures are not significantly different from their book value, and are accounted as financial assets at FVTFL. In the current period, the Group obtained RMB50,795,781.48 of income from wealth management investment.
Note 2: It is the non-principle preservation wealth management with floating yield purchased by the Group from banks and financial institutions in China, with an expected yield of 5.00% over a period of 5 years.
Note 3: AC Partnership shares are in relation to the shares of the Group invested in the partnership, and in the current period, the Group obtained RMB2,866,583.33 of dividends from relevant investment projects. In accordance with the terms of the partnership agreement, the investment costs and the corresponding investment income withdrawn by the Group from the partnership in current year are RMB44,670,925.59 and RMB44,670,925.59 respectively.
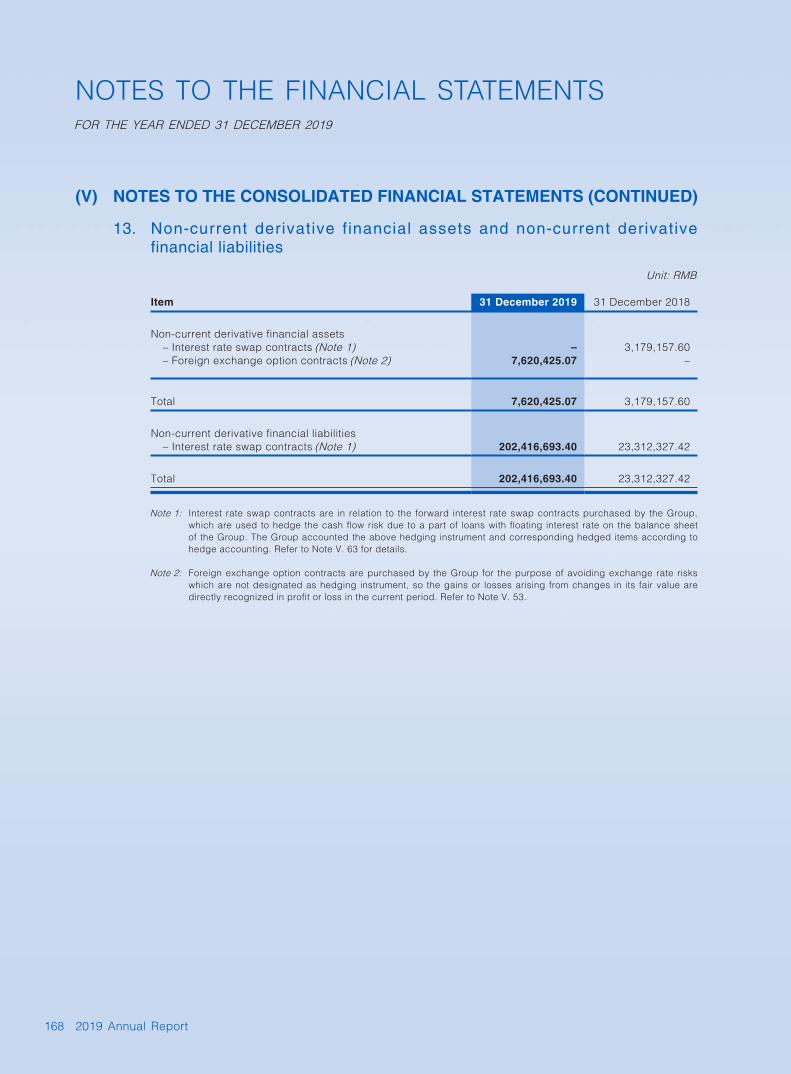
168 2019 Annual Report
NOTES TO THE FINANCIAL STATEMENTSFOR THE YEAR ENDED 31 DECEMBER 2019
(V) NOTES TO THE CONSOLIDATED FINANCIAL STATEMENTS (CONTINUED)
13. Non-current derivative financial assets and non-current derivative financial liabilities
Unit: RMB
Item 31 December 2019 31 December 2018
Non-current derivative financial assets– Interest rate swap contracts (Note 1) – 3,179,157.60– Foreign exchange option contracts (Note 2) 7,620,425.07 –
Total 7,620,425.07 3,179,157.60
Non-current derivative financial liabilities– Interest rate swap contracts (Note 1) 202,416,693.40 23,312,327.42
Total 202,416,693.40 23,312,327.42
Note 1: Interest rate swap contracts are in relation to the forward interest rate swap contracts purchased by the Group, which are used to hedge the cash flow risk due to a part of loans with floating interest rate on the balance sheet of the Group. The Group accounted the above hedging instrument and corresponding hedged items according to hedge accounting. Refer to Note V. 63 for details.
Note 2: Foreign exchange option contracts are purchased by the Group for the purpose of avoiding exchange rate risks which are not designated as hedging instrument, so the gains or losses arising from changes in its fair value are directly recognized in profit or loss in the current period. Refer to Note V. 53.

169China Molybdenum Co., Ltd.
NOTES TO THE FINANCIAL STATEMENTSFOR THE YEAR ENDED 31 DECEMBER 2019
(V) NOTES TO THE CONSOLIDATED FINANCIAL STATEMENTS (CONTINUED)
14. Fixed assets
(1) Fixed assets
Unit: RMB
Item
Buildings and mining structures
Machinery equipment
Electronic equipment, fixture and
furnitureTransportation
devices Total
I. Total original carrying amount1. Op ening balance at 1 January
2019 12,630,019,395.42 19,619,391,854.54 208,034,749.15 160,389,302.77 32,617,835,301.882. Increase in the current year 1,033,565,264.87 1,320,557,955.39 27,062,508.81 15,633,571.73 2,396,819,300.80
(1) Purchase 520,316,700.47 11,089,380.58 10,169,376.07 14,867,056.40 556,442,513.52(2) Tr ansferred from
construction in progress 402,716,190.49 1,255,991,086.62 10,843,051.26 300,884.96 1,669,851,213.33(3) In crease arising from a
business combination 110,532,373.91 53,477,488.19 6,050,081.48 465,630.37 170,525,573.953. Decrease in the current year 17,961,876.60 323,007,347.94 956,769.62 3,275,583.16 345,201,577.32
(1) Disposal or scrap 17,961,876.60 231,837,375.76 956,769.62 3,275,583.16 254,031,605.14(2) Other decrease (Note 1) – 91,169,972.18 – – 91,169,972.18
4. Re valuation of recultivation and asset retirement obligations (Note 2) 551,050,446.86 – – – 551,050,446.86
5. Tr anslation difference of financial statements denominated in foreign currencies 122,369,714.58 147,183,108.99 130,996.21 39,422.29 269,723,242.07
6. Cl osing balance at 31 December 2019 14,319,042,945.13 20,764,125,570.98 234,271,484.55 172,786,713.63 35,490,226,714.29
II. Accumulated depreciation1. Op ening balance at 1 January
2019 4,147,404,444.71 4,533,785,262.92 162,225,257.65 132,762,061.55 8,976,177,026.832. Increase in the current year 714,385,132.54 1,509,569,425.58 18,187,926.18 5,014,412.35 2,247,156,896.65
(1) Provision 714,385,132.54 1,509,569,425.58 18,187,926.18 5,014,412.35 2,247,156,896.653. Decrease in the current year 3,021,002.97 176,424,568.48 583,524.46 2,122,211.47 182,151,307.38
(1) Disposal or scrap 3,021,002.97 176,424,568.48 583,524.46 2,122,211.47 182,151,307.384. Tr anslation difference of financial
statements denominated in foreign currencies 27,872,563.19 (54,716,733.02) 5,344.74 6,395.38 (26,832,429.71)
5. Cl osing balance at 31 December 2019 4,886,641,137.47 5,812,213,387.00 179,835,004.11 135,660,657.81 11,014,350,186.39
III. Provision for impairment1. Opening balance at 1 January
2019 15,376,851.99 4,814,536.21 949,297.74 – 21,140,685.942. Increase in the current year 15,140,391.61 – – – 15,140,391.61
(1) Provision 15,140,391.61 – – – 15,140,391.613. Decrease in the current year – – – – –4. Translation difference of financial
statements denominated in foreign currencies – – – – –
5. Closing balance at 31 December 2019 30,517,243.60 4,814,536.21 949,297.74 – 36,281,077.55
IV. Carrying amount1. Closing carrying amount 9,401,884,564.06 14,947,097,647.77 53,487,182.70 37,126,055.82 24,439,595,450.352. Opening carrying amount 8,467,238,098.72 15,080,792,055.41 44,860,193.76 27,627,241.22 23,620,517,589.11

170 2019 Annual Report
NOTES TO THE FINANCIAL STATEMENTSFOR THE YEAR ENDED 31 DECEMBER 2019
(V) NOTES TO THE CONSOLIDATED FINANCIAL STATEMENTS (CONTINUED)
14. Fixed assets
(1) Fixed assets
Note 1: Other decrease is due to the confirmation of deductions of social contribution tax relating to the fixed assets purchased in previous years recognized by the subsidiaries in Brazil.
Note 2: At the end of the year, the Group reviewed the future recultivation and asset retirement obligations in the Congo (DRC), and adjusted the carrying amount of recultivation and asset retirement obligations according to the updated recultivation plan.
As at the end of the year, no fixed assets are used as collateral.
(2) The temporary idle fixed assets
Unit: RMB
ItemOriginal
carrying amountAccumulated depreciation
Provision for impairment
Net carrying amount
Closing balance: Buildings 13,256,849.24 4,023,384.89 – 9,233,464.35Closing balance: Machinery equipment 108,993,056.33 93,962,187.91 3,945,202.39 11,085,666.03
(3) At the end and the beginning of the year, the Group has no fixed assets leased under finance leases.
(4) At the end and the beginning of the year, the Group has no fixed assets leased out under operating leases.
(5) Details of the fixed assets without certificate of titles
Unit: RMB
Item Carrying amountThe reason of not completing the certificate of title
High-pressure roller mill workshop 20,636,859.32 Completed and settled, asset right transaction is in progress
High-pressure roller mill slope retaining 6,337,487.23 Completed and settled, asset right transaction is in progress
Tungsten and molybdenum extraction and separation workshop
5,902,626.01 Completed and settled, asset right transaction is in progress
Main extraction workshop 5,773,165.21 Completed and settled, asset right transaction is in progress
Main decomposition workshop 5,662,798.65 Completed and settled, asset right transaction is in progress
Office staff dining hall 5,097,554.58 Completed and settled, asset right transaction is in progress
Main crystallization workshop 4,842,383.65 Completed and settled, asset right transaction is in progress
Others 20,299,047.78 Completed and settled, asset right transaction is in progress
Total 74,551,922.43

171China Molybdenum Co., Ltd.
NOTES TO THE FINANCIAL STATEMENTSFOR THE YEAR ENDED 31 DECEMBER 2019
(V) NOTES TO THE CONSOLIDATED FINANCIAL STATEMENTS (CONTINUED)
15. Construction in progress
(1) Construction in progress status:
Unit: RMB
31 December 2019 31 December 2018
Item Book balanceProvision for impairment
Net carrying amount Book balance
Provision for impairment
Net carrying amount
Convey system project from Selection No. 3 Company to Sandaogou tailing pond 180,600.00 – 180,600.00 35,739,303.88 – 35,739,303.88
Raw ore convey system reconstruction project from Mining Company New 1# Crushing Station to Selection No. 3 Company 17,918,219.25 – 17,918,219.25 13,125,377.68 – 13,125,377.68
Expansion revamp project for 24000t/day of Selection No. 3 Company – – – 17,851,705.86 – 17,851,705.86
Construction project replacing Luchanggou Tailing 55,173,003.30 – 55,173,003.30 – – –
Project replacing Xuanshan Tailing 9,424,566.53 – 9,424,566.53 – – –APT Capacity extension project for 2000t/year of
tungsten company 1,551,000.00 – 1,551,000.00 1,689,000.00 – 1,689,000.00Eolybdenum mine project in East Gobi of Hami
of Xinjiang 83,182,564.43 31,615,388.19 51,567,176.24 83,182,564.43 31,615,388.19 51,567,176.24Building acquisition and decoration project 242,119,339.72 – 242,119,339.72 228,712,028.32 – 228,712,028.32Northparkes E48 mine northernextension project 81,255,495.17 – 81,255,495.17 50,302,990.06 – 50,302,990.06Northparkes E26 underground mine
development project 179,122,329.78 – 179,122,329.78 81,479,765.39 – 81,479,765.39Niobras tailing dam heightening project 83,913,900.00 – 83,913,900.00 – – –Copebras phosphorus production plant
maintenance project 339,435,195.97 – 339,435,195.97 116,367,926.07 – 116,367,926.07Copebras phosphorus production process
improvement projects 704,763.77 – 704,763.77 25,429,033.39 – 25,429,033.39Niobras niobium production plant maintenance
project 176,592,243.87 – 176,592,243.87 105,192,601.88 – 105,192,601.88TFM filtering equipment upgrading project – – – 50,862,357.87 – 50,862,357.87TFM dehydration equipment installation project 35,859,243.64 – 35,859,243.64 49,897,670.18 – 49,897,670.18TFM mining equipment purchase project – – – 1,698,810.83 – 1,698,810.83TFM No. 2 cobalt dryer improvement project – – – 152,450,758.55 – 152,450,758.55TFM mining zone transportation road
construction projects 4,708,692.58 – 4,708,692.58 35,562,064.68 – 35,562,064.68TFM production process optimization study 94,860,905.81 – 94,860,905.81 32,833,860.87 – 32,833,860.87TFM IT system change project – – – 35,918,500.58 – 35,918,500.58TFM mining zone power supply project 86,317,554.10 – 86,317,554.10 63,224,208.40 – 63,224,208.40TFM 2018 mining equipment acquisition project – – – 152,066,465.28 – 152,066,465.28TFM Kwatebala KT2 tailings pond
project Phase I 243,971,976.98 – 243,971,976.98 91,957,622.77 – 91,957,622.77Quicklime Plant 41,598,301.64 – 41,598,301.64 – – –Others 640,516,970.23 – 640,516,970.23 499,893,079.41 – 499,893,079.41
Total 2,418,406,866.77 31,615,388.19 2,386,791,478.58 1,925,437,696.38 31,615,388.19 1,893,822,308.19

172 2019 Annual Report
NOTES TO THE FINANCIAL STATEMENTSFOR THE YEAR ENDED 31 DECEMBER 2019
(V)
NO
TE
S T
O T
HE
CO
NS
OL
IDA
TE
D F
INA
NC
IAL
ST
AT
EM
EN
TS
(C
ON
TIN
UE
D)
15
. C
on
stru
ctio
n in
pro
gre
ss (
Co
ntin
ue
d)
(2)
Cha
nge
in s
igni
fican
t co
nstr
uctio
n in
pro
gres
s:
Uni
t: R
MB
Name
of pr
oject
Budg
etOp
ening
balan
ceInc
reas
e due
to co
nsoli
datio
nInc
reas
e in t
he
curre
nt ye
arTr
ansfe
r to
fixed
asse
tsTr
ansfe
r to
intan
gible
asse
tsOt
her r
educ
tions
Impa
irmen
t pr
ovisi
on
Tran
slatio
n dif
feren
ce
of fin
ancia
l sta
temen
ts de
nomi
nated
in
fore
ign
curre
ncies
Clos
ing ba
lance
Prop
ortio
n of
proje
ct inv
estm
ent
to bu
dget
amou
nt
Accu
mulat
ed ca
pitali
zed
inter
est
Includ
ing:
inter
est
capit
aliza
tion
for t
he ye
arSo
urce
of fu
nd(%
)
Conv
ey sy
stem
projec
t from
Selec
tion N
o. 3 C
ompa
ny to
Sa
ndao
gou t
ailing
pond
76,39
3,560
.0035
,739,3
03.88
–18
,311,2
10.21
53,86
9,914
.09–
––
–18
0,600
.0071
––
Fund
s in h
and
Raw
ore co
nvey
syste
m rec
onstr
uctio
n proj
ect fr
om M
ining
Co
mpan
y New
1# C
rushin
g Stat
ion to
Selec
tion N
o. 3
Comp
any
26,89
3,800
.0013
,125,3
77.68
–4,7
92,84
1.57
––
––
–17
,918,2
19.25
67–
–Fu
nds i
n han
dEx
pans
ion re
vamp
proje
ct for
2400
0t/da
y of S
electi
on N
o. 3
Comp
any
73,35
2,300
.0017
,851,7
05.86
–10
,598,9
69.01
28,45
0,674
.87–
––
––
39–
–Fu
nds i
n han
dCo
nstru
ction
proje
ct rep
lacing
Luch
angg
ou Ta
iling
405,0
90,00
0.00
––
55,17
3,003
.30–
––
––
55,17
3,003
.3014
–Fu
nds i
n han
dPro
ject re
placin
g Xua
nsha
n Tail
ing34
8,730
,000.0
0–
–9,4
24,56
6.53
––
––
–9,4
24,56
6.53
3–
–Fu
nds i
n han
d40
00t/d
flotat
ion ta
iling i
ron re
cycli
ng pr
oject
of Wu
Ye N
o.1
Comp
any
17,30
0,000
.00–
–13
,093,1
92.40
13,09
3,192
.40–
––
––
76–
–Fu
nds i
n han
dAP
T Cap
acity
exten
sion p
rojec
t for 2
000t/
year
of tun
gsten
co
mpan
y39
,583,0
00.00
1,689
,000.0
0–
––
–13
8,000
.00–
–1,5
51,00
0.00
85–
–Fu
nds i
n han
dEo
lybde
num
mine
proje
ct in
East
Gobi
of Ha
mi of
Xinji
ang
2,849
,000,0
00.00
51,56
7,176
.24–
––
––
––
51,56
7,176
.243
––
Fund
s in h
and
Acqu
isitio
n and
deco
ration
of bu
ilding
s25
0,000
,000.0
022
8,712
,028.3
2–
13,40
7,311
.40–
––
––
242,1
19,33
9.72
97–
–Fu
nds i
n han
dNo
rthpa
rkes E
48 m
ine no
rthern
exten
sion p
rojec
t25
7,161
,939.8
850
,302,9
90.06
–34
,026,7
53.26
4,040
,703.6
8–
––
966,4
55.53
81,25
5,495
.1733
––
Fund
s in h
and
North
parke
s E26
unde
rgrou
nd m
ine de
velop
ment
projec
t1,0
90,38
8,458
.5681
,479,7
65.39
–17
5,643
,373.3
083
,351,6
42.02
––
–5,3
50,83
3.11
179,1
22,32
9.78
24–
–Fu
nds i
n han
dNio
bras t
ailing
dam
heigh
tening
proje
ct26
9,256
,055.1
3–
–10
3,463
,116.0
220
,228,8
31.76
––
–67
9,615
.7483
,913,9
00.00
86–
–Fu
nds i
n han
dCo
pebra
s pho
spho
rus pr
oduc
tion p
lant m
ainten
ance
proje
ct61
9,599
,854.2
611
6,367
,926.0
7–
300,0
61,14
4.51
77,94
0,982
.93–
––
947,1
08.32
339,4
35,19
5.97
81–
–Fu
nds i
n han
dCo
pebra
s pho
spho
rus pr
oduc
tion p
roces
s imp
rovem
ent
projec
ts13
1,959
,635.2
525
,429,0
33.39
–21
,140,7
96.81
44,71
8,154
.65–
––
(1,14
6,911
.78)
704,7
63.77
50–
–Fu
nds i
n han
dNio
bras n
iobium
prod
uctio
n plan
t main
tenan
ce pr
oject
321,4
24,28
3.69
105,1
92,60
1.88
–15
1,774
,422.3
282
,670,9
73.00
––
–2,2
96,19
2.68
176,5
92,24
3.88
84–
–Fu
nds i
n han
dTF
M filt
ering
equip
ment
upgra
ding p
rojec
t55
,809,6
00.00
50,86
2,357
.87–
–51
,281,0
72.63
––
–41
8,714
.76–
93–
–Fu
nds i
n han
dTF
M de
hydra
tion e
quipm
ent in
stalla
tion p
rojec
t17
9,358
,102.0
049
,897,6
70.18
–96
,825,0
73.13
105,7
74,53
3.30
–5,7
90,16
2.29
–70
1,195
.9235
,859,2
43.64
79–
–Fu
nds i
n han
dTF
M mi
ning e
quipm
ent p
urcha
se pr
oject
72,53
1,551
.401,6
98,81
0.83
––
1,712
,795.9
7–
––
13,98
5.14
–11
4–
–Fu
nds i
n han
dTF
M No
. 2 co
balt d
ryer im
prove
ment
projec
t31
7,277
,576.0
015
2,450
,758.5
5–
143,2
65,78
9.67
296,9
71,57
0.35
––
–1,2
55,02
2.13
–94
––
Fund
s in h
and
TFM
minin
g zon
e tran
sport
ation
road
cons
tructi
on pr
ojects
171,2
65,71
0.00
35,56
2,064
.68–
15,44
9,031
.8346
,633,2
97.46
––
–33
0,893
.534,7
08,69
2.58
55–
–Fu
nds i
n han
dTF
M pro
ducti
on pr
oces
s opti
miza
tion s
tudy
1,883
,574,0
00.00
32,83
3,860
.87–
60,98
8,471
.21–
––
–1,0
38,57
3.73
94,86
0,905
.815
––
Fund
s in h
and
TFM
IT sy
stem
chan
ge pr
oject
38,79
6,825
.4735
,918,5
00.58
–2,2
68,41
8.48
38,48
2,611
.34–
––
295,6
92.28
–10
0–
–Fu
nds i
n han
dTF
M mi
ning z
one p
ower
supp
ly pro
ject
88,98
8,407
.2063
,224,2
08.40
–21
,873,7
81.46
––
––
1,219
,564.2
386
,317,5
54.09
96–
–Fu
nds i
n han
dTF
M 20
18 m
ining
equit
ymen
t acq
uisitio
n proj
ect
216,0
59,94
6.64
152,0
66,46
5.28
–40
,340,6
66.28
193,6
58,99
0.06
––
–1,2
51,85
8.50
–10
0–
–Fu
nds i
n han
dTF
M Kw
ateba
la KT
2 tail
ings p
ond p
rojec
t Pha
se I
824,5
86,84
0.00
91,95
7,622
.77–
151,8
36,82
4.45
2,555
,414.5
6–
––
2,732
,944.3
124
3,971
,976.9
730
––
Fund
s in h
and
Quick
lime P
lant
181,3
81,20
0.00
––
41,26
1,398
.45–
––
–33
6,903
.1941
,598,3
01.64
23–
–Fu
nds i
n han
dOt
hers
N/A
499,8
93,07
9.41
9,615
,404.8
167
6,818
,715.1
652
4,415
,858.2
612
,253,1
64.44
21,47
1,353
.89–
12,33
0,147
.4564
0,516
,970.2
4N/
A–
–Fu
nds i
n han
d
Total
1,893
,822,3
08.19
9,615
,404.8
12,1
61,83
8,870
.761,6
69,85
1,213
.3312
,253,1
64.44
27,39
9,516
.18–
31,01
8,788
.772,3
86,79
1,478
.58–
At
31 D
ecem
ber
201
9, t
he G
roup
mad
e p
rovi
sion
for
im
pai
rmen
t of
RM
B31
,615
,388
.19
(31
Dec
emb
er 2
018:
RM
B31
,615
,388
.19)
fo
r co
nstr
uctio
n in
pro
gre
ss.

173China Molybdenum Co., Ltd.
NOTES TO THE FINANCIAL STATEMENTSFOR THE YEAR ENDED 31 DECEMBER 2019
(V) NOTES TO THE CONSOLIDATED FINANCIAL STATEMENTS (CONTINUED)
16. Right-of-use assets
Unit: RMB
Item BuildingsMachinery
equipmentTransportation
devices Total
I. Total original carrying amount:1. Op ening balance at 1 January 2019 145,106,766.07 31,827,649.29 – 176,934,415.362. Increase in the current period 181,466,584.90 91,975,608.71 2,251,601.11 275,693,794.72
(1) Leasehold 84,144,474.87 91,975,608.71 2,251,601.11 178,371,684.69(2) In crease due to consolidation 97,322,110.03 – – 97,322,110.03
3. De crease in the current period – – –4. Tr anslation difference of financial
statements denominated in foreign currencies 3,460,142.32 (1,452,890.63) 18,384.54 2,025,636.23
5. Closing balance at 31 December 2019 330,033,493.29 122,350,367.37 2,269,985.65 454,653,846.31
II. Accumulated depreciation1. Opening balance at 1 January 2019 – – –2. Increase in the current period 71,446,504.59 35,128,275.00 562,900.30 107,137,679.89
(1) Provision 71,446,504.59 35,128,275.00 562,900.30 107,137,679.893. Decrease in the current period – – –4. Tr anslation difference of financial
statements denominated in foreign currencies 406,907.85 288,861.05 4,596.13 700,365.03
5. Closing balance at 31 December 2019 71,853,412.44 35,417,136.05 567,496.43 107,838,044.92
III. Provision for impairment1. Opening balance at 1 January 2019 – – – –2. Increase in the current period – – – –3. Decrease in the current period – – – –4. Tr anslation difference of financial
statements denominated in foreign currencies – – – –
5. Closing balance at 31 December 2019 – – – –
IV. Carrying amount1. Closing carrying amount 258,180,080.85 86,933,231.32 1,702,489.22 346,815,801.392. Opening carrying amount 145,106,766.07 31,827,649.29 – 176,934,415.36
The Group has leased multiple asset, including leases of buildings, machinery equipment and transportation devices, with lease terms of 1-11 years, 1-5 years and 4 years, respectively. Lease terms are negotiated on an individual basis, including variable terms and conditions. In determining lease terms and assessing the lengths of the irrevocable period, the Group applies the definition of contract and determines the enforceable period of contract.
In 2019, total cash outflows relating to lease amounted to RMB92,669,245.41.
Short-term lease expenses under simplified approach recognized in profit or loss for the year amounted to RMB2,067,330.40, and lease expenses on low-value assets amounted to RMB188,001.33. As at 31 December 2019, short-term lease portfolio of the Group is similar to leases corresponding to the above short-term lease expenses.
The Group's lease liabilities and interest expense on lease liabilities are set out in Note V. 35, and Note V. 50 respectively. As at 31 December 2019, except for the Group's payment of deposit to the lessor as guarantee for leasehold assets, lease agreements have no other additional guarantee terms. Leasehold assets shall not be used to guarantee borrowings.
As at 31 December 2019, the Group had no leases that have been entered into but not yet incepted.

174 2019 Annual Report
NOTES TO THE FINANCIAL STATEMENTSFOR THE YEAR ENDED 31 DECEMBER 2019
(V) NOTES TO THE CONSOLIDATED FINANCIAL STATEMENTS (CONTINUED)
17. Intangible assets
Details of intangible assets
Unit: RMB
Item Land use rights Mining rights
Rights to a copper off-take contract (Note)
Supplier relationship
(Note) Others Total
I. Total original carrying amount:1. Opening balance at 1 January 2019 531,980,339.39 24,404,408,422.83 – – 55,440,495.67 24,991,829,257.892. Increase for the current year 127,310,340.67 58,438,021.81 132,103,258.22 282,248,100.00 78,688,165.40 678,787,886.10
(1) Purchase – 58,438,021.81 – – 10,248,722.87 68,686,744.68(2) Tr ansfer from construction in
progress – – – – 12,253,164.44 12,253,164.44(3) In crease due to business
combination 127,310,340.67 – 132,103,258.22 282,248,100.00 56,186,278.09 597,847,976.983. Decrease for the current year – – – – 16,795,975.29 16,795,975.29
(1) Disposal – – – – 16,795,975.29 16,795,975.294. Tr anslation difference of financial
statements denominated in foreign currencies – 190,158,850.03 1,767,363.94 3,776,100.00 445,982.70 196,148,296.67
5. Closing balance at 31 December 2019 659,290,680.06 24,653,005,294.67 133,870,622.16 286,024,200.00 117,778,668.48 25,849,969,465.37
II. Accumulated amortization1. Opening balance at 1 January 2019 107,819,512.98 3,924,856,309.70 – – 28,101,155.87 4,060,776,978.552. Increase for the current year 13,294,561.91 1,297,583,399.94 1,495,189.05 7,880,769.45 31,146,107.38 1,351,400,027.73
(1) Provision 13,294,561.91 1,297,583,399.94 1,495,189.05 7,880,769.45 31,146,107.38 1,351,400,027.733. Decrease for the current year – – – – 11,826,592.92 11,826,592.92
(1) Disposal – – – – 11,826,592.92 11,826,592.924. Tr anslation difference of financial
statements denominated in foreign currencies – 2,685,331.36 12,208.36 64,347.22 (73,212.01) 2,688,674.93
5. Closing balance at 31 December 2019 121,114,074.89 5,225,125,041.00 1,507,397.41 7,945,116.67 47,347,458.32 5,403,039,088.29
III. Provision for impairment1. Opening balance at 1 January 2019 – – – – – –2. Increase for the current year – – – – – –3. Decrease for the current year – – – – – –4. Tr anslation difference of financial
statements denominated in foreign currencies – – – – – –
5. Closing balance at 31 December 2019 – – – – – –
IV. Carrying amount1. Closing carrying amount 538,176,605.17 19,427,880,253.67 132,363,224.75 278,079,083.33 70,431,210.16 20,446,930,377.082. Opening carrying amount 424,160,826.41 20,479,552,113.13 – – 27,339,339.80 20,931,052,279.34
At the end of the year, there are no land use rights nor mining rights used as collateral.
The land use rights were acquired with the lease period of 50 years and were situated in the PRC.
Note: Rights to a copper off-take contract and supplier relationship were acquired through acquisition of NSRC, please refer to Note VI. 1. (3) for details.
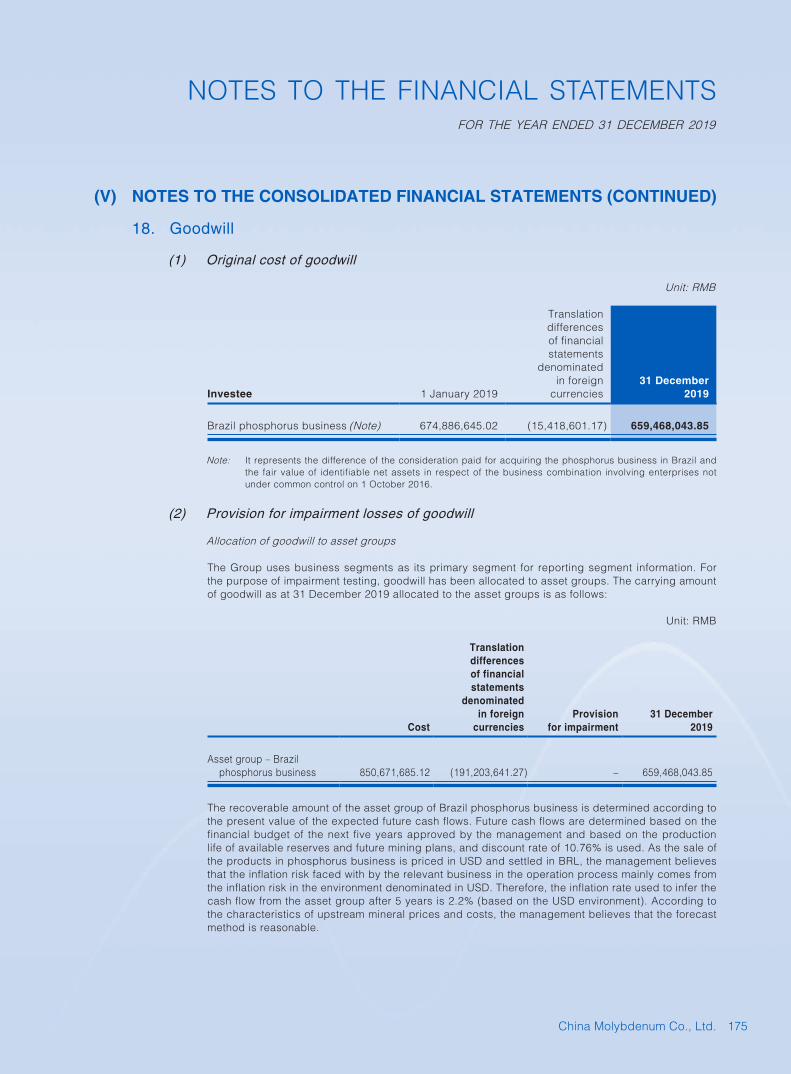
175China Molybdenum Co., Ltd.
NOTES TO THE FINANCIAL STATEMENTSFOR THE YEAR ENDED 31 DECEMBER 2019
(V) NOTES TO THE CONSOLIDATED FINANCIAL STATEMENTS (CONTINUED)
18. Goodwill
(1) Original cost of goodwill
Unit: RMB
Investee 1 January 2019
Translation differences of financial statements
denominated in foreign
currencies31 December
2019
Brazil phosphorus business (Note) 674,886,645.02 (15,418,601.17) 659,468,043.85
Note: It represents the difference of the consideration paid for acquiring the phosphorus business in Brazil and the fair value of identifiable net assets in respect of the business combination involving enterprises not under common control on 1 October 2016.
(2) Provision for impairment losses of goodwill
Allocation of goodwill to asset groups
The Group uses business segments as its primary segment for reporting segment information. For the purpose of impairment testing, goodwill has been allocated to asset groups. The carrying amount of goodwill as at 31 December 2019 allocated to the asset groups is as follows:
Unit: RMB
Cost
Translation differences of financial statements
denominated in foreign
currenciesProvision
for impairment31 December
2019
As set group – Brazil phosphorus business 850,671,685.12 (191,203,641.27) – 659,468,043.85
The recoverable amount of the asset group of Brazil phosphorus business is determined according to the present value of the expected future cash flows. Future cash flows are determined based on the financial budget of the next five years approved by the management and based on the production life of available reserves and future mining plans, and discount rate of 10.76% is used. As the sale of the products in phosphorus business is priced in USD and settled in BRL, the management believes that the inflation risk faced with by the relevant business in the operation process mainly comes from the inflation risk in the environment denominated in USD. Therefore, the inflation rate used to infer the cash flow from the asset group after 5 years is 2.2% (based on the USD environment). According to the characteristics of upstream mineral prices and costs, the management believes that the forecast method is reasonable.

176 2019 Annual Report
NOTES TO THE FINANCIAL STATEMENTSFOR THE YEAR ENDED 31 DECEMBER 2019
(V) NOTES TO THE CONSOLIDATED FINANCIAL STATEMENTS (CONTINUED)
18. Goodwill (Continued)
(2) Provision for impairment losses of goodwill (Continued)
Allocation of goodwill to asset groups (Continued)
The key assumptions for calculating the present value of future cash flows for the above asset group as at 31 December 2019 are as follows:
Key assumptions Consideration of the management
Budget gross margin On the basis of realized the average gross margin in the year before the budget year, appropriately modify the average gross margin according to the changes in the expected efficiency and the fluctuation of metal market price.
Discount rate The discount rate used is the pre-tax discount rate that reflects the specific risk of the related asset group.
Inflation of raw material price Consider the expected price index for the operating environment in the budget year.
The data of key assumptions of the sales price, discount rate, raw material price inflation used in the above asset group are consistent with the external information.
According to the above impairment test, the management believes that the relevant goodwill has not been impaired.
19. Long-term prepaid expenses
Unit: RMB
Item 1 January 2019
Addition for the
current year
Amortization for the
current year31 December
2019
Relocation compensation (Note 1) 43,758,280.74 – 6,361,673.24 37,396,607.50Geological Museum project (Note 2) 26,400,000.00 – 600,000.00 25,800,000.00Mining compensation (Note 3) 16,888,888.00 – 6,333,324.00 10,555,564.00Others 41,975,701.81 34,572,134.18 13,312,818.52 63,235,017.47
Total 129,022,870.55 34,572,134.18 26,607,815.76 136,987,188.97
Note 1: The Company paid relocation compensation to the villagers around the areas of tailing dams.
Note 2: According to the Geological Museum use right agreement signed by Luanchuan Finance Bureau and the Company on 18 December 2012, the Company would be allocated with 2,000 square meters showroom area in the Geological Museum for promoting the Company's product for 50 years from 1 January 2013.
Note 3: Mining compensation is in relation to the mining compensation paid by the Company in the current year, which is amortized over the benefit period.

177China Molybdenum Co., Ltd.
NOTES TO THE FINANCIAL STATEMENTSFOR THE YEAR ENDED 31 DECEMBER 2019
(V) NOTES TO THE CONSOLIDATED FINANCIAL STATEMENTS (CONTINUED)
20. Deferred tax assets/deferred tax liabilities
(1) Deferred tax assets before offsetting
Unit: RMB
Item
31 December 2019 31 December 2018Deductible temporary difference
Deferred tax assets
Deductible temporary difference
Deferred tax assets
Provision for asset impairment 447,539,683.25 129,376,269.17 425,775,628.63 122,753,188.11Deductible losses (Note 1) 1,363,261,227.63 459,371,803.27 1,088,825,124.06 367,172,809.90Differences in inventory costs 113,592,571.65 34,077,771.49 74,309,177.27 22,292,753.18Unrealized gross profit 516,168,803.06 98,127,502.24 330,615,931.78 87,273,326.32Deferred income from
government grant 66,754,605.90 14,809,851.87 74,045,061.50 16,593,907.19Fair value gains or losses 202,965,650.59 32,513,355.88 – –Outstanding expenses – net 1,858,615,499.86 511,048,352.44 1,642,780,661.96 468,911,472.51Losses on disposal of fixed
assets without filing 21,611,375.27 3,241,706.29 23,403,398.76 3,510,509.81Effects of non-monetary items
on exchange rates (Note 2) 697,024,270.68 236,988,252.03 417,204,788.84 141,849,628.20Differences in depreciation of
fixed assets 230,826,966.44 69,248,089.93 – –Others 76,862,355.68 23,874,397.76 197,434,932.47 65,803,753.85
Total 5,595,223,010.01 1,612,677,352.37 4,274,394,705.27 1,296,161,349.07
Note 1: The actual amount of deductible losses that the Group may eventually deduct from the income tax in 2018 should be subject to final assessment of the local taxation authority. For the deductible losses arising from a part of subsidiaries for business in Brazil in the current year, refer to Note V. 54 Note 2.
Note 2: Certain enterprises of the Group's business in Brazil adopt USD as functional currency, while make tax declaration and annual filing in BRL for the operating activities in Brazil in accordance with local tax regulations in Brazil. Management recognizes tax losses in the related financial statements denominated in BRL as a deferred tax assets and makes it an adjusting item for tax. In the meanwhile, the non-monetary items including inventories and fixed assets of such enterprises on the balance sheet are recognized and subsequently measured at historical exchange rate, resulting temporary difference between their tax bases and carrying amounts upon tax accounting, the Company accordingly recognize the relevant temporary difference as one deferred tax asset/liability.

178 2019 Annual Report
NOTES TO THE FINANCIAL STATEMENTSFOR THE YEAR ENDED 31 DECEMBER 2019
(V) NOTES TO THE CONSOLIDATED FINANCIAL STATEMENTS (CONTINUED)
20. Deferred tax assets/deferred tax liabilities (Continued)
(2) Deferred tax liabilities before offsetting
Unit: RMB
Item
31 December 2019 31 December 2018Taxable
temporary differences
Deferred tax liabilities
Taxable temporary
differencesDeferred
tax liabilities
Accrued interest income 398,958,458.40 64,960,664.86 229,062,505.15 35,836,088.08Differences in depreciation of
fixed assets 10,562,048,009.92 3,183,437,293.01 10,771,190,657.52 3,247,672,205.89Profit or loss arising from fair
value changes 1,051,311,960.24 253,081,736.99 336,932,447.87 96,104,110.24Additional provision under
Switzerland tax laws (Note 3) 1,367,335,172.10 191,526,185.37 – –Adjustment to the fair value
of assets in business combination not involving enterprises under common control (Note 4) 16,879,768,903.53 5,154,257,817.63 17,341,677,281.03 5,337,044,081.13
Others 26,317,636.82 7,444,962.22 238,382,677.18 75,025,210.61
Total 30,285,740,141.01 8,854,708,660.08 28,917,245,568.75 8,791,681,695.95
Note 3: It represents the taxable temporary differences arising from additional provision made to certain extent based on the carrying amount of inventories under Switzerland tax laws.
Note 4: In the course of Brazil business combination not involving enterprises under common control in 2016, identifiable net assets of the acquiree was recorded at the fair value at the acquisition date, and deferred tax liability was recognized in accordance with the differences between the fair value and tax base of the related assets on the date of acquisition. According to the local tax law of Brazil, the above taxable temporary differences can be reversed after meeting certain conditions in the future. However, as the above conditions exist uncertainty, in accordance with the conservatism principle, the management has still recognized deferred tax liabilities amounting to RMB1,141,280,876.89 on 31 December 2019 (2018: RMB1,143,597,622.94). If certain conditions are met in the future, the above deferred tax liabilities of the Group may be reversed to form one-time gain.
Others included in the balance represent deferred tax liabilities arising from adjustments to the fair value of assets for the acquisition of Congo (DRC) business in 2016 and the acquisition of Switzerland metal business platform.

179China Molybdenum Co., Ltd.
NOTES TO THE FINANCIAL STATEMENTSFOR THE YEAR ENDED 31 DECEMBER 2019
(V) NOTES TO THE CONSOLIDATED FINANCIAL STATEMENTS (CONTINUED)
20. Deferred tax assets/deferred tax liabilities (Continued)
(3) Deferred tax assets or liabilities at net after offsetting
Unit: RMB
Item
Closing set-off amount of deferred
tax assets and deferred tax
liabilities
Closing balance of deferred tax assets
and deferred tax liabilities after
offsetting
Opening set-off amount of deferred
tax assets and deferred tax
liabilities
Opening balance of deferred tax
assets and deferred tax liabilities after
offsetting
Deferred tax assets 967,168,894.25 645,508,458.12 1,079,416,557.20 525,597,815.59Deferred tax liabilities 967,168,894.25 7,887,539,765.83 1,079,416,557.20 8,021,118,162.47
The movement of deferred income tax assets of the year decreased RMB74,055,764.50 due to the translation of financial statements denominated in foreign currencies, and increased RMB33,906,194.74 due to business combination not involving enterprises under common control. The movement of deferred income tax liabilities of the year increased RMB386,834,006.43 due to the translation of financial statements denominated in foreign currencies, and increased RMB246,376,254.16 due to business combination not involving enterprises under common control.
(4) Details of unrecognized deferred tax assets
Unit: RMB
Item 31 December 2019 31 December 2018
Deductible losses 461,564,694.65 423,196,627.09Deductible temporary differences 81,089,662.12 91,982,054.85
Sub-total 542,654,356.77 515,178,681.94
Note: Due to the uncertainty in availability of sufficient taxable income in the future, deferred tax assets are not recognized.
(5) Deductible losses, for which deferred tax assets are not recognized, will expire in the following years:
Unit: RMB
Year 31 December 2019 31 December 2018
2019 – 100,772,089.722020 160,456,916.13 137,346,839.112021 124,820,435.10 98,186,466.462022 77,956,167.81 57,442,657.832023 38,342,279.26 29,448,573.972024 59,988,896.35 –
Sub-total 461,564,694.65 423,196,627.09

180 2019 Annual Report
NOTES TO THE FINANCIAL STATEMENTSFOR THE YEAR ENDED 31 DECEMBER 2019
(V) NOTES TO THE CONSOLIDATED FINANCIAL STATEMENTS (CONTINUED)
21. Other non-current assets
Unit: RMB
Item 31 December 2019 31 December 2018
Time deposit mature over 1 year and related interest receivable – 200,000,000.00Borrowings due from SNEL (Note 1) 1,282,235,518.80 1,251,660,684.70Amount due from TFM minority shareholders (Note 2) 370,521,427.93 334,381,507.50Brazil deductible social contribution tax (Note 3) 116,225,415.62 43,077,882.87Prepayments for water charges (Note 4) 63,000,000.00 63,000,000.00Prepayments for farmland occupation tax (Note 5) 8,028,346.01 18,836,266.71Prepayments for land (Note 6) 8,659,900.00 8,659,900.00Land acquisition compensation due from government (Note 7) 117,143,076.34 119,882,431.05Compensatory assets (Note 8) 125,656,688.78 165,358,581.74Litigation guarantee (Note 9) 81,164,498.37 64,697,389.96Loans to suppliers (Note 10) 46,652,988.69 –Prepayments for capital increment (Note 11) 255,627,445.55 –Others 4,287,711.21 4,004,130.69
Total 2,479,203,017.30 2,273,558,775.22
The Group recognizes ECL provision of relevant financial assets in the other non-current assets on the basis of ECL. At 31 December 2019, the management of the Group believes that the credit risk of the relevant financial assets excluding loans to suppliers has not increased significantly since its initial recognition, and has no significant ECL. Credit risk on loans to suppliers is set out in Note 10.
Note 1: TFHL's loan due from SNEL. The applicable interest rate for the loan is determined by 6-months Libor interest rate plus 3%, which will be settled by electricity charges payable in the future.
Note 2: TFM's loans due from Gécamines. As at 31 December 2019, the principal due to TFM is USD30,000,000.00 (equ iva len t to RMB209,286,000.00) ; the in te res t rece ivab le i s USD209,286,000.00 (equ iva len t to RMB161,235,427.93) and the applicable interest rate for the loan is determined based on the 1-year Libor interest rate plus 6%, which will be charged against dividends and consulting expenses of Gécamines in the future.
Note 3: Brazil social contribution tax applicable to Niobras and Copebras, of which the tax base is the balance of income from the sales of goods and rendering of services in Brazil after deducting deductible cost. As it is not required to pay the social contribution tax and goods circulation tax for export goods, tax payment remains undeducted at the end of the year. The social contribution tax is levied by the Brazil's federal government, so the tax credit can be used to deduct the enterprise income tax levied by the federal government without expiry date. The portion of deductible balance within one year is accounted for as other receivables by the Group. See Note V. 7 for details.
Note 4: Refer to prepayments for water charges of Xinjiang Luomu Mining Co., Ltd (Xinjiang Luomu).
Note 5: The land occupation tax related to the land to be used in the future of the tailings owned by the mine.
Note 6: The Group paid the land compensation and transfer payments in advance, and shall continue to handle the land transfer procedures after the relevant subsidiaries have resumed their production.
Note 7: Copebras holds the amount receivables from the state government of San Paulo, Brazil. Due to the local government suspended the payment of the remaining funds. Related issues are currently in the litigation stage, the management of the Group, based on the information and opinion of external lawyers, believe that the relevant funds can be recovered.
Note 8: Based on the agreement between the Group and Anglo American in the course of the acquisition of the Brazilian Niobium Phosphorus business, if Niobras and Copebras have incurred cash outflows in the course of the business due to tax-related contingencies, compensation will be provided by Anglo American. The Group recognized a liability for the Niobras and Copebras related contingencies at fair value (Note V. 37), accordingly recognizes the right of relevant tax related compensation as non – current assets.

181China Molybdenum Co., Ltd.
NOTES TO THE FINANCIAL STATEMENTSFOR THE YEAR ENDED 31 DECEMBER 2019
(V) NOTES TO THE CONSOLIDATED FINANCIAL STATEMENTS (CONTINUED)
21. Other non-current assets (Continued)
Note 9: Niobras and Copebras have some disputes and litigation arising from some of the tax, labor and civil related legal proceedings in the course of business. Some of these proceedings require the submission of litigation collateral at the request of the court. The deposit is restricted for use and the interest is calculated at the Brazilian benchmark interest rate during this period. After the end of the litigation, according to the results, the Company can call back the deposit or settle the litigation by the deposit.
Note 10: It represents loans that IXM provided to its suppliers. As at 31 December 2019, balance of loans to suppliers amounted to USD15,854,117.00, equivalent to RMB110,601,491.02, which is the loan provided to a third party supplier B by the Group, with interest rate ranging from 8% to 9% per annum, including the portion due within 1 year amounting to USD9,166,667.00 (equivalent to RMB63,948,502.33) recognized in other current assets.
During the period from 24 July 2019 to 31 December 2019, management made provision for expected credit loss on loans to suppliers amounting to USD250, 000.00, equivalent to RMB1,744,050.00.
Note 11: It represents the prepayment of the Group's subsidiary, W-Source Holding Limited to the associate, Huayue Nickel Cobalt, for capital injection. In accordance with a series of agreements between the Group and Huayue Nickel Cobalt, as well as other shareholders of Huayue Nickel Cobalt, the Group will inject capital to Huayue Nickel Cobalt. Upon capital injection, the Group's subscribed capital contribution will reach USD79,591,720.00, with shareholding ratio increased to 30%. The Group receives interest on prepaid capital injection at 6% before its actual transfer to capital.
22. Short-term borrowings
(1) Categories of short-term borrowings:
Unit: RMB
Item 31 December 2019 31 December 2018
Credit loan 4,548,599,863.40 4,588,152,515.23Secured loans with securities under the custody of
lenders 1,968,000,000.00 –Secured loans with securities under the Group's
custody (Note) 12,072,425,969.09 –
Total 18,589,025,832.49 4,588,152,515.23
Note: Details for securities of such secured loans are set out in Note V. 2 and 8.
(2) At the end of this year, there were no outstanding short-term borrowings of the Group that were overdue.

182 2019 Annual Report
NOTES TO THE FINANCIAL STATEMENTSFOR THE YEAR ENDED 31 DECEMBER 2019
(V) NOTES TO THE CONSOLIDATED FINANCIAL STATEMENTS (CONTINUED)
23. Held-for-trading financial liabilities
Unit: RMB
Item Closing fair value Opening fair value
1. Liabilities from forward commodity contract and gold lease measured at fair value (Note 1) 645,164,164.50 3,009,556,448.79
2. Payables at FVTPL (Note 2) 2,512,787,760.22 –3. Liabilities from floating-rate foreign currency loan contract
and forward exchange contract measured at fair value and forward rate swap contract (Note 3) – 691,117,466.05
4. Contingent consideration from the acquisition of copper-cobalt business in Congo (DRC) (Note 4) – 550,037,437.60
Total 3,157,951,924.72 4,250,711,352.44
Note 1: The Group concluded gold lease agreement with the bank. During the lease term, the Group may sell the leased gold to a third party, and then return the gold in the same specification and with the same weight to the bank until the lease is matured. The obligation of the Group to return the gold is recognized as a financial liability at fair value. Meanwhile, in order to hedge the risk in commodity price of related liabilities, the Group uses gold forward contract to manage the risk in the obligations to return the gold with the same quantity and quality to the bank under the gold lease agreement so as to evade the risk undertaken by the Group in the fluctuation of fair value of held-for-trading financial liabilities with the fluctuation of gold market price.
Note 2: The major products of the Group are copper, lead and zinc concentrates and cobaltous hydroxide etc., selling price of which is provisionally determined according to the market price upon delivery. Generally, the price is finally determined according to the monthly average spot price quoted by the London Metals Exchange (LME) or other agreed pricing methods within a specified period or a period subsequent to the delivery. The Group classifies the accounts receivable generated from relevant business as financial assets at FVTPL.
Note 3: The Group enters into a contract on borrowings denominated in foreign currency with floating-rate with the bank. In the meanwhile, to hedge exchange rate risk of relevant liabilities and the cash flow risk arising from the floating-rate, the Group purchases forward exchange contract and interest rate swap contract to mitigate the risk on related floating-rate borrowings denominated in foreign currency. The Group designates the floating-rate borrowings denominated in foreign currency as measured at fair value to reduce accounting mismatch. In 2019, relevant forward exchange contract and interest rate swap contract are due for settlement.
Note 4: On 17 November 2016, the Group completed acquisition of 56% of TFM equity held by Freeport. According to the terms of contingent consideration agreed in the acquisition agreement: if the monthly average delivery settlement price of LME Grade A copper is higher than USD3.50 per pound from 1 January 2018 to 31 December 2019, CMOC Limited shall pay PDK USD60 million no later than 10 January 2020. If the monthly average delivery settlement price of LME cobalt is higher than USD20 per pound within the 24 months from 1 January 2018 to 31 December 2019, CMOC Limited shall pay PDK USD60 million no later than 10 January 2020.
On 20 April 2017, the Group, through BHR controlled under the agreement, completed the acquisition of 24% of TFM's equity indirectly held by Lundin Mining Corporation. According to the agreement between both parties, Lundin enjoys the equal right to receive contingent consideration as Freeport does based on the transferred proportion of TFM's equity.
The Group recognizes the above contingent consideration as financial liabilities measured at fair value through profit or loss. As the above agreement has expired as at 31 December 2019, relevant consideration has been presented under other payables (Note V. 30) at the end of the year.

183China Molybdenum Co., Ltd.
NOTES TO THE FINANCIAL STATEMENTSFOR THE YEAR ENDED 31 DECEMBER 2019
(V) NOTES TO THE CONSOLIDATED FINANCIAL STATEMENTS (CONTINUED)
24. Derivative financial liabilities
Unit: RMB
Item 31 December 2019 31 December 2018
Derivative financial instrument of which hedge relationship is not designated (Note)
Commodity futures contracts 1,402,864,898.79 –Forward foreign exchange contracts 52,997,490.45 75,423,332.52Commodity option contracts 75,759,751.74 –Forward commodity contracts 1,109,305,912.09 –
Total 2,640,928,053.07 75,423,332.52
Note: For details, please refer to Note V. 3.
25. Notes payable
Unit: RMB
Categories 31 December 2019 31 December 2018
Bank acceptances (Note) 225,873,810.76 9,000,000.00Commercial acceptances 7,350,262.77 20,000,000.00
Total 233,224,073.53 29,000,000.00
Note: For details, please refer to Note V. 5 (3).
26. Accounts payable
Unit: RMB
Item 31 December 2019 31 December 2018
Payables for purchase of goods 1,665,858,901.82 959,709,363.91Others 278,647,504.80 159,363,735.15
Total 1,944,506,406.62 1,119,073,099.06
Aging analysis on accounts payable is set out as follows:
Unit: RMB
Item 31 December 2019 31 December 2018
Within 1 year 1,923,438,072.01 1,067,283,364.391 to 2 years 2,486,883.22 33,533,145.03Over 2 years 18,581,451.39 18,256,589.64
Total 1,944,506,406.62 1,119,073,099.06

184 2019 Annual Report
NOTES TO THE FINANCIAL STATEMENTSFOR THE YEAR ENDED 31 DECEMBER 2019
(V) NOTES TO THE CONSOLIDATED FINANCIAL STATEMENTS (CONTINUED)
27. Contract liabilities
Unit: RMB
Item 31 December 2019 31 December 2018
Receipts in advance of sales of goods (Note) 416,194,761.78 200,667,461.95
Total 416,194,761.78 200,667,461.95
Note: The Group recognized the receipts in advance collected on a basis of commodity sales contract as contract liabilities, and relevant contract liabilities were recognized as sales income when the control over the goods were transferred to the customers.
The receipts in advance for goods at the beginning of year have been recognized as income in the current year.
At the end of year, the contract liabilities of RMB415,578,082.85 at book value are expected to be recognized as income in 2020, and RMB616,678.93 is expected to be recognized as income in 2021 or subsequent years.
28. Employee benefits payable
(1) Details of employee benefits payable are as follows:
Unit: RMB
Item 1 January 2019Increase in the
current yearIncrease due to
consolidationDecrease in the
current year
Translation difference of
financial statements
denominated in foreign
currencies31 December
2019
1. Short-term compensation 459,511,097.23 2,129,416,072.10 144,977,176.84 2,095,894,383.21 7,427,137.61 645,437,100.572. Retirement benefits-defined
contribution plans 8,821,050.26 206,507,550.08 – 207,494,476.27 (179,667.24) 7,654,456.833. Others (Note) 49,012,312.29 12,595,107.02 – 22,753,566.31 692,767.84 39,546,620.84
Total 517,344,459.78 2,348,518,729.20 144,977,176.84 2,326,142,425.79 7,940,238.21 692,638,178.24
Note: It represents the liabilities related to annual leave and long service leave which are provided by Group's subsidiary in Australia to its employees and short-term compensation plan which is provided by Group's subsidiary in Congo (DRC) to its employees, expected to be paid within 12 months.

185China Molybdenum Co., Ltd.
NOTES TO THE FINANCIAL STATEMENTSFOR THE YEAR ENDED 31 DECEMBER 2019
(V) NOTES TO THE CONSOLIDATED FINANCIAL STATEMENTS (CONTINUED)
28. Employee benefits payable (Continued)
(2) Details of short-term compensation are as follows:
Unit: RMB
Item 1 January 2019Increase in the
current yearIncrease due to
consolidationDecrease in the
current year
Translation difference of
financial statements
denominated in foreign
currencies31 December
2019
I. Wages or salaries, bonuses, allowances and subsidies 445,968,993.85 1,955,671,470.43 144,977,176.84 1,922,105,987.65 7,001,860.17 631,513,513.64
II. Staff welfare 1,901,132.09 39,515,418.91 – 40,838,308.13 20,490.03 598,732.90III. Social security contributions 572,868.44 49,143,926.33 – 49,278,570.67 404,787.41 843,011.51
Including: Medical insurance 132,766.49 41,598,327.15 – 41,374,182.31 404,787.41 761,698.74Maternity
insurance 2,066.02 2,920,242.79 – 2,890,644.35 – 31,664.46Work injury
insurance 438,035.93 4,625,356.39 – 5,013,744.01 – 49,648.31IV. Housing funds 210,292.02 64,624,448.31 – 64,490,128.61 – 344,611.72V. Termination benefits – 4,982,728.91 – 3,880,542.93 – 1,102,185.98VI. Labor union and staff
education fund 10,857,810.83 15,478,079.21 – 15,300,845.22 – 11,035,044.82
Total 459,511,097.23 2,129,416,072.10 144,977,176.84 2,095,894,383.21 7,427,137.61 645,437,100.57
All the employee compensation payables are not overdue and not related to non-cash benefits, which will be expected to paid out in 2020.
(3) Retirement benefits – defined contribution plans
Unit: RMB
Item 1 January 2019Increase in the
current yearIncrease due to
consolidationDecrease in the
current year
Translation difference of
financial statements
denominated in foreign currencies
31 December 2019
1. Basis pension insurance 8,817,611.73 202,582,609.85 – 203,576,874.59 (179,667.24) 7,643,679.752. Unemployment insurance 3,438.53 3,924,940.23 – 3,917,601.68 – 10,777.08
Total 8,821,050.26 206,507,550.08 – 207,494,476.27 (179,667.24) 7,654,456.83
The Group participates, as required, in the pension insurance and unemployment insurance plan established by government institutions. According to such plans, the Group contributes monthly to such plans based the employee's basic salary. Except for above monthly contributions, the Group does not assume further payment obligations. The related expenditures are either included in cost of related assets or charged to profit or loss in the period when they are incurred.
In this year, the Group should contribute pension insurance and unemployment plans amounting to RMB202,582,609.85 and RMB3,924,940.23 (2018: RMB122,205,053.39and RMB2,146,983.85). As at 31 December 2019, the Group has outstanding contributions to pension insurance and unemployment plans that is due as of the reporting period amounting to RMB7,643,679.75 and RMB10,777,08 (31 December 2018: RMB8,817,611.73and RMB3,438.53). The relevant contributions have been paid after the reporting period.

186 2019 Annual Report
NOTES TO THE FINANCIAL STATEMENTSFOR THE YEAR ENDED 31 DECEMBER 2019
(V) NOTES TO THE CONSOLIDATED FINANCIAL STATEMENTS (CONTINUED)
29. Taxes payable
Unit: RMB
Item 31 December 2019 31 December 2018
PRC enterprise income tax 81,185,393.38 54,587,686.10Australia enterprise income tax 9,583,112.11 32,604,102.35Brazil enterprise income tax 68,106,596.92 120,387,200.95Congo (DRC) enterprise income tax 445,644.40 502,591,483.86Enterprise income tax of NSRC and its subsidiaries 126,238,562.11 –Urban maintenance and construction tax 158,532.08 2,087,423.36Value added tax 21,361,136.76 60,573,581.82Resource tax and royalties of mineral rights 14,610,318.74 244,149,616.24Education surcharges 316,963.94 2,287,877.21Individual income tax 28,688,231.54 57,786,768.77Congo (DRC) exchange tax 12,397,430.34 –Others 36,159,276.86 33,145,628.70
Total 399,251,199.18 1,110,201,369.36
30. Other payables
30.1 Summary of other payables
Unit: RMB
Item 31 December 2019 31 December 2018
Dividends payable 27,885,796.67 27,885,796.67Interest payable 246,838,776.68 230,624,891.14Other payables 1,310,013,350.12 769,271,109.25
Total 1,584,737,923.47 1,027,781,797.06
30.2 Dividends payable
Unit: RMB
Name of entity 31 December 2019 31 December 2018
Luanchuan Taifeng Industry and Trading Co., Ltd. (Note) 6,623,109.24 6,623,109.24Luanchuan Hongji Mining Co., Ltd. (Note) 15,943,017.89 15,943,017.89Luanchuan Chengzhi Mining Co., Ltd. (Note) 5,319,669.54 5,319,669.54
Total 27,885,796.67 27,885,796.67
Note: Minority shareholders of subsidiaries of the Group.

187China Molybdenum Co., Ltd.
NOTES TO THE FINANCIAL STATEMENTSFOR THE YEAR ENDED 31 DECEMBER 2019
(V) NOTES TO THE CONSOLIDATED FINANCIAL STATEMENTS (CONTINUED)
30. Other payables (Continued)
30.3 Interest payable
Unit: RMB
Item 31 December 2019 31 December 2018
Interest payable on bank borrowings 120,671,734.02 164,492,288.40Interest payable on medium-term notes with periodic
payments of interest payable and return of principal at maturity (Note 1) 66,132,602.75 66,132,602.74
Interest payable on corporate bonds in USD (Note 2) 49,061,289.22 –Interest payable on super short-term commercial paper 6,986,301.38 –Interest payable on corporate bonds in RMB 3,986,849.31 –
Total 246,838,776.68 230,624,891.14
Note 1: For the details, refer to Note V. 34.
Note 2: Interest payable on bonds in USD arises from the issuance of bonds in USD by CMOC Capital (a subsidiary of the Group). For the details, refer to Note V. 34.
30.4 Other payables
(a) Other payables by nature:
Unit: RMB
Item 31 December 2019 31 December 2018
Project and equipment funds 197,865,927.99 369,012,315.81Loyalties due to Gécamines 14,976,606.41 7,455,476.80Service and transportation expenses 74,337,086.32 159,496,614.87Electricity charge compensation due to SNEL
(Note 1) 69,762,000.00 68,632,000.00Deposits and advances 75,235,802.92 40,059,693.22Service fees payable 11,592,051.56 341,333.57Resource expenses payable 145,516,732.23 50,624,603.16Land compensation 2,980,567.50 1,616,800.00Consideration payable for acquisition
(Note V. 23, note 4) 597,959,999.97 –Others 119,786,575.22 72,032,271.82
Total 1,310,013,350.12 769,271,109.25
Note 1: TFM and SNEL had a dispute on the future fee of electricity in 2015, the management of TFM accrued the compensation based on the best estimation of the possible cash outflow in the future.

188 2019 Annual Report
NOTES TO THE FINANCIAL STATEMENTSFOR THE YEAR ENDED 31 DECEMBER 2019
(V) NOTES TO THE CONSOLIDATED FINANCIAL STATEMENTS (CONTINUED)
31. Non-current liabilities due within one year
Unit: RMB
Item 31 December 2019 31 December 2018
Long-term borrowings due within one year (Note V. 33) 3,663,675,996.17 2,922,422,080.00Lease liabilities due within one year (Note V. 35) 85,427,664.45 –Others – 7,417,144.28
Total 3,749,103,660.62 2,929,839,224.28
32. Other current liabilities
Unit: RMB
Item 31 December 2019 31 December 2018
Other accrued expenses 167,803,612.80 130,541,907.62Super short-term commercial paper (Note 1) 1,000,000,000.00 –
Total 1,167,803,612.80 130,541,907.62
Note 1: The Company issued super short-term commercial paper (19 Luanchuan Molybdenum SCP003) with par value of RMB1,000,000,000.00 at a fixed rate of 3.4% per annum with a maturity of 180 days, on 16 October 2019. The relevant bonds are permitted to trade and circulate on the National Inter-bank Bond Market.
33. Long-term borrowings
(1) Categories of long-term borrowings
Unit: RMB
Item 31 December 2019 31 December 2018
Secured borrowings (Note 1) 13,927,202,403.68 16,268,306,635.19Unsecured and non-guaranteed loans (Note 2) 6,015,383,358.37 6,850,970,277.55Less: long-term borrowings due within one year
(Note V. 31) 3,663,675,996.17 2,922,422,080.00
Total 16,278,909,765.88 20,196,854,832.74
Note 1: Borrowings obtained by the Group are through pledge of fixed deposits, equity of subsidiaries, held-for-trading financial assets and inventories, including:
In September 2016, CMOC LUXEMBOURG S.À.R.L (hereinafter referred to as "CMOC LUXEMBOURG") and CMOC BRASIL, the subsidiaries of the Group, obtained a total of USD900 million (equivalent to RMB6.2 billion) acquisition syndicated loan for the payment of the consideration of acquisition of the Brazil Niobium-Phosphorus business, which will be repaid by the agreed installments during the period from 14 September 2018 to 14 September 2023, with interest rates range from 3-month USD libor + 1.8% to 3-month USD libor + 2.75%; the Group pledged the 100% equity interest in CMOC LUXEMBOURG to the Bank of China Luxembourg branch and provide a joint guarantee.

189China Molybdenum Co., Ltd.
NOTES TO THE FINANCIAL STATEMENTSFOR THE YEAR ENDED 31 DECEMBER 2019
(V) NOTES TO THE CONSOLIDATED FINANCIAL STATEMENTS (CONTINUED)
33. Long-term borrowings (Continued)
(1) Categories of long-term borrowings (Continued)
Note1: (Continued)
In November 2016, CMOC DRC LIMITED (hereinafter referred to as "CMOC DRC"), a subsidiary of the Group, obtained a total of US $1.59 billion (equivalent to RMB11 billion) acquisitions syndicated loan for the payment of the consideration of acquisition of the Congo Copper-Cobalt business, which will be repaid by the agreed installments during the period from 15 March 2018 to 15 November 2023, with interest rates range from 3-month USD libor + 1.7% to 3-month USD libor + 2.2%; the Group pledged the 100% equity interest in CMOC DRC to the bank and provide a joint guarantee.
Note 2: On 6 April 2017, the Group's subsidiary BHR signed a syndicated credit loan agreement of a total loan commitment amount of USD690 million for the acquisition of 30% equity in TFHL. The syndicated loan will be repaid in instalments between 6 July 2019 and 6 April 2024 according to the agreement, and interest rate ranges from 3-month USD LIBOR plus 2.50% to 3-month USD LIBOR plus 2.64%.
The related default clauses have been agreed in the above loan contracts of the Group. The management of the Group verified the link indicators as agreed in the relevant default clauses at the end of each accounting period to determine that no events causing default existed.
(2) Analysis of long-term borrowings due over one year:
Unit: RMB
Expiration date 31 December 2019 31 December 2018
1 to 2 years 6,201,190,465.58 3,512,041,857.172 to 5 years 10,077,719,300.30 14,506,433,295.57More than 5 years – 2,178,379,680.00
Total 16,278,909,765.88 20,196,854,832.74
As 31 December 2019, the interest rate for the above loans was 1.0090% to 4.4770% per annum (31 December 2018: 0.5447% to 4.5225% per annum).
As at 31 December 2019, there is no outstanding long-term borrowing of the Group due but not paid.
34. Bonds payable
(1) Bonds payable
Unit: RMB
Item 31 December 2019 31 December 2018
Medium-term note 2,000,000,000.00 2,000,000,000.00Corporate bonds in RMB 1,000,000,000.00 –Corporate bonds in USD 2,092,860,000.00 –
Total 5,092,860,000.00 2,000,000,000.00

190 2019 Annual Report
NOTES TO THE FINANCIAL STATEMENTSFOR THE YEAR ENDED 31 DECEMBER 2019
(V) NOTES TO THE CONSOLIDATED FINANCIAL STATEMENTS (CONTINUED)
34. Bonds payable (Continued)
(2) Changes in bonds payable
Unit: RMB
Name Par value Issue date Term Issue amount 1 January 2019
Payment in
this year
Issued amount
for the year
Accrued interest
at par value
Interests paid
during the year
Closing interest
payable
Amortization of
premium and
depreciation
Exercise of
convertible
option during
the period
Amount due
within one year 31 December 2019 Name
16 Luanchuan Molybdenum
MTN001 (Note 1) 2,000,000,000.00 17 March 2016 5 years 2,000,000,000.00 2,000,000,000.00 – – 84,400,000.00 84,400,000.00 66,132,602.75 – – – – 2,000,000,000.00
19 CMOC 01 (Note 2) 1,000,000,000.00 28 November 2019 3 years 1,000,000,000.00 – – 1,000,000,000.00 3,986,849.31 – 3,986,849.31 – – – – 1,000,000,000.00
CMOC CAP B2202 (Note 3) USD300,000,000.00 1 February 2019 3 years 2,010,750,000.00 – – 2,010,750,000.00 106,405,653.22 57,344,364.00 49,061,289.22 – – 82,110,000.00 – 2,092,860,000.00
Total 5,010,750,000.00 2,000,000,000.00 – 3,010,750,000.00 194,792,502.53 141,744,364.00 119,180,741.28 – – 82,110,000.00 – 5,092,860,000.00
Note 1: The Company issued medium-term notes with a total par value of RMB2 billion (referred to: 16 Luanchuan Molybdenum MTN001) on 17 March 2016; and the relevant bonds are permitted to trade and circulate on the National Inter-bank Bond Market. The proceeds from the issue of the medium-term financing bonds were used to supply the Company and its subsidiaries' working capital and repayment of bank borrowings. The annual interest rate of the medium-term notes is a fixed rate, 4.22% with a term of 5 years and the interest is paid once a year in the duration. See Note V. 30 for the details of interest payable.
Note 2: The Company issued corporate bonds with par value of RMB1,000,000,000.00 (19 CMOC 01) on 28 November 2019. The relevant bonds are permitted to trade and circulate on the National Inter-bank Bond Market. Proceeds from issuance of the bonds were used as supplement to working capital of the Company and its subsidiaries and repayment of bank loans. The bonds bear a fixed interest rate of 4.28% per annum, with maturity of 3 years. Relevant interest shall be paid once a year in the duration of bonds. Please refer to Note V. 30 for interest payable.
Note 3: The Company's subsidiary issued bonds in USD with par value of USD300,000,000.00 on 1 February 2019 (CMOC CAP B2202). Relevant bonds are issued in HKEX. Proceeds from issuance of the bonds were used for the Company's general operation, including but not limit to repayment of partial existing debts of the Company. The bonds bear a fixed interest rate of 5.45% per annum, with maturity of 3 years. Relevant interest shall be paid twice a year in the duration of bonds. Please refer to Note V. 30 for interest payable.
35. Lease liabilities
Unit: RMB
Item 31 December 2019 31 December 2018
Operating lease payables 359,398,855.63Less: Lease liabilities included in non-current liabilities due
within 1 year (Note V. 31) 85,427,664.45
Total 273,971,191.18
The Group is not exposed to significant liquidity risk related to lease liabilities.

191China Molybdenum Co., Ltd.
NOTES TO THE FINANCIAL STATEMENTSFOR THE YEAR ENDED 31 DECEMBER 2019
(V) NOTES TO THE CONSOLIDATED FINANCIAL STATEMENTS (CONTINUED)
36. Long-term employee benefits payable
Unit: RMB
Item 31 December 2019 31 December 2018
1. Retirement benefits-net liability from defined benefit plan 227,754,812.25 107,051,507.492. Other long-term benefits
– Long service leave (Note) 23,930,847.09 19,851,708.41– Others 2,563,348.88 2,161,509.93
Total 254,249,008.22 129,064,725.83
Note: It represents liabilities relating to annual leave and long service leave accrued for employees by overseas companies of the Group, in which the portion expected to be paid within 12 months is accounted for in employee benefits payable.
37. Provisions
Unit: RMB
Item 31 December 2019 31 December 2018
Rehabilitation and asset abandonment cost (Note 1) 1,993,671,838.59 1,327,862,803.97Lawsuit (Note 2) 501,499,725.11 580,221,302.81
Total 2,495,171,563.70 1,908,084,106.78
Note 1: The Group has the obligation of rehabilitation, environmental restoration and dismantling of related assets due to the environmental impact caused by mineral production and development activities. The management's best estimate of future economic benefits outflow generated from the above obligations is recognized as provision upon discounting. The above estimate is determined based on the industry practices and the current local laws and regulations, and significant changes in related laws and regulations may have a significant impact on the Group's estimate.
Note 2: The Group's Niobium-Phosphorus business in Brazil is facing with a series of local litigations and disputes related to tax matters, labors and other civil cases. When the relevant litigations are likely to lose and result in economic benefits outflow, the management of the Group estimate the amount of potential economic benefits outflow and make corresponding provisions.

192 2019 Annual Report
NOTES TO THE FINANCIAL STATEMENTSFOR THE YEAR ENDED 31 DECEMBER 2019
(V) NOTES TO THE CONSOLIDATED FINANCIAL STATEMENTS (CONTINUED)
38. Deferred income
Unit: RMB
Item 31 December 2019 31 December 2018
Refunds of land-transferring fees (Note 1) 14,587,996.10 14,973,581.90R & D subsidies (Note 2) 3,000,000.00 3,000,000.00Demonstration base project subsidies (Note 2) 47,866,609.80 54,873,395.54Comprehensive tax and industrialization award for large-scale
tungsten associated copper rhenium 1,200,000.00 1,200,000.00Subsidy for the closure of Luchanggou Tailing 1,230,000.00 –Others 120,644.00 45,416.80Less: deferred income carried forward with 1 year – 7,417,144.28Total 68,005,249.90 66,675,249.96
Note 1: It represents the refunds of land-transferring fees received by the Group, which is included in deferred revenue, and amortized in the period of land use with the straight-line method.
Note 2: It represents the special funds for major science and technology of Henan Province, the special funds for mineral resources conservation and comprehensive utilization and the subsidies for the central mineral resources comprehensive utilization demonstration base received by the Group, which are to be used for the study of key technologies for molybdenum-tungsten dressing and deep processing, included in deferred income, and recognized as an other income in the future when related technology research costs are incurred.
Projects related to government grants:
Unit: RMB
Item of liabilities 1 January 2019 Increase in the yearRecorded in
other income 31 December 2019Related to assets/
income (Note)
Deferred income-subsidies for low-grade scheelite demonstration project 54,873,395.54 – 7,006,785.74 47,866,609.80 Related to assets
Subsidies of the return of Nannihu land premium 14,973,581.90 – 385,585.80 14,587,996.10 Related to assets
Special funds for comprehensive utilization of 3,000 tons/day Molybdenum selection tailings 3,000,000.00 – – 3,000,000.00 Related to assets
Comprehensive tax and industrialization award for large-scale tungsten associated copper rhenium 1,200,000.00 – – 1,200,000.00 Related to assets
Subsidies for installation of heavy metal automatic monitoring facilities 45,416.80 – 24,772.80 20,644.00 Related to assets
Subsidy for closing Luchanggou Tailing – 1,230,000.00 – 1,230,000.00 Related to assetsConstruction of Heluo Craftman Workshop – 100,000.00 – 100,000.00 Related to assets
Total 74,092,394.24 1,330,000.00 7,417,144.34 68,005,249.90
Note: For the government grants to be received by the Company, it will be divided to asses-related government grants and income-related government grants according to the definition and requirements by the government. For those not clearly defined by the government documents, the Company will make judgment according to whether it can form assets or not.

193China Molybdenum Co., Ltd.
NOTES TO THE FINANCIAL STATEMENTSFOR THE YEAR ENDED 31 DECEMBER 2019
(V) NOTES TO THE CONSOLIDATED FINANCIAL STATEMENTS (CONTINUED)
39. Other non-current liabilities
Unit: RMB
Item 31 December 2019 31 December 2018
Principal, interest and others payable to third parties 2,307,688.45 –Production progress fees payable to Gécamines (Note 1) 69,762,000.00 68,632,000.00Acquisition consideration payable to BHR shareholders (Note 2) – 3,225,704,000.00Deferred management bonus (Note 3) 46,250,434.05 –Share-based payments (Note 4) 119,631,887.87 –Others 189,508.47 –
Total 238,141,518.84 3,294,336,000.00
Note 1: In accordance with the mining agreement entered into between the Group and Gécamines, Gécamines needs to charge TFM production progress fees. On 31 December 2019, the outstanding payment is USD10 million; according to TFM's production plan, the remaining amount is expected to be paid after 2020.
Note 2: As disclosed in Note I. 2 and 3, at 20 January 2017, the Group concluded a frame cooperation agreement with BHR and its investors to obtain the control of BHR and its affiliated assets in the manner of control by agreement, and meanwhile promise to provide fixed annualized withdrawal returns to the investors of BHR over the corresponding period. The Group paid off consideration payable to shareholders of BHR in advance in 2019.
Note 3: It represents the management bonus determined before IXM becoming a subsidiary of the Group. The closing balance will be paid by installment in three years, of which, the portion expected to be paid within 12 months is presented under employee benefits payable.
Note 4: In 2018 and 2019, IXM announced a cash-settled share-based payment plan (Phantom Equity Retention Plan, "PERP") which will be exercised in five years and a cash-settled share-based payment plan (Phantom Equity Participant Plan, "PEPP") which will be exercised in four years, respectively. Both PERP and PEPP vested 25% per annum during the period from 2020 to 2023, and will be expired in 2029. Vesting conditions of PERP are mainly related to the net assets of IXM and employees' personal performance, while requiring employees continuing employment with IXM; Vesting conditions of PEPP are mainly related to requirement for continuing employment with IXM. In 2019, other non-current liabilities related to PERP and PEPP amounting to RMB110,331,699.39 and RMB9,300,188.48 were recognized respectively.

194 2019 Annual Report
NOTES TO THE FINANCIAL STATEMENTSFOR THE YEAR ENDED 31 DECEMBER 2019
(V) NOTES TO THE CONSOLIDATED FINANCIAL STATEMENTS (CONTINUED)
40. Share capital
As at 31 December 2019, the Company issues 21,599,240,583 shares, the par value of the Company's share is RMB0.2 per share, and the total capital stock is RMB4,319,848,116.60. The structures and types of shares are shown as follow:
Unit: shares
Changes for the year
1 January 2019 Issuing new shares BonusCapitalization of surplus reserve Others (Note) Sub-total 31 December 2019
2019:I. Shares restricted for trading
1. Shareholding of state-own legal-person – – – – – – –
2. Other domestic-owned shares – – – – – – –Total amount of shares restricted for
trading – – – – – – –II. Unrestricted trading shares
1. Ordinary shares denominated in RMB 17,665,772,583 – – – – – 17,665,772,583
2. Foreign-owned shares listed overseas 3,933,468,000 – – – – – 3,933,468,000
Total amount of unrestricted trading shares 21,599,240,583 – – – – – 21,599,240,583
III. Total amount of shares 21,599,240,583 – – – – – 21,599,240,583
2018:I. Shares restricted for trading
1. Shareholding of state-own legal-person – – – – – – –
2. Other domestic-owned shares 4,712,041,884 – – – (4,712,041,884) (4,712,041,884) –Total amount of shares restricted for
trading 4,712,041,884 – – – (4,712,041,884) (4,712,041,884) –II. Unrestricted trading shares
1. Ordinary shares denominated in RMB 12,953,730,699 – – – 4,712,041,884 4,712,041,884 17,665,772,583
2. Foreign-owned shares listed overseas 3,933,468,000 – – – – – 3,933,468,000
Total amount of unrestricted trading shares 16,887,198,699 – – – 4,712,041,884 4,712,041,884 21,599,240,583
III. Total amount of shares 21,599,240,583 – – – – – 21,599,240,583
Note: As at 24 July 2017, the Company privately placed 4,712,041,884 shares of RMB ordinary shares (A-share) to specific objects at a price of RMB3.82 per share with a par value of RMB0.20, and the total amount of funds raised was RMB17,999,999,996.88; after deducting the issuance expenses, the net of raised funds amounted to RMB17,858,632,663.30, including share capital of RMB942,408,376.80. After the issuance, the share capital of the Company was increased from 16,887,198,699 shares to 21,599,240,583 shares. The restricted stock trade period for the new shares is 12 months and restriction has been released in July 2018.

195China Molybdenum Co., Ltd.
NOTES TO THE FINANCIAL STATEMENTSFOR THE YEAR ENDED 31 DECEMBER 2019
(V) NOTES TO THE CONSOLIDATED FINANCIAL STATEMENTS (CONTINUED)
41. Capital reserve
Unit: RMB
Item 1 January 2019 Increase in the year Decrease in the year 31 December 2019
2019:Total capital premium 27,582,794,983.23 – – 27,582,794,983.23Including: Capital invested by investors 27,580,672,943.23 – – 27,580,672,943.23Others 2,122,040.00 – – 2,122,040.00
Total 27,582,794,983.23 – – 27,582,794,983.23
Item 1 January 2018 Increase in the year Decrease in the year 31 December 2018
2018:Total capital premium 27,582,794,983.23 – – 27,582,794,983.23Including: Capital invested by investors 27,580,672,943.23 – – 27,580,672,943.23Others 2,122,040.00 – – 2,122,040.00
Total 27,582,794,983.23 – – 27,582,794,983.23
42. Other comprehensive income
Unit: RMB
Amount recognized in the current year
Item 1 January 2019
Actual amount before income tax in the year
Less: Amount previously
included in other comprehensive
income transferred into
profit or lossLess: income tax expense
After-tax amount attributable to
owners of the parent company
After-tax amount attributable to minority
shareholder
Less: Amount previously
included in other comprehensive
income transferred into
retained earnings31 December
2019
I. Ot her comprehensive income that will not be reclassified to profit or loss (39,458,225.43) 77,702,248.27 – 17,261,474.99 60,440,773.28 – 44,800,000.00 (23,817,452.15)
Including: Ch anges in fair value of other investments in equity instruments (39,458,225.43) 87,140,719.07 – 18,396,305.79 68,744,413.28 – 44,800,000.00 (15,513,812.15)
Remeasurement of changes in defined benefit plans – (9,438,470.80) – (1,134,830.80) (8,303,640.00) – – (8,303,640.00)
II. Ot her comprehensive income that may be reclassified subsequently to profit or loss (759,869,194.78) 308,470,144.49 20,401,134.40 (27,029,273.71) 315,098,283.80 135,174,423.80 – (444,770,910.98)
Including: Cash flow hedge reserve (17,113,194.35) (179,673,041.01) 20,401,134.40 (27,029,273.71) (173,044,901.70) – – (190,158,096.05)Other comprehensive income that
may be reclassified to profit or loss under equity method (20,822,262.48) 20,822,262.48 – – 20,822,262.48 – – –
Foreign exchange difference from translation of financial statements (721,933,737.95) 467,320,923.02 – – 467,320,923.02 135,174,423.80 – (254,612,814.93)
Total of other comprehensive income (799,327,420.21) 386,172,392.76 20,401,134.40 (9,767,798.72) 375,539,057.08 135,174,423.80 44,800,000.00 (468,588,363.13)

196 2019 Annual Report
NOTES TO THE FINANCIAL STATEMENTSFOR THE YEAR ENDED 31 DECEMBER 2019
(V) NOTES TO THE CONSOLIDATED FINANCIAL STATEMENTS (CONTINUED)
43. Special reserve
Unit: RMB
Item 1 January 2019 Increase in the year Decrease in the year 31 December 2019
2019:Safety production expense 3,038,386.94 163,424,044.33 166,160,285.81 302,145.46
Total 3,038,386.94 163,424,044.33 166,160,285.81 302,145.46
Item 1 January 2018 Increase in the year Decrease in the year 31 December 2018
2018:Safety production expense 7,725,910.79 133,704,462.03 138,391,985.88 3,038,386.94
Total 7,725,910.79 133,704,462.03 138,391,985.88 3,038,386.94
44. Surplus reserve
Unit: RMB
Item 1 January 2019 Increase in the year Decrease in the year 31 December 2019
2019:Statutory surplus reserve (Note) 1,160,396,190.21 126,430,810.70 – 1,286,827,000.91
Item 1 January 2018 Increase in the year Decrease in the year 31 December 2018
2018:Statutory surplus reserve (Note) 968,190,696.10 192,205,494.11 – 1,160,396,190.21
Note: In accordance with the Company Law of the PRC, the Company appropriated the statutory surplus reserve at 10% of the net profit of 2019, which amounts to RMB126,430,810.70 (2018: RMB192,205,494.11).

197China Molybdenum Co., Ltd.
NOTES TO THE FINANCIAL STATEMENTSFOR THE YEAR ENDED 31 DECEMBER 2019
(V) NOTES TO THE CONSOLIDATED FINANCIAL STATEMENTS (CONTINUED)
45. Retained profits
Unit: RMB
Item 31 December 2019 31 December 2018
Retained profits at the end of previous year 8,682,123,314.63 5,880,287,139.89Add: Net profit attributable to shareholders of the parent
company for the year 1,857,014,210.98 4,635,583,953.16Transferred from other comprehensive income 44,800,000.00 –
Less: Appropriation to statutory surplus reserve (Note 1) 126,430,810.70 192,205,494.11Ordinary shares payable (Note 2) 2,375,916,464.13 1,641,542,284.31
Retained profits at the end of current year 8,081,590,250.78 8,682,123,314.63
Note 1: Refer to Note V.44 for details.
Note 2: Cash dividend has been approved in shareholders' meeting of the year.
As resolved at the Company's 2018 annual general meeting on 14 June 2019, the Company distributed to all shareholders cash dividends of RMB0.011 per share, RMB2,375,916,464.13 in total (2018: RMB1,641,542,284.31).
Note 3: Profit distribution declared after the balance sheet date.
According to a proposal of the board of directors, on the basis of 21,599,240,583 issued shares (with the par value of RMB0.2 per share), dividends in cash of RMB0.43 for every ten shares (2018: RMB0.11 per share) will be distributed to all the shareholders.
46. Operating income and operating costs
(1) Operating income (by category):
Unit: RMB
2019 2018Item Revenue Costs Revenue Costs
Principal operating activities 68,473,937,938.91 65,411,048,279.05 25,785,918,756.05 16,010,717,728.76Including: Sales of goods 19,297,085,807.79 14,756,114,519.74 25,785,918,756.05 16,010,717,728.76
Metal trading 49,176,852,131.12 50,654,933,759.31 – –Other operating activities 202,627,069.88 194,643,397.35 176,944,017.72 169,529,391.70Including: Income from hotel
services 65,879,624.30 47,753,389.08 58,766,484.37 47,841,714.15Other income 136,747,445.58 146,890,008.27 118,177,533.35 121,687,677.55
Total 68,676,565,008.79 65,605,691,676.40 25,962,862,773.77 16,180,247,120.46

198 2019 Annual Report
NOTES TO THE FINANCIAL STATEMENTSFOR THE YEAR ENDED 31 DECEMBER 2019
(V) NOTES TO THE CONSOLIDATED FINANCIAL STATEMENTS (CONTINUED)
46. Operating income and operating costs (Continued)
(2) Principal operating activities (classified by products)
Unit: RMB
2019 2018Name of products Revenue Costs Revenue Costs
Molybdenum, tungsten and related products 4,505,451,936.38 2,127,804,615.84 4,749,130,358.46 1,888,847,291.12
Niobium related products 2,266,737,876.53 1,462,542,498.12 2,155,536,187.79 1,508,705,257.58Phosphorus related products 2,832,467,143.61 2,294,591,570.59 2,821,185,746.52 2,323,517,812.18Copper, cobalt and related products 8,331,866,319.98 7,818,073,933.04 14,373,797,900.75 9,172,220,457.93Copper, gold and related products 1,322,524,050.21 1,030,953,199.21 1,458,264,277.62 1,030,876,464.38Concentrates metal trading 13,806,496,826.50 15,344,493,459.78 – –Refined metal trading 35,370,355,304.62 35,310,440,299.53 – –Others 38,038,481.08 22,148,702.94 228,004,284.91 86,550,445.57
Total 68,473,937,938.91 65,411,048,279.05 25,785,918,756.05 16,010,717,728.76
(3) Performance obligations
Sales of goods and metal business:
The Group sells mineral products including molybdenum, tungsten, niobium, phosphorus, copper, cobalt and gold, and copper, lead and zinc concentrates, refined metals, aluminium and other secondary metals to customers. In general, contracts on sales of relevant products solely contain one performance obligation, i,e, delivery of goods. The consideration for sales of products is determined based on the fixed price in the sales contract or temporary pricing arrangement. Revenue is recognized upon transfer of control to the client. Revenue from sales in the temporary pricing arrangement is recognized based on the fair value of products upon recognition of sales. Subsequent changes in the fair value of accounts receivable is included in revenue from sales of goods.
In the meanwhile, the Group carries out business by receipts in advance or sales on credit based on credit status of counterparties.
Income from hotel services:
The Group renders services to clients based on its own hotels, relevant revenue is recognized in the period when clients receives and consumes relevant services.
Other income:
The Group also provides customers with ancillary services including diesel and electricity, and receives revenue. Relevant revenue is recognized in the period when the customer obtains and consumes the goods.

199China Molybdenum Co., Ltd.
NOTES TO THE FINANCIAL STATEMENTSFOR THE YEAR ENDED 31 DECEMBER 2019
(V) NOTES TO THE CONSOLIDATED FINANCIAL STATEMENTS (CONTINUED)
46. Operating income and operating costs (Continued)
(4) Transaction prices allocated to unfulfilled (or partially performed) performance obligations and estimated timing for recognition of revenue:
Unit: RMB
Item Within 1 year 1-2 years 2-3 years Over 3 years Total
Molybdenum, tungsten and related products 89,345,240.58 – – – 89,345,240.58
Niobium related products – – – – –Phosphorus related
products 41,343,763.19 – – – 41,343,763.19Copper, cobalt and related
products 233,231,265.43 – – – 233,231,265.43Concentrates metal
trading 165,449,861.35 – – – 165,449,861.35Refined metal trading 116,151,246.47 – – – 116,151,246.47Others 20,872,872.44 101,115.48 – 850,944.04 21,824,931.96
Total 666,394,249.46 101,115.48 – 850,944.04 667,346,308.98
47. Taxes and levies
Unit: RMB
Item 2019 2018 Basis of calculation
Urban maintenance and construction tax 19,393,888.81 28,478,161.59 Note IVEducation surcharges 11,499,712.76 16,874,414.60 Note IVResource tax and royalties of mineral rights 680,177,121.92 858,283,891.36 Note IVOthers 101,645,478.68 115,156,668.06
Total 812,716,202.17 1,018,793,135.61
48. Selling expenses
Unit: RMB
Item 2019 2018
Salary, bonus and allowances 27,735,977.82 22,552,459.93Entertainment expenditures 2,274,749.37 1,763,395.47Traveling expense 4,791,553.98 3,720,342.20Market consulting fee 33,465,633.07 47,945,864.40Others 22,389,759.56 20,839,931.66
Total 90,657,673.80 96,821,993.66

200 2019 Annual Report
NOTES TO THE FINANCIAL STATEMENTSFOR THE YEAR ENDED 31 DECEMBER 2019
(V) NOTES TO THE CONSOLIDATED FINANCIAL STATEMENTS (CONTINUED)
49. Administrative expenses
Unit: RMB
Item 2019 2018
Salary, bonus and allowances 538,014,474.10 375,372,448.18Depreciation and amortization 159,654,092.85 94,397,645.37Consulting and agency fees 174,987,696.26 282,718,806.59Entertainment expenditures 34,877,757.06 21,299,752.05Insurance costs 98,527,971.16 25,048,693.32Traveling expense 42,909,602.78 26,614,708.57Others 184,724,915.05 107,893,485.18
Total 1,233,696,509.26 933,345,539.26
50. Financial expenses
Unit: RMB
Item 2019 2018
Interest expenses on bonds 229,441,618.42 93,400,000.00Discount interest of notes receivables 15,287,693.50 21,961,919.70Interest expenses on lease liabilities 16,804,328.07 –Bank loans interest expenses 1,578,693,657.32 1,335,377,172.75Total interest expenses 1,840,227,297.31 1,450,739,092.45Less: Interest income 929,942,890.97 1,037,941,410.44Exchange differences (54,028,588.95) (248,004,137.17)Gold lease charges 82,099,619.58 115,799,546.91Returns paid to BHR shareholders (Note) 142,003,384.79 211,902,215.20Others 170,478,980.41 150,550,821.47
Total 1,250,837,802.17 643,046,128.42
Note: As described in Note I.2.3, on 20 January 2017, the Group entered into a framework agreement for cooperation with BHR and its investors, acquired the control of BHR and its accessory assets based on the agreed control, and in the meanwhile promised to grant BHR's investors with returns for exit at a fixed rate per annum in corresponding period. Financial expenses were accrued based on the agreed returns.

201China Molybdenum Co., Ltd.
NOTES TO THE FINANCIAL STATEMENTSFOR THE YEAR ENDED 31 DECEMBER 2019
(V) NOTES TO THE CONSOLIDATED FINANCIAL STATEMENTS (CONTINUED)
51. Other income
Unit: RMB
Item 2019 2018Related to assets/Related to income
Government subsidies for stabilizing job posts 1,669,315.00 925,935.00 Related to incomeNannihu land transfer compensation 385,585.80 385,585.80 Related to assetsDeferred income-subsidies for low-grade scheelite
demonstration project 7,006,785.74 7,004,869.80 Related to assetsRewards for research and development 4,000,000.00 3,000,000.00 Related to incomeSubsidy for installation of heavy metal monitoring
facility 24,772.80 24,772.80 Related to assetsOthers 4,208,094.01 1,209,257.90 Related to income
Total 17,294,553.35 12,550,421.30
52. Investment income
(1) Details of investment income
Unit: RMB
Item 2019 2018
Income from long-term equity investments under equity method 21,744,539.34 69,110,578.55Gains on re-measurement of the fair value of the original long-term
equity investment upon the acquisition of the remaining equity in the joint venture (Note VI.1) 52,605,210.42 –
Investment income from other non-current financial assets in the current year (Note V. 12) 55,879,547.61 87,156,988.46
Investment income on disposal of held-for-trading financial assets 23,305,635.62 –Investment income on disposal of other non-current financial assets
(Note V. 12) 41,094,495.15 46,591,865.10Losses on disposal of derivative financial instruments – (589,586.35)
Total 194,629,428.14 202,269,845.76

202 2019 Annual Report
NOTES TO THE FINANCIAL STATEMENTSFOR THE YEAR ENDED 31 DECEMBER 2019
(V) NOTES TO THE CONSOLIDATED FINANCIAL STATEMENTS (CONTINUED)
52. Investment income (Continued)
(2) Gains (losses) from long-term equity investments under equity method:
Unit: RMB
Investee 2019 2018
Reasons for change between this year and last year
Yulu Mining 120,225,172.69 114,098,798.55The changes in profits of the invested company
Luoyang Shenyu 8,331.56 (177,816.66)The changes in profits of the invested company
High-tech (1,029,553.31) (7,066,150.12)The changes in profits of the invested company
Huan Yu (61,228,247.67) (56,493,675.24)The changes in profits of the invested company
Natural Resources Investment Fund (33,049,846.78) 18,749,422.02
The changes in profits of the invested company
You Qing (1,500,000.00) –The changes in profits of the invested company
Walvis Bay (1,573,631.88) –The changes in profits of the invested company
Huayue Nickel Cobalt (107,685.27) –The changes in profits of the invested company
Total 21,744,539.34 69,110,578.55The changes in profits of the invested company
There are no significant restrictions on remittance of investment income.
Investment income for both current and prior years is generated from the unlisted entities.
53. Gains (losses) from changes in fair value
Unit: RMB
2019 2018
Sources resulting in gains (losses) from changes in fair values:Gains (Losses) from changes in fair value of derivative financial instruments 2,286,536,445.42 (75,311,410.80)Losses from changes in fair values of gold lease and forward contract
measured at fair value (Note V. 23) (12,587,765.71) (29,484,358.79)Gains from changes in fair value of consumable biological assets (Note V. 8) 4,029,238.41 4,091,839.13Gains (Losses) on changes in fair value of the contingent consideration for the
acquisition of Congo (DRC) copper-cobalt business (Note V. 23) (38,551,625.73) 69,465,519.00Gains from the changes in the fair value of other non-current financial
assets at FVTPL 457,916,159.20 154,753,873.36Losses from the changes in the fair value of floating- rate foreign currency
loan contract, forward exchange contract and forward rate swap contract measured at fair value (Note V. 23) (10,879,956.62) (1,107,466.05)
Gains from changes in fair value of structured deposits 14,194,897.26 –Gains from changes in fair value of other held-for-trading financial assets 3,200,162.95 –
Total 2,703,857,555.18 122,407,995.85

203China Molybdenum Co., Ltd.
NOTES TO THE FINANCIAL STATEMENTSFOR THE YEAR ENDED 31 DECEMBER 2019
(V) NOTES TO THE CONSOLIDATED FINANCIAL STATEMENTS (CONTINUED)
54. Gains (losses) from credit impairment
Unit: RMB
Sources of credit impairment 2019 2018
Losses from bad debt of notes receivable (716,086.02) (12,350,471.85)Losses from bad debt of accounts receivable (4,612,888.56) (1,907,702.94)Gains (Losses) from bad debt of other receivables 747,670.57 (3,534,477.21)Losses from bad debt of other non-current assets (1,729,925.00) –
Total (6,311,229.01) (17,792,652.00)
55. Gains (Losses) from assets impairment
Unit: RMB
Item 2019 2018
Losses on decline in value of inventories (23,105,675.00) (34,967,300.30)Impairment losses on construction in progress – (31,615,388.19)Impairment losses on fixed assets (15,140,391.61) –
Total (38,246,066.61) (66,582,688.49)
56. Non-operating income
(1) Details of non-operating income:
Unit: RMB
Item 2019 2018
Government grants 3,608,926.28 1,960,000.00Bargain purchase arising from business combination
not under common control (Note VI. 1) 133,096,178.59 –Liquidated damages 20,616,623.88 –Others 13,066,153.58 618,175.70
Total 170,387,882.33 2,578,175.70
(2) Details of major government grants
Unit: RMB
Item 2019 2018Related to assets/Related to income
Policy rewards for private economy 2,500,000.00 – Related to incomeFund support for enterprise
technology center R & D platform – 1,100,000.00 Related to incomeCarried-forward subsidy for closing
Liushuigou Tailing – 860,000.00 Related to incomeOthers 1,108,926.28 – Related to income
Total 3,608,926.28 1,960,000.00

204 2019 Annual Report
NOTES TO THE FINANCIAL STATEMENTSFOR THE YEAR ENDED 31 DECEMBER 2019
(V) NOTES TO THE CONSOLIDATED FINANCIAL STATEMENTS (CONTINUED)
57. Non-operating expenses
Unit: RMB
Item 2019 2018
External donations 27,034,716.52 59,932,740.00Others 6,507,537.19 10,771,829.62
Total 33,542,253.71 70,704,569.62
58. Income tax expenses
Unit: RMB
Item 2019 2018
Current tax expenses calculated according to tax laws and relevant requirements 1,142,310,827.87 2,809,420,983.78
Differences arising on settlement of income tax for the previous year (6,609,658.92) 45,047,581.11Adjustments to deferred income tax (543,101,082.88) (1,014,652,655.50)
Total 592,600,086.07 1,839,815,909.39
Reconciliation of income tax expenses to the accounting profit is as follows:
Unit: RMB
2019 2018
Accounting profit 2,358,448,463.92 6,989,857,415.63Income tax expenses calculated at 15% (2018: 15%) 353,767,269.59 1,048,478,612.34Tax impact of non-deductible expenses 291,427,986.65 274,484,184.80Tax impact of tax free income/extra deductible expense (159,302,560.88) (78,381,156.49)
Tax impact of using previously unrecognized deductible losses and deductible temporary differences (1,811,160.89) (22,241,328.57)
Tax impact of unrecognized deductible loss and deductible temporary difference 7,751,430.48 14,603,307.41
Exchange rate impact of non-currency monetary items (Notes (V). 20, Note 2) (40,610,962.01) (41,104,893.32)
Deductible losses arising from tax return (Notes (V). 20, Note 2) (36,347,770.47) (154,482,424.28)Impact of different tax rate in subsidiaries in other jurisdictions 142,645,522.31 753,412,026.39Difference arising on settlement of income tax for the previous years (6,609,658.92) 45,047,581.11Tax for registered capital (Note) 8,051,598.58 –Changes in deferred income tax due to changes in tax rate 33,638,391.63 –
Total 592,600,086.07 1,839,815,909.39
Note: It represents the income tax paid based on the proportion of the registered capital under the tax law in Switzerland by IXM, the Group's subsidiary.

205China Molybdenum Co., Ltd.
NOTES TO THE FINANCIAL STATEMENTSFOR THE YEAR ENDED 31 DECEMBER 2019
(V) NOTES TO THE CONSOLIDATED FINANCIAL STATEMENTS (CONTINUED)
59. Calculation process of basic earnings per share and diluted earnings per share
For the purpose of calculating basic earnings per share, net profit for the current attributable to ordinary shareholders is as follows:
Unit: RMB
2019 2018
Net profit attributable to ordinary shareholders for the current year 1,857,014,210.98 4,635,583,953.16
In calculating the basic earnings per share, the denominator is the weighted average number of the issued and outstanding ordinary shares and its calculation process is as follows:
2019 2018
Number of ordinary shares issued at the beginning of year 21,599,240,583 21,599,240,583Add: Weighted average number of ordinary shares issued during the year – –Weighted average number of ordinary shares issued at the end of year 21,599,240,583 21,599,240,583
Earnings per share:
Unit: RMB
2019 2018
Calculated based on net profit attributable to shareholders of the Company:Basic earnings per share 0.09 0.21Diluted earnings per share N/A N/A
60. Notes to the cash flow statements
(1) Other cash received relating to operating activities
Unit: RMB
Item 2019 2018
IXM's receipts of settlement on investment income from derivative financial instruments 3,794,308,689.19 –
Receipts of interest income 855,855,351.20 1,127,367,187.31Receipts of compensative assets 43,443,739.57 –Receipts of government grants 13,167,409.01 8,295,192.90Others 46,482,794.05 618,175.70
Total 4,753,257,983.02 1,136,280,555.91

206 2019 Annual Report
NOTES TO THE FINANCIAL STATEMENTSFOR THE YEAR ENDED 31 DECEMBER 2019
(V) NOTES TO THE CONSOLIDATED FINANCIAL STATEMENTS (CONTINUED)
60. Notes to the cash flow statements (Continued)
(2) Other cash payments relating to operating activities
Unit: RMB
Item 2019 2018
IXM's payments of deposits for derivative financial instruments 1,143,247,916.44 –Payments for consulting fee, technology development fee and
transportation fee, etc. 762,691,974.45 872,791,117.25Payments of bank charges and consulting fees 28,807,240.06 55,991,820.38Payments of donations and penalty, etc. 33,542,253.71 58,445,000.00Others 61,623,762.77 184,135,938.98
Total 2,029,913,147.43 1,171,363,876.61
(3) Cash receipts from disposals and recovery of investments
Unit: RMB
Item 2019 2018
Cash receipts from withdrawal of bank structured deposits and wealth investment products of other financial institutions 3,826,228,265.13 5,999,365,075.34
Cash receipts from repayments of borrowings – 77,450,500.00Cash receipts from withdrawal of investment in other equity
instruments 456,000,000.00 –Cash receipts from withdrawal of other non-current financial assets 494,480,682.75 –Cash receipts from settlement of derivative instruments 7,467,840.94 –
Total 4,784,176,788.82 6,076,815,575.34
(4) Other cash receipts relating to investing activities
Unit: RMB
Item 2019 2018
Cash receipts from repayments of third parties and related parties 3,009,624,827.50 –

207China Molybdenum Co., Ltd.
NOTES TO THE FINANCIAL STATEMENTSFOR THE YEAR ENDED 31 DECEMBER 2019
(V) NOTES TO THE CONSOLIDATED FINANCIAL STATEMENTS (CONTINUED)
60. Notes to the cash flow statements (Continued)
(5) Net cash payments to acquire subsidiaries
Unit: RMB
Item Amount
Cash/cash equivalents paid in the current period for business combination occurred in the current period
Including: NSRC 3,416,902,221.72High-tech 120,395,000.00W-Source Holding Limited 7,885.26
Less: Cash and cash equivalents held by the subsidiary at the date of acquisition
Including: NSRC 1,463,979,419.17High-tech 4,308,179.25W-Source Holding Limited 7,885.26
Total 2,069,009.623.30
Note: Please refer to Note VI.1 for business combination.
(6) Cash payments to acquire investments
Unit: RMB
Item 2019 2018
Cash payments of purchasing bank structured deposits and wealth
investment products of other financial institutions 4,590,059,937.11 2,770,781,824.21
Cash payments of purchasing non-current financial assets 397,893,496.38 623,098,370.48
Cash payments of settlement derivative financial instrument 105,829,569.96 589,586.35
Cash payments for investment in Natural Resources Investment Fund – 1,457,743,680.00
Cash payments for investment in You Qing 1,500,000.00 –
Total 5,095,283,003.45 4,852,213,461.04
(7) Other cash payments relating to investing activities
Unit: RMB
Item 2019 2018
Cash payments for loans to third parties 17,843,254.65 26,911,616.95Cash payments for loans to related parties 255,627,445.55 1,038,298,500.00Cash payments for loans to suppliers 1,973,710,502.33 –
Total 2,247,181,202.53 1,065,210,116.95

208 2019 Annual Report
NOTES TO THE FINANCIAL STATEMENTSFOR THE YEAR ENDED 31 DECEMBER 2019
(V) NOTES TO THE CONSOLIDATED FINANCIAL STATEMENTS (CONTINUED)
60. Notes to the cash flow statements (Continued)
(8) Other cash receipts relating to financing activities
Unit: RMB
Item 2019 2018
Cash receipts from gold lease business 2,903,278,100.00 2,323,958,920.00Cash receipts from business of floating-rate foreign currency
loan contract and forward exchange contract and forward rate swap contract – 690,010,000.00
Total 2,903,278,100.00 3,013,968,920.00
(9) Other cash payments relating to financing activities
Unit: RMB
Item 2019 2018
Cash paid for gold leasing business 5,280,258,150.00 2,318,701,420.00Commission charge related to gold leasing business and guarantee fees related to loans 104,893,569.51 165,562,636.35Cash payments for the settlement of floating-rate foreign
currency loan contracts and forward foreign exchange contracts and forward interest rate swap contracts 701,997,422.67 –
Borrowing guarantee deposit and arrangement fee 110,673,543.53 90,394,100.43Acquisition of minority interests 3,225,704,000.00 –Cash payments of lease liabilities 90,439,355.75 –Fixed remuneration paid to BHR shareholders 142,003,386.65 211,902,215.20Others 11,071,616.98 –
Total 9,667,041,045.09 2,786,560,371.98

209China Molybdenum Co., Ltd.
NOTES TO THE FINANCIAL STATEMENTSFOR THE YEAR ENDED 31 DECEMBER 2019
(V) NOTES TO THE CONSOLIDATED FINANCIAL STATEMENTS (CONTINUED)
61. Supplementary information to the cash flow statement
(1) Supplementary information to the cash flow statement
Unit: RMB
Supplementary information 2019 2018
1. Re conciliation of net profit to cash flow from operating activities:
Net profit 1,765,848,377.85 5,150,041,506.24Add: Provision for impairment on assets 38,246,066.61 66,582,688.49
Provision for credit impairment 6,311,229.01 17,792,652.00Depreciation of fixed assets 2,247,156,896.65 2,614,789,058.40Amortization of right-of-use assets 107,137,679.89 –Amortization of intangible asset 1,351,400,027.73 1,327,667,594.82Amortization of long-term prepaid expenses 26,607,815.76 18,949,262.77Losses (gains) on disposal of fixed assets, intangible
assets and other long-term assets 64,265,650.01 31,121,956.96Losses (gains) on changes in fair value 1,090,451,134.01 (122,407,995.85)Financial expenses 2,077,885,913.31 1,619,978,579.12Gains arising from investments (194,629,428.14) (202,269,845.76)Increase in deferred tax assets (570,297,759.70) (1,014,652,655.50)Decrease in inventories (increase is filled in column
with "-") (2,738,129,651.59) (1,167,952,500.09)Decrease in receivables from operating activities
(increase is filled in column with "-") (1,110,585,810.00) 848,840,342.46Increase in payables from operating activities
(decrease is filled in column with "-") (2,314,488,338.12) 240,585,698.34Increase in provisions 897,645.00 –Amortization of deferred income (7,417,144.34) (7,415,228.40)Increase in special reserve (decrease is filled in
column with "-") (2,736,241.48) (4,687,523.85)Decrease in restricted bank deposits (increase is
filled in column with "-") – 17,570,000.00Bargain purchase arising from business combination
not under common control (133,096,178.59) –Net cash flow from operating activities 1,704,827,883.87 9,434,533,590.15
2. Significant investing and financing activities that do not involving cash:
3. Net changes in cash and cash equivalents:Closing balance of cash 12,392,247,511.85 23,240,703,274.03
Less: Opening balance of cash 23,240,703,274.03 19,781,418,278.86Add: Closing balance of cash equivalents – –Less: Opening balance of cash equivalents – –
Net increase (decrease) in cash and cash equivalents (10,848,455,762.18) 3,459,284,995.17

210 2019 Annual Report
NOTES TO THE FINANCIAL STATEMENTSFOR THE YEAR ENDED 31 DECEMBER 2019
(V) NOTES TO THE CONSOLIDATED FINANCIAL STATEMENTS (CONTINUED)
61. Supplementary information to the cash flow statement (Continued)
(2) Constitution of cash and cash equivalents
Unit: RMB
Item 31 December 2019 31 December 2018
1. Cash 12,392,247,511.85 23,240,703,274.03Including: Cash on hand 980,374.15 1,471,630.90
Bank deposits always available for payment 12,391,267,137.70 23,239,231,643.13Other monetary funds always available for payment – –
2. Cash equivalents – –3. Closing balance of cash and cash equivalents 12,392,247,511.85 23,240,703,274.03
Cash and cash equivalents exclude restricted cash and cash equivalents of the Company and subsidiaries within the Group and cash and bank balances due over 3 months.
62. Foreign currency monetary items
(1) Foreign currency monetary items
Unit: RMB
Item
Closing balance denominated
in foreign currency Exchange rate
Closing balance of foreign currency
translated into RMB
Monetary funds 631,994,368.09Including: RMB 287,475,156.08 1.0000 287,475,156.08
USD 2,775,137.30 6.9774 19,363,292.95EUR 2,148,270.15 7.8250 16,810,254.46HKD 8,256,998.75 0.8944 7,384,932.69CAD 2,389,866.54 5.3462 12,776,603.34AUD 5,372,313.24 4.8875 26,257,375.42BRL 136,773,648.86 1.7290 236,475,471.11GBP 825,472.86 9.1230 7,530,785.37CDF 97,470,110.50 0.0041 403,332.63ZAR 16,601,932.11 0.4947 8,212,414.31SGD 916,109.34 5.1833 4,748,432.15AED 37,846.48 1.8993 71,882.56CHF 157,488.00 7.2087 1,135,283.00CLP 15,542,861.55 0.0093 144,816.77MXN 2,002,612.58 0.3696 740,255.81NAD 129,478.20 0.4967 64,315.75VND 1,558,266,759.00 0.0003 470,454.00PEN 899,014.00 2.1032 1,890,774.42PLN 135,168.00 0.2822 38,143.63TRY 334.07 1.1723 391.64

211China Molybdenum Co., Ltd.
NOTES TO THE FINANCIAL STATEMENTSFOR THE YEAR ENDED 31 DECEMBER 2019
(V) NOTES TO THE CONSOLIDATED FINANCIAL STATEMENTS (CONTINUED)
62. Foreign currency monetary items (Continued)
(2) Functional currency for significant overseas operations
Name of subsidiariesThe main operating location abroad Functional currency Basis of choice
Copebras Brazil BRLAccording to the primary economic
environment
Niobras Brazil USDAccording to the primary economic
environment
COMC Brazil Brazil USDAccording to the primary economic
environment
CMOC Mining Australia USDAccording to the primary economic
environment
CMOC Mining Services Australia AUDAccording to the primary economic
environment
TFM Congo (DRC) USDAccording to the primary economic
environmentPurveyors South Africa Mine Services
CMOC("CMOC South Africa") Republic of South Africa USDAccording to the primary economic
environment
IXM B.V. Switzerland USDAccording to the primary economic
environment
63. Hedges
The Group enters into interest rate swap contracts to mitigate the cash flow risk arising from its floating-rate borrowings, i.e., some of the floating-rate borrowings are converted into fixed-rate borrowings. In 2018, the Group designated the acquired interest rate swap contracts as hedging instrument, and the critical terms of these interest rate swap contracts are similar to those of the borrowings. The Group determines the quantitative proportion between hedging instrument and the items hedged is 1:1 through qualitative analysis. The Group adopts cash flow hedging for such hedging, with the major terms as follows:
Nominal amount Maturity date Terms of the swap
USD450,000,000 6 February 2018 to 16 November 2023 Loan rate of 3M LIBOR +1.70% swapped to fixed rate of 4.233%
USD350,000,000 28 March 2018 to 16 November 2023 Loan rate of 3M LIBOR +2.75% swapped to fixed rate of 5.430%
USD300,000,000 4 December 2018 to 16 November 2023 Loan rate of 3M LIBOR swapped to fixed rate of 2.949%
At the balance sheet date, the loss arising from the changes in fair value of cash flow hedging instruments recognized in the other comprehensive income is RMB182,283,523.58 (2018: RMB20,133,169.82), and is expected to be transferred gradually to the income statement within 47 months after the balance sheet date.
In this year, the amount transferred from other comprehensive income to profit or loss by the Group is RMB12,122,214.50.

212 2019 Annual Report
NOTES TO THE FINANCIAL STATEMENTSFOR THE YEAR ENDED 31 DECEMBER 2019
(VI) CHANGE OF CONSOLIDATION SCOPE
1. Business combinations not involving enterprises under common control
(1) Business combinations not involving enterprises under common control occurred in the current period:
Unit: RMB
Acquiree Date of equity acquisitionCost on equity
acquisition
Percentage of equity acquired
Acquisitionmethod
Determinationbasis forthe acquisitiondate
Income of the acquiree from
the acquisition date to the end of
the period
Net profit (losses) of the acquiree
from the acquisition
date to the end of the period
(%)
NSRC (Note1) 24 July 2019 3,416,902,221.72 100.00% By cash Transfer of control 49,586,673,430.30 271,875,095.34High-tech (Note2) 14 May 2019 120,395,000.00 49.75% By cash Transfer of control 75,882,923.33 (5,828,254.11)W-Source Holding Limited (Note3) 18 November 2019 7,885.26 100.00% By cash Transfer of control – 2,025,012.22
Note1: As at 24 July 2019, the Group completed the transfer of 100% equity in NSRC acquired from NSR, a wholly-owned subsidiary of Natural Resources Investment Fund. Pursuant to the agreed consideration and price adjustment terms in the acquisition agreements, the actual consideration for the acquisition amounted to USD496,448,700, equivalent to RMB3,416,902,221.72.
Note 2: High-tech is a joint venture of the Company, of which 50.25% equity was previously held by the Company (Note V. 10, Note 1). The Company signed an equity transfer agreement on 27 December 2018 with the other shareholder of High-tech, acquiring the rest of 49.75% equity in its possession at an acquisition price of RMB120,395,000.00. The acquisition was completed in May 2019, thus High-tech became a wholly-owned subsidiary of the Company.
Note 3: In November 2019, a wholly-owned subsidiary of the Group, CMOC Co., Ltd entered the equity transfer agreement with Newstride Limited, to acquire 100% equity in W-Source Holding Limited at a consideration of USD1,125.87. The acquisition was completed on 18 November 2019, thus W-Source Holding Limited became a wholly-owned subsidiary of the Group.
(2) Consolidation cost and goodwill
Unit: RMB
Consolidation cost NSRC High-techW-Source Holding
Limited
– Cash 3,416,902,221.72 120,395,000.00 7,885.26– Fair value of equity held before
acquisition at the acquisition date – 121,605,000.00 –Total consolidation cost 3,416,902,221.72 242,000,000.00 7,885.26Less: Portion of the fair value of
identifiable net assets acquired 3,549,998,400.31 242,000,000.00 7,885.26Gap between goodwill/consolidation
cost and the portion of the fair value of identifiable net assets acquired (133,096,178.59) – –

213China Molybdenum Co., Ltd.
NOTES TO THE FINANCIAL STATEMENTSFOR THE YEAR ENDED 31 DECEMBER 2019
(VI) CHANGE OF CONSOLIDATION SCOPE (CONTINUED)
1. Business combinations not involving enterprises under common control (Continued)
(3) Acquiree's identifiable assets, liabilities at the acquisition date
Unit: RMB
NSRC (Note1) High-tech (Note2) W-Source Holding Limited (Note3)Acquisition date Acquisition date Acquisition date Acquisition date Acquisition date Acquisition datecarrying amount fair value carrying amount fair value carrying amount fair value
Assets:Cash and bank balances 1,463,979,419.17 1,463,979,419.17 4,308,179.25 4,308,179.25 7,885.26 7,885.26Held-for-trading financial assets 5,643,242,288.76 5,643,242,288.76 6,390,000.00 6,390,000.00 – –Derivative financial assets 1,704,853,552.64 1,704,853,552.64 – – – –Accounts receivable – – 14,661,022.10 14,661,022.10 – –Financing receivables – – 1,846,487.40 1,846,487.40 – –Prepayments 1,191,917,709.34 1,191,917,709.34 1,153,096.53 1,153,096.53 – –Other receivables 102,412,516.10 102,412,516.10 1,129,575.21 1,129,575.21 – –Inventories 11,217,917,997.51 11,217,917,997.51 30,794,146.26 30,593,555.96 – –Other current assets 1,975,091,935.23 1,975,091,935.23 699,097.53 699,097.53 – –Long-term equity investments 3,526,533.88 3,526,533.88 – – 73,538,850.00 73,538,850.00Other investments in equity
instruments 425,592.24 425,592.24 – – – –Fixed assets 70,641,734.48 77,711,911.70 56,354,650.31 92,813,662.25 – –Construction in progress 9,615,404.81 9,615,404.81 – – – –Right-of-use assets 97,322,110.03 97,322,110.03 – – – –Intangible assets 172,525,998.47 466,967,636.31 37,404,644.81 130,880,340.67 – –Deferred tax assets 33,906,194.74 33,906,194.74 – – – –Other non-current assets 52,410,517.17 52,410,517.17 – – 151,579,748.40 151,579,748.40
Sub-total of assets 23,739,789,504.57 24,041,301,319.63 154,740,899.40 284,475,016.90 225,126,483.66 225,126,483.66
Liabilities:Short-term borrowings 12,424,962,570.03 12,424,962,570.03 – – – –Held-for-trading financial
liabilities 3,365,604,589.22 3,365,604,589.22 – – – –Accounts payable – – 14,877,496.37 14,877,496.37 – –Derivative financial liabilities 676,829,198.68 676,829,198.68 – – – –Contract liabilities 2,299,530,379.85 2,299,530,379.85 80,511.44 80,511.44 – –Employee benefits payable 144,921,341.18 144,921,341.18 55,835.66 55,835.66 – –Taxes payable 104,378,460.58 104,378,460.58 (732,300.25) (732,300.25) – –Other payables 130,900,471.92 130,900,471.92 1,543,368.73 1,543,368.73 225,118,598.40 225,118,598.40Non-current liabilities due within
1 year 9,222,450.82 9,222,450.82 – – – –Other current liabilities – – 887,688.17 887,688.17 – –Long-term borrowings 904,636,791.49 904,636,791.49 – – – –Lease liabilities 97,322,110.03 97,322,110.03 – – – –Long-term employee benefits
payable 112,365,132.42 112,365,132.42 – – – –Deferred tax liabilities 170,864,387.87 220,613,837.38 – 25,762,416.78 – –
Sub-total of liabilities 20,441,537,884.09 20,491,287,333.60 16,712,600.12 42,475,016.90 225,118,598.40 225,118,598.40
Net assets 3,298,251,620.48 3,550,013,986.03 138,028,299.28 242,000,000.00 7,885.26 7,885.26Less: Minority interests 15,585.72 15,585.72 – – – –Net assets acquired 3,298,236,034.76 3,549,998,400.31 138,028,299.28 242,000,000.00 7,885.26 7,885.26

214 2019 Annual Report
NOTES TO THE FINANCIAL STATEMENTSFOR THE YEAR ENDED 31 DECEMBER 2019
(VI) CHANGE OF CONSOLIDATION SCOPE (CONTINUED)
1. Business combinations not involving enterprises under common control (Continued)
(3) Acquiree's identifiable assets, liabilities at the acquisition date (Continued)
Note 1: Management of the Group considers that there is no significant difference between the fair value and the carrying amount of identifiable assets and liabilities except for intangible assets of NSRC at the acquisition date. The fair value of the intangible assets of the above acquiree at the acquisition date is determined based on the appraisal report issued by China United Asset Appraisal Group (at Level 3 fair value measurement).
The intangible assets mainly comprise supplier relationship and rights to a copper off-take contract. The fair value of supplier relationship is assessed using excess income discount method, which means to determine the present value of the future cash flows generated from existing supplier relationship based on the estimate of revenue expected to be attributable to supplier relationship, taking the annual proportion of the current supplier relationship in the future into consideration. The expected long-term revenue growth rate is 2%, with weighted average cost of capital at 10.6%. An actual long-term revenue growth rate lower than 2% or weighted average cost of capital higher than 10.6% will result in decrease in the fair value of intangible assets. The fair value of rights to a copper off-take contract is assessed using income approach, by calculating the annual net profit receivable from the off-take contract during the estimated period, arriving at the value of such rights to a copper off-take contract by discounting, so as to assess the fair value of the rights to a copper off-take contract. The weighted average cost of capital is 12.6%.A weighted average cost of capital higher than 12.6% will result in decrease in the fair value of intangible assets.
Note 2: Management of the Group considers that there is no significant difference between the fair value and the carrying amount of identifiable assets and liabilities except for fixed assets and intangible assets of High-tech at the acquisition date. The fair value of the fixed assets and intangible assets of the above acquisition at the acquisition date is determined based on the appraisal report issued by Henan Zhongping Asset Appraisal Co., Ltd (at Level 3 fair value measurement).
Fixed assets mainly comprise buildings and machinery equipment. Both the buildings and machinery equipment are assessed using cost method, estimating the fair value on the basis of assessing the replacement cost of underlying assets and integrated depreciation ratio. The replacement cost is determined with reference to the purchase price or by restatement of budget, integrated depreciation ratio is determined based on site inspection.
Intangible assets mainly comprise land use rights, of which the fair value is determined using method of base price of land coefficient modification. The base price of land coefficient modification process principally includes selection of proper base price of land, determination of the modification coefficient based on the coefficient table, and arriving at appraisal stand-alone price of the parcel in the end.
Note 3: Management of the Group believes that there is no significant difference between the fair value and the carrying amount of identifiable assets and liabilities of W-Source Holding Limited at the acquisition date.
(4) Gains or losses arising from re-measurement of equity held before acquisition date at fair value
Unit: RMB
Acquiree
Carrying amount of equity held before acquisition at the acquisition date
Fair value of equity held before acquisition
at the acquisition date
Gains or losses arising from re-measurement of equity
held before acquisition date at fair value
High-tech 68,999,789.58 121,605,000.00 52,605,210.42
Note: The fair value is determined with reference to share of equity corresponding to the transaction price.

215China Molybdenum Co., Ltd.
NOTES TO THE FINANCIAL STATEMENTSFOR THE YEAR ENDED 31 DECEMBER 2019
(VII) INTERESTS IN OTHER ENTITIES
1. Interests in subsidiaries
(1) Constitution of the Group
Shareholding ratio (%)
Name of the subsidiary Main Business sitePlace of incorporation Nature of business Direct Indirect Acquisition method
China Molybdenum Refining Co., Ltd. ("Ye Lian") China Luanchuan, Henan Refining and sales of mineral products
100.00 – Investment Establishment
China Molybdenum Tungsten Sales and Trading Co., Ltd. ("Xiao Shou Mao Yi")
China Luanchuan, Henan Trading of mineral products
100.00 – Investment Establishment
Luoyang Dachuan Molybdenum Tungsten Technology Co., Ltd. ("Da Chuan")
China Luanchuan, Henan Processing and sales of mineral products
100.00 – Investment Establishment
Luoyang Mudu International Hotel Co., Ltd. ("International Hotel")
China Luoyang, Henan Hotel 100.00 – Investment Establishment
China Molybdenum Tungsten Co., Ltd ("Wu Ye") China Luanchuan, Henan Refining and sales of mineral products
100.00 – Investment Establishment
China Molybdenum (Hong Kong) Company Limited ("CMOC HK")
Hong Kong, China Hong Kong, China Trading of mineral products
100.00 – Investment Establishment
China Molybdenum Metal Material Company Limited ("Metal Material")
China Luoyang, Henan Processing and sales of mineral products
100.00 – Investment Establishment
Xinjiang Luomu Mining Co., Ltd ("Xin Jiang Luo Mu")
China Xinjiang Production and sales of mineral
70.00 – Investment Establishment
China Molybdenum Sales Co., Ltd. ("Sales Company")
China Luanchuan, Henan Trading of mineral products
100.00 – Investment Establishment
CMOC Limited Hong Kong, China Hong Kong, China Investment & Holding 100.00 – Investment Establishment
CMOC Mining Australia Australia Production, processing and sales of mineral products
– 100.00 Investment Establishment
CMOC Mining Services Australia Australia Mining services – 100.00 Investment Establishment
Luochuan Huqi Mining Company Limited ("Hu Qi") China Luanchuan, Henan Refining and sales of mineral products
100.00 – Investment Establishment
Luanchuan Fu Kai Trading Co., Ltd. ("Fu Kai") China Luanchuan, Henan Trading of Molybdenum products
100.00 – Investment Establishment
Luochuan Qixing Mining Company Limited ("Qi Xing")
China Luanchuan, Henan Refining and sales of mineral products
90.00 – Investment Establishment
Luanchuan Furun Mining Co., Ltd ("Fu Run") China Luanchuan, Henan Refining and sales of mineral products
100.00 – Investment Establishment
Luanchuan County Dadongpo Tungsten Molybdenum Co., Ltd. ("Da Dong Po")
China Luanchuan, Henan Refining and sales of mineral products
51.00 – Investment Establishment
Luanchuan County Jiuyang Mining Co., Ltd. ("Jiu Yang")
China Luanchuan, Henan Refining and sales of mineral products
51.00 – Investment Establishment
Luanchuan County Sanqiang Molybdenum Tungsten Co., Ltd. ("San Qiang")
China Luanchuan, Henan Refining and sales of mineral products
51.00 – Investment Establishment
Luoyang Mudulihao Business Co., Ltd. ("Mu Du Li Hao")
China Luoyang, Henan Hotel management – 100.00 Investment Establishment
Schmoke (Shanghai) International Trading Co., Ltd. ("Schmocke")
China Shanghai Import and export of goods and technology
100.00 – Investment Establishment
CMOC Mining USA LTD("CMOC USA") USA USA Consultancy – 100.00 Investment Establishment

216 2019 Annual Report
NOTES TO THE FINANCIAL STATEMENTSFOR THE YEAR ENDED 31 DECEMBER 2019
Shareholding ratio (%)
Name of the subsidiary Main Business sitePlace of incorporation Nature of business Direct Indirect Acquisition method
Shanghai Ruichao Investment Co., Ltd ("Rui Chao")
China Shanghai Consulting and enterprise operating and management
– 100.00 Investment Establishment
Tibet Schmocke China Tibet Consulting and asset management and sales
– 100.00 Investment Establishment
Upnorth Investment Limited("Upnorth") China BVI Investment & holding – 100.00 Investment Establishment
Beijing Yongbo Resources Investment holding Co., Ltd. ("Beijing Yongbo")
China Beijing Consulting and asset management and sales
100.00 – Investment Establishment
Luoyang Yuehe Properties Co., Ltd ("Luoyang Yuehe")
China Luoyang, Henan Consulting, asset management
100.00 – Investment Establishment
CMOC DRC Hong Kong, China Hong Kong, China Mining services – 100.00 Investment Establishment
CMOC UK Limited(Molybdenm UK) UK UK Mining services and sales
– 100.00 Investment Establishment
CMOC LUXEMBOURG Luxembourg Luxembourg Investment holding – 100.00 Investment Establishment
CMOC Brazil Brazil Brazil Investment holding – 100.00 Investment Establishment
Long March No.1 Investment Limited ("Long March")
Hong Kong, China Hong Kong, China Investment holding – 100.00 Investment Establishment
Bandra Investment Limited("Bandra") China BVI Investment holding – 100.00 Investment Establishment
Copebras Brazil Brazil Mining and processing
– 100.00 Business combination not
Niobras Brazil Brazil Mining and processing
– 100.00 Business combination not
CMOC International DRC Holdings Limited Bermuda Bermuda Investment holding – 100.00 Business combination not
TFHL Bermuda Bermuda Investment holding – 100.00 Business combination not
TFM Congo (DRC)) Congo (DRC)) Mining and processing
– 80.00 Business combination not
CMOC South Africa The Republic of South Africa
The Republic of South Africa
Logistics transportation
– 100.00 Business combination not
Oriental Red Investments Limited Virgin Islands, British
Virgin Islands, British
Investment holding – 100.00 Investment Establishment
NREIL Hong Kong, China Hong Kong, China Investment holding – 100.00 Investment Establishment
BHR Virgin Islands, British
Virgin Islands, British
Investment holding – 100.00 Control according to agreement
Ningbo Baiya Investment Co., Ltd. China Ningbo, Zhejiang Investment management
– 100.00 Investment Establishment
CMOC congo Congo (DRC)) Congo (DRC)) Consulting services – 100.00 Investment Establishment
Congo Construction Company SARL Congo (DRC)) Congo (DRC)) Refining and sales of mineral products
– 100.00 Business combination not
(VII) INTERESTS IN OTHER ENTITIES (CONTINUED)
1. Interests in subsidiaries (Continued)
(1) Constitution of the Group (Continued)

217China Molybdenum Co., Ltd.
NOTES TO THE FINANCIAL STATEMENTSFOR THE YEAR ENDED 31 DECEMBER 2019
Shareholding ratio (%)
Name of the subsidiary Main Business sitePlace of incorporation Nature of business Direct Indirect Acquisition method
CMOC Capital Limited Virgin Islands, British
Virgin Islands, British
Investment holding – 100.00 Investment Establishment
CMOC BHR Limited Hong Kong, China Hong Kong, China Investment holding – 100.00 Investment Establishment
High-tech (Note2) China Luoyang, Henan Production, processing and sales of metal products
100.00 – Business combination not
Shanghai Aoyide Trading Co., Ltd. (Note 1) China Shanghai Domestic non-ferrous trading
– 100.00 Investment Establishment
Luoyang Dinghong Trading Co., Ltd. (Note 1) China Luoyang, Henan Metal Material, Trading of mineral products etc.
– 100.00 Investment Establishment
Ridgeway Commodities SA (Note1) Switzerland Switzerland Metal trading – 100.00 Investment Establishment
NSRC (Note2) Switzerland Switzerland Investment holding – 100.00 Business combination not
CMOC Metals Holding Limited (Note1) Hong Kong, China Hong Kong, China Investment holding – 100.00 Investment Establishment
IXM & ITS SUBSIDIARY (Note2) Switzerland Netherland Metal trading – 100.00 Business combination not
W-Source Holding Limited (Note2) Hong Kong, China Hong Kong, China Investment holding – 100.00 Business combination not
Note 1: These subsidiaries are newly established by the Group during the year.
Note 2: These subsidiaries are acquired through business combinations not under common control.
(2) Significant non-wholly owned subsidiaries
Unit: RMB
Name of the subsidiaryMinority shareholder's
shareholding ratio
Profit or loss attributable
to minority interests in the current period
Dividends distributed to minority shareholder
in the current periodClosing balance
of minority interests
TFM 20% (87,477,416.92) – 5,388,831,689.76
Unit: RMB
Name of the subsidiaryMinority shareholder's
shareholding ratio
Profit or loss attributable
to minority interests in the previous period
Dividends distributed to minority shareholder in the previous period
Closing balance of minority interests
in the previous period
TFM 20% 518,181,395.46 – 5,388,306,926.21
(VII) INTERESTS IN OTHER ENTITIES (CONTINUED)
1. Interests in subsidiaries (Continued)
(1) Constitution of the Group (Continued)

218 2019 Annual Report
NOTES TO THE FINANCIAL STATEMENTSFOR THE YEAR ENDED 31 DECEMBER 2019
(VII) INTERESTS IN OTHER ENTITIES (CONTINUED)
1. Interests in subsidiaries (Continued)
(3) Financial information of significant non-wholly owned subsidiaries
Unit: RMB
31 December 2019
Name of the subsidiary Current assets Non-current assets Total assetsCurrent
liabilitiesNon-current
liabilities Total liabilities
TFM 6,830,390,125.41 35,705,830,506.81 42,536,220,632.22 911,838,387.36 14,680,223,796.04 15,592,062,183.40
Unit: RMB
31 December 2018Name of the subsidiary Current assets Non-current assets Total assets Current liabilities Non-current liabilities Total liabilities
TFM 7,520,364,803.49 35,024,483,437.52 42,544,848,241.01 2,081,572,892.02 13,521,740,717.96 15,603,313,609.98
Unit: RMB
2019
Name of the subsidiary Operating revenue Net profitTotal comprehensive
incomeCash flow from
operating activities
TFM 9,322,080,713.48 (437,387,084.59) (437,387,084.59) 386,749,174.13
Unit: RMB
2018
Name of the subsidiary Operating revenue Net profitTotal comprehensive
incomeCash flow from
operating activities
TFM 14,373,797,900.75 2,590,906,977.29 2,590,906,977.29 4,126,468,044.35

219China Molybdenum Co., Ltd.
NOTES TO THE FINANCIAL STATEMENTSFOR THE YEAR ENDED 31 DECEMBER 2019
(VII) INTERESTS IN OTHER ENTITIES (CONTINUED)
2. Interest in joint ventures and associates
(1) Significant joint ventures and associates
Shareholding ratio (%)
Name Main Business sitePlace of incorporation Nature of business Direct Indirect
Accounting treatments for investments in joint ventures and associates
Huan Yu Xuzhou, Jiangsu Xuzhou, Jiangsu Investment 50% – Equity methodYulu Mining (Note) Luoyang, Henan Luoyang, Henan Refining and sales of
mineral products40% – Equity method
Huayue Nickel Cobalt Indonesia Indonesia Refining and sales of mineral products
– 21% Equity method
Note: According to the resolution of shareholders' meeting in 2007 of Yulu Mining Co., Ltd., both investment parties share net profits of the company by ratio of 1 to 1 from 2008. Therefore, the Group actually shares 50% of profits or losses of Yulu Mining under equity method.
(2) Major financial information of key joint ventures
Unit: RMB
31 December 2019/2019
31 December 2018/2018
Joint ventures Huan Yu (Note1) Huan Yu (Note1)
Current assets 307,196,737.14 215,102,523.24Including: Cash and cash equivalent 9,150,249.49 6,077,578.08Non-current assets 2,695,467,286.55 2,620,273,694.61Total assets 3,002,664,023.69 2,835,376,217.85Current liabilities 767,152,127.12 129,076,368.97Non-current liabilities 610,216,405.11 950,000,000.00Total liabilities 1,377,368,532.23 1,079,076,368.97Minority interests (53,284,775.96) (42,677,212.81)Equity attributable to equity holders of the Company 1,678,580,267.42 1,798,977,061.69Share of net assets calculated based on shareholding proportion 839,290,133.71 899,488,530.84Adjusting events (Note2) 8,585,005.40 9,614,855.94Carrying amount of equity investments in joint ventures 847,875,139.11 909,103,386.78Fair value of equity investments of joint ventures where there is quoted price N/A N/AOperating income 40,625,421.94 –Financial expenses 66,847,273.74 54,396,812.46Income tax expenses – –Net loss (107,325,641.90) (120,198,492.44)Net profit from discontinued operations – –Other comprehensive income – –Total comprehensive income (107,325,641.90) (120,198,492.44)Dividends received from joint ventures in the current period – –
Note 1: The joint venture, Huan Yu of the Group, has 90% equity interest of Fu Chuan; meanwhile, through its subsidiary Fukai, the Group holds the remaining 10% interests of Fu Chuan.
Note 2: According to the agreement with local government, the local government shares 8% the dividend rights of Fu Chuan. Therefore, the Group actually shares 47% of the profits or losses of Fu Chuan under equity method.

220 2019 Annual Report
NOTES TO THE FINANCIAL STATEMENTSFOR THE YEAR ENDED 31 DECEMBER 2019
(VII) INTERESTS IN OTHER ENTITIES (CONTINUED)
2. Interest in joint ventures and associates (Continued)
(3) Major financial information of significant associates
Unit: RMB
31 December 2019/2019 31 December 2018/2018
Associates Yulu MiningHuayue Nickel
Cobalt Yulu MiningHuayue Nickel
Cobalt(Note) (Note)
Current assets 230,641,091.41 799,829,154.23 189,479,268.51 –Including: Cash and cash equivalent 271,784.58 348,636,430.96 345,364.87 –Non-current assets 50,317,797.08 204,386,552.44 54,658,124.73 –
Total assets 280,958,888.49 1,004,215,706.67 244,137,393.24 –
Current liabilities 40,533,022.18 657,943,120.83 46,845,212.72 –Non-current liabilities 2,000,000.00 – 3,000,000.00 –
Total liabilities 42,533,022.18 657,943,120.83 49,845,212.72 –
Minority interests – – – –Equity attributable to equity holders
of the Company 238,425,866.31 346,272,585.84 194,292,180.52 –Share of net assets calculated based
on shareholding proportion 95,370,346.52 72,717,243.05 77,716,872.21 –Adjusting events 13,248,344.96 424,297.52 8,876,646.58 –Carrying amount of equity
investments in associates 108,618,691.48 73,141,540.57 86,593,518.79 –Fair value of equity investments
of joint ventures where there is quoted price N/A N/A N/A N/A
Note: Although the Group holds 40% equity interest of Yulu Mining, but shares 50% dividend rights. Details refer to Note V. 10.
Unit: RMB
31 December 2019/2019 31 December 2018/2018Name of the subsidiary Yulu Mining Huayue Nickel Cobalt Yulu Mining Huayue Nickel Cobalt
Operating income 375,163,350.80 – 423,728,227.44 –Financial expenses (139,998.68) (1,031,309.11) (280,915.27) –Income tax expense (22,842,061.54) – (71,239,522.89) –Net profit 240,450,345.33 380,485.52 228,197,597.04 –Net profit from discontinued
operations – – – –Other comprehensive income – – – –Total comprehensive income 240,450,345.33 380,485.52 228,197,597.04 –Dividends received from associates
in the current year 98,200,000.00 – 120,000,000.00 –

221China Molybdenum Co., Ltd.
NOTES TO THE FINANCIAL STATEMENTSFOR THE YEAR ENDED 31 DECEMBER 2019
(VII) INTERESTS IN OTHER ENTITIES (CONTINUED)
3. Significant joint operation
(1) Significant joint operation
Shareholding proportion/shares (%)
Name of joint operationPrincipal operating place
Registration place Business nature Direct Indirect
Northparkes Joint Venture ("NJV") (Note) Australia Australia
Copper gold mining – 80%
Note: On 1 December 2013, the Company had completed acquiring 80% joint control interests of unincorporated joint venture in Northparkes Copper gold mining and some relevant assets related to Copper gold mining business of NJV held by North Mining Limited. Afterwards, the unincorporated joint venture NJV became a joint operation of the Group.
Northparkes mines held by NJV is a quality Copper and gold mining operation with advanced mining method of block caving in Goonumbla, situated northwest of the town of Parkes in New South Wales, Australia. The Northparkes mines started operating from 1993 and the remaining useful life is more than 20 years. The headquarters of NJV is located in the town of Parkes in New South Wales, Australia. The 80% interest of NJV under joint control is held by CMOC Mining, a subsidiary of the Company. The remaining 20% interest is held by Sumitomo Metal Mining Oceania Pty Ltd ("SMM") and SC Mineral Resources Pty Ltd ("SCM").
Pursuant to the NJV Management Agreement, the Company as the manager arrange the daily operation of the Northparkes mine which hold by the Company, as joint controllers of NJV jointly, both parties of the joint ventures are responsible for the assets and liabilities according to their respective proportion. The joint ventures have agreed to protect the rights of individual party (including their respective shares of the production volume) from the event of default by any other joint venture to ensure the benefits of all parties.
(2) Financial information of significant joint operation
As at 31 December 2019, the assets and liabilities and operation status of NJV are as follows:
Unit: RMB
Item 2019 2018
Net shares of operative costs 847,844,332.19 862,020,042.87
31 December 2019 31 December 2018
Share of total assets 2,287,120,066.01 2,047,531,832.04Share of total liabilities 543,350,180.79 463,957,993.08

222 2019 Annual Report
NOTES TO THE FINANCIAL STATEMENTSFOR THE YEAR ENDED 31 DECEMBER 2019
(VIII) FINANCIAL INSTRUMENTS AND RISK MANAGEMENT
The Group's major financial instruments include cash and bank balances, held-for-trading financial assets, derivative financial assets, accounts receivable, financing receivables, other receivables, other current assets, other investments in equity instruments, other non-current financial assets, non-current derivative financial assets, other non-current assets, held-for-trading financial liabilities, derivative financial liabilities, notes payable, accounts payable, other payables, borrowings, other current liabilities, non-current derivative financial liabilities, non-current liabilities due within one year, bonds payable, and other non-current liabilities,etc.. Details of these financial instruments are disclosed in Note V. The risks associated with these financial instruments and the policies on how to mitigate these risks are set out below. Management manages and monitors these exposures to ensure the risks are monitored within a certain range.
Unit: RMB'000
31 December 2019
31 December 2018
Financial assetsAt FVTPL
Held-for-trading financial assets 7,719,450 774,327Derivative financial assets 2,178,322 –Other non-current assets 4,356,783 3,906,622Non-current derivative financial assets 7,620 3,179
At FVTOCIFinancing receivables 375,936 1,623,841Other investments in equity instruments 85,344 448,174
At amortized costCash and bank balances 15,647,900 26,647,644Accounts receivable 1,510,508 861,000Other receivables 466,565 355,921Other current assets 2,810,880 1,308,928Other non-current assets 741,139 2,135,981
Financial liabilitiesAt FVTPL
Held-for-trading financial liabilities 3,157,952 4,250,711Derivative financial liabilities 2,640,928 75,423Non-current derivative financial liabilities 202,417 23,312
At amortized costShort-term borrowings 18,589,026 4,588,153Notes payable 233,224 29,000Accounts payable 1,944,506 1,119,073Other payables 1,584,738 1,027,782Non-current liabilities due within one year 3,663,676 2,922,422Other current liabilities 1,000,000 –Long-term borrowings 16,278,910 20,196,855Bonds payable 5,092,860 2,000,000Other non-current liabilities 2,308 3,225,704
The Group adopts sensitivity analysis technique to analyze how the profit and loss for the period and shareholders' equity would have been affected by reasonably possible changes in the relevant risk variables. As it is unlikely that risk variables will change in an isolated manner, and the interdependence among risk variables will have significant effect on the amount ultimately influenced by the changes in a single risk variable, the following are based on the assumption that the change in each risk variable is on a stand-alone basis.

223China Molybdenum Co., Ltd.
NOTES TO THE FINANCIAL STATEMENTSFOR THE YEAR ENDED 31 DECEMBER 2019
(VIII) FINANCIAL INSTRUMENTS AND RISK MANAGEMENT (CONTINUED)
1. Risk management objectives and policies
The Group's risk management objectives are to achieve a proper balance between risks and benefits, and minimize the adverse impacts of risks on the Group's operation performance, and maximize the benefits of the shareholders and other stakeholders. Based on these risk management objectives, the Group's basic risk management strategy is to identify and analyze the Group's exposure to various risks, establish an appropriate maximum tolerance to risk and practice risk management, and monitors these exposures regularly and effectively to ensure the risks are controlled within a certain range.
1.1 Market risk
1.1.1. Foreign exchange risk
Foreign exchange risk refers to the risk of loss due to exchange rate changes. The Group is subject to foreign exchange risk mainly related to USD, HKD, EUR, CAD, RMB, BRL, GBP, ZAR, SGD, CDF, CHF and AUD. The Group's subsidiaries in the PRC use RMB for settlement of their principal business activities. The Group's subsidiaries in Australia mainly use AUD or USD for settlement, the Group's Niobium and Phosphorus businesses in Brazil are principally settled in USD and BRL and the Group's Copper-Cobalt business in Congo (DRC) is principally settled in USD and CDF. Foreign currency transactions are mainly financing activities of domestic and Hong Kong subsidiaries settled in USD, operating activities of subsidiaries in Australia of which the functional currency is USD settled in AUD, operating activities of subsidiaries in Brazil of which the functional currency is USD settled in BRL, and operating activities of subsidiaries in Congo (DRC) of which the functional currency is USD settled in CDF. The group pays close attention to the influence of exchange rate on the foreign exchange risk. The group currently has not taken any measures to avoid foreign exchange risk, referring to Note V. 3, 13, 23 &24.
As at 31 December 2019, except for the financial assets and liabilities balance of each entity mentioned below use USD, HKD, AUD, EUR, CAD, RMB, BRL, GPB, CDF, ZAR, SGD, AED, CHF, CLP, MXN, NAD, VND, PEN and PLN, (converted in RMB) as functional currency, the Group's financial assets and financial liabilities are settled on the basis of the functional currency of each entity. The foreign exchange risk arising from the assets and liabilities of such foreign currency balances may have an impact on the Group's operating results.

224 2019 Annual Report
NOTES TO THE FINANCIAL STATEMENTSFOR THE YEAR ENDED 31 DECEMBER 2019
(VIII) FINANCIAL INSTRUMENTS AND RISK MANAGEMENT (CONTINUED)
1. Risk management objectives and policies (Continued)
1.1 Market risk (Continued)
1.1.1. Foreign exchange risk (Continued)
Unit: RMB'000
Item31 December
201931 December
2018
USDCash and bank balances 5,864 258,094Short-term borrowings – (171,580)
Sub-total 5,864 86,514
HKDCash and bank balances 3,736 896
Sub-total 3,736 896
AUDCash and bank balances 26,257 195,577
Sub-total 26,257 195,577
EURCash and bank balances 16,109 85,936Short-term borrowings – (1,760,749)
Sub-total 16,109 (1,674,813)
CADCash and bank balances 6,388 5,914
Sub-total 6,388 5,914
RMBCash and bank balances 287,475 1,814
Sub-total 287,475 1,814
BRLCash and bank balances 236,475 205,685
Sub-total 236,475 205,685

225China Molybdenum Co., Ltd.
NOTES TO THE FINANCIAL STATEMENTSFOR THE YEAR ENDED 31 DECEMBER 2019
Item31 December
201931 December
2018
GBPCash and bank balances 7,531 3,301
Sub-total 7,531 3,301
CDFCash and bank balances 403 140
Sub-total 403 140
ZARCash and bank balances 8,212 10,521
Sub-total 8,212 10,521
SGDCash and bank balances 4,748 28
Sub-total 4,748 28
AEDCash and bank balances 72 –
Sub-total 72 –
CHFCash and bank balances 1,135 –
Sub-total 1,135 –
CLPCash and bank balances 145 –
Sub-total 145 –
MXNCash and bank balances 740 –
Sub-total 740 –
(VIII) FINANCIAL INSTRUMENTS AND RISK MANAGEMENT (CONTINUED)
1. Risk management objectives and policies (Continued)
1.1 Market risk (Continued)
1.1.1. Foreign exchange risk (Continued)
Unit: RMB'000

226 2019 Annual Report
NOTES TO THE FINANCIAL STATEMENTSFOR THE YEAR ENDED 31 DECEMBER 2019
Item31 December
201931 December
2018
NADCash and bank balances 64 –
Sub-total 64 –
VNDCash and bank balances 470 –
Sub-total 470 –
PENCash and bank balances 1,891 –
Sub-total 1,891 –
PLNCash and bank balances 38 –
Sub-total 38 –
Total 607,753 (1,164,423)
The following table sets out in detail the sensitivity of the Group to the 10% rate of change in the exchange rate when exchanging the foreign currencies with the functional currency (including RMB, USD, HKD and BRL) of each entity. 10% ratio is used internally to report foreign exchange risk to the senior management, which represents the management's estimate of possible changes in the foreign exchange rate. Foreign exchange risk sensitivity analysis at the Group's reporting date is based on the changes on the settlement date and throughout the reporting period. A positive number indicates that an increase in profit before tax of a company with RMB as its functional currency is resulted from having USD, and EUR borrowings and RMB increase against those foreign currencies. A negative number indicates that a decrease in profit before tax of a company with RMB as its functional liabilities is resulted from having USD, HKD, EUR, and RMB increase against those foreign currencies, of companies with HKD as its functional currency is resulted from having USD and RMB cash and bank balances and HKD increase against those foreign currencies, and of companies with USD as their functional currency is resulted from having financial liabilities of AUD, HKD, EUR, CAD, RMB, BRL, GBP, CDF, ZAR, SDG, AED, CHF, CLP, MXN, NAD, VND, PEN and PLN, USD increase against them. If the relevant functional currency decreases against these foreign currencies, it will have an opposite effect on the pre-tax profit. The Group does not consider the effect of current forward foreign exchange contract in the sensitivity analysis as below.
(VIII) FINANCIAL INSTRUMENTS AND RISK MANAGEMENT (CONTINUED)
1. Risk management objectives and policies (Continued)
1.1 Market risk (Continued)
1.1.1. Foreign exchange risk (Continued)
Unit: RMB'000

227China Molybdenum Co., Ltd.
NOTES TO THE FINANCIAL STATEMENTSFOR THE YEAR ENDED 31 DECEMBER 2019
(VIII) FINANCIAL INSTRUMENTS AND RISK MANAGEMENT (CONTINUED)
1. Risk management objectives and policies (Continued)
1.1 Market risk (Continued)
1.1.1. Foreign exchange risk (Continued)
Unit: RMB'000
2019 2018
Item Changes in exchange ratesImpact on
profit
Impact on
shareholders' equity
Impact on profit
Impact on shareholders'
equity
Entities which are denominated in RMB Pre-tax profit and equity
Depreciation by 10% of USD against RMB (226) (226) 3,308 3,308Depreciation by 10% of HKD against RMB – – (3) (3)Depreciation by 10% of EUR against RMB (10) (10) 70,618 70,618
Entities which are denominated in HKD Pre-tax profit and equity
Depreciation by 10% of USD against HKD (360) (360) (11,959) (11,959)Depreciation by 10% of RMB against HKD (100) (100) (144) (144)
Entities which are denominated in USD Pre-tax profit and equity
Depreciation by 10% of AUD against USD (2,626) (2,626) (19,558) (19,558)Depreciation by 10% of HKD against USD (374) (374) (87) (87)Depreciation by 10% of EUR against USD (1,601) (1,601) 96.863 96.863Depreciation by 10% of CAD against USD (639) (639) (591) (591)Depreciation by 10% of RMB against USD (28,647) (28,647) (38) (38)Depreciation by 10% of BRL against USD (23,648) (23,648) (20,569) (20,569)Depreciation by 10% of GBP against USD (753) (753) (330) (330)Depreciation by 10% of CDF against USD (40) (40) (14) (14)Depreciation by 10% of ZAR against USD (821) (821) (1,052) (1,052)Depreciation by 10% of SGD against USD (475) (475) (3) (3)Depreciation by 10% of AED against USD (7) (7) – –Depreciation by 10% of CHF against USD (114) (114) – –Depreciation by 10% of CLP against USD (14) (14) – –Depreciation by 10% of MXN against USD (74) (74) – –Depreciation by 10% of NAD against USD (6) (6) – –Depreciation by 10% of VND against USD (47) (47) – –Depreciation by 10% of PEN against USD (189) (189) – –Depreciation by 10% of PLN against USD (4) (4) – –
The management of the Group believes that closing date foreign currency risk cannot reflect the risk of the duration. Sensitivity analysis cannot reflect inherent foreign currency risk.

228 2019 Annual Report
NOTES TO THE FINANCIAL STATEMENTSFOR THE YEAR ENDED 31 DECEMBER 2019
(VIII) FINANCIAL INSTRUMENTS AND RISK MANAGEMENT (CONTINUED)
1. Risk management objectives and policies (Continued)
1.1 Market risk (Continued)
1.1.2. Interest rate risk
The Group's cash flow interest rate risk of financial instruments relates primarily to variable-rate bank borrowings (see Note V.22 and 33 for details). The Group paid close attention to the impact on cash flow change risks from the changes in interest rate and also hedges part of the interest rate risk assumed by the Group through interest rate swap contracts (see Note V.63 for details).
Interest rate risk sensitivity analysis is based on the following assumptions:
• Changes in market interest rates affect the interest income or expense of floating rate financial instruments;
• Changes in the fair value of derivative financial instruments and other financial assets and liabilities are calculated at the market interest rate as at the balance sheet date, using the method of discounted cash flow analysis.
On the basis of the above assumptions, where all other variables are held constantly, the reasonably possible changes in the interest rate may have the following pre-tax effect on the profit or loss for the year and shareholders' equity:
Unit: RMB'000
2019 2018
Item Changes in interest ratesEffect on
profit
Effect on shareholders'
equityEffect on
profit
Effect on shareholders'
equity
Floating interest rate Increase 50 base points of interest rate (141,763) (149,713) (79,319) (79,319)
Floating interest rate Decrease 50 base points of interest rate 141,763 149,713 79,319 79,319
1.1.3. Commodity price risk
International Copper prices and Cobalt prices have a significant impact on the operating results of the Group's subsidiaries in Australia and Congo (DRC). Copper and Cobalt prices fluctuated in the past and the factors causing fluctuation were uncontrollable by the Group. The Group does not hedge against the fluctuation risk of Copper and Cobalt prices. In addition, IXM engages in business related to metal trading platform, of which the operating result is significantly affected by the international price fluctuation of metals. IXM hedges the risk of the metal price fluctuation through commodity futures contract and commodity option contract. Details are set out in Note V.3 and 24.
The table below shows the sensitivity analysis of the price of Copper and Cobalt on the balance sheet date, which reflects pre-tax impact of unpricing accounts receivable in the Group's subsidiaries in Australia and Congo (DRC) at the end of the year on the total profit and shareholders' equity when the market price of Copper and Cobalt is changed reasonably and possibly under the assumption that other variables remain unchanged.

229China Molybdenum Co., Ltd.
NOTES TO THE FINANCIAL STATEMENTSFOR THE YEAR ENDED 31 DECEMBER 2019
(VIII) FINANCIAL INSTRUMENTS AND RISK MANAGEMENT (CONTINUED)
1. Risk management objectives and policies (Continued)
1.1 Market risk (Continued)
1.1.3. Commodity price risk (Continued)
Unit: RMB'000
2019 2018
ItemIncrease/(Decrease) percentage
Impact on profit
Impact on shareholders'
equityImpact on
profit
Impact on shareholders'
equity
Market price of copper 5% 9,176 9,176 12,073 12,073Market price of copper (5%) (9,176) (9,176) (12,073) (12,073)
Unit: RMB'000
2019 2018
ItemIncrease/(Decrease) percentage
Impact on profit
Impact on shareholders'
equityImpact on
profit
Impact on shareholders'
equity
Market price of cobalt 5% 15,005 15,005 26,643 26,643Market price of cobalt (5%) (15,005) (15,005) (26,643) (26,643)
1.1.4. Other price risk
The equity instrument investments held by the Group, including financial assets classified as other non-current financial assets measured at fair value at each balance sheet date. As at the end of the reporting period, the equity instrument investments held by the Group mainly comprise listed securities and assets management plans, therefore, the Group is directly or indirectly exposed to the risk of the fluctuation of securities market price. If equity price of the equity instrument investments held by the Group increase or decrease by 5% while other variables remain the same, the interests of shareholders of the Group will increase or decrease by RMB87,562,887.85 at the end of the year (excluding the impact of income tax).
1.2 Credit risk
As at 31 December 2019, the Group's maximum exposure to credit risk which will cause a financial loss to the Group due to failure of other party to fulfill an obligation, including the book value of the financial assets has been recognized in the balance sheet of the Group.
In order to minimize the credit risk, the Group has specific personnel of the credit management department responsible for determination of credit limits, credit approvals and other monitoring procedures to ensure that follow-up action is taken to recover overdue debts. In addition, the Group reviews the recoverable amount of financial assets at each balance sheet date to ensure that adequate expected credit losses are made for irrecoverable amounts. In this regard, the management of the Group considers that the Group's credit risk is significantly reduced.
The Group's policies on assessment of significant increase in credit risk since initial recognition, basis for determination of credit impairment on financial assets, classification of financial instruments on expected credit loss on a portfolio basis, and direct written-down of financial instruments are set out in Note III. 10.2.1, Note III 10.2.2, Note III. 10.2.3, and Note III. 10.2.4.

230 2019 Annual Report
NOTES TO THE FINANCIAL STATEMENTSFOR THE YEAR ENDED 31 DECEMBER 2019
(VIII) FINANCIAL INSTRUMENTS AND RISK MANAGEMENT (CONTINUED)
1. Risk management objectives and policies (Continued)
1.2 Credit risk (Continued)
The credit risk on cash and bank balances is low because they are deposited with banks with high credit ratings.
The Group holds bank acceptances and commercial acceptances. Of which, most bank acceptances are issued by banks with higher credit rating, therefore, management of the Group considers relevant credit risk on bank acceptances is low; all clients corresponding to commercial acceptances have long-term cooperation with the Group, relevant provision for impairment on credit risk is accounted for based on credit levels of counterparties. Details are set out in Note V. 5.
The Group only trades with recognized, creditworthy third parties. Total amount of top five entities with the largest balances of accounts receivable as at 31 December 2019 takes 59.22% of the amount of total accounts receivable (31 December 2019: 55.06%). Accounts receivable balances are monitored on an ongoing basis with the result that the Group's exposure to credit risk is controlled. Products are sold only to companies whose credit information is in an acceptable range. Credit limits have been set for most of the customers and they are monitored systematically. For overseas sales, letters of credit are generally in use. Details of analysis related credit risk is in Note V. 4.
To credit risk arising from the other receivables, other current assets and other non-current assets, the Group's exposure to credit risk arising from default of counterparties is limited as most of the counterparties are entities with good credit standing and the Group does not expect any significant loss for uncollected advances to these entities. Details of analysis related credit risk is in Note V. 7, 9 & 21.
1.3 Liquidity risk
In the management of the liquidity risk, the Group monitors and maintains a level of cash and cash equivalents deemed adequate by the management to finance the Group's operations and mitigate the effects of fluctuations in cash flows. The management monitors the utilization of bank borrowings and ensures compliance with loan covenants.
The following is the maturity analysis for financial liabilities held by the Group which is based on undiscounted remaining contractual obligations:
Unit: RMB'000
2019 Within 1 year 1–2 years 2–5 years More than 5 years Total
Non-derivative financial liabilitiesBorrowings 23,027,701 2,603,542 11,004,659 – 36,635,902Held-for-trading financial liabilities 3,157,952 – – – 3,157,952Notes payable 233,224 – – – 233,224Accounts payable 1,952,876 – – – 1,952,876Other payables 1,584,738 – – – 1,584,738Non-current liabilities due within one year 3,749,104 – – – 3,749,104Bonds payable 241,889 2,241,889 3,250,349 – 5,734,127Lease liabilities – 75,550 124,260 85,435 285,245Derivative financial instrumentsDerivative financial liabilities 2,640,928 – – – 2,640,928Non-current derivative financial liabilities – – 202,417 – 202,417
Total 36,588,412 4,920,981 14,581,685 85,435 56,176,513

231China Molybdenum Co., Ltd.
NOTES TO THE FINANCIAL STATEMENTSFOR THE YEAR ENDED 31 DECEMBER 2019
(VIII) FINANCIAL INSTRUMENTS AND RISK MANAGEMENT (CONTINUED)
1. Risk management objectives and policies (Continued)
1.3 Liquidity risk (Continued)
Unit: RMB'000
2018 Within 1 year 1–2 years 2–5 years More than 5 years Total
Non-current derivative financial liabilities
Borrowings 5,490,073 3,737,189 16,024,195 2,082,353 27,333,810Held-for-trading financial liabilities 4,250,711 – – – 4,250,711Notes and accounts payable 1,148,073 – – – 1,148,073Other payables 1,027,782 – – – 1,027,782Non-current liabilities due within one year 2,993,231 – – – 2,993,231Bonds payable 84,400 84,400 2,168,800 – 2,337,600Other non-current liabilities – 3,439,836 68,632 – 3,508,468Derivative financial liabilities (settle
on a net basis)Derivative financial liabilities 75,423 – – – 75,423Non-current derivative financial liabilities – – 20,133 – 20,133
Total 15,069,693 7,261,425 18,281,760 2,082,353 42,695,231

232 2019 Annual Report
NOTES TO THE FINANCIAL STATEMENTSFOR THE YEAR ENDED 31 DECEMBER 2019
(IX) DISCLOSURE OF FAIR VALUE
1. The closing fair value of assets and liabilities measured at fair value
Unit: RMB'000
Fair value on 31 December 2019
ItemLevel 1
Fair valueLevel 2
Fair valueLevel 3
Fair value Total
1. Persistent fair value measurement(1) Held-for-trading financial assets:
– Accounts receivable – 6,564,070 – 6,564,070– Others 19,429 – 1,135,951 1,155,380
(2) Other equity instrument:– Equity instrument investments – – 85,344 85,344
(3) Inventories:– Consumable biological assets – – 45,902 45,902– Trading inventories – 11,298,753 – 11,298,753
(4) Financing receivables: – – 375,936 375,936(5) Others non-current financial assets:
– Other wealth management products by non-banking financial institutions – – 600,991 600,991
– Wealth management products by banks – – 124,950 124,950
– Share of partnership – – 1,354,796 1,354,796– Share of funds – – 425,950 425,950– Directional capital management
plan – – 1,538,294 1,538,294– Equity in unlisted companies – – 98,540 98,540– Equity in listed companies 213,262 – – 213,262
(6) Derivative financial assets: 1,465,849 670,161 49,933 2,185,943
The total assets measured continuously at fair value 1,698,540 18,532,984 5,836,587 26,068,111
(7) Held-for-trading financial liabilities:– Accounts payable – 2,512,788 – 2,512,788– Liabilities from forward commodity
contract and gold lease measured at fair value – 645,164 – 645,164
(8) Derivative financial liabilities: 1,402,865 1,364,720 75,760 2,843,345
The total liabilities measured continuously at fair value 1,402,865 4,522,672 75,760 6,001,297

233China Molybdenum Co., Ltd.
NOTES TO THE FINANCIAL STATEMENTSFOR THE YEAR ENDED 31 DECEMBER 2019
(IX) DISCLOSURE OF FAIR VALUE (CONTINUED)
1. The closing fair value of assets and liabilities measured at fair value (Continued)
Unit: RMB'000
Fair value on 31 December 2018
ItemLevel 1
Fair valueLevel 2
Fair valueLevel 3
Fair value Total
1. Persistent fair value measurement(1) Held-for-trading financial assets:
– Accounts receivable – 774,327 – 774,327(2) Others equity instrument:
– Equity instrument investments – – 448,174 448,174(3) Inventories:
– Consumable biological assets – – 42,907 42,907(4) Financing receivables: – – 1,623,841 1,623,841(5) Other non-current assets:
– Other wealth management products by non-banking financial institutions – – 951,566 951,566
– Share of partnership – – 1,106,295 1,106,295– Share of funds – – 142,296 142,296– Directional capital management
plan – – 1,459,480 1,459,480– Equity in unlisted companies – – 246,985 246,985
(6) No n-current derivative financial assets: – 3,179 – 3,179
The total assets measured continuously at fair value – 777,506 6,021,544 6,799,050
(7) Held-for-trading financial liabilities:– Liabilities from forward commodity
contract and gold lease measured at fair value – 3,009,556 – 3,009,556
– Contingent consideration at fair value – – 550,037 550,037
– Liabilities from float rate foreign currency loan contract and forward foreign exchange contract measured in fair value and forward rate swap contract – 691,117 – 691,117
(8) Derivative financial liabilities: – 98,736 – 98,736
The total liabilities measured continuously at fair value – 3,799,409 550,037 4,349,446

234 2019 Annual Report
NOTES TO THE FINANCIAL STATEMENTSFOR THE YEAR ENDED 31 DECEMBER 2019
(IX) DISCLOSURE OF FAIR VALUE (CONTINUED)
2. Determination basis of market price for items that are continuously measured at Level 2 fair value
Items that are continuously measured at the second level of fair value are accounts receivable, trading inventories, financing receivables and derivative financial assets at FVTPL, accounts payable at FVTPL and debt instruments and derivative financial liabilities at fair value, and the related fair value is determined with reference to the closing price and long-term offer of similar products and the yield rate of similar debt instruments in open market.
3. Determination basis of market price for items that are continuously measured at Level 3 fair value
Items that are continuously measured at the third level of fair value are held-for-trading financial assets, consumable biological assets, derivative financial assets, other equity instrument, other non-current financial assets and derivative financial liabilities. The fair value of held-for-trading assets and wealth management products included in other non-current financial assets is measured based on the expected yield rate provided by the third party financial institution and discounting of the future cash flow. The fair value of consumable biological assets is measured based on the prices of same kind wood, the growth period of tree and the discounting of the subsequently input and maintenance fee. The fair value of financing receivables is based on the note discount rate provided by the third party financial institution and discounting of the future cash flow. The fair values of share of partnership, share of funds, directional capital management plan and equity in unlisted company included in other equity instrument and other non-current financial assets are determined based on the comparable company analysis, the agreed price for transfer or the valuation report provided by third-party financial institutions, or the financial statements provided by the investee with appropriate adjustments. The fair values of derivative financial assets and derivative financial liabilities are determined by management's application of option pricing model.
Unit: RMB'000
Assets/liabilities measured at fair valueFair value on
31 December 2019 Valuation techniques Parameters
The significant input data that cannot be observed
The relationship between the input data that cannot be observed and the fair value
Held-for-trading financial assets/other non-current financial assets
1,861,892 Cash flow discount method The expected cash flows o f t h e p r o d u c t s , t h e yield of similar financial p r o d u c t s i n p r i v a t e market
T h e y i e l d o f s i m i l a r f i nanc ia l p roducts in private market
H ighe r y i e ld o f s im i l a r f i nanc ia l p roducts in private market, lower fair value
Other equity instrument/other non-current financial assets
3,502,924 Comparable companies ana l ys i s /Nego t i a t i ng transfer price/Net asset adjustment method
P r i c e - t o - s a l e s , r e c e n t t r a n s a c t i o n p r i c e , DLOM-discount of lack of marketability, lock-up period discount
Liquidity-lacked discount r a t e / l o c k - u p p e r i o d discount
The higher the discount rate is, the lower the fair value is.
Consumable biological assets 45,902 Cash flow discount method Timber price, growth cycle, and follow-up estimated investment
F o l l o w - u p e s t i m a t e d investment
Higher follow-up estimated investment and lower fair value
Financing receivables 375,936 Cash flow discount method Expec ted cash f l ow o f notes, note discount rate in private
The note discount rate in private market
Higher note discount rate in private market, lower fair value
Derivative financial assets 49,933 Option pricing model Present price of financial products, exercise price o f o p t i o n s , e f f e c t i v e period, risk-free interest rate, volatility
Volatility The higher the volatility is, the higher the fair value is.
Derivative financial liabilities 75,760

235China Molybdenum Co., Ltd.
NOTES TO THE FINANCIAL STATEMENTSFOR THE YEAR ENDED 31 DECEMBER 2019
(IX) DISCLOSURE OF FAIR VALUE (CONTINUED)
4. Reasons for transfers between the levels for i tems continuously measured at fair value and policies on recognition of timing of such transfers
As at 31 December 2019, included in other non-current financial assets, the equity in Company Y of which fair value amounted to RMB193,307,064.75 (31 December 2018: RMB150,355,920.00, as Company Y had its IPO on 14 February 2019, the fair value level of the above equity was measured at level 1 instead of level 3.
5. Financial instruments subsequently not measured at fair value
The management of the Group has assessed cash and bank balances, accounts receivable, other receivables, other current assets, short-term borrowings, notes payable, accounts payable, other payables, long-term borrowings due within a year, etc. As the remaining term is not long, fair values are approximate to book values.
The long-term financial liabilities which are not subsequently measured at fair values by the Group include long-term borrowings and other non-current liabilities. The floating rates of the long-term borrowings of the Group are linked to market interest rates.
(X) RELATED PARTY RELATIONSHIPS AND TRANSACTIONS
1. Parent of the Company
Name of the parentPlace of registration
Nature of business
Registered capital
Proportion of the Company's
ownership interest held by the parent
Proportion of the Company's
voting power held by the parent
Cathay Fortune Corporation ShanghaiInvestment management RMB181,818,200 24.69% 24.69%
On 12 January 2014, the Company received the Notice of Change of Control Rights of Luoyang Luanchuan Molybdenum Group Co., Ltd. from the shareholders Cathay Fortune Corporation ("CFC") and Luoyang Mining Group Co., Ltd. ("LMG"), notifying that CFC increased its shareholding H shares of the Company in the secondary market through its wholly-owned subsidiary, Cathy Fortune Investment, incorporated in Hong Kong. Upon completion, CFC and its persons acting in concert totally hold 1,827,706,322 shares of the Company (approximately 36.01% of the total share capital of the Company), surpassing 1,776,594,475 shares (approximately 35.01% of the total share capital of the Company) held by the original largest shareholder LMG, and become the Company's largest shareholder. CFC and LMG exchanged views on the change of control of the Company. LMG confirmed that it no longer had control over the Company and had no intention to increase its shareholding in the Company. Therefore, the controlling shareholder of the Company changed to CFC.
As at 31 December 2019, CFC actually holds 5,333,220,000.00 shares of the Company accounting for 24.69% of the total share capital of the Company. CFC is the actual controller of the Company.
2. Subsidiaries of the Company
For details of the subsidiaries of the Company, please refer to Note VII 1.

236 2019 Annual Report
NOTES TO THE FINANCIAL STATEMENTSFOR THE YEAR ENDED 31 DECEMBER 2019
(X) RELATED PARTY RELATIONSHIPS AND TRANSACTIONS (CONTINUED)
3. Associates and joint ventures of the Company
For details of associates and joint ventures of the Company, please refer to Note VII 2.
Other associates or joint ventures which have transactions with the Group in the current year or in previous years are as follows:
Associates or joint ventures Relationship with the Company
Fu Chuan A subsidiary held by joint ventureYulu Mining AssociateLuoyang Shenyu AssociateNatural Resources Investment Fund AssociateHuayue Nickel Cobalt Associate
4. Other related parties
Other related parties Relationship with the Company
LMG Shareholder of the CompanyCFC Shareholder of the CompanyGécamines (Note) Minority shareholder of a subsidiary
Note: The Group completed the acquisition of Congo (DRC) Copper-Cobalt business on 17 November 2016, and Gécamines, the minority shareholder of TFM, became related party of the Group.
5. Related party transactions
(1) Sales and purchase of goods, receipt of services
Unit: RMB
Related partyDetails of related party transaction 2019 2018
Luoyang Shenyu Sales of products 26,721,407.26 20,796,836.34Luoyang Shenyu Rendering of services 476,190.48 277,777.78Yulu Mining Sales of products – 5,419.18Yulu Mining Rendering of services 11,046,326.10 10,315,355.16Fu Chuan Purchases of products 25,250,836.79 –Fu Chuan Sales of products 175,271.34 21,330.00High-tech (Note) Purchases of products – 1,831,718.24High-tech (Note) Sales of products 12,315,086.19 –Gécamines Provision of technical support 94,139,828.40 115,974,552.91IXM (Note) Purchases of products 221,517,950.86 –IXM (Note) Sales of products 2,834,210,819.71 861,666,921.37
Note: It represents the above company's transaction with the Group before it becomes a wholly-owned subsidiary of the Group.

237China Molybdenum Co., Ltd.
NOTES TO THE FINANCIAL STATEMENTSFOR THE YEAR ENDED 31 DECEMBER 2019
(X) RELATED PARTY RELATIONSHIPS AND TRANSACTIONS (CONTINUED)
5. Related party transactions (Continued)
(2) Compensation for key management personnel
Unit: RMB'000
Item 2019 2018
Compensation for key management personnel 18,967 22,250
6. Amounts due from/to related parties
Unit: RMB
31 December 2019 31 December 2018Item Related party Carrying amount Bad debt provision Carrying amount Bad debt provision
Other receivables Luoyang Shenyu 291,666.67 – – –Other receivables Fu Chuan 406,254.22 – – –Prepayments Fu Chuan 9,069,559.58 – – –Contract liabilities IXM – – 5,777,674.29 –Accounts receivable Luoyang Shenyu – – 291,666.66 –Accounts receivable Fu Chuan – – 24,742.80 –Other current assets (Note 2) NSR – – 960,848,000.00 –Interest receivable (Note 2) NSR – – 12,964,129.33 –Interest receivable Huayue Nickel Cobalt 2,171,354.53 – – –Other current assets (Note 1) Gécamines – – 43,096,220.58 –Other non-current assets (Note(V), 21, Note11) Huayue Nickel Cobalt 255,627,445.55 – – –Other non-current assets (Note 1) Gécamines 370,521,427.93 – 334,381,507.50 –Accounts payable Fu Chuan 8,703,324.03 – – –Other payables Fu Chuan 11,384,276.00 – 11,384,276.00 –Other payables Gécamines 6,678,007.77 – 5,921,146.67 –Other non-current liabilities Gécamines 69,762,000.00 – 68,632,000.00 –
Note 1: The above receivables are fund borrowings due from minority shareholders of TFM and other related parties, TFM received interest from relevant parties in accordance with the agreed interest rate. During this year, there is no increase in borrowings which is lend to Gécamines by TFM and the interest accrued was USD23,112,214.09, equivalent to RMB159,929,587.84.
Note 2: The above receivables are NSR'S borrowings from NREIL, and NREIL collects interest from NSR at the agreed interest rate. Such receivables was received at the end of this year.

238 2019 Annual Report
NOTES TO THE FINANCIAL STATEMENTSFOR THE YEAR ENDED 31 DECEMBER 2019
(X) RELATED PARTY RELATIONSHIPS AND TRANSACTIONS (CONTINUED)
7. Emoluments of directors and supervisors
Emoluments of each director for the year 2019 are as follows:
Remuneration of directors
Salary and allowances Bonus Pension
Social insurance and housing funds other
than pension TotalUnit: RMB'000 Unit: RMB'000 Unit: RMB'000 Unit: RMB'000 Unit: RMB'000 Unit: RMB'000
Executive directors:Li Chaochun (Note 1) – 360.00 5,100.00 49.62 71.31 5,580.93Li Faben (Note 1) – 360.00 3,890.00 28.80 38.49 4,317.29
Non-executive directors:Guo Yimin (Note3) – – – – – –Yuan Honglin 90.00 – – – – 90.00Cheng Yunlei (Note 3) – – – – – –
Independent non-executive directors:Wang Yougui (Note 1) 300.00 – – – – 300.00Yan Ye (Note 1) 300.00 – – – – 300.00Li Shuhua (Note 1) 300.00 – – – – 300.00
Total 990.00 720.00 8,990.00 78.42 109.80 10,888.22
Emoluments of each director for the year 2018 are as follows:
Remuneration of directors
Salary and allowances Bonus Pension
Social insurance
and housing funds other
than pension TotalUnit: RMB'000 Unit: RMB'000 Unit: RMB'000 Unit: RMB'000 Unit: RMB'000 Unit: RMB'000
Executive directors:Li Chaochun (Note 1) – 360.00 3,000.00 52.71 66.03 3,478.74Li Faben (Note 1) – 360.00 2,000.00 30.76 32.65 2,423.41
Non-executive directors:Ma Hui (Note 1) 90.00 – – – – 90.00Yuan Honglin (Note 1) 90.00 – – – – 90.00Cheng Yunlei (Note 1) 90.00 – – – – 90.00
Independent non-executive directors:Bai Yanchun (Note 2) 116.67 – – – – 116.67Xu Shan (Note 2) 116.67 – – – – 116.67Cheng Yu (Note 2) 116.67 – – – – 116.67Wang Yougui (Note 1) 125.00 – – – – 125.00Yan Ye (Note 1) 125.00 – – – – 125.00Li Shuhua (Note 1) 125.00 – – – – 125.00
Total 995.01 720.00 5,000.00 83.47 98.68 6,897.16

239China Molybdenum Co., Ltd.
NOTES TO THE FINANCIAL STATEMENTSFOR THE YEAR ENDED 31 DECEMBER 2019
(X) RELATED PARTY RELATIONSHIPS AND TRANSACTIONS (CONTINUED)
7. Emoluments of directors and supervisors (Continued)
Emoluments of each supervisor for the year 2019 are as follows:
Salary and allowances Bonus Pension
Social insurance and housing funds other
than pension TotalUnit: RMB'000 Unit: RMB'000 Unit: RMB'000 Unit: RMB'000 Unit: RMB'000
Zhang Zhenhao 90.00 – – – 90.00Kou Youmin (Note 3) – – – – –Wang Zhengyan 320.00 2,140.00 28.80 38.49 2,527.29
Total 410.00 2,140.00 28.80 38.49 2,617.29
Emoluments of each supervisor for the year 2018 are as follows:
Salary and allowances Bonus Pension
Social insurance and housing funds other
than pension TotalUnit: RMB'000 Unit: RMB'000 Unit: RMB'000 Unit: RMB'000 Unit: RMB'000
Zhang Zhenhao 90.00 – – – 90.00Kou Youmin 90.00 – – – 90.00Wang Zhengyan 320.00 1,700.00 30.76 30.31 2,081.07
Total 500.00 1,700.00 30.76 30.31 2,261.07
Note 1: In accordance with resolutions in the First Extraordinary General Meetings in 2018 of CMOC, Li Chaochun and Li Faben were elected as executive directors of the Company; Ma Hui, Yuan Honglin and Cheng Yulei were elected as non-executive directors of the Company; Wang Yougui, Yan Ye and Li Shihua were elected as independent non-executive directors of the Company. The tenure of relevant directors is three years, beginning at 3 August 2018.
Note 2: Bai Yanchun, Xu Shan and Cheng Yu resigned at 3 August 2018 as their term as director expired.
Note 3: The agreed remuneration of Guo Yimin, Cheng Yunlei and Kou Youmin as director or supervisor of the Company are RMB90,000.00. As Guo Yimin, Cheng Yunlei and Kou Youmin also are director or supervisor of LMG, Luoyang, shareholder of the Company at the same time, according to Regulations on Clean Leadership in State-owned Enterprise, leaders in the state-owned enterprises shall not "assume leadership positions in enterprise funded by their own state-owned enterprises or in other enterprises, institutions, social organizations and intermediary agencies without approval, or accept remuneration and other income without authorization (for those approved to assume positions)", Guo Yimin, Cheng Yunlei and Kou Youmin gave up position allowances during their staying in the office provided by the Company.

240 2019 Annual Report
NOTES TO THE FINANCIAL STATEMENTSFOR THE YEAR ENDED 31 DECEMBER 2019
(X) RELATED PARTY RELATIONSHIPS AND TRANSACTIONS (CONTINUED)
7. Emoluments of directors and supervisors (Continued)
None (2018: None) of the top five of 2019 remunerations are directors or supervisors of the Company, and the emoluments of the other 5 staffs (2018: 5) are as follows:
Range of emolumentsNumber of
the current yearNumber of
the prior year
HK$1,500,001 to HK$2,000,000 (equivalent to RMB1,344,000 to RMB1,792,000) 1 –
HK$2,000,001 to HK$2,500,000 (equivalent to RMB1,792,000 to RMB2,239,000) 2 –
HK$2,500,001 to HK$3,000,000 (equivalent to RMB2,239,000 to RMB2,687,000) 2 –
HK$4,000,001 to HK$4,500,000 (equivalent to RMB3,344,000 to RMB3,762,000) – 3
HK$5,000,001 to HK$5,500,000 (equivalent to RMB4,180,000 to RMB4,597,000) – 1
HK$5,500,001 to HK$6,000,000 (equivalent to RMB4,597,000 to RMB5,015,000) – 1
(XI) COMMITMENTS AND CONTINGENCIES
1. Significant commitments
(1) Capital commitments
Unit: RMB'000
2019 2018
Contracted but not recognized in the financial statements:– Co mmitment for acquisition and construction of
long-term assets 1,634,566 1,099,082– Commitment for investment (Note) 423,652 3,764,321
Total 2,058,218 4,863,403
Note: The above commitment for investment included the Group's capital increment to Huayue Nickel Cobalt.
At the balance sheet date, the Group has no other commitments that need to be disclosed.

241China Molybdenum Co., Ltd.
NOTES TO THE FINANCIAL STATEMENTSFOR THE YEAR ENDED 31 DECEMBER 2019
(XI) COMMITMENTS AND CONTINGENCIES (CONTINUED)
1. Significant commitments (Continued)
(2) Operating lease commitments
As at 31 December 2018, the Group had the following commitments in respect of non-cancellable operating leases:
Unit: RMB'000
31 December 2018
Minimum lease payment under irrevocable agreementFirst year after the balance sheet date 45,654Second year after the balance sheet date 41,114Third year after the balance sheet date 28,269Fourth year after the balance sheet date 10,537Subsequent years 109,943
Total 235,517
2. Contingencies
(1) Pending litigation
Copper-Cobalt business of the Group in Congo (DRC)
At the end of 2015, TFM negotiated with SNEL to address the availability, supply quality and quantity of electricity. In accordance with the amended items of the power agreement included in the dispute settlement plan, TFM agrees to pay the electricity at the price of USD0.0569 per kilowatt-hour from January 2016 (the original electricity price was USD0.0350 per kilowatt-hour) and to pay USD10 million settlement compensation to get more continuous supply of electricity from SNEL. As at the date of this report, the two parties have not yet signed any formal agreement, and the negotiations are still in progress. In response to this contingent liability, TFM has accrued USD10 million in expenditure in prior years.
The Group's Copper-Cobalt business in Congo (DRC) may have some lawsuits, claims and liability claims in the daily business. The management considers that the results of such contingencies will not have a material adverse effect on the financial position, operating performance or cash flows of the business based on the information currently available.
The Group's Niobium-Phosphorus business in Brazil
The Group's Niobium-Phosphorus business in Brazil may face with various litigations and disputes in its daily business activities. The management determines the possibility of losing and consequent economic benefits outflow in accordance with the information available and the professional advice of external legal experts. If the possibility of economic benefits outflow were low, the management would determine as contingencies. The results of such contingencies will not have a material adverse effect on the financial position, operating performance or cash flows of the business based on the information currently available.

242 2019 Annual Report
NOTES TO THE FINANCIAL STATEMENTSFOR THE YEAR ENDED 31 DECEMBER 2019
(XI) COMMITMENTS AND CONTINGENCIES (CONTINUED)
2. Contingencies (Continued)
(2) Guarantees
As at 31 December 2019, the Group provides guarantees for the Australian Northparkes copper and gold mine business to Southwest Welsh government agencies of Australia, with guaranteed amount of AUD32,920,000 (equivalent to RMB160,790,000). The relevant business venture agrees to any liability of the business compulsory executed from this guarantee. As at 31 December 2019, no material guarantee responsibility was undertaken.
In 2019, IXM, a subsidiary of the Group, provided guarantee for a supplier located in China, assisting the supplier to get facility totaling USD50,000,000 from the bank. The maximum guarantee undertaken by IXM is limited to 5.0% of the unsettled principal and interest under the credit facility, while bearing no obligations on the remaining principle and interest of the facility. As at 31 December 2019, the Group's guarantee obligation on the utilized facility amounted to USD2,500,000, equivalent to RMB17,440,000.
(XII) EVENTS AFTER THE BALANCE SHEET DATE
1. Dividend distribution plan of 2019
According to the proposal of the board of directors, the Company will distribute a cash dividend of RMB0.43 (2018: RMB0.11 per share) for every ten shares to all shareholders based on the issued 21,599,240,583 shares (book value of RMB0.2 per share) for the year of 2019.
2. Assessment on the effect of Coronavirus Disease 2019 ("COVID-19")
At the beginning of 2020, the pandemic of Coronavirus Disease 2019 ("COVID-19") outbroke in China and all over the world. The Chinese government as well as governments around the globe then took various measures to prevent and control of the pandemic, including travel restriction, quarantine measure or suspension of operating and producing activities. The Group strictly complies with relevant requirements and carries out measures of fighting against the pandemic, strengthens support for control and prevention of COVID-19, and acts proactively to ensure employee's health and operation security. China has controlled the pandemic effectively so far, while COVID-19 still spread rapidly around the world. As of the approval of the financial statements, COVID-19 has had no material effect on production and operation of the Group, the pandemic's future effect on the Group depends on the progress of prevention and control of the pandemic overseas, duration of the pandemic and implementation of local control and prevention policies. As there is still uncertainty of the situation, the board of directors of the Company considers it unable to make reasonable estimate of COVID-19's financial impact on the consolidated financial statements of the Group. The Group will keep paying close attention to the development of COVID-19 around the world, assess and actively address the effect of the pandemic on the financial position and operation results of the Group.

243China Molybdenum Co., Ltd.
NOTES TO THE FINANCIAL STATEMENTSFOR THE YEAR ENDED 31 DECEMBER 2019
(XIII) OTHER SIGNIFICANT EVENTS
1. Segment reporting
(1) Reporting segment's determination basis and accounting policies
The management divided the Group's business into six (2018: Five) operating segments, namely Molybdenum Tungsten related products, Copper and gold-related products, Niobium and Phosphorus related products,Copper and Cobalt related products, metal business and others on the basis of the Group's internal organization structure, management requirements and internal reporting system. The Group's management evaluates the operating results of these segments regularly, in order to determine the allocation of resources and assess their performance.
These reporting segments are determined on the basis of internal management and reporting system. Information of segment reporting are disclosed according to segment accounting policies and measurement standards, the measurement basis should be corresponding with that of financial statements.
(2) Reporting segment's financial information
Unit: RMB'000
2019
Molybdenum & tungsten
related products
Copper & gold related
products
Niobium & Phosphorus
related products
Copper & cobalt related
productsMetal
trading OthersUnallocated
itemIntersegment eliminations Total
Operating incomeExternal income 4,505,452 1,322,524 5,099,205 8,331,866 49,176,852 240,666 – – 68,676,565Inter-segment income – – – – – – – – –Total segment operating income 4,505,452 1,322,524 5,099,205 8,331,866 49,176,852 240,666 – – 68,676,565Total operating income in the financial
statements 4,505,452 1,322,524 5,099,205 8,331,866 49,176,852 240,666 – – 68,676,565Operating cost 2,127,805 1,030,953 3,757,134 7,818,074 50,654,934 216,792 – – 65,605,692Taxes and levies 812,716 812,716Selling expenses 90,658 – 90,658Administrative expenses 1,233,697 – 1,233,697Research and development expenses 268,321 – 268,321Financial expenses 1,250,838 – 1,250,838Add: Gains (losses) from changes in
fair value 2,703,858 – 2,703,858Investment income 194,629 – 194,629Income (losses) from disposal of
assets (64,266) – (64,266)Other income 17,295 – 17,295Gains (losses) from assets
impairment (38,246) – (38,246)Gains (losses) from credit
impairment (6,311) – (6,311)Segment operating profit 2,221,602 – 2,221,602Operating profit in the financial
statements 2,221,602 – 2,221,602Add: Non-operating income 170,388 – 170,388Less: Non-operating expenses 33,542 – 33,542Total profit 2,358,448 – 2,358,448Less: Income tax expenses 592,600 – 592,600Net profit 1,765,848 – 1,765,848

244 2019 Annual Report
NOTES TO THE FINANCIAL STATEMENTSFOR THE YEAR ENDED 31 DECEMBER 2019
(XIII) OTHER SIGNIFICANT EVENTS (CONTINUED)
1. Segment reporting (Continued)
(2) Reporting segment's financial information (Continued)
Unit: RMB'000
2018
Molybdenum & tungsten related
products
Copper & gold related
products
Niobium & Phosphorus
related products
Copper & cobalt related
products OthersUnallocated
itemIntersegment eliminations Total
Operating incomeExternal income 4,749,130 1,458,264 4,976,722 14,373,798 404,949 – – 25,962,863Inter-segment income – – – – – – – –Total segment operating income 4,749,130 1,458,264 4,976,722 14,373,798 404,949 – – 25,962,863Total operating income in the
financial statements 4,749,130 1,458,264 4,976,722 14,373,798 404,949 – – 25,962,863Operating cost 1,888,847 1,030,876 3,832,223 9,172,220 256,081 – – 16,180,247Taxes and levies 1,018,793 – 1,018,793Selling expenses 96,822 – 96,822Administrative expenses 933,346 – 933,346Research and development
expenses 254,356 – 254,356Financial expenses 643,046 – 643,046
Add: Gains (losses) from changes in fair values 122,408 – 122,408Investment income 202,270 – 202,270Income (losses) from
disposal of assets (31,122) – (31,122)Other income 12,551 – 12,551Gains (losses) from
assets impairment (66,583) – (66,583)Gains (losses) from credit
impairment (17,793) – (17,793)Segment operating profit 7,057,984 – 7,057,984Operating profit in the financial
statements 7,057,984 – 7,057,984Add: Non-operating income 2,578 – 2,578Less: Non-operating expenses 70,705 – 70,705Total profit 6,989,857 – 6,989,857Less: Income tax expenses 1,839,815 – 1,839,815Net profit 5,150,042 – 5,150,042

245China Molybdenum Co., Ltd.
NOTES TO THE FINANCIAL STATEMENTSFOR THE YEAR ENDED 31 DECEMBER 2019
(XIII) OTHER SIGNIFICANT EVENTS (CONTINUED)
1. Segment reporting (Continued)
(2) Reporting segment's financial information (Continued)
(a) The Group mainly operates in China, Australia, Brazil and Congo (DRC) and Switzerland, and sells to the customers in China and other countries. The geographic disclosure of revenue and results of segments are classified by the destination of the products to deliver.
Unit: RMB'000
2019 2018
RevenueChina 29,779,395 7,997,091India 125,402 147,889Netherland 2,663,042 2,021Korea 3,095,868 208,302Taiwan 415,761 106,426Belgium 709,097 320,860Bulgaria 10,763 8,124Finland 918,630 5,196,062France 1,366,262 20,024Germany 1,124,746 211,609Greece – –Ireland 19,323 8,645Italy 349,458 55,308Slovenia – –Spain 199,827 22,090Sweden 221,740 13,889Switzerland 3,625,859 9,095Turkey 72,822 80,998UAE 1,110,445 4,194US 3,523,189 241,625Canada 108,330 28,545Brazil 3,251,468 2,821,186Mexico 556,519 34,144South Africa 1,463,559 4,791,132Zambia 3,414,195 2,532,595Australia 17,259 8,200Japan 1,295,568 907,741UK 2,517,761 –Singapore 1,214,439 –Russia 696,830 –Others 4,809,008 185,068
Total 68,676,565 25,962,863

246 2019 Annual Report
NOTES TO THE FINANCIAL STATEMENTSFOR THE YEAR ENDED 31 DECEMBER 2019
(XIII) OTHER SIGNIFICANT EVENTS (CONTINUED)
1. Segment reporting (Continued)
(3) External revenue by location of resources and non-current assets by location
Unit: RMB'000
Item 2019 2018
External revenue from Chinese business 9,625,294 6,009,999External revenue from Australian business 1,192,297 1,474,194External revenue from Brazil business 3,364,579 4,104,872External revenue from Congo (DRC) business 7,324,279 14,373,798External revenue from Switzerland business 47,170,116 –
Sub-total 68,676,565 25,962,863
Unit: RMB'000
Item 31 December 2019 31 December 2018
Non-current assets located in China 6,078,596 7,463,578Non-current assets located in Australia 4,351,098 4,229,002Non-current assets located in Brazil 10,474,322 10,182,430Non-current assets located in Congo (DRC) 35,979,341 35,293,150Non-current assets located in Switzerland 450,481 –
Sub-total 57,333,838 57,168,160
Note: The above non-current assets are not including deferred tax assets, other equity instrument, other non-current financial assets, and non-current derivative financial assets.
(4) Reliance on major clients
In 2019, there were no major clients of the Group with revenue accounting for over 10% of operating income of the Group. In 2018, the revenue of two major customers from copper-cobalt-related product segment in the year was RMB5,222,100,515.88 and RMB2,942,817,318.82 respectively, accounting for 20.11% and 11.33% of operating income of the Group in 2018.

247China Molybdenum Co., Ltd.
NOTES TO THE FINANCIAL STATEMENTSFOR THE YEAR ENDED 31 DECEMBER 2019
(XIV) NOTES TO KEY ITEMS IN THE COMPANY'S FINANCIAL STATEMENTS
1. Cash and bank balances
Unit: RMB
31 December 2019 31 December 2018
ItemAmount in
foreign currency Exchange rate Amount in RMBAmount in
foreign currency Exchange rate Amount in RMB
Cash: 2,520.51 22,398.59RMB – – 2,520.51 – – 22,398.59Bank balances: 3,233,635,426.55 12,329,516,593.36RMB – – 3,233,424,847.99 – – 12,190,929,776.21USD 30,185.28 6.9762 210,578.56 20,177,660.27 6.8632 138,483,316.06HKD – – – 28,560.86 0.8762 25,025.03EUR – – – 10,000.39 7.8473 78,476.06Other cash and bank balances: 745,765,954.89 2,436,964,394.85RMB – – 745,765,954.89 – – 2,436,964,394.85
Total 3,979,403,901.95 14,766,503,386.80
2. Held-for-trading financial assets
Unit: RMB
Item Closing fair value Opening fair value
Structured deposits (Note) 1,014,194,897.26 –
Total 1,014,194,897.26 –
It represents the Group's purchase of structured deposits denominated in RMB from domestic banking financial institutions in the current year, with yield rate pegged to indicators including interest rate and exchange rate, etc. The Group classified it as financial assets at FVTPL.
3. Accounts receivable
Unit: RMB
Category 31 December 2019 31 December 2018
Accounts receivable 69,757,554.20 178,457,336.22– Measured at amortized cost 69,757,554.20 178,457,336.22
Total 69,757,554.20 178,457,336.22

248 2019 Annual Report
NOTES TO THE FINANCIAL STATEMENTSFOR THE YEAR ENDED 31 DECEMBER 2019
(XIV) NOTES TO KEY ITEMS IN THE COMPANY'S FINANCIAL STATEMENTS (CONTINUED)
3. Accounts receivable (Continued)
Credit risk on accounts receivable:
Accounts receivable for which impairment provision is recognized based on the expected credit loss are as follows:
Unit: RMB
31 December 2019 31 December 2018Gross amount Bad debt provision Carrying amount Gross amount Bad debt provision Carrying amount
Accounts receivable with impairment provision recognized based on the expected credit loss 72,611,193.61 2,853,639.41 69,757,554.20 182,232,367.03 3,775,030.81 178,457,336.22
4. Financing receivables
RMB
Category 31 December 2019 31 December 2018
Notes receivable 59,095,591.76 1,610,443,851.38
Total 59,095,591.76 1,610,443,851.38
(a) Categories of notes receivable
Unit: RMB
Categories 31 December 2019 31 December 2018
Bank acceptances 57,942,983.42 1,290,166,178.96Commercial acceptances 1,152,608.34 320,277,672.42
Total 59,095,591.76 1,610,443,851.38
(b) Notes receivable endorsed or discounted by the Company as at the end and beginning of the year but not yet due at the balance sheet date:
Unit: RMB
Category
Amount derecognized as
at the end of 2019
Amount derecognized as
at the end of 2018
Bank acceptances 674,972,792.71 1,206,560,239.49
Total 674,972,792.71 1,206,560,239.49

249China Molybdenum Co., Ltd.
NOTES TO THE FINANCIAL STATEMENTSFOR THE YEAR ENDED 31 DECEMBER 2019
(XIV) NOTES TO KEY ITEMS IN THE COMPANY'S FINANCIAL STATEMENTS (CONTINUED)
5. Prepayments
Aging analysis of prepayments is as follows:
Unit: RMB
31 December 2019 31 December 2018Aging Amount Proportion Amount Proportion
(%) (%)
Within 1 year 1,682,436.54 23.30 29,999,441.55 59.631 to 2 years 5,264,505.10 72.90 19,856,592.96 39.472 to 3 years 69,739.15 0.97 446,384.92 0.89Over 3 years 204,133.97 2.83 3,580.00 0.01
Total 7,220,814.76 100.00 50,305,999.43 100.00
6. Other receivables
Unit: RMB
Item 31 December 2019 31 December 2018
Interest receivable 400,713,610.41 378,516,688.14Dividends receivable 44,006,084.08 44,006,084.08Other receivables 4,568,606,476.14 4,360,653,754.98
Total 5,013,326,170.63 4,783,176,527.20

250 2019 Annual Report
NOTES TO THE FINANCIAL STATEMENTSFOR THE YEAR ENDED 31 DECEMBER 2019
(XIV) NOTES TO KEY ITEMS IN THE COMPANY'S FINANCIAL STATEMENTS (CONTINUED)
6. Other receivables (Continued)
Credit risk on other receivables:
Other receivables of the Company, for which impairment provision is recognized based on the expected credit loss are as follows:
Unit: RMB
31 December 2019 31 December 2018Gross amount Impairment provision Carrying amount Gross amount Impairment provision Carrying amount
Other receivables with impairment provision recognized based on the expected credit loss 4,591,401,850.36 22,795,374.22 4,568,606,476.14 4,388,983,555.56 28,329,800.58 4,360,653,754.98
As at 31 December 2019, except for RMB22,795,374.22 (31 December 2018: RMB28,329,800.58) of the above receivables which were credit-impaired with impairment provision for full amount, management of the Group considered there was no significant credit loss on other receivables.
7. Inventories
Categories of inventories:
Unit: RMB
31 December 2019 31 December 2018
Item Gross amount
Provision for decline in value
of inventories Carrying amount Gross amount
Provision for decline in value
of inventories Carrying amount
Raw materials 70,388,974.87 1,945,548.70 68,443,426.17 67,080,374.16 1,945,548.70 65,134,825.46Finished goods 72,519,448.32 – 72,519,448.32 77,183,323.62 – 77,183,323.62Total 142,908,423.19 1,945,548.70 140,962,874.49 144,263,697.78 1,945,548.70 142,318,149.08

251China Molybdenum Co., Ltd.
NOTES TO THE FINANCIAL STATEMENTSFOR THE YEAR ENDED 31 DECEMBER 2019
(XIV) NOTES TO KEY ITEMS IN THE COMPANY'S FINANCIAL STATEMENTS (CONTINUED)
8. Long-term equity investments
Details of long-term equity investment as follows:
Unit: RMB
Investee Initial investment cost 31 December 2019 31 December 2018
Equity MethodYulu Mining 20,000,000.00 108,618,691.48 86,593,518.79High-tech 135,000,000.00 – 70,029,342.89Huan Yu 973,335,000.00 628,372,427.71 678,636,686.95Luoyang Shenyu 1,500,000.00 1,016,091.87 1,007,760.31
Sub-total 1,129,835,000.00 738,007,211.06 836,267,308.94
Cost Method-subsidiariesYe Lian 5,638,250.27 5,638,250.27 5,638,250.27Da Chuan 17,500,000.00 17,500,000.00 17,500,000.00Xiao Shou Mao Yi 2,000,000.00 2,000,000.00 2,000,000.00Da Dong Po 33,483,749.86 33,483,749.86 33,483,749.86Jiu Yang 17,028,900.00 17,028,900.00 17,028,900.00San Qiang 28,294,800.00 33,397,038.41 33,397,038.41International Hotel 210,000,000.00 210,000,000.00 210,000,000.00Wu Ye 100,000,000.00 100,000,000.00 100,000,000.00CMOC HK 1,869,455,300.96 1,869,455,300.96 1,869,455,300.96Metal Material 650,000,000.00 650,000,000.00 650,000,000.00Fu Run 8,803,190.84 8,803,190.84 8,803,190.84Xin Jiang Luo Mu 980,000,000.00 980,000,000.00 980,000,000.00Hu Qi 9,900,000.00 9,900,000.00 9,900,000.00Fu Kai 261,520,000.00 261,520,000.00 261,520,000.00Sales Company (Note) 50,000,000.00 50,700,000.00 50,700,000.00Qi Xing 46,963,636.00 46,963,636.00 46,963,636.00CMOC Limited (Note) 575,797,299.48 23,721,409,809.48 17,064,973,809.48Schmocke 500,000,000.00 660,000,000.00 660,000,000.00Beijing Yongbo 10,000,000.00 267,800,000.00 267,800,000.00CMOC Mining (Note) – 39,000,000.00 39,000,000.00High-tech 189,394,789.58 189,394,789.58 –
Sub-total 5,565,779,916.99 29,173,994,665.40 22,328,163,875.82
Total 29,912,001,876.46 23,164,431,184.76
Less: Provision for impairment – –Net amount of long-term equity investments 29,912,001,876.46 23,164,431,184.76
Note: The Company provided guarantees for the USD loans of subsidiaries in the year, and recognized an investment cost according to the fair value of the guarantee.

252 2019 Annual Report
NOTES TO THE FINANCIAL STATEMENTSFOR THE YEAR ENDED 31 DECEMBER 2019
(XIV) NOTES TO KEY ITEMS IN THE COMPANY'S FINANCIAL STATEMENTS (CONTINUED)
9. Other investments in equity instruments
Unit: RMB
Item 31 December 2019 31 December 2018
Equity U – 194,111,260.26
Total – 194,111,260.26
For details of the other investments in equity instruments of the Company, please refer to Notes (V). 11.
10. Other non-current financial assets
Unit: RMB
Item 31 December 2019 31 December 2018
Other wealth management products by non-banking financial institutions 600,990,751.70 951,566,173.88
Wealth management products by banks 124,950,476.72 –Others 4,928.00 4,928.00
Total 725,946,156.42 951,571,101.88
For details of other non-current assets of the Company, please refer to Notes (V). 12.
11. Non-current derivative financial assets
Unit: RMB
Item 31 December 2019 31 December 2018
Interest rate swap contracts – 3,179,157.60
Total – 3,179,157.60
For details of other non-current assets of the Company, please refer to Notes (V). 13.

253China Molybdenum Co., Ltd.
NOTES TO THE FINANCIAL STATEMENTSFOR THE YEAR ENDED 31 DECEMBER 2019
(XIV) NOTES TO KEY ITEMS IN THE COMPANY'S FINANCIAL STATEMENTS (CONTINUED)
12. Fixed assets
Unit: RMB
ItemBuilding and
mining engineeringMachinery
equipmentElectronic furniture
and fixturesTransportation
equipment Total
I. Total original carrying amount:1. Op ening balance 1 January
2019 2,684,842,262.37 849,684,338.26 159,486,546.70 126,439,279.84 3,820,452,427.172. Increase for the current year 105,899,360.01 32,029,143.20 13,739,384.04 12,106,601.90 163,774,489.15
(1) Purchase 16,052,652.18 3,835,128.42 3,228,203.52 11,805,716.94 34,921,701.06(2) Tr ansfer from
construction in progress 89,846,707.83 28,194,014.78 10,511,180.52 300,884.96 128,852,788.09
3. Decrease for the current year – – – 272,165.00 272,165.00(1) Disposal or retirement – – – 272,165.00 272,165.00
4. Cl osing balance 31 December 2019 2,790,741,622.38 881,713,481.46 173,225,930.74 138,273,716.74 3,983,954,751.32
II. Accumulated depreciation1. Op ening balance 1 January
2019 1,597,064,521.47 642,075,362.88 124,925,606.93 113,699,298.98 2,477,764,790.262. Increase for the current year 97,961,584.29 32,053,494.75 10,573,914.89 3,084,515.73 143,673,509.66
(1) Provision 97,961,584.29 32,053,494.75 10,573,914.89 3,084,515.73 143,673,509.663. Decrease for the current year – – – 261,278.40 261,278.40
(1) Disposal or retirement – – – 261,278.40 261,278.404. Cl osing balance 31 December
2019 1,695,026,105.76 674,128,857.63 135,499,521.82 116,522,536.31 2,621,177,021.52
III. Provision for impairment1. Op ening balance 1 January
2019 – 3,945,202.39 – – 3,945,202.392. Increase for the current year 15,140,391.60 – – – 15,140,391.60
(1)Provision 15,140,391.60 – – – 15,140,391.603. Decrease for the current year – – – – –4. Cl osing balance 31 December
2019 15,140,391.60 3,945,202.39 – – 19,085,593.99
IV. Carrying amount1. Closing carrying amount 1,080,575,125.02 203,639,421.44 37,726,408.92 21,751,180.43 1,343,692,135.812. Opening carrying amount 1,087,777,740.90 203,663,772.99 34,560,939.77 12,739,980.86 1,338,742,434.52

254 2019 Annual Report
NOTES TO THE FINANCIAL STATEMENTSFOR THE YEAR ENDED 31 DECEMBER 2019
(XIV) NOTES TO KEY ITEMS IN THE COMPANY'S FINANCIAL STATEMENTS (CONTINUED)
13. Intangible assets
Unit: RMB
Item Land use right Mining right Trademark rightNon proprietary
technology Others Total
I. Total original carrying amount:1. Opening balance 1 January 2019 327,749,522.82 408,985,700.00 1,286,750.00 83,974,165.18 10,724,484.15 832,720,622.152. Increase for the current year – – – 100,000.00 10,287,660.17 10,387,660.17
(1) Purchase – – – 100,000.00 207,345.15 307,345.15(2) Tr ansfer from construction
in progress – – – – 10,080,315.02 10,080,315.023. Decrease for the current year – – – – – –
(1) Disposal4. Cl osing balance 31 December
2019 327,749,522.82 408,985,700.00 1,286,750.00 84,074,165.18 21,012,144.32 843,108,282.32
II. Accumulated amortization1. Opening balance 1 January 2019 78,289,641.17 335,705,556.92 1,066,468.89 56,623,085.52 5,481,366.47 477,166,118.972. Increase for the current year 7,145,418.84 27,727,844.04 22,028.16 8,391,182.52 1,465,878.98 44,752,352.54
(1) Provision 7,145,418.84 27,727,844.04 22,028.16 8,391,182.52 1,465,878.98 44,752,352.543. Decrease for the current year – – – – – –
(1) Disposal – – – – – –4. Cl osing balance 31 December
2019 85,435,060.01 363,433,400.96 1,088,497.05 65,014,268.04 6,947,245.45 521,918,471.51
III. Provision for impairment1. Opening balance 1 January 2019 – – – – – –2. Increase for the current year – – – – – –3. Decrease for the current year – – – – – –4. Cl osing balance 31 December
2019 – – – – – –
IV. Carrying amount1. Closing carrying amount 242,314,462.81 45,552,299.04 198,252.95 19,059,897.14 14,064,898.87 321,189,810.812. Opening carrying amount 249,459,881.65 73,280,143.08 220,281.11 27,351,079.66 5,243,117.68 355,554,503.18

255China Molybdenum Co., Ltd.
NOTES TO THE FINANCIAL STATEMENTSFOR THE YEAR ENDED 31 DECEMBER 2019
(XIV) NOTES TO KEY ITEMS IN THE COMPANY'S FINANCIAL STATEMENTS (CONTINUED)
14. Deferred income tax assets/deferred income tax liabilities
(1) Deferred income tax assets or liabilities listed in net value after offsetting
Unit: RMB
Item 31 December 2019 31 December 2018
Deferred income tax assets:Impairment provision on assets 8,903,532.00 7,653,918.65Deferred income from government grants 2,818,199.42 2,876,037.29Outstanding expenses – net 44,877,414.72 33,598,814.96Losses on disposal of fixed assets without filing 3,241,706.29 3,510,509.81Profit or loss arising from fair value changes 27,342,085.16 14,516,353.69
Sub-total 87,182,937.59 62,155,634.40
Deferred income tax liabilities:Interest income 52,168,424.61 32,144,307.27Depreciation of fixed assets 1,362,631.51
Sub-total 53,531,056.12 32,144,307.27
Deferred tax assets/liabilities after offsetting 33,651,881.47 30,011,327.13
(2) Temporary differences corresponding to the assets/liabilities causing temporary differences
Unit: RMB
Temporary differences
Item 31 December 2019 31 December 2018
Impairment provision on assets 59,356,879.98 51,026,124.34Deferred income from government grants 18,787,996.10 19,173,581.90Profit or loss arising from fair value changes 182,280,567.72 96,775,691.28Outstanding expenses – net 299,182,764.82 223,992,099.76Losses on disposal of fixed assets without filing 21,611,375.27 23,403,398.76Interest income (347,789,497.35) (214,295,381.86)Depreciation of fixed assets (9,084,210.07) –
Sub-total 224,345,876.47 200,075,514.18

256 2019 Annual Report
NOTES TO THE FINANCIAL STATEMENTSFOR THE YEAR ENDED 31 DECEMBER 2019
(XIV) NOTES TO KEY ITEMS IN THE COMPANY'S FINANCIAL STATEMENTS (CONTINUED)
15. Breakdown of impairment provision on assets
Unit: RMB
1 January 2019Increase in
current yearDecrease in current year 31 December
2019Item Reversal Write-off
I. Im pairment provision for inventories 1,945,548.70 – – – 1,945,548.70
II. Im pairment provision on fixed assets 3,945,202.39 15,140,391.60 – – 19,085,593.99
Total 5,890,751.09 15,140,391.60 – – 21,031,142.69
16. Other non-current assets
Unit: RMB
Item 31 December 2019 31 December 2018
Deposit over one year – 200,000,000.00Prepaid farmland occupation tax 8,028,346.01 18,836,266.71
Total 8,028,346.01 218,836,266.71
17. Short-term borrowings
Unit: RMB
Item 31 December 2019 31 December 2018
Credit loan 1,178,000,000.00 2,006,257,000.00
Total 1,178,000,000.00 2,006,257,000.00
18. Held-for-trading financial liabilities
Details of held-for-trading financial liabilities are as follows:
Unit: RMB
Item Closing fair value Opening fair value
1. Li abilities from floating-rate foreign currency loan contract and forward foreign exchange contract measured in fair value and forward rate swap contract – 691,117,466.05
2. Li abilities from forward commodity contract and gold lease measured at fair value 645,164,164.50 3,009,556,448.79
Total 645,164,164.50 3,700,673,914.84
For details of held-for-trading financial liabilities of the Company, please refer to Notes (V). 23.

257China Molybdenum Co., Ltd.
NOTES TO THE FINANCIAL STATEMENTSFOR THE YEAR ENDED 31 DECEMBER 2019
(XIV) NOTES TO KEY ITEMS IN THE COMPANY'S FINANCIAL STATEMENTS (CONTINUED)
19. Derivative financial liabilities
Unit: RMB
Item 31 December 2019 31 December 2018
Derivative financial liabilities– Forward exchange contract (Note) – 70,753,781.72
Total – 70,753,781.72
Note: As at 23 April 2018, the Company and the bank entered into a forward exchange contract, stipulating to acquire euro and sell US dollar at a specific exchange rate on a specific day. The aforesaid derivative financial liability was due for closure in 2019.
20. Accounts payable
Unit: RMB
Category 31 December 2019 31 December 2018
Accounts payable 236,918,656.25 134,109,971.43
Total 236,918,656.25 134,109,971.43
21. Taxes payable
Unit: RMB
Item 31 December 2019 31 December 2018
Enterprise income tax – 48,791,823.82Value added tax 12,504,323.20 35,659,014.99Urban maintenance and construction tax 417,329.71 1,724,770.33Resource tax 5,251,464.53 25,677,555.75Education surcharges 250,397.83 1,034,862.20Other tax 4,489,973.22 4,474,520.05
Total 22,913,488.49 117,362,547.14
22. Other payables
Unit: RMB
Item 31 December 2019 31 December 2018
Interests payable 83,541,782.42 72,907,618.95Others 829,116,123.14 2,106,994,602.12
Total 912,657,905.56 2,179,902,221.07

258 2019 Annual Report
NOTES TO THE FINANCIAL STATEMENTSFOR THE YEAR ENDED 31 DECEMBER 2019
(XIV) NOTES TO KEY ITEMS IN THE COMPANY'S FINANCIAL STATEMENTS (CONTINUED)
23. Other current liabilities
Unit: RMB
Item 31 December 2019 31 December 2018
Accrued expenses 85,702,018.67 67,452,554.97Financial guarantee contracts (Note XIV. 8) 65,009,272.79 107,547,334.02Short-term bonds payable 1,000,000,000.00 –
Total 1,150,711,291.46 174,999,888.99
Financial guarantee contracts for subsidiaries under other current liabilities are accounted for based on the expected credit loss model. As at 31 December 2019, management of the Company considered that credit risk on relevant financial guarantee contracts was low in connection with the credit level of the guaranteed enterprises.
24. Provisions
Unit: RMB
Item 31 December 2019 31 December 2018
Land restoration and rehabilitation fee (Note V.37) 47,570,371.67 47,570,371.67
Total 47,570,371.67 47,570,371.67
25. Operating income and operating costs
Unit: RMB
Item 2019 2018
Main business income 3,427,554,180.14 3,799,725,807.80Other business income 106,992,722.02 91,138,444.69Main business cost 1,347,208,617.31 1,165,414,585.73Other business cost 106,841,574.17 93,164,314.23
26. Taxes and levies
Unit: RMB
Item 2019 2018Calculation and
payment standards
Urban maintenance and construction tax 15,716,651.93 24,465,846.82 Note IVEducation surcharges 9,429,162.14 14,662,813.21 Note IVResource tax 245,558,885.53 279,395,155.83 Note IVOthers 13,781,561.68 23,590,621.66
Total 284,486,261.28 342,114,437.52

259China Molybdenum Co., Ltd.
NOTES TO THE FINANCIAL STATEMENTSFOR THE YEAR ENDED 31 DECEMBER 2019
(XIV) NOTES TO KEY ITEMS IN THE COMPANY'S FINANCIAL STATEMENTS (CONTINUED)
27. Administrative expenses
Unit: RMB
Item 2019 2018
Wages and social security contribution 98,326,350.31 90,635,533.49Depreciation and amortization 24,769,265.89 14,069,745.91Consulting and professional fees 169,071,805.99 195,366,970.85Entertainment expenditures 9,082,037.46 8,306,413.06Insurance costs 68,314,628.23 17,106,475.42Others 38,276,148.53 39,210,450.31
Total 407,840,236.41 364,695,589.04
28. Financial expenses
Unit: RMB
Item 2019 2018
Interest expenses on bond 123,897,740.86 93,400,000.00Discount interest of notes receivable 15,212,363.48 19,526,129.62Interest expenses of bank loans 107,474,596.32 159,513,633.70Total interest expenses: 246,584,700.66 272,439,763.32Less: Interest income 560,330,300.98 803,909,376.38Exchange differences (11,234,357.77) (78,533,999.42)Gold lease charges 82,099,619.58 115,799,546.91Others (53,727,701.38) (33,707,429.80)
Total (296,608,039.89) (527,911,495.37)
29. Investment income
Unit: RMB
Item 2019 2018
Income from long-term equity investments under equity method 68,939,691.70 62,379,726.43Investment income from other non-current financial assets (Note V. 12) 51,240,647.85 47,233,314.62Investment loss on disposal of held-for-trading financial liabilities 1,763,037.25 –
Total 121,943,376.80 109,613,041.05

260 2019 Annual Report
NOTES TO THE FINANCIAL STATEMENTSFOR THE YEAR ENDED 31 DECEMBER 2019
(XIV) NOTES TO KEY ITEMS IN THE COMPANY'S FINANCIAL STATEMENTS (CONTINUED)
30. Gains (losses) on credit impairment
Unit: RMB
Sources of credit impairment 2019 2018
Gains (losses) on credit impairment of notes receivable and accounts receivable 299,909.30 (8,120,845.28)
Gains on credit impairment of other receivables 5,581,243.11 159,304.20
Total 5,881,152.41 (7,961,541.08)
31. Impairment gains (losses) on assets
Unit: RMB
Item 2019 2018
Gains (losses) on decline in value of inventories – (1,945,548.70)Gains (losses) on impairment of fixed assets (15,140,391.60) –
Total (15,140,391.60) (1,945,548.70)
32. Non-operating income
Unit: RMB
Item 2019 2018
Government grants 2,500,000.00 1,100,000.00Others 7,820,335.42 108,319.54
Total 10,320,335.42 1,208,319.54
33. Non-operating expenses
Unit: RMB
Item 2019 2018
External donations 24,730,000.00 58,410,000.00Others 5,049,566.01 4,262,322.64
Total 29,779,566.01 62,672,322.64

261China Molybdenum Co., Ltd.
NOTES TO THE FINANCIAL STATEMENTSFOR THE YEAR ENDED 31 DECEMBER 2019
(XIV) NOTES TO KEY ITEMS IN THE COMPANY'S FINANCIAL STATEMENTS (CONTINUED)
34. Income tax expenses
Unit: RMB
Item 2019 2018
Current tax expenses calculated according to tax laws and relevant requirements 142,762,151.52 330,100,520.25
Differences arising on settlement of income tax for the previous year 8,063,738.16 8,875,080.29Adjustments to deferred income tax (4,523,865.30) (74,610,440.37)
Total 146,302,024.38 264,365,160.17
Reconciliation of income tax expenses to the accounting profit is as follows:
Unit: RMB
Item 2019 2018
Accounting profit 1,386,810,131.36 2,186,420,101.30Income tax expenses calculated at 15% (2018: 15%) 208,021,519.70 327,963,015.20Tax impact of non-deductible expenses 960,024.99 3,171,316.72Tax impact of non-taxable income (70,743,258.47) (75,644,252.04)Difference arising on settlement of income tax for the previous
years 8,063,738.16 8,875,080.29
Total 146,302,024.38 264,365,160.17

262 2019 Annual Report
NOTES TO THE FINANCIAL STATEMENTSFOR THE YEAR ENDED 31 DECEMBER 2019
(XIV) NOTES TO KEY ITEMS IN THE COMPANY'S FINANCIAL STATEMENTS (CONTINUED)
35. Supplementary information to the cash flow statement
Unit: RMB
Supplementary information 2019 2018
1. Re conciliation of net profit into cash flow from operating activities:
Net profit 1,240,508,106.98 1,922,054,941.13Add: Provision for impairment losses of assets 15,140,391.60 1,945,548.70
Provision for credit impairment (5,881,152.41) 7,961,541.08Depreciation of fixed assets 143,673,509.66 146,511,351.37Amortization of intangible asset 44,752,352.54 43,794,025.13Amortization of long-term prepaid expenses 77,174,150.49 21,000,769.84Losses on disposal of fixed assets, intangible assetsand other long-term assets (7,097.16) 1,664,197.21Losses on changes in fair value (less gains) 218,236,080.59 119,912,602.50Financial expenses (income is filled in column with "-") 400,808,103.77 477,781,171.96Investment losses (income is filled in column with "-") (121,943,376.80) (109,613,041.05)Decrease in deferred tax assets (increase is filled in
column with "-") (3,640,554.34) (74,610,440.37)Decrease in inventories (increase is filled in column
with "-") 1,355,274.59 (4,156,290.22)Decrease in operating accounts receivable items
(increase is filled in column with "-") 1,260,414,246.27 649,765,651.07Increase in operating payables (decrease is filled in
column with "-") (78,339,373.92) 485,643,038.22Amortization of deferred income (387,501.74) (385,585.80)Increase in special reserve (decrease is filled in
column with "-") (2,493,954.36) (4,413,776.96)Net cash flow from operating activities 3,189,369,205.76 3,684,855,703.81
2. Net changes in cash and cash equivalents:Closing balance of cash 3,233,637,947.06 12,329,538,991.95Less: Opening balance of cash 12,329,538,991.95 11,364,847,728.10Add: Closing balance of cash equivalents – –Less: Opening balance of cash equivalents – –Net increase (decrease) in cash and cash equivalents (9,095,901,044.89) 964,691,263.85

263China Molybdenum Co., Ltd.
NOTES TO THE FINANCIAL STATEMENTSFOR THE YEAR ENDED 31 DECEMBER 2019
(XIV) NOTES TO KEY ITEMS IN THE COMPANY'S FINANCIAL STATEMENTS (CONTINUED)
36. Related party relationships and transactions
Please refer to Note VII. 1 for the subsidiaries of the Company and Note V. 10 for associates and joint ventures of the Company.
(1) Details on related party transactions
(1.1) Sales and purchase of goods, provision and receipt of services
Unit: RMB
Related party Related transaction typeContent of related party transactions
Related transaction pricing Methods and decision-making process
2019 Amount
2018 Amount
Sales Company Goods Sales Contract price 470,782,662.81 670,795,526.49Ye Lian Goods Sales Contract price 1,346,032,718.67 1,147,294,208.32Xiao Shou Mao Yi Goods Sales Contract price 49,366,822.54 134,208,897.66Da Dong Po Goods Sales/Provision of services
related to tailing processing
Contract price 48,624,048.49 57,697,102.70
Jiu Yang Goods Sales Contract price – 14,419,949.67San Qiang Goods Sales Contract price 69,070,216.75 76,559,482.61Wu Ye Goods Sales Contract price 733,289,320.85 721,185,417.62Metal Material Goods Sales/Provision of technique
know-howContract price 500,930,879.16 844,160,553.80
Total 3,218,096,669.27 3,666,321,138.87
San Qiang Service Receipt of service Contract price – 215,517.24Sales Company Goods Purchase of goods and
materialsContract price – 2,343,612.42
Da Chuan Service Receipt of service Contract price 3,622,641.52 5,433,962.28Jiu Yang Goods Purchase of goods and
materialsContract price 1,991,565.04 890,241.72
HK Goods Purchase of goods and materials
Contract price – 10,944,728.85
Fu Run Service Receipt of service Contract price – 189,826.43Metal Material Service/Goods Receipt of service/Purchase
of goods and materialsContract price 0.09 –
Xiao Shou Mao Yi Goods Purchase of goods and materials
Contract price 12,333,347.91 19,755,572.33
Ye Lian Service Receipt of service Contract price – –Schmocke Service Receipt of service Contract price 19,708,153.06 30,826,441.78Beijing Yongbo Service Receipt of service Contract price 34,081,522.13 45,434,313.11International Hotel Service Receipt of service Contract price 11,550,169.34 11,550,354.87Da Dong Po Service/Goods Receipt of service/Purchase
of goods and materialsContract price 40,148,750.94 40,829,044.54
Mudu Trading Goods Purchase of goods and materials
Contract price – 2,471,692.43
Total 123,436,150.03 170,885,308.00

264 2019 Annual Report
NOTES TO THE FINANCIAL STATEMENTSFOR THE YEAR ENDED 31 DECEMBER 2019
(XIV) NOTES TO KEY ITEMS IN THE COMPANY'S FINANCIAL STATEMENTS (CONTINUED)
36. Related party relationships and transactions (Continued)
(1) Details on related party transactions (Continued)
(1.2) Loans and borrowings of the related party
Except the related party financing disclosures in Note X. 6, the financing transactions between the Company and other related parties are as follows:
Unit: RMB
Lent to during the current year
Received during the current year
Received during the current year
Lent to during the previous year
Received during the previous year
Closing balance of previous year
Lent toSales Company 3,268,604,580.00 1,716,434,132.05 1,552,170,447.95 – – –Xiao Shou Mao Yi – – – – 106,143,525.86 –Ye Lian – 1,024,614,544.22 – 1,972,422,086.74 947,807,542.52 1,024,614,544.22International Hotel 72,800,210.93 77,887,058.43 82,489,065.18 69,822,529.44 84,300,065.34 87,575,912.68Jiu Yang 553,783,926.56 641,081,412.23 – 4,598,688.10 3,868,756.20 87,297,485.67CMOC HK 1,052,375,137.00 1,063,792,329.00 697,620,000.00 1,359,979,225.08 662,077,959.04 709,037,192.00CMOC Limited 9,229,820.00 – 1,206,409,050.00 1,662,109,258.03 857,950,085.75 1,197,179,230.00Qi Xing 381,569.86 15,134.15 67,108,663.30 380,200.00 – 66,742,227.59Schmocke 380,935,064.41 746,999,436.24 614,000,000.00 – 85,935,628.17 980,064,371.83Fu Run – 25,102.35 11,577,366.88 – 6,604,133.75 11,602,469.23Yuehe Properties 170,285.81 703.36 59,878,591.10 271,428.66 – 59,709,008.65
Total 5,338,280,594.57 5,270,849,852.03 4,291,253,184.41 5,069,583,416.05 2,754,687,696.63 4,223,822,441.87
Unit: RMB
Borrowed from during
the current yearRepaid during
current yearClosing balance of current year
Borrowed from during
the previous yearRepaid during previous year
Closing balance of previous year
Borrowed fromSales Company 5,453,875,020.21 5,732,413,755.05 164,234,982.55 6,778,424,981.64 6,500,875,725.91 442,773,717.39Xiao Shou Mao Yi 58,347,791.43 64,558,942.66 19,387,522.04 206,859,744.67 181,261,071.40 25,598,673.27Wu Ye – 962,573,213.68 306,187.25 1,000,958,313.30 143,117,302.11 962,879,400.93Metal Material 1,801,282,696.72 1,803,402,630.97 323,489.75 2,235,213,347.23 2,325,352,210.76 2,443,424.00San Qiang 154,190,825.65 154,424,899.29 396,790.70 30,182,825.52 29,551,961.18 630,864.34Da Dong Po 143,176,819.83 145,646,510.97 660,726.24 36,907,051.12 34,103,260.74 3,130,417.38Da Chuan 22,510,218.97 18,167,214.99 14,820,992.46 40,963,281.23 39,367,719.95 10,477,988.48Xin Jiang Luo Mu 3,232,879.67 4,262,565.83 179,304,822.89 22,184,789.02 34,607,666.00 180,334,509.05Fu Kai – – 11,295,366.25 – 4,633.75 11,295,366.25Hu Qi – – 9,895,366.25 – 4,633.75 9,895,366.25Ye Lian 1,048,534,843.46 1,048,027,115.58 507,727.88 – 206,605,913.73 –Schmocke 118,534,412.99 – 118,534,412.99 – – –Beijing Yongbo 1,014,693,728.20 1,132,667,763.17 34,332,236.83 154,452,171.80 2,145,900.00 152,306,271.80
Total 9,818,379,237.13 11,066,144,612.19 554,000,624.08 10,506,146,505.53 9,496,997,999.28 1,801,765,999.14

265China Molybdenum Co., Ltd.
NOTES TO THE FINANCIAL STATEMENTSFOR THE YEAR ENDED 31 DECEMBER 2019
(XIV) NOTES TO KEY ITEMS IN THE COMPANY'S FINANCIAL STATEMENTS (CONTINUED)
36. Related party relationships and transactions (Continued)
(1) Details on related party transactions (Continued)
(1.3) Interest of related parties
The borrowings/loans with other related parties are as follows:
2019 2018Unit: RMB Unit: RMB
Net interests paid to (charged from) related parties (109,066,589.31) (54,491,893.04)
(1.4) Guarantees with related party
Guarantor Guaranteed partyGuaranteed amount
Inception date of guarantee
Expiration date of guarantee
Whether execution of guarantee has been completed
China Molybdenum Co., Ltd. CMOC Mining AUD 37,000,000 18 December 2013 21 November 2023 NoChina Molybdenum Co., Ltd. CMOC Mining USD220,000,000 5 November 2018 16 November 2023 NoChina Molybdenum Co., Ltd. CMOC Limited USD80,000,000 29 May 2019 2 June 2020 NoChina Molybdenum Co., Ltd. CMOC Limited USD70,000,000 30 May 2019 29 May 2020 NoChina Molybdenum Co., Ltd. CMOC Brazil and
CMOC LUXEMBOURGUSD666,000,000 29 September 2016 14 September 2023 No
China Molybdenum Co., Ltd. CMOC DRC USD1,336,000,000 15 November 2016 15 November 2023 NoChina Molybdenum Co., Ltd. (Note) BHR Newwood Investment
Management LimitedUSD648,600,000 5 April 2017 5 April 2024 No
China Molybdenum Co., Ltd. CMOC Capital USD300,000,000 1 February 2019 1 February 2022 NoChina Molybdenum Co., Ltd. Fu Chuan RMB300,000,000 27 September 2019 27 September 2020 NoChina Molybdenum Co., Ltd. Fu Chuan RMB100,000,000 16 December 2019 16 December 2020 NoChina Molybdenum Co., Ltd. Fu Chuan RMB100,000,000 20 December 2019 20 December 2020 NoChina Molybdenum Co., Ltd. Fu Chuan RMB50,000,000 18 December 2019 18 December 2020 NoChina Molybdenum Co., Ltd. Fu Chuan RMB50,000,000 16 December 2019 16 December 2020 No
Note: On 11 July 2017, as decided by the resolution of the Investment Committee of the Company, the Company increased investment of RMB1,872,972,510.00 in the form of conversion of capital by debt in its wholly-owned subsidiary, CMOC Limited; in the meanwhile, the Company provided guarantee for the borrowings denominated in USD of BHR, subsidiary of CMOC Limited in 2019 and recognized relevant cost of investment based on the fair value of the guarantee.

266 2019 Annual Report
NOTES TO THE FINANCIAL STATEMENTSFOR THE YEAR ENDED 31 DECEMBER 2019
(XIV) NOTES TO KEY ITEMS IN THE COMPANY'S FINANCIAL STATEMENTS (CONTINUED)
36. Related party relationships and transactions (Continued)
(2) Amount due from and amount due to related parties
Unit: RMB
Item Related party 31 December 2019 31 December 2018
Accounts receivable San Qiang 33,296,039.53 11,666,745.16Sales Company – 64,790,119.90Xiao Shou Mao Yi 5,932,031.66 –Wu Ye – 101,944,164.01
Dividends receivable San Qiang 10,118,892.09 10,118,892.09Da Dong Po 6,893,440.23 6,893,440.23Jiu Yang 26,993,751.76 26,993,751.76
Other receivables Yuehe Properties 59,878,591.10 59,709,008.65International Hotel 82,489,065.18 87,575,912.68Qi Xing 67,108,663.30 66,742,227.59Ye Lian – 1,024,614,544.22Jiu Yang – 87,297,485.67Da Chuan 67,000,000.00 67,000,000.00CMOC Limited 1,206,409,050.00 1,197,179,230.00Schmoke 614,000,000.00 980,064,371.83Fu Run 11,577,366.88 11,602,469.23Sales Company 1,552,170,447.95 –CMOC HK 697,620,000.00 709,037,192.00
Interest receivable CMOC HK 180,111,775.01 155,175,290.31Sales Company 32,615,166.93 –Jiu Yang 4,949,621.25 –Schmoke 5,996,068.56 11,542,414.22CMOC Limited 56,131,366.83 22,977,840.31
Interest payable Schmoke – 11,542,414.22Xiao Shou Mao Yi 52,641.41 –Ye Lian 40,543.17 –Da Dong Po 14,675.07 –San Qiang 990.80 –Da Chuan 41,614.78 –International Hotel 392,361.29 –Wu Ye 17,672.57 –Metal Material 20,357.41 –Xin Jiang Luo Mu 523,590.03 –Beijing Yongbo 2,955,763.50 –

267China Molybdenum Co., Ltd.
NOTES TO THE FINANCIAL STATEMENTSFOR THE YEAR ENDED 31 DECEMBER 2019
(XIV) NOTES TO KEY ITEMS IN THE COMPANY'S FINANCIAL STATEMENTS (CONTINUED)
36. Related party relationships and transactions (Continued)
(2) Amount due from and amount due to related parties (Continued)
Unit: RMB
Item Related party 31 December 2019 31 December 2018
Other payables Sales Company 164,234,982.55 442,773,717.39Xiao Shou Mao Yi 19,316,840.04 25,598,673.27Wu Ye 306,187.25 962,879,400.93Metal Material 323,489.75 2,443,424.00Da Chuan 14,820,992.46 10,477,988.48Da Dong Po 660,726.24 3,130,417.38San Qiang 396,790.70 630,864.34Fu Kai 11,295,366.25 11,295,366.25Hu Qi 9,895,366.25 9,895,366.25Ye Lian 507,727.88 –Schmoke 118,534,412.99 –Xin Jiang Luo Mu 179,304,822.89 180,334,509.05CMOC HK 17,752,791.19 –Beijing Yongbo 34,332,236.83 152,306,271.80
Accounts payable Da Dong Po 56,707,429.51 36,861,068.99Da Chuan 3,840,000.00 –Schmoke 20,890,642.18 –Mudu Trading 1,992,480.00 2,891,880.00
Contract liabilities Xiao Shou Mao Yi – 48,567.15Metal Material 171,733,028.62 390,000,000.00Wu Ye 62,892,975.03 –

268 2019 Annual Report
NOTES TO THE FINANCIAL STATEMENTSFOR THE YEAR ENDED 31 DECEMBER 2019
(XVI) SUPPLEMENTARY INFORMATION
1. BREAKDOWN OF NON-RECURRING PROFIT OR LOSS
Unit: RMB
Item 2019
Net profit 1,765,848,377.85
Add (less): Non-recurring profit or loss items– Loss on disposal of non-current assets 64,265,650.01– Government grants (20,903,479.63)– Donation expenses 27,034,716.52– Investment income from acquisition of the long-term equity investment held by
the remaining equity in the joint venture (52,605,210.42)– Loss on impairment of fixed assets 15,140,391.61– Fair value changes arising from held-for-trading financial assets, derivative
financial assets, held-for-trading financial liabilities, derivative financial liabilities and other non-current financial assets besides the transactions under effective hedging relationship relating to the Company's normal course of operation, as well as investment income from disposal of the above financial assets/liabilities (2,828,166,471.97)
– Other losses on changes in the fair value 4,029,238.41– Gains from the deficit of investment cost for acquisition of subsidiary and the
share of fair value of identifiable net assets of the investee on acquisition (133,096,178.59)– Gains or losses from fair value changes in assets and liabilities including
inventories measured at fair value of IXM's metal trading business 1,581,795,820.24– Other net non-operating income or expenses other than the above (27,175,239.04)
Sub-total (1,369,680,762.84)Income tax effects from non-recurring profit or loss items 267,238,522.05Net profit after deducting non-recurring profit or loss items 663,406,137.06Including: Net profit attributable to shareholders of the parent company 746,685,213.05
Net profit attributable to minority interests (83,279,075.99)
2. RETURN ON NET ASSETS AND EARNINGS PER SHARE ("EPS")
The calculation of net assets and EPS prepared by China Molybdenum Co., Ltd. are in accordance with Information Disclosure and Presentation Rules for Entities with Public Offering of Securities No. 9 – Calculation and Disclosure of Return on Net Assets and Earnings per Share (Amended in 2010) issued by China Securities Regulatory Commission.
Unit: RMB
EPS
Profit for the reporting period
Weighted average return
on net assets Basic EPS Diluted EPS(%)
Net profit attributable to ordinary shareholders of the Company 4.54% 0.09 N/ANet profit after deduction of non-recurring profits or losses
attributable to ordinary shareholders of the Company 1.85% 0.03 N/A