NIPPON PAINT CO., LTD. - Morningstar
28
Year Ended March 31, 2002 ANNUAL REPORT 2002 NIPPON PAINT CO., LTD. Brought to you by Global Reports
-
Upload
khangminh22 -
Category
Documents
-
view
1 -
download
0
Transcript of NIPPON PAINT CO., LTD. - Morningstar

Year Ended March 31, 2002
A N N U A L R E P O R T 2 0 0 2
NIPPON PAINT CO., LTD.
Brought to you by Global Reports

Nippon Paint was founded in Tokyo in March 1881. In the subsequent 121 years, we have grown to become the
leading company in Japanese paints and coatings industry, and our growth continues today. We have developed
paints and coatings for a broad range of industrial sectors, including automobiles, buildings, industrial products,
and ships.
We employ two basic precepts in the conduct of our business to further our growth in the future as a global
company, i.e., “Grow and progress globally as a specialty chemical company that supplies high-value paint
coatings,” and “Build a worldwide cachet as an environment-conscious company that contributes to protecting the
environment and reducing the consumption of resources and energy.”
In addition, we are making every effort to contribute to the welfare of the community and the public based on
working for the shared prosperity of all our stakeholders, including our stockholders, customers, employees, and
the residents of our community.
The Nippon Paint consists of 19 manufacturing and sales companies in Japan, four companies in the United
States, three companies in Europe, and 10 manufacturing and sales companies in Asia. Every one of these
companies is engaged in the manufacture or sale of the finest products in regions where there is demand for them.
C o n t e n t s
Financial Highlights ................................ 1
Message from the Management .............. 2
New Business Plan ................................. 4
A New R&D Structure ...................... 5
Developing Eco-Products ................ 6
Environmental Protection Activities ... 6
Review of Operations .............................. 7
Financial Statements ............................ 13
Company Data ...................................... 24
Subsidiaries and Affiliates .......................... 25
Brought to you by Global Reports

01
NIPPON PAINT Co., Ltd.
ConsolidatedThousands of
Millions of yen U.S. dollars (Note)
For the years ended 31st March 2002 2001 2002
Net sales ....................................................................................................... ¥192,467 ¥199,673 $1,444,405Operating income .......................................................................................... 7,626 10,957 57,238Income before income taxes ......................................................................... 2,841 10,814 21,320Net income ................................................................................................... 813 5,679 6,101Capital expenditure ....................................................................................... 5,886 4,584 44,173Depreciation & amortization .......................................................................... 5,610 5,451 42,101Per share of common stock (Yen or U.S. dollars)
Net income ................................................................................................ ¥ 3.07 ¥ 21.40 $ 0.023Cash dividends .......................................................................................... 6.00 6.00 0.045
As of 31st March
Shareholders’ equity .................................................................................. ¥ 92,958 ¥ 92,223 $ 697,620Total assets ............................................................................................... 224,260 227,342 1,683,002
Non-ConsolidatedThousands of
Millions of yen U.S. dollars (Note)
For the years ended 31st March 2002 2001 2002
Net sales ....................................................................................................... ¥123,044 ¥127,882 $ 923,407Income before income taxes ......................................................................... 983 8,104 7,377Net income ................................................................................................... 564 5,111 4,233Per share of common stock (Yen or U.S. dollars)
Net income ................................................................................................ ¥ 2.13 ¥ 19.26 $ 0.016Cash dividends .......................................................................................... 6.00 6.00 0.045
As of 31st March
Shareholders’ equity ...................................................................... ¥ 85,963 ¥ 87,285 $ 645,126Total assets.................................................................................... 167,532 172,684 1,257,276
Note: U.S. dollar amounts represent translations from yen, for convenience only, at the rate of ¥133.25 = U.S.$1 in effect on 31st March, 2002.
FINANCIAL HIGHLIGHTS
'98
215.
0
'99
197.
9
'00
198.
2
'01
199.
7
'02
192.
5
Net Sales(¥ billions)
'98
89.1
'99
84.5
'00
88.8
'01
92.2
'02
93.0
Shareholders' Equity(¥ billions)
'98
233.
3
'99
222.
4
'00
222.
7
'01
227.
3
'02
224.
3
Total Assets(¥ billions)
Brought to you by Global Reports

Business Climate
The three-year management plan for Nippon Paint and its group
companies concluded as of the end of Fiscal 2001, ended March
31, 2002. We spared no effort to increase our profitability, but in-
stead met with the harsh reality of year-on-year declines in net sales,
operating income, and net income. Consolidated sales slid 3.6%
from the year before to ¥192,467 million (US$1,444.4 million). Op-
erating income tumbled 30.4% during the same period to ¥7,627
million (US$57.2 million), and net income after taxes plunged 85.7%
to ¥813 million (US$ 6.1 million).
The primary factor behind the decline in consolidated sales was
the general economic stagnation, including plummeting corporate
capital investment stemming from the prolonged slump in the
economy of Japan and other countries, and the downturn in indi-
vidual consumption. In turn, this resulted in a sharp dip in both the
volume and value of our shipments from the previous year.
Conditions were particularly harsh during the second half of the
year. Specifically, there was a significant drop in the number of ve-
hicles produced by domestic carmakers, one of our most important
customers. Additional factors were the slump in public works projects
and the slide in housing construction starts.
A breakdown of group companies in Japan and overseas shows
that the performance of our joint venture companies in Asia contin-
ued to grow from the year before. The performance of automotive
subsidiaries in Europe and the U.S. was down during the same pe-
riod, however, and sales in Japan fell year on year due to tottering
demand.
To survive under these circumstances in such a severe business
climate, we launched a three-year management plan in April 1999
based on reforming our financial foundation to achieve greater prof-
its. The plan ended during the year under review. During those three
years, we worked to develop new products with high added value,
focusing on environment-friendly products in a multitude of busi-
ness sectors, conduct aggressive sales activities, and cut costs.
The business climate changed at a rate far faster than we had
anticipated in our forecasts, however, and we were regrettably un-
able to achieve our profit targets. Further, the decline in earnings for
the year was the result of recording the valuation losses on our
investment securities portfolio resulting from a sagging domestic stock
market.
Based on our performance described in the foregoing, our earn-
ings per share (EPS) for the term fell to ¥3.07 from ¥21.40 during
the year before, and our return on equity (ROE) fell to 0.88% from
6.28% during the term before.
Appropriation
During the year under review, our income was down sharply from
that of the previous year. Despite this, however, we paid the same
dividend of ¥6.00 per share (US$ 0.045) as we did during the previ-
ous year.
We are allocating funds to internal reserves to beef up our finan-
cial foundation in the future and for investment in R&D activities and
production facilities as part of our efforts to improve corporate and
stockholder value from a long-term perspective.
New Business Plan
Nippon Paint group is proceeding with the implementation of a man-
agement plan based on a financial foundation contributing to greater
profits in the future so that we may deliver exceptional products to
the world’s markets and achieve global growth and expansion. The
year under review was the final year of the group’s three-year man-
agement plan launched in April 1999 to enhance our profitability
and streamline our corporate structure. In particular, we focused
our efforts on achieving higher operating profit and ROE, reducing
group personnel, and slashing interest-bearing debt.
As a result, we whittled our workforce by 4,237 people, an 11.5%
cutback, since the initiation of the plan. We also slashed interest-
bearing debt by ¥47.6 billion, or 26.5%, during the three years of
the plan. In both of these areas, we generally achieved the objec-
tives of our plan.
In the future, our group will conduct business based on two fun-
damental precepts, that is, “Grow and progress globally as a spe-
cialty chemical company that supplies high-value paint films,” and
“Build a worldwide cachet as an environment-conscious company
that contributes to protecting the environment and reducing the con-
sumption of resources and energy.”
02
NIPPON PAINT Co., Ltd.
MESSAGE FROM THE MANAGEMENT
Brought to you by Global Reports
To achieve these objectives, we have formulated a new manage-
ment plan slated to conclude in March 2006. This management
plan includes 1) creating new added value for the customer, 2) re-
forming our cost structure, 3) strengthening our financial structure,
and 4) implementing overseas strategy.
Environmental Activities
Global concerns in protecting the environment and conserving re-
source energy have grown stronger in recent years, and entities on
the demand side are increasing their opportunities for green pro-
curement.
Our corporate group is implementing Eco Action 21, which is
based on developing environment-friendly products and conduct-
ing activities to lessen the environmental burden with the objective
of becoming a trusted eco-company that puts an emphasis on the
importance of the environment, safety, and health in all stages of the
production process.
In addition, Nippon Paint has renewed the registration for the
ISO 14001 international certification standards for environmental
protection activities. The group’s manufacturing companies have
currently completed the evaluation registration, and the sales com-
panies are preparing for acquiring the certification.
Policies for the Future
We fully expect that business conditions will remain harsh in the
future, particularly in the Japanese and Western markets, and that
the direction of economic trends will be uncertain. Therefore, we
forecast that a difficult business climate will continue for our corpo-
rate group, characterized by declining sales prices caused by inten-
sified competition, with raw materials prices governed by exchange
rate and crude oil price trends.
It is our intention to further strengthen our technical and product
capabilities and reform our business systems to achieve the targets
of our new management plan slated to run until the fiscal year end-
ing March 2006. To achieve our targets, we will significantly raise
the bar for our consolidated sales targets in the fiscal year ending
March 2003 to ¥196,500 million, a 2% rise from the year under
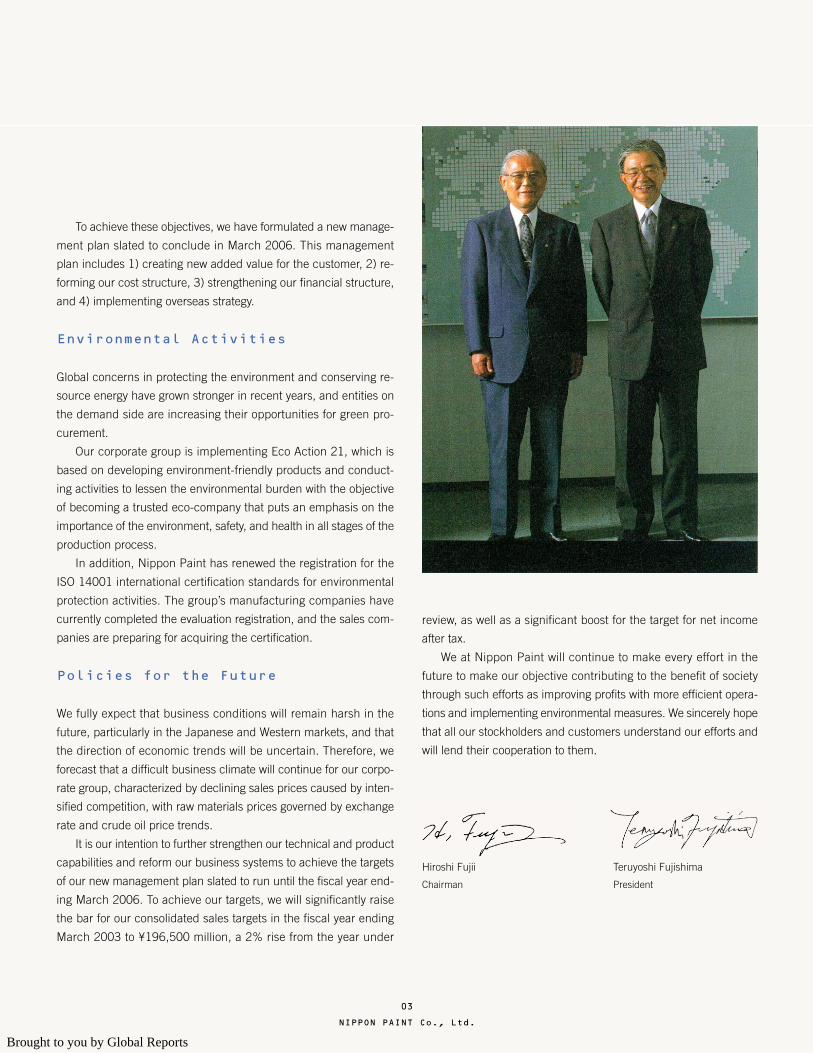
Hiroshi Fujii
Chairman
Teruyoshi Fujishima
President
03
NIPPON PAINT Co., Ltd.
review, as well as a significant boost for the target for net income
after tax.
We at Nippon Paint will continue to make every effort in the
future to make our objective contributing to the benefit of society
through such efforts as improving profits with more efficient opera-
tions and implementing environmental measures. We sincerely hope
that all our stockholders and customers understand our efforts and
will lend their cooperation to them.
Brought to you by Global Reports

The year under review marked the final year of our three-year busi-
ness plan. As we were not able to achieve our profit goals, we have
inaugurated a new business plan “2005 – the Mid-Term business
Plan for Reform” to run from April 2002 to the fiscal year ending
March 2006. We will strive to conduct even more painstaking efforts
to reform our business structure, cut costs, and rationalize our struc-
ture in the face of harsh business conditions.
Our target for ROE is 10%. We view this as an essential condi-
tion for continuing our growth in the future as a blue-chip global
company. We believe that it will be impossible to achieve this target
through efforts similar to those we have made in the past, so we aim
to create new added value.
The primary aspects of “2005 – the Mid-Term business Plan for
Reform,” starting in Fiscal Year 2002 (ending March 31, 2003), are
as follows.
Creating new added value for the customer. As significant new
demand cannot be expected in a mature industry, we will propose
effective strategic plans to resolve the issues faced by our custom-
ers and create an approach in which this plan can be efficiently
implemented.
Reforming the cost structure. Our profit ratio continues to fall
every year due to plunging market prices. Further, we expect per-
sonnel costs and fixed costs to rise due to the creation of a fund for
employee retirement benefits. Therefore, we must reduce strategic
costs to strengthen our profit foundation.
Strengthening our financial foundation. The introduction of
mark-to-market accounting methods means that valuation losses
on stock, real estate, and other investments can significantly impact
net income. Therefore, we will create a flexible and resilient struc-
ture capable of responding to any situation. Our entire group will
redouble its efforts to reduce interest-bearing debt, protect our claims,
and dispose of non-performing debt.
NEW BUSINESS PLAN
04
NIPPON PAINT Co., Ltd.
Business Targets for Fiscal 2002
A new R&D structure linked to the new mid-term management plan
Environment-friendly products development
High value-added products development
Product strategy
Developing environment-friendly products and new technologies
Creating new technologies and products for the customer's profit
Discovering new technologies and products to create new markets
Cost structure reformation
Developing new product technologies to reduce costs
Procuring raw materials at the most appropriate location in Japan and overseas
Introducing Total Supply Chain Management (TSCM)
Share expansion
Concentrating sales activities on high value-added products
Developing a solutions-oriented business
Stronger financial structure
Slashing interest-bearing debt
Cutting inventories
Reducing investment securities
Brought to you by Global Reports

A New R&D Structure
We unveiled a new R&D structure one year ago to prevail over the
slumping paints and coatings market and profit conditions. This new
structure is linked to our next mid-term management plan to achieve
follow-up from a different approach.
We established the Innovative Technology Laboratory in Tokyo
and Osaka to seek out the next-generation business sectors and to
search for new businesses. In addition, we reorganized four devel-
opment centers that provide technical support to three business
divisions (automotive coatings, trade-use paints, and industrial-use
coatings) to respond directly to their individual needs with a new
structure of featuring individual technical divisions under each of
the business divisions.
Facilities of the Innovative Technology Laboratory have opened
in Tokyo and Neyagawa, Osaka. It began operation in April 2002. Its
R&D policies are to accelerate our technological development that
aims to improve the added value of products and to conduct R&D
that focuses on high-function technology, environment-friendly chem-
istry, and process design technology. While the primary focus of the
Innovative Technology Laboratory is on the paints and coatings busi-
ness, it also is conducting research into electronic materials, life
sciences, and other related sectors, and pursuing other basic re-
search topics.
In addition, we opened four development centers in April 2001.
These four centers specialize in different fields and conduct techni-
cal research enabling us to provide value appealing to the customer
and to develop new products for the future. The first is Resin and
Materials Center, which is responsible for the overall management
of information related to the enormous quantity of paint resins. There
is also e-Laboratory, which shares technical information within the
company and creates systems as required. The Engineering Center
is responsible for such activities as the production process and the
development of painting technology. The fourth is the Color Design
Center.
The Engineering Center in particular has been given a new as-
signment, in which they are to concentrate on painting technology
research to meet the rising demands for reducing total costs, in-
cluding the cost of paint. Also, under the auspices of the Color De-
sign Center, which includes Automotive Group and Space Design
Group, we are conducting research into colors and the creation of
colors using digital equipment.
We also have a weathering test facility on Miyakojima Island in
Okinawa Prefecture. The facility conducts performance trials to ex-
pand the durability of paint films by exposing test boards, painted
and coated samples, and other items to harsh natural conditions,
especially intense sunlight and rain. There, we are striving to im-
prove quality and weather-resistant properties by conducting vari-
ous experiments to test the weather-resistant capabilities of paints
and coatings, including paints for metal sheets such as those used
in automobiles and buildings.
05
NIPPON PAINT Co., Ltd.
A New R&D Structure Linked to the New Mid-Term Business Plan
Traditional R&D process
The Innovative Technology Laboratory
Tokyo Group
Osaka Group
High-function technology
Environment-friendly chemistry
Process design technology
Resin and Materials Center e-Laboratory
Engineering Center Color Design Center
Development Centers
Weathering test facility on Miyakojima, Okinawa
Tokyo Laboratory Osaka Laboratory in Neyagawa
Central Research Center
Miyakojima weathering test facility
Brought to you by Global Reports

Developing ECO-Products
Nippon Paint’s product development concept emphasizes superior
performance, high added value, and environmental awareness. A
look at the percentage of environment-friendly products offered by
the Japanese paint industry shows that the average number of these
products in volume terms is 27.8%. In contrast, 35.6% of Nippon
Paint’s products incorporate environmental considerations. These
are primarily water-based paints and powdered coatings.
These products do not use organic solvents and limit the
use of volatile organic chemicals (VOCs). We intend to
devote more resources to this trend in various product
sectors in the future.
In recent years, consumers in this market have be-
come more interested in green procurement, in which they
select suppliers who offer environment-friendly parts and materials.
Nippon Paint will continue to actively develop and offer environ-
ment-friendly products and painting systems to protect the environ-
ment and respond to the needs of the customers in the market-
place.
Environmental Protection Activities
For the first time, we have formed a cooperative relationship with
Kansai Paint Co., Ltd. to develop environmental measures. We es-
tablished a joint venture Eco Systems Co., Ltd. in March 2001, a
company that recycles organic solvents and other paint factory
wastes, including waste paint. They extract the volatile organic sol-
vents from the plant’s waste paint, enabling them to be reused for
such applications as cleaning fluids for plant equipment.
The solid wastes from the plant are burned and used as
fuel for power generation, and the incinerated ash is used
as paint material.
There are two facilities for extracting organic solvents.
One is in western Japan, located at Kansai Paint’s
Amagasaki Plant. The other is in eastern Japan, located at
our Tochigi Plant. Every manufacturing plant in both companies
throughout Japan ships their waste materials to the nearest dis-
posal plant, where the waste paint and solvents are processed.
These plants have the capacity to process about 3,000 tons an-
nually, and the entire volume of disposed organic solvents can be
recycled. Thus, Japan’s two largest paint manufacturers are coop-
erating to achieve more efficient disposition of waste materials.
06
NIPPON PAINT Co., Ltd.
Environmental Protection Activities
Target Performance for Fiscal 2001 Targets for Fiscal 2002
ISO14001We received a new ISO 14001 evaluation and renewed our certification.
Promoting ISO 14001 certification acquisition for our affiliated companies. (Our goal is to acquire this certification at all of our affiliated companies in Japan by the end of Fiscal 2005.)
CO2We cut CO2 emission volume by 12% from Fiscal Year 1990 levels. (Our goal was a 7.5% reduction.)
Reducing CO2 emission volume by more than 12% from Fiscal Year 1990 totals.
Waste materialsWe reduced the final processed volume of waste materials by 79% from Fiscal Year 1990 totals.
Reducing the final processed volume of waste materials by at least 79% from Fiscal Year 1990 totals.
IncineratorsWe closed incinerators at three plants in Tochigi, Chiba, and Aichi Prefectures.
Closing the incinerator at the Okayama Plant by December.
Recycling of waste materials
Our recycling rate of waste materials increased by 87% from Fiscal 1990 levels. (Our initial target was an 86% increase.)
Increasing our recycling rate of waste materials by 92% from Fiscal Year 1990 levels.
Brought to you by Global Reports

REVIEW OF OPERATIONS
The business of our group can be broadly divided into the paints and coatingsbusiness and the fine chemicals business. Sales in the paints and coatings busi-
ness totaled ¥181,161 million, accounting for 94.1% of all sales. The remaining 5.9%
of sales are in the fine chemicals business, which totaled ¥11,306 million. Sales were
held in check by the poor performance of the economy as a whole. Sales in the paints
and coatings sector slid 3.4% from the year-before period, while sales in the fine chemi-
cals sector fell 6.4%.
The paints and coatings business includes automotive coatings, as well as trade-use
paints, industrial-use coatings, and other paints and coatings. We aim to produce and
sell each of these products in the most appropriate location both in Japan and over-
seas.
We also develop products that incorporate the concept of environmental protection
and added higher value. We develop and apply the technical expertise we have fostered
in the fine chemical business to create the next generation of mainstay products, which,
we expect, will make other revenue channel than the incumbent products in the paints
and coatings business.
07
NIPPON PAINT Co., Ltd.
Sales breakdown
Paints and CoatingsPaints and Coatings:¥181,161 million
94.1%
Trade-Use Paints:¥42,767 million
22.2%
Industrial Use Paints: ¥30,857 million16.0%
Others: ¥55,263 million28.7%
Fine ChemicalsFine Chemicals: ¥11,306 million5.9%
Automotive coatings:¥52,272 million
27.2%
Brought to you by Global Reports
In addition to water-based paints, our powdered coatings, which
have an extremely low VOC content, is garnering increased attention
as an environment-friendly product. The powdered intermediate coat
material is being used more frequently for trucks and sports utility
vehicles in the United States. During the year under review, General
Motors began using powdered coatings for the intermediate coat on
its truck production lines.
In Japan, our company and Nippon Bee Chemical manufacture
automotive coatings, and these products are sold through Daiwa
Paint Trading and specified agents. Among our group companies,
Nippon Bee Chemical handles the paints for plastics used in auto-
mobiles and buildings, as well as coatings. They have captured the
leading share in the market for these products. Overseas, NPA Coat-
ings and Morton Nippon Coatings in the United States, NP Automo-
tive Coatings (Europe) in Great Britain, and Daihan Automotive Coat-
ings in South Korea manufacture and sell products to local automo-
bile manufacturers.
In the future, we will continue to offer products to automobile
manufacturers that add value to their cars, and provide a total pack-
age of products and services. We also intend to step up our sales
activities throughout the world, focusing on carmakers in Europe
and North America.
Paints and Coatings
Automotive Coatings
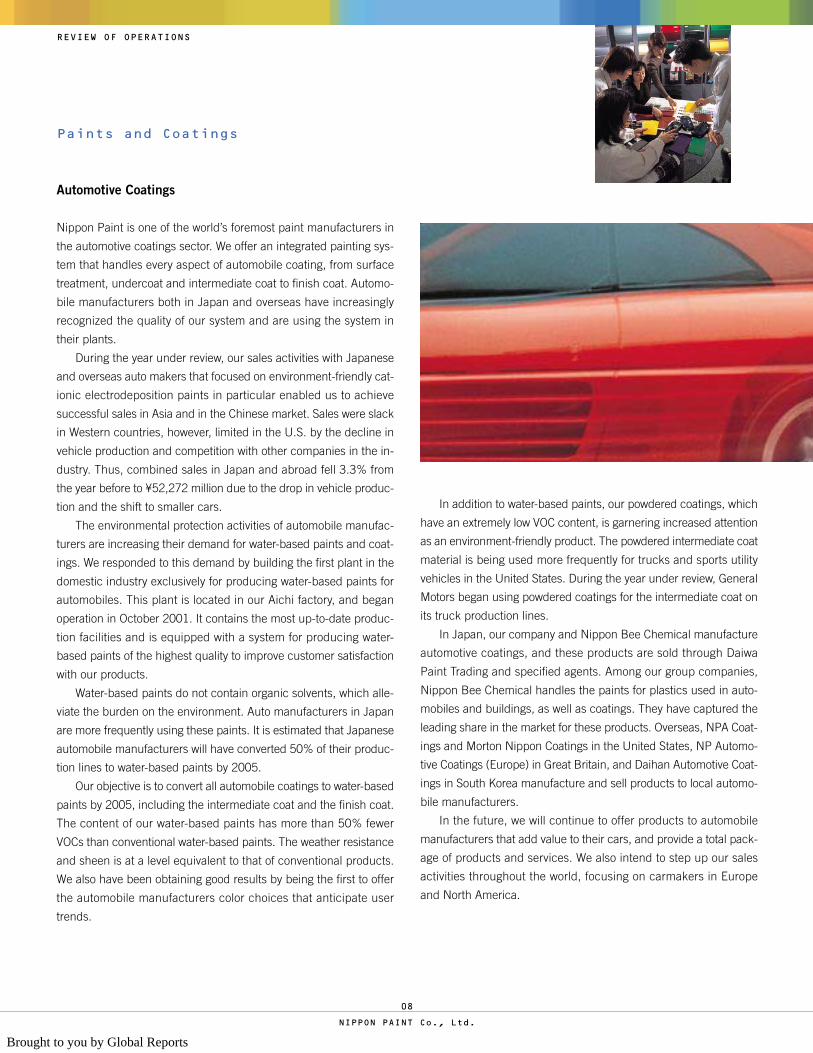
Nippon Paint is one of the world’s foremost paint manufacturers in
the automotive coatings sector. We offer an integrated painting sys-
tem that handles every aspect of automobile coating, from surface
treatment, undercoat and intermediate coat to finish coat. Automo-
bile manufacturers both in Japan and overseas have increasingly
recognized the quality of our system and are using the system in
their plants.
During the year under review, our sales activities with Japanese
and overseas auto makers that focused on environment-friendly cat-
ionic electrodeposition paints in particular enabled us to achieve
successful sales in Asia and in the Chinese market. Sales were slack
in Western countries, however, limited in the U.S. by the decline in
vehicle production and competition with other companies in the in-
dustry. Thus, combined sales in Japan and abroad fell 3.3% from
the year before to ¥52,272 million due to the drop in vehicle produc-
tion and the shift to smaller cars.
The environmental protection activities of automobile manufac-
turers are increasing their demand for water-based paints and coat-
ings. We responded to this demand by building the first plant in the
domestic industry exclusively for producing water-based paints for
automobiles. This plant is located in our Aichi factory, and began
operation in October 2001. It contains the most up-to-date produc-
tion facilities and is equipped with a system for producing water-
based paints of the highest quality to improve customer satisfaction
with our products.
Water-based paints do not contain organic solvents, which alle-
viate the burden on the environment. Auto manufacturers in Japan
are more frequently using these paints. It is estimated that Japanese
automobile manufacturers will have converted 50% of their produc-
tion lines to water-based paints by 2005.
Our objective is to convert all automobile coatings to water-based
paints by 2005, including the intermediate coat and the finish coat.
The content of our water-based paints has more than 50% fewer
VOCs than conventional water-based paints. The weather resistance
and sheen is at a level equivalent to that of conventional products.
We also have been obtaining good results by being the first to offer
the automobile manufacturers color choices that anticipate user
trends.
08
NIPPON PAINT Co., Ltd.
REVIEW OF OPERATIONS
Brought to you by Global Reports

Trade-Use Paints
The trade-use paints business covers a wide range of products, and
includes paints for buildings, condominiums, individual homes, and
bridges. We have developed and offer products that satisfy user needs
for low VOC content, superior durability, and long-term attractive-
ness.
During the year under review, we worked hard to uncover new
demand in this business sector by introducing environment-friendly
paint products for housing. In the repainting and repair market, we
worked to increase sales of water-based paint products both for in-
dividual homes that feature superior durability and for condomini-
ums to appeal these products’ long-term attractiveness. We also con-
tinued to expand the Colormony paint shops in Japan to encourage
owners to repaint their homes. Overall demand was sluggish, how-
ever, and sales in this sector totaled ¥42,767 million, down 2.8%
from the year before.
Our objective in the retail strategy for the Colormony shops is to
allow the general consumer to feel more familiar with paint products
and painting. Our retail strategy in the future will be to boost paint
sales by expanding these shops nationwide, increase the number of
training facilities for our painting crews, and develop repainting de-
mand.
Overseas, meanwhile, we continue to build a stronger base in
Southeast Asia. China has become an important market for us in
recent years, and sales there have been mushrooming recently, not
only for building paints, but also for automobile coatings and metal
plate precoatings.
Our group completed the construction of a resin manufacturing
plant in Shanghai in March 2002 capable of producing 10,000 tons
of resin a year. This plant will respond to the enormous demand for
paint products in that country. We fully expect our business in China
to expand in the future, and the construction of a comprehensive
technical center has been completed in September 2002. This cen-
ter is equipped with the latest IT.
In addition to Nippon Paint, the primary companies in this busi-
ness in Japan include the manufacturers AS Paint and NP Color
Plaza. Regional sales companies include Nippon Paint Hanbai
(Hokkaido), Nippon Paint Hanbai (Higashinihon), Nippon Paint
Hanbai (Chubu), Nippon Paint Hanbai (Nishinihon), and Nippon
Paint Hanbai (Shikoku). Sunrise Engineering conducts actual paint-
ing work as well as work inspection and management.
09
NIPPON PAINT Co., Ltd.
Technical Center (Shanghai)
Brought to you by Global Reports
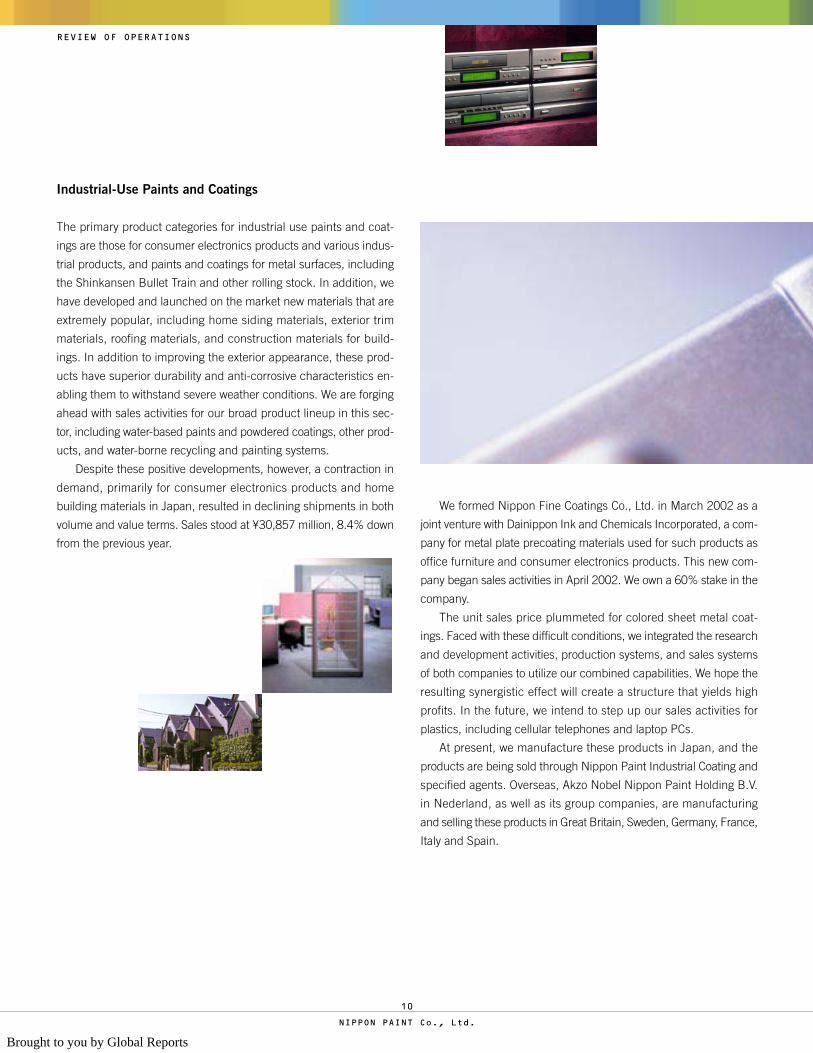
Industrial-Use Paints and Coatings
The primary product categories for industrial use paints and coat-
ings are those for consumer electronics products and various indus-
trial products, and paints and coatings for metal surfaces, including
the Shinkansen Bullet Train and other rolling stock. In addition, we
have developed and launched on the market new materials that are
extremely popular, including home siding materials, exterior trim
materials, roofing materials, and construction materials for build-
ings. In addition to improving the exterior appearance, these prod-
ucts have superior durability and anti-corrosive characteristics en-
abling them to withstand severe weather conditions. We are forging
ahead with sales activities for our broad product lineup in this sec-
tor, including water-based paints and powdered coatings, other prod-
ucts, and water-borne recycling and painting systems.
Despite these positive developments, however, a contraction in
demand, primarily for consumer electronics products and home
building materials in Japan, resulted in declining shipments in both
volume and value terms. Sales stood at ¥30,857 million, 8.4% down
from the previous year.
10
NIPPON PAINT Co., Ltd.
REVIEW OF OPERATIONS
We formed Nippon Fine Coatings Co., Ltd. in March 2002 as a
joint venture with Dainippon Ink and Chemicals Incorporated, a com-
pany for metal plate precoating materials used for such products as
office furniture and consumer electronics products. This new com-
pany began sales activities in April 2002. We own a 60% stake in the
company.
The unit sales price plummeted for colored sheet metal coat-
ings. Faced with these difficult conditions, we integrated the research
and development activities, production systems, and sales systems
of both companies to utilize our combined capabilities. We hope the
resulting synergistic effect will create a structure that yields high
profits. In the future, we intend to step up our sales activities for
plastics, including cellular telephones and laptop PCs.
At present, we manufacture these products in Japan, and the
products are being sold through Nippon Paint Industrial Coating and
specified agents. Overseas, Akzo Nobel Nippon Paint Holding B.V.
in Nederland, as well as its group companies, are manufacturing
and selling these products in Great Britain, Sweden, Germany, France,
Italy and Spain.
Brought to you by Global Reports
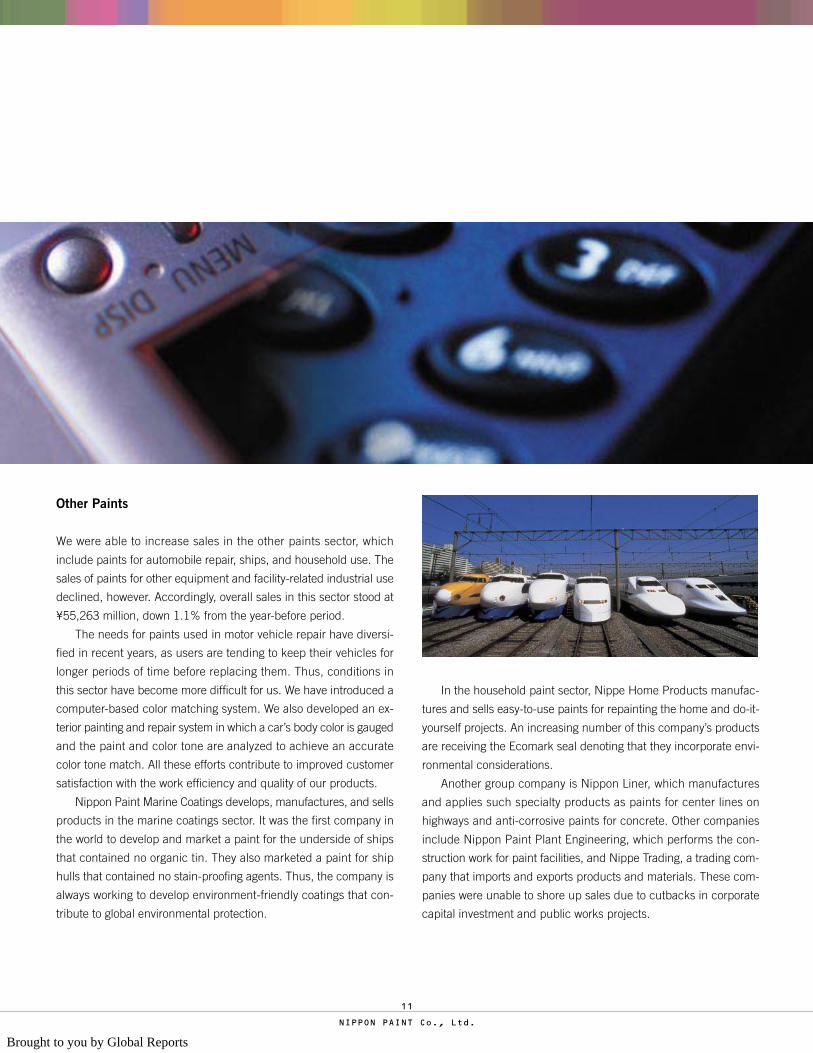
Other Paints
We were able to increase sales in the other paints sector, which
include paints for automobile repair, ships, and household use. The
sales of paints for other equipment and facility-related industrial use
declined, however. Accordingly, overall sales in this sector stood at
¥55,263 million, down 1.1% from the year-before period.
The needs for paints used in motor vehicle repair have diversi-
fied in recent years, as users are tending to keep their vehicles for
longer periods of time before replacing them. Thus, conditions in
this sector have become more difficult for us. We have introduced a
computer-based color matching system. We also developed an ex-
terior painting and repair system in which a car’s body color is gauged
and the paint and color tone are analyzed to achieve an accurate
color tone match. All these efforts contribute to improved customer
satisfaction with the work efficiency and quality of our products.
Nippon Paint Marine Coatings develops, manufactures, and sells
products in the marine coatings sector. It was the first company in
the world to develop and market a paint for the underside of ships
that contained no organic tin. They also marketed a paint for ship
hulls that contained no stain-proofing agents. Thus, the company is
always working to develop environment-friendly coatings that con-
tribute to global environmental protection.
In the household paint sector, Nippe Home Products manufac-
tures and sells easy-to-use paints for repainting the home and do-it-
yourself projects. An increasing number of this company’s products
are receiving the Ecomark seal denoting that they incorporate envi-
ronmental considerations.
Another group company is Nippon Liner, which manufactures
and applies such specialty products as paints for center lines on
highways and anti-corrosive paints for concrete. Other companies
include Nippon Paint Plant Engineering, which performs the con-
struction work for paint facilities, and Nippe Trading, a trading com-
pany that imports and exports products and materials. These com-
panies were unable to shore up sales due to cutbacks in corporate
capital investment and public works projects.
11
NIPPON PAINT Co., Ltd.
Brought to you by Global Reports
Fine Chemicals
There is a wide variety of business segments in the fine chemicals
sector. These include metal surface processing, electronic materi-
als, life sciences, and adhesives. We employ and expand the core
technologies fostered in our paints and coatings business to create
products for new business sectors.
During the term under review, sales fell in the fine chemicals
sector due to plunging demand for surface processing materials,
which account for a large part of sales in this category, resulting
from the sharp declines in the automotive industry and the elec-
tronic equipment and machinery industry. Demand also fell for photo
resists resulting from the slowdown in the electronics and IT indus-
tries. In addition, there was a downturn in demand for color filter
materials used in liquid crystal displays.
In the future, we intend to develop new products for the elec-
tronic materials sector based on our own high polymer technology,
photochemical technology, and composite design technology. We
also will continue to develop niche products based on our superior
technologies for the IT industry and clinical testing materials mar-
kets.
Surface processing agents are essential for improving rust resis-
tance and paint film adhesion before painting the surface of metals
and plastics. These agents are used in an extremely wide range of
sectors. The recent sluggishness in production, however, has re-
sulted in an inescapable decline in demand.
Nevertheless, our products hold the top share in products for
processing the surfaces of aluminum cans and other containers used
for beer and cold beverages. We are working to develop environ-
ment-friendly technology for use with the many types of metallic
materials for which demand is projected to rise in the future.
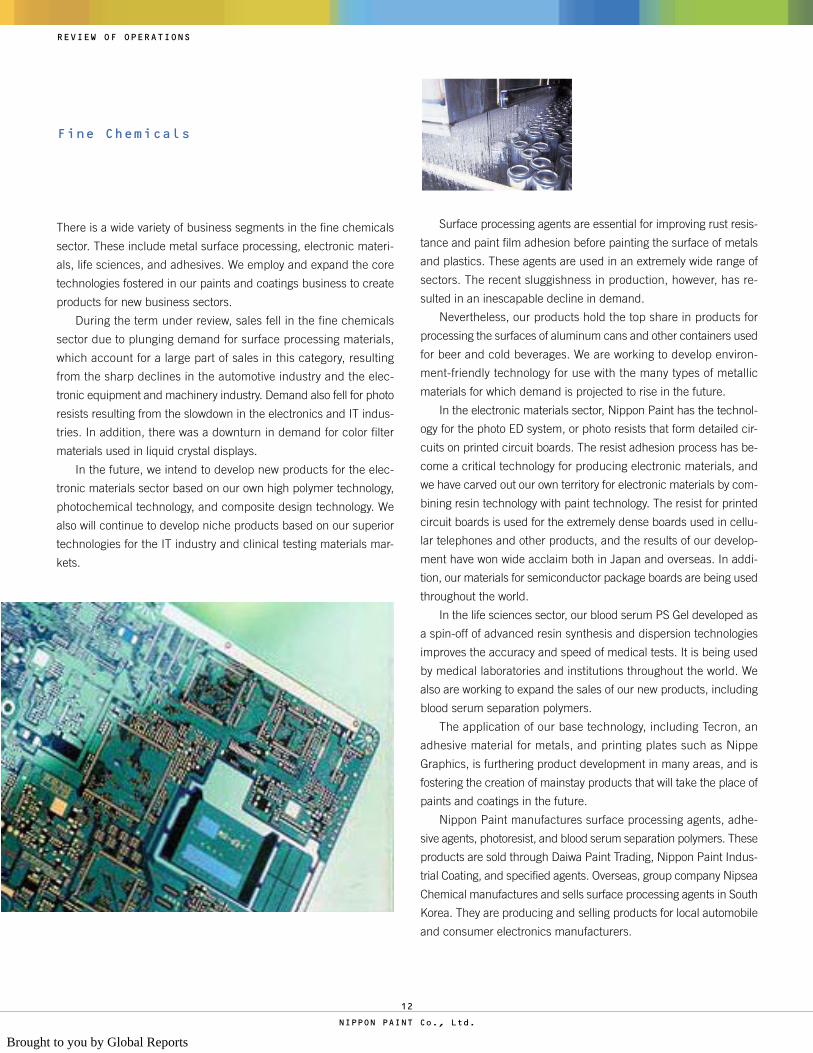
In the electronic materials sector, Nippon Paint has the technol-
ogy for the photo ED system, or photo resists that form detailed cir-
cuits on printed circuit boards. The resist adhesion process has be-
come a critical technology for producing electronic materials, and
we have carved out our own territory for electronic materials by com-
bining resin technology with paint technology. The resist for printed
circuit boards is used for the extremely dense boards used in cellu-
lar telephones and other products, and the results of our develop-
ment have won wide acclaim both in Japan and overseas. In addi-
tion, our materials for semiconductor package boards are being used
throughout the world.
In the life sciences sector, our blood serum PS Gel developed as
a spin-off of advanced resin synthesis and dispersion technologies
improves the accuracy and speed of medical tests. It is being used
by medical laboratories and institutions throughout the world. We
also are working to expand the sales of our new products, including
blood serum separation polymers.
The application of our base technology, including Tecron, an
adhesive material for metals, and printing plates such as Nippe
Graphics, is furthering product development in many areas, and is
fostering the creation of mainstay products that will take the place of
paints and coatings in the future.
Nippon Paint manufactures surface processing agents, adhe-
sive agents, photoresist, and blood serum separation polymers. These
products are sold through Daiwa Paint Trading, Nippon Paint Indus-
trial Coating, and specified agents. Overseas, group company Nipsea
Chemical manufactures and sells surface processing agents in South
Korea. They are producing and selling products for local automobile
and consumer electronics manufacturers.
REVIEW OF OPERATIONS
12
NIPPON PAINT Co., Ltd.
Brought to you by Global Reports

Thousands ofMillions of yen U.S. dollars
2002 2001 2000 1999 1998 2002(Consolidated)Net sales .................................................. ¥192,467 ¥199,673 ¥198,179 ¥197,873 ¥215,046 $1,444,405Income before income taxes ..................... 2,841 10,814 7,477 188 3,570 21,320Net income .............................................. 813 5,679 3,572 (2,847) 517 6,101
Yen U.S. dollars
Per share of common stock:Net income ............................................ ¥ 3.07 ¥ 21.40 ¥ 13.46 ¥ (10.73) ¥ 1.95 $ 0.023Cash dividends ...................................... 6.00 6.00 6.00 6.00 6.00 0.045
Thousands ofMillions of yen U.S. dollars
Balance sheet data:Shareholders’ equity ............................. ¥ 92,958 ¥ 92,223 ¥ 88,757 ¥ 84,493 ¥ 89,097 $ 697,620Total assets........................................... 224,260 227,342 222,654 222,355 233,283 1,683,002
IndicatorsReturn on assets (%) ............................ 0.36 2.52 1.61 (1.25) 0.22Return on equity (%) ............................ 0.88 6.28 4.12 (3.28) 0.58Stockholder equity (%) ......................... 41.50 40.60 39.90 38.00 38.20
Thousands ofMillions of yen U.S. dollars
2002 2001 2000 1999 1998 2002(Non-consolidated)Net sales .................................................. ¥123,044 ¥127,882 ¥128,351 ¥132,025 ¥146,882 $ 923,407Income before income taxes ..................... 983 8,104 5,159 3,938 4,441 7,377Net income .............................................. 564 5,111 3,064 1,624 2,640 4,233
Yen U.S. dollars
Per share of common stock:Net income ........................................... ¥ 2.13 ¥ 19.26 ¥ 11.55 ¥ 6.12 ¥ 9.95 $ 0.016Cash dividends ..................................... 6.00 6.00 6.00 6.00 6.00 0.045
Thousands ofMillions of yen U.S. dollars
Balance sheet data:Shareholders’ equity ............................. ¥ 85,963 ¥ 87,285 ¥ 83,799 ¥ 81,289 ¥ 81,291 $ 645,126Total assets........................................... 167,532 172,684 166,440 171,469 170,337 1,257,276
Note: U.S. dollar amounts represent translations from yen, for convenience only, at the rate of ¥133.25=U.S.$1 in effect on 31st March, 2002.
Five-Year Summary
FINANCIAL STATEMENTS
13
NIPPON PAINT Co., Ltd.
Brought to you by Global Reports
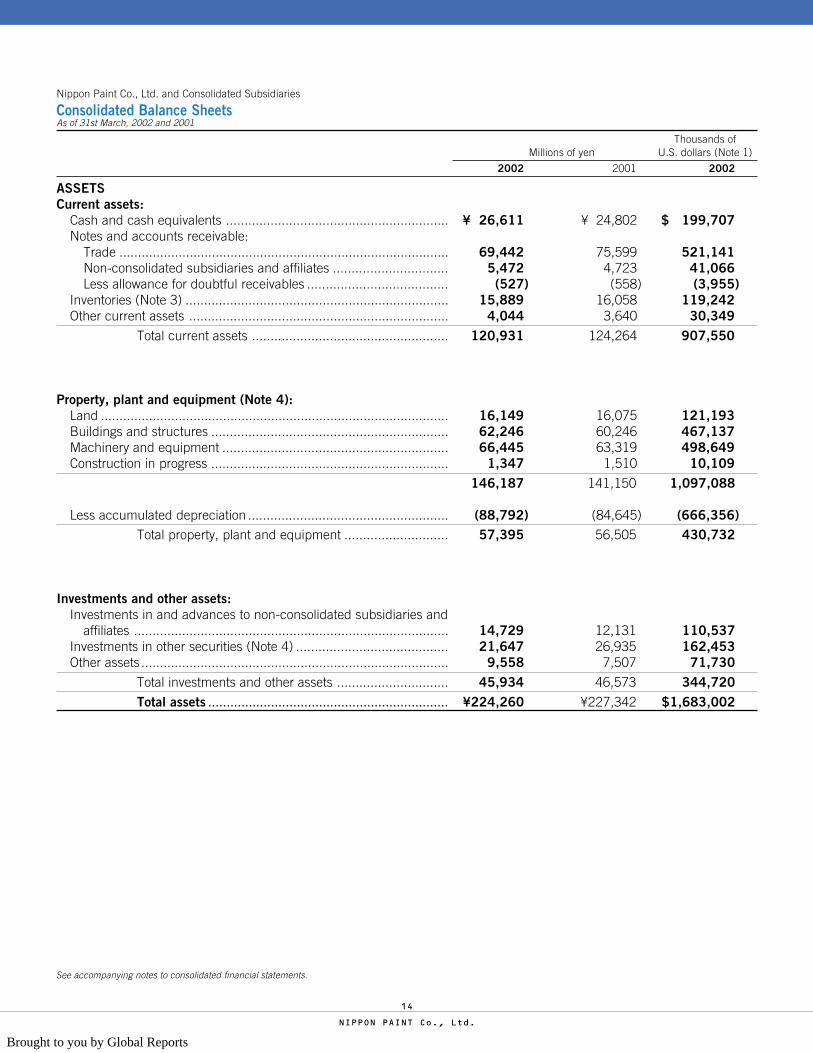
Nippon Paint Co., Ltd. and Consolidated Subsidiaries
Consolidated Balance SheetsAs of 31st March, 2002 and 2001
Thousands ofMillions of yen U.S. dollars (Note 1)
2002 2001 2002
ASSETSCurrent assets:
Cash and cash equivalents ............................................................ ¥ 26,611 ¥ 24,802 $ 199,707Notes and accounts receivable:
Trade ......................................................................................... 69,442 75,599 521,141Non-consolidated subsidiaries and affiliates ............................... 5,472 4,723 41,066Less allowance for doubtful receivables ...................................... (527) (558) (3,955)
Inventories (Note 3) ....................................................................... 15,889 16,058 119,242Other current assets ...................................................................... 4,044 3,640 30,349
Total current assets ..................................................... 120,931 124,264 907,550
Property, plant and equipment (Note 4):Land .............................................................................................. 16,149 16,075 121,193Buildings and structures ................................................................ 62,246 60,246 467,137Machinery and equipment ............................................................. 66,445 63,319 498,649Construction in progress ................................................................ 1,347 1,510 10,109
146,187 141,150 1,097,088
Less accumulated depreciation ...................................................... (88,792) (84,645) (666,356)Total property, plant and equipment ............................ 57,395 56,505 430,732
Investments and other assets:Investments in and advances to non-consolidated subsidiaries and
affiliates ..................................................................................... 14,729 12,131 110,537Investments in other securities (Note 4) ......................................... 21,647 26,935 162,453Other assets ................................................................................... 9,558 7,507 71,730
Total investments and other assets .............................. 45,934 46,573 344,720Total assets ................................................................. ¥224,260 ¥227,342 $1,683,002
See accompanying notes to consolidated financial statements.
14
NIPPON PAINT Co., Ltd.
Brought to you by Global Reports
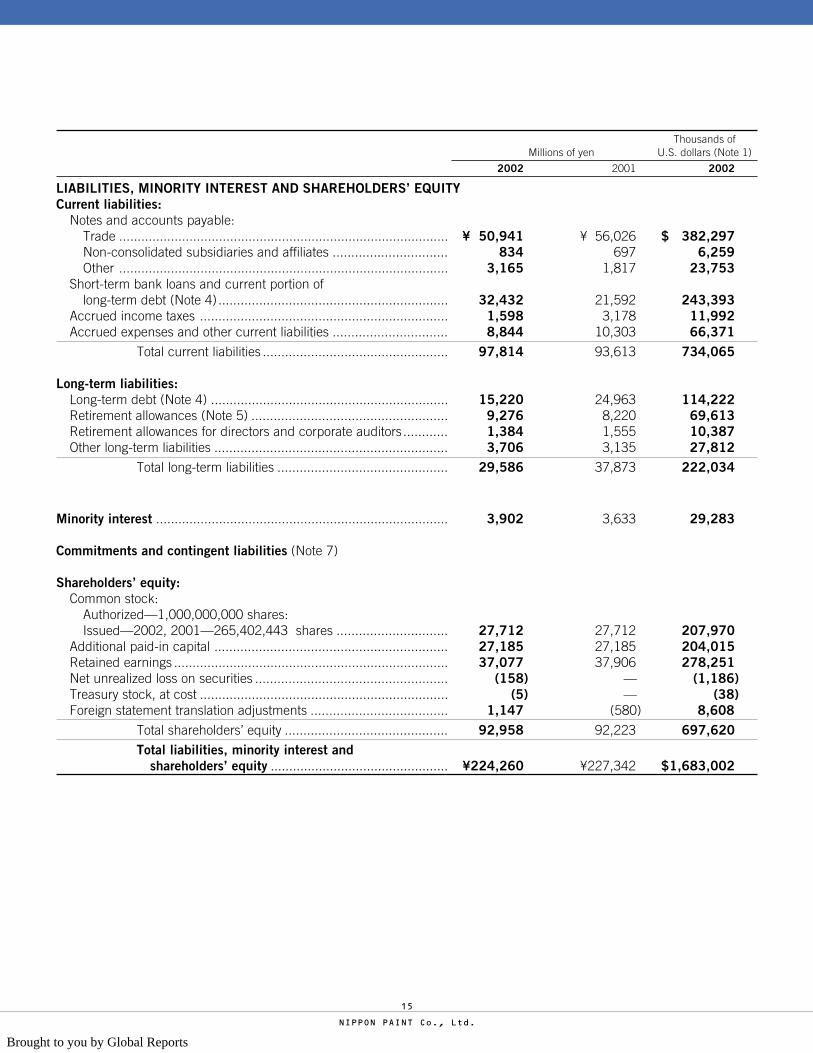
Thousands ofMillions of yen U.S. dollars (Note 1)
2002 2001 2002
LIABILITIES, MINORITY INTEREST AND SHAREHOLDERS’ EQUITYCurrent liabilities:
Notes and accounts payable:Trade ......................................................................................... ¥ 50,941 ¥ 56,026 $ 382,297Non-consolidated subsidiaries and affiliates ............................... 834 697 6,259Other ......................................................................................... 3,165 1,817 23,753
Short-term bank loans and current portion oflong-term debt (Note 4) .............................................................. 32,432 21,592 243,393
Accrued income taxes ................................................................... 1,598 3,178 11,992Accrued expenses and other current liabilities ............................... 8,844 10,303 66,371
Total current liabilities .................................................. 97,814 93,613 734,065
Long-term liabilities:Long-term debt (Note 4) ................................................................ 15,220 24,963 114,222Retirement allowances (Note 5) ..................................................... 9,276 8,220 69,613Retirement allowances for directors and corporate auditors............ 1,384 1,555 10,387Other long-term liabilities ............................................................... 3,706 3,135 27,812
Total long-term liabilities .............................................. 29,586 37,873 222,034
Minority interest ............................................................................... 3,902 3,633 29,283
Commitments and contingent liabilities (Note 7)
Shareholders’ equity:Common stock:
Authorized—1,000,000,000 shares:Issued—2002, 2001—265,402,443 shares .............................. 27,712 27,712 207,970
Additional paid-in capital ............................................................... 27,185 27,185 204,015Retained earnings .......................................................................... 37,077 37,906 278,251Net unrealized loss on securities .................................................... (158) — (1,186)Treasury stock, at cost ................................................................... (5) — (38)Foreign statement translation adjustments ..................................... 1,147 (580) 8,608
Total shareholders’ equity ............................................ 92,958 92,223 697,620Total liabilities, minority interest and
shareholders’ equity ................................................ ¥224,260 ¥227,342 $1,683,002
15
NIPPON PAINT Co., Ltd.
Brought to you by Global Reports

See accompanying notes to consolidated financial statements.
Nippon Paint Co., Ltd. and Consolidated Subsidiaries
Consolidated Statements of IncomeAs of 31st March, 2002 and 2001
Thousands ofMillions of yen U.S. dollars (Note 1)
2002 2001 2002
Net sales (Note 6) ............................................................................. ¥192,467 ¥199,673 $1,444,405Cost of sales (Note 6) ....................................................................... 126,773 130,975 951,392
Gross profit ................................................................................ 65,694 68,698 493,013Selling, general and administrative expenses ................................... 58,067 57,741 435,775
Operating income ....................................................................... 7,627 10,957 57,238Other income (expenses):Interest and dividend income ............................................................ 271 351 2,033Interest expenses .............................................................................. (1,061) (1,173) (7,962)Equity in earnings of affiliates ............................................................ 2,163 1,869 16,232Gain (loss) on sale of investment securities ........................................ (75) 849 (563)Write-down of investment securities ................................................... (4,855) (1,080) (36,435)Gain (loss) on sale or disposal of property, plants and equipments .... (127) 135 (953)Write-down of property, plants and equipment .................................. (370) (2,777)Other, net .......................................................................................... (732) (1,094) (5,493)
Income before income taxes ...................................................... 2,841 10,814 21,320Income taxes:
Current .......................................................................................... 4,207 5,785 31,572Deferred ........................................................................................ (2,506) (1,102) (18,807)
Minority interest ............................................................................... 327 452 2,454Net income ................................................................................ ¥ 813 ¥ 5,679 $ 6,101
Yen U.S. dollars (Note 1)
Amount per share:Net income .................................................................................... ¥ 3.07 ¥21.40 $0.023Cash dividends .............................................................................. 6.00 6.00 0.045
16
NIPPON PAINT Co., Ltd.
Brought to you by Global Reports

See accompanying notes to consolidated financial statements.
Nippon Paint Co., Ltd. and Consolidated Subsidiaries
Consolidated Statements of Shareholders’ EquityYears ended 31st March, 2002 and 2001
Number of Shares Thousands of(Thousands) Millions of yen U.S. dollars (Note 1)
2002 2001 2002 2001 2002
Common stock:Beginning balance .............................................................. 265,402 265,402 ¥27,712 ¥27,712 $207,970Ending balance ................................................................... 265,402 265,402 ¥27,712 ¥27,712 $207,970
Additional paid-in capital:Beginning balance ............................................................................................... ¥27,185 ¥27,185 $204,015Ending balance .................................................................................................... ¥27,185 ¥27,185 $204,015
Retained earnings:Beginning balance ............................................................................................... ¥37,906 ¥33,860 $284,473Add-
Previous year deferred income tax adjustment ................................................. 0 0 0Increase resulting from subsidiaries newly consolidated ................................... 0 0 0Net income ...................................................................................................... 813 5,679 6,101
Deduct-Cash dividends ................................................................................................ (1,592) (1,592) (11,947)Bonuses to directors and corporate auditors ..................................................... (50) (41) (376)
Ending balance .................................................................................................... ¥37,077 ¥37,906 $278,251
(Net) unrealized gain or loss on securities:Beginning balance ............................................................................................... ¥ — ¥— $ —Other comprehensive income (loss) for the year, net of tax .................................. (158) — (1,186)Ending balance .................................................................................................... ¥(158) ¥— $(1,186)
Treasury stock at cost:Beginning balance ............................................................................................... ¥— ¥— $ —Purchase ............................................................................................................. (5) — (38)Ending balance .................................................................................................... ¥(5) ¥— $(38)
17
NIPPON PAINT Co., Ltd.
Brought to you by Global Reports

Nippon Paint Co., Ltd. and Consolidated Subsidiaries
Consolidated Statements of Cash FlowsYears ended 31st March, 2002 and 2001
Thousands ofMillions of yen U.S. dollars (Note 1)
2002 2001 2002
Cash flows from operating activities:Net income .................................................................................... ¥ 2,841 ¥10,814 $ 21,320Adjustments to reconcile net income to net cash provided
by operating activities:Depreciation and amortization ................................................ 5,610 5,451 42,101Interest income and dividends ................................................ (271) (351) (2,034)Interest expenses ................................................................... 1,060 1,173 7,955Equity in earnings of affiliated companies ............................... (2,163) (1,869) (16,233)Gain (loss) on disposal or sales of property,
plant and equipment ........................................................... 497 (135) 3,730Gain (loss) on sale or write-down of investment securities ....... 4,929 231 36,991Decrease (increase) in accounts receivable ............................ 5,046 (7,795) 37,869Decrease (increase) in inventories .......................................... 169 (206) 1,268Increase (decrease) in accounts payable ................................ (4,947) 8,641 (37,126)Other ...................................................................................... 199 2,041 1,494
Sub total ............................................................................. 12,970 17,995 97,335
Interest and dividend income received ................................... 1,268 871 9,516Interest expenses paid ............................................................ (1,090) (1,352) (8,180)Income taxes paid .................................................................. (5,787) (5,348) (43,430)
Net cash provided by operating activities ................................ 7,361 12,166 55,241
Cash flows from investing activities:Acquisition of property, plant and equipment ................................. (4,543) (3,720) (34,094)Proceeds from sales of property, plant and equipment ................... 21 680 158Acquisition of short-term and other investments............................. (215) (12,588) (1,614)Proceeds from sale of short-term and other investments ............... 101 12,648 758Other ............................................................................................. 320 760 2,402
Net cash used in investing activities ....................................... (4,316) (2,220) (32,390)
Cash flows from financing activities:Increase (decrease) in short-term loans ......................................... 649 (10,478) 4,871Proceeds from long-term debt ....................................................... 2,881 4,059 21,621Repayment of long-term debt ........................................................ (3,344) (2,508) (25,096)Cash dividends .............................................................................. (1,802) (2,972) (13,523)Other ............................................................................................. 161 — 1,208
Net cash provided by (used in) financing activities ................. (1,455) (11,899) (10,919)
Efect of exchange rate changes on cash and cash equivalents ........ 219 159 1,644
Increase(decrease) in cash and cash equivalents .......................... 1,809 (1,794) 13,576
Cash and cash equivalents at beginning of year ............................ 24,802 26,596 186,131
Cash and cash equivalents at end of year ........................................ ¥26,611 ¥24,802 $199,707
See accompanying notes to consolidated financial statements.
18
NIPPON PAINT Co., Ltd.
Brought to you by Global Reports
Nippon Paint Co., Ltd. and Consolidated Subsidiaries
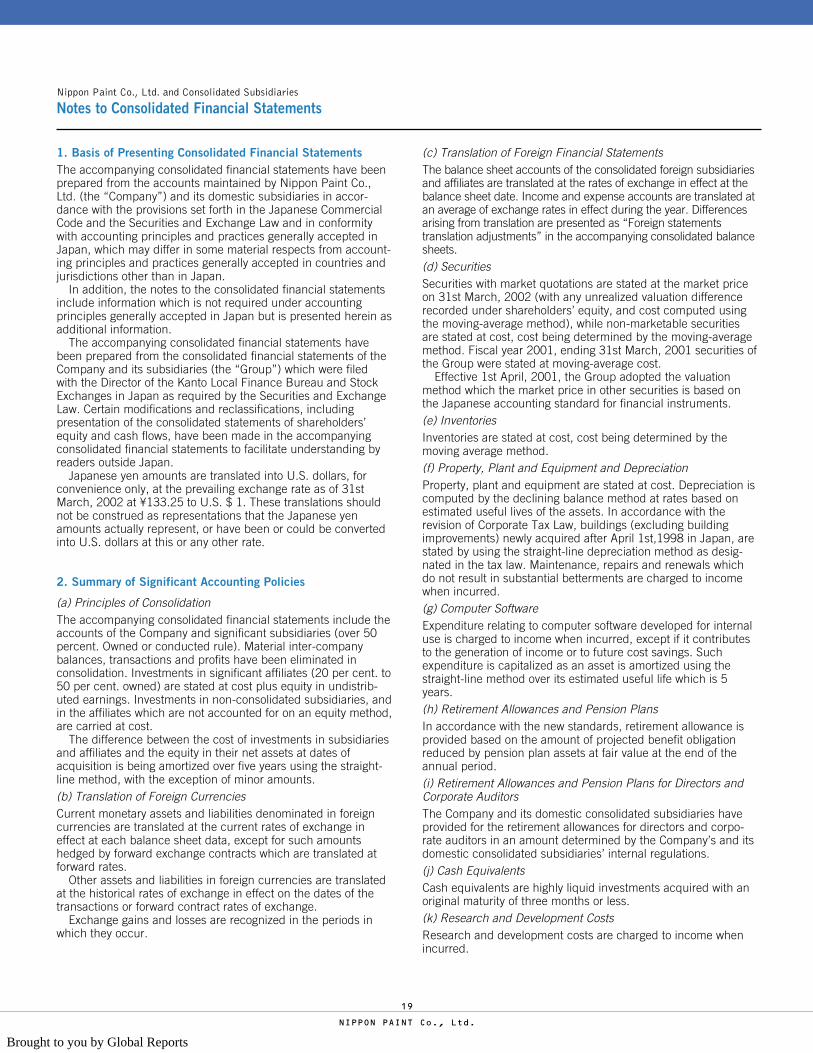
Notes to Consolidated Financial Statements
1. Basis of Presenting Consolidated Financial StatementsThe accompanying consolidated financial statements have beenprepared from the accounts maintained by Nippon Paint Co.,Ltd. (the “Company”) and its domestic subsidiaries in accor-dance with the provisions set forth in the Japanese CommercialCode and the Securities and Exchange Law and in conformitywith accounting principles and practices generally accepted inJapan, which may differ in some material respects from account-ing principles and practices generally accepted in countries andjurisdictions other than in Japan.
In addition, the notes to the consolidated financial statementsinclude information which is not required under accountingprinciples generally accepted in Japan but is presented herein asadditional information.
The accompanying consolidated financial statements havebeen prepared from the consolidated financial statements of theCompany and its subsidiaries (the “Group”) which were filedwith the Director of the Kanto Local Finance Bureau and StockExchanges in Japan as required by the Securities and ExchangeLaw. Certain modifications and reclassifications, includingpresentation of the consolidated statements of shareholders’equity and cash flows, have been made in the accompanyingconsolidated financial statements to facilitate understanding byreaders outside Japan.
Japanese yen amounts are translated into U.S. dollars, forconvenience only, at the prevailing exchange rate as of 31stMarch, 2002 at ¥133.25 to U.S. $ 1. These translations shouldnot be construed as representations that the Japanese yenamounts actually represent, or have been or could be convertedinto U.S. dollars at this or any other rate.
2. Summary of Significant Accounting Policies
(a) Principles of ConsolidationThe accompanying consolidated financial statements include theaccounts of the Company and significant subsidiaries (over 50percent. Owned or conducted rule). Material inter-companybalances, transactions and profits have been eliminated inconsolidation. Investments in significant affiliates (20 per cent. to50 per cent. owned) are stated at cost plus equity in undistrib-uted earnings. Investments in non-consolidated subsidiaries, andin the affiliates which are not accounted for on an equity method,are carried at cost.
The difference between the cost of investments in subsidiariesand affiliates and the equity in their net assets at dates ofacquisition is being amortized over five years using the straight-line method, with the exception of minor amounts.(b) Translation of Foreign CurrenciesCurrent monetary assets and liabilities denominated in foreigncurrencies are translated at the current rates of exchange ineffect at each balance sheet data, except for such amountshedged by forward exchange contracts which are translated atforward rates.
Other assets and liabilities in foreign currencies are translatedat the historical rates of exchange in effect on the dates of thetransactions or forward contract rates of exchange.
Exchange gains and losses are recognized in the periods inwhich they occur.
(c) Translation of Foreign Financial StatementsThe balance sheet accounts of the consolidated foreign subsidiariesand affiliates are translated at the rates of exchange in effect at thebalance sheet date. Income and expense accounts are translated atan average of exchange rates in effect during the year. Differencesarising from translation are presented as “Foreign statementstranslation adjustments” in the accompanying consolidated balancesheets.(d) SecuritiesSecurities with market quotations are stated at the market priceon 31st March, 2002 (with any unrealized valuation differencerecorded under shareholders’ equity, and cost computed usingthe moving-average method), while non-marketable securitiesare stated at cost, cost being determined by the moving-averagemethod. Fiscal year 2001, ending 31st March, 2001 securities ofthe Group were stated at moving-average cost.
Effective 1st April, 2001, the Group adopted the valuationmethod which the market price in other securities is based onthe Japanese accounting standard for financial instruments.(e) InventoriesInventories are stated at cost, cost being determined by themoving average method.(f) Property, Plant and Equipment and DepreciationProperty, plant and equipment are stated at cost. Depreciation iscomputed by the declining balance method at rates based onestimated useful lives of the assets. In accordance with therevision of Corporate Tax Law, buildings (excluding buildingimprovements) newly acquired after April 1st,1998 in Japan, arestated by using the straight-line depreciation method as desig-nated in the tax law. Maintenance, repairs and renewals whichdo not result in substantial betterments are charged to incomewhen incurred.(g) Computer SoftwareExpenditure relating to computer software developed for internaluse is charged to income when incurred, except if it contributesto the generation of income or to future cost savings. Suchexpenditure is capitalized as an asset is amortized using thestraight-line method over its estimated useful life which is 5years.(h) Retirement Allowances and Pension PlansIn accordance with the new standards, retirement allowance isprovided based on the amount of projected benefit obligationreduced by pension plan assets at fair value at the end of theannual period.(i) Retirement Allowances and Pension Plans for Directors andCorporate AuditorsThe Company and its domestic consolidated subsidiaries haveprovided for the retirement allowances for directors and corpo-rate auditors in an amount determined by the Company’s and itsdomestic consolidated subsidiaries’ internal regulations.(j) Cash EquivalentsCash equivalents are highly liquid investments acquired with anoriginal maturity of three months or less.(k) Research and Development CostsResearch and development costs are charged to income whenincurred.
19
NIPPON PAINT Co., Ltd.
Brought to you by Global Reports

(l) LeasesThe finance leases without covenants transferring ownership ofthe properties to lessees are not capitalized, and dealt in thesame way as operating leases.(m) Consumption TaxConsumption tax is excluded from the figures of the accompany-ing financial statements.(n) Net Income per SharePrimary net income per share is computed based on theweighted average number of shares outstanding during eachperiod.(o) Additional Paid-in CapitalThe Commercial Code of Japan provides that additional paid-incapital is not available for dividends, but may be used to reducea capital deficit by resolution of the shareholders or may becapitalized by resolution of the board of directors.(p) Appropriation of Retained EarningsCash dividends and bonuses to directors and corporate auditorsare recorded in the fiscal year in which a proposed appropriationis approved by a general meeting of shareholders.
3. InventoriesInventories as of 31st March, 2002 and 2001 consisted of:
Thousands ofMillions of yen U.S. dollars
2002 2001 2002Finished goods ................................... ¥10,392 ¥10,540 $ 77,989Work in process ................................. 2,863 3,076 21,486Raw materials and supplies ............... 2,634 2,442 19,767
¥15,889 ¥16,058 $119,242
4. Long-term DebtLong-term debt as of 31st March, 2002 and 2001 consisted of:
Thousands ofMillions of yen U.S. dollars
2002 2001 2002Secured:
Bank loans and other .................... ¥ 453 ¥ 624 $ 3,400Unsecured:
2.175 percent bondsdue 20th August, 2002 .............. 10,000 10,000 75,047
2.0 percent bondsdue 22nd May, 2003 .................. 5,000 5,000 37,523
Bank loans and other .................... 12,342 12,399 92,62327,795 28,023 208,593
Less-current portion includedcurrent liabilities ........................ 12,575 3,060 94,372
¥15,220 ¥24,963 $114,221
Property, plant and equipment and investments in securities withthe net book value of ¥800 million ($6,004 thousand) arecharged as collateral for long-term debt as of 31st March, 2002.
The aggregate annual maturities of long-term debt subsequentto 31st March, 2002 are summarized below:
Thousands ofMillions of yen U.S. dollars
Year ending 31st March,2003 ............................................. ¥12,575 $ 94,3712004 ............................................. 8,534 64,0462005 ............................................. 6,477 48,6082006 ............................................. 163 1,2232007 and after .............................. 46 345
¥27,795 $208,593
5. Retirement Allowances and Pension PlansThe Company and its domestic subsidiaries have contributory,noncontributory defined benefit plans and a lump-sum paymentat the time of retirement. The amount of the retirement allow-ance is, in general, determined on the basis of length of serviceand current basic salary at the time of retirement
Certain of the domestic consolidated subsidiaries also haveemployees’ retirement benefit plans and funded pension planssimilar to those of the Company.
The following tables set forth the changes in benefit obligation,plan assets and funded status of the Company and its domesticsubsidiaries on 31st March, 2001.
Thousands ofMillions of yen U.S. dollars
Benefit obligation ............................... ¥93,606 $702,484Fair value of plan assets ..................... 47,659 357,666Accrued pension liability recognized in
The Consolidated balance sheets ... 9,275 69,606Prepayment pension cost ................... (62) (465)Unrecognized prior service cost ......... (2,352) (17,651)Unrecognized actuarial difference ...... 20,956 157,268Unrecognized net transition obligation at date of adoption ........................... 18,130 136,060
Retirement and pension costs of the Company and its domesticsubsidiaries included the following components for the yearended 31st March, 2002.
Thousands ofMillions of yen U.S. dollars
Service cost ....................................... ¥2,940 $22,064Interest cost ....................................... 2,772 20,803Expected return on plan assets .......... (1,872) (14,049)Amortization:
Prior service cost ............................ (266) (1,996)Actuarial difference cost ................. 910 6,829Transition obligation at date of
adoption ..................................... 1,396 10,477Net periodic benefit cost .................... 5,880 44,128
20
NIPPON PAINT Co., Ltd.
Brought to you by Global Reports
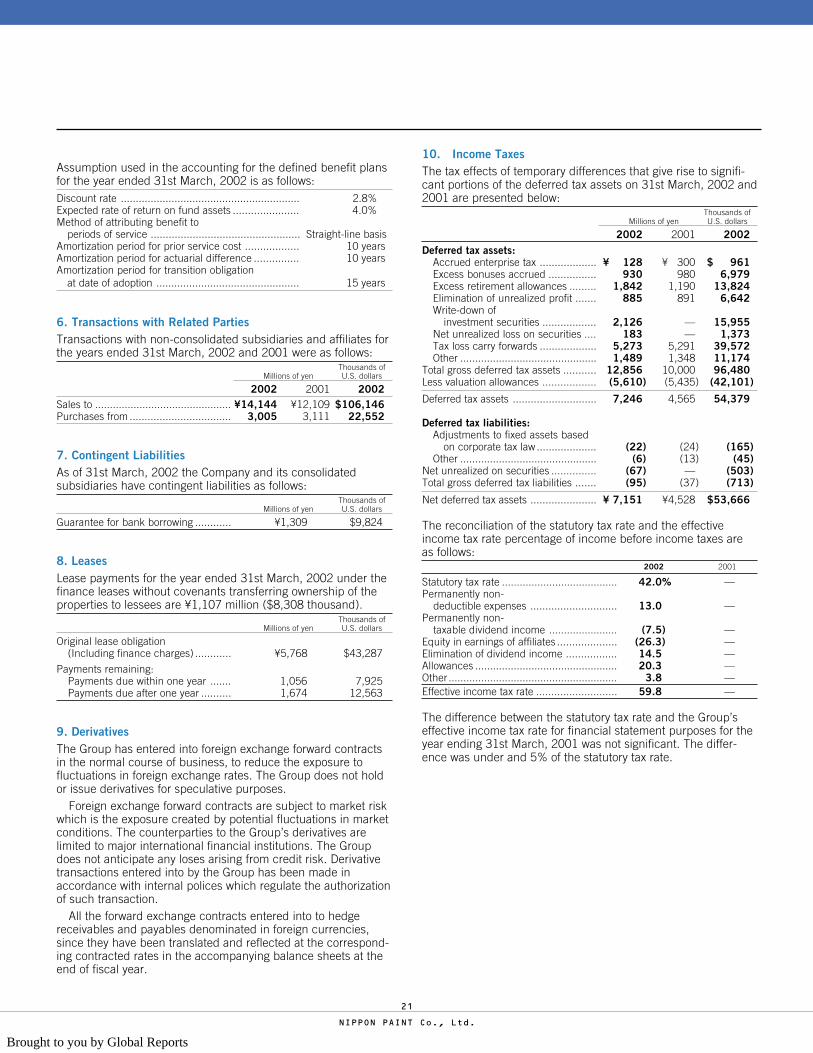
Assumption used in the accounting for the defined benefit plansfor the year ended 31st March, 2002 is as follows:Discount rate ............................................................ 2.8%Expected rate of return on fund assets ...................... 4.0%Method of attributing benefit to
periods of service .................................................. Straight-line basisAmortization period for prior service cost .................. 10 yearsAmortization period for actuarial difference ............... 10 yearsAmortization period for transition obligation
at date of adoption ................................................ 15 years
6. Transactions with Related PartiesTransactions with non-consolidated subsidiaries and affiliates forthe years ended 31st March, 2002 and 2001 were as follows:
Thousands ofMillions of yen U.S. dollars
2002 2001 2002Sales to .............................................. ¥14,144 ¥12,109 $106,146Purchases from .................................. 3,005 3,111 22,552
7. Contingent LiabilitiesAs of 31st March, 2002 the Company and its consolidatedsubsidiaries have contingent liabilities as follows:
Thousands ofMillions of yen U.S. dollars
Guarantee for bank borrowing ............ ¥1,309 $9,824
8. LeasesLease payments for the year ended 31st March, 2002 under thefinance leases without covenants transferring ownership of theproperties to lessees are ¥1,107 million ($8,308 thousand).
Thousands ofMillions of yen U.S. dollars
Original lease obligation(Including finance charges) ............ ¥5,768 $43,287
Payments remaining:Payments due within one year ....... 1,056 7,925Payments due after one year .......... 1,674 12,563
9. DerivativesThe Group has entered into foreign exchange forward contractsin the normal course of business, to reduce the exposure tofluctuations in foreign exchange rates. The Group does not holdor issue derivatives for speculative purposes.
Foreign exchange forward contracts are subject to market riskwhich is the exposure created by potential fluctuations in marketconditions. The counterparties to the Group’s derivatives arelimited to major international financial institutions. The Groupdoes not anticipate any loses arising from credit risk. Derivativetransactions entered into by the Group has been made inaccordance with internal polices which regulate the authorizationof such transaction.
All the forward exchange contracts entered into to hedgereceivables and payables denominated in foreign currencies,since they have been translated and reflected at the correspond-ing contracted rates in the accompanying balance sheets at theend of fiscal year.
10. Income TaxesThe tax effects of temporary differences that give rise to signifi-cant portions of the deferred tax assets on 31st March, 2002 and2001 are presented below:
Thousands ofMillions of yen U.S. dollars
2002 2001 2002Deferred tax assets:
Accrued enterprise tax ................... ¥ 128 ¥ 300 $ 961Excess bonuses accrued ................ 930 980 6,979Excess retirement allowances ......... 1,842 1,190 13,824Elimination of unrealized profit ....... 885 891 6,642Write-down of
investment securities .................. 2,126 — 15,955Net unrealized loss on securities .... 183 — 1,373Tax loss carry forwards ................... 5,273 5,291 39,572Other .............................................. 1,489 1,348 11,174
Total gross deferred tax assets ........... 12,856 10,000 96,480Less valuation allowances .................. (5,610) (5,435) (42,101)
Deferred tax assets ............................ 7,246 4,565 54,379
Deferred tax liabilities:Adjustments to fixed assets based
on corporate tax law .................... (22) (24) (165)Other .............................................. (6) (13) (45)
Net unrealized on securities ............... (67) — (503)Total gross deferred tax liabilities ....... (95) (37) (713)
Net deferred tax assets ...................... ¥ 7,151 ¥4,528 $53,666
The reconciliation of the statutory tax rate and the effectiveincome tax rate percentage of income before income taxes areas follows:
2002 2001
Statutory tax rate ....................................... 42.0% —Permanently non-
deductible expenses ............................. 13.0 —Permanently non-
taxable dividend income ....................... (7.5) —Equity in earnings of affiliates .................... (26.3) —Elimination of dividend income ................. 14.5 —Allowances ................................................ 20.3 —Other ......................................................... 3.8 —Effective income tax rate ........................... 59.8 —
The difference between the statutory tax rate and the Group’seffective income tax rate for financial statement purposes for theyear ending 31st March, 2001 was not significant. The differ-ence was under and 5% of the statutory tax rate.
21
NIPPON PAINT Co., Ltd.
Brought to you by Global Reports

11. Segment InformationInformation about operations in different industry segments of theGroup for the years ended 31st March, 2002 and 2001.
Millions of yen
2002Paint Fine-chemical Eliminations
Segment Segment Total or Corporate Consolidated
Sales and Operating IncomeSales to third parties .................................................................... ¥181,161 ¥11,306 ¥192,467 ¥ — ¥192,467Inter segment sales ...................................................................... — — — — —Operating expenses ..................................................................... 175,224 9,617 184,841 — 184,841Operating income ......................................................................... 5,937 1,689 7,626 — 7,626
Assets, Depreciation and Capital ExpenditureAssets .......................................................................................... 168,611 10,510 179,121 45,139 224,260Depreciation ................................................................................ 5,297 313 5,610 — 5,610Capital expenditure ...................................................................... 5,735 151 5,886 — 5,886
Millions of yen
2001Paint Fine-chemical Eliminations
Segment Segment Total or Corporate Consolidated
Sales and Operating IncomeSales to third parties .................................................................... ¥187,597 ¥12,076 ¥199,673 ¥ — ¥199,673Inter segment sales ...................................................................... — — — — —Operating expenses ..................................................................... 178,979 9,737 188,716 — 188,716Operating income ......................................................................... 8,618 2,339 10,957 — 10,957
Assets, Depreciation and Capital ExpenditureAssets .......................................................................................... 168,772 10,767 179,539 47,803 227,342Depreciation ................................................................................ 5,061 390 5,451 — 5,451Capital expenditure ...................................................................... 4,513 71 4,584 — 4,584
Thousands of U.S. dollars
2002Paint Fine-chemical Eliminations
Segment Segment Total or Corporate Consolidated
Sales and Operating IncomeSales to third parties .................................................................... $1,359,557 $84,848 $1,444,405 $ — $1,444,405Inter segment sales ...................................................................... — — — — —Operating expenses ..................................................................... 1,315,001 72,173 1,387,174 — 1,387,174Operating income ......................................................................... 44,556 12,675 57,231 — 57,231
Assets, Depreciation and Capital ExpenditureAssets .......................................................................................... 1,265,374 78,874 1,344,248 338,754 1,683,002Depreciation ................................................................................ 39,752 2,249 42,101 — 42,101Capital expenditure ...................................................................... 43,039 1,133 44,173 — 44,173
Paint segment consists of Automotive coatings, Industrial-usecoatings, Trade-use paints and Other paints and coatings.
Fine-chemical segments consists of color filter materials,electric materials, pretreatment chemicals, photo ED and bloodserum separation polymers.
12. Subsequent EventsThe following appropriations of retained earnings, which have not been reflected in the accompanying consolidated financial statementsfor the year ended 31st March, 2002, were approved at a shareholders’ meeting held on 27th June, 2002.
Thousands ofMillions of yen U.S. dollars
Cash dividends (¥3.00 - $0.023 per share) ............................................................................................. ¥796 $5,974
22
NIPPON PAINT Co., Ltd.
Brought to you by Global Reports

To the Board of DirectorsNippon Paint Co., Ltd.
We have audited the consolidated balance sheets of Nippon Paint Co., Ltd. and its
consolidated subsidiaries as of 31st March, 2002 and 2001, and the related consolidatedstatements of income, shareholders’ equity, and cash flows for the years then ended, all
expressed in Japanese yen. Our audits were made in accordance with auditing stan-
dards, procedures and practices generally accepted and applied in Japan and, accord-
ingly, included such tests of the accounting records and such other auditing procedures
as we considered necessary in the circumstances.
In our opinion, the accompanying consolidated financial statements expressed inJapanese yen, present fairly the consolidated financial position of Nippon Paint Co., Ltd.
and its consolidated subsidiaries as of 31st March, 2002 and 2001, and the consolidated
results of their operations and their cash flows for the years then ended, in conformity
with accounting principles and practices generally accepted in Japan applied on a
consistent basis.As described in Note 2, effective 1st April 2001, the consolidated financial state-
ments, Nippon Paint Co., Ltd. and its consolidated subsidiaries have adopted new
accounting standards for Securities.
The U.S. dollar amounts in the accompanying consolidated financial statements with
respect to the year ended 31st March, 2002 are presented solely for convenience. Our
audit also included the translation of yen amounts into U.S. dollar amounts and, in ouropinion, such translation has been made on the basis described in Note 1 to the consoli-
dated financial statements.
Osaka, Japan
27th June, 2002
ShinNihon & Co.
Report of Independent Certified Public Accountantson the Consolidated Financial Statements
See note 1 to the consolidated financial statements which explains the basis of preparing theconsolidated financial statements of Nippon Paint Co., Ltd. and its consolidated Japanese subsidiar-ies under Japanese accounting principles and practices.
23
NIPPON PAINT Co., Ltd.
Brought to you by Global Reports
General Information(as of 31st March, 2002)
Established:14th March, 1881
Head Office:2-1-2, Oyodo-Kita, Kita-Ku, Osaka 531-8511, JapanTel: +81-6-6458-1111Fax: +81-6-6455-9261
Stock Listings:Nippon Paint common stock-Code 4612- is listing on theTokyo, Osaka and Nagoya Stock Exchanges
Transfer Agent:The UFJ Trust and Banking Co., Ltd.Security Agency Business Department3-6-3, Fushimicho, Chuo-Ku, Osaka 541-8502, JapanTel: +81-6-6229-3011
Capital:¥27,712 million
Number of Shares Outstanding:265,402,443
Common Stock Trading Statistics :FY1997 FY1998 FY1999 FY2000 FY2001
High ¥400 ¥254 ¥328 ¥429 ¥487Low 181 180 195 232 245
Board of Directors andCorporate Auditors
ChairmanHiroshi Fujii *
PresidentTeruyoshi Fujishima *
Executive Vice PresidentHiromoto Ueno *
Senior Vice PresidentsKozo TaninoShizuo KatsunagaSekiya SuzukiKoichi Tokita
Vice PresidentsKiyohiko ChijiiwaSusumu IwatoMakoto Matsuura
Executive DirectorsTakashi YoshiiShouji NishioKatsufumi HasebeKiyomi Sakurai
Corporate AuditorsYukio NomuraRyuzo MizuguchiAtsushi ShimizuYoshio Iimura
* Representative Director(As of 27th June, 2002)
COMPANY DATA
24
NIPPON PAINT Co., Ltd.
Brought to you by Global Reports

SUBSIDIARIES AND AFFILIATES
Nippon Paint Hanbai (Hokkaido) Co., Ltd.Nippon Paint Hanbai (Higashinihon) Co., Ltd.Nippon Paint Hanbai (Chubu) Co., Ltd.Nippon Paint Hanbai (Nishinihon) Co., Ltd.Nippon Paint Hanbai (Shikoku) Co., Ltd.Nippon Paint Industrial Coating Co., Ltd.Daiwa Paint Trading Co., Ltd.Nippon Fine Coatings Co., Ltd.Nippon Bee Chemical Co., Ltd.AS Paint Co., Ltd.
Asahi Solvent Manufacturing. Co., Ltd.Nippoin Paint Marine Coatings Co., Ltd.Nippe Home Products Co., Ltd.NP Color Plaza Co., Ltd.Nippe Graphics Co., Ltd.Nippon Liner Co., Ltd.Sunrise Engineering Co., Ltd.Nippon Paint Plant Engineering Co., Ltd.Nippe Trading Co., Ltd.Eco Systems Co., Ltd.
Nippon Paint (USA) Inc.801 West Street, Wilmington, DE 19801-1545, U.S.A.
Nippon Paint Research Institute (America), Inc.44382 Macomb Industrial Drive, Clinton Township, MI 48036, U.S.A.
NPA Coatings Inc.11110 Berea Road, Cleveland, OH 44102, U.S.A.
Morton Nippon Coatings2701 East 170th Street, Lansing, IL 60438, U.S.A.
Nippon Paint (Europe) Ltd.Level 8, City Tower, 40 Basinghall Street, London EC2V 5DE, U.K.
NP Automotive Coatings (Europe) Ltd.Britannia Trade Park, Radway Road, Swindon, Wiltshire SN3 4ND, U.K.
Akzo Nobel Nippon Paint LimitedNorth Woolwich Road, London E16 2AP, U.K.
Akzo Nobel Nippon Paint ABOdensvivagen 32mS-594 32 Gamleby, Sweden
Akzo Nobel Nippon Paint GmbHLochnerstrasse 12 90441 Nürnberg, Germany
Akzo Nobel Nippon Paint SAB.P.n1266 76068 Le Harve Cadex, France
Akzo Nobel Nippon Paint España SA14-20 Feixa Llarga 08040 Zona Franca Barcelona, Spain
Akzo Nobel Nippon Paint2 Via Emilia, 20070 Fombio, Italy
Nipsea Chemical Co., Ltd.407-7, Mokne-Dong, Ansan-Si, Kyunggi-Do,425-100, Korea
Daihan Automotive Coatings Co., Ltd.615, Pakdal-dong, Manan-gu, Anyang-city, Kyonggi-Do, Korea
Asia Industries, Ltd.24, Tung-Yuan Road, Chung-Li Shih Tao-Yuan Hsien, Taiwan
Nippon Paint (Philippines) Inc.Hologram Street, Light Industry and Science Park of the PhilippinesCabuyao, Laguna, Philippines
Nippon Paint (China) Co., Ltd.287,Chuangye Road, Wangqiao Development Zone,Newpudong District, Shanghai, 201201, People’s Republic of ChinaLangfang Nippon Paint Co., Ltd..Fuzhong Road, Langfang Economic & Technical Development Zone,Hebei Province, 065001, People’s Republic of China
Suzhou Nippon Paint Co., Ltd.Miduqiao, Fengmenwai, Suzhou-city, Jiangsu Province, People’s Repub-lic of China
Nippon Paint (Chongqing) Chemicals Co., Ltd.75 Pan Long the Forth Village, Jiulong Town, Jiulongpo District, Chongqing400051, Sichuan Province, People’s Republic of China
Nippon Paint (Guangdong) Co., Ltd.Shui Kou Luo Tang Zone, Hui Yang City, Guangdong, People’s Republic ofChina
Nippon Paint (H.K.) Co., Ltd.Room 1101, Tower 1, Cheung Sha Wan Plaza, 833 Cheung Sha Wan Road,Kowloon, Hong Kong
Nippon Paint (Vietnam) Co., Ltd.Road No2 Bienhoa Industrial Zone1, Bienhoa City,Dongnai Province,Vietnam
Nippon Paint (Thailand) Co., Ltd.101 Soi Klabcharoen 1, Suksawad Road, Phrapradaeng,,Samutprakarn,10130, Thailand
Nippon Paint (Malaysia) Sdn. Bhd.Lot I-17, Taman Perindustrian, Subang Utama, 40000 Shah Alam, SelangorDarul Ehsan, Malaysia
Paint Marketing Company (M) Sdn. Bhd.Lot 63, Jalan Sesiku, 40700 Shah Alam, Selangor Darul Ehsan, Malaysia
Nippon Paint (Singapore) Co., Pte. Ltd.No.1, First Lok Yang Road, Jurong, Singapore 629728, Singapore
I.R.E.Corporation Ltd.18 Verdum Road #01-01, Singapore 207280
25
NIPPON PAINT Co., Ltd.
Brought to you by Global Reports
2-1-2, Oyodo-Kita, Kita-ku, Osaka 531-8511, Japan
Tel: 06-6458-1111
Printed in JapanThis annual report is printed
on recycled paper.
Brought to you by Global Reports