Removal characteristics of paint particles generated from paint ...
8
Vol.:(0123456789) 1 3 Journal of Material Cycles and Waste Management https://doi.org/10.1007/s10163-019-00834-4 ORIGINAL ARTICLE Removal characteristics of paint particles generated from paint spray booths Jae‑Rang Lee 1,2 · Seong‑Min Jeon 1 · Naim Hasolli 1 · Kang‑San Lee 1 · Kwan‑Young Lee 2 · Young‑Ok Park 1 Received: 15 June 2018 / Accepted: 21 January 2019 © The Author(s) 2019 Abstract The objective of this study is to eliminate the tackiness of sticky paint particles occurring in paint booths using calcium hydroxide. It ultimately aims to identify the optimal filtration velocity to determine the optimal operation condition for particle collection in the filter. As the filtration velocity increased further in the range of 0.2–0.5 m/min, the pressure drop increased rapidly, while the cleaning efficiency, overall collection efficiency, and fractional collection efficiency tended to decrease. The filtration velocity for optimal filtration condition was identified to be 0.2 m/min. Keywords Sticky paint particle · Calcium hydroxide · Filtration velocity · Overall collection efficiency · Fractional collection efficiency Introduction Air pollutant concentrations continue to increase owing to dramatic industrialization. Among various air pollutants, the inhalation of paint particle causes chronic respiratory diseases, lung cancer, dizziness, headache, and nausea in humans and exacerbates air pollution, thereby deteriorating the quality of life [1, 2]. In particular, the dust generated in the business site can cause unknown diseases in civilians [3]. The global auto‑ mobile demand is expected to grow and the production of automobiles will increase in proportion to the growing demand. As a result, automobile painting will also increase. The automobile paints are sticky and air pollutants from the paint spray booths will increase in the future [4]. Sticky paint particles generated inside paint booths tend to give rise to problems such as difficulty in treatment, unregulated emission, and significant environmental pollu‑ tion. Paint particles are emitted in a sticky state when paint is sprayed inside a paint booth [5, 6]. Previous studies have reported the use of wet scrubbers and disposable filters to remove paint particles. However, wet scrubbers require additional water treatment technology, and disposable filters need frequent replacement [7]. Existing methods such as the use of a filter to eliminate paint particles emitted in paint booths causes filter clogging as the paint is tacky. Sticky paint particles are particularly bad for filters, reducing their performance. Therefore, it is difficult to remove paint particles with a filter. Hence, a new technology is required for filtration to prevent sticky paint particles from being released into the atmosphere to reduce environmental pollution and improve our quality of life [8, 9]. In the present study, calcium hydroxide was used to eliminate sticky paint particles in the mixing chamber and to reduce tackiness before particles are collected on the * Young‑Ok Park [email protected] Jae‑Rang Lee [email protected] Seong‑Min Jeon [email protected] Naim Hasolli [email protected] Kang‑San Lee [email protected] Kwan‑Young Lee [email protected] 1 Climate Change Research Division, Korea Institute of Energy Research, 152 Gajeong‑ro, Yuseong‑gu, Daejeon 34129, Republic of Korea 2 Department of Chemical and Biological Engineering, Korea University, 145 Anam‑ro, Seongbuk‑gu, Seoul 02841, Republic of Korea
-
Upload
khangminh22 -
Category
Documents
-
view
4 -
download
0
Transcript of Removal characteristics of paint particles generated from paint ...

Vol.:(0123456789)1 3
Journal of Material Cycles and Waste Management https://doi.org/10.1007/s10163-019-00834-4
ORIGINAL ARTICLE
Removal characteristics of paint particles generated from paint spray booths
Jae‑Rang Lee1,2 · Seong‑Min Jeon1 · Naim Hasolli1 · Kang‑San Lee1 · Kwan‑Young Lee2 · Young‑Ok Park1
Received: 15 June 2018 / Accepted: 21 January 2019 © The Author(s) 2019
AbstractThe objective of this study is to eliminate the tackiness of sticky paint particles occurring in paint booths using calcium hydroxide. It ultimately aims to identify the optimal filtration velocity to determine the optimal operation condition for particle collection in the filter. As the filtration velocity increased further in the range of 0.2–0.5 m/min, the pressure drop increased rapidly, while the cleaning efficiency, overall collection efficiency, and fractional collection efficiency tended to decrease. The filtration velocity for optimal filtration condition was identified to be 0.2 m/min.
Keywords Sticky paint particle · Calcium hydroxide · Filtration velocity · Overall collection efficiency · Fractional collection efficiency
Introduction
Air pollutant concentrations continue to increase owing to dramatic industrialization. Among various air pollutants, the inhalation of paint particle causes chronic respiratory diseases, lung cancer, dizziness, headache, and nausea in humans and exacerbates air pollution, thereby deteriorating the quality of life [1, 2].
In particular, the dust generated in the business site can cause unknown diseases in civilians [3]. The global auto‑mobile demand is expected to grow and the production of automobiles will increase in proportion to the growing demand. As a result, automobile painting will also increase. The automobile paints are sticky and air pollutants from the paint spray booths will increase in the future [4].
Sticky paint particles generated inside paint booths tend to give rise to problems such as difficulty in treatment, unregulated emission, and significant environmental pollu‑tion. Paint particles are emitted in a sticky state when paint is sprayed inside a paint booth [5, 6]. Previous studies have reported the use of wet scrubbers and disposable filters to remove paint particles. However, wet scrubbers require additional water treatment technology, and disposable filters need frequent replacement [7].
Existing methods such as the use of a filter to eliminate paint particles emitted in paint booths causes filter clogging as the paint is tacky. Sticky paint particles are particularly bad for filters, reducing their performance. Therefore, it is difficult to remove paint particles with a filter. Hence, a new technology is required for filtration to prevent sticky paint particles from being released into the atmosphere to reduce environmental pollution and improve our quality of life [8, 9].
In the present study, calcium hydroxide was used to eliminate sticky paint particles in the mixing chamber and to reduce tackiness before particles are collected on the
* Young‑Ok Park [email protected]
Jae‑Rang Lee [email protected]
Seong‑Min Jeon [email protected]
Naim Hasolli [email protected]
Kang‑San Lee [email protected]
Kwan‑Young Lee [email protected]
1 Climate Change Research Division, Korea Institute of Energy Research, 152 Gajeong‑ro, Yuseong‑gu, Daejeon 34129, Republic of Korea
2 Department of Chemical and Biological Engineering, Korea University, 145 Anam‑ro, Seongbuk‑gu, Seoul 02841, Republic of Korea

Journal of Material Cycles and Waste Management
1 3
surface of the filter element. Subsequently, the optimal condition was identified by varying the filtration velocity.
Materials and methods
Materials
The paint used in the present study is a coating paint widely used by auto painting companies. Following the technique used in many automobile paint shops, the auto‑mobile paint (Scandal Red, Jevisco) and the paint thinner (DR‑421W, Noroo paint) were mixed in a one to one ratio and were used in this experiment. A number of publica‑tions have argued that calcium hydroxide contains many holes, which lead to its capacity for adsorption [10]. The physical properties of the calcium hydroxide used to eliminate the adhesiveness of the sticky paint particles are shown in Table 1. Calcium hydroxide images at 3000× and 5000× magnifications using Scanning Electron Micro‑scope (SEM) are shown in Fig. 1. The size distribution of the calcium hydroxide is shown in Fig. 2 and the aver‑age particle size is 1.3 µm. Although the exact cohesion mechanism between calcium hydroxide and paint has not been identified, the present study illustrates the cohesion of calcium hydroxide and sticky paint particles in Fig. 3.
Filter
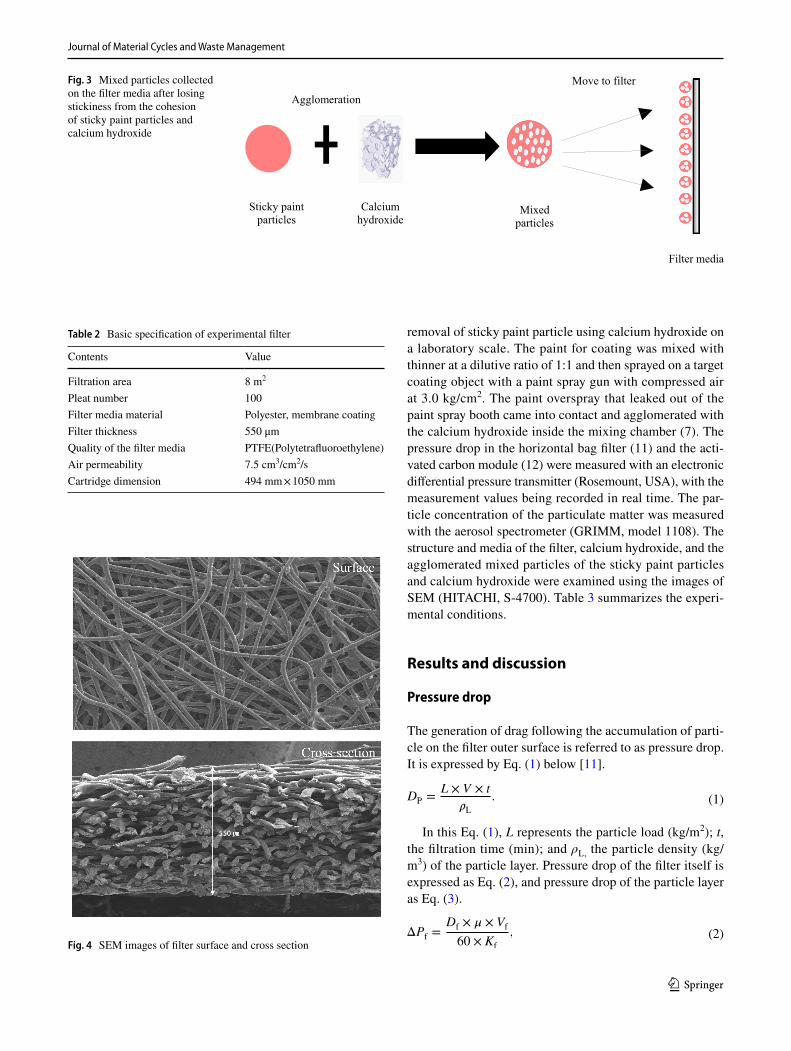
The material of the filter media used in this study is poly‑ester membrane, with a filtration area of 4 m2. Since two of these were installed, the total filtration area is 8 m2. The filter physical properties are presented in Table 2. The SEM images of the filter’s surface and cross section are shown in Fig. 4. The width of the filter was 550 µm. After losing stickiness from the cohesion of sticky paint particles and calcium hydroxide, the mixed particles were collected on a filter and played a part in discharging only clean air into the atmosphere. Figure 3 illustrates the pro‑duction method and filter collection of the mixed particles.
Experimental procedure
Figure 5 shows the schematic diagram of the test unit for testing the performance of the experimental unit for the
Table 1 Physical properties of the calcium hydroxide
Contents Value
BET surface area (m2/g) 37.3Average diameter (μm) 9.82Cumulative pore volume (cm2/g) 0.181Average pore diameter (nm) 10.07
Fig. 1 SEM images (× 3000, × 5000) of calcium hydroxide
0
0.1
0.2
0.3
0.4
0.5
0.6
0.7
0.8
0.9
1
0
0.5
1
1.5
2
2.5
3
3.5
4
0.1 1 10 100 1000
Cum
ulat
ive/
Nor
mal
ized
Num
ber D
istri
butio
n
Num
ber o
f Par
ticle
s, #
Aerodynamic Particle Size, ㎛
Number of Particle
Cumulative Number Distribution
Normalized Number Distribution
Fig. 2 Particle size distribution of calcium hydroxide
Journal of Material Cycles and Waste Management
1 3
removal of sticky paint particle using calcium hydroxide on a laboratory scale. The paint for coating was mixed with thinner at a dilutive ratio of 1:1 and then sprayed on a target coating object with a paint spray gun with compressed air at 3.0 kg/cm2. The paint overspray that leaked out of the paint spray booth came into contact and agglomerated with the calcium hydroxide inside the mixing chamber (7). The pressure drop in the horizontal bag filter (11) and the acti‑vated carbon module (12) were measured with an electronic differential pressure transmitter (Rosemount, USA), with the measurement values being recorded in real time. The par‑ticle concentration of the particulate matter was measured with the aerosol spectrometer (GRIMM, model 1108). The structure and media of the filter, calcium hydroxide, and the agglomerated mixed particles of the sticky paint particles and calcium hydroxide were examined using the images of SEM (HITACHI, S‑4700). Table 3 summarizes the experi‑mental conditions.
Results and discussion
Pressure drop
The generation of drag following the accumulation of parti‑cle on the filter outer surface is referred to as pressure drop. It is expressed by Eq. (1) below [11].
In this Eq. (1), L represents the particle load (kg/m2); t, the filtration time (min); and ρL, the particle density (kg/m3) of the particle layer. Pressure drop of the filter itself is expressed as Eq. (2), and pressure drop of the particle layer as Eq. (3).
(1)DP =L × V × t
�L
.
(2)ΔPf =Df × � × Vf
60 × Kf
,
Fig. 3 Mixed particles collected on the filter media after losing stickiness from the cohesion of sticky paint particles and calcium hydroxide
Agglomeration
Sticky paint particles
Calcium hydroxide
Mixed particles
Filter media
Move to filter
Table 2 Basic specification of experimental filter
Contents Value
Filtration area 8 m2
Pleat number 100Filter media material Polyester, membrane coatingFilter thickness 550 μmQuality of the filter media PTFE(Polytetrafluoroethylene)Air permeability 7.5 cm3/cm2/sCartridge dimension 494 mm × 1050 mm
Fig. 4 SEM images of filter surface and cross section

Journal of Material Cycles and Waste Management
1 3
In this Eqs. (2) and (3), ∆Pf, represent the pressure drop of the filter itself (Pa); ∆PP, the pressure drop of particle layer accumulated on the filter surface (Pa); Df, the thickness of filter (m); Dp, the thickness of the particle layer (m); µ, the viscosity of the gas (kg/m s); Vf, the filtration velocity (m/min); Kf, the filter permeability (m2); Kp, the particle layer permeability (m2); and 60 is the conversion factor (s/min).
The total pressure drop in the bag filter is defined as the sum of Eq. (2), which represents the pressure drop of the filter itself, and Eq. (3) represents the pressure drop of the particle layer. It is expressed as Eq. (4) [12].
(3)ΔPP =DP × � × VP
60 × KP
.
(4)ΔP = ΔPf + ΔPp.
The formation of the particle in the filter can be detected, and the pressure drop of the initial particle removal can be measured using the given equation.
The filter cleaning interval was defined as the time inter‑val between two cleaning operations. The filter cleaning interval also increased when the time for the pressure drop to reach the initial pressure drop becomes longer [13].
Figure 6 shows the changing trend of filter pressure drop in accordance with the filtration velocity. The increase in pressure drop was slow at a filtration velocity of 0.2 m/min compared to 0.5 m/min, and the filter cleaning interval was longer. At filtration velocities 0.2, 0.3, 0.4, and 0.5 m/min, the
Fig. 5 Schematic diagram of the laboratory scale test unit
Table 3 Summarizes of experimental conditions
Contents Value
Flow velocity 0.2–0.5 m/minFlow rate 1.6–4 Nm3/minNumber of filter elements 2Type of the filter Horizontal bag filterDimension of the filter Depth: 494 mm
Height: 1050 mmThickness: 100 mm
Pulsing system unit T‑type pulse injector
0
100
200
300
400
500
600
700
800
900
1000
0 200 400 600 800 1000 1200 1400
Pres
sure
dro
p,Pa
Filtration time, min
Filtration velocity: 0.2 m/minFiltration velocity: 0.3 m/minFiltration velocity: 0.4 m/minFiltration velocity: 0.5 m/min
Fig. 6 Filter pressure drop as function of filtration velocity

Journal of Material Cycles and Waste Management
1 3
average initial pressure drop was 127.72, 167.26, 196.56, and 295.18 Pa, respectively, and the average filter cleaning interval 427, 185, 115, and 40 min, respectively. As the filtration veloc‑ity increased, the tendency of the pressure drop grew faster, and the filter cleaning interval decreased.
The result showed that the filter pressure drop had a ten‑dency for a quick increase along with an increase in the filtra‑tion velocity. On the filter surface, particle accumulate and build a particle layer with the amount of particle captured by the mechanism of inertial impaction and direct interception. Filtration velocity is an important factor in particle collection equipment with filters, and is also a factor to be considered in respect to energy required for the operation of unit.
Cleaning efficiency
Pressure drop increases as the thickness of the particle layer formed on the surface of the filter increases through the course of the operation time. To operate for prolonged periods, the particle layer formed on the filter surface should be regularly cleaned. This task is referred to as the filter cleaning efficiency [14]. Figure 7 shows the dust stuck on the bag filter and the dust falling from the bag filter by a pulsing operation. The dust falling from the bag filter was stored in a hopper.
While removing the accumulated particle layer on the filter, the efficiency of filter pressure drop recovery is referred to as its cleaning efficiency. It is expressed as Eq. (5) below [15, 16].
In Eq. (5), ηcleaning represents the cleaning efficiency (%); ∆Pmax, the pressure drop (Pa) when the removal condition is reached; ∆PR, the remaining pressure drop (Pa) remaining in
(5)�cleaning =ΔPmax − ΔPR
ΔPmax − ΔPI
× 100 (%).
the filter after removal; and ∆PI, the initial pressure drop (Pa) of the filter. In this study, the removal operation employed the pulse‑jet type method. The cleaning efficiency of the fil‑ter following changes of filtration velocity can be determined through Eq. (5).
At filtration velocities of 0.2, 0.3, 0.4, and 0.5 m/min, the average cleaning efficiency was 99.68, 96.68, 93.12, and 89.4%, respectively. Figure 8 shows the cleaning efficiency according to the removal frequency. As the filtration veloc‑ity increased, the cleaning efficiency decreased. The average cleaning efficiency experienced a 10% difference on average up to the third removal between filtration velocities at 0.2 m/min and 0.5 m/min.
The particle layer accumulated on the filter surface was characterized by easier removal when the filtration velocity was lower rather than higher. In the removal operation, which cleans the particle layer accumulated on the filter surface, the remaining pressure drop was maintained at a high level when the filtration velocity was high rather than when it was slow. This is because a greater amount of particles dislodged from the filter surface tends to be re‑entrained when the filtration velocity is high compared to when it is low.
This study found that the cleaning efficiency was correlated with the residual pressure drop. Cleaning efficiencies of 99.68 and 89.4% were followed by residual pressure drops of 127 and 323, respectively. An inversely proportional relation was found the higher the cleaning efficiency, the lower the residual pressure drop.
Collection efficiency
Overall collection efficiency indicates the collection effi‑ciency of total number of particles being collected by filter element related to the inlet particle number concentration. It is expressed as Eq. (6) [17].
(6)�t =Cin − COut
Cin
× 100%.
Dust
Dust removal after pulsing
Air
The dust is falling
Normal operation
Filter
Compressed air pipe
(a) (b)
Fig. 7 Dust collection on the bag filter (a) and dust cleaning by shak‑ing off from bag filter (b)
80
82
84
86
88
90
92
94
96
98
100
0.2 0.3 0.4 0.5
Cle
anin
g ef
ficie
ncy,
%
Filtration velocity, m/min
First cycleSecond cycleThird cycle
Fig. 8 Cleaning efficiency trend according to filtration velocity

Journal of Material Cycles and Waste Management
1 3
In this Eq. (6), ηt represents the overall collection effi‑ciency (%); Cin, the inlet number concentration (#/cm3); and Cout, the outlet number concentration (#/cm3).
The collection efficiency of particles according to the diameter size is referred to as fractional collection efficiency. It is expressed as Eq. (7) [18].
In this Eq. (7), ηfx represent the fractional collection effi‑ciency (%) for a certain paint particle size; Cix, the paint par‑ticle number concentration (#/cm3) of the given particle size at the inlet; and Cox, the paint particle number concentration (#/cm3) of the given particle size at the outlet.
The total number of particle emitted into the atmosphere was determined through Eq. (6), and the collection efficiency according to the size of the particle ranging from small par‑ticles to large particles was determined through Eq. (7). Briefly, the collection efficiency of the filter was determined, and the interpretation of the experiment with regard to the changes in filtration velocity was made possible.
Figure 9 shows the fractional collection efficiency per particle size ranging between 0.25 and 32 µm according to the filtration velocity. In all the conditions of filtration velocities at 0.2, 0.3, 0.4, and 0.5 m/min, the collection effi‑ciency of the particle size 1 µm was maintained at 99.44, 98.4, 96.27, and 95.29%, respectively; at the particle size 2 µm, 99.87, 99.73, 98.6, and 98.24%, respectively; and at the particle size 10 µm, 99.88, 99.05, 99.3, and 98.81%, respectively. Fractional collection efficiency is characterized by its dropping efficiency when filtration velocity is high. In case of large particles, the collection efficiency increases, and it decreases when the particle size is small.
As shown in Fig. 10, the average of overall collection effi‑ciencies at filtration velocities of 0.2, 0.3, 0.4, and 0.5 m/min
(7)�fx =
(
1 −Cox
Cix
)
× 100%.
was 99.11, 97.28, 93.29, and 89.77%, respectively. When filtration velocity increased, the overall collection efficiency tended to decrease.
The decreasing tendency of collection efficiencies when filtration velocities are higher is due to the three factors that contribute to the penetration of particles: straight through, seepage, and pinhole plugs [19]. Due to these factors, par‑ticles infiltrating the interior of the collection filter increase and in turn decrease the collection efficiencies.
Filtration velocity has a decisive influence on the infil‑tration rate of particle in the filter. Therefore, an unlimited increase in the filtration velocity is not effective. Conversely, particles within the equipment may undergo sedimentation when the filtration velocity is unlimitedly low. It is impor‑tant to identify the filtration velocity that yields maximum efficiency.
Agglomeration between sticky paint particle and the calcium hydroxide
A mixing chamber performs the role of agglomeration sticky paint particles and the calcium hydroxide. As a result, the mixed particles that have lost adhesiveness accumulate in the filter, extending the lifespan of the filter. Figure 11 is a real image after sticky paint particle and the calcium hydroxide agglomerating together through contact with each other.
Figure 12 shows images of the agglomerated sticky paint particle and calcium hydroxide at magnifications using a SEM. The observation of the images showed that the average size of the sticky paint particles was 5 µm [20]. The areas expected to be the calcium hydroxide and un‑agglomerated sticky paint particles were 4.857 µm and 4.933 µm, respec‑tively. The remaining areas, observed by naked eye, were determined to be an agglomeration of the calcium hydroxide and sticky paint particles.
50
55
60
65
70
75
80
85
90
95
100
0.1 1 10 100
Frac
tiona
l col
lect
ion
effic
ienc
y, %
Particle diameter, ㎛
Filtration velocity: 0.2 m/minFiltration velocity: 0.3 m/minFiltration velocity: 0.4 m/minFiltration velocity: 0.5 m/min
Fig. 9 Fractional collection efficiency trend according to filtration velocity
99.11
97.28
93.29
89.77
84
86
88
90
92
94
96
98
100
0.2 0.3 0.4 0.5
Ove
rall
colle
ctio
n ef
ficie
ncy,
%
Filtration velocity, m/min
Fig. 10 Overall collection efficiency trend according to filtration velocity

Journal of Material Cycles and Waste Management
1 3
Conclusions
In this study, we used a hybrid air purifier to remove sticky paint particle generated from paint spray booth. The adhe‑siveness of the paint was eliminated using a mixing cham‑ber where agglomeration of the paint particle with calcium hydroxide takes place. A filtration velocity of 0.2 m/min showed a lower increase of pressure drop compared to 0.5 m/min. At filtration velocities of 0.2, 0.3, 0.4, and 0.5 m/min, the average initial pressure drop was 127.72, 167.26, 196.56, and 295.18 Pa, respectively; the average removal time 427, 185, 115, and 40 min; and the average cleaning efficiency 99.68, 96.68, 93.12, and 89.4%, respectively. The filtration velocity of 0.2 m/min yielded the best results. Filtration rates below 0.2 m/min were considered as terminal velocity at which mixed particles formed from the cohesion of sticky paint particles and calcium hydroxide sank to the bottom before being collected on a filter.
In conclusion, our study results serve as valuable data for determining the optimum conditions for the efficient opera‑tion of integral air purifiers in removing sticky paint particle generated from painting facilities.
Acknowledgements This subject is supported by Korea Ministry of Environment as “Eco Business Advancement Tech Development Business”.
OpenAccess This article is distributed under the terms of the Crea‑tive Commons Attribution 4.0 International License (http://creat iveco mmons .org/licen ses/by/4.0/), which permits unrestricted use, distribu‑tion, and reproduction in any medium, provided you give appropriate credit to the original author(s) and the source, provide a link to the Creative Commons license, and indicate if changes were made.
References
1. Annette PU, Corvalan C (2006) Preventing disease through healthy environments. World Health Organization, Geneva, pp 6–16
2. Pope CA, Burnett RT, Thun MJ, Calle EE, Krewski D, Ito K, Thurston GD (2002) Lung cancer, cardiopulmonary mortality, and long‑term exposure to fine particulate air pollution. J Am Med Assoc 287:1132–1141
3. Chalvatzaki E, Kopanakis I, Lazaridis M (2018) Size distri‑bution and metal composition of airborne particles in a waste management facility. J Mater Cycles Waste Manag 20:323–335
4. Salihoglu NK, Ucaroglu S, Salihoglu G (2018) Bioconversion of industrial wastes: paint sludge from automotive manufacturing. J Mater Cycles Waste Manag 20:2100–2109
Fig. 11 Real image after sticky paint particle and the calcium hydrox‑ide agglomerating
Fig. 12 Photographs of agglomerated calcium hydroxide and sticky paint particles by SEM and un‑agglomerated sticky paint particle pic‑ture

Journal of Material Cycles and Waste Management
1 3
5. Li F, Niu J, Zhan L (2006) A physically‑based model for pre‑diction of VOCs emissions from paint applied to an absorptive substrate. Build Environ 41:1317–1325
6. Lambourne R, Strivens TA (1999) Paint and surface coatings: theory and practice. Elsevier, Amsterdam
7. Chan TL, D’arcy JB, Schreck RM (1986) High‑solids paint over‑spray aerosols in a spray painting booth: particle size analysis and scrubber efficiency. Am Ind Hyg Assoc J 47(7):411–417
8. Duello L, Reaman D, McPhail H (2002) Paint booth supply air filtration. Met Finish 100(5):28–30
9. Dickenson TC (1997) Filters and filtration handbook. Elsevier, Amsterdam
10. Lancia A, Musmarra D, Pepe F, Volpicelli G (1993) Adsorption of mercuric chloride vapours from incinerator flue gases on calcium hydroxide particles. Combust Sci Technol 93(1):277–289
11. Huang SH, Chen CW, Chang CP, Lai CY, Chen CC (2007) Pene‑tration of 4.5 nm to 10 µm aerosol particles through fibrous filters. J Aerosol Sci 38(7):719–727
12. Hutten IM (2007) Handbook of nonwoven filter media. Elsevier, Amsterdam
13. Shim J, Joe YH, Park HS (2017) Influence of air injection noz‑zles on filter cleaning performance of pulse‑jet bag filter. Powder Technol 322:250–257
14. Lee KS, Sohn JR, Park YO (2015) Filtration performance char‑acteristics of ceramic candle filter based on inlet structure of
high‑temperature and high‑pressure dust collectors. J Ind Eng Chem 21:101–110
15. Hinds WC (2012) Aerosol technol: properties, behavior, and measurement of airborne particles. Wiley, Hoboken
16. Sibanda V, Greenwood RW, Seville JPK (2001) Particle sepa‑ration from gases using cross flow filtration. Powder Technol 118(1–2):193–202
17. Wang C, Otani Y (2012) Removal of nanoparticles from gas streams by fibrous filters: a review. Ind Eng Chem Res 52(1):5–17
18. Dennis R, Wilder J (1975) Fabric filter cleaning studies. United States Environmental Protection Agency, Washington, DC, p 650
19. Huang SL, Yin CY, Yap SY (2010) Particle size and metals con‑centrations of dust from a paint manufacturing plant. J Hazard Mater 174(1–3):839–842
20. Chan TL, Darcy JB, Schreck RM (1986) High‑solids paint over‑spray aerosols in a spray painting booth: particle size analysis and scrubber efficiency. Am Ind Hyg Assoc J 47(7):411–417
Publisher’s Note Springer Nature remains neutral with regard to jurisdictional claims in published maps and institutional affiliations.