Interactively Visualizing Procedurally Encoded Scalar Fields
Upload
khangminh22Category
view
0download
0
OPTIMIZING PROCEDURALLY GENERATED COOPERATIVE
MULTIPLAYER GAME LEVELS
by
Justin Heffron
A Thesis
Submitted to the Faculty of Purdue University
In Partial Fulfillment of the Requirements for the degree of
Master of Science
Department of Computer Graphics Technology
West Lafayette, Indiana
August 2020

THE PURDUE UNIVERSITY GRADUATE SCHOOL
STATEMENT OF COMMITTEE APPROVAL
Dr. Christos Mousas, Chair
Department of Computer Graphics Technology
Dr. David Whittinghill
Department of Computer Graphics Technology
Dr. Tim McGraw
Department of Computer Graphics Technology
Approved by:
Nicoletta Adamo-Villani
2

TABLE OF CONTENTS
LIST OF TABLES...........................................................................................................................3
LIST OF FIGURES.........................................................................................................................4
ABSTRACT....................................................................................................................................6
CHAPTER 1. INTRODUCTION....................................................................................................7
1.1 Problem Statement.................................................................................................................7
1.2 Research Question.................................................................................................................8
1.3 Research Significance............................................................................................................8
1.4 Purpose..................................................................................................................................9
1.5 Assumptions..........................................................................................................................9
1.6 Limitations.............................................................................................................................9
1.7 Delimitations..........................................................................................................................9
1.8 Definitions...........................................................................................................................10
1.9 Summary..............................................................................................................................10
CHAPTER 2. LITERATURE REVIEW.......................................................................................11
2.1 Virtual Reality.....................................................................................................................11
2.2 Virtual Reality Training.......................................................................................................12
2.3 Cooperative Games..............................................................................................................12
2.4 Video Games’ Effects on Cooperative Behavior.................................................................14
2.5 Procedural Content Generation............................................................................................14
2.6 Procedural Content Generation for Cooperative Games.....................................................17
2.7 Simulated Annealing...........................................................................................................18
CHAPTER 3. METHODOLOGY.................................................................................................20
3.1 Development........................................................................................................................20
3.2 Games..................................................................................................................................21
3.3 Game 1: Criminal Chase......................................................................................................21
3.4 Game 2: Dungeon Delver....................................................................................................23
3.5 Target Cooperation Value....................................................................................................26
3.6 Cost Terms...........................................................................................................................27
3.7 Optimization........................................................................................................................30
1

3.8 Optimization Moves............................................................................................................31
3.9 Stopping Condition..............................................................................................................33
3.10 Code Diagrams and Pseudocode.......................................................................................34
3.11 Example Results................................................................................................................37
3.12 Specific Overrides.............................................................................................................38
CHAPTER 4. PROBLEM FORMULATION...............................................................................39
4.1 Objectives............................................................................................................................39
4.2 Proposed Testing Methodology...........................................................................................39
4.3 Validation Questionnaire.....................................................................................................40
4.4 Data Logging.......................................................................................................................40
4.5 Testing Networking.............................................................................................................40
CHAPTER 5. RESULTS...............................................................................................................42
5.1 Games..................................................................................................................................42
5.2 Results..................................................................................................................................43
5.3 Issues....................................................................................................................................46
5.4 Parameter Tuning.................................................................................................................47
5.5 Cooling Rate........................................................................................................................48
CHAPTER 6. LIMITATIONS AND DESIGN GUIDELINES....................................................50
6.1 Limitations...........................................................................................................................50
6.2 Design Guidelines................................................................................................................50
CHAPTER 7. CONCLUSIONS AND FUTURE WORK.............................................................51
7.1 Conclusions..........................................................................................................................51
7.2 Future Work.........................................................................................................................51
REFERENCES..............................................................................................................................52
APPENDIX A. QUESTIONNAIRE.............................................................................................54
APPENDIX B. CODE SNIPPETS................................................................................................55
2

LIST OF TABLES
Table 1: A list of hazards for the dungeon crawler game..............................................................24
Table 2: An example list of moves of the RPG dungeon game, divided into the 5 main categoriesof moves.........................................................................................................................................31
Table 3: The minimum and maximum for optimized parameters.................................................47
3

LIST OF FIGURES
Figure 1: Forbes data on monthly connected headsets on Steam..................................................11
Figure 2: A screenshot of the game Rogue....................................................................................15
Figure 3: An Example Level Layout of the Criminal Chase Game..............................................21
Figure 4: An Screenshot of a First Person View from Within the Police Car...............................22
Figure 5: The street patch (left) and the street block/building patches(right) which are placedwithin the street patch....................................................................................................................23
Figure 6: Two Examples of Generated Levels for the Dungeon Delver Game.............................23
Figure 7: A Screenshot of Inside a Dungeon Level.......................................................................24
Figure 8: A Screenshot of Inside a Dungeon Level.......................................................................24
Figure 9: Dungeon room patches (from left to right): starting room, two exit room, diamondroom, L-shape room.......................................................................................................................26
Figure 10: Dungeon hallway patches............................................................................................26
Figure 11 11: A diagram showing the cost terms applied to each game.......................................30
Figure 12 Flowchart of the optimization logic..............................................................................34
Figure 13: Pseudocode of the main iteration loop, the random move picking, and the stopcondition........................................................................................................................................35
Figure 14: Pseudocode of a level move for the dungeon game.....................................................36
Figure 15: Pseudocode of an example move (propose adding a room).........................................36
Figure 16: Pseudocode of the move check equation.....................................................................36
Figure 17: Some example dungeon layouts from the prototype (Total Room Value=50)............37
Figure 18: Some example dungeon layouts from the prototype (Total Room Value=100)..........37
Figure 19: Some examples of the prototype optimization iterations along with in-gamescreenshots of the results...............................................................................................................38
Figure 20: An example of dungeons generated with a target coop value of 1..............................42
Figure 21: An example of a dungeon generated with a target coop value of 3.5..........................42
Figure 22: Examples of the city generation...................................................................................43
Figure 23: A graph of the total, layout, and game costs over time during an optimization..........44
Figure 24: The Acceptance frequency of all proposed moves......................................................44
Figure 25: The average time taken and total solution cost with target coop values of 1 and 3.5..45
4

Figure 26: The average enemy count and required keys with target coop values of 1 and 3.5.....45
Figure 27: The average player health and hazard value with target coop values of 1 and 3.5......45
Figure 28: The average percentage of lit torches with target coop values of 1 and 3.5................46
5

ABSTRACT
Procedural level generation is a novel area of research within the field of computer graphics and
game development. However, current research and implementations of procedural generation for
cooperative games is sparse. Further study is required to validate the use of automatic level
creation and to test additional methods of optimization for cooperative games. Additionally,
despite many recent developments, many areas within the field of virtual reality remain
underexplored. We propose a mathematically defined total cost function for controlling a
procedural level generation algorithm for cooperative virtual reality games. This cost term
controls an algorithm which gradually improves a generated solution over a series of iterations,
bringing it to an optimal state. We present here two games with procedurally created levels and
gameplay elements using this mathematical total cost function, as well as proposed experiments
to validate the effectiveness of this content in encouraging cooperation and potential use cases
for this technology.
6
CHAPTER 1. INTRODUCTION
1.1 Problem Statement
Procedural content generation (PCG) is an extremely versatile and up-and-coming area of
research, particularly for companies in the entertainment gaming industry. It allows developers to
automate many tasks and to semi-intelligently create large amounts of content quickly, thus
saving a significant amount of time and resources. Procedural generation typically incorporates a
stochastic process and can create game content at runtime, leading to infinite replayability in
games which make use of it. The rogue-like genre of games is particularly keen to use random
procedural generation to create an endless variation of game levels which are unique in each
playthrough.
Several considerations must be taken into consideration by the developers during the creation of
content generation algorithms. For example, the algorithm must be designed in such a way to
ensure a consistent experience (e.g. a consistent level of difficulty) with each “solution” or
“combination” of random elements. If done poorly, separate playthroughs can lead to vastly
different levels of difficulty. In addition, developers must account for many potential “edge
cases” which may cause a generated level or configuration to be unplayable or impossible to
complete.
One area which is yet under-explored is tailoring procedural content generation algorithms in a
way to encourage cooperation in a multiplayer game. Very few games handle cooperation in a
way which truly encourages players to work together, instead simply having them act as identical
(or near-identical) agents who act on their own. Two good examples of cooperative multiplayer
games are Portal 2’s1 multiplayer mode and Overcooked2. In both cases, the game requires
players to communicate with one another in order to complete a task.
Procedural content generation has immense potential to speed up the game development pipeline
and to create unique content in each playthrough. However, due to factors such as the complexity
of the issue, the high levels of creative and intuitive thinking to see its possible uses, and a
1 https://store.steampowered.com/app/620/Portal_2/2 https://store.steampowered.com/app/448510/Overcooked/
7

perceived lack of artist control over the generation process, many companies fail to utilize it to
its full potential (if at all).
This results in consistent but slow development times for hand-placed content which can greatly
limit the size and scope of a game with a limited timeline. By making use of current procedural
generation techniques, developers can significantly speed up their development pipeline and save
artists/designers the tedious tasks of repetitively assembling similar levels.
1.2 Research Question
The following items represent the research questions for this study:
● To what degree can we control procedural level generation through a mathematical
formula to effectively encourage cooperation
● To what degree are the levels of cooperation between two players in procedurally
generated game levels similar to the degrees of cooperation between two players in
manually created game levels?
● To what degree can this optimization algorithm ensure a fairly consistent level of
required cooperation and difficulty across solutions?
● To what degree does playing procedurally generated cooperative game levels improve
the cooperative behavior of individuals in performing cooperative tasks?
1.3 Research Significance
Procedural content generation holds immense potential for solving a wide variety of problems in
a highly efficient manner. In addition to being incorporated into existing game companies
workflows, procedural generation holds great potential for rapid development of virtual reality
training software. Additional research must be performed to help verify the effectiveness and
reliability of procedural generation to encourage its expanded usage in industry.
In addition to its applications in the field of entertainment video games, rapid generation of
collaborative content has potential applications for the field of collaborative training. Whether
for the purpose of creating games to teach team members to collaborate or to generate scenarios
for safety/training simulators, these same generative systems can be applied to the developing
field of serious gaming and VR training.
8

1.4 Purpose
The question which this research project intends to answer is as follows: to what degree can
cooperative game levels be defined mathematically to procedurally generation game content. The
results of the procedural content ideally should be user-tested and compared with a similar hand-
assembled game level for validity. However, due to the COVID-19 pandemic and subsequent
suspension of in-person user studies, this test was not able to be performed.
1.5 Assumptions
● Participants have some prior experience with video games
● Participants have some prior experience with virtual reality
● Participants should all be physically capable of interacting with virtual reality motion
tracked controllers
1.6 Limitations
● Due to health concerns resulting from the COVID-19 outbreak, user studies were not
able to be performed
● It may be difficult to accurately quantify the level of cooperation between two players
● Cooperation is a loosely defined concept and is highly situational and a user’s
awareness
● Different participants may have different social behaviors and be more or less
inclined to cooperation due to their personality
1.7 Delimitations
● Given the time constraints of the project, only two simple games will be developed to
test the generation algorithm.
● The generation will be balanced with two players in mind.
9

1.8 Definitions
Simulated Annealing: an optimization algorithm used for finding an optimal (or close-to-
optimal) solution to an optimization problem (Carr, 2012)
Procedural Content Generation (PCG): a method of automatically creating content (typically
randomly) in a structured, algorithmic way rather than creating content manually or by hand.
Virtual Reality: a digital experience/simulation in which a user is immersed in a virtual
environment
Cooperative (co-op) Games: a game in which two or more players must work together to
accomplish a shared goal
1.9 Summary
This study aims to validate the usage of a total cost function for procedurally generating levels
for a virtual reality cooperative game. Recent developments in procedural generation, the
efficiency of random level generation to create vast amounts of replayable content, and the
limitations of existing research in its applications for cooperative games necessitates further
research to examine its potential effectiveness and use cases. This project proposes the usage of a
mathematical total cost function to control a procedural generation system for creating
cooperative VR game levels.
10

CHAPTER 2. LITERATURE REVIEW
2.1 Virtual Reality
Virtual reality is one of the most popular recent developments in technology in the field of game
design. The emergence of consumer-affordable virtual reality equipment has created a boom in
development and research. According to a Reuters article from 2018, “The Global Virtual
Reality Market was valued at USD 3.13 billion in 2017 and is expected to reach USD 49.7
billion by 2023.” (Costello, 2018). According to a 2018 TrendForce study, total VR hardware
sales have increased from 3.7 million to 5 million between 2017-2018 (Tsaj, 2018). Similar
trends can be seen in the data from Forbes on monthly connected VR headsets as found through
Steam (Rogers, 2019).
Figure 1: Forbes data on monthly connected headsets on Steam3.
Market trends show a strong increase in virtual reality content, likely due to significantly reduced
prices making the hardware affordable to consumers, coupled with the novelty of the relatively
new technology. As compared to more traditional games or interactive digital media, immersive
virtual reality has much greater room for future development and a larger untapped market
potential. Industry developers and researchers alike must take advantage of the booming
popularity of this technology in order to utilize it to its full potential.
3 Retrieved from: https://www.forbes.com/sites/solrogers/2019/06/21/2019-the-year-virtual-reality-gets-real/
11

2.2 Virtual Reality Training
As virtual reality becomes more affordable and easily available to consumers and software
developers, new and creative use cases for the technology are being found. Virtual reality offers
an incredibly high level of immersion and a level of physical interaction/motion which
traditional computer games/software lack, while being safe to use (Noguchi, 2019). This allows
content creators to simulate potentially dangerous situations (such as construction job sites)
without the risk of physical injury or to simulate tasks with large consequences for failure (such
as performing surgery or flying planes) without risking damage to property of individuals (De
Vries, et al. 204). Additionally, using virtual reality technology is a highly engaging and novel
experience, often motivating greater levels of participation and focus which leads to long-term
retention benefits. As a result, companies are becoming increasingly interested in virtual reality
as an alternative to real-world or on-site training for applicable tasks.
In their 2013 paper, Farra et al. (Farra et al., 2013) discuss the potential for VR training for
disaster response for nurses. When compared with a more traditional web-based method of
instruction, the researchers found that virtual reality training resulted in significantly higher
retention of the information over a 2 month period.
Virtual reality training, along with virtual reality in general, is becoming increasingly popular
due to its many benefits. Given the importance of teamwork in many jobs (such for firefighters
and the police), cooperative virtual reality training software could be greatly beneficial.
2.3 Cooperative Games
Cooperative games are a subcategory of multiplayer games in which two or more players must
work cooperatively, typically against AI enemies or to solve puzzles (games with two or more
teams against each other are usually regarded as competitive, even though they involve
cooperation). Several different methods have been used throughout the history of video games to
encourage (or even force) cooperative behavior between players. In their paper “Game
Mechanics for Cooperative Games,” Rocha et al. lists some of the ways in which gameplay
elements can be used to encourage cooperative behavior. Perhaps the most obvious of these is
12

“shared goals” in which cooperating players have similar (or identical) objectives which they
need to complete, putting them on the same pathway to their goal. Two other similar design
patterns mentioned are “complementary” and “synergies between abilities” which both involve
asymmetry between the two (or more) players and their abilities. Creating differences between
players is done to ensure that no one player can “do everything” and thus must rely on each other
to make up for one’s own deficiencies (Rocha, 2008).
There are many other unique methods in which game mechanics can be used to force or
encourage two players to cooperate in a video game. Some of these different methods are noted
in a 2018 Gamasutra article by Thierry Lauret. Luaret defines four categories named “The Gate,
The Comfort, The Class, and the Job” (Lauret, 2018). “The Gate” refers to cooperative
mechanics which require both players to be present to complete a task (i.e. two players lifting a
gate, hence the name). “The comfort,” however, “ relies on having a challenge mechanic so
incredibly hard that having more than one player is a necessity.” As compared to gate mechanics,
comfort mechanics are theoretically possible but extremely difficult for a solo player to perform,
thus strongly encouraging cooperative behavior rather than rigidly enforcing it. “The Class” and
“The Job” both involve assigning different roles to each player, either through their player
avarater or character (as in the class) or simply through player actions (as in the job). Similarly,
in his 2011 Game Developers Conference (GDC) talk, Ubisoft’s Patrick Redding defines several
cooperative “dynamics” which are mechanics to create cooperative behavior between two
players. These are placed on a gradient of “prescriptive” (forced cooperation) to “voluntary”
(encouraged but not required cooperation). These dynamics are “gating/tethering, exotic
challenges, punitive systems, buffing systems, asymmetric abilities, combined abilities, survival/
attrition” (Redding, 2011).
The options available for cooperation-inducing mechanics are many and designers have
numerous options to choose from when designing such multiplayer games. The distinction
between forced and voluntary cooperation (being somewhat of a gradient/spectrum rather than
discrete states) is critical as well to define the degree of autonomy that players are allowed in a
game and to define the minimum level of cooperation that is desired. More coercive methods can
be utilized by developers/designers aiming to create an experience which is strictly multiplayer
13

(such as A Way Out4) while less coercive methods can be used to create a game in which
multiplayer is strongly encouraged and implied but not rigidly enforced (such as with dungeons
in World of Warcraft5).
2.4 Video Games’ Effects on Cooperative Behavior
The topic of the impact of video games on human psychology and behavior is quite broad,
especially with regards to violent video games. One subset of this research area is the effect of
games (either cooperative or competitive) on human cooperative behavior. A study by
Greitemeyer and Cox aimed to examine this effect. The researchers defined two condition
groups: one group of participants to play a game (Mario Kart: Double Dash6) in single player
mode and another to player with a partner. Following this, the groups were separated and the
participants were paired randomly with another participant (other than the one with which they
had played previously). Participants were asked to complete a moral/trust dilemma with playing
chips in which they were asked to give as many chips as they expected to receive from the other
person. The study found that those who had played the cooperative mode experienced higher
levels of trust than those who had played single player, even when paired with someone other
than their original partner. (Greitemeyer & Cox, 2013).
2.5 Procedural Content Generation
Procedural content generation (PCG) is a popular new area of research as it allows developers to
rapidly create large amounts of content without having to manually create them. This results in
slower upfront development times as the procedural generation algorithms are developed and
much quicker development speeds later as only fine-tuning needs to be made (Kruel, 2017).
The history of procedural generation in games can be traced back many years to early pioneering
games such as Rogue7. The original Rogue created a random dungeon for the player to explore
and fight their way through and featured a perma-death (permanent-death) system in which a
4 https://www.ea.com/games/a-way-out5 https://worldofwarcraft.com/en-us/6 https://www.mariowiki.com/Mario_Kart:_Double_Dash!!7 https://docs.freebsd.org/44doc/usd/30.rogue/paper.pdf
14

player’s death was permanent and required a complete restart of the game. This game’s core
concepts and namesake have spawned the genres “Rogue-Like” and “Rogue-Lite” which feature
randomly generated content and frequently similar permadeath mechanics to the original.
Figure 2: A screenshot8 of the game Rogue.
Another well-known title which features heavy amounts of procedural generation is Minecraft, a
sandbox exploration/crafting game and the current best-selling video game of all time9.
Procedural content can also be created by the developers and “baked” into static content, rather
than being generated at runtime. In his talk at the 2012 SIGGRAPH conference, Caleb Howard
of Electronic Arts explains how his team created 300 tracks for the snowboard racing game SSX,
a feat which would have been impossible if done manually (Howard, 2012).
As the growing number of unique and interesting use cases shows, the potential applications for
procedural content generation in the gaming industry are quite vast. A 2017 article by Jonas
Freiknecht and Wolfgang Effelsberg (Freiknecht & Effelsberg, 2017) examined the various
forms that procedural generation has taken in computer graphics as well as the prevalence of
each type as found in either scholarly research or in industry. Some of the types of procedural
content generation include: “creation of textures and materials, generation of floor plans,
humanoid model generation, animation of humanoid models, and artificial personality
generation” (Freiknecht & Effelsberg, 2017). One key takeaway from this study is the apparent
8 Taken from https://commons.wikimedia.org/wiki/File:Rogue_Screen_Shot_CAR.PNG9 https://www.engadget.com/2019/05/17/minecraft-has-sold-176-million-copies-worldwide/
15

divide between procedural content generation in research and in industry in some areas of
procedural generation, suggesting a lack of communication between the two fields. This is the
case with areas such as generating “stories and quests” which is more common in research,
despite its obvious potential use cases. Additionally, the authors mention that “large companies
are thrifty about how they model or automatically generate cities” (Freiknecht & Effelsberg,
2017). This shows that despite its increasing potential and the rise of popular procedural
modeling software such as Houdini10, companies can be slow to adopt procedural generation into
their existing workflow. This issue is also mentioned by Luiz Kruel in his 2017 GDC talk on
technical art and proceduralism. In this talk, he describes some of his experiences in his
profession (as well as some colleagues’ experiences) in which artists, designers, and
management are all slow and hesitant to adopt new methods of performing common tasks
(Kruel, 2017). As with many industries, veterans in game development tend to become “stuck in
a rut” and without exposure to newer, more innovative techniques, their workflow may remain
inefficient and outdated.
There are many possible reasons why developers, especially large developers with well-
established workflows, would not make use of procedural generation. As mentioned by Joel
Couture in a Gamasutra article, procedural generation “can create stages that are too hard, stages
that are too easy or plain dull, stages that feel like repeats of each other, or just otherwise create
an array of flavorless or frustrating experiences.” (Couture, 2016). In addition, procedural
content can impact the “flow” of the game due to a lack of direct designer influence and it is
often difficult to tune a generation algorithm to adequately replicate this flow. Additionally,
given the random element of content creation involved, games with procedural generation
sacrifice the hand placement of game elements for faster and more varied content. This
relinquishing of artist control can make developers feel uneasy and unsure over the consistency
of the product which they will be delivering.
However, when done effectively and when sufficient consideration has been given to the
possible edge cases, procedural content generation can be effective in creating game content
without having it feel “bland” or “soulless.” While a few llarger scale projects in recent years,
10 https://www.sidefx.com/products/houdini/
16
such as No Man’s Sky11 and Shadow of Mordor12appear to show a widening acceptance of PCG,
Additional research on procedural generation and its use cases are required to ease developer
anxieties regarding the topic and encourage its expanded usage in the gaming industry.
2.6 Procedural Content Generation for Cooperative Games
Many of the well-known coop-supported procedural games (such as Minecraft13, Don’t Starve14,
and No Man’s Sky15) feature extensive single player modes as well and appear to have coop as
an additional feature rather than a key element of the game. By comparison, many of the most
iconic cooperative games (such as Overcooked 16and Portal 217’s multiplayer mode) feature
manually created content.
Very little research has been done on the usage of procedural level generation in coop
multiplayer games. One noteworthy article, “Procedural Content Generation for Cooperative
Games” by Rafael Ramos stands alone in this area of study. In this study, the author aimed to
examine the viability of using a procedural generation algorithm in a simple cooperative game
(Geometry Friends) and whether or not users could determine which content was manually
created and that which was automatically created. The results found that users believe all content
to be made by hand and found strong levels of cooperation (even in levels which did not force
cooperation). This study is a critical beginning for this area of research (Ramos, 2015). However,
it has many limitations as mentioned by the author. Firstly, the generation algorithm used is not
evolutionary, meaning it generates a random solution and checks its viability. If the level is
unsuitable, a completely new solution is generated. By comparison, algorithms such as simulated
annealing progress through a series of iterations and gradually bring a solution closer to an
optimal state. Secondly, the scope of the game itself is quite small. All game levels are 2D and
take place on a single screen (no scrolling maps). This limits the content being generated to a
very small area. Additionally, the levels are fairly simple puzzles which require the users to
11 https://www.nomanssky.com/12 https://store.steampowered.com/app/241930/Middleearth_Shadow_of_Mordor/13 https://www.minecraft.net/en-us/14 https://www.klei.com/games/dont-starve15 https://www.nomanssky.com/16 https://store.steampowered.com/app/448510/Overcooked/17 https://store.steampowered.com/app/620/Portal_2/
17
cooperatively gather purple diamonds scattered about. The game features very few elements
(players, diamonds, platforms, walls) and simple cooperative mechanics. In order to verify the
usefulness of procedural generation for cooperative games, it must be applied to a wider array of
games with different genres and form factors.
2.7 Simulated Annealing
Simulated annealing is a stochastic optimization technique for finding a solution to a
computational problem through randomly generated solutions. It’s named is based on the
classical blacksmithing where metal is heated to a high temperature for making large changes.
As the material cools down over time, it becomes less malleable and changes become more
precise. Similarly, with simulated annealing, a series of optimization iterations will start with a
high temperature value which allows for a wide range of values to be accepted during each
proposed change to the solution, including potentially “bad” changes which take the solution
farther from a desired outcome. As the iterations progress and the temperature cools down, the
changes become less drastic until, ultimately, a final solution is reached which meets the desired
conditions (Carr, 2012). During each iteration, a “move” is performed: an action in which the
current configuration or solution is altered slightly in a random way. Depending on the desired
results and the content being optimized, developers can define any number of moves to be a part
of their optimization process.
In the paper “Make it Home: Automatic Optimization of Furniture Arrangement” explored the
use of simulated annealing as part of an algorithm to generate random arrangements of furniture.
(Yu, et al. 2011). The generation algorithm determines things such as pairwise relationships
between objects (such as between tables and chairs) and required visibility (such as between a
sofa and a tv) by providing examples of hand-placed furniture arrangements. Based on these
pairwise relationships, several cost terms are defined for the simulated annealing process. Less
accurate arrangements lead to higher costs which the optimization then tries to correct. During
each iteration, a random move of objects occurs. Then, the system re-assesses the current cost.
This cycle continues as the furniture arrangement becomes more optimal, ultimately resembling
a sensible configuration. The key factor which allows simulating annealing to be effective for
solving this problem is that the relationships between objects can be mathematically defined and
18
therefore optimized using cost terms. For instance, if a chair is very far away from its
corresponding table, the system knows to correct this by gradually moving the chair towards the
table (or vice versa), thus reducing the cost.
Another study conducted by Zhang, et al. in 2019 used simulated annealing to create a virtual
exercise game which can easily alter the difficulty (Zhang, et al. 2019). The game is similar to
preexisting dance games in which the user must perform a sequence of poses, one after the other.
The researchers used a Microsoft Kinect to capture full-body movements for gameplay. A series
of 10 movements were defined and the 100 different transitions between these poses were
measured for difficulty. Based on the difficulty of moving from one pose to another, the
generation algorithm is able to create sequences of poses for the player which have a fairly
uniform difficulty. A similar study, also in the vein of virtual reality exercise games, examined
the use of simulated annealing to generate optimized game levels of a user-specified difficulty by
formulating the game level design problem to a total cost function. One feature of this study is
that the generation system uses a series of predefined “chunks” which are assembled together
randomly to create the final level. (Xie, et al. 2018).
Simulated annealing is shown to be an effective means for generating solutions to complex
problems. Additionally, it allows a developer to mathematically define terms by which to
perform an optimization. It allows for solving complex problems and, as can be seen from the
various applications, it readily applied to many complex issues.
19
CHAPTER 3. METHODOLOGY
3.1 Development
The primary development tool for this project is the Unity 3D Game Engine. Models and other
assets were primarily acquired through the Unity Asset Store. A list of assets used in this project
is included below:
● Photon Unity Networking18 (networking scripts)
● Polygon Dungeons19 (fantasy dungeon 3D models)
● Polygon City20 (city 3D models)
● Epic Toon FX21 (cartoony VFX)
● An HDRI Image from HDRI Haven22 (a skybox)
● Steam VR23 (the VR framework for the project)
The game is developed in Unity using the Steam VR framework. This framework contains many
scripts to rapidly develop virtual reality projects and can be targeted to many different platforms,
including Vive, Oculus, and Windows Mixed Reality. The project was primarily targeted for the
HTC Vive Headset and testing was performed on a Windows Mixed Reality Headset (Samsung
Odyssey).
Input for the two games varied. For the thief chasing game, a keyboard was used, while for the
dungeon RPG game, two motion-tracked VR controllers were used. Likewise, the thief chasing
game was designed to be played while seated while the dungeon crawl game was designed to be
played while standing.
18 https://assetstore.unity.com/packages/tools/network/pun-2-free-11992219 https://assetstore.unity.com/packages/3d/environments/dungeons/polygon-dungeons-pack-10267720 https://assetstore.unity.com/packages/3d/environments/urban/polygon-city-pack-9521421 https://assetstore.unity.com/packages/vfx/particles/epic-toon-fx-5777222 https://hdrihaven.com/hdris/23 https://assetstore.unity.com/packages/tools/integration/steamvr-plugin-32647
20

In the initial stages of development, it was also planned to use the Virtuex Omni for movement.
However, due to the closure of campus due to health concerns, this was not feasible. Rather, for
the dungeon game, a gesture based movement system was employed.
3.2 Games
In order to test the algorithm and its effectiveness in encouraging cooperation, two games were
developed. The first game is a simple game in which the two players control police/law
enforcement officers who must locate and apprehend a criminal running through a city. The
users need to work together to corner and apprehend the thief. The second game is a fantasy
dungeon crawl game, somewhat in the vein of the original rogue game (a pioneer of procedural
content in games). The users are required to navigate through the dungeon, fighting various
enemies, solving puzzles, and ultimately locating various keys to open the door to the exit. These
two games are described in further detail below.
3.3 Game 1: Criminal Chase
The first game developed with the simulated annealing procedural generation algorithm is a thief
chase game. In this game, players would control two police officers in cars. They will be
instructed to chase down a criminal in a red sports car who will be driving around the city in an
attempt to evade the officers. If players get within a close distance of the criminal (~5 meters),
the criminal will have been successfully caught, thus ending the game and prompting a victory
message. The players each have a map which allows them to see the location of themselves and
the other player so that they can coordinate with one another.
Figure 3: An Example Level Layout of the Criminal Chase Game
21
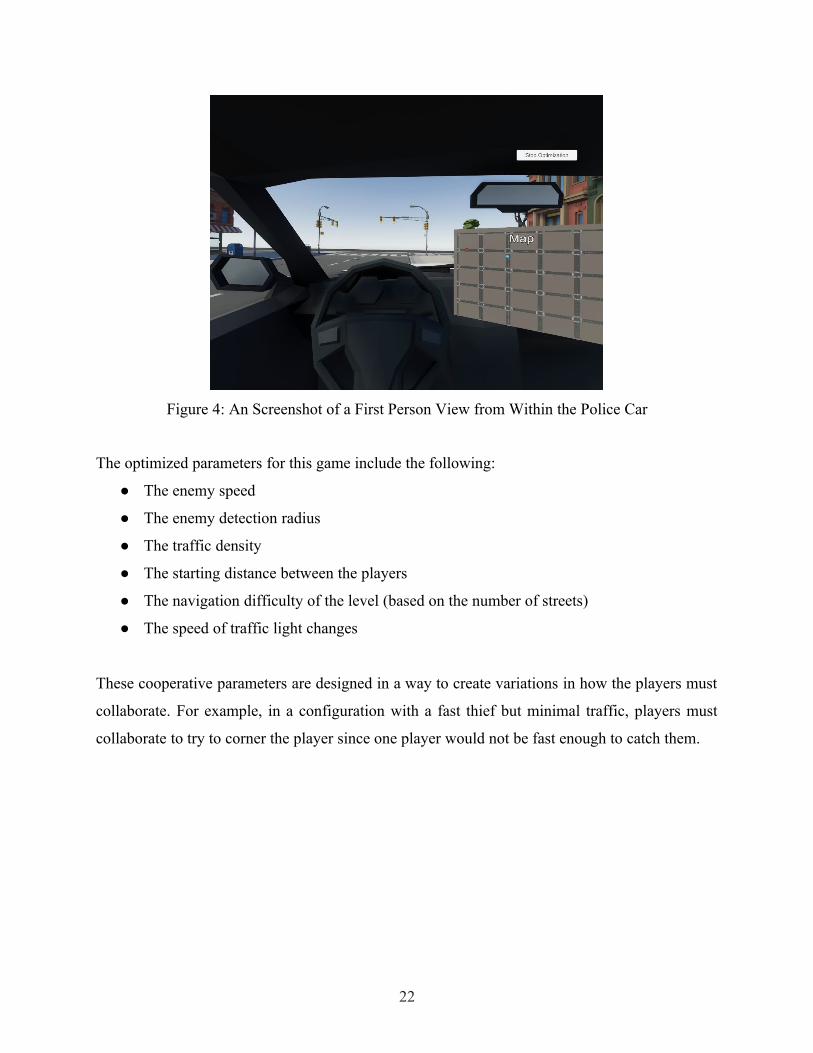
Figure 4: An Screenshot of a First Person View from Within the Police Car
The optimized parameters for this game include the following:
● The enemy speed
● The enemy detection radius
● The traffic density
● The starting distance between the players
● The navigation difficulty of the level (based on the number of streets)
● The speed of traffic light changes
These cooperative parameters are designed in a way to create variations in how the players must
collaborate. For example, in a configuration with a fast thief but minimal traffic, players must
collaborate to try to corner the player since one player would not be fast enough to catch them.
22

Figure 5: The street patch (left) and the street block/building patches(right) which are placedwithin the street patch
3.4 Game 2: Dungeon Delver
The second game developed is a fantasy RPG dungeon crawler game. In this game, players will
be instructed to collect a certain number of keys scattered throughout the generated dungeon in
order to unlock a door and escape the dungeon.
Figure 6: Two Examples of Generated Levels for the Dungeon Delver Game
23
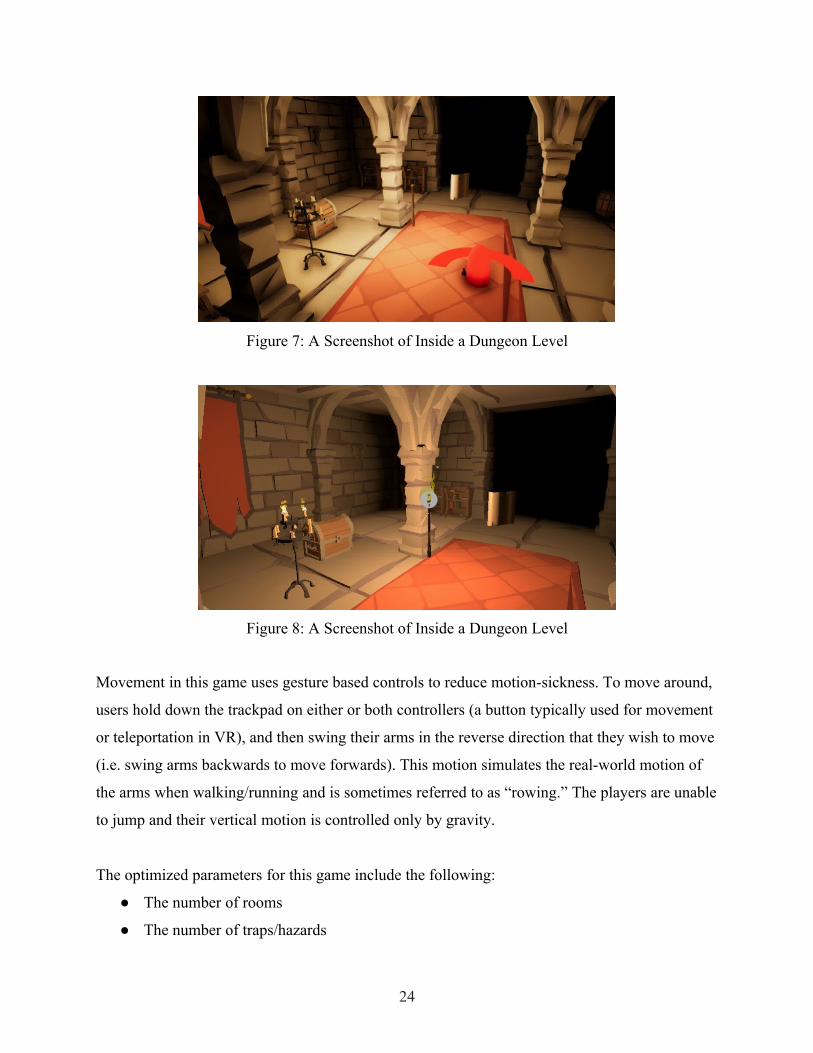
Figure 7: A Screenshot of Inside a Dungeon Level
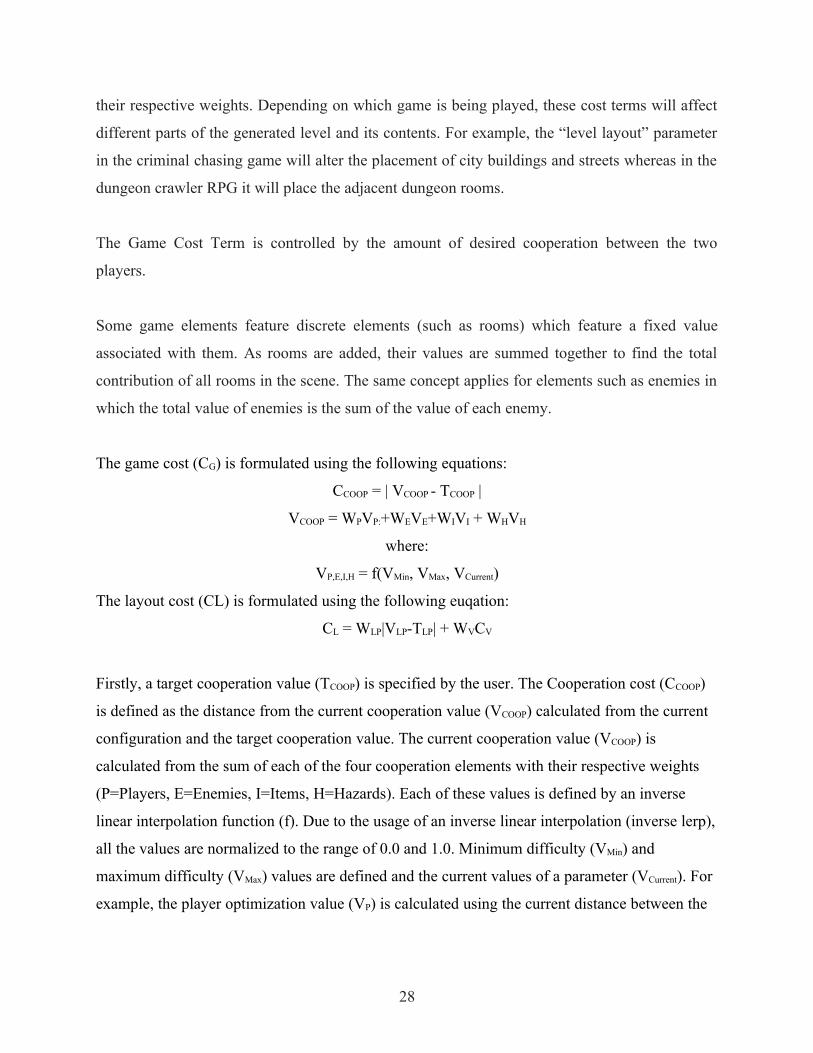
Figure 8: A Screenshot of Inside a Dungeon Level
Movement in this game uses gesture based controls to reduce motion-sickness. To move around,
users hold down the trackpad on either or both controllers (a button typically used for movement
or teleportation in VR), and then swing their arms in the reverse direction that they wish to move
(i.e. swing arms backwards to move forwards). This motion simulates the real-world motion of
the arms when walking/running and is sometimes referred to as “rowing.” The players are unable
to jump and their vertical motion is controlled only by gravity.
The optimized parameters for this game include the following:
● The number of rooms
● The number of traps/hazards
24

● The number of enemies
● The number of required keys
● The starting health of player
● The likelihood of a torch being lit by default
This game has slightly different cooperative elements due to asymmetrical player roles.
One optimization parameter is the chance for a torch in a room to be lit at the start of the game.
There is one grabbable torch which the players can use to light other torches in the scene to
illuminate their path. Fewer lit torches is a result of higher target cooperation values.
Traps and hazards often contain “cooperation-suggestive” elements which become significantly
more difficult when done alone. A list of these traps/hazards is given below:
Table 1: A list of hazards for the dungeon crawler game
Crates Must be pushed out of the way, are easier/quicker to push with more playerscooperating
Stone Doors Doors with switches, one player can stand on a switch, players can run through themselves if quick enough
Stuck Door Doors which can only be broken by the warrior character
Locked Door Doors which can only be unlocked by the mage character
Claptraps Traps a player temporarily, preventing them from moving
Pendulum Deals damage to a player when hit
This game features several patches used in its procedural generation which are divided into two
categories: rooms and hallways. The game begins with a fixed starting room from which to
build. When a new room or hallway is being added, a random door of the new patch is snapped
to a random available door (a door in a patch already in the level which does not have another
patch connected to it). Following this, the system performs a quick check using the bounding
boxes of all the patches in the scene to check for overlap, in which case the new room would be
discarded regardless of whether or not the addition of the room improved the current solution.
Below are some in-editor screenshots of the different patches.
25

Figure 9: Dungeon room patches (from left to right): starting room, two exit room, diamondroom, L-shape room
Figure 10: Dungeon hallway patches
3.5 Target Cooperation Value
The main adjustable parameter of the optimization algorithm is the target cooperation value. This
value is intended to control the degree of cooperation by adjusting the amount and intensity of
several level elements and gameplay parameters.
When the optimization begins, the cost will be very high due to the initial emptiness of the scene
and the lack of cooperative elements in it. As the optimization progresses, random moves will
begin to place gameplay elements and adjust parameters until the level matches closely the
desired cooperation level, thus decreasing the cost to near zero. This setup allows certain
configurations to rely on different gameplay elements in order to encourage cooperation than
other configurations. For example, one generated level for the city game may have a fast enemy
with minimal traffic and pedestrians whereas in another level the inverse may be true. This
26

allows for a diverse array of levels to be generated with different challenges to face across
configurations.
3.6 Cost Terms
The cost term comprises the core of the optimization algorithm. Cost here is defined as the
“distance” between the current solution and a desired solution. Higher costs penalize the
algorithm into making decisions to reduce the cost, thus dissuading it from making sub-optimal
changes resulting in poor content.
The total cost function (CTotal) will feature two main cost terms (C) which each break down into
more subterms. These are detailed below:
● Level Cost Term (CL)
o Adjacent Chunk Variation Cost (CV)
o Level Size Cost (CLS)
● Game Cost Term (CG)
o Players (CP)
o Enemies (CE)
o Items (CI)
o Environment Hazards (CH)
The Level Cost Term controls the foundational level structure, such as the placement of building
patches. This is separated from the target cooperation value in order to ensure levels are of a
consistent size/content amount. The Game Cost Term is controlled by the target cooperation
value. A higher desired cooperation would require more cooperative elements (such as more
difficult enemies or more hazards).
Each cost term is assigned a certain weight (W) to which it is multiplied. This value is user-
defined and is used to increase or decrease the influence of a particular cost term. The total cost
of the entire optimization solution is calculated from the sum of these two costs multiplied by
27
their respective weights. Depending on which game is being played, these cost terms will affect
different parts of the generated level and its contents. For example, the “level layout” parameter
in the criminal chasing game will alter the placement of city buildings and streets whereas in the
dungeon crawler RPG it will place the adjacent dungeon rooms.
The Game Cost Term is controlled by the amount of desired cooperation between the two
players.
Some game elements feature discrete elements (such as rooms) which feature a fixed value
associated with them. As rooms are added, their values are summed together to find the total
contribution of all rooms in the scene. The same concept applies for elements such as enemies in
which the total value of enemies is the sum of the value of each enemy.
The game cost (CG) is formulated using the following equations:
CCOOP = | VCOOP - TCOOP |
VCOOP = WPVP:+WEVE+WIVI + WHVH
where:
VP,E,I,H = f(VMin, VMax, VCurrent)
The layout cost (CL) is formulated using the following euqation:
CL = WLP|VLP-TLP| + WVCV
Firstly, a target cooperation value (TCOOP) is specified by the user. The Cooperation cost (CCOOP)
is defined as the distance from the current cooperation value (VCOOP) calculated from the current
configuration and the target cooperation value. The current cooperation value (VCOOP) is
calculated from the sum of each of the four cooperation elements with their respective weights
(P=Players, E=Enemies, I=Items, H=Hazards). Each of these values is defined by an inverse
linear interpolation function (f). Due to the usage of an inverse linear interpolation (inverse lerp),
all the values are normalized to the range of 0.0 and 1.0. Minimum difficulty (VMin) and
maximum difficulty (VMax) values are defined and the current values of a parameter (VCurrent). For
example, the player optimization value (VP) is calculated using the current distance between the
28

players by inverse interpolating this value between the minimum required cooperation player
distance and the maximum required cooperation player distance.
The level layout cost term is handled separately from the cooperative gameplay elements and is
defined by the cost term CL. VLP and TLP refer to the current value of the level patches and the
desired value for level patches, respectively. CV is the variation cost, a unique cost term
(calculated differently for different games) which is use to disincentivize the generation
algorithm from placing many of the same patches and attempts to alternatively create a diverse
and varied solution.
The individual cost of elements (such as enemy cost CE for example) will be calculated based on
which game is currently being played. One example would be an “enemy” optimization move in
the RPG game. The total value of the enemies would be determined by factors such as the
number of enemies and their difficulty. An example of this is the room placement cost term
equation as provided below. The current cost of the room optimization is defined as the distance
between the sum of the current room values (based on the number of rooms and their sizes) from
the desired total value.
CLP=∑i
❑
❑|Ri❑−R i'|
CT=CL+CCoop
where Rdenotes the desired room configuration, R∈{Ri❑
, where i=1,...,N} and R❑' denotes the
new room configuration.
Similar calculations will be performed for the additional cost term elements. Some additional
examples of these cost terms and their implementations in the two games are detailed in the
diagram below.
29

Figure 11 11: A diagram showing the cost terms applied to each game.
This optimization algorithm can be readily applied to numerous other game types which feature
similar elements (level, environment hazards, players, items, enemies).
3.7 Optimization
The optimization begins by generating a random starting condition, depending on the game
chosen. For the dungeon game, the starting condition is a starting room, from which the
optimization algorithm branches off of. For the city chasing game, the starting condition is a city
with completely random patches and default parameters for all variables. Then, it proceeds
through a number of iterations and checks (in the proposed case, one iteration/move per frame).
During an iteration, the system first decides which type of change to perform (called a “move”).
The types of moves are detailed in the section below (3.8). Once a type of move has been
randomly chosen, a random change to the scene is proposed. For example, for a level layout
move, the system could add or remove a room from the level. The cost (C) of the proposed
alteration (CP) is computed and compared to the cost of the current configuration (Cc). If the cost
30

of the proposed configuration is less than that of the current configuration (meaning the proposed
solution is closer to an optimal solution), the proposed change is accepted and the changes to the
level are made (such as actually adding the in-game object for a proposed room). However, if the
solution is less optimal/has a higher cost, the algorithm has a probability (p) of accepting
depending on the cost difference (D) and temperature (t) as defined by the function below:
p(CC∨C P)=exp(−1tD)<R(0,1)
where:
D=CC−CP
R(0,1) is a random floating point number between zero and one. When the optimization first
begins, due to the high temperature, the probability of accepting “bad” moves is quite high. As
the iterations continue, the temperature “cools down” as the solution becomes closer to its final
configuration.
In this equation, the value t refers to the current optimization temperature. As with the
metallurgical process which the simulated annealing process is named for, the optimization
begins with a very high temperature which lowers as the optimization progresses. While this can
be done gradually (i.e. linearly decreasing the temperature each iteration from max temperature
to zero), in this project, we lower the temperature in three fixed intervals. This temperature
impacts the optimization in multiple ways. First and foremost, as can be seen from the above
equation, a higher temperature results in a higher chance of a “bad” move being accepted.
Secondly, during the different temperature intervals, we prioritize certain moves (i.e. we
prioritize more drastic moves such as add/replace room during high temperatures with more
gradual/fine moves being for lower temperatures). Both of these result in the optimization
exploring a wider range of variations earlier on while gradually refining to a final configuration
(as with metal smithing).
3.8 Optimization Moves
Each iteration of the optimization process results in a random change, called a “move” being
proposed. This random move may or not be accepted depending on whether or not it is a
31

beneficial move and what the current temperature of the optimization is. Each random move
consists of a small change to the current optimization configuration/solution. Some of the options
for moves may take the solution in opposite directions. For example, there can exist moves for a
room based game generation to add a room or to remove a room.
When a move is proposed, before the actual changes are made in the scene (i.e. before a room is
added), the costs of the current solution and the proposed solution are calculated. For instance,
the current solution could contain the values of 3 different rooms while the proposed room
contains 4 different rooms, the cost being the difference between the room value and the ideal
room value. If the cost of the proposed solution is lower than the cost of the current solution, this
signifies that the proposed change is beneficial and the change is accepted. If the change is not
beneficial (if proposed cost ≥ current cost), the algorithm will accept or reject based on the
acceptance function defined in the previous section (3.8 optimization).
Only after the change has been accepted will the changes be made in the scene. In the case of
adding a room, at this stage the new room game object/prefab is actually instantiated into the
level and placed in the correct position, linked to an existing room by a doorway. It is in this
place that certain move-specific checks will be performed. When a room is being added, physics
overlap checks are used to check whether or not the new room would overlap an existing room.
Table 2: An example list of moves of the RPG dungeon game, divided into the 5 main categoriesof moves
Level Player Item Environment Enemy
Add Room Move Player Spawn
Add Key Add Lit Torch Add Enemy
Remove Room Increase Player Health
Remove Key Remove Lit Torch Remove Enemy
Move Room Decrease Player Health
Add Chest Add Trap Swap Enemy
Swap Rooms Remove Chest Remove Trap Increase Enemy Detect Radius
Replace Room Decrease Enemy Detect Radius
32

3.9 Stopping Condition
There are multiple methods of determining when the optimization should halt. First and
foremost, a maximum number of possible iterations should be set which will stop the
optimization when reached. Additionally, when the optimization begins to approach an
“acceptable” cost (where CT approaches 0), the moves will result in minimal to no positive
changes. If it is detected that no changes have been made over the last several hundred iterations,
the current solution can be regarded as the ideal solution and the optimization can stop. The
number of iterations to wait prior to stopping is user defined and depends on the complexity of
the problem being solved.
33

3.10 Code Diagrams and Pseudocode
Figure 12 Flowchart of the optimization logic.
34
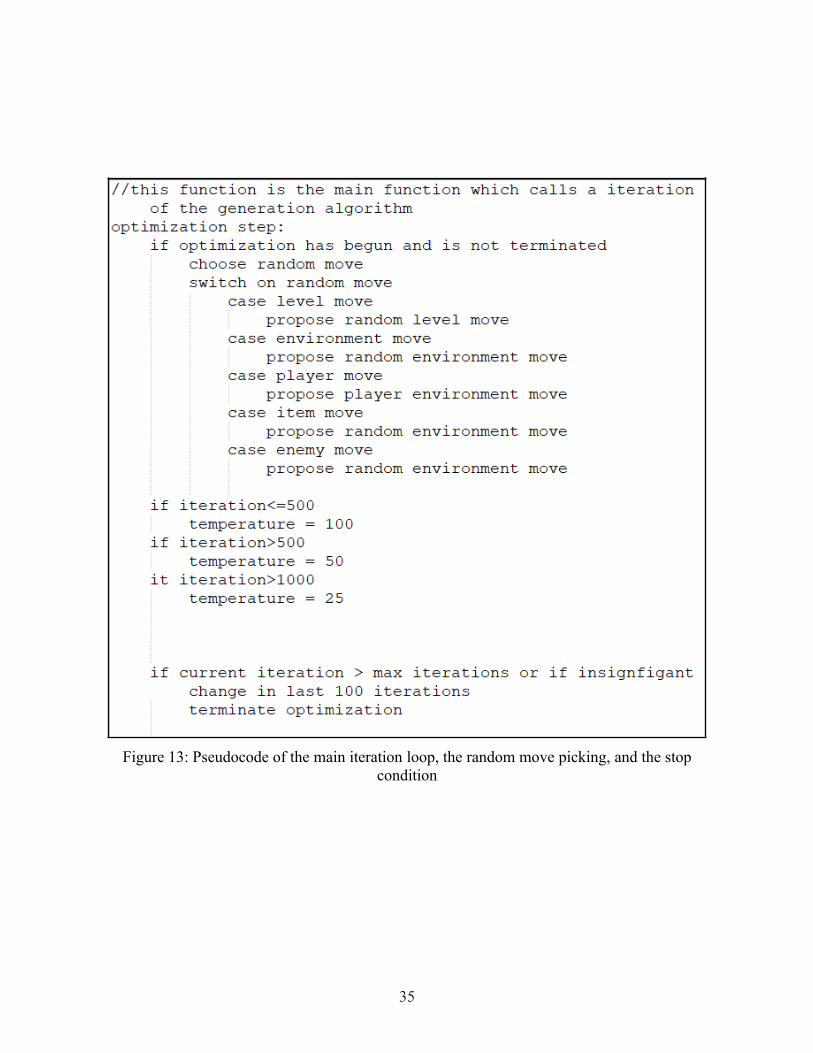
Figure 13: Pseudocode of the main iteration loop, the random move picking, and the stopcondition
35

Figure 14: Pseudocode of a level move for the dungeon game
Figure 15: Pseudocode of an example move (propose adding a room)
Figure 16: Pseudocode of the move check equation
36

3.11 Example Results
Based on this simulated annealing algorithm, here are some example layouts of levels in the
current prototype. Increasing the total value (as seen in the second set of images) leads to more
rooms being placed into the scene. A user-defined target total value can be adjusted to control
this. A higher target coop value results in a higher initial cost, resulting in moves adding value to
the scene in the form of additional rooms to reduce the cost (with the total cost being the
difference between the current value and optimalvalue). Likewise, increases in the ideal value for
the “coop” cost term could result in more enemies being placed.
Figure 17: Some example dungeon layouts from the prototype (Total Room Value=50).
Figure 18: Some example dungeon layouts from the prototype (Total Room Value=100).
In order to test the patterns of the simulated annealing algorithm and its changes to the game
level, we can plot the total cost of the level as it progresses through the iterations. Some
examples of this are shown below, along with screenshots of the corresponding game level. One
key element of the simulated annealing process is that it will occasionally accept a suboptimal
response (at the points where the trend line goes up rather than down) in order to overcome a
37

local minimum. However, the likelihood to accept a bad move decreases as the iterations
progress and the temperature is cooled.
Figure 19: Some examples of the prototype optimization iterations along with in-gamescreenshots of the results.
3.12 Specific Overrides
The simulated annealing algorithm works well to ensure varied configurations by examining a
wide range of possible solutions and using its decreasing temperature. However, there are several
instances where this system of proposing moves and accepting or rejecting based on costs must
be circumvented. For instance, in the case of a game where players must acquire a certain
number of items to complete their task (as in the dungeon RPG game), care must be taken to
ensure that enough of these are spawned in each solution. In this case, a more direct method must
be used, circumventing the typical system of suggesting change and discouraging bad moves. All
potential edge cases must be considered to prevent uncompletable solutions.
38

CHAPTER 4. PROBLEM FORMULATION
4.1 Objectives
This study aims to examine the validity of procedural content generation for levels in cooperative
games.
4.2 Proposed Testing Methodology
The cooperative level generation algorithm can be used in multiple potential experiments. Here,
we propose two different experiments. Given health concerns and the recent decision of the IRB
to suspend all in-person user studies, coupled with the nature of this project as a virtual reality
project (with VR headsets being difficult to sanitize properly), these experiments are not
currently able to be conducted. They are proposed here as potential areas of research.
Firstly, we propose an experiment to analyze the effects of the “target cooperation” variable and
its impacts on the resulting levels of cooperation among the players. To test this, a study would
be conducted of at least 16 groups of two players, with analysis being conducted across these 16
groups. Each player group would play both games with procedurally generated levels with target
cooperation values of low, medium, and high. Following playing each of these, the participants
would complete a brief questionnaire (included as a appendix). More information on this
questionnaire can be found in section 4.2. In addition to the data from this survey, additional
logged data will be used (please see section 4.3). Corrections will be made to account for the
increased level of familiarity with the game as they have played more successive levels. We
hypothesize that the target cooperation parameter will strongly correlate to the levels of
cooperation experienced by the participants as they play the games.
Secondly, we propose an experiment to analyze the effectiveness of playing procedurally
generated cooperative game levels on cooperation between two individuals.
39

4.3 Validation Questionnaire
A questionnaire for the proposed experiment can be used to gauge the level of cooperation
between two users. This questionnaire is included as Appendix A.
4.4 Data Logging
During the experiment, some quantitative data will be logged based on the players’ experience.
This data comes in various forms and contains mostly quantitative data. The following are the
pieces of data which will be logged:
● How long it took the players to complete the level
● The number of dialogue interactions over voice chat between the two players
● The distance of the two players to one another (logged 4 times/second)
4.5 Testing Networking
The Unity network package Photon will be used to facilitate networked functionality between the
two locations. Additionally, a common network solution will need to be found allowing the two
machines to connect. This may involve processes such as acquiring a router separate from the
campuses main network (to bypass restrictive firewalls) or using a pass-through app such as
Hamachi. A software such as Discord or Skype will be used to transmit voice between the two
players.
Given the time constraint of the project, before playing, the procedurally generated levels are
“baked” by saving the level configuration to a static scene. This is done in order to prevent the
data from the level configuration resulting from the procedural generation (such as the
room/level layout and all the optimized parameters) from needing to be synced over the network.
Having the levels be generated at runtime rather than generating them ahead of time and saving
them would require a large amount of data to be synced across the network, causing lag and
possibly the loss of data. This method also has the additional benefit of allowing the navigation
mesh (navmesh) to be baked without needing to worry about runtime baking.
40

The ideal solution to this issue would be to generate the level on one client machine (likely the
host machine) and have the optimized level data be transmitted only one time to the remaining
client machines upon loading into the game. Since the optimization would be completed prior to
playing the game itself, all of the parameters would remain static and would not need to update
after first loading the level.
41

CHAPTER 5. RESULTS
5.1 Games
Using a mathematical formula, coupled with a simulated annealing optimization algorithm, we
were able to successfully create a procedural generation system which can create random game
levels for two different cooperative virtual reality games. Adjusting the target coop parameter
has noticeable and expected impacts upon the content placed in the scene. For example,
increasing the target coop value for dungeon levels increases the number of enemies, hazards,
and required keys, while decreasing player health and the number of lit torches.
Figure 20: An example of dungeons generated with a target coop value of 1
Figure 21: An example of a dungeon generated with a target coop value of 3.5
42

Figure 22: Examples of the city generation
5.2 Results
To test the speed and efficacy of the generation algorithm, we ran a series of 10 (n=10) test cases
for the dungeon crawl RPG game, generating 10 unique levels for target coop values of 1 and
3.5. The average time taken for these optimizations to reach completion (for 3000 maximum
iterations), was around 44 seconds. This also includes the time taken for loading in assets and
models (which can increase depending on the complexity of assets and the number of unique
assets). When the optimization ran for the full 3000 iterations without reaching its other stopping
condition, it would run for around a minute. Occasionally, it would reach its stopping condition
from finding a low cost solution early, terminating the algorithm. The quickest solution was 15.4
seconds long and had a cost of 0.0. The longest solution had a duration of 62.08 seconds and had
a total cost of 0.14.
43

Figure 23: A graph of the total, layout, and game costs over time during an optimization
From the graph above showing the solution cost over time, the three different discrete
temperature intervals can be seen. As the optimization progresses, the chances of accepting bad
moves decreases significantly. This is clearly portrayed in the graph of the cost over time in the
diminishing frequency of spikes, eventually leading to a flat line at a near-zero cost.
Figure 24: The Acceptance frequency of all proposed moves
When looking at the individual parameters, it can be clearly seen that those with higher target
coop values feature more enemies, more hazards, lower player health, more required keys, and
fewer lit torches. Given that the optimization can prefer one parameter over another for reaching
its target coop amount, the deviations among these parameters for medium target coop value runs
44

are high. For example, one optimization solution may have a high enemy count to reach the coop
value while another may have very few enemies, relying on other methods.
Figure 25: The average time taken and total solution cost with target coop values of 1 and 3.5
Figure 26: The average enemy count and required keys with target coop values of 1 and 3.5
Figure 27: The average player health and hazard value with target coop values of 1 and 3.5
45
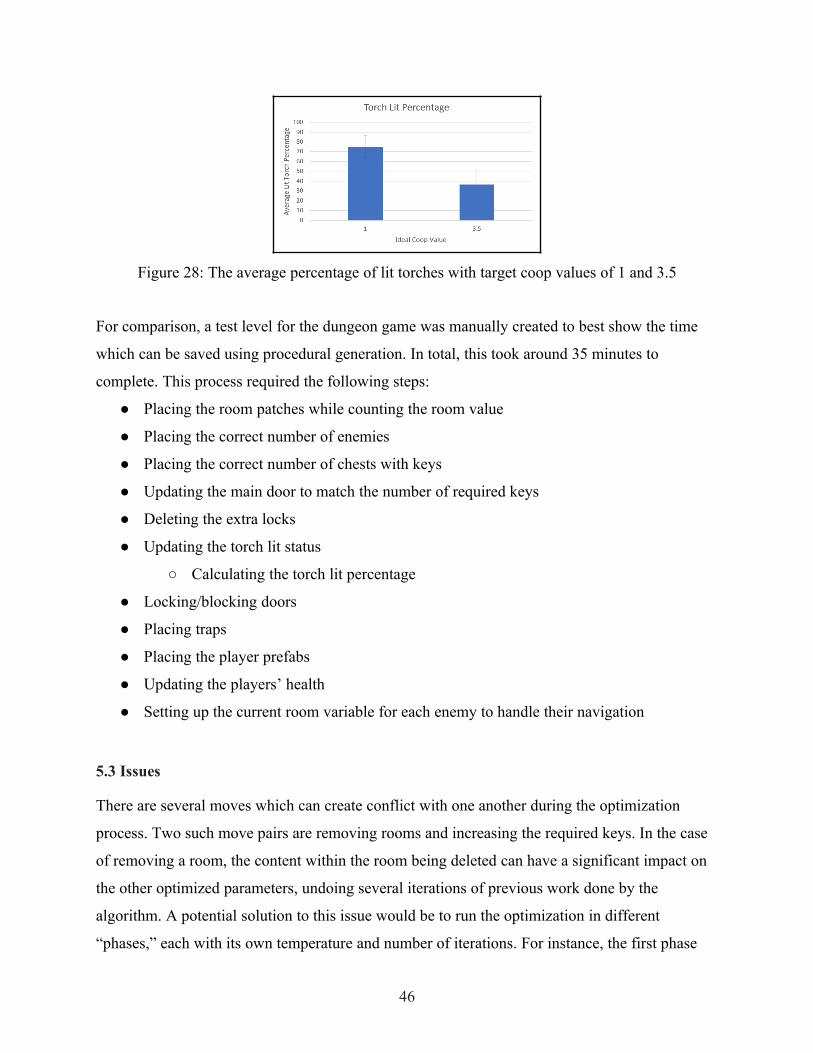
Figure 28: The average percentage of lit torches with target coop values of 1 and 3.5
For comparison, a test level for the dungeon game was manually created to best show the time
which can be saved using procedural generation. In total, this took around 35 minutes to
complete. This process required the following steps:
● Placing the room patches while counting the room value
● Placing the correct number of enemies
● Placing the correct number of chests with keys
● Updating the main door to match the number of required keys
● Deleting the extra locks
● Updating the torch lit status
○ Calculating the torch lit percentage
● Locking/blocking doors
● Placing traps
● Placing the player prefabs
● Updating the players’ health
● Setting up the current room variable for each enemy to handle their navigation
5.3 Issues
There are several moves which can create conflict with one another during the optimization
process. Two such move pairs are removing rooms and increasing the required keys. In the case
of removing a room, the content within the room being deleted can have a significant impact on
the other optimized parameters, undoing several iterations of previous work done by the
algorithm. A potential solution to this issue would be to run the optimization in different
“phases,” each with its own temperature and number of iterations. For instance, the first phase
46

would only consist of the room layout itself, without placing any content inside. After this, the
game would then move on to deciding upon parameters, and then work on the actual placement
of objects in the level. This division would solve numerous problems, including the
aforementioned issue of having content being removed as well as the issue with earlier-added
rooms being more likely to receive content given that they are present in the optimization longer.
In the case of increasing the required amount of keys, this parameter frequently conflicts with the
number of keys in the scene. Given there must be enough keys in the scene to meet the
requirement, solutions that do not meet this criteria are not acceptable. The current solution to
this issue is to simultaneously propose moves for increasing the required keys and adding a new
key.
Another issue that was noticed with some moves which have very small total impacts on the
level. For instance, given the large number of torches in a dungeon level, the original “light
torch” and “unlight torch” had very little change and the total torch lit percentage never deviated
much from its initial value. To remedy this, a loop was set up to propose the same move multiple
times (5 times in this case).
5.4 Parameter Tuning
During the creation of the optimization algorithm, several parameters needed to be tuned to give
optimal results. The most important of these variables is the temperature weight. This variable
factors into the probability acceptance function along with the temperature. The tested range was
from 1-100 with 50 being the final chosen value. Too low of a value can result in the algorithm
accepting too many bad moves and not reaching an acceptable cost. Too high values for this
parameter could result in only good moves being accepted, defeating the purpose of the
annealing algorithm to begin with.
In addition to the cooling rate, the maximum and minimum cooperation values for several
parameters were needed. These are used in the inverse linear interpolation function which is part
of the coop cost term. An example of this is the number of enemies in the scene. A minimal coop
solution will have 1 enemy and a maximum cooperation solution will have 4. In addition to these
interpolated values, solutions proposing any value outside of the maximum will be rejected. The
47

main parameters which needed adjustment to reach optimal solutions were the number of
required keys and the number of enemies.
Table 3: The minimum and maximum for optimized parameters
Parameter Minimum Coop Value Maximum Coop Value
Number Enemies 4 1
Player Health 200 50
Required Keys 1 5
Hazard Value 3 10
Torch Lit Percent 100 0
5.5 Cooling Rate
As mentioned previously, the simulated annealing algorithm makes use of a temperature
parameter which decreases throughout the optimization process. A higher temperature value
results in more “bad” or sub-optimal moves being accepted, increasing the variability of the
results and helping to overcome local minimums. The temperature is decreased over the course
of the optimization. Lower temperature lead to reduced probability of move acceptance, bringing
the decision making process closer to that of a greedy algorithm as the temperature falls from 1
to 0. For this project, rather than having the temperature decrease gradually over time, we instead
chose to make use of discrete temperature intervals. The optimization runs for a maximum of
3000 iterations and temperature values range from 0.0 to 1.0. The final intervals chosen are as
follows: a temperature of 1 for the first 1000 iterations, 0.5 for 1001-2000, and 0.25 for the
remainder of the optimization.
This method was chosen over a gradual decline for several reasons. Firstly,it allows us to clearly
see the relationship between the acceptance probability of moves as a result of the temperature.
Secondly, this method allows us to have different move probabilities for each temperature
interval. For instance, the “add rooms” move is given a higher probability at the start of the
optimization with a lower probability later due to its more drastic effect on the solution relative
to other moves. With this additional system in place, the temperature intervals control not only
48

the probability of accepting moves, but also the probability of proposing certain types of moves,
further allowing for an increase of volatility early on and a phase of refinement as it approaches
the end. This method is similar to the method employed by Xie et al. in their study in which they
decreased the temperature value “by 0.1 0.1 every 3,000 iterations, until it reaches zero” (Xie, et
al. 2018), although using fewer total iterations and fewer discrete intervals.
49

CHAPTER 6. LIMITATIONS AND DESIGN GUIDELINES
6.1 Limitations
Due to health concerns resulting from the Covid-19 outbreak, coupled with the cooperative
virtual reality nature of this project, we were not able to perform the proposed user studies. As
mentioned in the previous section, there are several potential experiments which can be derived
from the work completed as part of this project. There are several factors which make this study
particularly difficult to be conducted remotely while following social distancing rules, including:
the VR nature of the study, the small population of users with personal VR headsets, and the fact
that the study requires two participants simultaneously.
6.2 Design Guidelines
Below are included some suggestions for developers and researchers looking to utilize similar
methods of procedural generation.
● Developers looking to similarly work with VR should follow the standard guidelines for
VR games (such as those to avoid motion sickness)
● Patch-based methods of generation greatly simplify the generation process
● Using a smaller number of optimized parameters will greatly simplify the optimization
process and the total cost term function
● When developing for VR, considerations should be taken with regards to polygon count
to maintain an optimal performance at high resolutions
50

CHAPTER 7. CONCLUSIONS AND FUTURE WORK
7.1 Conclusions
In this project, we demonstrate the usage of a mathematical cost term function to control the
procedural generation for cooperative games. We were able to generate and tune an algorithm
using mathematical cost function to create this game content. Results from several case levels
show that the optimization can successfully create levels with higher or level of cooperative
elements based on a target cooperative element parameter. Additionally, the system was able to
create levels consistently and with a low cost (as long as the target coop value is within an
acceptable range of ~1-4).
7.2 Future Work
There are potential areas for future development for this project. Firstly, the same algorithm can
be tested with more game genres and game formats to show its generalizability. The same
methods could even be tested using non-entertainment simulations or educational games to test
its validity in more serious cases.
In addition to applying this same generation method/algorithm to more types of games, better
methods of evaluation can be designed. For the proposed experiment, the main methods of
evaluation would be a custom questionnaire and other minor metrics such as time for completion
and the number of vocal interactions between players. However, more robust methods of
evaluating the levels and their impact on cooperation can be researched and implemented.
The current optimization algorithm performs all move variants (i.e. level moves, items moves,
hazard moves, etc.) throughout the entire optimization. However, a more robust generation
system would perhaps opt to perform the generation in certain fixed ''stages.” For example, the
system could first generate all the rooms and the layout of the level before deciding to place
anything inside the rooms. This could help ensure a more even density of content throughout the
level as well as removing the need for moving content in the case of a game patch
51
REFERENCES
Carr, R. (2012). Simulated annealing. From MathWorld–A Wolfram Web Resource, created
byEric W. Weisstein.
Costello, H. (2018, July 2). Global Virtual Reality Market Size 2018: Growth Analysis,
Technology Trends, Key Features, Statistics, Types, Applications and Outlook 2023.
Reuters. Retrieved October 11, 2019, from
https://www.reuters.com/brandfeatures/venture-capital/article?id=40919.
Couture, J. (2016, May 3). The pros and cons of procedural generation in Overland.
Retrieved March 3, 2019 from
https://www.gamasutra.com/view/news/271814/The_pros_and_cons_of_procedural_gene
ration_in_Overland.php
De Vries, B., Verhagen, S., & Jessurun, A. J. (2004). Building management simulation centre.
Automation in Construction, 13(5), 679-687.
Farra, S., Miller, E., Timm, N., & Schafer, J. (2013). Improved training for disasters using 3-D
virtual reality simulation. Western journal of nursing research, 35(5), 655-671
Freiknecht, J., & Effelsberg, W. (2017). A survey on the procedural generation of virtual worlds.
Multimodal Technologies and Interaction, 1(4), 27.
Greitemeyer, T., & Cox, C. (2013). There's no “I” in team: Effects of cooperative video games
on cooperative behavior. European Journal of Social Psychology, 43(3), 224-228.
Howard, C., & Lemus, C. (2012, August). Asking the impossible on SSX: creating 300 tracks on
a ten track budget. In ACM SIGGRAPH 2012 Talks (p. 33). ACM..
Kruel, L. (2017). Technical Artist Bootcamp: Introduction to Proceduralism. Retrieved 9 Oct
2019 from: https://www.gdcvault.com/play/1024574/Technical-Artist-Bootcamp-
Introduction-to
Lauret, T. (2018, October 19). The four atoms of cooperative video games. Retrieved October 7,
2019, from
https://www.gamasutra.com/view/news/328756/The_four_atoms_of_cooperative_video_
games.php.
52

Noguchi, Y. (2019, October 8). Virtual Reality Goes To Work, Helping Train Employees. NPR.
Retrieved from https://www.npr.org/2019/10/08/767116408/virtual-reality-goes-to-work-
helping-train-employees
Ramos, R. P. Procedural Content Generation for Cooperative Games.
Redding, P. (2011). Keep it Together: Encouraging Cooperative Behavior During Co-op Play
[Video File]. Retrieved 8 Oct 2019 from: https://www.gdcvault.com/play/1014379/Keep-
it-Together-Encouraging-Cooperative
Rocha, J. B., Mascarenhas, S., & Prada, R. (2008). Game mechanics for cooperative games. ZON
Digital Games 2008, 72-80.
Rogers, S. (21 Jun, 2019). 2019: The Year Virtual Reality Gets Rea. Forbes. Retrieved 11 Oct
2019 from: https://www.forbes.com/sites/solrogers/2019/06/21/2019-the-year-virtual-
reality-gets-real/#79b45766ba99
Seif El-Nasr, M., Aghabeigi, B., Milam, D., Erfani, M., Lameman, B., Maygoli, H., & Mah, S.
(2010, April). Understanding and evaluating cooperative games. In Proceedings of the
SIGCHI Conference on Human Factors in Computing Systems (pp. 253-262). ACM.
Smith, G. "The future of procedural content generation in games." Tenth Artificial Intelligence
and Interactive Digital Entertainment Conference. 2014.\
Tcha-Tokey, K., Christmann, O., Loup-Escande, E., & Richir, S. (2016). Proposition and
validation of a questionnaire to measure the user experience in immersive virtual
environments.
Tsaj, J. (08 Jan 2018). TrendForce Forecasts VR Market Shipments at 5 Million Units in 2018,
Standalone VR Devices Will Be the Focus. Retrieved 11 Oct 2018 from:
https://press.trendforce.com/press/20180108-3045.html
Xie, B., Zhang, Y., Huang, H., Ogawa, E., You, T., & Yu, L. F. (2018). Exercise intensity-driven
level design. IEEE transactions on visualization and computer graphics, 24(4), 1661-
1670.
Yu, L. F., Yeung, S. K., Tang, C. K., Terzopoulos, D., Chan, T. F., & Osher, S. (2011). Make it
home: automatic optimization of furniture arrangement. ACM Trans. Graph., 30(4), 86.
Zhang, Y., Xie, B., Huang, H., Ogawa, E., You, T., & Yu, L. F. (2019, April). Pose-Guided
Level Design. In Proceedings of the 2019 CHI Conference on Human Factors in
Computing Systems (p. 554). ACM.
53
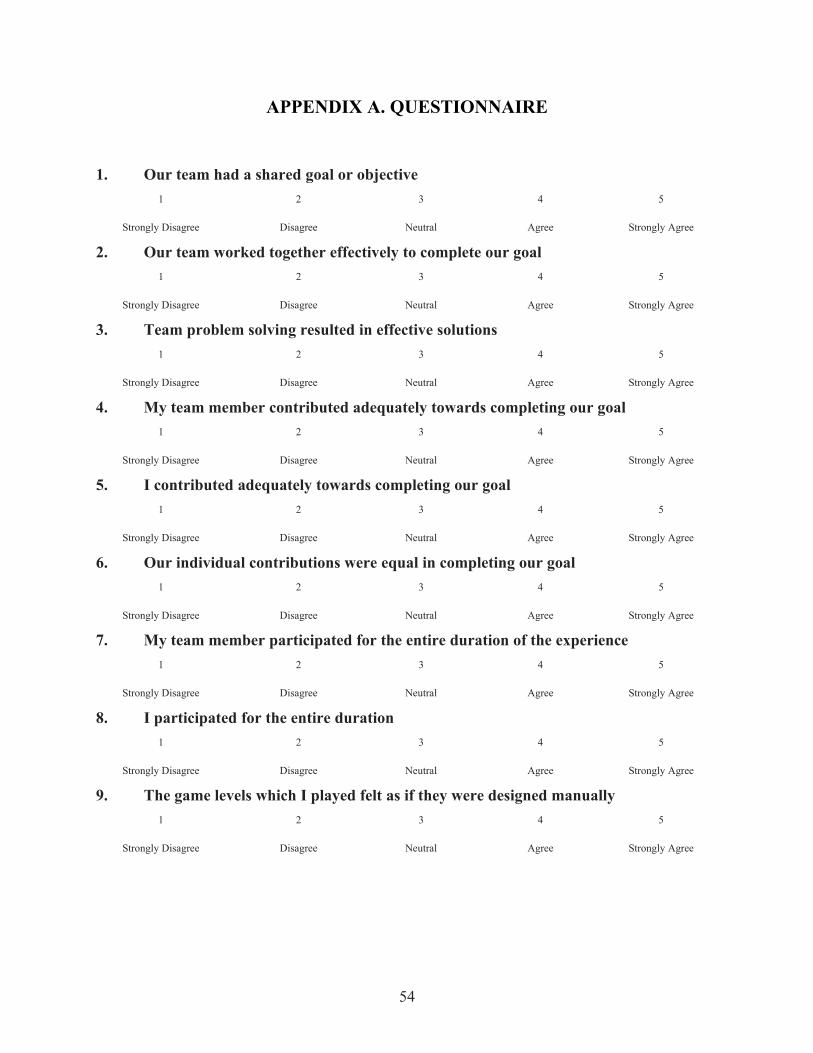
APPENDIX A. QUESTIONNAIRE
1. Our team had a shared goal or objective
1 2 3 4 5
Strongly Disagree Disagree Neutral Agree Strongly Agree
2. Our team worked together effectively to complete our goal
1 2 3 4 5
Strongly Disagree Disagree Neutral Agree Strongly Agree
3. Team problem solving resulted in effective solutions
1 2 3 4 5
Strongly Disagree Disagree Neutral Agree Strongly Agree
4. My team member contributed adequately towards completing our goal
1 2 3 4 5
Strongly Disagree Disagree Neutral Agree Strongly Agree
5. I contributed adequately towards completing our goal
1 2 3 4 5
Strongly Disagree Disagree Neutral Agree Strongly Agree
6. Our individual contributions were equal in completing our goal
1 2 3 4 5
Strongly Disagree Disagree Neutral Agree Strongly Agree
7. My team member participated for the entire duration of the experience
1 2 3 4 5
Strongly Disagree Disagree Neutral Agree Strongly Agree
8. I participated for the entire duration
1 2 3 4 5
Strongly Disagree Disagree Neutral Agree Strongly Agree
9. The game levels which I played felt as if they were designed manually
1 2 3 4 5
Strongly Disagree Disagree Neutral Agree Strongly Agree
54

APPENDIX B. CODE SNIPPETS
Figure A.1: Code snippet of the total cost function for the dungeon game
Figure A.2: Code snippet of the move acceptance function
55
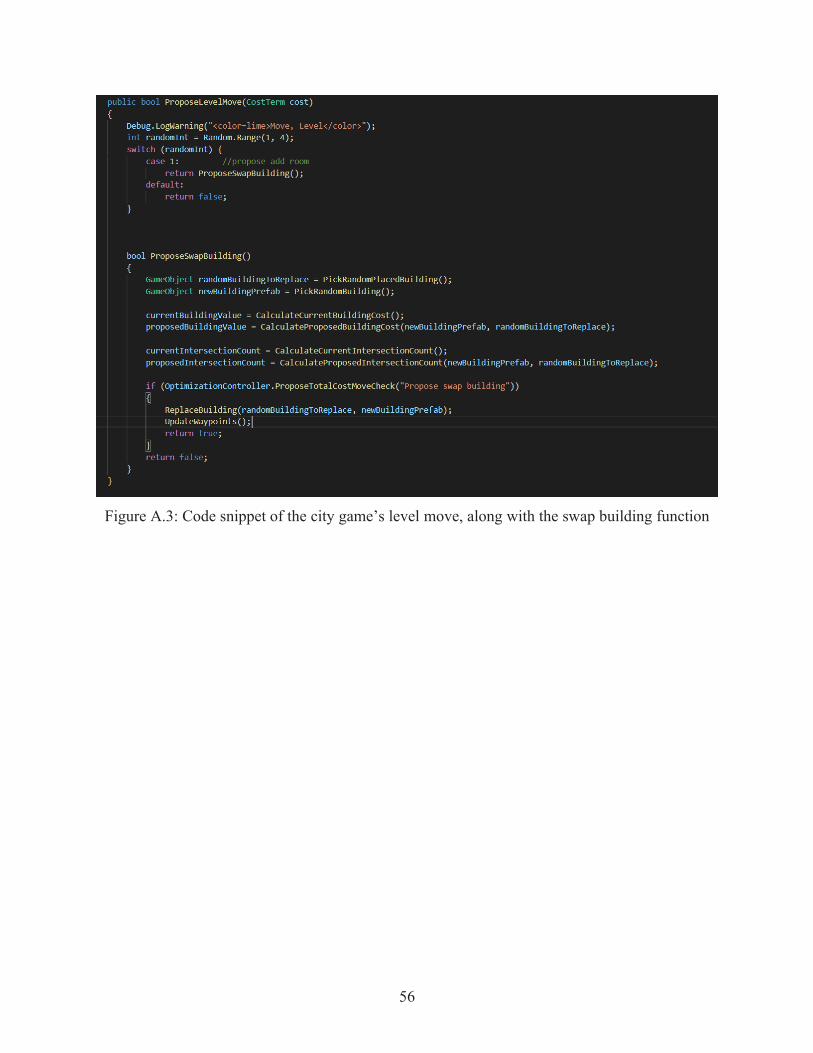
Figure A.3: Code snippet of the city game’s level move, along with the swap building function
56
Copyright © 2022 FDOKUMEN