Optimizing the location of antenatal classes
11
Optimising the location of antenatal classes Melanie N. Tomintz, PhD (Postdoctoral Research Fellow) a,n , Graham P. Clarke, PhD (Professor of Business Geography) b , Janette E. Rigby, PhD (Director, Centre for Health Geoinformatics) c , Josephine M. Green, PhD (Professor of Psychosocial Reproductive Health) d a Department of Geoinformation, Carinthia University of Applied Sciences, Europastrasse 4, 9524 Villach, Austria b School of Geography, University of Leeds, Leeds LS2 9JT, United Kingdom c NCG, National University of Ireland Maynooth, Co. Kildare, Ireland d Mother & Infant Research Unit, Department of Health Sciences, University of York, York YO10 5DD, United Kingdom article info Article history: Received 28 March 2011 Received in revised form 27 October 2011 Accepted 30 October 2011 Keywords: Antenatal classes Locating maternity services Health geography abstract Objectives: To combine microsimulation and location-allocation techniques to determine antenatal class locations which minimise the distance travelled from home by potential users. Design: Microsimulation modeling and location-allocation modeling. Setting: City of Leeds, UK. Participants: Potential users of antenatal classes. Methods: An individual-level microsimulation model was built to estimate the number of births for small areas by combining data from the UK Census 2001 and the Health Survey for England 2006. Using this model as a proxy for service demand, we then used a location-allocation model to optimize locations. Findings: Different scenarios show the advantage of combining these methods to optimize (re)locating antenatal classes and therefore reduce inequalities in accessing services for pregnant women. Key Conclusions: Use of these techniques should lead to better use of resources by allowing planners to identify optimal locations of antenatal classes which minimise women’s travel. Implications for practice: These results are especially important for health-care planners tasked with the difficult issue of targeting scarce resources in a cost-efficient, but also effective or accessible, manner. (169 words). & 2011 Elsevier Ltd. All rights reserved. Introduction The aim of this paper is to offer a methodology to help reduce inequalities in accessing antenatal classes. Historically classes have been offered to prepare parents-to-be for childbirth and issues following birth such as advice on infant feeding. McMillan et al. (2009) provide more detail of the types of service provided by antenatal classes in the comprehensive review of antenatal education ‘Birth and beyond: a review of the evidence about antenatal education’. For example, access to classes can provide improved health benefits in terms of promoting breast feeding, especially for low income mothers. In addition to advice and support, antenatal classes help to increase the confidence of parents-to-be and can produce new social networks. In 2004, the UK Department of Health (DoH) published the ‘National Service Framework for Children, Young People and Maternity Services’, which offered guidelines for the provision of maternity services of the ‘highest standards’ to meet the needs of pregnant women and mothers (Department of Health, 2004). It was argued that pregnant women need access to antenatal classes to prepare them for labour and birth. However, at the same time, antenatal classes in certain parts of the UK have been withdrawn, or the number of classes cut, due to financial problems (Clift- Matthews, 2007). This came at a time when UK Government policy was trying to encourage more community based services at the expense of centralised hospital treatment. The White Paper ‘Our Health, Our Care, Our Say: a New Direction for Community Services’ (Department of Health, 2006) outlined the aim of bring- ing maternity services (along with other health services) more into the community to provide better access to maternity care. A more recent White Paper ‘Maternity Matters’ (Department of Health, 2007) aimed to ensure that women have high quality, safe and accessible services and the choice of where to give birth. Therefore locations where antenatal services are offered should Contents lists available at SciVerse ScienceDirect journal homepage: www.elsevier.com/midw Midwifery 0266-6138/$ - see front matter & 2011 Elsevier Ltd. All rights reserved. doi:10.1016/j.midw.2011.10.010 n Corresponding author. E-mail addresses: [email protected], [email protected] (M.N. Tomintz), [email protected] (G.P. Clarke), [email protected] (J.E. Rigby), [email protected] (J.M. Green). Midwifery 29 (2013) 33–43
Transcript of Optimizing the location of antenatal classes

Midwifery 29 (2013) 33–43
Contents lists available at SciVerse ScienceDirect
Midwifery
0266-61
doi:10.1
n Corr
E-m
melanie
jan.rigb
journal homepage: www.elsevier.com/midw
Optimising the location of antenatal classes
Melanie N. Tomintz, PhD (Postdoctoral Research Fellow)a,n, Graham P. Clarke, PhD (Professor ofBusiness Geography)b, Janette E. Rigby, PhD (Director, Centre for Health Geoinformatics)c,Josephine M. Green, PhD (Professor of Psychosocial Reproductive Health)d
a Department of Geoinformation, Carinthia University of Applied Sciences, Europastrasse 4, 9524 Villach, Austriab School of Geography, University of Leeds, Leeds LS2 9JT, United Kingdomc NCG, National University of Ireland Maynooth, Co. Kildare, Irelandd Mother & Infant Research Unit, Department of Health Sciences, University of York, York YO10 5DD, United Kingdom
a r t i c l e i n f o
Article history:
Received 28 March 2011
Received in revised form
27 October 2011
Accepted 30 October 2011
Keywords:
Antenatal classes
Locating maternity services
Health geography
38/$ - see front matter & 2011 Elsevier Ltd. A
016/j.midw.2011.10.010
esponding author.
ail addresses: [email protected],
[email protected] (M.N. Tomintz), g.p.clar
[email protected] (J.E. Rigby), [email protected] (J
a b s t r a c t
Objectives: To combine microsimulation and location-allocation techniques to determine antenatal
class locations which minimise the distance travelled from home by potential users.
Design: Microsimulation modeling and location-allocation modeling.
Setting: City of Leeds, UK.
Participants: Potential users of antenatal classes.
Methods: An individual-level microsimulation model was built to estimate the number of births for
small areas by combining data from the UK Census 2001 and the Health Survey for England 2006. Using
this model as a proxy for service demand, we then used a location-allocation model to optimize
locations.
Findings: Different scenarios show the advantage of combining these methods to optimize (re)locating
antenatal classes and therefore reduce inequalities in accessing services for pregnant women.
Key Conclusions: Use of these techniques should lead to better use of resources by allowing planners to
identify optimal locations of antenatal classes which minimise women’s travel.
Implications for practice: These results are especially important for health-care planners tasked with the
difficult issue of targeting scarce resources in a cost-efficient, but also effective or accessible, manner. (169
words).
& 2011 Elsevier Ltd. All rights reserved.
Introduction
The aim of this paper is to offer a methodology to help reduceinequalities in accessing antenatal classes. Historically classeshave been offered to prepare parents-to-be for childbirth andissues following birth such as advice on infant feeding. McMillanet al. (2009) provide more detail of the types of service providedby antenatal classes in the comprehensive review of antenataleducation ‘Birth and beyond: a review of the evidence about
antenatal education’. For example, access to classes can provideimproved health benefits in terms of promoting breast feeding,especially for low income mothers. In addition to advice andsupport, antenatal classes help to increase the confidence ofparents-to-be and can produce new social networks.
ll rights reserved.
[email protected] (G.P. Clarke),
.M. Green).
In 2004, the UK Department of Health (DoH) published the‘National Service Framework for Children, Young People andMaternity Services’, which offered guidelines for the provisionof maternity services of the ‘highest standards’ to meet the needsof pregnant women and mothers (Department of Health, 2004). Itwas argued that pregnant women need access to antenatal classesto prepare them for labour and birth. However, at the same time,antenatal classes in certain parts of the UK have been withdrawn,or the number of classes cut, due to financial problems (Clift-Matthews, 2007). This came at a time when UK Governmentpolicy was trying to encourage more community based services atthe expense of centralised hospital treatment. The White Paper‘Our Health, Our Care, Our Say: a New Direction for CommunityServices’ (Department of Health, 2006) outlined the aim of bring-ing maternity services (along with other health services) moreinto the community to provide better access to maternity care. Amore recent White Paper ‘Maternity Matters’ (Department ofHealth, 2007) aimed to ensure that women have high quality,safe and accessible services and the choice of where to give birth.Therefore locations where antenatal services are offered should
M.N. Tomintz et al. / Midwifery 29 (2013) 33–4334
be women-focused and family-centred. The emphasis has againbeen placed on community maternity care to improve access andhence encourage a higher uptake of services.
The study area for this paper is Leeds, a city in West Yorkshire,UK with a population of around 750,000 people. In Leeds, inaddition to the standard antenatal classes, services are alsooffered for different ethnic groups, such as ethnic minoritycommunities (for example the ‘Haamla Service’). Teenagers alsoget a separate ‘parentcraft’ package, which is incorporated intotheir care pathway. Specially trained midwives give teenagersone-to-one sessions rather than group sessions (as is the case forstandard antenatal classes). The focus for Leeds Teaching Hospi-tals in recent years and local service commissioners has been toreduce health inequalities and improve access to services (MakingLeeds Better, 2005). This paper focuses on the locations ofstandard antenatal classes and offers a methodology for compar-ing these to optimal locations based on the number of small-areabirths.
The rest of the paper is structured as follows. Firstly, we brieflyreview the key literature in the field including a short overview ofthe proposed methods and their application in health relatedareas. In the section ‘Methods’, we examine the problem of how toestimate birth rates for small geographical areas. We argue thattaking one key demographic factor alone (age, social class, andethnic status) can lead to very different estimates at the small-area level. Therefore, we introduce the modelling method ofmicrosimulation, a technique, which enables us to estimate thenumber of small-area births based on a combination of demo-graphic characteristics and location-allocation models, which canbe used to locate classes ‘optimally’ in relation to the estimates ofdemand generated from the microsimulation process. In thesection ‘Findings’, a number of scenarios regarding alternativepolicy options are given. In the final section, we offer someconcluding comments.
Literature review
Inequalities in the uptake of antenatal classes are apparent fordifferent population groups. For example, Hirst and Eisner (1999)noted that women from disadvantaged areas were least likely toaccess such services. Similarly, a study by Hamlyn et al. (2000)showed that there were variations in access rates to antenatalclasses by women from different occupational groups. Theirsurvey found that 82% of mothers in higher paid occupationsattended antenatal classes in comparison to 54% from lower paidoccupations. The lowest attendance rate (27%) was found formothers who had never worked or who were long term unem-ployed. Women holding a university degree were almost eighttimes more likely to attend a class in comparison to mothers witha ‘minimum’ level of education. A recent study by Redshaw andHeikkila (2010) showed that the offer of antenatal classes washigher to first time mothers (87%) than mothers who have alreadygiven birth (50%). Further, the study showed that classes weremore often offered to younger women aged less than 19 (80%) incomparison to older women aged 40 or more (65%) whereas Asianand Black women were least offered antenatal classes in compar-ison to White women. A key question, which then emerges ishow to increase attendance rates, especially for disadvantagedmothers. One approach is to improve accessibility to services.The location of individual classes is important, especially whenwomen are dependent on public transport (Cliff and Deery, 1997).Although the National Health Service (NHS) provides classes freeof charge, a shortage of staff and resources means a limiteduniversal provision of such services. This makes it more difficultfor women in certain parts of cities or regions to access antenatal
classes. Factors such as language differences may also preventcertain ethnic groups making use of services. Although somewomen may feel accessing education and support services arenot as important as attending for antenatal checks and investiga-tions, McMillan et al. (2009) report the importance of antenatalclasses for helping prevent complications within pregnancy andthat classes are highly supportive for preparing mothers-to-be forlabour and birth and gaining access to good social supportnetworks. Therefore, making services more accessible, and focus-ing on certain population groups, could potentially increase theuptake of antenatal classes.
In order to locate classes optimally, it is important to be able toestimate the likely distribution of women giving birth acrossspatial areas. This is especially necessary if facilities are to belocated within communities rather than in central locations suchas major hospitals. In the UK (as in many other countries), data onthe residential location of pregnant women are difficult to obtain.Thus it is useful to employ modelling approaches (microsimula-tion in this case) that will estimate the likely number of births atthe household level, which can then be aggregated into smallzones such as Census output areas (effectively 2439 small com-munity areas in Leeds). If this data can be provided or estimated,it will allow a much better spatial targeting of antenatal classlocations. In the UK, the number of births is available from time totime at the Census ward level. In Leeds, this gives data for only 33areas, and a number of these are very large, heterogeneous areasin terms of population characteristics. Nevertheless, this data areuseful for this project as it allows us to test the results of themodel—ensuring that when aggregated, the total number ofbirths is close to the known Census ward level data.
Redshaw and Heikkila (2010) showed that in England mostantenatal classes were offered in North-East (73%) and leastclasses were offered in the East Midlands (62%). Further, theattendance rate varied between 37% and 45%. The majorityattended antenatal classes at the start of the third trimester and12% of women preferred private and voluntary sector paid-forcourses where women have to pay a contribution as these classesare not offered for free. These are non-profit charity organisations,which have to cover their expenses to exist. Such classes were lesscommon for women aged below 30, women living in moredeprived areas or women whose ethnic background are Black orwho are from Minority Ethnic groups. The report by TNS (TNS,2005) showed that antenatal classes are the maternity serviceleast accessed by pregnant women, with only a 37% attendancerate (58% for first time mothers). Non-attendees stated that theybelieved such classes were not important or useful. In addition,only 53% of mothers who attended antenatal classes weresatisfied with the choice offered of where and when the classtook place. Further, the survey detected some differences withindifferent population groups in accessing classes. Women in lowersocio-economic groups attended antenatal classes less often thanwomen in higher socio-economic groups. Since women in lowersocio-economic groups tend not to have the resources to attendprivately funded classes this may mean that they do not attend aclass at all. Further, single women were less likely to attend aclass in comparison to married women. In terms of ethnicity,Madhok et al. (1998) analysed satisfaction with health servicesamong Pakistani women in Middlesbrough, UK. Their findingsshowed that, in general, Pakistani women claimed to be satisfiedwith health services, although only a few attended antenatalclasses. In fact, only two pregnant women out of the 39 surveyedaccessed classes, with a frequent complaint voiced around thedifficulties of language barriers. The 37 non-attendees listedreasons that they ‘were not aware of the service’, which they‘did not have time to attend’, there were ‘language problems’ anda minority reported that they simply ‘did not bother’.
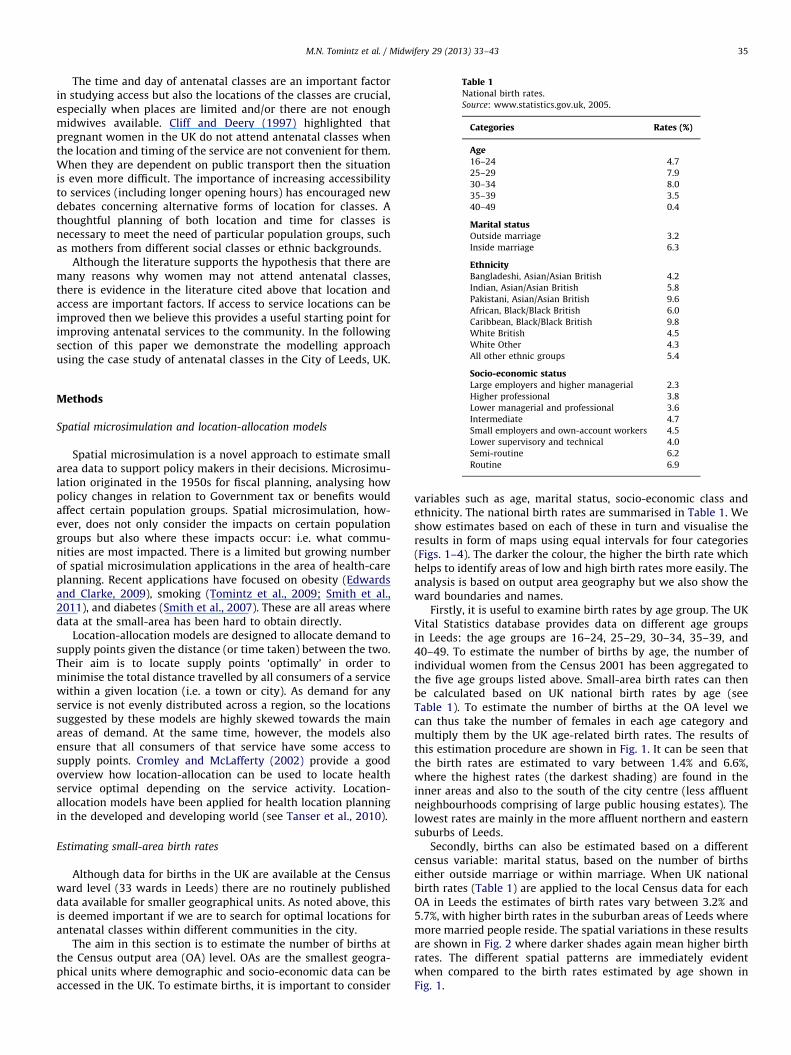
Table 1National birth rates.
Source: www.statistics.gov.uk, 2005.
Categories Rates (%)
Age16–24 4.7
25–29 7.9
30–34 8.0
35–39 3.5
40–49 0.4
Marital statusOutside marriage 3.2
Inside marriage 6.3
EthnicityBangladeshi, Asian/Asian British 4.2
Indian, Asian/Asian British 5.8
Pakistani, Asian/Asian British 9.6
African, Black/Black British 6.0
Caribbean, Black/Black British 9.8
White British 4.5
White Other 4.3
All other ethnic groups 5.4
M.N. Tomintz et al. / Midwifery 29 (2013) 33–43 35
The time and day of antenatal classes are an important factorin studying access but also the locations of the classes are crucial,especially when places are limited and/or there are not enoughmidwives available. Cliff and Deery (1997) highlighted thatpregnant women in the UK do not attend antenatal classes whenthe location and timing of the service are not convenient for them.When they are dependent on public transport then the situationis even more difficult. The importance of increasing accessibilityto services (including longer opening hours) has encouraged newdebates concerning alternative forms of location for classes. Athoughtful planning of both location and time for classes isnecessary to meet the need of particular population groups, suchas mothers from different social classes or ethnic backgrounds.
Although the literature supports the hypothesis that there aremany reasons why women may not attend antenatal classes,there is evidence in the literature cited above that location andaccess are important factors. If access to service locations can beimproved then we believe this provides a useful starting point forimproving antenatal services to the community. In the followingsection of this paper we demonstrate the modelling approachusing the case study of antenatal classes in the City of Leeds, UK.
Socio-economic statusLarge employers and higher managerial 2.3
Higher professional 3.8
Lower managerial and professional 3.6
Intermediate 4.7
Small employers and own-account workers 4.5
Lower supervisory and technical 4.0
Semi-routine 6.2
Routine 6.9
Methods
Spatial microsimulation and location-allocation models
Spatial microsimulation is a novel approach to estimate smallarea data to support policy makers in their decisions. Microsimu-lation originated in the 1950s for fiscal planning, analysing howpolicy changes in relation to Government tax or benefits wouldaffect certain population groups. Spatial microsimulation, how-ever, does not only consider the impacts on certain populationgroups but also where these impacts occur: i.e. what commu-nities are most impacted. There is a limited but growing numberof spatial microsimulation applications in the area of health-careplanning. Recent applications have focused on obesity (Edwardsand Clarke, 2009), smoking (Tomintz et al., 2009; Smith et al.,2011), and diabetes (Smith et al., 2007). These are all areas wheredata at the small-area has been hard to obtain directly.
Location-allocation models are designed to allocate demand tosupply points given the distance (or time taken) between the two.Their aim is to locate supply points ‘optimally’ in order tominimise the total distance travelled by all consumers of a servicewithin a given location (i.e. a town or city). As demand for anyservice is not evenly distributed across a region, so the locationssuggested by these models are highly skewed towards the mainareas of demand. At the same time, however, the models alsoensure that all consumers of that service have some access tosupply points. Cromley and McLafferty (2002) provide a goodoverview how location-allocation can be used to locate healthservice optimal depending on the service activity. Location-allocation models have been applied for health location planningin the developed and developing world (see Tanser et al., 2010).
Estimating small-area birth rates
Although data for births in the UK are available at the Censusward level (33 wards in Leeds) there are no routinely publisheddata available for smaller geographical units. As noted above, thisis deemed important if we are to search for optimal locations forantenatal classes within different communities in the city.
The aim in this section is to estimate the number of births atthe Census output area (OA) level. OAs are the smallest geogra-phical units where demographic and socio-economic data can beaccessed in the UK. To estimate births, it is important to consider
variables such as age, marital status, socio-economic class andethnicity. The national birth rates are summarised in Table 1. Weshow estimates based on each of these in turn and visualise theresults in form of maps using equal intervals for four categories(Figs. 1–4). The darker the colour, the higher the birth rate whichhelps to identify areas of low and high birth rates more easily. Theanalysis is based on output area geography but we also show theward boundaries and names.
Firstly, it is useful to examine birth rates by age group. The UKVital Statistics database provides data on different age groupsin Leeds: the age groups are 16–24, 25–29, 30–34, 35–39, and40–49. To estimate the number of births by age, the number ofindividual women from the Census 2001 has been aggregated tothe five age groups listed above. Small-area birth rates can thenbe calculated based on UK national birth rates by age (seeTable 1). To estimate the number of births at the OA level wecan thus take the number of females in each age category andmultiply them by the UK age-related birth rates. The results ofthis estimation procedure are shown in Fig. 1. It can be seen thatthe birth rates are estimated to vary between 1.4% and 6.6%,where the highest rates (the darkest shading) are found in theinner areas and also to the south of the city centre (less affluentneighbourhoods comprising of large public housing estates). Thelowest rates are mainly in the more affluent northern and easternsuburbs of Leeds.
Secondly, births can also be estimated based on a differentcensus variable: marital status, based on the number of birthseither outside marriage or within marriage. When UK nationalbirth rates (Table 1) are applied to the local Census data for eachOA in Leeds the estimates of birth rates vary between 3.2% and5.7%, with higher birth rates in the suburban areas of Leeds wheremore married people reside. The spatial variations in these resultsare shown in Fig. 2 where darker shades again mean higher birthrates. The different spatial patterns are immediately evidentwhen compared to the birth rates estimated by age shown inFig. 1.

Fig. 1. Birth rates (%) using age as the predictive variable (OA level for Leeds).
Fig. 2. Birth rates (%) using marital status as the predictive variable (OA level for Leeds).
M.N. Tomintz et al. / Midwifery 29 (2013) 33–4336
Thirdly, births can be estimated by examining variations inbirth rates by socio-economic status. The information of birthrates based on socio-economic status is only provided by male
head of household and can ignore single female households. TheUK national rates for England and Wales are also only based on a10% sample (see Table 1). These national rates were applied to
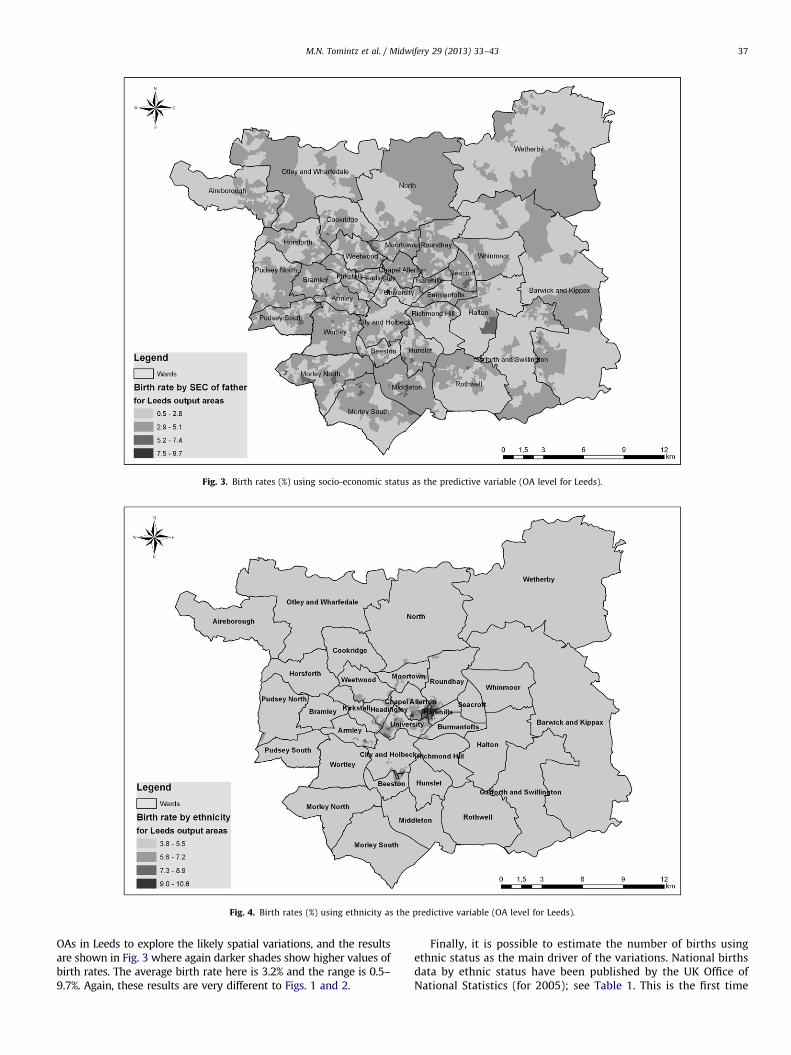
Fig. 3. Birth rates (%) using socio-economic status as the predictive variable (OA level for Leeds).
Fig. 4. Birth rates (%) using ethnicity as the predictive variable (OA level for Leeds).
M.N. Tomintz et al. / Midwifery 29 (2013) 33–43 37
OAs in Leeds to explore the likely spatial variations, and the resultsare shown in Fig. 3 where again darker shades show higher values ofbirth rates. The average birth rate here is 3.2% and the range is 0.5–9.7%. Again, these results are very different to Figs. 1 and 2.
Finally, it is possible to estimate the number of births usingethnic status as the main driver of the variations. National birthsdata by ethnic status have been published by the UK Office ofNational Statistics (for 2005); see Table 1. This is the first time
M.N. Tomintz et al. / Midwifery 29 (2013) 33–4338
that such data have been published for England and Wales. Whenthese national rates are applied to match the ethnic populationwithin each Leeds OA, this produces an estimate of an averagebirth rate for Leeds of 4.4% and a range from 3.8% to 10.6% (Fig. 4).The results show that highest rates (darker shades) occur inHarehills, Chapel Allerton, University and Beeston, which areassociated with the higher birth rate of the Pakistani populationin particular.
The maps above show clearly that estimations based ondifferent socio-economic attributes will provide very differentspatial patterns across the city. This makes it difficult for health-care planners to decide where to locate new services: which mapis most ‘accurate’? To overcome this problem we need to be ableto combine estimates of giving birth based on age, marital status,social class and ethnicity. The methodology we adopt here to dothis is spatial microsimulation. This modelling technique is firstbriefly described below, and then applied to the estimation ofbirth rates.
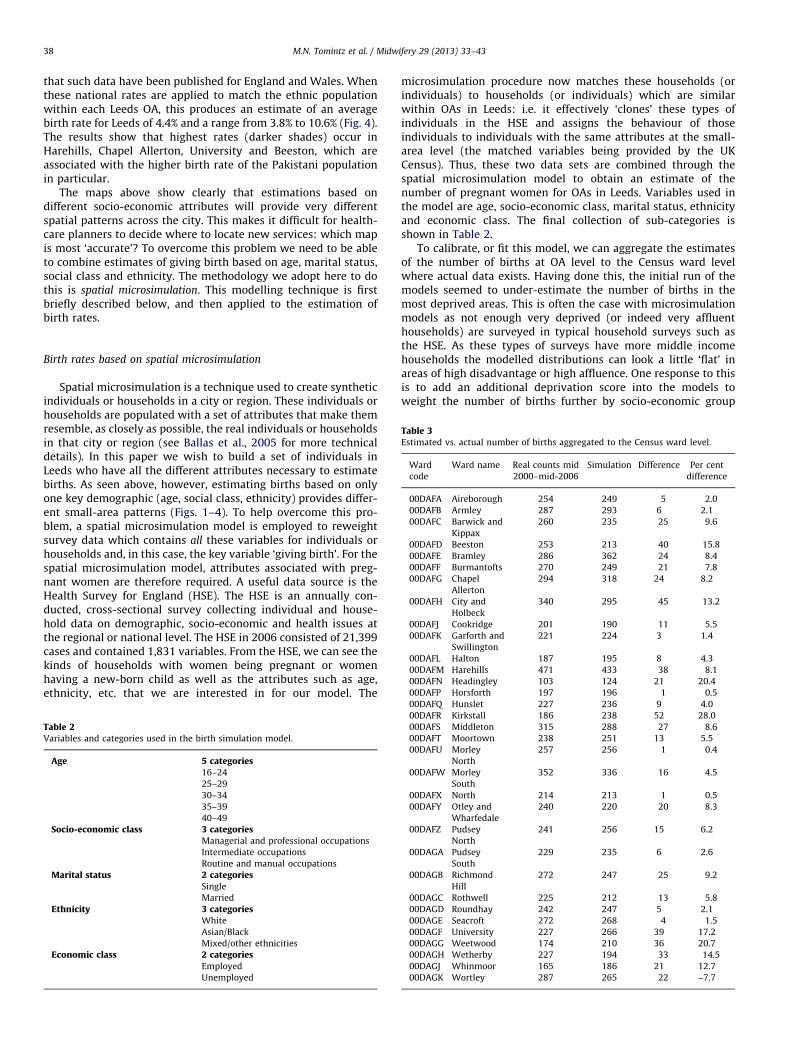
Table 3Estimated vs. actual number of births aggregated to the Census ward level.
Ward
code
Ward name Real counts mid
2000–mid-2006
Simulation Difference Per cent
difference
00DAFA Aireborough 254 249 �5 �2.0
00DAFB Armley 287 293 6 2.1
00DAFC Barwick and
Kippax
260 235 �25 �9.6
00DAFD Beeston 253 213 �40 �15.8
00DAFE Bramley 286 362 �24 �8.4
00DAFF Burmantofts 270 249 �21 �7.8
00DAFG Chapel
Allerton
294 318 24 8.2
00DAFH City and
Holbeck
340 295 �45 �13.2
00DAFJ Cookridge 201 190 �11 �5.5
00DAFK Garforth and
Swillington
221 224 3 1.4
00DAFL Halton 187 195 8 4.3
00DAFM Harehills 471 433 �38 �8.1
00DAFN Headingley 103 124 21 20.4
00DAFP Horsforth 197 196 �1 �0.5
Birth rates based on spatial microsimulation
Spatial microsimulation is a technique used to create syntheticindividuals or households in a city or region. These individuals orhouseholds are populated with a set of attributes that make themresemble, as closely as possible, the real individuals or householdsin that city or region (see Ballas et al., 2005 for more technicaldetails). In this paper we wish to build a set of individuals inLeeds who have all the different attributes necessary to estimatebirths. As seen above, however, estimating births based on onlyone key demographic (age, social class, ethnicity) provides differ-ent small-area patterns (Figs. 1–4). To help overcome this pro-blem, a spatial microsimulation model is employed to reweightsurvey data which contains all these variables for individuals orhouseholds and, in this case, the key variable ‘giving birth’. For thespatial microsimulation model, attributes associated with preg-nant women are therefore required. A useful data source is theHealth Survey for England (HSE). The HSE is an annually con-ducted, cross-sectional survey collecting individual and house-hold data on demographic, socio-economic and health issues atthe regional or national level. The HSE in 2006 consisted of 21,399cases and contained 1,831 variables. From the HSE, we can see thekinds of households with women being pregnant or womenhaving a new-born child as well as the attributes such as age,ethnicity, etc. that we are interested in for our model. The
Table 2Variables and categories used in the birth simulation model.
Age 5 categories16–24
25–29
30–34
35–39
40–49
Socio-economic class 3 categoriesManagerial and professional occupations
Intermediate occupations
Routine and manual occupations
Marital status 2 categoriesSingle
Married
Ethnicity 3 categoriesWhite
Asian/Black
Mixed/other ethnicities
Economic class 2 categoriesEmployed
Unemployed
microsimulation procedure now matches these households (orindividuals) to households (or individuals) which are similarwithin OAs in Leeds: i.e. it effectively ‘clones’ these types ofindividuals in the HSE and assigns the behaviour of thoseindividuals to individuals with the same attributes at the small-area level (the matched variables being provided by the UKCensus). Thus, these two data sets are combined through thespatial microsimulation model to obtain an estimate of thenumber of pregnant women for OAs in Leeds. Variables used inthe model are age, socio-economic class, marital status, ethnicityand economic class. The final collection of sub-categories isshown in Table 2.
To calibrate, or fit this model, we can aggregate the estimatesof the number of births at OA level to the Census ward levelwhere actual data exists. Having done this, the initial run of themodels seemed to under-estimate the number of births in themost deprived areas. This is often the case with microsimulationmodels as not enough very deprived (or indeed very affluenthouseholds) are surveyed in typical household surveys such asthe HSE. As these types of surveys have more middle incomehouseholds the modelled distributions can look a little ‘flat’ inareas of high disadvantage or high affluence. One response to thisis to add an additional deprivation score into the models toweight the number of births further by socio-economic group
00DAFQ Hunslet 227 236 9 4.0
00DAFR Kirkstall 186 238 52 28.0
00DAFS Middleton 315 288 �27 �8.6
00DAFT Moortown 238 251 13 5.5
00DAFU Morley
North
257 256 �1 �0.4
00DAFW Morley
South
352 336 �16 �4.5
00DAFX North 214 213 �1 �0.5
00DAFY Otley and
Wharfedale
240 220 �20 �8.3
00DAFZ Pudsey
North
241 256 15 6.2
00DAGA Pudsey
South
229 235 6 2.6
00DAGB Richmond
Hill
272 247 �25 �9.2
00DAGC Rothwell 225 212 �13 �5.8
00DAGD Roundhay 242 247 5 2.1
00DAGE Seacroft 272 268 �4 �1.5
00DAGF University 227 266 39 17.2
00DAGG Weetwood 174 210 36 20.7
00DAGH Wetherby 227 194 �33 �14.5
00DAGJ Whinmoor 165 186 21 12.7
00DAGK Wortley 287 265 �22 –7.7
M.N. Tomintz et al. / Midwifery 29 (2013) 33–43 39
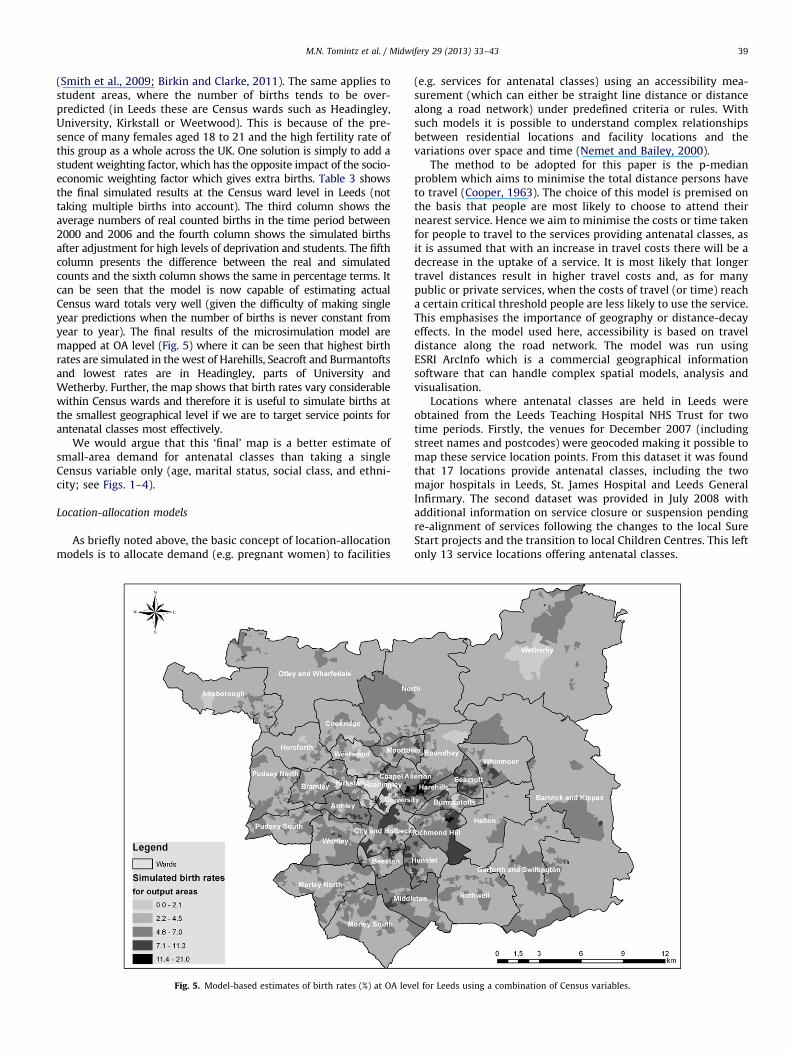
(Smith et al., 2009; Birkin and Clarke, 2011). The same applies tostudent areas, where the number of births tends to be over-predicted (in Leeds these are Census wards such as Headingley,University, Kirkstall or Weetwood). This is because of the pre-sence of many females aged 18 to 21 and the high fertility rate ofthis group as a whole across the UK. One solution is simply to add astudent weighting factor, which has the opposite impact of the socio-economic weighting factor which gives extra births. Table 3 showsthe final simulated results at the Census ward level in Leeds (nottaking multiple births into account). The third column shows theaverage numbers of real counted births in the time period between2000 and 2006 and the fourth column shows the simulated birthsafter adjustment for high levels of deprivation and students. The fifthcolumn presents the difference between the real and simulatedcounts and the sixth column shows the same in percentage terms. Itcan be seen that the model is now capable of estimating actualCensus ward totals very well (given the difficulty of making singleyear predictions when the number of births is never constant fromyear to year). The final results of the microsimulation model aremapped at OA level (Fig. 5) where it can be seen that highest birthrates are simulated in the west of Harehills, Seacroft and Burmantoftsand lowest rates are in Headingley, parts of University andWetherby. Further, the map shows that birth rates vary considerablewithin Census wards and therefore it is useful to simulate births atthe smallest geographical level if we are to target service points forantenatal classes most effectively.
We would argue that this ‘final’ map is a better estimate ofsmall-area demand for antenatal classes than taking a singleCensus variable only (age, marital status, social class, and ethni-city; see Figs. 1–4).
Location-allocation models
As briefly noted above, the basic concept of location-allocationmodels is to allocate demand (e.g. pregnant women) to facilities
Fig. 5. Model-based estimates of birth rates (%) at OA lev
(e.g. services for antenatal classes) using an accessibility mea-surement (which can either be straight line distance or distancealong a road network) under predefined criteria or rules. Withsuch models it is possible to understand complex relationshipsbetween residential locations and facility locations and thevariations over space and time (Nemet and Bailey, 2000).
The method to be adopted for this paper is the p-medianproblem which aims to minimise the total distance persons haveto travel (Cooper, 1963). The choice of this model is premised onthe basis that people are most likely to choose to attend theirnearest service. Hence we aim to minimise the costs or time takenfor people to travel to the services providing antenatal classes, asit is assumed that with an increase in travel costs there will be adecrease in the uptake of a service. It is most likely that longertravel distances result in higher travel costs and, as for manypublic or private services, when the costs of travel (or time) reacha certain critical threshold people are less likely to use the service.This emphasises the importance of geography or distance-decayeffects. In the model used here, accessibility is based on traveldistance along the road network. The model was run usingESRI ArcInfo which is a commercial geographical informationsoftware that can handle complex spatial models, analysis andvisualisation.
Locations where antenatal classes are held in Leeds wereobtained from the Leeds Teaching Hospital NHS Trust for twotime periods. Firstly, the venues for December 2007 (includingstreet names and postcodes) were geocoded making it possible tomap these service location points. From this dataset it was foundthat 17 locations provide antenatal classes, including the twomajor hospitals in Leeds, St. James Hospital and Leeds GeneralInfirmary. The second dataset was provided in July 2008 withadditional information on service closure or suspension pendingre-alignment of services following the changes to the local SureStart projects and the transition to local Children Centres. This leftonly 13 service locations offering antenatal classes.
el for Leeds using a combination of Census variables.

Fig. 6. Service points for antenatal classes in December 2007 and July 2008.
M.N. Tomintz et al. / Midwifery 29 (2013) 33–4340
Fig. 6 shows the locations where antenatal classes were held inDecember 2007 (grey dots) and in July 2008 (black crosses). It canbe seen that some service points remained in the same locationsincluding Wetherby, Cookridge, Horsforth, Kirkstall, Armley,University (where both hospitals are located), Morley North andHunslet. However, it should be noted that not all servicessurviving in July 2008 provide weekly courses. For instance, theservice points in Horsforth and Cookridge alternate antenatalclasses each month. Further, it can be noted that no antenatalclasses were offered in some of the very deprived areas in Leedsduring these time periods, such as Seacroft and Richmond Hill.
Given the discussion above, it is useful to try to locate servicesin such a way that pregnant women have the best opportunitiesto access services. With the help of location-allocation models, itis possible to model different scenarios to see where antenatalclasses should be provided based on demand (see the nextsection).
Findings
Best locations for 13 service points of antenatal classes
The first run of the location-allocation model located thirteenservice points aiming to minimise the travel distance for allpregnant women based on the Leeds road network. Results areshown in Fig. 7 where the grey dots are the existing locations (inJuly 2008) and the centres of the grey ‘spiders’ are the modelledoptimal locations for antenatal classes. The areas reached by eachof the ‘spider’s legs’ are the output areas which are assigned tothis centre. It can be seen that four existing locations match verywell with the optimal ones, but based on the model demandestimates services need to also be located in Aireborough, PudseyNorth, Moortown, Seacroft, Middleton, and between Barwick and
Kippax and Garforth and Swillington. When locating servicesbased on this location-allocation model then the average distancefor women to travel would be reduced from 3.6 km to 2.3 km andthe furthest distance women would need to travel would bereduced from 16.6 km to 10 km.
Impact on accessing a service location when closing more
service points
The next scenario explores the impact on service provisiongiven the possibility that more services have to close. As men-tioned earlier, the Leeds Teaching Hospital NHS Trust has reducedthe number of classes from 17 to 13. In addition, there are fourexisting classes which only operate occasionally and they areclearly under threat also. These service points are located inHorsforth, south of Armley, Hunslet, and Morley North and theseare now removed from the model to explore the impact suchclosure would have on accessing services.
Fig. 8 shows the best locations for only nine service locations(the centre of the grey spider plots indicating the optimallocations) whereas the grey dots are the actual nine servicelocations. It can be seen that services would need to be offerednot only in central Leeds (where a higher population densityexists) but also in the suburbs including the north-east and north-west, the east, south and west of Leeds. The larger ‘spiders’ reflectthe fact that these service locations now need to cover a largergeographical area (such as the west of Leeds) and hence morepregnant women than were seen for the 13 locations in Fig. 7.
Estimating pregnant women in lower socio-economic groups
The final scenario shows an example of how to target servicesbased on a specific group of pregnant women. As a key UKGovernment aim is to give more attention to ‘hard to reach’
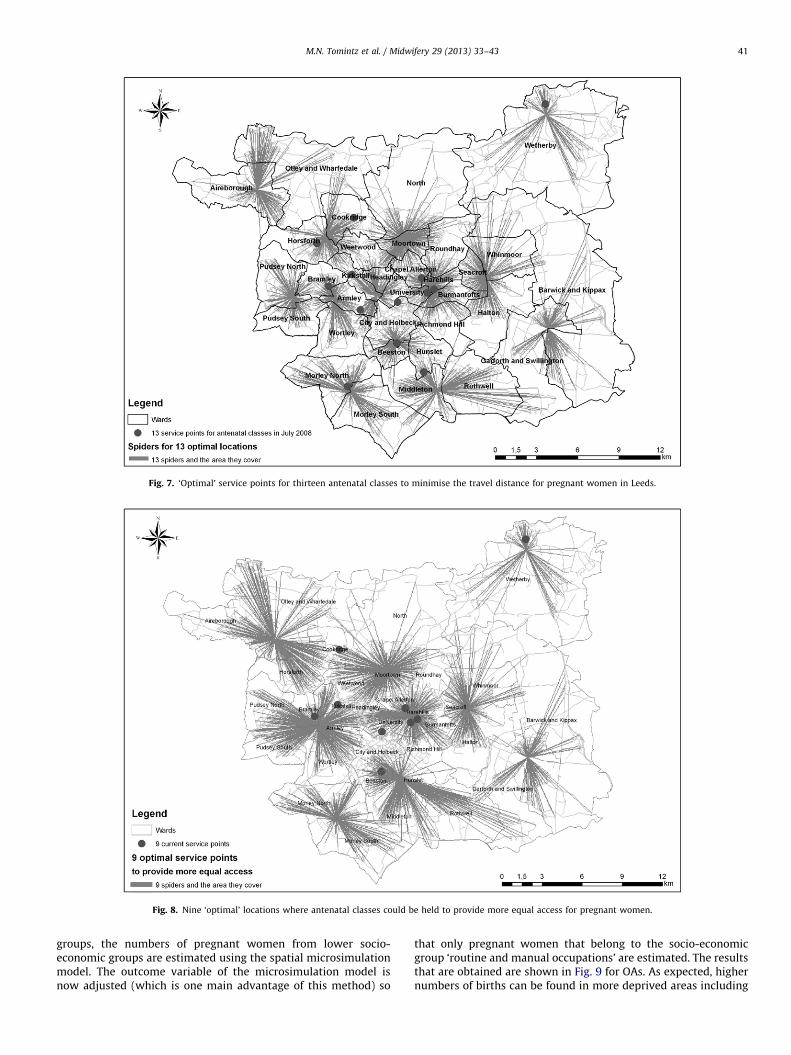
Fig. 8. Nine ‘optimal’ locations where antenatal classes could be held to provide more equal access for pregnant women.
Fig. 7. ‘Optimal’ service points for thirteen antenatal classes to minimise the travel distance for pregnant women in Leeds.
M.N. Tomintz et al. / Midwifery 29 (2013) 33–43 41
groups, the numbers of pregnant women from lower socio-economic groups are estimated using the spatial microsimulationmodel. The outcome variable of the microsimulation model isnow adjusted (which is one main advantage of this method) so
that only pregnant women that belong to the socio-economicgroup ‘routine and manual occupations’ are estimated. The resultsthat are obtained are shown in Fig. 9 for OAs. As expected, highernumbers of births can be found in more deprived areas including
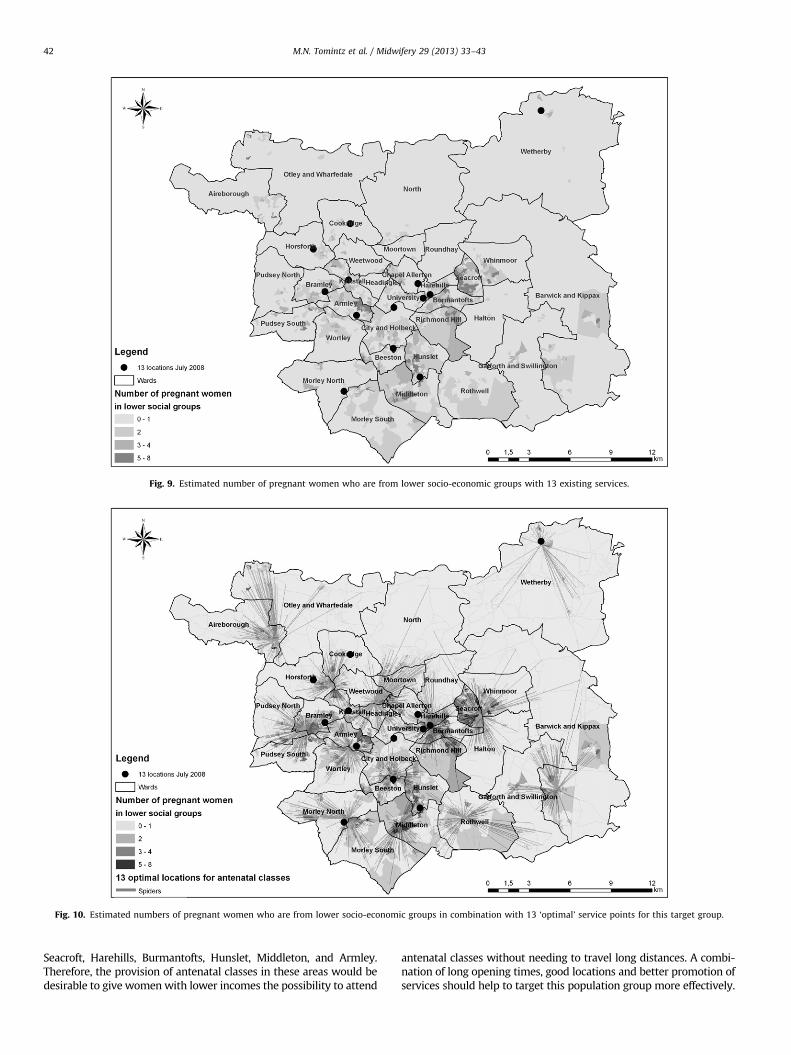
Fig. 9. Estimated number of pregnant women who are from lower socio-economic groups with 13 existing services.
Fig. 10. Estimated numbers of pregnant women who are from lower socio-economic groups in combination with 13 ‘optimal’ service points for this target group.
M.N. Tomintz et al. / Midwifery 29 (2013) 33–4342
Seacroft, Harehills, Burmantofts, Hunslet, Middleton, and Armley.Therefore, the provision of antenatal classes in these areas would bedesirable to give women with lower incomes the possibility to attend
antenatal classes without needing to travel long distances. A combi-nation of long opening times, good locations and better promotion ofservices should help to target this population group more effectively.
M.N. Tomintz et al. / Midwifery 29 (2013) 33–43 43
The results from Fig. 9 are now used as the demand variable inthe location-allocation model. Fig. 10 shows the 13 best locationsfor antenatal classes to support pregnant women from this lowersocial class background (to have more equal access to services).Areas with high estimations of the target group are found inSeacroft (especially in the west of Seacroft) where a location forantenatal classes would certainly be required. Further highdemand is found in Harehills, Burmantofts, Richmond Hill,Middleton, and Armley where the model now locates moreservices in these areas.
Discussion and conclusions
A key UK government aim is to provide more health serviceswithin communities to reduce inequalities in access to services.However, challenges due to increasing birth rates, shortages ofstaff and lack of resources for new facilities can provide a barrierto access. When antenatal classes have to close, or are withdrawndue to a lack of staff, pregnant women who want to attend aservice have either to travel further distances or they have to payto attend private and voluntary sector paid-for classes. Unfortu-nately, this has most impact on more deprived women who donot have the income to pay for antenatal classes and therefore therisk occurs that pregnant women from lower income commu-nities may not attend antenatal classes at all.
The results presented in this paper highlight that it is possibleto plan the location of antenatal classes more effectively byincreasing physical access to a set of more decentralised facilitiesand thus, it is hoped, increasing the attendance rate. Although weprovide a case study of Leeds, UK, this type of analysis could bereproduced for any region. It was shown that the applied modelsare powerful for demonstrating different scenarios concerningwhere to locate service points based on different criteria. Theanalysis was based on demand assigned to Census output areasand the accessibility measure was based on a road network. Thereare a number of limitations in this analysis. Firstly, we did notinclude public transport networks in detail. This will be an issuein more disadvantaged areas where people are less likely to own acar. Another layer of analysis to include this would be useful infuture research. Secondly, we have assumed that all nodes on theroad network are possible locations for a service point. In reality,certain areas may simply not be feasible as no opportune sitescould be found. Third, different types of services (Children’sCentres, Teenage classes, etc.), opening hours and capacity arenot considered in detail in the model, although again could formpart of future research to sophisticate the analysis further.Another limitation is that we assume that women travel fromtheir home location to their nearest antenatal class. However,especially in early stages of pregnancy women often still workand therefore could use the nearest location from their workplaceinstead of home place to visit antenatal classes. Incorporatingflows from work locations is another future research strategy.Finally, we note that, at the time of the study, the monitoring ofantenatal attendance rates was ad-hoc and cannot be used todraw on the levels of access. To have detailed information from allservice points would be valuable as further analysis could then beundertaken to explore variations in actual catchment area sizeand shape, and on the geodemographics of non-attendees (basedon age, social class, etc.).
Despite those limitations, we believe the spatial microsimula-tion approach, provides a useful modelling methodology forestimating births by small area, which are otherwise not availableor accessible. Further, the outcome variable (births by demo-graphic group) can be altered based on the area of policyapplication. For instance, the number of total births by women
can be simulated but so too can the numbers of births by differentage groups or socio-economic groups. The analysis in this papershows the potential of combining microsimulation estimates ofthe number of births with location-allocation models to findoptimal locations for providing antenatal classes (by minimisingthe distance to travel for the target group) which was not donebefore in this context. The findings of this paper can effectivelyinform service providers and commissioners with their decisionson managing and operationalising antenatal classes.
Acknowledgements
The authors are grateful to the White Rose Consortium forfunding this research. Thanks also go to the Leeds Teaching HospitalNHS Trust for their assistance and providing the necessary data sets.Special thanks go to Julie Scarfe, Head of Midwifery, for reading andimproving upon the final version of the manuscript.
References
Ballas, D., Rossiter, D., Thomas, B., Clarke, G.P., Dorling, D., 2005. GeographyMatters: Simulating the Local Impacts of National Social Policies. JosephRowntree Foundation, York.
Birkin, M., Clarke, G., 2011. Enhancing the calibration of spatial microsimulationmodels by adding geodemographics. Working Paper. School of Geography,University of Leeds.
Cliff, D., Deery, R., 1997. Too much like school: social class, age, marital status andattendance/non-attendance at antenatal classes. Midwifery 13, 139–145.
Clift-Matthews, V., 2007. Maternity services suffer again. British Journal ofMidwifery 14 (4), 184.
Cooper, L., 1963. Location-allocation problems. Operations Research 11 (3), 331–343.Cromley, E.K., McLafferty, S.L., 2002. GIS and Public Health. The Guildford Press,
New York.Department of Health, 2004. National Service Framework for Children, Young
People and Maternity Services. HMSO, London.Department of Health, 2006. Our Health, Our Care, Our Say: A New Direction for
Community Services. HMSO, London.Department of Health, 2007. Maternity Matters: Choice, Access and Continuity of
Care in a Safe Service. HMSO, London.Edwards, K.L., Clarke, G.P., 2009. The design and validation of a spatial micro-
simulation model of obesogenic environments for children in Leeds, UK:SimObesity. Social Science & Medicine 69 (7), 1127–1134.
Hamlyn, B., Brooker, S., Oleinikova, K., Wands, S., 2000. Infant Feeding 2000.HMSO, London.
Hirst, J., Eisner, M., 1999. Narrowing the gap: social class, age and ethnicdifferences in maternity outcomes. In: Marsh, G., Renfrew, M. (Eds.), Commu-nity-Based Maternity Care. Oxford University Press, Oxford, pp. 175–194.
Madhok, R., Hameed, A., Bhopal, R., 1998. Satisfaction with health services amongthe Pakistani population in Middlesbrough, England. Journal of Public HealthMedicine 20 (3), 295–301.
Making Leeds Better, 2005. Maternity care pathway. /http://www.makingleedsbetter.org.uk/index.php?id=54S (last accessed 23 January 2007).
McMillan, A.S., Barlow, J., Redshaw, M., 2009. Birth and Beyond: A Review of theEvidence about Antenatal Education. Department of Health, London, UK.
Nemet, G.F., Bailey, A.J., 2000. Distance and health care utilization among the ruralelderly. Social Science & Medicine 50 (9), 1197–1208.
Redshaw, M., Heikkila, K., 2010. Delivered with Care: A National Survey ofWomen’s Experience of Maternity Care 2000. National Perinatal EpidemiologyUnit, University of Oxford.
Smith, D.M., Pearce, J.R., Harland, K., 2011. Can a deterministic spatial microsimulationmodel provide reliable small-area estimates of health behaviours? An example ofsmoking prevalence in New Zealand. Health & Place 17, 618–624.
Smith, D.M., Clarke, G.P., Harland, K., 2009. Improving the synthetic data genera-tion process in spatial microsimulation models. Environment and Planning A41 (5), 1251–1268.
Smith, D.M., Harland, K., Clarke, G.P., 2007. SimHealth: estimating small areapopulations using deterministic spatial microsimulation in Leeds and Bradford.Working Paper 07/06. School of Geography, University of Leeds.
Tanser, F., Gething, P., Atkinson, P., 2010. Location-allocation planning. In: Brown,T., McLafferty, S., Moon, G. (Eds.), A Companion to Health and MedicalGeography. Blackwell Publishing Ltd., UK, pp. 540–566.
TNS for the COI Communications (on behalf of Department of Health), 2005. NHSMaternity Services Quantitative Research. Report, October 2005.
Tomintz, M.N., Clarke, G.P., Rigby, J.E., 2009. Planning the location of stop smokingservice at the local level: a geographic analysis. Journal of Smoking Cessation4 (2), 61–73.