
SECOND TRIMESTER ANTENATAL UMBILICAL COILING ...
133
SECOND TRIMESTER ANTENATAL UMBILICAL COILING INDEX AND ITS DOPPLER FLOW CHARACTERISTICS AND PERINATAL OUTCOME PROSPECTIVE STUDY DISSERTATION SUBMITTED TO In partial fulfillment of the requirement for the degree of DOCTOR OF OBSTETRICS AND GYNAECOLOGY (Branch II) M. S. (OBSTETRICS AND GYNAECOLOGY) of THE TAMIL NADU DR. M. G. R MEDICAL UNIVERSITY CHENNAI- 600032 DEPARTMENT OF OBSTETRICS AND GYNAECOLOGY TIRUNELVELI MEDICAL COLLEGE TIRUNELVELI- 11 MAY 2019
-
Upload
khangminh22 -
Category
Documents
-
view
3 -
download
0
Transcript of SECOND TRIMESTER ANTENATAL UMBILICAL COILING ...

SECOND TRIMESTER ANTENATAL UMBILICAL COILING INDEX
AND ITS DOPPLER FLOW CHARACTERISTICS AND PERINATAL
OUTCOME
PROSPECTIVE STUDY
DISSERTATION SUBMITTED TO
In partial fulfillment of the requirement for the degree of
DOCTOR OF OBSTETRICS AND GYNAECOLOGY
(Branch II) M. S. (OBSTETRICS AND GYNAECOLOGY)
of
THE TAMIL NADU DR. M. G. R MEDICAL UNIVERSITY
CHENNAI- 600032
DEPARTMENT OF OBSTETRICS AND GYNAECOLOGY
TIRUNELVELI MEDICAL COLLEGE
TIRUNELVELI- 11
MAY 2019

BONAFIDE CERTIFICATE
This is to certify that the dissertation entitled “SECOND TRIMESTER
UMBILICAL COILING INDEX AND ITS DOPPLER FLOW
CHARACTERISTICS AND PERINATAL OUTCOME -PROSPECTIVE
STUDY” submitted by Dr.Sharmila.S.Vandhana to the Tamilnadu Dr. M.G.R
Medical University, Chennai, in partial fulfillment of the requirement for the
award of M.S. Degree Branch – II (Obstetrics and Gynaecology) is a bonafide
research work carried out by her under direct supervision & guidance.
Prof. Dr.M.Sujatha, M.D.,O.G.,Department of Obstetrics and Gynaecology,
Tirunelveli Medical College,Tirunelveli- 627011.
Dr. Ramalakshmi, M.D., D.G.O.,Professor and Head,
Department of Obstetrics and Gynaecology,Tirunelveli Medical College
Tirunelveli- 627011.

CERTIFICATE
This is to certify that “SECOND TRIMESTER ANTENATAL
UMBILICAL COILING INDEX AND ITS DOPPLER FLOW
CHARACTERISTICS AND PERINATAL OUTCOME -PROSPECTIVE
STUDY”. presented here in by Dr.Sharmila .S. Vandhana is an original work
done in the Department of Obstetrics and Gynaecology, Tirunelveli Medical
College Hospital, Tirunelveli for the award of Degree of M.S. (Branch II)
Obstetrics and Gynaecology under my guidance and supervision during the
academic period of 2016 -2019.
The DEANTirunelveli Medical College,
Tirunelveli - 627011.

DECLARATION
I solemnly declare that the dissertation titled “SECOND TRIMESTER
ANTENATAL UMBILICAL COILING INDEX AND ITS DOPPLER
FLOW CHARACTERISTICS AND PERINATAL OUTCOME-
PROSPECTIVE STUDY” is done by me at Tirunelveli Medical College
hospital, Tirunelveli. I also declare that this bonafide work or a part of this work
was not submitted by me or any others for any award, degree, or diploma to any
other University, Board, either in or abroad.
The dissertation is submitted to The Tamilnadu Dr. M.G.R.Medical
University towards the partial fulfilment of requirements for the award of M.S.
Degree (Branch II) in Obstetrics and Gynaecology.
Place: TirunelveliDate:
Dr.Sharmila .S.VandhanaPostgraduate Student,
M.D Obstetrics and Gynaecology,Department of Obstetrics and Gynaecology,
Tirunelveli Medical CollegeTirunelveli.

ACKNOWLEDGEMENT
I am extremely thankful to Dr.S.M.Kannan, M.S., M.ch., Dean,
Tirunelveli Medical College, for granting me permission to undertake the study.
My sincere thanks to Prof. Dr.M.Sujatha. M.D.,O.G., Professor,
Department of Obstetrics and Gynaecology for her expert guidance and support
for the completion of the study.
I am extremely thankful to Dr. Ramalakshmi, M.D., D.G.O.,
Professor and Head of the Department of Obstetrics and Gynaecology for
granting me permission to undertake the study.
I am very grateful to Dr. Sheeba Rosatte Victor, M.D., D.G.O., and
Dr.Muthu Prabha , M.D.,O.G, and Dr. Tamil Kothai,M.D., OG., Additional
Professors, Department of Obstetrics and Gynaecology, for their valuable
suggestions and guidance in preparing this dissertation.
I am grateful to DR.Nancy Dora, DMRD, DNB, HOD Department of
Radiodioagnosis for her support.
My grateful thanks to the Assistant Professors of Department of
Obstetrics and Gynaecology, for their immense help during this study.
Thanks to my fellow post graduates and family members who assisted me
throughout the study.
I acknowledge the cooperation of the patients without whom this study
would not have been possible.

CERTIFICATE – II
This is certify that this dissertation work title “SECOND TRIMESTER
ANTENATAL UMBILCAL COILING INDEX AND ITS DOPPLER
FLOW CHARACTERISTICS AND PERINATAL OUTCOME-
PROSPECTIVE STUDY” of the candidate Dr.Sharmila.S.Vandhana with
registration Number 221616352 for the award of M.S. Degree in the branch of
OBSTETRICS AND GYNAECOLOGY (II). I personally verified the
urkund.com website for the purpose of plagiarism check. I found that the
uploaded thesis file contains from introduction to conclusion page and result
shows 12% percentage of plagiarism in the dissertation.
Guide & Supervisor sign with Seal.


CONTENTS
l. N Title Page No.
1 INTRODUCTION 1
2 REVIEW OF LITERATURE 3
3 AIM AND OBJECTIVE 35
4 MATERIALS AND METHODS 36
5 RESULTS AND ANALYSIS 45
6 DISCUSSION 85
7 SUMMARY 97
8 CONCLUSION 100
9 BIBLIOGRAPHY
10 ANNEXURE
i. Data Collection Proforma
ii. Master Chart
iii. Abbreviations

1
INTRODUCTION
The umbilical cord is the essential lifeline of fetus supplying nutrients,
oxygen and fluids necessary for life in utero. The trivascular conduit is well
protected by Whartons jelly, amniotic fluid and the helical pattern or coiling of
vessels.
Coiling makes the umbilical cord more flexible and strong and also provides
resistance to the external force that could compromise the blood flow to the
foetus. The coiling property of umbilical cord was first described by Berengarius
in 1521 and first quantified by Edmonds in 1954(4). The term umbilical cord
coiling index was introduced by Strong et al. (6)
Coiling of umbilical cord and its blood flow pattern has been the subject of
various anatomical and sonographic studies. These studies considered the
development, structure of umbilical cord, its blood flow pattern and assessed
utility of sonography to detect abnormal coiling and its blood flow pattern in
utero as a marker of foetal compromise. A number of publications have
appeared in the recent years about the abnormalities in cord coiling(10,11,12) .These
studies have shown the relationship between abnormal umbilical cord coiling to
adverse perinatal outcome. Very few studies have assessed blood flow
characteristics utilizing Doppler ultrasound and its association with umbilical
cord coiling index and perinatal outcome(21,22). Since both hypocoiling and
hypercoiling are associated with adverse perinatal outcome, we hypothesized

2
that abnormal coiling index may be associated with abnormal cord blood flow
pattern and adverse perinatal outcome.
Abnormal umbilical cord coiling and abnormal umbilical cord blood flow
pattern has been found to be associated with adverse perinatal outcomes like
intrauterine death, increased interventional delivery, fetal distress and increased
neonatal intensive care admissions(7,8). Hence if the coiling index and its Doppler
blood flow characteristics were measured antenatally, it would act as a predictor
of adverse perinatal outcome.
This study was done to determine whether abnormal umbilical cord coiling
patterns and its blood flow parameters measured sonographically between 20 to
28 weeks of gestation are associated with adverse perinatal outcomes.

3
REVIEW OF LITERATURE
The umbilical cord or the funiculus umbilicalis is essential for the survival
and wellbeing of the developing foetus. This trivascular channel allows
sufficient foetal blood to flow into and out from the placenta. It provides
nutrients and oxygen necessary for life in utero. The cord comprising of an outer
layer of amnion, a porous Whartons jelly, two umbilical arteries and one
umbilical vein are designed to maintain the blood flow to developing foetus.
Whartons jelly, amniotic fluid and helical pattern of coiling of the umbilical
vessels protects the umbilical cord. Cord is the most vulnerable connection
between the mother and the foetus susceptible to damage as it floats freely in the
amniotic fluid.
Development:
Gastrulation, the most characteristic event occurring during the third week of
gestation results in the formation of Trilaminar disc which consists of three germ
layers namely Ectoderm, Mesoderm and Endoderm(1). The first germ layer to be
formed is Endoderm followed by Ectoderm and lastly Mesoderm. A cavity
appears on the ectodermal side of the disc which is called the amniotic cavity.
Another cavity called the primary yolk sac develops on the endodermal side. The
trophoblast and underlying somatopleuric mesoderm (extra embryonic
mesoderm) form a membrane called the Chorion. The cells forming wall of the
cavity forms the amnion. Once the extraembryonic coelom is formed, the yolk
sac becomes smaller in size and is lined by cubical cells and is referred to as

4
Secondary yolk sac. There occurs a progressive increase in the size of the
embryonic disc. This increase in length results in its bulging into the amniotic
cavity. With further enlargement, the embryonic disc folds on itself at cranial
and caudal ends – referred to as head and tail folds.
The developing embryo along with amniotic cavity and yolk sac is suspended
in the extra embryonic coelom and is attached to the wall of blastocyst by a thin
un split part of extra embryonic mesoderm which later forms a structure called
Connecting stalk. Connecting stalk is the only connection between the embryo
and the placenta and its attachment becomes relatively smaller as the embryo
grows and is seen only near the caudal end. With the formation of tail fold, the
attachment of connecting stalk moves to the ventral aspect of the embryo and is
now attached in the region of umbilical opening.

5
Figure 1 Development of umbilical cord at 5 weeks and 10 weeks of gestation
By now blood vessels have developed in the embryo and placenta which are
interconnected by two arteries and two veins present in the connecting stalk.
Later right vein disappears. At this stage, the amnion has a circular attachment to
the margins of umbilical opening and forms a wide tube which contains:
1. Vitellointestinal duct and remnants of the yolk sac.
2. Whartons jelly
3. Blood vessels: 2 arteries and one vein
4. A small part of extra embryonic coelom
6
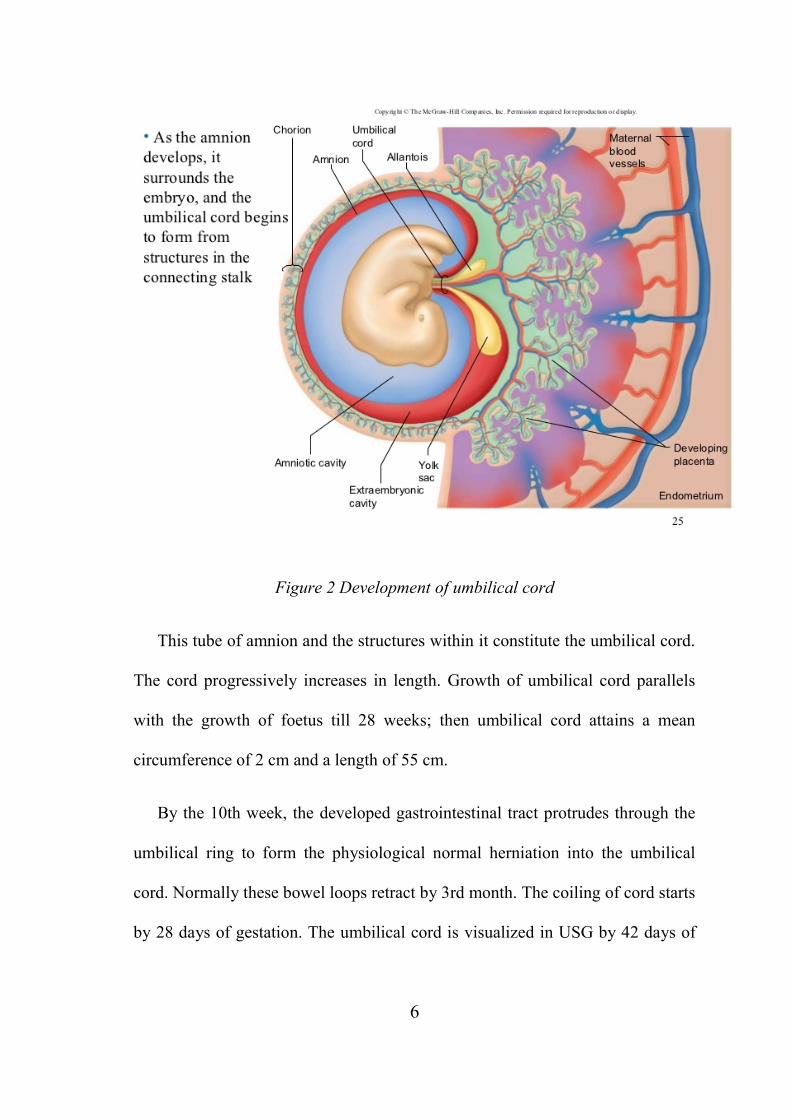
Figure 2 Development of umbilical cord
This tube of amnion and the structures within it constitute the umbilical cord.
The cord progressively increases in length. Growth of umbilical cord parallels
with the growth of foetus till 28 weeks; then umbilical cord attains a mean
circumference of 2 cm and a length of 55 cm.
By the 10th week, the developed gastrointestinal tract protrudes through the
umbilical ring to form the physiological normal herniation into the umbilical
cord. Normally these bowel loops retract by 3rd month. The coiling of cord starts
by 28 days of gestation. The umbilical cord is visualized in USG by 42 days of

7
gestation and well established by 8-9 weeks of gestation and appears as twisted
rope like echogenic structure(2).
Figure 3 Umbilical cord development with allantois
Foetal Circulation
Oxygenated blood from the placenta reaches the fetus through the
umbilical vein which joins the left branch of portal vein. Through the ductus
venosus, major portion of blood passes through the inferior vena cava and minor
portion through the substance of liver into the inferior vena cava.
Most of the oxygenated blood reaches the right atrium through the
inferior vena cava and pass through the foramen ovale into the left atrium, the
rest of the blood gets mixed up with the deoxygenated blood from the superior
vena cava and passes into the right ventricle(1). From the right ventricle blood
enters pulmonary trunk, most of which is deoxygenated. Only a small portion of
this blood reaches the lungs from where it passes into the left atrium. Major

8
portion of the blood passes via the ductus arteriosus into the aorta. So the blood
in left atrium is rich in oxygen and passes into the left ventricle from where it
reaches the aorta. Some portion of this oxygen rich blood reaches the brain, the
head and neck and the upper extremities through the carotid and the subclavian
arteries. Rest of the blood gets mixed up with poorly oxygenated blood from
ductus arteriosus. So those parts of the body supplied by branches of aorta
arising distal to its junction with the ductus arteriosus receive blood with
moderate oxygen.
Figure 4 Foetal circulation before birth

9
Changes in circulation at birth
Soon after birth several changes occur in the fetal circulation which leads
to establishment of adult type of circulation.
1. Muscles in the wall of umbilical arteries contract immediately after birth
leading to occlusion of their lumen which prevents the loss of fetal blood to
placenta.
2. The lumen of umbilical vein and ductus venosus also get occluded, but few
minutes after birth. This provides enough time for the fetal blood that’s in the
placenta to drain back into the fetus.
3. The ductus arteriosus also get occluded so that blood from right ventricle now
reaches the lungs where it is oxygenated.
4. There occurs an increase in size of pulmonary vessels which causes a larger
volume of blood to reach the left atrium from the lungs which in turn results in
an increase in pressure within the left atrium. At the same time pressure in the
right atrium is decreased because blood from the placenta no longer reaches right
atrium. All these changes result in an increase in pressure within the left atrium
compared with right atrium, causing closure of foramen ovale.
The occluded vessels in course of time are replaced by fibrous tissue
resulting in formation of various ligaments. Umbilical arteries form the medial
umbilical ligaments. Left umbilical vein forms the ligamentum teres. Ductus

10
venosus forms ligamentum venosum and ductus arteriosus forms the ligamentum
arteriosum.
Figure 5 Foetal circulation after birth
Morphology of umbilical cord
At term a normal umbilical cord is about 50-60 cm in length and range varies
between 30 to 100 cm. The average diameter is around 2 cm and varies between
1 to 2.5 cm. Umbilical cord appears to be moist and is dull white in colour. The

11
umbilical cord vessels are entrenched within a proteoglycan rich matrix known
as Whartons jelly surrounded by a thin layer of amnion(3). Whartons jelly was
named after Thomas Wharton (1614-1673), an English physician who first
described it. Whartons jelly cushions the umbilical vessels and thus prevents
disruption of blood flow due to compression or bending caused by foetal
movement and uterine contraction. Whartons jelly is metabolically active
throughout the pregnancy and is composed of an interconnecting cavity and
canalicular structures that facilitates transfer of water and metabolites between
amniotic fluid and umbilical blood vessels.
Helical course of the arteries around the vein determines the characteristic
structure of the umbilical cord. There are usually 10 to 11 coils between the fetal
umbilical ring and the placental insertion. Umbilical cord is a dynamic structure
and its morphology is influenced by a number of factors like - amount of
amniotic fluid and its composition, gestational age, foetoplacental
haemodynamics and maternal conditions complicating pregnancy.
Characteristic features of umbilical cord vessels
The cord contains two umbilical arteries and one umbilical vein. The
walls of umbilical arteries lack internal and external elastic lamina and are
replaced by mucous connective tissue. The umbilical vein possess a thickened
muscular layer with inter mingling oblique, circular, longitudinal smooth muscle
fibers as well as internal elastic lamina. The tunica media of these vessels
contain inter decussating helicoidal smooth muscle bundles instead of the usual

12
circular longitudinal fibers. The vascular tone of vessels is modified by
prostaglandins. These vessels are devoid of nerve fibers and vasa vasorum. The
outer surface of umbilical arteries have furrows knows as inner folds of Hoboken
and it alternates with dilated nodes of Hoboken. During spasm these structures
occlude the vessels and provide intrinsic capacity to control bleeding.
Figure 6 Morphology of umbilical cord vessels
Special features of umbilical vein
The umbilical vein pressure increases from 4.5mmHg at 18 weeks to
6mmHg at term(20,25). The area of vein is 30% larger than combined area of
arteries so the velocity of blood flow is half as slow as velocity in either
arteries(19). Blood flow through the umbilical vein is due to pressure gradient
during the cardiac cycle leading to decreased preload allowing blood from the
umbilical vein to reach the heart. The pressure gradient changes occurring during
fetal breathing movements also alter the blood flow such that the velocity of
blood flow increases during inspiration.

13
Coiling of cord
Coiling property was first described by Berengarius in 1521. A coil is
described as complete 360 degree of spiral course of umbilical vessels around
Whartons jelly. In1954 Edmonds et al(4) first quantified the umbilical coiling by
dividing the number of coils by umbilical cord length and called it as “THE
INDEX OF TWIST". He also postulated that umbilical cord coiling occurred as
a result of rotatory movement imparted to the embryo. Coiling can be either
clockwise (right sided) or anticlockwise (left sided). Studies have shown that left
sided coiling (85%) is more common than right sided coiling (15%) with a ratio
of 7:1(2,5). Handedness was believed to be a factor that determines the direction
of coiling because the ratio of right handed to left handed people in the world is
roughly 7:1, which is same as the ratio of anticlockwise to clockwise coiling of
umbilical cord. Later Strong et al eliminated the Bidirectional scores and named
it “THE UMBILICAL CORD COILING INDEX”(6).
According to Simpson, twisting of umbilical cord occurred as a result of
rotational torque which leads to differential blood flow between the left and right
umbilical arteries.
Coiling makes the cord more flexible, strong and provides resistance against
external force that could compromise blood flow to fetus(7).
Mechanism of coiling of umbilical cord is largely unknown; whether it is a
genetically determined or an acquired phenomenon is still a subject of debate.

14
Various hypothesis have been postulated to explain the origin of umbilical cord
coiling which includes
- Fetal movement
- Fetal hemodynamic forces
-Genetic factors
- Umbilical vascular wall mechanism
- Arrangement of muscle fibers (roach muscle fibers) in the umbilical arterial
wall
-Differential umbilical vascular growth rate.
Right umbilical artery is larger than left umbilical artery and so left sided
twisting is more common.
Figure 7 Umbilical cord coiling

15
Umbilical cord coiling index
Umbilical cord coiling index is defined as the number of coils in the
umbilical cord divided by the total length of the cord.
1/ distance in cm
The normal coiling pattern is the rate of 1coil per 5cm which equates to a
coiling index of 0.2/cm. The total number of coil becomes constant in the first
trimester by around 8 weeks whereas the length of cord continues to grow. So
umbilical cord coiling index decreases as the gestational age increases. The rate
of growth of umbilical cord length is about 3cm to 6 cm per month and the
growth rate is more in the second half of pregnancy. So the coiling index in the
third trimester is less than that in the second trimester. The rate of lengthening of
cord varies from individual to individual and so does the umbilical cord index.
The length of umbilical cord cannot be measured antenatally. Hence a
method was devised to measure the coiling index antenatally using
ultrasonogram. Antenatal UCI INDEX is calculated as reciprocal value of
distance between adjacent pair of coils measured in cm from inner edge of
arterial or venous wall to outer edge of next coil along the ipsilateral side.
Average of 3 readings at 3 different segments in the free floating cord is the final
value.

16
1/distance in cm between adjacent pair of coils
Figure 8: Color Doppler ultrasound of the umbilical cord . Umbilical coiling
index is measured from the inner edge of an artery to the outer edge of the same
artery at the adjacent umbilical twist along the ipsilateral cord side.
Cord coiling index less than 0.1 /cm is considered as hypocoiled and more
than 0.3 /cm is considered hypercoiled. A frequency of distribution of umbilical
coiling UCI done by Rana et al(8) concluded that:
<10th percentile Hypocoiled
10-90th percentile Normocoiled
>90th percentile Hypercoiled

17
Figure 9: A NORMOCOILED; B HYPOCOILED; C HYPERCOILED
Umbilical cord thickness depends upon the vessel luminal diameter and
amount of Whartons jelly. UCI is not related to umbilical cord thickness. Cross
sectional area of umbilical cord is calculated in the transverse section in free
floating portion of the cord.
Cross sectional area < 10th percentile: Lean cord
Cross sectional area >90th percentile: Large cord
There have been only a very few studies in literature which assessed the
association between antenatal sonographic umbilical cord coiling index and its
perinatal outcome. Some studies conducted in the early second trimester (14 to
16 weeks) showed that hypocoiling was associated with fetal growth restriction

18
(FGR) but no association was seen with preterm birth, low APGAR or abnormal
fetal heart rate patterns. But certain studies conducted in the mid second
trimester (18 to 23 weeks) showed that hypocoiling and hypercoiling were
associated with FGR and abnormal heart rate patterns(9,10,11,12). Some studies
conducted in the late second trimester (22 to 28 weeks) came to the conclusion
that hypocoiling is associated with FGR, preterm birth, LBW and low
APGAR(13,14,15). Few studies have shown that lean cord is associated with
hypocoiling, reduced venous blood flow and reduced amount of Whartons
jelly(16,18,25,27).
Umbilical blood vessel flow characteristics
Reynolds et al postulated that the umbilical cord is a trivascular pistonless
pulsometer pumping system that acts as a cardiac assist pump to sustain venous
return to placenta(19). Umbilical blood flow occurs as a result of decrease and
increase in venous pressure that are generated from the force of rising limb of
arterial pulse pressure. The presence of arterial coil around the vein along the
length of the cord provides multiple variations. In additive fashion these vascular
coils play a central role in determining blood flow from placenta to fetus. This
mechanism is very important in early gestation, when there is more coiling and
hence more the blood flow, even though placental resistance to blood flow is
partially elevated(23).
According to Poiseuilles law, three factors that influence the blood flow are
viscosity of blood, caliber of the vessel and blood flow velocity(20). Therefore a

19
hypocoiled /uncoiled cord leads to decreased blood flow causing fetal growth
impairment and making it susceptible to external compression(18). Hypercoiling
causes relative increase in resistance at the level of umbilical cord ring causing
congestion of extra abdominal umbilical vein and also increased turbulence in
arteries, all of which leads to a decrease in both arterial and venous flow.
Figure 10 Umbilical cord vessels
Weissman and Raio reported normograms for the diameter of umbilical
vessels showing that diameter of the vessels progressively increases and
gradually plateaus(21).
Degani et al found significant relationship between sonographic UCI and
doppler flow characteristics in the umbilical vein. Both hypo and hypercoiling
were associated with adverse perinatal outcome(22). Barbera demonstrated that

20
umbilical vein blood flow for estimated foetal weight does not change
significantly from 20 weeks of gestation to term(23,24).
Doppler blood flow of the umbilical cord
Umbilical vessel blood flow characteristics are studied by doppler
velocimetry. Before 20 weeks of gestation, the umbilical artery demonstrates
high resistance flow on spectrometry and with advancing age the resistance to
flow decreases. The umbilical artery has a characteristic saw toothed appearance
of arterial flow in one direction whereas umbilical vein blood flow is
continuous(29). These waveforms reflect the fetal cardiac cycle. The Doppler
frequency increases as the Doppler ultrasound beam becomes more aligned to
the flow direction (Angle of isonisation which is the angle between beam and
direction of flow). The Doppler sampling site near the foetal end of the cord
shows a high impedance flow and the portion close to placental end shows poor
wave, so free floating portion of cord is chosen to measure the indices.
The Commonly measured indices in the umbilical arteries:
PEAK SYSTOLIC VELOCITY ( PSV)
END DIASTOLIC VELOCITY(EDV)
RESISTANCE INDEX(RI): PSV-EDV/PSV
SYSTOLIC - DIASTOLIC RATIO(S/D): PSV/EDV
PULSATILITY INDEX(PI): PSV-EDV/Time averaged maximum
velocity
21
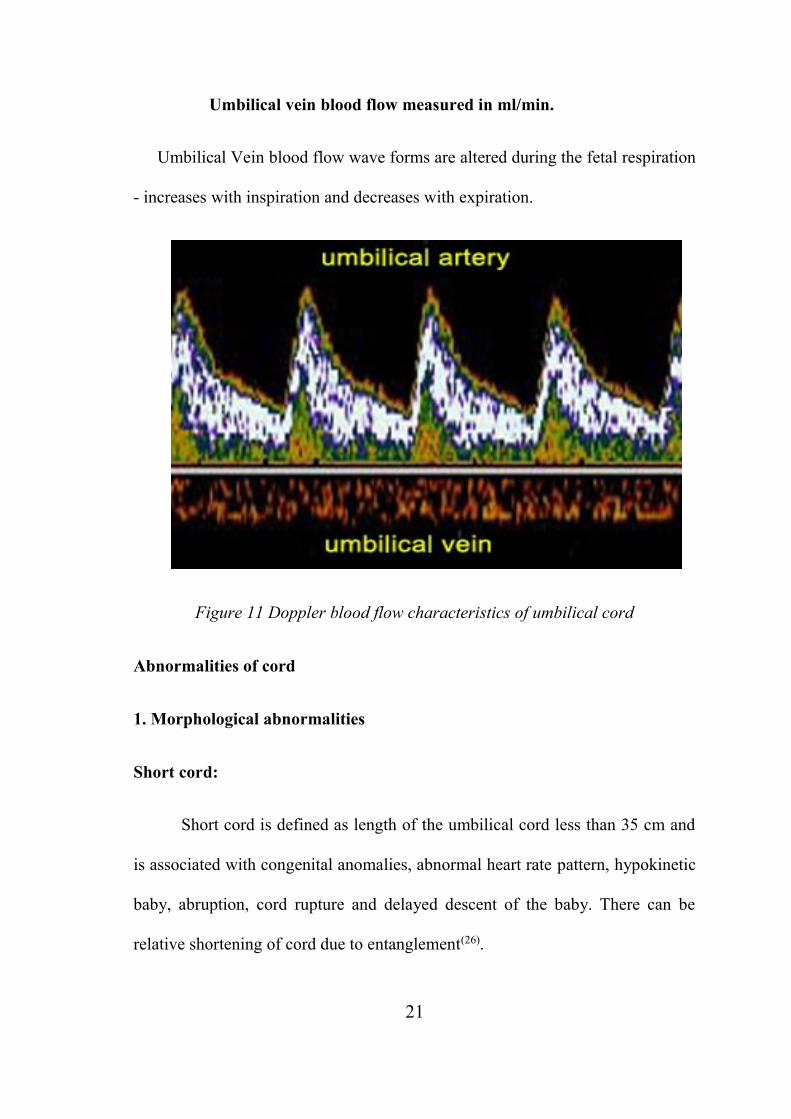
Umbilical vein blood flow measured in ml/min.
Umbilical Vein blood flow wave forms are altered during the fetal respiration
- increases with inspiration and decreases with expiration.
Figure 11 Doppler blood flow characteristics of umbilical cord
Abnormalities of cord
1. Morphological abnormalities
Short cord:
Short cord is defined as length of the umbilical cord less than 35 cm and
is associated with congenital anomalies, abnormal heart rate pattern, hypokinetic
baby, abruption, cord rupture and delayed descent of the baby. There can be
relative shortening of cord due to entanglement(26).

22
Long cord:
Long cord is defined as length of cord more than 70cm and is associated
with cord entanglement, true knot, cord prolapse and hyperkinetic baby.
Lean cord:
Lean cord (cross sectional area <10th percentile) is associated with small
for gestational age, fetal distress, abnormal heart rate pattern and increased
operative deliveries.
Large cord:
Large cord (cross sectional area > 90th percentile) is associated with
increased risk of aneuploidies. Large cord occurs due to excess of
polysaccharides and proteoglycans leading to increased fluid collection.
2. Vascular abnormalities
Single umbilical artery (SUA)
It is the most common umbilical cord anomaly with an incidence of 1%.
It’s present in nearly 0.85% of normal pregnancies and is usually associated with
maternal diabetes, pre eclampsia and epilepsy. Either there may be a congenital
absence of umbilical artery described as agenesis or a poorly developed
umbilical artery termed as hypoplastic / missing / atrophy of vessel. SUA may be
associated with congenital anomalies or can be isolated SUA without any

23
defects. Single umbilical artery is associated with genitourinary anomalies
(16%), aneuploidy (28%), LBW 25 -29% and FGR 34%.
Persistant right umbilical vein
This is due to altered development of cord between 4th to 7th weeks of
gestation and it occurs in 0.1-0.3% of pregnancies. This leads to abnormal course
of blood flow in the fetal liver. It is associated with genitourinary abnormalities,
gastrointestinal, cardiac and skeletal developmental abnormalities.
Aneurysm
Umbilical vein aneurysm is the dilatation of the vein with cord diameter
more than 8 mm causing increased venous pressure. Its etiology is unknown and
is a rare finding commonly associated with chromosomal abnormalities.
Haematoma
This occurs due to rupture of varix of umbilical vein. It is more common
during in utero invasive procedures and causes acute fetal distress.
3. Cord masses
Haemangioma
Haemangioma occurs due to the proliferation of primitive angiogenic
mesenchyme cells seen as hyper echogenic area in the main cord. It is associated
with chromosomal anomalies and MSAF.

24
4. Cord insertion abnormalities
Two most common type of cord insertion anomalies are velamentous
insertion and marginal insertion. Velamentous insertion occurs in 8.7% of twin
gestations and 1.1% of singleton pregnancies. Here the cord inserts in
chorioamniotic membrane and is associated with cord compression, preterm
labour, placental abruption, low APGAR and abnormal fetal heart rate pattern. In
Marginal insertion or Battledore placenta, cord is attached to the margin in 5-7%
of pregnancies. Marginal insertion has a high prevalence in multiple pregnancy
and leads to unequal placental sharing.
5. Lesions of cord
True cord lesions include urachal, allantoic or omphalomesentric duct,
hemangioma, hematoma, pseudocyst or mucoid degeneration of Whartons jelly.
Pseudocord lesions are omphalocele and gastrochisis.
6. Knots
Its incidence is 1%. Knots can be true knot or false knot. True knot is due
to increased fetal movements and seen more in mono amniotic twins and can
lead to fetal loss. False knot is more common due to kink in the umbilical cord
vessel and has no significance.

25
7. Cord strictures
It is the constriction or occlusion of cord due to decreased amount of
Whartons jelly. Strictures cannot be diagnosed antenatally and its etiology is
unknown and can lead to still birth.
8. Cord remnants
Remnant of yolk sac is seen as a small yellow body near the attachment
of cord to the placenta. Meckels diverticulum is the persistence of proximal part
of vitellointestinal duct. Exomphalos is the persistence of herniation of coils of
umbilical cord. True /false cyst of umbilical cord is the remnant of allantois. It is
associated with hydronephrosis, urachus and omphalocoele(26).
STUDIES ON UMBILICAL CORD COILING INDEX AND BLOOD
FLOW
Predanic et al, in the year 2005, performed routine foetal anomaly scan
among 425 consecutive women in the second trimester between 18 to 23 weeks
of gestation and studied the antenatal umbilical cord coiling index. Among the
women studied, only 294 antenatal women had adequate data regarding
obstetrics ultrasound, labour and other intrapartum events. The distance between
a pair of coils was measured and its reciprocal was taken as the umbilical cord
coiling index. The index thus calculated was correlated with various adverse
pregnancy outcomes like small for gestational age, mode of delivery, presence of
meconium-stained amniotic fluid, non-reassuring foetal heart rate patterns during

26
labour and Apgar scores at 1 and 5 minutes. The study showed abnormal coiling
index in 58 patients among whom 15 patients (25.7%) had non reassuring foetal
heart rate patterns during labour and 9 patients (15.5%) gave birth to small for
gestational age babies.
In contrast, there was no correlation between umbilical cord coiling
index and Apgar scores at 1 and 5 minutes, mode of deliver or presence of
meconium-stained amniotic fluid in labour. The conclusion of the study was that
abnormal umbilical cord coiling in the second trimester is associated with a
higher prevalence of small for gestational age neonates and non reassuring foetal
heart rate patterns in labour.
J.Rana et al in 1994, examined placentas from 635 deliveries occuring
beyond 24 weeks gestation and studied the umbilical cord coiling pattern. Rate
of fetal heart rate (FHR) disturbances and interventional delivery were higher in
the hypocoiled group (28.6 % versus 15.9% [ P =.01] and 19 % versus 7.1% [ P
=.002], respectively). The subjects with hypercoiled cords compared with those
found to have normocoiled cords had a higher rate of premature delivery (33.3%
versus 12.0% [P =.0006]). Conclusion was that hypocoiled cords could be
predictors of potential interventional delivery and intrapartum FHR disturbances
whereas hypercoiled cords were associated with an increased incidence of
premature delivery and maternal cocaine use.
In a prospective study by De Laat M W in 117 pregnancies, the antenatal
UCI was measured beyond 28 weeks of gestation by ultrasonography. The

27
postnatal UCI (pUCI) was calculated as the number of coils divided by the cord
length in cm. The correlation between aUCI and pUCI was assessed and
likelihood ratios for adverse pregnancy outcome were calculated. Study
concluded that hypocoiling of the cord had greater association with fetal demise,
intrapartum fetal heart rate decelerations, operative delivery, anatomic-
karyotypic abnormalities and chorio-amnionitis. Hypercoiling of the cord had
greater association with fetal growth restriction, intrapartum fetal heart rate
decelerations, vascular thrombosis and cord stenosis.
Degani et al studied 45 normal term fetuses in the laast 24 hours before
delivery. The umbilical coiling index was determined using ultrasound
and doppler flow velocities were obtained from umbilical vessels. Flow
characteristics were correlated with the umbilical coiling index. The mean (+/-
standard deviation) umbilical coiling index was 0.44 +/- 0.11 in the antepartum
period and 0.28 +/- 0.08 after birth. The correlations between sonographic
coiling index and umbilical arterial Doppler flow characteristics (mean velocity,
pulsatility index, resistance index, and systolic-diastolic ratio) were not
significant. The sonographic coiling index was related to time-averaged velocity
and flow in the umbilical vein. A good correlation was found between umbilical
vein flow and the coiling index, with a significant linear trend (r = 0.59, P <
.001). Conclusion was that intrauterine umbilical coiling index determined by
ultrasound correlates well with the actual index at birth. The sonographic

28
umbilical coiling index is related to Doppler flow characteristics in the umbilical
vein.
Predanic et al recorded umbilical coiling patterns and blood flow
characteristics in 200 consecutive pregnant patients in second trimester between
18-23 weeks' gestation. The mean antenatal UCI was 0.40, with 10th and 90th
centiles of 0.20 and 0.60, respectively. The mean +/- SD umbilical artery RI and
PSV and umbilical vein blood flow volume were 0.74 +/- 0.07, 25.1 +/- 6.4
cm/s, and 264 +/- 106 mL/min/kg, respectively. All Doppler variables correlated
significantly with antenatal UCI, with lower RI and higher PSV and umbilical
vein blood flow volume values being associated with higher antenatal UCI (P =
0.016, P < 0.001, and P = 0.032, respectively). However, when stratified by
antenatal UCI into hyper- (above 90th centile), normo- (10th-90th centile), and
hypocoiled (below 10th centile) umbilical cord groups, a significant difference
was observed for PSV only (P = 0.016). It was concluded that more prominent
umbilical coiling (higher antenatal UCI values) had a protective effect on blood
flow in terms of decreased arterial resistance and higher blood flow velocities, as
well as increased venous blood flow. However, due to lack of significant
differences between Doppler characteristics when stratified by antenatal UCI
into hypo-, normo-, and hypercoiled groups, the clinical implications of this
observation were uncertain.
De Nairo et al studied 116 consecutive women with a singleton gestation
who delivered at term and who underwent an ultrasound examination within 24

29
hours from delivery. After delivery, the umbilical coiling index was calculated.
Twelve (10.3%) cases had a lean umbilical cord (area < 10th centile). A
significant correlation was found between the umbilical coiling index and the
umbilical vein blood flow (r = 0.67, P < 0.001). A significant difference between
fetuses with and without a lean cord was found in terms of umbilical coiling
index (0.18 ± 0.08 vs. 0.29 ± 0.09, P < 0.005), cord area (87.6 ± 5.1 mm2 vs.
200.6 ± 34.6 mm2, P < 0.001), Wharton’s jelly amount (25.7 ± 10.3 mm2 vs.
122.1 ± 33.4 mm2, P < 0.001), umbilical vein blood flow (93.7 ± 17.8 ml/kg per
min vs. 126.0 ± 23.4 ml/kg per min, P < 0.001), and umbilical vein blood flow
mean velocity (6.6 ± 2.7 cm/s vs. 9.0 ± 3.6 cm/s, P < 0.05). The proportion of
fetuses with an umbilical vein blood flow < 80 ml/kg per min was higher when
the cord was lean than when it was normal (25% vs. 1.9%, P < 0.01). Conclusion
of the study was that lean umbilical cords differ from normal cords not only
from a structural point of view but also in the umbilical vein blood flow
characteristics. This could explain the increased incidence of intrapartum
complications and foetal growth restriction among foetuses with a lean and/or
hypocoiled cord.
Mana et al studied about the effect of umbilical vein blood flow on
perinatal outcome of fetuses with lean and/or hypo-coiled umbilical cord. They
evaluated the effect of umbilical vein (UV) blood flow measured by colour
directed pulsed wave Doppler on perinatal outcome of fetuses with lean and/or

30
hypocoiled umbilical cord after 24 weeks of gestation in 244 women with
singleton fetus after 24 weeks of gestation. Umbilical cord area, umbilical vessel
cross-sectional area and antenatal umbilical coiling index (UCI) were calculated
and compared with Doppler parameters including UV blood flow volume in
ml/min/kg, UV peak systolic velocity in cm/s, and umbilical artery pulsatility
index. Conclusion of the study was that foetuses with lean and/or hypocoiled
umbilical cord showed a noticeable decrease in UV blood flow of sufficient
magnitude that could affect foetal growth and this could explain the higher
prevalence of foetal intrapartum complications in growth-restricted foetuses.
Yung Sung Jo in his retrospective study of 251 pregnancies, calculated UCI
at 22-28 weeks gestation. The subjects were divided into normocoiled,
hypocoiled and hypercoiled groups and perinatal outcome was compared. The
incidence of preterm deliveries in hypocoiled group was 35%, which was
significantly greater than the normocoiled groups (p=0.041). The incidence of
neonates with low birth weights in the hypocoiled group was 36.4%, which was
significantly greater than the normocoiled groups (p=0.044). In the hypocoiled
group, 27.3% of newborns were admitted to the NICU which was significantly
greater than the normocoiled and hypercoiled groups (p=0.041. Thus it was
observed that hypercoiling of the umbilical cord during the late second trimester
of pregnancy was associated with high risk of preterm delivery and low
birthweight and the admission to the neonatal intensive care unit was increased.

31
Machin G A in his study of 1329 cases referred for placental pathology
services, noticed that 21% of cords were overcoiled and 13% were undercoiled.
Principal clinical correlations found in overcoiled cords were foetal demise
(37%), foetal intolerance to labour (14%), intrauterine growth retardation (10%),
and chorioamnionitis (10%). For undercoiled cords, the frequencies of these
adverse outcomes were 29%, 21%, 15%, and 29%, respectively. Abnormal cord
coiling was associated with thrombosis of chorionic plate vessels, umbilical
venous thrombosis, and cord stenosis.
Ercal T prospectively studied relationship between the number of coils in
the umbilical cord and perinatal outcome in 147 live born neonates. The mean
UCI was 0.20 +/- 10 (SD). Hypocoiled cord had higher incidence of meconium
staining, interventional delivery, Apgar scores, foetal blood pH and intrapartum
foetal heart rate disturbances. He concluded that the UCI had a strong
relationship with perinatal outcome and may be used antenatally as a marker for
identifying the foetus at risk
In a prospective study of 470 patients with singleton pregnancies by
Predanic M, he evaluated relationship between the umbilical cord thickness and
cord coiling patterns during the fetal sonographic anatomic survey in the second
trimester between 18 to 23 weeks. The mean aUCI was 0.41 with 10th and 90th
percentiles of 0.21 and 0.60, respectively. A total of 10.6% (34/321) and 9.3%
(30/321) of patients were categorized as having hypocoiled and hypercoiled
umbilical cords, respectively. The mean cord diameter +/- SD was 9.48 +/- 0.97

32
mm (range 7.0-12.5 mm). Final conclusion was that aUCI, or umbilical coiling
pattern does not correlate with umbilical cord thickness.
Khizer Razak conducted prospective study on 100 pregnant women
between 18 to 24 weeks of gestation and evaluated the relationship of
sonographic measurements of umbilical cord thickness, cross sectional area and
coiling index with perinatal outcome. He observed that hypocoiled cords are
associated with spontaneous preterm labour and low birth weights while
hypercoiled cords are associated with MSAF. The umbilical cord thickness and
cross sectional area are also associated with preterm labour, low birth weight and
NICU admission of the baby.
Bindu Sharma in her prospective study of 600 primigravidas with
uncomplicated singleton pregnancies between 18 and 22 weeks of gestation
assessed aUCI by colour Doppler. The mean aUCI was 0.41. Hypocoiling was
associated with spontaneous preterm delivery (47.87 %), low Apgar score
(52.13 %), LBW (52.59 %), FGR (21.28 %) and NICU admission (76.34 %).
Hypercoiling was associated with preterm deliveries (65.38 %), increased
caesarean sections (61.54 %), meconium staining of liquor (67.31 %), low Apgar
score (63.46 %) and NICU admission (72.55 %). There was a positive strong
correlation between abnormal coiling and low birth weight.
Morteza Tahmasembi studied the relationship of sonographic
measurements of umbilical cord thickness, cross-sectional area and coiling index
with pregnancy outcome in 255 singleton pregnant women from January 2010 to

33
January 2011. A statistically significant correlation was observed between small
umbilical cord thickness and cross-sectional area and low birth weight (LBW),
with sensitivity of 52.9% and 57.9%, specificity of 95.0% and 94.4%, positive
predictive value of 52.6% and 52.0%, and negative predictive value of 95.0%
and 95.0%, respectively. Also noted was significant correlation between small
umbilical cord thickness and cross-sectional area with meconium staining
(P<0.001). No significant correlation was seen between umbilical cord thickness
and cross-sectional area with low 5-min Apgar score. There was no statistically
significant correlation between umbilical cord coiling index and LBW, 5-min
Apgar score, and meconium staining. The study concluded that umbilical cord
diameter and cross-sectional area measured after 20 weeks of gestation are
useful for predicting LBW and meconium staining and have the potential to
serve as markers for adverse pregnancy outcome.
In a prospective analytical study conducted by T.Chitra , umbilical coiling
index was calculated at the time of delivery in 1000 antenatal women. The mean
umbilical coiling index was found to be 0.24 ± 0.09. Hypercoiling (>0.36) was
found to be associated with diabetes mellitus, polyhydramnios, cesarean
delivery, congenital anomalies, and respiratory distress of the newborn.
Hypocoiling (<0.12) was found to be significantly associated with hypertensive
disorders, abruptio placentae, preterm labour, oligohydramnios, and fetal heart
rate abnormalities. The study concluded that abnormal umbilical coiling index is
associated with several antenatal and perinatal adverse features.

34
Shalu Gupta in her study examined 107 cords. The mean UCI was 0.13 ±
0.08. Hypocoiled group had low Apgar score, meconium staining and poor
perinatal outcome. Final conclusion of the study was that hypocoiling is
associated with poor antenatal and perinatal outcome.
In a prospective cohort study done by J M Ndolo in second trimester
between 18 to 24 weeks, 436 singletone pregnancies were included . This study
concluded that abnormal coiling is associated with increased preterm birth.
C. Barbeiri et al in a prospective cross sectional study including 2,310 low-
risk pregnancies between 12 and 40 weeks’ gestation, determined the cross-
sectional area of the umbilical cord, its diameter and the diameter of its vessels
to establish a reference curve for these parameters during pregnancy. Means and
standard deviations (SDs), plus the 10th, 50th and 90th percentiles for each
measurement were calculated using polynomial regression analysis. They
concluded that these parameters increased significantly with gestational age. The
area of the cord also varied significantly with parity.

35
AIM OF THE STUDY
1. To study the correlation between abnormal antenatal umbilical cord
coiling index measured sonographically between 20 to 28 weeks of
gestation and adverse perinatal outcome.
2. To study the correlation between abnormal umbilical vein blood flow
measured sonographically between 20 to 28 weeks of gestation and
adverse perinatal outcome.

36
MATERIALS AND METHODS
Type of study:
Prospective Analytical study
Period of study:
September 2017 to August 2018
Study population
200 antenatal women who visited the antenatal op during the study period
and who met the inclusion and exclusion criteria were included in the study.
Study setting
The study was conducted in the Department of Obstetrics and Gynecology
in Tirunelveli Medical College Hospital, Tirunelveli.
Selection of cases
Inclusion criteria
Booked case
Singleton pregnancy
Willing to participate and have institutional delivery at Tirunelveli
Medical College and Hospital

37
Exclusion criteria
All high risk pregnancies like Gestational Hypertension, Gestational
Diabetes Mellitus, Anemia, Rh negative pregnancies and other
complications.
Multiple gestations
Anomalous baby
Single umbilical artery/placental anomaly
Pre existing medical /surgical illness in the past and present pregnancy
Malpresentations
Previous caesarean section
Inadequate visualisation of cord
Sample size: 200
Sampling technique: Convenient sampling
Study tool
Sonoscape S12 with Color Doppler (Ultrasound frequency 3.5 MHZ)
Study procedure
Antenatal UCI INDEX is calculated as reciprocal value of distance
between pair of coil measured in cm from inner edge of arterial or venous wall to

38
outer edge of next coil along the ipsilateral side of umbilical cord, direction of
coiling from the placental end to fetal end. The final value is the average of 3
readings at 3 different segments in the free floating cord.
1/distance in between adjacent pair of coils in cm
Figure 12 Color Doppler ultrasound showing measurement of the umbilical
coiling index from the inner edge of an artery to the outer edge of the same
artery at the adjacent umbilical twist along the ipsilateral cord side. The coiling
index 0.52

39
Percentiles were computed for each cord parameters studied.
Cord Coiling
<10th percentile: Hypocoiled
10-90th percentile: Normocoiled
>90th percentile: Hypercoiled
.
Umbilical vein blood flow was recorded when the foetus was in a quiescent
state without any body movements and during foetal apnea in the free floating
portion of the umbilical cord. Pulsed colour Doppler examination was done and
angle of isonisation was kept <15 degrees. The umbilical vein internal diameter
was taken in the perpendicular view of longitudinal section of cord by caliper
measurement.
Umbilical vein blood flow was calculated as
ml/min = (UVD x 0.5)2x UVmean x 60
UVmean: mean umbilical vein velocity in cm/s (Time averaged peak velocity
measured)
UVD: Diameter of vein cm
0.5: UV spatial velocity profile coefficient
Jacqueline Spurway et al in her study has proposed normogram for umbilical
vein blood flow according to gestational age.

40
Figure 13: Umbilical vein blood flow
Figure 14: Measurement of umbilical vein diameter

41
< 10th percentile: Decreased blood flow
>97th percentile: Increased blood flow
10th to 97th percentile: Normal blood flow
These measurements were taken only once between 20 to 28 weeks. The
cord parameters obtained with Doppler ultrasound are compared with adverse
perinatal outcomes in terms of gestational age at delivery, intrapartum non-
reassuring cardiotocography, meconium stained amniotic fluid, poor APGAR
score, the neonatal birth weight, and requirement of NICU admission.
Gestational age:
Gestational age is calculated by Naegles rule by adding 9 months and 7 days
to the date of last menstural period. Naegles rule can be applied only when the
women are sure of their last menstural period with regular cycles for last 3
cycles and there should not be any abortion or intake of oral contraceptive pills.
If there is discrepancy of 1 week between the Naegles rule and that assigned by
first trimester ultrasound, then gestational age as assigned by the 1st trimester
ultrasound is taken into consideration.
Colour of liquor:
Colour of liquor is noted, meconium stained liquor is taken into
consideration.

42
Intrauterine death:
The fetal deaths may be due to placental, cord, foetal and maternal
complications. Fetal deaths weighing 500 grams or more occuring during
pregnancy, both antepartum and intrapartum were included. The cause of IUD is
unknown in 25 to 35 %.
Mode of delivery:
For the purpose of study, normal vaginal delivery and operational deliveries
(forceps and vacuum) were included in the vaginal delivery. Emergency
caesarean sections were included ,except those done for malpresentations and
previous caesarean sections.
Fetal heart rate abnormalities:
Cardiotocographs were taken for all patients in labour and were interpreted
using NICE guidelines CG190 (2017) and thus classified as normal, suspicious
and pathological. Suspicious and pathological CTG were considered abnormal.
Birth weight:
All babies were weighed immediately after delivery and the birth weights
less than 2.5 kg were considered as low birth weight. Weight of the babies less
than 10th percentile for that gestational age was considered SGA for the purpose
of study. Sex of the baby was also noted.

43
APGAR score:
APGAR scores were noted at 1 minute and 5 minutes after delivery. An
APGAR of less than 7 at 1 min and 5 min was considered abnormal.
Colour HeartRate Respiration Reflex
ResponseMuscleTone
0 Pale or blue Absent Absent Absent Absent
1
Body pink,
extremities
blue
<100 Irregular
Grimace or
noticeable
facial
movements
Some
flexion of
extremities
2
Body and
extremities
pink
>100
Good
breathing and
crying
Coughs,
sneezes or
pulls away
Active and
spontaneous
movement
of limbs
NICU Admission
Babies admitted to NICU for various conditions like preterm, respiratory
distress syndrome and low birth weight were included in study.
Data management and analysis
Data was coded in the MS-EXCEL and analysed using SPSS software.
Qualitative data was expressed in percentage and analysed using chi square

44
chart. Quantitative data was expressed in mean and standard deviation and
analysed using independent t test.
The continous variables of the study subjects were described in terms of
averages and the category variables were described in terms of percentages.
The relationships between the continous variables were studied by Karl
Pearson correlation coefficient r and the ordinal variables by Spearman rank
correlation rs. The associations between the categorical variables were analyzed
and interpreted by χ2 (Chi-square) test. The statistical procedures were
performed with the help of the statistical package namely IBM SPSS statistics -
20. The P values less than or equal to 0.05 (P≤0.05) were considered as
statistically significant. A p value of less than 0.05 was considered significant.

45
RESULTS AND ANALYSIS
Description of mothers according to their age and obstetric score:
The mothers’ maternal age and obstetric score like gravida was described.
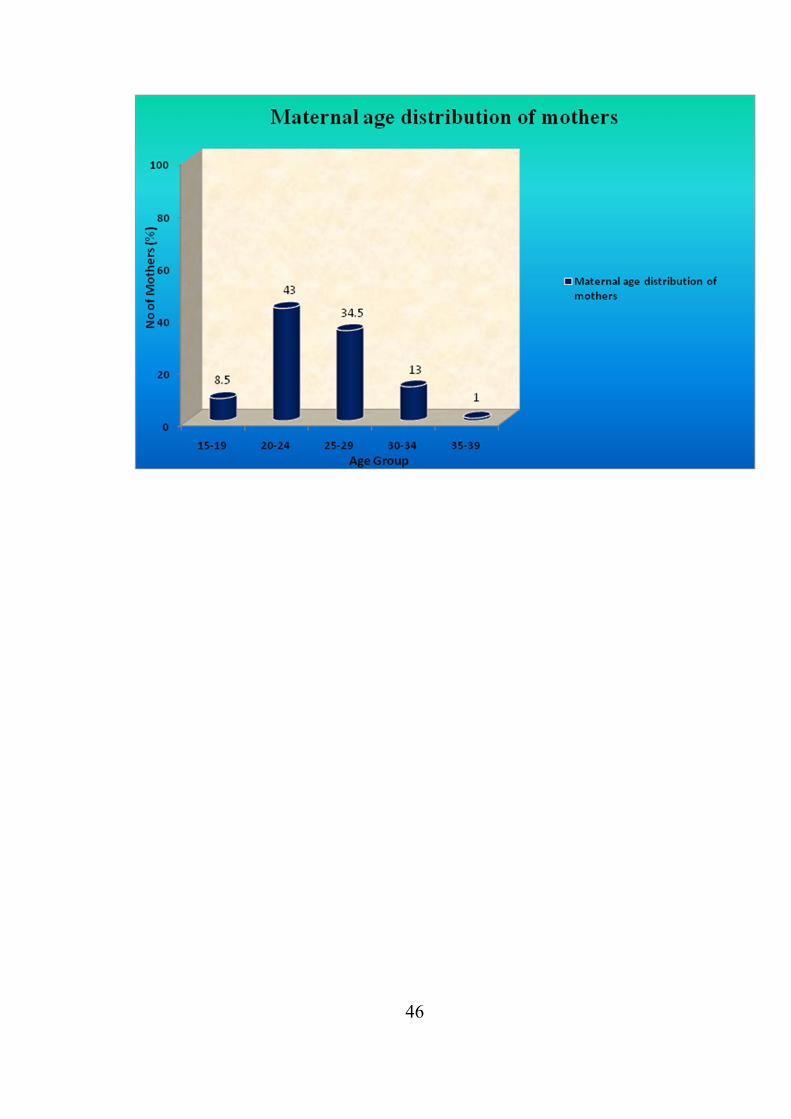
Table-1: Maternal age distribution of mothers:
Age group
(years)
No of
mothers% Mean age SD
15-19 17 8.5
24.8
(Range 17-37
years)
4.1
20-24 86 43.0
25-29 69 34.5
30-34 26 13.0
35-39 2 1.0
Total 200 100.0
The table -1 describes the mothers according to their age, with maximum of 43%
in the age group of 20-24 years. The mean age of mothers was 24.8±4.1 years
with minimum age as 17 and maximum as 37 years.
46

47
Table-2: Distribution of mothers according to their obstetrics score:
Sl No Obstetrics score Category Frequency %
1 Gravida
Primi 113 56.5
G2 57 28.5
G3 25 12.5
G4 5 2.5
The above table-2 states the obstetrics score of the study subjects. In respect of
gravida, the maximum was primi as 56.5% and the multi gravida was 43.5%.

48
Table-3(a): Description of Umbilical coiling index.
Variable Category Frequency %
Umbilical coiling
index
Hypo 24 12
Normal 154 77
Hyper 22 11
Total 200 100
The table-3(a) describes the normality of UCI . Among the UCI normal, hypo
and hyper were 77%, 12% and 11% respectively.

49
Table-3(b): Description of Doppler flow.
Variable Category Frequency Percentage
Umbilical vein
Doppler flow
Decreasing 21 10.5
Normal 172 86
Increasing 7 3.5
Total 200 100
Table 3 (b):In respect of UmV, the normal, decreasing and increasing were
86%, 10.5% and 3.5% respectively.
50
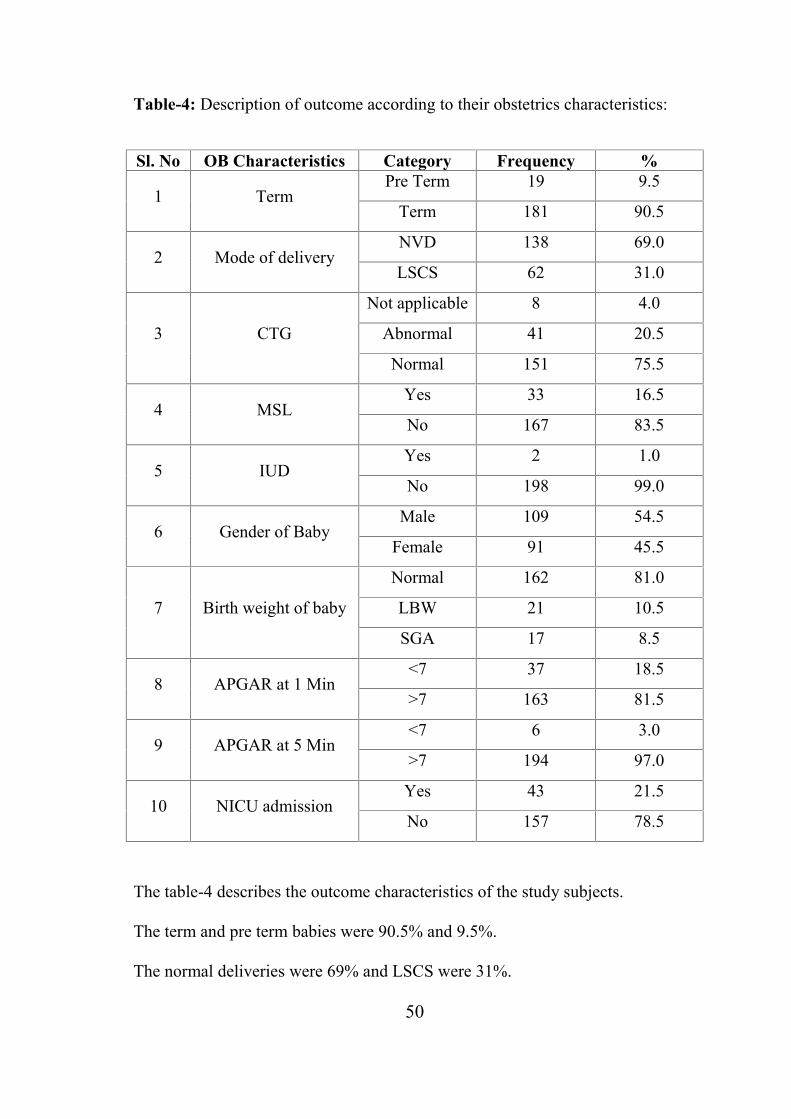
Table-4: Description of outcome according to their obstetrics characteristics:
Sl. No OB Characteristics Category Frequency %
1 TermPre Term 19 9.5
Term 181 90.5
2 Mode of deliveryNVD 138 69.0
LSCS 62 31.0
3 CTG
Not applicable 8 4.0
Abnormal 41 20.5
Normal 151 75.5
4 MSLYes 33 16.5
No 167 83.5
5 IUDYes 2 1.0
No 198 99.0
6 Gender of BabyMale 109 54.5
Female 91 45.5
7 Birth weight of baby
Normal 162 81.0
LBW 21 10.5
SGA 17 8.5
8 APGAR at 1 Min<7 37 18.5
>7 163 81.5
9 APGAR at 5 Min<7 6 3.0
>7 194 97.0
10 NICU admissionYes 43 21.5
No 157 78.5
The table-4 describes the outcome characteristics of the study subjects.
The term and pre term babies were 90.5% and 9.5%.
The normal deliveries were 69% and LSCS were 31%.

51
The CTG not applicable, abnormal and normal were 4%, 20.5% and 75.5%
respectively.
The MSL present was 16.5% and absent were 83.5%.
The IUD was 1% only.
In respect of the gender, the males were 54.5% and females were 45.5%.
The normal birth weight babies were 81% and low birth weight babies were
10.5%. The small for gestational age babies were 8.5%.
The APGAR scores at minute less than 7 babies were 18.5% and >7 were 81.5%.
At 5 minutes the APGAR score <7 babies were 3% and >7 were 97%.
The babies were admitted in NICU was 21.5%.

52
The term and pre term babies were 90.5% and 9.5%.
The normal deliveries were 69% and LSCS were 31%.

53
The CTG not applicable, abnormal and normal were 4%, 20.5% and 75.5%
respectively.

54
The MSL present was 16.5% and absent were 83.5%.
Live birth 99% ,IUD 1%

55
Males were 54.5% and Females were 45.5%

56
The normal birth weight babies were 81% and low birth weight babies were
10.5%. The small for gestational age babies were 8.5%.

57
The APGAR scores at 1 minute less than 7 babies were 18.5% and >7 were
81.5%
At 5 minutes the APGAR score <7 babies were 3% and >7 were 97%.

58
The babies were admitted in NICU was 21.5%.
Relationship between mothers’ age with AN Umbilical coiling and Doppler
flow:
The relationships between mothers’ ages with UCI and Doppler flow
were correlated.
Table-5 (a): Correlation between mothers’ maternal ages with UCI and UmV:
Variables n r Sig r2 % of r2 Determination
Mothers’ age x UCI 200 0.047 P=0.508 0.0022 0.22 Not determined
Mothers’ age x UMV 200 0.020 P=0.774 0.0004 0.04 Not determined
The table-5 (a) correlates the mothers’ age with UCI and UmV. There was no
statistically significant relationship between mothers’ age with UCI and UmV.

59
Relationship between AN Umbilical coiling and Doppler flow:
The relationships between UCI and Doppler flow were correlated.
Table 5(b) : Correlation between UCI and UmV:
Variables n r Sig r2 % of r2 Determination
UCI X UmV 200 0.221 P=0.002 0.049 4.9 Determined 4.9%
Table 5(b) : Correlates UCI and UmV. There was statistically significant
relationship between UCI and UmV. The UCI determined 4.9% of UmV.
Table-6: Association between Gravida with UCI:
Gravida Hypo Normal Hyper Total χ2 df Sig
Primi 17 79 17 113
8.549 6 P=0.201
G2 4 49 4 57
G3 2 22 1 25
G4 1 4 0 5
Total 24 154 22 200

60
The above table -6 states the relationship between gravida with UCI. The gravida
did not determine the UCI, hence there is no association between obstetric score
and UCI (P>0.05).

61
Table-7: Association between Gravida with UmV:
Gravida Decreasing Normal Increasing Total χ2 df Sig
Primi 16 91 6 113
9.073 6 P=0.169
G2 2 55 0 57
G3 2 22 1 25
G4 1 4 0 5
Total 21 172 7 200
The above table -7 states the relationship between gravida with UmV. The
gravida did not determine the UmV, hence there is no aasociation between
gravid and UmV (P>0.05).

62
Relationship between UCI and UmV with Outcome:
Table-8: Correlation between UCI and UmV with gestational age (GA):
Variables n r Sig r2 r2 (%) Determination
UCI x GA 200 0.301 P<0.001 0.091 9.1 Determined 9.1% of GA
UmV x GA 200 0.239 P=0.001 0.057 5.7 Determined 5.7% of GA
The table-8 correlates the UCI and UmV with gestational age. The results
revealed that there was positive correlation between UCI and UmV and the
gestational age (P<0.001). The UCI determined the GA 9.1% and the UMV
determined 5.7%.
Table-9: Correlation between UCI and UmV with birth weight of baby (BWB)
Variables n r Sig r2 r2 (%) Determination
UCI x BWB 200 0.293 P<0.001 0.086 8.6 Determined 8.6% of BWB
UmV x BWB 200 0.222 P=0.002 0.049 4.9 Determined 4.9% of BWB
The table-9 correlates the UCI and UmV with BWB. The results revealed that
there were positive correlation between UCI and UmV and the BWB
(P<0.001). The UCI determined the BWB 8.6% and the UmV determined 4.9%.

63
Table-10: Correlation between UCI and UmV with APGAR 1 and 5 Minutes.
Variables n rs Sig rs2 rs2 (%) APGAR DeterminationUCI x APGAR-
1min200 0.142 P=0.044 0.020 2.0 Determined 2.0% of A
UmV xAPGAR-
1min200 0.367 P<0.001 0.135 13.5 Determined 13.5% of A
UCI x APGAR-
5min200 0.142 P=0.045 0.020 2.0
Determined 2.0% of A
UmV xAPGAR-
5min200 0.273 P<0.001 0.075 7.5
Determined 7.5% of A
The table-10 correlates the UCI and UmV with APGAR at 1 and 5 Minutes. The
results revealed that there was positive correlation between UCI and the
APGAR-1and 5 minutes (P<0.05). The UCI determined the APGAR1 and 5
minutes 2.0% each. The statistically significant correlation between UmV and
the APGAR-1 and 5 minutes (P<0.001). The UmV determined APGAR-1 and 5
minutes as 13.5% and 7.8% respectively.

64
Table-11: Association between UCI with term of baby:
UCI Pre term Term Total χ2 df Sig
Hypo 10 14 24
33.587 2 P<0.001Normal 9 145 154
Hyper 0 22 22
Total 19 181 200
The above table -11 states the association between UCI with term of baby.
The UCI hypo was associated with pre term baby and normal was associated
with term baby. The associations were statistically very highly significant
(P<0.00).

65
Table-12: Association between UmV with term of baby:
UmV Pre term Term Total χ2 df Sig
Decreasing 10 11 21
39.870 2 P<0.001Normal 9 163 172
Increasing 0 7 7
Total 19 181 200
The above table -12 states the association between UmV with term of baby.
The UmV decreasing was associated with pre term baby and normal was
associated with term baby. The associations were statistically very highly
significant (P<0.00).

66
Table-13: Association between UCI with mode of delivery:
UCI NVD LSCS Total χ2 df Sig
Hypo 15 9 24
33.587 2 P<0.001Normal 115 39 154
Hyper 8 14 22
Total 138 62 200
The above table -13 states the association between UCI with mode of delivery.
The UCI normal was associated with NVD and hyper was associated with LSCS.
The association was statistically very highly significant (P<0.00).

67
Table-14: Association between UmV with mode of delivery:
UmV NVD LSCS Total χ2 df Sig
Decreasing 13 8 21
1.101 2 P=0.577Normal 121 51 172
Increasing 4 3 7
Total 138 62 200
The above table -14 states the association between UmV with mode of delivery.
The UmV had no statistically significant association with mode of delivery
(P>0.05).

68
Table-15: Association between UCI with CTG:
UCINot
applicableAbnormal Normal Total χ2 df Sig
Hypo 4 10 10 24
48.634 4 P<0.001Normal 4 18 132 154
Hyper 0 13 9 22
Total 8 41 151 200
The above table -15 states the association between UCI with CTG. The UCI of
normal was strongly associated with normal CTG (P<0.001). The UCI hyper was
associated with abnormal CTG (P<0.001)
Hypo Normal Hyper Total
4 4 0810
18 13
41
10
132
9
151
Not applicable Abnormal Normal

69
Table-16: Association between UmV with CTG:
UmVNot
applicableAbnormal Normal Total χ2 df Sig
Decreasing 4 9 8 21
31.917 4 P<0.001Normal 4 27 141 172
Increasing 0 5 2 7
Total 8 41 151 200
The above table -16 states the association between UmV with CTG. The UmV
of normal was strongly associated with normal CTG and increases UmV was
associated with abnormal CTG (P<0.001).
Decreasing Normal Increasing
4 4 09
27
58
141
2
21
172
7
Not applicable Abnormal Normal Total

70
Table-17: Association between UCI with MSL:
UCI No Yes Total χ2 df Sig
Hypo 21 3 24
32.578 2 P<0.001Normal 137 17 154
Hyper 9 13 22
Total 167 33 200
The above table -17 states the association between UCI with MSL. The UCI of
normal was strongly associated with MSL negative and hyper was associated
with MSL (P<0.001).

71
Table-18: Association between UmV with MSL:
UmV No Yes Total χ2 df Sig
Decreasing 18 3 21
15.886 2 P<0.001Normal 147 25 172
Increasing 2 5 7
Total 167 33 200
The above table -18 states the association between UmV with MSL. The UMV
of normal was strongly associated with MSL negative and increased UmV was
associated with MSL (P<0.001).

72
Table-19: Association between UCI with IUD:
UCI No Yes Total χ2 df Sig
Hypo 22 2 24
14.815 2 P<0.001Normal 154 0 154
Hyper 22 0 22
Total 198 2 200
The above table -19 states the association between UCI with IUD. The UCI of
hypo was strongly associated with IUD (P<0.001).

73
Table-20: Association between UmV with IUD:
UMV No Yes Total χ2 df Sig
Decreasing 19 2 21
17.220 2 P<0.001Normal 172 0 172
Increasing 7 0 7
Total 198 2 200
The above table -20 states the association between UmV with IUD. The UmV of
decreasing was strongly associated with IUD (P<0.001).

74
Table-21: Association between UCI with gender of baby:
UCI Male Female Total χ2 df Sig
Hypo 11 13 24
1.468 2 P=0.480Normal 84 70 154
Hyper 14 8 22
Total 109 91 200
The above table -21 states the association between UCI with gender of baby. The
UCI did not associate with gender of baby (P>0.05).

75
Table-22: Association between UmV with gender of baby:
UmV Male Female Total χ2 df Sig
Decreasing 9 12 21
1.994 2 P=0.369Normal 95 77 172
Increasing 5 2 7
Total 109 91 200
The above table -22 states the association between UmV with gender of baby.
The UmV did not associate with gender of baby (P>0.05).

76
Table-23: Association between UCI with SGA & LBW:
UCI SGA LBW Normal Total χ2 df Sig
Hypo 2 13 9 24
72.222 4 P<0.001Normal 6 7 141 154
Hyper 9 1 12 22
Total 17 21 162 200
The above table -23 states the association between UCI with SGA & LBW. The
UCI of hypo was strongly associated with LBW. The hyper was strongly
associated with SGA (P<0.001).

77
Table-24: Association between UMV with SGA & LBW:
UMV SGA LBW Normal Total χ2 df Sig
Decreasing 0 12 9 21
94.787 4 P<0.001Normal 10 9 153 172
Increasing 7 0 0 7
Total 17 21 162 200
The above table -24 states the association between UmV with SGA & LBW. The
UmV of decreasing was strongly associated with LBW and UmV of increasing
was strongly associated with SGA (P<0.001).

78
Table-25: Association between UCI with APGAR-1minutes:
UCIAPGAR score
Total χ2 df Sig<7 >7
Hypo 15 9 24
44.515 2 P<0.001Normal 14 140 154
Hyper 8 14 22
Total 37 163 200
The above table -25 states the association between UCI with APGAR-1 minutes.
The UCI of hypo was strongly associated with <7 APGAR-1minutes. The
normal and hyper UCI were associated with >7 APGAR-1minute.

79
Table-26: Association between UmV with APGAR-1minutes:
UMVAPGAR
Total χ2 df Sig<7 >7
Decreasing 15 6 21
53.316 2 P<0.001Normal 18 154 172
Increasing 4 3 7
Total 37 163 200
The above table -26 states the association between UmV with APGAR-
1minutes. The UmV of decreasing and increasing were strongly associated with
<7 APGAR -1minute. The normal UmV was associated with >7 APGAR-
1minute (P<0.001).

80
Table-27: Association between UCI with APGAR-5minutes:
UCIAPGAR
Total χ2 df Sig<7 >7
Hypo 5 19 24
31.173 2 P<0.001Normal 0 154 154
Hyper 1 21 22
Total 6 194 200
The above table -27 states the association between UCI with APGAR-5 minute.
The UCI of hypo was associated with <7 APGAR-5 minute. The normal UCI
was strongly associated with >7 APGAR-5 minute. (P<0.001).

81
Table-28: Association between UmV with APGAR-5minutes:
UmVAPGAR
Total χ2 df Sig<7 >7
Decreasing 5 16 21
39.633 2 P<0.001Normal 0 172 172
Increasing 1 6 7
Total 6 194 200
The above table -28 states the association between UmV with APGAR-5 minute.
The UmV of decreasing was associated with <7 APGAR-5 minute. The normal
was strongly associated with >7 APGAR-5 minute (P<0.001).

82
Table-29: Association between UCI with NICU admissions:
UCI No Yes Total χ2 df Sig
Hypo 10 14 24
41.585 2 P<0.001Normal 136 18 154
Hyper 10 12 22
Total 156 44 200
The above table -29 states the association between UCI with NICU admissions.
The UCI of hypo and hyper were associated with NICU admissions. The normal
was strongly associated with non NICU admissions (P<0.001).

83
Table-30: Association between UmV with NICU admissions:
UmV No Yes Total χ2 df Sig
Decreasing 7 14 21
47.465 2 P<0.001Normal 148 24 172
Increasing 1 6 7
Total 156 44 200
The above table -30 states the association between UmV with NICU admissions.
The UmV of decreasing and increasing were associated with NICU admissions.
The normal was associated with non NICU admissions (P<0.001).

84
Table-31: Association between umbilical cord coiling index and umbilical vein
blood flow
COILING INDEX
UMBILICAL
VEIN BLOOD
FLOW
NORMOCOILED HYPOCOILED HYPERCOILEDp
NORMAL 154 3 15 0.002
DECREASED 0 21 0
INCREASED 0 0 7
Table-31: Association between umbilical cord coiling index and umbilical vein
blood flow. Hypocoiling was associated with decreased umbilical vein blood
flow and hypercoiling was associated with increased umbilical vein blood flow.

85
DISCUSSION
A prospective study was conducted at Tirunelveli Medical College
Hospital on sonographic evaluation of umbilical cord coiling index and
umbilical vein bood flow in second trimester between 20 to 28 weeks and effect
on perinatal outcome.
285 women were recruited in the study out of which 14 had difficulty in
calculating coiling index and Doppler characteristics. 30 lost followup, 32 had
medical complication and 9 had malpresentation.
200 antenatal mothers who met the inclusion criteria were included in the
study. Coiling index and umbilical vein blood flow was determined using
ultrasound between 20 to 28 weeks of gestation. Various factors like age, parity,
mode of delivery, gestational age at delivery, meconium staining of liquor, CTG
abnormalities, intra uterine death, birth weight, APGAR and admission to NICU
were observed. The association between these factors and umbilical cord coiling
index and umbilical vein blood flow was analyzed using chi square tests and p
value < 0.05 was considered significant.
The mean umbilical cord coiling index 0.38. The mean umbilical vein
blood flow was 149.88 ml/min. Among the 200 antenatal women included, 154
(77%) were normocoiled, 24 (12%) were hypocoiled and 22 (11%) were
hypercoiled. Abnormal blood flow was noted in 27 patients and this accounted

86
for decreased umbilical vein blood flow noted in 21(10.5%) and increased
umbilical vein blood flow noted in 7 (3.5%).
Age
In this study population, about 17 patients were under the age of 20,86
patients were between 20 to 24 years, 69 patients were between 25 to 29 years
and 28 patients were above the age of 30.The mean age of mothers was
24.8±4.1 years with minimum age of 17 and maximum age of 37 years.
According to the age nearly 43% were in the age group of 20 to 24 years.
28 patients had abnormal umbilical vein blood flow ,4 below the age of
20 had abnormal blood flow and 3 of the patients above the age of 30 had
abnormal blood flow.
There was no significant association between maternal age and umbilical
vein blood flow.
Obstetric score:
In this study population, there were 113 primigravidas and 87
multigravidas. Among the 113 primigravidas, 79 belonged to the normocoiled
group, 17 belonged to the hypocoiled group and 17 belonged to the hypercoiled
group. Among the 87 mutigravidas 75 belonged to the normocoiled group, 7

87
belonged to the hypocoiled group and another 5 belonged to the hypercoiled
group. There was statistically no significant association between obstetric score
and umbilical cord coiling index.
In 28 women with abnormal umbilical vein blood flow, 22 patients were
primigravida and patients 6 were multigravida. There was no statistically
significant correlation between obstetric score and umbilical vein blood flow.
The obstetric score didn’t determine the umbilical cord coiling index and
umbilical vein blood flow in this study.
Gestational Age of Delivery:
Among the study group 181 women delivered at term and 19 women
delivered before 37 weeks. 154 women were Normocoiled, 24 women were
hypocoiled and 22 women were hypercoiled. 10 out of 24 in the hypocoiled
group delivered before 37 weeks whereas 9 out of 154 women in the
normocoiled group delivered before 37 weeks of gestation. None of the patients
in the hypercoiled group had preterm delivery. There was statistically significant
association between umbilical cord coiling index and preterm deliveries.
Hypocoiling was associated with preterm deliveries and normocoiling with term
deliveries with chi square value 33.587 and a p value of< 0.001.
Out of 28 patients with abnormal umbilical vein blood flow,10 had
preterm deliveries . Decreased umbilical vein blood flow was noted in all the 10
preterm deliveries, 9 out of 163 with normal umbilical vein blood flow had

88
preterm delivery. None of the patients with increased umbilical vein blood flow
had preterm deliveries. In this study there was significant association between
umbilical vein blood flow and preterm deliveries with p value <0.001. Thus
decreased umbilical vein blood flow was associated with preterm deliveries.
In this study there was positive correlation between umbilical cord coiling
index and umbilical vein blood flow to gestational age. The UCI determined the
gestational age in 9.1% and umbilical vein blood flow in 5.7%.
Thus in this study we found significant association between preterm
deliveries to hypocoiled and lean cord. Similar results were found in study by
Razak et al, Yung sung et al (13,15), Hypocoiled cords were associated with
spontaneous preterm labour and low birth weight (11,12).
Mode of Delivery:
In this study group, 138 women delivered vaginally and 62 delivered by
emergency caesarean section. 14 out of 22 women in the hypercoiled group, 9
out of 24 women in the hypocoiled group and 39 out of 154 women in the
Normocoiled group delivered by LSCS. Therefore, hypercoiling were
significantly associated with increased rate of emergency caesarean sections and
normocoiling was associated with normal vaginal deliveries. The chi square
value was 33.587 and the p value was <0.001. Similar studies in the past have
shown association between operative vaginal deliveries and emergency
caesarean section with abnormal coiling index (10,11).

89
Similarly, out of 28 patients with abnormal umbilical vein blood flow, 17
patients had vaginal delivery and 11 patients had LSCS. We could not find any
association between umbilical vein blood flow with mode of delivery.
Abnormal Heart Rate Pattern:
In this study group 151 women had normal heart rate pattern and 41 women
had abnormal heart rate patterns during labour. CTG tracing was not applicable
in 8 patients, among them 2 was IUD and 6 of them had gestational age less
than 32 weeks . 18 out of 154 women in the Normocoiled group, 10 out of 24
women in the hypocoiled group and 13 out of 22 women in the hypercoiled
group had abnormal CTG. Thus abnormal heart rate patterns picked up by
cardiotocography were significantly associated with hypercoiling and
normocoiling was strongly associated with normal fetal heart rate patterns. The p
value was <0.001 and the chi square value was 48.634.
Chitra et al, Strong et al and de Laat et al (28,6,7)also showed that fetal
heart rate variations were significantly associated with hypercoiling and
hypocoiling. This is because the hypocoilied and hypercoiled umbilical cords
were less flexible and more prone to kinking and torsion. Hypocoiling pattern,
cord thickness and decreased amount of whartons jelly plays an important role in
cord susceptibility to outer forces. Hypercoiled cords are more prone for torsion.
These abnormal coiling patterns cannot withstand the stress of labour.

90
Out of 28 women with abnormal umbilical vein blood flow ,9 out of
21with decreased umbilical vein blood flow and 5 out of 7 with increased
umbilical vein blood flow had abnormal CTG. Thus, there was significant
association between abnormal umbilical vein blood flow pattern and abnormal
fetal heart rate pattern, decreased umbilical vein blood flow was associated with
abnormal CTG with p value <0.001. Mana et al obtained similar results (24).
Meconium Stained Liquor:
In this study group, 33 women had meconium stained liquor. 17 out of 154
women in the Normocoiled group, 3 out of 24 women in the hypocoiled group
and 13 out of 22 women in the hypercoiled group had meconium stained liquor.
There was significant association between hypercoiling and meconium
staining of liquor. The p value was <0.001 and the chi square value was 32.578.
Many previous studies have found that meconium stained liquor was
significantly associated with hypercoiling(15) due to compression mediated flow
reduction and predisposition to development of foetoplacental vascular
thrombosis(27).
Out of 28 women with abnormal umbilical vein blood flow, 3 out of 21 with
decreased umbilical vein blood flow and 5 out of 7 with increased umbilical vein
blood flow had meconium staining of liquor. In this study there was significant
association between meconium stained liquor to abnormal umbilical vein blood

91
flow patterns with p value <0.001.Increased umbilical vein blood flow was
associated with increased risk of meconium stained liquor.
Intrauterine Death:
There were only 2 cases of intrauterine death and both belonged to the
hypocoiled group. These 2 cases had decreased umbilical vein blood flow. There
was significant association between hypocoiling and decreased umbilical vein
blood flow with intrauterine death. The p value was <0.001. This may be due to
the compromise in the foetomaternal circulation in the abnormal cord (7).
Gender of the baby:
In this study 109 were male babies and 91 were female babies. We
couldn’t find any association between umbilical cord coiling index and umbilical
vein blood flow to gender of the baby.
Birth Weight:
The average birth weight of the babies in the hypocoiled group was 2.39 kg,
hypercoiled group was 2.70 kg and the normocoiled group was 2.83 kg. 6 out of
154 women in the Normocoiled group,2 out of 24 women in the hypocoiled
group and 9 out of 22 women in the hypercoiled group had SGA babies whereas
7 out of 154 women in the Normocoiled group, 13 out of 24 women in the
hypocoiled group and 1 out of 22 women in the hypercoiled group had Low birth
weight babies. There was significant association between hypercoiling with
small for gestation age babies and hypocoilin with low birth weight babies . The
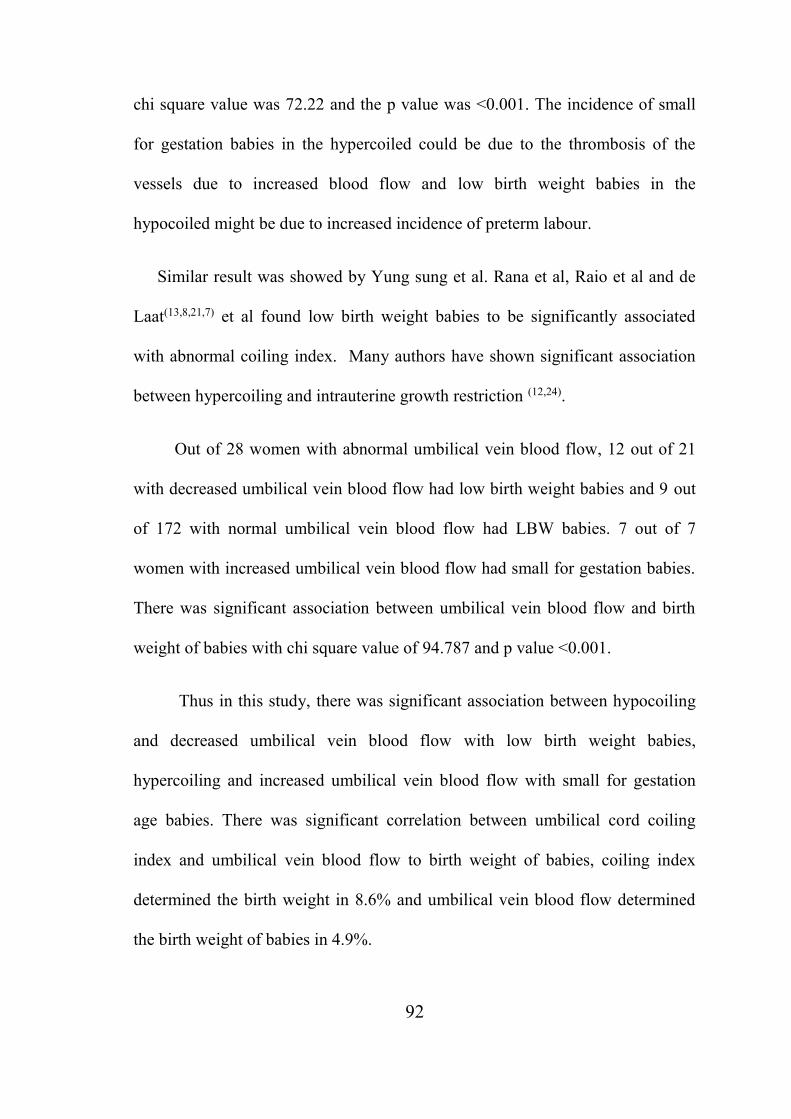
92
chi square value was 72.22 and the p value was <0.001. The incidence of small
for gestation babies in the hypercoiled could be due to the thrombosis of the
vessels due to increased blood flow and low birth weight babies in the
hypocoiled might be due to increased incidence of preterm labour.
Similar result was showed by Yung sung et al. Rana et al, Raio et al and de
Laat(13,8,21,7) et al found low birth weight babies to be significantly associated
with abnormal coiling index. Many authors have shown significant association
between hypercoiling and intrauterine growth restriction (12,24).
Out of 28 women with abnormal umbilical vein blood flow, 12 out of 21
with decreased umbilical vein blood flow had low birth weight babies and 9 out
of 172 with normal umbilical vein blood flow had LBW babies. 7 out of 7
women with increased umbilical vein blood flow had small for gestation babies.
There was significant association between umbilical vein blood flow and birth
weight of babies with chi square value of 94.787 and p value <0.001.
Thus in this study, there was significant association between hypocoiling
and decreased umbilical vein blood flow with low birth weight babies,
hypercoiling and increased umbilical vein blood flow with small for gestation
age babies. There was significant correlation between umbilical cord coiling
index and umbilical vein blood flow to birth weight of babies, coiling index
determined the birth weight in 8.6% and umbilical vein blood flow determined
the birth weight of babies in 4.9%.

93
Similar studies in the past had same results (24,26).De Laat et(7) al in his study
have found significant increase in the risk for small for gestational age and
interventional delivery for non-reassuring fetal status among hypercoiled.
APGAR:
In this study, babies of 37 patients had abnormal APGAR scores of <7 at 1
minute. 15 out of 24 babies of the hypocoiled group and 8 out of 22 babies of
the hypercoiled group and 14 out of 154 babies of the normocoiled group had
abnormal APGAR scores. There was significant association between
hypocoiling, hypercoiling and low APGAR scores at 1 minute
Similary , 15 out of 21 with decreased umbilical vein blood flow ,4 out of 7
with increased umbilical vein blood flow and 18 out of 154 with normal
umbilical vein blood flow had low APGAR score of <7 at 1 minute. Thus in this
study both increased and decreased umbilical vein blood flow was associated
with low APGAR score of <7 at 1 minute.
Similarly 5 out 24 in the hypocoiled group and 1 out of 22 in the hypercoiled
group had low APGAR of <7 at 5 minutes. None of the babies in the
normocoiled group had low APGAR . Hypocoiling was associated with low
APGAR of <7 at 5 minutes and normocoiling was strongly associated with
APGAR >7 at 5 mins.
Out of 28 patients with abnormal umbilical vein blood flow ,5 out of 21 with
decreased umbilical vein blood flow and 1 out of 7 with decreased umbilical
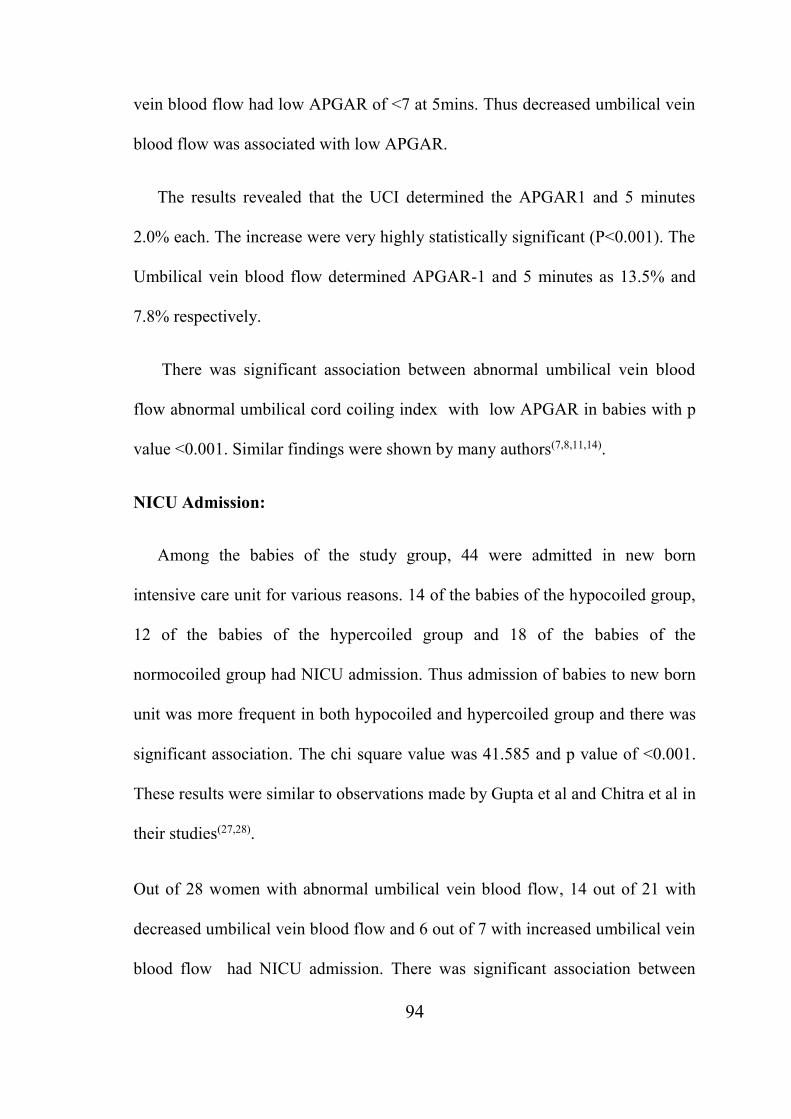
94
vein blood flow had low APGAR of <7 at 5mins. Thus decreased umbilical vein
blood flow was associated with low APGAR.
The results revealed that the UCI determined the APGAR1 and 5 minutes
2.0% each. The increase were very highly statistically significant (P<0.001). The
Umbilical vein blood flow determined APGAR-1 and 5 minutes as 13.5% and
7.8% respectively.
There was significant association between abnormal umbilical vein blood
flow abnormal umbilical cord coiling index with low APGAR in babies with p
value <0.001. Similar findings were shown by many authors(7,8,11,14).
NICU Admission:
Among the babies of the study group, 44 were admitted in new born
intensive care unit for various reasons. 14 of the babies of the hypocoiled group,
12 of the babies of the hypercoiled group and 18 of the babies of the
normocoiled group had NICU admission. Thus admission of babies to new born
unit was more frequent in both hypocoiled and hypercoiled group and there was
significant association. The chi square value was 41.585 and p value of <0.001.
These results were similar to observations made by Gupta et al and Chitra et al in
their studies(27,28).
Out of 28 women with abnormal umbilical vein blood flow, 14 out of 21 with
decreased umbilical vein blood flow and 6 out of 7 with increased umbilical vein
blood flow had NICU admission. There was significant association between

95
abnormal umbilical vein blood flows and increased NICU admissions. The chi
square value was 47.465 and the p value was <0.001. Thus increased new born
admission could be due to the preterm labour, fetal distress due to the meconium
aspiration and various other reasons.
Many authors have found that hypocoiling and lean cord co exist
because of decreased amount of Whartons jelly and marked segmental thinning
of umbilical cord vessels making it more prone for low APGAR, more NICU
admissions, low birth weight babies, abnormal fetal heart rate pattern(11,14,26,27).
UCI and Umbilical Vein Blood Flow:
In this study 28 patients had abnormal umbilical vein blood flow. Among
them 21 belonged to the hypocoiled group and 7 belonged to the hypercoiled
group. There was significant association between umbilical cord coiling index
and umbilical vein blood flow. Hypocoiled Cord had decreased umbilical vein
blood flow and hypercoiled cord increased umbilical vein blood flow compared
to the normocoiled. The umbilical cord coiling index determined the umbilical
vein blood flow in 4.9% and there was positive correlation between umbilical
cord coiling index and umbilical vein blood flow. The p value was 0.002
Degani et al(22) in his study demonstrated that umbilical vein blood flow is
decreased with decreased umbilical cord coiling index. The umbilical coiling
modulates the blood flow such that increased coiling bidirectionally stimulates
and increases blood conveyance. The direct correlation between increased
coiling and increased blood flow could be explained by piston effect(23,24).

96
Di Naro et al reported that thinner or leaner umbilical cords were
significantly associated with decreased antenatal umbilical cord coiling index,
cord cross-sectional area (thickness), amount of whartons jelly and venous blood
flow volume(18).

97
SUMMARY
In this study 200 antenatal patients who met the inclusion criteria were
included in the study.
The umbilical cord coiling index and its Doppler flow characteristics
were detected by the USG between 20 to 28 weeks. The mean
umbilical cord was 0.38, and the mean umbilical vein blood flow was
149.88 ml/min.
154 patients belonged to the normocoiled group, 24 patients belonged
to hypocoiled group, 22 belonged to the hypercoiled group. Of the
200, 172 had normal umbilical vein blood flow and 28 had abnormal
blood flow.
These patients were followed up and details regarding the mode of
delivery, gestational age of delivery, colour of liquor, fetal heart rate
abnormalities, birth weight, APGAR, NICU admissions were noted
and the data was analyzed.
In this study there was correlation between umbilical cord coiling
index and umbilical vein blood flow, showing that coiling index
determines the umbilical vein blood flow.
Hypocoiling was associated with decreased umbilical vein blood flow
and hypercoiling was associated with increased umbilical vein blood
flow.

98
There was no association between maternal age, parity to umbilical
cord coiling index and umbilical vein blood flow.
Abnormal fetal heart rate patterns, meconium stained liquor,
emergency Lscs , small for gestation babies were significantly
associated with hypercoiling.
Preterm deliveries, low birth weight babies, intrauterine death, poor
APGAR was significantly associated with hypocoiling .
Increased umbilical vein blood flow was associated with small for
gestation babies, meconium stained liquor and abnormal foetal heart
rate paatterns.
Decreased umbilical vein blood flow was associated with preterm
deliveries ,low birth weight babies, poor APGAR score.
There was significant association between abnormal umbilical vein
blood flow to meconium stained liquor , birth weight of babies and
increased NICU admissions.
There was positive correlation between umbilical coiling index and
umbilical vein blood flow to APGAR score, birth weight and
gestational age.

99
Therefore abnormal umbilical cord coiling index and abnormal
umbilical vein blood flow are associated with adverse perinatal
outcome.

100
CONCLUSION
Umbilical cord coiling index and its Doppler flow characteristics should be
part of antenatal ultrasound. The abnormal umbilical coiling and abnormal
umbilical vein blood flow detected during antenatal period could predict adverse
perinatal outcomes and would be useful to select pregnancies for intensified fetal
monitoring.

BIBLIOGRAPHY
1. Inderbir Singh. human embryology, sixth edition 2000,38-54.
2. Lacro RV, Jones KL, Benirschke K. The umbilical cord twist : origin, direction
and relevance. Am I obstet Gynecol 1987; 157 : 833 8.
3. Vizza E, Correr S, Goranova V, Heyn R, Angelucci PA, Forleo R, Motta PM. The
collagen skeleton of the human umbilical cord at term. A scanning electron
microscopy study after 2N-NaOH maceration. Reprod Fertil Dev 1996; 8: 885–94.
4. Edmonds HW. The spiral twists of the normal umbilical cord in twins
and in singletons. Am J Obstet Gynecol. 1954; 67:102-20 .
5. Harvey J.Kliman , The umbilical cord, Encyclopaedia of
reproduction.
6. Strong TH, Jarles DL, Vega JS et al. The umbilical coiling index. AmJ
Obstet Gynecol. 1994; 170:29-32.
7. De Laat MW, van Alderen ED, Franx A, Visser GH, BotsML, et al. The
umbilical coiling index in complicated pregnancy. Eur J Obstet Gynecol
Reprod Biol.2007;130:66-72.
8. Rana J, Ebert GA, Kappy KA .Adverse perinatal outcome in patients with anabnormal umbilical coiling index. Obstet Gynecol. 1995; 85:573- 77.
9. Degani S, Leibovich Z, Shapiro I, Gonen R, Ohel G. Early secondtrimester lowumbilical coiling index predicts small-for- gestationalage fetuses. J UltrasoundMed 2001;20:1183-8.
10.Predanic M, Perni SC, Chasen ST et al. Assessment of umbilical cord coilingduring the routine fetal sonographic anatomic survey in the second trimester. JUltrasound Med 2005; 24:185-91.
11.Sharma B, Bhardwaj N, Gupta S, et al. Association of Umbilical Coiling Index byColour DopplerUltrasonography at 18–22 Weeks of Gestation andPerinatalOutcome.J Obstet Gynecol India. 2012;62(6):650-654.
12.Predanic M, Perni SC, Chasen ST, Baergen RN, Chervenak FA.Ultrasoundevaluation of abnormal umbilical cord coiling in second trimester of gestation inassociation with adverse pregnancy outcome. Am J Obstet Gynecol2005;193:387-94.
13. Jo YS, Jang DK, Lee G (2011) The sonographic umbilical cord coiling in latesecond trimester of gestation and perinatal outcomes. Int J Med Sci 8:594-598.

14.Tahasembi M, Alighambari R (2011) Evaluation of umbilical cord thickness, crosssectional area and coiling index as predictors of pregnancy outcome. Indian JRadiol Imaging 21: 195-198.
15.Khizer Razak1, Deepika Meena2 and Meena GL1*. Coils & Kinks": A NovelTechnique to Evaluate the Perinatal Outcome. Gynecol Obstet 2017, 7:11 .DOI:10.4172/2161-0932.1000457
16.Strong TH, Elliott JP, Radin TG. Non-coiled umbilical blood vessels: a newmarker for the fetus at risk. Obstet Gynecol 1993; 81: 409 –11.
17.Ercal T, Lacin S, Altunyurt S et al. umbilical coiling index: Is it a marker for thefoetus at risk? Br J Clin Pract 1996; 50:254-6.
18.Di Naro E, Ghezzi F, Raio L et al Umbilical vein blood flow in fetuses withnormal and lean umbilical cord. Ultrasound Obstet Gynecol 2001;17:224 9.
19.Reynolds SRM. Mechanisms of placentofetal blood flow. Obstet Gynecol. 1978;51:245–9.
20. Edoardo Di Naro,Luigi Raio,Antonella Cromi,Alessandra Giocolano.sonograophic assesment of umbilical cord .Donald School Journal of Ultrasoundin Obstetrics and Gynecology ,January-March 2011;6(1):66-75.
21.Weissman A, Jakobi P, Bronshtein M, Goldstein I. Sonographic measurements ofumbilical cord and vessels during normal pregnancy. J Ultrasound Med1994;13:11-4.
22.Degani S, Lewingsky RM, Berger H, Spiegel D. Sonographic estimation ofumbilical coiling index and correlation with Doppler flow characteristics. ObstetGynecol 1995; 86: 990–993.
23.BaberaA, GalanHL, FerrazziE, RiganoS, JozwikM, BattagliaFC, Pardi G.Relationship of umbilical vein blood flow to growth parameters in the human fetus.Am J Obstet Gynecol 1999; 181: 174 –9.
24.Manal M.EL behery, Nouh AA, Alanwar AM, Diab AE. Effect of umbilical veinblood flow on perinatal outcome of fetuses with lean and/or hypo-coiled umbilicalcord. Springer; 2011 Jan;283(1):53-8
25.Mariam Moshiri ,Sadaf F. Zaidi ,Tracy J. Robinson , Puneet Bhargava, Joseph R.Siebert, Theodore J. Dubinsky, Douglas S. Katz et al Comprehensive ImagingReview of Abnormalities of the Umbilical Cord .RadioGraphics 2014; 34:179–196• Published online 10.1148/rg.341125127
26.Machin GA, Ackerman J, Gilbert BE. Abnormal umbilical cord coilingisassociated with adverse perinatal outcomes. PediatrDevPathol.2000;3:462-71.
27.Gupta S, Faridi MMA, Krishna J. Umbilical coiling index. J Obstet Gynecol India.2006 Jul/Aug; 56(4):315.

28.Chitra T, Sushanth YS, Raghavan S. Umbilical coiling index as a marker ofperinatal outcome: An analytical study. Obstetrics and Gynecology International.2012; 2012:6. Article ID: 213689.
29.Maulik D, Yarlagadda P, Downing G. Doppler velocimetry in obstetrics. ObstetGynecol Clin North Am 1990;17:163–86 .

NehahspfSf;F mwptpg;G kw;Wk; xg;Gjy; gbtk;
(kUj;Jt Ma;tpy; gq;Nfw;gj;w;F)
Ma;T nra;ag;gLk; jiyg;G:
gq;F ngWthpd; ngaH:
gq;F ngWthpd; taJ:
gq;F ngWth;
,jid
Fwpf;fTk;
1. ehd; NkNy Fwpg;gpl;Ls;s kUj;Jt Ma;tpd; tptuq;fis gbj;J
Ghpe;J nfhz;Nld;. vd;Dila re;Njfq;fis Nfl;fTk;>
mjw;fhd jFe;j tpsf;fq;fis ngwTk; tha;g;gspf;fg;gl;Ls;sJ
vd mwpe;J nfhz;Nld;.
2. ehd; ,t;tha;tpy; jd;dpr;irahf jhd; gq;Nfw;fpNwd;. ve;j
fhuzj;jpdhNyh ve;j fl;lj;jpYk;> ve;j rl;l rpf;fYf;Fk;
cl;glhky; ehd; ,t;tha;tpy; ,Ue;J tpyfp nfhs;syhk; vd;Wk;
mwpe;J nfhz;Nld;.
3. ,e;j Ma;T rk;ge;jkhfNth> ,ij rhHe;J NkYk; Ma;T
Nkw;fhs;Sk; NghJk; ,e;j Ma;tpy; gq;FngWk; kUj;JtH
vd;Dila kUj;Jt mwpf;iffis ghHg;gjw;F vd; mDkjp
Njitapy;iy vd mwpe;J nfhs;fpNwd;. ehd; Ma;tpy; ,Ue;J
tpyfpf; nfhz;lhYk; ,J nghUe;Jk;; vd mwpfpNwd;.
4. ,e;j Ma;tpd; %yk; fpilf;Fk; jftiyNah> KbitNah
gad;gLj;jpf; nfhs;s kWf;f khl;Nld;.
5. ,e;j Ma;tpy; gq;F nfhs;s xg;Gf; nfhs;fpNwd; vdf;F
nfhLf;fg;gl;lmwpTiufspd; gb ele;J nfhs;tJld;> Ma;it
Nkw;nfhs;Sk; kUj;Jt mzpf;F cz;ikAld; ,Ug;Ngd; vd;W
cWjpaspf;fpNwd;. vd; cly; eyk; ghjpf;fg;gl;lhNyh> my;yJ
vjpHghuhj> tof;fj;jpw;F khwhd Neha;Fwp njd;gl;lhNyh clNd
,ij kUj;Jt mzpaplk; njhptpg;Ngd; vd cWjp mspf;Nwd;.
gq;Nfw;gthpd; ifnahg;gk; / .................................................... ,lk; ...........................................
fl;iltpuy; Nuif
gq;Nfw;gthpd; ngaH kw;Wk; tpyhrk; ........................................................................................
Ma;thshpd; ifnahg;gk; /...................................................... ,lk; ............................................
Ma;thshpd; ngaH .........................................................................................................................
ikak; ...............................................................................................................................................
fy;tpawpT ,y;yhjtw;F (ifNuif itj;jtHfSf;F) ,J mtrpak; Njit
rhl;rpapd; ifnahg;gk; /...................................................... ,lk; ................................................
ngaH kw;Wk; tpyhrk; ................. ...................................................................................................

At 1 min At 5 min1 24404 20 PRIMI 0.25 HYPO 60 DEC 36W PRETERM NVD N - - F 2.5 - 6 7 +
2 23075 29 G2P1L1 0.39 NORMO 106.2 N 38W6D TERM LSCS N - - F 3.26 - 7 9 -
3 22358 24 G2P1L1 0.34 NORMO 132.2 N 39W TERM LSCS N - - M 3.3 - 7 8 -
4 22359 26 PRIMI 0.42 HYPER 148.3 N 37W 5D TERM NVD N + - M 2.8 - 7 8 -
5 233347 19 G2P1L1 0.36 NORMO 63.8 N 39W2D TERM NVD N - - M 3 - 7 8 -
6 23745 24 G2P1L1 0.38 NORMO 169.2 N 39W4D TERM NVD N - - F 2.7 - 7 8 -
7 20021 27 G2A1 0.4 NORMO 112.5 N 39W3D TERM NVD N - - F 2.55 SGA 7 8
8 23699 23 PRIMI 0.24 HYPO 66.3 DEC 36W 4D PRETERM NVD N - - F 2.5 - 6 7 +
9 23561 25 PRIMI 0.4 NORMO 170.9 N 39W 2D TERM NVD ABN - - M 2.8 - 7 8 -
10 23701 31 PRIMI 0.4 NORMO 92.2 N 37W1D TERM LSCS ABN - - M 2.6 - 7 8 -
11 21661 22 G3P1L1A1 0.44 HYPER 157.1 INC 39W 5D TERM NVD ABN + - M 2.3 SGA 3 5 +
12 23588 23 G3P1L1A1 0.39 NORMO 149.3 N 39W1D TERM NVD N - - F 2.8 - 7 9 -
13 23126 24 PRIMI 0.38 NORMO 220.2 N 39W2D TERM NVD N - - M 2.4 SGA 7 9 -
14 23488 21 PRIMI 0.37 NORMO 130.2 N 40W1D TERM LSCS N + - F 3 - 7 8 -
15 23444 32 PRIMI 0.36 NORMO 100.1 N 34W2D PRETERM NVD N - - M 2.3 - 6 8 +
16 23452 28 G3P1L1A1 0.4 NORMO 168.9 N 38W 4D TERM NVD N - - M 2.8 - 7 8 -
17 21077 25 G4P1L1A2 0.23 HYPO 61.2 DEC 39W 2D TERM LSCS ABN + - F 2.6 SGA 6 8 +
18 20559 21 PRIMI 0.35 NORMO 152.3 N 39W6D TERM NVD N - - M 2.52 SGA 7 8 -
19 23076 22 G2P1L1 0.35 NORMO 170.9 N 36W2D PRETERM NVD N - - M 2.4 - 7 8 -
20 20872 22 PRIMI 0.48 HYPER 180.5 INC 38W 2D TERM NVD ABN + - M 2.54 SGA 7 8 +
21 232692 25 G2P1L1 0.36 NORMO 112.3 N 37W TERM NVD N - - M 2.8 - 7 8 -
22 23280 23 G2A1 0.37 NORMO 96.3 N 37W6D TERM NVD N - - M 2.65 - 7 8 -
23 23600 26 G2P1L1 0.38 NORMO 170.1 N 40W TERM NVD N + - F 2.5 LBW 7 8 +
MSLSl.No.
Age
in y
ears
An UCI UCI UMV(ml/min)
inference of
UMV
GA atdelivery
Term/Preterm
Mode ofDelivery CTGIP NO Code NICUIUD Sex of
babyBirth
weight(kg) SGA /LBW APGAR
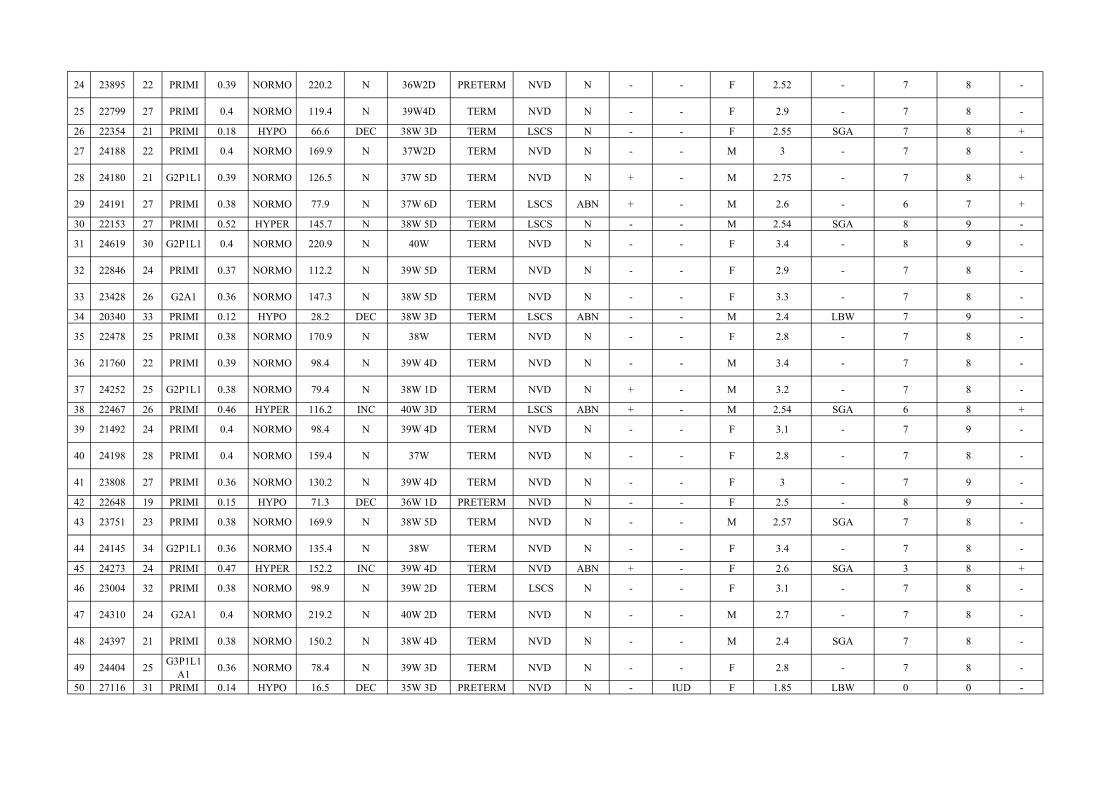
24 23895 22 PRIMI 0.39 NORMO 220.2 N 36W2D PRETERM NVD N - - F 2.52 - 7 8 -
25 22799 27 PRIMI 0.4 NORMO 119.4 N 39W4D TERM NVD N - - F 2.9 - 7 8 -
26 22354 21 PRIMI 0.18 HYPO 66.6 DEC 38W 3D TERM LSCS N - - F 2.55 SGA 7 8 +
27 24188 22 PRIMI 0.4 NORMO 169.9 N 37W2D TERM NVD N - - M 3 - 7 8 -
28 24180 21 G2P1L1 0.39 NORMO 126.5 N 37W 5D TERM NVD N + - M 2.75 - 7 8 +
29 24191 27 PRIMI 0.38 NORMO 77.9 N 37W 6D TERM LSCS ABN + - M 2.6 - 6 7 +
30 22153 27 PRIMI 0.52 HYPER 145.7 N 38W 5D TERM LSCS N - - M 2.54 SGA 8 9 -
31 24619 30 G2P1L1 0.4 NORMO 220.9 N 40W TERM NVD N - - F 3.4 - 8 9 -
32 22846 24 PRIMI 0.37 NORMO 112.2 N 39W 5D TERM NVD N - - F 2.9 - 7 8 -
33 23428 26 G2A1 0.36 NORMO 147.3 N 38W 5D TERM NVD N - - F 3.3 - 7 8 -
34 20340 33 PRIMI 0.12 HYPO 28.2 DEC 38W 3D TERM LSCS ABN - - M 2.4 LBW 7 9 -
35 22478 25 PRIMI 0.38 NORMO 170.9 N 38W TERM NVD N - - F 2.8 - 7 8 -
36 21760 22 PRIMI 0.39 NORMO 98.4 N 39W 4D TERM NVD N - - M 3.4 - 7 8 -
37 24252 25 G2P1L1 0.38 NORMO 79.4 N 38W 1D TERM NVD N + - M 3.2 - 7 8 -
38 22467 26 PRIMI 0.46 HYPER 116.2 INC 40W 3D TERM LSCS ABN + - M 2.54 SGA 6 8 +
39 21492 24 PRIMI 0.4 NORMO 98.4 N 39W 4D TERM NVD N - - F 3.1 - 7 9 -
40 24198 28 PRIMI 0.4 NORMO 159.4 N 37W TERM NVD N - - F 2.8 - 7 8 -
41 23808 27 PRIMI 0.36 NORMO 130.2 N 39W 4D TERM NVD N - - F 3 - 7 9 -
42 22648 19 PRIMI 0.15 HYPO 71.3 DEC 36W 1D PRETERM NVD N - - F 2.5 - 8 9 -
43 23751 23 PRIMI 0.38 NORMO 169.9 N 38W 5D TERM NVD N - - M 2.57 SGA 7 8 -
44 24145 34 G2P1L1 0.36 NORMO 135.4 N 38W TERM NVD N - - F 3.4 - 7 8 -
45 24273 24 PRIMI 0.47 HYPER 152.2 INC 39W 4D TERM NVD ABN + - F 2.6 SGA 3 8 +
46 23004 32 PRIMI 0.38 NORMO 98.9 N 39W 2D TERM LSCS N - - F 3.1 - 7 8 -
47 24310 24 G2A1 0.4 NORMO 219.2 N 40W 2D TERM NVD N - - M 2.7 - 7 8 -
48 24397 21 PRIMI 0.38 NORMO 150.2 N 38W 4D TERM NVD N - - M 2.4 SGA 7 8 -
49 24404 25 G3P1L1A1 0.36 NORMO 78.4 N 39W 3D TERM NVD N - - F 2.8 - 7 8 -
50 27116 31 PRIMI 0.14 HYPO 16.5 DEC 35W 3D PRETERM NVD N - IUD F 1.85 LBW 0 0 -

51 24385 23 G4P1L1A2 0.37 NORMO 126.4 N 37W 2D TERM NVD N - - M 3 - 7 8 -
52 24412 27 PRIMI 0.38 NORMO 219.9 N 39W 2D TERM NVD N - - F 2.8 - 7 8 -
53 22627 24 PRIMI 0.49 HYPER 134.5 N 38W TERM NVD N + - M 2.6 SGA 7 8 -
54 24330 34 PRIMI 0.4 NORMO 126.7 N 39W 1D TERM NVD ABN + - F 3.1 - 6 8 +
55 24131 21 G2A1 0.4 NORMO 170.3 N 37W 6D TERM NVD N - - M 2.7 - 8 9 -
56 24416 17 PRIMI 0.38 NORMO 67.2 N 40W 3D TERM NVD N - - M 2.9 - 7 9 -
57 24399 37 PRIMI 0.39 NORMO 194.5 N 38W 4D TERM LSCS N - - F 2.7 - 7 9 -
58 22737 20 PRIMI 0.19 HYPO 69.9 DEC 32W 2D PRETERM NVD - - - M 1.6 LBW 6 8 +
59 24130 21 G2P1L1 0.38 NORMO 112.6 N 39W 1D TERM NVD N - - M 2.5 SGA 7 8 -
60 24189 24 G2P1L1 0.39 NORMO 95.8 N 40W 4D TERM NVD N - - F 2.8 - 8 9 -
61 24456 27 PRIMI 0.37 NORMO 147.2 N 39W 3D TERM NVD N - - F 3.2 - 8 9 -
62 21959 17 PRIMI 0.45 HYPER 150.3 N 40W TERM LSCS ABN + - M 2.7 - 7 8 -
63 24489 29 PRIMI 0.38 NORMO 219.4 N 39W 4D TERM NVD N - - F 3.2 - 8 9 -
64 23574 23 G3P1L1A1 0.4 NORMO 109.2 N 38W 3D TERM NVD N - - M 3.1 - 7 9 -
65 24347 24 PRIMI 0.39 NORMO 149.4 N 40W TERM LSCS ABN - - F 2.8 - 8 9 -
66 28232 22 PRIMI 0.18 HYPO 34.6 DEC 34W 6D PRETERM NVD N - - M 2.2 - 6 7 +
67 10696 22 PRIMI 0.4 NORMO 79.4 N 38W 5D TERM LSCS N + - F 2.7 - 7 8 +
68 10733 28 PRIMI 0.38 NORMO 119.2 N 39W 4D TERM NVD N - - M 2.4 LBW 8 9 -
69 22813 22 PRIMI 0.44 HYPER 127.7 INC 38W TERM NVD N - - M 2.6 SGA 7 8 +
70 10588 26 G3P2L2 0.4 NORMO 194.3 N 38W 3D TERM NVD N - - M 2.9 - 7 9 -
71 11037 17 PRIMI 0.4 NORMO 120.2 N 37W 3D TERM NVD N - - M 2.65 - 7 8 -
72 10418 20 G3A2 0.39 NORMO 172.4 N 39W 3D TERM LSCS ABN - - F 2.8 - 7 8 -
73 114242 25 G2P1L1 0.38 NORMO 100.2 N 40W 3D TERM NVD N + - M 3 - 6 8 +
74 28731 26 G2P1L1 0.22 HYPO 63.8 DEC 32W 2D PRETERM NVD - + - F 2.1 LBW 6 8 +
75 10930 31 G3P1L1A1 0.37 NORMO 211.2 N 38W 6D TERM NVD N - - F 3.1 - 7 8 +
76 11075 19 PRIMI 0.39 NORMO 222.3 N 38W 5D TERM LSCS N - - F 3.2 - 7 9 -
77 10791 24 PRIMI 0.4 NORMO 152.5 N 39W 6D TERM NVD N - - M 2.9 . 7 8 -

78 22928 32 G2P1L1 0.59 HYPER 218.9 N 38W TERM NVD ABN - - F 3.21 - 7 8 +
79 11646 22 PRIMI 0.4 NORMO 119.1 N 40W TERM NVD N - - M 2.7 - 7 9 -
80 24454 18 PRIMI 0.39 NORMO 180.2 N 40W TERM LSCS N - - F 2.8 - 7 8 -
81 23673 20 PRIMI 0.4 NORMO 133.5 N 40W 2D TERM NVD N - - F 2.8 - 7 9 -
82 30746 24 PRIMI 0.21 HYPO 66.3 DEC 36W 4D PRETERM NVD N - - F 2.5 - 7 8 -
83 236992 22 G2P1L1 0.4 NORMO 200.4 N 38W 6D TERM NVD N + - M 2.8 - 6 8 +
84 23474 24 G2A1 0.38 NORMO 111.9 N 38W 1D TERM NVD N - - M 3.1 - 7 8 -
85 22804 30 PRIMI 0.58 HYPER 90.1 N 37W TERM LSCS ABN + - M 2.3 LBW 6 8 +
86 21846 26 PRIMI 0.4 NORMO 219.4 N 38W 2D TERM LSCS N - - M 2.4 LBW 7 8 -
87 23551 28 G3P1L1A1 0.41 NORMO 184.1 N 37W 4D TERM NVD N - - M 2.7 - 7 9 -
88 24597 27 PRIMI 0.4 NORMO 132.3 N 39W 5D TERM NVD N - - M 2.8 - 7 8 -
89 24690 25 G2P1L1 0.39 NORMO 156.7 N 38W 3D TERM NVD N - - M 2.7 - 7 9 -
90 23564 22 PRIMI 0.38 NORMO 138.4 N 38W TERM NVD N - - M 2.8 - 7 8 -
91 28548 22 PRIMI 0.26 HYPO 74.3 DEC 31W 2D PRETERM NVD - - - F 2.2 LBW 7 8 -
92 24497 25 G2A1 0.36 NORMO 221.1 N 39W 1D TERM NVD N - - F 2.9 - 7 8 -
93 24576 24 PRIMI 0.38 NORMO 164.2 N 38W 4D TERM NVD N - - M 2.7 - 7 9 -
94 24826 26 PRIMI 0.39 NORMO 186.2 N 40W TERM LSCS N - - M 2.8 - 7 8 -
95 23104 31 G2P1L1 0.72 HYPER 98.63 N 38W 3D TERM LSCS ABN + - M 2.54 SGA 6 7 +
96 24900 18 PRIMI 0.4 NORMO 109.2 N 37W 6D TERM LSCS N - - F 3.2 - 7 8 -
97 24711 28 G3P2L2 0.42 NORMO 132.1 N 38W 5D TERM NVD N + - M 3 - 7 8 -
98 24918 25 PRIMI 0.41 NORMO 211 N 34W 6D PRETERM NVD - - - M 1.8 LBW 6 7 +
99 24837 22 PRIMI 0.38 NORMO 133.1 N 38W 1D TERM LSCS N - - M 2.7 - 7 8 -
100 35747 19 PRIMI 0.14 HYPO 18.5 DEC 30W 4D PRETERM NVD - - IUD M 1.3 LBW - - -
101 24843 23 PRIMI 0.39 NORMO 1224.5 N 40W 3D TERM NVD N - - M 3.1 - 7 9 -
102 23820 29 G4P1L1A2 0.38 NORMO 180.45 N 38W TERM NVD N - - F 2.8 - 7 9 -
103 23814 22 PRIMI 0.37 NORMO 223.45 N 37W 5D TERM NVD N - - F 2.7 - 7 8 -
104 22931 21 PRIMI 0.63 HYPER 152.1 INC 38W 5D TERM LSCS ABN - - M 2.53 SGA 7 8 +

105 24258 28 G2P1L1 0.38 NORMO 113.65 N 38W 6D TERM NVD N - - M 2.7 - 7 9 -
106 24306 23 PRIMI 0.39 NORMO 134.5 N 37W2D TERM NVD N - - M 2.8 - 8 9 -
107 25072 27 PRIMI 0.37 NORMO 212.3 N 38W 4D TERM LSCS ABN - - M 2.8 - 8 9 -
108 23113 19 PRIMI 0.24 HYPO 71.9 DEC 38W 4D TERM LSCS ABN - - F 2.4 LBW 6 8 +
109 15072 24 PRIMI 0.38 NORMO 101.23 N 38W 6D TERM NVD N - - F 3.2 - 8 9 -
110 16315 20 PRIMI 0.4 NORMO 143.32 N 39W 5D TERM NVD N - - F 3 - 8 9 -
111 15683 25 G2A1 0.37 NORMO 157.67 N 37W 6D TERM NVD N - - M 2.8 - 7 8 -
112 16408 33 PRIMI 0.41 NORMO 156.34 N 39W 4D TERM NVD N - - M 2.9 - 6 7 +
113 22775 19 PRIMI 0.54 HYPER 267.2 INC 37W 4D TERM LSCS N + - F 2.54 SGA 5 7 +
114 16259 26 G2P1L1 0.41 NORMO 120.3 N 39W 4D TERM LSCS ABN - - M 3.2 - 7 9 -
115 16912 25 G3P1L1A1 0.38 NORMO 204.22 N 37W 5D TERM NVD N - - F 2.87 - 7 8 -
116 16632 29 PRIMI 0.42 NORMO 165.34 N 39W 4D TERM NVD N - - F 2.9 - 8 9 -
117 16248 22 PRIMI 0.4 NORMO 246.63 N 38W 6D TERM NVD N - - M 3.1 - 7 9 -
118 16896 25 PRIMI 0.39 NORMO 170.89 N 40W 2D TERM NVD N - - M 3 - 7 8 -
119 17110 21 G2A1 0.38 NORMO 127.8 N 39W 2D TERM LSCS ABN + - M 3.4 - 5 7 +
120 22763 30 G2P1L1 0.22 HYPO 210.5 N 37W 2D TERM NVD N - - F 2.4 LBW 7 8 -
121 24303 24 G2P1L1 0.37 NORMO 127.8 N 40W TERM NVD N - - F 2.8 - 7 9 -
122 25067 26 G2P1L1 0.38 NORMO 206.54 N 39W 3D TERM NVD N - - F 2.9 - 8 9 -
123 24957 18 PRIMI 0.36 NORMO 179.9 N 38W 5D TERM LSCS ABN - - M 2.8 - 7 8 -
124 23410 21 G2P1L1 0.62 HYPER 149.4 N 38W 5D TERM LSCS N - - M 2.9 - 7 8 -
125 24461 19 PRIMI 0.39 NORMO 156.78 N 38W 4D TERM LSCS N + - M 2.8 - 7 8 -
126 34675 29 G3P2L2 0.39 NORMO 122.21 N 39W 4D TERM NVD N - - M 3.2 - 7 8 -
127 34617 27 PRIMI 0.37 NORMO 146.88 N 38W 3D TERM NVD N - - M 2.8 - 8 9 -
128 33264 26 G3P1L1A1 0.38 NORMO 196.55 N 40W 3D TERM NVD N - - F 3.2 - 7 9 -
129 21979 31 G2P1L1 0.29 HYPO 198.8 N 39W TERM NVD N - - M 2.5 - 7 8 -
130 34915 23 G2P1L1 0.4 NORMO 162.23 N 39W 5D TERM NVD N - - F 2.7 - 7 8 -

131 35015 21 PRIMI 0.4 NORMO 201.23 N 39W 1D TERM NVD N - - F 2.9 - 8 9 -
132 34888 22 G2P1L1 0.41 NORMO 98.56 N 38W 6D TERM LSCS N - - M 2.9 - 7 8 -
133 34631 28 G2P1L1 0.58 HYPER 180.9 N 40W 2D TERM NVD N - - F 3.2 - 8 9 -
134 35368 36 G2A1 0.4 NORMO 134.65 N 38W 1D TERM LSCS N - - M 2.8 - 8 9 -
135 32390 32 G3A2 0.39 NORMO 118.9 N 38W 4D TERM NVD N - - M 2.9 - 7 8 -
136 23344 28 PRIMI 0.28 HYPO 75.65 DEC 38W 4D TERM LSCS ABN + - M 2.35 LBW 6 8 +
137 34266 21 PRIMI 0.42 NORMO 140.44 N 40W TERM NVD N - - M 2.9 - 8 9 -
138 35363 22 PRIMI 0.41 NORMO 200.1 N 38W 6D TERM NVD ABN - - F 3 - 8 9 -
139 34180 27 G2P1L1 0.38 NORMO 98.8 N 39W 2D TERM NVD ABN - - M 2.9 - 7 8 -
140 35442 21 PRIMI 0.36 NORMO 189.43 N 38W 4D TERM LSCS N + - F 2.9 - 7 8 -
141 32805 24 PRIMI 0.38 NORMO 154.3 N 39W 4D TERM NVD N - - F 2.87 - 8 9 -
142 35747 31 G2P1L1 0.37 NORMO 198.77 N 38W 2D TERM NVD N - - F 2.9 - 7 8 -
143 36088 26 G3P1L1A1 0.38 NORMO 133.56 N 39W4D TERM NVD N - - F 3.1 - 8 9 -
144 23173 27 G3A2 0.26 HYPO 63.4 DEC 38W 1D TERM LSCS ABN - - M 2.4 LBW 5 6 +
145 36111 25 G2A1 0.4 NORMO 178.89 N 40W 2D TERM LSCS ABN - - F 2.8 - 7 8 -
146 36299 27 G3P2L2 0.4 NORMO 167.89 N 39W TERM NVD N - - M 2.9 - 7 8 -
147 36371 19 PRIMI 0.42 NORMO 211.56 N 38W 5D TERM LSCS N - - M 2.8 - 8 9 -
148 36561 26 G4P1L1A2 0.38 NORMO 154.3 N 40W 2D TERM LSCS N - - M 2.8 - 7 8 -
149 21819 31 PRIMI 0.78 HYPER 110.5 N 38W 2D TERM LSCS N + - M 3.8 - 6 8 +
150 36531 24 PRIMI 0.36 NORMO 220.98 N 39W 4D TERM NVD N - - F 3.2 - 8 9 -
151 35745 26 G2P1L1 0.38 NORMO 168.88 N 38W 5D TERM NVD N - - F 2.8 - 7 8 -
152 36171 23 G3P1L1A1 0.41 NORMO 96.7 N 31W 2D PRETERM NVD - - - F 1.4 LBW 6 7 +
153 37272 21 PRIMI 0.38 NORMO 160.34 N 39W 3D TERM LSCS N - - M 2.7 - 7 8 -
154 22519 21 PRIMI 0.22 HYPO 60.9 DEC 38W 4D TERM LSCS ABN - - F 2.9 - 6 8 +
155 36598 27 G3A2 0.4 NORMO 205.88 N 38W 1D TERM NVD N - - F 2.9 - 7 8 -
156 37404 23 G2P1L1 0.36 NORMO 136.77 N 39W 5D TERM NVD N - - M 2.7 - 7 8 -

157 37154 26 PRIMI O.38 NORMO 95.78 N 38W 5D TERM NVD N - - M 3 - 7 9 -
158 37577 21 PRIMI 0.39 NORMO 132.87 N 39W 4D TERM LSCS ABN - - M 2.7 - 7 8 -
159 20849 17 PRIMI 0.46 HYPER 94.5 N 39W 2D TERM LSCS ABN - - F 2.9 - 7 8 -
160 35457 25 G2A1 0.4 NORMO 146.88 N 39W 3D TERM NVD N - - M 2.9 - 8 9 -
161 38359 27 G3P1L1A1 0.36 NORMO 199.78 N 40W TERM NVD N - - F 3.2 - 8 9 -
162 38383 29 G4A3 0.4 NORMO 171.78 N 39W 2D TERM LSCS N - - F 2.9 - 7 8 -
163 23251 19 PRIMI 0.4 NORMO 119.8 N 38W 1D TERM NVD N - - F 2.7 - 7 8 -
164 36079 33 G3P2L2 0.26 HYPO 69.8 DEC 38W 3D TERM NVD ABN - - M 2.4 LBW 5 6 +
165 38714 32 G2P1L1 0.34 NORMO 164.7 N 38W 1D TERM LSCS N - - F 3.1 - 7 8 -
166 23251 20 PRIMI 0.36 NORMO 98.77 N 36W2D PRETERM NVD N - - M 2.6 - 8 9 -
167 23647 22 PRIMI 0.34 NORMO 116.78 N 40W 2D TERM NVD N - - M 2.8 - 7 8 -
168 23658 31 PRIMI 0.54 HYPER 130.2 N 38W 3D TERM LSCS ABN + - F 3 - 6 8 +
169 23588 28 PRIMI 0.38 NORMO 220.56 N 35W 3D PRETERM NVD N - - F 2.5 - 8 9 +
170 23126 25 G2P1L1 0.34 NORMO 118.56 N 38W 6D TERM NVD N - - M 2.9 - 7 8 -
171 23698 24 G2A1 0.4 NORMO 159.8 N 39W 6D TERM NVD N + - F 2.7 - 8 9 -
172 20849 25 G2P1L1 0.18 HYPO 52.9 DEC 37W 5D TERM LSCS ABN - - F 2.3 LBW 6 8 +
173 23280 20 PRIMI 0.4 NORMO 174.56 N 37W 4D TERM LSCS N - - F 2.7 - 7 8 -
174 23600 24 G3A2 0.4 NORMO 213.78 N 38W 5D TERM NVD N - - M 2.9 - 7 9 -
175 23269 19 PRIMI 0.36 NORMO 92.7 N 39W 3D TERM NVD N - - M 2.7 - 5 7 +
176 23650 22 PRIMI 0.49 HYPER 155.7 N 38W 2D TERM LSCS ABN + - F 2.9 - 7 8 -
177 23438 21 PRIMI 0.39 NORMO 156.8 N 37W 2D TERM NVD N - - F 2.8 - 8 9 -
178 23803 27 G2A1 0.36 NORMO 120.89 N 38W 2D TERM LSCS N - - F 3.5 - 8 9 -
179 23701 30 G3P1L1A1 0.34 NORMO 156.77 N 38W 4D TERM LSCS ABN + - M 3.1 - 6 7 +
180 23479 28 PRIMI 0.29 HYPO 67.8 DEC 38W 5D TERM NVD ABN + - M 2.3 LBW 5 6 +
181 30148 21 PRIMI 0.38 NORMO 97.6 N 39W 4D TERM LSCS N - - F 2.8 - 7 8 -
182 30345 23 G2P1L1 0.36 NORMO 189.9 N 38W 2D TERM NVD N - - M 3 - 8 9 -
183 31383 24 G2A1 0.34 NORMO 166.6 N 40W TREM NVD ABN - - M 3 - 7 9 -

184 23647 34 PRIMI 0.48 HYPER 220.4 N 38W 1D TERM LSCS ABN - - F 2.56 - 7 8 +
185 31947 22 G2P1L0 0.37 NORMO 221.7 N 38W 4D TERM NVD N - - F 2.9 - 8 9 -
186 31088 28 PRIMI 0.39 NORMO 92.4 N 32W 2D PRETERM NVD - - - M 1.6 LBW 6 8 -
187 32011 29 G3P2L2 0.38 NORMO 230 N 39W4D TERM NVD N - - F 2.7 - 7 8 -
188 23708 23 PRIMI 0.24 HYPO 62.4 DEC 38W 1D TERM NVD N - - M 2.7 - 7 8 -
189 31530 26 PRIMI 0.38 NORMO 158.99 N 40W 3D TERM NVD N - - F 3.2 - 8 9 -
190 31234 24 PRIMI 0.4 NORMO 186.7 N 38W 4D TERM LSCS N - - M 2.9 - 7 8 -
191 31969 25 G3P1L1A1 0.35 NORMO 100.2 N 39W 2D TERM NVD N - - M 3.2 - 7 8 -
192 23192 23 PRIMI 0.49 HYPER 149.4 N 38W 4D TERM LSCS N - - M 2.8 - 8 9 -
193 31334 27 G2P1L1 0.4 NORMO 220.1 N 40W 4D TERM NVD N - - F 3.4 - 8 9 -
194 31465 22 PRIMI 0.36 NORMO 91.22 N 32W 1D PRETERM NVD - - - M 2 LBW 6 7 +
195 31643 21 G2P1L0 0.37 NORMO 187.8 N 40W TERM NVD N - - M 2.8 - 7 8 -
196 23075 34 PRIMI 0.22 HYPO 144.3 N 38W 4D TERM LSCS ABN - - M 3.4 - 7 8 -
197 32054 30 G2A1 0.34 NORMO 167.8 N 38W TERM LSCS ABN - - M 3 - 7 8 -
198 32079 32 PRIMI 0.36 NORMO 188.9 N 40W 2D TERM LSCS ABN + - F 3 - 6 7 +
199 32124 24 G2P1L1 0.38 NORMO 212.56 N 39W 4D TERM NVD N - - F 2.9 - 7 8 -
200 32334 22 PRIMI 0.36 NORMO 112.78 N 40W 2D TERM LSCS N + - M 2.9 - 7 8 -


QUESTIONAIRE
NAME : AGE : ID NO.:
ADDRESS :
CONTACT NUMBER :SOCIO ECONOMIC STATUS:OBST. SCORE : M/H:LMP : M/S:EDD :
GEST. AGE :PRESENT HISTORY :OBSTETRIC HISTORY:FAMILY HISTORY:
GA as per 1st trimester scan:GA as per LMP:
Medical disorders in the mother:Hypertension/PIH EpilepsyDiabetes Mellitus/GDM Thyroid DisturbancesAnaemia Heart Disease
Late Second Trimester Scan:SLIUG______ Weeks, ____________PresentationLiquor_______Anomaly surveyCoiling Index__________Cord diameterFoetal weightUmbilical vein blood flow volume
Clinical Examination:HEIGHT : cms WEIGHT: kgPULSE: BLOOD PRESSURE:PALLOR: + / - THYROID:
CVS: RS:
P/A:

P/V:Delivery Details:
CTG: Reactive / Non-Reactive
Onset of Labour: Spontaneous / Induced
Color of Liquor: Clear / Meconium Stained
Duration of Labour:Mode of Delivery: Labour Naturale / Operative Vaginal Delivery /LSCS
(indication:________________________________)
Baby Details:
Sex: M / F
Birth Weight: _____kgs
APGAR: 1 min________, 7 mins_________
Admission to NICU:

CONSENT FORM
STUDY TITLE: SECOND TRIMESTER ANTENATAL UMBILICAL COILING INDEX AND ITSDOPPLER FLOW CHARACTERISTICS AND PERINATAL OUTCOME –PROSPECTIVESTUDY AT TIRUNELVELI MEDICAL COLLEGE HOSPITAL ,TIRUNELVELI.
STUDY CENTRE: TIRUNELVELI MEDICA COLLEGE HOSPITAL ,TIRUNELVELI
PARTICIPANT NAME : AGE: ID. NO.I confirm that I have understood the purpose of the above study.i have the opportunity to askthe question and all my questions and doubts have been answered to my satisfaction.I understand that my participation in the study is voluntary and that I am free to withdraw atany time without giving any reason.I understand that the investigator, regulatory authorities and the ethics committee will notneed my permission to look at my health records both in respect to the current study and anyfurther research that may be conducted in relation to it , even if I withdraw from the study. Iunderstand that my identity will not be revealed in any information released to third parties ofpublished, unless as required under the law. I agree not to restrict the use of any or results thatarise from the study.
I hereby consent to participate in this study titled SECOND TRIMESTER ANTENATALUMBILICAL COILING INDEX AND ITS DOPPLER FLOW CHARACTERISTICS ANDPERINATAL OUTCOME –PROSPECTIVE STUDY AT TIRUNELVELI MEDICAL COLLEGEHOSPITAL ,TIRUNELVELI
Signature of InvestigatorPlace:Date:Study Investigators Name Institution:Thanking you,Yours faithfully,Signature/thumb impression of patient

KEY TO MASTER CHART
CTG – CardiotocographMsl – meconium stained liquorGA – Gestational AgeIUD – Intra Uterine DeathUCI – Umbilical Coiling IndexAN UCI – Antenatal Umbilical Coiling IndexUmV –Umbilical vein blood flowN – NormalAbN – AbnormalINC-IncreasedDEC-DecreasedNVD – Normal Vaginal DeliveryEmer LSCS – Emergency Lower Segment Caesarean SectionF – FemaleM – MaleNORMO – NormocoiledHYPO-HypocoiledHYPER-HypercoiledSGA –Small for gestational ageLBW-Low birth weight
ABBREVIATIONSUCI – UMBILICAL CORD COILING INDEXCTG - CARDIOTOCOGRAPHNICU – NEONATAL INTENSIVE CARE UNITLSCS – LOWER SEGMENT CAESEREAN SECTIONCPD – CEPHALO PELVIC DISPROPORTIONSGA-SMALL FOR GESTATION AGELBW –LOW BIRTH WEIGHT