Assessment of the Quality of Antenatal Care, Family Planning ...
144
Assessment of the Quality of Antenatal Care, Family Planning, and Sick Child Care Services in Nepal Further Analysis of the 2015 Nepal Health Facility Survey DHS Further Analysis Reports No. 123 Government of Nepal Ministry of Health and Population NEW ERA
-
Upload
khangminh22 -
Category
Documents
-
view
1 -
download
0
Transcript of Assessment of the Quality of Antenatal Care, Family Planning ...

Assessment of the Quality of Antenatal Care, Family Planning,
and Sick Child Care Services in Nepal
Further Analysis of the 2015 Nepal Health Facility Survey
DHS Further Analysis Reports No. 123
Government of Nepal Ministry of Health and Population
NEW ERA


DHS Further Analysis Reports No. 123
Assessment of the Quality of Antenatal Care, Family Planning, and Sick Child Care Services in Nepal
Further Analysis of the
2015 Nepal Health Facility Survey
Tsering Pema Lama
Madhav Chaulagain
Anjana Rai
Swadesh Gurung
Health for Life (H4L) Project, RTI International Kathmandu, Nepal
August 2019
Corresponding author: Tsering Pema Lama, Consultant, Health for Life Project, Kathmandu, Nepal; phone: +977-9808000126; email: [email protected]
New ERA Ministry of Health and Population

Editor: Diane Stoy Document Production: Natalie Shattuck and Joan Wardell
This report presents findings from a further analysis undertaken as part of the follow-up to the 2015 Nepal Health Facility Survey (2015 NHFS). This study was carried out with support provided by the United States Agency for International Development (USAID) through The DHS Program (#AID-OAA-C-13-00095). The views expressed are those of the authors and do not necessarily reflect the views of USAID or the United States Government.
Additional information about the 2015 NHFS may be obtained from Ministry of Health and Population, Ramshah Path, Kathmandu; telephone: +977-1-4262543/4262802, internet: http://www.mohp.gov.np, and New ERA, Rudramati Marg, Kalopul, P.O. Box 722, Kathmandu, Nepal; telephone: +977-1-4413603, email: [email protected], internet: http://www.newera.com.np/.
The DHS Program assists countries worldwide in the collection and use of data to monitor and evaluate population, health, and nutrition programs. Additional information about The DHS Program can be obtained from ICF, 530 Gaither Road, Suite 500, Rockville, MD 20850 USA; telephone: +1 301-572-0200, fax: +1 301-572-0999, email: [email protected], internet: www.DHSprogram.com.
Recommended citation:
Lama, T. P., M. Chaulagain, A. Rai, and S. Gurung. 2019. Assessment of the Quality of Antenatal Care, Family Planning, and Sick Child Care Services in Nepal: Further Analysis of the 2015 Nepal Health Facility Survey. DHS Further Analysis Reports No. 123. Rockville, Maryland, USA: ICF.

iii
CONTENTS
TABLES AND FIGURES ........................................................................................................................ v EXECUTIVE SUMMARY ....................................................................................................................... ix FOREWORD ........................................................................................................................................ xiii ACKNOWLEDGMENTS ....................................................................................................................... xv ABSTRACT......................................................................................................................................... xvii ACRONYMS AND ABBREVIATIONS ................................................................................................ xix
1 INTRODUCTION ........................................................................................................................ 1
2 DATA AND METHODS ............................................................................................................. 3 2.1 Data Sources ................................................................................................................ 3 2.2 Measurements of Quality of Care Dimensions ............................................................. 5
2.2.1 Dimension: Effective ........................................................................................ 6 2.2.2 Dimension: Efficient ......................................................................................... 7 2.2.3 Dimension: Timely ........................................................................................... 7 2.2.4 Dimension: Client-centered .............................................................................. 7 2.2.5 Dimension: Safe ............................................................................................... 8 2.2.6 Dimension: Reliable ......................................................................................... 8 2.2.7 Dimension: Appropriate ................................................................................... 9 2.2.8 Dimension: Equity ............................................................................................ 9
2.3 Analysis ....................................................................................................................... 10
3 RESULTS ................................................................................................................................ 11 3.1 Quality of ANC Services ............................................................................................. 11
3.1.1 Effectiveness .................................................................................................. 11 3.1.2 Efficiency ........................................................................................................ 13 3.1.3 Timeliness ...................................................................................................... 15 3.1.4 Client-centeredness ....................................................................................... 16 3.1.5 Safety ............................................................................................................. 18 3.1.6 Reliability ........................................................................................................ 19 3.1.7 Appropriateness ............................................................................................. 20
3.2 Quality of Care of Sick Child Care Service ................................................................. 22 3.2.1 Effectiveness .................................................................................................. 22 3.2.2 Efficiency ........................................................................................................ 28 3.2.3 Timeliness ...................................................................................................... 32 3.2.4 Client-centeredness ....................................................................................... 33 3.2.5 Safety ............................................................................................................. 35 3.2.6 Reliability ........................................................................................................ 36 3.2.7 Appropriateness ............................................................................................. 37
3.3 Quality of care of FP service ....................................................................................... 38 3.3.1 Effectiveness .................................................................................................. 39 3.3.2 Efficiency ........................................................................................................ 45 3.3.3 Timeliness ...................................................................................................... 48 3.3.4 Client-centeredness ....................................................................................... 49 3.3.5 Safety ............................................................................................................. 52 3.3.6 Reliability ........................................................................................................ 53 3.3.7 Appropriate ..................................................................................................... 54

iv
3.4 Equity Dimension Results for Each Service Area ....................................................... 55 3.4.1 Equity dimension: ANC services .................................................................... 55 3.4.2 Equity dimension: Sick child care services .................................................... 56 3.4.3 Equity dimension: FP services ....................................................................... 57
4 DISCUSSION AND CONCLUSION ......................................................................................... 59 4.1 Recommendations for the ANC Program ................................................................... 59 4.2 Recommendation for the Child Health Program ......................................................... 61 4.3 Recommendation for the FP Program ........................................................................ 63 4.4 Equity in ANC, Sick Child Care, and FP Services ...................................................... 66 4.5 Limitations ................................................................................................................... 67 4.6 Overall Recommendation ........................................................................................... 67
REFERENCES .................................................................................................................................... 69
APPENDIX A ANC QUALITY OF CARE DEFINITIONS BY DIMENSIONS .................................... 75
APPENDIX B SICK CHILD CARE SERVICE QUALITY OF CARE DEFINITIONS BY DIMENSION .......................................................................................................... 83
APPENDIX C FP SERVICE QUALITY OF CARE DEFINITIONS BY DIMENSIONS ....................... 91
APPENDIX D ANC QUALITY OF CARE RESULTS BY DIMENSIONS ........................................ 103
APPENDIX E SICK CHILD CARE SERVICE QUALITY OF CARE RESULTS BY DIMENSION ........................................................................................................ 109
APPENDIX F FP SERVICE QUALITY OF CARE RESULTS BY DIMENSIONS ........................... 116

v
TABLES AND FIGURES
Table 1 Facility characteristics in the analytic sample by type of services (ANC, FP, and outpatient curative care for sick children) .................................................... 4
Table 2 Weighted number of observed consultations for ANC, FP, and outpatient curative care for sick children by facility characteristics ...................................... 4
Table 3 Description of ANC client, FP client and caretakers of sick child characteristics ................................................................................................... 55
Table 4 Association of client satisfaction with 11 service components of ANC service and physical examination score by individual client characteristics among observed/interviewed ANC clients at ANC facilities (N=1502) .......................... 55
Table 5 Association of caretaker of sick child satisfaction, main danger sign assessment score, and main symptoms/signs assessment score by individual client characteristics at outpatient child care facilities (N=2186) ...... 56
Table 6 Association of client satisfaction with 11 service components of FP services and physical examination score by individual client characteristics among observed/interviewed FP clients at FP facilities (N=768) .................................. 57
Appendix Table A1 Definitions of quality of care dimensions with corresponding indicators specific for ANC service .................................................................................... 76
Appendix Table B1 Definitions of quality of care dimensions with corresponding indicators specific for outpatient curative child care service .............................................. 84
Appendix Table C1 Definitions of quality of care dimensions with corresponding indicators specific for FP service ....................................................................................... 92
Appendix Table D1 Mean, median, minimum and maximum of facility scores for the effectiveness dimension, by background characteristics ................................ 103
Appendix Table D2 Mean, median, minimum and maximum of facility scores for each quality of care indicator for the efficiency dimension by background characteristics ................................................................................................. 105
Appendix Table D3 Mean, median, minimum and maximum of facility scores for each quality of care indicator for dimension measuring appropriateness by background characteristics ................................................................................................. 107
Appendix Table E1 Mean, median, minimum and maximum of facility scores for each quality of care indicator for dimension measuring effectiveness by background characteristics ................................................................................................. 109
Appendix Table E2 Mean, median, minimum and maximum of facility scores for each quality of care indicator for dimension measuring efficiency by background characteristics ................................................................................................. 111
Appendix Table E3 Mean, median, minimum and maximum of facility scores for each quality of care indicator for dimension measuring reliability by background characteristics ................................................................................................. 115
Appendix Table E4 Mean, median, minimum and maximum of facility scores for each quality of care indicator for dimension measuring appropriateness by background characteristics ................................................................................................. 115

vi
Appendix Table F1 Mean, median, minimum and maximum of facility scores for each quality of care indicator for dimension measuring effectiveness by background characteristics ................................................................................................. 116
Appendix Table F2 Mean, median, minimum and maximum of facility scores for each quality of care indicator for dimension measuring efficiency by background characteristics ................................................................................................. 119
Appendix Table F3 Mean, median, minimum and maximum of facility scores for each quality of care indicator for dimension measuring appropriateness by background characteristics ................................................................................................. 122
Figure 1 Overall mean, minimum, mean, and median and maximum scores for
effectiveness dimension indicators for ANC service ......................................... 11 Figure 2 Overall minimum, mean, and median scores for efficiency indicators for
ANC services ..................................................................................................... 13 Figure 3 Mean percentage scores on timeliness dimension indicators by facility
type for ANC services ........................................................................................ 15 Figure 4 Percentage scores of client-centeredness dimension indicators by facility
type for ANC services ........................................................................................ 17 Figure 5 Infection prevention for ANC service index score by facility type (minimum,
mean, and median scores) ................................................................................ 18 Figure 6 Mean percent of ANC clients at each facility who would recommend facility
to family/friend by facility type, managing authority, and ecological region ...... 20 Figure 7 Mean percent score distribution for appropriateness dimension by facility
types for ANC services ...................................................................................... 21 Figure 8 Overall scores on effectiveness dimension indicators (1-3) for sick child
care service (minimum, mean, and median scores) ......................................... 22 Figure 9 Mean index of integrated assessment score for sick child care consultations
by facility type .................................................................................................... 24 Figure 10 Mean percent of sick children with pneumonia at a facility receiving
complete assessment by facility type ................................................................ 25 Figure 11 Mean percent of sick children with ear infection at each facility that
received complete assessment by facility type ................................................. 26 Figure 12 Mean percent of sick children with fever at each facility who received
complete assessment by facility type ................................................................ 27 Figure 13 Outpatient curative child care service readiness overall scores by domains
(minimum, mean and median) .......................................................................... 28 Figure 14 Service readiness to provide vaccination by facility type .................................. 30 Figure 15 Mean, minimum, and median vaccination service equipment score
by facility type .................................................................................................... 31 Figure 16 Timeliness indicators for sick child care services by facility type
(mean % score) ................................................................................................. 32 Figure 17 Percentage scores of outpatient curative child care service client-
centeredness dimension indicators by facility type ........................................... 33 Figure 18 Infection prevention index score for outpatient curative child care services
by facility type (minimum, mean, and median score) ........................................ 35

vii
Figure 19 Mean percent of caretaker of sick child clients at each facility who would recommend facility to family/friend by background characteristics ................... 37
Figure 20 Mean percent score distribution for appropriateness dimension indicators by facility type .................................................................................................... 37
Figure 21 Distribution of the mean number of services offered for the various types of FP services by facility type ............................................................................ 39
Figure 22 The mean reproductive history score for first-visit FP clients by facility type (minimum, mean, and median scores) .............................................................. 40
Figure 23 Mean physical examination/medical history score for first-visit FP clients (minimum, mean, and median scores) .............................................................. 41
Figure 24 The mean injectable procedure score for FP services (minimum, mean, and median scores) ........................................................................................... 42
Figure 25 Mean percent of clients at each facility given specific information on contraceptive method by facility type ................................................................ 43
Figure 26. Mean percent of clients at each facility given comprehensive counseling by background characteristics ........................................................................... 45
Figure 27 Overall FP service readiness domain scores (minimum, mean, and median scores) ............................................................................................................... 45
Figure 28 Distribution of timeliness indicators for FP services by facility type .................. 48 Figure 29 Client-centeredness indicators related to satisfaction with FP services
by facility type .................................................................................................... 49 Figure 30 Client-centeredness indicators related to privacy and confidentiality of FP
services by facility type...................................................................................... 50 Figure 31 Infection prevention index score for FP services by facility type (mean,
minimum, and median scores) .......................................................................... 52 Figure 32 Distribution of mean percent of FP clients at a facility who would recommend
facility by background characteristics ................................................................ 53 Figure 33 Distribution of mean percent score for appropriateness dimension
indicators for FP services by type of facility ...................................................... 54


ix
EXECUTIVE SUMMARY
In the era of the Sustainable Development Goals, increased access to care alone will not be sufficient to improve health outcomes if health systems cannot provide high quality care. Countries are now focused on achieving universal health coverage and access to quality, essential health care services that align with the goals on health. We know very little about the quality of care in Nepal’s health sector. The comprehensive data collected on antenatal care, family planning, and sick child care in the 2015 Nepal Health Facility Survey allows for the first in-depth assessment of the quality of care in these service areas. The Nepal Health Sector Strategy 2015-2020 defines high quality health care as effective, safe, client-centered, timely, equitable, culturally appropriate, efficient, and reliable care. This study used data from the 2015 Nepal Health Facility Survey to assess the quality of care at health facilities that provide antenatal care, sick child care, and family planning by the eight dimensions of quality.
Methods
We used the 2015 Nepal Health Facility Survey data to assess the eight dimensions of quality identified in the Nepal Health Sector Strategy. Our study defined the eight dimensions and operationalized indicators for each dimension of quality captured in the Nepal Health Facility Survey for antenatal care, family planning, and sick child care services. All indicators except for the equity dimension were constructed at the facility level. The indicators vary in terms of units, with some presented as a score (percent or ordinal) and others as a percent distribution. For the facility level indicators (which did not include the equity dimension), we calculated and compared the mean, median, minimum, and maximum values across all facilities (overall) and by facility characteristics such as facility type, management of authority, ecological zone, and provinces. Data collected at the individual client level (observation or exit interview) and the health worker level were aggregated to the facility level to allow for final comparisons at the facility level.
For the equity dimension, we compared the quality of care indicators collected with patient observation and exit instruments with the three individual client level characteristics (age, education, and ethnicity). F-tests were used to test for independence of categorical variables and to compare the median and mean scores for the process of care indicators that were ordinal scores across the individual level client characteristics.
Results
The analysis included 919 facilities that provide antenatal care services. In the effectiveness dimension, overall performance for each indicator was poor. The higher-level zonal/above facilities and district hospitals did not perform better than the lower-level government facilities in terms of physical examination scores for the clients who received antenatal care services. The private facilities had slightly higher mean and median scores compared to public facilities. There was very little variation by ecological regions and provinces. The efficiency dimension, which measured service readiness to provide antenatal care services, was poor, especially for the staff training score and availability of guidelines. Private facilities performed poorly in staff training and availability of guidelines but performed better with equipment availability and laboratory diagnostic capacity compared to the public facilities. The higher-level facilities (zonal/above and district hospitals) had higher service readiness scores for the availability of equipment, laboratory diagnostic capacity, and essential oral medicines and vaccines. The two indicators that measured timeliness showed that waiting time was an issue for the majority of clients in the zonal/above-level hospitals with an average mean of 54% of clients waiting

x
more than 30 minutes. The safety dimension included an infection prevention index score (0-4) and the availability of injection safety precaution guidelines. The infection prevention index was based on four domains. The facility scores were low due to poor performance in hand hygiene (availability of running water and soap or hand disinfection), and the availability of injection safety precaution guidelines in only 4.2% of the facilities.
The client-centeredness indicators that measured the mean percent of clients satisfied with overall antenatal care service and with 11 service components averaged 85% and 79% of clients per facility, respectively. The mean client satisfaction was lower for the zonal/above-level hospitals. Compared to the publicly managed facilities, a higher proportion of private facilities had private rooms for antenatal care service consultations, although they were less likely to have visual aids for client education on pregnancy and antenatal care. The indicators that measured whether a facility was reliable and appropriate showed much better performance in the private facilities.
A total of 934 outpatient curative care facilities for sick children were analyzed for sick child care services. Overall, four of the five basic child health services were provided with the median public facility and private facility providing four and two services, respectively. The other effectiveness indicators that measured the clinical process of care and the performance of the clinical procedures (sick child assessment in general and for specific diagnosis) as per evidence-based guidelines was poor in all indicators except for the main symptom assessment score. The efficiency of the facilities was assessed for service readiness to provide quality outpatient curative care and vaccination services. The outpatient curative care service readiness was poor for staff trained on child care training in the past 24 months (all facility types), availability of the Integrated Management of Newborn and Childhood Illness guidelines or chart booklets (not found in the majority of private facilities, zonal/above-level facilities, or urban health centers) and priority medicines, with the median facility having only one of three priority medicines.
Service readiness to provide vaccination services (three domains) showed that on average, only 23.4% of the facilities had at least one staff who received epidemiology in-service training in the 24 months before the survey and about 55% of facilities had a vaccination guideline. With timeliness of care, clients in the zonal/above-level facilities and the district hospitals reported waiting time as a problem with clients waiting longer than 30 minutes. The client-centeredness indicators were relatively better, but were similar to the antenatal care analysis. The public facilities (urban health centers and health posts) lacked private rooms for sick child consultations, while the private facilities lacked visual aids for client education on child health. The findings on safety were similar to those of the antenatal care facilities. The higher-level public facilities had lower infection prevention index scores (both mean and median) and the majority of facilities did not have injection safety precaution guidelines. The indicators for reliability of a facility were optimal. Among the various indicators that measured the appropriateness of service delivery, the areas that needed improvement were the distance to facility (for private facilities) and the hour or days of service (for the higher-level facilities and the facilities in Provinces 1, 6 and 7).
The dimensions of effectiveness, efficiency, and safety for the family planning services were relatively poor. In terms of effectiveness, there were fewer than the required number of modern family planning methods available in the higher-level facilities and private facilities. The indicators that measure the process of family planning care (taking reproductive history, conducting physical examinations, and providing comprehensive family planning counseling based on method) were poor in overall quality and need to be strengthened substantially. For example, on average, only 5.7% and 12.1% of clients at each facility received information on use of the contraceptive method and the method’s potential side effects, respectively. The effectiveness dimension that measured service readiness showed sub-optimal

xi
performance in all three domains that measured service readiness (availability of guidelines, trained staff, and availability of basic family planning equipment). The higher-level public facilities and private hospitals performed better in terms of service readiness to provide intrauterine contraceptive device and implant services, and the quality of stock. The results of the indicators for timeliness and safety dimensions were similar to those of the antenatal and sick child care facilities. The client-centeredness indicator that measured client satisfaction with overall care showed that a lower proportion of clients were satisfied at the zonal/above and private facilities. An average of 32% of clients at each facility were able to discuss their concerns about the family planning method, which showed low client-centeredness in terms of the process of care. The indicators that measured the reliability and appropriateness dimensions of quality performed much better.
Our analysis also found evidence of inequity in the process of antenatal care by age group and education. A separate analysis showed that clients who had never attended school and those who were age 20 or younger had significantly lower mean physical examination scores. In the family planning analysis, the mean and median physical examination score was lowest for the Terai/Madhesi ethnic group, although there was no significant difference in the bi-variate test of association.
The sick child care assessment included two measures of effective service (danger signs and main symptoms assessment scores). A significantly higher proportion of sick children whose caretaker never attended school were more likely to receive no danger sign assessment compared to those sick children whose caretaker had attended school. Similarly, the sick children whose caretakers who were from Terai/Madhesi and Muslim/other ethnic groups were also significantly more likely to not receive any danger sign assessment, while those from Janjati/Newar (minority) ethnic group had better scores. Inequity by education and ethnicity group was also evident in the main symptoms and signs assessment scores.
Conclusion
This study helped to identify potential areas of concern that should be addressed in the design of policies and programs that can improve the quality of health care. These concerns could be monitored more closely during implementation of the three service areas. Although service-specific interventions are proposed in this report, there are several findings that were similar across the three service programs that can be resolved through intervention by the health facility management teams and also by regular monitoring and supervision by the health facility quality improvement teams. Clinical care data need to be regularly monitored to ensure comprehensive assessment of the quality of care. Our findings also highlighted the need to improve the health care workers’ performance in terms of compliance with the standards of care through regular refresher trainings, as well as on-the-job monitoring and supervision.


xiii
FOREWORD
The 2015 Nepal Health Facility Survey (2015 NHFS) is the first nationally representative comprehensive survey conducted in Nepal as part of the Demographic and Health Surveys (DHS) in the country. It combines the components of the Service Provision Assessment (SPA) survey of the Demographic and Health Surveys (DHS) Program, supported by the United States Agency for International Development (USAID); the World Health Organization (WHO) Service Availability and Readiness Assessment; the United Nations Population Fund (UNFPA) Facility Assessment for Reproductive Health Commodities and Services; and the Nepal-specific Service Tracking Survey, funded by the UK Department for International Development (DFID).
The standard format of the main report includes only a descriptive presentation of findings, without using analytical statistical methods to ascertain the significance of change, readiness, and some causative association among variables. Though largely sufficient, the standard report is limited, particularly in providing answers to “why” questions, which are essential in reshaping important policies and programs. Hence, following the dissemination of the 2015 NHFS, the Ministry of Health and Population (MoHP) and partners convened and agreed on key areas to assess progress and gaps, and to assess determinants, in high priority public health programs that MoHP is implementing. In this context, further analysis has been carried out by relevant technical professionals from MoHP and partners who directly work on the given areas, with technical support and facilitation from research agencies.
The primary objective of this further analysis of 2015 NHFS is to provide more in-depth knowledge and insight into key issues that emerged based on data from the 2015 NHFS. This analysis will provide guidance in planning, implementing, refocusing, monitoring, and evaluating health programs related to issues in Nepal. The long-term objective of the further analysis is to strengthen the technical capacity of the local institutions and individuals to analyze and use data from complex national population and health surveys to better understand specific issues per country need and situation. The further analysis assesses quality of care at health facilities that provide antenatal care, sick child care, and family planning by eight dimensions of quality.
The further analysis of the 2015 NHFS is the concerted effort of various individuals and institutions, and it is with great pleasure that I acknowledge the work that has gone into producing this useful document. The participation and cooperation among the members of the Technical Advisory Committee in the different phases of the survey is highly regarded.
I also would like to thank the Public Health Administration Monitoring and Evaluation Division (PHAMED) of MoHP for its effort and dedication in the completion of this further analysis of the 2015 NHFS. I extend my appreciation to USAID/Nepal for providing financial support for the further analysis. I would also like to acknowledge ICF for its technical assistance at all stages. My sincere thanks go to the New ERA team for their management and coordination of the process.
Dr. Pushpa Chaudhary Secretary Ministry of Health and Population


xv
ACKNOWLEDGMENTS
Further analysis of the 2015 Nepal Health Facility Survey (NHFS) has been conducted under the aegis of the Public Health Administration Monitoring and Evaluation Division (PHAMED) of the Ministry of Health (MoHP). The United States Agency for International Development (USAID) provided financial support, and technical assistance was provided by ICF. Overall coordination, facilitation, administrative, and logistic support was provided by New ERA, a local research firm with extensive experience in conducting such studies.
This series consists of five reports based on the 2015 NHFS and is intended to meet information gaps in the areas of quality of care for maternal, child, and family planning services. The main report of the 2015 NHFS presented a descriptive analysis of the service availability and readiness of all basic health services offered at the health facilities and information on quality of care for sick child, family planning, and maternal health services. The five further analysis reports will examine quality of care by various dimensions of quality individually for maternal, child, and family planning services, providing further insight into the strengths and weakness in terms of facility readiness to provide quality care services.
I would like to express my deep sense of appreciation for the contributions of a number of stakeholders in the various phases of this study and for providing valuable inputs towards finalizing the report. My sincere gratitude goes to all members of National Monitoring and Evaluation Technical Advisory Group at MoHP for their valuable advice. I appreciate the leadership of Mr. Giri Raj Subedi, Sr. Public Health Administrator and the entire team of PHAMED for their contribution during the different phases of the studies.
My special gratitude goes to the authors Dr. Tsering Pema Lama, Mr. Madhav Chaulagain, Ms. Anjana Rai, and Mr. Swadesh Gurung from USAID-funded Health for Life Project, RTI International, for completing the analysis and write-up of the report. Special thanks to Dr. Rajendra Bhadra, Mr. Madan Bhatt and Mr. Uttam Neupane of Health for Life Project for reviewing the report and offering invaluable comments. I would also like to acknowledge Dr. Robert Timmons, Chief of Party, and Dr. Damodar Adhikari, Deputy Chief of Party, Health for Life Project, for their guidance throughout the production of this report. I would like to sincerely thank the in-country reviewers Drs. Deepak Paudel, Deputy Chief of Party, and Archana Amatya, Senior Technical Advisor, USAID’s Strengthening Systems for Better Health Activity, for their review and feedback on the final report.
The technical support provided by ICF is highly appreciated and acknowledged. My special thanks go to Dr. Wenjuan Wang, Dr. Shireen Assaf, and Dr. Cristina de la Torre for their technical support throughout the period and Diane Stoy for editorial support.
My appreciation also goes to the staff of New ERA, Mr. Yogendra Prasai and his team, and to Ms. Sabita Tuladhar of USAID for excellently managing the further analysis activities.
Dr. Bikash Devkota Chief, Policy Planning and Monitoring and Evaluation Division Ministry of Health and Population

xvii
ABSTRACT
In the era of the Sustainable Development Goals, increased access to care alone will not be sufficient to improve health outcomes if health systems cannot provide high quality care. The Nepal Health Sector Strategy 2015-2020 defines health care to be of good quality when it is effective, safe, client-centered, timely, equitable, culturally appropriate, efficient, and reliable. This study assessed the quality of care at health facilities that provide antenatal care, sick child care, and family planning by the eight dimensions using data from the 2015 Nepal Health Facility Survey. We operationalized indicators to measure each dimension and constructed the indicators (except for equity dimension) at the facility level. For the facility level indicators (except the equity dimension analysis), we calculated and compared the mean, median, minimum, and maximum values across all facilities (overall) and by facility characteristics (facility type, managing authority, ecological zone, and provinces). Overall, the facilities performed better in the dimensions of client-centeredness, reliability, appropriateness, and timeliness for all three service areas. The dimensions of efficiency, effectiveness, and safety showed relatively poor performance. Performance was low overall and varied across facilities with important implications for program design. Our analysis found evidence of inequity in the process of care by the client’s age group and education in the antenatal care observations and by the caretakers’ ethnicity and education level for the sick child care services. This study identified potential areas of concern that can be addressed in the design of policies and programs and that can be monitored more closely during implementation of all three service areas.
Key words: Quality of care, antenatal care, family planning, sick child care, Nepal


xix
ACRONYMS AND ABBREVIATIONS
AHW auxiliary health worker ANC antenatal care ANM auxiliary nurse midwife
BPb blood lead
CPR contraceptive prevalence rate
EPI epidemiology
FP family planning
GoN Government of Nepal
HP health post HTC HIV testing and counseling
IEC information, education, and communication IMCI integrated management of childhood illness IMNCI integrated management of neonatal and childhood illness IOM Institute of Medicine IUCD intrauterine contraceptive device IYCF infant and young child feeding
LMIS logistic management and information system
MDG Millennium Development Goal MMR maternal mortality ratio MoHP Ministry of Health and Population
NDHS Nepal Demographic and Health Survey NHFS Nepal Health Facility Survey NHSS Nepal Health Sector Strategy NSMP Nepal Safe Motherhood Program
PHCC primary health care centers PNC postnatal care
QI quality improvement QI-TWG Quality Improvement – Technical Working Group
SBA skilled birth attendant SDG sustainable development goal SPA service provision assessment STI sexually transmitted infection
UHC urban health centers
WHO World Health Organization


1
1 INTRODUCTION
Nepal has made impressive improvements in maternal, child, infant, and neonatal health in the last decade. The Millennium Development Goals (MDGs) focus on expanding access to basic health interventions known to be effective. Nepal has achieved all MDG 4 targets of reducing infant and child mortality rates, along with increasing immunization against measles. Nepal was also very close to meeting the targets for reducing the maternal mortality ratio (MMR) and increasing births attended by skilled birth attendants (SBAs) (National Planning Commission 2016). Progress in Nepal on the reproductive health targets were partially achieved with an almost two-fold increase in the contraceptive prevalence rate (CPR) for modern methods (24% in 1990 to ~50% in 2015) and a significant increase in antenatal care (ANC) coverage (National Planning Commission 2016).
Improving access to health care by expanding health services and strengthening community-based interventions were key factors in Nepal’s progress towards the MDG targets. The Nepal Safe Motherhood Program (NSMP) initiated both demand and supply side strengthening through the provision of free delivery care, financial incentives that cover the transport costs to the health facility for ANC and delivery care, and rapid expansion of birthing centers with 24 hour, 7 days- a-week delivery services (Ministry of Health and Population (MOHP) 2006).
In the era of the Sustainable Development Goals (SDGs), increased access to care alone will not be sufficient to improve health outcomes if health systems cannot provide high quality care (Kruk, Larson, and Twum-Danso 2016). Emerging evidence in maternal and newborn health show that improving coverage of health services has limited effect on health outcomes if the quality of care is poor ( Godlonton and Okeke 2016; Ng et al. 2014; Okeke and Chari 2015). The 2016 Nepal Demographic and Health Survey (NDHS) reported that 69% of women received four or more ANC visits from a skilled provider and 57% delivered at a health facility, compared to 50% and 35% respectively in 2011. Institutional delivery increased from 35% in 2011 to 57% in 2016, although home births are still common in rural areas (54.3%). These improvements in maternal health service coverage have not been reflected in the current MMR, which has decreased only slightly from 281 in 2006 to 259 in 2016 (Ministry of Health and Population 2015). A 2013 national assessment of birthing centers showed that the quality of clinical care (ANC and delivery care) was very poor and that facility readiness to provide quality care as per the NSMP guidelines was suboptimal (Ministry of Health and Population and Government of Nepal 2014). It is essential that clients be given quality clinical care at a health facility that meets the minimum standards of care in order to have a direct impact on health outcomes.
Access to quality, essential health care services and achievement of universal health coverage in line with the SDGs on health are now priorities in many low and middle-income countries including Nepal (United Nations 2016). Quality of care is one of the four strategic principles of the Nepal Health Sector Strategy (NHSS) 2015-20. The NHSS defines health care to be of good quality when it is effective, safe, client-centered, timely, equitable, culturally appropriate, efficient, and reliable (Ministry of Health and Population 2015). A first crucial step in the delivery of high quality care is the assessment of quality of care at health facilities and the identification of the gaps that weaken the quality of care.
Several indicators that measure the quality of care at point-of-delivery have been identified under the NHSS via the data obtained from the Nepal Health Facility Survey (NHFS) (MOH, New Era, NHSSP, and ICF 2017) and other sources under the auspices of the Ministry of Health. In addition, as warranted by the National Health Policy 2014, an autonomous accreditation body was to be established for quality

2
assurance of health services in the public and private sectors. However, an accreditation body has yet to be formed. Meanwhile, it is essential to begin assessing the quality of care with data available in the NHFS.
We currently know very little about the quality of care in the health sector of Nepal. The comprehensive data in the 2015 NHFS on ANC, family planning (FP), and sick child care allowed for the first in-depth assessment of the quality of care in these service areas, as identified under the NHSS definition of quality care.

3
2 DATA AND METHODS
2.1 Data Sources
The NHFS is equivalent to the service provision assessments (SPA) conducted in other countries that provide information on the availability of basic and essential health care services and the readiness of health facilities to provide quality health services. The 2015 NHFS provides an assessment of the current health care services in Nepal with representative samples from various facility types, managing authority (private versus public facilities), and the 13 development and ecological zones (MOH, New ERA, NHSSP, and ICF 2017). The 2015 NHFS serves as a baseline assessment for future national health facility assessments.
The 2015 NHFS conducted a general and service specific assessment of health facilities with types of available services, infrastructure, staff trained in eight health services areas (child health, FP, ANC, delivery and newborn care, HIV and sexually transmitted infection (STI), non-communicable diseases, tuberculosis, and malaria). All eight health service areas included a detailed health facility inventory assessment which collected data on facility infrastructure (running water, electricity, privacy), the availability of resources (equipment, supplies, and medicines), and infection control practices. Interviews with health providers collected information on their experience, qualifications, training/supervision, and perceptions of the service delivery environment. Unlike the other service areas, the FP, ANC, and sick child care services also included observation of client consultations that assessed the extent to which providers complied with service delivery and quality standards, and exit interviews with the ANC and FP clients, as well as the caretakers of sick children. In addition, postpartum clients were also interviewed upon discharge, although they were not observed for obstetric or delivery services. The exit interviews provided further insights into the quality of client-provider interactions and the client’s satisfaction with the services. The detailed methodology of the NHFS 2015 has been reported elsewhere (MOH, New ERA, NHSSP, and ICF 2017).
The quality of care analysis presented in this report focuses on ANC, FP, and sick child services because comprehensive data are available for these three service areas. The number of facilities, health workers interviewed, and number of clients observed and interviewed differed by service. The NHFS included all non-specialized government hospitals, all private hospitals with 100 or more inpatient beds, and all primary health care centers (PHCCs), with the remainder of randomly selected samples from health posts (HPs), private hospitals with at least 15 beds but fewer than 100 beds, stand-alone HIV testing and counseling sites (HTCs), and urban health centers (UHCs). In total, 963 health facilities were successfully surveyed with the majority (90%) government-operated public facilities and health posts as the most common type of facility.
In this analysis, we included all facilities that provided ANC, FP, and sick child care services with the same exclusion criteria used in the service specific analysis in the NHFS 2015 final report (MOH, New ERA, NHSSP, and ICF 2017). We excluded HTCs since they do not provide ANC, FP, or sick child care services. Table 1 shows the basic characteristics of ANC, FP, and sick child care services included in the analytic sample. In addition to the data from the facility audits, we used client observations and exit interviews for facilities in the analytic samples. A total of 1,502 ANC clients were observed and interviewed along with 2,480 ANC service providers from the 919 ANC service facilities. Likewise, data from a total of 2,928 FP providers and 770 FP clients (observed and interviewed) were analyzed. For the sick child analysis, we used observations of sick children (n=2,186), and exit interviews with the caretakers of the sick child and outpatient child care service providers (n=3,296).

4
Table 1 Facility characteristics in the analytic sample by type of services (ANC, FP, and outpatient curative care for sick children)
Variable Category Number of ANC
facilities1 Number of FP
facilities1
Number of outpatient curative care facilities for
sick children2
Facility type Zonal and above hospitals 6 5 6 District-level hospitals 15 16 15 Private hospitals 60 49 65 PHCCs 42 42 42 HPs 765 775 775 UHCs 31 32 31 Managing authority Public 859 870 870 Private 60 49 65 Ecological zone Mountain 118 118 118 Hill 479 474 481 Terai 322 326 336 Province 1 160 156 157 2 161 167 167 3 183 177 177 4 118 119 119 5 135 135 135 6 74 74 74 7 89 89 89 Overall 919 919 934
1 Excluded Sukra Raj Hospital, Kanti Hospital, and the stand-alone HTC sites. 2 Excluded Sukra Raj Hospital, Bir Hospital, and the stand-alone HTC sites.
Table 2 Weighted number of observed consultations for ANC, FP, and outpatient curative care for
sick children by facility characteristics
Variable Category Number of ANC
clients Number of FP clients
Number of sick children
Facility type Zonal and above hospitals 176 36 164 District-level hospitals 247 62 235 Private hospitals 292 17 308 PHCCs 172 81 146 HPs 610 544 1,306 UHCs 5 29 26 Managing authority Public 1,211 753 1,878 Private 292 17 308 Ecological zone Mountain 48 76 189 Hill 685 381 977 Terai 770 313 1,019 Province 1 261 145 302 2 309 125 530 3 476 261 559 4 83 57 160 5 224 88 289 6 53 24 150 7 96 69 197 Overall 1,502 770 2,186

5
2.2 Measurements of Quality of Care Dimensions
There is no universally accepted definition of quality of care. The complex nature of quality is acknowledged but defined differently by various experts and institutions. The Institute of Medicine (IOM) defines quality as “the degree to which health services for individuals and populations increase the likelihood of desired health outcomes and are consistent with current professional knowledge” (Institute of Medicine 2001). Donabedien, who is known as the architect of quality in health care, defines quality of care assessment simply as “determining whether what is already known to be the best care is being implemented” (Donabedian 1988). Donabedien introduced the classic quality of care framework with three elements: structure, process, and outcome (Donabedian 1988). Structure refers to stable, material characteristics (infrastructure, tools, and technology) and the resources of organizations that provide care and the financing of care (levels of funding, staffing, payment schemes, and incentives). Process denotes what is actually done in giving and receiving care. Process includes the patient’s activities in seeking and implementing care, as well as the practitioner’s activities in making a diagnosis and recommending or ensuring treatment. Outcomes, the effect of care on the health status of patients and populations, can be measured by health status and deaths, as well as patient satisfaction with care, patient knowledge, and salutary changes in the patient’s behavior (Donabedian 1988).
The elements of quality of care have evolved over the years to include specific domains for assessment and improvement. For example, the IOM proposes six specific aims for improving health care which would make health care safe, effective, patient-centered, timely, efficient, and equitable (Institute of Medicine 2001). Similarly, the World Health Organization (WHO) identified six dimensions of quality in health care and health systems, which were effective, efficient, accessible, acceptable/patient-centered, equitable, and safe (World Health Organization 2006). Campbell et al. have simplified this even further to define quality with two domains of access and effectiveness (effectiveness of clinical care and effectiveness of interpersonal care), although this definition is more specific to quality of care at the individual level (Campbell, Roland, and Buetow 2000). The NHSS 2015-2020 defines quality of care with eight dimensions, which are effective, safe, client-centered, timely, equitable, culturally appropriate, efficient, and reliable (Ministry of Health and Population 2015). This definition incorporates most of the quality dimensions of the WHO and IOM with two additional new dimensions - “culturally appropriate” and “reliable.”
We selected the eight dimensions of quality of care proposed by the NHSS as the operative conceptual framework for this analysis. Since the NHSS does not provide a definition for the eight dimensions, we created definitions for seven of the eight dimensions based on a literature review and consultation with experts from the Ministry of Health and Population (quality/management division) and the Quality Improvement Technical Working Group (QI-TWG). The NHSS quality dimensions of culturally appropriate and reliable were not included in any other quality dimensions. Given the diverse culture in Nepal and lack of data on what may be deemed culturally appropriate in the delivery and availability of health care services, we revised this dimension as appropriate/accessible. Furthermore, reliability is very difficult to measure and is subjective in nature because it is assessed from the client’s viewpoint.
The definition of the eight quality dimensions used in these analyses are:
1. Effective – services are based on scientific knowledge and evidence-based guidelines 2. Efficient – readiness to deliver health care which maximizes resource use and avoids wastage,
along with the ability and capacity to offer a specific service measured with tracer items such as trained staff, guidelines, equipment, diagnostic capacity, medicines, and commodities
3. Timely – reduction of delays in providing and receiving health care

6
4. Client-centered – provision of care that takes into account the preferences and aspirations of individual service users and respects the cultures of their communities
5. Safe – delivery of health care which minimizes risks and harm to service users, including avoiding preventable injuries and reducing medical errors
6. Reliable – ability to perform the promised service dependably and accurately 7. Appropriate – geographically reasonable and provided in a setting where skills and resources
are appropriate to the medical need 8. Equitable – delivery of health care which does not vary in quality because of personal
characteristics such as gender, race, ethnicity, geographical location, or socioeconomic status We identified the quality of care indicators for each dimension through a review of peer-reviewed literature, grey literature, and the 2015 NHFS report, as well as indicators that were the closest proxy measurements based on the data available. All indicators were constructed at the facility level.
Appendix A illustrates the indicators for measuring quality of care in ANC services and the various data components used to generate each indicator. Appendices B and C illustrate the indicators for sick child care services and FP services, respectively. These tables depict the indicators for each quality of care dimension, the indicator components (numerator, denominator, and the related NHFS question), along with the NHFS tool and relevant reference for that indicator. In several cases, we adapted indicators used in the NHFS 2015 final report to provide additional information. Several indicators have a percent or ordinal score in order to provide a more holistic picture beyond the individual components or aggregate, as presented in the NHFS 2015 report. For example, instead of presenting all essential equipment for ANC services (blood pressure apparatus, examination bed/table, fetoscope, adult weighing scale, and measuring tape) available and as an aggregate, as shown in Table 6.2 of the NHFS 2015 report (MOH, New ERA, NHSSP, and ICF 2017), we calculated a percent score (such as 80%) or an ordinal score (such as 4 of 5) for the equipment available, which provided additional information from the NHFS 2015/2016 report.
2.2.1 Dimension: Effective
A health facility that provides services based on scientific knowledge and evidence-based guidelines is deemed effective by our definition. The indicators to measure effective services or effectiveness varied by ANC, FP, and sick child services. In general, the indicators chosen for this dimension measured the type of services available, and were obtained from the facility audit/inventory questionnaire and then compared across all levels of the health system. For example, the indicator that measures ANC service included a total of 12 key ANC services, while the sick child care services included five key services. The FP service assessed the number of temporary FP methods. Other indicators were obtained from the client observation data to measure if the services were provided according to the guidelines or standard.
There was a total of three indicators for the ANC services (Appendix A), while the FP (Appendix C) and sick child care services (Appendix B) had a total of ten and eight indicators, respectively. The FP and sick child services had a greater number of indicators because there were several procedures observed for each FP method or sick child diagnosis to determine if they met the accepted standard of care such as percent of sick children at each facility diagnosed with fever of unknown origin who received a complete assessment.

7
2.2.2 Dimension: Efficient
The efficiency domain measures readiness to deliver health care in a manner that enhances resource use and avoids wastage through consideration of tracer items such as trained staff, guidelines, equipment, diagnostic capacity, medicines, and commodities.
The indicators for efficiency were based on service readiness to provide the required services (ANC, FP, and sick child care services) measured on several domains such as availability of guidelines, at least one staff trained in the past 24 months who received service specific training, and availability of the standard equipment, medicines/vaccines, and diagnostic capacity. Most data were obtained from the facility audit/inventory data, except for the staff training information, which was obtained from the health worker interviews but calculated at the facility level.
The ANC service had one overall service readiness indicator while the sick child care service had two separate service readiness indicators: outpatient curative care (six domains) and vaccination service (four domains). The FP service had four indicators: 1) measuring general FP service readiness (three domains); 2) intrauterine contraceptive device (IUCD) services; 3) implant services based on availability of the required equipment and supplies; and finally, 4) whether the facility had taken all organizational measures to store FP commodities according to standard. There were more indicators for FP services because the survey tool collected information on the types of equipment and supplies required for specific FP methods.
2.2.3 Dimension: Timely
The timeliness dimension includes indicators for service delivery that reduce delay in providing and receiving health care. Client waiting time is an important indicator of the quality of services offered by hospitals (Maxwell 1984). Other studies have shown that client waiting time is a factor that determines quality of care with longer waiting time negatively associated with client satisfaction (Agha and Do 2009; Assaf, Wang, and Mallick 2015; Hutchinson, Do, and Agha 2011; Tafese, Woldie, and Megeressa 2013; Wang et al. 2014). Timely care is equally important as skilled care. The time a client waited to see a health care provider was included in the client exit interview. The data were then divided into a binary variable with a cutoff of 30 or less minutes for ANC and sick child care services, and 15 minutes or less for FP services as a short wait time. The cutoff was determined based on the mean and median values of the wait time data for each service in other studies (Tessema, Gomersall, Mahmood, and Lawrence 2016; Wang et al. 2014).
The client’s perception of whether the waiting time was satisfactory or not was also assessed by the client’s response to the question on whether wait time to see provider was a major problem or not. This indicator has been used as a proxy indicator that measured client satisfaction in past studies (Tessema, Gomersall, Mahmood, and Lawrence 2017; Tumlinson et al. 2015).
2.2.4 Dimension: Client-centered
The client-centeredness domain considered the preferences and aspirations of the users of individual services and the cultures of their communities.
For each health service, the availability of visual aids for client education specific to that service area was assessed based on the facility audit data. In addition, each facility was assessed for the availability of whether a private room (visual and auditory privacy) for ANC, outpatient child care, and FP specific services was available, which is the first step toward ensuring privacy when consulting with a health

8
care provider. One way to understand client-centeredness, which indicates whether the care meets the aspirations and preferences of the individual service user, is through the client’s satisfaction with the services they received. Client satisfaction is often used as a non-health related outcome, which measures the consequence of care (Donabedian 1992).
Thus, two indicators of client satisfaction were measured by the client exit interview responses to questions about service quality. One measured the overall satisfaction with the services received based on response to a general satisfaction question, which has been used in several studies to analyze client satisfaction as an outcome (Assaf, Wang, and Mallick 2017). In addition, clients were asked to report on their perceptions of 11 aspects of the quality of the visit (waiting time, ability to discuss concerns with provider, amount of explanation given, quality of examination and treatment provided, visual privacy during examination, auditory privacy during examination, availability of medicines at facility, hours of service provision, number of days services available, cleanliness of the facility, and staff treatment of client). Clients were satisfied with all service components if the clients reported that they had no major problem with any of the 11 aspects. Several studies that analyzed service provision assessment (SPA) and other similar survey data have used the 11or 12 aspects of service components as proxy indicators for client satisfaction (Agha and Do 2009; Bessinger and Bertrand 2001; Hutchinson, Do, and Agha 2011; Wang et al. 2014).
The FP service has three additional client-centeredness indicators obtained from observation of the FP consultation data. The indicators were calculated as the percent of observed clients at a facility where: 1) the concerns about the methods were either asked by provider or expressed by clients about the contraceptive method including possible side effects; 2) provider ensured visual and auditory privacy during consultation; and 3) provider ensured confidentiality during consultation. Since FP consultations are sensitive in nature, a provider’s assurance of confidentiality and privacy are particularly important for a woman who wants to use a certain FP method without informing her husband or other family members. Since assurance of patient confidentiality has been associated with client satisfaction, it is essential to measure these processes of care, especially with FP services (Agha and Do 2009; Tessema, Gomersall, Mahmood, and Lawrence 2016).
2.2.5 Dimension: Safe
The safety dimension measures the delivery of health care that minimizes risks and harm to service users, including the avoidance of preventable injuries and the reduction of medical errors. Two indicators were used to measure whether safety measures were in place for each of the three services areas (ANC, FP, and sick child). Both indicators were generated from the facility audit questionnaire. The first was an infection prevention index score from 0 to 100 that was created by giving equal weight to each of the four domains (waste management, cleaning/disinfection, aseptic technique, and hand hygiene). The domains and the individual components within each domain were based on the WHO infection prevention memo (World Health Organization 2014). In addition, another indicator measured the availability of injection safety precaution guidelines because this would be one of the first steps, beyond health worker training, to ensure safety measures are in place for both the health worker and the client.
2.2.6 Dimension: Reliable
Health facilities that are able to perform the expected service dependably and accurately are defined as reliable. The NHFS and SPA surveys were not designed to measure reliability of services because this is a more complex measurement that requires data on whether the intended results were achieved

9
(Nolan, Resar, Haradan, and Griffin 2004). The intended results may differ from person to person and these surveys were not designed to conduct follow-up with clients to assess if their health outcomes improved, if the sick child was readmitted, if there were any side effects from FP, or if the pregnancy was normal.
Given the challenges of directly measuring reliability, we selected two indicators as proxy measures of some aspects of reliable health care service. Since one component of a reliable health care system is minimizing the failure rate, one indicator of reliability was whether the ANC, FP and sick child care consultations were provided by a qualified provider. The definitions of a qualified provider were selected by consultation with experts in the field and the national and international guidelines (Ministry of Health and Population Nepal 2006; WHO 2011). Another proxy indicator was assessing if the client said they would recommend the facility to a friend or family. This indicator has been used as a proxy measure of client satisfaction (Tumlinson et al. 2015).
2.2.7 Dimension: Appropriate
The quality of care dimension of appropriateness, defined as being geographically reasonable and provided in a setting where skills and resources are appropriate to medical need, was assessed with three indicators. One, a facility level characteristic, was the number of days the facility provided each of the specific services to determine if the number of days of service was standard. Proximity to care was related to the facility being geographically accessible and reasonable. This was determined by analyzing the response in the exit interview on whether the facility the client the visited for services was the one closest to their home (Tessema et al. 2017). Another indicator used to determine appropriateness from the client’s perspective was whether or not the timing of the service availability at the facility (in terms of hours or days of service) was a major problem to the client.
2.2.8 Dimension: Equity
Equitable care is defined as care in which health care delivery does not vary in quality because of personal characteristics such as gender, race, ethnicity, geographical location, or socioeconomic status. Equity is the only dimension of the eight that cannot be measured at the facility level since it is directly measured by personal characteristics of the individual such as gender, ethnicity, geographic location, and socioeconomic status. Given the limited data collected on individual characteristics in the NHFS, we assessed differences in service effectiveness and patient-centeredness indicators by three types of individual patient characteristics (education status, age, and ethnicity). Education status was a binary variable for whether the client had every attended school or not. Age was a continuous variable categorized into three groups (age ≤20, age 21-25, age >25, or don’t know). Ethnicity was categorized into five groups: Brahmin, Terai/Madhesi, Dalit, Janjati/Newar, and Muslim/other.
We compared the quality of care indicators which were collected by patient observation and exit tools with the three individual client level characteristics. The percentage distribution of client’s satisfaction with all 11 components was compared with the three characteristics (education status, age category, and ethnicity). In addition, the effectiveness indicators (physical examination score of ANC clients and FP clients; general danger sign score; and main symptoms assessment score for all sick children) were also compared in a bi-variate analysis.

10
2.3 Analysis
The Stata Statistical Software Release 15 (StataCorp 2017) was used to conduct this analysis. All indicators, except for the equity dimension, were constructed at the facility level. The indicators vary in terms of units with presented as scores (percent or ordinal score) and some as percent distribution indicators. The data and data source used to calculate each indicator are clearly listed in the tables in Appendices A-C.
For most of the facility level indicators (except the equity dimension analysis), we calculated and compared the mean, median, minimum, and maximum values across all facilities (overall) and by facility type (zonal and above hospitals, district-level hospitals, private hospitals, PHCCs, HPs, and UHCs), managing authority (private versus public), ecological region (mountain, hill and Terai), and the seven provinces. The facility background characteristics were chosen based on the definitions used in the NHFS 2015 report (MOH, New ERA, NHSSP, and ICF 2017). Facility level data that did not require the creation of scores, was not based on individual client or health worker level data, but showed how many facilities within each facility background characteristic provided the service or had the facility level indicator available were calculated as simple percentages.
Data collected at the individual client level (observation or exit interview) or health worker level were aggregated to the facility level so that the final comparisons at the facility level used facility weights. The results for the individual level data within a facility were calculated as a “mean percent” which was first computed by calculating the percent of clients for each facility meeting the requirements of a certain indicator and then averaging the percent of clients at a facility across the facilities by background characteristics. Construction of the individual client or health worker level data at the facility level in the form of mean percent of clients or health workers allowed for comparisons by facility background characteristics.
For the analysis of equity dimension, the unit of analysis was the client and the client’s weights. Since the Fisher’s tests for associations are not allowed with survey design, the default Pearson chi-square test for independence for categorical variables was used, where a p-value below 0.05 was considered significant.
11
3 RESULTS
3.1 Quality of ANC Services
The results for ANC service by quality of care dimensions are shown in Appendix D. The key findings are highlighted below.
3.1.1 Effectiveness
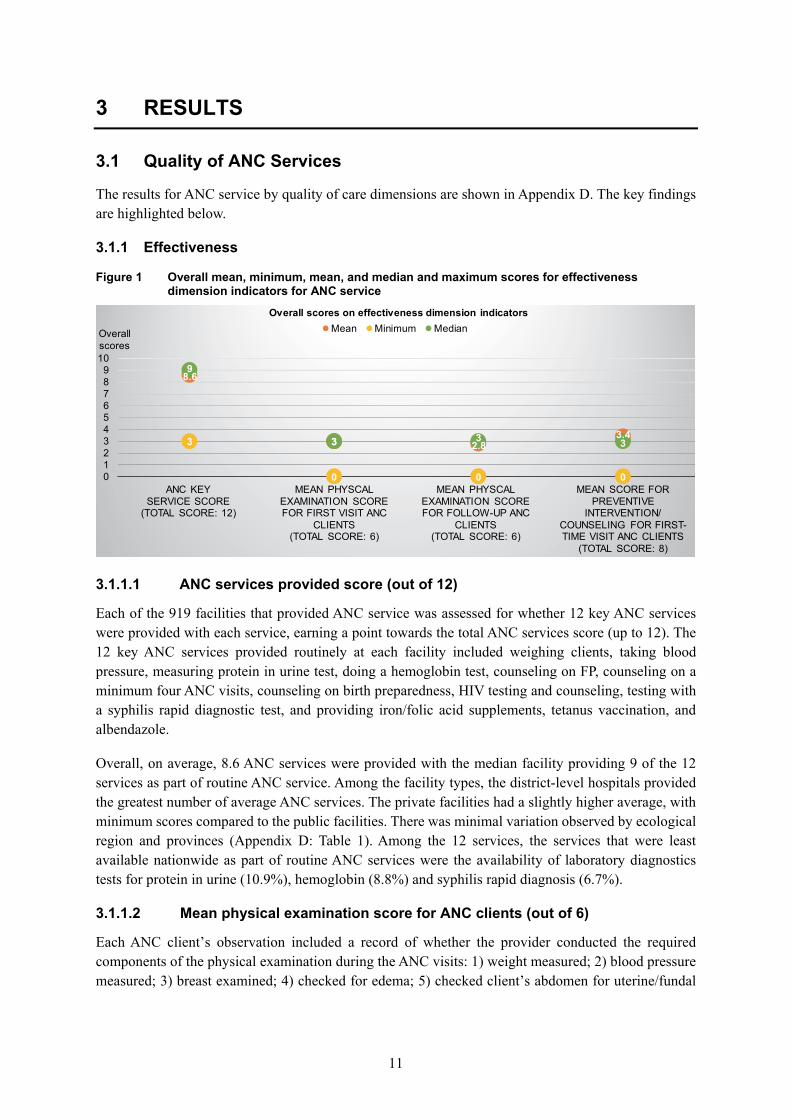
Figure 1 Overall mean, minimum, mean, and median and maximum scores for effectiveness dimension indicators for ANC service
3.1.1.1 ANC services provided score (out of 12)
Each of the 919 facilities that provided ANC service was assessed for whether 12 key ANC services were provided with each service, earning a point towards the total ANC services score (up to 12). The 12 key ANC services provided routinely at each facility included weighing clients, taking blood pressure, measuring protein in urine test, doing a hemoglobin test, counseling on FP, counseling on a minimum four ANC visits, counseling on birth preparedness, HIV testing and counseling, testing with a syphilis rapid diagnostic test, and providing iron/folic acid supplements, tetanus vaccination, and albendazole.
Overall, on average, 8.6 ANC services were provided with the median facility providing 9 of the 12 services as part of routine ANC service. Among the facility types, the district-level hospitals provided the greatest number of average ANC services. The private facilities had a slightly higher average, with minimum scores compared to the public facilities. There was minimal variation observed by ecological region and provinces (Appendix D: Table 1). Among the 12 services, the services that were least available nationwide as part of routine ANC services were the availability of laboratory diagnostics tests for protein in urine (10.9%), hemoglobin (8.8%) and syphilis rapid diagnosis (6.7%).
3.1.1.2 Mean physical examination score for ANC clients (out of 6)
Each ANC client’s observation included a record of whether the provider conducted the required components of the physical examination during the ANC visits: 1) weight measured; 2) blood pressure measured; 3) breast examined; 4) checked for edema; 5) checked client’s abdomen for uterine/fundal
8.6
3 2.83.43
0 0 0
9
3 3 3
0123456789
10
ANC KEY SERVICE SCORE
(TOTAL SCORE: 12)
MEAN PHYSCAL EXAMINATION SCORE FOR FIRST VISIT ANC
CLIENTS (TOTAL SCORE: 6)
MEAN PHYSCAL EXAMINATION SCORE FOR FOLLOW-UP ANC
CLIENTS (TOTAL SCORE: 6)
MEAN SCORE FOR PREVENTIVE
INTERVENTION/COUNSELING FOR FIRST-TIME VISIT ANC CLIENTS
(TOTAL SCORE: 8)
Overall scores
Overall scores on effectiveness dimension indicatorsMean Minimum Median

12
height using a measuring tape or ultrasound device to measure gestational age; and 6) examined conjunctiva/palm for anemia.
A separate analysis was conducted for ANC clients who were visiting a facility for the first consultation of their pregnancy (first visit ANC clients) and those returning for follow-up ANC visits. A total of 523 first ANC clients and 980 follow-up ANC clients were included in the analysis.
3.1.1.2.a Mean physical examination score for first visit ANC clients (out of 6)
Across facilities, the mean physical examination score was 3 and the median facility had a score of 3 examinations conducted of the six required examinations. By facility type, the HP level and zonal and above hospitals performed fewer examinations on average (Appendix D. Table 1). The minimum mean physical examination score was lowest at 0 for HP level facilities, while it was highest at 3.0 for the UHC level facilities, which indicates that the lowest performing UHC facility conducted a mean of 3 of 6 examinations. In comparisons by managing authority, the private facilities had slightly higher mean, median, and minimum scores. By ecological region, there were very little difference in the mean and median scores. There was slight variation by provinces, with Province 4 having the highest mean and median score, and the lowest minimum and maximum score as well.
Of the six physical examinations conducted, the physical examinations that were rarely performed were breast examinations, followed by checking for edema which was performed in only 5% and 26% of the first visit ANC clients, respectively.
3.1.1.2.b Mean physical examination score for follow-up visit ANC clients (out of 6)
Among the follow-up visits ANC clients, the physical examination score was similar overall compared to the first visit ANC clients. By facility type, the UHC level facilities had the highest mean score with an average of 3, a score for median facility of 4, and the highest maximum score of 6. The zonal/above hospitals, the PHCC, and the HP level facilities performed fewer examinations on average. None of the zonal and above-level hospitals, district-level hospitals, private hospitals, and PHCC level facilities conducted all six physical examinations for the observed follow-up ANC clients. The mean physical examination scores by managing authority, ecological regions, and provinces showed only slight variations. The mean and median scores were similar in the comparisons by province. The physical examinations that were performed in less than half of the follow-up ANC clients were breast examinations (~5%), checking for edema (~29%), and examination of conjunctiva/palms for anemia (~39%).
3.1.1.3 Mean score for preventive intervention/counseling for first-time visit ANC clients (out of 8)
To understand the quality of prevention intervention and counseling provided to the first-time visit ANC clients, each of the observed first-time visit ANC clients were given a score on whether the eight ANC interventions/counseling were conducted. A facility score was created based on the average scores of the observed first-time visit ANC clients for each facility. The eight prevention intervention/counseling components are outlined in Appendix D (Table 1).
In comparisons by facility type, the UHC facilities showed the best performance, while the HP level facilities had the poorest performance in terms of the preventive intervention and counseling for first-time ANC clients (Figure 1). Further, there were one HP and one PHCC level facility that did not conduct any of the preventive intervention and counseling for the observed first-time ANC clients (minimum score is 0). The private facilities on average had slightly higher mean scores than the publicly

13
managed facilities. There was very little variation by ecological region. Among the provinces, Province 4 performed the best, while the facilities in Province 2 had the lowest scores.
Among the eight service items, in the private facilities, albendazole was either not prescribed or provided for about 80% of the observed ANC clients. (Data not shown.) Furthermore, less than half the ANC clients were either asked, given, referred, or had a laboratory report for all four diagnostic tests, with the smallest proportion for the syphilis test. This finding was much lower for the HP and UHC level facilities.
3.1.2 Efficiency
3.1.2.1 Service readiness to provide ANC care
Service readiness to provide ANC care is measured by five domains: 1) availability of guidelines, 2) trained staff, 3) availability of functioning equipment, 4) diagnostics, and 5) availability of medicines and vaccines. These service readiness indicators are limited to the essential physical actions required to provide efficient ANC services.
Figure 2 Overall minimum, mean, and median scores for efficiency indicators for ANC services
3.1.2.1.a Domain 1: Percent of facilities with an ANC guideline available
(reproductive health clinical protocol or any other ANC guideline such as maternity guidelines or the National Medical Standard Volume III)
Overall, only 25% of the facilities had some form of ANC guideline, which could be either a reproductive health clinical protocol or any other ANC guideline such as a maternity guideline or the National Medical Standard Volume III (MOH, New ERA, NHSSP, and ICF 2017). Among the publicly managed facilities, the facilities least ready in terms of availability of guidelines were the UHCs (4.0%) and zonal/above hospitals (18.3%), while the PHCCs and district-level hospitals were the most likely to have the guidelines (27.5%). Public facilities had a much higher availability of guidelines at 26.4% compared to 4.3% of the private facilities. There were very few differences among ecological regions and provinces.
0.8
3.8
0.3
2.1
0 0 0 00
4
0
2
00.5
11.5
22.5
33.5
44.5
DOMAIN 2: STAFF TRAINING SCORE ON FIVE ANC
TRAINING TOPICS (TOTAL SCORE: 5)
DOMAIN 3: ANC EQUIPMENT SCORE (TOTAL SCORE: 5)
DOMAIN 4: LABORATORY DIAGNOSTICS SCORE
(TOTAL SCORE: 2)
DOMAIN 5: ESSENTIAL ORAL MEDICINE AND VACCINE
SCORE (TOTAL SCORE: 3)
Service readiness
score
Service readiness overall scores by domains Mean Minimum Median

14
3.1.2.1.b Domain 2: Staff training score in the past 24 months on five ANC training topics (max number of trainings out of 5)
A staff training score was created for ANC services at the facility level, where the maximum number of trainings any one ANC staff had received of five ANC topics in the past 24 months was assigned for each facility. The five topics of training were ANC screening (blood pressure, urine glucose, and protein), counseling for ANC (nutrition, FP, and newborn care), management of the complications of pregnancy, nutritional assessment of pregnant women, and prevention of mother-to-child transmission of HIV.
On average across facilities, the maximum number of ANC-related trainings in the previous 24 months by a staff person was very low at 0.8, with the median facility having a score of 0 training (Figure 2). At all levels of facility type, there were facilities with staff who had not received any training on the five topics in the past 24 months. On average, the district and PHCCs had the highest mean scores of 1.6 and 1.3 trainings completed by a staff person, respectively. The UHC and HP level facilities had the lowest mean score, while the private facilities performed poorly with the average of 0.3 trainings. All, except the private facilities and UHCs, had at least one facility with staff trained on all five ANC topics. There were only minor differences in the mean score by ecological region and province (Appendix D: Table 2).
3.1.2.1.c Domain 3: ANC equipment score for each facility (out of 5)
All 919 facilities that provide ANC services were assessed for five basic pieces of equipment (BP apparatus, examination bed/table, adult weighing scale, fetoscope, and measuring tape) and given an aggregate score from 0 to 5 based on whether the equipment was available and functioning. The score was then converted to a percentage score. On average, the facilities had 3.9 pieces of the ANC equipment available on site, with the median facility having four of the five pieces of basic equipment (Figure 2).
Among the public facilities, the HP facilities had slightly fewer functioning pieces of equipment, with at least one facility not having any basic ANC equipment. Similarly, at least one facility among the private facilities did not have any of the five basic pieces of equipment, which is of great concern in terms of service readiness to deliver quality care. There was little to no variation among the facilities by ecological regions. Among the provinces, the mean and minimum score was the highest for Province 4 (Appendix D: Table 2).
As shown in Table 6.2 of the NFHS 2015 report, among the five pieces of required equipment, the measuring tape was the least available in about 30% of the ANC facilities, while the other pieces of equipment were available in the majority (more than 85%) of the facilities. Further analysis of the availability of all five pieces of equipment showed that overall, only a quarter of facilities had all five pieces of equipment, with HP and UHC level facilities being the least likely to have all five. (Data not shown.) Fewer than one-fifth of the ANC service facilities in Provinces 1, 2, 6 and 7 had all five pieces of the required equipment. (Data not shown.)
3.1.2.1.d Domain 4: ANC laboratory diagnostics score for each facility (out of 2)
Among the facilities that offer ANC services, each facility was assigned a score (of 2) based on the availability of the testing kits for hemoglobin and urine protein tests as per the criteria defined in Table 6.4 of NFHS 2015 report. Among the 919 facilities, a facility has a average laboratory diagnostic score of 0.3, with the median facility having no laboratory diagnostic capacity, which indicates very poor

15
readiness to provide basic ANC-related laboratory services (Figure 2). This score is affected by the lack of laboratory services in HP facilities, which had a mean and median score of 0.1 and 0 respectively. The majority of HP facilities (~93%) and about 23% of PHCC level facilities did not have either laboratory test available. (Data not shown.) The higher-level public facilities such as the zonal/above and district hospitals, along with the private facilities, were equipped to perform both tests. In contrast, none of the UHCs has the capacity for either laboratory test. The findings were similar across ecological regions and provinces. Table 2 in Appendix D presents the detailed results by facility background characteristics.
3.1.2.1.e Domain 5: ANC essential oral medicine and vaccine score for each facility (out of 3)
Each facility was assigned a score based on the availability of the each of the two essential oral medicines (iron/folic acid and albendazole) and the tetanus toxoid vaccine. Overall, the mean and median facility had two of the three essential oral medicines/vaccine. Of the three items, the tetanus vaccine was available in only about 18% of HP-level facilities and among 25% of the 919 ANC facilities overall. In addition, the tetanus vaccine is not available on all days that ANC services are available, especially at the PHCC, HP, and UHC level public facilities. (Data not shown.)
By facility type, the HP level facilities had the least availability of the essential medicines/vaccine, which is primarily due to the lack of availability of tetanus toxoid vaccine which is only available a few days a month. As expected, the district hospital and zonal/above hospitals had higher mean scores, with the median facilities having a median score of 3. All the zonal/above hospitals, district hospitals, PHCCs, and UHCs had at least one of the three essential medicines/vaccine, while at least one private facility and HP-level facility had none (Appendix D: Table 2). The variations among ecological region and provinces were minimal when comparing the mean and median scores.
3.1.3 Timeliness
Figure 3 Mean percentage scores on timeliness dimension indicators by facility type for ANC services
46.139.5
75.566.4
72.261.8
87.278.7
85.477.6
87.9 85.4
Mean percent of clients at each facility who reported waiting time for consultation ≤30 minutes
Mean percent of clients at each facility reporting that waitingtime was NOT a problem
Percentage
Timeliness indicators for ANC services
Zonal/above hospitals District-level hospitals Private hospitals PHCCs HPs UHCs

16
3.1.3.1 Mean percent of clients at each facility who reported waiting time for consultation ≤ 30 minutes
All the observed ANC clients were asked during the exit interview about the waiting time for consultation with a health care provider from the time they arrived at the facility. Of the 1,502 ANC clients interviewed, about 30% reported seeing the provider immediately with a mean wait time of 33 minutes. A binary variable was created with the cutoff of more than 30 minutes and 30 or less minutes waiting time. The percent of clients who reported waiting time of 30 or less minutes was calculated for each facility and the average presented by facility type.
On average, 81.5% of clients at a facility waited 30 minutes or less to see a health care provider. The zonal/above facilities had the lowest mean percentage of clients, while three-fourths of the clients at the other facilities waited less than 30 minutes or less (Figure 3). This could be due to the heavy caseload in the higher-level hospitals. By managing authority and ecological region, the mean percent was lower in the private facilities (72.2%) and the Terai Region (79.7%). Province 1 had the lowest proportion of ANC clients on average who waited 30 minutes or less (74%), while Province 6 had the highest (87%).
3.1.3.2 Mean percent of clients at each facility who reported waiting time was NOT a problem
The percentage of ANC clients who did not report waiting time as a problem was calculated for each facility and the average percentage calculated by the background characteristics of the facility. Overall, an average 73% of the ANC clients reported not having a problem with the waiting time. By facility type, the average zonal/above hospital had only about 40% of the clients at each facility who reported not having a problem with the waiting time compared to the mean scores for the other public facilities (Figure 3). The ANC clients at the publicly managed facilities were more likely to be satisfied with the wait time (74.7%) than the ANC clients at a private facility (61.8%). The percent distribution was similar with the ecological regions. At the province level, the facilities in Provinces 3 and 1 had on average the lowest percentage of satisfied clients (67.7% and 69.6% respectively), while Provinces 4 and 6 had the highest at 89.7% and 88.7%, respectively.
3.1.4 Client-centeredness
3.1.4.1 Percent of facilities where visual aids for client education related to pregnancy or ANC were available
Each facility was assessed for the presence of a visual aid for ANC clients (related to pregnancy or ANC such as danger signs posters, blood lead (BPb) flip charts, ANC/postnatal care (PNC) job aids, and pamphlets for client education). Overall, about three-fourths of the facilities that provided ANC services had some form of visual aid. In comparisons by managing authority, the private facilities were least likely to have any visual aid compared to the public facilities. Among the public facilities, only 69% of the zonal/above hospitals had visual aids as compared to 81% of HP facilities (Figure 4). By ecological region and provinces, the mountain region and Province 3 lacked visual aids with only 68.4% and 63.3% of the facilities having any visual aids related to ANC and pregnancy.

17
Figure 4 Percentage scores of client-centeredness dimension indicators by facility type for ANC services
3.1.4.2 Mean percent of ANC clients at each facility who reported overall
satisfaction
Each of the ANC clients were asked about their overall satisfaction with the ANC service received at the facility. Those who reported being very satisfied or fairly satisfied were categorized as being satisfied. Among all facilities, about 85% of ANC clients at each facility were satisfied with the overall service. For each facility, the percentage of clients who reported overall satisfaction (from 1 or 10 ANC clients interviewed per facility) was calculated, along with the mean within each facility category. As shown in Figure 4, the zonal/above level hospitals had the lowest mean percentage of satisfied clients (76.4%), with the private hospital clients the most satisfied (89.4%). The facilities in the mountain region had the lowest mean percentage of satisfied clients (80.8%), while the highest was among the hill facilities (87.5%). The facilities in Provinces 4 and 1 had the highest mean percent of client satisfaction at each facility (92.2% and 91.5%, respectively), while the lowest was in Provinces 7 and 2 at 75% and 78.1%, respectively.
3.1.4.3 Mean percent of ANC clients at each facility who reported satisfaction with all service components
The ANC clients who were interviewed upon exit were deemed to be satisfied with all service components if the clients reported that they had no major problem with any of the following 11 service items: waiting time, ability to discuss concerns with provider, amount of explanation given, quality of examination and treatment provided, visual privacy during examination, auditory privacy during examination, availability of medicines at facility, hours of service provision, number of days services available, cleanliness of facility, and staff treatment of client. The percent of ANC clients reporting satisfaction with all service components and the mean score were calculated for the facilities by facility type, ecological region, and provinces.
Overall, 79% of ANC clients reported not having major problems with the 11 service items. Among the various facility types, the mean percentage of satisfied clients ranged from 65.2% to 81.4% with the zonal/above facilities the lowest and HP facilities the highest percentage of satisfied clients (Figure 4). The private hospitals had a slightly lower mean compared to public facilities.
69.376.4
65.2
85.1
75.9 79.1 77.383.6
56.5
89.4
75
93.4
75.381.2 79.8
90.381.2
86.981.4
72.378.1
85.476.3
42
Percent of facilities wherevisual aids for client educationrelated to pregnancy and ANC
were available
Mean percent of ANC clientsat each facility who reported
overall satisfaction
Mean percent of ANC clientsat each facility who reportedsatisfaction with all service
component
Percent of ANC facilities whereprivate room available during
ANC consultation
Percentage
Client-centerdness indicators for ANC services
Zonal/above hospitals District-level hospitals Private hospitals PHCCs HPs UHCs

18
By ecological regions, the facilities in the Terai Region had the lowest mean percentage of 73%, while the facilities in the hill region had highest mean (86%) of ANC clients reporting no major problem. Province 1 had the lowest mean percentage (68%) of satisfied clients, while Province 4 facilities had the highest mean percentage of satisfied ANC clients (96%).
As illustrated in Table 6.12.1 in the 2015 NFHS report, the wait time to see a provider was the most commonly reported major problem by the ANC clients, with a national average of 11.5% of clients and 25% of the clients at the zonal/above hospitals. The other service items were not major problems, with the national average at less than 5%.
3.1.4.4 Percent of ANC facilities where private room was available during ANC consultation
Overall, about 74% of the ANC facilities had a private room (visual and auditory privacy) for ANC consultation visits. By facility type, the majority of the facilities had a private room except for the UHC facilities (Figure 4). When comparing the private versus publicly managed facilities, only 72.4% of the public facilities had a private room compared to 93.4% of the private facilities. By ecological region, there was little difference with the percentage of facilities with a private room ranging from 72.7% to 74.8%. Similarly, Provinces 3 and 4 had relatively fewer facilities (~71%) with private room available, while Province 1 had the most (80%).
3.1.5 Safety
3.1.5.1 Infection prevention for ANC services index score (0-4)
Figure 5 Infection prevention for ANC service index score by facility type (minimum, mean, and median scores)
An infection prevention index score (range 0 to 4) was created by giving equal weight to all the domains and the indicators within a domain. The four domains were: 1) waste management, 2) cleaning/disinfection, 3) aseptic technique, and 4) hand hygiene. The overall mean infection prevention index score for ANC facilities was 2.7, with the median facility score 3. When analyzed by facility type, the median district hospital had an optimal infection prevention index score of 4, while the median facilities in all other categories had three of the four infection prevention domains (Figure 5). Among the ecological regions, the facilities in the hill had a slightly higher mean index score (2.8) compared to the Terai and mountain regions (2.6). At the province level, the ANC facilities in Provinces 2, 1, and 7
2.93.2
2.62.9 2.7
2.5
0
1
0 0 0 0
3
4
3 3 3 3
0
0.5
1
1.5
2
2.5
3
3.5
4
4.5
ZONAL/ABOVE HOSPITAL
DISTRICT HOSPITAL
PRIVATE HOSPITAL PHCCS HPS UHCS
Infection prevention for ANC services index score
Mean Minimum MedianService index
score

19
had the lowest mean index score of 2.4, 2.5, and 2.6 respectively, with the highest mean score (3.0) in Province 5.
Analysis of the individual domains showed that overall, less than half of the facilities (~44%) had all components of hand hygiene (domain 4), which can also be seen in Table 6.3 of the NFHS 2015 report (MOH, New ERA, NHSSP, and ICF 2018).
3.1.5.2 Percent of facilities with injection safety precaution guideline for standard precautions available (%)
All ANC facilities were assessed for the presence of an injection safety precaution guideline for standard precautions. The percent of facilities with the guideline was calculated by background characteristics. The overall availability of an injection safety precaution guideline at ANC facilities was very low (4.2%). The percentage of facilities with the guideline available ranged from 1.7% (private facilities) to 11% (zonal/above facilities). The private facilities were less likely to have the guideline than the public facilities. The facilities in the hills (6.2%) and Province 4 (15.5%) were more likely to have the guideline, while the least likely were the facilities in the Terai Region (1.6%) and Provinces 1 (0.8%) and 2 (1.6%).
3.1.6 Reliability
3.1.6.1 Percent of ANC consultations at each facility conducted by qualified provider
At the facility level, the percent of observed ANC clients served by a qualified health provider (general medical doctor, obstetrician/gynecologist, medical officer, nurse/auxiliary nurse midwife (ANM) or a health assistant/auxiliary health worker (AHW)/sub-auxiliary HW/public health inspector) was calculated. All ANC clients were seen by a qualified provider for each background characteristic.
Further analysis of provider type showed that the majority (67%) of the ANC clients were seen by an ANM, followed by 23% who were seen by a gynecologist/obstetrician. In the cross-tabulation of the type of health provider with facility, more than 90% of the ANC clients at district-level hospitals, PHCCs, HPs, and UHCs were seen by an ANM, while about 55% and 80% of ANC clients at zonal/above hospitals and private facilities, respectively, were seen by a gynecologist/obstetrician.

20
3.1.6.2 Mean percent of ANC clients at each facility who would recommend facility to a friend or family member
Figure 6 Mean percent of ANC clients at each facility who would recommend facility to family/friend by facility type, managing authority, and ecological region
Another proxy indicator to measure the reliability dimension of quality of care was whether the ANC clients would recommend the facility to a friend or family member. This assumed that if the service was deemed reliable, the likelihood of recommending the facility would also be high.
Most ANC clients (97.7%) reported that they would recommend the facility. Among the various types of facilities, the mean percent was high with very little variation (Figure 6). There was also little variation in the proportion by ecological region, managing authority, and provinces. However, some facilities in the hill and Terai regions and Provinces 2, 4, 5, and 7 had at least one facility where no ANC client reported that they would recommend the facility.
3.1.7 Appropriateness
3.1.7.1 Number of days per month ANC services are provided in a 28-day month
Overall, the mean number of days per month that ANC services were provided was 21.5 days, with the median facility open for 24 days of a 28-day month. (Appendix D: Table 3). The mean number of days ANC services was provided was slightly higher among private facilities (25.5 days) compared to public facilities (21.2 days). The minimum number of days that ANC services were available was 4 of 28 among the private facilities, and 1 of 28 among the public facilities.
Among the public facilities, the UHC facilities provided ANC services for the greatest number of days (24.1 days), followed by the HP facilities (21.2 days) and the PHCCs (20.3 days). The zonal/above hospitals and district-level hospitals offered ANC services for an average 18 days per month. At least one facility in the PHCC and HP facilities provided only one day of service in a 28-day month. Among the ecological regions and provinces, the facilities in the Terai Region and Province 5 were open for the fewest number of days a month, at 20 days and 18.1 days, respectively.
94 97.6 95.8 95.6 98.7 100 95.8 98 98.8 98.3 97.2
Zona
l/abo
ve h
ospi
tals
Dis
trict
hos
pita
l
Priv
ate
hosp
ital
PHC
C
HP
s
UH
Cs
priv
ate
publ
ic
Mou
ntai
n Hill
Tera
i
Facility type Managing authority Ecological region
Mean percent of ANC clients at a facility who would recommend facility to friend/family

21
Figure 7 Mean percent score distribution for appropriateness dimension by facility types for ANC services
3.1.7.2 Mean percent of ANC clients at each facility who reported the ANC facility
was the closest facility to their home
Overall, 90% of the ANC clients reported that the facility they sought service from was the closest facility to their home. This indicated that the facility of choice was geographically appropriate for the majority of the clients. By facility type, the zonal/above hospitals, followed closely by private hospitals, had the lowest mean percent score. In contrast, a higher percent of clients at the lower-level HPs, PHCCs and UHC facilities reported the facility as the closest to their home (Figure 7). This was expected, given that the higher-level facilities are fewer in number and not decentralized at the district level. There was little variation by ecological region. At the province level, the mean percent was the lowest for Province 3 (83.2%), while Province 2 had the highest mean (95%) of ANC clients at each facility reporting the facility to be the closest.
3.1.7.3 Mean percent of ANC clients at each facility who did not consider the hours or days of service at facility as a problem
The convenience and appropriateness of the timing of the facility was assessed by calculating the percent of ANC clients at each facility who reported the hours or days of service as not being a major or minor problem. Overall, the hours or days of service at a facility were reported to not be a problem by the majority of the ANC clients (85%). As illustrated in Figure 7, the zonal/above hospitals had a lower percent (76%) compared to other facility types. The UHC facilities were most likely to have conveniently timed service.
Among the ecological regions, the facilities in mountain region had the most convenient service hours or days, as reported by 92.2% of ANC clients at each facility compared to 81.1% in Terai Region. At the province level, Province 1 had the lowest mean percent of ANC clients at a facility reporting that they did not consider the hours or days of service at facility as a problem (72.8%) compared to the other provinces with 80%.

22
3.2 Quality of Care of Sick Child Care Service
The results for sick child care service by quality of care dimensions are shown in Appendix E. Below is description of the key findings by dimensions.
3.2.1 Effectiveness
Figure 8 Overall scores on effectiveness dimension indicators (1-3) for sick child care service (minimum, mean, and median scores)
3.2.1.1 Child health services provided score (out of 5)1
All 940 facilities (other than Sukra Raj Hospital, Bir Hospital, and the HTCs) were given a score from 0 to 5 that indicated the number of child health services provided at each facility. The five child health services were outpatient curative care, growth monitoring, child vaccination with four vaccines (BCG, Polio, Pentavalent, and Measles-Rubella), and an additional 2 vaccines - pneumococcal conjugate and Japanese encephalitis - as well as routine Vitamin A supplementation. Overall, four child health services were provided per facility, with the median facility providing four of the five services (Figure 8). In comparisons by facility type, among the public facilities, the mean was similar ranging from 3.8 to 4.2, with the median facility providing four services (Appendix E: Table 1).
In contrast, the private facilities had fewer child health services available with an average of 2.3 services and the median facility providing only two of the five services. As indicated in Table 4.1 of the NFHS 2015 report, the majority of the private facilities did not provide vaccination services with fewer than 10% of facilities offering all child vaccination services (MOH, New ERA, NHSSP, and ICF 2017). In addition, only 54% and 45% of the private facilities provided growth monitoring services and Vitamin A supplementation services. There was very little variation by ecological region and provinces, which had similar mean and median values.
1 This analysis included 940 facilities that also included facilities that did not provide outpatient child care services; the rest of the analysis was limited to facilities that offer outpatient curative care for sick children (N=934) and those that offer vaccination services (N=816).
4
0.5
1.7
0 0 0
4
0.3
1.8
0
0.5
1
1.5
2
2.5
3
3.5
4
NUMBER OF CHILD HEALTH SERVICES PROVIDED
(TOTAL SCORE: 5)
MEAN DANGER SIGN ASSESSMENT SCORE
(TOTAL SCORE: 3)
MEAN MAIN SYMPTOMS ASSESSMENT SCORE (OUT OF 3 MAIN SYMPTOMS ASSESSMENT)
Overall scores
Overall scores on effectiveness dimension indicatorsMean Minimum Median

23
3.2.1.2 Mean danger sign assessment score (out of 3 danger sign assessments)
Each sick child observation included a record of whether the provider asked about or whether the caretaker mentioned any of the three danger signs (inability to eat or drink, vomiting, and convulsions), regardless of the illness type. Among the facilities that provided outpatient services for children, the mean score based on the observation(s) of sick child assessments at each facility was assigned as the score for the facility.
Overall, at the facility level, the average facility had a mean of 0.5 of danger signs assessed (Figure 8). The median facility had an average of only 0.3 assessments, with the minimum and maximum of 0 and 3, respectively. This shows that the assessment of the three danger signs, regardless of the illness, was overlooked in the majority of facilities. By facility type, the zonal/above hospitals had on average mean danger sign assessment score of 0.6, with the lowest for UHCs, which had a mean score of 0.2 (Appendix E: Table 1). The maximum mean danger sign assessment score was 3 for private facilities, PHCCs, and HPs, which indicated that all of the higher-level public facilities lacked thorough danger sign assessments in more than half of their sick child consultations. The private facilities had a slightly higher mean score compared to the publicly managed facilities. There was very little difference in the facilities by ecological region. Province 2 had lowest mean and median facility that had no children assessed for any of the three danger signs (Appendix E: Table 1).
3.2.1.3 Mean main symptoms assessment score (out of 3 main symptoms assessments)
Each of the sick child observations included a record of whether the provider asked about or whether the caretaker mentioned that the child had the three main symptoms (cough or difficulty breathing - fast breathing or chest in-drawing - diarrhea, and fever) regardless of the illness type. At the facility level, each facility was assigned a score, which was the mean number of main symptoms that was compared by background characteristics.
The average for each facility was a mean and median main symptoms assessment score of less than 2 (Figure 8). By facility type, the average for each UHC was lowest with a mean score of 1.2 of 3 main symptoms assessed, and the zonal/above facilities with the highest mean at 2.9. Except for the zonal/above hospitals, there was at least one facility where no sick client was assessed for the three main symptoms (Appendix E: Table 1). In the comparisons by managing authority, the private facilities on average had a higher mean score. There was little variation by ecological region. Province 2 had lowest mean and median scores (Appendix E: Table 1).
3.2.1.4 Mean index of integrated assessment score (range 0-100)
The quality and completeness of the sick child assessment by the health care provider was assessed by creating an index (range 0-100) based on the 13 assessments for children age 2 and above and 16 assessments for children under age 2 (see Appendix E Table 1, indicator 4 for the list of assessments). First, a separate integrated assessment score index (ranging from 0-100) was created for sick children age 2 and above and for children under age 2 using the difference denominator of 13 and 16 assessments, respectively. The assessment scores were then combined for all the sick child assessments observed in a facility. Each facility was assigned the mean index score of the calculated indices by taking the mean score of all the observations at that facility. This mean index was then compared between facilities.
The overall average mean index of the integrated assessment was only 28 with a maximum score of 84.6. This indicated that at the facility level, all children did not receive the complete integrated

24
assessment. The median facility had a mean index score of 25, which meant that only 25% of the 13 or 16 assessments were completed for the sick children at that facility.
Figure 9 Mean index of integrated assessment score for sick child care consultations by facility type
Among the publicly managed facilities, the UHCs had a much lower mean score than the other public facilities (HPs, PHCCs, district and zonal/above hospitals), while the zonal/above, district hospitals and PHCCs had a similar mean of 28, which meant that at each facility, slightly more than 25% of the assessments were done for the observed children at that facility. Overall, the children visiting private facilities had higher number of assessments performed with higher mean, median, and maximum scores (Figure 9). Among the ecological regions, the facilities in the Terai Region had lower performance, while among the provinces, Province 2 had much lower scores (Appendix E: Table 1).
Of the 13 individual components of the assessments for children age 2 and above, the assessment for fever (client history of fever or took child’s temperature by thermometer) was conducted in about 80% of the sick child assessments. This was followed by about 60% of children being checked for cough or difficulty breathing (client history or counted breaths for 60 seconds). The assessments that were conducted with the lowest frequency of the 16 possible assessments for children under age 2 were pressing both feet to check for edema, checking for visible severe wasting by undressing child to examine from shoulders to ankles, and checking palmar pallor, at 1.7%, 2.5%, and 3.8% of observations, respectively.
3.2.1.5 Mean percent of sick children diagnosed with pneumonia that received a complete assessment
In total, there were 177 sick children who were diagnosed with pneumonia (unweighted). A complete assessment to diagnose pneumonia includes counting the breaths in one minute, looking for chest in-drawing, as well as looking and listening for stridor and wheezing per the integrated management of neonatal and childhood illness (IMNCI) guidelines. To assess if the sick children diagnosed with pneumonia in the Nepal NHFS sample had received a complete assessment per the IMNCI guidelines, we assessed the percentage of sick children diagnosed with pneumonia at each facility for whom the provider asked or caretaker of the sick child mentioned main symptoms of cough or difficulty breathing
28.3 28.5 30.9 28.1 25.518.5
10.1 7.80 0 0 2.8
54.3 57.1
84.6
69.2 68.8
50
0
10
20
30
40
50
60
70
80
90
100
ZONAL/ABOVE HOSPITALS
DISTRICT-LEVEL HOSPITALS
PRIVATE HOSPITALS
PHCCS HPS UHCS
Mean index scores
Mean index of integrated assessment score by facility typeMean Minimum Maximum

25
(fast breathing or chest in-drawing), and whether the health provider counted the respiration for a minute, auscultated the child (listened to the chest with stethoscope), or counted the pulse as per the IMNCI guidelines. The mean percent was then calculated for each background characteristic of the facility, with the results by facility type illustrated in Figure 10.
Figure 10 Mean percent of sick children with pneumonia at a facility receiving complete assessment by facility type2
An average of 48% of the children diagnosed with pneumonia at a facility received a complete assessment according to the guidelines. None of the zonal/above facilities completed all components of the complete assessment, while the UHCs had only one facility with one pneumonia diagnosis with a child who had all three assessments, which resulted in a 100% complete assessment score (Figure 9). The HP facilities had the greatest number of pneumonia cases, with the majority of the sick children receiving incomplete assessments. The private hospitals’ performance (with only 40% of clients at a facility receiving a complete assessment) was similar to the publicly managed facilities (43.4%). By ecological region, the facilities in the Terai Region had the lowest percentage with only about 38% of children with pneumonia receiving a complete assessment compared to the hills (43.4%) and mountain (50.1%) regions. Province 2 had the lowest proportion of children with pneumonia receiving a complete assessment (8.3%), with Provinces 1 and 5 the highest proportion of complete assessments at 58% each.
In the analysis by individual components of the assessment procedure, about 97% of the children with pneumonia were assessed for a client history of difficulty breathing by the provider asking or the caretaker mentioning the problem. Of the two physical examination procedures performed on the children with pneumonia, 72% of the children were assessed for a respiration rate for 60 seconds, while about 69% of children were auscultated (listen to chest with stethoscope) or had their pulse counted.
2 n=The number of sick children with pneumonia observed at each facility type.

26
3.2.1.6 Mean percent of sick children diagnosed with ear infection that received a complete assessment (%)
Among a small number of 123 sick children who were diagnosed with an ear infection, the percentage who received a complete assessment per the IMNCI guidelines was calculated at the facility level. The assessment for ear infection should include asking about ear pain and discharge, looking for pus draining from the ear, and feeling for tender swelling behind the ear. A complete assessment should include the child’s history of ear pain or discharge, and the provider looking in and feeling behind the child’s ear.
Figure 11 Mean percent of sick children with ear infection at each facility that received complete assessment by facility type3
Only about 16% of children with an ear infection diagnosis at a facility had a complete assessment. Figure 11 illustrates the mean percent distribution by facility type showing that except for the UHC (which had only one case of ear infection), complete assessment of ear infection cases remains low, especially in HPs, which had the greatest number of ear infection cases. The small number of ear infection cases in the zonal/above hospitals, private hospitals, and UHCs is not sufficient to measure this indicator with accuracy. The facilities in the mountain region had only about 3% complete assessments completed among the children with an ear infection diagnosis. Among the provinces, Province 3 facilities had the lowest mean percent of complete assessments (1.5%) and Province 2 facilities the highest (23.6%).
Among the individual components of the assessment, the client history of whether the child had ear pain or discharge was asked by a provider or mentioned by the caretaker in 76% of the cases that were diagnosed. The health care provider looked in the child’s ear in about 85% of the ear infection cases, but felt behind the child’s ear in only 25% of the cases. The IMNCI guidelines call for feeling for tender swelling behind the ear, which is necessary for diagnosing cases of mastoiditis, a more serious type of ear infection. This important procedure that differentiates between the types of ear infection was overlooked in the majority (75%) of cases.
3 n=the number of sick children with ear infection observed in each facility type.

27
3.2.1.7 Mean percent of sick children diagnosed with fever of unknown origin who received a complete assessment (%)
A total of 392 sick children were diagnosed with fever of unknown origin. Of these diagnoses, the percentage that received a complete assessment for fever was calculated at the facility level. According to the IMNCI guidelines, a diagnosis of fever should include asking about a history of fever (duration of fever, if more than 7 days, then if fever is present every day, and asking about the child having measles within the last 3 months), and a physical assessment looking or feeling for stiff neck, runny nose, bacterial cause of fever, fever due to malaria if in a malaria risk zone, and signs of measles. The physical and client history components used to define complete assessment for this analysis included a client history of fever (asked by provider or mentioned by caretaker as the main symptom) and the provider taking child’s temperature by thermometer, feeling the child for fever or body hotness, and checking for neck stiffness.
Figure 12 Mean percent of sick children with fever at each facility who received complete assessment by facility type4
On average, fewer than 1% of children diagnosed with fever at a facility received the complete assessment. The HPs and UHC facilities had 0% of children with a fever diagnosis receiving a complete assessment. The highest was at zonal/above hospitals with an average of 9% of children with a fever diagnosis receiving the complete assessment (Figure 12). In the aggregate, the public facilities had a slightly lower mean at 0.6%, with the best performing private facility only conducting a complete assessment in 33% of the children diagnosed with fever. Similarly, none of the facilities in the mountain region or in Provinces 4, 6 and 7 had conducted a complete assessment of the sick children diagnosed with fever.
The low percent of complete assessments at all levels was due primarily to the lack of examination for neck stiffness, which was done only in about 2% of the children diagnosed with fever. Taking the client history of fever and feeling for hotness, or taking the child’s temperature was done in 98% and 81% of the fever diagnosis cases, respectively. The examination for stiffness of the neck, which is done to rule out severe febrile diseases as per the IMNCI guideline, was overlooked in the majority of the cases during the physical examination.
4 n=number of sick children with fever observed at each facility type.

28
3.2.2 Efficiency
3.2.2.1 Service readiness to provide outpatient child curative care
Figure 13 Outpatient curative child care service readiness overall scores by domains (minimum, mean and median)
3.2.2.1.a Domain 1: Percent of facilities with IMNCI/IMCI guideline available
Overall, 61% of the facilities had either the IMNCI guideline or an IMNCI chart booklet. Among the publicly managed facilities, the facilities least ready in terms of availability of guidelines were the zonal/above hospitals (18.3%) and the UHCs (24.6%), with the PHCCs having the greatest availability (73.3%). In the aggregate, 65.1% of public facilities had the guidelines available compared to only 5.7% of private facilities. There were very little difference by ecological region. Among the provinces, 73% of Province 5 facilities had the guidelines, while only about 56% of facilities in Provinces 1 and 3 had any IMNCI/integrated management of childhood illness (IMCI) guideline (Appendix E: Table 2).
3.2.2.1.b Domain 2: Staff training score in the past 24 months on two child care training topics (max number of trainings out of 2)
A staff training score was created for outpatient child care services at the facility level, in which the maximum number of trainings any one staff had received was two topics in the past 24 months for each facility. The two topics of training were IMNCI/IMCI guidelines and infant and young child feeding (IYCF). Training in the past 24 months was very rare for the majority of the staff who provide curative care for sick children. As shown in Figure 13, a facility had an average staff training score of 0.4, which indicated that the majority of staff had not received any training on the two important topics.
For all levels of facility type, there were facilities with staff who had not received any training on the two topics in the past 24 months (minimum score is 0). On average, all facility types had received less than one training with the district and PHCCs having the highest mean staff training score of 0.7 (Appendix E: Table 2). The zonal/above hospitals had staff receiving a maximum of only one of two trainings. As illustrated in Table 4.4 of the NHFS 2015 report, none of the staff at zonal/above hospitals had received IYCF training in the past 24 months and overall, only 21.9% and 14.7% had received IMNCI/IMCI and IYCF training, respectively.
0.4
4
0.5
5.3
0.8
0
1
0 0 00
4
0
5
1
0
1
2
3
4
5
6
DOMAIN 2: STAFF TRAINING SCORE ON
CHILD CARE (TOTAL SCORE: 2)
DOMAIN 3: EQUIPMENT SCORE (TOTAL
SCORE: 6)
DOMAIN 4: LAB DIAGNOSTICS SCORE
(TOTAL SCORE: 3)
DOMAIN 5: ESSENTIAL ORAL MEDICINE
SCORE (TOTAL SCORE: 7)
DOMAIN 6: PRIORITY MEDICINE SCORE (TOTAL SCORE: 3)
Service readiness
score
Outpatient curative child care service readiness overall scores by domains
Mean Minimum Median

29
The staff at the private facilities were least likely to receive any training with a mean score of 0.1. There were only minor differences in the mean score by ecological region. Among the seven provinces, Province 6 had the highest mean and median score at 0.7 and 1, respectively (Appendix E: Table 2).
3.2.2.1.c Domain 3: Outpatient curative child care equipment score for each facility (out of 6)
All facilities that provide outpatient curative care for sick children were assessed for six basic pieces of equipment (child scale, infant scale, length or height measuring equipment, thermometer, stethoscope, and growth chart/child health card) and given an aggregate score from 0 to 6 based on the availability and functioning of the equipment. Overall, the mean and median outpatient curative child care equipment score was 4 of 6 (Figure 13).
By facility type, the zonal/above hospitals, district-level hospitals, and PHCCs had the highest mean scores at 4.5, 4.6 and 4.8, respectively. The median zonal/above and district hospitals had about five of the six pieces of equipment, while the median UHC facility only had three of the six pieces of equipment (Appendix E: Table 2). The private facilities had a slightly lower mean score at 3.5 than public facilities at 4.1. There were very little difference between facilities when disaggregated by ecological regions. At the province level, Province 2 was the least ready with the lowest mean score of 3.5 and the minimum number of equipment at one compared to two in the other provinces (Appendix E: Table 2).
As shown in Table 4.4 of the NFHS 2015 report, among the six pieces of equipment, the stethoscope and thermometer were available and functioning in more than 95% of the facilities, while the length or height measuring equipment was the least available at only 14% of facilities.
3.2.2.1.d Domain 4: Outpatient curative child care laboratory diagnostics capacity for each facility (out of 3)
Among the facilities that offer outpatient curative care services for sick children, the laboratory diagnostics capacity in terms of availability of equipment and test kits for conducting hemoglobin, malaria, and stool microscopy tests was calculated as score of three for each facility. This reflects the criteria defined in Table 4.6 of NHFS 2015 report. On average, among the 934 facilities, the laboratory diagnostic capacity is very low at 0.5 with the median facility having no laboratory capacity (Figure 13). By facility type, the higher-level public facilities such as the zonal/above and district hospitals have the highest mean score of 2.7 and 2.6 for each facility, with the median facility having all three lab diagnostic capabilities (Appendix E: Table 2). The lower-level HPs and UHCs have little to no lab capacity. The private facilities have a much higher laboratory capacity than the public facilities in general with mean score of 2.4 versus 0.3. By ecological region, the facilities in the mountain region had the lowest mean score of 0.2 and Terai Region had the highest mean score of 0.7. By provinces, the mean score for lab diagnostics capacity was highest for Province 3 at 0.6, while Province 6 has the least capacity at 0.3 (Appendix E: Table 2).
3.2.2.1.e Domain 5: Outpatient curative child care essential oral medicine score for each facility (out of 7)
Each facility was assigned a score from 0 to 7 based on the availability of seven essential oral medicine: oral rehydration salts, zinc tablets, amoxicillin syrup (suspension or dispersible), co-trimazole syrup (suspension or dispersible), paracetamol (syrup or suspension), Vitamin A capsules, and albendazole. On average, each facility has about 5.3 of the seven essential oral medicines. By facility type, the district-level hospitals, PHCCs, and HPs have the higher mean essential oral medicine score at 5.8, 5.5, and 5.4, respectively. There was at least one zonal/above and private facility that had none of the

30
essential oral medicines with a minimum score of 0 (Appendix E: Table 2). Moreover, the private hospitals had the lowest mean score at 4.1, which meant that each private facility had an average 4 of the 7 essential oral medicines. Among the provinces, there were very little difference in the mean score, which ranged from 5.0 to 5.6, with Province 4 having the highest mean score.
According to the NHFS 2015 report, amoxicillin was available the least in only about 24% of the facilities, while co-trimoxazole was available in about half of the facilities (Table 4.7). The other essential oral medicines were more widely available in more than 85% of the facilities.
3.2.2.1.f Domain 6: Outpatient curative child care priority medicine score for each facility (out of 3)
The availability of the three priority medicines (ampicillin powder, ceftriaxone powder, and gentamycin) was assessed by assigning a score to each facility. Overall, each facility had less than 1 of 3 priority medicines (Figure 13). By facility type, the zonal/above hospitals had a mean priority medicine score of 2.2. The median facility of the zonal/above, district hospitals and private hospitals had 2 of the 3 priority medicines. The UHCs were least likely to have any priority medicine with a mean score of 0.3, and the median with none of the priority medicines available. The maximum number of medicines available at any of the HP and UHC level facilities was 2 and 1 respectively, which indicated a lack of readiness in providing quality care for sick children. When comparing private and publicly managed facilities, the private facilities had a higher mean score of 1.7 compared to 0.7 (Appendix E. Table 2). There was very little variation between ecological regions. At the province level, facilities in Provinces 6 and 7 had the highest mean score of 1 of 3 medicines available, while the other provinces had fewer than one medicine.
3.2.2.1.g Service readiness to provide vaccination services
Figure 14 Service readiness to provide vaccination by facility type
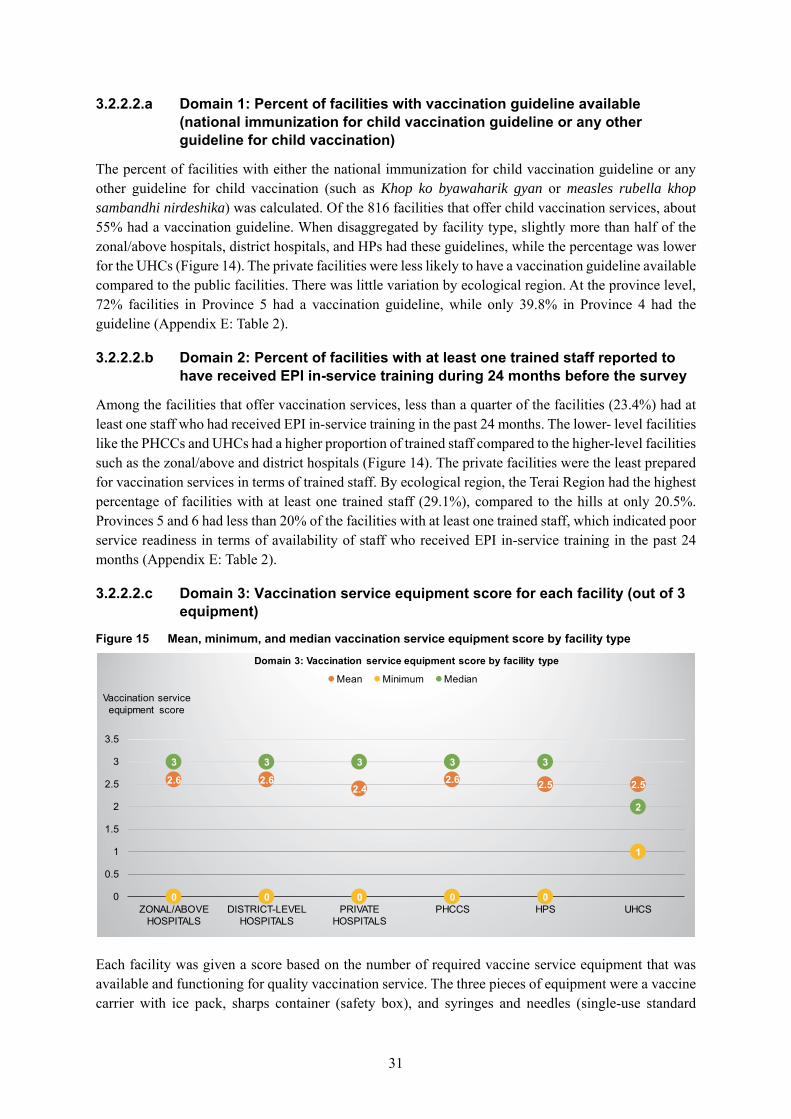
31
3.2.2.2.a Domain 1: Percent of facilities with vaccination guideline available (national immunization for child vaccination guideline or any other guideline for child vaccination)
The percent of facilities with either the national immunization for child vaccination guideline or any other guideline for child vaccination (such as Khop ko byawaharik gyan or measles rubella khop sambandhi nirdeshika) was calculated. Of the 816 facilities that offer child vaccination services, about 55% had a vaccination guideline. When disaggregated by facility type, slightly more than half of the zonal/above hospitals, district hospitals, and HPs had these guidelines, while the percentage was lower for the UHCs (Figure 14). The private facilities were less likely to have a vaccination guideline available compared to the public facilities. There was little variation by ecological region. At the province level, 72% facilities in Province 5 had a vaccination guideline, while only 39.8% in Province 4 had the guideline (Appendix E: Table 2).
3.2.2.2.b Domain 2: Percent of facilities with at least one trained staff reported to have received EPI in-service training during 24 months before the survey
Among the facilities that offer vaccination services, less than a quarter of the facilities (23.4%) had at least one staff who had received EPI in-service training in the past 24 months. The lower- level facilities like the PHCCs and UHCs had a higher proportion of trained staff compared to the higher-level facilities such as the zonal/above and district hospitals (Figure 14). The private facilities were the least prepared for vaccination services in terms of trained staff. By ecological region, the Terai Region had the highest percentage of facilities with at least one trained staff (29.1%), compared to the hills at only 20.5%. Provinces 5 and 6 had less than 20% of the facilities with at least one trained staff, which indicated poor service readiness in terms of availability of staff who received EPI in-service training in the past 24 months (Appendix E: Table 2).
3.2.2.2.c Domain 3: Vaccination service equipment score for each facility (out of 3 equipment)
Figure 15 Mean, minimum, and median vaccination service equipment score by facility type
Each facility was given a score based on the number of required vaccine service equipment that was available and functioning for quality vaccination service. The three pieces of equipment were a vaccine carrier with ice pack, sharps container (safety box), and syringes and needles (single-use standard
2.6 2.62.4
2.6 2.5 2.5
0 0 0 0 0
1
3 3 3 3 3
2
0
0.5
1
1.5
2
2.5
3
3.5
ZONAL/ABOVE HOSPITALS
DISTRICT-LEVEL HOSPITALS
PRIVATE HOSPITALS
PHCCS HPS UHCS
Vaccination service equipment score
Domain 3: Vaccination service equipment score by facility type
Mean Minimum Median
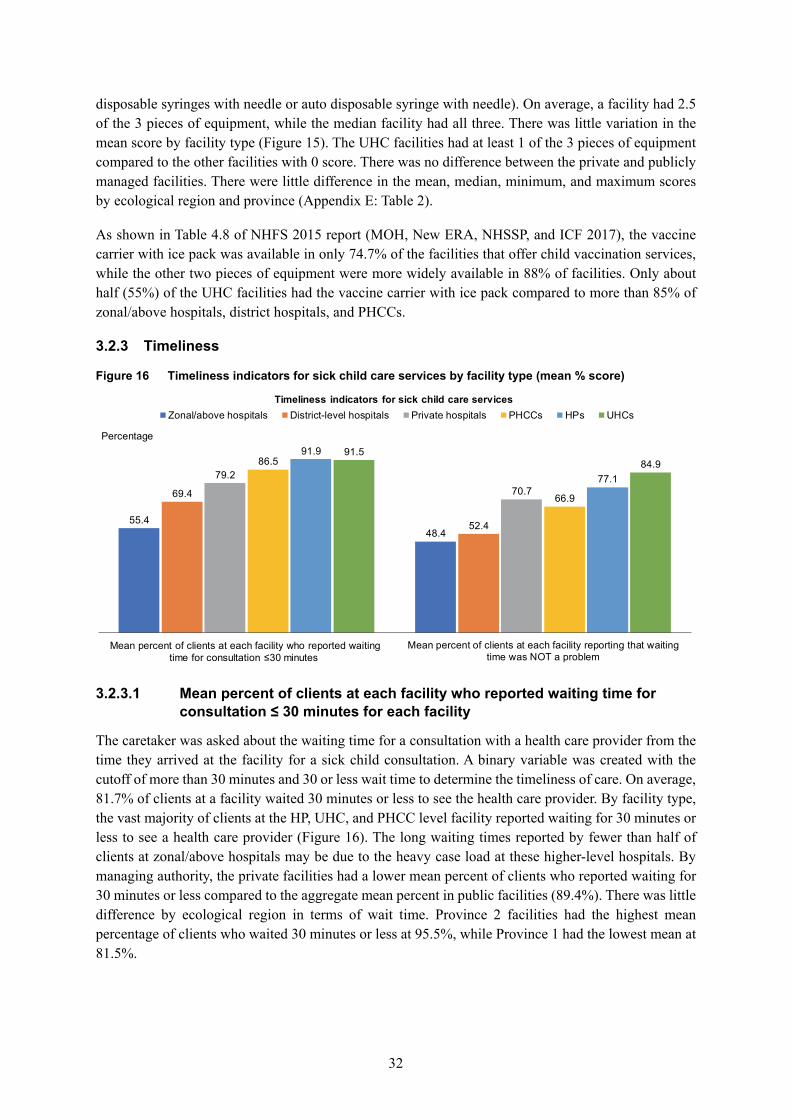
32
disposable syringes with needle or auto disposable syringe with needle). On average, a facility had 2.5 of the 3 pieces of equipment, while the median facility had all three. There was little variation in the mean score by facility type (Figure 15). The UHC facilities had at least 1 of the 3 pieces of equipment compared to the other facilities with 0 score. There was no difference between the private and publicly managed facilities. There were little difference in the mean, median, minimum, and maximum scores by ecological region and province (Appendix E: Table 2).
As shown in Table 4.8 of NHFS 2015 report (MOH, New ERA, NHSSP, and ICF 2017), the vaccine carrier with ice pack was available in only 74.7% of the facilities that offer child vaccination services, while the other two pieces of equipment were more widely available in 88% of facilities. Only about half (55%) of the UHC facilities had the vaccine carrier with ice pack compared to more than 85% of zonal/above hospitals, district hospitals, and PHCCs.
3.2.3 Timeliness
Figure 16 Timeliness indicators for sick child care services by facility type (mean % score)
3.2.3.1 Mean percent of clients at each facility who reported waiting time for
consultation ≤ 30 minutes for each facility
The caretaker was asked about the waiting time for a consultation with a health care provider from the time they arrived at the facility for a sick child consultation. A binary variable was created with the cutoff of more than 30 minutes and 30 or less wait time to determine the timeliness of care. On average, 81.7% of clients at a facility waited 30 minutes or less to see the health care provider. By facility type, the vast majority of clients at the HP, UHC, and PHCC level facility reported waiting for 30 minutes or less to see a health care provider (Figure 16). The long waiting times reported by fewer than half of clients at zonal/above hospitals may be due to the heavy case load at these higher-level hospitals. By managing authority, the private facilities had a lower mean percent of clients who reported waiting for 30 minutes or less compared to the aggregate mean percent in public facilities (89.4%). There was little difference by ecological region in terms of wait time. Province 2 facilities had the highest mean percentage of clients who waited 30 minutes or less at 95.5%, while Province 1 had the lowest mean at 81.5%.
55.448.4
69.4
52.4
79.270.7
86.5
66.9
91.9
77.1
91.584.9
Mean percent of clients at each facility who reported waiting time for consultation ≤30 minutes
Mean percent of clients at each facility reporting that waitingtime was NOT a problem
Percentage
Timeliness indicators for sick child care services Zonal/above hospitals District-level hospitals Private hospitals PHCCs HPs UHCs

33
3.2.3.2 Mean percent of clients at each facility who reported waiting time was NOT a problem
The percentage of caretakers of sick children who did not report waiting time as a problem was determined for each facility. Overall, about three-fourths of caretakers at a facility (74.3%) reported not having a problem with the waiting time, with the median facility having all the clients satisfied with the waiting time.
As shown in Figure 16, the lower-level public facilities such as the UHCs and HPs had a higher percentage of clients satisfied with the waiting time. This finding correlates with almost half the caretakers reporting that they saw a provider immediately. (Data not shown.) In contrast, only about half the clients at the higher-level facilities (the zonal/above and district hospitals) reported not having a problem with waiting time. However, all facility levels had at least one facility where all caretakers of sick child clients reported wait time to be a problem (minimum is 0), although there were also facilities with 100% clients satisfied with the wait time. The mean percent distribution was similar in the comparisons by managing authority and ecological region. At the province level, facilities in Province 1 had the lowest mean percent (67.4%), followed closely by Province 7 (69.5%), while Province 4 had the highest mean percent of 78.7% clients at each facility who report being satisfied with the wait time.
3.2.4 Client-centeredness
Figure 17 Percentage scores of outpatient curative child care service client-centeredness dimension indicators by facility type
3.2.4.1 Percent of facilities where visual aids for client education on child health
were available
Each facility was assessed for whether they had at least one type of visual aid for client education on child health (either visual aid for teaching caretakers, IEC (information, education, and communication) materials on IYCF, or information on IMCI). About half (48.8%) the facilities that provided outpatient curative child care services had some form of visual aid, while the median facility did not. As shown in Figure 17, the private facilities were the least likely to have any visual aid, while slightly more than half of PHCCs and HPs had visual aids related to child health. By ecological region and provinces, more than half of the facilities in the Terai Region and in Provinces 1, 2, and 3 did not have any visual aids related to child health.
40.6
79.2
64.174.1
43.4
74.8 70.7
82.9
14.2
95.2
82.691.1
54.4
82.8 81.888.4
52
81.2 80.8
64.5
35.7
77.5 78.1
42.5
Percent of facilities where visualaids for client education relatedto child health were available
Mean percent of caregivers ofsick children at each facility
who reported overallsatisfaction
Mean percent of caregivers ofsick children at each facilitywho reported satisfaction
with all service component
Percent of facilities whereprivate room available during
sick children consultation
Percentage
Client-centerdness indicators for sick child care services Zonal/above hospitals District-level hospitals Private hospitals PHCCs HPs UHCs

34
3.2.4.2 Mean percent of caregivers of sick children at each facility who reported overall satisfaction
Each main caretaker of the observed sick child was asked about their overall satisfaction with the service received at the facility. Those who reported being very satisfied or fairly satisfied were categorized as being satisfied in this analysis. The mean percent was then calculated from the percent distribution by each category of background characteristics. Among all the facilities, a mean of 82% of clients at a facility were satisfied with the overall service. Comparison by facility type showed that the district hospitals had the lowest mean percentage of satisfied clients and the private hospital clients were the most satisfied (Figure 17). The zonal/above hospitals, district hospitals, and UHCs had the lowest mean percent of satisfied clients with overall service. By managing authority, on average, the caretakers who took their children to a private facility had much higher satisfaction compared to public facilities. The facilities in the Terai Region had the lowest mean percentage of satisfied clients (77%) at each facility. At the province level, the Province 3 facilities had the highest client satisfaction on average at 92.3%, while the lowest was seen in Province 2 and 6 facilities with about 74% of clients on average at a facility reporting overall satisfaction.
3.2.4.3 Mean percent of caregivers of sick children at each facility who reported satisfaction with all service components
Caretakers of sick children who were interviewed upon exit were deemed satisfied with all service components if the caretakers reported that they had no major problem with any of the following 11 service items: waiting time, ability to discuss concerns with provider, amount of explanation given, quality of examination and treatment provided, visual privacy during examination, auditory privacy during examination, availability of medicines at facility, hours of service provision, number of days services available, cleanliness of facility, and staff treatment of client.
Overall, 78% of caretakers of sick children at a facility reported not having major problems with the 11 service items. Among the various facility types, the lower-level public facilities such as the PHCCs, HPs and UHCs and the private hospitals had higher levels of satisfaction while the zonal/above hospitals and district hospitals had relatively lower levels (Figure 17). In comparisons by managing authority, the public and private hospitals had a similar distribution. Among the three ecological regions, the facilities in the hill region had a higher mean percent (85.2%), compared to the mountain (74.8%) and Terai (77.2%). By province, Provinces 1 and 7 had a lower mean (71.4% and 75.7%, respectively) compared to the other provinces.
As illustrated in Tables 4.13.1 and 4.13.2 in the 2015 NHFS report, the two service items that were most commonly reported as a major problem by the caretakers were time to see a provider (national average of 8.4%) and availability of medicine (national average of 7.5%). The availability of medicines was reported as a major problem, primarily by the clients of public facilities (8.7%), as opposed to those at private facilities (0.7%).
3.2.4.5 Percent of outpatient child care facilities where private room available during sick children consultation
Overall, about 67% of the outpatient child care facilities had a private room for sick child consultation visits. By facility type, the majority of the facilities had a private room for sick child consultation, except for the lower-level facilities such as the UHCs and HPs. With comparisons by managing authority, only 65.3% of the public facilities had a private room compared to 91.1% of private facilities. By ecological region, 70.7% of facilities in the mountain region had a private room available, which was slightly

35
higher than the other two regions (66%). Among the provinces, Provinces 2 and 6 had the lowest percentage of facilities (~62%) with a private room available, while Province 1 had the highest at 76%.
3.2.5 Safety
Figure 18 Infection prevention index score for outpatient curative child care services by facility type (minimum, mean, and median score)
3.2.5.1 Infection prevention for outpatient curative child care services index
score (0-4)
An infection prevention index score from 0 to 4 was created by giving equal weight to all the domains and indicators within a domain. The four domains were 1) waste management, 2) cleaning/disinfection, 3) aseptic technique, and 4) hand hygiene. The overall mean infection prevention index score for child curative care facilities was 2.6 and the median facility had a score of 3. When analyzed by facility type, the higher-level facilities (such as zonal/above hospitals, district hospitals and PHCCs) had a lower mean score as illustrated in Figure 18. The HPs and UHCs had a higher mean score, with the median facilities for both these facility type scoring 3. This indicated that there were better infection prevention measures at the lower-level facilities. Further analysis showed that the HPs and UHCs had higher availability of domain 1 (waste management) and domain 3 (aseptic technique). (Data not shown.) There were facilities at each level that had at least one facility with an index score of 0, which meant that the facility did not have any of the infection prevention domain components (Figure 18).
The private facilities had a slightly lower mean infection prevention index score than the aggregate public facilities (2.2 versus 2.6). Among the ecological regions, the facilities in the hill region had a higher mean index score at 2.8, while the Terai facilities had lowest mean index of 2.3. At the province level, Provinces 2 and 7 facilities scored the lowest with a mean index of 2.1, with the median facility having only 2 of the 4 domains available.
Separate analysis of the individual domains showed that overall, less than half of the facilities (~44%) had all components of hand hygiene (domain 4), which can also be seen in Table 4.5 of NFHS 2015 report.
2.1 2.1 2.2 2.2
2.6 2.5
0 0 0 0 0 0
2 2 2 2
3 3
0
0.5
1
1.5
2
2.5
3
3.5
ZONAL/ABOVE HOSPITAL
DISTRICT HOSPITAL
PRIVATE HOSPITAL
PHCCS HPS UHCS
Infection prevention index score
Infection prevention for outpatient curative child care services index score
Mean Minimum Median

36
3.2.5.2 Percent of facilities with injection safety precaution guidelines for standard precautions available (%)
All outpatient child care facilities were assessed for whether an injection safety precaution guideline for standard precautions was observed and the percent of facilities with the guideline was calculated by background characteristics. Overall, only 3% of the facilities that provide curative child care services had an injection safety precaution guideline available. By facility type, the highest percentage of facilities with the guideline available were the zonal/above hospitals (11%), while only 2.8 % of the HPs had this guideline. There were few differences by managing authority. The facilities in the hills (4.5%) and Province 4 (12.1%) were more likely to have this guideline, while the least likely (less than 1%) were the facilities in the Terai Region and those in Provinces 1 and 2.
3.2.6 Reliability
3.2.6.1 Percent of sick children consultations at each facility conducted by qualified provider
At the facility level, the percent of sick children clients who were provided service by a qualified health care provider (either a general medical doctor, pediatrician, medical officer, ANM or a health assistant/AHW/sub-AHW /public health inspector) was calculated. Almost all (99.5%) the observed sick children at each facility were treated by a qualified health care provider. When disaggregating by facility type, all sick children at the zonal/above hospitals and UHCs were treated by a qualified provider (minimum 100%). Among the other facility types, although the mean was high (98-99%) and median was high (100%), the minimum was 0%, which indicated that at least one facility in each of the facility types had no sick children receive care from a qualified provider. Further analysis showed that the providers for those cases with a minimum score were either a clinical staff not on the list, an anesthetic assistant, or general surgeon.
There were no differences by managing authority and ecological region in terms of the mean percent. Similarly, at the province level, the only differences were in the minimum percentage, where it was 0% for facilities in Provinces 1, 2, 5 and 6. However, in Provinces 4 and 7, all sick children received care from a qualified provider (Appendix E: Table 3).
Among the various qualified provider categories, the majority (56%) of the sick children were seen by a HA/AHW/subAHW/public health inspector level health care provider, while about 16% and 14% were seen by a medical officer or a pediatrician. (Data not shown.) When cross-tabulating the type of health provider with the type of facility, the majority of the sick children seen by a HA/AHW/SAHW/public health inspector were those who visited the PHCC, HPs, and UHC facilities. In contrast, a higher proportion of children who visited private hospitals were seen by a pediatrician and at the zonal/above hospitals were seen by either a pediatrician or medical officer. (Data not shown.)

37
3.2.6.2 Mean percent of caretakers of sick children at each facility clients who reported they would recommend facility to a friend or family member
Figure 19 Mean percent of caretaker of sick child clients at each facility who would recommend facility to family/friend by background characteristics
Another proxy indicator that measures the reliability dimension of quality of care was whether the caretakers would recommend the facility to a friend or family member. This assumes that if the service was deemed reliable, the likelihood of recommending the facility would be high. The mean percent was then calculated for facilities within each category of background characteristics and compared.
The majority (96.2%) of the caretakers reported that they would recommend the facility. There was little variation by facility type or geographic location (Figure 19). Among the provinces, there was little difference as well. (Data not shown.)
3.2.7 Appropriateness
Figure 20 Mean percent score distribution for appropriateness dimension indicators by facility type
96.8 93.8 98.4 97.2 95.6 98.9 98.4 95.8 97.1 98.4 93.6
Zona
l/abo
ve h
ospi
tals
Dis
trict
hos
pita
l
Priv
ate
hosp
ital
PHC
C
HP
s
UH
Cs
priv
ate
publ
ic
Mou
ntai
n Hill
Tera
i
Facility type Managing authority Ecological region
Mean percent of caretakers of sick child at a facility who would recommend facility to friend/family

38
3.2.7.1 Number of days per month curative child care services are provided in a 28-day month
Overall, of a 28-day month, the mean number of days per month that curative child care services were provided was 24.3 days, with the median facility open for 24 days. The mean number of days that services were provided was slightly higher among private facilities at 26.1 days compared to public facilities (24.2 days), with the median public facility providing services for all 28 days (Appendix E: Table 4). Among the public facilities, the mean number of days ranged from 22.8 to 24.4 days. The zonal/above hospitals were open for a minimum of 24 days (the highest minimum), while the private hospitals and HPs had at least one facility open for only 6 days a month. Further analysis showed that one PHCC (Morang District) and one UHC (Rupendehi District) provided a minimum of only 1 day of service. In addition, there was one district hospital (Dolpa District) that did not provide any curative child care service in a 28-day month. There was little variation by ecological zones or province level, except for the minimum number of days.
3.2.7.2 Mean percent of caretakers of sick children who reported the curative child care facility being closest facility to their home
A mean 86% of the caretakers reported that the facility from which they sought service was the closest facility to their home. This indicated that the facility of choice was geographically appropriate for the majority of the clients at each facility. By facility type, the zonal/above hospitals had the lowest average, while the PHCCs, HPs and UHC facilities were reported as being closest to their home by the vast majority of clients (Figure 20). By managing authority, the private facilities had a much lower mean percent compared to the public facilities. Among the ecological regions, facilities in the hills had a mean value of 90.4%, while the Terai facilities were the most accessible for 94.7% of clients at a facility. At the province level, the average percent was the least for Province 3 (83.5%), while Province 2 facilities were the most accessible for 98.2% of clients at a facility.
3.2.7.3 Mean percent of caretakers of sick children at each facility who did not consider the hours or days of service at facility as a problem
The convenience and appropriateness of the timing of the facility was also assessed by calculating the percent of caretakers at each facility who reported the hours or days of service as not being a major or minor problem. Overall, the hours or days of service at a facility were reported to not be a problem for the majority of the caretakers (average of 81% at a facility). By facility type, the zonal/above hospitals and district hospitals had a relatively lower mean percent, while private facilities were relatively higher (Figure 20). The mean percent distribution was higher for facilities in hill region and Province 2 at 82.1% and 91.8%, respectively. Provinces 1, 6, and 7 had the lowest mean percent at 68.1%, 68.6%, and 71.3%, respectively. Further analysis showed that the percent of caretakers reporting the hours or days of service as a problem was 100% for the district hospital in the Dolpa District that had reported no days of outpatient curative child care services.
3.3 Quality of care of FP service
The results for FP service by quality of care dimensions are shown in Appendix F. Below is a description of the key findings by dimensions.

39
3.3.1 Effectiveness
3.3.1.1 Number of FP methods offered at the facility, through prescription and counseling, or through referral
Figure 21 Distribution of the mean number of services offered for the various types of FP services by facility type
We assessed the number of FP methods offered on site through prescription and counseling, or referral. Similar to the NHFS 2015, we analyzed the FP methods in three broad categories of services offered: 1) all nine FP methods (all permanent, traditional, and modern methods), 2) all seven modern methods, and 3) all five temporary modern methods. This made it easy to determine if the required number of FP services are being provided for each level of facility type. Appendix C details the type of methods for each category.
Figure 21 illustrates the mean number of services for all three categories of FP services by facility type. The zonal/above hospitals and district hospitals had the highest number of services offered in all three groups. The lower-level HP and UHC facilities offered fewer services on average. Private facilities offered a greater number of FP methods on average compared to the aggregate public facilities for the 9, 7, and 5 FP methods.
The PHCCs are mandated to provide all 7 modern FP methods, although some were only offering three methods and the median facility offers five methods (Appendix F: Table 1). In addition, the Government of Nepal (GoN) also recommends provision of all five temporary modern methods at all levels of public facilities. The median scores indicate that more than half of the facilities, except HPs and UHCs, offered five FP methods. The two temporary modern methods that were not offered by the majority of HPs and UHCs were the IUCD and implants.
There was very little variation in the FP services by ecological regions. By provinces, there were a few variations in the FP services offered, with Provinces 1 and 6 having higher mean and median scores and Provinces 2 and 4 with lower scores in all three categories of FP services (Appendix F: Table 1).

40
3.3.1.2 Mean reproductive history score for first-visit clients only (out of 6)
Reproductive history scores are based on observations of service delivered to the first time FP clients only (similar to NFHS 2015 report) and calculated as an aggregate of the number of the following six activities conducted by the FP provider who asked: the client’s age, pregnancy history, last menstrual period, desire for more children/desired timing of next child, breastfeeding status (if ever pregnant), and regularity of menstrual cycle. The scores were averaged across clients seen at a facility and across facilities by various background characteristics. A total of 147 FP clients were first-visit clients. The average number of first-visit FP clients was 1.3 clients per facility.
Figure 22 The mean reproductive history score for first-visit FP clients by facility type (minimum, mean, and median scores)
Overall, among all the facilities where first-visit FP clients were observed, the average facility has a mean reproductive history score of 2.4, which means that each observed client had on average only 2.4 of the 6 reproductive history activities. As shown in Figure 22, the private health facilities performed poorly compared to the public health facilities in taking a reproductive history. In addition, among the public facilities, the HPs had the maximum score with at least one HP facility offering all six activities for clients. The UHCs had a low maximum score of only three, which indicated that even the best performing UHC did not offer half of the activities. All levels of facilities had at least one facility where the first time FP clients did not have their reproductive history assessed (minimum score 0).
By ecological region, the mountain region facilities had the highest mean and median score of 3.2 and 3 respectively, compared to the hills and Terai with scores of less than 3. In addition, Province 4 facilities had the best performance with a mean reproductive history score of 3.4, while the average facilities in Provinces 1 and 2 had much lower mean scores of 1.7 and 1.6, respectively (Appendix F: Table 1). At least one facility in Provinces 6 and 7 had conducted all six reproductive history activities on all the first-visit FP clients (maximum score of 6). Table 5.8.1. in the NHFS 2015 report shows the distribution of each of the six client history activities by background characteristics (MOH, New ERA, NHSSP, and ICF 2017).
2.72.5
1.1
2.4 2.4 2.5
0 0 0 0 0 0
3.33
0
2 2
3
0
0.5
1
1.5
2
2.5
3
3.5
ZONAL/ABOVE HOSPITALS
DISTRICT-LEVEL HOSPITALS
PRIVATE HOSPITALS
PHCCS HPS UHCS
Mean score (out of 6)
Mean reproductive history score for first-visit FP clients by facility type
Mean Minimum Median
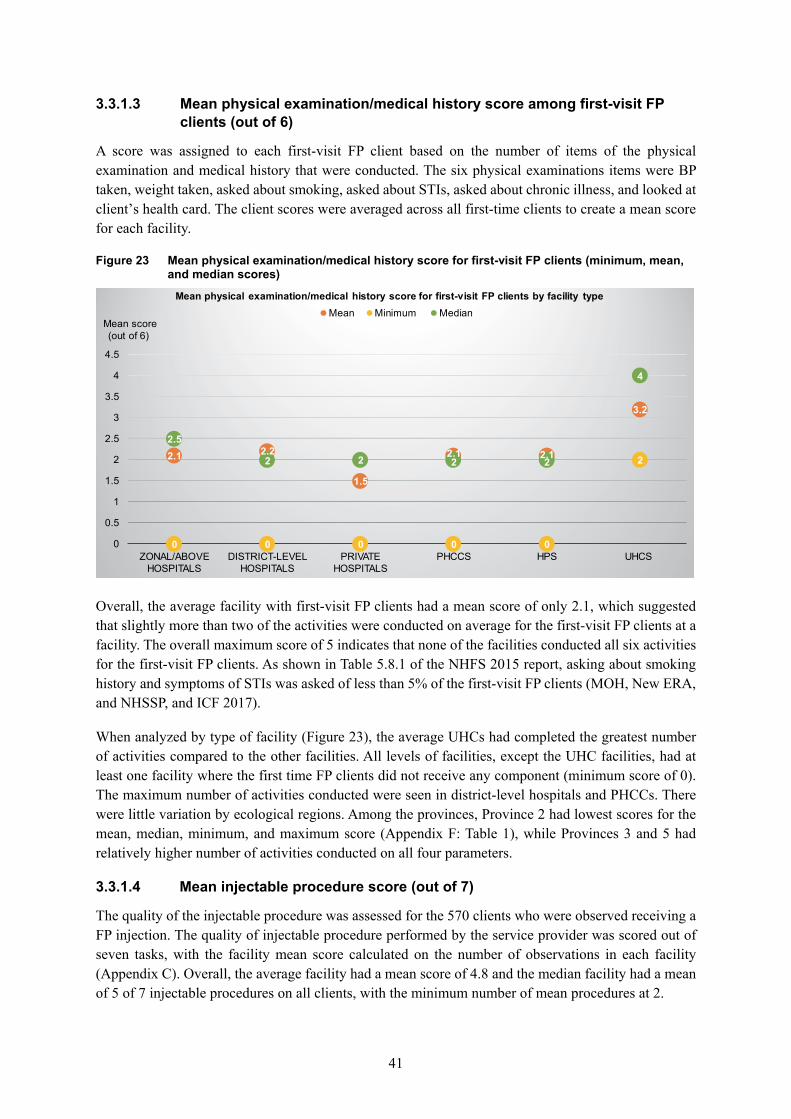
41
3.3.1.3 Mean physical examination/medical history score among first-visit FP clients (out of 6)
A score was assigned to each first-visit FP client based on the number of items of the physical examination and medical history that were conducted. The six physical examinations items were BP taken, weight taken, asked about smoking, asked about STIs, asked about chronic illness, and looked at client’s health card. The client scores were averaged across all first-time clients to create a mean score for each facility.
Figure 23 Mean physical examination/medical history score for first-visit FP clients (minimum, mean, and median scores)
Overall, the average facility with first-visit FP clients had a mean score of only 2.1, which suggested that slightly more than two of the activities were conducted on average for the first-visit FP clients at a facility. The overall maximum score of 5 indicates that none of the facilities conducted all six activities for the first-visit FP clients. As shown in Table 5.8.1 of the NHFS 2015 report, asking about smoking history and symptoms of STIs was asked of less than 5% of the first-visit FP clients (MOH, New ERA, and NHSSP, and ICF 2017).
When analyzed by type of facility (Figure 23), the average UHCs had completed the greatest number of activities compared to the other facilities. All levels of facilities, except the UHC facilities, had at least one facility where the first time FP clients did not receive any component (minimum score of 0). The maximum number of activities conducted were seen in district-level hospitals and PHCCs. There were little variation by ecological regions. Among the provinces, Province 2 had lowest scores for the mean, median, minimum, and maximum score (Appendix F: Table 1), while Provinces 3 and 5 had relatively higher number of activities conducted on all four parameters.
3.3.1.4 Mean injectable procedure score (out of 7)
The quality of the injectable procedure was assessed for the 570 clients who were observed receiving a FP injection. The quality of injectable procedure performed by the service provider was scored out of seven tasks, with the facility mean score calculated on the number of observations in each facility (Appendix C). Overall, the average facility had a mean score of 4.8 and the median facility had a mean of 5 of 7 injectable procedures on all clients, with the minimum number of mean procedures at 2.
2.1 2.2
1.5
2.1 2.1
3.2
0 0 0 0 0
2
2.5
2 2 2 2
4
0
0.5
1
1.5
2
2.5
3
3.5
4
4.5
ZONAL/ABOVE HOSPITALS
DISTRICT-LEVEL HOSPITALS
PRIVATE HOSPITALS
PHCCS HPS UHCS
Mean score (out of 6)
Mean physical examination/medical history score for first-visit FP clients by facility typeMean Minimum Median

42
Figure 24 The mean injectable procedure score for FP services (minimum, mean, and median scores)
By facility type, the average zonal/above hospital and private hospital had slightly higher mean scores, while the worst performing facility conducted at least of 4 of the 7 injectable procedures for all its FP clients (Figure 24). At least one of the district-level facilities had not conducted all seven injectable procedures, while the other facility types all had a maximum score of 7. There was little difference by ecological region with similar average scores. Among the provinces, the average facility in Provinces 1 and 3 had a slightly lower number of procedures performed with a mean score of 4.5. Only Province 6 had a maximum mean score of 6, while the other provinces had a maximum score of 7 (Appendix F: Table 1).
Further analysis showed that the procedure that was conducted least was washing hands with soap or disinfectant before giving an injection (11%), followed by drawing back of the plunger before injection (57.8%), and cleaning/air drying the injection site before injection (59.6%).
5.34.9 4.9
5.2
4.74.4
4
3
4.2
2 2
3
5 5
4.55 5
4
0
1
2
3
4
5
6
ZONAL/ABOVE HOSPITALS
DISTRICT-LEVEL HOSPITALS
PRIVATE HOSPITALS
PHCCS HPS UHCS
Mean scores (0-7)
Mean injectable procedure score by facility typeMean Minimum Median

43
3.3.1.5 Mean percent of clients at each facility provided with information about how to use the contraceptive method
Figure 25 Mean percent of clients at each facility given specific information on contraceptive method by facility type
To assess the quality of FP method counseling, one indicator was whether the clients were provided with appropriate information on using the contraceptive method that was provided. This was based on observation of FP counseling for users of pills or injections, condom, IUCDs, and implants, since there was no observation of the other FP methods. Of the total observed clients for each facility, the percentage of clients that received information on using the contraceptive method was calculated, along with the mean percent for each facility for each of the background characteristics.
On average, across all facilities only 5.7% of clients at each facility were provided with this information. By facility type, the zonal/above facilities, followed closely by PHCC facilities, had the highest mean percentage. The mean percentage differed with privately managed facilities having a slightly higher mean (6.7%) compared to the aggregate for public facilities (5.7%). The facilities in the mountain region had a higher mean (7.8%) compared to 6.4% in Terai Region and 4.6% in the hills. Among the provinces, Provinces 1 and 2 had the lowest mean percent at 3.1 and 2.7%, respectively, while Provinces 7 and 4 had the highest mean percent at 10.7% and 10.4%, respectively.
3.3.1.6 Mean percent of clients at each facility provided with information about contraceptive method’s potential side effects
Among the users of pills, injections, IUCDs and implants, the percentage of clients at each facility provided with information on the method’s potential side effects was assessed and the mean percent calculated for each background characteristic. Overall, 12.1% of clients at each facility were informed of potential side effects. As show in Figure 25, the quality of FP counseling in terms of provision of information on side effects was higher for the zonal/above level facilities. Performance was poor for the HP facilities, with fewer than 10% of clients at each HP being informed of the potential side effects of their contraceptive method.
Very little variation was seen in the quality of FP counseling on potential side effects by managing authority and ecological region. At the province level, Province 4, 6, and 2 facilities had the lowest
13.1
35.6
10.13.2
8.116.9
9.61.5
6.714.6
50
12.7
25.3
15.7
0.44.5
9.4 6.30.5
6.1
15.5
5.10
Provided with information onhow to use the contraceptive
method
Provided with information aboutcontraceptive method's
potential side effects
Provided with information onwhen to return for follow-up
Provided with information aboutprotection from STI
Mean percent of clients at each facility given specific information on contraceptive methods Zonal/above hospitals District-level hospitals Private hospitals PHCCs HPs UHCs
Mean percent

44
mean percent of clients informed about potential side effects at 5.5%, 6.8% and 7.5%, respectively, while Provinces 5 and 7 had the highest mean percent at 20%.
3.3.1.7 Mean percent of clients at each facility provided with information on when to return for follow-up (%)
Among the users of pills, injection, IUCDs and implants, the percentage of clients at each facility provided with information on when to return for follow-up was calculated and the mean percent calculated for each background characteristic.
Only 7.3% of FP clients observed at each facility were given information about when to return for follow-up. The PHCC facilities had the highest mean percent score, whereas the private hospitals, HPs and UHCs performed relatively poorly (Figure 25). Facilities in the mountain region had a much higher mean percent score of 15.1%, compared to 7.6% in Terai Region and 5.3% in hill region. Among the provinces, the facilities in Provinces 6 and 5 had a relatively higher mean percent score at 15.3% and 13.3%, while Provinces 4 and 2 had mean percent of only 1.4% and 2.7%.
3.3.1.8 Mean percent of clients at each facility provided with information about protection from STIs
For each facility, the percent of FP clients at each facility provided with information about whether the method provides protection against STIs, HIV, or dual protection was calculated and the mean percent calculated for each background characteristic.
The proportion of clients receiving information about protection from STIs was very low with an overall mean percent of 0.5% for each facility. None of the observed FP clients at the private and UHC level facilities received the information, and the highest mean percent was for the zonal/above facilities was only 3.2% (Figure 25). Among the ecological regions, the mountain region had the highest mean score of 1.5%, while the hills and Terai had scores of 0.6% and 0.2% of clients receiving this information. By provinces, Provinces 5 and 6 had a mean score of 0%, while the highest was 1% in Province 1 facilities.
3.3.1.9 Percent of clients at each facility provided information on how to use, side effects, and when to return for follow-up for the method prescribed or provided (%)
An overall quality of FP counseling indicator was calculated for comprehensive counseling on using a contraceptive method, knowing the side effects, and returning for follow-up for the method prescribed or provided. The mean percent of clients at each facility that received information on all three topics related to their method of contraception was calculated and compared by background characteristics.
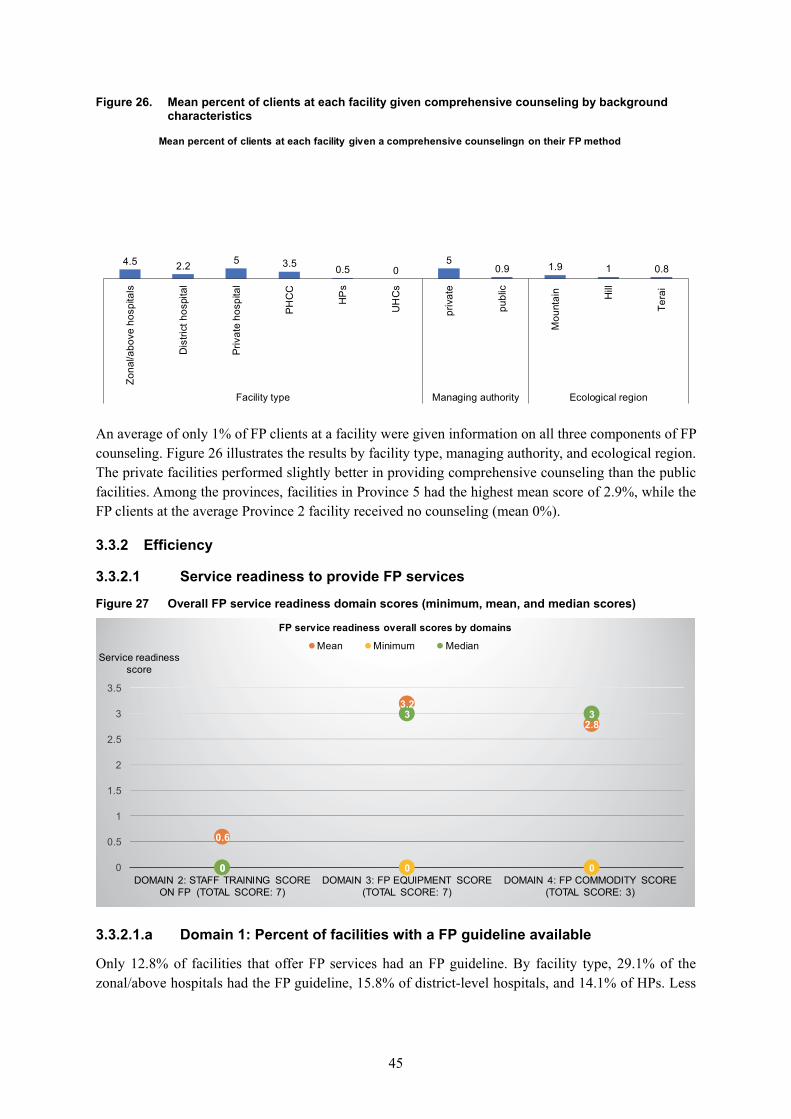
45
Figure 26. Mean percent of clients at each facility given comprehensive counseling by background characteristics
An average of only 1% of FP clients at a facility were given information on all three components of FP counseling. Figure 26 illustrates the results by facility type, managing authority, and ecological region. The private facilities performed slightly better in providing comprehensive counseling than the public facilities. Among the provinces, facilities in Province 5 had the highest mean score of 2.9%, while the FP clients at the average Province 2 facility received no counseling (mean 0%).
3.3.2 Efficiency
3.3.2.1 Service readiness to provide FP services
Figure 27 Overall FP service readiness domain scores (minimum, mean, and median scores)
3.3.2.1.a Domain 1: Percent of facilities with a FP guideline available
Only 12.8% of facilities that offer FP services had an FP guideline. By facility type, 29.1% of the zonal/above hospitals had the FP guideline, 15.8% of district-level hospitals, and 14.1% of HPs. Less
4.5 2.2 5 3.5 0.5 05
0.9 1.9 1 0.8
Zona
l/abo
ve h
ospi
tals
Dis
trict
hos
pita
l
Priv
ate
hosp
ital
PHC
C
HP
s
UH
Cs
priv
ate
publ
ic
Mou
ntai
n Hill
Tera
i
Facility type Managing authority Ecological region
Mean percent of clients at each facility given a comprehensive counselingn on their FP method
0.6
3.2
2.8
0 0 00
3 3
0
0.5
1
1.5
2
2.5
3
3.5
DOMAIN 2: STAFF TRAINING SCORE ON FP (TOTAL SCORE: 7)
DOMAIN 3: FP EQUIPMENT SCORE (TOTAL SCORE: 7)
DOMAIN 4: FP COMMODITY SCORE (TOTAL SCORE: 3)
Service readiness score
FP service readiness overall scores by domains
Mean Minimum Median

46
than 10% of PHCCs had an FP guideline, while no UHC had a guideline available. The private facilities were least likely to have an FP guideline at 1.3% compared to the aggregate of public facilities (13.5%).
3.3.2.1.b Domain 2: Staff training score in the past 24 months on seven FP training topics (maximum number of training topics of 7)
A staff training score was created for FP services at the facility level where the maximum number of trainings any one staff had received of seven FP topics in the past 24 months was assigned for each facility. The seven topics were general FP counseling, IUCD insertion and removal, implant insertion and removal, performing non-scalpel vasectomy, performing minilap tubal ligation, FP for HIV-positive women and post-partum FP (including post-partum IUCD). Training in the past 24 months was very rare for the majority of the FP staff. On average, a facility had at least one staff trained in 0.6 of the seven FP training topics (Figure 27). The maximum number of trainings a staff member received in the previous 24 months at any one of the facility was six.
The district-level hospitals facility had the highest mean score and the HPs the lowest at 0.5 (Appendix F: Table 2). There were facilities with staff who had not received any training on the seven topics in the past 24 months (minimum score of 0). The maximum training received by any one FP staff interviewed at a facility was six of seven topics for district hospitals, PHCCs, HPs, and UHCs. However, the zonal/above hospitals, the highest-level facility, had staff who received training on a maximum of three topics. There was minimal difference between the private and public facilities or by ecological region. At the province level, Province 7 had the highest mean score of 1.1, while Provinces 1 and 2 had facilities with staff who received training on only four FP topics in the past 24 months.
3.3.2.1.c Domain 3: FP service equipment score for each facility (out of 7)
All facilities that provide FP services were assessed for seven basic pieces of FP equipment (blood pressure apparatus, examination light, examination bed/table, FP counseling kit, pelvic model for IUCD, model for showing condom use, and FP-specific visual aids) and given an aggregate score from 0 to 7 based on whether the equipment was available and functioning. On average, only 3.2 pieces of the basic FP equipment were available at the facilities that offered FP services, with the median facility having 3 of the 7 pieces of basic equipment (Figure 27). By facility type, zonal/above and district-level hospitals had a highest mean score of FP equipment available at 4.8 and 4.4, respectively, while the private facilities, HPs, and UHCs had the lowest mean score at 3.2. Among the various facility types, there were at least one facility among the private hospitals, HPs, and UHCs that did not have any basic FP equipment (minimum score 0).
There were slight differences between facilities when disaggregated by managing authority and ecological regions. At the province level, Province 4 had slightly better facility readiness with the highest mean, median, and minimum scores (Appendix F: Table 2).
3.3.2.1.d Domain 4. FP service basic commodity score (out of 3)
Each facility was given a score from 0 to 3 based on the sum of the number of temporary FP methods of the three basic commodities available: combined oral contraceptive pills, injectable contraceptives, and male condoms. As shown in Figure 27, the mean FP commodity score was 2.8, although there were some facilities that did not have any of the basic commodities (minimum score 0).
By facility type, all the public level facilities performed well with a mean score of 2.8 or 2.9 and median score of 3, although the private hospitals had a mean score of 1.8. The minimum number of FP services provided was 2 in the higher-level zonal/above hospitals and district-level hospitals, but was 0 among

47
the lower-level public facilities (PHCC, HPs, and UHCs) and private hospitals. There were minimal differences by ecological region and provinces (Appendix F: Table 2).
3.3.2.2 Service readiness to provide IUCD services based on availability of all the required equipment/supplies (%)
Among the facilities that reported providing IUCD services (192 facilities), the facility readiness to provide the IUCD was assessed based on the availability of all the following equipment and supplies: sterile gloves, antiseptic solution, sponge holding forceps, sterile gauze pad or cotton wool, vaginal speculum (small, medium, and large), tenacula (vulsellum forceps), and uterine sounds.
Overall, 27.8% of the facilities that provide IUCD services had all the required equipment and supplies, while 58% of the zonal/above hospitals had the all the necessary equipment/supplies to provide IUCD services. The only UHC that provided IUCD services did not have all the required equipment/supplies, which resulted in a lack of facility readiness to provide quality IUCD services (Appendix F: Table 2). It was evident that health posts were also the least prepared because only one-fifth of the HPs that provide IUCD services had the required equipment and supplies. The IUCD services lacked all three sizes of vaginal speculum, which were missing in 62% of facilities overall and predominantly in HP facilities (74%). This resulted in low performance in service readiness. Almost half of the private facilities had all the equipment/supplies to provide IUCD compared to only about 25% of the public facilities. In the analysis by ecological region, the facilities in the mountain region had highest service readiness to provide IUCD services at 35.3%, while the hills had the lowest at 26.8%. By provinces, only 8.5% of Province 6 had all the required equipment/supplies, compared to 44.6% of facilities in Province 5.
3.3.2.3 Service readiness to provide implant services based on availability of all the required equipment/supplies (%)
Among the 366 facilities that reported providing implant services, the facility readiness to provide the implant was assessed based on the availability of all the following equipment and supplies: sterile gloves, antiseptic solution, sponge holding forceps, sterile gauze pad or cotton wool, local anesthetic, sterile syringe/needle or disposable syringe, canula and trochar for inserting implant, sealed implant pack, scapel with blade, and minor surgery kit with artery forceps.
As presented in Appendix E: Table 2, overall, less than half (42.8%) of the facilities that provide implant services had all the required equipment and supplies. Almost 75% and 70% of the district-level hospitals and zonal/above hospitals respectively had all the equipment/supplies to provide quality implant services, while only 38% of HPs were ready to provide implant services because they lacked all the required equipment/services. The private facilities had slightly higher readiness compared to public facilities. By ecological region, the Terai facilities had the lowest readiness at only 32.7% compared to 47% in both mountain and hill regions. Among the provinces, Province 3 facilities were the most ready to provide implant services with half (52.2%) having all the required equipment/supplies. Province 4 and Province 6 were the least ready at 30.1 and 33.2%, respectively.
3.3.2.4 Percent of facilities that met the quality of stock organization measures (%)
Among the facilities that provide FP services, 912 facilities reported storing contraceptive commodities in the facility. The quality of the stock organization was assessed based on measures which included commodities were off the floor and protected from water and sun; the room was protected from rodents and well-ventilated; and all commodities were organized according to expiration date. The percent of

48
facilities that met the quality of stock organization measures was calculated and the results shown in Appendix E: Table 2.
Overall, 67.3% of the facilities met the quality of stock organization measures. When compared by facility type, zonal/above hospitals performed the best at 92%, followed by district-level hospitals at 81.5% of the facilities meeting all the measures. When compared by managing authority, about 75% of the private facilities (compared to 67% of public facilities) met all the measures. Among the public facilities, only 65.8% of the HPs met all the stock organization measures. By ecological region, the hill and Terai region had relatively higher quality at 68% compared to 62% in the mountain region facilities. About three-fourths of the Province 1 facilities had all the quality of stock organization measures, while Province 2 only had 60% of the facilities.
3.3.3 Timeliness
Figure 28 Distribution of timeliness indicators for FP services by facility type
3.3.3.1 Mean percent of clients at each facility who reported waiting time for
consultation ≤ 30 minutes for each facility
During the exit interview, the FP clients were asked about the waiting time for consultation with the health care provider from the time they arrived at the facility. A binary variable was created with the cutoff of more than 30 minutes and 30 minutes or less wait time to determine timeliness of care. More than half the clients reported seeing the provider immediately with the mean wait time about 13 minutes. The mean was then calculated for each facility by background characteristics.
On average, 92% of clients at a facility waited 30 minutes or less to see the health care provider. As shown in Figure 28, among the various facility types, the lowest proportion of clients reporting waiting 30 minutes or less was for district-level hospitals. The average private facility had a higher proportion of clients who waited 30 minutes or less compared to the aggregate of public facilities (mean 91.9%). Little difference was seen by ecological region. However, at the province level, except for Province 6 facilities which had a mean percent of 68.6%, all other provinces had mean percent of 90% or higher.
87.4 84.676.2
71.1
96.7
82.589.8
81.1
92.3
81.9
93.9
81.1
Mean percent of FP clients at each facility who reported waiting time for consultation ≤30 minutes
Mean percent of FP clients at each facility reporting thatwaiting time was NOT a problem
Percentage
Timeliness indicators for FP services
Zonal/above hospitals District-level hospitals Private hospitals PHCCs HPs UHCs

49
3.3.3.2 Mean percent of clients at each facility who reported waiting time was NOT a problem
The percentage of FP clients who did not report waiting time as a problem (major or minor) was estimated for each facility. The mean percent for each facility was then calculated by background characteristics. Overall, the vast majority of clients (81.3%) reported the waiting time was not a problem. When analyzing by type of facility, more than 80% of clients at a facility at each level of facility (except for the district hospitals) were satisfied with the wait time (Figure 28). The percent distribution was similar when comparing the private and public facilities. FP clients at facilities in the Terai Region on average had a slightly lower percentage of clients satisfied with waiting time at 75.7% compared to 85% in the hills and mountain region facilities. Similarly, at the province level, Province 4 had the highest percentage of FP clients (99.3%) at a facility not having a problem with the waiting time, while Provinces 5 and 6 had a lower percentage of clients satisfied with the timeliness of care with a mean of 67.3% and 58.3%, respectively.
3.3.4 Client-centeredness
Figure 29 Client-centeredness indicators related to satisfaction with FP services by facility type
37.4
69.3
86
35
85.979
30.1
61.4
86
36.5
89.2 91.1
31.1
90.685.4
33.7
85.4 84.4
Mean percent of clients observed at eachfacility where their concerns about the
methods were discussed
Mean percent of clients at each facilitywho reported overall satisfaction
Mean percent of caregivers of sick childrenat each facility who reported satisfaction
with all service component
Percentage
Client-centerdness indicators related to satisfaction for FP services
Zonal/above hospitals District-level hospitals Private hospitals PHCCs HPs UHCs
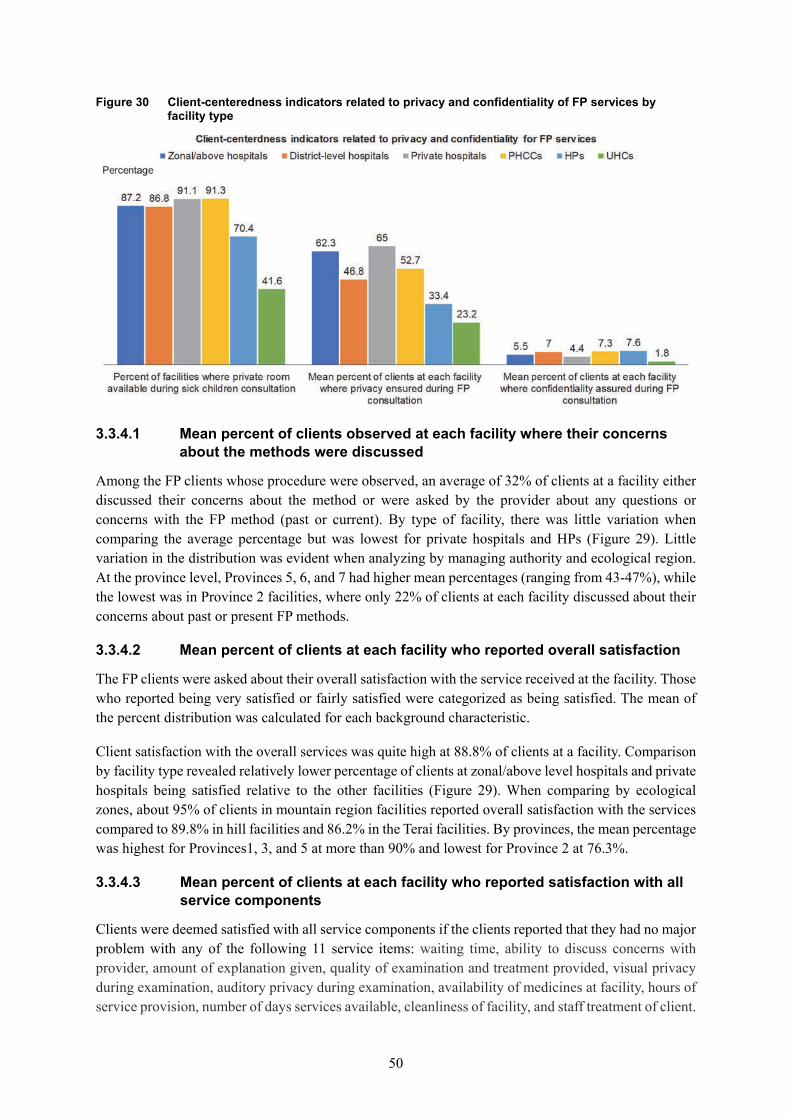
50
Figure 30 Client-centeredness indicators related to privacy and confidentiality of FP services by facility type
3.3.4.1 Mean percent of clients observed at each facility where their concerns
about the methods were discussed
Among the FP clients whose procedure were observed, an average of 32% of clients at a facility either discussed their concerns about the method or were asked by the provider about any questions or concerns with the FP method (past or current). By type of facility, there was little variation when comparing the average percentage but was lowest for private hospitals and HPs (Figure 29). Little variation in the distribution was evident when analyzing by managing authority and ecological region. At the province level, Provinces 5, 6, and 7 had higher mean percentages (ranging from 43-47%), while the lowest was in Province 2 facilities, where only 22% of clients at each facility discussed about their concerns about past or present FP methods.
3.3.4.2 Mean percent of clients at each facility who reported overall satisfaction
The FP clients were asked about their overall satisfaction with the service received at the facility. Those who reported being very satisfied or fairly satisfied were categorized as being satisfied. The mean of the percent distribution was calculated for each background characteristic.
Client satisfaction with the overall services was quite high at 88.8% of clients at a facility. Comparison by facility type revealed relatively lower percentage of clients at zonal/above level hospitals and private hospitals being satisfied relative to the other facilities (Figure 29). When comparing by ecological zones, about 95% of clients in mountain region facilities reported overall satisfaction with the services compared to 89.8% in hill facilities and 86.2% in the Terai facilities. By provinces, the mean percentage was highest for Provinces1, 3, and 5 at more than 90% and lowest for Province 2 at 76.3%.
3.3.4.3 Mean percent of clients at each facility who reported satisfaction with all service components
Clients were deemed satisfied with all service components if the clients reported that they had no major problem with any of the following 11 service items: waiting time, ability to discuss concerns with provider, amount of explanation given, quality of examination and treatment provided, visual privacy during examination, auditory privacy during examination, availability of medicines at facility, hours of service provision, number of days services available, cleanliness of facility, and staff treatment of client.

51
Overall, 85.6% of FP clients at each facility reported having no major problems with the 11 service items. Among the various facility types, the PHCCs had the highest mean percentage of clients satisfied, while district-level hospitals had the lowest (Figure 29). Very little variation was seen between private versus public and by ecological regions. When disaggregated by provinces, the lowest mean was around 78% (Provinces 5 and 7), while Province 4 facilities had the highest mean at 95.9% of clients reporting satisfaction with all service components.
3.3.4.4 Percent of FP facilities where private room available during FP consultation
Overall, 72% of the FP facilities had a private room for FP consultation. By facility type, the majority of the facilities had a private room for FP consultation, except for the lower-level facilities like UHCs and HPs (Figure 30). When comparing the private versus publicly managed facilities, only 70% of the public facilities had a private room compared to 91% of the private facilities. There were no differences when comparing by ecological region. Among the provinces, Province 2 and 3 facilities had the least privacy at 69% and Province 1 facilities with the most privacy at 77.2%.
3.3.4.5 Mean percent of clients at each facility where privacy was ensured during FP consultation
For each facility, the percent of clients for whom the provider took steps to ensure visual and auditory privacy was calculated and the mean calculated by background characteristics. Overall, 37% of the clients at a facility had visual and auditory privacy during their FP consultations. As shown in Figure 30, the private facilities, followed by the zonal/above facilities, had the highest, while the HPs and UHCs had the lowest assurance of privacy. On average, private facilities had almost two times the percentage of clients at a facility where privacy was ensured (private 65% versus public 36.3%). By ecological region, the facilities in the mountain region had on average of 54% of client’s privacy ensured, and were performing better than those facilities in the hill (35.7%) or Terai (34.2%) regions. At the province level, facilities in Province 5 had only 25% of the clients’ privacy ensured at each facility, while Province 6 had a higher level of privacy assurance with an average of 61.5%.
3.3.4.6 Mean percent of clients at each facility where confidentiality assured during FP consultation
The quality of care in terms of the percent of observed FP client visits where the provider assured the client of confidentially was calculated and the mean percent by each background characteristic compared. Only 7.2% of clients at each facility were orally assured of confidentially, which was very low. The percent of clients that were ensured of confidentiality was highest among PHCCs, HPs, and district hospitals and lowest in the UHCs (Figure 30). Public facilities (with a mean of 7.2%) and those in the hilly region (mean of 9.6%) performed slightly better. At the province level, 25.7% of clients at each Province 6 facility had confidentiality assured, while a very low average of 0.9%, 1.2%, and 1.5% clients at each of Province 4, 7, and 2 facilities, respectively, were assured of confidentiality.

52
3.3.5 Safety
Figure 31 Infection prevention index score for FP services by facility type (mean, minimum, and median scores)
3.3.5.1 Infection prevention for FP services index score (0-4)
An infection prevention index score ranging from 0 to 4 was created by giving equal weight to all domains and to the indicators within a domain. The four domains were 1) waste management, 2) cleaning/disinfection, 3) aseptic technique, and 4) hand hygiene. The individual indicators within the domains are shown in Appendix C. The overall average infection prevention index score for FP facilities was 2.9 and the median facility score was 3. When analyzed by facility type, the zonal/above hospitals had higher mean and median index scores, followed by district hospitals (Figure 31). By ecological region, facilities in the hilly region had a slightly higher mean index score of 3 with the Terai Region having the lowest mean score of 2.7. There was no difference in the median, minimum, and maximum scores. Provinces 3, 4, and 5 had higher mean scores at 3.0, 3.1 and 3.2, respectively, while Provinces 2 and 7 had the lowest mean index score of 2.5.
3.3.5.2 Injection safety precaution guideline for standard precautions available (%)
All facilities that provide FP services were assessed for whether an injection safety precaution guideline for standard precautions was observed. The percent of facilities with the guideline was also calculated by background characteristics. Only 3.9% of the facilities had an injection safety precaution guideline available at the health facility. The injection safety precaution guideline was found to be available in 16.6% of zonal/above hospitals, 5.3% of district hospitals, 3.4 % of PHCCs, 3.9% of HPs, 3.2 % of UHCs, and only 1.7% of private hospitals. The facilities in the hills (6%) were more likely to have this guideline compared to mountain (2.9%) and Terai (1.2%). Among the provinces, 15.3 % of facilities in Province 4 had the injection safety precaution guideline available, with the next highest (4.1%) in Province 6 facilities. Fewer than 1% of Provinces 1 and 2 facilities had the guidelines.
3.63.3
3 32.8 2.7
2
1
0 0 0 0
4 4
3 3 3 3
0
0.5
1
1.5
2
2.5
3
3.5
4
4.5
ZONAL/ABOVE HOSPITAL
DISTRICT HOSPITAL
PRIVATE HOSPITAL
PHCCS HPS UHCS
Infection prevention index score
Infection prevention for FP services index score
Mean Minimum Median

53
3.3.6 Reliability
3.3.6.1 Percent of FP visits at each facility conducted by qualified provider
At the facility level, the percent of FP clients who were provided service by a qualified FP provider (either a general medical doctor, obstetrician/gynecologist, medical officer, ANM, or a health assistant/AHW/ subAHW/public health inspector) was calculated.
On average almost all (99.5%) of the FP clients at a facility were seen by a qualified FP provider. When disaggregating by background characteristics, the mean percent (other than 100%) was 98.6% for the HP facilities, 90.1% for the mountain region, and 96.67% for Province 3. There was one HP level facility in the Sindupalchowk District where all four of the FP clients were served by a provider listed as “other clinical provider not listed above” which did not count as qualified provider by our definition. Among the various qualified provider categories, about 75% of the clients were served by a nurse/ANM, followed by 23% served by a HA/AHW/subAHW/public health inspector level health care provider. An obstetrician gynecologist was the FP provider for only 3.4% of the private facility clients and none at the public level facilities.
3.3.6.2 Mean percent of FP clients at each facility clients who reported they would recommend facility to a friend or family member
Figure 32 Distribution of mean percent of FP clients at a facility who would recommend facility by background characteristics
Another proxy indicator to measure the reliability dimension of quality of care was generated for each facility as the percent of FP clients who said they would recommend the facility to a friend or family member. The mean percent was calculated for the various background characteristics. Overall, the vast majority (98.4%) of the FP clients at a facility reported that they would recommend the facility. As illustrated in Figure 32, the mean percent did not vary by facility type, managing authority, or ecological region. Among the provinces, the mean percent was 100% for facilities in Provinces 4, 5, 6, and 7, with the lowest at 95.4% in Province 2.
97.9 97.9 98.4 99.2 98.3 100 98.4 98.4 100 99.7 96.4
Zona
l/abo
ve h
ospi
tals
Dis
trict
hos
pita
l
Priv
ate
hosp
ital
PHC
C
HP
s
UH
Cs
priv
ate
publ
ic
Mou
ntai
n Hill
Tera
i
Facility type Managing authority Ecological region
Mean percent of FP clients at a facility who would recommend facility to friend/family

54
3.3.7 Appropriate
Figure 33 Distribution of mean percent score for appropriateness dimension indicators for FP services by type of facility
3.3.7.1 Number of days per month FP services are provided in a 28-day month
Overall, from a 28-day month, the mean number of days per month that FP services were provided at a facility was 23.9 days, with the median facility open for 24 days. The mean number of days FP services was provided was higher among private facilities (25.8 days) compared to public facilities (23.8 days) (Appendix F: Table 3). Among the public facilities, the UHCs, PHCCs, and HPs were open for the greatest number of days (24 days on average). The UHCs provided FP services for at least 22 days, whereas all other facility types included facilities that were only open for 1-5 days. There was minimal variation by ecological zones or province.
3.3.7.2 Mean percent of clients at each facility who reported the FP facility being the closest facility to their home
For each facility, the percent of FP clients who reported the facility being closest to their home was calculated. The mean percent was also calculated by background characteristics. On the whole, 95% of FP clients at each facility reported that the facility they sought FP service from was the closest facility to their home. Among the facility types, the zonal/above hospitals followed by private hospitals had the lowest average percent of clients report the facility being the closest facility to their home (Figure 33). The publicly managed facilities were more likely to be located closer to the client’s home (mean 95.5%), compared to the private facilities (87%). There was no variation by ecological region or provinces.
3.3.7.3 Mean percent of clients at each facility who did consider the hours or days of service at facility as not a problem
The convenience and appropriateness of the timing of the facility was also assessed by calculating the percent of clients at each facility who reported the hours or days of service as not being a major or minor problem and then aggregating at the facility level. The mean percent was then calculated and compared by each background characteristic.
Overall, the hours or days of service at a facility was not a problem for the majority 83.5% of clients at a facility. By facility type, the UHC level facilities had a relatively lower percent (72%) of clients

55
reporting the timing of service to not be a problem, while the private facility clients reported the highest mean percent (Figure 33). The mean percent of clients at a private facility was much higher at about 95% compared to 83% at publicly managed facilities. In addition, the mean percent distribution was relatively higher for facilities in hill region (85.1%) and Provinces 2 (88.0%) and 3 (88.9%), and the lowest for facilities in the mountain (81.2%) region and Province 1 (76.3%).
3.4 Equity Dimension Results for Each Service Area
Table 3 shows the distribution of client characteristics by the three individual measurements (age category, education, and ethnicity) for the client level data used for each of the three service areas. The majority of the ANC clients are in the age 21-25 group, while the FP clients and caretakers of sick child are generally in the older age category of above age 25 or don’t know. When categorized as ever or never attended school, the majority of the clients had attended school in all three service sectors, although the difference was greatest with the ANC clients. The Janjati/Newar (minority) and Brahmin ethnic groups were more than 55% of the client population interviewed in all three service sectors.
Table 3 Description of ANC client, FP client and caretakers of sick child characteristics
Variable Category ANC clientN=1502
(%) FP clientN=768
(%)
Caretaker of sick childN=2186
(%)
Client’s age ≤ 20 29.2 6.2 13.8 21-25 42.6 25.2 37.2 >25 & don’t know 28.2 68.4 49.0 Clients education Ever attended school 78.2 55.8 67.7 Never attended school 21.8 44.2 37.2 Client’s ethnicity Brahmin 28.5 27.6 30.6 Terai/Madhesi 22.9 14.9 21.5 Dalit 11.1 14.6 14.0 Janajati/Newar 30.5 39.1 27.5 Muslim/other 7.0 3.8 6.4
3.4.1 Equity dimension: ANC services
Table 4 Association of client satisfaction with 11 service components of ANC service and physical examination score by individual client characteristics among observed/interviewed ANC clients at ANC facilities (N=1502)
N=
1502
Clients satisfied with
11 service components
ANC physical examination score (up to 6) (%, row)
Variable Category N (%) p-value 0 1 2 3 4 5 6 p-value
Client’s age ≤ 20 439 74.9 0.46
7.1 12.7 32.1 21.4 18.8 6.8 1.0 0.003 21-25 640 79.8 1.2 11.4 24.5 32.1 20.6 8.0 1.2
>25 & don’t know 423 79.3 3.5 17.3 24.7 31.3 12.8 8.1 2.3
Client’s education Ever attended school 175 77.3 0.38 3.4 14.3 25.4 27.5 19.4 9.0 1.0 0.03
Never attended school 327 81.5 4.1 10.4 33.7 33.1 12.6 3.1 3.1 Client’s
ethnicity Brahmin 428 81.3
0.52
3.7 13.9 25.7 25.1 21.4 9.4 0.8
0.46 Terai/Madhesi 344 74.1 3.0 17.9 30.1 29.2 15.4 3.6 0.6 Dalit 167 73.6 2.4 9.2 27.2 34.8 18.9 6.9 0.6 Janajati/Newar 459 80.1 3.8 10.2 27.5 30.7 16.1 9.7 2.1 Muslim/other 104 78.7 5.2 18.5 22.6 24.4 18.2 6.1 5.1

56
There were no significant differences in client satisfaction with the 11 service components by each of the three variables of client characteristics (age group, education, and ethnicity). The physical examination score ranged from 0 to 6, where a point was given for each of the six physical examination procedures (effectiveness dimension indicator 2). The mean and median score was lowest for the youngest category of ANC clients (age 20 or below) at 2.6 and 2.0, respectively. A bi-variate analysis of the categorical physical examination scores with the three age groups showed significant difference in the distribution of the scores across the age groups (Table 4). The test of association between the education and physical examination score showed significant difference in the distribution of scores with a higher proportion of those who ever attended school having a score of 4 and 5 compared to those who never attended school (Table 4). When examining for variation in the physical examination scores by ethnicity, the mean and median scores (2.5 and 2, respectively) were lowest for ANC clients who are from Terai/Madehsi ethnic group compared to the other ethnic groups. However, a bi-variate test of association showed no significant association between ethnicity and the ANC physical examination scores (Table 4).
3.4.2 Equity dimension: Sick child care services
Table 5 Association of caretaker of sick child satisfaction, main danger sign assessment score, and main symptoms/signs assessment score by individual client characteristics at outpatient child care facilities (N=2186)
Clients satisfied with 11 service
components Danger sign assessment score (out of 3) %, row
Main symptoms/ sign assessment
score (out of 3) %, row
Variable Category N % p-value 0 1 2 3 p-value 0 1 2 3 p-value
Client’s age ≤ 20 302 78.8
0.23 62.7 26.2 6.7 4.4
0.27 19.8 21.5 33.1 25.6
0.22 21-25 814 83.2 66.5 23.1 8.7 1.8 13.5 21.8 39.6 25.1 >25 & don’t know 1,070 79.1 66.4 22.9 9.2 1.4 13.6 22.1 40.0 24.3 Client’s
education Ever attended
school 1,371 79.9 0.53 61.4 26.7 10 1.9 0.002 11.4 20.6 40.9 27.2 <0.001
Never attended
school 815 81.6 73.5 17.9 6.5 2.2 19.5 24.2 35.6 20.7 Client’s
ethnicity Brahmin 668 78.4
0.30
64.1 24.9 9.9 1.1
0.02
9.4 18.5 44.2 27.9
<0.0001 Terai/Madhesi 469 82.1 74.9 18.6 5.8 0.7 27.1 23.8 34.6 14.6 Dalit 307 77.8 64.7 25.1 6.1 4.1 12.0 29.5 33.8 24. Janajati/Newar 601 84.4 59.3 26.6 11.2 2.9 8.9 19.4 40.3 31.4 Muslim/other 141 75.3 76.2 15.1 7.1 1.7* 24.8 26.1 33.4 15.7
As shown in Table 5, there were no significant associations between caretaker of sick child satisfaction with the 11 service components with the three variables of caretaker’s characteristics (age group, education, and ethnicity).
For the sick child care analysis, two measures of effective service (danger sign assessment score and main symptoms/signs assessment score) were compared by the three characteristics. The assessment of danger sign score (which included the assessment of inability to eat or drink, vomiting, and convulsions) did not vary by the age category (Table 5). There was significant association in the bi-variate analysis between education and danger sign assessment, with 73.5% who did not attend school being more likely to have no danger signs assessed compared to 61% of those who attended school (Table 5). In the comparisons of ethnicity of the caretaker of the sick child, the bi-variate analysis showed that a significantly lower percentage of the clients from Janjati/Newar ethnic group (59.3%) did not have any

57
danger sign assessed compared to 76% and 75% of the Muslim/other and Terai/Madhesi ethnic groups, respectively (Table 5).
The main symptoms/sign assessment (cough or difficulty breathing, diarrhea, and fever) with a score from 0 to 3 had no significant association with the age of the caretaker of sick child, as shown in Table 5. A test of association in the bi-variate analysis showed significant difference in the assessment score distribution by the two categories of education. The percentage of sick children who were not assessed for any of the three symptoms/signs was higher for the children whose caretaker had not attended school (19.5%) compared to those who had attended school (11.4%) (Table 5). Similar to the danger sign assessment scores, the test of association by ethnicity also showed that a significantly higher percentage of sick children whose caretakers were from the Muslim/other (24.8%) and Terai/Madhesi (27.1%) ethnic groups were not assessed for the three main symptoms or signs, compared to about 9% of those who were from Brahmin or Janjati/Newar ethnic groups (Table 5). A significantly higher proportion of Janjati/Newar ethnic group (31.4%), compared to 15% of the Terai/Madhesi and Muslim/other ethnic group, was assessed for all three main symptoms/signs.
3.4.3 Equity dimension: FP services
Table 6 Association of client satisfaction with 11 service components of FP services and physical examination score by individual client characteristics among observed/interviewed FP clients at FP facilities (N=768)
Clients satisfied with
11 service components
FP Physical examination score (up to 6) (%, row)
Variable Category N % p-value 0 1 2 3 4 5 6 p-value
Client’s age ≤ 20 48 81.6 0.74
9.9 20.1 39.3 23.3 7.4 0 0 0.28 21-25 194 87.2 12.6 29.6 18.2 31.9 5.2 2.0 0.5
>25 & don’t know 527 87.5 13.0 32.7 24.0 26.5 3.2 0.4 0 Clients
education Ever attended
school 429 86.7 0.80
11.7 30.0 22.2 30.3 4.2 1.3 0.2 0.58
Never attended
school 339 87.5 14.0 32.6 25.2 24.3 3.7 0.1 0 Client’s
ethnicity Brahmin 212 87.8
0.15
14.7 31.3 22.8 26.7 3.8 0.6 0
0.78 Terai/Madhesi 114 84.6 19.1 32.8 21.8 17. 8.4 0 0 Dalit 112 81.5 10.4 28.3 29.7 28.4 3.2 0 0 Janajati/Newar 301 91.2 9.3 33.0 22.1 30.7 3.1 1.5 0.4 Muslim/other 29 70.8 18.5 16.0 26.4 39.2 0 0 0
As shown in Table 6, there was no significant association between client satisfaction with the 11 service components with each of the three variables of FP client characteristics (age group, education, and ethnicity). The measure FP physical examination score was from 0 to 6, in which a point was given for each of the six physical examination procedures (effectiveness dimension indicator 4). However, the bi-variate test of association of each of the three client characteristic variables with the physical examination score showed no significant association (Table 6).


59
4 DISCUSSION AND CONCLUSION
4.1 Recommendations for the ANC Program
Our analyses of ANC service by quality of care dimensions illustrate areas of strengths and weaknesses by facility characteristics. Overall, the ANC service delivery was suboptimal or poor quality in the following three quality of care dimensions: effective, efficient, and safe. The quality of ANC service in terms of physical examination was poor for both first-visit and follow-up clients. This must be strengthened through refresher training of ANC providers on conducting all aspects of the physical examination, emphasizing breast examination, and checking for signs of anemia and edema. Although the private facilities and UHC level facilities had the best performance of conducting breast examinations and checking for anemia and edema, this needs to be done for ANC clients at all facility levels. Similarly, the quality of preventive intervention and counseling for first-time visit ANC clients was suboptimal at all facility types, except for the UHC facilities. This represents a missed opportunity to identify and prevent complications during pregnancy. The safe motherhood program can explore the use of a checklist (either a job-aid or QI tools) for ANC providers as a reminder to perform all the essential physical examination procedures, and preventive intervention and counseling on all clients. The effectiveness of using checklists to improve service delivery and compliance through management of complex or neglected tasks has been demonstrated in various medical fields (DuBose et al. 2008; Haynes et al. 2009; Perry et al. 2017; Wolff, Taylor, and McCabe 2004).
Among the five domains for service readiness in ANC services, lack of ANC guidelines, laboratory diagnostic capacity, and staff training were areas of weakness. One step to standardizing the quality of ANC service is ensuring that all facilities in both the private and public sector have ANC guidelines available for the health workers. This would help to ensure that protocols are followed. Such guidelines were missing in majority of the facilities and need to be provided immediately. In addition, comprehensive training on all five topics of ANC (ANC screening, counseling, complications of pregnancy and its management, nutritional assessment of pregnant woman, and prevention of mother-to-child transmission of HIV) was very rare across all facility types and geographic areas. These topics are usually included in the additional SBA in-service training provided to government facility ANM/staff nurses who work in maternal and newborn care (Government of Nepal and Ministry of Health and Population 2006). Although more than 8,500 ANMs who provide ANC services have received SBA training, the government plans to eventually appoint only SBA-trained ANMs at birthing centers (Department of Health Services and Government of Nepal 2017). In the future, the safe motherhood program should also develop a mechanism to include private health facility staff in similar training and should begin training service providers from the non-governmental private sector.
Basic laboratory diagnostic services such as hemoglobin and urine protein testing to identify and prevent pregnancy complications are integral parts of ANC, which were lacking in the majority of HP and UHC facilities, as well as some PHCC level facilities. Similar findings were found in the Nepal Birthing Center Assessment conducted in 2013 (Ministry of Health and Population Nepal and Government of Nepal 2014). Lack of diagnostic services can lead to delayed diagnosis or non-diagnosis of a potential pregnancy complication (such as pre-eclampsia/eclampsia), and can result in the inability to take preventive measures or receive timely treatment (World Health Organization 2015). Thus, it is essential for even the peripheral public facilities to have laboratory diagnostic services for conducting hemoglobin and urine protein tests. Given the decentralization of the management of health facilities in the federal system, one recommendation to the National Public Health Laboratory, Ministry of Health

60
is to provide financial and technical assistance to the peripheral facilities in establishing laboratory diagnostic services with the priority given to the birthing centers and to the non-birthing center HPs and UHCs with a large number of ANC clients. In terms of availability of functioning equipment, measuring tapes for conducting fundal height measurements must be made available at all facilities.
In the new federal system, there is the need for the province-level safe motherhood programs to work with the local logistic management division to regularly monitor and ensure the supply and availability of essential oral medicines and vaccines, especially at HP-level facilities and facilities in Province 2, where this availability was the weakest. Regular QI assessments by the health facility QI team need to be conducted at regular intervals to monitor service readiness, identify gaps, and intervene accordingly at the local level. This may be more efficient under the new federal system of localized management and delivery of health care services. The budget for improving the quality of care and monitoring/supervision activities should be included in the planning phase. Since supervision visits are more likely to occur than refresher trainings (MOH, New ERA, NHSSP, and ICF 2017), there is a need for the ANC supervision visits to also entail observation of the ANC client examination/counseling at all levels of the facility to ensure that standard guidelines are followed. The QI modules developed by the management division should be useful in identifying gaps in skills and the mentoring of health workers on ANC examinations (Ministry of Health 2018).
Although the higher-level zonal/above hospitals are expected to be equipped and staffed to provide a comprehensive ANC services, their performance in terms of adherence to standards of care service delivery was not optimal. The zonal/above hospitals performed about 9.5 of the 12 ANC services on average, which is equivalent to the PHCC level facility or private facilities. Fewer than half of the zonal/above hospitals reported providing essential ANC services such as testing for protein, hemoglobin, and syphilis rapid diagnosis. The laboratory capacity in higher-level facilities is a priority that needs to be strengthened and reasons for lack of such service should be further investigated. In addition, the zonal/above hospitals had longer waiting times which was reported as a problem by a greater proportion of patients. Similar long waiting times have been reported in other countries at higher-level facilities (Wang et al. 2014). The zonal/above hospitals also had a relatively lower proportion of satisfied clients with the overall service and the eleven service components. Long waiting time is known to be associated with increased client dissatisfaction and can have a negative impact on service uptake (Pizer and Prentice 2011).
As the referral hospitals, zonal/above hospitals are known to be overcrowded and overburdened. One way to reduce the burden on the higher-level facilities is to improve the service delivery capacity in the peripheral health facilities which are often bypassed (Karkee, Lee, and Binns 2015; MOHP, HERD, and NHSSP 2014; Shah 2016;). In addition, the zonal/above hospitals could conduct client flow analysis (Lynam, Smith, and Dwyer 1994) in order to reduce waiting times. Since the average number of days ANC services are provided at zonal/above and district hospitals was relatively low compared to the other facilities, there is a need to reduce the heavy case load and waiting time. In addition, the service hours and days at the zonal/above hospitals and facilities in Province 1 need to be assessed by the QI team in order to improve accessibility for clients.
Because the private facilities were less likely to have visual aids for client education, it is recommended that the safe motherhood program include the private sector facilities during the printing and distribution. The UHC and HP facilities also need to be provided with a private area for ANC consultation in order to improve the quality of client-centered ANC service, which was found to be lacking in these lower-level facilities.

61
Our results provided evidence that infection prevention practices are still not optimal. This suggests a need to strengthen infection prevention practices in all facilities, but especially in the UHC and private health facilities. Of the various infection prevention domains, less than half of the facilities had soap and running water (44.3%), which are very basic but essential supplies that were missing. Thus, there needs to be regular implementation of QI tools to assess infection prevention and regular monitoring by health facility QI team or local level monitoring body to help maintain optimal infection prevention standards. Furthermore, the vast majority of facilities did not have an injection safety precaution guideline because there is no injection safety guideline developed for the safe motherhood program. This needs to be done immediately by the Ministry of Health in order to avoid putting the health workers and clients at risk.
The ANC services were performed better in the following quality of care dimensions: timely, client-centered, reliable, and appropriate. The service delivery by qualified ANC providers was found to be optimal. Similarly, most of the clients who visited the lower-level health facilities reported them as being the closest facility to home. Despite the delivery of suboptimal performance of effective, efficient, and safe ANC service delivery, the vast majority of clients at each facility said they were satisfied with the services and would recommend the facility to a friend or family member. Further analysis with the NHFS data that assesses client satisfaction and its associated factors could enhance further understanding of service delivery.
4.2 Recommendation for the Child Health Program
Our analysis showed high availability of child curative services especially in the public facilities, although other components related to effectiveness of child services were generally poor. The basic assessments required by the IMNCI guidelines for any sick child were lacking in most facilities and were especially poorly conducted at the UHC and HP-level facilities. Under the IMNCI program, training of new and older staff should emphasize the importance of conducting danger sign and main symptom assessment for all sick children. In addition to the basic assessments, complete assessment that is specific to the child morbidity (fever of unknown origin, ear infection, and pneumonia) was lagging behind at the national level and all facility levels, especially in the zonal/above hospitals. There is a need for health care providers at all levels to abide by the IMNCI guidelines and to strengthen the training and supervision of staff in order to enhance the quality of clinical care for sick children.
Availability of services should come hand-in-hand with facility readiness to provide quality care (World Health Organization 2013). Interestingly, service readiness in zonal and above hospitals was poor, compared to other facilities in terms of most service components such as availability of the IMNCI guidelines, training of staff in previous 24 months, and availability of the essential oral medicines. The peripheral health facilities (HPs and UHCs) were the least prepared to provide laboratory services. However, the lack of laboratory services in a few higher-level government facilities is unacceptable. Of all the service readiness components of curative services, staff training in IMNCI and IYCF was the weakest. Based on the knowledge and skill assessments that used tools such as QI tools, the child health program should decide whether to provide refresher training or onsite coaching in order to enhance the capacity of service providers. The Ministry of Health should strictly enforce minimum service readiness standards for each facility level through the existing quality assurance mechanisms such as “supervisory checklists for health systems” and then immediately address the gaps in service.
The readiness to provide quality vaccine service was suboptimal with the majority of the staff having not received the EPI training in past 24 months and the lack of vaccination guidelines in almost half the facilities. Availability of vaccination service equipment was good on average, although the availability

62
of vaccine carriers with ice packs, which is very important to maintain the temperature of vaccines, was lacking in several facilities. Vaccine service readiness was observed to be comparatively poor in the Terai Region and Province 2 facilities. A recent national survey also showed that basic vaccinations were comparatively lower in the same regions (Ministry of Health Nepal, New ERA, and ICF 2017). Thus, addressing readiness of vaccination service through refresher trainings or on-site coaching at more regular intervals, provision of vaccination guidelines at all facility levels including the private sector, and regular monitoring of vaccination equipment could improve the overall quality of vaccination services.
Regular procurement of commodities and drugs in Nepal’s health facilities has been an area for improvement (MOHP, HERD, and NHSSP 2014). This analysis also showed that in addition to the lack of equipment for the outpatient care of sick children, the facilities lack readiness in the provision of basic and priority medicines as well. This study highlights the poor service readiness in the availability of essential oral medicines in the higher-level zonal/above hospitals. Amoxicillin and Cotrimoxazole syrup are essential medicines that were scarcely available as noted in the NHFS 2015 (MOH, New ERA, NHSSP, and ICF 2017). A 2013 survey conducted in Nepal also reported that Amoxicillin syrup/tab stock-out was most problematic among other essential drugs, especially at the peripheral health facilities (MOHP, HERD, and NHSSP 2014). The same survey showed that peripheral level health facilities (PHCCs and HPs) faced more problems with stock-out compared to the hospitals. In our analysis, it was true for priority medicines, whose availability was considerably higher among the higher-level facilities compared to the peripheral facilities. There is a different mechanism for procurement and supply in zonal and above hospitals compared to peripheral facilities. This may account for the availability of essential medicines. The Child Health Program needs to establish a mechanism that will make these medicines available at the higher-level hospitals round the year. On a quarterly basis, the Program should analyze the logistic management and information system (LMIS) information on the availability of these medicines at the health facilities and take definitive action accordingly.
The availability of equipment for curative services was lower in the peripheral health facilities. This was largely attributed the lack of height or length measuring equipment and a child weighing scale at these facilities. A study conducted in 2016/17 in selected health facilities of Nepal also showed there was low availability of weighing scales compared to other basic equipment (World Health Organization and Nepal Development Research Institute 2017). The recent NDHS revealed that stunting in Nepal remains at 36% among under 5 children, which is only a modest decrease from 2011 (Ministry of Health Nepal, New ERA, and ICF 2017). Since growth monitoring and promotion is crucial to preventing malnutrition (Ashworth, Shrimpton, and Jamil 2008), the availability of basic tools for monitoring the growth of infants and children is essential. Health management committees at the local level could play vital role in ensuring the availability of such basic tools equipment by using local resources.
There are several management issues that health facilities could address to improve the timeliness and safety dimensions of quality care. For instance, the longer waiting time at higher- level health facilities was problematic for clients. A study of delivery care services in Nepal showed that long waiting time at a health facility was one of the major components of dissatisfaction that lead to bypassing local birthing centers and opting to either deliver at home or go to a referral hospital (Khatri et al. 2017). One way to address this issue of long waiting time in the higher-level health facilities is to strengthen the two-way referral mechanism so that follow-up could be done at the peripheral level. The Child Health Program should focus on enhancement of the client flow and the capacity of zonal and above hospitals.

63
Infection prevention efforts remain moderate at all levels of health facilities. The overall infection prevention index score was moderate, although it was lower in the higher-level health facilities and the private facilities. Low availability of safety boxes or sharp containers in private facilities and higher-level facilities is a concern. Difficulty in maintaining or improving infection control was observed in the higher-level facilities where there is a higher influx of clients. In addition to improving infection prevention, the lack of injection safety precaution guidelines was evident in the vast majority of the facilities. Lack of standard guidelines can hamper adherence to safety precautions. However, availability of guidelines alone will not ensure adherence to protocols. A study in Uganda found that only half of health workers had ever read guidelines on infection control and that in-service training on infection control was an important factor for improving infection control (Wasswa et al. 2015). Regular in-service training on infection control by supervisors, along with the use of visual guidelines at the facility level, can improve the safety dimension of quality of care. The Child Health Program needs to work with Management Division and other divisions to take immediate action to improve the infection prevention practices at public as well as private health facilities.
The quality of care dimensions that were relatively better were reliability, client-centeredness, and appropriateness. Overall client satisfaction was quite high at the national level. By facility type, satisfaction was lower among clients visiting the district hospitals and zonal/above hospital, compared to the peripheral health facilities. This agreed with the IMNCI program assessment in which caretakers who visited PHCCs and HPs were highly satisfied with the overall service (World Health Organization and Nepal Development Research Institute 2017). According to our findings, the three major problems at the higher-level facilities were waiting time to see a provider, availability of medicines at facility, and amount of visual and auditory privacy. Despite the suboptimal quality of care, the majority of the caretakers said they would recommend the facility to their friends and family members. This could be due to the lack of availability of other facilities, especially in rural areas, as seen in rural Haiti where access to one health facility when there are no other choices played a key role rather than the facility readiness in the utilization of delivery care (Wang, Winner, and Burgert-Brucker 2017).
Research conducted in one of the districts of Nepal showed that mothers emphasized the importance of timely services, privacy, and responsiveness from providers in maternal and neonatal health services (Koirala, Madhu, and Aro 2015). Visual aids which are effective in providing information and educating the client and caretakers need to be made available at all health facilities, including the private sector. The availability of these visual aids at facilities should also be regularly monitored and made available by external quality assurance teams. Although the outpatient curative services for sick children were reported to be geographically appropriate for the majority of the clients, the service hours and days of service could be improved. This needs to be assessed and explored at the individual facility level, especially when there is increased client flow.
4.3 Recommendation for the FP Program
Nepal has stagnated in use of FP methods in the last decade. The decrease in TFR has shown positive progress, and the limited gain in the CPR (Ministry of Health and Population (MOHP) 2015) should be viewed cautiously and needs to be explored. This analysis of FP service by the quality of care dimensions has provided further insights into program improvement.
Our analysis revealed that the effectiveness, efficiency, and client-centeredness dimensions performed poorly to moderately in FP family services. One of the strategic directions for universal health coverage in Nepal is ensuring access to all basic health services. However, a primary barrier, as identified in this study, is the lack of FP commodities at all levels, especially at the peripheral level, which is accessible

64
by the vast majority of the population. It is also evident that availability of a greater number of choices of FP methods at a facility helps to promote contraceptive use (Ross and Stover 2013; Wang et al. 2015). However, provision of FP methods is limited at the peripheral level health facilities (MOH, HERD, and NHSSP 2014) despite strategies that aim to increase availability of at least five temporary modern FP methods (combined oral contraceptive pills, progestin-only injectable contraceptives, male condoms, IUCD, and implants). As shown in Table 5.4.1 in the NHFS 2015 report, the provision of IUCD and implant services in the HP and UHC level facilities is very low and can be improved (need reference for NFHS). This calls for major program action. The GoN should address this by strengthening readiness and supply chain management, and making long-acting reversible contraceptives available, specifically in the peripheral facilities and private hospitals. Moreover, local governments should also encourage facilities to practice FP micro-planning in low coverage and low availability areas. Micro-planning is a strategy to analyze the current FP situation and make context-specific response plans which have been shown to be effective in improving FP outcomes in the Doti District in Nepal (Nepal, Ancker, and Baral 2016).
The practice of taking a client’s reproductive history and performing a physical examination, which are mandatory in identifying a client’s health condition, reproductive need, and suitability of FP method, especially for the first-visit FP clients, was very poor overall. Table 5.8.1 in the NFHS 2015 report illustrates that breastfeeding status and desire for more children/desired timing of next child were not asked of the majority of the clients overall when taking a reproductive history (MOH, New ERA, NHSSP, and ICF 2017). Furthermore, the report also illustrates that medical history (namely smoking, STIs, and chronic illnesses) were assessed in only 3%, 4.3% and 18.8% of the first visit FP clients. Compared to public facilities, the private health facilities performed poorly in conducting comprehensive reproductive history and physical examinations.
Similar findings were evident in a systematic review that revealed that the private sector performed poorly in following the medical standard of practice when compared to public sector (Basu et al. 2012). To address this, FP trainings (in-service and refresher) should stress that all components of reproductive history and physical examination are extremely important and that these practices should be encouraged by service providers through the availability of guidelines and job-aids for FP staff in both the public and private sectors. Furthermore, the federal and local government should also strengthen its supervision and monitoring system and focus on the importance of effective counseling, history taking, and physical examination during coaching, supervision, and monitoring of service providers.
Another important but mostly neglected component identified in this analysis is the lack of comprehensive counseling provided for clients. Overall, only a very small proportion of clients were provided with information on how to use FP methods, the side effects, and directions for when to return for follow-up for the method prescribed or provided. Such negligence in providing proper FP counseling may lead to an increased discontinuation rate, contraceptive failure rate, and infection. To deliver high quality FP services and to ensure an increase in the CPR and other FP outcomes, it is essential for the service providers to be reminded during trainings of the importance of delivering comprehensive counseling to all FP clients. The GoN should encourage local governments to strengthen the existing quality improvement process and system, which supports peripheral facilities in identifying comprehensive gaps in service delivery through client participation and addressing them.
The current Family Health Division should make FP guidelines available at all level of health facilities including the private facilities. Currently, there are many different guidelines developed by the GoN and the various external development partners. The Family Health Division could consolidate all FP guidelines to make it more convenient for the service providers. However, in the federal system post-

65
decentralization, it is recommended that the Family Health Division facilitate provision of guidelines through a public access database and that the local governments ensure that necessary guidelines are available at all levels of health facilities.
Our results also suggest the need for substantial strengthening of knowledge and skills of service providers, which are key to facility readiness to deliver quality FP services. Evidence suggests there are significant differences in service delivery outcomes, such as clients being given correct information of protection from STIs, when being counseled by providers trained in past 2 years, compared to providers with no recent training (Assaf, Wang, and Mallick 2015). At present, the GoN provides only one training and does not have provisions for regular refresher trainings, which appear to be important given evidence of the poor clinical performance by service providers. More recently, the GoN has introduced onsite coaching which remains to be effectively implemented. The local government should strengthen and scale-up coaching, and provide more targeted attention to service providers’ knowledge and skills. The GoN should also monitor FP trainings and ensure that service providers have the necessary skills and abide by the FP guidelines.
All levels of health facilities need to be provided with the basic FP equipment in order to deliver quality service. Except for the BP apparatus and examination bed or table, the majority of the facilities lacked the other basic FP equipment, especially the lower-level public facilities and private facilities. In addition, the readiness to provide IUCD and implant services, in terms of availability of required equipment and supplies, was poor especially in lower-level health facilities. Compared to private facilities, fewer public facilities had all the required equipment/supplies for both implant and IUCD services. Poor service readiness to provide quality IUCD and implant services, specifically in Provinces 4, 6 and 7 as well as the Terai Region, demonstrates the need for major action in supply chain management at both the peripheral public facilities and the federal level. Since the new federal system requires the federal government to procure its own FP commodities, the provincial government should be actively engaged in developing a mechanism in which regular supplies are ensured at facilities and priority is given to filling the gaps in service readiness to deliver quality care.
In terms of client-centeredness of quality FP services, the vast majority of clients reported being satisfied with the overall service and with all eleven service components. There is still the need to improve the FP counseling skills and to improve discussions with the client about concerns with a specific choice of FP method. This may be strengthened through supportive supervision as well an emphasis on FP-related trainings. Although the majority of the facilities (except for the UHCs) had a private room for FP consultations, visual and auditory privacy during the observed consultation visits was poor, especially in the district hospitals, PHCCs, and peripheral public facilities. Considering the sociocultural sensitivity and stigma around FP, ensuring privacy and confidentiality of clients at all levels of health facilities is a necessity. Several studies in different countries have illustrated the importance of privacy and confidentiality in FP service provision (Atuahene, Afair, Adjuik, and Obed 2016; Tessema et al. 2016). Thus, it is essential for the service providers to abide by the national guidelines in ensuring privacy during FP consultations. This needs to be monitored on a regular basis by the supervisors and health facility.
Our analysis of FP services also showed that the timeliness, safety, reliability, and appropriateness dimensions performed comparatively better. However, there were few areas of improvement that need to be addressed. With timeliness, the higher-level facilities performed poorly in terms of waiting time for consultations compared to peripheral health facilities. Studies have shown waiting time to be significant predictor of overall client satisfaction (Agha and Do 2009; Aldana, Piechulek, and Al-Sabir 2001; Hutchinson, Do, and Agha 2011; Wang et al. 2015) and quality care is associated with increased

66
uptake and continuation of FP methods (Acharya and Cleland 2000; Arends-Kuenning and Kessy 2007; Blanc, Curtis, and Croft 2002; Mariko 2003). Addressing health worker shortages and increasing the number of service providers in high client load facilities will help reduce client waiting time. The higher-level facilities were also found to have provided FP services for fewer days on average in a 28-day month. Thus, waiting time could also have been affected due to the fewer service days. It is recommended that the managers of the zonal/above facilities conduct their own assessment to identify and understand the factors that influence long waiting times and address those factors. Moreover, educating clients on their rights to quality FP services, implementing interventions to improve the health literacy of clients, and involving community and clients in decision-making for service delivery are equally important in designing and implementing client-centered services.
The GoN should strengthen current infection prevention practices for FP services at all levels of health facilities, especially peripheral facilities. Infection prevention procedures have been identified as critical in improving efficient, continuous use of FP methods (Murphy and Steele 2000). The infection prevention index score could be improved substantially by improving hand hygiene, since all components of hand hygiene (running water, soap, or hand disinfectant) are found in fewer than half of all facilities (MOH, New ERA, NHSSP, and ICF 2017). Immediate action is also needed from the GoN to make injection safety guidelines available at all levels of health facilities, while the local governments should ensure that the guidelines are adhered to during service delivery through supportive supervision and monitoring.
To make FP services reliable, increasing access to FP services and continuation of FP services delivery through qualified providers is important. In Namibia and Senegal, a supervision visit in the last 6 months was significantly related with client satisfaction (Wang et al. 2014). Ensuring the competency of qualified providers is necessary as well. Almost all the service providers observed were qualified FP providers, although as seen in our analysis, this does not translate to the provision of optimal clinical care. Thus, it is vital that all levels of FP providers be given refresher trainings every 24 months and that the trainings emphasize the gaps in health worker knowledge and skills.
As per the GoN’s provision, FP services should be provided throughout the month (all working days). The local administrative body needs to strictly regulate this because service delivery gaps are evident. In addition, continued provision of FP services through satellite or outreach clinics to those who cannot reach the facilities is also recommended. In rural Haiti, use of modern contraceptives was significantly higher (more than 2 times) among those who had greater access (having more than one facility providing 3+ FP methods) to FP facilities compared to those who had low access (having no facility providing 3+ FP methods (Wang et al. 2015). Currently, a number of health care reforms are underway which provide an opportunity for service expansion at the primary health care level. The local government should encourage health facilities to utilize information from the health management information system, client exit interviews, social audits, and information from management committee meetings to plan and deliver context, province, and need-specific quality FP services.
4.4 Equity in ANC, Sick Child Care, and FP Services
Reducing inequities in health care must be synergistically integrated with quality improvement. Our analyses of the equity dimension found evidence of variation in some indicators of quality care based on certain client characteristics. The good performance in the equity dimension on client satisfaction with the 11 service items may be high because the baseline of the indicator was already high, which left little possibility for variation. We found that the quality of basic examinations and assessment varied by education level with those never attending school receiving lower quality care in all three service areas

67
(FP, ANC, and sick child care). The 2016 NDHS report shows that inequity in the utilization of ANC service and basic vaccination services by education level favors those with higher education, and that access to FP services favors those who have no education with this group having the highest proportion of modern contraceptive use and lowest unmet need (Ministry of Health, New ERA, and ICF 2017). In a recent study in Kenya, the authors found good performance in the equity dimension because there was no significant difference in the measures of quality of ANC (ANC physical examination score, client satisfaction, and whether visit was conducted by qualified ANC provider) by the ANC client’s education level (Lee, Madhavan, and Bauhoff 2016). The inequity in examination and assessments by ethnic background of FP, ANC clients, and caretakers of sick children an seen in our study is an area the government needs to further explore in order to achieve the goal of an equitable health service delivery system.
Measures of quality of care are limited in the NDHS but it is evident that counseling services on various ANC topics were lower for women in rural areas, the Terai Region, and those with no education, which supported our findings (Ministry of Health, New ERA and ICF 2017). Currently in Nepal, the equity gap is assessed on certain health outcome indicators by wealth quintile and ecological region, except for stunting, which also includes ethnicity group (Ministry of Health and Population 2015). It is recommended that the Ministry of Health and Population also assess inequity by ethnicity and education on all health outcomes, as well as including equity gap analysis on the process of care indicators which are lacking. Furthermore, it should also be stressed during training and supervision visits that health care providers in all service areas provide quality and patient-centered care to all clients.
4.5 Limitations
One of the limitations of this study is the complexity of defining quality of care in terms of the eight dimensions of quality of care, as defined by the NHSS, despite the lack of a clear definition for each dimension. A major limitation in the comparisons between the facility background characteristics is that there were no significance tests performed as non-parametric tests of significance that compared the difference in mean or median which was not possible using the survey design weights. The study sample also did not meet the requirements for parametric tests of significance.
There are also limitations to the indicators. All measurements were subject to the data collected in the 2015 NHFS. Some indicators such as client satisfaction are very subjective. Other indicators based on health worker performance are likely to be different in cases when the provider is being directly observed versus when they are not observed, a phenomenon known as the Hawthorne Effect (McCambridge, Witton, and Elbourne 2014; Mayo 2003). Finally, a few of the sick child care observation indicators under the effectiveness dimension are based on a small number of clients and may not be representative of the care being provided at each facility.
4.6 Overall Recommendation
The 2018 Lancet Global Health Commission on high-quality health systems in the SDG era asserts that providing health services without guaranteeing a minimum level of quality is ineffective, wasteful, and unethical (Kruk et al. 2018). An analysis of 16 low to middle-income countries showed that Nepal was one of the low performing countries in terms of adherence to WHO guidelines in improving ANC, FP, and sick child care services (Kruk et al. 2018).
The 2015 NHFS is the baseline assessment of components of quality of care across various service sectors. One recommendation for government and non-government stakeholders working towards

68
health system strengthening and improving quality of care is to hold workshops to review the results of these analyses and other secondary analysis of NHFS data, identify the most pressing issues, and inform action plans that address them. Further research is also encouraged to better understand the gaps and strengths in the current health system. There are blind spots in quality of care data in areas such as user experience, system competence, confidence in the system, and the wellbeing of the people (Kruk et al. 2018).
Our analyses showed high levels of satisfaction despite suboptimal quality of care in all three services. Satisfaction is strongly influenced by a host of other factors such as demographics, past care experiences, expectations, and potentially courtesy bias (Batbaatar et al. 2017). It is also important to note that client satisfaction is very subjective because it is a personal perspective and two individuals who receive the same quality of health care service may report very different levels of satisfaction. Thus, user satisfaction provides an important perspective, although other measures of confidence and user experience such as people’s trust in the health system, confidence that people can obtain the care they need, metrics that reveal preference such as bypassing, and patient retention need to be studied and measured.
In all three service areas, quality of care that ensures the services provided were effective, efficient, and safe were found to be poor compared to the other quality of care dimensions. These three dimensions need to be improved substantially through specific interventions. Since the gaps and strengths in delivering quality care vary by type of health facilities and type of service, it is essential that rigorous implementation of minimum service standards for health facilities ensure service readiness and that health facility and hospital QI systems regularly monitor quality of care and address the identified gaps. Furthermore, there is a need for the GoN to establish a quality improvement management information system to monitor real-time quality of care because the NHFS is very expensive to conduct frequently and regular QI data is needed to monitor progress in quality.
With the decentralization of health system management in the new federal government, it is vital that the local federal health departments ensure an adequate budget in the annual work planning and budgeting to implement QI related activities. Improvement efforts should be adapted for the local context because what works in one type of facility or setting may not work elsewhere. Thus, targeted actions by the local authority (federal government) is vital. Studies to understand contextual factors that promote or hinder reform are required even more now in the context of the new federal system of governance.
Although efforts are being made to monitor equity in service provision and health outcomes, there is a need for equity gap analysis and monitoring of process of care indicators to help identify inequity in service delivery, factors that influence inequity, and eventually reduce inequity in health outcomes. Our findings also highlighted the need to improve health care workers performance in terms of compliance with standards of care, which could be achieved through regular refresher trainings as well as regular monitoring, supervision, and on-the job trainings.
The current NHSS cites the eight quality of care dimensions but does not define the dimensions (Ministry of Health and Population 2015). Our analysis serves as reference for developing such indicators by quality of care dimensions. It is essential for the NHSS and the Ministry of Health and Population to identify and clearly define the key indicators within the quality of care dimensions because this will help health facilities understand and monitor the various dimensions of quality of care.

69
REFERENCES
Acharya, L. B., and J. Cleland. 2000. “Maternal and Child Health Services in Rural Nepal: Does Access or Quality Matter More?” Health Policy and Planning 15 (2): 223–29. https://doi.org/10.1093/heapol/15.2.223.
Agha, S., and M. Do. 2009. “The Quality of Family Planning Services and Client Satisfaction in the Public and Private Sectors in Kenya.” International Journal for Quality in Health Care 21 (2): 87–96. https://doi.org/10.1093/intqhc/mzp002.
Aldana, J. M., H. Piechulek, and A. Al-Sabir. 2001. “Client Satisfaction and Quality of Health Care in Rural Bangladesh.” Bulletin of the World Health Organization 79 (6): 512–17. https://www.who.int/bulletin/archives/79(6)512.pdf.
Arends-Kuenning, M., and F. L. Kessy. 2007. “The Impact of Demand Factors, Quality of Care and Access to Facilities on Contraceptive Use in Tanzania.” Journal of Biosocial Science 39 (1): 1–26. https://doi.org/10.1017/S0021932005001045.
Ashworth, A., R. Shrimpton, and K. Jamil. 2008. “Growth Monitoring and Promotion: Review of Evidence of Impact.” Maternal & Child Nutrition 4 (s1): 86–117. https://doi.org/10.1111/j.1740-8709.2007.00125.x.
Assaf, S., W. J. Wang, and L. Mallick. 2015. Quality of Care in Family Planning Services at Health Facilities in Senegal. DHS Analytical Studies, No. 55: 1-51. Rockville, Maryland, USA: ICF International. https://dhsprogram.com/pubs/pdf/AS55/AS55.pdf.
Assaf, S., W. Wang, and L. Mallick. 2017. “Quality of Care in Family Planning Services in Senegal and Their Outcomes.” BMC Health Services Research 17 (1): 1–16. https://doi.org/10.1186/s12913-017-2287-z.
Atuahene, M. D., E. O. Afari, M. Adjuik, and S.Obed. 2016. “Health Knowledge, Attitudes and Practices of Family Planning Service Providers and Clients in Akwapim North District of Ghana.” Contraception and Reproductive Medicine 1 (1): 5. https://doi.org/10.1186/s40834-016-0016-3.
Basu, S., J. Andrews, S. Kishore, R. Panjabi, and D. Stuckler. 2012. “Comparative Performance of Private and Public Healthcare Systems in Low- and Middle-Income Countries: A Systematic Review.” PLoS Medicine 9 (6): e1001244. https://doi.org/10.1371/journal.pmed.1001244.
Batbaatar, E., J. Dorjdagva, A. Luvsannyam, M. M. Savino, and P. Amenta. 2017. “Determinants of Patient Satisfaction: A Systematic Review.” Perspectives in Public Health 137 (2): 89–101. https://doi.org/10.1177%2F1757913916634136.
Bessinger, R. E., and J. T. Bertrand. 2001. “Monitoring Quality of Care in Family Planning Programs: A Comparison of Observations and Client Exit Interviews.” International Family Planning Perspectives 27 (2): 63-70. https://doi.org/10.2307/2673816.
Blanc, A. K., S. L. Curtis, and T. N. Croft. 2002. “Monitoring Contraceptive Continuation: Links to Fertility Outcomes and Quality of Care.” Studies in Family Planning 33 (2): 127–40. https://doi.org/10.1111/j.1728-4465.2002.00127.x.

70
Campbell, S. M., M. O. Roland, and S. A. Buetow. 2000. “Defining Quality of Care.” Social Science & Medicine 51: 1611–25. https://www.ncbi.nlm.nih.gov/pubmed/11072882.
Department of Health Services, and Government of Nepal. 2017. Annual Report Deparment of Health Services 2015/2016. Vol. 70. Kathmandu, Nepal: Government of Nepal. http://www.dohs.gov.np/wp-content/uploads/2017/06/DoHS_Annual_Report_2072_73.pdf.
Dhital, S. R., Dhital, M. K., and A. R. Aro. 2015. “IMedPub Journals Clients ‘ Perspectives on the Quality of Maternal and Neonatal Care in Banke.” Health Science Journal ISSN 9 (2): 1–6. http://www.hsj.gr/medicine/clients-perspectives-on-the-quality-of-maternal-and-neonatal-care-in-banke-nepal.php?aid=5538.
Donabedian, A. 1988. “The Quality of Care: How can it be asessed?” JAMA 260 (12): 1743-1748. https://doi.org/10.1001/jama.1988.03410120089033.
Donabedian, A. 1992. “The Role of Outcomes in Quality Assessment and Assurance.” Quality Review Bulletin 18 (11): 356–60. https://doi.org/10.1016/S0097-5990(16)30560-7.
DuBose, J. J., K. Inaba, A. Shiflett, C.Trankiem, P. G. R. Teixeira, A. Salim, P. Rhee, D. Demetriades, and H. Belzberg. 2008. “Measurable Outcomes of Quality Improvement in the Trauma Intensive Care Unit: The Impact of a Daily Quality Rounding Checklist.” The Journal of Trauma 64 (1): 22–27. https://doi.org/10.1097/TA.0b013e318161b0c8.
Godlonton, S., and E. N. Okeke. 2016. “Does a Ban on Informal Health Providers Save Lives? Evidence from Malawi.” Journal of Development Economics 118: 112–32. https://doi.org/10.1016/J.JDEVECO.2015.09.001.
Gouws, E., Bryce, J., Pariyo, G., Schellenberg, J. A., Amaral, J., & Habicht, J. P. 2005. “Measuring the quality of child health care at first-level facilities.” Social Science and Medicine, 61(3), 613–625. https://doi.org/10.1016/j.socscimed.2004.12.019
Government of Nepal, and Ministry of Health and Population. 2006. National Policy on Skilled Birth Attendants. Kathmandu, Nepal: Government of Nepal. http://mohp.gov.np/en/app/webroot/upload/files/Safe%20Motherhood%20and%20SBA%20Policy. pdf.
Haynes, A. B., T. G. Weiser, W. R. Berry, S. R. Lipsitz, A. S. Breizat, E. P. Dellinger, T. Herbosa, S. Joseph, P. L. Kibatala, M. C. Lapitan, et al. 2009. “A Surgical Safety Checklist to Reduce Morbidity and Mortality in a Global Population.” New England Journal of Medicine 360 (5): 491–99. https://www.nejm.org/doi/full/10.1056/NEJMsa0810119.
Hutchinson, P. L., M. Do, and S. Agha. 2011. “Measuring Client Satisfaction and the Quality of Family Planning Services: A Comparative Analysis of Public and Private Health Facilities in Tanzania, Kenya and Ghana.” BMC Health Services Research 11 (1): 203. https://doi.org/10.1186/1472-6963-11-203.
Institute of Medicine (US). 2001. Crossing the Quality Chasm: A New Health System for the 21st Century. Washington, DC, USA: National Academies Press (US). https://doi.org/10.17226/10027.

71
Karkee, R., A. H. Lee, and C. W. Binns. 2015. “Bypassing Birth Centres for Childbirth: An Analysis of Data from a Community-Based Prospective Cohort Study in Nepal.” Health Policy and Planning 30 (1): 1–7. https://doi.org/10.1093/heapol/czt090.
Khatri, R. B., T. P. Dangi, R. Gautam, K. N. Shrestha, C. S. E. Homer, and S. Jack. 2017. “Barriers to Utilization of Childbirth Services of a Rural Birthing Center in Nepal: A Qualitative Study.” PLOS ONE 12 (5): e0177602. https://doi.org/10.1371/journal.pone.0177602.
Kruk, M. E., A. D. Gage, C. Arsenault, K. Jordan, H. H. Leslie, S. Roder-DeWan, O. Adeyi, P. Barker, B. Daelmans, S. B. Doubuva, et al. 2018. “High-Quality Health Systems in the Sustainable Development Goals Era: Time for a Revolution.” The Lancet 6 (11): e1196–1252. https://doi.org/10.1016/S2214-109X(18)30386-3.
Kruk, M. E., E. Larson, and N. A. Y.Twum-Danso. 2016. “Time for a Quality Revolution in Global Health.” The Lancet 4 (9): e594–6. https://doi.org/10.1016/S2214-109X(16)30131-0.
Lee, E., S. Madhavan, and S. Bauhoff. 2016. “Levels and Variations in the Quality of Facility-Based Antenatal Care in Kenya: Evidence from the 2010 Service Provision Assessment.” Health Policy and Planning 31 (6): 777–84. https://doi.org/10.1093/heapol/czv132.
Lynam, P. F., T. Smith, and J. Dwyer. 1994. “Client Flow Analysis: A Practical Management Technique for Outpatient Clinic Settings.” International Journal for Quality in Health Care 6 (2): 179–86. https://doi.org/10.1093/intqhc/6.2.179
Mariko, M. 2003. “Quality of Care and the Demand for Health Services in Bamako, Mali: The Specific Roles of Structural, Process, and Outcome Components.” Social Science & Medicine (1982) 56 (6): 1183–96. https://doi.org/10.1016/S0277-9536(02)00117-X.
Maxwell, R. J. 1984. “Quality Assessment in Health.” British Medical Journal (Clinical Research Ed.) 288 (6428): 1470–72. https://doi.org/10.1136/bmj.288.6428.1470
Mayo, E. 2003. Human Problems of an Industrial Civilization. New York, NY, USA: Routledge Taylor and Francis Group. https://www.routledge.com/The-Human-Problems-of-an-Industrial-Civilization/Mayo/p/book/ 9780203487273.
McCambridge, J., J.Witton, and D. R. Elbourne. 2014. “Systematic Review of the Hawthorne Effect: New Concepts Are Needed to Study Research Participation Effects.” Journal of Clinical Epidemiology 67 (3): 267–77. https://doi.org/10.1016/j.jclinepi.2013.08.015.
Ministry of Health. 2018. Health Facility Quality Improvement Module for Health Services Strengthening. Kathmandu: Napal: Ministry of Health.
Ministry of Health, New ERA, and ICF International. 2017. Nepal Demographic and Health Survey 2016. Kathmandu, Nepal: Ministry of Health, New ERA and ICF International. https://www.dhsprogram.com/pubs/pdf/fr336/fr336.pdf.
Ministry of Health, Nepal; New ERA, Nepal; Nepal Health Sector Support Program (NHSSP); and ICF. 2017. Nepal Health Facility Survey 2015. Kathmandu, Nepal: Ministry of Health, Nepal. https://dhsprogram.com/pubs/pdf/SPA24/SPA24.pdf

72
Ministry of Health and Population. 2006. National Safe Motherhood and Newborn Health - Long Term Plan (2006-2017). Kathmandu, Nepal: Ministry of Health and Population. http://mohp.gov.np/downloads/SM%20Long%20Term%20Plan.pdf.
Ministry of Health and Population, Nepal and the Government of Nepal. 2014. Results from Assessing Birthing Centers in Nepal. Kathmandu, Nepal: Ministry of Health and Population. https://www.researchgate.net/publication/328761443_Results_from_Assessing_Birthing_Centers_in_Nepal_Family_Health_Division_Department_of_Health_Services_Ministry_of_Health_and_Population_Government_of_Nepal_Kathmandu_Nepal.
Ministry of Health and Population Nepal, Health Research and Social Development Forum (HERD), and Nepal Health Sector Support Programme (NHSSP). 2014. Service Tracking Survey 2013. Kathmandu, Nepal: Ministry of Health and Population, HERD, and NHSSP. http://www.nhssp.org.np/NHSSP_Archives/monitoring/Service_Tracking_Survey_2013.pdf.
Ministry of Health and Population. 2015. Nepal Health Sector Strategy 2015-2020. Kathmandu, Nepal: Ministry of Health and Population. http://nhsp.org.np/wp-content/uploads/2016/08/NHSS-English-Book-final-4-21-2016.pdf
Murphy, E., and C. Steele. 2000. “Client-Provider Interactions in Family Planning Services: Guidance from Research and Program Experience.” MAQ Paper 1 (2): 1–12. https://www.k4health.org/sites/default/files/vol2.pdf.
National Planning Commission. 2016. Nepal and the Millennium Development Goals-Final Status Report 2000-2015. Singha Durbar, Kathmandu: National Planning Commission. http://www.npc.gov.np/images/category/MDG-Status-Report-2016_pdf.
Nepal, C., S. Ancker, and B. Baral. 2016. “Micro-Planning for Family Planning: Lessons from Doti District in Nepal.” Paper presented at The International Conference on Famly Planning, January 25–28, Indonesia. https://www.researchgate.net/publication/299619056_Micro-planning_for_Family_Planning_Lessons_ from_Doti_district_in_Nepal.
Nolan, T., R. Resar, C. Haradan, and F. A. Griffin. 2004. “Improving the Reliability of Health Care.” Boston, Massachusetts, USA: .Institute for Healthcare Improvement. http://www.ihi.org/resources/Pages/IHIWhitePapers/ImprovingtheReliabilityofHealthCare.aspx.
Ng, M., A. Misra, V. Diwan, M. Agnani, A. Levin-Rector, and A. De Costa. 2014. “An Assessment of the Impact of the JSY Cash Transfer Program on Maternal Mortality Reduction in Madhya Pradesh, India.” Global Health Action 7: 24939. https://doi.org/10.3402/gha.v7.24939
Okeke, E. N., and A. V. Chari. 2015. “Can Institutional Deliveries Reduce Newborn Mortality? Evidence from Rwanda.” Working Papers. Santa Monica, California, USA: The Rand Corporation. https://doi.org/10.7249/WR1072.
Perry, W. R. G., S. Bagheri Nejad, K. Tuomisto, N. Kara, N. Roos, T. R. Dilip, L. R. Hirschhorn, I. Larizgoitia, K. Semrau, M. Mathai, et al. 2017. “Implementing the WHO Safe Childbirth Checklist: Lessons from a Global Collaboration.” BMJ Global Health 2 (3): e000241. https://doi.org/10.1136/bmjgh-2016-000241.

73
Pizer, S. D., and J. C. Prentice. 2011. “What Are the Consequences of Waiting for Health Care in the Veteran Population?” Journal of General Internal Medicine 26 (S2): 676–82. https://doi.org/10.1007/s11606-011-1819-1.
Ross, J., and J. Stover. 2013. “Use of Modern Contraception Increases When More Methods Become Available: Analysis of Evidence from 1982-2009.” Global Health, Science and Practice 1 (2): 203–12. https://doi.org/10.9745/GHSP-D-13-00010.
Shah, R. 2016. “Bypassing Birthing Centres for Child Birth: A Community-Based Study in Rural Chitwan Nepal.” BMC Health Services Research 16 (1): 597. https://doi.org/10.1186/s12913-016-1848-x.
StataCorp. 2017. Stata Statistical Software: Release 15, College Station, TX, StataCorp LLC.
Tafese, F., M. Woldie, and B. Megerssa. 2013. “Quality of Family Planning Services in Primary Health Centers of Jimma Zone, Southwest Ethiopia.” Ethiopian Journal of Health Sciences 23 (3): 245–54. http://dx.doi.org/10.4314/ejhs.v23i3.7
Tessema, G. A., J. S. Gomersall, M. A. Mahmood, and C. O. Laurence. 2016. “Factors Determining Quality of Care in Family Planning Services in Africa: A Systematic Review of Mixed Evidence.” PLoS ONE 11 (11): 1–23. https://doi.org/10.1371/journal.pone.0165627.
Tessema, G. A., M. A. Mahmood, J. S. Gomersall, Y. Assefa, T. G. Zemedu, M. Kifle, and C. O. Laurence. 2017. “Client and Facility Level Determinants of Quality of Care in Family Planning Services in Ethiopia: Multilevel Modelling.” PLoS ONE 12 (6): 1–20. https://doi.org/10.1371/journal.pone.0179167.
Tumlinson, K., B. W. Pence, S. L. Curtis, S. W. Marshall, and I. S. Speizer. 2015. “Quality of Care and Contraceptive Use in Urban Kenya.” International Perspectives on Sexual and Reproductive Health 41 (2): 69-79. https://doi.org/10.1363/4106915.
United Nations. 2016. “Health - United Nations Sustainable Development.” 2016. http://www.un.org/sustainabledevelopment/health/.
Wang, W. J., M. Do, J. Hembling, and P. Ametepi. 2014. “Assessing the Quality of Care in Family Planning, Antenatal, and Sick Child Services at Health Facilities in Kenya, Namibia, and Senegal.” DHS Analytical Studies, no. 44: xiv-pp. https://dhsprogram.com/pubs/pdf/AS44/AS44.pdf.
Wang, W., R. Winter, L. Mallick, L. Florey, C. R. Burgert-Brucker, and E. Carter. 2015. The Relationship Between the Health Service Environment and Service Utilization: Linking Population Data to Health Facilities Data in Haiti and Malawi. DHS Analytical Studies No. 51. Rockville, Maryland, USA: ICF International. https://www.dhsprogram.com/pubs/pdf/AS51/AS51.pdf.
Wang, W., M. Winner, and C. R. Burgert-Brucker. 2017. “Limited Service Availability, Readiness, and Use of Facility-Based Delivery Care in Haiti: A Study Linking Health Facility Data and Population Data.” Global Health, Science and Practice 5 (2): 244–60. https://doi.org/10.9745/GHSP-D-16-00311.
Wasswa, P., C.K. Nalwadda, E. Buregyeya, S.N. Gitta, P. Anguzu, and F. Nuwaha. 2015. “Implementation of Infection Control in Health Facilities in Arua District, Uganda: A Cross-Sectional Study.” BMC Infectious Diseases 15 (1): 268. https://doi.org/10.1186/s12879-015-0999-4.

74
Wolff, A. M., S. A. Taylor, and J. F. McCabe. 2004. “Using Checklists and Reminders in Clinical Pathways to Improve Hospital Inpatient Care.” The Medical Journal of Australia 181 (8): 428–31. http://www.ncbi.nlm.nih.gov/pubmed/15487958.
World Health Organization. 2006. “Quality of Care: A Process for Making Strategic Choices in Health Systems.” Vol. 267. Geneva, Switzerland: WHO. https://doi.org/10.1542/peds.2010-1791.
World Health Organization. 2011. “Essential Interventions, Commodities and Guidelines for Reproductive, Maternal, Newborn and Child Health.” Geneva, Switzerland: The Partnership for Maternal Health, Newborn and Child Health and the Aga Khan University. https://www.who.int/pmnch/topics/part_publications/essential_interventions_18_01_2012.pdf.
World Health Organization. 2013. “Service Availability and Readiness Assessment (SARA): Reference Manual: An Annual Monitoring System for Service Delivery.” Geneva, Switzerland: WHO. https://www.who.int/healthinfo/systems/sara_reference_manual/en/.
World Health Organization. 2014. “Aide-memoire for Infection Prevention and Control in a Health Care Facility,” 2014. Geneva, Switzerland: WHO. https://www.who.int/csr/resources/publications/infection-prevention-and-control/en/.
World Health Organization. 2015. “Pregnancy, Childbirth, Postpartum and Newborn Care: A Guide for Essential Practice.” Geneva, Switzerland: WHO, United Nations Population Fund, UNICEF. https://www.who.int/maternal_child_adolescent/documents/imca-essential-practice-guide/en/.
World Health Organization and Nepal Development Research Institute. 2017. “Assessment of Community Based Integrated Management of Neonatal and Childhood Illness Program.” Lalitpur, Nepal: WHO. http://www.ndri.org.np/wp-content/uploads/2017/11/CB-IMNCI-Report_28-April.pdf.

75
APPENDIX A ANC QUALITY OF CARE DEFINITIONS BY DIMENSIONS

76
Appe
ndix
Tab
le A
1 D
efin
ition
s of
qua
lity
of c
are
dim
ensi
ons
with
cor
resp
ondi
ng in
dica
tors
spe
cific
for A
NC
ser
vice
Con
tinue
d…
Dim
ensi
on
Indi
cato
r In
dica
tor d
escr
iptio
n/
num
erat
or
Den
omin
ator
K
ey c
ompo
nent
s &
que
stio
n nu
mbe
r N
FHS
tool
R
efer
ence
Effe
ctiv
e: p
rovi
ding
ser
vice
s ba
sed
on s
cien
tific
kno
wle
dge
and
evid
ence
-bas
ed g
uide
lines
1.
ANC
key
ser
vice
s sc
ore
(out
of 1
2)
Tota
l num
ber o
f AN
C
serv
ices
(out
of 1
2)
avai
labl
e at
the
faci
lity
per
the
inve
ntor
y qu
estio
nnai
re.
Pres
ence
of e
ach
serv
ice=
1, a
bsen
ce=0
.
NA
Doe
s th
e fa
cilit
y pr
ovid
e th
ese
ANC
ser
vice
s ro
utin
ely:
1)
W
eigh
ing
clie
nt: Q
.142
0.01
2)
Ta
king
Blo
od p
ress
ure:
Q.1
420.
02
3)
Prot
ein
in u
rine
test
: Q.1
406.
02
4)
Hem
oglo
bin
test
: Q.1
406.
04
5)
Cou
nsel
ing
on F
P: Q
.140
7.03
6)
C
ouns
elin
g on
min
imum
4 A
NC
vis
its:
Q.1
407.
01
7)
Cou
nsel
ing
on b
irth
prep
ared
ness
: Q
.140
7.02
8)
H
IV te
stin
g an
d co
unse
ling:
Q.1
420.
07
9)
Syph
ilis ra
pid
diag
nost
ic te
st: Q
.140
6.05
10
) Pr
ovid
e iro
n/fo
lic a
cid
supp
lem
ents
: Q
.140
2.01
/02
11)
Prov
ide
TT v
acci
natio
n: Q
.140
2.04
12
) Pr
ovid
e Al
beda
zole
: Q.1
402.
05
FA
(Lee
, Mad
hava
n, &
Ba
uhof
f 201
6)
2a.
Mea
n ph
ysic
al e
xam
sc
ore
for f
irst v
isit
ANC
cl
ient
s
The
aver
age
num
ber o
f ph
ysic
al e
xam
s pe
rform
ed
on fi
rst t
ime
ANC
clie
nts
at
the
faci
lity.
Bas
ed o
n ob
serv
atio
n. E
xam
with
so
me
elem
ents
=1; m
issi
ng
any
elem
ent=
0
NA
Req
uire
d ph
ysic
al e
xam
s co
nduc
ted:
•
Wei
ght m
easu
red
(Q.1
07.0
2)
• BP
mea
sure
d (Q
.107
.01)
•
Brea
st e
xam
inat
ion
(Q.1
07.0
6)
• C
heck
ed fo
r ede
ma
(Q.1
07.0
4)
• C
heck
ed c
lient
’s a
bdom
en fo
r ute
rine/
fund
al
heig
ht u
sing
mea
surin
g ta
pe o
r ultr
asou
nd
(Q.1
07.0
7)
• Ex
amin
ed c
onju
nctiv
a/pa
lm fo
r ane
mia
(Q
.107
.03)
O
(Lee
et a
l. 20
16)
2b.
Mea
n ph
ysic
al e
xam
sc
ore
for f
ollo
w-u
p AN
C c
lient
s
Aver
age
num
ber o
f req
uire
d ph
ysic
al e
xam
s (o
ut o
f 6)
perfo
rmed
on
follo
w-u
p AN
C c
lient
s Su
m o
f ph
ysic
al e
xam
sco
res
for
obse
rved
follo
w-u
p AN
C
visi
ts.
Exam
with
som
e el
emen
ts=1
; mis
sing
any
el
emen
t=0
NA
Req
uire
d ph
ysic
al e
xam
s co
nduc
ted:
•
Wei
ght m
easu
ed (Q
.107
.02)
•
BP m
easu
red
(Q.1
07.0
1)
• Br
east
exa
min
atio
n (Q
.107
.06)
•
Che
cked
for e
dem
a (Q
.107
.04)
•
Che
cked
clie
nt’s
abd
omen
for u
terin
e/fu
ndal
he
ight
usi
ng m
easu
ring
tape
(Q.1
07.0
7)
• Ex
amin
ed c
onju
nctiv
a/pa
lm fo
r ane
mia
(Q
.107
.03)
O
(Lee
et a
l. 20
16)

77
Appe
ndix
Tab
le A
1—co
ntin
ued
Dim
ensi
on
Indi
cato
r In
dica
tor d
escr
iptio
n/
num
erat
or
Den
omin
ator
K
ey c
ompo
nent
s &
que
stio
n nu
mbe
r N
FHS
tool
R
efer
ence
3.
Scor
e fo
r pre
vent
ive
inte
rven
tion/
coun
selin
g fo
r firs
t-tim
e vi
sit A
NC
cl
ient
s (o
ut o
f 8)
Aver
age
num
ber o
f pr
even
tive
serv
ices
(out
of
8) re
ceiv
ed b
y AN
C c
lient
s at
the
faci
lity.
Bas
ed o
n ob
serv
atio
n. S
um o
f in
divi
dual
sco
res
of A
NC
cl
ient
s ob
serv
ed in
eac
h fa
cilit
y. P
rese
nce
of e
ach
elem
ents
=1, a
bsen
ce=0
NA
1)
Prov
ider
gav
e or
pre
scrib
ed ir
on o
r fol
ic a
cid
tabl
ets
(Q.1
11.0
1)
2)
Prov
ider
gav
e or
pre
scrib
ed a
lben
dazo
le
(Q.1
13.0
1)
3)
Prov
ider
gav
e or
pre
scrib
ed T
T in
ject
ion
(Q.1
12.0
1)
4)
Prov
ider
gav
e ad
vice
or c
ouns
elin
g on
m
aint
aini
ng a
hea
lthy
preg
nanc
y (Q
.110
) 5)
Pr
ovid
er a
sked
, per
form
ed, r
efer
red
or
look
ed a
t rep
ort r
egar
ding
hem
oglo
bin
test
: Q
.108
.01
6)
Prov
ider
ask
ed, p
erfo
rmed
, ref
erre
d or
lo
oked
at r
epor
t reg
ardi
ng b
lood
gro
upin
g:
Q.1
08.0
2 7)
Pr
ovid
er a
sked
, per
form
ed, r
efer
red
or
look
ed a
t rep
ort r
egar
ding
any
urin
e te
st:
Q.1
08.0
3 8)
Pr
ovid
er a
sked
, per
form
ed, r
efer
red
or
look
ed a
t rep
ort r
egar
ding
syp
hilis
test
: Q
.108
.04
O
NA
Effic
ient
: del
iver
ing
heal
th c
are
in a
man
ner w
hich
max
imiz
es
reso
urce
use
and
avo
ids
was
tage
1.
ANC
ser
vice
read
ines
s sc
ore
1a.
Dom
ain
1: P
erce
ntag
e of
faci
litie
s w
ith a
n AN
C
guid
elin
e av
aila
ble
Num
ber o
f fac
ilitie
s w
ith a
ny
type
of A
NC
rela
ted
guid
elin
e av
aila
ble
(i.e.
m
ater
nal r
epro
duct
ive
heal
th c
linic
al p
roto
col o
r an
y ot
her A
NC
gui
delin
es
like
Mat
erni
ty
guid
elin
e/N
atio
nal m
edic
al
stan
dard
vol
ume
III)
Tota
l num
ber o
f fa
cilit
ies
ANC
gui
delin
e re
porte
d an
d ob
serv
ed:
Q.1
409/
1410
or
Q.1
411/
1412
FA
(Lee
et a
l. 20
16; W
HO
20
15)
1b.
Dom
ain
2: S
taff
train
ing
scor
e in
the
past
24
mon
ths
Mos
t num
ber o
f AN
C
train
ings
rece
ived
in 2
4 m
onth
s by
any
sta
ff pe
rson
at
the
faci
lity
out o
f fiv
e AN
C to
pic
area
s.
NA
Staf
f tra
ined
in A
NC
(at l
east
one
inte
rvie
wed
sta
ff):
• AN
C s
cree
ning
(e.g
. blo
od p
ress
ure,
urin
e gl
ucos
e an
d pr
otei
n): Q
.502
(01)
•
coun
selin
g fo
r AN
C (e
.g. n
utrit
ion,
FP
and
new
born
car
e): Q
.502
(02)
•
com
plic
atio
ns o
f pre
gnan
cy a
nd th
eir
man
agem
ent:
Q.5
02 (0
3)
• nu
tritio
nal a
sses
smen
t of p
regn
ant w
oman
an
d: Q
.502
(04)
•
prev
entio
n of
mot
her t
o ch
ild tr
ansm
issi
on o
f H
IV: Q
.505
(01)
or Q
.505
(05)
HW
I (L
ee e
t al.
2016
; WH
O
2015
)
Con
tinue
d…

78
Appe
ndix
Tab
le A
1—co
ntin
ued
1c.
Dom
ain
3: A
NC
eq
uipm
ent s
core
(out
of
5)
Sum
of s
core
s as
sign
ed fo
r ea
ch o
f the
five
equ
ipm
ent
requ
ired
for A
NC
. The
five
eq
uipm
ent a
re B
P ap
para
tus,
exa
min
atio
n be
d/ta
ble,
adu
lt w
eigh
ing
scal
e, fe
tosc
ope,
and
m
easu
ring
tape
. Ea
ch e
quip
men
t (av
aila
ble
and
func
tioni
ng)=
1,
abse
nce=
0.
NA
Equi
pmen
t ava
ilabl
e (o
bser
ved
or re
porte
d) a
nd
func
tioni
ng:
• BP
app
arat
us: Q
.142
1.01
or Q
.142
1.02
&03
• Ex
amin
atio
n be
d/ta
ble:
Q.1
421.
07
• Ad
ult w
eigh
ing
scal
e: Q
.142
1.06
•
Feto
scop
e: Q
.142
1.05
•
Mea
surin
g ta
pe: Q
.142
1.08
FA
(Lee
et a
l. 20
16; W
HO
20
15)
1d.
Dom
ain
4: A
NC
la
bora
tory
dia
gnos
tics
scor
e (o
ut o
f 2)
Sum
of s
core
s ba
sed
on th
e av
aila
bilit
y of
two
labo
rato
ry
diag
nost
ics
test
s fo
r AN
C
clie
nts:
hem
oglo
bin
test
and
ur
ine
dips
tick
prot
ein
test
Pr
esen
ce o
f eac
h la
b di
agno
stic
test
=1,
abse
nce=
0.
NA
Labo
rato
ry D
iagn
ostic
s te
st k
its a
vaila
ble
and
obse
rved
: •
Hem
oglo
bin
test
: Q.1
406.
04
• U
rine
dips
tick
prot
ein
test
: Q.1
406.
02
FA
(Lee
et a
l. 20
16; W
HO
20
15)
1e.
Dom
ain
5: A
NC
es
sent
ial o
ral
med
icin
es a
nd v
acci
ne
scor
e (o
ut o
f 3)
Sum
of i
ndiv
idua
l sco
res
assi
gned
for e
ach
type
of
med
icin
e/va
ccin
e ba
sed
on
avai
labi
lity
and
obse
rvat
ion.
Pr
esen
ce o
f at l
east
1 v
alid
do
se o
f m
edic
ine/
vacc
ine=
1,
abse
nce=
0
NA
Med
icin
e an
d va
ccin
atio
n av
aila
ble
and
obse
rved
(a
t lea
st 1
val
id d
ose)
•
Iron/
folic
aci
d: Q
.142
2.01
&02
or 0
3 O
R (Q
.210
&
Q.9
06.0
2 &
Q.9
06.0
3) O
R Q
.906
.04
• TT
Vac
cine
: Q.1
422.
05 O
R Q
.906
.08
• Al
bend
azol
e: Q
.142
2.07
OR
(Q.2
10 &
Q
.902
.01)
Tim
ely:
redu
cing
del
ays
in
prov
idin
g/re
ceiv
ing
heal
th c
are
1.
Mea
n pe
rcen
t of c
lient
s at
eac
h fa
cilit
y w
ho
repo
rted
wai
ting
time
for c
onsu
ltatio
n ≤
30
min
utes
Sum
of n
umbe
r of A
NC
cl
ient
s w
ho re
porte
d w
aitin
g ≤3
0 m
inut
es b
etw
een
arriv
al
time
and
cons
ulta
tion
at
each
faci
lity.
1=
wai
t tim
e ≤3
0 m
in;
0=w
ait t
ime
>30
min
Tota
l num
ber o
f AN
C
clie
nts
inte
rvie
wed
at
each
faci
lity
Q.2
01
E (T
esse
ma
et a
l. 20
17)
2.
Mea
n pe
rcen
t of c
lient
s at
eac
h fa
cilit
y w
ho
repo
rted
wai
ting
time
was
NO
T a
prob
lem
C
alcu
late
the
mea
n pe
rcen
t fo
r eac
h ba
ckgr
ound
ch
arac
teris
tic
Num
ber o
f AN
C c
lient
s w
ho
DID
NO
T re
port
wai
ting
time
to s
ee p
rovi
der a
s m
ajor
pro
blem
at e
ach
faci
lity
1=D
id n
ot re
port
as m
ajor
pr
oble
m
0=R
epor
ted
as m
ajor
pr
oble
m
Tota
l num
ber o
f AN
C
clie
nts
inte
rvie
wed
at
each
faci
lity
Q.2
02.0
1 E
(Tum
linso
n, P
ence
, C
urtis
, Mar
shal
l, &
Spei
zer 2
015)
Con
tinue
d…
Dim
ensi
on
Indi
cato
r In
dica
tor d
escr
iptio
n/
num
erat
or
Den
omin
ator
K
ey c
ompo
nent
s &
que
stio
n nu
mbe
r N
FHS
tool
R
efer
ence

79
Appe
ndix
Tab
le A
1—co
ntin
ued
Clie
nt-c
ente
red:
pro
vidi
ng
care
whi
ch ta
kes
into
acc
ount
th
e pr
efer
ence
s an
d as
pira
tions
of
indi
vidu
al s
ervi
ce u
sers
and
th
e cu
lture
s of
thei
r co
mm
uniti
es
1.
Perc
ent o
f fac
ilitie
s w
here
vis
ual a
ids
for
clie
nt e
duca
tion
rela
ted
to p
regn
ancy
/AN
C
wer
e av
aila
ble
Visu
al a
id a
vaila
ble
in th
e AN
C s
ervi
ce a
rea=
1,
othe
rwis
e=0
Num
ber o
f AN
C
faci
litie
s Q
.141
5 &
1416
FA
(A
gha
& D
o 20
09; L
ee
et a
l. 20
16)
2.
Mea
n pe
rcen
t sco
re o
f AN
C c
lient
s at
eac
h fa
cilit
y w
ho re
port
over
all s
atis
fact
ion
with
se
rvic
es re
ceiv
ed
Ove
rall
satis
fact
ion
repo
rted
by A
NC
clie
nts
for a
faci
lity.
If
very
or f
airly
sat
isfie
d=1,
ot
herw
ise=
0 C
alcu
late
the
mea
n pe
rcen
t fo
r eac
h ba
ckgr
ound
ch
arac
teris
tic
Num
ber o
f AN
C
inte
rvie
ws
at a
faci
lity
Q.2
08
E (A
ssaf
, Wan
g, &
M
allic
k 20
17)
3.
Mea
n pe
rcen
t of A
NC
cl
ient
s at
eac
h fa
cilit
y w
ho re
porte
d sa
tisfa
ctio
n w
ith a
ll el
even
com
pone
nts
Num
ber o
f clie
nts
who
re
porte
d th
at th
ey D
ID N
OT
have
a m
ajor
pro
blem
for
ALL
11 s
ervi
ce it
em=1
, R
epor
ted
at le
ast o
ne a
s as
m
ajor
pro
blem
=0
Cal
cula
te th
e m
ean
perc
ent
for e
ach
back
grou
nd
char
acte
ristic
Tota
l num
ber o
f clie
nts
inte
rvie
wed
for e
ach
faci
lity
Com
mon
pro
blem
s cl
ient
s’ re
porte
d at
hea
lth
faci
litie
s (1
1 ite
ms)
: 1)
Ti
me
wai
ted
to s
ee a
pro
vide
r (Q
.202
.01)
2)
Ab
ility
to d
iscu
ss p
robl
ems
or c
once
rns
abou
t you
r pre
gnan
cy (Q
.202
.02)
3)
Am
ount
of e
xpla
natio
n re
ceiv
ed a
bout
the
prob
lem
or t
reat
men
t (Q
.202
.03)
4)
Vi
sual
priv
acy
durin
g ex
amin
atio
n (Q
.202
.04)
5)
Au
dito
ry p
rivac
y du
ring
exam
inat
ion
(Q.2
02.0
5)
6)
Avai
labi
lity
of m
edic
ines
at t
he fa
cilit
y (Q
.202
.06)
7)
Th
e ho
urs
of s
ervi
ce a
t thi
s fa
cilit
y i.e
. whe
n th
ey o
pen
and
clos
e (Q
.202
.07)
8)
Th
e nu
mbe
r of d
ays
serv
ices
are
ava
ilabl
e to
you
(Q.2
02.0
8)
9)
The
clea
nlin
ess
of th
e fa
cilit
y (Q
.202
.09)
10
) Tr
eatm
ent o
f sta
ff to
war
ds c
lient
(Q.2
02.1
0)
11)
Cos
ts o
f ser
vice
s or
trea
tmen
t (Q
.202
.11)
E (A
gha
& D
o 20
09;
Bess
inge
r & B
ertra
nd
2001
; Wan
g, D
o,
Hem
blin
g, &
Am
etep
i 20
14)
4.
Perc
ent o
f AN
C
faci
litie
s w
here
priv
ate
room
ava
ilabl
e du
ring
ANC
con
sulta
tion
Indi
vidu
al p
rivat
e ro
om fo
r AN
C fa
cilit
y=1,
oth
erw
ise=
0 N
/A
Q.1
452
FA
(Agh
a &
Do
2009
; Lee
et
al.
2016
) Con
tinue
d…
Dim
ensi
on
Indi
cato
r In
dica
tor d
escr
iptio
n/
num
erat
or
Den
omin
ator
K
ey c
ompo
nent
s &
que
stio
n nu
mbe
r N
FHS
tool
R
efer
ence

80
Appe
ndix
Tab
le A
1—co
ntin
ued
Safe
ty: d
eliv
erin
g he
alth
car
e w
hich
min
imiz
es ri
sks
and
harm
to
ser
vice
use
rs, i
nclu
ding
av
oidi
ng p
reve
ntab
le in
jurie
s an
d re
duci
ng m
edic
al e
rrors
1.
Infe
ctio
n pr
even
tion
inde
x sc
ore
(0-4
) Su
m o
f com
posi
te s
core
s fro
m tr
acer
item
s ac
ross
pr
even
tion
dom
ains
. Po
ssib
le d
omai
n sc
ores
: 1=
all i
tem
s pr
esen
t; 0=
item
s m
issi
ng. T
otal
pos
sibl
e=4
poin
ts
NA
Dom
ain
1: W
aste
man
agem
ent
• W
aste
bin
: Q.1
451.
04
• Sh
arps
box
: Q.1
451.
06
Dom
ain
2: C
lean
ing
and
disi
nfec
tion;
•
Gen
eral
dis
infe
ctan
t: Q
.145
1.08
D
omai
n 3:
Ase
ptic
tech
niqu
e •
Syrin
ges/
need
les:
Q.1
451.
09
• St
erile
dis
posa
ble
glov
es: Q
.145
1.07
D
omai
n 4:
Han
d hy
gien
e •
Run
ning
wat
er: Q
.145
1.01
; •
Soap
/han
d di
sinf
ecta
nt: Q
.145
1.02
or 0
3
FA
(Wor
ld H
ealth
O
rgan
izat
ion
2014
)
2.
Perc
ent o
f fac
ility
with
In
ject
ion
safe
ty
prec
autio
n gu
idel
ine
for
stan
dard
pre
caut
ions
av
aila
ble
Faci
lity
with
gui
delin
e=1
(obs
erve
d or
repo
rted/
not
seen
); 0=
no
Tota
l num
ber o
f AN
C
faci
litie
s Q
.145
1.13
FA
N
A
Rel
iabl
e: a
ble
to p
erfo
rm th
e pr
omis
ed s
ervi
ce d
epen
dabl
y an
d ac
cura
tely
1.
Perc
ent o
f AN
C
cons
ulta
tions
at e
ach
faci
lity
cond
ucte
d by
qu
alifi
ed p
rovi
der
Sum
of p
rovi
der s
core
s fo
r ob
serv
ed A
NC
vis
its. E
xam
w
ith q
ualif
ied
prov
ider
=1;
othe
rwis
e=0
Tota
l cou
nt o
f AN
C
visi
ts o
bser
ved
at e
ach
faci
lity
Qua
lifie
d AN
C p
rovi
der:
gene
ral m
edic
al d
octo
r (0
1), O
B/G
YN (0
2), m
edic
al o
ffice
r (08
), nu
rse/
ANM
(1
0) ,
HA
(12)
O
(Lee
et a
l. 20
16;
Min
istry
of H
ealth
and
Po
pula
tion
Nep
al
2006
; WH
O 2
011)
2.
M
ean
perc
ent o
f AN
C
clie
nts
at e
ach
faci
lity
who
repo
rted
they
w
ould
reco
mm
end
faci
lity
to a
frie
nd o
r fa
mily
mem
ber
Num
ber o
f wom
en w
ho
repo
rted
Yes=
1, o
ther
wis
e=0
Cal
cula
te th
e m
ean
perc
ent
for f
acilit
ies
by b
ackg
roun
d ch
arac
teris
tics
Num
ber i
f wom
en
inte
rvie
wed
at e
ach
faci
lity
Q.2
09
E (T
umlin
son
et a
l. 20
15)
Appr
opria
te (i
n te
rms
of
acce
ssib
ility)
geo
grap
hica
lly
reas
onab
le, a
nd p
rovi
ded
in a
se
tting
whe
re s
kills
and
re
sour
ces
are
appr
opria
te to
m
edic
al n
eed
1.
Num
ber o
f day
s pe
r m
onth
AN
C s
ervi
ces
are
prov
ided
in a
28
day
mon
th
Sum
of d
ays
per m
onth
AN
C s
ervi
ces
prov
ided
at
the
faci
lity
NA
Use
s a
4-w
eek
(28
day)
mon
th: Q
.140
1 FA
(A
gha
& D
o 20
09)
2.
Mea
n pe
rcen
t of A
NC
cl
ient
s at
eac
h fa
cilit
y w
ho re
porte
d th
e AN
C
faci
lity
bein
g cl
oses
t fa
cilit
y to
thei
r hom
e
Sum
of w
omen
who
re
porte
d If
heal
th fa
cilit
y is
clo
sest
to
hom
e=1,
oth
erw
ise=
0 C
alcu
late
the
mea
n pe
rcen
t fo
r fac
ilitie
s by
bac
kgro
und
char
acte
ristic
s
Tota
l num
ber o
f w
omen
inte
rvie
wed
fro
m th
at fa
cilit
y
Clo
sest
hea
lth fa
cilit
y to
AN
C c
lient
’s h
ome:
Q.2
06
E (T
esse
ma
et a
l. 20
17)
Con
tinue
d…
Dim
ensi
on
Indi
cato
r In
dica
tor d
escr
iptio
n/
num
erat
or
Den
omin
ator
K
ey c
ompo
nent
s &
que
stio
n nu
mbe
r N
FHS
tool
R
efer
ence

81
Appe
ndix
Tab
le A
1—co
ntin
ued
3.
Mea
n pe
rcen
t of A
NC
cl
ient
s at
eac
h fa
cilit
y w
ho d
id n
ot c
onsi
der
the
hour
s or
day
s of
se
rvic
e at
faci
lity
as a
pr
oble
m
Sum
of n
umbe
r of w
omen
w
ho re
porte
d th
is a
s m
ajor
pr
oble
m=0
, oth
erw
ise=
1 C
alcu
late
the
mea
n pe
rcen
t fo
r fac
ilitie
s by
bac
kgro
und
char
acte
ristic
s
Tota
l num
ber o
f w
omen
inte
rvie
wed
fro
m th
at fa
cilit
y
The
hour
s/da
ys o
f ser
vice
at t
his
faci
lity
i.e. w
hen
they
ope
n an
d cl
ose
NO
T co
nsid
ered
a m
ajor
pr
oble
m: Q
.202
.07
& Q
.202
.08
E N
A
Equi
ty (a
t the
clie
nt le
vel)
1.
Diff
eren
ces
in %
of
ANC
clie
nt’s
sa
tisfa
ctio
n w
ith a
ll el
even
com
pone
nts
by
clie
nt c
hara
cter
istic
s (c
ateg
ory)
NA
NA
Look
ing
for a
ny s
igni
fican
t diff
eren
ces
in th
ese
indi
cato
rs b
y et
hnic
ity, e
duca
tion
and
age
E &
O
(Lee
et a
l. 20
16)
2.
Diff
eren
ce in
di
strib
utio
n of
phy
sica
l ex
amin
atio
n sc
ore
by
clie
nt c
hara
cter
istic
s (c
ateg
ory)
NA
NA
Look
ing
for a
ny s
igni
fican
t diff
eren
ces
in th
ese
indi
cato
rs b
y et
hnic
ity, e
duca
tion
and
age
E &
O
(Lee
et a
l. 20
16)
FA: F
acilit
y au
dit;
O: A
NC
obs
erva
tion;
E: A
NC
clie
nt e
xit i
nter
view
; HW
I: H
ealth
care
wor
ker i
nter
view
; NA
or N
/A: N
ot a
pplic
able
Dim
ensi
on
Indi
cato
r In
dica
tor d
escr
iptio
n/
num
erat
or
Den
omin
ator
K
ey c
ompo
nent
s &
que
stio
n nu
mbe
r N
FHS
tool
R
efer
ence


83
APPENDIX B SICK CHILD CARE SERVICE QUALITY OF CARE DEFINITIONS BY DIMENSION

84
Appe
ndix
Tab
le B
1 D
efin
ition
s of
qua
lity
of c
are
dim
ensi
ons
with
cor
resp
ondi
ng in
dica
tors
spe
cific
for o
utpa
tient
cur
ativ
e ch
ild c
are
serv
ice
Dim
ensi
on
Indi
cato
r N
umer
ator
D
enom
inat
or
Key
com
pone
nts
& Q
uest
ion
num
ber
NFH
S to
ol
Ref
eren
ce
Effe
ctiv
e: p
rovi
ding
ser
vice
s ba
sed
on s
cien
tific
kno
wle
dge
and
evid
ence
-bas
ed g
uide
lines
1.
Chi
ld h
ealth
ser
vice
s pr
ovid
ed s
core
(out
of
5)
Sum
of t
he s
core
s fo
r eac
h ke
y ch
ild s
ervi
ces
for a
fa
cilit
y.
Pres
ence
of e
ach
serv
ice=
1,
abse
nce=
0.
NA
1)
Doe
s th
e fa
cilit
y pr
ovid
e th
ese
basi
c ch
ild
heal
th s
ervi
ces:
2)
O
utpa
tient
cur
ativ
e ca
re fo
r sic
k ch
ildre
n: Q
. 10
2.03
=1 &
1201
a=1-
31
3)
Gro
wth
mon
itorin
g: Q
.102
.02=
1 &
1101
a=1-
31
4)
Chi
ld v
acci
natio
n (4
vac
cine
s: B
CG
, Pol
io,
Pent
aval
ent a
nd M
R):
Q. 1
02.0
1=1
& 10
01a(
01-0
4)=1
-31
5)
Chi
ld v
acci
natio
n (a
dditi
onal
2 v
acci
nes:
PC
V an
d JE
): Q
. 102
.01=
1 &
1101
a(05
&
06)=
1-31
6)
R
outin
e vi
tam
in A
sup
plem
enta
tion:
Q
1202
.02=
1
FA
(Min
istry
of H
ealth
N
epal
, New
ER
A,
Prog
ram
, & IC
F 20
16)
2.
Mea
n da
nger
sig
n as
sess
men
t sco
re (
out
of 3
)
Sum
of d
ange
r sig
ns
asse
ssed
or i
nqui
red
abou
t by
the
prov
ider
for o
bser
ved
sick
chi
ld c
lient
s at
eac
h cl
inic
. Ba
sed
on o
bser
vatio
n.
(dan
ger s
igns
: ina
bilit
y to
eat
or
drin
k, v
omiti
ng a
nd
conv
ulsi
ons)
Pr
esen
ce o
f eac
h as
sess
men
t/inq
uiry
=1,
abse
nce=
0.
Tota
l cou
nt o
f sic
k ch
ild o
bser
ved
at e
ach
faci
lity
Q. 1
06.0
1-03
O
(M
inis
try o
f Hea
lth
Nep
al e
t al.
2016
)
3.
Mea
n m
ain
sym
ptom
as
sess
men
t sco
re (o
ut
of 3
)
Sum
of n
umbe
r of
sym
ptom
s/si
gns
asse
ssed
: co
ugh
or d
iffic
ulty
bre
athi
ng,
diar
rhea
and
feve
r for
sic
k ch
ild c
lient
s ob
serv
ed a
t ea
ch c
linic
Pr
esen
ce o
f eac
h as
sess
men
t/inq
uiry
Tota
l cou
nt o
f sic
k ch
ild o
bser
ved
at e
ach
faci
lity
Q.1
05.0
1-03
O
(M
inis
try o
f Hea
lth
Nep
al e
t al.
2016
)
Con
tinue
d…

85
Appe
ndix
Tab
le B
1—co
ntin
ued
Dim
ensi
on
Indi
cato
r N
umer
ator
D
enom
inat
or
Key
com
pone
nts
& Q
uest
ion
num
ber
NFH
S to
ol
Ref
eren
ce
4.
Mea
n in
dex
of
inte
grat
ed a
sses
smen
t sc
ore–
asse
sses
the
qual
ity a
nd
com
plet
enes
s of
the
asse
ssm
ent r
ecei
ved
by th
e si
ck c
hild
(ran
ge
0-10
0)
Num
ber o
f ess
entia
l as
sess
men
t tas
ks w
ere
perfo
rmed
by
the
heal
th
wor
ker
Tota
l num
ber o
f as
sess
men
t=13
(if
child
>=2
4 m
onth
s)
And
if ch
ild <
24
mon
ths
then
add
ition
al
3 as
sess
men
ts
requ
ired
(den
omin
ator
=16)
1)
Che
cked
for a
bilit
y to
drin
k or
bre
astfe
ed:
Q.1
06.0
1 2)
C
heck
ed w
heth
er th
e ch
ild v
omits
ev
eryt
hing
: Q.1
06.0
2 3)
C
heck
ed w
heth
er th
e ch
ild h
as h
ad
conv
ulsi
on: Q
.106
.03
4)
Che
cked
for c
ough
or d
iffic
ulty
bre
athi
ng:
Q.1
05.0
2 or
Q.1
08.0
3 5)
C
heck
ed fo
r dia
rrhea
: Q.1
05.0
3 6)
C
heck
ed fo
r fev
er: Q
.105
.01
or Q
.108
.01
7)
Chi
ld w
eigh
ed th
e sa
me
day:
108
.14
8)
Chi
ld’s
wei
ght c
heck
ed a
gain
st a
re
com
men
ded
grow
th c
hart:
Q.1
08.1
5 9)
C
heck
ed fo
r pal
mar
pal
lor:
Q.1
08.0
6 10
) C
heck
ed fo
r vis
ible
sev
ere
was
ting:
Q
.108
.12
11)
Che
cked
for e
dem
a on
bot
h fe
et; Q
.108
.13
12)
Chi
ld’s
vac
cina
tion
stat
us c
heck
ed: Q
109.
11
or 1
09.0
8 13
) C
heck
for o
ther
pro
blem
s: Q
.108
.08
or
108.
07 o
r 108
.16
or 1
08.1
0 Fo
r chi
ldre
n un
der 2
yea
rs o
f age
: 14
) As
ked
abou
t bre
astfe
edin
g: Q
109.
03
15)
Aske
d if
the
child
take
s an
y ot
her f
ood
or
fluid
s: Q
109.
02
16)
Aske
d w
heth
er fe
edin
g ha
s ch
ange
d du
ring
the
illnes
s: Q
109.
04
O
(Gou
ws
et a
l. 20
05)
5.
Mea
n pe
rcen
t of s
ick
child
ren
at e
ach
faci
lity
diag
nose
d w
ith
pneu
mon
ia th
at
rece
ived
a c
ompl
ete
asse
ssm
ent (
%)
Num
ber o
f chi
ldre
n di
agno
sed
with
pne
umon
ia
who
rece
ived
all
thre
e as
sess
men
ts
Rec
eive
d al
l thr
ee
asse
ssm
ents
=1 fe
wer
than
th
ree
asse
ssm
ents
re
ceiv
ed=0
C
alcu
late
the
mea
n pe
rcen
t fo
r eac
h ba
ckgr
ound
ch
arac
teris
tic
Num
ber o
f chi
ldre
n ob
serv
ed w
ho w
ere
diag
nose
d w
ith
pneu
mon
ia a
t a fa
cilit
y
If Q
.202
=A th
en th
e as
sess
men
t sho
uld
have
in
clud
ed:
• C
ount
ing
the
brea
ths
in o
ne m
inut
e: Q
.108
=C
• Lo
oked
for c
hest
in d
raw
ing:
Q.1
05=B
•
Look
ed a
nd li
sten
for s
trido
r: Q
.108
=D
• Lo
oked
and
list
en fo
r whe
ezin
g: Q
.108
=D
O
(WH
O IM
CI 2
014)
Con
tinue
d…

86
Appe
ndix
Tab
le B
1—co
ntin
ued
Dim
ensi
on
Indi
cato
r N
umer
ator
D
enom
inat
or
Key
com
pone
nts
& Q
uest
ion
num
ber
NFH
S to
ol
Ref
eren
ce
6.
Mea
n pe
rcen
t of s
ick
child
ren
at e
ach
faci
lity
diag
nose
d w
ith e
ar
infe
ctio
n th
at re
ceiv
ed
a co
mpl
ete
asse
ssm
ent (
%)
Num
ber o
f sic
k ch
ildre
n at
ea
ch fa
cilit
y di
agno
sed
with
ea
r inf
ectio
n th
at re
ceiv
ed a
ll th
ree
asse
ssm
ents
D
id a
ll th
ree
asse
ssm
ents
=1
& if
mis
sed
one
then
=0
Cal
cula
te th
e m
ean
perc
ent
for e
ach
back
grou
nd
char
acte
ristic
Num
ber o
f chi
ldre
n ob
serv
ed w
ho w
ere
diag
nose
d w
ith e
ar
infe
ctio
n at
a fa
cilit
y
If Q
.206
=A-X
then
the
asse
ssm
ent s
houl
d ha
ve
incl
uded
: •
Look
ed a
t ear
: Q.1
08=J
•
Aske
d ab
out e
ar p
robl
em: Q
.105
=D
• Fe
el fo
r ten
der s
wel
ling
behi
nd th
e ea
r: Q
.108
=K
O
(WH
O IM
CI 2
014)
7.
Mea
n pe
rcen
t of s
ick
child
ren
at e
ach
faci
lity
diag
nose
d w
ith fe
ver o
f un
know
n or
igin
that
re
ceiv
ed a
com
plet
e as
sess
men
t (%
)
Num
ber o
f sic
k ch
ildre
n at
ea
ch fa
cilit
y di
agno
sed
with
fe
ver o
f unk
now
n or
igin
that
re
ceiv
ed a
ll th
ree
asse
ssm
ents
D
id a
ll th
ree
asse
ssm
ents
=1
& if
mis
sed
one
then
=0
Cal
cula
te th
e m
ean
perc
ent
for e
ach
back
grou
nd
char
acte
ristic
Num
ber o
f chi
ldre
n ob
serv
ed w
ho w
ere
diag
nose
d w
ith fe
ver a
t a
faci
lity
If Q
.205
=1 th
en th
e as
sess
men
t sho
uld
have
in
clud
ed:
• As
ked
abou
t or w
as to
ld a
bout
mai
n sy
mpt
om
of fe
ver:
Q.1
05=A
•
Feel
s ho
t or T
empe
ratu
re ta
ken:
Q. 1
08=A
or
B •
Che
cked
for n
eck
stiff
ness
: Q. 1
08=I
O
(WH
O IM
CI 2
014)
Effic
ient
: del
iver
ing
heal
th c
are
in a
man
ner w
hich
max
imiz
es
reso
urce
use
and
avo
ids
was
tage
1.
Serv
ice
read
ines
s to
pr
ovid
e ou
tpat
ient
cu
rativ
e ca
re
1a.
Dom
ain
1: P
erce
ntag
e of
faci
litie
s w
ith a
n IM
CI/I
MN
CI g
uide
line
Num
ber o
f fac
ilitie
s w
ith
IMC
I/IM
NC
I gui
delin
e To
tal n
umbe
r of
faci
litie
s IM
CI/I
MN
CI g
uide
line
obse
rved
: Q.1
205=
1 or
Q
1211
.01=
1 FA
(A
gha
& D
o 20
09;
WH
O 2
015)
1b.
Staf
f tra
inin
g sc
ore
in
the
past
24
mon
ths
on
two
child
car
e tra
inin
g to
pics
(max
num
ber o
f tra
inin
g ou
t of 2
)
Mos
t num
ber o
f tra
inin
gs
rela
ted
to c
hild
car
e se
rvic
es
rece
ived
in 2
4 m
onth
s by
an
y st
aff p
erso
n at
the
faci
lity
out o
f fiv
e AN
C to
pic
area
s.
NA
Staf
f tra
ined
in IM
CI/I
MN
CI o
r inf
ant a
nd y
oung
chi
ld
feed
ing
(IYC
F) in
the
past
24
mon
ths
(at l
east
one
in
terv
iew
ed s
taff)
: Q30
4.02
=1 o
r Q30
4.14
=1
HW
I (W
HO
201
5)
1c.
Dom
ain
3: O
utpa
tient
cu
rativ
e ch
ild c
are
equi
pmen
t sco
re fo
r ea
ch fa
cilit
y (o
ut o
f 6)
Sum
of s
core
s as
sign
ed fo
r ea
ch o
f the
six
equ
ipm
ent
requ
ired
for s
ick
child
car
e se
rvic
es. T
he s
ix e
quip
men
t ar
e ch
ild s
cale
, inf
ant s
cale
, le
ngth
or h
eigh
t mea
surin
g eq
uipm
ent,
ther
mom
eter
, st
etho
scop
e, a
nd g
row
th
char
t/chi
ld h
ealth
car
d Ea
ch e
quip
men
t (av
aila
ble
and
func
tioni
ng)=
1,
abse
nce=
0.
NA
Equi
pmen
t •
Chi
ld s
cale
: Q12
10.0
1(A&
B)=1
or Q
.110
4.01
(A
&B)=
1 or
Q.7
00.0
2 (A
&B)=
1 •
Infa
nt s
cale
: Q12
10.0
2(A&
B)=1
or Q
.110
4.02
(A
&B)=
1 or
Q.7
00.0
3 (A
&B)=
1 •
Leng
th o
r hei
ght m
easu
ring
equi
pmen
t: Q
.110
4.03
(A&B
)=1
or Q
.700
.04
(A&B
)=1
• Th
erm
omet
er: Q
.121
0.03
(A&B
)=1
or
Q.7
00.0
6 (A
&B)=
1 •
Stet
hosc
ope:
Q.1
210.
04 (A
&B)=
1 or
Q.7
00.0
7 (A
&B)=
1 •
Gro
wth
cha
rt/C
hild
hea
lth c
ard:
Q11
04.0
5A=1
FA
(WH
O 2
015)
Con
tinue
d…

87
Appe
ndix
Tab
le B
1—co
ntin
ued
Dim
ensi
on
Indi
cato
r N
umer
ator
D
enom
inat
or
Key
com
pone
nts
& Q
uest
ion
num
ber
NFH
S to
ol
Ref
eren
ce
1d.
Dom
ain
4: O
utpa
tient
cu
rativ
e ch
ild c
are
labo
rato
ry d
iagn
ostic
s ca
paci
ty s
core
for e
ach
faci
lity
(out
of 3
)
Sum
of s
core
s ba
sed
on th
e av
aila
bilit
y of
thre
e la
bora
tory
dia
gnos
tics
test
s fo
r sic
k ch
ild c
lient
s:
hem
oglo
bin
test
, mal
aria
te
st a
nd s
tool
mic
rosc
opy
Pres
ence
of e
ach
lab
diag
nost
ic te
st=1
, ab
senc
e=0.
NA
Labo
rato
ry D
iagn
ostic
s te
st k
its a
vaila
ble
and
obse
rved
: •
Hae
mog
lobi
n te
st: h
emog
lob
• M
alar
ia te
st: f
acm
alts
t •
Stoo
l mic
rosc
opy:
sto
olm
icro
1e.
Dom
ain
5: O
utpa
tient
cu
rativ
e ch
ild c
are
esse
ntia
l ora
l med
icin
e sc
ore
for e
ach
faci
lity
(out
of 7
)
Sum
of i
ndiv
idua
l sco
res
assi
gned
for e
ach
type
of
med
icin
e ba
sed
on
avai
labi
lity
and
obse
rvat
ion.
Pr
esen
ce o
f at l
east
1 v
alid
do
se o
f med
icin
e=1,
ab
senc
e=0
NA
Esse
ntia
l ora
l med
icin
es
• O
RS:
Q.1
210.
09A=
1 or
Q.9
06.0
9=1
• Zi
nc: Q
.906
.11=
1 •
Amox
icilli
n: Q
.901
.02=
1 •
Co-
trim
azol
e: Q
.901
.12=
1 •
Para
ceta
mol
: Q90
8.03
=1
• Vi
tam
in A
: Q90
6.10
=1
• Al
bend
azol
e: Q
902.
01=1
1f.
Dom
ain
6: O
utpa
tient
cu
rativ
e ch
ild c
are
prio
rity
med
icin
e sc
ore
for e
ach
faci
lity
(out
of
3)
Sum
of i
ndiv
idua
l sco
res
assi
gned
for e
ach
type
of
med
icin
e ba
sed
on
avai
labi
lity
and
obse
rvat
ion.
Pr
esen
ce o
f at l
east
1 v
alid
do
se o
f med
icin
e=1,
ab
senc
e=0
NA
Avai
labi
lity
of p
riorit
y m
edic
ine
belo
w:
• Am
pici
llin: Q
. 901
.04=
1 •
Cef
triax
one:
Q. 9
01.0
9=1
• G
enta
myc
in :
Q.9
01.1
6=1
Effic
ient
: del
iver
ing
heal
th c
are
in a
man
ner w
hich
max
imiz
es
reso
urce
use
and
avo
ids
was
tage
1.
Vacc
inat
ion
serv
ice
read
ines
s sc
ore
1a.
Dom
ain
1: P
erce
nt o
f fa
cilit
ies
with
va
ccin
atio
n gu
idel
ine
avai
labl
e
Num
ber o
f fac
ilitie
s w
ith
vacc
inat
ion
guid
elin
e To
tal n
umbe
r of
faci
litie
s D
omai
n 1:
Vac
cina
tion
guid
elin
e av
aila
ble
scor
e (%
): Q
.100
3=1
or Q
1005
=1
FA
(Agh
a &
Do
2009
; Lee
et
al.
2016
; WH
O
2015
)
1b.
Dom
ain
2: P
erce
nt o
f fa
cilit
ies
with
at l
east
on
e tra
ined
sta
ff re
porte
d to
hav
e re
ceiv
ed E
PI in
-ser
vice
tra
inin
g du
ring
24
mon
ths
prec
edin
g th
e su
rvey
Num
ber o
f fac
ilitie
s w
ith a
t le
ast o
ne tr
aine
d st
aff w
ho
rece
ived
EPI
in-s
ervi
ce
train
ing
Tota
l num
ber o
f fa
cilit
ies
Dom
ain
2: T
rain
ed s
taff
Staf
f rec
eive
d EP
I in-
serv
ice
train
ing
durin
g 24
m
onth
s pr
eced
ing
surv
ey: P
RO
VEPI
HW
I
1c.
Dom
ain
3: V
acci
natio
n se
rvic
e eq
uipm
ent
scor
e fo
r eac
h fa
cilit
y (o
ut o
f 3 e
quip
men
t)
Sum
of i
ndiv
idua
l sco
res
assi
gned
for e
ach
of th
e th
ree
type
of v
acci
ne
equi
pmen
t. Pr
esen
ce o
f equ
ipm
ent=
1,
abse
nce=
0
NA
Dom
ain
3: E
quip
men
t •
Vacc
ine
carri
er w
ith ic
e pa
ck: Q
.101
4=1
or 2
&
Q10
15=1
,2 o
r 3
• Sh
arps
con
tain
er b
ox: Q
.105
1.06
=1
• Sy
ringe
s an
d ne
edle
s: Q
.105
1.09
=1
FA
Con
tinue
d…

88
Appe
ndix
Tab
le B
1—co
ntin
ued
Dim
ensi
on
Indi
cato
r N
umer
ator
D
enom
inat
or
Key
com
pone
nts
& Q
uest
ion
num
ber
NFH
S to
ol
Ref
eren
ce
Tim
ely:
redu
cing
del
ays
in
prov
idin
g/re
ceiv
ing
heal
th c
are
1.
Mea
n pe
rcen
t of c
lient
s at
eac
h fa
cilit
y w
ho
repo
rted
wai
ting
time
for c
onsu
ltatio
n <=
30
min
utes
for e
ach
faci
lity
Cal
cula
te th
e m
ean
perc
ent
for e
ach
back
grou
nd
char
acte
ristic
Sum
of n
umbe
r of c
aret
aker
w
ho re
porte
d w
aitin
g <=
30
min
utes
bet
wee
n ar
rival
tim
e an
d co
nsul
tatio
n.
1=w
ait t
ime
<=30
min
; 0=
wai
t tim
e >3
0 m
in
Tota
l num
ber o
f car
e ta
kers
inte
rvie
wed
for
each
faci
lity
Q.2
01
E (T
esse
ma
et a
l. 20
17)
2.
Mea
n pe
rcen
t of c
lient
s at
eac
h fa
cilit
y w
ho
repo
rted
wai
ting
time
was
NO
T a
prob
lem
Cal
cula
te th
e m
ean
perc
ent
for e
ach
back
grou
nd
char
acte
ristic
Num
ber o
f car
etak
ers
who
D
ID N
OT
repo
rt w
aitin
g tim
e to
see
pro
vide
r as
prob
lem
at
the
faci
lity
1=D
id n
ot re
port
as p
robl
em
0=R
epor
ted
as m
ajor
or
min
or p
robl
em
Tota
l num
ber o
f ca
reta
kers
inte
rvie
wed
at
faci
lity
Q.2
02.0
1=1
E (T
umlin
son,
Pen
ce,
Cur
tis, M
arsh
all,
& Sp
eize
r, 20
15)
Clie
nt-c
ente
red:
pro
vidi
ng
care
whi
ch ta
kes
into
acc
ount
th
e pr
efer
ence
s an
d as
pira
tions
of
indi
vidu
al s
ervi
ce u
sers
and
th
e cu
lture
s of
thei
r co
mm
uniti
es
1.
Avai
labi
lity
of v
isua
l ai
ds fo
r clie
nt
educ
atio
n re
late
d to
ch
ild h
ealth
(%)
Visu
al a
id a
vaila
ble
in th
e ch
ild c
are
serv
ice
area
=1,
othe
rwis
e=0
N/A
At
leas
t one
item
from
Q.1
211(
03-0
5)=1
FA
(A
gha
& D
o 20
09; L
ee
et a
l. 20
16)
2.
Mea
n pe
rcen
t of
care
give
rs o
f sic
k ch
ildre
n at
eac
h fa
cilit
y w
ho re
porte
d ov
eral
l sa
tisfa
ctio
n
Ove
rall
satis
fact
ion
for a
fa
cilit
y. If
ver
y or
fairl
y sa
tisfie
d=1,
oth
erw
ise=
0 C
alcu
late
the
mea
n pe
rcen
t fo
r fac
ilitie
s by
bac
kgro
und
char
acte
ristic
s
Num
ber o
f sic
k ch
ild
care
take
r int
ervi
ews
at
a fa
cilit
y
Q.2
08=1
E
(Ass
af, W
ang,
&
Mal
lick
2017
)
3.
Mea
n pe
rcen
t of
care
give
rs o
f sic
k ch
ildre
n at
eac
h fa
cilit
y re
porte
d sa
tisfa
ctio
n w
ith a
ll el
even
co
mpo
nent
s
Num
ber o
f car
e ta
kers
who
re
porte
d th
at th
ey D
ID N
OT
have
a m
ajor
pro
blem
for
ALL
11 s
ervi
ce it
em=1
, R
epor
ted
at le
ast o
ne a
s as
m
ajor
pro
blem
=0
Cal
cula
te th
e m
ean
perc
ent
for f
acilit
ies
by b
ackg
roun
d ch
arac
teris
tics
Tota
l num
ber o
f car
e ta
kers
inte
rvie
wed
for
each
faci
lity
Com
mon
pro
blem
s cl
ient
s’ re
porte
d at
hea
lth
faci
litie
s (1
1 ite
ms)
: 1)
Ti
me
wai
ted
to s
ee a
pro
vide
r (Q
.202
.01)
2)
Ab
ility
to d
iscu
ss p
robl
ems
or c
once
rns
abou
t chi
ld’s
illn
ess
(Q.2
02.0
2)
3)
Amou
nt o
f exp
lana
tion
rece
ived
abo
ut th
e pr
oble
m o
r tre
atm
ent (
Q.2
02.0
3)
4)
Visu
al p
rivac
y du
ring
exam
inat
ion
(Q.2
02.0
4)
5)
Audi
tory
priv
acy
durin
g ex
amin
atio
n (Q
.202
.05)
6)
Av
aila
bilit
y of
med
icin
es a
t the
faci
lity
(Q.2
02.0
6)
7)
The
hour
s of
ser
vice
at t
his
faci
lity
i.e. w
hen
they
ope
n an
d cl
ose
(Q.2
02.0
7)
8)
The
num
ber o
f day
s se
rvic
es a
re a
vaila
ble
to y
ou (Q
.202
.08)
9)
Th
e cl
eanl
ines
s of
the
faci
lity
(Q.2
02.0
9)
10)
Trea
tmen
t of s
taff
tow
ards
clie
nt (Q
.202
.10)
11
) C
osts
of s
ervi
ces
or tr
eatm
ent (
Q.2
02.1
1)
E (A
gha
& D
o 20
09;
Bess
inge
r & B
ertra
nd
2001
; Wan
g, D
o,
Hem
blin
g, &
Am
etep
i 20
14)
Con
tinue
d…

89
Appe
ndix
Tab
le B
1—co
ntin
ued
Dim
ensi
on
Indi
cato
r N
umer
ator
D
enom
inat
or
Key
com
pone
nts
& Q
uest
ion
num
ber
NFH
S to
ol
Ref
eren
ce
4.
Perc
ent o
f out
patie
nt
child
car
e fa
cilit
ies
whe
re p
rivat
e ro
om
avai
labl
e du
ring
sick
ch
ildre
n co
nsul
tatio
n
Indi
vidu
al p
rivat
e ro
om fo
r si
ck c
hild
ser
vice
del
iver
y=1,
ot
herw
ise=
0
N/A
Q
.125
2 FA
(A
gha
& D
o 20
09; L
ee
et a
l. 20
16)
Safe
: del
iver
ing
heal
th c
are
whi
ch m
inim
izes
risk
s an
d ha
rm
to s
ervi
ce u
sers
, inc
ludi
ng
avoi
ding
pre
vent
able
inju
ries
and
redu
cing
med
ical
erro
rs
1.
Infe
ctio
n pr
even
tion
inde
x sc
ore
for s
ick
child
ser
vice
s (0
-4)
Sum
of c
ompo
site
sco
res
from
trac
er it
ems
acro
ss
prev
entio
n do
mai
ns.
Poss
ible
dom
ain
scor
es:
1=al
l ite
ms
pres
ent;
0=ite
ms
mis
sing
. Tot
al p
ossi
ble=
4 po
ints
NA
Dom
ain
1: W
aste
man
agem
ent
• W
aste
bin
: Q.1
251.
04=1
or Q
.125
1.05
=1
• Sh
arps
box
: Q.1
251.
06=1
D
omai
n 2:
Cle
anin
g an
d di
sinf
ectio
n;
• G
ener
al d
isin
fect
ant:
Q.1
251.
08=1
D
omai
n 3:
Ase
ptic
tech
niqu
e •
Syrin
ges/
need
les:
Q.1
251.
09=1
•
Ster
ile d
ispo
sabl
e gl
oves
: Q.1
251.
07=1
D
omai
n 4:
Han
d hy
gien
e •
Run
ning
wat
er: Q
.125
1.01
=1;
• So
ap/h
and
disi
nfec
tant
:Q.1
251.
02=1
or
Q.1
251.
03=1
FA
(WH
O 2
014)
2.
Inje
ctio
n sa
fety
pr
ecau
tion
guid
elin
e fo
r st
anda
rd p
reca
utio
ns
avai
labl
e
Faci
lity
with
gui
delin
e=1
(obs
erve
d or
repo
rted/
not
seen
); 0=
no
N/A
Q
.125
1.13
FA
(T
esse
ma
et a
l. 20
17)
Rel
iabl
e: “R
elia
bilit
y- a
bilit
y to
pe
rform
the
prom
ised
ser
vice
de
pend
ably
and
acc
urat
ely”
1.
Perc
ent o
f sic
k ch
ildre
n co
nsul
tatio
ns a
t eac
h fa
cilit
y co
nduc
ted
by
qual
ified
pro
vide
r
Sum
of p
rovi
der s
core
s fo
r ob
serv
ed S
C v
isits
. Exa
m
with
qua
lifie
d pr
ovid
er=1
; ot
herw
ise=
0
Tota
l cou
nt o
f sic
k ch
ild v
isits
obs
erve
d at
ea
ch fa
cilit
y
Qua
lifie
d SC
pro
vide
r: ge
nera
l med
ical
doc
tor (
01),
pedi
atric
ian
(06)
, med
ical
offi
cer (
08),
Nur
se (1
0),
HA
(12)
O
(Lee
et a
l. 20
16; W
HO
20
11)
2.
Mea
n pe
rcen
t of
care
take
rs o
f sic
k ch
ildre
n at
eac
h fa
cilit
y cl
ient
s w
ho re
porte
d th
ey w
ould
reco
mm
end
faci
lity
to a
frie
nd o
r fa
mily
mem
ber
Cal
cula
te th
e m
ean
perc
ent
for f
acilit
ies
by b
ackg
roun
d ch
arac
teris
tics
Num
ber o
f car
e ta
kers
w
ho re
porte
d Ye
s=1,
oth
erw
ise=
0
Num
ber i
f car
e ta
kers
in
terv
iew
ed a
t eac
h fa
cilit
y
Q.2
09
E (T
umlin
son
et a
l. 20
15)
Appr
opria
te (i
n te
rms
of
acce
ssib
ility)
geo
grap
hica
lly
reas
onab
le, a
nd p
rovi
ded
in a
se
tting
whe
re s
kills
and
re
sour
ces
are
appr
opria
te to
m
edic
al n
eed
1.
Num
ber o
f day
s pe
r m
onth
out
patie
nt
cura
tive
child
ser
vice
s ar
e pr
ovid
ed in
a 2
8-da
y m
onth
Num
ber o
f day
s pe
r mon
th
cura
tive
child
car
e se
rvic
es
prov
ided
at t
he fa
cilit
y
NA
Use
s a
4-w
eek
(28
day)
mon
th: Q
.120
1.01
FA
(A
gha
& D
o 20
09)
Con
tinue
d…

90
Appe
ndix
Tab
le B
1—co
ntin
ued
Dim
ensi
on
Indi
cato
r N
umer
ator
D
enom
inat
or
Key
com
pone
nts
& Q
uest
ion
num
ber
NFH
S to
ol
Ref
eren
ce
2.
Mea
n pe
rcen
t of
care
take
rs o
f sic
k ch
ildre
n at
eac
h fa
cilit
y w
ho re
porte
d th
e cu
rativ
e ch
ild c
are
faci
lity
bein
g cl
oses
t fa
cilit
y to
thei
r hom
e C
alcu
late
the
mea
n pe
rcen
t fo
r fac
ilitie
s by
bac
kgro
und
char
acte
ristic
s
Sum
of c
are
take
rs w
ho
repo
rted
If he
alth
faci
lity
is c
lose
st to
ho
me=
1, o
ther
wis
e=0
Tota
l num
ber o
f car
e ta
kers
inte
rvie
wed
fro
m th
at fa
cilit
y
Clo
sest
hea
lth fa
cilit
y to
car
e ta
ker’s
hom
e: Q
.206
E
(Tes
sem
a et
al.
2017
)
3.
Mea
n pe
rcen
t of
care
take
rs o
f sic
k ch
ildre
n at
eac
h fa
cilit
y w
ho d
id n
ot c
onsi
der
the
hour
s or
day
s of
se
rvic
e at
faci
lity
as a
pr
oble
m
C
alcu
late
the
mea
n pe
rcen
t fo
r fac
ilitie
s by
bac
kgro
und
char
acte
ristic
s
Sum
of n
umbe
r of c
are
take
rs w
ho re
porte
d th
is a
s m
ajor
pro
blem
=0,
othe
rwis
e=1
Tota
l num
ber o
f car
e ta
kers
inte
rvie
wed
fro
m th
at fa
cilit
y
The
hour
s/da
ys o
f ser
vice
at t
his
faci
lity
i.e. w
hen
they
ope
n an
d cl
ose
NO
T co
nsid
ered
a m
ajor
pr
oble
m: Q
.202
.07
& Q
.202
.08
E N
A
Equi
ty (a
t the
clie
nt le
vel)
1.
Diff
eren
ces
in %
of s
ick
child
clie
nt’s
sa
tisfa
ctio
n w
ith a
ll el
even
com
pone
nt b
y (c
ateg
ory)
NA
NA
Look
ing
for a
ny s
igni
fican
t diff
eren
ces
in th
ese
indi
cato
rs b
y et
hnic
ity, e
duca
tion
and
age=
E
& O
(L
ee e
t al.
2016
)
2.
Gen
eral
dan
ger s
igns
sc
ore
for e
ach
faci
lity
(max
num
ber o
f as
sess
men
t out
of 3
)
NA
NA
Look
ing
for a
ny s
igni
fican
t diff
eren
ces
in th
ese
indi
cato
rs b
y et
hnic
ity, e
duca
tion
and
age
E &
O
NA
3.
Mai
n sy
mpt
oms
asse
ssm
ent s
core
for
all s
ick
child
ren
rega
rdle
ss o
f illn
ess
type
(max
num
ber o
f as
sess
men
t out
of 3
)
Look
ing
for a
ny s
igni
fican
t diff
eren
ces
in th
ese
indi
cato
rs b
y et
hnic
ity, e
duca
tion
and
age
N
A
FA: F
acilit
y au
dit;
O: s
ick
child
obs
erva
tion;
E: c
lient
exi
t int
ervi
ew; H
WI:
Hea
lthca
re w
orke
r int
ervi
ew; N
A or
N/A
: Not
app
licab
le

91
APPENDIX C FP SERVICE QUALITY OF CARE DEFINITIONS BY DIMENSIONS

92
Appe
ndix
Tab
le C
1 D
efin
ition
s of
qua
lity
of c
are
dim
ensi
ons
with
cor
resp
ondi
ng in
dica
tors
spe
cific
for F
P se
rvic
e
Dim
ensi
on
Indi
cato
r N
umer
ator
D
enom
inat
or
Key
com
pone
nts
& Q
uest
ion
num
ber
NFH
S to
ol
Ref
eren
ce
Effe
ctiv
e: p
rovi
ding
ser
vice
s ba
sed
on s
cien
tific
kno
wle
dge
and
evid
ence
-bas
ed g
uide
lines
.
1a.
Num
ber o
f fam
ily
plan
ning
met
hods
of
fere
d (o
ut o
f 9)
Num
ber o
f FP
met
hods
pr
ovid
ed o
n si
te, t
hrou
gh
pres
crip
tion/
coun
selin
g or
th
ough
refe
rral
Cod
ed a
s co
ntin
uous
(0-9
)
N/A
D
oes
the
faci
lity
prov
ide,
pre
scrib
e/co
unse
l or r
efer
cl
ient
s fo
r any
of f
ollo
win
g m
etho
ds o
f FP:
1)
C
ombi
ned
oral
con
trace
ptiv
e pi
lls:
Q.1
302.
01=1
& Q
212=
1or2
; OR
Q
.130
2.01
=2
2)
Prog
estin
-onl
y in
ject
able
con
trace
ptiv
es
(DEP
O):
Q.1
302.
04=1
& Q
212=
1or2
; OR
Q
.130
2.04
=2
3)
Mal
e co
ndom
s: Q
.130
2.05
=1 &
Q21
2=1o
r2;
OR
Q.1
302.
05=2
4)
In
traut
erin
e co
ntra
cept
ive
devi
se (I
UC
D):
Q.1
302.
07=1
& Q
212=
1or2
; OR
Q
.130
2.07
=2
5)
Impl
ant:
Q.1
302.
08=1
& Q
212=
1or2
; OR
Q
.130
2.08
=2
6)
Emer
genc
y co
ntra
cept
ive
pills
: Q.1
302.
09=1
&
Q21
2=1o
r2; O
R Q
.130
2.09
=2
7)
Mal
e st
eriliz
atio
n:
Q.1
302.
12=1
or 2
1)
Fe
mal
e st
eriliz
atio
n: Q
.130
2.13
=1 o
r 2
2)
Cou
nsel
clie
nts
on p
erio
dic
abst
inen
ce:
Q.1
302.
11=2
FA
(Agh
a an
d D
o 20
09)
1b.
Num
ber o
f fam
ily
plan
ning
mod
ern
met
hods
offe
red
(out
of
7)
Num
ber o
f FP
mod
ern
met
hods
pro
vide
d,
pres
crib
e/co
unse
l or r
efer
cl
ient
s in
faci
lity.
C
oded
as
cont
inuo
us (0
-7)
N/A
D
oes
the
faci
lity
prov
ide,
pre
scrib
e/co
unse
l or r
efer
cl
ient
s fo
r any
of f
ollo
win
g 7
mod
ern
met
hods
of F
P:
1)
Com
bine
d or
al c
ontra
cept
ive
pills
: Q
.130
2.01
=1 &
Q21
2=1o
r2; O
R
Q.1
302.
01=2
2)
Pr
oges
tin-o
nly
inje
ctab
le c
ontra
cept
ives
(D
EPO
): Q
.130
2.04
=1 &
Q21
2=1o
r2; O
R
Q.1
302.
04=2
3)
M
ale
cond
oms:
Q.1
302.
05=1
& Q
212=
1or2
; O
R Q
.130
2.05
=2
4)
Intra
uter
ine
cont
race
ptiv
e de
vise
(IU
CD
): Q
.130
2.07
=1 &
Q21
2=1o
r2; O
R
Q.1
302.
07=2
5)
Im
plan
t: Q
.130
2.08
=1 &
Q21
2=1o
r2; O
R
Q.1
302.
08=2
6)
M
ale
ster
ilizat
ion:
a.
Q
.130
2.12
=1 o
r 2
7)
Fem
ale
ster
ilizat
ion:
Q.1
302.
13=1
or 2
FA
NA
Con
tinue
d…

93
Appe
ndix
Tab
le C
1—co
ntin
ued
Dim
ensi
on
Indi
cato
r N
umer
ator
D
enom
inat
or
Key
com
pone
nts
& Q
uest
ion
num
ber
NFH
S to
ol
Ref
eren
ce
1c.
Num
ber o
f fam
ily
plan
ning
mod
ern
tem
pora
ry m
etho
ds
offe
red
(out
of 5
)
Num
ber o
f FP
mod
ern
tem
pora
ry m
etho
ds
prov
ided
, pre
scrib
e/co
unse
l or
refe
r clie
nts
in fa
cilit
y.
Cod
ed a
s co
ntin
uous
(0-5
)
N/A
D
oes
the
faci
lity
prov
ide,
pre
scrib
e/co
unse
l or r
efer
cl
ient
s fo
r any
of f
ollo
win
g 5
tem
pora
ry m
oder
n m
etho
ds o
f FP:
C
ombi
ned
oral
con
trace
ptiv
e pi
lls:
Q.1
302.
01=1
& Q
212=
1or2
; OR
Q.1
302.
01=2
1)
Pr
oges
tin-o
nly
inje
ctab
le c
ontra
cept
ives
(D
EPO
): Q
.130
2.04
=1 &
Q21
2=1o
r2; O
R
Q.1
302.
04=2
2)
M
ale
cond
oms:
Q.1
302.
05=1
& Q
212=
1or2
; O
R Q
.130
2.05
=2
3)
Intra
uter
ine
cont
race
ptiv
e de
vise
(IU
CD
): Q
.130
2.07
=1 &
Q21
2=1o
r2; O
R
Q.1
302.
07=2
4)
Im
plan
t: Q
.130
2.08
=1 &
Q21
2=1o
r2; O
R
Q.1
302.
08=2
FA
NA
2.
Mea
n re
prod
uctiv
e hi
stor
y sc
ore
for f
irst-
visi
t clie
nts
only
(out
of
6):
Mea
n re
prod
uctiv
e hi
stor
y sc
ore
calc
ulat
ed fo
r eac
h fa
cilit
y (w
hen
mor
e th
an o
ne
obse
rvat
ion
for a
faci
lity)
Sum
of r
epro
duct
ive
hist
ory
scor
es fo
r obs
erve
d fir
st F
P vi
sits
at e
ach
clin
ic
Tota
l cou
nt o
f firs
t FP
visi
ts o
bser
ved
at e
ach
faci
lity
Prov
ider
ask
ed th
e cl
ient
abo
ut th
e fo
llow
ing:
1)
Ag
e: Q
. 106
.01
2)
Preg
nanc
y hi
stor
y: Q
.105
.03
or 0
1 or
Q
.106
.02
3)
Last
men
stru
al p
erio
d/cu
rrent
pre
gnan
cy
stat
us: Q
105.
02
4)
Des
ire fo
r mor
e ch
ildre
n or
Des
ired
timin
g of
bi
rth o
f nex
t chi
ld: Q
.106
.03
or Q
.106
.04
5)
Brea
stfe
edin
g st
atus
(If e
ver p
regn
ant):
Q
.105
.03
or Q
.131
b=1
6)
Reg
ular
ity o
f men
stru
al c
ycle
: Q.1
05.0
4
O
(Agh
a an
d D
o 20
09)
3.
Mea
n ph
ysic
al
exam
inat
ion/
med
ical
hi
stor
y sc
ore
amon
g fir
st-v
isit
FP c
lient
s (o
ut
of 6
) M
ean
phys
ical
exa
m s
core
ca
lcul
ated
for e
ach
faci
lity
(whe
n m
ore
than
one
ob
serv
atio
n fo
r a fa
cilit
y)
Sum
of r
epro
duct
ive
phys
ical
exa
m/m
edic
al
hist
ory
scor
e fo
r obs
erve
d fir
st F
P cl
ient
s at
eac
h fa
cilit
y, a
vera
ged
acro
ss a
ll fir
st ti
me
clie
nts
Tota
l cou
nt o
f firs
t FP
visi
ts o
bser
ved
at e
ach
faci
lity.
Prov
ider
took
/ask
ed a
bout
the
follo
win
g du
ring
phys
ical
exa
min
atio
n or
ask
ing
abou
t med
ical
hi
stor
y:
1)
Bloo
d pr
essu
re: Q
.107
.01
or q
1310
_02=
1 2)
W
eigh
t: Q
.107
.02
or q
1310
_01=
1 3)
As
ked
abou
t sm
okin
g: Q
.106
.05
4)
Aske
d ab
out S
TI s
ympt
oms:
Q.1
06.0
6 5)
As
ked
abou
t chr
onic
illn
ess:
Q.1
06.0
7 6)
Lo
oked
at c
lient
’s h
ealth
car
d: Q
.130
.01
O
(Agh
a an
d D
o 20
09)
Con
tinue
d…
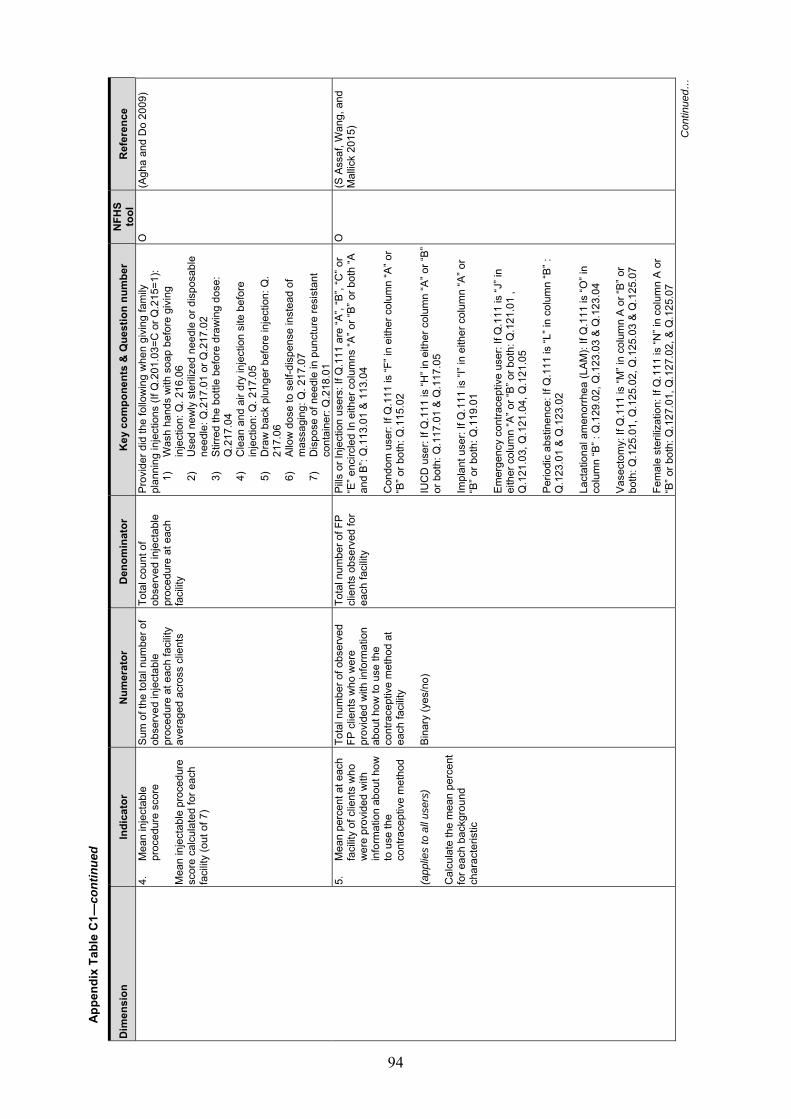
94
Appe
ndix
Tab
le C
1—co
ntin
ued
Dim
ensi
on
Indi
cato
r N
umer
ator
D
enom
inat
or
Key
com
pone
nts
& Q
uest
ion
num
ber
NFH
S to
ol
Ref
eren
ce
4.
Mea
n in
ject
able
pr
oced
ure
scor
e M
ean
inje
ctab
le p
roce
dure
sc
ore
calc
ulat
ed fo
r eac
h fa
cilit
y (o
ut o
f 7)
Sum
of t
he to
tal n
umbe
r of
obse
rved
inje
ctab
le
proc
edur
e at
eac
h fa
cilit
y av
erag
ed a
cros
s cl
ient
s
Tota
l cou
nt o
f ob
serv
ed in
ject
able
pr
oced
ure
at e
ach
faci
lity
Prov
ider
did
the
follo
win
g w
hen
givi
ng fa
mily
pl
anni
ng in
ject
ions
(If Q
.201
.03=
C o
r Q.2
15=1
): 1)
W
ash
hand
s w
ith s
oap
befo
re g
ivin
g in
ject
ion:
Q. 2
16.0
6 2)
U
sed
new
ly s
teril
ized
nee
dle
or d
ispo
sabl
e ne
edle
: Q.2
17.0
1 or
Q.2
17.0
2 3)
St
irred
the
bottl
e be
fore
dra
win
g do
se:
Q.2
17.0
4 4)
C
lean
and
air
dry
inje
ctio
n si
te b
efor
e in
ject
ion:
Q. 2
17.0
5 5)
D
raw
bac
k pl
unge
r bef
ore
inje
ctio
n: Q
. 21
7.06
6)
Al
low
dos
e to
sel
f-dis
pens
e in
stea
d of
m
assa
ging
: Q. 2
17.0
7 7)
D
ispo
se o
f nee
dle
in p
unct
ure
resi
stan
t co
ntai
ner:
Q.2
18.0
1
O
(Agh
a an
d D
o 20
09)
5.
Mea
n pe
rcen
t at e
ach
faci
lity
of c
lient
s w
ho
wer
e pr
ovid
ed w
ith
info
rmat
ion
abou
t how
to
use
the
cont
race
ptiv
e m
etho
d (a
pplie
s to
all
user
s)
Cal
cula
te th
e m
ean
perc
ent
for e
ach
back
grou
nd
char
acte
ristic
Tota
l num
ber o
f obs
erve
d FP
clie
nts
who
wer
e pr
ovid
ed w
ith in
form
atio
n ab
out h
ow to
use
the
cont
race
ptiv
e m
etho
d at
ea
ch fa
cilit
y Bi
nary
(yes
/no)
Tota
l num
ber o
f FP
clie
nts
obse
rved
for
each
faci
lity
Pills
or I
njec
tion
user
s: If
Q.1
11 a
re “A
”, “B
”, “C
” or
“E” e
ncirc
led
In e
ither
col
umns
“A” o
r “B”
or b
oth
“A
and
B”: Q
.113
.01
& 11
3.04
C
ondo
m u
ser:
If Q
.111
is “F
” in
eith
er c
olum
n “A
” or
“B” o
r bot
h: Q
.115
.02
IUC
D u
ser:
If Q
.111
is “H
” in
eith
er c
olum
n “A
” or “
B”
or b
oth:
Q.1
17.0
1 &
Q.1
17.0
5 Im
plan
t use
r: If
Q.1
11 is
“I” i
n ei
ther
col
umn
“A” o
r “B
” or b
oth:
Q.1
19.0
1 Em
erge
ncy
cont
race
ptiv
e us
er: I
f Q.1
11 is
“J” i
n ei
ther
col
umn
“A” o
r “B”
or b
oth:
Q.1
21.0
1 ,
Q.1
21.0
3, Q
.121
.04,
Q.1
21.0
5 Pe
riodi
c ab
stin
ence
: If Q
.111
is “L
” in
colu
mn
“B” :
Q
.123
.01
& Q
.123
.02
Lact
atio
nal a
men
orrh
ea (L
AM):
If Q
.111
is “O
” in
colu
mn
“B” :
Q.1
29.0
2, Q
.123
.03
& Q
.123
.04
Vase
ctom
y: If
Q.1
11 is
“M” i
n co
lum
n A
or “B
” or
both
: Q.1
25.0
1, Q
.125
.02,
Q.1
25.0
3 &
Q.1
25.0
7 Fe
mal
e st
eriliz
atio
n: If
Q.1
11 is
“N” i
n co
lum
n A
or
“B” o
r bot
h: Q
.127
.01,
Q.1
27.0
2, &
Q.1
25.0
7
O
(S A
ssaf
, Wan
g, a
nd
Mal
lick
2015
)
Con
tinue
d…

95
Appe
ndix
Tab
le C
1—co
ntin
ued
Dim
ensi
on
Indi
cato
r N
umer
ator
D
enom
inat
or
Key
com
pone
nts
& Q
uest
ion
num
ber
NFH
S to
ol
Ref
eren
ce
6.
Mea
n pe
rcen
t of c
lient
s at
eac
h fa
cilit
y w
ho
wer
e pr
ovid
ed w
ith
info
rmat
ion
abou
t co
ntra
cept
ive
met
hod’
s po
tent
ial s
ide
effe
cts
(app
lies
to o
nly
user
s of
pi
lls, i
njec
tion,
IUD
and
im
plan
t) C
alcu
late
the
mea
n pe
rcen
t fo
r eac
h ba
ckgr
ound
ch
arac
teris
tic
Tota
l num
ber o
f obs
erve
d FP
clie
nts
whe
re in
form
atio
n ab
out c
ontra
cept
ive
met
hod’
s po
tent
ial s
ide
effe
cts
was
pro
vide
d fo
r ea
ch fa
cilit
y Bi
nary
(yes
/no)
Tota
l num
ber o
f FP
clie
nts
obse
rved
for
each
faci
lity
Pills
or I
njec
tion
user
s: If
Q.1
11 a
re “A
”, “B
”, “C
” or
“E” e
ncirc
led
In e
ither
col
umns
“A” o
r “B”
or b
oth
“A
and
B”: Q
.113
.03
IUC
D u
ser:
If Q
.111
is “H
” in
eith
er c
olum
n “A
” or “
B”
or b
oth:
Q.1
17.0
3 Im
plan
t use
r: If
Q.1
11 is
“I” i
n ei
ther
col
umn
“A” o
r “B
” or b
oth:
Q.1
19.0
3 N
ot a
pplic
able
for c
ondo
ms,
em
erge
ncy
cont
race
ptiv
e pi
ll, p
erio
dic
abst
inen
ce, o
r Lac
tatio
nal
amen
orrh
ea (L
AM)
Vase
ctom
y: If
Q.1
11 is
“M” i
n co
lum
n A
or “B
” or
both
: Q.1
25.0
4 Fe
mal
e st
eriliz
atio
n: If
Q.1
11 is
“N” i
n co
lum
n A
or
“B” o
r bot
h: Q
.127
.03
O
(S A
ssaf
, Wan
g, a
nd
Mal
lick
2015
)
7.
Mea
n pe
rcen
t of c
lient
s at
eac
h fa
cilit
y in
form
atio
n pr
ovid
ed o
n w
hen
to re
turn
for
follo
w-u
p (a
pplie
s to
onl
y us
ers
of
pills
, inj
ectio
n, IU
D a
nd
impl
ant)
Cal
cula
te th
e m
ean
perc
ent
for e
ach
back
grou
nd
char
acte
ristic
Tota
l num
ber o
f obs
erve
d FP
clie
nts
whe
re in
form
atio
n on
whe
n to
retu
rn fo
r fol
low
-up
was
pro
vide
d at
eac
h fa
cilit
y Bi
nary
(yes
/no)
Tota
l num
ber o
f FP
clie
nts
obse
rved
at
each
faci
lity
Pills
or I
njec
tion
user
s: If
Q.1
11 a
re “A
”, “B
”, “C
” or
“E” e
ncirc
led
In e
ither
col
umns
“A” o
r “B”
or b
oth
“A
and
B”: Q
.113
.06
IUC
D u
ser:
If Q
.111
is “H
” in
eith
er c
olum
n “A
” or “
B”
or b
oth:
Q.1
17.0
2 &
Q.1
17.0
4 Im
plan
t use
r: If
Q.1
11 is
“I” i
n ei
ther
col
umn
“A” o
r “B
” or b
oth:
Q.1
19.0
4 Em
erge
ncy
cont
race
ptiv
e us
er: I
f Q.1
11 is
“J” i
n ei
ther
col
umn
“A” o
r “B”
or b
oth:
Q.1
21.0
2 Va
sect
omy:
If Q
.111
is “M
” in
colu
mn
A or
“B” o
r bo
th: Q
.125
.05
Fem
ale
ster
ilizat
ion:
If Q
.111
is “N
” in
colu
mn
A or
“B
” or b
oth:
Q.1
27.0
34
Not
app
licab
le fo
r con
dom
s, e
mer
genc
y co
ntra
cept
ive
pill,
per
iodi
c ab
stin
ence
, or L
acta
tiona
l am
enor
rhea
(LAM
)
O
(S A
ssaf
, Wan
g, a
nd
Mal
lick
2015
)
Con
tinue
d…

96
Appe
ndix
Tab
le C
1—co
ntin
ued
Dim
ensi
on
Indi
cato
r N
umer
ator
D
enom
inat
or
Key
com
pone
nts
& Q
uest
ion
num
ber
NFH
S to
ol
Ref
eren
ce
8.
Mea
n pe
rcen
t of c
lient
s at
eac
h fa
cilit
y pr
ovid
ed
with
info
rmat
ion
abou
t pr
otec
tion
from
STI
pr
ovid
ed:
(app
lies
to a
ll us
ers)
C
alcu
late
the
mea
n pe
rcen
t fo
r eac
h ba
ckgr
ound
ch
arac
teris
tic
Tota
l num
ber o
f obs
erve
d FP
clie
nts
at e
ach
faci
lity
prov
ided
with
info
rmat
ion
abou
t whe
ther
the
met
hod
prov
ides
pro
tect
ion
agai
nst
STI,
HIV
or d
ual p
rote
ctio
n Bi
nary
(yes
/no)
Tota
l num
ber o
f FP
clie
nts
obse
rved
at
each
faci
lity
Pills
or I
njec
tion
user
s: If
Q.1
11 a
re “A
”, “B
”, “C
” or
“E” e
ncirc
led
In e
ither
col
umns
“A” o
r “B”
or b
oth
“A
and
B”: Q
.113
.05
Con
dom
use
r: If
Q.1
11 is
“F” i
n ei
ther
col
umn
“A” o
r “B
” or b
oth:
Q.1
15.0
5 IU
CD
use
r: If
Q.1
11 is
“H” i
n ei
ther
col
umn
“A” o
r “B”
or
bot
h: Q
.117
.05
Impl
ant u
ser:
If Q
.111
is “I
” in
eith
er c
olum
n “A
” or
“B” o
r bot
h: Q
.119
.05
Emer
genc
y co
ntra
cept
ive
user
: If Q
.111
is “J
” in
eith
er c
olum
n “A
” or “
B” o
r bot
h: Q
.121
.06
Impl
ant u
ser:
If Q
.111
is “L
” in
colu
mn
“B” :
Q.1
23.0
3 La
ctat
iona
l am
enor
rhea
(LAM
): If
Q.1
11 is
“O” i
n co
lum
n “B
” : Q
.129
.05
Vase
ctom
y: If
Q.1
11 is
“M” i
n co
lum
n A
or “B
” or
both
: Q.1
25.0
6 Fe
mal
e st
eriliz
atio
n: If
Q.1
11 is
“N” i
n co
lum
n A
or
“B” o
r bot
h: Q
.127
.05
O
(S A
ssaf
, Wan
g, a
nd
Mal
lick
2015
)
9.
Mea
n pe
rcen
t of c
lient
s at
eac
h fa
cilit
y pr
ovid
ed
info
rmat
ion
on h
ow to
us
e, s
ide
effe
cts
and
whe
n to
retu
rn fo
r fo
llow
-up
for t
he
met
hod
pres
crib
ed o
r pr
ovid
ed
(app
lies
to o
nly
user
s of
pi
lls, i
njec
tion,
IUD
and
im
plan
t) C
alcu
late
the
mea
n pe
rcen
t fo
r eac
h ba
ckgr
ound
ch
arac
teris
tic
Tota
l num
ber o
f obs
erve
d FP
clie
nts
at e
ach
faci
lity
prov
ided
info
rmat
ion
on h
ow
to u
se, s
ide
effe
cts
and
whe
n to
retu
rn fo
r fol
low
-up
for t
he m
etho
d pr
escr
ibed
or
prov
ided
Bi
nary
(yes
/no)
Tota
l num
ber o
f FP
clie
nts
obse
rved
at
each
faci
lity
Com
bini
ng in
dica
tor 6
, 7 a
nd 8
NA
Con
tinue
d…

97
Appe
ndix
Tab
le C
1—co
ntin
ued
Dim
ensi
on
Indi
cato
r N
umer
ator
D
enom
inat
or
Key
com
pone
nts
& Q
uest
ion
num
ber
NFH
S to
ol
Ref
eren
ce
Effic
ient
: del
iver
ing
heal
th c
are
in a
man
ner w
hich
max
imiz
es
reso
urce
use
and
avo
ids
was
tage
1.
FP s
ervi
ce re
adin
ess
scor
es fo
r eac
h do
mai
n 1a
. Dom
ain
1: P
erce
nt o
f fa
cilit
ies
with
a F
P G
uide
line
avai
labl
e
Num
ber o
f fac
ilitie
s w
ith
IMC
I/IM
NC
I gui
delin
e To
tal n
umbe
r of
faci
litie
s A.
Dom
ain
1: G
uide
lines
sco
re
FP g
uide
line:
Q13
03=1
& Q
.130
4=1
FA
(WH
O 2
015)
1b.
Staf
f tra
inin
g in
the
past
24
mon
ths
on
seve
n FP
trai
ning
to
pics
(max
num
ber o
f tra
inin
g ou
t of 7
)
Mos
t num
ber o
f tra
inin
gs
rela
ted
to F
P se
rvic
es
rece
ived
in 2
4 m
onth
s by
an
y st
aff p
erso
n at
the
faci
lity
out o
f sev
en F
P to
pic
area
s.
NA
Staf
f in
follo
win
g se
ven
FP c
ompo
nent
s N
o tra
inin
g: Q
.400
=1 &
Q.4
01=2
1)
G
ener
al F
P co
unse
ling:
Q40
3.01
=1
2)
IUC
D in
serti
on a
nd re
mov
al: Q
403.
02=1
3)
Im
plan
t ins
ertio
n an
d re
mov
al: Q
403.
03=1
4)
Pe
rform
ing
non-
scal
pel v
asec
tom
y (N
SV):
Q40
3.04
=1
5)
Perfo
rmin
g m
inila
p tu
bal l
igat
ion:
Q
.403
.05=
1 6)
Fa
mily
pla
nnin
g fo
r HIV
pos
itive
wom
en:
Q.4
03.0
7=1
7)
Post
-par
tum
FP
(incl
. PPI
UC
D):
Q40
3.08
=1 H
WI
(Agh
a an
d D
o 20
09;
WH
O 2
015)
1c.
Dom
ain
3: F
P se
rvic
e eq
uipm
ent s
core
for
each
faci
lity
(out
of 7
)
Sum
of s
core
s as
sign
ed fo
r ea
ch o
f the
sev
en
equi
pmen
t req
uire
d fo
r FP
serv
ices
. Th
e se
ven
equi
pmen
t are
: 1.
BP
app
arat
us
2.
Exam
inat
ion
light
3.
Ex
amin
atio
n be
d or
ta
ble:
4.
FP
or c
ouns
ellin
g ki
t 5.
Pe
lvic
mod
el fo
r IU
CD
: 6.
M
odel
for s
how
ing
cond
om u
se
7.
FP s
peci
fic v
isua
l ai
ds
Ea
ch e
quip
men
t (av
aila
ble
and
func
tioni
ng)=
1,
abse
nce=
0.
NA
C. D
omai
n 3:
Equ
ipm
ent (
Scor
e: 0
-7)
1)
BP a
ppar
atus
: (Q
1314
.02(
A)=1
&
Q13
14.0
2(B)
=1 &
Q13
14.0
3(A)
=1 &
Q
1314
.03(
B)=1
) OR
(Q13
14.0
1(A)
=1 &
Q
1314
.01(
B)=1
), 2)
Ex
amin
atio
n lig
ht: (
Q13
14.0
4(A)
=1 &
Q
1314
.04(
B)=1
); O
R (Q
1314
.10(
A)=1
&
Q13
14.1
0(B)
=1)
3)
Exam
inat
ion
bed
or ta
ble:
Q13
14.0
5(A)
=1
4)
FP o
r cou
nsel
ling
kit:
Q13
14.1
1(A)
=1
5)
Pelv
ic m
odel
for I
UC
D: Q
1314
.08(
A)=1
6)
M
odel
for s
how
ing
cond
om u
se:
Q13
14.0
9(A)
=1
7)
FP s
peci
fic v
isua
l aid
s: Q
1314
.07(
A)=1
FA
(Agh
a an
d D
o 20
09;
WH
O 2
015)
Con
tinue
d…

98
Appe
ndix
Tab
le C
1—co
ntin
ued
Dim
ensi
on
Indi
cato
r N
umer
ator
D
enom
inat
or
Key
com
pone
nts
& Q
uest
ion
num
ber
NFH
S to
ol
Ref
eren
ce
1d.
Dom
ain
4: F
P se
rvic
e ba
sic
com
mod
ity s
core
(o
ut o
f 3)
Sum
of F
P co
mm
odity
av
aila
ble
for p
rovi
ding
the
basi
c th
ree
tem
pora
ry
mod
ern
FP m
etho
ds
(com
bine
d or
al
cont
race
ptiv
e pi
lls, i
njec
tabl
e co
ntra
cept
ive
and
mal
e co
ndom
s)
N/A
D
oes
the
faci
lity
prov
ide
and
have
com
mod
ity
avai
labl
e (o
bser
ved
or re
porte
d) a
ny o
f fol
low
ing
tem
pora
ry m
etho
ds o
f FP:
1)
C
ombi
ned
oral
con
trace
ptiv
e pi
lls:
Q.1
302.
01=1
& Q
212=
1or2
& Q
921.
01=1
or
3 2)
Pr
oges
tin-o
nly
inje
ctab
le c
ontra
cept
ives
(D
EPO
): Q
.130
2.04
=1 &
Q21
2=1o
r2; &
Q
921.
04=1
or 3
3)
M
ale
cond
oms:
Q.1
302.
05=1
& Q
212=
1or2
; &
Q92
1.05
=1 o
r 3
FA
(WH
O 2
015)
2.
Serv
ice
read
ines
s to
pr
ovid
e IU
CD
ser
vice
s ba
sed
on a
vaila
bilit
y of
al
l sev
en
equi
pmen
t/sup
plie
s (L
imite
d to
faci
litie
s pr
ovid
ing
IUC
D s
ervi
ces)
(B
inar
y: 0
or 1
)
If al
l tra
cer i
tem
s av
aila
ble
then
1;
0=no
t all
item
s av
aila
ble
at
FP fa
cilit
y pr
ovid
ing
IUC
D
serv
ices
Tota
l num
ber o
f fa
cilit
ies
that
pro
vide
im
plan
t ser
vice
s
Avai
labi
lity
of fo
llow
ing
equi
pmen
t and
sup
plie
s (li
mite
d to
onl
y th
ose
faci
litie
s pr
ovid
ing
IUC
D):
If Q
.130
2.07
=1
1)
Ster
ile g
love
s: Q
.131
6.01
=1
2)
Antis
eptic
sol
utio
n: Q
.131
6.02
=1
3)
Spon
ge h
oldi
ng fo
rcep
: Q.1
316.
03=1
4)
St
erile
gau
ze p
ad o
r cot
ton
woo
l: Q
.131
6.04
=1
5)
Vagi
nal s
pecu
lum
(Sm
all,
med
ium
and
la
rge)
: Q.1
318.
01-Q
.131
8.03
=1
6)
Tena
cula
: Q.1
318.
04=1
7)
U
terin
e so
und:
Q.1
318.
05=1
FA
(Min
istry
of H
ealth
N
epal
et a
l. 20
16)
3.
Serv
ice
read
ines
s to
pr
ovid
e im
plan
t se
rvic
es b
ased
on
avai
labi
lity
of a
ll th
e re
quire
d eq
uipm
ent/s
uppl
ies
(%)
(Lim
ited
to fa
cilit
ies
prov
idin
g im
plan
t ser
vice
s)
(Bin
ary:
0 o
r 1)
If al
l tra
cer i
tem
s av
aila
ble
then
1;
0=no
t all
item
s av
aila
ble
at
FP fa
cilit
y pr
ovid
ing
impl
ant
serv
ices
Tota
l num
ber o
f fa
cilit
ies
that
pro
vide
im
plan
t ser
vice
s
Avai
labi
lity
of fo
llow
ing
equi
pmen
t and
sup
plie
s (li
mite
d to
onl
y th
ose
faci
litie
s pr
ovid
ing
impl
ant):
If
Q.1
302.
08=1
1)
St
erile
glo
ves:
Q.1
316.
01=1
2)
An
tisep
tic s
olut
ion:
Q.1
316.
02=1
3)
Sp
onge
hol
ding
forc
ep: Q
.131
6.03
=1
4)
Ster
ile g
auze
pad
or c
otto
n w
ool:
Q.1
316.
04=1
5)
Lo
cal a
nest
hetic
: Q.1
320.
01=1
6)
St
erile
syr
inge
/nee
dle
or d
ispo
sabl
e sy
ringe
: Q
.132
0.02
=1
7)
Can
ula
and
Troc
har f
or in
serti
ng im
plan
t: Q
.132
0.03
=1
8)
Seal
ed im
plan
t pac
k: Q
.132
0.04
=1
9)
Scap
el w
ith b
lade
: Q.1
320.
05=1
10
) M
inor
sur
gery
kit
with
arte
ry fo
rcep
s:
Q.1
320.
06=1
FA
(Min
istry
of H
ealth
N
epal
et a
l. 20
16)
Con
tinue
d…

99
Appe
ndix
Tab
le C
1—co
ntin
ued
Dim
ensi
on
Indi
cato
r N
umer
ator
D
enom
inat
or
Key
com
pone
nts
& Q
uest
ion
num
ber
NFH
S to
ol
Ref
eren
ce
4.
Perc
ent o
f fac
ilitie
s th
at
met
the
qual
ity o
f sto
ck
orga
niza
tion
mea
sure
s (%
) A
mon
g fa
cilit
ies
that
kee
p FP
com
mod
ities
in s
tock
All i
tem
s of
qua
lity
stoc
k ar
rang
emen
ts fo
r FP
com
mod
ities
at e
ach
faci
lity:
al
l ite
ms=
1; e
lse
0
Tota
l num
ber o
f FP
faci
litie
s th
at k
eep
stoc
k of
com
mod
ities
Amon
g th
ose
faci
litie
s w
here
Q.2
12=1
or 2
(E
xclu
ding
thos
e w
here
FP
com
mod
ities
not
st
ocke
d)
1.
Com
mod
ities
off
the
floor
: Q.9
22.0
1=1
2.
Com
mod
ities
pro
tect
ed fr
om w
ater
: Q
.922
.02=
1 3.
C
omm
oditi
es p
rote
cted
from
the
sun:
Q
.922
.03=
1 4.
R
oom
pro
tect
ed fr
om ro
dent
s: Q
.922
.04=
1 5.
R
oom
wel
l ven
tilat
ed: Q
.922
.05=
1 6.
Al
l com
mod
ities
org
aniz
ed a
ccor
ding
to
expi
ratio
n da
te: Q
.923
=1
FA
(A
gha
and
Do
2009
; Te
ssem
a et
al.
2017
)
Tim
ely:
redu
cing
del
ays
in
prov
idin
g/re
ceiv
ing
heal
th c
are
1.
Mea
n pe
rcen
t of c
lient
s at
eac
h fa
cilit
y w
ho
repo
rted
wai
ting
time
for c
onsu
ltatio
n <=
30
min
utes
for e
ach
faci
lity
Cal
cula
te th
e m
ean
perc
ent
for e
ach
back
grou
nd
char
acte
ristic
Sum
of n
umbe
r of F
P cl
ient
s w
ho re
porte
d w
aitin
g <=
30
min
utes
bet
wee
n ar
rival
tim
e an
d co
nsul
tatio
n.
1=w
ait t
ime
<=30
min
; 0=
wai
t tim
e >3
0 m
in
Tota
l num
ber o
f FP
clie
nts
inte
rvie
wed
for
each
clie
nt
Q.2
01
E (T
esse
ma
et a
l. 20
17)
2.
Mea
n pe
rcen
t of c
lient
s at
eac
h fa
cilit
y w
ho
repo
rted
wai
ting
time
was
NO
T a
prob
lem
C
alcu
late
the
mea
n pe
rcen
t fo
r eac
h ba
ckgr
ound
ch
arac
teris
tic
Sum
of n
umbe
r of F
P cl
ient
s w
ho D
ID N
OT
repo
rt w
aitin
g tim
e to
see
pro
vide
r as
maj
or o
r min
or p
robl
em a
t ea
ch fa
cilit
y 1=
Did
not
repo
rt as
maj
or
prob
lem
0=
Rep
orte
d as
maj
or
prob
lem
Tota
l num
ber o
f FP
clie
nts
inte
rvie
wed
at
each
faci
lity
Q.2
02.0
1=3
E (T
umlin
son
et a
l. 20
15)
Clie
nt-c
ente
red:
pro
vidi
ng
care
whi
ch ta
kes
into
acc
ount
th
e pr
efer
ence
s an
d as
pira
tions
of
indi
vidu
al s
ervi
ce u
sers
and
th
e cu
lture
s of
thei
r co
mm
uniti
es
1.
Mea
n pe
rcen
t of c
lient
s ob
serv
ed a
t eac
h fa
cilit
y w
here
thei
r co
ncer
ns a
bout
the
met
hods
wer
e di
scus
sed
Cal
cula
te th
e m
ean
perc
ent
for e
ach
back
grou
nd
char
acte
ristic
Num
ber o
f obs
erva
tions
w
here
the
prov
ider
ask
ed
clie
nt a
bout
con
cern
s w
ith
fam
ily p
lann
ing
met
hod;
or
clie
nts
expr
esse
d co
ncer
ns
abou
t the
con
trace
ptiv
e m
etho
d in
clud
ing
poss
ible
si
de e
ffect
s
Num
ber o
f FP
clie
nts
obse
rved
at f
acilit
y Q
.109
.01(
A) o
r Q.1
09.0
2(B)
O
2.
Mea
n pe
rcen
t of c
lient
s at
eac
h fa
cilit
y w
ho
repo
rted
over
all
satis
fact
ion
Cal
cula
te th
e m
ean
perc
ent
for e
ach
back
grou
nd
char
acte
ristic
Ove
rall
repo
rt if
satis
fact
ion
for e
ach
faci
lity.
If v
ery
or
fairl
y sa
tisfie
d=1,
ot
herw
ise=
0
Num
ber o
f FP
clie
nts
inte
rvie
wed
at e
ach
faci
lity
Q.2
08=1
or 2
E
(Ass
af, W
ang,
and
M
allic
k 20
17)
Con
tinue
d…

100
Appe
ndix
Tab
le C
1—co
ntin
ued
Dim
ensi
on
Indi
cato
r N
umer
ator
D
enom
inat
or
Key
com
pone
nts
& Q
uest
ion
num
ber
NFH
S to
ol
Ref
eren
ce
3. M
ean
perc
ent o
f clie
nts
at
each
faci
lity
who
re
porte
d sa
tisfa
ctio
n w
ith a
ll el
even
co
mpo
nent
s C
alcu
late
the
mea
n pe
rcen
t fo
r eac
h ba
ckgr
ound
ch
arac
teris
tic
Num
ber o
f FP
clie
nts
who
re
porte
d th
at th
ey D
ID N
OT
have
a m
ajor
pro
blem
for
ALL
11 s
ervi
ce it
em=1
, R
epor
ted
at le
ast o
ne a
s as
m
ajor
pro
blem
=0
Num
ber o
f FP
clie
nts
inte
rvie
wed
for e
ach
faci
lity
Com
mon
pro
blem
s cl
ient
s’ re
porte
d at
hea
lth
faci
litie
s (1
1 ite
ms)
: 1)
Ti
me
wai
ted
to s
ee a
pro
vide
r (Q
.202
.01)
2)
Ab
ility
to d
iscu
ss p
robl
ems
or c
once
rns
abou
t fam
ily p
lann
ing
(Q.2
02.0
2)
3)
Amou
nt o
f exp
lana
tion
rece
ived
abo
ut th
e pr
oble
m o
r tre
atm
ent (
Q.2
02.0
3)
4)
Visu
al p
rivac
y du
ring
exam
inat
ion
(Q.2
02.0
4)
5)
Audi
tory
priv
acy
durin
g ex
amin
atio
n (Q
.202
.05)
6)
Av
aila
bilit
y of
med
icin
es a
t the
faci
lity
(Q.2
02.0
6)
7)
The
hour
s of
ser
vice
at t
his
faci
lity
i.e. w
hen
they
ope
n an
d cl
ose
(Q.2
02.0
7)
8)
The
num
ber o
f day
s se
rvic
es a
re a
vaila
ble
to y
ou (Q
.202
.08)
9)
Th
e cl
eanl
ines
s of
the
faci
lity
(Q.2
02.0
9)
10)
Trea
tmen
t of s
taff
tow
ards
clie
nt (Q
.202
.10)
11
) C
osts
of s
ervi
ces
or tr
eatm
ent (
Q.2
02.1
1)
E (W
ang
et a
l. 20
14;
Agha
and
Do
2009
; Be
ssin
ger a
nd
Bertr
and
2001
)
4.
Perc
ent o
f FP
faci
litie
s w
here
priv
ate
room
av
aila
ble
durin
g FP
co
nsul
tatio
n C
alcu
late
the
mea
n pe
rcen
t fo
r eac
h ba
ckgr
ound
ch
arac
teris
tic
Indi
vidu
al p
rivat
e ro
om fo
r FP
ser
vice
del
iver
y=1,
ot
herw
ise=
0
N/A
Q.1
352=
1 FA
(L
ee, M
adha
van,
and
Ba
uhof
f 201
6; A
gha
and
Do
2009
)
5.
Mea
n pe
rcen
t of c
lient
s at
eac
h fa
cilit
y w
here
pr
ivac
y en
sure
d du
ring
FP c
onsu
ltatio
n C
alcu
late
the
mea
n pe
rcen
t fo
r eac
h ba
ckgr
ound
ch
arac
teris
tic
Num
ber o
f obs
erve
d cl
ient
s at
eac
h fa
cilit
y w
here
the
prov
ider
ens
ured
vis
ual a
nd
audi
tory
priv
acy
durin
g th
e co
nsul
tatio
n
Tota
l num
ber o
f FP
obse
rvat
ions
at e
ach
faci
lity
Q.1
10=A
& B
(.01
& .0
2)
O
(Agh
a an
d D
o 20
09;
Tess
ema
et a
l. 20
17)
6.
Mea
n pe
rcen
t of c
lient
s at
eac
h fa
cilit
y w
here
co
nfid
entia
lity
assu
red
durin
g FP
con
sulta
tion
Cal
cula
te th
e m
ean
perc
ent
for e
ach
back
grou
nd
char
acte
ristic
Num
ber o
f obs
erve
d cl
ient
s at
eac
h fa
cilit
y w
here
the
prov
ider
ass
ured
the
clie
nt
oral
ly o
f con
fiden
tialit
y
Tota
l num
ber o
f FP
obse
rvat
ions
at e
ach
faci
lity
Q.1
10.0
3=C
O
(A
gha
and
Do
2009
; Te
ssem
a et
al.
2017
)
Con
tinue
d…
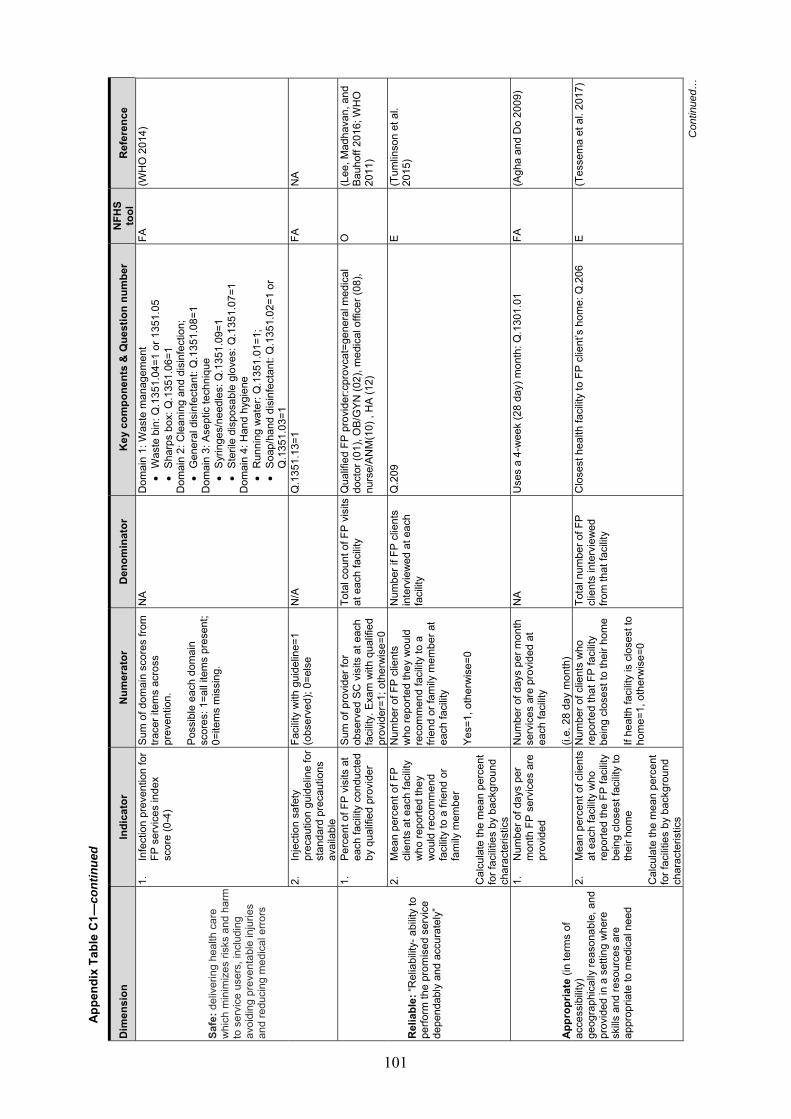
101
Appe
ndix
Tab
le C
1—co
ntin
ued
Dim
ensi
on
Indi
cato
r N
umer
ator
D
enom
inat
or
Key
com
pone
nts
& Q
uest
ion
num
ber
NFH
S to
ol
Ref
eren
ce
Safe
: del
iver
ing
heal
th c
are
whi
ch m
inim
izes
risk
s an
d ha
rm
to s
ervi
ce u
sers
, inc
ludi
ng
avoi
ding
pre
vent
able
inju
ries
and
redu
cing
med
ical
erro
rs
1.
Infe
ctio
n pr
even
tion
for
FP s
ervi
ces
inde
x sc
ore
(0-4
)
Sum
of d
omai
n sc
ores
from
tra
cer i
tem
s ac
ross
pr
even
tion.
Po
ssib
le e
ach
dom
ain
scor
es: 1
=all
item
s pr
esen
t; 0=
item
s m
issi
ng.
NA
Dom
ain
1: W
aste
man
agem
ent
• W
aste
bin
: Q.1
351.
04=1
or 1
351.
05
• Sh
arps
box
: Q.1
351.
06=1
D
omai
n 2:
Cle
anin
g an
d di
sinf
ectio
n;
• G
ener
al d
isin
fect
ant:
Q.1
351.
08=1
D
omai
n 3:
Ase
ptic
tech
niqu
e •
Syrin
ges/
need
les:
Q.1
351.
09=1
•
Ster
ile d
ispo
sabl
e gl
oves
: Q.1
351.
07=1
D
omai
n 4:
Han
d hy
gien
e •
Run
ning
wat
er: Q
.135
1.01
=1;
• So
ap/h
and
disi
nfec
tant
: Q.1
351.
02=1
or
Q.1
351.
03=1
FA
(WH
O 2
014)
2.
Inje
ctio
n sa
fety
pr
ecau
tion
guid
elin
e fo
r st
anda
rd p
reca
utio
ns
avai
labl
e
Faci
lity
with
gui
delin
e=1
(obs
erve
d); 0
=els
e N
/A
Q.1
351.
13=1
FA
N
A
Rel
iabl
e: “R
elia
bilit
y- a
bilit
y to
pe
rform
the
prom
ised
ser
vice
de
pend
ably
and
acc
urat
ely”
1.
Perc
ent o
f FP
visi
ts a
t ea
ch fa
cilit
y co
nduc
ted
by q
ualif
ied
prov
ider
Sum
of p
rovi
der f
or
obse
rved
SC
vis
its a
t eac
h fa
cilit
y. E
xam
with
qua
lifie
d pr
ovid
er=1
; oth
erw
ise=
0
Tota
l cou
nt o
f FP
visi
ts
at e
ach
faci
lity
Qua
lifie
d FP
pro
vide
r:cpr
ovca
t=ge
nera
l med
ical
do
ctor
(01)
, OB/
GYN
(02)
, med
ical
offi
cer (
08),
nurs
e/AN
M(1
0) ,
HA
(12)
O
(Lee
, Mad
hava
n, a
nd
Bauh
off 2
016;
WH
O
2011
)
2.
Mea
n pe
rcen
t of F
P cl
ient
s at
eac
h fa
cilit
y w
ho re
porte
d th
ey
wou
ld re
com
men
d fa
cilit
y to
a fr
iend
or
fam
ily m
embe
r C
alcu
late
the
mea
n pe
rcen
t fo
r fac
ilitie
s by
bac
kgro
und
char
acte
ristic
s
Num
ber o
f FP
clie
nts
who
repo
rted
they
wou
ld
reco
mm
end
faci
lity
to a
fri
end
or fa
mily
mem
ber a
t ea
ch fa
cilit
y Ye
s=1,
oth
erw
ise=
0
Num
ber i
f FP
clie
nts
inte
rvie
wed
at e
ach
faci
lity
Q.2
09
E (T
umlin
son
et a
l. 20
15)
Appr
opria
te (i
n te
rms
of
acce
ssib
ility)
ge
ogra
phic
ally
reas
onab
le, a
nd
prov
ided
in a
set
ting
whe
re
skills
and
reso
urce
s ar
e ap
prop
riate
to m
edic
al n
eed
1.
Num
ber o
f day
s pe
r m
onth
FP
serv
ices
are
pr
ovid
ed
Num
ber o
f day
s pe
r mon
th
serv
ices
are
pro
vide
d at
ea
ch fa
cilit
y (i.
e. 2
8 da
y m
onth
)
NA
Use
s a
4-w
eek
(28
day)
mon
th: Q
.130
1.01
FA
(A
gha
and
Do
2009
)
2.
Mea
n pe
rcen
t of c
lient
s at
eac
h fa
cilit
y w
ho
repo
rted
the
FP fa
cilit
y be
ing
clos
est f
acilit
y to
th
eir h
ome
Cal
cula
te th
e m
ean
perc
ent
for f
acilit
ies
by b
ackg
roun
d ch
arac
teris
tics
Num
ber o
f clie
nts
who
re
porte
d th
at F
P fa
cilit
y be
ing
clos
est t
o th
eir h
ome
If he
alth
faci
lity
is c
lose
st to
ho
me=
1, o
ther
wis
e=0
Tota
l num
ber o
f FP
clie
nts
inte
rvie
wed
fro
m th
at fa
cilit
y
Clo
sest
hea
lth fa
cilit
y to
FP
clie
nt’s
hom
e: Q
.206
E
(Tes
sem
a et
al.
2017
)
Con
tinue
d…

102
Appe
ndix
Tab
le C
1—co
ntin
ued
Dim
ensi
on
Indi
cato
r N
umer
ator
D
enom
inat
or
Key
com
pone
nts
& Q
uest
ion
num
ber
NFH
S to
ol
Ref
eren
ce
3.
Mea
n pe
rcen
t of c
lient
s at
eac
h fa
cilit
y w
ho d
id
cons
ider
the
hour
s or
da
ys o
f ser
vice
at
faci
lity
as n
ot a
pr
oble
m
Cal
cula
te th
e m
ean
perc
ent
for f
acilit
ies
by b
ackg
roun
d ch
arac
teris
tics
Num
ber o
f clie
nts
who
re
porte
d th
is a
s N
OT
a pr
oble
m=1
, oth
erw
ise=
0
Tota
l num
ber o
f FP
clie
nts
inte
rvie
wed
fro
m e
ach
faci
lity
The
hour
s/da
ys o
f ser
vice
at t
his
faci
lity
i.e. w
hen
they
ope
n an
d cl
ose
NO
T co
nsid
ered
a m
ajor
or
min
or p
robl
em: Q
.202
.07
& Q
.202
.08
E N
A
Equi
ty (a
t the
clie
nt le
vel)
1.
Diff
eren
ces
in %
of F
P cl
ient
’s s
atis
fact
ion
with
al
l ele
ven
com
pone
nts
by (c
ateg
ory)
NA
NA
Look
ing
for a
ny s
igni
fican
t diff
eren
ces
in th
ese
indi
cato
rs b
y et
hnic
ity, e
duca
tion
and
age
E (L
ee, M
adha
van,
and
Ba
uhof
f 201
6)
2.
Mea
n ph
ysic
al
exam
inat
ion
scor
e am
ong
first
tim
e FP
cl
ient
s (o
ut o
f 6)
NA
NA
Look
ing
for a
ny s
igni
fican
t diff
eren
ces
in th
ese
indi
cato
rs b
y et
hnic
ity, e
duca
tion
and
age
E (L
ee, M
adha
van,
and
Ba
uhof
f 201
6)
FA: F
acilit
y au
dit;
O: F
P ob
serv
atio
n; E
: FP
clie
nt e
xit i
nter
view
; HW
I: H
ealth
care
wor
ker i
nter
view
; NA
or N
/A: N
ot a
pplic
able

103
APPENDIX D ANC QUALITY OF CARE RESULTS BY DIMENSIONS
Appendix Table D1 Mean, median, minimum and maximum of facility scores for the effectiveness dimension, by background characteristics
Dimensions: Effectiveness Background characteristics Mean Median Minimum Maximum
1. ANC service score (out of 12) 12 services provided either observed or reported (if not seen):
• Weighing client • Taking Blood pressure • Protein in urine test • Hemoglobin test • Counseling on FP • Counseling on minimum 4 ANC
visits • Counseling on birth preparedness • HIV testing and counseling • Syphilis rapid diagnostic test • Provide iron/folic acid
supplements • Provide TT vaccination • Provide Albendazole
Facility type: Zonal and above hospitals District-level hospitals Private hospitals PHCCs HPs UHCs
Managing authority Private Public
Ecological region Mountain Hill Terai
Province 1 2 3 4 5 6 7
Overall
9.5
10.1 9.5 9.5 8.4 8.2
9.5 8.5
8.6 8.6 8.6
8.6 8.4 8.7 8.6 8.6 8.5 8.7
8.6
9
10 9 9 9 8
9 9
9 9 9
9 9 9 9 9 9 9
9
3 5 4 6 4 6
4 3
4 4 3
4 3 4 7 5 6 5
3
12 12 12 12 12 9
12 12
12 12 12
12 12 12 12 12 12 12
12
2a. Mean physical examination score for first visit ANC clients (out of 6)
Includes:
• Weight measured • BP measured • Breast examination • Checked for edema • Checked client’s abdomen for
uterine/fundal height using measuring tape or ultrasound
• Examined conjunctiva/palm for anemia
Facility type:
Zonal and above hospitals District-level hospitals Private hospitals PHCCs HPs UHCs
Managing authority Private Public
Ecological region Mountain Hill Terai
Province 1 2 3 4 5 6 7
Overall
2.6 2.8 3.0 2.7 2.6 3.6
3.0 2.6
2.7 2.7 2.6
2.9 2.3 2.8 3.2 2.9 2.7 2.6
3.0
2.8 2.8 3.0 2.6 2.5 3.5
3.0 2.5
2.5 2.8 2.5
2.9 2.3 2.6 3.0 2.8 2.5 2.5
3.0
0.8 0.4 1.0 0.5
0 3.0
1.0 0
2.0 0
0.5
0.8 0.5 1.0 0.4 0.8 0.5
0 0
4.4 5.4 6.0 6.0 5.0 4.0
6.0 6.0
4.0 6.0 6.0
5.0 6.0 6.0 4.7 5.4 5.2 5.0
6.0
Continued…

104
Appendix Table D1—continued
Dimensions: Effectiveness Background characteristics Mean Median Minimum Maximum 2b. Mean physical examination
score for follow-up ANC clients (out of 6)
Includes:
• Weight measured • BP measured • Breast examination • Checked for edema • Checked client’s abdomen for
uterine/fundal height using measuring tape or ultrasound
• Examined conjunctiva/palm for anemia
Facility type:
Zonal and above hospitals District-level hospitals Private hospitals PHCCs HPs UHCs
Managing authority Private Public
Ecological region Mountain Hill Terai
Province 1 2 3 4 5 6 7
Overall
2.6 3.0 2.9 2.6 2.7 3.0
2.9 2.7
2.6 2.9 2.6
3.0 2.3 2.9 3.0 2.9 2.5 2.5
2.8
2.9 3.0 3.0 2.5 2.9 4.0
3.0 2.9
2.8 3.0 2.8
2.9 2.2 2.9 3.2 3.0 2.5 2.5
3.0
0.8 0.4 1.0
0 0 0
1.0 0
1.0 0 0
0.8 0
1.0 0.4 0.8
0 0
0
4.4 5.4 5.4 5.0 6.0 6.0
5.4 6.0
5.0 5.2 6.0
5.0 5.0 6.0 5.0 5.4 5.2 5.0
6.0
3. Mean score for preventive intervention/counseling for first-time visit ANC clients (out of 8)
Provider gave or prescribed the following:
• iron or folic acid tablets • albendazole • TT injection
Provider gave advice or counseling on maintaining a healthy pregnancy Provider asked, performed, referred or looked at report regarding
• hemoglobin test • blood grouping • urine test • syphilis test
Facility type:
Zonal and above hospitals District-level hospitals Private hospitals PHCCs HPs UHCs
Managing authority Private Public
Ecological region Mountain Hill Terai
Province 1 2 3 4 5 6 7
Overall
4.4 3.9 3.6 3.8 3.1 5.6
3.6 3.3
3.5 3.6 3.2
3.8 2.9 3.4 4.1 3.4 3.3 3.6
3.4
4.8 3.7 3.0 3.6 3.0 8.0
3.0 3.0
3.0 3.5 3.0
4.0 2.4 3.0 4.0 3.1 3.4 3.3
3.0
1.4 1.0 1.0
0 0
2.5
1.0 0
0.5 0.5
0
0 0 0
2.0 1.0 0.8 0.5 0
7.2 7.5 6.6 8.0 8.0 8.0
6.6 8.0
8.0 8.0 8.0
8.0 8.0 8.0 7.2 7.5 8.0 7.0
8.0

105
Appendix Table D2 Mean, median, minimum and maximum of facility scores for each quality of care indicator for the efficiency dimension by background characteristics
Dimensions: Efficiency Background characteristics Mean Median Minimum Maximum
2a. Service readiness to provide ANC service:
Domain 1: Percent of facilities with an ANC guideline available Reproductive health clinical protocol or any other ANC guideline like maternity guideline/National medical standard volume III
Facility type: Zonal 5and above hospitals District-level hospitals Private hospitals PHCCs HPs UHCs
Managing authority Private Public
Ecological region Mountain Hill Terai
Province 1 2 3 4 5 6 7
Overall
18.3% 27.4% 4.3%
24.2% 27.5% 4.0%
4.3% 26.4%
17.5% 25.8% 26.5%
14.8% 24.1% 17.9% 31.4% 46.7% 24.8% 18.2%
25.0%
NA NA NA NA NA NA
NA NA
NA NA NA
NA NA NA NA NA NA NA
NA
NA NA NA NA NA NA
NA NA
NA NA NA
NA NA NA NA NA NA NA
NA
NA NA NA NA NA NA
NA NA
NA NA NA
NA NA NA NA NA NA NA
NA
2b. Service readiness to provide ANC service:
Domain 2: Staff training score in the past 24 months on five ANC training topics (max number of training out of 5)
• ANC screening • Counseling for ANC • Complications of pregnancy and
their management • Nutritional assessment of
pregnant woman • PMTCT of HIV
Facility type:
Zonal and above hospitals District-level hospitals Private hospitals PHCCs HPs UHCs
Managing authority Private Public
Ecological region Mountain Hill Terai
Province 1 2 3 4 5 6 7 Overall
1.1 1.6 0.3 1.3 0.8 0.5
0.3 0.9
1.1 0.7 0.8
0.7 0.6 0.8 0.7 0.6 1.4 1.4
0.8
0 1 0 0 0 0
0 0
0 0 0
0 0 0 0 0 0 1
0
0 0 0 0 0 0
0 0
0 0 0
0 0 0 0 0 0 0
0
5 5 4 5 5 4
4 5
5 5 5
5 5 5 5 5 5 5
5
2c. Service readiness to provide ANC service:
Domain 3: ANC Equipment score (out of 5)
• BP apparatus • Examination bed/table • Adult weighing scale • Fetoscope • Measuring tape
Facility type: Zonal and above hospitals District-level hospitals Private hospitals PHCCs HPs UHCs
Managing authority Private Public
4.3 4.4 4.1 4.3 3.8 4.0
4.1 3.8
5 4 4 4 4 4
4 4
3 2 0 2 0 2
0 0
5 5 5 5 5 5
5 5
Continued…

106
Appendix Table D2—continued
Dimensions: Efficiency Background characteristics Mean Median Minimum Maximum Ecological region
Mountain Hill Terai
Province 1 2 3 4 5 6 7
Overall
3.8 3.9 3.8
3.8 3.6 3.9 4.1 4.0 3.6 3.8
3.8
4 4 4
4 4 4 4 4 4 4
4
0 0 0
1 0 0 2 0 0 0
0
5 5 5
5 5 5 5 5 5 5
5
2d. Service readiness to provide ANC service:
Domain 4: ANC laboratory diagnostics score for each facility (out of 2 diagnostics)
• Hemoglobin test • Urine protein test
Facility type: Zonal and above hospitals District-level hospitals Private hospitals PHCCs HPs UHCs
Managing authority Private Public
Ecological region Mountain Hill Terai
Province 1 2 3 4 5 6 7
Overall
1.9 2.0 1.9 1.4 0.1 0
1.9 0.2
0.2 0.3 0.4
0.3 0.2 0.4 0.3 0.3 0.3 0.3
0.3
2 2 2 2 0 0
2 0
0 0 0
0 0 0 0 0 0 0
0
1 1 0 0 0 0
0 0
0 0 0
0 0 0 0 0 0 0
0
2 2 2 2 2 0
2 2
2 2 2
2 2 2 2 2 2 2
2
2e. Service readiness to provide ANC service:
Domain 5: ANC essential oral medicines and vaccine score (out of 3)
• Iron/folic acid • Albendazole • Tetanus toxoid vaccine
Facility type: Zonal and above hospitals District-level hospitals Private hospitals PHCCs HPs UHCs
Managing authority Private Public
Ecological region Mountain Hill Terai
Province 1 2 3 4 5 6 7
Overall
2.7 2.8 2.2 2.6 2.1 2.3
2.2 2.1
2.2 2.2 2.0
2.2 1.8 2.3 2.2 2.2 2.1 2.1
2.1
3 3 3 3 2 2
3 2
2 2 2
2 2 2 2 2 2 2
2
1 1 0 1 0 1
0 0
1 0 0
0 0 0 2 0 0 1
0
3 3 3 3 3 3
3 3
3 3 3
3 3 3 3 3 3 3
3

107
Appendix Table D3 Mean, median, minimum and maximum of facility scores for each quality of care indicator for dimension measuring appropriateness by background characteristics
Dimensions: Appropriateness Background characteristics Mean Median Minimum Maximum
1. Number of days per month ANC services are provided in a 28-day month
Facility type: Zonal and above hospitals District-level hospitals Private hospitals PHCCs HPs UHCs
Managing authority Private Public
Ecological region Mountain Hill Terai
Province 1 2 3 4 5 6 7
Overall
18.4 17.9 25.5 20.3 21.2 24.1
25.5 21.2
22.7 22.4 19.8
23.0 19.0 23.1 22.3 18.1 23.0 22.7
21.5
24 24 28 24 24 24
28 24
24 24 24
24 24 24 24 24 24 24
24
4 2 4 1 1
22
4 1
1 1 1
1 1 2 1 1 1 1
1
24 28 28 28 28 28
28 28
28 28 28
28 28 28 28 28 28 28
28


109
APPENDIX E SICK CHILD CARE SERVICE QUALITY OF CARE RESULTS BY DIMENSION
Appendix Table E1 Mean, median, minimum and maximum of facility scores for each quality of care indicator for dimension measuring effectiveness by background characteristics
Dimensions: Effectiveness Background characteristics Mean Median Minimum Maximum
1. Number of child health services provided (out of 5)
Five services include:
• Outpatient curative care for sick children
• Growth monitoring • Child vaccination (4 vaccines:
BCG, Polio, Pentavalent and MR) • Child vaccination (additional 2
vaccines: PCV and JE) • Routine vitamin A
supplementation:
Facility type: Zonal and above hospitals District-level hospitals Private hospitals PHCCs HPs UHCs
Managing authority Private Public
Ecological region Mountain Hill Terai
Province 1 2 3 4 5 6 7
Overall
3.8 4.1 2.3 4.2 4.1 3.8
2.3 4.1
3.9 3.9 4.0
3.9 4.0 3.8 4.1 4.2 3.9 3.7
4.0
4 4 2 4 4 4
2 4
4 4 4
4 4 4 4 4 4 4
4
1 1 0 2 1 0
0 0
1 0 0
0 1 0 2 0 1 0
0
5 5 5 5 5 5
5 5
5 5 5
5 5 5 5 5 5
5
5
2. Mean danger sign assessment score (out of 3)
Danger signs assessed or provider inquired about for each child includes: inability to eat or drink, vomiting and convulsions
Facility type: Zonal and above hospitals District-level hospitals Private hospitals PHCCs HPs UHCs
Managing authority Private Public
Ecological region Mountain Hill Terai
Province 1 2 3 4 5 6 7
Overall
0.6 0.5 0.6 0.5 0.4 0.2
0.6 0.4
0.5 0.5 0.4
0.6 0.3 0.4 0.6 0.5 0.5 0.5
0.5
0.5 0.5 0.6 0.4 0.2
0
0.6 0.3
0.3 0.5 0.2
0.5 0
0.3 0.5 0.3 0.3 0.3 0.3
0 0 0 0 0 0
0 0
0 0 0
0 0 0 0 0 0 0
0
2
1.7 3 3 3 1
3 3
3 3
2.7
3 2.5
3 2 2 3 2
3
3. Mean main symptoms assessment score (out of 3 main symptoms assessment)
Main symptoms/signs assessed for were cough or difficulty breathing, diarrhea and fever
Facility type: Zonal and above hospitals District-level hospitals Private hospitals PHCCs HPs UHCs
1.9 1.8 1.9 1.8 1.7 1.2
1.8 1.8
2 1.8 1.8
1
1.3
0 0 0 0 0
3 3 3 3 3 3
Continued…

110
Appendix Table E1—continued
Dimensions: Effectiveness Background characteristics Mean Median Minimum Maximum
Managing authority Private Public
Ecological region Mountain Hill Terai
Province 1 2 3 4 5 6 7
Overall
1.9 1.7
2.0 1.9 1.5
1.8 1.2 2.0 2.0 1.7 1.8 2.0
1.7
2
1.8
2 2
1.4
2 1.3
2 2
1.7 2 2
1.8
0 0
0 0 0
0 0 0 0 0 0 0
0
3 3
3 3 3
3 3 3 3 3 3 3
3
4. Mean index of integrated assessment score –quality and completeness of the assessment (range 0-100)
0= none of the assessments were carried out 100= all assessments were carried out. 13 assessments for children >=2years: ability to drink or breastfeed, child vomits everything, convulsion, cough or difficulty breathing, diarrhea, fever, Child weighed the same day, weight checked against a recommended growth chart, palmar pallor, visible severe wasting, edema on both feet, vaccination status, other problems. For children under 2 years of age (additional 3): breastfeeding, intake of any other food or fluids and whether feeding has changed during the illness
Facility type: Zonal and above hospitals District-level hospitals Private hospitals PHCCs HPs UHCs
Managing authority Private Public
Ecological region Mountain Hill Terai
Province 1 2 3 4 5 6 7
Overall
28.3% 28.5% 30.9% 28.1% 25.5% 18.5%
30.9% 25.8%
29.5% 29.9% 22.1%
29.6% 17.3% 29.6% 33.1% 29.6% 26.2% 28.4%
28.0%
28.8 27.2 30.2 27.9 24.3 18.8
30.2 24.4
29.4 28.9 19.8
28.4 15.4 28.9 30.8 25.8 24.9 26.7
24.9
10.1 7.8
0 0 0
2.8
0 0
6.3 0 0
7.7 0 0
7.7 6.3
0 0
0
54.3 57.1 84.6 69.2 68.8 50.0
84.6 69.2
69.2 84.6 63.9
62.5 63.9 84.6 62.5 60.4 69.2 61.5
84.6

111
Appendix Table E2 Mean, median, minimum and maximum of facility scores for each quality of care indicator for dimension measuring efficiency by background characteristics
Dimensions: Efficiency Background characteristics Mean Median Minimum Maximum
1a. Service readiness to provide outpatient curative care:
Domain 1: Percent of facilities with of IMNCI Guideline or IMNCI chart booklet
Facility type: Zonal and above hospitals District-level hospitals Private hospitals PHCCs HPs UHCs
Managing authority Private Public
Ecological region Mountain Hill Terai
Province 1 2 3 4 5 6 7
Overall
18.3% 56.6% 5.7%
73.3% 66.8% 24.6%
5.7% 65.1%
61.1% 61.9% 59.8%
56.0% 60.3% 56.1% 61.5% 72.9% 65.7% 59.0%
61.0%
NA NA NA NA NA NA
NA NA
NA NA NA
NA NA NA NA NA NA NA
NA
NA NA NA NA NA NA
NA NA
NA NA NA
NA NA NA NA NA NA NA
NA
NA NA NA NA NA NA
NA NA
NA NA NA
NA NA NA NA NA NA NA
NA
1b. Service readiness to provide outpatient curative care:
Domain 2: Staff training score in the past 24 months on two child care training topics (max number of training out of 2) Training topics: 1. IMCI/IMNCI 2. infant and young child feeding
(IYCF)
Facility type: Zonal and above hospitals District-level hospitals Private hospitals PHCCs HPs UHCs
Managing authority Private Public
Ecological region Mountain Hill Terai
Province 1 2 3 4 5 6 7
Overall
0.2 0.7 0.1 0.7 0.4 0.4
0.1 0.5
0.3 0.3 0.5
0.3 0.3 0.5 0.4 0.5 0.7 0.5
0.4
0
1 0 1 0 0
0 0
0 0 0
0 0 0 0 0 1 0
0
0 0 0 0 0 0
0 0
0 0 0
0 0 0 0 0 0 0
0
1 2 2 2 2 2
2 2
2 2 2
2 2 2 2 2 2 2
2
1c. Service readiness to provide outpatient curative care:
Domain 3: Outpatient curative child care equipment score for each facility (out of 6)
• Child scale • Infant scale • Length or height measuring
equipment • Thermometer • Stethoscope: • Growth chart/Child health card
Facility type: Zonal and above hospitals District-level hospitals Private hospitals PHCCs HPs UHCs
Managing authority Private Public
4.5 4.6 3.5 4.8 4.1 3.4
3.5 4.1
5 5 4 4 4 3
4 4
2 2 2 1 1 2
2 1
6 6 6 6 6 5
6 6
Continued…

112
Appendix Table E2—continued
Dimensions: Efficiency Background characteristics Mean Median Minimum Maximum
Ecological region Mountain Hill Terai
Province 1 2 3 4 5 6 7
Overall
4.0 4.2 3.8
4.0 3.5 4.0 4.3 4.3 3.9 4.3
4.0
4 4 4
4 4 4 4 4 4 4
4
2 2 1
2 1 2 2 2 2 2
1
6 6 6
6 6 6 6 6 6 6
6
1d. Service readiness to provide outpatient curative care:
Domain 4: Outpatient curative child care laboratory diagnostics capacity score for each facility (out of 3)
• Hemoglobin test • Malaria test • Stool microscopy
Facility type: Zonal and above hospitals District-level hospitals Private hospitals PHCCs HPs UHCs
Managing authority Private Public
Ecological region Mountain Hill Terai
Province 1 2 3 4 5 6 7
Overall
2.7 2.6 2.4 1.9 0.2
0.02
2.4 0.3
0.2 0.4 0.7
0.4 0.4 0.6 0.4 0.5 0.3 0.5
0.5
3 3 3 2 0 0
3 0
0 0 0
0 0 0 0 0 0 0
0
1 1 0 0 0 0
0 0
0 0 0
0 0 0 0 0 0 0
0
3 3 3 3 3 1
3 3
3 3 3
3 3 3 3 3 3 3
3
1e. Service readiness to provide outpatient curative care:
Domain 5: Outpatient curative child care essential oral medicine score for each facility (out of 7)
• Oral rehydration salts • Zinc tablets • Amoxicillin syrup, suspension, or
dispersible • Co-trimoxazole syrup, suspension
or dispersible • Paracetamol syrup, or suspension • Vitamin A capsules • Albendazole
Facility type: Zonal and above hospitals District-level hospitals Private hospitals PHCCs HPs UHCs
Managing authority Private Public
Ecological region Mountain Hill Terai
Province 1 2 3 4 5 6 7
Overall
4.4 5.8 4.1 5.5 5.4 5.1
4.1 5.4
5.5 5.5 5.1
5.3 5.0 5.4 5.6 5.5 5.0 5.4
5.3
4 6 5 5 5 5
5 5
5 6 5
5 5 6 6 6 5 5
5
0 2 0 3 1 1
0 0
0 0 0
0 0 0 0 0 0 0
0
7 7 7 7 7 7
7 7
7 7 7
7 7 7 7 7 7 7
7
Continued…

113
Appendix Table E2—continued
Dimensions: Efficiency Background characteristics Mean Median Minimum Maximum
1f. Service readiness to provide outpatient curative care:
Domain 6: Outpatient curative child care priority medicine score for each facility (out of 3)
• Ampicillin powder for injection • Ceftriaxone powder for injection • Gentamycin injection
Facility type: Zonal and above hospitals District-level hospitals Private hospitals PHCCs HPs UHCs
Managing authority Private Public
Ecological region Mountain Hill Terai
Province 1 2 3 4 5 6 7
Overall
2.2 1.8 1.7 1.1 0.7 0.3
1.7 0.7
0.8 0.8 0.7
0.8 0.6 0.7 0.9 0.7 1.0 1.0
0.8
2 2 2 1 1 0
2 1
1 1 1
1 1 0 1 1 1 1
1
1 0 0 0 0 0
0 0
0 0 0
0 0 0 0 0 0 0
0
3 3 3 3 2 1
3 3
3 3 3
3 3 3 3 3 3 3
3
2a. Service readiness to provide vaccination:
Domain 1: Percent of facilities with vaccination Guideline available (%):
• National immunization for child vaccination guideline,
• OR • Any other guideline for child
vaccination (i.e. Khopko Byawaharik gyan, Measles Rubella Khop sambandhi nirdeshika)
Facility type: Zonal and above hospitals District-level hospitals Private hospitals PHCCs HPs UHCs
Managing authority Private Public
Ecological region Mountain Hill Terai
Province 1 2 3 4 5 6 7
Overall
52.3% 54.4% 35.9% 47.8% 56.5% 30.1%
35.9% 55.2%
52.9% 55.8% 53.8%
51.3% 45.0% 61.2% 39.8% 72.0% 59.4% 55.6%
54.7%
NA NA NA NA NA NA
NA NA
NA NA NA
NA NA NA NA NA NA NA
NA
NA NA NA NA NA NA
NA NA
NA NA NA
NA NA NA NA NA NA NA
NA
NA NA NA NA NA NA
NA NA
NA NA NA
NA NA NA NA NA NA NA
NA
2b. Service readiness to provide vaccination:
Domain 2: Percent of facility with at least one trained staff reported to have received EPI in-service training during 24 months preceding survey:
Facility type: Zonal and above hospitals District-level hospitals Private hospitals PHCCs HPs UHCs
Managing authority Private Public
Ecological region Mountain Hill Terai
23.1% 20.8% 15.2% 32.3% 22.8% 27.8%
15.2% 23.7%
26.9% 20.5% 29.1%
NA NA NA NA NA NA
NA NA
NA NA NA
NA NA NA NA NA NA
NA NA
NA NA NA
NA NA NA NA NA NA
NA NA
NA NA NA
Continued…

114
Appendix Table E2—continued
Dimensions: Efficiency Background characteristics Mean Median Minimum Maximum
Province 1 2 3 4 5 6 7
Overall
28.0% 27.0% 24.9% 22.3% 16.4% 17.4% 22.5%
23.4%
NA NA NA NA NA NA NA
NA
NA NA NA NA NA NA NA
NA
NA NA NA NA NA NA NA
NA
2c. Service readiness to provide outpatient curative care:
Domain 3: Vaccination service equipment score for each facility (out of 3 equipment)
• Vaccine carrier with ice pack • Sharps container box • Syringes and needles
Facility type: Zonal and above hospitals District-level hospitals Private hospitals PHCCs HPs UHCs
Managing authority Private Public
Ecological region Mountain Hill Terai
Province 1 2 3 4 5 6 7
Overall
2.6 2.6 2.4 2.6 2.5 2.5
2.4 2.5
2.5 2.6 2.4
2.4 2.3 2.7 2.6 2.6 2.5 2.4
2.5
3 3 3 3 3 2
3 3
3 3 3
3 2 3 3 3 3 3
3
0 0 0 0 0 1
0 0
0 0 0
0 0 1 0 0 0 0
0
3 3 3 3 3 3
3 3
3 3 3
3 3 3 3 3 3 3
3

115
Appendix Table E3 Mean, median, minimum and maximum of facility scores for each quality of care indicator for dimension measuring reliability by background characteristics
Dimensions: Reliability Background characteristics Mean Median Minimum Maximum
1. Percent of sick children consultations at each facility conducted by qualified provider
Qualified provider is either one of the following:
• Generalist medical doctor • Pediatrician • Medical Officer (MBBS, BDS) • Nurse or Auxiliary Nurse Midwife
(ANM) • Health
Assistant/AHW/SAHW/Public health inspector
Facility type: Zonal and above hospitals District-level hospitals Private hospitals PHCCs HPs UHCs Managing authority Private Public Ecological region Mountain Hill Terai Province 1 2 3 4 5 6 7 Overall
100% 98.7% 98.4% 99.7% 99.6%
100%
98.4% 99.6%
99.2% 99.7% 99.4%
99.5% 99.1% 99.5%
100% 99.5% 99.6%
100%
99.5%
NA NA NA NA NA NA
NA NA
NA NA NA
NA NA NA NA NA NA NA
NA
NA NA NA NA NA NA
NA NA
NA NA NA
NA NA NA NA NA NA NA
NA
NA NA NA NA NA NA
NA NA
NA NA NA
NA NA NA NA NA NA NA
NA
Appendix Table E4 Mean, median, minimum and maximum of facility scores for each quality of care
indicator for dimension measuring appropriateness by background characteristics
Dimensions: Appropriate Background characteristics Mean Median Minimum Maximum
1. Number of days per month SC services are provided in a 28-day month
Facility type: Zonal and above hospitals District-level hospitals Private hospitals PHCCs HPs UHCs
Managing authority Private Public
Ecological region Mountain Hill Terai
Province 1 2 3 4 5 6 7
Overall
24.4 23.6 26.1 24.1 24.2 22.8
26.1 24.2
24.3 24.4 24.2
24.0 24.3 24.6 24.3 24.0 24.7 24.2
24.3
24 24 28 24 24 24
28 24
24 24 24
24 24 24 24 24 24 24
24
24 0 6 1 6 1
6 0
0 6 1
1 8 6
24 1 0 1
0
28 28 28 28 28 28
28 28
28 28 28
28 28 28 28 28 28 28
28
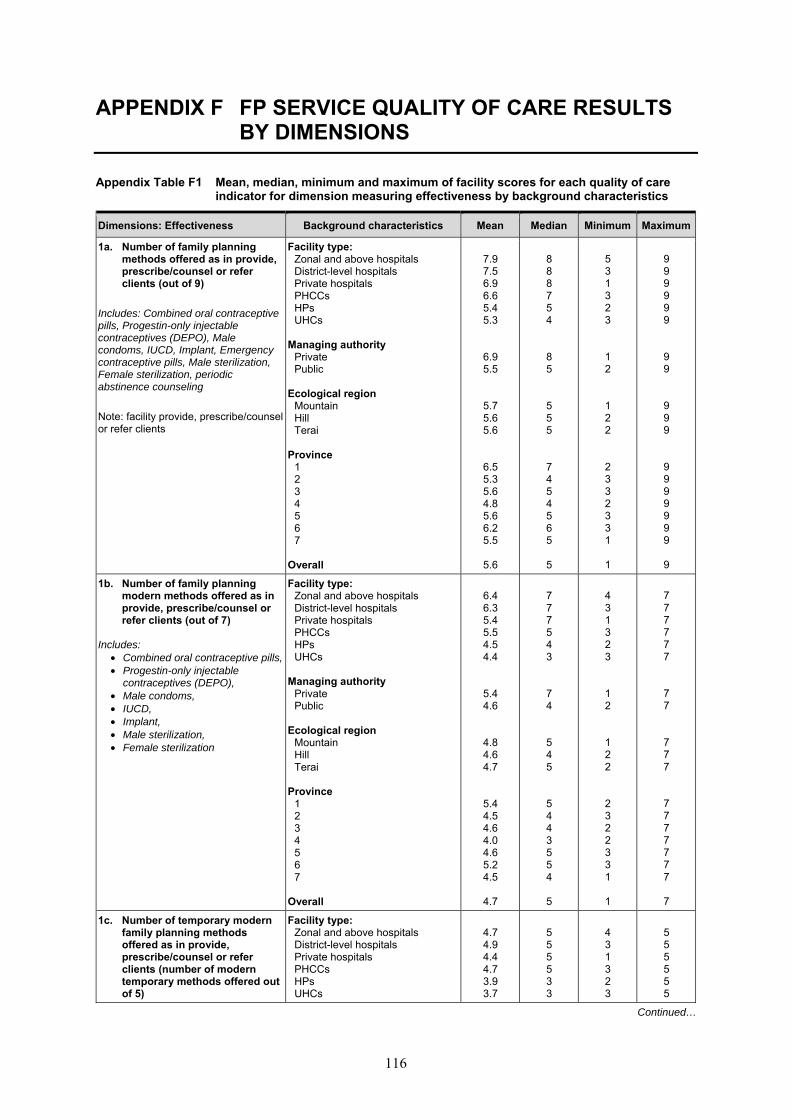
116
APPENDIX F FP SERVICE QUALITY OF CARE RESULTS BY DIMENSIONS
Appendix Table F1 Mean, median, minimum and maximum of facility scores for each quality of care indicator for dimension measuring effectiveness by background characteristics
Dimensions: Effectiveness Background characteristics Mean Median Minimum Maximum
1a. Number of family planning methods offered as in provide, prescribe/counsel or refer clients (out of 9)
Includes: Combined oral contraceptive pills, Progestin-only injectable contraceptives (DEPO), Male condoms, IUCD, Implant, Emergency contraceptive pills, Male sterilization, Female sterilization, periodic abstinence counseling Note: facility provide, prescribe/counsel or refer clients
Facility type: Zonal and above hospitals District-level hospitals Private hospitals PHCCs HPs UHCs
Managing authority Private Public
Ecological region Mountain Hill Terai
Province 1 2 3 4 5 6 7
Overall
7.9 7.5 6.9 6.6 5.4 5.3
6.9 5.5
5.7 5.6 5.6
6.5 5.3 5.6 4.8 5.6 6.2 5.5
5.6
8 8 8 7 5 4
8 5
5 5 5
7 4 5 4 5 6 5
5
5 3 1 3 2 3
1 2
1 2 2
2 3 3 2 3 3 1
1
9 9 9 9 9 9
9 9
9 9 9
9 9 9 9 9 9 9
9
1b. Number of family planning modern methods offered as in provide, prescribe/counsel or refer clients (out of 7)
Includes: • Combined oral contraceptive pills, • Progestin-only injectable
contraceptives (DEPO), • Male condoms, • IUCD, • Implant, • Male sterilization, • Female sterilization
Facility type: Zonal and above hospitals District-level hospitals Private hospitals PHCCs HPs UHCs
Managing authority Private Public
Ecological region
Mountain Hill Terai
Province 1 2 3 4 5 6 7
Overall
6.4 6.3 5.4 5.5 4.5 4.4
5.4 4.6
4.8 4.6 4.7
5.4 4.5 4.6 4.0 4.6 5.2 4.5
4.7
7 7 7 5 4 3
7 4
5 4 5
5 4 4 3 5 5 4
5
4 3 1 3 2 3
1 2
1 2 2
2 3 2 2 3 3 1
1
7 7 7 7 7 7
7 7
7 7 7
7 7 7 7 7 7 7
7
1c. Number of temporary modern family planning methods offered as in provide, prescribe/counsel or refer clients (number of modern temporary methods offered out of 5)
Facility type: Zonal and above hospitals District-level hospitals Private hospitals PHCCs HPs UHCs
4.7 4.9 4.4 4.7 3.9 3.7
5 5 5 5 3 3
4 3 1 3 2 3
5 5 5 5 5 5
Continued…

117
Appendix Table F1—continued
Dimensions: Effectiveness Background characteristics Mean Median Minimum Maximum
Includes: • Combined oral contraceptive pills, • Progestin-only injectable
contraceptives (DEPO), • Male condoms, • IUCD,
Implant
Managing authority Private Public
Ecological region Mountain Hill Terai
Province 1 2 3 4 5 6 7
Overall
4.2 3.9
4.0 3.9 4.0
4.3 3.8 3.9 3.6 4.0 4.2 3.8
3.9
5 4
4 4 4
5 3 4 3 4 5 4
4
1 2
1 2 1
2 3 1 2 3 3 1
1
5 5
5 5 5
5 5 5 5 5 5 5
5 2. Mean reproductive history
score for first-visit clients only (out of 6)
Six client history variables:
• Age • Pregnancy history • Last menstrual period (current
pregnancy status) • Desire for more children/desired
timing of next child • Breastfeeding status (if every
pregnant) • Regularity of menstrual cycle
Note: calculated the mean reproductive score for each facility (when more than one observation per facility) and then aggregated those by type of facility
Facility type: Zonal and above hospitals District-level hospitals Private hospitals PHCCs HPs UHCs
Managing authority Private Public
Ecological region Mountain Hill Terai
Province 1 2 3 4 5 6 7
Overall
2.7 2.5 1.1 2.4 2.4 2.5
1.1 2.5
3.2 2.4 2.2
1.7 1.6 2.6 3.4 2.8 2.7 2.8
2.4
3.3
3 0 2 2 3
0 2.3
3 2 2
1 2
2.3 4 3 2
2.7
2
0 0 0 0 0 0
0 0
0 0 0
0 0 0 2 0 1 0
0
5 5 4 5 6 3
4 6
6 5 6
5 4 5 4 5 6 6
6 3. Mean physical examination/
medical history score among first-visit FP clients (out of 6)
Six physical examination variables include:
• BP taken • Weight taken • Asked about smoking • Asked about sexually transmitted
infections (STIs) • Asked about chronic illness • Looked at client’s health card
Note: calculated the mean physical exam score for each facility (when more than one observation per facility) and then aggregated those by type of facility
Facility type: Zonal and above hospitals District-level hospitals Private hospitals PHCCs HPs UHCs
Managing authority Private Public
Ecological region Mountain Hill Terai
Province 1 2 3 4 5 6 7
Overall
2.1 2.2 1.5 2.1 2.1 3.2
1.5 2.1
2.3 2.1 2.0
2.4 1.5 2.2 2.0 2.6 1.9 1.8
2.1
2.5
2 2 2 2 4
2 2
2.3 3 2
3 1.5
3 1.5
3 2 2
2
0 0 0 0 0 2
0 0
1 0 0
0 0 0 1 0 0 0
0
3 5 3 5 4 4
3 5
4 5 4
4 3 5 3 5 4
3.5
5
Continued…

118
Appendix Table F1—continued
Dimensions: Effectiveness Background characteristics Mean Median Minimum Maximum
4. Mean Injectable procedure score (out of 7):
Seven tasks that provider performed when giving family planning injection
• Wash hands with soap before giving injection
• Used newly sterilized needle or disposable needle
• Stirred the bottle before drawing dose
• Clean and air dry injection site before injection
• Draw back plunger before injection
• Allow dose to self-dispense instead of massaging
• Dispose of needle in puncture resistant container
Facility type: Zonal and above hospitals District-level hospitals Private hospitals PHCCs HPs UHCs
Managing authority Private Public
Ecological region Mountain Hill Terai
Province 1 2 3 4 5 6 7
Overall
5.3 4.9 4.9 5.2 4.7 4.4
4.9 4.8
4.9 4.8 4.7
4.5 5.0 4.5 5.3 4.9 5.2 4.9
4.8
5 5
4.5 5 5 4
4.5 5
5 5 5
5 5
4.5 4.5
5 5 5
5
4 3
4.2 2 2 3
4.2 2
3 2 2
2 3 3 3 2 4 3
2
7
6.8 7 7 7 7
7 7
7 7 7
7 7 7 7 7 6 7
7

119
Appendix Table F2 Mean, median, minimum and maximum of facility scores for each quality of care indicator for dimension measuring efficiency by background characteristics
Dimensions: Efficiency Background characteristics Mean Median Minimum Maximum 1a. FP service readiness: Domain 1: Percent of facilities with a FP Guideline available
Facility type: Zonal and above hospitals District-level hospitals Private hospitals PHCCs HPs UHCs
Managing authority Private Public
Ecological region Mountain Hill Terai
Province 1 2 3 4 5 6 7
Overall
29.1% 15.8% 1.3% 9.7%
14.1% 0%
1.3% 13.5%
7.0% 15.9% 10.5%
0.9% 9.9% 8.2%
19.3% 30.8% 19.8% 7.1%
12.8%
NA NA NA NA NA NA
NA NA
NA NA NA
NA NA NA NA NA NA NA
NA
NA NA NA NA NA NA
NA NA
NA NA NA
NA NA NA NA NA NA NA
NA
NA NA NA NA NA NA
NA NA
NA NA NA
NA NA NA NA NA NA NA
NA
1b. FP service readiness: Domain 2: Staff training score in the past 24 months on seven FP training topics (max number of training out of 7) Training in 7 topics: 1. General FP counseling 2. IUCD insertion and removal 3. Implant insertion and removal 4. Performing non-scalpel
vasectomy (NSV) 5. Performing minilap tubal ligation 6. Family planning for HIV positive
women 7. Post-partum FP (incl. PPIUCD)
Facility type: Zonal and above hospitals District-level hospitals Private hospitals PHCCs HPs UHCs
Managing authority Private Public
Ecological region Mountain Hill Terai
Province 1 2 3 4 5 6 7
Overall
1.0 1.7 0.4 1.2 0.5 0.9
0.4 0.6
0.8 0.6 0.7
0.6 0.5 0.5 0.6 0.5 0.5 1.1
0.6
0 1 0 1 0 0
0 0
0 0 0
0 0 0 0 0 0 1
0
0 0 0 0 0 0
0 0
0 0 0
0 0 0 0 0 0 0
0
3 6 5 6 6 6
5 6
5 6 6
4 4 6 5 6 5 6
6
1c. FP service readiness: Domain 3: FP service equipment score for each facility (out of 7) Includes 7 equipment (available and functioning) : 1. BP apparatus 2. Examination light 3. Examination bed or table: 4. FP or counselling kit 5. Pelvic model for IUCD: 6. Model for showing condom use 7. FP specific visual aids
Facility type: Zonal and above hospitals District-level hospitals Private hospitals PHCCs HPs UHCs
Managing authority Private Public
4.8 4.4 3.2 4.0 3.2 3.1
3.2 3.2
5 4.5 3 4 3 3
3 3
2 2 0 1 0 0
0 0
7 7 7 7 7 7
7 7
Continued…

120
Appendix Table F2—continued
Dimensions: Efficiency Background characteristics Mean Median Minimum Maximum
Ecological region Mountain Hill Terai
Province 1 2 3 4 5 6 7
Overall
3.4 3.3 3.1
3.1 2.8 3.0 3.7 3.7 3.6 3.1
3.2
3 3 3
3 3 3 4 3 4 3
3
1 0 0
0 0 0 1 0 0 0
0
6 7 7
7 7 7 7 7 7 6
7
1d. FP service readiness: Domain 4: FP service basic commodity score (out of 3)
Includes:
• Combined oral contraceptive pills • Progestin-only injectable
contraceptives (DEPO), • Male condoms
Facility type: Zonal and above hospitals District-level hospitals Private hospitals PHCCs HPs UHCs
Managing authority Private Public
Ecological region Mountain Hill Terai
Province 1 2 3 4 5 6 7
Overall
2.8 2.9 1.8 2.9 2.9 2.9
1.8 2.9
2.9 2.9 2.8
2.8 2.9 2.8
2.9 2.8 2.8 2.9
2.8
3 3 3 3 3 3
3 3
3 3 3
3 3 3 3 3 3 3
3
2 2 0 0 0 0
0 0
0 0 0
0 0 0 0 0 0 0
0
3 3 3 3 3 3
3 3
3 3 3
3 3 3 3 3 3 3
3
2. Service readiness to provide IUCD services based on availability of all the required equipment/supplies (%)
Availability of ALL of the following equipment and supplies (limited to only those facilities providing IUCD) 1. Sterile gloves 2. Antiseptic solution 3. Sponge holding forcep 4. Sterile gauze pad or cotton wool 5. Vaginal speculum (Small,
medium and large 6. Tenacula 7. Uterine sound
Facility type: Zonal and above hospitals District-level hospitals Private hospitals PHCCs HPs UHCs
Managing authority Private Public
Ecological region Mountain Hill Terai
Province 1 2 3 4 5 6 7
Overall
58.1% 47.3% 48.0% 31.4% 20.1% 0%
48.0% 25.8%
35.3% 26.8% 27.4%
37.2% 28.0% 32.5% 14.4% 44.6% 8.5%
13.0%
27.8%
NA NA NA NA NA NA
NA NA
NA NA NA
NA NA NA NA NA NA NA
NA
NA NA NA NA NA NA
NA NA
NA NA NA
NA NA NA NA NA NA NA
NA
NA NA NA NA NA NA
NA NA
NA NA NA
NA NA NA NA NA NA NA
NA
Continued…

121
Appendix Table F2—continued
Dimensions: Efficiency Background characteristics Mean Median Minimum Maximum
3. Service readiness to provide implant services based on availability of all the required equipment/supplies (%)
Availability of following equipment and supplies (limited to only those facilities providing implant services): 1. Sterile gloves 2. Antiseptic solution 3. Sponge holding forcep 4. Sterile gauze pad or cotton wool 5. Local anesthetic 6. Sterile syringe/needle or
disposable syringe 7. Canula and Trochar for inserting
implant 8. Sealed implant pack 9. Scapel with blade 10. Minor surgery kit with artery
forceps
Facility type: Zonal and above hospitals District-level hospitals Private hospitals PHCCs HPs UHCs
Managing authority Private Public
Ecological region Mountain Hill Terai
Province 1 2 3 4 5 6 7
Overall
61.9% 74.6% 48.1% 41.4% 37.6%
100%
48.1% 42.4%
47.1% 47.8% 32.7%
40.8% 38.4% 52.2% 30.1% 49.3% 33.2% 40.7%
42.8%
NA NA NA NA NA NA
NA NA
NA NA NA
NA NA NA NA NA NA NA
NA
NA NA NA NA NA NA
NA NA
NA NA NA
NA NA NA NA NA NA NA
NA
NA NA NA NA NA NA
NA NA
NA NA NA
NA NA NA NA NA NA NA
NA
4. Percent of facilities that met the quality of stock organization measures (%)
1. Commodities off the floor 2. Commodities protected from
water 3. Commodities protected from the
sun 4. Room protected from rodents 5. Room well ventilated 6. All commodities organized
according to expiration date
Facility type: Zonal and above hospitals District-level hospitals Private hospitals PHCCs HPs UHCs
Managing authority Private Public
Ecological region Mountain Hill Terai
Province 1 2 3 4 5 6 7
Overall
91.7% 81.5% 74.8% 75.1% 65.8% 73.6%
74.8% 67.0%
62.0% 68.0% 68.3%
75.2% 60.1% 65.4% 66.9% 72.9% 65.4% 64.8%
67.3%
NA NA NA NA NA NA
NA NA
NA NA NA
NA NA NA NA NA NA NA
NA
NA NA NA NA NA NA
NA NA
NA NA NA
NA NA NA NA NA NA NA
NA
NA NA NA NA NA NA
NA NA
NA NA NA
NA NA NA NA NA NA NA
NA

122
Appendix Table F3 Mean, median, minimum and maximum of facility scores for each quality of care indicator for dimension measuring appropriateness by background characteristics
Dimensions: Appropriate Background characteristics Mean Median Minimum Maximum
1. Number of days per month FP services are provided in a 28-day month
Facility type: Zonal and above hospitals District-level hospitals Private hospitals PHCCs HPs UHCs
Managing authority Private Public
Ecological region Mountain Hill Terai
Province 1 2 3 4 5 6 7
Overall
21.7 21.1 25.8 23.7 23.8 24.0
25.8 23.8
24.2 23.9 23.8
23.7 23.7 23.8 24.2 24.0 24.8 23.2
23.9
24 24 28 24 24 24
28 24
24 24 24
24 24 24 24 24 24 24
24
4 3 5 4 1
22
5 1
4 2 1
4 4 4 3 4 4 1
1
28 28 28 28 28 28
28 28
28 28 28
28 28 28 28 28 28 28
28