Optimizing Guinea-Bissau's natural wealth
68
Optimizing Guinea-Bissau’s natural wealth Helen Edmundson Poverty Reduction and Economic Management Africa Region September 2014 Public Disclosure Authorized Public Disclosure Authorized Public Disclosure Authorized Public Disclosure Authorized
-
Upload
khangminh22 -
Category
Documents
-
view
0 -
download
0
Transcript of Optimizing Guinea-Bissau's natural wealth

Optimizing Guinea-Bissau’s
natural wealth
Helen Edmundson
Poverty Reduction and Economic Management
Africa Region
September 2014
Pub
lic D
iscl
osur
e A
utho
rized
Pub
lic D
iscl
osur
e A
utho
rized
Pub
lic D
iscl
osur
e A
utho
rized
Pub
lic D
iscl
osur
e A
utho
rized

ii
Acronyms and Abbreviations
CAIA Celula de Avalicao de Impacte Ambiental
CBA Cost Benefit Analysis
CER Certified Emission Reduction
CPIA Country Policy and Institutional Assessment
DBT Dulombi-Boé-Tchetche
EIA Environmental Impact assessment
EU European Union
EU ETS European Union Emission Trading Scheme
FAO Food and Agriculture Organization
GDP Gross Domestic Product
GEF Global Environment Fund
GNI Gross national income
MRV Monitoring Reporting and Verification
NTFR Non-timber forest resources
ODA Official Development Assistance
PA Protected areas
REDD Reducing Emissions from Deforestation and Forest Degradation
RER Real exchange rate
SEEA System of Integrated Economic and Environmental Accounts
SNA System of National Accounts
SSA Sub-Saharan Africa
UN United Nations
UNDP United Nations Development Programme
VER Voluntary Emission Reduction
WAEMU West African Economic and Monetary Union

iii
Acknowledgments
This paper was prepared during 2012-2013, with the involvement and advice of several experts in The
World Bank Group and the government and agencies of Guinea-Bissau, as well as local Bissau-Guineans.
Without their support and input this paper would not have been possible.
Esther G. Naikal and Marie Le-Grange from the Wealth Accounting and the Valuation of Ecosystem
Services (WAVES) team provided support and advice on the methodologies and cross-cutting assumptions
needed for the natural wealth and adjusted net savings calculations. Gary Joseph Raymond McMahon and
Martin Lokanc gave useful inputs and suggestions on Guinea-Bissau’s minerals, their prospects, and key
assumptions on how the sectors are likely to evolve. Jingjie Chu’s work and modelling on West Africa’s
Regional Fisheries Trust Fund contributed to the assessment of Guinea-Bissau’s fishing sector, updated
with local data. Tanya Yudelman’s expertise and knowledge of Guinea-Bissau’s biodiversity, in addition
to support and insights from Institute of Biodiversity and Protected Areas (IBAP) helped strengthen this
paper’s overview of protected areas.
The paper also benefited from peer review comments from Sebasstien Dessus, John Virdin, and Glenn-
Marie Lange. Fernando Blanco, Miria Pigato and Vera Songwe provided additional comments, which
further strengthened the overall narrative and focus of the findings. Judite Fernandes helped coordinate the
inputs from the peer reviewers, ensuring their comments were duly addressed.
Finally, this paper could not have been completed without the support and technical expertise of Jose
D'Bettencourt. He conducted all of the interviews and collated on-the-ground information. His knowledge
of the issues, combined with his familiarly of the country made his insights and findings invaluable.
The preparation and analysis in this paper has been a team effort. I apologize to those highlighted above for
any mistakes or misrepresentation of views. The findings are intended to help facilitate a dialogue on
Guinea-Bissau’s natural wealth, both exhaustible and renewable forms. I hope therefore that in this regard,
the paper starts a useful debate on how best Guinea-Bissau can benefit from its natural resources.

iv
Contents
Acronyms and Abbreviations ....................................................................................................................... ii
Acknowledgments ........................................................................................................................................ iii
Executive Summary ...................................................................................................................................... 1
A. Introduction ........................................................................................................................................... 4
B. What does the past tell us: Guinea-Bissau’s current natural wealth estimates ..................................... 5
C. What does the present tell us: new estimates of Guinea-Bissau’s natural wealth ................................. 8
I. Exhaustible resources ........................................................................................................................ 8
Phosphate ............................................................................................................................................ 10
Bauxite ................................................................................................................................................ 12
Exhaustible resource considerations ................................................................................................... 13
II. Non-Exhaustible resources ............................................................................................................. 17
Fishing................................................................................................................................................. 18
Timber and non-timber forest related resources ................................................................................. 25
Mangroves ........................................................................................................................................... 29
Carbon ................................................................................................................................................. 32
Crop and pasture land ......................................................................................................................... 33
Protected areas/Biodiversity ............................................................................................................... 38
III. Total wealth ................................................................................................................................ 42
D. What does the future hold: policy implications for sustainable development .................................... 43
Exhaustible resources .......................................................................................................................... 44
Non-exhaustible resources .................................................................................................................. 44
Fishing................................................................................................................................................. 44
Timber and non-timber forest resource ............................................................................................... 45
Carbon ................................................................................................................................................. 46
Crop and pasture land ......................................................................................................................... 47
Biodiversity/protected areas ................................................................................................................ 47
Appendix A - Methodologies and assumptions .......................................................................................... 49
References ................................................................................................................................................... 62
List of Figures
Figure 1. Current estimates of total wealth in Guinea-Bissau ...................................................................... 6
Figure 2. Current natural wealth per capita estimates for Guinea-Bissau ..................................................... 6

v
Figure 3. Phosphate, Bauxite and Petroleum prices have been increasing ................................................... 8
Figure 4. Guinea-Bissau’s RER has stayed relatively constant over the past decade ................................. 15
Figure 5. Landings of artisanal and industrial fish ...................................................................................... 24
Figure 6. Exports of processed and unprocessed wood .............................................................................. 27
Figure 7. Top five export destinations for Guinea-Bissau’s Exports .......................................................... 35
Figure 8. Top five exported products from Guinea-Bissau......................................................................... 35
Figure 9. Tourism arrivals and receipts of West Africa countries with “pre-emerging” tourism sectors ... 39
Figure 10. Average tourism receipts per tourist arrival .............................................................................. 39
Figure 11. New and old calculations of Guinea-Bissau’s total wealth ....................................................... 42
Figure 12. Gross and adjusted net savings .................................................................................................. 43
Figure 13. Total volume of timber exports ................................................................................................. 55
Figure 14. Export unit values of Guinea-Bissau’s main timber exports .................................................... 55
List of Tables
Table 1. Biomass and fishing potential estimates for demersal fish, 2011 ................................................. 19
Table 2. Artisanal and industrial fishers catch breakdown ......................................................................... 19
Table 3. Fishing licenses by vessel type and nationality ............................................................................ 22
Table 4. Industrial fish landings in Guinea-Bissau, 2010 ........................................................................... 24
Table 5. Guinea-Bissau’s changing forest landscape .................................................................................. 25
Table 6. Logging permit prices, US$ .......................................................................................................... 26
Table 7. Types and prices of hunting licenses, 2011 .................................................................................. 28
Table 8. Tariffs for non-timber forest resources ......................................................................................... 29
Table 9. Changes in mangrove coverage (1990-2007) ............................................................................... 30
Table 10. Guinea-Bissau’s Carbon Stocks .................................................................................................. 33
Table 11. Average and recent net crop production ..................................................................................... 34
Table 12. Total food surplus/deficit projected for 2012/13 ........................................................................ 36
Table 13. Main livestock production and prices ......................................................................................... 37
Table 14. Guinea-Bissau’s key laws and strategies relating to environmental protection .......................... 38
Table 15. Common assumptions across all natural wealth estimates ......................................................... 50
Table 16. Main assumptions used for the wealth calculations of phosphate and bauxite deposits ............. 51
Table 17. Landings by the artisanal sector, 2010 ........................................................................................ 52
Table 18. Prices for main categories of seafood landed by the artisanal sector .......................................... 53
Table 19. Main assumptions used for the wealth calculations of artisanal fishing ..................................... 53
Table 20. Non forest timber resource estimates .......................................................................................... 56
Table 21. Carbon Stocks (Mtons) in protected areas .................................................................................. 57
Table 22. Crop Unit Price (US$ 2010/ton) ................................................................................................. 59
Table 23. Product Export Unit Values (US$ 2010/ton) .............................................................................. 60
List of Boxes
Box 1. Definition of a mineral resource ........................................................................................................ 9
Box 2. Artisanal fishing assumptions ......................................................................................................... 21
Box 3. What is overfishing? ........................................................................................................................ 23

1
Executive Summary
With a GNI per capita of $5901, and over 70 percent of the population living on less than $2 a day, Guinea-
Bissau is one of the poorest countries in the world. Since independence in 1974, the country has had four
coup d’états, with additional coup attempts and other forms of political violence, and a short but intense
civil war. While democratic rule has been in place between 2000 and 2012, short
lived alliances have resulted in governments that have not survived beyond 18
months. Despite this rather dismal picture the country is not lacking in potential.
Guinea-Bissau’s natural wealth could be up to $3,8742 per capita, including
minerals such as bauxite and phosphate, fisheries, timber and rich fertile lands
and ecosystems (see left). These resources, if sustainably managed, could help
Guinea-Bissau overcome the low-income trap the country appears to be stuck in.
Transforming this potential into poverty reduction will not happen overnight. It
requires concerted action in areas of governance; macroeconomic management
to ensure economic rents are captured and turned into meaningful government
programs; and investment climate reform, to facilitate sustainable and inclusive
business practices. Following Parliamentary and Presidential elections in April
and May, 2014, Guinea Bissau’s new government has started the long journey
towards these goals. Budgets for 2014 and 2015 were quickly prepared and
presented in Parliament; funding for the country’s Foundation for the national parks was secured, and active
negotiations with mining companies have commenced. There is a feeling of renewal and vigor with this
new government, and a hope that patterns of the past do not unveil themselves in the future.
One area the new government could focus on is optimizing its natural assets. This paper provides an
assessment of Guinea-Bissau’s main sources of natural wealth, building on the World Bank’s work on
Wealth Accounting and the Valuation of Ecosystems (http://www.wavespartnership.org/). Previous
estimates of Guinea-Bissau’s wealth are based on data from international databases, and assumptions,
aggregated from cross-country assessments. This has helped provide a global overview of natural wealth.
It has not, however, provided country specific estimates. In-country reports and surveys, alongside on-the-
ground interviews with local fishermen, farmers, government agencies and residents of Bissau provide a
more detailed insight into Guinea-Bissau’s natural wealth. Using this information, this paper confirms the
findings of previous studies: the country is richly endowed with natural resources.
Agricultural land is by far the largest source of natural wealth ($1,734 per capita for crop lands and $591
per capita for pasture land). Given the low productivity levels currently pervading the agriculture sector,
and the array of currently unexploited horticultural products, the natural wealth of this sector deserves more
attention. In particular, productivity improvements could vastly improve the livelihood of the poorest
members of society.
1 2013 data, GNI, Atlas method. Countries with a GNI per capita below $1,035 in 2012 fall under the World Bank’s “low income”
country classification. All $ figures in this report refer to US$. 2 All natural wealth estimates are in US$, 2010 prices.

2
The next largest component lies in Guinea-Bissau’s forests. In addition to timber ($304 per capita), forest
lands provide a multitude of goods and services – non-timber forest resources (NTFR) ($366 per capita).
Recent illegal logging practices could however be adversely affecting the sustainability of the forests, as
well as reducing the amount of economic rent the government is able to capture. The wealth per capita
estimates are also affected by the omission of Guinea-Bissau’s mangrove forests, which act as a nursery
ground for fisheries (especially shrimp), benefiting a large swathe of the West African coast. Mangroves
also act as a natural flood-defense against storm surges, which is extremely valuable for the low-lying
floodplains making up much of Guinea-Bissau. While mangroves have not been quantified in this paper,
anecdotal evidence and research from other countries suggests the economic value of these forests is
significant.
In preparation for a more buoyant carbon market, Guinea-Bissau is working on a Reducing Emissions from
Deforestation and Forest Degradation (REDD) project. While the carbon price is not currently high enough
to warrant investment in essential Monitoring Reporting and Verification (MRV) of forestry activities, the
country has started to set up the infrastructure and institutional framework required to access the carbon
market (potential wealth per capita of $89 should the carbon price rise to $25 per ton of CO2).3 In the
meantime, additional resources are needed to ensure the forestry sector is properly managed.
Fisheries represent the third largest element of natural wealth ($305 per capita). Domestic data suggests
that sustainability levels are not being breeched i.e. the maximum sustainable yield has not been met.
However, there are two important caveats: first, as with the forest sector, management resources are
inadequate. At the artisanal level, public bodies are unable to keep track of foreign vessels (mainly from
Senegal and Guinea-Conakry) accessing Guinea-Bissau waters. At an industrial level, they are unable to
check the catch levels of boats with license fees, and it is believed that there are significant losses of fish
from illegal fishing. Second, aggregate levels mask fishing trends of individual species, which may be under
threat. It is likely therefore that domestic level data is underestimating the landing rates, and thus the
question of sustainability still remains.
The fourth largest component of natural wealth is the country’s protected areas (PA) and biodiversity that
lies within. The data required to fully quantify the “worth” of the country’s rich eco-systems, including
global existence values, is beyond the scope of this paper. The opportunity cost of protected lands is
therefore used as a proxy for its natural wealth value ($305 per capita).
Rents from biodiversity could be generated by fostering eco-tourism. Such an approach has been
successfully adopted in countries such as Costa Rica and Dominica. This is an area Guinea-Bissau could
explore, given the large endowment of biodiversity in the country. Ecotourism could simultaneously ensure
the protection of the environment and social structures needed to implement this protection, as well as create
economic benefits to local communities and the economy at large. Significant investment in tourism related
infrastructure, as well as political stability, is needed before this could become a reality.
Finally, minerals could provide Guinea-Bissau with an important revenue stream ($126 per capita for
phosphate and $55 per capita for bauxite). Rising mineral prices are making Guinea-Bissau an economically
3 A discussion on the chosen carbon price is presented in the Appendix.
3
viable place to engage in extraction activities. However, poor infrastructure and a potentially difficult
regulatory environment limit the rents from minerals, at least in the short term, owing to the large up-front
costs required to start operations. In addition to sustainability issues – i.e. converting natural wealth into
another form of wealth, it is recommended that the government considers how to manage the funds from
mineral extraction so growth is spread over the short and medium term. International experience also
suggests a strong macroeconomic framework is needed to avoid Dutch disease and macro volatility, which
can be particularly damaging for public investment management programs.
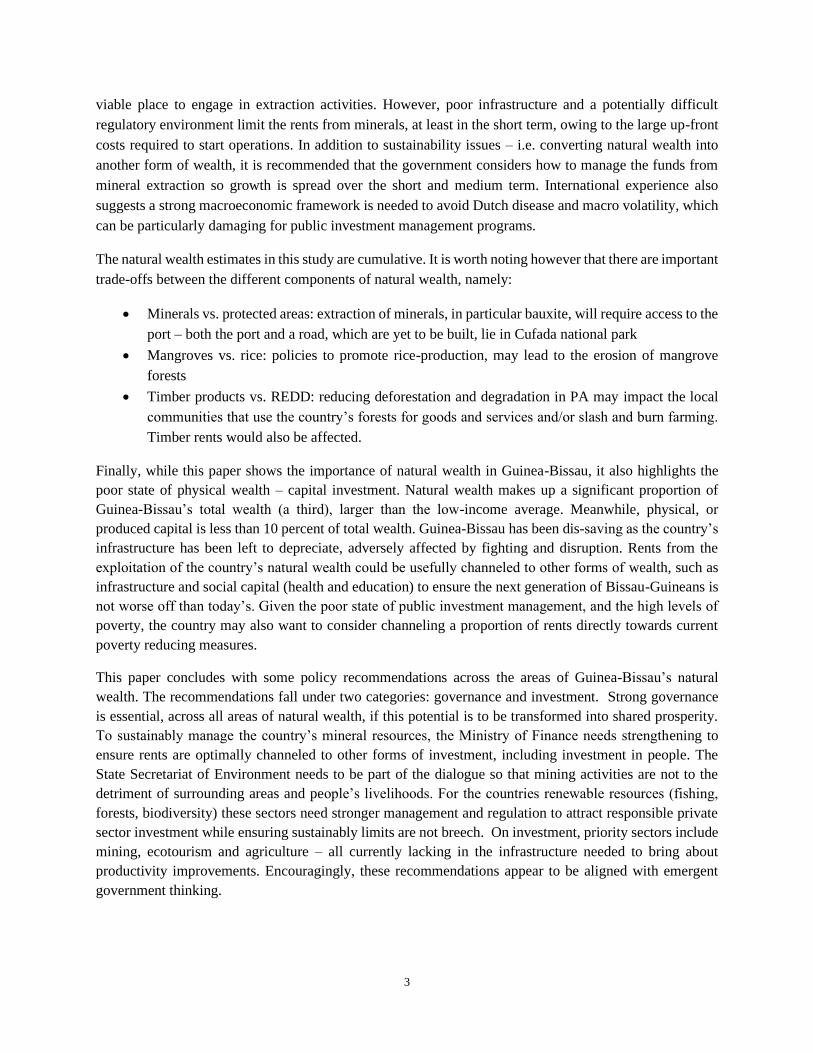
The natural wealth estimates in this study are cumulative. It is worth noting however that there are important
trade-offs between the different components of natural wealth, namely:
• Minerals vs. protected areas: extraction of minerals, in particular bauxite, will require access to the
port – both the port and a road, which are yet to be built, lie in Cufada national park
• Mangroves vs. rice: policies to promote rice-production, may lead to the erosion of mangrove
forests
• Timber products vs. REDD: reducing deforestation and degradation in PA may impact the local
communities that use the country’s forests for goods and services and/or slash and burn farming.
Timber rents would also be affected.
Finally, while this paper shows the importance of natural wealth in Guinea-Bissau, it also highlights the
poor state of physical wealth – capital investment. Natural wealth makes up a significant proportion of
Guinea-Bissau’s total wealth (a third), larger than the low-income average. Meanwhile, physical, or
produced capital is less than 10 percent of total wealth. Guinea-Bissau has been dis-saving as the country’s
infrastructure has been left to depreciate, adversely affected by fighting and disruption. Rents from the
exploitation of the country’s natural wealth could be usefully channeled to other forms of wealth, such as
infrastructure and social capital (health and education) to ensure the next generation of Bissau-Guineans is
not worse off than today’s. Given the poor state of public investment management, and the high levels of
poverty, the country may also want to consider channeling a proportion of rents directly towards current
poverty reducing measures.
This paper concludes with some policy recommendations across the areas of Guinea-Bissau’s natural
wealth. The recommendations fall under two categories: governance and investment. Strong governance
is essential, across all areas of natural wealth, if this potential is to be transformed into shared prosperity.
To sustainably manage the country’s mineral resources, the Ministry of Finance needs strengthening to
ensure rents are optimally channeled to other forms of investment, including investment in people. The
State Secretariat of Environment needs to be part of the dialogue so that mining activities are not to the
detriment of surrounding areas and people’s livelihoods. For the countries renewable resources (fishing,
forests, biodiversity) these sectors need stronger management and regulation to attract responsible private
sector investment while ensuring sustainably limits are not breech. On investment, priority sectors include
mining, ecotourism and agriculture – all currently lacking in the infrastructure needed to bring about
productivity improvements. Encouragingly, these recommendations appear to be aligned with emergent
government thinking.

4
A. Introduction
“Adam Smith’s classic was an inquiry into the wealth of nations, not the GNP or NNP of nations, nor the
United Nations Development Programme’s Human Development Index of nations”4
Using the internationally agreed System of National Accounts (SNA), the production and output of
economies is often used as a proxy for overall social welfare. The main indicator of the SNA – Gross
Domestic Product (GDP) - is not designed to provide a measure of wellbeing, welfare, or indeed wealth.
More significantly, it does not set out to capture the sustainability of any one growth path; it does not show
whether an individual’s consumption today, results in a lower level of consumption by an individual in the
future. Governments have a responsibility to ensure social welfare is maximized for people across different
segments of society, as well as across generations. Relying exclusively on GDP as measure of success at
achieving this goal is not therefore sufficient.
One of the main drawbacks is the static nature of GDP, which looks at value added at a single point in time.
GDP does not provide policy makers with a sense of whether government spending is conducive to
medium-term growth, the perennial question of when the business cycle starts and finishes, nor does it
provide an assessment of how natural wealth is being utilized. This issue is extremely pertinent for a number
of countries in Sub-Saharan Africa (SSA). Rising commodity prices and flows of foreign direct investment
into mineral and other natural resource sectors have helped bolster SSA’s growth prospects. Growth was
estimated at 4.7 percent in 2012 – 5.8 if South Africa is excluded, and over a quarter of countries had growth
rates at over 7 percent. The question of how sustainable this growth is remains. Can countries continue
growing at these high rates and is this growth supporting the welfare of citizens both today and tomorrow?
Guinea-Bissau has not had the stellar growth rates seen in other SSA countries. After the 1998-99 civil war,
economic growth has been anemic, averaging 2.1 percent, lower than population growth at 2.3 percent. The
coup d’état of 2012 further damped the country’s prospects, with a transitional government still in place at
the end of 2013. GDP contracted by 4.4 percent and 1.9 percent in 2012 and 2013 respectively. The
economy was essentially crippled for close to two months during the military’s overthrow of the
government in 2012, due to border closures and an exodus of development support. Stability appears to
have been restored following the Parliamentary and Presidential elections in 2014. Budgets were quickly
drawn up and granted Parliamentary approval not long after the new Ministers took office. Donors are keen
to support this fresh start and are convening a meeting in early 2015 to discuss the country’s new growth
strategy.
The cashew nut remains the country’s most important source of income, both for national income as a result
of vast cashew exports, and at a local level with much of the rural population employed in cashew
plantations. There are prospects to diversify, especially given the country’s rich natural resources:
phosphate and bauxite reserves are relatively unexplored; fisheries could generate significantly more
income; sustainably managed forests would ensure both timber and non-timber forest resources contribute
towards Guinea-Bissau’s growth for years to come; and the country’s rich bio-diversity offers a unique
4 P. Dasgupta, Human Well-Being and the Natural Environment OUP, Oxford, 2001 p30

5
opportunity for eco-tourism. All of these sectors could help bolster the country’s country poor rate of
revenue collection as well as provide much needed jobs
At present, most of Guinea-Bissau’s resources are not excessively exploited.5 The country is still at the
beginning of a journey towards ensuring resources are sustainably managed. The leaders of Guinea-Bissau
are in the fortunate position of being able to learn from other countries’ experiences, thus avoiding
sustainability traps many nations have fallen into. This does not imply that the journey will be easy or that
they have time to implement bad practice. Indeed, severe capacity constraints could limit the country’s
ability to implement sustainable policies.
This paper is organized as follows: first, the paper provides a brief overview of current natural wealth
estimates and information on Guinea-Bissau’s natural resources. The paper is then divided into three
sections – the first looks at the natural wealth of the country’s exhaustible resources, namely phosphate and
bauxite, and the second provides an overview of the country’s non-exhaustible, or renewable resources,
including: fishing, timber and non-timber forest resources (NTFR), carbon, crop and pasture land, and
protected areas (PA). The third part ties the results together by summarizing the different components of
Guinea-Bissau’s total wealth. The paper concludes with some recommendations and next steps.
B. What does the past tell us: Guinea-Bissau’s current natural wealth estimates
“Guinea-Bissau houses a wealth of biodiversity that is of local, national, and global significance,
particularly its vibrant coastal zone.”6
The World Bank, alongside the United Nations (UN), has been proactive in developing methodologies to
quantify the natural wealth of countries. Without some form of measurement not only is it is difficult to
gain traction with policy makers, but it is also difficult to assess the impact of social and economic policy.
The various approaches to measuring natural wealth have been heavily criticized, with suggestions that
they fall more under the category of art rather than science.7 While it is true that there is still a degree of
subjectivity involved in creating natural wealth estimates, there is international agreement on most of the
methodologies for these calculations.
In 1993, the System of National Accounts (SNA) added subsoil assets to the national balance sheet, making
mineral accounts a core component of the internationally agreed methodology for national accounts. The
System of Integrated Economic and Environmental Accounts (SEEA) Central Framework, which was
adopted as an international statistical standard by the UN Statistics Commission in 2012, provides further
discussion of issues related to calculating the asset value of minerals and energy stocks, and provides a
methodology for calculating depletion costs. The SEEA also includes guidance on calculating rents from
5 That is not to say that the natural resources are not being utilized, or that current practices are sustainable, rather that there is still
time to reverse activities that have the potential of making Guinea-Bissau’s non-exhaustible resources exhaustible. 6 “Maintaining coastal biodiversity and natural resources as mainstays of Guinea Bissau’s economy”, The Global Environment
Facility, 2010 7 See for example Solow’s comments on Arrow et al.s recent paper (2012) “ Sustainability and the measurement of wealth”

6
renewable natural resources, although apart from methodologies for calculating rents of timber, this is less
well developed.
The process of collecting relevant data and surveying natural resource sectors can often be more useful than
the final natural wealth estimate itself. This is particularly relevant for low income countries like Guinea-
Bissau where data are not always available or of variable quality. Interviews with local communities and
government agencies can shed light on the operation of sectors and the governance of natural resources,
which if acted upon can help strength sustainability and boost incomes.
To date, the most comprehensive assessment of Guinea-Bissau’s natural wealth is covered under the World
Bank’s Wealth of Nations publications.8 These wealth estimates use international databases to calculate
comparable natural wealth per capita estimates for more than 120 countries. In low income countries,
natural wealth estimates, on average, account for over a quarter of all wealth, while 16 percent is attributed
to physical capital and the remaining 58 percent to intangible (e.g. human and social) capital.9 For Guinea-
Bissau, “The Changing Wealth of Nations” estimates show that natural wealth represents close to 50 percent
of all capital, demonstrating simultaneously the importance of the natural environment for the country,
while at the same time the poor state of public infrastructure (Figure 2).
It is likely that these natural wealth estimates are significantly underestimated. On the one hand the
calculations omit key elements such as fishing, carbon credits, and biodiversity, and on the other, the data
and assumptions have been aggregated to allow for cross county comparisons; country specificities are
ignored. Furthermore, the potential wealth of sub-soil assets in Guinea-Bissau (phosphate and bauxite) has
not been included, owing to the relatively nascent prospects for extraction (Figure 2).
Figure 1. Current estimates of total wealth in
Guinea-Bissau
Figure 2. Current natural wealth per capita estimates
for Guinea-Bissau
Source: The Changing Wealth of Nations, 2011
8 “Where is the Wealth of Nations?: Measuring Capital for the 21st Century”, (2006) World Bank, Washington, D.C., and “The
Changing Wealth of Nations: Measuring Sustainable Development in the New Millennium” (2011), World Bank, Washington,
D.C. 9 Intangible capital is not specifically calculated, rather it is the residual of the total, physical and natural wealth estimates. This
paper does not attempt to calculate more specific intangible capital estimates for Guinea-Bissau, This is an area where future
research would be helpful.
Produced
Capital
Natural
capital
Intangible
capital
Net foreign
assets
-20%
-10%
0%
10%
20%
30%
40%
50%
60%
70%
80%
90%

7
This paper builds on the methodologies and estimates calculated under the publication series mentioned
above by including country specific assumptions, where available, as well as estimates for the potential
wealth per capita from phosphate, bauxite, fisheries, and carbon. The estimates have been updated using a
combination of desk based research and on the ground field work, where local communities and
organizations have been interviewed to determine the costs, and production levels associated with various
natural resource based sectors. This paper draws on analysis conducted by three main sources: (i) the World
Bank’s Country Economic Memorandum for Guinea-Bissau (2011, mimeo), which provides a helpful
overview of the country’s main sectors including agriculture, fishing and eco-tourism; (ii) “CarboVeg”, an
analysis on deforestation rates and the state of Guinea-Bissau’s forests – a much needed update on the Food
and Agriculture Organization’s (FAO) 1990 based assessment and (iii) World Bank analysis prepared to
assess the benefit of investing in the management of West Africa’s fisheries. The underlying methodologies
are based on quantifying economic rents from different resources. The main assumptions and calculations
are set out in the Appendix, with the high level results summarized in the body of this paper.
For phosphate and bauxite, the wealth calculations illustrate the potential wealth, given commercial mining
has yet to commence. Deposits of both minerals are thought to be substantial, and so while sustainability
issues may not therefore be an issue for the next generation, there are certain macroeconomic factors that
need to be considered, e.g. how to spend and manage the volatility of mineral rents, while maintaining
environmental and social considerations.
For most of the renewable or non-exhaustible resources the wealth calculations are based on rents if existing
practices were to continue. Contrary to previous studies, the fishing and forest sector do not appear to be
exceeding sustainability levels. However, there are two important caveats to this statement. First, an
aggregate overview of the sectors masks impacts on certain species, which may in fact be threatened, and
second, official data and monitoring of these sectors is not particularly strong, suggesting the rents could
be much higher if sustainability measures were put in place. Despite these two caveats, the use of national
data and qualitative information is preferred to using earlier studies that are either based on outdated data,
or extrapolations from neighboring countries.
There are two main areas that have not been quantified: water and mangroves. These resources are
particularly important to Guinea-Bissau, but without more research and data collection, estimates at this
stage would be purely speculative. There have been some attempts to quantify the economic value of the
country’s mangrove forests but this is still at an early stage and would need to be developed further to be
useful for policy making.

8
C. What does the present tell us: new estimates of Guinea-Bissau’s natural wealth
I. Exhaustible resources
“…income from these sources [phosphate mining, bauxite and possibly oil] could amount to as much as
30% of GDP”10
While mining in Guinea-Bissau is currently limited to small scale production of construction materials (e.g.
granite, limestone, and clays), rich mineral reserves of phosphate, bauxite and petroleum could see this
landscape change (Box 1 provides an overview of mineral reserve definitions). Poor infrastructure,
relatively low mineral prices, and political instability have prevented investment in this sector to date.
However, increasing commodity prices may be able to circumvent Guinea-Bissau’s weak institutional
environment and dilapidated infrastructure (Figure 3).
Interest in Guinea-Bissau’s minerals is not
a new phenomenon. International
organizations and companies have been
exploring the country’s lands for the past
forty years, and more recently, there have
been several offshore discoveries of heavy
oil deposits. What is new is a more
realistic outlook for mining sector
investment. The last decade has witnessed
a number of long term exploration leases
signed between the government and
interested investors. While a number of
companies are investigating the potential
of offshore oil in Guinea-Bissau, progress
is slow and extraction is still far off.
Bauxite, and in particular phosphate,
however, are closer to viability.
Calculations of Guinea-Bissau’s potential natural wealth from sub-soil assets have therefore been limited
to rents from phosphate and bauxite reserves.
This section provides an overview of the mining potential of phosphate and bauxite, as well as an indicative
wealth per capita estimate for the two minerals. These estimates are based on a number of assumptions,
which could easily change, not least because mining activity has not yet started in either of the bauxite or
phosphate sites.
10 S. Kyle, 2009, “The Macroeconomic Context for Trade in Guinea-Bissau”, Working Paper No.26, p8
Figure 3. Phosphate, Bauxite and Petroleum prices have been
increasing
US$, 2005 prices
Sources: World Bank commodities database and Bauxite prices from USGS
0
50
100
150
200
250
300
Phosphate ($/Mt) Bauxite ($/Mt)
Petroleum (crude) ($/bbl)
9
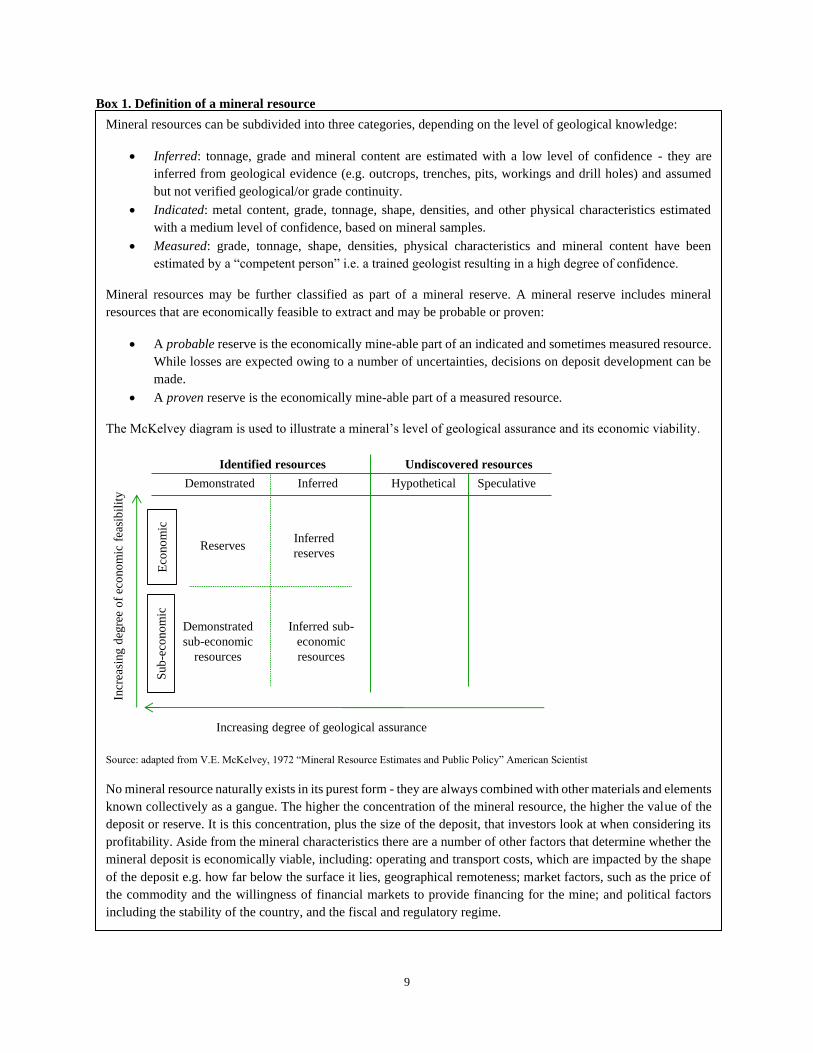
Box 1. Definition of a mineral resource
Mineral resources can be subdivided into three categories, depending on the level of geological knowledge:
• Inferred: tonnage, grade and mineral content are estimated with a low level of confidence - they are
inferred from geological evidence (e.g. outcrops, trenches, pits, workings and drill holes) and assumed
but not verified geological/or grade continuity.
• Indicated: metal content, grade, tonnage, shape, densities, and other physical characteristics estimated
with a medium level of confidence, based on mineral samples.
• Measured: grade, tonnage, shape, densities, physical characteristics and mineral content have been
estimated by a “competent person” i.e. a trained geologist resulting in a high degree of confidence.
Mineral resources may be further classified as part of a mineral reserve. A mineral reserve includes mineral
resources that are economically feasible to extract and may be probable or proven:
• A probable reserve is the economically mine-able part of an indicated and sometimes measured resource.
While losses are expected owing to a number of uncertainties, decisions on deposit development can be
made.
• A proven reserve is the economically mine-able part of a measured resource.
The McKelvey diagram is used to illustrate a mineral’s level of geological assurance and its economic viability.
Source: adapted from V.E. McKelvey, 1972 “Mineral Resource Estimates and Public Policy” American Scientist
No mineral resource naturally exists in its purest form - they are always combined with other materials and elements
known collectively as a gangue. The higher the concentration of the mineral resource, the higher the value of the
deposit or reserve. It is this concentration, plus the size of the deposit, that investors look at when considering its
profitability. Aside from the mineral characteristics there are a number of other factors that determine whether the
mineral deposit is economically viable, including: operating and transport costs, which are impacted by the shape
of the deposit e.g. how far below the surface it lies, geographical remoteness; market factors, such as the price of
the commodity and the willingness of financial markets to provide financing for the mine; and political factors
including the stability of the country, and the fiscal and regulatory regime.
Identified resources Undiscovered resources
Demonstrated Inferred Hypothetical Speculative
Reserves
Increasing degree of geological assurance
Incr
easi
ng d
egre
e o
f ec
ono
mic
fea
sib
ilit
y
Demonstrated
sub-economic
resources
Inferred sub-
economic
resources
Inferred
reserves
Eco
no
mic
S
ub
-eco
no
mic

10
Phosphate
Phosphate rock is found in the north of the country, just 5 kilometers from the small
town of Farim (population 7,000). The main deposit site is close to the Cacheu River,
25 kilometers from the border with Senegal, and approximately 100 kilometers
northeast of the capital city, Bissau. The Cacheu River has direct access to the
Atlantic and is navigable by boat (175 kilometers). At present, there are no tarred
roads to the coast. Any mining would therefore need to use river transport, or invest
in an 80 kilometer road to export the mined phosphate.
The United Nations Development Programme (UNDP) was the first international
organization to investigate the phosphate deposits, in 1978, shortly after
independence. Subsequently, in 1981-85, the Bureau de Recherches Géologiques et
Minières of France built upon these initial findings, and in 1986, Sofremines
conducted a prefeasibility study.
Despite promising findings, the infrastructure in Guinea-Bissau was deemed too
weak to warrant mining investment and the site was left untouched for over 10 years,
before Champion Resources Inc. of Canada acquired a 2 year exploration permit in 1997. Their findings
confirmed the results of previous assessments: Guinea-Bissau is rich in phosphate rock – close to 100
million tons of high quality clay bounded ore, with 30.1% raw phosphate rock (approximately 40 years’
worth of mining), plus an additional 400 million tons of lower quality calcium bounded rock (up to 200
years of mining potential). However, in addition to existing concerns of poor infrastructure, the onset of a
civil war in 1998 once again put mining prospects to bed for another decade.
After some deliberations with the government, GB Minerals (formerly GB Phosphate Mining Limited) was
granted an exploration license in 2009. More recently (February 2013), Plains Creek Phosphate Corporation
bought out GB Minerals, including its license in Guinea-Bissau.11 While the coup d’état in April 2012
delayed progress towards the construction of a functioning mine yet again, Plains Creek are trying to move
forward with positive pre-feasibility assessments paving the way.12 Negotiations between Plains Creek and
the government of Guinea-Bissau (on royalties, taxes, project areas) are moving ahead with the new
Ministers in place and the Company keen to start developing the mine as soon as possible.
Guinea-Bissau’s phosphate wealth estimates are based on the assessments made by Plains Creek. The
feasibility study outlines two proposals: (i) a 1.3 million ton per year Direct Shipping Option (DSO) product
production and (ii) a 1 million ton per year Beneficiated Phosphate Rock Concentrate (BPRC) product
production.13 Both proposals are for 25 year mines and rely on barges to transport phosphate down the river
11 Plains Creek Phosphate Corporation has subsequently changed its name to GB Minerals. 12 Refer to www.plainscreek.com for more information. The November 23rd 2012 news release provides details on their pre-
feasibility study. 13 The difference lies in the level of processing. The BPRC option involves additional refinement of the phosphate rock to a higher
grade, attracting a higher price and a higher variable cost.
Gu
inea
-Bis
sau
’s n
atu
ral
wea
lth
per
cap
ita
Phosphate

11
Cacheu, rather than include a road investment linking the mine with the coast. In both cases, phosphate
rock will be made available to the domestic market for use in fertilizers.
Owing to the poor electrification rates and reliability of electricity supply in Guinea-Bissau, both proposals
will rely on diesel generators for the operations of the mine. Poor transport links and expensive energy
supplies make Guinea-Bissau an expensive place to invest. High phosphate rock prices have helped offset
these challenges and have made the Farium deposit increasingly attractive to investors. The persistently
high demand for phosphate in recent years suggests that prices will remain high,14 however, as with all
commodity forecasts, there remains a large degree of uncertainty associated with this outlook.
The natural wealth estimates are extremely sensitive to fluctuations in the price of phosphate. A central
price of $125 per ton gives a natural wealth per capita figure of $126.15 However an increase in the price to
levels seen in 2012 ($185 per ton), increases the wealth per capita estimates to $682. Conversely, a $60
shift in the other direction would put the rents into negative territory.16
There are a number of positive spillover effects from phosphate mining, which extend beyond essential
fiscal revenues.17 The mine could directly employ a number of people living in the neighboring town Farim.
There could also be significant multiplier effects with jobs created in the services industry to cater for
people’s new found wealth. All of these avenues could create important poverty reducing opportunities for
the country’s poorest. Initial consultations with local communities in 2010 suggested that there is support
for the mining project, although people are frustrated by the lack of progress. An Association of the Young
People of Farim for Phosphate Development has been set up to ensure that any benefits from the mining
project spillover to the local area.
There are also a number of potentially negative consequences from the development of a phosphate mine,
both in terms of environmental and health impacts, and socio-economic effects. Phosphate mining,
especially when beneficiation takes place, requires a substantial amount of water to help with the processing
of the mineral. Once the phosphate has been separated from other components such as clays and sands, it
may be disposed of via rivers, or in a pre-identified waste disposal area. There is therefore a risk that the
local river, River Cacheu, is polluted and possibly drained. This could have a direct impact on the local
communities that use the river for washing and income generating activities such as fishing. Furthermore,
a large mining project is likely to attract migrants, which could undermine the social fabric of the local area
if service provision does not match increasing demand. Strong governance and institutional reform are
therefore essential if Guinea-Bissau’s phosphate reserves are to be transformed into poverty reduction and
economic growth.
14 There are concerns that the world’s phosphate resources are running low, and that we will reach “peak phosphate” in early 2030s.
Given its importance for agriculture, as a key ingredient in fertilizers, efficient use of the resource will be essential for sustainable
agricultural practices. 15 All estimates have been calculated in 2010 prices. A $150 per ton price of phosphate in today’s prices is equivalent to $146 in
2010 prices. 16 A full description of the calculations and assumption are included in the Appendix. The price of phosphate is assumed to stay
constant over the duration of the mine. 17 Calculations in the World Bank’s Country Economic Memorandum for Guinea-Bissau estimate fiscal revenues of between10-
15 percent of current revenues.

12
Bauxite
At the opposite end of the country, in the southeast, there are five neighboring
bauxite deposits in the Boe region. Boe, 100 kilometers from the port of Buba and
near the border with Guinea-Conakry, was formally the capital of Guinea-Bissau,
until the country declared independence from Portugal in 1974. Up until recently,
the area was infiltrated by landmines put in place during three periods of conflict:
the War of Liberation in the 1970s, the civil war in the late 1990s and the
Casamance rebellion in 2006.
The Dutch were the first to conduct a geological survey of the area in the 1950s,
concluding that the bauxite deposits amounted to over 100 Mt, with average
alumina and silica content of 46.5 and 3.5 per cent respectively.18 Twenty years
later, the Soviets returned to the site and in 1983 the first feasibility study took
place. Historical bauxite prices (US$10-15 per ton) have not been high enough to
attract mining investment in Guinea-Bissau, not least because the Boe region is not
connected to the shallow and under-developed Buba port, driving up the costs of
shipping and transport. Any investment therefore needs to factor in additional up-
front capital costs for roads and port rehabilitation.19
Recent bauxite prices have, along with other minerals, increased substantially, and are now in the range of
$30-50 per ton (as opposed to $15-20 per ton at the turn of the century).20 This has made Guinea-Bissau’s
bauxite deposits look significantly more attractive, and in 2007, Bauxite Angola entered into a contract with
the government to start exploring the region. While prospects looked promising, little investment has
actually taken place. The Minster of Natural Resources in the transitional government recently announced
(March 2013) that no investment had taken place, neither had there been any environmental impact
assessments or economic viability reports since the signing of the lease. It has also been suggested that the
lease is not in line with current legislation and could therefore be revoked.
Despite these set-backs, Bauxite Angola still maintains an interest in the region and has indicated that it
would invest in the road and the port, as well as the mining infrastructure.21 Unlike the phosphate deposits
however, there are still a number of outstanding issues and analysis that needs to be conducted before
commercial activity can take place. One of the major issues to be resolved, in addition to the legal standing
of Bauxite Angola and their relationship with the government of Guinea-Bissau, is the potential
environmental impact. While impacts on the environment from the Bauxite mine, if properly regulated, are
containable, it is the adverse effects on protected areas (PA) that need to be taken account of. The proposed
18 Bauxite can be refined into aluminum, attracting a much higher price, but at a much greater cost. The higher the alumina content
the more aluminum available for extraction. Conversely, the lower the silica content the better, as silica is difficult and costly to
remove. 19 Alternatively, the bauxite could be transported to the recently expanded port at Kamsar in Guinea. While farther than Buba, it
would only be necessary to build a new road or rail line to the Boke bauxite area of Guinea and use existing infrastructure. 20 Real prices. 21 The United Arab Emirates has recently announced an interest in Guinea-Bissau’s bauxite reserves, offering to build a large port
at Kamsar to export both bauxite and aluminum.
Gu
inea
-Bis
sau
’s n
atu
ral
wea
lth
per
cap
ita
Phosphate
Bauxite

13
road to the port would transverse directly through the soon to be established Boe national park, which is to
be part of the Dulombi-Boé-Tchetche (DBT) complex. Once at the port, there would be further
environmental impacts, both at the ocean access point and the Cufada protected area, impacting fishing,
terrestrial areas (Cufada), the riverine (rio buba) and marine biodiversity at the site and neighboring lagoons.
In 2008, Bauxite Angola upgraded part of an existing road through the Cufada national park (widening and
improving), in addition to clearing 113 hectares of land to make room for a larger port. There were no
environment impact assessments accompanying the construction, and calls to end the developments by the
Institute of Biodiversity and Protected Areas (IBAP) were ineffective. Local communities and NGOs are
acutely aware of the environmental and subsequent socio-economic damages a mine could bring to the area
and are actively rallying the government to prevent these sorts of incidences. It does not have to be one
project verses another. A bauxite mine and a national park could work together side by side, providing
environmental impacts are managed. Indeed, there could be several benefits, including direct and indirect
employment opportunities. Improved access to the region could also improve access to health and education
facilities as well as stimulate other income generating activities.
Owing to the uncertainties linked to the potential timing and project specification of a bauxite mine, the
natural wealth estimates for Guinea-Bissau’s bauxite reserves are indicative. However, they do at least
provide an indication of the scale of potential mineral rents. A number of the assumptions have been taken
from reports and studies on bauxite mines in Guinea-Conakry.22 A recent mine investment proposal in
Guinea-Conakry assumes a US$37 per ton price for bauxite and a variable cost of US$12 per ton. Bauxite
Angola have previously suggested the up-front capital costs for the mine and related infrastructure could
be up to $500 million, with some of the financing provided by the government given the public good nature
of the road and port. Assuming Bauxite Angola funds $400 million, with a mining start date of 2018, the
natural wealth estimate comes to $55 per capita. However, if the company pays for the full $500 million
this would drop to negative $86, suggesting that the mine is bordering on commercial viability.
Exhaustible resource considerations
There are three main issues that are worth considering when assessing potential rents from mineral
resources in Guinea-Bissau: (i) trade-offs between consumption and investment spending; (ii) managing
volatility and ensuring macroeconomic stability; and (iii) environmental and socio economic impacts. All
three issues underscore the need for stronger governance.
Consumption vs. investment
One of the main decisions facing governments with newly acquired resource rents, or even just the prospect
of resource rents, is whether to spend the resources on consumption, thus benefiting the population today,
or on investment, with some benefits accrued today, but with the lion’s share arriving in the future. As a
poor, capital scarce developing country, this decision is even more pronounced for Guinea-Bissau, as both
avenues represent worthwhile endeavors.
22 Bauxite in Guinea-Conakry is what cashew is to Guinea-Bissau, accounting for close to 85 percent of external revenues.

14
Freidman’s permanent income hypothesis can provide governments with a framework to help address this
dilemma – borrowing against potential future rents to invest and promote consumption today, and then
using the interest and increased productivity of investments to pay for the borrowing in the future. The
approach is appealing because of its apparent equality across time. However, Collier et. al. (2010) argue
against this approach for capital scarce developing countries, not least because access to finance, especially
international finance, is not always possible. This is definitely the case in low income Guinea-Bissau. With
over 70 percent of the population living on less than $2 a day, one could easily argue that resource rents
should be used to help alleviate poverty in the immediate term.
Social cost-benefit-analysis (CBA) (which utilizes a social discount rate), can help governments determine
whether revenues are used to support consumption today verses consumption tomorrow. The Guinea-
Bissau government is faced with a choice of spending money on consumption related activities, with a
social discount rate of 3.5-7.5, or investment in medium to long term wealth creation, such as capital
infrastructure or health and education systems.23
Domestic investment and in particular public investment in essential public goods is historically low in
Guinea-Bissau. The investment rate over the past 5 years has hovered around 10 percent of GDP, and
national savings closer to 4 percent of GDP. At the same time, health and education indicators are
depressing: child and infant mortality rates have been increasing since 2000, with a high proportion of
recorded deaths as a result of preventable diseases (malaria, diarrhea, respiratory infections); and just over
a quarter of children of primary school age are enrolled in school – only 12 percent of girls actually finish
(UNICEF). Given the poor state of existing infrastructure, as well as the abysmal performance of health
and education provision, there are a number of domestic investments that could potentially generate a high
rate of return, as well as improve the country’s Human Development Index (currently 177 out of 187,
(2013)). When this rate of return is greater than the social discount rate, CBA suggests the government
should invest in such wealth creating activities.24 The quality of public investment, including the ability to
maintain and ensure operating costs are factored into budgetary frameworks needs to be included in this
CBA assessment. In some cases it might worth investing in the investment process before channeling
money into poorly managed areas.
Volatility and stability
The causes and symptoms of Dutch disease are well documented as is the infamous resource curse.25 The
average poverty headcount in the 41 established and prospective natural resource rich developing countries
identified by the IMF is as high as 60 percent.26 Many of these countries struggle to raise non-resource
related revenues and public infrastructure remains weak and fragmented. An influx of foreign exchange
revenues can put pressure on the exchange rate in these countries, leading to an appreciation of the domestic
23 A derivation of the discount rate for Guinea-Bissau is presented in the Appendix. 24 Ideally, an institutional framework for resources rents and an associated communications strategy should be devised before the
revenues started flowing to help manage citizen’s expectations on expenditures, as well as internal public finance capacity. This
requires sufficient foresight and internal capacity – both elements are difficult to come by in a fragile state. 25 See for example Gelb (1988), Sachs and Warner (1999), Sachs and Warner (2001), and van der Ploeg (2011) 26 See Berg et al., 2012, “Public investment in resource rich developing countries”, IMF working paper. The average poverty
headcount is based on the proportion of the population living at or below $2 a day.

15
currency, thus hindering the tradables
sector. While Guinea-Bissau is unlikely to
witness an appreciation of their nominal
exchange rate, given it is part of the West
African Economic and Monetary Union
(WAEMU), which pegs its currency to the
Euro, an appreciation of the real exchange
rate (RER) seems almost inevitable, at
least in the short term.27
The RER in Guinea-Bissau has stayed
relatively constant during the past 10
years, especially as their trading partners
are subject to the same supply shocks and
inflationary pressures (Figure 4). Inflation
has generally been low over the past
decade, apart from in 2008 when soaring
international food prices adversely
affected the price of the country’s
consumer basket – in particular rice. Huge inflows of Official Development Assistance (ODA) since the
year 2000 do not appear to have affected the country’s inflation rate either. This may be due to aid money
filling an output gap rather than generating excess demand, and the use of the funds, which were mainly
used for imported products rather than stimulating domestic consumption.
Mining rents and economic activity from mining, could however, lead to an appreciation of the RER. It
would come from two main avenues: first, from increased government spending on both consumption and
capital related activities; and second, directly from mining activities.
Aside from inflationary pressures and effects on the RER, resource rents require strong macro oversight, to
manage the volatility of flows. Phosphate prices have fluctuated dramatically in recent years, in part because
of the concentration of phosphate production in one country: Morocco, and also because of “peak
phosphate” speculation – concerns that reserves are running out and the effect this will have on the
agriculture sector. As a core component of aluminum, bauxite prices are also likely to fluctuate, albeit in a
general upward trajectory.
The uncertainty caused by these fluctuations will make it difficult for the authorities to plan, and can
adversely affect welfare.28 Public investment is usually the area of spending that is cut first, adversely
affecting the quality and quantity of public infrastructure and thus long-term growth prospects. This is even
more marked in countries in a monetary union where other tools such as interest rates and allowing
27 With an estimated 30 percent contribution to GDP, it is impossible for there not to be some effect on the real economy, at least
in the short run. 28 Hnatkovska and Loayza (2005) estimate that a one-standard-deviation increase in macroeconomic volatility can lower average
annual GDP per capita growth by 1.28 percent. For more details on the model, and for an overview of links between macroeconomic
volatility and growth in developing countries, refer to N. V. Loayez, 2007.
Figure 4. Guinea-Bissau’s RER has stayed relatively
constant over the past decade
Annual percentage change CFAF per US$
Source: International Monetary Fund
-250-150-5050150250350450550650
-6
-4
-2
0
2
4
6
8
10
12
CPI (annual average) (LHS)
RER (LHS)
Nominal exchange rate (average) (RHS)
16
fluctuations in exchange rate are unavailable. Since the introduction of fiscal convergence criteria in
WAEMU, fiscal policy has been found to be pro-cyclical, with capital spending bearing the brunt of
government’s need to cut spending (World Bank, 2013).
In terms of taxation, setting the optimal rate requires an assessment of the uncertainty of commodity prices.
The larger the unit price, the larger the resource rents (assuming the marginal cost of production remains
constant). Governments also need a good appreciation of costs and reserves, as well as strong audit capacity
to ensure contract enforcement. Without this, the majority of the mineral rents will leave the country via
the international investor, rather than being channeled back into the country. Several Sub-Saharan African
(SSA) countries have fallen foul to international firms’ claims of limited profitability, subsequently wooing
them by significant tax holidays and royalty free periods (e.g. Zambia’s privatization of the copper mines
in the 1990s). While Guinea-Bissau’s environment – investment, governance, and general infrastructure -
is weak, careful consideration will be needed when assessing potential benefits to interested mining
companies, to ensure the country’s interests are safeguarded. This is a daunting challenge, with countries
such as Ghana, which has one of the highest Country Policy and Institutional Assessment (CPIA) ratings
in SSA (3.4, where 6 is the highest possible score) still struggling to capture mineral rents and transform
them into development assets (World Bank 2012). Prospects for Guinea-Bissau, with a CPIA rating of 2.6
are somewhat daunting.
Environmental and socio economic externalities
The rent calculations used to estimate phosphate and bauxite natural wealth are based on market prices and
as such have not taken into account any negative externalities that may arise from mining activity (e.g.
carbon emission, air and water pollution, environmental degradation), or any positive externalities such as
improved access to public services. This would require a much more detailed assessment and yet would
still be relatively high level, given mining activities have not started. As such, they have been excluded
from this analysis, however, it should be noted that they could have a significant impact on the above
estimates.
Unfortunately, given the country’s historical record – Bauxite Angola’s unauthorized construction through
the park – the likelihood of strong environmental regulation seems distant. Capacity within the government
to conduct environmental impact assessments is weak, and enforcement of environmental regulation
remains significantly under-resourced. Enacting laws to ensure companies abide by environmental
standards will only be as successful as the country’s ability to monitor and enforce them. The country’s
environment law includes a requirement of extractive industries to undertake an Environmental Impact
Assessment (EIA). A body has been set up to oversee and implement this new regulation - Celula de
Avalicao de Impacte Ambiental (CAIA). While this is a positive development, the issue of capacity, both
financial and human, is still a constraint.
Socio-economic considerations are a compulsory part of any EIA for projects (not for plans or programs)
in Guinea-Bissau however the implementation of these assessments remains fragmented and weak. Mining
activities could bring significant positive externalities – employment, training, and development of local
infrastructure, providing socio-economic considerations are factored into project planning. If regulations
are not strictly enforced, the alternative scenario is one of limited investment into local infrastructure and
17
slow growth in non-mining income generating activities.29 EIAs help highlight where potential tensions
may arise and mitigating factors to help ameliorate these negative side-effects. Stronger governance and
enforcement of the outcomes of an EIA is needed in Guinea-Bissau to ensure the recommendations are
followed through.
II. Non-Exhaustible resources
“The historical record shows that biological over- exploitation is almost universal at some point in the
development of a resource, and even when biological overexploitation is avoided, economic
overexploitation is the norm.”30
Unlike the mineral reserves described above, non-exhaustible resources are a form of wealth that if
maintained, can continue producing income for many years. This requires sustainable management as if
sustainability yields are breached the once non-exhaustible resources develop the characteristics of a finite
material.
Guinea-Bissau is rich in natural resources with many areas still left untouched and unexploited. However,
this is changing, and at a relatively fast pace. Weak institutional capacity has limited the country’s ability
to monitor and regulate key sectors such as fisheries and forestry. Weak administration also means local
data for these sectors are limited and of variable quality. Previous studies have relied on data collected
many years ago and extrapolated forward – e.g. FAO information on forests was collected in 1990 - or
alternatively, studies have used assumptions from neighboring countries. Recent analysis on Guinea-
Bissau’s forests, as well as interviews with local authorities and communities, has helped fill in the gaps
and paint a more accurate picture, although further work is needed to improve the quality of domestically
collected data.
This paper makes two key assumptions when estimating the value of per capita wealth of Guinea-Bissau’s
non-exhaustible resources: first, that current practices continue and second, that the estimates are
cumulative. By assuming that the status quo is maintained, the natural wealth estimates may be lower than
their potential. Recorded exports of fish, timber and agricultural goods are relatively small – although there
are genuine concerns that unofficial exports of these goods are much larger. The estimates are based on the
historical growth of these exports and domestic production levels. No step changes in production or rental
values due to improved infrastructure or training is introduced into the calculations. Given Guinea-Bissau
is starting from such a low base in terms of productivity, the potential could be significantly larger than
what is currently practiced.
The second assumption may overestimate natural wealth. Maximizing rents from all sectors is not
necessarily possible or optimal. There are important trade-offs between the different sectors. For example,
limiting forest degradation and/or deforestation to attract rents from carbon credits may adversely impact
29 Take for example the village of Mambia in Guinea-Conakry. Local infrastructure and housing are run down and land-owners are
not receiving the tax owed to them by the mining companies for use of their land. In the meantime, environment degradation by
the mines has adversely impacted the fertility of the soil and thus agriculture output 30 R. Hilburn et al, 1995, “Sustainable Exploitation of Renewable Resources”, Annual Review of Ecology and Systematics, Vol.
26 p.61.

18
the timber rents as well as the rents local communities get from non-timber forest resources. Similarly,
encouraging greater rice production could negatively affect mangrove forests and their associated co-
benefits. While this paper does not attempt to answer the question of how these trade-offs should be
answered, it does suggest how they should be approached.
This section provides an overview and natural wealth estimates of the following areas: fishing; timber and
non-timber forest resources, including mangroves; carbon; crop and pasture lands; and biodiversity/PAs.
Fishing
Despite having a coastline of only 274 km, Guinea-Bissau is situated next to a 45,000
Km2 continental shelf – one of the largest in West Africa. Seven river systems indent
the coast, adding fresh, nutrient rich, cold water to the warm shallow waters of the
continental shelf. These conditions create a favorable ecosystem for marine fish and
other species. In addition to the mainland coastline, the country’s geography is
defined by the 88 islands and islets of the Arquipélago dos Bijagós, creating
additional opportunities for artisanal fishing.
There are two main types of fish in Guinea-Bissau’s waters: pelagic (living in water
columns e.g. sardines, jacks, tuna), and demersal (bottom-dwelling e.g. cuttlefish,
breams), as well as crustaceans, cephalopods and others (e.g. shrimp, lobster,
octopus). While fisheries data in Guinea-Bissau are of variable quality, there have
been a number of scientific campaigns undertaken by international research centers
to assess the biomass and fishing potential of Guinea-Bissau’s coast. The latest review
took place during September-October 2011 (IMROP-CIPA, 2011) and confirms the
biomass and production rates of previous campaigns (2004 and 2008).
Demersal fish biomass is estimated at 126,531 tons, while fishing potential for demersal fish, cephalopod
and crustaceans is 47,139 tons (Table 1). 31 The pelagic fish biomass and small pelagic biomass is estimated
at 163,000 tons and 200,000 tons, respectively. The Secretariat of State Fisheries estimates the fishing
potential of pelagic fish to be approximately 73,000 tons, bringing the total fishing potential to just over
120,000 tons.
31 Biodynamic models are used to calculate fishing potential estimates. These models are based on a set of assumptions relating to
the ability of different fish species to reproduce, for example, a ratio of less than 40 percent of biomass for all types of fish is
assumed, except for elasmobranches, where a ratio of less than 10 percent is assumed, due to their longevity, tardy reproduction,
week fecundity and slow growth rate. The model used to calculate Guinea-Bissau’s fishing potential is based on Diop, M.,
Abdallahi, I., Bouzouma, M., Sidina, E., Hamady, B., Meissa, B. and N. Abdoulaye, 2004. Rapport du la Campagne D’evaluation
des Resources Demersales de la ZEE de la Guinee- Bissau. pp90
Fishing
Phosphate
Bauxite
Gu
inea
-Bis
sau
’s n
atu
ral
wea
lth
per
cap
ita
19
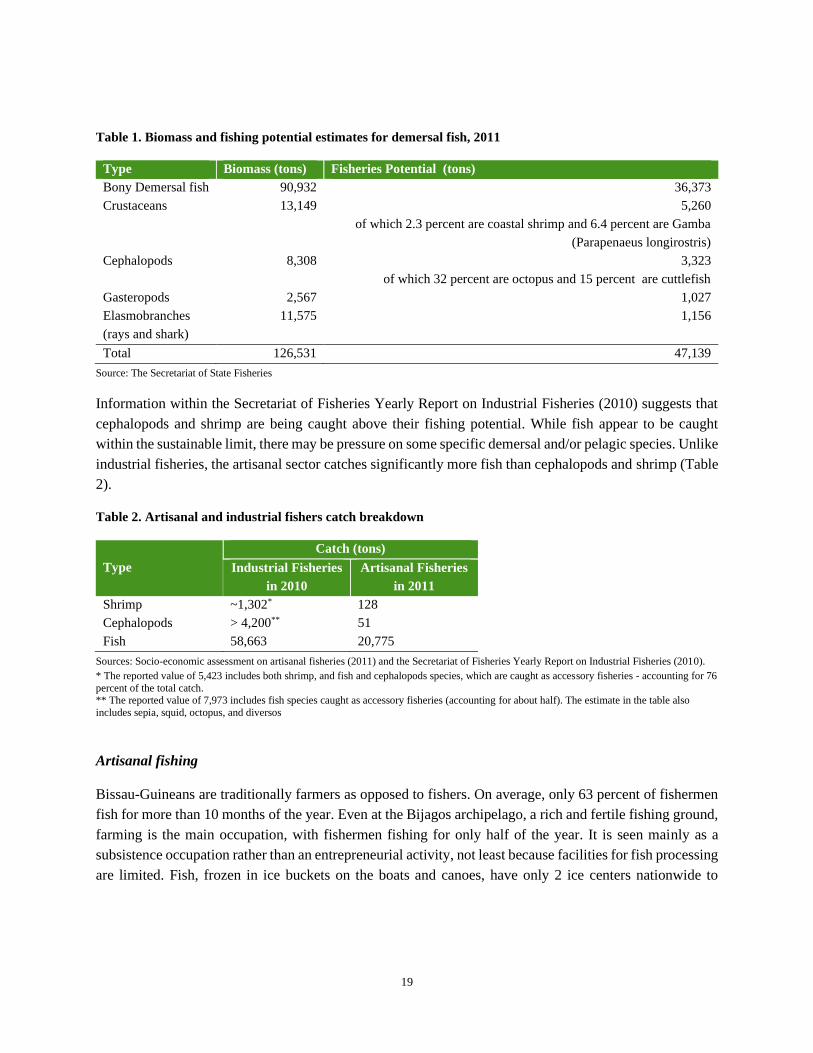
Table 1. Biomass and fishing potential estimates for demersal fish, 2011
Type Biomass (tons) Fisheries Potential (tons)
Bony Demersal fish 90,932 36,373
Crustaceans 13,149 5,260
of which 2.3 percent are coastal shrimp and 6.4 percent are Gamba
(Parapenaeus longirostris)
Cephalopods 8,308 3,323
of which 32 percent are octopus and 15 percent are cuttlefish
Gasteropods 2,567 1,027
Elasmobranches
(rays and shark)
11,575 1,156
Total 126,531 47,139
Source: The Secretariat of State Fisheries
Information within the Secretariat of Fisheries Yearly Report on Industrial Fisheries (2010) suggests that
cephalopods and shrimp are being caught above their fishing potential. While fish appear to be caught
within the sustainable limit, there may be pressure on some specific demersal and/or pelagic species. Unlike
industrial fisheries, the artisanal sector catches significantly more fish than cephalopods and shrimp (Table
2).
Table 2. Artisanal and industrial fishers catch breakdown
Type
Catch (tons)
Industrial Fisheries
in 2010
Artisanal Fisheries
in 2011
Shrimp ~1,302* 128
Cephalopods > 4,200** 51
Fish 58,663 20,775
Sources: Socio-economic assessment on artisanal fisheries (2011) and the Secretariat of Fisheries Yearly Report on Industrial Fisheries (2010).
* The reported value of 5,423 includes both shrimp, and fish and cephalopods species, which are caught as accessory fisheries - accounting for 76
percent of the total catch. ** The reported value of 7,973 includes fish species caught as accessory fisheries (accounting for about half). The estimate in the table also
includes sepia, squid, octopus, and diversos
Artisanal fishing
Bissau-Guineans are traditionally farmers as opposed to fishers. On average, only 63 percent of fishermen
fish for more than 10 months of the year. Even at the Bijagos archipelago, a rich and fertile fishing ground,
farming is the main occupation, with fishermen fishing for only half of the year. It is seen mainly as a
subsistence occupation rather than an entrepreneurial activity, not least because facilities for fish processing
are limited. Fish, frozen in ice buckets on the boats and canoes, have only 2 ice centers nationwide to

20
potentially transfer their fish to. Fish are therefore mainly smoked32 (in the south of the country), salted (in
the north) or dried – an occupation dominated by Guinea-Bissau’s women.
The socio-economic assessment of artisanal fisheries, undertaken in 2011 by the Secretariat of State of
Fisheries (CIPA 2011), is the latest report on the artisanal sector. 33 While the report provides a relatively
comprehensive overview of a sector that otherwise struggles to systematically record information, there are
a number of caveats worth highlighting. First, the assessment does not take into account vessels operated
by non-residents in Guinea-Bissau, or vessels based in Guinea-Conakry or Senegal that are operating in
Guinea-Bissau’s waters; arguably, artisanal fisheries statistics should include landings at Ziguinshor and
M’bour in Senegal and Kamsar in Guinea-Conakry. Second, fisheries practiced without a vessel – mainly
in rivers and estuaries are not considered. Third, the actual fishing effort (number of vessels) is based on
high level estimates, due to the difficultly of monitoring annual fishing. For example, fisheries activities
are seasonal, owing to the rainy season, and competing activities such as harvesting or planting; the fishing
effort is different for continental fisheries verses ocean fisheries; and while 168 landing sites are considered
in the socio-economic assessment, long-term monitoring is usually restricted to 25 sites, owing to limited
resources.
The assessment estimates that almost 22,000 tons of fish were landed by the artisanal fishing sector in 2011,
an 8 percent increase from 2009. However, these estimates could be grossly underestimated, for the reasons
highlighted above. The main factor affecting the artisanal fishing estimates is thought to be the presence of
foreign vessels, mainly from Senegal and Guinea-Conakry. While foreign vessels are estimated to make up
only 10 percent of the overall artisanal fishing fleet, they are much more efficient– up to 10 times more
productive than their Bissauan neighbors (FAO data), mainly due to better equipment and training.
The natural wealth calculations for Guinea-Bissau’s artisanal sector are based on an amalgamation of the
results captured in the CIPA study (2011), various West African regional fishing studies; and interviews
with local fishermen during February-March 2013. Using these different sources, the rental estimates are
calculated based on assumptions relating to the efficiency of different fishing vessels, the average price of
a ton of fish, and the costs of fishing (variable, fixed and labor costs) (see Box 2 for an overview). As noted
above, the data are of variable quality, and as such the wealth estimates provide more of an indication of
the potential scale, rather than a precise figure. Based on these assumptions, wealth per capita estimates
from artisanal fishing could be up to $132 per capita ($62.9 from non-motorized fishing and $69.1 from
motorized fishing). These estimates are based on the assumption that management of the sector improves,
as proposed under the West African Regional Fisheries Program, which is building up institutional capacity.
Without this reform, rents would fall to zero with sustainability limits breached and informal activity of
foreign vessels increasing, taking Guinea-Bissau’s rents elsewhere.
32 Fish smoking in the foreign fisherman settlements such as in Ilheu dos Porcos, are causing significant damage to the mangrove
plantations. 33 III Inquerito sobre os aspectos socio-ecónomicos da pesca na Guiné Bissau, CIPA 2011

21
Box 2. Artisanal fishing assumptions
• Efficiency
In 2011, 1,274 non-motorized canoes landed 12,675 tons of fish compared to a catch of 9,220 tons by 268 motorized
vehicles. Based on indicative figures for the number of outings by each types of vessel per year, and the number of
vessels in operation, the average catch for a motorized vessel is approximately 12.5 Kgs compared to 3.7 Kgs for a
non-motorized canoe.
• Price of fish
The average price per ton of fish caught is based on a weighted average annual fish catch. Demersal fish, at an
average of 500 CFA per kg, are the most popular, representing almost 50 percent of the total fishing catch in a
year.34
• Fishing costs – products
Variable costs include items such as bait, provisions for the crew, ice, salt, and any charges to off-load the fish at the
port – for the motorized vessels fuel costs are added on top of this.
Fixed costs cover the maintenance of the vessel and any navigation and fishing equipment – fixed costs for
motorized vessels are larger owing to engine repairs and the maintenance of generally bigger boats. A standard
amortization formula is used to capture the depreciation costs of the vessels and any navigation and fishing
equipment.
• Fishing costs – labor
There are no set wage rates in Guinea-Bissau, making labor cost estimation difficult. Fishing is often seen as a
subsistence occupation, and where the fish are not used directly for household consumption, it may be bartered for
other food stuffs rather than sold to a market. Based on interviews with local fishermen labor costs are assumed to
be 30 percent of daily profits when the fish is sold to a local market.
Industrial fishing
Guinea-Bissau has relatively low industrial fisheries. Foreign vessels currently pay license fees based on
negotiations between the government of Guinea-Bissau and the respective country. The EU and China, and
increasingly Korea, are the main fishing vessels licensed in the country (Error! Not a valid bookmark
self-reference.). The Secretariat of State of Fisheries estimated that a ton of fishing products caught by
industrial means in Guinea-Bissau was worth an average of $1,100 in 2010. The 2010 industrial fisheries
catch would therefore be worth close to $80 million, while Guinea-Bissau is in receipt of a much smaller
sum of around $18 million from licenses, fines, and sector support arriving from fisheries agreements.
Given the concerns of underreporting there are legitimate calls for Guinea-Bissau to renegotiate their
licenses, paying particular attention to the agreements with the EU, which are up for renewal.
34 A detailed breakdown of fish caught in each region, as well as the average price the fishermen receive when they sell the fish to
market is included in the Appendix.

22
Table 3. Fishing licenses by vessel type and nationality
Nationality
Trawl Trawl Tuna
Total Shrimp Cephalopod
Demersal
Fish
Pelagic
Fish Seiner
Pole
line Other
Belize 2 0 0 2 0 0 0 4
China 12 14 19 0 0 0 0 45
Union of
Comoros 0 0 0 2 0 0 0 2
Republic of
Korea 0 0 14 0 0 0 0 14
Greece 0 1 0 0 0 0 0 1
Spain 23 9 0 0 13 8 0 53
France 0 0 0 0 10 0 0 10
Guinea-
Bissau 1 1 1 0 0 0 0 3
Mauritania 0 0 1 0 0 0 0 1
Ireland 0 1 0 0 0 0 0 1
Panama 0 0 0 1 0 0 0 1
Portugal 3 1 0 0 0 0 0 4
Italy 0 2 0 0 0 0 0 2
Senegal 0 3 0 0 0 1 0 4
Total 41 32 35 5 23 9 0 145
Source: The Secretary of State of Fisheries (SEP) annual report, 2010
Guinea-Bissau lacks the resources and capacity to monitor industrial fishing in its waters, resulting in
several potentially adverse consequences. For example, many vessels are thought to operate under shrimp
licenses, with the vessel owners claiming that any fish and/or cephalopod caught are accessory fisheries.
There are also concerns that there may be illegal tuna fishing taking place under the guise of these shrimp
licenses, thereby escaping any regulation Guinea-Bissau does have in place. While Guinea-Bissau is not a
member of the International Commission for the Conservation of Atlantic Tunas (ICCAT), subscription
would facilitate the placement of international observers on all tuna licensed vessels.
The other concern relating to poor regulation and management of the sector is the ability of the authorities
to monitor how much fish is being taken out of their waters. Generally, foreign vessels land their catch in
ports around the world or in larger factory-vessels. The only fish landed in Guinea-Bissau is a compulsory
share (normally around 10 percent) pre-defined in the fishing license. At present, only Chinese operators
are obliged to do this as the EU negotiated to have this requirement removed. While the EU does not
therefore land any fish in Guinea-Bissau, there is an agreement that the EU or, the governments of the
countries with licenses to operate in Guinea-Bissau, will report landings made elsewhere. In practice,
however, reports are rarely submitted or are of poor quality. As a consequence, industrial fisheries statistics
are based on the reports of scarce on board fisheries observers, and their accuracy varies (Figure 5 and
Table 4).
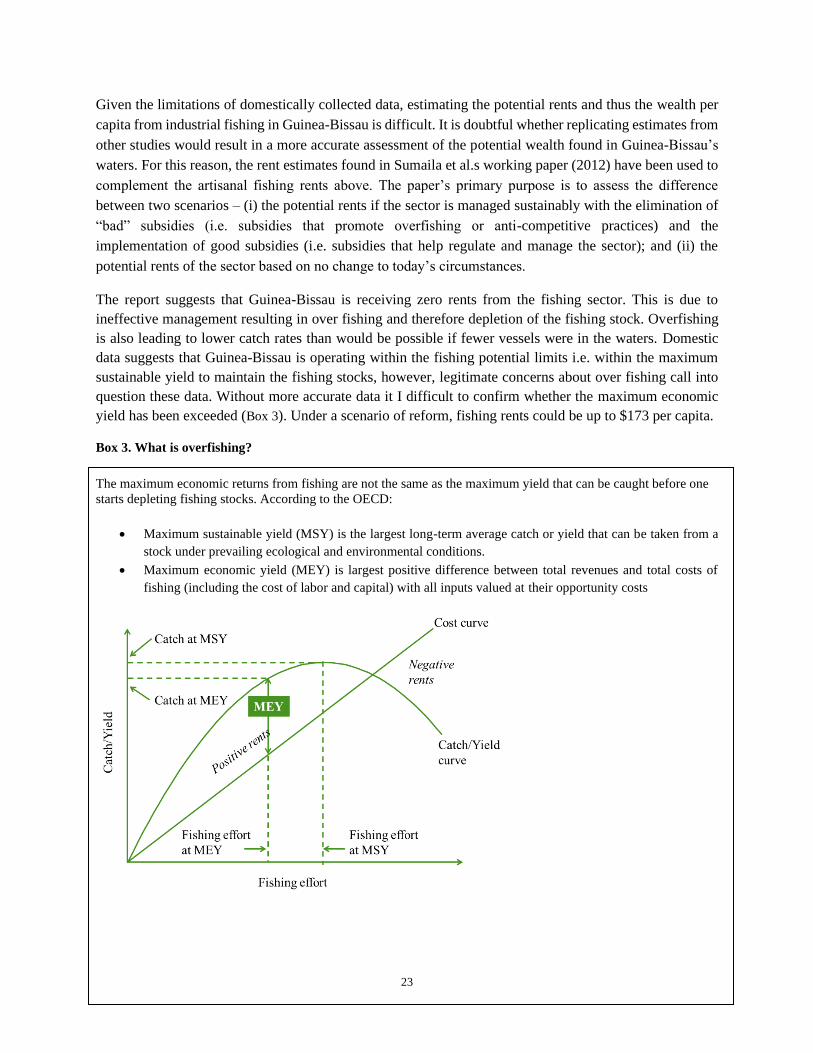
23
Given the limitations of domestically collected data, estimating the potential rents and thus the wealth per
capita from industrial fishing in Guinea-Bissau is difficult. It is doubtful whether replicating estimates from
other studies would result in a more accurate assessment of the potential wealth found in Guinea-Bissau’s
waters. For this reason, the rent estimates found in Sumaila et al.s working paper (2012) have been used to
complement the artisanal fishing rents above. The paper’s primary purpose is to assess the difference
between two scenarios – (i) the potential rents if the sector is managed sustainably with the elimination of
“bad” subsidies (i.e. subsidies that promote overfishing or anti-competitive practices) and the
implementation of good subsidies (i.e. subsidies that help regulate and manage the sector); and (ii) the
potential rents of the sector based on no change to today’s circumstances.
The report suggests that Guinea-Bissau is receiving zero rents from the fishing sector. This is due to
ineffective management resulting in over fishing and therefore depletion of the fishing stock. Overfishing
is also leading to lower catch rates than would be possible if fewer vessels were in the waters. Domestic
data suggests that Guinea-Bissau is operating within the fishing potential limits i.e. within the maximum
sustainable yield to maintain the fishing stocks, however, legitimate concerns about over fishing call into
question these data. Without more accurate data it I difficult to confirm whether the maximum economic
yield has been exceeded (Box 3). Under a scenario of reform, fishing rents could be up to $173 per capita.
Box 3. What is overfishing?
The maximum economic returns from fishing are not the same as the maximum yield that can be caught before one
starts depleting fishing stocks. According to the OECD:
• Maximum sustainable yield (MSY) is the largest long-term average catch or yield that can be taken from a
stock under prevailing ecological and environmental conditions.
• Maximum economic yield (MEY) is largest positive difference between total revenues and total costs of
fishing (including the cost of labor and capital) with all inputs valued at their opportunity costs

24
There are however large coordination failures in fishing, resulting in a tragedy of the commons, i.e. the optimal fishing
effort is exceeded due to overcrowding in the waters. As more and more fishermen enter the market, economic rents
decrease for all players. It is possible to have a situation where over fishing is taking place, and yet the fish population
is still biologically stable.
Given the sporadic nature of domestic fishing reporting, it is assumed that artisanal fishing is not part of
this estimate and thus the total wealth per capita from fishing could be up to US$305. While there is a
possibility of some double counting, the numerous examples of under reporting in Guinea-Bissau suggest
that even if part of the artisanal sector were to be captured in Sumaila’s paper, aggregating the two figures
would not lead to a gross over-estimation.
A similar story of the need for stronger governance of the sector emerges from interviews and data analysis.
Up-front investment in institutional capacity could help improve revenue collection from fisheries, while
capacity improvements in local artisanal fishing could boost incomes.
Figure 5. Landings of artisanal and industrial
fish
Table 4. Industrial fish landings in Guinea-Bissau, 2010
in tons, fish
Species Catch
(tons)
Throws
(no.) Hours Days
Shrimp 5,423 164,848 336,896 7,053
Cephalopods 7,973 174,053 395,045 5,749
Fish 58,663 270,261 558,428 8,633
Total 72,059 609,162 1,290,369 21,435
Source: SEP annual reports. Data for artisanal fishing is only available for 2006, 2009 and 2011. Industrial fishing is based on vessel owner reporting
of fish, shrimp and cephalopod species
-
20,000
40,000
60,000
80,000
100,000
Commerical Fishing Aristanal Fishing
25
Timber and non-timber forest related resources
Guinea-Bissau is host to a diversified set of forest land, ranging from mangroves to
densely packed sub-humid forests. Up to 70 percent of the country is thought to be
covered by some form of forest, equivalent to 2.58 million hectares. As a potential
recipient of REDD financing (Reducing Emissions from Deforestation and Forest
Degradation) there has been significant research into the country’s forest coverage
and rates of deforestation. Contrary to the FAO’s findings, the use of satellite
technology suggests that forest coverage has actually remained relatively stable over
the past 17 years (from 1990-2007). However, these aggregate deforestation figures
disguise a changing forest landscape. Open and closed forest coverage has been
decreasing, while savannah land – areas with fewer trees, has been increasing.
Meanwhile, mangrove coverage has fluctuated owing in part to rice planting
pressures (Table 5). The most recent data, covering a five year period from 2002-
2007, show that mangrove forests have stabilized/are marginally increasing. There
are concerns that they are under threat again as farmers shift back to rice production
in the wake of rising international rice prices.
There are limited resources to effectively manage the forest sector in Guinea-Bissau. The General
Directorate of Forests and Fauna (DGFF) has several regional delegations, however, both the delegations
and national level departments are understaffed, lacking the means to perform field visits and therefore
adequately govern the country’s forests. As a consequence, there is very limited information on the state of
Guinea-Bissau’s forests. This is made worse by irregular reporting by the delegations to national level staff.
Forest guards have recently been incorporated into the National Guard, in an attempt to improve the
regulation of the sector. They now have a structured career path and a significantly increased salary. Despite
these changes, submission of information to the DGFF remains sporadic, and usually only when a specific
request is made.
Table 5. Guinea-Bissau’s changing forest landscape
Forest type
1990-1994 1994-2002 2002-2007 1990-2007
Annual
change
(Ha)
Annual
change
(%)
Annual
change (Ha)
Annual
change
(%)
Annual
change
(Ha)
Annual
change
(%)
Annual
change
(Ha)
Annual
change
(%)
Closed
Forest -4,916 -4.6% -881 -1.0% -5,321 -6.6% -3,136 -2.9%
Open Forest -10,828 -1.3% -5,584 -0.7% -5,225 -0.7% -6,712 -0.8%
Savannah
Woodland 35,981 2.7%
5,03
4 0.3% 4,287 0.3% 12,096 0.9%
Mangroves -1,102 -0.5% 156 0.1% 2,068 0.9% 422 0.2%
Total 19,135 0.8% -1,274 -0.1% -4,191 -0.2% 2,670 0.1%
Source: Carboveg, 2013
Gu
inea
-Bis
sau
’s n
atu
ral
wea
lth
per
cap
ita
NTFR
Timber
Fishing
Phosphate
Bauxite
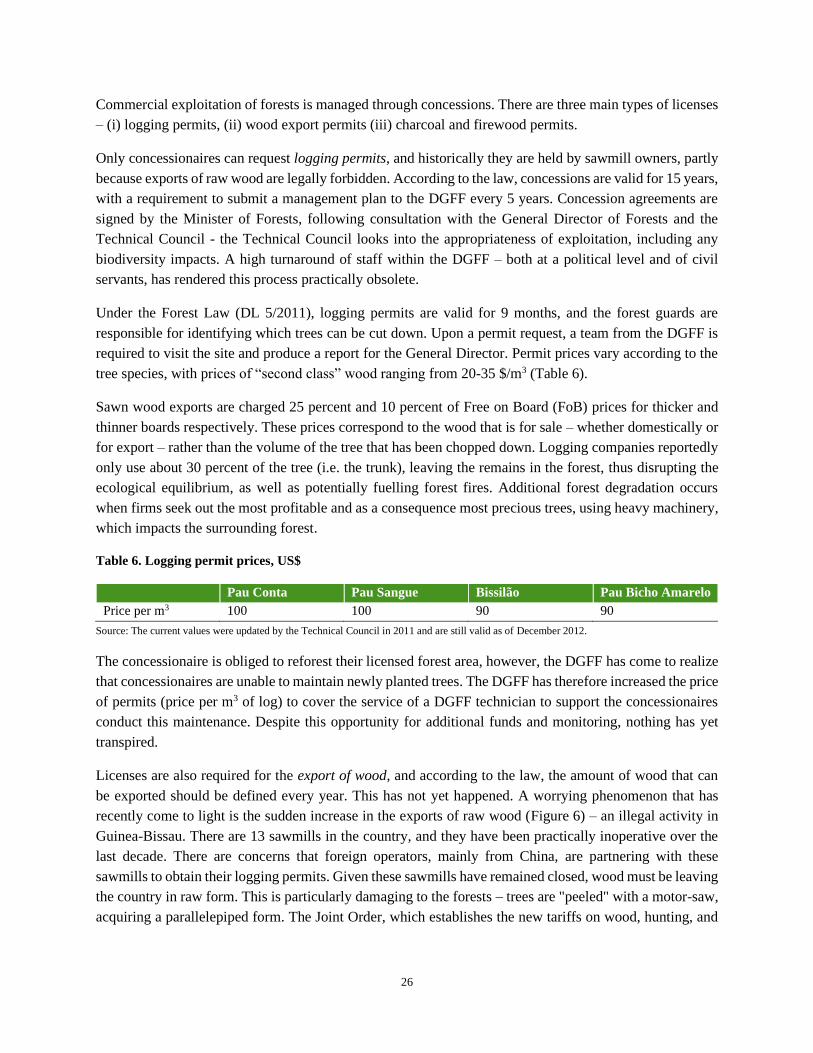
26
Commercial exploitation of forests is managed through concessions. There are three main types of licenses
– (i) logging permits, (ii) wood export permits (iii) charcoal and firewood permits.
Only concessionaires can request logging permits, and historically they are held by sawmill owners, partly
because exports of raw wood are legally forbidden. According to the law, concessions are valid for 15 years,
with a requirement to submit a management plan to the DGFF every 5 years. Concession agreements are
signed by the Minister of Forests, following consultation with the General Director of Forests and the
Technical Council - the Technical Council looks into the appropriateness of exploitation, including any
biodiversity impacts. A high turnaround of staff within the DGFF – both at a political level and of civil
servants, has rendered this process practically obsolete.
Under the Forest Law (DL 5/2011), logging permits are valid for 9 months, and the forest guards are
responsible for identifying which trees can be cut down. Upon a permit request, a team from the DGFF is
required to visit the site and produce a report for the General Director. Permit prices vary according to the
tree species, with prices of “second class” wood ranging from 20-35 $/m3 (Table 6).
Sawn wood exports are charged 25 percent and 10 percent of Free on Board (FoB) prices for thicker and
thinner boards respectively. These prices correspond to the wood that is for sale – whether domestically or
for export – rather than the volume of the tree that has been chopped down. Logging companies reportedly
only use about 30 percent of the tree (i.e. the trunk), leaving the remains in the forest, thus disrupting the
ecological equilibrium, as well as potentially fuelling forest fires. Additional forest degradation occurs
when firms seek out the most profitable and as a consequence most precious trees, using heavy machinery,
which impacts the surrounding forest.
Table 6. Logging permit prices, US$
Pau Conta Pau Sangue Bissilão Pau Bicho Amarelo
Price per m3 100 100 90 90
Source: The current values were updated by the Technical Council in 2011 and are still valid as of December 2012.
The concessionaire is obliged to reforest their licensed forest area, however, the DGFF has come to realize
that concessionaires are unable to maintain newly planted trees. The DGFF has therefore increased the price
of permits (price per m3 of log) to cover the service of a DGFF technician to support the concessionaires
conduct this maintenance. Despite this opportunity for additional funds and monitoring, nothing has yet
transpired.
Licenses are also required for the export of wood, and according to the law, the amount of wood that can
be exported should be defined every year. This has not yet happened. A worrying phenomenon that has
recently come to light is the sudden increase in the exports of raw wood (Figure 6) – an illegal activity in
Guinea-Bissau. There are 13 sawmills in the country, and they have been practically inoperative over the
last decade. There are concerns that foreign operators, mainly from China, are partnering with these
sawmills to obtain their logging permits. Given these sawmills have remained closed, wood must be leaving
the country in raw form. This is particularly damaging to the forests – trees are "peeled" with a motor-saw,
acquiring a parallelepiped form. The Joint Order, which establishes the new tariffs on wood, hunting, and
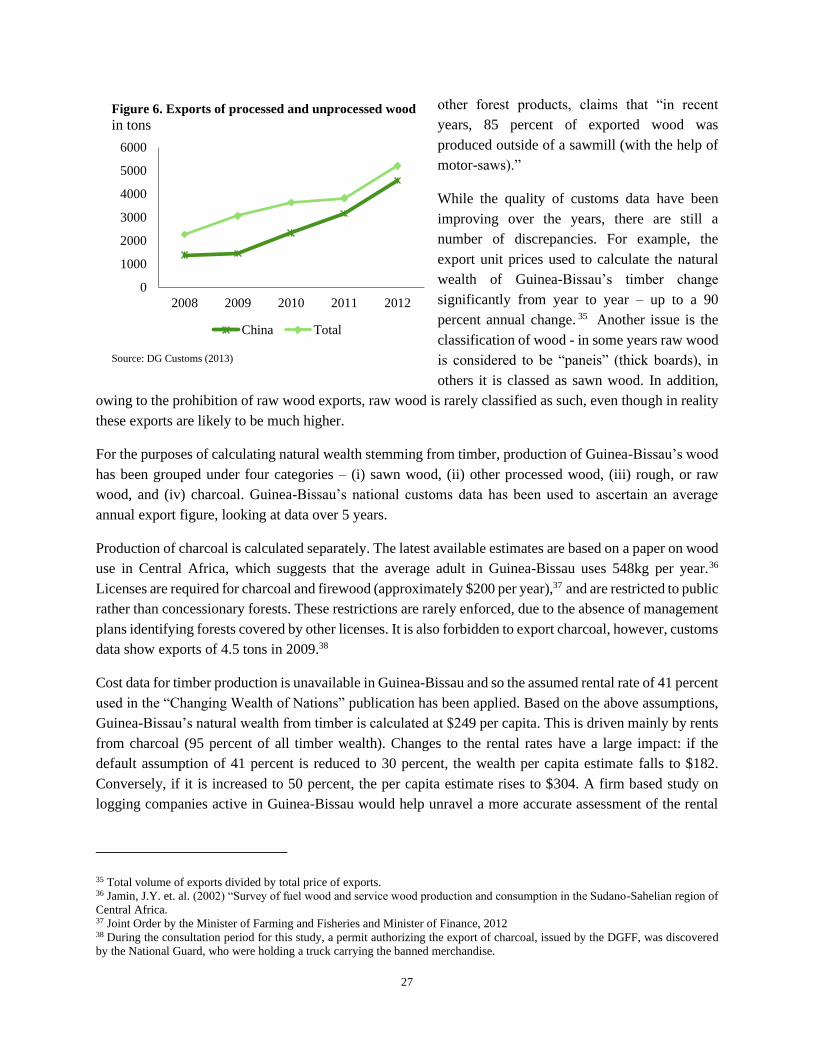
27
other forest products, claims that “in recent
years, 85 percent of exported wood was
produced outside of a sawmill (with the help of
motor-saws).”
While the quality of customs data have been
improving over the years, there are still a
number of discrepancies. For example, the
export unit prices used to calculate the natural
wealth of Guinea-Bissau’s timber change
significantly from year to year – up to a 90
percent annual change. 35 Another issue is the
classification of wood - in some years raw wood
is considered to be “paneis” (thick boards), in
others it is classed as sawn wood. In addition,
owing to the prohibition of raw wood exports, raw wood is rarely classified as such, even though in reality
these exports are likely to be much higher.
For the purposes of calculating natural wealth stemming from timber, production of Guinea-Bissau’s wood
has been grouped under four categories – (i) sawn wood, (ii) other processed wood, (iii) rough, or raw
wood, and (iv) charcoal. Guinea-Bissau’s national customs data has been used to ascertain an average
annual export figure, looking at data over 5 years.
Production of charcoal is calculated separately. The latest available estimates are based on a paper on wood
use in Central Africa, which suggests that the average adult in Guinea-Bissau uses 548kg per year.36
Licenses are required for charcoal and firewood (approximately $200 per year),37 and are restricted to public
rather than concessionary forests. These restrictions are rarely enforced, due to the absence of management
plans identifying forests covered by other licenses. It is also forbidden to export charcoal, however, customs
data show exports of 4.5 tons in 2009.38
Cost data for timber production is unavailable in Guinea-Bissau and so the assumed rental rate of 41 percent
used in the “Changing Wealth of Nations” publication has been applied. Based on the above assumptions,
Guinea-Bissau’s natural wealth from timber is calculated at $249 per capita. This is driven mainly by rents
from charcoal (95 percent of all timber wealth). Changes to the rental rates have a large impact: if the
default assumption of 41 percent is reduced to 30 percent, the wealth per capita estimate falls to $182.
Conversely, if it is increased to 50 percent, the per capita estimate rises to $304. A firm based study on
logging companies active in Guinea-Bissau would help unravel a more accurate assessment of the rental
35 Total volume of exports divided by total price of exports. 36 Jamin, J.Y. et. al. (2002) “Survey of fuel wood and service wood production and consumption in the Sudano-Sahelian region of
Central Africa. 37 Joint Order by the Minister of Farming and Fisheries and Minister of Finance, 2012 38 During the consultation period for this study, a permit authorizing the export of charcoal, issued by the DGFF, was discovered
by the National Guard, who were holding a truck carrying the banned merchandise.
Figure 6. Exports of processed and unprocessed wood
in tons
Source: DG Customs (2013)
0
1000
2000
3000
4000
5000
6000
2008 2009 2010 2011 2012
China Total

28
rate. Firms are protective of this information, and at present the DGFF has no information on their activities
or financial statements.
Better governance of Guinea-Bissau’s forests would help improve the sustainability of the land while also
creating a sector that could contribute to the country’s budget. Tighter regulation of the sector could help
support a thriving forestry sector with small scale manufacturing of wood based products rather than the
export of raw wood currently happening today.
Non-timber forest resources
Apart from timber, forests offer local communities a multitude of other goods and services, ranging from
hunting and the provision of food stuffs, to furniture and medicine. Placing a value on these activities is
difficult as often there are no market prices for goods and services provided by forests to the local
community.
In terms of recreation, official hunting by national citizens is rarely undertaken, with only 2 licenses granted
in 2007. Licenses for foreign residents and tourists are more common, although there were still only 37
authorized in 2007. While the market for game hunting is not well developed, it is possible that these figures
underestimate the amount of hunting that takes place, especially by local communities. Given the sector is
so poorly managed it is almost impossible, in the absence of more detailed survey data, to estimate the true
scale of hunting activities.
Hunting permit prices in Guinea-Bissau are exceptionally low when compared to permit prices in other
SSA countries (Table 7). Larger animals, such as buffalo, hippopotamus, wolves, lions, dolphin, etc. require
specific permits that attract different and often higher tariffs. There are also monthly quotas for both
nationals and for foreign residents or weekly quotas for tourists.39 Low permit prices have not and are
unlikely to stimulate demand for hunting tourism given the poor state of tourism infrastructure and political
instability. Moreover, low permit prices do not provide the authorities with sufficient income to regulate
and monitor any recreational or illegal hunting, calling into question the sustainability of such activities.
Table 7. Types and prices of hunting licenses, 2011
Hunting permit Period Price Prices in other SSA
countries (CFA) US$
Nationals - Larger
animals November-May 25,000 50
US$ 2,00-10,000 Tourists - Larger
animals One week 80,000 160
Nationals - Smaller
animals November-May 20,000 40
US$ 1,000-2,500 Tourists - Smaller
animals One week 75,000 150
Commercial Hunting 90 days 15,0000 300
Scientific hunting Exempt (CITES agreement)
39 Recent reports from the DGFF suggest that most of the hunting conducted by tourists is for smaller animals, mostly birds.
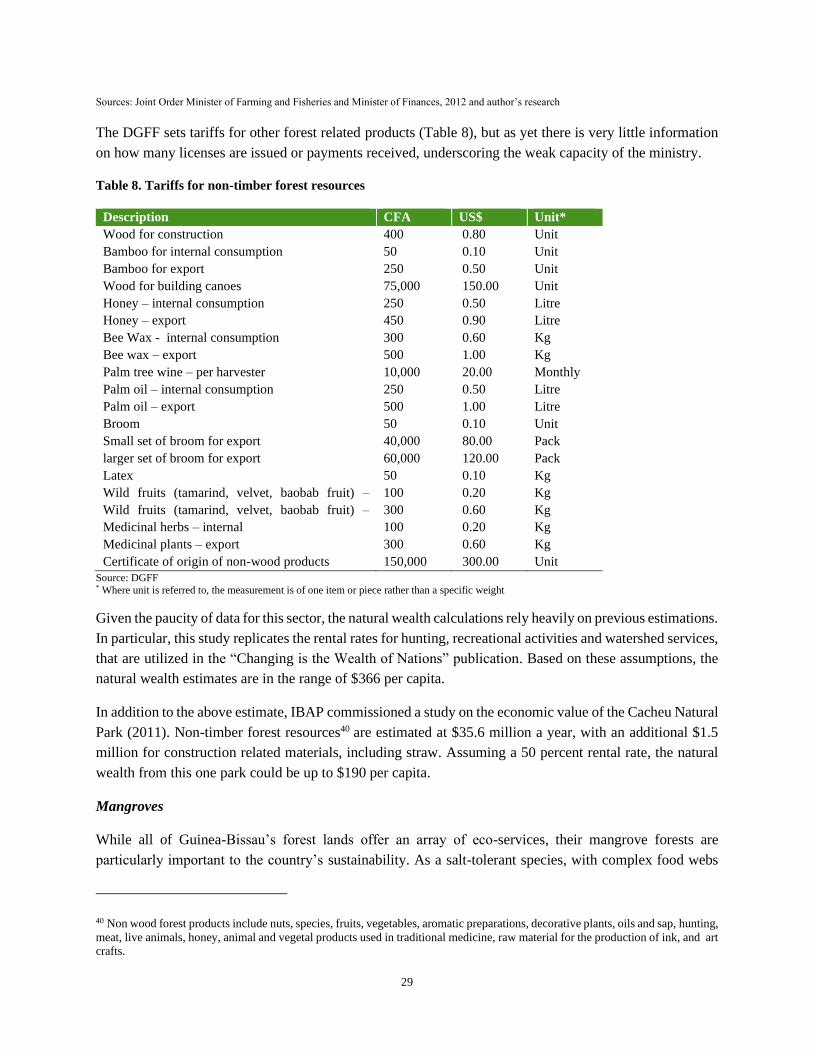
29
Sources: Joint Order Minister of Farming and Fisheries and Minister of Finances, 2012 and author’s research
The DGFF sets tariffs for other forest related products (Table 8), but as yet there is very little information
on how many licenses are issued or payments received, underscoring the weak capacity of the ministry.
Table 8. Tariffs for non-timber forest resources
Description CFA US$ Unit*
Wood for construction 400 0.80 Unit
Bamboo for internal consumption 50 0.10 Unit
Bamboo for export 250 0.50 Unit
Wood for building canoes 75,000 150.00 Unit
Honey – internal consumption 250 0.50 Litre
Honey – export 450 0.90 Litre
Bee Wax - internal consumption 300 0.60 Kg
Bee wax – export 500 1.00 Kg
Palm tree wine – per harvester 10,000 20.00 Monthly
Palm oil – internal consumption 250 0.50 Litre
Palm oil – export 500 1.00 Litre
Broom 50 0.10 Unit
Small set of broom for export 40,000 80.00 Pack
larger set of broom for export 60,000 120.00 Pack
Latex 50 0.10 Kg
Wild fruits (tamarind, velvet, baobab fruit) –
internal
100 0.20 Kg
Wild fruits (tamarind, velvet, baobab fruit) –
export
300 0.60 Kg
Medicinal herbs – internal 100 0.20 Kg
Medicinal plants – export 300 0.60 Kg
Certificate of origin of non-wood products 150,000 300.00 Unit
Source: DGFF * Where unit is referred to, the measurement is of one item or piece rather than a specific weight
Given the paucity of data for this sector, the natural wealth calculations rely heavily on previous estimations.
In particular, this study replicates the rental rates for hunting, recreational activities and watershed services,
that are utilized in the “Changing is the Wealth of Nations” publication. Based on these assumptions, the
natural wealth estimates are in the range of $366 per capita.
In addition to the above estimate, IBAP commissioned a study on the economic value of the Cacheu Natural
Park (2011). Non-timber forest resources40 are estimated at $35.6 million a year, with an additional $1.5
million for construction related materials, including straw. Assuming a 50 percent rental rate, the natural
wealth from this one park could be up to $190 per capita.
Mangroves
While all of Guinea-Bissau’s forest lands offer an array of eco-services, their mangrove forests are
particularly important to the country’s sustainability. As a salt-tolerant species, with complex food webs
40 Non wood forest products include nuts, species, fruits, vegetables, aromatic preparations, decorative plants, oils and sap, hunting,
meat, live animals, honey, animal and vegetal products used in traditional medicine, raw material for the production of ink, and art
crafts.

30
and ecosystem dynamics, mangroves are one of the most productive ecosystems in the world, acting as a
nursery ground for fish and other seafood.41 In addition, they contribute to the protection and stabilization
of coastlines, dissipating the energy of breaking waves, and trapping sediments. This is especially important
for low-lying Guinea-Bissau where most of their coastal in-land is barely 25m above sea level.
Guinea-Bissau’s National Adaptation Program of Action against climate change (NAPA) highlights the
importance of mitigating the impact of floods, which occur relatively frequently. Flooding, caused by high
tides or torrential rain, has had a deleterious impact on the country’s already stretched infrastructure as well
as food production. It has been reported that the floods of 2003, 2004, and 2005 destroyed up to 63 hectares
of land in the eastern regions ((Bafatá and Gabú) used for agricultural purposes. During flooding in 2005,
communities lost their paddy rice fields due to salt water invasion, which proved too strong for the weak
protective dam infrastructure. Almost 3,015 hectares of rice growing fields were made fallow and
unproductive.
About 6.5 percent of Guinea-Bissau’s land is covered by mangrove forests (approximately 9 percent of
total forest coverage). They constitute the basis for artisanal fishing and harvesting of oysters, shrimp and
fish, as well as acting as a nursery ground for fish and other seafood found further afield. Oyster fishing is
one of main incomes of the Bijago women and the largest source of protein in the archipelago. Other none
fishing related activities include salt production - the salt is often used as currency by women living in
coastal areas; honey – in 1999 honey production occupied 4 percent of the population living near the
mangrove areas; and hunting – mainly birds, but also crocodiles, manatees and the green monkey.
Deforestation of mangroves is mainly due to swamp rice production (replacing trees for the installation of
rice paddies through a dykes system), and the production of fuel wood and charcoal (partly for smoking of
fish, but also for other uses). These pressures have fluctuated over the years, at a country wide level but
also in specific geographical locations (Table 9). Mangroves are relatively good at regenerating, which
partly explains the varying coverage as populations migrate throughout the country.
Both international and domestic factors have influenced the
nation’s rice production – the main pressure on mangrove
41 Estimates of the annual market value of fisheries supported by mangroves range from $750 to $1,670 per hectare, depending on
the type of fish and crustacean (see Ronnback 1999 for a literature review of the economic benefits).
Table 9. Changes in mangrove
coverage (1990-2007)
Area Change in
forest coverage
Bissau -38%
Bafata -35%
Tombali -9%
Cacheu 21%
Bolama/Bijagos 21%
Biombo 20%
Quinara 10%
Source: CarboVeg

31
plantations.42 Historically, Bissau-Guineans are rice farmers, holding extensive traditional knowledge on
salt water rice paddies. In the early 1990s the Balanta tribe (about one third of the country’s population)
migrated towards Quinara and Tombali, which later became known as the barn of Guinea-Bissau.
Fluctuating international rice and cashew nut prices have influenced the population’s tendencies towards
one crop or another. The government has interfered in this market based structure by fixing the price of
both cashew and rice at one point or another. During the 1990s farmers shifted their activities towards
cashew, to take advantage of the favorable price ratio between cashew and rice. At the same time, the
government actively supported cashew plantations, further bolstering the country’s production of the heart
shaped nut.
As production increased, the price of cashew fell, corresponding with a global fall in cashew prices and an
increase in the price of rice. As a consequence, farmers are now shifting back to rice, and the government
is actively promoting rice farming, just as it did with cashew plantations 15 years ago.
Reducing the impact on mangrove forests does not necessarily mean prohibiting rice production. It does
however suggest that productivity improvements could be made in rice farming. The dykes and low level
infrastructure required for rice farming are often of poor quality and ill-maintained. This can lead to
additional deforestation of mangroves and more work in the medium-long term for the rice farmers.
There is a potential trade-off between encouraging people to farm rice, and maintaining the country’s
mangrove forests. Continuous mangrove deforestation would reduce the local communities access to non-
timber forest resources e.g. foods, medicine, oils etc.; affect the breeding ground for fish, especially shrimp,
one of the country’s more profitable seafood; and eliminate the natural barrier mangroves provide to
flooding and coastal erosion. On the other hand, limiting rice production – the country’s main food staple -
could adversely affect the nation’s ability to feed itself, while also put pressure on much needed
international reserves to fund rice imports. While this study does not attempt to quantify the specific wealth
from mangroves, the tension with rice production and the need for, inter alia, coastal protection against
storm surges suggests more research is needed to fully inform this trade-off.
Despite cost-based valuations of mangrove plantations becoming more prevalent, a consensus on the
methodology behind these valuations is yet to emerge. Most studies separate out the standard benefits from
forests, such as wood, food, medicines, shelter etc., from the unique coastal protection services offered by
mangroves. Any rents associated with their services as a nursery fishing ground would need to be subtracted
from fishing rents to avoid double counting.
A number of studies were completed in the mid to late 1990s with Barbier and Sathirathai coming up with
one of the highest estimates ($27,264-$35,921 per hectare) in their 2001 paper on Southern Thailand.43 The
42 The pressure imposed by the production of fuel for domestic use, salt production and smoking of fish is usually sustainable.
However, this pressure has been increasing in fishing camps, often occupied by foreign fishermen (in particular from Senegal and
Guinea-Conakry), who practice intensive fish smoking. This is a particular problem in Bolama/Bijagós, Tombali e Quínara.
43 See Barbier, E. and Sathirathai, S., 2001, “Valuing Mangrove Conservation in Southern Thailand” Contemporary Economic
Policy, Vol 19, No. 2, April 2001, pp109-122. Using these figures, Guinea-Bissau’s mangroves would be worth $6.6billion-$8.8
billion in 2007.

32
importance of West Africa’s mangroves has only recently come to light as mangrove deforestation rates in
the Gulf of Guinea and in countries like Sierra Leone have been recorded.44 While several studies looking
at the income generating activity potential of mangroves in various locations have been undertaken during
the last 15 years, no holistic overview or quantification of Guinea-Bissau’s mangroves exists.45
Carbon
With such a large part of the country covered in forest land, it is perhaps not surprising that Guinea-Bissau
is exploring opportunities to access the carbon market through REDD. Using data from remote sensing and
field work on above ground biomass, estimates on Guinea-Bissau’s carbon stocks and rates of deforestation
have been captured under the “Carboveg” research. This study has vastly improved the quality of data on
Guinea-Bissau’s forests undertaken by the FAO and other authors, who use estimates and extrapolations
based on data corresponding to 1990.
Forest land provides the population of Guinea-Bissau with much needed income and support. Up to 80
percent of the population is believed to live in coastal areas, taking advantage of the eco-system provided
by mangroves. Further inland, forests are being transformed into cashew nut farms, and as a consequence,
the landscape and level of carbon stocks are also changing. Other deforestation
pressures include poorly managed forest fires and socio-economic conditions and
cultural practices.
The proposed REDD projects currently under discussion are focused on the country’s
PAs, rather than attempting to reduce deforestation across the board. Carbon leakage
is a common problem when defining REDD carbon credits.46 The Carboveg study is
working with the government to establish an agreed methodology to measure the
baseline scenario and changes in carbon stocks so that carbon leakage can be
measured.
It may not be possible to set up REDD projects in all parks, because of the
complications caused by cashew plantations. For example, at Cacheu National Park,
where the natural flora (mainly mangroves) are protected, deforestation of open
forest and savannah has been increasing due to the plantation of cashew trees. The
transformation of forest land is creating an environmental pressure, which could turn
into a societal problem, not only in PAs but throughout the country: the destruction of natural ecosystems
twinned with the reliance on cashew as an income-generating activity increases the vulnerability of the
country. A REDD project cannot be used to monitor this change, since cashew tree plantations are not
considered to be “deforested” land: cashew plantations are small to medium sized trees, lasting for 20 years
or more. They are not structurally dissimilar to other forests, and cannot therefore be distinguished using
44 See for example research by the Wetlands International. 45 See for example ECOST (2005), “Environment and Economics of Production and Transformation units. The case of the
Farim/Cacheu, Mansoa and Geba/ Corubal Rivers”, in the “Ecosystems, Societies, Consilience, Precautionary principle:
Development of an assessment method of the societal cost for best fishing practices and efficient public policies” project; and
INEP/INEC (2007): Recensaemento e estudo sócio-económico e ambiental nas áreas protegidas e 2 km limítrofes 46 Leakage is said to occur when deforestation is simply deferred from one part of the country – a protected area – to a
neighboring site; thus the overall deforestation rate in the country stays the same.
Gu
ine
a-B
issa
u’s
nat
ura
l w
eal
th p
er
cap
ita
Carbon
NTFR
Timber
Fishing
Phosphate
Bauxite

33
satellite imagery with standard image processing tools. Identification of cashew can only be obtained
through research and development of new algorithms, or alternatively through high resolution aerial
photographs and field work.
Guinea-Bissau’s carbon stocks have been decreasing at a rate of 0.8% per year (Table 10), with carbon
stocks within closed forest decreasing at a rate of 4% per year as a result of changes to other forms of
forested land. Deforestation rates vary over time due to an array of agro-ecological, social, cultural and
economic factors. The international markets (cashew prices, rice prices, etc), together with cultural soil use
practices (e.g. burning for hunting or for agriculture) and preferences of the communities determine the
migration of the population, and consequently changes in forest coverage. Although not quantified, it is
thought that the regeneration capacity of Guinea-Bissau’s forests is high.
The first REDD projects are currently being set up in Cacheu and Cantanhez, with further field work to fine
tune the baseline. The yearly annual cost of MRV (monitoring, reporting and verification) in addition to
monitoring the relationship between the population distribution and the distribution of different agricultural
systems in the territory is estimated at US$200,000. This is based on a system (SIMOFLOR) devised by the
Secretary of State of Environment.
The CER (Certified Emission Reduction) price within the EU Emissions Trading Scheme (ETS) was
trading at an all-time low in mid-2013, barely reaching $0.50. Voluntary Emission Reduction (VERs)
credits are following suit. Such low prices do not provide the necessary incentives for a REDD carbon
credit. Assuming all deforestation in PAs is prevented, and using the current CER trading price of €0.51,
and an MRV cost of $200,000 per year, results in a negative wealth per capita value as the revenues from
the carbon credit are insufficient to cover the costs of monitoring and reporting. If the carbon price were to
rise back up to $20-25, the wealth per capita figure could be in the range of $70-89.47
Table 10. Guinea-Bissau’s Carbon Stocks
Forest Type Carbon stocks in 2007
(Mt of Carbon)
Proportion in
protected
territory
Transition from
forest to non-forest
(1990-2007)
yearly %
Transition to other
types of forest
(1990-2007)
yearly %
Closed Forest 6.2 2.0% 0.0% -4.0%
Open Forest 33.3 33.3% 0.3% - 0.9%
Savannah
Woodland 52.6 60.0% 1.3% 0.8%
Mangrove 4.6 9.0% 0.4% 0.2%
Total/average 96.7 0.8% 0.1%
Source: Carboveg, 2013
Crop and pasture land
47 The community led REDD projects currently being developed in Guinea-Bissau are based in two of the country’s protected areas,
focusing on mangrove forests. Carbon stocks within mangrove forests (“blue carbon”) are estimated to be much higher, potentially
20 times greater, than general forest land. The smaller forest coverage, and therefore small MRV costs, alongside higher carbon
stocks mean the break even carbon price estimated for these community-led REDD projects is around $6 per ton of CO2.
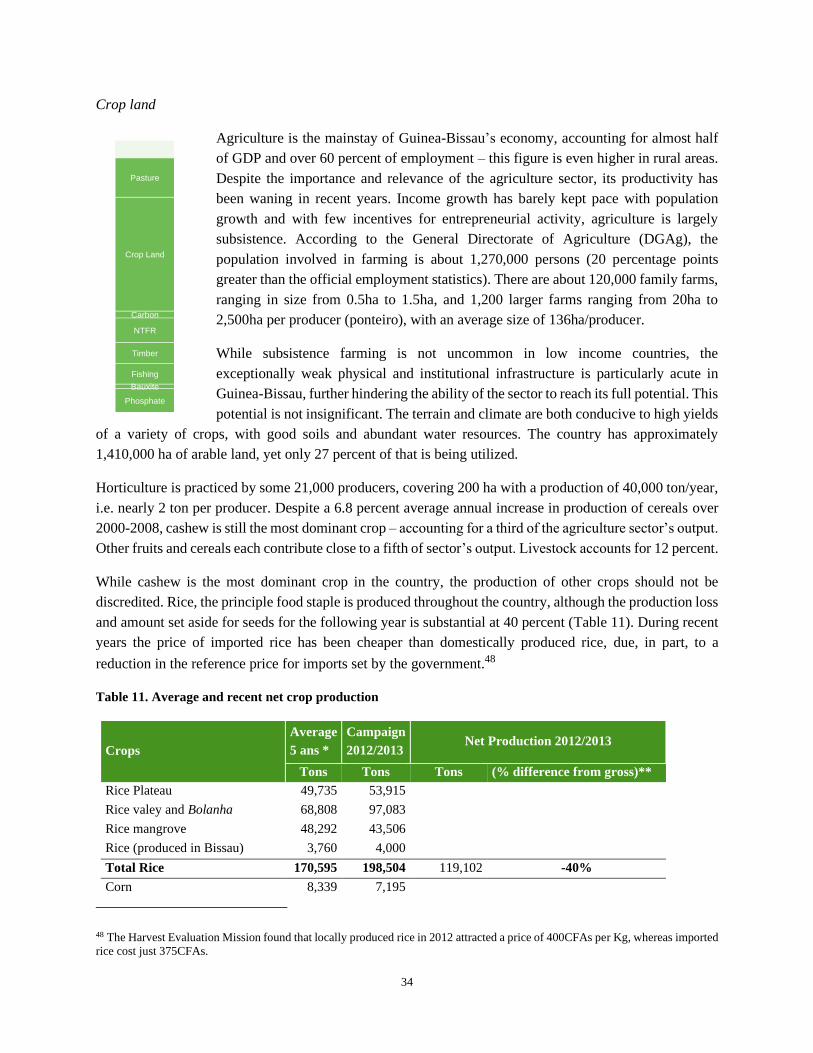
34
Crop land
Agriculture is the mainstay of Guinea-Bissau’s economy, accounting for almost half
of GDP and over 60 percent of employment – this figure is even higher in rural areas.
Despite the importance and relevance of the agriculture sector, its productivity has
been waning in recent years. Income growth has barely kept pace with population
growth and with few incentives for entrepreneurial activity, agriculture is largely
subsistence. According to the General Directorate of Agriculture (DGAg), the
population involved in farming is about 1,270,000 persons (20 percentage points
greater than the official employment statistics). There are about 120,000 family farms,
ranging in size from 0.5ha to 1.5ha, and 1,200 larger farms ranging from 20ha to
2,500ha per producer (ponteiro), with an average size of 136ha/producer.
While subsistence farming is not uncommon in low income countries, the
exceptionally weak physical and institutional infrastructure is particularly acute in
Guinea-Bissau, further hindering the ability of the sector to reach its full potential. This
potential is not insignificant. The terrain and climate are both conducive to high yields
of a variety of crops, with good soils and abundant water resources. The country has approximately
1,410,000 ha of arable land, yet only 27 percent of that is being utilized.
Horticulture is practiced by some 21,000 producers, covering 200 ha with a production of 40,000 ton/year,
i.e. nearly 2 ton per producer. Despite a 6.8 percent average annual increase in production of cereals over
2000-2008, cashew is still the most dominant crop – accounting for a third of the agriculture sector’s output.
Other fruits and cereals each contribute close to a fifth of sector’s output. Livestock accounts for 12 percent.
While cashew is the most dominant crop in the country, the production of other crops should not be
discredited. Rice, the principle food staple is produced throughout the country, although the production loss
and amount set aside for seeds for the following year is substantial at 40 percent (Table 11). During recent
years the price of imported rice has been cheaper than domestically produced rice, due, in part, to a
reduction in the reference price for imports set by the government.48
Table 11. Average and recent net crop production
Crops
Average
5 ans *
Campaign
2012/2013 Net Production 2012/2013
Tons Tons Tons (% difference from gross)**
Rice Plateau 49,735 53,915
Rice valey and Bolanha 68,808 97,083
Rice mangrove 48,292 43,506
Rice (produced in Bissau) 3,760 4,000
Total Rice 170,595 198,504 119,102 -40%
Corn 8,339 7,195
48 The Harvest Evaluation Mission found that locally produced rice in 2012 attracted a price of 400CFAs per Kg, whereas imported
rice cost just 375CFAs.
Gu
inea
-Bis
sau
’s n
atu
ral
wea
lth
per
cap
ita
Crop Land
Carbon
NTFR
Timber
Fishing
Phosphate
Bauxite
Pasture

35
Sorghum 17,066 23,547
Millet 18,055 16,954
Fonio 478 580
Dry cereals (produced in Bissau) 1,474 2,000
Total Dry cereals 45,412 50,276 42,735 -15%
Total Rice and Cereals 216,007 248,781 161 ,837 -35%
Cassava 44,197 20,755 15,774 -24%
Sweet Potato 18,253 13,340 11,459 -14.1
Peanut 34,695 45,214 45,214 0
Bean Mancanha 1,531 565 565 0
* 5 years average (2007-2011) ** The difference between gross and net production is due to either lost production, or grains set aside for seeds
Source: Harvest Evaluation Mission 2012/2013, GoGB/CILSS/WFP/FAO, 2013
Other fruits and cereals are an important source of food for the domestic market. Exports of these other
agricultural products are however limited, with cashew representing 99 percent of agricultural production
destined for export. Given the higher profits obtained from cashew, due to its low cost of production and
relatively low labor requirements, more and more land is being converted into cashew plantations. This is
true for non-irrigated land as well as for forest and savannah areas.
Over 95 percent of Guinea-Bissau’s exports are concentrated in just 5 export partners, with India alone
accounting for 76 percent. Out of these top five exporters, 70 percent of exports fall under the category of
raw cashew nuts. Guinea-Bissau therefore has a twin risk of an undiversified export portfolio, and an
undiversified set of export partners (Figures 7 and 8). In addition to the risk of cashew price fluctuations,
there is also a risk from relying on just one species, – one plague or disease of cashew trees would have
severe consequences. According to Harvest Evaluation Mission 2012/2013, the areas of Biombo, and Pitche
and Pirada in Gabu are considered structurally at risk. Nearly all of the arable land in these areas is occupied
by cashew.
Figure 7. Top five export destinations for Guinea-
Bissau’s Exports
Figure 8. Top five exported products from Guinea-
Bissau
India
76%
Vietnam
11%
Brazil
3%
Pakistan
3%
Togo
2%Other
5%
Coconut
s, Brazil
nuts and
cashew
nuts
68%
Petroleu
m oils
11%
Copper
ores and
concentr
ates
5%
Fish,
frozen,
excludin
g fish
fillet
3%
Rape or
colza
seeds
3%
Other
10%

36
Source: UN COMTRADE, mirror statistics
The shift towards cashew production, coupled with limited incentives to farm other products has left the
country in a vulnerable position. Despite rich agricultural potential, the country relies on food imports and
food aid to feed itself. A stark reminder of this vulnerability is the recent harvest evaluation’s mission for
2012/13, which concluded that even with food aid, the country faces a likely deficit in cereals, the country’s
main food staple (Table 12). A survey in June 2013, conducted by the World Food program (WFP), in
conjunction with the National Institute of Statistics (INE), confirms this worrying situation. According to
the survey, the percentage of the rural population under severe food insecurity increased from 20 percent
in 2011 to 40 percent in 2013 (or 260,000 people). Furthermore, the farmgate price of cashew fell by 59
percent, dramatically reducing farmers’ income and no doubt adversely affecting poverty rates of Guinea-
Bissau’s rural poor.
In 2006 and 2009, imports of non-processed agricultural products amounted to 26 percent of total imports
- rice alone accounted for 17 percent of total imports. The instability of 2012 no doubt affected domestic
production, reflected in the import figures - the share of imported rice increased to 21.5 percent and non-
processed agricultural products increased by 5 percentage points to 31 percent total imports.
Previous natural wealth calculations for croplands in Guinea-Bissau were limited to selected crops. Even
with this limitation in place, crop land accounts for the lion’s share of the country’s natural wealth at over
$1,000 per capita. A number of assumptions have been updated to calculate new crop land estimates,
including changes to prices, production and rental rates. Based on these updates, new natural wealth per
capita estimates for Guinea-Bissau are around $1,734 per capita.
Table 12. Total food surplus/deficit projected for 2012/13
Forecasts 2012/2013 Rice Blé Millet/sorghum
corn/other
Total
Tons Tons Tons Tons
Domestic availability 122,602 656 4,3363 166,621
Gross production 198,504 50,276 248,780
Net production 119,102 42,735 161,837
Initial Stocks 3,500 656 628 4,784
Needs 229,508 15,864 64,023 30,9395
Gross surplus/deficit -106,905 -15,208 -20,660 -142,774
Balance of imports and exports 101,291 9,203 5,131 115,625
Foreseen imports 100,055 9,203 109,258
Foreseen aid 1,236 0 5,131 6,367
Foreseen exports … … … …
Total surplus/deficit -5,614 -6,005 -15,529 -27,149
Source: Harvest Evaluation Mission 2012/2013, GoGB/CILSS/ PAM/FAO, 2013
Pasture land
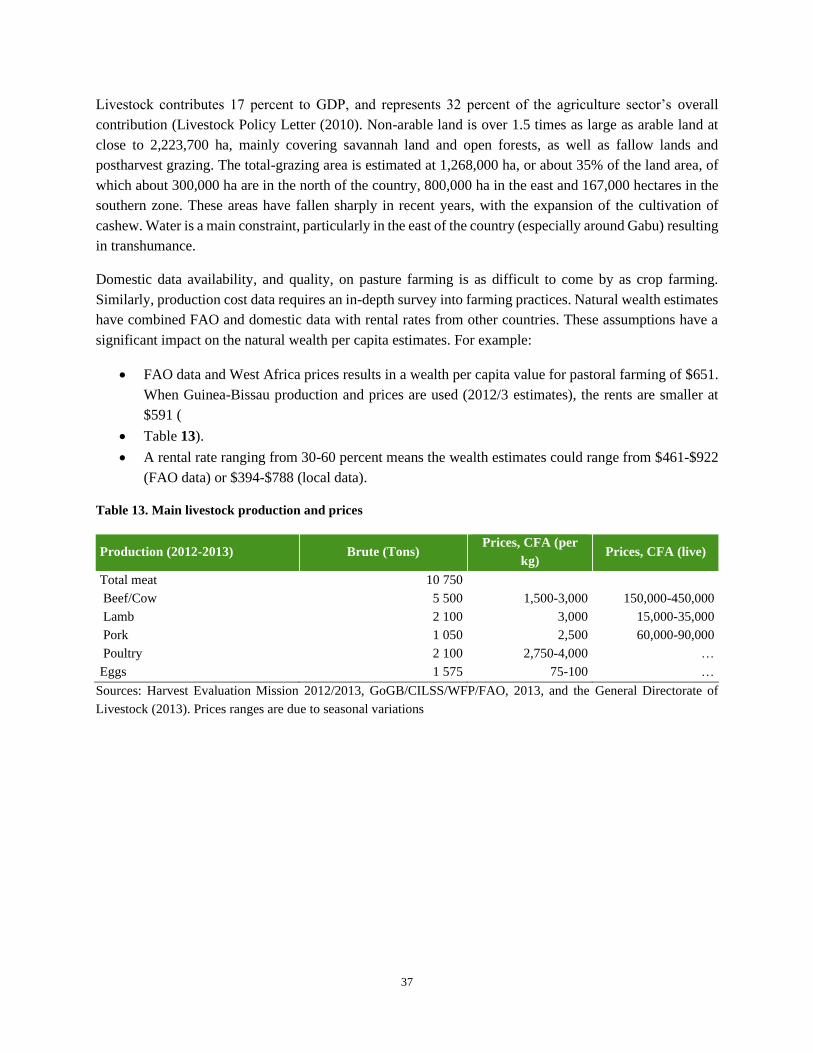
37
Livestock contributes 17 percent to GDP, and represents 32 percent of the agriculture sector’s overall
contribution (Livestock Policy Letter (2010). Non-arable land is over 1.5 times as large as arable land at
close to 2,223,700 ha, mainly covering savannah land and open forests, as well as fallow lands and
postharvest grazing. The total-grazing area is estimated at 1,268,000 ha, or about 35% of the land area, of
which about 300,000 ha are in the north of the country, 800,000 ha in the east and 167,000 hectares in the
southern zone. These areas have fallen sharply in recent years, with the expansion of the cultivation of
cashew. Water is a main constraint, particularly in the east of the country (especially around Gabu) resulting
in transhumance.
Domestic data availability, and quality, on pasture farming is as difficult to come by as crop farming.
Similarly, production cost data requires an in-depth survey into farming practices. Natural wealth estimates
have combined FAO and domestic data with rental rates from other countries. These assumptions have a
significant impact on the natural wealth per capita estimates. For example:
• FAO data and West Africa prices results in a wealth per capita value for pastoral farming of $651.
When Guinea-Bissau production and prices are used (2012/3 estimates), the rents are smaller at
$591 (
• Table 13).
• A rental rate ranging from 30-60 percent means the wealth estimates could range from $461-$922
(FAO data) or $394-$788 (local data).
Table 13. Main livestock production and prices
Production (2012-2013) Brute (Tons) Prices, CFA (per
kg) Prices, CFA (live)
Total meat 10 750
Beef/Cow 5 500 1,500-3,000 150,000-450,000
Lamb 2 100 3,000 15,000-35,000
Pork 1 050 2,500 60,000-90,000
Poultry 2 100 2,750-4,000 …
Eggs 1 575 75-100 …
Sources: Harvest Evaluation Mission 2012/2013, GoGB/CILSS/WFP/FAO, 2013, and the General Directorate of
Livestock (2013). Prices ranges are due to seasonal variations

38
Protected areas/Biodiversity
Guinea-Bissau has an extensive range of eco-systems, flora and fauna, and marine life which, due to the
country’s instability and inadequate tourism infrastructure, have yet to be fully
exploited. Policy makers are aware of the importance of the country’s biodiversity,
and since the early 1990s, have developed a number of plans and visions for its
protection. More recently, since the early 2000s, the government has established a
network of five national parks, and one community protected area (Urok), covering
close to 15 percent of the country. This area is expected to expand to cover
approximately 25 percent of the country in late 2014. The Institute of Biodiversity
and Protected Areas (IBAP) was set up to manage, coordinate and monitor these
PAs.49
Over the past 5 years, several additional laws have been ratified to ensure Guinea-
Bissau’s biodiversity is managed sustainably (Table 14). Implementation of these
laws remains a key constraint to environmental protection. The country lacks the
necessary resources to provide oversight and monitoring of activities in protected
areas. To address this issue, and in recognition of the global existence value of the
country’s biodiversity, a Global Environment Fund (GEF) and World Bank project has been working with
the government and other international and national partners to help establish the BioGuiné Foundation.
This conservation trust fund aims to provide a long-term financing mechanism to support the conservation
and management of Guinea-Bissau’s parks and biodiversity, a much need solution to help support the
financially autonomous IBAP, and its partners.
Table 14. Guinea-Bissau’s key laws and strategies relating to environmental protection
Year Laws and Strategies
1997 and 2011
decreto-Lei 3/97; decreto-Lei 5-
A/2011
Law on Protected Areas
2000 decret N°6-A/2000 Creation of Joao Vieira e Poilao National Park
2000 decret 11/2000 Creation of Orango National Park
2000 decret 12/2000 Creation of Cacheu Mangrove National Park
2000 decret 13/2000 Creation of Cufada Lagoons National Park
2004, decreto-Lei 2/2004 Law on Fauna
2004 National Plan for Environmental Management
2004 National Strategy on Protected Areas and Biodiversity Conservation
2004 Creation of CAIA
2005 decret N°9/2005 Creation of Urok Community Protected Area
2005 Creation of IBAP
2006 National Action Plan for Adaptation to Climate Change
49 IBAP currently operates under the 1997 Protected Areas Framework Law (Decree-Law 22/97)
Crop Land
Carbon
NTFR
Timber
Fishing
Phosphate
Bauxite
Pasture
Biodiversity

39
2010 Environmental Impact Assessment Law
2011 Framework Environment Law
2011 National Action Plan to Combat Desertification
2011 Law on Forests
2011 decret n°1/2011 Environmental Framework Law
2011 decret n°14/2011 Creation of Cantanhez National Park
Park fees, at around $10 are low, and well below the amount needed for IBAP to manage the country’s
national parks. In addition, only two parks are currently collecting fees (Orango and Joao Vieira e Poilao).
Willingness to pay studies in other SSA countries with rich biodiversity and wildlife suggest that park fees
could be increased to $25, provided the fees are earmarked for the park’s preservation. The distribution of
park fees is currently legislated in Guinea-Bissau with the proceeds split between IBAP’s headquarters, the
PA where the fee is raised, and the communities in that PA. Oversight of the funds remains weak and the
criteria by which the funds are spent could be strengthened.
One way of estimating the natural wealth from biodiversity, and more specifically, Guinea-Bissau’s PAs,
is by calculating the rents from activities, such as tourism, which utilize the country’s ecosystems. Tourism
numbers in Guinea-Bissau are low when compared to other West African countries with similar “pre-
emerging” tourism industries.50 Average receipts per tourist are also low, highlighting the weak tourism
multiplier effect in Guinea-Bissau (Figures 9 and 10). Weak infrastructure and poor linkages with local
communities limit the potential development effect tourism could have. This potential is significant: the
country is home to several animal species that have global significance e.g. five species of sea turtle, 51 salt-
water hippos, and several migratory water birds. In addition, the Cantanhez National Park has been
recognized by the WWF as one of the world’s 200 most important ecosystems.
The tourism industry as a whole is estimated to account for over 9 percent of the world’s GDP. Within
tourism, ecotourism52 is estimated as the fastest growing sector, growing at between 24-30 percent a year
(World Tourism Organization). The prices “eco-hotels” charge vary tremendously. Ghana, an already
established destination for tourists, has developed an ecotourism segment, riding off the back of the sea
turtles that visit the coast. Hotels range from $60 a night for a small hut on the beach, to $160 for something
more upmarket. Ecotourism packages can be much more exclusive; for example, watching turtles in
Zanzibar for 8 days can cost up to $4,000 per person.
Figure 9. Tourism arrivals and receipts of West
Africa countries with “pre-emerging” tourism
sectors
Figure 10. Average tourism receipts per
tourist arrival
Millions, US$ Tourist arrivals US$, Receipts per tourist arrival
50 The World Bank’s recently published “Tourism in Africa” (2013) report classifies countries into four groups: consolidating,
emerging, potential, and pre-emerging. Guinea-Bissau falls under the pre-emerging category. 51 Guinea-Bissau has protected the green turtle by law and has made efforts to remove foreign fishermen from the nesting ground
on Poilão Island. Despite being included in the protected areas list, the sea turtle remains under threat, as implementation of the
laws is weak and egg poaching is still prevalent. (“Status, Ecology, and Conservation of Sea Turtles in Guinea-Bissau” Catry P.,
et. al. 2009) 52 Ecotourism was defined by The International Ecotourism Society (TIES) in 1990 as “responsible travel to natural areas that
conserves the environment and sustains the well-being of local people”.

40
Source: World Tourism Organization (WTO), all data 2010, apart from Chad’s tourist arrivals, where the earliest data available is
2007
Ecotourism could be a significant generator of income for Guinea-Bissau, creating substantial economic
rents, which could be captured and turned into government revenue. The sector could also provide many
Bissau-Guineans with employment. Currently, however, Guinea-Bissau’s tourism infrastructure is in
significant disrepair. There are about 40 hoteliers, with a total accommodation capacity of around 1,000
beds.53 Most of these hotels are found in Bissau, with the lion’s share providing a minimal service and only
a hand-full that can be classed as 3-5 star. A few entrepreneurs, none Bissau-Guinean, have set up
accommodation out in the Bijagós islands, which could be classified as ecotourism friendly.
Over the past few years, the government has built-up an institutional infrastructure for ecotourism. An
ecotourism section sits underneath the State Secretariat for Tourism and directly liaises with the ecotourism
department in IBAP, helping to ensure ecotourism policies are directly linked to ecotourism
implementation. A familiar story on capacity constraints emerges, in the tourism specific departments and
across the State Secretariat for Tourism as a whole. The ecotourism section has helped consolidate some of
the relevant policies, but in the absence of a formal strategy, and few resources, both human and financial,
the section’s overall effectiveness remains limited.
Some of these capacity constraints are being addressed through the MAVA Foundation and International
Union for Conservation of Nature’s (IUCN) “Promotion d’un tourisme écologique et durable en Guinée
Bissau ecotourism” project, which is facilitating the preparation of a National Strategy for Ecotourism.
This initiative is also looking into the links between ecotourism and PAs in Guinea-Bissau. The Direcçao
Geral de Turismo, IBAP, CAIA, CDB_Habitat, (Foundation for the Conservation of Biodiversity and its
Habitat), AD (Action for Development), local communities and the private sector are all involved,
suggesting that the relevant stakeholders are both being consulted and actively involved in designing the
strategy. However, the government has yet to receive game-changing amounts of finance from the Bijagos
resorts and has minimal control over their activities, although IBAP is becoming increasing active. Tourism
may not therefore be one of the main contributors to Guinea-Bissau’s GDP during the next 3-5 years, but
53 Estimates taken from “Diagnosis of Tourism in Guinea Bissau”
-
50,000
100,000
150,000
200,000
250,000
-
20
40
60
80
100
120
Tourism recipts (US$ LHS axis)
Tourist arrivals (RHS axis) - 500 1,000 1,500
Togo
Niger
Chad
Guinea-
Bissau
Guinea-
Conakry

41
perhaps 10-15 years. This may be a positive outcome, as it provides the country with more time to ensure
any bourgeoning tourism industry grows in a way that protects the environment and is directly tied to
poverty reduction. Countries such as Costa Rica and Dominica for example, have successfully put in place
measures to promote socially inclusive ecotourism. Guinea-Bissau could follow suit, ensuring biodiversity
is sustainably managed, while simultaneously, maximizing economic rents from the PAs.
In the absence of more detailed information on tourism potential, the wealth of PAs is estimated by
calculating its opportunity cost, where the alternative is to use the land for farming as opposed to preserving
it for recreational purposes or preservation, both for domestic and global existence values. Assuming half
of the land in PAs is suitable for farming results in a wealth per capita figure of $305. While this may
capture the opportunity cost of farming, it is likely to be significantly below the potential wealth this land
brings, not least because it does not include Guinea-Bissau’s marine biodiversity, nor the additional
terrestrial areas due to be classified as PA by the end of 2014. IBAP is commissioning work to analyze the
country’s tourism potential. The results from this study should provide additional evidence to support their
work and potentially help improve the natural wealth per capita estimates. A more accurate valuation of the
country’s rich biodiversity should support IBAP and other partners generate the necessary resources they
need for its protection and sustainable use.

42
III. Total wealth
“…productivity growth is higher in countries with an adequate and efficient supply of infrastructure
services.”54
Guinea-Bissau’s macroeconomic data are of variable quality. Weak governance and institutional capacity
has limited the authorities’ ability to routinely track core macro-variables. Much of the data is recorded
manually with electronic updating undertaken in only a few sections of the Ministry of Finance. Estimates
for Guinea-Bissau’s total wealth rely on the availability of total consumption expenditure (for total wealth)
and 25 years of gross fixed capital formation data (for produced capital) – both series are somewhat patchy.
The National Accounts were revised in 2010, resulting in a GDP increase of almost 90 percent. These recent
updates to historical time series data have altered the original estimates of total wealth substantially. What
was previously calculated as $3,740 per capita (in 2005 prices) is now $8,500. Updating to 2010 and in
2010 prices increases the total wealth per capita figures further to $12,326. Total produced capital has not
changed as significantly, confirming
the poor rates of public and private
investment into the country’s capital
stock. At present, government
revenues finance just 80 percent of
the payroll and capital investment is
entirely donor driven. Private
investment is equally stagnant, with
few opportunities and a weak
financial sector as an alternative for
savings or financial assets. Using the
new natural capital estimates
increases the proportion of wealth
attributed to natural resources from
26 percent to almost one third of
total wealth in Guinea-Bissau
(Figure 1).
Compared to other low income
countries, these new estimates
suggest that Guinea-Bissau’s relative level of natural wealth is high (33 percent as opposed to 26 percent)
and that produced capital is exceptionally low (8 percent as opposed to 16 percent). In the very short term,
these indicative results highlight the importance of investing in other forms of capital – physical, human,
or social.
Consumption of fixed capital is slightly lower than low income country and SSA country averages (8
percent of GNI compared to 9 percent and 10 percent respectively). Savings rates are exceptionally low.
54 Calderón, C. 2009. “Infrastructure and Growth in Africa” Policy Research Working Paper, 4914, World Bank Washington D.C.
Natural capital
Figure 11. New and old calculations of Guinea-Bissau’s total
wealth
In percent of total wealth per capita
Source: Old calculations are from “The Changing Wealth of Nations”. The new
calculations are based on the author’s own estimates presented in this paper.
7% 8%
24%33%
76%66%
-7% -7%
-20%
0%
20%
40%
60%
80%
100%
Old Calculations New Calculations
Intangible capital
Natural capital
Net Foreign Assets
Produced capital

43
Guinea-Bissau’s gross national savings were around 2 percent of GNI in 2010. This is below the SSA
average (close to 17 percent) and well below the rates seen in high growth countries (20-25 percent of GNI)
(Figure ). The low adjusted net savings estimate is mainly due therefore to the low levels of overall savings,
rather than natural resource exploitation. Recent illegal logging activities would push these estimates down
further. This creates even more of an impetus to improve natural resource management to capture resource
rents and transform them into meaningful assets that can contribute to poverty reduction. Improving the
business climate so that the private sector can also take advantage of the opportunities presented by Guinea-
Bissau’s natural wealth would also help the government in raising tax revenue and delivering its shared
prosperity goals.
Figure 12. Gross and adjusted net savings
In percent of GNI (2010)
Source: UN and World Bank data, author’s calculations
D. What does the future hold: policy implications for sustainable development
“Sustainable development, implies meeting the needs of the present without compromising the ability of
future generations to meet their own needs”55
This paper confirms the presence of significant natural wealth potential in Guinea-Bissau. Some areas
appear to be under exploited, but with thoughtful policy responses rents could be increased, revenues
captured, jobs created and poverty reduced. There are, however, some areas that may be over-exploited.
Strengthened the governance of these sectors is essential to ensure their sustainability. This section provides
suggested policy responses and recommendations for each component of natural wealth.
55 Report of the World Commission on Environment and Development (11th December 1987).
-10%
-8%
-6%
-4%
-2%
0%
2%
4%

44
Exhaustible resources
As yet, Guinea-Bissau has yet to commence with commercial mining activity, although prospects for
phosphate in particular look promising and negotiations are actively taking place with the government. The
mining sector offers Guinea-Bissau the opportunity to generate significant resource rents, which if invested
wisely could help plug the country’s substantial infrastructure gap while also supporting current
expenditures to support the poorest. This approach requires strong governance and management to ensure
rents are channeled towards other forms of productive capital, be that infrastructure or human resources. At
the same time, there are legitimate concerns that a poorly regulated mining sector could have an adverse
effect on local communities and the surrounding environment. To help mitigate some of these concerns,
the government may want to consider:
• building capacity in the Ministry of Finance to analyze the impact of mineral resource revenues;
• balancing taxation levels and mining benefits, so that investors are not deterred while ensuring the
country captures essential revenue;
• strengthening capacity in the State Secretariat of Environment and associated regulatory bodies to
ensure environmental legislation is enforced; and
• improving the business and investment climate to attract interested private sector entities (both
domestic and foreign) into the sector and related activities.
Non-exhaustible resources
Non-exhaustible or renewable resources are responsible for providing most of Guinea-Bissau’s population
with a form of livelihood. Agriculture dominates the country’s employment and growth statistics, as well
as the natural wealth per capita estimates. Fisheries, forests and resources from the rest of the natural
environment provide additional forms of income. Maximizing rents and capturing revenue, while ensuring
sustainability, requires concerted policy action and an investment in governance. One of the key issues for
consideration by policy makers is how these sectors work together as important trade-offs are present. In
particular:
• Conversion of natural habitat to cashew plantations may reduce the wealth from timber and non-
timber forest resources.
• A shift towards rice plantations in mangrove areas could negatively affect the ability of mangroves
to act as a fishing nursery ground as well as diminish their natural flood defense mechanism.
• REDD projects to limit forest degradation and deforestation could reduce the resources available
to rural communities e.g. charcoal, timber for furniture
A more thorough analysis of these issues is needed to determine how to maximize social welfare, revenue,
economic growth and poverty reduction.
Fishing
Nationally collected data underestimate the quantity of fish caught and thus calls into question the
sustainability of the sector. Mass fishing by boats from neighboring Senegal and Guinea-Conakry are
reducing the rents available to domestic boats as well as important revenue for the government. There are

45
also concerns that commercial, foreign operated vessels are catching far greater quantities of fish than are
being reported.
Given the currently low license fees and variable terms and conditions, Guinea-Bissau struggles to finance
effective management of the sector. Poor surveillance further hinders their ability to charge higher fees as
countries do not want to pay for something that is not managed. The fishing license with the EU is coming
up for renewal. Given the rich fishing stock in Guinea-Bissau’s waters, the country could use this as an
opportunity to renegotiate the terms and condition of the licensing agreement and ask for support to manage
the sector.
Weak port infrastructure is a further constraint to optimizing fisheries potential. A new fishing port has
been concluded in Bissau by an AfDB grant, however, the operation of this port relies largely on private
initiative. At the moment, the port is not being utilised as there is a dispute between the Ministry of
Infrastructures and the Secretariat of State of Fisheries on where the management of the port should lie.
This internal disagreement is obfuscating private sector interest and delaying much needed port activity,
which could help stimulate value added in the sector.
In light of these barriers the recommendations for the fisheries sector are as follows:
• assess current monitoring capabilities against what is required to significantly reduce illegal
fishing;
• include more stringent reporting requirements on foreign vessels, and ensure this reporting takes
place;
• reassess the current licence fees, working with regional players to determine what fees may be
appropriate; and
• expeditiously resolves current tensions on the management of the port to enable private sector
involvement in its operation.
Timber and non-timber forest resource
Aggregate figures suggest that forestry is not under threat of breeching sustainability indicators. However,
there may be significant underreporting with certain tree species harvested more than others. Data for the
non-timber forest resources sector are limited, demonstrating the poor level of management and regulation.
Information that is available suggests that license fees are low and not regularly collected, limiting the
amount of finance available to monitor the sector.
While laws and regulations are in place, they are rarely enforced. Given the challenges currently facing the
sector (e.g. exports of raw wood and stripping of precious trees), the Forest Technical Council proposes
that the following regulations are adhered to and/or put in place:
• Production and export of wood to take place only by officially registered wood producers
(sawmills), with regular monitoring by the DGFF;
• logging permits to be issued only to officially registered wood producers (sawmills currently in
operation), with regular technical monitoring by the DGFF both in the forest and in the sawmill;

46
• land preparation (clearing and logging) permits only issued to owners who can prove they can use
the land; and
• monkeys to be included in the protected species list due to pressures from poaching.
In addition to these specific recommendations, there are other areas, which if strengthened could help
protect the sector from unsustainable behavior. For example:
• Strengthening the capacity of regional delegations to improve monitoring and reporting. Poor
availability of data severely affects the Ministry’s ability to assess progress and areas of concern.
• Establishing an information system of forestry data, especially results of monitoring activities. All
relevant parties should have access to the system, including the National Guard where the forest
guards operate.
• Conducting a survey and consolidating existing information to feed into a forest inventory. Using
this information, the Ministry will be able to assess forest management plans and their interaction
with public and community forest lands. A detailed map of forest land ownership and licenses will
help the Ministry implement the law regarding concessions; and
• Ensuring sufficient finance is available for the DGFF to conduct these activities. While a forest
fund is already in place it is under-funded. The forest sector may want to consider increasing the
tariffs of forest permits or license fees for hunting to help capitalize this fund.
Carbon
After much excitement and research into the possibility of a REDD project, the collapse of the Certified
Emission Reductions (CER) price in the European Union’s Emission Trading Scheme (EU ETS) as well as
broader Voluntary Emissions Reduction (VER) credits has, at least temporally, quashed these plans. The
preparation for these projects has, however, meant that the country has a much more detailed overview of
the forestry sector, and historical deforestation rates. It has also drawn the attention of the international
community, including from the World Bank and the Global Environment Facility.
To develop the projects further, in readiness for carbon credits, or indeed a REDD window in the Green
Climate Fund, additional research is needed on how to account for cashew plantations. A credible
monitoring, reporting and verification (MRV) system will also need to be in place to ensure leakage is
minimised and credits can be issued.
Aside from deforestation, Guinea-Bissau may also want to consider developing projects that consider forest
degradation. While Guinea-Bissau’s overall deforestation rate is only 0.8 percent per annum, (annual
average 1990-2007) there has been a shift in the types of forest, from high density, high carbon content
closed forests, to more open savannah land. This is due to a combination of commercial exploitation of
forests, disrupting eco-systems in search of the most profitable trees; and local communities removing trees
for personal use, especially charcoal. At present, charcoal represents a major threat to forest land. With

47
limited accessibility to modern forms of energy, local communities have no alternative but to use charcoal
for cooking and heating.56
As part of the broader climate change agenda, the forest sector would benefit from a more detailed overview
on the socio-economic dynamics between farming and forest systems, both in terms of mitigating and
adapting to climate change. This is particularly pertinent for the relationship between rice farming and
mangrove plantations, but also the cashew fruit and other forest areas.57
Crop and pasture land
Guinea-Bissau’s agriculture sector has significant potential. The lands are rich and fertile, the weather is
favorable, and the variety of crops allows for some diversification within farms. Dilapidated infrastructure
is, however, holding the sector back.
The natural wealth per capita estimates in this report are based on an assumed rental value for developing
countries. It is possible that these rental rates over-estimate the current wealth of Guinea-Bissau’s
agriculture, given the reportedly poor state of productivity in the sector. At present, the estimates give an
indication of the potential wealth if improvements were made to productivity. To date, attention has focused
on shifting production of cashew from raw exports to processed (de-shelled). It is estimated that 25,000
tons of processed cashew nuts, could lead to an increase in earnings of $20.4 million a year, while also
producing 18 million kWh/year of energy, using the husks of the nuts in biomass power plants. However,
it is not just cashew that needs support. Other areas of agri-business could benefit from investment. Guinea-
Bissau’s National Plan of Investment in Agriculture estimates that investment worth $200 million is needed
over 2010-2015, to address the main constraints in agriculture – both crops and livestock with an additional
$108 million for the fishing and forestry sectors. This investment would help the country close its cereal
deficit by 50 percent, increase agricultural production by 6 percent and meat production from 6 to 12
Kg/hab/year. Given most of Guinea-Bissau’s poor work in agriculture, investment in this sector would also
have a significant poverty reducing impact.
Biodiversity/protected areas
Guinea-Bissau has made progress towards sustaining its ecosystems by establishing a network of national
parks, and enforcing its protection by law. As with the management of other natural resources, the
implementation of these laws is weak and requires additional funding. As an extremely poor country,
Guinea-Bissau has limited resources to channel towards protecting the environment. New revenues could
be generated through increased park fees or creating ecotourism licences. Ultimately though, explicit
political commitment is needed to safeguard the country’s biodiversity, and if ecotourism is to really take
off, the following elements should be considered:
• Engaging the private sector on tourism bottlenecks: while there are likely to be several constraints,
the government will need to prioritize which area to invest in first e.g. transport infrastructure,
56 Up to 90 percent of the population is thought to rely on biomass as a source of energy. 57 For example, completing and operationalizing “The Monitoring Plan of Mangroves”, initiated by IBAP in 2008, would help the
country understand its rich mangrove resources and how best to preserve them.

48
telecommunications, ecotourism accreditation, transparent tax system, management of the national
parks. Understanding the restrictions to sustainable growth of the tourism industry will help the
government prioritize its resources.
• Learning from previous models of ecotourism: if Guinea-Bissau wants to promote ecotourism, then
the government will need to decide upon which model it wants to adopt. There are several examples
e.g. Costa Rica, Dominica, and closer to home, Kenya, and Rwanda, that Guinea Bissau can learn
from. This will also help manage expectations. Niche ecotourism packages can take time before
they are fully established. For example, the Nihiwatu project in Indonesia took 10 years before
investors were fully integrated into the local community, with a foundation set up for guests to pay
into, to support social and environmental development.
• Stabilizing the political environment: while poor infrastructure and a weak investment climate are
no doubt affecting the country’s ability to expand tourism, the main constraint is likely to be the
country’s fragile political environment. The number one recommendation in the Tourism in Africa
(2013) report for pre-emerging economies is to stabilize any fragility by empowering “responsible
democratic governments”.
Guinea-Bissau has a number of natural wealth assets, which have the potential of reducing poverty and
supporting economic growth. The challenge is how to transform this potential into something meaningful,
either directly reducing poverty, by boosting rents captured by households and business, or indirectly, by
raising revenues that can be channeled into development assets. Sectoral reform plans are beyond the scope
of this paper, however, one theme emerges across all areas of natural wealth: the need for strong governance
and institutions. Natural resource management, be that of exhaustible resources such as bauxite or
phosphate, or renewable resources such as the country’s land, forests, and fish, is essential if these assets
are to contribute to the country’s development goals.

49
Appendix A - Methodologies and assumptions
This appendix sets out the assumptions and methodologies used to calculate Guinea-Bissau’s natural
wealth.
Common assumptions across all natural wealth estimates
As detailed in the United Nations’ Integrated Environment and Economic Accounting Operational Manual
(2000), there are three methods of valuing natural resources:
(i) Net present value: the present value of a natural resource is the sum of the expected net revenue
flows i.e. revenue minus fixed and variable costs, including any “normal return” to capital.
(ii) Net price: the total quantity of the resource is multiplied by the market price at time t minus
the unit production cost.
(iii) User cost: the difference between the net returns from the sales of a resource and a “perpetual
income stream”, which comes from the investment of the user cost at an interest rate r.
Out of the three methods, the net price methodology offers the simplest and least data intensive way of
calculating resource rents – the wealth from natural resources. The user cost method is the most complex,
and offers policy makers a useful overview of the different streams of income from extracting exhaustible
resources. Theoretically it can help government determine how much economic rent needs to be re-invested
into capital, income generating activities, to create a steady stream of income, and how much can be used
for current expenditures. The net present value method is also data intensive, although less so than the user
cost methodology. Summing the expected net revenue flows, and discounting back to the present day,
directly addresses the question of inter-generational rents. While a number of assumptions have to be made
about extraction rates, resource prices, capital costs etc. it allows for some flexibility in estimating the rents
as well as sensitivity analysis
The net present value methodology has been used for the purposes of the natural wealth accounting exercise
in Guinea-Bissau. For the exhaustible resources, the mining companies have used the same methodology
in their own cost benefit analysis. The natural wealth calculations are therefore tied to proposals that are
being used to develop plans in Guinea-Bissau, and will ultimately be discussed with the government.
For the non-exhaustible resources, many of the assumptions/variables used in the first year are assumed to
stay constant throughout the discounting period. While this is not necessarily very realistic, the model used
to estimate the natural wealth can easily be updated with new information or used to assess the impact
increasing prices or costs would have on per capita wealth.
There are a set of common assumptions used across all components of natural wealth (Table 1).

50
Table 15. Common assumptions across all natural wealth estimates
Variable Value Rationale
Time period 25 years This represents a generation. In terms of the exhaustible resources, it also
represents the life time of the mine. For the mineral resources, net wealth
is calculated based on the mine operating for 25 years, irrespective of the
start date.
Social discount rate 4% The social discount rate is based on the following derivation:
r= δ+(γ+c/g)
The pure rate of time preference (δ) represents whether, as a society, we
care more about consumption today as opposed to consumption in the
future. One off catastrophes that would wipe out a population and thus
future generations increases this rate. Under the assumption that the
catastrophic risk is small, and that future generations are valued as much
as the current population, (δ) would be around 1.
The elasticity of marginal utility of consumption is captured by (γ).
Assuming society is moderately adverse to income inequality this would
also be low, at around 1.
Whereas mature or slow growth countries have low per capita growth
rates, and therefore a small social discount rate (the UK government for
example uses a 3.5 percent social discount rate), fast growing developing
countries tend to have a much higher c/g – consumption over growth of
GDP per capita. In essence, this tells us that people will have higher
incomes in the future and therefore marginal consumption is worth more
now rather than later. Guinea-Bissau’s growth rate has not reached the
levels of some developing countries. The average GDP per capita growth
rate has been negligible over the past 10 years, although increasing
cashew prices have helped this increase to around 1.5 percent. If we
assume that growth continues at this rate, or potentially higher under a
scenario of productive resource rents, then the social discount rate could
be in the range of 3.5 to 6.5, with future generations only mildly better
off than today’s citizens.
A discount rate of 4% represents a slightly below mid-range estimate,
reflecting the significant downside risks to growth in Guinea-Bissau.
Population 2010 figures All natural wealth per capita calculations are made using 2010
population estimates and 2010 US$ prices
Natural Wealth Estimates for Phosphate and Bauxite
Mineral wealth estimates are based on the net present value (NPV) of the resource rents over the life of the
mine. The resource rents (R), in year t are calculated as follows:
𝑅𝑡 = ((𝑃𝑢 − 𝑉𝐶𝑢) ∗ 𝑄𝑡) − 𝐹𝐶𝑡 − 𝐴
Where:
𝑃𝑢 = the unit price of a ton
𝑉𝐶𝑢 = the unit variable cost associated with the extraction of one ton
𝑄𝑡 = annual mineral production

51
𝐹𝐶𝑡 = annual fixed costs
𝐴 = amortized capital
The amortized capital represents the opportunity cost of capital or “allowed profits”:
𝐴𝑡 = 𝐼𝑡 ∗𝑝𝑟 ∗ (1 + 𝑝𝑟)𝑛
(1 + 𝑝𝑟)𝑛 − 1
Where
n = the life of the mine and
pr = the private sector discount rate.
The NPV of the rents are calculated by discounting the sum of annual rents using a social discount rate of
4 percent. Year 𝑡0 starts in 2013 and the final year, year 𝑡𝑛 is when the mine ceases to operate – 2040 for
the phosphate mine and 2042 for the bauxite mine.
𝑊 = ∑ 𝑅𝑡 ∗1
1 + 𝑟𝑡
𝑡=𝑛
𝑡=0
To obtain wealth per capita estimates, W is divided by 2010 population figures for Guinea-Bissau.
The assumptions used to calculate wealth estimates for Guinea-Bissau’s phosphate reserves are based on
the latest feasibility studies conducted by Plains Creek Phosphate Corporation. Assumptions for the Bauxite
reserves are taken from a number of different sources, since the planning by Bauxite Angola is less well
developed. Some of the costs have been taken from mining projects in neighboring Guinea-Conakry. Other
assumptions have been taken from press releases on the intentions of Bauxite Angola. Given the high degree
of mineral price volatility over recent years, the price is assumed to stay constant over the life of the mine
(Table 2).
There is a large degree of uncertainty associated with both estimates, as mining has not started at either of
the sites.
Table 16. Main assumptions used for the wealth calculations of phosphate and bauxite deposits
Assumption Phosphate Bauxite
Year production commences 2015 2018
Life of the mine 25 years 25 years
Upfront capital costs (US$)
165,114,000, split over two years
(57,504,000 in year one and
107,610,000 in year two)
400,000,000
Opportunity cost of capital 16% 16%
Unit cost of production (U$/ton) 73 11
Unit price (US$/ton) 121 36
Annual production (tons) 1,000,000 3,000,000
Annual fixed costs (US$) 2,590,000 6,000,000
Natural wealth per capita estimates ($) 126 55

52
Natural Wealth Estimates for fishing
There are two different wealth per capita estimates for fishing in Guinea-Bissau – artisanal estimates and
industrial fishing estimates.
Artisanal fishing
Fishermen in Guinea-Bissau either use a non-motorized vessel – akin to a canoe - or a motorized vessel for
fishing. The motorized vessels are more efficient at collecting fish, but also have higher variable and fixed
costs. There are no official wage rates for fishing in Guinea-Bissau; rather it depends on the price collected
on the day. Based on local interviews, fishermen, on average, are given 30 percent of the revenues. This
labor cost has been applied for fishermen using both motorized and non-motorized vessels
The average price per ton of fish is based on an assessment of the average catch composition and prices the
fishermen obtain when they sell their fish to the market – rather than the actual market price, which is
significantly higher (Tables 17 and 18). While a more detailed assessment would disaggregate the catch
composition in more detail, data limitations mean that averages have been used to calculate the natural
wealth estimates.
Table 17. Landings by the artisanal sector, 2010
Area Demersal Pelagic Large
pelagic
Other
seafood
Crustacean
s &
molluscs
Continenta
l Total
Bafata 40 5 1 - - 711 757
Bissau 154 274 - - - - 428
Blombo 1,808 1,104 6 - 31 - 2,949
Bolama 421 527 - 1 - - 949
Bubaque 552 624 14 12 - - 1,202
Cacheu 1,820 1,010 7 - - - 2,837
Cacine 1,643 1,720 125 39 - - 3,527
Caio 418 32 - - - - 450
Catio 399 484 - - - 886
Farim 260 91 10 - 74 - 435
Gabu 0 0 0 0 0 172 172
Porco 551 1,502 - - 6 50 2,109
Quinhamel 1,802 1,268 - - - - 3,070
Sao
vicente 166 53 1 - 13 8 241
Uno 11 195 - - - - 206
Uracane 235 839 - - - - 1,074
Varela 469 134 1 - - 604
Total 10,749 9,862 165 52 127 941 21,896
Source: 2011 Socio-Economic Assessment58
58 III Inquerito sobre os aspectos socio-ecónomicos da pesca na Guiné Bissau, CIPA 2011

53
Table 18. Prices for main categories of seafood landed by the artisanal sector
Fishing product Average CFAs/kg between
fishermen and the market*
Average CFAs/kg between market
and end consumers**
Pelagic 250 500-1,000
Large pelagic 250 800-1,500
Demersal 500 1,500-2,500
Continental 500
Crustaceans and molluscs 1,000 5,000
Tiger shrimp 6,000 10,000
Other 200 250 * As reported in the 2011 Socio-Economic Assessment ** Based on interviews conducted in Bissau during February-March 2013
Other assumptions on costs and fleet sizes, as well as their annual growth, have also been taken from the
2011 socio-economic assessment of Guinea-Bissau’s fishing sector. The fleet sizes of both the non-
motorized and motorized vessels have been capped, to reflect the size at which diminishing returns may
kick in due to overcrowding (Table 5). This is an estimate and could easily change if for example the
productivity of the fishermen vastly improved.
Table 19. Main assumptions used for the wealth calculations of artisanal fishing
Assumption Non-motorized vessel Motorized vessel
Number of vessels in 2011 1,274 268
Annual vessel growth 2% 5%
Maximum fleet size 2,000 500
Average catch per outing (tons) 0.08 0.38
Annual number of trips per year 127 89
Average price per ton of fish (US$) 775 (753 in 2010 prices) 775 (753 in 2010 prices)
Costs In US dollars, 2010 prices, unless otherwise indicated
Variable costs per outing $13 $143
Annual fixed costs $74 $258
Labor costs 30% of revenues 30% of revenues
Capital depreciation $110 $1,047
Natural wealth per capita estimates ($) 63 69
The estimates are limited to domestic artisanal fishing, but in practice there are likely to be a number of
foreign vessels operating in Guinea-Bissau waters, mainly from Senegal and Guinea Conakry. While no
specific estimates are available, anecdotal evidence based on conversations with the local population,
suggest this number could be quite large.
Industrial fishing
Ideally, resources rents from commercial fishing would follow a similar methodology to artisanal fishing,
using landings data, international fishing prices, and commercial fishing costs to calculate the resource
rents. However, domestically captured data are not readily available in Guinea-Bissau. Only the Chinese
are required, as part of their license, to land fish for domestic consumption – which is recorded; other fish,
destined for international markets, and the catch from other vessels, are not.

54
An indicative wealth per capita measure is therefore taken from Sumalia et al.s paper (2012) “Marine
fisheries as a source of sustainable wealth of nations”. The key assumptions are as follows:
• Landing data: the FAO’s global fisheries catch database, supplemented by the Sea Around Us
project, which provides a better assessment of country specific catch information.
• Fish prices: Sumaila et al. (2007) ex-vessel marine fish prices, using data from 1950-2007 in 35
countries (representing about 20 percent of global landings). This data has been augmented with
new sources and rules as to how prices relate across taxa, markets or years.
• Fishing costs: global database developed by Lam et al. (2011), capturing both variable and fixed
costs in 144 countries (98% of global landings).
The paper presents two different categories of fishing rent estimates: (i) a scenario where there is
insufficient management of the fishing industry, including “bad” subsidies i.e. subsidies that promote anti-
competitive behavior in the fishing market that can ultimately lead to over-fishing; and (ii) a scenario where
management of the fishing industry is adequate, and there are good subsidies that help regulate the sector
and ensure sustainability. For the purposes of this paper, the rents from scenario 2 are chosen, to illustrate
the potential fishing rents available to Guinea-Bissau. This is estimated at $224 per capita ~$173 in 2010
prices. However, it should be noted, that without active management of the fishing sector, scenario one
seems more likely and would result in zero rents captured by the government.
Natural Wealth Estimates for timber and non-timber forest resources
Historically, timber and wood production statistics for Guinea-Bissau have been computed by the FAO,
based on findings from 1990. Reports and reviews of the forest sector have relied on these estimates in
place of a better alternative. With the emergence of potential funds under the UN’s programme of Reducing
Emissions from Deforestation and Forest Degradation (REDD) the government of Guinea-Bissau has
explored opportunities to protect their forests. This has involved a more detailed overview of annual rates
of deforestation and better data capture of wood exports. These new data tell a very different story to the
FAO’s data and provide a more detailed assessment of the forest sector.
While the new data, especially from the customs authorities, has its flaws, it is more up-to-date and shows
progress towards better management of the sector. The natural wealth calculations of timber are based on
wood export data from the customs authorities in Guinea-Bissau. Rents from timber production are
calculated as follows:
𝑇𝑅 = (𝐸𝑈𝑉 ∗ (𝐴𝐸
0.85) + (0.548 ∗ 𝐶𝑈 ∗ 130)) ∗ 𝑟𝑇
where:
TR = timber rents
EUV = Export unit values
AE = annual average exports
CU = adult population using charcoal

55
𝑟𝑇 = rental rate of timber
The export unit values are calculated by dividing the total export volume in a given year by the total income
or value of the same export. An annual average value is taken based on values over a five year period. For
Guinea-Bissau, timber has been categorized as (i) sawnwood, (ii) other processed or sawnwood and (iii)
raw or rough wood. In theory, there should be no exports of raw wood as this is illegal, however as can be
seen from the customs data exports do occur (Figure Figure 2).
The export unit value data jumps around from year to year (Figure 11). One possible explanation for this is
the misclassification of wood types so as to mask potential raw wood exports, especially in recent years.
Comparisons with FAO regional data – for West Africa – suggest that sawnwood and raw wood prices in
Guinea-Bissau are higher than the regional average, whereas other wood attracts a much smaller price than
the rest of the region. To smooth out the EUV, an average of each individual consignment has been taken
for each year, eliminating values that look too high or low.59
Figure 13. Total volume of timber exports Figure 11. Export unit values of Guinea-Bissau’s
main timber exports
in tons in $ per ton
Source: Guinea-Bissau national authorities, World
Bank calculations
Source: Guinea-Bissau national authorities, World
Bank calculations
Unfortunately there is no domestic timber production data available for Guinea-Bissau. The DGFF remains
under resourced and unable to monitor all timber and forest related activities in the country. While the
forests offer the local communities an important source of wood for furniture and other household goods,
most of Guinea-Bissau’s timber is destined for export. It is therefore assumed that exports represent 85
59 Raw wood unit values less than $100 per ton and greater than $500 per ton where eliminated. Similarly, values less
than $125 per ton and greater than $850 per ton of sawn wood were removed to calculate average figures. For the
“other” wood category the ranges varied according to the type of product. For example, the bands for wood furniture
are higher than the bands for wood artifacts. The ranges were chosen based on an assessment of prices throughout the
period 2006-2012.
-
500
1,000
1,500
2,000
2,500
3,000
3,500
4,000
2006 2007 2008 2009 2010 2011 2012
Sawnwood
Other wood processed/sawn
Rough Wood
0
100
200
300
400
500
600
700
2008 2009 2010 2011 2012 West
Africa
regional
average
Sawnwood
Rough Wood
Other wood processed/sawn

56
percent of total timber production in the country, based on the quantity of wood that is produced outside of
domestic saw mills.
Charcoal estimates are added to the timber production estimates above. Data on charcoal production is not
readily available, and as such, this study relies on an estimate from a 2002 study, which suggests each
person uses 548kg of charcoal a year. By assuming 80 percent60 of the adult population (59 percent of the
total population in 2010) uses charcoal in Guinea-Bissau, the annual production of charcoal can be
estimated.
A rental rate is then applied to the revenue data which takes into account the cost of production. As this is
not readily available for Guinea-Bissau, the value adopted in the World Bank’s “Changing Wealth of
Nations” publication is used. This rental rate (41 percent) is based on a literature review of other developing
countries. A more accurate assessment of Guinea-Bissau’s natural wealth from timber resources would
require a detailed assessment of the cost structure of the different firms operating in the country. As present,
this information is not readily available.
Natural wealth estimates for non-timber resources are based on an extensive literature review on the value
of forests on livelihoods in developing countries, undertaken for the “Wealth of Nations” publications. The
main activities include hunting, recreational activities and watershed services. These rates have been
applied to the updated forest coverage figures for Guinea-Bissau. It is assumed that hunting and other
recreational activities take place in 10 percent of open forests and savannah land. Watershed services are
assumed to apply to all land with forest coverage (Table 6). Each of the four forest types are assumed to
either increase or decrease over the next 25 years depending on historical deforestation rates during 2002-
2007 (i.e. the latest available data).
Table 20. Non forest timber resource estimates
Type of Activity
Forest area activity undertaken in Rental rate ($
per hectare,
2010 prices)
Wealth per
capita % of total Hectares
(2013)
Hunting and
Fishing 10 % 729,469 5.9
$4
Recreation 10 % 2,282,284 14.2 $35
Watershed
Services 100% 2,576,382 11.8 $327
Total 5,588,135 $366
Natural Wealth Estimates for carbon
Carbon estimates are based on the certified emission reduction price (CER) traded in the European Union’s
Emissions trading scheme. Wealth calculations are estimated as follows:
60 Rate of charcoal use as captured be the UN

57
𝑊 = ∑[(𝐶𝑡 ∗ 𝑑𝑡 ∗ 𝐶𝐸𝑅𝑡) − 𝑀𝑅𝑉𝑡] ∗1
1 + 𝑟𝑡
𝑡=0
𝑡=𝑛
Where:
C: carbon stock in Guinea-Bissau’s protected areas,
d: deforestation rate
CER: certified emission reduction price (CER) traded in the European Union’s Emissions trading scheme
MRV: annual costs of monitoring, reporting and verifying the carbon stocks in the protected areas
r: social discount rate
The carbon stocks estimates are based on analysis conducted by Carboveg, who have been supporting the
government in their REDD plans. This is a vast improvement on previous FAO data, using modern
techniques to capture the forest areas as well as carbon embedded in the soils and forests (Error! Reference
source not found.). The assessment also takes into account forest degradation, not just deforestation.
Current logging practices in Guinea-Bissau mean that forest degradation is of particular concern as forest
land is often destroyed when loggers are searching for the highest quality trees.
Carbon rents will vary overtime, as the carbon price fluctuates. The financial crisis and the inability of the
EU to tighten the cap on emissions in the EU ETS have driven the CER price down to record low levels
(less than €0.50). At this price, it is not economical for Guinea-Bissau to enter the carbon market, owing to
the relatively high costs of MRV. If however, the CER price, and thus the VER price were to increase to
previous levels ($20-25), the rents from reducing carbon loss could be positive. A carbon price of $20-25
is commensurate with research on the cost of carbon required to offset damages from climate change.
Estimates for Guinea-Bissau’s wealth from carbon therefore range from $0, if the CER price remains low,
or up to $89 per capita if a carbon price of $25 is assumed.
Table 21. Carbon Stocks (Mtons) in protected areas
Forest type
Proportion in
a protected
area
Carbon stocks
(Mtons)
Closed Forest 2% 0.1
Open Forest 28% 9.3
Savanah Woodland 60% 31.5
Mangroves 9% 0.4
Total 41.4
Source: Carboveg

58
Natural Wealth Estimates for Crop and Pasture Land
Crop land
Guinea-Bissau’s agriculture sector, while mainly subsistence, is very rich in terms of the variety of products
farmed. Domestic data is limited; information from the FAO has been used to complement the domestic
data that is available. The small scale nature of farming also means that rental values are impossible to
compute without a detailed household study on farming income and costs. Rental rates are therefore based
on previous literature reviews as set out in the “Changing Wealth of Nations”. The yearly resource rents
are estimated as follows:
𝐶𝑅𝑡 = (𝐸𝑈𝑉 ∗ (𝐶𝑃 ∗ (1 + 𝑟)𝑡) ∗ 𝑟𝐶
where:
𝐶𝑅𝑡 = crop rents in year t
EUV = regional export unit values, domestic prices are used where available
CP = 5 yearly average crop production (2006-2010), based on FAO harvest (H) and yield (Y) data:
∑ 𝐻𝑡=2006−2010 𝑡∗ 𝑌𝑡
5
r = estimated annual average crop growth rate (1.7 percent)
𝑟𝐶 = rental rate of crops
Natural wealth per capita estimates are based on the summation of these yearly rents for 25 years,
discounted, and then divided by 2010 population.
Prices/Export Unit Values
Domestic prices for agricultural products are difficult to come by, and can often differ from region to region.
The prices used for the rental calculations are therefore based on a five year average of Export Unit Values
(EUV) of crops exported in West Africa (FAO data). The export unit values are calculated by dividing the
total export volume in a given year by the total income or value of the same export.
Export prices are not necessarily a good reflection of domestic prices as countries frequently impose quotas
and export tariffs. For example, sometimes the cost of trade facilitation measures (of which transport within
a country is one element) can dramatically increases the export price. However, these export unit values
offer a good alternative where domestic data is not available. Local rice and cashew prices are available,
and have been used in place of the regional averages (Table 7).

59
Table 22. Crop Unit Price (US$ 2010/ton)
Crop Average (2005-2009) EUVs
from FAO
Local Price
data
Bananas 458.5
Cashew nuts, with shell 653.7 463.0
Cassava 116.6
Cereals 824.8
Citrus Fruit 2,275.8
Coconuts 449.3
Fibre Crops 390.1
Fonio 71.3
Fruit Fresh 2,898.2
Groundnuts, with shell 464.1
Lemons and limes 1,669.2
Maize 138.3
Mangoes, guavas 757.2
Millet 156.1
Oil palm fruit 1,040.7
Oilcrops 246.2
Oranges 183.0
Papayas 856.3
Pineapples 494.3
Plantains 821.0
Pulses 356.6
Rice, paddy 1,155.6 500.0
Roots and Tubers 738.4
Sorghum 270.7
Sugar cane 2,742.0
Fresh Vegetables 1,045.1
Source: FAO, country research, EUV based on author’s calculations
Production
Production data was taken from the FAO’s database. There are a selected few crops where local data is
available: cashew, rice, sorghum, millet, fonio, other cereals, and cassava. In general, the locally produced
data is similar to the recorded values in the FAO database, the notable exceptions being cashew (domestic
data suggests production is almost 60 percent greater) and millet (domestic production should be 40 percent
lower).
Rental values
Production cost data is difficult to come by, especially as most farming is undertaken by families looking
after relatively small plots. Large scale commercial farming, of crops other than cashew, is non-existent.
The previously assumed rental rate of 30 percent (under the “Where is the Wealth of Nations” calculations)
is therefore applied, in place of anything more country specific. There are however two exceptions: cashew
and rice.

60
Cashew production in Guinea-Bissau, while profitable in terms of mass, is not that profitable once all of
the costs have been taken into account. The World Bank’s Country Economic Memorandum estimates that
the average profit on a $463 ton bag of raw cashew is $20 – a rental rate of less than 5 percent. This could
be dramatically increased to almost 50 percent (~$220) if the nuts were processed before export.
Rice production in Guinea-Bissau also suffers from low productivity and as a consequence low rental rates.
Irrigation costs of rice are high and while labor costs cannot be easily ascertained owing to the lack of
information on average wage rates in rural areas, rice is much more labor intensive than cashew farming.
Rising rice prices have meant that the rental price, compared to cashew, has been increasing, and so while
it may not be as high as other crops with a 30 percent rental rate it should be higher than the 5 percent
currently recorded for cashew.
Pasture land
Rents from pasture land are calculated in a similar way to crop land:
𝑃𝑅𝑡 = (𝐸𝑈𝑉 ∗ (𝑃𝑃 ∗ (1 + 𝑟)𝑡) ∗ 𝑟𝐶
where:
𝑃𝑅𝑡 = pasture rents in year t
EUV = regional export unit values, domestic prices are used where available
PP = 5 yearly average crop production (2006-2010)
r = estimated annual average pasture growth rate, assumed to be 0.9 percent across all products
𝑟𝑃 = rental rate of pasture,
Prices
Locally recorded prices per ton of meat are higher than the export unit values calculated for the West Africa
region (Table 8). This may be due to the limited supply of domestically produced pastoral products – the
FAO for example, estimated that the annual consumption of milk in 2007 was 10.8 liters per capita, which
is far below the recommended standard (62 liters per person per year).
Table 23. Product Export Unit Values (US$ 2010/ton)
Product Average 2005-
2009 EUVs
from FAO
Local
prices in
2012/3
(2010
prices)
Sheep meat 4,299 5,832
Goat meat 4,564 4,564
Hen eggs, in shell 3,765 2,430
Chicken meat 1,565 6,561

61
Cattle meat 3,255 4,374
Pig meat 3,357 4,860
Cow milk, whole, fresh 928 928 Source: FAO, country research, EUV based on author’s calculations
Production
The production data from the FAO corresponds with the latest data from the national authorities, the only
discrepancy is the production of pork. The FAO’s data is 10 times greater than the pork production figures
recorded by the DGAg in 2012. This has a significant impact on the rents from pastoral farming, as they
account for about a quarter of the final wealth per capita figures.
Natural Wealth Estimates for Biodiversity/Protected areas
There is growing awareness of the importance of biodiversity, not just for preservation’s sake, but the innate
economic value that it holds. Initiatives such as TEEB, The Economics of Ecosystems and Biodiversity,
have progressed this agenda by helping place values on these otherwise unquantifiable resources. For policy
makers, ecotourism offers a tangible way of both protecting the environment, and generating revenues.
Rents from ecotourism services can then be used as a proxy to measure the natural wealth of a country’s
biodiversity. Ecotourism is definitely a possibility in Guinea-Bissau given their plentiful supply and
diversity of flora and fauna. Estimating the potential wealth from biodiversity via this method requires more
information on tourists’ willingness to pay (via contingent valuation surveys) for services in Guinea-Bissau.
On the cost side, more analysis is needed to determine what the minimum cost is to make Guinea-Bissau
ecotourism friendly.
In the absence of this information, the opportunity cost of Guinea-Bissau’s protected lands is calculated as
a proxy for biodiversity. The average wealth per hectare of crop and pasture land ($102) is multiplied by
the number of hectares covered by half of the country’s protected areas (277,978 hectares). Only half of the
land is assumed to be appropriate for farming. Using this method, the natural wealth per capita of
biodiversity comes to $305.

62
References
Arrow, K. J., Dasgupta, P., Goulder, L. H., Mumford, K. J., & Oleson, K., “Sustainability and the
measurement of wealth” Environment and Development Economics, 17(03), 317-353 (2012).
Berg, A., Portillo, R., Yang, S. C. S., & Zanna, L. F. “Public investment in resource-abundant developing
countries” IMF Economic Review, 61(1), 92-129, (2013).
Calderón, C. Infrastructure and growth in Africa. The World Bank, D.C., (2009).
Catry, P., Barbosa, C., Paris, B., Indjai, B., Almeida, A., Limoges, B., ... & Pereira, H., Status, ecology, and
conservation of sea turtles in Guinea-Bissau. Journal Information, 8(2), (2009).
Christie, I., Fernandes, E., Messerli, H., & Twining-Ward, L., “Tourism in Africa: Harnessing Tourism for
Growth and Improved Livelihoods” The World Bank, Washington D.C., ((2013).
Collier, P., Van Der Ploeg, R., Spence, M., & Venables, A. J., “Managing Resource Revenues in
Developing Economies” IMF Staff Papers, 57(1), (2010).
Dasgupta, P., “Human Well-Being and the Natural Environment”, OUP, Oxford, 2001
Dessus, S., and Varoudakis, A., “Protecting Public Investment against shocks in the West Africa Economic
and Monetary Union: options for fiscal rules and risk sharing”, World Bank Policy Research Working
paper series, no.6562, World Bank, Washington D.C..
Dessus, S., and Varoudakis, A., “Protecting public investment against shocks in the West Africa Economic
and Monetary Union: options for fiscal rules and risk sharing”, World Bank Policy Research Working
paper series, no.6562, World Bank, Washington D.C..
Boakye, D., Dessus, S., Foday, Y., and Oppong, F., “Investing mineral wealth in development assets:
Ghana, Liberia and Sierra Leone” World Bank Policy Research Working paper series, no. 6089,
World Bank, Washington D.C..
Hilborn, R., Walters, C. J., & Ludwig, D., “Sustainable exploitation of renewable resources” Annual Review
of Ecology and Systematics, 26(1), 45-67, (1995).
III Inquerito sobre os aspectos socio-ecónomicos da pesca na Guiné Bissau, CIPA, (2011)
Kelleher, K., “The Sunken Billions: The Economic Justification for Fisheries Reform”, joint publication
World Bank/FAO, 2009.
Kyle, S., “The Macroeconomic Context for Trade in Guinea-Bissau”, Working Paper No.26, 2009.
63
Lange, G., “The contribution of minerals to sustainable economic development: mineral resource accounts
in Namibia. Research Discussion Paper No. 54, Directorate of Environmental Affairs, Ministry of
Environment and Tourism, Windhoek, Namibia, (2003).
Loayza, N. V., Ranciere, R., Servén, L., & Ventura, J., Macroeconomic volatility and welfare in developing
countries: an introduction. The World Bank Economic Review, 21(3), 343-357, (2007).
McKelvey, V. E., “Mineral resource estimates and public policy”. United States Mineral Resources:
Geological Survey Professional Paper, 820, 9-19, (1973).
Njiti, C. F., & Kemcha, G. M., “Survey of fuel wood and service wood production and consumption in the
Sudano-Sahelian region of Central Africa: the case of Garoua, Cameroon and its rural environs”
Savanes africaines: des espaces en mutation, des acteurs face à de nouveaux défis. Actes du colloque,
Garoua, Cameroun, (2003).
Report of the World Commission on Environment and Development, (1987).
Sathirathai, S., & Barbier, E. B., “Valuing mangrove conservation in southern Thailand” Contemporary
Economic Policy, 19(2), 109-122, (2001).
Solow, R., “A few comments on ‘Sustainability and the measurement of wealth” Environment and
Development Economics, 17(03), 354-355 (2012).
System of Environmental-Economic Accounting (SEEA), Central Framework, jointly published by The
World Bank, United Nations, OECD, IMF, FAO and the European Commission, 2012
The Global Environmental facility, “Maintaining coastal biodiversity and natural resources as mainstays of
Guinea Bissau’s economy”, (2010).
World Bank, “The Changing Wealth of Nations: Measuring Sustainable Development in the New
Millennium”, 2011.
World Bank, “Where is the Wealth of Nations?” (2006)