The Petrofac difference... - Morningstar
176
The Petrofac difference... Annual report and accounts 2011
-
Upload
khangminh22 -
Category
Documents
-
view
1 -
download
0
Transcript of The Petrofac difference... - Morningstar

The Petrofac difference...
Annual report and accounts 2011
The Petrofac difference…

Petrofac Annual report and accounts 2011 01
Com
pany
financia
l sta
tem
ents
Com
Com
pany
pany
Gro
up
fin
ancia
l sta
tem
ents
Gro
Gro
up
up
Gove
rnance
GG
Corp
ora
te
resp
onsi
bility
Corp
Corp
ora
tora
tee
Fin
ancia
l p
erf
orm
ance
and ris
kFin
aFin
ancia
ncia
ll
Revi
ew
of o
pera
tions
Ove
rvie
w
Ri
fti
Performance highlightsOur services and business modelChairman’s statementInterview with the Group Chief ExecutiveLeadership teamVision and valuesCreating sustainable growthEngineering, Construction, Operations & MaintenanceIntegrated Energy Services
22 41 50 65 107 153
Overview
02 Performance highlights
04 Our services and business model
06 Chairman’s statement
08 Interview with the Group Chief Executive
12 Leadership team
14 Vision and values
16 Creating sustainable growth
18 Engineering, Construction, Operations & Maintenance
20 Integrated Energy Services
Review of operations
23 Operating environment
25 Segmental analysis
26
26
29
32
Engineering, Construction, Operations & Maintenance
– Onshore Engineering & Construction
– Offshore Projects & Operations
– Engineering & Consulting Services
34 Integrated Energy Services
Financial performance and risk
42 Key performance indicators
44 Financial review
47 Key risks
Corporate responsibility
51 Our commitment to corporate responsibility
52 How we operate
54 Managing social and environmental risk
57 Our people
60 Keeping people safe
62 Safeguarding the environment
64 Our ethical core
Governance
66 Directors’ information
68 Corporate governance report
80 – Nominations Committee report
82 – Audit Committee report
86 – Board Risk Committee report
91 Directors’ remuneration report
106 Directors’ statements
Group financial statements
108 Independent auditors’ report
109 Consolidated income statement
110 Consolidated statement of comprehensive income
111 Consolidated statement of financial position
112 Consolidated statement of cash flows
113 Consolidated statement of changes in equity
114 Notes to the consolidated financial statements
Company financial statements
154 Independent auditors’ report (Petrofac Limited)
155 Company income statement
155 Company statement of comprehensive income
156 Company statement of financial position
157 Company statement of cash flows
158 Company statement of changes in equity
159 Notes to the Company financial statements
169 Shareholder information
170 Glossary
During 2011 we set out our strategic aim of more than doubling our recurring 2010 Group earnings by 2015. We believe we will achieve this ambitious target and keep on growing because we deliver a different kind of service to our customers.
Firstly, we are committed to developing and employing local people. This means we help create skilled national workforces and, by working with local partners, create real advantage for customers.
Secondly, we put customer responsiveness at the heart of our service delivery. Our teams aim to anticipate problems before they arise and always try to respond to customer needs quickly and effectively, however demanding the challenge.
Lastly, we offer our capabilities to our customers under flexible commercial models that are suited to their needs. We sell services directly or build an integrated proposition where we share the investment and risks involved in the project.
We believe these features make Petrofac distinctive and that, as we grow, this difference will help us achieve our vision – of becoming the world’s most admired oilfield service company.
Contents
…our local delivery, customer focus and commercial flexibility
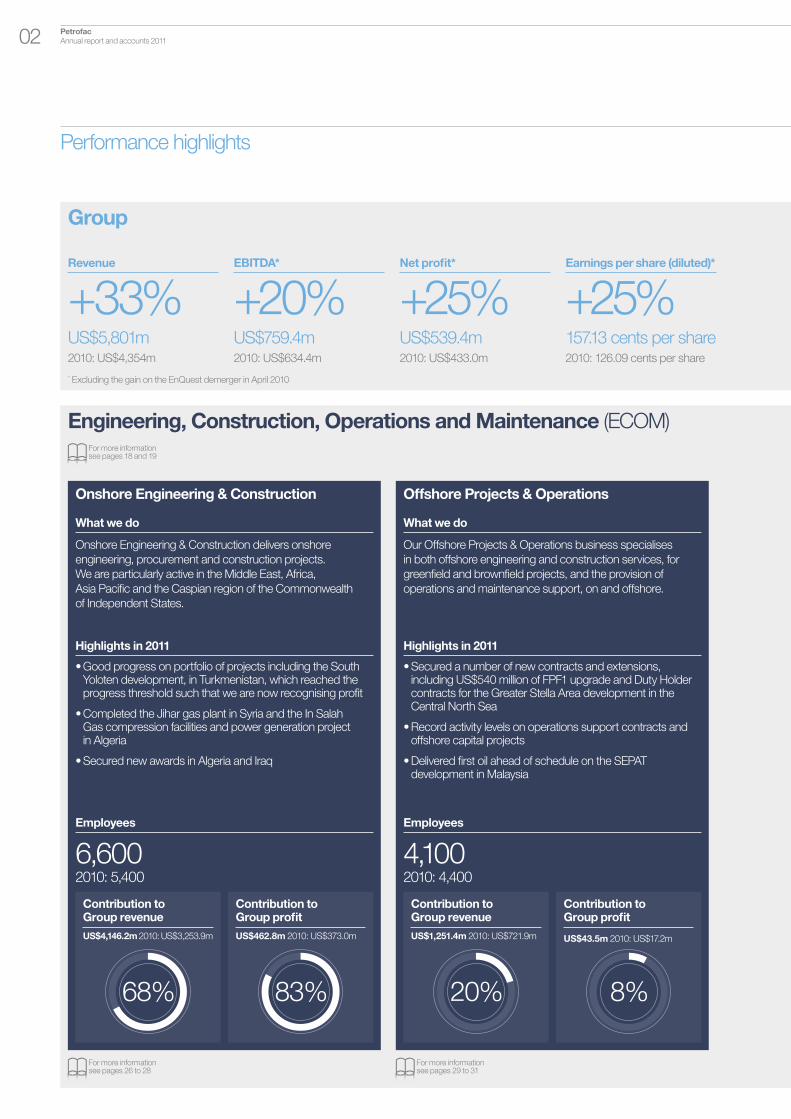
Performance highlights
Petrofac Annual report and accounts 201102
Group
Revenue
+33%US$5,801m 2010: US$4,354m
EBITDA*
+20%US$759.4m 2010: US$634.4m
Net profit*
+25%US$539.4m 2010: US$433.0m
Earnings per share (diluted)*
+25%157.13 cents per share2010: 126.09 cents per share
Engineering, Construction, Operations and Maintenance (ECOM)
For more information see pages 26 to 28
Onshore Engineering & Construction
What we do
Onshore Engineering & Construction delivers onshore
engineering, procurement and construction projects.
We are particularly active in the Middle East, Africa,
Asia Pacific and the Caspian region of the Commonwealth
of Independent States.
Highlights in 2011
• Good progress on portfolio of projects including the South Yoloten development, in Turkmenistan, which reached the progress threshold such that we are now recognising profit
• Completed the Jihar gas plant in Syria and the In Salah Gas compression facilities and power generation project in Algeria
• Secured new awards in Algeria and Iraq
Employees
6,6002010: 5,400
Contribution to Group revenue
US$4,146.2m 2010: US$3,253.9m
For more information see pages 29 to 31
Contribution to Group profit
US$462.8m 2010: US$373.0m
Offshore Projects & Operations
What we do
Our Offshore Projects & Operations business specialises
in both offshore engineering and construction services, for
greenfield and brownfield projects, and the provision of
operations and maintenance support, on and offshore.
Highlights in 2011
• Secured a number of new contracts and extensions, including US$540 million of FPF1 upgrade and Duty Holder contracts for the Greater Stella Area development in the Central North Sea
• Record activity levels on operations support contracts and offshore capital projects
• Delivered first oil ahead of schedule on the SEPAT development in Malaysia
Employees
4,1002010: 4,400
Contribution to Group revenue
US$1,251.4m 2010: US$721.9m
Contribution to Group profit
US$43.5m 2010: US$17.2m
83%68% 8%20%
For more information see pages 18 and 19
* Excluding the gain on the EnQuest demerger in April 2010
Petrofac Annual report and accounts 2011 03
Com
pany
financia
l sta
tem
ents
Com
Com
pany
pany
Gro
up
fin
ancia
l sta
tem
ents
Gro
Gro
up
up
Gove
rnance
GG
Corp
ora
te
resp
onsi
bility
Corp
Corp
ora
tora
tee
Fin
ancia
l p
erf
orm
ance
and ris
kFin
aFin
ancia
ncia
ll
Revi
ew
of o
pera
tions
Ove
rvie
w
Ri
fti
Performance highlightsOur services and business modelChairman’s statementInterview with the Group Chief ExecutiveLeadership teamVision and valuesCreating sustainable growthEngineering, Construction, Operations & MaintenanceIntegrated Energy Services
22 41 50 65 107 153
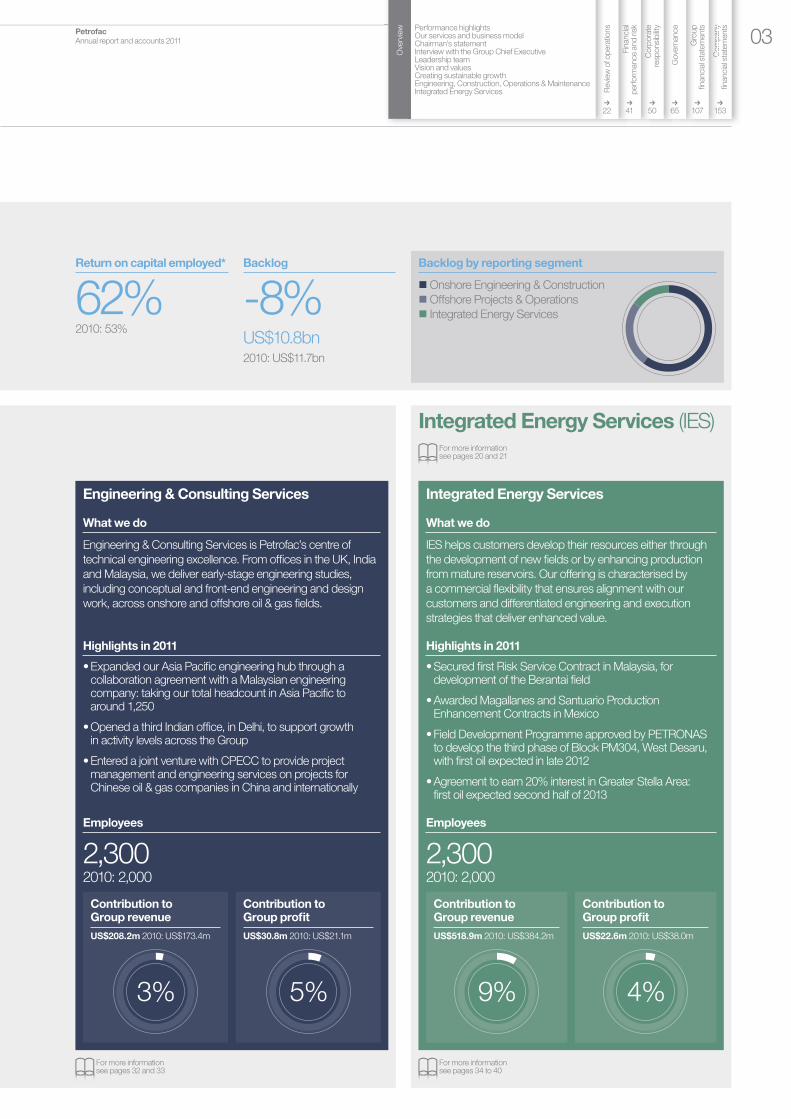
Return on capital employed*
62%2010: 53%
Backlog
-8%US$10.8bn 2010: US$11.7bn
Integrated Energy Services (IES)
For more information see pages 34 to 40
For more information see pages 32 and 33
Backlog by reporting segment
Onshore Engineering & Construction
Offshore Projects & Operations
Integrated Energy Services
Engineering & Consulting Services
What we do
Engineering & Consulting Services is Petrofac’s centre of
technical engineering excellence. From offices in the UK, India
and Malaysia, we deliver early-stage engineering studies,
including conceptual and front-end engineering and design
work, across onshore and offshore oil & gas fields.
Highlights in 2011
• Expanded our Asia Pacific engineering hub through a collaboration agreement with a Malaysian engineering company: taking our total headcount in Asia Pacific to around 1,250
• Opened a third Indian office, in Delhi, to support growth in activity levels across the Group
• Entered a joint venture with CPECC to provide project management and engineering services on projects for Chinese oil & gas companies in China and internationally
Employees
2,3002010: 2,000
Contribution to Group revenue
US$208.2m 2010: US$173.4m
Contribution to Group profit
US$30.8m 2010: US$21.1m
Integrated Energy Services
What we do
IES helps customers develop their resources either through
the development of new fields or by enhancing production
from mature reservoirs. Our offering is characterised by
a commercial flexibility that ensures alignment with our
customers and differentiated engineering and execution
strategies that deliver enhanced value.
Highlights in 2011
• Secured first Risk Service Contract in Malaysia, for development of the Berantai field
• Awarded Magallanes and Santuario Production Enhancement Contracts in Mexico
• Field Development Programme approved by PETRONAS to develop the third phase of Block PM304, West Desaru, with first oil expected in late 2012
• Agreement to earn 20% interest in Greater Stella Area: first oil expected second half of 2013
Employees
2,3002010: 2,000
Contribution to Group revenue
US$518.9m 2010: US$384.2m
Contribution to Group profit
US$22.6m 2010: US$38.0m
5%3% 4%9%
For more information see pages 20 and 21

Petrofac Annual report and accounts 201104
Our services
The scale and scope of Petrofac’s capabilities enable us to provide services to our customers across the entire life cycle of their oil & gas assets. Our services are delivered through two divisions – Engineering, Construction, Operations & Maintenance (ECOM) and Integrated Energy Services (IES).
Design
From the concept to the detail, our design services
draw on deep technical experience combined with a
long track record of delivering in the field. Our design
teams span the technical spectrum and are available
world-wide to discuss customers’ needs.
Build
Whether it is on or offshore, brown or greenfield,
our engineering, procurement and construction
businesses deliver customers’ projects with an acute
focus on schedule and cost. We work under both
reimbursable and lump-sum contractual models
from the million to the multi-billion dollar scale.
Maintain
Our people have deep experience in operating
oil & gas infrastructure. We provide project
management, operations and maintenance support
and engineering and construction solutions for
planned facility modifications and upgrades.
Manage
We provide a complete asset management service,
under a variety of different commercial models,
covering production enhancement, production
operations and maintenance work, both offshore
and onshore.
Train
Our global training business manages 14 training
facilities in six countries. We have an integrated
approach, working with customers to assess
capability needs and to build programmes to develop
competent, safe and efficient workforces.
Develop
We bring our spectrum of technical skills together
under integrated contracts to support customers
in developing their energy resources. We undertake
this development work under innovative commercial
structures, sharing risk with our customers in order to
align ourselves closely with them.
Train
Deve
lop
Des
ig
n
Refining and
alspetrochemicalscascassalscasca
CO2
Sequestration/capture
CO2 Storage
Storage
Oil & gas processing facilities and
pipelines

Petrofac Annual report and accounts 2011 05
Com
pany
financia
l sta
tem
ents
Com
Com
pany
pany
Gro
up
fin
ancia
l sta
tem
ents
Gro
Gro
up
up
Gove
rnance
GG
Corp
ora
te
resp
onsi
bility
Corp
Corp
ora
tora
tee
Fin
ancia
l p
erf
orm
ance
and ris
kFin
aFin
ancia
ncia
ll
Revi
ew
of o
pera
tions
Ove
rvie
w
Ri
fti
Performance highlightsOur services and business modelChairman’s statementInterview with the Group Chief ExecutiveLeadership teamVision and valuesCreating sustainable growthEngineering, Construction, Operations & MaintenanceIntegrated Energy Services
22 41 50 65 107 153
Our business model
We deliver our services on either a stand-alone or integrated basis and under a range of commercial models, which are tailored to meet our customers’ needs.
Engineering, Construction, Operations
& Maintenance
Reimbursable services
Where the cost of our services is reimbursed by the
customer plus an agreed margin. A large proportion
of services provided by Engineering & Consulting
Services and Offshore Projects & Operations are
remunerated on this basis.
Cost plus KPIs
Often our reimbursable contracts will include
incentive income linked to the successful delivery
of key performance indicators (KPIs), for example,
Duty Holder projects like the Kittiwake Platform in
the UK North Sea for Centrica.
Lump-sum turnkey
Onshore Engineering & Construction undertakes
engineering, procurement and construction (EPC)
projects predominantly on a lump-sum or fixed-price
basis, for example the South Yoloten project in
Turkmenistan. We expect to undertake more
lump-sum turnkey projects in Offshore Projects &
Operations as we take our EPC capability offshore.
Integrated Energy Services
Risk Service Contracts (RSC)
Where we develop, operate and maintain a field,
while the resource holder retains ownership and
control of their reserves. Our interests are aligned:
we will fund the development and will be reimbursed
(often from production cash flows) and will receive
a remuneration fee based upon our performance,
for example the Berantai project in Malaysia. RSCs
typically have low exposure to commodity prices
and reservoir performance.
Production Enhancement Contracts (PEC)
Where we are paid a tariff per barrel for oil & gas
production and therefore have no direct commodity
price exposure. PECs are appropriate for mature fields
which have a long production history. Our contracts
are long-term, for example, 15 years on the Ticleni
contract in Romania and 25 years for the Magallanes
and Santuario fields in Mexico.
Equity Upstream Investments
Upstream Investments through Production Sharing
Contracts (PSC), Concession Agreements and Equity,
of which Block PM304, the Chergui field and the
Greater Stella Area development are examples. We will
typically have some production and commodity price
exposure. Going forward, we expect to focus more
on Risk Service Contracts and Production
Enhancement Contracts.
Build
Main
tain
Manage
Offshore wind
Offshore developmentvveeveeveevveveveveeevve
and productionodrorororooooror doorodoorooororroo
Floating production
Undergroundreservoir
Liquefiednatural gas
OnOnshoressnsho ehoreoreeho esnshooress orshoooshohnshoresho eerensho eenssnsssssh eeeeOndevelopment opment eemeneeeeeennneeemmemmmeeeeeeeeemmmmmmmmmeeenenneeeeeneeeopment
and roductionprodurodu

Chairman’s statement
Petrofac Annual report and accounts 201106
1 Excluding the gain from the EnQuest demerger in April 2010.
2 Brent, a benchmark crude oil, averaged US$111 per barrel for 2011 (2010: US$80 per barrel).
Marketplace
These results were achieved against the backdrop of continuing
uncertainty within the global economic and political environment.
Despite this uncertainty, oil prices remained robust at more than
US$100 per barrel for most of the year2. This reflects continuing
growth in international energy demand, driven particularly by
China, and the challenge faced by the industry of growing supply.
Such an environment remains one in which our customers are
continuing to invest, and demand for our services remains strong.
Dividends
Reflecting our strong performance, the Company proposes a final
dividend of 37.20 cents per share for the year ended 31 December
2011 (2010: 30.00 cents), which, if approved, will be paid to
shareholders on 18 May 2012 provided they were on the register
on 20 April 2012. Shareholders who have not elected (before
2 March 2012) to receive dividends in US dollars will receive
a sterling equivalent of 23.39 pence per share.
Together with the interim dividend of 17.40 cents per share
(2010: 13.80 cents), equivalent to 10.54 pence, this gives a total
dividend for the year of 54.60 cents per share (2010: 43.80 cents),
an increase of 25%, in line with the increase in net profit.
Our growth journey
To align our whole business behind our strategic goals, in 2011,
we reshaped Petrofac into two divisions: Engineering, Construction,
Operations & Maintenance (ECOM) and Integrated Energy Services
(IES). We believe these changes will enable us to generate more
value from our capabilities, grow earnings and deliver higher
returns. We will report the results of these two divisions (ECOM
and IES) under four reporting segments: Onshore Engineering
& Construction, Offshore Projects & Operations, Engineering &
Consulting Services and Integrated Energy Services.
Petrofac has been developing its oil & gas capabilities for many
years, both through organic development and small
complementary acquisitions. Our new structure will enable
us to deliver even stronger, integrated support to our customers.
Our Board, like our strategy, also brings together proven experience
and new insights. In 2011, several new members joined the team.
Andy Inglis, Chief Executive of IES, Roxanne Decyk, Non-executive
Director, and I joined in March and Tim Weller succeeded
Keith Roberts as Chief Financial Officer in October.
The diversity of experience within our Board enriches our business
and this has been further complemented by these recent additions.
Andy Inglis’ industry experience and technical expertise informs our
strategy for IES; the knowledge and insight Roxanne Decyk gained
as Shell’s Head of Global Government Affairs helps us as we
consider our approach to new geographies, and Tim Weller’s
experience from other sectors and companies further expands
our knowledge base.
A strong leadership team
Quite rightly, stakeholders emphasise the importance, not just of
individual talent, but also of a strong and cohesive leadership team.
I have been pleased to find that Petrofac has a very constructive
boardroom culture. Debate on a range of issues, from our new
strategy and risk management to compliance with our Code
of Business Conduct, has been informed, intelligent and
wide-ranging. Board members freely challenge each others’
views, while laying differences of opinion aside and assuming full
‘cabinet responsibility’ when decisions are reached. The Board
is a genuine team, not just a collection of talented individuals and,
as such, no one person or group dominates the boardroom.
The behaviour, cohesiveness and effectiveness of the Board
is reinforced by the international site visits that form part of our
calendar. In 2011, we visited the Asab oil field, where Petrofac is
upgrading production capacity for the Abu Dhabi Company for
Onshore Oil Operations. Visiting our operations is a practical and
useful way to get to know both colleagues and the business.
Comprehensive induction programmes, including visits to
Group locations, also help new Board members get practical
understanding of the business.
Doing the right thing for stakeholders
The strength of our Board, and business, is rooted in Petrofac’s
commitment to corporate governance. This is demonstrated
by our full compliance with the UK Corporate Governance Code.
I am pleased to report that the Petrofac Board abides with the
spirit, as well as the letter, of the code and is focused on doing
the right thing by all our stakeholders.
Again this year, the Board evaluated Petrofac’s major processes
and procedures to ensure they are fit for purpose. Risk was
a particular emphasis: we spent significant time reviewing the
Group’s risk management framework, including the interface
between the Audit and Board Risk Committees. No business can
ever be free of risk and working, as we do, in a complex industry,
on demanding projects, in challenging environments, risk
is integral to our job. We will continue to strive to ensure that as
the Company and the size of our contracts grow, we will continue
to safeguard investor value.
2011 was another good year for Petrofac. Our revenue rose by 33% to US$5,801 million, and net profits1 increased by 25% to US$539.4 million.

Petrofac Annual report and accounts 2011 07
Com
pany
financia
l sta
tem
ents
Com
Com
pany
pany
Gro
up
fin
ancia
l sta
tem
ents
Gro
Gro
up
up
Gove
rnance
GG
Corp
ora
te
resp
onsi
bility
Corp
Corp
ora
tora
tee
Fin
ancia
l p
erf
orm
ance
and ris
kFin
aFin
ancia
ncia
ll
Revi
ew
of o
pera
tions
Ove
rvie
w
Ri
fti
Performance highlightsOur services and business modelChairman’s statementInterview with the Group Chief ExecutiveLeadership teamVision and valuesCreating sustainable growthEngineering, Construction, Operations & MaintenanceIntegrated Energy Services
22 41 50 65 107 153
Petrofac draws enormous benefit from the diversity of its people.
We actively encourage such diversity, and this, coupled with our
commitment to recruiting and developing local workforces has
led to us employing more than 80 nationalities across the Group.
The Company realises, however, that throughout the business and
at Board level we could improve our gender balance. We therefore
support Lord Davies’ Report on Women on Boards and aspire
to have 25% female Board representation by 2015.
While striving to achieve this target, on selecting people for the
Board, as elsewhere, we will always put the calibre of candidates
first, not their gender. In 2011, having assessed a wide range
of talented men and women, we made two new appointments
to the Board: René Médori and Marwan Chedid. René has been
Finance Director of Anglo American PLC since 2005 and is also
a Non-executive Director of SSE PLC and Anglo Platinum Limited.
Marwan recently became Chief Executive of our Engineering,
Construction, Operations & Maintenance (ECOM) division, having
joined Petrofac in 1992. Both René and Marwan have a wealth of
experience, which I am certain will further strengthen and
enhance our Board.
As mentioned earlier, Keith Roberts left Petrofac at the end of 2011,
after almost ten years. Keith helped transform Petrofac from
a modest-sized, privately owned company to the US$8 billion,
FTSE 100 business it is today. We have much to thank him for
and wish him well for the future.
The Petrofac difference
The theme of this year’s annual report is ‘the Petrofac difference’:
this difference is evident in how the Company does business,
as well as in what it does. Since joining Petrofac, I have been struck
by its distinctive culture, one characterised by inspired leadership,
entrepreneurial flair, exceptional capabilities, an innovative mindset
and strong customer relationships. It also has outstanding people:
having travelled this year to Petrofac operations in the UK, Middle
East and Asia, I have been impressed by employees’ can-do
attitude and their unbridled passion for and pride in the Company.
I hope to meet many more of our people in the coming year and
would like to thank them all for their contribution to Petrofac’s
continuing success.
Outlook
Petrofac has set a clear target for the medium term – aiming
to more than double 2010 recurring Group earnings by 2015.
As all signs point to our customers continuing to invest in oil & gas
infrastructure and developments, I am confident that Petrofac –
with its able leadership team, clear strategy, deep capability and
strong, integrated offering – will achieve this target.
Norman MurrayChairman

Interview with the Group Chief Executive
Petrofac Annual report and accounts 201108
Ayman Asfari talks about the highlights of 2011 and how Petrofac’s new two-divisional structure and strong values will stand us in good stead to meet our strategic goals.

Petrofac Annual report and accounts 2011 09
Com
pany
financia
l sta
tem
ents
Com
Com
pany
pany
Gro
up
fin
ancia
l sta
tem
ents
Gro
Gro
up
up
Gove
rnance
GG
Corp
ora
te
resp
onsi
bility
Corp
Corp
ora
tora
tee
Fin
ancia
l p
erf
orm
ance
and ris
kFin
aFin
ancia
ncia
ll
Revi
ew
of o
pera
tions
Ove
rvie
w
Ri
fti
Performance highlightsOur services and business modelChairman’s statementInterview with the Group Chief ExecutiveLeadership teamVision and valuesCreating sustainable growthEngineering, Construction, Operations & MaintenanceIntegrated Energy Services
22 41 50 65 107 153
Q:2011 has been another challenging year both politically and economically, yet Petrofac has delivered strong results and good operational performance. To what would you attribute this?
A:Despite the continuing economic slowdown and debt crisis,
the global requirement for hydrocarbons continues to increase.
As a result, demand for our services is robust and we are seeing
our customers, the oil & gas resource holders, maintaining or
increasing expenditure plans and, accordingly, the need for
services to support their operations.
Our operational performance has been achieved through the
combined efforts of our exceptionally talented employees, who are
focused on executing projects effectively and are guided by and
aligned to our values.
Q:During 2011, Petrofac has made some changes to its organisational structure. Can you explain what these are?
A:We have reorganised the Group into two focused divisions:
Engineering, Construction, Operations & Maintenance (ECOM),
led by Chief Executive, Marwan Chedid and Integrated Energy
Services (IES), led by Chief Executive, Andy Inglis.
At our Capital Markets Day in June, we presented the strategy
and organisation structure for IES which, we believe, will be a key
driver of the Group’s future growth. Towards the end of the year,
we launched ECOM, which combines our onshore and offshore
engineering, procurement and construction capabilities with our
operations management and consulting services. Although the
divisions will offer services on a stand-alone basis, we recognise
that additional value can often be achieved through integrating our
services and the new structure will facilitate this approach across
the Group.
Q:How does the new structure benefit customers and the business?
A:It is more streamlined; simpler for customers to understand;
allows us to be more focused on our strategic goals; and makes
collaboration and service integration easier.
Q:What were the operational highlights of the year?
A:During 2011, our teams effectively and efficiently progressed
several multi-billion dollar projects simultaneously: this involved our
largest ever contract, in South Yoloten, Turkmenistan, for
Turkmengas, which was awarded late in 2010 and got off to a very
good start in 2011; our continuing work on the onshore Asab oil
field and NGL4 integrated gas development projects in Abu Dhabi,
for the Abu Dhabi Company for Onshore Oil Operations and
GASCO respectively; and our ongoing work with Sonatrach and
its partners in Algeria, for the El Merk central processing facility
and the In Salah Gas project.
Q:What was the year’s key strategic focus?
A:The launch of the IES division in June was the primary focus.
It was very satisfying that it was validated almost immediately
with the award, in August, of two significant integrated services
contracts by PEMEX in Mexico.
Q:Although IES was launched in 2011, is it true to say that Petrofac has actually been building up its integrated services offering for many years?
A:Yes, over the last two decades we have been continuously
widening the scope and increasing the scale of our offering,
so we can bring deeper capabilities to customers’ operations.
The flexible commercial structures, through which IES delivers
services to customers, have also been part of our offering for some
time. We already have a strong track record for integrated service
delivery, on both greenfield and brownfield projects, tailoring the
commercial models to meet the needs of our customers.
The articulation of our IES strategy in June was, essentially
an identification of more potential markets and growth
opportunities. Andy Inglis joined us in early 2011 to become
Chief Executive of this division and is an excellent leader with the
skills to deliver these opportunities and, under the framework of
our IES strategy, will seek to deploy our human capital to deliver
even higher earnings and a greater return for the Group.

Interview with the Group Chief Executive continued
Petrofac Annual report and accounts 201110
Q:You have set yourselves the ambitious goal of more than doubling your recurring 2010 Group earnings by 2015. Why are you confident you will achieve this?
A:There are several reasons. We are in a market that is growing
and where our customers are continuing to invest, both due
to increasing demand and the difficulty of producing oil & gas.
Production is not getting any easier: in fact, it’s getting harder
by the day, particularly from mature assets.
One reason for our confidence, and something that I believe
differentiates Petrofac, is our focus. We are a focused business:
focused on oil & gas, predominately upstream, and focused
geographically as we concentrate on areas where we have,
or can build, a strong presence and know we can execute
effectively on the ground with local resources and partners.
Another factor is our passionate belief in the need for building
world-class competency in oil & gas operations. Through our
Training Services business we can help transfer knowledge and
build capacity in national workforces and build strong relationships
with local supply chains. This is a key part of our IES offering:
as well as supporting resource holders to unlock the value of their
assets without requiring them to give up reserves ownership
or control, we also enable them to access and develop local
resources, thereby supporting the sustainability of their operations.
Our strategy, with its focus on expanding our existing business into
new geographies, developing our EPC operations offshore and
implementing our IES plans, addresses all these points. We are not,
however, complacent. We know we will only achieve our goals if we
retain quality of execution and excellence in delivery and ensure all
our employees embrace our values and continue to live them.
Q:This year, Petrofac is re-emphasising its values of being safe, ethical, innovative, responsive, quality and cost conscious and driven to deliver. Why are the values so important to you and the business?
A:We are a people business. The values of our people are the brand
of our business and are what unite 15,000 individuals across our
operations. They are the common link of the business and make
us what we are. They are essential to achieving our strategic goals.
Our values are important for external stakeholders too. Our
customers have to know what we stand for and what they can
expect from us. They need to be confident that, whatever part of
the business and whichever of our people they work with, they will
experience the same high quality service and consistent approach.
Q:How can you ensure that you maintain this values-based culture as you grow?
A:The best way is through the leadership living the values and
using every possible opportunity to articulate them. For example,
in 2011, we launched a global campaign to recognise employees
who embody our values in action. The efforts of all short-listed
individuals and teams were acknowledged at our annual leadership
conference in Abu Dhabi, in November. We intend to continue
these annual awards in recognition of the outstanding contribution
of our employees.
Most of all though, the Petrofac difference is rooted in the
exceptional nature of our people and their continuing commitment
and dedication to our customers. They are what make us
successful and I would like to thank each of them for their
contribution in 2011.
Q:Apart from your business focus and values, what else differentiates Petrofac?
A:The breadth of our capabilities which give us the ability to deliver
integrated services with flexible commercial structures that meet
our customers’ needs, along with our commitment to working with
and developing local workforces, our competitive cost structure,
and a robust approach to risk management, enabling us to
generate better returns for our shareholders.

Petrofac Annual report and accounts 2011 11
Com
pany
financia
l sta
tem
ents
Com
Com
pany
pany
Gro
up
fin
ancia
l sta
tem
ents
Gro
Gro
up
up
Gove
rnance
GG
Corp
ora
te
resp
onsi
bility
Corp
Corp
ora
tora
tee
Fin
ancia
l p
erf
orm
ance
and ris
kFin
aFin
ancia
ncia
ll
Revi
ew
of o
pera
tions
Ove
rvie
w
Ri
fti
Performance highlightsOur services and business modelChairman’s statementInterview with the Group Chief ExecutiveLeadership teamVision and valuesCreating sustainable growthEngineering, Construction, Operations & MaintenanceIntegrated Energy Services
22 41 50 65 107 153
Q:In 2011, Petrofac launched a new Corporate Development & Strategy Group to ensure the Company had the right organisation and approach to achieve its 2015 goals. What will be its main focus?
A:If we are to continue growing, to 2015 and beyond, we need
to have efficient cost structures, systems and business processes,
to demonstrate excellence in delivery, to continue strengthening
our customer relationships and to keep growing our capabilities.
The new group, headed by Maroun Semaan, President, is part of
our strategy to make our whole organisation sustainable. It will help
us improve our operational performance and achieve our
objectives, by building the right type of organisation and accessing
strategic business development opportunities.
Continuing to build our workforce is essential to our growth. One of
Maroun’s main strategic priorities will be to ensure we have the right
mechanisms in place to become an employer of choice and to
attract, develop and retain the very best people in our industry.
Q:To close, how would you sum up Petrofac as it enters its fourth decade?
A:We are a growing business, with more than 15,000 people who are
united by a passion for what they do, strong values and a common
culture. We take immense pride in being flexible and responsive
to changing customer needs, and will continue to differentiate
our services while staying focused on achieving excellence in
execution. As we enter the new financial year and our fourth
decade, we are confident that we are on track to meet the
ambitious targets that we have set ourselves and our Company.
Ayman AsfariGroup Chief Executive
Our strategy for growth
It is our aim to become the world’s most admired oilfield service company.
We help customers develop their energy resources; bringing world-class capability and delivering it locally. We promote commercial arrangements that are aligned to our customers’ needs allowing us to deliver more value to the customer while increasing the returns from our most precious asset – our people.
During the year we have progressed three key initiatives which will help us to achieve our vision:
Expand existing business into new geographiesContinue to expand our offering into new countries and regions that offer exciting growth opportunities, particularly where they are in close proximity to our existing operations. We are building upon our positions in Turkmenistan, Iraq, Mexico and Nigeria. Our case study on the Rumaila oil field in Iraq, page 17, illustrates this initiative.
Develop our EPIC business offshoreDevelop our engineering, procurement, installation and construction (EPIC) capability offshore. Initially, our attention will be on existing markets, focusing particularly on the UKCS, Middle East and Malaysia. Our case study on SEPAT, Malaysia, page 30, illustrates this initiative.
Implement our Integrated Energy Services strategyImplement our Integrated Energy Services offering, which helps customers develop their resources either through the development of new fields or by enhancing production from mature reservoirs. This offering is characterised by a commercial flexibility that ensures alignment with our customers and differentiated engineering and execution strategies that deliver enhanced value. Our case study on the project for PEMEX in Mexico, page 20, illustrates this initiative.
We are, therefore, growing our capabilities and expanding our geographic reach in order to deliver our financial target – a doubling of our 2010 recurring Group earnings by 2015.
Leadership team
Engineering, Construction, Operations & Maintenance
Integrated Energy Services
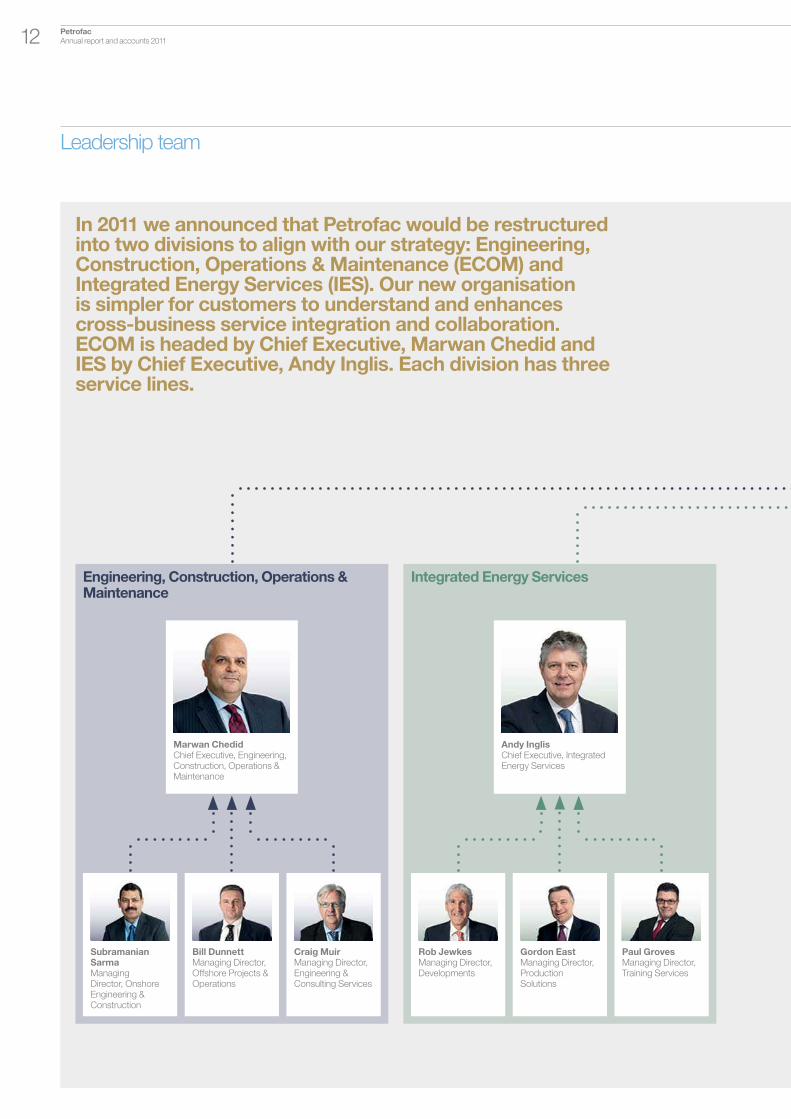
Bill DunnettManaging Director, Offshore Projects & Operations
Craig MuirManaging Director, Engineering & Consulting Services
Rob JewkesManaging Director, Developments
Gordon EastManaging Director, Production Solutions
Paul GrovesManaging Director, Training Services
Subramanian SarmaManaging Director, Onshore Engineering & Construction
In 2011 we announced that Petrofac would be restructured into two divisions to align with our strategy: Engineering, Construction, Operations & Maintenance (ECOM) and Integrated Energy Services (IES). Our new organisation is simpler for customers to understand and enhances cross-business service integration and collaboration. ECOM is headed by Chief Executive, Marwan Chedid and IES by Chief Executive, Andy Inglis. Each division has three service lines.
Marwan ChedidChief Executive, Engineering, Construction, Operations & Maintenance
Andy InglisChief Executive, Integrated Energy Services
Petrofac Annual report and accounts 201112

Ayman AsfariGroup Chief Executive
Corporate functions
Richard MilneGroup Director Legal & Commercial Affairs
Tim WellerChief Financial Officer
Geoff TranfieldGroup Head of Human Resources
Corporate development & strategy group
Maroun SemaanPresident
Rajesh VermaManaging Director
Petrofac Annual report and accounts 2011 13
Com
pany
financia
l sta
tem
ents
Com
Com
pany
pany
Gro
up
fin
ancia
l sta
tem
ents
Gro
Gro
up
up
Gove
rnance
GG
Corp
ora
te
resp
onsi
bility
Corp
Corp
ora
tora
tee
Fin
ancia
l p
erf
orm
ance
and ris
kFin
aFin
ancia
ncia
ll
Revi
ew
of o
pera
tions
Ove
rvie
w
Ri
fti
Performance highlightsOur services and business modelChairman’s statementInterview with the Group Chief ExecutiveLeadership teamVision and valuesCreating sustainable growthEngineering, Construction, Operations & MaintenanceIntegrated Energy Services
22 41 50 65 107 153
Vision and values
Petrofac Annual report and accounts 201114
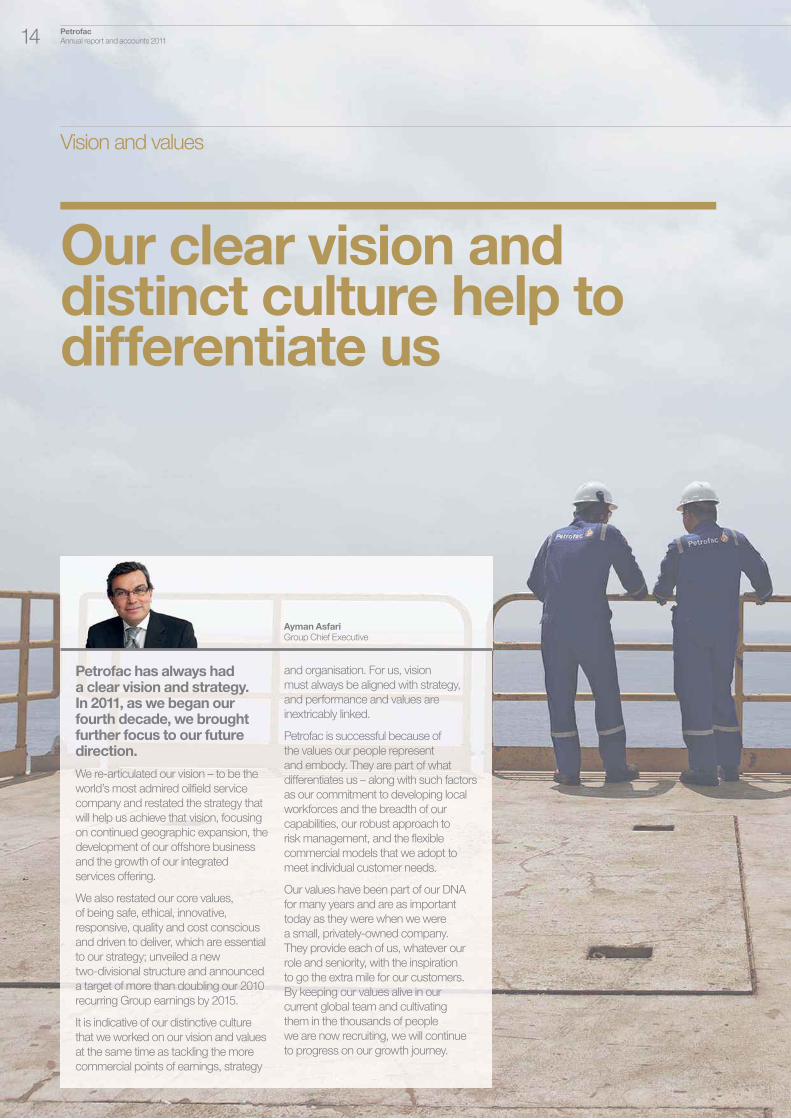
Our clear vision and distinct culture help to differentiate us
Petrofac has always had a clear vision and strategy. In 2011, as we began our fourth decade, we brought further focus to our future direction.
We re-articulated our vision – to be the
world’s most admired oilfield service
company and restated the strategy that
will help us achieve that vision, focusing
on continued geographic expansion, the
development of our offshore business
and the growth of our integrated
services offering.
We also restated our core values,
of being safe, ethical, innovative,
responsive, quality and cost conscious
and driven to deliver, which are essential
to our strategy; unveiled a new
two-divisional structure and announced
a target of more than doubling our 2010
recurring Group earnings by 2015.
It is indicative of our distinctive culture
that we worked on our vision and values
at the same time as tackling the more
commercial points of earnings, strategy
and organisation. For us, vision
must always be aligned with strategy,
and performance and values are
inextricably linked.
Petrofac is successful because of
the values our people represent
and embody. They are part of what
differentiates us – along with such factors
as our commitment to developing local
workforces and the breadth of our
capabilities, our robust approach to
risk management, and the flexible
commercial models that we adopt to
meet individual customer needs.
Our values have been part of our DNA
for many years and are as important
today as they were when we were
a small, privately-owned company.
They provide each of us, whatever our
role and seniority, with the inspiration
to go the extra mile for our customers.
By keeping our values alive in our
current global team and cultivating
them in the thousands of people
we are now recruiting, we will continue
to progress on our growth journey.
Ayman Asfari Group Chief Executive

Petrofac Annual report and accounts 2011 15
Com
pany
financia
l sta
tem
ents
Com
Com
pany
pany
Gro
up
fin
ancia
l sta
tem
ents
Gro
Gro
up
up
Gove
rnance
GG
Corp
ora
te
resp
onsi
bility
Corp
Corp
ora
tora
tee
Fin
ancia
l p
erf
orm
ance
and ris
kFin
aFin
ancia
ncia
ll
Revi
ew
of o
pera
tions
Ove
rvie
w
Ri
fti
Performance highlightsOur services and business modelChairman’s statementInterview with the Group Chief ExecutiveLeadership teamVision and valuesCreating sustainable growthEngineering, Construction, Operations & MaintenanceIntegrated Energy Services
22 41 50 65 107 153
Delivering significant efficiencies on equipment procurement for an Abu Dhabi project while maintaining quality, and reducing landfill waste by 80% with a landmark recycling project were just two of the achievements celebrated at our first EVE Awards ceremony.
Many other initiatives also won plaudits,
including a ‘model project’ that
completed two months ahead
of schedule and delivered ten million
man-hours without lost time incident,
and a drive to build staff engagement
around critical safety activity.
The awards recognised employees
who embody Petrofac’s values-based
culture, with, for example, the Abu Dhabi
project illustrating our value of being cost
conscious and the recycling scheme
demonstrating our commitment
to ethical behaviour. The 17 shortlisted
applications came from many different
functions and business areas and were
drawn from scores of entries around
the Group.
The winners collected their awards
at our leadership conference in
Abu Dhabi, in November.
Petrofac Annual report and accounts 201116
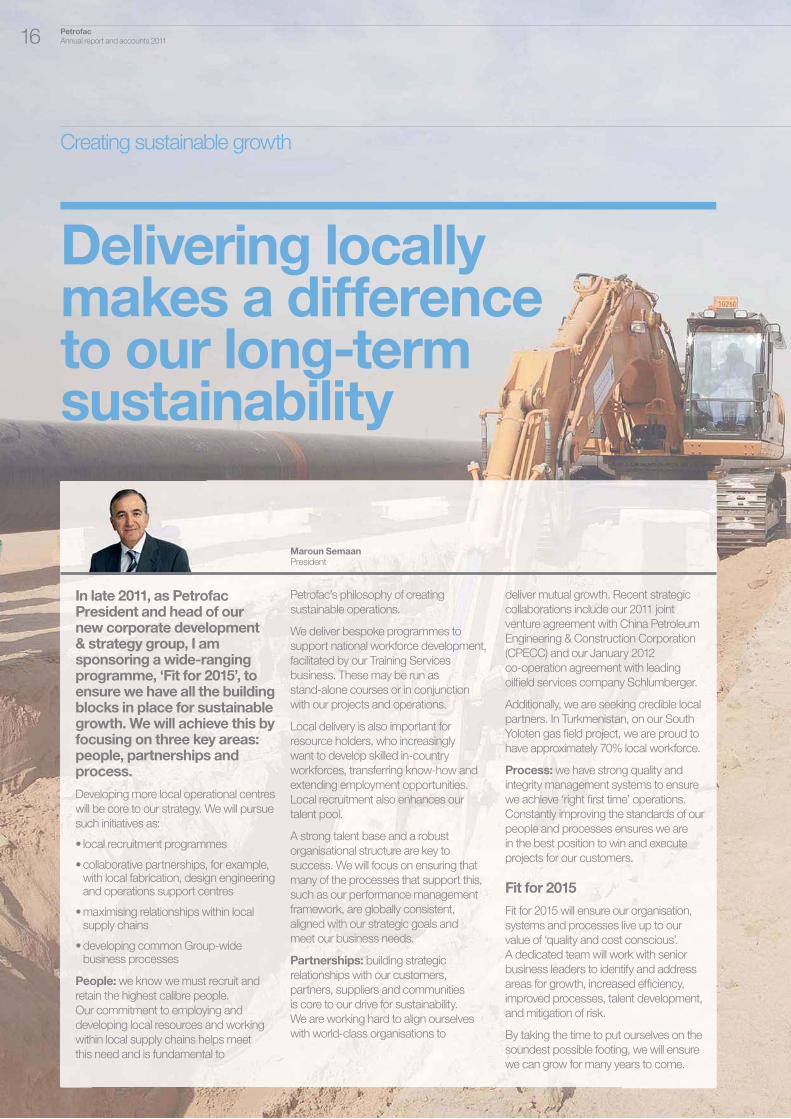
In late 2011, as Petrofac President and head of our new corporate development & strategy group, I am sponsoring a wide-ranging programme, ‘Fit for 2015’, to ensure we have all the building blocks in place for sustainable growth. We will achieve this by focusing on three key areas: people, partnerships and process.
Developing more local operational centres
will be core to our strategy. We will pursue
such initiatives as:
• local recruitment programmes
• collaborative partnerships, for example, with local fabrication, design engineering and operations support centres
• maximising relationships within local supply chains
• developing common Group-wide business processes
People: we know we must recruit and
retain the highest calibre people.
Our commitment to employing and
developing local resources and working
within local supply chains helps meet
this need and is fundamental to
Petrofac’s philosophy of creating
sustainable operations.
We deliver bespoke programmes to
support national workforce development,
facilitated by our Training Services
business. These may be run as
stand-alone courses or in conjunction
with our projects and operations.
Local delivery is also important for
resource holders, who increasingly
want to develop skilled in-country
workforces, transferring know-how and
extending employment opportunities.
Local recruitment also enhances our
talent pool.
A strong talent base and a robust
organisational structure are key to
success. We will focus on ensuring that
many of the processes that support this,
such as our performance management
framework, are globally consistent,
aligned with our strategic goals and
meet our business needs.
Partnerships: building strategic
relationships with our customers,
partners, suppliers and communities
is core to our drive for sustainability.
We are working hard to align ourselves
with world-class organisations to
deliver mutual growth. Recent strategic
collaborations include our 2011 joint
venture agreement with China Petroleum
Engineering & Construction Corporation
(CPECC) and our January 2012
co-operation agreement with leading
oilfield services company Schlumberger.
Additionally, we are seeking credible local
partners. In Turkmenistan, on our South
Yoloten gas field project, we are proud to
have approximately 70% local workforce.
Process: we have strong quality and
integrity management systems to ensure
we achieve ‘right first time’ operations.
Constantly improving the standards of our
people and processes ensures we are
in the best position to win and execute
projects for our customers.
Fit for 2015
Fit for 2015 will ensure our organisation,
systems and processes live up to our
value of ‘quality and cost conscious’.
A dedicated team will work with senior
business leaders to identify and address
areas for growth, increased efficiency,
improved processes, talent development,
and mitigation of risk.
By taking the time to put ourselves on the
soundest possible footing, we will ensure
we can grow for many years to come.
Delivering locally makes a difference to our long-term sustainability
Creating sustainable growth
Maroun Semaan President

Petrofac Annual report and accounts 2011 17
Com
pany
financia
l sta
tem
ents
Com
Com
pany
pany
Gro
up
fin
ancia
l sta
tem
ents
Gro
Gro
up
up
Gove
rnance
GG
Corp
ora
te
resp
onsi
bility
Corp
Corp
ora
tora
tee
Fin
ancia
l p
erf
orm
ance
and ris
kFin
aFin
ancia
ncia
ll
Revi
ew
of o
pera
tions
Ove
rvie
w
Ri
fti
Performance highlightsOur services and business modelChairman’s statementInterview with the Group Chief ExecutiveLeadership teamVision and valuesCreating sustainable growthEngineering, Construction, Operations & MaintenanceIntegrated Energy Services
22 41 50 65 107 153
Petrofac has recently strengthened its competitive position with the establishment of a strategic joint venture with China Petroleum Engineering & Construction Corporation (CPECC).
The September 2011 launch of the joint
venture, China Petroleum Petrofac
Engineering Services (CPPES),
marks the culmination of a seven-year
relationship and a track record of
co-operation between our businesses.
Operationally based in Sharjah, CPPES,
which is 51% owned by CPECC and
49% owned by Petrofac, is staffed by
employees of both companies.
CPPES will leverage the combined
resources of CPECC and Petrofac to
pursue mutually attractive engineering
& construction services opportunities.
We will initially focus on Chinese
oil & gas companies, offering support
for both domestic and international
projects.
Petrofac and CPECC are currently
working together on the Rumaila oil field
in southern Iraq, following the award of
an inspection, maintenance and repair
contract by BP in June 2011. Consistent
with our local content philosophy, this
contract seeks to maximise in-country
engagement by accessing the local
supply chain and resource pool.

Being responsive is what makes a difference to our customer relationships
Engineering, Construction, Operations & Maintenance
Our approach to the Asab oil field development project highlights many components of the customer responsiveness which underpins our service offering.
The US$2.3 billion project to upgrade
the field, for the Abu Dhabi Company for
Onshore Oil Operations (ADCO), has
involved many challenges. These range
from the vast size of the 40x20 km site,
extreme heat, fog and frequent
sandstorms, the logistics of managing
14,000 on-site staff and contractors,
representing 30 different nationalities
and utilising more than 1,500 vehicles
and heavy pieces of equipment whilst
driving around 32 million kilometres.
We have met all these challenges and
delivered on every milestone over the
course of the ongoing contract,
including the completion of 27 million
man-hours without a single lost time
incident. This has been achieved by
a pervasive safety culture on-site where
a variety of themed behavioural safety
programmes are routinely in progress.
A recent example of where the teams
have demonstrated extraordinarily high
levels of responsiveness was when
ADCO undertook some routine
maintenance work in their brownfield
facilities. During this particular period,
one of the live glass reinforced epoxy
(GRE) pipes in the area sustained
damage. Many contractors were
approached by ADCO to carry out the
repair works but all offered extended
lead times. Petrofac, along with
a GRE team, mobilised immediately,
even though it was a public holiday,
and supported ADCO in completing
the repair work.
The close and collaborative relationship
with ADCO, that this example
demonstrates, is key to our progress
on the project.
Petrofac Annual report and accounts 201118
Petrofac Annual report and accounts 2011 19
Com
pany
financia
l sta
tem
ents
Com
Com
pany
pany
Gro
up
fin
ancia
l sta
tem
ents
Gro
Gro
up
up
Gove
rnance
GG
Corp
ora
te
resp
onsi
bility
Corp
Corp
ora
tora
tee
Fin
ancia
l p
erf
orm
ance
and ris
kFin
aFin
ancia
ncia
ll
Revi
ew
of o
pera
tions
Ove
rvie
w
Ri
fti
Performance highlightsOur services and business modelChairman’s statementInterview with the Group Chief ExecutiveLeadership teamVision and valuesCreating sustainable growthEngineering, Construction, Operations & MaintenanceIntegrated Energy Services
22 41 50 65 107 153
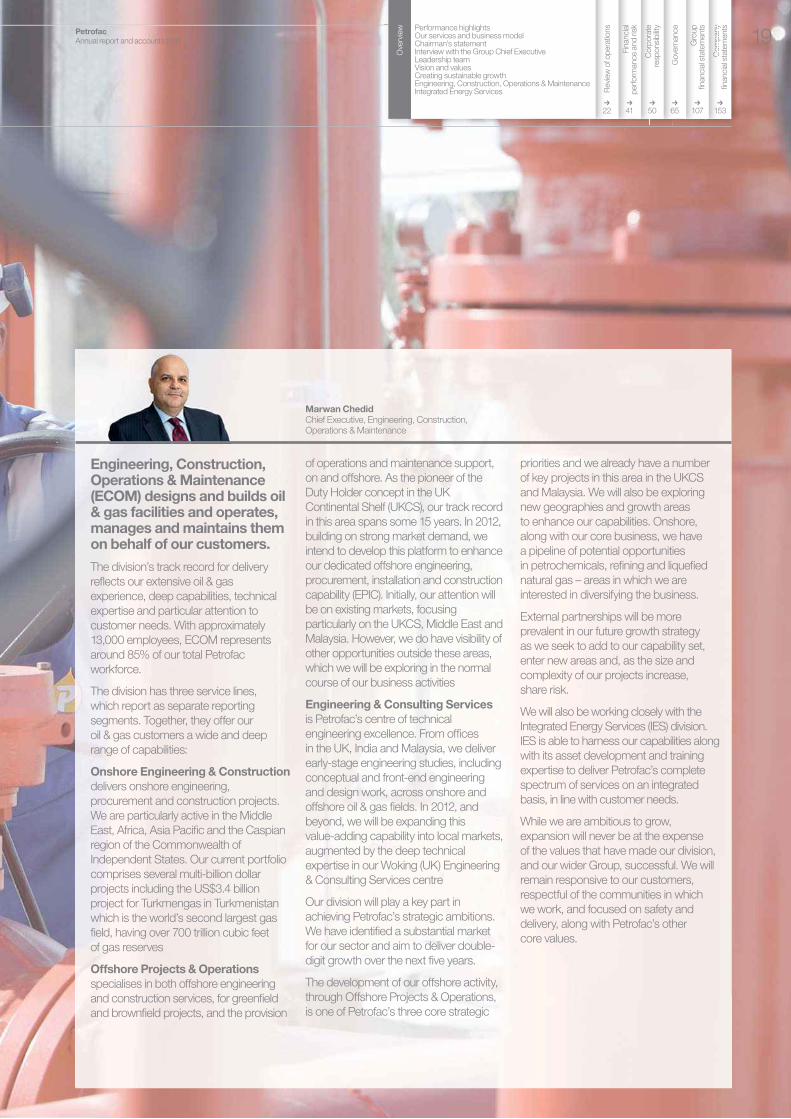
Engineering, Construction, Operations & Maintenance (ECOM) designs and builds oil & gas facilities and operates, manages and maintains them on behalf of our customers.
The division’s track record for delivery
reflects our extensive oil & gas
experience, deep capabilities, technical
expertise and particular attention to
customer needs. With approximately
13,000 employees, ECOM represents
around 85% of our total Petrofac
workforce.
The division has three service lines,
which report as separate reporting
segments. Together, they offer our
oil & gas customers a wide and deep
range of capabilities:
Onshore Engineering & Construction
delivers onshore engineering,
procurement and construction projects.
We are particularly active in the Middle
East, Africa, Asia Pacific and the Caspian
region of the Commonwealth of
Independent States. Our current portfolio
comprises several multi-billion dollar
projects including the US$3.4 billion
project for Turkmengas in Turkmenistan
which is the world’s second largest gas
field, having over 700 trillion cubic feet
of gas reserves
Offshore Projects & Operations
specialises in both offshore engineering
and construction services, for greenfield
and brownfield projects, and the provision
of operations and maintenance support,
on and offshore. As the pioneer of the
Duty Holder concept in the UK
Continental Shelf (UKCS), our track record
in this area spans some 15 years. In 2012,
building on strong market demand, we
intend to develop this platform to enhance
our dedicated offshore engineering,
procurement, installation and construction
capability (EPIC). Initially, our attention will
be on existing markets, focusing
particularly on the UKCS, Middle East and
Malaysia. However, we do have visibility of
other opportunities outside these areas,
which we will be exploring in the normal
course of our business activities
Engineering & Consulting Services
is Petrofac’s centre of technical
engineering excellence. From offices
in the UK, India and Malaysia, we deliver
early-stage engineering studies, including
conceptual and front-end engineering
and design work, across onshore and
offshore oil & gas fields. In 2012, and
beyond, we will be expanding this
value-adding capability into local markets,
augmented by the deep technical
expertise in our Woking (UK) Engineering
& Consulting Services centre
Our division will play a key part in
achieving Petrofac’s strategic ambitions.
We have identified a substantial market
for our sector and aim to deliver double-
digit growth over the next five years.
The development of our offshore activity,
through Offshore Projects & Operations,
is one of Petrofac’s three core strategic
priorities and we already have a number
of key projects in this area in the UKCS
and Malaysia. We will also be exploring
new geographies and growth areas
to enhance our capabilities. Onshore,
along with our core business, we have
a pipeline of potential opportunities
in petrochemicals, refining and liquefied
natural gas – areas in which we are
interested in diversifying the business.
External partnerships will be more
prevalent in our future growth strategy
as we seek to add to our capability set,
enter new areas and, as the size and
complexity of our projects increase,
share risk.
We will also be working closely with the
Integrated Energy Services (IES) division.
IES is able to harness our capabilities along
with its asset development and training
expertise to deliver Petrofac’s complete
spectrum of services on an integrated
basis, in line with customer needs.
While we are ambitious to grow,
expansion will never be at the expense
of the values that have made our division,
and our wider Group, successful. We will
remain responsive to our customers,
respectful of the communities in which
we work, and focused on safety and
delivery, along with Petrofac’s other
core values.
Marwan Chedid Chief Executive, Engineering, Construction, Operations & Maintenance

Petrofac has become the first foreign company in over 70 years to operate Mexico’s state oil fields.
Our commercial flexibility is at the core of the difference we bring to our customers
Integrated Energy Services
Following a live competitive tender,
national oil company Petróleos
Mexicanos (PEMEX) awarded us the
contract to re-develop and increase
production at two mature onshore fields
that have been in operation since the
early 60s.
Petrofac will deploy an integrated
services solution to re-activate and
develop PEMEX’s Magallanes and
Santuario fields. We will manage,
operate and maintain the blocks for
the 25-year life of the Production
Enhancement Contracts. PEMEX will
retain ownership of the fields.
The terms of the contracts – where
we invest around US$500 million in the
development for a 90% interest, are
reimbursed for 75% of both operational
and development expenditure with
a cost recovery mechanism and receive
tariffs for the baseline and incremental
production – provide essential asset
development funding for our customer.
The contracts, which were signed
in October 2011 and will see us using
and developing local workers, got off
to a good start. After a smooth
three-month transition, Petrofac took
over field operations on schedule.
Petrofac Annual report and accounts 201120

Andy Inglis Chief Executive, Integrated Energy Services
Petrofac Annual report and accounts 2011 21
Com
pany
financia
l sta
tem
ents
Com
Com
pany
pany
Gro
up
fin
ancia
l sta
tem
ents
Gro
Gro
up
up
Gove
rnance
GG
Corp
ora
te
resp
onsi
bility
Corp
Corp
ora
tora
tee
Fin
ancia
l p
erf
orm
ance
and ris
kFin
aFin
ancia
ncia
ll
Revi
ew
of o
pera
tions
Ove
rvie
w
Ri
fti
Performance highlightsOur services and business modelChairman’s statementInterview with the Group Chief ExecutiveLeadership teamVision and valuesCreating sustainable growthEngineering, Construction, Operations & MaintenanceIntegrated Energy Services
22 41 50 65 107 153
Integrated Energy Services (IES) harnesses Petrofac’s broad range of capabilitiesto provide integrated services to oil & gas resource holders.
We help customers develop their
resources either through the development
of new fields or by enhancing production
from mature reservoirs. Our offering is
characterised by commercial flexibility
that ensures alignment with our
customers combined with differentiated
execution strategies that deliver
enhanced value.
Forecasts of world oil production show
national oil companies (NOCs) will drive
material growth in oil production capacity
over the next two decades. NOCs have
the hydrocarbon resources to underpin
this increase, however, they face
a number of challenges in delivery.
Firstly, the NOC giant fields are in decline,
demanding significant technical focus
and capital investment to sustain
production. Secondly, many new sources
of production capacity are more complex
and finally, newly discovered fields are
smaller. Because of this increasing
difficulty and complexity, NOCs are faced
with a growing demand on their capability
and are seeking partners who can bring
integrated services to support the
development of their resources.
We believe we are well positioned
to respond to this need because of the
breadth and depth of our capability and
our track record of local delivery. While
the creation of IES took place only last
year, this is not a new business for
Petrofac. Over the last 15 years, Petrofac
has established a track record for leading
the development of a wide range
of integrated greenfield and brownfield
projects. During this time, we have
added competence beyond our core
engineering & construction capability to
include capability in asset management,
maintenance and operations, training,
brownfield engineering, well management
and production engineering.
A key differentiator of our integrated
offering is our training capability.
Petrofac has one of the largest training
organisations in the oil & gas industry,
which creates the platform for long-term
alignment with NOCs to develop
capability within their own workforces.
We are leveraging our integrated capability
by using three generic commercial
models. Firstly, the Production
Enhancement Contract (PEC), such as
our brownfield Ticleni contract for Petrom
where we are paid tariffs per barrel for
baseline and incremental production and
create value through the integration of our
subsurface, operations and projects
capability. Secondly, through the Risk
Service Contract (RSC), such as our
existing greenfield project Berantai in
Malaysia, where we are developing and
operating the field and will build local
operating capability, before handing back
operatorship to the resource holder. Value
is created through innovative concept
selection and our ability to manage and
deliver the overall field development from
concept to operation.
Thirdly, through traditional upstream
investments, such as our Cendor
Production Sharing Contract (PSC)
in Malaysia, whereby we develop a field
alongside our equity partners and recover
our investment through the sale
of production. Value is created through
the design of fast-track, cost effective
solutions and the efficient operatorship
of the post development asset.
We believe there is a growing desire
from our NOC customers to retain the
ownership of their reserves and the title
to their production. We therefore expect
to see an increase in PEC and RSC
contracting arrangements where we do
not book the reserves or the production.
The market opportunity is significant and
we believe our distinctive strategy and
proven capability can meet the growing
needs of our customers and make IES
a strong growth vehicle for Petrofac.
Review of operations
23 Operating environmentThe key drivers of capital and operational expenditures
should ensure that demand for our services remains strong.
25 Segmental analysisOur operations are organised into two divisions, which
report under four segments.
26 Engineering, Construction, Operations & MaintenanceEngineering, Construction, Operations & Maintenance
designs and builds oil & gas facilities and operates,
manages and maintains them on behalf of our customers.
The division has three service lines, which report as
separate reporting segments.
26 – Onshore Engineering & Construction
29 – Offshore Projects & Operations
32 – Engineering & Consulting Services
34 Integrated Energy ServicesIntegrated Energy Services harnesses Petrofac’s broad
range of capabilities to provide integrated services to oil &
gas resource holders. The division has three integrated
service lines, which report as one reporting segment.
Section 2
Petrofac Annual report and accounts 201122
Overview – supply and demand
The International Energy Agency’s (IEA)
new policies scenario2 anticipates that
global energy demand will increase by
approximately 40% between 2009 to 2035,
or around 1.3% per annum, driven by
population and Gross Domestic Product
(GDP) growth and increasing energy
intensity per capita. The majority of the
growth in demand will come from
non-OECD countries, particularly in China
(the world’s largest energy consumer),
India and the Middle East.
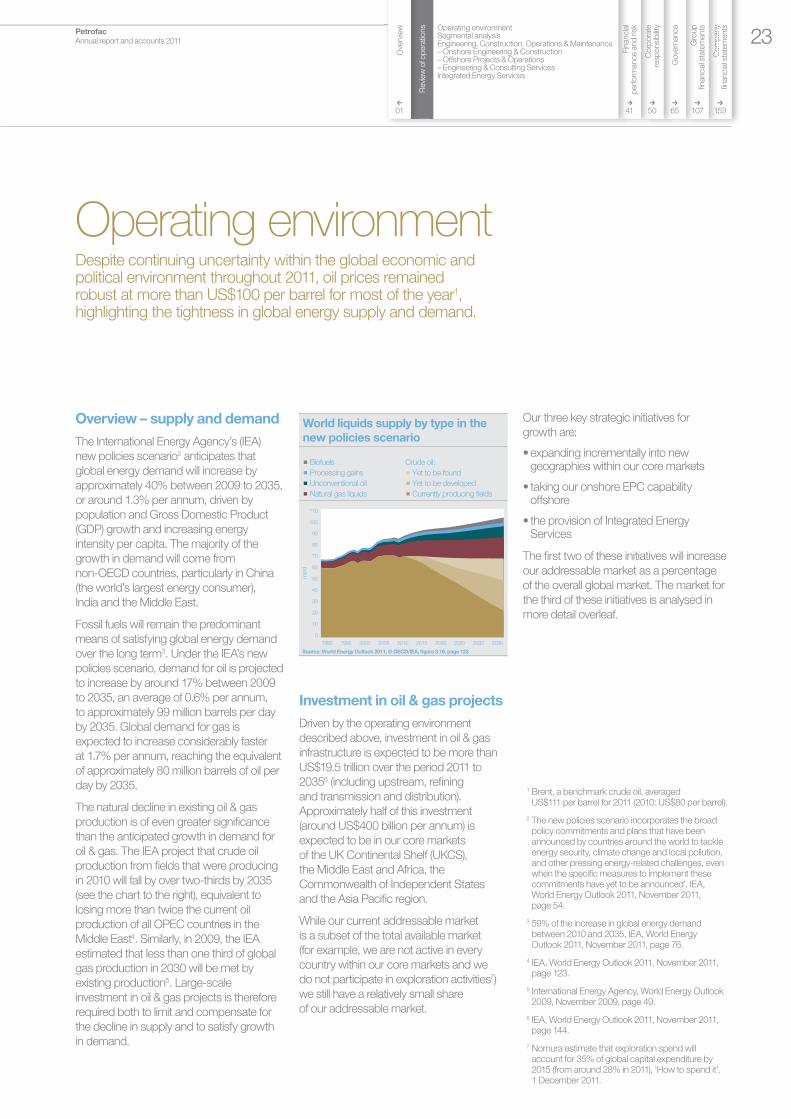
Fossil fuels will remain the predominant
means of satisfying global energy demand
over the long term3. Under the IEA’s new
policies scenario, demand for oil is projected
to increase by around 17% between 2009
to 2035, an average of 0.6% per annum,
to approximately 99 million barrels per day
by 2035. Global demand for gas is
expected to increase considerably faster
at 1.7% per annum, reaching the equivalent
of approximately 80 million barrels of oil per
day by 2035.
The natural decline in existing oil & gas
production is of even greater significance
than the anticipated growth in demand for
oil & gas. The IEA project that crude oil
production from fields that were producing
in 2010 will fall by over two-thirds by 2035
(see the chart to the right), equivalent to
losing more than twice the current oil
production of all OPEC countries in the
Middle East4. Similarly, in 2009, the IEA
estimated that less than one third of global
gas production in 2030 will be met by
existing production5. Large-scale
investment in oil & gas projects is therefore
required both to limit and compensate for
the decline in supply and to satisfy growth
in demand.
Investment in oil & gas projects
Driven by the operating environment
described above, investment in oil & gas
infrastructure is expected to be more than
US$19.5 trillion over the period 2011 to
20356 (including upstream, refining
and transmission and distribution).
Approximately half of this investment
(around US$400 billion per annum) is
expected to be in our core markets
of the UK Continental Shelf (UKCS),
the Middle East and Africa, the
Commonwealth of Independent States
and the Asia Pacific region.
While our current addressable market
is a subset of the total available market
(for example, we are not active in every
country within our core markets and we
do not participate in exploration activities7)
we still have a relatively small share
of our addressable market.
Our three key strategic initiatives for
growth are:
• expanding incrementally into new geographies within our core markets
• taking our onshore EPC capability offshore
• the provision of Integrated Energy Services
The first two of these initiatives will increase
our addressable market as a percentage
of the overall global market. The market for
the third of these initiatives is analysed in
more detail overleaf.
Operating environmentDespite continuing uncertainty within the global economic and political environment throughout 2011, oil prices remained robust at more than US$100 per barrel for most of the year1, highlighting the tightness in global energy supply and demand.
1 Brent, a benchmark crude oil, averaged US$111 per barrel for 2011 (2010: US$80 per barrel).
2 The new policies scenario incorporates the broad policy commitments and plans that have been announced by countries around the world to tackle energy security, climate change and local pollution, and other pressing energy-related challenges, even when the specific measures to implement these commitments have yet to be announced’, IEA, World Energy Outlook 2011, November 2011, page 54.
3 59% of the increase in global energy demand between 2010 and 2035, IEA, World Energy Outlook 2011, November 2011, page 76.
4 IEA, World Energy Outlook 2011, November 2011, page 123.
5 International Energy Agency, World Energy Outlook 2009, November 2009, page 49.
6 IEA, World Energy Outlook 2011, November 2011, page 144.
7 Nomura estimate that exploration spend will account for 35% of global capital expenditure by 2015 (from around 28% in 2011), ‘How to spend it’, 1 December 2011.
0
20
40
60
80
110
mb/d
1990 1995 2000 2005 2010 2015 2020 2025 2030 2035
World liquids supply by type in the
new policies scenario
p Biofuels
p Processing gains
p Unconventional oil
p Natural gas liquids
Crude oil:
p Yet to be found
p Yet to be developed
p Currently producing fields
100
90
70
50
30
10
Source: World Energy Outlook 2011, © OECD/IEA, figure 3.16, page 123
Petrofac Annual report and accounts 2011 23
Com
pany
financia
l sta
tem
ents
Com
Com
pany
pany
Gro
up
fin
ancia
l sta
tem
ents
Gro
Gro
up
up
Gove
rnance
GG
Corp
ora
te
resp
onsi
bility
Corp
Corp
ora
tora
tee
Fin
ancia
l p
erf
orm
ance
and ris
k
41 50 65 107 153
Revi
ew
of o
pera
tions
Fin
aFin
ancia
ncia
ll
44
Operating environmentSegmental analysisEngineering, Construction, Operations & Maintenance– Onshore Engineering & Construction– Offshore Projects & Operations– Engineering & Consulting ServicesIntegrated Energy Services
Ri
fi
Ove
rvie
w
01

Integrated Energy Services
At our Capital Markets Day in June 2011,
we analysed the market for Integrated
Energy Services as follows:
Fie
ld s
ize
Low Medium High
Reserve split by field size/complexity in NOC controlled countries1
p Giant > 500mm boe
p Large 200 – 500mm boe
p Medium 50 – 200mm boe
p Small 25 – 50mm boe
Technical complexity
NOC NOC/IOC
IES
Total reserve volume ~ 2,200bn boe
1 Oil & gas reserves, proved reserves based on BP reserves definition
SOURCE: IHS Herold, 2010 BP Statistical Review, Petrofac Analysis
The chart above shows the 2.2 trillion
barrels of oil equivalent of remaining
reserves in the 21 most significant national
oil company-controlled (NOC) countries
(both new developments and mature fields).
On the vertical axis, we have categorised
the fields by size – small, medium, large
to giant. On the horizontal axis, we have
divided the fields according to technical
complexity – low, medium and high. The
area of each box on the chart represents
the relative share of the 2.2 trillion barrels.
The exploitation of this resource base
breaks down into three distinct areas:
• the natural focus of the NOCs is on the large and giant fields with lower complexity. This is slightly less than 1 trillion barrels (shown with the blue boundary)
• whilst the NOCs are building their own capability, some of them may seek to partner with the international oil companies (IOCs) to develop the medium to higher complexity fields. To be material to the IOCs, this will typically be fields with at least 200 million barrels of reserves. This is an opportunity of slightly more than one trillion barrels (shown with the red boundary)
• this leaves a third set of opportunities in smaller, lower complexity fields, which are not the natural focus of either the NOCs or their IOC partners. In aggregate, around one to two hundred billion barrels (shown with the white boundary). This is the area that we believe our Integrated Energy Services division can address
Fie
ld s
ize
Low Medium High
Reserve split by field size/complexity in NOC controlled countries1
p Giant > 500mm boe
p Large 200 – 500mm boe
p Medium 50 – 200mm boe
p Small 25 – 50mm boe
Technical complexity
IES
Number, total fields ~ 4,500
1 Oil & gas reserves, proved reserves based on BP reserves definition
SOURCE: IHS Herold, 2010 BP Statistical Review, Petrofac Analysis
e.g. Ticleni
Berantai
Cendor
e.g. Chergui
In the chart above, we have taken the same
2.2 trillion barrels, and again categorised
them by technical complexity and field size.
However, instead of analysing the reserves
by volume, we have analysed the reserves
by the number of fields – estimated to be
c. 4,500 fields in total. The area of each
box on this chart therefore represents the
relative share of the 4,500 fields.
This analysis provides a different
perspective on the opportunity provided
by the low complexity smaller and medium
fields (shown again by the area with the
white boundary). It highlights the enormous
potential market for our Integrated Energy
Services division. Across these 21
hydrocarbon rich countries, we estimate
there are around 2,400 opportunities and
with the NOCs faced with growing
demands on their capability this provides
an opportunity for Petrofac to work with
them to develop these fields.
Drawing upon the extensive capabilities
of the wider Group, we believe Integrated
Energy Services can address this market
to provide a fully integrated service for
resource holders (particularly, but not
exclusively, NOCs). We are happy to work
under a range of flexible commercial
models that are aligned to specific
customer requirements.
In summary
Notwithstanding that we still face significant
competition in many of our established
markets, particularly Onshore Engineering
& Construction, the key drivers of capital
and operational expenditure should ensure
that demand for our services remains
strong. The substantial market opportunity
that we see for the provision of Integrated
Energy Services should help to drive strong
growth in that division and help us achieve
our ambition of more than doubling our
2010 recurring Group earnings by 2015.
Operating environment continued
Petrofac Annual report and accounts 201124

We present below an update on each of the Group’s reporting segments:
Revenue Operating profit1, 2, 4 Net profit1, 3 EBITDA1, 4
US$ millions 2011 2010 2011 2010 2011 2010 2011 2010
Onshore Engineering & Construction 4,146.2 3,253.9 553.8 438.1 462.8 373.0 584.9 471.8
Offshore Projects & Operations 1,251.4 721.9 56.9 24.5 43.5 17.2 61.4 27.3
Engineering & Consulting Services 208.2 173.4 32.9 19.8 30.8 21.1 39.7 25.6
Integrated Energy Services 518.9 384.2 53.4 73.7 22.6 38.0 89.9 127.5
Corporate, consolidation & elimination (324.0) (179.2) (17.7) (17.6) (20.3) (16.3) (16.5) (17.8)
Group 5,800.7 4,354.2 679.3 538.5 539.4 433.0 759.4 634.4
Revenue growth Operating margin Net margin EBITDA margin
Growth/margin analysis % 2011 2010 2011 2010 2011 2010 2011 2010
Onshore Engineering & Construction 27.4 29.7 13.4 13.5 11.2 11.5 14.1 14.5
Offshore Projects & Operations 73.3 15.2 4.5 3.4 3.5 2.4 4.9 3.8
Engineering & Consulting Services 20.0 51.8 15.8 11.4 14.8 12.2 19.1 14.7
Integrated Energy Services 35.0 (20.6) 10.3 19.2 4.4 9.9 17.3 33.2
Group 33.2 19.1 11.7 12.4 9.3 9.9 13.1 14.6
1 Excludes the gain on the EnQuest demerger in 2010.2 Profit from operations before tax and finance costs.3 Profit for the year attributable to Petrofac Limited shareholders.4 Operating profit and EBITDA includes the Group’s share of losses of associates.
Segmental analysisOur operations are organised into two divisions, which report under four segments:
New structure
2Divisions
Engineering, Construction, Operations & Maintenance (ECOM)Chief Executive – Marwan Chedid
Integrated Energy Services (IES)Chief Executive – Andy Inglis
Onshore Engineering &
Construction (OEC)
Offshore Projects & Operations
(OPO)
Engineering & Consulting
Services (ECS)Integrated Energy Services (IES)
4Reporting segments
6Service lines
Onshore Engineering & Construction
Offshore Projects & Operations
Engineering & Consulting
ServicesTraining
Production Solutions
Developments
Previous structure
Reporting segments
Engineering & Construction
Offshore Engineering &
OperationsEngineering, Training Services & Production Solutions
Energy Developments
Petrofac Annual report and accounts 2011 25
Com
pany
financia
l sta
tem
ents
Com
Com
pany
pany
Gro
up
fin
ancia
l sta
tem
ents
Gro
Gro
up
up
Gove
rnance
GG
Corp
ora
te
resp
onsi
bility
Corp
Corp
ora
tora
tee
Fin
ancia
l p
erf
orm
ance
and ris
k
41 50 65 107 153
Revi
ew
of o
pera
tions
Fin
aFin
ancia
ncia
ll
44
Operating environmentSegmental analysisEngineering, Construction, Operations & Maintenance– Onshore Engineering & Construction– Offshore Projects & Operations– Engineering & Consulting ServicesIntegrated Energy Services
Ri
fi
Ove
rvie
w
01

Onshore Engineering & Construction
undertakes engineering, procurement
and construction (EPC) projects
predominantly on a lump-sum basis,
with a typical duration of two to four years.
Onshore Engineering & Construction is
predominantly focused on markets in
the Middle East and Africa and the
Commonwealth of Independent States,
particularly the Caspian region.
We have continued our good operational
performance across our portfolio of
projects in 2011, including the completion
of the Jihar gas plant in Syria and the
In Salah Gas compression facilities and
power generation project in Algeria earlier
in the year.
We are making good progress on our
largest project, the South Yoloten
development in Turkmenistan, having
placed the majority of orders for
procurement items and undertaken early
construction activities. We have reached
the progress threshold such that we are
now recognising profit.
We have made substantial progress on the
Asab oil field development and the GASCO
natural gas liquids train in Abu Dhabi,
the El Merk central processing facility in
Algeria, the gas sweetening facilities for
Qatar Petroleum and the fuel gas and
gas oil pipelines project in Kuwait.
What we do
Onshore Engineering & Construction
delivers onshore engineering,
procurement and construction projects.
We are particularly active in the Middle
East, Africa, Asia Pacific and the Caspian
region of the Commonwealth of
Independent States.
Key highlights
• Good progress on portfolio of projects including the South Yoloten development, in Turkmenistan, which reached the progress threshold such that we are now recognising profit
• Completed the Jihar gas plant in Syria and the In Salah Gas compression facilities and power generation project in Algeria
• Secured new awards in Algeria and Iraq
Employees
6,600Contribution to Group revenue
Contribution to Group profit
Engineering, Construction, Operations & MaintenanceEngineering, Construction, Operations & Maintenance designs and builds oil & gas facilities and operates, manages and maintains them on behalf of our customers. The division has three service lines, which report as separate financial segments.
Onshore Engineering & Construction
83%
68%
Revenue US$ millions
2007 1,169.7
2008 1,993.5
2009 2,509.0
2010 3,253.9
2011 4,146.2
Net profit margin(%)
2007 10.5
2008 10.4
2009 10.6
2010 11.5
2011 11.2
Net profit US$ millions
2007 122.5
2008 206.3
2009 265.1
2010 373.0
2011 462.8
BacklogUS$ billions
2007 2.5
2008 2.4
2009 6.2
2010 9.0
2011 6.4
Petrofac Annual report and accounts 201126

Timeline for key Onshore Engineering & Construction contracts
NOC/NOC led company/consortium Joint NOC/IOC company/consortium IOC/IOC led company/consortium
2011 2013 20142012Original contract value to Petrofac
Asab onshore oil field development, Abu Dhabi
Karan co-generation and utilities, Saudi Arabia
El Merk gas processing facility, Algeria
Kauther gas compression project, Oman
GASCO 4th NGL train, Abu Dhabi
Gas sweetening facilities project, Qatar
Mina Al-Ahmadi refinery pipelines 2, Kuwait
Water injection project, Kuwait
South Yoloten gas plant, Turkmenistan
SEPAT early production system, Malaysia
Laggan-Tormore gas processing plant, UKCS
In Salah southern fields development, Algeria
Majnoon early production facility, Iraq
Badra oil field, Iraq
US$2,300m
Undisclosed
US$2,200m
US$350m
US$500m
>US$600m
US$400m
US$430m
US$3,400m
US$280m
>US$800m
US$1,200m
US$240m
US$330m
New awards
We were successful in securing the
following awards during the year:
In Salah southern fields, Algeria
In January 2011, we were awarded a
50-month US$1.2 billion lump-sum EPC
contract by In Salah Gas, an association
between Sonatrach, BP and Statoil, to
develop southern fields in the In Salah
development. As noted on page 26, we
successfully completed the compression
facilities and power generation project for
the same customer in early 2011 and
we believe this new award reflects our
dedication to this strategically important
market, where we maintain excellent
relationships with both our customers
and local construction partners.
Majnoon early production facility, Iraq
In March 2011, we announced the award of
our first contract in Iraq, a US$240 million
EPC management project with Shell.
The Majnoon field in southern Iraq is one
of Iraq’s largest developments and we are
delighted to be working with Shell to assist
them with unlocking the field’s potential.
We are providing engineering, procurement,
fabrication and construction management
services for the development of a new early
production system comprising two trains
each with capacity for 50,000 barrels of oil
per day, along with the upgrade of existing
brownfield facilities.
We have continued our good operational performance across our portfolio of projects in 2011
We were also successful in securing the
following project in early 2012:
Badra oilfield development
project, Iraq
In February 2012, we were awarded a
US$330 million lump-sum EPC contract
by Gazprom for the first phase of the
Badra oil field development project.
We will provide detailed design,
engineering, procurement, construction,
pre-commissioning, commissioning and
start-up work on the Badra development’s
central processing facility, which comprises
three crude oil processing trains. The first
phase of the project is expected to come
on stream in the second half of 2013, with
final completion scheduled during the
second half of 2015.
Petrofac Annual report and accounts 2011 27
Com
pany
financia
l sta
tem
ents
Com
Com
pany
pany
Gro
up
fin
ancia
l sta
tem
ents
Gro
Gro
up
up
Gove
rnance
GG
Corp
ora
te
resp
onsi
bility
Corp
Corp
ora
tora
tee
Fin
ancia
l p
erf
orm
ance
and ris
k
41 50 65 107 153
Revi
ew
of o
pera
tions
Fin
aFin
ancia
ncia
ll
44
Operating environmentSegmental analysisEngineering, Construction, Operations & Maintenance– Onshore Engineering & Construction– Offshore Projects & Operations– Engineering & Consulting ServicesIntegrated Energy Services
Ri
fi
Ove
rvie
w
01

Results
Revenue for the year increased by 27.4%
to US$4,146.2 million (2010: US$3,253.9
million), reflecting a substantial increase in
activity levels, particularly on the Asab oil
field development in Abu Dhabi and the
second phase of the South Yoloten project
in Turkmenistan.
Net profit for the year increased by 24.1% to
US$462.8 million (2010: US$373.0 million),
representing a net margin of 11.2% (2010:
11.5%). The net margin is consistent with
our medium-term guidance of ‘around 11%’.
The higher net margin in 2010 was due
to the completion of a number of projects
during 2010 and the first-time recognition
of profit on a number of contracts awarded
in 2009.
Onshore Engineering & Construction
headcount increased from 5,400 to 6,600
over the year, reflecting the increase in
activity levels.
Onshore Engineering & Construction
backlog stood at US$6.4 billion at
31 December 2011 (2010: US$9.0 billion).
Petrofac procurement teams scour all international markets to get the most competitively priced, highest quality equipment for customers’ projects.
The origin of goods being used in the development of the In Salah Gas southern fields in Algeria bear out our wide purchasing scope. The Sharjah-based procurement team has, for example, bought gas turbine generators from California, structural steel and flare fabrication from the UAE, line pipe from Turkey and Argentina, compressor rotors and glycol packages from Italy, substation packages from the UK, vessels from South Korea and chrome line pipe coating from Norway.
Post purchase, our southern fields logistics teams, based in Sharjah and Algeria, handle the challenging and complex task of ensuring goods arrive securely and on schedule at In Salah’s desert location via several Algerian ports. This exacting task involves the cross-continental integration of information, transportation, material handling, packaging and security.
Petrofac was awarded the US$1.2 billion lump-sum engineering, procurement and construction project to develop the southern fields at the beginning of 2011. The project is due to deliver first gas in early 2014.
Engineering, Construction, Operations & Maintenance continued
Petrofac Annual report and accounts 201128

What we do
Our Offshore Projects & Operations
business specialises in both offshore
engineering and construction services,
for greenfield and brownfield projects,
and the provision of operations and
maintenance support, on and offshore.
Key highlights
• Secured a number of new contracts and extensions, including US$540 million of FPF1 upgrade and Duty Holder contracts for the Greater Stella Area development in the Central North Sea
• Record activity levels on operations support contracts and offshore capital projects
• Delivered first oil ahead of schedule on the SEPAT development in Malaysia
Employees
4,100Contribution to Group revenue
Contribution to Group profit
Offshore Projects & Operations
8%
20%
Revenue US$ millions
2007 774.6
2008 776.6
2009 626.7
2010 721.9
2011 1,251.4
Net profit margin(%)
2007 2.5
2008 2.1
2009 2.0
2010 2.4
2011 3.5
Net profit US$ millions
2007 19.2
2008 16.4
2009 12.8
2010 17.2
2011 43.5
BacklogUS$ billions
2007 1.5
2008 1.1
2009 1.6
2010 2.4
2011 2.7
Offshore Projects & Operations provides
engineering and construction services at all
stages of greenfield and brownfield offshore
projects. In addition, through the provision
of operations management services,
we deliver production and maintenance
support and extend field life. The majority
of Offshore Projects & Operations’ activities
are in the UK Continental Shelf (UKCS),
but a growing proportion of activities are
outside of the UK, including in the UAE,
Iraq, Malaysia and Thailand. Services are
predominantly provided on a reimbursable
basis, but often with incentive income linked
to the successful delivery of performance
targets. Many of our production and
maintenance contracts are long-term
(typically three to five years) and in the case
of the provision of Duty Holder services1
are generally open-ended. Increasingly,
we are delivering our engineering and
construction services on a lump-sum basis
on offshore capital projects, as we progress
our strategy of taking our onshore EPC
capability offshore.
1 Contracts where the Group takes full responsibility for managing a customer’s asset and is responsible for the safety case of the asset, reporting to the Department of Energy and Climate Change.
Petrofac Annual report and accounts 2011 29
Com
pany
financia
l sta
tem
ents
Com
Com
pany
pany
Gro
up
fin
ancia
l sta
tem
ents
Gro
Gro
up
up
Gove
rnance
GG
Corp
ora
te
resp
onsi
bility
Corp
Corp
ora
tora
tee
Fin
ancia
l p
erf
orm
ance
and ris
k
41 50 65 107 153
Revi
ew
of o
pera
tions
Fin
aFin
ancia
ncia
ll
44
Operating environmentSegmental analysisEngineering, Construction, Operations & Maintenance– Onshore Engineering & Construction– Offshore Projects & Operations– Engineering & Consulting ServicesIntegrated Energy Services
Ri
fi
Ove
rvie
w
01

2011 saw record activity levels across the
business from both long-term operations
management contracts and offshore
capital projects, such as the SEPAT
development and the upgrade and life
extension works on the FPSO Berantai,
both in Malaysia (both projects are being
undertaken jointly with Onshore
Engineering & Construction). As at the end
of 2011, we had substantially completed
the SEPAT development for PETRONAS,
delivering first oil ahead of schedule.
We have also made good progress on the
awards secured in the second half of 2010,
including the Duty Holder contract for the
Sajaa gas plant in the UAE and the
Laggan-Tormore gas plant on the Shetland
Islands in the UK.
New awards
We secured a number of contract
extensions and new awards in 2011,
including:
• modification and upgrade works to the FPF1 floating production facility ahead of its deployment on the Greater Stella Area development in the Central North Sea and subsequently the provision of Duty Holder services to the FPF1 on a life of field contract (see the Integrated Energy Services section on page 39); in accordance with our standard accounting policy, we have booked the initial five years’ of estimated contract revenues into backlog in relation to the upgrade and Duty Holder contracts, which equates to US$540 million
• a US$63 million one-year contract to provide maintenance services on the Rumaila oil field in Iraq for BP
• two North Sea operations, maintenance, engineering and general support services contracts for GDF SUEZ worth £30 million over three years, with an additional two-year option
• an operations contract for the FPF3 floating, production, storage and offloading (FPSO) vessel (formerly the Jasmine Venture) in Thailand (see the Integrated Energy Services section on page 40)
• a four-year extension on our engineering, construction, operations and maintenance services contract with Marathon on its North Sea Brae assets; the base scope is valued at £36 million, although this does not include the value of any future projects which may be sanctioned
• a two-year extension to our Duty Holder contract with Centrica
Early first oil on our SEPAT project, Malaysia, was both good news for our team and a reinforcement of Petrofac’s strategic commitment to expanding its offshore offering.
We achieved first oil at the SEPAT offshore early production system in December 2011. The project, an engineering, procurement, construction, installation and commissioning (EPCIC) assignment in water depth of around 65 metres, is Petrofac’s first lump-sum offshore EPCIC contract in South East Asia.
“2011 was a very exciting and rewarding year for all of us here in the SEPAT project. Under strong leadership, we enjoyed excellent professionalism, co-operation, teamwork and understanding amongst us all,” reflected Teh Yat Hong, general manager, of our customer, PETRONAS.
Engineering, Construction, Operations & Maintenance continued
Petrofac Annual report and accounts 201130

Results
Reported revenue for the year increased
by 73.3% to US$1,251.4 million (2010:
US$721.9 million), reflecting record activity
levels across the business, particularly on
the SEPAT development and the FPSO
Berantai upgrade, the Sajaa gas plant
Duty Holder contract, the Laggan-Tormore
gas plant and the Apache UKCS
engineering and construction contract.
Around two-thirds of Offshore Projects &
Operations’ revenue was generated in the
UKCS and those revenues are generally
denominated in sterling. The average US
dollar to sterling exchange rate for 2011
was around 4% higher than in 2010,
which made a marginal contribution to
the reported revenue growth.
Net profit increased by 152.7% to
US$43.5 million (2010: US$17.2 million),
reflecting the significant increase in
activity levels, particularly from the SEPAT
development and the FPSO Berantai,
and a provision release in the first half of the
year following completion of a long-term
maintenance services contract.
Net margin increased to 3.5% (2010:
2.4%), reflecting the provision release
on the long-term maintenance services
contract, and a significant contribution
from capital projects, in particular the
SEPAT development and the FPSO
Berantai projects.
At 31 December 2011, headcount stood
at 4,100 (December 2010: 4,400) as the
increase in headcount due to new projects
was more than offset by the completion of
the long-term maintenance services
contract.
Offshore Projects & Operations backlog
increased to US$2.7 billion at 31 December
2011 (2010: US$2.4 billion).
2011 saw record activity levels across the business from both long-term operations management contracts and offshore capital projects
Above Aerial shot of the Laggan-Tormore accommodation facility.
Above Aerial view of the Laggan-Tormore gas plant project on the Shetland Islands, UK.
Financial reporting exchange rates
US$/Sterling
Year ended 31 December
2011
Year ended 31 December
2010
Average rate for year 1.60 1.54
Year-end rate 1.55 1.56
Petrofac Annual report and accounts 2011 31
Com
pany
financia
l sta
tem
ents
Com
Com
pany
pany
Gro
up
fin
ancia
l sta
tem
ents
Gro
Gro
up
up
Gove
rnance
GG
Corp
ora
te
resp
onsi
bility
Corp
Corp
ora
tora
tee
Fin
ancia
l p
erf
orm
ance
and ris
k
41 50 65 107 153
Revi
ew
of o
pera
tions
Fin
aFin
ancia
ncia
ll
44
Operating environmentSegmental analysisEngineering, Construction, Operations & Maintenance– Onshore Engineering & Construction– Offshore Projects & Operations– Engineering & Consulting ServicesIntegrated Energy Services
Ri
fi
Ove
rvie
w
01

What we do
Engineering & Consulting Services is
Petrofac’s centre of technical engineering
excellence. From offices in the UK, India
and Malaysia, we deliver early-stage
engineering studies, including conceptual
and front-end engineering and design
work, across onshore and offshore oil
& gas fields.
Key highlights
• Expanded our Asia Pacific engineering hub through a collaboration agreement with a Malaysian engineering company taking our total headcount in Asia Pacific to around 1,250
• Opened a third Indian office, in Delhi, to support growth in activity levels across the Group
• Entered a joint venture with CPECC to provide project management and engineering services on projects for Chinese oil & gas companies in China and internationally
Employees
2,300Contribution to Group revenue
Contribution to Group profit
Engineering & Consulting Services
5%
3%
Revenue US$ millions
2007 222.3
2008 235.0
2009 114.3
2010 173.4
2011 208.2
Net profit margin(%)
2007 5.8
2008 7.5
2009 15.2
2010 12.2
2011 14.8
Net profit US$ millions
2007 12.8
2008 17.5
2009 17.4
2010 21.1
2011 30.8
Engineering & Consulting Services operates
as our centre of technical engineering
excellence providing high-calibre
engineering resources and technical
assurance services across onshore and
offshore oil & gas projects. Engineering
& Consulting Services provides early
stage engineering studies, including
conceptual studies and FEED studies,
to external customers and in support of
ECOM and IES projects, primarily on a
reimbursable basis.
Building on the success of our offices in
Mumbai and Chennai, we opened our third
Indian engineering office, in Delhi, earlier in
2011, taking our total headcount for our
Indian engineering offices to around 1,700.
We have also continued to grow our
presence in Asia Pacific, establishing a new
engineering hub in Malaysia with the recent
signing of a collaboration agreement with a
Malaysian engineering company, which
takes our total headcount in Malaysia to
around 1,000. We have a further 250
employees in Asia Pacific, through our joint
venture with IKPT, in Indonesia.
In September 2011, we entered into a
strategic joint venture with China Petroleum
Engineering & Construction Corporation
(CPECC). Operationally based in Sharjah,
the joint venture will provide project
management and engineering services
on projects for Chinese oil & gas
companies in China and internationally.
Engineering, Construction, Operations & Maintenance continued
Petrofac Annual report and accounts 201132
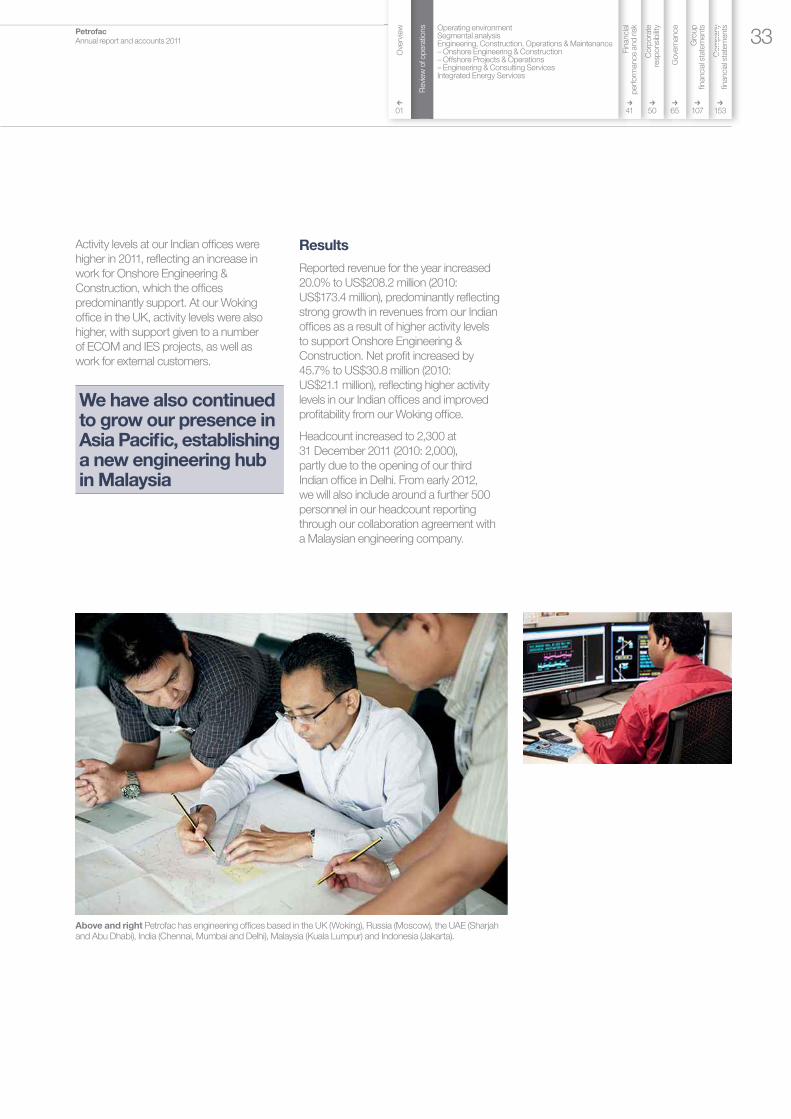
Activity levels at our Indian offices were
higher in 2011, reflecting an increase in
work for Onshore Engineering &
Construction, which the offices
predominantly support. At our Woking
office in the UK, activity levels were also
higher, with support given to a number
of ECOM and IES projects, as well as
work for external customers.
We have also continued to grow our presence in Asia Pacific, establishing a new engineering hub in Malaysia
Results
Reported revenue for the year increased
20.0% to US$208.2 million (2010:
US$173.4 million), predominantly reflecting
strong growth in revenues from our Indian
offices as a result of higher activity levels
to support Onshore Engineering &
Construction. Net profit increased by
45.7% to US$30.8 million (2010:
US$21.1 million), reflecting higher activity
levels in our Indian offices and improved
profitability from our Woking office.
Headcount increased to 2,300 at
31 December 2011 (2010: 2,000),
partly due to the opening of our third
Indian office in Delhi. From early 2012,
we will also include around a further 500
personnel in our headcount reporting
through our collaboration agreement with
a Malaysian engineering company.
Above and right Petrofac has engineering offices based in the UK (Woking), Russia (Moscow), the UAE (Sharjah and Abu Dhabi), India (Chennai, Mumbai and Delhi), Malaysia (Kuala Lumpur) and Indonesia (Jakarta).
Petrofac Annual report and accounts 2011 33
Com
pany
financia
l sta
tem
ents
Com
Com
pany
pany
Gro
up
fin
ancia
l sta
tem
ents
Gro
Gro
up
up
Gove
rnance
GG
Corp
ora
te
resp
onsi
bility
Corp
Corp
ora
tora
tee
Fin
ancia
l p
erf
orm
ance
and ris
k
41 50 65 107 153
Revi
ew
of o
pera
tions
Fin
aFin
ancia
ncia
ll
44
Operating environmentSegmental analysisEngineering, Construction, Operations & Maintenance– Onshore Engineering & Construction– Offshore Projects & Operations– Engineering & Consulting ServicesIntegrated Energy Services
Ri
fi
Ove
rvie
w
01

What we do
IES helps customers develop their
resources either through the development
of new fields or by enhancing production
from mature reservoirs. Our offering is
characterised by a commercial flexibility
that ensures alignment with our
customers and differentiated engineering
and execution strategies that deliver
enhanced value.
Key highlights
• Secured first Risk Service Contract in Malaysia, for development of the Berantai field
• Awarded Magallanes and Santuario Production Enhancement Contracts in Mexico
• Field Development Programme approved by PETRONAS to develop the third phase of Block PM304, West Desaru, with first oil expected in late 2012
• Agreement to earn 20% interest in Greater Stella Area: first oil expected second half of 2013
Employees
2,300Contribution to Group revenue
Contribution to Group profit
Integrated Energy ServicesIntegrated Energy Services harnesses Petrofac’s broad range of capabilities to provide integrated services to oil & gas resource holders. The division has three integrated service lines, which report as one financial segment.
4%
9%
Revenue US$ millions
2007 363.2
2008 435.1
2009 484.1
2010 384.2
2011 518.9
Net profit margin%
2007 12.4
2008 8.6
2009 12.6
20101 9.9
2011 4.4
Net profit US$ millions
2007 44.9
2008 37.4
2009 61.1
20101 38.0
2011 22.6
BacklogUS$ billions
2007 0.4
2008 0.5
2009 0.3
2010 0.3
2011 1.6
1 Excluding the gain on the EnQuest demerger.
Integrated Energy Services comprises
three discrete but integrated service lines,
Developments, Production Solutions and
Training Services. Where we can leverage
our service capabilities to enhance value,
mitigate risks and reduce costs, Integrated
Energy Services provides a fully integrated
service offering for resource holders under
flexible commercial models that are aligned
to their requirements. Projects cover
upstream developments, both greenfield
and brownfield, and related energy
infrastructure projects, and can include the
provision of financial capital in addition to
our intellectual capital. Our service offering
is underpinned by the ability to develop
resource holders’ local capability through
the provision of technical skills training
programmes and competency
development and assurance frameworks.
Integrated Energy Services was formally
launched as a new division at a Capital
Markets Day held in June 2011. We believe
that the scale of the opportunity for
Integrated Energy Services is significant
and that our service offering responds
directly to the needs of resource holders.
Petrofac has been on a journey for more
than ten years to add competence beyond
our core engineering & construction
capability, and it is the resulting scope and
depth of our service capability that now
positions us to offer a differentiated and
integrated solution to the marketplace.
Petrofac Annual report and accounts 201134

Petrofac along with its partners Kencana and Sapura were selected to deliver the Berantai project.
As part of this fast-track development, a wellhead platform will be installed to support the drilling of 18 wells, with a second wellhead platform expected to be installed in a subsequent phase. Both platforms will be connected to a Floating Production Storage and Offloading (FPSO) vessel, which will be jointly owned by the Berantai partners. The FPSO will undergo modification to ensure suitability for the Berantai development. Produced gas will be exported by subsea pipeline via the Angsi Field, while oil will be offloaded via shuttle tanker.
Under the terms of the RSC, the Berantai partners will receive a rate of return linked to their performance against an agreed incentive structure, including project costs, timing to first gas and sustained gas delivery after project completion, with an ongoing incentive structure based on operational uptime.
Integrated Energy Services deploys its
services to meet the individual needs of
customers using different commercial
frameworks: Risk Service Contracts (RSC),
Production Enhancement Contracts (PEC),
and traditional upstream equity investment
models including both Production Sharing
Contracts (PSC) and royalty concessions.
During 2011 we were awarded examples of
each, on which initial progress is discussed
below: the Berantai field in Malaysia (RSC),
the Magallanes and Santuario blocks in
Mexico (PECs), and the Greater Stella Area
development in the United Kingdom (equity
investment). In addition, we announced
a Co-operation Agreement with
Schlumberger Production Management
in January 2012, under which the two
divisions will work together to deliver
integrated and high-value production
projects in the emerging and growing
production services and production
enhancement market.
Within our Training Services business,
delegate numbers were higher than in
2010, and we saw the strongest growth
in our UK facilities, including the Altens and
Marine Training Centres in Aberdeen, and
in the Americas. In November 2011, we
entered into a strategic partnership with
Raytheon Company to deliver water
survival training to the oil & gas industry at
NASA’s Johnson Space Center underwater
facility in Houston.
Training Services is a key component of our
integrated offer. Through a well constructed
training and competence development
programme, our customers can attain
global standards with local capability.
This was the driving force behind the
memorandum of understanding (MOU) we
signed with PETRONAS in July 2011, to
collaborate in the areas of competency
development, capability building and
education activities. Already in 2012 we
have signed a five-year deal with Saudi
Petroleum Services Polytechnic to deliver a
construction and drilling training curriculum
into Saudi Aramco and its supply chain.
In Nigeria, our personnel continue to assist
Seven Energy with its asset development
both at the operational level and through
representation on Seven Energy’s
Board and management committees.
As at 31 December 2011, 80% of our
warrants had vested after reaching agreed
milestones. Earlier in the year, we invested
a further US$50 million in the company,
taking our interest up to 22.0%1. Since
entering into the strategic alliance with
Seven Energy in November 2010 we have
gained significant knowledge which will
be crucial in addressing the growing
opportunity set in Nigeria and establishing
an independent local presence in-country.
1 On a fully diluted basis assuming the full conversion of all convertible securities and exercise of all outstanding warrants and options.
Petrofac Annual report and accounts 2011 35
Com
pany
financia
l sta
tem
ents
Com
Com
pany
pany
Gro
up
fin
ancia
l sta
tem
ents
Gro
Gro
up
up
Gove
rnance
GG
Corp
ora
te
resp
onsi
bility
Corp
Corp
ora
tora
tee
Fin
ancia
l p
erf
orm
ance
and ris
k
41 50 65 107 153
Revi
ew
of o
pera
tions
Fin
aFin
ancia
ncia
ll
44
Operating environmentSegmental analysisEngineering, Construction, Operations & Maintenance– Onshore Engineering & Construction– Offshore Projects & Operations– Engineering & Consulting ServicesIntegrated Energy Services
Ri
fi
Ove
rvie
w
01

During the year, we made good progress
on Integrated Energy Services’ portfolio
of assets, both operational and in
development. An update on our key
projects is provided below:
Ticleni fields, Romania
We are continuing to make good progress
on the Ticleni oil field and its eight satellite
fields, in Romania. Ticleni represents our
first PEC, and 2011 was the first full year of
Petrofac operation after we secured the
award in July 2010, and took over full
operatorship in November of that year.
The fields’ production decline was halted
and reversed during 2011, with year-on-year
2011 oil production exceeding 2010 oil
production from the fields. Overall
production averaged approximately 3,500
bpd of oil equivalent in 2011 (of which 93%
was oil production and 7% gas production).
The pilot water flood programme is now
underway and the initial results are
expected during 2012. This programme
involves the drilling of one new well and the
injection of water into three existing wells.
In addition to this pilot programme, key
work items for the boosting of production
have commenced and will be progressed
in 2012. These include a multi-well drilling
programme, the working over and/or
maintenance of currently producing wells,
the reactivation of shut-in wells, and a
project to achieve automated measurement
on high production wells.
Magallanes and Santuario blocks, Mexico
In October 2011, we were awarded two
Production Enhancement Contracts by
Petroleos Mexicanos (PEMEX) to develop
the Magallanes and Santuario blocks in
central Mexico. Under the terms of the
25-year contracts, we will provide a fully
integrated solution to increase production
through the reactivation and development
of both blocks as well as managing their
ongoing operation and maintenance.
Summary of Integrated Energy Services’ key projects*
Name Location Field type Customer
Production Enhancement Contracts (PEC)
Ticleni Romania Oil field Petrom
Magallanes and Santuario Mexico Oil field PEMEX
Risk Service Contracts (RSC)
Berantai
Supporting infrastructure: FPSO Berantai
Malaysia Oil & gas field PETRONAS
Ohanet Algeria Gas field Sonatrach
Production Sharing Contracts (PSC)/equity
Block PM304 (Cendor phases one & two, West Desaru)
Supporting infrastructure: FPF5 MOPU
Malaysia Oil field PETRONAS
Chergui Tunisia Gas field ETAP
Greater Stella Area
Supporting infrastructure: FPF1
United Kingdom Oil & gas field N/A
Other
FPF3 (previously Jasmine Venture)
(deployed FPSO with Duty Holder contract)
Thailand Oil field Pearl Energy
Integrated Energy Services continued
Petrofac Annual report and accounts 201136
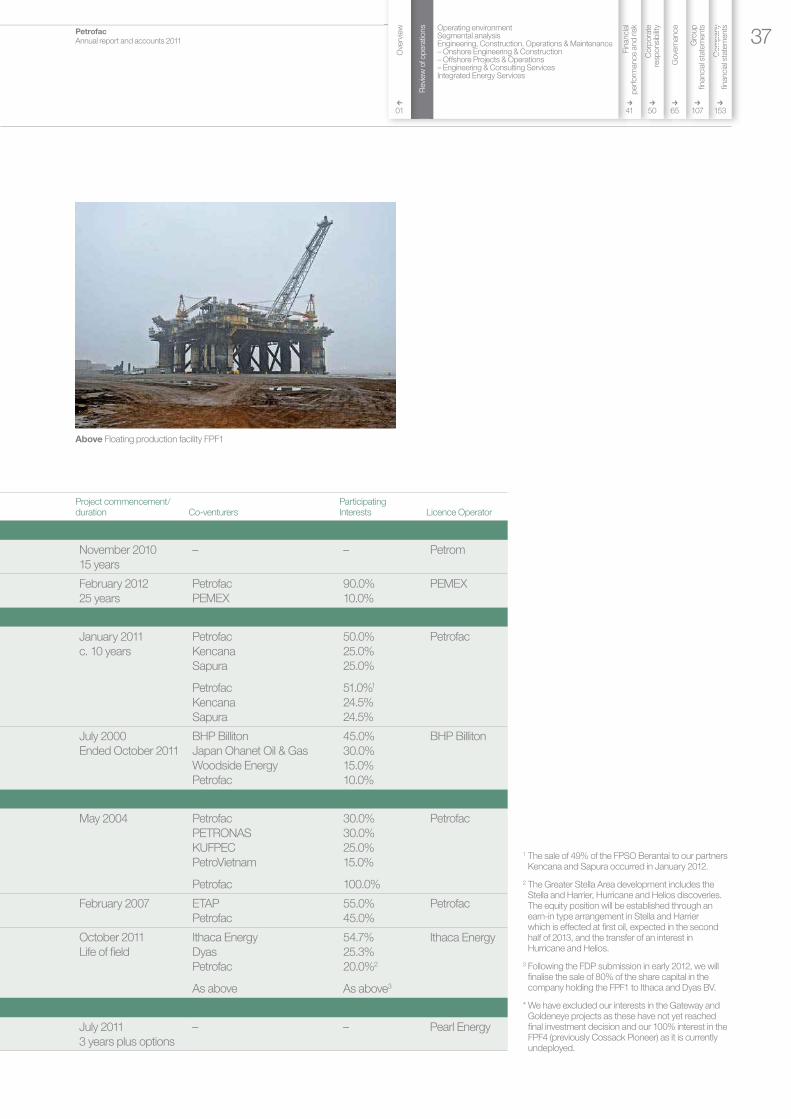
1 The sale of 49% of the FPSO Berantai to our partners Kencana and Sapura occurred in January 2012.
2 The Greater Stella Area development includes the Stella and Harrier, Hurricane and Helios discoveries. The equity position will be established through an earn-in type arrangement in Stella and Harrier which is effected at first oil, expected in the second half of 2013, and the transfer of an interest in Hurricane and Helios.
3 Following the FDP submission in early 2012, we will finalise the sale of 80% of the share capital in the company holding the FPF1 to Ithaca and Dyas BV.
* We have excluded our interests in the Gateway and Goldeneye projects as these have not yet reached final investment decision and our 100% interest in the FPF4 (previously Cossack Pioneer) as it is currently undeployed.
Project commencement/duration Co-venturers
Participating Interests Licence Operator
November 2010
15 years
– – Petrom
February 2012
25 years
Petrofac
PEMEX
90.0%
10.0%
PEMEX
January 2011
c. 10 years
Petrofac
Kencana
Sapura
Petrofac
Kencana
Sapura
50.0%
25.0%
25.0%
51.0%1
24.5%
24.5%
Petrofac
July 2000
Ended October 2011
BHP Billiton
Japan Ohanet Oil & Gas
Woodside Energy
Petrofac
45.0%
30.0%
15.0%
10.0%
BHP Billiton
May 2004 Petrofac
PETRONAS
KUFPEC
PetroVietnam
Petrofac
30.0%
30.0%
25.0%
15.0%
100.0%
Petrofac
February 2007 ETAP
Petrofac
55.0%
45.0%
Petrofac
October 2011
Life of field
Ithaca Energy
Dyas
Petrofac
As above
54.7%
25.3%
20.0%2
As above3
Ithaca Energy
July 2011
3 years plus options
– – Pearl Energy
Above Floating production facility FPF1
Petrofac Annual report and accounts 2011 37
Com
pany
financia
l sta
tem
ents
Com
Com
pany
pany
Gro
up
fin
ancia
l sta
tem
ents
Gro
Gro
up
up
Gove
rnance
GG
Corp
ora
te
resp
onsi
bility
Corp
Corp
ora
tora
tee
Fin
ancia
l p
erf
orm
ance
and ris
k
41 50 65 107 153
Revi
ew
of o
pera
tions
Fin
aFin
ancia
ncia
ll
44
Operating environmentSegmental analysisEngineering, Construction, Operations & Maintenance– Onshore Engineering & Construction– Offshore Projects & Operations– Engineering & Consulting ServicesIntegrated Energy Services
Ri
fi
Ove
rvie
w
01

We have committed to an investment of
approximately US$500 million for a 90%
interest in the contract to develop the
blocks, while a subsidiary of PEMEX will
retain a 10% economic interest in the
contract. Petrofac will be reimbursed for
75% of its operational and development
expenditure through a cost recovery
mechanism and will receive tariffs for each
barrel of baseline and incremental
production. Petrofac successfully
completed the transition and assumed
operational responsibility for these blocks
on 1 February 2012.
Berantai field, Malaysia
In January 2011, we secured our first RSC
in Malaysia, to lead the development of the
Berantai field, offshore Peninsular Malaysia,
for PETRONAS. We have a 50% interest
in the RSC, alongside local partners
Kencana and Sapura, both of whom hold
a 25% interest (together known as the
‘Berantai partners’).
Under the terms of the RSC, the Berantai
partners will receive a rate of return linked
to their performance against an agreed
incentive structure, including project costs,
timing to first gas and sustained gas
delivery measured six months after project
completion, with an ongoing incentive
structure based on operational uptime.
In January 2011, we secured our first RSC in Malaysia, to lead the development of the Berantai field
The Berantai partners are in the process of
developing the field and will subsequently
operate the field for a period of seven years
after first gas production. As part of the
fast-track development, a wellhead platform
has been installed to support the drilling of
18 wells, with the drilling programme
progressing well. The conversion and
upgrade of the FPSO Berantai is being
undertaken by Onshore Engineering &
Construction and Offshore Projects &
Operations and is in its final stages of
upgrade in Singapore. The FPSO Berantai
is expected to mobilise to the Berantai field
during the second quarter of 2012, and we
expect to achieve first gas from the field
shortly thereafter. A second wellhead
platform is expected to be installed in a
subsequent phase, with both platforms
being connected to the FPSO Berantai by
subsea flowlines. Gas will be exported by
subsea pipeline via a nearby host platform,
and critical tie-in works were completed in
late 2011.
Ohanet project, Algeria
Overall production was lower than in 2010,
averaging approximately 90,000 bpd of oil
equivalent for the first ten months of the
year (2010: 113,000 bpd of oil equivalent).
On average, we earned our share of the
monthly liquids production by the 11th day
of the month (2010: 11th), with the lower
production rates offsetting the higher
average oil & gas prices. The RSC expired
at the end of October 2011, as expected,
eight years from first gas, over which time
we earned our defined return.
Block PM304, Malaysia
As anticipated, and reported in the first half,
oil production from the first phase of
Cendor was lower in 2011 at 10,000 bpd
(2010: 13,300 bpd), despite achieving
production uptime of over 98%. Production
is now in decline as a result of the natural
decrease in field pressure. Gas lift facilities
were installed in the fourth quarter of 2011,
which are now operational, in order to
stabilise production in 2012.
The Field Development Programme (FDP)
for the third phase of development of Block
PM304 (West Desaru), was approved by
PETRONAS in February 2012. We intend to
accelerate the development of this fault
block by introducing an Early Production
System which will deploy the upgraded
Above Water and gas separation facility, Ticleni oil field, Romania.
Above One of 300 active wells on the Ticleni oil field, Romania.
Integrated Energy Services continued
Petrofac Annual report and accounts 201138
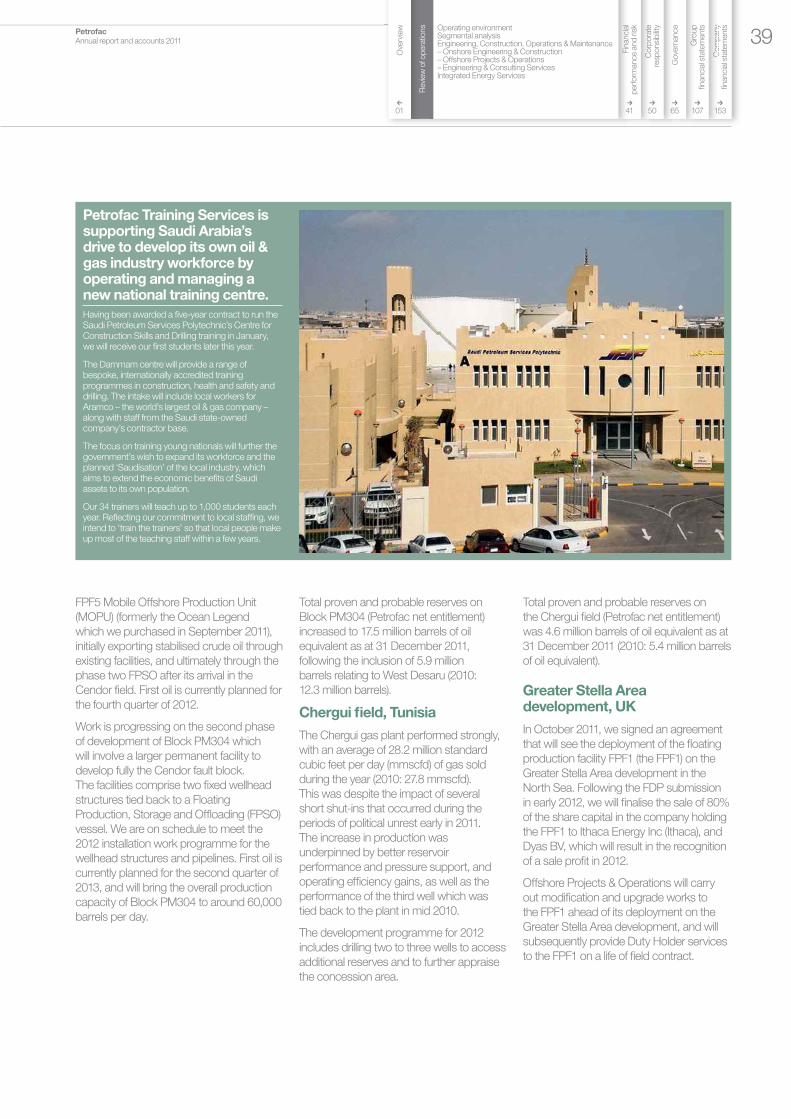
Petrofac Training Services is supporting Saudi Arabia’s drive to develop its own oil & gas industry workforce by operating and managing a new national training centre.
Having been awarded a five-year contract to run the Saudi Petroleum Services Polytechnic’s Centre for Construction Skills and Drilling training in January, we will receive our first students later this year.
The Dammam centre will provide a range of bespoke, internationally accredited training programmes in construction, health and safety and drilling. The intake will include local workers for Aramco – the world’s largest oil & gas company – along with staff from the Saudi state-owned company’s contractor base.
The focus on training young nationals will further the government’s wish to expand its workforce and the planned ‘Saudisation’ of the local industry, which aims to extend the economic benefits of Saudi assets to its own population.
Our 34 trainers will teach up to 1,000 students each year. Reflecting our commitment to local staffing, we intend to ‘train the trainers’ so that local people make up most of the teaching staff within a few years.
FPF5 Mobile Offshore Production Unit
(MOPU) (formerly the Ocean Legend
which we purchased in September 2011),
initially exporting stabilised crude oil through
existing facilities, and ultimately through the
phase two FPSO after its arrival in the
Cendor field. First oil is currently planned for
the fourth quarter of 2012.
Work is progressing on the second phase
of development of Block PM304 which
will involve a larger permanent facility to
develop fully the Cendor fault block.
The facilities comprise two fixed wellhead
structures tied back to a Floating
Production, Storage and Offloading (FPSO)
vessel. We are on schedule to meet the
2012 installation work programme for the
wellhead structures and pipelines. First oil is
currently planned for the second quarter of
2013, and will bring the overall production
capacity of Block PM304 to around 60,000
barrels per day.
Total proven and probable reserves on
Block PM304 (Petrofac net entitlement)
increased to 17.5 million barrels of oil
equivalent as at 31 December 2011,
following the inclusion of 5.9 million
barrels relating to West Desaru (2010:
12.3 million barrels).
Chergui field, Tunisia
The Chergui gas plant performed strongly,
with an average of 28.2 million standard
cubic feet per day (mmscfd) of gas sold
during the year (2010: 27.8 mmscfd).
This was despite the impact of several
short shut-ins that occurred during the
periods of political unrest early in 2011.
The increase in production was
underpinned by better reservoir
performance and pressure support, and
operating efficiency gains, as well as the
performance of the third well which was
tied back to the plant in mid 2010.
The development programme for 2012
includes drilling two to three wells to access
additional reserves and to further appraise
the concession area.
Total proven and probable reserves on
the Chergui field (Petrofac net entitlement)
was 4.6 million barrels of oil equivalent as at
31 December 2011 (2010: 5.4 million barrels
of oil equivalent).
Greater Stella Area development, UK
In October 2011, we signed an agreement
that will see the deployment of the floating
production facility FPF1 (the FPF1) on the
Greater Stella Area development in the
North Sea. Following the FDP submission
in early 2012, we will finalise the sale of 80%
of the share capital in the company holding
the FPF1 to Ithaca Energy Inc (Ithaca), and
Dyas BV, which will result in the recognition
of a sale profit in 2012.
Offshore Projects & Operations will carry
out modification and upgrade works to
the FPF1 ahead of its deployment on the
Greater Stella Area development, and will
subsequently provide Duty Holder services
to the FPF1 on a life of field contract.
Petrofac Annual report and accounts 2011 39
Com
pany
financia
l sta
tem
ents
Com
Com
pany
pany
Gro
up
fin
ancia
l sta
tem
ents
Gro
Gro
up
up
Gove
rnance
GG
Corp
ora
te
resp
onsi
bility
Corp
Corp
ora
tora
tee
Fin
ancia
l p
erf
orm
ance
and ris
k
41 50 65 107 153
Revi
ew
of o
pera
tions
Fin
aFin
ancia
ncia
ll
44
Operating environmentSegmental analysisEngineering, Construction, Operations & Maintenance– Onshore Engineering & Construction– Offshore Projects & Operations– Engineering & Consulting ServicesIntegrated Energy Services
Ri
fi
Ove
rvie
w
01

We will acquire a 20% interest from the
other co-venturers in the development,
consisting of three UKCS licences.
The capital budget for the full field
development, including delivery of the
FPF1, is approximately US$1 billion,
of which our share is 20%.
FPF3 – Jasmine field, Thailand
In June 2011, we acquired the FPF3
(formerly the Jasmine Venture) from field
operator Pearl Energy. This vessel is
currently deployed on the Jasmine field in
the Gulf of Thailand, and will be leased to
Pearl Energy, a subsidiary of Mubadala
Energy, for a minimum term of three years,
with options to extend for a further three
years. The transaction reflects our strong
ongoing relationship with Mubadala,
our partner in the Petrofac Emirates joint
venture.
We are also providing operations and
maintenance services for the FPF3 through
Offshore Projects & Operations. As both
owner of the FPSO and its service
provider, we can support Pearl Energy’s
current requirements, while working with
them to identify potential areas for further
support on this and future projects in the
Gulf of Thailand.
Results
Integrated Energy Services’ revenue
increased by 35.0% to US$518.9 million
(2010: US$384.2 million), primarily reflecting
the significant progress made on the
Berantai RSC as well as the contribution
from the Ticleni PEC.
Net profit for the year was lower at
US$22.6 million in 2011 (2010:
US$38.0 million), principally reflecting the
loss of contribution from Dubai Petroleum
as a result of the transition of our role in
2010 from service operator to a technical
services agreement (now accounted for
in Offshore Projects & Operations), lower
production on Cendor and the demerger of
the Don assets in April 2010. These factors
were partially offset by the higher average
oil price in 20111 alongside profit
contribution in relation to the vesting of
Seven Energy warrants and the lease
of the FPF3 FPSO in Thailand.
At 31 December 2011, headcount had
grown to 2,300 (2010: 2,000), reflecting the
increase in activity levels.
Integrated Energy Services’ backlog stood
at US$1.6 billion at 31 December 2011
(2010: US$0.3 billion).
1 For example, Brent, a benchmark crude oil, averaged US$111 per barrel for 2011 (2010: US$80 per barrel).
Above Delegates on an offshore survival training course at the Altens Training Centre, Aberdeen.
Above Delegates at the Jurong Island Training Centre, Singapore.
Integrated Energy Services continued
Petrofac Annual report and accounts 201140

Financial performance and risk42 Key performance indicators
To help the Group assess its performance, the Board
and Executive Management set annual KPI targets
and monitor and assess performance against these
benchmarks on a regular basis.
44 Financial reviewWe delivered another year of strong financial performance
in 2011, with revenue growth of 33% and net profit growth
of 25%.
47 Key risksA summary of the key risks that could lead to a significant
loss of reputation or prevent us from delivering our five-year
strategic plans.
Section 3
Petrofac Annual report and accounts 2011 41
Com
pany
financia
l sta
tem
ents
Com
Com
pany
pany
Gro
up
fin
ancia
l sta
tem
ents
Gro
Gro
up
up
Gove
rnance
GG
Corp
ora
te
resp
onsi
bility
50 65 107 153
Fin
ancia
l p
erf
orm
ance
and ris
kFi
Fin
ai
ncia
ll
Revi
ew
of o
pera
tions
Corp
Corp
ora
tora
tee
55
p
Key performance indicatorsFinancial reviewKey risks
Ri
fti
Ove
rvie
w
01 22

1 All KPIs above exclude the gain from the EnQuest demerger in April 2010, where applicable.
Key performance indicators1
To help the Group assess its performance, the Board and Executive Management set annual KPI targets and monitor and assess performance against these benchmarks on a regular basis.
Revenue
US$ millions +33%2007 2,440
2008 3,330
2009 3,655
2010 4,354
2011 5,801
Description
Measures the level of operating activity and
growth of the business.
Measurement
Revenue for the year as reported in the
consolidated income statement.
Lost time injury and recordable injury frequency rates
Rates per 200,000 man-hours
2007 0.070
2008 0.033
2009 0.020
2010 0.026
2011 0.018
Description
Provides a measure of the safety performance
of the Group, including partners.
Measurement
Lost time injury (LTI) and recordable injury (RI)
frequency rates are measured on the basis of
reported LTI and RI statistics for all Petrofac
companies, subcontractors and partners,
expressed as a frequency rate per 200,000
man-hours. We aim continually to improve our
safety record, but our target for these
measures is zero.
2007 0.35
2008 0.32
2009 0.36
2010 0.18
2011 0.14
Return on capital employed (ROCE)
%
2007 45.7
2008 52.7
2009 46.9
2010 53.0
2011 62.1
Description
ROCE is a measure of the efficiency with
which the Group is generating operating
profits from its capital.
Measurement
ROCE is calculated as EBITA (earnings
before interest, tax, amortisation and
impairment charges, calculated as EBITDA
less depreciation per note 3 to the financial
statements) divided by average capital
employed (being total equity and non-current
liabilities per the consolidated balance sheet).
Petrofac Annual report and accounts 201142

Cash generated from operations and cash conversion
US$ millions/%
2007 371.6
2008 586.6
2009 1,276.3
2010 207.3
2011 1,423.0
Description
These KPIs measure both the absolute
amount of cash generated from operations
and the conversion of EBITDA to cash.
Measurement
Cash generated from operations is as per
the consolidated cash flow statement;
cash conversion is cash from operations
divided by EBITDA.2007 123.3
2008 140.0
2009 232.2
2010 32.7
2011 187.4
Net profit
US$ millions +25%2007 188.7
2008 265.0
2009 353.6
2010 433.0
2011 539.4
Description
Provides a measure of the net profitability
of the business, that is, profit for the year
attributable to Petrofac Limited shareholders.
Measurement
Profit for the year attributable to Petrofac
Limited shareholders, as reported in
the consolidated income statement.
Employee numbers
Number of employees +11%2007 9,800
2008 11,100
2009 11,700
2010 13,900
2011 15,400
Description
Provides an indication of the Group’s
service capacity.
Measurement
For the purposes of the Annual Report,
employee numbers include agency,
contract staff and the Group’s share
of joint venture employees.
Backlog
US$ billions -8%2007 4.4
2008 4.0
2009 8.1
2010 11.7
2011 10.8
Description
The Group uses this KPI as a measure of the
visibility of future revenues.
Measurement
Backlog consists of the estimated revenue
attributable to the uncompleted portion of
lump-sum engineering, procurement and
construction contracts and variation orders
plus, with regard to engineering, operations,
maintenance and Integrated Energy Services
contracts, the estimated revenue attributable
to the lesser of the remaining term of the
contract and five years. Backlog will not
be booked on Integrated Energy Services
contracts where the Group has entitlement
to reserves. The Group uses this key
performance indicator as a measure of the
visibility of future revenue. Backlog is not
an audited measure.
Earnings per share (diluted) (EPS)
Cents per share +25%2007 54.61
2008 77.11
2009 103.19
2010 126.09
2011 157.13
Description
EPS provides a measure of net profitability of
the Group taking into account changes in the
capital structure, for example, the issuance
of additional share capital.
Measurement
As reported in the consolidated income
statement and calculated in accordance
with note 7 to the financial statements.
EBITDA
US$ millions +20%2007 301.3
2008 419.0
2009 549.7
2010 634.4
2011 759.4
Description
EBITDA means earnings before interest, tax,
depreciation, amortisation and impairment
and provides a measure of the operating
profitability of the business.
Measurement
EBITDA is calculated as profit before tax
and net finance income, but after our share
of losses of associates (as per the consolidated
income statement), adjusted to add back
charges for depreciation and amortisation
(as per note 3 to the financial statements).
Petrofac Annual report and accounts 2011 43
Com
pany
financia
l sta
tem
ents
Com
Com
pany
pany
Gro
up
fin
ancia
l sta
tem
ents
Gro
Gro
up
up
Gove
rnance
GG
Corp
ora
te
resp
onsi
bility
50 65 107 153
Fin
ancia
l p
erf
orm
ance
and ris
kFi
Fin
ai
ncia
ll
Revi
ew
of o
pera
tions
Corp
Corp
ora
tora
tee
55
p
Key performance indicatorsFinancial reviewKey risks
Ri
fti
Ove
rvie
w
01 22
Financial review 1
I am pleased to be able to report an excellent set of results. We delivered another year of strong financial performance in 2011, with revenue growth of 33% and net profit growth of 25%.
1 For the purposes of the Financial Review, references to prior year comparative figures, and growth rates and margins calculated thereon, exclude the gain from the EnQuest demerger in April 2010.
2 Including our share of losses of associates.
Revenue
Group revenue increased by
33.2% to US$5,800.7 million
(2010: US$4,354.2 million) due to strong
growth in all four reporting segments.
The strong growth in the Onshore
Engineering & Construction reporting
segment (up 27.4%), which accounted for
over two-thirds of the Group’s revenue, was
a result of high levels of activity on lump-
sum EPC contracts, particularly on the
Asab oil field development in Abu Dhabi
and the South Yoloten project in
Turkmenistan. The increase in revenues in
Offshore Projects & Operations (up 73.3%)
was a result of record activity levels across
the business, particularly from offshore
capital projects. The growth in Engineering
& Consulting Services (up 20.0%) reflects
strong growth in revenue from our Indian
offices as a result of higher activity levels
to support Onshore Engineering &
Construction. Integrated Energy Services
revenues grew by 35.0%, predominantly
due to the commencement of the Berantai
Risk Service Contract in Malaysia.
Operating profit2
Group operating profit for the year
increased 26.2% to US$679.3 million
(2010: US$538.5 million), representing an
operating margin of 11.7% (2010: 12.4%).
The decrease in operating margin was due
to disproportionately strong growth in the
lower margin Offshore Projects &
Operations reporting segment.
Net profit
Reported profit for the year attributable to
Petrofac Limited shareholders increased
24.6% to US$539.4 million (2010:
US$433.0 million). The increase was driven
predominantly by Onshore Engineering &
Construction and Offshore Projects &
Operations due to strong growth in revenue
and profits in these reporting segments as
a result of record levels of activity. The net
margin for the Group was lower at 9.3%
(2010: 9.9%), due to slightly lower net
margins in Onshore Engineering &
Construction and disproportionately strong
growth in the lower margin Offshore
Projects & Operations reporting segment
(albeit that reporting segment achieved a
significant improvement in net margin from
2.4% to 3.5%). Onshore Engineering &
Construction net margins were unusually
high in 2010 due to the completion of a
number of projects in 2010 and first-time
profit recognition on a number of projects
awarded in 2009. The Offshore Projects &
Operations reporting segment earns lower
net margins as services are predominantly
provided on a reimbursable basis.
Earnings Before Interest, Tax, Depreciation and Amortisation (EBITDA)2
EBITDA increased 19.7% to
US$759.4 million (2010: US$634.4 million),
representing an EBITDA margin of 13.1%
(2010: 14.6%). EBITDA margins were lower
in Onshore Engineering & Construction at
14.1% (2010: 14.5%) for the same reasons
that net margins were lower (see above).
The EBITDA margin for Offshore Projects &
Operations increased from 3.8% to 4.9%,
however, the strong growth in this relatively
lower margin reporting segment resulted in
lowering the average EBITDA margin for the
Group. EBITDA margin was lower in the
relatively higher margin Integrated Energy
Services reporting segment at 17.3%
(2010: 33.2%), primarily due to revenues
from the Berantai RSC, where we have not
yet recognised profit. Integrated Energy
Services results also decreased as a
proportion of the Group’s EBITDA
(from 20.1% in 2010 to 11.8% in 2011).
The EBITDA contribution from Engineering
& Consulting Services increased by more
than 50% (from US$25.6 million to
US$39.7 million), due to an increase in
EBITDA margin from 14.7% to 19.1% and
strong growth in activity levels.
Backlog
The Group’s backlog stood at
US$10.8 billion at 31 December 2011
(2010: US$11.7 billion). An increase in
backlog from new Integrated Energy
Services projects was more than offset
by a net reduction in Onshore Engineering
& Construction due to high levels of
progress across its portfolio of projects.
Exchange rates
The Group’s reporting currency is US
dollars. A significant proportion of Offshore
Projects & Operations’ revenue is generated
in the UKCS (approximately two-thirds) and
those revenues and associated costs are
generally denominated in sterling; however,
there was little change in the average
exchange rate for the US dollar against
sterling for the years ended 31 December
2011 and 2010 and therefore little exchange
rate impact on our US dollar reported results.
Financial reporting exchange rates
US$/Sterling
Year ended 31 December
2011
Year ended 31 December
2010
Average rate for year 1.60 1.54
Year-end rate 1.55 1.56
Petrofac Annual report and accounts 201144

The table on page 44 sets out the average
and year-end exchange rates for the US
dollar and sterling as used by the Group
for financial reporting purposes.
Interest
Net finance income for the year was lower
at US$1.3 million (2010: US$5.1 million),
due to lower finance income. While net
cash balances were higher on average in
2011 compared with the prior year, finance
income was lower as a larger proportion
of deposits were held in US dollars, which
attracted lower interest rates.
Taxation
Our policy in respect of tax is to:
• operate in accordance with the terms of the Petrofac Code of Business Conduct
• act with integrity in all tax matters
• work together with the tax authorities in jurisdictions that we operate in to build positive long-term relationships
• where disputes occur, to address them promptly
• manage tax in a pro-active manner to maximise value for our customers and shareholders
Responsibility for the tax policy and
management of tax risk rests with the Chief
Financial Officer and Group Head of Tax,
who report the Group’s tax position
regularly to the Group Audit Committee.
The Group’s tax affairs and the
management of tax risk are delegated
to a global team of tax professionals.
An analysis of the income tax charge is set
out in note 6 to the financial statements.
The income tax charge for the year as a
percentage of profit before tax was
marginally higher at 20.7% (2010: 20.3%).
The effective tax rate for the Group’s largest
reporting segment, Onshore Engineering &
Construction, was marginally higher at
17.4% (2010: 16.7%). The effective tax rate
for Offshore Projects & Operations was
lower at 22.1% (2010: 27.5%) due to a larger
proportion of profits coming from outside
the UK; however, the strong growth in
Offshore Projects & Operations resulted
in it contributing a greater proportion of
the Group’s income tax expense (8.7%
compared to 5.9% in 2010).
The Integrated Energy Services effective
tax rate increased from 46.2% to 55.3%;
however, the relative contribution from
Integrated Energy Services fell (from
29.6% to 19.8%) due to lower profitability.
The effective tax rate for Engineering &
Consulting Services was 6.6% after
reporting an effective a tax credit in 2010
(2010: 6.1% credit).
Earnings per share
Fully diluted earnings per share increased
to 157.13 cents per share (2010:
126.09 cents), an increase of 24.6%,
in line with the Group’s increase in profit
for the year attributable to Petrofac Limited
shareholders.
Operating cash flow and liquidity
The net cash generated from operations
was US$1,423.0 million (2010:
US$207.3 million), representing 187.4% of
EBITDA (2010: 32.7% of EBITDA excluding
the gain on the EnQuest demerger).
The increase in net cash generated from
operations was due to the cash generated
from operating profits before working
capital and other non-current changes
of US$796 million (2010: US$667 million)
and net working capital inflows of
US$758 million (2010: US$451 million
outflow), partially offset by a long-term
receivable of US$130 million from the
Berantai RSC which commenced in
January 2011.
Tim Weller Chief Financial Officer
Petrofac Annual report and accounts 2011 45
Com
pany
financia
l sta
tem
ents
Com
Com
pany
pany
Gro
up
fin
ancia
l sta
tem
ents
Gro
Gro
up
up
Gove
rnance
GG
Corp
ora
te
resp
onsi
bility
50 65 107 153
Fin
ancia
l p
erf
orm
ance
and ris
kFi
Fin
ai
ncia
ll
Revi
ew
of o
pera
tions
Corp
Corp
ora
tora
tee
55
p
Key performance indicatorsFinancial reviewKey risks
Ri
fti
Ove
rvie
w
01 22

The main net working capital inflows
included an increase in trade and other
payables of US$735 million (2010:
US$168 million) due to an increase in
advances received from customers of
US$358 million, an increase in billings in
excess of cost of US$211 million (2010:
US$283 million decrease), a reduction in
work in progress of US$192 million (2010:
US$470 million increase), partially offset by
an increase in trade receivables and other
receivables of US$301 million (2010:
US$267 million).
The other key movements in cash included:
• investing activities totalled US$522 million (2010: US$254 million), including:
–capital expenditure on Integrated Energy Services projects of US$352 million, predominantly in relation to the acquisition and upgrade of supporting infrastructure
–other capital expenditure of US$108 million, including temporary project camp facilities, office equipment and furniture and site-based vehicles
– investment of a further US$50 million (of an agreed US$75 million) in Seven Energy (see note 14 to the financial statements for details)
–US$16 million for deferred consideration in relation to an acquisition
• financing activities of US$228 million (2010: US$201 million), including:
–payment of the 2010 final dividend and 2011 interim dividend totalling US$159 million
– repayment of interest-bearing loans and borrowings of US$19 million
–financing the purchase of treasury shares for the purpose of making awards under the Group’s share schemes of US$49 million
• net income taxes paid of US$157 million (2010: US$99 million)
The net result of the above was the Group’s
net cash increased to US$1,495.2 million
at 31 December 2011 (2010:
US$975.3 million).
The Group reduced its levels of interest-
bearing loans and borrowings to
US$77.2 million (2010: US$87.7 million)
following scheduled loan repayments in
2011, contributing to the decrease in
the Group’s gross gearing ratio to 6.9%
(2010: 11.3%).
The Group’s total gross borrowings before
associated debt acquisition costs at the
end of 2011 were US$80.3 million
(2010: US$91.8 million), of which 39.0%
was denominated in US dollars (2010:
39.5%) and 60.7% was denominated in
sterling (2010: 60.5%).
None of the Company’s subsidiaries are
subject to any material restrictions on
their ability to transfer funds in the form
of cash dividends, loans or advances to
the Company.
Capital expenditure
Capital expenditure on property, plant
and equipment totalled US$435.4 million in
the year ended 31 December 2011 (2010:
US$116.2 million). The principal elements of
capital expenditure during the year were:
• capital expenditure on Integrated Energy Services projects of US$312 million, predominantly in relation to the acquisition and upgrade of supporting infrastructure
• other capital expenditure of US$123 million, including temporary project camp facilities, office equipment and furniture and site-based vehicles
Capital expenditure on intangible oil & gas
assets during the year was US$39.7 million
(2010: US$15.6 million) in respect of
capitalised expenditure, including near field
appraisal wells, in relation to Integrated
Energy Services’ interest in Block PM304,
offshore Malaysia.
Total equity
Total equity at 31 December 2011 was
US$1,113.8 million (2010: US$779.1 million).
The main elements of the net movement
were: net profit for the year of
US$539.6 million, less dividends paid
in the year of US$161.0 million and
the purchase of treasury shares of
US$49.1 million, which are held in the
Petrofac Employees Benefit Trust for the
purpose of making awards under the
Group’s share schemes (see note 25 to
the financial statements).
Return on capital employed
The Group’s return on capital employed for
the year ended 31 December 2011 was
62.1% (2010: 53.0%).
Dividends
The Company proposes a final dividend of
37.20 cents per share for the year ended
31 December 2011 (2010: 30.00 cents),
which, if approved, will be paid to
shareholders on 18 May 2012 provided
they were on the register on 20 April 2012.
Shareholders who have not elected (before
2 March 2012) to receive dividends in US
dollars will receive a sterling equivalent of
23.39 pence per share.
Together with the interim dividend of
17.40 cents per share (2010: 13.80 cents),
equivalent to 10.54 pence, this gives a total
dividend for the year of 54.60 cents per
share (2010: 43.80 cents), an increase of
24.7%, in line with the increase in net profit.
Gearing ratioUS$ millions (unless otherwise stated) 2011 2010
Interest-bearing loans and borrowings (A) 77.2 87.7
Cash and short-term deposits (B) 1,572.3 1,063.0
Net cash/(debt) (C = B – A) 1,495.2 975.3
Total equity (D) 1,113.8 779.1
Gross gearing ratio (A/D) 6.9% 11.3%
Net gearing ratio (C/D) Net cash position
Net cash position
Financial review continued
Petrofac Annual report and accounts 201146

The key risks that could lead to a significant loss of reputation or prevent us from delivering our five-year strategic plan are summarised
here, along with our approach to mitigating these risks. Details of how our risk framework has evolved during the year are included in the
Board Risk Committee Report on pages 86 to 89.
Risk Mitigation and management Comments/links
Sovereign, country and financial market
Over exposure to single
market/country/higher-risk
jurisdictions
Excessive concentration on a
particular market or geography
may have a significant impact
on the delivery of our five-year
strategic plan.
Formal exposure limits are not set, but our Executive Management
and the Board consider our concentration risk when they review
entry into new projects.
We take all reasonable measures to reduce and limit
our commercial exposure through the use of, for example,
out of country arbitration, advanced payments and careful cash
management. Specific consideration of this risk is a feature of
the Group Risk Committee and the Board Risk Committee.
See pages 18 to 21 for details
of how our ECOM and IES
businesses are diversifying
our business.
Counterparty failure
Financial or commercial
exposure from the failure of key
financial institutions, customers,
partners or subcontractors.
We aim to minimise our cash flow exposure on contracts and where
we deploy capital alongside our services, such as in Integrated
Energy Services, we will only do so where we are comfortable with
the counterparty risk and the contractual terms and conditions.
With respect to financial counterparty risk, we regularly monitor
our exposure and ensure that our financial assets are spread
across a large number of creditworthy financial institutions.
Our Sovereign and Financial Market Risk Policy requires that
material financial counterparty risk is only held with counterparties
that are rated by Standard and Poor’s as ‘A’ or better (or equivalent
rating from Moody’s).
See our Sovereign and
Financial Market Risk Policy –
available on our website:
www.petrofac.com/
governancedownloads
Liquidity risk
There is a risk that we are
unable to meet our financial
obligations as they fall due.
We manage liquidity risk by ensuring that we maintain an adequate
level of liquidity in the form of cash, readily available short-term
investments or committed credit facilities at all times.
See note 34 to the financial
statements
Business disruption
We are exposed to potential
regime change and civil/
political unrest, civil war or
sanctions that could affect
our operations.
We monitor carefully the changing landscape of political risk,
particularly for countries that are regarded as high-risk. This is also
reviewed regularly by the Board and the Board Risk Committee.
For high-risk countries our management will also seek to manage
our exposure in individual contracts, when agreeing terms and
conditions with our customers.
Despite the unrest in the Middle
East and North Africa during
2011, our activities suffered
minimal disruption (see page 86
for details).
Commodity or currency
Significant movements in
exchange rates could impact
our financial performance.
Oil & gas prices may have an
impact on the level of new
investment in the industry
and may affect demand for
our services.
The financial performance of
Integrated Energy Services
is more leveraged to the
price of oil & gas through
its Production Sharing
Contracts/equity positions.
The majority of our revenues are denominated in US dollars or
currencies pegged to the US dollar. In contracts priced in US
dollars (or currencies pegged to the US dollar) where the Group
is procuring equipment or incurring costs in other currencies,
we aim to hedge fully transactional exposures using forward
currency contracts.
Offshore Projects & Operations’ revenues and costs are principally
denominated in sterling. Our policy is not to hedge the sterling
profits generated by these activities as they are substantially
matched by the sterling costs of our corporate office and other
UK-based activities.
As detailed in the ‘operating environment’ section, we expect
demand for our services to remain robust and not be materially
impacted by short-term fluctuation in oil & gas prices.
Under our Sovereign and Financial Market Risk Policy we aim to
hedge, on a rolling annual basis, the net profit exposure resulting
from 75% of our low-estimate of hydrocarbon production. We will
not undertake hedging until a development has achieved steady-
state production.
See note 34 to the financial
statements for details of our oil
& gas derivative instruments
and foreign currency exposures
and how they are managed.
Over the medium term, growth
in the Integrated Energy
Services division is expected
to be primarily driven by Risk
Service Contracts and
Production Enhancement
Contracts, where we have no
direct oil & gas price exposure.
Key risks
Petrofac Annual report and accounts 2011 47
Com
pany
financia
l sta
tem
ents
Com
Com
pany
pany
Gro
up
fin
ancia
l sta
tem
ents
Gro
Gro
up
up
Gove
rnance
GG
Corp
ora
te
resp
onsi
bility
50 65 107 153
Fin
ancia
l p
erf
orm
ance
and ris
kFi
Fin
ai
ncia
ll
Revi
ew
of o
pera
tions
Corp
Corp
ora
tora
tee
55
p
Key performance indicatorsFinancial reviewKey risks
Ri
fti
Ove
rvie
w
01 22

Risk Mitigation and management Comments/links
Operational and contractual
Loss of major customer
relationship
Over exposure to any one
customer could have a
significant impact if we were to
lose that customer relationship.
We monitor the total value of contracts by customer to ensure
that we are not overly dependent upon any one customer.
Furthermore, we have a formal programme to ensure that we
maintain a regular dialogue with our major customers at a senior
level to understand their future plans and to understand any
concerns they may have with regard to our performance.
Competition
There is a risk that we lose our
market position in a strategic
geography or market.
As noted in the ‘operating environment’ section, we expect the
demand for our services to remain robust over the long term,
albeit we face significant competition in many of our markets.
Our five year strategic plans assume that a high level of competition
continues, however, our geographic and service expansion,
including the provision of Integrated Energy Services, has helped
to grow the size of the addressable market for our services,
and we remain confident that we will more than double our 2010
recurring Group earnings by 2015.
See pages 20 and 21 for details
of how we plan to deliver
Integrated Energy Services.
Major environmental, asset
integrity or accident event
A serious environmental, asset
integrity or health and safety
incident on any of our projects
has the potential to cause
significant commercial and
reputational damage.
Our strong culture of health, safety and environmental awareness
is central to our operational and business activities, our system of
business management and our delivery of quality and business
excellence. As we enter new geographical markets, sometimes
with new customers and partners, and assume responsibility for
new infrastructure, it is particularly important that our focus on
these issues is maintained. Our financial exposure to a significant
environmental, asset integrity, or health and safety incident is
generally mitigated through our commercial arrangements and
insurance programme, although such an incident may have an
adverse impact on our reputation.
Recorded incident data
demonstrates our ongoing
improvement in managing
health, safety and environmental
risks (see pages 60 to 63 for
details).
Contractual performance
Our financial performance
could be significantly affected
by the performance of a
relatively small number of
large contracts.
We have a strong track record of successful project execution which
reflects our rigorous approach to risk identification and mitigation,
from tender to project completion.
Our progress made on key projects is formally reported to the
Board and senior management (who also receive a detailed risk
analysis) on a regular basis.
Our design integrity assurance process involves the robust
challenge of design specifications, whether or not they are defined
by the customer, including peer assessment. We undertake
ongoing reviews of integrity risk throughout the life of a project.
Our subcontractor risk management strategy involves the retention
of competent subcontractors with a track record of delivery.
We have a number of strong subcontractor relationships with
proven high quality companies that we seek to work with
wherever possible.
We seek to avoid the acceptance of any liabilities that are
unquantifiable or for which we could not reasonably be regarded
as responsible, including losses of a consequential nature.
We monitor the adequacy of insurance provision and the extent to
which we can bear the financial consequences of a catastrophe.
See our Operational and
Contractual Risk Policy –
available on our website:
www.petrofac.com/
governancedownloads
Organisational
and succession
The availability of skilled
personnel, particularly at a
senior level, remains one of the
most significant challenges
facing the oil & gas industry.
We remain confident that our policies to promote and reward
on merit, targeted, but extensive, employee share ownership,
management and technical training programmes and access to
international labour markets, in particular the Middle East, Indian
subcontinent and Asia, a portfolio of world-class projects and
exciting prospects for continued growth will enable us to attract
and retain the necessary skilled personnel to undertake our
projects in hand.
See ‘Our people’ on page 57 to
59 for progress during 2011.
Key risks continued
Petrofac Annual report and accounts 201148

Risk Mitigation and management Comments/links
Ethical, social and regulatory
Major breach of our Code
of Business Conduct
Relating to working with
communities, workforce
relations, etc.
We take appropriate measures to understand the social risks and
impacts of our business activities and take steps to mitigate these
risks by engaging with, supporting and investing in the local
communities affected by our operations. We also seek
assurances that all third parties over whom we have responsibility
or who are acting under our direction conduct their business with
us in a manner that is consistent with the principles set out in our
Ethical, Social and Regulatory Risk policy and in our Code of
Business Conduct.
See our Ethical , Social and
Regulatory Risk Policy –
available on our website:
www.petrofac.com/
governancedownloads
Major regulatory breach,
including bribery and
corruption
We recognise the potential
financial and reputational risk
that could result from a breach
of local or international laws,
particularly in respect of
behaviour relating to bribery
and corruption.
Management takes a risk-based approach to due diligence and
risk assessment and has increased the level of due diligence
undertaken in respect of new contracts in pre-defined high-risk
countries, including commissioning independent investigation
where appropriate.
See page 64 for details of our
compliance and training
programme in relation to
anti-bribery and corruption.
Petrofac Annual report and accounts 2011 49
Com
pany
financia
l sta
tem
ents
Com
Com
pany
pany
Gro
up
fin
ancia
l sta
tem
ents
Gro
Gro
up
up
Gove
rnance
GG
Corp
ora
te
resp
onsi
bility
50 65 107 153
Fin
ancia
l p
erf
orm
ance
and ris
kFi
Fin
ai
ncia
ll
Revi
ew
of o
pera
tions
Corp
Corp
ora
tora
tee
55
p
Key performance indicatorsFinancial reviewKey risks
Ri
fti
Ove
rvie
w
01 22

Corporate responsibility
51 Our commitment to corporate responsibilityOur success is built on responsible business practices,
respect and support for the communities in which we
operate.
52 How we operatePetrofac’s values, of being safe, ethical, innovative,
responsive, quality and cost conscious and driven to deliver,
are core to the way we operate.
54 Managing social and environmental riskWe aim to be a force for good but realise our activities can
have negative impacts. The identification, assessment and
management of social and environmental risk is therefore
core to our corporate responsibility strategy.
57 Our peopleOur ambitious plans for growth require an expanding
number of exceptional people across all levels of our
business.
60 Keeping people safeMany Petrofac people work in challenging locations, carrying
out potentially hazardous activities. Wherever we operate, we
aim to provide a safe and secure environment for everyone
who comes in contact with our operations.
62 Safeguarding the environmentWe are committed to protecting the environment and
improving our environmental performance: this reflects both
responsible corporate behaviour and good business sense.
64 Our ethical corePetrofac is known for its technical capability and track record
for delivery. We aim to be equally known for our ethical values
and behaviour.
Section 4
Petrofac Annual report and accounts 201150

Our commitment to corporate responsibilityPetrofac’s success is built on responsible business practices, respect and support for the communities in which we operate.
This responsible approach is manifested in
the corporate values that are at the heart of
all of our activities, and embedded in the
core business systems and processes
supporting our global operations.
For a service company like Petrofac, acting
responsibly is not only ethical but it makes
good business sense. It helps us to:
• build strong relationships with our customers, which we achieve, for example, by employing and training local workforces
• develop trust in our reliability and integrity, which we are reinforcing, for instance, by developing a global compliance network
• manage risks more effectively, as we do with the social and environmental impact assessments that we carry out in all geographies
• establish strong employee engagement, which we can demonstrate by the fact that the 2011 PetroVoices survey of our staff scored us around or above global high performance norms
• create positive impressions with investors – as we hope to have done with the significant improvement in our 2011 Carbon Disclosure Project score
All these factors are good for business,
fundamental to obtaining licences to
operate around the world, and help deliver
better returns for our shareholders.
It is particularly important that a company
like Petrofac, which is often a ‘guest’ in a
country for a relatively short period, has a
targeted, effective approach to corporate
responsibility (CR). As project life cycles
may mean we are only in an area for two to
three years, we have a short time to make
a positive impact.
For a service company like Petrofac, acting responsibly is not only ethical but it makes good business sense.
In recognition of the importance of
corporate responsibility and as Petrofac
builds on three decades of tremendous
growth, we are continuing to develop a
more robust approach to CR. For example,
in 2011, we developed a new community
investment standard and introduced risk
screening as a routine part of our due
diligence assessment for third-party
suppliers. We also began developing more
effective systems to measure the value of
our approach, as a means of improving
what we do, in every area – from
environmental protection to community
investment.
As we continue to grow, we are determined
that the strength and impact of our CR will
increase in tandem.
Petrofac Annual report and accounts 2011 51
Com
pany
financia
l sta
tem
ents
Com
Com
pany
pany
Gro
up
fin
ancia
l sta
tem
ents
Gro
Gro
up
up
Gove
rnance
65 107 153
Corp
ora
te
resp
onsi
bility
G
66
py Our commitment to corporate responsibility
How we operateManaging social and environmental riskOur peopleKeeping people safeSafeguarding the environmentOur ethical core
CCorp
tora
te
Fin
ancia
l p
erf
orm
ance
and ris
kFin
aFin
ancia
ncia
ll
Revi
ew
of o
pera
tions
Ri
fti
Ove
rvie
w
01 22 41

How we operatePetrofac’s values – of being safe, ethical, innovative, responsive, quality and cost conscious and driven to deliver – are core to the way we operate.
Reflecting these values, we manage our
business ethically and transparently, in a
way that complies with international laws,
regulations and best-practice standards.
In 2011, we launched a global employee
training programme on our new standard
for the prevention of bribery and corruption,
in line with the UK Bribery Act.
Employing and developing local workers is
one of our key differentiators and central to
our strategy. In 2011, we reinforced our
emphasis on hiring local people, particularly
in areas where we intend to establish a
long-term presence, such as south-east
Asia and Romania.
Employing and developing local workers is one of our key differentiators and central to our strategy.
More widely, as a services business, the
quality of Petrofac’s human capital is vital to
its success. Our ambitious growth plans
make this even more fundamental: by 2016,
we need to recruit an extra 7,000 highly
skilled people. Effective employee
recruitment, development and retention
are critical to our operations around the
world. We are committed to looking
after our people and following fair and
transparent recruitment and performance
management procedures.
Identifying and managing risks
We take the safety of our people and our
plant extremely seriously and invest
significant resources in identifying and
managing the risks they face. In 2011,
we again strengthened the processes and
systems we use to maintain asset integrity
and security. At the same time as we
improved our corporate contingency
planning, we encouraged our people to
take personal responsibility for their own
safety by relaunching our global employee
safety campaign, Horizon Zero.
We are committed to protecting the
environment and achieving a good
environmental performance. We therefore
seek to minimise and mitigate any negative
impact of our operations, including
reducing our environmental footprint.
In 2011, we advanced towards a more
accurate picture of our total impacts by
developing a standardised environmental
data collection tool for all our businesses.
Our corporate governance systems
and processes are aligned to the
International Finance Corporation’s
respected performance standards,
peer and customer best practice and
to the principles of the UN Global
Compact (UNGC). In January 2011,
we communicated our progress to the
UNGC, which can be found on its website.
In order to raise awareness of
the UNGC principles, in 2012
we will be developing training
for our employees.
Above Where possible, we employ and develop local workers.
Left Stakeholders include investors, analysts, governments, customers and employees.
Corporate responsibility continued
Petrofac Annual report and accounts 201152

Engaging with stakeholders
Petrofac engages actively with local
communities from the earliest stage of
contract tendering and throughout the
lifespan of a project. Our aim is always to
create real, long-term opportunities and
benefits for our host communities.
We establish and maintain effective
relationships with interested and affected
stakeholders, including investors, analysts,
governments, customers and employees.
In 2011, stakeholder engagement activity
included one-to-one meetings,
presentations, roadshows, community
meetings and surveys. As Petrofac grows,
we realise that the range and expectations
of our stakeholders will widen. We are
therefore developing a more strategic
approach to stakeholder engagement,
enabling us to monitor perceptions
more effectively.
Petrofac supports and respects the protection of internationally recognised human rights.
Petrofac supports and respects the
protection of internationally recognised
human rights. This commitment is
demonstrated in our Code of Business
Conduct, in our ethical, social, regulatory
and equal employment opportunities
policies, in our promotion of diversity and
in our Group community investment
and security standards.
In 2011, we carried out a gap analysis of
our current human rights compliance,
in regard to our employees, to how security
is provided for our operations and to
our interactions with host communities.
We are currently piloting a system to
ensure that human rights concerns,
including consultation with stakeholders,
are factored into the wider social impact
and risk assessment process. We will
continue to draw on the expertise of
Maplecroft, a global risk and strategic
consultancy firm, to develop our human
rights processes further in 2012.
A new Petrofac training centre in Turkmenistan is delivering essential construction skills and health and safety training to the local workforce.
The facility, in Turkmenistan’s third largest city, Mary, in the vast Karakum Desert, is developing staff for Petrofac’s South Yoloten contract, for which Petrofac is the EPC contractor for Turkmengas. The well-equipped centre, which opened in April 2011, has six classrooms and offices and capacity for up to 250 students and 40 staff.
In its first nine months of operation, the centre had trained 906 delegates in such skills as welding, pipe fabricating and erecting, driving, scaffolding, and steel structural fabricating and erecting. In 2012, we plan to increase this number by 1,054.
Petrofac is committed to employing and developing people from communities around its operations. The Mary centre will help meet the Company’s pledge to recruit 70% of its Turkmenistan team locally.
Petrofac Annual report and accounts 2011 53
Com
pany
financia
l sta
tem
ents
Com
Com
pany
pany
Gro
up
fin
ancia
l sta
tem
ents
Gro
Gro
up
up
Gove
rnance
65 107 153
Corp
ora
te
resp
onsi
bility
G
66
py Our commitment to corporate responsibility
How we operateManaging social and environmental riskOur peopleKeeping people safeSafeguarding the environmentOur ethical core
CCorp
tora
te
Fin
ancia
l p
erf
orm
ance
and ris
kFin
aFin
ancia
ncia
ll
Revi
ew
of o
pera
tions
Ri
fti
Ove
rvie
w
01 22 41

Managing social and environmental riskPetrofac aims to be a force for good in its operations. We realise, however, that our activities can have negative as well as positive impacts and that, as we grow, the extent of such potential impacts will increase. The identification, assessment and management of social and environmental risk are therefore a core part of our CR strategy.
Managing social risk
Our community investment strategy
spearheads our efforts to protect the
Company from social risk. In line with our
overall business strategy, we aim to support
sustainable economic development in our
host countries not only by maintaining
effective relationships with our stakeholders
and managing the negative impacts of our
operations, but also through focused
community investment programmes,
where we can create additional training and
employment opportunities.
In 2011, we made progress in delivering
this strategy and aligning community
investment in support of our overall
business strategy. A key step was the
development of the Petrofac Community
Investment Standard, which embeds a
clear framework for achieving our strategic
community investment aims in our core
business processes.
Another significant initiative in our management of social risk was our implementation of the London Benchmark Community Investment Tool.
The standard requires all Petrofac
businesses to identify and assess the
impacts they have on communities,
from pre-award throughout the life cycle of
a project. In 2011, as described in the case
study on the next page, we carried out an
initial social and economic assessment
immediately after our award of two
Production Enhancement Contracts in
central Mexico. Following each social
impact assessment, Petrofac project plans
are developed with the aim of avoiding or
mitigating identified risks. This information,
complemented by consultation with local
communities and stakeholders, is used to
develop structured community investment
plans as, at the beginning of 2012, we were
doing in Tunisia and Romania.
Another significant initiative in our
management of social risk was our
implementation of the London Benchmark
Community Investment Tool. This tool will
enable Petrofac to evaluate its overall
contribution to the community, taking into
account cash, time and in-kind donations
and management costs. It will also help
record the outputs, and longer term
community and business impacts of our
community projects. We are harnessing our
international network of CR representatives
to record each of our specific activities
around the world, to help us build up an
accurate global picture. The findings will
enable us to establish robust key
performance indicators to help us measure
and improve future performance.
Total contribution analysis
� Education and employment US$658,919��
Infrastructure US$1,515,872
Discretionary US$1,547,297
Total US$3,724,188*
*Total includes US$2,100 for Enterprise initiatives
41%
18%
41%
Corporate responsibility continued
Petrofac Annual report and accounts 201154

Petrofac is taking careful account of local social needs as we embark on the reactivation and development of two mature oil fields, the Magallanes and Santuario blocks in Tabasco State, Mexico, following the 2011 award of two Production Enhancement Contracts.
As is customary, Petrofac is striving to have a positive impact in the area around our operations in Mexico by creating jobs, boosting community revenues and providing opportunities for local suppliers.
In Tabasco, we conducted an initial assessment of local economic, environmental and social circumstances, which we will follow with a more detailed social impact assessment survey in 2012. This included identifying local stakeholders and beginning a dialogue to explain the nature of the project and, in consultation with the community, considering initial opportunities for investment.
We also ran a workshop for our project team, focusing on Petrofac’s sustainability commitments as a signatory of the UN Global Compact. Participants learned how to build effective stakeholder engagement and developed a set of guiding sustainability principles for the operation.
The project requires the deployment of a 150-strong workforce and we are now recruiting in the area, in line with our strategic commitment to local content.
Community investment
Our community investment focuses on
three main areas: education and
employment, infrastructure and enterprise.
In 2011, the Group donated more than
US$3.7 million to community projects;
around 60% of this total was directed to our
strategic focus areas, with the remainder
being discretionary funding. In 2012 we aim
to decrease the amount of discretionary
spending and direct community
contributions to areas where we can make
the greatest impact.
In 2011, community investment included:
• the development of a comprehensive programme to support the community around our Chergui Gas Concession in Tunisia. This includes a significant contribution to employment development schemes and support for targeted projects to create alternative income streams for local fishermen and farmers
• a partnership with the University of Malay to establish a geo-science development centre and to sponsor two MSc/PhD graduates, in support of the Malaysian Government’s Economic Transformation Programme
• initiatives in the UK to encourage young people to pursue science and engineering careers. These included Petrofac engineers being involved in sixth-form mentoring programmes and ‘science ambassador’ school visits and our continued sponsorship of the Royal Academy of Engineering fellowships
• sponsorship of a Sharjah Government public education campaign – ‘Your Child, Your Responsibility’ – to raise awareness of the need for child car-safety seats
Once again, our people proved generous
in raising money for good causes.
In the UAE, for example, employees
donated US$88,000 to support
humanitarian relief for Somalia.
In 2011, an independent consultancy,
Corporate Citizenship, reviewed our
community activity and benchmarked us
against our peers. Having judged that
Petrofac is currently in the fourth quartile
of our peers, the consultancy suggested
we could move to the first quartile if –
as we are planning – we improved our
KPIs, data gathering and CR reporting.
This consultancy subsequently participated
in Petrofac’s first workshop for our network
of CR representatives. Training focused on
stakeholder engagement, the community
investment standard and our new
investment evaluation tool.
In 2012, we aim to improve the effectiveness
of our community investment approach by
implementing the standard and
complementary training in all our
businesses, further training on the London
Benchmark Community Investment Tool to
improve our data gathering, and developing
a social performance toolkit to support our
management of social risks and impacts.
Managing environmental risk
The recent history of the oil & gas sector
reminds us that our industry has inherently
high risk potential. Petrofac is tireless in its
efforts to ensure the technical integrity of
the plants we design, build and operate,
in order to minimise the risk of major
accidents, such as fire, explosion and spills.
In 2011, we again improved the robustness
of the systems and processes we use to
monitor and maintain the safety of our plant.
This focus is particularly important as we
grow and absorb assets that have not
previously been managed by us.
Such assets often require intensive
assessment, inspection and monitoring
until they reach Petrofac standards.
Petrofac Annual report and accounts 2011 55
Com
pany
financia
l sta
tem
ents
Com
Com
pany
pany
Gro
up
fin
ancia
l sta
tem
ents
Gro
Gro
up
up
Gove
rnance
65 107 153
Corp
ora
te
resp
onsi
bility
G
66
py Our commitment to corporate responsibility
How we operateManaging social and environmental riskOur peopleKeeping people safeSafeguarding the environmentOur ethical core
CCorp
tora
te
Fin
ancia
l p
erf
orm
ance
and ris
kFin
aFin
ancia
ncia
ll
Revi
ew
of o
pera
tions
Ri
fti
Ove
rvie
w
01 22 41

Each of our operations carries out regular
asset integrity assessments. These report
against around 30 measures covering plant
reliability and condition, management of
maintenance and assurance activities
and organisational matters, such as
competence assurance. In 2011, we again
improved the metrics we use to help us
assess performance and analyse
trends better.
Additionally, following the development of
a new software tool, we now have a more
comprehensive overview of the integrity
reviews carried out across all our
international projects, from design and
build to operations and maintenance.
During the year, we conducted detailed
audits of five major sites to assess their
protection against, and preparedness
for, major accidents, as part of a rolling
programme of major hazard-prevention
visits across all our locations. In addition,
Ayman Asfari personally conducted safety
focused visits to five operational sites
during the year.
Our Asset Integrity Review Board (AIRB),
which is co-chaired by our Offshore
Projects & Operations Managing Director
and our Group Director, Health, Safety,
Security, Environment and Integrity
Assurance (HSSEIA) continued to meet
monthly. The AIRB involves operations
managers from all our operated sites.
It provides a forum for peer review and
support and helps anticipate potential
issues. From 2012, due to Petrofac’s
international expansion, the AIRB will
meet twice monthly, enabling dedicated
meetings for both the eastern and western
hemispheres.
Engaging employees in asset integrity
We continued to engage all levels of our
people in asset integrity. Our annual safety
seminar focused on safety leadership and
maintaining plant integrity and was again
attended by our Group Chief Executive
and Group Chief Operating Officer,
now President. Our Group Director,
HSSEIA led integrity assurance training
in our Indian offices and we communicated
to the wider Petrofac workforce via
roadshows, videos and e-learning.
The application of our Group standard for
integrity management, introduced in 2010,
was a key focus of all communication. The
standard has 12 principles, ranging from
audit systems to response procedures, and
is mandatory across all our operations.
Petrofac proactively shares best practice
with its peers to help reduce risk. We are
members of the UK Oil Spill Prevention and
Response Advisory Group and support the
UK oil & gas industry safety initiative, Step
Change in Safety, and its working groups.
Our safety expertise offers particular
insights: Petrofac Training Services is a
leading emergency response trainer and
our UK Emergency Response Service
Centre in Aberdeen offers a 24-hour
integrated response capability.
Above Our UK Emergency Response Service Centre in Aberdeen offers a 24-hour integrated response capability.
Above Petrofac is tireless in its efforts to ensure the technical integrity of the plants we design, build and operate.
Corporate responsibility continued
Petrofac Annual report and accounts 201156

In 2011, we continued to invest significant
efforts in ensuring we have a sustainable
organisation that will support our growth
plans. Our human resources (HR) function,
working closely with the business, is
focused on the essential task of attracting,
developing and retaining the very best
people for our business.
Attracting the talent we need
To be prepared for growth, we need a clear
picture of the number and type of people
required to meet both our short and
long-term goals. To help achieve this, we
developed a strategic forecasting template
for the entire business and developed and
implemented staffing plans for new
locations, such as Mexico.
We continue to concentrate on the
processes and systems needed to ensure
we attract the best talent in a resource-
challenged industry.
Petrofac is a diverse business. Our
employees represent more than 80
nationalities and, wherever we operate,
we aim to recruit and develop local staff.
In 2011, we reinforced our emphasis on
local content, particularly in areas where
we intend to build and maintain a long-term
presence, such as south-east Asia
and Nigeria.
We work to ensure both men and women
have equal opportunities to develop
successful careers with Petrofac.
We welcomed the Davies’ Report
recommendations on Women on Boards
and committed to develop an inclusion and
diversity policy, which will be launched in
2012, and to monitor closely the numbers
and development of women in, and
entering, the business at all levels, and to
act on the findings. We also require
recruitment agencies to consider the
diversity of candidates when sourcing staff.
We increased our overall headcount by
10%, made several new executive
appointments, including a new Chairman
and Group CFO, the Chief Executive of our
IES division, and our first female Non-
executive Director, along with many other
important senior hires. Our graduate intake
was up a third on 2010.
Our strategy demands strong collaboration
across our businesses and geographies.
To support this, we are working to improve
our global mobility programmes to enable
efficient and timely cross-border transfer of
staff. The global roll-out of Petrofac’s new
Oracle system will help introduce more
consistent and efficient people
management processes and reporting
capabilities, particularly around
performance management, compensation
and learning management.
Our peoplePetrofac’s ambitious plans for growth require an expanding number of talented people across all levels of our business.
New talent
2,600new staff joined
Petrofac in 2011
98%of graduates hired
since 2008 are still
working for Petrofac
5%of Petrofac
employees left by
choice in 2011
Graduates recruitedNumbers
2007 115
2008 104
2009 120
2010 107
2011 146
Petrofac Annual report and accounts 2011 57
Com
pany
financia
l sta
tem
ents
Com
Com
pany
pany
Gro
up
fin
ancia
l sta
tem
ents
Gro
Gro
up
up
Gove
rnance
65 107 153
Corp
ora
te
resp
onsi
bility
G
66
py Our commitment to corporate responsibility
How we operateManaging social and environmental riskOur peopleKeeping people safeSafeguarding the environmentOur ethical core
CCorp
tora
te
Fin
ancia
l p
erf
orm
ance
and ris
kFin
aFin
ancia
ncia
ll
Revi
ew
of o
pera
tions
Ri
fti
Ove
rvie
w
01 22 41

Above Team Talk team briefing was rolled out across the business in 2011.
Developing our talent
Developing our people feeds into and
strengthens our talent pipeline and,
by building employee satisfaction,
boosts retention.
In 2011, we placed a strong emphasis on
our performance management process to
improve continuously the performance of
individuals and the organisation by ensuring
that the work undertaken by all our people
fully contributes to the goals of their teams
and the wider business. We ran a
performance management training
programme across the Group, with
separate modules for appraisers and
appraisees, in dozens of tailored events.
This strong emphasis on performance
management will continue into 2012
and beyond.
In 2011, staff at all levels benefited from
improved development opportunities.
The number of development days increased,
company-wide, for both technical and
non-technical skills. The ratio of people in
the 2011 PetroVoices employee survey
who thought Petrofac ‘did a good job of
developing people so they can reach their
full potential’ rose.
Around 90 people took part in the
Company’s Senior Leadership Excellence
Programme, run in conjunction with the
London Business School. Face-to-face
events in the UK and UAE were supported
by individual follow-up sessions to
reinforce learning and confirm future
development needs. Other programmes
are being run or developed across
the business.
We are continuously working to ensure our
experienced, mature staff coach and
mentor engineers and graduates who are
just embarking on their careers.
Retaining key staff
Petrofac continuously focuses on ensuring
we retain talent in an industry with clear
shortages. Placing an ongoing emphasis
on improving our people management
processes is key, as is listening to our
employees. In 2011 we ran our third
employee survey (PetroVoices). This had
its highest ever participation rate and
showed clear improvements in all
key areas. Localised action plans will be
implemented in 2012.
Petrofac is also crafting tailored tools and
processes to support and retain specific
groups. Graduates, for example, each
now have a bespoke progression and
development plan, while a social media-
style professional development tool is
being trialled to meet the communication
preferences of younger recruits.
Despite aggressive competition from other
employers, attrition remained broadly flat
and the PetroVoices survey showed an
increase in the number of respondents
who felt the Company ‘did a good job in
retaining its most talented people’.
The Company’s growth and recent
reorganisation provides the opportunity to
develop our workforce in the best way for
the business. Petrofac’s HR team, like other
core functions, is being systematically
developed and strengthened to provide the
calibre of operational and functional support
our strategic growth ambitions demand.
Our differentiating values
Our strong values are one of the key things
that differentiate us: the 2011 PetroVoices
survey found that 94% of respondents ‘fully
support’ our values, with 89% believing
they are ‘solid enough to act on every day’.
In 2011, to demonstrate the business
benefits our values deliver and to recognise
employees who embody them, we
launched the Petrofac EVE Awards, which
stand for Excellence, Values and Energy.
Strong applications were received from
around the Group, with 170 individuals and
teams going through the regional judging
process and 40 entries reaching the final
judging stage to determine our finalists and
winners. The emphasis our management
team places on our values was reinforced
by the EVE awards ceremony taking place
in conjunction with Petrofac’s annual
leadership conference.
Above We work to ensure that both men and women have equal opportunities to develop successful careers with Petrofac.
Corporate responsibility continued
Petrofac Annual report and accounts 201158

Communications
Effective communication is essential to
achieving our business goals. In 2011,
we focused on internal communication
and engagement, which was particularly
important during the transition to our new
two-divisional organisation.
Communicating with a dispersed, multi-
cultural workforce, many of whom are
offline, requires a bespoke and integrated
approach. Face-to-face communication is a
critical part of the mix and, during the year,
we rolled out our Team Talk team briefing
tool across Petrofac.
Team Talk was developed and piloted in
2010 in response to demand in the previous
year’s PetroVoices employee survey for
greater communication between managers
and their teams. We are pleased that it has
become so quickly embedded that 79% of
respondents to our 2011 survey say they
now get Company information through
face-to-face communication.
Our intranet, PetroNet, is likely to become
our primary internal communications
channel in the future. In 2011, we developed
and redesigned PetroNet to make it more
relevant and engaging. The site has been
moved to a new platform, is more
accessible and enables greater employee
interaction and collaboration. It will be rolled
out to our key geographies in early 2012.
During the year, we strove to ensure that
all communications, external and internal,
conveyed clear, consistent messages
about the Company, its strategic direction
and what differentiates us. Internal teams
and external advisors participated in our
first strategic communications summit; we
rearticulated Petrofac’s vision and values;
began development work on the Company
brand, and revised our tone of voice
guidelines. To ensure coherent corporate
messaging, communication teams across
the business were realigned under the
corporate function. Complementing
Group-wide channels, the divisions are
also developing their own tailored
communications, including new
internal newsletters.
As well as refreshing our intranet, we
worked on the relaunch of our external
online presence. Our new website, which
launched in February 2012, is more
representative of Petrofac’s position as an
international company and includes such
new features as regional hub sections,
with more local content.
In 2011, communications activity supported
a programme of major business activity,
including the launch of our two-divisional
structure, the Company’s Capital Markets
Day, the relaunch of our Horizon Zero safety
programme and the third PetroVoices
employee survey. There was also extensive
activity around Petrofac’s 30th anniversary,
including a Walk the World challenge that
inspired teams of employees to walk a total
of 294,000 miles.
The communications team also continued
to deliver Petrofacts, our quarterly
employee magazine, and again held the
Picture Petrofacts employee photography
competition, attracting stunning entries
from across the business.
Communications recorded the greatest
area of improvement in the 2011
PetroVoices employee survey, with 77%
of all responses being favourable – 3%
above our global high performing
norm benchmark. We believe this
strong performance reflects the high
priority Petrofac managers place on
communicating with their people.
We are committed to improving further
the professionalism, impact and value of
all our communications.
Graduate recruitment is crucial to establishing future generations of Petrofac leaders.
In 2011, we increased our efforts to recruit in emerging markets and in regions where we have long-term ambitions.
We targeted more than 40 universities in the Middle East, North Africa, CIS, Asia and the UK to identify promising young people. Our recruitment programme included regular communication with academic institutions, participation in careers fairs, and presentations to faculties and student groups.
As part of a significant internship programme, in collaboration with partner universities, we also offered eight-week placements to a number of undergraduates to allow them to experience Petrofac and to enable us to assess the students as possible recruits.
Following such concerted efforts, during the year we recruited 146 graduates – up a third on 2010 – including our first intakes from Algeria, Kazakhstan, Nigeria and China.
Petrofac Annual report and accounts 2011 59
Com
pany
financia
l sta
tem
ents
Com
Com
pany
pany
Gro
up
fin
ancia
l sta
tem
ents
Gro
Gro
up
up
Gove
rnance
65 107 153
Corp
ora
te
resp
onsi
bility
G
66
py Our commitment to corporate responsibility
How we operateManaging social and environmental riskOur peopleKeeping people safeSafeguarding the environmentOur ethical core
CCorp
tora
te
Fin
ancia
l p
erf
orm
ance
and ris
kFin
aFin
ancia
ncia
ll
Revi
ew
of o
pera
tions
Ri
fti
Ove
rvie
w
01 22 41

This safe working environment is delivered
in partnership with our employees.
To complement the action the Group takes
to reduce risk, as with our unremitting
focus on maintaining asset integrity, we also
encourage our people to play their part.
Our Horizon Zero Group safety campaign,
for instance, emphasises each individual’s
personal responsibility for their own safety
and that of their colleagues.
During the year, Petrofac’s safety
performance, measured according to
Occupational Safety and Health
Administration rules, showed some
significant improvements on 2010.
The recordable incident frequency rate was
0.14 per 200,000 man-hours (2010: 0.18)
and our lost time injury frequency rate was
0.018 (2010: 0.026). We had 24 ‘major
potential incidents’ (2010: 13). It is important
to note that this apparent increase reflects
the fact that our man-hours worked almost
doubled year-on-year and that the criteria
for reporting such incidents is the potential
for harm so that, although very few resulted
in personal injury or damage, each was
reviewed in great detail.
All incidents and accidents are assessed
and guidance from lessons learned is
widely circulated. In line with our Horizon
Zero campaign, our aspiration is to have
no incidents of any kind. In 2011, we were
pleased that many of the sites we manage
achieved this: indeed, certain locations
have reported no lost time incidents for
several years. Both the Kittiwake platform
and Bacton onshore terminal sites, where
we are Duty Holder for Centrica and
Eni Hewett, respectively, have been lost
time incident free for six years and in 2011
our onshore Asab oil field construction
project in Abu Dhabi reached the milestone
of 25 million man-hours worked without lost
time incident.
Both the Kittiwake platform and Bacton onshore terminal sites have been lost time incident free for six years.
Our goal is to have no safety lapses at all, an aspiration captured in the name of our Group safety campaign – Horizon Zero.
The campaign aims to unite all our people in a safer way of working through the constant application of Petrofac’s eight ‘Golden rules of safety’. Engagement channels include workshops, internal magazine articles, an animated video on the requirements of our golden rules and, reflecting the fact that driving is one of the biggest risk areas for our employees, a film focusing on the specific rule of safe driving.
In 2011, we relaunched Horizon Zero, which was first introduced in 2005, with a new identity, to reflect the changing needs of our increasingly expanding and diverse organisation.
To maintain consistency and improve best practice sharing and learning across the Group, Horizon Zero is now the umbrella for all new and existing Petrofac safety campaigns and plans.
Keeping people safeMany Petrofac people work in challenging locations, carrying out potentially hazardous activities while others work in modern offices in major cities. Wherever we operate, we aim to provide a safe and secure environment for everyone who comes in contact with our workplaces and operations.
Corporate responsibility continued
Petrofac Annual report and accounts 201160

Man-hours workedMillion man-hours completed by employees and subcontractors
2007 60
2008 67
2009 70
2010 76
2011 143
Lost time injury frequency ratePer 200,000 man-hours
2007 0.067
2008 0.033
2009 0.020
2010 0.026
2011 0.018
Recordable incident frequency ratePer 200,000 man-hours
2007 0.35
2008 0.32
2009 0.36
2010 0.18
2011 0.14
Driving incident frequency rateIncidents per million km driven
88 million kmWe drove 88 million km or almost 2,200 times around the world
2007 0.98
2008 0.22
2009 0.29
2010 0.03
2011 0.11
Security
Security was a key focus in 2011, as we
continued to work in some volatile regions.
The Petrofac Board had monthly security
briefings and we introduced a Group
security standard setting out mandatory
principles and procedures for all our
locations.
We expanded and strengthened our
security resource, introducing country
security managers in several countries.
We also strengthened our systems for
assessing and monitoring national security,
with systematic security scrutiny now a
routine component of risk assessment and
management in both new markets and
continuing operations.
Robust evacuation procedures are in place
for sensitive areas of operation. In 2011,
employees were evacuated smoothly from
two perceived trouble spots.
Employee health and welfare
As a responsible employer, Petrofac aims to
promote high standards of staff health and
welfare. Senior managers receive health
and fitness checks and comprehensive
medical assessments are provided for
those at risk, particularly if located offshore
or in a remote location. Most of our
locations have exercise and recreational
facilities, and our remote and offshore
facilities have on-site medical teams and
occupational health support.
Above Many Petrofac people work in challenging locations, carrying out potentially hazardous activities.
Petrofac Annual report and accounts 2011 61
Com
pany
financia
l sta
tem
ents
Com
Com
pany
pany
Gro
up
fin
ancia
l sta
tem
ents
Gro
Gro
up
up
Gove
rnance
65 107 153
Corp
ora
te
resp
onsi
bility
G
66
py Our commitment to corporate responsibility
How we operateManaging social and environmental riskOur peopleKeeping people safeSafeguarding the environmentOur ethical core
CCorp
tora
te
Fin
ancia
l p
erf
orm
ance
and ris
kFin
aFin
ancia
ncia
ll
Revi
ew
of o
pera
tions
Ri
fti
Ove
rvie
w
01 22 41
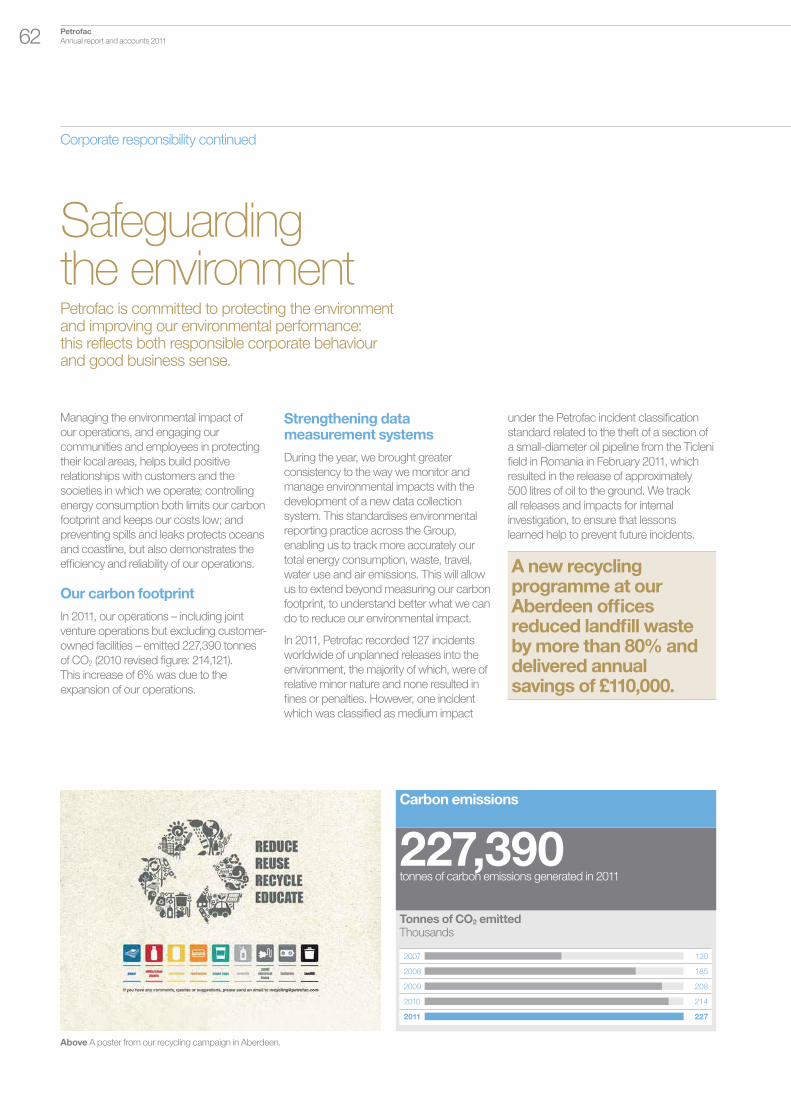
Managing the environmental impact of
our operations, and engaging our
communities and employees in protecting
their local areas, helps build positive
relationships with customers and the
societies in which we operate; controlling
energy consumption both limits our carbon
footprint and keeps our costs low; and
preventing spills and leaks protects oceans
and coastline, but also demonstrates the
efficiency and reliability of our operations.
Our carbon footprint
In 2011, our operations – including joint
venture operations but excluding customer-
owned facilities – emitted 227,390 tonnes
of CO2 (2010 revised figure: 214,121).
This increase of 6% was due to the
expansion of our operations.
Strengthening data measurement systems
During the year, we brought greater
consistency to the way we monitor and
manage environmental impacts with the
development of a new data collection
system. This standardises environmental
reporting practice across the Group,
enabling us to track more accurately our
total energy consumption, waste, travel,
water use and air emissions. This will allow
us to extend beyond measuring our carbon
footprint, to understand better what we can
do to reduce our environmental impact.
In 2011, Petrofac recorded 127 incidents
worldwide of unplanned releases into the
environment, the majority of which, were of
relative minor nature and none resulted in
fines or penalties. However, one incident
which was classified as medium impact
under the Petrofac incident classification
standard related to the theft of a section of
a small-diameter oil pipeline from the Ticleni
field in Romania in February 2011, which
resulted in the release of approximately
500 litres of oil to the ground. We track
all releases and impacts for internal
investigation, to ensure that lessons
learned help to prevent future incidents.
A new recycling programme at our Aberdeen offices reduced landfill waste by more than 80% and delivered annual savings of £110,000.
Safeguarding the environmentPetrofac is committed to protecting the environment and improving our environmental performance: this reflects both responsible corporate behaviour and good business sense.
Carbon emissions
227,390tonnes of carbon emissions generated in 2011
Tonnes of CO2 emittedThousands
2007 120
2008 185
2009 208
2010 214
2011 227
Above A poster from our recycling campaign in Aberdeen.
Corporate responsibility continued
Petrofac Annual report and accounts 201162

We appreciate that effective environmental
reporting requires not only measurement
but also the tracking of progress against
agreed targets. In 2011, we worked with
our business units to develop targets for
improving our environmental performance.
Petrofac’s new environment steering group
met twice during 2011, with our future
environmental strategy a key focus.
The group, which includes both senior
operations managers and functional
environmental heads, led a revision of our
environmental policy, helped frame our new
data collection system and assessed peer
performance as a means of setting future
goals and standards.
We once again shared our carbon
generation data with the worldwide Carbon
Disclosure Project (CDP) and were pleased
to achieve an increased rating, rising from
36 to 53 out of a possible score of 100.
This takes us into the CDP’s mid-range
category, which it classifies as
demonstrating ‘increased understanding
and measurement of company-specific
risks and opportunities related to climate
change’. We continued to participate in the
UK Government’s Carbon Reduction
Commitment Energy Efficiency Scheme
and are actively looking for opportunities to
improve our performance in this area.
We also continued to measure emissions
for our customers, as well as for our
operations, including providing extensive
monitoring under the Oslo-Paris Convention
environmental management requirements
and the European Environmental Emissions
Monitoring System.
Reducing environmental impacts
We acted further to control waste and
carbon emissions and improve energy
efficiency. A new recycling programme at
our Aberdeen offices reduced landfill waste
by more than 80% and delivered annual
savings of £110,000. The scheme involves
removing all waste bins and installing fixed
recycling points in all departments, as well
as the innovative option of providing
employees with compost for their home
gardens made from their composted office
waste. The programme, which won a 2011
Petrofac EVE (Excellence, Values, Energy)
Award, is being rolled out to other Group
locations. In another successful initiative, a
programme to improve the energy
efficiency of our office buildings led to a
16% reduction in energy consumption at
our Sharjah office tower.
Our fourth Planet Petrofac Environment
Month again engaged employees and local
people in practical steps to enhance their
surroundings.
In further partnership with our communities,
we maintained our membership of the Arab
Forum for Environment and Development
and worked closely with the Emirates
Environmental Group.
Going forward, we will continue to
strengthen the robustness and transparency
of our reporting and the consistency of
the Group’s environmental processes to
improve our performance further.
From road cleaning in Romania and cleaning beaches in Sharjah to constructing flora-friendly footpaths in the UK, more than 1,000 of our employees joined with local people to make a difference during Petrofac’s November 2011 Environment Month.
Environment Month encourages staff to realise how individual steps, both inside and outside work, can reduce our impact on the environment. This year, appropriately, the theme was ‘Be part of the solution’.
Staff, management and contractors from 17 Group locations, and their families, took part in activities around the world. They were joined by representatives from our customers, environment groups, schools, charities and other groups from Petrofac’s host communities.
Petrofac Annual report and accounts 2011 63
Com
pany
financia
l sta
tem
ents
Com
Com
pany
pany
Gro
up
fin
ancia
l sta
tem
ents
Gro
Gro
up
up
Gove
rnance
65 107 153
Corp
ora
te
resp
onsi
bility
G
66
py Our commitment to corporate responsibility
How we operateManaging social and environmental riskOur peopleKeeping people safeSafeguarding the environmentOur ethical core
CCorp
tora
te
Fin
ancia
l p
erf
orm
ance
and ris
kFin
aFin
ancia
ncia
ll
Revi
ew
of o
pera
tions
Ri
fti
Ove
rvie
w
01 22 41

Our newly appointed Group Head of
Compliance led a programme of initiatives
aimed at raising awareness of the need to
behave ethically, providing the tools and
training to support correct behaviour,
and embedding compliance procedures
into business processes. This activity
helps formalise Petrofac’s established
commitment to doing the right thing.
Preventing bribery and corruption was a
major focus for the year and will remain so
in the future. We built on the November
2010 launch of our new standard for the
prevention of bribery and corruption, in line
with the UK Bribery Act, with a dedicated
training programme. After being formally
launched in July 2011 by Petrofac’s Group
Chief Executive, the e-learning module was
rolled out to 3,000 employees in particularly
high-risk areas, before being opened up to
our entire workforce and included in our
induction programme. By the end of 2011,
around 70% of the employees initially
identified had completed the course, which
provides guidance in areas such as gifts
and entertainment, political contributions
and due diligence of third parties.
Additionally, staff in India, Iraq, Turkmenistan,
Algeria and Sharjah received face-to-face
training on the standard and on our wider
Code of Business Conduct.
Preventing bribery and corruption was a major focus for the year and will remain so in the future.
Embedding ethical business practices
We are now putting processes in place to
make the standard’s ten principles part of
the way we work. Reputational screening,
for example, is now a routine part of our
due diligence assessment for third-party
suppliers, along with technical and financial
suitability. Suppliers are identified as being
at low, medium or high risk of susceptibility
to bribery and corruption and we shape
our relationships with them accordingly.
The third-party risk assessment, and
supporting activity, will further help Petrofac
people to understand the risks in this area
and take adequate steps to mitigate them.
As well as adapting existing processes,
we are introducing new ones to support
our bribery and corruption standard.
We have created a register to record all
gifts and entertainment, given or received,
accepted or declined, which is currently
being embedded across the organisation
with support of senior management.
The register, is accompanied by a detailed
guide on gift and entertainment protocol.
Engaging our people in compliance
Strategically, our central compliance
function is not intended to monitor and
uphold the behaviour of our entire
organisation. Compliance must be
embedded in the businesses and our
people have a vital role to play in this
process. In 2011, we began developing
a network of ‘compliance champions’.
This included the creation of two full-time
compliance leads for each of our divisions,
reporting to their respective Chief Financial
Officers. We aim to identify champions in
every one of our businesses and functions.
The Group compliance function is also
working to develop closer relationships with
aligned functions, such as audit and
finance, to complement existing synergies
with the risk management team.
To harness further the wider Petrofac
community in support of ethical conduct,
the Group compliance team is responsible
for the management of Petrofac’s Speaking
Up programme. This ‘whistle blowing’
initiative encourages staff to raise concerns
about unacceptable behaviour via a free
confidential helpline and email service.
We realise that staff may feel uncomfortable
about ‘speaking up’ and that, although
69% of respondents in our 2011
PetroVoices employee survey indicated
knowledge of the Speaking Up process,
a 14% increase from the previous survey,
awareness could be higher. In 2012, a
Company-wide communications campaign
will aim to raise the profile of Speaking Up,
particularly among contractors and other
third parties. We also aim to extend the
range of languages spoken by our helpline
counsellors.
Looking ahead, in 2012, Petrofac will
continue to assess, monitor and curb the
reputational risk in our operations and value
chain. As part of this process, we will revise
the Code of Business Conduct to
incorporate changes in regulation and
culture, in line with our conviction that the
Code is a living document, and will further
re-emphasise the fairness and
transparency at the heart of our business.
Our ethical corePetrofac is known to customers for its technical capability and track record for delivery. We aim to be known equally for our ethical values and behaviour. Business ethics, particularly in the areas of bribery and corruption, are also increasingly important to regulators, customers and stakeholders who need the assurance of knowing they can trust us to do the right thing. Maintaining our good reputation is, therefore, essential for our continued success. In 2011, we worked to embed ethical conduct, one of our core values, even further into everything we do.
Corporate responsibility continued
Petrofac Annual report and accounts 201164

Governance
66 Directors’ informationWe have 11 Board members, comprising the Non-executive
Chairman, five independent Non-executive Directors and five
Executive Directors. The Secretary to the Board is
responsible to our Board and acted as Secretary to all
Committees during the year.
68 Corporate governance reportThe fundamental value of good governance is that it seeks to
ensure that a company is well run. The Board is committed
to the highest standards of corporate governance
throughout the Group and for promoting long-term
shareholder value in a responsible manner.
80 Nominations Committee reportFollowing another busy year, the Nominations Committee
has been responsible for identifying suitable candidates and
reviewing the composition and structure of the Board.
82 Audit Committee reportThis year was very much business as usual for the Audit
Committee, which monitored the integrity of the Company’s
financial statements and effectiveness of our financial and
regulatory compliance controls and systems.
86 Board Risk Committee reportThe Board Risk Committee has undertaken a thorough
review of the Group’s risk management framework during
the year to provide assurance of governance commitments
to the Board.
91 Directors’ remuneration reportFollowing another year of exceptional performance, the
Remuneration Committee has considered remuneration
policy and compensation for the Directors and
senior managers of the Group, with awareness of the
environment surrounding executive remuneration.
106 Directors’ statements
Section 5
Petrofac Annual report and accounts 2011 65
Com
pany
financia
l sta
tem
ents
Com
Com
pany
pany
Gro
up
fin
ancia
l sta
tem
ents
107 153
Gove
rnance
G
Corp
ora
te
resp
onsi
bility
Corp
Corp
ora
tora
tee
Fin
ancia
l p
erf
orm
ance
and ris
kFin
aFin
ancia
ncia
ll
Revi
ew
of o
pera
tions
Gro
Gro
up
up
11
Directors’ informationCorporate governance report– Nominations Committee report– Audit Committee report– Board Risk Committee reportDirectors’ remuneration reportDirectors’ statements
Ri
fti
Ove
rvie
w
01 22 41 50

Norman MurrayNon-executive Chairman
AppointmentAppointed to the Board on 1 March 2011 and became Chairman on 13 May 2011.
ExperiencePrior to his portfolio career, Norman spent 25 years in the venture capital industry. He co-founded Morgan Grenfell Private Equity Limited and was also a director of Morgan Grenfell Asset Management Limited. Until June 2011, he was chairman of Cairn Energy plc, having served on that board for 12 years. He is a former chairman of the British Venture Capital Association, a past president of the Institute of Chartered Accountants of Scotland and was a non-executive director of Robert Wiseman Dairies plc until February 2012. Norman is 64.
Key strengthsWide-reaching board, financial and commercial experience having served on various company boards, as both director and chairman; deep understanding of governance and regulatory matters gained in entrepreneurial environments and in energy markets.
Committee membershipChairman of Nominations Committee.
External appointmentsHe is a non-executive director of Greene King plc.
Ayman AsfariGroup Chief Executive
AppointmentAppointed to the Board on 11 January 2002.
ExperienceAyman joined the Group in 1991 to establish Petrofac International, of which he was CEO. He has more than 30 years’ experience in the oil & gas industry, having formerly worked as managing director of a major civil and mechanical construction business in Oman. Ayman is 53.
Key strengthsDistinguished record with strong operational leadership skills; clear strategic vision; entrepreneurial track record; international focus; wealth of oil industry knowledge.
Committee membershipMember of Nominations Committee.
External appointmentsMember of the board of trustees of the American University of Beirut.
Maroun SemaanPresident
AppointmentAppointed to the Board on 11 January 2002.
ExperienceMaroun joined the Group in 1991 to establish Petrofac International. He was Group Chief Operating Officer from January 2009 before becoming President on 1 January 2012. Prior to joining Petrofac, he managed oil & gas pipeline, process facilities and civil works construction contracts in Oman and Bahrain, with the Consolidated Contractors International Company. Maroun is 56.
Key strengthsWide-ranging business development skills; consistent execution of lump-sum engineering, procurement and construction (EPC) contracts; deep knowledge of the Middle East and North Africa (MENA) region; appreciation of enterprise risks and comprehensive management of subsidiaries and joint ventures.
Committee membershipNone
External appointmentsMember of the board of trustees of the American University of Sharjah and a founding member of the board of trustees of the Arab Forum for Environment and Development.
Thomas Thune AndersenNon-executive Director
AppointmentAppointed to the Board on 13 May 2010.
ExperienceThomas spent 32 years at the AP Møller-Mærsk group with an international career ending as CEO and president of Mærsk’s oil & gas company. He also served on Mærsk’s main board and its executive committee from 2005 to 2009. Thomas is 57.
Key StrengthsWide-ranging international experience; broad knowledge of energy, transportation, infrastructure and marine industries; proven track record executing growth strategies and mobilising and developing organisations; HSE experience and extensive knowledge from both an executive and non-executive standpoint.
Committee membershipChairman of the Remuneration Committee and member of the Audit and Nominations Committees.
External appointmentsHe is a non-executive director of SSE plc, chairman of the Lloyds’ Register Group board of trustees, chairman of DeepOcean, chairman of the Danish-UK Chamber of Commerce and vice-chairman of VKR Holding.
Stefano CaoNon-executive Director
AppointmentAppointed to the Board on 13 May 2010.
ExperienceStefano has 33 years’ experience in the oil & gas industry. Since February 2009, he has been CEO of Sintonia SA, a holding company owning infrastructure assets, including toll roads, airports and telecoms. From 2000 to 2008, Stefano was chief operating officer of Eni’s exploration & production division, before which he spent 24 years at Saipem SpA, the international oil & gas services group, holding such senior roles as chief executive officer, chairman and chief operating officer. He is a former independent director of Telecom Italia SpA. Stefano is 60.
Key strengthsStrong international business experience; broad knowledge of energy industry; significant knowledge of technical and commercial activities, both as operator and contractor.
Committee membershipChairman of the Board Risk Committee and Member of the Nominations and Remuneration Committees.
External appointmentsHe is CEO of Sintonia SA and a director of Atlantia SpA, Gemina SpA, Aeroporti di Roma SpA and Sagat SpA.
Roxanne DecykNon-executive Director
AppointmentAppointed to the Board on 1 March 2011.
ExperienceRoxanne retired from The Royal Dutch Shell Group in early 2011 having held a number of roles including head of global government affairs and corporate affairs director over a period of 11 years. She was a member of Shell’s executive committee from 2005 to 2009. Prior to joining Shell, Roxanne had various roles at Amoco Corporation and Navistar International Corporation. Roxanne is 59.
Key strengthsStrong track record in global and international government relations; extensive experience in the energy industry; communications, sales and marketing knowledge; reputation and brand strategy expertise; sustainable development knowledge; broad international human resources knowledge.
Committee membershipMember of the Audit, Board Risk, Nominations and Remuneration Committees.
External appointmentsShe is an independent director of Snap-on Incorporated and Alliant Techsystems Inc.
Directors’ information
Petrofac Annual report and accounts 201166

Andy InglisChief Executive, Integrated Energy Services
AppointmentAppointed to the Board on 1 March 2011.
ExperienceAndy joined Petrofac in January 2011 having spent 30 years with BP, latterly as CEO of its exploration and production business. He was an executive director on the BP plc board between 2007 and 2010. He started his BP career as a project engineer on various North Sea projects, followed by commercial and operating roles in BP’s upstream business. He became executive vice president and deputy chief executive of BP exploration & production in 2004. He is a former non-executive director of BAE Systems plc. Andy is 52.
Key strengthsBroad strategic understanding and deep technical knowledge of the oil & gas industry; proven global and operational leadership; considerable board and executive management experience.
Committee membershipNone
External appointmentsNone
Tim Weller Chief Financial Officer
AppointmentAppointed to the Board on 13 October 2011.
ExperienceTim joined Petrofac in September 2011 from Cable & Wireless Worldwide, where he had been chief financial officer between May 2010 and July 2011. A Fellow of the Institute of Chartered Accountants in England and Wales with a degree in Engineering Science, he started his career with KPMG in London, eventually becoming a partner in KPMG’s Infrastructure Business Unit. He was previously chief financial officer at United Utilities Group PLC between July 2006 and May 2010 and held chief financial officer roles with RWE Thames Water Limited and Innogy Holdings PLC (now RWE npower Holdings PLC) from 2002 to 2006. Tim is 48.
Key strengthsWide-ranging financial management experience; strategic and financial planning, cost control and capital efficiencies; external stakeholder communications and management; experience of major systems implementation.
Committee membershipNone
External appointmentsHe is a non-executive director of the Carbon Trust and of BBC Worldwide.
Marwan Chedid Chief Executive, Engineering, Construction, Operations and Maintenance
AppointmentAppointed to the Board on 19 January 2012.
ExperienceMarwan joined Petrofac in 1992 when the business was first established in Sharjah, having previously worked for CCC, a major consolidated contractor company based in the Gulf and the Middle East, for eight years. In 2007, he was appointed Chief Operating Officer of the Engineering & Construction International business with day-to-day responsibility for the successful delivery of overall operations. In January 2009, he became Managing Director of Engineering & Construction Ventures before being appointed as Chief Executive, ECOM with effect from 1 January 2012. Marwan is 51.
Key strengthsThorough knowledge of the oil & gas sector and contracting environments; solid commercial, operational and engineering experience; excellent understanding of growing a business.
Committee membershipNone
External appointmentsNone
Rijnhard van TetsNon-executive Director
AppointmentAppointed to the Board on 11 May 2007. Appointed as Senior Independent Director in May 2011.
ExperienceSenior Independent Director, Rijnhard is general partner of Laaken Asset Management NV. He advised the managing board of ABN AMRO between 2002 and 2007, having previously served as a managing board member for 12 years. At ABN AMRO, his roles included that of chairman of the wholesale clients and investment banking group. Rijnhard is 64.
Key strengthsExtensive financial background, with solid international board and senior management experience achieved from serving on various company boards and advisory trusts; excellent experience of governance and audit committees.
Committee membershipChairman of the Audit Committee and a member of the Board Risk and Nominations Committees.
External appointmentsHe is non-executive chairman of Arcadis NV, Euronext Amsterdam NV and Euronext NV, and a non-executive director of IFF Europe, NYSE Euronext Inc, BNP Paribas OBAM N.V. as well as various charities.
Mary Hitchon Secretary to the Board
AppointmentAppointed on 24 October 2005.
ExperienceJoining Petrofac shortly after IPO, Mary, a chartered secretary with almost 20 years’ experience in a UK-listed environment, has responsibility for the Group’s governance and listing rule compliance framework. She previously worked at TBI plc, the AXA group and Savills plc. Mary is 46.
Key strengthsGood understanding of governance matters; technical knowledge of regulatory issues; experience of guiding board behaviours and performance; effective stakeholder communication experience; excellent organisation skills.
Committee membershipSecretary of the Audit, Board Risk, Nominations and Remuneration Committees.
René MédoriNon-executive Director
AppointmentAppointed to the Board on 19 January 2012.
ExperienceRené is finance director of Anglo American plc, a position he has held since September 2005. He was group finance director of The BOC Group plc between June 2000 to May 2005, having held several finance appointments, including finance director of BOC’s gases business in the Americas, from 1997. René is 54.
Key strengthsExtensive and current international financial experience; well-established knowledge of governance and regulatory matters; good understanding of operational and strategic management; experience of balance sheet strengthening opportunities and the whole range of financing arrangements.
Committee membershipMember of the Audit, Board Risk and Nominations Committees.
External appointmentsHe is an executive director of Anglo American plc and non-executive director of Anglo Platinum Limited and SSE plc. He will step down from the SSE plc board on 25 June 2012.
Appointments after 31 December 2011
Petrofac Annual report and accounts 2011 67
Com
pany
financia
l sta
tem
ents
Com
Com
pany
pany
Gro
up
fin
ancia
l sta
tem
ents
107 153
Gove
rnance
G
Corp
ora
te
resp
onsi
bility
Corp
Corp
ora
tora
tee
Fin
ancia
l p
erf
orm
ance
and ris
kFin
aFin
ancia
ncia
ll
Revi
ew
of o
pera
tions
Gro
Gro
up
up
11
Directors’ informationCorporate governance report– Nominations Committee report– Audit Committee report– Board Risk Committee reportDirectors’ remuneration reportDirectors’ statements
Ri
fti
Ove
rvie
w
01 22 41 50

Dear shareholder
Following my appointment to the Board in March and my
appointment as Chairman in May, I am pleased to present
my first corporate governance report for 2011.
Since joining the Board, I have sought to understand the views of
numerous stakeholders to ensure that we continue to seek ways
to improve our processes. We will continue to strive to build on
the progress achieved by my predecessor in this area and I can
confirm that our Board maintains its commitment to achieving the
highest standards of corporate governance.
The fundamental value of good governance is that it seeks to
ensure that a company is well run. As well as promoting challenge,
accountability and transparency it provides a framework that
articulates a company’s goals and objectives and allows decisions
to be taken by the right people at the right time. It is not just about
making decisions in the right way; it is about making better
decisions. Throughout this report we have endeavoured to build
on our 2010 report to provide clear and engaging information for
all stakeholders. We believe that we continue to strengthen
and deepen our governance framework and will aim to improve
this further in 2012.
Have we complied with the UK Corporate Governance Code?
As a Jersey incorporated company with a premium listing on the
London Stock Exchange, Petrofac is required to report against the
UK Corporate Governance Code (UK Code)1, meeting the UK’s
highest standards of regulation and corporate governance. We
confirm that throughout the financial year, the Company applied all
of the principles set out in sections A to E of the UK Code for the
period under review. The Company’s auditors, Ernst & Young LLP
(Ernst & Young), are required to review whether the corporate
governance report reflects the Company’s compliance with the
nine provisions of the UK Code specified for their review by the
Listing Rules of the UK Listing Authority and to report if it does not
reflect such compliance. No such report has been made.
1 A copy of the UK Corporate Governance Code is publicly available at www.frc.org.uk
How have we responded to recent governance developments?
During 2010 and 2011 numerous reviews and consultations were
issued, partly in response to various corporate failures and the
continuing economic and financial difficulties facing the UK.
The UK Financial Reporting Council (FRC) published a number of
such reports during 2011, commencing with the Lord Sharman led
inquiry in March to identify lessons for companies and auditors
addressing going concerns and liquidity risks. The UK Government
Department for Business, Innovation and Skills (BIS) also published
a number of consultation papers during the year including papers
relating to executive remuneration and narrative reporting and
finally, the Association of British Insurers (ABI) produced a
report ‘Report on Board Effectiveness’, drawing together
recommendations to maximise the performance of company
boards. Petrofac took the opportunity to comment either directly
or indirectly on these and other consultations, where we felt it
appropriate.
As Chairman, I take responsibility for providing our Board with the
opportunity to consider all governance developments and for
ensuring that Directors receive appropriate training and education
on relevant issues, so that we can maintain our high standards
of corporate governance.
Your Board is committed to the highest standards of corporate governance and is responsible for promoting long-term shareholder value in a responsible manner that takes account of all our various stakeholders.
Norman Murray Chairman
Corporate governance report
Petrofac Annual report and accounts 201168

How have we responded to Lord Davies’ report?
In 2010, acting on concerns raised following the financial crisis that
a lack of diversity in the boardroom had contributed to the problem
of ‘group think’, the UK Government asked Lord Davies to review
the situation, identify barriers preventing women reaching the
boardroom and make recommendations as to what government
and businesses could do to increase the proportion of women on
corporate boards. Lord Davies published his report Women on
Boards in February 2011. The report found that women were
under-represented and concluded that there were clear benefits
for having greater gender diversity on boards. We published our
response to Lord Davies’ report on our website in September 2011
following a special meeting of the Nominations Committee.
Outlined below are our responses to the key recommendations.
Recommendation that companies should set out the
percentage of women they aim to have on their boards by
2013 and 2015. FTSE 100 boards should aim for a minimum
of 25% female representation by 2015. All chief executives
to review the percentage of women they aim to have on
their executive committees in 2013 and 2015.
Excluding me as Chairman, we aspire to have 15% female
representation on our Board by 2013 and 25% by 2015.
We currently have ten Directors excluding me of which one is a
woman, so clearly we need to maintain our focus if we are to
meet our aspirations for 2013 and 2015. When engaged in future
searches for Non-executive Directors, we will continue to require
search consultants to include a minimum number of female
candidates on the long and short lists. Your Board is clear, however,
that it will not appoint a woman to the Board unless she is the best
candidate for the role as we believe that tokenistic appointments
can destabilise a board and be detrimental to shareholders.
Petrofac faces particular challenges in seeking to build a Board with
more women. The majority of our employees are engineers, which
is a male-dominated profession and furthermore our Board has
an equal number of Executive and Non-executive Directors.
In common with other companies we are therefore only likely to
meet our aspirational targets for 2013 and 2015 by recruiting female
Non-executive Directors. Whilst we do not have a conventional
executive committee the Group Chief Executive reviews the
composition of the senior management team at the level below the
Board as a matter of course. Although it is unlikely that we will have
any women at this level in 2013, it is too early to predict what might
happen in 2015. We are very confident, however, that neither our
Board nor our employees are susceptible to ‘group think’
notwithstanding our lack of gender diversity given that otherwise
we have a very diverse Board and a workforce comprising more
than 80 nationalities.
Recommendation that quoted companies should be
required to disclose each year the proportion of women on
the board, women in senior executive positions and female
employees in the whole organisation.
13% of our employees are women and very few of them occupy
senior roles as the majority of our female employees do not tend to
fill operational roles. We do, however, have some senior women in
functional roles, including our Secretary to the Board and her
qualified staff as well as a positive track record of bringing women
into our graduate pool in recent years. Petrofac is wholly committed
to building its future pipeline of talent regardless of background or
gender. To that end the Nominations Committee agreed that we
would monitor the number of women in the business at all levels
from graduate to senior management positions, and that we would
continue to evaluate this and develop actions as part of the ongoing
review of the human resources (HR) strategy.
In response to the Davies’ report, the FRC published two
amendments to the UK Code that require companies to report
on their boardroom diversity policy each year and to include
gender diversity in the evaluation of board effectiveness.
These amendments will be implemented in a revised edition of
the UK Code to be issued in 2012 and will apply to financial years
beginning on or after October 2012. We intend over the next year
to develop an inclusion and diversity policy including aspirations
associated with gender. The policy will build on our Code of
Business Conduct equality of opportunity statement and will be
supported by diversity and inclusion training for all managers and
supervisors. We will formally report on our progress in next year’s
corporate governance report.
Petrofac Annual report and accounts 2011 69
Com
pany
financia
l sta
tem
ents
Com
Com
pany
pany
Gro
up
fin
ancia
l sta
tem
ents
107 153
Gove
rnance
G
Corp
ora
te
resp
onsi
bility
Corp
Corp
ora
tora
tee
Fin
ancia
l p
erf
orm
ance
and ris
kFin
aFin
ancia
ncia
ll
Revi
ew
of o
pera
tions
Gro
Gro
up
up
11
Directors’ informationCorporate governance report– Nominations Committee report– Audit Committee report– Board Risk Committee reportDirectors’ remuneration reportDirectors’ statements
Ri
fti
Ove
rvie
w
01 22 41 50
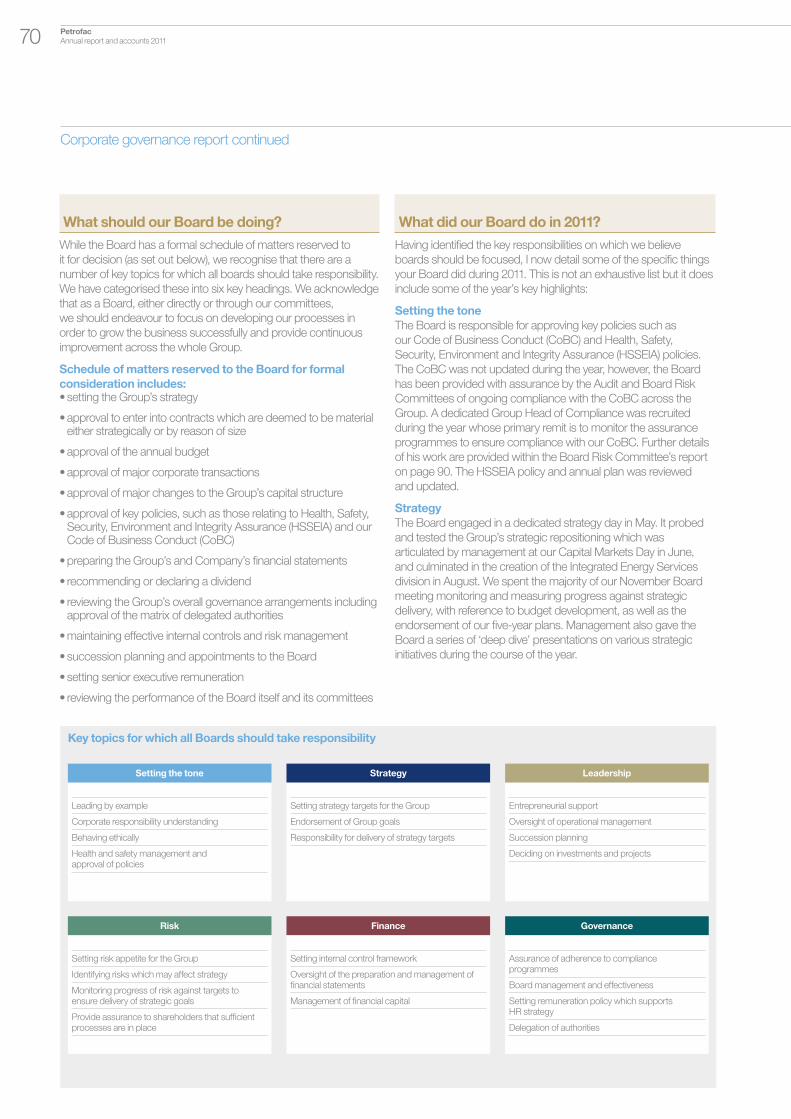
What should our Board be doing?
While the Board has a formal schedule of matters reserved to
it for decision (as set out below), we recognise that there are a
number of key topics for which all boards should take responsibility.
We have categorised these into six key headings. We acknowledge
that as a Board, either directly or through our committees,
we should endeavour to focus on developing our processes in
order to grow the business successfully and provide continuous
improvement across the whole Group.
Schedule of matters reserved to the Board for formal
consideration includes:• setting the Group’s strategy
• approval to enter into contracts which are deemed to be material either strategically or by reason of size
• approval of the annual budget
• approval of major corporate transactions
• approval of major changes to the Group’s capital structure
• approval of key policies, such as those relating to Health, Safety, Security, Environment and Integrity Assurance (HSSEIA) and our Code of Business Conduct (CoBC)
• preparing the Group’s and Company’s financial statements
• recommending or declaring a dividend
• reviewing the Group’s overall governance arrangements including approval of the matrix of delegated authorities
• maintaining effective internal controls and risk management
• succession planning and appointments to the Board
• setting senior executive remuneration
• reviewing the performance of the Board itself and its committees
What did our Board do in 2011?
Having identified the key responsibilities on which we believe
boards should be focused, I now detail some of the specific things
your Board did during 2011. This is not an exhaustive list but it does
include some of the year’s key highlights:
Setting the tone
The Board is responsible for approving key policies such as
our Code of Business Conduct (CoBC) and Health, Safety,
Security, Environment and Integrity Assurance (HSSEIA) policies.
The CoBC was not updated during the year, however, the Board
has been provided with assurance by the Audit and Board Risk
Committees of ongoing compliance with the CoBC across the
Group. A dedicated Group Head of Compliance was recruited
during the year whose primary remit is to monitor the assurance
programmes to ensure compliance with our CoBC. Further details
of his work are provided within the Board Risk Committee’s report
on page 90. The HSSEIA policy and annual plan was reviewed
and updated.
Strategy
The Board engaged in a dedicated strategy day in May. It probed
and tested the Group’s strategic repositioning which was
articulated by management at our Capital Markets Day in June,
and culminated in the creation of the Integrated Energy Services
division in August. We spent the majority of our November Board
meeting monitoring and measuring progress against strategic
delivery, with reference to budget development, as well as the
endorsement of our five-year plans. Management also gave the
Board a series of ‘deep dive’ presentations on various strategic
initiatives during the course of the year.
Key topics for which all Boards should take responsibility
Leading by example
Corporate responsibility understanding
Behaving ethically
Health and safety management and approval of policies
Setting the tone
Setting strategy targets for the Group
Endorsement of Group goals
Responsibility for delivery of strategy targets
Strategy
Entrepreneurial support
Oversight of operational management
Succession planning
Deciding on investments and projects
Leadership
Setting risk appetite for the Group
Identifying risks which may affect strategy
Monitoring progress of risk against targets to ensure delivery of strategic goals
Provide assurance to shareholders that sufficient processes are in place
Risk
Setting internal control framework
Oversight of the preparation and management of financial statements
Management of financial capital
Finance
Assurance of adherence to compliance programmes
Board management and effectiveness
Setting remuneration policy which supports HR strategy
Delegation of authorities
Governance
Corporate governance report continued
Petrofac Annual report and accounts 201170

Leadership
The leadership at Petrofac has been described as ‘entrepreneurial’
and this could be paraphrased as our management team putting
strategy into action. This year, the Board reviewed and approved
our new divisional organisational structure. During these
discussions, time was spent reviewing the pipeline for future
senior management and identifying any need for external hires.
Our delegated authorities stipulate which contracts require Board
approval and some of the matters which your Board considered
and approved were:
• the award of the In Salah lump-sum engineering, procurement and construction (EPC) contract in January 2011;
• bidding for the two Production Enhancement Contracts (PEC) awarded by PEMEX in August 2011;
• the acquisition of a 20% interest in licences from Ithaca in October 2011;
• agreement to accelerate production on West Desaru, offshore Malaysia; and
• entering into separate joint venture agreements with China Petroleum Engineering & Construction Corporation (CPECC) and Schlumberger
Risk
The Board continued to review significant risks facing the business
and these were outlined within the Group Chief Executive’s regular
reports to the Board. The Board Risk Committee sought to
address the new requirements regarding risk introduced by the UK
Code and an update is provided in its report on pages 88 and 89.
Governance
Significant time was spent reviewing the Group’s risk management
framework including the interface between the Audit and Board
Risk Committees. The respective roles are set out in the reports of
each of these committees later in this report. Following the 2010
Board evaluation, the Board engaged in a thorough review and
re-working of the Group’s delegated authorities. Our revised matrix
of delegated authorities takes into account the Company’s growth
since first listing and allows more operational matters to be
delegated to senior management thus giving the Board more
time to focus on strategy, significant risks and key decisions.
Further details of this exercise are included in the Board Risk
Committee report on page 88.
Finance
The Board regularly monitors the Group’s financial performance
and reviews all financial statements to the market. The Audit
Committee takes prime responsibility for assuring the Board that
the Group has satisfactory financial controls in place. The Board
reviewed and approved the 2012 budget in November.
How the Board spent its time during the year
������
Setting the tone (7%)
Strategy (32%)
Leadership, inc Risk (32%)
Finance (13%)
Governance (7%)
Other (9%)
Petrofac Annual report and accounts 2011 71
Com
pany
financia
l sta
tem
ents
Com
Com
pany
pany
Gro
up
fin
ancia
l sta
tem
ents
107 153
Gove
rnance
G
Corp
ora
te
resp
onsi
bility
Corp
Corp
ora
tora
tee
Fin
ancia
l p
erf
orm
ance
and ris
kFin
aFin
ancia
ncia
ll
Revi
ew
of o
pera
tions
Gro
Gro
up
up
11
Directors’ informationCorporate governance report– Nominations Committee report– Audit Committee report– Board Risk Committee reportDirectors’ remuneration reportDirectors’ statements
Ri
fti
Ove
rvie
w
01 22 41 50

Who is on our Board?
As Chairman, I am responsible for leading your Board and ensuring
that it operates effectively. Over the past two years, there have
been a number of membership changes, reflecting our policy that
Non-executive Directors should generally serve two three-year
terms. At 31 December 2011, we had nine Directors on the Board
comprising myself as Chairman, four Non-executive Directors and
four Executive Directors. Since the year end, we have announced
the appointment of a further two new Directors, one Executive and
one Non-executive. Accordingly, at the date of this report, your
Board has 11 members, who are set out in the table below:
Name Position Appointed
Norman Murray Chairman 1 March 2011
Rijnhard van Tets Senior Independent Director
Thomas Thune Andersen
Non-executive Director
Stefano Cao Non-executive Director
Roxanne Decyk Non-executive Director 1 March 2011
René Médori Non-executive Director 19 January 2012
Ayman Asfari Group Chief Executive
Maroun Semaan President
Marwan Chedid Chief Executive, ECOM 19 January 2012
Andy Inglis Chief Executive, IES 1 March 2011
Tim Weller Chief Financial Officer 13 October 2011
All Non-executive Directors who served during the year, and to
date, are independent in judgement and character. All Directors
are required to disclose any potential conflict to our Board for
its consideration and I am not aware of any relationship or
circumstance which is likely to prejudice, or could appear
to prejudice, the judgement of any Director.
Biographies of each of your Directors are shown on pages 66 and
67. We have made considerable efforts to build a board with the
right balance of skills, diversity and industry expertise. You will see
that your Directors are drawn from across the world and have
varied career histories, with no single type of person dominating the
Board. We are fortunate in that many of our Directors bring a great
deal of experience in the oil & gas industry, both in exploration and
production and lump-sum contracting. We believe this is essential
to safeguard the interests of our shareholders. The additional
strengths brought to the Board by our new Directors are detailed
further on page 77.
In May 2011, after six successful years, Rodney Chase stepped
down as Chairman. Rodney led our Board from our initial listing on
the London Stock Exchange though a period of considerable
growth and development. Kjell Almskog, our Senior Independent
Director, also stepped down from the Board in May, following the
completion of his two three-year terms. Keith Roberts, our Chief
Financial Officer, retired from the Board in October 2011. As valued
colleagues, I wish to thank them all for their considerable
contributions to Petrofac and wish them continued success.
How is our Board organised?
Role of the Chairman
As Chairman, I am responsible for leading the Board and ensuring
its effectiveness. I see both my role, and that of the Board’s,
as one which challenges management and once satisfied,
supports management.
Role of the Group Chief Executive
Ayman Asfari is our Group Chief Executive and is responsible
for the implementation and execution of strategy and the
day-to-day management of the Group. He is supported by
his senior management team, whose details are outlined on
pages 12 and 13.
Ayman and I have clearly defined terms of reference and these
are set out in writing. The split in responsibilities is shown in the
table below:
Roles
Chairman Group Chief Executive
Lead the Board Implement strategy
Ensure effective communication with shareholders
Develop manageable goals and priorities
Ensure effective communication flows between Directors
Lead and motivate the management teams
Facilitate the effective contribution of all Directors
Develop proposals to present to the Board on all areas reserved for its judgement
Role of the Senior Independent Director
Rijnhard van Tets is our Senior Independent Director, a position he
assumed in May 2011. He is available to shareholders to answer
any questions which cannot be addressed by the Chairman
or Group Chief Executive. He acts as a sounding board and
confidante to me as Chairman and is also available as an
intermediary for the other independent Directors as required.
Rijnhard would be called upon to chair our Board in the unlikely
event that I am unavailable to attend any meeting thus providing
suitable continuity.
Corporate governance report continued
Petrofac Annual report and accounts 201172

The Board
As a Jersey company, our Board is unitary in nature. This means
that all our Directors share equal responsibility for the decisions that
we make. Executive and Non-executive Directors need to be able
to work together in an atmosphere of openness, trust and mutual
respect. It is therefore important that all Directors see the Chairman
as a fair and impartial individual. My relationships with the Group
Chief Executive and the Senior Independent Director are
particularly important, as these two individuals represent the views
of management and Non-executive Directors, respectively. I hold
regular private meetings with Ayman and Rijnhard between our
Board meetings and I believe therefore that I am equally informed
about the views of management and Non-executive Directors. This
insight assists me in two ways: I am better able to set the agenda
for our Board meetings and I can ensure that all Directors
contribute at our meetings through their individual and collective
experience, challenge and support.
The Board is assisted by four committees (as set out in the
diagram below). Each committee is responsible for reviewing
and overseeing activities within its particular terms of reference.
At each scheduled Board meeting, the chairman of each
committee provides a summary of any committee meeting held
since the previous Board meeting and, in addition, the minutes of all
committee meetings are circulated to the Board. Reports for 2011
from each of these Committees are provided on pages 80 to 105.
Copies of each committee’s terms of reference are available on
the Company’s website (www.petrofac.com).
Board tenure
� Six years or more� Three − five years��
One − two years
Less than one year
Executive/Non-executive Director balance
� Executive Directors� Non-executive Directors� Non-executive Chairman
Geographical mix of Board members
� UK� Continental Europe��
US
Middle East
Responsible for decisions of strategic or substantive nature. Meetings generally held in Jersey and always outside of UK.
BoardNon-executive Chairman, 5 Executive Directors and 5 Non-executive Directors
Remuneration Committee 3 Non-executive Directors
Agrees remuneration policy and sets individual compensation levels for members of senior management
(Committee report pages 91 to 105)
Board Risk Committee 4 Non-executive Directors
Oversees the Group’s risk management and internal control processes for non-financial matters
(Committee report pages 86 to 90)
Nominations Committee Non-executive Chairman, 5 Non-executive Directors and 1 Executive Director
Takes primary responsibility for succession planning, Board/Director selection and composition
(Committee report pages 80 and 81)
Audit Committee 4 Non-executive Directors
Monitors the integrity of the Company’s financial statements and reviews financial and regulatory compliance and controls
(Committee report pages 82 to 85)
Shareholders
Elect the auditorsElect the Directors
Petrofac Annual report and accounts 2011 73
Com
pany
financia
l sta
tem
ents
Com
Com
pany
pany
Gro
up
fin
ancia
l sta
tem
ents
107 153
Gove
rnance
G
Corp
ora
te
resp
onsi
bility
Corp
Corp
ora
tora
tee
Fin
ancia
l p
erf
orm
ance
and ris
kFin
aFin
ancia
ncia
ll
Revi
ew
of o
pera
tions
Gro
Gro
up
up
11
Directors’ informationCorporate governance report– Nominations Committee report– Audit Committee report– Board Risk Committee reportDirectors’ remuneration reportDirectors’ statements
Ri
fti
Ove
rvie
w
01 22 41 50

How often does our Board meet?
The Board meets face-to-face at least six times a year at scheduled
meetings. In addition, the Board meets telephonically on an ad hoc
basis if items of business arise which cannot be held over until the
next scheduled face-to-face meeting. Scheduled meetings are
generally held over a two-day period, though at least two of these
are longer as during our annual programme of events we also hold
a dedicated strategy day as well as a site visit. Committee meetings
are held prior to the full Board meeting. Details of Director
attendance and eligibility to attend are set out in the table below:
Total number of meetings held during the year to 31 December 2011
Board meetings attended
Board meetings eligible to
attend
Norman Murray a 5 (5)
Rijnhard van Tets 6 (6)
Thomas Thune Andersen 6 (6)
Stefano Cao 6 (6)
Roxanne Decyk 5 (5)
Ayman Asfari 6 (6)
Maroun Semaan 6 (6)
Andy Inglis 5 (5)
Tim Weller 2 (2)
Former Directors
Rodney Chase a 2 (3)
Kjell Almskog 3 (3)
Keith Roberts 5 (5)
a Chairman.
Who attends Board meetings?
As well as Directors and the Secretary to the Board, regular guests
from operational and functional management are invited to attend
Board meetings. During 2011, selected members of the senior
management team attended part or all of at least one meeting.
We also had regular updates from the functional heads of HSSEIA,
HR, strategy and corporate responsibility (CR). Several other
members of operational management, one or two tiers
below managing director level, also attended some meetings.
We consider that this regular exposure to our senior management
is valuable, not least in its benefits to our succession planning
programme. It helps Directors get to know the Company and its
senior management better and it makes for more effective Board
meetings that, while always professional, are nevertheless lively
and engaging.
Where does our Board meet?
We make sure that we hold one of our six scheduled meetings in
Sharjah, which is the location of our largest office and the centre
of our ECOM business. While in Sharjah, our Board takes
the opportunity to meet more than 50 members of our local
management team over an informal dinner. In January 2012 our
Non-executive Directors also met with eight graduates and trainees
of different nationalities and disciplines. Every year we also hold
one meeting in a location where Petrofac has significant business.
In October 2011, we visited Abu Dhabi, the location of our joint
venture with Mubadala Petroleum Services Company, Petrofac
Emirates LLC. While there, we visited the Petrofac Emirates office,
had a tour of the Asab oil field development site and met with the
project management team. These two Board meetings in particular
allow us, not only to consider formal business, but also help us to
get to know Petrofac, its people and its customers. We held two
meetings in Jersey during 2011 and another two meetings in
different European locations. From 2012 we intend to continue to
hold one meeting in Sharjah and one in a location where we have
significant business, holding the remaining four meetings in Jersey.
Where is the Company resident?
Petrofac Limited was incorporated in Jersey under the Companies
(Jersey) Law 1991.
What is the selection process for our Board?
We have a formal, rigorous and transparent selection procedure
for the appointment of Directors.
The Nominations Committee is responsible for recommending new
Directors to our Board. The full Board, with the exception of the
existing Chairman, takes responsibility for considering the
appointment of a new Chairman. Board size and composition
are considered very carefully to ensure the correct balance of
individuals and diversity of experience is available. In addition,
individuals need to have sufficient time to give to our Board. Care is
taken to establish the existing commitments of all Non-executive
Directors, particularly the Chairman. Should a Director’s external
commitments change after appointment, they are required to make
me and the Board aware as soon as practicable so that we can
consider any potential conflict of interest, time commitment
challenge or residency status conflict. A detailed report on the
activities of the Nominations Committee is set out on page 80.
Corporate governance report continued
Petrofac Annual report and accounts 201174
How do we decide what Directors are paid?
The Remuneration Committee is responsible for determining
the remuneration and terms of employment of Executive Directors
as well as some members of senior management. This Committee
is also responsible for determining the Chairman’s fees. A detailed
report on the activities of the Remuneration Committee is provided
on pages 91 and 92. Responsibility for determining the
remuneration payable to the Non-executive Directors lies with
the full Board. The Executive Directors and I therefore effectively
determine the fees payable to the Non-executive Directors albeit
we take independent external advice. These fees are reviewed
each year and further details are provided on page 102.
What is our approach to shareholders re-appointing Directors?
In line with the UK Code, all your Directors will seek appointment
or re-appointment by shareholders at the 2012 annual general
meeting (AGM). Tim Weller, Marwan Chedid and René Médori will
seek appointment for the first time, having been appointed to the
Board since the last AGM. Full biographical details of all Directors
can be found on pages 66 and 67 and in the Notice of Meeting.
As required by the UK Code, the terms and conditions of
appointment of all Directors are available for inspection by any
person at our registered office in Jersey and at our corporate
services office in London. They will also be available for inspection
prior to the AGM to be held in May 2012.
How do we get the best out of our Board?
We invest time and effort in appointing our Directors and arranging
Board meetings so it would be disappointing if we did not get the
best out of our Board. I believe that your Board must operate in an
atmosphere of mutual trust and respect in order to be effective and
I therefore encourage Directors to be open and forthright. As well
as encouraging the right culture within the boardroom, I believe that
the following aspects of practical support for Directors are essential
to enable them to engage fully with the Company and allow them
to make the best possible contribution:
Evaluation
I believe that your Board should be continuously trying to improve
its effectiveness. The UK Code requires me, however, to evaluate
Board performance once a year. In 2010 we conducted an
externally facilitated Board evaluation which resulted in some
significant recommendations for improving the Board’s
performance. The table below sets out our progress in seeking
to implement those recommendations during 2011.
This year, given that we are a Board in transition, I carried out
one-to-one interviews with each Director towards the end of
2011 and early 2012, using a set of pre-defined questions.
These questions aimed to address the activities and responsibilities
of the Board as well as the Board committees. Each interview
gave sufficient time for each Director to raise any areas of concern
with me, plus the opportunity to discuss any topics relating to our
Board’s performance and areas for suggested development.
The Secretary to the Board and I have collated the results of these
interviews into a report for the whole Board. This was presented at
the end of February 2012 and I will report on the outcome of this
work in next year’s report.
My appraisal was conducted by Rijnhard van Tets, our Senior
Independent Director. Rijnhard did this through a series of
interviews with the Directors before meeting with me to
present feedback.
Progress report on 2010 evaluation recommendations
Action Progress
More strategic discussion. In 2010, our Board spent 15% of its time in Board meetings considering strategy. In 2011, this had increased to 32% following the introduction of a dedicated strategy day in May, a half day in November and regular strategic ‘deep dives’ at other Board meetings.
Articulate our risk appetite and significant risks more effectively.
The Board Risk Committee undertook a review of the Group’s risk framework during the year as a consequence of which, our Board has a clearer understanding of its attitude to the various risks facing the enterprise. A full report is given by the Board Risk Committee on pages 88 and 89.
Revisit the Group’s delegated authorities so the Board uses its time more effectively.
A new delegated authority matrix was approved by our Board in November 2011. A full report is also available in the Board Risk Committee’s report.
Focus more on succession planning. In 2010, the Nominations Committee spent 75% of its time leading searches for the new Chairman and the two new Directors appointed in early 2011. It therefore spent considerable time engaged in the practical application of Board succession planning but little time on wider succession planning. In 2011, the Nominations Committee has continued to focus on succession for our Board but has widened its remit to the management layer below the Board. In addition, from 2012 onwards our Board will receive two reports a year from the Group Head of Human Resources which will cover succession planning for the entire organisation.
Petrofac Annual report and accounts 2011 75
Com
pany
financia
l sta
tem
ents
Com
Com
pany
pany
Gro
up
fin
ancia
l sta
tem
ents
107 153
Gove
rnance
G
Corp
ora
te
resp
onsi
bility
Corp
Corp
ora
tora
tee
Fin
ancia
l p
erf
orm
ance
and ris
kFin
aFin
ancia
ncia
ll
Revi
ew
of o
pera
tions
Gro
Gro
up
up
11
Directors’ informationCorporate governance report– Nominations Committee report– Audit Committee report– Board Risk Committee reportDirectors’ remuneration reportDirectors’ statements
Ri
fti
Ove
rvie
w
01 22 41 50

Board agenda and papers
We spend considerable time developing the agenda for each of our
scheduled Board meetings. We have a number of standing items
and various matters, such as the forthcoming year’s budget or
HSSEIA plan, which are brought to the Board on the basis of a
12-month rolling programme. On average, however, at least half
of any Board meeting agenda is devoted to strategic and non-
recurring items. In addition, we take care to structure each agenda
so that the order of business changes from meeting to meeting.
I believe that taking this tailored approach encourages our Board to
engage more effectively. In accordance with the UK Code, we
ensure Board papers are dispatched in a timely manner, usually
one week prior to each meeting, so that all Directors have adequate
time to be briefed properly in advance of meetings. This is of
particular importance given our Directors’ geographical spread.
Directors are expected to challenge constructively all proposals
brought to meetings and well written papers help them to do this
effectively. When telephonic Board meetings are held, the
Secretary to the Board ensures that papers are circulated
electronically, generally at least 24 hours prior to the meeting.
Secretary to the Board
Our Secretary to the Board, Mary Hitchon, is responsible to our
Board and acted as Secretary to all committees during the year.
She is available to individual Directors in respect of Board
procedures and provides general support and advice. One of her
key roles is to advise me on governance matters so that I can
enhance the governance and effectiveness of the Board, the
committees and our individual Directors, which she does with
professionalism and integrity. She ensures that our Board is kept
properly informed and is consulted on all matters reserved to it and
that papers and other information are delivered in a timely fashion.
Training
As Chairman, I am responsible for the development needs of all
Directors. The UK Code puts greater emphasis on Director training
than ever, a governance development which I support.
Specific training was provided during the year via the Audit and
Remuneration Committees and full details are provided in their
respective reports. We did not consider that there was any need to
run any specific training for either the Nominations Committee or
Board Risk Committee, although the Group Head of Compliance
provided the Board with an opportunity to undertake the Group’s
anti-bribery and corruption training following a presentation to the
Board Risk Committee during the year. Neither did we organise any
formal training for the whole Board this year but I will be considering
the merits of doing so during 2012 and have asked each Director
for his or her views on the matter as part of this year’s Board
evaluation exercise. We continue to support Directors who wish to
attend external seminars run by professional advisers and this year
offered Directors the opportunity to become members of the
Deloitte Academy which provides them with the opportunity to
attend a range of relevant seminars and engage in online training.
In addition, for the first time the Secretary to the Board has
recorded all formal training undertaken by Directors during the
year. This will help me to assess the extent to which any Board
member might need additional developmental support.
While I believe that we can do more, we have made considerable
progress in relation to training during 2011.
Corporate governance report continued
Petrofac Annual report and accounts 201176

Induction
We appointed four new Directors in 2011 and two new Directors at the start of 2012. We work with each of our new Directors to provide
them with an individually tailored induction programme. Details of our new Directors’ individual programmes are set out in the table below:
Name and position Strengths Focus areas Induction programme
Norman MurrayNon-executive Chairman
Prior experience as chairman and director of a UK-listed company.
Experience of a FTSE 100 E&P company.
Strong financial experience.
To increase Norman’s knowledge of Petrofac’s business and its people.
Norman attended a formal presentation led by Freshfields on the role and responsibilities of a UK-listed director – this is compulsory for all our new Directors. He visited our offices in Sharjah, Aberdeen, Chennai, Mumbai, Woking and London, where he met senior operational management, key functional heads of the Group and new graduates. Norman visited our NGL 4 site in the UAE, which provided him with experience of our role as a contractor. Norman passed his offshore survival training in Aberdeen and is therefore now able to visit offshore installations.
Roxanne DecykNon-executive Director
Broad commercial experience and previous senior management experience within a major IOC.
Holds a number of non-executive directorships within the US.
To increase Roxanne’s knowledge of Petrofac and the UK-listed company environment.
Roxanne attended the Freshfields’ presentation referenced above. In addition, at her request, she attended one-on-one seminars with partners from Deloitte and Ernst & Young respectively on the roles of the Remuneration and Audit Committees. Roxanne visited our offices in Sharjah, Aberdeen, Woking and London, where she met senior operational management, key functional heads for the Group and new graduates. Roxanne visited our Asab site in the UAE.
Andy InglisChief Executive, IES
Previous experience as an executive director within BP plc and as a non-executive director at BAE Systems plc.
To increase Andy’s knowledge of Petrofac.
Andy attended the Freshfields’ presentation. Given that Andy already had extensive industry and listed company experience but was new to Petrofac, he undertook a comprehensive programme of visits around the Group. He visited 16 of the Group’s offices, many key sites and met senior customer representatives. During the course of these visits, he met our senior operational and functional management teams.
Tim WellerChief Financial Officer
Previous experience as a director of UK-listed entities and extensive financial experience.
To increase Tim’s knowledge of Petrofac.
Tim attended the Freshfields’ presentation. He has visited our Sharjah, Aberdeen, Woking, Chennai and Mumbai offices and has met our senior operational and functional management teams. Tim completed his offshore survival training in Aberdeen, which will allow him to visit offshore installations. We consider it important that all our senior management in functional roles have an appreciation of operational considerations and in particular HSE.
Directors appointed after year-end:
René MédoriNon-executive Director
Experience as chief financial officer within a major UK-listed entity and as a non-executive director within the oil & gas and utility sectors.
To increase René’s knowledge of Petrofac and assist him in preparing for his role as a member of the Audit, Board Risk and Nominations Committees.
The Freshfields’ seminar is compulsory and will be held during the year. René will be offered any formal training he may request in relation to his committee memberships. He will undertake a tour of the main Petrofac offices and will meet senior operational and functional management.
Marwan Chedid Chief Executive, ECOM
Promoted from within Petrofac’s engineering and construction business.
To increase Marwan’s understanding of the role of a director within a UK-listed entity.
The Freshfields’ seminar is compulsory and will be held during the year. Marwan will also be attending the London Business School’s Directors’ Forum in early 2012. Participants on this programme work with leading figures from other companies’ boards and professional advisers to develop their boardroom skills through role play and sharing best practice.
Petrofac Annual report and accounts 2011 77
Com
pany
financia
l sta
tem
ents
Com
Com
pany
pany
Gro
up
fin
ancia
l sta
tem
ents
107 153
Gove
rnance
G
Corp
ora
te
resp
onsi
bility
Corp
Corp
ora
tora
tee
Fin
ancia
l p
erf
orm
ance
and ris
kFin
aFin
ancia
ncia
ll
Revi
ew
of o
pera
tions
Gro
Gro
up
up
11
Directors’ informationCorporate governance report– Nominations Committee report– Audit Committee report– Board Risk Committee reportDirectors’ remuneration reportDirectors’ statements
Ri
fti
Ove
rvie
w
01 22 41 50

Percentage split between investors
� Institutional and private investors� Employees, former employees
(including beneficial interests)
and employee share ownership trusts
How does our Board formally satisfy itself that it has sound risk management and internal control systems?
The Board is responsible for reviewing the effectiveness of
Petrofac’s risk management and internal control systems, including
financial, operational and compliance controls. The Board currently
considers this by reference to the work undertaken during the year
by both the Audit and Board Risk Committees. In addition to
which, the Board also receives regular reports from members of
management with responsibility for the Group’s material enterprise
risks. Going forward, under our new risk framework structure
(as set out on page 88), the Audit Committee will provide our Board
with a formal report on the effectiveness of the Group’s financial
and regulatory controls at year-end while the Board Risk
Committee will provide a formal report on the effectiveness of
the Group’s risk management systems in relation to the Group’s
enterprise risks and project and investment risks. These two
reports will be the primary means by which our Board will take a
view on whether or not the Group has sound risk management
and internal control systems. We will continue to place considerable
reliance on reports made to the full Board and our Board will have
responsibility for approving the Group’s enterprise risk register.
The Board is satisfied that sound risk management and internal
control systems have been in place across the Group throughout
2011 and to today’s date when the financial statements were
approved. Petrofac also seeks to have a sound system of internal
control, based on the Group’s policies and guidelines, in all material
associates and joint ventures. As with all companies, our systems
of internal control and risk management are designed to manage
rather than eliminate business risk and can only ever provide
reasonable, and not absolute, assurance against material
misstatement or loss.
How does our Board identify Petrofac’s significant risks?
Management provides our Board with details of our current
significant risks and how we plan to mitigate them as part of each
Board pack. The risks that we consider significant today are shown
on pages 47 to 49.
The risks are identified by reference to:
• risk matrices received from each of our individual business units (bottom-up approach)
• the views of senior management (top-down approach)
Does our Board receive information which allows it to identify when delivery of its goals are under threat?
The Board receives a comprehensive written report from the Chief
Financial Officer, at each face-to-face Board meeting, as well as
periodic updates between such meetings. The Board is kept very
well informed about the Group’s financial performance for the year
to date as compared to the year’s budget or the latest revised
forecast, with explanations for any variances. The budget and
five-year plans submitted to the Board incorporate risk analysis as a
matter of course. In addition to financial goals, we have strategic
and operational goals and we are currently working on developing
a broader set of financial and non-financial key performance
indictators (KPIs), which should assist us in monitoring delivery of
these goals. At present, however, Ayman Asfari provides us with a
full presentation on business operations at each face-to-face Board
meeting, during which he highlights any possible impediments to
the delivery of our goals.
Shareholder information
Who are our major shareholders?
Ordinarily, shareholders of Jersey-incorporated companies with a
UK listing need only disclose their holdings if they hold voting rights
of 5% or more in a company. However, our Articles of Association
have been drafted so that any shareholder with 3% or more of our
voting rights must disclose their holding, bringing us in line with
UK-incorporated companies.
Those shareholders with holdings of 3% or more at the year-end
and as at the date of this report are as follows:
Number of ordinary shares
Percentage of issued share capital
Ayman Asfari and family 62,837,968 18.17
Maroun Semaan and family 28,135,388 8.14
Legal & General Group Plc 13,782,232 3.98
Geographical breakdown of shareholder base*
� North America� UK – Scotland���
UK – England/Wales
Europe
Rest of World
* Excluding employees, former employees and share ownership trusts.
Corporate governance report continued
Petrofac Annual report and accounts 201178

How does our Board engage with our shareholders and make sure that it is aware of shareholders’ views?
As a Board, we acknowledge our responsibilities to promote the
success of the Company for many people but our shareholders
are, of course, our principal focus.
Ayman Asfari, Tim Weller and the investor relations team, headed
by Jonathan Low, provide presentations to research analysts and
institutional investors, including a question and answer session,
following the announcement of our full and half year results.
These presentations are broadcast live on our website and may
therefore be followed by all shareholders. Ayman, Tim and the
investor relations team have a regular programme of meetings
scheduled each year and conduct a series of individual meetings
with existing and potential shareholders following our full and half-
year results and interim management statements. In 2011, they held
approximately 370 investor meetings, of which Ayman and/or the
Chief Financial Officer attended approximately half of the meetings.
I believe, therefore, that Ayman and Tim are well placed to provide
the rest of the Board with their insights into shareholder sentiment.
Directors receive brokers’ research notes from Jonathan and an
update from one of our joint brokers at each Board meeting.
We offer analysts and institutional shareholders the opportunity
to visit at least one of our operations every other year. In 2011,
we held a Capital Markets Day in London which provided an
update on the Group’s strategy and the roll-out of the Integrated
Energy Services division.
In the past, we wrote to our major shareholders at each year-end,
offering them the opportunity to meet the Chairman or the Senior
Independent Director. We rarely received any responses, perhaps
because December is a particularly busy time of year. I therefore
decided that I would write to shareholders offering to meet them
earlier in the year accompanied by our Secretary to the Board and
a member of the investor relations team. I met six of our largest
institutional shareholders and four key voting and advisory services
providers. Our discussions focused on governance related matters.
While shareholders focused on different points, some common
areas of debate emerged principally in relation to determination
of strategy, succession planning, board behaviour, executive
remuneration and how the Group manages its risk, particularly in
relation to HSSEIA. I did not talk about operational matters, as
these issues are dealt with by Ayman and Tim. I provided a report
to the Board after I had concluded the visits. Thomas Thune
Andersen, in his capacity as Chairman of the Remuneration
Committee, along with Carol Arrowsmith from Deloitte also
consulted with six of our major shareholders as well as three key
advisory services providers in early 2011 and again at the start of
this year to discuss remuneration policy.
We place considerable importance on communication with
our shareholders, including our employee shareholders.
All shareholders receive hard copies of our annual report
and accounts (ARA) and half-year reviews. These, and all
announcements we make to the market, together with copies of
presentations to analysts and interviews with Ayman and Tim are
available on our website (www.petrofac.com). All shareholders are
invited to attend the Company’s AGM at which they have the
opportunity to put questions to the Board and meet with those
Board Directors able to attend.
Our Annual General Meeting (AGM)
Full details of this year’s AGM, which will be held in London, are set
out in the Notice of AGM which accompanies the ARA and which
is also available on our website. As a matter of good practice, we
will conduct all resolutions on a poll and announce the results to the
market as soon as possible after the meeting.
I look forward to seeing as many of you as possible this year when
my colleagues and I will be available to answer your questions.
Norman Murray Chairman of the Board
2 March 2012
Petrofac Annual report and accounts 2011 79
Com
pany
financia
l sta
tem
ents
Com
Com
pany
pany
Gro
up
fin
ancia
l sta
tem
ents
107 153
Gove
rnance
G
Corp
ora
te
resp
onsi
bility
Corp
Corp
ora
tora
tee
Fin
ancia
l p
erf
orm
ance
and ris
kFin
aFin
ancia
ncia
ll
Revi
ew
of o
pera
tions
Gro
Gro
up
up
11
Directors’ informationCorporate governance report– Nominations Committee report– Audit Committee report– Board Risk Committee reportDirectors’ remuneration reportDirectors’ statements
Ri
fti
Ove
rvie
w
01 22 41 50

Dear shareholder
This year proved to be another busy one for the Nominations Committee and for the second consecutive year there have been several changes to the Board. Roxanne Decyk, Andy Inglis and I all joined the Board in March 2011 and I took over the role as Chairman of the Board and the Nominations Committee after the AGM in May 2011.
Following the decision by Keith Roberts to retire, in early 2011,
the Committee initiated an extensive selection process to identify
suitable candidates to succeed him as Chief Financial Officer.
With the assistance of specialist recruitment consultants,
Korn/Ferry Whitehead Mann, a planned succession exercise was
undertaken, involving a ‘mapping phase’ against agreed key criteria
for the role. A long list of internal and external candidates was
initially identified from which five candidates were shortlisted.
Each of the Committee members met with the final candidates
and following this rigorous process, Tim Weller’s appointment as
Chief Financial Officer was recommended to the Board by the
Committee. Tim joined the Group in September 2011 and following
a handover period, joined the Board in October 2011 at the same
time as Keith stepped down. The Committee believes that Tim will
bring tremendous value to the Group and thanks Keith for his
enormous contribution over the past ten years.
We regularly review the composition and balance of the Board
to ensure that we have the right structure, skills, knowledge
and experience in place to deliver our strategy in an organisation
which continues to grow and expand. We believe that our 50%
split between Executive and Non-executive Directors, while less
common than a few years ago, continues to be right for Petrofac.
We do not have a traditional executive committee as a
consequence of which our Board has a high operational focus
and we believe that our debate is enhanced by a strong executive
presence. In order to ensure, however, that we leave sufficient time
for other matters, our Board meetings last a whole day.
Norman Murray Chairman of the Nominations Committee
Nominations Committee report
Role of the Committee
Regularly reviews the composition and structure of the
Board and its committees.
Identifies and recommends for Board approval suitable
candidates to be appointed to the Board.
Considers succession planning for Directors and other senior
executives and in doing this considers diversity, experience,
knowledge and skills.
Membership and attendance at meetings held in 2011
Meetings attended (eligible to attend)
Current members
Norman Murray (Chairman) 3(4)
Ayman Asfari 5(6)
Thomas Thune Andersen 6(6)
Stefano Cao 6(6)
Roxanne Decyk 4(4)
René Médori n/a 1
Rijnhard van Tets 6(6)
Previous members
Rodney Chase 1(2)
Kjell Almskog 2(2)
1 Mr Médori was appointed a Director and member of the Nominations Committee in January 2012.
How the Committee spent its time during the year
Search for Directors
(Chairman, Non-executive Directors
and Executive Directors)
Board and committee composition
Governance
Other
�
�
�
�
Corporate governance report continued
Petrofac Annual report and accounts 201180

In the second half of 2011, the Committee engaged Egon Zehnder
International to assist with the search for an additional Non-
executive Director. Rijnhard van Tets, our Senior Independent
Director and Chairman of the Audit Committee, has served on
the Board for five years and so identifying individuals who were
qualified to serve on the Audit Committee was highlighted as very
important. After a considerable search process, two candidates
were shortlisted and then interviewed by the full Committee.
I am very pleased that René Médori, who has excellent international
and financial experience across a number of industries was
recommended by the Committee to the Board for appointment as
a Non-executive Director.
At the same time that the Committee recommended René for
appointment to the Board, it also recommended Marwan Chedid
be appointed a Director. Marwan, who is now responsible for our
Engineering, Construction, Operations & Maintenance (ECOM)
division, has been with the Company for 20 years. He is a very
experienced leader having enjoyed almost 30 years’ working in
the oil & gas industry. With his in-depth knowledge of both the
business and industry, the Committee had no hesitation in
recommending his appointment. Both Marwan and René were
appointed to the Board in January 2012.
Notwithstanding that our two most recent appointments to the
Board have been men, we remain committed to our aspiration
that excluding me, 15% and 25% of our Board should be female
by 2013 and 2015, respectively. We requested both search
consultants to ensure that women were included on our long
and short lists when looking for Tim and René but ultimately
we concluded that the best candidates for each role were male.
We will continue to press our search consultants to include more
female candidates in any future external searches. The Committee
will be monitoring diversity for the Group as a whole in future.
During the year we reviewed our terms of reference. We agreed
that they conform with best practice and as a result, they remain
unchanged from last year.
Norman Murray Chairman of the Nominations Committee
2 March 2012
Petrofac Annual report and accounts 2011 81
Com
pany
financia
l sta
tem
ents
Com
Com
pany
pany
Gro
up
fin
ancia
l sta
tem
ents
107 153
Gove
rnance
G
Corp
ora
te
resp
onsi
bility
Corp
Corp
ora
tora
tee
Fin
ancia
l p
erf
orm
ance
and ris
kFin
aFin
ancia
ncia
ll
Revi
ew
of o
pera
tions
Gro
Gro
up
up
11
Directors’ informationCorporate governance report– Nominations Committee report– Audit Committee report– Board Risk Committee reportDirectors’ remuneration reportDirectors’ statements
Ri
fti
Ove
rvie
w
01 22 41 50

Dear shareholder
The Audit Committee held three meetings during the year and it was very much business as usual. The Committee has responsibility for overseeing our financial reporting and has a structured agenda of matters to consider which coincide with key events in our financial reporting cycle.
Following on from our 2010 commitment to review the interface
between this Committee and that of the Board Risk Committee,
the terms of reference for both committees were reviewed and
updated during the year. While the Audit Committee continues to
concentrate on all financial and regulatory compliance internal
controls, the remit of the Board Risk Committee is to consider the
Group’s system of enterprise risk management. As Chairman of
the Audit Committee, I also serve on the Board Risk Committee.
In addition, two of my fellow members Roxanne and René also
serve on both Committees. The Board considers it very important
that there is a shared dialogue between committee members
notwithstanding the split in responsibilities.
In December 2010, the FRC published revised guidance on audit
committees which resulted in the Committee revising the non-audit
services policy, details of which are provided later in this report.
An important aspect of the Committee’s role is the continuing
review of the effectiveness of the Company’s financial and
regulatory compliance internal control process. As the Group
continues to grow and expand, the introduction of our Integrated
Energy Services (IES) division is one example of how the Group is
evolving. It is particularly important for the Committee to be satisfied
that our systems of internal controls appropriately reflect the
change in the size and shape of the Group, as well as being
embedded into each of our businesses.
Rijnhard van Tets Chairman of the Audit Committee
Audit Committee report
Role of the Committee
Monitors the integrity of the Company’s financial statements
and reviews significant financial reporting judgements.
Reviews the effectiveness of financial and regulatory
compliance controls and systems.
Monitors the effectiveness of the Group’s internal audit
function and reviews its material findings.
Oversees the relationship with the external auditors,
including agreeing their fee and assessing their independence
and effectiveness.
Membership and attendance at meetings held in 2011
Meetings attended (eligible to attend)
Current members
Rijnhard van Tets (Chairman) 3(3)
Thomas Thune Andersen 3(3)
Roxanne Decyk 2(2)
René Médori n/a 1
Previous members
Kjell Almskog 1(1)
1 Mr Médori was appointed a Director and member of the Audit Committee in January 2012.
How the Committee spent its time during the year
Whistle blowing
Finance and tax reviews/updates
Internal audit
External audit
Results review
Training
Other
�
�
�
�
�
�
�
Corporate governance report continued
Petrofac Annual report and accounts 201182

In line with the UK Code, we have encouraged committee members
to ensure that they keep up to date with technical developments
throughout the year. During 2011, I arranged for our auditors,
Ernst & Young, and the Finance Director of IES to provide four
training seminars to the Committee, albeit all Directors were invited.
Further details of the seminars are provided within this report.
I am delighted that René Médori joined the Committee following
his appointment in January 2012. I consider that the Committee
has an appropriate balance between those individuals with finance
or accounting training and those from an oil & gas background.
Both René and I have recent and relevant financial experience
and I have made considerable efforts during the year to ensure
that we and the rest of the Committee are kept up to date with
financial developments.
Looking ahead to 2012, we will continue to concentrate on ensuring
that the Group produces financial statements of an appropriate
standard and will monitor the framework of financial and regulatory
compliance controls. We will, in particular, look to ensure that
the detail of the interface between the Audit and Board Risk
Committees is developed so that the risk of any matter falling
between the two committees is minimised.
Rijnhard van Tets Chairman of the Audit Committee
2 March 2012
Petrofac Annual report and accounts 2011 83
Com
pany
financia
l sta
tem
ents
Com
Com
pany
pany
Gro
up
fin
ancia
l sta
tem
ents
107 153
Gove
rnance
G
Corp
ora
te
resp
onsi
bility
Corp
Corp
ora
tora
tee
Fin
ancia
l p
erf
orm
ance
and ris
kFin
aFin
ancia
ncia
ll
Revi
ew
of o
pera
tions
Gro
Gro
up
up
11
Directors’ informationCorporate governance report– Nominations Committee report– Audit Committee report– Board Risk Committee reportDirectors’ remuneration reportDirectors’ statements
Ri
fti
Ove
rvie
w
01 22 41 50

Financial reporting
The Committee assists the Board in the effective discharge of its
responsibilities for financial reporting and internal control. As set out
in our Directors’ statements on page 106, Directors are responsible
for the preparation of Group financial statements, in accordance
with International Financial Reporting Standards (IFRS), and for
being satisfied that they give a true and fair view. The Group has
an internal control and risk management framework in place
which permits the Company to prepare consolidated accounts.
This includes policies and procedures to ensure that adequate
accounting records are maintained and transactions accurately
recorded to ensure the Company’s financial reports and
communications to the market give a clear and balanced
assessment of the Company’s position.
During the year, the Committee considered and reviewed:
• 2010 full-year and 2011 half-year financial statements, including all requirements for financial reporting
• 2010 annual final results and half year results announcements made to the London Stock Exchange
• Company’s Interim Management Statements and all proposed announcements to be made by the Company to the extent that they contained material financial information
• revised accounting policies
• operation of the Company’s whistle blowing policy
• effectiveness of the Company’s internal control and risk management procedures
• recommendations that the Board approve the new Group reporting segments and the restating of historical numbers to the market
• updating the terms of reference following the review of the risk management framework
In addition, we reviewed the 2011 full-year results and the Annual
Report and Accounts at the start of 2012.
As part of these reviews, we discussed with the Chief Financial
Officer and the external auditors all significant accounting policies,
estimates and judgements that had been adopted.
Internal controls systems
The Committee took partial responsibility for reviewing the Group’s
internal controls primarily through its engagement with our internal
audit function and the Board Risk Committee. Our Group Head of
Internal Audit, Ajit Nair, is responsible for providing assurances on
the adequacy of internal control functions throughout the Group
and attends each Committee meeting. At the start of the year the
Committee agrees the annual internal audit plan, which is drawn up
on a risk-based approach. Any significant findings from internal
control audits undertaken during the year have been appropriately
investigated and the necessary actions taken to address and rectify
any weaknesses that may have been identified. Ajit provides a
progress report part way through the year as a consequence of
which the plan may be revised. A final report on the achievement of
the plan is given at the end of each year and in February 2012 the
internal audit department confirmed it had completed 78
assignments across a broad cross-section of the Group’s activities
during 2011. The Committee has reviewed the effectiveness of the
internal audit function and KPIs relating to the activity of the
department. In September 2011, Ajit gave a presentation to the
senior management team on internal audit matters. Action plans
with the managing director of each business unit were agreed and
as a result the Committee is encouraged that management is
giving its full attention to any outstanding issues.
Training
At the end of last year, I considered whether the Committee might
benefit from some formal training. As a result, the following topics
were identified and representatives of Ernst & Young as well as
management led these sessions outside formal committee
meetings. All Directors were invited to attend these seminars
and nearly all Directors chose to do so:
March 2011 Accounting for variation orders
Accounting for acquisitions
We are often required to account for variation orders and have a number of investments and joint venture arrangements which must be correctly treated.
August 2011 Accounting for contracts in IES
Given that the scope of our business is changing, particularly given the growing prominence of IES, it is important that the Board understands the basic accounting framework to be adopted for PEC, RSC and equity investment contracts.
October 2011 Financial focus for IES
Management demonstrated the process by which IES assesses both the commercial case and the accounting treatment to be adopted for a project.
November 2011 Revenue recognition – the new Exposure Draft
When to recognise revenue is a fundamental accounting judgement for any business and of particular relevance to Petrofac given the possible impact in relation to accounting for lump-sum EPC contracts.
Corporate governance report continued
Petrofac Annual report and accounts 201184

Whistle blowing process
The Company’s whistle blowing policy is communicated to
employees through the Company’s Code of Business Conduct
(CoBC) and is highlighted in employee induction packs. 69% of the
employees who completed the 2011 employee survey confirmed
that they were aware of the policy. Further education and publicity
programmes are being planned for 2012. Employees who know or
have genuine suspicions of any breaches of the CoBC can report
the matter to a manager or contact an independent helpline
anonymously. Our international external facility has been available
for a number of years and this service operates 24 hours a day,
seven days a week. All matters, however reported, are reviewed
and investigated by our Group Head of Compliance to assess
whether further investigation is warranted and to ensure that
appropriate action is taken. At each meeting, the Committee
received a detailed analysis of the issues reported together with
details of any action being taken. In future, the Committee
will continue to review alleged breaches of the CoBC relating to
financial compliance matters and the Board Risk Committee will
review all other matters.
Effectiveness of Group external auditors
Ernst & Young who have been the Company’s auditor since initial
listing, provide the Committee with relevant reports, reviews,
information and advice throughout the year as set out in their
engagement letter. Their performance was formally assessed and
the Committee judged that they remained effective. In making its
assessment of the external auditors, the Committee had due
regard to their expertise, resourcing and independence. The
Committee remains satisfied of their effectiveness and it does not
consider it necessary to conduct a tender process this year.
In accordance with UK regulations, our auditors adhere to a
rotation policy based on best practice and accounting standards.
Accordingly, a new lead audit partner will take over at the end of the
2012 audit.
Non-audit services policy
We have a non-audit services policy that sets out the
circumstances where we may appoint our external auditors to
undertake additional non-audit work. Management regularly
provide the Committee with reports on the extent of non-audit
services provided by our external auditors. These reports are
reviewed at each Committee meeting and challenged, where
necessary, to ensure such services fall within the agreed policy
and do not impair the objectivity or independence of the auditors.
The majority of the non-audit work carried out by the auditors
during the year related to tax compliance services in overseas
jurisdictions and the Committee believes that given their
experience, Ernst & Young were the most appropriate supplier
of this work. There were no breaches during the year of the
US$300,000 threshold requiring prior approval by the Committee.
Details of non-audit work carried out by Ernst & Young during 2011
are provided in note 4e to the financial statements.
Following the review of the FRC report in December 2010,
the Committee reviewed the existing policy and agreed to:
• revise the wording in relation to work from which the auditors are excluded to make reference to the guidance provided in Ethical Standards 5; and
• increase the fee level from US$200,000 to US$300,000 for which the Committee be requested to give prior approval, as it was felt this limit would more accurately reflect the current size of the Group
The current policy, a copy of which can be found on the
Company’s website, is summarised below:
• the external auditors are automatically prohibited from carrying out work which might impair their objectivity
• Tim Weller, as Chief Financial Officer, will seek approval from the Committee before appointing the external auditors to carry out a piece of non-audit work where:
– the fee is above US$300,000
– total non-audit fees for the year are approaching 50% of the annual audit fee
– the external auditors would ordinarily be prohibited from carrying out the work under the Company’s non-audit services policy but not prohibited under Ethical Standard 5 and the Chief Financial Officer wants to appoint them due to exceptional circumstances
• the Chief Financial Officer may appoint the external auditors to do
other types of non-audit work as listed in the policy
Petrofac Annual report and accounts 2011 85
Com
pany
financia
l sta
tem
ents
Com
Com
pany
pany
Gro
up
fin
ancia
l sta
tem
ents
107 153
Gove
rnance
G
Corp
ora
te
resp
onsi
bility
Corp
Corp
ora
tora
tee
Fin
ancia
l p
erf
orm
ance
and ris
kFin
aFin
ancia
ncia
ll
Revi
ew
of o
pera
tions
Gro
Gro
up
up
11
Directors’ informationCorporate governance report– Nominations Committee report– Audit Committee report– Board Risk Committee reportDirectors’ remuneration reportDirectors’ statements
Ri
fti
Ove
rvie
w
01 22 41 50

Dear shareholder
This has been a particularly busy year for the Board Risk Committee. The UK Code now requires the Board to determine the nature and extent of the significant risks it is willing to take in order to achieve its strategic objectives, in addition to which the Group has increased in size and complexity. The Board therefore requested the Board Risk Committee to undertake a review of the Group’s risk management framework, in order that it could be satisfied that the risk management framework enabled it to fulfil its governance commitment and furthermore that the systems in place continued to be fit for purpose. This was a large task requiring an additional Committee meeting outside the normal cycle of meetings and including an extensive review and revision of the Group’s system of delegated authorities. A full report on progress to date is provided later in this report.
The UK Bribery Act was implemented during the year and Petrofac
appointed Marcelo Cardoso, as Group Head of Compliance with
primary responsibility for ensuring that employees comply with the
Group’s CoBC, which includes compliance with our anti-bribery
and corruption standard. Marcelo provided the Committee with
both a general update on the CoBC and also management’s
progress in implementing processes for mitigating risks associated
with bribery and corruption.
There was, naturally, an increased focus from both the Committee
and the Board on the Group’s security arrangements given the
continuing political and social unrest in the Middle East and
North Africa. We sought assurance from management about the
Group’s project, office and country evacuation plans, as well as
business continuity plans, and we received monthly updates
outside scheduled meetings, with follow-up telephone calls
if deemed necessary.
As in previous years, the Committee reviewed the three Group
policies that cover non-financial controls and received general
updates on business continuity planning, security and
insurance cover.
Stefano Cao Chairman of the Board Risk Committee
Board Risk Committee report
Role of the Committee
Recommends risk appetite and delegations of authority.
Approves the annual assurance plan for enterprise risks.
Reviews the Group’s compliance system of corporate
standards and procedures for enterprise risks.
Recommends any areas of risk management change that
may be required for enterprise risks.
Reviews the Company’s risk transfer strategy, including
insurance provision.
Reviews the risk management and reporting systems for
projects and investments.
Membership and attendance at meetings held in 2011
Meetings attended (eligible to attend)
Current members
Stefano Cao (Chairman) 4(4)
Roxanne Decyk 2(2)
René Médori n/a 1
Rijnhard van Tets 4(4)
Previous members
Kjell Almskog 2(2)
1 Mr Médori was appointed a Director and member of the Board Risk Committee in 2012.
How the Committee spent its time during the year
Business continuity
Anti-bribery and corruption framework
Insurance
Group policies
Risk management framework
Security and travel
Governance/other
�
�
�
�
�
�
�
Corporate governance report continued
Petrofac Annual report and accounts 201186
The Committee received a great deal of support from management
over the course of the year: all Executive Directors made
themselves available to answer the Committee’s questions and
the Group Director Legal & Commercial Affairs and Group Head
of Enterprise Risk led the overall review of the Group’s risk
management framework. In addition, other members of the
management team made presentations to the Committee.
The Committee continues to use the revised Turnbull guidance,
published by the FRC in 2005, as its main guidance for discharging
its risk management obligations. Turnbull suggested companies
follow a principles-based approach and consider the following
questions:
• Do you know and understand your significant risks?
• How do you monitor your internal controls and risk management system?
• Is your Board receiving information which allows it to identify when delivery of its goals are under threat?
• What is your general control environment like?
We continue to believe that these questions are highly pertinent
and we look forward to the FRC’s limited review of the Turnbull
guidance scheduled for 2012. We welcomed the FRC paper
published in September 2011 on how boards might discharge
their risk obligations. We agree in particular that there is no universal
model for corporate risk management: each company needs
to think carefully about its own particular circumstances and
devise an appropriate framework. We also agree that while good
processes and reporting are essential, it is equally important to
have a culture that promotes personal ownership, openness and
trust. A company needs good processes, talented management
and the right values in order to promote truly effective
risk management.
I anticipate that 2012 will be another busy year for the Board Risk
Committee as our new risk management framework beds down
and we focus on assurance and reporting.
Stefano Cao Chairman of the Board Risk Committee
2 March 2012
Petrofac Annual report and accounts 2011 87
Com
pany
financia
l sta
tem
ents
Com
Com
pany
pany
Gro
up
fin
ancia
l sta
tem
ents
107 153
Gove
rnance
G
Corp
ora
te
resp
onsi
bility
Corp
Corp
ora
tora
tee
Fin
ancia
l p
erf
orm
ance
and ris
kFin
aFin
ancia
ncia
ll
Revi
ew
of o
pera
tions
Gro
Gro
up
up
11
Directors’ informationCorporate governance report– Nominations Committee report– Audit Committee report– Board Risk Committee reportDirectors’ remuneration reportDirectors’ statements
Ri
fti
Ove
rvie
w
01 22 41 50

Review of the Group’s risk management framework
As a result of the changes implemented by the UK Code there has
been an increased emphasis on companies being able to articulate
their risk appetite and to determine in advance what sort of risks
they will or will not take. The introduction of the UK Code in 2010
prompted the Board to request the Board Risk Committee
to undertake a review of the Group’s risk management framework
not only to ensure that the Board complies with the UK Code
but also that the risk management framework is appropriate given
the Group’s recent growth.
At the start of 2011, the Group Head of Enterprise Risk appointed
McKinsey & Company to assist him in this review. At the same time,
mainly in response to last year’s Board evaluation exercise, the
Group Director Legal & Commercial Affairs initiated a review of the
Group’s delegated authorities. The two exercises were clearly
linked as the Group’s delegated authorities matrix sets out which
matters are reserved for the Board’s consideration and which are
delegated below and to whom, and specifies the extent of
independent review.
In August 2011, management presented an initial report to the
Committee both in relation to the risk management framework and
the Group’s delegated authorities matrix. The Committee provided
direction and comment as a consequence of which management
made various revisions before returning to the Committee in
October 2011 with final drafts. The Committee then recommended
to the Board that it approve the revised risk management
framework and the revised matrix of delegated authorities which
it did at the end of 2011.
As a culmination of the work undertaken during 2011, the new risk
management framework which came into effect from January
2012 is explained in further detail on page 89 and is set out in the
diagram below:
Board
Divisional Risk Review
Business Units
Group Functions Internal Audit
Board Risk Committee Audit Committee
Group Risk Committee
Provides assurance on framework
Provides assurance on framework
Enterprise risk register given to Board Risk
Committee for review
Board oversight of framework of internal controls and risk management
Assurance to management and the Board
Responsible for approval of significant projects and investments and approval of enterprise risk register
Risk management is embedded within each business unit
Divisional management oversight and review of projects
Senior management consider risk on significant projects and investments for formal consideration by the Board. Oversight of enterprise risk register
Corporate governance report continued
Petrofac Annual report and accounts 201188

The Board retains ultimate responsibility for setting the Group’s risk
appetite and approving the enterprise risk register; that is risks
which the Board considers sufficiently significant that might prevent
the delivery of strategy or threaten Petrofac’s continued existence.
Details of the key risks facing the business are described on pages
47 to 49.
The Board Risk Committee is responsible for making
recommendations in relation to the Group’s risk appetite and
matrix of delegated authorities to the Board. In addition, it reviews
the enterprise risk register and is responsible for oversight of risk
management systems and providing the Board with formal
assurance that these systems are appropriate and effective.
Historically, we have talked about the Board Risk Committee
having primary responsibility for operational risk management.
This continues to be the case, but we have broadened
our definition to include Group enterprise risk management
which includes both operational risks and enterprise risks.
The Audit Committee has a number of roles including responsibility
for oversight of the Group’s financial and regulatory controls
and providing the Board with formal assurance that these systems
are appropriate and effective.
The Group Risk Committee is a management committee and
has been formed by the amalgamation of the former Group
Risk Review Committee and the Enterprise Risk Committee.
This committee provides reports directly to both the Board and
to the Board Risk Committee. The committee reviews the risks
for all material new business opportunities or projects after which
management will bring these matters to the Board for its formal
consideration provided the committee has concluded that the risk
associated with the investment or project has been appropriately
addressed. This committee also has primary responsibility for
drawing up and maintaining the Group enterprise risk register and
bringing it to the Board Risk Committee for its initial review as well
as to the Board for its further review and approval. Its members
are Ayman Asfari, Maroun Semaan, Andy Inglis, Marwan Chedid,
Tim Weller and Richard Milne.
Divisional Risk Review Each division has a Risk Review Committee
chaired by its Chief Executive which provides peer review
of proposed projects and investments.
Each of our individual businesses has its own business
management system that incorporates policies and procedures
that assist with the business’ risk management. Each business
produces its own risk matrix or register. Each business unit’s
management team meets regularly and monitors the risk matrix
as a matter of course. They note any change in risk assessment
at an individual and aggregate level and seek to take appropriate
mitigating action should they believe it necessary. The risk matrices
for each business are formally reviewed each month by Ayman and
his immediate management team. If a situation occurs which local
management judges to be serious, it will be reported up the chain
of command immediately.
Risk appetite
As part of the review of our risk management framework, the
Board Risk Committee considered at length how the Company
might articulate its risk appetite, engaging the whole Board in the
discussion. The Board considered that it should not apply a single,
aggregate risk appetite for the Company as a whole. It believes,
however, that it can go some way to articulating its tolerance
for individual types of risks on an aggregated basis, albeit this is
unlikely to be of a precise nature, such as might be seen within a
financial institution. The Board Risk Committee will continue to
consider this matter over the course of 2012 as it understands that
the Board must have a clear understanding of the Group’s risk and
tolerance for overall and individual types of risk at any one time so
that it is able to exercise appropriate stewardship. Currently, the
Board develops an understanding of the risks facing the business
by reliance upon the revised delegated authorities matrix; our
enterprise risk register; our policies and standards and ongoing
open dialogue with executive colleagues.
The Board concluded last year that the Group’s matrix of delegated
authorities should be revised. The Group has grown significantly
since the Company was initially listed while the matrix of delegated
authorities had remained largely unchanged. This had resulted in
the Board spending too much time considering relatively minor
operational matters. The Board believed that there was an
opportunity for management to deal with more routine matters
so that the Board could spend more time considering strategy,
significant risks and succession planning. The Group Director Legal
& Commercial Affairs worked with the Board Risk Committee over
a number of months to develop a revised matrix, taking account of
the Group’s increased size and evolving shape. The revised matrix
sets out clearly what requires Board approval and what may be
dealt with by management. For any matter that must go to the
Board, the risk associated with the business opportunity both
in isolation and from a Group perspective will be considered.
The Board does not therefore pre-judge whether or not it
will undertake a particular business opportunity but it has
determined which types of business it would wish to consider.
While the revised matrix of delegated authorities has generally
increased management’s authority with regard to routine business,
the Board has increased its oversight of business in any new
territory; joint venture arrangements; contracts with novel
technology, services or terms.
Our enterprise risk register continues to evolve. Management has
sought to identify the key risks facing Petrofac and the register will
be revisited regularly by the Group Risk Committee during 2012
and beyond. It will be reviewed by the Board Risk Committee
before being submitted to the Board for its consideration
and approval.
Executive Directors and selected members of senior management
are invited to the Board Risk Committee as a matter of course.
They respond to the Committee’s questions in a very open way,
which provides the Committee with reassurance that the Group’s
overall culture is one where risk management standards and
processes are embedded and respected within the organisation.
It is essential that a company has the right kind of management
and behaviours as well as the right kind of standards and
processes if it is to manage risk appropriately.
Petrofac Annual report and accounts 2011 89
Com
pany
financia
l sta
tem
ents
Com
Com
pany
pany
Gro
up
fin
ancia
l sta
tem
ents
107 153
Gove
rnance
G
Corp
ora
te
resp
onsi
bility
Corp
Corp
ora
tora
tee
Fin
ancia
l p
erf
orm
ance
and ris
kFin
aFin
ancia
ncia
ll
Revi
ew
of o
pera
tions
Gro
Gro
up
up
11
Directors’ informationCorporate governance report– Nominations Committee report– Audit Committee report– Board Risk Committee reportDirectors’ remuneration reportDirectors’ statements
Ri
fti
Ove
rvie
w
01 22 41 50

Assurance and reporting
The Board Risk Committee will continue its work in relation to the
Group’s risk management framework in 2012. Its primary areas
of focus will be in relation to further developing the assurance
programme for the Group’s enterprise risk management and
ensuring that our reporting on risk through the chain of command
is meaningful.
It is likely that Group Internal Audit will focus on providing assurance
for financial and regulatory controls and therefore continue to report
solely to the Audit Committee, while the relevant Group functions
will report to the Board Risk Committee on the range of enterprise
risks that fall within its remit.
Interface between the Board Risk Committee and Audit Committee
The Board Risk Committee and Audit Committee both revised
their respective terms of reference during 2011. As a result, the
Board Risk Committee will now take responsibility for assurance
and oversight of enterprise risk management while the Audit
Committee takes responsibility for assurance and oversight of
financial and regulatory controls. Whilst the Board has delegated
the detailed work to these two committees, it retains overall
responsibility for ensuring that the Group has effective internal
controls and risk management and therefore relies upon
assurances from both committees that this is the case. In addition,
the Board retains ultimate responsibility for the Group enterprise
risk register.
Rijnhard, Roxanne and now René are members of both the Board
Risk Committee and Audit Committee, thus helping to ensure that
each committee is aware of the other’s activities.
Bribery
The UK Bribery Act came into force in July 2011 and created a new
corporate offence of failing to prevent bribery. Our CoBC is clear
that Petrofac does not permit the giving or receiving of bribes.
Nevertheless, we have to ensure that we have in place adequate
procedures, designed to prevent bribery in our value chain.
The primary remit of our newly appointed Group Head of
Compliance is to ensure that employees are aware of and adhere
to the CoBC. He has initially focused on rolling out Petrofac’s
standard for prevention of bribery and corruption, including
the implementation of an extensive educational and training
programme and raising awareness of our whistle blowing process.
Online training, designed to communicate the existence
of our standard and its key principles was rolled out to an initial
targeted population of 3,000 in July 2011. At the end of the year,
2,003 employees across the Group had completed the anti-bribery
training, with new employees being required to undertake
the training within 90 days of joining the Group. The anti-bribery
training has been delivered to teams from Iraq, Turkmenistan
and Algeria and there has been engagement with project teams
in Nigeria and Mexico.
Security
The Board Risk Committee has followed events in the Middle East
and North Africa (MENA) during 2011. The majority of our work is,
of course, in the MENA region, but to date the Group has suffered
minimal disruption to its activities. Our Group Head of Security
provided the Board Risk Committee with a full update
on our security policies and procedures during our meeting in May.
While reviewing our security framework is important, the Board
was also concerned about the potential immediate impact on the
Group. It therefore requested that the Group Head of HSSEIA
provide a full additional update to the Board at the start of 2011
and regular updates on each country from then on.
Policies
During the year, the Board Risk Committee reviewed our three
Group policies, as listed in the table below. The reviews considered
whether the policies required any amendment and assurance that
they are being adhered to across the Group and were revised
as appropriate.
Policy Articulates our attitude to risks related to:
Sovereign and Financial Market Risk Policy
Country, inflation, commodity, currency, credit and counterparty risk
Ethical, Social and Regulatory Risk Policy
Ethics, non-compliance with a country’s local laws and regulations
Operational and Contractual Risk Policy
Project performance, business continuity, leadership change and HSSEIA
The Group Head of Treasury provided a full report at the start
of 2011 about the Sovereign and Financial Market Risk Policy
which, given the continued global financial insecurity, was timely.
The Board Risk Committee approved a number of standards
supporting one or other of the above policies: the community
standard regarding our in-country CR activities; and our
security standard.
Business continuity
We made good progress at the start of the year in relation to our
business continuity planning. Management has reported that its
hub offices in Sharjah, Aberdeen, Mumbai, Chennai, London,
Woking and Kuala Lumpur now have business recovery plans
and that testing these plans has been completed for three
offices. The remaining offices will be tested in due course.
Our Aberdeen and Woking offices have each been awarded
BS 25999 accreditation.
Insurance
The Board Risk Committee received two insurance updates during
the year, which covered both a general insurance update and a
catastrophe insurance update.
Corporate governance report continued
Petrofac Annual report and accounts 201190

Regular items Other items
• Update on performance for subsisting Performance Share Plan (PSP) awards
• Consideration of feedback from shareholders on 2011 remuneration proposals
• Approval of 2011 PSP structure and performance conditions
• Consideration of a new one-off incentive plan (Value Creation Plan)
• Consideration of 2011 salary increases and prior year bonus and provisional PSP award levels for the year
• Consideration of remuneration arrangements in respect of changes to Executive Directors
• Approval of 2011 PSP awards
• Approval of 2011 Deferred Bonus Share Plan (DBSP) awards under the annual bonus award cycle
• Confirmation of vesting status of 2008 PSP awards
• Review of provisional 2011 annual bonus pools
• Review of Restricted Share Plan (RSP) awards made during 2011
• Review of Committee terms of reference
• Approval of Directors’ remuneration report
Thomas Thune Andersen Chairman of the Remuneration Committee
Remuneration Committee report
Role of the Committee
Determine and agree with the Board the framework
or broad policy for the remuneration of Executive Directors,
the Chairman and certain senior managers.
Review the ongoing appropriateness and relevance
of the remuneration policy.
Ensure that incentives are appropriate to encourage
enhanced performance.
Approve the design of, and determine the targets
for, any performance related pay scheme.
Review the design of all share incentive plans before approval
by the Board and shareholders and monitor the application
of the rules of such schemes and the overall aggregate
amount of the awards.
Determine the remuneration of all Executive Directors,
the Chairman and certain senior managers and within
the agreed policy, taking into account remuneration trends
across the Company and remuneration practices in other
peer companies.
Membership and attendance at meetings held in 2011
Meetings attended (eligible to attend)
Current members
Thomas Thune Andersen (Chairman) 5(5)
Stefano Cao 5(5)
Roxanne Decyk (from 13 May 2011) 3(3)
Previous members
Kjell Almskog (until 13 May 2011) 2(2)
What did the Committee do in 2011?
Regular items
Items relating to Board changes
Consideration of feedback received
from shareholders on 2011
remuneration proposals
Consideration of 2012 remuneration
proposals, including the Value
Creation Plan
�
�
�
�
Directors’ remuneration report
Petrofac Annual report and accounts 2011 91
Com
pany
financia
l sta
tem
ents
Com
Com
pany
pany
Gro
up
fin
ancia
l sta
tem
ents
107 153
Gove
rnance
G
Corp
ora
te
resp
onsi
bility
Corp
Corp
ora
tora
tee
Fin
ancia
l p
erf
orm
ance
and ris
kFin
aFin
ancia
ncia
ll
Revi
ew
of o
pera
tions
Gro
Gro
up
up
11
Directors’ informationCorporate governance report– Nominations Committee report– Audit Committee report– Board Risk Committee reportDirectors’ remuneration reportDirectors’ statements
Ri
fti
Ove
rvie
w
01 22 41 50

Dear shareholder
As Chairman of Petrofac’s Remuneration Committee, I am pleased to present the Directors’ remuneration report after another year of exceptional performance.
2011 bonus and PSP outcomes
As outlined on pages 42 and 43, Petrofac has delivered strong
growth in 2011 across the majority of its KPIs, including revenue
and earnings. In reaching our decision on bonuses, we took this
into account, whilst acknowledging that some backlog targets were
only partially achieved. When coupled with strong individual
performance, 2011 bonus outcomes were 75%–100% of
maximum.
Our three-year TSR and EPS performance over 2009–2011
was such that the 2009 PSP awards have been earned in full.
2012 proposals
Base salaries continue to be generally conservative, and increases
for Executive Directors for 2012 are aligned with the wider UK and
UAE employee population. In addition, cash allowances to all
Executive Directors are being frozen for 2012.
The Committee intends to introduce a new one-off incentive plan
(the Value Creation Plan). Further details are provided below with a
summary of key terms on pages 98 and 99. There are no other
changes proposed to executive remuneration at Petrofac in 2012.
Value Creation Plan
We are a unique company, having been built up by a generation of
entrepreneurs who continue to have a major stake in the business.
Since IPO in 2005, the Company has delivered a total shareholder
return of over 700% – the FTSE 100 returned 27% over the same
period – and is the second best performing FTSE 100 company
over this time.
We are now moving into a new phase of development, supported
by recent appointments of key new talent. The core founding
shareholders consider that it is critical to foster within the new team
the entrepreneurial spirit that has driven Petrofac’s exceptional
performance to date.
To support this ambition, after careful consideration and
consultation with major shareholders, the Committee is proposing
the implementation of a new one-off incentive plan, in order to:
• ensure continued delivery of exceptional growth and shareholder value creation
• build sustained performance over the long term
• develop a new generation of leaders with an ownership mindset
Ayman Asfari and Maroun Semaan (who together own over
26% of Petrofac’s issued share capital) will not participate in
this new plan. The proposed incentive plan will provide strong
alignment with shareholders. Participants will only share in value
created through share price growth above a hurdle, subject to
the achievement of stretching long-term performance targets
linked to our ambitious goal of more than doubling 2010 Group
earnings by 2015.
Full details of the proposed new plan are set out in the Notice
of Annual General Meeting, where it will be presented for
shareholder approval.
Risk Management
As a matter of course, the Committee considers executive
remuneration matters with due reference to risk management.
We believe that the remuneration arrangements in place do not
raise health and safety, environmental, social or ethical issues,
nor inadvertently motivate irresponsible behaviours. There are
unambiguous risk management measures in the annual bonus,
PSP and the proposed Value Creation Plan.
The Committee values all feedback from shareholders and hopes
to receive your support at the forthcoming AGM.
Thomas Thune AndersenChairman of the Remuneration Committee
2 March 2012
Directors’ remuneration report continued
Petrofac Annual report and accounts 201192
Introduction
This remuneration report has been prepared in accordance with
Schedule 8 to the Large and Medium-sized Companies and
Groups (Accounts and Reports) Regulations 2008 of the United
Kingdom and relevant listing rules of the Financial Services
Authority. The Remuneration Committee takes responsibility for the
preparation of the report, which is approved by the Board.
This report sets out the remuneration policy and principles under
which Directors and senior managers are rewarded, and details
the remuneration and share interests of each Director for the year
ended 31 December 2011.
Although not a requirement of Jersey law, shareholders will be
invited to approve this report at the Annual General Meeting (AGM)
on 11 May 2012. The vote on this resolution will have advisory
status only and will cover the remuneration policy and overall
remuneration packages and will not be specific to individual levels
of remuneration. Members of the Remuneration Committee will
be available at the AGM to answer shareholders’ questions about
Directors’ remuneration.
The sections of this report dealing with Directors’ emoluments
and share interests have been audited (pages 103 to 105) by the
Group’s external auditors.
The Board and the Committee consider that, throughout 2011 and
up to the date of this report, the Company has complied with the
provisions of the UK Corporate Governance Code (UK Code)
relating to Directors’ remuneration.
The Committee takes its responsibility very seriously and monitors
developments in the area of executive remuneration closely, for
example, inputting into the recent BIS consultation paper on
executive remuneration.
As set out above, the Committee considers executive remuneration
matters in the context of alignment with risk management. Two
members of the Board Risk Committee sit on the Committee
which allows them to provide oversight on any Group risk factors
relating to remuneration matters. The Committee believes that the
remuneration arrangements in place do not raise health and safety,
environmental, social or ethical issues nor inadvertently motivate
irresponsible behaviours.
Information not subject to audit
Support for the Committee
The Committee has appointed Deloitte LLP (Deloitte) to provide
independent advice on remuneration matters. Deloitte is a member
of the Remuneration Consultants Group and as such voluntarily
operates under the code of conduct in relation to executive
remuneration consulting in the UK.
During 2011, Deloitte also provided tax services and an internal
audit secondee to the Company.
In addition, the Committee received support during 2011 from legal
advisors Norton Rose, who provided advice on certain matters
relating to compensation and benefits.
To continue with Committee training, Carol Arrowsmith of Deloitte
also provided the Committee with a formal update on the external
environment for executive remuneration during the course of a
meeting.
During 2011, the following individuals, none of whom were
Committee members, attended at least part of one meeting:
Individual Role Reason for attendance
Ayman Asfari Group Chief Executive To provide context for matters under discussion
Rodney Chase Chairman of the Board To provide context for matters under discussion
Norman Murray Chairman of the Board To provide context for matters under discussion
Mary Hitchon Secretary to the Board Secretary
Geoff Tranfield Group Head of HR To provide context for matters under discussion
Carol Arrowsmith
Partner at Deloitte LLP Advisor
None of the above individuals attended part of any meeting
in which their own compensation was discussed.
Petrofac Annual report and accounts 2011 93
Com
pany
financia
l sta
tem
ents
Com
Com
pany
pany
Gro
up
fin
ancia
l sta
tem
ents
107 153
Gove
rnance
G
Corp
ora
te
resp
onsi
bility
Corp
Corp
ora
tora
tee
Fin
ancia
l p
erf
orm
ance
and ris
kFin
aFin
ancia
ncia
ll
Revi
ew
of o
pera
tions
Gro
Gro
up
up
11
Directors’ informationCorporate governance report– Nominations Committee report– Audit Committee report– Board Risk Committee reportDirectors’ remuneration reportDirectors’ statements
Ri
fti
Ove
rvie
w
01 22 41 50

Remuneration policy – Executive DirectorsThe Committee aims to establish a level of remuneration which:
• is sufficient to attract, retain and motivate Executive Directors and key executives of the calibre required to achieve the Group’s objectives
• reflects the size and complexity of the Group’s business together with an executive’s individual contribution and geographical location
The remuneration policy for Executive Directors and certain senior managers is as follows:
• basic salaries would be median or below, against a relevant benchmarking group (see table below)
• the variable elements of remuneration would be structured so that individuals could achieve upper quartile total remuneration, subject to achievement of challenging performance standards
This policy has remained unchanged since 2007. The Committee believes that this policy will ensure that Executive Directors and senior managers are incentivised to deliver the Group’s strategic goals and long-term shareholder value.
Annual bonus targets relate to the delivery of short-term targets that the Committee considers are critical drivers of business growth and delivery of performance. In contrast, the PSP objectives reward long-term shareholder value creation and strong bottom-line performance.
The Committee believes that the most appropriate pay comparators are:
• for the Group Chief Executive and certain operational executives, a select group of international and UK oil & gas services companies (to the extent that data in relation to such companies is publicly available)
• for certain functional executives, FTSE companies of a similar size and complexity
The Committee also uses remuneration in UK companies of a similar size and complexity as an additional reference point when
considering the remuneration of operational Executive Directors and senior managers.
Summary of remuneration elements – policy
Fixed pay
Element Purpose Policy
Salary Core element of remuneration, paid for doing the expected day-to-day job
• Based on role and contribution – market median or below
Cash allowance Provide employees with an allowance for benefits and retirement planning
• Annual cash allowance in lieu of pension and company car contributions
• Market standard for role and geographical location, although current levels are below median
Pension n/a • Petrofac does not provide any formal pension arrangements for Executive Directors
Variable pay
Element Purpose Quantum Performance conditions
Annual bonus Incentivise executive performance on an annual basis against key financial targets and personal objectives
• Maximum cash award of 200% of salary
• Subject to achievement of financial, safety and personal performance targets
Performance Share Plan
Recognise and reward executives for the creation of shareholder value over the longer term
This element of reward is share-based to provide greater alignment with shareholder interests
• Maximum award of 200% of salary (300% in exceptional circumstances)
• Awards vest after three years, subject to achievement of performance conditions
• 50% of awards are subject to total shareholder return (TSR) relative to international peer group on an index TSR basis:
− 0% vesting below index performance − 30% vesting for performance equal to the index − 100% vesting for outperformance of the index by 25%
or more• 50% of awards are subject to achievement of compound
annual growth in earnings per share (EPS): − 0% vesting for 10% growth per annum − 30% vesting for 15% growth per annum − 100% vesting for 20% growth per annum
As set out in my covering letter, after careful consideration and consultation with major shareholders, the Committee is proposing the implementation of a new one-off incentive plan. Whilst Ayman Asfari and Maroun Semaan, two of the core founding shareholders consider the plan to be critical to continue driving the Company’s exceptional performance, the plan would be a one-off award and would not form part of ongoing remuneration policy.
Full details of the proposed new plan are set out in the Notice of AGM, where it will be presented for shareholder approval in May 2012. A summary of the key terms is provided on pages 98 and 99 of this report.
Directors’ remuneration report continued
Petrofac Annual report and accounts 201194
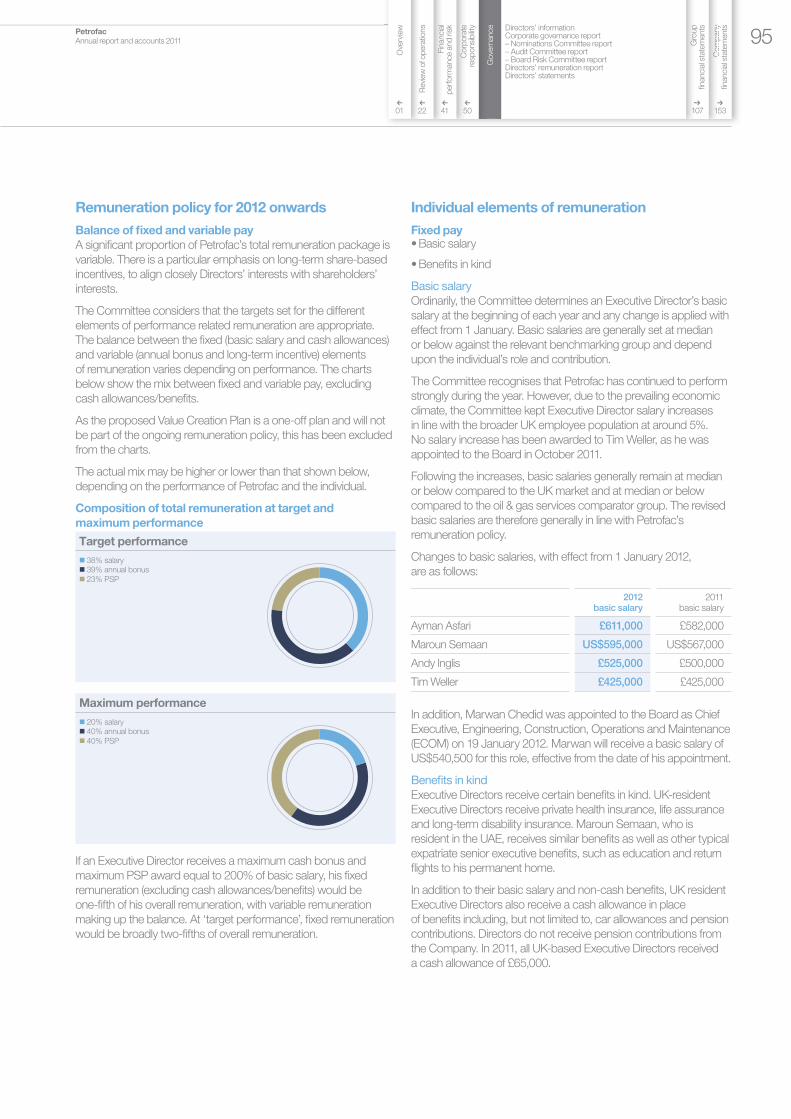
Remuneration policy for 2012 onwards
Balance of fixed and variable pay
A significant proportion of Petrofac’s total remuneration package is
variable. There is a particular emphasis on long-term share-based
incentives, to align closely Directors’ interests with shareholders’
interests.
The Committee considers that the targets set for the different
elements of performance related remuneration are appropriate.
The balance between the fixed (basic salary and cash allowances)
and variable (annual bonus and long-term incentive) elements
of remuneration varies depending on performance. The charts
below show the mix between fixed and variable pay, excluding
cash allowances/benefits.
As the proposed Value Creation Plan is a one-off plan and will not
be part of the ongoing remuneration policy, this has been excluded
from the charts.
The actual mix may be higher or lower than that shown below,
depending on the performance of Petrofac and the individual.
Composition of total remuneration at target and
maximum performance
Target performance
� 38% salary��
39% annual bonus
23% PSP
Maximum performance
� 20% salary��
40% annual bonus
40% PSP
If an Executive Director receives a maximum cash bonus and
maximum PSP award equal to 200% of basic salary, his fixed
remuneration (excluding cash allowances/benefits) would be
one-fifth of his overall remuneration, with variable remuneration
making up the balance. At ‘target performance’, fixed remuneration
would be broadly two-fifths of overall remuneration.
Individual elements of remuneration
Fixed pay• Basic salary
• Benefits in kind
Basic salary
Ordinarily, the Committee determines an Executive Director’s basic
salary at the beginning of each year and any change is applied with
effect from 1 January. Basic salaries are generally set at median
or below against the relevant benchmarking group and depend
upon the individual’s role and contribution.
The Committee recognises that Petrofac has continued to perform
strongly during the year. However, due to the prevailing economic
climate, the Committee kept Executive Director salary increases
in line with the broader UK employee population at around 5%.
No salary increase has been awarded to Tim Weller, as he was
appointed to the Board in October 2011.
Following the increases, basic salaries generally remain at median
or below compared to the UK market and at median or below
compared to the oil & gas services comparator group. The revised
basic salaries are therefore generally in line with Petrofac’s
remuneration policy.
Changes to basic salaries, with effect from 1 January 2012,
are as follows:
2012basic salary
2011basic salary
Ayman Asfari £611,000 £582,000
Maroun Semaan US$595,000 US$567,000
Andy Inglis £525,000 £500,000
Tim Weller £425,000 £425,000
In addition, Marwan Chedid was appointed to the Board as Chief
Executive, Engineering, Construction, Operations and Maintenance
(ECOM) on 19 January 2012. Marwan will receive a basic salary of
US$540,500 for this role, effective from the date of his appointment.
Benefits in kind
Executive Directors receive certain benefits in kind. UK-resident
Executive Directors receive private health insurance, life assurance
and long-term disability insurance. Maroun Semaan, who is
resident in the UAE, receives similar benefits as well as other typical
expatriate senior executive benefits, such as education and return
flights to his permanent home.
In addition to their basic salary and non-cash benefits, UK resident
Executive Directors also receive a cash allowance in place
of benefits including, but not limited to, car allowances and pension
contributions. Directors do not receive pension contributions from
the Company. In 2011, all UK-based Executive Directors received
a cash allowance of £65,000.
Petrofac Annual report and accounts 2011 95
Com
pany
financia
l sta
tem
ents
Com
Com
pany
pany
Gro
up
fin
ancia
l sta
tem
ents
107 153
Gove
rnance
G
Corp
ora
te
resp
onsi
bility
Corp
Corp
ora
tora
tee
Fin
ancia
l p
erf
orm
ance
and ris
kFin
aFin
ancia
ncia
ll
Revi
ew
of o
pera
tions
Gro
Gro
up
up
11
Directors’ informationCorporate governance report– Nominations Committee report– Audit Committee report– Board Risk Committee reportDirectors’ remuneration reportDirectors’ statements
Ri
fti
Ove
rvie
w
01 22 41 50

The Company pays a cash allowance in respect of housing
and transport to Maroun Semaan, in line with local market practice.
In 2011, Maroun Semaan received a cash allowance of
US$220,000 for the year.
Cash allowances for all Executive Directors will be frozen in 2012,
remaining at the same level as in 2011.
The table below sets out cash allowances for Executive Directors
from 1 January 2012:
2012 cash allowance
2011 cash allowance
Ayman Asfari £65,000 £65,000
Maroun Semaan US$220,000 US$220,000
Andy Inglis £65,000 £65,000
Tim Weller £65,000 £65,000
As an Executive Director based in the UAE, Marwan Chedid will
receive an annual cash allowance of US$200,000 in respect of
housing and transport, in line with local market practice.
In addition, Maroun Semaan and Marwan Chedid, as UAE resident
Executive Directors, are entitled by local statute to receive a cash
sum (called an end of service indemnity payment) from their
employer on the termination of their employment within the UAE.
Such payments are due to all expatriate employees working in the
UAE and are based on years of service and salary. Further details
are provided on pages 103 and 141. Accordingly, the Company
accrues an amount in respect of this each year.
Variable pay• Annual cash bonus
• Performance Share Plan
Annual cash bonus
Each January, the Committee decides whether to award each
Executive Director a cash bonus for the previous year. In doing
so, the Committee considers two principal elements:
• the extent to which the Group’s financial performance, and, as appropriate, the business unit or division for which the individual Director is primarily responsible, have achieved annually established budgets and targets
• the extent to which the individual has met personal objectives, which are agreed at the start of each year with the aim of achieving the Group’s business strategy. Each Executive Director’s personal objectives include health and safety targets. In addition, some Executive Directors have targets in relation to succession planning, risk management and the development and implementation of the Group’s CR programme. In this way, the Committee considers that it has an incentive structure for senior managers that promotes responsible behaviour
For 2011, in line with the stated policy, the Committee
set the maximum bonus potential at 200% of basic annual
salary for achievement of corporate and personal targets.
The Committee awarded cash bonuses of between 150% and
200% of salary to Ayman Asfari, Maroun Semaan and Andy Inglis,
in recognition of the Company’s strong growth in revenue and
earnings across all divisions. Despite this continued strong
performance, some very stretching backlog targets were only
partially achieved, and as such annual bonuses were scaled back
accordingly in certain cases.
Following his appointment in September 2011, and in recognition
of Petrofac’s exceptional financial performance and his strong start
in the role, Tim Weller will receive a cash bonus of 200% of salary
in respect of 2011 (pro-rated to reflect his part-year service).
The following table sets out the 2011 annual bonus awards made
to Executive Directors:
Annual bonus in respect of 2011
As % of 2011 basic salary
Ayman Asfari £875,000 150%
Maroun Semaan US$1,000,000 176%
Andy Inglis £1,000,000 200%
Tim Weller £275,000 200%
Directors’ remuneration report continued
Petrofac Annual report and accounts 201196

Performance Share Plan (PSP)
Executive Directors and certain senior managers may receive
performance-related share awards on an annual basis. Participants
are granted contingent awards to receive ordinary shares
in the Company, which will, in normal circumstances, vest after
three years, subject to their continued employment and to the
extent performance conditions are met.
Under the existing PSP, the maximum award level in any financial
year is 200% of basic annual salary, although an award
of up to 300% may be made under exceptional circumstances.
Award levels are determined based on a participant’s individual
contribution to the business.
The following table sets out the proposed 2012 PSP awards
for Executive Directors:
2012 PSP award (as % of 2012 basic salary)
Ayman Asfari 196%
Maroun Semaan 168%
Andy Inglis 191%
Tim Weller 159%
The Committee has proposed an exceptional PSP award
to Marwan Chedid of 231% of 2012 basic salary, reflecting his
strong individual contribution to the business and his promotion
to the Board.
Plan operation
The PSP is currently structured as follows:
PSP award
PSP award paid in shares
(amount dependent on performance achieved)
50% of award based on TSR performance relative to an index of sectoral comparators over the
three-year performance period
50% of award based on annual EPS growth over the three-year performance period
Year 0 Year 1 Year 3Year 2
The Committee considers that the PSP should balance alignment
with shareholder returns and reward for delivery of strong
underlying financial performance:
Relative TSR Remains the best measure of the Company’s ultimate delivery of shareholder returns
Absolute EPS Internal financial measure most closely linked to value creation in an oil & gas services business
Performance period
Three years is considered to be an appropriate long-term horizon for both performance measurement and retention
Relative TSR element (50% of award)
For the 2012 PSP grant, the TSR vesting schedule and, in particular
the required level of outperformance of the index, will remain the
same as previous grants.
TSR is the percentage return to a purchaser of an ordinary share in
the Company arising from share price appreciation and re-
investment of dividends over a given period. The TSR of the
Company is measured and then compared against the median
TSR of an index of a number of international peer companies, as
detailed in the table below.
2009 award
2010 award
2011 award
2012 award
Aker Solutions
AMEC
Chicago Bridge & Iron Co.
Entrepose Contracting
Fluor Corporation
Foster Wheeler
Halliburton
Helix Energy Solutions
JGC
Maire Tecnimont
Saipem
Schlumberger
SNC-Lavalin Group
Technip
Tecnicas Reunidas
Wood Group (John)
WorleyParsons
Vesting against the TSR element is determined in line with the
following:
TSR relative to an un-weighted comparator group index
Percentage of TSR element of award vesting1, 2
Less than index 0%
Equal to index 30%
Outperformance of index by up to 25%
Straight-line vesting between 30% and 100%
Outperformance of index by 25% or more
100%
1 The Committee is authorised under the rules of the PSP to make retrospective adjustment(s) to the comparator index for any year of award if one or more of the constituent companies are subject to de-listing, merger, acquisition or other such event.
2 It is assumed that a notional £100 is invested equally across all the companies making up the TSR index at the start of the performance period. At the end of the vesting period, the index will represent the value of what the initial notional investment of £100 would have returned over the period. This will be representative of the average return made by the Company’s competitors. This is then compared to the return by an equivalent notional investment of £100 in Petrofac over the same period.
Petrofac Annual report and accounts 2011 97
Com
pany
financia
l sta
tem
ents
Com
Com
pany
pany
Gro
up
fin
ancia
l sta
tem
ents
107 153
Gove
rnance
G
Corp
ora
te
resp
onsi
bility
Corp
Corp
ora
tora
tee
Fin
ancia
l p
erf
orm
ance
and ris
kFin
aFin
ancia
ncia
ll
Revi
ew
of o
pera
tions
Gro
Gro
up
up
11
Directors’ informationCorporate governance report– Nominations Committee report– Audit Committee report– Board Risk Committee reportDirectors’ remuneration reportDirectors’ statements
Ri
fti
Ove
rvie
w
01 22 41 50

In addition to achieving the TSR performance condition, the
Committee considers a further measure of underlying financial
performance.
For awards granted in 2010 onwards, vesting of the TSR element
is subject to achievement of strong underlying overall Company
performance. For awards granted before then, it is necessary to
achieve EPS growth over the period of at least RPI plus 3% over
the three-year vesting period.
EPS element (50% of award)
For the 2012 PSP grant, the EPS vesting schedule and in particular
the required level of performance will remain the same as the last
two years’ grants.
Earnings per share represent the earnings (excluding dividends),
in pence, attributable to one ordinary share. The Company’s EPS
performance over a three-year period is calculated and vesting
is in line with the vesting schedule attached to a particular award,
as shown in the table below:
Awards made from 2010 onwards Awards made prior to 2010
EPS compound annual growth over three-year period
EPS compound annual growth over three-year period
Percentage of EPS element of award vesting
10% or less 15% or less 0%
More than 10%, less than 15%
More than 15%, less than 20%
Straight-line vesting between 0% and 30%
15% 20% 30%
More than 15%, less than 20%
More than 20%, less than 25%
Straight-line vesting between 30% and 100%
20% or more 25% or more 100%
The Committee determines the EPS targets immediately before
the grant of each award. It considers internal growth projections,
market consensus figures and general external conditions.
The Committee believes the targets attached to the existing PSP
awards are extremely stretching.
Value Creation Plan (VCP)
After careful consideration and consultation with major
shareholders, the Committee is proposing the implementation
of a new one-off incentive plan. Full details of the proposed new
plan are set out in the Notice of the 2012 AGM, at which this plan
will be presented for shareholder approval.
Under the VCP, it is proposed that one-off share option awards
will be made in 2012 to a limited group of 10–15 key individuals at
senior executive level, including Executive Directors, responsible for
driving Company growth. The Group Chief Executive and President
– who together own more than 26% of Petrofac’s issued share
capital – will not participate in the VCP.
Although the VCP will not form part of our ongoing remuneration
framework, all awards granted under the plan will support
our policy of aligning executive and shareholders’ interests and
providing upper quartile remuneration where challenging standards
are met while paying basic fixed remuneration at median or below.
The Committee consulted extensively with major shareholders on the introduction of the VCP, modifying elements of the plan to take into account feedback received. During its discussions, the Committee reviewed the quantum of the proposed plan in the context of existing remuneration arrangements and potential costs associated with the plan. In doing so, it considered overall remuneration levels at Petrofac, the estimated cost of the plan and potential benefits to shareholders. It concluded that the overall levels of reward available are not excessive and the cost of the VCP is appropriate in the context of potential returns to shareholders if the performance targets are achieved.
As a result of shareholder feedback, the Committee also agreed to introduce a shareholding requirement for Executive Directors, as detailed later in this report.
Award valuesAwards with an expected value of between one and two times salary are proposed for Executive Directors (excluding the Group Chief Executive and President).
Options will be valued at 19.5% of face value using a recognised simulation model. This translates into a face value of award of roughly five times expected value. Accordingly, to achieve an expected value of between one and two times salary, a core award with a face value of c. five – ten times basic salary is required. For Executive Directors with divisional or business unit responsibility, the performance multiplier could further increase awards by a factor of up to 1.5 times. Awards to other members of the senior management team will be made at a lower value.
Grant of awardsIt is proposed that, subject to shareholder approval of the VCP, one-off awards will be made in May/June 2012. However, options may be granted until the second anniversary of adoption of the plan to senior recruits or existing executives who take on significantly increased responsibilities. Each participant of the plan will only ever receive one award.
Performance conditionsThe proposed VCP has four distinct stretching performance measures to ensure maximum alignment between participants and shareholders.
Group Profit After Tax (Group PAT) The Committee intends that awards would only vest upon delivery of performance over and above the Company’s very ambitious FY 2015 Group PAT growth targets. Group PAT is a key performance indicator for the Company and the Committee considers that this is the most appropriate way to measure the delivery of growth and the underlying financial health of the Company. The proposed Group PAT performance targets are set out in the table below:
Threshold Maximum
FY 2015 Group PAT1 Below US$862m (Two times FY2010 PAT)
US$1,293m or more (Three times FY2010 PAT)
Level of vesting2 0% 100%
1 In each case the Group PAT delivered in FY2010 has been adjusted to exclude the gain of US$124.9m on the EnQuest demerger and the trading net profit from Developments demerged assets of US$2.1m which arose in that year.
2 Between US$862m and US$1,293m, vesting would be on a straight line basis.
Exercise priceAwards would be made over premium-priced share options, with the exercise price set at a 10% premium to the Company’s share price at the date of grant. Accordingly, share price growth of at least 10% must be achieved before participants realise any value.
Directors’ remuneration report continued
Petrofac Annual report and accounts 201198

Divisional/business unit performance
To reflect the importance of strong operational performance
to the achievement of the Company’s growth aspirations, awards
to individuals with direct divisional or business unit responsibilities
will be subject to a multiplier which would potentially reduce or
increase the award by 50% dependent on individual divisional or
business unit earnings performance in FY 2015. There will be no
divisional or business unit multiplier for awards to Group roles.
The proposed divisional/business unit performance multiplier
is set out in the following table:
Multiplier factor Threshold Target Maximum
Level of achievement against divisional or business unit performance targets
Not less than 0.5x
1.0x Not more than 1.5x
Claw-back provisions
Claw-back (malus) provisions would allow the Committee to reduce
vesting outcomes in certain circumstances prior to the vesting date.
These circumstances include material misstatement of results and
misconduct under the Company’s Code of Business Conduct.
Additional performance safeguards
In addition to the above performance features, the Committee
will also evaluate performance taking full account of the following
safeguards:
• health & safety, environmental and ethical performance;
• relative TSR performance against peers (and in particular whether TSR performance is above median);
• EPS growth consistent with PAT growth;
• positive economic profit performance;
• delivery of Board-approved business plan; and
• any other material factors impacting risk management.
Vesting
Subject to performance against Group PAT and, where applicable,
divisional or business unit targets, the share options would vest in
equal tranches on the fourth, fifth and sixth anniversaries of grant.
The Committee considers that the additional holding period will
ensure the building of sustained performance over the long term.
Objectives of the VCP
Objectives Plan features
Ensuring continued delivery of exceptional growth and shareholder value creation
Awards will only result in significant vesting for delivery of performance over and above the Company’s ambitious growth targets:
Group Profit After Tax (Group PAT)Stretching targets – no vesting unless PAT in FY 2015 is two times PAT delivered in FY 2010; full vesting only if PAT in FY 2015 is three times PAT delivered in FY 2010.
Divisional/business unit performance earningsTo reflect the importance of strong operational performance, awards to individuals with direct divisional or business unit responsibility will be subject to a multiplier which would potentially reduce or increase the original award by 50% dependent on individual divisional or business unit earnings performance in FY 2015.
Shares will be granted at an exercise price set 10% above the market price on the date of grant.
Building sustained performance over the long term
Following the end of the four-year performance period (2012–2015), shares will vest in equal tranches on the fourth, fifth and sixth anniversaries of grant, only to the extent that performance conditions have been satisfied, with full vesting only occurring six years after award.
A claw-back (malus) provision would allow the Committee the right to reduce vesting outcomes in certain circumstances prior to the vesting date. The Committee would also evaluate performance taking full account of a number of safeguards (as set out below).
Developing a new generation of leaders with an ownership mindset
Participation will be limited to 10–15 key individuals at senior executive level, including Executive Directors, but will exclude participation by the Group Chief Executive and President. Only one award will be made to each individual.
Plan operation
The diagram below provides an illustration of how the VCP would operate:
May/June 2012
VCP award made
Core award vests based on FY 2015 Group PAT
Four-year performance period from FY 2012 to FY 2015
Divisional/business unit multiplier applied (where relevant)
Last potential exercise date
2012 2013 20152014
FY 2015 Group PAT performance tested
FY 2015 divisional/business unit performance tested
2016 2017 20192018 2020
one-third vests in 2016
one-third vests in 2017
one-third vests in 2018
Petrofac Annual report and accounts 2011 99
Com
pany
financia
l sta
tem
ents
Com
Com
pany
pany
Gro
up
fin
ancia
l sta
tem
ents
107 153
Gove
rnance
G
Corp
ora
te
resp
onsi
bility
Corp
Corp
ora
tora
tee
Fin
ancia
l p
erf
orm
ance
and ris
kFin
aFin
ancia
ncia
ll
Revi
ew
of o
pera
tions
Gro
Gro
up
up
11
Directors’ informationCorporate governance report– Nominations Committee report– Audit Committee report– Board Risk Committee reportDirectors’ remuneration reportDirectors’ statements
Ri
fti
Ove
rvie
w
01 22 41 50

Shareholding requirement
As a result of the discussions with shareholders on the VCP,
the Committee intends to introduce a shareholding requirement
for Executive Directors to build up a shareholding of three times
basic salary over a period of five years.
Wider workforce remuneration
When determining remuneration arrangements for Executive
Directors, the Committee takes into consideration as a matter of
course the pay and conditions of employees throughout the Group.
For 2012, it aligned Executive Director salary increases with those
in the wider UK and UAE workforce of around 5%, recognising that
average salary increases may be higher in other areas of the Group.
Within our highly competitive sector there is upward pressure on
remuneration levels at all grades. The Committee is aware that
securing increasingly sought-after key talent is critical to the
continued success of Petrofac.
Other discretionary share plans
Petrofac strongly encourages share plan participation by
employees to ensure alignment of their interests with those of
shareholders. The Company is proud of the high level of
participation in its share plans, as can be seen in the table below:
Plan
Number of employees with awards at
31 December 2011Percentage take-up
in each plan
DBSP 3,526 100%
SIP 1,203 30%*
PSP 41 100%
RSP 102 100%
* UK employees only
Deferred Bonus Share Plan (DBSP)
Under the DBSP, selected employees are required to defer a
proportion of their annual cash bonus into Company shares
(‘invested shares’). The Company will generally grant the participant
an additional award over a number of shares, being a specified
ratio to the number of his or her invested shares (‘matching shares’),
typically using a 1:1 ratio.
Subject to a participant’s continued employment, invested and
matching share awards may either vest 100% on the third
anniversary of grant; or alternatively, vest one-third on the first
anniversary of the grant, one-third on the second anniversary
and the final proportion on the third anniversary.
The Committee approves awards, having taken management’s
recommendations into consideration.
From 2011, eligibility to participate in the DBSP was extended
to certain Petrofac joint ventures (JVs) where Petrofac has a
shareholding of at least 25%, and where the Committee considers
it appropriate. The Committee believes that extending participation
levels will align the interests of key individuals in the Company’s JV
entities with those of Petrofac shareholders.
Since 2007, Executive Directors have not participated in the DBSP
as there are no performance conditions attached to matching
awards. If such individuals are considered for DBSP participation
in future years, the Company undertakes not to make matching
awards, unless they are subject to suitably stretching performance
conditions and a deferral period of at least three years. Prior to his
appointment as an Executive Director, Marwan Chedid received
awards under the DBSP.
Restricted Share Plan (RSP)
Under the RSP, selected employees are made grants of shares
on an ad hoc basis throughout the year.
The scheme is used primarily, but not exclusively, to make awards
to individuals who join the Group part way through the year, having
left accrued benefits with a previous employer.
The Committee approves awards, having taken management’s
recommendations into consideration and regularly monitors the
level of awards.
Executive Directors are not eligible to participate in the scheme.
However, prior to their respective appointments as Executive
Directors during 2011, Andy Inglis and Tim Weller received awards
under the RSP to compensate them for incentive opportunities
foregone elsewhere. Further details are provided on pages 102
and 104.
Share Incentive Plan (SIP)
On an all-employee basis, the Company offers participation to all
UK resident employees, including Executive Directors, in a UK
tax-approved SIP, which the Committee considers as part of its
oversight role. Under the SIP, all eligible employees may invest up
to £1,500 per tax year of gross salary (or, if less, 10% of salary) to
purchase ordinary shares (Partnership Shares). There is no holding
period for these shares. The Company does not make awards
of Matching or Free Shares under the SIP.
Separately, the Company offers a share dealing service to all
employees.
Directors’ remuneration report continued
Petrofac Annual report and accounts 2011100
General share plan information
Dividends and voting rights
Participants in the PSP, DBSP, RSP and the proposed VCP have
no dividend or voting rights in respect of their respective awards
until their awards vest or options are exercised under the VCP.
Under the PSP, DBSP and RSP, when the Company pays a
dividend, the shares under award will be increased by the number
of shares that could have been acquired with the amount of
dividend received, had the participant been the owner of the award
shares prior to vesting. The vesting of the additional shares will be
subject to the same performance conditions as the original award
shares.
Participants in the VCP will not receive additional shares in respect
of dividends prior to exercise.
Participants in the SIP receive dividends in respect of their shares,
in common with any other shareholder.
Funding policy
In 2007, the Board approved a funding policy in relation to the
Company’s employee benefit trust, which holds shares to be
used to satisfy awards under the Company’s DBSP, PSP and
RSP. This employee benefit trust would also be used for the
proposed VCP.
The Company reviews its contingent obligations under its share
incentive schemes on a quarterly basis. Under a loan arrangement
with the Group, the employee benefit trust has historically
purchased and held sufficient shares to cover between 80%
to 100% of shares potentially required to satisfy awards at any
time under the schemes.
Performance graph
As mentioned, the Company’s total shareholder return is defined as
our share price growth plus any dividends used to acquire further
shares in Petrofac. For shareholders’ information, the Company’s
TSR performance since 1 January 2007 is shown below compared
with the performance of the FTSE 100 Index.
The Committee believes the FTSE 100 Index is the most
appropriate index given the Company’s current positioning within it.
Graph showing TSR performance of Petrofac measured against
the FTSE 100 over the five-year period to 31 December 2011.
0
100
200
300
400
500
2007 2011201020092008
Petrofac FTSE 100
Executive Directors’ service contracts
Executive Directors have 12-month rolling service contracts with the
Company and are contractually restricted to a termination payment
equal to 12 months’ salary and benefits. None of the Executive
Directors is subject to a contractual retirement date. Further details
are shown below:
Name of Executive Director
Date of service contract
Date appointed to the Board
Number of months’
notice
Company and Director
Ayman Asfari 13 September 2005
11 January 2002
12
Maroun Semaan1 13 September 2005
11 January 2002
12
Andy Inglis 4 January 2011
1 March 2011
12
Tim Weller 29 June 2011
13 October 2011
12
Keith Roberts2 13 September 2005
6 April 2002
12
1 Maroun Semaan’s contract was varied on 1 December 2011 to reflect his new role as President.
2 Keith Roberts retired as a Director on 13 October 2011.
Marwan Chedid was appointed as an Executive Director on
19 January 2012. Further details on his terms and conditions
are provided below.
Board changes
Keith Roberts
Keith Roberts retired as a Director on 13 October 2011 and left
the Company on 31 December 2011.
All base salary, allowances and benefits ceased effective
31 December 2011, apart from his medical benefit which will
cease on 31 March 2012.
His 2011 cash bonus was determined using the applicable
performance conditions and paid in line with his service contract
and the normal timescales. This is disclosed in the emoluments
table on page 103.
The Committee decided that Keith’s subsisting PSP awards should
be scaled back to reflect the proportion of the relevant vesting
period that has elapsed upon his cessation of employment.
These awards will be released on the original vesting dates, to
the extent that the original performance conditions attached
to each award are met, in line with the standard good leaver
provisions within the plan rules.
Petrofac Annual report and accounts 2011 101
Com
pany
financia
l sta
tem
ents
Com
Com
pany
pany
Gro
up
fin
ancia
l sta
tem
ents
107 153
Gove
rnance
G
Corp
ora
te
resp
onsi
bility
Corp
Corp
ora
tora
tee
Fin
ancia
l p
erf
orm
ance
and ris
kFin
aFin
ancia
ncia
ll
Revi
ew
of o
pera
tions
Gro
Gro
up
up
11
Directors’ informationCorporate governance report– Nominations Committee report– Audit Committee report– Board Risk Committee reportDirectors’ remuneration reportDirectors’ statements
Ri
fti
Ove
rvie
w
01 22 41 50

Appointment of Tim Weller
In September 2011, Tim Weller joined Petrofac. He was appointed
to the Board as Chief Financial Officer on 13 October 2011.
The Committee considered Tim’s remuneration package in light
of his calibre and experience and the fact he would be joining the
Board shortly after his appointment.
For the most part, Tim has a standard remuneration package on a
similar basis to those of other current Executive Directors. His fixed
remuneration at appointment was set at a basic salary of £425,000,
with a cash allowance of £65,000 per annum in lieu of, but not
limited to, pension contributions and car allowance, in common
with other UK-based Executive Directors.
Tim will be eligible to participate in the annual bonus and PSP
on the same basis as other Executive Directors. He received a
pro-rated annual bonus in respect of 2011, reflecting his part-year
service, as outlined on page 96.
To attract an executive with such a strong track record, the
Committee also agreed to provide a one-off retention share award
under the RSP with a value of £380,000, in order to compensate
him for remuneration opportunities foregone. This award will vest
in equal tranches over three years.
Appointment of Marwan Chedid
Marwan Chedid became Chief Executive, Engineering,
Construction, Operations and Maintenance on 1 January 2012
and was appointed as an Executive Director on 19 January 2012.
He is based in the UAE.
Marwan will have a standard remuneration package, on a similar
basis to those of the other current non-UK based Executive
Directors. His fixed remuneration was set at US$540,500, with
a cash allowance of US$200,000 in respect of housing and
transport, in line with local UAE market practice.
In accordance with Petrofac’s remuneration policy, following
his appointment to the Board, Marwan Chedid will no longer
participate in the DBSP or RSP. He has outstanding awards under
these plans which are due to vest in upcoming years.
Marwan’s service contract is in line with those for other Executive
Directors, with a 12-month notice period required for both the
Company and individual.
Non-executive Directors – remuneration policy
and practice
The Board reviews and sets the fees of independent Non-executive
Directors annually, supported by independent professional advice.
When deciding an appropriate fee level for each Non-executive
Director, the Board takes into account the level of fees generally
paid to Non-executive Directors serving on boards of similarly-
sized, UK-listed companies and the responsibility and time
commitment required of the role.
Non-executive Directors do not have service contracts and are
not entitled to compensation on leaving the Board. However, if the
Chairman or a Non-executive Director is requested to resign, they
are entitled to prior notice or fees in lieu of three months’ notice.
DirectorDate of latest letter of appointment
Date appointed to the Board
Required notice from Company
(in months)
Norman Murray 28 January 2011
1 March 2011
3
Thomas Thune Andersen
11 February 2010
13 May 2010
3
Stefano Cao 11 February 2010
13 May 2010
3
Roxanne Decyk 28 January 2011
1 March 2011
3
Rijnhard van Tets 2 February 2007
11 May 2007
3
Rodney Chase1 13 September 2005
21 June 2005
3
Kjell Almskog1 13 September 2005
23 March 2005
3
1 Rodney Chase and Kjell Almskog stepped down from the Board at the 2011 AGM.
René Médori was appointed as a Non-executive Director on
19 January 2012. His terms of appointment and remuneration
are in line with Company policy.
Fees for Non-executive Directors are as shown in the table below:
Basic fee
Non-executive Chairman £230,000
Non-executive Director £60,000
Additional fee
Committee Chairman £14,000
Fees for Non-executive Directors are due to be reviewed later
in 2012.
The remuneration of the Chairman of the Board is set by the
Remuneration Committee. The Board as a whole is responsible for
deciding Non-executive Directors’ fees unless such fees exceed
£1,000,000 per annum in aggregate, in which case shareholder
approval in a general meeting would be sought.
Directors’ remuneration report continued
Petrofac Annual report and accounts 2011102

Audited information
Amount of each Director’s emoluments received in the financial year
The remuneration of each Director in respect of 2011 (with 2010 comparison) comprised:
Salaries and fees
US$’000
Cash allowances
US$’0001
Benefits US$’0002
Cash bonus US$’000
Post employment
benefit US$’0003
2011 total
US$’000
2010 total
US$’000
Executive Directors
Ayman Asfari4 931 104 75 1,400 – 2,510 2,365
Maroun Semaan 567 220 63 1,000 47 1,897 1,729
Andy Inglis4, 5 656 806 1 1,600 – 3,063 –
Tim Weller4, 5 145 23 – 440 – 608 –
Non-executive Directors
Norman Murray4, 5 247 – – – – 247 –
Thomas Thune Andersen 117 – – – – 117 66
Stefano Cao 117 – – – – 117 66
Roxanne Decyk5 79 – – – – 79 –
Rijnhard van Tets 117 – – – – 117 103
Former Directors
Kjell Almskog6 44 – – – – 44 103
Rodney Chase6 71 – – – – 71 170
Keith Roberts4, 6, 7 442 81 1 960 – 1,484 1,221
3,533 1,234 140 5,400 47 10,354 5,823
1 Payment in lieu of pension allowance and other benefits for UK-resident Directors and various allowances for the UAE resident Director. None of the Directors is eligible to receive pension contributions from the Company. Andy Inglis’ cash allowance includes a taxable one-off relocation allowance of £450,000 under the terms of his appointment, which was fully disclosed in the Petrofac 2010 annual report and accounts.
2 Ayman Asfari’s benefits primarily relate to the employment of a personal assistant who spends part of her time in the administration of his philanthropic work. Maroun Semaan receives, inter alia, benefits in relation to his children’s education and return flights to his permanent home.
3 Maroun Semaan is entitled by local statute to receive an end of service indemnity payment. Such payments are due to all expatriate employees working in the UAE and are based on years of service and salary. This sum is accrued by the Company and will be payable to him only on termination of his employment from the UAE. The amount disclosed is the benefit accrued for 2011. US$887,459 is the total liability which has been accrued in respect of Mr Semaan.
4 UK based Directors are paid in sterling. Amounts have been translated to US dollars based on the prevailing rate at the date of payment or award with the exception of the bonus amounts, which have been translated using the average exchange rate for the year.
5 Norman Murray, Andy Inglis and Roxanne Decyk were appointed Directors on 1 March 2011. Tim Weller was appointed as a Director on 13 October 2011. Their salaries and fees reflect the period from that date to the end of the year.
6 Kjell Almskog and Rodney Chase retired as Directors on 13 May 2011 and Keith Roberts retired as a Director on 13 October 2011. Remuneration reported reflects the period up to the date of their respective retirements from the Board.
7 Details of Keith Roberts’ termination arrangements are outlined on page 101.
Petrofac Annual report and accounts 2011 103
Com
pany
financia
l sta
tem
ents
Com
Com
pany
pany
Gro
up
fin
ancia
l sta
tem
ents
107 153
Gove
rnance
G
Corp
ora
te
resp
onsi
bility
Corp
Corp
ora
tora
tee
Fin
ancia
l p
erf
orm
ance
and ris
kFin
aFin
ancia
ncia
ll
Revi
ew
of o
pera
tions
Gro
Gro
up
up
11
Directors’ informationCorporate governance report– Nominations Committee report– Audit Committee report– Board Risk Committee reportDirectors’ remuneration reportDirectors’ statements
Ri
fti
Ove
rvie
w
01 22 41 50

Awards of shares
Share awards held at year end, including awards of shares made during the year, to Executive Directors are given in the table below:
Director and date of grant Plan
% of basic salary in year
of grant
Number of shares
under award at 31.12.10
Shares granted in
year
Dividend shares
granted in year1
Lapsed in year
Vested in year
Total number of
shares under award
at 31.12.11
Date from which
shares vest
Market price on date of
grant
Executive Directors
Ayman Asfari
19 March 2008 PSP 122.7 114,8442 – – – 114,844 nil 19.03.11 522p
19 March 2009 PSP 131.0 128,6512 – 2,537 – – 131,1883 19.03.12 545p
14 May 2010 PSP 200 90,1672 – 1,778 – – 91,9454 19.03.13 1103p
19 March 2011 PSP 200 – 104,5552 2,061 – – 106,6164 19.03.14 1426p
329,749
Maroun Semaan
19 March 2008 PSP 123.8 52,7122 – – – 52,712 nil 19.03.11 522p
19 March 2009 PSP 122.2 80,8812 – 1,595 – – 82,4763 19.03.12 545p
14 May 2010 PSP 225 67,9342 – 1,340 – – 69,2744 19.03.13 1103p
19 March 2011 PSP 225 – 48,9112 964 – – 49,8754 19.03.14 1426p
201,625
Andy Inglis
05 January 2011 RSP 200 – 61,6525 1,215 – – 62,8676 05.01.12 1649p
19 March 2011 PSP 300 – 107,7892 2,125 – – 109,914 19.03.14 1426p
172,781
Tim Weller
06 September 2011 RSP 89.4 – 29,7105 228 – – 29,938 06.09.12 1281p
29,938
Former Director
Keith Roberts7
19 March 2008 PSP 88.9 51,0402 – – – 51,040 nil 19.03.11 522p
19 March 2009 PSP 95.0 56,1372 – 1,107 4,774 – 52,470 19.03.12 545p
14 May 2010 PSP 200 54,2862 – 1,071 24,425 – 30,932 19.03.13 1103p
19 March 2011 PSP 200 – 35,9292 708 27,479 – 9,158 19.03.14 1426p
92,560
1 Dividends awarded on shares granted under the share plans are reinvested to buy further shares.
2 The award amounts disclosed under the PSP are the maximum number that can vest subject to the performance conditions attached to awards. The PSP performance conditions under which these awards would vest in full are explained on pages 97 and 98.
3 The performance conditions for the March 2008 PSP award were satisfied and the award vested in full on 19 March 2011 when the share price was 1426 pence. Shares awarded on 19 March 2009 have satisfied their performance conditions in full and will vest at 100% on 19 March 2012. Based on a share price of 1597 pence, which is the share price at 28 February 2012 (being the latest practicable date prior to the adoption of this Report by the Committee), the value of the awards made to the current Executive Directors would be as follows: Ayman Asfari: £2,095,072 and Maroun Semaan: £1,317,142.
4 Shares awarded under the RSP on 14 May 2010 and 19 March 2011 are not due to vest until 19 March 2013 and 19 March 2014, respectively. It is too early, in the Committee’s opinion, to provide shareholders with a meaningful assessment to the extent that these shares will vest, if at all.
5 Shares awarded under the RSP on 5 January 2011 and 6 September 2011 are not subject to performance conditions and will vest in equal annual tranches over three years from the date of grant, subject to continued employment.
6 Shares due to vest under the RSP on 5 January 2012 were delayed as a result of the Director being unable to deal at that time. These shares are due to vest on 5 March 2012 following the release of the Group’s financial results for 2011.
7 Keith Roberts retired from the Board on 13 October 2011 and the awards detailed above have been scaled back proportionally to reflect the number of shares that he was entitled to as at 31 December 2011. These awards will be released on the original vesting dates, as detailed in the table above, to the extent that the original performance conditions attached to each award are met.
Directors’ remuneration report continued
Petrofac Annual report and accounts 2011104

Sums paid to third parties in respect of Executive
Directors’ services
No sums were paid to third parties in respect of any Executive
Director’s services (2010: nil).
External appointments
Executive Directors are entitled to accept one non-executive
appointment outside the Company with the consent of the Board.
Any fees received may be retained by the Director. On joining
the Board, Tim Weller held two non-executive positions with the
Carbon Trust and BBC Worldwide. The Board approved these
existing appointments and accordingly, he received £3,849 and
£8,774 respectively in fees from the time of his appointment to the
Board to 31 December 2011.
Directors’ beneficial shareholdings at 31 December 2011
Directors’ personal shareholdings, which include family interests
and which are not related to their remuneration, have been
disclosed under the requirements of the UKLA listing rules and
are as follows:
Number of shares as at
31 December 2011
Number of shares as at
31 December 2010 (or at date of
appointment, if later)
Executive Directors
Ayman Asfari 62,837,968 62,782,114
Maroun Semaan 28,135,388 28,082,676
Non-executive Directors
Norman Murray 7,730 1,350
Thomas Thune Andersen 4,000 4,000
Roxanne Decyk 5,804 3,912
Rijnhard van Tets 100,000 100,000
The Company’s share price at the end of the financial year was
1441 pence and the market price during the year was in the range
of 1108 pence to 1685 pence.
Annual General Meeting
This remuneration report will be submitted for approval to the AGM
to be held on 11 May 2012.
On behalf of the Board
Thomas Thune AndersenChairman of the Remuneration Committee
2 March 2012
Petrofac Annual report and accounts 2011 105
Com
pany
financia
l sta
tem
ents
Com
Com
pany
pany
Gro
up
fin
ancia
l sta
tem
ents
107 153
Gove
rnance
G
Corp
ora
te
resp
onsi
bility
Corp
Corp
ora
tora
tee
Fin
ancia
l p
erf
orm
ance
and ris
kFin
aFin
ancia
ncia
ll
Revi
ew
of o
pera
tions
Gro
Gro
up
up
11
Directors’ informationCorporate governance report– Nominations Committee report– Audit Committee report– Board Risk Committee reportDirectors’ remuneration reportDirectors’ statements
Ri
fti
Ove
rvie
w
01 22 41 50
Directors’ responsibilities
The Directors are responsible for preparing the annual report and
the financial statements in accordance with applicable law and
regulations. The Directors have chosen to prepare the financial
statements in accordance with International Financial Reporting
Standards (IFRS). The Directors are also responsible for the
preparation of the Directors’ remuneration report, which they
have chosen to prepare, being under no obligation to do so under
Jersey law. The Directors are also responsible for the preparation
of the corporate governance report under the Listing Rules.
Jersey Company law (the ‘Law’) requires the Directors to prepare
financial statements for each financial period in accordance with
generally accepted accounting principles. The financial statements
are required by law to give a true and fair view of the state of affairs
of the Company at the period end and the profit or loss of the
Company for the period then ended. In preparing these financial
statements, the Directors should:
• select suitable accounting policies and then apply them consistently
• make judgements and estimates that are reasonable and prudent
• specify which generally accepted accounting principles have been adopted in their preparation
• prepare the financial statements on a going concern basis unless it is inappropriate to presume that the Company will continue in business
The Directors are responsible for keeping proper accounting
records which are sufficient to show and explain the Company’s
transactions and as such as to disclose with reasonable accuracy
at any time the financial position of the Company and enable them
to ensure that the financial statements prepared by the Company
comply with the Law. They are also responsible for safeguarding
the assets of the Company and hence for taking reasonable steps
for the prevention and detection of fraud and other irregularities.
The Directors are responsible for the maintenance and integrity of
the corporate and financial information included on the Company’s
website. Legislation in Jersey governing the preparation and
dissemination of financial statements may differ from legislation
in other jurisdictions.
Directors’ approach
The Board’s objective is to present a balanced and understandable
assessment of the Company’s position and prospects, particularly
in the annual report, half year report (formerly the interim report) and
other published documents and reports to regulators. The Board
has established an Audit Committee to assist with this obligation.
Going concern
The Company’s business activities, together with the factors likely
to affect its future development, performance and position are set
out in the business review on pages 22 to 40. The financial position
of the Company, its cash flows, liquidity position and borrowing
facilities are described in the financial review on pages 44 to 46.
In addition, note 34 to the financial statements include the
Company’s objectives, policies and processes for managing its
capital; its financial risk management objectives; details of its
financial instruments and hedging activities; and its exposures
to credit risk and liquidity risk.
The Company has considerable financial resources together
with long-term contracts with a number of customers and
suppliers across different geographic areas and industries.
As a consequence, the Directors believe that the Company is
well placed to manage its business risks successfully despite
the current uncertain economic outlook.
The Directors have a reasonable expectation that the Company
has adequate resources to continue in operational existence for the
foreseeable future. Thus they continue to adopt the going concern
basis of accounting in preparing the annual financial statements.
Responsibility statement under the Disclosure and Transparency Rules
Each of the Directors listed on pages 66 and 67 confirm that to the
best of their knowledge:
• the financial statements, prepared in accordance with IFRS, give a true and fair view of the assets, liabilities, financial position and profit of the Company and the undertakings included in the consolidation taken as a whole; and
• the operating and financial review includes a fair view of the development and performance of the business and the position of the Company and the undertakings included in the consolidation taken as a whole, together with a description of the principal risks and uncertainties that they face.
By order of the Board
Tim WellerChief Financial Officer
Directors’ statements
Petrofac Annual report and accounts 2011106

Group financial statements
108 Independent auditors’ report
109 Consolidated income statement
110 Consolidated statement of comprehensive income
111 Consolidated statement of financial position
112 Consolidated statement of cash flows
113 Consolidated statement of changes in equity
114 Notes to the consolidated financial statements
Section 6
Petrofac Annual report and accounts 2011 107
Com
pany
financia
l sta
tem
ents
153
Gro
up
fin
ancia
l sta
tem
ents
Gro
Gro
pup
Gove
rnance
GG
Corp
ora
te
resp
onsi
bility
Corp
Corp
ora
tora
tee
Fin
ancia
l p
erf
orm
ance
and ris
kFin
aFin
ancia
ncia
ll
Revi
ew
of o
pera
tions
Com
Com
pany
pany
1
Independent auditors’ reportConsolidated income statementConsolidated statement of comprehensive incomeConsolidated statement of financial positionConsolidated statement of cash flowsConsolidated statement of changes in equityNotes to the consolidated financial statements
Ri
fti
Ove
rvie
w
01 22 41 50 65

Independent Auditors’ report to the members of Petrofac Limited
We have audited the Group financial statements of Petrofac Limited (the Company) and its subsidiaries (together ‘the Group’) for the year ended 31 December 2011 which comprise the consolidated income statement, the consolidated statement of comprehensive income, the consolidated statement of financial position, the consolidated statement of cash flows, the consolidated statement of changes in equity and the related notes 1 to 35. The financial reporting framework that has been applied in their preparation is applicable Jersey law and International Financial Reporting Standards.
This report is made solely to the Company’s members, as a body, in accordance with Article 113A of the Companies (Jersey) Law 1991 and our engagement letter dated 15 February 2011. Our audit work has been undertaken so that we might state to the Company’s members those matters we are required to state to them in an auditors’ report and for no other purpose. To the fullest extent permitted by law, we do not accept or assume responsibility to anyone other than the Company and the Company’s members as a body, for our audit work, for this report, or for the opinions we have formed.
Respective responsibilities of Directors and auditor As explained more fully in the statement of Directors’ responsibilities set out on page 106, the Directors are responsible for the preparation of the Group financial statements and for being satisfied that they give a true and fair view. Our responsibility is to audit and express an opinion on the Group financial statements in accordance with applicable law and International Standards on Auditing (UK and Ireland). Those standards require us to comply with the Auditing Practices Board’s Ethical Standards for Auditors.
In addition the Company has also instructed us to: • report as to whether the information given in the corporate
governance report with respect to internal control and risk management systems in relation to financial reporting processes and about share capital structures is consistent with the financial statements
• review the directors’ statement in relation to going concern as set out on page 106, which for a premium listed UK incorporated company is specified for review by the Listing Rules of the Financial Services Authority
Scope of the audit of the financial statements An audit involves obtaining evidence about the amounts and disclosures in the financial statements sufficient to give reasonable assurance that the financial statements are free from material misstatement, whether caused by fraud or error. This includes an assessment of: whether the accounting policies are appropriate to the Group’s circumstances and have been consistently applied and adequately disclosed; the reasonableness of significant accounting estimates made by the Directors; and the overall presentation of the financial statements. In addition, we read all the financial and non-financial information in the annual report to identify material inconsistencies with the audited financial statements. If we become aware of any apparent material misstatements or inconsistencies we consider the implications for our report.
Opinion on financial statements In our opinion the Group financial statements:
• give a true and fair view of the state of the Group’s affairs as at 31 December 2011 and of its profit for the year then ended
• have been properly prepared in accordance with International Financial Reporting Standards
• have been prepared in accordance with the requirements of the Companies (Jersey) Law 1991
Opinion on other matter In our opinion, the information given in the Corporate Governance Report set out on pages 68 to 90 with respect to internal control and risk management systems in relation to financial reporting processes and about share capital structures is consistent with the financial statements.
Matters on which we are required to report by exception We have nothing to report in respect of the following:
• where the Companies (Jersey) Law 1991 requires us to report to you if, in our opinion: – proper accounting records have not been kept, or proper
returns adequate for our audit have not been received from branches not visited by us; or
– the financial statements are not in agreement with the accounting records and returns; or
– we have not received all the information and explanations we require for our audit
• under the Listing Rules we are required to review the part of the corporate governance report relating to the Company’s compliance with the nine provisions of the UK Corporate Governance Code specified for our review
• where the Company instructed us to review the directors’ statement, set out on page 106, in relation to going concern
Other matter We have reported separately on the parent company financial statements of Petrofac Limited for the year ended 31 December 2011 and on the information in the Directors’ remuneration report that is described as having been audited.
Justine Belton for and on behalf of Ernst & Young LLP London
2 March 2012
Notes:
1 The maintenance and integrity of the Petrofac Limited website is the responsibility of the Directors; the work carried out by the auditors does not involve consideration of these matters and, accordingly, the auditors accept no responsibility for any changes that may have occurred to the financial statements since they were initially presented on the website.
2 Legislation in Jersey governing the preparation and dissemination of financial statements may differ from legislation in other jurisdictions.
Petrofac Annual report and accounts 2011108

Consolidated income statement For the year ended 31 December 2011
Notes 2011
US$’0002010
US$’000
Revenue 4a 5,800,719 4,354,217
Cost of sales 4b (4,840,943) (3,595,142)
Gross profit 959,776 759,075
Selling, general and administration expenses 4c (283,392) (221,449)
Gain on EnQuest demerger 11 – 124,864
Other income 4f 11,600 5,013
Other expenses 4g (5,104) (4,053)
Profit from operations before tax and finance income/(costs) 682,880 663,450
Finance costs 5 (6,599) (5,131)
Finance income 5 7,877 10,209
Share of losses of associates 14 (3,593) (131)
Profit before tax 680,565 668,397
Income tax expense 6 (140,984) (110,545)
Profit for the year 539,581 557,852
Attributable to:
Petrofac Limited shareholders 539,425 557,817
Non-controlling interests 156 35
539,581 557,852
Earnings per share (US cents) 7
– Basic (excluding gain on EnQuest demerger) 159.01 127.76
– Diluted (excluding gain on EnQuest demerger) 157.13 126.09
– Basic (including gain on EnQuest demerger) 159.01 164.61
– Diluted (including gain on EnQuest demerger) 157.13 162.46
The attached notes 1 to 35 form part of these consolidated financial statements.
Petrofac Annual report and accounts 2011 109
Com
pany
financia
l sta
tem
ents
153
Gro
up
fin
ancia
l sta
tem
ents
Gro
Gro
pup
Gove
rnance
GG
Corp
ora
te
resp
onsi
bility
Corp
Corp
ora
tora
tee
Fin
ancia
l p
erf
orm
ance
and ris
kFin
aFin
ancia
ncia
ll
Revi
ew
of o
pera
tions
Com
Com
pany
pany
1
Independent auditors’ reportConsolidated income statementConsolidated statement of comprehensive incomeConsolidated statement of financial positionConsolidated statement of cash flowsConsolidated statement of changes in equityNotes to the consolidated financial statements
Ri
fti
Ove
rvie
w
01 22 41 50 65

Consolidated statement of comprehensive income For the year ended 31 December 2011
Notes 2011
US$’000 2010
US$’000
Profit for the year 539,581 557,852
Foreign currency translation 26 (15,927) (908)
Foreign currency translation recycled to income statement in the year on EnQuest demerger 26 – 45,818
Net loss on maturity of cash flow hedges recycled in the period 26 (3,675) (16,612)
Net changes in fair value of derivatives and financial assets designated as cash flow hedges 26 (13,590) (18,958)
Net changes in the fair value of available-for-sale financial assets 26 – 70
Disposal of available-for-sale financial assets 26 (70) (74)
Other comprehensive income (33,262) 9,336
Total comprehensive income for the period 506,319 567,188
Attributable to:
Petrofac Limited shareholders 506,163 567,153
Non-controlling interests 156 35
506,319 567,188
The attached notes 1 to 35 form part of these consolidated financial statements.
Petrofac Annual report and accounts 2011110
Consolidated statement of financial position At 31 December 2011
Notes 2011
US$’0002010
US$’000
Assets Non-current assets
Property, plant and equipment 9 593,737 287,158
Goodwill 12 106,681 105,832
Intangible assets 13 121,821 85,837
Investments in associates 14 164,405 16,349
Available-for-sale financial assets 16 – 101,494
Other financial assets 17 140,109 2,223
Deferred income tax assets 6c 29,142 26,301
1,155,895 625,194
Current assets
Non-current asset held for sale 18 44,330 –
Inventories 19 10,529 7,202
Work in progress 20 612,009 803,986
Trade and other receivables 21 1,353,042 1,056,759
Due from related parties 33 99,075 327
Other financial assets 17 29,634 42,350
Income tax receivable 15,364 2,525
Cash and short-term deposits 22 1,572,338 1,063,005
3,736,321 2,976,154
Total assets 4,892,216 3,601,348
Equity and liabilities Equity attributable to Petrofac Limited shareholders
Share capital 23 6,916 6,914
Share premium 2,211 992
Capital redemption reserve 10,881 10,881
Shares to be issued – 994
Treasury shares 24 (75,686) (65,317)
Other reserves 26 5,638 34,728
Retained earnings 1,160,776 787,270
1,110,736 776,462
Non-controlling interests 3,092 2,592
Total equity 1,113,828 779,054
Non-current liabilities
Interest-bearing loans and borrowings 27 16,450 40,226
Provisions 28 59,561 45,441
Other financial liabilities 29 23,542 11,453
Deferred income tax liabilities 6c 59,605 48,086
159,158 145,206
Current liabilities
Trade and other payables 30 1,744,182 1,021,436
Due to related parties 33 23,166 11,710
Interest-bearing loans and borrowings 27 60,711 47,435
Other financial liabilities 29 31,677 37,054
Liabilities directly associated with non-current asset held for sale 18 5,150 –
Income tax payable 96,122 105,559
Billings in excess of cost and estimated earnings 20 389,404 178,429
Accrued contract expenses 31 1,268,818 1,275,465
3,619,230 2,677,088
Total liabilities 3,778,388 2,822,294
Total equity and liabilities 4,892,216 3,601,348
The financial statements on pages 109 to 152 were approved by the Board of Directors on 2 March 2012 and signed on its behalf by Tim Weller – Chief Financial Officer.
The attached notes 1 to 35 form part of these consolidated financial statements.
Petrofac Annual report and accounts 2011 111
Com
pany
financia
l sta
tem
ents
153
Gro
up
fin
ancia
l sta
tem
ents
Gro
Gro
pup
Gove
rnance
GG
Corp
ora
te
resp
onsi
bility
Corp
Corp
ora
tora
tee
Fin
ancia
l p
erf
orm
ance
and ris
kFin
aFin
ancia
ncia
ll
Revi
ew
of o
pera
tions
Com
Com
pany
pany
1
Independent auditors’ reportConsolidated income statementConsolidated statement of comprehensive incomeConsolidated statement of financial positionConsolidated statement of cash flowsConsolidated statement of changes in equityNotes to the consolidated financial statements
Ri
fti
Ove
rvie
w
01 22 41 50 65

Consolidated statement of cash flows For the year ended 31 December 2011
Notes 2011
US$’000 2010
US$’000
Operating activities
Profit before tax 680,565 668,397
Gain on EnQuest demerger – (124,864)
680,565 543,533
Non-cash adjustments to reconcile profit before tax to net cash flows: Depreciation, amortisation, impairment and write off 4b, 4c 80,088 95,903
Share-based payments 4d 23,056 14,784
Difference between other long-term employment benefits paid and amounts recognised in the income statement 9,450 6,074
Net finance income 5 (1,278) (5,078)
(Gain)/loss on disposal of property, plant and equipment 4b, 4f, 4g (34) 315
Gain on fair value changes in Seven Energy warrants 4f (5,647) –
Gain on disposal of intangible assets 4f – (2,338)
Share of losses of associates 14 3,593 131
Other non-cash items, net 5,865 13,188
795,658 666,512
Working capital adjustments: Trade and other receivables (300,567) (266,757)
Work in progress 191,977 (470,288)
Due from related parties (98,748) 17,933
Inventories (3,327) (2,982)
Other current financial assets 17,142 (12,661)
Trade and other payables 735,124 167,707
Billings in excess of cost and estimated earnings 210,975 (282,715)
Accrued contract expenses (6,647) 438,809
Due to related parties 11,456 (45,616)
Other current financial liabilities 324 6,045
1,553,367 215,987
Long-term receivable from a customer 17 (130,206) –
Other non-current items, net (196) (8,720)
Cash generated from operations 1,422,965 207,267
Interest paid (3,156) (1,948)
Income taxes paid, net (156,848) (99,030)
Net cash flows from operating activities 1,262,961 106,289
Investing activities
Purchase of property, plant and equipment (420,360) (115,345)
Acquisition of subsidiaries, net of cash acquired 10 – (15,110)
Payment of deferred consideration on acquisition (15,969) –
Purchase of other intangible assets 13 (5,722) (153)
Purchase of intangible oil & gas assets 13 (39,728) (15,644)
Cash outflow on EnQuest demerger (including transaction costs) – (17,783)
Investment in associates 14 (50,282) (8,459)
Purchase of available-for-sale financial assets 16 – (101,494)
Proceeds from disposal of property, plant and equipment 886 3,219
Proceeds from disposal of available-for-sale financial assets 243 539
Proceeds from sale of intangible assets – 6,018
Interest received 8,468 10,257
Net cash flows used in investing activities (522,464) (253,955)
Financing activities
Repayment of interest-bearing loans and borrowings (19,489) (32,458)
Treasury shares purchased 24 (49,062) (36,486)
Equity dividends paid (159,087) (132,244)
Net cash flows used in financing activities (227,638) (201,188)
Net increase/(decrease) in cash and cash equivalents 512,859 (348,854)
Net foreign exchange difference (11,550) (7,793)
Cash and cash equivalents at 1 January 1,034,097 1,390,744
Cash and cash equivalents at 31 December 22 1,535,406 1,034,097
The attached notes 1 to 35 form part of these consolidated financial statements.
Petrofac Annual report and accounts 2011112

Consolidated statement of changes in equity For the year ended 31 December 2011
Attributable to shareholders of Petrofac Limited
Issued share
capital US$’000
Share premium US$’000
Capital redemption
reserve US$’000
Shares to be issued US$’000
*Treasury shares
US$’000 (note 24)
Other reserves US$’000 (note 26)
Retained earnings US$’000
Total US$’000
Non-controlling
interests US$’000
Total equity
US$’000
Balance at 1 January 2011 6,914 992 10,881 994 (65,317) 34,728 787,270 776,462 2,592 779,054
Net profit for the year – – – – – – 539,425 539,425 156 539,581
Other comprehensive income – – – – – (33,262) – (33,262) – (33,262)
Total comprehensive income for the year – – – – – (33,262) 539,425 506,163 156 506,319
Shares issued as payment of consideration on acquisition 2 1,219 – (994) – – – 227 – 227
Share-based payments charge (note 25) – – – – – 23,056 – 23,056 – 23,056
Shares vested during the year (note 24) – – – – 38,693 (33,776) (4,917) – – –
Transfer to reserve for share- based payments (note 25) – – – – – 17,974 – 17,974 – 17,974
Treasury shares purchased (note 24) – – – – (49,062) – – (49,062) – (49,062)
Income tax on share-based payments reserve – – – – – (3,082) – (3,082) – (3,082)
Dividends (note 8) – – – – – – (161,002) (161,002) – (161,002)
Movement in non-controlling interests – – – – – – – – 344 344
Balance at 31 December 2011 6,916 2,211 10,881 – (75,686) 5,638 1,160,776 1,110,736 3,092 1,113,828
Attributable to shareholders of Petrofac Limited
Issued share
capital US$’000
Share premium US$’000
Capital redemption
reserve US$’000
Shares to be issued US$’000
*Treasury shares
US$’000 (note 24)
Other reserves US$’000 (note 26)
Retained earnings US$’000
Total US$’000
Non-controlling
interests US$’000
Total equity
US$’000
Balance at 1 January 2010 8,638 69,712 10,881 1,988 (56,285) 25,394 834,382 894,710 2,819 897,529
Net profit for the year – – – – – – 557,817 557,817 35 557,852
Other comprehensive income – – – – – 9,336 – 9,336 – 9,336
Total comprehensive income for the year – – – – – 9,336 557,817 567,153 35 567,188
Shares issued as payment of consideration on acquisition 4 2,452 – (994) – – – 1,462 – 1,462
Share-based payments charge (note 25) – – – – – 14,784 – 14,784 – 14,784
Shares vested during the year (note 24) – – – – 27,454 (26,170) (1,284) – – –
Transfer to reserve for share- based payments (note 25) – – – – – 12,750 – 12,750 – 12,750
Treasury shares purchased (note 24) – – – – (36,486) – – (36,486) – (36,486)
Income tax on share-based payments reserve – – – – – (1,366) – (1,366) – (1,366)
EnQuest demerger share split and redemption (1,728) – – – – – 1,728 – – –
Distribution on EnQuest demerger – (71,172) – – – – (473,325) (544,497) – (544,497)
Dividends (note 8) – – – – – – (132,048) (132,048) – (132,048)
Movement in non-controlling interests – – – – – – – – (262) (262)
Balance at 31 December 2010 6,914 992 10,881 994 (65,317) 34,728 787,270 776,462 2,592 779,054
*Shares held by Petrofac Employee Benefit Trust and Petrofac Joint Venture Companies Employee Benefit Trust.
The attached notes 1 to 35 form part of these consolidated financial statements.
Petrofac Annual report and accounts 2011 113
Com
pany
financia
l sta
tem
ents
153
Gro
up
fin
ancia
l sta
tem
ents
Gro
Gro
pup
Gove
rnance
GG
Corp
ora
te
resp
onsi
bility
Corp
Corp
ora
tora
tee
Fin
ancia
l p
erf
orm
ance
and ris
kFin
aFin
ancia
ncia
ll
Revi
ew
of o
pera
tions
Com
Com
pany
pany
1
Independent auditors’ reportConsolidated income statementConsolidated statement of comprehensive incomeConsolidated statement of financial positionConsolidated statement of cash flowsConsolidated statement of changes in equityNotes to the consolidated financial statements
Ri
fti
Ove
rvie
w
01 22 41 50 65

Notes to the consolidated financial statements For the year ended 31 December 2011
1 Corporate information
The consolidated financial statements of Petrofac Limited (the Company) for the year ended 31 December 2011 were authorised for issue in accordance with a resolution of the Directors on 2 March 2012.
Petrofac Limited is a limited liability company registered and domiciled in Jersey under the Companies (Jersey) Law 1991 and is the holding company for the international group of Petrofac subsidiaries (together ‘the Group’). The Company’s 31 December 2011 financial statements are shown on pages 155 to 168. The Group’s principal activity is the provision of services to the oil & gas production and processing industry.
A full listing of all Group companies, and joint venture entities, is contained in note 35 to these consolidated financial statements.
2 Summary of significant accounting policies
Basis of preparation The consolidated financial statements have been prepared on a historical cost basis, except for derivative financial instruments and available-for-sale financial assets which have been measured at fair value. The presentation currency of the consolidated financial statements is United States dollars and all values in the financial statements are rounded to the nearest thousand (US$’000) except where otherwise stated.
Statement of compliance The consolidated financial statements of Petrofac Limited and its subsidiaries have been prepared in accordance with International Financial Reporting Standards (IFRS) and applicable requirements of Jersey law.
Basis of consolidation The consolidated financial statements comprise the financial statements of Petrofac Limited and its subsidiaries. The financial statements of its subsidiaries are prepared for the same reporting year as the Company and where necessary, adjustments are made to the financial statements of the Group’s subsidiaries to bring their accounting policies into line with those of the Group.
Subsidiaries are consolidated from the date on which control is transferred to the Group and cease to be consolidated from the date on which control is transferred out of the Group. Control is achieved where the Company has the power to govern the financial and operating policies of an investee entity so as to obtain benefits from its activities. All intra-Group balances and transactions, including unrealised profits, have been eliminated on consolidation.
Non-controlling interests in subsidiaries consolidated by the Group are disclosed separately from the Group’s equity and income statement and non-controlling interests are allocated their share of total comprehensive income for the year even if this results in a deficit balance.
New standards and interpretations The Group has adopted new and revised Standards and Interpretations issued by the International Accounting Standards Board (IASB) and the International Financial Reporting Interpretations Committee (IFRIC) of the IASB that are relevant to its operations and effective for accounting periods beginning on or after 1 January 2011. The principal effects of the adoption of these new and amended standards and improvements are discussed below:
• IAS 24 Related Party Disclosures (amendment) effective 1 January 2011
• improvements to IFRS’s (May 2010): – IFRS 3 Business Combinations – measurement options available
for non-controlling interest (NCI) effective 1 July 2010 – IFRS 7 Financial Instruments: Disclosures – collateral and
qualitative disclosures – IAS 1 Presentation of Financial Statements – analysis of other
comprehensive income
IAS 24 Related Party Disclosures (Amendment) The IASB has issued an amendment to IAS 24 that clarifies the identification of related party relationships, particularly in relation to significant influence or control. The new definitions emphasise a symmetrical view on related party relationships as well as clarifying in which circumstances persons and key management personnel affect related party relationships of an entity. While the adoption of the amendment did not have any current impact on the financial position, performance, or disclosure of the Group, as all required information is currently being appropriately captured and disclosed, it is relevant to the application of the Group’s accounting policy in identifying future potential related party relationships.
Improvements to IFRS The improvements did not have any impact on the accounting policies, financial position or performance of the Group.
Standards issued but not yet effective Standards issued but not yet effective up to the date of issuance of the Group’s financial statements are listed below and include only those standards and interpretations that are likely to have an impact on the disclosures, financial position or performance of the Group at a future date. The Group intends to adopt these standards when they become effective.
IAS 1 Financial Statement Presentation – Presentation of Items of Other Comprehensive Income (OCI) The amendments to IAS 1 change the grouping of items presented in OCI. Items that could be reclassified (or ‘recycled’) to profit or loss at a future point in time (for example, upon de-recognition or settlement) would be presented separately from items that will never be reclassified. The amendment affects presentation only and has therefore no impact on the Group’s financial position or performance. The amendment becomes effective for annual periods beginning on or after 1 July 2012.
IAS 27 Separate Financial Statements (as revised in 2011) As a consequence of the new IFRS 10 and IFRS 12, what remains of IAS 27 is limited to accounting for subsidiaries, jointly controlled entities, and associates in separate financial statements. The amendment becomes effective for annual periods beginning on or after 1 January 2013 but is not expected to have any financial impact on the separate financial statements of the Group but will require some changes in disclosure.
IAS 28 Investments in Associates and Joint Ventures (as revised in 2011) As a consequence of the new IFRS 11 and IFRS 12, IAS 28 has been renamed IAS 28 Investments in Associates and Joint Ventures, and describes the application of the equity method to investments in joint ventures in addition to associates. The Group is currently assessing the impact that this standard will have on its financial position and performance. The amendment becomes effective for annual periods beginning on or after 1 January 2013.
IFRS 7 Financial Instruments: Disclosures – Enhanced Derecognition Disclosure Requirements The amendment requires additional disclosure about financial assets that have been transferred but not de-recognised to enable the user of the Group’s financial statements to understand the relationship with those assets that have not been de-recognised and their associated liabilities. In addition, the amendment requires disclosures about continuing involvement in de-recognised assets to enable the user to evaluate the nature of, and risks associated with, the entity’s continuing involvement in those de-recognised assets. The amendment affects disclosure only and has no impact on the Group’s financial position or performance. The amendment becomes effective for annual periods beginning on or after 1 July 2011.
Petrofac Annual report and accounts 2011114

IFRS 9 Financial Instruments: Classification and Measurement IFRS 9 as issued reflects the first phase of the IASB’s work on the replacement of IAS 39 and applies to classification and measurement of financial assets and financial liabilities as defined in IAS 39. The standard is effective for annual periods beginning on or after 1 January 2015. In subsequent phases, the IASB will address hedge accounting and impairment of financial assets. The completion of this project is expected over the course of the first half of 2012. The adoption of the first phase of IFRS 9 will have an effect on the classification and measurement of the Group’s financial assets, but will potentially have no impact on classification and measurements of financial liabilities. The Group will quantify the effect in conjunction with the other phases, when issued, to present a comprehensive picture.
IFRS 10 Consolidated Financial Statements IFRS 10 replaces the portion of IAS 27 Consolidated and Separate Financial Statements that addresses the accounting for consolidated financial statements. It also includes the issues raised in SIC-12 Consolidation – Special Purpose Entities.
IFRS 10 establishes a single control model that applies to all entities including special purpose entities. The changes introduced by IFRS 10 will require management to exercise significant judgement to determine which entities are controlled, and therefore, are required to be consolidated by a parent, compared with the requirements that were in IAS 27. The Group is currently assessing the impact that this standard will have on its financial position and performance.
This standard becomes effective for annual periods beginning on or after 1 January 2013.
IFRS 11 Joint Arrangements IFRS 11 replaces IAS 31 Interests in Joint Ventures and SIC-13 Jointly-controlled Entities — Non-monetary Contributions by Venturers.
IFRS 11 removes the option to account for jointly-controlled entities (JCEs) using proportionate consolidation. Instead, JCEs that meet the definition of a joint venture must be accounted for using the equity method.
The application of this new standard will impact the financial position and performance of the Group but the quantification of this amount is still being determined. This standard becomes effective for annual periods beginning on or after 1 January 2013.
IFRS 12 Disclosure of Involvement with Other Entities IFRS 12 includes all of the disclosures that were previously in IAS 27 related to consolidated financial statements, as well as all of the disclosures that were previously included in IAS 31 and IAS 28. These disclosures relate to an entity’s interests in subsidiaries, joint arrangements, associates and structured entities. A number of new disclosures are also required. This standard becomes effective for annual periods beginning on or after 1 January 2013. The application of this standard affects disclosure only and will have no impact on the Group’s financial position or performance.
IFRS 13 Fair Value Measurement IFRS 13 establishes a single source of guidance under IFRS for all fair value measurements. IFRS 13 does not change when an entity is required to use fair value, but rather provides guidance on how to measure fair value under IFRS when fair value is required or permitted. The Group is currently assessing the impact that this standard will have on the financial position and performance of the Group. This standard becomes effective for annual periods beginning on or after 1 January 2013.
Significant accounting judgements and estimates Judgements In the process of applying the Group’s accounting policies, management has made the following judgements, apart from those involving estimations, which have the most significant effect on the amounts recognised in the consolidated financial statements: • revenue recognition on fixed-price engineering, procurement
and construction contracts: the Group recognises revenue on fixed-price engineering, procurement and construction contracts using the percentage-of-completion method, based on surveys of work performed. The Group has determined this basis of revenue recognition is the best available measure of progress on such contracts
Estimation uncertainty The key assumptions concerning the future and other key sources of estimation uncertainty at the statement of financial position date, that have a significant risk of causing a material adjustment to the carrying amounts of assets and liabilities within the next financial year are discussed below: • project cost to complete estimates: at each statement of financial
position date the Group is required to estimate costs to complete on fixed-price contracts. Estimating costs to complete on such contracts requires the Group to make estimates of future costs to be incurred, based on work to be performed beyond the statement of financial position date. This estimate will impact revenues, cost of sales, work-in-progress, billings in excess of costs and estimated earnings and accrued contract expenses
• onerous contract provisions: the Group provides for future losses on long-term contracts where it is considered probable that the contract costs are likely to exceed revenues in future years. Estimating these future losses involves a number of assumptions about the achievement of contract performance targets and the likely levels of future cost escalation over time US$ nil (2010: US$2,523,000)
• impairment of goodwill: the Group determines whether goodwill is impaired at least on an annual basis. This requires an estimation of the value in use of the cash-generating units to which the goodwill is allocated. Estimating the value in use requires the Group to make an estimate of the expected future cash flows from each cash-generating unit and also to determine a suitable discount rate in order to calculate the present value of those cash flows. The carrying amount of goodwill at 31 December 2011 was US$106,681,000 (2010: US$105,832,000) (note 12)
• deferred tax assets: the Group recognises deferred tax assets on all applicable temporary differences where it is probable that future taxable profits will be available for utilisation. This requires management to make judgements and assumptions regarding the amount of deferred tax that can be recognised based on the magnitude and likelihood of future taxable profits. The carrying amount of deferred tax assets at 31 December 2011 was US$29,142,000 (2010: US$26,301,000)
• income tax: the Company and its subsidiaries are subject to routine tax audits and also a process whereby tax computations are discussed and agreed with the appropriate authorities. Whilst the ultimate outcome of such tax audits and discussions cannot be determined with certainty, management estimates the level of provisions required for both current and deferred tax on the basis of professional advice and the nature of current discussions with the tax authority concerned
• recoverable value of intangible oil & gas and other intangible assets: the Group determines at each statement of financial position date whether there is any evidence of indicators of impairment in the carrying value of its intangible oil & gas and other intangible assets. Where indicators exist, an impairment test is undertaken which requires management to estimate the recoverable value of its intangible assets for example by reference to quoted market values, similar arm’s length transactions involving these assets or value in use calculations
Petrofac Annual report and accounts 2011 115
Com
pany
financia
l sta
tem
ents
153
Gro
up
fin
ancia
l sta
tem
ents
Gro
Gro
pup
Gove
rnance
GG
Corp
ora
te
resp
onsi
bility
Corp
Corp
ora
tora
tee
Fin
ancia
l p
erf
orm
ance
and ris
kFin
aFin
ancia
ncia
ll
Revi
ew
of o
pera
tions
Com
Com
pany
pany
1
Independent auditors’ reportConsolidated income statementConsolidated statement of comprehensive incomeConsolidated statement of financial positionConsolidated statement of cash flowsConsolidated statement of changes in equityNotes to the consolidated financial statements
Ri
fti
Ove
rvie
w
01 22 41 50 65

Notes to the consolidated financial statements continued For the year ended 31 December 2011
2 Summary of significant accounting policies continued
• units of production depreciation: estimated proven plus probable reserves are used in determining the depreciation of oil & gas assets such that the depreciation charge is proportional to the depletion of the remaining reserves over their life of production. These calculations require the use of estimates including the amount of economically recoverable reserves and future oil & gas capital expenditure
Interests in joint ventures
Investment in associates The Group’s investment in associates is accounted for using the equity method where the investment is initially carried at cost and adjusted for post acquisition changes in the Group’s share of net assets of the associate. Goodwill on the initial investment forms a part of the carrying amount of the investment and is not individually tested for impairment.
The Group recognises its share of the net profits after tax and non-controlling interest of the associates in its consolidated income statement. Share of associate’s changes in equity is also recognised in the Group’s consolidated statement of changes in equity. Any unrealised gains and losses resulting from transactions between the Group and the associate are eliminated to the extent of the interest in associates.
The financial statements of the associate are prepared using the same accounting policies and reporting periods as that of the Group.
The carried value of the investment is tested for impairment at each reporting date. Impairment, if any, is determined by the difference between the recoverable amount of the associate and its carrying value and is reported within the share of income of an associate in the Group’s consolidated income statement.
Foreign currency translation The Company’s functional and presentational currency is US dollars. In the financial statements of individual subsidiaries, joint ventures and associates, transactions in currencies other than a company’s functional currency are recorded at the prevailing rate of exchange at the date of the transaction. At the year end, monetary assets and liabilities denominated in foreign currencies are retranslated at the rates of exchange prevailing at the statement of financial position date. Non-monetary assets and liabilities that are measured at historical cost in a foreign currency are translated using the rate of exchange as at the dates of the initial transactions. Non-monetary assets and liabilities measured at fair value in a foreign currency are translated using the rate of exchange at the date the fair value was determined. All foreign exchange gains and losses are taken to the consolidated income statement with the exception of exchange differences arising on monetary assets and liabilities that form part of the Group’s net investment in subsidiaries. These are taken directly to the statement of changes in equity until the disposal of the net investment at which time they are recognised in the consolidated income statement.
The statements of financial position of overseas subsidiaries, joint ventures and associates are translated into US dollars using the closing rate method, whereby assets and liabilities are translated at the rates of exchange prevailing at the statement of financial position date. The income statements of overseas subsidiaries and joint ventures are translated at average exchange rates for the year. Exchange differences arising on the retranslation of net assets are taken directly to other reserves within the statement of changes in equity.
On the disposal of a foreign entity, accumulated exchange differences are recognised in the consolidated income statement as a component of the gain or loss on disposal.
Property, plant and equipment Property, plant and equipment is stated at cost less accumulated depreciation and any impairment in value. Cost comprises the purchase price or construction cost and any costs directly attributable to making that asset capable of operating as intended. The purchase price or construction cost is the aggregate amount paid and the fair value of any other consideration given to acquire the asset. Depreciation is provided on a straight-line basis, other than on oil & gas assets, at the following rates:
Oil & gas facilities 10% – 12.5% Plant and equipment 4% – 33% Buildings and leasehold improvements 5% – 33% (or lease term if shorter) Office furniture and equipment 25% – 100% Vehicles 20% – 33%
Tangible oil & gas assets are depreciated, on a field-by-field basis, using the unit-of-production method based on entitlement to proven and probable reserves, taking account of estimated future development expenditure relating to those reserves.
Each asset’s estimated useful life, residual value and method of depreciation are reviewed and adjusted if appropriate at each financial year end.
No depreciation is charged on land or assets under construction.
The carrying amount of an item of property, plant and equipment is derecognised on disposal or when no future economic benefits are expected from its use or disposal. The gain or loss arising from the derecognition of an item of property, plant and equipment is included in profit or loss when the item is derecognised. Gains are not classified as revenue.
Non-current assets held for sale Non-current assets or disposal Groups are classified as held for sale when it is expected that the carrying amount of an asset will be recovered principally through sale rather than continuing use. Assets are not depreciated when classified as held for sale.
Borrowing costs Borrowing costs directly attributable to the construction of qualifying assets, which are assets that necessarily take a substantial period of time to prepare for their intended use, are added to the cost of those assets, until such time as the assets are substantially ready for their intended use. All other borrowing costs are recognised as interest payable in the consolidated income statement in the period in which they are incurred.
Goodwill Goodwill acquired in a business combination is initially measured at cost, being the excess of the cost of the business combination over the net fair value of the identifiable assets, liabilities and contingent liabilities of the entity at the date of acquisition. Following initial recognition, goodwill is measured at cost less any accumulated impairment losses. Goodwill is reviewed for impairment annually, or more frequently if events or changes in circumstances indicate that such carrying value may be impaired. All transaction costs associated with business combinations are charged to the consolidated income statement in the year of such combination.
The Group has a number of contractual arrangements with other parties which represent joint ventures. These take the form of agreements to share control over other entities (jointly controlled entities) and commercial collaborations (jointly controlled operations). The Group’s interests in jointly controlled entities are accounted for by proportionate consolidation, which involves recognising the Group’s proportionate share of the joint venture’s assets, liabilities, income and expenses with similar items in the consolidated financial statements on a line-by-line basis. Where the Group collaborates with other entities in jointly controlled operations, the expenses the Group incurs and its share of the revenue earned is recognised in the consolidated income statement. Assets controlled by the Group and liabilities incurred by it are recognised in the statement of financial position. Where necessary, adjustments are made to the financial statements of the Group’s jointly controlled entities and operations to bring their accounting policies into line with those of the Group.
Petrofac Annual report and accounts 2011116

For the purpose of impairment testing, goodwill acquired is allocated to the cash-generating units that are expected to benefit from the synergies of the combination. Each unit or units to which goodwill is allocated represents the lowest level within the Group at which the goodwill is monitored for internal management purposes and is not larger than an operating segment determined in accordance with IFRS 8 ‘Operating Segments’.
Impairment is determined by assessing the recoverable amount of the cash-generating units to which the goodwill relates. Where the recoverable amount of the cash-generating units is less than the carrying amount of the cash-generating units and related goodwill, an impairment loss is recognised.
Where goodwill has been allocated to cash-generating units and part of the operation within those units is disposed of, the goodwill associated with the operation disposed of is included in the carrying amount of the operation when determining the gain or loss on disposal of the operation. Goodwill disposed of in this circumstance is measured based on the relative values of the operation disposed of and the portion of the cash-generating units retained.
Deferred consideration payable on a business combination When, as part of a business combination, the Group defers a proportion of the total purchase consideration payable for an acquisition, the amount provided for is the acquisition date fair value of the consideration. The unwinding of the discount element is recognised as a finance cost in the income statement. For business combinations prior to 1 January 2010, all changes in estimated deferred consideration payable on acquisition are adjusted against the carried goodwill. For business combinations after 1 January 2010, changes in estimated deferred consideration payable on acquisition are recognised in the consolidated income statement unless they are measurement period adjustments which are as a result of additional information obtained after the acquisition date about the facts and circumstances existing at the acquisition date, which are adjusted against carried goodwill.
Intangible assets – non oil & gas assets Intangible assets acquired in a business combination are initially measured at cost being their fair values at the date of acquisition and are recognised separately from goodwill where the asset is separable or arises from a contractual or other legal right and its fair value can be measured reliably. After initial recognition, intangible assets are carried at cost less accumulated amortisation and any accumulated impairment losses. Intangible assets with a finite life are amortised over their useful economic life using a straight-line method unless a better method reflecting the pattern in which the asset’s future economic benefits are expected to be consumed can be determined. The amortisation charge in respect of intangible assets is included in the selling, general and administration expenses line of the consolidated income statement. The expected useful lives of assets are reviewed on an annual basis. Any change in the useful life or pattern of consumption of the intangible asset is treated as a change in accounting estimate and is accounted for prospectively by changing the amortisation period or method. Intangible assets are tested for impairment whenever there is an indication that the asset may be impaired.
Oil & gas assets Capitalised costs The Group’s activities in relation to oil & gas assets are limited to assets in the evaluation, development and production phases.
Oil & gas evaluation and development expenditure is accounted for using the successful efforts method of accounting.
Evaluation expenditures Expenditure directly associated with evaluation (or appraisal) activities is capitalised as an intangible asset. Such costs include the costs of acquiring an interest, appraisal well drilling costs, payments to contractors and an appropriate share of directly attributable overheads incurred during the evaluation phase. For such appraisal activity, which may require drilling of further wells, costs continue to be carried as an asset whilst related hydrocarbons are considered capable of commercial development. Such costs are subject to technical, commercial and management review to confirm the continued intent to develop, or otherwise extract value. When this is no longer the case, the costs are written-off in the income statement. When such assets are declared part of a commercial development, related costs are transferred to tangible oil & gas assets. All intangible oil & gas assets are assessed for any impairment prior to transfer and any impairment loss is recognised in the consolidated income statement.
Development expenditures Expenditure relating to development of assets which include the construction, installation and completion of infrastructure facilities such as platforms, pipelines and development wells, is capitalised within property, plant and equipment.
Changes in unit-of-production factors Changes in factors which affect unit-of-production calculations are dealt with prospectively, not by immediate adjustment of prior years’ amounts.
Decommissioning Provision for future decommissioning costs is made in full when the Group has an obligation to dismantle and remove a facility or an item of plant and to restore the site on which it is located, and when a reasonable estimate of that liability can be made. The amount recognised is the present value of the estimated future expenditure. An amount equivalent to the discounted initial provision for decommissioning costs is capitalised and amortised over the life of the underlying asset on a unit-of-production basis over proven and probable reserves. Any change in the present value of the estimated expenditure is reflected as an adjustment to the provision and the oil & gas asset.
The unwinding of the discount applied to future decommissioning provisions is included under finance costs in the income statement.
Available-for-sale financial assets Investments classified as available-for-sale are initially stated at fair value, including acquisition charges associated with the investment.
After initial recognition, available-for-sale financial assets are measured at their fair value using quoted market rates or in the absence of market data other fair value calculation methodologies. Gains and losses are recognised as a separate component of equity until the investment is sold or impaired, at which time the cumulative gain or loss previously reported in equity is included in the consolidated income statement.
Impairment of assets (excluding goodwill) At each statement of financial position date, the Group reviews the carrying amounts of its tangible and intangible assets to assess whether there is an indication that those assets may be impaired. If any such indication exists, the Group makes an estimate of the asset’s recoverable amount. An asset’s recoverable amount is the higher of an asset’s fair value less costs to sell and its value in use. In assessing value in use, the estimated future cash flows attributable to the asset are discounted to their present value using a pre-tax discount rate that reflects current market assessments of the time value of money and the risks specific to the asset.
If the recoverable amount of an asset is estimated to be less than its carrying amount, the carrying amount of the asset is reduced to its recoverable amount. An impairment loss is recognised immediately in the consolidated income statement, unless the relevant asset is carried at a revalued amount, in which case the impairment loss is treated as a revaluation decrease.
Petrofac Annual report and accounts 2011 117
Com
pany
financia
l sta
tem
ents
153
Gro
up
fin
ancia
l sta
tem
ents
Gro
Gro
pup
Gove
rnance
GG
Corp
ora
te
resp
onsi
bility
Corp
Corp
ora
tora
tee
Fin
ancia
l p
erf
orm
ance
and ris
kFin
aFin
ancia
ncia
ll
Revi
ew
of o
pera
tions
Com
Com
pany
pany
1
Independent auditors’ reportConsolidated income statementConsolidated statement of comprehensive incomeConsolidated statement of financial positionConsolidated statement of cash flowsConsolidated statement of changes in equityNotes to the consolidated financial statements
Ri
fti
Ove
rvie
w
01 22 41 50 65
Notes to the consolidated financial statements continued For the year ended 31 December 2011
2 Summary of significant accounting policies continued
Where an impairment loss subsequently reverses, the carrying amount of the asset is increased to the revised estimate of its recoverable amount, but so that the increased carrying amount does not exceed the carrying amount that would have been determined had no impairment loss been recognised for the asset in prior years. A reversal of an impairment loss is recognised immediately in the consolidated income statement, unless the relevant asset is carried at a revalued amount, in which case the reversal of the impairment is treated as a revaluation increase.
Inventories Inventories are valued at the lower of cost and net realisable value. Net realisable value is the estimated selling price in the ordinary course of business, less estimated costs of completion and the estimated costs necessary to make the sale. Cost comprises purchase price, cost of production, transportation and other directly allocable expenses. Costs of inventories, other than raw materials, are determined using the first-in-first-out method. Costs of raw materials are determined using the weighted average method.
Work in progress and billings in excess of cost and estimated earnings Fixed price lump sum engineering, procurement and construction contracts are presented in the statement of financial position as follows: • for each contract, the accumulated cost incurred, as well as
the estimated earnings recognised at the contract’s percentage of completion less provision for any anticipated losses, after deducting the progress payments received or receivable from the customers, are shown in current assets in the statement of financial position under ‘work in progress’
• where the payments received or receivable for any contract exceed the cost and estimated earnings less provision for any anticipated losses, the excess is shown as ‘billings in excess of cost and estimated earnings’ within current liabilities
Trade and other receivables Trade receivables are recognised and carried at original invoice amount less an allowance for any amounts estimated to be uncollectable. An estimate for doubtful debts is made when there is objective evidence that the collection of the full amount is no longer probable under the terms of the original invoice. Impaired debts are derecognised when they are assessed as uncollectable.
Cash and cash equivalents Cash and cash equivalents consist of cash at bank and in hand and short-term deposits with an original maturity of three months or less. For the purpose of the cash flow statement, cash and cash equivalents consists of cash and cash equivalents as defined above, net of outstanding bank overdrafts.
Interest-bearing loans and borrowings All interest-bearing loans and borrowings are initially recognised at the fair value of the consideration received net of issue costs directly attributable to the borrowing.
After initial recognition, interest-bearing loans and borrowings are subsequently measured at amortised cost using the effective interest rate method. Amortised cost is calculated by taking into account any issue costs, and any discount or premium on settlement.
Provisions Provisions are recognised when the Group has a present legal or constructive obligation as a result of past events, it is probable that an outflow of resources will be required to settle the obligation and a reliable estimate can be made of the amount of the obligation. If the time value of money is material, provisions are discounted using a current pre-tax rate that reflects, where appropriate, the risks specific to the liability. Where discounting is used, the increase in the provision due to the passage of time is recognised in the consolidated income statement as a finance cost.
De-recognition of financial assets and liabilities Financial assets A financial asset (or, where applicable a part of a financial asset) is de-recognised where: • the rights to receive cash flows from the asset have expired • the Group retains the right to receive cash flows from the asset,
but has assumed an obligation to pay them in full without material delay to a third-party under a ‘pass-through’ arrangement; or
• the Group has transferred its rights to receive cash flows from the asset and either (a) has transferred substantially all the risks and rewards of the asset, or (b) has neither transferred nor retained substantially all the risks and rewards of the asset, but has transferred control of the asset
Financial liabilities A financial liability is de-recognised when the obligation under the liability is discharged or cancelled or expires.
If an existing financial liability is replaced by another from the same lender, on substantially different terms, or the terms of an existing liability are substantially modified, such an exchange or modification is treated as a de recognition of the original liability and the recognition of a new liability such that the difference in the respective carrying amounts together with any costs or fees incurred are recognised in the consolidated income statement.
Pensions and other long-term employment benefits The Group has various defined contribution pension schemes in accordance with the local conditions and practices in the countries in which it operates. The amount charged to the consolidated income statement in respect of pension costs reflects the contributions payable in the year. Differences between contributions payable during the year and contributions actually paid are shown as either accrued liabilities or prepaid assets in the statement of financial position.
The Group’s other long-term employment benefits are provided in accordance with the labour laws of the countries in which the Group operates, further details of which are given in note 28.
Share-based payment transactions Employees (including Directors) of the Group receive remuneration in the form of share-based payment transactions, whereby employees render services in exchange for shares or rights over shares (‘equity-settled transactions’).
Equity-settled transactions The cost of equity-settled transactions with employees is measured by reference to the fair value at the date on which they are granted. In valuing equity-settled transactions, no account is taken of any service or performance conditions, other than conditions linked to the price of the shares of Petrofac Limited (‘market conditions’), if applicable.
The cost of equity-settled transactions is recognised, together with a corresponding increase in equity, over the period in which the relevant employees become fully entitled to the award (the ‘vesting period’). The cumulative expense recognised for equity-settled transactions at each reporting date until the vesting date reflects the extent to which the vesting period has expired and the Group’s best estimate of the number of equity instruments that will ultimately vest. The income statement charge or credit for a period represents the movement in cumulative expense recognised as at the beginning and end of that period.
-
Petrofac Annual report and accounts 2011118

No expense is recognised for awards that do not ultimately vest, except for awards where vesting is conditional upon a market or non-vesting condition, which are treated as vesting irrespective of whether or not the market or non-vesting condition is satisfied, provided that all other performance conditions and service conditions are satisfied. Equity awards cancelled are treated as vesting immediately on the date of cancellation, and any expense not recognised for the award at that date is recognised in the income statement.
Petrofac Employee Benefit Trusts The Petrofac Employee Benefit Trust and the Petrofac Joint Venture Companies Employee Benefit Trust warehouse ordinary shares purchased to satisfy various new share scheme awards made to the employees of the Company and its joint venture partner employees, which will be transferred to the members of the scheme on their respective vesting dates subject to satisfying the performance conditions of each scheme. The trusts have been consolidated in the Group financial statements in accordance with SIC 12 ‘Special Purpose Entities’. The cost of shares temporarily held by the trusts are reflected as treasury shares and deducted from equity.
Leases The determination of whether an arrangement is, or contains a lease is based on the substance of the arrangement at inception date of whether the fulfilment of the arrangement is dependent on the use of a specific asset or assets or the arrangement conveys the right to use the asset.
Leases are classified as finance leases whenever the terms of the lease transfer substantially all the risks and rewards of ownership to the lessee. All other leases are classified as operating leases.
Assets held under finance leases are recognised as non-current assets of the Group at the lower of their fair value at the date of commencement of the lease and the present value of the minimum lease payments. These assets are depreciated on a straight-line basis over the shorter of the useful life of the asset and the lease term. The corresponding liability to the lessor is included in the consolidated statement of financial position as a finance lease obligation. Lease payments are apportioned between finance costs in the income statement and reduction of the lease obligation so as to achieve a constant rate of interest on the remaining balance of the liability.
The Group has entered into various operating leases the payments for which are recognised as an expense in the consolidated income statement on a straight-line basis over the lease terms.
Revenue recognition Revenue is recognised to the extent that it is probable economic benefits will flow to the Group and the revenue can be reliably measured. The following specific recognition criteria also apply:
Onshore Engineering & Construction Revenues from fixed-price lump-sum contracts are recognised on the percentage-of-completion method, based on surveys of work performed once the outcome of a contract can be estimated reliably. In the early stages of contract completion, when the outcome of a contract cannot be estimated reliably, contract revenues are recognised only to the extent of costs incurred that are expected to be recoverable.
Revenues from cost-plus-fee contracts are recognised on the basis of costs incurred during the year plus the fee earned measured by the cost-to-cost method.
Revenues from reimbursable contracts are recognised in the period in which the services are provided based on the agreed contract schedule of rates.
Provision is made for all losses expected to arise on completion of contracts entered into at the statement of financial position date, whether or not work has commenced on these contracts.
Incentive payments are included in revenue when the contract is sufficiently advanced that it is probable that the specified performance standards will be met or exceeded and the amount of the incentive payments can be measured reliably. Claims and variation orders are only included in revenue when negotiations have reached an advanced stage such that it is probable the claim/variation orders will be accepted and can be measured reliably.
Offshore Projects & Operations, Engineering & Consulting Services and Integrated Energy Services Revenues from reimbursable contracts are recognised in the period in which the services are provided based on the agreed contract schedule of rates.
Revenues from fixed-price contracts are recognised on the percentage-of-completion method, measured by milestones completed or earned value once the outcome of a contract can be estimated reliably. In the early stages of contract completion, when the outcome of a contract cannot be estimated reliably, contract revenues are recognised only to the extent of costs incurred that are expected to be recoverable.
Incentive payments are included in revenue when the contract is sufficiently advanced that it is probable that the specified performance standards will be met or exceeded and the amount of the incentive payments can be measured reliably. Claims are only included in revenue when negotiations have reached an advanced stage such that it is probable the claim will be accepted and can be measured reliably.
Integrated Energy Services Oil & gas revenues comprise the Group’s share of sales from the processing or sale of hydrocarbons on an entitlement basis, when the significant risks and rewards of ownership have been passed to the buyer.
Pre-contract/bid costs Pre-contract/bid costs incurred are recognised as an expense until there is a high probability that the contract will be awarded, after which all further costs are recognised as assets and expensed over the life of the contract.
Income taxes Income tax expense represents the sum of current income tax and deferred tax.
Current income tax assets and liabilities for the current and prior periods are measured at the amount expected to be recovered from, or paid to the taxation authorities. Taxable profit differs from profit as reported in the consolidated income statement because it excludes items of income or expense that are taxable or deductible in other years and it further excludes items that are never taxable or deductible. The Group’s liability for current tax is calculated using tax rates that have been enacted or substantively enacted by the statement of financial position date.
Petrofac Annual report and accounts 2011 119
Com
pany
financia
l sta
tem
ents
153
Gro
up
fin
ancia
l sta
tem
ents
Gro
Gro
pup
Gove
rnance
GG
Corp
ora
te
resp
onsi
bility
Corp
Corp
ora
tora
tee
Fin
ancia
l p
erf
orm
ance
and ris
kFin
aFin
ancia
ncia
ll
Revi
ew
of o
pera
tions
Com
Com
pany
pany
1
Independent auditors’ reportConsolidated income statementConsolidated statement of comprehensive incomeConsolidated statement of financial positionConsolidated statement of cash flowsConsolidated statement of changes in equityNotes to the consolidated financial statements
Ri
fti
Ove
rvie
w
01 22 41 50 65

Notes to the consolidated financial statements continued For the year ended 31 December 2011
2 Summary of significant accounting policies continued
Deferred income tax is recognised on all temporary differences at the statement of financial position date between the carrying amounts of assets and liabilities in the financial statements and the corresponding tax bases used in the computation of taxable profit, with the following exceptions: • where the temporary difference arises from the initial recognition
of goodwill or of an asset or liability in a transaction that is not a business combination that at the time of the transaction affects neither accounting nor taxable profit or loss
• in respect of taxable temporary differences associated with investments in subsidiaries, associates and joint ventures, where the timing of reversal of the temporary differences can be controlled and it is probable that the temporary differences will not reverse in the foreseeable future; and
• deferred income tax assets are recognised only to the extent that it is probable that a taxable profit will be available against which the deductible temporary differences, carried forward tax credits or tax losses can be utilised
The carrying amount of deferred income tax assets is reviewed at each statement of financial position date and reduced to the extent that it is no longer probable that sufficient taxable profit will be available to allow all or part of the deferred income tax assets to be utilised. Unrecognised deferred income tax assets are reassessed at each statement of financial position date and are recognised to the extent that it has become probable that future taxable profit will allow the deferred tax asset to be recovered.
Deferred income tax assets and liabilities are measured on an undiscounted basis at the tax rates that are expected to apply when the asset is realised or the liability is settled, based on tax rates and tax laws enacted or substantively enacted at the statement of financial position date.
Current and deferred income tax is charged or credited directly to other comprehensive income or equity if it relates to items that are credited or charged to respectively, other comprehensive income or equity. Otherwise, income tax is recognised in the consolidated income statement.
Derivative financial instruments and hedging The Group uses derivative financial instruments such as forward currency contracts, interest rate collars and swaps and oil price collars and forward contracts to hedge its risks associated with foreign currency, interest rate and oil price fluctuations. Such derivative financial instruments are initially recognised at fair value on the date on which a derivative contract is entered into and are subsequently remeasured at fair value. Derivatives are carried as assets when the fair value is positive and as liabilities when the fair value is negative.
Any gains or losses arising from changes in the fair value of derivatives that do not qualify for hedge accounting are taken to the consolidated income statement.
The fair value of forward currency contracts is calculated by reference to current forward exchange rates for contracts with similar maturity profiles. The fair value of interest rate cap, swap and oil price collar contracts is determined by reference to market values for similar instruments.
For the purposes of hedge accounting, hedges are classified as: • fair value hedges when hedging the exposure to changes in the
fair value of a recognised asset or liability; or • cash flow hedges when hedging exposure to variability in cash
flows that is either attributable to a particular risk associated with a recognised asset or liability or a highly probable forecast transaction
The Group formally designates and documents the relationship between the hedging instrument and the hedged item at the inception of the transaction, as well as its risk management objectives and strategy for undertaking various hedge transactions. The documentation also includes identification of the hedging instrument, the hedged item or transaction, the nature of risk being hedged and how the Group will assess the hedging instrument’s effectiveness in offsetting the exposure to changes in the hedged item’s fair value or cash flows attributable to the hedged risk. The Group also documents its assessment, both at hedge inception and on an ongoing basis, of whether the derivatives that are used in the hedging transactions are highly effective in offsetting changes in fair values or cash flows of the hedged items.
The treatment of gains and losses arising from revaluing derivatives designated as hedging instruments depends on the nature of the hedging relationship, as follows:
Cash flow hedges For cash flow hedges, the effective portion of the gain or loss on the hedging instrument is recognised directly in the statement of changes in equity, while the ineffective portion is recognised in the income statement. Amounts taken to equity are transferred to the income statement when the hedged transaction affects the consolidated income statement.
If the hedging instrument expires or is sold, terminated or exercised without replacement or rollover, or if its designation as a hedge is revoked, any cumulative gain or loss existing in equity at that time remains in equity and is recognised when the forecast transaction is ultimately recognised in the consolidated income statement. When a forecast transaction is no longer expected to occur, the cumulative gain or loss that was reported in the statement of changes in equity is immediately transferred to the consolidated income statement.
Embedded derivatives Contracts are assessed for the existence of embedded derivatives at the date that the Group first becomes party to the contract, with reassessment only if there is a change to the contract that significantly modifies the cash flows. Embedded derivatives which are not clearly and closely related to the underlying asset, liability or transaction are separated and accounted for as standalone derivatives.
Petrofac Annual report and accounts 2011120

3 Segment information
As described on pages 12 to 13 during the year, the Group reorganised to deliver its services through four reporting segments; Onshore Engineering & Construction, Offshore Projects & Operations, Engineering & Consulting Services and Integrated Energy Services. As a result the segment information has been realigned to fit the new Group organisational structure which now comprises the following four reporting segments:
• Onshore Engineering & Construction which provides engineering, procurement and construction project execution services to the onshore oil & gas industry
• Offshore Projects & Operations which provides offshore engineering, operations and maintenance on and offshore • Engineering & Consulting Services which provides technical engineering, consultancy, conceptual design, front end engineering and
design (FEED) and project management consultancy (PMC) across all sectors including renewables and carbon capture • Integrated Energy Services which co-invests with partners in oil & gas production, processing and transportation assets, provides
production improvement services under value aligned commercial structures and oil & gas related technical competency training and consultancy services
Management separately monitors the trading results of its four reporting segments for the purpose of making an assessment of their performance and making decisions about how resources are allocated to them. Each segment’s performance is measured based on its profitability which is reflected in a manner consistent with the results shown below. However, certain shareholder services related overheads, Group financing and consolidation adjustments are managed at a corporate level and are not allocated to reporting segments.
The following tables represent revenue and profit information relating to the Group’s reporting segments for the year ended 31 December 2011 and the comparative segmental information has been restated to reflect the revised Group organisational structure.
Year ended 31 December 2011
Onshore Engineering & Construction
US$’000
Offshore Projects &
Operations US$’000
Engineering & Consulting
Services US$’000
Integrated Energy
Services US$’000
Corporate & others US$’000
Consolidation adjustments
& eliminations US$’000
Total US$’000
Revenue
External sales 4,068,324 1,164,565 64,391 503,439 – – 5,800,719
Inter-segment sales 77,894 86,787 143,775 15,417 – (323,873) –
Total revenue 4,146,218 1,251,352 208,166 518,856 – (323,873) 5,800,719
Segment results 553,797 56,930 32,930 57,024 (420) (7,517) 692,744
Unallocated corporate costs – – – – (9,864) – (9,864)
Profit/(loss) before tax and finance income/(costs) 553,797 56,930 32,930 57,024 (10,284) (7,517) 682,880
Share of loss of associate – – – (3,593) – – (3,593)
Finance costs (1,450) (1,292) – (3,180) (2,921) 2,244 (6,599)
Finance income 8,375 212 58 357 1,807 (2,932) 7,877
Profit/(loss) before income tax 560,722 55,850 32,988 50,608 (11,398) (8,205) 680,565
Income tax (expense)/income (97,734) (12,323) (2,170) (27,983) 1,415 (2,189) (140,984)
Non-controlling interests (156) – – – – – (156)
Profit/(loss) for the year attributable to Petrofac Limited shareholders 462,832 43,527 30,818 22,625 (9,983) (10,394) 539,425
Other segment information
Capital expenditures:
Property, plant and equipment 54,028 58,572 7,599 311,948 6,059 (2,766) 435,440
Intangible oil & gas assets – – – 39,728 – – 39,728
Charges:
Depreciation 31,097 3,449 5,678 35,322 1,378 (145) 76,779
Amortisation – 1,047 1,078 1,184 – – 3,309
Other long-term employment benefits 12,013 352 – 396 100 – 12,861
Share-based payments 11,863 2,521 774 3,674 4,224 – 23,056
Petrofac Annual report and accounts 2011 121
Com
pany
financia
l sta
tem
ents
153
Gro
up
fin
ancia
l sta
tem
ents
Gro
Gro
pup
Gove
rnance
GG
Corp
ora
te
resp
onsi
bility
Corp
Corp
ora
tora
tee
Fin
ancia
l p
erf
orm
ance
and ris
kFin
aFin
ancia
ncia
ll
Revi
ew
of o
pera
tions
Com
Com
pany
pany
1
Independent auditors’ reportConsolidated income statementConsolidated statement of comprehensive incomeConsolidated statement of financial positionConsolidated statement of cash flowsConsolidated statement of changes in equityNotes to the consolidated financial statements
Ri
fti
Ove
rvie
w
01 22 41 50 65

Notes to the consolidated financial statements continued For the year ended 31 December 2011
3 Segment information continued
Year ended 31 December 2010 (as restated)
Onshore Engineering & Construction
US$’000
Offshore Projects &
Operations US$’000
Engineering & Consulting
Services US$’000
Integrated Energy
Services US$’000
Corporate & others US$’000
Consolidation adjustments
& eliminations US$’000
Total US$’000
Revenue
External sales 3,232,174 710,080 39,693 372,270 – – 4,354,217
Inter-segment sales 21,732 11,821 133,739 11,964 – (179,256) –
Total revenue 3,253,906 721,901 173,432 384,234 – (179,256) 4,354,217
Segment results 438,096 24,506 19,803 73,848 (900) (3,362) 551,991
Gain on EnQuest demerger – – – 124,864 – – 124,864
Unallocated corporate costs – – – – (13,405) – (13,405)
Profit/(loss) before tax and finance income/(costs) 438,096 24,506 19,803 198,712 (14,305) (3,362) 663,450
Share of loss of associate – – – (131) – – (131)
Finance costs – (968) (12) (3,805) (3,659) 3,313 (5,131)
Finance income 9,741 209 142 731 2,699 (3,313) 10,209
Profit/(loss) before income tax 447,837 23,747 19,933 195,507 (15,265) (3,362) 668,397
Income tax (expense)/income (74,848) (6,519) 1,215 (32,668) 2,275 – (110,545)
Non-controlling interests (35) – – – – – (35)
Profit/(loss) for the year attributable to Petrofac Limited shareholders 372,954 17,228 21,148 162,839 (12,990) (3,362) 557,817
Other segment information
Capital expenditures:
Property, plant and equipment 59,522 2,785 3,597 46,938 4,575 (1,178) 116,239
Intangible oil & gas assets – – – 15,644 – – 15,644
Charges:
Depreciation 33,710 2,238 4,719 52,933 367 (575) 93,392
Amortisation – 597 1,044 870 – – 2,511
Other long-term employment benefits 10,435 613 41 1,594 87 – 12,770
Share-based payments 7,693 1,167 718 2,299 2,907 – 14,784
Geographical segments The following tables present revenue from external customers based on their location and non-current assets by geographical segments for the years ended 31 December 2011 and 2010.
Year ended 31 December 2011
United Arab Emirates US$’000
United Kingdom US$’000
Turkmenistan US$’000
Malaysia US$’000
Algeria US$’000
Kuwait US$’000
Qatar US$’000
Other countries US$’000
Consolidated US$’000
Revenues from external customers 1,290,673 938,606 768,283 653,395 749,204 379,178 256,657 764,723 5,800,719
United Kingdom US$’000
United Arab Emirates US$’000
Tunisia US$’000
Algeria US$’000
Malaysia US$’000
Thailand US$’000
Other countries US$’000
Consolidated US$’000
Non-current assets:
Property, plant and equipment 71,276 104,466 41,824 26,889 255,958 47,854 45,470 593,737
Intangible oil & gas assets 1,130 – – – 102,345 – – 103,475
Other intangible assets 12,510 – – – – – 5,836 18,346
Goodwill 91,268 14,914 – – – – 499 106,681
Petrofac Annual report and accounts 2011122

Year ended 31 December 2010
Algeria
US$’000
United Arab Emirates US$’000
United Kingdom US$’000
Kuwait US$’000
Oman US$’000
Syria US$’000
Saudi Arabia US$’000
Other countries US$’000
Consolidated US$’000
Revenues from external customers 1,037,966 798,328 753,842 360,624 350,313 277,196 235,936 540,012 4,354,217
United Kingdom US$’000
United Arab Emirates US$’000
Tunisia US$’000
Algeria US$’000
Malaysia US$’000
Indonesia US$’000
Other countries US$’000
Consolidated US$’000
Non-current assets:
Property, plant and equipment 54,326 94,292 52,031 30,737 14,836 1,555 39,381 287,158
Intangible oil & gas assets – – – – 69,532 – – 69,532
Other intangible assets 9,365 – – – – 6,940 – 16,305
Goodwill 90,093 15,240 – – – – 499 105,832
Revenues disclosed in the above tables are based on where the project is located. Revenue from two customers amounted to US$1,651,994,000 (2010: US$1,422,410,000) in the Onshore Engineering & Construction segment.
4 Revenues and expenses
a. Revenue
2011
US$’0002010
US$’000
Rendering of services 5,650,892 4,202,371
Sale of crude oil & gas 143,122 146,075
Sale of processed hydrocarbons 6,705 5,771
5,800,719 4,354,217
Included in revenues from rendering of services are Offshore Projects & Operations, Engineering & Consulting Services and Integrated Energy Services revenues of a ‘pass-through’ nature with zero or low margins amounting to US$229,422,000 (2010: US$227,974,000). The revenues are included as external revenues of the Group since the risks and rewards associated with its recognition are assumed by the Group.
b. Cost of sales Included in cost of sales for the year ended 31 December 2011 is US$62,000 loss (2010: US$154,000 gain) on disposal of property, plant and equipment used to undertake various engineering and construction contracts. In addition, depreciation charged on property, plant and equipment of US$62,180,000 during 2011 (2010: US$85,186,000) is included in cost of sales (note 9).
Also included in cost of sales are forward points and ineffective portions on derivatives designated as cash flow hedges and losses on undesignated derivatives of US$5,881,000 (2010: US$3,409,000 loss). These amounts are an economic hedge of foreign exchange risk but do not meet the criteria within IAS 39 and are most appropriately recorded in cost of sales.
c. Selling, general and administration expenses
2011
US$’000 2010
US$’000
Staff costs 186,462 126,475
Depreciation (note 9) 14,599 8,206
Amortisation (note 13) 3,309 2,511
Other operating expenses 79,022 84,257
283,392 221,449
Other operating expenses consist mainly of office, travel, legal and professional and contracting staff costs.
d. Staff costs
2011
US$’000 2010
US$’000
Total staff costs:
Wages and salaries 1,044,361 828,439
Social security costs 37,936 31,809
Defined contribution pension costs 20,576 12,621
Other long-term employee benefit costs (note 28) 14,313 12,770
Expense of share-based payments (note 25) 23,056 14,784
1,140,242 900,423
Petrofac Annual report and accounts 2011 123
Com
pany
financia
l sta
tem
ents
153
Gro
up
fin
ancia
l sta
tem
ents
Gro
Gro
pup
Gove
rnance
GG
Corp
ora
te
resp
onsi
bility
Corp
Corp
ora
tora
tee
Fin
ancia
l p
erf
orm
ance
and ris
kFin
aFin
ancia
ncia
ll
Revi
ew
of o
pera
tions
Com
Com
pany
pany
1
Independent auditors’ reportConsolidated income statementConsolidated statement of comprehensive incomeConsolidated statement of financial positionConsolidated statement of cash flowsConsolidated statement of changes in equityNotes to the consolidated financial statements
Ri
fti
Ove
rvie
w
01 22 41 50 65
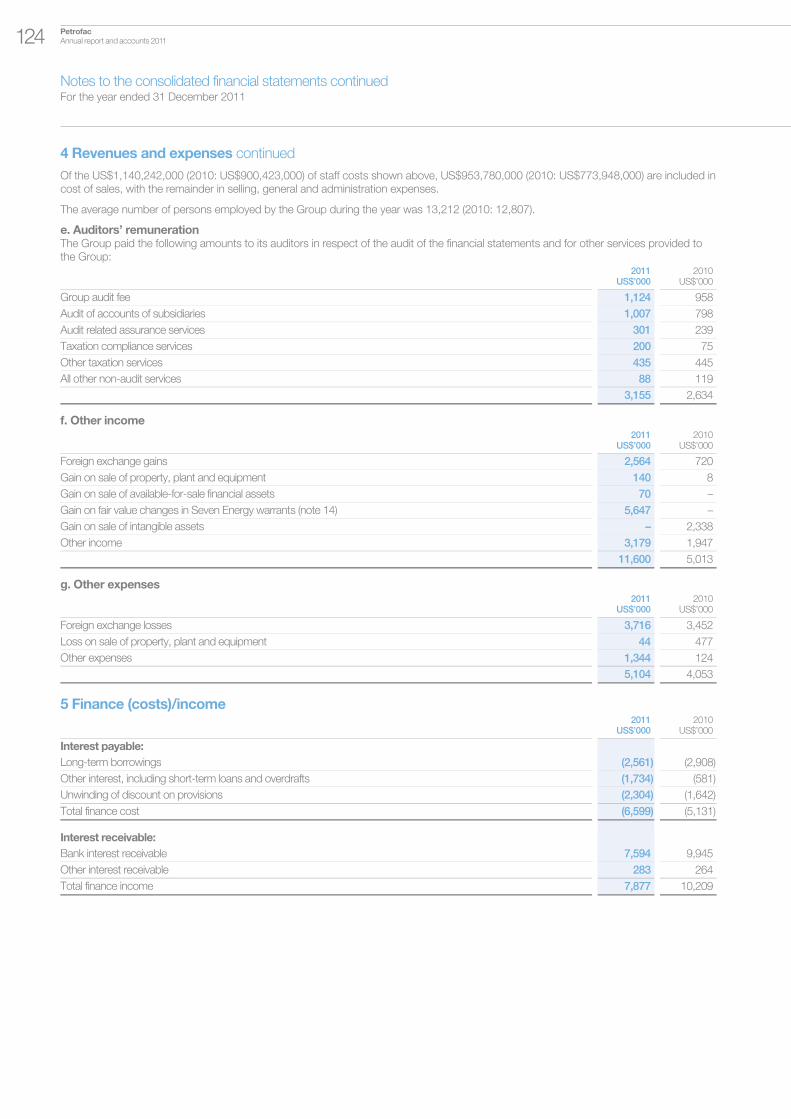
Notes to the consolidated financial statements continued For the year ended 31 December 2011
4 Revenues and expenses continued
Of the US$1,140,242,000 (2010: US$900,423,000) of staff costs shown above, US$953,780,000 (2010: US$773,948,000) are included in cost of sales, with the remainder in selling, general and administration expenses.
The average number of persons employed by the Group during the year was 13,212 (2010: 12,807).
e. Auditors’ remuneration The Group paid the following amounts to its auditors in respect of the audit of the financial statements and for other services provided to the Group:
2011
US$’000 2010
US$’000
Group audit fee 1,124 958
Audit of accounts of subsidiaries 1,007 798
Audit related assurance services 301 239
Taxation compliance services 200 75
Other taxation services 435 445
All other non-audit services 88 119
3,155 2,634
f. Other income
2011
US$’000 2010
US$’000
Foreign exchange gains 2,564 720
Gain on sale of property, plant and equipment 140 8
Gain on sale of available-for-sale financial assets 70 –
Gain on fair value changes in Seven Energy warrants (note 14) 5,647 –
Gain on sale of intangible assets – 2,338
Other income 3,179 1,947
11,600 5,013
g. Other expenses
2011
US$’000 2010
US$’000
Foreign exchange losses 3,716 3,452
Loss on sale of property, plant and equipment 44 477
Other expenses 1,344 124
5,104 4,053
5 Finance (costs)/income
2011
US$’000 2010
US$’000
Interest payable:
Long-term borrowings (2,561) (2,908)
Other interest, including short-term loans and overdrafts (1,734) (581)
Unwinding of discount on provisions (2,304) (1,642)
Total finance cost (6,599) (5,131)
Interest receivable:
Bank interest receivable 7,594 9,945
Other interest receivable 283 264
Total finance income 7,877 10,209
Petrofac Annual report and accounts 2011124

6 Income tax
a. Tax on ordinary activities The major components of income tax expense are as follows:
2011
US$’0002010
US$’000
Current income tax Current income tax charge 138,205 115,199
Adjustments in respect of current income tax of previous years 782 (2,843)
Deferred income tax Relating to origination and reversal of temporary differences 8,832 907
Adjustments in respect of deferred income tax of previous years (6,835) (2,718)
Income tax expense reported in the income statement 140,984 110,545
b. Reconciliation of total tax charge A reconciliation between the income tax expense and the product of accounting profit multiplied by the Company’s domestic tax rate is as follows:
2011
US$’000 2010
US$’000
Accounting profit before tax 680,565 668,397
At Jersey’s domestic income tax rate of 0% (2010: 0%) – –
Expected tax charge in higher rate jurisdictions 141,347 116,199
Expenditure not allowable for income tax purposes 2,741 1,073
Adjustments in respect of previous years (6,053) (5,561)
Tax effect of utilisation of tax losses not previously recognised (607) (568)
Unrecognised tax losses 1,388 1,634
Other permanent differences 1,338 (2,157)
Effect of change in tax rates 830 (75)
At the effective income tax rate of 20.7% (2010: 16.5%) 140,984 110,545
The Group’s effective tax rate for the year ended 31 December 2011 is 20.7% (2010: 16.5% including EnQuest demerger; 20.3% excluding EnQuest demerger). No chargeable gain arose for UK corporate tax purposes on the 2010 demerger of Petrofac’s UKCS business to EnQuest Plc. Excluding the gain on demerger, there has been no significant change to the Group’s effective tax rate. Any variance results from changes in jurisdictions in which profits are expected to be earned. From 1 April 2012 the UK corporation tax rate will be 25% and the change in UK rate was substantially enacted as at the balance sheet date. This change will impact the reversal of the temporary difference from this date onwards, reducing the Group’s UK deferred tax assets and liabilities for the period ended 31 December 2011.
c. Deferred income tax Deferred income tax relates to the following:
Consolidated statement of financial position
Consolidated income statement
2011 US$’000
2010 US$’000
2011 US$’000
2010 US$’000
Deferred income tax liabilities Fair value adjustment on acquisitions 2,889 1,412 1,477 (597)
Accelerated depreciation 42,884 36,581 6,303 14,630
Profit recognition 13,655 7,896 5,760 (4,768)
Other temporary differences 177 2,197 (2,020) 432
Gross deferred income tax liabilities 59,605 48,086
Deferred income tax assets Losses available for offset 1,846 2,258 412 (14,135)
Decelerated depreciation for tax purposes 1,967 2,403 436 327
Share scheme 9,950 15,721 (911) (230)
Profit recognition 11,310 4,160 (7,150) –
Other temporary differences 4,069 1,759 (2,310) 2,530
Gross deferred income tax assets 29,142 26,301
Deferred income tax charge/(credit) 1,997 (1,811)
Certain items of other temporary differences in 2010 have been reclassified to be consistent with current year presentation.
Petrofac Annual report and accounts 2011 125
Com
pany
financia
l sta
tem
ents
153
Gro
up
fin
ancia
l sta
tem
ents
Gro
Gro
pup
Gove
rnance
GG
Corp
ora
te
resp
onsi
bility
Corp
Corp
ora
tora
tee
Fin
ancia
l p
erf
orm
ance
and ris
kFin
aFin
ancia
ncia
ll
Revi
ew
of o
pera
tions
Com
Com
pany
pany
1
Independent auditors’ reportConsolidated income statementConsolidated statement of comprehensive incomeConsolidated statement of financial positionConsolidated statement of cash flowsConsolidated statement of changes in equityNotes to the consolidated financial statements
Ri
fti
Ove
rvie
w
01 22 41 50 65

Notes to the consolidated financial statements continued For the year ended 31 December 2011
6 Income tax continued
d. Unrecognised tax losses and tax credits Deferred income tax assets are recognised for tax loss carry-forwards and tax credits to the extent that the realisation of the related tax benefit through future taxable profits is probable. The Group did not recognise deferred income tax assets of US$26,626,000 (2010: US$18,366,000).
2011
US$’000 2010
US$’000
Expiration dates for tax losses No earlier than 2022 8,917 9,466
No expiration date 4,032 6,384
12,949 15,850
Tax credits (no expiration date) 13,677 2,516
26,626 18,366
7 Earnings per share
Basic earnings per share amounts are calculated by dividing the net profit for the year attributable to ordinary shareholders by the weighted average number of ordinary shares outstanding during the year.
Diluted earnings per share amounts are calculated by dividing the net profit attributable to ordinary shareholders, after adjusting for any dilutive effect, by the weighted average number of ordinary shares outstanding during the year, adjusted for the effects of ordinary shares granted under the employee share award schemes which are held in trust.
The following reflects the income and share data used in calculating basic and diluted earnings per share:
2011
US$’000 2010
US$’000
Net profit attributable to ordinary shareholders for basic and diluted earnings per share excluding gain on EnQuest demerger 539,425 432,953
Net profit attributable to ordinary shareholders for basic and diluted earnings per share including gain on EnQuest demerger 539,425 557,817
2011 Number
’000
2010 Number
’000
Weighted average number of ordinary shares for basic earnings per share 339,239 338,867
Effect of diluted potential ordinary shares granted under share-based payment schemes 4,069 4,493
Adjusted weighted average number of ordinary shares for diluted earnings per share 343,308 343,360
8 Dividends paid and proposed
2011
US$’000 2010
US$’000
Declared and paid during the year
Equity dividends on ordinary shares: Final dividend for 2009: 25.10 cents per share – 85,291
Interim dividend 2010: 13.80 cents per share – 46,757
Final dividend for 2010: 30.00 cents per share 101,788 –
Interim dividend 2011: 17.40 cents per share 59,214 –
161,002 132,048
2011
US$’000 2010
US$’000
Proposed for approval at AGM (not recognised as a liability as at 31 December)
Equity dividends on ordinary shares Final dividend for 2011: 37.20 cents per share (2010: 30.00 cents per share) 128,670 103,715
Petrofac Annual report and accounts 2011126

9 Property, plant and equipment
Oil & gas assets
US$’000
Oil & gas facilities
US$’000
Land, buildings
and leasehold
improvements US$’000
Plant and equipment
US$’000Vehicles
US$’000
Office furniture
and equipment
US$’000
Assets under
construction US$’000
Total US$’000
Cost At 1 January 2010 555,901 157,983 115,542 22,980 10,896 87,089 6,679 957,070
Additions 32,252 7,602 44,114 1,445 4,755 19,238 6,833 116,239
Acquisition of subsidiaries – – – 2,081 46 43 – 2,170
Disposals (470,447) – (1,847) (2,344) (854) (17,268) – (492,760)
Transfers – – 881 4 – (885) – –
Exchange difference – – (462) (712) (158) (809) (132) (2,273)
At 1 January 2011 117,706 165,585 158,228 23,454 14,685 87,408 13,380 580,446
Additions 2,774 306,704 63,619 5,388 2,815 29,926 24,214 435,440
Disposals – – (1,718) (2,269) (631) (10,311) – (14,929)
Transfers – (44,330) (20) – – 13,172 (13,152) (44,330)
Exchange difference (2,638) (1,721) (2,504) (245) – (1,103) (277) (8,488)
At 31 December 2011 117,842 426,238 217,605 26,328 16,869 119,092 24,165 948,139
Depreciation At 1 January 2010 (77,171) (102,280) (22,030) (16,618) (5,786) (55,189) – (279,074)
Charge for the year (32,204) (15,993) (23,981) (2,734) (3,462) (15,018) – (93,392)
Disposals 59,592 – 1,400 538 769 16,072 – 78,371
Transfers – – (83) – – 83 – –
Exchange difference – – 71 327 28 381 – 807
At 1 January 2011 (49,783) (118,273) (44,623) (18,487) (8,451) (53,671) – (293,288)
Charge for the year (13,390) (18,697) (19,978) (1,321) (3,502) (19,891) – (76,779)
Disposals – – 1,567 2,234 412 9,864 – 14,077
Transfers – – 12 – – (12) – –
Exchange difference 913 28 316 14 5 312 – 1,588
At 31 December 2011 (62,260) (136,942) (62,706) (17,560) (11,536) (63,398) – (354,402)
Net carrying amount: At 31 December 2011 55,582 289,296 154,899 8,768 5,333 55,694 24,165 593,737
At 31 December 2010 67,923 47,312 113,605 4,967 6,234 33,737 13,380 287,158
No interest has been capitalised within oil & gas facilities during the year (2010: nil) and the accumulated capitalised interest, net of depreciation at 31 December 2011, was nil (2010: US$432,000).
Additions to oil & gas facilities in 2011 mainly comprise of the purchase and upgrade of the FPF1, FPSO Berantai, FPF3, FPF4 and FPF5 for a combined cost of US$305,394,000. Transfers from oil & gas facilities include the transfer of the FPF1 to non-current asset held for sale as part of the pending Ithaca transaction (note 18).
Included in oil & gas assets are US$3,262,000 (2010: US$2,196,000) of capitalised decommissioning costs net of depreciation provided on the PM304 asset in Malaysia and the Chergui asset in Tunisia.
Of the total charge for depreciation in the income statement, US$62,180,000 (2010: US$85,186,000) is included in cost of sales and US$14,599,000 (2010: US$8,206,000) in selling, general and administration expenses.
Assets under construction comprise expenditures incurred in relation to a new office building in the United Arab Emirates and the Group ERP project.
Included in land, buildings and leasehold improvements is property, plant and equipment under finance lease agreements, for which book values are as follows:
Net book value US$’000
Gross book value 35,809
Depreciation (994)
At 31 December 2011 34,815
At 31 December 2010 –
Petrofac Annual report and accounts 2011 127
Com
pany
financia
l sta
tem
ents
153
Gro
up
fin
ancia
l sta
tem
ents
Gro
Gro
pup
Gove
rnance
GG
Corp
ora
te
resp
onsi
bility
Corp
Corp
ora
tora
tee
Fin
ancia
l p
erf
orm
ance
and ris
kFin
aFin
ancia
ncia
ll
Revi
ew
of o
pera
tions
Com
Com
pany
pany
1
Independent auditors’ reportConsolidated income statementConsolidated statement of comprehensive incomeConsolidated statement of financial positionConsolidated statement of cash flowsConsolidated statement of changes in equityNotes to the consolidated financial statements
Ri
fti
Ove
rvie
w
01 22 41 50 65

Notes to the consolidated financial statements continued For the year ended 31 December 2011
10 Business combinations
Scotvalve Services Limited On 14 January 2010, the Group acquired a 100% interest in the share capital of Scotvalve Services Limited (Scotvalve), a UK based company, involved in the servicing and repair of oilfield pressure control equipment. The consideration for the acquisition was sterling 4,630,000 (equivalent US$7,512,000) comprising of sterling 2,801,000 (equivalent US$4,545,000) as an initial cash payment, sterling 150,000 (equivalent US$243,000) to be settled in cash during 2010 and the balance being the discounted value of deferred consideration amounting to sterling 1,679,000 (equivalent US$2,724,000) payable based on the estimated future profitability of Scotvalve. The range of deferred consideration payable was from zero to a maximum of sterling 2,000,000 (equivalent US$3,122,000) over a three year period.
The fair value of net assets acquired was US$4,967,000 which included fair value of intangible assets recognised on acquisition of US$1,107,000.
These intangible assets recognised on acquisition comprise equipment manufacturer warranty repair licenses which are being amortised over their remaining economic useful lives of five years on a straight-line basis.
The residual goodwill of US$2,437,000 (2010: US$2,449,000) comprises the fair value of expected future synergies and business opportunities arising from the integration of the business in to the Group.
During the year a charge of US$54,000 (2010: US$59,000) for the unwinding of interest on deferred consideration payable has been reflected in the consolidated income statement.
The deferred consideration payable was re-assessed at year end in light of latest financial projections for the business and the current carried amount was reduced by sterling 459,000, equivalent US$735,000 (2010: sterling 135,000, equivalent US$208,000) with a corresponding increase in other income within the consolidated income statement.
Stephen Gillespie Consultants Limited On 1 April 2010, the Group acquired a 100% interest in the share capital of Stephen Gillespie Consultants Limited (SGC), a UK based provider of software consultancy to flow metering control system manufacturers for a consideration of sterling 4,523,000 (equivalent US$6,853,000) comprising of sterling 3,178,000 (equivalent US$4,815,000) paid upfront in cash and the balance being the discounted value of deferred consideration amounting to sterling 1,345,000 (equivalent US$2,038,000) payable based on the estimated future revenue of the company. The range of deferred consideration payable is from sterling 600,000 (equivalent US$937,000) to a maximum of sterling 1,200,000 (equivalent US$1,873,000) based on future revenue of SGC over a two year period.
The fair value of net assets acquired was US$3,382,000 which included fair value of intangible assets recognised on acquisition of US$2,065,000.
These intangible assets recognised on acquisition comprise of software related to metering technology which is being amortised over its remaining economic useful lives of five years on a straight-line basis.
The residual goodwill of US$3,562,000 (2010: US$3,578,000) comprises the fair value of expected future synergies and business opportunities arising from the integration of the business in to the Group.
During the year a charge of US$ nil (2010: US$25,000) for the unwinding of interest has been reflected in the consolidated income statement.
The deferred consideration payable was re-assessed at year end in light of latest financial projections for the business and the current carried amount was reduced by sterling 214,000, equivalent US$343,000 (2010: sterling 188,000, equivalent US$293,000) with a corresponding increase in other income within the consolidated income statement.
CO2DeepStore Limited On 27 April 2010, the Group acquired a 100% interest in the share capital of CO2DeepStore Limited (CO2DeepStore), a United Kingdom based company focused on the CO2 geological storage sector of the carbon capture and storage market for a cash consideration of sterling 220,000 (equivalent US$340,000).
The fair value of net assets acquired was US$340,000.
Under the terms of the acquisition agreement, costs of up to sterling 200,000 (equivalent US$312,000) will be payable to the former owners of CO2DeepStore three years from the date of completion based on the estimated future profitability of the company and will be recognised as an expense in the income statement over this period. The charge for the current year is sterling 67,000, equivalent US$107,000 (2010: sterling 44,000, equivalent US$68,000).
Petrofac Annual report and accounts 2011128

TNEI Services Limited On 14 June 2010, the Group acquired a 100% interest in the share capital of TNEI Services Limited (TNEI) through the acquisition of its holding company New Energy Industries Limited for a cash consideration of sterling 6,123,000 (equivalent US$8,913,000). TNEI provides services in the areas of power transmission and distribution, planning and environmental consent and energy management.
The fair value of net assets acquired was US$2,587,000.
The residual goodwill of US$7,695,000 (2010: US$7,728,000) comprises the fair value of expected future synergies and business opportunities arising from the integration of the business into the Group.
Under the terms of the acquisition agreement, sterling 1,538,000 (equivalent US$2,370,000) will be payable 50% in Petrofac shares and 50% in cash to the former owners of TNEI who remain as employees of the Petrofac Group in three equal tranches over three years from the date of completion which will be recognised as an expense in the income statement on a straight-line basis over the three years. The charge for the current year is sterling 513,000, equivalent US$821,000 (2010: sterling 278,000, equivalent US$428,000).
11 Gain on EnQuest demerger
On 5 April 2010, the Group’s interests in the Don area oil assets were demerged via a transfer of three of its subsidiaries, Petrofac Energy Developments Limited (PEDL), Petrofac Energy Developments Oceania Limited (PEDOL) and PEDL Limited (PEDLL) to EnQuest PLC for a deemed consideration for accounting purposes of US$553,300,000 which was settled by the issue of EnQuest PLC shares directly to Petrofac Limited shareholders. A gain of US$124,864,000 was made on the demerger transaction.
12 Goodwill
A summary of the movements in goodwill is presented below:
2011
US$’000 2010
US$’000
At 1 January 105,832 97,922
Acquisitions during the year (note 10) – 13,223
Reassessment of deferred consideration payable 820 (1,313)
Write off on EnQuest demerger – (1,146)
Exchange difference 29 (2,854)
At 31 December 106,681 105,832
Reassessment of deferred consideration payable comprises of the increase in deferred consideration payable on SPD Group Limited of US$820,000 (2010: US$3,141,000) and Caltec Limited of US$ nil (2010: US$4,285,000 decrease).
Goodwill acquired through business combinations has been allocated to three groups of cash-generating units, for impairment testing as follows: • Offshore Projects & Operations • Engineering & Consulting Services • Integrated Energy Services
These represent the lowest level within the Group at which the goodwill is monitored for internal management purposes. The goodwill previously monitored separately for Production Solutions, Training Services and Energy Developments is now monitored on a combined basis following the Group reorganisation.
Petrofac Annual report and accounts 2011 129
Com
pany
financia
l sta
tem
ents
153
Gro
up
fin
ancia
l sta
tem
ents
Gro
Gro
pup
Gove
rnance
GG
Corp
ora
te
resp
onsi
bility
Corp
Corp
ora
tora
tee
Fin
ancia
l p
erf
orm
ance
and ris
kFin
aFin
ancia
ncia
ll
Revi
ew
of o
pera
tions
Com
Com
pany
pany
1
Independent auditors’ reportConsolidated income statementConsolidated statement of comprehensive incomeConsolidated statement of financial positionConsolidated statement of cash flowsConsolidated statement of changes in equityNotes to the consolidated financial statements
Ri
fti
Ove
rvie
w
01 22 41 50 65

Notes to the consolidated financial statements continued For the year ended 31 December 2011
12 Goodwill continued
Offshore Projects & Operations, Engineering & Consulting Services and Integrated Energy Services cash-generating units The recoverable amounts for the Offshore Projects & Operations, Engineering & Consulting Services and Integrated Energy Services cash-generating units have been determined based on value in use calculations, using discounted pre-tax cash flow projections. Management has adopted a ten-year projection period to assess each unit’s value in use as it is confident based on past experience of the accuracy of long-term cash flow forecasts that these projections are reliable. The cash flow projections are based on financial budgets approved by senior management covering a five-year period, extrapolated for a further five years at a growth rate of 5% for Offshore Projects & Operations and Engineering & Consulting Services cash-generating units. For the Integrated Energy Services business the cash flows are based on field models over a ten-year horizon for Production Enhancement Contracts and Risk Service Contracts and on financial budgets approved by senior management covering a five-year period, extrapolated for a further five years at a growth rate of 2.5% for other operations as these include acquired businesses where there is less track record of achieving financial projections.
Carrying amount of goodwill allocated to each group of cash-generating units
2011
US$’000 2010
US$’000
Offshore Projects & Operations unit 27,904 27,992
Engineering & Consulting Services unit 7,695 7,728
Integrated Energy Services unit 71,082 70,112
106,681 105,832
Key assumptions used in value in use calculations for the Offshore Projects & Operations, Engineering & Consulting Services and Integrated Energy Services units:
Market share: the assumption relating to market share for the Offshore Projects & Operations unit is based on the unit re-securing those existing customer contracts in the UK which are due to expire during the projection period; for the Training business which is within Integrated Energy Services, the key assumptions relate to management’s assessment of maintaining the unit’s market share in the UK and developing further the business in international markets.
Capital expenditure: the Production Enhancement Contracts in the Integrated Energy Services unit require a minimum level of capital spend on the projects in the initial years to meet contractual commitments. If the capital is not spent a cash payment of the balance is required which does not qualify for cost recovery. The level of capital spend assumed in the value in use calculation is that expected over the period of the budget based on the current field development plans which assumes the minimum spend is met on each project and the contracts remain in force for the entire duration of the project.
Reserve volumes and production profiles: management has used its internally developed economic models of reserves and production as inputs in to the value in use for the Production Enhancement, Risk Service and Production Sharing Contracts. Management has used an oil price of US$85 per barrel to determine reserve volumes on Production Sharing Contracts.
Tariffs and payment terms: the tariffs and payment terms used in the value in use calculations for the Production Enhancement and Risk Service Contracts are those specified in the respective contracts with assumptions consistent with the current field development plan where KPI’s influence the payment terms.
Growth rate: estimates are based on management’s assessment of market share having regard to macro-economic factors and the growth rates experienced in the recent past by each unit. A growth rate of 5% per annum has been applied for the Offshore Projects & Operations and Engineering & Consulting Services cash-generating units for the remaining five years of the ten-year projection period and 2.5% per annum for the Integrated Energy Services cash-generating unit since it includes newly acquired businesses where there is less historic track record of achieving financial projections.
Discount rate: management has used a pre-tax discount rate of 13.8% per annum. In 2010 a discount rate of 14.6% was used for the Offshore Projects & Operations, Engineering & Consulting Services, Production Solutions and Training Services cash-generating units and a rate of 13.4% for the Energy Developments cash generating unit. The discount rate is derived from the estimated weighted average cost of capital of the Group and has been calculated using an estimated risk free rate of return adjusted for the Group’s estimated equity market risk premium and the Group’s cost of debt.
Sensitivity to changes in assumptions With regard to the assessment of value in use of the cash-generating units, management believes that no reasonably possible change in any of the above key assumptions would cause the carrying value of the relevant unit to exceed its recoverable amount, after giving due consideration to the macro-economic outlook for the oil & gas industry and the commercial arrangements with customers underpinning the cash flow forecasts for each of the units.
Petrofac Annual report and accounts 2011130

13 Intangible assets
2011
US$’000 2010
US$’000
Intangible oil & gas assets
Cost: At 1 January 69,532 53,888
Additions 39,728 15,644
Transfer to costs (5,785) –
Net book value of intangible oil & gas assets at 31 December 103,475 69,532
Other intangible assets
Cost: At 1 January 24,538 25,476
Additions on acquisition (note 10) – 3,172
Additions 5,722 153
Disposal – (4,220)
Exchange difference (504) (43)
At 31 December 29,756 24,538
Accumulated amortisation: At 1 January (8,233) (6,257)
Amortisation (3,309) (2,511)
Disposal – 540
Exchange difference 132 (5)
At 31 December (11,410) (8,233)
Net book value of other intangible assets at 31 December 18,346 16,305
Total intangible assets 121,821 85,837
Intangible oil & gas assets Oil & gas asset (part of the Integrated Energy Services segment) additions above comprise of US$38,688,000 (2010: US$15,644,000) of capitalised expenditure on the Group’s assets in Malaysia.
There were investing cash outflows relating to capitalised intangible oil & gas assets of US$39,728,000 (2010: US$15,644,000) in the current period arising from pre-development activities.
US$5,785,000 relates to a long-term receivable from a customer on the Berantai RSC contract being their share of development expenditure, which was transferred to costs.
Other intangible assets Other intangible asset additions above largely consist of US$4,003,000 of gas storage project development costs and US$1,634,000 of competency training software that formed part of the acquisition during the year of Skills XP.
Other intangible assets comprising project development expenditure customer contracts, proprietary software, LNG intellectual property and patent technology are being amortised over their estimated economic useful life on a straight-line basis and the related amortisation charges included in selling, general and administrative expenses (note 4c).
Petrofac Annual report and accounts 2011 131
Com
pany
financia
l sta
tem
ents
153
Gro
up
fin
ancia
l sta
tem
ents
Gro
Gro
pup
Gove
rnance
GG
Corp
ora
te
resp
onsi
bility
Corp
Corp
ora
tora
tee
Fin
ancia
l p
erf
orm
ance
and ris
kFin
aFin
ancia
ncia
ll
Revi
ew
of o
pera
tions
Com
Com
pany
pany
1
Independent auditors’ reportConsolidated income statementConsolidated statement of comprehensive incomeConsolidated statement of financial positionConsolidated statement of cash flowsConsolidated statement of changes in equityNotes to the consolidated financial statements
Ri
fti
Ove
rvie
w
01 22 41 50 65
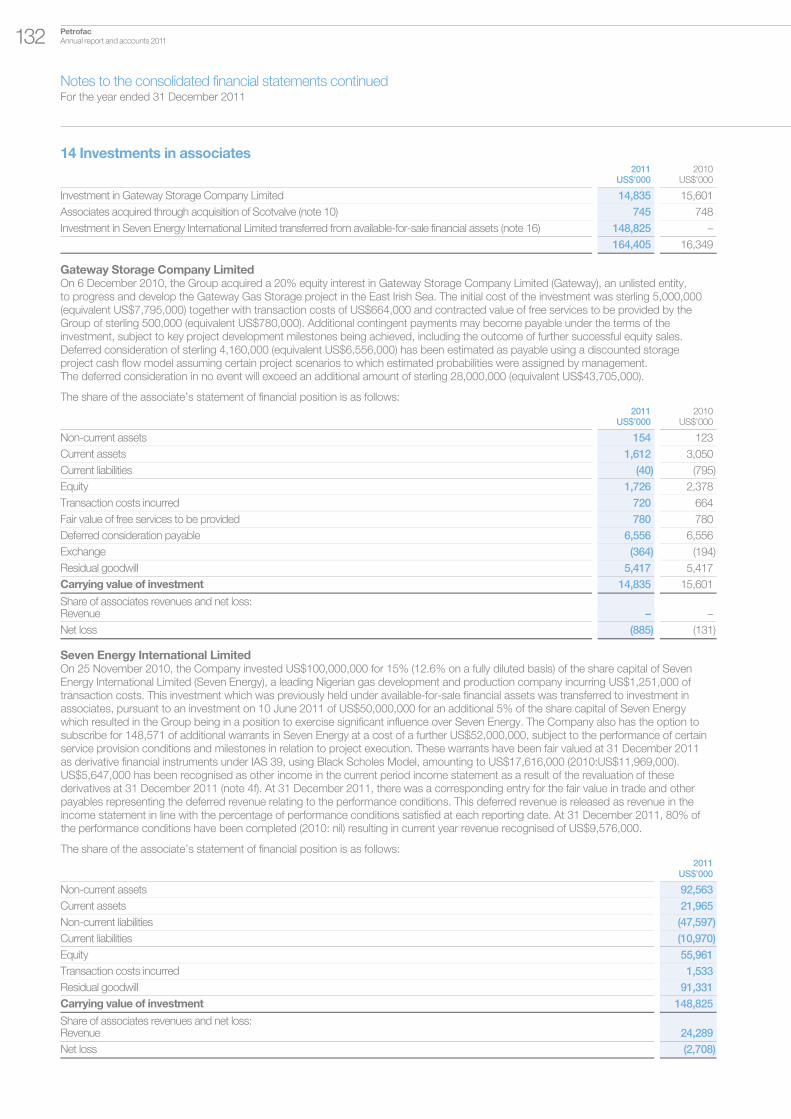
Notes to the consolidated financial statements continued For the year ended 31 December 2011
14 Investments in associates
2011
US$’000 2010
US$’000
Investment in Gateway Storage Company Limited 14,835 15,601
Associates acquired through acquisition of Scotvalve (note 10) 745 748
Investment in Seven Energy International Limited transferred from available-for-sale financial assets (note 16) 148,825 –
164,405 16,349
Gateway Storage Company Limited On 6 December 2010, the Group acquired a 20% equity interest in Gateway Storage Company Limited (Gateway), an unlisted entity, to progress and develop the Gateway Gas Storage project in the East Irish Sea. The initial cost of the investment was sterling 5,000,000 (equivalent US$7,795,000) together with transaction costs of US$664,000 and contracted value of free services to be provided by the Group of sterling 500,000 (equivalent US$780,000). Additional contingent payments may become payable under the terms of the investment, subject to key project development milestones being achieved, including the outcome of further successful equity sales. Deferred consideration of sterling 4,160,000 (equivalent US$6,556,000) has been estimated as payable using a discounted storage project cash flow model assuming certain project scenarios to which estimated probabilities were assigned by management. The deferred consideration in no event will exceed an additional amount of sterling 28,000,000 (equivalent US$43,705,000).
The share of the associate’s statement of financial position is as follows:
2011
US$’000 2010
US$’000
Non-current assets 154 123
Current assets 1,612 3,050
Current liabilities (40) (795)
Equity 1,726 2,378
Transaction costs incurred 720 664
Fair value of free services to be provided 780 780
Deferred consideration payable 6,556 6,556
Exchange (364) (194)
Residual goodwill 5,417 5,417
Carrying value of investment 14,835 15,601
Share of associates revenues and net loss: Revenue – –
Net loss (885) (131)
Seven Energy International Limited On 25 November 2010, the Company invested US$100,000,000 for 15% (12.6% on a fully diluted basis) of the share capital of Seven Energy International Limited (Seven Energy), a leading Nigerian gas development and production company incurring US$1,251,000 of transaction costs. This investment which was previously held under available-for-sale financial assets was transferred to investment in associates, pursuant to an investment on 10 June 2011 of US$50,000,000 for an additional 5% of the share capital of Seven Energy which resulted in the Group being in a position to exercise significant influence over Seven Energy. The Company also has the option to subscribe for 148,571 of additional warrants in Seven Energy at a cost of a further US$52,000,000, subject to the performance of certain service provision conditions and milestones in relation to project execution. These warrants have been fair valued at 31 December 2011 as derivative financial instruments under IAS 39, using Black Scholes Model, amounting to US$17,616,000 (2010:US$11,969,000). US$5,647,000 has been recognised as other income in the current period income statement as a result of the revaluation of these derivatives at 31 December 2011 (note 4f). At 31 December 2011, there was a corresponding entry for the fair value in trade and other payables representing the deferred revenue relating to the performance conditions. This deferred revenue is released as revenue in the income statement in line with the percentage of performance conditions satisfied at each reporting date. At 31 December 2011, 80% of the performance conditions have been completed (2010: nil) resulting in current year revenue recognised of US$9,576,000.
The share of the associate’s statement of financial position is as follows:
2011
US$’000
Non-current assets 92,563
Current assets 21,965
Non-current liabilities (47,597)
Current liabilities (10,970)
Equity 55,961
Transaction costs incurred 1,533
Residual goodwill 91,331
Carrying value of investment 148,825
Share of associates revenues and net loss: Revenue 24,289
Net loss (2,708)
Petrofac Annual report and accounts 2011132
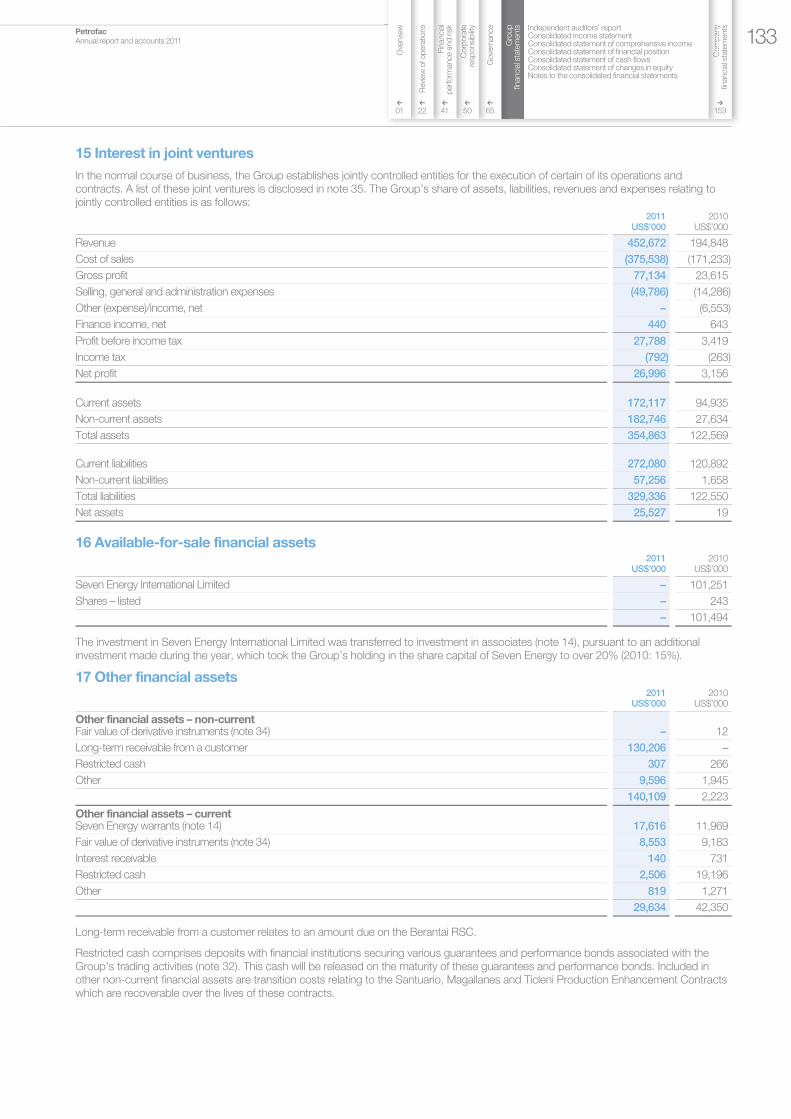
15 Interest in joint ventures
In the normal course of business, the Group establishes jointly controlled entities for the execution of certain of its operations and contracts. A list of these joint ventures is disclosed in note 35. The Group’s share of assets, liabilities, revenues and expenses relating to jointly controlled entities is as follows:
2011
US$’000 2010
US$’000
Revenue 452,672 194,848
Cost of sales (375,538) (171,233)
Gross profit 77,134 23,615
Selling, general and administration expenses (49,786) (14,286)
Other (expense)/income, net – (6,553)
Finance income, net 440 643
Profit before income tax 27,788 3,419
Income tax (792) (263)
Net profit 26,996 3,156
Current assets 172,117 94,935
Non-current assets 182,746 27,634
Total assets 354,863 122,569
Current liabilities 272,080 120,892
Non-current liabilities 57,256 1,658
Total liabilities 329,336 122,550
Net assets 25,527 19
16 Available-for-sale financial assets
2011
US$’0002010
US$’000
Seven Energy International Limited – 101,251
Shares – listed – 243
– 101,494
The investment in Seven Energy International Limited was transferred to investment in associates (note 14), pursuant to an additional investment made during the year, which took the Group’s holding in the share capital of Seven Energy to over 20% (2010: 15%).
17 Other financial assets
2011
US$’0002010
US$’000
Other financial assets – non-current Fair value of derivative instruments (note 34) – 12
Long-term receivable from a customer 130,206 –
Restricted cash 307 266
Other 9,596 1,945
140,109 2,223
Other financial assets – current Seven Energy warrants (note 14) 17,616 11,969
Fair value of derivative instruments (note 34) 8,553 9,183
Interest receivable 140 731
Restricted cash 2,506 19,196
Other 819 1,271
29,634 42,350
Long-term receivable from a customer relates to an amount due on the Berantai RSC.
Restricted cash comprises deposits with financial institutions securing various guarantees and performance bonds associated with the Group’s trading activities (note 32). This cash will be released on the maturity of these guarantees and performance bonds. Included in other non-current financial assets are transition costs relating to the Santuario, Magallanes and Ticleni Production Enhancement Contracts which are recoverable over the lives of these contracts.
Petrofac Annual report and accounts 2011 133
Com
pany
financia
l sta
tem
ents
153
Gro
up
fin
ancia
l sta
tem
ents
Gro
Gro
pup
Gove
rnance
GG
Corp
ora
te
resp
onsi
bility
Corp
Corp
ora
tora
tee
Fin
ancia
l p
erf
orm
ance
and ris
kFin
aFin
ancia
ncia
ll
Revi
ew
of o
pera
tions
Com
Com
pany
pany
1
Independent auditors’ reportConsolidated income statementConsolidated statement of comprehensive incomeConsolidated statement of financial positionConsolidated statement of cash flowsConsolidated statement of changes in equityNotes to the consolidated financial statements
Ri
fti
Ove
rvie
w
01 22 41 50 65

Notes to the consolidated financial statements continued For the year ended 31 December 2011
18 Asset held for sale
2011
US$’000 2010
US$’000
Non-current asset held for sale (note 9) 44,330 –
Liabilities directly associated with non-current asset held for sale 5,150 –
Non-current asset held for sale comprises FPF1 Ltd pending the completion of the Ithaca transaction. This entry is reported under the Integrated Energy Services segment.
19 Inventories
2011
US$’000 2010
US$’000
Crude oil 3,942 2,119
Processed hydrocarbons 84 90
Stores and spares 5,650 4,083
Raw materials 853 910
10,529 7,202
Included in the consolidated income statement are costs of inventories expensed of US$31,706,000 (2010: US$28,840,000).
20 Work in progress and billings in excess of cost and estimated earnings
2011
US$’000 2010
US$’000
Cost and estimated earnings 12,066,357 7,812,897
Less: billings (11,454,348) (7,008,911)
Work in progress 612,009 803,986
Billings 2,856,375 2,144,252
Less: cost and estimated earnings (2,466,971) (1,965,823)
Billings in excess of cost and estimated earnings 389,404 178,429
Total cost and estimated earnings 14,533,328 9,778,720
Total billings 14,310,723 9,153,163
21 Trade and other receivables
2011
US$’000 2010
US$’000
Trade receivables 869,124 785,383
Retentions receivable 71,375 26,297
Advances 215,470 179,101
Prepayments and deposits 30,802 34,059
Receivables from joint venture partners 121,477 –
Other receivables 44,794 31,919
1,353,042 1,056,759
Trade receivables are non-interest bearing and are generally on 30 to 60 days’ terms. Trade receivables are reported net of provision for impairment. The movements in the provision for impairment against trade receivables totalling US$869,124,000 (2010: US$785,383,000) are as follows:
2011 2010
Specific impairment
US$’000
General impairment
US$’000Total
US$’000
Specific impairment
US$’000
General impairment
US$’000 Total
US$’000
At 1 January 2,790 2,935 5,725 4,875 1,754 6,629
Charge for the year 524 (412) 112 2,189 1,796 3,985
Amounts written off (294) (1,854) (2,148) (2,197) (67) (2,264)
Unused amounts reversed (235) (120) (355) (1,738) (893) (2,631)
Transfers – – – (326) 326 –
Exchange difference (9) (39) (48) (13) 19 6
At 31 December 2,776 510 3,286 2,790 2,935 5,725
Petrofac Annual report and accounts 2011134

At 31 December, the analysis of trade receivables is as follows:
Neither past due nor
impaired US$’000
Number of days past due
< 30 days
US$’000
31–60 days
US$’000
61–90 days
US$’000
91–120 days
US$’000
121–360 days
US$’000
> 360 days
US$’000Total
US$’000
Unimpaired 570,445 156,310 108,780 13,857 3,615 13,233 616 866,856
Impaired – – – – 2,445 2,207 902 5,554
570,445 156,310 108,780 13,857 6,060 15,440 1,518 872,410
Less: impairment provision – – – – (441) (1,932) (913) (3,286)
Net trade receivables 2011 570,445 156,310 108,780 13,857 5,619 13,508 605 869,124
Unimpaired 599,661 125,821 34,562 10,897 7,324 834 164 779,263
Impaired – 3,230 1,085 157 1,633 4,023 1,717 11,845
599,661 129,051 35,647 11,054 8,957 4,857 1,881 791,108
Less: impairment provision – (1,211) (391) (244) (774) (2,295) (810) (5,725)
Net trade receivables 2010 599,661 127,840 35,256 10,810 8,183 2,562 1,071 785,383
The credit quality of trade receivables that are neither past due nor impaired is assessed by management with reference to externally prepared customer credit reports and the historic payment track records of the counterparties.
Advances represent payments made to certain of the Group’s subcontractors for projects in progress, on which the related work had not been performed at the statement of financial position date. The increase in advances during 2011 relates to new contract awards in the Onshore Engineering & Construction business partly offset by the unwinding of advances on more mature contracts.
Receivables from joint venture partners are amounts recoverable from venture partners on the Berantai floating production platform and PM304.
All trade and other receivables are expected to be settled in cash.
Certain trade and other receivables will be settled in cash using currencies other than the reporting currency of the Group, and will be largely paid in sterling and euros.
22 Cash and short-term deposits
2011
US$’0002010
US$’000
Cash at bank and in hand 490,446 244,018
Short-term deposits 1,081,892 818,987
Total cash and bank balances 1,572,338 1,063,005
Short-term deposits are made for varying periods of between one day and three months depending on the immediate cash requirements of the Group, and earn interest at respective short-term deposit rates. The fair value of cash and bank balances is US$1,572,338,000 (2010: US$1,063,005,000).
For the purposes of the consolidated cash flow statement, cash and cash equivalents comprise the following:
2011
US$’0002010
US$’000
Cash at bank and in hand 490,446 244,018
Short-term deposits 1,081,892 818,987
Bank overdrafts (note 27) (36,932) (28,908)
1,535,406 1,034,097
Petrofac Annual report and accounts 2011 135
Com
pany
financia
l sta
tem
ents
153
Gro
up
fin
ancia
l sta
tem
ents
Gro
Gro
pup
Gove
rnance
GG
Corp
ora
te
resp
onsi
bility
Corp
Corp
ora
tora
tee
Fin
ancia
l p
erf
orm
ance
and ris
kFin
aFin
ancia
ncia
ll
Revi
ew
of o
pera
tions
Com
Com
pany
pany
1
Independent auditors’ reportConsolidated income statementConsolidated statement of comprehensive incomeConsolidated statement of financial positionConsolidated statement of cash flowsConsolidated statement of changes in equityNotes to the consolidated financial statements
Ri
fti
Ove
rvie
w
01 22 41 50 65

Notes to the consolidated financial statements continued For the year ended 31 December 2011
23 Share capital
The share capital of the Company as at 31 December was as follows:
2011
US$’000 2010
US$’000
Authorised 750,000,000 ordinary shares of US$0.020 each (2010: 750,000,000 ordinary shares of US$0.020 each) 15,000 15,000
Issued and fully paid 345,821,729 ordinary shares of US$0.020 each (2010: 345,715,053 ordinary shares of US$0.020 each) 6,916 6,914
The movement in the number of issued and fully paid ordinary shares is as follows: Number
Ordinary shares: **Ordinary shares of US$0.025 each at 1 January 2010 345,532,388
Issued during the year as further deferred consideration payable for the acquisition of a subsidiary 182,665
Ordinary shares of US$0.020 each at 1 January 2011 345,715,053
Issued during the year as further deferred consideration payable for the acquisition of subsidiaries 106,676
Ordinary shares of US$0.020 each at 31 December 2011 345,821,729
The share capital comprises only one class of ordinary shares. The ordinary shares carry a voting right and the right to a dividend.
Share premium: The balance on the share premium account represents the amount received in excess of the nominal value of the ordinary shares.
Capital redemption reserve: The balance on the capital redemption reserve represents the aggregated nominal value of the ordinary shares repurchased and cancelled.
**In order to effect the demerger of the PEDL sub group to EnQuest, the existing issued ordinary share capital of Petrofac Limited was subdivided and converted into new ordinary Petrofac shares with a nominal value of US$0.02 each and Petrofac B shares of US$0.005 each and subsequent to this share split the B shares were purchased and cancelled in exchange for an allotment and issue of EnQuest ordinary shares directly to holders of Petrofac B shares.
24 Treasury shares
For the purpose of making awards under its employee share schemes, the Company acquires its own shares which are held by the Petrofac Employee Benefit Trust and the Petrofac Joint Venture Companies Employee Benefit Trust. All these shares have been classified in the statement of financial position as treasury shares within equity.
The movements in total treasury shares are shown below:
2011 2010
Number US$’000 Number US$’000
At 1 January 6,757,339 65,317 7,210,965 56,285
Acquired during the year 2,074,138 49,062 2,122,960 36,486
Vested during the year (3,095,460) (38,693) (2,576,586) (27,454)
At 31 December 5,736,017 75,686 6,757,339 65,317
Shares vested during the year include dividend shares and 8% uplift adjustment made in respect of the EnQuest demerger of 393,344 (2010: 120,504).
Petrofac Annual report and accounts 2011136

25 Share-based payment plans
Performance Share Plan (PSP) Under the Performance Share Plan of the Company, share awards are granted to Executive Directors and a restricted number of other senior executives of the Group. The shares cliff vest at the end of three years subject to continued employment and the achievement of certain pre-defined non-market and market-based performance conditions. The non-market-based condition governing the vesting of 50% of the total award, is subject to achieving between 10% and 20% earning per share (EPS) growth targets over a three-year period. The fair values of the equity-settled award relating to the EPS part of the scheme are estimated based on the quoted closing market price per Company share at the date of grant with an assumed vesting rate per annum built into the calculation (subsequently trued up at year end based on the actual leaver rate during the period from award date to year end) over the three-year vesting period of the plan. The fair value and assumed vesting rates of the EPS part of the scheme are shown below:
Fair value per
shareAssumed
vesting rate
2011 awards 1,426p 94.3%
2010 awards 1,103p 93.8%
2009 awards 545p 93.1%
2008 awards 522p 92.3%
The remaining 50% market performance based part of these awards is dependent on the total shareholder return (TSR) of the Group compared to an index composed of selected relevant companies. The fair value of the shares vesting under this portion of the award is determined by an independent valuer using a Monte Carlo simulation model taking into account the terms and conditions of the plan rules and using the following assumptions at the date of grant:
2011 awards 2010 awards 2009 awards 2008 awards
Expected share price volatility (based on median of comparator Group’s three-year volatilities) 51.0% 50.0% 49.0% 32.0%
Share price correlation with comparator Group 43.0% 39.0% 36.0% 22.0%
Risk-free interest rate 1.7% 1.50% 2.10% 3.79%
Expected life of share award 3 years 3 years 3 years 3 years
Fair value of TSR portion 788p 743p 456p 287p
The following shows the movement in the number of shares held under the PSP scheme outstanding but not exercisable:
2011
Number2010
Number
Outstanding at 1 January 1,350,189 1,432,680
Granted during the year 482,379 390,278
Vested during the year (421,309) (407,316)
Forfeited during the year (53,213) (65,453)
Outstanding at 31 December 1,358,046 1,350,189
The number of outstanding shares excludes the 8% uplift adjustment made in respect of the EnQuest demerger of 47,335 shares (2010: 82,594 shares) and any rolled up declared dividends of 68,073 shares (2010: 64,264 shares). The 8% uplift adjustment compensated the existing share plan holders for the loss in market value of Petrofac shares on flotation of EnQuest and employees have no legal right to receive dividend shares until the shares ultimately vest.
The number of awards still outstanding but not exercisable at 31 December 2011 is made up of 454,969 in respect of 2011 awards (2010: nil), 368,005 in respect of 2010 awards (2010: 390,278), 535,072 in respect of 2009 awards (2010: 538,602), and nil in respect of 2008 awards (2010: 421,309).
The charge recognised in the current year amounted to US$5,999,000 (2010: US$3,208,000).
Deferred Bonus Share Plan (DBSP) Executive Directors and selected employees were originally eligible to participate in this scheme although the Remuneration Committee decided in 2007 that Executive Directors should no longer continue to participate. Participants are required, or in some cases invited, to receive a proportion of any bonus in ordinary shares of the Company (‘Invested Awards’). Following such an award, the Company will generally grant the participant an additional award of a number of shares bearing a specified ratio to the number of his or her invested shares (‘Matching Shares’).
A change in the rules of the DBSP scheme was approved by shareholders at the annual general meeting of the Company on 11 May 2007 such that the 2007 share awards and for any awards made thereafter, the Invested and Matching Shares would, unless the Remuneration Committee of the Board of Directors determined otherwise, vest 33.33% on the first anniversary of the date of grant, a further 33.33% on the second anniversary of the date of grant and the final 33.34% of the award on the third anniversary of the date of grant.
Petrofac Annual report and accounts 2011 137
Com
pany
financia
l sta
tem
ents
153
Gro
up
fin
ancia
l sta
tem
ents
Gro
Gro
pup
Gove
rnance
GG
Corp
ora
te
resp
onsi
bility
Corp
Corp
ora
tora
tee
Fin
ancia
l p
erf
orm
ance
and ris
kFin
aFin
ancia
ncia
ll
Revi
ew
of o
pera
tions
Com
Com
pany
pany
1
Independent auditors’ reportConsolidated income statementConsolidated statement of comprehensive incomeConsolidated statement of financial positionConsolidated statement of cash flowsConsolidated statement of changes in equityNotes to the consolidated financial statements
Ri
fti
Ove
rvie
w
01 22 41 50 65

Notes to the consolidated financial statements continued For the year ended 31 December 2011
25 Share-based payment plans continued
At the year end the values of the bonuses settled by shares cannot be determined until all employees have confirmed the voluntary portion of their bonus they wish to be settled by shares rather than cash and until the Remuneration Committee has approved the mandatory portion of the employee bonuses to be settled in shares. Once the voluntary and mandatory portions of the bonus to be settled in shares are determined, the final bonus liability to be settled in shares is transferred to the reserve for share-based payments. The costs relating to the Matching Shares are recognised over the corresponding vesting period and the fair values of the equity-settled Matching Shares granted to employees are based on the quoted closing market price at the date of grant adjusted for the trued up percentage vesting rate of the plan. The details of the fair values and assumed vesting rates of the DBSP scheme are below:
Fair value per share
Assumed vesting rate
2011 awards 1,426p 97.0%
2010 awards 1,185p 90.8%
2009 awards 545p 91.8%
2008 awards 522p 90.9%
The following shows the movement in the number of shares held under the DBSP scheme outstanding but not exercisable:
2011
Number* 2010
Number*
Outstanding at 1 January 4,082,311 4,694,191
Granted during the year 1,538,252 1,397,094
Vested during the year (1,681,130) (1,792,895)
Forfeited during the year (129,687) (216,079)
Outstanding at 31 December 3,809,746 4,082,311
*Includes Invested and Matching Shares.
The number of outstanding shares exclude the 8% uplift adjustment made in respect of the EnQuest demerger of 188,177 shares (2010: 327,058 shares) and rolled up declared dividends of 158,691 shares (2010: 184,599 shares).
The number of awards still outstanding but not exercisable at 31 December 2011 is made up of 1,491,298 in respect of 2011 awards (2010: nil), 984,496 in respect of 2010 awards (2010: 1,313,894), 1,333,952 in respect of 2009 awards (2010: 1,948,340), and nil in respect of 2008 awards (2010: 820,077).
The charge recognised in the 2011 income statement in relation to matching share awards amounted to US$12,920,000 (2010: US$9,195,000).
Share Incentive Plan (SIP) All UK employees, including UK Executive Directors, are eligible to participate in the scheme. Employees may invest up to sterling 1,500 per tax year of gross salary (or, if lower, 10% of salary) to purchase ordinary shares in the Company. There is no holding period for these shares.
Restricted Share Plan (RSP) Under the Restricted Share Plan scheme, selected employees are granted shares in the Company over a discretionary vesting period which may or may not be, at the direction of the Remuneration Committee of the Board of Directors, subject to the satisfaction of performance conditions. At present there are no performance conditions applying to this scheme nor is there currently any intention to introduce them in the future. The fair values of the awards granted under the plan at various grant dates during the year are based on the quoted market price at the date of grant adjusted for an assumed vesting rate over the relevant vesting period. For details of the fair values and assumed vesting rate of the RSP scheme, see below:
Weighted average fair
value per share
Assumed vesting rate
2011 awards 1,463p 99.3%
2010 awards 990p 92.3%
2009 awards 430p 70.0%
2008 awards 478p 97.6%
The following shows the movement in the number of shares held under the RSP scheme outstanding but not exercisable:
2011
Number 2010
Number
Outstanding at 1 January 1,003,712 1,082,461
Granted during the year 204,402 203,384
Vested during the year (664,512) (176,360)
Forfeited during the year (8,822) (105,773)
Outstanding at 31 December 534,780 1,003,712
The number of outstanding shares exclude the 8% uplift adjustment made in respect of the EnQuest demerger of 27,982 shares (2010: 78,156 shares) and rolled up declared dividends of 27,090 shares (2010: 48,474 shares).
Petrofac Annual report and accounts 2011138

The number of awards still outstanding but not exercisable at 31 December 2011 is made up of 204,402 in respect of 2011 awards (2010: nil), 186,758 in respect of 2010 awards (2010: 195,580), 36,658 in respect of 2009 awards (2010: 36,658), 1,030 in respect of 2008 awards (2010: 665,542), and 105,932 in respect of 2007 awards (2010: 105,932).
The charge recognised in the 2011 income statement in relation to RSP awards amounted to US$4,137,000 (2010: US$2,381,000).
The Group has recognised a total charge of US$23,056,000 (2010: US$14,784,000) in the consolidated income statement during the year relating to the above employee share-based schemes (see note 4d) which has been transferred to the reserve for share-based payments along with US$17,974,000 of the bonus liability accrued for the year ended 31 December 2010 which has been settled in shares granted during the year (2010: US$12,750,000).
For further details on the above employee share-based payment schemes refer to pages 97 to 101 of the Directors’ remuneration report.
26 Other reserves Net
unrealised gains/(losses) on available-
for-sale-financial
assets US$’000
Net unrealised
(losses)/gains on
derivatives US$’000
Foreign currency
translation US$’000
Reserve for share-based
payments US$’000
Total US$’000
Balance at 1 January 2010 74 32,773 (64,328) 56,875 25,394
Foreign currency translation – – (908) – (908)
Foreign currency translation recycled to consolidated income statement in the year on EnQuest demerger (note 11) – – 45,818 – 45,818
Net gains on maturity of cash flow hedges recycled in the year – (16,612) – – (16,612)
Net changes in fair value of derivatives and financial assets designated as cash flow hedges – (18,958) – – (18,958)
Net changes in fair value of available-for-sale financial assets 70 – – – 70
Disposal of available-for-sale financial assets (74) – – – (74)
Share-based payments charge (note 25) – – – 14,784 14,784
Transfer during the year (note 25) – – – 12,750 12,750
Shares vested during the year (note 25) – – – (26,170) (26,170)
Deferred tax on share-based payments reserve – – – (1,366) (1,366)
Balance at 1 January 2011 70 (2,797) (19,418) 56,873 34,728
Foreign currency translation – – (15,927) – (15,927)
Net gains on maturity of cash flow hedges recycled in the year – (3,675) – – (3,675)
Net changes in fair value of derivatives and financial assets designated as cash flow hedges – (13,590) – – (13,590)
Disposal of available-for-sale financial assets (70) – – – (70)
Share-based payments charge (note 25) – – – 23,056 23,056
Transfer during the year (note 25) – – – 17,974 17,974
Shares vested during the year (note 25) – – – (33,776) (33,776)
Deferred tax on share-based payments reserve – – – (3,082) (3,082)
Balance at 31 December 2011 – (20,062) (35,345) 61,045 5,638
Nature and purpose of other reserves Net unrealised gains/(losses) on available-for-sale financial assets This reserve records fair value changes on available-for-sale financial assets held by the Group net of deferred tax effects. Realised gains and losses on the sale of available-for-sale financial assets are recognised as other income or expenses in the consolidated income statement.
Net unrealised gains/(losses) on derivatives The portion of gains or losses on cash flow hedging instruments that are determined to be effective hedges are included within this reserve net of related deferred tax effects. When the hedged transaction occurs or is no longer forecast to occur, the gain or loss is transferred out of equity to the consolidated income statement. Realised net gains amounting to US$3,979,000 (2010: US$16,764,000) relating to foreign currency forward contracts and financial assets designated as cash flow hedges have been recognised in cost of sales and a realised net loss of US$304,000 (2010: US$152,000) was deducted from revenues in respect of oil derivatives.
The forward currency points element and ineffective portion of derivative financial instruments relating to forward currency contracts and gains on un-designated derivatives amounting to a net loss of US$5,881,000 (2010: US$3,409,000 loss) have been recognised in the cost of sales.
Petrofac Annual report and accounts 2011 139
Com
pany
financia
l sta
tem
ents
153
Gro
up
fin
ancia
l sta
tem
ents
Gro
Gro
pup
Gove
rnance
GG
Corp
ora
te
resp
onsi
bility
Corp
Corp
ora
tora
tee
Fin
ancia
l p
erf
orm
ance
and ris
kFin
aFin
ancia
ncia
ll
Revi
ew
of o
pera
tions
Com
Com
pany
pany
1
Independent auditors’ reportConsolidated income statementConsolidated statement of comprehensive incomeConsolidated statement of financial positionConsolidated statement of cash flowsConsolidated statement of changes in equityNotes to the consolidated financial statements
Ri
fti
Ove
rvie
w
01 22 41 50 65

Notes to the consolidated financial statements continued For the year ended 31 December 2011
26 Other reserves continued
Foreign currency translation reserve The foreign currency translation reserve is used to record exchange differences arising from the translation of the financial statements in foreign subsidiaries. It is also used to record exchange differences arising on monetary items that form part of the Group’s net investment in subsidiaries.
Reserve for share-based payments The reserve for share-based payments is used to record the value of equity-settled share-based payments awarded to employees and transfers out of this reserve are made upon vesting of the original share awards.
The transfer during the year reflects the transfer from accrued expenses within trade and other payables of the bonus liability relating to the year ended 2011 of US$17,974,000 (2010 bonus of US$12,750,000) which has been voluntarily elected or mandatorily obliged to be settled in shares during the year (note 25).
27 Interest-bearing loans and borrowings
The Group had the following interest-bearing loans and borrowings outstanding:
31 December 2011
Actual interest rate % 31 December 2010
Actual interest rate %Effective
interest rate % Maturity 2011
US$’000 2010
US$’000
Current
Bank overdrafts (i) UK LIBOR + 1.50%
US LIBOR + 1.50%
UK LIBOR + 1.50%,
US LIBOR + 1.50%
UK LIBOR + 1.50%,
US LIBOR + 1.50%
on demand 36,932 28,908
Other loans:
Current portion of term loan (ii) US/UK LIBOR + 0.875%
US/UK LIBOR + 0.875%
3.16% to 3.96% (2010: 3.26%
to 4.14%)
17,119 14,241
Current portion of term loan (iii) US/UK LIBOR + 0.875%
US/UK LIBOR + 0.875%
1.67% to 3.55% (2010: 2.01%
to 3.91%)
6,660 4,286
60,711 47,435
Non-current
Term loan (ii) US/UK LIBOR + 0.875%
US/UK LIBOR + 0.875%
3.16% to 3.96% (2010: 3.26%
to 4.14%)
2012–2013 12,433 30,576
Term loan (iii) US/UK LIBOR + 0.875%
US/UK LIBOR + 0.875%
1.67% to 3.55% (2010: 2.01%
to 3.91%)
2012–2013 7,133 13,809
19,566 44,385
Less:
Debt acquisition costs net of accumulated amortisation and effective rate adjustments (3,116) (4,159)
16,450 40,226
Details of the Group’s interest-bearing loans and borrowings are as follows:
(i) Bank overdrafts Bank overdrafts are drawn down in US dollars and sterling denominations to meet the Group’s working capital requirements. These are repayable on demand.
(ii) Term loan This term loan at 31 December 2011 comprised drawings of US$14,857,000 (2010: US$23,057,000) denominated in US dollars and US$14,695,000 (2010: US$21,760,000) denominated in sterling. Both elements of the loan are repayable over a period of three years ending 30 September 2013.
(iii) Term loan This term loan at 31 December 2011 comprised drawings of US$10,075,000 (2010: US$13,203,000) denominated in US dollars and US$3,718,000 (2010: US$4,892,000) denominated in sterling. Both elements of the loan are repayable over a period of three years ending 30 September 2013.
The Group’s credit facilities and debt agreements contain covenants relating to interest and net borrowings cover. None of the Company’s subsidiaries are subject to any material restrictions on their ability to transfer funds in the form of cash dividends, loans or advances to the Company.
Petrofac Annual report and accounts 2011140

28 Provisions Other long-
term employment
benefits provision US$’000
Provision for
decommissioning US$’000
Otherprovisions US$’000
Total US$’000
At 1 January 2011 40,204 3,676 1,561 45,441
Additions during the year 12,861 2,649 1,237 16,747
Unused amounts reversed – (835) – (835)
Paid in the year (3,411) – – (3,411)
Unwinding of discount 1,452 167 – 1,619
At 31 December 2011 51,106 5,657 2,798 59,561
Other long-term employment benefits provision Labour laws in the United Arab Emirates require employers to provide for other long-term employment benefits. These benefits are payable to employees on being transferred to another jurisdiction or on cessation of employment based on their final salary and number of years service. All amounts are unfunded. The long-term employment benefits provision is based on an internally produced end of service benefits valuation model with the key underlying assumptions being as follows:
Senior
employeesOther
employees
Average number of years of future service 5 3
Average annual % salary increases 6% 4%
Discount factor 4% 4%
Senior employees are those earning a base of salary of over US$96,000 per annum.
Discount factor used is the local Dubai five-year Sukuk rate.
Provision for decommissioning The decommissioning provision primarily relates to the Group’s obligation for the removal of facilities and restoration of the site at the PM304 field in Malaysia and at Chergui in Tunisia. The liability is discounted at the rate of 4.16% on PM304 (2010: 3.80%) and 5.25% on Chergui (2010: 5.25%). The unwinding of the discount is classified as finance cost (note 5). The Group estimates that the cash outflows against these provisions will arise in 2026 on PM304 and in 2018 on Chergui.
Other provisions This represents amounts set aside to cover claims against the Group which will be settled via the captive insurance company Jermyn Insurance Company Limited.
29 Other financial liabilities
2011
US$’0002010
US$’000
Other financial liabilities – non-current Deferred consideration payable 12,889 11,279
Finance lease creditors (note 32) 10,644 –
Fair value of derivative instruments (note 34) – 174
Other 9 –
23,542 11,453
Other financial liabilities – current Deferred consideration payable 3,379 24,595
Interest payable 107 9
Fair value of derivative instruments (note 34) 22,466 12,197
Finance lease creditors (note 32) 5,392 –
Other 333 253
31,677 37,054
Included in deferred consideration payable above is an amount payable of US$6,466,000 (2010: US$6,556,000) relating to the Group’s investment in an associate (note 14).
Petrofac Annual report and accounts 2011 141
Com
pany
financia
l sta
tem
ents
153
Gro
up
fin
ancia
l sta
tem
ents
Gro
Gro
pup
Gove
rnance
GG
Corp
ora
te
resp
onsi
bility
Corp
Corp
ora
tora
tee
Fin
ancia
l p
erf
orm
ance
and ris
kFin
aFin
ancia
ncia
ll
Revi
ew
of o
pera
tions
Com
Com
pany
pany
1
Independent auditors’ reportConsolidated income statementConsolidated statement of comprehensive incomeConsolidated statement of financial positionConsolidated statement of cash flowsConsolidated statement of changes in equityNotes to the consolidated financial statements
Ri
fti
Ove
rvie
w
01 22 41 50 65

Notes to the consolidated financial statements continued For the year ended 31 December 2011
30 Trade and other payables
2011
US$’000 2010
US$’000
Trade payables 476,851 278,383
Advances received from customers 769,637 412,044
Accrued expenses 414,725 251,512
Other taxes payable 24,571 12,755
Other payables 58,398 66,742
1,744,182 1,021,436
Advances from customers represent payments received for contracts on which the related work had not been performed at the statement of financial position date.
Included in other payables are retentions held against subcontractors of US$29,200,000 (2010: US$6,170,000). Also included in other payables above is US$2,393,000 (2010: U$11,969,000) deferred revenue relating to the provision of services required to earn the right to subscribe for the additional Seven Energy warrants (note 14).
Certain trade and other payables will be settled in currencies other than the reporting currency of the Group, mainly in sterling, euros and Kuwaiti dinars.
31 Accrued contract expenses
2011
US$’000 2010
US$’000
Accrued contract expenses 1,268,818 1,272,942
Reserve for contract losses – 2,523
1,268,818 1,275,465
The reserve for contract losses in the prior year was to cover costs in excess of revenues on certain contracts.
32 Commitments and contingencies
Commitments In the normal course of business the Group will obtain surety bonds, letters of credit and guarantees, which are contractually required to secure performance, advance payment or in lieu of retentions being withheld. Some of these facilities are secured by issue of corporate guarantees by the Company in favour of the issuing banks.
At 31 December 2011, the Group had letters of credit of US$5,995,000 (2010: US$2,984,000) and outstanding letters of guarantee, including performance, advance payments and bid bonds, of US$2,185,385,000 (2010: US$2,951,553,000) against which the Group had pledged or restricted cash balances of, in aggregate, US$2,813,000 (2010: US$19,462,000).
At 31 December 2011, the Group had outstanding forward exchange contracts amounting to US$324,221,000 (2010: US$188,561,000).
These commitments consist of future obligations to either acquire or sell designated amounts of foreign currency at agreed rates and value dates (note 34).
Leases The Group has financial commitments in respect of non-cancellable operating leases for office space and equipment. These non-cancellable leases have remaining non-cancellable lease terms of between one and 17 years and, for certain property leases, are subject to renegotiation at various intervals as specified in the lease agreements. The future minimum rental commitments under these non-cancellable leases are as follows:
2011
US$’000 2010
US$’000
Within one year 23,856 18,031
After one year but not more than five years 44,674 41,239
More than five years 48,987 76,914
117,517 136,184
Included in the above are commitments relating to the lease of an office building extension in Aberdeen, United Kingdom of US$34,041,000 (2010: US$49,232,000).
Minimum lease payments recognised as an operating lease expense during the year amounted to US$37,272,000 (2010: US$35,625,000).
Petrofac Annual report and accounts 2011142
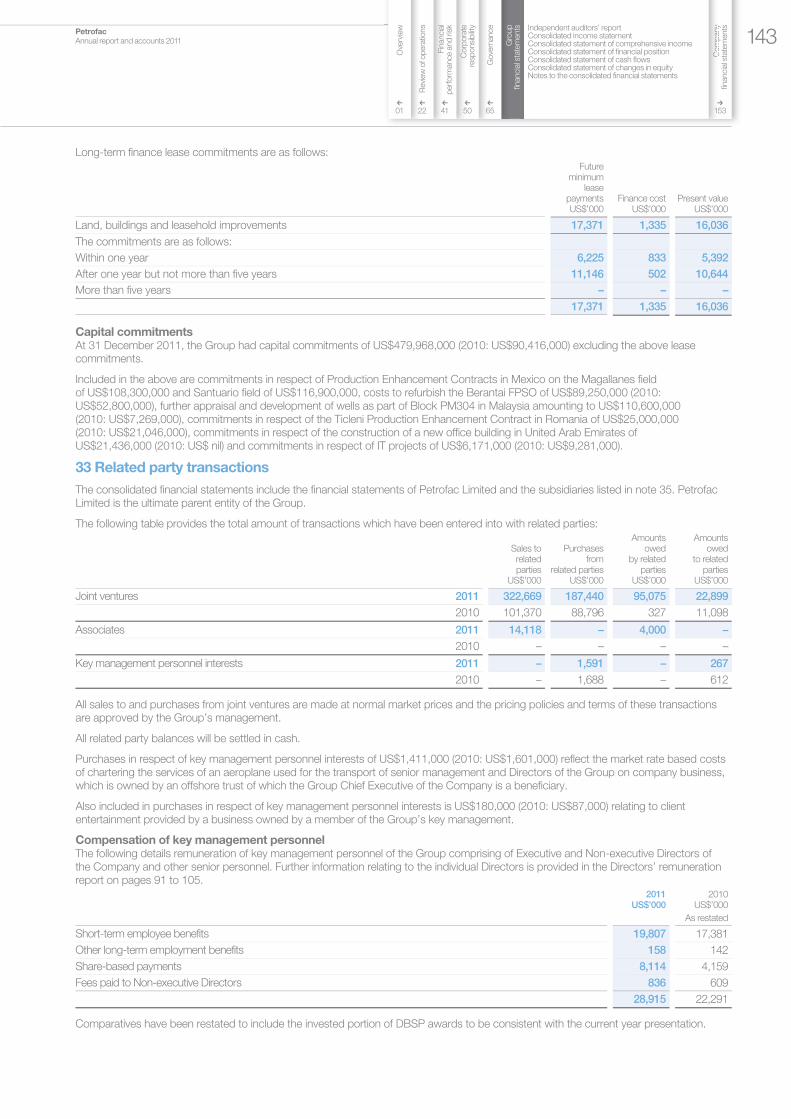
Long-term finance lease commitments are as follows:
Future minimum
lease payments US$’000
Finance cost US$’000
Present value US$’000
Land, buildings and leasehold improvements 17,371 1,335 16,036
The commitments are as follows:
Within one year 6,225 833 5,392
After one year but not more than five years 11,146 502 10,644
More than five years – – –
17,371 1,335 16,036
Capital commitments At 31 December 2011, the Group had capital commitments of US$479,968,000 (2010: US$90,416,000) excluding the above lease commitments.
Included in the above are commitments in respect of Production Enhancement Contracts in Mexico on the Magallanes field of US$108,300,000 and Santuario field of US$116,900,000, costs to refurbish the Berantai FPSO of US$89,250,000 (2010: US$52,800,000), further appraisal and development of wells as part of Block PM304 in Malaysia amounting to US$110,600,000 (2010: US$7,269,000), commitments in respect of the Ticleni Production Enhancement Contract in Romania of US$25,000,000 (2010: US$21,046,000), commitments in respect of the construction of a new office building in United Arab Emirates of US$21,436,000 (2010: US$ nil) and commitments in respect of IT projects of US$6,171,000 (2010: US$9,281,000).
33 Related party transactions
The consolidated financial statements include the financial statements of Petrofac Limited and the subsidiaries listed in note 35. Petrofac Limited is the ultimate parent entity of the Group.
The following table provides the total amount of transactions which have been entered into with related parties:
Sales to related parties
US$’000
Purchases from
related parties US$’000
Amounts owed
by related parties
US$’000
Amounts owed
to related parties
US$’000
Joint ventures 2011 322,669 187,440 95,075 22,899
2010 101,370 88,796 327 11,098
Associates 2011 14,118 – 4,000 –
2010 – – – –
Key management personnel interests 2011 – 1,591 – 267
2010 – 1,688 – 612
All sales to and purchases from joint ventures are made at normal market prices and the pricing policies and terms of these transactions are approved by the Group’s management.
All related party balances will be settled in cash.
Purchases in respect of key management personnel interests of US$1,411,000 (2010: US$1,601,000) reflect the market rate based costs of chartering the services of an aeroplane used for the transport of senior management and Directors of the Group on company business, which is owned by an offshore trust of which the Group Chief Executive of the Company is a beneficiary.
Also included in purchases in respect of key management personnel interests is US$180,000 (2010: US$87,000) relating to client entertainment provided by a business owned by a member of the Group’s key management.
Compensation of key management personnel The following details remuneration of key management personnel of the Group comprising of Executive and Non-executive Directors of the Company and other senior personnel. Further information relating to the individual Directors is provided in the Directors’ remuneration report on pages 91 to 105.
2011 US$’000
2010 US$’000
As restated
Short-term employee benefits 19,807 17,381
Other long-term employment benefits 158 142
Share-based payments 8,114 4,159
Fees paid to Non-executive Directors 836 609
28,915 22,291
Comparatives have been restated to include the invested portion of DBSP awards to be consistent with the current year presentation.
Petrofac Annual report and accounts 2011 143
Com
pany
financia
l sta
tem
ents
153
Gro
up
fin
ancia
l sta
tem
ents
Gro
Gro
pup
Gove
rnance
GG
Corp
ora
te
resp
onsi
bility
Corp
Corp
ora
tora
tee
Fin
ancia
l p
erf
orm
ance
and ris
kFin
aFin
ancia
ncia
ll
Revi
ew
of o
pera
tions
Com
Com
pany
pany
1
Independent auditors’ reportConsolidated income statementConsolidated statement of comprehensive incomeConsolidated statement of financial positionConsolidated statement of cash flowsConsolidated statement of changes in equityNotes to the consolidated financial statements
Ri
fti
Ove
rvie
w
01 22 41 50 65

Notes to the consolidated financial statements continued For the year ended 31 December 2011
34 Risk management and financial instruments
Risk management objectives and policies The Group’s principal financial assets and liabilities, other than derivatives, comprise available-for-sale financial assets, trade and other receivables, amounts due from/to related parties, cash and short-term deposits, work-in-progress, interest-bearing loans and borrowings, trade and other payables and deferred consideration.
The Group’s activities expose it to various financial risks particularly associated with interest rate risk on its variable rate cash and short-term deposits, loans and borrowings and foreign currency risk on both conducting business in currencies other than reporting currency as well as translation of the assets and liabilities of foreign operations to the reporting currency. These risks are managed from time to time by using a combination of various derivative instruments, principally interest rate swaps, caps and forward currency contracts in line with the Group’s hedging policies. The Group has a policy not to enter into speculative trading of financial derivatives.
The Board of Directors of the Company has established an Audit Committee and Risk Committee to help identify, evaluate and manage the significant financial risks faced by the Group and their activities are discussed in detail on pages 82 to 90.
The other main risks besides interest rate and foreign currency risk arising from the Group’s financial instruments are credit risk, liquidity risk and commodity price risk and the policies relating to these risks are discussed in detail below:
Interest rate risk Interest rate risk arises from the possibility that changes in interest rates will affect the value of the Group’s interest-bearing financial liabilities and assets.
The Group’s exposure to market risk arising from changes in interest rates relates primarily to the Group’s long-term variable rate debt obligations and its cash and bank balances. The Group’s policy is to manage its interest cost using a mix of fixed and variable rate debt. The Group’s cash and bank balances are at floating rates of interest.
Interest rate sensitivity analysis The impact on the Group’s pre-tax profit and equity due to a reasonably possible change in interest rates on loans and borrowings at the reporting date is demonstrated in the table below. The analysis assumes that all other variables remain constant.
Pre-tax profit Equity
100 basis point increase
US$’000
100 basis point
decrease US$’000
100 basis point increase
US$’000
100 basis point
decrease US$’000
31 December 2011 (516) 516 – –
31 December 2010 (710) 710 – –
The following table reflects the maturity profile of these financial liabilities and assets:
Year ended 31 December 2011
Within 1 year
US$’000
1–2 years
US$’000
2–3 years
US$’000
3–4 years
US$’000
4–5 years
US$’000
More than 5 years
US$’000 Total
US$’000
Financial liabilities
Floating rates Bank overdrafts (note 27) 36,932 – – – – – 36,932
Term loans (note 27) 23,779 19,566 – – – – 43,345
60,711 19,566 – – – – 80,277
Financial assets
Floating rates Cash and short-term deposits (note 22) 1,572,338 – – – – – 1,572,338
Restricted cash balances (note 17) 2,506 307 – – – – 2,813
1,574,844 307 – – – – 1,575,151
Petrofac Annual report and accounts 2011144

Year ended 31 December 2010
Within 1 year
US$’000
1–2 years
US$’000
2–3 years
US$’000
3–4 years
US$’000
4–5 years
US$’000
More than 5 years
US$’000Total
US$’000
Financial liabilities
Floating rates Bank overdrafts (note 27) 28,908 – – – – – 28,908
Term loans (note 27) 18,527 23,823 20,562 – – – 62,912
47,435 23,823 20,562 – – – 91,820
Financial assets
Floating rates Cash and short-term deposits (note 22) 1,063,005 – – – – – 1,063,005
Restricted cash balances (note 17) 19,196 266 – – – – 19,462
1,082,201 266 – – – – 1,082,467
Financial liabilities in the above table are disclosed gross of debt acquisition costs and effective rate adjustments of US$3,116,000 (2010: US$4,159,000).
Interest on financial instruments classified as floating rate is re-priced at intervals of less than one year. The other financial instruments of the Group that are not included in the above tables are non-interest bearing and are therefore not subject to interest rate risk.
Derivative instruments designated as cash flow hedges At 31 December 2011, the Group held no derivative instruments, designated as cash flow hedges in relation to floating rate interest-bearing loans and borrowings (2010: nil).
Foreign currency risk The Group is exposed to foreign currency risk on sales, purchases, and translation of assets and liabilities that are in a currency other than the functional currency of its operating units. The Group is also exposed to the translation of the functional currencies of its units to the US dollar reporting currency of the Group. The following table summarises the percentage of foreign currency denominated revenues, costs, financial assets and financial liabilities, expressed in US dollar terms, of the Group totals.
2011 % of foreign
currency denominated
items
2010 % of foreign
currency denominated
items
Revenues 36.4% 41.6%
Costs 57.7% 62.2%
Current financial assets 32.5% 34.8%
Non-current financial assets 0.0% 0.0%
Current financial liabilities 34.7% 51.2%
Non-current financial liabilities 54.2% 59.4%
The Group uses forward currency contracts to manage the currency exposure on transactions significant to its operations. It is the Group’s policy not to enter into forward contracts until a highly probable forecast transaction is in place and to negotiate the terms of the derivative instruments used for hedging to match the terms of the hedged item to maximise hedge effectiveness.
Foreign currency sensitivity analysis The income statements of foreign operations are translated into the reporting currency using a weighted average exchange rate of conversion. Foreign currency monetary items are translated using the closing rate at the reporting date. Revenues and costs in currencies other than the functional currency of an operating unit are recorded at the prevailing rate at the date of the transaction. The following significant exchange rates applied during the year in relation to US dollars:
2011 2010
Average rate Closing rate Average rate Closing rate
Sterling 1.60 1.55 1.54 1.56
Kuwaiti dinar 3.62 3.59 3.49 3.55
Euro 1.40 1.30 1.32 1.34
The following table summarises the impact on the Group’s pre-tax profit and equity (due to change in the fair value of monetary assets, liabilities and derivative instruments) of a reasonably possible change in US dollar exchange rates with respect to different currencies:
+10% US dollar rate
increase US$’000
−10% US dollar rate decrease US$’000
+10% US dollar rate
increase US$’000
−10% USdollar rate decrease US$’000
31 December 2011 (3,814) 3,814 49,659 (49,659)
31 December 2010 (3,750) 3,750 6,272 (6,272)
Pre-tax profit Equity
Petrofac Annual report and accounts 2011 145
Com
pany
financia
l sta
tem
ents
153
Gro
up
fin
ancia
l sta
tem
ents
Gro
Gro
pup
Gove
rnance
GG
Corp
ora
te
resp
onsi
bility
Corp
Corp
ora
tora
tee
Fin
ancia
l p
erf
orm
ance
and ris
kFin
aFin
ancia
ncia
ll
Revi
ew
of o
pera
tions
Com
Com
pany
pany
1
Independent auditors’ reportConsolidated income statementConsolidated statement of comprehensive incomeConsolidated statement of financial positionConsolidated statement of cash flowsConsolidated statement of changes in equityNotes to the consolidated financial statements
Ri
fti
Ove
rvie
w
01 22 41 50 65

Notes to the consolidated financial statements continued For the year ended 31 December 2011
34 Risk management and financial instruments continued
Derivative instruments designated as cash flow hedges At 31 December 2011, the Group had foreign exchange forward contracts as follows:
Contract value Fair value (undesignated) Fair value (designated) Net unrealised gain/(loss)
2011
US$’000 2010
US$’0002011
US$’0002010
US$’0002011
US$’0002010
US$’000 2011
US$’000 2010
US$’000
Euro purchases 222,617 171,072 – (1,794) (9,748) (2,046) (7,729) (1,827)
Sterling purchases 40,156 14,405 – (135) (1,815) 1,583 (1,425) 1,695
Yen (sales) purchases (4,030) 1,721 30 128 29 76 44 117
Singapore dollar purchases 45,683 – (471) – (1,302) – (1,180) –
Swiss francs purchases – 1,363 – – – 175 – 14
(10,290) (1)
The above foreign exchange contracts mature and will affect income between January 2012 and July 2013 (2010: between January 2011 and July 2013).
At 31 December 2011, the Group had cash and short-term deposits designated as cash flow hedges with a fair value loss of US$9,440,000 (2010: US$1,633,000 loss) as follows:
Fair value Net unrealised gain/(loss)
2011 US$’000
2010 US$’000
2011 US$’000
2010 US$’000
Euro cash and short-term deposits 180,520 15,730 (9,206) (1,798)
Sterling cash and short-term deposits 15,098 2,086 (377) (120)
Yen cash and short-term deposits 3,251 4,510 145 278
Swiss francs cash and short-term deposits – 660 – 7
(9,440) (1,633)
During 2011, changes in fair value losses of US$14,117,000 (2010: losses US$19,456,000) relating to these derivative instruments and financial assets were taken to equity and US$3,979,000 of gains (2010: US$16,764,000 gains) were recycled from equity into cost of sales in the income statement. The forward points and ineffective portions of the above foreign exchange forward contracts and loss on un-designated derivatives of US$5,881,000 (2010: US$3,409,000 loss) were recognised in the income statement (note 4b).
Commodity price risk – oil prices The Group is exposed to the impact of changes in oil & gas prices on its revenues and profits generated from sales of crude oil & gas. The Group’s policy is to manage its exposure to the impact of changes in oil & gas prices using derivative instruments, primarily swaps and collars. Hedging is only undertaken once sufficiently reliable and regular long-term forecast production data is available.
During the year the Group entered into various crude oil swaps and zero cost collars hedging oil production of 163,766 barrels (bbl) (2010: 176,400 bbl) with maturities ranging from January 2012 to December 2012. In addition, fuel oil swaps were also entered into for hedging gas production of 21,100 metric tons (MT) (2010: 43,750MT) with maturities from January 2012 to September 2012.
The fair value of oil derivatives at 31 December 2011 was US$636,000 liability (2010: US$1,163,000 liability) with net unrealised losses deferred in equity of US$332,000. During the year, losses of US$304,000 (2010: US$152,000 loss) were recycled from equity into the consolidated income statement on the occurrence of the hedged transactions and a gain in the fair value recognised in equity of US$527,000 (2010: US$1,163,000 loss).
The following table summarises the impact on the Group’s pre-tax profit and equity (due to a change in the fair value of oil derivative instruments and the underlifting asset/overlifting liability) of a reasonably possible change in the oil price:
Pre-tax profit Equity
+10 US$/bbl increase US$’000
−10 US$/bbl decrease US$’000
+10 US$/bbl increase US$’000
−10 US$/bbl decrease US$’000
31 December 2011 (1,050) 1,050 (1,716) 1,716
31 December 2010 (194) 194 (802) 802
Credit risk The Group trades only with recognised, creditworthy third parties. Business Unit Risk Review Committees (BURRC) have been set up by the Board of Directors to evaluate the creditworthiness of each individual third-party at the time of entering into new contracts. Limits have been placed on the approval authority of the BURRC above which the approval of the Board of Directors of the Company is required. Receivable balances are monitored on an ongoing basis with appropriate follow-up action taken where necessary. At 31 December 2011, the Group’s five largest customers accounted for 47.1% of outstanding trade receivables and work in progress (2010: 72.0%).
With respect to credit risk arising from the other financial assets of the Group, which comprise cash and cash equivalents, available-for-sale financial assets and certain derivative instruments, the Group’s exposure to credit risk arises from default of the counterparty, with a maximum exposure equal to the carrying amount of these instruments.
Petrofac Annual report and accounts 2011146

Liquidity risk The Group’s primary objective is to ensure sufficient liquidity to support future growth. Our Integrated Energy Services strategy includes the provision of financial capital and the potential impact on the Group’s capital structure is reviewed regularly. The Group is not exposed to any external capital constraints. The maturity profiles of the Group’s financial liabilities at 31 December 2011 are as follows:
Year ended 31 December 2011
6 months or less
US$’000
6–12 months
US$’000
1–2 years
US$’000
2–5 years
US$’000
More than 5 years
US$’000
Contractual undiscounted
cash flows US$’000
Carrying amount
US$’000
Financial liabilities
Interest-bearing loans and borrowings 48,346 12,365 19,566 – – 80,277 77,161
Finance lease creditors – 6,225 11,146 – – 17,371 16,036
Trade and other payables (excluding advances from customers) 958,936 15,609 – – – 974,545 974,545
Due to related parties 23,166 – – – – 23,166 23,166
Deferred consideration 1,554 1,975 13,094 – – 16,623 16,268
Derivative instruments 19,423 3,043 – – – 22,466 22,466
Interest payable 107 – – – – 107 107
Interest payments 356 263 158 – – 777 –
1,051,888 39,480 43,964 – – 1,135,332 1,129,749
Year ended 31 December 2010
6 months or less
US$’000
6–12 months
US$’000
1–2 years
US$’000
2–5 years
US$’000
More than 5 years
US$’000
Contractual undiscounted
cash flows US$’000
Carrying amount
US$’000
Financial liabilities
Interest-bearing loans and borrowings 37,776 9,659 23,823 20,562 – 91,820 87,661
Trade and other payables (excluding advances from customers) 551,233 58,159 – – – 609,392 609,392
Due to related parties 11,710 – – – – 11,710 11,710
Deferred consideration 24,595 – 11,279 – – 35,874 35,874
Derivative instruments 11,034 1,163 174 – – 12,371 12,371
Interest payable 9 – – – – 9 9
Interest payments 421 388 632 206 – 1,647 –
636,778 69,369 35,908 20,768 – 762,823 757,017
The Group uses various funded facilities provided by banks and its own financial assets to fund the above mentioned financial liabilities.
Capital management The Group’s policy is to maintain a healthy capital base to sustain future growth and maximise shareholder value.
The Group seeks to optimise shareholder returns by maintaining a balance between debt and capital and monitors the efficiency of its capital structure on a regular basis. The gearing ratio and return on shareholders’ equity is as follows:
2011
US$’0002010
US$’000
Cash and short-term deposits 1,572,338 1,063,005
Interest-bearing loans and borrowings (A) (77,161) (87,661)
Net cash (B) 1,495,177 975,344
Equity attributable to Petrofac Limited shareholders (C) 1,110,736 776,462
Profit for the year attributable to Petrofac Limited shareholders (D) 539,425 557,817
Gross gearing ratio (A/C) 6.9% 11.3%
Net gearing ratio (B/C) Net cash position
Net cash position
Shareholders’ return on investment (D/C) 48.6% 71.8%
Petrofac Annual report and accounts 2011 147
Com
pany
financia
l sta
tem
ents
153
Gro
up
fin
ancia
l sta
tem
ents
Gro
Gro
pup
Gove
rnance
GG
Corp
ora
te
resp
onsi
bility
Corp
Corp
ora
tora
tee
Fin
ancia
l p
erf
orm
ance
and ris
kFin
aFin
ancia
ncia
ll
Revi
ew
of o
pera
tions
Com
Com
pany
pany
1
Independent auditors’ reportConsolidated income statementConsolidated statement of comprehensive incomeConsolidated statement of financial positionConsolidated statement of cash flowsConsolidated statement of changes in equityNotes to the consolidated financial statements
Ri
fti
Ove
rvie
w
01 22 41 50 65

Notes to the consolidated financial statements continued For the year ended 31 December 2011
34 Risk management and financial instruments continued
Fair values of financial assets and liabilities The fair value of the Group’s financial instruments and their carrying amounts included within the Group’s statement of financial position are set out below:
Carrying amount Fair value
2011 US$’000
2010 US$’000
2011 US$’000
2010 US$’000
Financial assets
Cash and short-term deposits 1,572,338 1,063,005 1,572,338 1,063,005
Restricted cash 2,813 19,462 2,813 19,462
Available-for-sale financial assets – 101,494 – 101,494
Seven Energy warrants 17,616 11,969 17,616 11,969
Forward currency contracts – designated as cash flow hedge 8,376 7,961 8,376 7,961
Forward currency contracts – undesignated 177 1,234 177 1,234
Financial liabilities
Interest-bearing loans and borrowings 77,161 87,661 80,277 91,820
Deferred consideration 16,268 35,874 16,268 35,874
Oil derivative 636 1,163 636 1,163
Forward currency contracts – designated as cash flow hedge 21,212 8,173 21,212 8,173
Forward currency contracts – undesignated 618 3,035 618 3,035
Fair values of financial assets and liabilities Market values have been used to determine the fair values of available-for-sale financial assets, forward currency contracts and oil derivatives. The fair value of warrants over equity instruments in Seven Energy has been calculated using a Black Scholes option valuation model (note 14). The fair values of long-term interest-bearing loans and borrowings are equivalent to their amortised costs determined as the present value of discounted future cash flows using the effective interest rate. The Company considers that the carrying amounts of trade and other receivables, work-in-progress, trade and other payables, other current and non-current financial assets and liabilities approximate their fair values and are therefore excluded from the above table.
Fair value hierarchy The following financial instruments are measured at fair value using the hierarchy below for determination and disclosure of their respective fair values:
Tier 1: Unadjusted quoted prices in active markets for identical financial assets or liabilities Tier 2: Other valuation techniques where the inputs are based on all observation data (directly or indirectly) Tier 3: Other valuation techniques where the inputs are based on unobservable market data
Petrofac Annual report and accounts 2011148
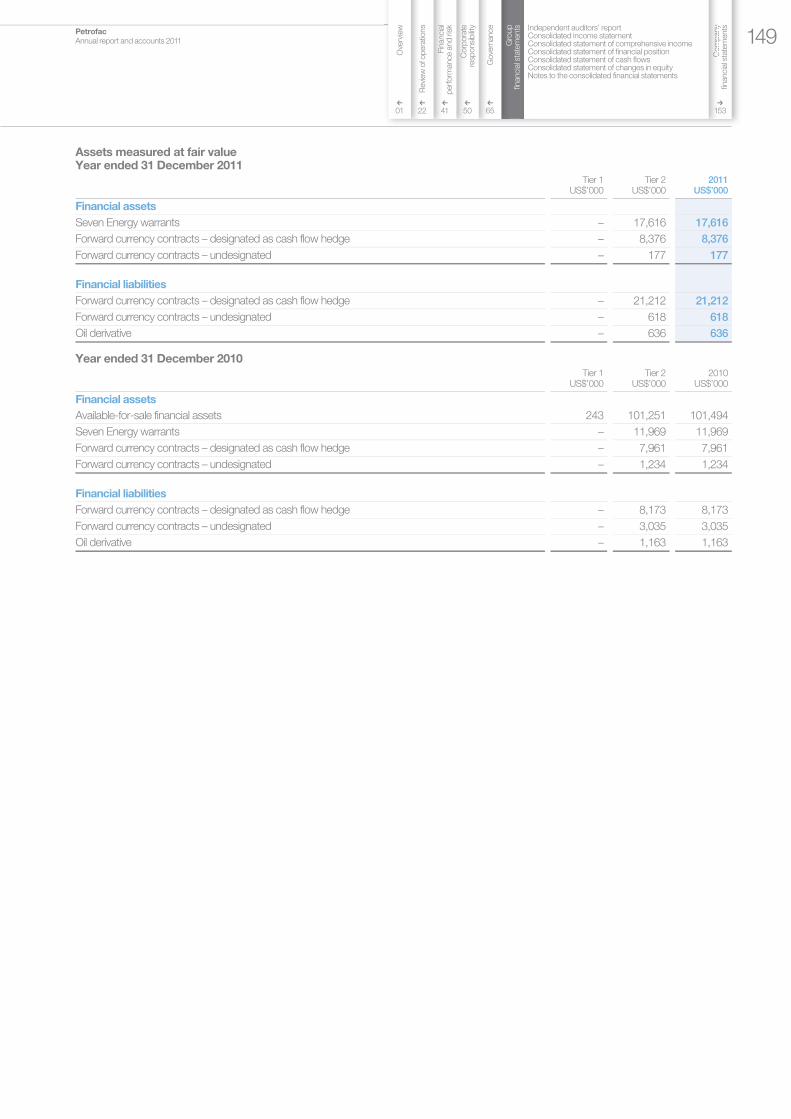
Assets measured at fair value Year ended 31 December 2011
Tier 1 US$’000
Tier 2 US$’000
2011 US$’000
Financial assets
Seven Energy warrants – 17,616 17,616
Forward currency contracts – designated as cash flow hedge – 8,376 8,376
Forward currency contracts – undesignated – 177 177
Financial liabilities
Forward currency contracts – designated as cash flow hedge – 21,212 21,212
Forward currency contracts – undesignated – 618 618
Oil derivative – 636 636
Year ended 31 December 2010 Tier 1
US$’000 Tier 2
US$’0002010
US$’000
Financial assets
Available-for-sale financial assets 243 101,251 101,494
Seven Energy warrants – 11,969 11,969
Forward currency contracts – designated as cash flow hedge – 7,961 7,961
Forward currency contracts – undesignated – 1,234 1,234
Financial liabilities
Forward currency contracts – designated as cash flow hedge – 8,173 8,173
Forward currency contracts – undesignated – 3,035 3,035
Oil derivative – 1,163 1,163
Petrofac Annual report and accounts 2011 149
Com
pany
financia
l sta
tem
ents
153
Gro
up
fin
ancia
l sta
tem
ents
Gro
Gro
pup
Gove
rnance
GG
Corp
ora
te
resp
onsi
bility
Corp
Corp
ora
tora
tee
Fin
ancia
l p
erf
orm
ance
and ris
kFin
aFin
ancia
ncia
ll
Revi
ew
of o
pera
tions
Com
Com
pany
pany
1
Independent auditors’ reportConsolidated income statementConsolidated statement of comprehensive incomeConsolidated statement of financial positionConsolidated statement of cash flowsConsolidated statement of changes in equityNotes to the consolidated financial statements
Ri
fti
Ove
rvie
w
01 22 41 50 65

Notes to the consolidated financial statements continued For the year ended 31 December 2011
35 Subsidiaries and joint ventures
At 31 December 2011, the Group had investments in the following subsidiaries and incorporated joint ventures:
Proportion of nominal value of issued shares
controlled by the Group
Name of company Country of incorporation 2011 2010
Trading subsidiaries
Petrofac Inc. USA *100 *100
Petrofac International Ltd Jersey *100 *100
Petrofac Energy Development UK Limited England *100 *100
Petrofac Energy Developments International Limited Jersey *100 *100
Petrofac UK Holdings Limited England *100 *100
Petrofac Facilities Management International Limited Jersey *100 *100
Petrofac Services Limited England *100 *100
Petrofac Training International Limited Jersey *100 *100
Petroleum Facilities E & C Limited Jersey *100 *100
Jermyn Insurance Company Limited Guernsey *100 *100
Atlantic Resourcing Limited Scotland 100 100
Petrofac Algeria EURL Algeria 100 100
Petrofac Engineering India Private Limited India 100 100
Petrofac Engineering Services India Private Limited India 100 100
Petrofac Engineering Limited England 100 100
Petrofac Offshore Management Limited Jersey 100 100
Petrofac FZE United Arab Emirates 100 100
Petrofac Facilities Management Group Limited Scotland 100 100
Petrofac Facilities Management Limited Scotland 100 100
Petrofac International Nigeria Ltd Nigeria 100 100
Petrofac Pars (PJSC) Iran 100 100
Petrofac Iran (PJSC) Iran 100 100
Plant Asset Management Limited Scotland 100 100
PFMAP Sendirian Berhad Malaysia 100 100
Petrofac (Malaysia-PM304) Limited England 100 100
Petrofac South East Asia Pte Ltd Singapore 100 –
Petrofac Netherlands Cooperatief U.A. Netherlands 100 –
Petrofac Netherlands Holding B.V. Netherlands 100 –
Petrofac Treasury B.V. Netherlands 100 –
Petrofac Kazakhstan B.V. Netherlands 100 –
PTS B.V. Netherlands 100 –
Petrofac Mexico SA de CV Mexico 100 –
Petrofac Mexico Servicios SA de CV Mexico 100 –
Petrofac Energy Developments Sdn Bhd Malaysia 100 –
Petrofac FPF003 Pte Ltd Singapore 100 –
Petrofac FPF004 Limited Jersey 100 –
Petrofac FPF005 Limited Malaysia 100 –
Petrofac GSA Limited Jersey 100 –
Petrofac Training Group Limited Scotland 100 100
Petrofac Training Holdings Limited Scotland 100 100
Petrofac Training Limited Scotland 100 100
Petrofac Training Inc. USA 100 100
Monsoon Shipmanagement Limited Jersey 100 100
Petrofac Annual report and accounts 2011150

Proportion of nominal value of issued shares
controlled by the Group
Name of company Country of incorporation 2011 2010
Trading subsidiaries continued
Petrofac E&C International Limited United Arab Emirates 100 100
Petrofac Saudi Arabia Limited Saudi Arabia 100 100
Petrofac Energy Developments (Ohanet) Jersey Limited Jersey 100 100
Petrofac Energy Developments (Ohanet) LLC USA 100 100
Petrofac (Cyprus) Limited Cyprus 100 100
PKT Technical Services Ltd Russia **50 **50
PKT Training Services Ltd Russia 100 100
Pt PCI Indonesia Indonesia 80 80
Petrofac Training Institute Pte Limited Singapore 100 100
Petrofac Training Sdn Bhd Malaysia 100 100
Sakhalin Technical Training Centre Russia 80 80
Petrofac Norge AS Norway 100 100
SPD Group Limited British Virgin Islands 100 51
SPD UK Limited Scotland 100 51
SPD LLC United Arab Emirates **49 **25
PT. Petrofac IKPT International Indonesia 51 51
Petrofac Kazakhstan Limited England 100 100
Petrofac International (UAE) LLC United Arab Emirates 100 100
Petrofac E&C Oman LLC Oman 100 100
Petrofac International South Africa (Pty) Limited South Africa 100 100
Eclipse Petroleum Technology Limited England 100 100
Caltec Limited England 100 100
i Perform Limited Scotland 100 100
Petrofac FPF1 Limited Jersey 100 100
Petrofac Platform Management Services Limited Jersey 100 100
Petrokyrgyzstan Limited Jersey 100 100
Scotvalve Services Limited Scotland 100 100
Stephen Gillespie Consultants Limited Scotland 100 100
CO2DeepStore Limited Scotland 100 100
CO2DeepStore Holdings Limited Jersey 100 100
CO2DeepStore (Aspen) Limited England 100 100
TNEI Services Limited England 100 100
Petrofac E&C Sdn Bhd Malaysia 100 100
Petrofac FPSO Holding Limited Jersey 100 100
The New Energy Industries Limited England 100 100
Petrofac Information Services Private Limited India 100 100
Petrofac Solutions & Facilities Support S.R.L Romania 100 100
Joint Ventures
Costain Petrofac Limited England 50 50
Kyrgyz Petroleum Company Kyrgyz Republic 50 50
MJVI Sendirian Berhad Brunei 50 50
Spie Capag – Petrofac International Limited Jersey 50 50
TTE Petrofac Limited Jersey 50 50
China Petroleum Petrofac Engineering Services Cooperatif U.A. Netherlands 49 –
Berantai Floating Production Limited Malaysia 51 –
Petrofac Emirates LLC United Arab Emirates 49 49
Petrofac Annual report and accounts 2011 151
Com
pany
financia
l sta
tem
ents
153
Gro
up
fin
ancia
l sta
tem
ents
Gro
Gro
pup
Gove
rnance
GG
Corp
ora
te
resp
onsi
bility
Corp
Corp
ora
tora
tee
Fin
ancia
l p
erf
orm
ance
and ris
kFin
aFin
ancia
ncia
ll
Revi
ew
of o
pera
tions
Com
Com
pany
pany
1
Independent auditors’ reportConsolidated income statementConsolidated statement of comprehensive incomeConsolidated statement of financial positionConsolidated statement of cash flowsConsolidated statement of changes in equityNotes to the consolidated financial statements
Ri
fti
Ove
rvie
w
01 22 41 50 65

Notes to the consolidated financial statements continued For the year ended 31 December 2011
35 Subsidiaries and joint ventures continued
Proportion of nominal value of issued shares
controlled by the Group
Name of company Country of incorporation 2011 2010
Dormant subsidiaries
Joint Venture International Limited Scotland 100 100
Montrose Park Hotels Limited Scotland 100 100
RGIT Ethos Health & Safety Limited Scotland 100 100
Scota Limited Scotland 100 100
Monsoon Shipmanagement Limited Cyprus 100 100
Rubicon Response Limited Scotland 100 100
Petrofac Services Inc USA *100 *100
Petrofac Training (Trinidad) Limited Trinidad 100 100
Petrofac ESOP Trustees Limited Jersey *100 *100
* Directly held by Petrofac Limited
**Companies consolidated as subsidiaries on the basis of control.
The Company’s interest in joint venture operations are disclosed on page 133.
Petrofac Annual report and accounts 2011152
Company financial statements
154 Independent auditors’ report (Petrofac Limited)
155 Company income statement
155 Company statement of comprehensive income
156 Company statement of financial position
157 Company statement of cash flows
158 Company statement of changes in equity
159 Notes to the Company financial statements
169 Shareholder information
170 Glossary
Section 7
Petrofac Annual report and accounts 2011 153
Com
pany
financia
l sta
tem
ents
Com
Com
pany
pany
Gro
up
fin
ancia
l sta
tem
ents
Gro
Gro
up
up
Gove
rnance
GG
Corp
ora
te
resp
onsi
bility
Corp
Corp
ora
tora
tee
Fin
ancia
l p
erf
orm
ance
and ris
kFin
aFin
ancia
ncia
ll
Revi
ew
of o
pera
tions Independent auditors’ report (Petrofac Limited)
Company income statementCompany statement of comprehensive incomeCompany statement of financial positionCompany statement of cash flowsCompany statement of changes in equityNotes to the Company financial statements
Shareholder informationGlossary
Ri
fti
Ove
rvie
w
01 22 41 50 65 107

Independent auditors’ report To the members of Petrofac Limited
We have audited the parent company financial statements of Petrofac Limited (the ‘Company’) for the year ended 31 December 2011 which comprise the Company income statement, the Company statement of comprehensive income, the company statement of financial position, the Company statement of cash flows, the Company statement of changes in equity and the related notes 1 to 18. The financial reporting framework that has been applied in their preparation is applicable Jersey law and International Financial Reporting Standards.
This report is made solely to the Company’s members, as a body, in accordance with Article 113A of the Companies (Jersey) Law 1991 and our engagement letter dated 15 February 2011. Our audit work has been undertaken so that we might state to the Company’s members those matters we are required to state to them in an auditor’s report and for no other purpose. To the fullest extent permitted by law, we do not accept or assume responsibility to anyone other than the Company and the Company’s members as a body, for our audit work, for this report, or for the opinions we have formed.
Respective responsibilities of Directors and auditors As explained more fully in the Directors’ Responsibilities Statement set out on page 106, the Directors are responsible for the preparation of the parent company financial statements and for being satisfied that they give a true and fair view. Our responsibility is to audit and express an opinion on the parent company financial statements in accordance with applicable law and International Standards on Auditing (UK and Ireland). Those standards require us to comply with the Auditing Practices Board’s Ethical Standards for Auditors.
In addition the Company has also instructed us to: • report to you our opinion on whether the section of the Directors’
remuneration report that is described as audited has been properly prepared in accordance with the basis of preparation described therein
• review certain elements of the report to shareholders by the Board on directors’ remuneration, which for a premium listed UK incorporated company is specified for review by the Listing Rules of the Financial Services Authority
Scope of the audit of the financial statements An audit involves obtaining evidence about the amounts and disclosures in the financial statements sufficient to give reasonable assurance that the financial statements are free from material misstatement, whether caused by fraud or error. This includes an assessment of: whether the accounting policies are appropriate to the parent company’s circumstances and have been consistently applied and adequately disclosed; the reasonableness of significant accounting estimates made by the Directors; and the overall presentation of the financial statements. In addition, we read all the financial and non-financial information in the annual report to identify material inconsistencies with the audited financial statements. If we become aware of any apparent material misstatements or inconsistencies we consider the implications for our report.
Opinion on financial statements In our opinion the parent company financial statements: • give a true and fair view of the state of the Company’s affairs as at
31 December 2011 and of its profit for the year then ended • have been properly prepared in accordance with International
Financial Reporting Standards • have been prepared in accordance with the requirements of the
Companies (Jersey) Law 1991
Opinion on other matter In our opinion the part of the Directors’ Remuneration Report to be audited, which you have instructed us to audit, has been properly prepared in accordance with the basis of preparation as described therein.
Matters on which we are required to report by exception We have nothing to report in respect of the following matters:
• where the Companies (Jersey) Law 1991 requires us to report to you if, in our opinion: – proper accounting records have not been kept, or proper
returns adequate for our audit have not been received from branches not visited by us
– the financial statements are not in agreement with the accounting records and returns
– we have not received all the information and explanations we require for our audit
• where the Company instructed us to review certain elements of the report to shareholders by the Board on director’s remuneration
Other matter We have reported separately on the group financial statements of Petrofac Limited for the year ended 31 December 2011.
Justine Belton for and on behalf of Ernst & Young LLP London
2 March 2012
1 The maintenance and integrity of the Petrofac Limited website is the responsibility of the Directors; the work carried out by the auditors does not involve consideration of these matters and, accordingly, the auditors accept no responsibility for any changes that may have occurred to the financial statements since they were initially presented on the website.
2 Legislation in Jersey governing the preparation and dissemination of financial statements may differ from legislation in other jurisdictions.
Petrofac Annual report and accounts 2011154

Company income statement For the year ended 31 December 2011
Notes 2011
US$’0002010
US$’000
Revenue 3 281,319 342,997
General and administration expenses 4 (14,706) (15,903)
Other income 5 6,063 177,890
Other expenses (935) (1,822)
Profit before tax and finance income/(costs) 271,741 503,162
Finance costs 6 (2,428) (1,800)
Finance income 6 1,791 2,678
Profit before tax 271,104 504,040
Income tax expense – –
Profit for the year 271,104 504,040
Company statement of comprehensive income For the year ended 31 December 2011
2011
US$’0002010
US$’000
Profit for the year 271,104 504,040
Other comprehensive income (loss) – –
Total comprehensive income for the year 271,104 504,040
The attached notes 1 to 18 form part of these Company financial statements.
Petrofac Annual report and accounts 2011 155
Com
pany
financia
l sta
tem
ents
Com
Com
pany
pany
Gro
up
fin
ancia
l sta
tem
ents
Gro
Gro
up
up
Gove
rnance
GG
Corp
ora
te
resp
onsi
bility
Corp
Corp
ora
tora
tee
Fin
ancia
l p
erf
orm
ance
and ris
kFin
aFin
ancia
ncia
ll
Revi
ew
of o
pera
tions Independent auditors’ report (Petrofac Limited)
Company income statementCompany statement of comprehensive incomeCompany statement of financial positionCompany statement of cash flowsCompany statement of changes in equityNotes to the Company financial statements
Shareholder informationGlossary
Ri
fti
Ove
rvie
w
01 22 41 50 65 107

Company statement of financial position At 31 December 2011
Notes 2011
US$’000 2010
US$’000
Assets
Non-current assets Property, plant and equipment 72 33
Investments in subsidiaries 8 236,274 233,231
Investment in associate 10 151,533 –
Available-for-sale investment 9 – 101,251
387,879 334,515
Current assets Trade and other receivables 320 300
Amounts due from subsidiaries 11 190,951 42,508
Warrants on investment in associate 10 17,616 11,969
Cash and short-term deposits 12 431,656 88,257
640,543 143,034
Total assets 1,028,422 477,549
Equity and liabilities
Equity attributable to Petrofac Limited shareholders Share capital 18 6,916 6,914
Share premium 2,211 992
Capital redemption reserve 10,881 10,881
Treasury shares 13 (75,686) (65,317)
Share-based payments reserve 52,408 45,154
Retained earnings 123,399 18,214
Total equity 120,129 16,838
Non-current liabilities
Interest-bearing loans and borrowings 15 11,342 26,887
Long-term employee benefit provisions 348 251
11,690 27,138
Current liabilities
Trade and other payables 7,937 18,804
Amounts due to subsidiaries 11 873,178 403,126
Interest-bearing loans and borrowings 15 15,488 11,643
896,603 433,573
Total liabilities 908,293 460,711
Total equity and liabilities 1,028,422 477,549
The financial statements on pages 155 to 168 were approved by the Board of Directors on 2 March 2012 and signed on its behalf by Tim Weller – Chief Financial Officer.
The attached notes 1 to 18 form part of these Company financial statements.
Petrofac Annual report and accounts 2011156

Company statement of cash flows For the year ended 31 December 2011
Notes 2011
US$’0002010
US$’000
Operating activities
Profit before tax 271,104 504,040
Gain on EnQuest demerger 5 – (177,890)
271,104 326,150
Adjustments for: Depreciation 4 30 20
Share-based payments 14 1,189 671
Difference between other long-term employment benefits paid and amounts recognised in the income statement 97 75
Net finance cost 6 637 (878)
Other non-cash items, net (1,011) 1,526
Operating profit before working capital changes 272,046 327,564
Trade and other receivables (20) (111)
Amounts due from subsidiaries (124,201) (15,199)
Trade and other payables (16,514) 6,024
Amounts due to subsidiaries 470,052 (44,922)
Cash generated from operations 601,363 273,356
Interest paid (2,428) (1,800)
Net cash flows generated from operating activities 598,935 271,556
Investing activities
Purchase of investment in associates financial assets 10 (50,282) (101,251)
Purchase of property, plant and equipment (69) (26)
Repayment of investment by subsidiaries 8 13,863 44,886
Interest received 1,791 5,270
Net cash flows used in investing activities (34,697) (51,121)
Financing activities
Repayment of interest-bearing loans and borrowings (12,499) (26,773)
Treasury shares purchased 13 (49,062) (36,486)
Equity dividends paid (159,087) (132,244)
Net cash flows used in financing activities (220,648) (195,503)
Net increase in cash and cash equivalents 343,590 24,932
Net foreign exchange difference on cash and cash equivalents (191) (1,062)
Cash and cash equivalents at 1 January 88,257 64,387
Cash and cash equivalents at 31 December 12 431,656 88,257
The attached notes 1 to 18 form part of these Company financial statements.
Petrofac Annual report and accounts 2011 157
Com
pany
financia
l sta
tem
ents
Com
Com
pany
pany
Gro
up
fin
ancia
l sta
tem
ents
Gro
Gro
up
up
Gove
rnance
GG
Corp
ora
te
resp
onsi
bility
Corp
Corp
ora
tora
tee
Fin
ancia
l p
erf
orm
ance
and ris
kFin
aFin
ancia
ncia
ll
Revi
ew
of o
pera
tions Independent auditors’ report (Petrofac Limited)
Company income statementCompany statement of comprehensive incomeCompany statement of financial positionCompany statement of cash flowsCompany statement of changes in equityNotes to the Company financial statements
Shareholder informationGlossary
Ri
fti
Ove
rvie
w
01 22 41 50 65 107

Company statement of changes in equity For the year ended 31 December 2011
Issued share
capital US$’000 (note 18)
Share premium US$’000
Capital redemption
reserve US$’000
*Treasury shares
US$’000 (note 13)
Reserve for share-based
payments US$’000 (note 14)
Retained earnings US$’000
Total equity
US$’000
Balance at 1 January 2010 8,638 69,712 10,881 (56,285) 43,790 119,103 195,839
Net profit for the year – – – – – 504,040 504,040
Other comprehensive income – – – – – – –
Total comprehensive income – – – – – 504,040 504,040
Share-based payments charge (note 14) – – – – 671 – 671
Shares vested during the year – – – 27,454 (26,170) (1,284) –
Treasury shares purchased (note 13) – – – (36,486) – – (36,486)
Transfer to reserve for share-based payments (note 14) – – – – 26,863 – 26,863
Shares issued as payment of deferred consideration 4 2,452 – – – – 2,456
EnQuest demerger share split and redemption (1,728) – – – – 1,728 –
Distribution on EnQuest demerger – (71,172) – – – (473,325) (544,497)
Dividends (note 7) – – – – – (132,048) (132,048)
Balance at 1 January 2011 6,914 992 10,881 (65,317) 45,154 18,214 16,838
Net profit for the year – – – – – 271,104 271,104
Other comprehensive income – – – – – – –
Total comprehensive income – – – – – 271,104 271,104
Share-based payments charge (note 14) – – – – 1,189 – 1,189
Shares vested during the year – – – 38,693 (33,776) (4,917) –
Treasury shares purchased (note 13) – – – (49,062) – – (49,062)
Transfer to reserve for share-based payments (note 14) – – – – 39,841 – 39,841
Shares issued as payment of deferred consideration 2 1,219 – – – – 1,221
Dividends (note 7) – – – – – (161,002) (161,002)
Balance at 31 December 2011 6,916 2,211 10,881 (75,686) 52,408 123,399 120,129
*Shares held by Petrofac Employee Benefit Trust and Petrofac Joint Venture Companies Employee Benefit Trust
The attached notes 1 to 18 form part of these Company financial statements.
Petrofac Annual report and accounts 2011158
Notes to the Company financial statements For the year ended 31 December 2011
1 Corporate information
The financial statements of Petrofac Limited (‘the Company’) referred to as the Company financial statements for the year ended 31 December 2011 were authorised for issue in accordance with a resolution of the Directors on 2 March 2012.
Petrofac Limited is a limited liability company registered in Jersey under the Companies (Jersey) Law 1991 and is the holding company for the international Group of Petrofac subsidiaries (together ‘the Group’). The Group’s principal activity is the provision of facilities solutions to the oil & gas production and processing industry.
2 Summary of significant accounting policies
Basis of preparation The separate financial statements have been prepared on a historical cost basis, except for derivative financial instruments and available-for-sale financial assets that have been measured at fair value. The functional and presentation currency of the separate financial statements is US dollars and all values in the separate financial statements are rounded to the nearest thousand (US$’000) except where otherwise stated.
Statement of compliance The separate financial statements have been prepared in accordance with International Financial Reporting Standards (IFRS) and applicable requirements of Jersey law.
Investments in subsidiaries Investments in subsidiaries are stated at cost less any provision for impairment.
Investments in associates Investments in associates are stated at cost less any provision for impairment.
Long-term loan receivables from subsidiaries Long-term loan receivables from subsidiaries are initially stated at fair value. After initial recognition, they are subsequently measured at amortised cost using the effective interest rate method.
Due from/due to subsidiaries Due from/due to subsidiaries are both interest bearing and non-interest-bearing short-term funding to and from subsidiaries. These are recognised at the fair value of consideration received/paid, less any provision for impairment.
Cash and cash equivalents Cash and cash equivalents consist of cash at bank and in hand and short-term deposits with an original maturity of three months or less. For the purpose of the cash flow statement, cash and cash equivalents consists of cash and cash equivalents as defined above, net of any outstanding bank overdrafts.
Interest-bearing loans and borrowings All interest-bearing loans and borrowings are initially recognised at the fair value of the consideration received net of issue costs directly attributable to the borrowing.
After initial recognition, interest-bearing loans and borrowings are subsequently measured at amortised cost using the effective interest rate method. Amortised cost is calculated by taking into account any issue costs, and any discount or premium on settlement.
Employee Benefit Trusts The Petrofac Employee Benefit Trust and the Petrofac Joint Venture Companies Employee Benefit Trust (EBT’s) are treated as extensions of the activities of the Company and accordingly the Company financial statements include all transactions and balances of the EBT’s except for transaction and balances between the Company and the EBT’s.
Share-based payment transactions Employees (including Directors) of the Group receive remuneration in the form of share-based payment transactions, whereby employees render services in exchange for shares or rights over shares (‘equity-settled transactions’).
Equity-settled transactions The cost of equity-settled transactions with employees is measured by reference to the fair value at the date on which they are granted. In valuing equity-settled transactions, no account is taken of any service or performance conditions, other than conditions linked to the price of the shares of Petrofac Limited (‘market conditions’), if applicable.
The cost of equity-settled transactions is recognised, together with a corresponding increase in equity, over the period in which the relevant employees become fully entitled to the award (the ‘vesting period’). The cumulative expense recognised for equity-settled transactions at each reporting date until the vesting date reflects the extent to which the vesting period has expired and the Group’s best estimate of the number of equity instruments that will ultimately vest. The income statement charge or credit for a period represents the movement in cumulative expense recognised as at the beginning and end of that period.
No expense is recognised for awards that do not ultimately vest, except for awards where vesting is conditional upon a market or non-vesting condition, which are treated as vesting irrespective of whether or not the market or non-vesting condition is satisfied, provided that all other performance conditions are satisfied. Equity awards cancelled are treated as vesting immediately on the date of cancellation, and any expense not recognised for the award at that date is recognised in the income statement.
The Company operates a number of share award schemes on behalf of the employees of the Group which are described in detail in note 25 of the consolidated financial statements of the Group.
The reserve for share-based payments is used to record the value of equity-settled share-based payments awarded to employees and transfers out of this reserve are made upon vesting of the original share awards. The share-based payments charges pertaining to fellow Group companies are recharged to them and shown as investment in subsidiaries. Subsequently they are transferred to due from subsidiaries and settled in cash.
Available-for-sale financial assets Investments classified as available-for-sale are initially stated at fair value, including acquisition charges associated with the investment.
After initial recognition, available-for-sale financial assets are measured at their fair value using quoted market rates or in the absence of market data other fair value calculation methodologies. Gains and losses are recognised as a separate component of equity until the investment is sold or impaired, at which time the cumulative gain or loss previously reported in equity is included in the income statement.
Petrofac Annual report and accounts 2011 159
Com
pany
financia
l sta
tem
ents
Com
Com
pany
pany
Gro
up
fin
ancia
l sta
tem
ents
Gro
Gro
up
up
Gove
rnance
GG
Corp
ora
te
resp
onsi
bility
Corp
Corp
ora
tora
tee
Fin
ancia
l p
erf
orm
ance
and ris
kFin
aFin
ancia
ncia
ll
Revi
ew
of o
pera
tions Independent auditors’ report (Petrofac Limited)
Company income statementCompany statement of comprehensive incomeCompany statement of financial positionCompany statement of cash flowsCompany statement of changes in equityNotes to the Company financial statements
Shareholder informationGlossary
Ri
fti
Ove
rvie
w
01 22 41 50 65 107

Notes to the Company financial statements continued For the year ended 31 December 2011
3 Revenues
Dividends from subsidiaries are recognised when the right to receive payment is established.
Seven Energy warrant revenues relate to the achievement of 80% of the project execution milestone required to earn the option to subscribe for 148,571 warrants in Seven Energy (note 10)
2011
US$’000 2010
US$’000
Dividend income from subsidiaries 271,743 342,997
Seven Energy warrant revenues (note 10) 9,576 –
281,319 342,997
4 General and administration expenses
2011
US$’000 2010
US$’000
Staff costs 10,027 10,750
Depreciation 30 20
Other operating expenses 4,649 5,133
14,706 15,903
Included in other operating expenses above are auditors’ remuneration of US$74,750 (2010: US$65,000) related to the fee for the audit of the parent company financial statements. It excludes fees in relation to the audit of the Group financial statements, which are borne by Petrofac Services Limited.
5 Other income
2011
US$’000 2010
US$’000
Increase in Seven Energy warrant valuation (note 10) 5,647 –
Others 416 –
Gain on demerger – 177,890
6,063 177,890
6 Finance costs/(income)
2011
US$’000 2010
US$’000
Interest payable:
Long-term borrowings (1,177) (1,205)
On amounts due to subsidiaries (1,251) (595)
Total finance cost (2,428) (1,800)
Interest receivable:
Bank interest receivable 555 44
On amounts due from subsidiaries 1,236 2,634
Total finance income 1,791 2,678
Petrofac Annual report and accounts 2011160

7 Dividends paid and proposed
2011
US$’000 2010
US$’000
Declared and paid during the year
Equity dividends on ordinary shares: Final dividend for 2009: 25.10 cents per share – 85,291
Interim dividend 2010: 13.80 cents per share – 46,757
Final dividend for 2010: 30.00 cents per share 101,788 –
Interim dividend 2011: 17.40 cents per share 59,214 –
161,002 132,048
2011
US$’0002010
US$’000
Proposed for approval at AGM (not recognised as a liability as at 31 December)
Equity dividends on ordinary shares
Final dividend for 2011: 37.20 cents per share (2010: 30.00 cents per share) 128,670 103,715
8 Investments in subsidiaries
2011
US$’0002010
US$’000
At 1 January 233,231 265,599
Investment in Petrofac UK Holdings Limited 3,035 22,331
Investment repaid by PEDL – (50,000)
Capitalisation of amount due from PEDL – 373,774
Derecognition of PEDL investment and amounts due on EnQuest demerger – (373,774)
Investment in Petrofac South East Asia Limited 8 –
Investment in Jermyn Insurance Company Limited – 3,001
Receipt from Petrofac Facilities Management Limited – (7,700)
Invested bonus in Deferred Bonus Share Plan (DBSP) charged to subsidiaries 16,906 12,518
Receipt of invested bonus in DBSP from subsidiaries (16,906) (12,518)
Share based payment amounts receivable from subsidiaries 23,021 14,113
Transferred to due from subsidiaries (23,021) (14,113)
As at 31 December 236,274 233,231
At 31 December 2011, the Company had investments in the following subsidiaries:
Proportion of nominal value of issued shares controlled by the Company
Name of company Country of incorporation 2011 2010
Trading subsidiaries
Petrofac Inc. USA 100 100
Petrofac International Ltd Jersey 100 100
Petrofac Energy Developments International Limited Jersey 100 100
Petrofac UK Holdings Limited England 100 100
Petrofac Facilities Management International Limited Jersey 100 100
Petrofac Services Limited England 100 100
Petrofac Services Inc. USA 100 100
Petrofac Training International Limited Jersey 100 100
Petroleum Facilities E & C Limited Jersey 100 100
Petrofac Energy Developments UK Limited England 100 100
Jermyn Insurance Company Limited Guernsey 100 100
Petrofac South East Asia Limited Singapore 99 –
Petrofac Annual report and accounts 2011 161
Com
pany
financia
l sta
tem
ents
Com
Com
pany
pany
Gro
up
fin
ancia
l sta
tem
ents
Gro
Gro
up
up
Gove
rnance
GG
Corp
ora
te
resp
onsi
bility
Corp
Corp
ora
tora
tee
Fin
ancia
l p
erf
orm
ance
and ris
kFin
aFin
ancia
ncia
ll
Revi
ew
of o
pera
tions Independent auditors’ report (Petrofac Limited)
Company income statementCompany statement of comprehensive incomeCompany statement of financial positionCompany statement of cash flowsCompany statement of changes in equityNotes to the Company financial statements
Shareholder informationGlossary
Ri
fti
Ove
rvie
w
01 22 41 50 65 107

Notes to the Company financial statements continued For the year ended 31 December 2011
9 Available-for-sale financial assets
2011
US$’000 2010
US$’000
At 1 January 101,251 –
Share capital – 100,000
Transaction costs – 1,251
Transfer to Investment in associates (101,251) –
At 31 December – 101,251
Investment in Seven Energy International Limited was transferred to investment in associate (see note 10), pursuant to an additional investment made during the year, which made the group’s holding in share capital of Seven Energy 20% (2010:15%).
10 Investment in associate
2011
US$’000 2010
US$’000
At 1 January – –
Transfer from available-for-sale financial assets (note 9) 101,251 –
Investment in share capital 50,000 –
Transaction costs 282 –
At 31 December 151,533 –
On 25 November 2010, the Company invested US$100,000,000 for 15% (12.6% on a fully diluted basis) of the share capital of Seven Energy International Limited (Seven Energy), a leading Nigerian gas development and production company incurring US$1,251,000 of transaction costs. This investment which was previously held under available-for-sale financial assets was transferred to investment in associates, pursuant to an investment on 10 June 2011 of US$50,000,000 for an additional 5% of the share capital of Seven Energy which resulted in the Group being in a position to exercise significant influence over Seven Energy. The Company also has the option to subscribe for 148,571 of additional warrants in Seven Energy at a cost of a further US$52,000,000, subject to the performance of certain service provision conditions and milestones in relation to project execution. These warrants have been fair valued at 31 December 2011 as derivative financial instruments under IAS 39, using Black Scholes Model, amounting to US$17,616,000 (2010: US$11,969,000). US$5,647,000 has been recognised as other income in the current period income statement as a result of the revaluation of these derivatives at 31 December 2011 (note 5). At 31 December 2011, there was a corresponding entry for the fair value in trade and other payables representing the deferred revenue relating to the performance conditions. This deferred revenue is released as revenue in the income statement in line with the percentage of performance conditions satisfied at each reporting date. At 31 December 2011, 80% of the performance conditions have been completed (2010: nil) resulting in current year revenue recognised of US$9,576,000.
11 Amounts due from/due to subsidiaries
Amounts due from/due to subsidiaries comprise both interest and non-interest bearing short-term loans provided to/received from subsidiaries listed in note 8.
12 Cash and short-term deposits
2011
US$’000 2010
US$’000
Cash at bank and in hand 24,579 19,687
Short-term deposits 407,077 68,570
Total cash and bank balances (cash and cash equivalents) 431,656 88,257
Short-term deposits are made for varying periods of between one day and one month depending on the immediate cash requirements of the Group, and earn interest at respective short-term deposit rates. The fair value of cash and bank balances is US$431,656,000 (2010: US$88,257,000).
Petrofac Annual report and accounts 2011162
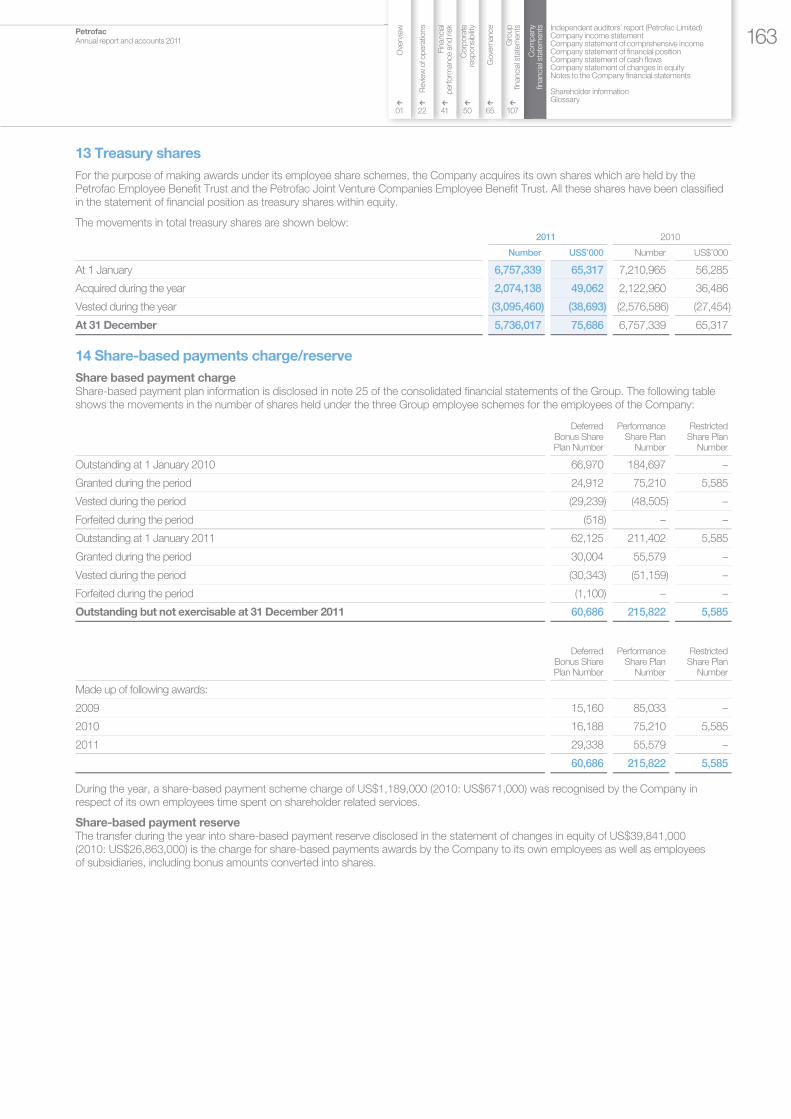
13 Treasury shares
For the purpose of making awards under its employee share schemes, the Company acquires its own shares which are held by the Petrofac Employee Benefit Trust and the Petrofac Joint Venture Companies Employee Benefit Trust. All these shares have been classified in the statement of financial position as treasury shares within equity.
The movements in total treasury shares are shown below:
2011 2010
Number US$’000 Number US$’000
At 1 January 6,757,339 65,317 7,210,965 56,285
Acquired during the year 2,074,138 49,062 2,122,960 36,486
Vested during the year (3,095,460) (38,693) (2,576,586) (27,454)
At 31 December 5,736,017 75,686 6,757,339 65,317
14 Share-based payments charge/reserve
Share based payment charge Share-based payment plan information is disclosed in note 25 of the consolidated financial statements of the Group. The following table shows the movements in the number of shares held under the three Group employee schemes for the employees of the Company:
Deferred Bonus Share Plan Number
Performance Share Plan
Number
Restricted Share Plan
Number
Outstanding at 1 January 2010 66,970 184,697 –
Granted during the period 24,912 75,210 5,585
Vested during the period (29,239) (48,505) –
Forfeited during the period (518) – –
Outstanding at 1 January 2011 62,125 211,402 5,585
Granted during the period 30,004 55,579 –
Vested during the period (30,343) (51,159) –
Forfeited during the period (1,100) – –
Outstanding but not exercisable at 31 December 2011 60,686 215,822 5,585
Deferred Bonus Share Plan Number
Performance Share Plan
Number
Restricted Share Plan
Number
Made up of following awards:
2009 15,160 85,033 –
2010 16,188 75,210 5,585
2011 29,338 55,579 –
60,686 215,822 5,585
During the year, a share-based payment scheme charge of US$1,189,000 (2010: US$671,000) was recognised by the Company in respect of its own employees time spent on shareholder related services.
Share-based payment reserve The transfer during the year into share-based payment reserve disclosed in the statement of changes in equity of US$39,841,000 (2010: US$26,863,000) is the charge for share-based payments awards by the Company to its own employees as well as employees of subsidiaries, including bonus amounts converted into shares.
Petrofac Annual report and accounts 2011 163
Com
pany
financia
l sta
tem
ents
Com
Com
pany
pany
Gro
up
fin
ancia
l sta
tem
ents
Gro
Gro
up
up
Gove
rnance
GG
Corp
ora
te
resp
onsi
bility
Corp
Corp
ora
tora
tee
Fin
ancia
l p
erf
orm
ance
and ris
kFin
aFin
ancia
ncia
ll
Revi
ew
of o
pera
tions Independent auditors’ report (Petrofac Limited)
Company income statementCompany statement of comprehensive incomeCompany statement of financial positionCompany statement of cash flowsCompany statement of changes in equityNotes to the Company financial statements
Shareholder informationGlossary
Ri
fti
Ove
rvie
w
01 22 41 50 65 107

Notes to the Company financial statements continued For the year ended 31 December 2011
15 Interest-bearing loans and borrowings
The Company had the following interest-bearing loans and borrowings outstanding:
31 December 2011
Actual interest rate % 31 December 2010
Actual interest rate % Effective interest rate % Maturity 2011
US$’000 2010
US$’000
Current
Current portion of term loan
(i) US LIBOR + 0.875%
US LIBOR + 0.875%
3.16% (2010: 3.26%)
8,828 7,357
Current portion of term loan (ii) US/UK LIBOR + 0.875%
US/UK LIBOR + 0.875%
1.67% to 3.55% (2010: 2.01%
to 3.91%)
6,660 4,286
15,488 11,643
Non-current
Term loan (ii) US/UK LIBOR + 0.875%
US/UK LIBOR + 0.875%
1.67% to 3.55% (2010: 2.01%
to 3.91%)
2012–2013 7,133 13,809
Term loan (i) US LIBOR + 0.875%
US LIBOR + 0.875%
3.16% (2010: 3.26%)
2012–2013 6,029 15,700
13,162 29,509
Less:
Debt acquisition costs net of accumulated amortisation and effective interest rate adjustments (1,820) (2,622)
11,342 26,887
Details of the Company’s interest-bearing loans and borrowings are as follows:
(i) Term loan This term loan at 31 December 2011 comprised drawings of US$14,857,000 (2010: US$23,057,000) denominated in US$ which is repayable over a period of three years ending 30 September 2013.
(ii) Term loan This term loan at 31 December 2011 comprised drawings of US$10,075,000 (2010: US$13,203,000) denominated in US$ and US$3,718,000 (2010: US$4,892,000) denominated in sterling. Both elements of the loan are repayable over a period of three years ending 30 September 2013.
Petrofac Annual report and accounts 2011164

16 Risk management and financial instruments
Risk management objectives and policies The Company’s principal financial assets and liabilities, are amounts due from and due to subsidiaries, cash and short-term deposits and interest-bearing loans and borrowings.
The Company’s activities expose it to various financial risks particularly associated with interest rate risks on its external variable rate loans and borrowings which are addressed by using derivative instruments to hedge this exposure. The Company has a policy not to enter into speculative trading of financial derivatives.
The other main risks besides interest rate are foreign currency risk, credit risk and liquidity risk and the policies relating to these risks are discussed in detail below:
Interest rate risk Interest rate risk arises from the possibility that changes in interest rates will affect the value of the Company’s interest-bearing financial liabilities and assets. The Company does not hedge its exposure on its interest-bearing funding to/from subsidiaries.
Interest rate sensitivity analysis The impact on the Company’s pre-tax profit and equity due to a reasonably possible change in interest rates is demonstrated in the table below. The analysis assumes that all other variables remain constant.
Pre-tax profit Equity
100 basis point increase
US$’000
100 basis point
decrease US$’000
100 basis point increase
US$’000
100 basis point
decrease US$’000
31 December 2011 (274) 274 – –
31 December 2010 (401) 401 – –
The following table reflects the maturity profile of interest bearing financial liabilities and assets, excluding interest bearing subsidiary related financial assets and liabilities:
Year ended 31 December 2011
Within 1 year
US$’000
1–2 years
US$’000
2–3 years
US$’000
3–4 years
US$’000
4–5 years
US$’000
More than 5 years
US$’000Total
US$’000
Financial liabilities
Floating rates Term loan (note 15) 15,488 13,162 – – – – 28,650
Amount due to subsidiaries (interest-bearing) 873,178 – – – – – 873,178
888,666 13,162 – – – – 901,828
Financial assets
Floating rates Cash and short-term deposits (note 12) 431,656 – – – – – 431,656
Amount due from subsidiaries (interest-bearing) 170,448 – – – – – 170,448
602,104 – – – – – 602,104
Petrofac Annual report and accounts 2011 165
Com
pany
financia
l sta
tem
ents
Com
Com
pany
pany
Gro
up
fin
ancia
l sta
tem
ents
Gro
Gro
up
up
Gove
rnance
GG
Corp
ora
te
resp
onsi
bility
Corp
Corp
ora
tora
tee
Fin
ancia
l p
erf
orm
ance
and ris
kFin
aFin
ancia
ncia
ll
Revi
ew
of o
pera
tions Independent auditors’ report (Petrofac Limited)
Company income statementCompany statement of comprehensive incomeCompany statement of financial positionCompany statement of cash flowsCompany statement of changes in equityNotes to the Company financial statements
Shareholder informationGlossary
Ri
fti
Ove
rvie
w
01 22 41 50 65 107

Notes to the Company financial statements continued For the year ended 31 December 2011
16 Risk management and financial instruments continued
Year ended 31 December 2010
Within 1 year
US$’000
1–2 years
US$’000
2–3 years
US$’000
3–4 years
US$’000
4–5 years
US$’000
More than 5 years
US$’000 Total
US$’000
Financial liabilities
Floating rates Term loan (note 15) 11,643 15,497 14,012 – – – 41,152
Amount due to subsidiaries (interest-bearing) 403,126 – – – – – 403,126
414,769 15,497 14,012 – – – 444,278
Financial assets
Floating rates Cash and short-term deposits (note 12) 88,257 – – – – – 88,257
Amount due from subsidiaries (interest-bearing) 42,508 – – – – – 42,508
130,765 – – – – – 130,765
Financial liabilities in the above table are disclosed gross of debt acquisition costs and effective interest rate adjustments of US$1,820,000 (2010: US$2,622,000).
Interest on financial instruments classified as floating rate is repriced at intervals of less than one year.
Derivative instruments designated as cash flow hedges There were no outstanding interest rate derivatives designated as cash flow hedges at 31 December 2011 and 31 December 2010.
Foreign currency risk Almost all of the financial assets and liabilities of the Company are denominated in US dollars. The foreign currency exposure is limited to sterling 2,391,927 equivalent US$3,717,773 (2010: sterling 3,134,000 equivalent US$4,892,000) of its interest-bearing loans and borrowings.
The following table summarises the impact on the Company’s pre-tax profit and equity (due to change in the fair value of monetary assets, liabilities and derivative instruments) of a reasonably possible change in US dollar exchange rates with respect to different currencies:
Pre-tax profit Equity
+10% US dollar rate increase
US$’000
–10% US dollar rate decrease
US$’000
+10% US dollar rate increase
US$’000
–10% US dollar rate decrease
US$’000
31 December 2011 (1,578) 1,578 – –
31 December 2010 (1,482) 1,482 – –
Credit risk The Company’s principal financial assets are cash and short-term deposits and amounts due from subsidiaries.
The Company manages its credit risk in relation to cash and short-term deposits by only depositing cash with financial institutions that have high credit ratings provided by international credit rating agencies.
Liquidity risk The Company’s objective is to maintain a balance between continuity of funding and flexibility through the use of term loans and revolving credit facilities to reduce its exposure to liquidity risk.
Petrofac Annual report and accounts 2011166

The maturity profiles of the Company’s financial liabilities at 31 December 2011 are as follows:
Year ended 31 December 2011
6 months or less
US$’000
6–12 months
US$’000
1–2 years
US$’000
2–5 years
US$’000
More than 5 years
US$’000
Contractual undiscounted
cash flows US$’000
Carrying amount
US$’000
Financial liabilities
Interest-bearing loans and borrowings 7,268 8,220 13,162 – – 28,650 26,830
Trade and other payables 7,937 – – – – 7,937 7,937
Amounts due to subsidiaries – 873,178 – – – 873,178 873,178
Interest payments 219 167 103 – – 489 –
15,424 881,565 13,265 – – 910,254 907,945
Year ended 31 December 2010
6 months or less
US$’000
6–12 months
US$’000
1–2 years
US$’000
2–5 years
US$’000
More than 5 years
US$’000
Contractual undiscounted
cash flows US$’000
Carrying amount
US$’000
Financial liabilities
Interest-bearing loans and borrowings 5,583 6,060 15,497 14,012 – 41,152 38,530
Trade and other payables 18,804 – – – – 18,804 18,804
Amounts due to subsidiaries – 403,126 – – – 403,126 403,126
Interest payments 250 234 391 134 – 1,009 –
24,637 409,420 15,888 14,146 – 464,091 460,460
The Company uses various funded facilities provided by banks and its own financial assets to fund the above mentioned financial liabilities.
Capital management The Company’s policy is to maintain a healthy capital base using a combination of external and internal financing to support its activities as the holding company for the Group.
The Company’s gearing ratio is as follows:
2011
US$’0002010
US$’000
Cash and short-term deposits (note 12) 431,656 88,257
Interest-bearing loans and borrowings (A) (note 15) (26,830) (38,530)
Net cash 404,826 49,727
Total equity (C) 120,129 16,838
Gross gearing ratio (A/C)* 22.3% 228.8%
Net gearing ratio (B/C) Net cash position
Net cash position
* Significant reduction in gross gearing ratio in 2011 is as a result of the build-up of retained earnings since the EnQuest demerger of 2010.
Petrofac Annual report and accounts 2011 167
Com
pany
financia
l sta
tem
ents
Com
Com
pany
pany
Gro
up
fin
ancia
l sta
tem
ents
Gro
Gro
up
up
Gove
rnance
GG
Corp
ora
te
resp
onsi
bility
Corp
Corp
ora
tora
tee
Fin
ancia
l p
erf
orm
ance
and ris
kFin
aFin
ancia
ncia
ll
Revi
ew
of o
pera
tions Independent auditors’ report (Petrofac Limited)
Company income statementCompany statement of comprehensive incomeCompany statement of financial positionCompany statement of cash flowsCompany statement of changes in equityNotes to the Company financial statements
Shareholder informationGlossary
Ri
fti
Ove
rvie
w
01 22 41 50 65 107

Notes to the Company financial statements continued For the year ended 31 December 2011
16 Risk management and financial instruments continued
Fair values of financial assets and liabilities The fair value of the Company’s financial instruments and their carrying amounts included within the Company’s statement of financial position are set out below:
Carrying amount Fair value
2011 US$’000
2010 US$’000
2011 US$’000
2010 US$’000
Financial assets
Cash and short-term deposits (note 12) 431,656 88,257 431,656 88,257
Financial liabilities
Interest-bearing loans and borrowings (note 15) 26,830 38,530 28,650 41,152
The fair values of long-term interest-bearing loans and borrowings and long-term receivable from a subsidiary are equivalent to amortised costs determined as the present value of discounted future cash flows using the effective interest rate. The Company considers that the carrying amounts of trade and other receivables, amounts due from/due to subsidiaries, trade and other payables and other current financial liabilities approximate their fair values and are therefore excluded from the above table.
Fair value hierarchy The following financial instruments are measured at fair value using the hierarchy below for determination and disclosure of their respective fair values:
Tier 1: Unadjusted quoted prices in active markets for identical financial assets or liabilities Tier 2: Other valuation techniques where the inputs are based on all observation data (directly or indirectly) Tier 3: Other valuation techniques where the inputs are based on unobservable market data
Assets and liabilities measured at fair value
Tier 2
US$’000 2011
US$’000
Financial assets
Seven Energy warrants 17,616 17,616
Tier 2
US$’000 2010
US$’000
Financial assets
Seven Energy warrants 11,969 11,969
17 Related party transactions
The Company’s related parties consist of its subsidiaries and the transactions and amounts due to/due from them are either of funding o investing nature (note 8). The Company is re-charged a portion of the key management personnel cost by one of its subsidiaries. The amount recharged during the year was US$2,547,000 (2010: US$2,854,000). For further details of the full amount of key management personnel costs refer to the Group accounts.
18 Share capital
The movements in share capital are disclosed in note 23 to the consolidated financial statements of the Group.
Petrofac Annual report and accounts 2011168
Shareholder information At 31 December 2011
Registrar Capita Registrars (Jersey) Limited 12 Castle Street St Helier Jersey JE2 3RT
UK Transfer Agent Capita Registrars The Registry 34 Beckenham Road Beckenham Kent BR3 4TU
Corporate Brokers Goldman Sachs Peterborough Court 133 Fleet Street London EC4A 2BB
JP Morgan Cazenove 10 Aldermanbury London EC2V 7RF
Company Secretary and registered office Ogier Corporate Services (Jersey) Limited Ogier House The Esplanade St Helier Jersey JE4 9WG
Auditors Ernst & Young LLP 1 More London Place London SE1 2AF
Legal Advisers to the Company Freshfields Bruckhaus Deringer LLP 65 Fleet Street London EC4Y 1HS
Corporate and Financial PR Tulchan Communications Group 85 Fleet Street London EC4Y 1AE
Stock Exchange Listing Petrofac shares are listed on the London Stock Exchange using code ‘PFC.L’.
Financial Calendar
11 May 2012 Annual General Meeting
18 May 2012 Final dividend payment
13 August 2012 Half Year Results announcement
October 2012 Interim dividend payment
Dates are based on current expectations.
Copies of all announcements will be available on the Company’s website at www.petrofac.com following their release.
Petrofac Annual report and accounts 2011 169
Com
pany
financia
l sta
tem
ents
Com
Com
pany
pany
Gro
up
fin
ancia
l sta
tem
ents
Gro
Gro
up
up
Gove
rnance
GG
Corp
ora
te
resp
onsi
bility
Corp
Corp
ora
tora
tee
Fin
ancia
l p
erf
orm
ance
and ris
kFin
aFin
ancia
ncia
ll
Revi
ew
of o
pera
tions Independent auditors’ report (Petrofac Limited)
Company income statementCompany statement of comprehensive incomeCompany statement of financial positionCompany statement of cash flowsCompany statement of changes in equityNotes to the Company financial statements
Shareholder informationGlossary
Ri
fti
Ove
rvie
w
01 22 41 50 65 107

A
AGM
Annual General Meeting
AIRB
Asset Integrity Review Board
Appraisal Well
A well drilled into a discovered
accumulation to provide data necessary
to define a Field Development
Programme for the accumulation
B
Backlog
Backlog consists of the estimated revenue
attributable to the uncompleted portion of
lump-sum engineering, procurement and
construction contracts and variation orders
plus, with regard to engineering, operations,
maintenance and Integrated Energy
Services contracts, the estimated revenue
attributable to the lesser of the remaining
term of the contract and five years.
Backlog will not be booked on Integrated
Energy Services contracts where the Group
has entitlement to reserves. The Group
uses this key performance indicator as a
measure of the visibility of future earnings.
Backlog is not an audited measure
Barrel
A unit of volume measurement used
for petroleum
bbl
One barrel of oil
Block
A subdivision of an underground petroleum
reservoir, by a resource owner, for the
purposes of licensing and administering
exploration, appraisal and production of
resources, by oil and gas companies
boe
Barrel of oil equivalent
bpd
Barrel per day
Brownfield Development
Further investment in a mature field, to
enhance its production capacity, thereby
increasing recovery and extending field life
C
Capex
Capital expenditure
CIS
Commonwealth of Independent States
Cost plus KPIs
A reimbursable contract which includes an
incentive income linked to the successful
delivery of key performance
indicators (KPIs)
CPECC
China Petroleum Engineering &
Construction Corporation
CPPES
China Petroleum Petrofac Engineering
Services
CR
Corporate responsibility
D
DBSP
Deferred Bonus Share Plan
DECC
Department of Energy and Climate
Change (UK)
Decommissioning
The re-use, recycling and disposal
of redundant oil & gas facilities
Duty Holder
A contracting model under which Petrofac
provides a complete managed service,
covering production and maintenance
work, both offshore and onshore, to reduce
the costs of operating and to extend the life
of the facilities
E
EBITDA
EBITDA is calculated as profit before tax
and net finance income, but after our share
of losses from associates (as per the
consolidated income statement), adjusted
to add back charges for depreciation and
amortisation (as per note 3 to the
financial statements)
EBT
Employee Benefit Trust
ECS
Engineering & Consulting Services.
This service line is Petrofac’s centre of
technical engineering excellence, delivering
early-stage engineering studies, including
conceptual and front-end engineering and
design work, across onshore and offshore
oil & gas fields
ECOM
Engineering, Construction, Operations
& Maintenance, one of two divisions,
which designs and builds oil & gas facilities
and operates, manages and maintains
them on behalf of Petrofac’s customers
EPC
Engineering, Procurement & Construction
EPCIC
Engineering, Procurement, Construction,
Installation and Commissioning
EPIC
Engineering, Procurement, Installation
and Construction
EPS
Earnings per share
ExCom
Executive Committee
F
FEED
Front End Engineering and Design
Field Development Programme (FDP)
A document setting out the manner in
which a hydrocarbon discovery is to be
developed and operated
FPSO
Floating Production, Storage and
Offloading vessel
FPF
Floating Production Facility
G
Gas field
A field containing natural gas but no oil
H
Hydrocarbon
A compound containing only the elements
hydrogen and carbon – can be solid,
liquid or gas
HSE
Health & Safety Executive (UK)
HSSEIA
Health, safety, security, environment and
integrity assurance
Glossary
Petrofac Annual report and accounts 2011170

I
IAS
International Accounting Standards
IFRS
International Financial Reporting Standards
IOC
International oil company
IES
Integrated Energy Services. The IES division
harnesses Petrofac’s existing service
capabilities and delivers them on an
integrated basis to resource holders with
the aim of supporting the development
of their oil & gas resources, enhancing
production from their mature reservoirs and
helping them to build national capability
K
KPI
Key performance indicator
L
LNG
Liquefied natural gas
Lump-sum turnkey project
An agreement in which a contractor
designs, constructs, and manages a
project until it is ready to be handed over
to the customer and operation can
begin immediately
LTI
Lost time injury
M
MENA
Middle East and North Africa region
mm boe
Million barrels of oil equivalents
mmscfd
Million standard cubic feet per day
MOPU
Mobile offshore production unit
MOU
Memorandum of understanding
N
NOC
National oil company
O
OEC
Onshore Engineering & Construction.
A service line, which delivers onshore
engineering, procurement and
construction projects
OECD
Organisation for Economic Cooperation
and Development
Oil field
A geographic area under which an oil
reservoir lies
OPEC
Organisation of Petroleum Exporting
Countries
OPO
Offshore Projects & Operations. A service
line which specialises in both offshore
engineering and construction services,
for greenfield and brownfield projects,
and the provision of operations and
maintenance support, on and offshore
P
PEC
Production Enhancement Contract is
where Petrofac is paid a tariff per barrel
for oil & gas production and therefore has
no commodity price exposure. PECs are
appropriate for mature fields which have
a long production history
PMC
Project Management Contractor –
managing an external construction
contractor to manage construction
of a facility
PSC
Production Sharing Contract
PSP
Performance Share Plan
R
Reimbursable services
Where the cost of Petrofac’s services are
reimbursed by the customer plus an
agreed margin
RI
Recordable injury
ROCE
Return on capital employed
RSC
Risk Service Contract is where Petrofac
develops, operates and maintains a field,
while the resource holder retains ownership
and control of its reserves
RSP
Restricted Share Plan
S
SIP
Share Incentive Plan
T
TSR
Total shareholder return
U
UKCS
United Kingdom Continental Shelf
UNGC
United Nations Global Compact
Upstream
The segment of the petroleum industry
having to do with exploration, development
and production of oil and gas resources
V
VCP
Value Creation Plan
Petrofac Annual report and accounts 2011 171
Com
pany
financia
l sta
tem
ents
Com
Com
pany
pany
Gro
up
fin
ancia
l sta
tem
ents
Gro
Gro
up
up
Gove
rnance
GG
Corp
ora
te
resp
onsi
bility
Corp
Corp
ora
tora
tee
Fin
ancia
l p
erf
orm
ance
and ris
kFin
aFin
ancia
ncia
ll
Revi
ew
of o
pera
tions Independent auditors’ report (Petrofac Limited)
Company income statementCompany statement of comprehensive incomeCompany statement of financial positionCompany statement of cash flowsCompany statement of changes in equityNotes to the Company financial statements
Shareholder informationGlossary
Ri
fti
Ove
rvie
w
01 22 41 50 65 107

Design and production by Radley Yeldar www.ry.com
This report has been printed on Revive 100 White Silk and Revive 100
premium uncoated paper’s which are certified by the Forest Stewardship
Council® and contain 100% recycled waste. The paper is made at a mill with
EMAS and ISO 14001 environmental management system accreditation.
This report was printed using vegetable oil based inks by a CarbonNeutral®
printer certified to ISO 14001 environmental management system and
registered to EMAS the Eco Management Audit Scheme.


Petrofac Services Limited
117 Jermyn Street
London SW1Y 6HH
United Kingdom
T +44 20 7811 4900
F +44 20 7811 4901
www.petrofac.com