De' Longhi S.p.A. - Morningstar
293
OFFERING MEMORANDUM CONFIDENTIAL 37,500,000 Shares De' Longhi S.p.A. (nominal value 53 per share) This oÅering memorandum relates to a Global OÅering of the ordinary shares of De' Longhi S.p.A. (sometimes referred to as the ""Company'' or ""De' Longhi''), a limited liability company organized under the laws of Italy. We are oÅering 37,500,000 shares as part of the Global OÅering. The institutional underwriters are oÅering 27,900,000 shares (i) in the United States only to qualiÑed institutional buyers (as deÑned below) in reliance on Rule 144A under the U.S. Securities Act of 1933, as amended (the ""Securities Act'') and (ii) outside the United States in oÅshore transactions in reliance on Regulation S under the Securities Act. Additionally, the Italian underwriters are oÅering 9,600,000 shares to retail investors in Italy by way of a public oÅering pursuant to a separate prospectus in the Italian language. Investing in our shares involves risks. You should refer to ""Risk Factors'' beginning on page 13. The oÅering price is 43.4 per share. The shares are quoted on the Italian automated screen-based quotation system, the Mercato Telematico Azionario (""Telematico'') under the symbol ""DLG''. The shares have not been registered under the Securities Act and are being oÅered (i) in the United States only to qualiÑed institutional buyers in reliance on Rule 144A and (ii) outside the United States in reliance on Regulation S under the Securities Act. For a description of certain restrictions on resale or transfer, you should refer to ""Transfer Restrictions'' beginning on page 145. In addition, the Company has granted to the Joint Global Coordinators, on behalf of the institutional underwriters, the right to purchase up to an additional 3,750,000 shares solely to cover over-allotments, if any. The institutional underwriters expect to deliver the shares to purchasers on or about July 24, 2001. Joint Global Coordinators and Bookrunners Merrill Lynch International UniCredit Banca Mobiliare S.p.A. Co-Lead Manager Schroder Salomon Smith Barney Co-Manager EUROMOBILIARE SIM S.p.A. The date of this oÅering memorandum is July 19, 2001 Brought to you by Global Reports
-
Upload
khangminh22 -
Category
Documents
-
view
0 -
download
0
Transcript of De' Longhi S.p.A. - Morningstar

O F F E R I N G M E M O R A N D U M C O N F I D E N T I A L
37,500,000 Shares
De' Longhi S.p.A.(nominal value 53 per share)
This oÅering memorandum relates to a Global OÅering of the ordinary shares of De' Longhi S.p.A.(sometimes referred to as the ""Company'' or ""De' Longhi''), a limited liability company organized underthe laws of Italy. We are oÅering 37,500,000 shares as part of the Global OÅering. The institutionalunderwriters are oÅering 27,900,000 shares (i) in the United States only to qualiÑed institutional buyers(as deÑned below) in reliance on Rule 144A under the U.S. Securities Act of 1933, as amended (the""Securities Act'') and (ii) outside the United States in oÅshore transactions in reliance on Regulation Sunder the Securities Act. Additionally, the Italian underwriters are oÅering 9,600,000 shares to retailinvestors in Italy by way of a public oÅering pursuant to a separate prospectus in the Italian language.
Investing in our shares involves risks. You should refer to ""Risk Factors''beginning on page 13.
The oÅering price is 43.4 per share. The shares are quoted on the Italian automated screen-basedquotation system, the Mercato Telematico Azionario (""Telematico'') under the symbol ""DLG''.
The shares have not been registered under the Securities Act and are being oÅered (i) in the UnitedStates only to qualiÑed institutional buyers in reliance on Rule 144A and (ii) outside the United States inreliance on Regulation S under the Securities Act. For a description of certain restrictions on resale ortransfer, you should refer to ""Transfer Restrictions'' beginning on page 145.
In addition, the Company has granted to the Joint Global Coordinators, on behalf of the institutionalunderwriters, the right to purchase up to an additional 3,750,000 shares solely to cover over-allotments, ifany. The institutional underwriters expect to deliver the shares to purchasers on or about July 24, 2001.
Joint Global Coordinators and Bookrunners
Merrill Lynch International UniCredit Banca Mobiliare S.p.A.
Co-Lead Manager
Schroder Salomon Smith Barney
Co-Manager
EUROMOBILIARE SIM S.p.A.
The date of this oÅering memorandum is July 19, 2001
Brought to you by Global Reports

THIS OFFERING MEMORANDUM DOES NOT CONSTITUTE AN OFFER TO SELL, OR ASOLICITATION OF AN OFFER TO BUY, ANY SHARES OFFERED BY ANY PERSON IN ANYJURISDICTION IN WHICH IT IS UNLAWFUL FOR SUCH PERSON TO MAKE SUCH ANOFFER OR SOLICITATION. NEITHER THE DELIVERY OF THIS OFFERING MEMORANDUMNOR ANY SALE MADE HEREUNDER SHALL UNDER ANY CIRCUMSTANCES IMPLY THATTHERE HAS BEEN NO CHANGE IN OUR AFFAIRS OR THOSE OF OUR SUBSIDIARIES ORTHAT THE INFORMATION SET FORTH IN THIS OFFERING MEMORANDUM IS CORRECTAS OF ANY DATE SUBSEQUENT TO THE DATE HEREOF.
This oÅering memorandum is highly conÑdential and has been prepared by us solely for use inconnection with the proposed institutional oÅering of our shares. We and the institutional underwritersreserve the right to reject any oÅer to purchase, in whole or in part, for any reason, or to sell less than allof the shares oÅered hereby. This oÅering memorandum is personal to the person to whom it has beenoÅered and delivered by the institutional underwriters and does not constitute an oÅer to any person or tothe public in general to subscribe or otherwise acquire the shares. Distribution of this oÅeringmemorandum to any other person (including those persons, if any, retained to advise such person withrespect to the oÅering) is unauthorized, and any disclosure of any of its contents, without our prior writtenconsent, is prohibited. By accepting delivery of this oÅering memorandum, you agree to the aboveconditions and to make no photocopies of this oÅering memorandum.
You also acknowledge that (i) you have not relied on the institutional underwriters or any personaÇliated with the institutional underwriters in connection with any investigation of the accuracy of suchinformation or your investment decision and (ii) no person has been authorized to give any information orto make any representation concerning De' Longhi or the shares (other than as contained in this oÅeringmemorandum) and, if given or made, any such other information or representation should not be reliedupon as having been authorized by us, De' Longhi SoparÑ S.A. (as the controlling shareholder) or theinstitutional underwriters.
IN MAKING AN INVESTMENT DECISION, YOU MUST RELY ON YOUR OWN EXAMINA-TION OF THE COMPANY AND THE TERMS OF THE GLOBAL OFFERING, INCLUDING THEMERITS AND RISKS INVOLVED. THE SHARES HAVE NOT BEEN RECOMMENDED BY ANYFEDERAL OR STATE SECURITIES COMMISSION OR REGULATORY AUTHORITY. FUR-THERMORE, SUCH AUTHORITIES HAVE NOT CONFIRMED THE ACCURACY OR DETER-MINED THE ADEQUACY OF THIS DOCUMENT. ANY REPRESENTATION TO THECONTRARY IS A CRIMINAL OFFENSE IN THE UNITED STATES.
THESE SECURITIES ARE SUBJECT TO RESTRICTIONS ON TRANSFERABILITY ANDRESALE AND MAY NOT BE TRANSFERRED OR RESOLD EXCEPT AS PERMITTED UNDERTHE SECURITIES ACT AND APPLICABLE STATE SECURITIES LAWS, PURSUANT TOREGISTRATION OR EXEMPTION THEREFROM. YOU SHOULD BE AWARE THAT YOU MAYBE REQUIRED TO BEAR THE FINANCIAL RISKS OF THIS INVESTMENT FOR ANINDEFINITE PERIOD OF TIME.
NO REPRESENTATION OR WARRANTY, EXPRESS OR IMPLIED, IS MADE BY THEINSTITUTIONAL MANAGERS AS TO THE ACCURACY OR COMPLETENESS OF THEINFORMATION SET FORTH IN THIS OFFERING MEMORANDUM, AND NOTHING CON-TAINED IN THIS OFFERING MEMORANDUM IS, OR SHALL BE, RELIED UPON AS APROMISE OR REPRESENTATION, WHETHER AS TO THE PAST OR THE FUTURE. THEINSTITUTIONAL UNDERWRITERS HAVE NOT INDEPENDENTLY VERIFIED ANY SUCHINFORMATION AND ASSUME NO RESPONSIBILITY FOR ITS ACCURACY ORCOMPLETENESS.
We are not, and none of the institutional underwriters or any of their respective representatives is,making any representation to any oÅeree or purchaser of the shares oÅered hereby regarding the legality ofan investment by such oÅeree or purchaser under appropriate legal, investment or similar laws. Eachinvestor should consult with his or her own advisers as to the legal, tax, business, Ñnancial and relatedaspects of a purchase of the shares.
In connection with the Global OÅering, Merrill Lynch International or certain of its aÇliates oragents, on behalf of the institutional underwriters, may over-allot or eÅect transactions which stabilize ormaintain the market price of the ordinary shares at levels above those which might otherwise prevail in theopen market. Such transactions may be eÅected on the Telematico, in the over-the-counter markets orotherwise. Such stabilizing, if commenced, may be discontinued at any time and must in any event bediscontinued 30 calendar days after the commencement of trading of the shares on the Telematico.
i
Brought to you by Global Reports

NOTICE TO NEW HAMPSHIRE RESIDENTS ONLY
NEITHER THE FACT THAT A REGISTRATION STATEMENT OR AN APPLICATION FORA LICENSE HAS BEEN FILED UNDER CHAPTER 421-B OF THE NEW HAMPSHIREREVISED STATUTES WITH THE STATE OF NEW HAMPSHIRE NOR THE FACT THAT ASECURITY IS EFFECTIVELY REGISTERED OR A PERSON IS LICENSED IN THE STATE OFNEW HAMPSHIRE CONSTITUTES A FINDING BY THE SECRETARY OF STATE OF NEWHAMPSHIRE THAT ANY DOCUMENT FILED UNDER RSA 421-B IS TRUE, COMPLETE ANDNOT MISLEADING. NEITHER ANY SUCH FACT NOR THE FACT THAT AN EXEMPTION ISAVAILABLE FOR A SECURITY OR A TRANSACTION MEANS THAT THE SECRETARY OFSTATE HAS PASSED IN ANY WAY UPON THE MERITS OR QUALIFICATIONS OF, ORRECOMMENDED OR GIVEN APPROVAL TO, ANY PERSON, SECURITY OR TRANSACTION.IT IS UNLAWFUL TO MAKE, OR CAUSE TO BE MADE, TO ANY PROSPECTIVE PUR-CHASER, CUSTOMER OR CLIENT ANY REPRESENTATION INCONSISTENT WITH THEPROVISIONS OF THIS PARAGRAPH.
INFORMATION FOR PROSPECTIVE INVESTORS IN THE NETHERLANDS
Each institutional manager understands and agrees that any of the shares that are oÅered in TheNetherlands shall, in order to comply with the Netherlands Securities Market Supervision Act 1995 (Wettoezicht eÅectenverkeer 1995, hereinafter the ""WTE''), only be oÅered to individuals or legal entitiessituated in The Netherlands who or which trade or invest in securities in the conduct of a business orprofession (which includes banks, securities Ñrms, insurance companies, pension funds, investmentinstitutions, central governments, large international and supranational organizations, other institutionalinvestors and other parties, including treasury departments of commercial enterprises, which are regularlyactive in the Ñnancial markets in a professional manner), in which case (i) it must be made clear bothupon making the oÅer and in any document or advertisement in which a forthcoming oÅering of suchshares is publicly announced (whether electronically or otherwise) that such oÅer is exclusively made tothe said individuals or legal entities; and (ii) a copy of this oÅering memorandum must be submitted tothe Dutch Securities Board (Stichting Toezicht EÅectenverkeer) before the oÅer date.
JAPAN
The shares have not been and will not be registered under the Securities and Exchange Law of Japan.Accordingly, each institutional underwriter has represented and agreed that it has not, directly orindirectly, oÅered or sold and will not, directly or indirectly, oÅer or sell, shares in Japan or to any personresident in Japan for Japanese securities law purposes, including any corporation or other entity organizedunder the laws of Japan, except pursuant to an exemption from the registration requirements of, andotherwise in compliance with, the Securities and Exchange Law.
NOTICE TO PROSPECTIVE INVESTORS IN THE UNITED KINGDOM
Neither this oÅering memorandum nor any document issued in connection with the Global OÅeringmay be issued or passed on in the United Kingdom except to a person who is of a kind described inArticle 11(3) of the Financial Services Act 1986 (Investment Advertisements) (Exemptions) Order 1996or is a person to whom such document may otherwise lawfully be issued or passed on.
SALES OF SHARES IN CANADA
A prospectus has not and will not be Ñled to qualify the sale of the shares in Canada or any Provinceor Territory thereof. Shares are not and may not be oÅered or sold, directly or indirectly, in any Provinceor Territory of Canada or to or for the account of any resident of Canada except pursuant to an exemptionfrom the applicable registration and prospectus Ñling requirements, and otherwise in compliance with theapplicable securities laws and regulations of such Province or Territory.
ii
Brought to you by Global Reports

INFORMATION FOR PROSPECTIVE INVESTORS IN AUSTRALIA
This oÅering memorandum has not been lodged with any regulatory authority in Australia. Apurchaser of the shares in Australia may be required to prepare and lodge an Australian Corporations Lawcompliant prospectus in relation to the shares if such person on-sells the shares within 12 months of theirissue if the on-sale is to be made to a person who is a sophisticated or professional investor within themeaning of section 708(8) or 708(11) of the Australian Corporations Law.
BELGIUM
The shares will not be oÅered publicly, directly or indirectly, in Belgium at the time of the GlobalOÅering. The oÅering has not been notiÑed to, and this oÅering memorandum has not been approved by,the Belgian Banking and Finance Commission. The shares may only be sold in Belgium to professionalinvestors as deÑned in Article 3 of the Royal Decree of July 7, 1999 on the public nature of Ñnancialtransactions, acting for their own account, and this oÅering memorandum may not be delivered or passedon to any other investors.
SPAIN
The oÅering of our shares has been registered with the Spanish Securities Market Commission(Comisi πon Nacional del Mercado de Valores) as a partial exemption of a public oÅering addressed toinstitutional investors only and subject to a limited Ñling pursuant to Article 7.1(a) of Royal Decree 291 ofMarch 27, 1992 relating to issues and public oÅerings (the ""Royal Decree''). In Spain, this oÅering is,therefore, solely and exclusively addressed to institutional investors as deÑned under Article 7.1(a) of theRoyal Decree, and any subsequent transfers of our shares oÅered pursuant to this oÅering memorandummay be carried out only to other investors who also qualify as institutional investors for the purposes ofArticle 7.1(a) of the Royal Decree. Accordingly, each purchaser shall be deemed to accept and representthat it will not resell the shares other than to institutional investors.
ITALY
The oÅer of the shares in the institutional oÅering has been notiÑed together with the oÅer of aminimum of 9,600,000 shares to the public in Italy to the Commissione Nazionale per le Societ fia e laBorsa (or ""CONSOB''), the Italian Securities and Exchange Commission. This oÅering memorandum hasnot been and will not be submitted to the clearance procedures of CONSOB and accordingly may not beused in connection with any oÅer or sale of the shares in Italy. For the purposes of the Italian publicoÅering in Italy, we have prepared a prospetto informativo in the Italian language. Any sale of shares inthe institutional oÅering in Italy will only be made to ""Professional investors'' as deÑned in CONSOBRegulation No. 11522 of July 1, 1998, as amended and adopted pursuant to Legislative Decree No. 58 ofFebruary 24, 1998 (the ""UniÑed Financial Act''), other than asset management companies authorized tomanage investment portfolios in accordance with investment instructions given on a discretionary client-by-client basis and Ñduciary companies (societ fia Ñduciarie) managing portfolio investments (regulated bySection 60, paragraph 4 of Legislative Decree No. 415 of July 23, 1996). Any such oÅer or sale or anydistribution of this oÅering memorandum or any rendering of advice in respect of investment in the shareswithin Italy and in connection with this oÅering must be conducted either by registered securities dealingfirms (societ fia d'intermediazione mobiliare or ""SIMs'') or by authorized banks or investment Ñrms, asdescribed by the UniÑed Financial Act and CONSOB Regulation No. 11522 of July 1, 1998. After thecompletion of the distribution, each of the institutional underwriters is required promptly to give writtennotice to CONSOB of the names of each of their Italian professional investors and to give written noticeof the total number of shares they have sold to these professional investors.
ENFORCEMENT OF JUDGMENTS
We are a limited liability company (also referred to as a ""societ fia per azioni'' or ""S.p.A.'' in Italy)organized and existing under the laws of Italy. All of our directors and most of our executive oÇcers (andtheir equivalents) reside outside the United States, principally in Italy. In addition, a substantial portion ofour assets and the assets of such persons is located outside the United States. As a result, it may not bepossible for investors to eÅect service of process within the United States upon us or any such other personor to enforce in a United States court against us or such other persons any judgments obtained in suchcourts whether or not predicated upon the civil liability provisions of the federal or state securities laws ofthe United States.
iii
Brought to you by Global Reports

We have been advised by our Italian legal counsel, Bonelli Erede Pappalardo, that, subject to thequaliÑcations described below, recognition and enforcement in Italy of Ñnal judgments of U.S. courts,including judgments obtained in actions predicated upon the civil liability provisions of the U.S. federalsecurities laws, is automatic and will not require retrial on the merits if, among other things: (i) the U.S.courts have jurisdiction in accordance with Italian law and have rendered a Ñnal judgment; (ii) processhas been appropriately served on the defendant in accordance with applicable U.S. laws and nofundamental right of the defense has been violated; (iii) the parties have had an opportunity to be heardin accordance with applicable U.S. law or, if the judgment has been obtained by default, such default hasbeen declared in accordance with applicable U.S. laws; (iv) there is no conÖicting Ñnal judgment by anItalian court or an action pending in Italy that commenced prior to the commencement of the proceedingbefore the U.S. court among the same parties and arising from the same facts and circumstances; and(v) the content of the U.S. judgment does not violate Italian public policy.
We have also been advised by Bonelli Erede Pappalardo that in original actions brought before Italiancourts there is doubt as to the enforceability of liabilities based solely on the U.S. federal securities lawsand that, in original actions, Italian courts do not only apply Italian rules of civil procedure but also applycertain substantive provisions of Italian law that are regarded as mandatory.
FORWARD-LOOKING STATEMENTS
This oÅering memorandum includes forward-looking statements. In particular, forward-lookingstatements are included under ""Summary'', ""Risk Factors'', ""Use of Proceeds'', ""Dividends'', ""OurBusiness'' and ""Management's Discussion and Analysis of Financial Condition and Results of Operations''.When used in this oÅering memorandum, the words ""intend(s)'', ""aim(s)'', ""expect(s)'', ""will'', ""may'',""believe(s)'', ""should'', ""anticipate(s)'', and similar expressions are intended to identify forward-lookingstatements. We have based these forward-looking statements on our current expectations and projectionsabout future events. These forward-looking statements are subject to risks, uncertainties and assumptionsabout us which could cause actual results to diÅer materially from those projected, including, among otherthings, our ability to develop and expand our business; our ability to expand our product lines; our futurecapital spending and investments; our ability to control and reduce costs; our ability to develop, implementand maintain new technologies; our ability to improve the design of our products; and the eÅects ofregulation in Italy and in foreign jurisdictions in which we manufacture or sell our products.
Additional factors that could cause actual results, performance or achievements to diÅer materiallyinclude, but are not limited to, those discussed under ""Risk Factors''.
These forward-looking statements speak only as of the date of this oÅering memorandum.
We undertake no obligations to publicly update or revise any forward-looking statements, whether as aresult of new information, future events or otherwise. In light of these risks, uncertainties and assumptions,the forward-looking events discussed in this oÅering memorandum might not occur. Any statementsregarding past trends or activities should not be taken as a representation that such trends or activities willcontinue in the future. You are urged to carefully review and consider the various disclosures made by usin this oÅering memorandum which attempt to advise you of the factors which aÅect our business.
iv
Brought to you by Global Reports
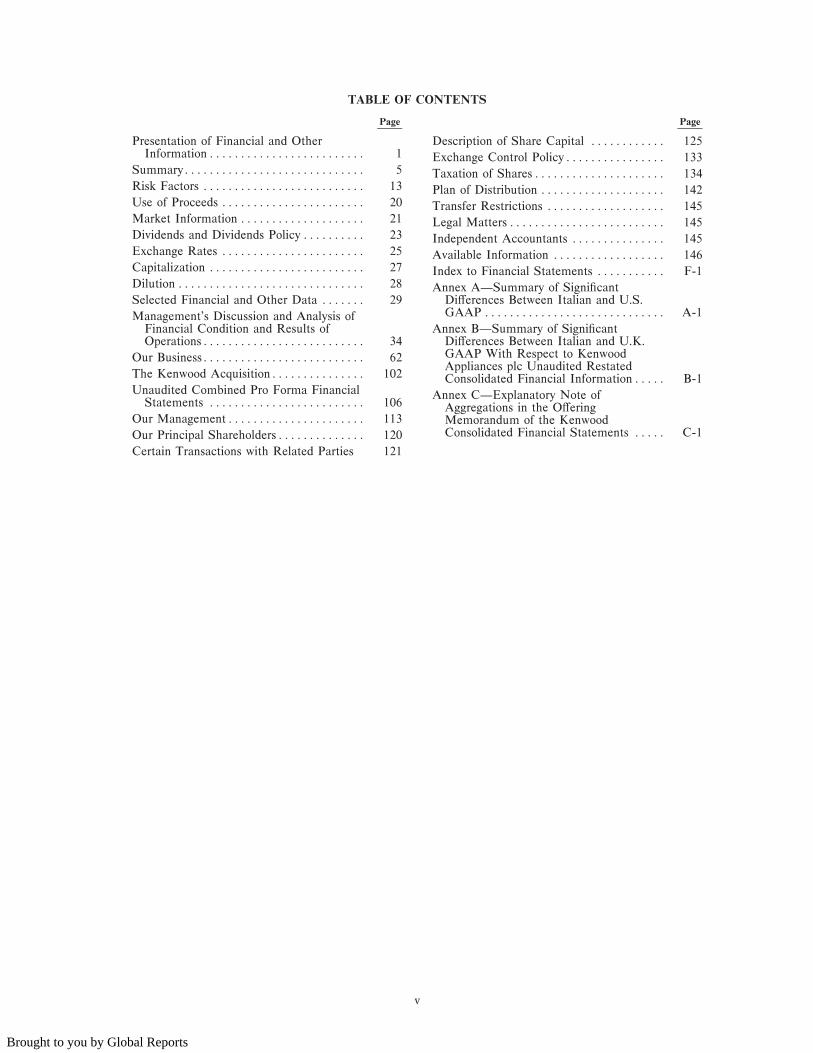
TABLE OF CONTENTS
Page Page
Presentation of Financial and Other Description of Share Capital ÏÏÏÏÏÏÏÏÏÏÏÏ 125InformationÏÏÏÏÏÏÏÏÏÏÏÏÏÏÏÏÏÏÏÏÏÏÏÏÏ 1 Exchange Control PolicyÏÏÏÏÏÏÏÏÏÏÏÏÏÏÏÏ 133
SummaryÏÏÏÏÏÏÏÏÏÏÏÏÏÏÏÏÏÏÏÏÏÏÏÏÏÏÏÏÏ 5 Taxation of SharesÏÏÏÏÏÏÏÏÏÏÏÏÏÏÏÏÏÏÏÏÏ 134Risk Factors ÏÏÏÏÏÏÏÏÏÏÏÏÏÏÏÏÏÏÏÏÏÏÏÏÏÏ 13 Plan of Distribution ÏÏÏÏÏÏÏÏÏÏÏÏÏÏÏÏÏÏÏÏ 142Use of Proceeds ÏÏÏÏÏÏÏÏÏÏÏÏÏÏÏÏÏÏÏÏÏÏÏ 20 Transfer Restrictions ÏÏÏÏÏÏÏÏÏÏÏÏÏÏÏÏÏÏÏ 145Market Information ÏÏÏÏÏÏÏÏÏÏÏÏÏÏÏÏÏÏÏÏ 21 Legal MattersÏÏÏÏÏÏÏÏÏÏÏÏÏÏÏÏÏÏÏÏÏÏÏÏÏ 145Dividends and Dividends PolicyÏÏÏÏÏÏÏÏÏÏ 23 Independent Accountants ÏÏÏÏÏÏÏÏÏÏÏÏÏÏÏ 145Exchange Rates ÏÏÏÏÏÏÏÏÏÏÏÏÏÏÏÏÏÏÏÏÏÏÏ 25 Available Information ÏÏÏÏÏÏÏÏÏÏÏÏÏÏÏÏÏÏ 146Capitalization ÏÏÏÏÏÏÏÏÏÏÏÏÏÏÏÏÏÏÏÏÏÏÏÏÏ 27 Index to Financial Statements ÏÏÏÏÏÏÏÏÏÏÏ F-1Dilution ÏÏÏÏÏÏÏÏÏÏÏÏÏÏÏÏÏÏÏÏÏÏÏÏÏÏÏÏÏÏ 28 Annex AÌSummary of SigniÑcantSelected Financial and Other Data ÏÏÏÏÏÏÏ 29 DiÅerences Between Italian and U.S.
GAAP ÏÏÏÏÏÏÏÏÏÏÏÏÏÏÏÏÏÏÏÏÏÏÏÏÏÏÏÏÏ A-1Management's Discussion and Analysis ofFinancial Condition and Results of Annex BÌSummary of SigniÑcantOperationsÏÏÏÏÏÏÏÏÏÏÏÏÏÏÏÏÏÏÏÏÏÏÏÏÏÏ 34 DiÅerences Between Italian and U.K.
GAAP With Respect to KenwoodOur BusinessÏÏÏÏÏÏÏÏÏÏÏÏÏÏÏÏÏÏÏÏÏÏÏÏÏÏ 62Appliances plc Unaudited Restated
The Kenwood AcquisitionÏÏÏÏÏÏÏÏÏÏÏÏÏÏÏ 102 Consolidated Financial InformationÏÏÏÏÏ B-1Unaudited Combined Pro Forma Financial Annex CÌExplanatory Note of
Statements ÏÏÏÏÏÏÏÏÏÏÏÏÏÏÏÏÏÏÏÏÏÏÏÏÏ 106 Aggregations in the OÅeringOur ManagementÏÏÏÏÏÏÏÏÏÏÏÏÏÏÏÏÏÏÏÏÏÏ 113 Memorandum of the Kenwood
Consolidated Financial Statements ÏÏÏÏÏ C-1Our Principal ShareholdersÏÏÏÏÏÏÏÏÏÏÏÏÏÏ 120
Certain Transactions with Related Parties 121
v
Brought to you by Global Reports

[THIS PAGE INTENTIONALLY LEFT BLANK]
Brought to you by Global Reports
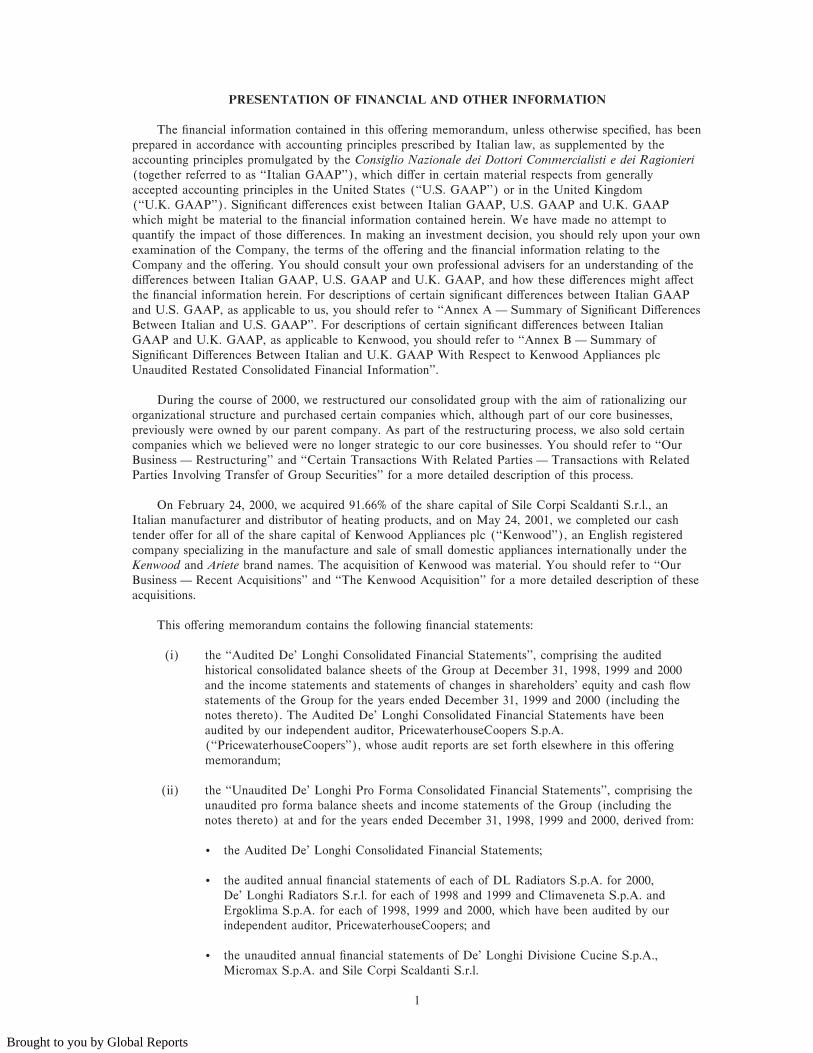
PRESENTATION OF FINANCIAL AND OTHER INFORMATION
The Ñnancial information contained in this oÅering memorandum, unless otherwise speciÑed, has beenprepared in accordance with accounting principles prescribed by Italian law, as supplemented by theaccounting principles promulgated by the Consiglio Nazionale dei Dottori Commercialisti e dei Ragionieri(together referred to as ""Italian GAAP''), which diÅer in certain material respects from generallyaccepted accounting principles in the United States (""U.S. GAAP'') or in the United Kingdom(""U.K. GAAP''). SigniÑcant diÅerences exist between Italian GAAP, U.S. GAAP and U.K. GAAPwhich might be material to the Ñnancial information contained herein. We have made no attempt toquantify the impact of those diÅerences. In making an investment decision, you should rely upon your ownexamination of the Company, the terms of the oÅering and the Ñnancial information relating to theCompany and the oÅering. You should consult your own professional advisers for an understanding of thediÅerences between Italian GAAP, U.S. GAAP and U.K. GAAP, and how these diÅerences might aÅectthe Ñnancial information herein. For descriptions of certain signiÑcant diÅerences between Italian GAAPand U.S. GAAP, as applicable to us, you should refer to ""Annex A Ì Summary of SigniÑcant DiÅerencesBetween Italian and U.S. GAAP''. For descriptions of certain signiÑcant diÅerences between ItalianGAAP and U.K. GAAP, as applicable to Kenwood, you should refer to ""Annex B Ì Summary ofSigniÑcant DiÅerences Between Italian and U.K. GAAP With Respect to Kenwood Appliances plcUnaudited Restated Consolidated Financial Information''.
During the course of 2000, we restructured our consolidated group with the aim of rationalizing ourorganizational structure and purchased certain companies which, although part of our core businesses,previously were owned by our parent company. As part of the restructuring process, we also sold certaincompanies which we believed were no longer strategic to our core businesses. You should refer to ""OurBusiness Ì Restructuring'' and ""Certain Transactions With Related Parties Ì Transactions with RelatedParties Involving Transfer of Group Securities'' for a more detailed description of this process.
On February 24, 2000, we acquired 91.66% of the share capital of Sile Corpi Scaldanti S.r.l., anItalian manufacturer and distributor of heating products, and on May 24, 2001, we completed our cashtender oÅer for all of the share capital of Kenwood Appliances plc (""Kenwood''), an English registeredcompany specializing in the manufacture and sale of small domestic appliances internationally under theKenwood and Ariete brand names. The acquisition of Kenwood was material. You should refer to ""OurBusiness Ì Recent Acquisitions'' and ""The Kenwood Acquisition'' for a more detailed description of theseacquisitions.
This oÅering memorandum contains the following Ñnancial statements:
(i) the ""Audited De' Longhi Consolidated Financial Statements'', comprising the auditedhistorical consolidated balance sheets of the Group at December 31, 1998, 1999 and 2000and the income statements and statements of changes in shareholders' equity and cash Öowstatements of the Group for the years ended December 31, 1999 and 2000 (including thenotes thereto). The Audited De' Longhi Consolidated Financial Statements have beenaudited by our independent auditor, PricewaterhouseCoopers S.p.A.(""PricewaterhouseCoopers''), whose audit reports are set forth elsewhere in this oÅeringmemorandum;
(ii) the ""Unaudited De' Longhi Pro Forma Consolidated Financial Statements'', comprising theunaudited pro forma balance sheets and income statements of the Group (including thenotes thereto) at and for the years ended December 31, 1998, 1999 and 2000, derived from:
‚ the Audited De' Longhi Consolidated Financial Statements;
‚ the audited annual Ñnancial statements of each of DL Radiators S.p.A. for 2000,De' Longhi Radiators S.r.l. for each of 1998 and 1999 and Climaveneta S.p.A. andErgoklima S.p.A. for each of 1998, 1999 and 2000, which have been audited by ourindependent auditor, PricewaterhouseCoopers; and
‚ the unaudited annual Ñnancial statements of De' Longhi Divisione Cucine S.p.A.,Micromax S.p.A. and Sile Corpi Scaldanti S.r.l.
1
Brought to you by Global Reports

The Unaudited De' Longhi Pro Forma Consolidated Financial Statements have beenadjusted to reÖect:
‚ the purchase on February 28, 2000 of a controlling interest in Sile Corpi Scaldanti S.r.l.,as if such acquisition had occurred on January 1, 1998. At the time of the acquisition,Sile Corpi Scaldanti S.r.l. represented approximately 0.4% of our total consolidated assets,0.6% of our total revenues and 0.9% of our net income, in each case as compared to ourconsolidated Ñnancial statements as of December 31, 1999 and for the year then ended;
‚ the purchase in December 2000, as part of our restructuring, of a controlling interest ineach of De' Longhi Divisione Cucine S.p.A., DL Radiators S.p.A., Climaveneta S.p.A.and Micromax S.p.A., together with 30% of the share capital of Ergoklima S.p.A., ineach case as if such acquisitions had occurred on January 1, 1998. At the time of theacquisition, these companies represented, in the aggregate, approximately 26.6% of ourconsolidated total assets, 25.0% of our total revenues and 17.5% of our net income, ineach case as compared to our consolidated Ñnancial statements as of December 31, 1999and for the year then ended;
‚ the sale in December 2000, as part of our restructuring, of Immobiliare FindomesticS.r.l., De' Longhi Radiators S.r.l., DL Canada Distributors Inc., 850721 Ontario Ltd. andE.S.C S.p.A., together with the sale of a controlling interest (equal to 60% of its sharecapital) of Nauta S.r.l., in each case as if such sale had occurred on January 1, 1998; and
‚ a capital increase of Lit. 250,587 million eÅected in April 2001 (thereby increasing ourtotal capitalization to Lit. 650,587 million), as if such capital increase had been eÅectedon January 1, 1998.
The Unaudited De' Longhi Pro Forma Consolidated Financial Statements have beenadjusted to reÖect an increase in our debt resulting from the payment for the companies wepurchased in 2000 and a reduction in our net debt due to the capital increase referred toabove. You should note that the purchase contracts for the companies we acquired inDecember 2000 as part of our restructuring process and referred to above includedapproximately Lit. 504,714 million in interest-free debt and, as a result, the Unaudited De'Longhi Pro Forma Consolidated Financial Statements do not include a charge for implicitinterest expense. In addition, the capital increase eÅected in April 2001 is treated as non-interest bearing for purposes of the Unaudited De' Longhi Pro Forma Consolidated FinancialStatements;
(iii) the ""Audited Kenwood Consolidated Financial Statements'', comprising the auditedhistorical consolidated balance sheets and income statements, statements of changes inshareholders' equity and cash Öow statements of Kenwood at and for the Ñscal years endedApril 2, 1999 and March 31, 2000 and 2001 (including the notes thereto). The AuditedKenwood Consolidated Financial Statements have been prepared in accordance with U.K.GAAP and have been audited by Ernst & Young, independent auditors, whose audit reportis set forth elsewhere in this oÅering memorandum;
(iv) the ""Unaudited Combined Pro Forma Financial Statements'' of the Group, as at and for theyears ended December 31, 1998, 1999 and 2000 (referred to, together with the UnauditedDe' Longhi Pro Forma Consolidated Financial Statements, as the ""Unaudited Pro FormaFinancial Statements''), derived from:
‚ the Unaudited De' Longhi Pro Forma Consolidated Financial Statements; and
‚ the ""Unaudited Restated Kenwood Consolidated Financial Statements'' based on theAudited Kenwood Consolidated Financial Statements, which have been restated for eachyear to reÖect a Ñscal year ended December 31, 1998, 1999 and 2000 and to reÖectItalian GAAP. For a description of aggregations used to prepare such Ñnancial statementsunder Italian GAAP, you should refer to ""Annex C Ì Explanatory Note of Aggregationsin the OÅering Memorandum of the Kenwood Consolidated Financial Statements''.
The Unaudited Combined Pro Forma Financial Statements, in addition to the adjustmentsmade to the Unaudited De' Longhi Pro Forma Consolidated Financial Statements referred toabove, have been adjusted to reÖect the acquisition of Kenwood as if such acquisition hadoccurred on January 1, 1998; and
2
Brought to you by Global Reports

(v) the ""Unaudited Interim De' Longhi Consolidated Financial Statements'', comprising theunaudited interim historical consolidated balance sheets and income statements and cash Öowstatements of the Group at and for the three months ended March 31, 2000 and 2001(including the notes thereto).
The Unaudited Pro Forma Financial Statements have been prepared for informational purposes only.We did not control Sile Corpi Scaldanti S.r.l. or Kenwood on January 1, 1998 nor did we operate theirbusinesses in any period prior to the respective closing dates for such acquisitions. Consequently, theUnaudited Pro Forma Financial Statements do not purport either to represent what our consolidatedresults of operations would actually have been if the acquisitions had taken place on January 1, 1998 or toproject our consolidated results of operations at any future date or for any future periods. You should alsorefer to the notes to the Unaudited De' Longhi Pro Forma Consolidated Financial Statements and theUnaudited Combined Pro Forma Financial Statements for a description of the assumptions used in thepresentation of these Ñnancial statements.
In Italy, there are no standards governing the preparation of pro forma Ñnancial statements. Althoughthe Unaudited Pro Forma Financial Statements have been prepared using the best practices as identiÑedand disclosed by CONSOB, such Ñnancial statements do not take into account standards generallyaccepted in other jurisdictions, in particular the United States and the United Kingdom. Accordingly, thepresentation, assumptions and adjustments of the Unaudited Pro Forma Financial Statements may diÅersigniÑcantly from those in other jurisdictions. Investors are cautioned against placing undue reliance on theUnaudited Pro Forma Financial Statements. You should refer to ""Risk Factors Ì Risks Relating to theCompany and the Group Ì The pro forma Ñnancial information included in this oÅering memorandumdoes not represent our actual historical results of operations''. The Unaudited De' Longhi Pro FormaConsolidated Financial Statements have been examined by PricewaterhouseCoopers, to the extent and asmore fully described in the report of independent auditors relating thereto included elsewhere in thisoÅering memorandum.
For convenience only, we have translated certain Lira Ñgures into Euro at the Ñxed exchange rateestablished by the European Council of Ministers on December 31, 1998 between the Lira and the Euroof Lit. 1,936.27 • 41.00. The exchange rate between Lire and U.S. dollars represents the Lire equivalent(at the Ñxed Lira/Euro rate) of Lit. 2,265 • $1.00, the Noon Buying Rate in the City of New York forcable transfers in foreign currencies as announced by the Federal Reserve Bank of New York for customspurposes on July 16, 2001. To obtain a current formulation of the value of Italian Lira amounts in U.S.dollars, you must Ñrst convert Lire into Euro at the Ñxed Lira/Euro conversion of Lit. 1,936.27 • 41.00,and then convert the resulting Euro amount into U.S. dollars at the prevailing exchange rate. By includingconvenience currency translations in this oÅering memorandum, we are not representing that the Liraamounts actually represent the dollar amounts shown or could be converted into dollars at the ratesindicated. For information about the exchange rate between the Lire and U.S. dollar for periods from 1996through July 16, 2001 and between the U.S. dollar and the Euro since January 1, 1999, you should referto ""Exchange Rates and the European Monetary System''.
‚ References to ""dollars'', ""$'' and ""U.S. dollars'' are to United States dollars;
‚ References to ""pounds'' or ""'' are to the British pound sterling;
‚ References to ""Lire'', ""Lira'' or ""Lit.'' are to Italian Lire;
‚ References to ""4'' or ""Euro'' are to the Euro, the single currency established for participants inthe third stage of the European Monetary Union, or EMU. You should also refer to ""ExchangeRates and the European Monetary System''; and
‚ References to ""billion'' or ""bn'' mean a thousand million.
In preparing our Ñnancial statements, we present Ñnancial data in millions of Lire. For theconvenience of the reader in this oÅering memorandum, unless otherwise not available, we have roundedmost Ñnancial data to millions of Lire. As a result of this rounding, the totals of the data presented hereinmay vary slightly from the actual arithmetic totals of such data. In the tables herein, a dash (""Ì'')represents no value while the number ""0.0'' (or ""(0.0)'') represents a rounded amount. Additionally,percentage Ñgures that would otherwise be derived by dividing by zero have also been represented by adash.
Unless otherwise indicated, information and statistics presented herein regarding market trends,market volumes, our market share and our market share relative to competitors are based primarily on
3
Brought to you by Global Reports

data derived from publicly available sources. This oÅering memorandum speciÑcally contains marketinformation and data relating to the business segments and geographic areas in which we operate. Theprincipally available source used by us for Italy, AC Nielsen, tracks sales for relevant products and marketsegments with respect to the retail distribution channel only. On a pro forma basis (excluding Kenwood),our sales to retailers represented approximately 71.4% of our consolidated sales revenues in 2000. Youshould refer to ""Our Business Ì Marketing and Sales''. Homogenous sources for market data are notavailable for all of our products and geographic segments. In order to provide statistically signiÑcantinformation on the size and performance of the market segments in which we operate, we have prepareddata based on a comparison, regrouping and combination of data reported by a number of oÇcial andindependent sources. Market data and estimates with respect to the diÅerent market segments in whichwe operate have been derived, in part, from AC Nielsen, Air Conditioners Index (September 2000);AC Nielsen, Durable Service Italia (September 2000); Gesellschaft F ur Konsumforschung, Durable GoodsPanel (October 2000) and RIC Research Corp. Year Data Book (1999 and 2000). For certain marketswhere independent public sources are not available, we have prepared estimates based on available dataderived from our distributors or other sources which we deemed relevant. As a result, you should note thatthe market data presented in this oÅering memorandum, as it applies to individual market segments, maybe only a partial representation of the broader market to which the product segment belongs.
In this oÅering memorandum, the terms the ""Company'' or ""De' Longhi'' refer to De' Longhi S.p.A.Unless the context indicates otherwise, the terms ""we,'' ""us'', ""our'', ""the Group'' and the ""De' LonghiGroup'' refer to us and our consolidated subsidiaries as a combined entity. The terms the ""GlobalOÅering'' and ""oÅering'' refer to the international institutional oÅering and the Italian retail public oÅeringtogether. The term ""the shares'' refers to our ordinary shares, unless the context indicates otherwise, whichare being oÅered to you in this oÅering memorandum as part of this oÅering.
Unless otherwise speciÑed, statements contained in this oÅering memorandum assume no exercise ofthe institutional underwriters' over-allotment option.
4
Brought to you by Global Reports

SUMMARY
This summary contains basic information about this oÅering. It likely does not contain all theinformation that may be important to you. You should refer to this entire oÅering memorandum, includingthe Ñnancial data and the related notes, before making an investment decision. In particular, you shouldconsider carefully the factors set forth under the heading ""Risk Factors.''
Introduction
We are the Italian parent company of an international group of companies that manufactures anddistributes around the world quality leading products generally related to health and well-being under theDe' Longhi, Kenwood, Vetrella, Ariete, La Supercalor, Radel, Elba, Ariagel, Simac and Climaveneta brandnames, among others. Our product oÅerings comprise the following four market segments and businessareas:
‚ heating products, including portable heating units (such as oil-Ñlled radiators, electric convectorsand fan heaters), in which we believe we are a world leader, and terminal units for central heatingsystems (such as multi-column radiators, steel radiators and bathroom radiators);
‚ air conditioning and air treatment products (including portable and Ñxed-wall air conditioners,humidiÑers, dehumidiÑers and air puriÑers for both residential and industrial use), in which we area leader in Italy (Source: AC Nielsen, Air Conditioners Index, September 2000) and, with respectto our portable products, in which we believe we are a world leader;
‚ cooking and food preparation products (including electric ovens, deep-fryers, toasters, electricbarbecues, coÅee machines, free-standing stoves and food processors), in which we are the leaderin Italy and a leader in the United Kingdom (Source: AC Nielsen, Durable Service Italia,September 2000 and Gesellschaft F ur Konsumforschung, Durable Goods Panel, October 2000);and
‚ household cleaning and ironing products, including vacuum cleaners, steam cleaners and ironingsystems, in which we are generally recognized as a leader in Italy (Source: AC Nielsen, DurableService Italia, September 2000).
Competitive Strengths
We believe that our competitive strengths include the following:
‚ a focus on innovation;
‚ our experienced marketing network;
‚ our brand name recognition;
‚ state-of-the-art manufacturing capabilities;
‚ an extensive distribution and sales network;
‚ our signiÑcant experience in integrating companies into our group; and
‚ manufacturing and distribution synergies resulting from our recent acquisition of Kenwood.
Strategy
Our objective is to strengthen our position in markets where we have achieved leadership and toincrease our market share in other areas, with the aim of maximizing the return on investment for ourshareholders and achieving higher levels of proÑtability. In order to achieve these goals, we intend to:
‚ continue to develop innovative products;
‚ expand geographically by leveraging our distribution network and increasing our distributionchannels;
‚ strengthen our brand names;
‚ maintain control over key manufacturing processes and focus on our research and developmentprograms;
‚ increase our eÇciency; and
‚ continue to evaluate strategic opportunities.
5
Brought to you by Global Reports

Our Restructuring Process
During the course of 2000, we restructured the Group with the aim of rationalizing our organizationalstructure, and we purchased certain companies which, although part of our core businesses, were previouslyowned directly and indirectly by our parent company. As a result of the restructuring, we acquired,through our wholly owned subsidiary De' Longhi Pinguino S.A., a controlling interest in each of De'Longhi Divisione Cucine S.p.a., DL Radiators S.p.A., Climaveneta S.p.A. and Micromax S.p.A., togetherwith 30% of the share capital of Ergoklima S.p.A., for an aggregate amount equal to Lit. 538,889 million.At the time of our acquisition in December 2000, such companies represented, in the aggregate,approximately 26.6% of our consolidated total assets, 25.0% of our total revenues and 17.5% of our netincome, in each case as compared to our consolidated Ñnancial statements as of December 31, 1999 andfor the year then ended.
In addition, as part of the restructuring process, we sold certain companies which we believed were nolonger strategic to our core businesses to related parties for an aggregate amount equal to Lit. 32,301million (or approximately 416,682 thousand). This included the sale of all of the share capital ofImmobiliare Findomestic S.r.l., De' Longhi Radiators S.r.l., DL Canada Distributors Inc., 850721 OntarioLtd. and I.S.C. Ì Industrie Scambiatori di Calore S.p.A., together with a controlling interest (equal to60% of its share capital) of Societ fia Nauta S.r.l. You should refer to ""Certain Transactions With RelatedParties Ì Transactions with Related Parties Involving Transfers of Group Securities'' for a more detaileddescription of each of these companies, the terms and conditions of the above transactions and of ourrestructuring process generally.
Recent Acquisitions
On May 24, 2001, we completed the acquisition of Kenwood, an English company specializing in themanufacture and sale of small domestic appliances internationally under the Kenwood and Ariete brandnames. The aggregate total purchase price for the Kenwood shares was equal to 45.9 million (orapproximately Lit. 143,000 million), plus the assumption of approximately 18 million (or approximatelyLit. 56,000 million) of debt. At the time of the acquisition, Kenwood's total assets represented 12.5% ofour consolidated total assets, and Kenwood's revenues represented 37.8% of our total revenues, in eachcase as compared to our consolidated Ñnancial statements as of December 31, 2000 and for the year thenended. As of December 31, 2000, Kenwood's net debt position was equal to Lit. 102,928 million. Youshould refer to ""The Kenwood Acquisition'' for a more detailed description of Kenwood and its principalactivities.
In addition, on February 24, 2000, we acquired 91.66% of the outstanding share capital of Sile CorpiScaldanti S.r.l., an Italian manufacturer and distributor of heating products, for an aggregate purchaseamount equal to Lit. 4,583 million. At the time of the acquisition, Sile Corpi Scaldanti S.r.l.'s total assetsrepresented 0.4% of our consolidated total assets, its revenues represented 0.6% of our total revenues andits net income represented 0.9% of our total net income, in each case as compared to our consolidatedÑnancial statements as at December 31, 1999, and for the year then ended.
6
Brought to you by Global Reports

The Global OÅering
The Global OÅeringÏÏÏÏÏÏÏÏÏÏÏÏÏÏÏÏ The Global OÅering comprises the International OÅering andthe Italian Retail OÅering. The Global OÅering includes37,500,000 shares of capital stock of the Company, nominalvalue 43 per share, before the exercise of the over-allotmentoption referred to below. The closing of the Italian RetailOÅering and the International OÅering are conditional upon eachother.
International OÅering ÏÏÏÏÏÏÏÏÏÏÏÏÏÏ 27,900,000 shares are being oÅered by the institutional under-writers (the ""International OÅering'') (i) only to qualiÑedinstitutional buyers in the United States in reliance onRule 144A under the Securities Act and (ii) outside the UnitedStates in reliance on Regulation S under the Securities Act. Youshould refer to ""Plan of Distribution''.
Italian Retail OÅering ÏÏÏÏÏÏÏÏÏÏÏÏÏÏ 9,600,000 shares are being oÅered in Italy by way of a publicoÅering to retail investors (the ""Italian OÅering''), subject tominimum lots of 250 shares or multiples thereof.
OÅering Price ÏÏÏÏÏÏÏÏÏÏÏÏÏÏÏÏÏÏÏÏÏ Euro 3.4 per share.
Over-Allotment Option ÏÏÏÏÏÏÏÏÏÏÏÏÏ The Company has granted to Merrill Lynch International and toUniCredit Banca Mobiliare S.p.A. (for the beneÑt of theinstitutional underwriters) an option to purchase up to 3,750,000additional shares to cover any over-allotments. This option maybe exercised from the date of determination of the oÅering priceuntil 30 days after the commencement of trading of the shareson the Telematico. You should refer to ""Plan of Distribution''.
Ordinary Shares Outstanding beforethe Global OÅering ÏÏÏÏÏÏÏÏÏÏÏÏÏÏ 112,000,000 shares. You should refer to ""Description of Share
Capital''.
Ordinary Shares Outstanding afterthe Global OÅering ÏÏÏÏÏÏÏÏÏÏÏÏÏÏ 149,500,000 shares.
Use of Proceeds ÏÏÏÏÏÏÏÏÏÏÏÏÏÏÏÏÏÏÏ We intend to use the net proceeds from this oÅering for generalcorporate purposes, including, among other things, to expand ouroperations, reduce our debt and for working capital needs. Youshould refer to ""Our Principal Shareholders''.
DividendsÏÏÏÏÏÏÏÏÏÏÏÏÏÏÏÏÏÏÏÏÏÏÏÏÏ Holders of the shares will be entitled to all dividends, if any,declared in subsequent Ñscal years. The declaration, payment andamount of any dividend is subject to the approval of theshareholders at the annual shareholders' meeting and will bedependent upon, among other things, the Ñnancial condition,results of operations, prospects, cash Öow, capital requirementsand reserves of the Company. You should refer to ""Dividends''and ""Description of Share Capital''.
7
Brought to you by Global Reports

Substitute Tax ÏÏÏÏÏÏÏÏÏÏÏÏÏÏÏÏÏÏÏÏ Dividends payable by the Company to non-residents of Italy aresubject to Italian substitute tax at a rate of 27%, which may bereduced by applicable treaties or conventions. You should referto ""Taxation of Shares Ì Italian Tax Considerations''.
Voting Rights ÏÏÏÏÏÏÏÏÏÏÏÏÏÏÏÏÏÏÏÏÏ Under Italian law, shareholders are entitled to one vote for eachshare held and are entitled to vote and attend ordinary andextraordinary meetings of the Company. You should refer to""Description of Share Capital Ì NotiÑcation of the Acquisitionof Shares and Voting Rights''.
Listing and Trading ÏÏÏÏÏÏÏÏÏÏÏÏÏÏÏÏ Prior to this oÅering, our shares have not been traded on anyexchange. An application has been made to list our shares on theTelematico. It is expected that trading on the Telematico willbegin on or around three working days after the date of pricing.You should refer to ""Risk Factors Ì Risks Relating to OurShares'' and ""Market Information''.
Joint Global CoordinatorsÏÏÏÏÏÏÏÏÏÏÏ Merrill Lynch International and UniCredit BancaMobiliare S.p.A. are joint global coordinators in respect of theGlobal OÅering. Merrill Lynch International and UniCreditBanca Mobiliare S.p.A. will act as joint lead managers and jointbookrunners of the International OÅering. UniCredit BancaMobiliare S.p.A. will act as lead manager of the Italian RetailOÅering.
Payment, Delivery and Settlement ÏÏÏÏ Payment for and delivery of the shares are expected to be madeon or about July 24, 2001. The shares will settle against paymentin Euro through the facilities of Monte Titoli (a centralizedsecurities depositary system) as well as through Euroclear andClearstream, Luxembourg. You should refer to ""Market Infor-mation Ì Clearance and Settlement in Italy''.
The ISIN for our shares is IT0003115950.
The Common Code for our shares is 132 77 877.
Lock-Up ÏÏÏÏÏÏÏÏÏÏÏÏÏÏÏÏÏÏÏÏÏÏÏÏÏ Each of the Company and De' Longhi SoparÑ S.A. (a companyindirectly controlled by Giuseppe De' Longhi), as the controllingshareholder, has agreed to certain restrictions relating to theissue or sale or other disposal of shares or other securitiesconvertible or exchangeable into the shares, subject to certainexceptions, during the period extending up to and including thedate falling 180 days after the Ñrst day of trading of the shareson the Telematico. See ""Plan of Distribution''.
Risk Factors ÏÏÏÏÏÏÏÏÏÏÏÏÏÏÏÏÏÏÏÏÏÏ You should refer to ""Risk Factors'' and other informationincluded in this oÅering memorandum for a discussion of factorsthat should be considered before investing in our shares.
8
Brought to you by Global Reports

Summary Pro Forma and Historical Consolidated Financial Data
The selected unaudited pro forma and historical Ñnancial information set forth below has been derivedfrom the following Ñnancial statements included elsewhere in this oÅering memorandum:
‚ the Unaudited De' Longhi Pro Forma Consolidated Financial Statements as at and for the yearsended December 31, 1998, 1999 and 2000, derived from the Audited De' Longhi ConsolidatedFinancial Statements; the audited annual Ñnancial statements of DL Radiators S.p.A. for 2000,De' Longhi Radiators S.r.l. for each of 1998 and 1999, and Climaveneta S.p.A. and ErgoklimaS.p.A. for each of 1998, 1999 and 2000; and the unaudited annual Ñnancial statements of De'Longhi Divisione Cucine S.p.A., Micromax S.p.A and Sile Corpi Scaldanti S.r.l.
‚ the Unaudited Combined Pro Forma Financial Statements of the Group as at and for the yearsended December 31, 1998, 1999 and 2000, derived from the Unaudited De' Longhi Pro FormaConsolidated Financial Statements and the Unaudited Restated Kenwood Consolidated FinancialStatements based on the Audited Kenwood Consolidated Financial Statements (which have beenrestated for each year to reÖect a Ñscal year ended December 31 instead of March 31 and toreÖect Italian GAAP); and
‚ the Unaudited Interim De' Longhi Consolidated Financial Statements at and for the three monthsended March 31, 2000 and 2001.
The Unaudited Pro Forma Financial Statements have been adjusted, among other things, to reÖectthe purchase in 2000 of a controlling interest in each of De' Longhi Divisione Cucine S.p.A., DLRadiators S.p.A., Climaveneta S.p.A., Micromax S.p.A., Ergoklima S.p.A. and Sile Corpi Scaldanti S.r.l.,in each case as if such acquisitions had occurred on January 1, 1998. In addition, the Unaudited ProForma Consolidated Financial Statements have been adjusted to reÖect an increase in our debt resultingfrom the payment for the companies we purchased in 2000 and a corresponding reduction in our net debtdue to a capital increase of Lit. 250,587 million eÅected in April 2001. You should note that the purchasecontracts for the companies we acquired in December 2000 as part of our restructuring process andreÖected in such Ñnancial statements included approximately Lit. 504,714 million in interest-free debt and,as a result, the Unaudited Pro Forma Consolidated Financial Statements do not include a charge forimplicit interest expense. In addition, the capital increase eÅected in April 2001 is treated as non-interestbearing for purposes of the Unaudited De' Longhi Pro Forma Consolidated Financial Statements.
The foregoing Ñnancial statements have been prepared in accordance with Italian GAAP, whichdiÅers in signiÑcant respects from U.S. GAAP and U.K. GAAP. For descriptions of certain signiÑcantdiÅerences between Italian GAAP and U.S. GAAP, as applicable to the Company, you should refer to""Annex A Ì Summary of SigniÑcant DiÅerences Between Italian and U.S. GAAP''. For descriptions ofcertain signiÑcant diÅerences between Italian GAAP and U.K. GAAP, as applicable to Kenwood, youshould refer to ""Annex B Ì Summary of SigniÑcant DiÅerences Between Italian and U.K. GAAP WithRespect to Kenwood Appliances plc Unaudited Restated Consolidated Financial Information''. You shouldalso read the notes to the Unaudited De' Longhi Pro Forma Consolidated Financial Statements and theUnaudited Combined Pro Forma Financial Statements for a description of the assumptions used in thepresentation of these Ñnancial statements. The selected consolidated Ñnancial data set forth below shouldalso be read in conjunction with ""Presentation of Financial and Other Information'' and ""Management'sDiscussion and Analysis of Financial Condition and Results of Operations''.
9
Brought to you by Global Reports

Year ended December 31,
Unaudited De' Longhi Unaudited Combined Pro FormaPro Forma(1) (including Kenwood)(2)
1998 1999 2000 2000 1998 1999 2000 2000
(Lit. millions) (5 thousands) (Lit. millions) (5 thousands)
Income Statement Data:
Revenues:
Net sales ÏÏÏÏÏÏÏÏÏÏÏÏÏÏÏÏÏÏÏÏÏ 1,269,314 1,374,841 1,561,334 806,362 1,724,722 1,799,725 2,042,711 1,054,972
Other revenues ÏÏÏÏÏÏÏÏÏÏÏÏÏÏÏÏ 21,384 18,979 23,158 11,960 21,384 18,979 29,470 15,220
Total revenuesÏÏÏÏÏÏÏÏÏÏÏÏÏÏÏ 1,290,698 1,393,820 1,584,492 818,322 1,746,106 1,818,704 2,072,181 1,070,192
Operating costs:
Materials, consumables and
goods ÏÏÏÏÏÏÏÏÏÏÏÏÏÏÏÏÏÏÏÏÏÏ 630,240 637,305 714,053 368,778 869,195 885,304 1,026,265 530,022
Services ÏÏÏÏÏÏÏÏÏÏÏÏÏÏÏÏÏÏÏÏÏÏ 263,697 288,996 354,763 183,220 367,348(3) 375,627(3) 450,831(3) 232,835(3)
Rents, leases and related costs ÏÏÏ 13,016 12,467 14,379 7,426 Ì Ì Ì Ì
Other costs ÏÏÏÏÏÏÏÏÏÏÏÏÏÏÏÏÏÏÏ 21,128 17,874 10,867 5,612 21,128 17,874 10,867 5,612
Total production costs ÏÏÏÏÏÏÏÏ 928,081 956,642 1,094,062 565,036 1,257,671 1,278,805 1,487,963 768,469
Value added margin(4) ÏÏÏÏÏÏÏÏ 362,617 437,178 490,430 253,286 488,435 539,899 584,218 301,723
Wages, salaries and beneÑts ÏÏÏÏÏ 202,160 213,311 235,795 121,778 279,603 275,942 290,807 150,189
Gross operating margin ÏÏÏÏÏÏÏ 160,457 223,867 254,635 131,508 208,832 263,957 293,411 151,534
Depreciation and amortization ÏÏÏ 70,834 77,084 75,030 38,750 89,589 94,872 94,075 48,586
Amortization of goodwill ÏÏÏÏÏÏÏÏ 30,251 30,311 30,252 15,624 43,142 43,417 44,123 22,788
Provisions and write-oÅs ÏÏÏÏÏÏÏÏ 28,576 15,942 17,806 9,196 31,714 18,169 17,806 9,196
Operating proÑtÏÏÏÏÏÏÏÏÏÏÏÏÏÏ 30,796 100,530 131,547 67,938 44,387 107,499 137,407 70,964
Net Ñnancial loss ÏÏÏÏÏÏÏÏÏÏÏÏÏÏ (73,187) (33,399) (45,418) (23,456) (98,580) (55,203) (68,856) (35,561)
Income from equity investmentsÏÏ 1,818 3,857 8,321 4,297 1,818 3,857 8,321 4,297
Extraordinary (loss) income ÏÏÏÏÏ (3,410) (4,116) 4,707 2,431 (14,391) (44,657) (4,520) (2,334)
Earnings before taxes and
minority interests ÏÏÏÏÏÏÏÏÏÏ (43,983) 66,872 99,157 51,210 (66,766) 11,496 72,352 37,366
Income taxesÏÏÏÏÏÏÏÏÏÏÏÏÏÏÏÏÏÏ 427 26,355 57,413 29,651 37 25,269 54,307 28,047
Net (loss) income before
minority interests ÏÏÏÏÏÏÏÏÏÏ (44,410) 40,517 41,744 21,559 (66,803) (13,773) 18,045 9,319
Minority interests ÏÏÏÏÏÏÏÏÏÏÏÏÏÏ 271 72 (204) (105) 271 72 (204) (105)
Net (loss) income ÏÏÏÏÏÏÏÏÏÏÏ (44,139) 40,589 41,540 21,454 (66,532) (13,701) 17,841 9,214
Other Financial Data:
EBITDA(5) ÏÏÏÏÏÏÏÏÏÏÏÏÏÏÏÏÏÏÏ 131,881 207,925 236,829 122,312 177,118 245,788 275,605 142,338
Capital expendituresÏÏÏÏÏÏÏÏÏÏÏÏ 72,990 37,259 52,394 27,059 89,757 54,765 63,768 32,933
Net working capital ÏÏÏÏÏÏÏÏÏÏÏÏ 553,934 524,255 638,194 329,600 688,820 651,026 779,286 402,468
Total assets ÏÏÏÏÏÏÏÏÏÏÏÏÏÏÏÏÏÏÏ 2,288,484 2,312,542 2,371,235 1,224,641 2,779,113 2,769,282 2,800,185 1,446,174
Net Ñnancial position ÏÏÏÏÏÏÏÏÏÏÏ 1,208,825 967,496 935,314 483,049 1,476,153 1,226,765 1,209,735 624,776
Shareholders' equity ÏÏÏÏÏÏÏÏÏÏÏÏ 551,765 706,348 723,724 373,772 623,246 736,179 725,519 374,699
(1) Prepared to give pro forma eÅect to the restructuring of the Group (including the acquisition and sale of various companies)
eÅected in 2000 and a capital increase of Lit. 250,587 million at nominal value in April 2001. You should refer to the
Unaudited De' Longhi Pro Forma Consolidated Financial Statements (including the notes thereto) for a discussion of the
assumptions used to prepare these Ñnancial statements.
(2) Prepared to reÖect the acquisition of all of the share capital of Kenwood in early 2001 as if such acquisition had occurred on
January 1, 1998. You should also refer to ""The Kenwood Acquisition'' and ""Unaudited Combined Pro Forma Financial
Statements''.
(3) Services expenses include rents, leases and related costs.
(4) Total revenues less total production costs.
(5) Operating earnings before interest, taxes and depreciation and amortization.
10
Brought to you by Global Reports

The summary consolidated historical Ñnancial information in the following table has been derivedfrom unaudited interim consolidated Ñnancial statements prepared by our management at and for the threemonths ended March 31, 2000 and 2001 and is not included in, and does not form part of, the UnauditedPro Forma Consolidated Financial Statements. Our results of operation and Ñnancial condition as at andfor the three months ended March 31, 2001 include the eÅects of our acquisition of Kenwood as ofJanuary 1, 2001 and have been prepared in accordance with Italian GAAP. You should also referto""Management's Discussion and Analysis of Financial Condition and Results of Operations Ì Results ofOperations for the Three Months Ended March 31, 2000 and 2001''. You should be aware that theinformation presented below may not be indicative of the results of the Group at year-end 2001. Youshould read the whole of this oÅering memorandum and not rely solely on the selected information set outbelow.
Unaudited Historical Consolidated
Three Months ended March 31,
2000(1) 2001(2) 2001
(Lit. millions) (5 thousands)
Income Statement Data
Revenues:
Net salesÏÏÏÏÏÏÏÏÏÏÏÏÏÏÏÏÏÏÏÏÏÏÏÏÏÏÏÏÏÏÏÏÏÏÏÏÏÏÏÏÏÏÏÏÏÏÏÏÏ 211,820 467,186 241,281
Other revenuesÏÏÏÏÏÏÏÏÏÏÏÏÏÏÏÏÏÏÏÏÏÏÏÏÏÏÏÏÏÏÏÏÏÏÏÏÏÏÏÏÏÏÏÏ 6,493 4,967 2,565
Total revenues ÏÏÏÏÏÏÏÏÏÏÏÏÏÏÏÏÏÏÏÏÏÏÏÏÏÏÏÏÏÏÏÏÏÏÏÏÏÏÏÏÏÏ 218,313 472,153 243,846
Operating costs:
Materials, consumables and goodsÏÏÏÏÏÏÏÏÏÏÏÏÏÏÏÏÏÏÏÏÏÏÏÏÏÏÏÏ 91,577 239,868 123,881
Services, rents, leases and related costs ÏÏÏÏÏÏÏÏÏÏÏÏÏÏÏÏÏÏÏÏÏÏÏ 64,604 102,847 53,116
Other costs ÏÏÏÏÏÏÏÏÏÏÏÏÏÏÏÏÏÏÏÏÏÏÏÏÏÏÏÏÏÏÏÏÏÏÏÏÏÏÏÏÏÏÏÏÏÏÏ 3,366 2,923 1,510
Total production costsÏÏÏÏÏÏÏÏÏÏÏÏÏÏÏÏÏÏÏÏÏÏÏÏÏÏÏÏÏÏÏÏÏÏÏÏ 159,547 345,638 178,507
Value added margin(3) ÏÏÏÏÏÏÏÏÏÏÏÏÏÏÏÏÏÏÏÏÏÏÏÏÏÏÏÏÏÏÏÏÏÏÏ 58,766 126,515 65,339
Wages, salaries and beneÑts ÏÏÏÏÏÏÏÏÏÏÏÏÏÏÏÏÏÏÏÏÏÏÏÏÏÏÏÏÏÏÏÏÏ 40,942 73,913 38,173
Gross operating marginÏÏÏÏÏÏÏÏÏÏÏÏÏÏÏÏÏÏÏÏÏÏÏÏÏÏÏÏÏÏÏÏÏÏÏ 17,824 52,602 27,166
Depreciation and amortization ÏÏÏÏÏÏÏÏÏÏÏÏÏÏÏÏÏÏÏÏÏÏÏÏÏÏÏÏÏÏÏ 13,946 23,259 12,012
Amortization of goodwill ÏÏÏÏÏÏÏÏÏÏÏÏÏÏÏÏÏÏÏÏÏÏÏÏÏÏÏÏÏÏÏÏÏÏÏ 455 10,356 5,348
Provisions and write-oÅsÏÏÏÏÏÏÏÏÏÏÏÏÏÏÏÏÏÏÏÏÏÏÏÏÏÏÏÏÏÏÏÏÏÏÏÏ 2,356 (199) (103)
Operating proÑt ÏÏÏÏÏÏÏÏÏÏÏÏÏÏÏÏÏÏÏÏÏÏÏÏÏÏÏÏÏÏÏÏÏÏÏÏÏÏÏÏÏ 1,067 19,186 9,909
Net Ñnancial lossÏÏÏÏÏÏÏÏÏÏÏÏÏÏÏÏÏÏÏÏÏÏÏÏÏÏÏÏÏÏÏÏÏÏÏÏÏÏÏÏÏÏ (11,640) (15,225) (7,863)
Extraordinary (loss) income ÏÏÏÏÏÏÏÏÏÏÏÏÏÏÏÏÏÏÏÏÏÏÏÏÏÏÏÏÏÏÏÏ (68) 2,598 1,342
Earnings before taxes and minority interests ÏÏÏÏÏÏÏÏÏÏÏÏÏÏÏÏÏ (10,641) 6,559 3,388
Income taxes ÏÏÏÏÏÏÏÏÏÏÏÏÏÏÏÏÏÏÏÏÏÏÏÏÏÏÏÏÏÏÏÏÏÏÏÏÏÏÏÏÏÏÏÏÏ 1,774 4,738 2,447
Net (loss) income before minority interests ÏÏÏÏÏÏÏÏÏÏÏÏÏÏÏÏÏ (12,415) 1,821 941
Minority interestsÏÏÏÏÏÏÏÏÏÏÏÏÏÏÏÏÏÏÏÏÏÏÏÏÏÏÏÏÏÏÏÏÏÏÏÏÏÏÏÏÏÏ Ì Ì Ì
Net (loss) incomeÏÏÏÏÏÏÏÏÏÏÏÏÏÏÏÏÏÏÏÏÏÏÏÏÏÏÏÏÏÏÏÏÏÏÏÏÏÏÏ (12,415) 1,821 941
(1) Does not include the eÅects of the restructuring of the Group (including the acquisition and sale of various companies)
eÅected in 2000 or the capital increase of Lit. 250,587 million in April 2001.
(2) Includes the eÅects of the restructuring of the Group (including the acquisition and sale of various companies) eÅected in
2000 and the acquisition of Kenwood. You should also refer to the Unaudited De' Longhi Pro Forma Consolidated Financial
Statements for a discussion of the assumptions used in preparing the Ñnancial statements as well as ""Management's
Discussion and Analysis of Financial Condition and Results of Operations''.
(3) Total revenues less total production costs.
11
Brought to you by Global Reports

AuditedHistorical Unaudited Historical
Consolidated Consolidated
At December 31, At March 31,
2000 2001(2) 2001
(Lit. millions) (5 thousands)
Other Financial Data:
EBITDA(1)ÏÏÏÏÏÏÏÏÏÏÏÏÏÏÏÏÏÏÏÏÏÏÏÏÏÏÏÏÏÏÏÏÏÏÏÏÏÏÏÏÏÏ 180,485 52,801 27,269
Capital expenditures ÏÏÏÏÏÏÏÏÏÏÏÏÏÏÏÏÏÏÏÏÏÏÏÏÏÏÏÏÏÏÏÏÏÏ 34,810 8,960 4,627
Net working capitalÏÏÏÏÏÏÏÏÏÏÏÏÏÏÏÏÏÏÏÏÏÏÏÏÏÏÏÏÏÏÏÏÏÏÏ 611,364 632,875 328,402
Total assets ÏÏÏÏÏÏÏÏÏÏÏÏÏÏÏÏÏÏÏÏÏÏÏÏÏÏÏÏÏÏÏÏÏÏÏÏÏÏÏÏÏ 2,402,205 2,980,992 1,539,554
Net Ñnancial position ÏÏÏÏÏÏÏÏÏÏÏÏÏÏÏÏÏÏÏÏÏÏÏÏÏÏÏÏÏÏÏÏÏ 1,192,801 1,340,992 692,565
Shareholders' equity ÏÏÏÏÏÏÏÏÏÏÏÏÏÏÏÏÏÏÏÏÏÏÏÏÏÏÏÏÏÏÏÏÏÏ 468,792 472,249 243,896
(1) Operating earnings before interest, taxes and depreciation and amortization.
(2) Includes the eÅects of the restructuring of the Group (including the acquisition and sale of various companies) eÅected in
2000 and the acquisition of Kenwood. You should also refer to the Unaudited De' Longhi Pro Forma Consolidated Financial
Statements for a discussion of the assumptions used in preparing the Ñnancial statements as well as ""Management's
Discussion and Analysis of Financial Condition and Results of Operations''.
12
Brought to you by Global Reports

RISK FACTORS
An investment in our shares involves risk. Prospective investors should carefully consider the risksdescribed below before investing in our shares. If any of the risks described below actually occur, ourbusiness, Ñnancial condition or results of operations could be materially adversely aÅected and,accordingly, the value and trading price of our shares may decline, resulting in a loss of all or part of anyinvestment in our shares. Furthermore, the risks and uncertainties described may not be the only ones weface. Additional risks and uncertainties not presently known to us or that we currently consider immaterialmay also impair our business operations.
Risks Relating to the Company and the Group
We face risks related to our international activities.
Our future growth is expected to come from countries in Western Europe (such as Great Britain andGermany) as well as other markets around the world, including the United States, Eastern Europe, Japanand, as a result of our acquisition of Kenwood, the Far East and South Africa. As part of our acquisitionof Kenwood, we acquired a manufacturing facility in the People's Republic of China (""China'') as well asa small assembly facility in England, countries in which we had not previously manufactured or assembledproducts. Moreover, most of our sales are transacted abroad. For the year ended December 31, 2000,approximately 67% of our consolidated revenues, or 71% of our combined pro forma revenues (includingthe Kenwood acquisition), were attributable to sales outside of Italy. Because we manufacture ourproducts and conduct our business in diÅerent countries, we are aÅected by several factors, includingmacroeconomic, political, business and legal conditions in these countries. Adverse changes inmacroeconomic conditions or changes in the political, business or legal environment (such as increasedduties, higher taxation, currency conversion limitations, restrictions on the transfer of funds, limitations onimports or exports, or the expropriation of private enterprises) could have a material adverse eÅect on ourbusiness, Ñnancial condition or results of operations.
The pro forma Ñnancial information included in this oÅering memorandum does not represent our actual
historical results of operations.
The Unaudited Pro Forma Financial Statements have been prepared for informational purposes onlyand present the balance sheets and income statements derived from the Audited Historical ConsolidatedFinancial Statements and from the audited and unaudited balance sheets and income statements of thecompanies acquired by the Group in 2000 and 2001, in each case adjusted as if each of the acquisitionshad been completed on January 1, 1998. You should refer to the notes to the Unaudited Pro FormaFinancial Statements for a description of the assumptions used to prepare such Ñnancial statements and""Presentation of Financial and Other Information.''
On January 1, 1998 we had not eÅected the restructuring process and therefore had neither purchasedDe' Longhi Divisione Cucine S.p.A., DL Radiators S.p.A., Climaveneta S.p.A., Micromax S.p.A. andErgoklima S.p.A.; nor had we sold Immobiliare Findomestic S.r.l., De' Longhi Radiators S.r.l., DLCanada Distributors Inc., 850721 Ontario Ltd., I.S.C. Ì Industrie Scambiatori di Calore S.p.A. and NautaS.r.l. At the time of the acquisitions, these companies represented, in the aggregate, approximately 26.6%of our consolidated total assets, 25.0% of our total revenues and 17.5% of our net income, in each case ascompared to our consolidated Ñnancial statements as of December 31, 1999 and for the year then ended.
In addition, on January 1, 1998 we had neither purchased Sile Corpi Scaldanti S.r.l. and Kenwood,nor had we eÅected a capital increase of Lit. 250,587 million. At the time of the respective acquisition,Sile Corpi Scaldanti S.r.l. represented 0.4% of our consolidated total assets, 0.6% of our total revenues and0.9% of our net income, in each case as compared to our consolidated Ñnancial statements as ofDecember 31, 1999 and for the year then ended; and Kenwood represented (on a restated basis) 12.5% ofour consolidated total assets and 37.8% of our total revenues, in each case as compared to our consolidatedÑnancial statements as of December 31, 2000 and for the year then ended. The results of operations andÑnancial condition of Sile Corpi Scaldanti S.r.l. and Kenwood reÖected the strategies of each of thecompanies' prior management, which we did not control. We were not responsible for the strategiesemployed by such prior management and our strategies may diÅer materially from those implemented inthe past.
As a result of the above, the Unaudited Pro Forma Financial Statements do not purport to representwhat our results of operations or Ñnancial position actually would have been if such purchases, sales and
13
Brought to you by Global Reports

capital increase had occurred on January 1, 1998 or to project our results of operations for any futureperiod.
In Italy, there are no standards governing preparation of pro forma Ñnancial statements. Although theUnaudited Pro Forma Financial Statements have been prepared using the best practices as identiÑed anddisclosed by CONSOB, such Ñnancial statements do not take into account U.S. or U.K. GAAP orstandards generally accepted in other jurisdictions. Accordingly, the presentation of, and the assumptionsand adjustments used to prepare, the Unaudited Pro Forma Financial Statements may diÅer signiÑcantlyfrom those in other jurisdictions. You are cautioned against placing undue reliance on the Unaudited ProForma Consolidated Financial Statements. The Unaudited De' Longhi Pro Forma Consolidated FinancialStatements have been examined by PricewaterhouseCoopers, to the extent and as more fully described inthe report of independent auditors relating thereto included elsewhere in this oÅering memorandum. Youshould also refer to the assumptions used to prepare the Unaudited Pro Forma Financial Statements setforth elsewhere in this oÅering memorandum.
Kenwood has incurred losses in the past and may not be able to achieve the objectives set forth in its
restructuring plan.
In early 2001, we acquired all of the capital stock of Kenwood, an English company specializing inthe manufacture and sale of small domestic appliances internationally under the Kenwood and Arietebrand names. You should also refer to ""The Kenwood Acquisition''. Prior to our acquisition, for therestated Ñscal years ended December 31, 1998, 1999 and 2000, Kenwood recorded consolidated net lossesequal to approximately Lit. 16,894 million, Lit. 49,358 million and Lit. 18,508 million, respectively. Forthe restated three months ended March 31, 2001, Kenwood recorded consolidated net losses equal toapproximately Lit. 2,535 million. Since 1997, Kenwood has been implementing a restructuring processaimed at transforming itself into a brand business and at reducing its exposure to manufacturing operationsin the United Kingdom. As a result of such plan, Kenwood has streamlined its operations in the UnitedKingdom, thereby reducing its committed cost base by an amount Kenwood estimates to be approximatelyLit. 47,000 million (or 14.6 million); it has improved and expanded the range of products it oÅers; and ithas refocused its marketing eÅorts. Although we believe that Kenwood's net losses were also due toextraordinary restructuring costs that were associated with the restructuring process, which has beensubstantially completed, and that it will improve its proÑtability levels and contribute to increased synergieswithin the Group in the future, we cannot assure you that Kenwood will be able to maintain or increase itsproÑts or that market conditions will not change in the future, which could, in turn, result in a materialadverse eÅect on our business and results of operation.
We face risks typical of acquisitions and, as a result, may not be able to fully realize potential synergies
with Kenwood.
We believe that the acquisition of Kenwood will contribute to signiÑcant manufacturing anddistribution synergies for the Group and will improve our competitive position. Nevertheless, ouracquisition requires us to assimilate the operations of Kenwood into our operations and may require us toincur certain expenditures and restructuring expenses. We cannot assure you that we will be able tointegrate Kenwood's business into our existing organization as planned, which could, in turn, result in aloss of part of Kenwood's customer base or its key personnel. Similarly, we may not achieve all of theexpected results, cost savings or other synergies from our acquisition. This, in turn, could have a materialadverse eÅect on our business and results of operations. In addition, there can be no assurance that ourrecent acquisition of Kenwood will not carry unforeseen liabilities. To the extent any customer or otherthird party asserts any material legal claims against Kenwood, our business, Ñnancial condition and resultsof operations could be materially and adversely aÅected.
We are exposed to price volatility of raw materials.
Our raw materials primarily consist of metals and plastics such as steel and acrylonite butadienestyrene (known as ""ABS''). Because the majority of these materials are commodity based, they areavailable from various independent suppliers. We are not dependent on any single foreign source for suchmaterials. However, we are subject to price volatility. For the year ended December 31, 2000, raw materialcosts increased by 18.7% largely due to a general increase in prices for such materials, especially steel(which increased from an average price of Lit. 650/kilogram in 1999 to Lit. 830/kilogram in 2000). Inorder to mitigate risks associated with price volatility, we typically enter into quarterly or six-monthforward supply agreements at Ñxed prices for certain materials. As a result, prices for our raw materials are
14
Brought to you by Global Reports

subject, in part, to exchange rate Öuctuations. You should refer to ""Ì We are exposed to foreign exchangerate Öuctuations.'' In addition, we cannot assure you that our current or future sources will continue toprovide raw materials to us at attractive prices, or at all, or that we will be able to obtain such rawmaterials in the future from these or other providers on the scale and within the time frames which werequire. Any failure to obtain such raw materials on a timely basis at an aÅordable cost, or any signiÑcantdelays or interruptions in supply, could have a material adverse eÅect on our business, Ñnancial conditionand results of operations.
We face risks associated with product recalls and product liability claims.
The sale and use of our products involve a risk of warranty and product liability claims, particularly inthe United States where product liability claims grounded on personal injuries are more common than inother countries. We are subject to possible claims for personal injury or property damage, which couldresult from the failure or alleged failure of our products or of components incorporated in products that wehave manufactured or sold. These claims could cause damage to our reputation and to the image of ourbrand names, negatively aÅecting our results of operations. While we make every eÅort to select reliablesuppliers for product components and although we rigorously control the quality of such goods, the risk ofdefects and product recalls cannot be completely eliminated. We have obtained insurance coverage forthese types of liabilities in amounts which we believe to be adequate. However, we may not be able toobtain such insurance on acceptable terms in the future, if at all; claims not covered by our insurance mayarise in the future; and our coverage may not be adequate to insure against all product liability claims. Apartially or completely uninsured claim, if successful and of signiÑcant magnitude, could have a materialadverse eÅect on our Ñnancial condition and results of operations.
We are exposed to foreign exchange and interest rate Öuctuations.
While we transact business largely in Euro zone currencies, a portion of our sales and operating proÑtsare aÅected by the impact of Öuctuations in foreign currency exchange rates on product prices and certainoperating expenses, including costs of raw materials and components. We believe that our exposure toÖuctuations in any particular currency is limited as a result of our diversiÑed business portfolio and due tothe fact that, for certain principal currencies such as the U.S. dollar, most of our net sales revenues areoÅset by our costs in the same currencies. Nevertheless, Öuctuations in the exchange rates of certainforeign currencies relative to the Euro may have an adverse impact on our sales and operating results andthe international competitiveness of our Italian-based manufacturing operations. We typically engage incertain foreign exchange transactions to hedge portions of our transactional exposure to Öuctuations inexchange rates between the Euro and the U.S. dollar, the pound sterling, the Canadian dollar and theJapanese Yen. We cannot assure you that our foreign exchange transactions will adequately protect usfrom the eÅects of currency Öuctuations or that, if signiÑcant Öuctuations were to occur, this would nothave an adverse eÅect on our Ñnancial position.
We also are subject to interest rate Öuctuations as a result of our debt position (which is generallysubject to variable market interest rates). As a result, we typically enter into interest rate contracts inconnection with our Ñnancial transactions with the aim of hedging a portion of our interest rate risk. As atDecember 31, 2000, we were party to interest rate contracts covering approximately 42.9% (or 4207,000thousand) of our total consolidated debt at such date (equal to 4483,000 thousand). Although weperiodically monitor the interest rate market and may subsequently enter into further hedging contractscovering some or all additional interest rate risks, we cannot assure you that such transactions willadequately protect us from the eÅects of interest rate Öuctuations or that, if signiÑcant Öuctuations were tooccur, this would not have an adverse eÅect on our Ñnancial position. You should also refer to""Management's Discussion and Analysis of Financial Condition and Results of Operations Ì Impact ofChanges in Exchange and Interest Rates''.
We rely upon certain key personnel.
Our success depends to a signiÑcant degree upon the eÅorts and abilities of certain key persons,including the Chairman of our Board of Directors, Giuseppe De' Longhi, who has provided importantguidance in the development of our operations; our Managing Director, Stefano Beraldo; our ViceChairman and Marketing Director, Fabio De' Longhi; and certain other members of our seniormanagement. Although we believe we could replace our key employees in an orderly fashion should theneed arise, the loss of the services of Giuseppe De' Longhi, Stefano Beraldo, Fabio De' Longhi or of othermembers of our senior management could have a material adverse eÅect on our results of operations.
15
Brought to you by Global Reports

We rely on the commercial success of our trademarks.
Our business is highly dependent on our ability to protect and promote our trademarks. These include,for speciÑc products, the De' Longhi, Pinguino, Ariagel, Simac and Climaveneta trademarks and, morerecently, the Kenwood and Ariete trademarks. We believe that our rights in these trademarks are asigniÑcant part of our business and that our ability to create demand for our products is dependent to alarge extent on our ability to exploit these trademarks. While we believe that our trademarks areadequately supported by applications for registrations, existing registrations and other legal protections inour principal markets, we cannot assure you as to the breadth or degree of protection that thesetrademarks may aÅord us, or that we will be able to successfully exploit our trademarks in the future.Moreover, we cannot assure you that others will not substantially challenge our intellectual property rightsor that we will be able to register our trademarks or otherwise adequately protect them in somejurisdictions. This uncertainty is likely to increase as we expand into new geographic areas and diversifyinto new product sectors. In light of our trademarks' importance to our business, any third party actionaimed at limiting our use of our trademarks could have a material adverse eÅect on our results ofoperation.
We are limited in the use of the Kenwood trademark.
Pursuant to a Worldwide Agreement dated December 1, 1986, as amended, Kenwood agreed withKabushiki Kaisha Kenwood, an unaÇliated Japanese company specializing in stereo and sound systems, todeÑne and regulate their respective rights in the ""Kenwood'' trademark. In particular, Kenwood agreed notto assert any rights against Kabushiki anywhere in the world for use of the trademark in relation to thesale of a speciÑed list of deÑned goods, including hi-Ñ, television, satellite receivers, computers andtelephones. You should refer to ""Our Business Ì Intellectual Property Ì Trademarks''. As a result of theabove agreement, we have certain limits on the use of the ""Kenwood'' brand name. In particular, we arenot allowed to sell or market our Kenwood products in Japan without the prior consent of Kabushiki. Wecannot assure you that our reputation will not suÅer damage as a result of issues aÅecting products soldunder the ""Kenwood'' name by Kabushiki. Further, if Kabushiki decided not to renew the WorldwideAgreement referred to above and to challenge our intellectual property rights in the future, we cannotassure you that we will be able to adequately protect the intended use of our trademarks in alljurisdictions. Any such action by Kabushiki aimed at limiting the use of our trademarks could have amaterial adverse eÅect on our results of operations. You should also refer to ""Ì We rely on thecommercial success of our trademarks.''
We rely on our patents to protect our proprietary technology.
We rely heavily on research and development eÅorts, and we manufacture a signiÑcant number ofproducts with features for which we have Ñled or obtained licenses for patents and design registrations inthe European Union and several foreign countries (including the United States). We cannot assure youthat our patents will aÅord us commercially signiÑcant protection of our technologies. With respect to ourfuture patent applications, we cannot assure you that we will be the Ñrst creator of inventions covered byour patent applications or that we will be the Ñrst to Ñle patent applications on such inventions. Althoughwe believe that our products do not infringe on the patents or other proprietary rights of third parties, wecannot assure you that other parties will not assert infringement claims against us or that such claims willnot be successful. We also cannot assure you that our competitors will not infringe any of our patents.Defense and prosecution of patent suits, even if successful, are both costly and time consuming. Anadverse outcome in the defense of a patent suit could subject us to signiÑcant liabilities to third parties,require disputed rights to be licensed from third parties or require us to cease selling our products.
We are controlled by our principal shareholder.
Prior to the oÅering, 100.0% of our issued and outstanding share capital is held directly and indirectlyby Giuseppe De' Longhi (referred to as the ""principal shareholder''). Assuming the sale of all the sharesbeing oÅered in the Global OÅering, the principal shareholder will own 70.0% of our fully diluted sharecapital (or 66.87% if the over-allotment option is exercised in full). Accordingly, the principal shareholderwill be able to pass resolutions at our ordinary and extraordinary shareholders' meetings, to appoint ourdirectors and, consequently, to generally direct our business aÅairs and corporate matters, such as ourstrategy, our investment policy, the approval of the annual Ñnancial statements and the declaration ofdividends. You should also refer to ""Our Principal Shareholders''. The concentration of ownership mayhave the eÅect of delaying, deterring or preventing a change in control of the Company, may discourage
16
Brought to you by Global Reports

bids for our shares at a premium over the market price of the shares and may otherwise adversely aÅectthe market price of the shares.
Risks Relating to the Market in which We Operate
We are subject to risks related to manufacturing operations in China.
As a result of our recent acquisition of Kenwood, a signiÑcant portion of our manufacturing operationsare now located in China and conducted by our wholly owned subsidiary, Tricom Industrial CompanyLimited. We believe that Tricom's manufacturing facilities and production structures in China provide uswith an important opportunity to outsource the production of certain of our more basic and less strategicproducts at signiÑcant cost-savings. As of the date of this oÅering memorandum, our manufacturingoperations in Qingxi are conducted pursuant to a processing contract between Tricom and a localgovernment processing enterprise in Qingxi. This contract will expire in 2005, at which time we maynegotiate to extend the agreement, subject to the approval of the relevant local authorities. If we areunable to extend the agreement, or if it is otherwise terminated prior to its scheduled expiry date, we maybe required to cease our operations in Qingxi. This could have a material adverse eÅect on our businessprospects and results of operations.
Since 1979, the government of China (the ""PRC government'') has been developing a comprehensivesystem of commercial laws, and has introduced legislation that aÅects various aspects of our business, suchas foreign investment, corporate organization and governance, commerce, taxation and trade. Many ofthese laws are relatively new. Moreover, China's legal system is based on written statutes, and prior courtcases may only be noted for reference but do not have binding precedential eÅect. Because of the limitedvolume of published cases and judicial interpretation and their non-binding nature, enforcement andinterpretation of these laws and regulations involve signiÑcant uncertainty. As China's legal systemdevelops, changes in such laws and regulations, their interpretation or their enforcement may lead toadditional restrictions on our business operations.
The economy of China diÅers from the economies of most developed countries in many respects,including the level of government involvement, development, growth rate, control of foreign exchange andallocation of resources. In recent years, the PRC government has implemented economic reform measuresaimed at moving from a planned economy to a more market oriented economy. We cannot assure you thatthe policies, measures, controls and other actions adopted or implemented by the PRC government fromtime to time will not restrict our business operations or adversely aÅect our Ñnancial results.
We face intense competition.
Certain of our businesses are highly competitive and, in recent years, some of the markets in whichwe operate (including Italy) have been characterized by signiÑcant consolidation among productmanufacturers resulting in larger and more competitive companies. Moreover, certain of our basic kitchenproducts and small household appliances have been characterized by a general decline in market prices inthe last year. Although we have a leading market share in segments of the European, U.S. and otherforeign markets (particularly with respect to products at the high end of the price range), we competewith a number of companies specializing in one or more of our business segments, some of which havegreater Ñnancial, technical and marketing resources than we do. Competition is based on a number offactors, including reliability, quality and reputation of the manufacturer and its products, innovations,marketing, distribution and price. We believe that we have achieved our leading position based on, amongother things, our ability to maximize economies of scale through a highly automated manufacturingprocess and our Öexible cost structure, our dedication to research and development, the regularintroduction of new and improved product models and the strength of our relationship with our customers.We cannot assure you, however, that we will be able to continue to compete successfully in the variousmarkets in which we operate or that our competitors will not devote substantial resources to thedevelopment of new products that will compete eÅectively with ours, thereby negatively aÅecting our sales.In addition, we cannot assure you that we will be able to maintain the necessary levels of investment inR&D and product innovation that we have maintained in the past.
We are subject to seasonal and climatic trends.
Certain of our businesses are subject to seasonal variations in consumer spending over which we haveno control and that aÅect sales. We experience higher revenues in the winter and summer months of eachyear primarily due to increased demand by customers for our heating and air conditioning products,
17
Brought to you by Global Reports

respectively, in anticipation of, and in response to, colder and warmer weather. This seasonality requires usto increase our production and accumulate inventory before the peak seasons, resulting in increasedworking capital and debt at that time. Although we believe that the geographic diversiÑcation of ourbusinesses and the wide range of our product lines minimizes the risks associated with seasonal andclimatic trends, signiÑcant anomalies in climatic conditions in our principal markets could result in lowerrevenues than expected during such peak periods, which could, in turn, have a material adverse eÅect onour business and results of operations.
Our performance is subject to Öuctuations in macroeconomic conditions.
We sell our products, particularly small household appliances, in large part to retailers, including massmerchandisers and department stores. In 2000, approximately Lit. 1,131 billion, or 71.4%, of our combinedpro forma net revenues (excluding Kenwood) were attributable to sales to retail customers. Retail salesdepend signiÑcantly on general economic conditions, and a decline in such conditions could have anegative impact on sales by retailers of the type of products we oÅer. A signiÑcant deterioration in theretail environment could have a material adverse eÅect on our sales and proÑtability.
We are subject to consumer protection, environmental and other governmental regulations.
Most federal, state, provincial and local authorities in Europe, the United States and other foreignjurisdictions in which we operate require us to comply with consumer safety standards and speciÑcations(and, in most instances, to obtain applicable certiÑcation) prior to marketing electrical appliances in thosejurisdictions where we sell such products. Although we believe that we have complied with all suchrequirements, we cannot assure you that all of our products meet such standards and speciÑcations. Adetermination that we have not complied with such rules and regulations could result in the imposition ofÑnes or an award of damages to private litigants. These and other initiatives could have a material adverseeÅect on our business, Ñnancial condition and results of operations.
We are also subject to a number of domestic governmental regulations in countries in which we haveour manufacturing facilities (including Italy, the United Kingdom and China) relating to the use andstorage of materials, discharge and disposal of factory wastes, safety standards of facilities and processesand employee age and health and safety standards. Although we have not been subject to material claimsin the past other than as described in this oÅering memorandum and although we believe that ouractivities conform in all material respects to presently applicable environmental, labor and safetyregulations, the failure to comply with present or future regulations could result in damages or Ñnes,suspension of production or cessation of certain activities. In particular, law and regulations (especially inChina where we are considering to move additional production capacity) are subject to change and may besubject to diÅering interpretations, leading to some uncertainty regarding their application. Compliancewith new regulations could require us to incur signiÑcant expenses that could have an adverse eÅect on ourresults of operations. Any failure to control the use of, or adequately restrict the discharge of, hazardoussubstances or comply with safety requirements and legislation could subject us to signiÑcant liabilities. Youshould refer to ""Our Business Ì Regulatory Environment.''
We may be adversely impacted by work stoppages and other labor relations matters.
We operate primarily in a unionized industry, which subjects us to the risk of strikes and other workstoppages. You should refer to ""Our Business Ì Employees''. Our operations have not suÅered materialdisruption as a result of strikes or work stoppages in the recent past. In June, 1999, we entered into anextension of our Italian collective bargaining agreement for the metals and machinery industry that isscheduled to expire in December, 2002. However, we may in the future be subject to strikes and workstoppages in connection with the negotiation of company-speciÑc or national labor contracts. Any strikes,work stoppages or other collective action may interrupt the production of our products and could have amaterial adverse eÅect on our business, prospects, results of operations and Ñnancial condition.
Risks Relating to our Shares
There has been no prior public market for our shares.
Prior to the Global OÅering, there was no public market for our shares. We will determine theoÅering price of the shares in coordination with the Global Coordinators following conclusion of the book-building process. There can be no assurance that the oÅering price will correspond to the price at whichthe shares will be traded after the Global OÅering. Following the Global OÅering, the prices at which our
18
Brought to you by Global Reports

shares will trade may Öuctuate substantially in response to a variety of factors, including announcements oftechnological innovations or new services by us or our competitors, Öuctuations in our operating results,industry trends, announcements by us or our competitors of signiÑcant acquisitions, partnerships or jointventures or the release of lock-up or other transfer restrictions on outstanding shares or the issue or salesof new shares. In addition, our operating results and prospects from time to time may be below theexpectations of market analysts and investors. Any of these events could result in a material decline in theprices of our shares.
Shares eligible for public sale after this oÅering could adversely aÅect the price of our shares.
The market prices of our shares could decline as a result of sales by our existing shareholders ofshares in the market after this oÅering, or the perception that these sales could occur. These sales alsomight make it diÇcult for us to sell equity securities in the future at a time and at a price that we deemappropriate. Following the oÅering, many of our shares will be subject to legal and contractual lock-upprovisions. You should refer to ""Plan of Distribution''. Furthermore, the shares being sold in this oÅeringwill not be freely transferable under U.S. securities laws immediately after issuance. You should refer to""Transfer Restrictions''.
It may be diÇcult to enforce judgments against us in Italian courts.
De' Longhi is a corporation organized under the laws of Italy. All of our directors and most of ouroÇcers are non-residents of the United States. As a result, investors may not be able to eÅect service ofprocess within the United States upon us or our directors or oÇcers regarding matters arising under theU.S. securities laws, or to enforce judgments of U.S. courts based upon these laws.
Our Italian legal counsel has advised us that it is doubtful that an Italian court would acceptjurisdiction in a lawsuit based upon U.S. securities laws and brought in an original action in Italy.Moreover, it is also doubtful that a foreign judgment based on the U.S. securities laws could be enforcedin Italy. Our Italian legal advisers have advised us that Italian courts have jurisdiction for challengingcorporate resolutions, while the general rules of jurisdiction and international treaties will apply to anyother claim by shareholders against us.
19
Brought to you by Global Reports

USE OF PROCEEDS
We expect to raise net proceeds of Lit. 235,009 million, or 4121.4 million from this oÅering(excluding the exercise of the over-allotment option) after deducting the estimated underwritingcommissions (not including any discretionary commissions) and estimated expenses of the oÅering to bepaid by us.
Assuming full exercise of the over-allotment option we expect to receive total net proceeds ofLit. 259,697 million, or 4134.1 million.
We intend to use the net proceeds from this oÅering for general corporate purposes, including, but notlimited to, expanding our operations, reducing our debt and for our working capital needs.
20
Brought to you by Global Reports

MARKET INFORMATION
Equity and convertible securities in Italy are traded on the Telematico, the electronic stock marketorganized and managed by Borsa Italiana S.p.A. (""Borsa Italiana''). The Telematico is subject to thesupervision and control of CONSOB, the public authority responsible for, inter alia, regulating investmentcompanies, securities markets and public oÅerings of securities in Italy to ensure the transparency andregularity of dealings and to protect investors. Borsa Italiana is a limited liability company (societ fia perazioni) that was established to manage the Italian regulated Ñnancial markets (including the Telematico)as part of the implementation in Italy of the EU Investment Services Directive pursuant to LegislativeDecree No. 415 of July 23, 1996 (the ""Eurosim Decree''). Borsa Italiana became operational in January1998, and has issued rules governing the organization and the administration of the Italian StockExchange, the over-the-counter sales of securities, futures and options markets as well as the admission tolisting on and trading in these markets. The shareholders of Borsa Italiana are primarily Ñnancialintermediaries.
Market Regulations
A three-day rolling cash settlement period applies to all trades of equity securities in Italy eÅected ona regulated market. Any person, through any authorized intermediary, may purchase or sell listed securitiesfollowing (i) in the case of sales, deposit of the securities and (ii) in the case of purchases, deposit of100 percent of their value in cash or deposit of listed securities or government bonds of an equivalentamount. No ""closing price'' is reported for the electronic trading system, but an oÇcial price for eachsecurity, calculated as a weighted average of all trades eÅected during the trading day, net of tradesexecuted on a ""cross-border'' basis, and a reference price for each security calculated as a weightedaverage of the last ten percent of the trades eÅected during such day, net of trades executed on a ""cross-border'' basis, are published daily.
If the opening price of a security (established each trading day prior to the commencement of tradingbased on bids received) diÅers by more than ten percent (or such other amount established by BorsaItaliana) from the previous day's reference price, trading in that security will not be permitted until BorsaItaliana authorizes the re-commencement of trading. If in the course of a trading day the price of asecurity Öuctuates by more than Ñve percent from the last reported sale price (or ten percent from theprevious day's reference price), a Ñve-minute automatic suspension in the trading of that security will bedeclared by Borsa Italiana. In the event of such a suspension, orders already placed may not be modiÑedor cancelled, and new orders may not be processed. Borsa Italiana has the authority to suspend trading inany security in response to extreme price Öuctuations or for other reasons. In urgent circumstances,CONSOB may, where necessary, adopt measures required to ensure the transparency of the market,orderly trading and protection of investors.
Securities Trading
EÅective September 1, 1996, the Eurosim Decree, among other things, implemented in Italy, two EUdirectives relating to Ñnancial markets and established a new regulatory framework for the Italian Ñnancialmarkets. The UniÑed Financial Act consolidates the regulation of the Italian Ñnancial markets, primarilyby restating the provisions of the Eurosim Decree. The UniÑed Financial Act took eÅect on July 1, 1998.
Various implementing regulations have been promulgated pursuant to the UniÑed Financial Act. TheUniÑed Financial Act provides (with minor exceptions) that trading of equity securities, as well as anyother investment services, may be carried out with the public only by registered dealing Ñrms and banks.Banks and investment services Ñrms organized in a member country of the EU are permitted to operate inItaly provided that the intent of the bank or investment services Ñrm to operate in Italy is communicatedto CONSOB and the Bank of Italy by the competent authority of the relevant member state. Non-EUbanks and non-EU investment services Ñrms may operate in Italy subject to the speciÑc authorization ofCONSOB and with the consent of the Bank of Italy. The settlement of stock exchange transactions isfacilitated by Monte Titoli. Most Italian banks and investment companies have securities accounts withMonte Titoli.
BeneÑcial owners of the shares may hold their interests through custody accounts with Ñnancialintermediaries.
For a description of stock transfer rules in Italy, you should refer to ""Description of Share Capital ÌForm and Transfer of Shares.''
21
Brought to you by Global Reports

Clearance and Settlement in Italy
The settlement of stock exchange transactions is carried out through Monte Titoli, a centralizedsecurities clearing system owned by the Bank of Italy and certain of the major Italian banks and Ñnancialinstitutions. Most Italian banks and certain Italian securities dealers (""SIMs'') have securities accountswith Monte Titoli, and beneÑcial owners of shares may hold their interests through speciÑc custodyaccounts with any such institution. The beneÑcial owners of shares held with Monte Titoli may transfertheir shares, collect dividends, create liens and exercise other rights with respect to the shares throughsuch accounts. Participants in Euroclear and Clearstream, Luxembourg may hold their interests in sharesand transfer their shares, collect dividends, create liens and exercise other rights with respect to suchshares, through Euroclear or Clearstream, Luxembourg.
Pursuant to the UniÑed Financial Act, Legislative Decree No. 213 and CONSOB RegulationNo. 11768/38, shareholders will no longer be able to obtain the physical delivery of share certiÑcates inrespect of their shares.
Disclosure of Ownership Interest
BeneÑcial owners of our ordinary shares may hold their interests through custody accounts withintermediaries. For a description of CONSOB requirements as to the disclosure of beneÑcial ownership ofsecurities, you should refer to ""Description of Share Capital''.
Trading by us in the Shares
Under Italian law, we may purchase the shares in certain limited circumstances. We are notpermitted, however, to underwrite our own newly issued shares. You should also refer to ""Description ofShare Capital Ì Purchase of Our Own Shares.''
22
Brought to you by Global Reports

DIVIDENDS AND DIVIDEND POLICY
The shares will be eligible for all dividends, if any, payable in respect of the Ñscal year endingDecember 31, 2001. We currently intend to declare a dividend, although we make no assurance as towhether we will make such a declaration or the amount of such dividend. The payment of futuredividends, if any, and the amounts thereof, will depend on a number of factors including, but not limitedto, the amount of distributable proÑts and reserves on an unconsolidated basis, our capital expenditure andinvestment plans, earnings, level of proÑtability, ratio of debt to equity, applicable restrictions on thepayment of dividends under Italian law, the level of dividends paid by other comparable listed companiesin Italy and elsewhere and such other factors as the board of directors and shareholders may deemrelevant. Any cash dividends which we declare will be paid in Lire or Euro until the Euro becomes theonly currency used in Italy. You should also refer to ""Exchange Rates''.
Consistent with Italian law, our payment of annual dividends is made out of our distributable proÑtsand reserves on an unconsolidated basis for each relevant year, and must be recommended by the board ofdirectors. Any such recommendation is subject to approval by our shareholders at the annual shareholders'meeting which must be convened for the approval of our annual Ñnancial statements within four months(or, in certain exceptional circumstances, six months) after the end of the Ñnancial year to which suchÑnancial statement relate.
Pursuant to applicable Italian law, before dividends may be paid with respect to any Ñnancial year, wemust allocate to our legal reserve (Riserva Legale) an amount equal to 5% of our net proÑt on anunconsolidated basis for such year, until such reserve, including amounts set aside during prior years, isequal to at least 20% of the aggregate nominal amount of our issued and outstanding share capital. Suchrestriction on the payment of dividends also applies, on an unconsolidated basis, to each of our Italiansubsidiaries. At March 31, 2001, the amount of such reserve was Lit. 4,565 million which is equal to 1.1%of the aggregate nominal value of our then issued share capital. Assuming full subscription of this oÅering,the total nominal value of our fully diluted issued and outstanding share capital will increase byapproximately Lit. 217,830 million. Prior to paying any dividends, as required under Italian law, we willhave to make annual allocations to our legal reserve as described above.
Finally, amounts determined by the shareholders at the shareholders' meeting may be set aside in thestatutory reserve fund and in any other reserve funds established by the shareholders. The residual amountof our net income may be paid as dividends or set aside in optional reserves which may be distributed(referred to as ""distributable reserves''), provided that the legal reserve described above remains equal toor greater than the statutorily required minimum.
In addition to paying dividends from unconsolidated distributable proÑts, we may also distributedividends by charging reserves available for distribution, some of which may only be charged for suchdistributions, provided that, prior to such distribution, the legal reserve is at or above the legally requiredminimum referred to above. No dividends may be distributed in the event of losses that aÅect sharecapital until the share capital is replenished or reduced accordingly.
Our shareholders may adopt a resolution at an extraordinary shareholders' meeting to convert reservesavailable for distribution into additional share capital. Any ordinary shares resulting from any such increasein share capital may be allocated to shareholders in proportion to their ownership before such increase,without further contribution or payment from shareholders. Alternatively, the nominal value of theoutstanding shares can be increased in order to reÖect the increase in share capital.
In addition to annual dividends, our bylaws give the board of directors the power to approve thedistribution of interim dividends. Pursuant to Italian law, after the approval of the preceding Ñnancialyear's Ñnancial statements and provided such Ñnancial statements do not reÖect current and/oraccumulated losses, interim dividends may be distributed provided they do not exceed the lower of (i) theproÑt of the current Ñnancial year, net of the amount to be attributed to legal and other reserves and(ii) distributable reserves. Once paid in compliance with applicable laws, shareholders cannot be requiredto repay interim dividends or annual dividends on the basis of duly approved Ñnancial statements if theshareholders collected such dividends in good faith.
Dividends in respect of ordinary shares will automatically be credited to your deposit account with anintermediary participant in Monte Titoli or Clearstream Banking, soci πet πe anonyme or Euroclear withoutthe need for you to present documentation proving your ownership of the shares. Dividends not collectedwithin Ñve years from the date they become payable will be forfeited in our favor.
23
Brought to you by Global Reports

As a general rule, dividends payable on our ordinary shares to non-residents of Italy without apermanent establishment in Italy to which the ordinary shares are eÅectively connected are subject todeduction of Italian substitute tax at a rate of 27%, which may be reduced by virtue of applicable taxtreaties. You should also refer to""Taxation of Shares'' for more information concerning withholding andother taxes on dividends.
Italian regulations do not contain any speciÑc restrictions on the payment of dividends to non-residents of Italy. Italian law provides that we must supply the Italian taxation authorities with certaininformation concerning the identity (i) of those of our shareholders who elected to treat the payment oftheir dividends as part of their taxable income and (ii) of those of our shareholders who are not residentin Italy. Shareholders should provide us with their Italian tax identiÑcation number, if any, and non-resident shareholders should provide us with their name, country of establishment and address. Individualsshould provide us with their name, address and place and date of birth. Partnerships should provide theinformation required for legal entities, as well as, for one of their representatives, the information requiredfor individuals.
24
Brought to you by Global Reports

EXCHANGE RATES
The European Monetary System and the Euro
Under the provisions of the Treaty on European Union (the ""Maastricht Treaty''), which came intoeÅect on November 1, 1993, a European Monetary Union with a single European currency under themonetary control of a European Central Bank, superseded the Exchange Rate Mechanism (""ERM'') andthe European Monetary System (""EMS''). The European Monetary Institute (""EMI'') was subsequentlyestablished with responsibility for the technical preparations for European Monetary Union (""EMU'')(including instruments, procedures and regulations) as well as for strengthening cooperation andcoordination among the monetary authorities of the member states. The EMI was also responsible formonitoring the EMS until full monetary union. The EMI is empowered, among other things, to makerecommendations about the monetary policy of member states. On May 2, 1998, the Council of theEuropean Union determined that Italy, Austria, Belgium, Finland, France, Germany, Ireland, Luxem-bourg, the Netherlands, Portugal and Spain (the ""Participating Member States'') fulÑlled the necessaryconditions (price stability, governmental Ñnances, including annual deÑcits and total debt, exchange ratesstability and long-term interest rate stability) to join EMU and to adopt the Euro as their single currency.
Pursuant to the Maastricht Treaty, the third stage of EMU took place on January 1, 1999. The EurooÇcially became a currency, alongside each of the national currencies of Participating Member States,which were Ñxed at irrevocable conversion rates to the Euro until June 30, 2002, when all participatingcountries are expected to use the Euro as their only currency. Also on January 1, 1999, the EuropeanCentral Bank in Frankfurt began to determine monetary policy for the Participating Member Statescentrally, and the existing ERM was replaced by a system in which the currencies of EU membercountries that are not Participating Member Countries are linked to the Euro rather than to the Ñxed gridcentral rates of the ERM. The national currencies of Participating Member States will continue to be legaltender for transactions between Participating Member States and all other nations.
Because the currencies of the Participating Member States are Ñxed at irrevocable conversion ratesagainst the Euro, the conversion of one Participating Member State's national currency into that ofanother country (whether a Participating Member State or not) can be determined only through thebilateral conversion method, which involves converting the Ñrst currency into Euro and then converting thisEuro amount into the second currency. The conversion rate between the Euro and the ParticipatingMember States' national currencies were irrevocably Ñxed on December 31, 1998. The conversion ratebetween the Euro and the Italian Lira was Ñxed at Lit. 1,936.27 per Euro. The following table sets forththe bilateral conversion rates between the Italian Lira and each of the ten other Participating MemberStates' national currencies:
100 Belgian/ 10 1 1 1 100 100 10 10Luxembourg French Deutsche Irish Dutch Portuguese Spanish Austrian Finnish
Francs Francs Mark Punt Guilder Escudos Pesetas Shillings Marks
Lira (Italy) ÏÏÏÏÏÏ 4,799.89 2,951.83 989.999 2,458.56 878.641 965.807 1,163.72 1,407.14 3,256.57
Italian companies may, in the interim, elect to replace Lira with Euro in all their accountingdocumentation having an application outside the company, but they are not compelled to do so. Once anyaccounting document having an application outside the company has been expressed in Euro, however, allsubsequent accounting documentation (except for such documents that are prepared for internal use only)must be expressed in Euro.
Banks, Ñnancial institutions, insurance companies, listed companies and their subsidiaries may decidenot to adopt Euro as an accounting unit, in which case they are nonetheless allowed to draft and publishtheir mandatory accounting documents in Euro.
Cash dividends, if any, will be paid by us in Italian Lire or Euro until December 31, 2001 and then,following the introduction of the single currency, in Euro.
Fluctuations in exchange rates between Euro and the currencies outside EMU will obviously have animpact on the equivalent price of the shares on the Telematico in such currencies. Concurrently, suchexchange rate Öuctuations could adversely aÅect the value of the shares in those other currencies andresult in a decrease of the equivalent that shareholders who convert their dividends into a foreign currencywould be able to receive.
25
Brought to you by Global Reports

Exchange Rates
The following tables show, for the periods indicated, information concerning the exchange ratesbetween the U.S. Dollar and the Lira and between the U.S. Dollar and the Euro. These rates are providedsolely for your convenience. We do not represent that the named currencies could have been converted atthese rates or any other rate.
The column of averages in the tables below shows the averages of the relevant exchange rates on thelast business day of each month during the relevant period. The high and low columns show the highestand the lowest mid-market quotes, respectively, on any business day during the relevant period.
Lire per U.S. Dollar(1)
Year ended December 31, End of Period Average(2) High Low
1996 ÏÏÏÏÏÏÏÏÏÏÏÏÏÏÏÏÏÏÏÏÏÏÏÏÏÏÏÏÏÏÏÏÏÏÏÏÏÏÏÏÏÏÏÏÏÏ 1,519 1,543 1,602 1,496
1997 ÏÏÏÏÏÏÏÏÏÏÏÏÏÏÏÏÏÏÏÏÏÏÏÏÏÏÏÏÏÏÏÏÏÏÏÏÏÏÏÏÏÏÏÏÏÏ 1,769 1,703 1,841 1,516
1998 ÏÏÏÏÏÏÏÏÏÏÏÏÏÏÏÏÏÏÏÏÏÏÏÏÏÏÏÏÏÏÏÏÏÏÏÏÏÏÏÏÏÏÏÏÏÏ 1,654 1,736 1,828 1,592
1999 ÏÏÏÏÏÏÏÏÏÏÏÏÏÏÏÏÏÏÏÏÏÏÏÏÏÏÏÏÏÏÏÏÏÏÏÏÏÏÏÏÏÏÏÏÏÏ 1,923 1,817 1,933 1,639
2000 ÏÏÏÏÏÏÏÏÏÏÏÏÏÏÏÏÏÏÏÏÏÏÏÏÏÏÏÏÏÏÏÏÏÏÏÏÏÏÏÏÏÏÏÏÏÏ 2,062 2,096 2,341 1,874
2001 (through July 16) ÏÏÏÏÏÏÏÏÏÏÏÏÏÏÏÏÏÏÏÏÏÏÏÏÏÏÏÏÏÏ 2,265 2,165 2,313 2,031
(1) Based on the U.S. Federal Reserve Bank noon buying rate for the Lira for 1996, 1997 and 1998. For 1999, 2000 and 2001,
based on the noon buying rate for Euro and then converted in Lira at the Ñxed Lira/Euro conversion rate of
Lit. 1,936.27 • 41.00.
(2) Based on the average of the exchange rates for the last business day of each month during the relevant period.
Given its recent introduction, there is insuÇcient historical exchange rate data concerning the Euro.As a result, this section provides historical exchange rate data concerning the European Currency Unit (or""ECU'') as well. The ECU, the predecessor to the Euro, was a composite (or ""basket'') currency,consisting of speciÑed amounts of the currencies of the EU member states, not all of which are currentlymembers of EMU. In accordance with European Council Regulation No. 1103/97, substitution of theEuro for the ECU on January 1, 1999 was at the rate of one Euro per ECU.
U.S. Dollar per Euro(1)
Year ended December 31, End of Period Average(2) High Low
1996 ÏÏÏÏÏÏÏÏÏÏÏÏÏÏÏÏÏÏÏÏÏÏÏÏÏÏÏÏÏÏÏÏÏÏÏÏÏÏÏÏÏÏÏÏÏÏÏÏ 1.25 1.25 1.29 1.22
1997 ÏÏÏÏÏÏÏÏÏÏÏÏÏÏÏÏÏÏÏÏÏÏÏÏÏÏÏÏÏÏÏÏÏÏÏÏÏÏÏÏÏÏÏÏÏÏÏÏ 1.10 1.13 1.25 1.05
1998 ÏÏÏÏÏÏÏÏÏÏÏÏÏÏÏÏÏÏÏÏÏÏÏÏÏÏÏÏÏÏÏÏÏÏÏÏÏÏÏÏÏÏÏÏÏÏÏÏ 1.17 1.12 1.23 1.07
1999 ÏÏÏÏÏÏÏÏÏÏÏÏÏÏÏÏÏÏÏÏÏÏÏÏÏÏÏÏÏÏÏÏÏÏÏÏÏÏÏÏÏÏÏÏÏÏÏÏ 1.01 1.07 1.18 1.00
2000 ÏÏÏÏÏÏÏÏÏÏÏÏÏÏÏÏÏÏÏÏÏÏÏÏÏÏÏÏÏÏÏÏÏÏÏÏÏÏÏÏÏÏÏÏÏÏÏÏ 0.94 0.92 1.03 0.83
2001 (through July 16) ÏÏÏÏÏÏÏÏÏÏÏÏÏÏÏÏÏÏÏÏÏÏÏÏÏÏÏÏÏÏÏÏ 0.85 0.89 0.95 0.84
(1) Based on the U.S. Federal Reserve Bank noon buying rate for ECU for 1996, 1997 and 1998, and for Euro for 1999, 2000
and 2001.
(2) Based on the average of the exchange rates for the last business day of each month during the relevant period.
26
Brought to you by Global Reports

CAPITALIZATION
The following table sets forth our net short term debt (net of cash) and capitalization at March 31,2001. We have adjusted our net short term debt (net of cash) and capitalization at such date to reÖect therepayment of Lit. 320,600 million of shareholders' debt in April 2001 to certain aÇliated parties, and acapital increase of Lit. 250,587 million at nominal value eÅected in April 2001 by De' Longhi SoparÑ S.A.We have also adjusted our net short term debt and capitalization to reÖect the proceeds from the sale ofthe shares pursuant to the Global OÅering (before any deduction of management and underwritingcommissions, selling concessions and estimated expenses that we may owe and excluding the exercise ofthe over-allotment option). You should refer to ""Description of Share Capital'' for information relating tothe number of our shares authorized for issuance in the Global OÅering.
Unaudited Consolidated
March 31, 2001(1)
Historical Adjusted(3)
De' Longhi(2) Pro Forma(4)(5) (oÅering price)
(Lit. millions)
Net short term debt (net of cash)ÏÏÏÏÏÏÏÏÏÏÏÏÏÏÏÏÏÏÏ 197,573 267,586(4) 20,712(4)
Long term debt ÏÏÏÏÏÏÏÏÏÏÏÏÏÏÏÏÏÏÏÏÏÏÏÏÏÏÏÏÏÏÏÏÏÏ 664,515 664,515 664,515
Debt for acquisition of investments ÏÏÏÏÏÏÏÏÏÏÏÏÏÏÏÏÏÏ 478,904 158,304(4) 158,304(4)
Shareholders' equity:
Share capitalÏÏÏÏÏÏÏÏÏÏÏÏÏÏÏÏÏÏÏÏÏÏÏÏÏÏÏÏÏÏÏÏÏÏÏ 400,000 650,587(5) 868,417(5)
Other reserves ÏÏÏÏÏÏÏÏÏÏÏÏÏÏÏÏÏÏÏÏÏÏÏÏÏÏÏÏÏÏÏÏÏ 70,428 70,428 99,472
Net incomeÏÏÏÏÏÏÏÏÏÏÏÏÏÏÏÏÏÏÏÏÏÏÏÏÏÏÏÏÏÏÏÏÏÏÏÏ 1,821 1,821 1,821
Minority interestsÏÏÏÏÏÏÏÏÏÏÏÏÏÏÏÏÏÏÏÏÏÏÏÏÏÏÏÏÏÏÏ 636 636 636
Total shareholders' equity and minority interestsÏÏÏÏÏÏÏ 472,885 723,472 970,346
Total capitalization ÏÏÏÏÏÏÏÏÏÏÏÏÏÏÏÏÏÏÏÏÏÏÏÏÏÏÏÏÏÏÏ 1,616,304 1,546,291 1,793,165
(1) This table should be read in conjunction with our Unaudited Interim Consolidated Financial Statements (and the notes
thereto) contained elsewhere in this oÅering memorandum.
(2) Historical data was prepared including all of outstanding shares of Kenwood.
(3) Adjusted to assume consummation of the Global OÅering at the oÅering price of 43.4 (Lit. 6,583) per ordinary share,
excluding exercise of the over-allotment option.
(4) Adjusted to reÖect the repayment of Lit. 320,600 million of debt for acquisition of investments in April 2001 to certain
aÇliated parties. See ""Certain Transactions with Related Parties.'' See ""Management's Discussion and Analysis of Financial
Condition and Results of Operations Ì Recent Developments After March 31, 2001'' and ""Certain Transactions With
Related Parties''.
(5) Adjusted to reÖect a capital increase of Lit. 250,587 million at nominal value eÅected in April 2001 by De' Longhi SoparÑ
S.A. See ""Our Principal Shareholders''.
27
Brought to you by Global Reports

DILUTION
The diÅerence between the initial public oÅering price per share and the net tangible book value pershare after the Global OÅering constitutes the dilution to investors in this Global OÅering. Net tangiblebook value per share is determined by dividing our net tangible book value (shareholders' equity less netgoodwill) by the number of outstanding shares.
At March 31, 2001, on a pro forma basis (calculated to reÖect the capital increase eÅected in April2001) we had a net tangible book value of Lit. 80,397 million, or Lit. 718 per share. After giving furthereÅect to the sale of our shares pursuant to this Global OÅering (excluding the exercise of the over-allotment option), after deducting estimated underwriting discounts and estimated expenses of the GlobalOÅering, our pro forma net tangible book value at the same date would have been Lit. 315,406, orLit. 2,110 per share, representing an immediate dilution of Lit. 4,157 per share, or 66.3%, to new investors.
The following table illustrates the foregoing information with respect to dilution to new investors inLire on a per share basis:
Lit. millions Lit. per share
OÅering Price ÏÏÏÏÏÏÏÏÏÏÏÏÏÏÏÏÏÏÏÏÏÏÏÏÏÏÏÏÏÏÏÏÏÏÏÏÏÏÏÏÏÏÏÏÏÏÏÏÏÏÏÏÏ 235,009 6,267
Net tangible book value before the Global OÅering ÏÏÏÏÏÏÏÏÏÏÏÏÏÏÏÏÏÏÏÏÏ 80,397(1)(2) 718(2)
Net tangible book value after Global OÅering ÏÏÏÏÏÏÏÏÏÏÏÏÏÏÏÏÏÏÏÏÏÏÏÏÏÏ 315,406 2,110
Dilution to new investorsÏÏÏÏÏÏÏÏÏÏÏÏÏÏÏÏÏÏÏÏÏÏÏÏÏÏÏÏÏÏÏÏÏÏÏÏÏÏÏÏÏÏÏÏ 155,894 4,157
(1) Other intangible assets were not deducted as they are mainly composed of trademarks and patents which could be soldseparately from all other assets of the business.
(2) Based on number of shares outstanding immediately before the Global OÅering as a result of a capital increase of Lit. 250,587million at nominal value eÅected in April 2001 by De' Longhi SoparÑ S.A.
28
Brought to you by Global Reports

SELECTED FINANCIAL AND OTHER DATA
The selected unaudited pro forma and historical Ñnancial information set forth below has been derivedfrom the following Ñnancial statements included elsewhere in this oÅering memorandum:
‚ the Unaudited De' Longhi Pro Forma Consolidated Financial Statements as at and for the yearsended December 31, 1998, 1999 and 2000, derived from the Audited De' Longhi ConsolidatedFinancial Statements; the audited annual Ñnancial statements of DL Radiators S.p.A. for 2000;De'Longhi Radiators S.r.l. for each of 1998 and 1999, and Climaveneta S.p.A. and ErgoklimaS.p.A. for each of 1998, 1999 and 2000; and the unaudited annual Ñnancial statements of De'Longhi Divisione Cucine S.p.A., Micromax S.p.A and Sile Corpi Scaldanti S.r.l.; and
‚ the Unaudited Interim De' Longhi Consolidated Financial Statements, comprising the unauditedinterim historical consolidated balance sheets and income statements of the Group at and for thethree months ended March 31, 2000 and 2001.
The Unaudited De' Longhi Pro Forma Consolidated Financial Statements have been adjusted, amongother things, to reÖect the purchase in 2000 of a controlling interest in each of De' Longhi DivisioneCucine S.p.A., DL Radiators S.p.A., Climaveneta S.p.A., Micromax S.p.A., Ergoklima S.p.A. and SileCorpi Scaldanti S.r.l., in each case as if such acquisitions had occurred on January 1, 1998. In addition,the Unaudited De' Longhi Pro Forma Consolidated Financial Statements have been adjusted to reÖect anincrease in our debt resulting from the payment of the companies we purchased in 2000 and acorresponding reduction in our net debt due to a capital increase of Lit. 250,587 million eÅected inApril 2001. You should note that the purchase contracts for the companies we acquired in December 2000as part of our restructuring process and reÖected in such Ñnancial statements included approximately Lit.504,714 million in interest-free debt and, as a result, the Unaudited Pro Forma Consolidated FinancialStatements do not include a charge for implicit interest expense. In addition, the capital increase eÅectedin April 2001 is treated as non-interest bearing for purposes of the Unaudited De' Longhi Pro FormaConsolidated Financial Statements.
The following discussion does not include the eÅects of our recent acquisition of Kenwood. We arealso including, elsewhere in this oÅering memorandum, for your convenience and for informationalpurposes only, a comparison of our Ñnancial condition and results of operations (including the eÅects ofthe Kenwood acquisition) as set forth in the Unaudited Combined Pro Forma Financial Statements. Youshould refer to ""Unaudited Combined Pro Forma Financial Statements''. The Unaudited Combined ProForma Financial Statements are based on the Unaudited De' Longhi Pro Forma Consolidated FinancialStatements and the Unaudited Restated Kenwood Consolidated Financial Statements derived from theAudited Kenwood Consolidated Financial Statements, which have been restated to reÖect a Ñscal yearended December 31 instead of March 31 and to reÖect Italian GAAP. The Unaudited Combined ProForma Financial Statements, in addition to the adjustments reÖected in the Unaudited De' Longhi ProForma Consolidated Financial Statements have been adjusted to reÖect the acquisition of Kenwood as ifsuch acquisition had occurred on January 1, 1998.
The foregoing Ñnancial statements have been prepared in accordance with Italian GAAP, whichdiÅers in signiÑcant respects from U.S. GAAP and U.K. GAAP. For descriptions of certain signiÑcantdiÅerences between Italian GAAP and U.S. GAAP, as applicable to the Company, you should refer to""Annex A Ì Summary of SigniÑcant DiÅerences Between Italian and U.S. GAAP''. For descriptions ofcertain signiÑcant diÅerences between Italian GAAP and U.K. GAAP you should refer to ""Annex B ÌSummary of SigniÑcant DiÅerences Between Italian and U.K. GAAP''. You should also read the notes tothe Unaudited De' Longhi Pro Forma Consolidated Financial Statements and the Unaudited Pro FormaConsolidated Financial Statements for a description of the assumptions used in the presentation of theseÑnancial statements. The selected consolidated Ñnancial data set forth below should also be read inconjunction with ""Presentation of Financial and Other Information'' and ""Management's Discussion andAnalysis of Financial Condition and Results of Operations''.
29
Brought to you by Global Reports

Unaudited De' Longhi Pro Forma(1)
Year ended December 31,
1998 1999 2000 2000
(Lit. millions) (5 thousands)
Income Statement Data:
Revenues:
Net salesÏÏÏÏÏÏÏÏÏÏÏÏÏÏÏÏÏÏÏÏÏÏÏÏÏÏÏÏÏÏÏÏÏÏÏÏÏÏÏÏÏ 1,269,314 1,374,841 1,561,334 806,362
Other revenuesÏÏÏÏÏÏÏÏÏÏÏÏÏÏÏÏÏÏÏÏÏÏÏÏÏÏÏÏÏÏÏÏÏÏÏÏ 21,384 18,979 23,158 11,960
Total revenues ÏÏÏÏÏÏÏÏÏÏÏÏÏÏÏÏÏÏÏÏÏÏÏÏÏÏÏÏÏÏÏÏÏÏ 1,290,698 1,393,820 1,584,492 818,322
Operating costs:
Materials, consumables and goodsÏÏÏÏÏÏÏÏÏÏÏÏÏÏÏÏÏÏÏÏ 630,240 637,305 714,053 368,778
ServicesÏÏÏÏÏÏÏÏÏÏÏÏÏÏÏÏÏÏÏÏÏÏÏÏÏÏÏÏÏÏÏÏÏÏÏÏÏÏÏÏÏÏ 263,697 288,996 354,763 183,220
Rents, leases and related costsÏÏÏÏÏÏÏÏÏÏÏÏÏÏÏÏÏÏÏÏÏÏÏ 13,016 12,467 14,379 7,426
Other costs ÏÏÏÏÏÏÏÏÏÏÏÏÏÏÏÏÏÏÏÏÏÏÏÏÏÏÏÏÏÏÏÏÏÏÏÏÏÏÏ 21,128 17,874 10,867 5,612
Total production costsÏÏÏÏÏÏÏÏÏÏÏÏÏÏÏÏÏÏÏÏÏÏÏÏÏÏÏÏ 928,081 956,642 1,094,062 565,036
Value added margin(2) ÏÏÏÏÏÏÏÏÏÏÏÏÏÏÏÏÏÏÏÏÏÏÏÏÏÏÏ 362,617 437,178 490,430 253,286
Wages, salaries and beneÑts ÏÏÏÏÏÏÏÏÏÏÏÏÏÏÏÏÏÏÏÏÏÏÏÏÏ 202,160 213,311 235,795 121,778
Gross operating marginÏÏÏÏÏÏÏÏÏÏÏÏÏÏÏÏÏÏÏÏÏÏÏÏÏÏÏ 160,457 223,867 254,635 131,508
Depreciation and amortization ÏÏÏÏÏÏÏÏÏÏÏÏÏÏÏÏÏÏÏÏÏÏÏ 70,834 77,084 75,030 38,750
Amortization of goodwill ÏÏÏÏÏÏÏÏÏÏÏÏÏÏÏÏÏÏÏÏÏÏÏÏÏÏÏ 30,251 30,311 30,252 15,624
Provisions and write-oÅsÏÏÏÏÏÏÏÏÏÏÏÏÏÏÏÏÏÏÏÏÏÏÏÏÏÏÏÏ 28,576 15,942 17,806 9,196
Operating proÑt ÏÏÏÏÏÏÏÏÏÏÏÏÏÏÏÏÏÏÏÏÏÏÏÏÏÏÏÏÏÏÏÏÏ 30,796 100,530 131,547 67,938
Net Ñnancial lossÏÏÏÏÏÏÏÏÏÏÏÏÏÏÏÏÏÏÏÏÏÏÏÏÏÏÏÏÏÏÏÏÏÏ (73,187) (33,399) (45,418) (23,456)
Income from equity investments ÏÏÏÏÏÏÏÏÏÏÏÏÏÏÏÏÏÏÏÏÏ 1,818 3,857 8,321 4,297
Extraordinary (loss) income ÏÏÏÏÏÏÏÏÏÏÏÏÏÏÏÏÏÏÏÏÏÏÏÏ (3,410) (4,116) 4,707 2,431
Earnings before taxes and minority interests ÏÏÏÏÏÏÏÏÏ (43,983) 66,872 99,157 51,210
Income taxes ÏÏÏÏÏÏÏÏÏÏÏÏÏÏÏÏÏÏÏÏÏÏÏÏÏÏÏÏÏÏÏÏÏÏÏÏÏ 427 26,355 57,413 29,651
Net (loss) income before minority interests ÏÏÏÏÏÏÏÏÏ (44,410) 40,517 41,744 21,559
Minority interestsÏÏÏÏÏÏÏÏÏÏÏÏÏÏÏÏÏÏÏÏÏÏÏÏÏÏÏÏÏÏÏÏÏÏ 271 72 (204) (105)
Net (loss) income for the year ÏÏÏÏÏÏÏÏÏÏÏÏÏÏÏÏÏÏÏÏ (44,139) 40,589 41,540 21,454
(1) Prepared to give pro forma eÅect to the restructuring of the Group (including the acquisition and sale of various companies)
eÅected in 2000 and a capital injection of Lit. 250,587 million at nominal value in April 2001. You should refer to the
Unaudited De' Longhi Pro Forma Consolidated Financial Statements (including the notes thereto) for a discussion of the
assumptions used to prepare these Ñnancial statements.
(2) Equal to total revenues less total production costs.
30
Brought to you by Global Reports

Unaudited De' Longhi Pro Forma(1)
Year ended December 31,
1998 1999 2000 2000
(Lit. millions) (5 thousands)
Balance sheet data:
Receivables from shareholders ÏÏÏÏÏÏÏÏÏÏÏÏÏÏÏÏÏÏÏÏÏÏÏ 9,100 25,000 Ì Ì
Goodwill ÏÏÏÏÏÏÏÏÏÏÏÏÏÏÏÏÏÏÏÏÏÏÏÏÏÏÏÏÏÏÏÏÏÏÏÏÏÏÏÏÏ 605,789 575,540 545,343 281,646
Other intangible assets ÏÏÏÏÏÏÏÏÏÏÏÏÏÏÏÏÏÏÏÏÏÏÏÏÏÏÏÏÏ 234,494 216,347 203,123 104,904
Total intangible assetsÏÏÏÏÏÏÏÏÏÏÏÏÏÏÏÏÏÏÏÏÏÏÏÏÏÏÏÏ 840,283 791,887 748,466 386,550
Tangible assetsÏÏÏÏÏÏÏÏÏÏÏÏÏÏÏÏÏÏÏÏÏÏÏÏÏÏÏÏÏÏÏÏÏÏÏÏ 370,112 348,788 344,097 177,711
Financial assets ÏÏÏÏÏÏÏÏÏÏÏÏÏÏÏÏÏÏÏÏÏÏÏÏÏÏÏÏÏÏÏÏÏÏÏ 37,772 36,509 17,678 9,130
Total Ñxed assets ÏÏÏÏÏÏÏÏÏÏÏÏÏÏÏÏÏÏÏÏÏÏÏÏÏÏÏÏÏÏÏÏ 1,248,167 1,177,184 1,110,241 573,392
ReceivablesÏÏÏÏÏÏÏÏÏÏÏÏÏÏÏÏÏÏÏÏÏÏÏÏÏÏÏÏÏÏÏÏÏÏÏÏÏÏÏ 505,166 557,852 615,735 318,001
Inventory ÏÏÏÏÏÏÏÏÏÏÏÏÏÏÏÏÏÏÏÏÏÏÏÏÏÏÏÏÏÏÏÏÏÏÏÏÏÏÏÏ 305,996 289,581 370,539 191,367
Other current assets ÏÏÏÏÏÏÏÏÏÏÏÏÏÏÏÏÏÏÏÏÏÏÏÏÏÏÏÏÏÏÏ 132,196 105,880 138,741 71,654
Payables ÏÏÏÏÏÏÏÏÏÏÏÏÏÏÏÏÏÏÏÏÏÏÏÏÏÏÏÏÏÏÏÏÏÏÏÏÏÏÏÏÏ (291,722) (336,938) (357,813) (184,795)
Other current liabilitiesÏÏÏÏÏÏÏÏÏÏÏÏÏÏÏÏÏÏÏÏÏÏÏÏÏÏÏÏÏ (97,702) (92,120) (129,008) (66,627)
Net working capitalÏÏÏÏÏÏÏÏÏÏÏÏÏÏÏÏÏÏÏÏÏÏÏÏÏÏÏÏÏÏ 553,934 524,255 638,194 329,600
Total capital employed ÏÏÏÏÏÏÏÏÏÏÏÏÏÏÏÏÏÏÏÏÏÏÏÏÏÏÏ 1,811,201 1,726,439 1,748,435 902,991
Reserve for staÅ severance indemnities ÏÏÏÏÏÏÏÏÏÏÏÏÏÏÏ 34,261 34,797 37,525 19,380
Reserve for risks and other chargesÏÏÏÏÏÏÏÏÏÏÏÏÏÏÏÏÏÏÏ 15,873 17,469 51,235 26,461
Long term liabilities ÏÏÏÏÏÏÏÏÏÏÏÏÏÏÏÏÏÏÏÏÏÏÏÏÏÏÏÏÏ 50,134 52,266 88,760 45,841
Cash and cash equivalents ÏÏÏÏÏÏÏÏÏÏÏÏÏÏÏÏÏÏÏÏÏÏÏÏÏÏ (87,859) (157,045) (135,979) (70,227)
Short term debt ÏÏÏÏÏÏÏÏÏÏÏÏÏÏÏÏÏÏÏÏÏÏÏÏÏÏÏÏÏÏÏÏÏÏÏ 3,200 145,582 54,336 28,062
Long term debt ÏÏÏÏÏÏÏÏÏÏÏÏÏÏÏÏÏÏÏÏÏÏÏÏÏÏÏÏÏÏÏÏÏÏÏ 648,434 336,385 519,143 268,115
Debt for acquisition of investments ÏÏÏÏÏÏÏÏÏÏÏÏÏÏÏÏÏÏÏ 504,714 504,714 504,714 260,663
Pro forma debtÏÏÏÏÏÏÏÏÏÏÏÏÏÏÏÏÏÏÏÏÏÏÏÏÏÏÏÏÏÏÏÏÏÏÏÏ 140,336 137,860 (6,900) (3,564)
Net Ñnancial position ÏÏÏÏÏÏÏÏÏÏÏÏÏÏÏÏÏÏÏÏÏÏÏÏÏÏÏÏ 1,208,825 967,496 935,314 483,049
Share capital ÏÏÏÏÏÏÏÏÏÏÏÏÏÏÏÏÏÏÏÏÏÏÏÏÏÏÏÏÏÏÏÏÏÏÏÏÏ 550,587 650,587 650,587 336,000
Reserves ÏÏÏÏÏÏÏÏÏÏÏÏÏÏÏÏÏÏÏÏÏÏÏÏÏÏÏÏÏÏÏÏÏÏÏÏÏÏÏÏÏ 26,315 36,362 27,252 14,074
Pro forma related reserves ÏÏÏÏÏÏÏÏÏÏÏÏÏÏÏÏÏÏÏÏÏÏÏÏÏÏ 19,002 (21,190) 4,345 2,244
Net (loss) income for the year ÏÏÏÏÏÏÏÏÏÏÏÏÏÏÏÏÏÏÏÏÏÏ (44,139) 40,589 41,540 21,454
Shareholders' equity ÏÏÏÏÏÏÏÏÏÏÏÏÏÏÏÏÏÏÏÏÏÏÏÏÏÏÏÏÏ 551,765 706,348 723,724 373,772
Minority interestsÏÏÏÏÏÏÏÏÏÏÏÏÏÏÏÏÏÏÏÏÏÏÏÏÏÏÏÏÏÏÏÏÏÏ 477 329 637 329
Total shareholders' equity and minority interestsÏÏÏÏÏÏ 552,242 706,677 724,361 374,101
Total liabilities and shareholders' equityÏÏÏÏÏÏÏÏÏÏÏÏÏ 1,811,201 1,726,439 1,748,435 902,991
Memorandum accountsÏÏÏÏÏÏÏÏÏÏÏÏÏÏÏÏÏÏÏÏÏÏÏÏÏÏÏÏÏ 46,058 98,326 24,254 12,526
(1) Prepared to give pro forma eÅect to the restructuring of the Group (including the acquisition and sale of various companies)
eÅected in 2000 and a capital increase of Lit. 250,587 million at nominal value eÅected in April 2001.
The selected consolidated historical Ñnancial information in the following tables has been derived fromunaudited interim consolidated Ñnancial statements prepared by our management at and for the threemonths ended March 31, 2001, and is not included in, and does not form part of, the Unaudited ProForma Consolidated Financial Statements. Our results of operations and Ñnancial condition for and as atthe three months ended March 31, 2001 include the eÅects of our acquisition of Kenwood as of January 1,2001 and have been prepared in accordance with Italian GAAP. You should also refer to ""Management'sDiscussion and Analysis of Financial Condition and Results of Operations Ì Results of Operations for the
31
Brought to you by Global Reports

Three Months Ended March 31, 2000 and 2001''. You should be aware that the information presentedbelow may not be indicative of the results of the Group at year-end 2001. You should read the whole ofthis oÅering memorandum and not rely solely on the selected information set out below.
Three Months ended March 31,
Unaudited Historical Consolidated
2000(1) 2001(2) 2001
(Lit. millions) (5 thousands)
Income Statement Data:
Revenues:
Net sales ÏÏÏÏÏÏÏÏÏÏÏÏÏÏÏÏÏÏÏÏÏÏÏÏÏÏÏÏÏÏÏÏÏÏÏÏÏÏÏÏÏÏÏÏÏÏÏÏÏ 211,820 467,186 241,281
Other revenues ÏÏÏÏÏÏÏÏÏÏÏÏÏÏÏÏÏÏÏÏÏÏÏÏÏÏÏÏÏÏÏÏÏÏÏÏÏÏÏÏÏÏÏÏ 6,493 4,967 2,565
Total revenuesÏÏÏÏÏÏÏÏÏÏÏÏÏÏÏÏÏÏÏÏÏÏÏÏÏÏÏÏÏÏÏÏÏÏÏÏÏÏÏÏÏÏÏ 218,313 472,153 243,846
Operating costs:
Materials, consumables and goods ÏÏÏÏÏÏÏÏÏÏÏÏÏÏÏÏÏÏÏÏÏÏÏÏÏÏÏÏ 91,577 239,868 123,881
Services, rents, leases and related costs ÏÏÏÏÏÏÏÏÏÏÏÏÏÏÏÏÏÏÏÏÏÏÏÏ 64,604 102,847 53,116
Other costs ÏÏÏÏÏÏÏÏÏÏÏÏÏÏÏÏÏÏÏÏÏÏÏÏÏÏÏÏÏÏÏÏÏÏÏÏÏÏÏÏÏÏÏÏÏÏÏ 3,366 2,923 1,510
Value added margin(3) ÏÏÏÏÏÏÏÏÏÏÏÏÏÏÏÏÏÏÏÏÏÏÏÏÏÏÏÏÏÏÏÏÏÏÏÏ 58,766 126,515 65,339
Wages, salaries and beneÑts ÏÏÏÏÏÏÏÏÏÏÏÏÏÏÏÏÏÏÏÏÏÏÏÏÏÏÏÏÏÏÏÏÏ 40,942 73,913 38,173
Gross operating margin ÏÏÏÏÏÏÏÏÏÏÏÏÏÏÏÏÏÏÏÏÏÏÏÏÏÏÏÏÏÏÏÏÏÏÏ 17,824 52,602 27,166
Depreciation and amortization ÏÏÏÏÏÏÏÏÏÏÏÏÏÏÏÏÏÏÏÏÏÏÏÏÏÏÏÏÏÏÏ 13,946 23,259 12,012
Amortization of goodwill ÏÏÏÏÏÏÏÏÏÏÏÏÏÏÏÏÏÏÏÏÏÏÏÏÏÏÏÏÏÏÏÏÏÏÏÏ 455 10,356 5,348
Provisions and write-oÅs ÏÏÏÏÏÏÏÏÏÏÏÏÏÏÏÏÏÏÏÏÏÏÏÏÏÏÏÏÏÏÏÏÏÏÏÏ 2,356 (199) (103)
Operating proÑt ÏÏÏÏÏÏÏÏÏÏÏÏÏÏÏÏÏÏÏÏÏÏÏÏÏÏÏÏÏÏÏÏÏÏÏÏÏÏÏÏÏ 1,067 19,186 9,909
Net Ñnancial loss ÏÏÏÏÏÏÏÏÏÏÏÏÏÏÏÏÏÏÏÏÏÏÏÏÏÏÏÏÏÏÏÏÏÏÏÏÏÏÏÏÏÏ (11,640) (15,225) (7,863)
Extraordinary (loss) income ÏÏÏÏÏÏÏÏÏÏÏÏÏÏÏÏÏÏÏÏÏÏÏÏÏÏÏÏÏÏÏÏÏ (68) 2,598 1,342
Earnings before taxes and minority interestsÏÏÏÏÏÏÏÏÏÏÏÏÏÏÏÏÏÏ (10,641) 6,559 3,388
Income taxesÏÏÏÏÏÏÏÏÏÏÏÏÏÏÏÏÏÏÏÏÏÏÏÏÏÏÏÏÏÏÏÏÏÏÏÏÏÏÏÏÏÏÏÏÏÏ 1,774 4,738 2,447
Net (loss) income before minority interests ÏÏÏÏÏÏÏÏÏÏÏÏÏÏÏÏÏÏ (12,415) 1,821 941
Minority interests ÏÏÏÏÏÏÏÏÏÏÏÏÏÏÏÏÏÏÏÏÏÏÏÏÏÏÏÏÏÏÏÏÏÏÏÏÏÏÏÏÏÏ Ì Ì Ì
Net (loss) income ÏÏÏÏÏÏÏÏÏÏÏÏÏÏÏÏÏÏÏÏÏÏÏÏÏÏÏÏÏÏÏÏÏÏÏÏÏÏÏ (12,415) 1,821 941
(1) Does not include the eÅects of the restructuring of the Group (including the acquisition and sale of various companies)
eÅected in 2000 or the capital increase of Lit. 250,587 million eÅected in April 2001.
(2) Includes the eÅects of the restructuring of the Group (including the acquisition and sale of various companies) eÅected in
2000 and the acquisition of all of the share capital of Kenwood. You should also refer to the Unaudited De' Longhi Pro
Forma Consolidated Financial Statements for a discussion of the assumptions used in preparing the Ñnancial statements as
well as ""Management's Discussion of Financial Condition and Results of Operations''.
(3) Total revenues less total production costs.
32
Brought to you by Global Reports

Unaudited HistoricalAudited HistoricalConsolidatedConsolidatedAt March 31,At December 31,
2000(1) 2001(2) 2001
(Lit. millions) (5 thousands)
Balance sheet data:
Receivables from shareholders ÏÏÏÏÏÏÏÏÏÏÏÏÏÏÏÏÏÏÏÏÏÏÏÏ Ì Ì Ì
GoodwillÏÏÏÏÏÏÏÏÏÏÏÏÏÏÏÏÏÏÏÏÏÏÏÏÏÏÏÏÏÏÏÏÏÏÏÏÏÏÏÏÏÏÏ 545,344 642,439 331,792
Other intangible assets ÏÏÏÏÏÏÏÏÏÏÏÏÏÏÏÏÏÏÏÏÏÏÏÏÏÏÏÏÏÏÏ 203,123 201,080 103,849
Total intangible assets ÏÏÏÏÏÏÏÏÏÏÏÏÏÏÏÏÏÏÏÏÏÏÏÏÏÏÏÏÏ 748,467 843,519 435,641
Tangible assets ÏÏÏÏÏÏÏÏÏÏÏÏÏÏÏÏÏÏÏÏÏÏÏÏÏÏÏÏÏÏÏÏÏÏÏÏÏ 344,097 381,242 196,895
Financial assets ÏÏÏÏÏÏÏÏÏÏÏÏÏÏÏÏÏÏÏÏÏÏÏÏÏÏÏÏÏÏÏÏÏÏÏÏÏ 17,679 16,138 8,335
Total Ñxed assetsÏÏÏÏÏÏÏÏÏÏÏÏÏÏÏÏÏÏÏÏÏÏÏÏÏÏÏÏÏÏÏÏÏÏ 1,110,243 1,240,899 640,871
Receivables ÏÏÏÏÏÏÏÏÏÏÏÏÏÏÏÏÏÏÏÏÏÏÏÏÏÏÏÏÏÏÏÏÏÏÏÏÏÏÏÏ 615,735 638,191 329,598
Inventory ÏÏÏÏÏÏÏÏÏÏÏÏÏÏÏÏÏÏÏÏÏÏÏÏÏÏÏÏÏÏÏÏÏÏÏÏÏÏÏÏÏÏ 370,539 499,377 257,907
Other current assets ÏÏÏÏÏÏÏÏÏÏÏÏÏÏÏÏÏÏÏÏÏÏÏÏÏÏÏÏÏÏÏÏÏ 141,294 199,908 103,244
Payables ÏÏÏÏÏÏÏÏÏÏÏÏÏÏÏÏÏÏÏÏÏÏÏÏÏÏÏÏÏÏÏÏÏÏÏÏÏÏÏÏÏÏÏ (357,814) (472,961) (244,264)
Other current liabilities ÏÏÏÏÏÏÏÏÏÏÏÏÏÏÏÏÏÏÏÏÏÏÏÏÏÏÏÏÏÏ (158,390) (231,640) (119,632)
Net working capital ÏÏÏÏÏÏÏÏÏÏÏÏÏÏÏÏÏÏÏÏÏÏÏÏÏÏÏÏÏÏÏ 611,364 632,875 326,853
Total capital employed ÏÏÏÏÏÏÏÏÏÏÏÏÏÏÏÏÏÏÏÏÏÏÏÏÏÏÏÏÏ 1,721,607 1,873,774 967,724
Reserve for staÅ severance indemnities ÏÏÏÏÏÏÏÏÏÏÏÏÏÏÏÏÏ 37,526 40,957 21,153
Reserve for risks and other charges ÏÏÏÏÏÏÏÏÏÏÏÏÏÏÏÏÏÏÏÏ 21,852 18,940 9,782
Long term liabilities ÏÏÏÏÏÏÏÏÏÏÏÏÏÏÏÏÏÏÏÏÏÏÏÏÏÏÏÏÏÏÏ 59,378 59,897 30,935
Short term debt, net ÏÏÏÏÏÏÏÏÏÏÏÏÏÏÏÏÏÏÏÏÏÏÏÏÏÏÏÏÏÏÏÏÏ 169,055 197,573 102,038
Long term debt ÏÏÏÏÏÏÏÏÏÏÏÏÏÏÏÏÏÏÏÏÏÏÏÏÏÏÏÏÏÏÏÏÏÏÏÏÏ 519,142 664,515 343,193
Debt for acquisition of investmentsÏÏÏÏÏÏÏÏÏÏÏÏÏÏÏÏÏÏÏÏÏ 504,604 478,904 247,333
Net Ñnancial position ÏÏÏÏÏÏÏÏÏÏÏÏÏÏÏÏÏÏÏÏÏÏÏÏÏÏÏÏÏÏ 1,192,801 1,340,992 692,564
Share capital ÏÏÏÏÏÏÏÏÏÏÏÏÏÏÏÏÏÏÏÏÏÏÏÏÏÏÏÏÏÏÏÏÏÏÏÏÏÏÏ 400,000 400,000 206,583
Reserves ÏÏÏÏÏÏÏÏÏÏÏÏÏÏÏÏÏÏÏÏÏÏÏÏÏÏÏÏÏÏÏÏÏÏÏÏÏÏÏÏÏÏÏ 40,812 70,428 36,373
Net income for the yearÏÏÏÏÏÏÏÏÏÏÏÏÏÏÏÏÏÏÏÏÏÏÏÏÏÏÏÏÏÏ 27,980 1,821 940
Shareholders' equity ÏÏÏÏÏÏÏÏÏÏÏÏÏÏÏÏÏÏÏÏÏÏÏÏÏÏÏÏÏÏÏ 468,792 472,249 243,896
Minority interests ÏÏÏÏÏÏÏÏÏÏÏÏÏÏÏÏÏÏÏÏÏÏÏÏÏÏÏÏÏÏÏÏÏÏÏ 636 636 329
Total shareholders' equity and minority interests ÏÏÏÏÏÏÏ 469,428 472,885 244,225
Total liabilities and shareholders' equity ÏÏÏÏÏÏÏÏÏÏÏÏÏÏ 1,721,607 1,873,774 967,724
(1) Does not include the eÅects of the restructuring of the Group (including the acquisition and sale of various companies)
eÅected in 2000 or the capital increase of Lit. 250,587 million eÅected in April 2001.
(2) Includes the eÅects of the restructuring of the Group (including the acquisition and sale of various companies) eÅected in
2000 and the acquisition of all of the share capital of Kenwood. You should also refer to the Unaudited De' Longhi Pro
Forma Consolidated Financial Statements for a discussion of the assumptions used in preparing the Ñnancial statements as
well as ""Management's Discussion and Analysis of Financial Condition and Results of Operations''.
33
Brought to you by Global Reports

MANAGEMENT'S DISCUSSION AND ANALYSIS OFFINANCIAL CONDITION AND RESULTS OF OPERATIONS
You should read the following discussion of our Ñnancial condition and results of operations at and forthe three months ended March 31, 2000 and 2001 and at and for the years ended December 31, 1998,1999 and 2000, in conjunction with our Unaudited Interim De' Longhi Consolidated Financial Statementsand the Unaudited De' Longhi Pro Forma Consolidated Financial Statements (including the notesthereto) appearing elsewhere in this oÅering memorandum. The pro forma balance sheets and incomestatements at and for the years ended December 31, 1998, 1999 and 2000, set forth in the Unaudited De'Longhi Pro Forma Consolidated Financial Statements, have been prepared for information purposes only.The Unaudited De' Longhi Pro Forma Consolidated Financial Statements are derived from the AuditedDe' Longhi Consolidated Financial Statements, the audited annual Ñnancial statements of DL RadiatorsS.p.A. for 2000, De' Longhi Radiators S.r.l. for each of 1998 and 1999, and Climaveneta S.p.A. andErgoklima S.p.A. for each of 1998, 1999 and 2000; and the unaudited annual Ñnancial statements ofMicromax S.p.A, De' Longhi Divisione Cucine S.p.A. and Sile Corpi Scaldanti S.r.l. The Unaudited De'Longhi Pro Forma Consolidated Financial Statements have been adjusted to reÖect:
‚ the purchase in 2000 of a controlling interest in each of De' Longhi Divisione Cucine S.p.A., DLRadiators S.p.A., Climaveneta S.p.A., Micromax S.p.A., Ergoklima S.p.A. and Sile CorpiScaldanti S.r.l., in each case as if such acquisitions had occurred on January 1, 1998;
‚ the sale in 2000 of all of the share capital of Immobiliare Findomestic S.r.l., De' Longhi RadiatorsS.r.l., DL Canada Distributors Inc., 850721 Ontario Ltd. and I.S.C. Ì Industrie Scambiatori diCalore S.p.A., together with the sale of a controlling interest (equal to 60% of its share capital) ofNauta S.r.l., in each case as if such sale had occurred on January 1, 1998; and
‚ a capital increase of Lit. 250,587 million on April 18, 2001 (increasing our total capitalization toLit. 650,587 million), as if such capital increase had been eÅected on January 1, 1998.
You should read the Unaudited De' Longhi Pro Forma Consolidated Financial Statements includedelsewhere in this oÅering memorandum for a description of the assumptions made in preparing theconsolidated balance sheets and income statements of the Group at and for the years ended December 31,1998, 1999 and 2000.
Unless otherwise indicated, the following discussion does not include the eÅects of our recentacquisition of Kenwood. We are also including, elsewhere in this oÅering memorandum, for yourconvenience and for informational purposes only, our Ñnancial condition and results of operations includingthe eÅects of the Kenwood acquisition at and for the years ended December 31, 1998, 1999 and 2000. Youshould refer to ""Unaudited Combined Pro Forma Financial Statements'' for a presentation of suchÑnancial information. The Unaudited Combined Pro Forma Financial Statements are based on theUnaudited De' Longhi Pro Forma Consolidated Financial Statements and the Unaudited RestatedKenwood Consolidated Financial Statements derived from the Audited Kenwood Consolidated FinancialStatements, which have been restated to reÖect a Ñscal year ended December 31 instead of March 31 andto reÖect Italian GAAP. The Unaudited Combined Pro Forma Financial Statements, in addition to theadjustments reÖected in the Unaudited De' Longhi Pro Forma Consolidated Financial Statements havebeen adjusted to reÖect the acquisition of Kenwood as if such acquisition had occurred on January 1,1998.
The Unaudited De' Longhi Pro Forma Consolidated Financial Statements have been adjusted toreÖect an increase in our debt resulting from the payment for the companies we purchased in 2000 and acorresponding reduction in our net debt due to a capital increase of Lit. 250,587 million eÅected in April2001. You should note that the purchase contracts for the companies we acquired in December 2000 aspart of our restructuring process included approximately Lit. 504,714 million in interest-free debt and, as aresult, the Unaudited De' Longhi Pro Forma Consolidated Financial Statements do not include a chargefor implicit interest expense. In addition, the capital increase eÅected in April 2001 is treated as non-interest bearing for purposes of the Unaudited De' Longhi Pro Forma Consolidated Financial Statements.
On January 1, 1998, we had neither purchased De' Longhi Divisione Cucine S.p.A., DL RadiatorsS.p.A., Climaveneta S.p.A., Micromax S.p.A., Ergoklima S.p.A. and Sile Corpi Scaldanti S.r.l.; nor hadwe sold Immobiliare Findomestic S.r.l., De' Longhi Radiators S.r.l., DL Canada Distributors Inc., 850721Ontario Ltd., I.S.C. Ì Industrie Scambiatori di Calore S.p.A. and Nauta S.r.l.; nor had we eÅected acapital increase of Lit. 250,587 million. In addition, the results of operations and Ñnancial condition of SileCorpi Scaldanti S.r.l. reÖected the strategies of the company's prior management, which we did not
34
Brought to you by Global Reports

control. We were not responsible for the strategies employed by such prior management and our strategiesmay diÅer materially from those implemented in the past. Consequently, the Unaudited De' Longhi ProForma Consolidated Financial Statements do not purport to represent what our results of operations orÑnancial position would actually have been if such purchases, sales and capital increase had occurred onJanuary 1, 1998 or to project our results of operations for any future period.
The Unaudited Interim De' Longhi Consolidated Financial Statements and the Unaudited De' LonghiPro Forma Consolidated Financial Statements have been prepared in accordance with the Italian GAAP,which diÅers in certain material respects from U.S. GAAP and U.K. GAAP. For descriptions of certainsigniÑcant diÅerences between Italian GAAP and U.S. GAAP, as applicable to the Company, you shouldrefer to ""Annex A Ì Summary of SigniÑcant DiÅerences Between Italian and U.S. GAAP''. Fordescriptions of certain signiÑcant diÅerences between Italian GAAP and U.K. GAAP, as applicable toKenwood, you should refer to ""Annex B Ì Summary of SigniÑcant DiÅerences Between Italian and U.K.GAAP''. You should also read ""Presentation of Financial and Other Information'' included elsewhere inthis oÅering memorandum.
General
Our results of operations have been characterized by a general increase in revenues and operatingproÑt over the last three years, particularly with respect to our cooking and food preparation, airconditioning and heating businesses. The principal factors that have signiÑcantly aÅected our revenuesduring these periods are the following:
‚ the launch of new products and new product models, particularly coÅee machines, fryers, electricovens, kitchen and electric home appliances, oil and water heaters, and portable, Ñxed wall-mounted and industrial-sized air conditioners;
‚ the consolidation and reinforcement of our leading position in certain product lines, includingportable and Ñxed wall-mounted air conditioning units, industrial-sized air conditioning systems,dehumidiÑers and oil-Ñlled radiators;
‚ the expansion of our businesses internationally, and in particular, in the United States, Canada,the United Kingdom and Japan (which in the aggregate accounted for 28.8% of our total revenuesin 2000 as compared to 22.1% in 1998). Our sales outside of Italy increased from 63.9% of ourtotal revenues in 1998 to 66.9% in 2000; and
‚ macroeconomic factors aÅecting the global demand for our products, including, among otherthings, general economic conditions aÅecting our principal markets, such as the United States andJapan (you should refer to ""Our Business Ì Industry Overview'').
The principal factors that have led to an increase in our operating proÑt (from 2.4% of our totalrevenues in 1998 to 8.3% in 2000) are the following:
‚ an increase in our industrial gross margin both in absolute terms and as a percentage of our totalrevenues resulting from an overall decrease over the same period in our cost of goods sold as apercentage of our total revenues (from 66.3% in 1998 to 62.6% in 2000). You should refer to""Ì Industrial Gross Margin''.
‚ our strategy of expansion through signiÑcant investments which resulted in a higher proportionalincrease in our services expenses, primarily transportation costs, outsourcing of certain manufactur-ing processes (such as assembly work) and advertising and promotional costs; and
‚ our operating leverage resulting from the ability of our existing distribution network to sustain theincrease in the volume of business over the period which decreased our cost base relative to ournet sales revenues.
Restructuring
During the course of 2000, we restructured our Group with the aim of rationalizing our organizationalstructure, and we purchased certain companies which, although part of our core businesses, previously weredirectly and indirectly owned by our parent company. As a result of the restructuring, we acquired,through our wholly owned subsidiary De' Longhi Pinguino S.A., a controlling interest in each of De'Longhi Divisione Cucine S.p.A. (including its wholly owned subsidiary Elba S.p.A.), DL Radiators S.p.A.(including its consolidated subsidiaries Radel S.p.A. and De' Longhi Clima Polska Sp.Zo.o.), Climaveneta
35
Brought to you by Global Reports
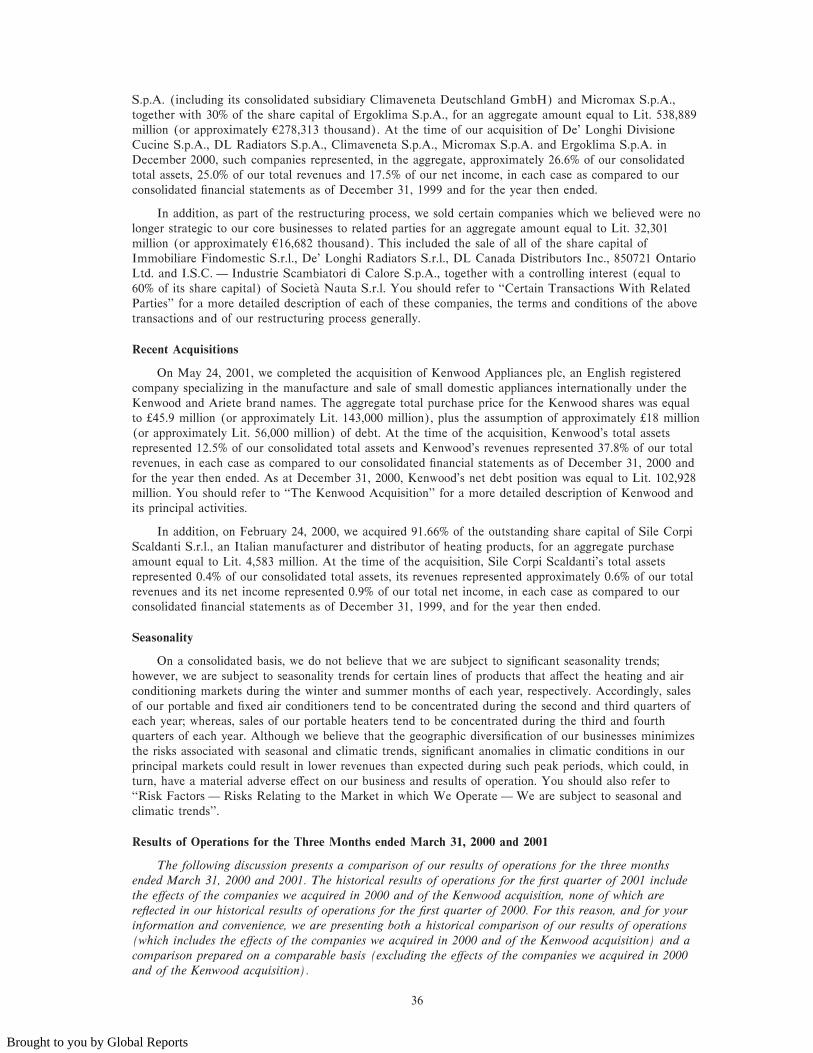
S.p.A. (including its consolidated subsidiary Climaveneta Deutschland GmbH) and Micromax S.p.A.,together with 30% of the share capital of Ergoklima S.p.A., for an aggregate amount equal to Lit. 538,889million (or approximately 4278,313 thousand). At the time of our acquisition of De' Longhi DivisioneCucine S.p.A., DL Radiators S.p.A., Climaveneta S.p.A., Micromax S.p.A. and Ergoklima S.p.A. inDecember 2000, such companies represented, in the aggregate, approximately 26.6% of our consolidatedtotal assets, 25.0% of our total revenues and 17.5% of our net income, in each case as compared to ourconsolidated Ñnancial statements as of December 31, 1999 and for the year then ended.
In addition, as part of the restructuring process, we sold certain companies which we believed were nolonger strategic to our core businesses to related parties for an aggregate amount equal to Lit. 32,301million (or approximately 416,682 thousand). This included the sale of all of the share capital ofImmobiliare Findomestic S.r.l., De' Longhi Radiators S.r.l., DL Canada Distributors Inc., 850721 OntarioLtd. and I.S.C. Ì Industrie Scambiatori di Calore S.p.A., together with a controlling interest (equal to60% of its share capital) of Societ fia Nauta S.r.l. You should refer to ""Certain Transactions With RelatedParties'' for a more detailed description of each of these companies, the terms and conditions of the abovetransactions and of our restructuring process generally.
Recent Acquisitions
On May 24, 2001, we completed the acquisition of Kenwood Appliances plc, an English registeredcompany specializing in the manufacture and sale of small domestic appliances internationally under theKenwood and Ariete brand names. The aggregate total purchase price for the Kenwood shares was equalto 45.9 million (or approximately Lit. 143,000 million), plus the assumption of approximately 18 million(or approximately Lit. 56,000 million) of debt. At the time of the acquisition, Kenwood's total assetsrepresented 12.5% of our consolidated total assets and Kenwood's revenues represented 37.8% of our totalrevenues, in each case as compared to our consolidated Ñnancial statements as of December 31, 2000 andfor the year then ended. As at December 31, 2000, Kenwood's net debt position was equal to Lit. 102,928million. You should refer to ""The Kenwood Acquisition'' for a more detailed description of Kenwood andits principal activities.
In addition, on February 24, 2000, we acquired 91.66% of the outstanding share capital of Sile CorpiScaldanti S.r.l., an Italian manufacturer and distributor of heating products, for an aggregate purchaseamount equal to Lit. 4,583 million. At the time of the acquisition, Sile Corpi Scaldanti's total assetsrepresented 0.4% of our consolidated total assets, its revenues represented approximately 0.6% of our totalrevenues and its net income represented 0.9% of our total net income, in each case as compared to ourconsolidated Ñnancial statements as of December 31, 1999, and for the year then ended.
Seasonality
On a consolidated basis, we do not believe that we are subject to signiÑcant seasonality trends;however, we are subject to seasonality trends for certain lines of products that aÅect the heating and airconditioning markets during the winter and summer months of each year, respectively. Accordingly, salesof our portable and Ñxed air conditioners tend to be concentrated during the second and third quarters ofeach year; whereas, sales of our portable heaters tend to be concentrated during the third and fourthquarters of each year. Although we believe that the geographic diversiÑcation of our businesses minimizesthe risks associated with seasonal and climatic trends, signiÑcant anomalies in climatic conditions in ourprincipal markets could result in lower revenues than expected during such peak periods, which could, inturn, have a material adverse eÅect on our business and results of operation. You should also refer to""Risk Factors Ì Risks Relating to the Market in which We Operate Ì We are subject to seasonal andclimatic trends''.
Results of Operations for the Three Months ended March 31, 2000 and 2001
The following discussion presents a comparison of our results of operations for the three monthsended March 31, 2000 and 2001. The historical results of operations for the Ñrst quarter of 2001 includethe eÅects of the companies we acquired in 2000 and of the Kenwood acquisition, none of which arereÖected in our historical results of operations for the Ñrst quarter of 2000. For this reason, and for yourinformation and convenience, we are presenting both a historical comparison of our results of operations(which includes the eÅects of the companies we acquired in 2000 and of the Kenwood acquisition) and acomparison prepared on a comparable basis (excluding the eÅects of the companies we acquired in 2000and of the Kenwood acquisition).
36
Brought to you by Global Reports

The following table sets forth the Unaudited Historical Consolidated Income Statement data for theperiods indicated.
Unaudited De' Longhi Historical
Three months ended March 31,
2000 2001
Historical Consolidated Historical% VariationConsolidated Comparable Restated Consolidated
De' Longhi De' Longhi 2000 Kenwood De' Longhi Comparable HistoricalGroup(1) Group(2) Acquisitions(3) Group(4) Adjustments(5) Group 2001/2000(6) 2001/2000
(Lit. millions, except percentages)
Revenues:
Net salesÏÏÏÏÏÏÏÏÏÏÏÏÏÏÏÏÏÏ 211,820 253,613 89,249 124,324 Ì 467,186 19.7% 120.6%
Other revenuesÏÏÏÏÏÏÏÏÏÏÏÏÏ 6,493 4,489 478 Ì Ì 4,967 (30.9)% (23.5)%
Total revenues ÏÏÏÏÏÏÏÏÏÏÏ 218,313 258,102 89,727 124,324 Ì 472,153 18.2% 116.3%
Operating costs:
Materials, consumables
and goods ÏÏÏÏÏÏÏÏÏÏÏÏÏÏÏ 91,577 104,680 45,739 89,449 Ì 239,868 14.3% 161.9%
Services, rents, leases and
related costs ÏÏÏÏÏÏÏÏÏÏÏÏÏ 64,604 69,503 14,952 18,392 Ì 102,847 7.6% 59.2%
Other costs ÏÏÏÏÏÏÏÏÏÏÏÏÏÏÏÏ 3,366 2,660 263 Ì Ì 2,923 (21.0)% (13.2)%
Value added margin ÏÏÏÏÏÏ 58,766 81,259 28,773 16,483 Ì 126,515 38.3% 115.3%
Wages, salaries and beneÑtsÏÏ 40,942 45,399 15,181 13,333 Ì 73,913 10.9% 80.5%
Gross operating marginÏÏÏÏ 17,824 35,860 13,592 3,150 Ì 52,602 101.2% 195.1%
Depreciation and amortization 13,946 14,507 4,583 4,169 Ì 23,259 4.0% 66.8%
Amortization of goodwillÏÏÏÏÏÏ 455 471 843 2,479 6,563 10,356 3.5% 2,176.0%
Provisions and write-oÅsÏÏÏÏÏ 2,356 1,483 237 (1,919) Ì (199) (37.1)% Ì
Operating proÑt ÏÏÏÏÏÏÏÏÏÏ 1,067 19,399 7,929 (1,579) (6,563) 19,186 1,718.1% 1,698.1%
Net Ñnancial lossÏÏÏÏÏÏÏÏÏÏÏ (11,640) (7,306) (3,885) (4,034) Ì (15,225) (37.2)% 30.8%
Extraordinary (loss) income (68) 12 41 2,545 Ì 2,598 Ì Ì
Earnings before taxes and
minority interests ÏÏÏÏÏÏÏ (10,641) 12,105 4,085 (3,068) (6,563) 6,559 Ì Ì
Income tax expense (beneÑt) 1,774 3,895 1,376 (533) Ì 4,738 119.6% 167.1%
Net (loss) income before
minority interests ÏÏÏÏÏÏÏ (12,415) 8,210 2,709 (2,535) (6,563) 1,821 Ì Ì
Minority interestsÏÏÏÏÏÏÏÏÏÏÏ Ì Ì Ì Ì Ì Ì Ì Ì
Net (loss) incomeÏÏÏÏÏÏÏÏ (12,415) 8,210 2,709 (2,535) (6,563) 1,821 Ì Ì
(1) Includes the results of operations for De' Longhi Radiators S.r.l. which was subsequently sold by the Group in
December 2000.
(2) Restated on a comparable basis to exclude the eÅects of the companies acquired in 2000 and the eÅects of the acquisition of
Kenwood in early 2001.
(3) ReÖects the consolidated results of operations for the companies acquired in 2000.
(4) Converted to Lire from pound sterling based on the average of the exchange rates for the last business day of each month
during the relevant period. For a description of aggregations used to prepare the restated Ñnancial statements for Kenwood,
you should refer to ""Annex C Ì Explanatory Note of Aggregations in the OÅering Memorandum of the Kenwood
Consolidated Financial Statements''.
(5) ReÖects amortization of goodwill in connection with the companies acquired during the course of 2000 and the Kenwood
acquisition.
(6) ReÖects percentage variation between the historical consolidated De' Longhi group in 2000 and the comparable De' Longhi
group in 2001 (not including the eÅects of the companies acquired in 2000 and the eÅects of the acquisition of Kenwood
Appliances plc).
37
Brought to you by Global Reports

Three Months Ended March 31, 2001 Compared to the Three Months Ended March 31, 2000
Revenues
Our total revenues consist of revenues derived from the following business segments:
‚ air conditioning;
‚ heating;
‚ cooking and food preparation;
‚ cleaning and ironing; and
‚ other revenue sources.
For the three months ended March 31, 2001, our total revenues increased by Lit. 253,840 million, or116.3%, from Lit. 218,313 million in 2000 to Lit. 472,153 million in 2001. This was due principally to ouracquisition of certain companies acquired during the course of 2000 as part of our restructuring processand to our acquisition of Kenwood in 2001. You should refer to ""The Kenwood Acquisition'' and ""CertainTransactions with Related Parties''.
On a comparable basis (excluding the eÅects of the companies acquired in 2000 and of the Kenwoodacquisition), our total revenues increased by Lit. 39,789 million, or 18.2%, from Lit. 218,313 million in2000 to Lit. 258,102 million in 2001. This was due primarily to an increase in revenues derived from ourcooking and food preparation and our air conditioning businesses and to increased sales in foreign markets,especially the United States and the United Kingdom.
As part of our restructuring process in 2000, we sold De' Longhi Radiators S.r.l., which we believedwas no longer strategic to our core business, to a related party on December 28, 2000. You should refer to""Certain Transactions With Related Parties Ì Transactions with Related Parties Involving Transfers ofGroup Securities''. The following table shows, on a comparable basis (excluding in 2001 the eÅects of thecompanies acquired in 2000 and of the Kenwood acquisition and excluding in 2000 the revenuesattributable to De' Longhi Radiators S.r.l.), a breakdown of our revenues attributable to each of ourprincipal business segments, for each of the periods indicated:
Unaudited De' Longhi
Three months endedMarch 31, % Variation
Historical Comparable Comparable2000 2001 2001/2000
(Lit. millions, except percentages)
Air conditioningÏÏÏÏÏÏÏÏÏÏÏÏÏÏÏÏÏÏÏÏÏÏÏÏÏÏÏÏÏÏÏÏÏÏÏÏÏÏÏÏÏÏÏÏ 48,542 65,931 35.8%
HeatingÏÏÏÏÏÏÏÏÏÏÏÏÏÏÏÏÏÏÏÏÏÏÏÏÏÏÏÏÏÏÏÏÏÏÏÏÏÏÏÏÏÏÏÏÏÏÏÏÏÏÏ 20,233(1) 44,600 120.4%
Cooking and food preparation ÏÏÏÏÏÏÏÏÏÏÏÏÏÏÏÏÏÏÏÏÏÏÏÏÏÏÏÏÏÏÏÏ 80,127 105,504 31.7%
Cleaning and ironing ÏÏÏÏÏÏÏÏÏÏÏÏÏÏÏÏÏÏÏÏÏÏÏÏÏÏÏÏÏÏÏÏÏÏÏÏÏÏÏÏ 27,405 25,107 (8.4)%
OtherÏÏÏÏÏÏÏÏÏÏÏÏÏÏÏÏÏÏÏÏÏÏÏÏÏÏÏÏÏÏÏÏÏÏÏÏÏÏÏÏÏÏÏÏÏÏÏÏÏÏÏÏÏ 15,292 16,960 10.9%
Total revenues ÏÏÏÏÏÏÏÏÏÏÏÏÏÏÏÏÏÏÏÏÏÏÏÏÏÏÏÏÏÏÏÏÏÏÏÏÏÏÏÏÏÏÏ 191,599(1) 258,102 34.7%
(1) Adjusted to exclude revenues attributable to De' Longhi Radiators S.r.l., which was not a member of the consolidated group
in March 2001.
38
Brought to you by Global Reports

The following table shows, on a comparable basis (excluding in 2001 the eÅects of the companiesacquired in 2000 and of the Kenwood acquisition and excluding in 2000 the revenues attributable to De'Longhi Radiators S.r.l.), a breakdown of our revenues attributable to each of the principal geographicmarkets in which we sell our products for each of the periods indicated:
Unaudited De' Longhi
Three months endedMarch 31, % Variation
Historical Comparable Comparable2000 2001 2001/2000
(Lit. millions, except percentages)
ItalyÏÏÏÏÏÏÏÏÏÏÏÏÏÏÏÏÏÏÏÏÏÏÏÏÏÏÏÏÏÏÏÏÏÏÏÏÏÏÏÏÏÏÏÏÏÏÏÏÏÏÏÏ 83,097(1) 101,956 22.7%
United Kingdom ÏÏÏÏÏÏÏÏÏÏÏÏÏÏÏÏÏÏÏÏÏÏÏÏÏÏÏÏÏÏÏÏÏÏÏÏÏÏÏÏÏ 17,213 29,449 71.1%
Rest of EuropeÏÏÏÏÏÏÏÏÏÏÏÏÏÏÏÏÏÏÏÏÏÏÏÏÏÏÏÏÏÏÏÏÏÏÏÏÏÏÏÏÏÏÏ 35,208(1) 44,076 25.2%
North America (U.S.A., Canada and Mexico)ÏÏÏÏÏÏÏÏÏÏÏÏÏÏÏÏ 25,046 31,576 26.1%
JapanÏÏÏÏÏÏÏÏÏÏÏÏÏÏÏÏÏÏÏÏÏÏÏÏÏÏÏÏÏÏÏÏÏÏÏÏÏÏÏÏÏÏÏÏÏÏÏÏÏÏÏ 11,816 13,238 12.0%
Rest of the worldÏÏÏÏÏÏÏÏÏÏÏÏÏÏÏÏÏÏÏÏÏÏÏÏÏÏÏÏÏÏÏÏÏÏÏÏÏÏÏÏÏ 19,219 37,807 96.7%
Total revenues ÏÏÏÏÏÏÏÏÏÏÏÏÏÏÏÏÏÏÏÏÏÏÏÏÏÏÏÏÏÏÏÏÏÏÏÏÏÏÏÏÏ 191,599(1) 258,102 34.7%
(1) Adjusted to exclude revenues attributable to De' Longhi Radiators S.r.l., which was not a member of the consolidated group
in March 2001.
If we include the revenues attributable to De' Longhi Radiators S.r.l., our total revenues for the threemonths ended March 31, 2000 were Lit. 218,313 million (as compared to Lit. 191,599 million excludingthe eÅects of De' Longhi Radiators S.r.l.). As a result, our total revenues over the relevant period wouldhave increased by Lit. 39,789 million, or 18.2%, from Lit. 218,313 million in 2000 to Lit. 258,102 millionin 2001. This was attributable primarily to sales in the Rest of Europe (excluding Italy and the UnitedKingdom), which totaled Lit. 57,082 million, including the eÅects of De' Longhi Radiators S.r.l., (or Lit.35,208 million excluding the eÅects of De' Longhi Radiators S.r.l.).
The following discussion presents a comparison of the revenues during the relevant periods, calculatedon a comparable basis, attributable to each of our principal business segments and, where relevant,geographic sales markets.
Air conditioning
We sell a complete range of air conditioners, humidiÑers, dehumidiÑers and air puriÑers, includingportable units as well as high-power Ñxed units for industrial use. On a comparable basis, for the threemonths ended March 31, 2001, revenues derived from our air conditioning business increased by Lit.17,389 million, or 35.8%, from Lit. 48,542 million in 2000 to Lit. 65,931 million in 2001. This wasprimarily due to an increase in sales of portable and Ñxed air conditioning units and of air treatmentsystems.
Heating
As part of our heating business, we sell portable heating units (including oil-Ñlled radiators, electricconvectors, fan heaters, natural gas heaters, natural gas-electric heaters, kerosene heaters, wood and coalburning stoves) and terminal units for central heating systems (including multi-column radiators, steelradiators and bathroom radiators). On a comparable basis, for the three months ended March 31, 2001,revenues derived from our heating business increased by Lit. 24,367 million, or 120.4%, from Lit. 20,233million in 2000 to Lit. 44,600 million in 2001. This increase was attributable primarily to an increase insales of oil-Ñlled radiators, particularly in the United Kingdom and Japan, as well as higher sales due to acold winter season.
If we include the revenues of De' Longhi Radiators S.r.l., our revenues attributable to this line ofbusiness for the three months ended March 31, 2000 were Lit. 46,268 million.
Cooking and food preparation
We sell a variety of products, including electric ovens, electric deep-fryers, toasters, electric barbecuesand contact grills, coÅee machines, free-standing stoves, cooking tops and built-in ovens, together withother food processing appliances (juicers, mixers, blenders and ice-cream makers). On a comparable basis,
39
Brought to you by Global Reports

for the three months ended March 31, 2001, revenues derived from our cooking and food preparationbusiness increased by Lit. 25,377 million, or 31.7%, from Lit. 80,127 million in 2000 to Lit. 105,504million in 2001. This was primarily due to a general increase in sales of cooking products and particularlyto an increase in sales of coÅee machines in Italy, Japan and the United States and of deep-fryers in theUnited Kingdom and the United States.
Cleaning and ironing
We sell a wide range of Öoor-care and ironing appliances, including vacuum cleaners, steam cleaners,extractor cleaners and ironing systems. On a comparable basis, for the three months ended March 31,2001, revenues derived from our cleaning and ironing business decreased by Lit. 2,298 million, or 8.4%,from Lit. 27,405 million in 2000 to Lit. 25,107 million in 2001. This was primarily due to a general declinein sales of steam cleaners and the late introduction of new models of electric brooms, oÅset in part by acorresponding increase in sales of a new multifunctional steam extractor (Triplosimac) and an increase insales of ironing systems.
Materials, consumables and goods
Purchases of materials, consumables and goods consist primarily of raw materials, semi-Ñnished andÑnished products, components, other miscellaneous material acquisitions and changes in inventory (whichincludes the diÅerence in the value of inventory of Ñnished and semi-Ñnished products and work inprogress, and changes in the value of inventory of raw materials at the beginning of the period and atperiod end).
For the three months ended March 31, 2001, our materials purchases increased by Lit. 148,291million, or 161.9%, from Lit. 91,577 million in 2000 to Lit. 239,868 million in 2001. This was dueprincipally to our acquisition of Kenwood and the companies acquired during the course of 2000 as part ofour restructuring process.
On a comparable basis, for the three months ended March 31, 2001, materials purchases increased byLit. 13,103 million, or 14.3%, from Lit. 91,577 in 2000 to Lit. 104,680 million in 2001. During the sameperiod, our materials purchases decreased slightly as a percentage of total revenues from 41.9% in 2000 to40.6% in 2001. This was primarily due to an increase in sales volumes of high margin goods, such asheating products.
Services, rents, leases and related costs
Services and related costs consist primarily of lease expenses, rents, advertising and promotional costs,professional services and consulting fees (including technical assistance fees), commissions, transportationcosts, logistics and warehousing costs, travel expenses, insurance costs and other expenses.
For the three months ended March 31, 2001, our services, rents and related costs increased by Lit.38,243 million, or 59.2%, from Lit. 64,604 million in 2000 to Lit. 102,847 million in 2001. This was dueprincipally to our acquisition of Kenwood and the companies we acquired during the course of 2000 aspart of our restructuring process.
On a comparable basis, for the three months ended March 31, 2001, our services, rents and relatedcosts increased by Lit. 4,899 million or 7.6%, from Lit. 64,604 million in 2000 to Lit. 69,503 million in2001. During the same period, our services, rents and related costs decreased slightly as a percentage oftotal revenues from 29.6% in 2000 to 26.9% in 2001. This was due primarily to an increase in our publicityand advertising costs related to our commercial activities.
Wages, salaries and beneÑts
Wages, salaries and beneÑts are composed of personnel costs, consisting primarily of wages, salaries,social contributions and employee severance payments. For the three months ended March 31, 2001,wages, salaries and beneÑts increased by Lit. 32,971 million, or 80.5%, from Lit. 40,942 million in 2000 toLit. 73,913 million in 2001. This was due principally to our acquisition of Kenwood and the companies weacquired during the course of 2000 as part of our restructuring process.
On a comparable basis, for the three months ended March 31, 2001, wages, salaries and beneÑtsincreased by Lit. 4,457 million, or 10.9%, from Lit. 40,942 million in 2000 to Lit. 45,399 million in 2001.During the same period, wages, salaries and beneÑts decreased slightly as a percentage of total revenues
40
Brought to you by Global Reports

from 18.8% in 2000 to 17.6% in 2001. This was due principally to (i) an increase in median salaries paidto our employees, resulting from labor union contract renewals and discretionary bonuses paid to certainemployees and (ii) an increase in the number of personnel.
Operating proÑt
For the three months ended March 31, 2001, as a result of the factors described above, our operatingproÑt increased by Lit. 18,119 million, or 1,698.1%, from Lit. 1,067 million in 2000 to Lit. 19,186 millionin 2001.
On a comparable basis, as a result of the factors described above, our operating proÑt increased byLit. 18,332 million or 1,718.1%, from Lit. 1,067 million in 2000 to Lit. 19,399 million in 2001. During thesame period, our operating proÑt increased as a percentage of total revenues from 0.5% in 2000 to 7.5% in2001. This was due primarily to high sales volumes in our air conditioning, heating and cooking and foodpreparation businesses, which more than oÅset our Ñxed costs that otherwise typically have a greaterimpact on our total revenues during the Ñrst quarter. During 2000, approximately Lit. 2,000 million of ouroperating proÑt was attributable to De' Longhi Radiators S.r.l.
Net Ñnancial losses
Net Ñnancial losses consist primarily of Ñnancial income and interest, Ñnance costs and bank chargesand realized and unrealized gains and losses on foreign exchange transactions and balances. For the threemonths ended March 31, 2001, our net Ñnancial losses increased by Lit. 3,585 million, or 30.8%, from Lit.11,640 million in 2000 to Lit. 15,225 million in 2001. This was due principally to our acquisition ofKenwood and the companies we acquired during the course of 2000 as part of our restructuring process.
On a comparable basis, for the three months ended March 31, 2001, our net Ñnancial losses decreasedby Lit. 4,335 million, or 37.2%, from Lit. 11,640 million in 2000 to Lit. 7,306 million in 2001. This wasprimarily due to increased revenues resulting from our hedging operations which oÅset a correspondingincrease in Ñnancial costs deriving from higher interest rates (which increased approximately 1% over therelevant period) and by the additional indebtedness we incurred as a result of the acquisition of Kenwood.
Net income (loss)
As a result of the factors described above, for the three months ended March 31, 2001, our netincome was equal to Lit. 1,821 million as compared to a net loss of Lit. 12,415 million for the Ñrst quarterof 2000.
On a comparable basis, our net income totaled Lit. 8,210 million for the Ñrst quarter of 2001 ascompared to a loss of Lit. 12,415 million for the Ñrst quarter of 2000.
41
Brought to you by Global Reports

Results of Operations for the Years ended December 31, 1998, 1999 and 2000
The following discussion presents a comparison of the Unaudited De' Longhi Pro Forma Consolidatedresults of operations. You should also read the Unaudited De' Longhi Pro Forma Consolidated FinancialStatements presented elsewhere in this oÅering memorandum.
The following table sets forth the Unaudited Pro Forma De' Longhi Consolidated Income Statementdata for the periods indicated.
Unaudited De' Longhi Pro Forma
Year ended December 31,
Percentage Percentage Percentage%Variationof Total of Total of Total
1998 Revenues 1999 Revenues 2000 Revenues 1999/1998 2000/1999
(Lit. millions, except percentages)
Revenues:
Net sales ÏÏÏÏÏÏÏÏÏÏÏÏÏÏÏÏÏ 1,269,314 98.3% 1,374,841 98.6% 1,561,334 98.5% 8.3% 13.6%
Other revenues ÏÏÏÏÏÏÏÏÏÏÏÏ 21,384 1.7% 18,979 1.4% 23,158 1.5% (11.2)% 22.0%
Total revenues ÏÏÏÏÏÏÏÏÏÏÏ 1,290,698 100.0% 1,393,820 100.0% 1,584,492 100.0% 8.0% 13.7%
Operating costs:
Materials, consumables andgoods ÏÏÏÏÏÏÏÏÏÏÏÏÏÏÏÏÏÏ 630,240 48.8% 637,305 45.7% 714,053 45.1% 1.1% 12.0%
Services ÏÏÏÏÏÏÏÏÏÏÏÏÏÏÏÏÏÏ 263,697 20.4% 288,996 20.7% 354,763 22.4% 9.6% 22.8%
Rents, leases and relatedcosts ÏÏÏÏÏÏÏÏÏÏÏÏÏÏÏÏÏÏÏ 13,016 1.0% 12,467 0.9% 14,379 0.9% (4.2)% 15.3%
Other costsÏÏÏÏÏÏÏÏÏÏÏÏÏÏÏÏ 21,128 1.6% 17,874 1.3% 10,867 0.7% (15.4)% (39.2)%
Total production costs ÏÏÏÏ 928,081 71.9% 956,642 68.6% 1,094,062 69.0% 3.1% 14.4%
Value added margin(1) ÏÏÏÏ 362,617 28.1% 437,178 31.4% 490,430 31.0% 20.6% 12.2%
Wages, salaries and beneÑts 202,160 15.7% 213,311 15.3% 235,795 14.9% 5.5% 10.5%
Total operating costsÏÏÏÏÏÏ 1,130,241 87.6% 1,169,953 83.9% 1,329,857 83.9% 3.5% 13.7%
Gross operating margin ÏÏÏ 160,457 12.4% 223,867 16.1% 254,635 16.1% 39.5% 13.7%
Depreciation and amortization 70,834 5.5% 77,084 5.5% 75,030 4.7% 8.8% (2.7)%
Amortization of goodwill ÏÏÏÏ 30,251 2.3% 30,311 2.2% 30,252 1.9% 0.2% (0.2)%
Provisions and write-oÅs ÏÏÏÏ 28,576 2.2% 15,942 1.1% 17,806 1.1% (44.2)% 11.7%
Operating proÑtÏÏÏÏÏÏÏÏÏÏ 30,796 2.4% 100,530 7.2% 131,547 8.3% 226.4% 30.9%
Net Ñnancial loss ÏÏÏÏÏÏÏÏÏÏ (73,187) (5.7)% (33,399) (2.4)% (45,418) (2.9)% (54.4)% 36.0%
Income from equityinvestments ÏÏÏÏÏÏÏÏÏÏÏÏÏ 1,818 0.1% 3,857 0.3% 8,321 0.5% 112.2% 115.7%
Extraordinary (loss) incomeÏÏÏ (3,410) (0.3)% (4,116) (0.3)% 4,707 0.3% (20.7)% 214.4%
Earnings before taxes andminority interests ÏÏÏÏÏÏ (43,983) (3.4)% 66,872 4.8% 99,157 6.3% 252.0% 48.3%
Income taxes ÏÏÏÏÏÏÏÏÏÏÏÏÏÏ 427 0.0% 26,355 1.9% 57,413 3.6% 6.1% 117.8%
Net (loss) income beforeminority interests ÏÏÏÏÏÏ (44,410) (3.4)% 40,517 2.9% 41,744 2.6% (191.2)% 3.0%
Minority interests ÏÏÏÏÏÏÏÏÏÏ 271 0.0% 72 0.0% (204) 0.0% (73.4)% (383.3)%
Net (loss) income for theyearÏÏÏÏÏÏÏÏÏÏÏÏÏÏÏÏÏÏ (44,139) (3.4)% 40,589 2.9% 41,540 2.6% 192.0% 2.3%
(1) Total revenues minus total production costs.
42
Brought to you by Global Reports

Fiscal Year Ended December 31, 2000 Compared to Fiscal Year Ended December 31, 1999
Revenues
The following table shows a breakdown of our revenues attributable to each of our principal businesssegments for each of the periods indicated:
Unaudited De' Longhi Pro Forma
Year ended December 31, % Variation1999 2000 2000/1999
(Lit. millions, except percentages)
Air conditioningÏÏÏÏÏÏÏÏÏÏÏÏÏÏÏÏÏÏÏÏÏÏÏÏÏÏÏÏÏÏÏÏÏÏÏÏÏÏÏÏÏÏÏ 430,162 465,062 8.1%
Heating ÏÏÏÏÏÏÏÏÏÏÏÏÏÏÏÏÏÏÏÏÏÏÏÏÏÏÏÏÏÏÏÏÏÏÏÏÏÏÏÏÏÏÏÏÏÏÏÏÏÏ 349,398 410,919 17.6%
Cooking and food preparation ÏÏÏÏÏÏÏÏÏÏÏÏÏÏÏÏÏÏÏÏÏÏÏÏÏÏÏÏÏÏÏ 438,480 509,849 16.3%
Cleaning and ironing ÏÏÏÏÏÏÏÏÏÏÏÏÏÏÏÏÏÏÏÏÏÏÏÏÏÏÏÏÏÏÏÏÏÏÏÏÏÏÏ 134,384 133,361 (0.8)%
Other(1)ÏÏÏÏÏÏÏÏÏÏÏÏÏÏÏÏÏÏÏÏÏÏÏÏÏÏÏÏÏÏÏÏÏÏÏÏÏÏÏÏÏÏÏÏÏÏÏÏÏÏ 41,396 65,301 57.7%
Total revenues ÏÏÏÏÏÏÏÏÏÏÏÏÏÏÏÏÏÏÏÏÏÏÏÏÏÏÏÏÏÏÏÏÏÏÏÏÏÏÏÏÏÏ 1,393,820 1,584,492 13.7%
(1) Includes revenues deriving from the sale of accessories, spare parts, scraps, raw materials and semi-manufactured products as
well as revenues from services, contingent assets, capital gains, recovery of transport costs and residual revenues.
The following table shows a breakdown of our revenues attributable to each of the principalgeographic markets in which we sell our products for each of the periods indicated:
Unaudited De' Longhi Pro Forma
Year ended December 31, % Variation1999 2000 2000/1999
(Lit. millions, except percentages)
ItalyÏÏÏÏÏÏÏÏÏÏÏÏÏÏÏÏÏÏÏÏÏÏÏÏÏÏÏÏÏÏÏÏÏÏÏÏÏÏÏÏÏÏÏÏÏÏÏÏÏÏÏÏÏ 517,894 523,891 1.2%
United Kingdom ÏÏÏÏÏÏÏÏÏÏÏÏÏÏÏÏÏÏÏÏÏÏÏÏÏÏÏÏÏÏÏÏÏÏÏÏÏÏÏÏÏÏ 143,442 160,876 12.2%
Rest of EuropeÏÏÏÏÏÏÏÏÏÏÏÏÏÏÏÏÏÏÏÏÏÏÏÏÏÏÏÏÏÏÏÏÏÏÏÏÏÏÏÏÏÏÏÏ 382,809 422,917 10.5%
North America (U.S.A., Canada and Mexico)ÏÏÏÏÏÏÏÏÏÏÏÏÏÏÏÏÏ 147,114 194,670 32.3%
JapanÏÏÏÏÏÏÏÏÏÏÏÏÏÏÏÏÏÏÏÏÏÏÏÏÏÏÏÏÏÏÏÏÏÏÏÏÏÏÏÏÏÏÏÏÏÏÏÏÏÏÏÏ 66,931 101,532 51.7%
Rest of the worldÏÏÏÏÏÏÏÏÏÏÏÏÏÏÏÏÏÏÏÏÏÏÏÏÏÏÏÏÏÏÏÏÏÏÏÏÏÏÏÏÏÏ 135,629 180,606 33.2%
Total revenues ÏÏÏÏÏÏÏÏÏÏÏÏÏÏÏÏÏÏÏÏÏÏÏÏÏÏÏÏÏÏÏÏÏÏÏÏÏÏÏÏÏÏ 1,393,820 1,584,492 13.7%
For the year ended December 31, 2000, our total revenues increased by Lit. 190,672 million, or13.7%, from Lit. 1,393,820 million in 1999 to Lit. 1,584,492 million in 2000. This was due primarily to ageneral increase in revenues in our cooking and food preparation, air conditioning and heating businessesand to increased sales in foreign markets, particularly Japan, the United States, Canada and the UnitedKingdom. The following discussion presents a comparison of the revenues attributable during the relevantperiods to each of our principal business segments and, where relevant, geographic sales markets.
Air conditioning
For the year ended December 31, 2000, revenues attributable to our air conditioning businessincreased by Lit. 34,900 million, or 8.1%, from Lit. 430,162 million in 1999 to Lit. 465,062 million in2000. This was primarily due to an increase in sales prices and a general increase in sales volumes ofÑxed-wall air conditioning units, hydronic (or water-based) air conditioning systems and industrial airconditioning systems, which was oÅset somewhat by a decrease in sales of Pinguino portable airconditioning units resulting from mild climate conditions, particularly in Italy. The increase in revenueswas also due to a general increase in the use of our air conditioning and treatment systems worldwide,both for commercial and personal use, resulting from the following principal factors:
‚ a growth in sales of our industrial air conditioning systems (particularly the Ermetici line ofproducts) in Italy, the United Kingdom, Japan and China due to the Group's increasedtechnological expertise and its ability to customize products based on client needs and requests;
43
Brought to you by Global Reports

‚ an increase in demand for hydronic air conditioning systems, particularly by professional installers,resulting from a general growth in the construction market in Europe; and
‚ an increase in orders for Ñxed, wall-mounted air conditioning units resulting from technologicalimprovements in our products and from the growth of our sales network and a correspondingimprovement in sales coverage, particularly in Europe, the former Soviet Union and North Africa.
Heating
For the year ended December 31, 2000, our revenues attributable to our heating business increased byLit. 61,521 million, or 17.6%, from Lit. 349,398 million in 1999 to Lit. 410,919 million in 2000. Thisincrease was attributable primarily to an increase in sales volumes of our oil-Ñlled radiators (particularlyour Radia and Rapido models) and bathroom radiators (Caldobagno), particularly in the UnitedKingdom, Japan and the United States. The increase was also due to higher prices resulting fromexchange rate Öuctuations (particularly in the United States and Japan) for our oil-Ñlled radiators. Thisincrease was oÅset somewhat by a decline in the sale of Ñxed heating units during 2000 as compared to1999 as a result of reduced demand in Europe (especially in Germany) for such products.
Cleaning and ironing
For the year ended December 31, 2000, revenues attributable to our cleaning and ironing businessdecreased slightly by Lit. 1,023 million, or 0.8%, from Lit. 134,384 million in 1999 to Lit. 133,361 millionin 2000. This decrease was due primarily to a decrease in sales of electric brooms and dusters resultingfrom increased competition, both domestically and in Europe generally, as well as from the lateintroduction of new models by the Group into the market. The decrease was oÅset in part by an increasein sales, particularly in Europe, of ironing systems and steam cleaners (and especially the success of ournew Triplo Simac product).
Cooking and food preparation
For the year ended December 31, 2000, revenues attributable to our cooking and food preparationbusiness segment increased by Lit. 71,369 million, or 16.3%, from Lit. 438,480 million in 1999 toLit. 509,849 million in 2000. This increase was due primarily to an increase in sales volumes of free-standing stoves and cooking tops, coÅee makers, electric fryers and toasters, as well as to the introductionof new products and models into the market (such as microwave ovens and coÅee machines). This, inturn, resulted principally from:
‚ a general economic growth trend, and a corresponding increase in demand, in the markets wherewe sell our coÅee makers, particularly in Japan and the United States;
‚ our strategic focus on design and technology with respect to free-standing stoves and acorresponding increase in sales in certain signiÑcant markets, particularly in Europe and Asia; and
‚ our strategic focus on quality and, in particular, our consolidation of electric fryers under the""premium'' label, leading to a signiÑcant increase in sales in North America and Europe.
Other revenues
Our ""other revenues'' are comprised principally of revenues deriving from sales of accessories, spareparts, raw materials, scrap and semi-manufactured products, as well as revenues from miscellaneousservices, contingent assets, capital gains, the recovery of transport costs and residual revenues. For the yearended December 31, 2000, our revenues deriving from these sources increased by Lit. 4,179 million, or22.0%, from Lit. 18,979 million in 1999 to Lit. 23,158 million in 2000. This increase was due primarily toan increase in revenues attributable to write-oÅs of excess provisions recorded in previous years, certainVAT reimbursements and to the sale of scrap and raw materials.
Total operating costs
Our operating costs consist of purchases of materials, consumables and goods; services expenses;wages, salaries and beneÑts; rents, leases and related costs; and other operating costs.
Our total operating costs increased by Lit. 159,904 million, or 13.7%, from Lit. 1,169,953 million in1999 to Lit. 1,329,857 million in 2000. This increase was due primarily to an increase (Lit. 76,748
44
Brought to you by Global Reports

million) in the cost of materials, consumables and goods, an increase (Lit. 65,767 million) in servicesexpenses and an increase (Lit. 22,484 million) in wages, salaries and beneÑts.
Materials, consumables and goods
The following table sets forth the components of materials, consumables and goods purchased duringthe periods indicated:
Unaudited De' Longhi Pro Forma
Year ended December 31, % Variation1999 2000 2000/1999
(Lit. millions, except percentages)
Raw materials ÏÏÏÏÏÏÏÏÏÏÏÏÏÏÏÏÏÏÏÏÏÏÏÏÏÏÏÏÏÏÏÏÏÏÏÏÏÏÏÏÏÏÏÏÏÏÏ 236,486 280,678 18.7%
Components ÏÏÏÏÏÏÏÏÏÏÏÏÏÏÏÏÏÏÏÏÏÏÏÏÏÏÏÏÏÏÏÏÏÏÏÏÏÏÏÏÏÏÏÏÏÏÏÏÏ 316,467 374,992 18.5%
Semi-Ñnished and Ñnished products ÏÏÏÏÏÏÏÏÏÏÏÏÏÏÏÏÏÏÏÏÏÏÏÏÏÏÏÏÏ 37,361 112,415 200.9%
Miscellaneous acquisitions ÏÏÏÏÏÏÏÏÏÏÏÏÏÏÏÏÏÏÏÏÏÏÏÏÏÏÏÏÏÏÏÏÏÏÏÏÏ 25,371 26,772 5.5%
Changes in inventoryÏÏÏÏÏÏÏÏÏÏÏÏÏÏÏÏÏÏÏÏÏÏÏÏÏÏÏÏÏÏÏÏÏÏÏÏÏÏÏÏÏÏ 23,973 (76,867) (420.6)%
Increases in Ñxed assets for internal work ÏÏÏÏÏÏÏÏÏÏÏÏÏÏÏÏÏÏÏÏÏÏÏÏ (2,353) (3,937) (67.3)%
Total ÏÏÏÏÏÏÏÏÏÏÏÏÏÏÏÏÏÏÏÏÏÏÏÏÏÏÏÏÏÏÏÏÏÏÏÏÏÏÏÏÏÏÏÏÏÏÏÏÏÏÏÏÏ 637,305 714,053 12.0%
For the year ended December 31, 2000, materials purchases increased by Lit. 76,748 million, or12.0%, from Lit. 637,305 million in 1999 to Lit. 714,053 million in 2000. During the same period, ourmaterials purchases decreased slightly as a percentage of total revenues from 45.7% in 1999 to 45.1% in2000. This was due primarily to the following factors:
‚ the strengthening of the U.S. dollar, Japanese Yen and pound sterling (relative to the Euro)resulting in exchange rate losses and higher proportional costs for our purchases denominated inthese currencies;
‚ a general increase in prices of our primary raw materials, especially steel (from an average price ofLit. 650/kilogram in 1999 to an average price of Lit. 830/kilogram in 2000); and
‚ a strategic shift in our policy favoring the acquisition of Ñnished products (such as small kitchenappliances and coÅee makers) over components and semi-Ñnished products.
Services expenses
Services expenses consist primarily of advertising and promotional costs, professional services andconsulting fees (including technical assistance fees), commissions, transportation costs, logistics andwarehousing costs, travel expenses, insurance costs and other expenses.
For the year ended December 31, 2000, services expenses increased by Lit. 65,767 million, or 22.8%,from Lit. 288,996 million in 1999 to Lit. 354,763 million in 2000. This increase was due primarily to:
‚ an increase of 25.9% in our professional services costs (from Lit. 40,130 million in 1999 toLit. 50,528 million in 2000) resulting from our decision to outsource additional labor functions toexternal sources;
‚ an increase of 33.3% in our transportation costs (from Lit. 46,739 million in 1999 to Lit. 62,307million in 2000) resulting from an increase in the volume transported over the period of both ouracquired goods and materials as well as our products for sale. The increase in transportation costswas also due to a general increase in our transportation rates due to increased oil costs worldwide;
‚ an increase of 16.7% in our promotional costs (from Lit. 9,771 million in 1999 to Lit. 11,408million in 2000) resulting from our decision to reinforce and expand our client base throughpromotional campaigns about our products; and
‚ an increase of 28.8% in our logistics and warehousing costs (from Lit. 9,181 million in 1999 toLit. 11,824 million in 2000) resulting from a corresponding increase in the number of warehousesused by the Group.
45
Brought to you by Global Reports

Rents, leases and related costs
Rents, leases and related costs consist of rental and other similar costs. For the year endedDecember 31, 2000, rents, leases and related costs increased by Lit. 1,912 million, or 15.3%, fromLit. 12,467 million in 1999 to Lit. 14,379 million in 2000.
Other costs
Other operating costs consist primarily of expenses for oÇce and store supplies, losses on loans,association membership contributions, garbage disposal taxes, value-added taxes and other local taxes. Forthe year ended December 31, 2000, other operating costs decreased by Lit. 7,007 million, or 39.2%, fromLit. 17,874 million in 1999 to Lit. 10,867 million in 2000. This was due principally to our policy of closelymanaging our loans portfolio and covering our exposure through insurance, thereby reducing our loanlosses by Lit. 3,890 million (from Lit. 4,992 million in 1999 to Lit. 1,102 million in 2000). The decreasewas also due, in part, to a reduction in our tax costs (equal to Lit. 1,124 million) and a decrease in ourother miscellaneous expenses (Lit. 1,073 million).
Value added margin
As a result of the factors described above, we recorded a value added margin of Lit. 490,430 millionfor the year ended December 31, 2000, as compared to a value added margin of Lit. 437,178 million in1999.
Wages, salaries and beneÑts
The following table sets forth the components of our wages, salaries and beneÑts costs for the periodsindicated:
Unaudited De' Longhi Pro Forma
Year endedDecember 31, % Variation
1999 2000 2000/1999
(Lit. millions, except percentages)
Wages and salaries ÏÏÏÏÏÏÏÏÏÏÏÏÏÏÏÏÏÏÏÏÏÏÏÏÏÏÏÏÏÏÏÏÏÏÏÏÏÏÏÏÏÏÏ 153,437 170,175 10.9%
Social contributionsÏÏÏÏÏÏÏÏÏÏÏÏÏÏÏÏÏÏÏÏÏÏÏÏÏÏÏÏÏÏÏÏÏÏÏÏÏÏÏÏÏÏÏ 47,631 51,258 7.6%
Employee severance pay ÏÏÏÏÏÏÏÏÏÏÏÏÏÏÏÏÏÏÏÏÏÏÏÏÏÏÏÏÏÏÏÏÏÏÏÏÏÏÏ 10,817 12,298 13.7%
OtherÏÏÏÏÏÏÏÏÏÏÏÏÏÏÏÏÏÏÏÏÏÏÏÏÏÏÏÏÏÏÏÏÏÏÏÏÏÏÏÏÏÏÏÏÏÏÏÏÏÏÏÏÏÏÏ 1,426 2,064 44.7%
Total ÏÏÏÏÏÏÏÏÏÏÏÏÏÏÏÏÏÏÏÏÏÏÏÏÏÏÏÏÏÏÏÏÏÏÏÏÏÏÏÏÏÏÏÏÏÏÏÏÏÏÏÏÏ 213,311 235,795 10.5%
The following table sets forth the total number of our employees at the dates indicated:
Unaudited De' Longhi Pro Forma
As atDecember 31, % Variation
1999 2000 2000/1999
Executives ÏÏÏÏÏÏÏÏÏÏÏÏÏÏÏÏÏÏÏÏÏÏÏÏÏÏÏÏÏÏÏÏÏÏÏÏÏÏÏÏÏÏÏÏÏÏÏÏÏÏÏÏÏÏ 43 56 30.2%
Employees ÏÏÏÏÏÏÏÏÏÏÏÏÏÏÏÏÏÏÏÏÏÏÏÏÏÏÏÏÏÏÏÏÏÏÏÏÏÏÏÏÏÏÏÏÏÏÏÏÏÏÏÏÏÏ 982 1,057 7.6%
Other Personnel ÏÏÏÏÏÏÏÏÏÏÏÏÏÏÏÏÏÏÏÏÏÏÏÏÏÏÏÏÏÏÏÏÏÏÏÏÏÏÏÏÏÏÏÏÏÏÏÏÏÏ 2,586 2,747 6.2%
Total ÏÏÏÏÏÏÏÏÏÏÏÏÏÏÏÏÏÏÏÏÏÏÏÏÏÏÏÏÏÏÏÏÏÏÏÏÏÏÏÏÏÏÏÏÏÏÏÏÏÏÏÏÏÏÏÏÏÏÏ 3,611 3,860 6.8%
For the year ended December 31, 2000, wages, salaries and beneÑts increased by Lit. 22,484 million,or 10.5%, from Lit. 213,311 million in 1999 to Lit. 235,795 million in 2000. As shown in the tables above,this increase was primarily due to:
‚ a general increase in the median salaries paid to our employees, resulting from a series of contractrenewals and discretionary bonuses paid to certain of our employees; and
‚ an increase in the number of our personnel, from 3,611 employees at year-end 1999 to 3,860employees at year-end 2000 (or from a median of 3,563 employees in 1999 to 3,867 in 2000).
46
Brought to you by Global Reports

The increase in 2000 was partially oÅset by a reduction in our per capita costs resulting from a lowermedian age for our employees.
Gross operating margin
As a result of the factors described above, we recorded a gross operating margin of Lit. 254,635million for the year ended December 31, 2000, as compared to a gross operating margin of Lit. 223,867million in 1999.
Depreciation and amortization
The following table presents the components of our depreciation and amortization costs for the periodspresented.
Unaudited De' Longhi Pro Forma
Year endedDecember 31, % Variation
1999 2000 2000/1999
(Lit. millions, except percentages)
Depreciation of intangible assets ÏÏÏÏÏÏÏÏÏÏÏÏÏÏÏÏÏÏÏÏÏÏÏÏÏÏÏÏÏÏÏÏ 4,993 5,106 2.3%
Depreciation of trademarks ÏÏÏÏÏÏÏÏÏÏÏÏÏÏÏÏÏÏÏÏÏÏÏÏÏÏÏÏÏÏÏÏÏÏÏÏ 14,770 14,571 (1.3)%
Depreciation of tangible assetsÏÏÏÏÏÏÏÏÏÏÏÏÏÏÏÏÏÏÏÏÏÏÏÏÏÏÏÏÏÏÏÏÏÏ 57,321 55,353 (3.4)%
Subtotal ÏÏÏÏÏÏÏÏÏÏÏÏÏÏÏÏÏÏÏÏÏÏÏÏÏÏÏÏÏÏÏÏÏÏÏÏÏÏÏÏÏÏÏÏÏÏÏÏÏÏ 77,084 75,030 (2.7)%
Amortization of goodwill ÏÏÏÏÏÏÏÏÏÏÏÏÏÏÏÏÏÏÏÏÏÏÏÏÏÏÏÏÏÏÏÏÏÏÏÏÏÏ 30,311 30,252 (0.2)%
Total depreciation and amortization ÏÏÏÏÏÏÏÏÏÏÏÏÏÏÏÏÏÏÏÏÏÏÏÏÏÏÏ 107,395 105,282 (2.0)%
For the year ended December 31, 2000, depreciation and amortization charges (not includingamortization of goodwill) decreased by Lit. 2,054 million, or 2.7%, from Lit. 77,084 million in 1999 toLit. 75,030 million in 2000. Total depreciation and amortization (including amortization of goodwill), as apercentage of total revenues, decreased slightly from 7.7% in 1999 to 6.6% in 2000.
Provisions and write-oÅs
Provisions and write-oÅs consist primarily of provisions for contingent risks and liabilities (includingthose associated with legal claims against the Group and product warranties) and write-oÅs of assets.
For the year ended December 31, 2000, provisions and write-oÅs increased by Lit. 1,864 million, or11.7%, from Lit. 15,942 million in 1999 to Lit. 17,806 million in 2000. This was due to principally to amodest increase of Lit. 1,698 million in provisions made by the Group for legal claims and guarantees(totaling Lit. 8,415 million in 2000 as compared to Lit. 6,717 million in 1999).
Operating proÑt
As a result of the factors described above, we recorded an operating proÑt of Lit. 131,547 million in2000, as compared to Lit. 100,530 million in 1999.
Net Ñnancial losses
For the year ended December 31, 2000, net Ñnancial losses were Lit. 45,418 million, as comparedwith net losses of Lit. 33,399 million in 1999. The increase of 36.0% in net Ñnancial losses was dueprimarily to:
‚ an increase in interest rate charges (from Lit. 41,545 million in 1999 to Lit. 57,975 million in2000) resulting from a general increase in interbank interest rates in Italy over the period;
‚ interest payments on our bonds due 2003 that became payable for the Ñrst time in 2000 (totalingLit. 11,056 million); and
‚ a decrease in our net income derived from hedging instruments as compared to the prior year(from Lit. 10,328 million in 1999 to Lit. 7,601 million in 2000) resulting largely from exchangerate losses accumulated as a result of Öuctuations in non-Euro denominated currencies.
47
Brought to you by Global Reports

As a result of the factors described above, our net Ñnancial losses increased slightly as a percentage oftotal revenues from 2.4% in 1999 to 2.9% in 2000.
You should note that the purchase contracts for the companies acquired in 2000 do not includeinterest payments as part of the purchase price (which totaled Lit. 538,889 million in the aggregate) and,as a result, the Unaudited De' Longhi Pro Forma Consolidated Financial Statements do not include acharge for implicit interest expense. In addition, the capital increase eÅected in April 2001 is treated asnon-interest bearing for purposes of such Ñnancial statements. You should refer to ""Presentation ofFinancial and Other Information''.
Income from equity investments
For the year ended December 31, 2000, our income from equity investments increased by Lit. 4,464million, or 115.7%, from Lit. 3,857 million in 1999 to Lit. 8,321 million in 2000. This increase was dueprincipally to tax credits received in 2000 on dividend distributions, totaling Lit. 5,807 million, and toproceeds received from the sale of our equity holdings totaling Lit. 1,410 million.
Extraordinary income (loss)
Extraordinary items are gains or losses generated from the disposal of assets or other items of agenerally non-recurring nature.
For the year ended December 31, 2000, extraordinary items amounted to a net gain of Lit. 4,707million. For the year ended December 31, 1999, extraordinary items amounted to a net loss of Lit. 4,116million. The gain in 2000 was primarily due to tax reimbursements from the Italian tax authorities(totaling Lit. 2,767 million) relating to taxes paid in prior periods, oÅset somewhat by payment made inconnection with tax obligations for previous years and certain provisions. The losses in 1999 wereprincipally due to restructuring costs associated with various companies of our Group.
Income taxes
Income taxes consist of current taxes and deferred taxes calculated on the basis of the tax rates ineÅect in the various countries in which we operate.
For the year ended December 31, 2000, income taxes totaled Lit. 57,413 million, as compared toLit. 26,355 million for the year ended December 31, 1999. The eÅective tax rate for the Group was 57.9%in 2000, as compared to 39.4% in 1999. The corporate income tax rate in Italy (known as Imposta sulReddito delle Persone Giuridiche or ""IRPEG'') was equal to 37% in both 1999 and 2000. In addition, weare required to pay a regional corporate tax imposed on production (known as Imposta Regionale sulleAttivit fia Produttive or ""IRAP''), which is equal to 4.25% of our value added margin, less certain non-deductible costs. The increase in our income taxes recorded in 2000 was primarily due to an increase inIRAP (resulting from a higher value added margin in 2000) and to variations of IRPEG paid bycompanies within the Group.
Net income
As a result of the factors described above, we recorded net income of Lit. 41,540 million in 2000, ascompared to net income of Lit. 40,589 million in 1999.
48
Brought to you by Global Reports

Fiscal Year Ended December 31, 1999 Compared to Fiscal Year Ended December 31, 1998
Revenues
The following table shows a breakdown of our revenues attributable to each of our principal businesssegments, for each of the periods indicated:
Unaudited De' Longhi Pro Forma
Year ended December 31, % Variation1998 1999 1999/1998
(Lit. millions, except percentages)
Air conditioningÏÏÏÏÏÏÏÏÏÏÏÏÏÏÏÏÏÏÏÏÏÏÏÏÏÏÏÏÏÏÏÏÏÏÏÏÏÏÏÏÏÏÏ 351,829 430,162 22.3%
Heating ÏÏÏÏÏÏÏÏÏÏÏÏÏÏÏÏÏÏÏÏÏÏÏÏÏÏÏÏÏÏÏÏÏÏÏÏÏÏÏÏÏÏÏÏÏÏÏÏÏÏ 334,460 349,398 4.5%
Cooking and food preparation ÏÏÏÏÏÏÏÏÏÏÏÏÏÏÏÏÏÏÏÏÏÏÏÏÏÏÏÏÏÏÏ 413,453 438,480 6.1%
Cleaning and ironing ÏÏÏÏÏÏÏÏÏÏÏÏÏÏÏÏÏÏÏÏÏÏÏÏÏÏÏÏÏÏÏÏÏÏÏÏÏÏÏ 143,622 134,384 (6.4)%
Other(1)ÏÏÏÏÏÏÏÏÏÏÏÏÏÏÏÏÏÏÏÏÏÏÏÏÏÏÏÏÏÏÏÏÏÏÏÏÏÏÏÏÏÏÏÏÏÏÏÏÏÏ 47,334 41,396 (12.5)%
Total revenues ÏÏÏÏÏÏÏÏÏÏÏÏÏÏÏÏÏÏÏÏÏÏÏÏÏÏÏÏÏÏÏÏÏÏÏÏÏÏÏÏÏÏ 1,290,698 1,393,820 8.0%
(1) Includes revenues from the sale of accessories, spare parts, scraps, raw materials and semi-manufactured products as well as
revenues from services, contingent assets, capital gains, the recovery of transport costs and residual revenues.
The following table shows a breakdown of our revenues attributable to each of the principalgeographic markets in which we sell our products for each of the periods indicated:
Unaudited De' Longhi Pro Forma
Year ended December 31, % Variation
1998 1999 1999/1998
(Lit. millions, except percentages)
ItalyÏÏÏÏÏÏÏÏÏÏÏÏÏÏÏÏÏÏÏÏÏÏÏÏÏÏÏÏÏÏÏÏÏÏÏÏÏÏÏÏÏÏÏÏÏÏÏÏÏÏÏÏÏ 465,541 517,894 11.2%
United Kingdom ÏÏÏÏÏÏÏÏÏÏÏÏÏÏÏÏÏÏÏÏÏÏÏÏÏÏÏÏÏÏÏÏÏÏÏÏÏÏÏÏÏÏ 131,267 143,442 9.3%
Rest of EuropeÏÏÏÏÏÏÏÏÏÏÏÏÏÏÏÏÏÏÏÏÏÏÏÏÏÏÏÏÏÏÏÏÏÏÏÏÏÏÏÏÏÏÏÏ 372,893 382,809 2.6%
North America (U.S.A. and Canada) ÏÏÏÏÏÏÏÏÏÏÏÏÏÏÏÏÏÏÏÏÏÏÏÏ 111,314 147,114 32.2%
JapanÏÏÏÏÏÏÏÏÏÏÏÏÏÏÏÏÏÏÏÏÏÏÏÏÏÏÏÏÏÏÏÏÏÏÏÏÏÏÏÏÏÏÏÏÏÏÏÏÏÏÏÏ 43,184 66,931 55.0%
Rest of the worldÏÏÏÏÏÏÏÏÏÏÏÏÏÏÏÏÏÏÏÏÏÏÏÏÏÏÏÏÏÏÏÏÏÏÏÏÏÏÏÏÏÏ 166,409 135,629 (18.5)%
Total revenues ÏÏÏÏÏÏÏÏÏÏÏÏÏÏÏÏÏÏÏÏÏÏÏÏÏÏÏÏÏÏÏÏÏÏÏÏÏÏÏÏÏÏ 1,290,698 1,393,820 8.0%
For the year ended December 31, 1999, our total revenues increased by Lit. 103,122 million, or 8.0%,from Lit. 1,290,698 million in 1998 to Lit. 1,393,820 million in 1999. This was due primarily to a generalincrease in revenues in our air conditioning, cooking and food preparation and heating businesses and toincreased sales in our domestic and foreign markets, especially Italy, the United States, Canada and Japan.The following discussion presents a comparison of the revenues during the relevant periods attributable toeach of our principal business segments and, where relevant, geographic sales markets.
Air conditioning
For the year ended December 31, 1999, revenues attributable to our air conditioning businessincreased by Lit. 78,333 million, or 22.3%, from Lit. 351,829 million in 1998 to Lit. 430,162 million in1999. This increase was primarily due to an increase in sales volumes generally in Europe and particularlyin Italy of our Pinguino portable air conditioners, as well as a general increase in sales volumes of ourÑxed wall-mounted air conditioners, hydronic air conditioning systems, industrial air conditioning systemsand dehumidiÑers. The increase in sales volumes was due to continued favorable market demand for ourproduct lines in this business segment as well as the following principal factors:
‚ the introduction by our Group of new and innovative portable air conditioners bolstered, in part,by warm climatic conditions in Italy and Europe and by a general growth trend in the market forsingle and split-system air conditioning units;
‚ our strategic focus on developing innovative Ñxed wall-mounted and hydronic air conditioningsystems, together with the reinforcement of our sales network, particularly with respect to originalequipment manufacturers (or ""OEM''), leading to increased sales of these products;
49
Brought to you by Global Reports

‚ continued growth in sales of our industrial air conditioning systems due to improved technologicalexpertise and our ability to customize products based on client needs and requests; and
‚ the launch of our dehumidiÑers and our success in penetrating certain markets for these products,including Europe (particularly the Italian domestic market) and North America.
Heating
For the year ended December 31, 1999, the revenues attributable to our heating business increased byLit. 14,938 million, or 4.5%, from Lit. 334,460 million in 1998 to Lit. 349,398 million in 1999. Thisincrease was attributable primarily to increased sales volumes of our oil-Ñlled radiators, particularly inJapan and the United States, resulting from our success in promoting these products commercially, as wellas certain qualitative and technological improvements made with respect to such products during thecourse of the year. The increase in revenues was also due to a growth in revenues attributable to sales ofterminal units for central heating systems, particularly in the United Kingdom.
Cooking and food preparation
For the year ended December 31, 1999, the revenues attributable to our cooking and food preparationbusiness increased by Lit. 25,027 million, or 6.1%, from Lit. 413,453 million in 1998 to Lit. 438,480million in 1999. This increase was due primarily to a continued increase in sales volumes of coÅee makers,particularly in Europe and the United States, and to an increase in sales volumes of electric deep-fryers,particularly in the United Kingdom and the United States. These increases, in turn, resulted from thelaunch of new and innovative products during the course of the year and from a general growth in themarket for these products (especially for coÅee makers).
Cleaning and ironing
For the year ended December 31, 1999, the revenues attributable to our cleaning and ironing businessdecreased by Lit. 9,238 million, or 6.4%, from Lit. 143,622 million in 1998 to Lit. 134,384 million in 1999.This decrease was due primarily to a decrease in sales volumes of electric dusters, particularly in Italy, andof dry steam cleaners in the European markets. This, in turn, resulted from continued and increasedcompetition in these product categories, as well as from a general change in consumer preferences duringthe course of the year from electric dusters to steam cleaners. In addition, the decrease in our revenueswas also attributable to the general economic crisis in the former Soviet Union, which resulted in areduction by more than half of our sales volumes for such products in those markets in 1999 as comparedto the prior year.
Other revenues
For the year ended December 31, 1999, other revenues decreased by Lit. 2,405 million, or 11.2%,from Lit. 21,384 million in 1998 to Lit. 18,979 million in 1999.
Total operating costs
Our total operating costs increased by Lit. 39,712 million, or 3.5%, from Lit. 1,130,241 million in1998 to Lit. 1,169,953 million in 1999. As discussed in greater detail below, this increase was dueprimarily to an increase (Lit. 25,299 million) in our services expenses and an increase (Lit. 11,151million) in our wages, salaries and beneÑts expenses.
50
Brought to you by Global Reports

Materials, consumables and goods
The following table sets forth the components of materials, consumables and goods purchased duringthe periods indicated:
Unaudited De' Longhi Pro Forma
Year ended December 31, % Variation1998 1999 1999/1998
(Lit. millions, except percentages)
Raw materials ÏÏÏÏÏÏÏÏÏÏÏÏÏÏÏÏÏÏÏÏÏÏÏÏÏÏÏÏÏÏÏÏÏÏÏÏÏÏÏÏÏÏÏÏÏÏ 268,400 236,486 (11.9%)
Components ÏÏÏÏÏÏÏÏÏÏÏÏÏÏÏÏÏÏÏÏÏÏÏÏÏÏÏÏÏÏÏÏÏÏÏÏÏÏÏÏÏÏÏÏÏÏÏÏ 264,856 316,467 19.5%
Semi-Ñnished and Ñnished products ÏÏÏÏÏÏÏÏÏÏÏÏÏÏÏÏÏÏÏÏÏÏÏÏÏÏÏÏ 29,529 37,361 26.5%
Miscellaneous acquisitions ÏÏÏÏÏÏÏÏÏÏÏÏÏÏÏÏÏÏÏÏÏÏÏÏÏÏÏÏÏÏÏÏÏÏÏÏ 30,790 25,371 (17.6%)
Changes in inventoryÏÏÏÏÏÏÏÏÏÏÏÏÏÏÏÏÏÏÏÏÏÏÏÏÏÏÏÏÏÏÏÏÏÏÏÏÏÏÏÏÏ 40,454 23,973 (40.7%)
Increased in Ñxed assets for internal work ÏÏÏÏÏÏÏÏÏÏÏÏÏÏÏÏÏÏÏÏÏÏÏ (3,789) (2,353) 37.9%
Total ÏÏÏÏÏÏÏÏÏÏÏÏÏÏÏÏÏÏÏÏÏÏÏÏÏÏÏÏÏÏÏÏÏÏÏÏÏÏÏÏÏÏÏÏÏÏÏÏÏÏÏÏ 630,240 637,305 1.1%
For the year ended December 31, 1999, materials purchases increased by Lit. 7,065 million, or 1.1%,from Lit. 630,240 million in 1998 to Lit. 637,305 million in 1999. During the same period, our materialspurchases decreased slightly as a percentage of total revenues from 48.8% in 1998 to 45.7% in 1999. Thisdecrease was due primarily to a signiÑcant decrease in the price of our primary raw materials, especiallysteel (from an average price of Lit. 820/kilogram in 1998 to an average price of Lit. 650/kilogram in1999) and plastics (from an average price of Lit. 3,500/kilogram in 1998 to an average price ofLit.2,870/kilogram in 1999).
Services expenses
For the year ended December 31, 1999, our services expenses increased by Lit. 25,299 million, or9.6%, from Lit. 263,697 million in 1998 to Lit. 288,996 million in 1999. This increase was due primarilyto:
‚ an increase of 14.4% in our advertising costs (from Lit. 51,978 million in 1998 to Lit. 59,484million in 1999) following our decision to advertise the launch of certain new products with theaim of consolidating and increasing our market share; and
‚ an increase of 22.6% in our transportation costs (from Lit. 38,118 million in 1998 to Lit. 46,739million in 1999) resulting from an increase in the volume transported over the period of both ouracquired goods and materials as well as our products for sale.
Rents, leases and related costs
For the year ended December 31, 1999, rents, leases and related costs decreased slightly by Lit. 549million, or 4.2%, from Lit. 13,016 million in 1998 to Lit. 12,467 million in 1999.
Other costs
For the year ended December 31, 1999, other operating costs decreased by Lit. 3,254 million, or15.4%, from Lit. 21,128 million in 1998 to Lit. 17,874 million in 1999. This was due principally to ourpolicy of closely managing our receivables and covering our exposure through insurance, thereby reducingour bad debt losses by Lit. 2,443 million, or 32.9% (from Lit. 7,435 million in 1998 to Lit. 4,992 million in1999).
Value added margin
As a result of the factors described above, we recorded a value added margin of Lit. 437,178 millionfor the year ended December 31, 1999, as compared to a value added margin of Lit. 362,617 million in1998.
51
Brought to you by Global Reports

Wages, salaries and beneÑts
The following table sets forth the components of our wages, salaries and beneÑts costs for the periodsindicated:
Unaudited De' Longhi Pro Forma
Year ended December 31, % Variation
1998 1999 1999/1998
(Lit. millions, except percentages)
Wages and salaries ÏÏÏÏÏÏÏÏÏÏÏÏÏÏÏÏÏÏÏÏÏÏÏÏÏÏÏÏÏÏÏÏÏÏÏÏÏÏÏÏÏÏ 143,760 153,437 6.7%
Social contributionsÏÏÏÏÏÏÏÏÏÏÏÏÏÏÏÏÏÏÏÏÏÏÏÏÏÏÏÏÏÏÏÏÏÏÏÏÏÏÏÏÏÏ 46,853 47,631 1.6%
Employee severance pay ÏÏÏÏÏÏÏÏÏÏÏÏÏÏÏÏÏÏÏÏÏÏÏÏÏÏÏÏÏÏÏÏÏÏÏÏÏÏ 10,038 10,817 7.7%
OtherÏÏÏÏÏÏÏÏÏÏÏÏÏÏÏÏÏÏÏÏÏÏÏÏÏÏÏÏÏÏÏÏÏÏÏÏÏÏÏÏÏÏÏÏÏÏÏÏÏÏÏÏÏÏ 1,509 1,426 (5.5%)
Total ÏÏÏÏÏÏÏÏÏÏÏÏÏÏÏÏÏÏÏÏÏÏÏÏÏÏÏÏÏÏÏÏÏÏÏÏÏÏÏÏÏÏÏÏÏÏÏÏÏÏÏÏ 202,160 213,311 5.5%
The following table sets forth the total number of our employees at the dates indicated:
Unaudited De' Longhi Pro Forma
As at December 31, % Variation1998 1999 1999/1998
Executives ÏÏÏÏÏÏÏÏÏÏÏÏÏÏÏÏÏÏÏÏÏÏÏÏÏÏÏÏÏÏÏÏÏÏÏÏÏÏÏÏÏÏÏÏÏÏÏÏÏÏÏÏÏ 45 43 (4.4%)
Employees ÏÏÏÏÏÏÏÏÏÏÏÏÏÏÏÏÏÏÏÏÏÏÏÏÏÏÏÏÏÏÏÏÏÏÏÏÏÏÏÏÏÏÏÏÏÏÏÏÏÏÏÏÏ 942 982 4.2%
Other Personnel ÏÏÏÏÏÏÏÏÏÏÏÏÏÏÏÏÏÏÏÏÏÏÏÏÏÏÏÏÏÏÏÏÏÏÏÏÏÏÏÏÏÏÏÏÏÏÏÏÏ 2,480 2,586 4.2%
Total ÏÏÏÏÏÏÏÏÏÏÏÏÏÏÏÏÏÏÏÏÏÏÏÏÏÏÏÏÏÏÏÏÏÏÏÏÏÏÏÏÏÏÏÏÏÏÏÏÏÏÏÏÏÏÏÏ 3,467 3,611 4.1%
For the year ended December 31, 1999, wages, salaries and beneÑts increased by Lit. 11,151 million,or 5.5%, from Lit. 202,160 million in 1998 to Lit. 213,311 million in 1999. This increase was primarilydue:
‚ a general increase in the average salaries paid to our employees, resulting from a series of contractrenewals and discretionary bonuses paid to certain of our employees; and
‚ an increase in the number of our personnel, from 3,467 employees at year-end 1998 to 3,611employees at year end 1999 (or from an average of 3,526 employees in 1998 to 3,563 in 1999).
Gross Operating Margin
As a result of the factors described above, we recorded a gross operating margin of Lit. 223,867million for the year ended December 31, 1999, as compared to a gross operating margin of Lit. 160,457million in 1998.
Depreciation and amortization
The following table presents the components of our depreciation and amortization costs for the periodspresented.
Unaudited De' Longhi Pro Forma
Year ended December 31, % Variation
1998 1999 1999/1998
(Lit. millions, except percentages)
Depreciation of intangible assets ÏÏÏÏÏÏÏÏÏÏÏÏÏÏÏÏÏÏÏÏÏÏÏÏÏÏÏÏÏÏ 6,189 4,993 (19.3%)
Depreciation of trademarks ÏÏÏÏÏÏÏÏÏÏÏÏÏÏÏÏÏÏÏÏÏÏÏÏÏÏÏÏÏÏÏÏÏÏ 13,205 14,770 11.8%
Depreciation of tangible assetsÏÏÏÏÏÏÏÏÏÏÏÏÏÏÏÏÏÏÏÏÏÏÏÏÏÏÏÏÏÏÏÏ 51,440 57,321 11.4%
Subtotal ÏÏÏÏÏÏÏÏÏÏÏÏÏÏÏÏÏÏÏÏÏÏÏÏÏÏÏÏÏÏÏÏÏÏÏÏÏÏÏÏÏÏÏÏÏÏÏÏ 70,834 77,084 8.8%
Amortization of goodwill ÏÏÏÏÏÏÏÏÏÏÏÏÏÏÏÏÏÏÏÏÏÏÏÏÏÏÏÏÏÏÏÏÏÏÏÏ 30,251 30,311 0.2%
Total ÏÏÏÏÏÏÏÏÏÏÏÏÏÏÏÏÏÏÏÏÏÏÏÏÏÏÏÏÏÏÏÏÏÏÏÏÏÏÏÏÏÏÏÏÏÏÏÏÏÏÏ 101,085 107,395 6.2%
For the year ended December 31, 999, depreciation and amortization charges (not includingamortization of goodwill) increased by Lit. 6,310 million, or 6.2%, from Lit. 101,085 million in 1998 toLit. 107,395 million in 1999. This was due primarily to an increase of Lit. 5,881 million in the depreciation
52
Brought to you by Global Reports

of tangible assets following certain investments and purchases of assets made by the Group during thecourse of 1999. Total depreciation and amortization (including amortization of goodwill), as a percentageof total revenues, decreased slightly from 7.8% in 1998 to 7.7% in 1999.
Provisions and write-oÅs
For the year ended December 31, 1999, provisions and write-oÅs decreased by Lit. 12,634 million, or44.2%, from Lit. 28,576 million in 1998 to Lit. 15,942 million in 1999. This was due principally to areduction of Lit. 8,533 million in provisions for bad debts and contingent risks, which in 1998 were Lit.17,403 million, and Lit. 6,200 million, respectively. The provisions in 1998 were due principally toexceptional funds set aside for product liability proceedings relating to certain claims (net of insurancecoverage) that were pending during the year.
Operating proÑt
As a result of the factors described above, we recorded an operating proÑt of Lit. 100,530 million in1999, as compared to Lit. 30,796 million in 1998.
Net Ñnancial losses
For the year ended December 31, 1999, net Ñnancial losses were Lit. 33,399 million, as comparedwith net losses of Lit. 73,187 million in 1998. The decrease of 54% in our net Ñnancial losses as comparedto the prior year was due primarily to:
‚ a reduction in our total debt over the period and a reduction in interest rates in Italy over thesame period as a result of Italy's entry into the EMU; and
‚ an increase in our net income derived from hedging transactions as compared to the prior year(from a loss of Lit. 8,416 million in 1998 to a gain of 10,328 million in 1999) resulting largelyfrom our decision to implement more conservative hedging policies.
As a result of the above, our net Ñnancial losses as a percentage of total revenues decreased signiÑcantlyfrom 5.7% in 1998 to 2.4% in 1999.
You should note that the purchase contracts for the companies acquired in 2000 do not includeinterest payments as part of the purchase price (which totaled Lit. 538,889 million in the aggregate) and,as a result, the Unaudited De' Longhi Pro Forma Consolidated Financial Statements do not include acharge for implicit interest expense. In addition, the capital increase eÅected in April 2001 is treated asnon-interest bearing for purposes of such Ñnancial statements.
Income from equity investments
For the year ended December 31, 1999, our income from equity investments increased by Lit. 2,039million, or 112.2%, from Lit. 1,818 million in 1998 to Lit. 3,857 million in 1999. This increase wasprincipally due to proceeds received from our equity holdings (which increased from Lit. 829 million in1998 to Lit. 4,300 million in 1999).
Extraordinary income (loss)
For the year ended December 31, 1999, extraordinary items amounted to a net loss of Lit. 4,116million. For the year ended December 31, 1998, extraordinary items amounted to a net loss of Lit. 3,410million. The loss in 1999 was principally due to restructuring costs associated with various members of theGroup. The loss recorded in 1998 was due primarily to restructuring costs as well as to write-oÅs of non-commercial loans and to taxes payable in previous years (oÅset somewhat by a tax credit totaling Lit.14,527 million recognized as a result of new accounting principles adopted by the Group).
Income taxes
For the year ended December 31, 1999, income taxes totaled Lit. 26,355 million, as compared to Lit.427 million for the year ended December 31, 1998. The eÅective tax rate for the Group was 39.4% in1999, as compared to no eÅective tax rate as a result of losses recorded in 1998. The corporate tax rate inItaly was equal to 37% in 1998 and 1999. In 1999, the Group beneÑted from tax losses recorded inprevious years, oÅset somewhat by IRAP payments and by the impact of certain deferred and other taxliabilities that were not deductible.
53
Brought to you by Global Reports

Net income (loss)
As a result of the factors described above, we recorded net income of Lit. 40,589 million in 1999, ascompared to a net loss of Lit. 44,139 million in 1998.
Gross Industrial Margin Results for Years Ended December 31, 1998, 1999 and 2000
We have provided below, for informational purposes only, a reconciliation and comparison of the grossindustrial margin of the Group for the relevant periods. The gross industrial margin consists of the totalrevenues derived from each business segment in which the Group operates, net of the cost of goods sold(comprising the aggregate of the cost of materials and components; external manufacturing service fees;wages, salaries and beneÑts; industrial depreciation costs; and other Ñxed industrial costs). The followingtable sets forth, for each of our business segments, the gross industrial margin for our Group (including asa percentage of our total revenues) for the periods indicated.
Unaudited De' Longhi Pro Forma
Year ended December 31,
1998 1999 2000
Segment Segment SegmentIndustrial Industrial IndustrialMargin % Margin % Margin %
(Lit. millions, except percentages)
Heating ÏÏÏÏÏÏÏÏÏÏÏÏÏÏÏÏÏÏÏÏÏÏÏ 119,760 35.8% 141,808 40.6% 168,899 41.1%
Air conditioning ÏÏÏÏÏÏÏÏÏÏÏÏÏÏÏÏ 124,463 35.4% 171,953 40.0% 180,837 38.9%
Cooking and food preparationÏÏÏÏÏ 145,463 35.2% 162,161 37.0% 189,282 37.1%
Cleaning and ironing ÏÏÏÏÏÏÏÏÏÏÏÏ 46,829 32.6% 47,832 35.6% 46,492 34.9%
Gross industrial margin ÏÏÏÏÏÏÏÏ 436,515 35.1% 523,754 38.7% 585,510 38.5%
Other(1) ÏÏÏÏÏÏÏÏÏÏÏÏÏÏÏÏÏÏÏÏÏÏÏ (1,769) (3.7)% 1,465 3.5% 6,666 10.2%
Total gross industrial margin ÏÏÏ 434,746 33.7% 525,219 37.7% 592,176 37.4%
(1) Includes gross industrial margin deriving from sales of accessories, spare parts, scraps, raw materials and semi-manufactured
products as well as services, contingent assets, capital gains and recovery of transport costs.
54
Brought to you by Global Reports

The following table presents, for informational purposes only, a reconciliation between the grossindustrial margin of the Group and the gross operating margin of the Group for the periods indicated.
Unaudited De' Longhi Pro Forma
Year ended December 31,
1998 1999 2000
Segment Segment SegmentIndustrial Industrial IndustrialMargin % Margin % Margin %
(Lit. billions, except percentages)
Total revenuesÏÏÏÏÏÏÏÏÏÏÏÏÏÏÏÏÏÏÏÏÏÏÏ 1,290.6 100.0% 1,393.8 100.0% 1,584.5 100.0%
Cost of goods sold ÏÏÏÏÏÏÏÏÏÏÏÏÏÏÏÏÏÏÏ (855.9) (66.3)% (868.6) (62.3)% (992.3) (62.6)%
Gross industrial margin ÏÏÏÏÏÏÏÏÏÏÏÏÏÏÏ 434.7 33.7% 525.2 37.7% 592.2 37.4%
Less:
Variable sales costs ÏÏÏÏÏÏÏÏÏÏÏÏÏÏÏÏÏÏÏ (100.1) (102.6) (115.7)
Advertising, promotional andmerchandising costs ÏÏÏÏÏÏÏÏÏÏÏÏÏÏÏÏ (58.9) (65.9) (79.2)
Fixed sales costs ÏÏÏÏÏÏÏÏÏÏÏÏÏÏÏÏÏÏÏÏÏ (104.2) (112.9) (119.4)
Technical costs ÏÏÏÏÏÏÏÏÏÏÏÏÏÏÏÏÏÏÏÏÏÏ (30.5) (31.0) (31.2)
General and administrative costsÏÏÏÏÏÏÏÏ (57.7) (60.1) (62.5)
Plus:
Depreciation and amortizationÏÏÏÏÏÏÏÏÏÏ 48.4 54.8 52.4
Provisions and write-oÅsÏÏÏÏÏÏÏÏÏÏÏÏÏÏÏ 28.6 15.9 17.8
Other costsÏÏÏÏÏÏÏÏÏÏÏÏÏÏÏÏÏÏÏÏÏÏÏÏÏÏ 0.2 0.5 0.2
Gross operating margin ÏÏÏÏÏÏÏÏÏÏÏÏÏ 160.5 223.9 254.6
Comparison of gross industrial margin for fiscal years ended December 31, 2000 and 1999
For the year ended December 31, 2000, our gross industrial margin increased by Lit. 66,957 million,or 12.7%, from Lit. 525,219 million in 1999 to Lit. 592,176 million in 2000. During the same period, ourgross industrial margin, as a percentage of total revenues, decreased slightly from 37.7% in 1999 to 37.4%in 2000. This was due to:
‚ lower sales recorded by our air conditioning business segment (which traditionally is characterizedby higher margins than our other business segments);
‚ the favorable impact of exchange rates on our purchases and sales denominated in currenciesoutside the Euro zone and, in particular, the U.S. dollar, pound sterling and Japanese Yen; and
‚ a general increase in the cost of raw materials in 2000 (and in particular in the cost of steel) ascompared to the prior year and a corresponding negative impact on our production costs.
Heating
For the year ended December 31, 2000, the gross industrial margin for our heating business increasedby Lit. 27,091 million, or 19.1%, from Lit. 141,808 million in 1999 to Lit. 168,899 million in 2000. Duringthe same period, the gross industrial margin, as a percentage of total revenues, increased slightly from40.6% in 1999 to 41.1% in 2000. This was due to a general increase in the margins for our products(including, among others, our oil-Ñlled radiators), which, together with an increase in sales prices, oÅsetsomewhat the negative impact of higher costs for raw materials, such as steel.
Air Conditioning
For the year ended December 31, 2000, the gross industrial margin for our air conditioning businessincreased by Lit. 8,884 million, or 5.2%, from Lit. 171,953 million in 1999 to Lit. 180,837 million in 2000.During the same period, the gross industrial margin, as a percentage of total revenues, decreased slightlyfrom 40.0% in 1999 to 38.9% in 2000. This was due, in part, to the increase in products costs resultingfrom an increase in costs for raw materials, particularly steel. The less than proportional increase in the
55
Brought to you by Global Reports

gross industrial margin relative to revenues was also due to mild climatic conditions during the summermonths, particularly in Italy (our most important market) which resulted in a slight decrease in salesrevenues in Italy relating to portable air conditioners.
Cooking and food preparation
For the year ended December 31, 2000, the gross industrial margin for our cooking and foodpreparation business increased by Lit. 27,121 million, or 16.7%, from Lit. 162,161 million in 1999 toLit. 189,282 million in 2000. During the same period, the gross industrial margin, as a percentage of totalrevenues, increased slightly from 37.0% in 1999 to 37.1% in 2000, despite an increase in the cost of rawmaterials, resulting from an improved sales mix.
Cleaning and ironing
For the year ended December 31, 2000, the gross industrial margin for our cleaning and ironing businessdecreased by Lit. 1,340 million, or 2.8%, from Lit. 47,832 million in 1999 to Lit. 46,492 million in 2000.During the same period, the gross industrial margin, as a percentage of total revenues, decreased from 35.6% in1999 to 34.9% in 2000. This was due to a decrease in the margins attributable to our electric brooms anddusters resulting from an increase in the costs of our raw materials and, with respect to our electric brooms,the late introduction of new and innovative models by the Group (offset somewhat by increased margins forour ironing systems resulting from the introduction of new models into the market).
Comparison of gross industrial margin for fiscal years ended December 31, 1999 and 1998
For the year ended December 31, 1999, our gross industrial margin increased by Lit. 90,473 million,or 20.8%, from Lit. 434,746 million in 1998 to Lit. 525,219 million in 1999. During the same period, ourgross industrial margin, as a percentage of total revenues, increased from 33.7% in 1998 to 37.7% in 1999.This was due to:
‚ a decrease in the cost of raw materials (principally plastics and steel) in 1999 as compared to theprior year, which had positive results on our margins (particularly with respect to our heatingbusiness);
‚ the positive impact of our product mix relating to our various business segments; and
‚ our ability to generally maintain our product prices which, in addition to a moderately favorableimpact of exchange rates in currencies outside the Euro zone, allowed us to take advantage of thereduction in raw material costs and thereby increase our margins.
Heating
For the year ended December 31, 1999, the gross industrial margin for our heating business increasedby Lit. 22,048 million, or 18.4%, from Lit. 119,760 million in 1998 to Lit. 141,808 million in 1999. Duringthe same period, the gross industrial margin, as a percentage of total revenues, increased from 35.8% in1998 to 40.6% in 1999. This was due principally to a decrease in costs for raw materials, which hadparticularly favorable eÅects on margins for our oil-Ñlled radiators and Ñxed heaters, as well as a favorableimpact on sales for our gas ovens and Ñxed heaters (oÅset slightly by reduced margins with respect to ourconvectors).
Air Conditioning
For the year ended December 31, 1999, the gross industrial margin for our air conditioning businessincreased by Lit. 47,490 million, or 38.2%, from Lit. 124,463 million in 1998 to Lit. 171,953 million in1999. During the same period, the gross industrial margin, as a percentage of total revenues, increasedfrom 35.4% in 1998 to 40.0% in 1999. This was due to reduced production costs resulting from thedecrease in raw material costs, particularly plastics and steel. In addition, the increase was due to animproved product mix resulting from:
‚ generally favorable climatic conditions in 1999 with a corresponding increase in sales of ourportable air conditioners (both single and split systems), which generally have a higher marginthan other products; and
56
Brought to you by Global Reports

‚ technological and other qualitative improvements in the products oÅered to our customers duringthe course of the year and the reinforcement of our sales network, particularly with respect to ourÑxed hydronic and wall-based air conditioning systems.
Cooking and food preparation
For the year ended December 31, 1999, the gross industrial margin for our cooking and foodpreparation business increased by Lit. 16,698 million, or 11.5%, from Lit. 145,463 million in 1998 toLit. 162,161 million in 1999. During the same period, the gross industrial margin, as a percentage of totalrevenues, increased from 35.2% in 1998 to 37.0% in 1999. This was due to:
‚ a decrease in product costs resulting from signiÑcant reductions in our raw material costs(particularly plastics and steel);
‚ an improvement in the sales mix of our cooking products due primarily to increased sales of ourcoÅee makers and electric deep-fryers and generally higher margins attributable to some of ourprincipal markets, including North America, Japan and Italy; and
‚ the introduction and launch of new models and products, including our electric deep-fryers andmicrowave ovens.
The increase referred to above was oÅset somewhat by increased pressure on our product prices,particularly with respect to our free-standing stoves and ovens, resulting from increased competition andthe economic crisis aÅecting the former Soviet Union.
Cleaning and ironing
For the year ended December 31, 1999, the gross industrial margin for our cleaning and ironingbusiness increased slightly by Lit. 1,003 million, or 2.1%, from Lit. 46,829 million in 1998 to Lit. 47,832million in 1999. During the same period, the gross industrial margin, as a percentage of total revenues,increased from 32.6% in 1998 to 35.6% in 1999. This was due to reduced products costs resulting fromlower raw material costs, from the launch of new products and from sales of products which were generallycharacterized by higher margins than in previous years.
The Introduction of the Euro
On January 1, 1999, 11 of the 15 member countries of the European Union, including Italy,established Ñxed conversion rates between their existing sovereign currencies and the Euro. Theparticipating countries adopted the Euro as their common currency on the same day. The Euro trades oncurrency exchanges and is available for non-cash transactions during the transition period betweenJanuary 1, 1999, and January 1, 2002. You should refer to ""Exchange Rates Ì the European MonetarySystem and the Euro''.
During the transition period, we and our suppliers and customers must manage transactions in boththe Euro and the Italian lira. Although we have not had problems as of the date of this oÅeringmemorandum, this could cause logistical problems in the future. Our SAP information system has beenimplemented in order to:
‚ convert individual currencies into Euro;
‚ convert individual currencies of participating countries into each other's currencies;
‚ execute conversion calculations utilizing six-digit exchange rates and other prescribedrequirements;
‚ accommodate the new Euro currency symbol; and
‚ permit pricing, advertising, billing, accounting, internal Ñnancial calculations, sales and othertransactions or practices to be eÅected simultaneously in Euro and the participating countries'respective individual currencies.
While we believe that our systems will not be adversely impacted by Euro conversion, there can be noassurance that our third-party suppliers and customers will be able to successfully implement the necessaryprotocols.
57
Brought to you by Global Reports

Our orders to suppliers are generally stated in Euro and the Italian lira. Thus far, we have notexperienced any signiÑcant problems with third parties as a result of the introduction of the Euro.
Liquidity and Capital Resources
Cash Öow for the year ended December 31, 2000 compared with the Ñrst three months ended March 31,
2001
The following discussion presents a comparison of our historical cash Öows for the periods indicated.You should read the Unaudited Interim De' Longhi Consolidated Financial Statements presented elsewherein this oÅering memorandum in conjunction with the following discussion.
The table below sets forth the principal components of our cash Öow for the periods indicated:
Historical De' Longhi(1)
Audited UnauditedYear ended Three months ended
December 31, March 31,2000 2001
(Lit. millions)
Cash Öows provided by operating activities ÏÏÏÏÏÏÏÏÏÏÏÏÏÏÏÏÏÏÏÏÏÏÏÏÏ 92,739 25,955
Cash Öows (used in) provided by changes in working capital ÏÏÏÏÏÏÏÏÏÏ (43,415) 31,957
Cash Öows used in investing activities ÏÏÏÏÏÏÏÏÏÏÏÏÏÏÏÏÏÏÏÏÏÏÏÏÏÏÏÏÏ (20,717) (9,955)
Cash Öows used in Ñnancing activities ÏÏÏÏÏÏÏÏÏÏÏÏÏÏÏÏÏÏÏÏÏÏÏÏÏÏÏÏÏ (601) (135)
Cash Öows attributable to the change in consolidation area(2)ÏÏÏÏÏÏÏÏÏÏ (707,721) (196,013)
Cash Öow for the periodÏÏÏÏÏÏÏÏÏÏÏÏÏÏÏÏÏÏÏÏÏÏÏÏÏÏÏÏÏÏÏÏÏÏÏÏÏÏÏ (679,715) (148,191)
(1) You should also refer to the Unaudited Interim De' Longhi Consolidated Financial Statements set forth elsewhere in this
oÅering memorandum.
(2) This line item reÖects the net cash Öow eÅects resulting from the acquisitions which occurred during 2000 and the Ñrst
quarter of 2001.
For the three months ended March 31, 2001, cash Öows provided by operating activities wereLit. 25,955 million, as compared to Lit. 92,739 million for the year ended December 31, 2000.
For the three months ended March 31, 2001, we recorded a cash inÖow from changes in workingcapital equal to Lit. 31,957 million, as compared to an outÖow of Lit. 43,415 million during 2000. ThisdiÅerence was due principally to an increase in accounts receivable deriving from year-end sales (whichare generally higher than accounts receivable derived from sales at other times of the year) and to anincrease in inventory resulting from production dynamics relating to our oil-Ñlled radiators and airconditioning products.
For the three months ended March 31, 2001, cash outÖow from investing activities was Lit. 9,955million as compared to Lit. 20,717 million during 2000. This trend reÖects our investment (totalingLit. 196,000 million) relating to the acquisition of Kenwood in early 2001.
Cash Öows used in Ñnancing activities were Lit. 135 million for the three months ended March 31,2001, as compared to Lit. 601 million during 2000. This decrease was due principally to a decrease in ourcash outÖows generally relating to the Group members and a reduction in our provision coveringconvertible notes.
Cash Öows attributable to the change in consolidation area were Lit. 196,013 million for the threemonths ended March 31, 2001, as compared to Lit. 707,721 million for the year ended December 31,2000. This decrease was due to the acquisitions made in 2000.
As a result of the factors described above, our net Ñnancial position for the three months endedMarch 31, 2001 was Lit. 1,340,992 million as compared with Lit. 1,192,801 million as of December 31,2000.
58
Brought to you by Global Reports

Cash Öow for the year ended December 31, 1999 compared with cash Öow for the year ended
December 31, 2000
The following discussion presents a comparison of our pro forma cash Öows for the periods indicated.You should read the Unaudited De' Longhi Pro Forma Consolidated Financial Statements presentedelsewhere in this oÅering memorandum in conjunction with the following discussion.
The table below sets forth the principal components of our cash Öow for the periods indicated.
Unaudited De' Longhi Pro Forma(1)
Year ended December 31,
1999 2000
(Lit. millions)
Cash Öows provided by operating activitiesÏÏÏÏÏÏÏÏÏÏÏÏÏÏÏÏÏÏÏÏÏÏÏÏÏÏÏ 150,117 153,928
Cash Öows provided by (used in) changes in working capital ÏÏÏÏÏÏÏÏÏÏÏ 13,779 (103,627)
Cash Öows used in investing activitiesÏÏÏÏÏÏÏÏÏÏÏÏÏÏÏÏÏÏÏÏÏÏÏÏÏÏÏÏÏÏÏ (36,561) (38,032)
Cash Öows provided by Ñnancing activitiesÏÏÏÏÏÏÏÏÏÏÏÏÏÏÏÏÏÏÏÏÏÏÏÏÏÏÏ 113,994 19,913
Cash Öow for the yearÏÏÏÏÏÏÏÏÏÏÏÏÏÏÏÏÏÏÏÏÏÏÏÏÏÏÏÏÏÏÏÏÏÏÏÏÏÏÏÏÏÏ 241,329 32,182
(1) You should also refer to the Unaudited De' Longhi Pro Forma Consolidated Financial Statements set forth elsewhere in this
oÅering memorandum.
During 2000, cash Öows provided by operating activities were Lit. 153,928 million, as compared toLit. 150,117 million during 1999. This trend was due principally to an increase in 2000 in our tax liability(equal to Lit. 31,058 million) and interest charges (equal to Lit. 12,019 million).
During 2000, we recorded a cash outÖow from changes in working capital equal to Lit. 103,627million, as compared to an inÖow of Lit. 13,779 million during 1999. This diÅerence was due principally toan exceptional increase in our inventory stock of air conditioners in 2000 resulting from unfavorableclimatic conditions, primarily in Italy.
During 2000, cash outÖow from investing activities was Lit. 38,032 million as compared to Lit. 36,561million during 1999. This trend was due principally to continued investment in Ñxed assets to Ñnance ouractivities.
Cash Öows provided by Ñnancing activities were Lit. 19,913 million during 2000, as compared toLit. 113,994 million during 1999. This trend was due principally to a capital increase of Lit. 100,000million eÅected on December 27, 1999.
As a result of the factors described above, our net Ñnancial position as of December 31, 2000 wasLit. 935,314 million as compared with Lit. 967,496 million as of December 31, 1999.
In the past, we have relied primarily on cash Öow from operating activities to Ñnance our operationsand expansion.
Restructuring, Expansion and Other Capital Investments
As part of the restructuring of our consolidated group, we acquired certain companies which, althoughpart of our core business, were previously owned by our parent company. You should refer to""Ì Restructuring''. We intend to use the net proceeds from this oÅering to, among other things, make thelast purchase payment for these companies (equal to Lit. 158,304 million), which is due on December 31,2001. You should also refer to""Certain Transactions With Related Parties'' for a more detailed descriptionof our repayment obligations.
In addition, we intend to complete the restructuring process implemented by Kenwood in 1997 aimedat, among other things, reducing its exposure to manufacturing operations in the United Kingdom. Youshould refer to ""The Kenwood Acquisition Ì History and Corporate Structure.'' We expect the residualcosts in 2001 relating to this restructuring process to be approximately 0.6 million (or approximatelyLit. 1,900 million).
In order to implement our strategies, we intend to make signiÑcant capital investments during thenext three years in order to expand our facilities and further develop our operations and activities.Although we expect to carry out our projects in a timely manner, we cannot assure you that our current
59
Brought to you by Global Reports

plans will be implemented within the expected timeframes or that our costs will not be higher thananticipated due to unforeseen circumstances. In particular, we are currently engaged in the followingexpansion and development projects relating to our manufacturing and warehousing facilities:
‚ We are expanding our manufacturing facility in Pieve d'Alpago, Italy, which is operated byErgoklima S.p.A., and constructing three new production lines for air conditioning units. Theexpansion of the facility, which began in 2000 and is expected to be completed on or aboutSeptember 2001, will add approximately 5,000 square meters to the current plant and is estimatedto cost approximately Lit. 5.5 billion;
‚ We are upgrading and automating our production facilities in Fossalta di Piave (Veneto), Italy,which is operated by Sile Corpi Scaldanti. The development project for the facility, which beganin early 2001 and is expected to be completed on or about April 2002, is estimated to costapproximately Lit. 7.0 billion; and
‚ We are expanding our warehousing facility in Mignagola (Treviso), Italy, and constructingadditional oÇces at our headquarters in Treviso, which are both operated by De' Longhi S.p.A.The expansion of the warehouse, which will add approximately 13,800 square meters to theexisting warehouse, is scheduled to begin on or about July 2001 and is expected to be completedon or about September 2002. The construction of the new oÇces, which will add approximately anadditional 1,150 square meters to our existing oÇce space, is scheduled to begin on or aboutNovember 2001 and is expected to be completed on or about November 2002. These expansionplans are estimated to cost, in the aggregate, approximately Lit. 10.5 billion.
We expect to rely primarily on cash Öow from operating activities to Ñnance our development andexpansion.
Impact of Changes in Exchange and Interest Rates
A portion of our sales are aÅected by Öuctuations in foreign currency exchange rates. For the yearended December 31, 2000, total sales denominated in currencies other than the Euro totaled Lit. 504,100million, or 31.9%, of pro forma consolidated revenues (not including the recent acquisition of Kenwood)for the period. In order to manage and limit our exposure to foreign currency exchange risks, we typicallyenter into foreign exchange contracts (principally forward sales and structured options) for the relevantcurrencies. In particular, we enter into hedging contracts relating to our exposure to Öuctuations to theU.S. dollar, the pound sterling, the Japanese Yen and the Canadian dollar. As a policy matter, wegenerally cover approximately 40% to 50% of our exposure relating to foreign currency exchange risk(based on projections of our sales, net of purchases, in the relevant currencies) at the time that the annualbudget is approved; however, we may decide to initially hedge additional portions of our exposure toexchange rate risks, depending on our expectations about trends in currency values. During the course ofthe year, we constantly monitor trends in the currency markets and may subsequently enter into furtherhedging contracts covering some or all additional foreign exchange risk. We believe that, on a consolidatedbasis, the Group's exposure to any particular currency is limited as a result of its diversiÑed businessportfolio in foreign markets throughout the world.
In addition to currency rate contracts, we also typically enter into interest rate derivative contracts inconnection with Ñnancial transactions with the aim of hedging a portion of our interest rate risk. As atDecember 31, 2000, we had total consolidated long-term and short-term debt equal to Lit. 573,479 million(or Euro 296 million) and, as of the same date, we were party to interest rate contracts (through 2004)covering a net aggregate amount of Euro 207 million, or 42.9% of our consolidated debt (of which Euro150 million related to bonds issued by De' Longhi Pinguino S.A. due in 2003). We periodically monitortrends in interest rate markets and, based on such trends, may subsequently enter into further hedgingcontracts covering some or all additional interest rate risk. You should refer to ""Risk Factors Ì RisksRelating to the Company and the Group Ì We are exposed to foreign exchange and interest rateÖuctuations.''
Pricing Policies
Over the course of 2001, prices for our products have generally remained stable, or increased, in mostof our markets and across all of our business segments. Our heating and air conditioning products havegenerally been characterized by an increase in prices due primarily to our focus on sales of products withhigher margins. Although there has been a general market trend towards decreasing prices with respect to
60
Brought to you by Global Reports

our cooking and food preparation business and our cleaning and ironing business, we have tended largely tomaintain our prices, and where possible, to increase prices, especially in Italy and the rest of Europe,where demand for our products and our brand name recognition is strongest. In addition, we believe thatwe have been able to mitigate the eÅects associated with this trend towards decreasing prices principallythrough our strategy of continuing to introduce higher margin innovative products (such as, for example,high eÇciency electric brooms), thereby allowing us to promote and market a better mix of products.
Recent Developments After March 31, 2001
On April 17, 2001, De' Longhi Pinguino S.A. acquired additional shares of Kenwood as part of a cashtender oÅer commenced on February 16, 2001, thereby increasing its holding to 99.28% of the capitalstock of Kenwood. You should refer to ""The Kenwood Acquisition''. On the same date, we delisted theKenwood shares on the OÇcial List and cancelled trading of such shares on the London Stock Exchange.Subsequently, on May 24, 2001, we completed the tender oÅer by purchasing the remaining 0.72% ofKenwood's share capital from minority shareholders. As a result, we now own 100% of the capital stock ofKenwood.
On April 18, 2001, our shareholders resolved to increase our share capital by an amount equal toLit. 250,587 million. The capital increase was entirely subscribed, and paid for, by our existingshareholders. As a result, our total capitalization increased to Lit. 650,587 million.
On April 23, 2001, we completed a second purchase payment equal to Lit. 320,600 million inconsideration of our acquisition of certain aÇliated companies in December 2000 as part of ourrestructuring process. You should refer to ""Ì Restructuring''. We are required to make the last purchasepayment, equal to Lit. 158,304 million, on December 31, 2001. The purchase contracts for thesecompanies included approximately Lit. 504,714 million (of the total purchase price of Lit. 538,889million) in interest-free debt.
On April 24, 2001, we agreed to extend the term of a distribution contract, together with certainpayments that were owed to us (totaling 15.8 million New Zealand dollars, or approximately Lit. 15,000million) over a four year period in exchange for 49% of the capital stock of Parex Industries Limited, theexclusive distributor of our products in New Zealand and Australia.
On June 12, 2001, our Board of Directors approved a stock option plan pursuant to which we mayissue up to 7,500,000 options to certain of our employees and managers, subject to certain limitations,exercisable at a price equal to the purchase price of the shares pursuant to the Global OÅering. Youshould refer to ""Our Management Ì Shareholdings of Our Directors, Statutory Auditors and PrincipalManagement.''
UniCredit Banca Mobiliare S.p.A. (""UBM''), which is the lead manager of the Italian public oÅeringand a joint global coordinator of the Global OÅering, has provided Ñnancing as part of a syndicate ofbanks in connection with our acquisition of Kenwood. As of June 22, 2001, UBM had provided us withoutstanding loans totaling approximately Lit. 88,500 million.
61
Brought to you by Global Reports

OUR BUSINESS
Overview
We are the Italian parent company of an international group of companies that manufactures anddistributes around the world quality leading products generally related to health and well-being under theDe' Longhi, Kenwood, Vetrella, Ariete, La Supercalor, Radel, Elba, Ariagel, Simac and Climaveneta brandnames, among others. Our product oÅerings comprise the following four market segments and businessareas:
‚ heating products, including portable heating units (such as oil-Ñlled radiators, electric convectorsand fan heaters), in which we believe we are a world leader, and terminal units for central heatingsystems (such as multi-column radiators, steel radiators and bathroom radiators);
‚ air conditioning and air treatment products (including portable and Ñxed-wall air conditioners,humidiÑers, dehumidiÑers and air puriÑers for both residential and industrial use), in which we area leader in Italy (Source: AC Nielsen, Air Conditioners Index, September 2000) and, with respectto our portable products, in which we believe we are a world leader;
‚ cooking and food preparation products (including electric ovens, deep-fryers, toasters, electricbarbecues, coÅee machines, free-standing stoves and food processors), in which we are the leaderin Italy and a leader in the United Kingdom (Source: AC Nielsen, Durable Service Italia,September 2000 and Gesellschaft F ur Konsumforschung, Durable Goods Panel, October 2000);and
‚ household cleaning and ironing products, including vacuum cleaners, steam cleaners and ironingsystems, in which we are generally recognized as a leader in Italy (Source: AC Nielsen, DurableService Italia, September 2000).
Our objective is to strengthen our position in markets where we have achieved a leadership positionand to increase our market share in other areas, with the aim of maximizing the return on investment forour shareholders and achieving higher levels of proÑtability. In order to achieve these goals, we intend to(i) continue to develop innovative products, (ii) expand geographically by leveraging our distributionnetwork, (iii) strengthen our brand names, (iv) increase our distribution channels, (v) maintain controlover key manufacturing processes and focus on our research and development programs, (vi) increase oureÇciency and (vii) continue to evaluate strategic opportunities.
On a pro forma basis (including the eÅects of the acquisitions we made in connection with therestructuring process in 2000 and of the Kenwood acquisition in 2001), our pro forma consolidatedrevenues for the three years ended December 31, 1998, 1999 and 2000, were Lit. 1,746,106 million, Lit.1,818,704 million and Lit. 2,072,181 million, respectively (with Kenwood's restated consolidated revenuesbeing Lit. 455,408 million, Lit. 424,884 million and Lit. 487,689 million, respectively). For the sameperiods, our pro forma consolidated earnings before income taxes, depreciation and amortization (net ofprovisions and write-downs) were Lit. 177,118 million, Lit. 245,788 million and Lit. 275,605 million,respectively (with Kenwood's restated consolidated earnings before income taxes, depreciation andamortization (net of provisions and write-downs) being Lit. 45,237 million, Lit. 37,863 million and Lit.38,776 million, respectively). As of March 31, 2001, we operated 15 manufacturing facilities in Italy, theUnited Kingdom and China, and we had 5,358 employees on a pro forma basis including Kenwood.Kenwood had 1,422 employees at the same date.
Restructuring
During the course of 2000, we restructured our Group with the aim of rationalizing our organizationalstructure, and we purchased certain companies which, although part of our core businesses, previously wereowned by our parent company. As a result of the restructuring, we acquired, through our wholly ownedsubsidiary De' Longhi Pinguino S.A., a controlling interest in each of De' Longhi Divisione Cucine S.p.A.,DL Radiators S.p.A., Climaveneta S.p.A. and Micromax S.p.A., together with 30% of the share capital ofErgoklima S.p.A., for an aggregate amount equal to Lit. 538,889 million (or approximately 4278,313thousand). At the time of our acquisitions, such companies represented, in the aggregate, approximately26.6% of our consolidated total assets, 25.0% of our total revenues and 17.5% of our net income, in eachcase as compared to our consolidated Ñnancial statements as of and for the year ended December 31,1999.
62
Brought to you by Global Reports

In addition, as part of the restructuring process, we sold certain companies which we believed were nolonger strategic to our core businesses to related parties for an aggregate amount equal to Lit. 32,301million (or approximately 416,682 thousand). This included the sale of all of the share capital ofImmobiliare Findomestic S.r.l., De' Longhi Radiators S.r.l., DL Canada Distributors Inc., 850721 OntarioLtd. and I.S.C. Ì Industrie Scambiatori di Calore S.p.A., together with a controlling interest (equal to60% of its share capital) of Societ fia Nauta S.r.l. You should refer to ""Certain Transactions With RelatedParties'' for a more detailed description of each of these companies, the terms and conditions of the abovetransactions and of our restructuring process generally.
Recent Acquisitions
On May 24, 2001, we completed the acquisition of Kenwood Appliances plc, an English companyspecializing in the manufacture and sale of small domestic appliances internationally under the Kenwoodand Ariete brand names. The aggregate total purchase price for the Kenwood shares was equal to 45.9million (or approximately Lit. 143,000 million), plus the assumption of approximately 18 million (orapproximately Lit. 56,000 million) of debt. At the time of the acquisition, Kenwood's total assetsrepresented 12.5% of our consolidated total assets and Kenwood's revenues represented 37.8% of our totalrevenues, in each case as compared to our consolidated Ñnancial statements as of December 31, 2000, andfor the year then ended. As at December 31, 2000, Kenwood's net debt position was equal to Lit.102,928 million. You should refer to ""The Kenwood Acquisition'' for a more detailed description ofKenwood and its principal activities.
In addition, on February 24, 2000, we acquired 91.66% of the outstanding share capital of Sile CorpiScaldanti S.r.l., an Italian manufacturer and distributor of heating products, for an aggregate purchaseamount equal to Lit. 4,583 million. At the time of the acquisition, Sile Corpi Scaldanti's total assetsrepresented approximately 0.4% of our consolidated total assets, its revenues represented 0.6% of our totalrevenues and its net income represented 0.9% of our total net income, in each case as compared to ourconsolidated Ñnancial statements as of December 31, 1999, and for the year then ended.
Our History and Development
We trace our origins to 1902 when the De' Longhi family Ñrst began to produce wood-burning stovesas artisans, and afterwards, in the 1950s when the original artisan workshop was transformed into a smallfactory for the production of component parts for heating products.
In 1973, we were established as G. de' Longhi S.a.s., an Italian partnership controlled by GiuseppeDe' Longhi, and began to market and sell our Ñrst appliance, an oil-Ñlled electric radiator, which was thenmanufactured and produced externally by third parties. Subsequently, in 1975, we began to internallyproduce oil-Ñlled electric radiators as a result of the initial success of the product. We also launched anintense research and development program, which would characterize all of our future production. In 1978,G. de' Longhi S.a.s. was transformed into de' Longhi S.p.A., a limited liability company.
The eighties
The 1980s were characterized by the rapid growth and expansion of our businesses. In 1980, weregistered the De' Longhi brand name and initiated an international expansion process through theintroduction and launch of oil-Ñlled radiators in the United States. We soon became a leader in the mobileheating market as a result of the success we achieved in the United States. In 1982, we began to distributeour products in Japan.
In subsequent years, we began to direct our research and development eÅorts and technologicalexpertise with the aim of expanding and diversifying our product range; reducing the seasonal and climaticrisks associated with our heating products, and optimizing our production capabilities throughout the yearrather than only during peak periods associated with our heating products. As a result of this strategy, weregistered numerous patents and, between 1985 to 1987, we designed and produced our Ñrst airconditioning and air treatment systems (including the Pinguino portable air conditioner), as well as ourÑrst cooking and food preparation products (including our Sfornatutto multi-function oven and theFriggimeglio rotating deep fryer).
In the early 1980s, we also launched our advertising strategy, which is still used today, of assigningproduct names that describe the speciÑc needs served and functions performed by such products. Inparticular, this strategy was aimed at creating an immediate association by consumers between our
63
Brought to you by Global Reports

products and the beneÑts of using them. Thus, we began to market, among other products, the Sfornatutto(or ""bake everything'') multi-function oven, the Friggimeglio (or ""fry better'') rotating deep fryer, theTasciugo (or ""I'll dry you'') dehumidiÑer, and the Caldobagno (or ""hot bathroom'') fan heater.
In 1986, as part of our international expansion strategy, we established De' Longhi Ltd. as our Ñrstdirect distribution channel in Great Britain. Between 1986 and 1989, as part of our eÅorts to expand anddiversify our product range, we acquired Elba S.p.A. (an Italian manufacturer and distributor of cookingranges), Ariagel S.p.A. (an Italian manufacturer and distributor of medium-sized air conditioningsystems) and Radel S.p.A. (an Italian company active in the central heating sector with speciÑc expertisein the area of molding and soldering plates).
On January 22, 1987, De' Longhi S.p.A. and Radel S.p.A. were merged into Finadel S.p.A., aspecially established holding company which, on the same date, changed its name to De' Longhi S.p.A.
In 1988, we acquired De' Longhi America Inc. (which was previously one of our distributors, knownas Utac America Inc.) in order to support the distribution of our products in the United States. In thesame year, we also launched the production of microwave ovens, thereby increasing our presence in thecooking and food preparation market.
In 1989, we acquired Vetrella S.p.A. (an Italian company specializing in the production anddistribution of house cleaning products) and EÅeplast S.r.l. (an Italian company specializing in plasticmolding). We also established De' Longhi Nederland B.V. in the same year as a distribution channel tomarket our products in The Netherlands.
The nineties
The 1990s were characterized by our focus on strengthening our production and manufacturingcapabilities, increasing the range of our products and expanding our businesses further internationally. In1990, we began operating our manufacturing facility in Mignagola, and in the same year, we alsoestablished De' Longhi France S.a.r.l. as a distribution channel used to market our products in France.
During the early 1990s, we beneÑted from successes of our research and development programs. In1992, we created our Ñrst dehumidiÑer; in 1994, we produced the Ñrst natural-gas, environmentally friendlyair conditioner; and in 1995, we launched the production of coÅee makers in order to further expand therange of our products.
In later years, we continued to expand our operations through acquisitions and the establishment ofdistribution channels and representative oÇces. In 1995, we acquired MicromaxÓSimac S.r.l., an Italiancompany specializing in the manufacture of ironing systems and food preparation products. In the sameyear, we established direct distribution branches in each of Japan, Germany, and Canada. Between 1995and 1999, we opened representative oÇces in Moscow, Shanghai and Kiev.
On June 22, 1995, De' Longhi Finanziaria S.A., a Luxembourg company established in 1992 andcontrolled by Giuseppe De' Longhi, transferred its corporate headquarters from Luxembourg to Milan andchanged its name to De' Longhi Finanziaria S.p.A. On December 7, 1995, de' Longhi S.p.A., togetherwith other companies controlled by Giuseppe De' Longhi, merged into De' Longhi Finanziaria S.p.A.,which transferred its headquarters from Milan to Treviso. On the same day, we changed our name toDe' Longhi S.p.A.
On June 24, 1997, we spun oÅ two of our business units and established Divisione Radiatori S.p.A.and De' Longhi Divisione Cucine S.p.A. as separate companies to operate and specialize in our heatingand food preparation businesses, respectively. At the time of the spin-oÅs, all of the share capital of RadelS.p.A. was transferred to Divisione Radiatori, and all of the share capital of Elba S.p.A. was transferred toDe' Longhi Divisione Cucine.
The new millennium
On February 28, 2000, as part of our expansion strategy, we acquired 91.66% of the share capital ofSile Corpi Scaldanti S.r.l., an Italian manufacturer and distributor of heating products.
During 2000, we restructured our Group with the aim of rationalizing our organizational structure andincluding in our consolidated group certain companies which were part of our core businesses but whichpreviously had been controlled by other aÇliated companies. As a result of the restructuring, we acquireda controlling interest in several companies, and we also sold certain companies that previously were part of
64
Brought to you by Global Reports

our consolidated group but which we believed were no longer strategic to our core businesses. You shouldrefer to ""Certain Transactions With Related Parties'' for a more detailed description of each of thesecompanies, the terms and conditions of the above transactions and of our restructuring process.
On May 24, 2001, we completed our cash tender oÅer for all of the share capital of KenwoodAppliances plc, an English company specializing in the manufacture and sale of small domestic appliancesinternationally under the Kenwood and Ariete brand names. You should refer to ""The KenwoodAcquisition'' for a more detailed description of Kenwood and its principal activities.
Our current corporate structure
The following chart illustrates the corporate structure of the principal companies comprising our groupand each of their respective activities as of the date of this oÅering memorandum:
De' Longhi S.p.A.Sale of Heating, Air Conditioning and Air Treatment, Cooking and Food
Preparation and Cleaning and Ironing Products
Climaveneta S.p.A.
Manufacture and distribution of air
conditioningequipment
Micromax S.p.A.Design and production of
component for airconditioners, refrigerationunits and dehumidifiers
Simac Vetrella S.p.A.Manufacture and distribution
of ironing systems, food preparation and cleaning
products
Sile CorpiScaldanti S.r.l.
Manufacture of fixed heating units
De' Longhi Japan Corp.
Importation anddistribution of Group
products
De' Longhi Ltd.Importation and
distribution of Group products
Kenwood Appliances plc
Manufacture and sale of small domestic
appliances
La Supercalor S.p.A.
Distribution of Groupproducts
E-Services S.r.l.Provision of software
products and information
DL RadiatorsS.p.A.
Distribution of fixed heating units
De' LonghiDeutschland GmbH
Importation and distribution of Group
products
De' LonghiAmerica Inc.
Importation anddistribution of Group
products
ClimavenetaDeutschland
GmbHDistribution of airconditioning andrefrigeration units
De' Longhi France
Importation and distribution of Group
products
Radel S.p.A.Manufacture of heating products
De' LonghiNederland BV Importation and
distribution of Groupproducts
De' LonghiCanada Inc.
Importation and distribution of Group
products
De' Longhi Clima Polska Sp.Zo.o.
Distribution of heating products
VES Heitztechnik Vertrieb GmbH
Sub-holding company
Kenwood Marks Ltd.Holder of intellectual property
Kenwood Ltd.Distribution of Kenwood products
Kenwood Appliances (HongKong) Ltd.
Trading company
Kenwood International Ltd.Holding Company
Tricom Industrial Company Limited
Manufacture of food preparation products
Kenwood Appliances(Malaysia) Ltd.
Distribution of Kenwood products
100%
99.99%
100%
80%
90%
91.66%
70%
70%
30%
95%
99.9%
51%
98%
100%
100%
100% 100%
100%
4%
100% 100%
Ariagel S.p.A.Manufacture anddistribution of airconditioners and
dehumidifiers
De' LonghiPinguino S.A.
Holding FinanceCompany
De' Longhi DivisioneCucine S.p.A.
Holding Company
Elba S.p.A.Manufacture and distribution
of heating and foodpreparation products
100%
100%
100%
100%
100%
100%
100%
100%
100%
100%100%
100%
100%100%100%100%
100%
Ergoklima S.p.A.Manufacture of air conditioning and refrigeration units
96%Climre S.A.
Insurance activities
Kenwood Appliances(Singapore) Ltd.
Distribution of Kenwood products
Ariete S.p.A.Manufacture and distribution of food preparation and air
conditioning products
KenwoodManufacturing GmbHDistribution of Kenwood
products
KenwoodElektrogeräte GmbH
Distribution of Kenwoodproducts
Kenwood FranceS.A.
Distribution of Kenwood products
Kenwood Appliances Pty Ltd;
Distribution of Kenwoodproducts
65
Brought to you by Global Reports

Industry and Market Overview
We operate in various market segments generally associated with the concept of health and well-being. SpeciÑcally, we distribute on a worldwide basis products for heating; air conditioning; cooking andfood preparation; and cleaning and ironing. The wide range of business segments and geographic areas inwhich we operate make it especially diÇcult to obtain data on the sizes of the relevant markets.Homogeneous sources for market data covering all of our product and geographic segments are notavailable. Accordingly, in order to provide statistically signiÑcant information on the size and performanceof the market segments in which we operate, we have prepared data based on a comparison, regroupingand combination of data reported by a number of various oÇcial and independent sources. However, youshould note that the data presented below, as it applies to individual market segments in which we operate,may be only a partial representation of the broader market to which the product segments belong.
Heating
We believe, based upon our internally-generated estimates with the support of a number ofindependent sources, that the worldwide heating market segments in which we operated in 2000 werevalued at approximately Lit. 6,000 billion.
Since 1999, the market has contracted slightly as a result, in our opinion, of a corresponding decreasein demand in Europe for Ñxed heating products (particularly in Germany where the market previously hadbeen characterized by sustained growth following the reuniÑcation of the country). This decrease wassomewhat oÅset by an increase in demand for portable heating products. We believe that the growth indemand for portable heating products during the last two years is attributable to a trend favoring productsrelated to domestic comfort (with particular attention given to aesthetic qualities of products). This hasincreasingly led to growth in demand for products with a high design content. In addition, growth indemand has been characterized by increasing attention to safety standards, which has, in turn, resulted inhigher demand for products containing the most current technological solutions and a trend in favor ofbrand name products that satisfy safety concerns.
Air conditioning and air treatment
We believe, based upon our internally-generated estimates with the support of a number ofindependent sources, that the worldwide air conditioning and air treatment market segments in which weoperated in 2000 were valued at approximately Lit. 79,000 billion.
Since 1999, the market for air conditioning and air treatment products has grown signiÑcantly.According to our estimates, this market (including both the residential and commercial sectors) grew byapproximately 20% in Italy and 10% in the rest of Europe over the period. We believe that this growth wasdue to a trend among consumers favoring products related to comfort, well-being and health, particularlyÑxed modular equipment and hydronic and direct expansion systems (which have had signiÑcantly highersales volumes in Europe over the last two years) and, to a lesser degree, dehumidiÑers. In addition, webelieve that consumers over the same period have tended to favor products with distinctive functions anddesign.
Cooking and food preparation
We believe, based upon our internally-generated estimates with the support of a number ofindependent sources, that the worldwide cooking and food preparation market segments in which weoperated in 2000 were valued at approximately Lit. 32,000 billion, with an annual growth rate ofapproximately 3% over the last two years (despite a general trend of declining prices).
We believe that the overall growth in the market for cooking and food preparation products was dueprincipally to increased demand for combined and multifunction top ovens and espresso machines, both ofwhich have been characterized by a trend of worldwide expansion. We believe that these growth trends(especially in Great Britain where we estimate market growth to have been between 10% and 15% in 1999and 2000, respectively) have particularly favored products characterized by high performance capabilitiesand automatic features. In addition, we believe that the growth in this market over the last two years wasdue to:
‚ electric deep-fryers, where the market was characterized by an increase in demand for innovativeproducts that promote a healthier cooking process, accentuate food Öavors and are also easy to useand clean;
66
Brought to you by Global Reports

‚ free-standing and built-in ovens, where the market was characterized by an increase in demand(even in emerging markets) for products with a high aesthetic and design content and, inparticular, for products with stainless steel Ñnishes;
‚ kettles and toasters, where the market was characterized by an increase in demand for productswith a high aesthetic value; and
‚ other food preparation products (including Ñxed stand mixers and food processors), where themarket was characterized by an increase in demand for high performance appliances.
Cleaning and ironing
We believe, based upon our internally-generated estimates with the support of a number ofindependent sources, that the worldwide cleaning and ironing market segments in which we operated in2000 were valued at approximately Lit. 19,000 billion, with an annual growth rate in 1999 and 2000 ofapproximately 4% (despite a general trend of declining prices).
We believe that the growth in the cleaning and ironing market over the last two years was due to atrend among consumers favoring products related to hygiene, well-being and health. This trend wascharacterized by higher demand for innovative house cleaning products (which also tended to be in thehigher price range), such as steam extractors and steam cleaners and new appliances for vacuuming anddust treatment. The growth was also due to higher demand for increasingly powerful and smallerhousehold appliances with a wide array of functions. These included electric sweepers (also known aselectric brooms), which began to replace the classic upright vacuum cleaners as a result, we believe, oftheir improved ergonomics, convenience and frequency of use compared to upright cleaners (as well ascomparable power capabilities of electric sweepers). We believe that the overall growth in the cleaning andironing market was also due to signiÑcant growth in demand in Europe (especially Great Britain, Germanyand Spain) for ironing systems that include a separate boiler to make steam. We believe that this was due,in turn, to increasingly better performance for these products as compared to older models in terms ofspeed, lifecycle, safety and quality of the ironing.
Our Competitive Strengths
We believe that our principal competitive strengths include the following:
‚ Innovation. We understand and satisfy changing consumer needs in each of our businesssegments by developing and oÅering new products that oÅer innovative technology and designfeatures. By anticipating trends and customer preferences, we believe that we are able to createdemand for new and innovative products where previously no market existed. For example, in thepast, we succeeded in launching the Ñrst oil-Ñlled electric radiator and the Ñrst Pinguino portableair conditioner, where no market previously existed for either product. Our strength in promotinginnovation is also due to our signiÑcant experience and investments in research and development,with an emphasis on technology, functionality, eÇciency and the environment.
‚ Marketing Network. We carefully plan and manage marketing and advertising with the aim ofachieving, where possible, leadership positions for our products in the applicable market segments.As a result of this strategy, eleven product lines today occupy leadership positions in Italy, Europeand other world markets. For the year ended December 31, 2000, these 11 product lines providedapproximately 48% of our pro forma combined consolidated revenues (including the recentacquisition of Kenwood). We also beneÑt from our past success in advertising certain productsegments, which permits us to promote other products in the same market segment, therebyachieving additional manufacturing, distribution and brand synergies.
‚ Brand Recognition. We are able to leverage oÅ our brand names, such as De' Longhi, Kenwood,SIMAC, Vetrella, Ariete, La Supercalor, Ariagel, Radel, Elba, Superclima, and Climaveneta.Furthermore, as a result of our brand name recognition and consumer perception about the qualityof such products, we are generally able to maintain higher products margins with respect to ourprincipal product segments.
‚ Manufacturing Capabilities. We beneÑt from state-of-the-art manufacturing capabilities (incor-porating advanced technologies, processing solutions and quality controls) and from extensiveproduction expertise and experience, which permits us to accommodate high levels of productioncapacity. Moreover, having recently acquired a manufacturing facility in China as part of our
67
Brought to you by Global Reports

acquisition of Kenwood, we may expand our facilities even further, if needed, with relatively lowadditional labor costs. We also beneÑt from our use of common processing techniques (such asplate molding and plastic injection) for diÅerent product lines, which, in turn, gives us greatereÇciency and Öexibility in managing our production lines in response to changes in consumerpreferences.
‚ Sales and Distribution Network. We beneÑt from a complex and extensive distribution and salesnetwork, which is organized by brand name and the principal sales channels being employed. Youshould refer to ""Ì Marketing and Sales''. In addition to dedicating sales personnel to our mostsigniÑcant clients, we employ an extensive network of sales agents throughout Italy and we beneÑtfrom a direct presence in our target markets through our subsidiaries, representative oÇces andlocal distributors throughout the world. On a pro forma basis (including the eÅects of ourrestructuring process), approximately 63.9%, 62.8% and 66.9% of our consolidated revenues for theyears ended 1998, 1999 and 2000, respectively, were generated in over 50 countries other thanItaly (or 69.0%, 67.7% and 71.3%, respectively, on a pro forma combined basis including the eÅectof the Kenwood acquisition). We believe that, due to the breadth and depth of our distributionand sales network, we can signiÑcantly increase sales over current volumes with only marginalincreases in Ñxed costs.
‚ Integration Experience. We beneÑt from signiÑcant experience and success in integratingcompanies that we have acquired in the past. We successfully integrated, for example, Simac-Vetrella S.p.A. (an Italian manufacturer and distributor of ironing systems and cleaning products,which we acquired in 1989) and Ariagel S.p.A. (an Italian distributor of medium-sized airconditioning systems, which we acquired in 1986). Our competitive strength, in our opinion, stemsfrom our ability both to preserve successful aspects of the acquired entity's identity (includingunique product features, successful sales structures and brand names) while increasing synergiesby centralizing certain administrative functions and sharing technological expertise.
‚ Kenwood Acquisition. We believe that our recent acquisition of Kenwood will permit us tostrengthen our position as a leading European manufacturer and distributor of cooking and foodpreparation appliances and cleaning and ironing products and will contribute to manufacturing anddistribution synergies within the Group. In addition, we believe that the acquisition of Kenwoodwill improve our competitive position as a result of:
‚ its complimentary product lines and geographic distribution channels;
‚ the recognition of its brand name;
‚ the high quality of its products; and
‚ its experience in decentralizing and outsourcing production processes.
Our Strategy
Our objective is to consolidate and enhance our position in markets where we have achieved aleadership position and to strengthen and increase our market share in other areas, with the aim ofmaximizing the return on investment for our shareholders and achieving higher levels of proÑtability. Inorder to achieve these goals, we intend to implement the following strategies:
We intend to develop innovative products and strengthen our leadership position in core markets.
We will continue to devote a substantial amount of attention to broadening the range and depth ofour product lines, thereby increasing our recognition as a specialist in our market segments. We believethat our increased proÑtability in recent years is due primarily to our ability to create, develop,manufacture and oÅer unique high-quality products that are innovative in terms of both technology anddesign and that may be sold at higher prices with higher margins. We plan to continue to pursue thisstrategy by developing and regularly introducing innovative products that are characterized by both theireÇciency and attention to design. As part of this strategy, we have recently introduced a new trademark(in the form of the ""Class A'' logo) which is used to indicate that a particular product is eÇcient in termsof power consumption and performance, that it is easy to use and that high quality materials were used tomake the product.
68
Brought to you by Global Reports

We intend to implement the following strategies with respect to each of our four lines of business:
‚ Heating. We plan to consolidate and strengthen our leadership position with respect to heatingproducts by promoting and advertising our recently introduced line of portable oil-Ñlled radiatorsand by continuing to invest in research and development programs with the aim of developingother innovative solutions that are both power-eÇcient and aesthetically pleasing. In addition, weplan to leverage oÅ the existing success and brand recognition of our oil-Ñlled radiators bypromoting a series of new models of convectors and fan heaters that have been produced usinghighly advanced technology and a new modern design.
‚ Air conditioning and treatment. We plan to broaden our range of portable air conditioners byintroducing new wall-mounted units, as well as new models that incorporate an exclusivetechnology that uses both air and water cooling systems, thereby enabling a better performance-to-energy eÇciency ratio. We also intend to develop more eÇcient thermo-cooling (termorefriger-anti) units that operate with reduced noise levels. As part of this strategy, we recently introducedour innovative Evolution System thermo-cooling unit, which is particularly energy eÇcient andwhich can perform multiple functions, ranging from cooling air (which is normally performed byair conditioners) to heating air and heating water for hygiene use (which is normally performed byboilers). With respect to our industrial-sized air conditioning units, we plan to continue to producecustomized equipment to address customer needs and requirements. Finally, we intend to continueto develop new lines of dehumidiÑers, humidiÑers and air puriÑers addressing consumer demandresulting from growing attention and awareness to health and quality issues.
‚ Cooking and food preparation. We plan to leverage our success in sales of recently introducedproduct models by continuing to expand our product lines. As part of this strategy, we intend toexpand the range of our cooking products by, among other things, promoting various models ofmulti-function top ovens (particularly our stainless steel models), which are generally at thehigher end of the price range. We also intend to expand our product line of electric ovens byoÅering sizes not currently available and to expand the range of deep-fryers by continuing to oÅermodels with rotating baskets and by introducing new models that include removable baskets and adisposal system for cooking oil. With respect to our food preparation products, we plan tointroduce, under the Kenwood brand name, a new food processor that includes innovative featuresto optimize operation and a smaller design for better storage. We expect to maintain our currentgrowth in sales of coÅee makers by improving the design of existing models and by focusing ourmarketing eÅorts on the Superautomatica coÅee maker, which is designed to integrate multiplefunctions and is priced at the high end of the price range.
‚ Cleaning and ironing. We plan to take advantage of the current trend in Italy favoring high-endmulti-function steam appliances (such as our Triplo Simac steam cleaner) by oÅering productsspeciÑcally designed to be eÇcient and meet multi-functional needs. As part of this strategy, wealso plan to introduce a new vacuum cleaner that uses water Ñltration instead of a dust collectionbag. We expect to introduce an innovative iron, based on our exclusive steam generatingtechnology, that is designed to operate more quickly, includes additional automatic features andhas a longer product life-span than earlier models.
We plan to expand geographically by leveraging the presence of our worldwide branch network.
We believe that our sales in Italy as well as in our principal international markets (including theUnited States, the United Kingdom and Japan) will grow in the future. Our belief is based on the pastgrowth of our business segments, on projected growth rates in the air conditioning and air treatmentappliances market (for both Italy and the Mediterranean basin), on the worldwide growth in demand inrecent years for espresso machines and on current demand for portable heating products in the UnitedStates, Russia, Great Britain and Japan. We also believe that our sales growth can be sustained by ourability to stimulate demand (refer to "" Ì Our Competitive Strengths Ì Innovation'') in products andgeographic market segments not otherwise characterized by high growth rates and by signiÑcantdistribution synergies that we believe will be realized as a result of our acquisition of Kenwood.
As part of our growth strategy in Italy, we have recently reorganized our marketing structure(according to the brand names being sold and the principal client segments) with the aim of better
69
Brought to you by Global Reports

focusing on our customers. With respect to our growth strategy in Europe, we have adopted the followingapproaches:
‚ in Great Britain, we plan to leverage on the leadership position of Kenwood in order to furthergrow our businesses and increase our proÑtability, with a particular focus on the cooking and foodpreparation sectors; and
‚ in Germany and France (countries in which both we and Kenwood have subsidiaries), we plan toleverage our existing distribution channels by, among other things, increasing our marketing eÅortsand using specialist retailers to increase our market presence and expand our distribution using""do-it-yourself'' sales outlets for our portable air conditioning and heating products (with the aimof achieving a leadership position in those market segments).
With respect to our growth strategy in other worldwide markets, we have adopted the following approachesfor speciÑc areas:
‚ in Japan, we plan to strengthen our leadership position in coÅee makers and to expand ourpresence in the market for household cleaning products by introducing new models and expandingour distribution base. We also plan to use our existing distribution channels in order to marketKenwood products in that market;
‚ in the United States, we plan to reinforce our distribution channels by expanding our presencewith the aim of introducing and marketing many of our products. We also plan to continue tointroduce new products speciÑcally created for the local market (such as certain models ofceramic heaters and coÅee machines). We also intend to increase our advertising and promotionaleÅorts in order to provide sales support for our fryers and coÅee makers, while also expanding therange of portable heating and air treatment products we oÅer in the United States; and
‚ in Australia, we plan to expand our distribution base with a particular focus on increasing our saleswith respect to free standing ovens and coÅee makers.
We intend to strengthen our brand names and increase customer loyalty to our products.
We will continue to manage each of our brand names in order to promote speciÑc products andmaintain their distinct identities. We intend to leverage the broad brand name recognition of the De'Longhi and Kenwood trademarks, and more particularly, the brand name recognition in Italy of the Arieteand Simac trademarks (with respect to our food preparation, house cleaning and ironing products). Ineach case, our aim is to oÅer and market to consumers quality products that are in the medium-to-highprice range. We also intend to leverage the Italian brand name recognition of the Ariagel and LaSupercalor trademarks (with respect to air conditioning and other Group products), in each case with theaim of marketing products that are in the medium-to-low price range and that are targeted to mass marketretailers. We will also leverage the recognition of the Climaveneta brand name to promote our medium tolarge-sized air conditioning units as well as our air conditioning systems targeted to professional installersin Europe.
As part of our overall strategy regarding our brand names, each of the members of our Group willcontinue to manage the marketing, research and development, design, planning, and sales for each of itsproducts. We believe that this will maintain the distinct identity of our various brand names. However, inorder to ensure eÇciency, we will continue to centralize overall management and certain administrativeand back-oÇce functions (such as Ñnancial planning, logistics, purchasing, quality control and humanresources).
We plan to increase the capacity of, and to optimize, our distribution channels.
We continually monitor our domestic and international distribution channels for new trends andchanges in consumer preferences in order to meet our goals and the needs of our customers. Accordingly,our strategy with regard to our distribution channels focuses on promoting and sustaining the brand namerecognition of our products in order to consolidate leadership positions in each of our markets and withrespect to each of our product lines. As part of this strategy, we recently acquired Kenwood. By adoptingthese strategies, we believe that we will be able to continue implementing pricing policies that permit ourclients to obtain attractive proÑt margins.
As a result, we believe that we are well-positioned to face the current trend of consolidating consumerdistribution channels.
70
Brought to you by Global Reports

We will continue to maintain control over key manufacturing processes and focus on our research and
development programs.
We intend to maintain and develop our manufacturing expertise and technological know-how as partof our general strategy to retain a substantial portion of our initial production processes as in-housefunctions. We believe that this provides us with a competitive advantage by permitting us to better monitorand improve our strategic products, which generally have more sophisticated technology and components.As part of this strategy, we will continue to invest in research and development programs and in theimprovement and updating of our industrial processes (including with respect to our plate molding andplastic injection techniques). At the same time, we will outsource the production of more basic and lessstrategic products to select manufacturers located principally in China and Eastern Europe. In this regard,we believe that Kenwood's existing manufacturing facilities and its production structures in China provideus with an important opportunity to achieve rapidly our objectives at signiÑcant cost-savings. As part ofour strategy, we are in the process of upgrading the production facilities and increasing the productioncapacity of the Qingxi Town manufacturing facility in China with the goal of producing certain Groupproducts that we currently manufacture in Italy.
We intend to streamline our operations and increase our operating eÇciencies.
We plan to reduce our operating costs and increase our eÇciency by adopting measures primarilyintended to optimize our inventory levels. To achieve this, we will:
‚ carefully review and revise our annual and other periodic sales projections by delegating greaterresponsibility over our sales budgets directly to our sales personnel;
‚ complete the implementation of the Group's information systems. As part of this strategy, we havealready implemented the SAP system for a substantial number of our Group members, and weintend to continue to adopt the SAP system, where appropriate;
‚ improve our product deliveries processes by reducing product transportation costs through, amongother things, increased direct deliveries instead of warehousing and by leveraging our size througheconomies of scale;
‚ standardize, where possible, component parts of our various product lines and models andgenerally reduce the number of product models manufactured by the Group; and
‚ centralize certain administrative and back-oÇce activities.
We will continue to evaluate strategic growth opportunities and possible acquisitions.
We believe that our acquisition of Kenwood, as a result of its complementary products andgeographical markets, will improve our competitive position, particularly with respect to our cooking andfood preparation business. Moreover, we believe that the integration of Kenwood into our group will leadto signiÑcant manufacturing and distribution synergies. We believe that the current trend of consolidationin the market may present us with attractive opportunities to expand our operations (including throughstrategic arrangements and acquisitions). Accordingly, although we have no current or contemplatedagreements other than as disclosed in this oÅering memorandum, we plan to continue to evaluate strategicopportunities domestically and internationally that present attractive options to expand our businesses orour client base.
Our Activities
We design, manufacture and market several product lines that are related to well-being. Our productsare generally recognized for their functionality, quality, design and innovation. We believe that ourexperience allows us to successfully broaden the range and depth of our product lines, thereby increasingour recognition as a multi-specialist with respect to the market segments in which we operate. Moreover,due to the similarity of some of our products across diÅerent market segments, we also have been able toachieve signiÑcant production, commercial, and marketing synergies.
Our products may be grouped into the following four general market segments and business areas:
‚ heating products, including portable heating units (such as oil-Ñlled radiators, electric convectorsand fan heaters) and terminal units for central heating systems (such as multi-column radiators,steel radiators and bathroom radiators);
71
Brought to you by Global Reports

‚ air conditioning and air treatment products, including portable and Ñxed-wall (including industrial-sized) air conditioners, humidiÑers, dehumidiÑers and air puriÑers;
‚ cooking and food preparation products, including electric ovens, deep-fryers, toasters, electricbarbecues, coÅee machines, free standing kitchens and food processors; and
‚ household cleaning and ironing products, including vacuum cleaners, steam cleaners and ironingsystems.
The table below sets forth the contribution of each principal business area to our pro formaconsolidated revenues and to Kenwood's consolidated revenues for the periods indicated:
Unaudited Restated and Combined Pro Forma
Year ended December 31, % Variation
1998 1999 2000 1999/1998 2000/1999
(Lit. millions, except percentages)
De' Longhi Group:
HeatingÏÏÏÏÏÏÏÏÏÏÏÏÏÏÏÏÏÏÏÏÏÏÏÏÏÏÏÏ 334,460 349,398 410,919 4.5% 17.6%
Air conditioningÏÏÏÏÏÏÏÏÏÏÏÏÏÏÏÏÏÏÏÏÏ 351,829 430,162 465,062 22.3% 8.1%
Cooking and food preparation ÏÏÏÏÏÏÏÏÏ 413,453 438,480 509,849 6.1% 16.3%
Cleaning and ironingÏÏÏÏÏÏÏÏÏÏÏÏÏÏÏÏÏ 143,622 134,384 133,361 (6.4)% (0.8)%
Other ÏÏÏÏÏÏÏÏÏÏÏÏÏÏÏÏÏÏÏÏÏÏÏÏÏÏÏÏÏ 47,334 41,396 65,301 (12.5)% 57.7%
Total De' LonghiÏÏÏÏÏÏÏÏÏÏÏÏÏÏÏÏÏÏ 1,290,698 1,393,820 1,584,492 8.0% 13.7%
Kenwood Group:
Cooking and food preparation ÏÏÏÏÏÏÏÏÏ 359,110 325,493 363,280 (9.4)% 11.6%
Cleaning and ironingÏÏÏÏÏÏÏÏÏÏÏÏÏÏÏÏÏ 67,727 77,772 97,376 14.8% 25.2%
Air conditioningÏÏÏÏÏÏÏÏÏÏÏÏÏÏÏÏÏÏÏÏÏ 9,936 9,328 6,939 (6.1)% (25.6)%
Other ÏÏÏÏÏÏÏÏÏÏÏÏÏÏÏÏÏÏÏÏÏÏÏÏÏÏÏÏÏ 18,635 12,291 20,094 (34.0)% 63.5%
Total Kenwood ÏÏÏÏÏÏÏÏÏÏÏÏÏÏÏÏÏÏÏ 455,408 424,884 487,689 (6.7)% 14.8%
Total combined revenues ÏÏÏÏÏÏÏÏÏÏÏ 1,746,106 1,818,704 2,072,181 4.2% 13.9%
We sell our products under several brand names (including De' Longhi, Kenwood, SIMAC, Vetrella,Ariete, La Supercalor, Ariagel, Radel, Elba, Superclima, and Climaveneta), each of which is associatedwith a speciÑc market segment and pricing policy. The De' Longhi and Kenwood brand names areassociated with products in the medium-to-high price range in all our principal geographic markets.
Our clients generally include consumers, professional installers and medium- and large-sizedconstruction designers located throughout the world. You should refer to ""Management's Discussion andAnalysis of Financial Condition and Results of Operations'' and ""The Kenwood Acquisition'' for abreakdown of our sales revenues and those of Kenwood according to our principal geographic markets.
72
Brought to you by Global Reports

Heating
The following table shows each of the market segments in which we operate our heating business,together with the principal product lines and models oÅered by our Group members and the brand namesunder which our products are marketed within each segment.
Market Segment Product lines (models) Brand Names
Mobile Products ‚ Oil-Ñlled electric radiators ‚ De' Longhi(Dragon De' Longhi, Radia ‚ La SupercalorDe' Longhi, and Rapido ‚ RadelDe' Longhi);
‚ Fan heaters (Caldobagno);
‚ Natural gas and combined heaters;and
‚ Convectors
Fixed Products ‚ Terminal heating units ‚ De' Longhi‚ Radel
In the 1970s, we launched our Ñrst oil-Ñlled electric radiator. As a result of the initial success of theproduct, we soon broadened and diversiÑed our operations to include other mobile heating products as wellas Ñxed heating units (such as convection heaters) that beneÑted from technological and processingsynergies. As part of our expansion, we also acquired other signiÑcant manufacturers and distributors ofheating products (including Supercalor S.p.A. and Radel S.p.A.).
Mobile heating units
We produce and sell a wide range of mobile heating appliances, including oil-Ñlled electric radiators,electric (portable and wall-mounted) convectors, fan heaters, natural gas heaters, combined naturalgas/electric heaters, kerosene heaters, wood and coal-burning stoves and ranges. We believe that we areparticularly known for our oil-Ñlled electric radiators, in which we oÅer four product lines with uniquedesigns and technical features. As of the date of this oÅering memorandum, our range of mobile heatingproducts included over 25 diÅerent models of oil-Ñlled electric radiators, 55 models of convectors and fanheaters and 25 models of stoves.
As shown in the above table, we market our mobile heating products under the Dragon De' Longhi,Rapido De' Longhi, Radia De' Longhi, La Supercalor, and Radel brand names and models. We distributeour mobile heating products through consumer distribution channels, which include third-party originalequipment manufacturers (or ""OEMs''), such as Whirlpool, AEG, Electrolux and Soler y Palau, who, inturn, sell directly to retail consumers. As a result of the high demand for our products from these andother large and specialized retailers, we believe that we will also be able to promote other product lineswithin our heating business line using these same sales channels.
We believe that our products are known for their quality features and technological solutions. Forexample, among our most prominent products are:
‚ the Caldobagno programmable fan heater used in home bathrooms, which includes a combinationof features (such as an electronic thermostat; automatic power selection; a 24-hour timer with twodaily settings; a motorized swivel base and a foot switch) previously found only in separateproducts; and
‚ the Dragon De' Longhi and Rapido De' Longhi oil-Ñlled electric radiators, which use convectionheat motion in order to combine high levels of eÇciency with low temperatures for exposedsurfaces.
In addition, our products are characterized by relatively low power usage and several safety features. Theseinclude, for example, an automatic shut-oÅ mechanism for our stoves in the event that noxious orcombustive gases are released. Similarly, we recently created automatic systems for our heating productsthat allow users to maintain a constant ambient temperature at reduced levels of power consumption.
73
Brought to you by Global Reports

Terminal units for Ñxed heating systems
We produce and sell steel radiators (or so-called ""terminal units'') for Ñxed heating systems in theEuropean market. We oÅer products covering the principal market segments for convection heaters,including multi-column radiators, steel plate radiators and bathroom and decorative radiators with a varietyof sizes and Ñnishes intended to meet the most diverse aesthetic preferences and functional needs. As ofthe date of this oÅering memorandum, our range of terminal units included over six basic models withvarying sizes. As shown in the above table, we market these terminal units under the De' Longhi andRadel brand names.
We believe that our oÅering in this market segment includes a relatively wide range of productscharacterized by high quality and workmanship. We also believe that the broad range of products we oÅer,together with our high level of client service and manufacturing and customization Öexibility, makes us anattractive supplier for professional installers and designers.
Air conditioning and air treatment
The following table shows each of the market segments in which we operate our air conditioning andair treatment business, together with the principal product lines and models and the brand names underwhich our products are marketed within each segment.
Market Segment Product lines (models) Brand Names
Portable air conditioners ‚ Single-unit portable air conditioners (Pinguino) ‚ De' Longhi‚ Split-system portable air conditioners ‚ Ariagel
(Pinguino) ‚ Superclima‚ Mizushi
Wall-mounted air conditioners ‚ Split wall-mounted units ‚ De' Longhi‚ Ariagel‚ Superclima‚ Radel‚ Climaveneta
Thermo-cooling machinery and ‚ Medium-sized machinery and systems ‚ De' Longhisystems ‚ Large-sized machinery and systems ‚ Climaveneta
Other air treatment units ‚ HumidiÑers ‚ De' Longhi‚ DehumidiÑers (Tasciugo) ‚ Ariagel‚ PuriÑers ‚ Superclima
We oÅer a wide range of air conditioners, humidiÑers, dehumidiÑers and air puriÑers that range inrated capacity from 0.4 Kw (for our portable dehumidiÑers) to 2,400 Kw for our thermo-cooling units forindustrial and large building usage. We incorporate advanced technological solutions as part of ourproduction processes, which are bolstered by an intense research and development program conducted bythe Group. We have focused our eÅorts on producing products that use natural gas, which have a lowerimpact on the environment, as well as synthetic gases for refrigeration purposes. We continue to developexclusive and patented solutions that reduce noise levels of our products, optimize energy eÇciency andautomate control functions. We have also beneÑted from the expertise and know-how of ClimavenetaS.p.A., an Italian company that specializes in the manufacture of medium- and large-sized thermo-coolingunits.
Portable air conditioners
In 1986, we launched in Italy the Pinguino, an innovative, versatile and ready-to-use portable airconditioner for cooling small spaces. The success of this product soon spread to other markets worldwide,resulting in our position as a world leader in the manufacture and sales of portable air conditioners with arated capacity of between 1.9 Kw and 4 Kw.
Portable air conditioners do not require any installation and beneÑt from facility in moving the unitsto diÅerent locations. The Pinguino line of products includes both ""single-unit'' air conditioners (where theentire cooling system is contained in a single housing unit) and ""split'' air conditioners (where the coolingsystem is made up of an external and internal unit). As of the date of this oÅering memorandum, our
74
Brought to you by Global Reports

range of portable air conditioners included approximately 30 models marketed under the De' Longhi,Ariagel and Superclima brand names to retail consumers as well as the OEM market. As a result of thepast success of our product sales to these customers, we believe that we will also be able to promote otherproduct lines within our air conditioning business line using these same sales channels.
Our models of air conditioners operate using several diÅerent cooling systems. Certain models operateusing an air cooling system (which optimizes electricity usage), while others use water cooling systems(which optimize cooling capacity) or a combination of both systems. We have developed a patented andexclusive technology that allows the use of both air and water cooling systems and ensures that our single-unit air conditioners have a cooling capacity comparable to portable split-unit air conditioners. Among ourmost prominent models is the Pinguino Eco, which incorporates technology using natural coolant gas withlow environmental impact. All of our models provide for greater eÇciency and energy yields through theuse of an exclusive patented technology to recover condensate.
Wall-mounted (split) air conditioners
We oÅer a complete range of wall-mounted air conditioners that can support up to three internalcooling units, thus making them suitable for individual residences, oÇces or small businesses. As of thedate of this oÅering memorandum, we oÅered approximately 25 models of wall-mounted air conditionerswith a rated capacity of between 1.8 Kw and 10 Kw. As shown in the above table, these products aremarketed under the De' Longhi, Ariagel, Superclima, Radel, and Climaveneta brand names primarily toretail consumers and professional installers. In addition, we target the OEM market, which resells productsunder private labels and brand names.
Medium- and large-sized cooling machinery and units
We oÅer a broad range of thermo-cooling machines and systems with a capacity of between 2 Kwand 2,400 Kw. As a general matter, thermo-cooling systems with a capacity of between 2 Kw and 37 Kware suitable for large residential units, oÇces or medium- to large-sized businesses while similar systemswith a capacity of between 40 Kw and 2,400 Kw are suitable for large commercial and residentialestablishments and for manufacturing processes and applications (generally used for cooling machinery).In addition, some of our models are used as a high-yield heating source that incorporates heat pumpmechanisms. As of the date of this oÅering memorandum, we oÅered approximately 600 models of coolingmachinery and units. As shown in the above table, we market these products under the De' Longhi andClimaveneta brand names primarily to medium- and large-sized professional system installers. Due to ourpast success in marketing and selling our range of products, we have become a leader in Italy with respectto the market for medium- and large-sized cooling machinery and units.
As part of our product oÅering, we provide a range of solutions that are intended to meet the diverseneeds of our customers. Accordingly, our products may combine one or more external units with one ormore internal terminals, that adapt to diÅerent available technologies and that include heat pump systems.With respect to our large-sized cooling systems, we also provide customers with technical solutionsspeciÑcally designed to meet a variety of installation needs and to provide speciÑc technologies required forsuch arrangements. For example, we have customized thermo-cooling units for our large-sized systems inorder to produce:
‚ models based on an exclusive technology in Europe that uses methane gas instead of electricity;
‚ air conditioning machinery equipped with heat pumps capable of producing hot and cold watersimultaneously using two separate circuits regardless of external temperatures, enabling uniformcooling conditions in large structures with diÅerent sun exposures; and
‚ free cooling chillers for large structures or industrial processes that provide cooling systems duringall seasons by, among other things, using cold external air, thereby resulting in signiÑcant energysavings.
Other products for air treatment
We also produce and sell other air treatment appliances, including dehumidiÑers, humidiÑers andpuriÑers marketed primarily to retail consumers under the De' Longhi, Superclima, and Ariagel brandnames. In addition, we target the OEM market for sales of products to be resold under private labels andbrand names.
75
Brought to you by Global Reports

Our dehumidiÑers are single-unit, portable systems used to reduce the amount of humidity in the airand are produced using the same technology as our air conditioners. In 1992, we launched the Tasciugoline of dehumidiÑers for home use, which has become a leading product in Europe with signiÑcant marketshares in other worldwide markets. As of the date of this oÅering memorandum, we oÅer over 10 patentedmodels of energy-eÇcient dehumidiÑers.
Our humidiÑers are single-unit systems used to provide an area with a controllable quantity ofsterilized air that is saturated with water or steam and, in certain models, is combined with aromatic andscented fragrances. As of the date of this oÅering memorandum, we oÅer four models of humidiÑers.
Our puriÑers are single-unit systems used to purify the air by Ñltering out dust, smoke and othersuspended particles by passing the air through mechanical and/or electrostatic Ñlters. As of the date of thisoÅering memorandum, we oÅer two models of puriÑers.
Cooking and food preparation
The following table shows each of the market segments in which we operate related to our cookingand food preparation business, together with the principal product lines and models and the brand namesunder which our products are marketed within each segment.
Market Segment Product lines (models) Brand Names
Cooking ‚ Countertop ovens (Sfornatutto) ‚ De' Longhi‚ Fryers (Friggimeglio) ‚ Kenwood‚ CoÅee makers ‚ Ariete‚ Toasters and kettles‚ Electric grills and barbecues
Stoves ‚ Free standing and built-in stoves and ‚ De' Longhicook tops ‚ Elba
Food preparation ‚ Fixed-stand mixers and food processors ‚ De' Longhi(Kenwood Chef) ‚ Kenwood
‚ Pasta makers (Pastamatic SIMAC) ‚ SIMAC‚ Hand mixers ‚ Ariete‚ Ice cream makers (Gelataio SIMAC)‚ Food processors (Bravo SIMAC)‚ Graters and food mills (Grat fi , Pass fi )
We manufacture and sell a wide range of cooking and food preparation products, including countertopovens (which are specially-designed toaster ovens), fryers, toasters, barbecues, electric grills, coÅeemakers, ""free-standing'' stoves, cook tops and ""built-in'' ovens (which are ovens installed in kitchencabinets), as well as mixers, food processors and other food preparation appliances. We believe that oursuccess in these market segments is attributable to our focus on technology and functionality, as well asour research and development eÅorts with respect to product materials and design. In addition, our growthhas been bolstered by our strategic acquisitions of Micromax-Simac S.r.l., Elba S.p.A., and most recently,Kenwood.
Cooking products
Countertop ovens. We produce and sell countertop ovens, including microwave ovens, electric ovensand combined ovens (those that feature traditional and microwave cooking) with capacities and sizesranging from 7 to 30 liters. As of the date of this oÅering memorandum, we oÅer over 20 diÅerent modelsof countertop ovens marketed primarily to retail consumers under the De' Longhi and Sfornatutto brandnames or under private label to the OEM market.
We believe that our wide range of products permits us to compete on an equal footing with othermajor international players and has permitted us to acquire a leading position in Italy and a signiÑcantglobal market share. With respect to our electric ovens, we focus on maximizing user satisfaction byoÅering products that combine practical usage and superior cooking results. Similarly, with respect to ourcombined ovens, we believe that we are recognized for our wide range of products and our focus on qualityand design (particularly our ""retro'' and stainless steel design product lines). In addition, as a result of our
76
Brought to you by Global Reports

focus on research and innovation, we believe that we are at the cutting edge of development with respectto sophisticated oven control systems, including an innovative voice command system.
Fryers. We produce and sell deep fryers (including models with round and rectangular baskets andremovable bowls). As of the date of this oÅering memorandum, we oÅer over 18 models targeted primarilyat retail consumers and marketed under the De' Longhi, Friggimeglio, SIMAC and Kenwood brand names.Most of our Friggimeglio fryers are produced using a patented rotating, tilted basket (that optimizescooking processes and cuts oil consumption in half) and a patented system for draining oil.
Espresso and coÅee makers. We produce and sell coÅee machines, including espresso makers (usingboth steam and pump technologies), machines for American-style coÅee and machines that can makeboth espresso and American-style coÅee. As of the date of this oÅering memorandum, we oÅer over 45models of coÅee makers that are marketed primarily to retail consumers under the De' Longhi, Ariete andKenwood brand names. Our products are made using exclusive patented technology, including a milkfrothing system (called IFD or Instant Froth Dispenser) and a two-pump circuit for making coÅee andcappuccino simultaneously. We believe that we are recognized for the wide range of our products and ourfocus on consumer preferences, which has permitted us to acquire a leading position in Japan and asigniÑcant market share in Italy.
Electric grills. We produce and sell contact and electric grills. As of the date of this oÅeringmemorandum, we oÅer over 15 models of electric grills that are marketed primarily to retail consumersunder the De' Longhi, Kenwood, Ariete, Supercalor and SIMAC brand names. We believe that our focuson, and development of, speciÑc in-house technologies that optimize the cooking process, including apractical rotating grill and a system for circulating aromas, has permitted us to acquire a leading positionin Italy.
Other cooking products. During the course of 2000, we launched a new product line of cookingappliances, including toasters marketed under the De' Longhi brand. In addition, as a result of ouracquisition of Kenwood in early 2001, we began to sell toasters and kettles marketed under the Kenwoodbrand name.
Ovens and stoves
We produce and sell free-standing stoves and ovens, cooktops and built-in ovens. As of the date ofthis oÅering memorandum, we oÅer over approximately 20 models of free-standing and built in ovens thatare marketed primarily to retail consumers under the De' Longhi and Elba brand names, as well as to theOEM market using private labels (including such as Whirlpool, Zanussi, Candy, Bauknecht, and Ariston).
We believe that our wide range of products is characterized by unique design features (productÑnishes, technologies, and colors) which incorporate aesthetic concepts and consumer preferences that varyaccording to geographic area and diÅering cultures. In addition, we recently launched a line of innovativefree-standing ovens and stoves that includes a casing made entirely of stainless steel and characterized byhigh quality design, a focus on technology and a professional appearance.
Food preparation products
We oÅer a wide range of products related to food preparation, including Ñxed-stand mixers (known asthe Kenwood Chef) and food processors. These products are characterized by a powerful motor,sophisticated transmission system and large number of accessories for diÅerent tasks. In addition, we oÅerthe Bravo food processors, Gelataio ice cream maker, Pastamatic pasta maker, the battery-operated Grat fi cheese grater and the Pass fi electric food mill. As of the date of this oÅering memorandum, we oÅer about60 models of food preparation products marketed primarily to retail consumers under the De' Longhi,Kenwood, SIMAC and Ariete brand names.
As a result of our acquisition of Kenwood in early 2001, we have become a leader in the Englishmarket and have gained a signiÑcant market share in Europe with respect to food preparation products.We believe that, as a result of the high demand for Kenwood's products and in particular the high qualityand reputation of the Kenwood Chef in various markets around the world (including Great Britain,Austria, Scandinavia and South Africa), we will be able to promote other product lines of the KenwoodGroup.
77
Brought to you by Global Reports

Cleaning and ironing systems
The following table shows each of the market segments in which we operate related to our cleaningand ironing business, together with our principal product lines and models and the brand names underwhich our products are marketed within each segment.
Market Segment Product lines (models) Brand Names
House cleaning ‚ Electric brooms (Colombina) ‚ De' Longhi‚ Steam cleaners (Vapor π ) ‚ SIMAC‚ Steam extractors (Triplo Simac) ‚ Ariete‚ Vacuum cleaners ‚ Vetrella
Ironing ‚ Steam ironing systems (Stiromeglio, Stirella, and ‚ De' LonghiStiromatic) ‚ Kenwood
‚ SIMAC‚ Ariete
We produce and sell a wide range of appliances relating to household cleaning and ironing, includingelectric brooms (also known as electric sweepers), steam and multifunction cleaners, steam extractors(which combine steam cleaning action with dirt vacuuming capabilities) and steam ironing systems. Wehave targeted key market segments which, in our opinion, are characterized by high growth, high demandand high margins. As of the date of this oÅering memorandum, we oÅered over 40 models of ironing andcleaning products marketed primarily to retail consumers under the De' Longhi, Kenwood, SIMAC, Arieteand Vetrella brand names. Our expertise and technological know-how have been bolstered, in our opinion,by our strategic acquisitions of MicromaxÓSimac S.r.l. in 2000 and Ariete S.p.A. (a subsidiary ofKenwood) in 2001.
Design, Manufacturing and Distribution
We believe that an essential element of our success is that all of our products are recognized for theirquality features, eÇciency, functionality, design and innovation. Accordingly, we are intensively involved inall aspects of the production process to ensure that all products maintain these high standards. All of ourproducts are designed, manufactured, inspected and marketed in accordance with the followingorganizational phases:
‚ product concept and management;
‚ research and development;
‚ industrial and graphic design;
‚ manufacturing and production;
‚ quality control and quality assurance;
‚ logistics;
‚ distribution;
‚ marketing and sales; and
‚ after-sales assistance.
Product concept and management
We believe that innovation represents a particularly important aspect of our mission and that theintroduction of unique and innovative products has allowed us to create a demand for such products whereno market previously existed. Our Marketing Department is generally responsible, in conjunction with ourresearch and development division, for creating and developing concepts for new Group products. TheMarketing Department includes 30 employees speciÑcally dedicated to product development. In addition,the Company's Marketing Department centralizes all of the marketing functions for the Group members(other than Climaveneta, Elba, Kenwood, and Ariete, which maintain separate marketing departments).
Our Group's marketing departments constantly monitor, collect and update information relating totrends in technologies and the changing needs, desires and preferences of consumers. This information iscollected from, reviewed, processed through and compared with research and market surveys and
78
Brought to you by Global Reports

commercial databases, as well as with information received from our sales representatives and our ownanalysis of initiatives conducted by our principal competitors.
On the basis of the above information, our Marketing Department develops a conceptual proÑle ofproposed new products, together with an estimate of manufacturing costs and projected proÑts associatedwith such products. The reÑnement of the conceptual proÑle and the technical development of eachproduct is then assigned to relevant divisions within the Group (including the research and development,design and manufacturing departments).
Our Marketing Department is also responsible for product management, which includes thecoordination of the production cycle with a view to meeting (or accelerating) market launch times,insuring a smooth and eÇcient production process, and managing market expectations regarding newproducts. In addition, the department analyzes the potential use of external manufacturers to producespeciÑed products with a lower technological content. These manufacturers are chosen based on certaincriteria that include their degree of specialization and cost eÇciency.
Research and development
We invest signiÑcantly in our research and development (""R&D'') facilities, which consist of 10laboratories and 13 engineering departments located in or near our manufacturing facilities in order topromote interaction between the design and manufacturing phases.
Air Conditioning
Our engineering departments and R&D laboratories located at our Treviso (De' Longhi) andCandiolo (Ariagel) manufacturing facilities in Italy are dedicated to portable and Ñxed small- andmedium-sized air conditioning and air treatment systems while those located at our Climaveneta andErgoklima manufacturing plants are dedicated to equipment for industrial use and large buildings. As ofthe date of this oÅering memorandum, approximately 77 employees in the aggregate worked at thesefacilities, conducting research with respect to thermodynamics, Öuid dynamics, psychrometrics, and energyeÇciency (using calorimetric chambers), acoustics and air Öuid mechanics (using sophisticated equipmentsuch as semi-sound-proof rooms and pressure bearing tunnels), as well as electronics and electricalengineering technology applicable to air conditioning equipment.
Heating
Our engineering department and R&D laboratory in Treviso designs and tests new thermodynamicsolutions which, together with speciÑcally designed electronic control systems, permit us to manufactureoil-Ñlled electric radiators, convectors and stoves with low surface temperatures that comply withapplicable safety and energy saving regulations. Our signiÑcant R&D facilities and experience in theheating sector, and speciÑcally with respect to radiators, also permitted us to produce water-Ñlled radiatorsmarketed and sold by our subsidiaries Radel and Sile Corpi Scaldanti (both of which have dedicatedtechnical R&D facilities). As of the date of this oÅering memorandum, approximately 22 employeesworked at these facilities, conducting R&D activities with respect to our heating products.
Cooking and food preparation
Our engineering departments and R&D laboratories located at the Mignagola manufacturing facilityare responsible for research and development activities relating to our cooking and food preparationbusiness. As of the date of this oÅering memorandum, approximately 54 employees worked at thesefacilities. As a result of the activities performed at these facilities, we developed sophisticated models forcirculating microwaves inside oven cavities, which has allowed us to design products with superior cookingresults. Our R&D facilities located at our Elba manufacturing plant in Italy are responsible for activitieswith respect to our built-in and free-standing stoves.
Cleaning and ironing
Our R&D facility located at our Simac-Vetrella manufacturing facility in Italy is dedicated to steamcleaners and ironing systems.
79
Brought to you by Global Reports

Kenwood and Ariete facilities
Kenwood's primary R&D activities (including conceptual design and product development activities)are carried out through laboratories located at Kenwood's headquarters in Havant, England. Theselaboratories are electronically connected through an intranet system to Kenwood's manufacturing facilitylocated in Qingxi Town, China. The engineering departments located at the manufacturing plant in Chinaare responsible for the operational aspects of new product development and design focusing on thereÑnement of solutions aimed at developing sophisticated, powerful, quieter and more reliable technologyfor food preparation products. As of the date of this oÅering memorandum, the facilities in England andChina employed 21 individuals.
Ariete, Kenwood's Italian subsidiary, has a separate in-house research facility for R&D activitiesrelating to coÅee makers, ironing systems and steam cleaning products.
Industrial and graphic design
We pay close attention to the design of our products with the aim of optimizing functional andergonomic aspects and promoting the identity of each brand. We believe that our products aredistinguished by their design and that more sophisticated design solutions permit us to market our leadingproducts in the high price range within their respective market segments. Accordingly, we modify thedegree of design sophistication based upon a particular product's price levels. Our designs have receivednumerous awards and signiÑcant recognition over the years. These include the Design Management Award(which we received in 2000 in connection with the innovative design of our products), the Troph πee duDesign award (which we received in 1995 in recognition of a radiator with a linear surface) and thenomination and notice we recently received for receipt of the Golden Compass (which will be awarded inthe fall of 2001 in recognition of developing signiÑcant small appliances over the last 20 years).
Management of our brand image is centralized at the Group level through the Industrial DesignDepartment, which is responsible for ensuring a uniform and cohesive approach to the product imagesassociated with our brand names. As part of this centralized policy, the Industrial Design Department wasrecently assigned the responsibility of managing the brand image of the various trademarks associated withKenwood and Ariete. In addition, each of our subsidiaries has its own industrial design department thatmanages commercial aspects of, and compliance with design, regulatory and manufacturing requirements.
The Industrial Design Department uses sophisticated CAD-CAM (computer aided design andcomputer aided manufacturing) tools to transform product concepts proposed by the marketingdepartments and the R&D divisions into virtual models, which are subsequently reÑned in terms of theproduct's aesthetic appearance. On the basis of these models, prototypes are created as customer samplesprior to beginning the manufacturing process and to prepare the product for production with the aim ofbolstering future sales. During the production phase, the virtual models are manipulated and operatedusing digitally controlled machines that are able to reproduce their features. We believe that our platemolding expertise allows the industrial design department to create sophisticated and aestheticallyappealing products.
The Industrial Design Department is also involved in subsequent phases of product development,including the creation of molds and manufacturing processes, and proposes stylistic alternatives thatdiÅerentiate products earmarked for the OEM market from those marketed under our proprietary brandnames.
Kenwood products are characterized by their own unique designs that are managed by a dedicatedfacility located in Havant, England. Ariete products marketed under the Ariete brand name include designfeatures which are distinct from other Kenwood products and are managed by a separate departmentlocated in Italy. As a general policy, Kenwood products marketed under the Kenwood brand name aredesigned with the intention of creating products that are a ""joy to own'' and are characterized by a sturdyappearance, using classical colors (such as white) and metal. In contrast, products marketed under theAriete brand name are characterized by a design intended to convey practicality with Öair and innovation.
Manufacturing and production
We make our products using in-house facilities as well as third-party specialized manufacturers. As ofMarch 31, 2001, we managed manufacturing plants located in Italy and three manufacturing plants(recently acquired as part of the Kenwood acquisition in early 2001) located in Great Britain, Italy andChina. We believe that these facilities are characterized by modern equipment, specialized manufacturing
80
Brought to you by Global Reports

capabilities and, in certain cases (especially with respect to our principal plants), complementaryproduction lines that allow us to produce diÅerent products or the same parts for diÅerent products. Thecomplementary production feature of our manufacturing facilities allows us to reallocate our productionrequirements more easily from one plant to another in order to quickly and eÇciently respond to changesin consumer demand dictated by seasonal or commercial factors. Depending on production needs, certainof our manufacturing plants are capable of handling multiple working shifts per day or of operating on acontinuous basis.
We control all fundamental aspects of the production cycle through use of our in-housemanufacturing facilities. These include:
‚ the creation of equipment and molds (which is essential for ensuring the rapid creation of newproducts);
‚ the execution of complex cold steel buckling processes, plastic molding, welding, painting andenameling; and
‚ the assembly of the Ñnal product.
We purchase from third parties selected components for our products, including compressors for airconditioning equipment, cables and electric wiring and certain electronically controlled components formore sophisticated products (which are often produced based on speciÑcations and drawings furnished byour engineering departments).
The Planning Department schedules the overall production processes for our manufacturing plants onthe basis of a budget prepared annually and updated periodically by the Sales Department. This allows usto operate and use our plants in an optimal manner; to properly plan our purchases of materials and toeÇciently make any adjustments to our labor force requirements to meet production needs. We arecurrently in the process of initiating a plan to improve our production process aimed at reducing ourinventories of supplies and semi-Ñnished and Ñnished goods.
The following table illustrates the products made and the number of workers employed at each of ourmanufacturing facilities:
Location Products No. of employees(1)
Italy:
Ampezzo (Udine)ÏÏÏÏÏÏÏÏÏÏÏÏÏÏÏÏÏÏÏÏ Food cooking and preparation, heating 156
Bassano del Grappa (Vicenza) ÏÏÏÏÏÏÏÏÏ Large air conditioning equipment 103
Borso del Grappa (Treviso) ÏÏÏÏÏÏÏÏÏÏÏÏ Heating, cooking 374
Candiolo (Turin)ÏÏÏÏÏÏÏÏÏÏÏÏÏÏÏÏÏÏÏÏÏ Fixed and mobile air conditioning and air treatment 64
Fossalta di Piave (Venice)ÏÏÏÏÏÏÏÏÏÏÏÏÏ Fixed heating units 29
Gorgo al Monticano (Treviso)ÏÏÏÏÏÏÏÏÏÏ Heating, food preparation, house cleaning, ironing 328
Mignagola (Treviso) ÏÏÏÏÏÏÏÏÏÏÏÏÏÏÏÏÏÏ Food cooking and preparation, air conditioning, dehumidiÑer 543
Moimacco (Udine) ÏÏÏÏÏÏÏÏÏÏÏÏÏÏÏÏÏÏÏ Fixed heating units 309
Pianiga (Venice) ÏÏÏÏÏÏÏÏÏÏÏÏÏÏÏÏÏÏÏÏÏ Ironing, house cleaning and food preparation 127
Pieve d'Alpago (Belluno)(3)ÏÏÏÏÏÏÏÏÏÏÏÏ Large air conditioning equipment, heat exchangers 135
Prato(2) ÏÏÏÏÏÏÏÏÏÏÏÏÏÏÏÏÏÏÏÏÏÏÏÏÏÏÏÏÏ Air conditioning, food preparation, house cleaning, ironing 41
Treviso ÏÏÏÏÏÏÏÏÏÏÏÏÏÏÏÏÏÏÏÏÏÏÏÏÏÏÏÏÏ Heating, portable air conditioning, air treatment, dehumidiÑer 613
Outside Italy:
Havant, England(2) ÏÏÏÏÏÏÏÏÏÏÏÏÏÏÏÏÏÏÏ Food preparation and water Ñlter cartridges 79
Qingxi Town, China(2) ÏÏÏÏÏÏÏÏÏÏÏÏÏÏÏÏ Food cooking and preparation 755
Total employeesÏÏÏÏÏÏÏÏÏÏÏÏÏÏÏÏÏÏÏÏ 3,656
(1) At December 31, 2000 (calculated on a pro forma basis including Kenwood).
(2) Plants acquired with Kenwood in early 2001.
(3) Includes two separate manufacturing facilities relating to production plants of Ergoklima S.p.A. and Micromax S.p.A.
81
Brought to you by Global Reports

De' Longhi production facilities
The plant located at our headquarters in Treviso includes facilities for the initial manufacturing andproduction of various products and are equipped with:
‚ mechanical (progressive and transfer) presses;
‚ sophisticated welding equipment for oil-Ñlled electric radiators; and
‚ anaphoretic painting equipment.
The plant also incorporates assembly shops that produce air conditioning systems (including the Pinguinoportable unit), dehumidiÑers, and a majority of our heating products (including oil-Ñlled electric radiators,fan heaters, convectors, and natural gas catalytic and infrared heaters).
The plant in Mignagola is the largest facility by surface area (totaling 60,000 m2) and is set up forinitial manufacturing stages of our products carried out by four shops equipped with advanced technologiesfor:
‚ molding various products using cold plate buckling with progressive and transfer molds;
‚ welding, which is fully automated for microwave oven cavities and fryer tubs;
‚ cataphoretic painting; and
‚ electrophoretic enameling.
The plant also includes assembly shops for manufacturing Ñxed air conditioning and air treatmentappliances and dehumidiÑers as well as electric grills, electric ovens, and microwave ovens.
The plant in Ampezzo specializes in assembling coÅee makers and manufacturing fan heaters, electricovens, and electric grills. We believe that the plant, despite its relatively recent launch in 2000, hasachieved eÇciency and operating levels in line with our general standards for similar facilities.
The plant in Candiolo produces wall-mounted and mobile air conditioners and dehumidiÑers.
The plant in Gorgo al Monticano specializes in molding thermoplastic components (which areprovided to other production facilities of the Group) and includes assembly shops for the production of awide range of steam ironing systems, extraction systems, electric brooms, fryers, and fan heaters.
The plant in Pianiga produces house cleaning products (including multifunction Öoor washer-dryers,dry and wet vacuum cleaners, steam surface cleaners, ironing systems and polishers) and food preparationproducts (including ice cream makers and dough mixers).
The plant in Borso del Grappa is one of the largest stove production facilities in Europe by surfacearea (approximately 52,049 m2) and includes assembly shops for the production of gas and electric built-inand free-standing stoves, built-in cooking tops, and kerosene, gas and wood/coal-burning heaters. Theassembly shops are equipped with mechanical presses and sophisticated welding, painting, and enamelingequipment for stoves.
The plant in Moimacco is fully automated and among the most modern in Europe with respect tocold plate molding, resistance welding and Ñnishing. The facility specializes in the production of water-circulating steel radiators for commercial use. Recently, we expanded the capacity of the plant in order toprovide for potential signiÑcant increases in demand with minimal investments. You should refer to""Management's Discussion and Analysis of Financial Condition and Results of Operations Ì CapitalInvestments'' for a discussion of our current expansion plans.
The plant in Fossalta di Piave produces bathroom radiators.
The plants in Bassano del Grappa and Pieve d'Alpago (consisting of two separate production units)operate in an integrated manner for the manufacture of refrigeration and air conditioning units forindustrial use and large institutional buildings. The assembly lines are equipped with sophisticated dualclimate rooms used to test the products and to simulate extreme operating conditions.
Kenwood production facilities
As a result of our acquisition of Kenwood, we added three production units to the 12 plants alreadyowned by the Group. As a result of a restructuring process initiated by Kenwood in 1998 to reduce itsexposure to manufacturing operations in the United Kingdom, Kenwood transferred its U.K. motor
82
Brought to you by Global Reports

winding business from Great Britain to Qingxi Town in China and assigned a signiÑcant portion of itsprimary manufacturing processes to certain specialized manufacturers selected mainly on the basis ofproduction capacity and the quality of production processes.
Kenwood (through its subsidiary Tricom) has operated the Qingxi Town production plant in Chinasince 1992. The factory produces motors, components and attachments for the Kenwood Chef Ñxed-standmixer and other food preparation appliances. The Qingxi manufacturing operations are conducted pursuantto a processing contract between Kenwood's Hong Kong subsidiary and a local China processing enterprisein Qingxi. This contract expires in 2005, at which time we may negotiate to extend the agreement with theapproval of the relevant local China authorities. As of December 31, 2000, the plant in China had over730 employees, and we expect to hire an additional 500 employees by the end of 2002. We believe that wehave a signiÑcant competitive advantage as a result of the plant in China, which provides us with anoperational production facility (thereby avoiding the time constraints and other potential problemsassociated with a start-up facility) in a country with low labor costs. In addition, we believe that we willbe able to increase the production capacity of the plant in China without signiÑcant additional Ñxed costs.However, we cannot assure you that will be accomplished within the timeframe or budget that we havecurrently estimated. You should refer to ""Risk Factors Ì Risks Relating to the Market in which WeOperate Ì We are subject to risks associated with our manufacturing operations in China.''
In China, there are numerous national and local laws and regulations which provide for laborprotection in areas such as legal working age, maximum working hours, minimum wage and holidayentitlement and employees' pensions. Many of these laws are relatively new. In addition, local authoritiesin China sometimes adopt practices which may not be entirely consistent with national laws andregulations. Therefore, although we believe that we have complied with all published labor protectionrequirements in China, we cannot assure you that the Chinese labor authorities will not raise issues withrespect to the operation of the Qingxi Town production plant.
The Kenwood production facility in Havant, England designs and assembles food preparationappliances, including the Kenwood Chef, using a system that allows us to customize products to meetspeciÑc characteristics for each market. This system permits us, at the end of the packaging process, toadd only those product accessories that diÅer according to market (including, for example, instructionmanuals and electric plugs). In addition, the production facility in Havant produces other Kenwoodproducts, such as water Ñlter cartridges.
The production facility in Prato, Italy assembles a small quantity of appliances marketed under theAriete brand name related to cooking and food preparation products and to cleaning and ironing systems.In addition, the facility is used to purchase other products from external manufacturers.
Quality Control and Quality Assurance
The Quality Department is responsible for constantly monitoring product quality through both qualitycontrol and quality assurance measures. Quality control refers to review procedures relating to qualitativerequirements for products. Quality assurance, in contrast, refers to internally implemented rules andprocedures aimed at avoiding the risks and preventing the causes of non-conformity to quality controlstandards.
As a preliminary quality control measure, we purchase only from suppliers that are included on a pre-approved list and whose production processes are monitored on a periodic basis through inspections. Thematerials supplied are also subject to sample inspections, which are carried out taking into account boththe special characteristics of the materials being supplied as well as qualitative aspects of previouspurchases from the same supplier. In addition, we keep detailed records relating to previously usedproduction facilities, which allow us to exercise more comprehensive control over the eÇciency and qualityof work that we outsource to other manufacturers.
We conduct qualitative inspections of our products during the production phase using automated teststhat are designed to ensure that Ñnished products meet certain quality standards in terms of safety andfunctional conformity. In addition, we conduct ad hoc inspections in order to verify the completeness andthe aesthetic appearance of our products.
83
Brought to you by Global Reports

Finished products undergo further sample inspections on a random basis. These inspections include:
‚ a complete construction analysis to review the durability and quality of the product;
‚ a ""re-testing'' analysis to determine whether the product meets safety, functionality, and aestheticrequirements; and
‚ a ""real life'' test that simulate actual usage conditions for prolonged periods.
As of the date of this oÅering memorandum, the following subsidiaries of the Group had obtainedISO 9001 certiÑcation relating to quality standards as of the year indicated:
‚ Climaveneta in 1992;
‚ Kenwood in 1991 with respect to the Havant plant;
‚ Radel in 1995;
‚ SimacÓVetrella in 1996 with respect to the Pianiga (Venice) plant;
‚ Elba in 1998; and
‚ Ariagel in 2001.
We have initiated procedures to obtain relevant certiÑcations that ISO standards have been met withrespect to the Group. We believe that all of our subsidiaries operating in the air conditioning business aswell as Kenwood and its subsidiaries will be issued certiÑcation by the end of 2002. All of our subsidiariesoperate in accordance with internal procedures that satisfy the requirements of ISO 9001 regulations.
Logistics
The companies in our Group use logistics and handling systems tailored to our respective products,distribution networks and customers. These systems generally distinguish between primary logistics(transporting products from our plants to regional warehouses) and secondary logistics (delivering productsfrom regional warehouses to customers).
Primary logistics are handled directly by the Group through a network of nine warehouses. Ourcentral warehouse, which is located at the Mignagola plant, is equipped with a computerized system thathandles warehousing requirements for products being transported from various plants and transfers suchproducts to relevant loading docks based on the orders received.
Secondary logistics are generally outsourced and incorporate diÅerent procedures depending on wherethe products are Ñnally delivered. In Italy, we generally rely on TNT Tecnologistica, an unaÇliatedlogistics and distribution company, which has numerous distribution warehouses throughout the country.We monitor delivery times and product assortment at distribution centers using an on-line control systemdeveloped internally and integrated with the information technology system of TNT Tecnologistica.Outside Italy, we rely primarily on external companies that manage typical distribution logistics, includingwarehouse storage facilities, handling procedures and delivery of the product to the end customer. In theUnited States, we have established an extranet system for the electronic exchange of logistical information(using ""EDI'' or Electronic Data Interchange) through our customer network.
Kenwood uses two main warehouses (located in Havant, England and Roermond, The Netherlands)to store and distribute its products. The Havant warehouse is primarily used to distribute products in theUnited Kingdom and is operated by us. The Roermond warehouse, which is leased, and operated by UPS(WWL), is used as an outsourced facility for other destinations. A small percentage of Kenwood'sproducts are shipped directly from its overseas plants to the customer. Kenwood generally uses itswarehouse located in Calenzano, Italy for the storage and distribution of Ariete products.
Distribution
We have developed a distribution network that we believe adequately covers the principal markets inwhich we operate. We believe that this network constitutes a signiÑcant competitive advantage because itwill permit us to sustain sales volumes higher than current levels with marginal increases in Ñxed costs.Our distribution network is designed to adapt to individual markets and types of customers, which webelieve allows us to maximize control and maintain adequate pricing policies. As part of this strategy, wehave established independent distribution networks for each of our brand names.
84
Brought to you by Global Reports

In order to motivate our sales force, we provide incentive programs (including beneÑts as high as 30%of annual compensation) for our sales personnel which are linked to sales volumes and margin results.Similarly, in Italy, we provide incentives to our external sales agents, importers, and distributors in theform of commissions based on results related to Italian distribution networks. Foreign distributors alsoreceive volume-related sales incentives.
Distribution of products under the De' Longhi brand name
Products marketed under the De' Longhi brand name are primarily targeted at retail consumers,professional installers and medium- and large-sized plant designers. You should refer to ""Ì Marketing andSales''. Our sales and distribution structure for retail consumers is divided into the following salesdepartments, each of which targets a distinct segment of the retail market:
‚ export household appliances;
‚ Italian household appliances; and
‚ Italian comfort and kitchen products (which also markets and sells free-standing and built-inovens under the Elba brand name).
Our sales and distribution structure for professional installers and medium- and large-sized plant designersis divided between:
‚ professional air conditioning; and
‚ home systems,
both of which are aimed at designers and professional installers in the Italian and principal foreignmarkets.
In Italy, we use approximately 100 sales agents to promote our products. These agents are locatedthroughout Italy and vary in size depending on the geographic area being covered and on thecharacteristics of their respective customers.
In foreign markets, our branches directly distribute our products in countries where we can rely on""critical mass'' sales levels (such as Benelux, Canada, France, Germany, Japan, Great Britain, and theUnited States). In approximately 45 countries, we rely on expert distributors who are usually subject to anexclusive distribution arrangement. In other countries (such as China, Russia, and Ukraine), we rely onrepresentative sales oÇces.
Distribution of products under our other brand names
Products marketed under our other brand names (such as Ariagel, SIMAC, Climaveneta, Radel, Elba,and La Supercalor) are distributed through our sales departments or through representative sales oÇces.We rely on multi-Ñrm distribution agents in Italy and on distributors or importers outside Italy (with theexception of Climaveneta, which distributes its products through a subsidiary in Germany). In addition, wealso distribute these products through:
‚ our subsidiaries in Austria, Benelux, Canada, France, Japan, Germany, Great Britain, Hong Kong,Malaysia, Poland, Singapore, the United States and South Africa;
‚ our representative oÇces in China, Russia, and Ukraine; and
‚ local distributors in other countries (including Greece, Spain, New Zealand and Australia).
As a result of our recent acquisition, our distribution capabilities have been expanded to include theKenwood distribution network. This has increased our coverage of the United Kingdom and includesbranches in Austria, France, Germany, Hong Kong, Italy, Malaysia, Singapore and South Africa. Webelieve that the Kenwood acquisition will contribute to signiÑcant distribution synergies as a result of theseadditional distribution networks and also as a result of the complementary geographical distribution ofKenwood's branch oÇces (and particularly in markets where we or Kenwood historically have not beenstrong, such as Canada, Italy, and the United States for Kenwood, and the Far East and South Africa forour Group). As of March 31, 2001, Kenwood's sales department, located at its headquarters in Havant,consists of over 50 dedicated staÅ.
85
Brought to you by Global Reports

Marketing and Sales
We distribute our products worldwide to the following principal client segments:
‚ retail consumers, principally independent retailers, including specialty chains, wholesalers and largedepartment stores and OEMs, catalog sales and end consumers;
‚ professional installers, consisting of installation specialists for air conditioning and heating systems(primarily our steel radiators and Ñxed wall-mounted air conditioners), plumbers and refrigerationtechnicians who oÅer end consumers sales and installation services using standardized appliancesthat require non-complex installation; and
‚ medium- and large-sized architectural, engineering and design Ñrms which provide industrial-sizedheating and cooling systems to corporate clients, generally commissioned by contract.
We have adapted our distribution channels to Ñt the widely varying needs of each of our principalgeographic markets.
On a pro forma basis (excluding Kenwood), our retail consumers accounted for approximately 71.4%of our consolidated sales revenues for the year ended December 31, 2000, and our professional installersand medium- and large-sized architectural, engineering and design Ñrms accounted for the remaining28.6% of consolidated sales revenues. We target our retail consumers for sales and distribution of cookingand food preparation products, mobile electric and gas heaters, portable air conditioners, dehumidiÑers,puriÑers, humidiÑers and house cleaning and ironing appliances.
We do not depend to any signiÑcant degree on any one client or group of related clients. On a proforma basis (excluding Kenwood), our top three and top 10 clients represented 5.0% and 13.0%,respectively, of our consolidated pro forma combined revenues for the year ended December 31, 2000.
After-Sales Assistance
We have established a centralized division (made up of over 40 employees as of the date of thisoÅering memorandum) to handle after-sales customer services. In addition, the division is responsible forgathering statistical and other information relating to product failures and defects, which is then processedby our quality control oÇce with the aim of improving production. After-sales services, which form anessential component of our sales policy, are generally provided according to geographic area and producttype. We use a broad network of outside authorized assistance centers to provide after-sales services. Inforeign markets, these assistance centers are managed directly by our local branch oÇces or distributors(which in certain cases also provide the services). We devote special attention to training staÅ members atour assistance centers, branch oÇces and distributors by oÅering specialized courses on a regular basis andby publishing and disseminating relevant technical documentation, which is accessible through ourcomputer information network.
We also manage the distribution of spare parts and technical documentation in connection withproducts marketed and sold to professional installers. In addition, we oÅer training courses for theseinstallers and provide for assistance call-center personnel to answer technical and other questions.
With regard to products marketed and sold by Climaveneta, we have created a separate service forafter-sales assistance in order to address the more critical and complex issues related to its products. Thisservice includes systems for automatically recording and diagnosing problems and may be used remotely.As a result, it is often capable of quickly providing expert maintenance calls in response to technical andother questions.
Kenwood also provides a centralized after-sales service for products marketed and sold under each ofthe Kenwood and Ariete brand names.
Information Systems
Our subsidiary, E-Services S.r.l., is responsible for managing our information systems and those of ourprincipal subsidiaries. In 1996, we began a process to adopt the SAP (""Systems, Applications,Procedures'') management software system as a single information system to be used by all Groupmembers and intended to provide rapid, homogenous and integrated information. The SAP systemintegrates the management of the principal aspects of our production and sales activities, includinglogistics, inventory, warehousing, orders and sales as well as the transportation of raw materials, semi-Ñnished goods and Ñnished goods between our subsidiaries and our distribution network. Information
86
Brought to you by Global Reports

processed using the SAP system also provides the basis for our internal accounting management andcontrol system. As of the date of this oÅering memorandum, the SAP system has been adopted byDe' Longhi, Simac-Vetrella, DL Radiators, Radel, Elba, De' Longhi America Inc., De' Longhi Nederlandand De' Longhi Deutschland GmbH. As a result of the expertise and know-how gained in connection withadopting the SAP system to the various Group members, E-Services has been certiÑed to develop andimplement application software in a SAP environment.
We plan to extend and integrate our information system to the other members of our Group,including those companies acquired as part of the Kenwood acquisition (which currently use onemanagement information system for purchasing, production and warehousing and a diÅerent managementinformation system for sales). We also plan to more fully utilize options oÅered by the SAP systemarchitecture with the aim of eÇciently integrating our suppliers and other partners that are outside theconsolidated Group. We believe that the process of integrating the information technologies systems of allour consolidated subsidiaries using SAP software will be completed by 2003.
Promotional and Advertising Policies
We believe that our promotional and advertising policies are essential to our success and development.On a pro forma basis (including Kenwood), we invested Lit. 87.9 billion, Lit. 96.8 billion and Lit. 104.1billion in promotional and advertising campaigns for the years ended December 31, 1998, 1999 and 2000,respectively. Kenwood invested Lit. 27.4 billion, Lit. 27.5 billion and Lit. 28.2 billion in promotional andadvertising campaigns during the same periods.
We focus our promotional and advertising campaigns on speciÑc features of selected appliances thatare marketed in the higher price range, and we seek to emphasize attractive qualities and beneÑts derivingfrom the use of such products. As part of this strategy, we assign product names that describe the speciÑcneeds served and functions performed by our products, thereby creating an immediate association byconsumers between our products and the beneÑts of using them. Thus, we market, among other products,the Sfornatutto (or ""bake everything'') multi-function oven, the Friggimeglio (or ""fry better'') rotatingdeep fryer, the Tasciugo (or ""I'll dry you'') dehumidiÑer, and the Caldobagno (or ""hot bathroom'') fanheater. We believe that the success of this approach is conÑrmed by the propensity for such names to beused synonymously for similar products in entire market segments and has allowed us both to maximizesales of products used in our promotional campaigns and to leverage their brand recognition in order tosuccessfully oÅer a wide variety of other appliances.
As a general matter, our advertising campaigns and press releases are conducted on three levels. First,we use various media channels, especially television, to promote our products and to reach the massconsumer public. Second, we engage in cooperative advertising, which consists of advertising andpromotional activities managed directly by our customers (and supervised by us), who receive credit fromus for their investment in such activities. These activities include the use of Öiers, mailings, presscampaigns and, to a lesser extent, television campaigns. Third, we engage in promotional andmerchandising activities, including participation in trade fairs and other initiatives, such as participation incatalogs and speciÑc events (or ""demonstrations'') organized at points of sale.
Kenwood has historically conducted its advertising activities principally in Italy, where it operatesthrough its subsidiary, Ariete S.p.A. We believe that sales of Kenwood products can be substantiallyincreased by the increased use of promotional and advertising activities.
Our Suppliers
We generally purchase our raw materials, components and Ñnished goods from a variety of suppliers.Although we give preference to a select group of suppliers with which we have established strongrelationships over time, we are not dependent on any single foreign source for such materials. On a proforma basis (excluding Kenwood) for the year ended 2000, our top three and the top ten suppliers of rawmaterials represented 6.3% and 10.4%, respectively, of our pro forma purchases. Similarly, our top threeand top ten suppliers of component parts represented 6.2% and 13.1%, respectively, of our pro formapurchases for the same period. With respect to Ñnished goods, our top three and top ten suppliers ofÑnished goods represented 2.9% and 5.3%, respectively, of our pro forma purchases in 2000. In addition, inorder to mitigate risks associated with price volatility, we typically enter into quarterly or six-monthforward supply agreements at Ñxed prices for certain materials. As a result, prices for our raw materials aresubject, in part, to exchange rate Öuctuations. You should refer to ""Risk Factors Ì Risks Relating to theCompany and the Group Ì We are exposed to foreign exchange rate Öuctuations.''
87
Brought to you by Global Reports

In February 1999, Kenwood concluded an agreement pursuant to which it agreed to purchase, from aprimary Chinese supplier, speciÑc products (including fryers, coÅee makers, food processors and kettles) inan amount equal to HK$600 million (or approximately Lit. 165,000 million), subject to minimumpurchases equal to HK$150 million (approximately Lit. 41,000 million) per year. The contract will expirein 2004.
Raw Materials
The principal raw materials that we use in our production include cold steel laminates and plasticmaterials (especially Acrylonitrile Butadiene Styrene or ""ABS''). We purchase the raw materials for allproducts manufactured in our in-house facilities. Third-party manufacturers purchase raw materialsindependently, though we require that such materials be purchased only from authorized suppliers. Asmentioned above, we generally purchase our raw materials from a variety of suppliers, and we are notdependent on any single foreign source for such materials. You should refer to ""Ì Our Suppliers''. Theprincipal raw materials we use are described below:
‚ Steel. We use steel in the production of our heating products (including our radiators), and airconditioning units (including our Ñxed-wall units). We purchase steel mainly in Italy, Austria,Germany and France.
‚ ABS. We use ABS in the production of our cooking and food preparation products; our ironingand cleaning products (including vacuum cleaners); and our air conditioning products (includingportable and Ñxed-wall air conditioners). We purchase ABS mainly in Germany and Italy.
Prices for our raw materials may Öuctuate as a result of changes, sometimes signiÑcant, in the short-and medium-term prices due to availability of the product in the market. In order to mitigate risksassociated with price volatility, we typically enter into three- or six-month forward supply agreements atÑxed prices for certain materials. Prices for our raw materials are subject, in part, to exchange rateÖuctuations. You should refer to ""Management's Discussion and Analysis of Financial Condition andResults of Operations Ì Exchange Rate and Interest Rate Risk Policies'' and ""Risk Factors Ì RisksRelating to the Company and the Group Ì We are exposed to foreign exchange rate Öuctuations.''
The table below shows the average purchase prices for steel and ABS for the periods indicated. Webelieve that these prices are representative of the trends in purchase prices for our principal raw materials.
Year ended December 31,
1998 1999 2000
(Lit./Kg)
Steel ÏÏÏÏÏÏÏÏÏÏÏÏÏÏÏÏÏÏÏÏÏÏÏÏÏÏÏÏÏÏÏÏÏÏÏÏÏÏÏÏÏÏÏÏÏÏÏÏÏÏÏÏÏÏÏÏÏÏÏÏÏÏÏ 820 650 830
ABS ÏÏÏÏÏÏÏÏÏÏÏÏÏÏÏÏÏÏÏÏÏÏÏÏÏÏÏÏÏÏÏÏÏÏÏÏÏÏÏÏÏÏÏÏÏÏÏÏÏÏÏÏÏÏÏÏÏÏÏÏÏÏÏ 3,500 2,870 2,860
Regulatory Environment
We are subject to laws generally applicable to commercial and manufacturing enterprises in Italy andthe other countries in which we operate. We do not believe that any particular laws have a material impacton our operations.
Most federal, state, provincial and local authorities in Europe, the United States and other foreignjurisdictions in which we operate require us to comply with consumer safety standards and speciÑcations(and, in most instances, to obtain applicable certiÑcation) prior to marketing electrical appliances in thosejurisdictions where we sell such products. Although we believe that we have complied with all suchrequirements, we cannot assure you that all of our products meet such standards and speciÑcations (youshould refer to ""Risk Factors''). We are also subject to a number of domestic governmental regulations incountries in which we have our manufacturing facilities (including Italy, the United Kingdom and China)relating to the use and storage of materials, discharge and disposal of factory wastes, safety standards offacilities and processes and labor protection.
Quality control. In EU countries, we mark our products with the letters ""EC'' in order to certifythat the products conform to, and comply with, all applicable European directives. In addition toperforming regular inspections at our laboratories to ensure compliance with regulatory standards, we alsocollaborate and consult with certain quality control institutions, including IMQ (Istituto Marchio diQualit fia or the Quality Brand Institute), AFNOR (Association Fran•caise de Normalisation or the FrenchStandards Association), LCIE (Laboratoire Central des Industries Electriques or the Central Electrical
88
Brought to you by Global Reports

Industries Laboratory), VDE (Verband Der Elektrotechnik or the Electro-technical Institute), TUVRheinland Product Safety, and BSI (the British Standards Institute).
In non-EU countries, we obtain requisite approvals for our products by requesting quality certiÑcationfrom various third party domestic institutes, including Underwriters Laboratories Inc. (for the U.S.market), the Canadian Standard Association (for the Canadian market), GOST (for the Russian market),the Chief Electrical Inspectorate (for the Australian market) and TUV Rheinland Argentina S.A. (for theSouth American markets).
Safety standards. We have arranged for our products to comply with the Directive of the EuropeanParliament regarding the standardization of the legislation of the member countries regarding pressureequipment. As of the date of this oÅering memorandum, the regulations implementing the directive havenot yet been issued in Italy.
Environmental matters. We believe that our activities comply with applicable regulations, and wehave invested signiÑcant resources towards R&D activities to promote applied research for technologieswith reduced environmental impact. As part of this strategy, we are already capable of ensuring that ourproduction processes comply with the requirements of the 1997 Kyoto Protocol which, when applied,would require industrialized countries to reduce their emissions of certain polluting gases. In thealternative, we have the technical capability to produce products using natural gases, which are generallyconsidered to be an excellent substitute (instead of commonly-used synthetic gases) and reduce the so-called ""greenhouse eÅect''.
Competition
We face competition from other manufacturers and distributors in all of the markets in which weoperate. We believe that we are subject to a broad, diversiÑed competitive environment in which it isdiÇcult to identify comparable companies as a result of the large array of market segments and geographicareas in which we operate. Certain of our businesses are highly competitive and, in recent years, some ofthe markets in which we operate (including Italy) have been characterized by signiÑcant consolidationamong product manufacturers resulting in larger and more competitive companies. We compete with anumber of companies which have greater Ñnancial, technical and marketing resources than we do. Wecannot assure you that we will be able to continue to compete successfully in the various markets in whichwe operate or that our competitors will not devote substantial resources to the development of newproducts that will compete eÅectively with ours. We believe that our principal competitors include:
‚ for our heating products: Sanyo, Argo Clima, Glen Dimplex and Philips;
‚ for our air conditioning products: Aermec, Sanyo Argo Clima, Bosch und Siemens, Carrier,Electrolux, Mitsubishi and Philips;
‚ for our cooking and food preparation products: Braun, Bosch und Siemens, Electrolux, MorphyRichards, Maytag, Moulinex, Saeco, SEB, Philips and Whirlpool; and
‚ for our cleaning and ironing products: Bosch und Siemens, Candy, Miele, Moulinex, Philips, Poltiand SEB.
89
Brought to you by Global Reports

Intellectual Property
Trademarks
We have registered two general kinds of trademarks. These include trademarks that are (i) associatedwith our market segments and lines of business and (ii) applied to our product groups. As of March 31,2001, we registered approximately 650 trademarks relating to the Group.
Our principal trademarks
As at March 31, 2001, the principal registered trademarks that we owned were the De' Longhi,Ariagel, Ariete, Climaveneta, Elba, Kenwood, La Supercalor, Radel, Simac and Vetrella. The followingtable illustrates our principal trademarks and the form of the trademark, in each case as of the date of thisoÅering memorandum:
Trademark Type
De' Longhi Image
Ariagel Image
Ariete Image
Climaveneta Image and in all characters
Elba With special handwriting
Kenwood Image
La Supercalor Image and with special handwriting
Radel With special handwriting and in all characters
Simac Image
Vetrella Image and name
Pursuant to a Worldwide Agreement dated December 1, 1986, as amended, Kenwood agreed withKabushiki Kaisha Kenwood, an unaÇliated Japanese company specializing in stereo and sound systems, todeÑne and regulate the ""Kenwood'' trademark. In particular, Kenwood agreed not to assert any rightsagainst Kabushiki anywhere in the world for use of the trademark in relation to sale of a speciÑed list ofdeÑned goods, including hi-Ñ, television, satellite receivers, computers and telephones. The WorldwideAgreement is governed under English law and has an initial term ending on December 1, 2007, subject toautomatic renewal unless otherwise terminated by at least three months' prior written notice. Kenwood andKabushiki also entered into an exclusive license agreement governing the use of the trademark in theUnited Kingdom. For each 10-year renewal period, Kabushiki agreed to pay a fee to Kenwood equal to 3%of sales in the United Kingom relating to the speciÑed list of deÑned goods. Kabushiki has the right toterminate the license agreement in the event of a change of control in Kenwood's share capital. OnApril 5, 2001, Kenwood notiÑed Kabushiki of our acquisition of Kenwood. As of the date of this oÅeringmemorandum, Kabushiki has not exercised its right to terminate the license agreement. As a result of theabove, we have certain limits on the use of the ""Kenwood'' brand name, although only in the stereo andsound systems sector. In particular, we are not allowed to sell or market the Kenwood products in Japanunder the Kenwood brand name without the prior consent of Kabushiki. You should also refer to ""RiskFactors Ì Risks Relating to the Company and the Group Ì We rely on the commercial success of ourtrademarks'' and ""Ì We are limited in the use of the Kenwood trademark''.
As a result of certain claims initiated by Calor S.A. (a French company active in the food preparationbusiness) to the eÅect that our La Supercalor trademark could be confused with its existing Calortrademark, we may not use the La Supercalor trademark in France or Portugal.
Other trademarks associated with our product groups
In addition to the above trademarks, we also own certain other registered trademarks which areapplied to product groups. The following table illustrates, as of March 31, 2001, our principal trademarks
90
Brought to you by Global Reports

associated with our product groups and the form of the trademark, in each case as of the date of thisoÅering memorandum:
Trademark Type
Alfredo All characters and with special handwriting
Ariadry With special handwriting
Bravosimac Name
Caldobagno With special handwriting
Caldobagno Swing With special handwriting
Caldosvelto With special handwriting
Classe A Image
Colombina With special handwriting
Dragon De' Longhi Image
Friggimeglio Image
Gratfi Image
IFD Instant Froth Dispenser Image
Il Bravosimac Name
Il Gelataio Name and Image
Passfi Image
Pastamatic/Pasta-matic Name
Pinguino Image and name
Rapido De' Longhi Image
Roto-fryer Image and in all characters
Sfornatutto Image
Stirella Image
Stiromeglio In all characters
Super Clima In all characters
Tasciugo Image
Vaporfi Image
Patents
We cover our inventions, where appropriate, by patent applications in our relevant markets. As part ofour policy to protect and to defend our inventions and related industrial designs of our products, we haveÑled approximately 200 patents (including those Ñled by Kenwood) for inventions, models and industrialdesigns related to our manufacturing production and design processes. The table below illustrates andbrieÖy describes the principal patents relating to inventions that we have Ñled with the relevant patentoÇces:
Application Description
Radiator Oil-Ñlled electric radiator speciÑcally for room heating
Radiator Electric radiator speciÑcally for room heating
Radiator Free-standing portable electric radiator and manufacturingprocedure for same
Air conditioner Easy to install wall air conditioner
Air conditioner Appliance for the production of hot or cold water or airusing coolant Öuid
Air conditioner Combined air conditioner and puriÑed water maker andprocedure for operation of said equipment
Air conditioner Air conditioning appliance and procedure using coolantÖuid without noxious eÅects (at least to the ozone layer)
91
Brought to you by Global Reports

Application Description
DehumidiÑer Appliance for removal of moisture, particularly from linens
DehumidiÑer Appliance for air dehumidiÑcation
Fryer Deep fryer with revolving basket at a special angle forcyclical immersion frying
Fryer Appliance for frying food products (cooking oil drain tube)
Fryer Appliance for frying food products (cooking oil savingsystem)
Fryer Nova fryer (folding handle)
Fryer Swallow deep fryer
Fryer Nova fryer (watertight heater)
Fryer Device for moving basket of a fryer
Top oven Free-standing electric top oven for domestic use, withcooking compartment directly controlled by thermostat
Top oven Multifunction oven for the cooking of foods
Oven Microwave oven with voice commands and automaticprocedure for the cooking of food products made with thisoven
CoÅee maker Espresso coÅee machines speciÑcally for domestic use
CoÅee maker Valve device for automatic priming of a pump speciÑcallyfor machines for making a coÅee infusion
CoÅee maker Brazil aroma selector
CoÅee maker Brazil anti-drip valve
CoÅee maker Device and procedure for producing foam on a milk-basedbeverage
Vacuum cleaner Vacuum cleaning machine
Electric sweeper and vacuum cleaner Suction nozzle for vacuum cleaning equipment
Vacuum cleaners Separator group for wet vacuum cleaning machines
Steam cleaner Steam cleaning machines
Irons Push-button steam control in the iron with separate boiler
Food mill Electric-motor food mill
Dough mixer Machine for processing pasta
Dough mixer Prag food processor interlock
Ice cream machine Appliance for making ice cream and similar chilledproducts, with removable freezing container
Grater Tool for grating cheese and similar items
We have also Ñled numerous industrial designs with applicable authorities in Italy and internationally.The principal designs which we have registered include:
‚ the ""multiple patent for seven models comprising air conditioning equipment'' in France,Germany, Great Britain, the United States, Israel, Hong Kong, China, Brazil and Italy;
‚ the ""air conditioning appliance with the upper portion of its body in a rounded shape'' (applied tothe new Pinguino one-piece air conditioner) in Italy, Great Britain, and the United States; and,
‚ the ""air dehumidiÑer appliance'' in Italy, Great Britain and Spain.
Policy for protecting intellectual property
Over the years, we have maintained a policing program to protect our trademarks, patents and designsand have taken legal action where appropriate to prevent others from registering or using marks andproducts which are considered to create confusion with us, our trademarks or our products.
92
Brought to you by Global Reports

As part of our policy, prior to manufacturing or marketing our products, we conduct various databasesearches and we review various market surveys to ascertain whether similar third-party trademarks orinventions (including those not patented) exist which could conÖict with ours. Once we have taken theseprecautionary measures, we then Ñle applications to register our trademarks, patents and industrial designs.We generally register our trademarks, patents and industrial designs in both the countries where wemanufacture or market the product as well as those countries where there is a particularly strong incidenceof counterfeiting (with the aim of inhibiting the marketing and manufacture of counterfeit products). Oncethe registrations are obtained, we conduct internal checks to ensure that the trademarks and patents areused in accordance with the respective Ñlings. We also conduct external checks and, if necessary, issuewarnings regarding any improper use or violation of our intellectual property rights.
Properties
Owned Properties
Our headquarters are located at Via L. Seitz, 47, 31100 Treviso, Italy. The following table sets forththe principal real estate we own as of the date of this oÅering memorandum.
Location Purpose Size(1)
Cazzago di Pianiga (Venice), via Stazione 26 Industrial, warehouse andoÇce use 4
Gorgo al Monticano (Treviso), via Serenissima, 32(2) Industrial, warehouse andoÇce use 4
Fossalta di Piave (Venice), via delle Industrie, 2 Industrial, warehouse andoÇce use 4
Candiolo (Turin), via Simonis, 8 Warehouse use 4
Wellingborougth Ì Northants (Great Britain), unit 8-9, Warehouse and oÇce use 4Bridle Close (Stewarts Rd Business Park)
Wellingborougth Ì Northants (Great Britain), unit 7, Warehouse use 3Bridle Close (Stewarts Rd Business Park)
Borso del Grappa (Treviso), via Fabbian Matteo, 7 Industrial, warehouse andoÇce use 4
Treviso, via L. Seitz, 47 Industrial, warehouse andoÇce use 4
Mignagola di Carbonera (Treviso), via Duca D'Aosta, 121 Industrial, warehouse andoÇce use 4
Moimacco (Udine), Strada Statale 54, 21 Industrial, warehouse andoÇce use 4
Pieve d'Alpago (Belluno) via dell'Industria, 13 Industrial, warehouse andoÇce use 4
Bassano del Grappa (Vicenza), via Sarson, 57/C(2) Industrial, warehouse andoÇce use 4
(1) The area (in square meters) of the property is classiÑed as follows: 1 • up to 100 square meters; 2 • from 101 to 200 square
meters; 3 • from 201 to 400 square meters; and 4 • more than 400 square meters.
(2) Real estate that is partly owned by the Group and partly rented.
Leased Properties
The following table sets forth the properties which we leased as of the date of this oÅeringmemorandum.
Location Purpose Size(1) Lease Expiry Date
Candiolo (Turin), via Simonis 8 Industrial, warehouse and 4 December 2006oÇce use
Prato, Loc. Macrolotto, via Toscana 57 A/B OÇce and industrial use 4 December 2006
Settimello di Calenzano (Florence), via Warehouse use 4 August 2005Baldanzese, 198
93
Brought to you by Global Reports

Location Purpose Size(1) Lease Expiry Date
Madrid (Spain), Calle Fernando Diaz de OÇce use 1 June 2002Mendoza 48
Norderstedt (Germany), Oststr. 122 Haus B, OÇce use 3 February 2002II, OG D-22844
Norderstedt (Germany), Oststr. 122 Haus B, Warehouse use 1 February 2002II, OG D-22844
Bassano del Grappa (Vicenza), via Sarson, 57 Industrial use(2) 4 June 2002
Mississauga (Ontario L4W3Y4, Canada), Warehouse and oÇce use 4 October 2002Ronsa Court n. 1040
Asnieres (France), Rue de Fr fieres Chaussons OÇce use 4 January 2010
Tokyo 101-0044 (Japan), Kajicho Chiyoda-ku, OÇce use 3 February andn. 1-5-6 December 2003(6)
Tokyo (Japan), Kajicho Chiyoda-Ku, OÇce use 2 March 2003n. 1-6-15
Osaka (Japan), Bingomachi Chou-Ku, OÇce use 2 February 2003n. 3-3-15
Tokyo (Japan), Kitashinagawa Shinagawa-Ku Warehouse use 3 June 2002n. 1-3-9
Tokyo (Japan), Yokoi Building 1F, 1-10-1 Restaurant 1 July 2002Kajicho Chiyoda-Ku
Osaka (Japan), Minamikaneden Suita City, Warehouse use 3 May 2002n. 2-21-25
Kenauweg (Netherlands), 25, 2331 BA OÇce use 4 March 2006Leiden 2303 DB
Mainhausen (Germany), Dieselstrasse 21 Warehouse and oÇce use 4 December 2003
Saddle Brook (New Jersey. U.S.A.), Park 80 OÇce use 4 December 2006West, Plaza 1
Martinez (California 94533, U.S.A.), 4589 Warehouse use 4 November 2004Pacheco Boulevard
Wayne (New Jersey, U.S.A.), 82 Totowa Warehouse use 4 December 2006Road
Clifton (New Jersey, U.S.A.), 101 Kuller Warehouse use 4 December 2006Road
Shanghai (China), Unit B, 21st Öoor, OÇce use 2 October 2001Shanghai Industrial Investment Building,18 Cao Xi Bei Road
Borso del Grappa (Treviso), via Vallina Warehouse use 4 September 2001Orticella, 22
Borso del Grappa (Treviso), via Fabbian Warehouse use(5) 4 January 2004Matteo 7
Treviso, via Castellana 17 Warehouse use 4 June 2003
Ampezzo, via G. Ellero, 23 Industrial use 4 March 2006
Spercenigo di S. Biagio di Callalta, Via Warehouse use 4 March 2003Matteoti 1 (Treviso)
Francavilla al Mare, via Nazionale Adriatica Guest quarters 1 February 2002Nord, 120
Treviso, via Da Milano Parking 4 March 2004
Bari, via Kennedy, 89 OÇce use 1 April 2002
Treviso, via Santa Caterina, 37 Guest quarters 1 February 2002
Treviso, Rivale Castelvecchio n.1 Residential use 1 April 2005
Treviso, via don Lorenzo Milani, 10 Residential use 1 August 2003
Treviso, via don Lorenzo Milani, 10 Garage 1 August 2001
Treviso, SS Postumia 41/B Warehouse use 4 December 2001
Campagnano (Rome), via della Celsetta 6 OÇce use 1 March 2007
94
Brought to you by Global Reports

Location Purpose Size(1) Lease Expiry Date
Warsaw (Poland), Dzierzoniowska Street n. 4 OÇce use 2 None(3)
Borso del Grappa (Treviso), via Vallina Warehouse use 4 March 2002Orticella, 22
Pieve d'Alpago (Belluno), viale del Lavoro, 32 Industrial, warehouse and 4 May 2009oÇce use
Treviso, Via Seitz 47 OÇce use(5) 4 December 2001
Havant (Hampshire, U.K.), New Lane Industrial, warehouse and 4 June 2016oÇce use
Hilsea Portsmouth (Hampshire, U.K.), Warehouse use 4 January 2009Limberline Road
Singapore 388574, 61 Lorong 17, # 05-02 Warehouse and oÇce use 3 December 2002Lam Leong Bld
46100 Petaling Jaya Selangor (Malaysia), Warehouse and oÇce use 3 December 2002Suite 1.2 Delteq Technoplex, 2A Jalan 243Section 51A
63263 Neu-Isenburg, (Germany), OÇce use 3 December 2001Dornhofstrasse 89
2355 Wiener-Neudorf (Austria), Warehouse and oÇce use 3 June 2004Industriezentrum NO-Sued Strasse 2a
Johannesburg 2093 (South Africa), 28 Warehouse and oÇce use 4 March 2002Blumberg Street Industria West
Cape Town (South Africa), Units 1&2, 39 OÇce use 4 February 2002Grey Street Paarden Eiland,
94150 Rungis, Paris (France), 13 rue du pont OÇce use 4 December 2001des Halles
Seregno (Milan), via Strauss 13-15 Warehouse and oÇce use 4 June 2003
Gorgo al Monticano (Treviso), via Industrial, warehouse and 4 December 2001(4)
Serenissima, 32 oÇce use (2)
Motta di Livenza (Treviso), via dei Rori, Warehouse use 4 February 2004Zona Industriale Nord
Qingxi Town (China), Industrial Zone 2(7) OÇce and industrial use 4 December 2042
Hong Kong, 16th Floor Tins Enterprises Warehouse and oÇce use 4 March 2004Center, 777 Lai Chi Kok Road, Kowloon
Vilvoorde (Belgium), Mechelsesteenweg 277 Showroom and oÇce use 1 May 2002
(1) The area (in square meters) of the property is classiÑed as follows: 1 • up to 100 square meters; 2 • from 101 to 200 square
meters; 3 • from 201 to 400 square meters; and 4 • more than 400 square meters.
(2) Real estate that is partly property of the Group and partly rented.
(3) Termination subject to 3 months' prior notice.
(4) Property leased pursuant to 3 leases expiring between December 2001 and December 2005.
(5) Property rented by another member of the consolidated group.
(6) DiÅerent expiry date for each Öoor leased.
(7) Leased pursuant to an agreement approved by Dongguan Municipal State Land Administration Bureau, which may be
renewable for a term of 20 years subject to the approval of such Bureau and the payment of an appropriate lease premium.
95
Brought to you by Global Reports

Manufacturing Facilities
The following table sets forth our primary manufacturing facilities as of the date of this oÅeringmemorandum.
Location Purpose Size(1) Leased/Owned Utilization(2)
Treviso, via L. Seitz, 47 Mobile heating/air 4 Owned 80%conditioning/dehumidiÑers
Mignagola di Carbonera (Treviso), Fixed and mobile air 4 Owned 72%via Duca D'Aosta, 121 conditioning/cooking/food
preparation/dehumidiÑers
Borso del Grappa (Treviso), via Ranges/cooktops/heating 4 Owned 85%Fabbian Matteo, 7
Gorgo al Monticano(3)(4) (Treviso), Heating/food preparation/ 4 Owned 80%via Serenissima, 32 house cleaning and ironing
Moimacco (Udine), Strade Fixed heating 4 Owned 70%Statale 54, 21
Pieve d'Alpago (Belluno), via Large facility air conditioning 4 Owned 85%dell'Industria 13(4)
Bassano del Grappa(3), (Vicenza), Large facility air conditioning 4 Owned 85%via Sarson 57 C
Qingxi Town, Industrial Zone 2 Food preparation 4 Leased 60%(China)(5)
Ampezzo (Udine), via G. Ellero, 23 Cooking/food 4 Leased 62%preparation/heating
Gorgo al Monticano (Treviso), via Heating/food preparation/ 4 Leased 80%Serenissima, 32(3)(4) house cleaning and ironing
Bassano del Grappa (Vicenza), via Large facility air conditioning 3 Leased 85%Sarson, 57 C(3) systems
Prato, Loc. Macrolotto Air conditioning/food 4 Leased 65%preparation/housecleaning/ironing
Pieve d'Alpago (Belluno), viale Semi Ñnished products 1 Leased 55%del Lavoro, 32 (Ergoklima)(4)
Pieve d'Alpago (Belluno), viale Component parts for large 1 Leased 55%del Lavoro, 32 (Micromax)(4) facility air conditioning
Candiolo (Turin), via Simonis, 8(4) Fixed and mobile air 3 Leased 82%conditioners/dehumidiÑers
Havant New Lane, Havant, Water Ñlters/food preparation 4 Leased 88%Hampshire
(1) The area (in square meters) of the property is classiÑed as follows: 1 • up to 3,000 square meters; 2 • from 3,001 to 5,000
square meters; 3 • from 5,001 to 8,000 square meters; and 4 • over 8,000 square meters.
(2) Refers to the estimated average rate of use as compared to productive capacity of each manufacturing facility for the three
month period ending June 30, 2001. These estimates have been calculated, for each manufacturing facility, on the basis of
(i) the product or products currently manufactured at such location, (ii) the number of work shifts conducted per day,
(iii) the number of employees and (iv) the degree of outsourcing of manufactured or semi-manufactured products or parts.
You should note that the above estimates are subject to variation resulting from, among other things, changes in market
demand for our products; increases in our work force or in the number of shifts per day conducted at the facility; expansion
and modernization plans; and modiÑcations with respect to the kinds of products manufactured for each facility.
(3) Real estate that is partly owned by the Group and partly leased.
(4) Facility that is Ñnance leased.
(5) Leased pursuant to an agreement approved by Dongguan Municipal State Land Administration Bureau in China, which may be
renewable for a term of 20 years subject to the approval of such Bureau and the payment of an appropriate lease premium.
96
Brought to you by Global Reports

Employees
The following table shows the number of our employees and those of our recent Kenwood acquisitionfor the periods indicated, divided by principal categories of personnel:
Year ended December 31,
1998 1999 2000
De' Longhi:
Executives ÏÏÏÏÏÏÏÏÏÏÏÏÏÏÏÏÏÏÏÏÏÏÏÏÏÏÏÏÏÏÏÏÏÏÏÏÏÏÏÏÏÏÏÏÏÏÏÏÏÏÏÏÏÏÏÏÏÏ 45 43 56
Employees ÏÏÏÏÏÏÏÏÏÏÏÏÏÏÏÏÏÏÏÏÏÏÏÏÏÏÏÏÏÏÏÏÏÏÏÏÏÏÏÏÏÏÏÏÏÏÏÏÏÏÏÏÏÏÏÏÏÏ 942 982 1,057
Production workers ÏÏÏÏÏÏÏÏÏÏÏÏÏÏÏÏÏÏÏÏÏÏÏÏÏÏÏÏÏÏÏÏÏÏÏÏÏÏÏÏÏÏÏÏÏÏÏÏÏÏÏ 2,480 2,586 2,747
TotalÏÏÏÏÏÏÏÏÏÏÏÏÏÏÏÏÏÏÏÏÏÏÏÏÏÏÏÏÏÏÏÏÏÏÏÏÏÏÏÏÏÏÏÏÏÏÏÏÏÏÏÏÏÏÏÏÏÏÏÏÏ 3,467 3,611 3,860
Kenwood:
Executives ÏÏÏÏÏÏÏÏÏÏÏÏÏÏÏÏÏÏÏÏÏÏÏÏÏÏÏÏÏÏÏÏÏÏÏÏÏÏÏÏÏÏÏÏÏÏÏÏÏÏÏÏÏÏÏÏÏÏ 18 16 15
Employees ÏÏÏÏÏÏÏÏÏÏÏÏÏÏÏÏÏÏÏÏÏÏÏÏÏÏÏÏÏÏÏÏÏÏÏÏÏÏÏÏÏÏÏÏÏÏÏÏÏÏÏÏÏÏÏÏÏÏ 615 565 515
Production workers ÏÏÏÏÏÏÏÏÏÏÏÏÏÏÏÏÏÏÏÏÏÏÏÏÏÏÏÏÏÏÏÏÏÏÏÏÏÏÏÏÏÏÏÏÏÏÏÏÏÏÏ 1,395 1,257 799
TotalÏÏÏÏÏÏÏÏÏÏÏÏÏÏÏÏÏÏÏÏÏÏÏÏÏÏÏÏÏÏÏÏÏÏÏÏÏÏÏÏÏÏÏÏÏÏÏÏÏÏÏÏÏÏÏÏÏÏÏÏÏ 2,028 1,838 1,329
Total GroupÏÏÏÏÏÏÏÏÏÏÏÏÏÏÏÏÏÏÏÏÏÏÏÏÏÏÏÏÏÏÏÏÏÏÏÏÏÏÏÏÏÏÏÏÏÏÏÏÏÏÏÏÏÏÏ 5,495 5,449 5,189
The relations with our employees in Italy are subject to national collective bargaining agreementsapplicable to the metals and machinery industry, covering approximately 3,676 employees at year end2000. In June, 1999, we renewed our Italian collective bargaining agreement for the metals and machineryindustry that is scheduled to expire in December, 2002. However, we may in the future be subject tostrikes and work stoppages in connection with the negotiation of company-speciÑc or national laborcontracts.
Our subsidiary, Radel S.p.A., resorted to temporary unemployment compensation in 1999 and 2000,for two days a week for Ñve weeks, involving a maximum number of 235 employees. Simac-Vetrella S.p.A.also resorted to temporary unemployment compensation for one day on June 11, 1999 involving a total of79 workers.
Other than as mentioned above, the Group has not experienced any strike that signiÑcantly inÖuencedproduction activity.
Since 1998, Kenwood has been implementing a restructuring process aimed at, among other things,reducing its exposure to manufacturing operations in the United Kingdom. As a result of this process,Kenwood reduced the number of manufacturing employees in the U.K. (from 902 employees in 1998 to79 employees at March 31, 2001). You should also refer to ""The Kenwood Acquisition Ì History andCorporate Structure'' and ""Managements' Discussion and Analysis of Financial Condition and Results ofOperations Ì Restructuring Expansion and Other Capital Investments''.
Pursuant to a stock option plan approved by our Board of Directors on June 12, 2001, we may issueup to 7,500,000 stock options to certain of our employees and managers, subject to certain limitations,exercisable at a price equal to the purchase price of the shares pursuant to the Global OÅering. Inaccordance with the plan, 50% of the stock options will be exercisable as of January 1, 2004 and theremaining stock options may be exercised beginning January 1, 2005. Stefano Beraldo (our ManagingDirector and General Manager) and Fabio De' Longhi (Vice Chairman of the Board and our Commercialand Marketing Director) were granted and held, as of the date of this oÅering memorandum, options topurchase 1,665,000 shares in the aggregate at a price equal to the purchase price of the shares pursuant tothe Global OÅering. You should refer to ""Our Management''.
Research and Development Policies
We devote a signiÑcant amount of time and eÅort to R&D programs and activities. On a pro formabasis (excluding Kenwood), for the years ended December 1998, 1999 and 2000, we invested Lit. 51,645million, Lit. 55,109 million and Lit. 57,778 million, respectively, in R&D activities (including investmentsin our moulding machinery). In the aggregate, approximately 222 of our employees are involved inresearch and development activities. Moreover, our research and development programs are supported by
97
Brought to you by Global Reports

collaborative relationships with various Italian universities and with internationally recognized researchcenters. We believe that this provides us with the following two competitive advantages.
First, we believe that our focus and attention to R&D has resulted in increased eÇciencies andsynergies in our production cycle and in increased control over production costs through innovation of theproduction processes. We have been able, and continue to, apply the expertise and know-how developed aspart of our R&D activities (speciÑcally with respect to sheet metal molding, welding, plastic injectionmolding, painting and enameling, gas utilization, and electronics and electrotechnology) to design andbuild production facilities for our various businesses which are highly automated, modern and eÇcientfrom a cost perspective.
Second, we believe that our R&D eÅorts have allowed us to create innovative solutions andtechnologies that have resulted in the introduction of new and innovative products in the market. Theseinclude, for example:
‚ the Dragon De' Longhi, which was the Ñrst portable electric heater with relatively low externalsurface temperatures built by the Group;
‚ the Pinguino, our Ñrst portable air conditioner;
‚ the Friggimeglio, which was the Ñrst deep fryer with a rotating basket using less oil and promotinghealthier foods; and
‚ the Kenwood Chef, the leading Ñxed-stand mixer in the United Kingdom (Source: Gesellschaft f urKonsumforschung, 2001) and, in management's opinion, one of the leading Ñxed-stand mixers inScandinavia, France and South Africa.
In addition, we have successfully supported, and often anticipated, changes in client needs and in theapplicable regulatory framework.
Legal and Tax Proceedings
Legal Proceedings
We are involved from time to time in various claims and litigation incidental to the ordinary course ofour business, including proceedings relating to product liability (particularly in the United States), the useof our trademarks, employee relations and amounts owed to us by companies to whom we have suppliedmerchandise. You should also refer to ""Risk Factors Ì Risks Relating to the Company and the Group ÌWe face risks associated with product recalls and product liability claims''.
In 1993, two roof repairmen working for an unaÇliated company sustained serious injuries whileworking on our premises. One of the two repairman later died as a result of the injuries. InSeptember 1996, the estate of the repairman brought an action against us in a court in Venice, Italy,alleging that it was entitled to damages in the minimum amount of Lit. 724 million (plus interest). InDecember 1996, the repairman who survived the accident brought an action against us in a court inVenice, Italy, claiming damages in an amount of Lit. 2,100 million (plus interest). In addition, inJanuary 1998, Istituto Nazionale per l'Assicurazione contro gli Infortuni sul Lavoro (or ""INAIL''), theItalian national insurance agency, initiated a related action against us in the court in Venice allegingcompensation in an amount of Lit. 1,200 million (plus interest). We are presently awaiting a Ñnal decisionby the relevant court on this matter. We believe that the actions will not have a material adverse eÅect onour business or prospects, and we intend to vigorously defend our position.
In 1996, Societ fie Compagnie M fiediterran πeenne des Caf πes S.A, a former client of Micromax, broughtan action against us in a court in Treviso, Italy alleging, among other things, that it was entitled tocompensation for breach of a letter of intent entered into with De' Longhi S.p.A. after our acquisition ofMicromax and relating to the manufacturing and production of a line of coÅee machines. In thecomplaint, Societ fie Compagnie is claiming damages in the amount of 80 million French Francs, orapproximately Lit. 23,600 million, plus an additional Lit. 154 million, for our alleged failure to complywith the letter of intent. We submitted a reply to the claim in which we denied the merits of the claim.We are presently awaiting a Ñnal decision by the relevant court on this matter. We believe that the actionwill not have a material adverse eÅect on our business or prospects, and we intend to vigorously defend ourposition.
In 1998, a former employee of Ariete brought an action against us in a court in Prato, Italy alleging,among other things, that he was entitled to additional equitable compensation from Ariete as a result ofcertain products (including a vegetable puree machine and steam cleaner) which he claims to haveinvented and which beneÑted the company. In the complaint, the employee is claiming damages in theamount of Lit. 47,000 million for his contributions to the various inventions and as his fair share of past
98
Brought to you by Global Reports

revenues recorded by Ariete in connection with such products. We submitted a reply to the claim in whichwe denied the merits of the claim. The proceeding is currently pending. We believe that the action will nothave a material adverse eÅect on our business or prospects, and we intend to vigorously defend ourposition.
In 1998, we recalled certain ironing systems that were manufactured and sold by our group, as aresult of safety concerns relating to the products. Despite our recall, in October 1998, a repairmansustained injuries while attempting to Ñx the ironing system. In accordance with involuntary personalinjury law in Italy, an investigation was conducted in order to determine whether any criminal liability isassociated with the defective ironing systems. As of the date of this oÅering memorandum, there has beenno determination to proceed with a criminal proceeding and no legal claim for damages or compensationhas been formally Ñled in connection with the matter. We believe that the investigation will not have amaterial adverse eÅect on our business or prospects. Although we have recalled the defective products andhave taken additional steps to ensure that similar accidents do not occur, we cannot assure you that noneof these products is continuing to be used in a manner that could lead to further injuries.
In September 1998, SEB S.A. and Tefal S.p.A. (its Italian subsidiary) requested an interiminjunction to prohibit the manufacture, distribution and advertising of certain models of electric fryers inItaly. In March 2000, the court in Treviso granted the injunction. A similar request for an interiminjunction was subsequently Ñled in France in October 2000 and granted by the relevant court in Paris inJanuary 2001. As a result of the injunction granted in Italy, in April 2000, SEB initiated an action againstus in a court in Treviso alleging, among other things, that we infringed on their patent rights relating tocertain models of electric fryers and, therefore, it was entitled to compensation and damages. SEB alsoÑled similar claims against us in France in July 2000 and in the United Kingdom in November 2000. Inthe complaints, SEB is claiming provisional damages in the amount of Lit. 50,000 million in Italy andFrench Francs 1.5 million (or approximately Lit. 442.8 million) in France in connection with such allegedpatent violations. SEB has also brought a claim in Great Britain requesting damages for an unspeciÑedamount. In each case, we submitted a reply to the claim in which we denied the merits of the claim. InJune 2000, a court in Munich, Germany, ruled against SEB in a similar proceeding brought in Germanyagainst an unaÇliated third party for alleged patent violation, which is currently being appealed. Since theoriginal claim was Ñled against us, we have discontinued producing the model of fryers which was thebasis of SEB's claim. We are presently awaiting a Ñnal decision by the relevant court on this matter. Webelieve that these proceedings will not have a material adverse eÅect on our business or prospects, and weintend to vigorously defend our position.
In October 1998, the Italian Treasury (Ministero del Tesoro) imposed a Ñne of Lit. 1,344 million onElba S.p.A., one of our subsidiaries, for alleged sales of certain products in violation of an embargo againstthe Republics of Serbia and Montenegro under Italian law. In 2001, we commenced an action in theCourt of Treviso to appeal the Ñne. We are presently waiting to initiate proceedings by the relevant courton this matter. We believe that the action will not have a material adverse eÅect on our business orprospects, and we intend to vigorously defend our position.
In 2000, we Ñled a complaint against Electrolux France S.A., a distributor of cooking and foodpreparation products, in a court in Treviso, Italy alleging that Elba S.p.A. (our subsidiary) was entitled topayment from Electrolux for gas cookers and other products provided to it since 1998 pursuant to certaininvoices. Electrolux Ñled a counterclaim against us in a court in Treviso, Italy alleging, among otherthings, that it was entitled to compensation for our refusal to pay for recall expenses associated with thegas cookers which we had manufactured on behalf of Electrolux. The claim provides that the ovenssupplied to Electrolux (and subsequently sold to consumers in France) did not meet requirements ofrecently implemented French safety standards. As a result, the gas cookers were recalled three times. Weand our insurers agreed to pay a portion of expenses related to the initial recall only. In the complaint,Electrolux is claiming damages in the amount of approximately French Francs 6.3 million, orapproximately Lit. 1,900 million, for our failure to make the payments. We submitted a reply to the claimin which we denied the merits of the claim. We are presently awaiting the commencement of hearings bythe relevant court on this matter, which is expected on or about July 2001. We believe that the action willnot have a material adverse eÅect on our business or prospects, and we intend to vigorously defend ourposition.
In 2000, Family Line Marketing Ltd., an Israeli distributor of our products, brought an action againstus in a court in Tel Aviv, Israel, alleging termination without cause of a distribution agreement originallyconcluded with us in 1990 and granting to Family Line a long term exclusive right to distribute
99
Brought to you by Global Reports

De' Longhi products in Israel. The amount of the claim is NIS 10,000,000, or approximately Lit. 5,300million. We have Ñled a counterclaim against Family Line and its controlling shareholder. We arepresently awaiting a Ñnal decision by the relevant court on this matter. We believe that the action will nothave a material adverse eÅect on our business or prospects, and we intend to vigorously defend ourposition.
Over the last few years, several of our sales agents have brought independent actions against us inItaly alleging that they were entitled to post-termination indemnity payments under Italian law in additionto those already provided by us pursuant to the applicable collective bargaining agreement (accordoeconomico colletivo) in Italy. The sales agents that have initiated the actions are claiming additional post-termination compensation totaling approximately Lit. 2,200 million (plus interest) in the aggregate. Weare presently contesting the merit of each of these matters. In our opinion, these actions will not have amaterial adverse eÅect on our business or prospects, and we intend to vigorously defend our position.
We are presently contesting each of these matters and believe that we will ultimately prevail.However, the outcome of any litigation is inherently uncertain and we cannot assure you of our success.An adverse determination could aÅect our rights and could have a material adverse eÅect on our business,our consolidated Ñnancial position or our results of operations.
Tax Investigations
We are involved from time to time in various tax claims and proceedings incidental to the ordinarycourse of our business, including proceedings relating to the payment of VAT (""value added taxes''). Wedo not believe that the outcome of any such pending claims or proceedings is likely to have a materialadverse eÅect on our consolidated Ñnancial position or results of operations.
The German tax authority is currently pursuing a tax claim regarding certain tax losses totalingDeutsch Marks 10.7 million (or approximately Lit. 10,600 million) recorded by our subsidiary, De' LonghiDeutschland GmbH, since 1995. We are presently awaiting the Ñnal order from the German tax authorityin connection with this investigation. We believe that the proceeding will not have a material adverseeÅect on our business or prospects, and we intend to vigorously defend our position.
The United States Internal Revenue Service is currently investigating a tax claim regarding thealleged non-recognition of tax losses in previous years totaling U.S.$2,738,964 (or approximately Lit. 6,035million) between 1996 and 1999. We submitted a reply to the tax authorities relating to the claim. We arepresently awaiting for a Ñnal decision from the relevant U.S. tax authorities in connection with thisinvestigation. We believe that the proceeding will not have a material adverse eÅect on our business orprospects, and we intend to vigorously defend our position.
The Italian Finance Authority (Guardia di Finanza) is currently investigating a tax claim regardingwrite-oÅs recorded by us and relating to our shareholding in Immobiliare Findomestic S.p.A. from 1995 to1998. We submitted a reply to the tax authorities denying the merits of the claim. The maximum amountof taxes to be paid in connection with the write-oÅs would be approximately Lit. 2,870 million, in additionto interest and penalties required under Italian law. We are presently awaiting a determination from theItalian Finance Authority of whether it will proceed further with this investigation. We believe that theproceeding will not have a material adverse eÅect on our business or prospects, and we intend to vigorouslydefend our position.
Similarly, the Italian Finance Authority is currently investigating a tax claim regarding certain write-oÅs recorded by our subsidiary, Elba S.p.A., relating to its shareholding in Immobiliare Findomestic S.p.A.from 1996 to 1998. The maximum amount of taxes to be paid in connection with the write-oÅs would beapproximately Lit. 2,795 million, in addition to interest and penalties required under Italian law. We arepresently awaiting the Ñnal order from the Italian Finance Authority in connection with this investigation.We believe that the proceeding will not have a material adverse eÅect on our business or prospects.
In May 2001, the Venetian division of the Italian Customs Authority (Agenzia delle Dogane) beganan investigation relating to certain VAT payments owed by us during 1998 and 1999. Pursuant to theinvestigation, the Italian Customs Authority has indicated that certain documentation is missing withrespect to VAT payments totaling approximately Lit. 4,500 million owed for goods exported outside theEuropean Union. We are currently in the process of retrieving documentation intended to verify the exportof certain goods for which VAT payments would have been due and payable. We believe that theproceeding will not have a material adverse eÅect on our business or prospects, and we intend to vigorouslydefend the proceeding.
100
Brought to you by Global Reports

Pursuant to an agreement dated April 24, 2001, De' Longhi SoparÑ S.A. provided us with anindemnity for any losses or other liabilities exceeding 41,000,000 per Ñscal year arising from a violation oftax laws relating to De' Longhi S.p.A. prior to December 31, 2000.
Following a tax audit carried out by the Venetian division of the Italian Finance Authority (Guardiadi Finanza), the Tax OÇce of Venice asserted that, with respect to VAT payments made in 1995 and1996, Simac-Vetrella improperly deducted VAT on certain expenses. In 2000, a claim was brought beforethe Tax Court of Venice. The maximum amount of VAT due pursuant to the claim is equal toapproximately Lit. 545 million (plus interest), in addition to penalties totaling approximately Lit. 552million. We are presently awaiting a Ñnal decision by the relevant tax court of this matter. As part of thesame tax audit, the Venetian division of the Italian Finance Authority asserted certain objections relatingto 1995, 1996 and 1997 which may require us to pay additional income taxes totaling approximatelyLit. 226 million (plus interest and penalties). We believe that these actions will not have a materialadverse eÅect on our business or prospects, and we intend to vigorously defend the proceeding.
We are presently contesting each of these matters and believe that we will ultimately prevail.However, the outcome of any tax proceeding is inherently uncertain, and we cannot assure you of oursuccess in these matters. An adverse determination could aÅect our rights, and could have a materialadverse eÅect on our business, our consolidated Ñnancial position or our results of operations.
101
Brought to you by Global Reports

THE KENWOOD ACQUISITION
The Tender OÅer
On February 16, 2001, we (through our wholly owned Luxembourg subsidiary De' Longhi PinguinoS.A.) commenced a cash tender oÅer to acquire the entire capital stock of Kenwood Appliances plc, anEnglish company specializing in the manufacture and sale of small domestic appliances internationallyunder the Kenwood and Ariete brand names. The oÅer price was 100 pence in cash per Kenwood share,representing a 37% premium over the closing middle market price on December 12, 2000 (the last dealingday prior to the announcement by Kenwood that it was engaged in talks regarding a possible takeover).On May 24, 2001, we completed the tender oÅer by acquiring all of the share capital of Kenwood for anaggregate total purchase price equal to 45.9 million (or approximately Lit. 143,000 million). As part ofthe acquisition, we also acquired approximately 18 million (or approximately Lit. 56,500 million) inassumed debt. Since we acquired Kenwood through a tender oÅer, Kenwood did not provide us with anyrepresentations or warranties, or with any indemnities. Prior to our acquisition, for the restated Ñscal yearsended December 31, 1998, 1999 and 2000, Kenwood recorded net sales equal to 158.3 million, 144.4million and 151.5 million, respectively, and a proÑt before taxes, depreciation, amortization andextraordinary items equal to 15.7 million, 12.9 million and 12.2 million, respectively. As atDecember 31, 2000, Kenwood recorded total assets equal to 63.5 million.
History and Corporate Structure
The Kenwood brand name was established in 1947 and Ñrst gained wide recognition in the Englishmarket in the 1950s with the introduction and distribution of various product lines related to cooking andfood preparation. Subsequently, Kenwood expanded its operations to cover other international markets. In1983, Thorn EMI acquired control of Kenwood from its founder, Kenneth Wood. Subsequently, in 1989,Kenwood was subject to a management buy-out from Thorn EMI. In 1992, all of the share capital ofKenwood was listed on the London Stock Exchange.
In 1994, Kenwood acquired Ariete S.p.A., an Italian company specializing in the manufacture anddistribution of cooking and food preparation products characterized by distinctive designs, thusstrengthening Kenwood's position in Italy. Kenwood also decided to diversify its business by entering intothe cleaning and ironing products market.
During the latter part of the 1990s, Kenwood was signiÑcantly aÅected by adverse Ñnancial conditionsresulting from increasing production costs and, since 1997, has been implementing a restructuring processaimed at transforming itself into a brand business, reducing its exposure to manufacturing operations in theUnited Kingdom and restructuring its Italian operations. As a result of this process, Kenwood streamlinedits operations in the U.K. by, among other things, reducing its U.K. manufacturing capacity (from 902employees in 1998 to 79 at March 31, 2001) and transferring the majority of this activity to China. As aresult, Kenwood reduced its committed cost base by an amount Kenwood estimates to be approximately14.6 million. Kenwood has improved and expanded its product range and it has refocused its marketingeÅorts. Kenwood's management estimates that the total cost of the restructuring program wasapproximately 16.4 million (or approximately Lit. 47,400 million), which was incurred as extraordinarycosts. The restructuring process is due to be completed this year. You should refer to ""Ì KenwoodFinancial Information''.
On April 17, 2001, we de-listed the Kenwood shares on the OÇcial List and cancelled trading of suchshares on the London Stock Exchange.
Synergies Related to the Kenwood Integration
Kenwood is a leader in the United Kingdom in the distribution of cooking and food preparationproducts (Source: Gesellschaft F ur Konsumfroschung, Durable Goods Products, October 2000). Webelieve that the acquisition of Kenwood will:
‚ permit us to create a leading European manufacturer and distributor of air conditioning, heating,cooking and food preparation appliances;
‚ contribute to signiÑcant manufacturing and distribution synergies of the Group; and
‚ improve our competitive position.
102
Brought to you by Global Reports

As a result, we believe that the acquisition represents an important opportunity for us to grow and improveour proÑtability. However, there can be no assurance that Kenwood will not incur additional extraordinarycharges as a result of the restructuring process or that market conditions will not change in the future,which could, in turn, result in a material adverse eÅect on our business and our results of operation.
In particular, we believe that the integration of Kenwood into our existing operation provides us withthe following synergies and beneÑts:
‚ Economies of scale. We believe that the combined buying power of the De' Longhi and theKenwood groups will permit us to achieve signiÑcant economies of scale as a result of increasedcritical mass and leverage with respect to our joint suppliers. In this connection, we recentlyobtained substantial reductions in the purchase price of Ñnished goods from certain Kenwoodsuppliers.
‚ Complementary production expertise. Historically, the De' Longhi and Kenwood groups haveused diÅerent production models, which have produced diÅerentiated but complementaryexpertise. For example, De' Longhi has a strong manufacturing tradition (with a focus on modernproduction facilities and product expertise) whereas Kenwood has a strong tradition focused moreon design than on production (emphasizing instead substantial outsourcing of production and areallocation of manufacturing capabilities to countries with low labor costs). We believe that thecombination of these diÅerent approaches oÅers signiÑcant growth opportunities by allowing us, forexample, to incrementally reallocate our production volumes to the Qingxi Town plant in China.Conversely, Kenwood will be able to beneÑt from De' Longhi's superior production expertise andknow-how.
‚ Complementary products. We believe that the line of Kenwood Chef Ñxed-stand mixers, whichhas had signiÑcant success in several markets, can be sold successfully in Italy through our strongdistribution network. In addition, Kenwood distributes a broad range of toasters and electric kettleswhich Ñt well into our product oÅering in the same appliance segments. We believe that additionalsynergies can be achieved with respect to the fryer segment, the steam cleaners and ironingsystems segment and the electric graters and food mill sector.
‚ Complementary distribution networks. We believe that the distribution structures of the De'Longhi and Kenwood groups are highly complementary. Kenwood, for example, has strongdistribution networks where we do not yet have a consolidated presence, such as South Africa andthe Far East. This existing network can be used as a platform to introduce our brand names in therelevant markets where our appliances are not included in the Kenwood oÅering. Similarly, webelieve the De' Longhi distribution network can be used eÅectively to promote Kenwood andAriete products in Italy, North America, and Japan.
‚ Customer relationships. We believe that we will be able to realize synergies as a result of ourcombined customer relationships. In particular, our increased number of employees after theacquisition will be dedicated to manage and develop these relationships; to engage in promotionalactivities targeted at clients; and to design new products reserved exclusively for strategiccustomers.
We have established Ñve joint working groups to integrate Kenwood into our existing operations in theareas of production, purchasing, sales and marketing, Ñnance and working capital, and logistics. Thesegroups are coordinated on a regular basis by a committee that includes the managing director of De'Longhi and the chief executive oÇcer of Kenwood. We believe that the synergies that can be realizedthrough this integration process will allow us to generate substantial additional revenues in the future.
103
Brought to you by Global Reports

Kenwood Financial Information
The unaudited Ñnancial information set forth below, which is provided for informational purposesonly, has been derived from the Audited Kenwood Consolidated Financial Statements and has beenrestated for each year to reÖect a Ñscal year ended December 31, 1998, 1999 and 2000 and to reÖectItalian GAAP. For a description of aggregations used to prepare such Ñnancial information under ItalianGAAP, you should refer to ""Annex C Ì Explanatory Note of Aggregations in the OÅering Memorandumof the Kenwood Consolidated Financial Statements''. You should note that we did not control Kenwoodprior to our acquisition in early 2001. In addition, the results of operations of Kenwood presented belowreÖected the strategy of its management, which we did not control. We were not responsible for thestrategies employed by such prior management and our strategies may diÅer materially from thoseemployed in the past. Consequently, the Ñnancial information presented below does not purport torepresent what our results of operations would actually have been or to project our results of operations forany future period. The following table sets forth the Unaudited Restated Kenwood Consolidated IncomeStatement data for the periods indicated.
Unaudited Restated Kenwood(1)
Year ended December 31,
1998 1999 2000 2000
(Lit. millions) (5 thousands)
Income Statement Data:
Revenues:
Net salesÏÏÏÏÏÏÏÏÏÏÏÏÏÏÏÏÏÏÏÏÏÏÏÏÏÏÏÏÏÏÏÏÏÏÏÏ 455,408 424,884 481,377 248,610
Other revenuesÏÏÏÏÏÏÏÏÏÏÏÏÏÏÏÏÏÏÏÏÏÏÏÏÏÏÏÏÏÏÏ Ì Ì 6,312 3,260
Total revenues ÏÏÏÏÏÏÏÏÏÏÏÏÏÏÏÏÏÏÏÏÏÏÏÏÏÏÏÏÏ 455,408 424,884 487,689 251,870
Operating costs:
Materials, consumables and goodsÏÏÏÏÏÏÏÏÏÏÏÏÏÏÏ 238,955 247,999 312,212 161,244
Services ÏÏÏÏÏÏÏÏÏÏÏÏÏÏÏÏÏÏÏÏÏÏÏÏÏÏÏÏÏÏÏÏÏÏÏÏ 90,635 74,164 81,689 42,189
Rents, leases and related costsÏÏÏÏÏÏÏÏÏÏÏÏÏÏÏÏÏÏ Ì Ì Ì Ì
Other costsÏÏÏÏÏÏÏÏÏÏÏÏÏÏÏÏÏÏÏÏÏÏÏÏÏÏÏÏÏÏÏÏÏÏ Ì Ì Ì Ì
Value added margin ÏÏÏÏÏÏÏÏÏÏÏÏÏÏÏÏÏÏÏÏÏÏÏÏ 125,818 102,721 93,788 48,437
Wages, salaries and beneÑtsÏÏÏÏÏÏÏÏÏÏÏÏÏÏÏÏÏÏÏÏ 77,443 62,631 55,012 28,411
Gross operating marginÏÏÏÏÏÏÏÏÏÏÏÏÏÏÏÏÏÏÏÏÏÏ 48,375 40,090 38,776 20,026
Depreciation and amortizationÏÏÏÏÏÏÏÏÏÏÏÏÏÏÏÏÏÏ 18,755 17,788 19,045 9,836
Amortization of goodwill ÏÏÏÏÏÏÏÏÏÏÏÏÏÏÏÏÏÏÏÏÏÏ 9,318 9,533 10,298 5,318
Provisions and write-oÅsÏÏÏÏÏÏÏÏÏÏÏÏÏÏÏÏÏÏÏÏÏÏÏ 3,138 2,227 Ì Ì
Operating proÑt ÏÏÏÏÏÏÏÏÏÏÏÏÏÏÏÏÏÏÏÏÏÏÏÏÏÏÏÏ 17,164 10,542 9,433 4,872
Net Ñnancial lossÏÏÏÏÏÏÏÏÏÏÏÏÏÏÏÏÏÏÏÏÏÏÏÏÏÏÏÏÏ (17,564) (13,975) (15,609) (8,061)
Income from equity investments ÏÏÏÏÏÏÏÏÏÏÏÏÏÏÏÏ Ì Ì Ì Ì
Extraordinary income (loss) ÏÏÏÏÏÏÏÏÏÏÏÏÏÏÏÏÏÏÏ (10,981) (40,541)(2) (9,227) (4,765)
Earnings before taxes ÏÏÏÏÏÏÏÏÏÏÏÏÏÏÏÏÏÏÏÏÏÏÏ (11,381) (43,974) (15,403) (7,954)
Income taxes ÏÏÏÏÏÏÏÏÏÏÏÏÏÏÏÏÏÏÏÏÏÏÏÏÏÏÏÏÏÏÏÏ 5,513 5,384 3,105 1,604
Net income (loss) before minority interests ÏÏÏÏ (16,894) (49,358) (18,508) (9,558)
Minority interests ÏÏÏÏÏÏÏÏÏÏÏÏÏÏÏÏÏÏÏÏÏÏÏÏÏÏÏÏ Ì Ì Ì Ì
Net loss for the year ÏÏÏÏÏÏÏÏÏÏÏÏÏÏÏÏÏÏÏÏÏÏÏÏ (16,894) (49,358) (18,508) (9,558)
(1) Conversion from pound sterling to Lire is based on the average of the exchange rates for the last business day of each month
during the relevant period.
(2) Includes writedown relating to valuation of certain properties (including plant and equipment) totaling approximately
Lit. 22,067 million in April 1999.
104
Brought to you by Global Reports

The following table shows a breakdown of Kenwood's consolidated revenues attributable to each of itsbusiness segments for the periods indicated:
Unaudited Restated Kenwood(1)
Year ended December 31, % Variation
1998 1999 2000 1999/1998 2000/1999
(Lit. millions, except percentages)
Cooking and food preparationÏÏÏÏÏÏÏÏÏÏÏÏÏÏ 359,110 325,493 363,280 (9.4)% 11.6%
Cleaning and ironing ÏÏÏÏÏÏÏÏÏÏÏÏÏÏÏÏÏÏÏÏÏ 67,727 77,772 97,376 14.8% 25.2%
Air conditioning ÏÏÏÏÏÏÏÏÏÏÏÏÏÏÏÏÏÏÏÏÏÏÏÏÏ 9,936 9,328 6,939 (6.1)% (25.6)%
Other ÏÏÏÏÏÏÏÏÏÏÏÏÏÏÏÏÏÏÏÏÏÏÏÏÏÏÏÏÏÏÏÏÏÏ 18,635 12,291 20,094 (34.0)% 63.5%
Total revenues ÏÏÏÏÏÏÏÏÏÏÏÏÏÏÏÏÏÏÏÏÏÏÏÏ 455,408 424,884 487,689 (6.7)% 14.8%
(1) Conversion from pound sterling to Lire is based on the average of the exchange rates for the last business day of each month
during the relevant period.
The following table shows a breakdown of Kenwood's consolidated revenues attributable to each ofthe principal geographic markets in which it sells its products for the periods indicated:
Unaudited Restated Kenwood(1)
Year ended December 31, % Variation
1998 1999 2000 1999/1998 2000/1999
(Lit. millions, except percentages)
Italy ÏÏÏÏÏÏÏÏÏÏÏÏÏÏÏÏÏÏÏÏÏÏÏÏÏÏÏÏÏÏÏÏÏÏÏ 75,256 69,508 71,353 (7.6)% 2.7%
United KingdomÏÏÏÏÏÏÏÏÏÏÏÏÏÏÏÏÏÏÏÏÏÏÏÏÏ 121,591 120,634 146,931 (0.8)% 21.8%
Rest of Europe ÏÏÏÏÏÏÏÏÏÏÏÏÏÏÏÏÏÏÏÏÏÏÏÏÏÏ 151,904 138,846 146,692 (8.6)% 5.7%
North America (U.S.A., Canada andMexico)ÏÏÏÏÏÏÏÏÏÏÏÏÏÏÏÏÏÏÏÏÏÏÏÏÏÏÏÏÏÏ 15,170 16,810 15,650 10.8% (6.9)%
Japan ÏÏÏÏÏÏÏÏÏÏÏÏÏÏÏÏÏÏÏÏÏÏÏÏÏÏÏÏÏÏÏÏÏÏ 1,976 1,500 3,429 (24.1)% 128.6%
Rest of WorldÏÏÏÏÏÏÏÏÏÏÏÏÏÏÏÏÏÏÏÏÏÏÏÏÏÏÏ 89,511 77,586 103,634 (13.3)% 33.6%
Total revenues ÏÏÏÏÏÏÏÏÏÏÏÏÏÏÏÏÏÏÏÏÏÏÏÏ 455,408 424,884 487,689 (6.7)% 14.8%
(1) Conversion from pound sterling to Lire is based on the average of the exchange rates for the last business day of each month
during the relevant year.
The industrial gross margin consists of the total revenues derived from each business segment inwhich the Group operates, net of the cost of goods sold (comprising the aggregate of the cost of materialsand components; external manufacturing service fees; wages, salaries and beneÑts; industrial depreciationcosts; and other Ñxed industrial costs). The following table sets forth, for each relevant business segment,the industrial gross margin for the consolidated Kenwood group (including as a percentage of net sales)for the periods indicated.
Unaudited Restated Kenwood(1)
Year ended December 31,
1998 1999 2000
Segment Segment SegmentIndustrial Industrial IndustrialMargin % Margin % Margin %
(Lit. millions, except percentages)
Air conditioningÏÏÏÏÏÏÏÏÏÏÏÏÏÏÏÏÏÏÏÏÏÏÏÏÏÏÏÏÏÏ 2,538 25.6% 3,123 33.5% 1,581 22.8%
Cooking and food preparation ÏÏÏÏÏÏÏÏÏÏÏÏÏÏÏÏÏÏ 110,187 30.7% 110,271 33.9% 123,487 34.0%
Cleaning and ironingÏÏÏÏÏÏÏÏÏÏÏÏÏÏÏÏÏÏÏÏÏÏÏÏÏÏ 28,529 42.1% 25,699 33.0% 31,289 32.1%
Other(2) ÏÏÏÏÏÏÏÏÏÏÏÏÏÏÏÏÏÏÏÏÏÏÏÏÏÏÏÏÏÏÏÏÏÏÏÏ 9,373 50.3% 7,161 58.3% 9,595 47.7%
Total industrial gross margin ÏÏÏÏÏÏÏÏÏÏÏÏÏÏÏÏÏ 150,627 33.1% 146,254 34.4% 165,952 34.0%
(1) Conversion from pound sterling to Lire is based on the average of the exchange rates for the last business day of each month
during the relevant year.
(2) Includes revenues deriving from the sale of accessories, spare parts and scraps.
105
Brought to you by Global Reports

UNAUDITED COMBINED PRO FORMA FINANCIAL STATEMENTS
In early 2001, we acquired all of the share capital of Kenwood. You should refer to ""Management'sDiscussion and Analysis of Financial Condition and Results of Operations Ì Recent Developments'' and""The Kenwood Acquisition'' for a description of Kenwood. The Unaudited Pro Forma ConsolidatedFinancial Statements are derived from the Unaudited De' Longhi Pro Forma Consolidated FinancialStatements and the Unaudited Restated Kenwood Consolidated Financial Statements which are based onAudited Kenwood Consolidated Financial Statements, which have been restated for each year to reÖect aÑscal year ended December 31 instead of March 31 and to reÖect Italian GAAP. For a description ofaggregations used to prepare the Ñnancial information of Kenwood under Italian GAAP, you should referto ""Annex C Ì Explanatory Note of Aggregations in the OÅering Memorandum of the KenwoodConsolidated Financial Statements''. The Unaudited Combined Pro Forma Financial Statements, inaddition to the adjustments made to the Unaudited De' Longhi Pro Forma Consolidated FinancialStatements, have been adjusted to reÖect the acquisition of Kenwood as if such acquisition had occurredon January 1, 1998.
On January 1, 1998, we had not purchased De' Longhi Divisione Cucine S.p.A., DL Radiators S.p.A.,Climaveneta S.p.A., Micromax S.p.A., Ergoklima S.p.A., Sile Corpi Scaldanti S.r.l. and KenwoodAppliances plc; nor had we sold Immobiliare Findomestic S.r.l., De' Longhi Radiators S.r.l., DL CanadaDistributors Inc., 850721 Ontario Ltd., I.S.C. Ì Industrie Scambiatori di Calore S.p.A. and Nauta S.r.l.;nor had we eÅected a capital increase of Lit. 250,587 million. In addition, the results of operations andÑnancial condition of Sile Corpi Scaldanti S.r.l. and Kenwood reÖected the strategies of each of thecompany's prior management, which we did not control. We were not responsible for the strategiesemployed by such prior management and our strategies may diÅer materially from those implemented inthe past. Consequently, the Unaudited Combined Pro Forma Financial Statements do not purport torepresent what our results of operations or Ñnancial position would actually have been if such purchases,sales and capital increase had occurred on January 1, 1998 or to project our results of operations for anyfuture period.
The Unaudited Combined Pro Forma Financial Statements have been prepared in accordance withItalian GAAP, which diÅers in certain material respects from U.S. GAAP and U.K. GAAP. Fordescriptions of certain signiÑcant diÅerences between Italian GAAP and U.S. GAAP, as applicable to theCompany, you should refer to ""Annex A Ì Summary of SigniÑcant DiÅerences Between Italian and U.S.GAAP''. For descriptions of certain signiÑcant diÅerences between Italian GAAP and U.K. GAAP, asapplicable to the Company, you should refer to ""Annex B Ì Summary of SigniÑcant DiÅerences BetweenItalian and U.K. GAAP''. You should also read ""Presentation of Financial and Other Information''included elsewhere in this oÅering memorandum.
106
Brought to you by Global Reports

Combined Pro Forma Income Statement Data
The following table sets forth the Unaudited Combined Pro Forma Income Statement data (includingthe eÅect of the Kenwood acquisition) for the year ended December 31, 2000.
Year ended December 31, 2000
Unaudited
Pro Forma Restated Pro Forma Pro Forma Pro FormaDe' Longhi Kenwood(2) Adjustments(3) Combined Combined
(Lit. millions) (5 thousands)
Revenues:
Net sales ÏÏÏÏÏÏÏÏÏÏÏÏÏÏÏÏÏÏÏÏÏÏÏÏÏÏÏÏÏÏÏÏÏ 1,561,334 481,377 Ì 2,042,711 1,054,972
Other revenues ÏÏÏÏÏÏÏÏÏÏÏÏÏÏÏÏÏÏÏÏÏÏÏÏÏÏÏÏ 23,158 6,312 Ì 29,470 15,220
Total revenues ÏÏÏÏÏÏÏÏÏÏÏÏÏÏÏÏÏÏÏÏÏÏÏÏÏÏÏ 1,584,492 487,689 Ì 2,072,181 1,070,192
Operating costs:
Materials, consumables and goods ÏÏÏÏÏÏÏÏÏÏÏÏ 714,053 312,212 Ì 1,026,265 530,022
Services(1) ÏÏÏÏÏÏÏÏÏÏÏÏÏÏÏÏÏÏÏÏÏÏÏÏÏÏÏÏÏÏÏÏ 369,142 81,689 Ì 450,831 232,835
Other costsÏÏÏÏÏÏÏÏÏÏÏÏÏÏÏÏÏÏÏÏÏÏÏÏÏÏÏÏÏÏÏÏ 10,867 Ì Ì 10,867 5,612
Value added margin ÏÏÏÏÏÏÏÏÏÏÏÏÏÏÏÏÏÏÏÏÏÏ 490,430 93,788 Ì 584,218 301,723
Wages, salaries and beneÑt ÏÏÏÏÏÏÏÏÏÏÏÏÏÏÏÏÏÏ 235,795 55,012 Ì 290,807 150,189
Gross operating margin ÏÏÏÏÏÏÏÏÏÏÏÏÏÏÏÏÏÏÏ 254,635 38,776 Ì 293,411 151,534
Depreciation and amortizationÏÏÏÏÏÏÏÏÏÏÏÏÏÏÏÏ 75,030 19,045 Ì 94,075 48,586
Amortization of goodwill ÏÏÏÏÏÏÏÏÏÏÏÏÏÏÏÏÏÏÏÏ 30,252 10,298 3,573 44,123 22,788
Provisions and write-oÅs ÏÏÏÏÏÏÏÏÏÏÏÏÏÏÏÏÏÏÏÏ 17,806 Ì Ì 17,806 9,196
Operating proÑtÏÏÏÏÏÏÏÏÏÏÏÏÏÏÏÏÏÏÏÏÏÏÏÏÏÏ 131,547 9,433 (3,573) 137,407 70,965
Net Ñnancial loss ÏÏÏÏÏÏÏÏÏÏÏÏÏÏÏÏÏÏÏÏÏÏÏÏÏÏ (45,418) (15,609) (7,829) (68,856) (35,561)
Income from equity investments ÏÏÏÏÏÏÏÏÏÏÏÏÏÏ 8,321 Ì Ì 8,321 4,297
Extraordinary income (loss) ÏÏÏÏÏÏÏÏÏÏÏÏÏÏÏÏÏ 4,707 (9,227) Ì (4,520) (2,334)
Earnings before taxes and minority interests ÏÏ 99,157 (15,403) (11,402) 72,352 37,367
Income tax expense (beneÑt) ÏÏÏÏÏÏÏÏÏÏÏÏÏÏÏÏ 57,413 3,105 (6,211) 54,307 28,047
Net income (loss) before minority interests ÏÏ 41,744 (18,508) (5,191) 18,045 9,319
Minority interests ÏÏÏÏÏÏÏÏÏÏÏÏÏÏÏÏÏÏÏÏÏÏÏÏÏÏ (204) Ì Ì (204) 105
Net income (loss) for the year ÏÏÏÏÏÏÏÏÏÏÏÏÏ 41,540 (18,508) (5,191) 17,841 9,214
(1) Services expenses for the Unaudited Combined Pro Forma Financial Statements include rents, leases and related costs.
(2) Conversion from pound sterling to Lire is based on the average of the exchange rates for the last business day of each month
during the relevant period.
(3) You should see the notes to the Unaudited Pro Forma Combined Consolidated Financial Statements for a description of the
adjustments made in these Ñnancial statements.
107
Brought to you by Global Reports

The following table sets forth our Unaudited Combined Pro Forma Income Statement data (includingthe eÅects of the Kenwood acquisition) for the year ended December 31, 1999.
Year ended December 31, 1999
Unaudited
Pro Forma Restated Pro Forma Pro Forma Pro FormaDe' Longhi Kenwood(2) Adjustments(3) Combined Combined
(Lit. millions) (5 thousands)
Revenues:
Net sales ÏÏÏÏÏÏÏÏÏÏÏÏÏÏÏÏÏÏÏÏÏÏÏÏÏÏÏÏÏÏÏÏÏ 1,374,841 424,884 Ì 1,799,725 929,480
Other revenues ÏÏÏÏÏÏÏÏÏÏÏÏÏÏÏÏÏÏÏÏÏÏÏÏÏÏÏÏ 18,979 Ì Ì 18,979 9,802
Total revenues ÏÏÏÏÏÏÏÏÏÏÏÏÏÏÏÏÏÏÏÏÏÏÏÏÏÏÏ 1,393,820 424,884 Ì 1,818,704 939,282
Operating costs:
Materials, consumables and goods ÏÏÏÏÏÏÏÏÏÏÏÏ 637,305 247,999 Ì 885,304 457,221
Services(1) ÏÏÏÏÏÏÏÏÏÏÏÏÏÏÏÏÏÏÏÏÏÏÏÏÏÏÏÏÏÏÏÏ 301,463 74,164 Ì 375,627 193,995
Other costsÏÏÏÏÏÏÏÏÏÏÏÏÏÏÏÏÏÏÏÏÏÏÏÏÏÏÏÏÏÏÏÏ 17,874 Ì Ì 17,874 9,231
Value added margin ÏÏÏÏÏÏÏÏÏÏÏÏÏÏÏÏÏÏÏÏÏÏ 437,178 102,721 Ì 539,899 278,835
Wages, salaries and beneÑt ÏÏÏÏÏÏÏÏÏÏÏÏÏÏÏÏÏÏ 213,311 62,631 Ì 275,942 142,512
Gross operating margin ÏÏÏÏÏÏÏÏÏÏÏÏÏÏÏÏÏÏÏ 223,867 40,090 Ì 263,957 136,322
Depreciation and amortizationÏÏÏÏÏÏÏÏÏÏÏÏÏÏÏÏ 77,084 17,788 Ì 94,872 48,997
Amortization of goodwill ÏÏÏÏÏÏÏÏÏÏÏÏÏÏÏÏÏÏÏÏ 30,311 9,533 3,573 43,417 22,423
Provisions and write-oÅs ÏÏÏÏÏÏÏÏÏÏÏÏÏÏÏÏÏÏÏÏ 15,942 2,227 Ì 18,169 9,384
Operating proÑtÏÏÏÏÏÏÏÏÏÏÏÏÏÏÏÏÏÏÏÏÏÏÏÏÏÏ 100,530 10,542 (3,573) 107,499 55,519
Net Ñnancial loss ÏÏÏÏÏÏÏÏÏÏÏÏÏÏÏÏÏÏÏÏÏÏÏÏÏÏ (33,399) (13,975) (7,829) (55,203) (28,510)
Income from equity investments ÏÏÏÏÏÏÏÏÏÏÏÏÏÏ 3,857 Ì Ì 3,857 1,991
Extraordinary loss ÏÏÏÏÏÏÏÏÏÏÏÏÏÏÏÏÏÏÏÏÏÏÏÏÏÏ (4,116) (40,541) Ì (44,657) (23,063)
Earnings before taxes and minority interests ÏÏ 66,872 (43,974) (11,402) 11,496 5,937
Income tax expense (beneÑt) ÏÏÏÏÏÏÏÏÏÏÏÏÏÏÏÏ 26,355 5,384 (6,470) 25,269 13,050
Net income (loss) before minority interests ÏÏ 40,517 (49,358) (4,932) (13,773) (7,113)
Minority interests ÏÏÏÏÏÏÏÏÏÏÏÏÏÏÏÏÏÏÏÏÏÏÏÏÏÏ 72 Ì Ì 72 37
Net income (loss) for the year ÏÏÏÏÏÏÏÏÏÏÏÏÏ 40,589 (49,358) (4,932) (13,701) (7,076)
(1) Services expenses for the Unaudited Combined Pro Forma Financial Statements include rents, leases and related costs.
(2) Conversion from pound sterling to Lire is based on the average of the exchange rates for the last business day of each month
during the relevant period.
(3) You should see the notes to the Unaudited Combined Pro Forma Financial Statements for a description of the adjustments
made in these Ñnancial statements.
108
Brought to you by Global Reports

The following table sets forth our Unaudited Combined Pro Forma Income Statement data (includingthe eÅects of the Kenwood acquisition) for the year ended December 31, 1998.
Year ended December 31, 1998
Unaudited
Pro Forma Restated Pro Forma Pro Forma Pro FormaDe' Longhi Kenwood(2) Adjustments(3) Combined Combined
(Lit. millions) (5 thousands)
Revenues:
Net sales ÏÏÏÏÏÏÏÏÏÏÏÏÏÏÏÏÏÏÏÏÏÏÏ 1,269,314 455,408 Ì 1,724,722 890,745
Other revenuesÏÏÏÏÏÏÏÏÏÏÏÏÏÏÏÏÏÏÏ 21,384 Ì Ì 21,384 11,044
Total revenues ÏÏÏÏÏÏÏÏÏÏÏÏÏÏÏÏÏ 1,290,698 455,408 Ì 1,746,106 901,789
Operating costs:
Materials, consumables and goods ÏÏ 630,240 238,955 Ì 869,195 448,902
Services(1)ÏÏÏÏÏÏÏÏÏÏÏÏÏÏÏÏÏÏÏÏÏÏÏ 276,713 90,635 Ì 367,348 189,719
Other costsÏÏÏÏÏÏÏÏÏÏÏÏÏÏÏÏÏÏÏÏÏÏ 21,128 Ì Ì 21,128 10,911
Value added margin ÏÏÏÏÏÏÏÏÏÏÏÏ 362,617 125,818 Ì 488,435 252,256
Wages, salaries and beneÑtsÏÏÏÏÏÏÏÏ 202,160 77,443 Ì 279,603 144,403
Gross operating marginÏÏÏÏÏÏÏÏÏÏ 160,457 48,375 Ì 208,832 107,853
Depreciation and amortizationÏÏÏÏÏÏ 70,834 18,755 Ì 89,589 46,269
Amortization of goodwill ÏÏÏÏÏÏÏÏÏÏ 30,251 9,318 3,573 43,142 22,281
Provisions and write-oÅsÏÏÏÏÏÏÏÏÏÏÏ 28,576 3,138 Ì 31,714 16,379
Operating proÑt ÏÏÏÏÏÏÏÏÏÏÏÏÏÏÏÏ 30,796 17,164 (3,573) 44,387 22,924
Net Ñnancial lossÏÏÏÏÏÏÏÏÏÏÏÏÏÏÏÏÏ (73,187) (17,564) (7,829) (98,580) (50,912)
Income from equity investments ÏÏÏÏ 1,818 Ì Ì 1,818 939
Extraordinary loss ÏÏÏÏÏÏÏÏÏÏÏÏÏÏÏÏ (3,410) (10,981) Ì (14,391) (7,432)
Earnings before taxes and minorityinterests ÏÏÏÏÏÏÏÏÏÏÏÏÏÏÏÏÏÏÏÏ (43,983) (11,381) (11,402) (66,766) (34,482)
Income tax expense (beneÑt) ÏÏÏÏÏÏ 427 5,513 (5,903) 37 19
Net loss before minority interests (44,410) (16,894) (5,499) (66,803) (34,501)
Minority interests ÏÏÏÏÏÏÏÏÏÏÏÏÏÏÏÏ 271 Ì Ì 271 140
Net loss for the year ÏÏÏÏÏÏÏÏÏÏÏÏ (44,139) (16,894) (5,499) (66,532) (34,361)
(1) Services expenses for the Unaudited Combined Pro Forma Financial Statements include rents, leases and related costs.
(2) Conversion from pound sterling to Lire is based on the average of the exchange rates for the last business day of each month
during the relevant period.
(3) You should see the notes to the Unaudited Combined Pro Forma Combined Financial Statements for a description of the
adjustments made in these Ñnancial statements.
109
Brought to you by Global Reports

Pro Forma Combined Balance Sheet Data
The following table sets forth the Unaudited Combined Pro Forma Consolidated Balance Sheet data(including the eÅect of the Kenwood acquisition) at December 31, 2000.
At December 31, 2000
Unaudited
Pro Forma Restated Pro Forma Pro Forma Pro FormaDe' Longhi Kenwood(1) Adjustments(2) Combined Combined
(Lit. millions) (5 thousands)
Balance sheet data:
Receivables from shareholders ÏÏÏÏÏÏÏ Ì Ì Ì Ì Ì
Goodwill ÏÏÏÏÏÏÏÏÏÏÏÏÏÏÏÏÏÏÏÏÏÏÏÏÏ 545,343 35,127 71,470 651,940 336,699
Other intangible assetsÏÏÏÏÏÏÏÏÏÏÏÏÏÏ 203,123 Ì Ì 203,123 104,904
Total intangible assets ÏÏÏÏÏÏÏÏÏÏÏÏ 748,466 35,127 71,470 855,063 441,603
Tangible assets ÏÏÏÏÏÏÏÏÏÏÏÏÏÏÏÏÏÏÏÏ 344,097 39,436 Ì 383,533 198,078
Financial assets ÏÏÏÏÏÏÏÏÏÏÏÏÏÏÏÏÏÏÏÏ 17,678 Ì Ì 17,678 9,130
Total Ñxed assets ÏÏÏÏÏÏÏÏÏÏÏÏÏÏÏÏ 1,110,241 74,563 71,470 1,256,274 648,811
Receivables ÏÏÏÏÏÏÏÏÏÏÏÏÏÏÏÏÏÏÏÏÏÏÏ 615,735 142,724 Ì 758,459 391,711
Inventory ÏÏÏÏÏÏÏÏÏÏÏÏÏÏÏÏÏÏÏÏÏÏÏÏÏ 370,539 95,172 Ì 465,711 240,520
Other current assets ÏÏÏÏÏÏÏÏÏÏÏÏÏÏÏÏ 138,741 14,846 18,584 172,171 88,919
PayablesÏÏÏÏÏÏÏÏÏÏÏÏÏÏÏÏÏÏÏÏÏÏÏÏÏÏ (357,813) (72,611) Ì (430,424) (222,295)
Other current liabilities ÏÏÏÏÏÏÏÏÏÏÏÏÏ (129,008) (57,623) Ì (186,631) (96,387)
Net working capital ÏÏÏÏÏÏÏÏÏÏÏÏÏÏ 638,194 122,508 18,584 779,286 402,468
Total capital employedÏÏÏÏÏÏÏÏÏÏÏÏ 1,748,435 197,071 90,054 2,035,560 1,051,279
Reserve for staÅ severance indemnities 37,525 3,050 Ì 40,575 20,955
Reserve for risks and other charges ÏÏÏ 51,235 7,859 Ì 59,094 30,520
Long term liabilities ÏÏÏÏÏÏÏÏÏÏÏÏÏÏ 88,760 10,909 Ì 99,669 51,475
Cash and cash equivalentsÏÏÏÏÏÏÏÏÏÏÏ (135,979) (11,591) Ì (147,570) (76,214)
Short term debt ÏÏÏÏÏÏÏÏÏÏÏÏÏÏÏÏÏÏÏ 54,336 109,490 23,487 187,313 96,739
Long term debtÏÏÏÏÏÏÏÏÏÏÏÏÏÏÏÏÏÏÏÏ 519,143 5,029 148,006 672,178 347,151
Debt for acquisition of investments ÏÏÏ 504,714 Ì Ì 504,714 260,663
Pro forma debt ÏÏÏÏÏÏÏÏÏÏÏÏÏÏÏÏÏÏÏÏ (6,900) Ì Ì (6,900) (3,564)
Net Ñnancial position ÏÏÏÏÏÏÏÏÏÏÏÏÏ 935,314 102,928 171,493 1,209,735 624,776
Share capital ÏÏÏÏÏÏÏÏÏÏÏÏÏÏÏÏÏÏÏÏÏÏ 650,587 12,279 (12,279) 650,587 336,000
Other reserves ÏÏÏÏÏÏÏÏÏÏÏÏÏÏÏÏÏÏÏÏÏ 27,252 89,463 (89,463) 27,252 14,074
Pro forma related reserves ÏÏÏÏÏÏÏÏÏÏÏ 4,345 Ì 25,494 29,839 15,411
Net income (loss) for the yearÏÏÏÏÏÏÏ 41,540 (18,508) (5,191) 17,841 9,214
Shareholders' equity ÏÏÏÏÏÏÏÏÏÏÏÏÏÏ 723,724 83,234 (81,439) 725,519 374,699
Minority interests ÏÏÏÏÏÏÏÏÏÏÏÏÏÏÏÏÏÏ 637 Ì Ì 637 329
Total shareholders' equity andminority interests ÏÏÏÏÏÏÏÏÏÏÏÏÏÏ 724,361 83,234 (81,439) 726,156 375,028
Total liabilities and shareholders'equity ÏÏÏÏÏÏÏÏÏÏÏÏÏÏÏÏÏÏÏÏÏÏÏÏ 1,748,435 197,071 90,054 2,035,560 1,051,279
Memorandum accounts ÏÏÏÏÏÏÏÏÏÏÏÏÏ 24,254 Ì Ì 24,254 12,526
(1) Conversion from pound sterling to Lire is based on the exchange rate as announced by the European Central Bank on
December 31, 2000.
(2) You should see the notes to the Unaudited Combined Pro Forma Financial Statements for a description of the adjustments
made in these Ñnancial statements.
110
Brought to you by Global Reports

The following table sets forth the Unaudited Combined Pro Forma Balance Sheet data (including theeÅect of the Kenwood acquisition) at December 31, 1999.
At December 31, 1999
Unaudited
Pro Forma Restated Pro Forma Pro Forma Pro FormaDe' Longhi Kenwood(1) Adjustments(2) Combined Combined
(Lit. millions) (5 thousands)
Balance sheet data:
Receivables from shareholdersÏÏÏÏ 25,000 Ì Ì 25,000 12,911
Goodwill ÏÏÏÏÏÏÏÏÏÏÏÏÏÏÏÏÏÏÏÏÏÏ 575,540 45,353 75,043 695,936 359,421
Other intangible assets ÏÏÏÏÏÏÏÏÏÏ 216,347 Ì Ì 216,347 111,734
Total intangible assetsÏÏÏÏÏÏÏÏÏ 791,887 45,353 75,043 912,283 471,155
Tangible assetsÏÏÏÏÏÏÏÏÏÏÏÏÏÏÏÏÏ 348,788 70,169 Ì 418,957 216,373
Financial assets ÏÏÏÏÏÏÏÏÏÏÏÏÏÏÏÏ 36,509 Ì Ì 36,509 18,855
Total Ñxed assets ÏÏÏÏÏÏÏÏÏÏÏÏÏ 1,177,184 115,522 75,043 1,367,749 706,383
ReceivablesÏÏÏÏÏÏÏÏÏÏÏÏÏÏÏÏÏÏÏÏ 557,852 136,766 Ì 694,618 358,740
Inventory ÏÏÏÏÏÏÏÏÏÏÏÏÏÏÏÏÏÏÏÏÏ 289,581 92,360 Ì 381,941 197,256
Other current assets ÏÏÏÏÏÏÏÏÏÏÏÏ 105,880 13,984 12,373 132,237 68,295
Payables ÏÏÏÏÏÏÏÏÏÏÏÏÏÏÏÏÏÏÏÏÏÏ (336,938) (68,930) Ì (405,868) (209,613)
Other current liabilitiesÏÏÏÏÏÏÏÏÏÏ (92,120) (59,782) Ì (151,902) (78,451)
Net working capitalÏÏÏÏÏÏÏÏÏÏÏ 524,255 114,398 12,373 651,026 336,227
Total capital employed ÏÏÏÏÏÏÏÏ 1,726,439 229,920 87,416 2,043,775 1,055,522
Reserve for staÅ severanceindemnitiesÏÏÏÏÏÏÏÏÏÏÏÏÏÏÏÏÏÏ 34,797 2,791 Ì 37,588 19,413
Reserve for risks and other charges 17,469 25,445 Ì 42,914 22,163
Long term liabilities ÏÏÏÏÏÏÏÏÏÏ 52,266 28,236 Ì 80,502 41,576
Cash and cash equivalents ÏÏÏÏÏÏÏ (157,045) (10,692) Ì (167,737) (86,629)
Short term debt ÏÏÏÏÏÏÏÏÏÏÏÏÏÏÏÏ 145,582 99,760 15,658 261,000 134,795
Long term debt ÏÏÏÏÏÏÏÏÏÏÏÏÏÏÏÏ 336,385 6,537 148,006 490,928 253,543
Debt for acquisition of investments 504,714 Ì Ì 504,714 260,663
Pro forma debtÏÏÏÏÏÏÏÏÏÏÏÏÏÏÏÏÏ 137,860 Ì Ì 137,860 71,199
Net Ñnancial position ÏÏÏÏÏÏÏÏÏ 967,496 95,605 163,664 1,226,765 633,571
Share capital ÏÏÏÏÏÏÏÏÏÏÏÏÏÏÏÏÏÏ 650,587 12,279 (12,279) 650,587 336,000
Other reserves ÏÏÏÏÏÏÏÏÏÏÏÏÏÏÏÏÏ 36,362 143,158 143,158 36,362 18,779
Pro forma related reserves ÏÏÏÏÏÏÏ (21,190) Ì 84,121 62,931 32,501
Net income (loss) for the year ÏÏÏ 40,589 (49,358) (4,932) (13,701) (7,076)
Shareholders' equity ÏÏÏÏÏÏÏÏÏÏ 706,348 106,079 (76,248) 736,179 380,205
Minority interests ÏÏÏÏÏÏÏÏÏÏÏÏÏÏ 329 Ì Ì 329 170
Total shareholders' equity andminority interestsÏÏÏÏÏÏÏÏÏÏÏ 706,677 106,079 (76,248) 736,508 380,375
Total liabilities andshareholders' equityÏÏÏÏÏÏÏÏÏ 1,726,439 229,920 87,416 2,043,775 1,055,522
Memorandum of accounts ÏÏÏÏÏÏÏ 98,326 Ì Ì 98,326 50,781
(1) Conversion from pound sterling to Lire is based on the exchange rate as announced by the European Central Bank on
December 31, 1999.
(2) You should see the notes to the Unaudited Pro Forma Combined Financial Statements for a description of the adjustments
made in these Ñnancial statements.
111
Brought to you by Global Reports

The following table sets forth the Unaudited Combined Pro Forma Consolidated Balance Sheet data(including the eÅect of the Kenwood acquisition) at December 31, 1998.
At December 31, 1998
Unaudited
Pro Forma Restated Pro Forma Pro Forma Pro FormaDe' Longhi Kenwood(1) Adjustments(2) Combined Combined
(Lit. millions) (5 thousands)
Balance sheet data:
Receivables from shareholders ÏÏÏÏ 9,100 Ì Ì 9,100 4,700
Goodwill ÏÏÏÏÏÏÏÏÏÏÏÏÏÏÏÏÏÏÏÏÏÏ 605,789 49,190 78,616 733,595 378,870
Other intangible assetsÏÏÏÏÏÏÏÏÏÏÏ 234,494 Ì Ì 234,494 121,106
Total intangible assets ÏÏÏÏÏÏÏÏÏ 840,283 49,190 78,616 968,089 499,976
Tangible assets ÏÏÏÏÏÏÏÏÏÏÏÏÏÏÏÏÏ 370,112 98,181 Ì 468,293 241,853
Financial assets ÏÏÏÏÏÏÏÏÏÏÏÏÏÏÏÏÏ 37,772 Ì Ì 37,772 19,508
Total Ñxed assets ÏÏÏÏÏÏÏÏÏÏÏÏÏ 1,248,167 147,371 78,616 1,474,154 761,337
Receivables ÏÏÏÏÏÏÏÏÏÏÏÏÏÏÏÏÏÏÏÏ 505,166 103,583 Ì 608,749 314,393
Inventory ÏÏÏÏÏÏÏÏÏÏÏÏÏÏÏÏÏÏÏÏÏÏ 305,996 89,968 Ì 395,964 204,498
Other current assets ÏÏÏÏÏÏÏÏÏÏÏÏÏ 132,196 28,286 5,903 166,385 85,931
PayablesÏÏÏÏÏÏÏÏÏÏÏÏÏÏÏÏÏÏÏÏÏÏÏ (291,722) (53,395) Ì (345,117) (178,238)
Other current liabilities ÏÏÏÏÏÏÏÏÏÏ (97,702) (39,459) Ì (137,161) (70,838)
Net working capital ÏÏÏÏÏÏÏÏÏÏÏ 553,934 128,983 5,903 688,820 355,746
Total capital employedÏÏÏÏÏÏÏÏÏ 1,811,201 276,354 84,519 2,172,074 1,121,783
Reserve for staÅ severanceindemnities ÏÏÏÏÏÏÏÏÏÏÏÏÏÏÏÏÏÏ 34,261 2,802 Ì 37,063 19,141
Reserve for risks and other charges 15,873 19,262 Ì 35,135 18,146
Long term liabilities ÏÏÏÏÏÏÏÏÏÏÏ 50,134 22,064 Ì 72,198 37,287
Cash and cash equivalentsÏÏÏÏÏÏÏÏ (87,859) (36,902) Ì (124,761) (64,434)
Short term debt ÏÏÏÏÏÏÏÏÏÏÏÏÏÏÏÏ 3,200 141,302 7,829 152,331 78,672
Long term debtÏÏÏÏÏÏÏÏÏÏÏÏÏÏÏÏÏ 648,434 7,093 148,006 803,533 414,990
Debt for acquisition of investments 504,714 Ì Ì 504,714 260,663
Pro forma debt ÏÏÏÏÏÏÏÏÏÏÏÏÏÏÏÏÏ 140,336 Ì Ì 140,336 72,478
Net Ñnancial positionÏÏÏÏÏÏÏÏÏÏ 1,208,825 111,493 155,835 1,476,153 762,369
Share capital ÏÏÏÏÏÏÏÏÏÏÏÏÏÏÏÏÏÏÏ 550,587 12,279 (12,279) 550,587 284,354
Other reserves ÏÏÏÏÏÏÏÏÏÏÏÏÏÏÏÏÏÏ 26,315 147,412 (147,412) 26,315 13,591
Pro forma related reservesÏÏÏÏÏÏÏÏ 19,002 Ì 93,874 112,876 58,296
Net loss for the year ÏÏÏÏÏÏÏÏÏÏÏÏ (44,139) (16,894) (5,499) (66,532) (34,361)
Shareholders' equity ÏÏÏÏÏÏÏÏÏÏÏ 551,765 142,797 (71,316) 623,246 321,880
Minority interests ÏÏÏÏÏÏÏÏÏÏÏÏÏÏÏ 477 Ì Ì 477 246
Total shareholders' equity andminority interests ÏÏÏÏÏÏÏÏÏÏÏ 552,242 142,797 (71,316) 623,723 322,126
Total liabilities and shareholders'equity ÏÏÏÏÏÏÏÏÏÏÏÏÏÏÏÏÏÏÏÏÏ 1,811,201 276,354 84,519 2,172,074 1,121,783
Memorandum of accountsÏÏÏÏÏÏÏÏ 46,058 Ì Ì 46,058 23,787
(1) Conversion from pound sterling to Lire is based on the exchange rate as announced by the European Central Bank on
December 31, 1998.
(2) You should see the notes to the Unaudited Pro Forma Combined Financial Statements for a description of the adjustments
made in these Ñnancial statements.
112
Brought to you by Global Reports

OUR MANAGEMENT
Our management is divided among the Company's Board of Directors (""Board of Directors'' or ""Board'')(Consiglio di Amministrazione) and our principal managers, who manage our day-to-day operations. Pursuant to theItalian Civil Code, we also have a supervisory body, the Board of Statutory Auditors (Collegio Sindacale). Althoughour bylaws permit our Board of Directors to appoint an executive committee, we have not done so.
Board of Directors
Pursuant to our bylaws, our Board of Directors may have between 3 and 13 members, elected by ourshareholders at a general meeting. At the last general shareholders' meeting on April 18, 2001, the following sevenmembers of the Board of Directors were elected:
Name Position Age(1) Term(2) Principal Activities(3)
Giuseppe De' Longhi(4) ÏÏÏ Chairman 62 2004 COB, Radel S.p.A.
Director, Climaveneta S.p.A
Director, Ergoklima S.p.A.
COB, De' Longhi Divisione Cucine S.p.A.
COB, Elba S.p.A.
Director, Simac-Vetrella S.p.A.
Fabio De' Longhi ÏÏÏÏÏÏÏÏ Vice Chairman 33 2004 Director, Kenwood Appliances plc
Director, Radel S.p.A.
Director, Climaveneta S.p.A.
Director, Ergoklima S.p.A.
Director, De' Longhi Divisione Cucine S.p.A.
Director, Elba S.p.A.
COB, Simac-Vetrella S.p.A.
COB, E-Services S.r.l.
COB, De' Longhi Canada Inc.
Director, De' Longhi Japan Corp.
Director, De' Longhi Ltd.
Director, De' Longhi Pinguino S.A.
Stefano Beraldo ÏÏÏÏÏÏÏÏÏÏ Managing Director 44 2004 Director, Kenwood Appliances plc
Director, Radel S.p.A.
Director, De' Longhi Divisione Cucine S.p.A.
Director, Elba S.p.A.
Director, De' Longhi Pinguino S.A.
Giorgio BrunettiÏÏÏÏÏÏÏÏÏÏ Independent Director 64 2004 Director, Autogrill S.p.A.
Director, Carraro S.p.A.
Director, Messaggerie Libri S.p.A.
Director, Campagnolo S.r.l.
Professor, Bocconi University
Carlo Garavaglia ÏÏÏÏÏÏÏÏÏ Independent Director 58 2004 COB, ON Banca S.p.A.
Vice Chairman, Banca Popolare Commercio e
Industria S.c.a r.l.
Vice Chairman of Board, Aedes S.p.A.
COB, Banques BPCI International S.A.
Director, AFV Acciaierie Beltrame S.p.A.
COB, OAM S.p.A.
PBSA, Apok πe Two S.p.A.
PBSA, Comitalia Compagnia Fiduciaria S.p.A.
113
Brought to you by Global Reports

Name Position Age(1) Term(2) Principal Activities(3)
Colin Gordon ÏÏÏÏÏÏÏÏÏÏÏÏ Director 54 2004 Director, Kenwood Appliances plc
Director, Kenwood Limited
Director, Kenwood International Limited
Director, Kenwood Marks Limited
Director, Kenwood Trustees Limited
Director, Kenwood Appliances (Australia)
(Pty) Ltd. - Australia
Director, Kenwood Appliances (Ireland)
Limited
Giorgio Sandri ÏÏÏÏÏÏÏÏÏÏÏ Director 56 2004 Director, Max Information S.r.l.
(1) At March 31, 2001.
(2) Term will end on the date of approval of the Ñnancial statements for the year ending December 31, 2003.
(3) ""COB'' in this table means Chairman of the Board and ""PBSA'' means President of the Board of Statutory Auditors.
(4) Giuseppe De' Longhi is the father of Fabio De' Longhi.
Election, Duties and Powers
Our directors are elected by a majority vote of our shareholders and each member of our Board is elected for amaximum term of three years. Directors may be re-elected for consecutive terms. Their oÇce may be revoked at anytime by shareholders entitled to vote at the general shareholders' meeting (though, if removed without cause, adirector may have a claim against us for damages). Directors may resign at any time by written notice to our Boardof Directors and the Chairman of the Board of Statutory Auditors. Vacancies may be Ñlled in accordance withexisting law, i.e., by resolution of the remaining Directors (with the approval of the Board of Statutory Auditors) untilthe next shareholders' meeting, at which time the appointment may be conÑrmed by the shareholders. In accordancewith our bylaws, if, in the case of an even number of Board members, half of our Board or if, in the case of an oddnumber of Board members, a majority resigns or otherwise cease to be Directors, the entire Board shall be removedand our Board of Statutory Auditors must promptly convene a shareholders' meeting to appoint a new Board.
Our Board elects the Chairman and the Vice Chairman of the Board of Directors if the Chairman and the ViceChairman of our Board are not elected by the shareholders at a shareholders' meeting. Our Board may also appointan executive committee, if any, composed of at least the Chairman of the Board and any Managing Director. Thisappointment or removal must be approved by a majority of the Directors present.
The Chairman of our Board presides over shareholder's meetings, convenes Board meetings, and supervises theexecution of our Board resolutions and our general administration. In the event of the absence of the Chairman or hisinability to act, the Chairman will be replaced by the Vice Chairman or another nominated director. In the event ofthe absence of the Chairman at a shareholder's meeting, the shareholders at the shareholder's meeting will nominatea substitute.
Our Board of Directors meets regularly, at least once every three months, and must meet at any time it isconvened by the Chairman or his substitute and by request of two members of our Board of Statutory Auditors. Ourshareholders determine, on an annual basis, director remuneration. The Directors may receive additional compensationas set by the Board of Directors, with the prior approval of the Board of Statutory Auditors, for particular additionalresponsibilities. Our Board may, from time to time, confer powers to perform speciÑed acts to one or more of itsmembers, the executive oÇcers, our employees, or to other persons. The Chairman, the Vice Chairman and eachother director is our legal representative (subject to the powers and activities conferred to them).
As of the date of this oÅering memorandum, our Chairman of the Board of Directors, Giuseppe De' Longhi,held, either directly or indirectly (through De' Longhi SoparÑ S.A.), 100.0% of our share capital. Upon theconsummation of the Global OÅering (assuming full exercise of the over-allotment option), Giuseppe De' Longhi isexpected to hold 66.8% of our share capital. Pursuant to a stock option plan approved by our Board on June 12, 2001,we may issue up to 7,500,000 options to certain of our employees and managers, subject to certain limitations,exercisable at a price equal to the oÅering price of the shares pursuant to the Global OÅering. As of the date of thisoÅering memorandum, Stefano Beraldo and Fabio De' Longhi held options to purchase 1,665,000 shares in theaggregate. You should refer to ""Our Principal Shareholders'' and ""Risk Factors Ì Risks Relating to the Companyand the Group Ì We are controlled by our principal shareholder''.
114
Brought to you by Global Reports

Description of our Principal Directors
Giuseppe De' Longhi is our controlling shareholder and Chairman of the Board of Directors. He began workingfor us soon after obtaining a business and economics degree from the Ca'Foscari University of Venice in 1962.Mr. De' Longhi is also Chairman of the Board of Directors and Director of other Group companies.
Stefano Beraldo has been our Managing Director and General Manager since 2000. Mr. Beraldo began his careerin the auditing and management consulting services. Prior to joining us, he also served as manager for the Benettongroup and as general manager of GS Euromercato S.p.A. Mr. Beraldo holds a business and economics degree fromthe Ca'Foscari University of Venice.
Fabio De' Longhi is the son of Mr. Giuseppe De' Longhi and has served as our Commercial and MarketingDirector since 1995. He was elected Vice Chairman of the Board of Directors in April 2001. Mr. De' Longhi beganhis career in Italy and in other foreign countries where he worked extensively in our Sales and Marketing oÇce. Heholds a business and economics degree from the Bocconi University in Milan. He is presently Vice Chairman of theBoard of Directors and a Director of various other Group companies.
Colin Gordon was elected to the Board of Directors in April 2001. Since 1997, he has been Chief ExecutiveOÇcer of Kenwood Appliances plc. Prior to that, he was President of Europe and Group Strategy Director forInternational Distillers and Vintners, Ltd.
Our Principal Managers
Our principal managers are responsible for, among other things, our day-to-day management and currentlyconsist of the following persons.
With Group asName Position Age(1) Manager since
Stefano Beraldo ÏÏÏÏÏÏÏÏÏÏ Managing Director 44 2000
Fabio De' Longhi ÏÏÏÏÏÏÏÏ Commercial and Marketing Director 33 1995
Giacomo BorinÏÏÏÏÏÏÏÏÏÏÏ Industrial Design Director 46 2000
Riccardo Bulian ÏÏÏÏÏÏÏÏÏÏ Production Director 37 2000
Vladimiro Carminati ÏÏÏÏÏÏ Sales and Marketing Director for Italy (air conditioning and 43 1999cooking appliances)
Giuseppe Catterin ÏÏÏÏÏÏÏÏ Head of Personnel 58 1987
Pier Luigi Cavicchi ÏÏÏÏÏÏÏ Logistics Director 39 2000
Francesco Cogliati ÏÏÏÏÏÏÏÏ Service Director 53 2000
Sergio Cogo ÏÏÏÏÏÏÏÏÏÏÏÏÏ Purchasing Director 48 1989
Caterina Del Turco ÏÏÏÏÏÏÏ Legal AÅairs Director 37 2001
Daniele Faccioni ÏÏÏÏÏÏÏÏÏ Information Technology Director 46 1996
Silvano Gatto ÏÏÏÏÏÏÏÏÏÏÏÏ International Sales and Marketing Director (household 48 1992appliances export division)
Giancarlo MarconiÏÏÏÏÏÏÏÏ R&D(2) Director (household appliances) 56 1985
Sergio Novello ÏÏÏÏÏÏÏÏÏÏÏ Marketing and Advertising Director 34 2000
Francesco Omiccioli ÏÏÏÏÏÏ Quality Control Director 38 2001
Franco Petten πoÏÏÏÏÏÏÏÏÏÏÏ Sales Director (small household appliances for Italy) 50 1990
Lorenza Scanferla ÏÏÏÏÏÏÏÏ Group Controller and Investor Relations Director 47 1995
Carlo SegatoÏÏÏÏÏÏÏÏÏÏÏÏÏ Strategy Director 49 1990
Paolo Solinas ÏÏÏÏÏÏÏÏÏÏÏÏ Sales and Marketing Director (air conditioning and home 56 1992system)
Sergio Zanolin ÏÏÏÏÏÏÏÏÏÏÏ R&D Director (air conditioning) 48 1988
Paolo ZanollaÏÏÏÏÏÏÏÏÏÏÏÏ R&D Director (radiators) 55 2001
(1) As of March 31, 2001.
(2) ""R&D'' in this table means Research & Development.
115
Brought to you by Global Reports

None of our principal managers holds, either directly or indirectly, any interests in De' Longhi or any of oursubsidiaries other than in connection with the stock option plan described under ""Ì Election, Duties and Powers.''
Description of our Principal Managers
Giacomo Borin has served as our Industrial Design Director since 2000, and has been with our group since 1990.Prior to joining us, he worked as industrial design manager at Zanussi Elettronica and Selecos S.p.A.
Riccardo Bulian has been our Production Director since 2000 and prior to that, he worked extensively in ourProduction OÇce. Prior to joining us, he worked as a production manager assistant at Ferriere Nord Pittini.Mr. Bulian holds a mechanical engineering degree from the University of Padua.
Vladimiro Carminati has been our Sales and Marketing Director for Italy (air conditioning and kitchen) since1999. Prior to joining us, Mr. Carminati worked in marketing at various other companies.
Giuseppe Catterin has been our Head of Personnel since 1987 and worked extensively in our human resourcesdepartment. Prior to joining us, he worked as personnel manager at Ialf and Ceramica Appiani. Mr. Catterin holds adegree in accounting from the Istituto Pio X of Treviso.
Pier Luigi Cavicchi has served as our Logistics Director since 2000 and has been with our group since 1996. Priorto joining us, he worked as logistics assistant at Messagerie Trasporti Nazionali and logistics manager at ConsorzioInteregionale Coop. di Consumo. Mr. Cavicchi holds a business and economics degree from Bologna University.
Francesco Cogliati has served as our Service Director since 2000. Prior to that, he worked as technical supportmanager at Candy S.p.A. and Gias S.r.l. and as technical support coordinator and sales assistant manager at WorwerkFolletto S.r.l.
Sergio Cogo has served as our Purchasing Director since 1989. Prior to joining us, he worked as a purchaser atZanussi S.p.A. Mr. Cogo holds a business and economics degree from the Ca' Foscari University of Venice.
Caterina Del Turco has served as our Legal AÅairs Director since 2001 and has worked with us since 1995. Priorto joining us, she worked as a lawyer and in the legal department of Marzotto S.p.A. Ms. Del Turco holds a lawdegree from Padua University and a degree in European Union law from the European College of Bruge.
Daniele Faccioni has served as our IT Director since 1996. Prior to joining us, he worked as senior IT managerat Andersen Consulting, as Managing Director at Metodo and as IT Director at Gruppo Grassetto. Mr. Faccioni holdsan engineering degree from Padua University.
Silvano Gatto has been our International Sales and Marketing Director (house appliances export division) since1995 and has been working with our group as a manager since 1992. He began working for us in sales in 1989. Priorto that, he worked in sales and marketing in various other companies.
Giancarlo Marconi has served as our R&D Director since 1985 and has worked with us since 1978. Prior tojoining us, he worked as a designer at Ferdinando Zoppas S.p.A. and as a technical support manager at ZanussiS.p.A.
Sergio Novello has been our Marketing and Advertising Director since 2000 and, prior to that, he worked as oneof our product managers. Prior to joining us, he served as a product manager at Carraro S.p.A. Mr. Novello holds anengineering degree from Padua University.
Francesco Omiccioli has served as our Quality Control Director since 2001. Prior to joining us, he worked asquality controller in other various companies. Mr. Omiccioli holds a management engineering degree from MilanPolytechnic University.
Franco Petten πo has been our Marketing Director (household appliances) since 2000 and, prior to that, he workedextensively as a manager in our Marketing OÇce. Prior to joining us, Mr. Petten πo served as marketing and businessmanager at Etas Kompass and Rank Xerox S.p.A.
Lorenza Scanferla has served as our Group Controller and Investor Relations Director since 1995. Prior tojoining us, she worked as group controller and reporting manager at Ferruzzi Finanziaria S.p.A. and as planningmanager and group controller at Stefanel S.p.A. Ms. Scanferla holds a business and economics degree from the Ca'Foscari University of Venice.
Carlo Segato has been our Strategy Director since 2000. Prior to joining us in 1990, he held various managerialposts in the marketing oÇce at Zanussi S.p.A. and Eco Italia. Mr. Segato holds a philosophy degree from PaduaUniversity.
116
Brought to you by Global Reports

Paolo Solinas has served as our Sales and Marketing Director (Air Conditioning and Home System) since 1992.Prior to joining us, he worked as sales and marketing manager at Rank Xerox, Bellato and Errevi. Mr. Solinas holds aphysics degree from Cagliari University.
Sergio Zanolin has been our R&D Director (Air Conditioning) since 1988. Prior to joining us, he served asR&D project manager at Ross S.p.A. and as technical manager at Pozzi Energie S.p.A.
Paolo Zanolla has been our R&D Director (Radiators) since 2001. He began working for us as a member of ourR&D team in 1982. Prior to joining us, Mr. Zanolla served as lab R&D assistant at IRE S.p.A. and Gas Fire S.p.A.
Description of Certain Other Group Managers
Philippe Crevoisier, age 43, has served as Managing Director of Ariete S.p.A. since 1995 and as Sales andMarketing Director of Kenwood Appliances plc since 2000. Mr. Crevoisier is also Chairman of the Board of ArieteS.p.A.
Dario Mel πo, age 44, currently serves as Managing Director of Simac-Vetrella S.p.A., as Director of Sile CorpiScaldanti S.r.l. and as Chairman of the Board of La Supercalor S.p.A. Mr. Mel πo holds a business and economicsdegree from the University of Bologna.
Antonio Pilati, age 52, currently serves as Managing Director of Elba S.p.A. and as a Director of De' LonghiDivisione Cucine S.p.A., and prior to that, he served as Technical Manager at Elba S.p.A. Before joining us, Mr.Pilati worked extensively in the R&D division of various other companies. He holds an economics degree from theUniversity of Padua.
Silvio Sartori, age 60, is Managing Director and Chairman of the Board of Climaveneta S.p.A. and ErgoklimaS.p.A., and prior to that, he worked as a manager in various other companies of our Group. Mr. Sartori holds aneconomics degree from the University of Padua.
Board of Statutory Auditors
Our Board of Statutory Auditors has a duty to shareholders (to whom it reports), to us and to our creditors.Pursuant to Italian law, as amended by the Draghi Law (you should refer to""Description of Share Capital''), ourBoard of Statutory Auditors must oversee our compliance with applicable laws and our bylaws, our properadministration, the adequacy of internal controls and accounting reporting systems as well as the adequacy ofprovisions concerning the supply of information by our subsidiaries. The Board of Statutory Auditors must promptlyreport any irregularities to CONSOB and is also required to report speciÑc matters to our shareholders and, ifnecessary, to the relevant court. Our Directors are obliged to report to the Board of Statutory Auditors promptly, inaccordance with the provisions of our bylaws and at least quarterly, regarding material activities and transactionscarried out by us. Any member of the Board of Statutory Auditors may request information directly from us and anytwo members of the Board of Statutory Auditors may convene meetings of the shareholders, of the Board of Directorsor of the Executive Committee seek information on our management from the Directors, carry out inspections andveriÑcations at the Company and exchange information with our external auditors. The members of the Board ofStatutory Auditors are required to be present at meetings of the Board of Directors and shareholders' meetings.Pursuant to our bylaws, the Board of Statutory Auditors is composed of the Chairman, two standing members andtwo alternate members. Statutory Auditors are appointed by the shareholders (on the basis of lists presented byshareholders holding at least 2% of our voting capital) at the shareholders' general meeting for a three-year term andmay be re-elected for subsequent terms. The general shareholders' meeting also determines the Statutory Auditors'remuneration for their entire term.
117
Brought to you by Global Reports

Current members of our Board of Statutory Auditors, who were appointed at the shareholders' meeting onApril 18, 2001 and who will remain in oÇce until the shareholders' meeting to approve our consolidated Ñnancialstatements for the year ending December 31, 2003, are as follows:
Name Position Age(1) Term(2) Principal Activity(3)
Gianluca Ponzellini ÏÏÏÏÏÏÏ President 54 2004 PBSA, Banca Intesa S.p.A.PBSA, Autogrill S.p.A.MBSA, Caretti & Associati S.p.A.MBSA, Euromobiliare Asset Managements SGRS.p.A.Director, Schema 28 S.p.A. (Gruppo EdizioneHolding S.p.A.)
Giancarlo MalerbaÏÏÏÏÏÏÏÏ Standing Member 40 2004 Director, Aedes S.p.A.MBSA, DB Asicura S.p.A.MBSA, Finanza & Futuro S.p.A.MBSA, Finanza & Futuro Consulenza S.I.M.PBSA, Immobiliare Indra S.p.A.MBSA, De' Longhi Divisione Cucine S.p.A.
Massimo Lanfranchi ÏÏÏÏÏÏ Standing Member 50 2004 PBSA, Industrie Confezioni Tessili S.p.A.PBSA, Luciano Mercato S.r.l. Tessuto perL'ArredamentoMBSA, Associazione Calcio Venezia 1907 S.r.l.PBSA, Ca' Da Mosto S.r.l.PBSA, Venezia Infomatica e Sistemi-VenisS.p.A.PBSA, Briot Italia S.p.A.PBSA, Societ fia Organismi di Attestazione EuroS.p.A.
Emilio Ettore GnechÏÏÏÏÏÏ Alternate 39 2004 Director, Aedes S.p.A.Member PBSA, Agilent Technologies Italia S.r.l.
MBSA, Liguria -- Societ fia di AssicurazioneS.p.A.MBSA, Ligura Vita S.p.A.PBSA, Messaggerie Musicali S.p.A.MBSA, Riello Condizionatori Gruppo GiordanoRiello S.p.A.PBSA, Rubatino 87 S.r.l.
Francesco Nobili ÏÏÏÏÏÏÏÏÏ Alternate 38 2004 MBSA, Ceccato Aria Compressa S.p.A.Member MBSA, Edizioni Suvini Zerboni S.p.A.
PBSA, Fulcron S.p.A.MBSA, Messaggerie Musicali S.p.A.MBSA, Sony Music Entert (Italy) S.p.A.PBSA, Vismara S.r.l.
(1) At March 31, 2001.
(2) Term will end on the date of approval of the Ñnancial statements for the year ending December 31, 2003.
(3) ""PBSA'' in this table refers to President of the Board of Statutory Auditors and ""MBSA'' refers to Member of the Board of Statutory
Auditors.
As of March 31, 2001, no members of our Board of Statutory Auditors held, either directly or indirectly, anyshares in De' Longhi or any of its subsidiaries.
118
Brought to you by Global Reports

Executive compensation
The table below shows the compensation paid by us and our consolidated subsidiaries to our directors, themembers of our Board of Statutory Auditors and to our General Manager for the year ended December 31, 2000:
Other Group TotalName Position De' Longhi S.p.A. members Compensation
(Lit.)
Giuseppe De' Longhi ÏÏÏÏÏ Chairman of the Board of Directors 600,000,000 20,000,000 620,000,000
Fabio De' Longhi ÏÏÏÏÏÏÏÏ Vice Chairman of the Board of Directors, 276,300,000(1) 41,317,000 317,617,000Commercial and Marketing Manager
Stefano Beraldo ÏÏÏÏÏÏÏÏÏÏ Managing Director, General Manager 380,262,000(2) Ì 380,262,000
Giorgio BrunettiÏÏÏÏÏÏÏÏÏÏ Independent Director Ì Ì Ì
Carlo Garavaglia ÏÏÏÏÏÏÏÏÏ Independent Director 87,100,000(3) Ì 87,100,000
Colin Gordon(4) ÏÏÏÏÏÏÏÏÏÏ Director Ì Ì Ì
Giorgio Sandri ÏÏÏÏÏÏÏÏÏÏÏ Director 15,000,000 Ì 15,000,000
Gianluca Ponzellini(5) ÏÏÏÏÏ President, Statutory Auditors Ì Ì Ì
Massimo Lanfranchi(5) ÏÏÏÏ Member, Statutory Auditors Ì Ì Ì
Giancarlo Malerba(5)ÏÏÏÏÏÏ Member, Statutory Auditors 58,500,000 10,200,000 68,700,000
Emilio Ettore Gnech(5)ÏÏÏÏ Alternate Ì Ì Ì
Francesco Nobili(5) ÏÏÏÏÏÏÏ Alternate Ì Ì Ì
(1) Of which Lit. 261,300,000 is attributable to Mr. De' Longhi's role as our Commercial and Marketing Manager.
(2) Of which Lit. 330,262,000 is attributable to Mr. Beraldo's role as our General Manager from July to December 2000.
(3) Related to Mr. Garavaglia's prior role as President of our Board of Statutory Auditors.
(4) Nominated at our shareholder's meeting on April 18, 2001 and therefore, did not receive compensation in 2000.
(5) Nominated at our shareholders' meeting on April 18, 2001. The aggregate amount of compensation paid by us during the Ñscal year ended
December 31, 2000 to members of our Board of Statutory Auditors was approximately Lit. 860 million.
Shareholdings of Our Directors, Statutory Auditors and Principal Management
As of the date of this oÅering memorandum, our Chairman of the Board of Directors, Giuseppe De' Longhi,held, either directly or indirectly (through De' Longhi SoparÑ S.A.), 100.0% of our share capital. Upon theconsummation of the Global OÅering (assuming full exercise of the over-allotment option), Giuseppe De' Longhi isexpected to hold 66.87% of our share capital. Pursuant to a stock option plan approved by our Board on June 12,2001, we may issue up to 7,500,000 stock options to certain of our employees and managers, subject to certainlimitations, exercisable at a price equal to the oÅering price of the shares pursuant to the Global OÅering. Inaccordance with the plan, 50% of the stock options will be exercisable as of January 1, 2004, and the remaining stockoptions may be exercised beginning January 1, 2005. Stefano Beraldo and Fabio De' Longhi were granted and held, asof the date of this oÅering memorandum, options to purchase 1,665,000 shares in the aggregate. As of the date of thisoÅering memorandum, no other members of our Board of Directors, Board of Statutory Auditors or principalmanagement held any direct interest in the Company. You should refer to ""Our Principal Shareholders'' and ""RiskFactors Ì Risks Relating to the Company and the Group Ì We are controlled by our principal shareholder''.
119
Brought to you by Global Reports

OUR PRINCIPAL SHAREHOLDERS
As of the date of this oÅering memorandum, De' Longhi SoparÑ S.A. (a Luxembourg companyindirectly controlled by Giuseppe De' Longhi through a trust arrangement) holds 111,999,660 shares, or99.99%, of our issued share capital. Giuseppe De' Longhi directly holds the remaining 340 shares, or0.01%, of our share capital. After the Global OÅering (assuming full exercise of the over-allotmentoption), Giuseppe De' Longhi will hold directly or indirectly 73.08% of our authorized and issued shares.Accordingly, he will continue to control the Group. You should refer to ""Risk Factors Ì We arecontrolled by our principal shareholder''.
The interests of Giuseppe De' Longhi in De' Longhi SoparÑ S.A. are indirectly held through theLong E Trust, a trust organized under the laws of Jersey. Pursuant to the trust arrangement, PirunicoTrustees (Jersey) Limited acts as trustee on behalf of the beneÑciary, Giuseppe De' Longhi. The trusteehas full discretionary power to manage the assets held by the trust, provided that it exercises such powers(including the exercise of voting rights) in the interest of the beneÑciary.
In addition, Giuseppe De' Longhi is the Chairman of the Board of Directors. Fabio De' Longhi, theson of Giuseppe De' Longhi, is the Vice Chairman of the Board of Directors and the Commercial andMarketing Manager of the Company.
As part of our restructuring process in 2000, we acquired certain companies controlled directly andindirectly by Giuseppe De' Longhi, our principal shareholder, for an aggregate amount equal toLit. 538,889 million. You should refer to ""Business Ì Restructuring''. The purchase contracts for thecompanies we acquired provided for a down-payment of Lit. 34,175 million and approximately Lit. 504,714million in interest-free debt. On April 23, 2001, we paid down Lit. 320,600 million of the interest-freedebt. We are required to repay the balance of such debt (Lit. 158,304 million) on December 31, 2001.
The Company has granted to Merrill Lynch International and to UniCredit Banca Mobiliare (for thebeneÑt of the underwriters) an option to purchase up to 3,750,000 additional shares to cover any over-allotments. This option may be exercised from the date of determination of the oÅering price until 30 daysafter the commencement of trading of the shares on the Telematico. You should refer to ""Plan ofDistribution''.
The following table sets forth certain information, as of the date of this oÅering memorandum and asadjusted to reÖect the sale by De' Longhi of between 37,500,000 and 41,250,000 shares oÅered in theGlobal OÅering, with respect to the beneÑcial ownership of shares by (i) each person who is the beneÑcialowner of two percent or more of the outstanding shares, (ii) each director or person who has agreed tobecome a director of De' Longhi and (iii) all executive oÇcers and directors of De' Longhi.
Percentage Percentage of Outstanding Percentage ofOutstanding of Share Outstanding Share Shares Owned Share Capital
Shares Owned Capital Shares Capital After Exercise After ExerciseBefore the Owned Before Owned After After the of Over- of Over-
Global the Global the Global Global Allotment AllotmentShareholder OÅering OÅering OÅering OÅering Option(1) Option(1)
De' Longhi SoparÑS.A.(2) ÏÏÏÏÏÏÏÏÏÏÏÏ 111,999,660 99.99% 111,999,660 74.92% 111,999,660 73.08%
Giuseppe De' Longhi ÏÏ 340 0.01% 340 0.01% 340 0.01%
De' Longhi S.p.A ÏÏÏÏÏ Ì Ì Ì Ì Ì Ì
Institutional InvestorsÏÏ Ì Ì 27,900,000 18.66% 31,650,000 20.65%
Public in ItalyÏÏÏÏÏÏÏÏ Ì Ì 9,600,000 6.42% 9,600,000 6.26%
TotalÏÏÏÏÏÏÏÏÏÏÏÏÏÏÏÏ 112,000,000 100.00% 149,500,000 100.00% 153,250,000 100.00%
(1) Assuming exercise of the over-allotment option in full.
(2) Giuseppe De' Longhi controls De' Longhi SoparÑ S.A.
Each of the Company and De' Longhi Soparfi S.A. has agreed to certain restrictions relating to the issueor sale or other disposal of shares or other securities convertible or exchangeable into the shares, subject tocertain exceptions, during the period extending up to and including the date falling 180 days after the first dayof trading of the shares on the Telematico. You should refer to ""Plan of Distribution''.
120
Brought to you by Global Reports

CERTAIN TRANSACTIONS WITH RELATED PARTIES
The following is a description of transactions since January 1998 to which we or our subsidiaries havebeen a party, and in which any of our directors, executive oÇcers or holders of more than 5% of ourcapital stock (or any of such person's immediate family members) had or will have a direct materialinterest, other than compensation arrangements which are otherwise described under ""Our Management''.
General
We have entered into a number of contracts that are important to our business and which werenegotiated between parties under common control. Although we believe that these contracts are fair to usin all material respects, it is possible that we might have obtained more favorable terms from independentthird parties. In particular, as part of our restructuring process in 2000, we agreed to sell to aÇliatedcompanies outside our Group all of the share capital of Immobiliare Findomestic S.r.l., De' LonghiRadiators S.r.l., DL Canada Distributors Inc., 850721 Ontario Ltd. and I.S.C. Ì Industrie Scambiatoridi Calore S.p.A., together with a controlling interest (equal to 60% of its share capital) of Nauta S.r.l.You should also refer to ""Our Business Ì Restructuring''.
Following the Global OÅering, we expect to continue to have certain contractual and other businessrelationships with aÇliated parties, principally as part of the normal course of our business. We expect thatthe terms of such agreements will be no less favorable to us than the terms we could obtain in comparabledealings with unrelated third parties.
Transactions with Related Parties Involving Transfers of Group Securities
Since 1998, we have eÅected a series of transactions with related parties intended to rationalize ourorganizational structure and include in our consolidated group certain companies which, although part ofour core businesses, were directly and indirectly controlled by our principal shareholder, Giuseppe De'Longhi. In particular, several of those companies were acquired by us in 2000 as part of our restructuringin anticipation of our initial public oÅering. We acquired through our wholly-owned subsidiary De' LonghiPinguino S.A., a controlling interest in each of De' Longhi Divisione Cucine S.p.A. (including its wholly-owned subsidiary Elba S.p.A.), DL Radiators S.p.A. (including its consolidated subsidiaries Radel S.p.A.and De' Longhi Clima Polska Sp.Zo.o), Climaveneta S.p.A. (including its consolidated subsidiariesErgoklima S.p.A., in which it held 70% of the share capital, Climaveneta Deutschland GmbH) andMicromax S.p.A., together with 30% of the share capital of Ergoklima S.p.A., for an aggregate amountequal to Lit. 538,889 million (or approximately 4278,313 thousand). The purchase contracts for thecompanies we acquired provided for a down-payment of Lit. 34,175 million and approximately Lit. 504,714million in interest-free debt. On April 23, 2001, we paid down Lit. 320,600 million of the interest-freedebt. We are required to repay the balance of such debt (Lit. 158,304 million) on December 31, 2001.
In addition, as part of the restructuring process, we sold to related parties certain companies which webelieved were no longer strategic to our core businesses for an aggregate amount equal to Lit. 32,301million (or approximately 416,682 thousand). This included the sale of all of the share capital ofImmobiliare Findomestic S.r.l., De' Longhi Radiators S.r.l., DL Canada Distributors Inc., 850721 OntarioLtd. and I.S.C. Ì Industrie Scambiatori di Calore S.p.A., together with a controlling interest (equal to60% of its share capital) of Societ fia Nauta S.r.l.
During the past three years, we have entered into the following transactions (which include thepurchases referred to above) involving the purchase and sale of capital stock of the Company orcompanies successively purchased by the Group:
‚ On November 9, 2000, De' Longhi S.p.A. purchased 1% of the capital stock of EÅeplast S.p.A.from Elba S.p.A. for Lit. 58 million.
‚ On December 18, 2000, Mr. Giorgio Sandi (one of the members of our Board of Directors),together with an unaÇliated Italian company, purchased 1% of the capital stock of MaxInformation S.r.l. from De' Longhi S.p.A. for Lit. 175 million each, or Lit. 350 million in theaggregate.
‚ On December 20, 2000, DL Radiators S.p.A. purchased 100% of the capital stock of De' LonghiClima Polska Sp.Zo.o from De' Longhi Radiators S.r.l. for 4,000 Polish Zloty, or approximatelyLit. 2 million.
121
Brought to you by Global Reports

‚ On December 21, 1998, De' Longhi SoparÑ S.A. (a company controlled by Giuseppe De' Longhi)purchased 90% of the capital stock of Climaveneta S.p.A. from De' Longhi S.p.A. for Lit. 75,000million.
‚ On December 21, 1998, De' Longhi SoparÑ S.A. purchased 30% of the capital stock of ErgoklimaS.p.A. from De' Longhi S.p.A. for Lit. 13,500 million.
‚ On December 22, 2000, DL Radiators S.p.A. purchased 100% of the capital stock of VESHeiztechnik Vertrieb GmbH from De' Longhi Radiators S.r.l. for approximately Lit. 2,102million.
‚ On December 28, 1999, De' Longhi SoparÑ S.A. purchased 100% of the capital stock ofMicromax-Simac S.r.l. from De' Longhi S.p.A. for Lit. 500,000 million.
‚ On December 28, 2000, De' Longhi Pinguino S.A. purchased 91.66% of the capital stock of SileCorpi Scaldanti S.r.l. from De' Longhi S.p.A. for Lit. 5,000 million.
‚ On December 28, 2000, Saturno S.A. (a Luxembourg company controlled by GiuseppeDe' Longhi) purchased 100% of the capital stock of De' Longhi Canada Distributors Inc. fromDe' Longhi S.p.A. for Lit. 1 million.
‚ On December 28, 2000, Saturno S.A. purchased 100% of the capital stock of 850721 Ontario Ltd.from De' Longhi Pinguino S.A. (our Luxembourg subsidiary) for two Canadian dollars.
‚ On December 28, 2000, De' Longhi Pinguino S.A. purchased 100% of the capital stock ofMicromax S.p.A. from De' Longhi SoparÑ S.A., for 12.8 million, or approximately Lit. 39,718million. The price of the acquisition was based on an independent appraisal speciÑcally conductedfor this purpose. As of the date of this oÅering memorandum, we have paid Lit. 27,482 million ofthe purchase price and will pay the balance (equal to Lit. 12,236 million) on or prior toDecember 31, 2001.
‚ On December 28, 2000, De' Longhi Pinguino S.A. purchased 30% of the capital stock ofErgoklima S.p.A. from De' Longhi SoparÑ S.A., for 428 million, or approximately Lit. 54,215million. The price of the acquisition was based on an independent appraisal speciÑcally conductedfor this purpose. As of the date of this oÅering memorandum, we have paid Lit. 38,725 million ofthe purchase price and will pay the balance (equal to Lit. 15,490 million) on or prior toDecember 31, 2001.
‚ On December 28, 2000, De' Longhi Pinguino S.A. purchased 99.92% of the capital stock of DLRadiators S.p.A. from Xarroco -Marketing and Investmentos Ltda (a company controlled byGiuseppe De' Longhi), for 450 million, or approximately Lit. 96,426 million. The price of theacquisition was based on an independent appraisal speciÑcally conducted for this purpose. As ofthe date of this oÅering memorandum, we have paid Lit. 67,769 million of the purchase price andwill pay the balance (equal to Lit. 28,657 million) on or prior to December 31, 2001.
‚ On December 28, 2000, De' Longhi Pinguino S.A. purchased 90% of the capital stock ofClimaveneta S.p.A. from De' Longhi SoparÑ S.A., for 4143 million, or approximately Lit. 276,887million. The price of the acquisition was based on an independent appraisal speciÑcally conductedfor this purpose. As of the date of this oÅering memorandum, we have paid Lit. 191,691 million ofthe purchase price and will pay the balance (equal to Lit. 85,196 million) on or prior toDecember 31, 2001.
‚ On December 28, 2000, De' Longhi Pinguino S.A. purchased 99.99% of the capital stock ofDe' Longhi Divisione Cucine S.p.A. from De' Longhi SoparÑ S.A., for 437 million, orapproximately Lit. 71,642 million. The price of the acquisition was based on an independentappraisal speciÑcally conducted for this purpose. As of the date of this oÅering memorandum, wehave paid Lit. 54,917 million of the purchase price and will pay the balance (equal to Lit. 16,725million) on or prior to December 31, 2001.
‚ On December 28, 2000, Saturno S.A. purchased 100% of the capital stock of Italia Distribuidorade Eletrodom πesticos Ltda from De' Longhi S.p.A. for U.S.$1.
‚ On December 28, 2000, Saturno S.A. purchased 99% of the capital stock of De' Longhi RadiatorsS.r.l. from De' Longhi S.p.A. for Lit. 4,158 million.
122
Brought to you by Global Reports

‚ On December 28, 2000, Saturno S.A. purchased 1% of the capital stock of De' Longhi RadiatorsS.r.l. from Micromax S.p.A. for Lit. 42 million.
‚ On December 28, 2000, Saturno S.A. purchased 60% of the capital stock of Societ fia Nauta S.r.l.from De' Longhi S.p.A. for Lit. 1,800 million.
‚ On December 28, 2000, De' Longhi SoparÑ S.A. purchased 10% of the capital stock of I.S.C. ÌIndustrie Scambiatori di Calore S.p.A. from Micromax S.p.A. for Lit. 2,000 million.
‚ On December 28, 2000, De' Longhi SoparÑ S.A. purchased 90% of the capital stock of I.S.C. ÌIndustrie Scambiatori di Calore S.p.A. from Ergoklima S.r.l. for Lit. 18,000 million.
‚ On December 28, 2000, Saturno S.A. purchased 1% of the capital stock of ImmobiliareFindomestic S.r.l. from De' Longhi S.p.A. for Lit. 63 million.
‚ On December 28 2000, Saturno S.A. purchased 99% of the capital stock of ImmobiliareFindomestic S.r.l. from Elba S.p.A. for Lit. 6,237 million.
Bonds
During the last three years, as shown in the following table, the Group repaid certain bonds issued byDe' Longhi S.p.A.:
Issuer Amount (Lire) Subscribed By Maturity Repayment
De' Longhi S.p.A. ÏÏÏÏÏÏÏÏÏÏÏÏÏÏÏÏ 9,900,000,000 Various members of the 1998 1998De' Longhi family
De' Longhi S.p.A. ÏÏÏÏÏÏÏÏÏÏÏÏÏÏÏÏ 269,000,000,000 Giuseppe De' Longhi(1) 2007 2000
De' Longhi S.p.A. ÏÏÏÏÏÏÏÏÏÏÏÏÏÏÏÏ 8,000,000,000 Giuseppe De' Longhi 2006 1999
De' Longhi S.p.A. ÏÏÏÏÏÏÏÏÏÏÏÏÏÏÏÏ 48,000,000,000 De' Longhi SoparÑ S.A.(2) 2005 2000
(1) Following the spin-oÅ of De' Longhi S.p.A., a portion of the bond was transferred to De' Longhi Divisione Cucine S.p.A.
and to Divisione Radiatori S.p.A., which repaid the bonds transferred to them during the course of 2000.
(2) Directly and indirectly owned and controlled by Giuseppe De' Longhi.
Other Transactions
Leases of Company Divisions and Services
Pursuant to a lease agreement dated October 1, 1995 between De' Longhi Radiators S.r.l. (acontrolled subsidiary of De' Longhi S.p.A.) and DL Radiators S.p.A., we leased the heating productsdivision (Divisione Corpi Scaldanti) of DL Radiators S.p.A., which at the time was not part of ourconsolidated group, in order to market our heating products. Subsequently, on March 31, 2000, De' LonghiRadiators S.r.l. and DL Radiators S.p.A. mutually terminated the lease agreement and De' LonghiRadiators S.r.l. agreed not to compete with DL Radiators S.p.A. with respect to activities that areidentical or similar to those carried out by its heating products division (Divisione Corpi Scaldanti) for aperiod of Ñve years ending on March 31, 2005. In addition, De' Longhi Radiators S.r.l. agreed to payLit. 1.2 billion to DL Radiators S.p.A. as estimated reimbursement costs for certain expenses paid by DLRadiators S.p.A. on behalf of De' Longhi Radiators S.r.l. with respect to the Ñrst three months of 2000.
Pursuant to a lease agreement dated January 14, 2000 between De' Longhi S.p.A. and E-ServicesS.r.l. (a 51% controlled subsidiary of De' Longhi S.p.A.), E-Services S.r.l. agreed to provide certaincomputer services to members of the Group. The lease agreement, which expires on December 31, 2001,provides for the use of SAP program licenses and includes an annual payment to E-Services S.r.l. ofLit. 1,250 million.
Assignment of trademarks
On July 3, 2000, Simac-Vetrella S.p.A. assigned all of its trademarks and distinctive logos, includingthe Simac and Vetrella trademarks, to De' Longhi Nederland B.V. (a controlled subsidiary of De' LonghiS.p.A.). Pursuant to the agreement, the consideration paid to Simac-Vetrella S.p.A. for the assignment ofthe trademarks and logos (which was based on an independent appraisal speciÑcally conducted for thispurpose) was equal to Lit. 12,000 million.
123
Brought to you by Global Reports

Mergers and Spin-OÅs
On March 13, 2000, Mizushi Italia S.r.l., Rodia S.r.l. and IMCA Italia S.r.l. were merged into ArieteS.p.A.
On March 17, 2000, Divisione Radiatori S.p.A. was merged into Finsanmarco Di.val. S.r.l. (anindirectly controlled subsidiary owned by Giuseppe De' Longhi). Finsanmarco Di.val S.r.l., the survivingcompany, was simultaneously transformed into a joint-stock corporation and changed its named to DLRadiators S.p.A.
On January 16, 2001, Simac-Vetrella S.p.A. was merged into EÅeplast S.r.l. (a wholly ownedsubsidiary of De' Longhi S.p.A.). The surviving company was simultaneously transformed into a joint-stock corporation and changed its name to Simac-Vetrella S.p.A.
124
Brought to you by Global Reports
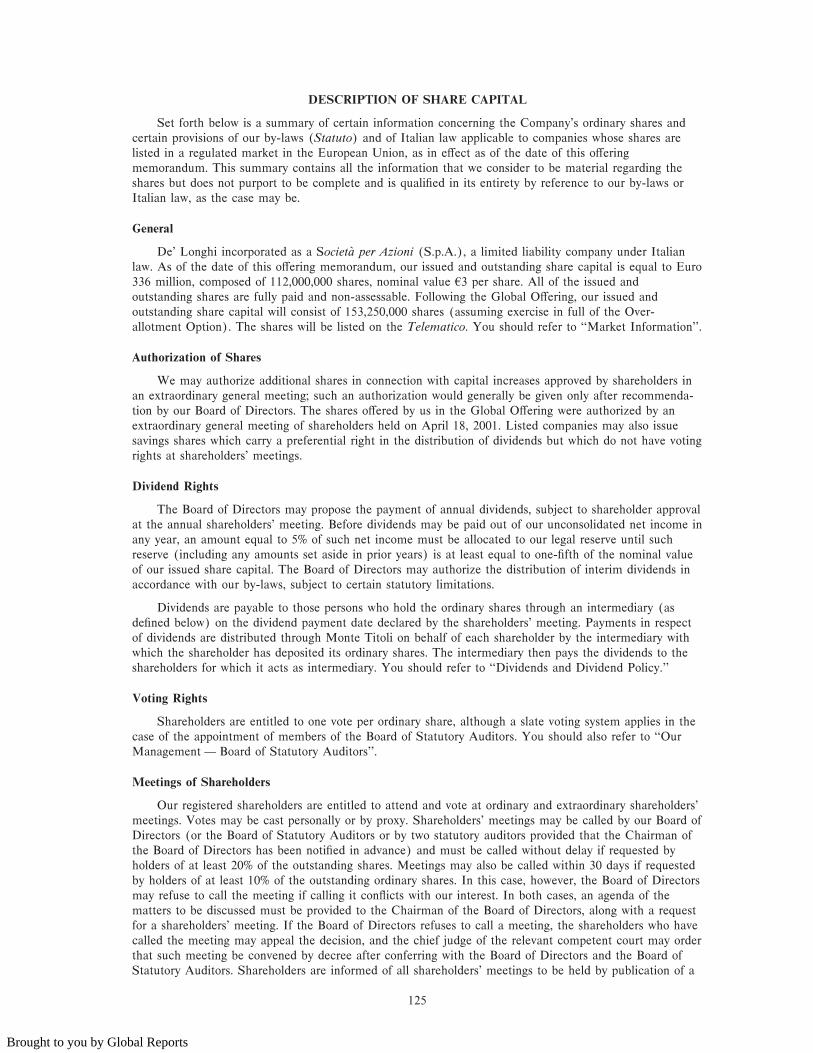
DESCRIPTION OF SHARE CAPITAL
Set forth below is a summary of certain information concerning the Company's ordinary shares andcertain provisions of our by-laws (Statuto) and of Italian law applicable to companies whose shares arelisted in a regulated market in the European Union, as in eÅect as of the date of this oÅeringmemorandum. This summary contains all the information that we consider to be material regarding theshares but does not purport to be complete and is qualiÑed in its entirety by reference to our by-laws orItalian law, as the case may be.
General
De' Longhi incorporated as a Societ fia per Azioni (S.p.A.), a limited liability company under Italianlaw. As of the date of this oÅering memorandum, our issued and outstanding share capital is equal to Euro336 million, composed of 112,000,000 shares, nominal value 43 per share. All of the issued andoutstanding shares are fully paid and non-assessable. Following the Global OÅering, our issued andoutstanding share capital will consist of 153,250,000 shares (assuming exercise in full of the Over-allotment Option). The shares will be listed on the Telematico. You should refer to ""Market Information''.
Authorization of Shares
We may authorize additional shares in connection with capital increases approved by shareholders inan extraordinary general meeting; such an authorization would generally be given only after recommenda-tion by our Board of Directors. The shares oÅered by us in the Global OÅering were authorized by anextraordinary general meeting of shareholders held on April 18, 2001. Listed companies may also issuesavings shares which carry a preferential right in the distribution of dividends but which do not have votingrights at shareholders' meetings.
Dividend Rights
The Board of Directors may propose the payment of annual dividends, subject to shareholder approvalat the annual shareholders' meeting. Before dividends may be paid out of our unconsolidated net income inany year, an amount equal to 5% of such net income must be allocated to our legal reserve until suchreserve (including any amounts set aside in prior years) is at least equal to one-Ñfth of the nominal valueof our issued share capital. The Board of Directors may authorize the distribution of interim dividends inaccordance with our by-laws, subject to certain statutory limitations.
Dividends are payable to those persons who hold the ordinary shares through an intermediary (asdeÑned below) on the dividend payment date declared by the shareholders' meeting. Payments in respectof dividends are distributed through Monte Titoli on behalf of each shareholder by the intermediary withwhich the shareholder has deposited its ordinary shares. The intermediary then pays the dividends to theshareholders for which it acts as intermediary. You should refer to ""Dividends and Dividend Policy.''
Voting Rights
Shareholders are entitled to one vote per ordinary share, although a slate voting system applies in thecase of the appointment of members of the Board of Statutory Auditors. You should also refer to ""OurManagement Ì Board of Statutory Auditors''.
Meetings of Shareholders
Our registered shareholders are entitled to attend and vote at ordinary and extraordinary shareholders'meetings. Votes may be cast personally or by proxy. Shareholders' meetings may be called by our Board ofDirectors (or the Board of Statutory Auditors or by two statutory auditors provided that the Chairman ofthe Board of Directors has been notiÑed in advance) and must be called without delay if requested byholders of at least 20% of the outstanding shares. Meetings may also be called within 30 days if requestedby holders of at least 10% of the outstanding ordinary shares. In this case, however, the Board of Directorsmay refuse to call the meeting if calling it conÖicts with our interest. In both cases, an agenda of thematters to be discussed must be provided to the Chairman of the Board of Directors, along with a requestfor a shareholders' meeting. If the Board of Directors refuses to call a meeting, the shareholders who havecalled the meeting may appeal the decision, and the chief judge of the relevant competent court may orderthat such meeting be convened by decree after conferring with the Board of Directors and the Board ofStatutory Auditors. Shareholders are informed of all shareholders' meetings to be held by publication of a
125
Brought to you by Global Reports

notice in the Italian OÇcial Gazette (Gazzetta UÇciale) at least 30 days before the date Ñxed for themeeting subject to certain exceptions provided under Italian law. The notice is also published in at leasttwo national daily newspapers, as recommended by CONSOB.
Ordinary shareholders' meetings must be convened at least once a year to approve the annual Ñnancialstatements of the Company. Such meetings must be held within four months (or, in certain circumstances,six months) of the end of the previous Ñscal year. At these ordinary meetings, shareholders may:
‚ resolve upon and approve the distribution of dividends;
‚ appoint and elect the Board of Directors and the Board of Statutory Auditors;
‚ determine the remuneration of Directors and Statutory Auditors;
‚ vote on the alleged liability of the Directors and Statutory Auditors; and
‚ vote on any other business matter submitted by the directors or reserved for the vote of theshareholders' meeting under applicable law or our by-laws.
Extraordinary shareholders' meetings may be called to vote on proposed amendments to the by-laws,capital increases, mergers, consolidations, demergers, issuance of debentures, appointment of liquidatorsand similar extraordinary actions. The notice of a shareholders' meeting generally speciÑes two meetingdates (or ""calls'') and may specify three calls for extraordinary shareholders' meetings.
The quorum required for shareholder action at an ordinary shareholders' meeting on Ñrst call is 50%or more of the total number of issued and outstanding ordinary shares, while on second call there is noquorum requirement. In either case, resolutions may be approved by holders of the majority of theordinary shares present or represented at the meeting.
The quorum required at an extraordinary shareholders' meeting on the Ñrst, second and third call ismore than 50%, more than one-third and more than one-Ñfth, respectively, of our issued share capital.Resolutions of any extraordinary shareholders' meeting require the approval of at least two-thirds of theholders of shares present or represented at such meeting,
Holders of shares with Monte Titoli need only instruct the relevant intermediary associated withMonte Titoli through which the beneÑcial owner holds its shares to obtain admission tickets and proxyforms. Shareholders may attend shareholders' meetings by proxy. If a company has share capital up toLit. 10 billion, then any one proxy cannot represent more than 50 shareholders. If a company has sharecapital of between Lit. 10 billion and Lit. 50 billion, then any one proxy cannot represent more than 100shareholders. If a company has share capital of more than Lit. 50 billion, then any one proxy cannotrepresent more than 200 shareholders. A proxy may be appointed only for a single shareholders' meeting(including, however, the Ñrst, second and third calls of such meeting) and may be exercised only by theperson expressly named in the applicable form. The person exercising the proxy cannot be one of oursubsidiaries, a Director, Statutory Auditor or one of our employees or an employee of one of oursubsidiaries. The limitations on proxy voting set out in this paragraph do not apply in the event thatproxies are solicited and collected pursuant to the UniÑed Financial Act (as set out below).
Pursuant to the UniÑed Financial Act, proxies may be solicited and collected by an intermediary(such as a bank, investment company, asset management company or company having proxy solicitation asits sole purpose). CONSOB has established provisions that govern the transparency and properperformance of the solicitation and collection of proxies. A shareholder who has been a registered holderof at least 1% (or less as established by CONSOB) of a listed company's voting rights for at least sixmonths is entitled to solicit other shareholders, through certain Ñnancial intermediaries with ad hoc proxystatements and proxy cards (in the forms previously approved by CONSOB).
Proxies may also be collected by a shareholders' association from among its members provided thatsuch association has been formed by a notarized private agreement, does not carry out business activitiesother than those relevant to the purpose of the association and is made up of at least 50 individuals, eachof whom owns not more than 0.1% of our voting capital. Members of the shareholders' association may,but are not obliged to, grant proxies to the legal representative of the association, and proxies may also begranted in respect of only some of the matters to be discussed at the relevant shareholders' meeting. Theassociation may vote in diÅerent manners in compliance with the instructions given by each member whohas granted a proxy to the association. CONSOB has established regulations that govern the transparencyand the proper performance of the solicitation and collection of proxies.
126
Brought to you by Global Reports

Form and Transfer of Shares
Since January 1, 1999, shareholders cannot obtain the physical delivery of share certiÑcatesrepresenting shares of Italian listed companies. Pursuant to the Italian United Financial Act, LegislativeDecree No. 213 of 1998 and CONSOB Regulation No. 11768 of December 23, 1998, shares of Italianlisted companies are no longer represented by paper certiÑcates and the transfer and exchange of sharestakes place exclusively through an automated book-entry system.
The new book-entry system commenced operations on October 5, 1998, when Monte Titoli cancelledall certiÑcates representing listed Ñnancial instruments in its possession and returned them to the issuingcompanies. At the same time, Monte Titoli registered the shares in accounts held under the name of thedepositing intermediaries (as described below) and gave them and the issuing companies notice of theregistration. The intermediaries, in turn, registered the shares in the shareholders' accounts.
Since January 1, 1999, shareholders have been allowed to exercise their rights only after they havedeposited their share certiÑcates with an intermediary and authorized it to deposit the shares with acompany operating a centralized clearing system. The intermediary will, in turn, deposit the shares withMonte Titoli, currently the only company authorized by CONSOB to operate a centralized depositarysystem. Intermediaries include:
‚ an Italian or EU-based bank;
‚ a non-EU bank authorized by the Bank of Italy to operate in the Italian market;
‚ an Italian investment company (Societ fia di Intermediazione Mobiliare or ""SIM'');
‚ an EU investment company;
‚ a non-EU investment company authorized by CONSOB to provide investment services in Italy;
‚ an Italian asset management company;
‚ a stockbroker registered under Italian law;
‚ an entity operating a centralized clearing system;
‚ the company which has issued the shares or its parent company;
‚ the Bank of Italy;
‚ a Ñnancial intermediary registered on the list kept by the Bank of Italy;
‚ the Italian Post OÇce (Poste Italiane S.p.A.);
‚ Cassa Depositi e Prestiti (a state-owned entity mainly responsible for extending loans to publicadministration bodies);
‚ the Italian Treasury; and
‚ managers of foreign clearing, settlement and guarantee systems for Ñnancial investments (providedthat such managers are subject to supervision (and regulation at least as stringent as that providedunder Italian law).
In order to transfer shares under the system introduced by Decree No. 213, you will be required togive instructions to your intermediary. If the transferee's intermediary is also your intermediary, then theintermediary will simply transfer the shares from your account to the account of the transferee. If,however, the transferee is a client of another intermediary, your intermediary will instruct a companyoperating a centralized clearing system to transfer the shares to the account of the transferee'sintermediary, who will then register the shares on the transferee's account.
Each intermediary maintains a custody account for each of its clients. This account sets out theÑnancial instruments of each client and records all transfers, payment of dividends, exercise of rightsattributable to such instruments, charges or other encumbrances on the instruments. Should you need to
127
Brought to you by Global Reports

prove that you own ordinary shares, you may request a certiÑcate from your intermediary stating that itholds our ordinary shares on deposit on your behalf. You request should include:
‚ the quantity of the Ñnancial instruments in respect of which the statement is requested;
‚ the rights which you intend to exercise (for rights exercisable at shareholders' meetings, youshould indicate the date and nature of the meeting); and
‚ the duration in respect of which you request the certiÑcate be valid.
The intermediary must issue the certiÑcate within Ñve days of receiving your request and will nottransfer the shares referred to in the certiÑcate until the certiÑcate expires or is returned.
Pursuant to the Global OÅering, all of our shares have been deposited with Monte Titoli. Accordingly,it will not be possible for a shareholder to obtain physical delivery of share certiÑcates representing theshares. Instead, transfers of the shares will be possible using the procedures described above. Euroclear andClearstream, Luxembourg have accepted our shares for clearance and you may therefore elect to holdshares through them. You must rely on the procedures of Monte Titoli, Euroclear and Clearstream,Luxembourg to exercise your rights as a holder of ordinary shares.
Preemptive Rights
Pursuant to Italian law, holders of shares are entitled to subscribe for new issues of shares, debenturesconvertible into ordinary shares and any other warrants, rights or options entitling the holders to subscribefor shares in proportion to their holdings, unless such issues are for non-cash consideration or pre-emptiverights are waived or limited by a resolution adopted at an extraordinary shareholders' meeting when theCompany's interest so requires.
Reports to Shareholders
We are required to publish, in the Italian language, audited annual unconsolidated and consolidatedÑnancial statements prepared in accordance with Italian GAAP. We also produce an annual report to ourshareholders in Italian, which includes our consolidated accounts. We are also required to produce semi-annual and quarterly reports to our shareholders in the Italian language, which contain the directors'report. The annual report contains audited Ñnancial statements prepared in accordance with Italian GAAP.
Preference Shares
We are permitted in accordance with Italian law and our by-laws to issue preference shares. Holdersof preference shares would typically not be entitled to vote in ordinary shareholders' meetings, but wouldbe entitled to vote together with the ordinary shares in extraordinary shareholders' meetings unless, if theby-laws so provide. However, Italian law provides for special meetings of holders of each class of shares,inter alia, for the approval of resolutions adopted by the shareholders which aÅect their rights vis- fia-vis theother classes of shares. Preference shares would have preferential rights to the payment of dividends and tothe repayment of capital in the event of liquidation.
We have no present intention of issuing preference shares and none are currently authorized oroutstanding. The authorization of preference shares is subject to approval of the current shareholders at anextraordinary shareholders' meeting.
Liquidation Rights
Pursuant to Italian law and subject to the satisfaction of the claims of all other creditors, ourshareholders are entitled to a distribution in liquidation that is equal to the nominal value of their shares(to the extent available of our net assets). Holders of preference and savings shares, if any such shares areissued in the future by us, would be entitled to a priority right to any such distribution from liquidation upto their nominal value. Thereafter, all shareholders would rank equally in their claims to the distribution orsurplus assets, if any. Shares rank pari passu among themselves in liquidation.
Purchase of Our Own Shares
We may purchase our own fully-paid shares, subject to certain conditions and limitations provided byItalian law. These purchases must be authorized by an ordinary shareholders' meeting and made only outof retained earnings or distributable reserves resulting from the latest approved unconsolidated Ñnancial
128
Brought to you by Global Reports

statements. In addition, Italian law requires that these purchases take place by way of a public oÅering(oÅerta pubblica di acquisto o di scambio) or on Telematico in a manner agreed with Borsa Italiana inorder to ensure the equal treatment of shareholders. Subject to certain limitations, the foregoing does notapply to shares held by our employees or employees of our subsidiaries. Our purchases may not exceed,except in limited circumstances, 10% of our outstanding share capital, and the aggregate purchase price ofthese shares may not exceed the earnings available for distribution or the distributable reserves resultingfrom the last Ñnancial statements approved by the shareholders. Ordinary shares held in excess of the 10%limit must be sold within one year of the date of purchase. Similar requirements and limitations apply withrespect to purchases of our shares by our subsidiaries. A corresponding reserve equal to the purchase priceof shares purchased by us must be created in the balance sheet and such reserve is not available fordistribution unless such shares are sold or cancelled. Ordinary shares purchased and held by us may beresold only pursuant to a resolution of the shareholders adopted at an ordinary shareholders' meeting. Thevoting rights attached to the shares held by us or our subsidiaries cannot be exercised, but the ordinaryshares can be counted for quorum purposes in shareholder meetings. Dividends and other rights, includingpre-emptive rights, attached to such shares will accrue to the beneÑt of other shareholders in proportion totheir respective shareholdings.
The UniÑed Financial Act provides that the purchase by a listed company of its own shares and thepurchase of shares of a listed company by its wholly-owned subsidiaries must take place by way of a publicoÅering or on the market, in a manner agreed with Borsa Italiana ensuring the equality of treatmentamong shareholders. Subject to certain limitations, the foregoing does not apply to shares being purchasedby a company from its employees or from the employees of its controlling company or subsidiaries.
At the date hereof, we do not own, directly or indirectly, any of our own shares.
NotiÑcation of the Acquisition of Shares and Voting Rights
Pursuant to Italian securities laws, including the UniÑed Financial Act and CONSOB Regula-tion No. 11971 of May 14, 1999, as amended, any acquisition of any interest in excess of 2% in the votingshares of a listed company, as well as the acquisition by a listed company of an interest exceeding 10% ofthe voting shares of an unlisted company, must be notiÑed to CONSOB and the company whose sharesare acquired within Ñve business days following the acquisition. The voting rights attributable to any sharesin respect of which such notiÑcation has not been made, may not be exercised. Any resolution taken inviolation of the foregoing may be annulled if the resolution would not have been adopted in the absence ofsuch votes.
In addition, any person whose aggregate interest in the voting shares of a listed company exceeds orfalls below 2%, 5%, 7.5%, 10% and successive percentages being multiples of Ñve of the listed company'svoting share capital, is obliged to notify CONSOB and the issuer. For the purpose of calculating theseownership thresholds, shares owned by any person, irrespective of whether the voting rights attributablethereto are exercisable by such person or by a third party, are taken into consideration, and, except incertain circumstances, account should also be taken of shares held through, or shares the voting rights ofwhich are exercisable by, subsidiaries, Ñduciaries or intermediaries. For the purpose of calculating theownership thresholds of 5%, 10%, 25%, 50% and 75%, shares which: (i) a person has an option to, directlyor indirectly, acquire or sell; and (ii) a person may acquire further to the exercise of a warrant orconversion right which is exercisable within 60 days, should also be taken into account. The notiÑcationmust be repeated when such person, upon the exercise of the right referred to in (i) or (ii) above,acquires shares which cause its aggregate ownership in the listed company to exceed the relevantthresholds. NotiÑcation should be made in all cases within Ñve trading days of the event which gives riseto the notiÑcation obligation.
Cross Ownership Restrictions
Cross ownership means the ownership by two or more companies of one another's shares. Crossownership of listed companies may not exceed 2% of their respective voting shares and cross ownershipbetween a listed company and an unlisted company may not exceed 2% of the voting shares of the listedcompany and 10% of the voting shares of the unlisted company. If the relative threshold is exceeded, thecompany which is the last to exceed such threshold may not exercise the voting rights attributable to theshares in excess of the threshold and must sell the excess shares within a period of 12 months. If thecompany does not sell the excess shares, it may not exercise the voting rights in respect of its entireshareholding. If it is not possible to ascertain which is the last company to exceed the threshold, the
129
Brought to you by Global Reports

limitation on voting rights and the obligation to sell the excess shares will apply to both of the companiesconcerned. The 2% limit for cross ownership is increased to 5% on the condition that such limit is onlyexceeded by the two companies concerned following an agreement authorized in advance by an ordinaryshareholders' meeting of each of the two companies. Furthermore, if a party holds an interest in excess of2% of a listed company's share capital, such listed company, or the party which controls the listedcompany, may not purchase an interest above 2% in a listed company controlled by the Ñrst party. In caseof non-compliance, voting rights attributable to the shares held in excess may not be exercised. If it is notpossible to ascertain which is the latter party to exceed the limit, the limitation on voting rights will,subject to a diÅerent agreement between the two parties, apply to both. Any shareholders' resolution takenin violation of the limitation on voting rights may be annulled if the resolution would not have beenadopted in the absence of such votes. The foregoing provisions in relation to cross ownership do not applywhen the thresholds are exceeded following a public tender oÅer aimed at acquiring at least 60% of acompany's ordinary shares or when a controlled company purchases shares of a controlling company withinthe limit set forth in Article 2359 bis of the Italian Civil Code and following the procedures describedunder ""Ì Purchase by Us of our Own Shares''; however, certain restrictions on the manner of purchasewill apply.
NotiÑcation of Shareholders' Agreements
As at the date of this oÅering memorandum, we are not aware of any shareholders' agreementsgoverning the ownership, transfer or voting of our ordinary shares.
Pursuant to the UniÑed Financial Act, agreements among shareholders of a listed company or of itsparent company relating to the exercise of voting rights must be notiÑed to CONSOB (within Ñve days),published in summary form in the press (within 10 days) and Ñled with the Chamber of Commerce(within 15 days). Failure to comply with the above rules will render the agreements null and void, andvoting rights that are the subject of such agreements cannot be exercised. These rules also apply toshareholders' agreements which:
‚ regulate or otherwise require prior consultation for the exercise of voting rights in a listed companyor its controlling company;
‚ contain limitations on the transfer of shares or securities which grant the right to purchase orsubscribe shares;
‚ provide for the purchase of shares or securities that grant the right to purchase or subscribe shares;or
‚ result in the exercise (including joint exercise) of a dominant inÖuence over the company.
Any shareholders' agreement of the nature described above may have a maximum term of three yearsor, if executed for an unlimited term, any party is free to withdraw upon six months' notice. In the case ofa public tender oÅer, a party to these agreements may withdraw from them without notice, suchwithdrawal being eÅective only in the event that the relevant shares are actually sold.
CONSOB Regulation No. 11971 contains provisions which govern the method and content of thenotiÑcation and publication of the agreements including subsequent amendments thereto. The regulationalso provides that any party to an agreement referred to above concerning more than 5% of the listedcompany's share capital is obliged to notify CONSOB and the listed company in question of its overallshareholding in the listed company, unless such information has already been supplied in compliance withother provisions of the UniÑed Financial Act.
Anti-trust Regulations
In accordance with Italian anti-trust laws, the Italian anti-trust authority is required to prohibit theacquisition of control in a company that would thereby create or strengthen a dominant position in thedomestic market or a signiÑcant part thereof and which would result in the elimination or substantialreduction, on a lasting basis, of competition, provided that certain turnover thresholds are exceeded. If theturnover of the acquiring party and the company to be acquired exceed certain other monetary thresholds,the anti-trust review of the acquisition falls within the exclusive jurisdiction of the European Commission.
130
Brought to you by Global Reports

Shareholders' Action Against Directors, General Directors and Statutory Auditors
Under Italian law, actions against members of a board of directors may be brought by a companypursuant to a resolution adopted at an ordinary shareholders' meeting. In respect of listed companies, acompany's action may be brought against directors, general directors (direttori generali) and statutoryauditors by holders of at least 5% of the shares who have been registered in the shareholders' register forat least six months.
We may waive or settle the suit unless shareholders holding more than 5% of the shares vote againstsuch waiver or settlement. We will reimburse the legal costs of the action in the event that the claim ofthe shareholders is successful and the court does not award costs against the relevant directors, generaldirectors or statutory auditors and, in any event, we will reimburse such costs awarded by the court againstthe relevant directors, general directors or statutory auditors, if not recoverable.
In addition, a single shareholder may bring an action against members of a board of directors fordamages directly suÅered due to negligence or willful misconduct.
Minority Shareholders' Rights
Any shareholder may, within three months of its option, challenge any resolution on which he or shedid not vote (unless he or she abstained) or in respect of which he or she dissented on the basis that itwas not adopted in conformity with applicable law or our by-laws. Directors and statutory auditors mayalso challenge shareholders' resolutions on this basis. In a limited number of cases (including a resolutionapproving a merger or demerger which involves distribution of unlisted shares), applicable Italian lawsgrant dissenting and abstaining shareholders the right of redemption of their shares from the issuer at aprice equal to the average market price of the previous six months prior to the exercise of suchredemption.
Any of our shareholders may bring to the attention of the Board of Statutory Auditors facts or actswhich are deemed wrongful. If such shareholders represent more than 2% of our share capital, the Boardof Statutory Auditors must investigate without delay and report its Ñndings and recommendations at ournext shareholders' meeting. Shareholders representing more than 5% of our share capital have the right toreport major irregularities to the relevant court. In addition, pursuant to the UniÑed Financial Act,shareholders who have been registered for at least six months as representing at least 5% of our sharecapital may commence derivative suits before the competent court against directors, statutory auditors andgeneral managers. We may waive or settle the suit unless shareholders holding more than 5% of the sharesvote against such waiver or settlement. We will reimburse the legal costs of such action in the event thatthe claim of such shareholders is successful and either (i) the court does not award such costs against therelevant directors, statutory auditors or general managers or (ii) such costs cannot be recovered from suchdirectors, auditors or general managers.
Pursuant to the slate voting system, introduced in our by-laws in accordance with the UniÑedFinancial Act, minority shareholders may appoint one member of the Board of Statutory Auditors; and ifthe Board of Statutory Auditors has more than three members, minority shareholders may appoint up totwo members. You should refer to ""Our Management Ì Board of Statutory Auditors.''
Our shareholders may examine certain documents made available at our registered oÇce inconnection with a shareholders' meeting, which has already been convened, and obtain the relevant copiesof such documents at their own expense.
Tender OÅer Rules
Pursuant to the UniÑed Financial Act, a public tender oÅer must be made by any person or group ofpersons acting in concert that, by reason of purchases of shares, holds more than 30% of the commonstock of a company listed on a regulated exchange. The tender oÅer must cover all the shares of commonstock of the listed company. Similarly, a tender oÅer for the entire common stock of a listed companymust be made by any person who, having more than 30% of the common stock without exercising majorityvoting rights at ordinary shareholders' meetings, acquires by way of acquisition or exercise of subscriptionor conversion rights during a 12-month period more than 3% of the common stock. The oÅer must belaunched within 30 days from the date on which the 30% threshold was exceeded, at a price not lowerthan the average of the weighted average of the market price for the shares in the previous 12 months, andthe highest price paid for the shares by the oÅeror in the same period. CONSOB Regulation No. 11971,
131
Brought to you by Global Reports

implementing the UniÑed Financial Act, establishes a number of exemptions from the duty to launch atender oÅer, such as:
‚ when a third party exercises the majority of voting rights at an ordinary shareholders' meeting;
‚ in respect of transfers of shares among related persons; and
‚ in cases of mergers and split-ups.
The UniÑed Financial Act provides further that the acquisition of an interest above 30% of thecommon stock of a listed company does not trigger the obligation to launch a 100% tender oÅer if theperson concerned has exceeded the threshold as a result of a public tender oÅer launched on 60% or moreof the common stock of the listed company. This provision, however, is available only if (i) the tenderoÅer has been approved by shareholders of the listed company holding a majority of the shares (excluding,for the purpose of calculating such majority, the oÅeror, the shareholder holding an absolute or relativemajority shareholding exceeding 10% and all persons acting in concert with the oÅeror and the currentmajority shareholders), and (ii) the oÅeror (or its subsidiaries, controlling person, related companies andother persons connected to it by virtue, inter alia, of shareholders' agreements) has not acquired more than1% of the common stock of the listed company in the preceding 12 months; CONSOB shall ensurecompliance with these conditions before allowing the oÅer to be launched. After such oÅer has beencompleted, the oÅeror nevertheless becomes subject to the duty to launch an oÅer for 100% of thecommon stock if, in the course of the subsequent 12 months, (i) it (or its aÇliates) purchases more than1% of the common stock of the listed company, or (ii) the listed company approves a merger or split-up.Finally, the UniÑed Financial Act provides that any person, or group of persons acting in concert, holding90% or more of the common stock of a listed company must launch an oÅer on the remaining sharesunless an adequate distribution is restored so as to ensure proper trading within a period of four months.
Any shareholder holding more than 98% of the common stock of a listed company pursuant to atender oÅer concerning all the voting shares issued by the listed company, has the right to obtain title tothe remaining voting shares within four months after the end of the tender oÅer if it has stated in the oÅerdocument its intention to make such an acquisition at a price set by a court-appointed expert.
In the event of a breach of these rules, voting rights relating to the entire number of suchshareholder's shares may not be exercised and the shares exceeding such thresholds must be sold within12 months of such breach.
132
Brought to you by Global Reports

EXCHANGE CONTROL POLICY
The following discussion of exchange controls in Italy summarizes relevant Italian laws in force at thedate of this oÅering memorandum. This is not a comprehensive description of all exchange controlconsiderations that may be relevant to your decision to purchase our shares.
There are no exchange controls in Italy. Residents of Italy may hold foreign currency and foreignsecurities of any kind, within and outside Italy. Non-residents of Italy may invest in Italian securitieswithout restriction and may export fund, instruments or credit or payment and securities from Italy. Theseexports may be denominated in both foreign currency and Lire, representing interest, dividends, other assetdistributions and the proceeds of sales.
Certain procedural requirements, however, are imposed by an Italian law that implements a EuropeanUnion directive regarding the free movement of capital. This legislation requires that physical transfers byresidents or non-residents of cash, investments of credit or other securities in excess of Lit. 20 millionmust be reported in writing to the Italian Exchange OÇce (UÇcio Italiano Cambi). In the case ofindirect transfers, banks or other intermediaries are required to maintain records of such transactions forÑve years (for inspection at any time by Italian tax and judicial authorities).
Non-compliance with these reporting and record-keeping requirements may result in administrativeÑnes or, in the case of false reporting or in certain cases of incomplete reporting, criminal penalties. TheItalian Exchange OÇce is required to maintain reports for a period of ten years and may use them,directly or through other government oÇces, to police money laundering, tax evasion and any other crimeor violation.
If you are an individual, a non-proÑt entity or a speciÑc kind of partnership (in particular, a ""societ fiasemplice'' or similar partnership organized in accordance with Article 5 of Presidential Decree No. 917 ofDecember 22, 1986) and reside in Italy, you must disclose in your annual tax Ñling:
(i) all investments held outside Italy at the end of a taxable period;
(ii) all Ñnancial assets held outside Italy at the end of a taxable period; and
(iii) the total amount of transfers eÅected in a taxable period to, from, within and betweencountries other than Italy relating to such foreign investments or Ñnancial assets.
You must make the disclosure under clause (iii) above even if you no longer own foreign investmentsor Ñnancial assets at the end of the taxable period. No disclosure is required in respect of foreigninvestments or Ñnancial assets deposited for management with qualiÑed Italian Ñnancial intermediaries,provided that the income derived from the foreign investments or Ñnancial assets collected through thesame intermediaries. In addition, disclosure requirements do not apply if the total value of foreigninvestments and Ñnancial assets held at the end of the taxable period (or the total amount of the transferseÅected during the year) does not exceed Lit. 20 million. Corporate residents of Italy are exempt fromsuch tax disclosure requirements with respect to their annual tax declarations because this information isrequired to be disclosed in their Ñnancial statements.
We cannot assure you that the present regulatory environment within or outside Italy will endure orthat particular policies now in eÅect will be maintained, although Italy is required to maintain certainregulations and policies by virtue or its membership in the European Union and other internationalorganizations and its adherence to various bilateral and multinational international agreements.
133
Brought to you by Global Reports

TAXATION OF SHARES
The following is a summary of the material Italian and U.S. federal tax consequences of thepurchase, ownership and disposition of the shares. The summary does not purport to be a completedescription of all of the tax considerations that may be relevant to your decision to purchase, own ordispose of the shares. The following summary does not discuss the treatment of shares that are held byItalian companies or in connection with a permanent establishment or Ñxed base through which a non-Italian resident beneÑcial owner carries on business or performs personal services in Italy.
This summary is based upon tax laws and the practice in Italy and the United States in eÅect on thedate of this oÅering memorandum, which are subject to change and are potentially retroactive. You shouldconsult your own advisers as to the Italian, United States or other tax consequences of your purchase,beneÑcial ownership and disposition of the shares including, in particular, the eÅect of any state, regionalor local tax laws.
Italian Tax Considerations
Taxation of Dividends
The current tax treatment of dividends provided for by Decree No. 461 of November 21, 1997 can besummarized as follows:
‚ Italian law provides for a Ñnal withholding of income tax at a 12.5% rate on dividends paid toItalian real property investment funds regulated by Law No. 86/94 and to individual shareholdersholding shares not in connection with the exercise of entrepreneurial activities who are residents ofItaly for tax purposes and own a ""non-qualiÑed'' interest in a corporation. An interest is deÑned as""qualiÑed'' if it amounts to (i) more than 5% of the share capital or 2% of the shares with votingrights in an ordinary shareholders' meeting of a corporation whose stock is listed on a regulatedmarket, whether in Italy or abroad, or (ii) more than 25% of the share capital or 20% of theshares with voting rights in an ordinary shareholders' meeting of any corporation whose stock isnot listed on a regulated market. As to dividends paid to Italian-resident individual shareholders,the 12.5% Ñnal withholding tax will apply, provided they timely declare to meet the relevantrequirements (i.e., to be resident in Italy for tax purposes; not to hold the relevant interest inconnection with the exercise of entrepreneurial activities; and to hold a ""non-qualiÑed'' interest).
‚ The above Ñnal withholding tax will not be applied to resident individual owners of registeredshares who so request as of the date of the collection of dividends or who do not promptly submita declaration that they meet the requirements for the application of the Ñnal withholding tax. Insuch cases, as in the case of dividends deriving from a ""qualiÑed interest'', the Italian residentindividual shareholders will receive the gross amount of the dividends and include them in theirincome tax return. The dividends will have attached to them a tax credit which is currently equalto 58.73% of their gross amount, to the extent that such tax credit is covered by taxes paid by thecompany distributing the dividends, as provided by Article 105, paragraph 1, letters (a) and (b) ofPresidential Decree No. 917, December 22, 1986. Law No. 388 of December 23, 2000 hasreduced the amount of the tax credit to (i) 56.25% of gross dividends for dividend distributionsdeclared between January 1, 2002 (inclusive) and January 1, 2004 (exclusive); and (ii) 53.85% ofgross dividends for dividend distributions declared as of January 1, 2004. The dates describedabove assume that the distributing company has adopted a Ñscal year corresponding to thecalendar year (i.e., January 1 to December 31).
‚ If the tax credit exceeds the amount of tax owed by a shareholder at the end of the Ñscal year,and provided the income out of which the dividends are distributed has been fully subject tocorporate income tax at the level of the company distributing the dividends, the excess amountcan be carried forward or a refund can be requested. However, no such carry forward or refundmay be requested if the income out of which the dividends are distributed has not been fullysubject to corporate income tax at the level of the company distributing the dividends.
‚ The company is not required to apply any withholding tax with respect to dividends on shares thatare registered in the centralized deposit system managed by Monte Titoli S.p.A. Instead of thewithholding tax, a substitute tax is to be applied on dividends paid on such shares, at the samerate and under the same conditions as the withholding tax in the event that such tax is due. Thesubstitute tax is applied by the Italian bank or broker with which the shares are deposited thatparticipates in the Monte Titoli system, as well as by non-resident intermediaries (operating
134
Brought to you by Global Reports

through a representative appointed in Italy) participating in the Monte Titoli system or in foreigncentralized deposit systems in turn participating in the Monte Titoli system.
‚ Furthermore, the 12.5% Ñnal withholding tax or substitute tax regime described herein does notapply in case shares representing a ""non-qualiÑed'' interest not held in connection with theexercise of entrepreneurial activities are held in a discretionary investment portfolio of securitiesmanaged by an authorized professional intermediary and the shareholders opt to be taxed at a Öatrate of 12.5% on the appreciation of the investment portfolio accrued at each year-end pursuant tothe so-called discretionary investment portfolio regime (""risparmio gestito'' regime), as describedbelow in ""Capital Gains''. In this case, the dividends are included in the calculation of theaggregate appreciation of the investment portfolio accrued at each year-end, subject to a 12.5%substitute tax.
‚ Dividends paid to Italian investment funds will form part of the aggregate increase in value of themanaged assets of such investment funds accrued at the end of each year, calculated as thediÅerence between the value of the assets at the beginning of the tax year and the value of theassets at the end of the same tax year. Such increase in value of the managed assets is subject toa 12.5% substitute tax.
‚ Dividends paid to Italian pension funds will form part of the aggregate increase in value of themanaged assets of such pension funds accrued at the end of each year, calculated as the diÅerencebetween the value of the assets at the beginning of the tax year and the value of the assets at theend of the same tax year. Such increase in value of the managed assets is subject to an 11%substitute tax.
‚ Dividends paid to (i) Italian resident shareholders who are exempt from corporate income tax and(ii) non-resident shareholders without a permanent establishment in Italy to which the shares areeÅectively connected are subject to a 27% Ñnal withholding tax. A reduced rate of 12.5% appliesto non resident shareholders who own savings shares (""azioni di risparmio''). Under domesticItalian law, provided an ad hoc refund procedure is implemented in accordance with Italian law,non-resident shareholders who own common stock may recover up to 4/9 of the tax withheld fromthe Italian tax authorities by providing evidence of full payment of income tax on such dividendsin their country of residence in an amount at least equal to the total refund claimed. Expenses andextensive delays have been encountered by non-residents seeking refunds from the Italian taxauthorities.
As an alternative to such refund procedure, reduced rates of withholding or substitute tax (for sharesregistered with a centralized deposit system managed by Monte Titoli) may apply to non-residentshareholders, without a permanent establishment in Italy to which the shares are eÅectively connected,who are entitled to, and comply with, procedures for claiming beneÑts under a double taxation treatyentered into by Italy with the non-resident shareholders' country of residence. Italy has entered into doubletax treaties with over 60 foreign countries, including all members of the EU, Argentina, Australia, Brazil,Canada, Japan, New Zealand, Norway, Switzerland, the United States and some countries in Africa, theMiddle East and the Far East. It should be noted, however that relief is generally not available under mosttax treaties, unless otherwise speciÑcally provided, to a non-resident beneÑcial owner that is a tax-exemptentity or, with a few exceptions, a partnership or a trust. Under the currently applicable Italy-UnitedStates Double Tax Treaty (the ""U.S. Convention''), as well as under the new treaty signed on August 25,1999 but not yet applicable, dividends paid on shares of the company to a U.S. resident individual fullyeligible for beneÑts of the U.S. convention, may generally be subject to Italian withholding tax orsubstitute tax (for shares registered in the centralized deposit system managed by Monte Titoli) at areduced rate of 15% provided that the dividends are not eÅectively connected with (i) a permanentestablishment in Italy through which such U.S. resident carries on a business or (ii) a Ñxed base in Italythrough which such U.S. resident performs independent personal services and to the extent that theprocedure for claiming the application of a reduced rate of withholding or substitute tax is timely followed.
In order to obtain the application of a reduced rate of withholding under an applicable tax treaty, abeneÑcial owner will generally have to Ñle an application with the Company requesting the reduced rate ofwithholding under the speciÑed treaty, together with (i) a certiÑcation by the tax authorities of suchbeneÑcial owner's country of residence to the eÅect that the beneÑcial owner is a resident of that countryfor purposes of the applicable tax treaty and that, as far as is known to such tax authority, such beneÑcialowner has no permanent establishment or Ñxed base in Italy and, if required (ii) an aÇdavit of a bank insuch beneÑcial owner's country of residence certifying that the declarations contained in such beneÑcial
135
Brought to you by Global Reports

owner's application and the certiÑcation of the tax authorities are true and correct in all material respects.Certain tax treaties may provide for the Ñling of speciÑed forms. The certiÑcation by the tax authorities ofthe beneÑcial owner's country of residence should have a validity through March 31 of the year followingthe year of submission. The time for processing requests for certiÑcation by the applicable authoritiesvaries.
If the shares are registered in the centralized deposit system managed by Monte Titoli, the Companyis not required to withhold any tax on dividends. Instead of the withholding tax, a substitute tax is to beapplied on dividends paid on such shares, at the same rates and under the same conditions as thewithholding tax in the event such tax is due. The substitute tax is applied by the Italian bank or brokerwith which the shares are deposited that participates in the Monte Titoli system as well as by non-residentintermediaries (operating through a representative in Italy) participating in the Monte Titoli system or inforeign centralized deposit systems in turn participating in the Monte Titoli system.
In order to enable a non-resident beneÑcial owner without a permanent establishment in Italy towhich the shares are eÅectively connected to obtain the reduced rate of substitute tax on dividends fromshares registered with Monte Titoli pursuant to an applicable double tax treaty, the following proceduremust be followed. The intermediary through which the beneÑcial owner holds its shares that is required toapply the substitute tax on dividends must timely receive (i) a declaration from the beneÑcial owner thatcontains all the data that identiÑes such person as being the beneÑcial owner of the shares and indicatesthe existence of the conditions necessary for the application of the treaty, as well as the elements that arenecessary in order to determine the applicable treaty substitute tax rate, and (ii) a certiÑcation issued bythe tax authorities of such beneÑcial owner's country of residence stating that the beneÑcial owner is aresident of that country for purposes of the applicable tax treaty and that, as far as it is known to such taxauthority, the beneÑcial owner has no permanent establishment or a Ñxed base in Italy (which certiÑcatewill be eÅective until March 31 of the year following the one of submission, subject to periodic renewal).The foregoing documentation must be kept by the intermediary for the entire period in which the Italiantax authorities are entitled to issue an assessment with respect to the tax year in which the dividends arepaid or, if an assessment is issued, until the assessment is settled. If the intermediary is not a resident inItaly, the foregoing duties and obligations must be carried out by a bank or a SIM that is a resident inItaly (or a permanent establishment in Italy of a foreign bank or investment company) and has beenappointed by the non-resident intermediary as its Ñscal representative in Italy.
At present, the substitute tax regime described above (and not the withholding tax regime) representsthe ordinary tax regime applicable as to dividends issued with respect to listed shares.
Capital Gains
Pursuant to Decree No. 461 of November 21, 1997, the Italian capital gains tax (""CGT'') regime isgenerally applicable to capital gains realized, inter alia (i) by Italian resident individuals holding sharesnot in connection with the exercise of entrepreneurial activities and (ii) by non-resident individuals orcorporations without a permanent establishment in Italy to which the shares are eÅectively connectedthrough the disposal of participations, securities and/or rights through which participations may beacquired in Italian resident corporations, even though such participations, securities and/or rights are heldoutside Italy.
As a general rule, CGT is levied at a rate of 27% (in the case of a disposal of a ""qualiÑed'' interest asdeÑned above in the section entitled ""Taxation of Dividends'') or 12.5% (in the case of a disposal of a""non-qualiÑed'' interest). The disposal of a ""qualiÑed'' interest is deemed to occur when a beneÑcial owner(i) owns participations, securities and/or rights through which participations may be acquired representing,in the aggregate, a ""qualiÑed'' interest as deÑned above, and (ii) in any twelve-month period following thedate the ownership test under (i) is met, such beneÑcial owner engages in the disposal of participations,securities and/or rights that individually or in the aggregate constitute a ""qualiÑed'' interest, as deÑnedabove.
As a consequence, under current legislation, in principle, any capital gains realized by (i) Italianresident individuals who do not hold the shares within an entrepreneurial activity and (ii) non-residentindividuals or corporations without a permanent establishment in Italy to which the shares are eÅectivelyconnected, upon disposal of a ""non-qualiÑed'' interest in the Company will be subject to 12.5% CGT.
136
Brought to you by Global Reports

Taxpayers can opt for one of the three following regimes in order to pay the 12.5% CGT due withrespect to capital gains realised upon disposal of a ""non-qualiÑed'' interest:
‚ Pursuant to the tax declaration regime (""regime della dichiarazione''), the taxpayer will have toreport the overall capital gains realized in a certain Ñscal year, net of any incurred capital loss, inhis annual income tax return and pay the applicable CGT together with the balance income taxamount due for the same period. Losses in excess of any capital gains may be carried forwardagainst the relevant capital gains realized in each of the following years up to the fourth;
‚ Pursuant to the non-discretionary investment portfolio regime (""risparmio amministrato'' regime),the CGT due on each capital gain realized on each transfer of shares in any Ñscal year, net of anyincurred capital loss, is paid on behalf of the taxpayer by the professional intermediary with whichthe securities and/or rights are deposited. Any capital losses realized in any tax year may becarried forward against capital gains subsequently realized in the same tax year or in each of thefollowing years up to the fourth;
‚ Pursuant to the discretionary investment portfolio regime (""risparmio gestito'' regime), substitutetax is at a Öat rate of 12.5% due on the appreciation of the investment portfolio accrued, even ifnot realized, at each year-end (which appreciation includes any capital gains on disposal of a""non-qualiÑed'' interest in a corporation held in the investment portfolio) and is applied on behalfof the taxpayer by the managing professional intermediary. Any depreciation of the investmentportfolio accrued at each year-end may be carried forward against appreciation accrued in each ofthe following years up to the fourth.
Under the tax declaration and the non-discretionary investment portfolio regimes, as to securitiesand/or rights that have been held for more than 12 months, the taxable capital gain is determined byapplying to the actual gain an adjustment coeÇcient (so-called ""equalizzatore''). The amount and themethod of application of such coeÇcient has been determined by a Decree of the Ministry of Financedated August 4, 2000 and became eÅective as of January 1, 2001.
Any capital gains realized in a Ñscal year by (i) Italian resident individuals who do not hold theshares within an entrepreneurial activity and (ii) non-resident individuals or corporations without apermanent establishment in Italy to which the shares are eÅectively connected, upon disposal of a""qualiÑed'' interest in the Company will be generally subject to 27% CGT. Such CGT must be assessedpursuant to the tax declaration regime and paid together with the overall balance income tax due by thetaxpayer for the same Ñscal year.
Decree No. 461 and Legislative Decree No. 259 of July 21, 1999, provide for some exceptions to theabove regulation with respect to shareholders who are not resident of Italy for tax purposes and do nothave a permanent establishment in Italy to which the shares are eÅectively connected.
In particular, an exemption from CGT is provided for non-residents on gains realized on disposal oflisted securities and/or rights deemed a disposal of a ""non-qualiÑed'' interest in an Italian residentcorporation, whose stock is listed on a regulated market, even though such securities and/or rights are heldin Italy and regardless of the provisions set forth by any applicable double tax treaty.
If a non-Italian resident without a permanent establishment in Italy to which the shares areeÅectively connected elects for the ""risparmio amministrato'' or the ""risparmio gestito'' regime describedabove, this exemption from Italian CGT applies only if such non-resident timely Ñles a self-declaration notto be resident in Italy for tax purposes with the authorized Ñnancial intermediary applying the ""risparmioamministrato'' or ""risparmio gestito'' regime.
The exemption does not apply, in any event, to capital gain realized from the disposal of a ""qualiÑed''interest in an Italian corporation; in the latter case, CGT applies at a rate of 27% even if the seller is anon-resident of Italy for tax purposes and the shares are held outside Italy. However, the provisions ofDecree No. 461 do not preclude the application of any provision of a double taxation treaty executed byItaly which is more favorable. The majority of double taxation treaties entered into by Italy, in accordancewith the OECD model, provide that capital gains realized from the disposal of Italian securities aresubject to CGT only in the country of residence of the seller, which in the case of non-resident sellers isnot Italy.
Therefore, if the foreign seller (i) is a resident, for tax purposes, of a country which executed adouble taxation treaty with Italy that, with reference to taxation of capital gains, is in accordance with theOECD model and (ii) is fully eligible for beneÑts under such a treaty, the capital gain realized from the
137
Brought to you by Global Reports

disposal of Italian securities will not be subject to CGT in Italy pursuant to the provisions of theapplicable double taxation treaty, no matter whether the interest disposed of is ""qualiÑed'' or ""non-qualiÑed''. Non-residents who dispose of an interest in an Italian corporation may in certain cases berequired to timely provide appropriate documentation (including a certiÑcate of residence issued by the taxauthorities of their country of residence) establishing that the above mentioned conditions of non-taxabilityof capital gains realized pursuant to the applicable double tax treaty have been satisÑed, in order to beexempted from Italian CGT under the applicable double tax treaty.
Transfer tax
Royal Decree No. 3278 of December 30, 1923, as amended by Legislative Decree No. 435 ofNovember 21, 1997 (""Decree No. 435'') regulates the application of transfer tax on securities includingshares. Pursuant to Decree No. 435, in general transfer tax is currently payable upon transfer of shares inthe following cases at the following rates:
‚ Lit. 140 per Lit. 100,000 (or fraction thereof) of the price at which the shares are transferred,when the transfer is made between private subjects directly or through the intervention ofintermediaries other than banks, other investment companies regulated by Legislative DecreeJuly 23, 1996, No. 415, as superseded by the UniÑed Financial Act, stock brokers or SIMs;
‚ Lit. 50 per Lit. 100,000 (or fraction thereof) of the price at which the shares are transferred,when the transfer is made either (a) between private subjects and banks or other investmentcompanies regulated by Legislative Decree July 23, 1996, No. 415, as superseded by the UniÑedFinancial Act, stock brokers or SIMs or (b) between private subjects through the intervention ofsuch professional intermediaries; and
‚ Lit. 12 per Lit. 100,000 (or fraction thereof) of the price at which the shares are transferred,when the transfer is made between banks, other investment companies regulated by LegislativeDecree July 23, 1996, No. 415, as superseded by the UniÑed Financial Act, stock brokers orSIMs.
However, the above transfer tax does not apply, inter alia, to the following:
‚ contracts concluded in regulated markets regarding the transfer of listed securities, shares, quotasand participations in corporations of any kind, including contracts between a qualiÑed intermediaryand his principals on behalf of which are made or between qualiÑed intermediaries;
‚ oÅ-market transactions regarding securities listed on regulated markets, provided that suchtransactions occurred:
(a) between banks, other investment companies regulated by Legislative Decree July 23, 1996,No. 415, as superseded by the UniÑed Financial Act, stock brokers or SIMs;
(b) between the subjects mentioned in (a) above, on the one hand, and non-Italian residentson the other hand; and
(c) between the subjects mentioned in (a) above, on the one hand, and undertakings forcollective investment in transferable securities, on the other hand;
‚ sales of securities occurring in the context of a public oÅer (oÅerta pubblica di vendita) (i) aimedat listing the securities on a stock exchange, or (ii) involving Ñnancial instruments already listedon a stock exchange; and
‚ contracts related to securities not listed on regulated markets, provided that such transactionsoccurred between non-Italian residents and banks, SIMs or other investment companies regulatedby Decree No. 415 of July 23, 1996, as superseded by the UniÑed Financial Act, or stockbrokers.
The change of depository (e.g., Euroclear, Clearstream or Monte Titoli) not involving a transfer ofthe ownership of the transferred securities will not trigger the Italian tax.
Inheritance and gift tax
Italian inheritance and gift tax is payable on transfer of the shares in an Italian corporation by reasonof death or donation, even if the shares are held outside Italy and irrespective of whether the deceased orthe donor is resident in Italy or not.
138
Brought to you by Global Reports

Italian inheritance and gift tax are applicable at diÅerent rates depending on the relationship betweenthe donor or deceased and the donee, legatee or heir, respectively. The applicable rates are diÅerent in thecase of inheritance and gift.
Inheritance and gift tax is, however, not due on the value of inheritance attributable to each heir oron the value of gifts attributable to each donee up to Lit. 350 million (or Lit. 1 billion in certain cases).
Inheritance and gift tax paid in a country outside Italy in respect of the same estate on assets existingin that country are deductible in whole or in part from Italian inheritance and gift tax due in respect ofsuch estate.
A proposal to abolish inheritance and gift tax is expected to be examined by Italian authoritiessometime in 2001.
United States Taxation
The following summary of the material U.S. federal income tax consequences to U.S. Taxpayers (asdeÑned below) of the purchase, ownership and disposition of shares is based on the advice of Latham& Watkins, our United States counsel. This discussion is intended only as a descriptive summary and doesnot purport to be a complete analysis or listing of all possible tax considerations. The discussion deals onlywith shares held as capital assets and does not address any special United States tax consequences thatmay be applicable to U.S. Taxpayers that are subject to special treatment under the United States InternalRevenue Code of 1986, as amended (the ""Code''), such as dealers in securities, Ñnancial institutions, lifeinsurance companies, tax-exempt entities, persons holding shares as part of a hedging, constructiveownership or conversion transaction or a straddle or whose functional currency is not the United Statesdollar, investors liable for alternative minimum tax, or investors that actually or constructively own 10% ormore of the voting stock of the company. In addition, it does not address tax consequences to holdersowning shares through pass-through entities. The discussion below is based on the provisions of the Code,and regulations, rulings and judicial decisions thereunder as of the date hereof, and such authorities maybe repealed, revoked or modiÑed (possibly on a retroactive basis) so as to result in U.S. federal incometax consequences diÅerent from those discussed below. Prospective investors should consult their own taxadvisers to determine the U.S. federal, state and local consequences to them of the purchase, ownershipand disposition of shares.
As used in this section, the term ""U.S. Taxpayer'' means a beneÑcial owner of shares who is:
‚ an individual citizen or resident of the United States for U.S. federal income tax purposes;
‚ a corporation, or other entity treated as a corporation for U.S. federal income tax purposes, createdor organized under the laws of the United States or any state or political subdivision thereof;
‚ an estate whose income is subject to U.S. federal income taxation regardless of its source; or
‚ a trust if a court within the United States is able to exercise primary supervision over theadministration of the trust and one or more U.S. persons have the authority to control allsubstantial decisions of the trust, or if the trust elects under U.S. Treasury Regulations to be taxedas a United States person.
The summary assumes that we are not a passive foreign investment company (""PFIC'') for U.S.federal income tax purposes, which we believe to be the case. Our possible status as a PFIC must bedetermined annually and therefore may be subject to change. If we were to be a PFIC in any year,possibly materially adverse consequences would result for U.S. taxpayers.
Dividends
Subject to the passive foreign investment company rules discussed below, distributions paid on theshares generally will be treated as dividends for U.S. federal income tax purposes to the extent paid out ofour current or accumulated earnings and proÑts as determined for U.S. federal income tax purposes, butwill not be eligible for the dividends received deduction generally allowed to corporations.
To the extent that a distribution exceeds our earnings and proÑts, it will be treated, Ñrst, as a non-taxable return of capital to the extent of the U.S. Taxpayer's tax basis in the shares (thereby increasingthe amount of gain, or decreasing the amount of loss, to be recognized by the U.S. Taxpayer on asubsequent disposition of the shares), and thereafter as a capital gain. A U.S. Taxpayer must include ingross income, on the date of receipt, the gross amount of such dividends, including any Italian tax
139
Brought to you by Global Reports

withheld therefrom (including a substitute tax), without regard to whether any portion of such tax may berefunded to the U.S. Taxpayer by the Italian tax authorities. The amount of any dividend paid in Lire willbe converted into U.S. dollars calculated by reference to the exchange rate in eÅect on the date thedistribution is received, regardless of whether the Lire are actually converted into dollars at that time. U.S.Taxpayers may recognize foreign currency gain or loss (generally treated as U.S.-source ordinary gain orloss) upon the disposition of such Lire measured by the diÅerences between such dollar value when thedividend was included in income and the amount realized on such disposition. Prospective investors shouldbe aware that we do not intend to calculate our earnings and proÑts for U.S. federal income taxpurposes.
Subject to certain conditions and limitations, Italian tax withheld from dividends (including asubstitute tax) will be treated as a foreign income tax eligible for deduction from taxable income or creditagainst the U.S. Taxpayer's U.S. federal income tax liability. However, a U.S. Taxpayer will not beentitled to a deduction or foreign tax credit with respect to the amount of Italian tax that may be refundedto a U.S. Taxpayer pursuant to Italian law or the income tax convention between the United States andItaly (the ""Treaty''). Accordingly, a U.S. Taxpayer who is eligible for, but does not apply to receive, areduction under the Treaty will not be able to claim a deduction or foreign tax credit for that portion ofItalian taxes withheld in excess of 15% of the dividend. Prospective investors should read ""Italian TaxConsiderations Ì Taxation of Dividends'', to obtain information on the procedure for obtaining a taxrefund. For the purposes of computing the foreign tax credit, dividends paid on the shares will be treatedas income from sources outside the United States, but generally will be grouped separately, together withother items of ""passive income'' or, in the case of certain U.S. Taxpayers, ""Ñnancial services income.''
Sale or disposition of ordinary shares
Subject to the passive foreign investment company rules discussed below, a U.S. Taxpayer generallywill recognize capital gain or loss on the sale or other disposition of shares equal to the diÅerence betweenthe U.S. dollar value of the amount realized and the U.S. Taxpayer's adjusted tax basis (determined inU.S. dollars) in the shares. Any gain or loss will generally be treated as arising from U.S. sources forforeign tax credit limitation purposes. Generally, such gain or loss will be capital gain or loss, qualifying forreduced tax rates depending on the U.S. Taxpayer's holding period for such shares.
The U.S. Taxpayer's initial tax basis in the shares generally will be equal to the U.S. dollar value ofthe purchase price determined on the date of purchase. If ordinary shares are treated as traded on an""established securities market'', a cash basis U.S. Taxpayer (or, if it elects, an accrual basis U.S.Taxpayer) will determine the dollar value of the cost of such shares by translating the amount paid at thespot rate of exchange on the settlement date of the purchase. The conversion of dollars to Lire and theimmediate use of that currency to purchase shares generally will not result in taxable gain or loss to a U.S.Taxpayer for U.S. federal income tax purposes.
The amount realized on a disposition of ordinary shares generally will be the dollar value of thepayment received determined on (i) the date of receipt of payment in the case of a cash basis U.S.Taxpayer and (ii) the date of disposition in the case of an accrual basis U.S. Taxpayer. If the ordinaryshares are treated as traded on an ""established securities market'', a cash basis U.S. Taxpayer (or, if itelects, an accrual basis U.S. Taxpayer) will determine the U.S. dollar value of the amount realized bytranslating the amount received at the spot rate of exchange on the settlement date of the sale.
A U.S. Taxpayer will have a tax basis in any foreign currency received equal to the U.S. dollaramount realized. Any gain or loss realized by a U.S. Taxpayer on a subsequent conversion of foreigncurrency for a diÅerent amount will be ordinary income or loss.
Passive foreign investment company
A non-U.S. company is a passive foreign investment company (a ""PFIC'') in any taxable year inwhich, after taking into account the income and assets of certain subsidiaries, either (i) at least 75% of itsgross income is passive income or (ii) at least 50% of the quarterly average value (or, if it is not a publiclytraded corporation and so elects, by adjusted basis) of its assets is attributable to assets that produce or areheld to produce passive income. Based on the projected composition of the company's assets and incomeand its operations, the company believes it is not and will not become a PFIC in the near future. However,whether or not the company will be considered a PFIC will depend on the nature and source of its incomeand the value of its assets, as determined from time to time. If the company is treated as a PFIC, we donot currently intend to provide information necessary for the ""qualiÑed electing fund'' election as the
140
Brought to you by Global Reports

term is deÑned in the relative provisions of the U.S. federal income tax law. Prospective investors shouldconsult their own tax advisers about the consequences of our classiÑcation as a PFIC.
If we were a PFIC, a U.S. Taxpayer would be subject to special rules with respect to:
‚ any gain realized on the sale or other disposition of the shares; and
‚ any ""excess distribution'' by the company to the U.S. Taxpayer (generally, any distributions to theU.S. Taxpayer in respect of the shares during a single taxable year that are greater than 125% ofthe average annual distributions received by the U.S. Taxpayer in respect of the shares during thethree preceding taxable years or, if shorter, the U.S. Taxpayer's holding period for the shares).
Under these rules:
‚ the gain or excess distribution would be allocated ratably over the U.S. Taxpayer's holding periodfor the shares;
‚ the amount allocated to the taxable year in which the gain or excess distribution was realizedwould be taxable as ordinary income; and
‚ the amount allocated to each prior year, other than the current year and any taxable year prior tothe Ñrst taxable year in which we were a PFIC, would be subject to tax at the highest tax ratewould be imposed in respect of the tax attributable to each such year.
As an alternative to the special rules described above, U.S. Taxpayers that are holders of ""marketablestock'' in a PFIC may elect mark-to-market treatment with respect to their shares. In the case of U.S.Taxpayers other than certain regulated investment companies, the shares will not be considered marketablestock unless the shares are regularly traded on a qualiÑed exchange or other market. Under recentlyÑnalized treasury regulations, a foreign stock exchange such as the Telematico may constitute a qualiÑedexchange if it meets certain trading, listing and Ñnancial disclosure and other requirements set forth in theregulations. If the mark-to-market election is available, an electing U.S. Taxpayer would, in general,include as ordinary income each year an amount equal to the increase in value of its shares for that year(measured at the close of the holder's taxable year) and would be allowed a deduction for any decrease inthe value of its shares for the year, but only to the extent of previously included mark-to-market income.
Special rules apply with respect to the calculation of the amount of the foreign tax credit with respectto excess distributions by a PFIC.
A U.S. Taxpayer who owns shares during any year in which we are a PFIC is required to make anannual return on Internal Revenue Service Form 8621 regarding distributions received with respect toshares and any gain realized on the disposition of its shares.
Information reporting and backup withholding
In general, information reporting requirements may apply to dividends paid in respect of the shares orthe proceeds received on the sale or exchange of the shares within the United States or by a broker withcertain U.S. connections. Backup withholding may apply to payments to a U.S. Taxpayer of dividends orthe proceeds of a sale or other disposition of shares if such U.S. Taxpayer fails to provide an accuratetaxpayer identiÑcation number or, upon request, to certify that such U.S. Taxpayer is not subject tobackup withholding, or otherwise to comply with the applicable requirements of backup withholding.Prospective purchasers of shares should consult their own tax advisers regarding the application of theinformation reporting and backup withholding rules. The amount of any backup withholding from apayment to a U.S. Taxpayer will be allowed as a credit against the U.S. Taxpayer's U.S. federal incometax liability and a refund of any excess amount withheld under the backup withholding rules may beobtained by Ñling the appropriate claim for refund with the Internal Revenue Service and furnishing anyrequired information.
141
Brought to you by Global Reports

PLAN OF DISTRIBUTION
The Global OÅering consists of an oÅering to retail investors in Italy and an oÅering to institutionalinvestors in the United States, Europe and elsewhere. Merrill Lynch International and UniCredit BancaMobiliare S.p.A. (""UBM'') are acting as joint global coordinators (the ""Joint Global Coordinators'') onbehalf of the institutional underwriters named below in connection with (i) an Italian public oÅering toinvestors in Italy; and (ii) a concurrent international oÅering (a) to professional investors in Italy, (b) toqualiÑed institutional buyers (""QIBs'') in reliance on the exemption from registration provided byRule 144A under the Securities Act and (c) in oÅshore transactions in reliance on Regulation S under theSecurities Act. UniCredit Banca Mobiliare is the lead manager of the Italian OÅering.
The International OÅering
We have entered into an underwriting agreement with De' Longhi SoparÑ S.A. and the Joint GlobalCoordinators, as representatives of the institutional underwriters. Subject to the terms and conditions setforth in the underwriting agreement, we have agreed to issue and sell 27,900,000 shares in connection withthe international oÅering to the institutional underwriters, and each of the institutional underwriters hasagreed, severally and not jointly, to purchase from us the number of shares set forth opposite its namebelow.
Institutional Underwriters Number of Ordinary Shares
Merrill Lynch International ÏÏÏÏÏÏÏÏÏÏÏÏÏÏÏÏÏÏÏÏÏÏÏÏÏÏÏÏÏÏÏÏÏÏÏÏÏÏÏÏ 11,160,000
UniCredit Banca Mobiliare S.p.A. ÏÏÏÏÏÏÏÏÏÏÏÏÏÏÏÏÏÏÏÏÏÏÏÏÏÏÏÏÏÏÏÏÏÏ 11,160,000
Salomon Brothers International Limited(1)ÏÏÏÏÏÏÏÏÏÏÏÏÏÏÏÏÏÏÏÏÏÏÏÏÏÏÏÏ 4,185,000
EUROMOBILIARE SIM S.p.A. ÏÏÏÏÏÏÏÏÏÏÏÏÏÏÏÏÏÏÏÏÏÏÏÏÏÏÏÏÏÏÏÏÏÏÏ 1,395,000
Total ÏÏÏÏÏÏÏÏÏÏÏÏÏÏÏÏÏÏÏÏÏÏÏÏÏÏÏÏÏÏÏÏÏÏÏÏÏÏÏÏÏÏÏÏÏÏÏÏÏÏÏÏÏÏÏÏÏ 27,900,000
(1) Schroder is a trademark of Schroders Holdings plc and is used under license by Salomon Brothers International Limited.
Some of the institutional underwriters are oÅering the shares in the United States through their U.S.-registered broker-dealer aÇliates to qualiÑed institutional buyers in reliance on Rule 144A under theSecurities Act.
In the underwriting agreement, the several institutional underwriters have agreed, subject to the termsand conditions set forth in that agreement, to purchase all of our shares being issued in the internationaloÅering under the terms of the underwriting agreement if any of our shares are issued. In the event of adefault by an institutional underwriter, the underwriting agreement provides that in certain circumstances,the purchase commitments of the non-defaulting institutional underwriters may be increased or theunderwriting agreement terminated.
Prior to the Global OÅering, there has been no public market for our shares. We can provide you noassurance that an active trading market will develop for the shares or that the shares will trade in thepublic market after the Global OÅering at or above the oÅering price.
The institutional underwriters propose to oÅer the shares initially at the oÅering price. Theinstitutional underwriters will purchase shares at the oÅering price less aggregate commissions of 3.75% ofthe oÅer price per share. In addition, we may pay to the Joint Global Coordinators, at our sole discretion,an additional discretionary commission of up to 1.0% of the purchase price per share.
We and De' Longhi SoparÑ S.A. have given certain representations and warranties to the institutionalunderwriters and the Company has agreed to indemnify the institutional underwriters against certainliabilities, including liabilities under applicable securities laws, or to contribute to payments theinstitutional underwriters may be required to make in respect of these liabilities. We have agreed toreimburse the Joint Global Coordinators for some of their expenses incurred in connection with the GlobalOÅering.
The Italian public oÅering and the international oÅering may be terminated by the Joint GlobalCoordinators at any time upon the occurrence of certain events prior to the time at which the shares willbe ready for delivery. You should also refer to ""Ì The Italian Public OÅering.''
142
Brought to you by Global Reports

Over-allotment Option
The Company has granted the institutional underwriters an option, exercisable at the direction of theJoint Global Coordinators from the date of determination of the oÅering price until 30 days aftercommencement of trading of the shares on Telematico, to purchase up to an additional 3,750,000 shares.The option may be exercised from time to time and is exercisable solely to cover overÓallotments createdin the international oÅering, if any.
The Italian Public OÅering
We have also entered into an Italian purchase agreement with the Italian underwriters for the sale ofour shares to the public in Italy. Subject to the terms and conditions in the Italian purchase agreement,and concurrently with the sale of the shares to the institutional underwriters pursuant to the underwritingagreement, we have agreed to sell to the Italian underwriters, and the Italian underwriters, severally andnot jointly, have agreed to purchase 9,600,000 shares from us. The closing of the Italian public oÅeringand the institutional oÅering are conditional upon each other.
Intersyndicate Agreement
The institutional underwriters and the Italian underwriters have entered into an intersyndicateagreement that provides for the co-ordination of their activities. The intersyndicate agreement provides,among other things, that the Joint Global Coordinators shall have the authority to manage the orderlydistribution of the shares. Under the terms of the intersyndicate agreement, the institutional underwritersand the Italian underwriters are permitted to sell our shares to each other for the purposes of resale at theoÅering price, less an amount determined by the Joint Global Coordinators.
No Sales of Similar Securities
Subject to certain exceptions as may be agreed between the parties and except as described in thisoÅering memorandum, we and De' Longhi SoparÑ S.A. have agreed not to sell or transfer any shares for180 days after the date of this oÅering memorandum without Ñrst obtaining the written consent of theJoint Global Coordinators, such consent not to be unreasonably withheld. SpeciÑcally, each of us hasagreed not to directly or indirectly:
‚ oÅer, pledge, sell or contract to sell any shares;
‚ sell any option or contract to purchase any shares;
‚ authorize the issuance by us of any shares;
‚ purchase any option or contract to purchase any shares;
‚ grant any option, right or warrant for the sale of any shares;
‚ lend or otherwise dispose of or transfer any shares;
‚ request or demand that we Ñle a registration statement related to the shares; or
‚ enter into any swap or other agreement that transfers, in whole or in part, the economicconsequence of ownership of any shares whether any such swap or transaction is to be settled bydelivery of shares or other securities, in cash or otherwise.
This lock-up provision applies to shares and to securities convertible into or exchangeable orexercisable for or repayable with shares. It also applies to shares owned now or acquired later by theperson executing the agreement or for which the person executing the agreement later acquires the powerof disposition.
Price Stabilization and Short Positions
In connection with the Global OÅering, the Joint Global Coordinators, on behalf of the institutionalunderwriters, may engage in transactions that stabilize the market price of the shares. Such transactionsconsist of bids or purchases to peg, Ñx or maintain the price of the shares. If the institutional underwriterscreate a short position in the shares in connection with the Global OÅering, i.e., if they sell more sharesthan are listed on the cover page of this oÅering memorandum, the Joint Global Coordinators may reduce
143
Brought to you by Global Reports

that short position by purchasing shares in the open market. Purchases of a security to stabilize the priceor to reduce a short position may cause the price of the securities to be higher than it might be in theabsence of such purchases.
Neither we nor any of the institutional underwriters makes any representation or prediction as to thedirection or magnitude of any eÅect that the transactions described above may have on the price of theshares. In addition, neither we nor any of the institutional underwriters makes any representation that theJoint Global Coordinators will engage in these transactions, or that these transactions, once commenced,will not be discontinued without notice. These transactions may be eÅected on the Telematico, in the over-the-counter market or otherwise.
Other Relationships
UBM, which is the lead manager of the Italian public oÅering and a Joint Global Coordinator, hasprovided Ñnancing to De' Longhi as part of a syndicate of banks in connection with our acquisition ofKenwood. As of June 22, 2001, UBM had provided us with outstanding loans totaling approximatelyLit. 88,500 million, for which it received customary fees and commissions.
Transfer Restrictions
You should refer to ""Transfer Restrictions'' and the selling restrictions set forth elsewhere in thisoÅering memorandum for a description of certain transfer and selling restrictions applicable to our shares.
Selling Restrictions
Each institutional underwriter has represented and agreed that it has not oÅered or sold and will notoÅer or sell any shares to any persons in the United Kingdom, except to persons whose ordinary activitiesinvolve them in acquiring, holding, managing or disposing of investments (as principal or agent) for thepurposes of their businesses or otherwise in circumstances that have not resulted and will not result in anoÅer to the public in the United Kingdom within the meaning of the Public OÅers of SecuritiesRegulations 1995.
Each institutional underwriter oÅering shares has represented and agreed that it has not oÅered orsold, or distributed any oÅering material, and will not oÅer or sell or distribute any oÅering material,directly or indirectly, in Italy or to a resident of Italy other than to a professional investor as deÑned in therelevant Italian regulations. Each institutional underwriter has further agreed that any such oÅer or sale orany distribution of this oÅering memorandum or any rendering of advice in respect of an investment in theshares within Italy must be conducted either by securities dealing Ñrms (SIMs) or by authorized banks orinvestment Ñrms, as described by the UniÑed Financial Act and CONSOB Regulation No. 11522 ofJuly 1, 1998.
No action has been or will be taken in any jurisdiction other than Italy that would permit a publicoÅering of the shares or the possession, circulation or distribution of this oÅering memorandum or anyother material relating to us or the shares in any jurisdiction where action for that purpose is required.Accordingly, the shares may not be oÅered or sold, directly or indirectly, and neither this oÅeringmemorandum nor any other oÅering material or advertisements in connection with the shares may bedistributed or published in or from any country or jurisdiction except under circumstances that will resultin compliance with any applicable rules and regulations of any such country or jurisdiction.
Purchasers of shares may be required to pay stamp taxes and other charges in accordance with thelaws and practices of the country of purchase in addition to the oÅering price set forth on the cover pageof this oÅering memorandum.
Delivery of Shares
It is expected that delivery of the shares will be made against payment therefor on or aboutJuly 24, 2001.
144
Brought to you by Global Reports

TRANSFER RESTRICTIONS
You are advised to consult legal counsel prior to making any oÅer for resale, pledge or other transferof our shares on account of the following restrictions.
If you purchase our shares oÅered hereby in the United States pursuant to Rule 144A you will bedeemed to have represented and agreed as follows (terms used in this ""Transfer Restrictions'' section thatare deÑned in Rule 144A or Regulation S under the Securities Act are used herein as deÑned therein).
(i) You (a) are a QIB, (b) are aware that the sale of our shares to you is being made in reliance onRule 144A and (c) are acquiring our shares for your own account or for the account of anotherqualiÑed institutional buyer, as the case may be.
(ii) You understand that our shares have not been and will not be registered under the Securities Actand are being oÅered in the United States in reliance on Rule 144A only in a transaction notinvolving a public oÅering in the United States within the meaning of the Securities Act, andmay not be reoÅered, resold, pledged or otherwise transferred except (a) to a person whom thebeneÑcial owner and/or any person acting on its behalf reasonably believes is a QIB, (b) in anoÅshore transaction outside the United States in accordance with Rule 903 or 904 underRegulation S to persons other than U.S. persons as deÑned in Regulation S or (c) pursuant to anexemption from registration under the Securities Act provided by Rule 144, in each case inaccordance with any applicable securities laws of any state of the United States or any otherjurisdiction. No representation can be made as to the availability of the exemption provided byRule 144 under the Securities Act for resale of our ordinary shares.
We will not recognize any oÅer, sale, pledge or other transfer made other than in compliance with theabove-stated restrictions.
If you purchase our shares outside the United States pursuant to Regulation S you will be deemed tohave represented and agreed as follows:
(i) You (a) are, and the person for whose account you are acquiring our shares, if any, is outsidethe United States, (b) you are not an aÇliate of the Company or a person acting on behalf of anaÇliate of the Company and (c) you are not in the business of buying or selling securities or, ifyou are in such business, did not acquire our ordinary shares in the initial distribution of ourordinary shares.
(ii) You are aware that our shares have not and will not be registered under the Securities Act andare being oÅered outside the United States in reliance on Regulation S.
(iii) If you purchase our shares pursuant to Regulation S you will be required, or will be deemed byour purchase thereof, to conÑrm that you are aware of the restrictions on the oÅer and sale ofour shares pursuant to Regulation S described in this oÅering circular.
We will not recognize any oÅer, sale, pledge or other transfer made other than in compliance with theabove-stated restrictions.
LEGAL MATTERS
The validity of the shares and certain other legal matters will be passed upon by Bonelli EredePappalardo, our Italian legal advisers. Latham & Watkins will pass upon certain U.S. and English lawmatters. The validity of the shares and certain other legal matters will be passed upon for the underwritersby Grimaldi CliÅord Chance, Italian legal advisers to the underwriters. CliÅord Chance Limited LiabilityPartnership, international legal advisers to the underwriters, will pass upon certain U.S. and English lawmatters.
INDEPENDENT ACCOUNTANTS
The Audited De' Longhi Consolidated Financial Statements included in this oÅering memorandumhave been audited in accordance with generally accepted auditing standards in Italy by Price-waterhouseCoopers, independent accountants, to the extent and for the periods indicated in their reportsthereon. PricewaterhouseCoopers also performed limited examination procedures in accordance with theapplicable standards issued by CONSOB on the Unaudited De' Longhi Pro Forma Consolidated FinancialStatements. The Audited Kenwood Consolidated Financial Statements included in this oÅering
145
Brought to you by Global Reports

memorandum have been audited in accordance with United Kingdom auditing standards by Ernst& Young, independent auditors, as stated in their report appearing herein.
AVAILABLE INFORMATION
In accordance with Italian regulation, we make publicly available, but do not mail to shareholdersunless speciÑcally requested in writing: (i) an annual report containing audited consolidated Ñnancialstatements for the year no later than April 30 of the following year (which may be extended to June 30 ofthe following year in certain circumstances); (ii) an interim report containing consolidated Ñnancialstatements that are subject to a limited review not constituting an audit by external auditors for the Ñrstsix months of each year no later than October 31 of the year; and (iii) quarterly selected unauditedÑnancial data for the Ñrst and third quarters of each year no later than 45 days after the end of each suchquarter.
We are not currently required to Ñle periodic reports under Section 13 or 15(d) of the U.S. SecuritiesExchange Act of 1934, as amended (the ""Exchange Act''). In order to preserve the exemption for resalesand transfers under Rule 144A, we will either (a) ensure that we qualify for exemption fromSection 12(g) of the Exchange Act by furnishing to the United States Securities and ExchangeCommission the information required by Rule 12g3-2(b) thereunder or (b) provide upon request to anyholder or beneÑcial holder of the shares or prospective purchasers designated by such holder or beneÑcialowner information required to be delivered pursuant to Rule 144A(d)(4) under the Securities Act. Wewill also furnish certain information to Borsa Italiana, which is responsible for managing and organizingthe Telematico.
146
Brought to you by Global Reports

INDEX TO FINANCIAL STATEMENTS
The Ñnancial statements and independent accountants' reports set out on pages F-2 to F-125 of thisoÅering memorandum are an integral part of this oÅering memorandum.
The following Ñnancial statements (other than the Audited Kenwood Consolidated FinancialStatements) are a substantially equivalent translation from those issued in Italian into the Englishlanguage, have been reformatted in a manner diÅerent from those issued in Italian, and omit certaininformation that is not regarded as material.
Audited Historical Consolidated Financial Statements:
De' Longhi S.p.A.:
Reports of Independent Auditors ÏÏÏÏÏÏÏÏÏÏÏÏÏÏÏÏÏÏÏÏÏÏÏÏÏÏÏÏÏÏÏÏÏÏÏÏÏÏÏÏÏÏÏÏÏÏÏÏÏÏÏÏ F-2
Consolidated Balance Sheets as at December 31, 1998, 1999 and 2000ÏÏÏÏÏÏÏÏÏÏÏÏÏÏÏÏÏÏÏÏ F-5
Consolidated Income Statements for the years ending December 31, 1998, 1999 and 2000 ÏÏÏ F-6
Consolidated Statement of Changes in Shareholders' Equity for the years endingDecember 31, 1998, 1999 and 2000ÏÏÏÏÏÏÏÏÏÏÏÏÏÏÏÏÏÏÏÏÏÏÏÏÏÏÏÏÏÏÏÏÏÏÏÏÏÏÏÏÏÏÏÏÏÏÏÏ F-7
Consolidated Cash Flow Statements for the years ending December 31, 1998, 1999 and 2000 F-8
Notes to the Consolidated Financial Statements ÏÏÏÏÏÏÏÏÏÏÏÏÏÏÏÏÏÏÏÏÏÏÏÏÏÏÏÏÏÏÏÏÏÏÏÏÏÏÏ F-9
Kenwood Appliances plc:
Report of Independent AuditorsÏÏÏÏÏÏÏÏÏÏÏÏÏÏÏÏÏÏÏÏÏÏÏÏÏÏÏÏÏÏÏÏÏÏÏÏÏÏÏÏÏÏÏÏÏÏÏÏÏÏÏÏÏ F-38
Consolidated Balance Sheets as at April 2, 1999 and March 31, 2000 and 2001 ÏÏÏÏÏÏÏÏÏÏÏÏ F-39
Consolidated Income Statements for the years ending April 2, 1999 and March 31, 2000 and2001ÏÏÏÏÏÏÏÏÏÏÏÏÏÏÏÏÏÏÏÏÏÏÏÏÏÏÏÏÏÏÏÏÏÏÏÏÏÏÏÏÏÏÏÏÏÏÏÏÏÏÏÏÏÏÏÏÏÏÏÏÏÏÏÏÏÏÏÏÏÏÏÏÏÏ F-40
Consolidated Statement of Shareholders' Equity for the years ending April 2, 1999 andMarch 31, 2000 and 2001 ÏÏÏÏÏÏÏÏÏÏÏÏÏÏÏÏÏÏÏÏÏÏÏÏÏÏÏÏÏÏÏÏÏÏÏÏÏÏÏÏÏÏÏÏÏÏÏÏÏÏÏÏÏÏÏÏ F-41
Consolidated Statement of Cash Flows for the years ending April 2, 1999 and March 31,2000 and 2001 ÏÏÏÏÏÏÏÏÏÏÏÏÏÏÏÏÏÏÏÏÏÏÏÏÏÏÏÏÏÏÏÏÏÏÏÏÏÏÏÏÏÏÏÏÏÏÏÏÏÏÏÏÏÏÏÏÏÏÏÏÏÏÏÏÏ F-42
Notes to the Consolidated Financial Statements ÏÏÏÏÏÏÏÏÏÏÏÏÏÏÏÏÏÏÏÏÏÏÏÏÏÏÏÏÏÏÏÏÏÏÏÏÏÏÏ F-43
Unaudited Interim Consolidated Financial Statements:
Consolidated Balance Sheets as at December 31, 2000 and March 31, 2001ÏÏÏÏÏÏÏÏÏÏÏÏÏÏÏÏ F-70
Consolidated Income Statements for the periods ending March 31, 2000 and 2001 ÏÏÏÏÏÏÏÏÏÏ F-71
Statements of Cash Flow for the periods ending March 31, 2000 and 2001 ÏÏÏÏÏÏÏÏÏÏÏÏÏÏÏÏ F-72
Notes to the Unaudited Interim Consolidated Financial StatementsÏÏÏÏÏÏÏÏÏÏÏÏÏÏÏÏÏÏÏÏÏÏÏ F-73
Unaudited De' Longhi Pro Forma Consolidated Financial Statements (not includingKenwood):
Report of Independent AuditorsÏÏÏÏÏÏÏÏÏÏÏÏÏÏÏÏÏÏÏÏÏÏÏÏÏÏÏÏÏÏÏÏÏÏÏÏÏÏÏÏÏÏÏÏÏÏÏÏÏÏÏÏÏ F-76
Unaudited Restated Consolidated Balance Sheets as at December 31, 1998, 1999 and 2000 ÏÏ F-77
Unaudited Restated Consolidated Income Statements for the years ending December 31,1998, 1999 and 2000 ÏÏÏÏÏÏÏÏÏÏÏÏÏÏÏÏÏÏÏÏÏÏÏÏÏÏÏÏÏÏÏÏÏÏÏÏÏÏÏÏÏÏÏÏÏÏÏÏÏÏÏÏÏÏÏÏÏÏÏÏ F-78
Unaudited Restated Consolidated Cash Flow Statements for the years ending December 31,1999 and 2000 ÏÏÏÏÏÏÏÏÏÏÏÏÏÏÏÏÏÏÏÏÏÏÏÏÏÏÏÏÏÏÏÏÏÏÏÏÏÏÏÏÏÏÏÏÏÏÏÏÏÏÏÏÏÏÏÏÏÏÏÏÏÏÏÏÏ F-79
Unaudited Restated Consolidated Statements of Changes in Shareholders' Equity for theyears ending December 31, 1999 and 2000ÏÏÏÏÏÏÏÏÏÏÏÏÏÏÏÏÏÏÏÏÏÏÏÏÏÏÏÏÏÏÏÏÏÏÏÏÏÏÏÏÏÏ F-80
Notes to the Unaudited De' Longhi Pro Forma Consolidated Financial Statements ÏÏÏÏÏÏÏÏÏ F-81
Reconciliation to Historical Consolidated Financial Statements ÏÏÏÏÏÏÏÏÏÏÏÏÏÏÏÏÏÏÏÏÏÏÏÏÏÏ F-106
Unaudited Pro Forma Consolidated Financial Statements (including Kenwood):
Unaudited Pro Forma Consolidated Balance Sheets at December 31, 1998, 1999 and 2000 ÏÏÏ F-114
Unaudited Pro Forma Consolidated Income Statements for the years ending December 31,1998, 1999 and 2000 ÏÏÏÏÏÏÏÏÏÏÏÏÏÏÏÏÏÏÏÏÏÏÏÏÏÏÏÏÏÏÏÏÏÏÏÏÏÏÏÏÏÏÏÏÏÏÏÏÏÏÏÏÏÏÏÏÏÏÏÏ F-115
Unaudited Pro Forma Consolidated Cash Flow Statements for the years ending December 31,1999 and 2000 ÏÏÏÏÏÏÏÏÏÏÏÏÏÏÏÏÏÏÏÏÏÏÏÏÏÏÏÏÏÏÏÏÏÏÏÏÏÏÏÏÏÏÏÏÏÏÏÏÏÏÏÏÏÏÏÏÏÏÏÏÏÏÏÏÏ F-116
Notes to the Unaudited Pro Forma Consolidated Financial StatementsÏÏÏÏÏÏÏÏÏÏÏÏÏÏÏÏÏÏÏÏ F-117
Reconciliation to De' Longhi Pro Forma Consolidated Financial Statements (not includingKenwood) ÏÏÏÏÏÏÏÏÏÏÏÏÏÏÏÏÏÏÏÏÏÏÏÏÏÏÏÏÏÏÏÏÏÏÏÏÏÏÏÏÏÏÏÏÏÏÏÏÏÏÏÏÏÏÏÏÏÏÏÏÏÏÏÏÏÏÏÏÏ F-118
F-1
Brought to you by Global Reports

organizzazionee revisione contabile
Piazza Crispi 831100 TrevisoTel. +39 0422 542726Fax +39 0422 579889
uffici in ItaliaTreviso Bari BolognaBrescia Firenze GenovaMilano Napoli PadovaPalermo Roma TorinoUdine Verona
AUDITORS' REPORT
To the Board of DirectorsDe' Longhi S.p.A.
We have audited the consolidated balance sheet statement together with the notes limited to the dataand information pertaining to the balance sheet only of De' Longhi S.p.A. and its subsidiaries for the yearended December 31, 1998.
Our examination was carried out in accordance with established auditing standards and, in accordancewith such auditing standards, we made reference to the accounting principles established by the ItalianProfession (National Boards of Dottori Commercialisti and Ragionieri).
Our examination was limited to the consolidated balance sheet statement for the year endedDecember 31, 1998 together with the notes limited to the data and information pertaining to the balancesheet only, consequently the statement of income for the year 1998 together with the notes limited to thedata and information pertaining to the statement of income and the proÑt for the year shown in thebalance sheet at December 31, 1998 have not been examined by us.
In our opinion, the above mentioned balance sheet and the notes, limited to the data and informationpertaining to the balance sheet only, have been properly prepared and give a true and fair view of theÑnancial position of De' Longhi S.p.A. at December 31, 1998 in conformity with Italian law governingconsolidated Ñnancial statements, referred to in the second paragraph.
COOPERS & LYBRAND S.p.A.
S/ Roberto Adami
Treviso, June 30, 1999
The above report is an English translation of the report prepared for use in Italy and relates to the originalversion of the consolidated Ñnancial statements prepared in the Italian language. Such Ñnancial statementswere prepared using accounting principles, procedures and reporting practices generally accepted in Italyand are not intended to present the results of operations or statement of position in accordance withaccounting principles and practices generally accepted in countries and jurisdictions other than those ofItaly. The standards, procedures and practices utilized to audit such Ñnancial statements are thosegenerally accepted and applied in Italy.
Coopers & Lybrand S.p.A. - capitale sociale 4.600.000.000 interamente versato - autorizzata ai sensi della legge 23/11/1939n. 1966 e del R.D. 22/4/1940 n. 531 - iscritta nell'albo speciale delle società di revisione con delibera Consob n. 10821 e nelregistro dei revisori contabili D.M. 12/4/1995 - R.E.A Treviso n. 0222771 - C.F. / P.IVA 00714780152
F-2
Brought to you by Global Reports

AUDITORS' REPORT
To the shareholders ofDe' Longhi S.p.A.
1 We have audited the consolidated Ñnancial statements of De' Longhi S.p.A. (the ""Company'') as ofDecember 31, 1999. These Ñnancial statements are the responsibility of De' Longhi S.p.A.'s directors.Our responsibility is to express an opinion on these Ñnancial statements based on our audit.
2 We conducted our audit in accordance with the auditing standards and criteria recommended byCONSOB. Those standards and criteria require that we plan and perform the audit to obtain thenecessary assurance about whether the Ñnancial statements are free of material misstatement and,taken as a whole, are presented fairly. An audit includes examining, on a test basis, evidencesupporting the amounts and disclosures in the Ñnancial statements. An audit also includes assessingthe accounting principles used and signiÑcant estimates made by the directors. We believe that ouraudit provides a reasonable basis for our opinion.
For the opinion on the consolidated Ñnancial statements of the prior period (limited to theconsolidated balance sheet and relevant notes), which are presented for comparative purposes asrequired by law, reference is made to the report issued by Coopers & Lybrand S.p.A. dated June 30,1999.
3 In our opinion, the consolidated Ñnancial statements of De' Longhi S.p.A. as of December 31, 1999comply with the laws governing the criteria for their preparation; accordingly, they give a true and fairview of the Ñnancial position and of the results of operations of the Company.
Treviso, June 26, 2000
PricewaterhouseCoopers S.p.A.
S/ Roberto Adami(Partner)
The above report is an English translation of the report prepared for use in Italy and relates to the originalversion of the consolidated Ñnancial statements prepared in the Italian language. Such Ñnancial statementswere prepared using accounting principles, procedures and reporting practices generally accepted in Italyand are not intended to present the results of operations or statement of position in accordance withaccounting principles and practices generally accepted in countries and jurisdictions other than those ofItaly. The standards, procedures and practices utilized to audit such Ñnancial statements are thosegenerally accepted and applied in Italy.
F-3
Brought to you by Global Reports

AUDITORS' REPORT
To the shareholders ofDe' Longhi S.p.A.
1 We have audited the consolidated Ñnancial statements of De' Longhi S.p.A. and subsidiaries(De' Longhi Group) as of December 31, 2000. These Ñnancial statements are the responsibility ofDe' Longhi S.p.A.'s directors. Our responsibility is to express an opinion on these Ñnancial statementsbased on our audit.
2 We conducted our audit in accordance with the auditing standards and criteria recommended byCONSOB. Those standards and criteria require that we plan and perform the audit to obtain thenecessary assurance about whether the Ñnancial statements are free of material misstatement and,taken as a whole, are presented fairly. An audit includes examining, on a test basis, evidencesupporting the amounts and disclosures in the Ñnancial statements. An audit also includes assessingthe accounting principles used and signiÑcant estimates made by the directors. We believe that ouraudit provides a reasonable basis for our opinion. The Ñnancial statements of some subsidiaries havebeen examined by other auditors who have provided us with their audit opinions. Our opinion,expressed in this report, is also based on the audits performed by these other auditors with regard toapproximately 7% of total consolidated assets and approximately 21% of consolidated revenues.
For the opinion on the consolidated Ñnancial statements of the prior period, which are presented forcomparative purposes as required by law, reference is made to our report issued on June 26, 2000.
3 In our opinion, the consolidated Ñnancial statements of De' Longhi S.p.A. as of December 31, 2000comply with the laws governing the criteria for their preparation; accordingly, they give a true and fairview of the Ñnancial position and of the results of operations of De' Longhi Group.
Treviso, April 11, 2001
PricewaterhouseCoopers S.p.A.
S/Roberto Adami(Partner)
The above report is an English translation of the report prepared for use in Italy and relates to the originalversion of the consolidated Ñnancial statements prepared in the Italian language. Such Ñnancial statementswere prepared using accounting principles, procedures and reporting practices generally accepted in Italyand are not intended to present the results of operations or statement of position in accordance withaccounting principles and practices generally accepted in countries and jurisdictions other than those ofItaly. The standards, procedures and practices utilized to audit such Ñnancial statements are thosegenerally accepted and applied in Italy.
F-4
Brought to you by Global Reports

DE' LONGHI S.P.A.
CONSOLIDATED BALANCE SHEETS
AS AT DECEMBER 31, 1998, 1999 AND 2000
1998 1999 2000
(Millions of Lire)
Receivables from shareholders ÏÏÏÏÏÏÏÏÏÏÏÏÏÏÏÏÏÏÏÏÏÏÏÏÏÏÏÏÏÏÏ 9,100 25,000 Ì
Goodwill, net ÏÏÏÏÏÏÏÏÏÏÏÏÏÏÏÏÏÏÏÏÏÏÏÏÏÏÏÏÏÏÏÏÏÏÏÏÏÏÏÏÏÏÏÏÏ 12,421 10,658 545,344
Other intangible assets ÏÏÏÏÏÏÏÏÏÏÏÏÏÏÏÏÏÏÏÏÏÏÏÏÏÏÏÏÏÏÏÏÏÏÏÏÏ 214,338 198,879 203,123
Total intangible assets ÏÏÏÏÏÏÏÏÏÏÏÏÏÏÏÏÏÏÏÏÏÏÏÏÏÏÏÏÏÏÏÏÏÏÏÏÏÏ 226,759 209,537 748,467
Tangible assets, net ÏÏÏÏÏÏÏÏÏÏÏÏÏÏÏÏÏÏÏÏÏÏÏÏÏÏÏÏÏÏÏÏÏÏÏÏÏÏÏÏ 283,628 267,287 344,097
Financial assetsÏÏÏÏÏÏÏÏÏÏÏÏÏÏÏÏÏÏÏÏÏÏÏÏÏÏÏÏÏÏÏÏÏÏÏÏÏÏÏÏÏÏÏÏ 41,350 35,597 17,679
Total Ñxed assets ÏÏÏÏÏÏÏÏÏÏÏÏÏÏÏÏÏÏÏÏÏÏÏÏÏÏÏÏÏÏÏÏÏÏÏÏÏÏÏÏ 551,737 512,421 1,110,243
Receivables, net ÏÏÏÏÏÏÏÏÏÏÏÏÏÏÏÏÏÏÏÏÏÏÏÏÏÏÏÏÏÏÏÏÏÏÏÏÏÏÏÏÏÏÏ 497,195 513,534 615,735
Inventory, net ÏÏÏÏÏÏÏÏÏÏÏÏÏÏÏÏÏÏÏÏÏÏÏÏÏÏÏÏÏÏÏÏÏÏÏÏÏÏÏÏÏÏÏÏÏ 243,725 227,605 370,539
Other assets ÏÏÏÏÏÏÏÏÏÏÏÏÏÏÏÏÏÏÏÏÏÏÏÏÏÏÏÏÏÏÏÏÏÏÏÏÏÏÏÏÏÏÏÏÏÏ 125,860 109,534 141,294
Payables ÏÏÏÏÏÏÏÏÏÏÏÏÏÏÏÏÏÏÏÏÏÏÏÏÏÏÏÏÏÏÏÏÏÏÏÏÏÏÏÏÏÏÏÏÏÏÏÏÏ (230,242) (258,132) (357,814)
Other liabilitiesÏÏÏÏÏÏÏÏÏÏÏÏÏÏÏÏÏÏÏÏÏÏÏÏÏÏÏÏÏÏÏÏÏÏÏÏÏÏÏÏÏÏÏÏ (111,426) (90,700) (158,390)
Net working capital ÏÏÏÏÏÏÏÏÏÏÏÏÏÏÏÏÏÏÏÏÏÏÏÏÏÏÏÏÏÏÏÏÏÏÏÏÏÏÏÏ 525,112 501,841 611,364
Total capital employed ÏÏÏÏÏÏÏÏÏÏÏÏÏÏÏÏÏÏÏÏÏÏÏÏÏÏÏÏÏÏÏÏÏÏÏ 1,085,949 1,039,262 1,721,607
Reserve for staÅ severance indemnitiesÏÏÏÏÏÏÏÏÏÏÏÏÏÏÏÏÏÏÏÏÏÏÏÏ 24,333 24,302 37,526
Reserve for risks and other charges ÏÏÏÏÏÏÏÏÏÏÏÏÏÏÏÏÏÏÏÏÏÏÏÏÏÏÏ 19,067 15,726 21,852
Long-term liabilities ÏÏÏÏÏÏÏÏÏÏÏÏÏÏÏÏÏÏÏÏÏÏÏÏÏÏÏÏÏÏÏÏÏÏÏÏÏÏÏ 43,400 40,028 59,378
Cash and cash equivalents ÏÏÏÏÏÏÏÏÏÏÏÏÏÏÏÏÏÏÏÏÏÏÏÏÏÏÏÏÏÏÏÏÏÏ (78,600) (145,815) (130,979)
Short-term debt ÏÏÏÏÏÏÏÏÏÏÏÏÏÏÏÏÏÏÏÏÏÏÏÏÏÏÏÏÏÏÏÏÏÏÏÏÏÏÏÏÏÏÏ 179,162 312,854 300,034
Debt for acquisition of investments ÏÏÏÏÏÏÏÏÏÏÏÏÏÏÏÏÏÏÏÏÏÏÏÏÏÏÏ Ì Ì 504,604
Long-term debt ÏÏÏÏÏÏÏÏÏÏÏÏÏÏÏÏÏÏÏÏÏÏÏÏÏÏÏÏÏÏÏÏÏÏÏÏÏÏÏÏÏÏÏ 605,883 346,047 519,142
Net Ñnancial positionÏÏÏÏÏÏÏÏÏÏÏÏÏÏÏÏÏÏÏÏÏÏÏÏÏÏÏÏÏÏÏÏÏÏÏÏÏÏÏ 706,445 513,086 1,192,801
Share capitalÏÏÏÏÏÏÏÏÏÏÏÏÏÏÏÏÏÏÏÏÏÏÏÏÏÏÏÏÏÏÏÏÏÏÏÏÏÏÏÏÏÏÏÏÏÏ 300,000 400,000 400,000
Reserves ÏÏÏÏÏÏÏÏÏÏÏÏÏÏÏÏÏÏÏÏÏÏÏÏÏÏÏÏÏÏÏÏÏÏÏÏÏÏÏÏÏÏÏÏÏÏÏÏÏ 26,315 36,362 40,812
Net income for the year ÏÏÏÏÏÏÏÏÏÏÏÏÏÏÏÏÏÏÏÏÏÏÏÏÏÏÏÏÏÏÏÏÏÏÏÏ 9,209 49,125 27,980
Shareholders' equityÏÏÏÏÏÏÏÏÏÏÏÏÏÏÏÏÏÏÏÏÏÏÏÏÏÏÏÏÏÏÏÏÏÏÏÏÏÏÏÏ 335,524 485,487 468,792
Minority interestsÏÏÏÏÏÏÏÏÏÏÏÏÏÏÏÏÏÏÏÏÏÏÏÏÏÏÏÏÏÏÏÏÏÏÏÏÏÏÏÏÏÏ 580 661 636
Total shareholders' equity and minority interests ÏÏÏÏÏÏÏÏÏÏÏÏÏÏ 336,104 486,148 469,428
Total liabilities and shareholders' equity ÏÏÏÏÏÏÏÏÏÏÏÏÏÏÏÏÏÏÏÏÏ 1,085,949 1,039,262 1,721,607
Memorandum accounts ÏÏÏÏÏÏÏÏÏÏÏÏÏÏÏÏÏÏÏÏÏÏÏÏÏÏÏÏÏÏÏÏÏÏÏÏÏ 126,482 177,567 24,254
The accompanying notes are an integral part of these Consolidated Financial Statements.
F-5
Brought to you by Global Reports

DE' LONGHI S.P.A.
CONSOLIDATED INCOME STATEMENTS
FOR THE YEARS ENDING DECEMBER 31, 1998, 1999 AND 2000
Unaudited1998 1999 2000
(Millions of Lire)
Net sales ÏÏÏÏÏÏÏÏÏÏÏÏÏÏÏÏÏÏÏÏÏÏÏÏÏÏÏÏÏÏÏÏÏÏÏÏÏÏÏÏÏÏÏÏÏÏÏÏÏ 1,068,600 1,136,044 1,222,951
Other revenues ÏÏÏÏÏÏÏÏÏÏÏÏÏÏÏÏÏÏÏÏÏÏÏÏÏÏÏÏÏÏÏÏÏÏÏÏÏÏÏÏÏÏÏÏ 22,473 22,531 27,073
Total revenues ÏÏÏÏÏÏÏÏÏÏÏÏÏÏÏÏÏÏÏÏÏÏÏÏÏÏÏÏÏÏÏÏÏÏÏÏÏÏÏÏÏÏÏÏ 1,091,073 1,158,575 1,250,024
Materials, consumables and goods ÏÏÏÏÏÏÏÏÏÏÏÏÏÏÏÏÏÏÏÏÏÏÏÏÏÏÏÏ 549,484 541,941 555,254
Services ÏÏÏÏÏÏÏÏÏÏÏÏÏÏÏÏÏÏÏÏÏÏÏÏÏÏÏÏÏÏÏÏÏÏÏÏÏÏÏÏÏÏÏÏÏÏÏÏÏÏ 235,411 254,967 301,812
Rents, leases and related costs ÏÏÏÏÏÏÏÏÏÏÏÏÏÏÏÏÏÏÏÏÏÏÏÏÏÏÏÏÏÏÏ 11,950 11,885 14,241
Other costs ÏÏÏÏÏÏÏÏÏÏÏÏÏÏÏÏÏÏÏÏÏÏÏÏÏÏÏÏÏÏÏÏÏÏÏÏÏÏÏÏÏÏÏÏÏÏÏ 19,478 15,596 8,543
Total production costs ÏÏÏÏÏÏÏÏÏÏÏÏÏÏÏÏÏÏÏÏÏÏÏÏÏÏÏÏÏÏÏÏÏÏÏÏÏÏ 816,323 824,389 879,850
Value added marginÏÏÏÏÏÏÏÏÏÏÏÏÏÏÏÏÏÏÏÏÏÏÏÏÏÏÏÏÏÏÏÏÏÏÏÏÏÏÏÏ 274,750 334,186 370,174
Wages, salaries and beneÑts ÏÏÏÏÏÏÏÏÏÏÏÏÏÏÏÏÏÏÏÏÏÏÏÏÏÏÏÏÏÏÏÏÏ 148,558 158,766 173,659
Gross operating margin ÏÏÏÏÏÏÏÏÏÏÏÏÏÏÏÏÏÏÏÏÏÏÏÏÏÏÏÏÏÏÏÏÏÏÏÏÏ 126,192 175,420 196,515
Depreciation and amortization ÏÏÏÏÏÏÏÏÏÏÏÏÏÏÏÏÏÏÏÏÏÏÏÏÏÏÏÏÏÏÏ 56,336 60,034 58,309
Amortization of goodwillÏÏÏÏÏÏÏÏÏÏÏÏÏÏÏÏÏÏÏÏÏÏÏÏÏÏÏÏÏÏÏÏÏÏÏÏ 1,768 1,769 1,884
Provisions and write-oÅs ÏÏÏÏÏÏÏÏÏÏÏÏÏÏÏÏÏÏÏÏÏÏÏÏÏÏÏÏÏÏÏÏÏÏÏÏ 26,619 14,754 16,030
Operating proÑt ÏÏÏÏÏÏÏÏÏÏÏÏÏÏÏÏÏÏÏÏÏÏÏÏÏÏÏÏÏÏÏÏÏÏÏÏÏÏÏÏÏÏÏ 41,469 98,863 120,292
Net Ñnancial loss ÏÏÏÏÏÏÏÏÏÏÏÏÏÏÏÏÏÏÏÏÏÏÏÏÏÏÏÏÏÏÏÏÏÏÏÏÏÏÏÏÏÏ (63,649) (25,616) (39,211)
Income from equity investments ÏÏÏÏÏÏÏÏÏÏÏÏÏÏÏÏÏÏÏÏÏÏÏÏÏÏÏÏÏ 189 835 8,481
Extraordinary gain (loss) ÏÏÏÏÏÏÏÏÏÏÏÏÏÏÏÏÏÏÏÏÏÏÏÏÏÏÏÏÏÏÏÏÏÏÏ 43,395 (7,040) (19,935)
Earnings before taxes and minority interests ÏÏÏÏÏÏÏÏÏÏÏÏÏÏÏÏÏÏÏ 21,404 67,042 69,627
Income taxes ÏÏÏÏÏÏÏÏÏÏÏÏÏÏÏÏÏÏÏÏÏÏÏÏÏÏÏÏÏÏÏÏÏÏÏÏÏÏÏÏÏÏÏÏÏ 12,470 17,916 41,443
Net income before minority interests ÏÏÏÏÏÏÏÏÏÏÏÏÏÏÏÏÏÏÏÏÏÏÏÏÏ 8,934 49,126 28,184
Minority interestsÏÏÏÏÏÏÏÏÏÏÏÏÏÏÏÏÏÏÏÏÏÏÏÏÏÏÏÏÏÏÏÏÏÏÏÏÏÏÏÏÏÏ 275 (1) (204)
Net incomeÏÏÏÏÏÏÏÏÏÏÏÏÏÏÏÏÏÏÏÏÏÏÏÏÏÏÏÏÏÏÏÏÏÏÏÏÏÏÏÏÏÏÏÏÏÏÏ 9,209 49,125 27,980
The accompanying notes are an integral part of these Consolidated Financial Statements
F-6
Brought to you by Global Reports

DE' LONGHI S.P.A.
CONSOLIDATED STATEMENT OF CHANGES IN SHAREHOLDERS' EQUITY
FOR THE YEARS ENDING DECEMBER 31, 1998, 1999 AND 2000
Net TotalShare Income Shareholders'Capital Reserves (loss) Equity
(Millions of Lire)
January 1, 1998 ÏÏÏÏÏÏÏÏÏÏÏÏÏÏÏÏÏÏÏÏÏÏÏÏÏÏÏÏÏÏÏÏÏÏÏÏÏÏÏÏ 300,000 25,667 Ì 325,667
Change in conversion diÅerence ÏÏÏÏÏÏÏÏÏÏÏÏÏÏÏÏÏÏÏÏÏÏÏÏÏÏÏ Ì 648 Ì 648
Net income ÏÏÏÏÏÏÏÏÏÏÏÏÏÏÏÏÏÏÏÏÏÏÏÏÏÏÏÏÏÏÏÏÏÏÏÏÏÏÏÏÏÏÏÏ Ì Ì 9,209 9,209
December 31, 1998ÏÏÏÏÏÏÏÏÏÏÏÏÏÏÏÏÏÏÏÏÏÏÏÏÏÏÏÏÏÏÏÏÏÏÏÏÏÏ 300,000 26,315 9,209 335,524
Capital Increase ÏÏÏÏÏÏÏÏÏÏÏÏÏÏÏÏÏÏÏÏÏÏÏÏÏÏÏÏÏÏÏÏÏÏÏÏÏÏÏÏ 100,000 Ì Ì 100,000
Allocation of 1998 net income ÏÏÏÏÏÏÏÏÏÏÏÏÏÏÏÏÏÏÏÏÏÏÏÏÏÏÏÏ Ì 9,211 (9,209) 2
Change in conversion diÅerence ÏÏÏÏÏÏÏÏÏÏÏÏÏÏÏÏÏÏÏÏÏÏÏÏÏÏÏ Ì 836 Ì 836
Net income ÏÏÏÏÏÏÏÏÏÏÏÏÏÏÏÏÏÏÏÏÏÏÏÏÏÏÏÏÏÏÏÏÏÏÏÏÏÏÏÏÏÏÏÏ Ì Ì 49,125 49,125
December 31, 1999ÏÏÏÏÏÏÏÏÏÏÏÏÏÏÏÏÏÏÏÏÏÏÏÏÏÏÏÏÏÏÏÏÏÏÏÏÏÏ 400,000 36,362 49,125 485,487
Allocation of 1999 net income ÏÏÏÏÏÏÏÏÏÏÏÏÏÏÏÏÏÏÏÏÏÏÏÏÏÏÏÏ Ì 49,125 (49,125) Ì
Attribution of substitution taxÏÏÏÏÏÏÏÏÏÏÏÏÏÏÏÏÏÏÏÏÏÏÏÏÏÏÏÏÏ Ì (44,074) Ì (44,074)
Change in conversion diÅerence ÏÏÏÏÏÏÏÏÏÏÏÏÏÏÏÏÏÏÏÏÏÏÏÏÏÏÏ Ì (601) Ì (601)
Net income ÏÏÏÏÏÏÏÏÏÏÏÏÏÏÏÏÏÏÏÏÏÏÏÏÏÏÏÏÏÏÏÏÏÏÏÏÏÏÏÏÏÏÏÏ Ì Ì 27,980 27,980
December 31, 2000ÏÏÏÏÏÏÏÏÏÏÏÏÏÏÏÏÏÏÏÏÏÏÏÏÏÏÏÏÏÏÏÏÏÏÏÏÏÏ 400,000 40,812 27,980 468,792
The accompanying notes are an integral part of these Consolidated Financial Statements.
F-7
Brought to you by Global Reports

DE' LONGHI S.P.A.
CONSOLIDATED CASH FLOW STATEMENTS
FOR THE YEARS ENDING DECEMBER 31, 1998, 1999 AND 2000
1998 1999 2000
(Millions of Lire)
Net income for the year ÏÏÏÏÏÏÏÏÏÏÏÏÏÏÏÏÏÏÏÏÏÏÏÏÏÏÏÏÏÏÏÏÏÏÏÏ 9,209 49,125 27,980
Depreciation and amortization ÏÏÏÏÏÏÏÏÏÏÏÏÏÏÏÏÏÏÏÏÏÏÏÏÏÏÏÏÏÏÏ 58,104 61,803 60,193
Reserve for staÅ severance indemnitiesÏÏÏÏÏÏÏÏÏÏÏÏÏÏÏÏÏÏÏÏÏÏÏÏ (2,627) 314 (1,675)
Provisions and writedowns net of applications ÏÏÏÏÏÏÏÏÏÏÏÏÏÏÏÏÏÏ 11,028 535 Ì
Change in deferred taxes provision ÏÏÏÏÏÏÏÏÏÏÏÏÏÏÏÏÏÏÏÏÏÏÏÏÏÏÏ (30,571) 1,598 1,179
Other non-cash chargesÏÏÏÏÏÏÏÏÏÏÏÏÏÏÏÏÏÏÏÏÏÏÏÏÏÏÏÏÏÏÏÏÏÏÏÏÏ Ì (3,686) 5,062
Cash Öows provided by operating activitiesÏÏÏÏÏÏÏÏÏÏÏÏÏÏÏÏÏÏÏÏÏ 45,143 109,689 92,739
Changes in assets and liabilities during the year:
Receivables ÏÏÏÏÏÏÏÏÏÏÏÏÏÏÏÏÏÏÏÏÏÏÏÏÏÏÏÏÏÏÏÏÏÏÏÏÏÏÏÏÏÏÏÏÏÏÏ 1,023 (16,339) (11,223)
InventoryÏÏÏÏÏÏÏÏÏÏÏÏÏÏÏÏÏÏÏÏÏÏÏÏÏÏÏÏÏÏÏÏÏÏÏÏÏÏÏÏÏÏÏÏÏÏÏÏÏ 81,138 16,120 (71,464)
Payables ÏÏÏÏÏÏÏÏÏÏÏÏÏÏÏÏÏÏÏÏÏÏÏÏÏÏÏÏÏÏÏÏÏÏÏÏÏÏÏÏÏÏÏÏÏÏÏÏÏ (22,841) 25,167 6,797
Other current assets and current liabilities ÏÏÏÏÏÏÏÏÏÏÏÏÏÏÏÏÏÏÏÏÏ 45,173 (4,906) 4,927
Receivables and payables with aÇliates ÏÏÏÏÏÏÏÏÏÏÏÏÏÏÏÏÏÏÏÏÏÏÏ 17,771 (14,268) 27,548
Cash Öows provided by (used in) changes in working capital ÏÏÏÏÏ 122,264 5,774 (43,415)
Net investments in tangible assets ÏÏÏÏÏÏÏÏÏÏÏÏÏÏÏÏÏÏÏÏÏÏÏÏÏÏÏÏ (7,943) (26,767) (32,450)
Net disposal of Ñnancial assetsÏÏÏÏÏÏÏÏÏÏÏÏÏÏÏÏÏÏÏÏÏÏÏÏÏÏÏÏÏÏÏ (5,879) 213 (29)
Net investment in intangible assets ÏÏÏÏÏÏÏÏÏÏÏÏÏÏÏÏÏÏÏÏÏÏÏÏÏÏÏ 8,613 (1,473) (6,714)
Other receivables ÏÏÏÏÏÏÏÏÏÏÏÏÏÏÏÏÏÏÏÏÏÏÏÏÏÏÏÏÏÏÏÏÏÏÏÏÏÏÏÏÏÏ (6,182) 5,087 18,476
Cash Öows used in investing activitiesÏÏÏÏÏÏÏÏÏÏÏÏÏÏÏÏÏÏÏÏÏÏÏÏÏ (11,391) (22,940) (20,717)
Capital increase ÏÏÏÏÏÏÏÏÏÏÏÏÏÏÏÏÏÏÏÏÏÏÏÏÏÏÏÏÏÏÏÏÏÏÏÏÏÏÏÏÏÏÏ (378) 100,000 Ì
Changes in conversion reserve ÏÏÏÏÏÏÏÏÏÏÏÏÏÏÏÏÏÏÏÏÏÏÏÏÏÏÏÏÏÏÏ 650 836 (601)
Cash Öows provided by (used) in changes in Ñnancing activities ÏÏ 272 100,836 (601)
Net change in consolidation ÏÏÏÏÏÏÏÏÏÏÏÏÏÏÏÏÏÏÏÏÏÏÏÏÏÏÏÏÏÏÏÏÏ Ì Ì (707,721)
Cash Öow for the yearÏÏÏÏÏÏÏÏÏÏÏÏÏÏÏÏÏÏÏÏÏÏÏÏÏÏÏÏÏÏÏÏÏÏÏÏÏÏ 156,288 193,359 (679,715)
Net Ñnancial position at the beginning of the year ÏÏÏÏÏÏÏÏÏÏÏÏÏÏ (862,733) (706,445) (513,086)
Net Ñnancial position at the end of the year ÏÏÏÏÏÏÏÏÏÏÏÏÏÏÏÏÏÏÏ (706,445) (513,086) (1,192,801)
Change in shareholders' equity for substitution tax ÏÏÏÏÏÏÏÏÏÏÏÏÏÏ (44,077)
Change in other payables for substitution taxÏÏÏÏÏÏÏÏÏÏÏÏÏÏÏÏÏÏÏ 44,077
The accompanying notes are an integral part of these Consolidated Financial Statements.
F-8
Brought to you by Global Reports

DE' LONGHI S.P.A.
NOTES TO THE CONSOLIDATED FINANCIAL STATEMENTSFOR 1998, 1999 AND 2000
Description of Business
The consolidated Ñnancial statements of De' Longhi S.p.A. and its subsidiaries collectively, (""theCompany'' or ""the Group'') for the three year period ending on December 31, 2000 have been prepared inaccordance with the standards for consolidated Ñnancial statements set forth by Legislative DecreeNo. 127 of April 9, 1991. They comprise the consolidated balance sheets, income statements and thefollowing explanatory notes. Moreover, the latter includes all the supplementary information deemednecessary in order to provide a true and fair picture of the Group's Ñnancial and economic position.
For the purpose of compiling the consolidated Ñnancial statements, we used the annual statementsprepared by the Boards of Directors of the individual companies, adjusting them, when necessary, toreverse tax items and make them compliant with Group accounting policies. These, in turn, are inconformity with the laws regarding consolidated Ñnancial statements, as interpreted and integrated by theaccounting principles set forth by the Consiglio Nazionale dei Dottori Commercialisti e Ragionieri (Italianaccounting profession) and, where necessary, those set by the International Accounting StandardsCommittee (IASC).
The amounts reported in the consolidated balance sheet, consolidated income statement and theexplanatory notes are expressed in millions of Lit. (or in billions in the section pertaining to the notes) toprovide a clearer illustration and facilitate assessment of the Ñnancial position of the Group and its resultsof operations.
In the consolidated Ñnancial statements as of December 31, 2000 the corresponding items of theconsolidated Ñnancial statements as of December 31, 1998 and December 31, 1999 are shown. To allow acomparison between the consolidated Ñnancial statements as of December 31, 1998, December 31, 1999and the consolidated Ñnancial statements as of December 31, 2000, certain reclassiÑcations wereperformed.
Consolidation
The Consolidated Financial Statements as of December 31, 2000 include the Ñnancial statements ofthe parent company De' Longhi S.p.A. and its directly and indirectly controlled Italian and foreignsubsidiaries.
A list of the main companies that are consolidated on a line by line basis is as follows:
PercentageCompany Location Shareholders' Equity Held
Ariagel S.p.A. ÏÏÏÏÏÏÏÏÏÏÏÏÏÏÏÏÏÏÏÏÏÏÏÏÏÏ Candiolo (TO) Lit. 1,500,000,000 80%
La Supercalor S.p.A. ÏÏÏÏÏÏÏÏÏÏÏÏÏÏÏÏÏÏÏÏ Seregno (MI) Lit. 1,000,000,000 95%
Simac-Vetrella S.p.A.(****) ÏÏÏÏÏÏÏÏÏÏÏÏÏ Cazzago di Pianiga (VE) Lit. 3,000,000,000 100%
EÅeplast S.p.A.(****)ÏÏÏÏÏÏÏÏÏÏÏÏÏÏÏÏÏÏÏ Gorgo al Mont. (TV) Lit. 700,000,000 100%
De' Longhi Pinguino S.A. ÏÏÏÏÏÏÏÏÏÏÏÏÏÏÏÏ Luxembourg (L) EUR 26,500,000 100%
DL Radiators S.p.A.(*) ÏÏÏÏÏÏÏÏÏÏÏÏÏÏÏÏÏ Treviso EUR 6,000,000 100%
De' Longhi America Inc. ÏÏÏÏÏÏÏÏÏÏÏÏÏÏÏÏ Saddle Brook (U.S.A.) USD 9,100,000 100%
De' Longhi LTD ÏÏÏÏÏÏÏÏÏÏÏÏÏÏÏÏÏÏÏÏÏÏÏ Wellingborough (G.B.) GBP 4,000,000 100%
De' Longhi France SARLÏÏÏÏÏÏÏÏÏÏÏÏÏÏÏÏ Asnieres Cedex (F) FRF 18,000,000 100%
De' Longhi Nederland B.V. ÏÏÏÏÏÏÏÏÏÏÏÏÏÏ DB Leiden (NL) HÖ 500,000 100%
De' Longhi Canada Inc. ÏÏÏÏÏÏÏÏÏÏÏÏÏÏÏÏÏ Mississauga (CAN) CAD 1 100%
E-Services S.r.l. ÏÏÏÏÏÏÏÏÏÏÏÏÏÏÏÏÏÏÏÏÏÏÏÏ Treviso EUR 50,000 51%
De' Longhi Japan Corp ÏÏÏÏÏÏÏÏÏÏÏÏÏÏÏÏÏÏ Tokyo (JAP JPY 50,000,000 100%
De' Longhi Deutschland GMBH ÏÏÏÏÏÏÏÏÏÏ Mainhausen (D) DM 4,000,000 100%
Radel S.p.A.(*) ÏÏÏÏÏÏÏÏÏÏÏÏÏÏÏÏÏÏÏÏÏÏÏÏ Moimacco (UD) Lit. 10,000,000,000 98%
DL Clima Polska ÏÏÏÏÏÏÏÏÏÏÏÏÏÏÏÏÏÏÏÏÏÏÏ Varsavia (P) PLZ 4,000 100%
Company controlled by a Ñduciary(***)ÏÏÏÏ DM 50,000 100%
F-9
Brought to you by Global Reports

DE' LONGHI S.P.A.
NOTES TO THE CONSOLIDATED FINANCIAL STATEMENTSFOR 1998, 1999 AND 2000 Ì (Continued)
PercentageCompany Location Shareholders' Equity Held
DL Div. Cucine S.p.A.(*) ÏÏÏÏÏÏÏÏÏÏÏÏÏÏÏ Treviso Lit 29,706,000,000 99%
Elba S.p.A.(*) ÏÏÏÏÏÏÏÏÏÏÏÏÏÏÏÏÏÏÏÏÏÏÏÏÏ Treviso Lit 900,000,000 100%
Sile Corpi SC. S.r.l. ÏÏÏÏÏÏÏÏÏÏÏÏÏÏÏÏÏÏÏÏÏ Fossalta di Piave (VE) Lit 180,000,000 92%
Climaveneta S.p.A.(*) ÏÏÏÏÏÏÏÏÏÏÏÏÏÏÏÏÏÏ Bassano G. (VI) Lit 3,110,000,000 90%
Ergoklima S.p.A.(*) ÏÏÏÏÏÏÏÏÏÏÏÏÏÏÏÏÏÏÏÏ Pieve d'Alpago (BL) EUR 520,000 100%
Climaveneta GmbH(*) ÏÏÏÏÏÏÏÏÏÏÏÏÏÏÏÏÏÏ Norderstedt (D) DM 600,000 70%
De' Longhi Radiators S.r.l.(**) ÏÏÏÏÏÏÏÏÏÏÏ Treviso Lit
Micromax S.p.A.(*) ÏÏÏÏÏÏÏÏÏÏÏÏÏÏÏÏÏÏÏÏ Pieve d'Alpago (BL) EUR 969,000 100%
(*) This company was acquired by De' Longhi Pinguino on December 28, 2000. Only the balance sheet was consolidated.
(**) This company was sold in December of 2000. Only the income statement was consolidated.
(***) This company, 100% owned by a Ñduciary trust, is a sales company that engages in the marketing of ""heating'' products
in Germany. The Group, consistent with Article 39 Legislative Decree No. 127/91, has omitted the name of the
subsidiary to avoid causing damage to the rest of the Group companies.
(****) In January 2001, a merger occurred between Simac-Vetrella S.p.A. and EÅeplast S.p.A., and the company's name was
changed to Simac Vetrella S.p.A.
An itemized list of shareholdings, accounted for using the equity method, is provided in the note forÑnancial assets.
Compared to 1999, the consolidation underwent a signiÑcant change due to acquisitions and disposalstaking place in December 2000 and the transfer of undertakings in the ""Ñxed heating'' segment.
The main transactions leading to changes in the consolidation are described below:
‚ as a result of the transfer of the sale of ""heating'' products from De' Longhi Radiators S.r.l. to DLRadiators S.p.A., only 3 months of operations are included in the 2000 consolidated Ñnancialstatements (as opposed to 12 months in 1999). The leasing contract between the twoaforementioned companies expired on March 31, 2000 and, as of April 1, 2000, this business wasagain taken over by the lessor (DL Radiators S.p.A.). On December 28, 2000 the stake owned inDe' Longhi Radiators S.r.l. was sold, due to the latter company being inactive and thus no longerof strategic importance to the Group.
‚ the Company transferred the share capital investments in the companies Nauta S.r.l., De' LonghiCanada Distributors Inc. and Ontario LTD. The removal of these companies from theconsolidation had little eÅect on the consolidated Ñnancial and economic position given that theywere either inactive or provided a limited range of services for the Group.
‚ the acquisition, by De' Longhi Pinguino S.A. Ì a wholly-owned subsidiary of De' LonghiS.p.A. Ì of the shareholdings listed below, with their consequent inclusion in the consolidation;the acquisitions, completed on December 28, 2000, included:
‚ 99.99% of the share capital of De' Longhi Divisione Cucine S.p.A. for a total of Lit. 71.7billion by De' Longhi SoparÑ;
‚ 99.92% of the share capital of DL Radiators S.p.A. for a total of Lit. 96.4 billion byXarocco Ì MKG and Investments Ltda;
‚ 90% of the share capital of Climaveneta S.p.A. for a total of Lit. 276.9 billion, by De' LonghiSoparÑ, taking into account that the remaining 10% is made up of owned shares;
‚ 100% of the share capital of Micromax S.p.A. for a total of Lit. 39.7 billion, by De' LonghiSoparÑ; and
‚ 30% of the share capital of Ergoklima S.p.A. for a total of Lit. 54.2 billion by De' LonghiSoparÑ.
F-10
Brought to you by Global Reports

DE' LONGHI S.P.A.
NOTES TO THE CONSOLIDATED FINANCIAL STATEMENTSFOR 1998, 1999 AND 2000 Ì (Continued)
These transactions totalled Lit. 538.9 billion in purchase price plus an additional Lit. 125 million inaccessory charges. The book values were determined on the basis of appraisals performed byindependent experts. The acquired companies were included in the consolidation as of December 31,2000 only as it relates to the balance sheet.
‚ the acquisition of the stake in the company Sile Corpi Scaldanti for an amount of Lit. 4.6 billion
‚ the establishment of the company DL Clima Polska, which engages in the marketing of productsbelonging to the ""Ñxed heating'' segment in Poland
‚ the establishment of the company E-Services Srl, for share capital of Euro 50,000, resulting in51% Group ownership, linked to the stipulation of a company leasing contract with De' LonghiS.p.A..
The consolidation as of December 31, 2000 diÅered signiÑcantly from that of the previous year as aresult of acquisitions made at the end of December 2000.
Consequently, some items shown in comparison with the amounts of 1999 may not be consistent withthe latter. For this reason, a table is provided below which shows the changes in the main balance-sheetitems compared to 1999, calculated on the basis of a consistent consolidation (*).
2000 ConsolidatedConsolidated EÅect of the Without
Total Acquisitions (**) Acquisitions (*) 1999 DiÅerence
A B (A-B)(In millions of Italian lire)
Receivables from shareholders ÏÏÏÏÏÏÏ Ì Ì Ì 25,000 (25,000)
Intangible assets ÏÏÏÏÏÏÏÏÏÏÏÏÏÏÏÏÏÏÏ 748,467 551,057 197,410 209,537 (12,127)
Tangible assets ÏÏÏÏÏÏÏÏÏÏÏÏÏÏÏÏÏÏÏÏ 344,097 85,712 258,385 267,287 (8,902)
Long-term investments ÏÏÏÏÏÏÏÏÏÏÏÏÏ 22,679 5,551 17,128 43,598 (26,470)
Total Ñxed assets ÏÏÏÏÏÏÏÏÏÏÏÏÏÏÏÏÏÏ 1,115,243 642,320 472,923 520,422 (47,499)
InventoryÏÏÏÏÏÏÏÏÏÏÏÏÏÏÏÏÏÏÏÏÏÏÏÏÏ 370,539 71,470 299,069 227,605 71,464
Receivables from customers ÏÏÏÏÏÏÏÏÏÏ 615,735 107,175 508,560 497,337 11,223
Receivables from associatedcompanies Ì subsidiarycompanies Ì parent companies ÏÏÏÏ 30,942 Ì 30,942 4,015 26,927
Receivables from others ÏÏÏÏÏÏÏÏÏÏÏÏ 115,129 31,048 84,081 95,507 (11,426)
Other assets/cash on hand ÏÏÏÏÏÏÏÏÏÏ 130,980 24,995 105,985 145,815 (39,830)
Total working capital ÏÏÏÏÏÏÏÏÏÏÏÏÏÏÏ 1,263,325 234,688 1,028,637 970,279 58,358
Accrued income and prepaid expenses 23,637 571 23,066 4,337 18,729
Total assets ÏÏÏÏÏÏÏÏÏÏÏÏÏÏÏÏÏÏÏÏÏÏÏ 2,402,205 877,579 1,524,626 1,520,038 4,588
Net equityÏÏÏÏÏÏÏÏÏÏÏÏÏÏÏÏÏÏÏÏÏÏÏÏ 469,429 Ì 469,429 486,148 (16,719)
Reserve for risks and other charges ÏÏÏ 21,852 4,832 17,020 15,726 1,294
Reserve for staÅ severance indemnities 37,526 11,130 26,396 24,302 2,094
Debentures and bonds ÏÏÏÏÏÏÏÏÏÏÏÏÏÏ 290,440 Ì 290,440 92,711 197,729
Liabilities with banksÏÏÏÏÏÏÏÏÏÏÏÏÏÏÏ 533,006 128,901 404,105 397,107 6,998
Other Ñnance providers ÏÏÏÏÏÏÏÏÏÏÏÏÏ 26,437 18,348 8,089 23,572 (15,483)
Payables to suppliers ÏÏÏÏÏÏÏÏÏÏÏÏÏÏÏ 357,814 95,797 262,017 258,132 3,885
Advances/other payablesÏÏÏÏÏÏÏÏÏÏÏÏ 220,234 26,054 194,180 62,027 132,153
F-11
Brought to you by Global Reports

DE' LONGHI S.P.A.
NOTES TO THE CONSOLIDATED FINANCIAL STATEMENTSFOR 1998, 1999 AND 2000 Ì (Continued)
2000 ConsolidatedConsolidated EÅect of the Without
Total Acquisitions (**) Acquisitions (*) 1999 DiÅerence
A B (A-B)(In millions of Italian lire)
Payables to subsidiary companies Ìassociated companies Ì parentcompanies ÏÏÏÏÏÏÏÏÏÏÏÏÏÏÏÏÏÏÏÏÏÏ 417,092 Ì 417,092 153,818 263,274
Total payablesÏÏÏÏÏÏÏÏÏÏÏÏÏÏÏÏÏÏÏÏÏ 1,845,023 269,100 1,575,923 987,367 588,556
Accrued expenses and deferred income 28,375 2,050 26,325 6,495 19,830
Total liabilities ÏÏÏÏÏÏÏÏÏÏÏÏÏÏÏÏÏÏÏÏ 2,402,205 287,112 2,115,093 1,520,038 595,055
Net equity eÅect resulting fromchange in the area of consolidation Ì 590,467 (590,467) Ì (590,467)
(*) These acquisitions refer to the purchase of shareholdings on December 28, 2000; the eÅects shown in the table above also
include the allocation of goodwill.
(**) In the column ""eÅects of acquisitions'' the amount disclosed under the item ""intangible assets'' mainly comprises goodwill
resulting from the purchases of shareholdings, which account for approximately Lit. 536.6 billion.
Summary of SigniÑcant Accounting Policies
The most important accounting principles adopted in the preparation of the consolidated Ñnancialstatements are the following:
Consolidation criteria and methods
‚ The data has been consolidated line by line, the book value of consolidated shareholdings beingreplaced by the corresponding net equity shares.
‚ Any diÅerences arising in the year in which a company is consolidated for the Ñrst time arerecorded as:
‚ if positive, where possible, to the assets and liabilities of the companies included in theconsolidation. Any residual amounts are recorded to ""Goodwill'';
‚ if negative, it is recorded as a part of Net Equity, under the item ""Reserves''.
‚ Goodwill is amortized according to its estimated useful life.
‚ The portions of net equity and net proÑts in which third-party shareholders have claims are shownseparately as ""Minority Interests''.
‚ Receivables and payables, costs and revenues and all items pertaining to transactions between groupcompanies have been eliminated, including dividends distributed among Group companies. Anynon-realized proÑts, capital gains and capital losses deriving from intercompany transactions areeliminated.
‚ The eÅects of allowances and value adjustments made by the individual consolidated companies forthe purpose of attaining tax beneÑts under current laws are likewise eliminated, the relative taxeÅects being considered where applicable.
F-12
Brought to you by Global Reports

DE' LONGHI S.P.A.
NOTES TO THE CONSOLIDATED FINANCIAL STATEMENTSFOR 1998, 1999 AND 2000 Ì (Continued)
Foreign currency translation
The Ñnancial statements of foreign subsidiaries are translated into Italian Lire in the followingmanner:
‚ assets and liabilities are recorded at rates of exchange in eÅect at year-end; for currencies ofcountries in the EU, they are represented by the permanent exchange rates Ñxed by the EuropeanCommission on December 1998;
‚ the items in the income statement are translated using the average yearly exchange rates; and
‚ net equity items are assessed at historical exchange rates.
Exchange rate diÅerences resulting from this method are recorded under a speciÑc consolidated equityitem, ""Reserves''.
The Lira/currency exchange rates applied for the purposes of translation are shown below.
Exchange Rate as ofCurrency Ave. Exchange Rate 2000(**) December 31, 2000(*)
French franc(*) ÏÏÏÏÏÏÏÏÏÏÏÏÏÏÏÏÏÏÏÏÏÏÏÏÏÏÏÏÏÏÏÏÏ FRF 295.182 295.182
Dutch guilder(*) ÏÏÏÏÏÏÏÏÏÏÏÏÏÏÏÏÏÏÏÏÏÏÏÏÏÏÏÏÏÏÏÏ NLG 878.641 878.641
German mark(*) ÏÏÏÏÏÏÏÏÏÏÏÏÏÏÏÏÏÏÏÏÏÏÏÏÏÏÏÏÏÏÏÏ DM 989.999 989.999
Luxembourg/Belgian franc(*) ÏÏÏÏÏÏÏÏÏÏÏÏÏÏÏÏÏÏÏÏÏ LUF/BEF 47.999 47.999
Pound sterling ÏÏÏÏÏÏÏÏÏÏÏÏÏÏÏÏÏÏÏÏÏÏÏÏÏÏÏÏÏÏÏÏÏÏÏ GBP 3,178.432 3,102.499
US dollar ÏÏÏÏÏÏÏÏÏÏÏÏÏÏÏÏÏÏÏÏÏÏÏÏÏÏÏÏÏÏÏÏÏÏÏÏÏÏÏ USD 2,102.587 2,080.892
Japanese yen ÏÏÏÏÏÏÏÏÏÏÏÏÏÏÏÏÏÏÏÏÏÏÏÏÏÏÏÏÏÏÏÏÏÏÏÏ JPY 19.513 18.109
Canadian dollar ÏÏÏÏÏÏÏÏÏÏÏÏÏÏÏÏÏÏÏÏÏÏÏÏÏÏÏÏÏÏÏÏÏÏ CAD 1,414.986 1,386.516
Portuguese escudoÏÏÏÏÏÏÏÏÏÏÏÏÏÏÏÏÏÏÏÏÏÏÏÏÏÏÏÏÏÏÏÏ PTE 9.658 9.658
Spanish pesetaÏÏÏÏÏÏÏÏÏÏÏÏÏÏÏÏÏÏÏÏÏÏÏÏÏÏÏÏÏÏÏÏÏÏÏ ESP 11.637 11.637
Polish zloty ÏÏÏÏÏÏÏÏÏÏÏÏÏÏÏÏÏÏÏÏÏÏÏÏÏÏÏÏÏÏÏÏÏÏÏÏÏ PLZ 483.41 502.95
Greek drachma ÏÏÏÏÏÏÏÏÏÏÏÏÏÏÏÏÏÏÏÏÏÏÏÏÏÏÏÏÏÏÏÏÏÏ GRD 5.682 5.682
Austrian schilling ÏÏÏÏÏÏÏÏÏÏÏÏÏÏÏÏÏÏÏÏÏÏÏÏÏÏÏÏÏÏÏÏ ATS 140.71 140.71
(*) Rates Ñxed by the E.C. in 1998.
(**) Source: UIC (Italian Exchange OÇce).
Tangible assets, net
Tangible assets are recorded at their purchase or production cost inclusive of any directly attributableancillary expenses. Some categories of assets have undergone revaluations pursuant to Laws No. 576/75,No. 72/83 and No. 413/91 (and of additional value allocated in consequence of mergers andconsolidations). Any Ñxed assets that, at year-end, experience permanent impairments in value are writtendown accordingly. The original book value is restored in subsequent Ñnancial periods if the reasons for thewrite-down no longer exist.
Tangible assets are shown net of accumulated depreciation, systematically calculated in each Ñnancialperiod on the basis of the estimated economic useful life. The depreciation applied to Ñxed assets acquiredduring the Ñnancial period is reduced by one half to reÖect their shorter period of use.
F-13
Brought to you by Global Reports

DE' LONGHI S.P.A.
NOTES TO THE CONSOLIDATED FINANCIAL STATEMENTSFOR 1998, 1999 AND 2000 Ì (Continued)
The following rates have been used:
Industrial Buildings ÏÏÏÏÏÏÏÏÏÏÏÏÏÏÏÏÏÏÏÏÏÏÏÏÏÏÏÏÏÏÏÏÏÏÏÏÏÏÏÏ 3.0%
Lightweight constructions ÏÏÏÏÏÏÏÏÏÏÏÏÏÏÏÏÏÏÏÏÏÏÏÏÏÏÏÏÏÏÏÏÏÏÏ 10.0%
General/speciÑc plant ÏÏÏÏÏÏÏÏÏÏÏÏÏÏÏÏÏÏÏÏÏÏÏÏÏÏÏÏÏÏÏÏÏÏÏÏÏÏ 10.0-15.5%
OvensÏÏÏÏÏÏÏÏÏÏÏÏÏÏÏÏÏÏÏÏÏÏÏÏÏÏÏÏÏÏÏÏÏÏÏÏÏÏÏÏÏÏÏÏÏÏÏÏÏÏÏÏ 15.0%
Misc. equipment ÏÏÏÏÏÏÏÏÏÏÏÏÏÏÏÏÏÏÏÏÏÏÏÏÏÏÏÏÏÏÏÏÏÏÏÏÏÏÏÏÏÏÏ 25.0%
PuriÑcation systems ÏÏÏÏÏÏÏÏÏÏÏÏÏÏÏÏÏÏÏÏÏÏÏÏÏÏÏÏÏÏÏÏÏÏÏÏÏÏÏÏ 15.0%
OÇce furnishings and equipment ÏÏÏÏÏÏÏÏÏÏÏÏÏÏÏÏÏÏÏÏÏÏÏÏÏÏÏÏÏ 12.0%
Electromechanical equipment ÏÏÏÏÏÏÏÏÏÏÏÏÏÏÏÏÏÏÏÏÏÏÏÏÏÏÏÏÏÏÏÏ 20.0%
Chemical laboratory equipment ÏÏÏÏÏÏÏÏÏÏÏÏÏÏÏÏÏÏÏÏÏÏÏÏÏÏÏÏÏÏ 25.0%
Waste disposal facilitiesÏÏÏÏÏÏÏÏÏÏÏÏÏÏÏÏÏÏÏÏÏÏÏÏÏÏÏÏÏÏÏÏÏÏÏÏÏ 15.0%
Transport vehiclesÏÏÏÏÏÏÏÏÏÏÏÏÏÏÏÏÏÏÏÏÏÏÏÏÏÏÏÏÏÏÏÏÏÏÏÏÏÏÏÏÏÏ 20.0%
Automobiles ÏÏÏÏÏÏÏÏÏÏÏÏÏÏÏÏÏÏÏÏÏÏÏÏÏÏÏÏÏÏÏÏÏÏÏÏÏÏÏÏÏÏÏÏÏÏ 25.0%
Routine maintenance costs are expensed as incurred, while any maintenance costs which increase thelife of the assets to which they relate are capitalized to the assets and amortized on the basis of theirestimated economic useful life.
Assets acquired through Ñnancial lease contracts are recognized in conjunction with InternationalAccounting Principle (IAS No. 17), which provides that the present value of the future minimum leasepayments is to be capitalized to Ñxed assets and amortized on the basis of the rates applicable to therespective assets, while the corresponding Ñnancial liabilities payable to lessors is to be recorded as aliability. The depreciation and interest expenses are recorded in the income statement.
Intangible assets
Intangible assets are recorded at their purchase cost plus any additional charges and are systematicallyamortized on the basis of their economic useful life.
Whenever these assets experience a permanent impairment in value, they are written downaccordingly. Should the reasons for the write-down no longer exist, the original book value is restored insubsequent Ñnancial periods.
Start-up costs include incorporation expenses and capital increases and are amortized over a period ofÑve years.
Research & development costs are capitalized if they relate to speciÑc, clearly deÑned products whosetechnical feasibility and future market prospects have been reasonably demonstrated. The book value issystematically amortized over a period of Ñve years.
Licences, trademarks and similar rights are amortized on the basis of their remaining economic usefullife, estimated as ten to twenty years for trademarks, four years for user rights and ten years for patents.
Goodwill is systematically amortized over a period of ten years in some cases and twenty years inothers based on reasonable estimates of their future economic useful life and the Group's prospects forreceiving beneÑts, which is estimated according to the characteristics of the sector in which aÇliatesoperate.
The values have been recorded with the consent of the board of statutory auditors, where theirapproval is required. It should be noted that, pursuant to Article 2426 of the Civil Code, until start-upcosts, research, development and advertising costs having a long-term economic useful life are completelyamortized, dividends may be distributed only if the available reserves are suÇcient to cover the residualamount of capitalized costs.
F-14
Brought to you by Global Reports

DE' LONGHI S.P.A.
NOTES TO THE CONSOLIDATED FINANCIAL STATEMENTSFOR 1998, 1999 AND 2000 Ì (Continued)
Financial assets
Investments in non-consolidated aÇliates and subsidiary companies are accounted for using the equitymethod, whereas share capital investments in other companies are valued on the basis of their purchasecost, adjusted for permanent impairments in value. The original book value is restored in subsequentÑnancial periods should the reasons for the write-down no longer exist.
Financial receivables are recorded at their estimated net realizable value.
Other long-term investments are shown at their cost, adjusted for permanent impairments in value.
Receivables and payables
Receivables are recorded at their net realizable value.
Payables are shown at their nominal value.
Inventory
Inventory is recorded either at the purchase or production cost determined using the lower of cost ormarket value. The cost of production has been used for Ñnished and semi-Ñnished products. The valuationof work in progress also includes the cost of production, according to the actual stage of work completed atyear-end. Obsolete or slow-moving inventory is adjusted through a speciÑc inventory valuation allowance.
Short-term Ñnancial assets
Short-term Ñnancial assets are recorded at the lower of cost or market value. Should the reasons forthe write-down no longer exist, the original book value is restored in subsequent Ñnancial periods.
Accrued income, prepayments, accrued liabilities and deferred income
This item comprises the portion of costs and revenues pertaining to two or more Ñnancial periods onan accrual basis.
Cash and cash equivalents
These items are shown at face value.
Reserve for staÅ severance indemnities
The reserve for staÅ severance indemnities is recorded in compliance with the law and labor contractscurrently in force. It reÖects the total liabilities accrued on behalf of employees at the balance-sheet date.
Reserve for risks and other charges
SpeciÑc provisions have been recorded to cover expenses of a precise nature, either certain or likely,whose existence or occurrence may not be determined at year-end. These provisions reÖect the bestestimate that may be made on the basis of available information.
Revenues and expenses
These are recorded in accordance with prudence on an accrual basis
Revenues are recorded net of returned products, discounts, rebates and premiums. Taxes directlyrelated to sale of products and the performance of services are likewise deducted. Revenues from the saleof products is recognized when property changes hands, which generally coincides with shipment of themerchandise.
Costs are recorded on the same basis as revenues.
F-15
Brought to you by Global Reports

DE' LONGHI S.P.A.
NOTES TO THE CONSOLIDATED FINANCIAL STATEMENTSFOR 1998, 1999 AND 2000 Ì (Continued)
Foreign currency transactions
Foreign currency transactions are recorded at the exchange rates in eÅect on the date of thetransaction. Any exchange rate diÅerences for the year are recognized in the income statement under theitem Ñnancial income and expenses.
Receivables and payables outstanding at year-end are adjusted to year-end exchange rates only if theoverall adjustment results in a loss. This adjustment is made through a provision for exchange rate risks, asprovided by the law.
Financial instruments
Financial instruments used for hedging against foreign exchange risks are valued in a manner that isconsistent with the assets and liabilities to which they relate. With regard to hedging transactions involvingassets and liabilities not denominated in Lire, expenses, revenues and diÅerences between the originalcontract value and the forward value are recognized in the period to which they relate.
Income taxes
Income taxes are determined on the basis of taxable income and in conformity with the laws currentlyin force in the individual countries. The net balance of advance and deferred taxes has also been calculatedper the instructions issued by the Consiglio Nazionale dei Dottori Commercialisti e Ragionieri (Italianaccounting profession) in document No. 25. Deferred taxes have thus been calculated on the tax liabilitymethod to consider the tax eÅects on some consolidation adjustments and all the temporary diÅerencesarising from the diÅerence between the book values of assets and liabilities and the corresponding taxvalues with the application of current tax rates. The beneÑt of carrying forward tax losses is considered tothe extent that it is deemed likely that future taxable income will be suÇcient to absorb them during theperiod in which they are deductible under current tax regulations.
Deferred taxes on retained earnings of subsidiaries are considered whenever the proÑts are likely to bedistributed and whenever the share capital investments are not maintained on a permanent basis.
Memorandum accounts
Commitments and guarantees are reported in the memorandum accounts at their contract value.
Receivables from Shareholders
During 2000, the receivables from shareholders for the capital increase subscribed in December 1999,amounting to Lit. 25 billion, were collected in full.
Revaluation of Assets
The intangible asset item ""trademarks'' and the tangible asset items ""large-scale plant'' and""general/speciÑc plant'' include some revaluations of certain property.
For the year ending December 31, 2000, the Company, under the provisions of Article 14 ofLaw 342/2000, adjusted the tax values of the property items listed below which were owned atDecember 31, 1999 which had greater carrying values in the Ñnancial statements.
F-16
Brought to you by Global Reports

DE' LONGHI S.P.A.
NOTES TO THE CONSOLIDATED FINANCIAL STATEMENTSFOR 1998, 1999 AND 2000 Ì (Continued)
This adjustment resulted in the payment of a 19% substitution tax on the diÅerence between the taxand book values. The table below provides a breakdown of the items aÅected by the adjustment and thecorresponding substitution tax paid:
DiÅerence BetweenStatutory and SubstitutionTax Values Tax
Trademarks ÏÏÏÏÏÏÏÏÏÏÏÏÏÏÏÏÏÏÏÏÏÏÏÏÏÏÏÏÏÏÏÏÏÏÏÏÏÏÏÏÏÏÏÏÏ 190.7 36.2
Large-scale plantÏÏÏÏÏÏÏÏÏÏÏÏÏÏÏÏÏÏÏÏÏÏÏÏÏÏÏÏÏÏÏÏÏÏÏÏÏÏÏÏÏ 15.9 3.0
General/speciÑc plant ÏÏÏÏÏÏÏÏÏÏÏÏÏÏÏÏÏÏÏÏÏÏÏÏÏÏÏÏÏÏÏÏÏÏÏÏ 25.4 4.8
232.0 44.0
This substitution tax has been directly accounted for by deducting the amount from the net equityitem ""extraordinary reserves''.
In addition, as per the above-mentioned law regulating the value adjustments, a tax restriction wasplaced on the Company's net equity items ""extraordinary reserves'' (Lit. 34 billion), the item ""legalreserve'' (Lit. 4.5 billion) and ""share capital'' (Lit. 193.5 billion) for an overall total of Lit. 232 billion,equivalent to the amount of the realignment.
Tangible Assets
The tangible assets have been assessed as follows:
December 31, 1998 December 31, 1999 December 31, 2000 1999/2000Gross Net Gross Net Gross Net on net values
Millions of Lit.
Land and buildings ÏÏÏÏÏÏÏ 194,189 153,942 194,582 148,965 238,656 176,387 27,422
Plant and machinery ÏÏÏÏÏÏ 216,832 88,850 221,090 75,335 367,561 113,743 38,408
Industrial equipment ÏÏÏÏÏÏ 110,180 3,091 126,983 32,264 174,543 40,217 7,953
Sundry items ÏÏÏÏÏÏÏÏÏÏÏÏ 37,395 10,110 38,746 10,037 42,025 11,302 1,265
Fixed assets and advancesÏÏ 635 635 686 686 2,448 2,448 1,762
Total ÏÏÏÏÏÏÏÏÏÏÏ 559,231 283,628 582,087 267,287 825,233 344,097 76,810
The increase of Lit. 76.8 billion is due to the consolidation of the companies acquired at the end ofDecember 2000, which accounted for approximately Lit. 84 billion, from purchases made during theÑnancial period, amounting to about Lit. 35 billion, less Lit. 41 billion in depreciation for the year.
The increases in the ""industrial equipment'' is primarily due to dyes and equipment to be used in themanufacture of new products, and the item ""plant and machinery''. This item includes goods acquiredthrough leasing, which may be broken down (net of accumulated depreciation):
1998 1999 2000
Buildings ÏÏÏÏÏÏÏÏÏÏÏÏÏÏÏÏÏÏÏÏÏÏÏÏÏÏÏÏÏÏÏÏÏÏÏÏÏÏÏÏÏÏÏÏÏÏÏÏ 8,669 8,163 8,035
Plant and equipmentÏÏÏÏÏÏÏÏÏÏÏÏÏÏÏÏÏÏÏÏÏÏÏÏÏÏÏÏÏÏÏÏÏÏÏÏÏÏÏ 5,283 4,929 20,324
Other goods ÏÏÏÏÏÏÏÏÏÏÏÏÏÏÏÏÏÏÏÏÏÏÏÏÏÏÏÏÏÏÏÏÏÏÏÏÏÏÏÏÏÏÏÏÏÏ 1,369 595 279
15,321 13,687 28,638
F-17
Brought to you by Global Reports

DE' LONGHI S.P.A.
NOTES TO THE CONSOLIDATED FINANCIAL STATEMENTSFOR 1998, 1999 AND 2000 Ì (Continued)
The table below shows the movements during 2000 with regard to the main tangible asset items:
Fixed AssetsIndustrial and Under
Land and Plant and Commercial ConstructionBuildings Machinery Equipment Other Goods and Advances Total
Millions of Lit.
Net opening balanceÏÏÏÏÏÏÏÏÏÏÏÏÏÏÏÏÏÏÏ 148,965 75,335 32,264 10,037 686 267,287
Change in the area of consolidation ÏÏÏÏÏÏ 31,873 44,455 5,163 1,584 1,322 84,397
Increases ÏÏÏÏÏÏÏÏÏÏÏÏÏÏÏÏÏÏÏÏÏÏÏÏÏÏÏÏ 1,649 10,042 18,970 3,252 897 34,810
Decreases ÏÏÏÏÏÏÏÏÏÏÏÏÏÏÏÏÏÏÏÏÏÏÏÏÏÏÏÏ (488) Ì (556) (364) (100) (1,508)
DepreciationÏÏÏÏÏÏÏÏÏÏÏÏÏÏÏÏÏÏÏÏÏÏÏÏÏÏ (5,870) (16,179) (15,821) (3,482) Ì (41,352)
Translation diÅerences and othermovementsÏÏÏÏÏÏÏÏÏÏÏÏÏÏÏÏÏÏÏÏÏÏÏÏÏ 258 90 197 275 (357) 463
Net closing balanceÏÏÏÏÏÏÏÏÏÏÏÏÏÏÏÏÏÏÏÏ 176,387 113,743 40,217 11,302 2,448 344,097
Intangible Assets
This item is broken down as follows:
1999/2000December 31, 1998 December 31, 1999 December 31, 2000 On NetGross Net Gross Net Gross Net Values
Millions of Lit.
Start-up costs ÏÏÏÏÏÏÏÏÏÏÏÏÏÏÏÏÏÏÏÏÏÏÏÏÏÏÏÏÏ 6,439 369 6,468 237 8,532 637 400
Research, development and advertising costs ÏÏÏ 5,589 2,051 5,610 992 6,147 698 (294)
Patent rights ÏÏÏÏÏÏÏÏÏÏÏÏÏÏÏÏÏÏÏÏÏÏÏÏÏÏÏÏÏÏ 24,426 4,887 26,552 4,423 33,980 6,659 2,236
Licences, trademarks and similar rights ÏÏÏÏÏÏÏ 239,920 206,162 238,832 192,214 257,977 191,075 (1,139)
Goodwill ÏÏÏÏÏÏÏÏÏÏÏÏÏÏÏÏÏÏÏÏÏÏÏÏÏÏÏÏÏÏÏÏÏ 15,529 12,421 15,535 10,658 560,679 545,344 534,686
Sundry itemsÏÏÏÏÏÏÏÏÏÏÏÏÏÏÏÏÏÏÏÏÏÏÏÏÏÏÏÏÏÏ 6,282 869 6,448 1,013 11,699 4,054 3,041
Total ÏÏÏÏÏÏÏÏÏÏÏÏÏÏÏÏÏÏÏÏÏÏÏÏÏÏÏÏÏÏÏÏÏÏÏÏ 298,185 226,759 299,445 209,537 879,014 748,467 538,930
The increase of Lit. 538.9 billion compared to 1999 is mainly attributable to the consolidation of thecompanies acquired at the end of December 2000 and Sile Corpi Scaldanti, acquired in February 2000.They account for an increase of approximately Lit. 551.1 billion in the value of intangible assets (primarilygoodwill and trademarks) and additional amortization of about Lit. 18.8 billion.
The increase of Lit. 534.7 billion in the item ""goodwill'' is attributable to amortization, calculated asLit. 1.9 billion, and the consolidation of acquired companies (the diÅerence was determined by comparingthe price paid to the net equity as of December 31, 2000). This diÅerence was temporarily attributed togoodwill, pending its allocation, where possible, to individual asset and liability items based on theassessments that will be made by independent experts. It was not amortized given that, as notedpreviously, the acquisitions were made at the end of December 2000. Amortization will begin during 2001,when the companies acquired will contribute to the results achieved by the Group.
F-18
Brought to you by Global Reports

DE' LONGHI S.P.A.
NOTES TO THE CONSOLIDATED FINANCIAL STATEMENTSFOR 1998, 1999 AND 2000 Ì (Continued)
The division below serves to illustrate the diÅerences resulting from the acquisition (price minus netequity) and those already included in the Ñnancial statements of the acquired companies. This item maybe broken down as follows:
Goodwill
Billions of Lit.
Directly controlled subsidiaries:
Climaveneta ÏÏÏÏÏÏÏÏÏÏÏÏÏÏÏÏÏÏÏÏÏÏÏÏÏÏÏÏÏÏÏÏÏÏÏÏÏÏÏÏÏÏÏÏ 265.2
Ergoklima (30%)ÏÏÏÏÏÏÏÏÏÏÏÏÏÏÏÏÏÏÏÏÏÏÏÏÏÏÏÏÏÏÏÏÏÏÏÏÏÏÏÏ 36.1
Micromax ÏÏÏÏÏÏÏÏÏÏÏÏÏÏÏÏÏÏÏÏÏÏÏÏÏÏÏÏÏÏÏÏÏÏÏÏÏÏÏÏÏÏÏÏÏÏ 11.0
DL Radiators ÏÏÏÏÏÏÏÏÏÏÏÏÏÏÏÏÏÏÏÏÏÏÏÏÏÏÏÏÏÏÏÏÏÏÏÏÏÏÏÏÏÏÏ 88.3
Divisione Cucine ÏÏÏÏÏÏÏÏÏÏÏÏÏÏÏÏÏÏÏÏÏÏÏÏÏÏÏÏÏÏÏÏÏÏÏÏÏÏÏÏ 42.2
442.8
Sile Corpi Scaldanti ÏÏÏÏÏÏÏÏÏÏÏÏÏÏÏÏÏÏÏÏÏÏÏÏÏÏÏÏÏÏÏÏÏÏÏÏÏ 3.3
Indirectly controlled subsidiaries:
ElbaÏÏÏÏÏÏÏÏÏÏÏÏÏÏÏÏÏÏÏÏÏÏÏÏÏÏÏÏÏÏÏÏÏÏÏÏÏÏÏÏÏÏÏÏÏÏÏÏÏÏÏ 35.2
RadelÏÏÏÏÏÏÏÏÏÏÏÏÏÏÏÏÏÏÏÏÏÏÏÏÏÏÏÏÏÏÏÏÏÏÏÏÏÏÏÏÏÏÏÏÏÏÏÏÏÏ 99.3
Ergoklima (70%)ÏÏÏÏÏÏÏÏÏÏÏÏÏÏÏÏÏÏÏÏÏÏÏÏÏÏÏÏÏÏÏÏÏÏÏÏÏÏÏÏ (41.7)
Clima Deutschland GmbHÏÏÏÏÏÏÏÏÏÏÏÏÏÏÏÏÏÏÏÏÏÏÏÏÏÏÏÏÏÏÏÏ 0.7
539.6
Consolidation adjustments ÏÏÏÏÏÏÏÏÏÏÏÏÏÏÏÏÏÏÏÏÏÏÏÏÏÏÏÏÏÏÏÏ (3.0)
536.6
The item ""research, development and advertising costs'' has decreased due to amortisation during theyear as well as the capitalization of costs for developing the ""new Vocal Microwave'' project.
The item ""Licences, trademarks and similar rights'' mainly refers to the value attributed totrademarks resulting from the merger of 1995. More speciÑcally, the item refers to the ""De' Longhi''trademark and other registered Group trademarks (including ""Pinguino'', ""Sfornatutto'', ""Friggimeglio'',""Stiromeglio'', etc.).
The table below shows the movements during 2000 with regard to the main intangible asset items:
Start-up and Research and Licences,Expansion Development Patent Trademarks and Sundry
Costs Costs Rights Similar Rights Goodwill Items Total
Millions of Lit.
Net opening balance ÏÏÏÏÏÏÏÏÏÏÏÏÏÏÏÏÏ 237 992 4,423 192,214 10,658 1,013 209,537
Changes in the consolidation area ÏÏÏÏÏÏ 67 Ì 2,274 11,417 536,570 729 551,057
IncreasesÏÏÏÏÏÏÏÏÏÏÏÏÏÏÏÏÏÏÏÏÏÏÏÏÏÏÏ 459 254 2,343 Ì Ì 3,409 6,465
AmortisationÏÏÏÏÏÏÏÏÏÏÏÏÏÏÏÏÏÏÏÏÏÏÏÏ (126) (569) (2,391) (12,671) (1,884) (1,200) (18,841)
Foreign currency Translation diÅerencesand Other movementsÏÏÏÏÏÏÏÏÏÏÏÏÏÏ Ì 21 10 115 Ì 103 249
Net closing balanceÏÏÏÏÏÏÏÏÏÏÏÏÏÏÏÏÏÏ 637 698 6,659 191,075 545,344 4,054 748,467
F-19
Brought to you by Global Reports

DE' LONGHI S.P.A.
NOTES TO THE CONSOLIDATED FINANCIAL STATEMENTSFOR 1998, 1999 AND 2000 Ì (Continued)
Financial Assets
1998 1999 2000
Equity investments ÏÏÏÏÏÏÏÏÏÏÏÏÏÏÏÏÏÏÏÏÏÏÏÏÏÏÏÏÏÏÏÏÏÏÏÏÏÏÏÏÏÏÏÏÏÏÏÏ 15,117 14,370 14,357
Accounts receivable from aÇliates ÏÏÏÏÏÏÏÏÏÏÏÏÏÏÏÏÏÏÏÏÏÏÏÏÏÏÏÏÏÏÏÏÏÏÏ 5,473 Ì Ì
Accounts receivable from other companies ÏÏÏÏÏÏÏÏÏÏÏÏÏÏÏÏÏÏÏÏÏÏÏÏÏÏÏÏ 20,760 21,227 3,279
Other securities ÏÏÏÏÏÏÏÏÏÏÏÏÏÏÏÏÏÏÏÏÏÏÏÏÏÏÏÏÏÏÏÏÏÏÏÏÏÏÏÏÏÏÏÏÏÏÏÏÏÏÏ Ì Ì 43
Total Ñnancial assetsÏÏÏÏÏÏÏÏÏÏÏÏÏÏÏÏÏÏÏÏÏÏÏÏÏÏÏÏÏÏÏÏÏÏÏÏÏÏÏÏÏÏÏÏÏÏÏ 41,350 35,597 17,679
Equity investments
1998 1999 2000
Equity investments in subsidiary companies ÏÏÏÏÏÏÏÏÏÏÏÏÏÏÏÏÏÏÏÏÏÏÏÏÏÏÏ 2,409 2,409 2,409
Equity investments in associated companies ÏÏÏÏÏÏÏÏÏÏÏÏÏÏÏÏÏÏÏÏÏÏÏÏÏÏÏ 12,118 11,577 11,629
Other companies ÏÏÏÏÏÏÏÏÏÏÏÏÏÏÏÏÏÏÏÏÏÏÏÏÏÏÏÏÏÏÏÏÏÏÏÏÏÏÏÏÏÏÏÏÏÏÏÏÏÏ 590 384 319
Total ÏÏÏÏÏÏÏÏÏÏÏÏÏÏÏÏÏÏÏÏÏÏÏÏÏÏÏÏÏÏÏÏÏÏÏÏÏÏÏÏÏÏÏÏÏÏÏÏÏÏÏÏÏÏÏÏÏÏÏÏ 15,117 14,370 14,357
An itemized list of shareholdings that were not consolidated follows:
Group ValuationInvestments Book Value Holding Criteria Location Currency Share Capital
Subsidiary Companies:
Clim.Re S.A. ÏÏÏÏÏÏÏÏÏÏÏÏÏÏÏÏ 2,409 100.00 Net Equity Luxembourg Flux 50,000,000
Associated Companies:
Omas S.r.l. ÏÏÏÏÏÏÏÏÏÏÏÏÏÏÏÏÏÏ 2,027 40.00 Net Equity S.Vittorio di Lit. 700,000,000Gualtieri (RE)
EÅegici S.r.l.ÏÏÏÏÏÏÏÏÏÏÏÏÏÏÏÏÏ 144 25.00 Net Equity Gorgo al Monticano Lit. 470,000,000
Liguria Vita ÏÏÏÏÏÏÏÏÏÏÏÏÏÏÏÏÏ 3,458 30.00 Net Equity Treviso Lit. 12,000,000,000
Interest held through a trustcompany ÏÏÏÏÏÏÏÏÏÏÏÏÏÏÏÏÏÏ 6,000 Net Equity Lit. 300,000,000
Total associated companiesÏÏÏÏÏ 11,629
The subsidiary Clim.Re S.A., which provides limited insurance services on behalf of several Groupcompanies, has been excluded from the consolidation since its activities are dissimilar to those in whichthe Group operates. It has been accounted for using the equity method, similar to that used for otherassociated companies.
The interest held through a trust company relates to a company that manufactures Ñnished productson behalf of the Company. The Group has availed itself of the right, granted by the applicable laws(Article 39 of Legislative Decree No. 127/91), to omit the name of the subsidiary in order to avoidcausing damage to the latter or Group companies.
Receivables
Receivables due in a period beyond 12 months include Lit. 436 million (Lit. 111 million in 1999 andLit. 882 million in 1998) in receivables from customers and Lit. 3.7 billion (Lit. 159 million in 1999 andLit. 156 million in 1998) from others.
Trade receivables are shown net of a provision for doubtful accounts, amounting to Lit. 11.4 billion,which represents a reasonable estimate of risk, as assessed at the time the Ñnancial statements wereprepared, and included an estimate related to the exposure for receivables in litigation.
F-20
Brought to you by Global Reports

DE' LONGHI S.P.A.
NOTES TO THE CONSOLIDATED FINANCIAL STATEMENTSFOR 1998, 1999 AND 2000 Ì (Continued)
The changes in the provision for doubtful accounts are summarised in the table below.
Trans.1998 1999 Increases Decreases DiÅerence 2000
Provision for doubtful accounts ÏÏÏÏÏÏÏÏÏÏÏÏÏÏÏÏ 19,075 23,325 8,607 (20,515) 11 11,428
The increase in receivables from customers mainly results from the change in consolidation, whichaccounts for approximately Lit. 107 billion. The variation, when considering a consolidation comparablewith that of 1999, thus indicates an improvement in terms of payment collection, considering the increasein sales in 2000 compared to 1999.
Inventory
""Inventory'' shown net of the inventory obsolescence reserve, may be broken down as follows:
1998 1999 2000
Raw materials ÏÏÏÏÏÏÏÏÏÏÏÏÏÏÏÏÏÏÏÏÏÏÏÏÏÏÏÏÏÏÏÏÏÏÏÏÏÏÏÏÏÏÏÏÏÏÏÏÏ 69,890 66,365 131,009
Work in progressÏÏÏÏÏÏÏÏÏÏÏÏÏÏÏÏÏÏÏÏÏÏÏÏÏÏÏÏÏÏÏÏÏÏÏÏÏÏÏÏÏÏÏÏÏÏÏ 20,035 24,224 41,234
Finished products ÏÏÏÏÏÏÏÏÏÏÏÏÏÏÏÏÏÏÏÏÏÏÏÏÏÏÏÏÏÏÏÏÏÏÏÏÏÏÏÏÏÏÏÏÏÏ 153,800 137,016 198,296
Inventory, net ÏÏÏÏÏÏÏÏÏÏÏÏÏÏÏÏÏÏÏÏÏÏÏÏÏÏÏÏÏÏÏÏÏÏÏÏÏÏÏÏÏÏÏÏÏÏÏÏÏ 243,725 227,605 370,539
The increase in inventory is attributable to the consolidation of acquired companies, which account forabout Lit. 71 billion, and also reÖects the trend in the sale of air-conditioning equipment, negativelyinÖuenced by adverse weather conditions. The value of inventory has been adjusted through an inventoryobsolescence reserve of Lit. 8.2 billion (Lit. 11.5 billion for 1999 and 7.3 billion for 1998) relating toproducts and raw materials that are obsolete or turn over slowly and thus are no longer consideredstrategic for the Group.
We further note that a valuation of inventory on the basis of current costs would not result in anysigniÑcant diÅerences from the values above.
Other Assets
1998 1999 2000
From subsidiary companies ÏÏÏÏÏÏÏÏÏÏÏÏÏÏÏÏÏÏÏÏÏÏÏÏÏÏÏÏÏÏÏÏÏÏÏÏÏÏ Ì 2,059 Ì
From associated companies ÏÏÏÏÏÏÏÏÏÏÏÏÏÏÏÏÏÏÏÏÏÏÏÏÏÏÏÏÏÏÏÏÏÏÏÏÏÏ 6,177 1,925 2,528
From others ÏÏÏÏÏÏÏÏÏÏÏÏÏÏÏÏÏÏÏÏÏÏÏÏÏÏÏÏÏÏÏÏÏÏÏÏÏÏÏÏÏÏÏÏÏÏÏÏÏÏÏ 115,011 101,213 115,129
Accrued income and prepayments ÏÏÏÏÏÏÏÏÏÏÏÏÏÏÏÏÏÏÏÏÏÏÏÏÏÏÏÏÏÏÏÏ 4,672 4,337 23,637
Total other assets ÏÏÏÏÏÏÏÏÏÏÏÏÏÏÏÏÏÏÏÏÏÏÏÏÏÏÏÏÏÏÏÏÏÏÏÏÏÏÏÏÏÏ 125,860 109,534 141,294
Receivables from subsidiary companies
This item includes, in 1999, the amount receivable from the company Distribuidora de Elett. Ltda,which was sold to third parties at the end of December 2000.
Consequently, the residual amount receivable as of December 31, 2000 of Lit. 0.7 billion has beenreclassiÑed and included in the item ""Receivables from others''.
Receivables from associated companies
The amount shown relates to receivables from the associated company Omas S.r.l.
F-21
Brought to you by Global Reports

DE' LONGHI S.P.A.
NOTES TO THE CONSOLIDATED FINANCIAL STATEMENTSFOR 1998, 1999 AND 2000 Ì (Continued)
Receivables from others
The item receivables from others comprises:
1998 1999 2000
Tax credits ÏÏÏÏÏÏÏÏÏÏÏÏÏÏÏÏÏÏÏÏÏÏÏÏÏÏÏÏÏÏÏÏÏÏÏÏÏÏÏÏÏÏÏÏÏÏÏÏÏÏÏÏ 51,096 35,592 57,097
Advances to suppliers ÏÏÏÏÏÏÏÏÏÏÏÏÏÏÏÏÏÏÏÏÏÏÏÏÏÏÏÏÏÏÏÏÏÏÏÏÏÏÏÏÏÏÏ 1,943 5,792 3,443
Deferred tax assets ÏÏÏÏÏÏÏÏÏÏÏÏÏÏÏÏÏÏÏÏÏÏÏÏÏÏÏÏÏÏÏÏÏÏÏÏÏÏÏÏÏÏÏÏÏ 36,698 35,100 36,279
Advances to personnel ÏÏÏÏÏÏÏÏÏÏÏÏÏÏÏÏÏÏÏÏÏÏÏÏÏÏÏÏÏÏÏÏÏÏÏÏÏÏÏÏÏÏ 3,980 263 123
Other receivablesÏÏÏÏÏÏÏÏÏÏÏÏÏÏÏÏÏÏÏÏÏÏÏÏÏÏÏÏÏÏÏÏÏÏÏÏÏÏÏÏÏÏÏÏÏÏÏ 21,138 24,307 14,438
Total receivables from othersÏÏÏÏÏÏÏÏÏÏÏÏÏÏÏÏÏÏÏÏÏÏÏÏÏÏÏÏÏÏÏÏÏÏÏÏÏ 114,855 101,054 111,380
Collectible after 12 months ÏÏÏÏÏÏÏÏÏÏÏÏÏÏÏÏÏÏÏÏÏÏÏÏÏÏÏÏÏÏÏÏÏÏÏÏÏÏ 156 159 3,749
Total receivables from othersÏÏÏÏÏÏÏÏÏÏÏÏÏÏÏÏÏÏÏÏÏÏÏÏÏÏÏÏÏÏÏÏÏ 115,011 101,213 115,129
""Tax credits'' includes tax credits totalling Lit. 6 billion and VAT credits of Lit. 51 billion. Thechange from 1999 is mainly attributable to the increased VAT credit, which was, in turn, a consequence ofthe higher export sales reported by some Group companies that were not able to buy non-taxable goodsand services to the full extent allowed, as per current laws.
""Deferred tax assets'' refers to the sum of advance taxes, which have been calculated on the basis ofthe temporary diÅerences arising between the book value of assets and their corresponding tax values. Italso includes the net operating losses that can be used in future years.
The overall balance of deferred tax assets as of December 31, 2000 is the following:
1998 1999 2000
Temporary diÅerences (taxed funds, etc.)ÏÏÏÏÏÏÏÏÏÏÏÏÏÏÏÏÏÏÏÏÏÏÏÏÏÏÏÏÏ 15,444 25,904 20,347
Tax lossesÏÏÏÏÏÏÏÏÏÏÏÏÏÏÏÏÏÏÏÏÏÏÏÏÏÏÏÏÏÏÏÏÏÏÏÏÏÏÏÏÏÏÏÏÏÏÏÏÏÏÏÏÏÏÏÏ 14,527 Ì Ì
Consolidation adjustments ÏÏÏÏÏÏÏÏÏÏÏÏÏÏÏÏÏÏÏÏÏÏÏÏÏÏÏÏÏÏÏÏÏÏÏÏÏÏÏÏÏÏ 6,727 9,196 15,932
Total ÏÏÏÏÏÏÏÏÏÏÏÏÏÏÏÏÏÏÏÏÏÏÏÏÏÏÏÏÏÏÏÏÏÏÏÏÏÏÏÏÏÏÏÏÏÏÏÏÏÏÏÏÏÏÏÏ 36,698 35,100 36,279
""Other receivables'' includes receivables from the company ""Cogef S.p.A. in liquidation'' for a netvalue of Lit. 6.7 billion. On March 30, 2001 this receivable was transferred to third parties withoutrecourse at a book value of Lit. 6.7 billion.
""Collectible after 12 months'' includes guarantee deposits and receivables for refundable taxes. Theincrease compared to the previous year is attributable to the registration tax refund receivable.
F-22
Brought to you by Global Reports

DE' LONGHI S.P.A.
NOTES TO THE CONSOLIDATED FINANCIAL STATEMENTSFOR 1998, 1999 AND 2000 Ì (Continued)
Accrued income and prepayments
This item may be broken down as follows:
1998 1999 2000
Accrued Income:
Interest receivable on hedging transactions ÏÏÏÏÏÏÏÏÏÏÏÏÏÏÏÏÏÏÏÏÏÏÏÏÏÏÏÏÏÏ 1,456 1,900 17,263
Other Ñnancial income ÏÏÏÏÏÏÏÏÏÏÏÏÏÏÏÏÏÏÏÏÏÏÏÏÏÏÏÏÏÏÏÏÏÏÏÏÏÏÏÏÏÏÏÏÏÏÏ 189 194 2,049
Total ÏÏÏÏÏÏÏÏÏÏÏÏÏÏÏÏÏÏÏÏÏÏÏÏÏÏÏÏÏÏÏÏÏÏÏÏÏÏÏÏÏÏÏÏÏÏÏÏÏÏÏÏÏÏÏÏÏÏ 1,645 2,094 19,312
Prepaid Expenses:
Advertising and insurance costsÏÏÏÏÏÏÏÏÏÏÏÏÏÏÏÏÏÏÏÏÏÏÏÏÏÏÏÏÏÏÏÏÏÏÏÏÏÏÏÏ 1,438 819 1,217
Financial expenses ÏÏÏÏÏÏÏÏÏÏÏÏÏÏÏÏÏÏÏÏÏÏÏÏÏÏÏÏÏÏÏÏÏÏÏÏÏÏÏÏÏÏÏÏÏÏÏÏÏÏ 468 Ì 1,798
Other general expensesÏÏÏÏÏÏÏÏÏÏÏÏÏÏÏÏÏÏÏÏÏÏÏÏÏÏÏÏÏÏÏÏÏÏÏÏÏÏÏÏÏÏÏÏÏÏÏ 1,121 1,424 1,310
Total ÏÏÏÏÏÏÏÏÏÏÏÏÏÏÏÏÏÏÏÏÏÏÏÏÏÏÏÏÏÏÏÏÏÏÏÏÏÏÏÏÏÏÏÏÏÏÏÏÏÏÏÏÏÏÏÏÏÏ 3,027 2,243 4,325
Total accrued income and prepaid expenses ÏÏÏÏÏÏÏÏÏÏÏÏÏÏÏÏÏÏÏÏÏÏÏÏÏ 4,672 4,337 23,637
The increase of Lit. 19.3 billion from 1999 to 2000 in ""accrued income and prepaid expenses'' ismainly attributable to the portion of hedging transaction revenues relating to the year.
Payables
This balance represents the amounts payable to third parties for the supply of goods and services. Thisitem increased by Lit. 99.7 billion in 2000 compared to 1999 mainly as a result of the consolidation of thecompanies acquired at the end of December 2000.
Other Liabilities
1998 1999 2000
Advances ÏÏÏÏÏÏÏÏÏÏÏÏÏÏÏÏÏÏÏÏÏÏÏÏÏÏÏÏÏÏÏÏÏÏÏÏÏÏÏÏÏÏÏÏÏÏÏÏÏÏÏÏÏÏ 5,265 2,542 5,451
Notes payable ÏÏÏÏÏÏÏÏÏÏÏÏÏÏÏÏÏÏÏÏÏÏÏÏÏÏÏÏÏÏÏÏÏÏÏÏÏÏÏÏÏÏÏÏÏÏÏÏÏÏ 48 Ì 73
Due to associated companiesÏÏÏÏÏÏÏÏÏÏÏÏÏÏÏÏÏÏÏÏÏÏÏÏÏÏÏÏÏÏÏÏÏÏÏÏÏÏ 837 275 1,368
Tax payables ÏÏÏÏÏÏÏÏÏÏÏÏÏÏÏÏÏÏÏÏÏÏÏÏÏÏÏÏÏÏÏÏÏÏÏÏÏÏÏÏÏÏÏÏÏÏÏÏÏÏÏ 39,570 29,805 74,306
Social security payables ÏÏÏÏÏÏÏÏÏÏÏÏÏÏÏÏÏÏÏÏÏÏÏÏÏÏÏÏÏÏÏÏÏÏÏÏÏÏÏÏÏÏ 6,143 7,358 9,887
Other payablesÏÏÏÏÏÏÏÏÏÏÏÏÏÏÏÏÏÏÏÏÏÏÏÏÏÏÏÏÏÏÏÏÏÏÏÏÏÏÏÏÏÏÏÏÏÏÏÏÏÏ 55,534 44,225 38,930
Total ÏÏÏÏÏÏÏÏÏÏÏÏÏÏÏÏÏÏÏÏÏÏÏÏÏÏÏÏÏÏÏÏÏÏÏÏÏÏÏÏÏÏÏÏÏÏÏÏÏÏÏÏÏÏ 107,397 84,205 130,015
Accrued expenses and deferred income ÏÏÏÏÏÏÏÏÏÏÏÏÏÏÏÏÏÏÏÏÏÏÏÏÏÏÏÏÏ 4,029 6,495 28,375
Total other liabilitiesÏÏÏÏÏÏÏÏÏÏÏÏÏÏÏÏÏÏÏÏÏÏÏÏÏÏÏÏÏÏÏÏÏÏÏÏÏÏÏÏÏ 111,426 90,700 158,390
Advances
This balance refers to advances received from customers for supplies and as guarantees.
Due to associated companies
The item refers to payables to the company Omas S.r.l.
F-23
Brought to you by Global Reports

DE' LONGHI S.P.A.
NOTES TO THE CONSOLIDATED FINANCIAL STATEMENTSFOR 1998, 1999 AND 2000 Ì (Continued)
Tax payables
This item may be broken down as follows:
1998 1999 2000
Direct taxes payable ÏÏÏÏÏÏÏÏÏÏÏÏÏÏÏÏÏÏÏÏÏÏÏÏÏÏÏÏÏÏÏÏÏÏÏÏÏÏÏÏÏÏÏÏÏÏÏ 28,000 18,857 61,482
Indirect taxes payableÏÏÏÏÏÏÏÏÏÏÏÏÏÏÏÏÏÏÏÏÏÏÏÏÏÏÏÏÏÏÏÏÏÏÏÏÏÏÏÏÏÏÏÏÏÏ 4,610 5,070 5,406
Withholding taxes payable ÏÏÏÏÏÏÏÏÏÏÏÏÏÏÏÏÏÏÏÏÏÏÏÏÏÏÏÏÏÏÏÏÏÏÏÏÏÏÏÏÏÏ 4,041 5,254 6,539
Other taxes payable ÏÏÏÏÏÏÏÏÏÏÏÏÏÏÏÏÏÏÏÏÏÏÏÏÏÏÏÏÏÏÏÏÏÏÏÏÏÏÏÏÏÏÏÏÏÏÏ 2,919 624 879
Total taxes payable ÏÏÏÏÏÏÏÏÏÏÏÏÏÏÏÏÏÏÏÏÏÏÏÏÏÏÏÏÏÏÏÏÏÏÏÏÏÏÏÏÏÏÏÏ 39,570 29,805 74,306
""Tax payables'' increased Lit. 44.5 billion compared to 1999 due to the consolidation of thecompanies acquired at the end of December 2000 as well as the increase in the item ""direct taxespayable''. This item includes the amounts due for current taxes net of advances, credits, withholding taxand the substitution tax of Lit. 44 billion relative to the previously described realignment of Ñscal values.
Social Security payables
This item may be broken down as follows:
1998 1999 2000
INPS (National Institute of Social Insurance) ÏÏÏÏÏÏÏÏÏÏÏÏÏÏÏÏÏÏÏÏÏÏÏÏÏÏÏ 4,726 4,939 7,952
FASI- INPDAI (Social Security Institute for Industrial Executives)ÏÏÏÏÏÏÏÏÏ 344 288 491
ENASARCO (National Board for the Assistance to Commercial Agents andRepresentatives) ÏÏÏÏÏÏÏÏÏÏÏÏÏÏÏÏÏÏÏÏÏÏÏÏÏÏÏÏÏÏÏÏÏÏÏÏÏÏÏÏÏÏÏÏÏÏÏÏÏÏÏ 331 338 340
INAIL (Nat. Board for the Insurance against Industrial Accidents) ÏÏÏÏÏÏÏÏÏ 151 56 264
Other Institutions ÏÏÏÏÏÏÏÏÏÏÏÏÏÏÏÏÏÏÏÏÏÏÏÏÏÏÏÏÏÏÏÏÏÏÏÏÏÏÏÏÏÏÏÏÏÏÏÏÏÏÏÏ 591 1,737 840
Total social securities payable ÏÏÏÏÏÏÏÏÏÏÏÏÏÏÏÏÏÏÏÏÏÏÏÏÏÏÏÏÏÏÏÏÏÏÏÏÏÏ 6,143 7,358 9,887
Other payables
This item may be broken down as follows:
1998 1999 2000
To personnel ÏÏÏÏÏÏÏÏÏÏÏÏÏÏÏÏÏÏÏÏÏÏÏÏÏÏÏÏÏÏÏÏÏÏÏÏÏÏÏÏÏÏÏÏÏÏÏÏÏÏÏÏÏ 13,820 18,719 28,332
To third parties for acquisition of shares ÏÏÏÏÏÏÏÏÏÏÏÏÏÏÏÏÏÏÏÏÏÏÏÏÏÏÏÏÏÏ 1,000 Ì Ì
OthersÏÏÏÏÏÏÏÏÏÏÏÏÏÏÏÏÏÏÏÏÏÏÏÏÏÏÏÏÏÏÏÏÏÏÏÏÏÏÏÏÏÏÏÏÏÏÏÏÏÏÏÏÏÏÏÏÏÏÏ 40,714 25,506 10,598
Total other payables ÏÏÏÏÏÏÏÏÏÏÏÏÏÏÏÏÏÏÏÏÏÏÏÏÏÏÏÏÏÏÏÏÏÏÏÏÏÏÏÏÏÏÏ 55,534 44,225 38,930
F-24
Brought to you by Global Reports

DE' LONGHI S.P.A.
NOTES TO THE CONSOLIDATED FINANCIAL STATEMENTSFOR 1998, 1999 AND 2000 Ì (Continued)
Accrued liabilities and deferred income
This item may be broken down as follows:
1998 1999 2000
Accrued Liabilities for:
Interests payable to Banks ÏÏÏÏÏÏÏÏÏÏÏÏÏÏÏÏÏÏÏÏÏÏÏÏÏÏÏÏÏÏÏÏÏÏÏÏÏÏÏÏÏÏ 2,882 1,676 4,694
Expenses for interest rate hedging transactions ÏÏÏÏÏÏÏÏÏÏÏÏÏÏÏÏÏÏÏÏÏÏÏÏÏ 210 561 6,939
Interest on Bond loan issues ÏÏÏÏÏÏÏÏÏÏÏÏÏÏÏÏÏÏÏÏÏÏÏÏÏÏÏÏÏÏÏÏÏÏÏÏÏÏÏÏ 268 Ì 11,056
Other accrued expenses ÏÏÏÏÏÏÏÏÏÏÏÏÏÏÏÏÏÏÏÏÏÏÏÏÏÏÏÏÏÏÏÏÏÏÏÏÏÏÏÏÏÏÏÏ 669 1,078 828
Total Accrued liabilities ÏÏÏÏÏÏÏÏÏÏÏÏÏÏÏÏÏÏÏÏÏÏÏÏÏÏÏÏÏÏÏÏÏÏÏÏÏÏÏÏ 4,029 3,315 23,517
Total Deferred income ÏÏÏÏÏÏÏÏÏÏÏÏÏÏÏÏÏÏÏÏÏÏÏÏÏÏÏÏÏÏÏÏÏÏÏÏÏÏÏÏÏ Ì 3,180 4,858
Total accrued liabilities and deferred income ÏÏÏÏÏÏÏÏÏÏÏÏÏÏÏÏÏÏÏÏÏÏ 4,029 6,495 28,375
The increase of Lit. 21.9 billion compared to 1999 is due to the interest accrued in the Ñnancialperiod for bond loan issues (Lit. 11 billion) and hedging costs relative to transactions in derivatives.
Financial hedging instruments and other derivative contracts
In order to reduce the Ñnancial risks resulting from the Öuctuations in exchange and interest rateswhich aÅect international commercial and Ñnancial transactions, the Group hedged contracts within thelimits deÑned by typical operating requirements. The nominal values of the derivatives (net of anytransactions that oÅset each other) outstanding as of December 31, 2000 are as follows:
Derivatives in foreign exchange:
USD 42,000,000;
GBP 33,400,000; and
JPY 3,023,000,000.
The instruments utilized include both forward transactions and structured options.
Interest rate swaps
The Company uses derivatives as a means of hedging against possible losses caused by interest rateÖuctuations. Their purpose is to Ñx in advance a maximum interest expense on part of its debt. Thecurrent derivatives cover a time span that extends to the end of 2004. The overall initial nominal value ofEuro 207 million will decrease over the years as debt is repaid. During that time span, the weightedaverage rate payable by the Company on hedging transactions will range from a minimum of 4.25% to amaximum of 5.9%.
More speciÑcally, of the total Euro 207 million mentioned above, Euro 150 million is related to theissuance of a bond on the Euromarket by De' Longhi Pinguino in April 2000.
The current estimation (as of March 31, 2001) of derivative transactions (in foreign exchange andinterest rates) shows no potential losses for the Group.
F-25
Brought to you by Global Reports

DE' LONGHI S.P.A.
NOTES TO THE CONSOLIDATED FINANCIAL STATEMENTSFOR 1998, 1999 AND 2000 Ì (Continued)
Reserve for StaÅ Severance Indemnities
The table below summarises the movements during the year for each category of employees.
Managers OÇce staÅ Workers Total
January 1, 2000ÏÏÏÏÏÏÏÏÏÏÏÏÏÏÏÏÏÏÏÏÏÏÏÏÏÏÏÏÏÏÏÏÏÏÏÏÏÏ 2,896 7,610 13,796 24,302
Accrual for the period ÏÏÏÏÏÏÏÏÏÏÏÏÏÏÏÏÏÏÏÏÏÏÏÏÏÏÏÏÏÏÏÏ 645 2,344 4,112 7,101
Indemnities paid ÏÏÏÏÏÏÏÏÏÏÏÏÏÏÏÏÏÏÏÏÏÏÏÏÏÏÏÏÏÏÏÏÏÏÏÏÏ (339) (1,275) (3,398) (5,012)
Change in consolidation ÏÏÏÏÏÏÏÏÏÏÏÏÏÏÏÏÏÏÏÏÏÏÏÏÏÏÏÏÏÏÏ 234 3,154 7,747 11,135
December 31, 2000ÏÏÏÏÏÏÏÏÏÏÏÏÏÏÏÏÏÏÏÏÏÏÏÏÏÏÏÏÏÏÏÏÏÏÏ 3,436 11,833 22,257 37,526
Reserve for Risks and Other Charges
This item includes amounts set aside against potential risks for the payment of the retirementindemnities that must be paid to agents, subject to the conditions stated in Article 1751 of the Civil Code,as applied to the applicable agent agreements.
The variations in the fund were as follows:
Variance in1998 1999 Withdrawals Allocation Consolidation 2000
Agents' indemnities ÏÏÏÏÏÏÏÏÏÏÏÏÏ 4,996 5,341 (822) 866 1,020 6,405
Other provisions
This item may be broken down as follows:
Trans. Variance in1998 1999 Withdr. Allocation DiÅerence Consolidation 2000
Product warranty fund ÏÏÏÏÏÏÏ 2,156 2,259 (565) 634 (5) 62 2,385
Prize contest fund ÏÏÏÏÏÏÏÏÏÏÏ Ì 114 (114) Ì Ì Ì Ì
Prov. for subsidiaryrestructuringÏÏÏÏÏÏÏÏÏÏÏÏÏÏ 4,815 Ì Ì Ì Ì Ì Ì
Prov. for exchange rateÖuctuationsÏÏÏÏÏÏÏÏÏÏÏÏÏÏÏ Ì 3 (393) Ì Ì 390 Ì
Prov. for returned goodsÏÏÏÏÏÏ 950 950 (451) 396 (19) Ì 1,312
Prov. for litigation risks ÏÏÏÏÏÏ 4,300 5,000 (2,546) 6,446 1,550 10,450
Other provisions ÏÏÏÏÏÏÏÏÏÏÏÏ 1,850 2,059 (1,778) 820 (213) 848 1,300
Total ÏÏÏÏÏÏÏÏÏÏÏÏÏÏÏÏÏÏ 14,071 10,385 (5,847) 8,296 (237) 2,850 15,447
The product warranty fund has been set aside for some consolidated companies on the basis of aprudent estimate of warranty services to be performed on products sold as of December 31, 2000.
The provision for ""litigation risks'' is set aside against risks of varying nature that could causepotential liabilities to arise. More speciÑcally, the amounts prudently set aside by the parent companyinclude Lit. 5 billion against the risk of liabilities that could arise in connection with litigation proceedingstaking place in the American market (limited to the insurance deductible to be paid by us). There arealso other litigation proceedings in-process with third parties, and in some cases the amounts claimed areof a considerable nature. It should be noted that, on the basis of diÅerent expert opinions, the Group doesnot deem there to be a reasonable risk of the event occurring and materially inÖuencing its Ñnancialposition. The amounts prudently set aside are rather aimed at covering any legal expenses that may beincurred in connection with these litigation proceedings.
F-26
Brought to you by Global Reports

DE' LONGHI S.P.A.
NOTES TO THE CONSOLIDATED FINANCIAL STATEMENTSFOR 1998, 1999 AND 2000 Ì (Continued)
The provision for litigation risks also includes amounts prudently set aside by the subsidiarycompanies Simac-Vetrella S.p.A. for litigation in process with the Tax Authorities and with third parties.It is deemed, also on the basis of opinions received, that these proceedings are not likely to result in moreexpenses than are already accrued for.
In previous years the parent company and a subsidiary company, Elba S.p.A., received ascertainmentreports from the tax authorities. On the basis of the information currently at our disposal, we have deemedit unnecessary to make any further provisions for tax liabilities.
Cash and Cash Equivalents
1998 1999 2000
Cash balances ÏÏÏÏÏÏÏÏÏÏÏÏÏÏÏÏÏÏÏÏÏÏÏÏÏÏÏÏÏÏÏÏÏÏÏÏÏÏÏÏÏÏ 75,955 141,385 128,975
Marketable securities ÏÏÏÏÏÏÏÏÏÏÏÏÏÏÏÏÏÏÏÏÏÏÏÏÏÏÏÏÏÏÏÏÏÏÏÏ 2,645 4,430 2,004
Total ÏÏÏÏÏÏÏÏÏÏÏÏÏÏÏÏÏÏÏÏÏÏÏÏÏÏÏÏÏÏÏÏÏÏÏÏÏÏÏÏÏÏÏÏÏÏ 78,600 145,815 130,979
Cash balances
This item refers to deposits with lending institutions and includes signiÑcant amounts collected fromcustomers at year-end.
Marketable securities
This item is composed of bonds, government securities and shareholdings purchased for the purpose ofutilizing cash.
Short-term Debt
1998 1999 2000
Payable to banks Ì short-term ÏÏÏÏÏÏÏÏÏÏÏÏÏÏÏÏÏÏÏÏÏÏÏÏÏÏÏÏÏÏÏÏÏÏ 295,778 144,771 304,304
Payable to other lenders, short-termÏÏÏÏÏÏÏÏÏÏÏÏÏÏÏÏÏÏÏÏÏÏÏÏÏÏÏÏÏÏ 18,870 23,572 26,437
Payable to parent company and subsidiary ÏÏÏÏÏÏÏÏÏÏÏÏÏÏÏÏÏÏÏÏÏÏÏÏ 9,484 152,542 2,704
Other receivablesÏÏÏÏÏÏÏÏÏÏÏÏÏÏÏÏÏÏÏÏÏÏÏÏÏÏÏÏÏÏÏÏÏÏÏÏÏÏÏÏÏÏÏÏÏÏ Ì Ì (4,998)
Receivables from parent companies ÏÏÏÏÏÏÏÏÏÏÏÏÏÏÏÏÏÏÏÏÏÏÏÏÏÏÏÏÏÏ (144,970) (8,031) (28,413)
Total short-term debt ÏÏÏÏÏÏÏÏÏÏÏÏÏÏÏÏÏÏÏÏÏÏÏÏÏÏÏÏÏÏÏÏÏÏÏÏÏÏ 179,162 312,854 300,034
Payable to other lenders, short term
With regard to this item, a sum of Lit. 26.4 billion is attributable to the amount payable on leasingcontracts as calculated using the Ñnancial method.
Payable to parent company and subsidiary
This item relates to a loan due to the subsidiary Clim. Re S.A., and it has not been consolidated. In1999, this item mainly related to a foreign currency loan entered into by the parent company, the risk ofwhich is hedged by a derivative instrument.
F-27
Brought to you by Global Reports

DE' LONGHI S.P.A.
NOTES TO THE CONSOLIDATED FINANCIAL STATEMENTSFOR 1998, 1999 AND 2000 Ì (Continued)
Receivables from parent companies
The breakdown of receivables from parent companies is as follows:
1998 1999 2000
De' Longhi SoparÑ ÏÏÏÏÏÏÏÏÏÏÏÏÏÏÏÏÏÏÏÏÏÏÏÏÏÏÏÏÏÏÏÏÏÏÏÏÏÏÏÏÏÏÏÏÏÏÏÏ 144,970 8,000 28,370
De' Longhi Holding ÏÏÏÏÏÏÏÏÏÏÏÏÏÏÏÏÏÏÏÏÏÏÏÏÏÏÏÏÏÏÏÏÏÏÏÏÏÏÏÏÏÏÏÏÏÏÏ Ì 31 43
Total ÏÏÏÏÏÏÏÏÏÏÏÏÏÏÏÏÏÏÏÏÏÏÏÏÏÏÏÏÏÏÏÏÏÏÏÏÏÏÏÏÏÏÏÏÏÏÏÏÏÏÏÏÏÏÏÏ 144,970 8,031 28,413
The receivables from the parent company De' Longhi SoparÑ are of a Ñnancial nature and refer to thetransfer of shareholdings by the subsidiary companies Ergoklima S.p.A. and Micromax S.p.A., taking placeat the end of December 2000. This amount was fully collected in 2001.
Other receivables
The amount shown primarily refers to prepaid taxes on the Reserve for staÅ severence indemnitiesand a receivable of Lit. 5 billion due from a Trust Company, which was transferred on April 9, 2001 tothe Parent Company De'Longhi SoparÑ at face value.
Long-term Debt
1998 1999 2000
Payable to banks Ì medium/long termÏÏÏÏÏÏÏÏÏÏÏÏÏÏÏÏÏÏÏÏÏÏÏÏÏÏÏÏ 212,412 252,336 228,702
Bond issues ÏÏÏÏÏÏÏÏÏÏÏÏÏÏÏÏÏÏÏÏÏÏÏÏÏÏÏÏÏÏÏÏÏÏÏÏÏÏÏÏÏÏÏÏÏÏÏÏÏÏÏ 244,710 92,711 290,440
Payable to parent companies ÏÏÏÏÏÏÏÏÏÏÏÏÏÏÏÏÏÏÏÏÏÏÏÏÏÏÏÏÏÏÏÏÏÏÏÏÏ 148,125 1,000 Ì
Other long-term debt ÏÏÏÏÏÏÏÏÏÏÏÏÏÏÏÏÏÏÏÏÏÏÏÏÏÏÏÏÏÏÏÏÏÏÏÏÏÏÏÏÏÏÏ 636 Ì Ì
Total long-term debtÏÏÏÏÏÏÏÏÏÏÏÏÏÏÏÏÏÏÏÏÏÏÏÏÏÏÏÏÏÏÏÏÏÏÏÏÏÏÏÏ 605,883 346,047 519,142
Payable to banks
A portion of the payable to banks, i.e., Lit. 246 billion, is secured by mortgages on tangible propertyfor an amount of Lit. 475 billion.
Bond issues
The amount disclosed in the Ñnancial statements refers to the bond listed in the Luxembourg stockexchange, issued by the subsidiary company De' Longhi Pinguino S.A. in April 2000 for a total of Euro150 million, due to expire in 2003, and it accrues interest with an annual coupon of 5.625%. This loan isnot secured by guarantees.
In 2000 the bonds to the Parent company, totalling Lit. 92.7 billion were paid in full.
Shareholders' Equity
For the purpose of the attribution of the tax credit under Article 105 of President's DecreeNo. 917/86, with respect to the parent company, the total taxes falling in box ""A'' (Article 105, clause 1,letter a) amount to Lit. 21.9 billion, 22.3 billion and Lit. 33.7 billion for 1998, 1999 and 2000, respectively.Those falling in box B (Article 105, clause 1, letter b) amount to Lit. 34.3 billion, Lit. 72.4 billion andLit. 80.5 billion for 1998, 1999 and 2000.
F-28
Brought to you by Global Reports

DE' LONGHI S.P.A.
NOTES TO THE CONSOLIDATED FINANCIAL STATEMENTSFOR 1998, 1999 AND 2000 Ì (Continued)
Share capital
The Share Capital is divided into 400,000,000 ordinary shares having a face value of 1,000 Lire each,for a total capital of Lit. 400 billion. The shares are registered and indivisible. Each share entitles theholder to one vote at the shareholders' meeting.
Reserves
1998 1999 2000
Legal reserves ÏÏÏÏÏÏÏÏÏÏÏÏÏÏÏÏÏÏÏÏÏÏÏÏÏÏÏÏÏÏÏÏÏÏÏÏÏÏÏÏÏÏÏÏÏÏÏÏÏÏÏÏ 1,440 1,820 4,565
Retained earnings ÏÏÏÏÏÏÏÏÏÏÏÏÏÏÏÏÏÏÏÏÏÏÏÏÏÏÏÏÏÏÏÏÏÏÏÏÏÏÏÏÏÏÏÏÏÏÏÏÏ 5,866 7,703 1,937
Other reserves ÏÏÏÏÏÏÏÏÏÏÏÏÏÏÏÏÏÏÏÏÏÏÏÏÏÏÏÏÏÏÏÏÏÏÏÏÏÏÏÏÏÏÏÏÏÏÏÏÏÏÏÏ 19,009 26,839 34,310
Total reservesÏÏÏÏÏÏÏÏÏÏÏÏÏÏÏÏÏÏÏÏÏÏÏÏÏÏÏÏÏÏÏÏÏÏÏÏÏÏÏÏÏÏÏÏÏÏÏÏÏ 26,315 36,362 40,812
Legal reserve
As of December 31, 1999, this item totalled Lit. 1.8 billion. The increase of Lit. 2.7 billioncorresponds to the proÑts for the 1999 amount allocated, on approval of the shareholders at the generalmeeting of June 29, 2000.
Extraordinary reserve
The extraordinary reserve amounts to Lit. 34.2 billion. The increase of Lit. 8.1 billion fromDecember 31, 1999 is mainly due to:
‚ allocation of Lit. 52.1 billion of the parent company's proÑts for 1999;
‚ withdrawal, for accounting purposes, of the substitution tax payable Ì Lit. 44 billion Ì due to theadjustment of the Company's tax basis of assets to the same amount as the carrying value.
Minority Interests
Minority interests amount to Lit. 637 million. The table below itemizes the minority interests heldand the corresponding values with regard to net equity and (loss) income for 2000.
Company % of Shares Net Equity ProÑt for Year
Ariagel S.p.A.ÏÏÏÏÏÏÏÏÏÏÏÏÏÏÏÏÏÏÏÏÏÏÏÏÏÏÏÏÏÏÏÏÏÏÏÏÏÏÏÏÏÏÏÏÏÏÏ 10% 342 66
E-Services S.r.l. ÏÏÏÏÏÏÏÏÏÏÏÏÏÏÏÏÏÏÏÏÏÏÏÏÏÏÏÏÏÏÏÏÏÏÏÏÏÏÏÏÏÏÏÏÏ 49% 132 84
La Supercalor S.p.A.ÏÏÏÏÏÏÏÏÏÏÏÏÏÏÏÏÏÏÏÏÏÏÏÏÏÏÏÏÏÏÏÏÏÏÏÏÏÏÏÏÏ 5% 90 8
Sile Corpi Scaldanti S.r.l. ÏÏÏÏÏÏÏÏÏÏÏÏÏÏÏÏÏÏÏÏÏÏÏÏÏÏÏÏÏÏÏÏÏÏÏÏÏ 8.30% 153 46
Other minor interestsÏÏÏÏÏÏÏÏÏÏÏÏÏÏÏÏÏÏÏÏÏÏÏÏÏÏÏÏÏÏÏÏÏÏÏÏÏÏÏÏÏ (81) Ì
Total ÏÏÏÏÏÏÏÏÏÏÏÏÏÏÏÏÏÏÏÏÏÏÏÏÏÏÏÏÏÏÏÏÏÏÏÏÏÏÏÏÏÏÏÏÏÏÏÏÏÏ 636 204
F-29
Brought to you by Global Reports

DE' LONGHI S.P.A.
NOTES TO THE CONSOLIDATED FINANCIAL STATEMENTSFOR 1998, 1999 AND 2000 Ì (Continued)
A comparison between the net equity and year-end proÑts of the Parent Company De' Longhi S.p.A.and the consolidated net equity and year-end proÑts is shown below:
Income for Income for Income forNet Equity Net Equity Net Equity the Year the Year the Year
1998 1999 2000 1998 1999 2000
Annual Ñnancial statements of ParentCompanyÏÏÏÏÏÏÏÏÏÏÏÏÏÏÏÏÏÏÏÏÏÏÏÏ 327,989 482,881 473,273 7,380 54,891 34,467
DiÅ. between net equity of aÇliatesand book value of shareholdings,year-end proÑt of consolidatedcompanies, movements in the area ofconsolidation and write-oÅ ofdividendsÏÏÏÏÏÏÏÏÏÏÏÏÏÏÏÏÏÏÏÏÏÏÏÏ 12,820 14,968 (67) (2,639) 601 5,611
Elimination of inter-company proÑts ÏÏÏ (32,533) (41,693) (56,833) 298 (9,139) (21,242)
Elimination of tax-related itemsÏÏÏÏÏÏÏ 11,537 7,742 31,474 (3,508) (3,797) 15,062
Other adjustments ÏÏÏÏÏÏÏÏÏÏÏÏÏÏÏÏÏÏ 15,711 21,589 20,945 7,678 6,569 (5,918)
Shareholders equity ÏÏÏÏÏÏÏÏÏÏÏÏÏÏÏÏÏ 335,524 485,487 468,792 9,209 49,125 27,980
Minority interestsÏÏÏÏÏÏÏÏÏÏÏÏÏÏÏÏÏÏÏ 580 661 637 (275) 1 204
Consolidated Financial Statements ÏÏÏÏ 336,104 486,148 469,429 8,934 49,126 28,184
Memorandum Accounts
The breakdown and comparison with the previous Ñnancial period is shown below.
1998 1999 2000
Property c/o third partiesÏÏÏÏÏÏÏÏÏÏÏÏÏÏÏÏÏÏÏÏÏÏÏÏÏÏÏÏÏÏÏÏÏÏÏÏÏÏÏÏÏÏÏÏÏ 1,591 Ì 2,408
Guarantees on behalf of third parties ÏÏÏÏÏÏÏÏÏÏÏÏÏÏÏÏÏÏÏÏÏÏÏÏÏÏÏÏÏÏÏÏÏÏÏ 105,810 128,525 20,135
Other commitments ÏÏÏÏÏÏÏÏÏÏÏÏÏÏÏÏÏÏÏÏÏÏÏÏÏÏÏÏÏÏÏÏÏÏÏÏÏÏÏÏÏÏÏÏÏÏÏÏÏ 19,081 49,042 1,711
Total memorandum accounts ÏÏÏÏÏÏÏÏÏÏÏÏÏÏÏÏÏÏÏÏÏÏÏÏÏÏÏÏÏÏÏÏÏÏÏÏÏ 126,482 177,567 24,254
Guarantees on behalf of third parties
These guarantees have been issued mainly on behalf of third parties that in 1999 also included non-consolidated group companies. The decrease of Lit. 108.4 billion compared to 1999 is due to:
‚ The change in the consolidation resulting from the acquisition of shareholdings at the end ofDecember 2000.
‚ The termination of a commitment relating to a guarantee of Lit. 40 billion provided to BancoAmbrosiano Veneto following the signing of an agreement with the parent company De' LonghiSoparÑ S.A., which undertook all the obligations resulting from this guarantee.
Other commitments
The reduction of Lit. 47.3 billion is due to:
‚ The termination of a Lit. 17.6 billion commitment to the company ""Cogef S.p.A. in liquidation''as a result of an agreement with the parent company De' Longhi SoparÑ which, as ofDecember 28, 2000, undertook all the obligations borne by De' Longhi S.p.A., releasing the latterfrom any claims that may be set forth relative to the commitments to the banking system of""Cogef S.p.A. in liquidation''.
‚ Termination of the commitment to the parent company De' Longhi SoparÑ, which amounted toLit. 30 billion as of December 31, 1999, as a result of the payment in 2000 of compensation ofLit. 18.7 billion, given the conditions provided in the agreement undersigned in 1997.
F-30
Brought to you by Global Reports

DE' LONGHI S.P.A.
NOTES TO THE CONSOLIDATED FINANCIAL STATEMENTSFOR 1998, 1999 AND 2000 Ì (Continued)
Net Sales
Net sales in 2000 rose by Lit. 87 billion, or 7.6%, which, if we consider consolidation comparable tothat of 1999, amounts to 17%.
Net sales may be broken down as follows:
Sales by geographical region:
1998 % 1999 % 2000 %
Italy ÏÏÏÏÏÏÏÏÏÏÏÏÏÏÏÏÏÏÏÏÏÏÏÏÏÏÏÏÏÏÏÏÏÏÏÏÏ 434,672 40.7 441,000 38.8 422,000 34.5
United States and Canada ÏÏÏÏÏÏÏÏÏÏÏÏÏÏÏÏÏÏÏ 75,015 7.0 147,000 12.9 199,000 16.3
Japan ÏÏÏÏÏÏÏÏÏÏÏÏÏÏÏÏÏÏÏÏÏÏÏÏÏÏÏÏÏÏÏÏÏÏÏÏ Ì Ì 67,000 5.9 103,000 8.4
European Union ÏÏÏÏÏÏÏÏÏÏÏÏÏÏÏÏÏÏÏÏÏÏÏÏÏÏÏ 349,655 32.7 Ì Ì Ì Ì
Great Britain ÏÏÏÏÏÏÏÏÏÏÏÏÏÏÏÏÏÏÏÏÏÏÏÏÏÏÏÏÏÏ Ì Ì 92,000 8.1 98,000 8.0
Germany(*) ÏÏÏÏÏÏÏÏÏÏÏÏÏÏÏÏÏÏÏÏÏÏÏÏÏÏÏÏÏÏ Ì Ì 42,000 3.7 66,000 5.4
Others in EuropeÏÏÏÏÏÏÏÏÏÏÏÏÏÏÏÏÏÏÏÏÏÏÏÏÏÏÏ 97,873 9.2 205,000 18.0 225,000 18.4
Rest of the WorldÏÏÏÏÏÏÏÏÏÏÏÏÏÏÏÏÏÏÏÏÏÏÏÏÏÏ 111,385 10.4 70,044 6.2 93,951 7.7
Total ÏÏÏÏÏÏÏÏÏÏÏÏÏÏÏÏÏÏÏÏÏÏÏÏÏÏÏÏÏÏÏÏÏ 1,068,600 1,064,044 1,206,951
Germany(**) ÏÏÏÏÏÏÏÏÏÏÏÏÏÏÏÏÏÏÏÏÏÏÏÏÏÏÏÏÏ Ì Ì 72,000 6.4 16,000 1.3
Total net sales ÏÏÏÏÏÏÏÏÏÏÏÏÏÏÏÏÏÏÏÏÏÏÏÏÏ 1,068,600 100.0 1,136,044 100.0 1,222,951 100.0
Sales by product lines:
1998 % 1999 % 2000 %
Cooking and food preparation ÏÏÏÏÏÏÏÏÏÏÏÏÏÏÏÏ 22,246 2.1 329,000 29.0 403,000 33.0
Heating(*)ÏÏÏÏÏÏÏÏÏÏÏÏÏÏÏÏÏÏÏÏÏÏÏÏÏÏÏÏÏÏÏÏ 355,983 33.3 228,000 20.1 299,000 24.4
Air conditioning and climate control ÏÏÏÏÏÏÏÏÏÏ 243,300 22.8 298,000 26.2 320,000 26.1
Home cleaning and ironing ÏÏÏÏÏÏÏÏÏÏÏÏÏÏÏÏÏÏ 441,482 41.3 133,000 11.7 134,000 11.0
OthersÏÏÏÏÏÏÏÏÏÏÏÏÏÏÏÏÏÏÏÏÏÏÏÏÏÏÏÏÏÏÏÏÏÏÏÏ 5,589 0.5 35,044 3.1 39,951 3.3
Total ÏÏÏÏÏÏÏÏÏÏÏÏÏÏÏÏÏÏÏÏÏÏÏÏÏÏÏÏÏÏÏÏÏ 1,068,600 1,023,044 1,195,951
Heating(**)ÏÏÏÏÏÏÏÏÏÏÏÏÏÏÏÏÏÏÏÏÏÏÏÏÏÏÏÏÏÏÏ Ì Ì 113,000 9.9 27,000 2.2
Total net sales ÏÏÏÏÏÏÏÏÏÏÏÏÏÏÏÏÏÏÏÏÏÏÏÏÏ 1,068,600 100.0 1,136,044 100.0 1,222,951 100.0
(*) The sales of De' Longhi Radiators S.r.l. are not considered.
(**) Amounts related to the sales of De' Longhi Radiators S.r.l.
Other Revenues
The item ""other revenues'' comprises:
1998 1999 2000
Transportation refunds ÏÏÏÏÏÏÏÏÏÏÏÏÏÏÏÏÏÏÏÏÏÏÏÏÏÏÏÏÏÏÏÏÏÏÏÏÏÏÏÏÏÏÏÏÏÏ 7,760 9,680 9,080
Trade fees ÏÏÏÏÏÏÏÏÏÏÏÏÏÏÏÏÏÏÏÏÏÏÏÏÏÏÏÏÏÏÏÏÏÏÏÏÏÏÏÏÏÏÏÏÏÏÏÏÏÏÏÏÏÏÏÏ 1,453 1,350 2,210
Contingent assets ÏÏÏÏÏÏÏÏÏÏÏÏÏÏÏÏÏÏÏÏÏÏÏÏÏÏÏÏÏÏÏÏÏÏÏÏÏÏÏÏÏÏÏÏÏÏÏÏÏÏ 4,253 2,638 6,063
Compensation for damages ÏÏÏÏÏÏÏÏÏÏÏÏÏÏÏÏÏÏÏÏÏÏÏÏÏÏÏÏÏÏÏÏÏÏÏÏÏÏÏÏÏÏ 1,271 472 1,674
Capital gains ÏÏÏÏÏÏÏÏÏÏÏÏÏÏÏÏÏÏÏÏÏÏÏÏÏÏÏÏÏÏÏÏÏÏÏÏÏÏÏÏÏÏÏÏÏÏÏÏÏÏÏÏÏÏ 2,239 258 184
Other sundry incomesÏÏÏÏÏÏÏÏÏÏÏÏÏÏÏÏÏÏÏÏÏÏÏÏÏÏÏÏÏÏÏÏÏÏÏÏÏÏÏÏÏÏÏÏÏÏÏ 5,497 8,133 7,862
Total ÏÏÏÏÏÏÏÏÏÏÏÏÏÏÏÏÏÏÏÏÏÏÏÏÏÏÏÏÏÏÏÏÏÏÏÏÏÏÏÏÏÏÏÏÏÏÏÏÏÏÏÏÏÏÏÏÏ 22,473 22,531 27,073
F-31
Brought to you by Global Reports

DE' LONGHI S.P.A.
NOTES TO THE CONSOLIDATED FINANCIAL STATEMENTSFOR 1998, 1999 AND 2000 Ì (Continued)
Materials, Consumables and Goods
This item may be broken down as follows:
1998 1999 2000
Purchases of raw materials ÏÏÏÏÏÏÏÏÏÏÏÏÏÏÏÏÏÏÏÏÏÏÏÏÏÏÏÏÏÏÏÏÏÏÏÏÏÏÏÏÏÏ 87,427 66,411 96,885
Purchases of components ÏÏÏÏÏÏÏÏÏÏÏÏÏÏÏÏÏÏÏÏÏÏÏÏÏÏÏÏÏÏÏÏÏÏÏÏÏÏÏÏÏÏÏÏ 238,938 273,322 324,799
Purchases of Ñnished productsÏÏÏÏÏÏÏÏÏÏÏÏÏÏÏÏÏÏÏÏÏÏÏÏÏÏÏÏÏÏÏÏÏÏÏÏÏÏÏÏ 155,132 162,808 172,277
Other sundry purchases ÏÏÏÏÏÏÏÏÏÏÏÏÏÏÏÏÏÏÏÏÏÏÏÏÏÏÏÏÏÏÏÏÏÏÏÏÏÏÏÏÏÏÏÏÏ 17,808 18,539 31,672
Change in raw materials ÏÏÏÏÏÏÏÏÏÏÏÏÏÏÏÏÏÏÏÏÏÏÏÏÏÏÏÏÏÏÏÏÏÏÏÏÏÏÏÏÏÏÏÏ (13,213) 2,397 (16,188)
Change in WIP and Ñnished goods ÏÏÏÏÏÏÏÏÏÏÏÏÏÏÏÏÏÏÏÏÏÏÏÏÏÏÏÏÏÏÏÏÏÏÏ 65,742 20,810 (50,254)
Increases in Ñxed assets for internal work ÏÏÏÏÏÏÏÏÏÏÏÏÏÏÏÏÏÏÏÏÏÏÏÏÏÏÏÏÏÏ (2,350) (2,346) (3,937)
Total ÏÏÏÏÏÏÏÏÏÏÏÏÏÏÏÏÏÏÏÏÏÏÏÏÏÏÏÏÏÏÏÏÏÏÏÏÏÏÏÏÏÏÏÏÏÏÏÏÏÏÏÏÏÏÏÏÏ 549,484 541,941 555,254
Services
The item ""services'' comprises the following:
1998 1999 2000
AdvertisingÏÏÏÏÏÏÏÏÏÏÏÏÏÏÏÏÏÏÏÏÏÏÏÏÏÏÏÏÏÏÏÏÏÏÏÏÏÏÏÏÏÏÏÏÏÏÏÏÏÏÏÏÏÏÏÏ 46,972 58,561 64,127
Outsourcing ÏÏÏÏÏÏÏÏÏÏÏÏÏÏÏÏÏÏÏÏÏÏÏÏÏÏÏÏÏÏÏÏÏÏÏÏÏÏÏÏÏÏÏÏÏÏÏÏÏÏÏÏÏÏÏ 29,920 31,409 40,170
Commissions ÏÏÏÏÏÏÏÏÏÏÏÏÏÏÏÏÏÏÏÏÏÏÏÏÏÏÏÏÏÏÏÏÏÏÏÏÏÏÏÏÏÏÏÏÏÏÏÏÏÏÏÏÏÏ 27,174 29,436 27,954
Transportation ÏÏÏÏÏÏÏÏÏÏÏÏÏÏÏÏÏÏÏÏÏÏÏÏÏÏÏÏÏÏÏÏÏÏÏÏÏÏÏÏÏÏÏÏÏÏÏÏÏÏÏÏÏ 34,185 42,577 53,497
Technical servicing ÏÏÏÏÏÏÏÏÏÏÏÏÏÏÏÏÏÏÏÏÏÏÏÏÏÏÏÏÏÏÏÏÏÏÏÏÏÏÏÏÏÏÏÏÏÏÏÏÏ 8,531 9,811 14,613
Travel and promotional expenses ÏÏÏÏÏÏÏÏÏÏÏÏÏÏÏÏÏÏÏÏÏÏÏÏÏÏÏÏÏÏÏÏÏÏÏÏÏ 6,527 11,747 20,519
Insurance expenses ÏÏÏÏÏÏÏÏÏÏÏÏÏÏÏÏÏÏÏÏÏÏÏÏÏÏÏÏÏÏÏÏÏÏÏÏÏÏÏÏÏÏÏÏÏÏÏÏÏ 6,993 7,787 4,148
Warehouse expenses and contributionsÏÏÏÏÏÏÏÏÏÏÏÏÏÏÏÏÏÏÏÏÏÏÏÏÏÏÏÏÏÏÏÏÏ 6,469 9,075 11,271
Consulting services and other legal and notary fees ÏÏÏÏÏÏÏÏÏÏÏÏÏÏÏÏÏÏÏÏÏÏ 5,447 9,986 11,932
UtilitiesÏÏÏÏÏÏÏÏÏÏÏÏÏÏÏÏÏÏÏÏÏÏÏÏÏÏÏÏÏÏÏÏÏÏÏÏÏÏÏÏÏÏÏÏÏÏÏÏÏÏÏÏÏÏÏÏÏÏÏ 6,174 6,378 7,829
Postal and telephone chargesÏÏÏÏÏÏÏÏÏÏÏÏÏÏÏÏÏÏÏÏÏÏÏÏÏÏÏÏÏÏÏÏÏÏÏÏÏÏÏÏÏ 3,957 3,792 4,206
Third-party maintenance services ÏÏÏÏÏÏÏÏÏÏÏÏÏÏÏÏÏÏÏÏÏÏÏÏÏÏÏÏÏÏÏÏÏÏÏÏÏ 4,167 5,261 5,419
Other services ÏÏÏÏÏÏÏÏÏÏÏÏÏÏÏÏÏÏÏÏÏÏÏÏÏÏÏÏÏÏÏÏÏÏÏÏÏÏÏÏÏÏÏÏÏÏÏÏÏÏÏÏÏ 48,895 29,147 36,127
Total servicesÏÏÏÏÏÏÏÏÏÏÏÏÏÏÏÏÏÏÏÏÏÏÏÏÏÏÏÏÏÏÏÏÏÏÏÏÏÏÏÏÏÏÏÏÏÏÏÏÏÏ 235,411 254,967 301,812
The item other services includes the gross fees paid in 2000 to the directors and statutory auditors ofthe parent company, amounting to Lit. 0.7 billion and Lit. 0.2 billion respectively.
Other Costs
This item may be broken down as follows:
1998 1999 2000
Contingent liabilitiesÏÏÏÏÏÏÏÏÏÏÏÏÏÏÏÏÏÏÏÏÏÏÏÏÏÏÏÏÏÏÏÏÏÏÏÏÏÏÏÏÏÏÏÏÏÏÏÏÏÏÏÏ 2,550 1,371 1,635
Sundry taxes and duties ÏÏÏÏÏÏÏÏÏÏÏÏÏÏÏÏÏÏÏÏÏÏÏÏÏÏÏÏÏÏÏÏÏÏÏÏÏÏÏÏÏÏÏÏÏÏÏÏÏ 2,935 2,544 2,433
Excess and payment of damagesÏÏÏÏÏÏÏÏÏÏÏÏÏÏÏÏÏÏÏÏÏÏÏÏÏÏÏÏÏÏÏÏÏÏÏÏÏÏÏÏÏÏ 1,248 Ì Ì
Losses on receivables ÏÏÏÏÏÏÏÏÏÏÏÏÏÏÏÏÏÏÏÏÏÏÏÏÏÏÏÏÏÏÏÏÏÏÏÏÏÏÏÏÏÏÏÏÏÏÏÏÏÏÏ 7,310 4,380 314
Other sundry expenses ÏÏÏÏÏÏÏÏÏÏÏÏÏÏÏÏÏÏÏÏÏÏÏÏÏÏÏÏÏÏÏÏÏÏÏÏÏÏÏÏÏÏÏÏÏÏÏÏÏÏ 5,435 7,301 4,161
Total other costs ÏÏÏÏÏÏÏÏÏÏÏÏÏÏÏÏÏÏÏÏÏÏÏÏÏÏÏÏÏÏÏÏÏÏÏÏÏÏÏÏÏÏÏÏÏÏÏÏÏÏÏ 19,478 15,596 8,543
F-32
Brought to you by Global Reports

DE' LONGHI S.P.A.
NOTES TO THE CONSOLIDATED FINANCIAL STATEMENTSFOR 1998, 1999 AND 2000 Ì (Continued)
Wages, Salaries and BeneÑts
The breakdown by categories of employees is shown in the table below (Group workforce as ofDecember 31, 2000 and average in 2000):
December 31 Average December 31 Average1999 1999 2000 2000
Workers ÏÏÏÏÏÏÏÏÏÏÏÏÏÏÏÏÏÏÏÏÏÏÏÏÏÏÏÏÏÏÏÏÏÏÏÏÏÏÏÏÏÏÏÏ 1,745 1,716 2,747 2,754
OÇce staÅ ÏÏÏÏÏÏÏÏÏÏÏÏÏÏÏÏÏÏÏÏÏÏÏÏÏÏÏÏÏÏÏÏÏÏÏÏÏÏÏÏÏÏ 817 821 1,057 1,058
Managers ÏÏÏÏÏÏÏÏÏÏÏÏÏÏÏÏÏÏÏÏÏÏÏÏÏÏÏÏÏÏÏÏÏÏÏÏÏÏÏÏÏÏÏ 33 35 56 55
Total ÏÏÏÏÏÏÏÏÏÏÏÏÏÏÏÏÏÏÏÏÏÏÏÏÏÏÏÏÏÏÏÏÏÏÏÏÏÏÏÏÏÏÏ 2,595 2,572 3,860 3,867
The 2000 data include employees of the companies acquired at the end of December 2000.Considering an area of consolidation comparable to that of 1999, the workforce increased by 250employees.
Depreciation, Amortisation and Write-oÅs
Depreciation and amortisation amounted to Lit. 60.2 billion (Lit. 61.8 billion in 1999 and Lit. 58.1billion).
The write-oÅs of receivables, amounting to Lit. 6.9 billion, are attributable to the amounts prudentlyset aside as provision for doubtful accounts.
Net Financial Loss
1998 1999 2000
Financial incomeÏÏÏÏÏÏÏÏÏÏÏÏÏÏÏÏÏÏÏÏÏÏÏÏÏÏÏÏÏÏÏÏÏÏÏÏÏÏÏÏÏÏÏÏÏÏÏ 18,745 31,055 58,316
Interest and Ñnancial expenses ÏÏÏÏÏÏÏÏÏÏÏÏÏÏÏÏÏÏÏÏÏÏÏÏÏÏÏÏÏÏÏÏÏÏÏ (83,361) (56,204) (97,579)
Adjustment to Ñnancial assets ÏÏÏÏÏÏÏÏÏÏÏÏÏÏÏÏÏÏÏÏÏÏÏÏÏÏÏÏÏÏÏÏÏÏÏÏ 967 (467) 52
Net Ñnancial loss ÏÏÏÏÏÏÏÏÏÏÏÏÏÏÏÏÏÏÏÏÏÏÏÏÏÏÏÏÏÏÏÏÏÏÏÏÏÏÏÏÏÏÏÏÏÏ (63,649) (25,616) (39,211)
Financial income
1998 1999 2000
(a) from other receivables entered as Ñxed assets ÏÏÏÏÏÏÏÏÏÏÏÏÏÏÏÏÏÏÏÏÏÏ Ì Ì 19
(c) from securities entered as current assets that do not represent long-term investments ÏÏÏÏÏÏÏÏÏÏÏÏÏÏÏÏÏÏÏÏÏÏÏÏÏÏÏÏÏÏÏÏÏÏÏÏÏÏÏÏÏÏÏÏÏÏ Ì 2,812 3,097
(d) other income:
Ó from subsidiary companiesÏÏÏÏÏÏÏÏÏÏÏÏÏÏÏÏÏÏÏÏÏÏÏÏÏÏÏÏÏÏÏÏÏÏÏÏ 216 252 68
Ó from parent companies ÏÏÏÏÏÏÏÏÏÏÏÏÏÏÏÏÏÏÏÏÏÏÏÏÏÏÏÏÏÏÏÏÏÏÏÏÏÏÏ 2,084 2,271 401
Ó others ÏÏÏÏÏÏÏÏÏÏÏÏÏÏÏÏÏÏÏÏÏÏÏÏÏÏÏÏÏÏÏÏÏÏÏÏÏÏÏÏÏÏÏÏÏÏÏÏÏÏÏÏÏ 16,445 25,720 54,731
Total other Ñnancial income ÏÏÏÏÏÏÏÏÏÏÏÏÏÏÏÏÏÏÏÏÏÏÏÏÏÏÏÏÏÏÏÏ 18,745 31,055 58,316
The income arising from securities, amounting to Lit. 3.1 billion, consists of Lit. 1.4 billion in capitalgains realised through the sale of securities, Lit. 1.1 billion from interests on debentures and Lit. 0.6 billionfrom interests on government securities.
F-33
Brought to you by Global Reports

DE' LONGHI S.P.A.
NOTES TO THE CONSOLIDATED FINANCIAL STATEMENTSFOR 1998, 1999 AND 2000 Ì (Continued)
The other income, amounting to Lit. 54.7 billion, may be broken down as follows:
1998 1999 2000
Exchange rate gains and transactions in derivatives(*) ÏÏÏÏÏÏÏÏÏÏÏÏÏÏÏÏÏÏ 8,902 23,432 46,242
Bank interests receivable ÏÏÏÏÏÏÏÏÏÏÏÏÏÏÏÏÏÏÏÏÏÏÏÏÏÏÏÏÏÏÏÏÏÏÏÏÏÏÏÏÏÏÏ 796 701 8,059
ProÑt from hedging operations ÏÏÏÏÏÏÏÏÏÏÏÏÏÏÏÏÏÏÏÏÏÏÏÏÏÏÏÏÏÏÏÏÏÏÏÏÏÏ 3,406 Ì Ì
Other incomeÏÏÏÏÏÏÏÏÏÏÏÏÏÏÏÏÏÏÏÏÏÏÏÏÏÏÏÏÏÏÏÏÏÏÏÏÏÏÏÏÏÏÏÏÏÏÏÏÏÏÏÏÏ 3,341 1,587 430
Total ÏÏÏÏÏÏÏÏÏÏÏÏÏÏÏÏÏÏÏÏÏÏÏÏÏÏÏÏÏÏÏÏÏÏÏÏÏÏÏÏÏÏÏÏÏÏÏÏÏÏÏÏÏÏÏÏ 16,445 25,720 54,731
Interest and Ñnancial expenses
1998 1999 2000
From subsidiary companies ÏÏÏÏÏÏÏÏÏÏÏÏÏÏÏÏÏÏÏÏÏÏÏÏÏÏÏÏÏÏÏÏÏÏÏÏÏÏÏ 107 (115) (409)
From parent companies ÏÏÏÏÏÏÏÏÏÏÏÏÏÏÏÏÏÏÏÏÏÏÏÏÏÏÏÏÏÏÏÏÏÏÏÏÏÏÏÏÏÏ 16,689 (13,042) (6,641)
OthersÏÏÏÏÏÏÏÏÏÏÏÏÏÏÏÏÏÏÏÏÏÏÏÏÏÏÏÏÏÏÏÏÏÏÏÏÏÏÏÏÏÏÏÏÏÏÏÏÏÏÏÏÏÏÏÏÏ 66,565 (43,047) (90,529)
Total interests and Ñnancial expensesÏÏÏÏÏÏÏÏÏÏÏÏÏÏÏÏÏÏÏÏÏÏÏÏÏÏÏ 83,361 (56,204) (97,579)
The item ""other interests and Ñnancial expenses'' may be broken down as follows:
1998 1999 2000
Interests payable to banks ÏÏÏÏÏÏÏÏÏÏÏÏÏÏÏÏÏÏÏÏÏÏÏÏÏÏÏÏÏÏÏÏÏÏÏÏÏÏÏÏÏÏ 17,672 8,406 4,417
Medium/long term interests payable ÏÏÏÏÏÏÏÏÏÏÏÏÏÏÏÏÏÏÏÏÏÏÏÏÏÏÏÏÏÏÏÏÏ 21,515 11,718 23,341
Interests payable to other Ñnance providersÏÏÏÏÏÏÏÏÏÏÏÏÏÏÏÏÏÏÏÏÏÏÏÏÏÏÏÏ Ì 1,477 1,178
Interests payable on bonds ÏÏÏÏÏÏÏÏÏÏÏÏÏÏÏÏÏÏÏÏÏÏÏÏÏÏÏÏÏÏÏÏÏÏÏÏÏÏÏÏÏ 833 477 11,056
Bank charges ÏÏÏÏÏÏÏÏÏÏÏÏÏÏÏÏÏÏÏÏÏÏÏÏÏÏÏÏÏÏÏÏÏÏÏÏÏÏÏÏÏÏÏÏÏÏÏÏÏÏÏÏÏ 2,344 1,584 2,283
Total ÏÏÏÏÏÏÏÏÏÏÏÏÏÏÏÏÏÏÏÏÏÏÏÏÏÏÏÏÏÏÏÏÏÏÏÏÏÏÏÏÏÏÏÏÏÏÏÏÏÏÏÏÏÏÏÏ 42,364 23,662 42,275
Exch. Rate losses and expenses for derivative transactions(*) ÏÏÏÏÏÏÏÏÏÏÏÏ 18,465 13,912 38,695
Interests payable for leasingÏÏÏÏÏÏÏÏÏÏÏÏÏÏÏÏÏÏÏÏÏÏÏÏÏÏÏÏÏÏÏÏÏÏÏÏÏÏÏÏÏ Ì 666 1,244
Factor commissionsÏÏÏÏÏÏÏÏÏÏÏÏÏÏÏÏÏÏÏÏÏÏÏÏÏÏÏÏÏÏÏÏÏÏÏÏÏÏÏÏÏÏÏÏÏÏÏÏ 1,574 1,310 2,726
Other Ñnancial expensesÏÏÏÏÏÏÏÏÏÏÏÏÏÏÏÏÏÏÏÏÏÏÏÏÏÏÏÏÏÏÏÏÏÏÏÏÏÏÏÏÏÏÏÏ 4,162 3,351 5,589
Sundry expenses ÏÏÏÏÏÏÏÏÏÏÏÏÏÏÏÏÏÏÏÏÏÏÏÏÏÏÏÏÏÏÏÏÏÏÏÏÏÏÏÏÏÏÏÏÏÏÏÏÏÏ Ì 146 Ì
Total ÏÏÏÏÏÏÏÏÏÏÏÏÏÏÏÏÏÏÏÏÏÏÏÏÏÏÏÏÏÏÏÏÏÏÏÏÏÏÏÏÏÏÏÏÏÏÏÏÏÏÏÏÏÏÏÏ 5,736 5,473 9,559
Total sundry interests and Ñnancial expenses ÏÏÏÏÏÏÏÏÏÏÏÏÏÏÏÏÏÏÏÏÏÏ 66,565 43,047 90,529
(*) The items exchange rate proÑts/losses and income/expenses from/for derivative transactions account respectively for the
proÑts/losses on commercial and Ñnancial transactions and on hedging transactions for oÅsetting possible exchange and
interest rate losses.
The net expenses/income resulting from the management of exchange rate/derivative transactionsamount to net income of Lit. 7.5 billion in 2000, net income of Lit. 9.5 billion in 1999 and net expense ofLit. 6.2 billion in 1998.
Income from Equity Investments
This item may be broken down as follows:
1998 1999 2000
Dividends from other shareholdingsÏÏÏÏÏÏÏÏÏÏÏÏÏÏÏÏÏÏÏÏÏÏÏÏÏÏÏÏÏÏÏÏÏÏÏÏÏÏÏÏ Ì 92 90
Other income ÏÏÏÏÏÏÏÏÏÏÏÏÏÏÏÏÏÏÏÏÏÏÏÏÏÏÏÏÏÏÏÏÏÏÏÏÏÏÏÏÏÏÏÏÏÏÏÏÏÏÏÏÏÏÏÏÏÏ 189 743 8,391
Total income from equity investmentsÏÏÏÏÏÏÏÏÏÏÏÏÏÏÏÏÏÏÏÏÏÏÏÏÏÏÏÏÏÏÏÏÏÏ 189 835 8,481
F-34
Brought to you by Global Reports

DE' LONGHI S.P.A.
NOTES TO THE CONSOLIDATED FINANCIAL STATEMENTSFOR 1998, 1999 AND 2000 Ì (Continued)
The item ""Other income'' mainly relates to the tax credit for dividends paid in 2000 by De' LonghiRadiators S.r.l. and the capital gains realised through the sale of some shareholdings.
Extraordinary Gain (loss)
This item may be broken down as follows:
1998 1999 2000
Capital gains on transfersÏÏÏÏÏÏÏÏÏÏÏÏÏÏÏÏÏÏÏÏÏÏÏÏÏÏÏÏÏÏÏÏÏÏÏÏÏÏÏÏÏ 52,515 225 294
Other incomeÏÏÏÏÏÏÏÏÏÏÏÏÏÏÏÏÏÏÏÏÏÏÏÏÏÏÏÏÏÏÏÏÏÏÏÏÏÏÏÏÏÏÏÏÏÏÏÏÏÏÏ 15,939 342 3,319
Sub-total ÏÏÏÏÏÏÏÏÏÏÏÏÏÏÏÏÏÏÏÏÏÏÏÏÏÏÏÏÏÏÏÏÏÏÏÏÏÏÏÏÏÏÏÏÏÏÏÏÏÏÏÏÏÏ 68,454 567 3,613
Write-down of inventoryÏÏÏÏÏÏÏÏÏÏÏÏÏÏÏÏÏÏÏÏÏÏÏÏÏÏÏÏÏÏÏÏÏÏÏÏÏÏÏÏÏÏ (6,200) (3,650) Ì
Subsidiary restructuring costs ÏÏÏÏÏÏÏÏÏÏÏÏÏÏÏÏÏÏÏÏÏÏÏÏÏÏÏÏÏÏÏÏÏÏÏÏÏ (7,262) (2,215) Ì
Extraordinary expensesÏÏÏÏÏÏÏÏÏÏÏÏÏÏÏÏÏÏÏÏÏÏÏÏÏÏÏÏÏÏÏÏÏÏÏÏÏÏÏÏÏÏÏ (11,597) (1,742) (23,548)
Sub-total ÏÏÏÏÏÏÏÏÏÏÏÏÏÏÏÏÏÏÏÏÏÏÏÏÏÏÏÏÏÏÏÏÏÏÏÏÏÏÏÏÏÏÏÏÏÏÏÏÏÏÏÏÏÏ (25,059) (7,607) (23,548)
Total ÏÏÏÏÏÏÏÏÏÏÏÏÏÏÏÏÏÏÏÏÏÏÏÏÏÏÏÏÏÏÏÏÏÏÏÏÏÏÏÏÏÏÏÏÏÏÏÏÏÏÏÏÏÏ 43,395 (7,040) (19,935)
""Other income'' mainly comprises the extraordinary income arising from the refund of the registrationtax paid for the deed of merger of December 20, 1995, amounting to Lit. 2.3 billion, pursuant to thejudgement of 1st instance of the Revenue Commission, issued on June 19, 2000.
The item ""extraordinary expenses'' mainly regards:
‚ a compensation of Lit. 18.7 billion due to the company De' Longhi SoparÑ S.A. as a result ofagreements undersigned in 1997 at the time De' Longhi SoparÑ S.A. purchased a majority stake inLiguria Assicurazioni S.p.A. The contract provided for the payment of a compensation to De'Longhi SoparÑ subject to certain conditions, which due in 2000; and
‚ the amount paid for settling, through a deed of consent, the litigation with the Revenue Departmentof Treviso, pertaining to the 1994 Ñnancial period.
Income Taxes
The item is broken down as follows:
1998 1999 2000
Current taxesÏÏÏÏÏÏÏÏÏÏÏÏÏÏÏÏÏÏÏÏÏÏÏÏÏÏÏÏÏÏÏÏÏÏÏÏÏÏÏÏÏÏÏÏÏÏÏÏÏÏÏÏ 28,551 15,807 29,554
Deferred taxes ÏÏÏÏÏÏÏÏÏÏÏÏÏÏÏÏÏÏÏÏÏÏÏÏÏÏÏÏÏÏÏÏÏÏÏÏÏÏÏÏÏÏÏÏÏÏÏÏÏÏÏ (16,081) 2,109 11,889
Total income taxes ÏÏÏÏÏÏÏÏÏÏÏÏÏÏÏÏÏÏÏÏÏÏÏÏÏÏÏÏÏÏÏÏÏÏÏÏÏÏÏÏÏÏÏÏÏÏÏ 12,470 17,916 41,443
Subsequent Events
Increase in share capital
A special meeting was called in early April 2001 by the Board of Directors. On the agenda was aproposal to increase share capital with purchase option reserved to shareholders. In this regard, we havebeen informed that the shareholders of Parent Company De' Longhi S.p.A. have conÑrmed their intentionto subscribe the entire increase in share capital in the amount of Lit. 250,587 million.
Kenwood
In early 2001, De' Longhi S.p.A. (through a subsidiary) completed, by means of a take-over bid, itsacquisition of the entire share capital of Kenwood Appliances plc. for a total cost at the end of thetake-over bid of approximately GBP 46.2 million (Lit. 142.4 billion). Kenwood is the head of a Groupthat manufactures food preparation products and home cleaning and iron products, and in the Ñscal yearending March 31, 2001 had sales of approximately GBP 155.2 million (Lit. 484 billion).
F-35
Brought to you by Global Reports

®THIS PAGE INTENTIONALLY LEFT BLANK©
F-36
Brought to you by Global Reports

AUDITED HISTORICAL CONSOLIDATED
FINANCIAL STATEMENTS
OF
KENWOOD APPLIANCES PLCAS OF AND FOR THE PERIODS ENDED
APRIL 2, 1999 AND MARCH 31, 2000 AND 2001
F-37
Brought to you by Global Reports

KENWOOD APPLIANCES PLC
REPORT OF INDEPENDENT AUDITORS
To the Board of DirectorsKenwood Appliances plc
We have audited the accompanying consolidated balance sheets of Kenwood Appliances plc as ofApril 2, 1999, March 31, 2000 and 2001 and the related consolidated income statements and consolidatedstatements of total recognized gains and losses, reconciliation of shareholders' funds and cash Öows foreach of the years then ended. These Ñnancial statements are the responsibility of the Company'smanagement. Our responsibility is to express an opinion in these Ñnancial statements based on our audits.
We conducted our audits in accordance with United Kingdom auditing standards which do not diÅerin any signiÑcant respect from those generally accepted in the United States. Those standards require thatwe plan and perform the audit to obtain reasonable assurance about whether the Ñnancial statements arefree of material misstatement. An audit includes examining, on a test basis, evidence supporting theamounts and disclosures in the Ñnancial statements. An audit also includes assessing the accountingprinciples used and signiÑcant estimates made by the management, as well as evaluating the overallÑnancial statement presentation. We believe that our audits provide a reasonable basis for our opinion.
In our opinion, the Ñnancial statements referred to above present fairly, in all material respects, theconsolidated Ñnancial position of Kenwood Appliances plc at April 2, 1999, March 31, 2000 andMarch 31, 2001 and its consolidated results of operations and its consolidated cash Öows for each of thethree years in the period ended March 31, 2001 in conformity with accounting principles generallyaccepted in the United Kingdom.
Ernst & YoungSouthampton, England
May 31, 2001
F-38
Brought to you by Global Reports

KENWOOD APPLIANCES PLC
CONSOLIDATED BALANCE SHEET
AT MARCH 31, 2001, MARCH 31, 2000 AND APRIL 2, 1999
March 31, March 31, April 2,Notes 2001 2000 1999
000 000 000
FIXED ASSETS
Tangible assets ÏÏÏÏÏÏÏÏÏÏÏÏÏÏÏÏÏÏÏÏÏÏÏÏÏÏÏÏÏÏÏÏÏÏÏÏÏÏÏ 12 13,655 20,588 27,467
Investments ÏÏÏÏÏÏÏÏÏÏÏÏÏÏÏÏÏÏÏÏÏÏÏÏÏÏÏÏÏÏÏÏÏÏÏÏÏÏÏÏÏÏ 13 1,417 1,927 1,927
15,072 22,515 29,394
CURRENT ASSETS
Stocks ÏÏÏÏÏÏÏÏÏÏÏÏÏÏÏÏÏÏÏÏÏÏÏÏÏÏÏÏÏÏÏÏÏÏÏÏÏÏÏÏÏÏÏÏÏÏ 14 22,354 25,760 21,698
Debtors ÏÏÏÏÏÏÏÏÏÏÏÏÏÏÏÏÏÏÏÏÏÏÏÏÏÏÏÏÏÏÏÏÏÏÏÏÏÏÏÏÏÏÏÏÏ 15 38,435 36,839 40,658
Cash at bank and in hand ÏÏÏÏÏÏÏÏÏÏÏÏÏÏÏÏÏÏÏÏÏÏÏÏÏÏÏÏÏÏ 11,011 10,773 9,670
71,800 73,372 72,026
CREDITORS:Amounts falling due within one year ÏÏÏÏÏÏÏÏÏÏÏÏÏÏÏÏÏÏÏ 17 (69,600) (72,550) (76,489)
Net Current Assets/(Liabilities) ÏÏÏÏÏÏÏÏÏÏÏÏÏÏÏÏÏÏÏÏÏÏÏÏ 2,200 822 (4,463)
Total Assets less Current Liabilities ÏÏÏÏÏÏÏÏÏÏÏÏÏÏÏÏÏÏÏÏÏ 17,272 23,337 24,931
CREDITORS:Amounts falling due after more than one year ÏÏÏÏÏÏÏÏÏÏÏ 18 (4,371) (3,635) (602)
Provisions for Liabilities and Charges ÏÏÏÏÏÏÏÏÏÏÏÏÏÏÏÏÏÏÏ 21 (483) (506) (1,005)
12,418 19,196 23,324
CAPITAL AND RESERVES
Called up share capital ÏÏÏÏÏÏÏÏÏÏÏÏÏÏÏÏÏÏÏÏÏÏÏÏÏÏÏÏÏÏÏÏ 22 4,586 4,586 4,586
Share premium ÏÏÏÏÏÏÏÏÏÏÏÏÏÏÏÏÏÏÏÏÏÏÏÏÏÏÏÏÏÏÏÏÏÏÏÏÏÏÏ 23 25,101 25,101 25,101
Special reserve ÏÏÏÏÏÏÏÏÏÏÏÏÏÏÏÏÏÏÏÏÏÏÏÏÏÏÏÏÏÏÏÏÏÏÏÏÏÏÏ 23 642 2,180 2,180
ProÑt and loss accountÏÏÏÏÏÏÏÏÏÏÏÏÏÏÏÏÏÏÏÏÏÏÏÏÏÏÏÏÏÏÏÏÏ 23 (17,911) (12,671) (8,543)
SHAREHOLDERS' FUNDS Ì equity interests ÏÏÏÏÏÏÏÏÏÏÏ 12,418 19,196 23,324
F-39
Brought to you by Global Reports

KENWOOD APPLIANCES PLC
CONSOLIDATED INCOME STATEMENT
FOR THE YEARS ENDED MARCH 31, 2001, MARCH 31, 2000 AND APRIL 2, 1999
Year to Year to Year toMarch 31, March 31, April 2,
Notes 2001 2000 1999
000 000 000
TURNOVER ÏÏÏÏÏÏÏÏÏÏÏÏÏÏÏÏÏÏÏÏÏÏÏÏÏÏÏÏÏÏÏÏÏÏÏÏÏÏÏ 2
Continuing operations ÏÏÏÏÏÏÏÏÏÏÏÏÏÏÏÏÏÏÏÏÏÏÏÏÏÏÏÏÏÏÏÏ 158,191 143,359 145,016
Discontinued operations ÏÏÏÏÏÏÏÏÏÏÏÏÏÏÏÏÏÏÏÏÏÏÏÏÏÏÏÏÏÏ 282 2,021 9,105
158,473 145,380 154,121
Cost of sales ÏÏÏÏÏÏÏÏÏÏÏÏÏÏÏÏÏÏÏÏÏÏÏÏÏÏÏÏÏÏÏÏÏÏÏÏÏÏÏÏ 3 (109,167) (92,203) (100,206)
Gross proÑtÏÏÏÏÏÏÏÏÏÏÏÏÏÏÏÏÏÏÏÏÏÏÏÏÏÏÏÏÏÏÏÏÏÏÏÏÏÏÏÏÏ 49,306 53,177 53,915
Distribution costs ÏÏÏÏÏÏÏÏÏÏÏÏÏÏÏÏÏÏÏÏÏÏÏÏÏÏÏÏÏÏÏÏÏÏÏÏ 3 (34,695) (34,568) (37,181)
Administrative expenses ÏÏÏÏÏÏÏÏÏÏÏÏÏÏÏÏÏÏÏÏÏÏÏÏÏÏÏÏÏÏ 3 (13,050) (12,223) (13,766)
(47,745) (46,791) (50,947)
1,561 6,386 2,968
Other operating income/(expenditure)ÏÏÏÏÏÏÏÏÏÏÏÏÏÏÏÏÏÏ 3 155 (271) 166
Operating proÑt ÏÏÏÏÏÏÏÏÏÏÏÏÏÏÏÏÏÏÏÏÏÏÏÏÏÏÏÏÏÏÏÏÏÏÏÏÏ 4
Continuing operations ÏÏÏÏÏÏÏÏÏÏÏÏÏÏÏÏÏÏÏÏÏÏÏÏÏÏÏÏÏÏÏÏ 1,721 6,413 3,680
Discontinued operations ÏÏÏÏÏÏÏÏÏÏÏÏÏÏÏÏÏÏÏÏÏÏÏÏÏÏÏÏÏÏ (5) (298) (546)
1,716 6,115 3,134
EXCEPTIONAL ITEMS
Continuing operations ÏÏÏÏÏÏÏÏÏÏÏÏÏÏÏÏÏÏÏÏÏÏÏÏÏÏÏÏÏÏÏÏ (2,991) (2,765) (8,884)
Discontinued operations ÏÏÏÏÏÏÏÏÏÏÏÏÏÏÏÏÏÏÏÏÏÏÏÏÏÏÏÏÏÏ Ì (1,483) Ì
Bank interest receivable ÏÏÏÏÏÏÏÏÏÏÏÏÏÏÏÏÏÏÏÏÏÏÏÏÏÏÏÏÏÏ 214 282 704
Interest payable ÏÏÏÏÏÏÏÏÏÏÏÏÏÏÏÏÏÏÏÏÏÏÏÏÏÏÏÏÏÏÏÏÏÏÏÏÏ 8 (3,125) (3,269) (4,708)
(2,911) (2,987) (4,004)
Loss on ordinary activities before taxation ÏÏÏÏÏÏÏÏÏÏÏÏÏÏÏ (4,186) (1,120) (9,754)
Tax on loss on ordinary activitiesÏÏÏÏÏÏÏÏÏÏÏÏÏÏÏÏÏÏÏÏÏÏÏ 10 (2,865) (1,366) (1,519)
Loss attributable to members of the parent company ÏÏÏÏÏÏ (7,051) (2,486) (11,273)
Note of Historical Cost Losses
There is no diÅerence between the historical cost and the retained loss for the year in the years endedMarch 31, 2001, March 31, 2000 or April 2, 1999.
F-40
Brought to you by Global Reports

KENWOOD APPLIANCES PLC
CONSOLIDATED STATEMENT OF SHAREHOLDERS' EQUITY
FOR THE YEARS ENDED MARCH 31, 2001, MARCH 31, 2000 AND APRIL 2, 1999
March 31, March 31, April 2,2001 2000 1999
000 000 000
Statement of Total Recognized Gains and Losses
Loss attributable to members of the parent company ÏÏÏÏÏÏÏÏÏÏÏÏÏÏÏ (7,051) (2,486) (11,273)
Exchange diÅerences on retranslation of net assets of subsidiaryundertakings ÏÏÏÏÏÏÏÏÏÏÏÏÏÏÏÏÏÏÏÏÏÏÏÏÏÏÏÏÏÏÏÏÏÏÏÏÏÏÏÏÏÏÏÏÏÏÏ 1,025 29 (63)
Exchange diÅerence on foreign currency hedging loansÏÏÏÏÏÏÏÏÏÏÏÏÏÏ (752) (133) 75
Adjustments to goodwill related to previous acquisitions (note 14)ÏÏÏÏ Ì (1,538) Ì
Total losses related to the year ÏÏÏÏÏÏÏÏÏÏÏÏÏÏÏÏÏÏÏÏÏÏÏÏÏÏÏÏÏÏÏÏÏÏ (6,778) (4,128) (11,261)
Prior year adjustmentÏÏÏÏÏÏÏÏÏÏÏÏÏÏÏÏÏÏÏÏÏÏÏÏÏÏÏÏÏÏÏÏÏÏÏÏÏÏÏÏÏÏ Ì Ì 829
Total losses recognized since last annual report ÏÏÏÏÏÏÏÏÏÏÏÏÏÏÏÏÏÏÏÏ (6,778) (4,128) (10,432)
March 31, March 31, April 2,2001 2000 1999
000 000 000
Reconciliation of Shareholders' Funds
Total recognized losses for the year ÏÏÏÏÏÏÏÏÏÏÏÏÏÏÏÏÏÏÏÏÏÏÏÏÏÏÏÏÏÏ (6,778) (4,128) (11,261)
Shareholders' funds brought forward ÏÏÏÏÏÏÏÏÏÏÏÏÏÏÏÏÏÏÏÏÏÏÏÏÏÏÏÏÏ 19,196 23,324 34,585
Shareholders' funds carried forward ÏÏÏÏÏÏÏÏÏÏÏÏÏÏÏÏÏÏÏÏÏÏÏÏÏÏÏÏÏÏ 12,418 19,196 23,324
F-41
Brought to you by Global Reports

KENWOOD APPLIANCES PLC
CONSOLIDATED STATEMENT OF CASH FLOWS
FOR THE YEARS ENDED MARCH 31, 2001, MARCH 31, 2000 AND APRIL 2, 1999
Year to Year to Year toMarch 31, March 31, April 2,
Notes 2001 2000 1999
000 000 000
Cash Öow from operating activities ÏÏÏÏÏÏÏÏÏÏÏÏÏÏÏÏÏÏÏÏÏÏ 5(a) 14,474 10,491 18,774
Cash Öow from exceptional itemsÏÏÏÏÏÏÏÏÏÏÏÏÏÏÏÏÏÏÏÏÏÏÏÏ 5(b) 4,201 (3,454) (2,777)
Returns on investments and servicing of Ñnance ÏÏÏÏÏÏÏÏÏÏÏ 5(b) (2,235) (2,987) (4,004)
TaxationÏÏÏÏÏÏÏÏÏÏÏÏÏÏÏÏÏÏÏÏÏÏÏÏÏÏÏÏÏÏÏÏÏÏÏÏÏÏÏÏÏÏÏÏÏ 5(b) (1,380) (716) (763)
Capital expenditure ÏÏÏÏÏÏÏÏÏÏÏÏÏÏÏÏÏÏÏÏÏÏÏÏÏÏÏÏÏÏÏÏÏÏÏ 5(b) (4,643) (930) (4,666)
Acquisitions and disposals ÏÏÏÏÏÏÏÏÏÏÏÏÏÏÏÏÏÏÏÏÏÏÏÏÏÏÏÏÏÏ 5(b) (4,681) 990 Ì
FinancingÏÏÏÏÏÏÏÏÏÏÏÏÏÏÏÏÏÏÏÏÏÏÏÏÏÏÏÏÏÏÏÏÏÏÏÏÏÏÏÏÏÏÏÏ 5(b) (9,108) (1,521) (21,402)
(Decrease)/ increase in cash in the year ÏÏÏÏÏÏÏÏÏÏÏÏÏÏÏÏÏ (3,372) 1,873 (14,838)
Year to Year to Year toMarch 31, March 31, April 2,
2001 2000 1999
000 000 000
Reconciliation of Net Cash Flow to Movement in Net Debt (Note 16)
(Decrease)/ increase in cash in the year ÏÏÏÏÏÏÏÏÏÏÏÏÏÏÏÏÏÏÏÏÏÏÏÏÏÏ (3,372) 1,873 (14,838)
Cash outÖow from decrease in debt and lease Ñnancing ÏÏÏÏÏÏÏÏÏÏÏÏÏÏ 9,108 1,521 21,402
Change in net debt resulting from cash Öows ÏÏÏÏÏÏÏÏÏÏÏÏÏÏÏÏÏÏÏÏÏÏÏ 5,736 3,394 6,564
Translation diÅerenceÏÏÏÏÏÏÏÏÏÏÏÏÏÏÏÏÏÏÏÏÏÏÏÏÏÏÏÏÏÏÏÏÏÏÏÏÏÏÏÏÏÏÏ (476) 1,815 (324)
Movement in net debt in the year ÏÏÏÏÏÏÏÏÏÏÏÏÏÏÏÏÏÏÏÏÏÏÏÏÏÏÏÏÏÏÏÏ 5,260 5,209 6,240
Net debt brought forward ÏÏÏÏÏÏÏÏÏÏÏÏÏÏÏÏÏÏÏÏÏÏÏÏÏÏÏÏÏÏÏÏÏÏÏÏÏÏÏ (24,007) (29,216) (35,456)
Net debt carried forward ÏÏÏÏÏÏÏÏÏÏÏÏÏÏÏÏÏÏÏÏÏÏÏÏÏÏÏÏÏÏÏÏÏÏÏÏÏÏÏÏ (18,747) (24,007) (29,216)
F-42
Brought to you by Global Reports

KENWOOD APPLIANCES PLC
NOTES TO THE CONSOLIDATED FINANCIAL STATEMENTS
AT MARCH 31, 2001, MARCH 31, 2000 AND APRIL 2, 1999
1. ACCOUNTING POLICIES
Accounting convention
The accounts are prepared under the historical cost convention and in accordance with applicableAccounting Standards.
Basis of consolidation
The group accounts consolidate the accounts of Kenwood Appliances plc and all its subsidiaryundertakings drawn up to March 31, 2001, March 31, 2000 and April 2, 1999.
Goodwill
Goodwill arising on acquisitions made prior to April 3, 1998 has been set oÅ directly against reserves.Goodwill arising on acquisitions after that date will be capitalized as an asset in the balance sheet andamortized over its useful economic life if Ñnite. It will be reviewed for impairment at the end of the Ñrstfull Ñnancial year following the acquisition and in other periods if events or changes in circumstancesindicate that the carrying value may not be recoverable.
If a subsidiary, associate or business is subsequently sold or closed, any goodwill arising on acquisitionthat was written oÅ directly to reserves or that has not been amortized through the proÑt and loss accountis taken into account in determining the proÑt or loss on sale or closure.
Trademarks
Expenditure relating to the acquisition and renewal of trademarks is written oÅ as incurred.
Depreciation
Freehold land is not depreciated. Depreciation is provided on all other tangible Ñxed assets at ratescalculated to write oÅ the cost or valuation, less estimated residual value, of each asset evenly over itsexpected useful life as follows:
Freehold buildings ÏÏÏÏÏÏÏÏÏÏÏÏÏÏÏÏÏÏÏÏÏÏÏÏ at 2% per annum
Leasehold buildings ÏÏÏÏÏÏÏÏÏÏÏÏÏÏÏÏÏÏÏÏÏÏÏ over the lease term
Plant, equipment, tooling and motor vehicles ÏÏ at rates ranging from 5% to 33% per annum
Stocks
Stocks are stated at the lower of cost and net realizable value after making due allowance for anyobsolete or slow moving items. Cost comprises direct materials, direct labour and attributable overheadsbased on the normal level of activity.
Guarantee provisions
Many of the groups' products carry formal guarantees of satisfactory performance for varying periodsfollowing purchase by customers. Provision is made for the estimated cost of honoring unexpiredguarantees.
Research and development expenditure
Research and development expenditure, and the expense of establishing and protecting parent rights inrespect of inventions derived therefrom, is wholly written oÅ as incurred.
F-43
Brought to you by Global Reports

KENWOOD APPLIANCES PLC
NOTES TO THE CONSOLIDATED FINANCIAL STATEMENTS Ì (Continued)
Deferred taxation
Deferred taxation is provided using the liability method on all timing diÅerences to the extent thatthey are expected to reverse in the future without being replaced, calculated at the rate at which it isanticipated the timing diÅerences will reverse.
Foreign currencies
The accounts of overseas subsidiary undertakings are translated on the following bases:
(i) assets and liabilities at the rate of exchange ruling at the balance sheet date and
(ii) proÑt and loss items at the average rate of exchange ruling during the period.
The exchange diÅerence arising on the retranslation of opening net assets is taken directly to reserves.Exchange diÅerences due to the translation of the proÑt and loss account at the average rate as opposed tothe closing rate are also taken directly to reserves. All other translation diÅerences are taken to the proÑtand loss account with the exception of diÅerences on foreign currency borrowing, to the extent that theyare used to Ñnance or provide a hedge against group equity investment in foreign enterprises, which aretaken direct to reserves together with the exchange diÅerence on the carrying amount of the relatedinvestments.
Tax charges and credits attributable to exchange diÅerences on those borrowings are also dealt with inreserves.
Derivative instruments
The group uses forward foreign exchange contracts to reduce exposure to foreign exchange rates.
There is no direct matching of forward foreign exchange contracts to speciÑc trading transactions.Accordingly, gains and losses on these contracts are recorded in the proÑt and loss account on theirsettlement dates as the diÅerence between the contract rate and the market spot rate of exchange.
Leasing and hire purchase commitments
Assets held under Ñnance leases and hire purchase contracts are capitalized in the balance sheet andare depreciated over their useful lives. The interest element of the rental obligations is charged to theproÑt and loss account over the period of the lease and represents a constant proportion of the balance ofcapital repayments outstanding.
Rentals payable under operating leases are charged in the proÑt and loss account as incurred over thelease term.
Pensions
The company operates a deÑned beneÑt pension scheme, which requires contributions to be made to aseparately administered fund. Contributions to the fund are charged to the proÑt and loss account so as tospread the cost of pensions over the employee's working lives within the group. The regular cost isattributed to individual years using the projected unit credit method. Variations in pension cost, which areidentiÑed as a result of actuarial valuations, are amortized over the average expected remaining workinglives of the employees in equal instalments, taking account of interest on the remaining unamortizedamount carried forward in the balance sheet. DiÅerences between the amounts funded and the amountscharged to the proÑt and loss account are treated as either provisions or prepayments in the balance sheet.
2. TURNOVER AND SEGMENTAL ANALYSIS
Turnover represents the amounts derived from the provision of goods and services which fall withinthe group's ordinary activities, stated net of value added tax.
The turnover and pre-tax proÑt is attributable to the continuing activity, the selling and marketing ofsmall domestic appliances. The discontinued operations in 2001 relate to Poland, and in 2000 and 1999
F-44
Brought to you by Global Reports

KENWOOD APPLIANCES PLC
NOTES TO THE CONSOLIDATED FINANCIAL STATEMENTS Ì (Continued)
relate to the international sales operations in New Zealand, Poland and Freshwater Ó a specialisedengineering division.
An analysis of turnover by geographical segment is given below:
Year to Year to Year toMarch 31 March 31 April 2
2001 2000 1999
000 000 000
United KingdomÏÏÏÏÏÏÏÏÏÏÏÏÏÏÏÏÏÏÏÏÏÏÏÏÏÏÏÏÏÏÏÏÏÏÏÏÏÏÏ 49,793 42,063 40,939
Continental Europe ÏÏÏÏÏÏÏÏÏÏÏÏÏÏÏÏÏÏÏÏÏÏÏÏÏÏÏÏÏÏÏÏÏÏÏÏ 71,592 69,105 80,563
Americas ÏÏÏÏÏÏÏÏÏÏÏÏÏÏÏÏÏÏÏÏÏÏÏÏÏÏÏÏÏÏÏÏÏÏÏÏÏÏÏÏÏÏÏÏÏ 6,151 6,466 7,905
Australasia ÏÏÏÏÏÏÏÏÏÏÏÏÏÏÏÏÏÏÏÏÏÏÏÏÏÏÏÏÏÏÏÏÏÏÏÏÏÏÏÏÏÏÏ 5,589 5,148 5,962
Middle East/AsiaÏÏÏÏÏÏÏÏÏÏÏÏÏÏÏÏÏÏÏÏÏÏÏÏÏÏÏÏÏÏÏÏÏÏÏÏÏÏ 19,330 17,661 13,875
AfricaÏÏÏÏÏÏÏÏÏÏÏÏÏÏÏÏÏÏÏÏÏÏÏÏÏÏÏÏÏÏÏÏÏÏÏÏÏÏÏÏÏÏÏÏÏÏÏÏ 6,018 4,937 4,877
158,473 145,380 154,121
Turnover, group proÑt on ordinary activities before taxation and net assets representing continuing anddiscontinued operations are analyzed by geographical market as follows:
The following analysis of turnover by geographical origin shows turnover by location of the group'soperations as required by the accounting standard SSAP 25. However, a signiÑcant proportion of theproducts sold are manufactured by third parties in various countries, the origin of which is not reÖected inthe following analysis.
F-45
Brought to you by Global Reports

KENWOOD APPLIANCES PLC
NOTES TO THE CONSOLIDATED FINANCIAL STATEMENTS Ì (Continued)
Financial Year to March 31, 2001
United Continental Rest ofKingdom Europe World Total
000 000 000 000
Turnover by Destination
Continuing ÏÏÏÏÏÏÏÏÏÏÏÏÏÏÏÏÏÏÏÏÏÏÏÏÏÏÏÏÏÏÏÏÏÏÏÏÏÏ 49,793 71,310 37,088 158,191
Discontinued ÏÏÏÏÏÏÏÏÏÏÏÏÏÏÏÏÏÏÏÏÏÏÏÏÏÏÏÏÏÏÏÏÏÏÏÏ Ì 282 Ì 282
49,793 71,592 37,088 158,473
Turnover by Origin
Continuing
Total sales ÏÏÏÏÏÏÏÏÏÏÏÏÏÏÏÏÏÏÏÏÏÏÏÏÏÏÏÏÏÏÏÏÏÏÏÏ 79,466 71,784 35,504 186,754
Inter segment ÏÏÏÏÏÏÏÏÏÏÏÏÏÏÏÏÏÏÏÏÏÏÏÏÏÏÏÏÏÏÏÏÏ (13,807) (1,580) (13,176) (28,563)
Sales to third partiesÏÏÏÏÏÏÏÏÏÏÏÏÏÏÏÏÏÏÏÏÏÏÏÏÏÏÏÏ 65,659 70,204 22,328 158,191
Discontinued ÏÏÏÏÏÏÏÏÏÏÏÏÏÏÏÏÏÏÏÏÏÏÏÏÏÏÏÏÏÏÏÏÏÏÏÏ Ì 282 Ì 282
Turnover to third parties ÏÏÏÏÏÏÏÏÏÏÏÏÏÏÏÏÏÏÏÏÏÏÏÏÏÏÏÏ 65,659 70,486 22,328 158,473
Operating ProÑt Ì Segment ProÑt
Continuing ÏÏÏÏÏÏÏÏÏÏÏÏÏÏÏÏÏÏÏÏÏÏÏÏÏÏÏÏÏÏÏÏÏÏÏÏÏÏ (5,905) 4,597 3,029 1,721
Discontinued ÏÏÏÏÏÏÏÏÏÏÏÏÏÏÏÏÏÏÏÏÏÏÏÏÏÏÏÏÏÏÏÏÏÏÏÏ Ì (5) Ì (5)
(5,905) 4,592 3,029 1,716
Exceptional items ÏÏÏÏÏÏÏÏÏÏÏÏÏÏÏÏÏÏÏÏÏÏÏÏÏÏÏÏÏÏÏÏÏÏ (2,991)
Net interest and income from investments ÏÏÏÏÏÏÏÏÏÏÏÏÏ (2,911)
Loss on ordinary activities before taxationÏÏÏÏÏÏÏÏÏÏÏÏÏÏ (4,186)
Net Assets Ì by segment
Continuing ÏÏÏÏÏÏÏÏÏÏÏÏÏÏÏÏÏÏÏÏÏÏÏÏÏÏÏÏÏÏÏÏÏÏÏÏÏÏ 16,276 8,997 5,225 30,498
Discontinued ÏÏÏÏÏÏÏÏÏÏÏÏÏÏÏÏÏÏÏÏÏÏÏÏÏÏÏÏÏÏÏÏÏÏÏÏ Ì 13 Ì 13
16,276 9,010 5,225 30,511
Unallocated net liabilitiesÏÏÏÏÏÏÏÏÏÏÏÏÏÏÏÏÏÏÏÏÏÏÏÏÏÏÏÏ (18,093)
Total net assetsÏÏÏÏÏÏÏÏÏÏÏÏÏÏÏÏÏÏÏÏÏÏÏÏÏÏÏÏÏÏÏÏÏÏÏÏ 12,418
F-46
Brought to you by Global Reports

KENWOOD APPLIANCES PLC
NOTES TO THE CONSOLIDATED FINANCIAL STATEMENTS Ì (Continued)
Financial Year to March 31, 2000
United Continental Rest ofKingdom Europe World Total
000 000 000 000
Turnover by Destination
Continuing ÏÏÏÏÏÏÏÏÏÏÏÏÏÏÏÏÏÏÏÏÏÏÏÏÏÏÏÏÏÏÏÏÏÏÏÏÏÏ 42,063 67,345 33,951 143,359
Discontinued ÏÏÏÏÏÏÏÏÏÏÏÏÏÏÏÏÏÏÏÏÏÏÏÏÏÏÏÏÏÏÏÏÏÏÏÏ Ì 1,760 261 2,021
42,063 69,105 34,212 145,380
Turnover by Origin
Continuing
Total sales ÏÏÏÏÏÏÏÏÏÏÏÏÏÏÏÏÏÏÏÏÏÏÏÏÏÏÏÏÏÏÏÏÏÏÏÏ 75,395 69,496 37,749 182,640
Inter segment ÏÏÏÏÏÏÏÏÏÏÏÏÏÏÏÏÏÏÏÏÏÏÏÏÏÏÏÏÏÏÏÏÏ (14,546) (8,602) (16,133) (39,281)
Sales to third partiesÏÏÏÏÏÏÏÏÏÏÏÏÏÏÏÏÏÏÏÏÏÏÏÏÏÏÏÏ 60,849 60,894 21,616 143,359
Discontinued ÏÏÏÏÏÏÏÏÏÏÏÏÏÏÏÏÏÏÏÏÏÏÏÏÏÏÏÏÏÏÏÏÏÏÏÏ Ì 1,760 261 2,021
Turnover to third parties ÏÏÏÏÏÏÏÏÏÏÏÏÏÏÏÏÏÏÏÏÏÏÏÏÏÏÏÏ 60,849 62,654 21,877 145,380
Operating ProÑt Ì Segment ProÑt
Continuing ÏÏÏÏÏÏÏÏÏÏÏÏÏÏÏÏÏÏÏÏÏÏÏÏÏÏÏÏÏÏÏÏÏÏÏÏÏÏ (68) 3,059 3,422 6,413
Discontinued ÏÏÏÏÏÏÏÏÏÏÏÏÏÏÏÏÏÏÏÏÏÏÏÏÏÏÏÏÏÏÏÏÏÏÏÏ Ì (285) (13) (298)
(68) 2,774 3,409 6,115
Exceptional items ÏÏÏÏÏÏÏÏÏÏÏÏÏÏÏÏÏÏÏÏÏÏÏÏÏÏÏÏÏÏÏÏÏÏ (4,248)
Net interest and income from investments ÏÏÏÏÏÏÏÏÏÏÏÏÏ (2,987)
Loss on ordinary activities before taxationÏÏÏÏÏÏÏÏÏÏÏÏÏÏ (1,120)
Net assets Ì by segment
Continuing ÏÏÏÏÏÏÏÏÏÏÏÏÏÏÏÏÏÏÏÏÏÏÏÏÏÏÏÏÏÏÏÏÏÏÏÏÏÏ 26,408 9,181 5,111 40,700
Discontinued ÏÏÏÏÏÏÏÏÏÏÏÏÏÏÏÏÏÏÏÏÏÏÏÏÏÏÏÏÏÏÏÏÏÏÏÏ Ì 629 14 643
26,408 9,810 5,125 41,343
Unallocated net liabilitiesÏÏÏÏÏÏÏÏÏÏÏÏÏÏÏÏÏÏÏÏÏÏÏÏÏÏÏÏ (22,147)
Total net assetsÏÏÏÏÏÏÏÏÏÏÏÏÏÏÏÏÏÏÏÏÏÏÏÏÏÏÏÏÏÏÏÏÏÏÏÏ 19,196
F-47
Brought to you by Global Reports

KENWOOD APPLIANCES PLC
NOTES TO THE CONSOLIDATED FINANCIAL STATEMENTS Ì (Continued)
Financial Year to April 2, 1999
United Continental Rest ofKingdom Europe World Total
000 000 000 000
Turnover by Destination
Continuing ÏÏÏÏÏÏÏÏÏÏÏÏÏÏÏÏÏÏÏÏÏÏÏÏÏÏÏÏÏÏÏÏÏÏÏÏÏÏ 37,927 78,189 28,900 145,016
Discontinued ÏÏÏÏÏÏÏÏÏÏÏÏÏÏÏÏÏÏÏÏÏÏÏÏÏÏÏÏÏÏÏÏÏÏÏÏ 3,012 2,374 3,719 9,105
40,939 80,563 32,619 154,121
Turnover by Origin
Continuing
Total sales ÏÏÏÏÏÏÏÏÏÏÏÏÏÏÏÏÏÏÏÏÏÏÏÏÏÏÏÏÏÏÏÏÏÏÏÏ 68,027 80,469 33,994 182,490
Inter segment ÏÏÏÏÏÏÏÏÏÏÏÏÏÏÏÏÏÏÏÏÏÏÏÏÏÏÏÏÏÏÏÏÏ (14,056) (8,386) (15,032) (37,474)
Sales to third partiesÏÏÏÏÏÏÏÏÏÏÏÏÏÏÏÏÏÏÏÏÏÏÏÏÏÏÏÏ 53,971 72,083 18,962 145,016
Discontinued ÏÏÏÏÏÏÏÏÏÏÏÏÏÏÏÏÏÏÏÏÏÏÏÏÏÏÏÏÏÏÏÏÏÏÏÏ 3,012 2,374 3,719 9,105
Turnover to third parties ÏÏÏÏÏÏÏÏÏÏÏÏÏÏÏÏÏÏÏÏÏÏÏÏÏÏÏÏ 56,983 74,457 22,681 154,121
Operating ProÑt Ì Segment ProÑt
Continuing ÏÏÏÏÏÏÏÏÏÏÏÏÏÏÏÏÏÏÏÏÏÏÏÏÏÏÏÏÏÏÏÏÏÏÏÏÏÏ (746) 2,555 1,871 3,680
Discontinued ÏÏÏÏÏÏÏÏÏÏÏÏÏÏÏÏÏÏÏÏÏÏÏÏÏÏÏÏÏÏÏÏÏÏÏÏ (96) (545) 95 (546)
(842) 2,010 1,966 3,134
Exceptional items ÏÏÏÏÏÏÏÏÏÏÏÏÏÏÏÏÏÏÏÏÏÏÏÏÏÏÏÏÏÏÏÏÏÏ (8,884)
Net interest and income from investments ÏÏÏÏÏÏÏÏÏÏÏÏÏ (4,004)
Loss on ordinary activities before taxationÏÏÏÏÏÏÏÏÏÏÏÏÏÏ (9,754)
Net assets Ì by segment
Continuing ÏÏÏÏÏÏÏÏÏÏÏÏÏÏÏÏÏÏÏÏÏÏÏÏÏÏÏÏÏÏÏÏÏÏÏÏÏÏ 17,242 22,388 7,257 46,887
Discontinued ÏÏÏÏÏÏÏÏÏÏÏÏÏÏÏÏÏÏÏÏÏÏÏÏÏÏÏÏÏÏÏÏÏÏÏÏ 2,558 917 167 3,642
19,800 23,305 7,424 50,529
Unallocated net liabilitiesÏÏÏÏÏÏÏÏÏÏÏÏÏÏÏÏÏÏÏÏÏÏÏÏÏÏÏÏ (27,205)
Total net assetsÏÏÏÏÏÏÏÏÏÏÏÏÏÏÏÏÏÏÏÏÏÏÏÏÏÏÏÏÏÏÏÏÏÏÏÏ 23,324
Unallocated net assets comprise:
March 31, March 31, April 2,2001 2000 1999
000 000 000
Investments in own sharesÏÏÏÏÏÏÏÏÏÏÏÏÏÏÏÏÏÏÏÏÏÏÏÏÏÏÏÏÏÏÏÏÏÏÏÏÏÏ 1,417 1,927 1,927
Cash at bank and in hand ÏÏÏÏÏÏÏÏÏÏÏÏÏÏÏÏÏÏÏÏÏÏÏÏÏÏÏÏÏÏÏÏÏÏÏÏÏÏ 11,011 10,773 9,670
Bank overdraftsÏÏÏÏÏÏÏÏÏÏÏÏÏÏÏÏÏÏÏÏÏÏÏÏÏÏÏÏÏÏÏÏÏÏÏÏÏÏÏÏÏÏÏÏÏÏÏ Ì (121) (2,706)
Loans ÏÏÏÏÏÏÏÏÏÏÏÏÏÏÏÏÏÏÏÏÏÏÏÏÏÏÏÏÏÏÏÏÏÏÏÏÏÏÏÏÏÏÏÏÏÏÏÏÏÏÏÏÏÏÏ (27,626) (33,282) (34,564)
Discounted bills ÏÏÏÏÏÏÏÏÏÏÏÏÏÏÏÏÏÏÏÏÏÏÏÏÏÏÏÏÏÏÏÏÏÏÏÏÏÏÏÏÏÏÏÏÏÏ Ì Ì (707)
Net tax liabilities ÏÏÏÏÏÏÏÏÏÏÏÏÏÏÏÏÏÏÏÏÏÏÏÏÏÏÏÏÏÏÏÏÏÏÏÏÏÏÏÏÏÏÏÏÏ (2,639) (1,130) (480)
Provision for deferred tax ÏÏÏÏÏÏÏÏÏÏÏÏÏÏÏÏÏÏÏÏÏÏÏÏÏÏÏÏÏÏÏÏÏÏÏÏÏÏ (256) (314) (345)
(18,093) (22,147) (27,205)
F-48
Brought to you by Global Reports

KENWOOD APPLIANCES PLC
NOTES TO THE CONSOLIDATED FINANCIAL STATEMENTS Ì (Continued)
3. COST OF SALES AND OPERATING EXPENSES
Year to March 31, 2001 Year to March 31, 2000 Year to April 2, 1999
Continuing Discontinued Continuing Discontinued Continuing Discontinued
000 000 000 000 000 000
Cost of sales ÏÏÏÏÏÏÏÏÏÏÏÏÏÏÏÏÏÏ 108,956 211 90,627 1,576 93,355 6,851
Distribution costs ÏÏÏÏÏÏÏÏÏÏÏÏÏÏ 34,643 52 34,037 531 35,102 2,079
Administrative expenses ÏÏÏÏÏÏÏÏ 13,012 38 12,034 189 13,307 459
Other operating(income)/expenditure ÏÏÏÏÏÏÏÏ (141) (14) 248 23 (428) 262
4. OPERATING PROFIT
This is stated after charging/(crediting):
Year to Year to Year toMarch 31, March 31, April 2,
2001 2000 1999
000 000 000
Auditors' remuneration
audit services Ì U.K. ÏÏÏÏÏÏÏÏÏÏÏÏÏÏÏÏÏÏÏÏÏÏÏÏÏÏÏÏÏÏÏÏÏÏÏÏÏÏÏ 70 127 93
non audit services Ì U.K.ÏÏÏÏÏÏÏÏÏÏÏÏÏÏÏÏÏÏÏÏÏÏÏÏÏÏÏÏÏÏÏÏÏÏÏÏ 573 136 121
audit services Ì overseasÏÏÏÏÏÏÏÏÏÏÏÏÏÏÏÏÏÏÏÏÏÏÏÏÏÏÏÏÏÏÏÏÏÏÏÏÏ 125 144 166
non audit services Ì overseas ÏÏÏÏÏÏÏÏÏÏÏÏÏÏÏÏÏÏÏÏÏÏÏÏÏÏÏÏÏÏÏÏÏ 29 9 52
Depreciation of owned assets ÏÏÏÏÏÏÏÏÏÏÏÏÏÏÏÏÏÏÏÏÏÏÏÏÏÏÏÏÏÏÏÏÏÏÏ 5,357 5,604 7,155
Depreciation of assets held under Ñnance leases and hire purchasecontracts ÏÏÏÏÏÏÏÏÏÏÏÏÏÏÏÏÏÏÏÏÏÏÏÏÏÏÏÏÏÏÏÏÏÏÏÏÏÏÏÏÏÏÏÏÏÏÏÏÏÏ 284 249 52
Research and development ÏÏÏÏÏÏÏÏÏÏÏÏÏÏÏÏÏÏÏÏÏÏÏÏÏÏÏÏÏÏÏÏÏÏÏÏÏ 2,869 2,963 3,174
Operating lease rentals
land and buildings ÏÏÏÏÏÏÏÏÏÏÏÏÏÏÏÏÏÏÏÏÏÏÏÏÏÏÏÏÏÏÏÏÏÏÏÏÏÏÏÏÏÏ 787 333 520
plant and machineryÏÏÏÏÏÏÏÏÏÏÏÏÏÏÏÏÏÏÏÏÏÏÏÏÏÏÏÏÏÏÏÏÏÏÏÏÏÏÏÏÏ 624 531 645
Operating exceptionals (in 2001 includes 340,000 in respect of nonaudit U.K. services)ÏÏÏÏÏÏÏÏÏÏÏÏÏÏÏÏÏÏÏÏÏÏÏÏÏÏÏÏÏÏÏÏÏÏÏÏÏÏÏÏÏ 1,862 (267) 1,005
The operating exceptionals charge in the year to March 31, 2001 of 1,862,000 includes charges of1,019,000 to address the prior year impact of a number of accounting issues in relation to stock. Thisexceptional charge did not have a cash impact. The balance of 843,000 relates to costs incurred inrelation to the sale of the Company to De' Longhi Pinguino S.A.
The operating exceptionals in the years March 31, 2000 and April 2, 1999 relate respectively to areversal of a bad debt provision previously charged to operating exceptionals and the write down of certainplant and equipment arising from an impairment review in accordance with FRS 11.
F-49
Brought to you by Global Reports

KENWOOD APPLIANCES PLC
NOTES TO THE CONSOLIDATED FINANCIAL STATEMENTS Ì (Continued)
5. NOTES TO THE GROUP STATEMENT OF CASH FLOWS
(a) Reconciliation of operating proÑt to net cash inÖow from operating activities
Year to Year to Year toMarch 31, March 31, April 2,
2001 2000 1999
000 000 000
Operating proÑtÏÏÏÏÏÏÏÏÏÏÏÏÏÏÏÏÏÏÏÏÏÏÏÏÏÏÏÏÏÏÏÏÏÏÏÏÏÏÏÏÏÏÏÏÏÏÏ 1,716 6,115 3,134
Depreciation ÏÏÏÏÏÏÏÏÏÏÏÏÏÏÏÏÏÏÏÏÏÏÏÏÏÏÏÏÏÏÏÏÏÏÏÏÏÏÏÏÏÏÏÏÏÏÏÏÏ 6,113 5,853 7,207
Decrease/(Increase) in debtors ÏÏÏÏÏÏÏÏÏÏÏÏÏÏÏÏÏÏÏÏÏÏÏÏÏÏÏÏÏÏÏÏÏ 89 (950) 2,574
Decrease/(increase) in stocksÏÏÏÏÏÏÏÏÏÏÏÏÏÏÏÏÏÏÏÏÏÏÏÏÏÏÏÏÏÏÏÏÏÏÏ 3,676 (6,002) 10,455
Increase/(decrease) in creditorsÏÏÏÏÏÏÏÏÏÏÏÏÏÏÏÏÏÏÏÏÏÏÏÏÏÏÏÏÏÏÏÏÏ 2,880 5,475 (4,596)
Net cash inÖow from continuing activities ÏÏÏÏÏÏÏÏÏÏÏÏÏÏÏÏÏÏÏÏÏÏÏÏ 14,474 10,491 18,774
(b) Analysis of cash Öows for headings netted in the cash Öow statement
Year to Year to Year toMarch 31, March 31, April 2,
2001 2000 1999
000 000 000
Net cash inÖow/(outÖow) in respect of exceptional items
Fundamental reorganization ÏÏÏÏÏÏÏÏÏÏÏÏÏÏÏÏÏÏÏÏÏÏÏÏÏÏÏÏÏÏÏÏÏÏÏÏ (3,250) (3,454) (2,777)
Proceeds from the sale of Ñxed assets ÏÏÏÏÏÏÏÏÏÏÏÏÏÏÏÏÏÏÏÏÏÏÏÏÏÏÏÏ 7,451 Ì Ì
4,201 (3,454) (2,777)
Returns on investments and servicing of Ñnance
Interest received ÏÏÏÏÏÏÏÏÏÏÏÏÏÏÏÏÏÏÏÏÏÏÏÏÏÏÏÏÏÏÏÏÏÏÏÏÏÏÏÏÏÏÏÏÏÏ 214 282 704
Interest paid ÏÏÏÏÏÏÏÏÏÏÏÏÏÏÏÏÏÏÏÏÏÏÏÏÏÏÏÏÏÏÏÏÏÏÏÏÏÏÏÏÏÏÏÏÏÏÏÏÏ (2,449) (3,269) (4,708)
Net cash outÖow for returns on investments and servicing of Ñnance ÏÏ (2,235) (2,987) (4,004)
Taxation
Corporation tax received (including advance corporation tax) ÏÏÏÏÏÏÏÏ Ì 137 825
Overseas tax paid ÏÏÏÏÏÏÏÏÏÏÏÏÏÏÏÏÏÏÏÏÏÏÏÏÏÏÏÏÏÏÏÏÏÏÏÏÏÏÏÏÏÏÏÏÏ (1,380) (853) (1,588)
Net cash outÖow for taxation ÏÏÏÏÏÏÏÏÏÏÏÏÏÏÏÏÏÏÏÏÏÏÏÏÏÏÏÏÏÏÏÏÏÏÏ (1,380) (716) (763)
Capital expenditure
Purchase of tangible Ñxed assetsÏÏÏÏÏÏÏÏÏÏÏÏÏÏÏÏÏÏÏÏÏÏÏÏÏÏÏÏÏÏÏÏÏ (4,742) (3,391) (5,499)
Receipts from sales of tangible Ñxed assetsÏÏÏÏÏÏÏÏÏÏÏÏÏÏÏÏÏÏÏÏÏÏÏÏ 99 2,461 833
Net cash outÖow from capital expenditure ÏÏÏÏÏÏÏÏÏÏÏÏÏÏÏÏÏÏÏÏÏÏÏÏ (4,643) (930) (4,666)
Acquisitions and disposals
Sale of Freshwater operation (Note 13) ÏÏÏÏÏÏÏÏÏÏÏÏÏÏÏÏÏÏÏÏÏÏÏÏÏÏ Ì 990 Ì
Settlement of Ariete acquisition (Note 13) ÏÏÏÏÏÏÏÏÏÏÏÏÏÏÏÏÏÏÏÏÏÏÏ (4,681) Ì Ì
Net cash (outÖow)/inÖow from acquisitions and disposalsÏÏÏÏÏÏÏÏÏÏÏ (4,681) 990 Ì
F-50
Brought to you by Global Reports

KENWOOD APPLIANCES PLC
NOTES TO THE CONSOLIDATED FINANCIAL STATEMENTS Ì (Continued)
Year to Year to Year toMarch 31, March 31, April 2,
2001 2000 1999
000 000 000
Financing
New loans ÏÏÏÏÏÏÏÏÏÏÏÏÏÏÏÏÏÏÏÏÏÏÏÏÏÏÏÏÏÏÏÏÏÏÏÏÏÏÏÏÏÏÏÏÏÏÏÏÏÏÏ 572 991 Ì
Net cash outÖow from discounted bills ÏÏÏÏÏÏÏÏÏÏÏÏÏÏÏÏÏÏÏÏÏÏÏÏÏÏÏ Ì (707) (2,006)
Repayment of loans ÏÏÏÏÏÏÏÏÏÏÏÏÏÏÏÏÏÏÏÏÏÏÏÏÏÏÏÏÏÏÏÏÏÏÏÏÏÏÏÏÏÏÏ (9,540) (1,282) (18,541)
Repayment of capital element of Ñnance lease rentalsÏÏÏÏÏÏÏÏÏÏÏÏÏÏÏ (140) (523) (855)
Net cash outÖow from ÑnancingÏÏÏÏÏÏÏÏÏÏÏÏÏÏÏÏÏÏÏÏÏÏÏÏÏÏÏÏÏÏÏÏÏ (9,108) (1,521) (21,402)
6. DIRECTORS' REMUNERATION
Year toMarch 31,
2001
000
Emoluments ÏÏÏÏÏÏÏÏÏÏÏÏÏÏÏÏÏÏÏÏÏÏÏÏÏÏÏÏÏÏÏÏÏÏÏÏÏÏÏÏÏÏÏÏÏÏÏÏÏÏÏÏÏÏ 1,101,809
Company contributions paid to deÑned beneÑt pension schemesÏÏÏÏÏÏÏÏÏÏÏ 124,944
Compensation for loss of oÇce ÏÏÏÏÏÏÏÏÏÏÏÏÏÏÏÏÏÏÏÏÏÏÏÏÏÏÏÏÏÏÏÏÏÏÏÏÏÏ 127,457
Emoluments include fees paid to employing companies for the services of Mr D. Nash andMr J. Tregar of 76,910.
2001
No.
Members of deÑned beneÑt pension schemes ÏÏÏÏÏÏÏÏÏÏÏÏÏÏÏÏÏÏÏÏÏÏÏÏÏÏÏÏÏÏÏ 2
The amounts in respect of the highest paid director are as follows:
2001
EmolumentsÏÏÏÏÏÏÏÏÏÏÏÏÏÏÏÏÏÏÏÏÏÏÏÏÏÏÏÏÏÏÏÏÏÏÏÏÏÏÏÏÏÏÏÏÏÏÏÏÏÏÏÏÏÏÏÏ 236,686
Company contributions paid to deÑned beneÑt pension schemes ÏÏÏÏÏÏÏÏÏÏÏÏ 92,453
Accrued pension beneÑt ÏÏÏÏÏÏÏÏÏÏÏÏÏÏÏÏÏÏÏÏÏÏÏÏÏÏÏÏÏÏÏÏÏÏÏÏÏÏÏÏÏÏÏÏÏÏ 6,248
Individual Director's Emoluments
Salary/ BeneÑts 2000Fees Bonus in Kind Total
Executive Directors
P. Crevoisier ÏÏÏÏÏÏÏÏÏÏÏÏÏÏÏÏÏÏÏÏÏÏÏÏÏÏÏÏÏÏÏÏÏÏÏÏÏÏÏÏ 123,302 73,418 49,530 246,250
A. J. Formela ÏÏÏÏÏÏÏÏÏÏÏÏÏÏÏÏÏÏÏÏÏÏÏÏÏÏÏÏÏÏÏÏÏÏÏÏÏÏÏ 102,250 Ì 11,509 113,759
C. J. Gordon (Chief Executive) ÏÏÏÏÏÏÏÏÏÏÏÏÏÏÏÏÏÏÏÏÏÏÏ 189,163 Ì 10,542 199,705
P. HotstonÏÏÏÏÏÏÏÏÏÏÏÏÏÏÏÏÏÏÏÏÏÏÏÏÏÏÏÏÏÏÏÏÏÏÏÏÏÏÏÏÏÏ Ì Ì Ì Ì
M. J. Lapham ÏÏÏÏÏÏÏÏÏÏÏÏÏÏÏÏÏÏÏÏÏÏÏÏÏÏÏÏÏÏÏÏÏÏÏÏÏÏ 122,700 Ì 12,921 135,621
G. R. WickendenÏÏÏÏÏÏÏÏÏÏÏÏÏÏÏÏÏÏÏÏÏÏÏÏÏÏÏÏÏÏÏÏÏÏÏÏ 99,500 Ì 12,162 111,662
F-51
Brought to you by Global Reports

KENWOOD APPLIANCES PLC
NOTES TO THE CONSOLIDATED FINANCIAL STATEMENTS Ì (Continued)
Salary/ BeneÑts 2000Fees Bonus in Kind Total
Non-Executive Directors
A. J. Douglas ÏÏÏÏÏÏÏÏÏÏÏÏÏÏÏÏÏÏÏÏÏÏÏÏÏÏÏÏÏÏÏÏÏÏÏÏÏÏÏ 15,750 Ì Ì 15,750
Professor F. R. Hartley(2) ÏÏÏÏÏÏÏÏÏÏÏÏÏÏÏÏÏÏÏÏÏÏÏÏÏÏÏÏÏ 10,350 Ì Ì 10,350
D. P. Nash (Chairman)(1) ÏÏÏÏÏÏÏÏÏÏÏÏÏÏÏÏÏÏÏÏÏÏÏÏÏÏÏÏ 75,000 Ì Ì 75,000
B. Purgavie ÏÏÏÏÏÏÏÏÏÏÏÏÏÏÏÏÏÏÏÏÏÏÏÏÏÏÏÏÏÏÏÏÏÏÏÏÏÏÏÏÏ 21,000 Ì Ì 21,000
J. A. Treger(3) ÏÏÏÏÏÏÏÏÏÏÏÏÏÏÏÏÏÏÏÏÏÏÏÏÏÏÏÏÏÏÏÏÏÏÏÏÏÏ 5,325 Ì Ì 5,325
764,340 73,418 96,664 934,422
Individual Director's Emoluments
CompensationSalary/ for loss of BeneÑts 1999Fees oÇce in Kind Total
Executive Directors
P. Crevoisier(3)ÏÏÏÏÏÏÏÏÏÏÏÏÏÏÏÏÏÏÏÏÏÏÏÏÏÏÏÏÏÏÏÏÏÏ 59,337 Ì 24,707 84,044
A. J. Douglas(2) ÏÏÏÏÏÏÏÏÏÏÏÏÏÏÏÏÏÏÏÏÏÏÏÏÏÏÏÏÏÏÏÏÏ 40,000 Ì 3,576 43,576
A. J. FormelaÏÏÏÏÏÏÏÏÏÏÏÏÏÏÏÏÏÏÏÏÏÏÏÏÏÏÏÏÏÏÏÏÏÏÏ 99,167 Ì 10,493 109,660
C. J. Gordon (Chief Executive) ÏÏÏÏÏÏÏÏÏÏÏÏÏÏÏÏÏÏÏ 182,500 Ì 11,985 194,485
P. Hotston(2) ÏÏÏÏÏÏÏÏÏÏÏÏÏÏÏÏÏÏÏÏÏÏÏÏÏÏÏÏÏÏÏÏÏÏÏ 20,000 150,000 1,988 171,988
M. J. Lapham ÏÏÏÏÏÏÏÏÏÏÏÏÏÏÏÏÏÏÏÏÏÏÏÏÏÏÏÏÏÏÏÏÏÏ 117,500 Ì 11,334 128,834
G. R. WickendenÏÏÏÏÏÏÏÏÏÏÏÏÏÏÏÏÏÏÏÏÏÏÏÏÏÏÏÏÏÏÏÏ 95,000 Ì 11,024 106,024
Non-Executive Directors
A. J. Douglas(3) ÏÏÏÏÏÏÏÏÏÏÏÏÏÏÏÏÏÏÏÏÏÏÏÏÏÏÏÏÏÏÏÏÏ 9,725 Ì Ì 9,725
Professor F. R. HartleyÏÏÏÏÏÏÏÏÏÏÏÏÏÏÏÏÏÏÏÏÏÏÏÏÏÏÏ 20,700 Ì Ì 20,700
D. P. Nash (Chairman)(1) ÏÏÏÏÏÏÏÏÏÏÏÏÏÏÏÏÏÏÏÏÏÏÏÏ 75,000 Ì Ì 75,000
B. PurgavieÏÏÏÏÏÏÏÏÏÏÏÏÏÏÏÏÏÏÏÏÏÏÏÏÏÏÏÏÏÏÏÏÏÏÏÏÏ 20,700 Ì Ì 20,700
739,629 150,000 75,107 964,736
Note
(1) Fees were paid to an employing company.
(2) To date of resignation.
(3) Part year only.
Pension Entitlement
All Executive Directors except Mr P. Crevoisier are members of the Kenwood Pension Scheme.
The scheme provides a pension of 1/60th of Ñnal pensionable salary for each year of service. Finalpensionable salary is based on a three year average of the member's basic salary less ∂ of the lowerearnings limit. For members who joined the scheme after June 1, 1989, Ñnal pensionable salary isrestricted to the earnings cap (90,600 for the tax year 1999/00, 87,600 for the tax year 1998/99).Members are required to contribute at the rate of 5% of Contribution Pay.
Mr. Lapham is entitled to a pension of two thirds of his salary in the twelve months prior toretirement at age 65. The normal pension age for each Director is 65. However, their accrued pension isavailable from age 60 without any actuarial reduction.
F-52
Brought to you by Global Reports

KENWOOD APPLIANCES PLC
NOTES TO THE CONSOLIDATED FINANCIAL STATEMENTS Ì (Continued)
The members also have the following entitlement under the scheme:
On death of the member after retirement, a spouse's pension of 50% of the member's pension
On death of the member in service, a spouse's pension of 50% of the member's pension allowing forcontinued service to normal retirement date plus a lump sum of three time salary (four times salary forMr Gordon)
All pensions accrued prior to April 5, 1997 in excess of the guaranteed minimum pension increase inpayment at the rate of 4% per annum or the increase in the RPI if less. Pensions accrued afterApril 6, 1997 increase in payment at the rate of 5% per annum or the increase in the RPI if less.
An option of a transfer value on leaving service when an immediate pension is not payable. Thetransfer value does not make an allowance for discretionary beneÑts.
Directors' Pension Entitlement
Amount of AdditionalPension During Accrued Pension
the Year at End of the YearPayable at Normal (or date of leaving) Company
Retirement Age Payable at Normal ContributionsName Age (excluding inÖation) Retirement Age to FURBS
2000
Mr M. J. Lapham ÏÏÏÏÏÏÏÏÏÏÏÏÏÏÏÏÏÏÏÏÏÏÏÏ 50 2,387 49,256 Ì
Mr C. J. GordonÏÏÏÏÏÏÏÏÏÏÏÏÏÏÏÏÏÏÏÏÏÏÏÏÏÏ 53 1,535 4,656 67,550
Mr G. R. WickendenÏÏÏÏÏÏÏÏÏÏÏÏÏÏÏÏÏÏÏÏÏÏ 44 1,524 3,272 Ì
Mr A. J. Formela ÏÏÏÏÏÏÏÏÏÏÏÏÏÏÏÏÏÏÏÏÏÏÏÏÏ 39 1,526 3,523 14,586
1999
Mr A. J. Douglas(2) ÏÏÏÏÏÏÏÏÏÏÏÏÏÏÏÏÏÏÏÏÏÏÏ 36 688 2,920 5,729
Mr P. Hotston(1)ÏÏÏÏÏÏÏÏÏÏÏÏÏÏÏÏÏÏÏÏÏÏÏÏÏÏ 52 310 39,624 Ì
Mr M. J. Lapham ÏÏÏÏÏÏÏÏÏÏÏÏÏÏÏÏÏÏÏÏÏÏÏÏ 49 5,210 45,680 Ì
Mr C. J. GordonÏÏÏÏÏÏÏÏÏÏÏÏÏÏÏÏÏÏÏÏÏÏÏÏÏÏ 52 1,501 3,042 71,890
Mr G. R. WickendenÏÏÏÏÏÏÏÏÏÏÏÏÏÏÏÏÏÏÏÏÏÏ 43 1,466 1,703 Ì
Mr A. J. Formela ÏÏÏÏÏÏÏÏÏÏÏÏÏÏÏÏÏÏÏÏÏÏÏÏÏ 38 1,473 1,947 16,250
(1) Mr. Hotston left service on May 31, 1998 and his pension beneÑts were augmented by the value of 35,392.
(2) Mr. Douglas resigned as an executive director on August 14, 1998. After this time he remained on the Board as a non-
executive director but without any pension entitlement.
F-53
Brought to you by Global Reports

KENWOOD APPLIANCES PLC
NOTES TO THE CONSOLIDATED FINANCIAL STATEMENTS Ì (Continued)
The directors in oÇce at March 31, 2001, March 31, 2000 or April 2, 1999 and their families had thefollowing beneÑcial interests in the share capital of the company:
Number of Ordinary Shares Number of Sharesave Options(1)
At At At At At AtMarch 31, March 31, April 2, March 31, March 31, April 2,
2001 2000(*) 1999 2001 2000 1999
000 000 000 000 000 000
Executive Directors
P. Crevoisier ÏÏÏÏÏÏÏÏÏÏÏÏÏÏÏÏÏÏÏÏÏÏÏ Ì Ì Ì Ì Ì Ì
A. J. Formela ÏÏÏÏÏÏÏÏÏÏÏÏÏÏÏÏÏÏÏÏÏÏ Ì 9,905 9,905 Ì 5,575 5,575
C. J. GordonÏÏÏÏÏÏÏÏÏÏÏÏÏÏÏÏÏÏÏÏÏÏÏ Ì 40,000 40,000 Ì 17,424 17,424
M. J. LaphamÏÏÏÏÏÏÏÏÏÏÏÏÏÏÏÏÏÏÏÏÏÏ Ì 369,940 369,940 Ì 17,424 17,424
G. R. Wickenden ÏÏÏÏÏÏÏÏÏÏÏÏÏÏÏÏÏÏÏ Ì 4,000 4,000 Ì Ì Ì
M. O. Young(3) ÏÏÏÏÏÏÏÏÏÏÏÏÏÏÏÏÏÏÏÏ Ì 1,075 Ì Ì Ì Ì
Non Executive Directors
A. J. Douglas ÏÏÏÏÏÏÏÏÏÏÏÏÏÏÏÏÏÏÏÏÏÏ Ì 3,000 3,000 Ì Ì Ì
D. P. Nash ÏÏÏÏÏÏÏÏÏÏÏÏÏÏÏÏÏÏÏÏÏÏÏÏ Ì 60,000 60,000 Ì Ì Ì
B. R. Purgavie ÏÏÏÏÏÏÏÏÏÏÏÏÏÏÏÏÏÏÏÏÏ Ì 8,000 8,000 Ì Ì Ì
J. A. Treger(2)ÏÏÏÏÏÏÏÏÏÏÏÏÏÏÏÏÏÏÏÏÏÏ Ì 7,945,000 7,945,000 Ì Ì Ì
Professor F. R. Hartley ÏÏÏÏÏÏÏÏÏÏÏÏÏÏ Ì Ì 5,250 Ì Ì Ì
(*) Or subsequent date of appointment.
Number ofOrdinary OptionShares Date of Grant Prices From To Director
80,000 March 20, 1995 254p March 20, 1998 March 19, 2005 P. Crevoisier378,000 March 3, 1997 139p March 3, 2000 March 2, 2007 C. J. Gordon170,000 December 17, 1997 111.5p December 17, 2000 December 16, 2007 A. J. Formela155,000 January 16, 1998 112.5p January 16, 2001 January 15, 2008 G. R. Wickenden50,000 July 17, 1998 106.5p July 17, 2001 July 16, 2008 P. Crevoisier93,000 July 17, 1998 106.5p July 17, 2001 July 16, 2008 A. J. Formela89,000 July 17, 1998 106.5p July 17, 2001 July 16, 2008 G. R. Wickenden
150,000 July 17, 1998 106.5p July 17, 2001 July 16, 2008 M. J. Lapham201,000 July 17, 1998 106.5p July 17, 2001 July 16, 2008 C. J. Gordon35,000(3) July 17, 1998 106.5p July 17, 2001 July 17, 2008 M. O. Young35,000 August 4, 1999 79p August 5, 2002 August 3, 2009 A. J. Formela35,000 August 4, 1999 79p August 5, 2002 August 3, 2009 M. J. Lapham35,000 August 4, 1999 79p August 5, 2002 August 3, 2009 G. R. Wickenden
100,000 August 8, 2000 87.5p August 8, 2003 August 8, 2010 P. Crevoiser26,000 August 8, 2000 87.5p August 8, 2003 August 8, 2010 C. J. Gordon26,000 August 8, 2000 87.5p August 8, 2003 August 8, 2010 M. J. Lapham
150,000 September 21, 2000 76.5p September 21, 2003 September 21, 2010 M. O. Young
Note
(1) Sharesave option granted in February 1998 at a price of 0.99 per share. These options were cancelled on May 23, 2001.
(2) Mr. Treger is a possible beneÑciary of a discretionary trust by virtue of which he is deemed (within the meaning of
Section 324 of the Companies Act) to have an interest in the Kenwood shares owned by Kalco Investments Limited, UKAV
Continuation Fund, Inc., and UKAV Multifund, Inc.
(3) At date of appointment.
(4) After the end of the year under review De'Longhi Pinguino S.A. oÅered to purchase options held under the Executive Share
Option Scheme at the oÅer price of 1.00 and cancellation of those options issued at a value above this price.
Executive options are exercisable between the third and tenth anniversary of the date of grant.
Sharesave options are exercisable on completion of Ñve years' saving under a related SAYE contract.
F-54
Brought to you by Global Reports

KENWOOD APPLIANCES PLC
NOTES TO THE CONSOLIDATED FINANCIAL STATEMENTS Ì (Continued)
None of the directors have, or have had during the year, any material interest in any contract with thecompany or its subsidiaries requiring disclosure under Section 232 of the Companies Act 1985.
The mid-market price of the company's ordinary shares at March 31, 2001 was 99p (2000: 68.5p,1999: 76p) and the range during the Ñnancial year ended March 31, 2001 was 58p to 99p (2000: 59p to83.5p, 1999: 76p to 160p).
7. STAFF COSTS
Year to Year to Year toMarch 31, March 31, April 2,
2001 2000 1999
000 000 000
Wages and salaries ÏÏÏÏÏÏÏÏÏÏÏÏÏÏÏÏÏÏÏÏÏÏÏÏÏÏÏÏÏÏÏÏÏÏÏÏÏÏÏÏÏÏÏÏ 14,932 15,229 21,671
Social security costs ÏÏÏÏÏÏÏÏÏÏÏÏÏÏÏÏÏÏÏÏÏÏÏÏÏÏÏÏÏÏÏÏÏÏÏÏÏÏÏÏÏÏÏ 2,245 2,542 3,027
Other pension costs ÏÏÏÏÏÏÏÏÏÏÏÏÏÏÏÏÏÏÏÏÏÏÏÏÏÏÏÏÏÏÏÏÏÏÏÏÏÏÏÏÏÏÏ 1,086 746 1,063
18,263 18,517 25,761
The average number of persons employed by the group, including executive directors, during the yearwas as follows:
Year to Year to Year toMarch 31, March 31, April 2,
2001 2000 1999
No. No. No.
OÇce management and administration ÏÏÏÏÏÏÏÏÏÏÏÏÏÏÏÏÏÏÏÏÏÏÏÏÏÏÏ 191 163 183
Manufacturing and distributionÏÏÏÏÏÏÏÏÏÏÏÏÏÏÏÏÏÏÏÏÏÏÏÏÏÏÏÏÏÏÏÏÏÏ 1,203 1,661 1,847
1,394 1,824 2,030
8. INTEREST PAYABLE AND SIMILAR CHARGES
Year to Year to Year toMarch 31, March 31, April 2,
2001 2000 1999
000 000 000
Bank loans, overdrafts and other loansÏÏÏÏÏÏÏÏÏÏÏÏÏÏÏÏÏÏÏÏÏÏÏÏÏÏÏÏ 3,012 3,054 4,392
Finance charges payable under Ñnance leases and hire purchasecontracts ÏÏÏÏÏÏÏÏÏÏÏÏÏÏÏÏÏÏÏÏÏÏÏÏÏÏÏÏÏÏÏÏÏÏÏÏÏÏÏÏÏÏÏÏÏÏÏÏÏÏ 42 58 286
Other loans ÏÏÏÏÏÏÏÏÏÏÏÏÏÏÏÏÏÏÏÏÏÏÏÏÏÏÏÏÏÏÏÏÏÏÏÏÏÏÏÏÏÏÏÏÏÏÏÏÏÏ 71 157 30
3,125 3,269 4,708
9. EXCEPTIONAL ITEMS
Year to Year to Year toMarch 31, March 31, April 2,
2001 2000 1999
000 000 000
Restructuring costs ÏÏÏÏÏÏÏÏÏÏÏÏÏÏÏÏÏÏÏÏÏÏÏÏÏÏÏÏÏÏÏÏÏÏÏÏÏÏÏÏÏÏÏÏÏ (2,991) (2,765) (2,353)
Provision for impairment in asset values ÏÏÏÏÏÏÏÏÏÏÏÏÏÏÏÏÏÏÏÏÏÏÏÏÏÏÏ Ì Ì (6,531)
(2,991) (2,765) (8,884)
Loss on sale of operation Ì FreshwaterÏÏÏÏÏÏÏÏÏÏÏÏÏÏÏÏÏÏÏÏÏÏÏÏÏÏÏÏ Ì (1,483) Ì
(2,991) (4,248) (8,884)
F-55
Brought to you by Global Reports

KENWOOD APPLIANCES PLC
NOTES TO THE CONSOLIDATED FINANCIAL STATEMENTS Ì (Continued)
Any tax losses arising from the fundamental restructuring will be recognized in the tax charges for theyears in which they are utilized. The eÅect on the tax charge for the year was Nil (2000: Nil, 1999:Nil). The group completed its fundamental restructuring during the 2001 Ñnancial year.
10. TAX ON PROFIT ON ORDINARY ACTIVITIES
Year to Year to Year toMarch 31, March 31, April 2,
2001 2000 1999
000 000 000
Based on the proÑt for the year:
U.K. corporation tax ÏÏÏÏÏÏÏÏÏÏÏÏÏÏÏÏÏÏÏÏÏÏÏÏÏÏÏÏÏÏÏÏÏÏÏÏÏÏÏÏÏÏÏ Ì Ì Ì
Deferred taxation ÏÏÏÏÏÏÏÏÏÏÏÏÏÏÏÏÏÏÏÏÏÏÏÏÏÏÏÏÏÏÏÏÏÏÏÏÏÏÏÏÏÏÏÏÏÏ 58 31 (64)
58 31 (64)
Overseas taxation ÏÏÏÏÏÏÏÏÏÏÏÏÏÏÏÏÏÏÏÏÏÏÏÏÏÏÏÏÏÏÏÏÏÏÏÏÏÏÏÏÏÏÏÏÏÏ (2,537) (1,431) (756)
(2,479) (1,400) (820)
(Under)/over provision in previous year:
U.K. corporation tax ÏÏÏÏÏÏÏÏÏÏÏÏÏÏÏÏÏÏÏÏÏÏÏÏÏÏÏÏÏÏÏÏÏÏÏÏÏÏÏÏÏÏÏ Ì Ì 5
Overseas taxation ÏÏÏÏÏÏÏÏÏÏÏÏÏÏÏÏÏÏÏÏÏÏÏÏÏÏÏÏÏÏÏÏÏÏÏÏÏÏÏÏÏÏÏÏÏÏ (386) 34 (478)
Deferred taxation ÏÏÏÏÏÏÏÏÏÏÏÏÏÏÏÏÏÏÏÏÏÏÏÏÏÏÏÏÏÏÏÏÏÏÏÏÏÏÏÏÏÏÏÏÏÏ Ì Ì (226)
(2,865) (1,366) (1,519)
No credit in respect of unutilized tax losses of U.K. or overseas companies has been included in theseaccounts, which has increased the eÅective rate of tax of the group.
11. DIVIDENDS
No dividends were declared in respect of the years ended March 31, 2001, March 31, 2000 andApril 2, 1999.
12. TANGIBLE FIXED ASSETS
PlantLand and Buildings Equipment
Long Tooling andLeasehold Short Motor
Freehold Buildings Leasehold Vehicles Total
000 000 000 000 000
Cost:At April 1, 2000ÏÏÏÏÏÏÏÏÏÏÏÏÏÏÏÏÏÏÏÏÏÏÏÏ 11,978 1,928 35 51,303 65,244Exchange diÅerences ÏÏÏÏÏÏÏÏÏÏÏÏÏÏÏÏÏÏÏÏ 62 198 19 1,062 1,341AdditionsÏÏÏÏÏÏÏÏÏÏÏÏÏÏÏÏÏÏÏÏÏÏÏÏÏÏÏÏÏÏ Ì Ì 500 4,242 4,742Disposals ÏÏÏÏÏÏÏÏÏÏÏÏÏÏÏÏÏÏÏÏÏÏÏÏÏÏÏÏÏÏ (11,949) Ì (126) (11,229) (23,304)
At March 31, 2001 ÏÏÏÏÏÏÏÏÏÏÏÏÏÏÏÏÏÏÏÏÏ 91 2,126 428 43,378 48,023
Depreciation:At April 1, 2000ÏÏÏÏÏÏÏÏÏÏÏÏÏÏÏÏÏÏÏÏÏÏÏÏ 6,201 255 17 38,183 44,656Exchange diÅerences ÏÏÏÏÏÏÏÏÏÏÏÏÏÏÏÏÏÏÏÏ (5) 15 307 338 655Charge for the year ÏÏÏÏÏÏÏÏÏÏÏÏÏÏÏÏÏÏÏÏÏ 15 28 65 5,491 5,599Disposals ÏÏÏÏÏÏÏÏÏÏÏÏÏÏÏÏÏÏÏÏÏÏÏÏÏÏÏÏÏÏ (6,209) Ì (92) (10,241) (16,542)
At March 31, 2001 ÏÏÏÏÏÏÏÏÏÏÏÏÏÏÏÏÏÏÏÏÏ 2 298 297 33,771 34,368
Net book value:At March 31, 2001 ÏÏÏÏÏÏÏÏÏÏÏÏÏÏÏÏÏÏÏÏÏ 89 1,828 131 11,607 13,655
F-56
Brought to you by Global Reports

KENWOOD APPLIANCES PLC
NOTES TO THE CONSOLIDATED FINANCIAL STATEMENTS Ì (Continued)
The net book value of Ñxed assets above for the Group includes an amount of 698,000 in respect ofassets held under Ñnance leases and hire purchase contracts.
PlantLand and Buildings Equipment
Long Tooling andLeasehold Short Motor
Freehold Buildings Leasehold Vehicles Total
000 000 000 000 000
Cost:
At April 2, 1999 ÏÏÏÏÏÏÏÏÏÏÏÏÏÏÏÏÏÏÏÏÏÏÏÏÏ 12,792 1,930 38 54,574 69,334
Exchange diÅerences ÏÏÏÏÏÏÏÏÏÏÏÏÏÏÏÏÏÏÏÏÏ (265) (2) (3) (1,359) (1,629)
Additions ÏÏÏÏÏÏÏÏÏÏÏÏÏÏÏÏÏÏÏÏÏÏÏÏÏÏÏÏÏÏÏ Ì Ì Ì 3,391 3,391
Disposals ÏÏÏÏÏÏÏÏÏÏÏÏÏÏÏÏÏÏÏÏÏÏÏÏÏÏÏÏÏÏÏ (549) Ì Ì (5,303) (5,852)
At March 31, 2000 ÏÏÏÏÏÏÏÏÏÏÏÏÏÏÏÏÏÏÏÏÏÏÏ 11,978 1,928 35 51,303 65,244
Depreciation:
At April 2, 1999 ÏÏÏÏÏÏÏÏÏÏÏÏÏÏÏÏÏÏÏÏÏÏÏÏÏ 6,240 218 17 35,392 41,867
Exchange diÅerences ÏÏÏÏÏÏÏÏÏÏÏÏÏÏÏÏÏÏÏÏÏ (33) (2) (1) (983) (1,019)
Charge for the yearÏÏÏÏÏÏÏÏÏÏÏÏÏÏÏÏÏÏÏÏÏÏÏ 139 39 1 5,674 5,853
Disposals ÏÏÏÏÏÏÏÏÏÏÏÏÏÏÏÏÏÏÏÏÏÏÏÏÏÏÏÏÏÏÏ (145) Ì Ì (1,900) (2,045)
At March 31, 2000 ÏÏÏÏÏÏÏÏÏÏÏÏÏÏÏÏÏÏÏÏÏÏÏ 6,201 255 17 38,183 44,656
Net book value:
At March 31, 2000 ÏÏÏÏÏÏÏÏÏÏÏÏÏÏÏÏÏÏÏÏÏÏÏ 5,777 1,673 18 13,120 20,588
The net book value of Ñxed assets above for the Group includes an amount of 556,000 in respect ofassets held under Ñnance leases and hire purchase contracts.
PlantLand and Buildings Equipment
Long Tooling andLeasehold Short Motor
Freehold Buildings Leasehold Vehicles Total
000 000 000 000 000
Cost:
At April 3, 1998 ÏÏÏÏÏÏÏÏÏÏÏÏÏÏÏÏÏÏÏÏÏÏÏÏÏ 12,632 1,861 29 55,198 69,720
Exchange diÅerences ÏÏÏÏÏÏÏÏÏÏÏÏÏÏÏÏÏÏÏÏÏ 149 66 (10) 799 1,004
Additions ÏÏÏÏÏÏÏÏÏÏÏÏÏÏÏÏÏÏÏÏÏÏÏÏÏÏÏÏÏÏÏ 11 3 19 5,466 5,499
Disposals ÏÏÏÏÏÏÏÏÏÏÏÏÏÏÏÏÏÏÏÏÏÏÏÏÏÏÏÏÏÏÏ Ì Ì Ì (6,889) (6,889)
At April 2, 1999 ÏÏÏÏÏÏÏÏÏÏÏÏÏÏÏÏÏÏÏÏÏÏÏÏÏ 12,792 1,930 38 54,574 69,334
Depreciation:
At April 3, 1998 ÏÏÏÏÏÏÏÏÏÏÏÏÏÏÏÏÏÏÏÏÏÏÏÏÏ 1,290 170 16 31,186 32,662
Exchange diÅerences ÏÏÏÏÏÏÏÏÏÏÏÏÏÏÏÏÏÏÏÏÏ (60) 7 (3) 574 518
Charge for the yearÏÏÏÏÏÏÏÏÏÏÏÏÏÏÏÏÏÏÏÏÏÏÏ 210 41 4 6,952 7,207
Disposals ÏÏÏÏÏÏÏÏÏÏÏÏÏÏÏÏÏÏÏÏÏÏÏÏÏÏÏÏÏÏÏ Ì Ì Ì (6,056) (6,056)
Provision for impairment ÏÏÏÏÏÏÏÏÏÏÏÏÏÏÏÏÏÏ 4,800 Ì Ì 2,736 7,536
At April 2, 1999 ÏÏÏÏÏÏÏÏÏÏÏÏÏÏÏÏÏÏÏÏÏÏÏÏÏ 6,240 218 17 35,392 41,867
Net book value:
At April 2, 1999 ÏÏÏÏÏÏÏÏÏÏÏÏÏÏÏÏÏÏÏÏÏÏÏÏÏ 6,552 1,712 21 19,182 27,467
F-57
Brought to you by Global Reports

KENWOOD APPLIANCES PLC
NOTES TO THE CONSOLIDATED FINANCIAL STATEMENTS Ì (Continued)
The net book value of Ñxed assets above for the Group includes an amount of 1,182,000 in respectof assets held under Ñnance leases and hire purchase contracts.
13. INVESTMENTS
March 31, March 31, April 2,2001 2000 1999
000 000 000
Investments in subsidiary undertakings ÏÏÏÏÏÏÏÏÏÏÏÏÏÏÏÏÏÏÏÏÏÏÏÏÏÏÏÏ Ì Ì Ì
Investments in own sharesÏÏÏÏÏÏÏÏÏÏÏÏÏÏÏÏÏÏÏÏÏÏÏÏÏÏÏÏÏÏÏÏÏÏÏÏÏÏÏ 1,417 1,927 1,927
1,417 1,927 1,927
Investments in own shares
Cost:
At March 31, 2001, March 31, 2000 and April 2, 1999 ÏÏÏÏÏÏÏÏÏÏÏÏ 3,988
Provision:
At March 31, 2000 and April 2, 1999 ÏÏÏÏÏÏÏÏÏÏÏÏÏÏÏÏÏÏÏÏÏÏÏÏÏÏÏ (2,061)
Charge in the year to March 31, 2001ÏÏÏÏÏÏÏÏÏÏÏÏÏÏÏÏÏÏÏÏÏÏÏÏÏÏÏ (510)
At March 31, 2001ÏÏÏÏÏÏÏÏÏÏÏÏÏÏÏÏÏÏÏÏÏÏÏÏÏÏÏÏÏÏÏÏÏÏÏÏÏÏÏÏÏÏÏ 2,571
Net book value:
At March 31, 2001ÏÏÏÏÏÏÏÏÏÏÏÏÏÏÏÏÏÏÏÏÏÏÏÏÏÏÏÏÏÏÏÏÏÏÏÏÏÏÏÏÏÏÏ 1,417
At March 31, 2000 and April 2, 1999 ÏÏÏÏÏÏÏÏÏÏÏÏÏÏÏÏÏÏÏÏÏÏÏÏÏÏÏ 1,927
The own shares are investments listed on the London Stock Exchange. The market value of theseinvestments at March 31, 2001 was 1,417,000 (2000: 971,000, 1999: 1,077,000). If they had been soldat this value there would have been no liability for corporation tax arising from the sale. The directorshave reviewed the carrying amount and consider that no further provision is required.
The shares are held by National Westminster Bank plc on behalf of the Kenwood 1992 EmployeeShare Ownership Plan Trust. There have been no options granted over these shares to date. Costs inrespect of operating this scheme are charged to the proÑt and loss account as incurred.
The purchase of these shares was funded by an external loan, which has been included in the groupand company balance sheets, as the loan is guaranteed by Kenwood Appliances plc.
F-58
Brought to you by Global Reports

KENWOOD APPLIANCES PLC
NOTES TO THE CONSOLIDATED FINANCIAL STATEMENTS Ì (Continued)
Details of the principal trading investments in which the company holds more than 20% of thenominal value of any class of share capital are as follows:
Country of Registration(or incorporation)
Name of Company and Operation
* Ariete S.p.A. Italy
Kenwood Limited England
Kenwood Marks Limited England
Kenwood International Limited England
* Kenwood Manufacturing GmbH Austria
* Kenwood Appliances (Ireland) Limited Eire
* Soci πet πe Kenwood France France
* Kenwood Elektroger ate GmbH Germany
Kenwood Appliances (HK) Limited Hong Kong
* Kenwood Appliances (Malaysia) SND BHD Malaysia
* Kenwood Appliances Limited New Zealand
* Kenwood Polska Sp.Zo.o. Poland
* Kenwood Appliances (Singapore) Limited Singapore
* Kenwood Home Appliances (PTY) Limited South Africa
* Tricom Industrial Company Limited Hong Kong
All the undertakings are wholly owned. Kenwood Marks Limited is engaged in the collection oflicence fees and royalties arising form the use of the Kenwood trademark. Kenwood International limitedacts as the intermediate holding company for overseas subsidiary undertakings.
All other subsidiary undertakings are principally engaged in the manufacture and distribution ofdomestic appliances (*denotes that shares are held through an intermediate holding company).
During June 1999 the group completed the sale of Freshwater, a specialised engineering division. Thedisposal is analyzed as follows:
000
Net assets disposed:
Fixed assets ÏÏÏÏÏÏÏÏÏÏÏÏÏÏÏÏÏÏÏÏÏÏÏÏÏÏÏÏÏÏÏÏÏÏÏÏÏÏÏÏÏÏÏÏÏÏÏÏÏ 1,346
StocksÏÏÏÏÏÏÏÏÏÏÏÏÏÏÏÏÏÏÏÏÏÏÏÏÏÏÏÏÏÏÏÏÏÏÏÏÏÏÏÏÏÏÏÏÏÏÏÏÏÏÏÏÏÏ 914
DebtorsÏÏÏÏÏÏÏÏÏÏÏÏÏÏÏÏÏÏÏÏÏÏÏÏÏÏÏÏÏÏÏÏÏÏÏÏÏÏÏÏÏÏÏÏÏÏÏÏÏÏÏÏÏ 469
Creditors ÏÏÏÏÏÏÏÏÏÏÏÏÏÏÏÏÏÏÏÏÏÏÏÏÏÏÏÏÏÏÏÏÏÏÏÏÏÏÏÏÏÏÏÏÏÏÏÏÏÏÏ (171)
2,558
Loss on disposal ÏÏÏÏÏÏÏÏÏÏÏÏÏÏÏÏÏÏÏÏÏÏÏÏÏÏÏÏÏÏÏÏÏÏÏÏÏÏÏÏÏÏÏÏÏ (1,483)
Sale proceedsÏÏÏÏÏÏÏÏÏÏÏÏÏÏÏÏÏÏÏÏÏÏÏÏÏÏÏÏÏÏÏÏÏÏÏÏÏÏÏÏÏÏÏÏÏÏÏÏ 1,075
SatisÑed by:
Cash ÏÏÏÏÏÏÏÏÏÏÏÏÏÏÏÏÏÏÏÏÏÏÏÏÏÏÏÏÏÏÏÏÏÏÏÏÏÏÏÏÏÏÏÏÏÏÏÏÏÏÏÏÏÏÏ 990
Deferred consideration ÏÏÏÏÏÏÏÏÏÏÏÏÏÏÏÏÏÏÏÏÏÏÏÏÏÏÏÏÏÏÏÏÏÏÏÏÏÏÏÏ 85
1,075
On March 6, 2000, the directors announced that the outstanding dispute over the purchase of theItalian subsidiary (Ariete) had been resolved.
This decision resulted in a further payment of 14.8bn Lire (4.7m) to the vendors in April 2000.The group made a provision of 3.0m against the potential settlement in its report and accounts for 1997.The balance of the payment has been charged against reserves as an adjustment to the goodwill written oÅat the date of acquisition (November 1994).
F-59
Brought to you by Global Reports

KENWOOD APPLIANCES PLC
NOTES TO THE CONSOLIDATED FINANCIAL STATEMENTS Ì (Continued)
14. STOCKS
2001 2000 1999
000 000 000
Raw materials and components ÏÏÏÏÏÏÏÏÏÏÏÏÏÏÏÏÏÏÏÏÏÏÏÏÏÏÏÏÏÏÏÏÏÏÏ 1,911 1,052 917
Work in progress ÏÏÏÏÏÏÏÏÏÏÏÏÏÏÏÏÏÏÏÏÏÏÏÏÏÏÏÏÏÏÏÏÏÏÏÏÏÏÏÏÏÏÏÏÏÏÏ 2,739 2,435 2,637
Finished goods and goods for resaleÏÏÏÏÏÏÏÏÏÏÏÏÏÏÏÏÏÏÏÏÏÏÏÏÏÏÏÏÏÏÏÏ 17,704 22,273 18,144
22,354 25,760 21,698
15. DEBTORS
March 31, March 31, April 2,2001 2000 1999
000 000 000
Trade debtors ÏÏÏÏÏÏÏÏÏÏÏÏÏÏÏÏÏÏÏÏÏÏÏÏÏÏÏÏÏÏÏÏÏÏÏÏÏÏÏÏÏÏÏÏÏÏÏÏÏ 34,553 32,662 36,482
Corporation tax recoverableÏÏÏÏÏÏÏÏÏÏÏÏÏÏÏÏÏÏÏÏÏÏÏÏÏÏÏÏÏÏÏÏÏÏÏÏÏÏ 84 84 189
Overseas tax recoverable ÏÏÏÏÏÏÏÏÏÏÏÏÏÏÏÏÏÏÏÏÏÏÏÏÏÏÏÏÏÏÏÏÏÏÏÏÏÏÏÏ 482 687 1,945
Other debtors ÏÏÏÏÏÏÏÏÏÏÏÏÏÏÏÏÏÏÏÏÏÏÏÏÏÏÏÏÏÏÏÏÏÏÏÏÏÏÏÏÏÏÏÏÏÏÏÏÏ 958 588 520
Prepayments and accrued incomeÏÏÏÏÏÏÏÏÏÏÏÏÏÏÏÏÏÏÏÏÏÏÏÏÏÏÏÏÏÏÏÏÏ 2,358 2,818 1,522
38,435 36,839 40,658
Amounts falling due after more than one year included in debtors above are:
March 31, March 31, April 2,2001 2000 1999
000 000 000
Other debtors ÏÏÏÏÏÏÏÏÏÏÏÏÏÏÏÏÏÏÏÏÏÏÏÏÏÏÏÏÏÏÏÏÏÏÏÏÏÏÏÏÏÏÏÏÏÏÏÏÏ 99 105 Ì
Prepayments and accrued incomeÏÏÏÏÏÏÏÏÏÏÏÏÏÏÏÏÏÏÏÏÏÏÏÏÏÏÏÏÏÏÏÏÏ 1,058 1,528 Ì
1,157 1,633 Ì
16. ANALYSIS OF NET DEBT
April 1, Exchange March 31,2000 Cash Flow Movement 2001
000 000 000 000
Cash at bank and in handÏÏÏÏÏÏÏÏÏÏÏÏÏÏÏÏÏÏÏÏÏÏÏÏÏÏÏ 10,773 (83) 321 11,011
Overdrafts ÏÏÏÏÏÏÏÏÏÏÏÏÏÏÏÏÏÏÏÏÏÏÏÏÏÏÏÏÏÏÏÏÏÏÏÏÏÏÏÏ (121) 121 Ì Ì
10,652 38 321 11,011
Debt due within one year ÏÏÏÏÏÏÏÏÏÏÏÏÏÏÏÏÏÏÏÏÏÏÏÏÏÏÏ (33,282) 6,410 (754) (27,626)
Debt due after more than one year ÏÏÏÏÏÏÏÏÏÏÏÏÏÏÏÏÏÏÏ (991) (572) (28) (1,591)
Finance leases ÏÏÏÏÏÏÏÏÏÏÏÏÏÏÏÏÏÏÏÏÏÏÏÏÏÏÏÏÏÏÏÏÏÏÏÏ (386) (140) (15) (541)
(34,659) 5,698 (797) (29,758)
Total ÏÏÏÏÏÏÏÏÏÏÏÏÏÏÏÏÏÏÏÏÏÏÏÏÏÏÏÏÏÏÏÏÏÏÏÏÏÏÏÏ (24,007) 5,736 (476) (18,747)
F-60
Brought to you by Global Reports
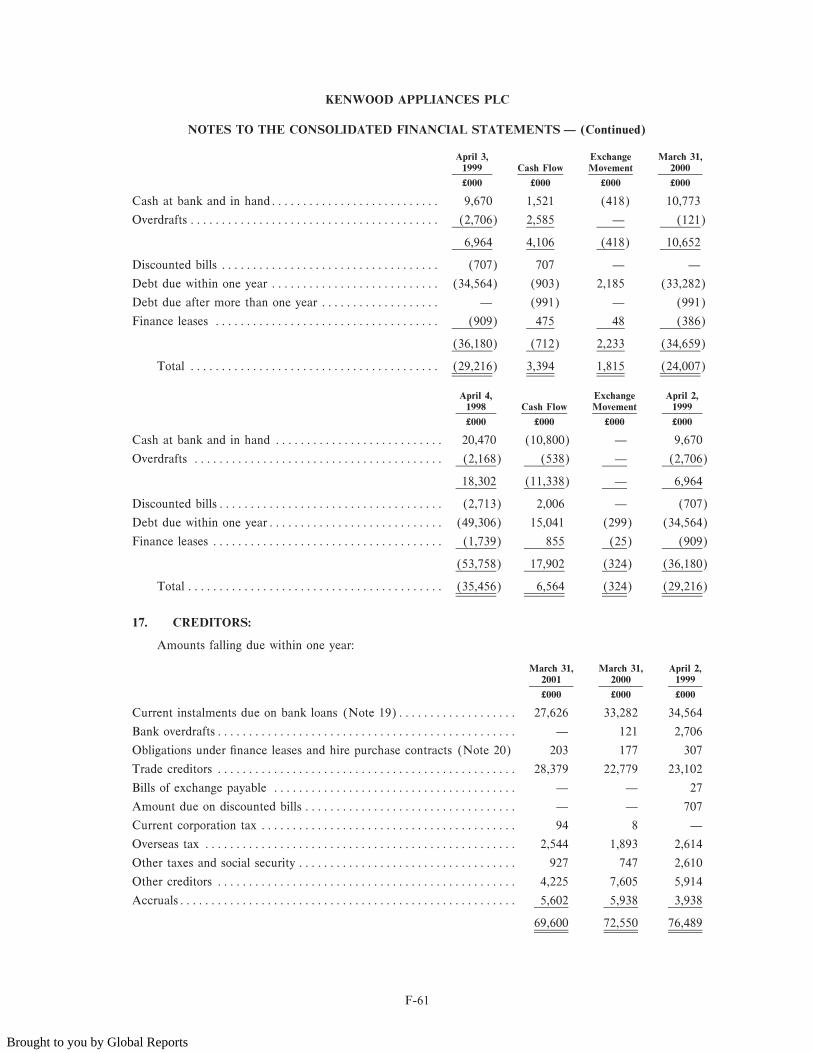
KENWOOD APPLIANCES PLC
NOTES TO THE CONSOLIDATED FINANCIAL STATEMENTS Ì (Continued)
April 3, Exchange March 31,1999 Cash Flow Movement 2000
000 000 000 000
Cash at bank and in handÏÏÏÏÏÏÏÏÏÏÏÏÏÏÏÏÏÏÏÏÏÏÏÏÏÏÏ 9,670 1,521 (418) 10,773
Overdrafts ÏÏÏÏÏÏÏÏÏÏÏÏÏÏÏÏÏÏÏÏÏÏÏÏÏÏÏÏÏÏÏÏÏÏÏÏÏÏÏÏ (2,706) 2,585 Ì (121)
6,964 4,106 (418) 10,652
Discounted bills ÏÏÏÏÏÏÏÏÏÏÏÏÏÏÏÏÏÏÏÏÏÏÏÏÏÏÏÏÏÏÏÏÏÏÏ (707) 707 Ì Ì
Debt due within one year ÏÏÏÏÏÏÏÏÏÏÏÏÏÏÏÏÏÏÏÏÏÏÏÏÏÏÏ (34,564) (903) 2,185 (33,282)
Debt due after more than one year ÏÏÏÏÏÏÏÏÏÏÏÏÏÏÏÏÏÏÏ Ì (991) Ì (991)
Finance leases ÏÏÏÏÏÏÏÏÏÏÏÏÏÏÏÏÏÏÏÏÏÏÏÏÏÏÏÏÏÏÏÏÏÏÏÏ (909) 475 48 (386)
(36,180) (712) 2,233 (34,659)
Total ÏÏÏÏÏÏÏÏÏÏÏÏÏÏÏÏÏÏÏÏÏÏÏÏÏÏÏÏÏÏÏÏÏÏÏÏÏÏÏÏ (29,216) 3,394 1,815 (24,007)
April 4, Exchange April 2,1998 Cash Flow Movement 1999
000 000 000 000
Cash at bank and in hand ÏÏÏÏÏÏÏÏÏÏÏÏÏÏÏÏÏÏÏÏÏÏÏÏÏÏÏ 20,470 (10,800) Ì 9,670
Overdrafts ÏÏÏÏÏÏÏÏÏÏÏÏÏÏÏÏÏÏÏÏÏÏÏÏÏÏÏÏÏÏÏÏÏÏÏÏÏÏÏÏ (2,168) (538) Ì (2,706)
18,302 (11,338) Ì 6,964
Discounted billsÏÏÏÏÏÏÏÏÏÏÏÏÏÏÏÏÏÏÏÏÏÏÏÏÏÏÏÏÏÏÏÏÏÏÏÏ (2,713) 2,006 Ì (707)
Debt due within one yearÏÏÏÏÏÏÏÏÏÏÏÏÏÏÏÏÏÏÏÏÏÏÏÏÏÏÏÏ (49,306) 15,041 (299) (34,564)
Finance leases ÏÏÏÏÏÏÏÏÏÏÏÏÏÏÏÏÏÏÏÏÏÏÏÏÏÏÏÏÏÏÏÏÏÏÏÏÏ (1,739) 855 (25) (909)
(53,758) 17,902 (324) (36,180)
Total ÏÏÏÏÏÏÏÏÏÏÏÏÏÏÏÏÏÏÏÏÏÏÏÏÏÏÏÏÏÏÏÏÏÏÏÏÏÏÏÏÏ (35,456) 6,564 (324) (29,216)
17. CREDITORS:
Amounts falling due within one year:
March 31, March 31, April 2,2001 2000 1999
000 000 000
Current instalments due on bank loans (Note 19)ÏÏÏÏÏÏÏÏÏÏÏÏÏÏÏÏÏÏÏ 27,626 33,282 34,564
Bank overdraftsÏÏÏÏÏÏÏÏÏÏÏÏÏÏÏÏÏÏÏÏÏÏÏÏÏÏÏÏÏÏÏÏÏÏÏÏÏÏÏÏÏÏÏÏÏÏÏÏ Ì 121 2,706
Obligations under Ñnance leases and hire purchase contracts (Note 20) 203 177 307
Trade creditors ÏÏÏÏÏÏÏÏÏÏÏÏÏÏÏÏÏÏÏÏÏÏÏÏÏÏÏÏÏÏÏÏÏÏÏÏÏÏÏÏÏÏÏÏÏÏÏÏ 28,379 22,779 23,102
Bills of exchange payable ÏÏÏÏÏÏÏÏÏÏÏÏÏÏÏÏÏÏÏÏÏÏÏÏÏÏÏÏÏÏÏÏÏÏÏÏÏÏÏ Ì Ì 27
Amount due on discounted bills ÏÏÏÏÏÏÏÏÏÏÏÏÏÏÏÏÏÏÏÏÏÏÏÏÏÏÏÏÏÏÏÏÏÏ Ì Ì 707
Current corporation tax ÏÏÏÏÏÏÏÏÏÏÏÏÏÏÏÏÏÏÏÏÏÏÏÏÏÏÏÏÏÏÏÏÏÏÏÏÏÏÏÏÏ 94 8 Ì
Overseas tax ÏÏÏÏÏÏÏÏÏÏÏÏÏÏÏÏÏÏÏÏÏÏÏÏÏÏÏÏÏÏÏÏÏÏÏÏÏÏÏÏÏÏÏÏÏÏÏÏÏÏ 2,544 1,893 2,614
Other taxes and social security ÏÏÏÏÏÏÏÏÏÏÏÏÏÏÏÏÏÏÏÏÏÏÏÏÏÏÏÏÏÏÏÏÏÏÏ 927 747 2,610
Other creditors ÏÏÏÏÏÏÏÏÏÏÏÏÏÏÏÏÏÏÏÏÏÏÏÏÏÏÏÏÏÏÏÏÏÏÏÏÏÏÏÏÏÏÏÏÏÏÏÏ 4,225 7,605 5,914
AccrualsÏÏÏÏÏÏÏÏÏÏÏÏÏÏÏÏÏÏÏÏÏÏÏÏÏÏÏÏÏÏÏÏÏÏÏÏÏÏÏÏÏÏÏÏÏÏÏÏÏÏÏÏÏÏ 5,602 5,938 3,938
69,600 72,550 76,489
F-61
Brought to you by Global Reports

KENWOOD APPLIANCES PLC
NOTES TO THE CONSOLIDATED FINANCIAL STATEMENTS Ì (Continued)
18. CREDITORS:
Amounts falling due after more than one year:
March 31, March 31, April 2,2001 2000 1999
000 000 000
Bank loans (Note 19) ÏÏÏÏÏÏÏÏÏÏÏÏÏÏÏÏÏÏÏÏÏÏÏÏÏÏÏÏÏÏÏÏÏÏÏÏÏÏÏÏÏÏ 1,591 991 Ì
Obligations under Ñnance leases and hire purchase contracts (Note 20) 338 209 602
Other creditors ÏÏÏÏÏÏÏÏÏÏÏÏÏÏÏÏÏÏÏÏÏÏÏÏÏÏÏÏÏÏÏÏÏÏÏÏÏÏÏÏÏÏÏÏÏÏÏÏ 2,442 2,435 Ì
4,371 3,635 602
19. LOANS
March 31, March 31, April 2,2001 2000 1999
000 000 000
Wholly repayable within Ñve yearsÏÏÏÏÏÏÏÏÏÏÏÏÏÏÏÏÏÏÏÏÏÏÏÏÏÏÏÏÏÏÏÏ 29,217 34,273 34,654
Falling due within one year (Note 17) ÏÏÏÏÏÏÏÏÏÏÏÏÏÏÏÏÏÏÏÏÏÏÏÏÏÏÏÏ 27,626 33,282 34,564
Falling due after more than one year (Note 18) ÏÏÏÏÏÏÏÏÏÏÏÏÏÏÏÏÏÏÏÏ 1,591 991 Ì
29,217 34,273 34,564
The loans are repayable as follows:
March 31, March 31, April 2,2001 2000 1999
Bank loans:
Amounts falling due within one year ÏÏÏÏÏÏÏÏÏÏÏÏÏÏÏÏÏÏÏÏÏÏÏÏÏÏÏÏ 22,543 28,199 29,481
Between one and two years ÏÏÏÏÏÏÏÏÏÏÏÏÏÏÏÏÏÏÏÏÏÏÏÏÏÏÏÏÏÏÏÏÏÏÏÏ 1,591 991 Ì
24,134 29,190 29,481
ESOP loan:
Amounts falling due within one year ÏÏÏÏÏÏÏÏÏÏÏÏÏÏÏÏÏÏÏÏÏÏÏÏÏÏÏÏ 5,083 5,083 5,083
29,217 34,273 34,564
The loans are secured by a Ñxed and Öoating charge over the assets of the U.K. and Hong Kongoperations.
The bank and ESOP loans were fully repaid subsequent to March 31, 2001.
F-62
Brought to you by Global Reports

KENWOOD APPLIANCES PLC
NOTES TO THE CONSOLIDATED FINANCIAL STATEMENTS Ì (Continued)
20. OBLIGATIONS UNDER FINANCE LEASES AND HIRE PURCHASE CONTRACTS
The maturity of these amounts is as follows:
March 31, March 31, April 2,2001 2000 1999
000 000 000
Amounts payable:
Within one yearÏÏÏÏÏÏÏÏÏÏÏÏÏÏÏÏÏÏÏÏÏÏÏÏÏÏÏÏÏÏÏÏÏÏÏÏÏÏÏÏÏÏÏÏÏÏ 220 204 337
Within two to Ñve years ÏÏÏÏÏÏÏÏÏÏÏÏÏÏÏÏÏÏÏÏÏÏÏÏÏÏÏÏÏÏÏÏÏÏÏÏÏÏÏ 364 224 636
After Ñve years ÏÏÏÏÏÏÏÏÏÏÏÏÏÏÏÏÏÏÏÏÏÏÏÏÏÏÏÏÏÏÏÏÏÏÏÏÏÏÏÏÏÏÏÏÏÏ 11 Ì Ì
595 428 973
Less: Ñnance charges allocated to future periods ÏÏÏÏÏÏÏÏÏÏÏÏÏÏÏÏÏÏÏÏ (54) (42) (64)
541 386 909
Finance leases and hire purchase contracts are analyzed as follows:
Current obligations (Note 18) ÏÏÏÏÏÏÏÏÏÏÏÏÏÏÏÏÏÏÏÏÏÏÏÏÏÏÏÏÏÏÏÏÏ 203 177 307
Non-current obligations (Note 19)ÏÏÏÏÏÏÏÏÏÏÏÏÏÏÏÏÏÏÏÏÏÏÏÏÏÏÏÏÏÏ 338 209 602
541 386 909
21. PROVISIONS FOR LIABILITIES AND CHARGES
The movements in provisions for liabilities and charges are as follows:
Deferred GroupRestructuring taxation Total
000 000 000
At April 4, 1998 ÏÏÏÏÏÏÏÏÏÏÏÏÏÏÏÏÏÏÏÏÏÏÏÏÏÏÏÏÏÏÏÏÏÏÏÏÏÏÏÏÏÏÏÏÏÏ 1,098 55 1,153
Charged in the year ÏÏÏÏÏÏÏÏÏÏÏÏÏÏÏÏÏÏÏÏÏÏÏÏÏÏÏÏÏÏÏÏÏÏÏÏÏÏÏÏÏÏÏ 2,353 290 2,643
Provision released in the year ÏÏÏÏÏÏÏÏÏÏÏÏÏÏÏÏÏÏÏÏÏÏÏÏÏÏÏÏÏÏÏÏÏÏÏ (162) Ì (162)
Utilized Ì 1997 restructuring ÏÏÏÏÏÏÏÏÏÏÏÏÏÏÏÏÏÏÏÏÏÏÏÏÏÏÏÏÏÏÏÏÏÏÏ (936) Ì (936)
Utilized Ì 1999 restructuring ÏÏÏÏÏÏÏÏÏÏÏÏÏÏÏÏÏÏÏÏÏÏÏÏÏÏÏÏÏÏÏÏÏÏÏ (1,693) Ì (1,693)
At April 3, 1999 ÏÏÏÏÏÏÏÏÏÏÏÏÏÏÏÏÏÏÏÏÏÏÏÏÏÏÏÏÏÏÏÏÏÏÏÏÏÏÏÏÏÏÏÏÏÏ 660 345 1,005
Provision released in the year ÏÏÏÏÏÏÏÏÏÏÏÏÏÏÏÏÏÏÏÏÏÏÏÏÏÏÏÏÏÏÏÏÏÏÏ (110) (31) (141)
Utilized Ì 2000 restructuring ÏÏÏÏÏÏÏÏÏÏÏÏÏÏÏÏÏÏÏÏÏÏÏÏÏÏÏÏÏÏÏÏÏÏÏ (358) Ì (358)
At April 1, 2000 ÏÏÏÏÏÏÏÏÏÏÏÏÏÏÏÏÏÏÏÏÏÏÏÏÏÏÏÏÏÏÏÏÏÏÏÏÏÏÏÏÏÏÏÏÏÏ 192 314 506
Provision released in the year ÏÏÏÏÏÏÏÏÏÏÏÏÏÏÏÏÏÏÏÏÏÏÏÏÏÏÏÏÏÏÏÏÏÏÏ Ì (58) (58)
Charge ÏÏÏÏÏÏÏÏÏÏÏÏÏÏÏÏÏÏÏÏÏÏÏÏÏÏÏÏÏÏÏÏÏÏÏÏÏÏÏÏÏÏÏÏÏÏÏÏÏÏÏÏÏÏ 200 Ì 200
Utilized ÏÏÏÏÏÏÏÏÏÏÏÏÏÏÏÏÏÏÏÏÏÏÏÏÏÏÏÏÏÏÏÏÏÏÏÏÏÏÏÏÏÏÏÏÏÏÏÏÏÏÏÏÏ (165) Ì (165)
At March 31, 2001ÏÏÏÏÏÏÏÏÏÏÏÏÏÏÏÏÏÏÏÏÏÏÏÏÏÏÏÏÏÏÏÏÏÏÏÏÏÏÏÏÏÏÏÏ 227 256 483
F-63
Brought to you by Global Reports

KENWOOD APPLIANCES PLC
NOTES TO THE CONSOLIDATED FINANCIAL STATEMENTS Ì (Continued)
Deferred taxation provided in the accounts and the amounts provided are as follows:
NotProvided Provided
March 31, March 31, April 2, March 31, March 31, April 2,2001 2000 1999 2001 2000 1999
000 000 000 000 000 000
Capital allowances inadvance of depreciationÏÏ 256 289 289 Ì Ì 248
Other timing diÅerences ÏÏÏ Ì 25 56 Ì Ì (248)
256 314 345 Ì Ì Ì
No provision has been made for deferred taxation in respect of earnings, which are retained overseasbecause the availability of double tax relief will ensure that no tax will be payable on any earningsremitted to the United Kingdom.
22. SHARE CAPITAL
Allotted, Called Up andAuthorised Fully Paid
2001 2000 1999 2001 2000 1999
000 000 000 000 000 000
Ordinary shares of 10p
Each ÏÏÏÏÏÏÏÏÏÏÏÏÏÏÏÏÏÏÏÏÏÏÏÏÏÏÏÏÏÏÏÏÏÏÏÏÏÏÏÏÏÏÏÏ 20,168 20,168 20,168 4,586 4,586 4,586
(a) The Executive Share Scheme
At June 24, 1999 some 68 employees held options over 2,071,300 ordinary shares exercisable asfollows:
310,845 between 1999 and 2002 at 2.75p per share.57,050 between 1999 and 2003 at 2.90p per share.173,905 between 1999 and 2004 at 3.23p per share80,000 between 1999 and 2005 at 2.54p per share.5,500 between 1999 and 2006 at 1.95p per share.378,000 between 2000 and 2007 at 1.39p per share.170,000 between 2000 and 2007 at 1.12¥p per share.20,000 between 2000 and 2007 at 1.01p per share.155,000 between 2001 and 2008 at 1.12¥p per share.721,000 between 2001 and 2008 at 1.06¥p per share.
At June 30, 2000 some 68 employees held options over 2,225,100 ordinary shares exercisable asfollows:
265,300 between 1999 and 2002 at 2.75p per share.46,750 between 1999 and 2003 and 2.90p per share.155,550 between 1999 and 2004 at 3.23 per share.80,000 between 1999 and 2005 at 2.54 per share.5,500 between 1999 and 2006 at 1.95p per share.378,000 between 2000 and 2007 at 1.39p per share.170,000 between 2000 and 2007 at 1.12¥p per share.20,000 between 2000 and 2007 at 1.01p per share.155,000 between 2001 and 2008 at 1.12¥p per share.701,000 between 2001 and 2008 at 1.06¥p per share166,000 between 2002 and 2009 at 79p per share.50,000 between 2002 and 2009 at 67¥p per share.32,000 between 2003 and 2010 at 65p per share.
F-64
Brought to you by Global Reports

KENWOOD APPLIANCES PLC
NOTES TO THE CONSOLIDATED FINANCIAL STATEMENTS Ì (Continued)
At March 31, 2001 some 59 employees held options over 1,716,750 ordinary shares exercisable asfollows:
18,700 between 2001 and 2002 at 2.75p per share.3,600 between 2001 and 2004 at 3.23p per share.80,000 between 2001 and 2005 at 2.54p per share.378,000 between 2001 and 2007 at 1.39p per share.519,000 between 2001 and 2008 at 1.06¥p per share.60,000 between 2002 and 2009 at 79p per share.50,000 between 2002 and 2009 at 67¥p per share.22,000 between 2003 and 2010 at 65p per share.194,950 between 2003 and 2010 at 70p per share.240,500 between 2003 and 2010 at 87¥p per share.150,000 between 2003 and 2010 at 76¥p per share.
Following the end of the year under review De' Longhi Pinguino S.A. made an oÅer to purchase/cashcancel the options held under this scheme for a price of 1.00 per share.
(b) The Sharesave Scheme:
At June 24, 1999 shares held were exercisable as follows:
45 employees held options over 55,276 ordinary shares at a price of 2.65p per share exercisablebetween 1999 and 2001.
165 employees held options over 802,087 ordinary shares at a price of 99p per share exercisablebetween 2008 and 2010.
At March 31, 2000 shares held were exercisable as follows:
29 employees held options over 36,408 ordinary shares at a price of 2.65p per share exercisablebetween 2000 and 2001.
84 employees held options over 540,782 ordinary shares at a price of 99p per share exercisablebetween 2003 and 2004.
At March 31, 2001 shares held were exercisable as follows:
69 employees held options over 440,437 ordinary shares at a price of 99p per share exercisablebetween 2003 and 2004.
Following the end of the year under review De' Longhi Pinguino S.A. made an oÅer to holders ofoptions to cancel all options under the scheme.
(c) The ESOP Scheme
Under the terms of the ESOP scheme the trustees originally purchased a total of 1,399,219 ofordinary shares, 2.85p per share. A further 18,151 ordinary shares were acquired at the time of the rightsissue in 1994. The shares were purchased by De' Longhi Pinguino S.A. under the terms of theRecommended Unconditional Cash OÅer subsequent to March 31, 2001.
F-65
Brought to you by Global Reports

KENWOOD APPLIANCES PLC
NOTES TO THE CONSOLIDATED FINANCIAL STATEMENTS Ì (Continued)
23. RESERVES
NonShare Distributable ProÑt
Premium Special and LossAccount Reserve Account
000 000 000
At April 4, 1998 ÏÏÏÏÏÏÏÏÏÏÏÏÏÏÏÏÏÏÏÏÏÏÏÏÏÏÏÏÏÏÏÏÏÏÏÏÏÏÏÏÏÏÏÏÏ 25,101 2,180 1,889
Prior year adjustment ÏÏÏÏÏÏÏÏÏÏÏÏÏÏÏÏÏÏÏÏÏÏÏÏÏÏÏÏÏÏÏÏÏÏÏÏÏÏÏÏÏ Ì Ì 829
As restated ÏÏÏÏÏÏÏÏÏÏÏÏÏÏÏÏÏÏÏÏÏÏÏÏÏÏÏÏÏÏÏÏÏÏÏÏÏÏÏÏÏÏÏÏÏÏÏÏÏÏ 25,101 2,180 2,718
Loss for the year ÏÏÏÏÏÏÏÏÏÏÏÏÏÏÏÏÏÏÏÏÏÏÏÏÏÏÏÏÏÏÏÏÏÏÏÏÏÏÏÏÏÏÏÏÏ Ì Ì (11,273)
Exchange diÅerences ÏÏÏÏÏÏÏÏÏÏÏÏÏÏÏÏÏÏÏÏÏÏÏÏÏÏÏÏÏÏÏÏÏÏÏÏÏÏÏÏÏ Ì Ì (63)
Exchange diÅerences on foreign currency hedging loans ÏÏÏÏÏÏÏÏÏÏÏÏ Ì Ì 75
At April 3, 1999 ÏÏÏÏÏÏÏÏÏÏÏÏÏÏÏÏÏÏÏÏÏÏÏÏÏÏÏÏÏÏÏÏÏÏÏÏÏÏÏÏÏÏÏÏÏ 25,101 2,180 (8,543)
Adjustments to goodwill relating to previous acquisitions (Note 15) ÏÏ Ì Ì (1,538)
Loss for the year ÏÏÏÏÏÏÏÏÏÏÏÏÏÏÏÏÏÏÏÏÏÏÏÏÏÏÏÏÏÏÏÏÏÏÏÏÏÏÏÏÏÏÏÏÏ Ì Ì (2,486)
Exchange diÅerences ÏÏÏÏÏÏÏÏÏÏÏÏÏÏÏÏÏÏÏÏÏÏÏÏÏÏÏÏÏÏÏÏÏÏÏÏÏÏÏÏÏ Ì Ì 29
Exchange diÅerences on foreign currency hedging loans ÏÏÏÏÏÏÏÏÏÏÏÏ Ì Ì (133)
At April 1, 2000 ÏÏÏÏÏÏÏÏÏÏÏÏÏÏÏÏÏÏÏÏÏÏÏÏÏÏÏÏÏÏÏÏÏÏÏÏÏÏÏÏÏÏÏÏÏ 25,101 2,180 (12,671)
Loss for the year ÏÏÏÏÏÏÏÏÏÏÏÏÏÏÏÏÏÏÏÏÏÏÏÏÏÏÏÏÏÏÏÏÏÏÏÏÏÏÏÏÏÏÏÏÏ Ì Ì (7,051)
Foreign exchangeÏÏÏÏÏÏÏÏÏÏÏÏÏÏÏÏÏÏÏÏÏÏÏÏÏÏÏÏÏÏÏÏÏÏÏÏÏÏÏÏÏÏÏÏÏ Ì Ì 1,025
Exchange diÅerences on foreign currency hedging loans ÏÏÏÏÏÏÏÏÏÏÏÏ Ì Ì (752)
ReclassiÑcation for goodwill from previous acquisitions ÏÏÏÏÏÏÏÏÏÏÏÏÏ Ì (1,538) 1,538
At March 31, 2001 ÏÏÏÏÏÏÏÏÏÏÏÏÏÏÏÏÏÏÏÏÏÏÏÏÏÏÏÏÏÏÏÏÏÏÏÏÏÏÏÏÏÏÏ 25,101 642 17,911
The cumulative amount of goodwill written oÅ at March 31, 2001 was 32,358,000 (2000:32,358,000; 1999: 30,820,000).
24. COMMITMENTS
Capital commitments
March 31, March 31, April 2,2001 2000 1999
000 000 000
Contracted ÏÏÏÏÏÏÏÏÏÏÏÏÏÏÏÏÏÏÏÏÏÏÏÏÏÏÏÏÏÏÏÏÏÏÏÏÏÏÏÏÏÏÏÏÏÏÏÏÏÏÏÏÏ 1,991 408 985
F-66
Brought to you by Global Reports

KENWOOD APPLIANCES PLC
NOTES TO THE CONSOLIDATED FINANCIAL STATEMENTS Ì (Continued)
Leasing commitments
Annual commitments under non-cancellable operating leases are as follows:
March 31, March 31, April 2,2001 2000 1999
000 000 000
Plant and machinery:
Expiring within one yearÏÏÏÏÏÏÏÏÏÏÏÏÏÏÏÏÏÏÏÏÏÏÏÏÏÏÏÏÏÏÏÏÏÏÏÏÏÏÏÏÏÏ 164 186 27
Expiring between two and Ñve years ÏÏÏÏÏÏÏÏÏÏÏÏÏÏÏÏÏÏÏÏÏÏÏÏÏÏÏÏÏÏÏÏ 314 237 358
In over Ñve years ÏÏÏÏÏÏÏÏÏÏÏÏÏÏÏÏÏÏÏÏÏÏÏÏÏÏÏÏÏÏÏÏÏÏÏÏÏÏÏÏÏÏÏÏÏÏÏÏ 38 Ì Ì
516 423 385
Land and buildings:
Expiring within one yearÏÏÏÏÏÏÏÏÏÏÏÏÏÏÏÏÏÏÏÏÏÏÏÏÏÏÏÏÏÏÏÏÏÏÏÏÏÏÏÏÏÏ 460 449 45
Expiring between two and Ñve years ÏÏÏÏÏÏÏÏÏÏÏÏÏÏÏÏÏÏÏÏÏÏÏÏÏÏÏÏÏÏÏÏ 26 137 759
In over Ñve years ÏÏÏÏÏÏÏÏÏÏÏÏÏÏÏÏÏÏÏÏÏÏÏÏÏÏÏÏÏÏÏÏÏÏÏÏÏÏÏÏÏÏÏÏÏÏÏÏ 405 441 Ì
891 1,027 804
25. CONTINGENT LIABILITIES
Kenwood Appliances plc has issued guarantees to banks in respect of other group companies'overdrafts and advances. These guarantees are given in the normal course of business.
26. PENSION COMMITMENTS
As disclosed in the Report and Accounts year ended April 2, 1999
The group operates a number of pension schemes throughout the world. The major scheme (which isoperated in the U.K.) covers the majority of scheme members and is of the deÑned beneÑt type. Theassets of the main scheme are held in separate trustee administered funds.
The pension cost relating to the U.K. scheme is assessed in accordance with the advice of a qualiÑedactuary using the projected unit credit method.
The assumptions which have the most signiÑcant eÅect on the results of the valuation are thoserelating to the rate of return on investments and the rates of increase in salaries and pensions. An actuarialvaluation was conducted as at September 30, 1996, using the following principal assumptions:
(a) rate of return on investments 10% per annum;
(b) rate of salary increases 7.5% per annum;
(c) future pensions will be increased at 4% per annum; and
(d) dividends will increase by 5.5% per annum.
The market value of the assets at September 30 1996 was 9,271,000 and the actuarial value of theassets was equal to 93% of the present value of beneÑts accrued to members after allowing for expectedfuture increases in earnings. This deÑcit will be reduced by additional contributions in future years.
As disclosed in the Report and Accounts years ended March 31, 2001 and March 31, 2000
The group operates a number of pension schemes throughout the world. The major scheme (which isoperated in the U.K.) covers the majority of scheme members and is of the deÑned beneÑt type. Theassets of the main scheme are held in separate trustee administered funds.
The pension cost relating to the U.K. scheme is assessed in accordance with the advice of a qualiÑedactuary using the projected unit credit method.
F-67
Brought to you by Global Reports

KENWOOD APPLIANCES PLC
NOTES TO THE CONSOLIDATED FINANCIAL STATEMENTS Ì (Continued)
The assumptions, which have the most signiÑcant eÅect on the results of the valuation, are thoserelating to the rate of return on investments and the rates of increase in salaries and pensions. An actuarialvaluation was conducted at September 30, 1999, using the following principal assumptions:
(a) price inÖation 3% pa;
(b) investment return on future contributions 7.25% pa;
(c) investment return on existing assets 6.5% pa;
(d) increase in salaries 4% pa;
(e) increase in lower earnings limit 3% pa; and
(f) increase in pensions 3% pa.
The market value of the assets at September 30, 1999 was 13,479,000 and the actuarial value of theassets was equal to 79% of the present value of beneÑts accrued to members after allowing for expectedfuture increases in earnings. This deÑcit will be reduced by additional contributions in future years.
27. POST BALANCE SHEET EVENTS
Since March 31, 2001
The Group's secured borrowings were repaid on April 5, 2001 and the associated charges werereleased.
The Company's shares were delisted from the London Stock Exchange on April 17, 2000.
The Company was acquired by De' Longhi Pinguino S.A. under the terms of the agreed oÅer. TheoÅer was completed on May 24, 2001.
28. PARENT UNDERTAKING AND CONTROLLING PARTY
The Company's immediate undertaking is De' Longhi Pinguino S.A. The Company's ultimate parentundertaking and controlling party is De' Longhi S.p.A., which is incorporated in Italy. Copies of its Groupaccounts, which will include the Company from March 1, 2001, will be available from Via L.Seitz 47,31100 Treviso, Italy.
F-68
Brought to you by Global Reports

UNAUDITED INTERIM CONSOLIDATED FINANCIAL STATEMENTS
F-69
Brought to you by Global Reports
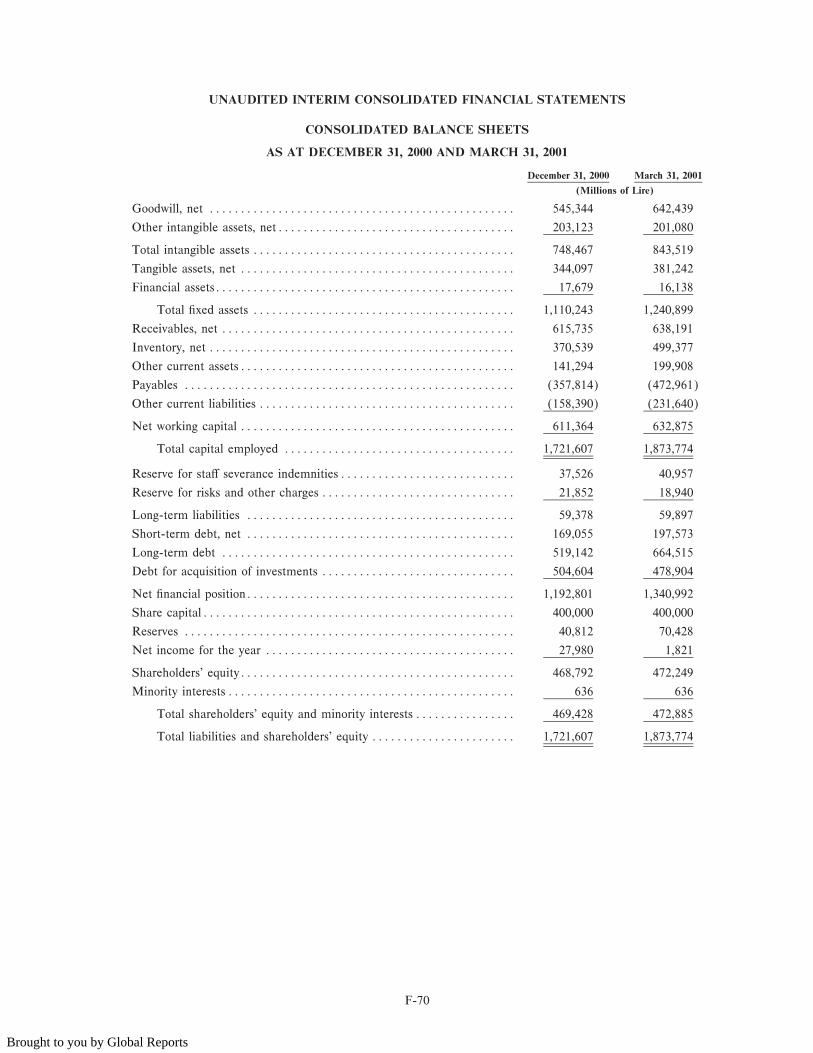
UNAUDITED INTERIM CONSOLIDATED FINANCIAL STATEMENTS
CONSOLIDATED BALANCE SHEETS
AS AT DECEMBER 31, 2000 AND MARCH 31, 2001
December 31, 2000 March 31, 2001
(Millions of Lire)
Goodwill, net ÏÏÏÏÏÏÏÏÏÏÏÏÏÏÏÏÏÏÏÏÏÏÏÏÏÏÏÏÏÏÏÏÏÏÏÏÏÏÏÏÏÏÏÏÏÏÏÏÏ 545,344 642,439
Other intangible assets, netÏÏÏÏÏÏÏÏÏÏÏÏÏÏÏÏÏÏÏÏÏÏÏÏÏÏÏÏÏÏÏÏÏÏÏÏÏÏ 203,123 201,080
Total intangible assets ÏÏÏÏÏÏÏÏÏÏÏÏÏÏÏÏÏÏÏÏÏÏÏÏÏÏÏÏÏÏÏÏÏÏÏÏÏÏÏÏÏÏ 748,467 843,519
Tangible assets, net ÏÏÏÏÏÏÏÏÏÏÏÏÏÏÏÏÏÏÏÏÏÏÏÏÏÏÏÏÏÏÏÏÏÏÏÏÏÏÏÏÏÏÏÏ 344,097 381,242
Financial assetsÏÏÏÏÏÏÏÏÏÏÏÏÏÏÏÏÏÏÏÏÏÏÏÏÏÏÏÏÏÏÏÏÏÏÏÏÏÏÏÏÏÏÏÏÏÏÏÏ 17,679 16,138
Total Ñxed assets ÏÏÏÏÏÏÏÏÏÏÏÏÏÏÏÏÏÏÏÏÏÏÏÏÏÏÏÏÏÏÏÏÏÏÏÏÏÏÏÏÏÏ 1,110,243 1,240,899
Receivables, net ÏÏÏÏÏÏÏÏÏÏÏÏÏÏÏÏÏÏÏÏÏÏÏÏÏÏÏÏÏÏÏÏÏÏÏÏÏÏÏÏÏÏÏÏÏÏÏ 615,735 638,191
Inventory, net ÏÏÏÏÏÏÏÏÏÏÏÏÏÏÏÏÏÏÏÏÏÏÏÏÏÏÏÏÏÏÏÏÏÏÏÏÏÏÏÏÏÏÏÏÏÏÏÏÏ 370,539 499,377
Other current assetsÏÏÏÏÏÏÏÏÏÏÏÏÏÏÏÏÏÏÏÏÏÏÏÏÏÏÏÏÏÏÏÏÏÏÏÏÏÏÏÏÏÏÏÏ 141,294 199,908
Payables ÏÏÏÏÏÏÏÏÏÏÏÏÏÏÏÏÏÏÏÏÏÏÏÏÏÏÏÏÏÏÏÏÏÏÏÏÏÏÏÏÏÏÏÏÏÏÏÏÏÏÏÏÏ (357,814) (472,961)
Other current liabilities ÏÏÏÏÏÏÏÏÏÏÏÏÏÏÏÏÏÏÏÏÏÏÏÏÏÏÏÏÏÏÏÏÏÏÏÏÏÏÏÏÏ (158,390) (231,640)
Net working capital ÏÏÏÏÏÏÏÏÏÏÏÏÏÏÏÏÏÏÏÏÏÏÏÏÏÏÏÏÏÏÏÏÏÏÏÏÏÏÏÏÏÏÏÏ 611,364 632,875
Total capital employed ÏÏÏÏÏÏÏÏÏÏÏÏÏÏÏÏÏÏÏÏÏÏÏÏÏÏÏÏÏÏÏÏÏÏÏÏÏ 1,721,607 1,873,774
Reserve for staÅ severance indemnitiesÏÏÏÏÏÏÏÏÏÏÏÏÏÏÏÏÏÏÏÏÏÏÏÏÏÏÏÏ 37,526 40,957
Reserve for risks and other charges ÏÏÏÏÏÏÏÏÏÏÏÏÏÏÏÏÏÏÏÏÏÏÏÏÏÏÏÏÏÏÏ 21,852 18,940
Long-term liabilities ÏÏÏÏÏÏÏÏÏÏÏÏÏÏÏÏÏÏÏÏÏÏÏÏÏÏÏÏÏÏÏÏÏÏÏÏÏÏÏÏÏÏÏ 59,378 59,897
Short-term debt, net ÏÏÏÏÏÏÏÏÏÏÏÏÏÏÏÏÏÏÏÏÏÏÏÏÏÏÏÏÏÏÏÏÏÏÏÏÏÏÏÏÏÏÏ 169,055 197,573
Long-term debt ÏÏÏÏÏÏÏÏÏÏÏÏÏÏÏÏÏÏÏÏÏÏÏÏÏÏÏÏÏÏÏÏÏÏÏÏÏÏÏÏÏÏÏÏÏÏÏ 519,142 664,515
Debt for acquisition of investments ÏÏÏÏÏÏÏÏÏÏÏÏÏÏÏÏÏÏÏÏÏÏÏÏÏÏÏÏÏÏÏ 504,604 478,904
Net Ñnancial positionÏÏÏÏÏÏÏÏÏÏÏÏÏÏÏÏÏÏÏÏÏÏÏÏÏÏÏÏÏÏÏÏÏÏÏÏÏÏÏÏÏÏÏ 1,192,801 1,340,992
Share capitalÏÏÏÏÏÏÏÏÏÏÏÏÏÏÏÏÏÏÏÏÏÏÏÏÏÏÏÏÏÏÏÏÏÏÏÏÏÏÏÏÏÏÏÏÏÏÏÏÏÏ 400,000 400,000
Reserves ÏÏÏÏÏÏÏÏÏÏÏÏÏÏÏÏÏÏÏÏÏÏÏÏÏÏÏÏÏÏÏÏÏÏÏÏÏÏÏÏÏÏÏÏÏÏÏÏÏÏÏÏÏ 40,812 70,428
Net income for the year ÏÏÏÏÏÏÏÏÏÏÏÏÏÏÏÏÏÏÏÏÏÏÏÏÏÏÏÏÏÏÏÏÏÏÏÏÏÏÏÏ 27,980 1,821
Shareholders' equityÏÏÏÏÏÏÏÏÏÏÏÏÏÏÏÏÏÏÏÏÏÏÏÏÏÏÏÏÏÏÏÏÏÏÏÏÏÏÏÏÏÏÏÏ 468,792 472,249
Minority interests ÏÏÏÏÏÏÏÏÏÏÏÏÏÏÏÏÏÏÏÏÏÏÏÏÏÏÏÏÏÏÏÏÏÏÏÏÏÏÏÏÏÏÏÏÏÏ 636 636
Total shareholders' equity and minority interests ÏÏÏÏÏÏÏÏÏÏÏÏÏÏÏÏ 469,428 472,885
Total liabilities and shareholders' equity ÏÏÏÏÏÏÏÏÏÏÏÏÏÏÏÏÏÏÏÏÏÏÏ 1,721,607 1,873,774
F-70
Brought to you by Global Reports

UNAUDITED INTERIM CONSOLIDATED FINANCIAL STATEMENTS
CONSOLIDATED INCOME STATEMENTS
FOR THE PERIODS ENDING MARCH 31, 2000 AND 2001
March 31, 2000 % March 31, 2001 % % Variance
(Millions of Lire)
Net sales ÏÏÏÏÏÏÏÏÏÏÏÏÏÏÏÏÏÏÏÏÏÏÏÏÏÏ 211,820 97.0% 467,186 99.0% 19.7%
Other revenues ÏÏÏÏÏÏÏÏÏÏÏÏÏÏÏÏÏÏÏÏÏ 6,493 3.0% 4,967 1.0% -30.9%
Total revenuesÏÏÏÏÏÏÏÏÏÏÏÏÏÏÏÏÏÏ 218,313 100.0% 472,153 100.0% 18.2%
Materials, consumables and goods ÏÏÏÏÏ 91,577 -41.9% 239,868 -40.6% 14.3%
Services, rents, leases and related costs 64,604 -29.6% 102,847 -26.9% 7.6%
Other costsÏÏÏÏÏÏÏÏÏÏÏÏÏÏÏÏÏÏÏÏÏÏÏÏÏ 3,366 -1.5% 2,923 -1.0% -21.0%
Total production costsÏÏÏÏÏÏÏÏÏÏÏ 159,547 -73.1% 345,638 -68.5% 10.8%
Value added margin ÏÏÏÏÏÏÏÏÏÏÏÏÏÏÏÏÏ 58,766 26.9% 126,515 31.5% 38.3%
Wages, salaries and beneÑts ÏÏÏÏÏÏÏÏÏÏ 40,942 -18.8% 73,913 -17.6% 10.9%
Gross operating margin ÏÏÏÏÏÏÏÏÏÏÏÏÏÏ 17,824 8.2% 52,602 13.9% 101.2%
Depreciation and amortizationÏÏÏÏÏÏÏÏÏ 13,946 -6.4% 23,259 -5.6% 4.0%
Amortization of goodwill ÏÏÏÏÏÏÏÏÏÏÏÏÏ 455 -0.2% 10,356 -0.2% 3.5%
Provisions and write-oÅs ÏÏÏÏÏÏÏÏÏÏÏÏÏ 2,356 -1.1% (199) -0.6% -37.1%
Operating proÑt ÏÏÏÏÏÏÏÏÏÏÏÏÏÏÏÏÏÏÏÏ 1,067 0.5% 19,186 7.5% 1718.1%
Net Ñnancial loss ÏÏÏÏÏÏÏÏÏÏÏÏÏÏÏÏÏÏÏ (11,640) -5.3% (15,225) -2.8% -37.2%
Extraordinary (loss) gainÏÏÏÏÏÏÏÏÏÏÏÏÏ (68) 0.0% 2,598 0.0% N/A
Earnings before taxes and minorityinterests ÏÏÏÏÏÏÏÏÏÏÏÏÏÏÏÏÏÏÏÏÏÏÏÏÏ (10,641) -4.9% 6,559 4.7% N/A
Income taxes ÏÏÏÏÏÏÏÏÏÏÏÏÏÏÏÏÏÏÏÏÏÏÏ 1,774 -0.8% 4,738 -1.5% 119.6%
Net (loss) income before minorityinterests ÏÏÏÏÏÏÏÏÏÏÏÏÏÏÏÏÏÏÏÏÏÏÏÏÏ (12,415) -5.7% 1,821 3.2% N/A
Minority interests ÏÏÏÏÏÏÏÏÏÏÏÏÏÏÏÏÏÏÏ Ì Ì Ì Ì Ì
Net (loss) income ÏÏÏÏÏÏÏÏÏÏÏÏÏÏÏÏÏÏ (12,415) -5.7% 1,821 3.2% N/A
F-71
Brought to you by Global Reports

UNAUDITED INTERIM CONSOLIDATED FINANCIAL STATEMENTS
STATEMENTS OF CASH FLOW
FOR THE PERIODS ENDING DECEMBER 31, 2000 AND MARCH 31, 2001
December 31, March 31,2000 2001
(Millions of Lire)
Net income(loss) for year ÏÏÏÏÏÏÏÏÏÏÏÏÏÏÏÏÏÏÏÏÏÏÏÏÏÏÏÏÏÏÏÏÏÏÏÏÏÏÏÏÏÏÏÏ 27,980 1,821
Depreciation and amortizationÏÏÏÏÏÏÏÏÏÏÏÏÏÏÏÏÏÏÏÏÏÏÏÏÏÏÏÏÏÏÏÏÏÏÏÏÏÏÏÏÏ 60,193 26,654
Net changes in reserves for risks and other charges ÏÏÏÏÏÏÏÏÏÏÏÏÏÏÏÏÏÏÏÏÏÏÏ 4,566 (2,520)
Cash Öows provided by operating activities ÏÏÏÏÏÏÏÏÏÏÏÏÏÏÏÏÏÏÏÏÏÏÏÏÏÏÏÏÏÏ 92,739 25,955
Change in receivables ÏÏÏÏÏÏÏÏÏÏÏÏÏÏÏÏÏÏÏÏÏÏÏÏÏÏÏÏÏÏÏÏÏÏÏÏÏÏÏÏÏÏÏÏÏÏÏÏ (11,223) 84,658
Change in inventory ÏÏÏÏÏÏÏÏÏÏÏÏÏÏÏÏÏÏÏÏÏÏÏÏÏÏÏÏÏÏÏÏÏÏÏÏÏÏÏÏÏÏÏÏÏÏÏÏÏ (71,464) (57,029)
Change in payables ÏÏÏÏÏÏÏÏÏÏÏÏÏÏÏÏÏÏÏÏÏÏÏÏÏÏÏÏÏÏÏÏÏÏÏÏÏÏÏÏÏÏÏÏÏÏÏÏÏÏ 6,797 20,305
Change in other current assets and liabilitiesÏÏÏÏÏÏÏÏÏÏÏÏÏÏÏÏÏÏÏÏÏÏÏÏÏÏÏÏÏ 32,475 (15,977)
Cash Öows (used in) provided by changes in working capital ÏÏÏÏÏÏÏÏÏÏÏÏÏÏÏ (43,415) 31,957
Net investment in intangible assetsÏÏÏÏÏÏÏÏÏÏÏÏÏÏÏÏÏÏÏÏÏÏÏÏÏÏÏÏÏÏÏÏÏÏÏÏÏ (6,714) (2,536)
Net investment in tangible assets ÏÏÏÏÏÏÏÏÏÏÏÏÏÏÏÏÏÏÏÏÏÏÏÏÏÏÏÏÏÏÏÏÏÏÏÏÏÏ (32,450) (8,960)
Net investment in Ñnancial assets ÏÏÏÏÏÏÏÏÏÏÏÏÏÏÏÏÏÏÏÏÏÏÏÏÏÏÏÏÏÏÏÏÏÏÏÏÏÏ 18,447 1,541
Cash Öows used in investing activities ÏÏÏÏÏÏÏÏÏÏÏÏÏÏÏÏÏÏÏÏÏÏÏÏÏÏÏÏÏÏÏÏÏÏ (20,717) (9,955)
Change in shareholders' equity ÏÏÏÏÏÏÏÏÏÏÏÏÏÏÏÏÏÏÏÏÏÏÏÏÏÏÏÏÏÏÏÏÏÏÏÏÏÏÏÏ Ì Ì
Change in conversion reserveÏÏÏÏÏÏÏÏÏÏÏÏÏÏÏÏÏÏÏÏÏÏÏÏÏÏÏÏÏÏÏÏÏÏÏÏÏÏÏÏÏÏ (601) (135)
Cash Öows used in Ñnancing activities ÏÏÏÏÏÏÏÏÏÏÏÏÏÏÏÏÏÏÏÏÏÏÏÏÏÏÏÏÏÏÏÏÏÏ (601) (135)
Cash Öows attributable to the change in consolidation areaÏÏÏÏÏÏÏÏÏÏÏÏÏÏÏÏÏ (707,721) (196,013)
Cash Öows for the period ÏÏÏÏÏÏÏÏÏÏÏÏÏÏÏÏÏÏÏÏÏÏÏÏÏÏÏÏÏÏÏÏÏÏÏÏÏÏÏÏÏÏÏÏÏ (679,715) (148,191)
Net Ñnancial position at the beginning of the period ÏÏÏÏÏÏÏÏÏÏÏÏÏÏÏÏÏÏÏÏÏÏ (513,086) (1,192,801)
Cash Öow for the periodÏÏÏÏÏÏÏÏÏÏÏÏÏÏÏÏÏÏÏÏÏÏÏÏÏÏÏÏÏÏÏÏÏÏÏÏÏÏÏÏÏÏÏÏÏÏ (679,715) (148,191)
Net Ñnancial position at end of the periodÏÏÏÏÏÏÏÏÏÏÏÏÏÏÏÏÏÏÏÏÏÏÏÏÏÏÏÏÏÏÏ (1,192,801) (1,340,992)
F-72
Brought to you by Global Reports

UNAUDITED INTERIM CONSOLIDATED FINANCIAL STATEMENTS
NOTES TO THE UNAUDITED INTERIM CONSOLIDATED FINANCIAL STATEMENTS
Unaudited Condensed Consolidated Interim Financial Statements
The accompanying unaudited condensed consolidated Ñnancial statements of De' Longhi SpA (the""Company'') as at and for the quarters ended March 31, 2000 and 2001 contain, in the opinion ofManagement, all adjustments (consisting of normal recurring accruals) necessary to present fairly theCompany's Ñnancial position as at March 31, 2000 and 2001, and the results of its operations and cashÖows for the three-month periods ended March 31, 2000 and 2001. The Ñnancial statements have beenprepared on the basis of, and in accordance with, accounting principles prescribed by Italian law andsupplemented by the accounting principles issued by the Consiglio Nazionale dei Dottori Commercialisti eRagioneri.
The information was prepared on the same basis as the actual consolidation at each period end. MorespeciÑcally:
‚ The consolidated Ñnancial statements as at and for the three months ended March 31, 2001 do notinclude the eÅects of the capital increase of April 18, 2001 and the subsequent events described inNote 2. The Ñnancial statements include the net loss of the Kenwood Group for March 2001 only.
‚ The consolidated income statement for the three months ended March 31, 2000 doesn't includethe activity and the related eÅects of consolidation of companies acquired after this date.
‚ The consolidated balance sheet and cash Öow statement as at and for the year endedDecember 31, 2000 included all acquisitions made during 2000.
Acquisition of the Kenwood Group
On February 16, 2001, we acquired a controlling interest in Kenwood Group plc (""Kenwood''), andEnglish company headquartered in Havant Hampshire. As of May 24, 2001, we acquired the remainingshares of Kenwood. The total purchase price paid for Kenwood was Lit. 143,000 million plus theassumption of an additional Lit. 56,500 million in debt. Kenwood specializes in the manufacture and saleof small domestic appliances internationally under the Kenwood and Ariete brand names. The acquisitioncomplements the Company's existing product lines and adds additional manufacturing capacity and salespresence in attractive markets.
Subsequent Events
Subsequent events occurring after March 31, 2001 can be summarised as follows:
‚ On April 18, 2001, the general shareholders' meeting voted a paid capital increase of Lit. 250,587million for subscription and payment in its entirety by the existing shareholders of De' LonghiS.p.A. As a result, the Company's share capital stands at Lit. 650,587 million.
‚ On April 23, 2001 an instalment of Lit. 320,600 million was paid in conjunction with theacquisitions of December 28, 2000. The Ñnal instalment amounting to Lit. 158,304 million will berepaid December 31, 2001 without interest charges.
Comparative income statements
In order to perform a consistent analysis of trends between activity during the three months endedMarch 31, 2001 and that of the same period of the previous year, it has been decided to separateinformation relating to:
1) companies consolidated as at March 31, 2000 (hereafter ""Consolidated De' Longhi S.p.A.'');
2) companies acquired on December 28, 2000;
3) Kenwood Group, which was acquired in early 2001; and
4) consolidation adjustments relating to the acquisitions in points 2) and 3) above.
F-73
Brought to you by Global Reports

UNAUDITED INTERIM CONSOLIDATED FINANCIAL STATEMENTS
NOTES TO THE UNAUDITED INTERIM CONSOLIDATED FINANCIAL STATEMENTS Ì(Continued)
March 31, 2000 March 31, 2001 Amort. of goodwillConsolidated Consolidated Companies Kenwood for acquired Consolidated
De' Longhi S.p.A. De' Longhi S.p.A. acquired in 2000 Group companies total
(Millions of Lire)
Net salesÏÏÏÏÏÏÏÏÏÏÏÏÏÏÏÏÏÏÏÏ 211,820 253,613 89,249 124,324 Ì (467,186)
Other revenuesÏÏÏÏÏÏÏÏÏÏÏÏÏÏÏ 6,493 4,489 478 Ì (4,967)
Total revenues ÏÏÏÏÏÏÏÏÏÏÏÏÏÏÏ 218,313 258,102 89,727 124,324 Ì (472,153)
Materials, consumablesand goods ÏÏÏÏÏÏÏÏÏÏÏÏÏÏÏÏÏ (91,577) (104,680) (45,739) (89,449) Ì 239,868
ServicesÏÏÏÏÏÏÏÏÏÏÏÏÏÏÏÏÏÏÏÏÏ (64,604) (69,503) (14,952) (18,392) Ì 102,847
Rents, leases and related costs ÏÏ (3,366) (2,660) (263) Ì Ì 2,923
Total production costs ÏÏÏÏÏÏÏÏÏ (159,547) (176,843) (60,954) (107,841) Ì 345,638
Value added margin ÏÏÏÏÏÏÏÏÏÏ 58,766 81,259 28,773 16,483 Ì (126,515)
Wages, salaries and beneÑts ÏÏÏÏ (40,942) (45,399) (15,181) (13,333) Ì 73,913
Gross operating margin ÏÏÏÏÏÏÏÏ 17,824 35,860 13,592 3,150 Ì (52,602)
Depreciation and amortization ÏÏ (13,946) (14,507) (4,583) (4,169) Ì 23,259
Amortization of goodwillÏÏÏÏÏÏÏ (455) (471) (843) (2,479) (6,563) 10,356
Provisions and write-oÅs ÏÏÏÏÏÏÏ (2,356) (1,483) (237) 1,919 Ì (199)
Operating proÑt (loss) ÏÏÏÏÏÏÏÏ 1,067 19,399 7,929 (1,579) (6,563) (19,186)
Net Ñnancial loss ÏÏÏÏÏÏÏÏÏÏÏÏÏ (11,640) (7,306) (3,885) (4,034) Ì 15,225
Extraordinary (loss) gain ÏÏÏÏÏÏ (68) 12 41 2,545 Ì (2,598)
Earnings before taxes andminority interests ÏÏÏÏÏÏÏÏÏÏÏ (10,641) 12,105 4,085 (3,068) (6,563) (6,559)
Income tax expense beneÑt ÏÏÏÏ 1,774 3,895 1,376 (533) Ì 4,738
Net (loss) income beforeminority interestÏÏÏÏÏÏÏÏÏÏÏÏ (12,415) 8,210 2,709 (2,535) (6,563) 1,821
Minority interest ÏÏÏÏÏÏÏÏÏÏÏÏÏ Ì Ì Ì Ì Ì Ì
Net (loss) income ÏÏÏÏÏÏÏÏÏÏÏÏ (12,415) 8,210 2,709 (2,535) (6,563) 1,821
F-74
Brought to you by Global Reports

UNAUDITED DE' LONGHI PRO FORMA CONSOLIDATED FINANCIAL STATEMENTS(NOT INCLUDING KENWOOD)
F-75
Brought to you by Global Reports

Report of Independent Auditors
To the Board of Directors,De' Longhi S.p.A.
1 We have examined the enclosed pro forma consolidated Ñnancial statements of the De' Longhi Groupfor the years ending December 31, 2000, 1999 and 1998 and the supplementary notes thereto.
2 These pro forma consolidated Ñnancial statements were prepared in accordance with the requirementsof art. 2.2.1 of the ""Regolamento dei Mercati'' (market regulations) for markets organized andoperated by Borsa Italiana S.p.A. They were also prepared for the purpose of showing theretrospective eÅect (as of January 1, 1998) of the Group's structure at January 1, 2000 as a result ofcertain transactions that occurred during the period under review, as described in detail in the notes tothe pro forma consolidated Ñnancial statements.
3 The pro forma consolidated Ñnancial statements for the three years ended December 31, 2000, werebased on restatements of the historical consolidated Ñnancial statements of De' Longhi S.p.A. atDecember 31, 2000, 1999 and 1998, which we audited and issued opinions on April 11, 2001,June 26, 2000 and June 30, 1999, respectively. They were also based on the balance sheets of certainsubsidiaries that were only consolidated as of December 31, 2000 and which we audited to the extentwe deemed necessary within the framework of the pro forma consolidated Ñnancial statements. Ouraudit report on the year ending December 31, 1998 did not cover the income statement for thatperiod.
4 The pro forma consolidated Ñnancial statements were prepared to represent the eÅects on De' LonghiGroup's consolidated Ñnancial statements of the transactions mentioned in paragraph 2 above as ifthey had taken place at the start of the three-year period ended December 31, 2000. This presentationmakes it possible to make a comparative analysis of the equity, income and cash-Öow performance ofthe De' Longhi Group over the three-year period ended December 31, 2000. It must be noted,however, that if the aforementioned transactions really had occurred on the assumed dates, the resultsobtained would not necessarily have been those reÖected in the accompanying pro forma consolidatedÑnancial statement.
5 Our examination consisted of checking that the pro forma consolidated Ñnancial statements wereprepared correctly on the basis of the assumptions adopted and disclosed in the footnotes and includedall the procedures we deemed appropriate in the circumstances.
6 On the basis of the work performed we believe that the underlying assumptions adopted byDe' Longhi S.p.A. in preparing the pro forma consolidated Ñnancial statements and supplementarynotes for the periods ending December 31, 2000, 1999 and 1998 are reasonable. The methods used toprepare the pro forma consolidated Ñnancial statements were correctly applied with respect to theinformation objectives described above.
Treviso, April 20, 2001
PricewaterhouseCoopers S.p.A.
Roberto Adami(Partner)
The above report is an English translation of the Italian report prepared for use in Italy and relates to theoriginal version of the pro forma consolidated Ñnancial statements prepared in the Italian language. Theexamination report on pro forma Ñnancial statements is required by the Italian securities market regulator,CONSOB. Such Ñnancial statements were prepared using accounting principles, procedures and reportingpractices generally accepted in Italy and are not intended to present the results of operations or statementof position in accordance with accounting principles and practices generally accepted in countries andjurisdictions other than those of Italy. The standards, procedures and practices utilized to examine suchÑnancial statements are those generally accepted and applied in Italy. The accompanying pro formaÑnancial statements do not purport to represent what the actual results of operations or Ñnancial positionwould have been if the pro forma transactions had occurred as of January 1, 1998, or to project the resultsof operations for any future period.
F-76
Brought to you by Global Reports

UNAUDITED DE LONGHI PRO FORMA CONSOLIDATED FINANCIAL STATEMENTS(NOT INCLUDING KENWOOD)
UNAUDITED RESTATED CONSOLIDATED BALANCE SHEETS AS
AT DECEMBER 31, 1998, 1999 AND 2000
1998 1999 2000
(Millions of Lire)
Receivables from shareholders ÏÏÏÏÏÏÏÏÏÏÏÏÏÏÏÏÏÏÏÏÏÏÏÏÏÏÏÏÏÏÏ 9,100 25,000 Ì
Goodwill, net ÏÏÏÏÏÏÏÏÏÏÏÏÏÏÏÏÏÏÏÏÏÏÏÏÏÏÏÏÏÏÏÏÏÏÏÏÏÏÏÏÏÏÏÏÏ 605,789 575,540 545,343
Other intangible assets, netÏÏÏÏÏÏÏÏÏÏÏÏÏÏÏÏÏÏÏÏÏÏÏÏÏÏÏÏÏÏÏÏÏÏ 234,494 216,347 203,123
Total intangible assets ÏÏÏÏÏÏÏÏÏÏÏÏÏÏÏÏÏÏÏÏÏÏÏÏÏÏÏÏÏÏÏÏÏÏÏÏÏÏ 840,283 791,887 748,466
Tangible assets, net ÏÏÏÏÏÏÏÏÏÏÏÏÏÏÏÏÏÏÏÏÏÏÏÏÏÏÏÏÏÏÏÏÏÏÏÏÏÏÏÏ 370,112 348,788 344,097
Financial assetsÏÏÏÏÏÏÏÏÏÏÏÏÏÏÏÏÏÏÏÏÏÏÏÏÏÏÏÏÏÏÏÏÏÏÏÏÏÏÏÏÏÏÏÏ 37,772 36,509 17,678
Total Ñxed assets ÏÏÏÏÏÏÏÏÏÏÏÏÏÏÏÏÏÏÏÏÏÏÏÏÏÏÏÏÏÏÏÏÏÏÏÏÏÏ 1,248,167 1,177,184 1,110,241
Receivables, net ÏÏÏÏÏÏÏÏÏÏÏÏÏÏÏÏÏÏÏÏÏÏÏÏÏÏÏÏÏÏÏÏÏÏÏÏÏÏÏÏÏÏÏ 505,166 557,852 615,735
Inventory, net ÏÏÏÏÏÏÏÏÏÏÏÏÏÏÏÏÏÏÏÏÏÏÏÏÏÏÏÏÏÏÏÏÏÏÏÏÏÏÏÏÏÏÏÏÏ 305,996 289,581 370,539
Other current assetsÏÏÏÏÏÏÏÏÏÏÏÏÏÏÏÏÏÏÏÏÏÏÏÏÏÏÏÏÏÏÏÏÏÏÏÏÏÏÏÏ 132,196 105,880 138,741
Payables ÏÏÏÏÏÏÏÏÏÏÏÏÏÏÏÏÏÏÏÏÏÏÏÏÏÏÏÏÏÏÏÏÏÏÏÏÏÏÏÏÏÏÏÏÏÏÏÏÏ (291,722) (336,938) (357,813)
Other current liabilities ÏÏÏÏÏÏÏÏÏÏÏÏÏÏÏÏÏÏÏÏÏÏÏÏÏÏÏÏÏÏÏÏÏÏÏÏÏ (97,702) (92,120) (129,008)
Net working capital ÏÏÏÏÏÏÏÏÏÏÏÏÏÏÏÏÏÏÏÏÏÏÏÏÏÏÏÏÏÏÏÏÏÏÏÏÏÏÏÏ 553,934 524,255 638,194
Total capital employed ÏÏÏÏÏÏÏÏÏÏÏÏÏÏÏÏÏÏÏÏÏÏÏÏÏÏÏÏÏÏÏÏÏ 1,811,201 1,726,439 1,748,435
Reserve for staÅ severance indemnitiesÏÏÏÏÏÏÏÏÏÏÏÏÏÏÏÏÏÏÏÏÏÏÏÏ 34,261 34,797 37,525
Reserves for risks and other charges ÏÏÏÏÏÏÏÏÏÏÏÏÏÏÏÏÏÏÏÏÏÏÏÏÏÏ 15,873 17,469 51,235
Long-term liabilities ÏÏÏÏÏÏÏÏÏÏÏÏÏÏÏÏÏÏÏÏÏÏÏÏÏÏÏÏÏÏÏÏÏÏÏÏÏÏÏ 50,134 52,266 88,760
Cash and cash equivalents ÏÏÏÏÏÏÏÏÏÏÏÏÏÏÏÏÏÏÏÏÏÏÏÏÏÏÏÏÏÏÏÏÏÏ (87,859) (157,045) (135,979)
Short-term debt ÏÏÏÏÏÏÏÏÏÏÏÏÏÏÏÏÏÏÏÏÏÏÏÏÏÏÏÏÏÏÏÏÏÏÏÏÏÏÏÏÏÏÏ 3,200 145,582 54,336
Long-term debt ÏÏÏÏÏÏÏÏÏÏÏÏÏÏÏÏÏÏÏÏÏÏÏÏÏÏÏÏÏÏÏÏÏÏÏÏÏÏÏÏÏÏÏ 648,434 336,385 519,143
Debt for acquisition of investments ÏÏÏÏÏÏÏÏÏÏÏÏÏÏÏÏÏÏÏÏÏÏÏÏÏÏÏ 504,714 504,714 504,714
Pro Forma debt ÏÏÏÏÏÏÏÏÏÏÏÏÏÏÏÏÏÏÏÏÏÏÏÏÏÏÏÏÏÏÏÏÏÏÏÏÏÏÏÏÏÏÏ 140,336 137,860 (6,900)
Net Ñnancial positionÏÏÏÏÏÏÏÏÏÏÏÏÏÏÏÏÏÏÏÏÏÏÏÏÏÏÏÏÏÏÏÏÏÏÏÏÏÏÏ 1,208,825 967,496 935,314
Share capitalÏÏÏÏÏÏÏÏÏÏÏÏÏÏÏÏÏÏÏÏÏÏÏÏÏÏÏÏÏÏÏÏÏÏÏÏÏÏÏÏÏÏÏÏÏÏ 550,587 650,587 650,587
Reserves ÏÏÏÏÏÏÏÏÏÏÏÏÏÏÏÏÏÏÏÏÏÏÏÏÏÏÏÏÏÏÏÏÏÏÏÏÏÏÏÏÏÏÏÏÏÏÏÏÏ 26,315 36,362 27,252
Pro Forma related reserves ÏÏÏÏÏÏÏÏÏÏÏÏÏÏÏÏÏÏÏÏÏÏÏÏÏÏÏÏÏÏÏÏÏÏ 19,002 (21,190) 4,345
Net (loss) income for the year ÏÏÏÏÏÏÏÏÏÏÏÏÏÏÏÏÏÏÏÏÏÏÏÏÏÏÏÏÏÏ (44,139) 40,589 41,540
Shareholders' equityÏÏÏÏÏÏÏÏÏÏÏÏÏÏÏÏÏÏÏÏÏÏÏÏÏÏÏÏÏÏÏÏÏÏÏÏÏÏÏÏ 551,765 706,348 723,724
Minority interestsÏÏÏÏÏÏÏÏÏÏÏÏÏÏÏÏÏÏÏÏÏÏÏÏÏÏÏÏÏÏÏÏÏÏÏÏÏÏÏÏÏÏ 477 329 637
Total shareholders' equity and minority interests ÏÏÏÏÏÏÏÏÏÏÏÏ 552,242 706,677 724,361
Total liabilities and shareholders' equity ÏÏÏÏÏÏÏÏÏÏÏÏÏÏÏÏÏÏÏ 1,811,201 1,726,439 1,748,435
Memorandum accounts ÏÏÏÏÏÏÏÏÏÏÏÏÏÏÏÏÏÏÏÏÏÏÏÏÏÏÏÏÏÏÏÏÏÏÏÏÏ 46,058 98,326 24,254
The accompanying notes are an integral part of these Pro Forma Consolidated Financial Statements.
F-77
Brought to you by Global Reports

UNAUDITED DE' LONGHI PRO FORMA CONSOLIDATED FINANCIAL STATEMENTS(NOT INCLUDING KENWOOD)
UNAUDITED RESTATED CONSOLIDATED INCOME STATEMENTS
FOR THE YEARS ENDING DECEMBER 31, 1998, 1999 AND 2000
1998 % 1999 % 2000 %
(Millions of Lire)
Net sales ÏÏÏÏÏÏÏÏÏÏÏÏÏÏÏÏÏÏÏÏÏÏÏÏÏÏÏÏÏÏÏÏÏÏÏÏ 1,269,314 98.3% 1,374,841 98.6% 1,561,334 98.5%
Other revenues ÏÏÏÏÏÏÏÏÏÏÏÏÏÏÏÏÏÏÏÏÏÏÏÏÏÏÏÏÏÏÏ 21,384 1.7% 18,979 1.4% 23,158 1.5%
Total revenues ÏÏÏÏÏÏÏÏÏÏÏÏÏÏÏÏÏÏÏÏÏÏÏÏÏÏÏÏ 1,290,698 100% 1,393,820 100% 1,584,492 100%
Materials, consumables and goods ÏÏÏÏÏÏÏÏÏÏÏÏÏÏÏ 630,240 48.8% 637,305 45.7% 714,053 45.1%
Services ÏÏÏÏÏÏÏÏÏÏÏÏÏÏÏÏÏÏÏÏÏÏÏÏÏÏÏÏÏÏÏÏÏÏÏÏÏ 263,697 20.4% 288,996 20.7% 354,763 22.4%
Rents, leases and related costs ÏÏÏÏÏÏÏÏÏÏÏÏÏÏÏÏÏÏ 13,016 1.0% 12,467 0.9% 14,379 0.9%
Other costsÏÏÏÏÏÏÏÏÏÏÏÏÏÏÏÏÏÏÏÏÏÏÏÏÏÏÏÏÏÏÏÏÏÏÏ 21,128 1.6% 17,874 1.3% 10,867 0.7%
Total production costs ÏÏÏÏÏÏÏÏÏÏÏÏÏÏÏÏÏÏÏÏÏ 928,081 71.9% 956,642 68.6% 1,094,062 69.0%
Value added margin ÏÏÏÏÏÏÏÏÏÏÏÏÏÏÏÏÏÏÏÏÏÏÏÏÏÏÏ 362,617 28.1% 437,178 31.4% 490,430 31.0%
Wages, salaries and beneÑtsÏÏÏÏÏÏÏÏÏÏÏÏÏÏÏÏÏÏÏÏÏ 202,160 15.7% 213,311 15.3% 235,795 14.9%
Gross operating margin ÏÏÏÏÏÏÏÏÏÏÏÏÏÏÏÏÏÏÏÏÏÏÏÏ 160,457 12.4% 223,867 16.1% 254,635 16.1%
Depreciation and amortizationÏÏÏÏÏÏÏÏÏÏÏÏÏÏÏÏÏÏÏ 70,834 5.5% 77,084 5.5% 75,030 4.7%
Amortization of goodwill ÏÏÏÏÏÏÏÏÏÏÏÏÏÏÏÏÏÏÏÏÏÏÏ 30,251 2.3% 30,311 2.2% 30,252 1.9%
Provisions and write-oÅs ÏÏÏÏÏÏÏÏÏÏÏÏÏÏÏÏÏÏÏÏÏÏÏ 28,576 2.2% 15,942 1.1% 17,806 1.1%
Operating proÑt ÏÏÏÏÏÏÏÏÏÏÏÏÏÏÏÏÏÏÏÏÏÏÏÏÏÏÏÏÏÏÏ 30,796 2.4% 100,530 7.2% 131,547 8.3%
Net Ñnancial loss ÏÏÏÏÏÏÏÏÏÏÏÏÏÏÏÏÏÏÏÏÏÏÏÏÏÏÏÏÏ (73,187) (5.7)% (33,399) (2.4)% (45,418) (2.9)%
Income from equity investments ÏÏÏÏÏÏÏÏÏÏÏÏÏÏÏÏÏ 1,818 0.1% 3,857 0.3% 8,321 0.7%
Extraordinary (loss) gain ÏÏÏÏÏÏÏÏÏÏÏÏÏÏÏÏÏÏÏÏÏÏÏ (3,410) (0.3)% (4,116) (0.3)% 4,707 0.3%
Earnings before taxes and minority interests ÏÏÏÏÏÏÏ (43,983) (3.4)% 66,872 4.8% 99,157 6.3%
Income taxes ÏÏÏÏÏÏÏÏÏÏÏÏÏÏÏÏÏÏÏÏÏÏÏÏÏÏÏÏÏÏÏÏÏ 427 0.0% 26,355 1.9% 57,413 3.6%
Net (loss) income before minority interests ÏÏÏÏÏÏÏ (44,410) (3.4)% 40,517 2.9% 41,744 2.6%
Minority interests ÏÏÏÏÏÏÏÏÏÏÏÏÏÏÏÏÏÏÏÏÏÏÏÏÏÏÏÏÏ 271 0.0% 72 0.0% (204) 0.0%
Net (loss) income for the year ÏÏÏÏÏÏÏÏÏÏÏÏÏÏÏÏÏÏ (44,139) (3.4)% 40,589 2.9% 41,540 2.6%
The accompanying notes are an integral part of these Pro Forma Consolidated Financial Statements.
F-78
Brought to you by Global Reports

UNAUDITED PRO FORMA CONSOLIDATED FINANCIAL STATEMENTS(NOT INCLUDING KENWOOD)
UNAUDITED RESTATED CONSOLIDATED CASH FLOW STATEMENTSFOR THE YEARS ENDING DECEMBER 31, 1999 AND 2000
1999 2000
(Millions of Lire)
Net income for the yearÏÏÏÏÏÏÏÏÏÏÏÏÏÏÏÏÏÏÏÏÏÏÏÏÏÏÏÏÏÏÏÏÏÏÏÏÏÏÏÏÏÏÏÏÏÏÏÏ 40,589 41,540
Depreciation and amortizationÏÏÏÏÏÏÏÏÏÏÏÏÏÏÏÏÏÏÏÏÏÏÏÏÏÏÏÏÏÏÏÏÏÏÏÏÏÏÏÏÏÏÏ 107,395 105,282
Provisions and writedowns net of applications ÏÏÏÏÏÏÏÏÏÏÏÏÏÏÏÏÏÏÏÏÏÏÏÏÏÏÏÏÏÏ 2,133 7,106
Cash Öows provided by operating activities ÏÏÏÏÏÏÏÏÏÏÏÏÏÏÏÏÏÏÏÏÏÏÏÏÏÏÏÏÏÏÏÏ 150,117 153,928
Changes in assets and liabilities during the year:
Receivables ÏÏÏÏÏÏÏÏÏÏÏÏÏÏÏÏÏÏÏÏÏÏÏÏÏÏÏÏÏÏÏÏÏÏÏÏÏÏÏÏÏÏÏÏÏÏÏÏÏÏÏÏÏÏÏÏÏÏ (52,686) (57,883)
Inventory ÏÏÏÏÏÏÏÏÏÏÏÏÏÏÏÏÏÏÏÏÏÏÏÏÏÏÏÏÏÏÏÏÏÏÏÏÏÏÏÏÏÏÏÏÏÏÏÏÏÏÏÏÏÏÏÏÏÏÏÏ 16,415 (80,957)
Other current assets ÏÏÏÏÏÏÏÏÏÏÏÏÏÏÏÏÏÏÏÏÏÏÏÏÏÏÏÏÏÏÏÏÏÏÏÏÏÏÏÏÏÏÏÏÏÏÏÏÏÏÏ 10,407 (7,855)
Payables ÏÏÏÏÏÏÏÏÏÏÏÏÏÏÏÏÏÏÏÏÏÏÏÏÏÏÏÏÏÏÏÏÏÏÏÏÏÏÏÏÏÏÏÏÏÏÏÏÏÏÏÏÏÏÏÏÏÏÏÏÏ 45,214 20,877
Other current liabilities ÏÏÏÏÏÏÏÏÏÏÏÏÏÏÏÏÏÏÏÏÏÏÏÏÏÏÏÏÏÏÏÏÏÏÏÏÏÏÏÏÏÏÏÏÏÏÏÏ (5,571) 22,191
Cash Öows provided by (used in) changes in working capitalÏÏÏÏÏÏÏÏÏÏÏÏÏÏÏÏÏ 13,779 (103,627)
Net investments in intangible assetsÏÏÏÏÏÏÏÏÏÏÏÏÏÏÏÏÏÏÏÏÏÏÏÏÏÏÏÏÏÏÏÏÏÏÏÏÏÏ (1,678) (6,508)
Net investments in tangible assets ÏÏÏÏÏÏÏÏÏÏÏÏÏÏÏÏÏÏÏÏÏÏÏÏÏÏÏÏÏÏÏÏÏÏÏÏÏÏÏ (35,997) (50,662)
Net disposal of Ñnancial assets ÏÏÏÏÏÏÏÏÏÏÏÏÏÏÏÏÏÏÏÏÏÏÏÏÏÏÏÏÏÏÏÏÏÏÏÏÏÏÏÏÏÏ 1,114 19,138
Cash Öows used in investing activities ÏÏÏÏÏÏÏÏÏÏÏÏÏÏÏÏÏÏÏÏÏÏÏÏÏÏÏÏÏÏÏÏÏÏÏÏ (36,561) (38,032)
Capital increaseÏÏÏÏÏÏÏÏÏÏÏÏÏÏÏÏÏÏÏÏÏÏÏÏÏÏÏÏÏÏÏÏÏÏÏÏÏÏÏÏÏÏÏÏÏÏÏÏÏÏÏÏÏÏÏ 100,000 Ì
Changes in pro forma and conversion reserve ÏÏÏÏÏÏÏÏÏÏÏÏÏÏÏÏÏÏÏÏÏÏÏÏÏÏÏÏÏÏ 13,994 19,913
Cash Öows provided by Ñnancing activities ÏÏÏÏÏÏÏÏÏÏÏÏÏÏÏÏÏÏÏÏÏÏÏÏÏÏÏÏÏÏÏÏ 113,994 19,913
Cash Öow for the year ÏÏÏÏÏÏÏÏÏÏÏÏÏÏÏÏÏÏÏÏÏÏÏÏÏÏÏÏÏÏÏÏÏÏÏÏÏÏÏÏÏÏÏÏÏÏÏÏÏ 241,329 32,182
Net Ñnancial position at the beginning of the yearÏÏÏÏÏÏÏÏÏÏÏÏÏÏÏÏÏÏÏÏÏÏÏÏÏÏ (1,208,825) (967,496)
Cash Öow for the year ÏÏÏÏÏÏÏÏÏÏÏÏÏÏÏÏÏÏÏÏÏÏÏÏÏÏÏÏÏÏÏÏÏÏÏÏÏÏÏÏÏÏÏÏÏÏÏÏÏ 241,329 32,182
Net Ñnancial position at the end of the year ÏÏÏÏÏÏÏÏÏÏÏÏÏÏÏÏÏÏÏÏÏÏÏÏÏÏÏÏÏÏÏ (967,496) (935,314)
Change in shareholders' equity for substitution tax ÏÏÏÏÏÏÏÏÏÏÏÏÏÏÏÏÏÏÏÏÏÏÏÏÏ Ì (44,077)
Change in other payables for substitution tax ÏÏÏÏÏÏÏÏÏÏÏÏÏÏÏÏÏÏÏÏÏÏÏÏÏÏÏÏÏÏ Ì 44,077
The accompanying notes are an integral part of these Pro Forma Consolidated Financial Statements.
F-79
Brought to you by Global Reports

UNAUDITED PRO FORMA CONSOLIDATED FINANCIAL STATEMENTS(NOT INCLUDING KENWOOD)
UNAUDITED RESTATED CONSOLIDATED STATEMENTSOF CHANGES IN SHAREHOLDERS' EQUITY
FOR THE YEARS ENDING DECEMBER 31, 1999 AND 2000
Net Income TotalShare Pro forma for the Shareholders'Capital Reserves Reserve Year Equity
(Millions of Lire)
December 31, 1998 ÏÏÏÏÏÏÏÏÏÏÏÏÏÏÏÏÏÏÏÏÏÏÏÏÏÏÏ 550,587 26,315 19,002 (44,139) 551,765
Capital increase ÏÏÏÏÏÏÏÏÏÏÏÏÏÏÏÏÏÏÏÏÏÏÏÏÏÏÏÏÏÏ 100,000 Ì Ì Ì 100,000
Allocation of 1998 net lossÏÏÏÏÏÏÏÏÏÏÏÏÏÏÏÏÏÏÏÏÏ Ì 9,211 (53,350) 44,139 Ì
Change in conversion diÅerence ÏÏÏÏÏÏÏÏÏÏÏÏÏÏÏÏ Ì 836 Ì Ì 836
Change in pro forma reserve ÏÏÏÏÏÏÏÏÏÏÏÏÏÏÏÏÏÏÏ Ì Ì 13,158 Ì 13,158
Net income ÏÏÏÏÏÏÏÏÏÏÏÏÏÏÏÏÏÏÏÏÏÏÏÏÏÏÏÏÏÏÏÏÏ Ì Ì Ì 40,589 40,589
December 31, 1999 ÏÏÏÏÏÏÏÏÏÏÏÏÏÏÏÏÏÏÏÏÏÏÏÏÏÏÏ 650,587 36,362 (21,190) 40,589 706,348
Allocation of 1999 net incomeÏÏÏÏÏÏÏÏÏÏÏÏÏÏÏÏÏÏ Ì 49,125 (8,536) (40,589) Ì
Change in conversion diÅerence ÏÏÏÏÏÏÏÏÏÏÏÏÏÏÏÏ Ì (601) Ì Ì (601)
Attribution of substitution tax ÏÏÏÏÏÏÏÏÏÏÏÏÏÏÏÏÏÏ Ì (44,074) Ì Ì (44,074)
Change in pro forma reserve ÏÏÏÏÏÏÏÏÏÏÏÏÏÏÏÏÏÏÏ Ì (13,560) 34,071 Ì 20,511
Net income ÏÏÏÏÏÏÏÏÏÏÏÏÏÏÏÏÏÏÏÏÏÏÏÏÏÏÏÏÏÏÏÏÏ Ì Ì Ì 41,540 41,540
December 31, 2000 ÏÏÏÏÏÏÏÏÏÏÏÏÏÏÏÏÏÏÏÏÏÏÏÏÏÏÏ 650,587 27,252 4,345 41,540 723,724
The accompanying notes are an integral part of these Pro Forma Consolidated Financial Statements.
F-80
Brought to you by Global Reports

UNAUDITED PRO FORMA CONSOLIDATED FINANCIAL STATEMENTS(NOT INCLUDING KENWOOD)
NOTES TO THE UNAUDITED DE' LONGHI PRO FORMACONSOLIDATED FINANCIAL STATEMENTS
Description of Business and basis of presentation
The Pro Forma Consolidated Financial Statements of De' Longhi S.p.A. and its subsidiaries(collectively, ""the Company'' or ""the Group'') have been prepared using the criteria required byLegislative Decree No. 127/91 and reclassiÑed for the purposes of Ñnancial analysis. The aim of thepro forma consolidated Ñnancial statements is to represent, exclusively for the purposes of comparison, theeÅects of certain recent restructuring operations within the Group as if they had taken place at the start ofthe three-year period being presented. These operations are outlined below.
In 2000 the Group initiated a series of operations to rationalize its structure and bring under itscontrol certain businesses which, though related to the core business, were held by external companiescontrolled directly or indirectly by Giuseppe De' Longhi, the ""Controlling Shareholder''. As a result, theGroup acquired the following holdings through its subsidiary, De' Longhi Pinguino S.A., on December 28,2000:
‚ 99.99% of the stock of De' Longhi Divisione Cucine S.p.A. for Lit. 71,642 million;
‚ 99.92% of the stock of DL Radiators S.p.A. for Lit. 96,426 million;
‚ 90% of the stock of Climaveneta S.p.A. for Lit. 276,887 million (the remaining 10.0% being heldby Climaveneta itself);
‚ 100% of the stock of Micromax S.p.A. for Lit. 39,718 million; and
‚ 30% of the stock of Ergoklima S.p.A. for Lit. 54,216 million.
The total investment was Lit. 538,889 million.
The acquisition contracts provided for a down-payment of Lit. 34,175 million upon entering into theagreement (paid prior to December 31, 2000) and three instalments for the remining Lit. 504,714 millionby December 31, 2001, without interest. The aforementioned acquisitions gave rise to goodwill ofLit. 442.8 billion. The goodwill was calculated as the diÅerence between the amounts paid and theshareholders' equities of the acquired companies (goodwill doesn't include investments accounted for inaccordance with the cost or equity method of accounting).
In December 2000 the Group disposed of the following investments not deemed strategic with respectto the core business:
‚ 60% of the stock of Nauta S.p.A., for Lit. 1,800 million;
‚ 100% of the stock of Immobiliare Findomestic S.r.l, for Lit. 6,300 million;
‚ 100% of the stock of De' Longhi Radiators S.r.l, for Lit. 4,200 million;
‚ 100% of the stock of De' Longhi Canada Distributors Ltd and Ontario Ltd., for Lit. 1 million; and
‚ 100% of the stock of I.S.C. Industria Scambiatori di Calore S.p.A. a components maker (held by aÑduciary), for Lit. 20,000 million.
Prior to March 31, 2000, the marketing of Ñxed radiator products was performed by De' LonghiRadiators S.r.l. (wholly-owned by De' Longhi S.p.A.) under a leasing agreement with Divisione RadiatoriS.p.A. (now DL Radiators S.p.A.). Upon termination of this contract, control of the marketing divisionreturned to the lessor, which was subsequently taken over by the Group.
On April 18, 2001, the shareholders voted:
‚ a share capital increase, at nominal value and being subscribed and paid in by current shareholders,of Lit. 250,587 million, resulting in an increase to capital stock by Lit. 650,587 million;
‚ to convert the capital stock into Euros; and
‚ to change the nominal value of the shares from 40.516 to 43 by regrouping.
F-81
Brought to you by Global Reports

UNAUDITED PRO FORMA CONSOLIDATED FINANCIAL STATEMENTS(NOT INCLUDING KENWOOD)
NOTES TO THE UNAUDITED DE' LONGHI PRO FORMACONSOLIDATED FINANCIAL STATEMENTS Ì (Continued)
Assumptions used in the preparation of the pro forma consolidated Ñnancial statements as at
December 31, 1998, 1999 and 2000
The pro forma consolidated Ñnancial statements as of and for the three year period endedDecember 31, 2000 diÅer from the historical consolidated Ñnancial statements due to the fact that theyinclude the income statements of the acquisitions described in Note 1 (whereas, in the historicalconsolidated Ñnancial statements, these acquisitions are consolidated line by line in the balance sheet only)and also contain pro-forma adjustments.
The signiÑcant assumptions made in preparing the pro-forma consolidated Ñnancial statements are asfollows:
Acquisition of De' Longhi Divisione Cucine S.p.A., Climaveneta S.p.A., Ergoklima S.p.A., Micromax
S.p.A. and DL Radiators S.p.A. (and subsidiaries)
Regarding these acquisitions, the pro forma consolidated Ñnancial statements state:
‚ the diÅerence between the cost of acquisition and the relative shareholders' equity recorded asgoodwill;
‚ amortization of goodwill, calculated on a presumed period of economic usefulness of 20 years,consistent with Italian law;
‚ the interest free short-term debt incurred for acquisition of the aforementioned investments(Lit. 504,714 million); given the nature of the debt, no interest expense was recorded in the incomestatement;
‚ a ""pro forma reserve'', under shareholders' equity, to reÖect the equity eÅects of consolidation andpro-forma preparation of the consolidated Ñnancial statements.
Further, by retrospectively reÖecting the above mentioned acquisitions to January 1, 1998 it was necessaryto make certain accounting adjustments in order for the pro forma consolidated Ñnancial statements toreÖect a January 1, 1998 acquisition date instead of the actual legal purchase dates during 1998, 1999 and2000.
Assumptions due to divested entities
Consistent with the assumptions presented above, the pro forma consolidated Ñnancial statements donot take into account the income and equity eÅects (which are reÖected in the historical consolidatedÑnancial statements) of the companies that had been disposed of at December 31, 2000. Theaccompanying Ñnancial statements reÖect the following pro forma adjustments:
‚ elimination of the capital gains on the disposals incurred at the end of December 2000 (describedin Note 1) totalling Lit. 14,240 million, net of tax (Lit. 1,416 million);
‚ recognition of Lit. 42,100 million of Ñnancial receivables relating to the disposal of the investmentslisted in Note 1 (and consequent recognition of interest income) and to the sale of an investmentacquired and resold at book value (Lit. 9,804 million) in 2000;
‚ elimination of an indemnity of Lit. 11,761 million (Lit. 6,907 million net of tax) granted byDe' Longhi S.p.A. in 2000 to the parent company De' Longhi SoparÑ, following the latter'sacquisition in 1997 of an investment in Liguria Assicurazioni S.p.A.; this adjustment was necessarybecause the pro-forma consolidated Ñnancial statements assume that this adjustment to the saleprice had already been made at January 1, 1998. At December 31, 2000 De' Longhi S.p.A. had noresidual obligations regarding this investment;
‚ recognition for the years 1998 and 1999 of Lit. 4,583 million of debt and interest expense relatingto the acquisition of Sile Corpi Scaldanti S.r.l., in February 2000;
F-82
Brought to you by Global Reports

UNAUDITED PRO FORMA CONSOLIDATED FINANCIAL STATEMENTS(NOT INCLUDING KENWOOD)
NOTES TO THE UNAUDITED DE' LONGHI PRO FORMACONSOLIDATED FINANCIAL STATEMENTS Ì (Continued)
‚ consolidation of the assets and liabilities of De' Longhi Radiators S.r.l so that the pro-formaconsolidated Ñnancial statements reÖect the heating products marketing business. It was alsonecessary for the pro-forma consolidated Ñnancial statements at December 31, 1998 and 1999 toshow the eÅects of Radel S.p.A. (wholly-owned by Divisione Radiatori S.p.A.) relating to theinvestment's book value (Lit. 71,501 million) and the goodwill (Lit. 37,993 million) arising fromthe merger of Divisione Radiatori S.p.A. into DL Radiators S.p.A. on March 17, 2000, with thecorresponding pro-forma debt. Such adjustment was made to include the relevant productionbusiness in the pro-forma consolidated Ñnancial statements; and
‚ Climaveneta S.p.A. and Ergoklima S.p.A. were transferred by De' Longhi S.p.A. to De' LonghiSoparÑ on December 29, and 30, 1998 as part of a restructuring by the Controlling Shareholder.The restructuring project was subsequently modiÑed in response to changes in product range byboth Climaveneta S.p.A. and Ergoklima S.p.A. as well as by De' Longhi S.p.A., making re-integration with the Group desirable for reasons of synergy. The capital gains realized byDe' Longhi S.p.A. in 1998 (Lit. 35,766 million) were therefore written oÅ, net of the relative taxconsolidation eÅects.
Capital Increase
Retroactively January 1, 1998 of the capital increase of Lit. 250,587 million (see Note 1), and theconsequent reduction of indebtedness.
Tax EÅects of Pro forma Adjustments
The tax eÅects of the pro-forma adjustments described above have been stated where applicable,under current Italian law.
Income and Equity EÅects
The table below is a reconciliation of the Group's historical shareholders' equity at December 31,1998, 1999 and 2000 and the shareholders' equity in the corresponding pro-forma consolidated Ñnancialstatements.
F-83
Brought to you by Global Reports

UNAUDITED PRO FORMA CONSOLIDATED FINANCIAL STATEMENTS(NOT INCLUDING KENWOOD)
NOTES TO THE UNAUDITED DE' LONGHI PRO FORMACONSOLIDATED FINANCIAL STATEMENTS Ì (Continued)
1998 1999 2000
Sh. equity Income (loss) Sh. Equity Income Sh. Equity Income
(Millions of Lire)
De' Longhi S.p.A. consolidated ÏÏÏÏÏÏÏ 335,524 9,209 485,487 49,125 468,792 27,980
Acquired companies ÏÏÏÏÏÏÏÏÏÏÏÏÏÏÏÏ 89,407 7,934 118,528 13,576 Ì 29,546
Divested companies ÏÏÏÏÏÏÏÏÏÏÏÏÏÏÏÏÏ (276) (2) (202) (38) Ì Ì
Incoming and outgoing companiesÏÏÏÏÏ 89,131 7,932 118,326 13,538 Ì 29,546
Capital increase ÏÏÏÏÏÏÏÏÏÏÏÏÏÏÏÏÏÏÏÏ 250,587 Ì 250,587 Ì 250,587 Ì
Elimination of value of investmentsÏÏÏÏ (670,054) Ì (670,054) Ì Ì Ì
Goodwill ÏÏÏÏÏÏÏÏÏÏÏÏÏÏÏÏÏÏÏÏÏÏÏÏÏÏ 503,882 Ì 503,882 Ì Ì Ì
Amortization of goodwillÏÏÏÏÏÏÏÏÏÏÏÏÏ 52,073 (27,072) 25,001 (27,072) Ì (25,001)
Capital gains on disposal ofinvestments ÏÏÏÏÏÏÏÏÏÏÏÏÏÏÏÏÏÏÏÏÏÏ Ì (37,711) Ì Ì Ì (14,240)
Write-oÅ of Liguria Assicurazioniindemnity ÏÏÏÏÏÏÏÏÏÏÏÏÏÏÏÏÏÏÏÏÏÏÏ Ì Ì Ì Ì Ì 11,761
Pro Forma Ñnancial income fromdisposal of investments net of tax ÏÏÏ 1,449 1,449 2,897 1,448 4,345 1,448
Recognition of investment in divestedcompany ÏÏÏÏÏÏÏÏÏÏÏÏÏÏÏÏÏÏÏÏÏÏÏÏ Ì 2,584 Ì 3,439 Ì 555
Elimination of dividends of acquiredcompanies ÏÏÏÏÏÏÏÏÏÏÏÏÏÏÏÏÏÏÏÏÏÏÏ Ì (504) Ì (880) Ì Ì
Other write-oÅs and write-backs ÏÏÏÏÏÏ (76) 1 153 15 Ì Ì
Pro forma adjustments ÏÏÏÏÏÏÏÏÏÏÏÏÏÏ 137,861 (61,253) 112,466 (23,050) 254,932 (25,477)
Consolidation adjustments ÏÏÏÏÏÏÏÏÏÏÏ (10,751) (27) (9,931) 975 Ì 9,491
Total adjustmentsÏÏÏÏÏÏÏÏÏÏÏÏÏÏÏÏÏÏÏ 216,241 (53,348) 220,861 (8,537) 254,932 13,560
Pro forma consolidated ÏÏÏÏÏÏÏÏÏÏÏÏÏÏ 551,765 (44,139) 706,348 40,589 723,724 41,540
A ""pro forma reserve'' was created to reÖect the pro forma adjustments in the table above.
Summary of SigniÑcant Accounting Policies
The main accounting policies applied in the accompanying consolidated Ñnancial statements are thosecontemplated in Article 2426 of the Civil Code and Article 35, Decree No. 127/91 and are as follows:
Consolidation criteria and methods
The Group's pro-forma consolidated Ñnancial statements were prepared on the basis of theassumptions described in Note 2 and using the consolidation criteria, as detailed below:
‚ The Group consolidates all entities that it either (i) holds a controlling interest in the sharecapital or (ii) is able to exert dominant inÖuence. Consolidation is on a line by line basis, thebook value of investments being eliminated against the corresponding ownership percentages ofshareholders' equity.
‚ Any diÅerences arising in the year in which a company is consolidated for the Ñrst time arerecorded as:
‚ the relevant assets acquired and liabilities assumed are recorded at fair market value; any residualamounts are recorded as goodwill; and
F-84
Brought to you by Global Reports

UNAUDITED PRO FORMA CONSOLIDATED FINANCIAL STATEMENTS(NOT INCLUDING KENWOOD)
NOTES TO THE UNAUDITED DE' LONGHI PRO FORMACONSOLIDATED FINANCIAL STATEMENTS Ì (Continued)
‚ if negative, it is recorded directly to ""other reserves'' in shareholders' equity.
‚ Positive diÅerence is amortized over the period of its estimated economic usefulness.
‚ Minority interests' proportionate share of subsidiaries' equity and net income are stated separatelyunder consolidated shareholders' equity as ""other reserves''.
‚ Receivables and payables, costs and revenues and all transactions between companies in theconsolidated group, including dividends distributed within the Group, are eliminated, as areunrealized proÑts and capital gains and losses on transactions between Group companies.
‚ Also eliminated from the consolidated Ñnancial statements are the eÅects of amortization andvaluation adjustments made by companies for tax purposes, their tax eÅects being taken intoaccount where applicable.
Foreign currency translation
Foreign company Ñnancial statements are converted into Lire as follows:
‚ assets and liabilities are converted at year end rates, which in the case of EU countries were Ñxedirrevocably by the EU Commission on December 31, 1998;
‚ income statement amounts are converted at average exchanges rates for the year;
‚ shareholders' equity amounts are converted at historical rates.
Exchange diÅerences resulting from this method are recognized in the ""conversion reserve'' in theconsolidated shareholders' equity.
Tangible assets
Tangible assets are stated at purchase or production cost and may be adjusted within the limits ofmonetary revaluation laws (576/75, 72/83 and 413/91). Assets are written down when there is apermanent loss of value. The original value may be reversed in subsequent periods if the causes of thewritedown cease to exist.
Tangible assets are recorded net of depreciation, which is calculated annually on the basis of theremaining useful life of the assets. The half-year convention for depreciation is used in the year assets areplaced in service.
The rates applied are as follows:
Industrial buildingsÏÏÏÏÏÏÏÏÏÏÏÏÏÏÏÏÏÏÏÏÏÏÏÏÏÏÏÏÏÏÏÏÏÏÏÏÏÏÏÏÏ 3.0%
Lightweight constructions ÏÏÏÏÏÏÏÏÏÏÏÏÏÏÏÏÏÏÏÏÏÏÏÏÏÏÏÏÏÏÏÏÏÏÏ 10.0%
General/speciÑc plant ÏÏÏÏÏÏÏÏÏÏÏÏÏÏÏÏÏÏÏÏÏÏÏÏÏÏÏÏÏÏÏÏÏÏÏÏÏÏ 10.0-15.5%
Furnaces ÏÏÏÏÏÏÏÏÏÏÏÏÏÏÏÏÏÏÏÏÏÏÏÏÏÏÏÏÏÏÏÏÏÏÏÏÏÏÏÏÏÏÏÏÏÏÏÏÏ 15.0%
Sundry equipment ÏÏÏÏÏÏÏÏÏÏÏÏÏÏÏÏÏÏÏÏÏÏÏÏÏÏÏÏÏÏÏÏÏÏÏÏÏÏÏÏÏ 25.0%
PuriÑcation systems ÏÏÏÏÏÏÏÏÏÏÏÏÏÏÏÏÏÏÏÏÏÏÏÏÏÏÏÏÏÏÏÏÏÏÏÏÏÏÏÏ 15.0%
OÇce furniture and machinesÏÏÏÏÏÏÏÏÏÏÏÏÏÏÏÏÏÏÏÏÏÏÏÏÏÏÏÏÏÏÏÏ 12.0%
Electromechanical machines ÏÏÏÏÏÏÏÏÏÏÏÏÏÏÏÏÏÏÏÏÏÏÏÏÏÏÏÏÏÏÏÏÏ 20.0%
Chemistry laboratory ÏÏÏÏÏÏÏÏÏÏÏÏÏÏÏÏÏÏÏÏÏÏÏÏÏÏÏÏÏÏÏÏÏÏÏÏÏÏÏ 25.0%
Freight vehiclesÏÏÏÏÏÏÏÏÏÏÏÏÏÏÏÏÏÏÏÏÏÏÏÏÏÏÏÏÏÏÏÏÏÏÏÏÏÏÏÏÏÏÏÏ 20.0%
Cars ÏÏÏÏÏÏÏÏÏÏÏÏÏÏÏÏÏÏÏÏÏÏÏÏÏÏÏÏÏÏÏÏÏÏÏÏÏÏÏÏÏÏÏÏÏÏÏÏÏÏÏÏÏ 25.0%
These rates are deemed representative of the normal period of economic usefulness for tangible assetsused in the manufacturing sector in which Group companies operate.
F-85
Brought to you by Global Reports

UNAUDITED PRO FORMA CONSOLIDATED FINANCIAL STATEMENTS(NOT INCLUDING KENWOOD)
NOTES TO THE UNAUDITED DE' LONGHI PRO FORMACONSOLIDATED FINANCIAL STATEMENTS Ì (Continued)
Routine maintenance costs are recognized in the income statement. Maintenance costs which increasethe economic useful life of an asset are capitalized and depreciated on the basis of the residual period ofuse.
Assets acquired under Ñnancial leasing agreements are recognized as required by InternationalAccounting Standard (""IAS'') 17, whereby the present value of the future minimum lease payments isrecognized under tangible assets and depreciated using the relevant rates. The corresponding obligationsare recognized as liabilities. Depreciation and interest expense for the year are recognized in the incomestatement.
Intangible assets
Intangible assets are recognized at acquisition cost and are amortized over the period of theirexpected economic life.
Assets are written down when there is an impairment in value, apart from amortization recognized.The original value may be written back in subsequent periods if the causes of the writedown are reversed.
Start-up costs, which include incorporation and capital increase expenses, are amortized over Ñveyears.
Research and development (R&D) expenses are capitalized if they relate to clearly deÑned productswhich have been shown to be technologically feasible and suitable for a given future market. Such assetsare amortized over Ñve years.
Concessions, trademarks and similar assets are amortized over their residual period of economicusefulness which is set at 20 years for trademarks, four years for the use of intellectual property and10 years for patents.
Goodwill is amortized from 10 to 20 years depending on its future usefulness and the prospects
Financial assets
Investments in associates and non-consolidated subsidiaries are accounted for on the equity method ofaccounting, whereas investments in other companies are stated at acquisition cost and adjusted in case ofpermanent impairment. The original value may be written back in subsequent periods if the causes of thewritedown are reversed. Financial receivables are recorded at net realizable value.
Other capitalized securities are stated at cost and written down in cases of permanent impairment ofeconomic use across the Group in the relevant sectors.
Receivables and payables
Receivables are recognized at their net realizable value.
Payables are stated at face value.
Inventory
Inventory is stated at the lower of cost or market value on an average weighted cost basis. Productioncost is used for Ñnished and semi-Ñnished goods. Work in-process is stated as a percentage of productioncost on the basis of actual processing completed at year end. Obsolete or slow-moving inventories arewritten down to reÖect their presumed future usefulness.
Accruals and deferrals
These include costs and income items for two or more years and are recorded on an accrual basis.
F-86
Brought to you by Global Reports

UNAUDITED PRO FORMA CONSOLIDATED FINANCIAL STATEMENTS(NOT INCLUDING KENWOOD)
NOTES TO THE UNAUDITED DE' LONGHI PRO FORMACONSOLIDATED FINANCIAL STATEMENTS Ì (Continued)
Reserve for staÅ severance indemnities
A reserve for staÅ severance indemnities is made to cover the Company's liabilities on behalf of itsemployees at year end in accordance with current legislation and labour agreements.
Reserves for risks and other charges
Reserves for risks and other charges are set up to cover certain or probable losses or debts whoseprecise amount or date of occurrence cannot be quantiÑed at year end. Such provisions reÖect the bestpossible estimate on the basis of available data.
Cash and cash equivalents
Cash is stated at face value.
Cash equivalents and short-term investments are stated at the lower of cost or market value. Forwritedowns, original values may be restored if the causes of the writedowns are reversed.
Costs and revenues
Revenues from product sales are recognized upon transfer of property, which is usually Ñxed at theshipment date.
Revenues are recognized net of returns, discounts, allowances and bonuses as well as dues directlyattributable to sales of products and provision of services.
Revenues and expenses are recognized on an accrual basis.
Exchange diÅerences created by foreign currency transactions
Foreign currency transactions are stated at the rates in eÅect at the time they are recorded. AnydiÅerences arising during the period are recognized in the income statement under Ñnancial income andlosses.
Payables and receivables at year end and the related hedging contracts are adjusted to balance sheetdate rates only if there is a net loss by provision to an exchange risk reserve as allowed by Italian law.
Income taxes
Income tax expense is calculated on taxable income as required by law in the relevant country.Deferred tax assets and liabilities are recognized in order to reÖect the tax eÅect on certain consolidationadjustments and on all temporary diÅerences between asset and liability book values and the correspondingtax values. BeneÑts from net operating losses are stated to the extent that such losses can be absorbed byfuture taxable income in the same period that the losses become deductible under current tax law.
Deferred tax assets and liabilities are recorded on non-distributed proÑts of subsidiaries if such proÑtsare likely to be distributed and if the investments are not held on a permanent basis.
Financial instruments
Financial instruments used for exchange rate risk hedging are recorded in relation to hedged asset andliability items on the balance sheet. Income and losses and any eÅects arising from diÅerences between theunderlying contract amounts and spot values of asset and liability hedging operations are recorded on anaccrual basis.
Memorandum accounts
Commitments and guarantees are stated at contract values.
F-87
Brought to you by Global Reports

UNAUDITED PRO FORMA CONSOLIDATED FINANCIAL STATEMENTS(NOT INCLUDING KENWOOD)
NOTES TO THE UNAUDITED DE' LONGHI PRO FORMACONSOLIDATED FINANCIAL STATEMENTS Ì (Continued)
Receivables from Shareholders
Receivables from shareholders at December 31, 1998 (Lit. 9,100 million) refers to callable capital forthe capital increase of De' Longhi S.p.A. voted by an extraordinary meeting of shareholders on July 17,1997. Said resolution brought capital stock to Lit. 300,000 million. Receivables from shareholders atDecember 31, 1999 (Lit. 25,000 million) refers to callable capital for the new capital increase ofDe' Longhi S.p.A. voted by an extraordinary meeting of shareholders on December 27, 1999 whichbrought capital stock to Lit. 400,000 million. In 2000 all receivables from shareholders were collected.
Tangible Assets
Land Industrial and Fixed Assetsand Plant and Commercial Under
Buildings Machinery Equipment Other Assets Construction Totals
(Millions of Lire)
Balance at December 31, 1998 ÏÏÏÏÏ 182,389 142,683 33,545 10,783 712 370,112
Acquisitions ÏÏÏÏÏÏÏÏÏÏÏÏÏÏÏÏÏÏÏÏÏ 841 10,274 20,217 4,816 1,111 37,259
Disposals and retirements ÏÏÏÏÏÏÏÏÏ (16) (244) (1,053) (723) Ì (2,036)
Amortization ÏÏÏÏÏÏÏÏÏÏÏÏÏÏÏÏÏÏÏÏ (7,075) (29,384) (16,896) (3,966) Ì (57,321)
Other changes and conversiondiÅerences ÏÏÏÏÏÏÏÏÏÏÏÏÏÏÏÏÏÏÏÏ 317 516 174 323 (556) 774
Balance at December 31, 1999 ÏÏÏÏÏ 176,456 123,845 35,987 11,233 1,267 348,788
Acquisitions ÏÏÏÏÏÏÏÏÏÏÏÏÏÏÏÏÏÏÏÏÏ 7,340 16,083 22,367 4,525 2,081 52,396
Disposals and retirements ÏÏÏÏÏÏÏÏÏ (488) (1,277) (732) (897) (106) (3,500)
Amortization ÏÏÏÏÏÏÏÏÏÏÏÏÏÏÏÏÏÏÏÏ (7,179) (26,127) (17,663) (4,384) Ì (55,353)
Other changes and conversiondiÅerences ÏÏÏÏÏÏÏÏÏÏÏÏÏÏÏÏÏÏÏÏ 258 1,219 258 825 (794) 1,766
Balance at December 31, 2000 ÏÏÏÏÏ 176,387 113,743 40,217 11,302 2,448 344,097
Land and buildings includes properties belonging to the Group and used for production andadministration purposes.
The Lit.10,274 million of acquisitions to plant and machinery at December 31, 1999 with respect to1998 was a result of the purchasing of general plant machinery (presses and welding machines). In 2000the Group made further investments (Lit. 16,655 million) in general plant. At December 31, 2000, plantand machinery includes leased assets as required by IAS 17 in the amount of Lit. 16,215 million. Thelease is recorded as a liability in the Company's balance sheet.
At December 31, 2000, the tax value of the plant/machinery and general/speciÑc plant categories waswritten up to equal the same amount of the assets as reÖected in the balance sheet, as allowed under theprovisions of the 2000 Finance Law (Decree No. of 342 November 21, 2000). In doing so, the Companypaid a 19% tax on the stepped up value of the two categories (Lit. 15,900 million and Lit. 25,400 million).
As for industrial and commercial equipment, the Group's main investments in 1999 and 2000 were forthe purchase and in-house construction of production equipment and moulds.
Other assets refers to oÇce furniture and machines, internal and industrial vehicles, cars, Ñxed assetsunder construction and advances. The balance for 2000 relates mainly to oÇce furniture and machines(Lit. 2,645 million), internal and industrial vehicles (Lit. 828 million) and Ñxed assets under constructionand advances (Lit. 820 million).
F-88
Brought to you by Global Reports

UNAUDITED PRO FORMA CONSOLIDATED FINANCIAL STATEMENTS(NOT INCLUDING KENWOOD)
NOTES TO THE UNAUDITED DE' LONGHI PRO FORMACONSOLIDATED FINANCIAL STATEMENTS Ì (Continued)
Goodwill
Goodwill
(Millions of Lire)
Balance at December 31, 1998 ÏÏÏÏÏÏÏÏÏÏÏÏÏÏÏÏÏÏÏÏÏÏÏÏÏÏÏÏÏÏÏÏÏÏÏÏÏÏÏÏÏÏÏÏÏÏÏÏÏÏ 605,789
AcquisitionsÏÏÏÏÏÏÏÏÏÏÏÏÏÏÏÏÏÏÏÏÏÏÏÏÏÏÏÏÏÏÏÏÏÏÏÏÏÏÏÏÏÏÏÏÏÏÏÏÏÏÏÏÏÏÏÏÏÏÏÏÏÏÏÏÏÏ Ì
Disposals and retirements ÏÏÏÏÏÏÏÏÏÏÏÏÏÏÏÏÏÏÏÏÏÏÏÏÏÏÏÏÏÏÏÏÏÏÏÏÏÏÏÏÏÏÏÏÏÏÏÏÏÏÏÏÏÏ Ì
Amortization ÏÏÏÏÏÏÏÏÏÏÏÏÏÏÏÏÏÏÏÏÏÏÏÏÏÏÏÏÏÏÏÏÏÏÏÏÏÏÏÏÏÏÏÏÏÏÏÏÏÏÏÏÏÏÏÏÏÏÏÏÏÏÏÏÏ (30,311)
Other changes and conversion diÅerences ÏÏÏÏÏÏÏÏÏÏÏÏÏÏÏÏÏÏÏÏÏÏÏÏÏÏÏÏÏÏÏÏÏÏÏÏÏÏÏÏÏ 62
Balance at December 31, 1999 ÏÏÏÏÏÏÏÏÏÏÏÏÏÏÏÏÏÏÏÏÏÏÏÏÏÏÏÏÏÏÏÏÏÏÏÏÏÏÏÏÏÏÏÏÏÏÏÏÏÏ 575,540
AcquisitionsÏÏÏÏÏÏÏÏÏÏÏÏÏÏÏÏÏÏÏÏÏÏÏÏÏÏÏÏÏÏÏÏÏÏÏÏÏÏÏÏÏÏÏÏÏÏÏÏÏÏÏÏÏÏÏÏÏÏÏÏÏÏÏÏÏÏ Ì
Disposals and retirements ÏÏÏÏÏÏÏÏÏÏÏÏÏÏÏÏÏÏÏÏÏÏÏÏÏÏÏÏÏÏÏÏÏÏÏÏÏÏÏÏÏÏÏÏÏÏÏÏÏÏÏÏÏÏ Ì
Amortization ÏÏÏÏÏÏÏÏÏÏÏÏÏÏÏÏÏÏÏÏÏÏÏÏÏÏÏÏÏÏÏÏÏÏÏÏÏÏÏÏÏÏÏÏÏÏÏÏÏÏÏÏÏÏÏÏÏÏÏÏÏÏÏÏÏ (30,252)
Other changes and conversion diÅerences ÏÏÏÏÏÏÏÏÏÏÏÏÏÏÏÏÏÏÏÏÏÏÏÏÏÏÏÏÏÏÏÏÏÏÏÏÏÏÏÏÏ 55
Balance at December 31, 2000 ÏÏÏÏÏÏÏÏÏÏÏÏÏÏÏÏÏÏÏÏÏÏÏÏÏÏÏÏÏÏÏÏÏÏÏÏÏÏÏÏÏÏÏÏÏÏÏÏÏÏ 545,343
Goodwill results from diÅerences between purchase price and shareholders' equity of the acquiredcompanies:
‚ already consolidated in previous years; and
‚ acquired by the Group in 2000 and thus consolidated for purposes of the pro-forma balance sheet.
The table below details the goodwill arising from these consolidated investments:
Goodwill
(Billions of Lire)
Companies acquired directly:
Climaveneta S.p.A. ÏÏÏÏÏÏÏÏÏÏÏÏÏÏÏÏÏÏÏÏÏÏÏÏÏÏÏÏÏÏÏÏÏÏÏÏÏÏÏÏÏÏÏÏÏÏÏÏÏÏÏÏÏÏÏÏÏÏÏ 265.2
Ergoklima S.p.A. (30%) ÏÏÏÏÏÏÏÏÏÏÏÏÏÏÏÏÏÏÏÏÏÏÏÏÏÏÏÏÏÏÏÏÏÏÏÏÏÏÏÏÏÏÏÏÏÏÏÏÏÏÏÏÏÏÏ 36.1
Micromax S.p.A. ÏÏÏÏÏÏÏÏÏÏÏÏÏÏÏÏÏÏÏÏÏÏÏÏÏÏÏÏÏÏÏÏÏÏÏÏÏÏÏÏÏÏÏÏÏÏÏÏÏÏÏÏÏÏÏÏÏÏÏÏÏ 11
DL Radiators S.p.A. ÏÏÏÏÏÏÏÏÏÏÏÏÏÏÏÏÏÏÏÏÏÏÏÏÏÏÏÏÏÏÏÏÏÏÏÏÏÏÏÏÏÏÏÏÏÏÏÏÏÏÏÏÏÏÏÏÏÏ 88.3
Divisione Cucine S.p.A. ÏÏÏÏÏÏÏÏÏÏÏÏÏÏÏÏÏÏÏÏÏÏÏÏÏÏÏÏÏÏÏÏÏÏÏÏÏÏÏÏÏÏÏÏÏÏÏÏÏÏÏÏÏÏÏ 42.2
TotalÏÏÏÏÏÏÏÏÏÏÏÏÏÏÏÏÏÏÏÏÏÏÏÏÏÏÏÏÏÏÏÏÏÏÏÏÏÏÏÏÏÏÏÏÏÏÏÏÏÏÏÏÏÏÏÏÏÏÏÏÏÏÏÏÏÏÏÏ 442.8
Sile Corpi Scaldanti S.r.l. ÏÏÏÏÏÏÏÏÏÏÏÏÏÏÏÏÏÏÏÏÏÏÏÏÏÏÏÏÏÏÏÏÏÏÏÏÏÏÏÏÏÏÏÏÏÏÏÏÏÏÏÏÏÏ 3.3
Companies controlled indirectly:
Elba S.p.A. ÏÏÏÏÏÏÏÏÏÏÏÏÏÏÏÏÏÏÏÏÏÏÏÏÏÏÏÏÏÏÏÏÏÏÏÏÏÏÏÏÏÏÏÏÏÏÏÏÏÏÏÏÏÏÏÏÏÏÏÏÏÏÏÏÏÏ 35.2
Radel S.p.A. ÏÏÏÏÏÏÏÏÏÏÏÏÏÏÏÏÏÏÏÏÏÏÏÏÏÏÏÏÏÏÏÏÏÏÏÏÏÏÏÏÏÏÏÏÏÏÏÏÏÏÏÏÏÏÏÏÏÏÏÏÏÏÏÏÏ 99.3
Ergoklima S.p.A. (70%) ÏÏÏÏÏÏÏÏÏÏÏÏÏÏÏÏÏÏÏÏÏÏÏÏÏÏÏÏÏÏÏÏÏÏÏÏÏÏÏÏÏÏÏÏÏÏÏÏÏÏÏÏÏÏÏ (41.7)
Climaveneta Gmbh ÏÏÏÏÏÏÏÏÏÏÏÏÏÏÏÏÏÏÏÏÏÏÏÏÏÏÏÏÏÏÏÏÏÏÏÏÏÏÏÏÏÏÏÏÏÏÏÏÏÏÏÏÏÏÏÏÏÏÏ 0.7
Other consolidation adjustmentsÏÏÏÏÏÏÏÏÏÏÏÏÏÏÏÏÏÏÏÏÏÏÏÏÏÏÏÏÏÏÏÏÏÏÏÏÏÏÏÏÏÏÏÏÏÏÏÏÏ (3.0)
TotalÏÏÏÏÏÏÏÏÏÏÏÏÏÏÏÏÏÏÏÏÏÏÏÏÏÏÏÏÏÏÏÏÏÏÏÏÏÏÏÏÏÏÏÏÏÏÏÏÏÏÏÏÏÏÏÏÏÏÏÏÏÏÏÏÏÏÏÏ 536.6
Prior year goodwill ÏÏÏÏÏÏÏÏÏÏÏÏÏÏÏÏÏÏÏÏÏÏÏÏÏÏÏÏÏÏÏÏÏÏÏÏÏÏÏÏÏÏÏÏÏÏÏÏÏÏÏÏÏÏÏÏÏÏÏÏ 8.7
TotalÏÏÏÏÏÏÏÏÏÏÏÏÏÏÏÏÏÏÏÏÏÏÏÏÏÏÏÏÏÏÏÏÏÏÏÏÏÏÏÏÏÏÏÏÏÏÏÏÏÏÏÏÏÏÏÏÏÏÏÏÏÏÏÏÏÏÏÏ 545.3
F-89
Brought to you by Global Reports

UNAUDITED PRO FORMA CONSOLIDATED FINANCIAL STATEMENTS(NOT INCLUDING KENWOOD)
NOTES TO THE UNAUDITED DE' LONGHI PRO FORMACONSOLIDATED FINANCIAL STATEMENTS Ì (Continued)
The goodwill of the companies acquired during 2000, as detailed in the previous table, is beingamortized over a period of 20 years. The diÅerence between the purchase price and the net book value ofthe equity of the company was allocated temporarily to goodwill pending the allocation, where possible, toindividual assets and liabilities on the basis of fair values determined by independent experts. An economicuseful life of 20 years was used to be consistent with the economic useful lives of those assets(trademarks, buildings, etc.) to which this goodwill will be attributed in the future.
Goodwill which arose during previous years refers principally to the following acquisitions: Simao-Vetrella S.p.A., ARIAGEL S.p.A., LA SUPERCALOR S.p.A., De' Longhi Netherland B.V.,EEFEPLAST S.p.A. Such goodwill is being amortized over a period of 10 years which is consistent withits economic useful life.
Other Intangible Assets
Concessions,R&D and Licenses,Advertising Patent Trademarks
Start-up Costs Rights and Similar Others Total
(Millions of Lire)
Balance at December 31, 1998ÏÏÏÏÏÏÏÏÏÏÏÏ 575 2,051 7,801 221,362 2,705 234,494
Acquisitions ÏÏÏÏÏÏÏÏÏÏÏÏÏÏÏÏÏÏÏÏÏÏÏÏÏÏÏ 26 Ì 1,296 Ì 793 2,115
Disposals and retirements ÏÏÏÏÏÏÏÏÏÏÏÏÏÏÏÏ Ì Ì (490) Ì (7) (497)
AmortizationÏÏÏÏÏÏÏÏÏÏÏÏÏÏÏÏÏÏÏÏÏÏÏÏÏÏÏ (235) (853) (2,997) (14,770) (908) (19,761)
Other changes and conversion diÅerencesÏÏÏ (1) (205) 1,414 (1,078) (134) (39)
Balance at December 31, 1999ÏÏÏÏÏÏÏÏÏÏÏÏ 365 993 7,024 205,516 2,451 216,347
Acquisitions ÏÏÏÏÏÏÏÏÏÏÏÏÏÏÏÏÏÏÏÏÏÏÏÏÏÏÏ 493 254 2,616 Ì 3,511 6,874
Disposals and retirements ÏÏÏÏÏÏÏÏÏÏÏÏÏÏÏÏ Ì Ì 0 (9) (703) (712)
AmortizationÏÏÏÏÏÏÏÏÏÏÏÏÏÏÏÏÏÏÏÏÏÏÏÏÏÏÏ (220) (569) (2,990) (14,571) (1,327) (19,678)
Other changes and conversion diÅerencesÏÏÏ Ì 20 9 140 122 292
Balance at December 31, 2000ÏÏÏÏÏÏÏÏÏÏÏÏ 638 698 6,659 191,074 4,054 203,123
Start-up costs includes extraordinary expenses and charges for company incorporation.
R&D and advertising costs covers long-term costs for prototype and new product development.
Patent rights relate mainly to software licenses for the SAP information system and costs incurred forÑling industrial patents. The increases in 2000 refer to new business software developed in-house.
Concessions, licences, trademarks and similar refers to trademarks recorded in prior years followingthe merger in 1995 of De' Longhi S.p.A. (incorporating company) and other companies. The trademarksinclude the Company's own trademark and other Group trademarks (Pinguino, Sfornatutto, Friggimeglio,etc.).
In preparing the parent company's Ñnancial statements at December 31, 2000, the tax value of suchtrademarks was ""re-aligned'' upwards to the balance sheet value as allowed under the Ñscal provisions ofthe 2000 Finance Law (Decree No. 342 of November 21, 2000). This involved the application of a 19%substitute tax on the increased trademark values (Lit. 190,700 million) and resulted in a decrease in the""extraordinary reserves'' item under shareholders' equity.
Other intangible assets includes long-term costs for improvements to third party assets as well asleased assets of Lit. 1,689 million in 2000.
F-90
Brought to you by Global Reports

UNAUDITED PRO FORMA CONSOLIDATED FINANCIAL STATEMENTS(NOT INCLUDING KENWOOD)
NOTES TO THE UNAUDITED DE' LONGHI PRO FORMACONSOLIDATED FINANCIAL STATEMENTS Ì (Continued)
Financial assets
1998 1999 2000
(Millions of Lire)
a) Subsidiaries: Clim.Re S.A. ÏÏÏÏÏÏÏÏÏÏÏÏÏÏÏÏÏÏÏÏÏÏÏÏÏÏÏÏÏÏÏÏÏÏÏÏÏ 2,409 2,409 2,409
Total subsidiariesÏÏÏÏÏÏÏÏÏÏÏÏÏÏÏÏÏÏÏÏÏÏÏÏÏÏÏÏÏÏÏÏÏÏÏÏÏÏÏÏÏÏÏÏÏÏ 2,409 2,409 2,409
b) Associates:
Omas S.r.l. ÏÏÏÏÏÏÏÏÏÏÏÏÏÏÏÏÏÏÏÏÏÏÏÏÏÏÏÏÏÏÏÏÏÏÏÏÏÏÏÏÏÏÏÏÏÏÏÏÏÏ 2,039 1,842 2,027
EÅegici S.r.l. ÏÏÏÏÏÏÏÏÏÏÏÏÏÏÏÏÏÏÏÏÏÏÏÏÏÏÏÏÏÏÏÏÏÏÏÏÏÏÏÏÏÏÏÏÏÏÏÏÏ 159 139 144
Liguria Vita ÏÏÏÏÏÏÏÏÏÏÏÏÏÏÏÏÏÏÏÏÏÏÏÏÏÏÏÏÏÏÏÏÏÏÏÏÏÏÏÏÏÏÏÏÏÏÏÏÏÏ 3,616 3,457 3,457
Investment held by a Ñduciary ÏÏÏÏÏÏÏÏÏÏÏÏÏÏÏÏÏÏÏÏÏÏÏÏÏÏÏÏÏÏÏÏÏÏ 6,304 6,139 6,000
Total associates ÏÏÏÏÏÏÏÏÏÏÏÏÏÏÏÏÏÏÏÏÏÏÏÏÏÏÏÏÏÏÏÏÏÏÏÏÏÏÏÏÏÏÏÏÏ 12,118 11,577 11,628
c) Other ventures:
S.P. TasoglouÏÏÏÏÏÏÏÏÏÏÏÏÏÏÏÏÏÏÏÏÏÏÏÏÏÏÏÏÏÏÏÏÏÏÏÏÏÏÏÏÏÏÏÏÏÏÏÏÏ 528 330 275
Other venturesÏÏÏÏÏÏÏÏÏÏÏÏÏÏÏÏÏÏÏÏÏÏÏÏÏÏÏÏÏÏÏÏÏÏÏÏÏÏÏÏÏÏÏÏÏÏÏÏ 160 166 44
Total other ventures ÏÏÏÏÏÏÏÏÏÏÏÏÏÏÏÏÏÏÏÏÏÏÏÏÏÏÏÏÏÏÏÏÏÏÏÏÏÏÏÏÏ 688 496 319
Sub-total ÏÏÏÏÏÏÏÏÏÏÏÏÏÏÏÏÏÏÏÏÏÏÏÏÏÏÏÏÏÏÏÏÏÏÏÏÏÏÏÏÏÏÏÏÏÏÏÏÏÏ 15,215 14,482 14,356
Receivables from associatesÏÏÏÏÏÏÏÏÏÏÏÏÏÏÏÏÏÏÏÏÏÏÏÏÏÏÏÏÏÏÏÏÏÏÏÏÏÏÏÏÏ 659 Ì Ì
Receivables from others ÏÏÏÏÏÏÏÏÏÏÏÏÏÏÏÏÏÏÏÏÏÏÏÏÏÏÏÏÏÏÏÏÏÏÏÏÏÏÏÏÏÏÏÏ 21,898 22,027 3,322
Total ÏÏÏÏÏÏÏÏÏÏÏÏÏÏÏÏÏÏÏÏÏÏÏÏÏÏÏÏÏÏÏÏÏÏÏÏÏÏÏÏÏÏÏÏÏÏÏÏÏÏÏÏÏÏ 37,772 36,509 17,678
Receivables from associates refers to amounts due from Italia Distribudora de Eletrodomesticos Ltda.This credit was written oÅ completely in 1999.
Receivables from others at December 31, 1998 and 1999 refers principally to tax rebate claims(Lit. 18,241 million). It also includes advance taxes paid on the employee severance indemnity reserve(Lit. 2,854 million and Lit. 2,680 million, respectively). In the year ending December 31, 2000, the entireamount due from the tax authorities was collected.
The balance at December 31, 2000 includes advance taxes paid on the employee severance indemnityreserve (Lit. 1,864 million) and deposits with vendors and suppliers (Lit. 1,415 million).
Receivables
The table below details receivables and the bad debt reserve:
1998 1999 2000
(Millions of Lire)
Receivables ÏÏÏÏÏÏÏÏÏÏÏÏÏÏÏÏÏÏÏÏÏÏÏÏÏÏÏÏÏÏÏÏÏÏÏÏÏÏÏÏÏÏÏÏÏÏÏÏÏÏÏ 525,193 583,313 627,163
Bad debt reserve ÏÏÏÏÏÏÏÏÏÏÏÏÏÏÏÏÏÏÏÏÏÏÏÏÏÏÏÏÏÏÏÏÏÏÏÏÏÏÏÏÏÏÏÏÏÏÏ (20,027) (25,461) (11,428)
Total receivables, net ÏÏÏÏÏÏÏÏÏÏÏÏÏÏÏÏÏÏÏÏÏÏÏÏÏÏÏÏÏÏÏÏÏÏÏÏÏÏÏ 505,166 557,852 615,735
The increase in receivables from customers in 1999 and 2000 is smaller, as a percentage, than thegrowth of the Group's revenues.
The bad debt reserve was reduced during 2000 as a result of the decision to write oÅ certain amountsrelating to previous years. Management believes that the balance of the reserve at December 31, 2000 issuÇcient not only with respect to speciÑc doubtful accounts but also in relation to total receivables.
F-91
Brought to you by Global Reports

UNAUDITED PRO FORMA CONSOLIDATED FINANCIAL STATEMENTS(NOT INCLUDING KENWOOD)
NOTES TO THE UNAUDITED DE' LONGHI PRO FORMACONSOLIDATED FINANCIAL STATEMENTS Ì (Continued)
Provisions were made to the bad debt reserve to cover certain amounts under litigation as well asother doubtful accounts. In 2000, Lit. 21,978 million was speciÑcally reserved to cover losses that becamecertain.
Inventory
1998 1999 2000
(Millions of Lire)
Raw, auxiliary and consumable materials ÏÏÏÏÏÏÏÏÏÏÏÏÏÏÏÏÏÏÏÏÏÏÏÏÏÏ 106,487 104,127 131,009
Work-in process and semi-Ñnished products ÏÏÏÏÏÏÏÏÏÏÏÏÏÏÏÏÏÏÏÏÏÏÏÏ 29,137 34,554 41,234
Finished products ÏÏÏÏÏÏÏÏÏÏÏÏÏÏÏÏÏÏÏÏÏÏÏÏÏÏÏÏÏÏÏÏÏÏÏÏÏÏÏÏÏÏÏÏÏÏ 170,372 150,900 198,296
Total ÏÏÏÏÏÏÏÏÏÏÏÏÏÏÏÏÏÏÏÏÏÏÏÏÏÏÏÏÏÏÏÏÏÏÏÏÏÏÏÏÏÏÏÏÏÏÏÏÏÏÏÏÏ 305,996 289,581 370,539
Warehouse inventories are stated net of the inventories obsolescence reserve (slow-moving stock).
The increase in the value of inventories at December 31, 2000 is a direct result of increased sales andbad weather in the summer which penalized the expected growth in sales of conditioning and treatmentproducts for the main markets.
Other Current Assets
1998 1999 2000
(Millions of Lire)
Receivables from associatesÏÏÏÏÏÏÏÏÏÏÏÏÏÏÏÏÏÏÏÏÏÏÏÏÏÏÏÏÏÏÏÏÏÏÏÏÏÏ 6,177 1,925 2,529
Receivables from non-consolidated subsidiaries ÏÏÏÏÏÏÏÏÏÏÏÏÏÏÏÏÏÏÏÏÏ Ì 2,059 Ì
Receivables from tax authorities, VAT ÏÏÏÏÏÏÏÏÏÏÏÏÏÏÏÏÏÏÏÏÏÏÏÏÏÏÏÏ 16,852 21,055 51,034
Receivables from tax authorities, other ÏÏÏÏÏÏÏÏÏÏÏÏÏÏÏÏÏÏÏÏÏÏÏÏÏÏÏÏ 48,702 26,468 6,063
Receivables from others ÏÏÏÏÏÏÏÏÏÏÏÏÏÏÏÏÏÏÏÏÏÏÏÏÏÏÏÏÏÏÏÏÏÏÏÏÏÏÏÏÏ 55,338 49,501 55,478
Total ÏÏÏÏÏÏÏÏÏÏÏÏÏÏÏÏÏÏÏÏÏÏÏÏÏÏÏÏÏÏÏÏÏÏÏÏÏÏÏÏÏÏÏÏÏÏÏÏÏÏÏÏÏ 127,069 101,008 115,104
Accrued income and pre-paid expenses ÏÏÏÏÏÏÏÏÏÏÏÏÏÏÏÏÏÏÏÏÏÏÏÏÏÏÏÏ 5,127 4,872 23,637
Total other current assetsÏÏÏÏÏÏÏÏÏÏÏÏÏÏÏÏÏÏÏÏÏÏÏÏÏÏÏÏÏÏÏÏÏÏÏÏ 132,196 105,880 138,741
Receivables from associates in 1998 refers to trade receivables from Italia Distribudora deEletrodomesticos Ltda (Lit. 4,718 million) and Omas S.r.l (Lit. 1,454 million). The balance with respectto the associate Omas S.r.l was Lit. 1,925 million at December 31, 1999 and Lit. 2,529 million atDecember 31, 2000.
Receivables from non-consolidated subsidiaries for 1999 includes Lit. 2,059 million from ItaliaDistribudora de Eletrodomesticos Ltda. This company was sold to a third party in 2000. The aÇliatereceivable at December 31, 2000 was thus reclassed to accounts receivable.
The increase in VAT credit in 2000 was mainly due to increased export sales by certain Groupcompanies which were not able to make full use of tax-free purchasing of goods and services possibleunder current Italian law.
Receivables from tax authorities, other consists mainly of amounts due from tax authorities foradvances and tax credits (Lit. 48,702 million at December 31, 1998 and decreasing thereafter) as well asVAT receivables.
F-92
Brought to you by Global Reports

UNAUDITED PRO FORMA CONSOLIDATED FINANCIAL STATEMENTS(NOT INCLUDING KENWOOD)
NOTES TO THE UNAUDITED DE' LONGHI PRO FORMACONSOLIDATED FINANCIAL STATEMENTS Ì (Continued)
Receivables from others breaks down as follows:
1998 1999 2000
(Millions of Lire)
Receivables for advance taxÏÏÏÏÏÏÏÏÏÏÏÏÏÏÏÏÏÏÏÏÏÏÏÏÏÏÏÏÏÏÏÏÏÏÏÏÏÏÏÏÏ 37,430 34,638 34,745
Accrued income ÏÏÏÏÏÏÏÏÏÏÏÏÏÏÏÏÏÏÏÏÏÏÏÏÏÏÏÏÏÏÏÏÏÏÏÏÏÏÏÏÏÏÏÏÏÏÏÏÏÏ 4,476 5,986 2,626
Advances to suppliers ÏÏÏÏÏÏÏÏÏÏÏÏÏÏÏÏÏÏÏÏÏÏÏÏÏÏÏÏÏÏÏÏÏÏÏÏÏÏÏÏÏÏÏÏÏÏ 3,811 3,995 3,443
Other receivablesÏÏÏÏÏÏÏÏÏÏÏÏÏÏÏÏÏÏÏÏÏÏÏÏÏÏÏÏÏÏÏÏÏÏÏÏÏÏÏÏÏÏÏÏÏÏÏÏÏÏ 9,621 4,882 14,664
Total receivables from othersÏÏÏÏÏÏÏÏÏÏÏÏÏÏÏÏÏÏÏÏÏÏÏÏÏÏÏÏÏÏÏÏÏÏÏÏ 55,338 49,501 55,478
Receivables for advanced tax refers to amounts calculated on temporary diÅerences between asset andliability values and the corresponding tax amounts as well as amounts derived from net operating lossesretainable for tax purposes. The balance at December 31, 2000 is made up of temporary diÅerences(Lit. 18,813 million) and ""consolidation adjustments'' (Lit. 15,932 million).
Accrued income refers to revenues for which invoices have not yet been issued or received.
Advances to suppliers includes amounts paid to suppliers under contract and relates to theprocurement of production materials.
Other receivables at December 31, 2000 includes the balance due from Cogef S.p.A. in liquidation(Lit. 6,700 million net; in 1998 and 1999 it was Lit. 2,830 million and Lit. 3,348 million, respectively). In2001 this amount was transferred to third parties without recourse for Lit. 6,700 million. The item alsoincludes Lit. 3,240 million in tax rebate claims.
Accrued income and pre-paid expenses includes the year's interest on hedging operations and, to alesser extent, advertising costs and other charges. The signiÑcant increase in the year closing December 31,2000 was due to forward operations (Lit. 17,263 million) and pre-paid advertising expenses as well asother charges (Lit. 3,015 million).
Payables
Payables consist entirely of obligations falling due within 12 months. Most of these accounts refer toraw materials, components, Ñnished products and, to a lesser extent, professional services and consulting.
Other Current Liabilities
1998 1999 2000
(Millions of Lire)
Advances from customers ÏÏÏÏÏÏÏÏÏÏÏÏÏÏÏÏÏÏÏÏÏÏÏÏÏÏÏÏÏÏÏÏÏÏÏÏÏÏÏÏÏ 7,610 5,505 5,453
Taxes payable ÏÏÏÏÏÏÏÏÏÏÏÏÏÏÏÏÏÏÏÏÏÏÏÏÏÏÏÏÏÏÏÏÏÏÏÏÏÏÏÏÏÏÏÏÏÏÏÏÏÏÏ 47,052 35,098 44,923
Payables to social securities authorities ÏÏÏÏÏÏÏÏÏÏÏÏÏÏÏÏÏÏÏÏÏÏÏÏÏÏÏÏÏÏ 8,901 10,011 9,887
Other payablesÏÏÏÏÏÏÏÏÏÏÏÏÏÏÏÏÏÏÏÏÏÏÏÏÏÏÏÏÏÏÏÏÏÏÏÏÏÏÏÏÏÏÏÏÏÏÏÏÏÏÏ 29,081 34,601 37,983
Payables to non-consolidated subsidiaries ÏÏÏÏÏÏÏÏÏÏÏÏÏÏÏÏÏÏÏÏÏÏÏÏÏÏÏÏ Ì Ì 2,704
Payables to associatesÏÏÏÏÏÏÏÏÏÏÏÏÏÏÏÏÏÏÏÏÏÏÏÏÏÏÏÏÏÏÏÏÏÏÏÏÏÏÏÏÏÏÏÏÏ 837 276 1,369
Total ÏÏÏÏÏÏÏÏÏÏÏÏÏÏÏÏÏÏÏÏÏÏÏÏÏÏÏÏÏÏÏÏÏÏÏÏÏÏÏÏÏÏÏÏÏÏÏÏÏÏÏÏÏÏÏ 93,481 85,491 102,319
Accrued expenses and deferred income ÏÏÏÏÏÏÏÏÏÏÏÏÏÏÏÏÏÏÏÏÏÏÏÏÏÏÏÏÏÏ 4,221 6,629 26,689
Total other current liabilities ÏÏÏÏÏÏÏÏÏÏÏÏÏÏÏÏÏÏÏÏÏÏÏÏÏÏÏÏÏÏÏÏÏÏÏ 97,702 92,120 129,008
Taxes payable for each year is mainly for current taxes and withholding amounts applied as asubstitute tax. The amount for December 31, 2000 also includes the portion falling due in 2001 of the
F-93
Brought to you by Global Reports

UNAUDITED PRO FORMA CONSOLIDATED FINANCIAL STATEMENTS(NOT INCLUDING KENWOOD)
NOTES TO THE UNAUDITED DE' LONGHI PRO FORMACONSOLIDATED FINANCIAL STATEMENTS Ì (Continued)
substitute tax charge (Lit. 14,695 million) arising from the write-up of the tax basis of existing assets andthe application of the 19% rate to the increase.
Other payables breaks down as follows:
1998 1999 2000
(Millions of Lire)
Payables to employees ÏÏÏÏÏÏÏÏÏÏÏÏÏÏÏÏÏÏÏÏÏÏÏÏÏÏÏÏÏÏÏÏÏÏÏÏÏÏÏÏÏÏÏÏÏ 20,076 26,062 27,628
Other payablesÏÏÏÏÏÏÏÏÏÏÏÏÏÏÏÏÏÏÏÏÏÏÏÏÏÏÏÏÏÏÏÏÏÏÏÏÏÏÏÏÏÏÏÏÏÏÏÏÏÏÏÏ 9,005 8,539 10,355
Total other payables ÏÏÏÏÏÏÏÏÏÏÏÏÏÏÏÏÏÏÏÏÏÏÏÏÏÏÏÏÏÏÏÏÏÏÏÏÏÏÏÏÏÏÏ 29,081 34,601 37,983
Payables to employees includes liabilities accrued on behalf of Group employees for outstandingholidays, additional salaries and social security contributions.
Other payables at December 31, 2000 refers in particular to amounts payable by the subsidiary DLRadiators S.p.A, which was disposed of during the year. The item also includes Lit. 2,219 million of coststo be incurred during the year.
Payables to non-consolidated subsidiaries and associates refers to amounts owed to the subsidiaryClim.Re S.A. and Omas S.r.l, respectively.
Accrued expenses and deferred income at December 31, 2000 includes interest charges on a bondissue by the subsidiary De' Longhi Pinguino S.A. (Lit. 11,056 million), charges on interest and exchangerate hedging operations (Lit. 6,940 million) and interest charges by banks (Lit. 4,694 million).
Reserve for StaÅ Severance Indemnities
The table below details movements in the reserve over the three years.
Totale
(Millions of Lire)
Balance at December 31, 1998 ÏÏÏÏÏÏÏÏÏÏÏÏÏÏÏÏÏÏÏÏÏÏÏÏÏÏÏÏÏÏÏÏÏÏÏÏÏÏÏÏÏÏÏÏÏÏÏÏÏÏ 34,261
ProvisionsÏÏÏÏÏÏÏÏÏÏÏÏÏÏÏÏÏÏÏÏÏÏÏÏÏÏÏÏÏÏÏÏÏÏÏÏÏÏÏÏÏÏÏÏÏÏÏÏÏÏÏÏÏÏÏÏÏÏÏÏÏÏÏÏÏÏ 8,590
AppropriationsÏÏÏÏÏÏÏÏÏÏÏÏÏÏÏÏÏÏÏÏÏÏÏÏÏÏÏÏÏÏÏÏÏÏÏÏÏÏÏÏÏÏÏÏÏÏÏÏÏÏÏÏÏÏÏÏÏÏÏÏÏÏ (8,054)
Balance at December 31, 1999 ÏÏÏÏÏÏÏÏÏÏÏÏÏÏÏÏÏÏÏÏÏÏÏÏÏÏÏÏÏÏÏÏÏÏÏÏÏÏÏÏÏÏÏÏÏÏÏÏÏÏ 34,797
ProvisionsÏÏÏÏÏÏÏÏÏÏÏÏÏÏÏÏÏÏÏÏÏÏÏÏÏÏÏÏÏÏÏÏÏÏÏÏÏÏÏÏÏÏÏÏÏÏÏÏÏÏÏÏÏÏÏÏÏÏÏÏÏÏÏÏÏÏ 10,018
AppropriationsÏÏÏÏÏÏÏÏÏÏÏÏÏÏÏÏÏÏÏÏÏÏÏÏÏÏÏÏÏÏÏÏÏÏÏÏÏÏÏÏÏÏÏÏÏÏÏÏÏÏÏÏÏÏÏÏÏÏÏÏÏÏ (7,290)
Balance at December 31, 2000 ÏÏÏÏÏÏÏÏÏÏÏÏÏÏÏÏÏÏÏÏÏÏÏÏÏÏÏÏÏÏÏÏÏÏÏÏÏÏÏÏÏÏÏÏÏÏÏÏÏÏ 37,525
The balance of the reserve reÖects the Group's liability at December 31, of each year on behalf ofemployees of the Company and its Italian subsidiaries at year end, net of any advances paid.
F-94
Brought to you by Global Reports

UNAUDITED PRO FORMA CONSOLIDATED FINANCIAL STATEMENTS(NOT INCLUDING KENWOOD)
NOTES TO THE UNAUDITED DE' LONGHI PRO FORMACONSOLIDATED FINANCIAL STATEMENTS Ì (Continued)
Reserves for Risks and Other Charges
The table below details movements in the reserve over the three years.
Reserve for Total ReservesRetirement Other for Risks Otherand Similar Reserves and Charges Liabilities Total
(Millions of Lire)
Balance at December 31, 1998ÏÏÏÏÏÏÏÏÏÏÏÏÏÏ 5,060 10,813 15,873 Ì 15,873
Provisions ÏÏÏÏÏÏÏÏÏÏÏÏÏÏÏÏÏÏÏÏÏÏÏÏÏÏÏÏÏ 1,145 6,994 8,139 Ì 8,139
Applications ÏÏÏÏÏÏÏÏÏÏÏÏÏÏÏÏÏÏÏÏÏÏÏÏÏÏÏ (709) (5,834) (6,543) Ì (6,543)
Balance at December 31, 1999ÏÏÏÏÏÏÏÏÏÏÏÏÏÏ 5,496 11,973 17,469 Ì 17,469
Provisions ÏÏÏÏÏÏÏÏÏÏÏÏÏÏÏÏÏÏÏÏÏÏÏÏÏÏÏÏÏ 1,154 8,953 10,107 Ì 10,107
Applications ÏÏÏÏÏÏÏÏÏÏÏÏÏÏÏÏÏÏÏÏÏÏÏÏÏÏÏ (852) (4,878) (5,730) Ì (5,730)
ReclassiÑcations ÏÏÏÏÏÏÏÏÏÏÏÏÏÏÏÏÏÏÏÏÏÏÏÏ (606) 606 Ì Ì Ì
Other provisions ÏÏÏÏÏÏÏÏÏÏÏÏÏÏÏÏÏÏÏÏÏÏÏÏ Ì Ì Ì 29,389 29,389
Balance at December 31, 2000ÏÏÏÏÏÏÏÏÏÏÏÏÏÏ 5,192 16,654 21,846 29,389 51,235
Reserves for retirement and similar includes the supplementary client indemnity reserve which was setup to cover the potential risk of severance indemnity.
Other reserves break down as follows:
1998 1999 2000
(Millions of Lire)
Reserve for future risks ÏÏÏÏÏÏÏÏÏÏÏÏÏÏÏÏÏÏÏÏÏÏÏÏÏÏÏÏÏÏÏÏÏÏÏÏÏÏÏÏÏÏÏÏ 4,300 6,150 10,450
Product warranty reserve ÏÏÏÏÏÏÏÏÏÏÏÏÏÏÏÏÏÏÏÏÏÏÏÏÏÏÏÏÏÏÏÏÏÏÏÏÏÏÏÏÏÏÏ 2,156 2,259 2,627
Sales returns reserveÏÏÏÏÏÏÏÏÏÏÏÏÏÏÏÏÏÏÏÏÏÏÏÏÏÏÏÏÏÏÏÏÏÏÏÏÏÏÏÏÏÏÏÏÏÏÏ 950 950 1,314
OthersÏÏÏÏÏÏÏÏÏÏÏÏÏÏÏÏÏÏÏÏÏÏÏÏÏÏÏÏÏÏÏÏÏÏÏÏÏÏÏÏÏÏÏÏÏÏÏÏÏÏÏÏÏÏÏÏÏÏÏ 3,407 2,614 2,263
Total ÏÏÏÏÏÏÏÏÏÏÏÏÏÏÏÏÏÏÏÏÏÏÏÏÏÏÏÏÏÏÏÏÏÏÏÏÏÏÏÏÏÏÏÏÏÏÏÏÏÏÏÏÏÏÏÏ 10,813 11,973 16,654
Reserve for future risks refers to various sorts of risk that might produce liabilities. Conservativeprovisions made by the parent company (Lit. 5,000 million) relate to the risk of liabilities related tolitigation in the U.S. The reserve also includes prudential provisions made by subsidiaries regardinglitigation with tax authorities and third parties.
Further, there are a number of disputes with third parties involving claims for large amounts.Consistent with counsel opinion, management believes there are no grounds for assuming there is anyreasonable risk of such claims succeeding and therefore the Group's Ñnancial position being aÅected. Theprudential provisions are intended merely to cover the legal expenses of such litigation.
Product warranty reserve contains provisions made by certain Group companies on the basis ofestimated future costs for work under guarantees on products whose revenues have already beenrecognized.
Other liabilities is a lieu tax debt of Lit. 29,389 million, payment of which will be recorded in futureperiods.
F-95
Brought to you by Global Reports

UNAUDITED PRO FORMA CONSOLIDATED FINANCIAL STATEMENTS(NOT INCLUDING KENWOOD)
NOTES TO THE UNAUDITED DE' LONGHI PRO FORMACONSOLIDATED FINANCIAL STATEMENTS Ì (Continued)
Cash and Cash Equivalents
1998 1999 2000
(Millions of Lire)
Cash ÏÏÏÏÏÏÏÏÏÏÏÏÏÏÏÏÏÏÏÏÏÏÏÏÏÏÏÏÏÏÏÏÏÏÏÏÏÏÏÏÏÏÏÏÏÏÏÏÏÏÏÏÏÏÏÏÏÏ 85,294 152,694 128,975
Marketable securities ÏÏÏÏÏÏÏÏÏÏÏÏÏÏÏÏÏÏÏÏÏÏÏÏÏÏÏÏÏÏÏÏÏÏÏÏÏÏÏÏÏÏÏÏ 2,565 4,351 7,004
Cash and cash equivalents ÏÏÏÏÏÏÏÏÏÏÏÏÏÏÏÏÏÏÏÏÏÏÏÏÏÏÏÏÏÏÏÏÏÏÏÏÏÏÏÏ 87,859 157,045 135,979
Cash for the three years includes positive balances with banks. Marketable securities refers to short-term corporate and government debt and equity securities.
Short-Term Debt
1998 1999 2000
(Millions of Lire)
Short-term payables to banks ÏÏÏÏÏÏÏÏÏÏÏÏÏÏÏÏÏÏÏÏÏÏÏÏÏÏÏÏÏÏÏÏÏÏÏ 96,728 Ì 53,717
Payables to other lenders ÏÏÏÏÏÏÏÏÏÏÏÏÏÏÏÏÏÏÏÏÏÏÏÏÏÏÏÏÏÏÏÏÏÏÏÏÏÏÏ 51,442 23,626 26,327
Payables to related parties ÏÏÏÏÏÏÏÏÏÏÏÏÏÏÏÏÏÏÏÏÏÏÏÏÏÏÏÏÏÏÏÏÏÏÏÏÏÏ Ì 150,956 Ì
Payables to subsidiaries ÏÏÏÏÏÏÏÏÏÏÏÏÏÏÏÏÏÏÏÏÏÏÏÏÏÏÏÏÏÏÏÏÏÏÏÏÏÏÏÏ Ì Ì 2,704
Receivables from related parties for loans ÏÏÏÏÏÏÏÏÏÏÏÏÏÏÏÏÏÏÏÏÏÏÏÏÏ (144,970) (29,000) (28,412)
Short-term debtÏÏÏÏÏÏÏÏÏÏÏÏÏÏÏÏÏÏÏÏÏÏÏÏÏÏÏÏÏÏÏÏÏÏÏÏÏÏÏÏÏÏÏÏÏÏÏ 3,200 145,582 54,336
Short-term payables to banks include the Lit. 250,587 million capital increase.
The table below details the Group's short-term indebtedness to banks at December 31, 2000:
Short-term
(Millionsof Lire)
Current accountsÏÏÏÏÏÏÏÏÏÏÏÏÏÏÏÏÏÏÏÏÏÏÏÏÏÏÏÏÏÏÏÏÏÏÏÏÏÏÏÏÏÏÏÏÏÏÏÏÏÏÏÏÏÏÏÏÏÏÏÏÏÏÏÏÏÏÏ 13,471
Short-term borrowing in Lira and foreign currency ÏÏÏÏÏÏÏÏÏÏÏÏÏÏÏÏÏÏÏÏÏÏÏÏÏÏÏÏÏÏÏÏÏÏÏÏÏÏ 173,775
Bills portfolioÏÏÏÏÏÏÏÏÏÏÏÏÏÏÏÏÏÏÏÏÏÏÏÏÏÏÏÏÏÏÏÏÏÏÏÏÏÏÏÏÏÏÏÏÏÏÏÏÏÏÏÏÏÏÏÏÏÏÏÏÏÏÏÏÏÏÏÏÏÏ 55,792
TotalÏÏÏÏÏÏÏÏÏÏÏÏÏÏÏÏÏÏÏÏÏÏÏÏÏÏÏÏÏÏÏÏÏÏÏÏÏÏÏÏÏÏÏÏÏÏÏÏÏÏÏÏÏÏÏÏÏÏÏÏÏÏÏÏÏÏÏÏÏÏÏÏÏ 243,038
Medium/long-term loans ÏÏÏÏÏÏÏÏÏÏÏÏÏÏÏÏÏÏÏÏÏÏÏÏÏÏÏÏÏÏÏÏÏÏÏÏÏÏÏÏÏÏÏÏÏÏÏÏÏÏÏÏÏÏÏÏÏÏÏÏ 61,266
Retroactive application of capital increaseÏÏÏÏÏÏÏÏÏÏÏÏÏÏÏÏÏÏÏÏÏÏÏÏÏÏÏÏÏÏÏÏÏÏÏÏÏÏÏÏÏÏÏÏÏÏ (250,587)
TotalÏÏÏÏÏÏÏÏÏÏÏÏÏÏÏÏÏÏÏÏÏÏÏÏÏÏÏÏÏÏÏÏÏÏÏÏÏÏÏÏÏÏÏÏÏÏÏÏÏÏÏÏÏÏÏÏÏÏÏÏÏÏÏÏÏÏÏÏÏÏÏÏÏ 53,717
To reduce Ñnancial risks connected with exchange and interest rate Öuctuations, the Group hasentered into hedging contracts within the limits deÑned by management.
Payables to other lenders refers mainly to the residual portion of debt on leasing contracts, as requiredby IAS 17. In particular, the balance for 1998 also includes variable rate debt to factoring companies(Lit. 16,097 million) for invoice discounting. The amount was repaid in 2000.
Payables to related parties for 1998 and 1999 refers to a variable rate loan provided by De' LonghiSoparÑ S.A. The loan was fully repaid in 2000.
Receivables from related parties for loans in 1998 includes a loan granted to De' Longhi SoparÑ S.A.(Lit. 54,000 million) and a receivable arising from the disposal of investments in Climaveneta S.p.A. andErgoklima S.p.A.
F-96
Brought to you by Global Reports

UNAUDITED PRO FORMA CONSOLIDATED FINANCIAL STATEMENTS(NOT INCLUDING KENWOOD)
NOTES TO THE UNAUDITED DE' LONGHI PRO FORMACONSOLIDATED FINANCIAL STATEMENTS Ì (Continued)
Long-Term Debt
1998 1999 2000
(Millions of Lire)
Payables to banks, medium/long-termÏÏÏÏÏÏÏÏÏÏÏÏÏÏÏÏÏÏÏÏÏÏÏÏÏÏÏÏÏ 238,586 233,674 228,702
Bond issues ÏÏÏÏÏÏÏÏÏÏÏÏÏÏÏÏÏÏÏÏÏÏÏÏÏÏÏÏÏÏÏÏÏÏÏÏÏÏÏÏÏÏÏÏÏÏÏÏÏÏÏ 254,711 102,711 290,441
Payables to related parties ÏÏÏÏÏÏÏÏÏÏÏÏÏÏÏÏÏÏÏÏÏÏÏÏÏÏÏÏÏÏÏÏÏÏÏÏÏÏÏ 155,137 Ì Ì
Long-term debt ÏÏÏÏÏÏÏÏÏÏÏÏÏÏÏÏÏÏÏÏÏÏÏÏÏÏÏÏÏÏÏÏÏÏÏÏÏÏÏÏÏÏÏÏÏÏÏÏ 648,434 336,385 519,143
Bond issues refers, in 1998 and 1999, to two variable rate bond issues held by De' Longhi SoparÑS.A. and partially repaid in 1999 (the rest repaid in 2000). In 2000 the subsidiary De' Longhi PinguinoS.A. issued a three-year Eurobond at 5.625% (Lit. 290,440 million).
Debt for Acquisition of Investments
Debt for acquisition of investments refers to acquisition of the companies listed in Note 2.
Pro forma debt (net of receivables)
Pro forma debt (net of receivables) includes:
‚ the pro forma debt relating to the acquisition of DL Radiators S.p.A. and Sile Corpi ScaldantiS.r.l. (see Assumptions due to divested entities) totaling Lit. 114,077 million for 1998 and 1999;
‚ the diÅerence between the pro forma credit relating to disposal of the companies in Note 1)(Lit. 42,100 million) and the value of the corresponding investments (Lit. 6,039 million in 1998and Lit. 6,215 million in 1999);
‚ Ñnancial income arising from the above mentioned pro forma credit, totaling Lit. 2,300 millionand calculated for each year in relation to total receivables of Lit. 6,900 million at December 31,2000;
‚ the advanced payment of Lit. 34,175 million for the acquisition of the companies in Note 1.
Shareholders' Equity
On April 18, 2001 the shareholders voted a capital increase by nominal payment of Lit. 250,587million, thus bringing capital stock to Lit. 650,587 million. The eÅects of this increase have beenretroactively reÖected as of January 1, 1998 without considering the eÅects of interest expense.
In 1999 there was a capital increase of Lit. 100 billion (100 million ordinary shares of nominal valueLit. 1,000 each).
The pro forma reserve serves to reÖect the equity and income eÅects from the assumptions used inthe preparation of these pro forma consolidated Ñnancial statements. This reserve also includes proÑts andlosses stated in the pro forma income statement.
Retained earnings includes changes in the balance sheets of consolidated companies after the datethey were acquired.
F-97
Brought to you by Global Reports

UNAUDITED PRO FORMA CONSOLIDATED FINANCIAL STATEMENTS(NOT INCLUDING KENWOOD)
NOTES TO THE UNAUDITED DE' LONGHI PRO FORMACONSOLIDATED FINANCIAL STATEMENTS Ì (Continued)
The table below details the make up of shareholders' equity in 1998, 1999 and 2000.
1998 1999 2000
(Millions of Lire)
Share capital ÏÏÏÏÏÏÏÏÏÏÏÏÏÏÏÏÏÏÏÏÏÏÏÏÏÏÏÏÏÏÏÏÏÏÏÏÏÏÏÏÏÏÏÏÏÏÏÏÏÏ 550,587 650,587 650,587
Reserves ÏÏÏÏÏÏÏÏÏÏÏÏÏÏÏÏÏÏÏÏÏÏÏÏÏÏÏÏÏÏÏÏÏÏÏÏÏÏÏÏÏÏÏÏÏÏÏÏÏÏÏÏÏÏ 26,315 36,362 27,252
Pro Forma reserve ÏÏÏÏÏÏÏÏÏÏÏÏÏÏÏÏÏÏÏÏÏÏÏÏÏÏÏÏÏÏÏÏÏÏÏÏÏÏÏÏÏÏÏÏÏ 19,002 (21.190) 4,345
Net (loss) income for the year ÏÏÏÏÏÏÏÏÏÏÏÏÏÏÏÏÏÏÏÏÏÏÏÏÏÏÏÏÏÏÏÏÏÏÏ (44.139) 40,589 41,540
Shareholders' equity ÏÏÏÏÏÏÏÏÏÏÏÏÏÏÏÏÏÏÏÏÏÏÏÏÏÏÏÏÏÏÏÏÏÏÏÏÏÏÏÏÏÏÏÏ 551,765 706,348 723,724
Minority interests ÏÏÏÏÏÏÏÏÏÏÏÏÏÏÏÏÏÏÏÏÏÏÏÏÏÏÏÏÏÏÏÏÏÏÏÏÏÏÏÏÏÏÏÏÏÏ 477 329 637
Total shareholders' equity and minority interests ÏÏÏÏÏÏÏÏÏÏÏÏÏÏÏÏ 552,242 706,677 724,361
Memorandum Accounts
1998 1999 2000
(Millions of Lire)
Assets held by third parties ÏÏÏÏÏÏÏÏÏÏÏÏÏÏÏÏÏÏÏÏÏÏÏÏÏÏÏÏÏÏÏÏÏÏÏÏÏÏÏÏÏ 1,591 1,514 2,408
Personal guarantees in favour of third parties ÏÏÏÏÏÏÏÏÏÏÏÏÏÏÏÏÏÏÏÏÏÏÏÏÏÏ 24,687 47,297 20,135
Other commitments ÏÏÏÏÏÏÏÏÏÏÏÏÏÏÏÏÏÏÏÏÏÏÏÏÏÏÏÏÏÏÏÏÏÏÏÏÏÏÏÏÏÏÏÏÏÏÏ 19,780 49,515 1,711
Total ÏÏÏÏÏÏÏÏÏÏÏÏÏÏÏÏÏÏÏÏÏÏÏÏÏÏÏÏÏÏÏÏÏÏÏÏÏÏÏÏÏÏÏÏÏÏÏÏÏÏÏÏÏÏÏÏ 46,058 98,326 24,254
The reduction in personal guarantees in favour of third parties in 2000 is due to the extinguishment ofa commitment on a guarantee provided for Banco Ambrosiano Veneto (Lit. 40 billion) following anagreement entered into by De' Longhi SoparÑ S.A., which took over all the obligations relative to suchguarantee.
Other commitments reÖects a decrease in 2000 following the extinguishment of a commitment(Lit. 17.6 billion) to Cogef S.p.A. in liquidation by virtue of an agreement entered into with De' LonghiSopraÑ S.A. which, on December 28, 2000, agreed to take over all the liabilities of De' Longhi S.p.A. andprovide indemnity against any claim that may be made in relation to Cogef S.p.A's commitments to banks.
Further, a Lit. 30 billion commitment to De' Longhi SoparÑ S.A. was extinguished following thepayment of an outstanding indemnity.
Revenues
1998 1999 2000
(Millions of Lire)
Net sales ÏÏÏÏÏÏÏÏÏÏÏÏÏÏÏÏÏÏÏÏÏÏÏÏÏÏÏÏÏÏÏÏÏÏÏÏÏÏÏÏÏÏÏÏÏÏÏÏÏ 1,269,314 1,374,841 1,561,334
Other revenues ÏÏÏÏÏÏÏÏÏÏÏÏÏÏÏÏÏÏÏÏÏÏÏÏÏÏÏÏÏÏÏÏÏÏÏÏÏÏÏÏÏÏÏÏ 21,384 18,979 23,158
Total ÏÏÏÏÏÏÏÏÏÏÏÏÏÏÏÏÏÏÏÏÏÏÏÏÏÏÏÏÏÏÏÏÏÏÏÏÏÏÏÏÏÏÏÏÏÏÏÏ 1,290,698 1,393,820 1,584,492
F-98
Brought to you by Global Reports

UNAUDITED PRO FORMA CONSOLIDATED FINANCIAL STATEMENTS(NOT INCLUDING KENWOOD)
NOTES TO THE UNAUDITED DE' LONGHI PRO FORMACONSOLIDATED FINANCIAL STATEMENTS Ì (Continued)
Detailed below are the items which make up other revenues.
1998 1999 2000
(Millions of Lire)
Reimbursement of transport expenses ÏÏÏÏÏÏÏÏÏÏÏÏÏÏÏÏÏÏÏÏÏÏÏÏÏÏÏÏÏÏÏÏ 8,552 8,382 8,274
Royalties ÏÏÏÏÏÏÏÏÏÏÏÏÏÏÏÏÏÏÏÏÏÏÏÏÏÏÏÏÏÏÏÏÏÏÏÏÏÏÏÏÏÏÏÏÏÏÏÏÏÏÏÏÏÏÏÏ 473 550 1,579
Contingent gains ÏÏÏÏÏÏÏÏÏÏÏÏÏÏÏÏÏÏÏÏÏÏÏÏÏÏÏÏÏÏÏÏÏÏÏÏÏÏÏÏÏÏÏÏÏÏÏÏÏÏ 5,155 3,173 6,953
Compensation for damages ÏÏÏÏÏÏÏÏÏÏÏÏÏÏÏÏÏÏÏÏÏÏÏÏÏÏÏÏÏÏÏÏÏÏÏÏÏÏÏÏÏ 2,009 599 1,673
Capital gains ÏÏÏÏÏÏÏÏÏÏÏÏÏÏÏÏÏÏÏÏÏÏÏÏÏÏÏÏÏÏÏÏÏÏÏÏÏÏÏÏÏÏÏÏÏÏÏÏÏÏÏÏÏ 2,261 268 196
Other revenues ÏÏÏÏÏÏÏÏÏÏÏÏÏÏÏÏÏÏÏÏÏÏÏÏÏÏÏÏÏÏÏÏÏÏÏÏÏÏÏÏÏÏÏÏÏÏÏÏÏÏÏ 2,934 6,007 4,483
Total ÏÏÏÏÏÏÏÏÏÏÏÏÏÏÏÏÏÏÏÏÏÏÏÏÏÏÏÏÏÏÏÏÏÏÏÏÏÏÏÏÏÏÏÏÏÏÏÏÏÏÏÏÏÏÏÏ 21,384 18,979 23,158
Reimbursement of transport expenses represents amounts charged to national customers for freightcosts.
Materials, Consumables and Goods
1998 1999 2000
(Millions of Lire)
Cost of raw material procurementÏÏÏÏÏÏÏÏÏÏÏÏÏÏÏÏÏÏÏÏÏÏÏÏÏÏÏÏÏÏÏÏÏ 268,400 236,486 280,678
Cost of components procurement ÏÏÏÏÏÏÏÏÏÏÏÏÏÏÏÏÏÏÏÏÏÏÏÏÏÏÏÏÏÏÏÏÏ 264,856 316,467 374,992
Cost of Ñnished product procurementÏÏÏÏÏÏÏÏÏÏÏÏÏÏÏÏÏÏÏÏÏÏÏÏÏÏÏÏÏÏ 29,529 37,361 112,415
Other purchases ÏÏÏÏÏÏÏÏÏÏÏÏÏÏÏÏÏÏÏÏÏÏÏÏÏÏÏÏÏÏÏÏÏÏÏÏÏÏÏÏÏÏÏÏÏÏÏ 30,790 25,371 26,772
Changes in raw materials, components and Ñnished product inventories ÏÏÏÏÏÏÏÏÏÏÏÏÏÏÏÏÏÏÏÏÏÏÏÏÏÏÏÏÏÏÏÏÏÏÏÏÏÏÏÏÏÏÏÏÏÏÏÏÏÏ 40,454 23,973 (76,867)
Increases through internal productionÏÏÏÏÏÏÏÏÏÏÏÏÏÏÏÏÏÏÏÏÏÏÏÏÏÏÏÏÏÏ (3,789) (2,353) (3,937)
Total ÏÏÏÏÏÏÏÏÏÏÏÏÏÏÏÏÏÏÏÏÏÏÏÏÏÏÏÏÏÏÏÏÏÏÏÏÏÏÏÏÏÏÏÏÏÏÏÏÏÏÏÏÏ 630,240 637,305 714,053
F-99
Brought to you by Global Reports

UNAUDITED PRO FORMA CONSOLIDATED FINANCIAL STATEMENTS(NOT INCLUDING KENWOOD)
NOTES TO THE UNAUDITED DE' LONGHI PRO FORMACONSOLIDATED FINANCIAL STATEMENTS Ì (Continued)
Services
1998 1999 2000
(Millions of Lire)
AdvertisingÏÏÏÏÏÏÏÏÏÏÏÏÏÏÏÏÏÏÏÏÏÏÏÏÏÏÏÏÏÏÏÏÏÏÏÏÏÏÏÏÏÏÏÏÏÏÏÏÏÏÏÏ 51,978 59,484 64,537
External processing ÏÏÏÏÏÏÏÏÏÏÏÏÏÏÏÏÏÏÏÏÏÏÏÏÏÏÏÏÏÏÏÏÏÏÏÏÏÏÏÏÏÏÏÏÏ 35,918 40,130 50,528
Commissions ÏÏÏÏÏÏÏÏÏÏÏÏÏÏÏÏÏÏÏÏÏÏÏÏÏÏÏÏÏÏÏÏÏÏÏÏÏÏÏÏÏÏÏÏÏÏÏÏÏÏ 33,694 36,443 38,220
Transport ÏÏÏÏÏÏÏÏÏÏÏÏÏÏÏÏÏÏÏÏÏÏÏÏÏÏÏÏÏÏÏÏÏÏÏÏÏÏÏÏÏÏÏÏÏÏÏÏÏÏÏÏÏ 38,118 46,739 62,307
Promotional expenses ÏÏÏÏÏÏÏÏÏÏÏÏÏÏÏÏÏÏÏÏÏÏÏÏÏÏÏÏÏÏÏÏÏÏÏÏÏÏÏÏÏÏÏ 8,507 9,771 11,408
Technical assistance ÏÏÏÏÏÏÏÏÏÏÏÏÏÏÏÏÏÏÏÏÏÏÏÏÏÏÏÏÏÏÏÏÏÏÏÏÏÏÏÏÏÏÏÏ 11,184 11,199 14,639
Travel expenses ÏÏÏÏÏÏÏÏÏÏÏÏÏÏÏÏÏÏÏÏÏÏÏÏÏÏÏÏÏÏÏÏÏÏÏÏÏÏÏÏÏÏÏÏÏÏÏÏ 7,355 8,214 9,945
Insurance expenses ÏÏÏÏÏÏÏÏÏÏÏÏÏÏÏÏÏÏÏÏÏÏÏÏÏÏÏÏÏÏÏÏÏÏÏÏÏÏÏÏÏÏÏÏÏ 7,651 9,269 8,915
Stores and warehouse expenses and contributionsÏÏÏÏÏÏÏÏÏÏÏÏÏÏÏÏÏÏÏÏ 6,371 9,181 11,824
Consulting ÏÏÏÏÏÏÏÏÏÏÏÏÏÏÏÏÏÏÏÏÏÏÏÏÏÏÏÏÏÏÏÏÏÏÏÏÏÏÏÏÏÏÏÏÏÏÏÏÏÏÏÏ 11,855 12,590 14,995
Motive force ÏÏÏÏÏÏÏÏÏÏÏÏÏÏÏÏÏÏÏÏÏÏÏÏÏÏÏÏÏÏÏÏÏÏÏÏÏÏÏÏÏÏÏÏÏÏÏÏÏÏ 10,146 11,294 13,713
Postal ÏÏÏÏÏÏÏÏÏÏÏÏÏÏÏÏÏÏÏÏÏÏÏÏÏÏÏÏÏÏÏÏÏÏÏÏÏÏÏÏÏÏÏÏÏÏÏÏÏÏÏÏÏÏÏÏ 4,351 4,415 4,774
Maintenance, 3rd parties ÏÏÏÏÏÏÏÏÏÏÏÏÏÏÏÏÏÏÏÏÏÏÏÏÏÏÏÏÏÏÏÏÏÏÏÏÏÏÏÏ 5,693 6,013 7,240
Other services ÏÏÏÏÏÏÏÏÏÏÏÏÏÏÏÏÏÏÏÏÏÏÏÏÏÏÏÏÏÏÏÏÏÏÏÏÏÏÏÏÏÏÏÏÏÏÏÏÏ 30,876 24,254 41,718
Total ÏÏÏÏÏÏÏÏÏÏÏÏÏÏÏÏÏÏÏÏÏÏÏÏÏÏÏÏÏÏÏÏÏÏÏÏÏÏÏÏÏÏÏÏÏÏÏÏÏÏÏÏÏ 263,697 288,996 354,763
Rents, Leases and Related Costs
1998 1999 2000
(Millions of Lire)
Property rents and other chargesÏÏÏÏÏÏÏÏÏÏÏÏÏÏÏÏÏÏÏÏÏÏÏÏÏÏÏÏÏÏÏÏÏÏÏÏÏ 11,601 11,255 13,419
OthersÏÏÏÏÏÏÏÏÏÏÏÏÏÏÏÏÏÏÏÏÏÏÏÏÏÏÏÏÏÏÏÏÏÏÏÏÏÏÏÏÏÏÏÏÏÏÏÏÏÏÏÏÏÏÏÏÏÏÏ 1,415 1,212 960
Total ÏÏÏÏÏÏÏÏÏÏÏÏÏÏÏÏÏÏÏÏÏÏÏÏÏÏÏÏÏÏÏÏÏÏÏÏÏÏÏÏÏÏÏÏÏÏÏÏÏÏÏÏÏÏÏÏ 13,016 12,467 14,379
Property rents and other charges refers to rents on properties where certain Group companies do theirbusiness as well as charges for the hiring of various vehicles by the Group and certain related parties.
Other Costs
1998 1999 2000
(Millions of Lire)
Contingent lossesÏÏÏÏÏÏÏÏÏÏÏÏÏÏÏÏÏÏÏÏÏÏÏÏÏÏÏÏÏÏÏÏÏÏÏÏÏÏÏÏÏÏÏÏÏÏÏÏÏÏ 2,707 2,296 1,788
Taxes ÏÏÏÏÏÏÏÏÏÏÏÏÏÏÏÏÏÏÏÏÏÏÏÏÏÏÏÏÏÏÏÏÏÏÏÏÏÏÏÏÏÏÏÏÏÏÏÏÏÏÏÏÏÏÏÏÏÏÏ 3,200 4,310 3,186
Franchise and compensation for damage ÏÏÏÏÏÏÏÏÏÏÏÏÏÏÏÏÏÏÏÏÏÏÏÏÏÏÏÏÏÏ 1,264 612 200
Losses on receivables ÏÏÏÏÏÏÏÏÏÏÏÏÏÏÏÏÏÏÏÏÏÏÏÏÏÏÏÏÏÏÏÏÏÏÏÏÏÏÏÏÏÏÏÏÏÏ 7,435 4,992 1,102
Other sundry charges ÏÏÏÏÏÏÏÏÏÏÏÏÏÏÏÏÏÏÏÏÏÏÏÏÏÏÏÏÏÏÏÏÏÏÏÏÏÏÏÏÏÏÏÏÏÏ 6,522 5,664 4,591
Total ÏÏÏÏÏÏÏÏÏÏÏÏÏÏÏÏÏÏÏÏÏÏÏÏÏÏÏÏÏÏÏÏÏÏÏÏÏÏÏÏÏÏÏÏÏÏÏÏÏÏÏÏÏÏÏÏ 21,128 17,874 10,867
Taxes are made up of indirect taxes, dues and other charges such as local property tax, stamp duties,and non-deductible VAT. Other sundry charges includes association memberships and other contributions.
F-100
Brought to you by Global Reports

UNAUDITED PRO FORMA CONSOLIDATED FINANCIAL STATEMENTS(NOT INCLUDING KENWOOD)
NOTES TO THE UNAUDITED DE' LONGHI PRO FORMACONSOLIDATED FINANCIAL STATEMENTS Ì (Continued)
Wages, Salaries and BeneÑts
1998 1999 2000
(Millions of Lire)
Payroll ÏÏÏÏÏÏÏÏÏÏÏÏÏÏÏÏÏÏÏÏÏÏÏÏÏÏÏÏÏÏÏÏÏÏÏÏÏÏÏÏÏÏÏÏÏÏÏÏÏÏÏÏÏÏÏ 143,760 153,437 170,175
Social security charges ÏÏÏÏÏÏÏÏÏÏÏÏÏÏÏÏÏÏÏÏÏÏÏÏÏÏÏÏÏÏÏÏÏÏÏÏÏÏÏÏÏÏ 46,853 47,631 51,258
Employee severance indemnity reserveÏÏÏÏÏÏÏÏÏÏÏÏÏÏÏÏÏÏÏÏÏÏÏÏÏÏÏÏÏ 8,471 8,590 10,019
Pension schemes and similar ÏÏÏÏÏÏÏÏÏÏÏÏÏÏÏÏÏÏÏÏÏÏÏÏÏÏÏÏÏÏÏÏÏÏÏÏÏ 1,567 2,227 2,279
Other costsÏÏÏÏÏÏÏÏÏÏÏÏÏÏÏÏÏÏÏÏÏÏÏÏÏÏÏÏÏÏÏÏÏÏÏÏÏÏÏÏÏÏÏÏÏÏÏÏÏÏÏÏ 1,509 1,426 2,064
Total ÏÏÏÏÏÏÏÏÏÏÏÏÏÏÏÏÏÏÏÏÏÏÏÏÏÏÏÏÏÏÏÏÏÏÏÏÏÏÏÏÏÏÏÏÏÏÏÏÏÏÏÏÏ 202,160 213,311 235,795
The table below details changes in the number of employees over the three-year period by category.
1998 1999 2000
Number Average Number Average Number Average
Managers ÏÏÏÏÏÏÏÏÏÏÏÏÏÏÏÏÏÏÏÏÏÏÏÏÏÏÏÏ 45 47 43 46 56 55
OÇce staÅ ÏÏÏÏÏÏÏÏÏÏÏÏÏÏÏÏÏÏÏÏÏÏÏÏÏÏÏ 942 947 982 995 1,057 1,058
Operatives ÏÏÏÏÏÏÏÏÏÏÏÏÏÏÏÏÏÏÏÏÏÏÏÏÏÏÏ 2,480 2,532 2,586 2,522 2,747 2,754
Total ÏÏÏÏÏÏÏÏÏÏÏÏÏÏÏÏÏÏÏÏÏÏÏÏÏÏÏÏ 3,467 3,526 3,611 3,563 3,860 3,867
Depreciation and Amortization
1998 1999 2000
(Millions of Lire)
Depreciation of property, plant and equipment ÏÏÏÏÏÏÏÏÏÏÏÏÏÏÏÏÏÏÏÏÏÏ 51,440 57,321 55,353
Amortization of goodwill ÏÏÏÏÏÏÏÏÏÏÏÏÏÏÏÏÏÏÏÏÏÏÏÏÏÏÏÏÏÏÏÏÏÏÏÏÏÏÏÏ 30,251 30,311 30,252
Amortization of trademarksÏÏÏÏÏÏÏÏÏÏÏÏÏÏÏÏÏÏÏÏÏÏÏÏÏÏÏÏÏÏÏÏÏÏÏÏÏÏ 13,205 14,770 14,571
Amortization of other intangible assets ÏÏÏÏÏÏÏÏÏÏÏÏÏÏÏÏÏÏÏÏÏÏÏÏÏÏÏÏ 6,189 4,993 5,106
Total depreciation and amortization ÏÏÏÏÏÏÏÏÏÏÏÏÏÏÏÏÏÏÏÏÏÏÏÏÏÏÏ 101,085 107,395 105,282
Further details on depreciation and amortization by category of assets can be found in the relevantnotes to the balance sheet items above.
Provisions and Write-oÅs
1998 1999 2000
(Millions of Lire)
Provisions to bad debt reserve ÏÏÏÏÏÏÏÏÏÏÏÏÏÏÏÏÏÏÏÏÏÏÏÏÏÏÏÏÏÏÏÏÏÏÏÏÏÏÏ 17,403 8,870 7,945
Provisions to risk reserves ÏÏÏÏÏÏÏÏÏÏÏÏÏÏÏÏÏÏÏÏÏÏÏÏÏÏÏÏÏÏÏÏÏÏÏÏÏÏÏÏÏÏ 9,011 6,717 8,415
Other provisions ÏÏÏÏÏÏÏÏÏÏÏÏÏÏÏÏÏÏÏÏÏÏÏÏÏÏÏÏÏÏÏÏÏÏÏÏÏÏÏÏÏÏÏÏÏÏÏÏÏÏ 2,162 355 1,446
Total provisions and writed-oÅsÏÏÏÏÏÏÏÏÏÏÏÏÏÏÏÏÏÏÏÏÏÏÏÏÏÏÏÏÏÏÏÏÏÏ 28,576 15,942 17,806
This item includes provisions against risks relating to normal business.
The largest provision made in 1998 was due to the need to increase the reserve due to certaincountries being impacted by economic crises. The amount of such provisions also reÖects the extensiveinsurance coverage taken out on most receivables.
F-101
Brought to you by Global Reports

UNAUDITED PRO FORMA CONSOLIDATED FINANCIAL STATEMENTS(NOT INCLUDING KENWOOD)
NOTES TO THE UNAUDITED DE' LONGHI PRO FORMACONSOLIDATED FINANCIAL STATEMENTS Ì (Continued)
Net Financial Loss
1998 1999 2000
(Millions of Lire)
Interest and Other Financial Income
Income from other Group companiesÏÏÏÏÏÏÏÏÏÏÏÏÏÏÏÏÏÏÏÏÏÏÏÏÏÏÏÏÏ 2,299 265 1,347
Gains on FX and hedgeing operations ÏÏÏÏÏÏÏÏÏÏÏÏÏÏÏÏÏÏÏÏÏÏÏÏÏÏÏÏ 12,915 24,851 48,128
Interest income from banks and extended payment agreements ÏÏÏÏÏÏÏ 1,887 2,987 8,979
Other Ñnancial income ÏÏÏÏÏÏÏÏÏÏÏÏÏÏÏÏÏÏÏÏÏÏÏÏÏÏÏÏÏÏÏÏÏÏÏÏÏÏÏÏÏ 2,048 2,367 2,722
Financial income (pro forma adjustments) ÏÏÏÏÏÏÏÏÏÏÏÏÏÏÏÏÏÏÏÏÏÏÏÏ 2,300 2,300 2,300
Total Ñnancial income ÏÏÏÏÏÏÏÏÏÏÏÏÏÏÏÏÏÏÏÏÏÏÏÏÏÏÏÏÏÏÏÏÏÏÏÏÏ 21,449 32,770 63,476
Interest and Other Financial Losses
Interest charges to parent company ÏÏÏÏÏÏÏÏÏÏÏÏÏÏÏÏÏÏÏÏÏÏÏÏÏÏÏÏÏÏ (16,689) (13,265) (7,340)
Interest charges on bond issueÏÏÏÏÏÏÏÏÏÏÏÏÏÏÏÏÏÏÏÏÏÏÏÏÏÏÏÏÏÏÏÏÏÏÏ Ì Ì (11,056)
Losses on FX and hedging operations ÏÏÏÏÏÏÏÏÏÏÏÏÏÏÏÏÏÏÏÏÏÏÏÏÏÏÏÏ (21,331) (14,523) (40,527)
Interest charges on short-term borrowing from banks ÏÏÏÏÏÏÏÏÏÏÏÏÏÏÏ (25,523) (15,298) (12,548)
Interest charges on medium/long-term bank loansÏÏÏÏÏÏÏÏÏÏÏÏÏÏÏÏÏÏ (22,831) (12,982) (27,031)
Interest charges on invoice discounting ÏÏÏÏÏÏÏÏÏÏÏÏÏÏÏÏÏÏÏÏÏÏÏÏÏÏÏ (2,352) (4,894) (2,848)
Other Ñnancial chargesÏÏÏÏÏÏÏÏÏÏÏÏÏÏÏÏÏÏÏÏÏÏÏÏÏÏÏÏÏÏÏÏÏÏÏÏÏÏÏÏÏ (5,910) (5,207) (7,544)
Total interest and Ñnancial chargesÏÏÏÏÏÏÏÏÏÏÏÏÏÏÏÏÏÏÏÏÏÏÏÏÏÏÏ (94,636) (66,169) (108,894)
Net Financial Loss ÏÏÏÏÏÏÏÏÏÏÏÏÏÏÏÏÏÏÏÏÏÏÏÏÏÏÏÏÏÏÏÏÏÏÏÏÏÏÏÏ (73,187) (33,399) (45,418)
No Ñnancial income was posted on the Lit. 250,587 million relative to the capital increase onApril 18, 2001.
Income from Equity Investments
1998 1999 2000
(Millions of Lire)
Income from investmentsÏÏÏÏÏÏÏÏÏÏÏÏÏÏÏÏÏÏÏÏÏÏÏÏÏÏÏÏÏÏÏÏÏÏÏÏÏÏÏÏÏÏÏÏÏÏ 829 4,300 8,269
Adjustments to the value of investments ÏÏÏÏÏÏÏÏÏÏÏÏÏÏÏÏÏÏÏÏÏÏÏÏÏÏÏÏÏÏÏÏÏ 989 (443) 52
Total ÏÏÏÏÏÏÏÏÏÏÏÏÏÏÏÏÏÏÏÏÏÏÏÏÏÏÏÏÏÏÏÏÏÏÏÏÏÏÏÏÏÏÏÏÏÏÏÏÏÏÏÏÏÏÏÏÏÏÏ 1,818 3,857 8,321
The income from equity investments at December 31, 2000 includes a tax credit on dividendsreceived (Lit. 5,807 million).
F-102
Brought to you by Global Reports

UNAUDITED PRO FORMA CONSOLIDATED FINANCIAL STATEMENTS(NOT INCLUDING KENWOOD)
NOTES TO THE UNAUDITED DE' LONGHI PRO FORMACONSOLIDATED FINANCIAL STATEMENTS Ì (Continued)
Extraordinary (Loss) Income
1998 1999 2000
(Millions of Lire)
Capital gains on disposals ÏÏÏÏÏÏÏÏÏÏÏÏÏÏÏÏÏÏÏÏÏÏÏÏÏÏÏÏÏÏÏÏÏÏÏÏÏÏÏÏÏ 377 228 324
Advance taxes, previous years ÏÏÏÏÏÏÏÏÏÏÏÏÏÏÏÏÏÏÏÏÏÏÏÏÏÏÏÏÏÏÏÏÏÏÏÏÏÏ 14,527 Ì 8,373
Other extraordinary income ÏÏÏÏÏÏÏÏÏÏÏÏÏÏÏÏÏÏÏÏÏÏÏÏÏÏÏÏÏÏÏÏÏÏÏÏÏÏÏÏ 1,350 509 4,156
Extraordinary income ÏÏÏÏÏÏÏÏÏÏÏÏÏÏÏÏÏÏÏÏÏÏÏÏÏÏÏÏÏÏÏÏÏÏÏÏÏÏÏÏÏÏÏÏÏ 16,254 737 12,853
Cost of restructuring branchesÏÏÏÏÏÏÏÏÏÏÏÏÏÏÏÏÏÏÏÏÏÏÏÏÏÏÏÏÏÏÏÏÏÏÏÏÏÏ (7,262) (2,215) Ì
Extraordinary writedown of non-commercial receivables ÏÏÏÏÏÏÏÏÏÏÏÏÏÏÏÏ (6,000) Ì Ì
Prior year taxes ÏÏÏÏÏÏÏÏÏÏÏÏÏÏÏÏÏÏÏÏÏÏÏÏÏÏÏÏÏÏÏÏÏÏÏÏÏÏÏÏÏÏÏÏÏÏÏÏÏÏ (71) (796) (3,892)
Capital losses on disposals ÏÏÏÏÏÏÏÏÏÏÏÏÏÏÏÏÏÏÏÏÏÏÏÏÏÏÏÏÏÏÏÏÏÏÏÏÏÏÏÏÏ (344) (213) (34)
OthersÏÏÏÏÏÏÏÏÏÏÏÏÏÏÏÏÏÏÏÏÏÏÏÏÏÏÏÏÏÏÏÏÏÏÏÏÏÏÏÏÏÏÏÏÏÏÏÏÏÏÏÏÏÏÏÏÏÏ (5,987) (1,629) (4,220)
Total extraordinary lossesÏÏÏÏÏÏÏÏÏÏÏÏÏÏÏÏÏÏÏÏÏÏÏÏÏÏÏÏÏÏÏÏÏÏÏÏÏÏ (19,664) (4,853) (8,146)
Extraordinary (Loss) Income ÏÏÏÏÏÏÏÏÏÏÏÏÏÏÏÏÏÏÏÏÏÏÏÏÏÏÏÏÏÏÏÏÏÏ (3,410) (4,116) 4,707
Other extraordinary income at December 31, 2000 includes rebates (Lit. 2,767 million) on indirecttaxes (stamp tax) paid in prior years.
Prior year taxes includes charges totaling Lit. 3,892 million for taxes relating to previous yearsfollowing settlements with the authorities (De' Longhi S.p.A. Lit. 1,379 million and subsidiaryClimaveneta S.p.A. Lit. 2,513 million).
Advance tax for 2000 refers to credit for advanced taxes relating to retainable losses of the subsidiaryMicromax S.p.A, given the reasonable prospects of future income and new business plans.
Other extraordinary charges includes contingent losses arising in previous years.
Income Taxes
1998 1999 2000
(Millions of Lire)
Current taxesÏÏÏÏÏÏÏÏÏÏÏÏÏÏÏÏÏÏÏÏÏÏÏÏÏÏÏÏÏÏÏÏÏÏÏÏÏÏÏÏÏÏÏÏÏÏÏÏÏÏÏÏ 12,874 21,362 38,672
Deferred (advanced) taxes ÏÏÏÏÏÏÏÏÏÏÏÏÏÏÏÏÏÏÏÏÏÏÏÏÏÏÏÏÏÏÏÏÏÏÏÏÏÏÏÏ (12,447) 4,993 18,741
Total ÏÏÏÏÏÏÏÏÏÏÏÏÏÏÏÏÏÏÏÏÏÏÏÏÏÏÏÏÏÏÏÏÏÏÏÏÏÏÏÏÏÏÏÏÏÏÏÏÏÏÏÏÏÏÏ 427 26,355 57,413
Tax charges stated in the Group's pro-forma consolidated Ñnancial statements relate to current anddeferred taxes at the rates current in the various countries where Group companies operate.
In 2000 the charge for income tax, IRPEG and IRAP was 57.9% against 39.4% in 1999.
The increased incidence of tax charges for 2000 with respect to the theoretical charge calculated atcurrent nominal rates is largely explained by the impact of IRAP and the eÅects of pro-forma adjustments.
In 1999, on the other hand, the Group beneÑted from prior year tax losses which considerablyreduced the Ñscal burden on pre-tax income for the year in spite of being partly oÅset by the eÅects ofIRAP and non-deductible charges.
In 1998 the tax burden was practically zero, mainly due to the posting of advance taxes which oÅsetthe tax burden for the year.
F-103
Brought to you by Global Reports

UNAUDITED PRO FORMA CONSOLIDATED FINANCIAL STATEMENTS(NOT INCLUDING KENWOOD)
NOTES TO THE UNAUDITED DE' LONGHI PRO FORMACONSOLIDATED FINANCIAL STATEMENTS Ì (Continued)
Group Structure
The Group's pro-forma consolidated balance sheet includes that of the parent company, De' LonghiS.p.A., and those of the companies in which the parent directly or indirectly holds a majority of votingshares.
The table below details companies consolidated line by line at December 31, 2000.
InterestName Based In Capital Stock Held
ARIAGEL S.P.A ÏÏÏÏÏÏÏÏÏÏÏÏÏÏÏÏÏÏÏÏÏ Candiolo (TO) Lit. 1.500.000.000 80%
LA SUPERCALOR S.P.A ÏÏÏÏÏÏÏÏÏÏÏÏÏ Seregno (MI) Lit. 1.000.000.000 95%
SIMAC-VETRELLA S.P.A.(*)ÏÏÏÏÏÏÏÏÏ Cazzago di Pianiga (VE) Lit. 3.000.000.000 100%
EFFEPLAST S.P.A.(*) ÏÏÏÏÏÏÏÏÏÏÏÏÏÏÏÏ Gorgo al Mont. (TV) Lit. 700.000.000 100%
DE' LONGHI PINGUINO S.A. ÏÏÏÏÏÏÏÏ Luxembourg (L) EUR 26.500.000 100%
DL RADIATORS S.P.A ÏÏÏÏÏÏÏÏÏÏÏÏÏÏÏ Treviso EUR 6.000.000 100%
DE' LONGHI AMERICA INC. ÏÏÏÏÏÏÏÏÏ Saddle Brook (U.S.A.) USD 9.100.000 100%
DE' LONGHI LTD.ÏÏÏÏÏÏÏÏÏÏÏÏÏÏÏÏÏÏÏ Wellingborough (G.B.) GBP 4.000.000 100%
DE' LONGHI FRANCE SARL ÏÏÏÏÏÏÏÏ Asnieres Cedex (F) FRF 18.000.000 100%
DE' LONGHI NEDERLAND BV ÏÏÏÏÏÏÏ DB Leiden (NL) NLG 500.000 100%
DE' LONGHI CANADA INC. ÏÏÏÏÏÏÏÏÏ Mississauga (CAN) CAD 1 100%
E-SERVICES S.r.l.ÏÏÏÏÏÏÏÏÏÏÏÏÏÏÏÏÏÏÏÏ Treviso EUR 50.000 51%
DE' LONGHI JAPAN Corp. ÏÏÏÏÏÏÏÏÏÏÏ Tokyo (JAP) JPY 50.000.000 100%
DE' LONGHI DEUTSCHLANDGMBH ÏÏÏÏÏÏÏÏÏÏÏÏÏÏÏÏÏÏÏÏÏÏÏÏÏÏÏÏ Mainhausent (D) DM 4.000.000 100%
RADEL S.P.A ÏÏÏÏÏÏÏÏÏÏÏÏÏÏÏÏÏÏÏÏÏÏÏÏ Moimacco (UD) Lit. 10.000.000.000 98%
DE' LONGHI CLIMA POLSKA ÏÏÏÏÏÏÏÏ Warsaw (P) PLZ 4.000 100%
Company held by a FIDUCIARY ÏÏÏÏÏÏÏÏ Ì DM 50.000 100%
DE' LONGHI DIVISIONE CUCINES.P.AÏÏÏÏÏÏÏÏÏÏÏÏÏÏÏÏÏÏÏÏÏÏÏÏÏÏÏÏÏÏ Treviso Lit. 29.706.000.000 99%
ELBA S.P.AÏÏÏÏÏÏÏÏÏÏÏÏÏÏÏÏÏÏÏÏÏÏÏÏÏÏ Treviso Lit. 900.000.000 100%
SILE CORPI SCALDANTI S.r.l. ÏÏÏÏÏÏÏÏ Fossalta di Piave (VE) Lit. 180.000.000 92%
CLIMAVENETA S.P.A ÏÏÏÏÏÏÏÏÏÏÏÏÏÏÏ Bassano G. (VI) Lit. 3.110.000.000 90%
ERGOKLIMA S.P.A ÏÏÏÏÏÏÏÏÏÏÏÏÏÏÏÏÏÏ Pieve d'Alpago (BL) EUR 520.000 100%
CLIMAVENETA GMBH ÏÏÏÏÏÏÏÏÏÏÏÏÏÏ Norderstedt (D) DM 600.000 70%
MICROMAX S.P.A ÏÏÏÏÏÏÏÏÏÏÏÏÏÏÏÏÏÏÏ Pieve d'Alpago (BL) EUR 969.000 100%
(*) In January 2001 Simac Vetrella S.p.A. was merged into EÅeplast S.p.A, the company name being changed to Simac-Vetrella
S.p.A.
Subsidiaries and associates in which the parent company holds between 20% and 50% of capital stockare accounted for on the equity method of accounting.
F-104
Brought to you by Global Reports

UNAUDITED PRO FORMA CONSOLIDATED FINANCIAL STATEMENTS(NOT INCLUDING KENWOOD)
NOTES TO THE UNAUDITED DE' LONGHI PRO FORMACONSOLIDATED FINANCIAL STATEMENTS Ì (Continued)
At December 31, 2000 such investments were as follows.
InterestName Based In Capital Stock Held
Clim. Re S.A.(*) ÏÏÏÏÏÏÏÏÏÏÏÏÏÏÏÏÏÏÏÏÏÏÏÏÏÏÏÏÏÏÏ Luxembourg 50.000.000 LUF 100%
Omas S.r.l ÏÏÏÏÏÏÏÏÏÏÏÏÏÏÏÏÏÏÏÏÏÏÏÏÏÏÏÏÏÏÏÏÏÏÏÏÏ S. Vittorio (RE) 700 million Lira 40%
EÅegici S.r.lÏÏÏÏÏÏÏÏÏÏÏÏÏÏÏÏÏÏÏÏÏÏÏÏÏÏÏÏÏÏÏÏÏÏÏÏ Gorgo al Monticano 470 million Lira 25%
Liguria Vita ÏÏÏÏÏÏÏÏÏÏÏÏÏÏÏÏÏÏÏÏÏÏÏÏÏÏÏÏÏÏÏÏÏÏÏÏ Treviso 12.000 million Lira 30%
Company controlled by a Ñduciary(**) ÏÏÏÏÏÏÏÏÏÏÏÏÏ Ì 300 million Lira 40%
(*) Subsidiary not consolidated because it only supplies limited insurance services on behalf of Group companies, which is not
deemed a Group activity as such.
(**) A manufacturer of Ñnished products for the Group; the subsidiary's name is omitted as allowed by law (Article 39, Decree
No. 127/91) to avoid prejudice to it and to De' Longhi S.p.A.
F-105
Brought to you by Global Reports

UNAUDITED PRO FORMA CONSOLIDATED FINANCIAL STATEMENTS(NOT INCLUDING KENWOOD)
RECONCILIATION TO HISTORICAL CONSOLIDATED FINANCIAL STATEMENTS
December 31, 1998
Pro FormaAdjustments
De' Longhi 2000 and Pro FormaConsolidated Acquisitions ReclassiÑcations Consolidated
(Millions of Lire)
Receivables from shareholders ÏÏÏÏÏÏÏÏÏÏÏÏÏÏÏÏÏÏÏ 9,100 Ì Ì 9,100Goodwill, net ÏÏÏÏÏÏÏÏÏÏÏÏÏÏÏÏÏÏÏÏÏÏÏÏÏÏÏÏÏÏÏÏÏÏ 12,421 Ì 593,368 605,789Other intangible assets ÏÏÏÏÏÏÏÏÏÏÏÏÏÏÏÏÏÏÏÏÏÏÏÏÏÏ 214,338 30,835 (10,679) 234,494
Intangible assets ÏÏÏÏÏÏÏÏÏÏÏÏÏÏÏÏÏÏÏÏÏÏÏÏÏÏÏÏÏÏÏ 226,759 30,835 582,689 840,283Tangible assets, netÏÏÏÏÏÏÏÏÏÏÏÏÏÏÏÏÏÏÏÏÏÏÏÏÏÏÏÏÏ 283,628 67,081 19,403 370,112Financial assets ÏÏÏÏÏÏÏÏÏÏÏÏÏÏÏÏÏÏÏÏÏÏÏÏÏÏÏÏÏÏÏÏ 41,350 61,543 (65,121) 37,772
Total Ñxed assetsÏÏÏÏÏÏÏÏÏÏÏÏÏÏÏÏÏÏÏÏÏÏÏÏÏÏÏ 551,737 159,459 536,971 1,248,167Receivables, net ÏÏÏÏÏÏÏÏÏÏÏÏÏÏÏÏÏÏÏÏÏÏÏÏÏÏÏÏÏÏÏ 497,195 95,449 (87,478) 505,166Inventory, net ÏÏÏÏÏÏÏÏÏÏÏÏÏÏÏÏÏÏÏÏÏÏÏÏÏÏÏÏÏÏÏÏÏ 243,724 63,786 (1,514) 305,996Other current assets ÏÏÏÏÏÏÏÏÏÏÏÏÏÏÏÏÏÏÏÏÏÏÏÏÏÏÏÏ 125,860 18,130 (11,794) 132,196Payables ÏÏÏÏÏÏÏÏÏÏÏÏÏÏÏÏÏÏÏÏÏÏÏÏÏÏÏÏÏÏÏÏÏÏÏÏÏÏ (230,241) (122,471) 60,990 (291,722)Other current liabilities ÏÏÏÏÏÏÏÏÏÏÏÏÏÏÏÏÏÏÏÏÏÏÏÏÏ (111,426) (20,742) 34,466 (97,702)
Net working capital ÏÏÏÏÏÏÏÏÏÏÏÏÏÏÏÏÏÏÏÏÏÏÏÏÏÏÏÏ 525,112 34,152 (5,330) 553,934
Total capital employed ÏÏÏÏÏÏÏÏÏÏÏÏÏÏÏÏÏÏÏÏÏÏ 1,085,949 193,611 531,641 1,811,201
Reserve for staÅ severance indemnities ÏÏÏÏÏÏÏÏÏÏÏÏ 24,333 10,041 (113) 34,261Reserve for risks and other charges ÏÏÏÏÏÏÏÏÏÏÏÏÏÏÏ 19,067 1,696 (4,890) 15,873
Long-term liabilities ÏÏÏÏÏÏÏÏÏÏÏÏÏÏÏÏÏÏÏÏÏÏÏÏÏÏÏÏ 43,400 11,737 (5,003) 50,134Cash and cash equivalents ÏÏÏÏÏÏÏÏÏÏÏÏÏÏÏÏÏÏÏÏÏÏÏ (78,600) (9,517) 258 (87,859)Short-term debtÏÏÏÏÏÏÏÏÏÏÏÏÏÏÏÏÏÏÏÏÏÏÏÏÏÏÏÏÏÏÏÏ 179,162 65,810 (241,772) 3,200Long-term debt ÏÏÏÏÏÏÏÏÏÏÏÏÏÏÏÏÏÏÏÏÏÏÏÏÏÏÏÏÏÏÏÏ 605,883 36,174 6,377 648,434Debt for acquisition of investmentsÏÏÏÏÏÏÏÏÏÏÏÏÏÏÏÏ Ì Ì 504,714 504,714Pro forma debt (net of receivables) ÏÏÏÏÏÏÏÏÏÏÏÏÏÏÏ Ì Ì 140,336 140,336
Net Ñnancial position ÏÏÏÏÏÏÏÏÏÏÏÏÏÏÏÏÏÏÏÏÏÏÏÏÏÏÏ 706,445 92,467 409,913 1,208,825Share capital ÏÏÏÏÏÏÏÏÏÏÏÏÏÏÏÏÏÏÏÏÏÏÏÏÏÏÏÏÏÏÏÏÏÏ 300,000 45,486 205,101 550,587Reserves ÏÏÏÏÏÏÏÏÏÏÏÏÏÏÏÏÏÏÏÏÏÏÏÏÏÏÏÏÏÏÏÏÏÏÏÏÏÏ 26,315 35,987 (35,987) 26,315Pro forma reserve ÏÏÏÏÏÏÏÏÏÏÏÏÏÏÏÏÏÏÏÏÏÏÏÏÏÏÏÏÏÏ 19,002 19,002Net income (loss) for the year ÏÏÏÏÏÏÏÏÏÏÏÏÏÏÏÏÏÏÏ 9,209 7,934 (61,282) (44,139)
Shareholders' equity ÏÏÏÏÏÏÏÏÏÏÏÏÏÏÏÏÏÏÏÏÏÏÏÏÏÏÏÏ 335,524 89,407 126,834 551,765Minority interests ÏÏÏÏÏÏÏÏÏÏÏÏÏÏÏÏÏÏÏÏÏÏÏÏÏÏÏÏÏÏ 580 Ì (103) 477
Total shareholders' equity and minority interests 336,104 89,407 126,731 552,242
Total liabilities and shareholders' equity ÏÏÏÏÏÏÏ 1,085,949 193,611 531,641 1,811,201
Memorandum accounts ÏÏÏÏÏÏÏÏÏÏÏÏÏÏÏÏÏÏÏÏÏÏÏÏÏ 126,482 35,748 (116,172) 46,058
F-106
Brought to you by Global Reports

UNAUDITED PRO FORMA CONSOLIDATED FINANCIAL STATEMENTS(NOT INCLUDING KENWOOD)
RECONCILIATION TO HISTORICAL CONSOLIDATED FINANCIAL STATEMENTS
December 31, 1998
Pro FormaAdjustments
De' Longhi 2000 and Pro FormaConsolidated Acquisitions ReclassiÑcations Consolidated
(Millions of Lire)
Net sales ÏÏÏÏÏÏÏÏÏÏÏÏÏÏÏÏÏÏÏÏÏÏÏÏÏÏÏÏÏÏÏÏÏÏÏÏÏ 1,068,600 401,592 (200,878) 1,269,314Other revenues ÏÏÏÏÏÏÏÏÏÏÏÏÏÏÏÏÏÏÏÏÏÏÏÏÏÏÏÏÏÏÏÏ 22,473 5,599 (6,688) 21,384
Total revenues ÏÏÏÏÏÏÏÏÏÏÏÏÏÏÏÏÏÏÏÏÏÏÏÏÏÏÏÏÏ 1,091,073 407,191 (207,566) 1,290,698Materials, consumables and goods ÏÏÏÏÏÏÏÏÏÏÏÏÏÏÏÏ 549,484 272,049 (191,293) 630,240Services ÏÏÏÏÏÏÏÏÏÏÏÏÏÏÏÏÏÏÏÏÏÏÏÏÏÏÏÏÏÏÏÏÏÏÏÏÏÏ 235,411 37,357 (9,071) 263,697Rents, leases and related costs ÏÏÏÏÏÏÏÏÏÏÏÏÏÏÏÏÏÏÏ 11,950 7,480 (6,414) 13,016Other costsÏÏÏÏÏÏÏÏÏÏÏÏÏÏÏÏÏÏÏÏÏÏÏÏÏÏÏÏÏÏÏÏÏÏÏÏ 19,478 1,882 (232) 21,128
Total production costs ÏÏÏÏÏÏÏÏÏÏÏÏÏÏÏÏÏÏÏÏÏÏ 816,323 318,768 (207,010) 928,081
Value added margin ÏÏÏÏÏÏÏÏÏÏÏÏÏÏÏÏÏÏÏÏÏÏÏÏÏÏÏÏ 274,750 88,423 (556) 362,617Wages, salaries and beneÑts ÏÏÏÏÏÏÏÏÏÏÏÏÏÏÏÏÏÏÏÏÏ 148,558 54,268 (666) 202,160
Gross operating margin ÏÏÏÏÏÏÏÏÏÏÏÏÏÏÏÏÏÏÏÏÏÏÏÏÏ 126,192 34,155 110 160,457Depreciation and amortisationÏÏÏÏÏÏÏÏÏÏÏÏÏÏÏÏÏÏÏÏ 56,336 11,644 2,854 70,834Amortization of goodwill ÏÏÏÏÏÏÏÏÏÏÏÏÏÏÏÏÏÏÏÏÏÏÏÏ 1,768 Ì 28,483 30,251Provisions and write-oÅs ÏÏÏÏÏÏÏÏÏÏÏÏÏÏÏÏÏÏÏÏÏÏÏÏ 26,619 2,007 (50) 28,576
Operating proÑtÏÏÏÏÏÏÏÏÏÏÏÏÏÏÏÏÏÏÏÏÏÏÏÏÏÏÏÏÏÏÏÏ 41,469 20,504 (31,177) 30,796Net Ñnancial (loss) incomeÏÏÏÏÏÏÏÏÏÏÏÏÏÏÏÏÏÏÏÏÏÏ (63,649) (9,866) 328 (73,187)Income from equity investments ÏÏÏÏÏÏÏÏÏÏÏÏÏÏÏÏÏÏ 189 2,764 (1,135) 1,818Extraordinary gain (loss)ÏÏÏÏÏÏÏÏÏÏÏÏÏÏÏÏÏÏÏÏÏÏÏÏ 43,395 (512) (46,293) (3,410)
Earnings before taxes and minority interests ÏÏÏÏÏÏÏÏ 21,404 12,890 (78,277) (43,983)Income taxes ÏÏÏÏÏÏÏÏÏÏÏÏÏÏÏÏÏÏÏÏÏÏÏÏÏÏÏÏÏÏÏÏÏÏ 12,470 4,956 (16,999) 427
Net income (loss) before minority interests ÏÏÏÏÏÏÏÏ 8,934 7,934 (61,278) (44,410)Minority interests ÏÏÏÏÏÏÏÏÏÏÏÏÏÏÏÏÏÏÏÏÏÏÏÏÏÏÏÏÏÏ 275 Ì (4) 271
Net income (loss) ÏÏÏÏÏÏÏÏÏÏÏÏÏÏÏÏÏÏÏÏÏÏÏÏÏÏÏÏÏ 9,209 7,934 (61,282) (44,139)
F-107
Brought to you by Global Reports

UNAUDITED PRO FORMA CONSOLIDATED FINANCIAL STATEMENTS(NOT INCLUDING KENWOOD)
RECONCILIATION TO HISTORICAL CONSOLIDATED FINANCIAL STATEMENTS
December 31, 1999
Pro FormaAdjustments
De' Longhi 2000 and Pro FormaConsolidated Acquisitions ReclassiÑcations Consolidated
(Millions of Lire)
Receivables from shareholders ÏÏÏÏÏÏÏÏÏÏÏÏÏÏÏÏÏÏÏ 25,000 Ì Ì 25,000Goodwill, net ÏÏÏÏÏÏÏÏÏÏÏÏÏÏÏÏÏÏÏÏÏÏÏÏÏÏÏÏÏÏÏÏÏÏ 10,658 Ì 564,882 575,540Other intangible assets ÏÏÏÏÏÏÏÏÏÏÏÏÏÏÏÏÏÏÏÏÏÏÏÏÏÏ 198,879 26,689 (9,221) 216,347
Intangible assets ÏÏÏÏÏÏÏÏÏÏÏÏÏÏÏÏÏÏÏÏÏÏÏÏÏÏÏÏÏÏÏ 209,537 26,689 555,661 791,887Tangible assets, netÏÏÏÏÏÏÏÏÏÏÏÏÏÏÏÏÏÏÏÏÏÏÏÏÏÏÏÏÏ 267,287 64,774 16,727 348,788Financial assets ÏÏÏÏÏÏÏÏÏÏÏÏÏÏÏÏÏÏÏÏÏÏÏÏÏÏÏÏÏÏÏÏ 35,597 110,952 (110,040) 36,509
Total Ñxed assetsÏÏÏÏÏÏÏÏÏÏÏÏÏÏÏÏÏÏÏÏÏÏÏÏÏÏÏ 512,421 202,415 462,348 1,177,184Receivables, net ÏÏÏÏÏÏÏÏÏÏÏÏÏÏÏÏÏÏÏÏÏÏÏÏÏÏÏÏÏÏÏ 513,534 95,274 (50,956) 557,852Inventory, net ÏÏÏÏÏÏÏÏÏÏÏÏÏÏÏÏÏÏÏÏÏÏÏÏÏÏÏÏÏÏÏÏÏ 227,605 62,904 (928) 289,581Other current assets ÏÏÏÏÏÏÏÏÏÏÏÏÏÏÏÏÏÏÏÏÏÏÏÏÏÏÏÏ 109,534 19,436 (23,090) 105,880Payables ÏÏÏÏÏÏÏÏÏÏÏÏÏÏÏÏÏÏÏÏÏÏÏÏÏÏÏÏÏÏÏÏÏÏÏÏÏÏ (258,132) (125,729) 46,923 (336,938)Other current liabilities ÏÏÏÏÏÏÏÏÏÏÏÏÏÏÏÏÏÏÏÏÏÏÏÏÏ (90,700) (27,702) 26,282 (92,120)
Net working capital ÏÏÏÏÏÏÏÏÏÏÏÏÏÏÏÏÏÏÏÏÏÏÏÏÏÏÏÏ 501,841 24,183 (1,769) 524,255
Total capital employed ÏÏÏÏÏÏÏÏÏÏÏÏÏÏÏÏÏÏÏÏÏÏ 1,039,262 226,598 460,579 1,726,439
Reserve for staÅ severance indemnities ÏÏÏÏÏÏÏÏÏÏÏÏ 24,302 10,530 (35) 34,797Reserve for risks and other charges ÏÏÏÏÏÏÏÏÏÏÏÏÏÏÏ 15,726 1,829 (86) 17,469
Long-term liabilities ÏÏÏÏÏÏÏÏÏÏÏÏÏÏÏÏÏÏÏÏÏÏÏÏÏÏÏÏ 40,028 12,359 (121) 52,266Cash and cash equivalents ÏÏÏÏÏÏÏÏÏÏÏÏÏÏÏÏÏÏÏÏÏÏÏ (145,815) (11,443) 213 (157,045)Short-term debtÏÏÏÏÏÏÏÏÏÏÏÏÏÏÏÏÏÏÏÏÏÏÏÏÏÏÏÏÏÏÏÏ 312,854 72,733 (240,005) 145,582Long-term debt ÏÏÏÏÏÏÏÏÏÏÏÏÏÏÏÏÏÏÏÏÏÏÏÏÏÏÏÏÏÏÏÏ 346,047 34,421 (44,083) 336,385Debt for acquisition of investmentsÏÏÏÏÏÏÏÏÏÏÏÏÏÏÏÏ Ì Ì 504,714 504,714Pro forma debt (net of receivables) ÏÏÏÏÏÏÏÏÏÏÏÏÏÏÏ Ì Ì 137,860 137,860
Net Ñnancial position ÏÏÏÏÏÏÏÏÏÏÏÏÏÏÏÏÏÏÏÏÏÏÏÏÏÏÏ 513,086 95,711 358,699 967,496Share capital ÏÏÏÏÏÏÏÏÏÏÏÏÏÏÏÏÏÏÏÏÏÏÏÏÏÏÏÏÏÏÏÏÏÏ 400,000 47,386 203,201 650,587Reserves ÏÏÏÏÏÏÏÏÏÏÏÏÏÏÏÏÏÏÏÏÏÏÏÏÏÏÏÏÏÏÏÏÏÏÏÏÏÏ 36,362 57,566 (57,566) 36,362Pro forma reserve ÏÏÏÏÏÏÏÏÏÏÏÏÏÏÏÏÏÏÏÏÏÏÏÏÏÏÏÏÏÏ Ì Ì (21,190) (21,190)Net income (loss) for the year ÏÏÏÏÏÏÏÏÏÏÏÏÏÏÏÏÏÏÏ 49,125 13,576 (22,112) 40,589
Shareholders' equity ÏÏÏÏÏÏÏÏÏÏÏÏÏÏÏÏÏÏÏÏÏÏÏÏÏÏÏÏ 485,487 118,528 102,333 706,348Minority interests ÏÏÏÏÏÏÏÏÏÏÏÏÏÏÏÏÏÏÏÏÏÏÏÏÏÏÏÏÏÏ 661 Ì (332) 329
Total shareholders' equity and minority interests 486,148 118,528 102,001 706,677
Total liabilities and shareholders' equity ÏÏÏÏÏÏÏ 1,039,262 226,598 460,579 1,726,439
Memorandum accounts ÏÏÏÏÏÏÏÏÏÏÏÏÏÏÏÏÏÏÏÏÏÏÏÏÏ 177,567 30,302 (109,543) 98,326
F-108
Brought to you by Global Reports

UNAUDITED PRO FORMA CONSOLIDATED FINANCIAL STATEMENTS(NOT INCLUDING KENWOOD)
RECONCILIATION TO HISTORICAL CONSOLIDATED FINANCIAL STATEMENTS
December 31, 1999
Pro FormaAdjustments
De' Longhi 2000 and Pro FormaConsolidated Acquisitions ReclassiÑcations Consolidated
(Millions of Lire)
Net sales ÏÏÏÏÏÏÏÏÏÏÏÏÏÏÏÏÏÏÏÏÏÏÏÏÏÏÏÏÏÏÏÏÏÏÏÏÏ 1,136,044 432,485 (193,688) 1,374,841Other revenues ÏÏÏÏÏÏÏÏÏÏÏÏÏÏÏÏÏÏÏÏÏÏÏÏÏÏÏÏÏÏÏÏ 22,531 4,837 (8,389) 18,979
Total revenues ÏÏÏÏÏÏÏÏÏÏÏÏÏÏÏÏÏÏÏÏÏÏÏÏÏÏÏÏÏ 1,158,575 437,322 (202,077) 1,393,820Materials, consumables and goods ÏÏÏÏÏÏÏÏÏÏÏÏÏÏÏÏ 541,941 284,797 (189,433) 637,305Services ÏÏÏÏÏÏÏÏÏÏÏÏÏÏÏÏÏÏÏÏÏÏÏÏÏÏÏÏÏÏÏÏÏÏÏÏÏÏ 254,967 44,758 (10,729) 288,996Rents, leases and related costs ÏÏÏÏÏÏÏÏÏÏÏÏÏÏÏÏÏÏÏ 11,885 7,001 (6,419) 12,467Other costsÏÏÏÏÏÏÏÏÏÏÏÏÏÏÏÏÏÏÏÏÏÏÏÏÏÏÏÏÏÏÏÏÏÏÏÏ 15,596 3,287 (1,009) 17,874
Total production costs ÏÏÏÏÏÏÏÏÏÏÏÏÏÏÏÏÏÏÏÏÏÏ 824,389 339,843 (207,590) 956,642
Value added margin ÏÏÏÏÏÏÏÏÏÏÏÏÏÏÏÏÏÏÏÏÏÏÏÏÏÏÏÏ 334,186 97,479 5,513 437,178Wages, salaries and beneÑts ÏÏÏÏÏÏÏÏÏÏÏÏÏÏÏÏÏÏÏÏÏ 158,766 55,168 (623) 213,311
Gross operating margin ÏÏÏÏÏÏÏÏÏÏÏÏÏÏÏÏÏÏÏÏÏÏÏÏÏ 175,420 42,311 6,136 223,867Depreciation and amortisationÏÏÏÏÏÏÏÏÏÏÏÏÏÏÏÏÏÏÏÏ 60,034 16,127 923 77,084Amortization of goodwill ÏÏÏÏÏÏÏÏÏÏÏÏÏÏÏÏÏÏÏÏÏÏÏÏ 1,769 Ì 28,542 30,311Provisions and writeoÅs ÏÏÏÏÏÏÏÏÏÏÏÏÏÏÏÏÏÏÏÏÏÏÏÏÏ 14,754 1,267 (79) 15,942
Operating proÑtÏÏÏÏÏÏÏÏÏÏÏÏÏÏÏÏÏÏÏÏÏÏÏÏÏÏÏÏÏÏÏÏ 98,863 24,917 (23,250) 100,530Net Ñnancial (loss) incomeÏÏÏÏÏÏÏÏÏÏÏÏÏÏÏÏÏÏÏÏÏÏ (25,616) (6,160) (1,623) (33,399)Income from equity investments ÏÏÏÏÏÏÏÏÏÏÏÏÏÏÏÏÏÏ 835 1,857 1,165 3,857Extraordinary (loss) gainÏÏÏÏÏÏÏÏÏÏÏÏÏÏÏÏÏÏÏÏÏÏÏÏ (7,040) (540) 3,464 (4,116)
Earnings before taxes and minority interests ÏÏÏÏÏÏÏÏ 67,042 20,074 (20,244) 66,872Income taxes ÏÏÏÏÏÏÏÏÏÏÏÏÏÏÏÏÏÏÏÏÏÏÏÏÏÏÏÏÏÏÏÏÏÏ 17,916 6,498 1,941 26,355
Net income (loss) before minority interests ÏÏÏÏÏÏÏÏ 49,126 13,576 (22,185) 40,517Minority interests ÏÏÏÏÏÏÏÏÏÏÏÏÏÏÏÏÏÏÏÏÏÏÏÏÏÏÏÏÏÏ (1) Ì 73 72
Net income (loss) ÏÏÏÏÏÏÏÏÏÏÏÏÏÏÏÏÏÏÏÏÏÏÏÏÏÏÏÏÏ 49,125 13,576 (22,112) 40,589
F-109
Brought to you by Global Reports

UNAUDITED PRO FORMA CONSOLIDATED FINANCIAL STATEMENTS(NOT INCLUDING KENWOOD)
RECONCILIATION TO HISTORICAL CONSOLIDATED FINANCIAL STATEMENTS
Pro FormaAdjustments
De' Longhi 2000 and Pro FormaConsolidated Acquisitions ReclassiÑcations Consolidated
(Millions of Lire)
Receivables from shareholders ÏÏÏÏÏÏÏÏÏÏÏÏÏ Ì Ì Ì Ì
Goodwill, net ÏÏÏÏÏÏÏÏÏÏÏÏÏÏÏÏÏÏÏÏÏÏÏÏÏÏÏÏ 545,344 Ì (1) 545,343
Other intangible assets ÏÏÏÏÏÏÏÏÏÏÏÏÏÏÏÏÏÏÏÏ 203,123 Ì Ì 203,123
Intangible assets ÏÏÏÏÏÏÏÏÏÏÏÏÏÏÏÏÏÏÏÏÏÏÏÏÏ 748,467 Ì (1) 748,466
Tangible assets, netÏÏÏÏÏÏÏÏÏÏÏÏÏÏÏÏÏÏÏÏÏÏÏ 344,097 Ì Ì 344,097
Financial assets ÏÏÏÏÏÏÏÏÏÏÏÏÏÏÏÏÏÏÏÏÏÏÏÏÏÏ 17,679 Ì (1) 17,678
Total Ñxed assetsÏÏÏÏÏÏÏÏÏÏÏÏÏÏÏÏÏÏÏÏÏ 1,110,243 Ì (2) 1,110,241
Receivables, net ÏÏÏÏÏÏÏÏÏÏÏÏÏÏÏÏÏÏÏÏÏÏÏÏÏ 615,735 Ì Ì 615,735
Inventory, net ÏÏÏÏÏÏÏÏÏÏÏÏÏÏÏÏÏÏÏÏÏÏÏÏÏÏÏ 370,539 Ì Ì 370,539
Other current assets ÏÏÏÏÏÏÏÏÏÏÏÏÏÏÏÏÏÏÏÏÏÏ 141,294 Ì (2,553) 138,741
Payables ÏÏÏÏÏÏÏÏÏÏÏÏÏÏÏÏÏÏÏÏÏÏÏÏÏÏÏÏÏÏÏÏ (357,814) Ì 1 (357,813)
Other current liabilities ÏÏÏÏÏÏÏÏÏÏÏÏÏÏÏÏÏÏÏ (158,390) Ì 29,382 (129,008)
Net working capital ÏÏÏÏÏÏÏÏÏÏÏÏÏÏÏÏÏÏÏÏÏÏ 611,364 Ì 26,830 638,194
Total capital employed ÏÏÏÏÏÏÏÏÏÏÏÏÏÏÏÏ 1,721,607 Ì 26,828 1,748,435
Reserve for staÅ severance indemnities ÏÏÏÏÏÏ 37,526 Ì (1) 37,525
Reserve for risks and other charges ÏÏÏÏÏÏÏÏÏ 21,852 Ì 29,383 51,235
Long-term liabilities ÏÏÏÏÏÏÏÏÏÏÏÏÏÏÏÏÏÏÏÏÏÏ 59,378 Ì 29,382 88,760
Cash and cash equivalents ÏÏÏÏÏÏÏÏÏÏÏÏÏÏÏÏÏ (130,979) Ì (5,000) (135,979)
Short-term debtÏÏÏÏÏÏÏÏÏÏÏÏÏÏÏÏÏÏÏÏÏÏÏÏÏÏ 300,034 Ì (245,698) 54,336
Long-term debt ÏÏÏÏÏÏÏÏÏÏÏÏÏÏÏÏÏÏÏÏÏÏÏÏÏÏ 519,142 Ì 1 519,143
Debt for acquisition of investmentsÏÏÏÏÏÏÏÏÏÏ 504,604 Ì 110 504,714
Pro forma debt (net of receivables) ÏÏÏÏÏÏÏÏÏ Ì Ì (6,900) (6,900)
Net Ñnancial position ÏÏÏÏÏÏÏÏÏÏÏÏÏÏÏÏÏÏÏÏÏ 1,192,801 Ì (257,487) 935,314
Share capital ÏÏÏÏÏÏÏÏÏÏÏÏÏÏÏÏÏÏÏÏÏÏÏÏÏÏÏÏ 400,000 Ì 250,587 650,587
Reserves ÏÏÏÏÏÏÏÏÏÏÏÏÏÏÏÏÏÏÏÏÏÏÏÏÏÏÏÏÏÏÏÏ 40,812 Ì (13,560) 27,252
Pro forma reserve ÏÏÏÏÏÏÏÏÏÏÏÏÏÏÏÏÏÏÏÏÏÏÏÏ 4,345 4,345
Net income (loss) for the year ÏÏÏÏÏÏÏÏÏÏÏÏÏ 27,980 29,547 (15,987) 41,540
Shareholders' equity ÏÏÏÏÏÏÏÏÏÏÏÏÏÏÏÏÏÏÏÏÏÏ 468,792 29,547 225,385 723,724
Minority interests ÏÏÏÏÏÏÏÏÏÏÏÏÏÏÏÏÏÏÏÏÏÏÏÏ 636 Ì 1 637
Total shareholders' equity and minorityinterests ÏÏÏÏÏÏÏÏÏÏÏÏÏÏÏÏÏÏÏÏÏÏÏÏÏÏ 469,429 29,547 225,385 724,361
Total liabilities and shareholders' equity 1,721,607 29,547 (2,719) 1,748,435
Memorandum accounts ÏÏÏÏÏÏÏÏÏÏÏÏÏÏÏÏÏÏÏ 24,254 Ì Ì 24,254
F-110
Brought to you by Global Reports

UNAUDITED PRO FORMA CONSOLIDATED FINANCIAL STATEMENTS(NOT INCLUDING KENWOOD)
RECONCILIATION TO HISTORICAL CONSOLIDATED FINANCIAL STATEMENTS
Pro FormaAdjustments
De' Longhi 2000 and Pro FormaConsolidated Acquisitions ReclassiÑcations Consolidated
(Millions of Lire)
Net sales ÏÏÏÏÏÏÏÏÏÏÏÏÏÏÏÏÏÏÏÏÏÏÏÏÏÏÏÏÏÏÏ 1,222,951 580,653 (242,270) 1,561,334
Other revenues ÏÏÏÏÏÏÏÏÏÏÏÏÏÏÏÏÏÏÏÏÏÏÏÏÏÏ 27,073 6,280 (10,195) 23,158
Total revenues ÏÏÏÏÏÏÏÏÏÏÏÏÏÏÏÏÏÏÏÏÏÏÏ 1,250,024 586,933 (252,465) 1,584,492
Materials, consumables and goods ÏÏÏÏÏÏÏÏÏÏ 555,254 401,186 (242,387) 714,053
Services ÏÏÏÏÏÏÏÏÏÏÏÏÏÏÏÏÏÏÏÏÏÏÏÏÏÏÏÏÏÏÏÏ 301,812 59,637 (6,686) 354,763
Rents, leases and related costs ÏÏÏÏÏÏÏÏÏÏÏÏÏ 14,241 6,342 (6,204) 14,379
Other costsÏÏÏÏÏÏÏÏÏÏÏÏÏÏÏÏÏÏÏÏÏÏÏÏÏÏÏÏÏÏ 8,543 2,419 (95) 10,867
Total production costs ÏÏÏÏÏÏÏÏÏÏÏÏÏÏÏÏ 879,850 469,584 (255,372) 1,094,062
Value added margin ÏÏÏÏÏÏÏÏÏÏÏÏÏÏÏÏÏÏÏÏÏÏ 370,174 117,349 2,907 490,430
Wages, salaries and beneÑts ÏÏÏÏÏÏÏÏÏÏÏÏÏÏÏ 173,659 61,778 358 235,795
Gross operating margin ÏÏÏÏÏÏÏÏÏÏÏÏÏÏÏÏÏÏÏ 196,515 55,571 2,549 254,635
Depreciation and amortisationÏÏÏÏÏÏÏÏÏÏÏÏÏÏ 58,309 21,732 (5,011) 75,030
Amortisation of goodwill ÏÏÏÏÏÏÏÏÏÏÏÏÏÏÏÏÏÏ 1,884 Ì 28,368 30,252
Provisions and writeoÅs ÏÏÏÏÏÏÏÏÏÏÏÏÏÏÏÏÏÏÏ 16,030 1,778 (2) 17,806
Operating proÑtÏÏÏÏÏÏÏÏÏÏÏÏÏÏÏÏÏÏÏÏÏÏÏÏÏÏ 120,292 32,061 (20,806) 131,547
Net Ñnancial (loss) incomeÏÏÏÏÏÏÏÏÏÏÏÏÏÏÏÏ (39,211) (6,754) 547 (45,418)
Income from equity investments ÏÏÏÏÏÏÏÏÏÏÏÏ 8,481 2,322 (2,482) 8,321
Extraordinary (loss) gainÏÏÏÏÏÏÏÏÏÏÏÏÏÏÏÏÏÏ (19,935) 10,821 13,821 4,707
Earnings before taxes and minority interests ÏÏ 69,627 38,450 (8,920) 99,157
Income taxes ÏÏÏÏÏÏÏÏÏÏÏÏÏÏÏÏÏÏÏÏÏÏÏÏÏÏÏÏ 41,443 8,903 7,067 57,413
Net income (loss) before minority interests ÏÏ 28,184 29,547 (15,987) 41,744
Minority interests ÏÏÏÏÏÏÏÏÏÏÏÏÏÏÏÏÏÏÏÏÏÏÏÏ (204) Ì Ì (204)
Net income (loss) ÏÏÏÏÏÏÏÏÏÏÏÏÏÏÏÏÏÏÏÏÏÏÏ 27,980 29,547 (15,987) 41,540
F-111
Brought to you by Global Reports

®THIS PAGE INTENTIONALLY LEFT BLANK©
F-112
Brought to you by Global Reports

UNAUDITED PRO FORMA CONSOLIDATED FINANCIAL STATEMENTS(INCLUDING KENWOOD)
F-113
Brought to you by Global Reports

UNAUDITED PRO FORMA CONSOLIDATED FINANCIAL STATEMENTS(INCLUDING KENWOOD)
UNAUDITED PRO FORMA CONSOLIDATED BALANCE SHEETSAS AT DECEMBER 31, 1998, 1999 AND 2000
These unaudited pro forma consolidated Ñnancial statements have been derived from the unauditedDe' Longhi pro forma consolidated Ñnancial statements (not including Kenwood) and the unauditedrestated Kenwood consolidated Ñnancial statements. These unaudited pro forma consolidated Ñnancialstatements have also been adjusted to reÖect the acquisition of Kenwood as if such acquisition of Kenwoodhad occurred on January 1, 1998.
1998 1999 2000
(Millions of Lire)
Receivables from shareholders ÏÏÏÏÏÏÏÏÏÏÏÏÏÏÏÏÏÏÏÏÏÏÏÏÏÏÏÏÏÏÏ 9,100 25,000 Ì
Goodwill, net ÏÏÏÏÏÏÏÏÏÏÏÏÏÏÏÏÏÏÏÏÏÏÏÏÏÏÏÏÏÏÏÏÏÏÏÏÏÏÏÏÏÏÏÏÏ 733,595 695,936 651,940
Other intangible assets, netÏÏÏÏÏÏÏÏÏÏÏÏÏÏÏÏÏÏÏÏÏÏÏÏÏÏÏÏÏÏÏÏÏÏ 234,494 216,347 203,123
Total intangible assets ÏÏÏÏÏÏÏÏÏÏÏÏÏÏÏÏÏÏÏÏÏÏÏÏÏÏÏÏÏÏÏÏÏÏÏÏÏÏ 968,089 912,283 855,063
Tangible assets, net ÏÏÏÏÏÏÏÏÏÏÏÏÏÏÏÏÏÏÏÏÏÏÏÏÏÏÏÏÏÏÏÏÏÏÏÏÏÏÏÏ 468,293 418,957 383,533
Financial assetsÏÏÏÏÏÏÏÏÏÏÏÏÏÏÏÏÏÏÏÏÏÏÏÏÏÏÏÏÏÏÏÏÏÏÏÏÏÏÏÏÏÏÏÏ 37,772 36,509 17,678
Total Ñxed assets ÏÏÏÏÏÏÏÏÏÏÏÏÏÏÏÏÏÏÏÏÏÏÏÏÏÏÏÏÏÏÏÏÏÏÏÏÏÏ 1,474,154 1,367,749 1,256,274
Receivables, net ÏÏÏÏÏÏÏÏÏÏÏÏÏÏÏÏÏÏÏÏÏÏÏÏÏÏÏÏÏÏÏÏÏÏÏÏÏÏÏÏÏÏÏ 608,749 694,618 758,459
Inventory, net ÏÏÏÏÏÏÏÏÏÏÏÏÏÏÏÏÏÏÏÏÏÏÏÏÏÏÏÏÏÏÏÏÏÏÏÏÏÏÏÏÏÏÏÏÏ 395,964 381,941 465,711
Other current assetsÏÏÏÏÏÏÏÏÏÏÏÏÏÏÏÏÏÏÏÏÏÏÏÏÏÏÏÏÏÏÏÏÏÏÏÏÏÏÏÏ 166,385 132,237 172,171
Payables ÏÏÏÏÏÏÏÏÏÏÏÏÏÏÏÏÏÏÏÏÏÏÏÏÏÏÏÏÏÏÏÏÏÏÏÏÏÏÏÏÏÏÏÏÏÏÏÏÏ (345,117) (405,868) (430,424)
Other current liabilities ÏÏÏÏÏÏÏÏÏÏÏÏÏÏÏÏÏÏÏÏÏÏÏÏÏÏÏÏÏÏÏÏÏÏÏÏÏ (137,161) (151,902) (186,631)
Net working capital ÏÏÏÏÏÏÏÏÏÏÏÏÏÏÏÏÏÏÏÏÏÏÏÏÏÏÏÏÏÏÏÏÏÏÏÏÏÏÏÏ 688,820 651,026 779,286
Total capital employed ÏÏÏÏÏÏÏÏÏÏÏÏÏÏÏÏÏÏÏÏÏÏÏÏÏÏÏÏÏÏÏÏÏ 2,172,074 2,043,775 2,035,560
Reserve for staÅ severance indemnitiesÏÏÏÏÏÏÏÏÏÏÏÏÏÏÏÏÏÏÏÏÏÏÏÏ 37,063 37,588 40,575
Reserve for risks and other charges ÏÏÏÏÏÏÏÏÏÏÏÏÏÏÏÏÏÏÏÏÏÏÏÏÏÏÏ 35,135 42,914 59,094
Long-term liabilities ÏÏÏÏÏÏÏÏÏÏÏÏÏÏÏÏÏÏÏÏÏÏÏÏÏÏÏÏÏÏÏÏÏÏÏÏÏÏÏ 72,198 80,502 99,669
Cash and cash equivalents ÏÏÏÏÏÏÏÏÏÏÏÏÏÏÏÏÏÏÏÏÏÏÏÏÏÏÏÏÏÏÏÏÏÏ (124,761) (167,737) (147,570)
Short-term debt ÏÏÏÏÏÏÏÏÏÏÏÏÏÏÏÏÏÏÏÏÏÏÏÏÏÏÏÏÏÏÏÏÏÏÏÏÏÏÏÏÏÏÏ 152,331 261,000 187,313
Long-term debt ÏÏÏÏÏÏÏÏÏÏÏÏÏÏÏÏÏÏÏÏÏÏÏÏÏÏÏÏÏÏÏÏÏÏÏÏÏÏÏÏÏÏÏ 803,533 490,928 672,178
Debt for acquisition of investments ÏÏÏÏÏÏÏÏÏÏÏÏÏÏÏÏÏÏÏÏÏÏÏÏÏÏÏ 504,714 504,714 504,714
Pro Forma debt ÏÏÏÏÏÏÏÏÏÏÏÏÏÏÏÏÏÏÏÏÏÏÏÏÏÏÏÏÏÏÏÏÏÏÏÏÏÏÏÏÏÏÏ 140,336 137,860 (6,900)
Net Ñnancial positionÏÏÏÏÏÏÏÏÏÏÏÏÏÏÏÏÏÏÏÏÏÏÏÏÏÏÏÏÏÏÏÏÏÏÏÏÏÏÏ 1,476,153 1,226,765 1,209,735
Share capitalÏÏÏÏÏÏÏÏÏÏÏÏÏÏÏÏÏÏÏÏÏÏÏÏÏÏÏÏÏÏÏÏÏÏÏÏÏÏÏÏÏÏÏÏÏÏ 550,587 650,587 650,587
Reserves ÏÏÏÏÏÏÏÏÏÏÏÏÏÏÏÏÏÏÏÏÏÏÏÏÏÏÏÏÏÏÏÏÏÏÏÏÏÏÏÏÏÏÏÏÏÏÏÏÏ 26,315 36,362 27,252
Pro Forma related reserves ÏÏÏÏÏÏÏÏÏÏÏÏÏÏÏÏÏÏÏÏÏÏÏÏÏÏÏÏÏÏÏÏÏÏ 112,876 62,931 29,839
Net income (loss) for the year ÏÏÏÏÏÏÏÏÏÏÏÏÏÏÏÏÏÏÏÏÏÏÏÏÏÏÏÏÏÏ (66,532) (13,701) 17,841
Shareholders' equityÏÏÏÏÏÏÏÏÏÏÏÏÏÏÏÏÏÏÏÏÏÏÏÏÏÏÏÏÏÏÏÏÏÏÏÏÏÏÏÏ 623,246 736,179 725,519
Minority interestsÏÏÏÏÏÏÏÏÏÏÏÏÏÏÏÏÏÏÏÏÏÏÏÏÏÏÏÏÏÏÏÏÏÏÏÏÏÏÏÏÏÏ 477 329 637
Total shareholders' equity and minority interests ÏÏÏÏÏÏÏÏÏÏÏÏ 623,723 736,508 726,156
Total liabilities and shareholders' equity ÏÏÏÏÏÏÏÏÏÏÏÏÏÏÏÏÏÏÏ 2,172,074 2,043,775 2,035,560
Memorandum accounts ÏÏÏÏÏÏÏÏÏÏÏÏÏÏÏÏÏÏÏÏÏÏÏÏÏÏÏÏÏÏÏÏÏÏÏÏÏ 46,058 98,326 24,254
The accompanying notes are an integral part of these Pro Forma Consolidated Financial Statements.
F-114
Brought to you by Global Reports

UNAUDITED PRO FORMA CONSOLIDATED FINANCIAL STATEMENTS(INCLUDING KENWOOD)
UNAUDITED PRO FORMA CONSOLIDATED INCOME STATEMENTSFOR THE YEARS ENDING DECEMBER 31, 1998, 1999 AND 2000
1998 % 1999 % 2000 %
(Millions of Lire)
Net sales ÏÏÏÏÏÏÏÏÏÏÏÏÏÏÏÏÏÏÏÏÏÏÏÏÏÏ 1,724,722 98.8% 1,799,725 99.0% 2,042,711 98.6%
Other revenues ÏÏÏÏÏÏÏÏÏÏÏÏÏÏÏÏÏÏÏÏÏ 21,384 1.2% 18,979 1.0% 29,470 1.4%
Total revenues ÏÏÏÏÏÏÏÏÏÏÏÏÏÏÏÏÏÏ 1,746,106 100% 1,818,704 100% 2,072,181 100%
Materials, consumables and goods ÏÏÏÏÏ 869,195 49.8% 885,304 48.7% 1,026,265 49.5%
Services, rents, leases and related costs 367,348 21.0% 375,627 20.7% 450,831 21.8%
Other costsÏÏÏÏÏÏÏÏÏÏÏÏÏÏÏÏÏÏÏÏÏÏÏÏÏ 21,128 1.2% 17,874 1.0% 10,867 0.5%
Total production costs ÏÏÏÏÏÏÏÏÏÏÏ 1,257,671 72.0% 1,278,805 70.3% 1,487,963 71.8%
Value added margin ÏÏÏÏÏÏÏÏÏÏÏÏÏÏÏÏÏ 488,435 28.0% 539,899 29.7% 584,218 28.2%
Wages, salaries and beneÑtsÏÏÏÏÏÏÏÏÏÏÏ 279,603 16.0% 275,942 15.2% 290,807 14.0%
Gross operating margin ÏÏÏÏÏÏÏÏÏÏÏÏÏÏ 208,832 12.0% 263,957 14.5% 293,411 14.2%
Depreciation and amortizationÏÏÏÏÏÏÏÏÏ 89,589 5.1% 94,872 5.2% 94,075 4.5%
Amortization of goodwill ÏÏÏÏÏÏÏÏÏÏÏÏÏ 43,142 2.5% 43,417 2.4% 44,123 2.1%
Provisions and write-oÅs ÏÏÏÏÏÏÏÏÏÏÏÏÏ 31,714 1.8% 18,169 1.0% 17,806 0.9%
Operating proÑt ÏÏÏÏÏÏÏÏÏÏÏÏÏÏÏÏÏÏÏÏÏ 44,387 2.5% 107,499 5.9% 137,407 6.6%
Net Ñnancial loss ÏÏÏÏÏÏÏÏÏÏÏÏÏÏÏÏÏÏÏ (98,580) -5.6% (55,203) -3.0% (68,856) -3.3%
Income from equity investments ÏÏÏÏÏÏÏ 1,818 0.1% 3,857 0.2% 8,321 0.4%
Extraordinary loss ÏÏÏÏÏÏÏÏÏÏÏÏÏÏÏÏÏÏÏ (14,391) -0.8% (44,657) -2.5% (4,520) -0.2%
Earnings before taxes and minorityinterests ÏÏÏÏÏÏÏÏÏÏÏÏÏÏÏÏÏÏÏÏÏÏÏÏÏ (66,766) -3.8% 11,496 0.6% 72,352 3.5%
Income taxes ÏÏÏÏÏÏÏÏÏÏÏÏÏÏÏÏÏÏÏÏÏÏÏ 37 0.0% 25,269 1.4% 54,307 2.6%
Net (loss) income before minorityinterest ÏÏÏÏÏÏÏÏÏÏÏÏÏÏÏÏÏÏÏÏÏÏÏÏÏÏ (66,803) -3.8% (13,773) -0.8% 18,045 0.9%
Minority interests ÏÏÏÏÏÏÏÏÏÏÏÏÏÏÏÏÏÏÏ 271 0.0% 72 0.0% (204) 0.0%
Net (loss) income for the year ÏÏÏÏÏÏÏÏ (66,532) -3.8% (13,701) -0.8% 17,841 0.9%
The accompanying notes are an integral part of these Pro Forma Consolidated Financial Statements.
F-115
Brought to you by Global Reports

UNAUDITED PRO FORMA CONSOLIDATED FINANCIAL STATEMENTS(INCLUDING KENWOOD)
UNAUDITED PRO FORMA CONSOLIDATED CASH FLOW STATEMENTSFOR THE YEARS ENDING DECEMBER 31, 1998, 1999 AND 2000
1999 2000
(Millions of Lire)
Net income for the year ÏÏÏÏÏÏÏÏÏÏÏÏÏÏÏÏÏÏÏÏÏÏÏÏÏÏÏÏÏÏÏÏÏÏÏÏÏÏÏÏÏÏÏÏÏÏ (13,701) 17,841
Depreciation and amortization ÏÏÏÏÏÏÏÏÏÏÏÏÏÏÏÏÏÏÏÏÏÏÏÏÏÏÏÏÏÏÏÏÏÏÏÏÏÏÏÏÏ 138,289 138,198
Provisions and writedowns net of applications ÏÏÏÏÏÏÏÏÏÏÏÏÏÏÏÏÏÏÏÏÏÏÏÏÏÏÏÏ 5,314 (10,534)
Cash Öows provided by operating activitiesÏÏÏÏÏÏÏÏÏÏÏÏÏÏÏÏÏÏÏÏÏÏÏÏÏÏÏÏÏÏÏ 129,902 145,505
Changes in assets and liabilities during the year:
Receivables ÏÏÏÏÏÏÏÏÏÏÏÏÏÏÏÏÏÏÏÏÏÏÏÏÏÏÏÏÏÏÏÏÏÏÏÏÏÏÏÏÏÏÏÏÏÏÏÏÏÏÏÏÏÏÏÏÏ (71,593) (64,526)
InventoryÏÏÏÏÏÏÏÏÏÏÏÏÏÏÏÏÏÏÏÏÏÏÏÏÏÏÏÏÏÏÏÏÏÏÏÏÏÏÏÏÏÏÏÏÏÏÏÏÏÏÏÏÏÏÏÏÏÏÏ 24,962 (84,202)
Other current assetsÏÏÏÏÏÏÏÏÏÏÏÏÏÏÏÏÏÏÏÏÏÏÏÏÏÏÏÏÏÏÏÏÏÏÏÏÏÏÏÏÏÏÏÏÏÏÏÏÏÏ 20,846 (15,004)
Payables ÏÏÏÏÏÏÏÏÏÏÏÏÏÏÏÏÏÏÏÏÏÏÏÏÏÏÏÏÏÏÏÏÏÏÏÏÏÏÏÏÏÏÏÏÏÏÏÏÏÏÏÏÏÏÏÏÏÏÏ 53,476 24,919
Other current liabilities ÏÏÏÏÏÏÏÏÏÏÏÏÏÏÏÏÏÏÏÏÏÏÏÏÏÏÏÏÏÏÏÏÏÏÏÏÏÏÏÏÏÏÏÏÏÏÏ 8,890 20,214
Cash Öows provided by (used in) changes in working capital ÏÏÏÏÏÏÏÏÏÏÏÏÏÏÏ 36,581 (118,599)
Net investments in intangible assets ÏÏÏÏÏÏÏÏÏÏÏÏÏÏÏÏÏÏÏÏÏÏÏÏÏÏÏÏÏÏÏÏÏÏÏÏ (1,678) (6,508)
Net investments in tangible assets ÏÏÏÏÏÏÏÏÏÏÏÏÏÏÏÏÏÏÏÏÏÏÏÏÏÏÏÏÏÏÏÏÏÏÏÏÏÏ (15,531) (38,498)
Net disposal of Ñnancial assetsÏÏÏÏÏÏÏÏÏÏÏÏÏÏÏÏÏÏÏÏÏÏÏÏÏÏÏÏÏÏÏÏÏÏÏÏÏÏÏÏÏ 1,114 19,138
Cash Öows used in investing activitiesÏÏÏÏÏÏÏÏÏÏÏÏÏÏÏÏÏÏÏÏÏÏÏÏÏÏÏÏÏÏÏÏÏÏÏ (16,095) (25,868)
Capital increase ÏÏÏÏÏÏÏÏÏÏÏÏÏÏÏÏÏÏÏÏÏÏÏÏÏÏÏÏÏÏÏÏÏÏÏÏÏÏÏÏÏÏÏÏÏÏÏÏÏÏÏÏÏ 100,000 Ì
Changes in pro forma and conversion reserve ÏÏÏÏÏÏÏÏÏÏÏÏÏÏÏÏÏÏÏÏÏÏÏÏÏÏÏÏ (999) 15,991
Cash Öows provided by Ñnancing activitiesÏÏÏÏÏÏÏÏÏÏÏÏÏÏÏÏÏÏÏÏÏÏÏÏÏÏÏÏÏÏÏ 99,001 15,991
Cash Öow for the yearÏÏÏÏÏÏÏÏÏÏÏÏÏÏÏÏÏÏÏÏÏÏÏÏÏÏÏÏÏÏÏÏÏÏÏÏÏÏÏÏÏÏÏÏÏÏÏÏ 249,389 17,029
Net Ñnancial position at the beginning of the year ÏÏÏÏÏÏÏÏÏÏÏÏÏÏÏÏÏÏÏÏÏÏÏÏ (1,476,154) (1,226,765)
Cash Öow for the yearÏÏÏÏÏÏÏÏÏÏÏÏÏÏÏÏÏÏÏÏÏÏÏÏÏÏÏÏÏÏÏÏÏÏÏÏÏÏÏÏÏÏÏÏÏÏÏÏ 249,389 17,029
Net Ñnancial position at the end of the year ÏÏÏÏÏÏÏÏÏÏÏÏÏÏÏÏÏÏÏÏÏÏÏÏÏÏÏÏÏ (1,226,765) (1,209,736)
Change in shareholders' equity for substitution tax ÏÏÏÏÏÏÏÏÏÏÏÏÏÏÏÏÏÏÏÏÏÏÏÏ Ì (44,077)
Change in other payables for substitution taxÏÏÏÏÏÏÏÏÏÏÏÏÏÏÏÏÏÏÏÏÏÏÏÏÏÏÏÏÏ Ì 44,077
The accompanying notes are an integral part of these Pro Forma ConsolidatedFinancial Statements.
F-116
Brought to you by Global Reports

UNAUDITED PRO FORMA CONSOLIDATED FINANCIAL STATEMENTS(INCLUDING KENWOOD)
NOTES TO THE UNAUDITED PRO FORMA CONSOLIDATED FINANCIAL STATEMENTS
The Unaudited Pro Forma Consolidated Financial Statements (including Kenwood) of theDe' Longhi Group (hereafter referred to as the ""Unaudited Pro forma Consolidated FinancialStatements'') have been prepared to give a more accurate representation of the equity, Ñnancial andeconomic position of the De' Longhi Group under these circumstances as if they existed January 1, 1998,including the acquisition of the Kenwood Group which took place during the Ñrst few months of 2001.
Valuation Criteria:
The data used in the Unaudited Pro forma Consolidated Financial Statements of the Group formedthe basis for these Unaudited Pro forma Consolidated Financial Statements.
With respect to the consolidated Ñnancial statements of the Kenwood Group, the year-end waschanged to be consistent with that of the De' Longhi Group (December 31 compared to March 31). Thiswas performed in order to have consistent information for the valuation criteria adopted by the De' LonghiGroup.
Assumptions adopted in preparing the Unaudited Pro Forma Consolidated Financial Statements:
The acquisition date was made retroactive to January 1, 1998. We have consolidated the proforma consolidated Ñnancial statements of De' Longhi with the consolidated pro forma Ñnancialstatements of the Kenwood Group.
The goodwill that arose upon the acquisition of the Kenwood Group was calculated based on100% ownership as a result of the purchase made through the Public OÅering and, subsequently, apurchase of the minority interest, amounting to Lire 148,006 million including all acquisition costs.
The value for Goodwill was retrospectively recorded as of January 1, 1998 and is beingsystematically amortized over a period of 20 years consistent with the accounting policies of theDe' Longhi Group.
A deferred tax asset amounting to Lire 9,884 million was recorded December 31, 2000 relating to thetax loss carry-forwards that will be utilized in the future. The beneÑt was quantiÑed using the followingcriteria:
The portion of loss carry-forwards that were recognized are those that are reasonably expected tobe utilized based on the results attained by the Kenwood Group.
The tax beneÑt was quantiÑed applying the current tax rate on income in eÅect in the UnitedKingdom (approximately 30%).
The impact of these deferred tax assets was recorded in the pro forma income statements relatingto this three-year period, based on the corresponding tax losses of those years.
The long-term debt used to Ñnance the Kenwood Group acquisition was recorded by theCompany at an amount of Lire 148,006 million and had an average interest rate of 5.5% during theperiod.
F-117
Brought to you by Global Reports
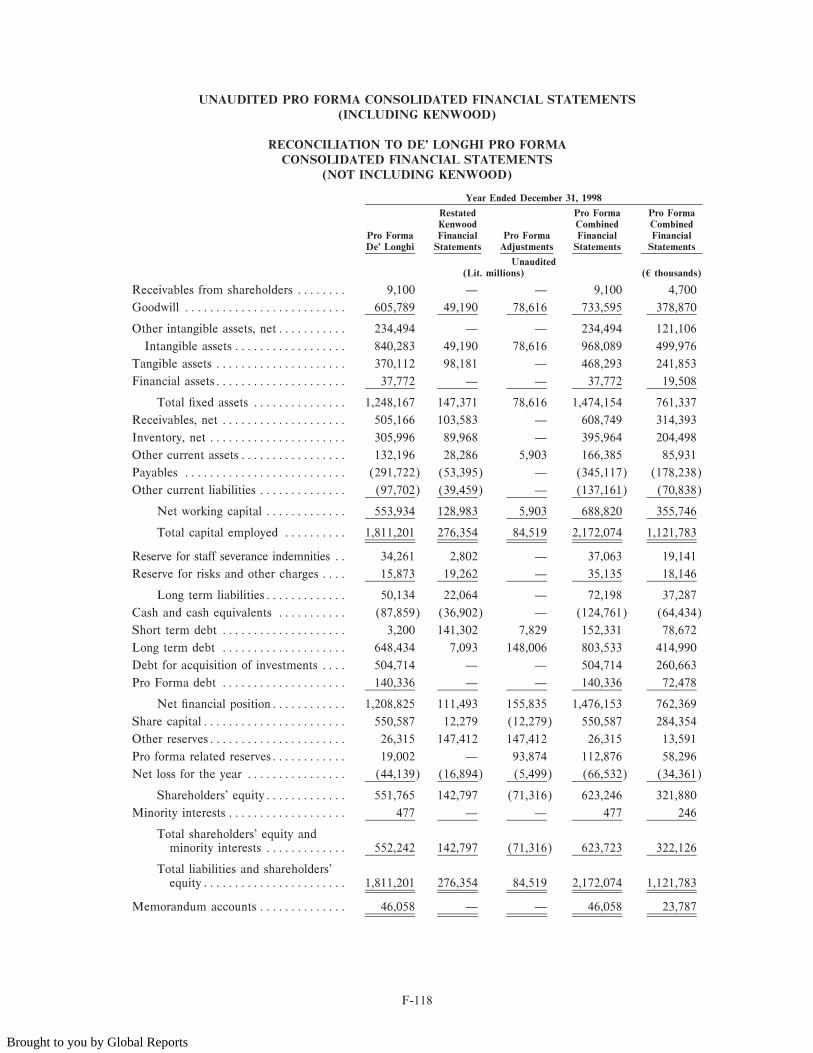
UNAUDITED PRO FORMA CONSOLIDATED FINANCIAL STATEMENTS(INCLUDING KENWOOD)
RECONCILIATION TO DE' LONGHI PRO FORMACONSOLIDATED FINANCIAL STATEMENTS
(NOT INCLUDING KENWOOD)
Year Ended December 31, 1998
Restated Pro Forma Pro FormaKenwood Combined Combined
Pro Forma Financial Pro Forma Financial FinancialDe' Longhi Statements Adjustments Statements Statements
Unaudited(Lit. millions) (5 thousands)
Receivables from shareholders ÏÏÏÏÏÏÏÏ 9,100 Ì Ì 9,100 4,700
Goodwill ÏÏÏÏÏÏÏÏÏÏÏÏÏÏÏÏÏÏÏÏÏÏÏÏÏÏ 605,789 49,190 78,616 733,595 378,870
Other intangible assets, netÏÏÏÏÏÏÏÏÏÏÏ 234,494 Ì Ì 234,494 121,106
Intangible assets ÏÏÏÏÏÏÏÏÏÏÏÏÏÏÏÏÏÏ 840,283 49,190 78,616 968,089 499,976
Tangible assets ÏÏÏÏÏÏÏÏÏÏÏÏÏÏÏÏÏÏÏÏÏ 370,112 98,181 Ì 468,293 241,853
Financial assetsÏÏÏÏÏÏÏÏÏÏÏÏÏÏÏÏÏÏÏÏÏ 37,772 Ì Ì 37,772 19,508
Total Ñxed assets ÏÏÏÏÏÏÏÏÏÏÏÏÏÏÏ 1,248,167 147,371 78,616 1,474,154 761,337
Receivables, net ÏÏÏÏÏÏÏÏÏÏÏÏÏÏÏÏÏÏÏÏ 505,166 103,583 Ì 608,749 314,393
Inventory, net ÏÏÏÏÏÏÏÏÏÏÏÏÏÏÏÏÏÏÏÏÏÏ 305,996 89,968 Ì 395,964 204,498
Other current assetsÏÏÏÏÏÏÏÏÏÏÏÏÏÏÏÏÏ 132,196 28,286 5,903 166,385 85,931
Payables ÏÏÏÏÏÏÏÏÏÏÏÏÏÏÏÏÏÏÏÏÏÏÏÏÏÏ (291,722) (53,395) Ì (345,117) (178,238)
Other current liabilities ÏÏÏÏÏÏÏÏÏÏÏÏÏÏ (97,702) (39,459) Ì (137,161) (70,838)
Net working capital ÏÏÏÏÏÏÏÏÏÏÏÏÏ 553,934 128,983 5,903 688,820 355,746
Total capital employed ÏÏÏÏÏÏÏÏÏÏ 1,811,201 276,354 84,519 2,172,074 1,121,783
Reserve for staff severance indemnities ÏÏ 34,261 2,802 Ì 37,063 19,141
Reserve for risks and other charges ÏÏÏÏ 15,873 19,262 Ì 35,135 18,146
Long term liabilitiesÏÏÏÏÏÏÏÏÏÏÏÏÏ 50,134 22,064 Ì 72,198 37,287
Cash and cash equivalents ÏÏÏÏÏÏÏÏÏÏÏ (87,859) (36,902) Ì (124,761) (64,434)
Short term debt ÏÏÏÏÏÏÏÏÏÏÏÏÏÏÏÏÏÏÏÏ 3,200 141,302 7,829 152,331 78,672
Long term debt ÏÏÏÏÏÏÏÏÏÏÏÏÏÏÏÏÏÏÏÏ 648,434 7,093 148,006 803,533 414,990
Debt for acquisition of investments ÏÏÏÏ 504,714 Ì Ì 504,714 260,663
Pro Forma debt ÏÏÏÏÏÏÏÏÏÏÏÏÏÏÏÏÏÏÏÏ 140,336 Ì Ì 140,336 72,478
Net Ñnancial positionÏÏÏÏÏÏÏÏÏÏÏÏ 1,208,825 111,493 155,835 1,476,153 762,369
Share capitalÏÏÏÏÏÏÏÏÏÏÏÏÏÏÏÏÏÏÏÏÏÏÏ 550,587 12,279 (12,279) 550,587 284,354
Other reservesÏÏÏÏÏÏÏÏÏÏÏÏÏÏÏÏÏÏÏÏÏÏ 26,315 147,412 147,412 26,315 13,591
Pro forma related reservesÏÏÏÏÏÏÏÏÏÏÏÏ 19,002 Ì 93,874 112,876 58,296
Net loss for the year ÏÏÏÏÏÏÏÏÏÏÏÏÏÏÏÏ (44,139) (16,894) (5,499) (66,532) (34,361)
Shareholders' equityÏÏÏÏÏÏÏÏÏÏÏÏÏ 551,765 142,797 (71,316) 623,246 321,880
Minority interests ÏÏÏÏÏÏÏÏÏÏÏÏÏÏÏÏÏÏÏ 477 Ì Ì 477 246
Total shareholders' equity andminority interests ÏÏÏÏÏÏÏÏÏÏÏÏÏ 552,242 142,797 (71,316) 623,723 322,126
Total liabilities and shareholders'equityÏÏÏÏÏÏÏÏÏÏÏÏÏÏÏÏÏÏÏÏÏÏÏ 1,811,201 276,354 84,519 2,172,074 1,121,783
Memorandum accounts ÏÏÏÏÏÏÏÏÏÏÏÏÏÏ 46,058 Ì Ì 46,058 23,787
F-118
Brought to you by Global Reports

UNAUDITED PRO FORMA CONSOLIDATED FINANCIAL STATEMENTS(INCLUDING KENWOOD)
RECONCILIATION TO DE' LONGHI PRO FORMACONSOLIDATED FINANCIAL STATEMENTS
(NOT INCLUDING KENWOOD)
Year Ended December 31, 1999
Restated Pro Forma Pro FormaKenwood Combined Combined
Pro Forma Financial Pro Forma Financial FinancialDe' Longhi Statements Adjustments Statements Statements
Unaudited(Lit. millions) (5 thousands)
Receivables from shareholders ÏÏÏÏÏÏÏÏ 25,000 Ì Ì 25,000 12,911
Goodwill ÏÏÏÏÏÏÏÏÏÏÏÏÏÏÏÏÏÏÏÏÏÏÏÏÏÏ 216,347 Ì Ì 216,347 111,734
Other intangible assetsÏÏÏÏÏÏÏÏÏÏÏÏÏÏÏ 791,887 45,353 75,043 912,283 471,155
Total intangible assets ÏÏÏÏÏÏÏÏÏÏÏÏÏÏÏ 348,788 70,169 Ì 418,957 216,373
Tangible assets ÏÏÏÏÏÏÏÏÏÏÏÏÏÏÏÏÏÏÏÏÏ 575,540 45,353 75,043 695,936 359,421
Financial assetsÏÏÏÏÏÏÏÏÏÏÏÏÏÏÏÏÏÏÏÏÏ 36,509 Ì Ì 36,509 18,855
Total Ñxed assets ÏÏÏÏÏÏÏÏÏÏÏÏÏÏÏ 1,177,184 115,522 75,043 1,367,749 706,383
Receivables ÏÏÏÏÏÏÏÏÏÏÏÏÏÏÏÏÏÏÏÏÏÏÏÏ 557,852 136,766 Ì 694,618 358,740
InventoryÏÏÏÏÏÏÏÏÏÏÏÏÏÏÏÏÏÏÏÏÏÏÏÏÏÏ 289,581 92,360 Ì 381,941 197,256
Other current assetsÏÏÏÏÏÏÏÏÏÏÏÏÏÏÏÏÏ 105,880 13,984 12,373 132,237 68,295
Payables ÏÏÏÏÏÏÏÏÏÏÏÏÏÏÏÏÏÏÏÏÏÏÏÏÏÏ (336,938) (68,930) Ì (405,868) (209,613)
Other current liabilities ÏÏÏÏÏÏÏÏÏÏÏÏÏÏ (92,120) (59,782) Ì (151,902) (78,451)
Net working capital ÏÏÏÏÏÏÏÏÏÏÏÏÏ 524,255 114,398 12,373 651,026 336,227
Total capital employed ÏÏÏÏÏÏÏÏÏÏ 1,726,439 229,920 87,416 2,043,775 1,055,522
Reserve for staff severance indemnities ÏÏ 34,797 2,791 Ì 37,588 19,413
Reserve for risks and other charges ÏÏÏÏ 17,469 25,445 Ì 42,914 22,163
Long term liabilitiesÏÏÏÏÏÏÏÏÏÏÏÏÏ 52,266 28,236 Ì 80,502 41,576
Cash and cash equivalents ÏÏÏÏÏÏÏÏÏÏÏ (157,045) (10,692) Ì (167,737) (86,629)
Short term debt ÏÏÏÏÏÏÏÏÏÏÏÏÏÏÏÏÏÏÏÏ 145,582 99,760 15,658 261,000 134,795
Long term debt ÏÏÏÏÏÏÏÏÏÏÏÏÏÏÏÏÏÏÏÏ 336,385 6,537 148,006 490,928 253,543
Debt for acquisition of investments ÏÏÏÏ 504,714 Ì Ì 504,714 260,663
Pro Forma debt ÏÏÏÏÏÏÏÏÏÏÏÏÏÏÏÏÏÏÏÏ 137,860 Ì Ì 137,860 71,199
Net Ñnancial positionÏÏÏÏÏÏÏÏÏÏÏÏ 967,496 95,605 163,664 1,226,765 633,571
Share capitalÏÏÏÏÏÏÏÏÏÏÏÏÏÏÏÏÏÏÏÏÏÏÏ 650,587 12,279 (12,279) 650,587 336,000
Other reservesÏÏÏÏÏÏÏÏÏÏÏÏÏÏÏÏÏÏÏÏÏÏ 36,362 143,158 143,158 36,362 18,779
Pro forma related reservesÏÏÏÏÏÏÏÏÏÏÏÏ (21,190) Ì 84,121 62,931 32,501
Net income (loss) for the year ÏÏÏÏÏÏÏ 40,589 (49,358) (4,932) (13,701) (7,076)
Shareholders' equityÏÏÏÏÏÏÏÏÏÏÏÏÏ 706,348 106,079 (76,248) 736,179 380,205
Minority interests ÏÏÏÏÏÏÏÏÏÏÏÏÏÏÏÏÏÏÏ 329 Ì Ì 329 170
Total shareholders' equity andminority interests ÏÏÏÏÏÏÏÏÏÏÏÏÏ 706,677 106,079 (76,248) 736,508 380,375
Total liabilities and shareholders'equityÏÏÏÏÏÏÏÏÏÏÏÏÏÏÏÏÏÏÏÏÏÏÏ 1,726,439 229,920 87,416 2,043,775 1,055,522
Memorandum accounts ÏÏÏÏÏÏÏÏÏÏÏÏÏÏ 98,326 Ì Ì 98,326 50,781
F-119
Brought to you by Global Reports

UNAUDITED PRO FORMA CONSOLIDATED FINANCIAL STATEMENTS(INCLUDING KENWOOD)
RECONCILIATION TO DE' LONGHI PRO FORMACONSOLIDATED FINANCIAL STATEMENTS
(NOT INCLUDING KENWOOD)
Year Ended December 31, 2000
Restated Pro Forma Pro FormaKenwood Combined Combined
Pro Forma Financial Pro Forma Financial FinancialDe' Longhi Statements Adjustments Statements Statements
Unaudited(Lit. millions) (5 thousands)
Receivables from shareholders ÏÏÏÏÏÏÏÏ Ì Ì Ì Ì Ì
Goodwill ÏÏÏÏÏÏÏÏÏÏÏÏÏÏÏÏÏÏÏÏÏÏÏÏÏÏ 545,343 35,127 71,470 651,940 336,699
Other intangible assets, netÏÏÏÏÏÏÏÏÏÏÏ 203,123 Ì Ì 203,123 104,904
Total intangible assets ÏÏÏÏÏÏÏÏÏÏÏÏÏÏÏ 748,466 35,127 71,470 855,063 441,603
Tangible assets, net ÏÏÏÏÏÏÏÏÏÏÏÏÏÏÏÏÏ 344,097 39,436 Ì 383,533 198,078
Financial assetsÏÏÏÏÏÏÏÏÏÏÏÏÏÏÏÏÏÏÏÏÏ 17,678 Ì Ì 17,678 9,130
Total Ñxed assets ÏÏÏÏÏÏÏÏÏÏÏÏÏÏÏ 1,110,241 74,563 71,470 1,256,274 648,811
Receivables, net ÏÏÏÏÏÏÏÏÏÏÏÏÏÏÏÏÏÏÏÏ 615,735 142,724 Ì 758,459 391,711
Inventory, net ÏÏÏÏÏÏÏÏÏÏÏÏÏÏÏÏÏÏÏÏÏÏ 370,539 95,172 Ì 465,711 240,520
Other current assetsÏÏÏÏÏÏÏÏÏÏÏÏÏÏÏÏÏ 138,741 14,846 18,584 172,171 88,919
Payables ÏÏÏÏÏÏÏÏÏÏÏÏÏÏÏÏÏÏÏÏÏÏÏÏÏÏ (357,813) (72,611) Ì (430,424) (222,295)
Other current liabilities ÏÏÏÏÏÏÏÏÏÏÏÏÏÏ (129,008) (57,623) Ì (186,631) (96,387)
Net working capital ÏÏÏÏÏÏÏÏÏÏÏÏÏ 638,194 122,508 18,584 779,286 402,468
Total capital employed ÏÏÏÏÏÏÏÏÏÏ 1,748,435 197,071 90,054 2,035,560 1,051,279
Reserve for staff severance indemnities ÏÏ 37,525 3,050 Ì 40,575 20,955
Reserve for risks and other charges ÏÏÏÏ 51,235 7,859 Ì 59,094 30,520
Long term liabilitiesÏÏÏÏÏÏÏÏÏÏÏÏÏ 88,760 10,909 Ì 99,669 51,475
Cash and cash equivalents ÏÏÏÏÏÏÏÏÏÏÏ (135,979) (11,591) Ì (147,570) (76,214)
Short term debt ÏÏÏÏÏÏÏÏÏÏÏÏÏÏÏÏÏÏÏÏ 54,336 109,490 23,487 187,313 96,739
Long term debt ÏÏÏÏÏÏÏÏÏÏÏÏÏÏÏÏÏÏÏÏ 519,143 5,029 148,006 672,178 347,151
Debt for acquisition of investments ÏÏÏÏ 504,714 Ì Ì 504,714 260,663
Pro Forma debt ÏÏÏÏÏÏÏÏÏÏÏÏÏÏÏÏÏÏÏÏ (6,900) Ì Ì (6,900) (3,564)
Net Ñnancial positionÏÏÏÏÏÏÏÏÏÏÏÏ 935,314 102,928 171,493 1,209,735 624,775
Share capitalÏÏÏÏÏÏÏÏÏÏÏÏÏÏÏÏÏÏÏÏÏÏÏ 650,587 12,279 (12,279) 650,587 336,000
Other reservesÏÏÏÏÏÏÏÏÏÏÏÏÏÏÏÏÏÏÏÏÏÏ 27,252 89,463 (89,463) 27,252 14,074
Pro forma related reservesÏÏÏÏÏÏÏÏÏÏÏÏ 4,345 Ì 25,494 29,839 15,411
Net income (loss) for the year ÏÏÏÏÏÏÏ 41,540 (18,508) (5,191) 17,841 9,214
Shareholders' equityÏÏÏÏÏÏÏÏÏÏÏÏÏ 723,724 83,234 (81,439) 725,519 374,699
Minority interests ÏÏÏÏÏÏÏÏÏÏÏÏÏÏÏÏÏÏÏ 637 Ì Ì 637 329
Total shareholders' equity andminority interests ÏÏÏÏÏÏÏÏÏÏÏÏÏ 724,361 83,234 (81,439) 726,156 375,028
Total liabilities and shareholders'equityÏÏÏÏÏÏÏÏÏÏÏÏÏÏÏÏÏÏÏÏÏÏÏ 1,748,435 197,071 90,054 2,035,560 1,051,279
Memorandum accounts ÏÏÏÏÏÏÏÏÏÏÏÏÏÏ 24,254 Ì Ì 24,254 12,526
F-120
Brought to you by Global Reports

UNAUDITED PRO FORMA CONSOLIDATED FINANCIAL STATEMENTS(INCLUDING KENWOOD)
RECONCILIATION TO DE' LONGHI PRO FORMACONSOLIDATED FINANCIAL STATEMENTS
(NOT INCLUDING KENWOOD)
Year Ended December 31, 1998
Pro Forma Pro FormaCombined Combined
Pro Forma Restated Pro Forma Financial FinancialDe' Longhi Kenwood Adjustments Statements Statements
Unaudited(Lit. millions) (5 thousands)
Revenues:
Net sales ÏÏÏÏÏÏÏÏÏÏÏÏÏÏÏÏÏÏÏÏÏÏÏÏÏÏÏ 1,269,314 455,408 Ì 1,724,722 890,745
Other revenues ÏÏÏÏÏÏÏÏÏÏÏÏÏÏÏÏÏÏÏÏÏÏ 21,384 Ì Ì 21,384 11,044
Total revenuesÏÏÏÏÏÏÏÏÏÏÏÏÏÏÏÏÏÏÏÏÏÏÏ 1,290,698 455,408 Ì 1,746,106 901,789
Operating costs:
Materials, consumables and goods ÏÏÏÏÏÏ 630,240 238,955 Ì 869,195 448,902
Services(1) ÏÏÏÏÏÏÏÏÏÏÏÏÏÏÏÏÏÏÏÏÏÏÏÏÏÏ 276,713 90,635 Ì 367,348 189,719
Other costs ÏÏÏÏÏÏÏÏÏÏÏÏÏÏÏÏÏÏÏÏÏÏÏÏÏ 21,128 Ì Ì 21,128 10,9117
Value added marginÏÏÏÏÏÏÏÏÏÏÏÏÏÏÏÏÏÏ 362,617 125,818 Ì 488,435 252,256
Wages, salaries and beneÑt ÏÏÏÏÏÏÏÏÏÏÏÏ 202,160 77,443 Ì 279,603 144,403
Gross operating margin ÏÏÏÏÏÏÏÏÏÏÏÏÏÏÏ 160,457 48,375 Ì 208,832 107,853
Depreciation and amortization ÏÏÏÏÏÏÏÏÏ 70,834 18,755 Ì 89,589 46,269
Amortization of goodwill ÏÏÏÏÏÏÏÏÏÏÏÏÏÏ 30,251 9,318 3,573 43,142 22,281
Provisions and write-oÅs ÏÏÏÏÏÏÏÏÏÏÏÏÏÏ 28,576 3,138 Ì 31,714 16,379
Operating proÑt ÏÏÏÏÏÏÏÏÏÏÏÏÏÏÏÏÏÏÏÏÏ 30,796 17,164 (3,573) 44,387 22,924
Net Ñnancial loss ÏÏÏÏÏÏÏÏÏÏÏÏÏÏÏÏÏÏÏÏ (73,187) (17,564) (7,829) (98,580) (50,912)
Income from equity investmentsÏÏÏÏÏÏÏÏ 1,818 Ì Ì 1,818 939
Extraordinary lossÏÏÏÏÏÏÏÏÏÏÏÏÏÏÏÏÏÏÏÏ (3,410) (10,981) Ì (14,391) (7,432)
Earnings before taxes and minorityinterests ÏÏÏÏÏÏÏÏÏÏÏÏÏÏÏÏÏÏÏÏÏÏÏÏÏÏ (43,983) (11,381) (11,402) (66,766) (34,482)
Income tax expense (beneÑt)ÏÏÏÏÏÏÏÏÏÏ 427 5,513 (5,903) 37 19
Net loss before minority interestsÏÏÏÏÏÏÏ (44,410) (16,894) (5,499) (66,803) (34,501)
Minority interests ÏÏÏÏÏÏÏÏÏÏÏÏÏÏÏÏÏÏÏÏ 271 Ì Ì 271 140
Net loss for the year ÏÏÏÏÏÏÏÏÏÏÏÏÏÏÏÏÏ (44,139) (16,894) (5,499) (66,532) (34,361)
(1) Services expenses for the unaudited pro forma consolidated Ñnancial statements include rents, leases and related costs.
F-121
Brought to you by Global Reports

UNAUDITED PRO FORMA CONSOLIDATED FINANCIAL STATEMENTS(INCLUDING KENWOOD)
RECONCILIATION TO DE' LONGHI PRO FORMACONSOLIDATED FINANCIAL STATEMENTS
(NOT INCLUDING KENWOOD)
Year Ended December 31, 1999
Pro Forma Pro FormaCombined Combined
Pro Forma Restated Pro Forma Financial FinancialDe' Longhi Kenwood Adjustments Statements Statements
(Unaudited)(Lit. millions) (5 thousands)
Revenues:Net sales ÏÏÏÏÏÏÏÏÏÏÏÏÏÏÏÏÏÏÏÏÏÏÏÏ 1,374,841 424,884 Ì 1,799,725 929,480Other revenues ÏÏÏÏÏÏÏÏÏÏÏÏÏÏÏÏÏÏÏ 18,979 Ì Ì 18,979 9,802
Total revenuesÏÏÏÏÏÏÏÏÏÏÏÏÏÏÏÏ 1,393,820 424,884 Ì 1,818,704 939,282Operating costs:Materials, consumables and goods ÏÏÏ 637,305 247,999 Ì 885,304 457,221Services(1) ÏÏÏÏÏÏÏÏÏÏÏÏÏÏÏÏÏÏÏÏÏÏÏ 301,463 74,164 Ì 375,627 193,995Other costs ÏÏÏÏÏÏÏÏÏÏÏÏÏÏÏÏÏÏÏÏÏÏ 17,874 Ì Ì 17,874 9,231
Value added marginÏÏÏÏÏÏÏÏÏÏÏ 437,178 102,721 Ì 539,899 278,835Wages, salaries and beneÑts ÏÏÏÏÏÏÏÏ 213,311 62,631 Ì 275,942 142,512
Gross operating margin ÏÏÏÏÏÏÏÏ 223,867 40,090 Ì 263,957 136,322Depreciation and amortization ÏÏÏÏÏÏ 77,084 17,788 Ì 94,872 48,997Amortization of goodwill ÏÏÏÏÏÏÏÏÏÏÏ 30,311 9,533 3,573 43,417 22,423Provisions and write-oÅs ÏÏÏÏÏÏÏÏÏÏÏ 15,942 2,227 Ì 18,169 9,384
Operating proÑt ÏÏÏÏÏÏÏÏÏÏÏÏÏÏ 100,530 10,542 (3,573) 107,499 55,519Net Ñnancial loss ÏÏÏÏÏÏÏÏÏÏÏÏÏÏÏÏÏ (33,399) (13,975) (7,829) (55,203) (28,510)Income from equity investmentsÏÏÏÏÏ 3,857 Ì Ì 3,857 1,991Extraordinary lossÏÏÏÏÏÏÏÏÏÏÏÏÏÏÏÏÏ (4,116) (40,541) Ì (44,657) (23,063)
Earnings before taxes andminority interests ÏÏÏÏÏÏÏÏÏÏÏ 66,872 (43,974) (11,402) 11,496 5,937
Income tax expense (beneÑt)ÏÏÏÏÏÏÏ 26,355 5,384 (6,470) 25,269 13,050
Net income (loss) beforeminority interests ÏÏÏÏÏÏÏÏÏÏÏ 40,517 (49,358) (4,932) (13,773) (7,113)
Minority interests ÏÏÏÏÏÏÏÏÏÏÏÏÏÏÏÏÏ 72 Ì Ì 72 37
Net income (loss) for the yearÏÏ 40,589 (49,358) (4,932) (13,701) (7,076)
(1) Services expenses for the unaudited pro forma consolidated Ñnancial statements include rents, leases and related costs.
F-122
Brought to you by Global Reports

UNAUDITED PRO FORMA CONSOLIDATED FINANCIAL STATEMENTS(INCLUDING KENWOOD)
RECONCILIATION TO DE' LONGHI PRO FORMACONSOLIDATED FINANCIAL STATEMENTS
(NOT INCLUDING KENWOOD)
Year Ended December 31, 2000
Pro Forma Pro FormaCombined Combined
Pro Forma Restated Pro Forma Financial FinancialDe' Longhi Kenwood Adjustments Statements Statements
(Unaudited)(Lit. millions) (5 thousands)
Revenues:Net sales ÏÏÏÏÏÏÏÏÏÏÏÏÏÏÏÏÏÏÏÏÏÏÏÏ 1,561,334 481,377 Ì 2,042,711 1,054,972Other revenues ÏÏÏÏÏÏÏÏÏÏÏÏÏÏÏÏÏÏÏ 23,158 6,312 Ì 29,470 15,220
Total revenuesÏÏÏÏÏÏÏÏÏÏÏÏÏÏÏÏ 1,584,492 487,689 Ì 2,072,181 1,070,192Operating costs:Materials, consumables and goods ÏÏÏ 714,053 312,212 Ì 1,026,265 530,022Services(1) ÏÏÏÏÏÏÏÏÏÏÏÏÏÏÏÏÏÏÏÏÏÏÏ 369,142 81,689 Ì 450,831 232,835Other costs ÏÏÏÏÏÏÏÏÏÏÏÏÏÏÏÏÏÏÏÏÏÏ 10,867 Ì Ì 10,867 5,612
Value added marginÏÏÏÏÏÏÏÏÏÏÏÏÏÏÏ 490,430 93,788 Ì 584,218 301,723Wages, salaries and beneÑts ÏÏÏÏÏÏÏÏ 235,795 55,012 Ì 290,807 150,189
Gross operating margin ÏÏÏÏÏÏÏÏÏÏÏÏ 254,635 38,776 Ì 293,411 151,534Depreciation and amortization ÏÏÏÏÏÏ 75,030 19,045 Ì 94,075 48,586Amortization of goodwill ÏÏÏÏÏÏÏÏÏÏÏ 30,252 10,298 3,573 44,123 22,788Provisions and write-oÅs ÏÏÏÏÏÏÏÏÏÏÏ 17,806 Ì Ì 17,806 9,196
Operating proÑt ÏÏÏÏÏÏÏÏÏÏÏÏÏÏÏÏÏÏ 131,547 9,433 (3,573) 137,407 70,965Net Ñnancial loss ÏÏÏÏÏÏÏÏÏÏÏÏÏÏÏÏÏ (45,418) (15,609) (7,829) (68,856) (35,561)Income from equity investmentsÏÏÏÏÏ 8,321 Ì Ì 8,321 4,297Extraordinary income (loss) ÏÏÏÏÏÏÏÏ 4,707 (9,227) Ì (4,520) (2,334)
Earnings before taxes and minorityinterests ÏÏÏÏÏÏÏÏÏÏÏÏÏÏÏÏÏÏÏÏÏÏÏ 99,157 (15,403) (11,402) 72,352 37,367
Income tax expense (beneÑt)ÏÏÏÏÏÏÏ 57,413 3,105 (6,211) 54,307 28,047
Net income (loss) before minorityinterests ÏÏÏÏÏÏÏÏÏÏÏÏÏÏÏÏÏÏÏÏÏÏÏ 41,744 (18,508) (5,191) 18,045 9,319
Minority interests ÏÏÏÏÏÏÏÏÏÏÏÏÏÏÏÏÏ (204) Ì Ì (204) 105
Net income (loss) for the yearÏÏÏÏÏÏ 41,540 (18,508) (5,191) 17,841 9,214
(1) Services expenses for the unaudited pro forma consolidated Ñnancial statements include rents, leases and related costs.
F-123
Brought to you by Global Reports

UNAUDITED PRO FORMA CONSOLIDATED FINANCIAL STATEMENTS(INCLUDING KENWOOD)
RECONCILIATION TO DE' LONGHI PRO FORMACONSOLIDATED FINANCIAL STATEMENTS
(NOT INCLUDING KENWOOD)
Year Ended December 31, 1999
Pro Forma Pro FormaCombined Combined
Pro Forma Restated Pro Forma Financial FinancialDe' Longhi Kenwood Adjustments Statements Statements
Unaudited(Lit. millions) (5 thousands)
Net income for the year ÏÏÏÏÏÏÏÏÏÏÏÏÏÏÏÏ 40,589 (49,358) (4,932) (13,701) (7,076)Depreciation and amortization ÏÏÏÏÏÏÏÏÏÏÏ 107,395 27,321 3,573 138,289 71,421Provisions and writedowns, net of
applications ÏÏÏÏÏÏÏÏÏÏÏÏÏÏÏÏÏÏÏÏÏÏÏÏÏ 2,133 3,181 Ì 5,314 2,744
Cash Öows provided by operating activitiesÏÏÏÏÏÏÏÏÏÏÏÏÏÏÏÏÏÏÏÏÏÏÏÏÏÏÏÏ 150,117 (18,856) (1,359) 129,902 67,089
Changes in assets and liabilities during theyear:
Receivables ÏÏÏÏÏÏÏÏÏÏÏÏÏÏÏÏÏÏÏÏÏÏÏÏÏÏÏ (52,686) (18,907) Ì (71,593) (36,975)Inventory ÏÏÏÏÏÏÏÏÏÏÏÏÏÏÏÏÏÏÏÏÏÏÏÏÏÏÏÏÏ 16,415 8,547 Ì 24,962 12,892Other current assets ÏÏÏÏÏÏÏÏÏÏÏÏÏÏÏÏÏÏÏÏ 10,407 16,909 (6,470) 20,846 10,766PayablesÏÏÏÏÏÏÏÏÏÏÏÏÏÏÏÏÏÏÏÏÏÏÏÏÏÏÏÏÏÏ 45,214 8,262 Ì 53,476 27,619Other current liabilities ÏÏÏÏÏÏÏÏÏÏÏÏÏÏÏÏÏ (5,571) 14,461 Ì 8,890 4,591
Cash Öows provided by changes in workingcapital ÏÏÏÏÏÏÏÏÏÏÏÏÏÏÏÏÏÏÏÏÏÏÏÏÏÏÏÏÏ 13,779 29,272 (6,470) 36,581 18,893
Net investments in intangible assets ÏÏÏÏÏÏ (1,678) Ì Ì (1,678) (867)Net investments in tangible assets ÏÏÏÏÏÏÏÏ (35,997) 20,466 Ì (15,531) (8,020)Net disposal of Ñnancial assets ÏÏÏÏÏÏÏÏÏÏÏ 1,114 Ì Ì 1,114 575
Cash Öows used in investing activities ÏÏÏÏÏ (36,561) 20,466 Ì (16,095) (8,312)Capital increase ÏÏÏÏÏÏÏÏÏÏÏÏÏÏÏÏÏÏÏÏÏÏÏ 100,000 Ì Ì 100,000 51,646Changes in pro-forma and conversion
reserve ÏÏÏÏÏÏÏÏÏÏÏÏÏÏÏÏÏÏÏÏÏÏÏÏÏÏÏÏÏ 13,994 (14,993) Ì (999) (516)
Cash Öows provided by Ñnancing activitiesÏÏÏÏÏÏÏÏÏÏÏÏÏÏÏÏÏÏÏÏÏÏÏÏÏÏÏÏ 113,994 (14,993) Ì 99,001 51,130
Cash Öow for the year ÏÏÏÏÏÏÏÏÏÏÏÏÏÏÏÏÏÏ 241,329 15,889 (7,829) 249,389 128,800Net Ñnancial position at the beginning of
the year ÏÏÏÏÏÏÏÏÏÏÏÏÏÏÏÏÏÏÏÏÏÏÏÏÏÏÏÏ (1,208,825) (111,494) (155,835) (1,476,154) (762,370)Cash Öow for the year ÏÏÏÏÏÏÏÏÏÏÏÏÏÏÏÏÏÏ 241,329 15,889 (7,829) 249,389 128,799
Net Ñnancial position at the end of the year ÏÏÏÏÏÏÏÏÏÏÏÏÏÏÏÏÏÏÏÏÏÏÏÏÏÏÏÏ (967,496) (95,605) (163,664) (1,226,765) (633,571)
F-124
Brought to you by Global Reports
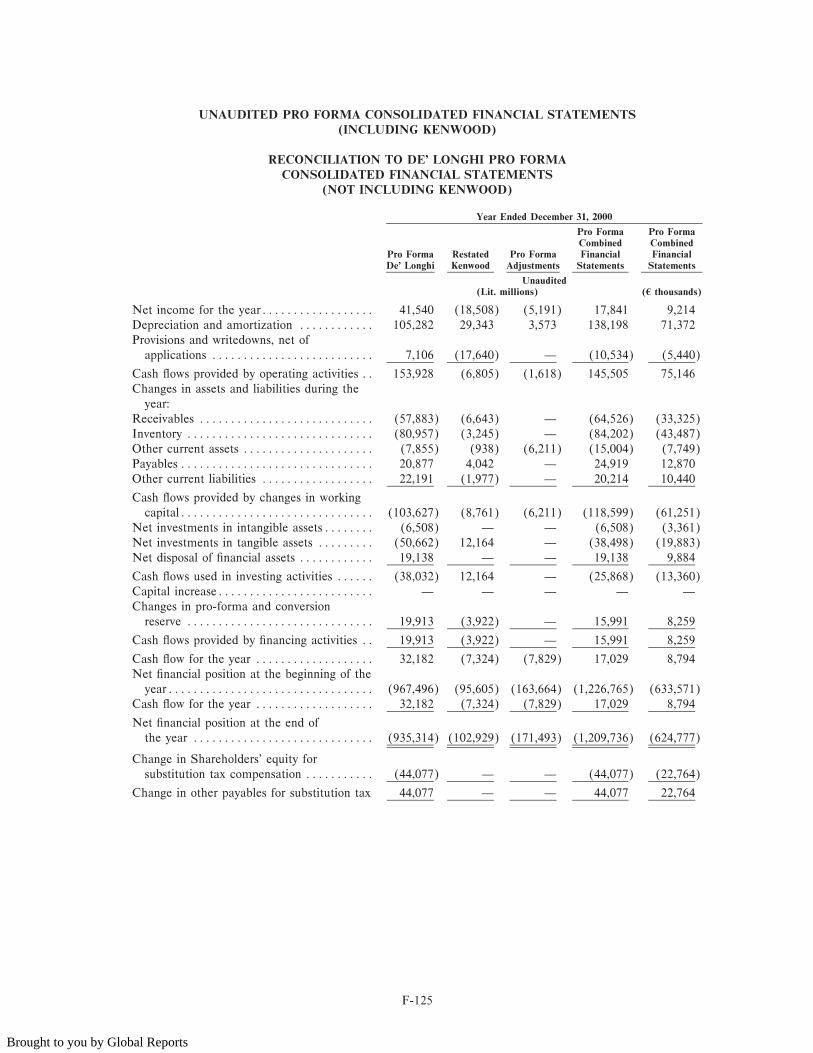
UNAUDITED PRO FORMA CONSOLIDATED FINANCIAL STATEMENTS(INCLUDING KENWOOD)
RECONCILIATION TO DE' LONGHI PRO FORMACONSOLIDATED FINANCIAL STATEMENTS
(NOT INCLUDING KENWOOD)
Year Ended December 31, 2000
Pro Forma Pro FormaCombined Combined
Pro Forma Restated Pro Forma Financial FinancialDe' Longhi Kenwood Adjustments Statements Statements
Unaudited(Lit. millions) (5 thousands)
Net income for the yearÏÏÏÏÏÏÏÏÏÏÏÏÏÏÏÏÏÏ 41,540 (18,508) (5,191) 17,841 9,214Depreciation and amortization ÏÏÏÏÏÏÏÏÏÏÏÏ 105,282 29,343 3,573 138,198 71,372Provisions and writedowns, net of
applications ÏÏÏÏÏÏÏÏÏÏÏÏÏÏÏÏÏÏÏÏÏÏÏÏÏÏ 7,106 (17,640) Ì (10,534) (5,440)
Cash Öows provided by operating activities ÏÏ 153,928 (6,805) (1,618) 145,505 75,146Changes in assets and liabilities during the
year:Receivables ÏÏÏÏÏÏÏÏÏÏÏÏÏÏÏÏÏÏÏÏÏÏÏÏÏÏÏÏ (57,883) (6,643) Ì (64,526) (33,325)Inventory ÏÏÏÏÏÏÏÏÏÏÏÏÏÏÏÏÏÏÏÏÏÏÏÏÏÏÏÏÏÏ (80,957) (3,245) Ì (84,202) (43,487)Other current assets ÏÏÏÏÏÏÏÏÏÏÏÏÏÏÏÏÏÏÏÏÏ (7,855) (938) (6,211) (15,004) (7,749)Payables ÏÏÏÏÏÏÏÏÏÏÏÏÏÏÏÏÏÏÏÏÏÏÏÏÏÏÏÏÏÏÏ 20,877 4,042 Ì 24,919 12,870Other current liabilities ÏÏÏÏÏÏÏÏÏÏÏÏÏÏÏÏÏÏ 22,191 (1,977) Ì 20,214 10,440
Cash Öows provided by changes in workingcapitalÏÏÏÏÏÏÏÏÏÏÏÏÏÏÏÏÏÏÏÏÏÏÏÏÏÏÏÏÏÏÏ (103,627) (8,761) (6,211) (118,599) (61,251)
Net investments in intangible assetsÏÏÏÏÏÏÏÏ (6,508) Ì Ì (6,508) (3,361)Net investments in tangible assets ÏÏÏÏÏÏÏÏÏ (50,662) 12,164 Ì (38,498) (19,883)Net disposal of Ñnancial assets ÏÏÏÏÏÏÏÏÏÏÏÏ 19,138 Ì Ì 19,138 9,884
Cash Öows used in investing activities ÏÏÏÏÏÏ (38,032) 12,164 Ì (25,868) (13,360)Capital increaseÏÏÏÏÏÏÏÏÏÏÏÏÏÏÏÏÏÏÏÏÏÏÏÏÏ Ì Ì Ì Ì ÌChanges in pro-forma and conversion
reserve ÏÏÏÏÏÏÏÏÏÏÏÏÏÏÏÏÏÏÏÏÏÏÏÏÏÏÏÏÏÏ 19,913 (3,922) Ì 15,991 8,259
Cash Öows provided by Ñnancing activities ÏÏ 19,913 (3,922) Ì 15,991 8,259
Cash Öow for the year ÏÏÏÏÏÏÏÏÏÏÏÏÏÏÏÏÏÏÏ 32,182 (7,324) (7,829) 17,029 8,794Net Ñnancial position at the beginning of the
yearÏÏÏÏÏÏÏÏÏÏÏÏÏÏÏÏÏÏÏÏÏÏÏÏÏÏÏÏÏÏÏÏÏ (967,496) (95,605) (163,664) (1,226,765) (633,571)Cash Öow for the year ÏÏÏÏÏÏÏÏÏÏÏÏÏÏÏÏÏÏÏ 32,182 (7,324) (7,829) 17,029 8,794
Net Ñnancial position at the end of the year ÏÏÏÏÏÏÏÏÏÏÏÏÏÏÏÏÏÏÏÏÏÏÏÏÏÏÏÏÏ (935,314) (102,929) (171,493) (1,209,736) (624,777)
Change in Shareholders' equity forsubstitution tax compensation ÏÏÏÏÏÏÏÏÏÏÏ (44,077) Ì Ì (44,077) (22,764)
Change in other payables for substitution tax 44,077 Ì Ì 44,077 22,764
F-125
Brought to you by Global Reports

[THIS PAGE INTENTIONALLY LEFT BLANK]
Brought to you by Global Reports

Annex A
SUMMARY OF SIGNIFICANT DIFFERENCES BETWEEN ITALIAN AND U.S. GAAP
The accounting principles prescribed by Italian law and supplemented by the accounting principlesissued by the Consiglio Nazionale dei Dottori Commercialisti e dei Ragionieri (collectively, ""ItalianGAAP'') were used to prepare the Pro Forma Consolidated Ñnancial statements (the ""FinancialStatements'') of De' Longhi SpA (""the Company'') as of and for the three year period endedDecember 31, 2000. Italian GAAP diÅers in certain signiÑcant respects from accounting principlesgenerally accepted in the United States of America (""U.S. GAAP''). Certain signiÑcant diÅerencesbetween Italian GAAP and U.S. GAAP relevant to the consolidated Financial Statements are summarizedbelow. This summary should not be considered exhaustive. The diÅerences included here are only itemsthat are applicable to De' Longhi S.p.A. as of and for the three years ended December 31, 2000.
No attempt has been made to identify future diÅerences between Italian GAAP and U.S. GAAP asresulting from prescribed changes in accounting standards. Regulatory bodies that promulgate ItalianGAAP and U.S. GAAP have signiÑcant on-going projects that could aÅect a future comparison such asthis. Finally, no attempt has been made to identify future diÅerences between Italian GAAP andU.S. GAAP that may aÅect the Ñnancial statements due to transactions or events that may occur in thefuture.
The diÅerences identiÑed here are based on discussions with management and their representations tous. The conclusions arrived at here may diÅer from those that would be reached under a full audit usinggenerally accepted auditing standards in the United States of America.
ITALIAN GAAP U.S. GAAP
Pro Forma Ñnancial statements
Under regulations promulagated by CONSOB, Under U.S. GAAP, the primary Ñnancial""pro forma'' Ñnancial statements can be used to statements are historical in nature. Pro formasupplement or replace the primary Ñnancial presentations are limited to the latest auditedstatements as the basis for an investor to make a period and their presentation is limited to factualdecision. There are no explicit guidelines for the information. Under Article 11 of Rule S-X, thepreparation and presentation of these Ñnancial United States Securities and Exchangestatements, instead their preparation is based on Commission (""SEC'') has promulgated certainbest practice and pre-clearance reviews with guidelines as to the types of transactions, andCONSOB. The intent of these Ñnancial statements when, that can be presented in a pro forma.is to reÖect the impact of various transactions,including acquisitions, divestitures, capitalincreases, deferred tax assets etc. as of the Ñrst dayof the period presented.
Push down and carve out basis accounting
The pro forma Ñnancial statements of the In U.S. GAAP, entities that are controlled byCompany are presented on a stand alone basis. another entity and for which stand alone ÑnancialThe Company has a signiÑcant amount of related statements are required must present the relevantparty transactions, including ownership by the assets, costs, revenues and obligations associatedparent company, De' Longhi SoparÑ SA with that entity, even if they are resident in the(""SoparÑ''). None of the operations, costs, assets, Ñnancial statements of a related party or aÇliate.or debt of SoparÑ that are used in or attributable As such, the stand alone Ñnancial statements ofto the Company have been reÖected in the stand the Company would require that any debt, assets,alone Ñnancial statements of the Issuer. revenues, expenses, etc., that may be at the SoparÑ
or other aÇliate level be reÖected in the standalone historical Ñnancial statements.
A-1
Brought to you by Global Reports

ITALIAN GAAP U.S. GAAP
Receivables from shareholders
Under Italian GAAP receivables from shareholders Under U.S. GAAP, receivables from shareholdersfor future callable capital can be presented as a must be presented within shareholders' capital,Ñnancial asset, with an oÅsetting amount in equity. unless they are secured by an irrevocable letter of
credit or other liquid collateral and have a statedmaturity in a short time period.
Minority interest
Under Italian GAAP, minority interest is Under U.S. GAAP, the interest of the minorityconsidered part of the total stockholders' equity, interest in the net book value of subsidiaries isand is therefore considered part of the equity of considered to be a liability, generally reÖected inthe consolidated entity. the ""mezzanine'' section of the balance sheet, after
long term liabilities and before shareholders'equity.
Inventory capitalization
Under Italian GAAP, all direct and certain Under U.S. GAAP, all costs associated with theindirect costs which can reasonably be attributed production process are capitalized into inventory.to the product are capitalized into inventory.
Transactions among companies under common
control
The Company and SoparÑ has performed internal Under U.S. GAAP, acquisitions and disposalstransactions whereby certain assets and businesses among companies under common control result inwere transferred among entities under common a carryover basis (i.e. pre-transaction historicalcontrol. Under Italian GAAP, these transactions cost) being used for the new entities. Any amountsresult in a step-up of the assets to their appraised distributed in excess of the historical cost basis ofvalue under a reorganization plan. the Company would be considered a dividend and
charged to retained earnings.
Deferred income taxes
Prior to 1999, Italian GAAP required the Under U.S. GAAP, deferred tax assets orcomprehensive accounting for diÅerences between liabilities are recognized on diÅerences betweenthe reported carrying amount of assets and the Ñnancial reporting and tax bases of assets andliabilities in the Ñnancial statements and the liabilities at each reporting date. Such deferred taxcorresponding tax basis. However, deferred tax assets and liabilities relate to diÅerences betweenassets and liabilities were recognized only when Italian Ñnancial reporting and tax reportingthere was a reasonable expectation of their reversal methodologies and would also include thosein the foreseeable future. BeneÑts from tax loss temporary diÅerences that arise from any U.S.carry-forwards were recognized only at the time of GAAP adjustments. The beneÑts of tax loss carry-the realization of such beneÑts. Deferred tax forwards are recognized as deferred tax assets, withbalances were adjusted when changes in tax rates an appropriate valuation allowance for the amount.were enacted. Under U.S. GAAP, a net deferred tax asset is
recognized when it is more likely than not,In March 1999, a new accounting principle on generally deÑned as a probability greater than 50%,taxation was introduced in Italy applicable to that the asset will be realized. Deferred taxÑnancial statements with year-end subsequent to balances are adjusted in the period that includesMarch 31, 1999. This standard requires deferred the enactment date.taxes to be recognized on all temporary diÅerencesand on tax losses carried forward. Deferred tax During 1998, the Company recorded the adoptionassets can only be recognized when their of the new Italian accounting principle, whichrecoverability is probable. Deferred tax liabilities resulted in additional income. If U.S. GAAPmay not be recognized if there is little likelihood Ñnancial statements were prepared for years priorthat the liability will materialize. to 1999, this one time adjustment would have to
be adopted as of the date prior to the Ñrst date ofthe earliest income statement presented.
A-2
Brought to you by Global Reports

ITALIAN GAAP U.S. GAAP
Capitalized internal software implementation costs
Under Italian GAAP, the Company has Under U.S. GAAP, costs related to thecapitalized implementation costs for internal use implementation of internal use software must meetsoftware, of which a percentage of these costs were certain criteria to be capitalized, and all businessincurred in relation to business process re- process re-engineering costs should be expensed asengineering. incurred.
Consolidation and investment in subsidiaries
Under Italian GAAP, the consolidated Ñnancial U.S. GAAP states that interest costs should bestatements comprise the accounts of the Company included as a component of the historical cost ofand those manufacturing, commercial and (1) facilities for a company's own use andÑnancing companies in which it controls directly or (2) assets intended for sale or lease that areindirectly the majority of the voting rights at an constructed as separate discrete projects.ordinary meeting or suÇcient votes to be able toexercise a determinant inÖuence at such meeting. Under U.S. GAAP, consolidation is generallyThe subsidiaries whose main business is not required for all majority-owned subsidiariesmanufacturing, commercial or other activities not (investments greater than 50% of the outstandinginstrumental to those of the Company are voting stock), except when control is likely to beaccounted for by using the equity method. temporary or the majority owner does not hold
control.
Purchase method
The Company has accounted for the acquisitions Under U.S. GAAP, the acquirer is required toof the various entities by eliminating the historical perform an assessment of the fair values of thebook value of the acquired companies against the assets acquired and liabilities assumed. The fairinvestment. The diÅerence, known as goodwill, is value assessment includes an analysis of assets,capitalized and depreciated on a straight line basis such as intangibles (patents, trademarks, brands,over the period of its estimated useful life up to a etc.) that are not currently recorded in themaximum of 20 years. Ñnancial statements.
The date to refer in the acquisition of companiesin certain circumstances also may diÅer from thedate required by U.S. GAAP.
Purchased in-process research and developmentcosts would need to be capitalized to the extentthey create an identiÑable intangible asset andthen expensed by the acquirer as of the date ofconsummation of the combination unless there isan alternative future use in research anddevelopment projects or otherwise.
Amortization of goodwill
Under Italian GAAP, goodwill arising on Under U.S. GAAP, goodwill arising from businessacquisition of investments in subsidiaries and acquisition is capitalized and amortized on aequity investments is capitalized and amortized on straight-line basis over the period of its estimateda straight-line basis, over the period of its useful life, generally 10 to 25 years, up to aestimated useful life up to maximum 20 years. maximum of 40 years.
A-3
Brought to you by Global Reports

ITALIAN GAAP U.S. GAAP
Marketable securities
Under Italian GAAP, securities to be held until Under U.S. GAAP, marketable equity and all debtmaturity are classiÑed as Ñnancial Ñxed assets; securities held for investment must be classiÑed,marketable securities are classiÑed as current according to management's intent, into one of theÑnancial assets. following categories:
Securities held as Ñnancial Ñxed assets are ‚ trading;recorded at cost, adjusted on an accrual basis for
‚ available-for-sale; andthe diÅerence between cost and redemption value.
‚ held-to-maturity.Securities held as current assets are recorded atthe lower of purchase cost Ì adjusted by the issue Trading securities (those actively bought and sold)discount on an accruals basis Ì and estimated are reported at fair value with the resultingmarket value. unrealized gain or loss recognized currently in the
statement of income.Securities purchased through ""repurchaseagreements'' are classiÑed as current Ñnancial Available-for-sale securities (debt and equityassets and stated at purchase cost. The diÅerence securities not classiÑed as either trading or held-to-between the spot and forward price is credited or maturity) are reported at fair value with thecharged against income on an accrual basis, the resulting unrealized gain or loss recorded directlycontra-item in the balance sheet being accruals, in a separate component of shareholders' equityprepayments and deferrals. until realized, at which time the gain or loss is
recorded in the statement of income. Held-to-Write-downs on Ñnancial Ñxed assets are written maturity securities (a classiÑcation allowed onlydown to reÖect any other than temporary for debt securities, not equity, except for preferredimpairment in value. stock with required redemption dates, which the
company has the positive intent and ability to holdWrite-downs on Ñnancial current assets to reÖect a to maturity) are carried at amortized cost.decrease in value of the security in line withmarket trends are deducted directly from the The treatment of securities purchased throughcarrying value of the securities. Write-downs repurchase agreements is consistent with ItalianeÅected in prior periods are not maintained if the GAAP.original reasons no longer apply.
Impairments in value, which are permanent, areMarket value is based on the average price during accounted for as realized losses. The cost basis ofthe last month of the year for quoted securities the individual securities is written down to fairlisted on regulated markets; net equity for value as the new cost basis, which is not changedunquoted shares, or estimated realizable value for for subsequent recoveries in fair value.unquoted bonds.
Fair value is the amount at which a ÑnancialTransfers among categories of investments are instrument could be exchanged in a currentrecorded at their book value at the time of transaction between willing parties, other than in atransfer. forced or liquidation sale. If a quoted market price
is available for an instrument, the fair value is theproduct of the number of trading units of theinstrument times its market price at the reportingdate.
Transfers among categories of investments areaccounted for at fair value. For a securitytransferred from the trading category, theunrealized holding gain or loss at the date of thetransfer will already have been recognized inearnings and should not be reversed.
A-4
Brought to you by Global Reports

ITALIAN GAAP U.S. GAAP
Start-up costs
Under Italian GAAP, start-up costs can be Under U.S. GAAP, costs of start-up activities,capitalized as intangible assets and amortized to including organization costs, must be expensed asthe income statement over their useful life, incurred.generally not to exceed Ñve years.
Impairment of long-lived assets
Under Italian GAAP, long-lived assets must be Under U.S. GAAP, long-lived assets and certainwritten down for permanent impairments in value. identiÑable intangibles to be held and used by anA permanent impairment is generally considered to entity are reviewed for impairment when events orexist when the future proÑts expected to be changes in circumstances indicate that the carryinggenerated through the use of the asset are not amount of an asset may not be recoverable. AsuÇcient to cover the future depreciation charges. triggering event would need to occur, such as aProperty, plant and equipment and other assets no history of recurring losses or a change in businesslonger used in operations and held for sale are climate, for an impairment review to take place. InclassiÑed as current assets on the balance sheet performing the review for recoverability, the entityand are valued at the lower of net book value or should estimate the future gross cash Öowsnet realizable value. Should the conditions expected to result from the use of the asset and itsrequiring a write-down of a long-lived asset no eventual disposition. If the sum of the expectedlonger exist at any balance sheet date, the write- future cash Öows (undiscounted and withoutdown should be reversed. interest charges) is less than the carrying amount
of the asset, an impairment loss is recognized.Otherwise, an impairment loss is not recognized.Measurement of an impairment loss for long-livedassets and identiÑable intangibles that an entityexpects to hold and use should be based on thefair value of the asset. Additionally, long-livedassets and certain identiÑable intangibles to bedisposed of are normally accounted for at thelower of the carrying amount or the fair value lesscost to sell.
Revaluation of Ñxed and intangible assets
In accordance with Italian law, the Company has Under U.S. GAAP, revaluation of Ñxed andrevalued certain Ñxed and certain intangible assets. intangible assets is not permitted.The amount of each revaluation increased thevalue of the related Ñxed asset and was credited toreserves in shareholders' equity. Depreciationexpense recorded subsequently in the incomestatement is based on the revalued amount of therelated assets. Gain or loss on disposal of revaluedassets is calculated based on the diÅerencebetween the sale proceeds and the carrying amountof the revalued asset at the date of sale.
A-5
Brought to you by Global Reports

ITALIAN GAAP U.S. GAAP
Revenue recognition
Under Italian GAAP, sales revenues are Under U.S. GAAP, revenue is recognized whenrecognized upon transfer of ownership which four characteristics of a sale are present. Inusually takes place upon shipment of goods. general, (i) persuasive evidence of an arrangement
must exist, (ii) delivery must occur or servicesmust have been rendered, (iii) the seller's pricemust be Ñxed or determinable, and(iv) collectibility must be reasonably assured. Thefour criteria deÑne at what point the earningsprocess is complete and therefore revenue can berecognized. For the Group, risk of loss generallypasses upon delivery, as a result, under U.S.GAAP recognition of revenue would be deferreduntil delivery occurred.
Extraordinary items
Under Italian GAAP, extraordinary items include The deÑnition of extraordinary items underboth items of a recurring and non-recurring nature. U.S. GAAP is more restrictive and only items thatRecurring items reported as extraordinary items are both unusual in nature and infrequent inunder Italian GAAP include gains and losses on occurrence are classiÑed as extraordinary, net ofextraordinary disposal of Ñxed assets and applicable income taxes.investments of a non-recurring nature, adjustmentsof prior year accruals to actual amounts realizedand other matters.
Unrealized foreign exchange gains/(losses)
Under Italian GAAP, receivables and payables Under U.S. GAAP, all receivables/payables stateddenominated in foreign currency were accounted in foreign currency are to be revalued at year endfor at the exchange rate in force at the date of to the applicable year end exchange rate, with alltransaction; unrealized losses resulting from diÅerences to be recorded in the proÑt and loss asadjustment to the period end exchange rate were unrealized foreign exchange gains/(losses).accrued in an exchange rate provision and charged U.S. GAAP may result in unrealized foreignto income. Unrealized currency exchange gains are exchange gains in excess of unrealized losses.recognized only up to the unrealized lossaccounted for in accordance with the previouslystated policy.
A-6
Brought to you by Global Reports

ITALIAN GAAP U.S. GAAP
Derivative instruments
Under Italian GAAP, hedging contracts are Under U.S. GAAP derivative Ñnancial instrumentsaccounted applying a policy consistent with must be designated to a speciÑc asset or liability orevaluation of the assets and liabilities covered. group of similar assets or liabilities in order to beThey are recorded to the statement income over accounted for as a hedge.the duration of the contracts.
Derivative Ñnancial instruments which are enteredNon hedging derivatives are valued comparing the into in order to hedge certain exposures and whichoriginal value of the contract and the contract meet deÑned criteria in order to be classiÑed asvalue at year-end. Any capital losses are charged hedges are accounted for in a manner so as toagainst income; any gains are not recorded, as they oÅset gains and losses from the derivative Ñnancialare not realized. instruments against the gains and losses on the
transaction or commitment being hedged.Premiums collected or paid through the purchaseand sale of put and call operations of portfolio Derivative Ñnancial instruments that are enteredshares are recorded as other asset/liabilities until into for speculative or trading purposes, or whichthey expire or exercised. Commencing from 1999, do not meet the strict criteria for hedgeif the option is exercised, the premium collected or accounting, are recorded at fair value with allpaid represent an additional component of the unrealized gains and losses recognized in income.purchase or selling value of the underlyinginstruments. If the option is not exercised the Premiums received/paid for options are generallypremium is recorded to the statement of income as recorded at fair value, except that for purchasedÑnancial income or Ñnancial charges. In prior options meeting the hedging criteria, the timeyears, the premium collected or paid was generally value of the premium paid is generally amortizedamortized over the life of the option while the over the life of the option while the intrinsicintrinsic element is recorded as part of the basis of element is recorded as part of the basis of thethe hedged exposure. hedged exposure.
U.S. GAAP requires detailed disclosure ofderivative contracts used by the Group for tradingand other than trading purposes. Disclosuresinclude, but are not limited to, fair value, averagefair value, notional amount of contractsoutstanding, maturity of instruments and theaccounting treatment of each.
Other signiÑcant diÅerences
Selected presentation and disclosure diÅerences
There are a number of signiÑcant presentation and disclosure diÅerences between Italian GAAP andU.S. GAAP. Some of the more signiÑcant presentation and disclosure diÅerences are summarized below:
Format of the balance sheet
Under Italian GAAP, certain items shown as current assets have a maturity period exceeding oneyear while the current portion of long term receivables is shown under long term assets. In addition, noseparate total of current and long term liabilities are provided in the balance sheet under Italian GAAP.However, disclosures regarding the current and long-term portions of assets and liabilities are required.U.S. GAAP requires a classiÑcation of assets between current and long-term portions, generally with assetslisted in order of liquidity and debts in order of their term.
The Italian balance sheet also treats cash and debt on a net basis, and presents intangible andtangible Ñxed assets Ñrst. A reformatted balance sheet on the U.S. basis will generally appear verydiÅerent.
Format of the income statement
The income statement, under Italian GAAP, is presented by nature of expense (e.g., salaries andwages, etc) rather than by function (e.g., cost of sales). Certain capitalized expenses or government grants
A-7
Brought to you by Global Reports

oÅsetting operating expenses are presented on a gross basis. The income statement under U.S. GAAP isorganized on a functional basis. Expenses are generally shown net of amounts capitalized or reimbursed.
Format of the cash Öow statement
The statement of changes in Ñnancial position is not required by Italian GAAP, but its preparation isrecommended. U.S. GAAP requires the presentation of a cash Öow statement and the preparation diÅerssigniÑcantly from Italian practices. Such diÅerences include the deÑnition of ""cash and cash equivalents'',the presentation of certain line items (e.g., acquisitions) and the prescribed presentation of cash generatedor used in operating, investing and Ñnancing activities.
Disclosure diÅerences
Disclosures in Ñnancial statements are generally more extensive under U.S. GAAP than under ItalianGAAP. Disclosures required under U.S. GAAP, which are not typically found, or required to the sameextent, under Italian GAAP include but are not limited to:
‚ The consolidated Ñnancial statements under Italian GAAP are presented as supplementaryÑnancial statements to the statutory accounts. The consolidated Ñnancial statements under USGAAP are presented as the primary rather than the supplementary Ñnancial statements;
‚ A description of cash and cash equivalents;
‚ Concentrations of credit risk;
‚ Details of Ñnancial instruments including;
‚ Market values;
‚ Nature of instruments and terms including credit and market risk, cash requirements, informationregarding Ñnancial instruments used as hedges of Ñrm commitments, amount of loss, if any partyof the Ñnancial instrument fails to perform and policy regarding collateral requirements;
‚ Financing facilities and terms including the description of the debt instrument, due dates, interestrates, whether the debt is secured or unsecured, and repayments due for the subsequent Ñve years;
‚ Description of leasing commitments including minimum lease payments for the Ñve subsequentyears;
‚ The amount of asset valuation allowances on taxes, inventories and investments;
‚ Reconciliation from the statutory tax rate to the eÅective tax rate and information regarding netoperating loss carry-forwards and their dates of expiration;
‚ Earnings per share information (for public companies only);
‚ Reporting of the components and accumulated balances of comprehensive income, which aÅectsthe presentation of the primary Ñnancial statements as well as footnote disclosures;
‚ Non-cash transactions referenced to the statement of cash Öows and interest and income taxespaid during each year;
‚ U.S. GAAP segment data presentation is based on how management operates the company, and ismeant to allow investors to analyze the Ñnancial results as senior management does;
‚ ClassiÑcation of leasehold improvements;
‚ Advance payments on purchases of inventories/Ñxed assets classiÑed within the related assetaccount;
‚ Discussion of use of estimates; and
‚ Post retirement beneÑts.
A-8
Brought to you by Global Reports

Annex B
SUMMARY OF SIGNIFICANT DIFFERENCES BETWEEN ITALIANAND U.K. GAAP WITH RESPECT TO KENWOOD APPLIANCES PLC
UNAUDITED RESTATED CONSOLIDATED FINANCIAL INFORMATION
The Unaudited Restated Consolidated Financial Information of Kenwood Appliances plc and itssubsidiaries presented in this oÅering memorandum have been prepared and presented in conformity withItalian GAAP (as deÑned earlier in this oÅering memorandum). The signiÑcant diÅerences between U.K.GAAP and Italian GAAP with respect to Kenwood Appliances plc Unaudited Restated ConsolidatedFinancial Statements are discussed below. This summary should not be taken as exhaustive of alldiÅerences between U.K. GAAP and Italian GAAP. In particular, no attempt has been made to identifyall disclosure, presentation or classiÑcation diÅerences that would aÅect the manner in which transactionsor events are presented in the Ñnancial statements or notes thereto.
U.K. GAAP ITALIAN GAAP
Business combinations
The preferred treatment of positive goodwill arising Goodwill arising from acquisitions is capitalizedon business combinations for periods ending prior and amortized on a straight-line basis, over theto December 23, 1998 is to write oÅ to reserves. period of its estimated useful life, generally 5 to
10 years up to a maximum of 20 years ifThe goodwill remains written oÅ against reserves considered appropriate.until such time as the related business is disposedof (when the goodwill should be taken intoaccount in computing the gain or loss on disposalof the business).
For periods ending on or after December 23, 1998goodwill is required to be capitalized and shown asan intangible asset on the balance sheet. Thegoodwill is required to be amortized over itsestimated useful economic life, usually to amaximum of 20 years. The amortization chargeshould be recognized in the income statement.
The goodwill is reviewed for impairment at theend of the Ñrst full Ñnancial year following theacquisition and in other periods if events orchanges in circumstances indicate that the carryingvalue may not be recoverable.
Deferred Taxation Deferred income taxes
Deferred taxation is provided using the liability Prior to 1999, Italian GAAP required themethod on all timing diÅerences to the extent they comprehensive accounting for diÅerences betweenare expected to reverse in the future without being the reported carrying amount of assets andreplaced, calculated at the rate at which it is liabilities in the Ñnancial statements and theanticipated the timing diÅerences will reverse. A corresponding tax basis. However, deferred taxdeferred tax asset can only be carried forward assets and liabilities were recognized only whenwhere its recovery without replacement by there was a reasonable expectation of their reversalequivalent asset balances is assured beyond in the foreseeable future. BeneÑts from tax lossreasonable doubt. carry-forwards were recognized only at the time of
the realization of such beneÑts. Deferred taxbalances were adjusted when changes in tax rateswere enacted.
In March 1999, a new accounting principle ontaxation was introduced in Italy applicable toÑnancial statements with year-ends subsequent toMarch 31, 1999. This standard requires deferredtaxes to be recognized on all temporary diÅerences
B-1
Brought to you by Global Reports

U.K. GAAP ITALIAN GAAPand on tax losses carried forward. Deferred taxassets can only be recognized when theirrecoverability is probable. Deferred tax liabilitiesmay not be recognized if there is little likelihoodthat the liability will materialize.
Employee Share Ownership Plan (ESOP)
The ESOP is a trust funded by an external loan, Italian GAAP does not have any speciÑc guidanceguaranteed by Kenwood, which was used to on accounting for ESOPs. The shares held by theacquire shares in the company that could be issued ESOP and any diminution in their carrying valueon favorable terms or free to employees under a are not recognized under the Italian GAAPproÑt sharing scheme. presentation.
U.K. GAAP requires that the company accountsfor the transactions of its ESOP trust as if it hadconducted them itself; the trust is merely portrayedas an extension of the company. The followingrules apply:
‚ the shares are classiÑed as Ñxed assets,carried at their acquisition cost less anypermanent diminution in value;
‚ the cost of a write down in the carryingvalue is treated as a non-operatingexceptional charge in the proÑt and lossaccount; and
‚ Ñnance costs and any administrativeexpenses are charged as they accrue.
Discontinued operation
Under U.K. GAAP, the results of operations of a Under Italian GAAP there is no requirement toreporting entity that are sold or terminated and separately identify results of operations of thesatisfy all of the following conditions must be reporting entity that, have been or are imminentlyclassiÑed as discontinuing and shown separately due to be sold or terminated, on the incomefrom those of continuing operations in the income statement.statement:
‚ the sale or termination is completed eitherin the period or before the earlier of threemonths after the commencement of thesubsequent period and the date on whichthe Ñnancial statements are approved;
‚ if a termination, the former activities haveceased permanently,
‚ the sale or termination has a materialeÅect on the nature and focus of thereporting entity's operations and representsa material reduction in its operatingfacilities either from its withdrawal from aparticular market (whether class ofbusiness or geographical) or from amaterial reduction in turnover in thereporting entity's continuing markets;
‚ the assets, liabilities, results of operationsand activities are clearly distinguishable,physically, operationally and for Ñnancialreporting purposes.
B-2
Brought to you by Global Reports

U.K. GAAP ITALIAN GAAPDiscount ClassiÑcation
Early settlement discounts and retrospective Under Italian GAAP presentation retrospectiverebates are classiÑed as distribution costs in the rebates are netted oÅ against revenue. EarlyKenwood Group Financial Statements. settlement discounts are treated as a cost of
Ñnance and included with Ñnancial expense.
Exceptional Items
ClassiÑcation of items as non-operating exceptional Italian GAAP criteria for the classiÑcation ofexpenditure is restricted under U.K. GAAP to the certain items as extraordinary are generally lessfollowing: restrictive. Items classiÑed as exceptional, both
operating and non-operating under U.K. GAAP‚ proÑts or losses on the sale or termination
are classiÑed as extraordinary items under theof an operation;
Italian GAAP presentation.‚ costs of a fundamental reorganization or
restructuring having a material eÅect onthe nature and focus of the reportingentity's operations; and
‚ proÑts or losses on the disposal of Ñxedassets.
Other material items arising from the ordinaryactivities of Kenwood but which individually byvirtue of their size, require separate disclosure, arehighlighted as operating exceptional charges on theface of the income statements.
B-3
Brought to you by Global Reports

[THIS PAGE INTENTIONALLY LEFT BLANK]
Brought to you by Global Reports

Annex C
EXPLANATORY NOTE OF AGGREGATIONS IN THE OFFERING MEMORANDUMOF THE KENWOOD CONSOLIDATED FINANCIAL STATEMENTS
U.K. GAAP ITALIAN GAAP
CONSOLIDATED BALANCE SHEET
Tangible Ñxed assets Tangible AssetsInvestments in own shares Not Recognized
Stocks InventoryReserve for risks and other charges
Debtors ReceivablesOther current assets
Cash at bank and in hand Cash and cash equivalentsBorrowings Short term debt
Trade and other creditors due within 1 year PayablesOther current liabilitiesReserve for staÅ severance indemnities
Creditors: amounts falling due after Long term debtmore than 1 yearProvision for liabilities and charges Reserve for risks and other chargesCalled up share capital Share capitalShare premium Other reservesSpecial reserve Other reservesProÑt and loss account Other reserves
CONSOLIDATED INCOME STATEMENTS
Sales from continuing operations Net salesSales from discontinuing operations Net sales
Cost of sales Materials, consumables and goodsServices, rents, leases and related costsWages, salaries and beneÑtProvisions and write oÅsDepreciation and amortization
Distribution costs Net salesServices, rents, leases and related costsWages, salaries and beneÑtDepreciation and amortizationNet Ñnancial gain (loss)
Administrative expenses Services, rents, leases and related costsWages, salaries and beneÑtDepreciation and amortization
Other operating expenditure Services, rents, leases and related costs
Exceptional items Ì fundamental reorganization Extraordinary expensesExceptional items Ì loss on sale of operation Extraordinary expenses
Bank interest receivable Net Ñnancial gain (loss)Interest payable Net Ñnancial gain (loss)
Tax on ordinary activities Income taxes
C-1
Brought to you by Global Reports

REGISTERED AND HEAD OFFICE OF THE COMPANY
De' Longhi S.p.A.Via L. Seitz, 4731100 Treviso
Italy
JOINT GLOBAL COORDINATORS
Merrill Lynch International UniCredit Banca Mobiliare S.p.A.Ropemaker Place Via Tommaso Grossi, 10
25 Ropemaker Street 20122 MilanLondon EC2Y 9LY Italy
England
LEGAL ADVISERS TO THE COMPANY
As to Italian law: As to tax matters under Italian law:Bonelli Erede Pappalardo Studio Legale Studio Legale e Tributario Biscozzi Nobili
Via Barozzi 1 Via Cino del Duca, 820122 Milan 20122 Milan
Italy Italy
As to United States and English law:Latham & Watkins
99 BishopsgateLondon EC2M 3XF
England
LEGAL ADVISERS TO THE INSTITUTIONAL MANAGERS
As to Italian law: As to United States and English law:Grimaldi CliÅord Chance CliÅord Chance Limited Liability Partnership
Via Clerici, 7 200 Aldersgate Street20121 Milan London EC1A 4HD
Italy England
INDEPENDENT AUDITORS
PricewaterhouseCoopers S.p.A.Piazza Crispi, 831100 Treviso
Italy
O
U44218
Brought to you by Global Reports