Vontobel Fund - Morningstar Document Library
335
Vontobel Fund Vontobel Asset Management Société d'Investissement à Capital Variable Unaudited semi-annual report as at February 28, 2019 R.C.S. Luxembourg No. B38170
-
Upload
khangminh22 -
Category
Documents
-
view
0 -
download
0
Transcript of Vontobel Fund - Morningstar Document Library

Vontobel FundVontobel Asset Management
Société d'Investissement à Capital Variable
Unaudited semi-annual reportas at February 28, 2019
R.C.S. Luxembourg No. B38170

2
The following Sub-Funds are available to investors in the Federal Republic of Germany:
Vontobel Fund - Swiss Money
Vontobel Fund - Euro Short Term Bond
Vontobel Fund - US Dollar Money
Vontobel Fund - Swiss Franc Bond
Vontobel Fund - Euro Bond
Vontobel Fund - EUR Corporate Bond Mid Yield
Vontobel Fund - High Yield Bond
Vontobel Fund - Bond Global Aggregate
Vontobel Fund - Eastern European Bond
Vontobel Fund - Value Bond
Vontobel Fund - Absolute Return Bond (EUR)
Vontobel Fund - Absolute Return Bond Dynamic
Vontobel Fund - Global Convertible Bond
Vontobel Fund - Sustainable Emerging Markets Local Currency Bond
Vontobel Fund - Swiss Mid and Small Cap Equity
Vontobel Fund - European Mid and Small Cap Equity
Vontobel Fund - Japanese Equity
Vontobel Fund - mtx China Leaders
Vontobel Fund - European Equity
Vontobel Fund - US Equity
Vontobel Fund - Global Equity
Vontobel Fund - Global Equity Income
Vontobel Fund - Emerging Markets Equity
Vontobel Fund - Asia Pacific Equity
Vontobel Fund - New Power
Vontobel Fund - Clean Technology
Vontobel Fund - Future Resources
Vontobel Fund - mtx Sustainable Asian Leaders (ex Japan)
Vontobel Fund - mtx Sustainable Emerging Markets Leaders
Vontobel Fund - mtx Sustainable Global Leaders
Vontobel Fund - Commodity
Vontobel Fund - Dynamic Commodity
Vontobel Fund - Non-Food Commodity
Vontobel Fund - Emerging Markets Debt
Vontobel Fund - Global Bond
Vontobel Fund - Global Corporate Bond Mid Yield
Vontobel Fund - Emerging Markets Corporate Bond
Vontobel Fund - TwentyFour Absolute Return Credit Fund
Vontobel Fund - TwentyFour Strategic Income Fund
Vontobel Fund - LCR Global Bond
Vontobel Fund - Multi Asset Income
Vontobel Fund - TwentyFour Monument European Asset Backed Securities
Vontobel Fund - Multi Asset Defensive
Vontobel Fund - Vescore Artificial Intelligence Multi Asset
Vontobel Fund - Vescore Global Equity Multi Factor
Vontobel Fund - Alternative Risk Premia
Vontobel Fund - Emerging Markets Blend
Investors are informed that
Vontobel Fund - Absolute Return Credit Fund (from 13 November 2018: Vontobel Fund – Credit Opportunities)
Vontobel Fund - Multi Asset Solution
Vontobel Fund - Emerging Markets Debt Defensive
Vontobel Fund - Multi Asset Alphabet
Vontobel Fund - Future Mobility
Vontobel Fund - Commodity Alpha
Vontobel Fund - Tail Risk Optima
Vontobel Fund - Global Equity X
no notice has been filed for the Sub-Funds pursuant to section 310 of the German Investment Code (KAGB).
Therefore, shares in these Sub-Funds may not be sold to the public in the Federal Republic of Germany.

3
Unaudited semi-annual report as at February 28, 2019 This document does not constitute an offer to purchase or subscribe to shares. Subscription to shares of the
Sub-Funds of Vontobel Fund, a Luxembourg SICAV, should always be undertaken only on the basis of the
prospectus, the Key Investor Information Document (KIID), the Articles of Association, and the annual and semi-
annual reports (plus, in the case of Italy, the Modulo di Sottoscrizione). We also recommend that you contact your
relationship manager or other advisors prior to each investment. An investment in Sub-Funds of Vontobel Fund
involves risks, which are explained in the prospectus. All the above-mentioned documents and a list of the
changes in the portfolio during the financial year and the composition of the benchmarks are available free of
charge from Vontobel Fonds Services AG, Gotthardstrasse 43, CH-8022 Zurich (the representative in
Switzerland); Bank Vontobel AG, Gotthardstrasse 43, CH-8022 Zurich (the paying agent in Switzerland); Erste
Bank der oesterreichischen Sparkassen AG, Am Belvedere 1, A-1100 Vienna (the paying agent in Austria); B.
Metzler seel. Sohn & Co. KGaA, Untermainanlage 1, D-60329 Frankfurt am Main (the paying agent in Germany);
the authorised distributors, at the registered office of the Fund, 11-13, Boulevard de la Foire, L-1528
Luxembourg, or at www.vontobel.com/AM. The shareholders agree that Vontobel Fonds Services AG, Zurich, may consult entries in the register of shareholders in order to offer services to shareholders.

Vontobel Fund
4
Société d'Investissement à Capital Variable (SICAV), R.C.S. Luxembourg No. B38170
Organisation 6
Combined Umbrella Fund 9
Vontobel Fund - Swiss Money 11
Vontobel Fund - Euro Short Term Bond 17
Vontobel Fund - US Dollar Money 23
Vontobel Fund - Swiss Franc Bond 28
Vontobel Fund - Euro Bond 35
Vontobel Fund - EUR Corporate Bond Mid Yield 38
Vontobel Fund - High Yield Bond 46
Vontobel Fund - Bond Global Aggregate 51
Vontobel Fund - Eastern European Bond 57
Vontobel Fund - Value Bond 60
Vontobel Fund - Absolute Return Bond (EUR) 65
Vontobel Fund - Absolute Return Bond Dynamic 70
Vontobel Fund - Global Convertible Bond 75
Vontobel Fund - Sustainable Emerging Markets Local Currency Bond 80
Vontobel Fund - Swiss Mid and Small Cap Equity 85
Vontobel Fund - European Mid and Small Cap Equity 87
Vontobel Fund - Japanese Equity 89
Vontobel Fund - mtx China Leaders 91
Vontobel Fund - European Equity 93
Vontobel Fund - US Equity 96
Vontobel Fund - Global Equity 99
Vontobel Fund - Global Equity Income 103
Vontobel Fund - Emerging Markets Equity 106
Vontobel Fund - Asia Pacific Equity 110
Vontobel Fund - New Power 114
Vontobel Fund - Clean Technology 117
Vontobel Fund - Future Resources 120
Vontobel Fund - mtx Sustainable Asian Leaders (ex Japan) 123
Vontobel Fund - mtx Sustainable Emerging Markets Leaders 127
Vontobel Fund - mtx Sustainable Global Leaders 131
Vontobel Fund - Commodity 134
Vontobel Fund - Dynamic Commodity 138
Vontobel Fund - Non-Food Commodity 141
Vontobel Fund - Emerging Markets Debt 144
Vontobel Fund - Global Bond 154

Vontobel Fund
5
Vontobel Fund - Credit Opportunities 158
Vontobel Fund - Global Corporate Bond Mid Yield 163
Vontobel Fund - Emerging Markets Blend 170
Vontobel Fund - Emerging Markets Corporate Bond 177
Vontobel Fund - TwentyFour Absolute Return Credit Fund 183
Vontobel Fund - TwentyFour Strategic Income Fund 188
Vontobel Fund - LCR Global Bond 195
Vontobel Fund - Multi Asset Solution 197
Vontobel Fund - Multi Asset Income 200
Vontobel Fund - TwentyFour Monument European Asset Backed Securities 205
Vontobel Fund - Multi Asset Defensive 210
Vontobel Fund - Multi Asset Alphabet 216
Vontobel Fund - Vescore Artificial Intelligence Multi Asset 219
Vontobel Fund - Vescore Global Equity Multi Factor 221
Vontobel Fund - Alternative Risk Premia 231
Shares Summary 233
Net Asset Value Summary 244
Notes to the Financial Statements 254
General information 328

Organisation
6
Registered office of the Fund Vontobel Fund 11-13, Boulevard de la Foire L-1528 Luxembourg Tel. +352 2605 9950, Fax +352 2460 9913
Board of Directors
Chairman of the Board of Directors
Dominic Gaillard
Members of the Board of Directors
Philippe Hoss
Dorothee Wetzel
Bank Vontobel AG, Zurich
Elvinger Hoss Prussen, public limited company, Luxembourg
Vontobel Asset Management S.A., Zurich
Management company Vontobel Asset Management S.A.
2-4, rue Jean l’Aveugle
L-1148 Luxembourg
Custodian, Administrator, Transfer Agent,
Registar and Domiciliary Agent and
Listing Agent
RBC Investor Services Bank S.A.
14, Porte de France
L-4360 Esch-sur-Alzette
Tel. +352 2605-1, Fax +352 2460 9500
Investment managers Vontobel Asset Management AG
Gotthardstrasse 43
CH-8022 Zurich, Switzerland
Vontobel Asset Management Inc.
1540 Broadway, 38th Floor
New York, NY 10036, USA
TwentyFour Asset Management LLP
8th Floor
The Monument Building
11 Monument Street
London EC3R 8AF, Great Britain
Sumitomo Mitsui Asset Management Company Ltd.
since April 1, 2019:
Sumitomo Mitsui DS Asset Management Company, Limited.
Atago Green Hills MORI Tower 28F, 2-5-1 Atago,
Minato-ku, Tokyo, JP-105-6228, Japan
Vontobel Asset Management S.A.
Milan branch
Piazza degli Affari 2
I-20123 Milan, Italy
Vontobel Asset Management S.A.
Munich branch
Leopoldstrasse 8-10
D-80802 Munich, Germany
Euronova Asset Management UK LLP
7-9 North St. David Street
Edinburgh
Midlothian EH2 1AW, Great Britain
Sub-investment managers Vontobel Asset Management AG
Gotthardstrasse 43
CH-8022 Zürich, Switzerland
Legal advisor in Luxembourg Elvinger Hoss Prussen, public limited company
2, Place Winston Churchill, B.P. 425
L-2014 Luxembourg

Organisation
7
Réviseur d’entreprises agréé Ernst & Young S.A.
35E Avenue John F. Kennedy
L-1855 Luxembourg
Representative for Switzerland Vontobel Fonds Services AG
Gotthardstrasse 43
CH-8022 Zurich
Tel. +41 58 283 74 77, Fax +41 58 283 53 05
Paying agent in Switzerland Bank Vontobel AG
Gotthardstrasse 43
CH-8022 Zurich
Tel. +41 58 283 71 11, Fax +41 58 283 76 50
Paying and information agent in Germany B. Metzler seel. Sohn & Co. KGaA
Untermainanlage 1
D-60329 Frankfurt am Main
Tel. +49 69 210 40, Fax +49 69 281 429
Paying agent in Austria Erste Bank der oesterreichischen Sparkassen AG
Am Belvedere 1
A-1100 Vienna
Tel. +43 50 100 12 139, Fax +43 50 100 912 139
Paying agents in Italy Raiffeisen Landesbank Südtirol AG
Via Laurin, 1
I-39100 Bolzano
State Street Bank International GmbH – Succursale Italia
Via Ferrante Aporti, 10
I-20125 Milan
BNP Paribas Securities Services
Milan branch
Piazza Lina Bo Bardi 3
I-20124 Milan
Société Générale Securities Services S.p.A.
Via Benigno Crespi, 19/A
I-20159 Milan
Banca Sella Holding S.p.A.
Piazza Gaudenzio Sella, 1
I-13900 Biella
CACEIS Bank, Italy Branch
Milan branch
Piazza Cavour 2
I-20121 Milan
Allfunds Bank S.A.U.
Milan branch
Via Bocchetto 6
I-20123 Milan
Iccrea Banca S.p.A. – Istituto Centrale del Credito Cooperativo
Via Lucrezia Romana 41/47
I-00178 Rome

Organisation
8
Paying agent in Liechtenstein Liechtensteinische Landesbank AG
Städtle 44
FL-9490 Vaduz
Paying agent in Sweden Skandinaviska Enskilda Banken AB (publ)
Investor Services
ST - M1
SE-106 40 Stockholm
Tel. +46 8 763 5168
Financial and central agent in France BNP Paribas Securities Services S.A.
3, Rue d’Antin
F-75002 Paris
Facilities agent for Great Britain Carne Financial Services (UK) LLP
since April 8, 2019:
Suites 1.15 - 1.16
1st Floor
5 Old Bailey
London EC4M 7BA
Facilities Agent for Ireland Carne Global Financial Services Limited
2nd Floor Block E Iveagh Court
Harcourt Road
Dublin 2

9
The accompanying notes form an essential part of these financial statements.CHF
Combined Umbrella Fund
Cost
Assets(2)
Investments in securities at market value 27,514,808,928
985,646,617Cash at banks
13,241,685Receivable from foreign currencies
80,914,358Receivable from subscriptions
(2) 212,231,097Interest and dividends receivable
81,084,890Receivable for investments sold
407,382,640Receivable for forward foreign exchange contracts
594,074Interest receivable on Contracts for Difference
(9) 48,120,671Unrealised gain on forward foreign exchange contracts
(9) 460,405Unrealised gain on futures
(9) 2,058,435Unrealised gain on Contracts for Difference
(9) 935,883Options contracts at market value
(9) 7,668,259Options at cost of purchase
64,874,967Other assetsTotal Assets 29,420,022,909
Combined Statement of NetAssetsas at February 28, 2019
26,143,511,564
Liabilities90,550,726Bank overdraft
6,174Provision for expenses
57,060,004Payable for redemptions
99,466,505Payable for investments purchased
410,341,180Payable on forward foreign exchange contracts
13,236,264Payable on foreign currencies
324,923Interest and dividends payable
(9) 329,258Payable on swaps
(9) 13,581,317Unrealised loss on forward foreign exchange contracts
60Payable interest on Contracts for Difference
(9) 22,851,977Unrealised loss on futures
(9) 2,677,839Unrealised loss on swaps
(9) 3,495,838Unrealised loss on options
(9) 7,365Unrealised loss on Contracts for Difference
573,019Audit fees, printing and publishing expenses
(5) 5,060,441Service Fee payable
(4) 1,038,115Subscription tax payable
(3) 16,756,469Management Fee payable
(3) 3,176,242Performance Fee payable
(9) 657,225Options at cost of purchase
40,232,833Other liabilitiesTotal Liabilities 781,423,774Total net assets at the end of the period 28,638,599,135
Notes

10
The accompanying notes form an essential part of these financial statements.CHF
Combined Umbrella Fund
Net assets at the beginning of the reporting period 26,503,806,581
Revaluation of opening combined Net Asset Value 739,736,637
Net investment income/loss 201,331,780
Change in unrealised appreciation/depreciation on:
Investments 64,997,619
Futures -13,092,726
Forward foreign exchange contracts 24,783,526
Swaps 2,802,182
Contracts for Difference -3,986,680
Options 1,723,875
Net realised gain/loss on investments -180,731,402(2)
Net realised gain/loss on forward foreign exchange contracts -231,150,573(2)
Net realised gain/loss on currency exchange 55,680,249(2)
Net realised gain/loss on futures 11,442,921(2)
Net realised gain/loss on swaps -2,443,678(2)
Net realised gain/loss on Contracts for Difference -38,954,902(2)
Net realised gain/loss on options 11,512,812(2)
Increase/Decrease in net assets resulting from operations -96,084,997Subscriptions of shares 7,648,649,784
Redemptions of shares -6,086,364,280
Dividend distribution -71,144,590(11)
Net assets at the end of the period 28,638,599,135
Combined Statement ofOperations and Changes in NetAssetsfrom September 1, 2018 to February 28, 2019
Bank interest 5,254,395
Income
Net interest on bonds 267,279,613(2)
Interest on Contracts for Difference 35,511(2)
Interest on swaps 323,958(2)
Net dividends 78,141,991
Other income 525,061Total Income 351,560,529
Combined Statement of NetIncomefrom September 1, 2018 to February 28, 2019
Management Fees 103,767,671(3)
Expenses
Performance Fee 3,219,394(3)
Administration fee 111,544
Audit fees, printing and publishing expenses 1,259,664
Subscription tax 3,016,303(4)
Bank interest 1,132,522
Interest on swaps 1,391,777(2)
Net interest on Contracts for Difference 60(2)
Service Fees 31,352,063(5)
Capital gains tax 1,457,110
Other Fees payable 3,520,641(8)
Total Expenses 150,228,749Net investment income/loss 201,331,780
Notes

11
Vontobel Fund - Swiss Money
AssetsInvestments in securities at market value 124,873,894(2)
7,917,013Cash at banks
44Receivable from foreign currencies
548,249Receivable from subscriptions
645,971Interest and dividends receivable(2)
9,359Unrealised gain on futures(9)
Total Assets 133,994,530
125,983,237Statement of Net Assetsas at February 28, 2019
LiabilitiesBank overdraft 9,359
Payable for redemptions 774,633
Payable on foreign currencies 44
Unrealised loss on forward foreign exchange contracts 188,435(9)
Audit fees, printing and publishing expenses 1,551
Service Fee payable 12,982(5)
Subscription tax payable 2,130(4)
Management Fee payable 15,067(3)
Other liabilities 1,560Total Liabilities 1,005,761Total net assets at the end of the period 132,988,769Net assets at the beginning of the reporting period 128,154,992
Net investment income 400,818
Change in unrealised appreciation/depreciation on:
Investments 530,490
Futures 11,724
Forward foreign exchange contracts -400,827
Net realised gain/loss on investments -965,849(2)
Net realised gain/loss on forward foreign exchange contracts 25,676(2)
Net realised gain/loss on currency exchange 130,278(2)
Net realised gain/loss on futures -14,426(2)
Increase/Decrease in net assets resulting from operations -282,116Subscriptions of shares 52,883,570
Redemptions of shares -47,511,591
Dividend distribution -256,086(11)
Total net assets at the end of the period 132,988,769
Statement of Operations andChanges in Net Assetsfrom September 1, 2018to February 28, 2019
Notes CHFThe accompanying notes form an essential part of these financial statements.
Cost

12
Vontobel Fund - Swiss Money
IncomeBank interest 7,465
Net interest on bonds 701,338(2)
Total Income 708,803ExpensesManagement Fees 100,339(3)
Audit fees, printing and publishing expenses 14,192
Subscription tax 6,944(4)
Bank interest 74,040
Service Fees 86,717(5)
Other Fees payable 25,753(8)
Total Expenses 307,985Net investment income 400,818
Statement of Net Incomefrom September 1, 2018to February 28, 2019
Notes CHFThe accompanying notes form an essential part of these financial statements.

13
Vontobel Fund - Swiss Money
The accompanying notes form an essential part of these financial statements.
Portfolio as at February 28, 2019
* Any deviations of the percentages of the nets assets are due to rounding.
Securities Marketvalue in
CHF
% of netassets*
Quantity Ccy Maturity
2,600,000 2,605,460 1.9618.04.19AusNet ServicesHoldings Pty Ltd 12EMTN
CHF 1.125%
Transferable securities admitted to an official exchangeBondsAustralia
1,315,000 1,316,052 0.9925.03.19Bendigo &Adelaide Bank Ltd14 EMTN
CHF 1.125%
1,750,000 1,779,575 1.3417.04.20National AustraliaBank Ltd 13 EMTN
CHF 1.000%
4.295,701,087Total - Australia
400,000 410,800 0.3113.08.20Corp Andina deFomento 13 EMTN
CHF 1.500%Venezuela, Bolivarian Republic Of
0.31410,800Total - Venezuela, Bolivarian Republic Of
2,225,000 2,259,265 1.7003.12.19Banco de Chile 13CHF 1.500%Chile
100,000 100,080 0.0821.03.19Banco de Chile 14CHF 1.250%1,300,000 1,306,760 0.9826.06.19Banco de Credito e
Inversiones SA 14CHF 1.125%
2,000,000 2,026,000 1.5226.09.19Banco SantanderChile 13
CHF 1.750%
4.285,692,105Total - Chile
2,325,000 2,392,425 1.8003.06.20Deutsche BahnFinance GMBH 10EMTN
CHF 1.750%Germany
620,000 614,420 0.4605.07.21Deutsche Bank AG16 EMTN
CHF 0.750%
600,000 681,856 0.5101.04.20SAP SE 15 FRNEMTN
EUR 0,000%
800,000 798,554 0.6010.05.19Deutsche Bank AG16 FRN
USD 2.944%
3.374,487,255Total - Germany
450,000 463,050 0.3514.07.21OP Corporate Bankplc 14 EMTN
CHF 1.000%Finland
1,200,000 1,362,677 1.0208.03.21SaastopankkienKeskuspankkiSuomi Oyj 18 FRNEMTN
EUR 0.181%
2,000,000 1,992,879 1.5026.10.20MunicipalityFinance PLC 18FRN
USD 2.775%
2.873,818,606Total - Finland
365,000 371,570 0.2822.05.20Banque Federativedu Credit MutuelSA 14 EMTN
CHF 1.125%France
1,650,000 1,674,255 1.2612.08.19Caisse Francaisede FinancementLocal 09
CHF 2.625%
3,000,000 3,069,000 2.3109.10.20Engie SA 12 EMTNCHF 1.125%2,400,000 2,453,280 1.8406.11.19Regie Autonome
des TransportsParisiens 06 EMTN
CHF 2.625%
Securities Marketvalue in
CHF
% of netassets*
Quantity Ccy Maturity
1,000,000 1,094,931 0.8212.01.23RCI Banque SA 18FRN EMTN
EUR 0.101%
6.518,663,036Total - France
100,000 101,570 0.0816.12.19Central AmericanBank for EconomicIntegration 13EMTN
CHF 1.500%Honduras
0.08101,570Total - Honduras
200,000 200,900 0.1528.05.19China ConstructionBank Asia Corp Ltd14 EMTN
CHF 1.375%Hong Kong
0.15200,900Total - Hong Kong
750,000 850,882 0.6415.10.19Italy BuoniPoliennali DelTesoro 16
EUR 0.050%Italy
0.64850,882Total - Italy
600,000 598,210 0.4525.07.22Mitsubishi UFJFinancial Group Inc17 FRN
USD 2.104%Japan
0.45598,210Total - Japan
650,000 649,674 0.4912.12.19Bank of Montreal16 FRN
USD 1.551%Canada
0.49649,674Total - Canada
700,000 704,900 0.5320.06.19Kazakhstan TemirZholy National CoJSC 14
CHF 2.590%Kazakhstan
0.53704,900Total - Kazakhstan
1,860,000 1,875,624 1.4102.07.19LGT Bank AG 12CHF 2.000%Liechtenstein
1.411,875,624Total - Liechtenstein
350,000 364,560 0.2710.07.20EuropeanInvestment Bank 05
CHF 2.375%Luxembourg
45,000 45,365 0.0302.08.19EuropeanInvestment Bank 12
CHF 1.250%
1,020,000 1,036,830 0.7925.10.19Gazprom OAO ViaGaz Capital SA 13EMTN
CHF 2.850%
475,000 482,790 0.3623.12.19Glencore FinanceEurope Ltd 13EMTN
CHF 2.125%
25,000 25,475 0.0201.12.20Glencore FinanceEurope Ltd 14EMTN
CHF 1.250%

14
Vontobel Fund - Swiss Money
The accompanying notes form an essential part of these financial statements.
Portfolio as at February 28, 2019
* Any deviations of the percentages of the nets assets are due to rounding.
Securities Marketvalue in
CHF
% of netassets*
Quantity Ccy Maturity
200,000 208,300 0.1610.05.21Glencore FinanceEurope Ltd 16EMTN
CHF 2.250%
1.632,163,320Total - Luxembourg
1,100,000 1,102,750 0.8310.04.19PetroleosMexicanos 12EMTN
CHF 2.500%Mexico
375,000 377,625 0.2808.12.20PetroleosMexicanos 15EMTN
CHF 1.500%
1.111,480,375Total - Mexico
500,000 504,750 0.3820.09.19BNZ InternationalFundingLtd/London 12EMTN
CHF 1.125%New Zealand
0.38504,750Total - New Zealand
300,000 305,250 0.2327.12.19ABN AMRO BankNV 13 EMTN
CHF 1.500%Netherlands
140,000 142,590 0.1124.04.20ABN AMRO BankNV 14 EMTN
CHF 1.125%
2,005,000 2,044,098 1.5426.06.20CooperatieveRabobank UA 13EMTN
CHF 1.000%
1,600,000 1,649,440 1.2427.04.20EBN BV 10CHF 2.125%1,015,000 1,019,466 0.7704.07.19EBN BV 12CHF 0.625%1,500,000 1,566,000 1.1819.08.20Nederlandse
WaterschapsbankNV 05 EMTN
CHF 2.375%
125,000 125,325 0.0917.06.19NIBC Bank NV 16EMTN
CHF 1.375%
500,000 567,453 0.4330.03.19VolkswagenInternationalFinance NV 0.019%17-30.03.19 FRN
EUR 0,000%
700,000 786,248 0.5911.05.22DaimlerInternationalFinance BV 17 FRNEMTN
EUR 0,000%
2,225,000 2,532,081 1.9023.07.20Deutsche BahnFinance BV 14 FRNEMTN
EUR 0,000%
1,000,000 998,771 0.7516.03.22SiemensFinancieringsmaatschappij NV 17 FRN
USD 1.931%
8.8311,736,722Total - Netherlands
650,000 666,835 0.5014.02.20Norske Tog AS 11EMTN
CHF 2.125%Norway
735,000 749,333 0.5602.12.20SpareBank 1 NordNorge 14 EMTN
CHF 0.875%
1.061,416,168Total - Norway
Securities Marketvalue in
CHF
% of netassets*
Quantity Ccy Maturity
2,765,000 2,835,508 2.1312.11.20RaiffeisenlandesbankNiederoesterreich-Wien AG 12 EMTN
CHF 1.000%Austria
2.132,835,508Total - Austria
405,000 408,402 0.3103.09.19Export-Import Bankof Korea 14 EMTN
CHF 1.125%Korea, Republic Of
715,000 726,583 0.5402.12.19Korea RailroadCorp 13
CHF 1.500%
0.851,134,985Total - Korea, Republic Of
1,385,000 1,418,240 1.0702.10.20Nordea Bank Abp12 EMTN
CHF 1.125%Sweden
1,350,000 1,370,385 1.0320.12.19SvenskaHandelsbanken AB13 EMTN
CHF 1.250%
2.102,788,625Total - Sweden
1,500,000 1,505,250 1.1315.11.19Aduno Holding AG18
CHF 0,000%Switzerland
280,000 288,400 0.2223.09.20Allreal Holding AG13
CHF 2.000%
500,000 500,650 0.3802.04.19Allreal Holding AG14
CHF 1.250%
200,000 202,700 0.1531.03.21Allreal Holding AG15
CHF 0.750%
410,000 420,455 0.3226.02.20Axpo Holding AG10
CHF 2.625%
1,665,000 1,706,126 1.2816.12.19Basellandschaftliche Kantonalbank 09
CHF 2.500%
1,605,000 1,613,988 1.2120.04.20Basellandschaftliche Kantonalbank 16
CHF 0,000%
3,000,000 3,043,499 2.2808.10.20ChocoladefabrikenLindt & SpruengliAG 14
CHF 0.500%
300,000 302,160 0.2325.07.19Coop-GruppeGenossenschaft 12
CHF 1.250%
2,500,000 2,519,249 1.8931.07.20Coop-GruppeGenossenschaft 15
CHF 0.250%
2,000,000 2,009,400 1.5111.07.19Credit Suisse AG14
CHF 0.750%
700,000 700,350 0.5306.05.21Emissions- undFinanz AG 16
CHF 0.375%
1,710,000 1,710,855 1.2917.04.19Geberit AG 15CHF 0.050%1,575,000 1,605,713 1.2118.09.20Givaudan SA 14CHF 1.000%1,800,000 1,803,960 1.3609.04.20Givaudan SA 18
FRNCHF 0,000%
2,545,000 2,569,686 1.9304.10.19GlarnerKantonalbank 13
CHF 1.000%
1,075,000 1,086,288 0.8201.07.21Hiag ImmobilienHolding AG 15
CHF 1.000%
875,000 875,000 0.6609.09.21Kraftwerke Linth-Limmern AG 15
CHF 0.500%
100,000 100,220 0.0810.04.19Lonza Swiss FinanzAG 13
CHF 1.750%
1,500,000 1,546,950 1.1630.06.20LuzernerKantonalbank AG10
CHF 1.875%
365,000 376,863 0.2819.05.21Mobimo HoldingAG 14
CHF 1.625%

15
Vontobel Fund - Swiss Money
The accompanying notes form an essential part of these financial statements.
Portfolio as at February 28, 2019
* Any deviations of the percentages of the nets assets are due to rounding.
Securities Marketvalue in
CHF
% of netassets*
Quantity Ccy Maturity
250,000 250,825 0.1917.06.19OC Oerlikon CorpAG 14
CHF 1.250%
100,000 103,170 0.0803.08.20PfandbriefbankschweizerischerHypothekarinstituteAG 10
CHF 1.625%
100,000 102,030 0.0801.11.19PfandbriefzentralederschweizerischenKantonalbankenAG 09
CHF 2.375%
2,400,000 2,405,760 1.8105.06.20Schindler HoldingAG 18
CHF 0,000%
1,350,000 1,367,145 1.0312.03.20SchwyzerKantonalbank 14
CHF 0.750%
1,100,000 1,100,330 0.8308.03.19SGS SA 11CHF 2.625%1,800,000 1,813,500 1.3612.07.21Sika AG 18CHF 0.125%870,000 872,610 0.6611.10.19Sonova Holding AG
16CHF 0,000%
370,000 382,395 0.2916.04.21Swiss Prime SiteAG 14
CHF 1.750%
565,000 566,752 0.4301.11.19Syngenta FinanceAG 14
CHF 0.750%
500,000 505,500 0.3822.11.19Valiant Bank AG 14CHF 1.000%2,575,000 2,592,252 1.9425.06.19Zurich Insurance
Co Ltd 12 EMTNCHF 1.500%
29.0038,550,031Total - Switzerland
2,000,000 2,024,600 1.5216.10.19SlovakiaGovernmentInternational Bond13
CHF 1.375%Slovakia
1.522,024,600Total - Slovakia
45,000 45,360 0.0305.10.20SantanderConsumer FinanceSA 15 EMTN
CHF 0.500%Spain
150,000 151,950 0.1123.03.21SantanderConsumer FinanceSA 16 EMTN
CHF 0.600%
170,000 176,970 0.1423.10.20TelefonicaEmisiones SA 13EMTN
CHF 2.595%
0.28374,280Total - Spain
2,265,000 2,279,723 1.7104.12.19AT&T Inc 14CHF 0.500%United States
700,000 717,500 0.5406.12.19General Electric Co04
CHF 3.125%
600,000 605,580 0.4611.09.19Goldman SachsGroup Inc/The 14EMTN
CHF 1.250%
180,000 182,250 0.1409.09.21Goldman SachsGroup Inc/The 16EMTN
CHF 0.550%
3,400,000 3,407,139 2.5730.03.20MondelezInternational Inc 17
CHF 0.050%
2,250,000 2,280,375 1.7103.09.20Wells Fargo & Co14 EMTN
CHF 0.625%
2,500,000 2,838,995 2.1326.08.19McDonald's Corp15 FRN EMTN
EUR 0,000%
700,000 698,052 0.5206.05.19Apple Inc 14 FRNUSD 1.090%
Securities Marketvalue in
CHF
% of netassets*
Quantity Ccy Maturity
700,000 698,707 0.5313.03.20John Deere CapitalCorp 17 FRN
USD 1.617%
500,000 492,925 0.3722.11.20Starbucks Corp 17USD 2.200%10.6814,201,246Total - United States
1,005,000 1,009,221 0.7611.06.19ASB FinanceLtd/London 13EMTN
CHF 0.875%United Kingdom
90,000 91,350 0.0705.02.20ASB FinanceLtd/London 14EMTN
CHF 1.125%
360,000 364,500 0.2708.09.21BAT InternationalFinance PLC 14EMTN
CHF 0.625%
2,700,000 2,749,950 2.0628.08.20BP Capital MarketsPLC 14
CHF 1.000%
1,650,000 1,686,960 1.2717.07.20Credit AgricoleSA/London 14EMTN
CHF 1.250%
800,000 806,400 0.6127.01.20Credit AgricoleSA/London 15EMTN
CHF 0.375%
89.99119,673,640Total - Transferable securities admitted to anofficial exchange
89.99119,673,640Total - Bonds
5.046,708,381Total - United Kingdom
900,000 639,467 0.4803.03.20Nissan FinancialServices AustraliaPty Ltd 17
AUD 3.000%
Transferable securities and money market instruments dealt in on anotherregulated marketBondsAustralia
0.48639,467Total - Australia
2,000,000 1,420,215 1.0721.01.20Bank of NovaScotia/The 15 FRN
AUD 2.560%Canada
1,000,000 998,442 0.7513.08.19Toronto-DominionBank/The 16 FRN
USD 1.470%
2.303,058,124Total - Transferable securities and money marketinstruments dealt in on another regulated market
2.303,058,124Total - Bonds
1.822,418,657Total - Canada
500,000 354,586 0.2720.08.20Sumitomo MitsuiBankingCorp/Sydney 18FRN
AUD 2.705%
Other transferable securitiesBondsJapan
0.27354,586Total - Japan

16
Vontobel Fund - Swiss Money
The accompanying notes form an essential part of these financial statements.
Portfolio as at February 28, 2019
* Any deviations of the percentages of the nets assets are due to rounding.
Securities Marketvalue in
CHF
% of netassets*
Quantity Ccy Maturity
800,000 566,516 0.4219.10.23Korea DevelopmentBank/The 18 FRN
AUD 3.054%Korea, Republic Of
0.69921,102Total - Bonds
0.42566,516Total - Korea, Republic Of
7,963 1,221,028 0.92Vontobel Fund -High Yield Bond - I
EUR
Investment fundsLuxembourg
1.612,142,130Total - Other transferable securities
0.921,221,028Total - Investment funds
0.921,221,028Total - Luxembourg
93.90124,873,894Total - Investment in securities

17
Vontobel Fund - Euro Short Term Bond
AssetsInvestments in securities at market value 111,059,542(2)
1,575,395Cash at banks
64Receivable from foreign currencies
143,035Receivable from subscriptions
1,863,477Interest and dividends receivable(2)
201,573Receivable for investments sold
13,000Unrealised gain on futures(9)
Total Assets 114,856,086
113,572,371Statement of Net Assetsas at February 28, 2019
LiabilitiesBank overdraft 13,000
Payable for redemptions 1,210,269
Payable on foreign currencies 64
Payable on swaps 19,185(9)
Unrealised loss on forward foreign exchange contracts 617,222(9)
Unrealised loss on swaps 178,742(9)
Audit fees, printing and publishing expenses 989
Service Fee payable 10,831(5)
Subscription tax payable 6,071(4)
Management Fee payable 20,044(3)
Other liabilities 1,378Total Liabilities 2,077,795Total net assets at the end of the period 112,778,291Net assets at the beginning of the reporting period 126,251,464
Net investment income 1,856,342
Change in unrealised appreciation/depreciation on:
Investments 907,835
Futures 14,950
Forward foreign exchange contracts -593,490
Swaps 167,884
Net realised gain/loss on investments -1,007,205(2)
Net realised gain/loss on forward foreign exchange contracts -154,515(2)
Net realised gain/loss on currency exchange -388,584(2)
Net realised gain/loss on futures -12,350(2)
Net realised gain/loss on swaps -154,843(2)
Increase/Decrease in net assets resulting from operations 636,024Subscriptions of shares 20,699,890
Redemptions of shares -34,565,900
Dividend distribution -243,187(11)
Total net assets at the end of the period 112,778,291
Statement of Operations andChanges in Net Assetsfrom September 1, 2018to February 28, 2019
Notes EURThe accompanying notes form an essential part of these financial statements.
Cost

18
Vontobel Fund - Euro Short Term Bond
IncomeBank interest 2,960
Net interest on bonds 2,196,299(2)
Total Income 2,199,259ExpensesManagement Fees 133,372(3)
Audit fees, printing and publishing expenses 16,683
Subscription tax 19,167(4)
Bank interest 4,013
Interest on swaps 63,570(2)
Service Fees 78,398(5)
Other Fees payable 27,714(8)
Total Expenses 342,917Net investment income 1,856,342
Statement of Net Incomefrom September 1, 2018to February 28, 2019
Notes EURThe accompanying notes form an essential part of these financial statements.

19
Vontobel Fund - Euro Short Term Bond
The accompanying notes form an essential part of these financial statements.
Portfolio as at February 28, 2019
* Any deviations of the percentages of the nets assets are due to rounding.
Securities Marketvalue in
EUR
% of netassets*
Quantity Ccy Maturity
2,900,000 2,556,951 2.2729.07.19African Export-Import Bank/The14 EMTN
USD 4.750%
Transferable securities admitted to an official exchangeBondsEgypt
2.272,556,951Total - Egypt
550,000 346,608 0.3119.09.19Glencore AustraliaHoldings Pty Ltd 14
AUD 4.500%Australia
1,000,000 620,636 0.5515.12.22Macquarie GroupLtd 17 FRN
AUD 3.105%
0.86967,244Total - Australia
300,000 266,612 0.2431.03.20BahrainGovernmentInternational Bond10
USD 5.500%Bahrain
0.24266,612Total - Bahrain
1,500,000 1,500,240 1.3315.04.19Deutsche Bank AG14 FRN EMTN
EUR 0.260%Germany
500,000 517,250 0.4615.07.20Fresenius SE & CoKGaA 13
EUR 2.875%
250,000 256,010 0.2327.05.26LandesbankBaden-Wuerttemberg 14FRN EMTN
EUR 2.875%
250,000 260,070 0.2310.02.21O2 TelefonicaDeutschlandFinanzierungsGmbH 14
EUR 2.375%
200,000 212,046 0.1915.12.23PrestigeBidCoGmbH 16
EUR 6.250%
1,000,000 1,012,110 0.9021.04.75RWE AG 15 FRNEUR 2.750%3,000,000 3,014,940 2.6614.10.21Volkswagen
Financial ServicesAG 15 EMTN
EUR 0.750%
1,000,000 999,820 0.8916.10.20VolkswagenFinancial ServicesAG 18 EMTN
EUR 0.250%
500,000 498,095 0.4412.04.21VolkswagenFinancial ServicesAG 18 EMTN
EUR 0.375%
300,000 313,932 0.2806.09.22VolkswagenLeasing GmbH 12EMTN
EUR 2.375%
250,000 259,788 0.2304.04.22VolkswagenLeasing GmbH 14EMTN
EUR 2.125%
7.848,844,301Total - Germany
1,500,000 1,601,895 1.4231.12.99Orange SA 14 FRNEMTN
EUR 4.000%France
500,000 493,195 0.4414.03.22RCI Banque SA 17FRN EMTN
EUR 0.361%
300,000 304,242 0.2701.04.22Societe GeneraleSA 16 EMTN
EUR 1.000%
200,000 207,114 0.1819.10.22TDF InfrastructureSAS 15
EUR 2.880%
Securities Marketvalue in
EUR
% of netassets*
Quantity Ccy Maturity
2,000,000 2,054,441 1.8131.12.99TOTAL SA 15 FRNEMTN
EUR 2.250%
200,000 196,658 0.1711.01.23Valeo SA 17 EMTNEUR 0.625%750,000 910,949 0.8131.12.99Credit Agricole SA
09 FRNGBP 8.125%
500,000 457,739 0.4104.04.21Banque PSAFinance SA 11
USD 5.750%
500,000 446,702 0.4031.12.99BNP Paribas SA 05USD 6.250%2,000,000 1,768,403 1.5731.12.99La Mondiale SAM
13 FRNUSD 7.625%
7.488,441,338Total - France
1,000,000 1,023,930 0.9119.10.20National Bank ofGreece SA 17EMTN
EUR 2.750%Greece
0.911,023,930Total - Greece
220,000 195,782 0.1721.08.20Credit SuisseGroup FundingGuernsey Ltd 15EMTN
CHF 0.625%Guernsey
200,000 204,244 0.1814.04.22Credit SuisseGroup FundingGuernsey Ltd 15EMTN
EUR 1.250%
0.35400,026Total - Guernsey
500,000 528,695 0.4708.07.21IndonesiaGovernmentInternational Bond14 EMTN
EUR 2.875%Indonesia
0.47528,695Total - Indonesia
200,000 205,714 0.1815.05.23Ardagh PackagingFinance PLC /Ardagh HoldingsUSA Inc 16
EUR 4.125%Ireland
1,050,000 1,080,356 0.9624.07.39Cloverie PLC forZurich InsuranceCo Ltd 09 FRNEMTN
EUR 7.500%
1,500,000 1,513,245 1.3423.09.20FCA Capital IrelandPLC 16 EMTN
EUR 1.250%
1,000,000 1,047,040 0.9323.01.20GE CapitalEuropean FundingUnlimited Co 09EMTN
EUR 5.375%
1,500,000 1,511,940 1.3418.06.19GE CapitalEuropean FundingUnlimited Co 12EMTN
EUR 2.875%
400,000 401,548 0.3621.01.22GE CapitalEuropean FundingUnlimited Co 15EMTN
EUR 0.800%
5.115,759,843Total - Ireland
250,000 262,013 0.2320.02.21Aeroporti di RomaSpA 13 EMTN
EUR 3.250%Italy

20
Vontobel Fund - Euro Short Term Bond
The accompanying notes form an essential part of these financial statements.
Portfolio as at February 28, 2019
* Any deviations of the percentages of the nets assets are due to rounding.
Securities Marketvalue in
EUR
% of netassets*
Quantity Ccy Maturity
1,000,000 1,038,690 0.9215.01.75Enel SpA 14 FRNEUR 5.000%1,000,000 1,043,270 0.9331.12.99Intesa Sanpaolo
SpA 09 FRNEUR 8.375%
1,000,000 1,060,259 0.9416.07.20Intesa SanpaoloSpA 10 EMTN
EUR 5.150%
200,000 197,898 0.1827.06.22Intesa SanpaoloSpA 17 EMTN
EUR 0.875%
1,000,000 1,039,520 0.9201.02.20Italy BuoniPoliennali DelTesoro 04
EUR 4.500%
6,000,000 6,417,179 5.7001.08.21Italy BuoniPoliennali DelTesoro 06
EUR 3.750%
750,000 796,755 0.7101.03.21Italy BuoniPoliennali DelTesoro 10
EUR 3.750%
500,000 556,890 0.4901.03.22Italy BuoniPoliennali DelTesoro 11
EUR 5.000%
600,000 586,272 0.5218.05.22Mediobanca Bancadi CreditoFinanziario SpA 17FRN EMTN
EUR 0.481%
250,000 253,895 0.2319.01.21Mediobanca SpA16 EMTN
EUR 1.630%
700,000 703,794 0.6217.02.20Mediobanca SpA17 EMTN
EUR 0.750%
550,000 557,288 0.4928.05.20RAIRadiotelevisioneItaliana SpA 15
EUR 1.500%
900,000 916,470 0.8115.06.20Republic of ItalyGovernmentInternational Bond05 FRN EMTN
EUR 2.000%
250,000 257,403 0.2316.01.23Telecom ItaliaSpA/Milano 15EMTN
EUR 3.250%
500,000 478,010 0.4218.01.23UniCredit SpA 18EMTN
EUR 1.000%
1,900,000 2,248,947 2.0024.06.19Telecom ItaliaSpA/Milano 04EMTN
GBP 6.375%
16.3418,414,553Total - Italy
500,000 499,910 0.4419.09.21Asahi GroupHoldings Ltd 17
EUR 0.321%Japan
1,000,000 1,000,470 0.8922.11.19Mercedes-BenzJapan Co Ltd 16EMTN
EUR 0.125%
700,000 701,848 0.6221.11.20TakedaPharmaceutical CoLtd 18
EUR 0.375%
1.952,202,228Total - Japan
1,000,000 895,065 0.7926.09.20EurasianDevelopment Bank13
USD 5.000%Kazakhstan
0.79895,065Total - Kazakhstan
2,634,000 1,654,517 1.4608.07.19UniCreditInternational BankLuxembourg SA 14EMTN
AUD 5.000%Luxembourg
Securities Marketvalue in
EUR
% of netassets*
Quantity Ccy Maturity
650,000 588,360 0.5203.07.20ArcelorMittal 15EMTN
CHF 2.500%
1,000,000 895,560 0.7930.09.19Fiat ChryslerFinance Europe 14EMTN
CHF 3.125%
310,000 277,788 0.2525.10.19Gazprom OAO ViaGaz Capital SA 13EMTN
CHF 2.850%
750,000 672,001 0.6023.12.19Glencore FinanceEurope Ltd 13EMTN
CHF 2.125%
500,000 532,345 0.4714.01.22ArcelorMittal 15EMTN
EUR 3.125%
398,000 427,703 0.3801.11.21Crystal AlmondSARL 16
EUR 10.000%
200,000 220,514 0.2015.07.22Fiat ChryslerFinance Europe SA14 EMTN
EUR 4.750%
350,000 382,214 0.3415.02.21FMC Finance VIISA 11
EUR 5.250%
1,500,000 1,547,280 1.3720.03.20Gazprom OAO ViaGaz Capital SA 13EMTN
EUR 3.389%
500,000 507,590 0.4517.03.21Glencore FinanceEurope Ltd 15EMTN
EUR 1.250%
6.837,705,872Total - Luxembourg
500,000 532,930 0.4705.10.20MoroccoGovernmentInternational Bond10
EUR 4.500%Morocco
0.47532,930Total - Morocco
615,000 545,945 0.4808.12.20PetroleosMexicanos 15EMTN
CHF 1.500%Mexico
1,500,000 1,529,114 1.3627.11.20PetroleosMexicanos 13
EUR 3.130%
1,500,000 1,502,310 1.3315.03.19PetroleosMexicanos 16EMTN
EUR 3.750%
250,000 250,568 0.2221.08.21PetroleosMexicanos 17EMTN
EUR 2.500%
3.393,827,937Total - Mexico
600,000 676,272 0.6027.04.21ABN AMRO BankNV 11 EMTN
EUR 6.375%Netherlands
300,000 309,984 0.2715.10.23CableCommunicationsSystems NV 16
EUR 5.000%
1,500,000 1,521,300 1.3506.12.21Cetin Finance BV16
EUR 1.423%
500,000 504,875 0.4518.05.20General MotorsFinancialInternational BV 16EMTN
EUR 1.168%
500,000 523,155 0.4631.12.99Telefonica EuropeBV 14 FRN
EUR 5.000%
1,000,000 1,028,460 0.9131.12.99Telefonica EuropeBV 14 FRN
EUR 4.200%

21
Vontobel Fund - Euro Short Term Bond
The accompanying notes form an essential part of these financial statements.
Portfolio as at February 28, 2019
* Any deviations of the percentages of the nets assets are due to rounding.
Securities Marketvalue in
EUR
% of netassets*
Quantity Ccy Maturity
1,750,000 1,808,538 1.6131.12.99VolkswagenInternationalFinance NV 14 FRN
EUR 3.750%
1,000,000 901,168 0.8031.12.99CooperatieveRabobank UA 09FRN
USD 11.000%
6.457,273,752Total - Netherlands
1,000,000 884,957 0.7829.04.20Africa FinanceCorp 15 EMTN
USD 4.375%Nigeria
0.78884,957Total - Nigeria
400,000 253,223 0.2203.06.21Hyundai CapitalServices Inc 16
AUD 3.500%Korea, Republic Of
500,000 316,098 0.2822.11.19Korea DevelopmentBank/The 14
AUD 4.500%
0.50569,321Total - Korea, Republic Of
1,000,000 1,054,350 0.9318.05.21Volvo Car AB 16EUR 3.250%Sweden
2,200,000 2,287,780 2.0310.06.75Volvo Treasury AB14 FRN
EUR 4.200%
2.963,342,130Total - Sweden
1,400,000 867,798 0.7619.01.23Banco SantanderSA 17 FRN EMTN
AUD 3.445%Spain
425,000 390,017 0.3523.10.20TelefonicaEmisiones SA 13EMTN
CHF 2.595%
200,000 197,366 0.1812.01.23CaixaBank SA 17EMTN
EUR 1.125%
200,000 202,668 0.1821.04.22Criteria Caixa SAU15 EMTN
EUR 1.625%
1.471,657,849Total - Spain
1,200,000 1,084,015 0.9606.05.21Banque OuestAfricaine deDeveloppement 16
USD 5.500%Togo
0.961,084,015Total - Togo
1,500,000 1,506,375 1.3408.07.19Turkiye GarantiBankasi AS 14EMTN
EUR 3.375%Turkey
200,000 174,631 0.1504.06.19Turkiye HalkBankasi AS 14
USD 4.750%
1.491,681,006Total - Turkey
250,000 158,324 0.1405.08.21Bank of AmericaCorp 16
AUD 3.300%United States
2,000,000 1,251,281 1.1102.06.20Ford Motor CreditCo LLC 16
AUD 3.588%
800,000 503,377 0.4527.07.21Wells Fargo & Co16
AUD 3.000%
750,000 677,687 0.6006.12.19General Electric Co04
CHF 3.125%
Securities Marketvalue in
EUR
% of netassets*
Quantity Ccy Maturity
750,000 791,670 0.7015.06.24CEMEX FinanceLLC 16
EUR 4.625%
1,000,000 997,860 0.8810.05.21General MotorsFinancial Co Inc 17FRN EMTN
EUR 0.352%
400,000 391,076 0.3526.03.22General MotorsFinancial Co Inc 18FRN EMTN
EUR 0.240%
500,000 548,095 0.4912.10.21Goldman SachsGroup Inc/The 06
EUR 4.750%
1,589,000 1,392,366 1.2309.01.20Ford Motor CreditCo LLC 17 FRN
USD 3.797%
1,000,000 874,181 0.7807.08.20General Motors Co17 FRN
USD 3.539%
1,000,000 868,201 0.7718.09.20Hyundai CapitalAmerica 17 EMTN
USD 2.750%
600,000 527,665 0.4708.07.21Hyundai CapitalAmerica 18
USD 3.750%
7.978,981,783Total - United States
1,500,000 928,696 0.8213.12.22Vodafone GroupPLC 17 FRN
AUD 2.975%United Kingdom
645,000 575,703 0.5108.09.21BAT InternationalFinance PLC 14EMTN
CHF 0.625%
350,000 354,060 0.3125.11.20Abbey NationalTreasury ServicesPLC/UnitedKingdom 15 EMTN
EUR 0.880%
400,000 432,384 0.3828.03.22Anglo AmericanCapital PLC 12EMTN
EUR 3.500%
392,000 408,942 0.3629.04.21Anglo AmericanCapital PLC 13EMTN
EUR 2.500%
1,887,000 2,057,434 1.8214.01.21Barclays Bank PLC10 EMTN
EUR 6.000%
500,000 509,635 0.4501.04.22Barclays PLC 14EMTN
EUR 1.500%
1,000,000 1,025,420 0.9123.03.21Barclays PLC 16EMTN
EUR 1.875%
700,000 701,134 0.6213.05.20FCE Bank PLC 15EMTN
EUR 1.114%
500,000 500,675 0.4417.09.19FCE Bank PLC 15FRN EMTN
EUR 0.669%
250,000 254,670 0.2301.07.22Hammerson PLC14
EUR 2.000%
300,000 302,181 0.2704.12.21HSBC HoldingsPLC 18 FRN EMTN
EUR 0.591%
750,000 775,620 0.6926.02.21Imperial TobaccoFinance PLC 14EMTN
EUR 2.250%
2,500,000 2,655,575 2.3624.03.20Lloyds Bank PLC10 EMTN
EUR 6.500%
2,000,000 2,173,660 1.9422.07.20NationwideBuilding Society 10EMTN
EUR 6.750%
300,000 299,130 0.2727.09.21NatWest MarketsPLC 18 FRN EMTN
EUR 0.590%
500,000 521,195 0.4618.06.76NGG Finance PLC13 FRN
EUR 4.250%
1,000,000 1,002,250 0.8931.12.99SSE PLC 15 FRNEUR 2.375%500,000 516,140 0.4613.06.21Standard
Chartered PLC 14EMTN
EUR 1.625%

22
Vontobel Fund - Euro Short Term Bond
The accompanying notes form an essential part of these financial statements.
Portfolio as at February 28, 2019
* Any deviations of the percentages of the nets assets are due to rounding.
Securities Marketvalue in
EUR
% of netassets*
Quantity Ccy Maturity
500,000 504,135 0.4517.03.22Yorkshire BuildingSociety 15 EMTN
EUR 1.250%
1,000,000 1,340,355 1.1915.05.21Bank of ScotlandPLC 96
GBP 9.375%
1,000,000 1,208,724 1.0731.12.99Barclays Bank PLC08 FRN
GBP 14.000%
750,000 1,008,578 0.8921.05.21Barclays Bank PLC09 EMTN
GBP 10.000%
200,000 234,549 0.2119.11.20FCE Bank PLC 13EMTN
GBP 3.250%
1,000,000 1,201,750 1.0728.10.19GKN Holdings PLC99
GBP 6.750%
500,000 546,069 0.4824.01.21Jaguar Land RoverAutomotive PLC 17
GBP 2.750%
1,000,000 1,178,540 1.0515.09.21Jerrold Finco Plc 16EMTN
GBP 6.250%
98.48111,059,542Total - Transferable securities admitted to anofficial exchange
98.48111,059,542Total - Bonds
20.6023,217,204Total - United Kingdom
98.48111,059,542Total - Investment in securities

23
Vontobel Fund - US Dollar Money
AssetsInvestments in securities at market value 103,358,745(2)
1,576,708Cash at banks
94Receivable from foreign currencies
42,565Receivable from subscriptions
836,948Interest and dividends receivable(2)
Total Assets 105,815,060
103,579,575Statement of Net Assetsas at February 28, 2019
LiabilitiesProvision for expenses 23
Payable for redemptions 248,748
Payable for investments purchased 453,244
Payable on foreign currencies 94
Audit fees, printing and publishing expenses 983
Service Fee payable 9,472(5)
Subscription tax payable 1,694(4)
Management Fee payable 22,322(3)
Other liabilities 99Total Liabilities 736,679Total net assets at the end of the period 105,078,381Net assets at the beginning of the reporting period 96,364,436
Net investment income 1,388,330
Change in unrealised appreciation/depreciation on:
Investments 133,478
Net realised gain/loss on investments -106,174(2)
Net realised gain/loss on currency exchange -119(2)
Increase/Decrease in net assets resulting from operations 1,415,515Subscriptions of shares 36,212,372
Redemptions of shares -28,657,371
Dividend distribution -256,571(11)
Total net assets at the end of the period 105,078,381
Statement of Operations andChanges in Net Assetsfrom September 1, 2018to February 28, 2019
IncomeBank interest 18,401
Net interest on bonds 1,623,012(2)
Total Income 1,641,413ExpensesManagement Fees 145,852(3)
Audit fees, printing and publishing expenses 18,686
Subscription tax 5,524(4)
Bank interest 10
Service Fees 63,928(5)
Other Fees payable 19,083(8)
Total Expenses 253,083Net investment income 1,388,330
Statement of Net Incomefrom September 1, 2018to February 28, 2019
Notes USDThe accompanying notes form an essential part of these financial statements.
Cost

24
Vontobel Fund - US Dollar Money
The accompanying notes form an essential part of these financial statements.
Portfolio as at February 28, 2019
* Any deviations of the percentages of the nets assets are due to rounding.
Securities Marketvalue in
USD
% of netassets*
Quantity Ccy Maturity
1,800,000 1,807,200 1.7229.07.19African Export-Import Bank/The14 EMTN
USD 4.750%
Transferable securities admitted to an official exchangeBondsEgypt
1.721,807,200Total - Egypt
600,000 596,250 0.5705.05.20CNOOC Finance2015 Australia PtyLtd 15
USD 2.625%Australia
500,000 501,820 0.4807.11.19CommonwealthBank of Australia16 FRN
USD 1.674%
1,000,000 1,000,350 0.9415.03.19CommonwealthBank of Australia16 FRN EMTN
USD 1.710%
500,000 501,015 0.4819.08.19Westpac BankingCorp 16 FRN
USD 0.010%
2.472,599,435Total - Australia
1,000,000 999,650 0.9510.04.19Sinopec GroupOverseasDevelopment 2014Ltd 14
USD 2.750%British Virgin Islands
400,000 399,364 0.3803.05.19Sinopec GroupOverseasDevelopment 2016Ltd 16
USD 2.125%
500,000 499,760 0.4807.05.19State GridOverseasInvestment 2014Ltd 14
USD 2.750%
1.811,898,774Total - British Virgin Islands
400,000 399,044 0.3811.02.20Tencent HoldingsLtd 15 EMTN
USD 2.875%Cayman Islands
0.38399,044Total - Cayman Islands
1,500,000 1,497,225 1.4231.07.19Export-Import Bankof China/The 14
USD 2.500%China
1.421,497,225Total - China
500,000 521,228 0.5004.04.21Banque PSAFinance SA 11
USD 5.750%France
500,000 496,250 0.4716.09.20Societe GeneraleSA 15 EMTN
USD 2.630%
0.971,017,478Total - France
750,000 746,760 0.7126.03.20Credit SuisseGroup FundingGuernsey Ltd 16
USD 2.750%Guernsey
0.71746,760Total - Guernsey
600,000 598,764 0.5719.05.19ICBCIL Finance CoLtd 16 EMTN
USD 2.375%Hong Kong
Securities Marketvalue in
USD
% of netassets*
Quantity Ccy Maturity
1,000,000 994,780 0.9505.04.20ICBCIL Finance CoLtd 17 EMTN
USD 3.000%
1.521,593,544Total - Hong Kong
200,000 200,020 0.1917.04.19Oil India Ltd 14USD 3.875%India
0.19200,020Total - India
1,500,000 1,496,250 1.4208.09.19Bank of Tokyo-Mitsubishi UFJLtd/The 14
USD 2.350%Japan
1,000,000 996,570 0.9505.08.19Central NipponExpressway Co Ltd14
USD 2.170%
2,000,000 1,995,760 1.9029.05.19Japan Bank forInternationalCooperation 14
USD 1.750%
980,000 979,941 0.9306.03.19Japan FinanceOrganization forMunicipalities 14
USD 2.125%
200,000 195,064 0.1913.04.21Japan Tobacco Inc16 EMTN
USD 2.000%
500,000 504,410 0.4813.09.21Mitsubishi UFJFinancial Group Inc16 FRN
USD 2.017%
600,000 600,966 0.5723.07.19Mitsubishi UFJLease & FinanceCo Ltd 14 FRNEMTN
USD 3.122%
500,000 496,165 0.4719.10.20Mitsubishi UFJTrust & BankingCorp 15
USD 2.650%
1,000,000 995,088 0.9526.03.20Mizuho Bank Ltd15
USD 2.400%
200,000 198,758 0.1905.03.20MUFG Bank Ltd 15USD 2.300%894,000 925,746 0.8804.03.20Nomura Holdings
Inc 10USD 6.700%
1,756,000 1,756,509 1.6719.03.19Nomura HoldingsInc 14
USD 2.750%
1,000,000 999,960 0.9506.03.19Sumitomo MitsuiTrust Bank Ltd 17
USD 2.050%
11.5512,141,187Total - Japan
500,000 500,570 0.4814.06.19Bank of NovaScotia/The 16 FRN
USD 1.320%Canada
500,000 500,975 0.4711.06.20Toronto-DominionBank/The 18
USD 3.000%
0.951,001,545Total - Canada
500,000 502,335 0.4809.04.19Qatar GovernmentInternational Bond09
USD 6.550%Qatar
0.48502,335Total - Qatar
200,000 203,842 0.1926.09.20EurasianDevelopment Bank13
USD 5.000%Kazakhstan
0.19203,842Total - Kazakhstan

25
Vontobel Fund - US Dollar Money
The accompanying notes form an essential part of these financial statements.
Portfolio as at February 28, 2019
* Any deviations of the percentages of the nets assets are due to rounding.
Securities Marketvalue in
USD
% of netassets*
Quantity Ccy Maturity
500,000 512,620 0.4901.06.20ArcelorMittal 15USD 5.125%Luxembourg
0.49512,620Total - Luxembourg
3,000,000 3,028,770 2.8812.08.19Petronas CapitalLtd 09
USD 5.250%Malaysia
2.883,028,770Total - Malaysia
1,500,000 1,529,880 1.4605.03.20PetroleosMexicanos 10
USD 6.000%Mexico
1.461,529,880Total - Mexico
1,000,000 993,280 0.9504.06.20ABN AMRO BankNV 15
USD 2.450%Netherlands
1,500,000 1,491,015 1.4220.09.19ABN AMRO BankNV 16 EMTN
USD 1.800%
850,000 844,254 0.8017.01.20Deutsche TelekomInternationalFinance BV 17
USD 2.225%
1,000,000 1,008,670 0.9601.10.19EDP Finance BV 09USD 4.900%500,000 496,770 0.4702.10.23ING Groep NV 18
FRNUSD 3.797%
500,000 501,158 0.4828.10.19MondelezInternationalHoldingsNetherlands BV 16FRN
USD 1.649%
5.085,335,147Total - Netherlands
1,000,000 1,007,700 0.9629.04.20Africa FinanceCorp 15 EMTN
USD 4.375%Nigeria
0.961,007,700Total - Nigeria
400,000 407,592 0.3930.01.20PanamaGovernmentInternational Bond09
USD 5.200%Panama
0.39407,592Total - Panama
700,000 696,038 0.6621.01.20Export-Import Bankof Korea 15
USD 2.250%Korea, Republic Of
1,250,000 1,251,137 1.1921.10.19Export-Import Bankof Korea 16 FRN
USD 1.501%
400,000 404,560 0.3927.11.21Export-Import Bankof Korea 18
USD 3.500%
1,155,000 1,155,104 1.1017.03.19Korea DevelopmentBank/The 13
USD 3.000%
500,000 498,215 0.4728.10.19Korea Hydro &Nuclear Power CoLtd 14 EMTN
USD 2.375%
500,000 495,870 0.4712.04.20Korea South-EastPower Co Ltd 17
USD 2.375%
4.284,500,924Total - Korea, Republic Of
Securities Marketvalue in
USD
% of netassets*
Quantity Ccy Maturity
500,000 501,190 0.4729.05.20Nordea Bank AB 17FRN
USD 1.787%Sweden
500,000 500,480 0.4817.06.19SvenskaHandelsbanken AB14 FRN
USD 3.278%
0.951,001,670Total - Sweden
960,000 980,842 0.9327.04.20TelefonicaEmisiones SA 10
USD 5.134%Spain
0.93980,842Total - Spain
500,000 498,880 0.4718.06.19EmiratesTelecommunications Group Co PJSC14 EMTN
USD 2.375%United Arab Emirates
0.47498,880Total - United Arab Emirates
500,000 504,105 0.4817.05.21American ExpressCo 18
USD 3.375%United States
500,000 499,955 0.4801.04.19Bank of AmericaCorp 14
USD 2.650%
1,000,000 1,004,590 0.9621.07.21Bank of AmericaCorp 17 FRN
USD 1.967%
700,000 697,354 0.6608.10.19Bayer US FinanceLLC 14
USD 2.375%
500,000 502,525 0.4814.08.20BMW US CapitalLLC 18
USD 3.250%
500,000 503,855 0.4807.12.20Caterpillar FinancialServices Corp 18
USD 3.350%
785,000 786,444 0.7507.06.19Citigroup Inc 16FRN
USD 3.537%
535,000 536,354 0.5109.03.20CVS Health Corp18 FRN
USD 3.231%
2,000,000 1,983,720 1.8902.03.20Daimler FinanceNorth America LLC15
USD 2.250%
500,000 497,590 0.4705.07.19Daimler FinanceNorth America LLC16
USD 1.500%
1,000,000 994,470 0.9512.02.21Daimler FinanceNorth America LLC17 FRN
USD 2.241%
500,000 504,375 0.4805.11.21Daimler FinanceNorth America LLC18
USD 3.750%
885,000 880,675 0.8420.09.19DiscoveryCommunicationsLLC 17
USD 2.200%
1,050,000 1,049,979 1.0012.03.19Ford Motor CreditCo LLC 14
USD 2.375%
800,000 798,232 0.7609.01.20Ford Motor CreditCo LLC 17 FRN
USD 3.797%
454,000 459,866 0.4407.08.19General Electric Co09
USD 6.000%
124,000 124,208 0.1209.05.19General MotorsFinancial Co Inc 16FRN
USD 4.147%
200,000 202,634 0.1906.11.21General MotorsFinancial Co Inc 18
USD 4.200%
2,250,000 2,249,348 2.1429.04.19Glencore FundingLLC 14
USD 3.125%

26
Vontobel Fund - US Dollar Money
The accompanying notes form an essential part of these financial statements.
Portfolio as at February 28, 2019
* Any deviations of the percentages of the nets assets are due to rounding.
Securities Marketvalue in
USD
% of netassets*
Quantity Ccy Maturity
250,000 250,963 0.2405.06.20Goldman SachsBank USA/NewYork NY 18
USD 3.200%
1,000,000 1,036,730 0.9915.06.20Goldman SachsGroup Inc/The 10
USD 6.000%
1,000,000 995,520 0.9513.12.19Goldman SachsGroup Inc/The 16
USD 2.300%
500,000 500,905 0.4825.04.19Goldman SachsGroup Inc/The 16FRN
USD 1.750%
1,000,000 1,004,430 0.9613.12.19Goldman SachsGroup Inc/The 16FRN
USD 3.134%
1,892,000 1,882,049 1.7915.09.19Harley-DavidsonFinancial ServicesInc 14 EMTN
USD 2.400%
1,017,000 1,001,491 0.9526.02.20Harley-DavidsonFinancial ServicesInc 15 EMTN
USD 2.150%
238,000 235,998 0.2227.09.19Hyundai CapitalAmerica 16
USD 1.750%
2,500,000 2,499,499 2.3818.03.19Hyundai CapitalAmerica 16 EMTN
USD 2.500%
344,000 342,645 0.3301.07.19Hyundai CapitalAmerica 16 EMTN
USD 2.000%
500,000 494,310 0.4718.09.20Hyundai CapitalAmerica 17 EMTN
USD 2.750%
500,000 501,865 0.4818.09.20Hyundai CapitalAmerica 17 FRNEMTN
USD 3.178%
750,000 749,970 0.7113.11.19Industrial &Commercial Bankof China Ltd/NewYork NY 14
USD 3.231%
532,000 534,601 0.5123.04.19JPMorgan Chase &Co 09
USD 6.300%
1,200,000 1,223,280 1.1622.07.20JPMorgan Chase &Co 10
USD 4.400%
500,000 496,525 0.4729.10.20JPMorgan Chase &Co 15
USD 2.550%
1,499,000 1,511,727 1.4413.05.19Morgan Stanley 09USD 7.300%1,000,000 1,022,370 0.9726.01.20Morgan Stanley 10USD 5.500%500,000 504,045 0.4827.01.20Morgan Stanley 15
FRNUSD 1.870%
446,000 446,575 0.4210.02.21Morgan Stanley 18FRN
USD 3.247%
1,000,000 983,840 0.9430.09.20National Grid NorthAmerica Inc 15EMTN
USD 2.380%
900,000 899,991 0.8604.03.19Nissan MotorAcceptance Corp14 EMTN
USD 2.350%
986,000 969,711 0.9213.07.20Nissan MotorAcceptance Corp17 EMTN
USD 2.150%
1,500,000 1,492,395 1.4226.03.20UBS AG/StamfordCT 15
USD 2.350%
700,000 696,507 0.6620.11.19Volkswagen Groupof America FinanceLLC 14
USD 2.450%
500,000 505,620 0.4813.11.20Volkswagen Groupof America FinanceLLC 18
USD 3.875%
450,000 451,323 0.4323.07.21Wells Fargo BankNA 18 FRN
USD 3.325%
36.1938,015,164Total - United States
Securities Marketvalue in
USD
% of netassets*
Quantity Ccy Maturity
500,000 497,185 0.4708.06.20Barclays PLC 15USD 2.875%United Kingdom
500,000 491,375 0.4715.02.23Barclays PLC 18FRN
USD 4.114%
900,000 892,944 0.8509.09.19BAT InternationalFinance PLC 16EMTN
USD 1.625%
250,000 252,115 0.2414.09.21BNZ InternationalFundingLtd/London 16 FRNEMTN
USD 1.939%
1,000,000 995,780 0.9516.01.20BP Capital MarketsPLC 14 EMTN
USD 2.518%
500,000 500,180 0.4810.05.19BP Capital MarketsPLC 14 FRN
USD 1.350%
500,000 497,130 0.4721.01.20NationwideBuilding Society 15
USD 2.350%
444,000 441,642 0.4216.10.20Santander UKGroup HoldingsPLC 15
USD 2.875%
1,520,000 1,513,637 1.4319.08.19StandardChartered PLC 16EMTN
USD 2.100%
500,000 501,995 0.4819.08.19StandardChartered PLC 16FRN EMTN
USD 3.015%
300,000 300,495 0.2906.04.20State Bank ofIndia/London 17FRN EMTN
USD 2.252%
84.9989,312,056Total - Transferable securities admitted to anofficial exchange
84.9989,312,056Total - Bonds
6.556,884,478Total - United Kingdom
500,000 502,525 0.4804.11.21National AustraliaBank Ltd 18 FRN
USD 3.448%
Transferable securities and money market instruments dealt in on anotherregulated marketBondsAustralia
0.48502,525Total - Australia
500,000 507,570 0.4827.01.20Electricite deFrance SA 10
USD 4.600%France
0.48507,570Total - France
725,000 726,494 0.6911.09.22Mizuho FinancialGroup Inc 17 FRN
USD 2.951%Japan
0.69726,494Total - Japan
500,000 501,115 0.4818.07.19Bank of Montreal16 FRN
USD 1.330%Canada
500,000 501,445 0.4805.11.19Toronto-DominionBank/The 14 FRN
USD 1.340%
500,000 506,125 0.4814.12.20Toronto-DominionBank/The 15 FRN
USD 1.590%
1.441,508,685Total - Canada

27
Vontobel Fund - US Dollar Money
The accompanying notes form an essential part of these financial statements.
Portfolio as at February 28, 2019
* Any deviations of the percentages of the nets assets are due to rounding.
Securities Marketvalue in
USD
% of netassets*
Quantity Ccy Maturity
500,000 501,600 0.4801.10.19ING Bank NV 14FRN
USD 1.340%Netherlands
0.48501,600Total - Netherlands
500,000 501,535 0.4812.06.20Citibank NA 17FRN
USD 1.810%United States
500,000 500,745 0.4801.05.20Citibank NA 18USD 3.050%500,000 500,400 0.4808.04.19Citigroup Inc 14
FRNUSD 1.430%
1,500,000 1,501,470 1.4206.01.20Daimler FinanceNorth America LLC17 FRN
USD 1.635%
1,000,000 1,000,570 0.9512.03.19Ford Motor CreditCo LLC 14 FRN
USD 3.606%
500,000 499,555 0.4804.11.19Ford Motor CreditCo LLC 14 FRN
USD 3.668%
4.294,504,275Total - United States
759,000 761,292 0.7221.02.20BNZ InternationalFundingLtd/London 17 FRN
USD 1.752%United Kingdom
3,000,000 3,003,150 2.8515.04.19Credit AgricoleSA/London 14 FRNEMTN
USD 1.480%
1,000,000 1,030,433 0.9825.02.20NationwideBuilding Society 10
USD 6.250%
500,000 500,205 0.4814.03.19Santander UK PLC16 FRN
USD 2.140%
500,000 500,460 0.4801.12.20UBS AG/London17 FRN
USD 2.486%
13.3714,046,689Total - Transferable securities and money marketinstruments dealt in on another regulated market
13.3714,046,689Total - Bonds
5.515,795,540Total - United Kingdom
98.36103,358,745Total - Investment in securities

28
Vontobel Fund - Swiss Franc Bond
AssetsInvestments in securities at market value 223,322,560(2)
7,029,838Cash at banks
74Receivable from foreign currencies
915,823Receivable from subscriptions
1,292,627Interest and dividends receivable(2)
11,849Unrealised gain on futures(9)
Total Assets 232,572,771
215,641,278Statement of Net Assetsas at February 28, 2019
LiabilitiesBank overdraft 11,849
Provision for expenses 33
Payable for redemptions 313,231
Payable for investments purchased 1,467,911
Payable on foreign currencies 74
Payable on swaps 78,776(9)
Unrealised loss on forward foreign exchange contracts 565,259(9)
Unrealised loss on swaps 554,849(9)
Audit fees, printing and publishing expenses 3,727
Service Fee payable 37,784(5)
Subscription tax payable 9,043(4)
Management Fee payable 94,514(3)
Other liabilities 1,636Total Liabilities 3,138,686Total net assets at the end of the period 229,434,085Net assets at the beginning of the reporting period 398,890,020
Net investment income 1,037,545
Change in unrealised appreciation/depreciation on:
Investments -180,736
Futures 21,174
Forward foreign exchange contracts -1,495,538
Swaps 127,704
Net realised gain/loss on investments 2,023,569(2)
Net realised gain/loss on forward foreign exchange contracts -163,904(2)
Net realised gain/loss on currency exchange 467,741(2)
Net realised gain/loss on futures 314,491(2)
Net realised gain/loss on swaps -202,478(2)
Increase/Decrease in net assets resulting from operations 1,949,568Subscriptions of shares 36,035,090
Redemptions of shares -207,118,724
Dividend distribution -321,869(11)
Total net assets at the end of the period 229,434,085
Statement of Operations andChanges in Net Assetsfrom September 1, 2018to February 28, 2019
Notes CHFThe accompanying notes form an essential part of these financial statements.
Cost

29
Vontobel Fund - Swiss Franc Bond
IncomeBank interest 25,432
Net interest on bonds 2,212,574(2)
Interest on swaps 51,178(2)
Total Income 2,289,184ExpensesManagement Fees 689,134(3)
Audit fees, printing and publishing expenses 12,092
Subscription tax 36,652(4)
Bank interest 44,380
Interest on swaps 99,542(2)
Service Fees 288,349(5)
Other Fees payable 81,490(8)
Total Expenses 1,251,639Net investment income 1,037,545
Statement of Net Incomefrom September 1, 2018to February 28, 2019
Notes CHFThe accompanying notes form an essential part of these financial statements.

30
Vontobel Fund - Swiss Franc Bond
The accompanying notes form an essential part of these financial statements.
Portfolio as at February 28, 2019
* Any deviations of the percentages of the nets assets are due to rounding.
Securities Marketvalue in
CHF
% of netassets*
Quantity Ccy Maturity
1,000,000 711,738 0.3114.08.20Toyota FinanceAustralia Ltd 18
AUD 2.700%
Transferable securities admitted to an official exchangeBondsAustralia
500,000 357,127 0.1627.08.19UBS AG/Australia14
AUD 4.000%
1,000,000 1,047,500 0.4607.02.22CommonwealthBank of Australia14 EMTN
CHF 1.500%
1,200,000 1,166,400 0.5002.11.26TransurbanQueenslandFinance Pty Ltd 16EMTN
CHF 0.650%
1.433,282,765Total - Australia
800,000 958,228 0.4124.05.24Barry CallebautServices NV 16
EUR 2.380%Belgium
500,000 518,024 0.2315.06.23Barry CallebautServices NV 13
USD 5.500%
0.641,476,252Total - Belgium
2,000,000 2,014,000 0.8824.02.22Corp Andina deFomento 16 EMTN
CHF 0.150%Venezuela, Bolivarian Republic Of
0.882,014,000Total - Venezuela, Bolivarian Republic Of
500,000 486,121 0.2126.04.21Export-Import Bankof China/The 16
USD 2.000%Cayman Islands
1,000,000 1,016,901 0.4503.04.22Saudi ElectricityGlobal Sukuk Co12
USD 4.210%
0.661,503,022Total - Cayman Islands
1,200,000 1,192,200 0.5205.12.24Banco de Chile 16CHF 0.250%Chile
0.521,192,200Total - Chile
500,000 489,921 0.2128.11.22Export-Import Bankof China/The 17EMTN
USD 2.750%China
0.21489,921Total - China
2,840,000 3,750,220 1.6313.10.31Kommunekredit 06EMTN
CHF 2.880%Denmark
1.633,750,220Total - Denmark
3,000,000 2,265,799 0.9907.02.22Kreditanstalt fuerWiederaufbau 19
CAD 2.000%Germany
2,000,000 2,018,000 0.8831.12.99Allianz SE 14 FRNEMTN
CHF 3.250%
1,100,000 1,252,350 0.5519.09.23DEPFA DeutschePfandbriefbank AG06 EMTN
CHF 3.125%
1,000,000 1,006,500 0.4401.12.25Deutsche BahnFinance BV 15EMTN
CHF 0.100%
Securities Marketvalue in
CHF
% of netassets*
Quantity Ccy Maturity
1,640,000 1,687,560 0.7403.06.20Deutsche BahnFinance GMBH 10EMTN
CHF 1.750%
270,000 257,310 0.1119.12.23Deutsche Bank AG15 EMTN
CHF 0.625%
2,950,000 2,923,450 1.2705.07.21Deutsche Bank AG16 EMTN
CHF 0.750%
3,430,000 3,574,060 1.5512.08.20KFW 10CHF 2.250%2,010,000 2,372,805 1.0325.08.25Kreditanstalt fuer
Wiederaufbau 05EMTN
CHF 2.500%
1,100,000 1,273,665 0.5607.07.45Allianz SE 15 FRNEUR 2.240%8.1218,631,499Total - Germany
2,000,000 2,156,000 0.9415.04.21MunicipalityFinance PLC 09EMTN
CHF 3.000%Finland
2,000,000 2,362,000 1.0330.03.26MunicipalityFinance PLC 11EMTN
CHF 2.380%
300,000 141,600 0.0631.12.99Nordic InvestmentBank 86 FRN
CHF 1.375%
600,000 617,400 0.2714.07.21OP Corporate Bankplc 14 EMTN
CHF 1.000%
2.305,277,000Total - Finland
1,000,000 1,066,500 0.4611.04.23Banque Federativedu Credit MutuelSA 13 EMTN
CHF 1.625%France
1,500,000 1,598,250 0.7012.09.22BNP Paribas SA 12EMTN
CHF 1.880%
2,750,000 2,754,125 1.2014.10.24Electricite deFrance SA 16EMTN
CHF 0.300%
550,000 552,475 0.2420.04.22RCI Banque SA 17EMTN
CHF 0.500%
1,300,000 1,300,000 0.5730.05.23RCI Banque SA 18EMTN
CHF 0.550%
3,050,000 4,140,375 1.8030.06.32SNCF Reseau EPIC06 EMTN
CHF 3.250%
1,000,000 1,260,500 0.5510.03.31SNCF Reseau EPIC11 EMTN
CHF 2.625%
1,100,000 1,100,000 0.4822.02.22Societe GeneraleSA 17 EMTN
CHF 0.400%
1,000,000 1,054,000 0.4629.08.24Total CapitalInternational SA 14EMTN
CHF 1.000%
1,000,000 1,005,000 0.4413.07.26Total CapitalInternational SA 18EMTN
CHF 0.288%
1,000,000 1,141,440 0.5029.05.37SNCF Reseau EPIC16 EMTN
EUR 1.500%
750,000 737,759 0.3202.12.21BPCE SA 16USD 2.750%7.7217,710,424Total - France
1,000,000 1,013,000 0.4426.08.22Central AmericanBank for EconomicIntegration 16EMTN
CHF 0.370%Honduras
0.441,013,000Total - Honduras

31
Vontobel Fund - Swiss Franc Bond
The accompanying notes form an essential part of these financial statements.
Portfolio as at February 28, 2019
* Any deviations of the percentages of the nets assets are due to rounding.
Securities Marketvalue in
CHF
% of netassets*
Quantity Ccy Maturity
250,000 261,750 0.1126.02.21Russian Railwaysvia RZD CapitalPLC 13
CHF 2.730%Ireland
0.11261,750Total - Ireland
790,000 743,123 0.3213.04.26Japan Tobacco Inc16 EMTN
USD 2.800%Japan
1,000,000 1,007,418 0.4401.06.23Tokyo MetropolitanGovernment 18
USD 3.250%
0.761,750,541Total - Japan
2,500,000 2,542,500 1.1117.05.24Heathrow FundingLtd 16 EMTN
CHF 0.500%Jersey
1,600,000 1,624,000 0.7122.02.22UBS GroupFundingSwitzerland AG 16
CHF 0.750%
1.824,166,500Total - Jersey
1,500,000 1,512,000 0.6630.12.22Bank of Montreal18 EMTN
CHF 0.050%Canada
3,000,000 3,046,500 1.3319.11.25Bank of NovaScotia/The 18EMTN
CHF 0.200%
2,000,000 2,015,000 0.8831.07.23Canadian ImperialBank of Commerce18 EMTN
CHF 0.150%
1,000,000 1,011,500 0.4407.02.29Province of AlbertaCanada 19 EMTN
CHF 0.375%
700,000 698,600 0.3015.03.39Province ofManitoba Canada19 EMTN
CHF 0.800%
2,000,000 1,933,000 0.8407.11.31Province of NewBrunswick Canada16
CHF 0.200%
3,000,000 3,157,499 1.3721.11.24Province of QuebecCanada 14 EMTN
CHF 0.750%
15,000 15,098 0.0118.07.23Royal Bank ofCanada 18 EMTN
CHF 0.100%
500,000 500,362 0.2215.03.23ExportDevelopmentCanada 18
USD 2.750%
6.0513,889,559Total - Canada
1,855,000 1,926,418 0.8420.06.22Kazakhstan TemirZholy National CoJSC 14
CHF 3.638%Kazakhstan
0.841,926,418Total - Kazakhstan
1,500,000 1,556,250 0.6810.05.21LGT Bank AG 14CHF 1.500%Liechtenstein
0.681,556,250Total - Liechtenstein
1,750,000 1,822,800 0.7910.07.20EuropeanInvestment Bank 05
CHF 2.375%Luxembourg
2,000,000 2,357,000 1.0311.02.25EuropeanInvestment Bank 10
CHF 2.625%
Securities Marketvalue in
CHF
% of netassets*
Quantity Ccy Maturity
800,000 872,000 0.3824.08.22EuropeanInvestment Bank 10EMTN
CHF 2.000%
4,000,000 4,417,999 1.9402.08.24EuropeanInvestment Bank 12
CHF 1.500%
1,175,000 1,323,638 0.5821.02.28EuropeanInvestment Bank 13
CHF 1.380%
1,680,000 1,707,720 0.7425.10.19Gazprom OAO ViaGaz Capital SA 13EMTN
CHF 2.850%
1,000,000 1,042,500 0.4530.11.21Gazprom OAO ViaGaz Capital SA 16
CHF 2.750%
250,000 254,100 0.1123.12.19Glencore FinanceEurope Ltd 13EMTN
CHF 2.125%
305,000 317,658 0.1410.05.21Glencore FinanceEurope Ltd 16EMTN
CHF 2.250%
2,500,000 2,461,910 1.0715.10.21EuropeanInvestment Bank 14
USD 2.125%
7.2316,577,325Total - Luxembourg
500,000 502,877 0.2212.08.19Petronas CapitalLtd 09
USD 5.250%Malaysia
0.22502,877Total - Malaysia
1,935,000 1,948,545 0.8508.12.20PetroleosMexicanos 15EMTN
CHF 1.500%Mexico
800,000 828,000 0.3614.12.21PetroleosMexicanos 16EMTN
CHF 2.380%
600,000 684,306 0.3021.02.24PetroleosMexicanos 17EMTN
EUR 3.750%
1.513,460,851Total - Mexico
2,200,000 2,195,600 0.9602.08.24ASB Finance Ltd17 EMTN
CHF 0.200%New Zealand
0.962,195,600Total - New Zealand
1,500,000 1,509,000 0.6618.12.24ABN AMRO BankNV 16 EMTN
CHF 0.300%Netherlands
1,700,000 1,779,050 0.7814.10.20BNG Bank NV 05EMTN
CHF 2.250%
2,000,000 2,349,000 1.0221.07.25BNG Bank NV 05EMTN
CHF 2.500%
1,495,000 1,618,338 0.7130.04.24BNG Bank NV 14EMTN
CHF 1.250%
2,000,000 2,158,000 0.9424.07.23Deutsche BahnFinance GMBH 13EMTN
CHF 1.375%
1,000,000 1,029,000 0.4522.09.22EBN BV 14CHF 0.500%3,000,000 3,159,000 1.3722.09.26EBN BV 14CHF 0.875%1,000,000 993,000 0.4303.09.24Enel Finance
International NV 17EMTN
CHF 0.550%
2,000,000 2,223,000 0.9727.01.23NederlandseWaterschapsbankNV 06 EMTN
CHF 2.380%

32
Vontobel Fund - Swiss Franc Bond
The accompanying notes form an essential part of these financial statements.
Portfolio as at February 28, 2019
* Any deviations of the percentages of the nets assets are due to rounding.
Securities Marketvalue in
CHF
% of netassets*
Quantity Ccy Maturity
1,000,000 1,086,000 0.4709.08.24NederlandseWaterschapsbankNV 12 EMTN
CHF 1.250%
2,500,000 2,795,000 1.2213.09.27NederlandseWaterschapsbankNV 12 EMTN
CHF 1.375%
1,750,000 1,789,375 0.7821.08.23Shell InternationalFinance BV 15EMTN
CHF 0.375%
2,330,000 2,431,355 1.0621.08.28Shell InternationalFinance BV 15EMTN
CHF 0.875%
500,000 573,153 0.2530.03.21GeberitInternational BV 15
EUR 0.690%
1,200,000 1,405,352 0.6124.05.21Robert BoschInvestmentNederland BV 13EMTN
EUR 1.625%
11.7226,897,623Total - Netherlands
1,000,000 1,025,900 0.4514.02.20Norske Tog AS 11EMTN
CHF 2.125%Norway
1,125,000 1,182,938 0.5108.02.21Statnett SF 11EMTN
CHF 2.375%
0.962,208,838Total - Norway
1,000,000 1,004,500 0.4430.12.20HYPO NOE GruppeBank AG 17 EMTN
CHF 0,000%Austria
740,000 739,630 0.3217.10.23Hypoe NOELandesbank fuerNiederoesterreichund Wien AG 16EMTN
CHF 0.125%
1,400,000 1,505,700 0.6614.02.22KommunalkreditAustria AG 06EMTN
CHF 2.500%
1,070,000 1,380,300 0.6025.02.30OesterreichischeKontrollbank AG 05
CHF 2.880%
1,300,000 1,515,800 0.6622.11.24OesterreichischeKontrollbank AG 06
CHF 2.625%
760,000 779,380 0.3412.11.20RaiffeisenlandesbankNiederoesterreich-Wien AG 12 EMTN
CHF 1.000%
1,500,000 1,509,750 0.6606.10.21VorarlbergerLandes- undHypothekenbankAG 16 EMTN
CHF 0.125%
1,000,000 1,225,667 0.5313.12.22Heta AssetResolution AG 12
EUR 2.375%
4.219,660,727Total - Austria
1,350,000 1,738,125 0.7612.02.30Asian DevelopmentBank 10 EMTN
CHF 2.750%Philippines
0.761,738,125Total - Philippines
1,450,000 1,412,300 0.6208.02.44Akademiska HusAB 18 EMTN
CHF 0.650%Sweden
2,000,000 2,107,000 0.9228.02.22Kommuninvest ISverige AB 12EMTN
CHF 1.250%
Securities Marketvalue in
CHF
% of netassets*
Quantity Ccy Maturity
2,225,000 2,358,500 1.0216.09.24LansforsakringarHypotek AB 14EMTN
CHF 0.880%
900,000 967,050 0.4217.07.23SvenskExportkredit AB 13EMTN
CHF 1.250%
2.986,844,850Total - Sweden
1,000,000 1,005,000 0.4401.07.25AargauischeKantonalbank 16
CHF 0.060%Switzerland
500,000 503,000 0.2211.02.26AargauischeKantonalbank 19
CHF 0.125%
465,000 495,923 0.2216.05.22Alpiq Holding AG12
CHF 3.000%
160,000 169,040 0.0729.07.24Alpiq Holding AG14
CHF 2.625%
1,200,000 1,247,400 0.5429.05.24Axpo Holding AG16
CHF 1.750%
1,800,000 1,818,900 0.7928.11.25Banque CantonaleVaudoise 17
CHF 0.250%
700,000 706,650 0.3122.02.34Canton of Basel-City 19
CHF 0.500%
650,000 622,700 0.2704.07.46Canton of GenevaSwitzerland 16
CHF 0.600%
1,000,000 1,011,000 0.4429.11.27Canton of GenevaSwitzerland 17
CHF 0.250%
2,000,000 2,038,999 0.8926.11.27Canton ofGraubuenden 15
CHF 0.250%
2,190,000 1,997,280 0.8727.06.44Canton of Ticino 16CHF 0.400%2,300,000 2,337,949 1.0127.06.25Canton of Zurich
18CHF 0,000%
1,140,000 1,159,950 0.5102.11.22ElectriciteD'emosson SA 17
CHF 1.375%
1,335,000 1,379,055 0.6012.05.22Grande Dixence SA16
CHF 1.750%
1,850,000 1,829,650 0.8028.07.28KinderspitalZuerich-Eleonorenstiftung16
CHF 0.250%
130,000 125,385 0.0527.03.42Kraftwerke Linth-Limmern AG 12
CHF 2.875%
1,690,000 1,814,215 0.7910.12.26Kraftwerke Linth-Limmern AG 13
CHF 2.380%
680,000 658,920 0.2902.04.48Kraftwerke Linth-Limmern AG 13
CHF 3.000%
970,000 1,001,040 0.4406.12.22Kraftwerke Linth-Limmern AG 16
CHF 1.500%
1,400,000 1,513,400 0.6621.02.25KraftwerkeOberhasli AG 13
CHF 1.875%
1,500,000 1,507,500 0.6621.01.30PfandbriefbankschweizerischerHypothekarinstituteAG 15
CHF 0.375%
500,000 515,700 0.2225.06.37PfandbriefbankschweizerischerHypothekarinstituteAG 15
CHF 0.875%
540,000 570,888 0.2525.01.45PfandbriefbankschweizerischerHypothekarinstituteAG 15
CHF 1.000%
1,600,000 1,625,600 0.7105.08.26PfandbriefbankschweizerischerHypothekarinstituteAG 16
CHF 0.250%
1,500,000 1,503,750 0.6622.04.25Raiffeisen SchweizGenossenschaft 16
CHF 0.300%
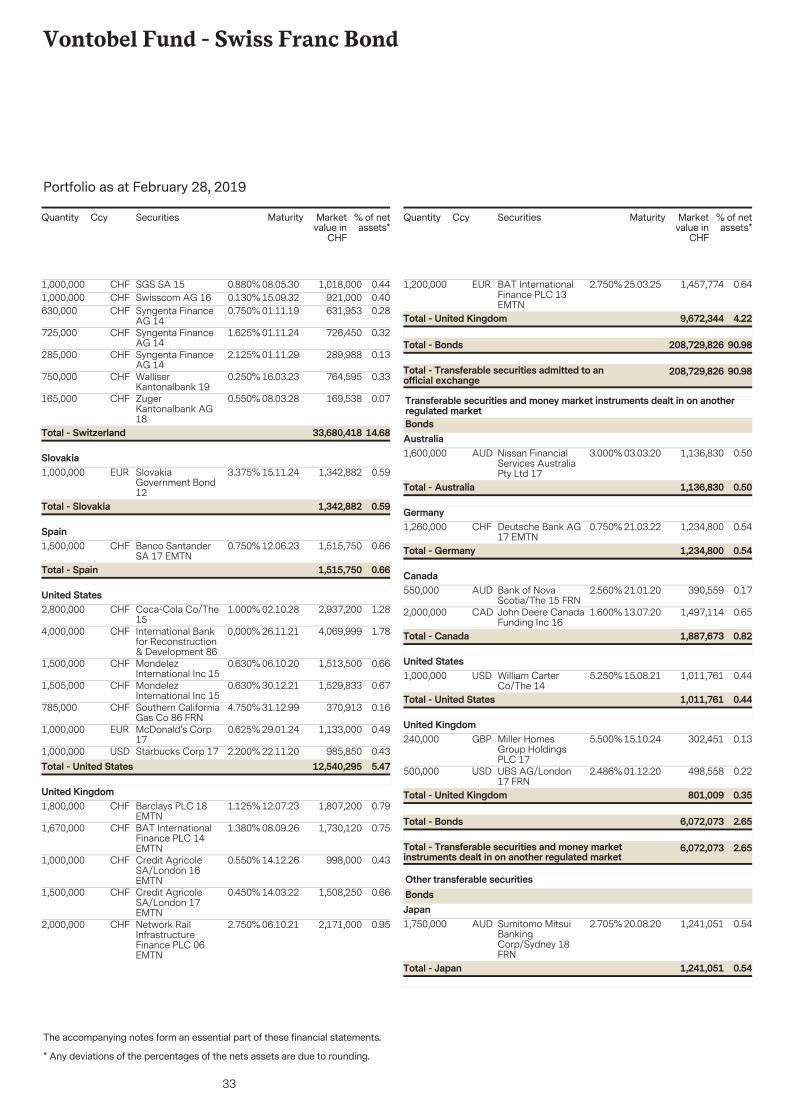
33
Vontobel Fund - Swiss Franc Bond
The accompanying notes form an essential part of these financial statements.
Portfolio as at February 28, 2019
* Any deviations of the percentages of the nets assets are due to rounding.
Securities Marketvalue in
CHF
% of netassets*
Quantity Ccy Maturity
1,000,000 1,018,000 0.4408.05.30SGS SA 15CHF 0.880%1,000,000 921,000 0.4015.09.32Swisscom AG 16CHF 0.130%630,000 631,953 0.2801.11.19Syngenta Finance
AG 14CHF 0.750%
725,000 726,450 0.3201.11.24Syngenta FinanceAG 14
CHF 1.625%
285,000 289,988 0.1301.11.29Syngenta FinanceAG 14
CHF 2.125%
750,000 764,595 0.3316.03.23WalliserKantonalbank 19
CHF 0.250%
165,000 169,538 0.0708.03.28ZugerKantonalbank AG18
CHF 0.550%
14.6833,680,418Total - Switzerland
1,000,000 1,342,882 0.5915.11.24SlovakiaGovernment Bond12
EUR 3.375%Slovakia
0.591,342,882Total - Slovakia
1,500,000 1,515,750 0.6612.06.23Banco SantanderSA 17 EMTN
CHF 0.750%Spain
0.661,515,750Total - Spain
2,800,000 2,937,200 1.2802.10.28Coca-Cola Co/The15
CHF 1.000%United States
4,000,000 4,069,999 1.7826.11.21International Bankfor Reconstruction& Development 86
CHF 0,000%
1,500,000 1,513,500 0.6606.10.20MondelezInternational Inc 15
CHF 0.630%
1,505,000 1,529,833 0.6730.12.21MondelezInternational Inc 15
CHF 0.630%
785,000 370,913 0.1631.12.99Southern CaliforniaGas Co 86 FRN
CHF 4.750%
1,000,000 1,133,000 0.4929.01.24McDonald's Corp17
EUR 0.625%
1,000,000 985,850 0.4322.11.20Starbucks Corp 17USD 2.200%5.4712,540,295Total - United States
1,800,000 1,807,200 0.7912.07.23Barclays PLC 18EMTN
CHF 1.125%United Kingdom
1,670,000 1,730,120 0.7508.09.26BAT InternationalFinance PLC 14EMTN
CHF 1.380%
1,000,000 998,000 0.4314.12.26Credit AgricoleSA/London 16EMTN
CHF 0.550%
1,500,000 1,508,250 0.6614.03.22Credit AgricoleSA/London 17EMTN
CHF 0.450%
2,000,000 2,171,000 0.9506.10.21Network RailInfrastructureFinance PLC 06EMTN
CHF 2.750%
Securities Marketvalue in
CHF
% of netassets*
Quantity Ccy Maturity
1,200,000 1,457,774 0.6425.03.25BAT InternationalFinance PLC 13EMTN
EUR 2.750%
90.98208,729,826Total - Transferable securities admitted to anofficial exchange
90.98208,729,826Total - Bonds
4.229,672,344Total - United Kingdom
1,600,000 1,136,830 0.5003.03.20Nissan FinancialServices AustraliaPty Ltd 17
AUD 3.000%
Transferable securities and money market instruments dealt in on anotherregulated marketBondsAustralia
0.501,136,830Total - Australia
1,260,000 1,234,800 0.5421.03.22Deutsche Bank AG17 EMTN
CHF 0.750%Germany
0.541,234,800Total - Germany
550,000 390,559 0.1721.01.20Bank of NovaScotia/The 15 FRN
AUD 2.560%Canada
2,000,000 1,497,114 0.6513.07.20John Deere CanadaFunding Inc 16
CAD 1.600%
0.821,887,673Total - Canada
1,000,000 1,011,761 0.4415.08.21William CarterCo/The 14
USD 5.250%United States
0.441,011,761Total - United States
240,000 302,451 0.1315.10.24Miller HomesGroup HoldingsPLC 17
GBP 5.500%United Kingdom
500,000 498,558 0.2201.12.20UBS AG/London17 FRN
USD 2.486%
2.656,072,073Total - Transferable securities and money marketinstruments dealt in on another regulated market
2.656,072,073Total - Bonds
0.35801,009Total - United Kingdom
1,750,000 1,241,051 0.5420.08.20Sumitomo MitsuiBankingCorp/Sydney 18FRN
AUD 2.705%
Other transferable securitiesBondsJapan
0.541,241,051Total - Japan

34
Vontobel Fund - Swiss Franc Bond
The accompanying notes form an essential part of these financial statements.
Portfolio as at February 28, 2019
* Any deviations of the percentages of the nets assets are due to rounding.
Securities Marketvalue in
CHF
% of netassets*
Quantity Ccy Maturity
600,000 424,887 0.1919.10.23Korea DevelopmentBank/The 18 FRN
AUD 3.054%Korea, Republic Of
0.731,665,938Total - Bonds
0.19424,887Total - Korea, Republic Of
26,966 2,723,872 1.19Vontobel Fund -Global Bond - HI(CHF)
CHF
Investment fundsLuxembourg
9,938 1,182,799 0.52Vontobel Fund -Global ConvertibleBond HI HedgedCap
CHF
19,226 2,948,052 1.27Vontobel Fund -High Yield Bond - I
EUR
3.718,520,661Total - Other transferable securities
2.986,854,723Total - Investment funds
2.986,854,723Total - Luxembourg
97.34223,322,560Total - Investment in securities

35
Vontobel Fund - Euro Bond
AssetsInvestments in securities at market value 55,117,550(2)
1,381,392Cash at banks
966Receivable from foreign currencies
10,855Receivable from subscriptions
439,123Interest and dividends receivable(2)
1,152,183Receivable for investments soldTotal Assets 58,102,069
54,241,798Statement of Net Assetsas at February 28, 2019
LiabilitiesPayable for redemptions 117,448
Payable for investments purchased 1,013,052
Payable on foreign currencies 966
Interest and dividends payable 899
Unrealised loss on futures 14,470(9)
Audit fees, printing and publishing expenses -1,662
Service Fee payable 7,979(5)
Subscription tax payable 3,715(4)
Management Fee payable 31,182(3)
Other liabilities 1,328Total Liabilities 1,189,377Total net assets at the end of the period 56,912,692Net assets at the beginning of the reporting period 77,489,583
Net investment income 314,174
Change in unrealised appreciation/depreciation on:
Investments 996,368
Futures -57,083
Net realised gain/loss on investments 200,978(2)
Net realised gain/loss on currency exchange 262(2)
Net realised gain/loss on futures -355,912(2)
Increase/Decrease in net assets resulting from operations 1,098,787Subscriptions of shares 23,833,646
Redemptions of shares -45,429,323
Dividend distribution -80,001(11)
Total net assets at the end of the period 56,912,692
Statement of Operations andChanges in Net Assetsfrom September 1, 2018to February 28, 2019
IncomeNet interest on bonds 681,979(2)
Total Income 681,979ExpensesManagement Fees 229,157(3)
Audit fees, printing and publishing expenses 16,324
Subscription tax 12,006(4)
Bank interest 7,441
Service Fees 70,604(5)
Other Fees payable 32,273(8)
Total Expenses 367,805Net investment income 314,174
Statement of Net Incomefrom September 1, 2018to February 28, 2019
Notes EURThe accompanying notes form an essential part of these financial statements.
Cost

36
Vontobel Fund - Euro Bond
The accompanying notes form an essential part of these financial statements.
Portfolio as at February 28, 2019
* Any deviations of the percentages of the nets assets are due to rounding.
Securities Marketvalue in
EUR
% of netassets*
Quantity Ccy Maturity
500,000 510,770 0.9022.06.28Kingdom ofBelgiumGovernment Bond18
EUR 0.800%
Transferable securities admitted to an official exchangeBondsBelgium
0.90510,770Total - Belgium
500,000 712,960 1.2515.08.46BundesrepublikDeutschland 14
EUR 2.500%Germany
250,000 397,210 0.7004.01.37BundesrepublikDeutschlandBundesanleihe 05
EUR 4.000%
1,500,000 2,331,840 4.1004.07.42BundesrepublikDeutschlandBundesanleihe 10
EUR 3.250%
4,000,000 4,152,800 7.2915.02.28BundesrepublikDeutschlandBundesanleihe 18
EUR 0.500%
13.347,594,810Total - Germany
1,200,000 1,339,860 2.3525.05.24BpifranceFinancement SA 13EMTN
EUR 2.500%France
300,000 489,276 0.8625.10.32FranceGovernment BondOAT 01
EUR 5.750%
500,000 746,080 1.3125.10.38French RepublicGovernment BondOAT 06
EUR 4.000%
500,000 618,515 1.0925.04.26French RepublicGovernment BondOAT 10
EUR 3.500%
500,000 601,050 1.0625.10.27French RepublicGovernment BondOAT 12
EUR 2.750%
1,700,000 2,366,672 4.1625.05.45French RepublicGovernment BondOAT 13
EUR 3.250%
725,000 741,218 1.3025.05.28French RepublicGovernment BondOAT 17
EUR 0.750%
12.136,902,671Total - France
250,000 255,200 0.4515.05.28IrelandGovernment Bond18
EUR 0.900%Ireland
0.45255,200Total - Ireland
300,000 319,752 0.5604.05.26AssicurazioniGenerali SpA 14EMTN
EUR 4.130%Italy
250,000 251,840 0.4429.01.29AssicurazioniGenerali SpA 19EMTN
EUR 3.875%
1,000,000 1,299,270 2.2801.05.31Italy BuoniPoliennali DelTesoro 00
EUR 6.000%
2,750,000 2,921,435 5.1301.03.21Italy BuoniPoliennali DelTesoro 10
EUR 3.750%
Securities Marketvalue in
EUR
% of netassets*
Quantity Ccy Maturity
750,000 882,023 1.5501.09.28Italy BuoniPoliennali DelTesoro 13
EUR 4.750%
5,250,000 5,397,577 9.4901.12.24Italy BuoniPoliennali DelTesoro 14
EUR 2.500%
10,000,000 10,052,899 17.6701.05.20Italy BuoniPoliennali DelTesoro 15
EUR 0.700%
2,000,000 2,012,920 3.5415.04.22Italy BuoniPoliennali DelTesoro 15
EUR 1.350%
2,500,000 2,467,025 4.3301.11.21Italy BuoniPoliennali DelTesoro 16
EUR 0.350%
500,000 478,560 0.8401.06.26Italy BuoniPoliennali DelTesoro 16
EUR 1.600%
750,000 640,628 1.1301.03.47Italy BuoniPoliennali DelTesoro 16
EUR 2.700%
1,000,000 979,290 1.7201.06.27Italy BuoniPoliennali DelTesoro 17
EUR 2.200%
500,000 516,880 0.9101.10.23Italy BuoniPoliennali DelTesoro 18
EUR 2.450%
500,000 502,940 0.8801.12.28Italy BuoniPoliennali DelTesoro 18
EUR 2.800%
1,250,000 1,162,875 2.0401.09.38Italy BuoniPoliennali DelTesoro 18
EUR 2.950%
250,000 252,223 0.4401.09.49Italy BuoniPoliennali DelTesoro 19
EUR 3.850%
150,000 147,068 0.2613.02.24Societa' Per LAGestione DIAttivita' SpA 19EMTN
EUR 2.625%
53.2130,285,205Total - Italy
1,000,000 1,043,120 1.8322.04.25EDP Finance BV 15EMTN
EUR 2.000%Netherlands
1.831,043,120Total - Netherlands
500,000 503,665 0.8824.01.24PKO BankHipoteczny SA 18
EUR 0.750%Poland
0.88503,665Total - Poland
500,000 504,375 0.8917.10.22Caixa EconomicaMontepio GeralCaixa EconomicaBancaria SA 17EMTN
EUR 0.875%Portugal
200,000 255,924 0.4515.04.37PortugalObrigacoes doTesouro OT 06
EUR 4.100%
250,000 307,688 0.5415.02.30PortugalObrigacoes doTesouro OT 14
EUR 3.875%

37
Vontobel Fund - Euro Bond
The accompanying notes form an essential part of these financial statements.
Portfolio as at February 28, 2019
* Any deviations of the percentages of the nets assets are due to rounding.
Securities Marketvalue in
EUR
% of netassets*
Quantity Ccy Maturity
500,000 522,890 0.9215.06.29PortugalObrigacoes doTesouro OT 19
EUR 1.950%
2.801,590,877Total - Portugal
750,000 799,883 1.4130.04.25AutonomousCommunity ofMadrid Spain 15
EUR 1.826%Spain
500,000 551,070 0.9716.10.24Cores 14EUR 2.500%250,000 370,760 0.6530.07.40Spain Government
Bond 07EUR 4.900%
500,000 528,430 0.9330.07.30Spain GovernmentBond 15
EUR 1.950%
600,000 620,718 1.0931.10.27Spain GovernmentBond 17
EUR 1.450%
1,015,000 1,008,838 1.7730.07.35Spain GovernmentBond 19
EUR 1.850%
6.823,879,699Total - Spain
1,000,000 1,005,040 1.7730.04.20UniCredit BankCzech Republic &Slovakia AS 15EMTN
EUR 0.630%Czech Republic
1.771,005,040Total - Czech Republic
150,000 153,711 0.2726.02.34CyprusGovernmentInternational Bond19 EMTN
EUR 2.750%Cyprus
94.4053,724,768Total - Transferable securities admitted to anofficial exchange
94.4053,724,768Total - Bonds
0.27153,711Total - Cyprus
500,000 535,465 0.9414.11.29VseobecnaUverova Banka AS14
EUR 2.250%
Transferable securities and money market instruments dealt in on anotherregulated marketBondsSlovakia
0.94535,465Total - Slovakia
300,000 333,672 0.5931.10.46Spain GovernmentBond 16
EUR 2.900%Spain
0.59333,672Total - Spain
Securities Marketvalue in
EUR
% of netassets*
Quantity Ccy Maturity
500,000 523,645 0.9225.09.28CyprusGovernmentInternational Bond18 EMTN
EUR 2.375%Cyprus
2.451,392,782Total - Transferable securities and money marketinstruments dealt in on another regulated market
2.451,392,782Total - Bonds
0.92523,645Total - Cyprus
96.8555,117,550Total - Investment in securities

38
Vontobel Fund - EUR Corporate Bond Mid Yield
AssetsInvestments in securities at market value 1,530,886,295(2)
25,773,783Cash at banks
1,064Receivable from foreign currencies
4,105,149Receivable from subscriptions
19,828,727Interest and dividends receivable(2)
2,676,688Receivable for investments soldTotal Assets 1,583,271,706
1,523,827,325Statement of Net Assetsas at February 28, 2019
LiabilitiesBank overdraft 277,400
Payable for redemptions 1,252,790
Payable for investments purchased 5,555,386
Payable on foreign currencies 1,065
Unrealised loss on forward foreign exchange contracts 543,783(9)
Unrealised loss on futures 53,991(9)
Audit fees, printing and publishing expenses 47,534
Service Fee payable 211,053(5)
Subscription tax payable 50,561(4)
Management Fee payable 764,136(3)
Other liabilities 2,688Total Liabilities 8,760,387Total net assets at the end of the period 1,574,511,319Net assets at the beginning of the reporting period 1,805,142,568
Net investment income 15,658,662
Change in unrealised appreciation/depreciation on:
Investments 8,013,873
Futures -357,919
Forward foreign exchange contracts -3,273,703
Swaps 2,166,411
Net realised gain/loss on investments -10,741,983(2)
Net realised gain/loss on forward foreign exchange contracts -2,744,013(2)
Net realised gain/loss on currency exchange 438,076(2)
Net realised gain/loss on futures 1,121,098(2)
Net realised gain/loss on swaps -2,211,308(2)
Increase/Decrease in net assets resulting from operations 8,069,194Subscriptions of shares 260,069,333
Redemptions of shares -494,370,111
Dividend distribution -4,399,665(11)
Total net assets at the end of the period 1,574,511,319
Statement of Operations andChanges in Net Assetsfrom September 1, 2018to February 28, 2019
Notes EURThe accompanying notes form an essential part of these financial statements.
Cost

39
Vontobel Fund - EUR Corporate Bond Mid Yield
IncomeBank interest 22,647
Net interest on bonds 22,567,595(2)
Interest on swaps 51,111(2)
Other income 2,420Total Income 22,643,773ExpensesManagement Fees 5,079,210(3)
Audit fees, printing and publishing expenses 41,022
Subscription tax 150,654(4)
Bank interest 46,173
Interest on swaps 138,889(2)
Service Fees 1,438,389(5)
Other Fees payable 90,774(8)
Total Expenses 6,985,111Net investment income 15,658,662
Statement of Net Incomefrom September 1, 2018to February 28, 2019
Notes EURThe accompanying notes form an essential part of these financial statements.

40
Vontobel Fund - EUR Corporate Bond Mid Yield
The accompanying notes form an essential part of these financial statements.
Portfolio as at February 28, 2019
* Any deviations of the percentages of the nets assets are due to rounding.
Securities Marketvalue in
EUR
% of netassets*
Quantity Ccy Maturity
3,500,000 3,620,960 0.2322.03.23Scentre GroupTrust 1 / ScentreGroup Trust 2 16EMTN
EUR 1.380%
Transferable securities admitted to an official exchangeBondsAustralia
3,000,000 3,050,880 0.1916.07.20Scentre GroupTrust 1 14 EMTN
EUR 1.500%
3,000,000 3,234,390 0.2116.07.24Scentre GroupTrust 1 14 EMTN
EUR 2.250%
0.639,906,230Total - Australia
8,000,000 8,447,200 0.5424.05.24Barry CallebautServices NV 16
EUR 2.380%Belgium
8,000,000 8,471,440 0.5411.05.26Belfius Bank SA 16EUR 3.125%6,000,000 4,751,580 0.3031.12.99Belfius Bank SA/NV
18 FRNEUR 3.625%
5,500,000 5,023,272 0.3215.06.23Barry CallebautServices NV 13
USD 5.500%
1.7026,693,492Total - Belgium
3,000,000 2,519,136 0.1506.12.27Alibaba GroupHolding Ltd 17
USD 3.400%Cayman Islands
3,000,000 2,490,129 0.1606.12.47Alibaba GroupHolding Ltd 17
USD 4.200%
2,000,000 1,679,002 0.1106.12.57Alibaba GroupHolding Ltd 17
USD 4.400%
0.426,688,267Total - Cayman Islands
8,000,000 9,294,400 0.5917.10.42Allianz SE 12 FRNEUR 5.630%Germany
3,500,000 3,950,380 0.2531.12.99Allianz SE 13 FRNEMTN
EUR 4.750%
4,500,000 4,593,240 0.2907.07.45Allianz SE 15 FRNEUR 2.240%7,000,000 7,087,920 0.4505.07.25O2 Telefonica
DeutschlandFinanzierungsGmbH 18
EUR 1.750%
7,500,000 7,836,675 0.5015.01.25Unitymedia HessenGmbH & Co KG /Unitymedia NRWGmbH 14
EUR 4.000%
3,000,000 3,048,120 0.1931.01.24Volkswagen BankGmbH 19 EMTN
EUR 1.875%
7,300,000 7,321,608 0.4716.10.23VolkswagenFinancial ServicesAG 18 EMTN
EUR 1.375%
2.7443,132,343Total - Germany
5,000,000 5,144,600 0.3307.06.27Stora Enso OYJ 17EMTN
EUR 2.500%Finland
7,350,000 7,487,292 0.4715.04.36Stora Enso OYJ 06USD 7.250%0.8012,631,892Total - Finland
5,500,000 5,471,785 0.3517.01.33APRR SA 17 EMTNEUR 1.500%France
6,000,000 6,070,680 0.3913.05.26Autoroutes du Sudde la France SA 16EMTN
EUR 1.000%
Securities Marketvalue in
EUR
% of netassets*
Quantity Ccy Maturity
1,100,000 1,127,599 0.0718.01.27Autoroutes du Sudde la France SA 17EMTN
EUR 1.250%
7,000,000 8,019,900 0.5104.07.43AXA SA 13 FRNEMTN
EUR 5.130%
7,000,000 7,531,370 0.4831.12.99AXA SA 14 FRNEMTN
EUR 3.880%
3,000,000 3,156,270 0.2006.07.47AXA SA 16 FRNEMTN
EUR 3.375%
8,000,000 8,993,840 0.5709.02.22Bouygues SA 12EUR 4.500%12,000,000 13,744,440 0.8718.07.23BPCE SA 13EUR 4.630%2,000,000 2,089,600 0.1317.03.21BPCE SA 14 EMTNEUR 2.130%8,000,000 8,108,400 0.5118.01.23BPCE SA 17 EMTNEUR 1.125%5,000,000 5,036,200 0.3203.09.25Cie Generale des
EtablissementsMichelin SCA 18
EUR 0.875%
7,000,000 8,076,740 0.5130.09.41CNP Assurances11 FRN
EUR 6.875%
10,000,000 10,691,000 0.6831.12.99CNP Assurances14 FRN
EUR 4.000%
4,000,000 4,070,640 0.2605.02.29CNP Assurances19 EMTN
EUR 2.750%
6,000,000 6,079,440 0.3929.09.24Coentreprise deTransportd'Electricite SA 17
EUR 0.875%
9,900,000 10,484,892 0.6731.12.99Electricite deFrance SA 14 FRNEMTN
EUR 4.125%
9,000,000 9,153,720 0.5831.12.99Electricite deFrance SA 18 FRN
EUR 4.000%
4,000,000 4,140,200 0.2620.01.25Gecina SA 15EMTN
EUR 1.500%
7,000,000 6,607,580 0.4230.01.29Gecina SA 16EMTN
EUR 1.000%
1,000,000 1,110,300 0.0727.10.21Holdingd'Infrastructures deTransport SAS 06
EUR 4.880%
2,000,000 2,065,900 0.1324.03.25Holdingd'Infrastructures deTransport SAS 14
EUR 2.250%
1,000,000 968,180 0.0627.11.27Holdingd'Infrastructures deTransport SAS 17EMTN
EUR 1.625%
4,000,000 4,220,320 0.2719.02.26Klepierre 16 EMTNEUR 1.880%10,000,000 10,060,400 0.6412.09.25Orange SA 18
EMTNEUR 1.000%
9,000,000 9,511,020 0.6023.09.24Orano SA 09 EMTNEUR 4.875%2,000,000 2,037,000 0.1317.11.20RCI Banque SA 15
EMTNEUR 1.380%
13,000,000 13,212,030 0.8408.06.22RCI Banque SA 15EMTN
EUR 1.250%
1,500,000 1,503,705 0.1012.01.22RCI Banque SA 17EMTN
EUR 0.750%
8,000,000 8,408,560 0.5308.06.46SCOR SE 15 FRNEUR 3.000%8,000,000 8,284,560 0.5319.10.22TDF Infrastructure
SAS 15EUR 2.880%
9,500,000 9,418,775 0.6007.04.26TDF InfrastructureSAS 16
EUR 2.500%
13,000,000 13,024,440 0.8303.04.24Teleperformance17
EUR 1.500%
8,000,000 8,217,760 0.5231.12.99TOTAL SA 15 FRNEMTN
EUR 2.250%
13,500,000 14,685,840 0.9431.12.99TOTAL SA 16 FRNEMTN
EUR 3.875%

41
Vontobel Fund - EUR Corporate Bond Mid Yield
The accompanying notes form an essential part of these financial statements.
Portfolio as at February 28, 2019
* Any deviations of the percentages of the nets assets are due to rounding.
Securities Marketvalue in
EUR
% of netassets*
Quantity Ccy Maturity
11,000,000 11,495,550 0.7305.08.25Transport etInfrastructures GazFrance SA 15
EUR 2.200%
6,000,000 6,490,560 0.4122.01.24Valeo SA 14 EMTNEUR 3.250%2,000,000 1,928,220 0.1218.03.26Valeo SA 16 EMTNEUR 1.630%5,000,000 5,089,550 0.3224.11.23Vivendi SA 16EUR 1.125%3,000,000 3,757,265 0.2431.12.99Orange SA 14 FRN
EMTNGBP 5.750%
7,000,000 5,228,699 0.3331.12.99SCOR SE 18 FRNUSD 5.250%17.11269,372,930Total - France
5,000,000 5,106,100 0.3214.04.22Credit SuisseGroup FundingGuernsey Ltd 15EMTN
EUR 1.250%Guernsey
0.325,106,100Total - Guernsey
11,600,000 13,005,804 0.8302.10.43Aquarius &Investments PLCfor ZurichInsurance Co Ltd13 FRN EMTN
EUR 4.250%Ireland
2,000,000 2,547,120 0.1619.12.22Bank of Ireland 12EMTN
EUR 10.000%
6,000,000 6,051,720 0.3811.06.24Bank of Ireland 14FRN EMTN
EUR 4.250%
4,000,000 4,756,520 0.3022.02.27GE CapitalEuropean FundingUnlimited Co 07EMTN
EUR 4.625%
1.6726,361,164Total - Ireland
5,000,000 5,240,250 0.3320.02.21Aeroporti di RomaSpA 13 EMTN
EUR 3.250%Italy
4,000,000 3,888,240 0.2508.06.27Aeroporti di RomaSpA 17 EMTN
EUR 1.625%
12,000,000 15,082,920 0.9610.07.42AssicurazioniGenerali SpA 12FRN EMTN
EUR 10.125%
2,000,000 2,050,360 0.1314.01.20AssicurazioniGenerali SpA 14EMTN
EUR 2.880%
2,000,000 2,131,680 0.1404.05.26AssicurazioniGenerali SpA 14EMTN
EUR 4.130%
11,000,000 11,571,780 0.7316.07.24Banca Monte deiPaschi di SienaSpA 14
EUR 2.880%
10,000,000 10,021,200 0.6426.11.25Banca Monte deiPaschi di SienaSpA 15
EUR 2.130%
8,500,000 9,343,455 0.5910.01.74Enel SpA 13 FRNEUR 6.500%2,000,000 2,052,180 0.1302.02.26Eni SpA 15 EMTNEUR 1.500%10,700,000 11,162,989 0.7131.12.99Intesa Sanpaolo
SpA 09 FRNEUR 8.375%
5,000,000 5,148,350 0.3318.06.21Intesa SanpaoloSpA 14 EMTN
EUR 2.000%
3,000,000 3,085,110 0.2015.09.26Intesa SanpaoloSpA 14 EMTN
EUR 3.928%
4,000,000 4,037,760 0.2614.01.20Intesa SanpaoloSpA 15 EMTN
EUR 1.125%
Securities Marketvalue in
EUR
% of netassets*
Quantity Ccy Maturity
8,000,000 8,013,600 0.5104.03.22Intesa SanpaoloSpA 15 EMTN
EUR 1.130%
2,000,000 1,992,540 0.1323.04.25Intesa SanpaoloSpA 15 EMTN
EUR 2.860%
5,000,000 5,200,150 0.3331.12.99Intesa SanpaoloSpA 16 FRN EMTN
EUR 7.000%
10,000,000 9,999,500 0.6431.12.99Intesa SanpaoloVita SpA 14 FRN
EUR 4.750%
5,000,000 5,327,400 0.3401.05.21Italy BuoniPoliennali DelTesoro 13
EUR 3.750%
15,000,000 16,383,151 1.0301.09.24Italy BuoniPoliennali DelTesoro 14
EUR 3.750%
15,000,000 15,096,900 0.9615.04.22Italy BuoniPoliennali DelTesoro 15
EUR 1.350%
6,500,000 6,318,455 0.4027.09.22Mediobanca Bancadi CreditoFinanziario SpA 17EMTN
EUR 0.625%
8,500,000 9,523,315 0.6018.04.23Mediobanca SpA13
EUR 5.750%
3,600,000 3,656,088 0.2319.01.21Mediobanca SpA16 EMTN
EUR 1.630%
3,000,000 3,016,260 0.1917.02.20Mediobanca SpA17 EMTN
EUR 0.750%
10,000,000 10,132,500 0.6428.05.20RAIRadiotelevisioneItaliana SpA 15
EUR 1.500%
9,000,000 8,490,060 0.5425.10.26Snam SpA 16EMTN
EUR 0.875%
5,000,000 5,094,750 0.3219.01.24Telecom ItaliaSpA/Milano 16EMTN
EUR 3.630%
3,000,000 3,001,260 0.1919.07.23Telecom ItaliaSpA/Milano 17EMTN
EUR 2.500%
4,000,000 4,571,600 0.2931.10.22UniCredit SpA 12EMTN
EUR 6.950%
5,000,000 4,925,550 0.3131.12.99UniCredit SpA 14FRN EMTN
EUR 6.750%
6,000,000 6,063,420 0.3924.10.26UniCredit SpA 16EMTN
EUR 2.125%
5,500,000 5,258,110 0.3318.01.23UniCredit SpA 18EMTN
EUR 1.000%
4,000,000 5,005,435 0.3215.09.76Enel SpA 14 FRNGBP 6.625%1,800,000 2,196,013 0.1419.05.23Telecom Italia
SpA/Milano 06EMTN
GBP 5.875%
10,125,000 8,908,702 0.5712.01.24Intesa SanpaoloSpA 14
USD 5.250%
14.80232,991,033Total - Italy
11,000,000 11,008,580 0.7019.09.25Asahi GroupHoldings Ltd 17
EUR 1.151%Japan
0.7011,008,580Total - Japan
12,000,000 12,235,680 0.7813.09.23Glencore FinanceEurope SA 16EMTN
EUR 1.875%Jersey
19,199,000 19,075,550 1.2111.02.30Heathrow FundingLtd 15 EMTN
EUR 1.500%

42
Vontobel Fund - EUR Corporate Bond Mid Yield
The accompanying notes form an essential part of these financial statements.
Portfolio as at February 28, 2019
* Any deviations of the percentages of the nets assets are due to rounding.
Securities Marketvalue in
EUR
% of netassets*
Quantity Ccy Maturity
9,000,000 8,005,155 0.5129.03.49HBOS CapitalFunding LP 03
USD 6.850%
2.5039,316,385Total - Jersey
4,000,000 4,079,880 0.2601.11.24Arena LuxembourgFinance Sarl 17
EUR 2.875%Luxembourg
2,500,000 2,510,725 0.1601.08.25ContourGlobalPower Holdings SA18
EUR 4.125%
2,000,000 2,205,140 0.1415.07.22Fiat ChryslerFinance Europe SA14 EMTN
EUR 4.750%
2,000,000 2,039,500 0.1324.01.24Gazprom OAO ViaGaz Capital SA 18
EUR 2.949%
9,000,000 9,191,610 0.5918.01.22Glencore FinanceEurope SA 14EMTN
EUR 1.630%
1,000,000 1,080,090 0.0703.04.20HeidelbergCementFinanceLuxembourg SA 10
EUR 7.500%
8,000,000 8,241,360 0.5226.05.23Holcim FinanceLuxembourg SA 16EMTN
EUR 1.375%
5,000,000 5,197,650 0.3317.04.25PrologisInternationalFunding II SA 15EMTN
EUR 1.880%
6,000,000 7,446,540 0.4724.01.33Telecom ItaliaFinance SA 03EMTN
EUR 7.750%
2.6741,992,495Total - Luxembourg
11,000,000 13,224,090 0.8506.07.22ABN AMRO BankNV 12 EMTN
EUR 7.125%Netherlands
9,000,000 9,127,800 0.5806.12.21Cetin Finance BV16
EUR 1.423%
5,000,000 5,099,150 0.3231.12.99CooperatieveRabobank UA 18FRN
EUR 4.625%
6,000,000 6,109,560 0.3915.10.24Dufry One BV 17EUR 2.500%3,500,000 3,528,245 0.2212.02.24EDP Finance BV 16
EMTNEUR 1.130%
5,000,000 4,909,050 0.3122.11.27EDP Finance BV 17EMTN
EUR 1.500%
5,000,000 5,031,950 0.3226.01.26EDP Finance BV 18EMTN
EUR 1.625%
10,000,000 9,959,900 0.6301.06.26Enel FinanceInternational NV 16
EUR 1.380%
2,750,000 2,680,288 0.1716.09.26Enel FinanceInternational NV 18EMTN
EUR 1.125%
7,000,000 7,552,650 0.4829.03.24Fiat ChryslerAutomobiles NV 16EMTN
EUR 3.750%
2,000,000 2,221,160 0.1411.03.24Gas Natural FenosaFinance BV 14EMTN
EUR 2.880%
3,000,000 3,017,910 0.1919.01.27Gas Natural FenosaFinance BV 17EMTN
EUR 1.375%
3,500,000 3,398,850 0.2209.04.25Koninklijke KPN NVEUR 0.625%4,800,000 5,222,976 0.3304.10.21Koninklijke KPN NV
11 EMTNEUR 4.500%
3,000,000 3,348,000 0.2111.04.22Naturgy Finance BV13 EMTN
EUR 3.875%
Securities Marketvalue in
EUR
% of netassets*
Quantity Ccy Maturity
8,000,000 8,338,480 0.5301.06.23Ren Finance BV 16EMTN
EUR 1.750%
6,500,000 6,513,845 0.4118.01.28Ren Finance BV 18EMTN
EUR 1.750%
3,500,000 3,662,085 0.2331.12.99RepsolInternationalFinance BV 15 FRN
EUR 3.875%
8,000,000 11,472,320 0.7314.02.33RWE AG 03 EMTNEUR 5.750%6,000,000 5,144,160 0.3306.07.24Samvardhana
MothersonAutomotiveSystems Group BV17
EUR 1.800%
1,000,000 1,028,460 0.0731.12.99Telefonica EuropeBV 14 FRN
EUR 4.200%
8,400,000 8,789,004 0.5631.12.99Telefonica EuropeBV 14 FRN
EUR 5.000%
3,000,000 2,928,900 0.1931.12.99Telefonica EuropeBV 18 FRN
EUR 3.000%
5,000,000 4,919,650 0.3131.12.99VolkswagenInternationalFinance NV 17 FRN
EUR 2.700%
1,000,000 1,018,520 0.0616.11.27VolkswagenInternationalFinance NV 18
EUR 2.625%
2,500,000 3,445,036 0.2231.01.34innogy Finance BV12 EMTN
GBP 4.750%
9.00141,692,039Total - Netherlands
6,500,000 6,753,565 0.4330.04.25Brisa ConcessaoRodoviaria SA 15EMTN
EUR 1.875%Portugal
5,500,000 5,824,335 0.3710.05.27Brisa ConcessaoRodoviaria SA 17EMTN
EUR 2.375%
3,500,000 4,649,295 0.3005.03.30CP - Comboios dePortugal EPE 10
EUR 5.700%
6,000,000 6,432,300 0.4116.09.75EDP - Energias dePortugal SA 15FRN
EUR 5.380%
5,500,000 5,716,315 0.3630.04.79EDP - Energias dePortugal SA 19FRN
EUR 4.496%
7,100,000 7,174,408 0.4519.09.23Galp Gas NaturalDistribuicao SA 16EMTN
EUR 1.375%
2.3236,550,218Total - Portugal
1,500,000 1,491,675 0.0917.09.25SKF AB 18EUR 1.250%Sweden
0.091,491,675Total - Sweden
10,000,000 9,053,456 0.5831.12.99Vontobel HoldingAG 18 FRN
CHF 2.625%Switzerland
8,000,000 8,610,320 0.5518.09.25Credit Suisse AG13 FRN
EUR 5.750%
5,000,000 4,989,100 0.3217.07.25Credit SuisseGroup AG 17 FRNEMTN
EUR 1.250%
6,000,000 6,245,160 0.4016.11.22UBS GroupFunding Jersey Ltd15
EUR 1.750%

43
Vontobel Fund - EUR Corporate Bond Mid Yield
The accompanying notes form an essential part of these financial statements.
Portfolio as at February 28, 2019
* Any deviations of the percentages of the nets assets are due to rounding.
Securities Marketvalue in
EUR
% of netassets*
Quantity Ccy Maturity
3,000,000 3,061,050 0.1930.11.24UBS GroupFunding Jersey Ltd16
EUR 1.500%
9,300,000 10,181,081 0.6431.12.99UBS GroupFundingSwitzerland AG 15FRN
EUR 5.750%
7,000,000 6,330,184 0.4031.12.99Credit SuisseGroup AG 18 FRN
USD 7.500%
3.0848,470,351Total - Switzerland
2,000,000 2,216,920 0.1420.06.23AbertisInfraestructuras SA13
EUR 3.750%Spain
7,000,000 7,255,780 0.4627.02.25AbertisInfraestructuras SA14
EUR 2.500%
3,800,000 3,459,178 0.2227.02.27AbertisInfraestructuras SA16
EUR 1.000%
3,000,000 3,061,620 0.1920.01.21Banco BilbaoVizcaya ArgentariaSA 16
EUR 1.000%
5,000,000 5,642,750 0.3631.12.99Banco BilbaoVizcaya ArgentariaSA 16 FRN
EUR 8.880%
4,000,000 4,007,160 0.2511.09.22Banco BilbaoVizcaya ArgentariaSA 17 EMTN
EUR 0.750%
2,000,000 1,997,080 0.1328.02.24Banco BilbaoVizcaya ArgentariaSA 19 EMTN
EUR 1.125%
4,000,000 4,258,800 0.2704.04.26Banco SantanderSA 16 EMTN
EUR 3.250%
14,200,000 19,157,220 1.2124.03.36Bankia SA 06EUR 4.125%6,700,000 6,611,761 0.4212.01.23CaixaBank SA 17
EMTNEUR 1.125%
7,000,000 7,347,760 0.4731.12.99CaixaBank SA 17FRN
EUR 6.750%
14,000,000 14,573,440 0.9315.02.27CaixaBank SA 17FRN EMTN
EUR 3.500%
6,000,000 6,230,940 0.4018.04.25Cellnex TelecomSA 17 EMTN
EUR 2.875%
14,000,000 14,631,540 0.9323.05.22Merlin PropertiesSocimi SA 16EMTN
EUR 2.375%
16,000,000 15,750,560 0.9928.09.27NorteGas EnergiaDistribucion SAU17 EMTN
EUR 2.065%
4,000,000 4,100,680 0.2618.03.25SantanderIssuances SAU 15EMTN
EUR 2.500%
12,000,000 14,110,680 0.9030.04.24Spain GovernmentBond 14
EUR 3.800%
12,000,000 12,304,680 0.7830.04.28Spain GovernmentBond 18
EUR 1.400%
1,800,000 1,983,816 0.1317.10.29TelefonicaEmisiones SA 14EMTN
EUR 2.932%
9,000,000 10,192,950 0.6523.01.23TelefonicaEmisiones SAU 13EMTN
EUR 3.990%
Securities Marketvalue in
EUR
% of netassets*
Quantity Ccy Maturity
4,500,000 4,502,745 0.2922.01.27TelefonicaEmisiones SAU 18EMTN
EUR 1.447%
10.38163,398,060Total - Spain
8,000,000 7,984,320 0.5115.06.27Altria Group Inc 19EUR 2.200%United States
10,000,000 9,920,100 0.6221.06.27AmericanInternational GroupInc 17
EUR 1.875%
3,000,000 3,096,150 0.2010.09.21Bank of AmericaCorp 14 EMTN
EUR 1.380%
6,000,000 6,042,660 0.3826.07.23Bank of AmericaCorp 16 EMTN
EUR 0.750%
3,500,000 3,694,460 0.2315.06.24CEMEX FinanceLLC 16
EUR 4.625%
10,000,000 10,473,601 0.6607.03.22DiscoveryCommunicationsLLC 14
EUR 2.380%
2,000,000 2,003,000 0.1331.12.99DZ Bank CapitalFunding Trust I 03FRN
EUR 2.192%
7,000,000 6,587,420 0.4217.05.29General Electric Co17
EUR 1.500%
4,000,000 4,034,520 0.2601.04.24General MotorsFinancial Co Inc 19EMTN
EUR 2.200%
7,500,000 8,202,300 0.5201.02.23Goldman SachsGroup Inc/The 13EMTN
EUR 3.250%
6,000,000 6,019,140 0.3827.07.26Goldman SachsGroup Inc/The 16EMTN
EUR 1.625%
9,000,000 9,434,970 0.6030.03.23Morgan Stanley 14EUR 1.880%6,000,000 6,282,540 0.4031.03.21Morgan Stanley 14
EMTNEUR 2.380%
4,000,000 3,994,480 0.2523.10.26Morgan Stanley 17FRN EMTN
EUR 1.342%
6,000,000 6,768,240 0.4302.06.26Prologis LP 14EUR 3.000%2,500,000 2,137,042 0.1415.02.50AT&T Inc 18USD 5.150%2,000,000 1,659,682 0.1120.09.47Discovery
CommunicationsLLC 17
USD 5.200%
7,300,000 6,547,049 0.4215.07.39MeccanicaHoldings USA Inc09
USD 7.375%
5,400,000 4,499,731 0.2915.01.40MeccanicaHoldings USA Inc09
USD 6.250%
6.95109,381,405Total - United States
3,000,000 3,270,960 0.2114.01.21Barclays Bank PLC10 EMTN
EUR 6.000%United Kingdom
15,000,000 17,213,550 1.0930.03.22Barclays Bank PLC11 EMTN
EUR 6.625%
6,000,000 6,425,460 0.4125.03.25BAT InternationalFinance PLC 13EMTN
EUR 2.750%
4,000,000 4,025,400 0.2623.05.22BAT InternationalFinance PLC 15EMTN
EUR 1.000%
10,000,000 9,416,900 0.6013.03.27BAT InternationalFinance PLC 15EMTN
EUR 1.250%

44
Vontobel Fund - EUR Corporate Bond Mid Yield
The accompanying notes form an essential part of these financial statements.
Portfolio as at February 28, 2019
* Any deviations of the percentages of the nets assets are due to rounding.
Securities Marketvalue in
EUR
% of netassets*
Quantity Ccy Maturity
11,000,000 10,381,250 0.6616.01.30BAT InternationalFinance PLC 17EMTN
EUR 2.250%
17,000,000 17,679,661 1.1220.12.26Credit AgricoleSA/London 16EMTN
EUR 1.875%
6,000,000 5,855,160 0.3710.02.22FCE Bank PLC 15EMTN
EUR 1.130%
3,700,000 3,551,112 0.2311.05.23FCE Bank PLC 16EMTN
EUR 1.620%
17,000,000 17,317,561 1.1001.07.22Hammerson PLC14
EUR 2.000%
3,000,000 3,027,810 0.1915.03.23Hammerson PLC16
EUR 1.750%
7,000,000 7,418,950 0.4731.12.99HSBC HoldingsPLC 14 FRN
EUR 5.250%
2,500,000 2,736,425 0.1726.02.26Imperial BrandsFinance PLC 14EMTN
EUR 3.375%
8,500,000 8,790,360 0.5626.02.21Imperial TobaccoFinance PLC 14EMTN
EUR 2.250%
7,000,000 6,828,570 0.4315.01.24Lloyds BankingGroup PLC 18 FRNEMTN
EUR 0.625%
3,000,000 3,149,190 0.2009.06.23MotabilityOperations GroupPLC 15 EMTN
EUR 1.630%
2,500,000 2,509,075 0.1614.03.25MotabilityOperations GroupPLC 17 EMTN
EUR 0.875%
6,000,000 5,878,920 0.3722.09.24National Grid GasFinance PLC 16EMTN
EUR 0.625%
6,000,000 6,408,300 0.4107.10.21Rentokil Initial PLC13 EMTN
EUR 3.250%
3,000,000 3,006,750 0.1931.12.99SSE PLC 15 FRNEUR 2.375%7,000,000 6,947,990 0.4403.10.23Standard
Chartered PLC 17FRN EMTN
EUR 0.750%
9,000,000 9,066,960 0.5803.10.27StandardChartered PLC 17FRN EMTN
EUR 1.625%
2,000,000 1,967,120 0.1220.03.23Yorkshire BuildingSociety 18 EMTN
EUR 0.875%
3,500,000 4,261,849 0.2731.12.99Barclays PLC 17FRN
GBP 7.250%
9,500,000 11,715,908 0.7403.03.25Heathrow FinancePLC 14
GBP 5.750%
2,000,000 2,772,966 0.1817.02.22Imperial TobaccoFinance PLC 09EMTN
GBP 9.000%
5,000,000 6,259,831 0.4027.10.45Legal & GeneralGroup PLC 15 FRNEMTN
GBP 5.380%
5,000,000 6,400,994 0.4116.06.23Scottish WidowsLtd 13
GBP 5.500%
4,000,000 5,098,322 0.3224.03.23Tesco PLC 06EMTN
GBP 5.000%
Securities Marketvalue in
EUR
% of netassets*
Quantity Ccy Maturity
6,000,000 6,310,117 0.4013.09.28Yorkshire BuildingSociety 17 FRNEMTN
GBP 3.375%
90.941,431,878,080Total - Transferable securities admitted to anofficial exchange
90.941,431,878,080Total - Bonds
13.06205,693,421Total - United Kingdom
2,500,000 2,246,970 0.1414.01.22UniCredit SpA 19EMTN
USD 6.572%
Transferable securities and money market instruments dealt in on anotherregulated marketBondsItaly
0.142,246,970Total - Italy
7,000,000 7,785,680 0.4931.10.46Spain GovernmentBond 16
EUR 2.900%Spain
0.497,785,680Total - Spain
10,000,000 10,300,300 0.6605.09.26AT&T Inc 18EUR 1.800%United States
0.6610,300,300Total - United States
5,500,000 6,110,124 0.3915.10.24Miller HomesGroup HoldingsPLC 17
GBP 5.500%United Kingdom
1.6826,443,074Total - Transferable securities and money marketinstruments dealt in on another regulated market
1.6826,443,074Total - Bonds
0.396,110,124Total - United Kingdom
117,000 11,996,010 0.76Vontobel Fund -Global Bond - HI(EUR)
EUR
Other transferable securitiesInvestment fundsLuxembourg
27,500 3,851,375 0.24Vontobel Fund -Global ConvertibleBond - I
EUR
112,500 12,090,375 0.77Vontobel Fund -Global CorporateBond Mid Yield -HG (hedged) EUR
EUR
240,000 32,440,800 2.07Vontobel Fund -High Yield Bond - I
EUR

45
Vontobel Fund - EUR Corporate Bond Mid Yield
The accompanying notes form an essential part of these financial statements.
Portfolio as at February 28, 2019
* Any deviations of the percentages of the nets assets are due to rounding.
Securities Marketvalue in
EUR
% of netassets*
Quantity Ccy Maturity
123,000 12,186,581 0.77Vontobel Fund -CreditOpportunities - X
USD
4.6172,565,141Total - Other transferable securities
4.6172,565,141Total - Investment funds
4.6172,565,141Total - Luxembourg
97.231,530,886,295Total - Investment in securities

46
Vontobel Fund - High Yield Bond
AssetsInvestments in securities at market value 185,419,147(2)
6,301,368Cash at banks
680Receivable from foreign currencies
132,799Receivable from subscriptions
3,316,955Interest and dividends receivable(2)
4,526,437Receivable for investments sold
318,040Unrealised gain on forward foreign exchange contracts(9)
Total Assets 200,015,426
191,960,313Statement of Net Assetsas at February 28, 2019
LiabilitiesBank overdraft 917
Payable for redemptions 840,480
Payable for investments purchased 309,539
Payable on foreign currencies 682
Interest and dividends payable 16,781
Audit fees, printing and publishing expenses -1,607
Service Fee payable 44,197(5)
Subscription tax payable 10,621(4)
Management Fee payable 132,616(3)
Performance Fee payable 81(3)
Other liabilities -895Total Liabilities 1,353,412Total net assets at the end of the period 198,662,014Net assets at the beginning of the reporting period 278,996,693
Net investment income 5,291,185
Change in unrealised appreciation/depreciation on:
Investments -1,204,157
Forward foreign exchange contracts -317,111
Swaps 433,282
Net realised gain/loss on investments -3,220,787(2)
Net realised gain/loss on forward foreign exchange contracts -6,020,956(2)
Net realised gain/loss on currency exchange 716,879(2)
Net realised gain/loss on swaps -420,236(2)
Increase/Decrease in net assets resulting from operations -4,741,901Subscriptions of shares 11,011,263
Redemptions of shares -86,369,833
Dividend distribution -234,208(11)
Total net assets at the end of the period 198,662,014
Statement of Operations andChanges in Net Assetsfrom September 1, 2018to February 28, 2019
Notes EURThe accompanying notes form an essential part of these financial statements.
Cost

47
Vontobel Fund - High Yield Bond
IncomeBank interest 29,374
Net interest on bonds 6,598,185(2)
Interest on swaps 111,753(2)
Total Income 6,739,312ExpensesManagement Fees 970,921(3)
Performance Fee 81(3)
Audit fees, printing and publishing expenses 27,142
Subscription tax 37,051(4)
Bank interest 12,006
Interest on swaps 142,076(2)
Service Fees 234,830(5)
Other Fees payable 24,020(8)
Total Expenses 1,448,127Net investment income 5,291,185
Statement of Net Incomefrom September 1, 2018to February 28, 2019
Notes EURThe accompanying notes form an essential part of these financial statements.

48
Vontobel Fund - High Yield Bond
The accompanying notes form an essential part of these financial statements.
Portfolio as at February 28, 2019
* Any deviations of the percentages of the nets assets are due to rounding.
Securities Marketvalue in
EUR
% of netassets*
Quantity Ccy Maturity
3,000,000 2,739,967 1.3815.06.23Barry CallebautServices NV 13
USD 5.500%
Transferable securities admitted to an official exchangeBondsBelgium
1.382,739,967Total - Belgium
500,000 433,060 0.2213.07.22Longfor GroupHoldings Ltd 17
USD 3.875%Cayman Islands
0.22433,060Total - Cayman Islands
800,000 758,896 0.3801.02.23KME AG 18EUR 6.750%Germany
3,000,000 3,180,690 1.6115.12.23PrestigeBidCoGmbH 16
EUR 6.250%
500,000 522,445 0.2615.01.25Unitymedia HessenGmbH & Co KG /Unitymedia NRWGmbH 14
EUR 4.000%
2.254,462,031Total - Germany
2,000,000 2,065,520 1.0401.02.26Crown EuropeanHoldings SA 18
EUR 2.875%France
4,000,000 4,227,120 2.1323.09.24Orano SA 09 EMTNEUR 4.875%1,500,000 1,473,588 0.7431.12.99Credit Agricole SA
16 FRNUSD 8.125%
3.917,766,228Total - France
800,000 706,279 0.3623.04.23Yanlord Land HKCo Ltd 18
USD 6.750%Hong Kong
0.36706,279Total - Hong Kong
500,000 540,473 0.2715.07.27Ardagh PackagingFinance PLC /Ardagh HoldingsUSA Inc 17
GBP 4.750%Ireland
2,000,000 2,345,377 1.1815.09.24Virgin MediaReceivablesFinancing Notes IDAC 16
GBP 5.500%
1,000,000 885,694 0.4515.05.23Ardagh PackagingFinance PLC /Ardagh HoldingsUSA Inc 16
USD 4.625%
1.903,771,544Total - Ireland
1,000,000 1,256,910 0.6310.07.42AssicurazioniGenerali SpA 12FRN EMTN
EUR 10.125%Italy
1,000,000 1,187,690 0.6012.12.42AssicurazioniGenerali SpA 12FRN EMTN
EUR 7.750%
1,000,000 67,548 0.0301.08.22CooperativaMuratori &Cementisti-CMC diRavenna SC 17
EUR 6.875%
Securities Marketvalue in
EUR
% of netassets*
Quantity Ccy Maturity
4,000,000 314,960 0.1615.02.23CooperativaMuratori &Cementisti-CMC diRavenna SC 17
EUR 6.000%
1,000,000 1,043,270 0.5331.12.99Intesa SanpaoloSpA 09 FRN
EUR 8.375%
1,000,000 1,164,670 0.5913.09.23Intesa SanpaoloSpA 13 EMTN
EUR 6.625%
2,000,000 2,502,718 1.2515.09.76Enel SpA 14 FRNGBP 6.625%3.797,537,766Total - Italy
1,000,000 1,032,860 0.5215.05.25Avis BudgetFinance Plc 17
EUR 4.500%Jersey
1,000,000 1,012,480 0.5130.01.26Avis BudgetFinance Plc 18
EUR 4.750%
3,500,000 3,113,116 1.5729.03.49HBOS CapitalFunding LP 03
USD 6.850%
2.605,158,456Total - Jersey
2,000,000 1,767,366 0.8915.05.22First QuantumMinerals Ltd 14
USD 7.250%Canada
0.891,767,366Total - Canada
2,500,000 2,526,625 1.2701.08.23ContourGlobalPower Holdings SA18
EUR 3.375%Luxembourg
2,000,000 2,008,580 1.0101.08.25ContourGlobalPower Holdings SA18
EUR 4.125%
4,384,000 4,711,178 2.3801.11.21Crystal AlmondSARL 16
EUR 10.000%
3,000,000 3,051,630 1.5401.08.24INEOS GroupHoldings SA 16
EUR 5.375%
600,000 631,428 0.3220.12.23LHMC Finco Sarl18
EUR 6.250%
1,300,000 1,332,864 0.6720.12.23LHMC Finco Sarl18 FRN
EUR 5.750%
1,000,000 1,241,090 0.6224.01.33Telecom ItaliaFinance SA 03EMTN
EUR 7.750%
2,000,000 1,654,764 0.8315.11.33Telecom ItaliaCapital SA 04
USD 6.375%
8.6417,158,159Total - Luxembourg
2,000,000 1,755,089 0.8813.02.22MTN MauritiusInvestment Ltd 16
USD 5.373%Mauritius Islands
0.881,755,089Total - Ile Maurice
2,000,000 1,902,538 0.9616.04.26Cemex SAB de CV16
USD 7.750%Mexico
0.961,902,538Total - Mexico
2,000,000 2,064,720 1.0315.05.26Darling GlobalFinance BV 18
EUR 3.625%Netherlands
800,000 819,600 0.4115.11.25Intertrust Group BV18
EUR 3.375%

49
Vontobel Fund - High Yield Bond
The accompanying notes form an essential part of these financial statements.
Portfolio as at February 28, 2019
* Any deviations of the percentages of the nets assets are due to rounding.
Securities Marketvalue in
EUR
% of netassets*
Quantity Ccy Maturity
2,100,000 2,017,638 1.0215.07.25KongsbergActuation SystemsBV 18
EUR 5.000%
1,000,000 857,360 0.4306.07.24SamvardhanaMothersonAutomotiveSystems Group BV17
EUR 1.800%
1,000,000 1,037,410 0.5231.12.99Telefonica EuropeBV 16 FRN
EUR 3.750%
1,000,000 964,500 0.4931.12.99Telefonica EuropeBV 17 FRN
EUR 2.625%
2,000,000 1,779,485 0.9015.04.23Fiat ChryslerAutomobiles NV 15
USD 5.250%
4.809,540,713Total - Netherlands
2,000,000 1,553,807 0.7831.12.99Julius Baer GroupLtd 17 FRN
USD 4.750%Switzerland
2,500,000 2,265,412 1.1431.12.99UBS GroupFundingSwitzerland AG 16FRN
USD 6.875%
1.923,819,219Total - Switzerland
2,000,000 2,257,100 1.1431.12.99Banco BilbaoVizcaya ArgentariaSA 16 FRN
EUR 8.880%Spain
3,000,000 3,122,880 1.5615.02.27CaixaBank SA 17FRN EMTN
EUR 3.500%
1,600,000 1,599,408 0.8115.09.24MasariaInvestments SAU17
EUR 5.000%
2,000,000 1,984,400 1.0015.09.24MasariaInvestments SAU17 FRN
EUR 5.250%
4.518,963,788Total - Spain
1,000,000 916,343 0.4624.01.24Export Credit Bankof Turkey 19
USD 8.250%Turkey
0.46916,343Total - Turkey
3,500,000 3,551,696 1.7815.04.24BWAY Holding Co18
EUR 4.750%United States
1,625,000 1,664,553 0.8415.03.25Quintiles IMS Inc17
EUR 3.250%
1,000,000 926,706 0.4715.10.21ADT Corp/The 14USD 6.250%2,000,000 1,727,391 0.8715.07.22ADT Security
Corp/The 13USD 3.500%
1,000,000 889,391 0.4501.04.23Avis Budget CarRental LLC / AvisBudget Finance Inc13
USD 5.500%
2,500,000 2,336,875 1.1815.03.22HCA Inc 12USD 5.875%1,000,000 875,340 0.4430.04.24Lennar Corp 17USD 4.500%1,000,000 933,231 0.4715.02.25Netflix Inc 15USD 5.875%2,500,000 2,314,240 1.1601.01.26Newfield
Exploration Co 15USD 5.375%
2,000,000 1,766,593 0.8915.03.22Oasis PetroleumInc 14
USD 6.875%
1,000,000 884,798 0.4515.09.27Olin Corp 17USD 5.125%
Securities Marketvalue in
EUR
% of netassets*
Quantity Ccy Maturity
4,000,000 3,699,904 1.8501.12.22Scientific GamesInternational Inc 15
USD 10.000%
4,000,000 3,495,214 1.7515.11.22SM Energy Co 15USD 6.125%3,000,000 2,544,637 1.2815.11.27United States
TreasuryNote/Bond 17
USD 2.250%
3,000,000 2,658,768 1.3430.04.23United StatesTreasuryNote/Bond 18
USD 2.750%
2,000,000 1,764,082 0.8901.04.23Whiting PetroleumCorp 15
USD 6.250%
16.1132,033,419Total - United States
2,000,000 1,977,260 1.0016.11.24Titan GlobalFinance PLC 17
EUR 2.375%United Kingdom
1,900,000 1,808,534 0.9115.05.22Travelex FinancingPLC 17
EUR 8.000%
2,830,000 3,490,107 1.7503.03.25Heathrow FinancePLC 14
GBP 5.750%
2,300,000 2,672,547 1.3515.01.24Jerrold Finco Plc 17GBP 6.125%3,000,000 2,599,201 1.3115.05.25Neptune Energy
Bondco PLC 18USD 6.625%
2,250,000 2,071,435 1.0431.12.99StandardChartered PLC 16FRN
USD 7.500%
62.94125,051,049Total - Transferable securities admitted to anofficial exchange
62.94125,051,049Total - Bonds
7.3614,619,084Total - United Kingdom
3,000,000 2,858,997 1.4401.02.25Silversea CruiseFinance Ltd 17
USD 7.250%
Transferable securities and money market instruments dealt in on anotherregulated marketBondsBahamas
1.442,858,997Total - Bahamas
200,000 180,014 0.0915.05.24Avolon HoldingsFunding Ltd 19
USD 5.250%Cayman Islands
150,000 134,958 0.0715.08.22Park AerospaceHoldings Ltd 17
USD 5.250%
500,000 442,518 0.2204.02.23Yuzhou PropertiesCo Ltd 19
USD 8.500%
0.38757,490Total - Cayman Islands
3,000,000 3,063,990 1.5431.03.26ProGroup AG 18EUR 3.000%Germany
1.543,063,990Total - Germany
4,500,000 4,522,210 2.2820.11.25Smurfit KappaTreasury FundingLtd 95
USD 7.500%Ireland
2.284,522,210Total - Ireland
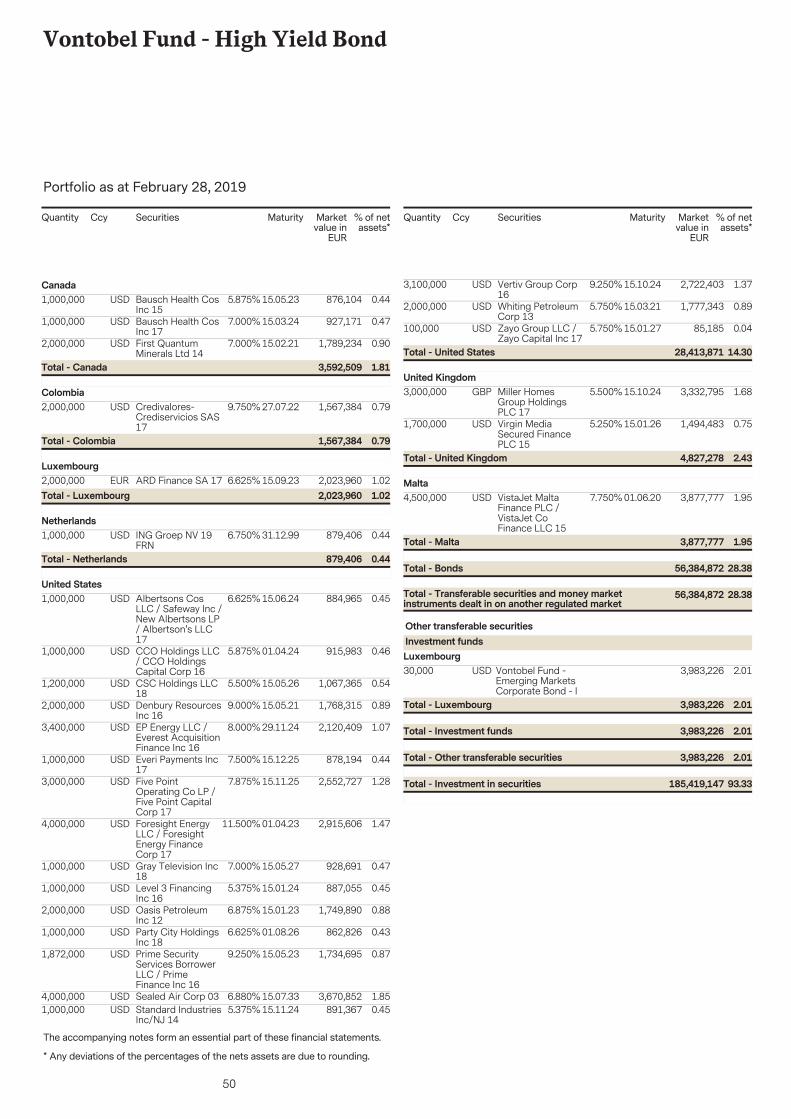
50
Vontobel Fund - High Yield Bond
The accompanying notes form an essential part of these financial statements.
Portfolio as at February 28, 2019
* Any deviations of the percentages of the nets assets are due to rounding.
Securities Marketvalue in
EUR
% of netassets*
Quantity Ccy Maturity
1,000,000 876,104 0.4415.05.23Bausch Health CosInc 15
USD 5.875%Canada
1,000,000 927,171 0.4715.03.24Bausch Health CosInc 17
USD 7.000%
2,000,000 1,789,234 0.9015.02.21First QuantumMinerals Ltd 14
USD 7.000%
1.813,592,509Total - Canada
2,000,000 1,567,384 0.7927.07.22Credivalores-Crediservicios SAS17
USD 9.750%Colombia
0.791,567,384Total - Colombia
2,000,000 2,023,960 1.0215.09.23ARD Finance SA 17EUR 6.625%Luxembourg
1.022,023,960Total - Luxembourg
1,000,000 879,406 0.4431.12.99ING Groep NV 19FRN
USD 6.750%Netherlands
0.44879,406Total - Netherlands
1,000,000 884,965 0.4515.06.24Albertsons CosLLC / Safeway Inc /New Albertsons LP/ Albertson's LLC17
USD 6.625%United States
1,000,000 915,983 0.4601.04.24CCO Holdings LLC/ CCO HoldingsCapital Corp 16
USD 5.875%
1,200,000 1,067,365 0.5415.05.26CSC Holdings LLC18
USD 5.500%
2,000,000 1,768,315 0.8915.05.21Denbury ResourcesInc 16
USD 9.000%
3,400,000 2,120,409 1.0729.11.24EP Energy LLC /Everest AcquisitionFinance Inc 16
USD 8.000%
1,000,000 878,194 0.4415.12.25Everi Payments Inc17
USD 7.500%
3,000,000 2,552,727 1.2815.11.25Five PointOperating Co LP /Five Point CapitalCorp 17
USD 7.875%
4,000,000 2,915,606 1.4701.04.23Foresight EnergyLLC / ForesightEnergy FinanceCorp 17
USD 11.500%
1,000,000 928,691 0.4715.05.27Gray Television Inc18
USD 7.000%
1,000,000 887,055 0.4515.01.24Level 3 FinancingInc 16
USD 5.375%
2,000,000 1,749,890 0.8815.01.23Oasis PetroleumInc 12
USD 6.875%
1,000,000 862,826 0.4301.08.26Party City HoldingsInc 18
USD 6.625%
1,872,000 1,734,695 0.8715.05.23Prime SecurityServices BorrowerLLC / PrimeFinance Inc 16
USD 9.250%
4,000,000 3,670,852 1.8515.07.33Sealed Air Corp 03USD 6.880%1,000,000 891,367 0.4515.11.24Standard Industries
Inc/NJ 14USD 5.375%
Securities Marketvalue in
EUR
% of netassets*
Quantity Ccy Maturity
3,100,000 2,722,403 1.3715.10.24Vertiv Group Corp16
USD 9.250%
2,000,000 1,777,343 0.8915.03.21Whiting PetroleumCorp 13
USD 5.750%
100,000 85,185 0.0415.01.27Zayo Group LLC /Zayo Capital Inc 17
USD 5.750%
14.3028,413,871Total - United States
3,000,000 3,332,795 1.6815.10.24Miller HomesGroup HoldingsPLC 17
GBP 5.500%United Kingdom
1,700,000 1,494,483 0.7515.01.26Virgin MediaSecured FinancePLC 15
USD 5.250%
2.434,827,278Total - United Kingdom
4,500,000 3,877,777 1.9501.06.20VistaJet MaltaFinance PLC /VistaJet CoFinance LLC 15
USD 7.750%Malta
28.3856,384,872Total - Transferable securities and money marketinstruments dealt in on another regulated market
28.3856,384,872Total - Bonds
1.953,877,777Total - Malta
30,000 3,983,226 2.01Vontobel Fund -Emerging MarketsCorporate Bond - I
USD
Other transferable securitiesInvestment fundsLuxembourg
2.013,983,226Total - Other transferable securities
2.013,983,226Total - Investment funds
2.013,983,226Total - Luxembourg
93.33185,419,147Total - Investment in securities

51
Vontobel Fund - Bond Global Aggregate
AssetsInvestments in securities at market value 395,552,670(2)
69,413,608Cash at banks
462Receivable from foreign currencies
1,448,715Receivable from subscriptions
6,583,681Interest and dividends receivable(2)
1,206,972Receivable for investments sold
146,287,386Receivable for forward foreign exchange contracts
6,015,179Options at cost of purchase(9)
Total Assets 626,508,673
390,117,900Statement of Net Assetsas at February 28, 2019
LiabilitiesBank overdraft 24,368,125
Payable for redemptions 379,032
Payable for investments purchased 8,789,044
Payable on forward foreign exchange contracts 147,794,584
Payable on foreign currencies 462
Payable on swaps 83,672(9)
Unrealised loss on forward foreign exchange contracts 1,955,077(9)
Unrealised loss on futures 650,543(9)
Unrealised loss on swaps 579,265(9)
Unrealised loss on options 2,813,878(9)
Audit fees, printing and publishing expenses 4,052
Service Fee payable 67,119(5)
Subscription tax payable 18,570(4)
Management Fee payable 175,867(3)
Performance Fee payable 2,717,100(3)
Other liabilities 1,730Total Liabilities 190,398,120Total net assets at the end of the period 436,110,553Net assets at the beginning of the reporting period 417,565,405
Net investment income 4,653,054
Change in unrealised appreciation/depreciation on:
Investments 13,414,278
Futures -444,305
Forward foreign exchange contracts -1,461,957
Swaps 11,661
Options 802,684
Net realised gain/loss on investments -1,175,087(2)
Net realised gain/loss on forward foreign exchange contracts -6,134,010(2)
Net realised gain/loss on currency exchange 2,753,382(2)
Net realised gain/loss on futures 4,529,673(2)
Net realised gain/loss on swaps 64,201(2)
Net realised gain/loss on options 9,787,167(2)
Increase/Decrease in net assets resulting from operations 26,800,741Subscriptions of shares 55,083,674
Redemptions of shares -60,090,570
Dividend distribution -3,248,697(11)
Statement of Operations andChanges in Net Assetsfrom September 1, 2018to February 28, 2019
Notes EURThe accompanying notes form an essential part of these financial statements.
Cost

52
Vontobel Fund - Bond Global Aggregate
Total net assets at the end of the period 436,110,553Statement of Operations andChanges in Net Assetsfrom September 1, 2018to February 28, 2019
IncomeBank interest 59,258
Net interest on bonds 9,922,923(2)
Other income 77,272Total Income 10,059,453ExpensesManagement Fees 1,103,020(3)
Performance Fee 2,755,063(3)
Administration fee 98,331
Audit fees, printing and publishing expenses 22,885
Subscription tax 45,847(4)
Bank interest 77,171
Interest on swaps 218,000(2)
Service Fees 534,963(5)
Other Fees payable 551,119(8)
Total Expenses 5,406,399Net investment income 4,653,054
Statement of Net Incomefrom September 1, 2018to February 28, 2019
Notes EURThe accompanying notes form an essential part of these financial statements.

53
Vontobel Fund - Bond Global Aggregate
The accompanying notes form an essential part of these financial statements.
Portfolio as at February 28, 2019
* Any deviations of the percentages of the nets assets are due to rounding.
Securities Marketvalue in
EUR
% of netassets*
Quantity Ccy Maturity
3,700,000 3,503,900 0.8116.04.30Egypt GovernmentInternational Bond18 EMTN
EUR 5.625%
Transferable securities admitted to an official exchangeBondsEgypt
1,000,000 880,890 0.2024.05.21African Export-Import Bank/The16 EMTN
USD 4.000%
1.014,384,790Total - Egypt
2,205,000 1,908,361 0.4420.01.23Provincia deBuenosAires/Argentina 17
EUR 5.375%Argentina
0.441,908,361Total - Argentina
3,600,000 2,850,948 0.6531.12.99Belfius Bank SA/NV18 FRN
EUR 3.625%Belgium
0.652,850,948Total - Belgium
1,800,000 1,436,965 0.3317.01.25Country GardenHoldings Co Ltd 18
USD 5.125%Cayman Islands
2,000,000 1,738,684 0.4008.04.43Saudi ElectricityGlobal Sukuk Co 213
USD 5.060%
0.733,175,649Total - Cayman Islands
1,500,000 1,732,995 0.4031.12.99DONG Energy A/S13 FRN
EUR 6.250%Denmark
2,000,000 2,122,320 0.4831.12.99Nykredit RealkreditA/S 15 FRN
EUR 6.250%
0.883,855,315Total - Denmark
1,500,000 1,523,250 0.3523.04.75Bertelsmann SE &Co KGaA 15 FRN
EUR 3.000%Germany
1,200,000 1,204,668 0.2812.02.21Deutsche Bank AG19 EMTN
EUR 1.625%
0.632,727,918Total - Germany
600,000 609,414 0.1415.06.25Ivory CoastGovernmentInternational Bond17
EUR 5.125%Ivory Coast
3,526,000 3,375,264 0.7722.03.30Ivory CoastGovernmentInternational Bond18
EUR 5.250%
1,300,000 1,223,378 0.2822.03.48Ivory CoastGovernmentInternational Bond18
EUR 6.625%
1.195,208,056Total - Ivory Coast
4,400,000 4,721,464 1.0831.12.99Air France-KLM 15FRN
EUR 6.250%France
Securities Marketvalue in
EUR
% of netassets*
Quantity Ccy Maturity
3,000,000 3,080,580 0.7108.12.23Akuo Energy SAS17
EUR 4.250%
1,400,000 1,603,980 0.3704.07.43AXA SA 13 FRNEMTN
EUR 5.130%
1,800,000 1,936,638 0.4431.12.99AXA SA 14 FRNEMTN
EUR 3.880%
5,500,000 5,410,735 1.2424.09.28Caisse Nationalede ReassuranceMutuelle AgricoleGroupama 18
EUR 3.375%
1,400,000 1,496,740 0.3431.12.99CNP Assurances14 FRN
EUR 4.000%
2,000,000 2,256,620 0.5231.12.99Groupama SA 14FRN
EUR 6.380%
5,250,000 5,647,530 1.2931.12.99La Mondiale SAM14 FRN
EUR 5.050%
1,400,000 1,403,458 0.3212.01.22RCI Banque SA 17EMTN
EUR 0.750%
1,500,000 1,569,045 0.3631.12.99Societe GeneraleSA 09 FRN
EUR 9.375%
2,200,000 2,393,248 0.5531.12.99TOTAL SA 16 FRNEMTN
EUR 3.875%
7,000,000 6,127,075 1.4131.12.99AXA SA 13 EMTNUSD 5.500%2,200,000 1,965,490 0.4531.12.99BNP Paribas SA 05USD 6.250%1,000,000 851,945 0.2031.12.99Electricite de
France SA 14 FRNUSD 5.630%
9.2840,464,548Total - France
7,400,000 7,577,082 1.7419.10.20National Bank ofGreece SA 17EMTN
EUR 2.750%Greece
1.747,577,082Total - Greece
4,600,000 4,018,607 0.9205.04.20ICBCIL Finance CoLtd 17 EMTN
USD 3.000%Hong Kong
0.924,018,607Total - Hong Kong
1,100,000 1,113,101 0.2601.07.19GazprombankOJSC Via GPBEurobond FinancePLC 14
EUR 4.000%Ireland
1,400,000 1,078,272 0.2531.12.99Cloverie PLC forZurich InsuranceCo Ltd 16 EMTN
USD 4.750%
1,500,000 1,339,804 0.3130.10.22Eurotorg LLC ViaBonitron DAC 17
USD 8.750%
1,300,000 965,270 0.2230.11.26Saderea DAC 14EMTN
USD 12.500%
2,000,000 1,796,294 0.4031.12.99Tinkoff CreditSystems Via TCSFinance Ltd 17 FRN
USD 9.250%
1.446,292,741Total - Ireland
3,400,000 3,145,635 0.7231.05.38Israel ChemicalsLtd 18
USD 6.375%Israel
0.723,145,635Total - Israel

54
Vontobel Fund - Bond Global Aggregate
The accompanying notes form an essential part of these financial statements.
Portfolio as at February 28, 2019
* Any deviations of the percentages of the nets assets are due to rounding.
Securities Marketvalue in
EUR
% of netassets*
Quantity Ccy Maturity
2,000,000 2,375,380 0.5412.12.42AssicurazioniGenerali SpA 12FRN EMTN
EUR 7.750%Italy
2,400,000 2,417,664 0.5529.01.29AssicurazioniGenerali SpA 19EMTN
EUR 3.875%
2,600,000 1,340,118 0.3118.01.28Banca Monte deiPaschi di SienaSpA 18 FRN EMTN
EUR 5.375%
300,000 23,622 0.0115.02.23CooperativaMuratori &Cementisti-CMC diRavenna SC 17
EUR 6.000%
6,650,000 6,937,746 1.6031.12.99Intesa SanpaoloSpA 09 FRN
EUR 8.375%
3,900,000 4,056,117 0.9331.12.99Intesa SanpaoloSpA 16 FRN EMTN
EUR 7.000%
6,000,000 6,038,460 1.3801.08.19Italy BuoniPoliennali DelTesoro 14
EUR 1.500%
8,800,000 9,084,328 2.0915.12.21Italy BuoniPoliennali DelTesoro 14
EUR 2.150%
5,000,000 5,140,550 1.1801.12.24Italy BuoniPoliennali DelTesoro 14
EUR 2.500%
7,500,000 7,548,450 1.7415.04.22Italy BuoniPoliennali DelTesoro 15
EUR 1.350%
5,000,000 4,860,400 1.1115.11.24Italy BuoniPoliennali DelTesoro 17
EUR 1.450%
1,250,000 1,111,675 0.2512.10.27Telecom ItaliaSpA/Milano 17EMTN
EUR 2.375%
3,600,000 3,879,612 0.8931.12.99UniCredit SpA 10FRN
EUR 9.375%
1,100,000 1,150,490 0.2628.10.25UniCredit SpA 13FRN EMTN
EUR 5.750%
4,800,000 4,860,000 1.1120.02.29UniCredit SpA 19FRN EMTN
EUR 4.875%
800,000 767,823 0.1827.09.23Republic of ItalyGovernmentInternational Bond93
USD 6.875%
14.1361,592,435Total - Italy
2,400,000 2,134,708 0.4929.03.49HBOS CapitalFunding LP 03
USD 6.850%Jersey
0.492,134,708Total - Jersey
3,400,000 3,063,075 0.7025.06.23Frontera EnergyCorp 18
USD 9.700%Canada
0.703,063,075Total - Canada
2,600,000 2,380,257 0.5520.06.22Kazakhstan TemirZholy National CoJSC 14
CHF 3.638%Kazakhstan
0.552,380,257Total - Kazakhstan
Securities Marketvalue in
EUR
% of netassets*
Quantity Ccy Maturity
1,000,000 1,019,970 0.2301.11.24Arena LuxembourgFinance Sarl 17
EUR 2.875%Luxembourg
0.231,019,970Total - Luxembourg
3,800,000 3,305,962 0.7621.04.27PetroleosMexicanos 15EMTN
EUR 2.750%Mexico
5,320,000 5,348,781 1.2321.02.24PetroleosMexicanos 17EMTN
EUR 3.750%
1,400,000 1,355,732 0.3126.02.29PetroleosMexicanos 18
EUR 4.750%
3,140,000 13,743,520 3.1403.06.27Mexican Bonos 07MXN 7.500%1,800,000 1,642,273 0.3807.02.26Credito Real SAB
de CV SOFOM ER19
USD 9.500%
5.8225,396,268Total - Mexico
1,400,000 1,467,844 0.3431.12.99ABN AMRO BankNV 15 FRN
EUR 5.750%Netherlands
1,500,000 1,576,140 0.3631.12.99CooperatieveCentrale Raiffeisen-BoerenleenbankBA/Netherlands 15FRN
EUR 5.500%
1,200,000 1,355,592 0.3107.03.22Petrobras GlobalFinance BV 11EMTN
EUR 5.875%
3,000,000 3,113,820 0.7131.12.99Swiss ReinsuranceCo via ELM BV 15FRN
EUR 2.600%
1,100,000 1,150,941 0.2631.12.99Telefonica EuropeBV 14 FRN
EUR 5.000%
2,000,000 2,074,820 0.4831.12.99Telefonica EuropeBV 16 FRN
EUR 3.750%
3,700,000 3,612,310 0.8331.12.99Telefonica EuropeBV 18 FRN
EUR 3.000%
1,500,000 1,483,710 0.3431.12.99VolkswagenInternationalFinance NV 15 FRN
EUR 2.500%
500,000 491,965 0.1131.12.99VolkswagenInternationalFinance NV 17 FRN
EUR 2.700%
2,600,000 2,267,482 0.5227.03.28ABN AMRO BankNV 17 FRN
USD 4.400%
4.2618,594,624Total - Netherlands
30,200,000 40,116,774 9.2105.03.30CP - Comboios dePortugal EPE 10
EUR 5.700%Portugal
10,350,000 11,400,732 2.6113.12.21Rede FerroviariaNacional - REFEREPE 06
EUR 4.250%
11.8251,517,506Total - Portugal
3,390,000 3,069,122 0.6931.12.99Vontobel HoldingAG 18 FRN
CHF 2.625%Switzerland
700,000 633,018 0.1531.12.99Credit SuisseGroup AG 18 FRN
USD 7.500%

55
Vontobel Fund - Bond Global Aggregate
The accompanying notes form an essential part of these financial statements.
Portfolio as at February 28, 2019
* Any deviations of the percentages of the nets assets are due to rounding.
Securities Marketvalue in
EUR
% of netassets*
Quantity Ccy Maturity
1,000,000 766,400 0.1831.12.99UBS GroupFundingSwitzerland AG 18FRN
USD 5.000%
1.024,468,540Total - Switzerland
600,000 585,444 0.1313.03.28SenegalGovernmentInternational Bond18
EUR 4.750%Senegal
0.13585,444Total - Senegal
4,600,000 5,191,330 1.1931.12.99Banco BilbaoVizcaya ArgentariaSA 16 FRN
EUR 8.875%Spain
1,400,000 1,386,406 0.3231.12.99Banco SantanderSA 14 FRN
EUR 6.250%
1,000,000 1,049,680 0.2431.12.99CaixaBank SA 17FRN
EUR 6.750%
3,200,000 2,826,304 0.6531.12.99CaixaBank SA 18FRN
EUR 5.250%
2,500,000 2,350,225 0.5417.04.30CaixaBank SA 18FRN EMTN
EUR 2.250%
900,000 885,969 0.2028.09.27NorteGas EnergiaDistribucion SAU17 EMTN
EUR 2.065%
2,500,000 2,562,925 0.5918.03.25SantanderIssuances SAU 15EMTN
EUR 2.500%
3.7316,252,839Total - Spain
900,000 768,948 0.1818.04.23Sri LankaGovernmentInternational Bond18
USD 5.750%Sri Lanka
0.18768,948Total - Sri Lanka
1,050,000 857,391 0.2014.09.27Republic ofTajikistanInternational Bond17
USD 7.125%Tadzhikistan
0.20857,391Total -Tadzhikistan
1,700,000 1,478,987 0.3427.07.27Banque OuestAfricaine deDeveloppement 17
USD 5.000%Togo
0.341,478,987Total - Togo
180,000,000 6,888,800 1.5823.02.21Czech RepublicGovernment Bond18
CZK 0.750%Czech Republic
1.586,888,800Total - Czech Republic
1,600,000 1,506,241 0.3614.06.25Turkey GovernmentInternational Bond17 EMTN
EUR 3.250%Turkey
Securities Marketvalue in
EUR
% of netassets*
Quantity Ccy Maturity
1,400,000 1,282,880 0.2924.01.24Export Credit Bankof Turkey 19
USD 8.250%
1,000,000 840,002 0.1905.02.20Turkiye HalkBankasi AS 13
USD 3.875%
600,000 481,881 0.1111.02.21Turkiye HalkBankasi AS 15
USD 4.750%
1,800,000 1,450,069 0.3325.04.24Turkiye Is Bankasi17
USD 6.125%
1.285,561,073Total - Turkey
6,400,000 6,028,992 1.3817.02.24Banque Centralede TunisieInternational Bond17
EUR 5.625%Tunisia
1.386,028,992Total - Tunisia
6,340,000 5,586,405 1.2801.09.19UkraineGovernmentInternational Bond15
USD 7.750%Ukraine
1.285,586,405Total - Ukraine
600,000 550,032 0.1323.04.30Abu Dhabi NationalEnergy Co PJSC 18
USD 4.875%United Arab Emirates
3,200,000 1,596,070 0.3606.02.25Emirates Airline 13USD 4.500%0.492,146,102Total - United Arab Emirates
1,500,000 1,343,506 0.3103.03.26Bank of AmericaCorp 16
USD 4.450%United States
2,000,000 1,898,639 0.4313.09.25Citigroup Inc 13USD 5.500%1,500,000 1,027,487 0.2401.05.20EP Energy LLC /
Everest AcquisitionFinance Inc 12
USD 9.375%
1,800,000 1,580,434 0.3618.03.19Hyundai CapitalAmerica 16 EMTN
USD 2.500%
1.345,850,066Total - United States
1,200,000 1,377,084 0.3230.03.22Barclays Bank PLC11 EMTN
EUR 6.625%United Kingdom
3,500,000 4,174,238 0.9516.08.19Bank of ScotlandPLC 99 EMTN
GBP 6.375%
3,300,000 4,018,315 0.9231.12.99Barclays PLC 17FRN
GBP 7.250%
2,000,000 2,466,507 0.5703.03.25Heathrow FinancePLC 14
GBP 5.750%
1,950,000 2,435,412 0.5631.12.99Lloyds BankingGroup PLC 14 FRN
GBP 7.625%
2,900,000 3,424,203 0.7931.12.99NationwideBuilding Society 14FRN EMTN
GBP 6.875%
2,000,000 2,592,660 0.5931.12.99Zurich Finance UKPLC 03 FRN EMTN
GBP 6.630%
1,500,000 1,597,756 0.3731.12.99Lloyds Bank PLC09 FRN
USD 12.000%

56
Vontobel Fund - Bond Global Aggregate
The accompanying notes form an essential part of these financial statements.
Portfolio as at February 28, 2019
* Any deviations of the percentages of the nets assets are due to rounding.
Securities Marketvalue in
EUR
% of netassets*
Quantity Ccy Maturity
1,000,000 920,638 0.2131.12.99StandardChartered PLC 16FRN
USD 7.500%
5.2823,006,813Total - United Kingdom
2,100,000 2,099,706 0.4815.03.26Rexel SA 19EUR 2.750%
76.34332,888,599Total - Transferable securities admitted to anofficial exchange
76.34332,888,599Total - Bonds
0.482,099,706FRANCE
275,000,000 5,559,796 1.2622.02.28Autonomous Cityof Buenos AiresArgentina 17 FRN
ARS 44.620%
Transferable securities and money market instruments dealt in on anotherregulated marketBondsArgentina
1.265,559,796Total - Argentina
5,000,000 4,356,766 1.0026.02.24Yuzhou PropertiesCo Ltd 19
USD 8.500%Cayman Islands
1.004,356,766Total - Cayman Islands
2,996,000 2,665,459 0.6113.01.22Oilflow SPV 1 DAC17
USD 12.000%Ireland
0.612,665,459Total - Ireland
1,000,000 1,049,940 0.2408.06.48AssicurazioniGenerali SpA 16FRN EMTN
EUR 5.000%Italy
0.241,049,940Total - Italy
2,000,000 1,873,312 0.4315.01.35Fideicomiso PAPacifico Tres 16
USD 8.250%Colombia
0.431,873,312Total - Colombia
600,000 558,547 0.1315.01.29Suzano AustriaGmbH 19
USD 6.000%Austria
0.13558,547Total - Austria
4,000,000 3,426,644 0.7927.10.21Turkiye VakiflarBankasi TAO 16
USD 5.500%Turkey
0.793,426,644Total - Turkey
Securities Marketvalue in
EUR
% of netassets*
Quantity Ccy Maturity
1,500,000 1,376,570 0.3215.07.33Sealed Air Corp 03USD 6.880%United States
4.7820,867,034Total - Transferable securities and money marketinstruments dealt in on another regulated market
4.7820,867,034Total - Bonds
0.321,376,570Total - United States
5,200,000 4,655,660 1.0714.12.23SG Issuer SA 18EMTN
USD 0,000%
Other transferable securitiesBondsLuxembourg
1.074,655,660Total - Luxembourg
500,000 512,480 0.1215.05.27Netflix Inc 17EUR 3.625%United States
1.195,168,140Total - Bonds
0.12512,480Total - United States
8,000 1,081,360 0.25Vontobel Fund -High Yield Bond - I
EUR
Investment fundsLuxembourg
38,500 3,814,499 0.87Vontobel Fund -CreditOpportunities - X
USD
239,000 31,733,038 7.27Vontobel Fund -Emerging MarketsCorporate Bond - I
USD
9.5841,797,037Total - Other transferable securities
8.3936,628,897Total - Investment funds
8.3936,628,897Total - Luxembourg
90.70395,552,670Total - Investment in securities

57
Vontobel Fund - Eastern European Bond
AssetsInvestments in securities at market value 80,355,097(2)
3,372,466Cash at banks
272,915Receivable from foreign currencies
10,232Receivable from subscriptions
1,594,462Interest and dividends receivable(2)
67,928Unrealised gain on forward foreign exchange contracts(9)
Total Assets 85,673,100
95,375,033Statement of Net Assetsas at February 28, 2019
LiabilitiesPayable for redemptions 166,685
Payable on foreign currencies 273,370
Interest and dividends payable 231,130
Audit fees, printing and publishing expenses 1,202
Service Fee payable 13,089(5)
Subscription tax payable 4,943(4)
Management Fee payable 62,636(3)
Other liabilities 1,353Total Liabilities 754,408Total net assets at the end of the period 84,918,692Net assets at the beginning of the reporting period 88,978,144
Net investment income 1,225,181
Change in unrealised appreciation/depreciation on:
Investments 5,410,005
Forward foreign exchange contracts -382,763
Net realised gain/loss on investments -2,017,675(2)
Net realised gain/loss on forward foreign exchange contracts 1,183,115(2)
Net realised gain/loss on currency exchange -87,488(2)
Increase/Decrease in net assets resulting from operations 5,330,375Subscriptions of shares 2,667,800
Redemptions of shares -10,415,763
Dividend distribution -1,641,864(11)
Total net assets at the end of the period 84,918,692
Statement of Operations andChanges in Net Assetsfrom September 1, 2018to February 28, 2019
IncomeBank interest 1,009
Net interest on bonds 1,867,669(2)
Total Income 1,868,678ExpensesManagement Fees 466,847(3)
Audit fees, printing and publishing expenses 19,026
Subscription tax 15,683(4)
Bank interest 20,097
Service Fees 94,180(5)
Other Fees payable 27,664(8)
Total Expenses 643,497Net investment income 1,225,181
Statement of Net Incomefrom September 1, 2018to February 28, 2019
Notes EURThe accompanying notes form an essential part of these financial statements.
Cost

58
Vontobel Fund - Eastern European Bond
The accompanying notes form an essential part of these financial statements.
Portfolio as at February 28, 2019
* Any deviations of the percentages of the nets assets are due to rounding.
Securities Marketvalue in
EUR
% of netassets*
Quantity Ccy Maturity
50,000,000 666,350 0.7813.03.19Federal Grid CoOJS via FederalGrid Finance Ltd 12EMTN
RUB 8.450%
Transferable securities admitted to an official exchangeBondsIreland
90,000,000 1,198,530 1.4102.04.19Russian Railwaysvia RZD CapitalPLC 12
RUB 8.300%
300,000 267,961 0.3230.10.22Eurotorg LLC ViaBonitron DAC 17
USD 8.750%
2.512,132,841Total - Ireland
450,000 397,195 0.4726.07.22Topaz Marine SA17
USD 9.125%Luxembourg
0.47397,195Total - Luxembourg
29,000,000 7,603,416 8.9623.09.22PolandGovernment Bond02
PLN 5.750%Poland
15,000,000 4,631,434 5.4525.08.23PolandGovernment Bond08
PLN 2.750%
20,000,000 4,927,413 5.8025.10.20PolandGovernment Bond10
PLN 5.250%
25,000,000 6,410,568 7.5625.10.21PolandGovernment Bond11
PLN 5.750%
8,500,000 2,132,377 2.5125.10.23PolandGovernment Bond12
PLN 4.000%
10,000,000 2,418,059 2.8525.07.25PolandGovernment Bond14
PLN 3.250%
22,500,000 5,232,450 6.1625.04.20PolandGovernment Bond15
PLN 1.500%
10,000,000 2,293,785 2.7025.07.26PolandGovernment Bond15
PLN 2.500%
15,000,000 3,490,427 4.1125.07.21PolandGovernment Bond16
PLN 1.750%
46.1039,139,929Total - Poland
9,250,000 2,049,897 2.4111.06.21RomaniaGovernment Bond11
RON 5.950%Romania
4,500,000 974,840 1.1529.04.20RomaniaGovernment Bond13
RON 5.750%
10,000,000 2,245,333 2.6526.04.23RomaniaGovernment Bond13
RON 5.850%
6.215,270,070Total - Romania
50,000,000 666,610 0.7814.04.21Russian FederalBond - OFZ 11
RUB 7.600%Russia
140,000,000 1,858,056 2.1911.12.19Russian FederalBond - OFZ 12
RUB 6.800%
Securities Marketvalue in
EUR
% of netassets*
Quantity Ccy Maturity
35,000,000 468,441 0.5503.02.27Russian FederalBond - OFZ 12
RUB 8.150%
270,000,000 3,592,857 4.2415.05.19Russian FederalBond - OFZ 13
RUB 6.700%
100,000,000 1,316,055 1.5527.05.20Russian FederalBond - OFZ 13
RUB 6.400%
135,000,000 1,743,715 2.0525.01.23Russian FederalBond - OFZ 13
RUB 7.000%
35,000,000 435,707 0.5119.01.28Russian FederalBond - OFZ 13
RUB 7.050%
11.8710,081,441Total - Russia
7,000,000 933,032 1.1014.09.22Turkey GovernmentBond 12
TRY 8.500%Turkey
10,000,000 2,964,802 3.4926.10.22Turkey GovernmentBond 12
TRY 2.000%
2,500,000 305,410 0.3608.03.23Turkey GovernmentBond 13
TRY 7.100%
4,000,000 1,047,059 1.2303.05.23Turkey GovernmentBond 13
TRY 1.000%
6,000,000 773,485 0.9127.09.23Turkey GovernmentBond 13
TRY 8.800%
7.096,023,788Total - Turkey
1,550,000,000 5,482,726 6.4612.11.20HungaryGovernment Bond04
HUF 7.500%Hungary
500,000,000 1,614,080 1.9024.06.19HungaryGovernment Bond08
HUF 6.500%
500,000,000 1,869,691 2.2024.06.25HungaryGovernment Bond14
HUF 5.500%
84.8172,011,761Total - Transferable securities admitted to anofficial exchange
84.8172,011,761Total - Bonds
10.568,966,497Total - Hungary
8,500,000 1,833,788 2.1624.02.25RomaniaGovernment Bond14
RON 4.750%
Transferable securities and money market instruments dealt in on anotherregulated marketBondsRomania
2.161,833,788Total - Romania
150,000,000 1,895,042 2.2325.06.32Russian RailwaysJSC 12 FRN
RUB 9.400%Russia
2.231,895,042Total - Russia

59
Vontobel Fund - Eastern European Bond
The accompanying notes form an essential part of these financial statements.
Portfolio as at February 28, 2019
* Any deviations of the percentages of the nets assets are due to rounding.
Securities Marketvalue in
EUR
% of netassets*
Quantity Ccy Maturity
5,000,000 682,389 0.8024.02.27Turkey GovernmentBond 17
TRY 11.000%Turkey
5.194,411,219Total - Transferable securities and money marketinstruments dealt in on another regulated market
5.194,411,219Total - Bonds
0.80682,389Total - Turkey
100,000,000 903,657 1.0607.03.20SERBIA 13RSD 10.000%
Other transferable securitiesBondsSerbia
1.06903,657Total - Bonds
1.06903,657Total - Serbia
18,361 3,028,460 3.57VONTOBEL EUROBOND /-I- CAP
EUR
Investment fundsLuxembourg
4.633,932,117Total - Other transferable securities
3.573,028,460Total - Investment funds
3.573,028,460Total - Luxembourg
94.6380,355,097Total - Investment in securities

60
Vontobel Fund - Value Bond
AssetsInvestments in securities at market value 82,223,308(2)
12,350,695Cash at banks
30Receivable from foreign currencies
905,587Interest and dividends receivable(2)
1,576,267Receivable for investments sold
217,485Options contracts at market value(9)
Total Assets 97,273,372
81,351,690Statement of Net Assetsas at February 28, 2019
LiabilitiesBank overdraft 3,019,883
Provision for expenses 11
Payable for redemptions 436,554
Payable for investments purchased 226,957
Payable on foreign currencies 30
Unrealised loss on forward foreign exchange contracts 881,793(9)
Unrealised loss on futures 445,455(9)
Audit fees, printing and publishing expenses 607
Service Fee payable 16,189(5)
Subscription tax payable 6,657(4)
Management Fee payable 21,680(3)
Performance Fee payable 649(3)
Options at cost of purchase 217,485(9)
Other liabilities 60Total Liabilities 5,274,010Total net assets at the end of the period 91,999,362Net assets at the beginning of the reporting period 121,505,468
Net investment income 959,993
Change in unrealised appreciation/depreciation on:
Investments 621,365
Futures -365,420
Forward foreign exchange contracts -4,413,015
Options 264,052
Net realised gain/loss on investments 1,222,987(2)
Net realised gain/loss on forward foreign exchange contracts 2,118,404(2)
Net realised gain/loss on currency exchange 217,149(2)
Net realised gain/loss on futures 478,873(2)
Net realised gain/loss on options -102,100(2)
Increase/Decrease in net assets resulting from operations 1,002,288Subscriptions of shares 1,015,022
Redemptions of shares -30,698,249
Dividend distribution -825,167(11)
Total net assets at the end of the period 91,999,362
Statement of Operations andChanges in Net Assetsfrom September 1, 2018to February 28, 2019
Notes CHFThe accompanying notes form an essential part of these financial statements.
Cost

61
Vontobel Fund - Value Bond
IncomeBank interest 31,621
Net interest on bonds 1,280,566(2)
Other income 29,554Total Income 1,341,741ExpensesManagement Fees 146,659(3)
Performance Fee 649(3)
Audit fees, printing and publishing expenses 12,646
Subscription tax 21,279(4)
Bank interest 40,971
Service Fees 122,445(5)
Other Fees payable 37,099(8)
Total Expenses 381,748Net investment income 959,993
Statement of Net Incomefrom September 1, 2018to February 28, 2019
Notes CHFThe accompanying notes form an essential part of these financial statements.

62
Vontobel Fund - Value Bond
The accompanying notes form an essential part of these financial statements.
Portfolio as at February 28, 2019
* Any deviations of the percentages of the nets assets are due to rounding.
Securities Marketvalue in
CHF
% of netassets*
Quantity Ccy Maturity
1,500,000 1,498,888 1.6324.05.21African Export-Import Bank/The16 EMTN
USD 4.000%
Transferable securities admitted to an official exchangeBondsEgypt
1.631,498,888Total - Egypt
1,000,000 1,214,766 1.3202.08.21Bulgarian EnergyHolding EAD 16
EUR 4.875%Bulgaria
1.321,214,766Total - Bulgaria
600,000 606,501 0.6627.01.24Saudi ElectricityGlobal Sukuk Co 418
USD 4.222%Cayman Islands
0.66606,501Total - Cayman Islands
5,000,000 6,453,562 7.0215.04.26DeutscheBundesrepublikInflation LinkedBond 15
EUR 0.100%Germany
400,000 463,382 0.5031.07.26Volkswagen BankGmbH 19 EMTN
EUR 2.500%
1,000,000 1,130,051 1.2312.04.21VolkswagenFinancial ServicesAG 18 EMTN
EUR 0.375%
8.758,046,995Total - Germany
1,500,000 1,724,616 1.8718.01.23BPCE SA 17 EMTNEUR 1.125%France
1,700,000 1,959,887 2.1308.06.22RCI Banque SA 15EMTN
EUR 1.250%
1,000,000 1,174,723 1.2819.10.22TDF InfrastructureSAS 15
EUR 2.880%
500,000 595,812 0.6531.12.99TOTAL SA 16 FRNEMTN
EUR 2.708%
1,000,000 992,913 1.0831.12.99AXA SA 13 EMTNUSD 5.500%400,000 405,382 0.4431.12.99BNP Paribas SA 05USD 6.250%500,000 523,488 0.5722.10.23BPCE SA 13 EMTNUSD 5.700%400,000 390,582 0.4222.05.22BPCE SA 17 EMTNUSD 3.000%
8.447,767,403Total - France
500,000 495,500 0.5405.04.20ICBCIL Finance CoLtd 17 EMTN
USD 3.000%Hong Kong
0.54495,500Total - Hong Kong
700,000 720,297 0.7815.11.21Indonesia AsahanAluminium PerseroPT 18
USD 5.230%Indonesia
0.78720,297Total - Indonesia
1,000,000 1,271,848 1.3802.10.43Aquarius &Investments PLCfor ZurichInsurance Co Ltd13 FRN EMTN
EUR 4.250%Ireland
Securities Marketvalue in
CHF
% of netassets*
Quantity Ccy Maturity
2,000,000 2,288,779 2.4923.09.20FCA Capital IrelandPLC 16 EMTN
EUR 1.250%
3.873,560,627Total - Ireland
1,000,000 1,347,283 1.4612.12.42AssicurazioniGenerali SpA 12FRN EMTN
EUR 7.750%Italy
2,000,000 2,336,060 2.5418.06.21Intesa SanpaoloSpA 14 EMTN
EUR 2.000%
400,000 471,913 0.5131.12.99Intesa SanpaoloSpA 16 FRN EMTN
EUR 7.000%
2,200,000 2,511,742 2.7215.04.22Italy BuoniPoliennali DelTesoro 15
EUR 1.350%
500,000 551,351 0.6015.11.24Italy BuoniPoliennali DelTesoro 17
EUR 1.450%
600,000 661,614 0.7227.09.22Mediobanca Bancadi CreditoFinanziario SpA 17EMTN
EUR 0.625%
800,000 918,842 1.0020.02.29UniCredit SpA 19FRN EMTN
EUR 4.875%
500,000 501,482 0.5512.09.23Eni SpA 18USD 4.000%10.109,300,287Total - Italy
500,000 492,855 0.5419.04.22Daiwa SecuritiesGroup Inc 17
USD 3.129%Japan
0.54492,855Total - Japan
1,000,000 1,156,652 1.2513.09.23Glencore FinanceEurope SA 16EMTN
EUR 1.875%Jersey
1,000,000 1,008,982 1.1029.03.49HBOS CapitalFunding LP 03
USD 6.850%
2.352,165,634Total - Jersey
900,000 934,650 1.0220.06.22Kazakhstan TemirZholy National CoJSC 14
CHF 3.638%Kazakhstan
500,000 507,669 0.5526.09.20EurasianDevelopment Bank13
USD 5.000%
1.571,442,319Total - Kazakhstan
650,000 659,969 0.7214.03.22Eastern andSouthern AfricanTrade andDevelopment Bank17 EMTN
USD 5.375%Kenya
0.72659,969Total - Kenya
400,000 406,560 0.4423.12.19Glencore FinanceEurope Ltd 13EMTN
CHF 2.125%Luxembourg
80,000 81,520 0.0901.12.20Glencore FinanceEurope Ltd 14EMTN
CHF 1.250%

63
Vontobel Fund - Value Bond
The accompanying notes form an essential part of these financial statements.
Portfolio as at February 28, 2019
* Any deviations of the percentages of the nets assets are due to rounding.
Securities Marketvalue in
CHF
% of netassets*
Quantity Ccy Maturity
250,000 289,257 0.3101.11.24Arena LuxembourgFinance Sarl 17
EUR 2.875%
0.84777,337Total - Luxembourg
500,000 572,325 0.6215.03.24Nemak SAB de CV17
EUR 3.250%Mexico
2,900,000 3,307,479 3.6021.02.24PetroleosMexicanos 17EMTN
EUR 3.750%
1,000,000 1,001,092 1.0915.03.22MexicoGovernmentInternational Bond12
USD 3.625%
5.314,880,896Total - Mexico
600,000 612,060 0.6731.03.20Bharti AirtelInternationalNetherlands BV 14
CHF 3.000%Netherlands
500,000 681,866 0.7406.07.22ABN AMRO BankNV 12 EMTN
EUR 7.125%
500,000 575,241 0.6306.12.21Cetin Finance BV16
EUR 1.423%
500,000 595,977 0.6531.12.99CooperatieveCentrale Raiffeisen-BoerenleenbankBA/Netherlands 15FRN
EUR 5.500%
900,000 1,004,529 1.0831.12.99VolkswagenInternationalFinance NV 17 FRN
EUR 2.700%
3.773,469,673Total - Netherlands
600,000 575,939 0.6317.01.23Oman GovernmentInternational Bond18
USD 4.125%Oman
0.63575,939Total - Oman
1,000,000 1,506,867 1.6305.03.30CP - Comboios dePortugal EPE 10
EUR 5.700%Portugal
500,000 589,494 0.6430.04.79EDP - Energias dePortugal SA 19FRN
EUR 4.496%
1,000,000 1,146,261 1.2519.09.23Galp Gas NaturalDistribuicao SA 16EMTN
EUR 1.375%
3.523,242,622Total - Portugal
1,000,000 972,511 1.0631.12.99SkandinaviskaEnskilda BankenAB 17 FRN
USD 5.625%Sweden
1.06972,511Total - Sweden
600,000 603,727 0.6631.12.99UBS GroupFundingSwitzerland AG 19FRN
USD 7.000%Switzerland
0.66603,727Total - Switzerland
Securities Marketvalue in
CHF
% of netassets*
Quantity Ccy Maturity
400,000 512,079 0.5631.12.99Banco BilbaoVizcaya ArgentariaSA 16 FRN
EUR 8.875%Spain
600,000 681,842 0.7411.09.22Banco BilbaoVizcaya ArgentariaSA 17 EMTN
EUR 0.750%
1,000,000 1,119,434 1.2212.01.23CaixaBank SA 17EMTN
EUR 1.125%
500,000 590,418 0.6415.02.27CaixaBank SA 17FRN EMTN
EUR 3.500%
3.162,903,773Total - Spain
1,000,000 1,024,732 1.1106.05.21Banque OuestAfricaine deDeveloppement 16
USD 5.500%Togo
1.111,024,732Total - Togo
1,000,000 1,118,662 1.2204.05.21Turkiye VakiflarBankasi TAO 16
EUR 2.375%Turkey
1.221,118,662Total - Turkey
1,000,000 1,236,830 1.3414.01.21Barclays Bank PLC10 EMTN
EUR 6.000%United Kingdom
1,000,000 1,301,772 1.4130.03.22Barclays Bank PLC11 EMTN
EUR 6.625%
1,000,000 1,105,628 1.2013.09.21FCE Bank PLC 17EMTN
EUR 0.869%
300,000 360,680 0.3931.12.99HSBC HoldingsPLC 14 FRN
EUR 5.250%
1,000,000 1,204,965 1.3124.03.20Lloyds Bank PLC10 EMTN
EUR 6.500%
2,000,000 2,465,742 2.6822.07.20NationwideBuilding Society 10EMTN
EUR 6.750%
800,000 921,528 1.0004.03.25Royal Bank ofScotland GroupPLC 18 FRN EMTN
EUR 2.000%
1,500,000 1,836,561 2.0023.11.22StandardChartered PLC 12EMTN
EUR 3.625%
1,500,000 1,715,631 1.8617.03.22Yorkshire BuildingSociety 15 EMTN
EUR 1.250%
500,000 676,449 0.7416.08.19Bank of ScotlandPLC 99 EMTN
GBP 6.375%
13.9312,825,786Total - United Kingdom
200,000 226,843 0.2515.03.26Rexel SA 19EUR 2.750%
76.7370,594,542Total - Transferable securities admitted to anofficial exchange
76.7370,594,542Total - Bonds
0.25226,843FRANCE

64
Vontobel Fund - Value Bond
The accompanying notes form an essential part of these financial statements.
Portfolio as at February 28, 2019
* Any deviations of the percentages of the nets assets are due to rounding.
Securities Marketvalue in
CHF
% of netassets*
Quantity Ccy Maturity
1,100,000 1,097,333 1.1931.12.99ING Groep NV 19FRN
USD 6.750%
Transferable securities and money market instruments dealt in on anotherregulated marketBondsNetherlands
1.191,097,333Total - Netherlands
1,000,000 1,133,113 1.2428.09.22NorteGas EnergiaDistribucion SAU17 EMTN
EUR 0.918%Spain
1.241,133,113Total - Spain
500,000 630,106 0.6815.10.24Miller HomesGroup HoldingsPLC 17
GBP 5.500%United Kingdom
3.112,860,552Total - Transferable securities and money marketinstruments dealt in on another regulated market
3.112,860,552Total - Bonds
0.68630,106Total - United Kingdom
15,000 1,685,870 1.83Vontobel Fund -CreditOpportunities - X
USD
Other transferable securitiesInvestment fundsLuxembourg
1.831,685,870Total - Other transferable securities
1.831,685,870Total - Investment funds
1.831,685,870Total - Luxembourg
62,000 7,082,344 7.70Vontobel Fund -Absolute ReturnBond Dynamic
EUR
Investment fundsLuxembourg
7.707,082,344Total - Investment funds
7.707,082,344Total - Luxembourg
89.3782,223,308Total - Investment in securities

65
Vontobel Fund - Absolute Return Bond (EUR)
AssetsInvestments in securities at market value 62,811,902(2)
21,071,320Cash at banks
41,208Receivable from subscriptions
696,798Interest and dividends receivable(2)
561,034Options contracts at market value(9)
Total Assets 85,182,262
63,221,587Statement of Net Assetsas at February 28, 2019
LiabilitiesBank overdraft 1,233,022
Payable for redemptions 89,436
Payable for investments purchased 1,253,882
Interest and dividends payable 16
Unrealised loss on forward foreign exchange contracts 64,330(9)
Unrealised loss on futures 37,306(9)
Audit fees, printing and publishing expenses 17
Service Fee payable 11,663(5)
Subscription tax payable 5,448(4)
Management Fee payable 35,987(3)
Performance Fee payable 2,896(3)
Options at cost of purchase 387,651(9)
Other liabilities 1,349Total Liabilities 3,123,003Total net assets at the end of the period 82,059,259Net assets at the beginning of the reporting period 74,511,837
Net investment income 457,505
Change in unrealised appreciation/depreciation on:
Investments 1,062,456
Futures -8,992
Forward foreign exchange contracts -40,287
Options 597,347
Net realised gain/loss on investments -328,254(2)
Net realised gain/loss on forward foreign exchange contracts -813,411(2)
Net realised gain/loss on currency exchange 140,525(2)
Net realised gain/loss on futures 158,950(2)
Net realised gain/loss on options 159,518(2)
Increase/Decrease in net assets resulting from operations 1,385,357Subscriptions of shares 19,209,162
Redemptions of shares -12,943,546
Dividend distribution -103,551(11)
Total net assets at the end of the period 82,059,259
Statement of Operations andChanges in Net Assetsfrom September 1, 2018to February 28, 2019
Notes EURThe accompanying notes form an essential part of these financial statements.
Cost

66
Vontobel Fund - Absolute Return Bond (EUR)
IncomeBank interest 20,936
Net interest on bonds 848,352(2)
Other income 18,958Total Income 888,246ExpensesManagement Fees 238,269(3)
Performance Fee 2,954(3)
Audit fees, printing and publishing expenses 26,516
Subscription tax 14,141(4)
Bank interest 9,246
Service Fees 92,318(5)
Other Fees payable 47,297(8)
Total Expenses 430,741Net investment income 457,505
Statement of Net Incomefrom September 1, 2018to February 28, 2019
Notes EURThe accompanying notes form an essential part of these financial statements.

67
Vontobel Fund - Absolute Return Bond (EUR)
The accompanying notes form an essential part of these financial statements.
Portfolio as at February 28, 2019
* Any deviations of the percentages of the nets assets are due to rounding.
Securities Marketvalue in
EUR
% of netassets*
Quantity Ccy Maturity
400,000 378,800 0.4616.04.30Egypt GovernmentInternational Bond18 EMTN
EUR 5.625%
Transferable securities admitted to an official exchangeBondsEgypt
500,000 440,445 0.5424.05.21African Export-Import Bank/The16 EMTN
USD 4.000%
1.00819,245Total - Egypt
200,000 159,663 0.1917.01.25Country GardenHoldings Co Ltd 18
USD 5.125%Cayman Islands
800,000 712,876 0.8727.01.24Saudi ElectricityGlobal Sukuk Co 418
USD 4.222%
1.06872,539Total - Cayman Islands
200,000 200,778 0.2412.02.21Deutsche Bank AG19 EMTN
EUR 1.625%Germany
3,000,000 3,413,460 4.1715.04.26DeutscheBundesrepublikInflation LinkedBond 15
EUR 0.100%
1,000,000 996,190 1.2112.04.21VolkswagenFinancial ServicesAG 18 EMTN
EUR 0.375%
5.624,610,428Total - Germany
600,000 574,350 0.7022.03.30Ivory CoastGovernmentInternational Bond18
EUR 5.250%Ivory Coast
0.70574,350Total - Ivory Coast
1,800,000 1,829,359 2.2308.06.22RCI Banque SA 15EMTN
EUR 1.250%France
1,000,000 1,035,570 1.2619.10.22TDF InfrastructureSAS 15
EUR 2.880%
1,000,000 1,050,470 1.2831.12.99TOTAL SA 16 FRNEMTN
EUR 2.708%
1,000,000 875,296 1.0731.12.99AXA SA 13 EMTNUSD 5.500%300,000 268,021 0.3331.12.99BNP Paribas SA 05USD 6.250%500,000 461,478 0.5622.10.23BPCE SA 13 EMTNUSD 5.700%400,000 344,315 0.4222.05.22BPCE SA 17 EMTNUSD 3.000%
7.155,864,509Total - France
1,000,000 873,610 1.0605.04.20ICBCIL Finance CoLtd 17 EMTN
USD 3.000%Hong Kong
1.06873,610Total - Hong Kong
300,000 311,106 0.3818.07.24IndonesiaGovernmentInternational Bond17 EMTN
EUR 2.150%Indonesia
Securities Marketvalue in
EUR
% of netassets*
Quantity Ccy Maturity
400,000 362,842 0.4415.11.21Indonesia AsahanAluminium PerseroPT 18
USD 5.230%
0.82673,948Total - Indonesia
1,000,000 1,121,190 1.3702.10.43Aquarius &Investments PLCfor ZurichInsurance Co Ltd13 FRN EMTN
EUR 4.250%Ireland
1,900,000 1,916,777 2.3423.09.20FCA Capital IrelandPLC 16 EMTN
EUR 1.250%
1,000,000 1,046,020 1.2721.02.23VnesheconombankVia VEB FinancePLC 13
EUR 4.032%
200,000 148,503 0.1830.11.26Saderea DAC 14EMTN
USD 12.500%
5.164,232,490Total - Ireland
500,000 593,845 0.7212.12.42AssicurazioniGenerali SpA 12FRN EMTN
EUR 7.750%Italy
200,000 201,472 0.2529.01.29AssicurazioniGenerali SpA 19EMTN
EUR 3.875%
2,000,000 2,059,340 2.5218.06.21Intesa SanpaoloSpA 14 EMTN
EUR 2.000%
500,000 520,015 0.6331.12.99Intesa SanpaoloSpA 16 FRN EMTN
EUR 7.000%
500,000 516,155 0.6315.12.21Italy BuoniPoliennali DelTesoro 14
EUR 2.150%
1,200,000 1,207,752 1.4715.04.22Italy BuoniPoliennali DelTesoro 15
EUR 1.350%
400,000 388,832 0.4715.11.24Italy BuoniPoliennali DelTesoro 17
EUR 1.450%
700,000 680,449 0.8327.09.22Mediobanca Bancadi CreditoFinanziario SpA 17EMTN
EUR 0.625%
700,000 708,750 0.8620.02.29UniCredit SpA 19FRN EMTN
EUR 4.875%
500,000 442,079 0.5412.09.23Eni SpA 18USD 4.000%8.927,318,689Total - Italy
1,000,000 868,947 1.0619.04.22Daiwa SecuritiesGroup Inc 17
USD 3.129%Japan
1.06868,947Total - Japan
950,000 844,989 1.0329.03.49HBOS CapitalFunding LP 03
USD 6.850%Jersey
1.03844,989Total - Jersey

68
Vontobel Fund - Absolute Return Bond (EUR)
The accompanying notes form an essential part of these financial statements.
Portfolio as at February 28, 2019
* Any deviations of the percentages of the nets assets are due to rounding.
Securities Marketvalue in
EUR
% of netassets*
Quantity Ccy Maturity
400,000 358,026 0.4414.03.22Eastern andSouthern AfricanTrade andDevelopment Bank17 EMTN
USD 5.375%Kenya
0.44358,026Total - Kenya
300,000 305,991 0.3701.11.24Arena LuxembourgFinance Sarl 17
EUR 2.875%Luxembourg
0.37305,991Total - Luxembourg
500,000 443,308 0.5412.08.19Petronas CapitalLtd 09
USD 5.250%Malaysia
0.54443,308Total - Malaysia
400,000 403,624 0.4915.03.24Nemak SAB de CV17
EUR 3.250%Mexico
400,000 347,996 0.4221.04.27PetroleosMexicanos 15EMTN
EUR 2.750%
2,000,000 2,010,820 2.4521.02.24PetroleosMexicanos 17EMTN
EUR 3.750%
500,000 447,379 0.5526.05.21Comision Federalde Electricidad 11
USD 4.875%
300,000 273,712 0.3307.02.26Credito Real SABde CV SOFOM ER19
USD 9.500%
500,000 441,253 0.5415.03.22MexicoGovernmentInternational Bond12
USD 3.625%
4.783,924,784Total - Mexico
1,000,000 1,202,190 1.4606.07.22ABN AMRO BankNV 12 EMTN
EUR 7.125%Netherlands
1,000,000 1,014,200 1.2406.12.21Cetin Finance BV16
EUR 1.423%
500,000 491,965 0.6031.12.99VolkswagenInternationalFinance NV 17 FRN
EUR 2.700%
3.302,708,355Total - Netherlands
400,000 338,477 0.4117.01.23Oman GovernmentInternational Bond18
USD 4.125%Oman
0.41338,477Total - Oman
1,000,000 1,328,370 1.6205.03.30CP - Comboios dePortugal EPE 10
EUR 5.700%Portugal
1,000,000 1,010,480 1.2319.09.23Galp Gas NaturalDistribuicao SA 16EMTN
EUR 1.375%
2.852,338,850Total - Portugal
Securities Marketvalue in
EUR
% of netassets*
Quantity Ccy Maturity
600,000 585,444 0.7113.03.28SenegalGovernmentInternational Bond18
EUR 4.750%Senegal
0.71585,444Total - Senegal
800,000 902,840 1.1031.12.99Banco BilbaoVizcaya ArgentariaSA 16 FRN
EUR 8.875%Spain
500,000 500,895 0.6111.09.22Banco BilbaoVizcaya ArgentariaSA 17 EMTN
EUR 0.750%
1,000,000 986,830 1.2012.01.23CaixaBank SA 17EMTN
EUR 1.125%
500,000 520,480 0.6315.02.27CaixaBank SA 17FRN EMTN
EUR 3.500%
600,000 529,932 0.6531.12.99CaixaBank SA 18FRN
EUR 5.250%
4.193,440,977Total - Spain
200,000 163,313 0.2014.09.27Republic ofTajikistanInternational Bond17
USD 7.125%Tadzhikistan
0.20163,313Total -Tadzhikistan
1,100,000 993,681 1.2106.05.21Banque OuestAfricaine deDeveloppement 16
USD 5.500%Togo
1.21993,681Total - Togo
600,000 606,504 0.7431.03.25Turkey GovernmentInternational Bond19
EUR 4.625%Turkey
1,000,000 1,004,250 1.2308.07.19Turkiye GarantiBankasi AS 14EMTN
EUR 3.375%
200,000 183,269 0.2224.01.24Export Credit Bankof Turkey 19
USD 8.250%
2.191,794,023Total - Turkey
600,000 565,218 0.6917.02.24Banque Centralede TunisieInternational Bond17
EUR 5.625%Tunisia
0.69565,218Total - Tunisia
1,000,000 1,090,320 1.3314.01.21Barclays Bank PLC10 EMTN
EUR 6.000%United Kingdom
900,000 1,032,813 1.2630.03.22Barclays Bank PLC11 EMTN
EUR 6.625%
1,600,000 1,559,455 1.8913.09.21FCE Bank PLC 17EMTN
EUR 0.869%
1,000,000 1,086,830 1.3222.07.20NationwideBuilding Society 10EMTN
EUR 6.750%

69
Vontobel Fund - Absolute Return Bond (EUR)
The accompanying notes form an essential part of these financial statements.
Portfolio as at February 28, 2019
* Any deviations of the percentages of the nets assets are due to rounding.
Securities Marketvalue in
EUR
% of netassets*
Quantity Ccy Maturity
700,000 710,822 0.8704.03.25Royal Bank ofScotland GroupPLC 18 FRN EMTN
EUR 2.000%
1,000,000 1,008,270 1.2317.03.22Yorkshire BuildingSociety 15 EMTN
EUR 1.250%
500,000 596,320 0.7316.08.19Bank of ScotlandPLC 99 EMTN
GBP 6.375%
600,000 730,603 0.8931.12.99Barclays PLC 17FRN
GBP 7.250%
150,000 187,339 0.2331.12.99Lloyds BankingGroup PLC 14 FRN
GBP 7.625%
9.758,002,772Total - United Kingdom
300,000 299,958 0.3715.03.26Rexel SA 19EUR 2.750%
65.5853,816,921Total - Transferable securities admitted to anofficial exchange
65.5853,816,921Total - Bonds
0.37299,958FRANCE
400,000 348,541 0.4226.02.24Yuzhou PropertiesCo Ltd 19
USD 8.500%
Transferable securities and money market instruments dealt in on anotherregulated marketBondsCayman Islands
0.42348,541Total - Cayman Islands
750,000 659,555 0.8031.12.99ING Groep NV 19FRN
USD 6.750%Netherlands
0.80659,555Total - Netherlands
1,000,000 998,890 1.2328.09.22NorteGas EnergiaDistribucion SAU17 EMTN
EUR 0.918%Spain
1.23998,890Total - Spain
380,000 422,154 0.5115.10.24Miller HomesGroup HoldingsPLC 17
GBP 5.500%United Kingdom
2.962,429,140Total - Transferable securities and money marketinstruments dealt in on another regulated market
2.962,429,140Total - Bonds
0.51422,154Total - United Kingdom
Securities Marketvalue in
EUR
% of netassets*
Quantity Ccy Maturity
400,000 358,128 0.4414.12.23SG Issuer SA 18EMTN
USD 0,000%
Other transferable securitiesBondsLuxembourg
0.44358,128Total - Bonds
0.44358,128Total - Luxembourg
22,000 2,179,713 2.65Vontobel Fund -CreditOpportunities - X
USD
Investment fundsLuxembourg
3.092,537,841Total - Other transferable securities
2.652,179,713Total - Investment funds
2.652,179,713Total - Luxembourg
40,000 4,028,000 4.91Vontobel Fund -Absolute ReturnBond Dynamic
EUR
Investment fundsLuxembourg
4.914,028,000Total - Investment funds
4.914,028,000Total - Luxembourg
76.5462,811,902Total - Investment in securities

70
Vontobel Fund - Absolute Return Bond Dynamic
AssetsInvestments in securities at market value 18,112,255(2)
2,260,441Cash at banks
11Receivable from foreign currencies
44,985Receivable from subscriptions
205,022Interest and dividends receivable(2)
120,361Receivable for investments sold
69,516Options contracts at market value(9)
93,638Options at cost of purchase(9)
Total Assets 20,906,229
18,000,414Statement of Net Assetsas at February 28, 2019
LiabilitiesBank overdraft 1,230,279
Payable for investments purchased 100,049
Payable on foreign currencies 11
Unrealised loss on forward foreign exchange contracts 41,580(9)
Unrealised loss on futures 68,682(9)
Audit fees, printing and publishing expenses 49
Service Fee payable 7,358(5)
Subscription tax payable 746(4)
Management Fee payable 8,028(3)
Performance Fee payable 41,187(3)
Other liabilities 1,294Total Liabilities 1,499,263Total net assets at the end of the period 19,406,966Net assets at the beginning of the reporting period 9,158,526
Net investment income 45,932
Change in unrealised appreciation/depreciation on:
Investments 239,821
Futures -64,429
Forward foreign exchange contracts -86,210
Options 39,419
Net realised gain/loss on investments -51,757(2)
Net realised gain/loss on forward foreign exchange contracts 167,341(2)
Net realised gain/loss on currency exchange 12,922(2)
Net realised gain/loss on futures -3,147(2)
Net realised gain/loss on options 232,058(2)
Increase/Decrease in net assets resulting from operations 531,950Subscriptions of shares 11,061,166
Redemptions of shares -1,340,881
Dividend distribution -3,795(11)
Total net assets at the end of the period 19,406,966
Statement of Operations andChanges in Net Assetsfrom September 1, 2018to February 28, 2019
Notes EURThe accompanying notes form an essential part of these financial statements.
Cost

71
Vontobel Fund - Absolute Return Bond Dynamic
IncomeBank interest 2,258
Net interest on bonds 213,988(2)
Total Income 216,246ExpensesManagement Fees 46,095(3)
Performance Fee 41,206(3)
Audit fees, printing and publishing expenses 13,649
Subscription tax 2,243(4)
Bank interest 9,630
Service Fees 35,998(5)
Other Fees payable 21,493(8)
Total Expenses 170,314Net investment income 45,932
Statement of Net Incomefrom September 1, 2018to February 28, 2019
Notes EURThe accompanying notes form an essential part of these financial statements.

72
Vontobel Fund - Absolute Return Bond Dynamic
The accompanying notes form an essential part of these financial statements.
Portfolio as at February 28, 2019
* Any deviations of the percentages of the nets assets are due to rounding.
Securities Marketvalue in
EUR
% of netassets*
Quantity Ccy Maturity
300,000 284,100 1.4616.04.30Egypt GovernmentInternational Bond18 EMTN
EUR 5.625%
Transferable securities admitted to an official exchangeBondsEgypt
1.46284,100Total - Egypt
100,000 58,621 0.3131.12.38Argentine RepublicGovernmentInternational Bond05
EUR 2.260%Argentina
100,000 49,210 0.2501.05.20Provincia deBuenosAires/Argentina 06
EUR 3.000%
0.56107,831Total - Argentina
100,000 107,087 0.5502.08.21Bulgarian EnergyHolding EAD 16
EUR 4.875%Bulgaria
0.55107,087Total - Bulgaria
200,000 159,663 0.8217.01.25Country GardenHoldings Co Ltd 18
USD 5.125%Cayman Islands
0.82159,663Total - Cayman Islands
100,000 100,389 0.5212.02.21Deutsche Bank AG19 EMTN
EUR 1.625%Germany
3,500,000 3,982,369 20.5115.04.26DeutscheBundesrepublikInflation LinkedBond 15
EUR 0.100%
21.034,082,758Total - Germany
100,000 101,569 0.5215.06.25Ivory CoastGovernmentInternational Bond17
EUR 5.125%Ivory Coast
200,000 191,450 0.9922.03.30Ivory CoastGovernmentInternational Bond18
EUR 5.250%
1.51293,019Total - Ivory Coast
100,000 103,895 0.5429.09.27Metsa Board OYJ17
EUR 2.750%Finland
0.54103,895Total - Finland
200,000 214,612 1.1131.12.99Air France-KLM 15FRN
EUR 6.250%France
100,000 108,026 0.5631.12.99AXA SA 14 FRNEMTN
EUR 3.941%
100,000 103,441 0.5329.07.21Bollore SA 15EUR 2.880%100,000 107,572 0.5531.12.99La Mondiale SAM
14 FRNEUR 5.050%
100,000 105,047 0.5431.12.99TOTAL SA 16 FRNEMTN
EUR 2.708%
Securities Marketvalue in
EUR
% of netassets*
Quantity Ccy Maturity
200,000 175,059 0.9031.12.99AXA SA 13 EMTNUSD 5.500%130,000 116,143 0.6031.12.99BNP Paribas SA 05USD 6.250%
4.79929,900Total - France
100,000 102,393 0.5319.10.20National Bank ofGreece SA 17EMTN
EUR 2.750%Greece
0.53102,393Total - Greece
100,000 103,702 0.5318.07.24IndonesiaGovernmentInternational Bond17 EMTN
EUR 2.150%Indonesia
150,000 156,155 0.8125.10.25Perusahaan ListrikNegara PT 18
EUR 2.875%
1.34259,857Total - Indonesia
200,000 224,239 1.1502.10.43Aquarius &Investments PLCfor ZurichInsurance Co Ltd13 FRN EMTN
EUR 4.250%Ireland
200,000 148,503 0.7730.11.26Saderea DAC 14EMTN
USD 12.500%
200,000 179,629 0.9331.12.99Tinkoff CreditSystems Via TCSFinance Ltd 17 FRN
USD 9.250%
2.85552,371Total - Ireland
150,000 151,104 0.7829.01.29AssicurazioniGenerali SpA 19EMTN
EUR 3.875%Italy
200,000 15,748 0.0815.02.23CooperativaMuratori &Cementisti-CMC diRavenna SC 17
EUR 6.000%
100,000 104,327 0.5431.12.99Intesa SanpaoloSpA 09 FRN
EUR 8.375%
100,000 102,967 0.5318.06.21Intesa SanpaoloSpA 14 EMTN
EUR 2.000%
200,000 208,006 1.0731.12.99Intesa SanpaoloSpA 16 FRN EMTN
EUR 7.000%
500,000 503,230 2.5915.04.22Italy BuoniPoliennali DelTesoro 15
EUR 1.350%
1,200,000 1,166,495 6.0115.11.24Italy BuoniPoliennali DelTesoro 17
EUR 1.450%
250,000 269,418 1.3931.12.99UniCredit SpA 10FRN
EUR 9.375%
200,000 202,500 1.0420.02.29UniCredit SpA 19FRN EMTN
EUR 4.875%
14.032,723,795Total - Italy
150,000 133,419 0.6929.03.49HBOS CapitalFunding LP 03
USD 6.850%Jersey
0.69133,419Total - Jersey

73
Vontobel Fund - Absolute Return Bond Dynamic
The accompanying notes form an essential part of these financial statements.
Portfolio as at February 28, 2019
* Any deviations of the percentages of the nets assets are due to rounding.
Securities Marketvalue in
EUR
% of netassets*
Quantity Ccy Maturity
100,000 100,906 0.5215.03.24Nemak SAB de CV17
EUR 3.250%Mexico
450,000 452,434 2.3321.02.24PetroleosMexicanos 17EMTN
EUR 3.750%
400,000 383,820 1.9824.11.25PetroleosMexicanos 18
EUR 3.625%
200,000 182,475 0.9407.02.26Credito Real SABde CV SOFOM ER19
USD 9.500%
5.771,119,635Total - Mexico
100,000 102,612 0.5318.03.20MontenegroGovernmentInternational Bond15
EUR 3.880%Montenegro
0.53102,612Total - Montenegro
400,000 531,348 2.7405.03.30CP - Comboios dePortugal EPE 10
EUR 5.700%Portugal
2.74531,348Total - Portugal
200,000 177,404 0.9131.12.99UBS GroupFundingSwitzerland AG 19FRN
USD 7.000%Switzerland
0.91177,404Total - Switzerland
100,000 97,574 0.5013.03.28SenegalGovernmentInternational Bond18
EUR 4.750%Senegal
0.5097,574Total - Senegal
200,000 225,710 1.1631.12.99Banco BilbaoVizcaya ArgentariaSA 16 FRN
EUR 8.875%Spain
100,000 98,683 0.5112.01.23CaixaBank SA 17EMTN
EUR 1.125%
200,000 209,936 1.0831.12.99CaixaBank SA 17FRN
EUR 6.750%
100,000 104,096 0.5415.02.27CaixaBank SA 17FRN EMTN
EUR 3.500%
200,000 176,644 0.9131.12.99CaixaBank SA 18FRN
EUR 5.250%
4.20815,069Total - Spain
200,000 163,313 0.8414.09.27Republic ofTajikistanInternational Bond17
USD 7.125%Tadzhikistan
0.84163,313Total -Tadzhikistan
Securities Marketvalue in
EUR
% of netassets*
Quantity Ccy Maturity
300,000 271,004 1.4006.05.21Banque OuestAfricaine deDeveloppement 16
USD 5.500%Togo
1.40271,004Total - Togo
300,000 311,970 1.6218.05.20Turkey GovernmentInternational Bond10
EUR 5.125%Turkey
200,000 200,850 1.0308.07.19Turkiye GarantiBankasi AS 14EMTN
EUR 3.375%
200,000 183,269 0.9424.01.24Export Credit Bankof Turkey 19
USD 8.250%
3.59696,089Total - Turkey
400,000 376,812 1.9417.02.24Banque Centralede TunisieInternational Bond17
EUR 5.625%Tunisia
1.94376,812Total - Tunisia
100,000 105,556 0.5415.06.24CEMEX FinanceLLC 16
EUR 4.625%United States
0.54105,556Total - United States
100,000 114,757 0.5930.03.22Barclays Bank PLC11 EMTN
EUR 6.625%United Kingdom
100,000 100,503 0.5211.11.25Barclays PLC 15FRN EMTN
EUR 2.630%
200,000 200,226 1.0325.03.24Royal Bank ofScotland GroupPLC 14 FRN EMTN
EUR 3.625%
200,000 243,534 1.2631.12.99Barclays PLC 17FRN
GBP 7.250%
100,000 124,893 0.6431.12.99Lloyds BankingGroup PLC 14 FRN
GBP 7.625%
200,000 236,152 1.2231.12.99NationwideBuilding Society 14FRN EMTN
GBP 6.875%
5.261,020,065Total - United Kingdom
100,000 99,986 0.5215.03.26Rexel SA 19EUR 2.750%
79.4415,416,555Total - Transferable securities admitted to anofficial exchange
79.4415,416,555Total - Bonds
0.5299,986FRANCE

74
Vontobel Fund - Absolute Return Bond Dynamic
The accompanying notes form an essential part of these financial statements.
Portfolio as at February 28, 2019
* Any deviations of the percentages of the nets assets are due to rounding.
Securities Marketvalue in
EUR
% of netassets*
Quantity Ccy Maturity
200,000 174,271 0.9026.02.24Yuzhou PropertiesCo Ltd 19
USD 8.500%
Transferable securities and money market instruments dealt in on anotherregulated marketBondsCayman Islands
0.90174,271Total - Cayman Islands
200,000 177,934 0.9213.01.22Oilflow SPV 1 DAC17
USD 12.000%Ireland
0.92177,934Total - Ireland
250,000 262,485 1.3408.06.48AssicurazioniGenerali SpA 16FRN EMTN
EUR 5.000%Italy
1.34262,485Total - Italy
200,000 175,881 0.9131.12.99ING Groep NV 19FRN
USD 6.750%Netherlands
4.07790,571Total - Transferable securities and money marketinstruments dealt in on another regulated market
4.07790,571Total - Bonds
0.91175,881Total - Netherlands
200,000 179,064 0.9214.12.23SG Issuer SA 18EMTN
USD 0,000%
Other transferable securitiesBondsLuxembourg
0.92179,064Total - Bonds
0.92179,064Total - Luxembourg
13,000 1,726,065 8.90Vontobel Fund -Emerging MarketsCorporate Bond - I
USD
Investment fundsLuxembourg
9.821,905,129Total - Other transferable securities
8.901,726,065Total - Investment funds
8.901,726,065Total - Luxembourg
93.3318,112,255Total - Investment in securities

75
Vontobel Fund - Global Convertible Bond
AssetsInvestments in securities at market value 61,673,699(2)
3,146,636Cash at banks
45Receivable from foreign currencies
966Receivable from subscriptions
36,997Interest and dividends receivable(2)
21,378Unrealised gain on forward foreign exchange contracts(9)
2,750Options contracts at market value(9)
21,500Options at cost of purchase(9)
Total Assets 64,903,971
62,970,527Statement of Net Assetsas at February 28, 2019
LiabilitiesBank overdraft 79,176
Payable for redemptions 26,040
Payable on foreign currencies 46
Audit fees, printing and publishing expenses 141
Service Fee payable 13,531(5)
Subscription tax payable 3,352(4)
Management Fee payable 40,219(3)
Other liabilities 1,336Total Liabilities 163,841Total net assets at the end of the period 64,740,130Net assets at the beginning of the reporting period 94,759,434
Net investment loss on investments -686,401
Change in unrealised appreciation/depreciation on:
Investments 1,815,695
Futures 9,438
Forward foreign exchange contracts 34,901
Options 2,750
Net realised gain/loss on investments -2,394,091(2)
Net realised gain/loss on forward foreign exchange contracts -1,629,793(2)
Net realised gain/loss on currency exchange -541,036(2)
Net realised gain/loss on futures -374,298(2)
Net realised gain/loss on options 43,071(2)
Increase/Decrease in net assets resulting from operations -3,719,764Subscriptions of shares 4,913,557
Redemptions of shares -31,213,097Total net assets at the end of the period 64,740,130
Statement of Operations andChanges in Net Assetsfrom September 1, 2018to February 28, 2019
Notes EURThe accompanying notes form an essential part of these financial statements.
Cost

76
Vontobel Fund - Global Convertible Bond
IncomeBank interest 20,596
Net interest on bonds -295,629(2)
Net dividends 46,818Total Income -228,215ExpensesManagement Fees 297,504(3)
Audit fees, printing and publishing expenses 22,914
Subscription tax 10,751(4)
Bank interest 12,299
Service Fees 79,007(5)
Other Fees payable 35,711(8)
Total Expenses 458,186Net investment loss on investments -686,401
Statement of Net Incomefrom September 1, 2018to February 28, 2019
Notes EURThe accompanying notes form an essential part of these financial statements.
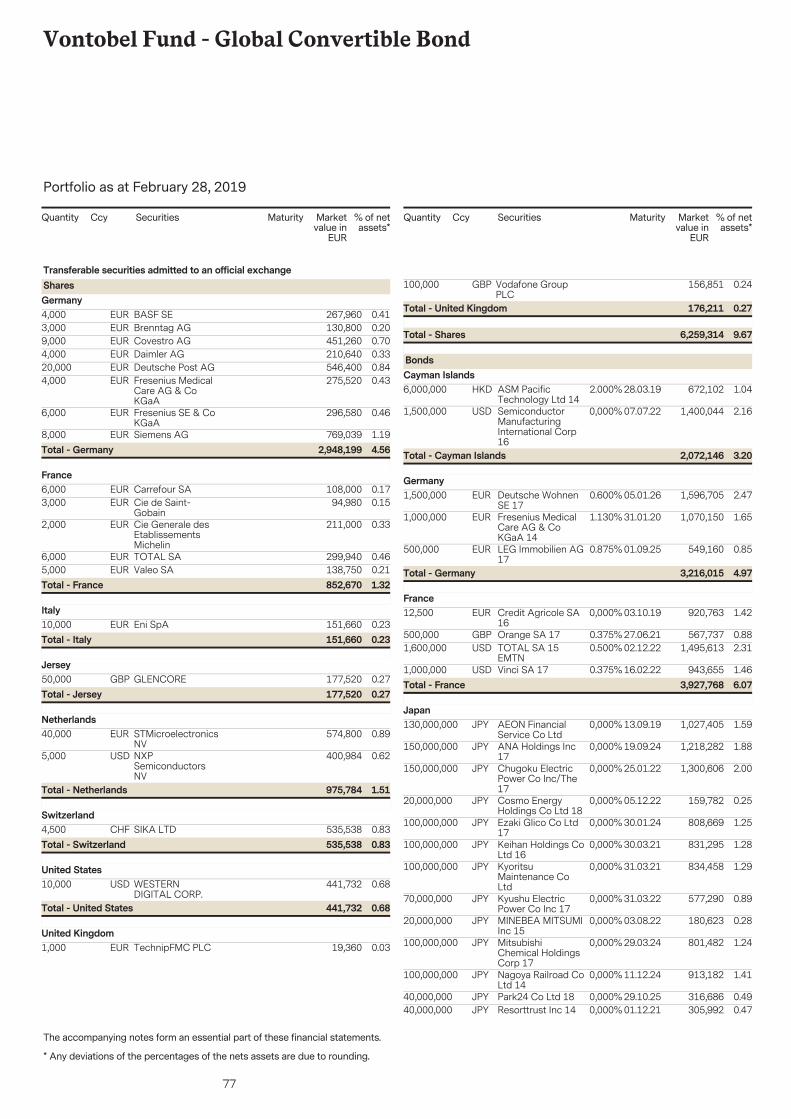
77
Vontobel Fund - Global Convertible Bond
The accompanying notes form an essential part of these financial statements.
Portfolio as at February 28, 2019
* Any deviations of the percentages of the nets assets are due to rounding.
Securities Marketvalue in
EUR
% of netassets*
Quantity Ccy Maturity
4,000 267,960 0.41BASF SEEUR
Transferable securities admitted to an official exchangeSharesGermany
3,000 130,800 0.20Brenntag AGEUR9,000 451,260 0.70Covestro AGEUR4,000 210,640 0.33Daimler AGEUR20,000 546,400 0.84Deutsche Post AGEUR4,000 275,520 0.43Fresenius Medical
Care AG & CoKGaA
EUR
6,000 296,580 0.46Fresenius SE & CoKGaA
EUR
8,000 769,039 1.19Siemens AGEUR4.562,948,199Total - Germany
6,000 108,000 0.17Carrefour SAEURFrance
3,000 94,980 0.15Cie de Saint-Gobain
EUR
2,000 211,000 0.33Cie Generale desEtablissementsMichelin
EUR
6,000 299,940 0.46TOTAL SAEUR5,000 138,750 0.21Valeo SAEUR
1.32852,670Total - France
10,000 151,660 0.23Eni SpAEURItaly
0.23151,660Total - Italy
50,000 177,520 0.27GLENCOREGBPJersey
0.27177,520Total - Jersey
40,000 574,800 0.89STMicroelectronicsNV
EURNetherlands
5,000 400,984 0.62NXPSemiconductorsNV
USD
1.51975,784Total - Netherlands
4,500 535,538 0.83SIKA LTDCHFSwitzerland
0.83535,538Total - Switzerland
10,000 441,732 0.68WESTERNDIGITAL CORP.
USDUnited States
0.68441,732Total - United States
1,000 19,360 0.03TechnipFMC PLCEURUnited Kingdom
Securities Marketvalue in
EUR
% of netassets*
Quantity Ccy Maturity
100,000 156,851 0.24Vodafone GroupPLC
GBP
9.676,259,314Total - Shares
0.27176,211Total - United Kingdom
6,000,000 672,102 1.0428.03.19ASM PacificTechnology Ltd 14
HKD 2.000%
BondsCayman Islands
1,500,000 1,400,044 2.1607.07.22SemiconductorManufacturingInternational Corp16
USD 0,000%
3.202,072,146Total - Cayman Islands
1,500,000 1,596,705 2.4705.01.26Deutsche WohnenSE 17
EUR 0.600%Germany
1,000,000 1,070,150 1.6531.01.20Fresenius MedicalCare AG & CoKGaA 14
EUR 1.130%
500,000 549,160 0.8501.09.25LEG Immobilien AG17
EUR 0.875%
4.973,216,015Total - Germany
12,500 920,763 1.4203.10.19Credit Agricole SA16
EUR 0,000%France
500,000 567,737 0.8827.06.21Orange SA 17GBP 0.375%1,600,000 1,495,613 2.3102.12.22TOTAL SA 15
EMTNUSD 0.500%
1,000,000 943,655 1.4616.02.22Vinci SA 17USD 0.375%6.073,927,768Total - France
130,000,000 1,027,405 1.5913.09.19AEON FinancialService Co Ltd
JPY 0,000%Japan
150,000,000 1,218,282 1.8819.09.24ANA Holdings Inc17
JPY 0,000%
150,000,000 1,300,606 2.0025.01.22Chugoku ElectricPower Co Inc/The17
JPY 0,000%
20,000,000 159,782 0.2505.12.22Cosmo EnergyHoldings Co Ltd 18
JPY 0,000%
100,000,000 808,669 1.2530.01.24Ezaki Glico Co Ltd17
JPY 0,000%
100,000,000 831,295 1.2830.03.21Keihan Holdings CoLtd 16
JPY 0,000%
100,000,000 834,458 1.2931.03.21KyoritsuMaintenance CoLtd
JPY 0,000%
70,000,000 577,290 0.8931.03.22Kyushu ElectricPower Co Inc 17
JPY 0,000%
20,000,000 180,623 0.2803.08.22MINEBEA MITSUMIInc 15
JPY 0,000%
100,000,000 801,482 1.2429.03.24MitsubishiChemical HoldingsCorp 17
JPY 0,000%
100,000,000 913,182 1.4111.12.24Nagoya Railroad CoLtd 14
JPY 0,000%
40,000,000 316,686 0.4929.10.25Park24 Co Ltd 18JPY 0,000%40,000,000 305,992 0.4701.12.21Resorttrust Inc 14JPY 0,000%

78
Vontobel Fund - Global Convertible Bond
The accompanying notes form an essential part of these financial statements.
Portfolio as at February 28, 2019
* Any deviations of the percentages of the nets assets are due to rounding.
Securities Marketvalue in
EUR
% of netassets*
Quantity Ccy Maturity
40,000,000 314,705 0.4923.07.20Sankyo Co Ltd 15JPY 0,000%30,000,000 245,114 0.3813.09.23SBI Holdings
Inc/Japan 18JPY 0,000%
250,000,000 2,441,423 3.7630.09.22Sony CorpJPY 0,000%40,000,000 346,907 0.5410.12.21Teijin Ltd 14JPY 0,000%100,000,000 790,604 1.2219.12.19Toppan Printing Co
Ltd 13JPY 0,000%
150,000,000 1,191,988 1.8430.08.19Toray Industries Inc14
JPY 0,000%
700,000 600,204 0.9311.10.19Gunma BankLtd/The 14
USD 0,000%
23.4815,206,697Total - Japan
900,000 990,999 1.5304.08.23Citigroup GlobalMarkets FundingLuxembourg SCA16 EMTN
EUR 0.500%Luxembourg
1.53990,999Total - Luxembourg
800,000 996,656 1.5401.07.22Airbus Group SE15 EMTN
EUR 0,000%Netherlands
2,000,000 2,385,060 3.6814.06.21Airbus SE 16 EMTNEUR 0,000%2,000,000 1,882,761 2.9103.07.24STMicroelectronics
NV 17USD 0.250%
8.135,264,477Total - Netherlands
2,000,000 1,681,549 2.6019.06.24DP World Ltd 14USD 1.750%United Arab Emirates
2.601,681,549Total - United Arab Emirates
800,000 918,769 1.4202.11.20National Grid NorthAmerica Inc 15EMTN
GBP 0.900%United States
85,000 77,587 0.1215.02.22Fortive Corp 19USD 0.875%1.54996,356Total - United States
1,200,000 1,259,928 1.9525.01.21Technip SA 16EUR 0.880%United Kingdom
900,000 1,342,429 2.0728.04.23BP Capital MarketsPLC 16
GBP 1.000%
55.5435,958,364Total - Bonds
4.022,602,357Total - United Kingdom
700,000 584,553 0.9025.01.23Shizuoka BankLtd/The 18 FRN
USD
Convertible Bonds - Floating RateJapan
66.1142,802,231Total - Transferable securities admitted to anofficial exchange
0.90584,553Total - Convertible Bonds - Floating Rate
0.90584,553Total - Japan
Securities Marketvalue in
EUR
% of netassets*
Quantity Ccy Maturity
2,000,000 2,098,024 3.2429.01.21China RailwayConstruction CorpLtd 16
USD 0,000%
Transferable securities and money market instruments dealt in on anotherregulated marketBondsChina
1,500,000 1,370,076 2.1205.02.21CRRC Corp Ltd 16USD 0,000%5.363,468,100Total - China
1,000,000 1,007,970 1.5618.02.21RAG-Stiftung 15EMTN
EUR 0,000%Germany
1.561,007,970Total - Germany
100,000,000 810,010 1.2530.08.19HIS Co Ltd 14JPY 0,000%Japan
140,000,000 1,100,759 1.6918.06.20Iida GroupHoldings Co Ltd 15
JPY 0,000%
80,000,000 658,712 1.0231.03.21Kandenko Co Ltd16
JPY 0,000%
40,000,000 381,577 0.5907.10.22Medipal HoldingsCorp 17
JPY 0,000%
20,000,000 204,112 0.3230.12.21Mirait HoldingsCorp 16
JPY 0,000%
70,000,000 615,239 0.9529.01.21Nipro Corp 16JPY 0,000%120,000,000 1,026,795 1.5922.03.21Relo Group Inc 18JPY 0,000%80,000,000 694,080 1.0728.03.22Senko Group
Holdings Co Ltd 17JPY 0,000%
100,000,000 793,381 1.2316.10.20Shimizu Corp 15JPY 0,000%60,000,000 494,266 0.7623.06.23Toho Holdings Co
Ltd 18JPY 0,000%
800,000 693,844 1.0720.09.19NHK Spring Co Ltd14
USD 0,000%
11.547,472,775Total - Japan
1,000,000 991,690 1.5328.05.20America Movil SABde CV 15
EUR 0,000%Mexico
1.53991,690Total - Mexico
500,000 457,996 0.7101.12.19NXPSemiconductorsNV 14
USD 1.000%Netherlands
0.71457,996Total - Netherlands
1,000,000 1,164,115 1.8015.06.20Booking HoldingsInc 13
USD 0.350%United States
1,200,000 1,303,826 2.0115.06.19Illumina Inc 14USD 0,000%500,000 493,721 0.7615.03.21NuVasive Inc 16USD 2.250%500,000 562,567 0.8701.12.20ON Semiconductor
Corp 15USD 1.000%
26.1416,922,760Total - Transferable securities and money marketinstruments dealt in on another regulated market
26.1416,922,760Total - Bonds
5.443,524,229Total - United States

79
Vontobel Fund - Global Convertible Bond
The accompanying notes form an essential part of these financial statements.
Portfolio as at February 28, 2019
* Any deviations of the percentages of the nets assets are due to rounding.
Securities Marketvalue in
EUR
% of netassets*
Quantity Ccy Maturity
2,000,000 1,789,286 2.7609.08.21Shanghai PortGroup BVI HoldingCo Ltd 17
USD 0,000%
Other transferable securitiesBondsBritish Virgin Islands
2.761,789,286Total - British Virgin Islands
20,000,000 159,422 0.2527.09.23Sumitomo ForestryCo Ltd 18
JPY 0,000%Japan
3.011,948,708Total - Other transferable securities
3.011,948,708Total - Bonds
0.25159,422Total - Japan
95.2661,673,699Total - Investment in securities

80
Vontobel Fund - Sustainable Emerging Markets Local CurrencyBond
AssetsInvestments in securities at market value 113,040,338(2)
5,589,342Cash at banks
76,236Receivable from foreign currencies
2,721,090Receivable from subscriptions
2,132,143Interest and dividends receivable(2)
1,262,747Receivable for investments sold
156,434Unrealised gain on forward foreign exchange contracts(9)
Total Assets 124,978,330
116,265,979Statement of Net Assetsas at February 28, 2019
LiabilitiesBank overdraft 537,550
Provision for expenses 23
Payable for redemptions 374,983
Payable on foreign currencies 76,360
Interest and dividends payable 28,539
Unrealised loss on futures 224,688(9)
Audit fees, printing and publishing expenses 137
Service Fee payable 48,704(5)
Subscription tax payable 7,189(4)
Management Fee payable 88,581(3)
Other liabilities 1,384Total Liabilities 1,388,138Total net assets at the end of the period 123,590,192Net assets at the beginning of the reporting period 115,006,096
Net investment income 3,199,902
Change in unrealised appreciation/depreciation on:
Investments 12,503,083
Futures -198,975
Forward foreign exchange contracts 147,305
Net realised gain/loss on investments -9,554,899(2)
Net realised gain/loss on forward foreign exchange contracts -2,276,480(2)
Net realised gain/loss on currency exchange -137,269(2)
Net realised gain/loss on futures 423,010(2)
Increase/Decrease in net assets resulting from operations 4,105,677Subscriptions of shares 23,276,597
Redemptions of shares -18,440,256
Dividend distribution -357,922(11)
Total net assets at the end of the period 123,590,192
Statement of Operations andChanges in Net Assetsfrom September 1, 2018to February 28, 2019
Notes USDThe accompanying notes form an essential part of these financial statements.
Cost

81
Vontobel Fund - Sustainable Emerging Markets Local CurrencyBond
IncomeBank interest 16,194
Net interest on bonds 3,994,047(2)
Total Income 4,010,240ExpensesManagement Fees 537,419(3)
Audit fees, printing and publishing expenses 30,553
Subscription tax 20,035(4)
Bank interest 31,247
Service Fees 154,838(5)
Other Fees payable 36,247(8)
Total Expenses 810,339Net investment income 3,199,902
Statement of Net Incomefrom September 1, 2018to February 28, 2019
Notes USDThe accompanying notes form an essential part of these financial statements.

82
Vontobel Fund - Sustainable Emerging Markets Local CurrencyBond
The accompanying notes form an essential part of these financial statements.
Portfolio as at February 28, 2019
* Any deviations of the percentages of the nets assets are due to rounding.
Securities Marketvalue in
USD
% of netassets*
Quantity Ccy Maturity
23,000,000 3,160,800 2.5631.12.45Argentine RepublicGovernmentInternational Bond05
ARS 3.310%
Transferable securities admitted to an official exchangeBondsArgentina
57,000,000 2,081,637 1.6806.03.20Bonos de la NacionArgentina conAjuste por CER 18
ARS 4.000%
4.245,242,437Total - Argentina
3,200,000,000 5,190,053 4.2001.03.35Bonos de laTesoreria de laRepublica en pesos15
CLP 5.000%Chile
4.205,190,053Total - Chile
62,000,000,000 3,933,589 3.1815.05.28Indonesia TreasuryBond 12
IDR 6.130%Indonesia
38,000,000,000 2,359,474 1.9115.05.33Indonesia TreasuryBond 12
IDR 6.630%
14,000,000,000 1,027,039 0.8315.03.24Indonesia TreasuryBond 13
IDR 8.375%
15,000,000,000 1,090,450 0.8815.03.34Indonesia TreasuryBond 13
IDR 8.375%
15,000,000,000 1,008,884 0.8215.08.32Indonesia TreasuryBond 16
IDR 7.500%
7.629,419,436Total - Indonesia
3,000,000,000 1,018,505 0.8204.05.22Colombian TES 12COP 7.000%Colombia
0.821,018,505Total - Colombia
550,000 3,115,130 2.5205.12.24Mexican Bonos 05MXN 10.000%Mexico
500,000 2,920,599 2.3620.11.36Mexican Bonos 06MXN 10.000%1,000,000 4,687,208 3.8013.11.42Mexican Bonos 12MXN 7.750%
8.6810,722,937Total - Mexico
5,000,000 1,650,316 1.3412.08.37Peru GovernmentBond 07
PEN 6.900%Peru
4,000,000 1,335,606 1.0812.08.31Peru GovernmentBond 08
PEN 6.950%
2.422,985,922Total - Peru
80,000,000 1,547,976 1.2515.01.21PhilippineGovernmentInternational Bond10
PHP 4.950%Philippines
1.251,547,976Total - Philippines
8,000,000 2,096,745 1.7025.04.28Republic of PolandGovernment Bond13
PLN 2.750%Poland
1.702,096,745Total - Poland
Securities Marketvalue in
USD
% of netassets*
Quantity Ccy Maturity
5,300,000 4,348,652 3.5201.09.33SingaporeGovernment Bond13
SGD 3.375%Singapore
3.524,348,652Total - Singapore
30,000,000 1,501,392 1.2128.02.41Republic of SouthAfrica GovernmentBond 10
ZAR 6.500%South Africa
16,000,000 1,065,142 0.8628.02.35Republic of SouthAfrica GovernmentBond 15
ZAR 8.875%
65,000,000 4,285,530 3.4731.01.40Republic of SouthAfrica GovernmentBond 15
ZAR 9.000%
5.546,852,064Total - South Africa
70,000,000 4,589,846 3.7226.11.57Czech RepublicGovernment Bond07
CZK 4.850%Czech Republic
25,000,000 1,153,681 0.9317.09.25Czech RepublicGovernment Bond14
CZK 2.400%
30,000,000 1,264,213 1.0213.10.33Czech RepublicGovernment Bond17
CZK 2.000%
5.677,007,740Total - Czech Republic
850,000,000 3,073,776 2.4922.12.26HungaryGovernment Bond17
HUF 2.750%Hungary
2.493,073,776Total - Hungary
25,000,000 1,451,338 1.1715.12.28UruguayGovernmentInternational Bond11
UYU 4.375%Uruguay
1.171,451,338Total - Uruguay
17,500,000,000 1,262,102 1.0212.10.21International Bankfor Reconstruction& Development 18EMTN
IDR 8.400%United States
205,000,000 2,748,013 2.2225.11.24InternationalFinance Corp 14
INR 6.300%
52.5664,967,696Total - Transferable securities admitted to anofficial exchange
52.5664,967,696Total - Bonds
3.244,010,115Total - United States

83
Vontobel Fund - Sustainable Emerging Markets Local CurrencyBond
The accompanying notes form an essential part of these financial statements.
Portfolio as at February 28, 2019
* Any deviations of the percentages of the nets assets are due to rounding.
Securities Marketvalue in
USD
% of netassets*
Quantity Ccy Maturity
20,000 5,647,314 4.5701.01.25Brazil Notas doTesouro NacionalSerie F 14
BRL 10.000%
Transferable securities and money market instruments dealt in on anotherregulated marketBondsBrazil
4.575,647,314Total - Brazil
10,000,000 2,463,645 2.0015.09.25MalaysiaGovernment Bond15
MYR 3.960%Malaysia
10,000,000 2,462,317 1.9917.08.23MalaysiaGovernment Bond16
MYR 3.800%
3.994,925,962Total - Malaysia
4,000,000 1,250,948 1.0112.02.29Peru GovernmentBond 18
PEN 5.940%Peru
10,200,000 3,661,599 2.9612.08.26PeruvianGovernmentInternational Bond06
PEN 8.200%
3.974,912,547Total - Peru
10,000,000 2,449,262 1.9812.02.29RomaniaGovernment Bond18
RON 5.000%Romania
14.5117,935,085Total - Transferable securities and money marketinstruments dealt in on another regulated market
14.5117,935,085Total - Bonds
1.982,449,262Total - Romania
900,000,000 1,304,291 1.0518.09.24Costa RicaGovernmentInternational Bond16
CRC 8.050%
Other transferable securitiesBondsCosta Rica
800,000,000 1,220,695 0.9925.06.25Costa RicaGovernmentInternational Bond17
CRC 9.200%
2.042,524,986Total - Costa Rica
130,000,000 2,751,559 2.2305.02.27DominicanRepublic Bond 16
DOP 11.250%Dominican Republic
80,000,000 1,556,405 1.2615.02.23DominicanRepublicInternational Bond18
DOP 8.900%
3.494,307,964Total - Dominican Republic
Securities Marketvalue in
USD
% of netassets*
Quantity Ccy Maturity
10,000,000 1,695,016 1.3702.11.26Ghana GovernmentBond 16
GHS 19.000%Ghana
5,000,000 884,576 0.7222.03.21Republic of GhanaGovernment Bonds18
GHS 16.500%
2.092,579,592Total - Ghana
110,000,000 1,093,175 0.8825.10.38KenyaInfrastructure Bond18
KES 11.950%Kenya
0.881,093,175Total - Kenya
14,500,000,000 4,687,382 3.8030.06.32Colombian TES 16COP 7.000%Colombia
3,500,000,000 1,144,348 0.9318.10.34Colombian TES 18COP 7.250%4.735,831,730Total - Colombia
25,000,000 1,733,936 1.4015.01.29NamibiaGovernment Bonds- NCPI Linked 17
NAD 4.500%Namibia
1.401,733,936Total - Namibia
10,000,000 2,077,960 1.6824.09.31RomaniaGovernment Bond16
RON 3.650%Romania
1.682,077,960Total - Romania
18,000,000 955,637 0.7704.09.22ZambiaGovernment Bond17
ZMW 11.000%Zambia
0.77955,637Total - Zambia
200,000,000 1,071,513 0.8715.03.23Sri LankaGovernment Bonds18
LKR 10.000%Sri Lanka
0.871,071,513Total - Sri Lanka
30,000,000 1,115,883 0.9020.01.21UkraineGovernmentInternational Bond18**
UAH 15.700%Ukraine
0.901,115,883Total - Ukraine
75,000,000 2,029,389 1.6415.03.28UruguayGovernmentInternational Bond17
UYU 8.500%Uruguay
1.642,029,389Total - Uruguay
215,000,000 2,126,857 1.7225.01.23Serbia TreasuryBonds 18
RSD 4.500%
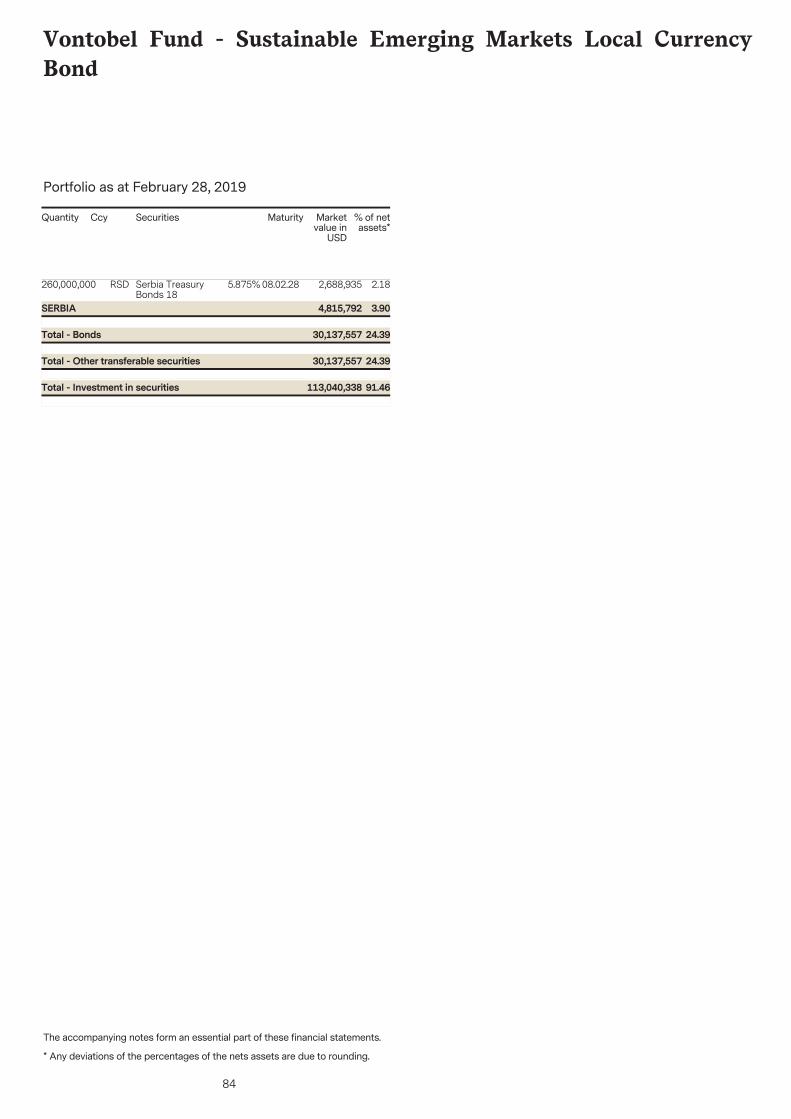
84
Vontobel Fund - Sustainable Emerging Markets Local CurrencyBond
The accompanying notes form an essential part of these financial statements.
Portfolio as at February 28, 2019
* Any deviations of the percentages of the nets assets are due to rounding.
Securities Marketvalue in
USD
% of netassets*
Quantity Ccy Maturity
260,000,000 2,688,935 2.1808.02.28Serbia TreasuryBonds 18
RSD 5.875%
24.3930,137,557Total - Other transferable securities
24.3930,137,557Total - Bonds
3.904,815,792SERBIA
91.46113,040,338Total - Investment in securities

85
Vontobel Fund - Swiss Mid and Small Cap Equity
AssetsInvestments in securities at market value 288,335,262(2)
3,264,982Cash at banks
95Receivable from foreign currencies
143,346Receivable from subscriptions
-86Interest and dividends receivable(2)
851Other assetsTotal Assets 291,744,450
248,035,642Statement of Net Assetsas at February 28, 2019
LiabilitiesProvision for expenses 32
Payable for redemptions 45,978
Payable for investments purchased 494,869
Payable on foreign currencies 95
Audit fees, printing and publishing expenses 4,195
Service Fee payable 69,154(5)
Subscription tax payable 16,089(4)
Management Fee payable 272,800(3)
Other liabilities 1,669Total Liabilities 904,881Total net assets at the end of the period 290,839,569Net assets at the beginning of the reporting period 348,327,575
Net investment loss on investments -2,266,369
Change in unrealised appreciation/depreciation on:
Investments -45,785,665
Net realised gain/loss on investments 745,409(2)
Net realised gain/loss on currency exchange -34(2)
Increase/Decrease in net assets resulting from operations -47,306,659Subscriptions of shares 32,139,992
Redemptions of shares -42,321,339Total net assets at the end of the period 290,839,569
Statement of Operations andChanges in Net Assetsfrom September 1, 2018to February 28, 2019
IncomeNet dividends 128,484Total Income 128,484ExpensesManagement Fees 1,816,548(3)
Audit fees, printing and publishing expenses 19,294
Subscription tax 47,081(4)
Bank interest 8,314
Service Fees 446,903(5)
Other Fees payable 56,713(8)
Total Expenses 2,394,853Net investment loss on investments -2,266,369
Statement of Net Incomefrom September 1, 2018to February 28, 2019
Notes CHFThe accompanying notes form an essential part of these financial statements.
Cost

86
Vontobel Fund - Swiss Mid and Small Cap Equity
The accompanying notes form an essential part of these financial statements.
Portfolio as at February 28, 2019
* Any deviations of the percentages of the nets assets are due to rounding.
Securities Marketvalue in
CHF
% of netassets*
Quantity Ccy Maturity
125,000 3,875,000 1.33ams AGCHF
Transferable securities admitted to an official exchangeSharesAustria
60,810 3,697,248 1.27KTM INDUSTRIESAG
CHF
2.607,572,248Total - Austria
170,000 1,965,200 0.68AFG Arbonia-Forster Holding AG
CHFSwitzerland
76,000 12,388,000 4.26Baloise HoldingAG
CHF
4,500 3,645,000 1.25Banque CantonaleVaudoise
CHF
3,400 5,844,600 2.01BARRYCALLEBAUT AG/NAM.
CHF
1,300 6,116,500 2.10Belimo Holding AGCHF113,085 7,610,621 2.62BKW AGCHF7,000 2,165,800 0.74Bucher Industries
AGCHF
12,000 3,434,400 1.18BurckhardtCompressionHolding AG
CHF
79,200 2,364,120 0.81Calida Holding AGCHF107,000 10,239,900 3.52Cembra Money
Bank AGCHF
3,350 21,741,500 7.48ChocoladefabrikenLindt & SpruengliAG
CHF
300,000 6,435,000 2.21Clariant AGCHF17,800 2,616,600 0.90Daetwyler Holding
AGCHF
8,700 7,094,850 2.44Emmi AGCHF12,500 7,206,250 2.48EMS-Chemie
Holding AGCHF
45,000 8,001,000 2.75Flughafen ZuerichAG
CHF
2,144 3,059,488 1.05Forbo Holding AGCHF160,000 7,276,800 2.50Galenica AGCHF4,500 3,982,500 1.37Georg Fischer AGCHF9,962 1,346,862 0.46HOCHDORF
Holding AGCHF
3,100 5,499,400 1.89Interroll HoldingAG
CHF
80,000 10,420,000 3.58Kuehne + NagelInternational AG
CHF
310,000 11,634,300 4.00LogitechInternational SA
CHF
891 2,579,445 0.89Metall Zug AGCHF144,000 2,551,680 0.88Molecular Partners
AGCHF
53,043 4,604,132 1.58ORIORCHF21,500 15,523,000 5.34Partners Group
Holding AGCHF
65,000 6,604,000 2.27PSP SwissProperty AG
CHF
92,500 20,868,000 7.18Schindler HoldingAG
CHF
420,000 4,410,000 1.52SIG COMBIBLOCGROUP AG
CHF
72,000 13,438,800 4.62Sonova HoldingAG
CHF
Securities Marketvalue in
CHF
% of netassets*
Quantity Ccy Maturity
17,000 13,243,000 4.55Straumann HoldingAG
CHF
50,000 4,935,000 1.70Sulzer AGCHF58,000 4,294,900 1.48Sunrise
CommunicationsGroup AG
CHF
95,000 5,424,500 1.87Swatch GroupAG/The
CHF
75,000 10,852,500 3.73Temenos GroupAG
CHF
45,546 5,174,026 1.78Valiant Holding AGCHF14,500 3,878,750 1.33Valora Holding AGCHF2,152 4,669,840 1.61VETROP. HLD
SA.SAINT-PREXCHF
45,000 5,622,750 1.93Vifor Pharma AGCHF
99.14288,335,262Total - Transferable securities admitted to anofficial exchange
99.14288,335,262Total - Shares
96.54280,763,014Total - Switzerland
99.14288,335,262Total - Investment in securities

87
Vontobel Fund - European Mid and Small Cap Equity
AssetsInvestments in securities at market value 120,548,435(2)
10,411,773Cash at banks
24,864Receivable from subscriptions
3,048Interest and dividends receivable(2)
396,958Receivable for investments sold
190,916Other assetsTotal Assets 131,575,994
111,082,594Statement of Net Assetsas at February 28, 2019
LiabilitiesBank overdraft 172
Payable for redemptions 68,176
Audit fees, printing and publishing expenses 1,763
Service Fee payable 34,489(5)
Subscription tax payable 4,414(4)
Management Fee payable 102,726(3)
Other liabilities -54,240Total Liabilities 157,500Total net assets at the end of the period 131,418,494Net assets at the beginning of the reporting period 156,409,675
Net investment loss on investments -426,718
Change in unrealised appreciation/depreciation on:
Investments -17,629,891
Net realised gain/loss on investments -781,090(2)
Net realised gain/loss on currency exchange 91,653(2)
Increase/Decrease in net assets resulting from operations -18,746,046Subscriptions of shares 3,077,974
Redemptions of shares -9,306,696
Dividend distribution -16,413(11)
Total net assets at the end of the period 131,418,494
Statement of Operations andChanges in Net Assetsfrom September 1, 2018to February 28, 2019
IncomeBank interest 3,989
Net dividends 637,715Total Income 641,704ExpensesManagement Fees 701,937(3)
Audit fees, printing and publishing expenses 16,000
Subscription tax 13,293(4)
Bank interest 22,959
Service Fees 288,527(5)
Other Fees payable 25,706(8)
Total Expenses 1,068,422Net investment loss on investments -426,718
Statement of Net Incomefrom September 1, 2018to February 28, 2019
Notes EURThe accompanying notes form an essential part of these financial statements.
Cost

88
Vontobel Fund - European Mid and Small Cap Equity
The accompanying notes form an essential part of these financial statements.
Portfolio as at February 28, 2019
* Any deviations of the percentages of the nets assets are due to rounding.
Securities Marketvalue in
EUR
% of netassets*
Quantity Ccy Maturity
35,000 4,697,000 3.57Barco NVEUR
Transferable securities admitted to an official exchangeSharesBelgium
3.574,697,000Total - Belgium
105,000 3,022,950 2.30Aareal Bank AGEURGermany
50,000 2,418,500 1.84Aurubis AGEUR60,000 2,158,800 1.64CANCOM SEEUR90,000 2,182,500 1.66Elmos
Semiconductor AGEUR
160,000 2,962,400 2.25Freenet AGEUR60,000 5,382,000 4.11GRENKE AGEUR23,300 3,905,080 2.97Hypoport AGEUR550,000 2,494,250 1.90MLP SEEUR450,000 1,215,000 0.92PANTAFLIX AGEUR60,000 886,560 0.67SERVICEWARE SEEUR70,000 3,650,500 2.78STROEER AKTEUR
23.0430,278,540Total - Germany
100,000 3,144,000 2.40Cargotec OyjEURFinland
200,000 1,700,000 1.29Ferratum OyjEUR3.694,844,000Total - Finland
100,000 2,468,000 1.88Plastic Omnium SAEURFrance
1.882,468,000Total - France
580,500 3,523,635 2.68Dalata Hotel GroupPLC
EURIreland
900,000 576,000 0.44DATALEXEUR1,400,000 2,063,600 1.57Green REIT plcEUR511,000 797,160 0.61IRISH RESIDENT
PROPERTIES REITEUR
115,000 4,767,901 3.62Kingspan GroupPLC
EUR
460,000 2,493,200 1.90Origin EnterprisesPLC
EUR
1,100,000 2,518,393 1.92Greencore GroupPLC
GBP
1,200,000 1,902,812 1.45IFG Group PLCGBP350,000 2,365,082 1.80UDG Healthcare
PLCGBP
15.9921,007,783Total - Ireland
85,000 2,761,650 2.10Aalberts IndustriesNV
EURNetherlands
202,198 2,988,486 2.28Arcadis NVEUR4.385,750,136Total - Netherlands
10,000 879,000 0.67Lenzing AGEURAustria
195,000 4,130,100 3.14ST&T AGEUR3.815,009,100Total - Austria
Securities Marketvalue in
EUR
% of netassets*
Quantity Ccy Maturity
500,000 3,665,204 2.79Dometic Group ABSEKSweden
280,000 1,611,643 1.23Inwido ABSEK4.025,276,847Total - Sweden
8,000 5,091,797 3.87Partners GroupHolding AG
CHFSwitzerland
3.875,091,797Total - Switzerland
110,000 2,608,336 1.98XP Power LtdGBPSingapore
1.982,608,336Total - Singapore
2,250,000 1,335,122 1.02BENCHMARKHOLDINGS PLC
GBPUnited Kingdom
1,700,000 3,570,372 2.72Biffa PLCGBP250,000 2,216,443 1.69Bodycote PLCGBP877,500 1,824,492 1.39Devro PLCGBP750,000 4,621,241 3.51Draper Esprit PLCGBP200,000 1,960,048 1.49FDM GROUP
(HOLDINGS) PLCGBP
1,700,000 4,368,642 3.32Hollywood BowlGroup PLC
GBP
2,500,000 2,949,417 2.24IP Group PLCGBP440,000 1,380,105 1.05KNIGHTS GROUP
HOLDINGS PLCGBP
350,000 2,360,994 1.80Midwich GroupPLC
GBP
1,200,000 1,421,327 1.08N Brown GroupPLC
GBP
300,000 2,449,476 1.86PHOENIX GROUPHOLDINGS PLC
GBP
450,000 3,059,217 2.33SDL PLCGBP
91.73120,548,435Total - Transferable securities admitted to anofficial exchange
91.73120,548,435Total - Shares
25.5033,516,896Total - United Kingdom
91.73120,548,435Total - Investment in securities

89
Vontobel Fund - Japanese Equity
AssetsInvestments in securities at market value 5,897,853,360(2)
276,368,923Cash at banks
580,021Receivable from subscriptions
1,922,258Interest and dividends receivable(2)
76,294,127Receivable for investments soldTotal Assets 6,253,018,689
6,209,755,750Statement of Net Assetsas at February 28, 2019
LiabilitiesProvision for expenses 5,339
Payable for redemptions 121,606
Payable for investments purchased 77,341,176
Audit fees, printing and publishing expenses 179,743
Service Fee payable 1,672,111(5)
Subscription tax payable 232,625(4)
Management Fee payable 5,589,399(3)
Other liabilities 173,801Total Liabilities 85,315,800Total net assets at the end of the period 6,167,702,889Net assets at the beginning of the reporting period 7,041,054,627
Net investment income 12,787,746
Change in unrealised appreciation/depreciation on:
Investments -695,196,049
Net realised gain/loss on investments -46,874,609(2)
Net realised gain/loss on currency exchange 268,903(2)
Increase/Decrease in net assets resulting from operations -729,014,009Subscriptions of shares 359,479,894
Redemptions of shares -503,817,623Total net assets at the end of the period 6,167,702,889
Statement of Operations andChanges in Net Assetsfrom September 1, 2018to February 28, 2019
IncomeBank interest 523
Net dividends 55,445,809Total Income 55,446,332ExpensesManagement Fees 26,637,607(3)
Audit fees, printing and publishing expenses 1,291,458
Subscription tax 725,536(4)
Bank interest 552,886
Service Fees 11,103,541(5)
Other Fees payable 2,347,558(8)
Total Expenses 42,658,586Net investment income 12,787,746
Statement of Net Incomefrom September 1, 2018to February 28, 2019
Notes JPYThe accompanying notes form an essential part of these financial statements.
Cost

90
Vontobel Fund - Japanese Equity
The accompanying notes form an essential part of these financial statements.
Portfolio as at February 28, 2019
* Any deviations of the percentages of the nets assets are due to rounding.
Securities Marketvalue in
JPY
% of netassets*
Quantity Ccy Maturity
47,800 185,225,000 3.00AICA KOGYO COLTD
JPY
Transferable securities admitted to an official exchangeSharesJapan
11,100 277,222,500 4.49CENTRAL JAPANRAILWAY CO
JPY
53,300 158,514,200 2.57COMSYSHOLDINGS CORP
JPY
47,100 79,387,050 1.29Dai-ichi LifeInsurance CoLtd/The
JPY
17,200 207,948,000 3.37Daikin IndustriesLtd
JPY
42,600 203,713,200 3.30Denso CorpJPY19,400 178,383,000 2.89Eisai Co LtdJPY44,100 174,195,000 2.82Idemitsu Kosan Co
LtdJPY
50,500 205,282,500 3.33Japan Airlines CoLtd
JPY
3,600 233,748,000 3.79Keyence CorpJPY65,500 163,029,500 2.64KIRIN HOLDINGS
CO LTDJPY
47,700 130,268,700 2.11KOMATSU LTDJPY73,000 166,659,000 2.70LION CORP.JPY92,400 290,043,600 4.70MITSUBISHI CORPJPY510,300 294,290,010 4.77Mitsubishi UFJ
Financial Group IncJPY
81,400 214,692,500 3.48Mitsui Fudosan CoLtd
JPY
15,700 211,557,500 3.43Nidec CorpJPY7,200 219,168,000 3.55NINTENDO
CO.LTDJPY
84,100 403,764,100 6.56Nippon Telegraph& Telephone Corp
JPY
160,400 106,184,800 1.72OJI HOLDINGSCORPORATION
JPY
17,300 85,202,500 1.38OLYMPUS CORPJPY32,800 175,184,800 2.84Sony CorpJPY127,800 201,029,400 3.26Taiyo Nippon
Sanso CorpJPY
82,500 368,692,500 5.98TakedaPharmaceutical CoLtd
JPY
60,400 404,498,800 6.57Toyota Motor CorpJPY18,000 177,480,000 2.88Tsuruha Holdings
IncJPY
579,200 172,601,600 2.80Yahoo Japan CorpJPY72,400 209,887,600 3.40YAMATO
HOLDINGS COLTD
JPY
95.625,897,853,360Total - Transferable securities admitted to anofficial exchange
95.625,897,853,360Total - Shares
95.625,897,853,360Total - Japan
95.625,897,853,360Total - Investment in securities

91
Vontobel Fund - mtx China Leaders
AssetsInvestments in securities at market value 256,162,847(2)
3,717,709Cash at banks
2,172,432Receivable from subscriptions
4,210Interest and dividends receivable(2)
1,036,535Other assetsTotal Assets 263,093,733
247,600,463Statement of Net Assetsas at February 28, 2019
LiabilitiesProvision for expenses 54
Payable for redemptions 847,179
Payable for investments purchased 1,674,339
Audit fees, printing and publishing expenses 4,315
Service Fee payable 61,417(5)
Subscription tax payable 15,637(4)
Management Fee payable 318,828(3)
Other liabilities 1,750Total Liabilities 2,923,519Total net assets at the end of the period 260,170,214Net assets at the beginning of the reporting period 260,004,679
Net investment loss on investments -1,413,863
Change in unrealised appreciation/depreciation on:
Investments -651,986
Net realised gain/loss on investments -431,827(2)
Net realised gain/loss on forward foreign exchange contracts -693(2)
Net realised gain/loss on currency exchange 22,414(2)
Increase/Decrease in net assets resulting from operations -2,475,955Subscriptions of shares 78,259,469
Redemptions of shares -75,462,428
Dividend distribution -155,551(11)
Total net assets at the end of the period 260,170,214
Statement of Operations andChanges in Net Assetsfrom September 1, 2018to February 28, 2019
IncomeBank interest 22,793
Net dividends 1,003,495Total Income 1,026,288ExpensesManagement Fees 1,963,243(3)
Audit fees, printing and publishing expenses 18,017
Subscription tax 45,020(4)
Bank interest 2,362
Service Fees 379,927(5)
Other Fees payable 31,582(8)
Total Expenses 2,440,151Net investment loss on investments -1,413,863
Statement of Net Incomefrom September 1, 2018to February 28, 2019
Notes USDThe accompanying notes form an essential part of these financial statements.
Cost

92
Vontobel Fund - mtx China Leaders
The accompanying notes form an essential part of these financial statements.
Portfolio as at February 28, 2019
* Any deviations of the percentages of the nets assets are due to rounding.
Securities Marketvalue in
USD
% of netassets*
Quantity Ccy Maturity
4,308,000 4,220,342 1.62Brilliance ChinaAutomotiveHoldings Ltd
HKD
Transferable securities admitted to an official exchangeSharesBermuda Islands
1.624,220,342Total - Bermuda Islands
172,500 1,025,147 0.39AAC TechnologiesHoldings Inc
HKDCayman Islands
3,044,000 11,362,080 4.37China ResourcesLand Ltd
HKD
4,926,000 9,249,909 3.56Geely AutomobileHoldings Ltd
HKD
560,100 23,960,277 9.21Tencent HoldingsLtd
HKD
5,179,641 5,938,650 2.28XINYI GLASSHOLDING CO LTD
HKD
145,100 26,782,558 10.29Alibaba GroupHolding Ltd ADR
USD
15,300 3,451,986 1.33NetEase Inc ADRUSD31.4381,770,607Total - Cayman Islands
384,449 2,629,246 1.01DONG-E E JIAO -A-
CNYChina
546,400 3,660,034 1.41GREE ELEC -A-CNY1,416,497 7,306,866 2.81Hangzhou
Hikvision DigitalTechnology Co Ltd
CNY
1,093,280 7,810,412 3.00MIDEA GROUP COLTD -A-
CNY
17,490,000 8,154,859 3.13Bank of China LtdHKD20,380,000 18,121,960 6.97China
Construction BankCorp
HKD
3,639,000 10,013,396 3.85China LifeInsurance Co Ltd
HKD
1,828,600 6,883,697 2.65China PacificInsurance GroupCo Ltd
HKD
9,140,000 7,894,442 3.03China Petroleum &Chemical Corp
HKD
2,460,800 9,341,963 3.59China Vanke CoLtd
HKD
18,445,000 14,192,574 5.46Industrial &Commercial Bankof China Ltd
HKD
2,563,000 3,069,178 1.18PICC Property &Casualty Co Ltd
HKD
1,980,500 20,852,746 8.01Ping An InsuranceGroup Co of ChinaLtd
HKD
354,000 4,194,032 1.61Sunny OpticalTechnology GroupCo Ltd
HKD
3,120,000 3,255,248 1.25ZHEJIANGEXPRESSWAY COLTD H
HKD
1,654,000 9,281,688 3.57Zhuzhou CSRTimes Electric CoLtd
HKD
47,900 7,767,943 2.99Baidu Inc ADRUSD55.52144,430,284Total - China
Securities Marketvalue in
USD
% of netassets*
Quantity Ccy Maturity
2,398,000 8,828,615 3.39China OverseasLand & InvestmentLtd
HKDHong Kong
6,299,355 10,865,765 4.18CNOOC LTDHKD3,152,000 6,047,234 2.32Guangdong
Investment LtdHKD
98.46256,162,847Total - Transferable securities admitted to anofficial exchange
98.46256,162,847Total - Shares
9.8925,741,614Total - Hong Kong
98.46256,162,847Total - Investment in securities

93
Vontobel Fund - European Equity
AssetsInvestments in securities at market value 364,955,892(2)
9,789,725Cash at banks
209Receivable from foreign currencies
71,112Receivable from subscriptions
146,229Interest and dividends receivable(2)
811,427Other assetsTotal Assets 375,774,594
323,344,320Statement of Net Assetsas at February 28, 2019
LiabilitiesPayable for redemptions 532,393
Payable on foreign currencies 209
Unrealised loss on forward foreign exchange contracts 28,689(9)
Audit fees, printing and publishing expenses 4,802
Service Fee payable 70,870(5)
Subscription tax payable 12,833(4)
Management Fee payable 283,029(3)
Other liabilities 1,678Total Liabilities 934,503Total net assets at the end of the period 374,840,091Net assets at the beginning of the reporting period 414,733,350
Net investment loss on investments -792,224
Change in unrealised appreciation/depreciation on:
Investments -19,382,369
Forward foreign exchange contracts -115,156
Net realised gain/loss on investments -636,218(2)
Net realised gain/loss on forward foreign exchange contracts 691,689(2)
Net realised gain/loss on currency exchange 9,856(2)
Increase/Decrease in net assets resulting from operations -20,224,422Subscriptions of shares 35,461,101
Redemptions of shares -55,079,768
Dividend distribution -50,170(11)
Total net assets at the end of the period 374,840,091
Statement of Operations andChanges in Net Assetsfrom September 1, 2018to February 28, 2019
IncomeBank interest 190
Net dividends 1,734,639Total Income 1,734,829ExpensesManagement Fees 1,903,410(3)
Audit fees, printing and publishing expenses 22,724
Subscription tax 39,375(4)
Bank interest 31,440
Service Fees 491,655(5)
Other Fees payable 38,449(8)
Total Expenses 2,527,053Net investment loss on investments -792,224
Statement of Net Incomefrom September 1, 2018to February 28, 2019
Notes EURThe accompanying notes form an essential part of these financial statements.
Cost

94
Vontobel Fund - European Equity
The accompanying notes form an essential part of these financial statements.
Portfolio as at February 28, 2019
* Any deviations of the percentages of the nets assets are due to rounding.
Securities Marketvalue in
EUR
% of netassets*
Quantity Ccy Maturity
171,230 11,737,816 3.13Anheuser-BuschInBev SA/NV
EUR
Transferable securities admitted to an official exchangeSharesBelgium
50,065 4,234,498 1.13Groupe BruxellesLambert SA
EUR
61,663 4,015,495 1.07KBC Group NVEUR5.3319,987,809Total - Belgium
66,911 5,863,256 1.56Coloplast A/SDKKDenmark
1.565,863,256Total - Denmark
25,399 5,425,226 1.45adidas AGEURGermany
95,266 6,561,922 1.75Fresenius MedicalCare AG & CoKGaA
EUR
123,452 6,102,232 1.63Fresenius SE & CoKGaA
EUR
166,700 15,703,141 4.19SAP SEEUR9.0233,792,521Total - Germany
90,902 9,967,404 2.66Air Liquide SAEURFrance
64,566 6,873,051 1.83EssilorInternational SA
EUR
1,790 996,672 0.27HermesInternational
EUR
19,221 4,265,140 1.14L'Oreal SAEUR13,057 3,943,214 1.05LVMH Moet
Hennessy LouisVuitton SE
EUR
26,174 3,962,744 1.06Pernod Ricard SAEUR97,730 11,717,827 3.12Safran SAEUR60,781 9,542,617 2.55TeleperformanceEUR138,536 11,625,941 3.10Vinci SAEUR
16.7862,894,610Total - France
891,835 3,688,630 0.98AIB GROUP PLCEURIreland
127,286 5,277,278 1.41Kingspan GroupPLC
EUR
91,636 6,515,320 1.74Paddy Power PLCEUR114,140 8,699,478 2.32DCC PLCGBP101,190 14,340,951 3.83Accenture PLCUSD149,701 11,897,726 3.17Medtronic PLCUSD
13.4550,419,383Total - Ireland
22,553 772,440 0.21BRUNELLOCUCINELLI SPA
EURItaly
0.21772,440Total - Italy
14,516 5,373,823 1.43Eurofins ScientificSE
EURLuxembourg
1.435,373,823Total - Luxembourg
Securities Marketvalue in
EUR
% of netassets*
Quantity Ccy Maturity
185,288 3,950,340 1.05ABN AMRO GroupNV
EURNetherlands
92,849 8,226,421 2.19Heineken NVEUR400,453 19,047,548 5.09Unilever NVEUR
8.3331,224,309Total - Netherlands
263,549 2,641,505 0.71SvenskaHandelsbanken AB
SEKSweden
102,295 1,651,550 0.44Swedbank ABSEK1.154,293,055Total - Sweden
232,417 18,513,479 4.94Nestle SACHFSwitzerland
44,609 3,224,633 0.86Pargesa HoldingSA
CHF
53,231 6,334,937 1.69SIKA LTDCHF315,996 3,537,767 0.94UBS Group AGCHF
8.4331,610,816Total - Switzerland
48,860 7,666,134 2.05Aena SAEURSpain
105,693 6,996,877 1.87Amadeus ITHolding SA
EUR
508,305 3,670,979 0.98Bankinter SAEUR491,853 8,272,966 2.20Grifols SAEUR200,892 5,331,674 1.42Industria de Diseno
Textil SAEUR
8.5231,938,630Total - Spain
6,709 9,998,631 2.67BOOKINGHOLDINGS INC
USDUnited States
134,562 10,273,839 2.74Philip MorrisInternational Inc
USD
5.4120,272,470Total - United States
531,683 10,734,680 2.86RELX PLCEURUnited Kingdom
257,635 6,027,825 1.61ASHTEAD GROUPPLC
GBP
225,248 6,243,577 1.67BUNZL PLCGBP179,037 6,093,020 1.63Diageo PLCGBP1,308,900 3,571,529 0.95Domino's Pizza
Group PLCGBP
175,580 9,243,521 2.47London StockExchange GroupPLC
GBP
214,241 14,432,027 3.84Reckitt BenckiserGroup PLC
GBP
1,636,045 6,707,755 1.79RENTOKIL INITIALPLC
GBP
96.44361,497,056Total - Shares
16.8263,053,934Total - United Kingdom

95
Vontobel Fund - European Equity
The accompanying notes form an essential part of these financial statements.
Portfolio as at February 28, 2019
* Any deviations of the percentages of the nets assets are due to rounding.
Securities Marketvalue in
EUR
% of netassets*
Quantity Ccy Maturity
24,358 3,458,836 0.92UNIBAILRODAMCOWESTFIELD /REIT
EUR
Real EstateFrance
97.36364,955,892Total - Transferable securities admitted to anofficial exchange
0.923,458,836Total - Real Estate
0.923,458,836Total - France
97.36364,955,892Total - Investment in securities

96
Vontobel Fund - US Equity
AssetsInvestments in securities at market value 2,689,387,332(2)
119,270,354Cash at banks
489,230Receivable from foreign currencies
15,362,912Receivable from subscriptions
1,766,580Interest and dividends receivable(2)
1,357,594Unrealised gain on forward foreign exchange contracts(9)
93,522Other assetsTotal Assets 2,827,727,524
2,254,889,038Statement of Net Assetsas at February 28, 2019
LiabilitiesBank overdraft 129
Provision for expenses 526
Payable for redemptions 4,431,578
Payable for investments purchased 11,300,115
Payable on foreign currencies 489,430
Audit fees, printing and publishing expenses 54,275
Service Fee payable 566,544(5)
Subscription tax payable 106,763(4)
Management Fee payable 2,132,558(3)
Other liabilities 4,037Total Liabilities 19,085,955Total net assets at the end of the period 2,808,641,569Net assets at the beginning of the reporting period 2,338,088,997
Net investment loss on investments -2,418,775
Change in unrealised appreciation/depreciation on:
Investments -71,128,051
Forward foreign exchange contracts 2,806,585
Net realised gain/loss on investments 51,753,462(2)
Net realised gain/loss on forward foreign exchange contracts -15,441,377(2)
Net realised gain/loss on currency exchange -392,382(2)
Increase/Decrease in net assets resulting from operations -34,820,538Subscriptions of shares 1,256,615,016
Redemptions of shares -750,829,395
Dividend distribution -412,511(11)
Total net assets at the end of the period 2,808,641,569
Statement of Operations andChanges in Net Assetsfrom September 1, 2018to February 28, 2019
Notes USDThe accompanying notes form an essential part of these financial statements.
Cost

97
Vontobel Fund - US Equity
IncomeBank interest 967,110
Net dividends 13,015,731
Other income 28,976Total Income 14,011,817ExpensesManagement Fees 12,563,083(3)
Audit fees, printing and publishing expenses 70,084
Subscription tax 306,233(4)
Bank interest 5,063
Service Fees 3,366,294(5)
Other Fees payable 119,835(8)
Total Expenses 16,430,592Net investment loss on investments -2,418,775
Statement of Net Incomefrom September 1, 2018to February 28, 2019
Notes USDThe accompanying notes form an essential part of these financial statements.

98
Vontobel Fund - US Equity
The accompanying notes form an essential part of these financial statements.
Portfolio as at February 28, 2019
* Any deviations of the percentages of the nets assets are due to rounding.
Securities Marketvalue in
USD
% of netassets*
Quantity Ccy Maturity
1,054,387 82,410,888 2.93AB INBEV /SADRUSD
Transferable securities admitted to an official exchangeSharesBelgium
2.9382,410,888Total - Belgium
962,382 87,095,571 3.10Medtronic PLCUSDIreland
3.1087,095,571Total - Ireland
492,814 40,957,772 1.46APTIV PLCUSDJersey
1.4640,957,772Total - Jersey
1,598,097 90,000,596 3.20AlimentationCouche-Tard Inc
CADCanada
3.2090,000,596Total - Canada
172,509 45,283,613 1.61Adobe SystemsInc
USDUnited States
1,192,884 44,566,146 1.59Air Lease CorpUSD90,292 101,119,817 3.60Alphabet IncUSD61,663 101,116,837 3.60Amazon.com IncUSD281,077 49,511,714 1.76American Tower
CorpUSD
397,628 37,365,103 1.33Amphenol CorpUSD300,729 74,818,368 2.66Becton Dickinson
and CoUSD
326 98,517,200 3.51BerkshireHathaway Inc
USD
31,321 53,152,990 1.89BOOKINGHOLDINGS INC
USD
1,405,328 56,381,759 2.01Boston ScientificCorp
USD
203,341 27,398,166 0.98Casey's GeneralStores Inc
USD
434,832 79,100,289 2.82CME Group Inc/ILUSD1,613,935 73,175,813 2.61Coca-Cola Co/TheUSD1,544,509 59,726,163 2.13Comcast CorpUSD416,736 70,495,062 2.51CONSTELLATION
BRAND -A-USD
597,054 35,029,158 1.25COPART INCUSD167,634 28,315,059 1.01Ecolab IncUSD144,369 24,440,228 0.87Edwards
Lifesciences CorpUSD
268,776 25,743,365 0.92ELECTRONICARTS
USD
729,376 27,118,200 0.97FLOOR & DECORHOLDINGS INC -A-
USD
270,632 50,104,808 1.78Home DepotInc/The
USD
381,478 52,125,154 1.86Johnson &Johnson
USD
1,615,352 53,613,533 1.91Kraft Heinz Co/TheUSD481,558 29,582,108 1.05Las Vegas Sands
CorpUSD
274,302 47,470,704 1.69M&T Bank CorpUSD189,149 35,522,182 1.26Martin Marietta
Materials IncUSD
Securities Marketvalue in
USD
% of netassets*
Quantity Ccy Maturity
495,505 111,374,658 3.96Mastercard IncUSD925,188 103,648,812 3.68Microsoft CorpUSD1,629,662 76,854,860 2.74Mondelez
International IncUSD
86,132 14,911,172 0.53Moody's CorpUSD508,719 43,612,480 1.55NIKE IncUSD74,128 27,572,651 0.98O'Reilly
Automotive IncUSD
771,520 89,218,573 3.18PepsiCo IncUSD342,327 43,140,049 1.54PNC Financial
Services GroupInc/The
USD
135,316 58,618,891 2.09SHERWIN-WILLIAMS CO
USD
625,438 43,943,274 1.56Starbucks CorpUSD860,834 44,152,176 1.57TJX Cos Inc/TheUSD404,235 97,913,802 3.49UnitedHealth
Group IncUSD
714,262 105,796,486 3.76Visa IncUSD557,413 62,898,483 2.24Walt Disney
Co/TheUSD
1,096,963 54,727,484 1.95Wells Fargo & CoUSD84.002,359,177,390Total - United States
251,056 29,745,115 1.06ROYALCARIBBEANCRUISES LTD
USDLiberia
95.752,689,387,332Total - Transferable securities admitted to anofficial exchange
95.752,689,387,332Total - Shares
1.0629,745,115Total - Liberia
95.752,689,387,332Total - Investment in securities

99
Vontobel Fund - Global Equity
AssetsInvestments in securities at market value 2,651,312,511(2)
102,377,778Cash at banks
699,765Receivable from foreign currencies
3,967,822Receivable from subscriptions
2,050,539Interest and dividends receivable(2)
1,280,470Unrealised gain on forward foreign exchange contracts(9)
972,463Other assetsTotal Assets 2,762,661,348
2,193,129,529Statement of Net Assetsas at February 28, 2019
LiabilitiesBank overdraft 198
Provision for expenses 622
Payable for redemptions 3,899,252
Payable on foreign currencies 700,363
Audit fees, printing and publishing expenses 10,584
Service Fee payable 619,013(5)
Subscription tax payable 126,570(4)
Management Fee payable 2,386,381(3)
Other liabilities 3,878Total Liabilities 7,746,861Total net assets at the end of the period 2,754,914,487Net assets at the beginning of the reporting period 2,842,079,846
Net investment loss on investments -7,427,590
Change in unrealised appreciation/depreciation on:
Investments -133,235,611
Forward foreign exchange contracts 3,762,299
Net realised gain/loss on investments 37,270,778(2)
Net realised gain/loss on forward foreign exchange contracts -22,325,450(2)
Net realised gain/loss on currency exchange -520,263(2)
Increase/Decrease in net assets resulting from operations -122,475,837Subscriptions of shares 493,969,871
Redemptions of shares -457,842,943
Dividend distribution -816,450(11)
Total net assets at the end of the period 2,754,914,487
Statement of Operations andChanges in Net Assetsfrom September 1, 2018to February 28, 2019
Notes USDThe accompanying notes form an essential part of these financial statements.
Cost
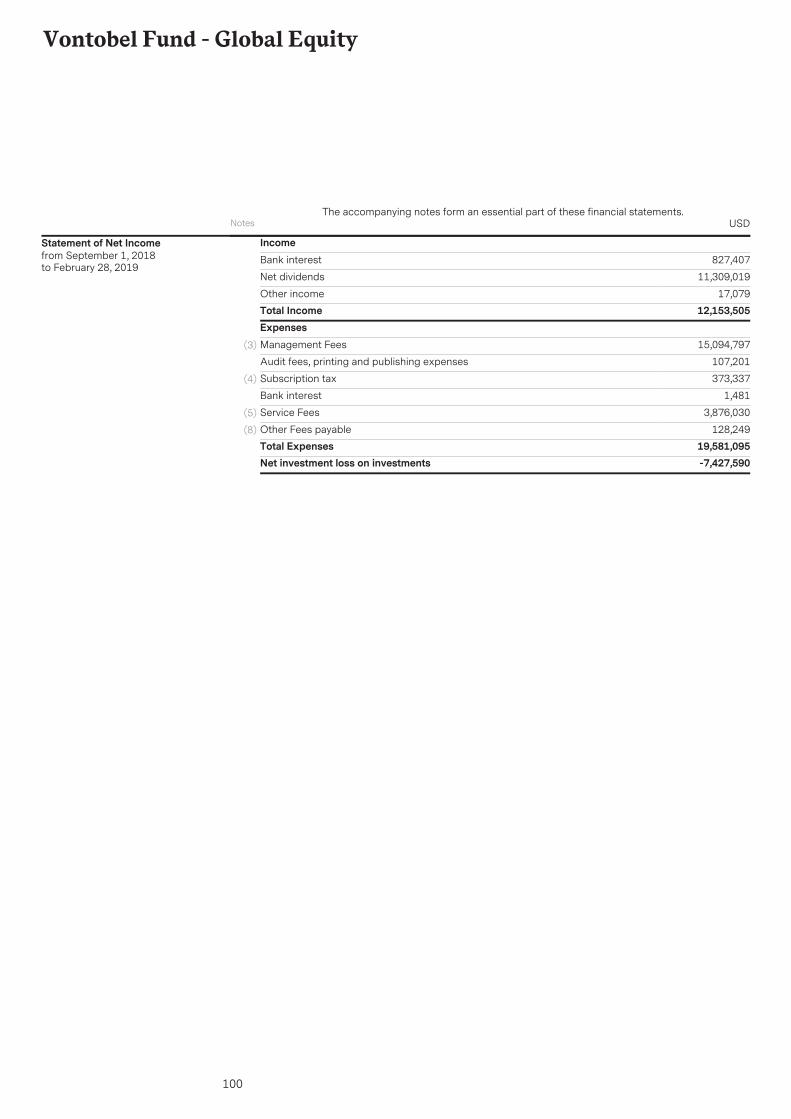
100
Vontobel Fund - Global Equity
IncomeBank interest 827,407
Net dividends 11,309,019
Other income 17,079Total Income 12,153,505ExpensesManagement Fees 15,094,797(3)
Audit fees, printing and publishing expenses 107,201
Subscription tax 373,337(4)
Bank interest 1,481
Service Fees 3,876,030(5)
Other Fees payable 128,249(8)
Total Expenses 19,581,095Net investment loss on investments -7,427,590
Statement of Net Incomefrom September 1, 2018to February 28, 2019
Notes USDThe accompanying notes form an essential part of these financial statements.

101
Vontobel Fund - Global Equity
The accompanying notes form an essential part of these financial statements.
Portfolio as at February 28, 2019
* Any deviations of the percentages of the nets assets are due to rounding.
Securities Marketvalue in
USD
% of netassets*
Quantity Ccy Maturity
833,960 65,097,154 2.36Anheuser-BuschInBev SA/NV
EUR
Transferable securities admitted to an official exchangeSharesBelgium
2.3665,097,154Total - Belgium
6,921,321 31,353,584 1.14Ambev SA ADRUSDBrazil
1.1431,353,584Total - Brazil
619,185 26,487,641 0.96Tencent HoldingsLtd
HKDCayman Islands
271,473 49,687,703 1.81Alibaba GroupHolding Ltd ADR
USD
2.7776,175,344Total - Cayman Islands
926,882 52,170,426 1.89Fresenius SE & CoKGaA
EURGermany
652,540 69,995,055 2.54SAP SEEUR4.43122,165,481Total - Germany
625,592 85,412,157 3.10Safran SAEURFrance
3.1085,412,157Total - France
3,832,363 111,944,675 4.06HDFC Bank LtdINRIndia
2,965,850 76,777,766 2.79HousingDevelopmentFinance Corp Ltd
INR
6.85188,722,441Total - India
642,702 52,034,163 1.89Paddy Power PLCEURIreland
365,361 31,709,325 1.15DCC PLCGBP920,420 83,298,010 3.02Medtronic PLCUSD
6.06167,041,498Total - Ireland
54,403 31,731,819 1.15Keyence CorpJPYJapan
1.1531,731,819Total - Japan
1,545,299 87,027,153 3.16AlimentationCouche-Tard Inc
CADCanada
437,880 37,543,949 1.36Canadian NationalRailway Co
CAD
4.52124,571,102Total - Canada
1,738,126 94,140,842 3.42Unilever NVEURNetherlands
3.4294,140,842Total - Netherlands
Securities Marketvalue in
USD
% of netassets*
Quantity Ccy Maturity
701,307 63,611,794 2.31Nestle SACHFSwitzerland
2.3163,611,794Total - Switzerland
1,947,687 58,861,240 2.14Industria de DisenoTextil SA
EURSpain
2.1458,861,240Total - Spain
845,691 33,024,234 1.20TaiwanSemiconductorManufacturing CoLtd ADR
USDTaiwan
1.2033,024,234Total - Taiwan
87,136 97,585,349 3.54Alphabet IncUSDUnited States
54,540 89,436,328 3.25Amazon.com IncUSD276,235 48,658,795 1.77American Tower
CorpUSD
258,885 64,407,999 2.34Becton Dickinsonand Co
USD
392,350 78,980,055 2.87BerkshireHathaway Inc
USD
30,896 52,431,748 1.90BOOKINGHOLDINGS INC
USD
427,341 77,737,601 2.82CME Group Inc/ILUSD283,536 38,742,359 1.41Johnson &
JohnsonUSD
180,396 31,219,332 1.13M&T Bank CorpUSD173,809 32,641,330 1.18Martin Marietta
Materials IncUSD
478,632 107,582,114 3.91Mastercard IncUSD769,814 86,242,262 3.13Microsoft CorpUSD518,823 44,478,696 1.61NIKE IncUSD71,705 26,671,392 0.97O'Reilly
Automotive IncUSD
595,043 68,810,773 2.50PepsiCo IncUSD223,935 28,220,289 1.02PNC Financial
Services GroupInc/The
USD
548,154 38,513,300 1.40Starbucks CorpUSD805,662 41,322,404 1.50TJX Cos Inc/TheUSD389,450 94,332,579 3.42UnitedHealth
Group IncUSD
681,057 100,878,163 3.66Visa IncUSD457,892 51,668,533 1.88Walt Disney
Co/TheUSD
939,481 46,870,707 1.70Wells Fargo & CoUSD48.911,347,432,108Total - United States
2,162,693 49,721,076 1.80RELX PLCEURUnited Kingdom
1,004,518 77,053,428 2.80Reckitt BenckiserGroup PLC
GBP
4.60126,774,504Total - United Kingdom

102
Vontobel Fund - Global Equity
The accompanying notes form an essential part of these financial statements.
Portfolio as at February 28, 2019
* Any deviations of the percentages of the nets assets are due to rounding.
Securities Marketvalue in
USD
% of netassets*
Quantity Ccy Maturity
297,073 35,197,209 1.28ROYALCARIBBEANCRUISES LTD
USDLiberia
96.242,651,312,511Total - Transferable securities admitted to anofficial exchange
96.242,651,312,511Total - Shares
1.2835,197,209Total - Liberia
96.242,651,312,511Total - Investment in securities

103
Vontobel Fund - Global Equity Income
AssetsInvestments in securities at market value 29,751,291(2)
236,328Cash at banks
26Receivable from foreign currencies
887Receivable from subscriptions
41,330Interest and dividends receivable(2)
24,009Unrealised gain on forward foreign exchange contracts(9)
45,815Other assetsTotal Assets 30,099,686
27,038,781Statement of Net Assetsas at February 28, 2019
LiabilitiesBank overdraft 1
Provision for expenses 8
Payable for redemptions 13,941
Payable on foreign currencies 26
Audit fees, printing and publishing expenses 5,115
Service Fee payable 21,813(5)
Subscription tax payable 2,247(4)
Management Fee payable 32,847(3)
Other liabilities 1,525Total Liabilities 77,523Total net assets at the end of the period 30,022,163Net assets at the beginning of the reporting period 40,608,215
Net investment loss on investments -67,368
Change in unrealised appreciation/depreciation on:
Investments -1,101,629
Forward foreign exchange contracts 75,292
Net realised gain/loss on investments 450,294(2)
Net realised gain/loss on forward foreign exchange contracts -433,513(2)
Net realised gain/loss on currency exchange 13,558(2)
Increase/Decrease in net assets resulting from operations -1,063,366Subscriptions of shares 1,210,383
Redemptions of shares -10,651,834
Dividend distribution -81,235(11)
Total net assets at the end of the period 30,022,163
Statement of Operations andChanges in Net Assetsfrom September 1, 2018to February 28, 2019
IncomeBank interest 3,778
Net dividends 264,084Total Income 267,862ExpensesManagement Fees 232,273(3)
Audit fees, printing and publishing expenses 23,830
Subscription tax 6,715(4)
Bank interest 12
Service Fees 38,216(5)
Other Fees payable 34,184(8)
Total Expenses 335,230Net investment loss on investments -67,368
Statement of Net Incomefrom September 1, 2018to February 28, 2019
Notes USDThe accompanying notes form an essential part of these financial statements.
Cost

104
Vontobel Fund - Global Equity Income
The accompanying notes form an essential part of these financial statements.
Portfolio as at February 28, 2019
* Any deviations of the percentages of the nets assets are due to rounding.
Securities Marketvalue in
USD
% of netassets*
Quantity Ccy Maturity
4,407 326,789 1.09KBC Group NVEUR
Transferable securities admitted to an official exchangeSharesBelgium
1.09326,789Total - Belgium
49,900 446,106 1.49Dairy FarmInternationalHoldings Ltd
USDBermuda Islands
1.49446,106Total - Bermuda Islands
77,904 352,905 1.18Ambev SA ADRUSDBrazil
30,488 286,587 0.95Itau UnibancoHolding SA ADR
USD
2.13639,492Total - Brazil
64,483 322,013 1.07Sands China LtdHKDCayman Islands
1.07322,013Total - Cayman Islands
10,408 594,357 1.98AXEL SPRINGERSE N NAMEN-AKT.V
EURGermany
9,456 532,240 1.77Fresenius SE & CoKGaA
EUR
8,770 940,719 3.14SAP SEEUR6.892,067,316Total - Germany
2,425 331,086 1.10Safran SAEURFrance
4,452 372,608 1.24SanofiEUR5,212 498,056 1.66Vinci SAEUR
4.001,201,750Total - France
13,300 458,481 1.53Hong KongExchanges andClearing Ltd
HKDHong Kong
83,727 946,621 3.15Link REITHKD4.681,405,102Total - Hong Kong
7,673 694,407 2.31Medtronic PLCUSDIreland
2.31694,407Total - Ireland
6,229 534,076 1.78Canadian NationalRailway Co
CADCanada
1.78534,076Total - Canada
173,617 449,592 1.50Wal-Mart deMexico SAB de CV
MXNMexico
1.50449,592Total - Mexico
Securities Marketvalue in
USD
% of netassets*
Quantity Ccy Maturity
24,346 591,050 1.97ABN AMRO GroupNV
EURNetherlands
27,046 1,464,873 4.88Unilever NVEUR6.852,055,923Total - Netherlands
9,855 569,225 1.90CARNIVAL CORPUSDPanama
1.90569,225Total - Panama
15,439 462,945 1.54Bank Pekao SAPLNPoland
1.54462,945Total - Poland
31,569 360,297 1.20SvenskaHandelsbanken AB
SEKSweden
27,484 505,273 1.68Swedbank ABSEK2.88865,570Total - Sweden
8,640 783,687 2.62Nestle SACHFSwitzerland
4,645 424,494 1.41Novartis AGCHF8,875 730,526 2.43Pargesa Holding
SACHF
2,311 643,284 2.14Roche Holding AGCHF27,137 345,954 1.15UBS Group AGCHF
9.752,927,945Total - Switzerland
40,400 748,082 2.49United OverseasBank Ltd
SGDSingapore
2.49748,082Total - Singapore
1,774 316,946 1.06Aena SAEURSpain
24,782 748,940 2.49Industria de DisenoTextil SA
EUR
3.551,065,886Total - Spain
104,109 808,468 2.69TaiwanSemiconductorManufacturing CoLtd
TWDTaiwan
2.69808,468Total - Taiwan
10,099 783,884 2.61AbbottLaboratories
USDUnited States
2,272 400,213 1.33American TowerCorp
USD
7,408 1,347,589 4.49CME Group Inc/ILUSD20,638 935,727 3.12Coca-Cola Co/TheUSD6,196 846,621 2.82Johnson &
JohnsonUSD
13,012 431,868 1.44Kraft Heinz Co/TheUSD3,630 628,208 2.09M&T Bank CorpUSD

105
Vontobel Fund - Global Equity Income
The accompanying notes form an essential part of these financial statements.
Portfolio as at February 28, 2019
* Any deviations of the percentages of the nets assets are due to rounding.
Securities Marketvalue in
USD
% of netassets*
Quantity Ccy Maturity
5,241 1,178,020 3.92Mastercard IncUSD7,989 923,848 3.08PepsiCo IncUSD5,770 501,644 1.67Philip Morris
International IncUSD
2,524 318,074 1.06PNC FinancialServices GroupInc/The
USD
9,609 675,128 2.25Starbucks CorpUSD11,665 581,967 1.94Wells Fargo & CoUSD
31.829,552,791Total - United States
14,045 515,322 1.72British AmericanTobacco PLC
GBPUnited Kingdom
655,838 554,279 1.85Lloyds BankingGroup PLC
GBP
6,571 504,041 1.68Reckitt BenckiserGroup PLC
GBP
44,969 1,034,171 3.44RELX PLCGBP
99.1029,751,291Total - Transferable securities admitted to anofficial exchange
99.1029,751,291Total - Shares
8.692,607,813Total - United Kingdom
99.1029,751,291Total - Investment in securities
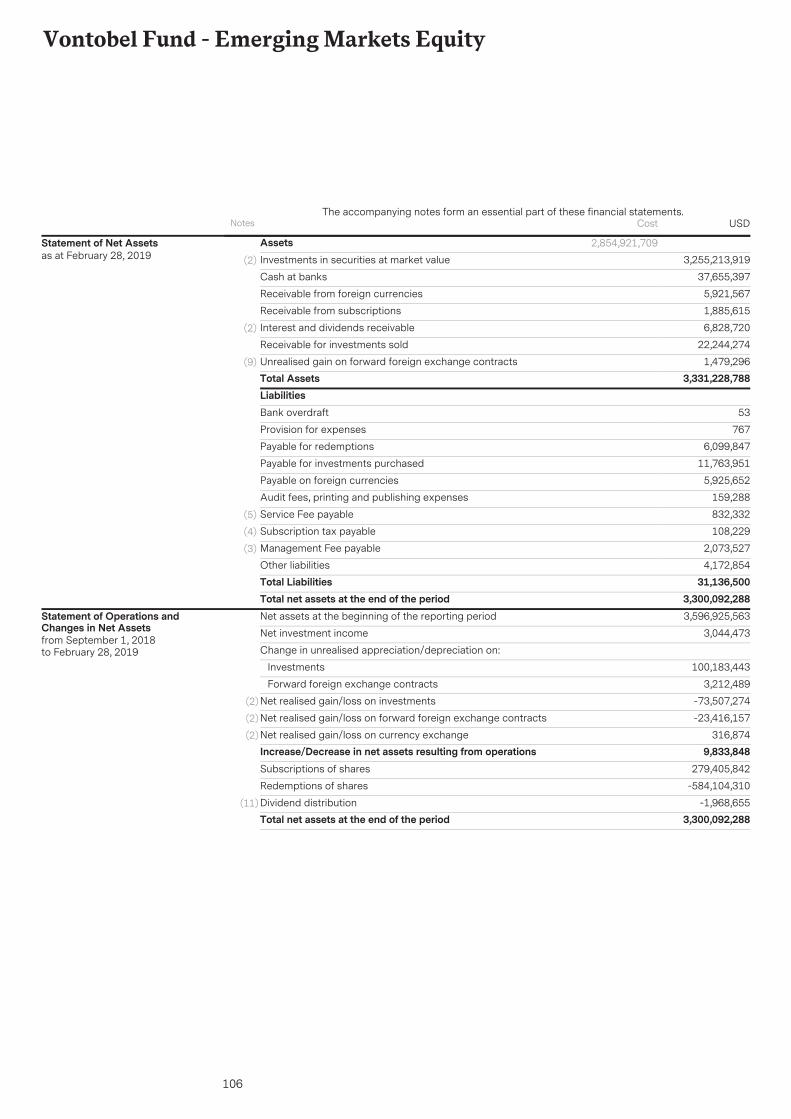
106
Vontobel Fund - Emerging Markets Equity
AssetsInvestments in securities at market value 3,255,213,919(2)
37,655,397Cash at banks
5,921,567Receivable from foreign currencies
1,885,615Receivable from subscriptions
6,828,720Interest and dividends receivable(2)
22,244,274Receivable for investments sold
1,479,296Unrealised gain on forward foreign exchange contracts(9)
Total Assets 3,331,228,788
2,854,921,709Statement of Net Assetsas at February 28, 2019
LiabilitiesBank overdraft 53
Provision for expenses 767
Payable for redemptions 6,099,847
Payable for investments purchased 11,763,951
Payable on foreign currencies 5,925,652
Audit fees, printing and publishing expenses 159,288
Service Fee payable 832,332(5)
Subscription tax payable 108,229(4)
Management Fee payable 2,073,527(3)
Other liabilities 4,172,854Total Liabilities 31,136,500Total net assets at the end of the period 3,300,092,288Net assets at the beginning of the reporting period 3,596,925,563
Net investment income 3,044,473
Change in unrealised appreciation/depreciation on:
Investments 100,183,443
Forward foreign exchange contracts 3,212,489
Net realised gain/loss on investments -73,507,274(2)
Net realised gain/loss on forward foreign exchange contracts -23,416,157(2)
Net realised gain/loss on currency exchange 316,874(2)
Increase/Decrease in net assets resulting from operations 9,833,848Subscriptions of shares 279,405,842
Redemptions of shares -584,104,310
Dividend distribution -1,968,655(11)
Total net assets at the end of the period 3,300,092,288
Statement of Operations andChanges in Net Assetsfrom September 1, 2018to February 28, 2019
Notes USDThe accompanying notes form an essential part of these financial statements.
Cost
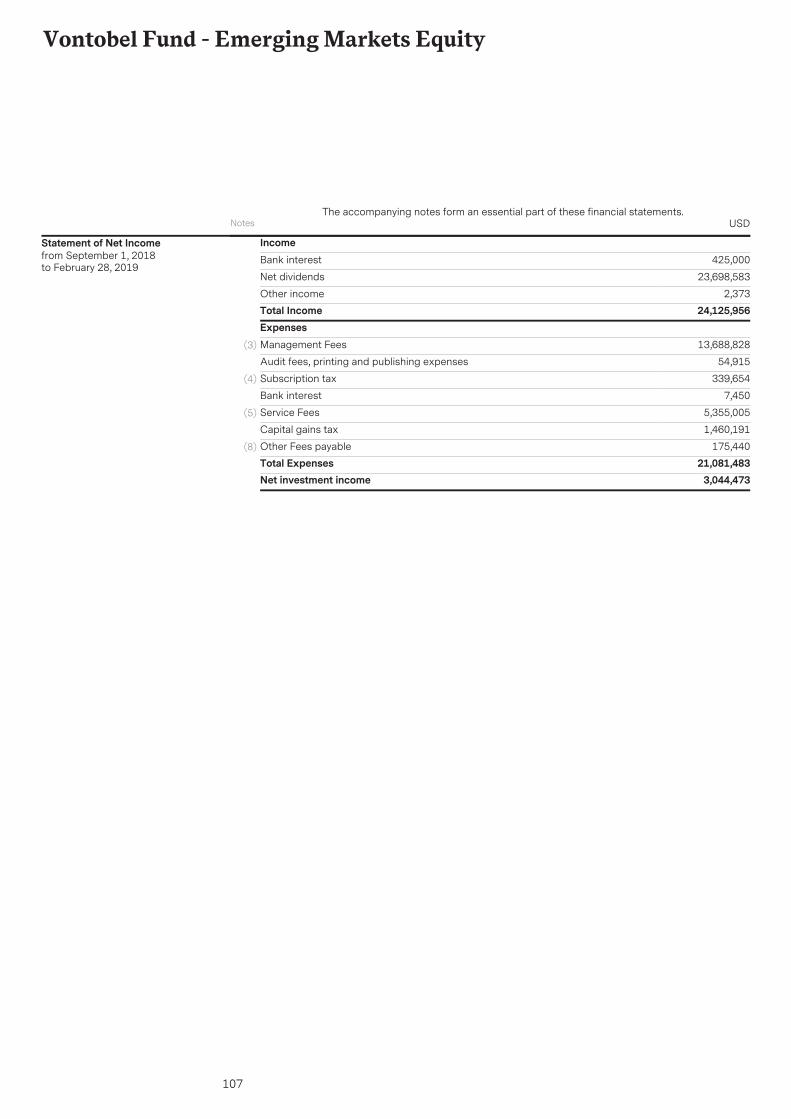
107
Vontobel Fund - Emerging Markets Equity
IncomeBank interest 425,000
Net dividends 23,698,583
Other income 2,373Total Income 24,125,956ExpensesManagement Fees 13,688,828(3)
Audit fees, printing and publishing expenses 54,915
Subscription tax 339,654(4)
Bank interest 7,450
Service Fees 5,355,005(5)
Capital gains tax 1,460,191
Other Fees payable 175,440(8)
Total Expenses 21,081,483Net investment income 3,044,473
Statement of Net Incomefrom September 1, 2018to February 28, 2019
Notes USDThe accompanying notes form an essential part of these financial statements.

108
Vontobel Fund - Emerging Markets Equity
The accompanying notes form an essential part of these financial statements.
Portfolio as at February 28, 2019
* Any deviations of the percentages of the nets assets are due to rounding.** See note 10
Securities Marketvalue in
USD
% of netassets*
Quantity Ccy Maturity
886,373 69,188,402 2.10Anheuser-BuschInBev SA/NV
EUR
Transferable securities admitted to an official exchangeSharesBelgium
2.1069,188,402Total - Belgium
240,800 58,536,072 1.77Credicorp LtdUSDBermuda Islands
1.7758,536,072Total - Bermuda Islands
4,842,207 18,373,344 0.56CCR SABRLBrazil
1,517,493 33,232,918 1.01Equatorial EnergiaSA
BRL
3,187,257 36,782,758 1.11LOJAS RENNERSA
BRL
5,018,704 71,474,993 2.17UltraparParticipacoes SA
BRL
30,026,099 136,018,229 4.11Ambev SA ADRUSD7,048,899 66,259,651 2.01Itau Unibanco
Holding SA ADRUSD
10.97362,141,893Total - Brazil
6,649,198 33,204,542 1.01Sands China LtdHKDCayman Islands
3,064,886 131,110,409 3.97Tencent HoldingsLtd
HKD
722,068 132,160,106 4.00Alibaba GroupHolding Ltd ADR
USD
404,832 90,366,599 2.74NetEase Inc ADRUSD11.72386,841,656Total - Cayman Islands
9,742,248 39,399,186 1.19INNER MONGOLIAYI LI IND.-A-
CNHChina
6,781,229 72,516,333 2.20WULIANGYE YIBINCO LTD -A-
CNH
3.39111,915,519Total - China
1,613,355 55,616,018 1.69Hong KongExchanges andClearing Ltd
HKDHong Kong
3,496,626 39,532,993 1.20Link REITHKD11,501,730 76,851,229 2.32TECHTRONIC
INDUSTRIES COLTD
HKD
5.21172,000,240Total - Hong Kong
9,294,407 38,373,995 1.16Bharti Infratel LtdINRIndia
5,228,373 77,473,163 2.35HCL TechnologiesLtd
INR
5,626,554 164,353,628 4.99HDFC Bank LtdINR3,609,107 93,429,935 2.83Housing
DevelopmentFinance Corp Ltd
INR
15,304,876 59,402,249 1.80ITC LtdINR23,966,969 61,615,986 1.87Power Grid Corp of
India LtdINR
Securities Marketvalue in
USD
% of netassets*
Quantity Ccy Maturity
4,005,395 111,699,679 3.38Tata ConsultancyServices Ltd
INR
10,306,043 67,626,214 2.05Zee EntertainmentEnterprises Ltd
INR
20.43673,974,849Total - India
29,039,752 56,926,822 1.73Bank Central AsiaTbk PT
IDRIndonesia
242,283,657 66,312,189 2.01Bank RakyatIndonesia PerseroTbk PT
IDR
282,414,356 77,496,589 2.34TelekomunikasiIndonesia PerseroTbk PT
IDR
6.08200,735,600Total - Indonesia
1,233,920 59,647,693 1.81BANCOLOMBIASA / ADR
USDColombia
1.8159,647,693Total - Colombia
13,356,400 31,301,276 0.95Malayan BankingBhd
MYRMalaysia
5,962,600 36,656,872 1.11Public Bank BhdMYR2.0667,958,148Total - Malaysia
3,330,196 31,092,140 0.94GrupoAeroportuario delPacifico SAB deCV
MXNMexico
8,394,161 32,283,427 0.98InfraestructuraEnergetica NovaSAB de CV
MXN
26,445,475 68,482,157 2.08Wal-Mart deMexico SAB de CV
MXN
1,239,702 112,354,192 3.40FomentoEconomicoMexicano SAB deCV ADR
USD
7.40244,211,916Total - Mexico
989,426 99,822,022 3.02Heineken NVEURNetherlands
2,140,758 115,948,303 3.52Unilever NVEUR6.54215,770,325Total - Netherlands
1,186,661 35,582,518 1.08Bank Pekao SAPLNPoland
1.0835,582,518Total - Poland
39,571 43,832,559 1.33LG Household &Health Care Ltd
KRWKorea, Republic Of
83,662 34,287,114 1.04NCSOFTCORPORATION
KRW
216,519 58,034,345 1.75Samsung Fire &Marine InsuranceCo Ltd
KRW
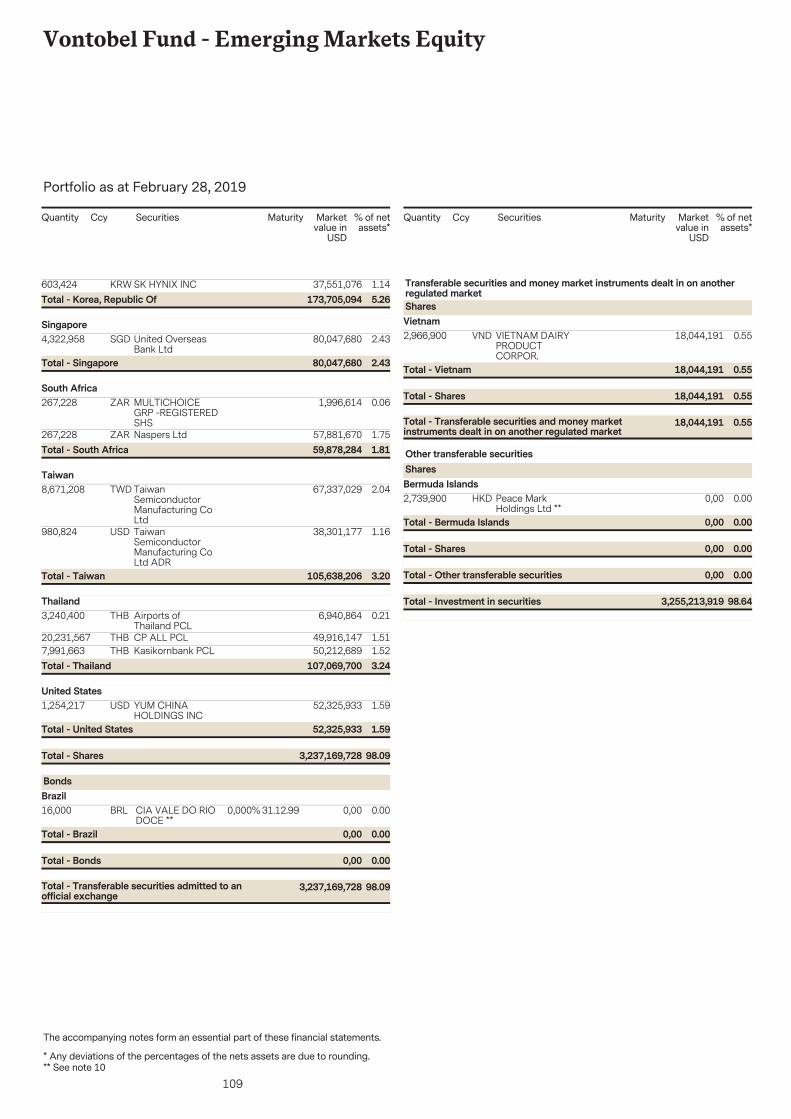
109
Vontobel Fund - Emerging Markets Equity
The accompanying notes form an essential part of these financial statements.
Portfolio as at February 28, 2019
* Any deviations of the percentages of the nets assets are due to rounding.** See note 10
Securities Marketvalue in
USD
% of netassets*
Quantity Ccy Maturity
603,424 37,551,076 1.14SK HYNIX INCKRW5.26173,705,094Total - Korea, Republic Of
4,322,958 80,047,680 2.43United OverseasBank Ltd
SGDSingapore
2.4380,047,680Total - Singapore
267,228 1,996,614 0.06MULTICHOICEGRP -REGISTEREDSHS
ZARSouth Africa
267,228 57,881,670 1.75Naspers LtdZAR1.8159,878,284Total - South Africa
8,671,208 67,337,029 2.04TaiwanSemiconductorManufacturing CoLtd
TWDTaiwan
980,824 38,301,177 1.16TaiwanSemiconductorManufacturing CoLtd ADR
USD
3.20105,638,206Total - Taiwan
3,240,400 6,940,864 0.21Airports ofThailand PCL
THBThailand
20,231,567 49,916,147 1.51CP ALL PCLTHB7,991,663 50,212,689 1.52Kasikornbank PCLTHB
3.24107,069,700Total - Thailand
1,254,217 52,325,933 1.59YUM CHINAHOLDINGS INC
USDUnited States
98.093,237,169,728Total - Shares
1.5952,325,933Total - United States
16,000 0,00 0.0031.12.99CIA VALE DO RIODOCE **
BRL 0,000%
BondsBrazil
98.093,237,169,728Total - Transferable securities admitted to anofficial exchange
0.000,00Total - Bonds
0.000,00Total - Brazil
Securities Marketvalue in
USD
% of netassets*
Quantity Ccy Maturity
2,966,900 18,044,191 0.55VIETNAM DAIRYPRODUCTCORPOR.
VND
Transferable securities and money market instruments dealt in on anotherregulated marketSharesVietnam
0.5518,044,191Total - Transferable securities and money marketinstruments dealt in on another regulated market
0.5518,044,191Total - Shares
0.5518,044,191Total - Vietnam
2,739,900 0,00 0.00Peace MarkHoldings Ltd **
HKD
Other transferable securitiesSharesBermuda Islands
0.000,00Total - Other transferable securities
0.000,00Total - Shares
0.000,00Total - Bermuda Islands
98.643,255,213,919Total - Investment in securities

110
Vontobel Fund - Asia Pacific Equity
AssetsInvestments in securities at market value 572,180,539(2)
28,392,490Cash at banks
2,196,778Receivable from foreign currencies
915,882Receivable from subscriptions
662,688Interest and dividends receivable(2)
17,620,018Receivable for forward foreign exchange contracts
27,867Unrealised gain on forward foreign exchange contracts(9)
Total Assets 621,996,262
475,610,911Statement of Net Assetsas at February 28, 2019
LiabilitiesBank overdraft 2
Provision for expenses 103
Payable for redemptions 256,720
Payable for investments purchased 107,616
Payable on forward foreign exchange contracts 17,712,284
Payable on foreign currencies 2,196,581
Audit fees, printing and publishing expenses 7,958
Service Fee payable 142,004(5)
Subscription tax payable 25,432(4)
Management Fee payable 441,992(3)
Other liabilities 1,153,358Total Liabilities 22,044,050Total net assets at the end of the period 599,952,212Net assets at the beginning of the reporting period 469,315,752
Net investment loss on investments -1,168,877
Change in unrealised appreciation/depreciation on:
Investments 13,539,319
Forward foreign exchange contracts 20,012
Net realised gain/loss on investments 3,252,244(2)
Net realised gain/loss on forward foreign exchange contracts -375,620(2)
Net realised gain/loss on currency exchange -113,617(2)
Increase/Decrease in net assets resulting from operations 15,153,461Subscriptions of shares 167,290,226
Redemptions of shares -51,761,600
Dividend distribution -45,627(11)
Total net assets at the end of the period 599,952,212
Statement of Operations andChanges in Net Assetsfrom September 1, 2018to February 28, 2019
Notes USDThe accompanying notes form an essential part of these financial statements.
Cost

111
Vontobel Fund - Asia Pacific Equity
IncomeBank interest 308,654
Net dividends 2,240,724Total Income 2,549,378ExpensesManagement Fees 2,446,809(3)
Audit fees, printing and publishing expenses 24,821
Subscription tax 71,076(4)
Bank interest 392
Service Fees 754,260(5)
Capital gains tax 362,564
Other Fees payable 58,333(8)
Total Expenses 3,718,255Net investment loss on investments -1,168,877
Statement of Net Incomefrom September 1, 2018to February 28, 2019
Notes USDThe accompanying notes form an essential part of these financial statements.

112
Vontobel Fund - Asia Pacific Equity
The accompanying notes form an essential part of these financial statements.
Portfolio as at February 28, 2019
* Any deviations of the percentages of the nets assets are due to rounding.** See note 10
Securities Marketvalue in
USD
% of netassets*
Quantity Ccy Maturity
89,858 12,430,502 2.07CSL LtdAUD
Transferable securities admitted to an official exchangeSharesAustralia
157,337 7,276,786 1.21Ramsay HealthCare Ltd
AUD
3.2819,707,288Total - Australia
267,814 11,869,883 1.98British AmericanTobaccoBangladesh Co Ltd
BDTBangladesh
1.9811,869,883Total - Bangladesh
1,241,719 7,276,570 1.21ANTA SportsProducts Ltd
HKDCayman Islands
2,439,606 12,182,918 2.03Sands China LtdHKD725,386 31,030,975 5.17Tencent Holdings
LtdHKD
170,279 31,430,099 5.24Alibaba GroupHolding Ltd ADR
USD
172,281 6,510,499 1.09BAOZUN INC/SADR
USD
104,599 23,599,626 3.93NetEase Inc ADRUSD350,373 6,846,288 1.14ZTO Express
Cayman Inc ADRUSD
19.81118,876,975Total - Cayman Islands
710,417 2,872,211 0.48INNER MONGOLIAYI LI IND.-A-
CNHChina
1,480,014 15,822,251 2.64WULIANGYE YIBINCO LTD -A-
CNH
968,959 7,044,332 1.17Vipshop HoldingsLtd ADR
USD
4.2925,738,794Total - China
1,352,505 13,525,524 2.26AIA Group LtdHKDHong Kong
178,000 6,136,113 1.02Hong KongExchanges andClearing Ltd
HKD
908,634 10,273,133 1.71Link REITHKD451,744 3,018,446 0.50TECHTRONIC
INDUSTRIES COLTD
HKD
5.4932,953,216Total - Hong Kong
1,542,428 6,364,175 1.06Bharti Infratel LtdINRIndia
422,335 3,540,064 0.59GlenmarkPharmaceuticalsLtd
INR
1,070,626 15,854,203 2.64HCL TechnologiesLtd
INR
904,991 26,418,185 4.40HDFC Bank LtdINR823,396 21,301,832 3.55Housing
DevelopmentFinance Corp Ltd
INR
5,099,832 19,781,119 3.30ITC LtdINR2,233,403 5,738,116 0.96Power Grid Corp of
India LtdINR
Securities Marketvalue in
USD
% of netassets*
Quantity Ccy Maturity
663,476 18,490,715 3.08Tata ConsultancyServices Ltd
INR
1,044,266 6,847,881 1.14Zee EntertainmentEnterprises Ltd
INR
20.72124,336,290Total - India
6,702,027 13,128,788 2.19Bank Central AsiaTbk PT
IDRIndonesia
38,344,428 10,487,354 1.75Bank RakyatIndonesia PerseroTbk PT
IDR
2,399,688 14,558,466 2.43PT GUDANGGARAMTBK/DEMAT
IDR
72,057,505 19,759,206 3.29TelekomunikasiIndonesia PerseroTbk PT
IDR
9.6657,933,814Total - Indonesia
469,353 3,887,724 0.65British AmericanTobacco MalaysiaBhd
MYRMalaysia
1,799,409 10,030,877 1.68Guinness AnchorBhd
MYR
2,188,500 5,126,317 0.85Malayan BankingBhd
MYR
164,900 5,998,579 1.00Nestle MalaysiaBhd
MYR
1,087,200 6,680,599 1.11Public Bank BhdMYR5.2931,724,096Total - Malaysia
5,498,640 5,003,988 0.83Puregold PriceClub Inc
PHPPhilippines
1,862,000 3,151,295 0.53Robinsons RetailHoldings Inc
PHP
2,030,110 5,344,156 0.89Universal RobinaCorp
PHP
2.2513,499,439Total - Philippines
169,285 4,650,276 0.78Kangwon Land IncKRWKorea, Republic Of
6,953 7,701,796 1.28LG Household &Health Care Ltd
KRW
15,302 6,271,203 1.05NCSOFTCORPORATION
KRW
114,373 5,358,409 0.89Osstem Implant CoLtd
KRW
62,470 5,664,655 0.94S-1 CorpKRW30,862 8,272,051 1.38Samsung Fire &
Marine InsuranceCo Ltd
KRW
111,210 6,920,598 1.15SK HYNIX INCKRW7.4744,838,988Total - Korea, Republic Of
526,550 9,768,137 1.63United OverseasBank Ltd
SGDSingapore
1.639,768,137Total - Singapore

113
Vontobel Fund - Asia Pacific Equity
The accompanying notes form an essential part of these financial statements.
Portfolio as at February 28, 2019
* Any deviations of the percentages of the nets assets are due to rounding.** See note 10
Securities Marketvalue in
USD
% of netassets*
Quantity Ccy Maturity
817,516 8,452,418 1.41President ChainStore Corp
TWDTaiwan
2,425,758 18,820,045 3.14TaiwanSemiconductorManufacturing CoLtd
TWD
4.5527,272,463Total - Taiwan
8,269,300 4,997,021 0.83Thai Beverage PCLSGDThailand
7,247,415 17,871,538 2.98CP ALL PCLTHB1,021,794 6,416,629 1.07Kasikornbank PCLTHB
4.8829,285,188Total - Thailand
54,175 3,327,970 0.55Las Vegas SandsCorp
USDUnited States
250,182 10,392,561 1.74YUM CHINAHOLDINGS INC
USD
93.59561,525,102Total - Transferable securities admitted to anofficial exchange
93.59561,525,102Total - Shares
2.2913,720,531Total - United States
3,652,135 3,470,529 0.58Habib Bank LtdPKR
Transferable securities and money market instruments dealt in on anotherregulated marketSharesPakistan
72,630 4,320,236 0.72Nestle Pakistan LtdPKR1.307,790,765Total - Pakistan
470,410 2,864,672 0.48VIETNAM DAIRYPRODUCTCORPOR.
VNDVietnam
1.7810,655,437Total - Transferable securities and money marketinstruments dealt in on another regulated market
1.7810,655,437Total - Shares
0.482,864,672Total - Vietnam
5,700,500 0,00 0.00Peace MarkHoldings Ltd **
HKD
Other transferable securitiesSharesBermuda Islands
0.000,00Total - Other transferable securities
0.000,00Total - Shares
0.000,00Total - Bermuda Islands
95.37572,180,539Total - Investment in securities

114
Vontobel Fund - New Power
AssetsInvestments in securities at market value 188,687,983(2)
4,806,228Cash at banks
225Receivable from foreign currencies
61,143Receivable from subscriptions
166,763Interest and dividends receivable(2)
391,561Receivable for investments sold
22,778Unrealised gain on forward foreign exchange contracts(9)
347,957Other assetsTotal Assets 194,484,638
161,191,555Statement of Net Assetsas at February 28, 2019
LiabilitiesPayable for redemptions 1,290,934
Payable on foreign currencies 225
Audit fees, printing and publishing expenses -387
Service Fee payable 49,329(5)
Subscription tax payable 12,225(4)
Management Fee payable 198,698(3)
Other liabilities 1,516Total Liabilities 1,552,540Total net assets at the end of the period 192,932,098Net assets at the beginning of the reporting period 194,528,558
Net investment loss on investments -569,665
Change in unrealised appreciation/depreciation on:
Investments -679,318
Forward foreign exchange contracts -148,263
Net realised gain/loss on investments -324,788(2)
Net realised gain/loss on forward foreign exchange contracts 193,586(2)
Net realised gain/loss on currency exchange 84,660(2)
Increase/Decrease in net assets resulting from operations -1,443,788Subscriptions of shares 24,051,163
Redemptions of shares -24,203,835Total net assets at the end of the period 192,932,098
Statement of Operations andChanges in Net Assetsfrom September 1, 2018to February 28, 2019
IncomeBank interest 22,700
Net dividends 997,724Total Income 1,020,424ExpensesManagement Fees 1,210,516(3)
Audit fees, printing and publishing expenses 29,006
Subscription tax 34,374(4)
Bank interest 6,961
Service Fees 279,179(5)
Other Fees payable 30,053(8)
Total Expenses 1,590,089Net investment loss on investments -569,665
Statement of Net Incomefrom September 1, 2018to February 28, 2019
Notes EURThe accompanying notes form an essential part of these financial statements.
Cost

115
Vontobel Fund - New Power
The accompanying notes form an essential part of these financial statements.
Portfolio as at February 28, 2019
* Any deviations of the percentages of the nets assets are due to rounding.
Securities Marketvalue in
EUR
% of netassets*
Quantity Ccy Maturity
57,500 1,608,808 0.83Pampa Energia SAADR
USD
Transferable securities admitted to an official exchangeSharesArgentina
0.831,608,808Total - Argentina
1,130,240 4,311,793 2.24China ResourcesGas Group Ltd
HKDBermuda Islands
210,000 2,972,864 1.54GasLog LtdUSD3.787,284,657Total - Bermuda Islands
180,528 3,508,461 1.82HollysysAutomationTechnologies Ltd
USDBritish Virgin Islands
1.823,508,461Total - British Virgin Islands
3,060,000 2,399,785 1.24CIMC EnricHoldings Ltd
HKDCayman Islands
1.242,399,785Total - Cayman Islands
7,617,762 4,994,107 2.58China LongyuanPower Group CorpLtd
HKDChina
1,410,000 1,419,693 0.74Xinjiang GoldwindScience &Technology Co Ltd
HKD
3.326,413,800Total - China
80,000 5,854,355 3.03Vestas WindSystems A/S
DKKDenmark
3.035,854,355Total - Denmark
17,000 2,448,000 1.27Continental AGEURGermany
205,000 3,957,525 2.06InfineonTechnologies AG
EUR
35,000 1,333,500 0.69OSRAM Licht AGEUR116,191 1,824,199 0.95PSI AG
Gesellschaft FuerProdukte undSysteme derInformationstechnologie
EUR
37,500 3,604,875 1.87Siemens AGEUR15,000 1,350,900 0.70Wacker Chemie
AGEUR
7.5414,518,999Total - Germany
85,000 5,815,700 3.01Schneider ElectricSE
EURFrance
3.015,815,700Total - France
Securities Marketvalue in
EUR
% of netassets*
Quantity Ccy Maturity
310,000 1,597,071 0.83Beijing EnterprisesHoldings Ltd
HKDHong Kong
0.831,597,071Total - Hong Kong
72,000 6,674,559 3.46Ingersoll-Rand PLCUSDIreland
3.466,674,559Total - Ireland
310,000 5,564,500 2.88Prysmian SpAEURItaly
700,000 3,041,500 1.58Snam SpAEUR4.468,606,000Total - Italy
80,000 3,017,984 1.56Denso CorpJPYJapan
500,000 5,498,576 2.85Mitsubishi ElectricCorp
JPY
27,500 1,887,423 0.98TDK CORP*OPR*
JPY
5.3910,403,983Total - Japan
93,800 2,020,898 1.05Keyera CorpCADCanada
100,000 506,112 0.26Peyto Exploration& DevelopmentCorp
CAD
120,000 2,590,972 1.34Stantec IncCAD155,000 3,356,723 1.74Canadian Solar IncUSD
4.398,474,705Total - Canada
37,500 3,007,377 1.56NXPSemiconductorsNV
USDNetherlands
1.563,007,377Total - Netherlands
28,121 5,214,190 2.70Samsung SDI CoLtd
KRWKorea, Republic Of
2.705,214,190Total - Korea, Republic Of
130,000 2,265,083 1.17ABB LtdCHFSwitzerland
1.172,265,083Total - Switzerland
330,000 4,440,150 2.30Gamesa CorpTecnologica SA
EURSpain
816,711 6,004,459 3.12Iberdrola SAEUR5.4210,444,609Total - Spain
280,000 1,022,669 0.53CHROMA ATE INCTWDTaiwan

116
Vontobel Fund - New Power
The accompanying notes form an essential part of these financial statements.
Portfolio as at February 28, 2019
* Any deviations of the percentages of the nets assets are due to rounding.
Securities Marketvalue in
EUR
% of netassets*
Quantity Ccy Maturity
120,000 4,115,219 2.13TaiwanSemiconductorManufacturing CoLtd ADR
USD
2.665,137,888Total - Taiwan
40,000 1,075,063 0.56VEONEER INC/SWDH DEP REC
SEKUnited States
70,000 4,892,070 2.54AMETEK IncUSD85,000 2,861,948 1.48Applied Materials
IncUSD
22,000 1,945,745 1.01ASPENTECHNOLOGYINC
USD
92,699 2,004,259 1.04Cabot Oil & GasCorp
USD
67,500 3,115,065 1.61First Solar IncUSD30,000 1,989,637 1.03ICF International
IncUSD
45,000 2,094,889 1.09Itron IncUSD45,000 3,335,778 1.73KEYSIGHT
TECHNOLOGIESINC
USD
64,000 2,426,908 1.26MasTec IncUSD27,500 2,097,941 1.09Microchip
Technology IncUSD
51,000 8,407,587 4.36NextEra Energy IncUSD130,000 2,452,270 1.27ON
SEMICONDUCTOR CORP
USD
33,000 2,117,309 1.10Power IntegrationsInc
USD
200,000 6,259,769 3.24Quanta ServicesInc
USD
19,000 2,979,398 1.54RockwellAutomation Inc
USD
15,000 4,263,414 2.21RoperTechnologies Inc
USD
50,000 1,855,625 0.96SOLAREDGETECHNOLOGIESINC
USD
77,500 6,920,347 3.59Synopsys IncUSD33,000 3,641,969 1.89United
Technologies CorpUSD
24,000 3,145,482 1.63Universal DisplayCorp
USD
117,500 1,647,910 0.85Welbilt IncUSD68,500 3,275,512 1.70WESCO
International IncUSD
38.7874,805,895Total - United States
250,000 2,476,050 1.28National Grid PLCGBPUnited Kingdom
96.67186,511,975Total - Transferable securities admitted to anofficial exchange
96.67186,511,975Total - Shares
1.282,476,050Total - United Kingdom
Securities Marketvalue in
EUR
% of netassets*
Quantity Ccy Maturity
67,000 2,176,008 1.13SFA EngineeringCorp
KRW
Transferable securities and money market instruments dealt in on anotherregulated marketSharesKorea, Republic Of
1.132,176,008Total - Transferable securities and money marketinstruments dealt in on another regulated market
1.132,176,008Total - Shares
1.132,176,008Total - Korea, Republic Of
97.80188,687,983Total - Investment in securities

117
Vontobel Fund - Clean Technology
AssetsInvestments in securities at market value 239,400,237(2)
6,041,401Cash at banks
31Receivable from foreign currencies
200,457Receivable from subscriptions
115,889Interest and dividends receivable(2)
10,150Unrealised gain on forward foreign exchange contracts(9)
184,788Other assetsTotal Assets 245,952,953
211,218,623Statement of Net Assetsas at February 28, 2019
LiabilitiesPayable for redemptions 373,178
Payable on foreign currencies 31
Audit fees, printing and publishing expenses 1,604
Service Fee payable 58,896(5)
Subscription tax payable 15,591(4)
Management Fee payable 253,537(3)
Other liabilities 1,561Total Liabilities 704,398Total net assets at the end of the period 245,248,555Net assets at the beginning of the reporting period 254,396,736
Net investment loss on investments -900,144
Change in unrealised appreciation/depreciation on:
Investments -1,742,896
Forward foreign exchange contracts -58,304
Net realised gain/loss on investments -2,556,569(2)
Net realised gain/loss on forward foreign exchange contracts 6,512(2)
Net realised gain/loss on currency exchange 132,465(2)
Increase/Decrease in net assets resulting from operations -5,118,936Subscriptions of shares 28,918,711
Redemptions of shares -32,947,956Total net assets at the end of the period 245,248,555
Statement of Operations andChanges in Net Assetsfrom September 1, 2018to February 28, 2019
IncomeBank interest 21,273
Net dividends 1,142,267
Other income 111Total Income 1,163,651ExpensesManagement Fees 1,587,848(3)
Audit fees, printing and publishing expenses 23,421
Subscription tax 44,454(4)
Bank interest 9,422
Service Fees 369,153(5)
Other Fees payable 29,497(8)
Total Expenses 2,063,795Net investment loss on investments -900,144
Statement of Net Incomefrom September 1, 2018to February 28, 2019
Notes EURThe accompanying notes form an essential part of these financial statements.
Cost

118
Vontobel Fund - Clean Technology
The accompanying notes form an essential part of these financial statements.
Portfolio as at February 28, 2019
* Any deviations of the percentages of the nets assets are due to rounding.
Securities Marketvalue in
EUR
% of netassets*
Quantity Ccy Maturity
233,782 2,135,183 0.87Cia deSaneamentoBasico do Estadode Sao Paulo ADR
USD
Transferable securities admitted to an official exchangeSharesBrazil
0.872,135,183Total - Brazil
4,660,600 4,296,372 1.75CRRC Corp LtdHKDChina
11,942,106 3,193,094 1.30HuanengRenewables CorpLtd
HKD
1,000,000 4,928,091 2.01Zhuzhou CSRTimes Electric CoLtd
HKD
5.0612,417,557Total - China
40,000 2,551,898 1.04ORSTEDDKKDenmark
41,312 3,023,189 1.23Vestas WindSystems A/S
DKK
2.275,575,087Total - Denmark
23,003 3,312,432 1.35Continental AGEURGermany
99,473 2,095,896 0.85GEA Group AGEUR48,587 4,267,882 1.74Henkel AG & Co
KGaAEUR
180,000 3,474,900 1.42InfineonTechnologies AG
EUR
68,006 3,408,461 1.39KION Group AGEUR35,000 1,333,500 0.54OSRAM Licht AGEUR38,233 3,675,338 1.50Siemens AGEUR
8.7921,568,409Total - Germany
161,701 5,119,453 2.09Cie de Saint-Gobain
EURFrance
353,500 3,971,573 1.62SuezEUR3.719,091,026Total - France
3,873,077 3,327,746 1.36China EverbrightInternational Ltd
HKDHong Kong
3,354,242 5,651,350 2.30GuangdongInvestment Ltd
HKD
700,000 3,531,892 1.44MTR Corp LtdHKD5.1012,510,988Total - Hong Kong
85,000 3,524,100 1.44Kingspan GroupPLC
EURIreland
55,558 5,150,349 2.10Ingersoll-Rand PLCUSD139,717 4,327,583 1.76Johnson Controls
International plcUSD
115,000 2,775,270 1.13NVENT ELECTRICPLC
USD
6.4315,777,302Total - Ireland
Securities Marketvalue in
EUR
% of netassets*
Quantity Ccy Maturity
224,278 4,025,790 1.64Prysmian SpAEURItaly
1.644,025,790Total - Italy
80,000 3,017,984 1.23Denso CorpJPYJapan
37,697 3,170,162 1.29East Japan RailwayCo
JPY
18,000 2,460,159 1.00MurataManufacturing CoLtd
JPY
31,100 3,306,028 1.35Nidec CorpJPY94,000 3,563,187 1.46OMRON CORPJPY
6.3315,517,520Total - Japan
71,197 4,342,004 1.77FERGUSON PLCGBPJersey
1.774,342,004Total - Jersey
173,000 3,746,536 1.53Canadian Solar IncUSDCanada
1.533,746,536Total - Canada
110,000 3,573,900 1.46Aalberts IndustriesNV
EURNetherlands
33,000 5,316,960 2.17ASML Holding NVEUR45,000 3,608,852 1.47NXP
SemiconductorsNV
USD
5.1012,499,712Total - Netherlands
73,612 3,231,567 1.32ANDRITZ AGEURAustria
1.323,231,567Total - Austria
20,000 3,708,396 1.51Samsung SDI CoLtd
KRWKorea, Republic Of
1.513,708,396Total - Korea, Republic Of
7,000 2,458,450 1.00Geberit AGCHFSwitzerland
1.002,458,450Total - Switzerland
200,000 2,691,000 1.10Gamesa CorpTecnologica SA
EURSpain
337,333 2,480,072 1.01Iberdrola SAEUR2.115,171,072Total - Spain
300,000 1,095,717 0.45CHROMA ATE INCTWDTaiwan
0.451,095,717Total - Taiwan

119
Vontobel Fund - Clean Technology
The accompanying notes form an essential part of these financial statements.
Portfolio as at February 28, 2019
* Any deviations of the percentages of the nets assets are due to rounding.
Securities Marketvalue in
EUR
% of netassets*
Quantity Ccy Maturity
49,000 1,316,952 0.54VEONEER INC/SWDH DEP REC
SEKUnited States
8,000 914,165 0.37Acuity Brands IncUSD28,407 4,519,874 1.84Air Products &
Chemicals IncUSD
67,000 5,979,222 2.44American WaterWorks Co Inc
USD
110,000 5,016,510 2.05AO Smith CorpUSD180,000 6,060,595 2.47Applied Materials
IncUSD
71,820 2,561,351 1.04BorgWarner IncUSD68,809 4,391,280 1.79CSX CorpUSD54,000 2,492,052 1.02First Solar IncUSD65,000 3,025,951 1.23Itron IncUSD83,000 6,152,657 2.51KEYSIGHT
TECHNOLOGIESINC
USD
130,000 3,162,378 1.29LKQ CorpUSD64,436 2,443,441 1.00MasTec IncUSD20,000 2,709,405 1.10NVIDIA CorpUSD89,449 2,799,651 1.14Quanta Services
IncUSD
71,024 5,224,353 2.13Regal Beloit CorpUSD18,745 5,327,847 2.17Roper
Technologies IncUSD
100,157 8,943,499 3.66Synopsys IncUSD75,000 3,953,192 1.61Tetra Tech IncUSD37,789 8,614,113 3.52Thermo Fisher
Scientific IncUSD
35,000 4,587,161 1.87Universal DisplayCorp
USD
98,000 6,502,064 2.65Xylem Inc/NYUSD39.4496,697,713Total - United States
90,133 3,367,224 1.37Pentair PLCUSDUnited Kingdom
95.80234,937,253Total - Shares
1.373,367,224Total - United Kingdom
12,000 4,462,984 1.82Equinix IncUSD
Real EstateUnited States
97.62239,400,237Total - Transferable securities admitted to anofficial exchange
1.824,462,984Total - Real Estate
1.824,462,984Total - United States
97.62239,400,237Total - Investment in securities

120
Vontobel Fund - Future Resources
AssetsInvestments in securities at market value 53,261,859(2)
3,303,852Cash at banks
14,219Receivable from subscriptions
54,097Interest and dividends receivable(2)
26,223Receivable for investments sold
1,270Unrealised gain on forward foreign exchange contracts(9)
31,828Other assetsTotal Assets 56,693,348
56,041,611Statement of Net Assetsas at February 28, 2019
LiabilitiesPayable for redemptions 2,393
Audit fees, printing and publishing expenses 536
Service Fee payable 25,357(5)
Subscription tax payable 3,620(4)
Management Fee payable 61,361(3)
Other liabilities 1,396Total Liabilities 94,663Total net assets at the end of the period 56,598,685Net assets at the beginning of the reporting period 74,286,678
Net investment loss on investments -74,183
Change in unrealised appreciation/depreciation on:
Investments -5,222,944
Forward foreign exchange contracts -4,728
Net realised gain/loss on investments -829,694(2)
Net realised gain/loss on forward foreign exchange contracts -1,505(2)
Net realised gain/loss on currency exchange 33,160(2)
Increase/Decrease in net assets resulting from operations -6,099,894Subscriptions of shares 2,977,836
Redemptions of shares -14,565,935Total net assets at the end of the period 56,598,685
Statement of Operations andChanges in Net Assetsfrom September 1, 2018to February 28, 2019
IncomeBank interest 9,833
Net dividends 428,948
Other income 58,319Total Income 497,100ExpensesManagement Fees 415,041(3)
Audit fees, printing and publishing expenses 23,268
Subscription tax 10,789(4)
Bank interest 2,597
Service Fees 97,524(5)
Other Fees payable 22,064(8)
Total Expenses 571,283Net investment loss on investments -74,183
Statement of Net Incomefrom September 1, 2018to February 28, 2019
Notes EURThe accompanying notes form an essential part of these financial statements.
Cost

121
Vontobel Fund - Future Resources
The accompanying notes form an essential part of these financial statements.
Portfolio as at February 28, 2019
* Any deviations of the percentages of the nets assets are due to rounding.
Securities Marketvalue in
EUR
% of netassets*
Quantity Ccy Maturity
1,162,680 243,355 0.43Clean TeQHoldings Ltd
AUD
Transferable securities admitted to an official exchangeSharesAustralia
496,770 1,514,643 2.67IndependenceGroup NL
AUD
227,000 249,617 0.44LYNAS CORP LTDAUD122,350 293,542 0.52Orocobre LtdAUD590,000 274,627 0.49Pilbara Minerals
LtdAUD
325,300 99,590 0.18Talga ResourcesLtd
AUD
455,140 654,045 1.15Western Areas LtdAUD5.883,329,419Total - Australia
12,940 603,192 1.07Bunge LtdUSDBermuda Islands
67,000 948,486 1.67GasLog LtdUSD2.741,551,678Total - Bermuda Islands
1,142,000 895,606 1.58CIMC EnricHoldings Ltd
HKDCayman Islands
151,100 1,369,249 2.42ENN ENERGYHOLDINGS
HKD
4.002,264,855Total - Cayman Islands
16,870 610,680 1.08SOCIE.QUIMICA YMIN/SPON.ADR-B
USDChile
1.08610,680Total - Chile
14,910 998,821 1.76BASF SEEURGermany
1.76998,821Total - Germany
12,920 1,145,229 2.02Arkema SAEURFrance
2.021,145,229Total - France
101,400 971,123 1.72ASAHI KASEICORP
JPYJapan
75,300 961,743 1.70JGC CorpJPY64,500 764,525 1.35Kubota CorpJPY22,900 1,073,459 1.90Nitto Denko CorpJPY93,460 1,288,060 2.27Sekisui Chemical
Co LtdJPY
8.945,058,910Total - Japan
288,470 607,844 1.07CES EnergySolutions Corp
CADCanada
58,110 774,971 1.37Enerflex LtdCAD45,220 455,014 0.80First Quantum
Minerals LtdCAD
121,260 278,151 0.49Ivanhoe Mines LtdCAD35,520 765,270 1.35Keyera CorpCAD
Securities Marketvalue in
EUR
% of netassets*
Quantity Ccy Maturity
401,270 1,787,384 3.16Lundin MiningCorp
CAD
56,800 617,363 1.09NEOPERFORMANCEMATERIALS INC
CAD
39,980 1,909,600 3.38NUTRIEN LTDCAD12.717,195,597Total - Canada
18,635 689,539 1.22Yara InternationalASA
NOKNorway
1.22689,539Total - Norway
4,650 707,759 1.25NOVATEK JOINTSTOCK CO/SGDR
USDRussia
1.25707,759Total - Russia
47,210 1,356,427 2.40Lundin PetroleumAB
SEKSweden
2.401,356,427Total - Sweden
7,070 1,124,917 1.99Air Products &Chemicals Inc
USDUnited States
17,650 1,415,007 2.50Albemarle CorpUSD94,480 393,286 0.69Amyris IncUSD60,150 976,705 1.73ARCONIC INCUSD7,400 654,478 1.16ASPEN
TECHNOLOGYINC
USD
10,150 911,780 1.61Celanese CorpUSD11,730 1,133,134 2.00Concho Resources
IncUSD
7,500 1,080,443 1.91DEERE & CO.USD23,390 726,739 1.28DELEK US
HOLDINGS INC(NEW)
USD
11,980 1,082,903 1.91DiamondbackEnergy Inc
USD
38,300 1,790,383 3.16DowDuPont IncUSD16,670 283,860 0.50FERRO CORP.USD29,830 1,515,470 2.68Hess CorpUSD27,650 1,751,709 3.09Hexcel CorpUSD116,220 1,955,542 3.47Kinder Morgan
Inc/DEUSD
24,950 1,358,698 2.40MarathonPetroleum Corp
USD
40,000 57,258 0.10Marrone BioInnovations Inc
USD
16,950 901,608 1.59Nucor CorpUSD9,020 1,116,509 1.97Pioneer Natural
Resources CoUSD
2,983 1,134,834 2.01SHERWIN-WILLIAMS CO
USD
18,350 1,536,553 2.71Tractor Supply CoUSD57,670 2,026,324 3.59Trimble Navigation
LtdUSD
9,450 644,578 1.14W.R.GRACE ANDCOMPANY
USD
30,300 710,202 1.25Williams Cos IncUSD

122
Vontobel Fund - Future Resources
The accompanying notes form an essential part of these financial statements.
Portfolio as at February 28, 2019
* Any deviations of the percentages of the nets assets are due to rounding.
Securities Marketvalue in
EUR
% of netassets*
Quantity Ccy Maturity
18,660 1,238,046 2.19Xylem Inc/NYUSD48.6327,520,966Total - United States
127,090 327,337 0.58Tullow Oil PLCGBPUnited Kingdom
25,780 504,642 0.89TECHNIPFMC PLCUSD
94.1053,261,859Total - Transferable securities admitted to anofficial exchange
94.1053,261,859Total - Shares
1.47831,979Total - United Kingdom
94.1053,261,859Total - Investment in securities
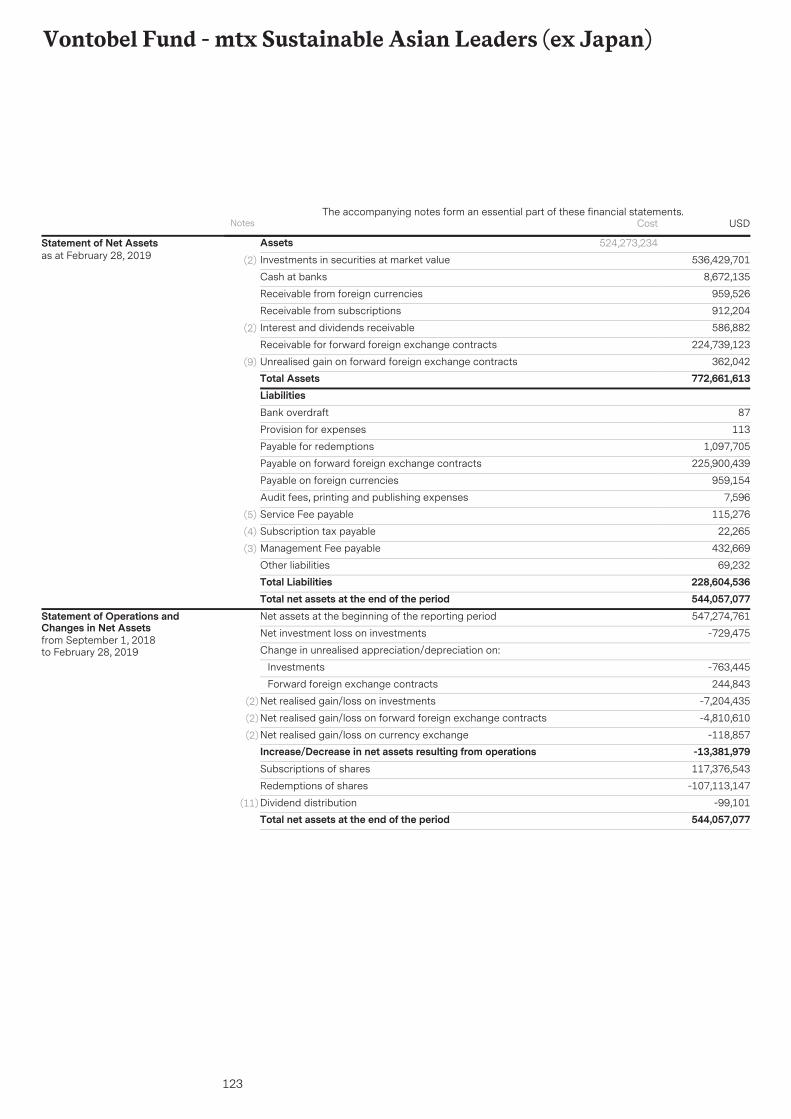
123
Vontobel Fund - mtx Sustainable Asian Leaders (ex Japan)
AssetsInvestments in securities at market value 536,429,701(2)
8,672,135Cash at banks
959,526Receivable from foreign currencies
912,204Receivable from subscriptions
586,882Interest and dividends receivable(2)
224,739,123Receivable for forward foreign exchange contracts
362,042Unrealised gain on forward foreign exchange contracts(9)
Total Assets 772,661,613
524,273,234Statement of Net Assetsas at February 28, 2019
LiabilitiesBank overdraft 87
Provision for expenses 113
Payable for redemptions 1,097,705
Payable on forward foreign exchange contracts 225,900,439
Payable on foreign currencies 959,154
Audit fees, printing and publishing expenses 7,596
Service Fee payable 115,276(5)
Subscription tax payable 22,265(4)
Management Fee payable 432,669(3)
Other liabilities 69,232Total Liabilities 228,604,536Total net assets at the end of the period 544,057,077Net assets at the beginning of the reporting period 547,274,761
Net investment loss on investments -729,475
Change in unrealised appreciation/depreciation on:
Investments -763,445
Forward foreign exchange contracts 244,843
Net realised gain/loss on investments -7,204,435(2)
Net realised gain/loss on forward foreign exchange contracts -4,810,610(2)
Net realised gain/loss on currency exchange -118,857(2)
Increase/Decrease in net assets resulting from operations -13,381,979Subscriptions of shares 117,376,543
Redemptions of shares -107,113,147
Dividend distribution -99,101(11)
Total net assets at the end of the period 544,057,077
Statement of Operations andChanges in Net Assetsfrom September 1, 2018to February 28, 2019
Notes USDThe accompanying notes form an essential part of these financial statements.
Cost

124
Vontobel Fund - mtx Sustainable Asian Leaders (ex Japan)
IncomeBank interest 72,491
Net dividends 2,666,758Total Income 2,739,249ExpensesManagement Fees 2,700,034(3)
Audit fees, printing and publishing expenses 27,086
Subscription tax 63,115(4)
Bank interest 5,237
Service Fees 718,528(5)
Capital gains tax -97,889
Other Fees payable 52,613(8)
Total Expenses 3,468,724Net investment loss on investments -729,475
Statement of Net Incomefrom September 1, 2018to February 28, 2019
Notes USDThe accompanying notes form an essential part of these financial statements.
*
* Recapture of Capital gains tax due to decreased gains on Thai securities

125
Vontobel Fund - mtx Sustainable Asian Leaders (ex Japan)
The accompanying notes form an essential part of these financial statements.
Portfolio as at February 28, 2019
* Any deviations of the percentages of the nets assets are due to rounding.
Securities Marketvalue in
USD
% of netassets*
Quantity Ccy Maturity
8,434,000 8,262,386 1.52Brilliance ChinaAutomotiveHoldings Ltd
HKD
Transferable securities admitted to an official exchangeSharesBermuda Islands
1.528,262,386Total - Bermuda Islands
4,660,000 17,393,985 3.20China ResourcesLand Ltd
HKDCayman Islands
845,700 36,177,837 6.65Tencent HoldingsLtd
HKD
8,120,000 9,309,880 1.71XINYI GLASSHOLDING CO LTD
HKD
11.5662,881,702Total - Cayman Islands
326,400 2,232,249 0.41DONG-E E JIAO -A-
CNYChina
1,095,435 7,337,718 1.35GREE ELEC -A-CNY2,658,528 13,713,765 2.52Hangzhou
Hikvision DigitalTechnology Co Ltd
CNY
20,433,000 18,169,088 3.34ChinaConstruction BankCorp
HKD
4,243,600 16,110,027 2.96China Vanke CoLtd
HKD
19,710,000 15,165,933 2.79Industrial &Commercial Bankof China Ltd
HKD
6,790,000 8,130,986 1.49PICC Property &Casualty Co Ltd
HKD
2,307,000 24,290,475 4.46Ping An InsuranceGroup Co of ChinaLtd
HKD
656,000 7,771,992 1.43Sunny OpticalTechnology GroupCo Ltd
HKD
6,368,000 6,644,044 1.22ZHEJIANGEXPRESSWAY COLTD H
HKD
3,288,000 18,451,144 3.39Zhuzhou CSRTimes Electric CoLtd
HKD
44,700 7,248,999 1.33Baidu Inc ADRUSD26.69145,266,420Total - China
2,564,200 25,642,899 4.72AIA Group LtdHKDHong Kong
4,634,500 19,365,214 3.56BOC Hong KongHoldings Ltd
HKD
3,958,000 14,572,001 2.68China OverseasLand & InvestmentLtd
HKD
11,527,000 19,882,936 3.65CNOOC LTDHKD7,102,000 13,625,461 2.50Guangdong
Investment LtdHKD
17.1193,088,511Total - Hong Kong
228,240 3,379,858 0.62HCL TechnologiesLtd
INRIndia
Securities Marketvalue in
USD
% of netassets*
Quantity Ccy Maturity
2,015,524 8,292,133 1.52INDRAPRASTHAGAS LTD
INR
4,391,425 14,262,859 2.63YES BANK LTDINR4.7725,934,850Total - India
53,337,186 14,587,934 2.68Bank RakyatIndonesia PerseroTbk PT
IDRIndonesia
66,356,500 18,195,908 3.35TelekomunikasiIndonesia PerseroTbk PT
IDR
6.0332,783,842Total - Indonesia
13,841 5,617,072 1.03KOREA ZINC COLTD
KRWKorea, Republic Of
42,477 14,746,082 2.71LG Chem LtdKRW16,443 18,213,812 3.35LG Household &
Health Care LtdKRW
41,076 16,834,136 3.09NCSOFTCORPORATION
KRW
226,895 9,097,105 1.67SamsungElectronics Co Ltd
KRW
25,384 25,409,385 4.68SamsungElectronics Co Ltd
USD
16.5389,917,592Total - Korea, Republic Of
1,354,100 24,939,465 4.58DBS GroupHoldings Ltd
SGDSingapore
4.5824,939,465Total - Singapore
2,665,000 20,676,184 3.80TaiwanSemiconductorManufacturing CoLtd
TWDTaiwan
118,000 4,655,100 0.86TaiwanSemiconductorManufacturing CoLtd ADR
USD
4.6625,331,284Total - Taiwan
5,915,700 9,099,684 1.67PTT PUBLICCOMPANYLIMITED
THBThailand
1.679,099,684Total - Thailand
20,500 5,565,545 1.02BROADCOM INCUSDUnited States
96.14523,071,281Total - Transferable securities admitted to anofficial exchange
96.14523,071,281Total - Shares
1.025,565,545Total - United States

126
Vontobel Fund - mtx Sustainable Asian Leaders (ex Japan)
The accompanying notes form an essential part of these financial statements.
Portfolio as at February 28, 2019
* Any deviations of the percentages of the nets assets are due to rounding.
Securities Marketvalue in
USD
% of netassets*
Quantity Ccy Maturity
123,369 13,358,420 2.46Com2uSCorpKRW
Transferable securities and money market instruments dealt in on anotherregulated marketSharesKorea, Republic Of
2.4613,358,420Total - Transferable securities and money marketinstruments dealt in on another regulated market
2.4613,358,420Total - Shares
2.4613,358,420Total - Korea, Republic Of
98.60536,429,701Total - Investment in securities

127
Vontobel Fund - mtx Sustainable Emerging Markets Leaders
AssetsInvestments in securities at market value 3,228,773,008(2)
36,896,112Cash at banks
768,721Receivable from foreign currencies
8,917,888Receivable from subscriptions
2,982,073Interest and dividends receivable(2)
120Receivable for investments sold
406,204Unrealised gain on forward foreign exchange contracts(9)
Total Assets 3,278,744,126
3,157,947,211Statement of Net Assetsas at February 28, 2019
LiabilitiesBank overdraft 181
Provision for expenses 560
Payable for redemptions 5,467,904
Payable for investments purchased 1,875,134
Payable on foreign currencies 769,255
Audit fees, printing and publishing expenses 64,000
Service Fee payable 649,821(5)
Subscription tax payable 97,464(4)
Management Fee payable 2,181,679(3)
Other liabilities 397,866Total Liabilities 11,503,864Total net assets at the end of the period 3,267,240,262Net assets at the beginning of the reporting period 2,505,146,412
Net investment loss on investments -1,226,626
Change in unrealised appreciation/depreciation on:
Investments 116,419,154
Forward foreign exchange contracts 763,342
Net realised gain/loss on investments -55,508,808(2)
Net realised gain/loss on forward foreign exchange contracts -5,231,360(2)
Net realised gain/loss on currency exchange -748,172(2)
Increase/Decrease in net assets resulting from operations 54,467,530Subscriptions of shares 1,220,430,168
Redemptions of shares -509,120,342
Dividend distribution -3,683,506(11)
Total net assets at the end of the period 3,267,240,262
Statement of Operations andChanges in Net Assetsfrom September 1, 2018to February 28, 2019
Notes USDThe accompanying notes form an essential part of these financial statements.
Cost

128
Vontobel Fund - mtx Sustainable Emerging Markets Leaders
IncomeBank interest 597,890
Net dividends 14,324,402Total Income 14,922,292ExpensesManagement Fees 12,219,384(3)
Audit fees, printing and publishing expenses 74,247
Subscription tax 264,219(4)
Bank interest 34,848
Service Fees 3,679,187(5)
Capital gains tax -262,198
Other Fees payable 139,231(8)
Total Expenses 16,148,918Net investment loss on investments -1,226,626
Statement of Net Incomefrom September 1, 2018to February 28, 2019
Notes USDThe accompanying notes form an essential part of these financial statements.
*
* Recapture of Capital gains tax due to decreased gains on Thai securities

129
Vontobel Fund - mtx Sustainable Emerging Markets Leaders
The accompanying notes form an essential part of these financial statements.
Portfolio as at February 28, 2019
* Any deviations of the percentages of the nets assets are due to rounding.** See note 10
Securities Marketvalue in
USD
% of netassets*
Quantity Ccy Maturity
23,304,000 22,829,635 0.70Brilliance ChinaAutomotiveHoldings Ltd
HKD
Transferable securities admitted to an official exchangeSharesBermuda Islands
0.7022,829,635Total - Bermuda Islands
12,519,200 109,460,633 3.35B3 SA - BRASILBOLSA BALCAO
BRLBrazil
3,711,100 38,127,789 1.17BANCOBRADESCO SA
BRL
3,550,000 40,959,553 1.25BCO BRADESCOSA /PREF.
BRL
9,032,200 66,352,167 2.03ESTACIO PARTBRL2,212,400 33,059,915 1.01Porto Seguro SABRL
8.81287,960,057Total - Brazil
23,220,000 86,670,638 2.65China ResourcesLand Ltd
HKDCayman Islands
3,914,100 167,438,284 5.13Tencent HoldingsLtd
HKD
39,361,762 45,129,362 1.38XINYI GLASSHOLDING CO LTD
HKD
9.16299,238,284Total - Cayman Islands
2,025,900 13,859,113 0.42DONG-E E JIAO -A-
CNYChina
5,039,240 33,764,811 1.03GREE ELEC -A-CNY6,782,557 34,997,241 1.07Hangzhou
Hikvision DigitalTechnology Co Ltd
CNY
83,072,000 73,867,303 2.26ChinaConstruction BankCorp
HKD
18,528,800 70,340,543 2.15China Vanke CoLtd
HKD
99,587,000 76,626,986 2.35Industrial &Commercial Bankof China Ltd
HKD
25,116,000 30,076,028 0.92PICC Property &Casualty Co Ltd
HKD
11,647,500 122,635,931 3.76Ping An InsuranceGroup Co of ChinaLtd
HKD
1,879,600 22,268,478 0.68Sunny OpticalTechnology GroupCo Ltd
HKD
23,446,152 24,462,319 0.75ZHEJIANGEXPRESSWAY COLTD H
HKD
12,956,300 72,705,801 2.23Zhuzhou CSRTimes Electric CoLtd
HKD
17.62575,604,554Total - China
7,822,600 78,228,128 2.39AIA Group LtdHKDHong Kong
21,647,000 90,451,072 2.77BOC Hong KongHoldings Ltd
HKD
Securities Marketvalue in
USD
% of netassets*
Quantity Ccy Maturity
18,596,000 68,463,569 2.10China OverseasLand & InvestmentLtd
HKD
60,854,000 104,966,315 3.21CNOOC LTDHKD32,444,000 62,244,577 1.91Guangdong
Investment LtdHKD
12.38404,353,661Total - Hong Kong
10,191,106 41,861,283 1.28INDRAPRASTHAGAS LTD
INRIndia
19,845,549 64,497,419 1.98YES BANK LTDINR3.26106,358,702Total - India
360,158,200 98,574,039 3.02Bank RakyatIndonesia PerseroTbk PT
IDRIndonesia
300,636,700 82,496,935 2.52TelekomunikasiIndonesia PerseroTbk PT
IDR
5.54181,070,974Total - Indonesia
672,200 79,111,218 2.42Nice Ltd ADRUSDIsrael
2.4279,111,218Total - Israel
2,722,277 31,378,725 0.96POLYMETALGBPJersey
0.9631,378,725Total - Jersey
3,555,615 20,114,377 0.62ARCACONTINENTALSAB DE CV
MXNMexico
835,700 75,739,491 2.31FomentoEconomicoMexicano SAB deCV ADR
USD
2.9395,853,868Total - Mexico
1,371,118 34,685,816 1.06X5 Retail Group NVUSDNetherlands
1.0634,685,816Total - Netherlands
106,593 43,258,477 1.32KOREA ZINC COLTD
KRWKorea, Republic Of
160,953 55,875,558 1.71LG Chem LtdKRW81,729 90,530,723 2.77LG Household &
Health Care LtdKRW
241,639 99,030,670 3.03NCSOFTCORPORATION
KRW
1,481,614 59,403,684 1.82SamsungElectronics Co Ltd
KRW
101,520 101,266,200 3.10SamsungElectronics Co Ltd
USD
13.75449,365,312Total - Korea, Republic Of

130
Vontobel Fund - mtx Sustainable Emerging Markets Leaders
The accompanying notes form an essential part of these financial statements.
Portfolio as at February 28, 2019
* Any deviations of the percentages of the nets assets are due to rounding.** See note 10
Securities Marketvalue in
USD
% of netassets*
Quantity Ccy Maturity
7,698,600 141,528,458 4.33DBS GroupHoldings Ltd
SGDSingapore
4.33141,528,458Total - Singapore
2,533,654 59,685,237 1.83Mondi LtdZARSouth Africa
428,441 3,201,130 0.10MULTICHOICEGRP -REGISTEREDSHS
ZAR
428,441 92,800,456 2.84Naspers LtdZAR4.77155,686,823Total - South Africa
410,000 3,183,891 0.10TaiwanSemiconductorManufacturing CoLtd
TWDTaiwan
3,485,800 136,120,490 4.16TaiwanSemiconductorManufacturing CoLtd ADR
USD
4.26139,304,381Total - Taiwan
14,693,200 22,613,577 0.69PTT PUBLICCOMPANYLIMITED
THBThailand
0.6922,613,577Total - Thailand
150,752 41,511,071 1.27BROADCOM INCUSDUnited States
93.913,068,455,116Total - Transferable securities admitted to anofficial exchange
93.913,068,455,116Total - Shares
1.2741,511,071Total - United States
348,734 37,760,987 1.16Com2uSCorpKRW
Transferable securities and money market instruments dealt in on anotherregulated marketSharesKorea, Republic Of
1.1637,760,987Total - Transferable securities and money marketinstruments dealt in on another regulated market
1.1637,760,987Total - Shares
1.1637,760,987Total - Korea, Republic Of
1,466,869 122,556,905 3.75LUKOIL PJSC ADRUSD
Other transferable securitiesSharesRussia
3.75122,556,905Total - Shares
3.75122,556,905Total - Russia
Securities Marketvalue in
USD
% of netassets*
Quantity Ccy Maturity
1,852,143 0,00 0.00Romania PropertyFund Ltd **
GBP
Investment fundsGuernsey
3.75122,556,905Total - Other transferable securities
0.000,00Total - Investment funds
0.000,00Total - Guernsey
98.823,228,773,008Total - Investment in securities

131
Vontobel Fund - mtx Sustainable Global Leaders
AssetsInvestments in securities at market value 75,613,685(2)
976,140Cash at banks
1,268,510Receivable from foreign currencies
39,084Receivable from subscriptions
59,505Interest and dividends receivable(2)
1,452,769Receivable for investments sold
61,285Unrealised gain on forward foreign exchange contracts(9)
219,388Other assetsTotal Assets 79,690,366
71,376,950Statement of Net Assetsas at February 28, 2019
LiabilitiesBank overdraft 189
Provision for expenses 20
Payable for redemptions 235,230
Payable on foreign currencies 1,257,800
Audit fees, printing and publishing expenses 1,705
Service Fee payable 56,497(5)
Subscription tax payable 5,760(4)
Management Fee payable 80,470(3)
Other liabilities 2,993Total Liabilities 1,640,664Total net assets at the end of the period 78,049,702Net assets at the beginning of the reporting period 101,307,455
Net investment income 61,868
Change in unrealised appreciation/depreciation on:
Investments -6,684,155
Forward foreign exchange contracts 84,860
Net realised gain/loss on investments 2,463,318(2)
Net realised gain/loss on forward foreign exchange contracts -977,611(2)
Net realised gain/loss on currency exchange -22,962(2)
Increase/Decrease in net assets resulting from operations -5,074,682Subscriptions of shares 5,468,325
Redemptions of shares -23,532,163
Dividend distribution -119,233(11)
Total net assets at the end of the period 78,049,702
Statement of Operations andChanges in Net Assetsfrom September 1, 2018to February 28, 2019
Notes USDThe accompanying notes form an essential part of these financial statements.
Cost
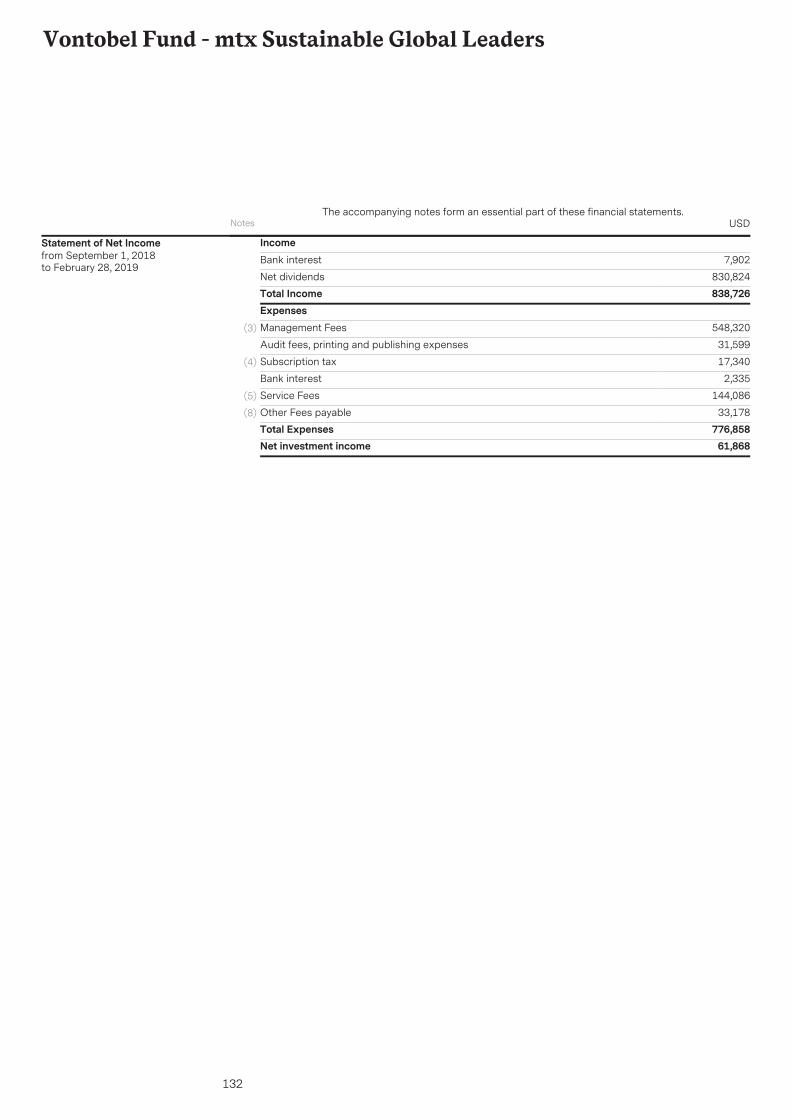
132
Vontobel Fund - mtx Sustainable Global Leaders
IncomeBank interest 7,902
Net dividends 830,824Total Income 838,726ExpensesManagement Fees 548,320(3)
Audit fees, printing and publishing expenses 31,599
Subscription tax 17,340(4)
Bank interest 2,335
Service Fees 144,086(5)
Other Fees payable 33,178(8)
Total Expenses 776,858Net investment income 61,868
Statement of Net Incomefrom September 1, 2018to February 28, 2019
Notes USDThe accompanying notes form an essential part of these financial statements.

133
Vontobel Fund - mtx Sustainable Global Leaders
The accompanying notes form an essential part of these financial statements.
Portfolio as at February 28, 2019
* Any deviations of the percentages of the nets assets are due to rounding.
Securities Marketvalue in
USD
% of netassets*
Quantity Ccy Maturity
13,595 1,008,098 1.29KBC Group NVEUR
Transferable securities admitted to an official exchangeSharesBelgium
1.291,008,098Total - Belgium
61,650 3,423,425 4.39Norwegian CruiseLine Holdings Ltd
USDBermuda Islands
4.393,423,425Total - Bermuda Islands
146,974 984,782 1.26ZHUHAI GREEELECTRIC APPL -A-
CNHChina
1.26984,782Total - China
10,559 805,457 1.03BASF SEEURGermany
6,302 1,033,357 1.32Continental AGEUR7,834 840,318 1.08SAP SEEUR14,240 1,558,756 2.00Siemens AGEUR
5.434,237,888Total - Germany
745,000 3,112,950 3.99BOC Hong KongHoldings Ltd
HKDHong Kong
1,204,000 2,076,765 2.66CNOOC LTDHKD6.655,189,715Total - Hong Kong
7,800,000 2,140,378 2.74TelekomunikasiIndonesia PerseroTbk PT
IDRIndonesia
2.742,140,378Total - Indonesia
32,075 3,774,907 4.84Nice Ltd ADRUSDIsrael
4.843,774,907Total - Israel
55,500 1,340,386 1.72KDDI CorpJPYJapan
46,000 2,207,024 2.83Sony CorpJPY4.553,547,410Total - Japan
48,004 1,214,380 1.56X5 Retail Group NVUSDNetherlands
1.561,214,380Total - Netherlands
163,353 3,189,105 4.09Telenor ASANOKNorway
4.093,189,105Total - Norway
7,924 2,750,852 3.52LG Chem LtdKRWKorea, Republic Of
3.522,750,852Total - Korea, Republic Of
Securities Marketvalue in
USD
% of netassets*
Quantity Ccy Maturity
166,900 3,068,233 3.93DBS GroupHoldings Ltd
SGDSingapore
3.933,068,233Total - Singapore
20,653 1,636,544 2.10AbbVie IncUSDUnited States
6,755 1,169,628 1.50Apple IncUSD54,071 1,682,690 2.16AT&T IncUSD3,579 1,173,948 1.50Biogen IncUSD7,351 3,258,109 4.17BlackRock IncUSD8,219 2,263,184 2.90BROADCOM INCUSD7,020 583,502 0.75Celgene CorpUSD3,820 666,361 0.85CIGNA
CORPORATIONUSD
35,162 2,495,799 3.20CognizantTechnologySolutions Corp
USD
34,634 2,002,884 2.57CVS Health CorpUSD11,573 1,868,461 2.39Facebook IncUSD19,600 2,313,780 2.96HUBBELL INCUSD6,210 869,586 1.11Jazz
PharmaceuticalsPLC
USD
16,950 2,316,048 2.97Johnson &Johnson
USD
6,730 1,111,258 1.42Jones Lang LaSalleInc
USD
11,200 1,938,944 2.48Moody's CorpUSD32,788 1,985,969 2.54Nucor CorpUSD14,180 1,628,431 2.09PVH CorpUSD6,605 1,599,863 2.05UnitedHealth
Group IncUSD
41.7132,564,989Total - United States
101,240 2,242,078 2.87COMPASSGROUP PLC
GBPUnited Kingdom
109,200 2,510,593 3.22Mondi PLCGBP
92.0571,846,833Total - Transferable securities admitted to anofficial exchange
92.0571,846,833Total - Shares
6.094,752,671Total - United Kingdom
45,085 3,766,852 4.83LUKOIL PJSC ADRUSD
Other transferable securitiesSharesRussia
4.833,766,852Total - Other transferable securities
4.833,766,852Total - Shares
4.833,766,852Total - Russia
96.8875,613,685Total - Investment in securities

134
Vontobel Fund - Commodity
AssetsInvestments in securities at market value 562,339,721(2)
6,512,465Cash at banks
11,214Receivable from foreign currencies
84,391Receivable from subscriptions
4,672,486Interest and dividends receivable(2)
596,340Interest receivable on Contracts for Difference
553,703Unrealised gain on forward foreign exchange contracts(9)
839,716Unrealised gain on Contracts for Difference(9)
34,401,307Other assetsTotal Assets 610,011,343
608,314,031Statement of Net Assetsas at February 28, 2019
LiabilitiesProvision for expenses 121
Payable for redemptions 873,963
Payable on foreign currencies 11,230
Audit fees, printing and publishing expenses 8,096
Service Fee payable 80,649(5)
Subscription tax payable 14,479(4)
Management Fee payable 295,496(3)
Other liabilities 14,568,528Total Liabilities 15,852,562Total net assets at the end of the period 594,158,781Net assets at the beginning of the reporting period 527,469,427
Net investment income 3,148,961
Change in unrealised appreciation/depreciation on:
Investments 998,158
Forward foreign exchange contracts 196,174
Contracts for Difference -2,024,565
Net realised gain/loss on investments -347,253(2)
Net realised gain/loss on forward foreign exchange contracts -7,154,372(2)
Net realised gain/loss on currency exchange -359,230(2)
Net realised gain/loss on Contracts for Difference -34,780,845(2)
Increase/Decrease in net assets resulting from operations -40,322,972Subscriptions of shares 341,833,371
Redemptions of shares -234,821,045Total net assets at the end of the period 594,158,781
Statement of Operations andChanges in Net Assetsfrom September 1, 2018to February 28, 2019
Notes USDThe accompanying notes form an essential part of these financial statements.
Cost

135
Vontobel Fund - Commodity
IncomeBank interest 278,230
Net interest on bonds 5,856,052(2)
Interest on Contracts for Difference 35,646(2)
Total Income 6,169,928ExpensesManagement Fees 2,116,444(3)
Audit fees, printing and publishing expenses 18,602
Subscription tax 43,422(4)
Bank interest 34,956
Service Fees 768,114(5)
Other Fees payable 39,429(8)
Total Expenses 3,020,967Net investment income 3,148,961
Statement of Net Incomefrom September 1, 2018to February 28, 2019
Notes USDThe accompanying notes form an essential part of these financial statements.

136
Vontobel Fund - Commodity
The accompanying notes form an essential part of these financial statements.
Portfolio as at February 28, 2019
* Any deviations of the percentages of the nets assets are due to rounding.
Securities Marketvalue in
USD
% of netassets*
Quantity Ccy Maturity
2,250,000 2,248,335 0.3824.06.19Macquarie BankLtd 14 EMTN
USD 2.600%
Transferable securities admitted to an official exchangeBondsAustralia
32,250,000 32,151,344 5.4109.09.19National AustraliaBank Ltd 14
USD 2.125%
7,000,000 6,989,080 1.1821.05.19Westpac BankingCorp 14
USD 2.000%
8,500,000 8,515,895 1.4315.05.20Westpac BankingCorp 18
USD 3.050%
8.4049,904,654Total - Australia
9,560,000 9,544,130 1.6110.05.19Corp Andina deFomento 16
USD 2.000%Venezuela, Bolivarian Republic Of
10,118,000 9,987,579 1.6818.07.20Corp Andina deFomento 17
USD 2.200%
3.2919,531,709Total - Venezuela, Bolivarian Republic Of
3,750,000 3,743,063 0.6331.07.19Export-Import Bankof China/The 14
USD 2.500%China
0.633,743,063Total - China
2,600,000 2,584,920 0.4430.08.19DeutschePfandbriefbank AG16 EMTN
USD 1.625%Germany
17,000,000 16,866,040 2.8404.05.20DeutschePfandbriefbank AG17 EMTN
USD 2.250%
4,400,000 4,361,720 0.7330.10.19ErsteAbwicklungsanstalt16 EMTN
USD 1.375%
5,000,000 4,964,200 0.8416.08.19FMSWertmanagement16
USD 1.000%
3,000,000 2,986,680 0.5015.08.19Kreditanstalt fuerWiederaufbau 12EMTN
USD 1.625%
4,000,000 3,989,320 0.6724.05.19LandesbankBaden-Wuerttemberg 16EMTN
USD 1.500%
7,000,000 6,960,800 1.1729.07.19NRW Bank 16EMTN
USD 1.250%
7.1942,713,680Total - Germany
4,000,000 3,978,240 0.6702.08.19Agence Francaisede Developpement16 EMTN
USD 1.375%France
4,000,000 3,990,680 0.6715.07.19BPCE SA 14USD 2.500%1,500,000 1,492,620 0.2524.09.19Caisse
d'Amortissementde la Dette Sociale17
USD 1.750%
10,000,000 9,931,900 1.6713.01.20Caissed'Amortissementde la Dette Sociale17
USD 1.875%
Securities Marketvalue in
USD
% of netassets*
Quantity Ccy Maturity
40,911,000 40,890,135 6.8928.03.19Dexia Credit LocalSA 16
USD 1.875%
10.1560,283,575Total - France
12,000,000 11,927,400 2.0025.09.19Development Bankof Japan Inc 12EMTN
USD 1.625%Japan
7,000,000 6,985,160 1.1829.05.19Japan Bank forInternationalCooperation 14
USD 1.750%
5,000,000 4,989,700 0.8429.05.19Japan Bank forInternationalCooperation 14
USD 1.750%
4,700,000 4,680,918 0.7924.02.20Japan Bank forInternationalCooperation 17
USD 2.250%
3,636,000 3,635,927 0.6106.03.19Japan FinanceOrganization forMunicipalities 14
USD 2.125%
2,000,000 1,999,880 0.3406.03.19Japan FinanceOrganization forMunicipalities 14
USD 2.125%
26,650,000 26,494,631 4.4513.11.19Japan InternationalCooperationAgency 14
USD 1.875%
3,000,000 3,000,870 0.5119.03.19Nomura HoldingsInc 14
USD 2.750%
5,000,000 4,993,500 0.8420.05.19Tokyo MetropolitanGovernment 14
USD 2.125%
11.5668,707,986Total - Japan
3,000,000 2,995,380 0.5005.06.19Bank of NovaScotia/The 14
USD 2.050%Canada
14,085,000 14,041,477 2.3711.09.19Bank of NovaScotia/The 14
USD 2.125%
5,000,000 4,985,050 0.8423.09.19Royal Bank ofCanada 14
USD 2.200%
10,000,000 9,950,100 1.6724.10.19Toronto-DominionBank/The 17
USD 1.900%
5.3831,972,007Total - Canada
3,000,000 3,028,770 0.5112.08.19Petronas CapitalLtd 09
USD 5.250%Malaysia
0.513,028,770Total - Malaysia
1,800,000 1,787,904 0.3004.06.20ABN AMRO BankNV 15
USD 2.450%Netherlands
4,000,000 3,976,040 0.6720.09.19ABN AMRO BankNV 16 EMTN
USD 1.800%
2,360,000 2,355,304 0.4011.06.19BNG Bank NV 14EMTN
USD 1.875%
3,000,000 2,982,390 0.5030.10.19BNG Bank NV 17EMTN
USD 1.750%
2,527,000 2,516,589 0.4202.12.19CooperatieveRabobank UA 14EMTN
USD 2.250%
2,150,000 2,139,207 0.3616.03.20ING Bank NV 15USD 2.450%2,000,000 1,999,660 0.3422.03.19ING Bank NV 16
EMTNUSD 2.300%

137
Vontobel Fund - Commodity
The accompanying notes form an essential part of these financial statements.
Portfolio as at February 28, 2019
* Any deviations of the percentages of the nets assets are due to rounding.
Securities Marketvalue in
USD
% of netassets*
Quantity Ccy Maturity
14,000,000 13,939,239 2.3405.09.19NederlandseWaterschapsbankNV 14
USD 1.750%
5.3331,696,333Total - Netherlands
5,000,000 4,999,400 0.8415.03.19KommunalbankenAS 14
USD 2.125%Norway
3,000,000 2,998,890 0.5027.11.19KommunalbankenAS 18 EMTN
USD 2.625%
8,355,000 8,296,181 1.4015.11.19SpareBank 1Boligkreditt AS 12
USD 1.750%
2.7416,294,471Total - Norway
4,000,000 3,971,920 0.6716.08.19Asian DevelopmentBank 16
USD 1.000%Philippines
0.673,971,920Total - Philippines
5,000,000 4,990,500 0.8412.08.19Export-Import Bankof Korea 14
USD 2.375%Korea, Republic Of
7,000,000 6,960,380 1.1721.01.20Export-Import Bankof Korea 15
USD 2.250%
33,263,000 33,185,165 5.5926.05.19Export-Import Bankof Korea 16
USD 1.750%
1,481,000 1,481,133 0.2517.03.19Korea DevelopmentBank/The 13
USD 3.000%
5,400,000 5,376,672 0.9011.03.20Korea DevelopmentBank/The 14
USD 2.500%
5,785,000 5,742,712 0.9712.09.19Korea DevelopmentBank/The 16
USD 1.375%
4,800,000 4,782,864 0.8028.10.19Korea Hydro &Nuclear Power CoLtd 14 EMTN
USD 2.375%
7,700,000 7,636,398 1.2912.04.20Korea South-EastPower Co Ltd 17
USD 2.375%
11.8170,155,824Total - Korea, Republic Of
2,500,000 2,499,550 0.4225.03.19SkandinaviskaEnskilda BankenAB 14 EMTN
USD 2.375%Sweden
5,000,000 4,952,100 0.8312.05.20Swedbank HypotekAB 15
USD 2.000%
1.257,451,650Total - Sweden
22,000,000 22,209,880 3.7425.10.19Temasek Financial ILtd 09
USD 4.300%Singapore
3.7422,209,880Total - Singapore
4,000,000 3,994,749 0.6729.07.19Citigroup Inc 14USD 2.500%United States
1,800,000 1,798,686 0.3028.05.19Credit SuisseAG/New York NY14
USD 2.300%
3,000,000 2,975,790 0.5029.01.20Dexia Credit LocalSA/New York NY15
USD 1.875%
5,000,000 4,959,850 0.8329.01.20Dexia Credit LocalSA/New York NY15
USD 1.875%
Securities Marketvalue in
USD
% of netassets*
Quantity Ccy Maturity
4,400,000 4,505,776 0.7615.03.20Goldman SachsGroup Inc/The 10
USD 5.375%
8,000,000 7,980,160 1.3423.10.19Goldman SachsGroup Inc/The 14
USD 2.550%
13,700,000 13,766,993 2.3223.04.19JPMorgan Chase &Co 09
USD 6.300%
10,000,000 9,974,900 1.6823.06.20JPMorgan Chase &Co 15
USD 2.750%
13,000,000 12,994,150 2.1922.03.19JPMorgan Chase &Co 16
USD 1.850%
18,000,000 18,152,819 3.0613.05.19Morgan Stanley 09USD 7.300%8,495,000 8,622,340 1.4523.09.19Morgan Stanley 09USD 5.625%3,500,000 3,496,255 0.5923.07.19Morgan Stanley 14USD 2.375%
15.6993,222,468Total - United States
7,000,000 6,999,801 1.1814.03.19Santander UK PLC16
USD 2.500%United Kingdom
89.52531,887,791Total - Transferable securities admitted to anofficial exchange
89.52531,887,791Total - Bonds
1.186,999,801Total - United Kingdom
3,000,000 2,979,030 0.5001.06.20Japan Bank forInternationalCooperation 17
USD 2.125%
Transferable securities and money market instruments dealt in on anotherregulated marketBondsJapan
0.502,979,030Total - Transferable securities and money marketinstruments dealt in on another regulated market
0.502,979,030Total - Bonds
0.502,979,030Total - Japan
40,000 3,770,400 0.63CEL IB MANCR PR-Z- CAP
USD
Other transferable securitiesInvestment fundsLuxembourg
250,000 23,702,500 3.99Vontobel Fund -DynamicCommodity - S
USD
4.6227,472,900Total - Other transferable securities
4.6227,472,900Total - Investment funds
4.6227,472,900Total - Luxembourg
94.70562,665,246Total - Investment in securities 64721339
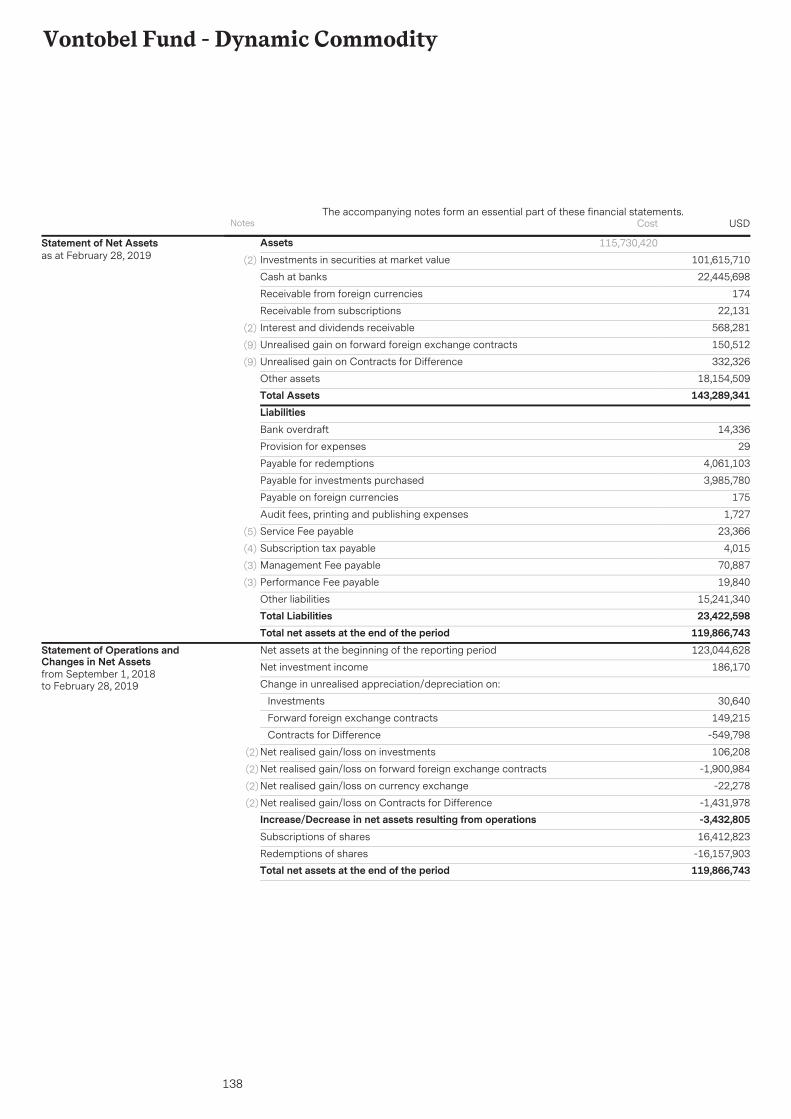
138
Vontobel Fund - Dynamic Commodity
AssetsInvestments in securities at market value 101,615,710(2)
22,445,698Cash at banks
174Receivable from foreign currencies
22,131Receivable from subscriptions
568,281Interest and dividends receivable(2)
150,512Unrealised gain on forward foreign exchange contracts(9)
332,326Unrealised gain on Contracts for Difference(9)
18,154,509Other assetsTotal Assets 143,289,341
115,730,420Statement of Net Assetsas at February 28, 2019
LiabilitiesBank overdraft 14,336
Provision for expenses 29
Payable for redemptions 4,061,103
Payable for investments purchased 3,985,780
Payable on foreign currencies 175
Audit fees, printing and publishing expenses 1,727
Service Fee payable 23,366(5)
Subscription tax payable 4,015(4)
Management Fee payable 70,887(3)
Performance Fee payable 19,840(3)
Other liabilities 15,241,340Total Liabilities 23,422,598Total net assets at the end of the period 119,866,743Net assets at the beginning of the reporting period 123,044,628
Net investment income 186,170
Change in unrealised appreciation/depreciation on:
Investments 30,640
Forward foreign exchange contracts 149,215
Contracts for Difference -549,798
Net realised gain/loss on investments 106,208(2)
Net realised gain/loss on forward foreign exchange contracts -1,900,984(2)
Net realised gain/loss on currency exchange -22,278(2)
Net realised gain/loss on Contracts for Difference -1,431,978(2)
Increase/Decrease in net assets resulting from operations -3,432,805Subscriptions of shares 16,412,823
Redemptions of shares -16,157,903Total net assets at the end of the period 119,866,743
Statement of Operations andChanges in Net Assetsfrom September 1, 2018to February 28, 2019
Notes USDThe accompanying notes form an essential part of these financial statements.
Cost
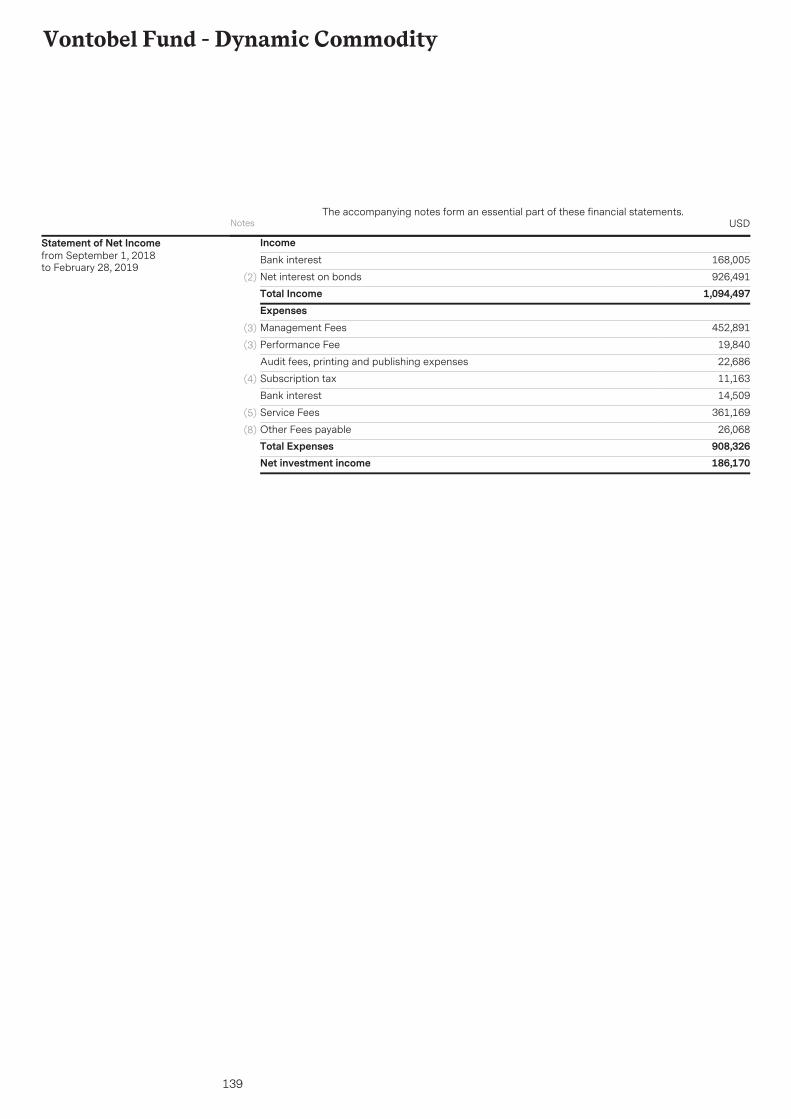
139
Vontobel Fund - Dynamic Commodity
IncomeBank interest 168,005
Net interest on bonds 926,491(2)
Total Income 1,094,497ExpensesManagement Fees 452,891(3)
Performance Fee 19,840(3)
Audit fees, printing and publishing expenses 22,686
Subscription tax 11,163(4)
Bank interest 14,509
Service Fees 361,169(5)
Other Fees payable 26,068(8)
Total Expenses 908,326Net investment income 186,170
Statement of Net Incomefrom September 1, 2018to February 28, 2019
Notes USDThe accompanying notes form an essential part of these financial statements.

140
Vontobel Fund - Dynamic Commodity
The accompanying notes form an essential part of these financial statements.
Portfolio as at February 28, 2019
* Any deviations of the percentages of the nets assets are due to rounding.
Securities Marketvalue in
USD
% of netassets*
Quantity Ccy Maturity
250,000 249,815 0.2124.06.19Macquarie BankLtd 14 EMTN
USD 2.600%
Transferable securities admitted to an official exchangeBondsAustralia
1,500,000 1,502,805 1.2515.05.20Westpac BankingCorp 18
USD 3.050%
1.461,752,620Total - Australia
10,000,000 9,921,800 8.2824.01.20FMSWertmanagement17
USD 1.750%Germany
3,000,000 2,986,680 2.4915.08.19Kreditanstalt fuerWiederaufbau 12EMTN
USD 1.625%
3,000,000 2,998,350 2.5001.04.19Kreditanstalt fuerWiederaufbau 14
USD 1.875%
10,000,000 9,947,500 8.3015.10.19Kreditanstalt fuerWiederaufbau 14
USD 1.750%
5,000,000 4,971,700 4.1515.07.19Kreditanstalt fuerWiederaufbau 16
USD 1.000%
7,000,000 6,908,160 5.7615.12.20Kreditanstalt fuerWiederaufbau 17
USD 1.875%
31.4837,734,190Total - Germany
2,000,000 1,996,680 1.6718.04.19MunicipalityFinance PLC 15EMTN
USD 1.250%Finland
1.671,996,680Total - Finland
3,000,000 2,979,390 2.4927.01.20Council Of EuropeDevelopment Bank17
USD 1.875%France
13,500,000 13,493,115 11.2528.03.19Dexia Credit LocalSA 16
USD 1.875%
2,000,000 1,989,920 1.6618.02.20Dexia Credit LocalSA 17
USD 2.250%
15.4018,462,425Total - France
4,000,000 3,983,760 3.3224.02.20Japan Bank forInternationalCooperation 17
USD 2.250%Japan
3.323,983,760Total - Japan
2,500,000 2,492,275 2.0811.09.19Bank of NovaScotia/The 14
USD 2.125%Canada
4,000,000 3,988,040 3.3323.09.19Royal Bank ofCanada 14
USD 2.200%
5.416,480,315Total - Canada
4,000,000 3,999,680 3.3415.03.19EuropeanInvestment Bank 14
USD 1.875%Luxembourg
3.343,999,680Total - Luxembourg
Securities Marketvalue in
USD
% of netassets*
Quantity Ccy Maturity
5,000,000 4,999,000 4.1713.03.19NederlandseWaterschapsbankNV 14
USD 1.875%Netherlands
4.174,999,000Total - Netherlands
4,000,000 3,991,400 3.3326.04.19OesterreichischeKontrollbank AG 16
USD 1.125%Austria
3.333,991,400Total - Austria
1,000,000 994,340 0.8321.01.20Export-Import Bankof Korea 15
USD 2.250%Korea, Republic Of
0.83994,340Total - Korea, Republic Of
2,000,000 1,997,100 1.6723.04.19Kommuninvest ISverige AB 16
USD 1.500%Sweden
5,000,000 4,988,950 4.1601.06.20Kommuninvest ISverige AB 18EMTN
USD 2.500%
500,000 499,910 0.4225.03.19SkandinaviskaEnskilda BankenAB 14 EMTN
USD 2.375%
2,000,000 1,980,840 1.6512.05.20Swedbank HypotekAB 15
USD 2.000%
7.909,466,800Total - Sweden
2,000,000 1,995,040 1.6623.10.19Goldman SachsGroup Inc/The 14
USD 2.550%United States
2,000,000 1,989,060 1.6623.09.19JPMorgan ChaseBank NA 16
USD 1.650%
81.6397,845,310Total - Transferable securities admitted to anofficial exchange
81.6397,845,310Total - Bonds
3.323,984,100Total - United States
40,000 3,770,400 3.15CEL IB MANCR PR-Z- CAP
USD
Other transferable securitiesInvestment fundsLuxembourg
3.153,770,400Total - Other transferable securities
3.153,770,400Total - Investment funds
3.153,770,400Total - Luxembourg
84.80101,647,238Total - Investment in securities 15 77710

141
Vontobel Fund - Non-Food Commodity
AssetsInvestments in securities at market value 68,375,760(2)
7,049,869Cash at banks
71Receivable from foreign currencies
797Receivable from subscriptions
420,960Interest and dividends receivable(2)
23,253Unrealised gain on forward foreign exchange contracts(9)
894,244Unrealised gain on Contracts for Difference(9)
8,367,222Other assetsTotal Assets 85,132,176
68,105,377Statement of Net Assetsas at February 28, 2019
LiabilitiesBank overdraft 4,044
Provision for expenses 27
Payable on foreign currencies 71
Audit fees, printing and publishing expenses 2,405
Service Fee payable 18,566(5)
Subscription tax payable 4,037(4)
Management Fee payable 5,846(3)
Other liabilities 4,751,634Total Liabilities 4,786,630Total net assets at the end of the period 80,345,546Net assets at the beginning of the reporting period 118,467,936
Net investment income 632,062
Change in unrealised appreciation/depreciation on:
Investments 197,651
Forward foreign exchange contracts 58,890
Contracts for Difference -1,420,132
Net realised gain/loss on investments 155,963(2)
Net realised gain/loss on forward foreign exchange contracts -357,885(2)
Net realised gain/loss on currency exchange 5,235(2)
Net realised gain/loss on Contracts for Difference -2,897,792(2)
Increase/Decrease in net assets resulting from operations -3,626,008Subscriptions of shares 16,000,066
Redemptions of shares -50,496,448Total net assets at the end of the period 80,345,546
Statement of Operations andChanges in Net Assetsfrom September 1, 2018to February 28, 2019
Notes USDThe accompanying notes form an essential part of these financial statements.
Cost

142
Vontobel Fund - Non-Food Commodity
IncomeBank interest 119,060
Net interest on bonds 794,146(2)
Total Income 913,207ExpensesManagement Fees 45,804(3)
Audit fees, printing and publishing expenses 18,427
Subscription tax 5,079(4)
Bank interest 6,369
Service Fees 176,651(5)
Other Fees payable 28,814(8)
Total Expenses 281,144Net investment income 632,062
Statement of Net Incomefrom September 1, 2018to February 28, 2019
Notes USDThe accompanying notes form an essential part of these financial statements.

143
Vontobel Fund - Non-Food Commodity
The accompanying notes form an essential part of these financial statements.
Portfolio as at February 28, 2019
* Any deviations of the percentages of the nets assets are due to rounding.
Securities Marketvalue in
USD
% of netassets*
Quantity Ccy Maturity
1,000,000 996,941 1.2409.09.19National AustraliaBank Ltd 14
USD 2.125%
Transferable securities admitted to an official exchangeBondsAustralia
1.24996,941Total - Australia
2,000,000 1,985,680 2.4716.08.19FMSWertmanagement16
USD 1.000%Germany
4,000,000 3,968,720 4.9324.01.20FMSWertmanagement17
USD 1.750%
2,000,000 1,999,840 2.4907.03.19FMSWertmanagement17 EMTN
USD 1.625%
4,000,000 3,949,960 4.9220.04.20Kreditanstalt fuerWiederaufbau 15
USD 1.500%
5,000,000 4,961,750 6.1730.09.19Kreditanstalt fuerWiederaufbau 16
USD 1.250%
2,000,000 1,981,140 2.4722.01.20State of NorthRhine-WestphaliaGermany 14
USD 1.625%
23.4518,847,090Total - Germany
6,000,000 5,990,040 7.4618.04.19MunicipalityFinance PLC 15EMTN
USD 1.250%Finland
7.465,990,040Total - Finland
2,000,000 1,989,920 2.4818.02.20Dexia Credit LocalSA 17
USD 2.250%France
2.481,989,920Total - France
2,000,000 1,988,340 2.4713.11.19Japan InternationalCooperationAgency 14
USD 1.875%Japan
2.471,988,340Total - Japan
4,500,000 4,486,095 5.5911.09.19Bank of NovaScotia/The 14
USD 2.125%Canada
2,000,000 1,994,020 2.4823.09.19Royal Bank ofCanada 14
USD 2.200%
8.076,480,115Total - Canada
6,000,000 5,998,800 7.4713.03.19NederlandseWaterschapsbankNV 14
USD 1.875%Netherlands
2,000,000 1,991,200 2.4805.09.19NederlandseWaterschapsbankNV 14
USD 1.750%
2,000,000 1,986,020 2.4709.09.19NederlandseWaterschapsbankNV 16 EMTN
USD 1.250%
12.429,976,020Total - Netherlands
Securities Marketvalue in
USD
% of netassets*
Quantity Ccy Maturity
2,000,000 1,999,700 2.4915.03.19KommunalbankenAS 14
USD 2.125%Norway
2,000,000 1,999,260 2.4927.11.19KommunalbankenAS 18 EMTN
USD 2.625%
4.983,998,960Total - Norway
2,000,000 1,995,700 2.4826.04.19OesterreichischeKontrollbank AG 16
USD 1.125%Austria
2.481,995,700Total - Austria
3,000,000 2,978,940 3.7116.08.19Asian DevelopmentBank 16
USD 1.000%Philippines
3.712,978,940Total - Philippines
1,100,000 1,093,774 1.3621.01.20Export-Import Bankof Korea 15
USD 2.250%Korea, Republic Of
2,000,000 1,995,320 2.4826.05.19Export-Import Bankof Korea 16
USD 1.750%
3.843,089,094Total - Korea, Republic Of
2,000,000 1,997,100 2.4923.04.19Kommuninvest ISverige AB 16
USD 1.500%Sweden
3,000,000 2,995,710 3.7212.04.19SvenskExportkredit AB 16
USD 1.250%
2,000,000 1,980,840 2.4712.05.20Swedbank HypotekAB 15
USD 2.000%
8.686,973,650Total - Sweden
2,000,000 2,073,460 2.5815.06.20Goldman SachsGroup Inc/The 10
USD 6.000%United States
1,000,000 997,490 1.2423.06.20JPMorgan Chase &Co 15
USD 2.750%
85.1068,375,760Total - Transferable securities admitted to anofficial exchange
85.1068,375,760Total - Bonds
3.823,070,950Total - United States
85.1068,375,760Total - Investment in securities

144
Vontobel Fund - Emerging Markets Debt
AssetsInvestments in securities at market value 3,294,972,557(2)
182,035,156Cash at banks
7,902Receivable from foreign currencies
19,946,756Receivable from subscriptions
65,770,244Interest and dividends receivable(2)
2,845,825Receivable for investments soldTotal Assets 3,565,578,440
3,359,368,630Statement of Net Assetsas at February 28, 2019
LiabilitiesBank overdraft 33,797,084
Provision for expenses 623
Payable for redemptions 6,521,177
Payable for investments purchased 7,000,700
Payable on foreign currencies 7,916
Interest and dividends payable 14,285
Unrealised loss on forward foreign exchange contracts 3,976,881(9)
Unrealised loss on futures 20,816,287(9)
Audit fees, printing and publishing expenses 76,242
Service Fee payable 493,269(5)
Subscription tax payable 82,542(4)
Management Fee payable 1,355,184(3)
Other liabilities 6,225Total Liabilities 74,148,415Total net assets at the end of the period 3,491,430,025Net assets at the beginning of the reporting period 2,757,514,944
Net investment income 75,639,207
Change in unrealised appreciation/depreciation on:
Investments 153,499,477
Futures -11,790,511
Forward foreign exchange contracts -1,984,784
Net realised gain/loss on investments -68,263,417(2)
Net realised gain/loss on forward foreign exchange contracts -13,622,543(2)
Net realised gain/loss on currency exchange 5,728,247(2)
Net realised gain/loss on futures 7,360,121(2)
Increase/Decrease in net assets resulting from operations 146,565,797Subscriptions of shares 1,248,320,737
Redemptions of shares -649,709,404
Dividend distribution -11,262,049(11)
Total net assets at the end of the period 3,491,430,025
Statement of Operations andChanges in Net Assetsfrom September 1, 2018to February 28, 2019
Notes USDThe accompanying notes form an essential part of these financial statements.
Cost

145
Vontobel Fund - Emerging Markets Debt
IncomeBank interest 493,268
Net interest on bonds 85,280,227(2)
Net dividends 1,415,312
Other income 88,756Total Income 87,277,563ExpensesManagement Fees 7,663,271(3)
Audit fees, printing and publishing expenses 73,782
Subscription tax 222,459(4)
Bank interest 288,421
Service Fees 2,862,793(5)
Other Fees payable 527,630(8)
Total Expenses 11,638,356Net investment income 75,639,207
Statement of Net Incomefrom September 1, 2018to February 28, 2019
Notes USDThe accompanying notes form an essential part of these financial statements.

146
Vontobel Fund - Emerging Markets Debt
The accompanying notes form an essential part of these financial statements.
Portfolio as at February 28, 2019
* Any deviations of the percentages of the nets assets are due to rounding.
Securities Marketvalue in
USD
% of netassets*
Quantity Ccy Maturity
4,300,000 4,610,073 0.1308.05.48AngolanGovernmentInternational Bond18
USD 9.375%
Transferable securities admitted to an official exchangeBondsAngola
0.134,610,073Total - Angola
28,750,000 31,754,187 0.9116.04.26Egypt GovernmentInternational Bond18 EMTN
EUR 4.750%Egypt
84,700,000 91,336,152 2.6116.04.30Egypt GovernmentInternational Bond18 EMTN
EUR 5.625%
4,940,000 4,851,722 0.1420.06.24African Export-Import Bank/The17 EMTN
USD 4.125%
3,901,000 4,042,489 0.1211.10.23African Export-Import Bank/The18 EMTN
USD 5.250%
3.78131,984,550Total - Egypt
77,500,000 2,830,296 0.0806.03.20Bonos de la NacionArgentina conAjuste por CER 18
ARS 4.000%Argentina
31,700,000 20,771,176 0.5931.12.38Argentine RepublicGovernmentInternational Bond03
EUR 2.260%
97,550,000 65,116,315 1.8731.12.38Argentine RepublicGovernmentInternational Bond05
EUR 2.260%
25,580,000 36,382,204 1.0431.12.33Argentine RepublicGovernmentInternational Bond10
EUR 7.820%
15,300,000 21,421,811 0.6131.12.33Argentine RepublicGovernmentInternational Bond10
EUR 7.820%
67,550,000 60,335,409 1.7315.01.27Argentine RepublicGovernmentInternational Bond16
EUR 5.000%
8,200,000 7,244,375 0.2115.01.28Argentine RepublicGovernmentInternational Bond17
EUR 5.250%
500,000 391,343 0.0115.05.35Provincia deBuenosAires/Argentina 06
EUR 4.000%
4,700,000 4,631,900 0.1320.01.23Provincia deBuenosAires/Argentina 17
EUR 5.375%
3,900,000 3,043,911 0.0911.01.28Argentine RepublicGovernmentInternational Bond18
USD 5.875%
6.36222,168,740Total - Argentina
Securities Marketvalue in
USD
% of netassets*
Quantity Ccy Maturity
15,006,000 15,294,265 0.4414.09.23Aruba GovernmentInternational Bonds12
USD 4.625%Aruba
0.4415,294,265Total - Aruba
4,361,000 4,594,139 0.1315.05.33BahamasGovernmentInternational Bond03
USD 6.625%Bahamas
8,000,000 8,636,880 0.2520.11.29BahamasGovernmentInternational Bond09
USD 6.950%
3,500,000 3,611,265 0.1016.01.24BahamasGovernmentInternational Bond14
USD 5.750%
28,550,000 29,404,216 0.8421.11.28BahamasGovernmentInternational Bond17
USD 6.000%
1.3246,246,500Total - Bahamas
44,200,000 26,145,626 0.7520.02.38Belize GovernmentInternational Bond13
USD 4.938%Belize
0.7526,145,626Total - Belize
5,800,000 5,740,550 0.1629.01.24Wanda PropertiesInternational Co Ltd14
USD 7.250%Bermuda Islands
0.165,740,550Total - Bermuda Islands
47,800,000 12,128,294 0.3515.11.26Petroleos deVenezuela SA 13
USD 6.000%Venezuela, Bolivarian Republic Of
62,285,000 15,780,527 0.4516.05.24Petroleos deVenezuela SA 14
USD 6.000%
4,850,000 1,412,563 0.0409.12.20VenezuelaGovernmentInternational Bond05
USD 6.000%
5,450,000 1,607,750 0.0507.05.23VenezuelaGovernmentInternational Bond08
USD 9.000%
500,000 146,250 0.0007.05.28VenezuelaGovernmentInternational Bond08
USD 9.250%
9,200,000 2,714,000 0.0813.10.24VenezuelaGovernmentInternational Bond09
USD 8.250%
0.9733,789,384Total - Venezuela, Bolivarian Republic Of

147
Vontobel Fund - Emerging Markets Debt
The accompanying notes form an essential part of these financial statements.
Portfolio as at February 28, 2019
* Any deviations of the percentages of the nets assets are due to rounding.
Securities Marketvalue in
USD
% of netassets*
Quantity Ccy Maturity
1,200,000 717,504 0.0201.11.22SamarcoMineracao SA 12
USD 4.125%Brazil
0.02717,504Total - Brazil
3,000,000 2,663,400 0.0831.12.99Baoxin AutoFinance I Ltd 17FRN
USD 5.625%British Virgin Islands
0.082,663,400Total - British Virgin Islands
15,000,000 15,463,800 0.4427.01.24Country GardenHoldings Co Ltd 18
USD 8.000%Cayman Islands
1,000,000 873,880 0.0307.05.25Lamar Funding Ltd15
USD 3.958%
23,350,000 23,851,791 0.6805.07.34Lima Metro Line 2Finance Ltd 15
USD 5.875%
2,150,000 281,973 0.0125.04.25Odebrecht FinanceLtd 13
USD 4.375%
12,966,000 1,718,643 0.0527.06.29Odebrecht FinanceLtd 14
USD 5.250%
3,500,000 3,167,605 0.0916.05.27OmGrid FundingLtd 17
USD 5.196%
750,000 607,309 0.0202.06.25Peru EnhancedPass-ThroughFinance Ltd 06
USD 0,000%
1.3245,965,001Total - Cayman Islands
16,750,000 15,692,908 0.4530.04.25Empresa ElectricaGuacolda SA 15
USD 4.560%Chile
0.4515,692,908Total - Chile
7,300,000 8,442,933 0.2415.06.25Ivory CoastGovernmentInternational Bond17
EUR 5.125%Ivory Coast
32,900,000 35,861,677 1.0322.03.30Ivory CoastGovernmentInternational Bond18
EUR 5.250%
92,150,000 98,746,559 2.8322.03.48Ivory CoastGovernmentInternational Bond18
EUR 6.625%
4.10143,051,169Total - Ivory Coast
3,900,000 3,875,781 0.1120.06.24EcuadorGovernmentInternational Bond14
USD 7.950%Ecuador
1,570,000 1,714,880 0.0528.03.22EcuadorGovernmentInternational Bond16
USD 10.750%
13,250,000 13,801,863 0.4013.12.26EcuadorGovernmentInternational Bond16
USD 9.650%
Securities Marketvalue in
USD
% of netassets*
Quantity Ccy Maturity
5,500,000 5,683,645 0.1602.06.23EcuadorGovernmentInternational Bond17
USD 8.750%
16,000,000 16,590,560 0.4802.06.27EcuadorGovernmentInternational Bond17
USD 9.625%
47,350,000 47,265,243 1.3523.10.27EcuadorGovernmentInternational Bond17
USD 8.875%
10,700,000 10,143,600 0.2923.01.28EcuadorGovernmentInternational Bond18
USD 7.875%
2.8499,075,572Total - Ecuador
27,821,000 28,670,653 0.8221.09.34El SalvadorGovernmentInternational Bond04
USD 7.625%El Salvador
0.8228,670,653Total - El Salvador
6,300,000 6,717,123 0.1911.07.22Georgian RailwayJSC 12
USD 7.750%Georgia
0.196,717,123Total - Georgia
21,200,000 25,462,048 0.7314.10.30Ghana GovernmentInternational Bond15
USD 10.750%Ghana
3,500,000 3,400,215 0.1016.05.29Ghana GovernmentInternational Bond18
USD 7.625%
0.8328,862,263Total - Ghana
10,800,000 12,243,849 0.3511.12.24CGNPCInternational Ltd 17EMTN
EUR 1.625%Hong Kong
19,500,000 22,460,669 0.6411.09.25CGNPCInternational Ltd 18
EUR 2.000%
500,000 573,313 0.0214.06.22CNAC HKFinbridge Co Ltd18
EUR 1.750%
10,700,000 10,791,164 0.3131.12.99MCC Holding HongKong Corp Ltd 18FRN
USD 4.950%
1.3246,068,995Total - Hong Kong
4,850,000 5,536,502 0.1501.02.27NTPC Ltd 17 EMTNEUR 2.750%India
2,000,000 1,944,620 0.0618.03.26ICICI BankLtd/Dubai 16EMTN
USD 4.000%
0.217,481,122Total - India

148
Vontobel Fund - Emerging Markets Debt
The accompanying notes form an essential part of these financial statements.
Portfolio as at February 28, 2019
* Any deviations of the percentages of the nets assets are due to rounding.
Securities Marketvalue in
USD
% of netassets*
Quantity Ccy Maturity
10,996,000 14,285,750 0.4114.06.28IndonesiaGovernmentInternational Bond16 EMTN
EUR 3.750%Indonesia
26,800,000 31,646,905 0.9118.07.24IndonesiaGovernmentInternational Bond17 EMTN
EUR 2.150%
32,150,000 36,950,037 1.0624.04.25IndonesiaGovernmentInternational Bond18
EUR 1.750%
37,500,000 44,453,282 1.2725.10.25Perusahaan ListrikNegara PT 18
EUR 2.875%
120,000,000,000
8,127,037 0.2311.12.20Jasa Marga PerseroTbk PT 17
IDR 7.500%
3.88135,463,011Total - Indonesia
19,300,000 22,229,864 0.6320.02.24Credit Bank ofMoscow Via CBOMFinance PLC 19
EUR 5.150%Ireland
11,415,000 18,414,357 0.5325.03.31Russian RailwaysVia RZD CapitalPLC 11
GBP 7.487%
24,650,000 20,841,637 0.6030.11.26Saderea DAC 14EMTN
USD 12.500%
3,500,000 3,579,520 0.1031.12.99Tinkoff CreditSystems Via TCSFinance Ltd 17 FRN
USD 9.250%
11,870,000 12,403,794 0.3622.11.25VnesheconombankVia VEB FinancePLC 10
USD 6.800%
2.2277,469,172Total - Ireland
15,555,000 1,394,681 0.0415.02.23CooperativaMuratori &Cementisti-CMC diRavenna SC 17
EUR 6.000%Italy
0.041,394,681Total - Italy
5,000,000 6,298,550 0.1820.01.40Qatar GovernmentInternational Bond09
USD 6.400%Qatar
0.186,298,550Total - Qatar
32,660,000 34,046,771 0.9720.06.22Kazakhstan TemirZholy National CoJSC 14
CHF 3.638%Kazakhstan
17,550,000 18,171,869 0.5205.12.23Kazakhstan TemirZholy National CoJSC 18
CHF 3.250%
16,800,000 19,456,329 0.5609.11.28KazakhstanGovernmentInternational Bond18 EMTN
EUR 2.375%
1,000,000,000 2,675,564 0.0814.06.20Development Bankof Kazakhstan JSC17
KZT 9.500%
2.1374,350,533Total - Kazakhstan
Securities Marketvalue in
USD
% of netassets*
Quantity Ccy Maturity
10,000,000,000 3,152,500 0.0915.02.44Fideicomiso PAConcesion Ruta alMar 17
COP 6.750%Colombia
13,955,000 21,250,674 0.6128.01.33ColombiaGovernmentInternational Bond03
USD 10.380%
0.7024,403,174Total - Colombia
17,050,000 9,135,894 0.2630.06.29CongoleseInternational Bond07
USD 6.000%Congo
0.269,135,894Total - Congo
135,500,000 37,792,963 1.0816.07.32Swiss InsuredBrazil PowerFinance Sarl 18
BRL 9.850%Luxembourg
14,150,000 16,430,829 0.4724.01.24Gazprom OAO ViaGaz Capital SA 18
EUR 2.949%
3,031,000 3,045,943 0.0921.07.20CSN Resources SA10
USD 6.500%
12,000,000 10,301,520 0.3024.01.26Puma InternationalFinancing SA 18
USD 5.000%
1.9467,571,255Total - Luxembourg
39,200,000 40,532,800 1.1611.05.221MDB Energy Ltd12
USD 5.990%Malaysia
1.1640,532,800Total - Malaysia
29,223,000 31,949,506 0.9225.04.44OCP SA 14USD 6.875%Morocco
0.9231,949,506Total - Morocco
7,413,000 9,703,900 0.2826.07.23North MacedoniaGovernmentInternational Bond16
EUR 5.625%Macedonia
0.289,703,900Total - Macedonia
3,250,000 3,993,506 0.1124.02.25PetroleosMexicanos 05
EUR 5.500%Mexico
20,620,000 22,543,612 0.6516.04.26PetroleosMexicanos 14EMTN
EUR 3.750%
15,750,000 15,602,857 0.4521.04.27PetroleosMexicanos 15EMTN
EUR 2.750%
15,000,000 16,905,937 0.4821.02.28PetroleosMexicanos 17EMTN
EUR 4.875%
25,150,000 27,479,886 0.7924.11.25PetroleosMexicanos 18
EUR 3.625%
16,300,000 17,973,917 0.5126.02.29PetroleosMexicanos 18
EUR 4.750%

149
Vontobel Fund - Emerging Markets Debt
The accompanying notes form an essential part of these financial statements.
Portfolio as at February 28, 2019
* Any deviations of the percentages of the nets assets are due to rounding.
Securities Marketvalue in
USD
% of netassets*
Quantity Ccy Maturity
61,000,000 81,029,811 2.3219.03.14MexicoGovernmentInternational Bond14 EMTN
GBP 5.625%
9,500,000 9,869,740 0.2807.02.26Credito Real SABde CV SOFOM ER19
USD 9.500%
3,461,000 3,289,888 0.0901.06.20Grupo Famsa SABde CV 13
USD 7.250%
2,500,000 2,016,500 0.0614.01.48InfraestructuraEnergetica NovaSAB de CV 17
USD 4.875%
25,700,000 25,625,984 0.7304.02.26PetroleosMexicanos 17
USD 6.875%
14,800,000 14,332,172 0.4113.03.27PetroleosMexicanos 18
USD 6.500%
6.88240,663,810Total - Mexico
28,586,000 27,363,949 0.7829.10.25NamibiaInternational Bonds15
USD 5.250%Namibia
0.7827,363,949Total - Namibia
7,300,000 8,210,565 0.2417.08.21JP MorganStructuredProducts BV 16EMTN
EUR 3.500%Netherlands
750 755 0.0027.01.25Petrobras GlobalFinance BV 17
USD 5.299%
0.248,211,320Total - Netherlands
12,300,000 12,291,267 0.3523.02.30NigeriaGovernmentInternational Bond18
USD 7.143%Nigeria
1,500,000 1,640,100 0.0521.01.31NigeriaGovernmentInternational Bond18
USD 8.747%
2,500,000 2,473,875 0.0723.02.38NigeriaGovernmentInternational Bond18
USD 7.696%
0.4716,405,242Total - Nigeria
10,000,000 9,182,100 0.2615.06.26Oman GovernmentInternational Bond16
USD 4.750%Oman
8,800,000 8,256,864 0.2408.03.27Oman GovernmentInternational Bond17
USD 5.375%
3,650,000 3,240,215 0.0908.03.47Oman GovernmentInternational Bond17
USD 6.500%
14,800,000 14,007,312 0.4117.01.28Oman GovernmentInternational Bond18
USD 5.625%
Securities Marketvalue in
USD
% of netassets*
Quantity Ccy Maturity
7,000,000 6,349,560 0.1817.01.48Oman GovernmentInternational Bond18
USD 6.750%
1.1841,036,051Total - Oman
5,115,000 4,892,702 0.1407.08.27Banco General SA17
USD 4.125%Panama
17,859,000 24,123,402 0.6928.04.34PanamaGovernmentInternational Bond04
USD 8.125%
0.8329,016,104Total - Panama
17,550,000 22,193,037 0.6430.01.26PeruvianGovernmentInternational Bond15
EUR 2.750%Peru
0.6422,193,037Total - Peru
55,050,000 62,978,803 1.8029.10.35RomanianGovernmentInternational Bond15 EMTN
EUR 3.875%Romania
4,800,000 5,090,809 0.1508.02.38RomanianGovernmentInternational Bond18 EMTN
EUR 3.375%
32,800,000 37,437,131 1.0711.03.39RomanianGovernmentInternational Bond18 EMTN
EUR 4.125%
3.02105,506,743Total - Romania
30,700,000 24,093,667 0.6920.09.22ZambiaGovernmentInternational Bond12
USD 5.375%Zambia
37,537,000 30,624,561 0.8814.04.24ZambiaGovernmentInternational Bond14
USD 8.500%
1.5754,718,228Total - Zambia
8,000,000 7,807,600 0.2204.03.28Saudi GovernmentInternational Bond17 EMTN
USD 3.625%Saudi Arabia
45,600,000 47,799,288 1.3716.01.50Saudi GovernmentInternational Bond19
USD 5.250%
1.5955,606,888Total - Saudi Arabia
86,150,000 95,719,123 2.7413.03.28SenegalGovernmentInternational Bond18
EUR 4.750%Senegal
2.7495,719,123Total - Senegal

150
Vontobel Fund - Emerging Markets Debt
The accompanying notes form an essential part of these financial statements.
Portfolio as at February 28, 2019
* Any deviations of the percentages of the nets assets are due to rounding.
Securities Marketvalue in
USD
% of netassets*
Quantity Ccy Maturity
19,900,000 14,247,465 0.4101.01.26SeychellesInternational Bond10
USD 8.000%Seychelles Islands
0.4114,247,465Total - Seychelles Islands
3,900,000 2,854,683 0.0811.04.22Theta Capital PteLtd 14
USD 7.000%Singapore
1,720,000 1,155,720 0.0331.10.26Theta Capital PteLtd 16
USD 6.750%
0.114,010,403Total - Singapore
13,080,000 13,162,666 0.3815.12.28AI Candelaria SpainSLU 18
USD 7.500%Spain
0.3813,162,666Total - Spain
8,400,000 8,172,276 0.2318.04.23Sri LankaGovernmentInternational Bond18
USD 5.750%Sri Lanka
11,800,000 11,260,976 0.3318.04.28Sri LankaGovernmentInternational Bond18
USD 6.750%
0.5619,433,252Total - Sri Lanka
19,000,000 19,213,370 0.5506.08.23Eskom HoldingsSOC Ltd 13 EMTN
USD 6.750%South Africa
3,850,000 3,955,644 0.1110.08.28Eskom HoldingsSOC Ltd 18
USD 6.350%
0.6623,169,014Total - South Africa
47,324,000 44,002,802 1.2614.09.27Republic ofTajikistanInternational Bond17
USD 7.125%Tadzhikistan
1.2644,002,802Total -Tadzhikistan
43,450,000 43,044,177 1.2327.07.27Banque OuestAfricaine deDeveloppement 17
USD 5.000%Togo
1.2343,044,177Total - Togo
2,000,000 1,962,420 0.0615.01.36National Gas Co ofTrinidad & TobagoLtd 06
USD 6.050%Trinidad and Tobago
0.061,962,420Total - Trinidad and Tobago
3,000,000 3,698,133 0.1105.06.28CEZ AS 13 EMTNEUR 3.000%Czech Republic
0.113,698,133Total - Czech Republic
Securities Marketvalue in
USD
% of netassets*
Quantity Ccy Maturity
21,900,000 23,476,191 0.6714.06.25Turkey GovernmentInternational Bond17 EMTN
EUR 3.250%Turkey
51,600,000 60,484,960 1.7316.02.26Turkey GovernmentInternational Bond18
EUR 5.200%
35,200,000 40,516,731 1.1631.03.25Turkey GovernmentInternational Bond19
EUR 4.625%
12,030,000 10,850,699 0.3127.04.28Akbank Turk AS 18FRN
USD 6.797%
18,917,000 15,923,763 0.4626.04.23RonesansGayrimenkulYatirim AS 18
USD 7.250%
5,393,000 4,815,787 0.1429.03.27Turkiye SinaiKalkinma BankasiAS 17 FRN
USD 7.625%
9,050,000 8,499,851 0.2430.01.23Turkiye VakiflarBankasi TAO 18EMTN
USD 5.750%
4.71164,567,982Total - Turkey
78,060,000 83,734,147 2.4017.02.24Banque Centralede TunisieInternational Bond17
EUR 5.625%Tunisia
21,975,000 24,725,410 0.7131.10.23Banque Centralede TunisieInternational Bond18
EUR 6.750%
3.11108,459,557Total - Tunisia
9,800,000 9,266,194 0.2701.09.24UkraineGovernmentInternational Bond15
USD 7.750%Ukraine
6,250,000 5,782,813 0.1701.09.26UkraineGovernmentInternational Bond15
USD 7.750%
6,000,000 5,506,800 0.1601.09.27UkraineGovernmentInternational Bond15
USD 7.750%
5,000,000 4,963,000 0.1401.02.24UkraineGovernmentInternational Bond18
USD 8.994%
13,600,000 13,664,600 0.3801.11.28UkraineGovernmentInternational Bond18
USD 9.750%
1.1239,183,407Total - Ukraine
9,000,000 10,801,708 0.3102.05.24Abu Dhabi NationalEnergy Co PJSC 14EMTN
EUR 2.750%United Arab Emirates
8,300,000 8,428,899 0.2402.11.47Abu Dhabi CrudeOil Pipeline LLC 17
USD 4.600%
5,000,000 4,969,200 0.1411.10.47Abu DhabiGovernmentInternational Bond17
USD 4.125%
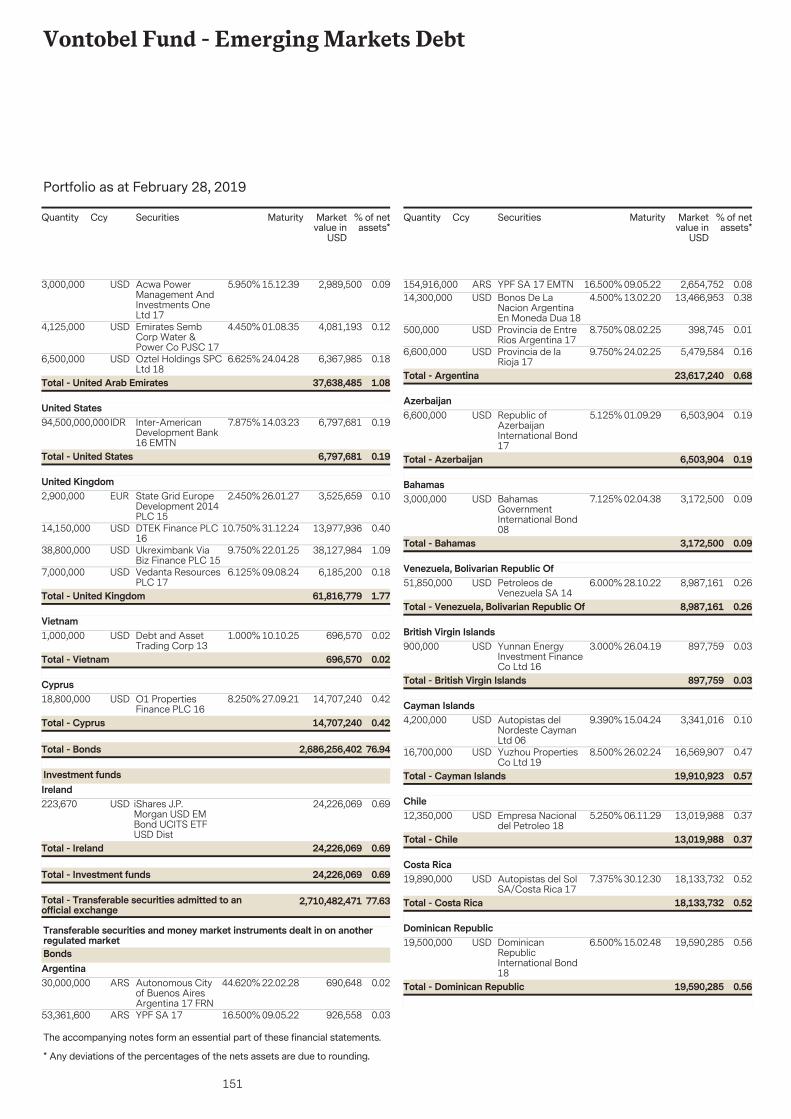
151
Vontobel Fund - Emerging Markets Debt
The accompanying notes form an essential part of these financial statements.
Portfolio as at February 28, 2019
* Any deviations of the percentages of the nets assets are due to rounding.
Securities Marketvalue in
USD
% of netassets*
Quantity Ccy Maturity
3,000,000 2,989,500 0.0915.12.39Acwa PowerManagement AndInvestments OneLtd 17
USD 5.950%
4,125,000 4,081,193 0.1201.08.35Emirates SembCorp Water &Power Co PJSC 17
USD 4.450%
6,500,000 6,367,985 0.1824.04.28Oztel Holdings SPCLtd 18
USD 6.625%
1.0837,638,485Total - United Arab Emirates
94,500,000,000 6,797,681 0.1914.03.23Inter-AmericanDevelopment Bank16 EMTN
IDR 7.875%United States
0.196,797,681Total - United States
2,900,000 3,525,659 0.1026.01.27State Grid EuropeDevelopment 2014PLC 15
EUR 2.450%United Kingdom
14,150,000 13,977,936 0.4031.12.24DTEK Finance PLC16
USD 10.750%
38,800,000 38,127,984 1.0922.01.25Ukreximbank ViaBiz Finance PLC 15
USD 9.750%
7,000,000 6,185,200 0.1809.08.24Vedanta ResourcesPLC 17
USD 6.125%
1.7761,816,779Total - United Kingdom
1,000,000 696,570 0.0210.10.25Debt and AssetTrading Corp 13
USD 1.000%Vietnam
0.02696,570Total - Vietnam
18,800,000 14,707,240 0.4227.09.21O1 PropertiesFinance PLC 16
USD 8.250%Cyprus
76.942,686,256,402Total - Bonds
0.4214,707,240Total - Cyprus
223,670 24,226,069 0.69iShares J.P.Morgan USD EMBond UCITS ETFUSD Dist
USD
Investment fundsIreland
77.632,710,482,471Total - Transferable securities admitted to anofficial exchange
0.6924,226,069Total - Investment funds
0.6924,226,069Total - Ireland
30,000,000 690,648 0.0222.02.28Autonomous Cityof Buenos AiresArgentina 17 FRN
ARS 44.620%
Transferable securities and money market instruments dealt in on anotherregulated marketBondsArgentina
53,361,600 926,558 0.0309.05.22YPF SA 17ARS 16.500%
Securities Marketvalue in
USD
% of netassets*
Quantity Ccy Maturity
154,916,000 2,654,752 0.0809.05.22YPF SA 17 EMTNARS 16.500%14,300,000 13,466,953 0.3813.02.20Bonos De La
Nacion ArgentinaEn Moneda Dua 18
USD 4.500%
500,000 398,745 0.0108.02.25Provincia de EntreRios Argentina 17
USD 8.750%
6,600,000 5,479,584 0.1624.02.25Provincia de laRioja 17
USD 9.750%
0.6823,617,240Total - Argentina
6,600,000 6,503,904 0.1901.09.29Republic ofAzerbaijanInternational Bond17
USD 5.125%Azerbaijan
0.196,503,904Total - Azerbaijan
3,000,000 3,172,500 0.0902.04.38BahamasGovernmentInternational Bond08
USD 7.125%Bahamas
0.093,172,500Total - Bahamas
51,850,000 8,987,161 0.2628.10.22Petroleos deVenezuela SA 14
USD 6.000%Venezuela, Bolivarian Republic Of
0.268,987,161Total - Venezuela, Bolivarian Republic Of
900,000 897,759 0.0326.04.19Yunnan EnergyInvestment FinanceCo Ltd 16
USD 3.000%British Virgin Islands
0.03897,759Total - British Virgin Islands
4,200,000 3,341,016 0.1015.04.24Autopistas delNordeste CaymanLtd 06
USD 9.390%Cayman Islands
16,700,000 16,569,907 0.4726.02.24Yuzhou PropertiesCo Ltd 19
USD 8.500%
0.5719,910,923Total - Cayman Islands
12,350,000 13,019,988 0.3706.11.29Empresa Nacionaldel Petroleo 18
USD 5.250%Chile
0.3713,019,988Total - Chile
19,890,000 18,133,732 0.5230.12.30Autopistas del SolSA/Costa Rica 17
USD 7.375%Costa Rica
0.5218,133,732Total - Costa Rica
19,500,000 19,590,285 0.5615.02.48DominicanRepublicInternational Bond18
USD 6.500%Dominican Republic
0.5619,590,285Total - Dominican Republic

152
Vontobel Fund - Emerging Markets Debt
The accompanying notes form an essential part of these financial statements.
Portfolio as at February 28, 2019
* Any deviations of the percentages of the nets assets are due to rounding.
Securities Marketvalue in
USD
% of netassets*
Quantity Ccy Maturity
42,755,000 43,313,808 1.2413.01.22Oilflow SPV 1 DAC17
USD 12.000%Ireland
1.2443,313,808Total - Ireland
9,250,000 9,964,748 0.2919.11.25Republic ofCameroonInternational Bond15
USD 9.500%Cameroun
0.299,964,748Total - Cameroun
10,212,500 10,165,318 0.2905.07.23ShaMaranPetroleum Corp 18
USD 12.000%Canada
0.2910,165,318Total - Canada
1,700,000 1,517,063 0.0427.07.22Credivalores-Crediservicios SAS17
USD 9.750%Colombia
9,400,000 9,635,000 0.2815.01.34Fideicomiso PACostera 16
USD 6.750%
38,600,000 41,169,601 1.1815.01.35Fideicomiso PAPacifico Tres 16
USD 8.250%
1.5052,321,664Total - Colombia
13,945,360 14,283,482 0.4120.08.21Andrade GutierrezInternational SA 18
USD 11.000%Luxembourg
1,200,000 1,213,992 0.0326.07.24JSL Europe SA 17USD 7.750%0.4415,497,474Total - Luxembourg
17,100,000 17,623,260 0.5015.06.26EquisarInternational Inc 11
USD 6.628%Malaysia
0.5017,623,260Total - Malaysia
49,200,000 51,818,315 1.4815.03.15MexicoGovernmentInternational Bond15
EUR 4.000%Mexico
1.4851,818,315Total - Mexico
2,400,000 2,544,072 0.0715.01.29Suzano AustriaGmbH 19
USD 6.000%Austria
0.072,544,072Total - Austria
14,700,000 15,311,961 0.4411.05.36AeropuertoInternacional deTocumen SA 16
USD 5.625%Panama
0.4415,311,961Total - Panama
Securities Marketvalue in
USD
% of netassets*
Quantity Ccy Maturity
4,175,000 4,041,317 0.1226.10.26Republic ofSuriname 16
USD 9.250%EN-Suriname
0.124,041,317EN-Total - Surinam
6,300,000 3,935,799 0.1106.05.20Yasar Holding AS14
USD 8.875%Turkey
0.113,935,799Total - Turkey
1,820,000,000 13,000,072 0.3717.03.31Banque Centralede Tunisie SA 01
JPY 4.200%Tunisia
0.3713,000,072Total - Tunisia
3,000,000 3,220,904 0.0927.03.20Aabar InvestmentsPJSC 15 EMTN
EUR 0.500%United Arab Emirates
52,200,000 51,330,721 1.4727.03.22Aabar InvestmentsPJSC 15 EMTN
EUR 1.000%
11.68407,922,925Total - Transferable securities and money marketinstruments dealt in on another regulated market
11.68407,922,925Total - Bonds
1.5654,551,625Total - United Arab Emirates
7,000,000 7,000,000 0.2006.03.24HKN Energy Ltd 19USD 11.000%
Other transferable securitiesBondsCayman Islands
0.207,000,000Total - Cayman Islands
25,350,000 25,291,948 0.7322.05.19Costa RicaGovernmentInternational Bond16
USD 4.370%Costa Rica
0.7325,291,948Total - Costa Rica
5,600,000 2,936,772 0.0820.08.20JP MorganStructuredProducts BV 15EMTN
USD 6.250%Netherlands
0.082,936,772Total - Netherlands
25,000,000 25,000,000 0.7217.08.21JPMorgan ChaseBank NA 19 EMTN
USD 6.750%United States
1.7360,228,720Total - Bonds
0.7225,000,000Total - United States
163,900 24,780,041 0.71Vontobel Fund -Emerging MarketsCorporate Bond - I
USD
Investment fundsLuxembourg

153
Vontobel Fund - Emerging Markets Debt
The accompanying notes form an essential part of these financial statements.
Portfolio as at February 28, 2019
* Any deviations of the percentages of the nets assets are due to rounding.
Securities Marketvalue in
USD
% of netassets*
Quantity Ccy Maturity
622,000 91,558,400 2.62Vontobel Fund-Emerging MarketsBlend - I
USD
5.06176,567,161Total - Other transferable securities
3.33116,338,441Total - Investment funds
3.33116,338,441Total - Luxembourg
94.373,294,972,557Total - Investment in securities
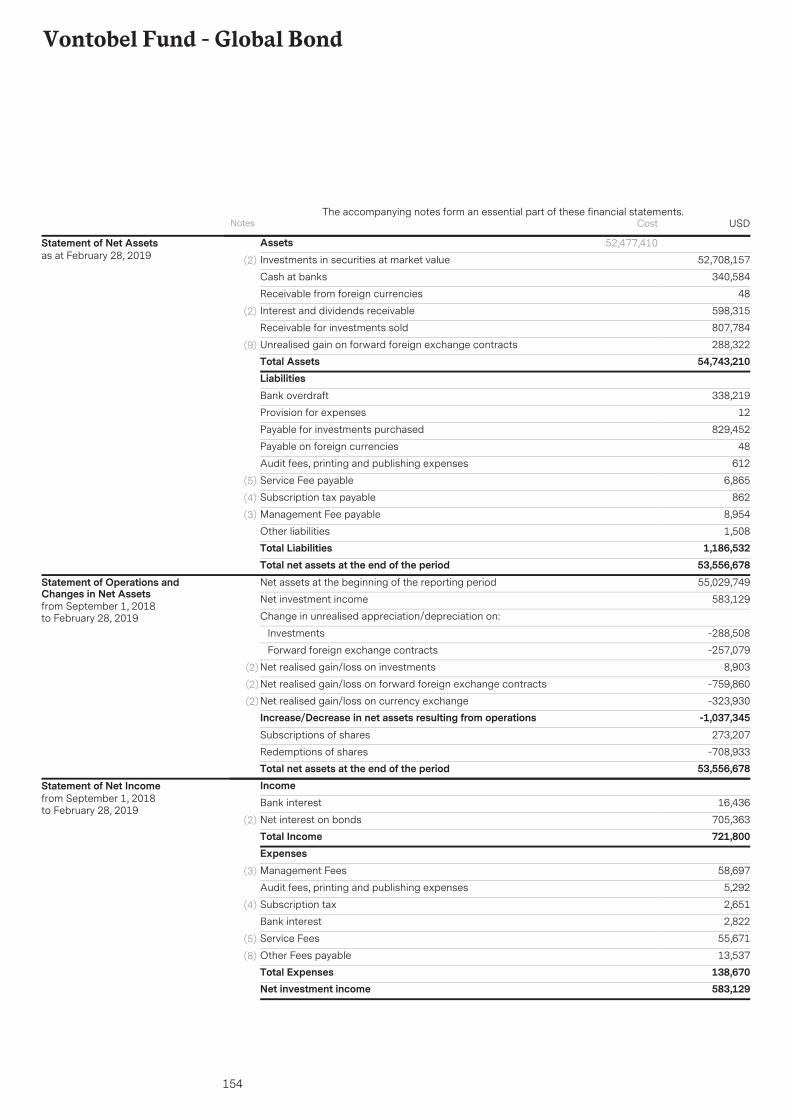
154
Vontobel Fund - Global Bond
AssetsInvestments in securities at market value 52,708,157(2)
340,584Cash at banks
48Receivable from foreign currencies
598,315Interest and dividends receivable(2)
807,784Receivable for investments sold
288,322Unrealised gain on forward foreign exchange contracts(9)
Total Assets 54,743,210
52,477,410Statement of Net Assetsas at February 28, 2019
LiabilitiesBank overdraft 338,219
Provision for expenses 12
Payable for investments purchased 829,452
Payable on foreign currencies 48
Audit fees, printing and publishing expenses 612
Service Fee payable 6,865(5)
Subscription tax payable 862(4)
Management Fee payable 8,954(3)
Other liabilities 1,508Total Liabilities 1,186,532Total net assets at the end of the period 53,556,678Net assets at the beginning of the reporting period 55,029,749
Net investment income 583,129
Change in unrealised appreciation/depreciation on:
Investments -288,508
Forward foreign exchange contracts -257,079
Net realised gain/loss on investments 8,903(2)
Net realised gain/loss on forward foreign exchange contracts -759,860(2)
Net realised gain/loss on currency exchange -323,930(2)
Increase/Decrease in net assets resulting from operations -1,037,345Subscriptions of shares 273,207
Redemptions of shares -708,933Total net assets at the end of the period 53,556,678
Statement of Operations andChanges in Net Assetsfrom September 1, 2018to February 28, 2019
IncomeBank interest 16,436
Net interest on bonds 705,363(2)
Total Income 721,800ExpensesManagement Fees 58,697(3)
Audit fees, printing and publishing expenses 5,292
Subscription tax 2,651(4)
Bank interest 2,822
Service Fees 55,671(5)
Other Fees payable 13,537(8)
Total Expenses 138,670Net investment income 583,129
Statement of Net Incomefrom September 1, 2018to February 28, 2019
Notes USDThe accompanying notes form an essential part of these financial statements.
Cost

155
Vontobel Fund - Global Bond
The accompanying notes form an essential part of these financial statements.
Portfolio as at February 28, 2019
* Any deviations of the percentages of the nets assets are due to rounding.
Securities Marketvalue in
USD
% of netassets*
Quantity Ccy Maturity
800,000 826,400 1.5412.01.21Australia & NewZealand BankingGroup Ltd 11EMTN
USD 4.880%
Transferable securities admitted to an official exchangeBondsAustralia
800,000 818,480 1.5310.12.20National AustraliaBank Ltd 10
USD 4.380%
3.071,644,880Total - Australia
200,000 349,034 0.6528.03.41Kingdom ofBelgiumGovernment Bond10
EUR 4.250%Belgium
0.65349,034Total - Belgium
300,000 318,771 0.6001.03.22IPIC GMTN Ltd 11EMTN
USD 5.500%Cayman Islands
0.60318,771Total - Cayman Islands
200,000 247,528 0.4628.05.24CarlsbergBreweries A/S 14EMTN
EUR 2.500%Denmark
0.46247,528Total - Denmark
400,000 466,908 0.8718.01.27Autoroutes du Sudde la France SA 17EMTN
EUR 1.250%France
300,000 387,789 0.7210.02.22BPCE SA 12 EMTNEUR 4.500%400,000 498,136 0.9330.05.23Gecina SA 13
EMTNEUR 2.880%
200,000 234,522 0.4430.07.21Gecina SA 14EMTN
EUR 1.750%
400,000 462,845 0.8616.02.27Klepierre 17 EMTNEUR 1.375%500,000 587,239 1.1018.05.26Pernod Ricard SA
16EUR 1.500%
600,000 694,363 1.3008.06.22RCI Banque SA 15EMTN
EUR 1.250%
550,000 546,696 1.0227.01.20BPCE SA 15USD 2.250%1,100,000 1,099,791 2.0619.06.21Total Capital
International SA 14USD 2.750%
9.304,978,289Total - France
800,000 954,732 1.7820.02.21Aeroporti di RomaSpA 13 EMTN
EUR 3.250%Italy
1,100,000 1,505,025 2.8116.09.24AssicurazioniGenerali SpA 09EMTN
EUR 5.130%
500,000 598,945 1.1216.07.24Banca Monte deiPaschi di SienaSpA 14
EUR 2.880%
400,000 510,912 0.9510.07.23Eni SpA 13 EMTNEUR 3.250%300,000 399,400 0.7512.09.25Eni SpA 13 EMTNEUR 3.750%300,000 351,746 0.6618.06.21Intesa Sanpaolo
SpA 14 EMTNEUR 2.000%
900,000 1,026,572 1.9204.03.22Intesa SanpaoloSpA 15 EMTN
EUR 1.130%
Securities Marketvalue in
USD
% of netassets*
Quantity Ccy Maturity
500,000 617,642 1.1501.02.37Italy BuoniPoliennali DelTesoro 05
EUR 4.000%
1,250,000 1,603,261 2.9901.03.24Italy BuoniPoliennali DelTesoro 13
EUR 4.500%
1,400,000 1,367,137 2.5501.03.32Italy BuoniPoliennali DelTesoro 15
EUR 1.650%
200,000 227,972 0.4318.03.19Mediobanca Bancadi CreditoFinanziario SpA 14EMTN
EUR 2.250%
500,000 575,368 1.0724.10.26UniCredit SpA 16EMTN
EUR 2.125%
18.189,738,712Total - Italy
50,000,000 477,367 0.8920.09.22Development Bankof Japan Inc 02
JPY 1.700%Japan
50,000,000 470,055 0.8820.06.23Development Bankof Japan Inc 03
JPY 1.050%
500,000 494,735 0.9219.04.22Daiwa SecuritiesGroup Inc 17
USD 3.129%
2.691,442,157Total - Japan
1,000,000 1,196,170 2.2323.05.22Heathrow FundingLtd 14 EMTN
EUR 1.880%Jersey
2.231,196,170Total - Jersey
500,000 492,305 0.9215.07.22Enbridge Inc 17USD 2.900%Canada
0.92492,305Total - Canada
400,000 297,477 0.5630.06.21Fonterra Co-operative GroupLtd 14
AUD 4.500%New Zealand
0.56297,477Total - New Zealand
300,000 405,279 0.7613.03.28Allianz Finance IIBV 13
EUR 3.000%Netherlands
450,000 599,362 1.1214.09.22Enel FinanceInternational NV 09EMTN
EUR 5.000%
300,000 356,357 0.6727.01.25Enel FinanceInternational NV 15EMTN
EUR 1.970%
300,000 352,176 0.6621.01.25Gas Natural FenosaFinance BV 15EMTN
EUR 1.380%
500,000 620,779 1.1601.03.22Koninklijke KPN NV12 EMTN
EUR 4.250%
700,000 822,979 1.5428.05.20RepsolInternationalFinance BV 13EMTN
EUR 2.630%
350,000 417,209 0.7820.11.20SABIC Capital I BV13
EUR 2.750%

156
Vontobel Fund - Global Bond
The accompanying notes form an essential part of these financial statements.
Portfolio as at February 28, 2019
* Any deviations of the percentages of the nets assets are due to rounding.
Securities Marketvalue in
USD
% of netassets*
Quantity Ccy Maturity
900,000 925,389 1.7211.01.21CooperatieveCentrale Raiffeisen-BoerenleenbankBA/Netherlands 11
USD 4.500%
450,000 436,685 0.8215.07.24EDP Finance BV 17USD 3.625%1,000,000 993,080 1.8411.05.20Shell International
Finance BV 15USD 2.130%
11.075,929,295Total - Netherlands
400,000 412,708 0.7701.03.24Statoil ASA 13USD 3.700%Norway
0.77412,708Total - Norway
300,000 324,974 0.6120.05.26AbertisInfraestructuras SA16
EUR 1.375%Spain
200,000 306,978 0.5731.01.37Spain GovernmentBond 05
EUR 4.200%
700,000 963,275 1.8031.01.23Spain GovernmentBond 13
EUR 5.400%
1,000,000 1,338,986 2.5030.04.24Spain GovernmentBond 14
EUR 3.800%
1,300,000 1,564,480 2.9230.07.30Spain GovernmentBond 15
EUR 1.950%
600,000 722,765 1.3527.05.22TelefonicaEmisiones SAU 14EMTN
EUR 2.240%
9.755,221,458Total - Spain
500,000 498,880 0.9318.06.19EmiratesTelecommunications Group Co PJSC14 EMTN
USD 2.375%United Arab Emirates
0.93498,880Total - United Arab Emirates
600,000 699,959 1.3113.05.21Prologis LP 15EUR 1.380%United States
800,000 787,488 1.4709.02.22Apple Inc 15USD 2.150%1,100,000 1,092,245 2.0421.04.20Bank of America
Corp 15USD 2.250%
400,000 380,468 0.7120.09.26Cisco Systems Inc16
USD 2.500%
300,000 292,515 0.5501.05.26Citigroup Inc 16USD 3.400%350,000 347,841 0.6501.04.23Coca-Cola Co/The
13USD 2.500%
500,000 500,510 0.9320.07.25CVS Health Corp15
USD 3.880%
450,000 435,848 0.8109.10.22General Electric Co12
USD 2.700%
600,000 599,880 1.1218.03.19Hyundai CapitalAmerica 16 EMTN
USD 2.500%
500,000 478,880 0.8915.11.26Illinois Tool WorksInc 16
USD 2.650%
800,000 793,728 1.4812.02.22Microsoft Corp 15USD 2.380%1,000,000 983,840 1.8430.09.20National Grid North
America Inc 15EMTN
USD 2.380%
1,100,000 1,093,378 2.0512.03.20Toyota MotorCredit Corp 15
USD 2.150%
750,000 918,340 1.7115.02.36United StatesTreasuryNote/Bond 06
USD 4.500%
Securities Marketvalue in
USD
% of netassets*
Quantity Ccy Maturity
1,300,000 1,317,874 2.4715.02.42United StatesTreasuryNote/Bond 12
USD 3.125%
800,000 798,504 1.4923.05.19Volkswagen Groupof America FinanceLLC 14
USD 2.130%
21.5211,521,298Total - United States
600,000 704,332 1.3216.02.23BP Capital MarketsPLC 15 EMTN
EUR 1.110%United Kingdom
200,000 230,758 0.4310.03.23BritishTelecommunications PLC 16 EMTN
EUR 1.125%
500,000 570,272 1.0613.05.20FCE Bank PLC 15EMTN
EUR 1.114%
400,000 457,133 0.8514.03.25MotabilityOperations GroupPLC 17 EMTN
EUR 0.875%
550,000 933,442 1.7416.02.29Abbey NationalTreasury ServicesPLC/London 12EMTN
GBP 5.250%
250,000 328,548 0.6116.08.28HSBC HoldingsPLC
GBP 2.630%
250,000 450,059 0.8411.12.31Legal & GeneralFinance PLC 00EMTN
GBP 5.875%
650,000 1,029,075 1.9307.03.25Lloyds Bank PLC12 EMTN
GBP 5.130%
650,000 881,623 1.6529.04.22NationwideBuilding Society 15EMTN
GBP 2.250%
300,000 296,919 0.5510.01.23Barclays PLC 17USD 3.684%500,000 508,475 0.9515.04.24Credit Agricole
SA/London 14EMTN
USD 3.875%
400,000 409,852 0.7730.03.22HSBC HoldingsPLC 12
USD 4.000%
95.4051,089,450Total - Transferable securities admitted to anofficial exchange
95.4051,089,450Total - Bonds
12.706,800,488Total - United Kingdom
300,000 222,024 0.4108.09.21Scentre GroupTrust 1 14
AUD 4.500%
Transferable securities and money market instruments dealt in on anotherregulated marketBondsAustralia
0.41222,024Total - Australia

157
Vontobel Fund - Global Bond
The accompanying notes form an essential part of these financial statements.
Portfolio as at February 28, 2019
* Any deviations of the percentages of the nets assets are due to rounding.
Securities Marketvalue in
USD
% of netassets*
Quantity Ccy Maturity
550,000 542,734 1.0201.02.26Anheuser-BuschCos LLC /Anheuser-BuschInBev WorldwideInc 18
USD 3.650%United States
1.43764,758Total - Transferable securities and money marketinstruments dealt in on another regulated market
1.43764,758Total - Bonds
1.02542,734Total - United States
550,000 427,914 0.7902.06.23Province of OntarioCanada 12
CAD 2.850%
Other transferable securitiesBondsCanada
550,000 426,035 0.8001.09.25Province of QuebecCanada 15
CAD 2.750%
1.59853,949Total - Other transferable securities
1.59853,949Total - Bonds
1.59853,949Total - Canada
98.4252,708,157Total - Investment in securities

158
Vontobel Fund - Credit Oppertunities
AssetsInvestments in securities at market value 20,382,803(2)
2,436,258Cash at banks
20Receivable from foreign currencies
336,275Interest and dividends receivable(2)
45,781Unrealised gain on futures(9)
Total Assets 23,201,137
21,110,359Statement of Net Assetsas at February 28, 2019
LiabilitiesBank overdraft 67,054
Provision for expenses 5
Payable for investments purchased 511,328
Payable on foreign currencies 20
Payable on swaps 25,083(9)
Unrealised loss on forward foreign exchange contracts 3,102(9)
Unrealised loss on swaps 168,873(9)
Audit fees, printing and publishing expenses 616
Service Fee payable 9,356(5)
Subscription tax payable 361(4)
Management Fee payable 7,241(3)
Other liabilities 13Total Liabilities 793,052Total net assets at the end of the period 22,408,085Net assets at the beginning of the reporting period 22,010,701
Net investment income 254,028
Change in unrealised appreciation/depreciation on:
Investments -270,266
Futures 38,592
Forward foreign exchange contracts -109,627
Swaps 619,033
Options 15,420
Net realised gain/loss on investments -156,701(2)
Net realised gain/loss on forward foreign exchange contracts 617,000(2)
Net realised gain/loss on currency exchange -178,302(2)
Net realised gain/loss on futures 18,192(2)
Net realised gain/loss on swaps -434,565(2)
Net realised gain/loss on options -15,420(2)
Increase/Decrease in net assets resulting from operations 397,384Subscriptions of shares 13,399,870
Redemptions of shares -13,399,870Total net assets at the end of the period 22,408,085
Statement of Operations andChanges in Net Assetsfrom September 1, 2018to February 28, 2019
Notes USDThe accompanying notes form an essential part of these financial statements.
Cost

159
Vontobel Fund - Credit Oppertunities
IncomeBank interest 17,000
Net interest on bonds 512,655(2)
Interest on swaps 416(2)
Total Income 530,072ExpensesManagement Fees 46,341(3)
Audit fees, printing and publishing expenses 568
Subscription tax 1,084(4)
Bank interest 12,567
Interest on swaps 171,695(2)
Service Fees 47,544(5)
Other Fees payable -3,756(8)
Total Expenses 276,043Net investment income 254,028
Statement of Net Incomefrom September 1, 2018to February 28, 2019
Notes USDThe accompanying notes form an essential part of these financial statements.

160
Vontobel Fund - Credit Oppertunities
The accompanying notes form an essential part of these financial statements.
Portfolio as at February 28, 2019
* Any deviations of the percentages of the nets assets are due to rounding.
Securities Marketvalue in
USD
% of netassets*
Quantity Ccy Maturity
250,000 269,587 1.2016.04.30Egypt GovernmentInternational Bond18 EMTN
EUR 5.625%
Transferable securities admitted to an official exchangeBondsEgypt
1.20269,587Total - Egypt
400,000 53,020 0.2427.06.29Odebrecht FinanceLtd 14
USD 5.250%Cayman Islands
0.2453,020Total - Cayman Islands
500,000 576,501 2.5705.07.25O2 TelefonicaDeutschlandFinanzierungsGmbH 18
EUR 1.750%Germany
200,000 228,414 1.0216.10.23VolkswagenFinancial ServicesAG 18 EMTN
EUR 1.375%
3.59804,915Total - Germany
100,000 109,002 0.4922.03.30Ivory CoastGovernmentInternational Bond18
EUR 5.250%Ivory Coast
0.49109,002Total - Ivory Coast
210,000 248,441 1.1129.09.27Metsa Board OYJ17
EUR 2.750%Finland
1.11248,441Total - Finland
500,000 569,635 2.5307.05.22Atos SE 18EUR 0.750%France
300,000 353,440 1.5807.11.28Atos SE 18EUR 2.500%200,000 241,195 1.0831.12.99Electricite de
France SA 14 FRNEMTN
EUR 4.125%
500,000 579,075 2.5731.12.99Electricite deFrance SA 18 FRN
EUR 4.000%
200,000 215,098 0.9631.12.99La Poste SA 18FRN
EUR 3.125%
150,000 180,503 0.8123.09.24Orano SA 09 EMTNEUR 4.875%300,000 345,255 1.5402.07.25Teleperformance
18EUR 1.875%
200,000 295,375 1.3230.09.41CNP Assurances11 FRN
GBP 7.375%
200,000 170,112 0.7631.12.99SCOR SE 18 FRNUSD 5.250%13.152,949,688Total - France
300,000 349,785 1.5619.10.20National Bank ofGreece SA 17EMTN
EUR 2.750%Greece
1.56349,785Total - Greece
Securities Marketvalue in
USD
% of netassets*
Quantity Ccy Maturity
200,000 198,956 0.8905.04.20ICBCIL Finance CoLtd 17 EMTN
USD 3.000%Hong Kong
0.89198,956Total - Hong Kong
300,000 355,626 1.5925.10.25Perusahaan ListrikNegara PT 18
EUR 2.875%Indonesia
1.59355,626Total - Indonesia
200,000 203,418 0.9130.10.22Eurotorg LLC ViaBonitron DAC 17
USD 8.750%Ireland
200,000 169,101 0.7530.11.26Saderea DAC 14EMTN
USD 12.500%
200,000 204,544 0.9231.12.99Tinkoff CreditSystems Via TCSFinance Ltd 17 FRN
USD 9.250%
2.58577,063Total - Ireland
400,000 35,865 0.1615.02.23CooperativaMuratori &Cementisti-CMC diRavenna SC 17
EUR 6.000%Italy
400,000 475,188 2.1131.12.99Intesa SanpaoloSpA 09 FRN
EUR 8.375%
300,000 349,312 1.5630.08.23Intesa SanpaoloSpA 18 EMTN
EUR 2.125%
200,000 227,729 1.0231.12.99Intesa SanpaoloVita SpA 14 FRN
EUR 4.750%
200,000 230,587 1.0320.02.29UniCredit SpA 19FRN EMTN
EUR 4.875%
200,000 277,845 1.2419.05.23Telecom ItaliaSpA/Milano 06EMTN
GBP 5.875%
7.121,596,526Total - Italy
200,000 203,842 0.9114.03.22Eastern andSouthern AfricanTrade andDevelopment Bank17 EMTN
USD 5.375%Kenya
0.91203,842Total - Kenya
500,000 571,792 2.5601.08.25ContourGlobalPower Holdings SA18
EUR 4.125%Luxembourg
319,000 390,354 1.7401.11.21Crystal AlmondSARL 16
EUR 10.000%
100,000 119,835 0.5320.12.23LHMC Finco Sarl18
EUR 6.250%
200,000 282,646 1.2624.01.33Telecom ItaliaFinance SA 03EMTN
EUR 7.750%
300,000 417,832 1.8625.09.20Gazprom OAO ViaGaz Capital SA 13EMTN
GBP 5.338%
100,000 126,963 0.5728.04.34Gazprom OAO ViaGaz Capital SA 04EMTN
USD 8.625%

161
Vontobel Fund - Credit Oppertunities
The accompanying notes form an essential part of these financial statements.
Portfolio as at February 28, 2019
* Any deviations of the percentages of the nets assets are due to rounding.
Securities Marketvalue in
USD
% of netassets*
Quantity Ccy Maturity
250,000 251,270 1.1226.07.22Topaz Marine SA17
USD 9.125%
9.642,160,692Total - Luxembourg
300,000 330,808 1.4726.02.29PetroleosMexicanos 18
EUR 4.750%Mexico
200,000 216,642 0.9716.04.26Cemex SAB de CV16
USD 7.750%
2.44547,450Total - Mexico
100,000 115,949 0.5215.10.24Dufry One BV 17EUR 2.500%Netherlands
200,000 218,808 0.9815.07.25KongsbergActuation SystemsBV 18
EUR 5.000%
500,000 555,857 2.4731.12.99Telefonica EuropeBV 18 FRN
EUR 3.000%
300,000 310,401 1.3915.08.50DemeterInvestments BV forSwiss Re Ltd 15FRN
USD 5.750%
5.361,201,015Total - Netherlands
200,000 215,492 0.9619.10.21Access Bank PLC16 EMTN
USD 10.500%Nigeria
0.96215,492Total - Nigeria
200,000 206,156 0.9218.06.20DNO ASA 15USD 8.750%Norway
0.92206,156Total - Norway
300,000 366,223 1.6316.09.75EDP - Energias dePortugal SA 15FRN
EUR 5.380%Portugal
1.63366,223Total - Portugal
500,000 507,875 2.2715.11.21LG Display Co Ltd18
USD 3.875%Korea, Republic Of
2.27507,875Total - Korea, Republic Of
240,000 247,138 1.1031.12.99Credit SuisseGroup AG 18 FRN
USD 7.500%Switzerland
1.10247,138Total - Switzerland
100,000 111,108 0.5013.03.28SenegalGovernmentInternational Bond18
EUR 4.750%Senegal
0.50111,108Total - Senegal
200,000 219,714 0.9820.04.26ACS ServiciosComunicaciones yEnergia SL 18
EUR 1.875%Spain
Securities Marketvalue in
USD
% of netassets*
Quantity Ccy Maturity
200,000 201,145 0.9031.12.99CaixaBank SA 18FRN
EUR 5.250%
300,000 338,945 1.5215.09.24MasariaInvestments SAU17 FRN
EUR 5.250%
200,000 267,656 1.1912.09.23Banco SantanderSA 18 EMTN
GBP 2.750%
4.591,027,460Total - Spain
200,000 185,964 0.8314.09.27Republic ofTajikistanInternational Bond17
USD 7.125%Tadzhikistan
0.83185,964Total -Tadzhikistan
200,000 230,209 1.0331.03.25Turkey GovernmentInternational Bond19
EUR 4.625%Turkey
1.03230,209Total - Turkey
300,000 321,807 1.4417.02.24Banque Centralede TunisieInternational Bond17
EUR 5.625%Tunisia
1.44321,807Total - Tunisia
100,000 114,388 0.5101.10.26Starfruit Finco BV /Starfruit US HoldcoLLC 18
EUR 6.500%United States
200,000 211,714 0.9515.10.58Comcast Corp 18USD 4.950%200,000 180,000 0.8015.09.20Frontier
CommunicationsCorp 16
USD 8.875%
2.26506,102Total - United States
200,000 216,777 0.9715.05.22Travelex FinancingPLC 17
EUR 8.000%United Kingdom
200,000 277,313 1.2431.12.99Barclays PLC 17FRN
GBP 7.250%
100,000 134,200 0.6015.09.21Jerrold Finco Plc 16EMTN
GBP 6.250%
200,000 285,123 1.2727.10.45Legal & GeneralGroup PLC 15 FRNEMTN
GBP 5.380%
100,000 134,453 0.6031.12.99NationwideBuilding Society 14FRN EMTN
GBP 6.875%
200,000 199,714 0.8931.12.99Barclays PLC 18FRN
USD 7.750%
300,000 314,580 1.4013.07.22LiquidTelecommunications Financing Plc 17
USD 8.500%
600,000 727,746 3.2531.12.99Lloyds Bank PLC09 FRN
USD 12.000%
200,000 204,710 0.9131.12.99Royal Bank ofScotland GroupPLC 15 FRN
USD 7.500%
11.132,494,616Total - United Kingdom

162
Vontobel Fund - Credit Oppertunities
The accompanying notes form an essential part of these financial statements.
Portfolio as at February 28, 2019
* Any deviations of the percentages of the nets assets are due to rounding.
Securities Marketvalue in
USD
% of netassets*
Quantity Ccy Maturity
200,000 205,824 0.9225.01.22Global PortsFinance PLC 16
USD 6.872%Cyprus
0.92205,824Total - Cyprus
100,000 113,854 0.5115.03.26Rexel SA 19EUR 2.750%
81.9618,365,436Total - Transferable securities admitted to anofficial exchange
81.9618,365,436Total - Bonds
0.51113,854FRANCE
200,000 198,442 0.8926.02.24Yuzhou PropertiesCo Ltd 19
USD 8.500%
Transferable securities and money market instruments dealt in on anotherregulated marketBondsCayman Islands
0.89198,442Total - Cayman Islands
200,000 202,614 0.9013.01.22Oilflow SPV 1 DAC17
USD 12.000%Ireland
0.90202,614Total - Ireland
200,000 200,276 0.8931.12.99ING Groep NV 19FRN
USD 6.750%Netherlands
0.89200,276Total - Netherlands
300,000 303,819 1.3622.10.21Korea ExpresswayCorp 18
USD 3.625%Korea, Republic Of
1.36303,819Total - Korea, Republic Of
100,000 101,338 0.4515.05.28Amcor FinanceUSA Inc 18
USD 4.500%United States
400,000 332,000 1.4801.04.23Foresight EnergyLLC / ForesightEnergy FinanceCorp 17
USD 11.500%
106,000 111,849 0.5015.05.23Prime SecurityServices BorrowerLLC / PrimeFinance Inc 16
USD 9.250%
2.43545,187Total - United States
100,000 126,502 0.5615.10.24Miller HomesGroup HoldingsPLC 17
GBP 5.500%United Kingdom
250,000 255,397 1.1431.12.99Lloyds BankingGroup PLC 18 FRN
USD 7.500%
Securities Marketvalue in
USD
% of netassets*
Quantity Ccy Maturity
200,000 185,130 0.8301.05.22Petra Diamonds USTreasury PLC 17
USD 7.250%
9.002,017,367Total - Transferable securities and money marketinstruments dealt in on another regulated market
9.002,017,367Total - Bonds
2.53567,029Total - United Kingdom
90.9620,382,803Total - Investment in securities

163
Vontobel Fund - Global Corporate Bond Mid Yield
AssetsInvestments in securities at market value 236,706,731(2)
11,374,904Cash at banks
23,745Receivable from foreign currencies
2,959,278Receivable from subscriptions
2,342,122Interest and dividends receivable(2)
3,015,878Receivable for investments sold
397,631Unrealised gain on forward foreign exchange contracts(9)
Total Assets 256,820,289
237,425,457Statement of Net Assetsas at February 28, 2019
LiabilitiesBank overdraft 2,972,299
Provision for expenses 45
Payable for redemptions 4,775,329
Payable for investments purchased 1,008,851
Payable on foreign currencies 23,756
Payable on swaps 109,230(9)
Unrealised loss on futures 164,609(9)
Unrealised loss on swaps 1,099,072(9)
Audit fees, printing and publishing expenses 2,500
Service Fee payable 27,167(5)
Subscription tax payable 7,452(4)
Management Fee payable 84,911(3)
Other liabilities 178Total Liabilities 10,275,399Total net assets at the end of the period 246,544,890Net assets at the beginning of the reporting period 188,316,410
Net investment income 2,792,730
Change in unrealised appreciation/depreciation on:
Investments 1,449,896
Futures -215,922
Forward foreign exchange contracts -90,288
Swaps -1,099,072
Net realised gain/loss on investments -1,086,496(2)
Net realised gain/loss on forward foreign exchange contracts -4,183,323(2)
Net realised gain/loss on currency exchange -524,742(2)
Net realised gain/loss on futures -23,801(2)
Net realised gain/loss on swaps 1,284,570(2)
Increase/Decrease in net assets resulting from operations -1,696,448Subscriptions of shares 118,366,377
Redemptions of shares -57,373,518
Dividend distribution -1,067,931(11)
Total net assets at the end of the period 246,544,890
Statement of Operations andChanges in Net Assetsfrom September 1, 2018to February 28, 2019
Notes USDThe accompanying notes form an essential part of these financial statements.
Cost

164
Vontobel Fund - Global Corporate Bond Mid Yield
IncomeBank interest 88,953
Net interest on bonds 3,887,590(2)
Interest on swaps 87,951(2)
Total Income 4,064,495ExpensesManagement Fees 519,120(3)
Audit fees, printing and publishing expenses 18,206
Subscription tax 20,325(4)
Bank interest 11,494
Interest on swaps 484,910(2)
Service Fees 182,932(5)
Other Fees payable 34,777(8)
Total Expenses 1,271,764Net investment income 2,792,730
Statement of Net Incomefrom September 1, 2018to February 28, 2019
Notes USDThe accompanying notes form an essential part of these financial statements.

165
Vontobel Fund - Global Corporate Bond Mid Yield
The accompanying notes form an essential part of these financial statements.
Portfolio as at February 28, 2019
* Any deviations of the percentages of the nets assets are due to rounding.
Securities Marketvalue in
USD
% of netassets*
Quantity Ccy Maturity
300,000 342,529 0.1431.12.99KBC Group NV 14FRN
EUR 5.625%
Transferable securities admitted to an official exchangeBondsBelgium
800,000 832,000 0.3415.06.23Barry CallebautServices NV 13
USD 5.500%
0.481,174,529Total - Belgium
500,000 516,240 0.2110.04.24Sinopec GroupOverseasDevelopment 2014Ltd 14
USD 4.375%British Virgin Islands
1,000,000 973,300 0.4003.05.26Sinopec GroupOverseasDevelopment 2016Ltd 16
USD 3.500%
500,000 474,495 0.1913.09.27Sinopec GroupOverseasDevelopment 2017Ltd 17
USD 3.250%
0.801,964,035Total - British Virgin Islands
1,500,000 1,417,755 0.5706.12.47Alibaba GroupHolding Ltd 17
USD 4.200%Cayman Islands
1,000,000 1,030,920 0.4227.01.24Country GardenHoldings Co Ltd 18
USD 8.000%
1,000,000 1,014,690 0.4127.01.24Saudi ElectricityGlobal Sukuk Co 418
USD 4.222%
1.403,463,365Total - Cayman Islands
700,000 652,414 0.2617.07.27Cencosud SA 17USD 4.375%Chile
1,500,000 1,405,335 0.5730.04.25Empresa ElectricaGuacolda SA 15
USD 4.560%
0.832,057,749Total - Chile
2,000,000 2,306,004 0.9305.07.25O2 TelefonicaDeutschlandFinanzierungsGmbH 18
EUR 1.750%Germany
1,000,000 1,142,071 0.4616.10.23VolkswagenFinancial ServicesAG 18 EMTN
EUR 1.375%
1,000,000 1,122,029 0.4615.08.25VolkswagenLeasing GmbH 18EMTN
EUR 1.625%
1.854,570,104Total - Germany
1,000,000 1,159,970 0.4715.04.36Stora Enso OYJ 06USD 7.250%Finland
0.471,159,970Total - Finland
400,000 492,037 0.2031.12.99AXA SA 14 FRNEMTN
EUR 3.941%France
4,000,000 4,628,405 1.8915.07.24BPCE SA 19EUR 1.000%300,000 394,156 0.1630.09.41CNP Assurances
11 FRNEUR 6.875%
Securities Marketvalue in
USD
% of netassets*
Quantity Ccy Maturity
500,000 608,692 0.2531.12.99CNP Assurances14 FRN
EUR 4.000%
1,500,000 1,879,726 0.7627.09.48Credit AgricoleAssurances SA 16FRN
EUR 4.750%
1,000,000 1,158,149 0.4731.12.99Electricite deFrance SA 18 FRN
EUR 4.000%
500,000 601,678 0.2423.09.24Orano SA 09 EMTNEUR 4.875%400,000 478,741 0.1908.06.46SCOR SE 15 FRNEUR 3.000%1,000,000 1,179,204 0.4819.10.22TDF Infrastructure
SAS 15EUR 2.880%
900,000 1,035,765 0.4202.07.25Teleperformance18
EUR 1.875%
500,000 619,362 0.2531.12.99TOTAL SA 16 FRNEMTN
EUR 3.875%
300,000 363,429 0.1531.12.99TOTAL SA 16 FRNEMTN
EUR 3.369%
500,000 500,280 0.2012.09.23BPCE SA 18USD 4.000%500,000 505,270 0.2031.12.99Credit Agricole SA
14 FRNUSD 6.625%
500,000 499,940 0.2017.03.25Credit Agricole SA15
USD 4.380%
500,000 559,325 0.2331.12.99Credit Agricole SA16 FRN
USD 8.125%
6.2915,504,159Total - France
300,000 295,902 0.1224.01.22State Bank ofIndia/London3.250% 17-24.01.22 EMTN
USD 3.250%India
0.12295,902Total - India
2,300,000 2,726,468 1.1025.10.25Perusahaan ListrikNegara PT 18
EUR 2.875%Indonesia
900,000 929,628 0.3815.11.21Indonesia AsahanAluminium PerseroPT 18
USD 5.230%
1.483,656,096Total - Indonesia
1,000,000 1,155,371 0.4727.09.26Abbott IrelandFinancing DAC 18
EUR 1.500%Ireland
1,000,000 1,354,062 0.5522.02.27GE CapitalEuropean FundingUnlimited Co 07EMTN
EUR 4.625%
400,000 405,540 0.1615.05.21AerCap IrelandCapital DAC /AerCap GlobalAviation Trust 15
USD 4.500%
1,000,000 1,003,069 0.4101.02.22AerCap IrelandCapital DAC /AerCap GlobalAviation Trust 16
USD 3.950%
500,000 450,665 0.1821.07.27AerCap IrelandCapital DAC /AerCap GlobalAviation Trust 17
USD 3.650%
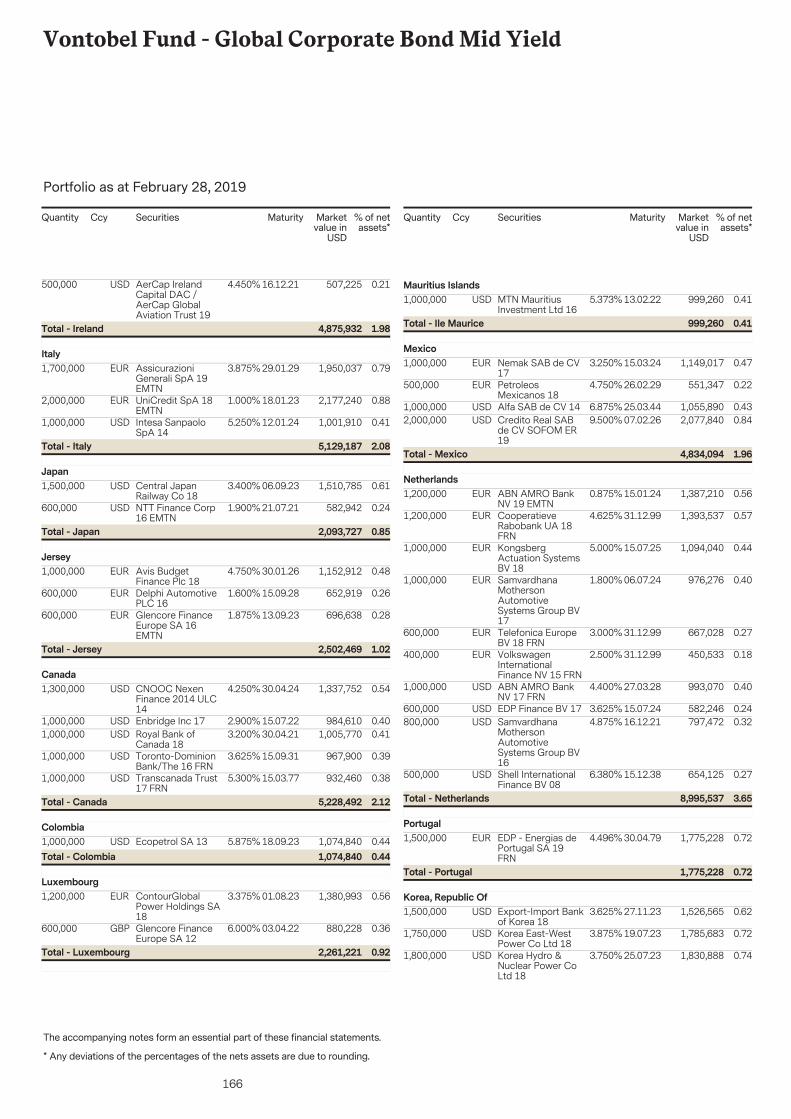
166
Vontobel Fund - Global Corporate Bond Mid Yield
The accompanying notes form an essential part of these financial statements.
Portfolio as at February 28, 2019
* Any deviations of the percentages of the nets assets are due to rounding.
Securities Marketvalue in
USD
% of netassets*
Quantity Ccy Maturity
500,000 507,225 0.2116.12.21AerCap IrelandCapital DAC /AerCap GlobalAviation Trust 19
USD 4.450%
1.984,875,932Total - Ireland
1,700,000 1,950,037 0.7929.01.29AssicurazioniGenerali SpA 19EMTN
EUR 3.875%Italy
2,000,000 2,177,240 0.8818.01.23UniCredit SpA 18EMTN
EUR 1.000%
1,000,000 1,001,910 0.4112.01.24Intesa SanpaoloSpA 14
USD 5.250%
2.085,129,187Total - Italy
1,500,000 1,510,785 0.6106.09.23Central JapanRailway Co 18
USD 3.400%Japan
600,000 582,942 0.2421.07.21NTT Finance Corp16 EMTN
USD 1.900%
0.852,093,727Total - Japan
1,000,000 1,152,912 0.4830.01.26Avis BudgetFinance Plc 18
EUR 4.750%Jersey
600,000 652,919 0.2615.09.28Delphi AutomotivePLC 16
EUR 1.600%
600,000 696,638 0.2813.09.23Glencore FinanceEurope SA 16EMTN
EUR 1.875%
1.022,502,469Total - Jersey
1,300,000 1,337,752 0.5430.04.24CNOOC NexenFinance 2014 ULC14
USD 4.250%Canada
1,000,000 984,610 0.4015.07.22Enbridge Inc 17USD 2.900%1,000,000 1,005,770 0.4130.04.21Royal Bank of
Canada 18USD 3.200%
1,000,000 967,900 0.3915.09.31Toronto-DominionBank/The 16 FRN
USD 3.625%
1,000,000 932,460 0.3815.03.77Transcanada Trust17 FRN
USD 5.300%
2.125,228,492Total - Canada
1,000,000 1,074,840 0.4418.09.23Ecopetrol SA 13USD 5.875%Colombia
0.441,074,840Total - Colombia
1,200,000 1,380,993 0.5601.08.23ContourGlobalPower Holdings SA18
EUR 3.375%Luxembourg
600,000 880,228 0.3603.04.22Glencore FinanceEurope SA 12
GBP 6.000%
0.922,261,221Total - Luxembourg
Securities Marketvalue in
USD
% of netassets*
Quantity Ccy Maturity
1,000,000 999,260 0.4113.02.22MTN MauritiusInvestment Ltd 16
USD 5.373%Mauritius Islands
0.41999,260Total - Ile Maurice
1,000,000 1,149,017 0.4715.03.24Nemak SAB de CV17
EUR 3.250%Mexico
500,000 551,347 0.2226.02.29PetroleosMexicanos 18
EUR 4.750%
1,000,000 1,055,890 0.4325.03.44Alfa SAB de CV 14USD 6.875%2,000,000 2,077,840 0.8407.02.26Credito Real SAB
de CV SOFOM ER19
USD 9.500%
1.964,834,094Total - Mexico
1,200,000 1,387,210 0.5615.01.24ABN AMRO BankNV 19 EMTN
EUR 0.875%Netherlands
1,200,000 1,393,537 0.5731.12.99CooperatieveRabobank UA 18FRN
EUR 4.625%
1,000,000 1,094,040 0.4415.07.25KongsbergActuation SystemsBV 18
EUR 5.000%
1,000,000 976,276 0.4006.07.24SamvardhanaMothersonAutomotiveSystems Group BV17
EUR 1.800%
600,000 667,028 0.2731.12.99Telefonica EuropeBV 18 FRN
EUR 3.000%
400,000 450,533 0.1831.12.99VolkswagenInternationalFinance NV 15 FRN
EUR 2.500%
1,000,000 993,070 0.4027.03.28ABN AMRO BankNV 17 FRN
USD 4.400%
600,000 582,246 0.2415.07.24EDP Finance BV 17USD 3.625%800,000 797,472 0.3216.12.21Samvardhana
MothersonAutomotiveSystems Group BV16
USD 4.875%
500,000 654,125 0.2715.12.38Shell InternationalFinance BV 08
USD 6.380%
3.658,995,537Total - Netherlands
1,500,000 1,775,228 0.7230.04.79EDP - Energias dePortugal SA 19FRN
EUR 4.496%Portugal
0.721,775,228Total - Portugal
1,500,000 1,526,565 0.6227.11.23Export-Import Bankof Korea 18
USD 3.625%Korea, Republic Of
1,750,000 1,785,683 0.7219.07.23Korea East-WestPower Co Ltd 18
USD 3.875%
1,800,000 1,830,888 0.7425.07.23Korea Hydro &Nuclear Power CoLtd 18
USD 3.750%

167
Vontobel Fund - Global Corporate Bond Mid Yield
The accompanying notes form an essential part of these financial statements.
Portfolio as at February 28, 2019
* Any deviations of the percentages of the nets assets are due to rounding.
Securities Marketvalue in
USD
% of netassets*
Quantity Ccy Maturity
1,100,000 1,105,093 0.4522.01.22Korea MidlandPower Co Ltd 19
USD 3.375%
2.536,248,229Total - Korea, Republic Of
1,200,000 1,235,688 0.5031.12.99Credit SuisseGroup AG 18 FRN
USD 7.500%Switzerland
0.501,235,688Total - Switzerland
1,000,000 1,083,245 0.4420.05.26AbertisInfraestructuras SA16
EUR 1.375%Spain
600,000 771,048 0.3131.12.99Banco BilbaoVizcaya ArgentariaSA 16 FRN
EUR 8.875%
1,000,000 1,123,703 0.4612.01.23CaixaBank SA 17EMTN
EUR 1.125%
1,000,000 1,195,271 0.4931.12.99CaixaBank SA 17FRN
EUR 6.750%
1,000,000 1,120,948 0.4528.09.27NorteGas EnergiaDistribucion SAU17 EMTN
EUR 2.065%
1,000,000 997,180 0.4011.04.22Banco SantanderSA 17
USD 3.500%
2.556,291,395Total - Spain
1,500,000 1,523,295 0.6102.11.47Abu Dhabi CrudeOil Pipeline LLC 17
USD 4.600%United Arab Emirates
1,500,000 1,469,535 0.6024.04.28Oztel Holdings SPCLtd 18
USD 6.625%
1.212,992,830Total - United Arab Emirates
500,000 564,801 0.2321.06.27AmericanInternational GroupInc 17
EUR 1.875%United States
1,000,000 1,154,596 0.4722.05.26American TowerCorp 18
EUR 1.950%
1,000,000 1,160,392 0.4715.12.26Becton Dickinsonand Co 16
EUR 1.900%
2,000,000 2,143,170 0.8717.05.29General Electric Co17
EUR 1.500%
500,000 574,263 0.2301.04.24General MotorsFinancial Co Inc 19EMTN
EUR 2.200%
1,000,000 1,142,332 0.4627.07.26Goldman SachsGroup Inc/The 16EMTN
EUR 1.625%
1,500,000 1,705,693 0.6923.10.26Morgan Stanley 17FRN EMTN
EUR 1.342%
1,000,000 1,193,062 0.4815.01.38VerizonCommunicationsInc 17
EUR 2.875%
1,000,000 1,301,676 0.5320.09.24DiscoveryCommunicationsLLC 17
GBP 2.500%
986,000 948,995 0.3828.04.26Amcor FinanceUSA Inc 16
USD 3.630%
3,000,000 3,105,179 1.2601.12.28American ElectricPower Co Inc 18
USD 4.300%
400,000 419,652 0.1701.06.22AmericanInternational GroupInc 12
USD 4.875%
Securities Marketvalue in
USD
% of netassets*
Quantity Ccy Maturity
1,000,000 980,620 0.4001.04.26AmericanInternational GroupInc 16
USD 3.900%
500,000 467,615 0.1901.05.45Amgen Inc 15USD 4.400%1,000,000 1,041,240 0.4223.01.29Anheuser-Busch
InBev WorldwideInc 19
USD 4.750%
2,000,000 1,966,220 0.8015.10.28Apache Corp 18USD 4.375%1,000,000 1,002,770 0.4117.02.26AT&T Inc 16USD 4.125%1,500,000 1,460,070 0.5915.02.50AT&T Inc 18USD 5.150%1,000,000 1,000,300 0.4121.04.25Bank of America
Corp 15USD 3.950%
500,000 498,085 0.2025.11.27Bank of AmericaCorp 16
USD 4.183%
1,000,000 995,940 0.4020.01.23Bank of AmericaCorp 17 FRN
USD 3.124%
1,000,000 1,016,910 0.4123.07.24Bank of AmericaCorp 18 FRN
USD 3.864%
1,640,000 1,576,516 0.6415.08.24BAT Capital Corp18
USD 3.222%
2,000,000 2,049,160 0.8321.09.25BP Capital MarketsAmerica Inc 18
USD 3.796%
500,000 538,610 0.2201.09.45Burlington NorthernSanta Fe LLC 15
USD 4.700%
1,500,000 1,428,675 0.5828.07.26Capital OneFinancial Corp 16
USD 3.750%
1,000,000 1,015,770 0.4130.04.25Capital OneFinancial Corp 18
USD 4.250%
1,500,000 1,525,965 0.6223.01.24Citibank NA 19USD 3.650%1,000,000 1,080,990 0.4413.09.25Citigroup Inc 13USD 5.500%2,000,000 1,965,160 0.8027.10.22Citigroup Inc 17USD 2.700%500,000 492,595 0.2024.07.23Citigroup Inc 17
FRNUSD 2.876%
2,000,000 2,047,340 0.8301.06.24Citigroup Inc 18FRN
USD 4.044%
300,000 342,453 0.1415.06.35Comcast Corp 05USD 5.650%1,500,000 1,548,285 0.6315.10.38Comcast Corp 18USD 4.600%2,000,000 1,944,120 0.7901.10.27Concho Resources
Inc 17USD 3.750%
1,000,000 958,017 0.3904.04.28CRH AmericaFinance Inc 18
USD 3.950%
1,000,000 1,001,020 0.4120.07.25CVS Health Corp15
USD 3.880%
2,200,000 2,213,002 0.9009.03.23CVS Health Corp18
USD 3.700%
1,000,000 1,001,470 0.4125.03.28CVS Health Corp18
USD 4.300%
1,000,000 953,220 0.3920.03.28DiscoveryCommunicationsLLC 17
USD 3.950%
500,000 472,470 0.1920.09.47DiscoveryCommunicationsLLC 17
USD 5.200%
400,000 407,258 0.1715.10.20Enbridge EnergyPartners LP 15
USD 4.380%
2,000,000 2,042,660 0.8315.09.23Energy TransferPartners LP 18
USD 4.200%
650,000 660,010 0.2715.02.25EnterpriseProducts OperatingLLC 14
USD 3.750%
2,000,000 1,995,640 0.8115.07.28EQM MidstreamPartners LP 18
USD 5.500%
1,500,000 1,513,395 0.6115.07.23EQT MidstreamPartners LP 18
USD 4.750%
400,000 393,828 0.1609.05.23General MotorsFinancial Co Inc 16
USD 3.700%

168
Vontobel Fund - Global Corporate Bond Mid Yield
The accompanying notes form an essential part of these financial statements.
Portfolio as at February 28, 2019
* Any deviations of the percentages of the nets assets are due to rounding.
Securities Marketvalue in
USD
% of netassets*
Quantity Ccy Maturity
1,500,000 1,500,060 0.6109.04.21General MotorsFinancial Co Inc 18
USD 3.550%
800,000 810,536 0.3306.11.21General MotorsFinancial Co Inc 18
USD 4.200%
1,000,000 942,110 0.3827.10.27Glencore FundingLLC 17
USD 3.875%
450,000 538,061 0.2201.10.37Goldman SachsGroup Inc/The 07
USD 6.750%
700,000 693,091 0.2825.04.21Goldman SachsGroup Inc/The 16
USD 2.630%
1,250,000 1,214,125 0.4929.09.25Goldman SachsGroup Inc/The 17FRN
USD 3.272%
2,000,000 2,013,540 0.8205.10.21Hewlett PackardEnterprise Co 18
USD 3.500%
600,000 625,818 0.2515.03.45Home DepotInc/The 14
USD 4.400%
500,000 530,850 0.2206.12.48Home DepotInc/The 18
USD 4.500%
250,000 249,950 0.1018.03.19Hyundai CapitalAmerica 16 EMTN
USD 2.500%
1,400,000 1,401,988 0.5708.07.21Hyundai CapitalAmerica 18
USD 3.750%
400,000 402,724 0.1623.09.22JPMorgan Chase &Co 12
USD 3.250%
400,000 399,896 0.1601.05.23JPMorgan Chase &Co 13
USD 3.380%
2,000,000 2,030,700 0.8223.07.24JPMorgan Chase &Co 18 FRN
USD 3.797%
3,000,000 2,825,460 1.1515.11.27Kellogg Co 17USD 3.400%1,000,000 1,026,720 0.4201.06.25Kinder Morgan
Inc/DE 14USD 4.300%
1,500,000 1,416,555 0.5701.06.24Macy's RetailHoldings Inc 14
USD 3.625%
590,000 482,827 0.2015.12.34Macy's RetailHoldings Inc 14
USD 4.500%
1,000,000 969,000 0.3913.08.42MetLife Inc 12USD 4.125%400,000 408,804 0.1710.04.24MetLife Inc 14USD 3.600%400,000 393,780 0.1612.02.45Microsoft Corp 15USD 3.750%1,500,000 1,632,855 0.6606.02.57Microsoft Corp 17USD 4.500%400,000 418,700 0.1701.11.22Morgan Stanley 12USD 4.880%400,000 402,180 0.1623.10.24Morgan Stanley 14USD 3.700%1,000,000 973,130 0.3922.07.28Morgan Stanley 17
FRNUSD 3.591%
300,000 282,939 0.1113.08.42PepsiCo Inc 12USD 3.600%1,000,000 1,039,040 0.4215.06.43Prudential Financial
Inc 12 FRNUSD 5.625%
2,000,000 2,166,500 0.8815.05.24Sabine PassLiquefaction LLC14
USD 5.750%
1,000,000 974,600 0.4015.02.27Time Warner Inc 16USD 3.800%2,500,000 2,543,825 1.0315.12.26Valero Energy
Partners LP 16USD 4.375%
927,000 958,527 0.3921.09.28VerizonCommunicationsInc 18
USD 4.329%
300,000 332,268 0.1301.08.35Wachovia Corp 05USD 5.500%1,000,000 954,430 0.3923.10.26Wells Fargo & Co
16USD 3.000%
500,000 490,950 0.2022.07.22Wells Fargo & Co17
USD 2.625%
2,000,000 2,005,880 0.8123.07.21Wells Fargo BankNA 18 FRN
USD 3.325%
37.7593,063,629Total - United States
Securities Marketvalue in
USD
% of netassets*
Quantity Ccy Maturity
700,000 801,099 0.3211.11.25Barclays PLC 15FRN EMTN
EUR 2.630%United Kingdom
1,000,000 1,111,303 0.4514.11.23Barclays PLC 17FRN EMTN
EUR 0.625%
500,000 562,876 0.2316.11.24Titan GlobalFinance PLC 17
EUR 2.375%
500,000 693,281 0.2831.12.99Barclays PLC 17FRN
GBP 7.250%
1,000,000 1,314,192 0.5316.08.28HSBC HoldingsPLC
GBP 2.630%
1,500,000 2,285,364 0.9428.09.26Imperial BrandsFinance PLC 11EMTN
GBP 5.500%
400,000 533,838 0.2231.12.99Legal & GeneralGroup PLC 04 FRNEMTN
GBP 5.875%
800,000 1,140,492 0.4627.10.45Legal & GeneralGroup PLC 15 FRNEMTN
GBP 5.380%
350,000 479,683 0.1902.12.19Marks & SpencerPLC 09 EMTN
GBP 6.125%
2,000,000 2,052,680 0.8414.05.25Anglo AmericanCapital PLC 15
USD 4.875%
1,000,000 989,730 0.4010.01.23Barclays PLC 17USD 3.684%1,500,000 1,510,980 0.6125.06.24Royal Bank of
Scotland GroupPLC 18 FRN
USD 4.519%
400,000 390,312 0.1615.09.25Santander UKGroup HoldingsPLC 15 EMTN
USD 4.750%
1,500,000 1,485,450 0.6015.03.24StandardChartered PLC 18FRN
USD 3.885%
500,000 499,985 0.2017.04.19State Bank ofIndia/London 14
USD 3.620%
1,500,000 1,503,030 0.6130.05.25Vodafone GroupPLC 18
USD 4.125%
81.45200,801,962Total - Transferable securities admitted to anofficial exchange
81.45200,801,962Total - Bonds
7.0417,354,295Total - United Kingdom
500,000 547,550 0.2219.10.75BHP BillitonFinance USA Ltd15 FRN
USD 6.750%
Transferable securities and money market instruments dealt in on anotherregulated marketBondsAustralia
0.22547,550Total - Australia
1,000,000 1,024,910 0.4215.05.24Avolon HoldingsFunding Ltd 19
USD 5.250%Cayman Islands
0.421,024,910Total - Cayman Islands
450,000 463,244 0.1915.01.22Pernod Ricard SA11
USD 4.450%France
0.19463,244Total - France

169
Vontobel Fund - Global Corporate Bond Mid Yield
The accompanying notes form an essential part of these financial statements.
Portfolio as at February 28, 2019
* Any deviations of the percentages of the nets assets are due to rounding.
Securities Marketvalue in
USD
% of netassets*
Quantity Ccy Maturity
800,000 835,016 0.3412.11.24Israel Electric CorpLtd 14
USD 5.000%Israel
0.34835,016Total - Israel
1,000,000 949,730 0.3914.07.22Intesa SanpaoloSpA 17
USD 3.125%Italy
1,500,000 1,535,175 0.6114.01.22UniCredit SpA 19EMTN
USD 6.572%
1.002,484,905Total - Italy
400,000 426,628 0.1715.01.35Fideicomiso PAPacifico Tres 16
USD 8.250%Colombia
0.17426,628Total - Colombia
1,000,000 1,007,740 0.4127.08.21ABN AMRO BankNV 18 EMTN
USD 3.400%Netherlands
1,100,000 1,101,518 0.4531.12.99ING Groep NV 19FRN
USD 6.750%
0.862,109,258Total - Netherlands
2,000,000 2,122,800 0.8614.07.26Suzano AustriaGmbH 16
USD 5.750%Austria
0.862,122,800Total - Austria
2,000,000 1,936,260 0.7914.12.23Credit SuisseGroup AG 17 FRN
USD 2.997%Switzerland
0.791,936,260Total - Switzerland
1,750,000 2,052,567 0.8305.09.26AT&T Inc 18EUR 1.800%United States
1,500,000 1,522,830 0.6215.08.53Allstate Corp/The13 FRN
USD 5.750%
400,000 405,352 0.1615.05.28Amcor FinanceUSA Inc 18
USD 4.500%
1,200,000 1,184,148 0.4801.02.26Anheuser-BuschCos LLC /Anheuser-BuschInBev WorldwideInc 18
USD 3.650%
4,000,000 3,985,479 1.6101.03.29AT&T Inc 19USD 4.350%2,000,000 2,000,340 0.8101.03.29Boston Scientific
Corp 19USD 4.000%
1,500,000 1,596,630 0.6531.03.25Cheniere CorpusChristi HoldingsLLC 17
USD 5.875%
1,000,000 929,090 0.3809.05.27CRH AmericaFinance Inc 17
USD 3.400%
900,000 883,341 0.3618.05.25CRH America Inc15
USD 3.880%
1,500,000 1,576,515 0.6415.06.23Diamond 1 FinanceCorp / Diamond 2Finance Corp 16
USD 5.450%
1,000,000 1,143,550 0.4615.07.36Diamond 1 FinanceCorp / Diamond 2Finance Corp 16
USD 8.100%
Securities Marketvalue in
USD
% of netassets*
Quantity Ccy Maturity
1,400,000 1,519,821 0.6215.07.44FirstEnergyTransmission LLC14
USD 5.450%
500,000 519,705 0.2125.01.29Fox Corp 19USD 4.709%500,000 523,970 0.2101.02.29HCA Inc 19USD 5.875%500,000 538,750 0.2201.12.86Wells Fargo Capital
X 06USD 5.950%
13.1132,332,659Total - Transferable securities and money marketinstruments dealt in on another regulated market
13.1132,332,659Total - Bonds
8.2620,382,088Total - United States
1,600,000 1,606,640 0.6515.05.28Mid-AtlanticInterstateTransmission LLC18
USD 4.100%
Other transferable securitiesBondsUnited States
0.651,606,640Total - Bonds
0.651,606,640Total - United States
13,000 1,965,470 0.80Vontobel Fund -Emerging MarketsCorporate Bond - I
USD
Investment fundsLuxembourg
1.453,572,110Total - Other transferable securities
0.801,965,470Total - Investment funds
0.801,965,470Total - Luxembourg
96.01236,706,731Total - Investment in securities

170
Vontobel Fund - Emerging Markets Blend
AssetsInvestments in securities at market value 122,649,353(2)
18,679,680Cash at banks
26,228Receivable from subscriptions
2,509,642Interest and dividends receivable(2)
370,791Unrealised gain on forward foreign exchange contracts(9)
Total Assets 144,235,694
121,822,315Statement of Net Assetsas at February 28, 2019
LiabilitiesBank overdraft 15,309,700
Provision for expenses 14
Payable for redemptions 1,706
Payable for investments purchased 1,000,100
Unrealised loss on futures 123,797(9)
Audit fees, printing and publishing expenses 1,607
Service Fee payable 20,688(5)
Subscription tax payable 2,058(4)
Management Fee payable 38,825(3)
Other liabilities -391Total Liabilities 16,498,104Total net assets at the end of the period 127,737,590Net assets at the beginning of the reporting period 64,181,954
Net investment income 2,601,112
Change in unrealised appreciation/depreciation on:
Investments 5,458,731
Futures -54,567
Forward foreign exchange contracts 1,114,039
Net realised gain/loss on investments -1,136,978(2)
Net realised gain/loss on forward foreign exchange contracts 22,479(2)
Net realised gain/loss on currency exchange -75,766(2)
Net realised gain/loss on futures -58,069(2)
Increase/Decrease in net assets resulting from operations 7,870,981Subscriptions of shares 131,417,669
Redemptions of shares -75,733,014Total net assets at the end of the period 127,737,590
Statement of Operations andChanges in Net Assetsfrom September 1, 2018to February 28, 2019
Notes USDThe accompanying notes form an essential part of these financial statements.
Cost

171
Vontobel Fund - Emerging Markets Blend
IncomeBank interest 60,915
Net interest on bonds 2,876,412(2)
Net dividends 96,498Total Income 3,033,825ExpensesManagement Fees 208,677(3)
Audit fees, printing and publishing expenses 4,124
Subscription tax 5,211(4)
Bank interest 47,135
Service Fees 92,022(5)
Other Fees payable 75,544(8)
Total Expenses 432,713Net investment income 2,601,112
Statement of Net Incomefrom September 1, 2018to February 28, 2019
Notes USDThe accompanying notes form an essential part of these financial statements.

172
Vontobel Fund - Emerging Markets Blend
The accompanying notes form an essential part of these financial statements.
Portfolio as at February 28, 2019
* Any deviations of the percentages of the nets assets are due to rounding.
Securities Marketvalue in
USD
% of netassets*
Quantity Ccy Maturity
200,000 214,422 0.1708.05.48AngolanGovernmentInternational Bond18
USD 9.375%
Transferable securities admitted to an official exchangeBondsAngola
0.17214,422Total - Angola
1,000,000 1,104,493 0.8616.04.26Egypt GovernmentInternational Bond18 EMTN
EUR 4.750%Egypt
2,800,000 3,019,377 2.3716.04.30Egypt GovernmentInternational Bond18 EMTN
EUR 5.625%
3.234,123,870Total - Egypt
3,750,000 515,348 0.4031.12.45Argentine RepublicGovernmentInternational Bond05
ARS 3.310%Argentina
64,000,000 2,337,277 1.8206.03.20Bonos de la NacionArgentina conAjuste por CER 18
ARS 4.000%
500,000 327,621 0.2631.12.38Argentine RepublicGovernmentInternational Bond03
EUR 2.260%
1,120,000 747,619 0.5931.12.38Argentine RepublicGovernmentInternational Bond05
EUR 2.260%
193,750 275,569 0.2231.12.33Argentine RepublicGovernmentInternational Bond10
EUR 7.820%
1,000,000 893,196 0.7015.01.27Argentine RepublicGovernmentInternational Bond16
EUR 5.000%
200,000 176,692 0.1415.01.28Argentine RepublicGovernmentInternational Bond17
EUR 5.250%
500,000 391,343 0.3115.05.35Provincia deBuenosAires/Argentina 06
EUR 4.000%
2,000,000 1,971,021 1.5420.01.23Provincia deBuenosAires/Argentina 17
EUR 5.375%
5.987,635,686Total - Argentina
400,000 412,716 0.3216.01.24BahamasGovernmentInternational Bond14
USD 5.750%Bahamas
0.32412,716Total - Bahamas
150,000 38,060 0.0315.11.26Petroleos deVenezuela SA 13
USD 6.000%Venezuela, Bolivarian Republic Of
Securities Marketvalue in
USD
% of netassets*
Quantity Ccy Maturity
1,015,000 257,160 0.2016.05.24Petroleos deVenezuela SA 14
USD 6.000%
0.23295,220Total - Venezuela, Bolivarian Republic Of
1,000,000 887,800 0.7031.12.99Baoxin AutoFinance I Ltd 17FRN
USD 5.625%British Virgin Islands
500,000 516,120 0.4018.04.21RKPF Overseas2019 B Ltd 19
USD 7.750%
1.101,403,920Total - British Virgin Islands
500,000 462,560 0.3614.08.22eHi Car ServicesLtd 17
USD 5.875%Cayman Islands
200,000 26,510 0.0227.06.29Odebrecht FinanceLtd 14
USD 5.250%
0.38489,070Total - Cayman Islands
1,250,000 1,171,113 0.9230.04.25Empresa ElectricaGuacolda SA 15
USD 4.560%Chile
0.921,171,113Total - Chile
3,750,000 4,087,577 3.2022.03.30Ivory CoastGovernmentInternational Bond18
EUR 5.250%Ivory Coast
1,000,000 1,071,585 0.8422.03.48Ivory CoastGovernmentInternational Bond18
EUR 6.625%
4.045,159,162Total - Ivory Coast
300,000 310,017 0.2402.06.23EcuadorGovernmentInternational Bond17
USD 8.750%Ecuador
200,000 218,510 0.1731.01.29EcuadorGovernmentInternational Bond19
USD 10.750%
0.41528,527Total - Ecuador
1,050,000 1,261,092 0.9914.10.30Ghana GovernmentInternational Bond15
USD 10.750%Ghana
1,500,000 1,457,235 1.1416.05.29Ghana GovernmentInternational Bond18
USD 7.625%
2.132,718,327Total - Ghana
1,000,000 1,299,177 1.0214.06.28IndonesiaGovernmentInternational Bond16 EMTN
EUR 3.750%Indonesia

173
Vontobel Fund - Emerging Markets Blend
The accompanying notes form an essential part of these financial statements.
Portfolio as at February 28, 2019
* Any deviations of the percentages of the nets assets are due to rounding.
Securities Marketvalue in
USD
% of netassets*
Quantity Ccy Maturity
1,700,000 1,953,811 1.5324.04.25IndonesiaGovernmentInternational Bond18
EUR 1.750%
1,400,000 1,659,589 1.3025.10.25Perusahaan ListrikNegara PT 18
EUR 2.875%
28,000,000,000 1,896,309 1.4811.12.20Jasa Marga PerseroTbk PT 17
IDR 7.500%
5.336,808,886Total - Indonesia
1,800,000 2,073,252 1.6220.02.24Credit Bank ofMoscow Via CBOMFinance PLC 19
EUR 5.150%Ireland
700,000 1,129,220 0.8825.03.31Russian RailwaysVia RZD CapitalPLC 11
GBP 7.487%
2,600,000 2,198,306 1.7330.11.26Saderea DAC 14EMTN
USD 12.500%
500,000 511,360 0.4031.12.99Tinkoff CreditSystems Via TCSFinance Ltd 17 FRN
USD 9.250%
4.635,912,138Total - Ireland
2,350,000 210,704 0.1615.02.23CooperativaMuratori &Cementisti-CMC diRavenna SC 17
EUR 6.000%Italy
0.16210,704Total - Italy
500,000 491,035 0.3801.04.23First QuantumMinerals Ltd 17
USD 7.250%Canada
1,315,000 1,349,006 1.0625.06.23Frontera EnergyCorp 18
USD 9.700%
1.441,840,041Total - Canada
2,000,000 2,084,922 1.6320.06.22Kazakhstan TemirZholy National CoJSC 14
CHF 3.638%Kazakhstan
1,000,000 1,035,434 0.8105.12.23Kazakhstan TemirZholy National CoJSC 18
CHF 3.250%
450,000 521,152 0.4109.11.28KazakhstanGovernmentInternational Bond18 EMTN
EUR 2.375%
2.853,641,508Total - Kazakhstan
100,000 152,280 0.1228.01.33ColombiaGovernmentInternational Bond03
USD 10.380%Colombia
200,000 232,614 0.1815.02.27ColombiaGovernmentInternational Bond97
USD 8.375%
0.30384,894Total - Colombia
Securities Marketvalue in
USD
% of netassets*
Quantity Ccy Maturity
988,000 529,400 0.4130.06.29CongoleseInternational Bond07
USD 6.000%Congo
0.41529,400Total - Congo
3,300,000 920,419 0.7216.07.32Swiss InsuredBrazil PowerFinance Sarl 18
BRL 9.850%Luxembourg
387,000 388,908 0.3021.07.20CSN Resources SA10
USD 6.500%
1,000,000 858,460 0.6724.01.26Puma InternationalFinancing SA 18
USD 5.000%
250,000 251,270 0.2026.07.22Topaz Marine SA17
USD 9.125%
1.892,419,057Total - Luxembourg
500,000 495,329 0.3921.04.27PetroleosMexicanos 15EMTN
EUR 2.750%Mexico
250,000 273,160 0.2124.11.25PetroleosMexicanos 18
EUR 3.625%
500,000 539,562 0.4224.08.23PetroleosMexicanos 18 FRN
EUR 2.090%
1,150,000 1,527,611 1.2019.03.14MexicoGovernmentInternational Bond14 EMTN
GBP 5.625%
1,700,000 1,766,163 1.3907.02.26Credito Real SABde CV SOFOM ER19
USD 9.500%
400,000 374,704 0.2911.10.22Docuformas SAPIde CV 17
USD 9.250%
260,000 247,146 0.1901.06.20Grupo Famsa SABde CV 13
USD 7.250%
1,000,000 806,600 0.6314.01.48InfraestructuraEnergetica NovaSAB de CV 17
USD 4.875%
3,000,000 2,991,359 2.3504.02.26PetroleosMexicanos 17
USD 6.875%
1,250,000 1,122,750 0.8815.01.25Unifin FinancieraSAB de CV SOFOMENR 17
USD 7.000%
7.9510,144,384Total - Mexico
3,500,000 3,350,375 2.6229.10.25NamibiaInternational Bonds15
USD 5.250%Namibia
2.623,350,375Total - Namibia
735,000 604,317 0.4714.05.22Ajecorp BV 12USD 6.500%Netherlands
500,000 449,275 0.3517.07.24CIMPOR FinancialOperations BV 14
USD 5.750%
0.821,053,592Total - Netherlands

174
Vontobel Fund - Emerging Markets Blend
The accompanying notes form an essential part of these financial statements.
Portfolio as at February 28, 2019
* Any deviations of the percentages of the nets assets are due to rounding.
Securities Marketvalue in
USD
% of netassets*
Quantity Ccy Maturity
350,000 349,752 0.2723.02.30NigeriaGovernmentInternational Bond18
USD 7.143%Nigeria
0.27349,752Total - Nigeria
2,000,000 1,876,560 1.4708.03.27Oman GovernmentInternational Bond17
USD 5.375%Oman
200,000 177,546 0.1408.03.47Oman GovernmentInternational Bond17
USD 6.500%
400,000 362,832 0.2817.01.48Oman GovernmentInternational Bond18
USD 6.750%
1.892,416,938Total - Oman
300,000 405,231 0.3228.04.34PanamaGovernmentInternational Bond04
USD 8.125%Panama
0.32405,231Total - Panama
1,700,000 1,940,339 1.5211.03.39RomanianGovernmentInternational Bond18 EMTN
EUR 4.125%Romania
1.521,940,339Total - Romania
1,000,000 784,810 0.6220.09.22ZambiaGovernmentInternational Bond12
USD 5.375%Zambia
413,000 336,946 0.2614.04.24ZambiaGovernmentInternational Bond14
USD 8.500%
0.881,121,756Total - Zambia
1,000,000 1,048,230 0.8216.01.50Saudi GovernmentInternational Bond19
USD 5.250%Saudi Arabia
0.821,048,230Total - Saudi Arabia
1,600,000 1,777,720 1.3913.03.28SenegalGovernmentInternational Bond18
EUR 4.750%Senegal
1.391,777,720Total - Senegal
500,000 357,977 0.2801.01.26SeychellesInternational Bond10
USD 8.000%Seychelles Islands
0.28357,977Total - Seychelles Islands
Securities Marketvalue in
USD
% of netassets*
Quantity Ccy Maturity
1,800,000 1,317,546 1.0311.04.22Theta Capital PteLtd 14
USD 7.000%Singapore
1.031,317,546Total - Singapore
1,000,000 1,006,320 0.7915.12.28AI Candelaria SpainSLU 18
USD 7.500%Spain
0.791,006,320Total - Spain
500,000 505,615 0.4006.08.23Eskom HoldingsSOC Ltd 13 EMTN
USD 6.750%South Africa
0.40505,615Total - South Africa
2,000,000 1,859,640 1.4614.09.27Republic ofTajikistanInternational Bond17
USD 7.125%Tadzhikistan
1.461,859,640Total -Tadzhikistan
17,000,000 1,114,677 0.8726.11.57Czech RepublicGovernment Bond07
CZK 4.850%Czech Republic
1,000,000 1,232,711 0.9705.06.28CEZ AS 13 EMTNEUR 3.000%1.842,347,388Total - Czech Republic
1,500,000 1,758,284 1.3816.02.26Turkey GovernmentInternational Bond18
EUR 5.200%Turkey
1,700,000 1,956,773 1.5331.03.25Turkey GovernmentInternational Bond19
EUR 4.625%
750,000 737,963 0.5814.11.21Global LimanIsletmeleri 14
USD 8.125%
4,100,000 3,451,256 2.7026.04.23RonesansGayrimenkulYatirim AS 18
USD 7.250%
500,000 457,265 0.3611.02.21Turkiye HalkBankasi AS 15
USD 4.750%
300,000 262,386 0.2129.06.28Turkiye Is BankasiAS 17 FRN
USD 7.000%
800,000 714,376 0.5629.03.27Turkiye SinaiKalkinma BankasiAS 17 FRN
USD 7.625%
400,000 375,684 0.2930.01.23Turkiye VakiflarBankasi TAO 18EMTN
USD 5.750%
7.619,713,987Total - Turkey
3,000,000 3,218,069 2.5217.02.24Banque Centralede TunisieInternational Bond17
EUR 5.625%Tunisia
2.523,218,069Total - Tunisia

175
Vontobel Fund - Emerging Markets Blend
The accompanying notes form an essential part of these financial statements.
Portfolio as at February 28, 2019
* Any deviations of the percentages of the nets assets are due to rounding.
Securities Marketvalue in
USD
% of netassets*
Quantity Ccy Maturity
1,000,000 945,530 0.7401.09.24UkraineGovernmentInternational Bond15
USD 7.750%Ukraine
750,000 693,938 0.5401.09.26UkraineGovernmentInternational Bond15
USD 7.750%
1,000,000 1,004,750 0.7901.11.28UkraineGovernmentInternational Bond18
USD 9.750%
2.072,644,218Total - Ukraine
1,000,000 1,200,190 0.9402.05.24Abu Dhabi NationalEnergy Co PJSC 14EMTN
EUR 2.750%United Arab Emirates
700,000 730,709 0.5723.04.30Abu Dhabi NationalEnergy Co PJSC 18
USD 4.875%
1.511,930,899Total - United Arab Emirates
6,750,000,000 485,549 0.3814.03.23Inter-AmericanDevelopment Bank16 EMTN
IDR 7.875%United States
0.38485,549Total - United States
1,795,000 1,763,911 1.3822.01.25Ukreximbank ViaBiz Finance PLC 15
USD 9.750%United Kingdom
1.381,763,911Total - United Kingdom
925,000 723,628 0.5727.09.21O1 PropertiesFinance PLC 16
USD 8.250%Cyprus
76.2497,381,725Total - Transferable securities admitted to anofficial exchange
76.2497,381,725Total - Bonds
0.57723,628Total - Cyprus
59,600,000 1,021,349 0.8109.05.22YPF SA 17 EMTNARS 16.500%
Transferable securities and money market instruments dealt in on anotherregulated marketBondsArgentina
770,000 573,950 0.4529.09.24City of CordobaArgentina 16
USD 7.875%
500,000 398,745 0.3108.02.25Provincia de EntreRios Argentina 17
USD 8.750%
500,000 415,120 0.3224.02.25Provincia de laRioja 17
USD 9.750%
1.892,409,164Total - Argentina
3,000,000 519,990 0.4128.10.22Petroleos deVenezuela SA 14
USD 6.000%Venezuela, Bolivarian Republic Of
0.41519,990Total - Venezuela, Bolivarian Republic Of
Securities Marketvalue in
USD
% of netassets*
Quantity Ccy Maturity
930,000 739,796 0.5815.04.24Autopistas delNordeste CaymanLtd 06
USD 9.390%Cayman Islands
1,550,000 1,537,926 1.2026.02.24Yuzhou PropertiesCo Ltd 19
USD 8.500%
1.782,277,722Total - Cayman Islands
250,000 263,563 0.2106.11.29Empresa Nacionaldel Petroleo 18
USD 5.250%Chile
1,500,000 1,526,790 1.1929.01.25Engie Energia ChileSA 14
USD 4.500%
1.401,790,353Total - Chile
2,650,000 2,684,636 2.0913.01.22Oilflow SPV 1 DAC17
USD 12.000%Ireland
2.092,684,636Total - Ireland
1,187,500 1,182,014 0.9305.07.23ShaMaranPetroleum Corp 18
USD 12.000%Canada
0.931,182,014Total - Canada
900,000 803,151 0.6327.07.22Credivalores-Crediservicios SAS17
USD 9.750%Colombia
1,550,000 1,588,750 1.2415.01.34Fideicomiso PACostera 16
USD 6.750%
3,000,000 3,199,709 2.5015.01.35Fideicomiso PAPacifico Tres 16
USD 8.250%
4.375,591,610Total - Colombia
1,590,000 1,628,551 1.2720.08.21Andrade GutierrezInternational SA 18
USD 11.000%Luxembourg
1.271,628,551Total - Luxembourg
1,000,000 1,030,600 0.8115.06.26EquisarInternational Inc 11
USD 6.628%Malaysia
0.811,030,600Total - Malaysia
400,000 421,287 0.3315.03.15MexicoGovernmentInternational Bond15
EUR 4.000%Mexico
0.33421,287Total - Mexico
600,000 636,018 0.5015.01.29Suzano AustriaGmbH 19
USD 6.000%Austria
0.50636,018Total - Austria
291,000 303,114 0.2411.05.36AeropuertoInternacional deTocumen SA 16
USD 5.625%Panama

176
Vontobel Fund - Emerging Markets Blend
The accompanying notes form an essential part of these financial statements.
Portfolio as at February 28, 2019
* Any deviations of the percentages of the nets assets are due to rounding.
Securities Marketvalue in
USD
% of netassets*
Quantity Ccy Maturity
400,000 407,992 0.3214.05.24Promerica FinancialCorp 18
USD 9.700%
0.56711,106Total - Panama
413,000 399,776 0.3126.10.26Republic ofSuriname 16
USD 9.250%EN-Suriname
0.31399,776EN-Total - Surinam
1,730,000 1,080,783 0.8506.05.20Yasar Holding AS14
USD 8.875%Turkey
0.851,080,783Total - Turkey
30,000,000 214,287 0.1717.03.31Banque Centralede Tunisie SA 01
JPY 4.200%Tunisia
0.17214,287Total - Tunisia
800,000 786,678 0.6227.03.22Aabar InvestmentsPJSC 15 EMTN
EUR 1.000%United Arab Emirates
18.2923,364,575Total - Transferable securities and money marketinstruments dealt in on another regulated market
18.2923,364,575Total - Bonds
0.62786,678Total - United Arab Emirates
1,000,000 1,000,000 0.7906.03.24HKN Energy Ltd 19USD 11.000%
Other transferable securitiesBondsCayman Islands
0.791,000,000Total - Cayman Islands
800,000 798,168 0.6222.05.19Costa RicaGovernmentInternational Bond16
USD 4.370%Costa Rica
0.62798,168Total - Costa Rica
200,000 104,885 0.0820.08.20JP MorganStructuredProducts BV 15EMTN
USD 6.250%Netherlands
1.491,903,053Total - Other transferable securities
1.491,903,053Total - Bonds
0.08104,885Total - Netherlands
96.02122,649,353Total - Investment in securities

177
Vontobel Fund - Emerging Markets Corporate Bond
AssetsInvestments in securities at market value 239,759,122(2)
6,630,561Cash at banks
844Receivable from foreign currencies
565,925Receivable from subscriptions
3,795,837Interest and dividends receivable(2)
1,757,522Receivable for investments sold
91,134Unrealised gain on forward foreign exchange contracts(9)
4,164Unrealised gain on futures(9)
Total Assets 252,605,109
238,025,307Statement of Net Assetsas at February 28, 2019
LiabilitiesBank overdraft 1,841,389
Provision for expenses 33
Payable for redemptions 3,731
Payable for investments purchased 6,896,831
Payable on foreign currencies 844
Audit fees, printing and publishing expenses 11,726
Service Fee payable 35,130(5)
Subscription tax payable 5,591(4)
Management Fee payable 102,176(3)
Other liabilities 2,781Total Liabilities 8,900,232Total net assets at the end of the period 243,704,877Net assets at the beginning of the reporting period 151,511,891
Net investment income 6,071,122
Change in unrealised appreciation/depreciation on:
Investments 8,760,166
Futures 49,138
Forward foreign exchange contracts 95,343
Net realised gain/loss on investments 485,116(2)
Net realised gain/loss on forward foreign exchange contracts -396,765(2)
Net realised gain/loss on currency exchange -165,771(2)
Net realised gain/loss on futures -58,759(2)
Increase/Decrease in net assets resulting from operations 14,839,590Subscriptions of shares 146,332,975
Redemptions of shares -68,979,579Total net assets at the end of the period 243,704,877
Statement of Operations andChanges in Net Assetsfrom September 1, 2018to February 28, 2019
Notes USDThe accompanying notes form an essential part of these financial statements.
Cost

178
Vontobel Fund - Emerging Markets Corporate Bond
IncomeBank interest 34,407
Net interest on bonds 6,491,509(2)
Net dividends 316,106Total Income 6,842,022ExpensesManagement Fees 499,725(3)
Audit fees, printing and publishing expenses 10,220
Subscription tax 12,485(4)
Bank interest 7,894
Service Fees 183,443(5)
Other Fees payable 57,133(8)
Total Expenses 770,900Net investment income 6,071,122
Statement of Net Incomefrom September 1, 2018to February 28, 2019
Notes USDThe accompanying notes form an essential part of these financial statements.

179
Vontobel Fund - Emerging Markets Corporate Bond
The accompanying notes form an essential part of these financial statements.
Portfolio as at February 28, 2019
* Any deviations of the percentages of the nets assets are due to rounding.
Securities Marketvalue in
USD
% of netassets*
Quantity Ccy Maturity
1,500,000 982,863 0.4031.12.38Argentine RepublicGovernmentInternational Bond03
EUR 2.260%
Transferable securities admitted to an official exchangeBondsArgentina
1,000,000 667,517 0.2731.12.38Argentine RepublicGovernmentInternational Bond05
EUR 2.260%
200,000 284,458 0.1231.12.33Argentine RepublicGovernmentInternational Bond10
EUR 7.820%
1,000,000 782,685 0.3215.05.35Provincia deBuenosAires/Argentina 06
EUR 4.000%
4,000,000 3,646,921 1.5027.07.23GeneracionMediterranea SA /Generacion FriasSA / CentralTermica Roca SA16
USD 9.625%
2,000,000 1,799,100 0.7416.03.24Provincia deBuenosAires/Argentina 16
USD 9.125%
3.358,163,544Total - Argentina
2,000,000 1,979,500 0.8129.01.24Wanda PropertiesInternational Co Ltd14
USD 7.250%Bermuda Islands
0.811,979,500Total - Bermuda Islands
1,802,000 1,077,452 0.4401.11.22SamarcoMineracao SA 12
USD 4.125%Brazil
2,767,000 1,733,442 0.7126.09.24SamarcoMineracao SA 14
USD 5.375%
1.152,810,894Total - Brazil
1,408,000 1,250,022 0.5131.12.99Baoxin AutoFinance I Ltd 17FRN
USD 5.625%British Virgin Islands
0.511,250,022Total - British Virgin Islands
3,250,000 2,987,498 1.2318.04.23Alpha Star HoldingV Ltd 18
USD 6.625%Cayman Islands
2,000,000 1,796,940 0.7428.06.25China EvergrandeGroup 17
USD 8.750%
4,000,000 4,123,679 1.7027.01.24Country GardenHoldings Co Ltd 18
USD 8.000%
1,500,000 1,363,560 0.5617.01.25Country GardenHoldings Co Ltd 18
USD 5.125%
4,525,000 3,942,859 1.6231.12.99CSN Islands XIICorp 10
USD 7.000%
500,000 462,560 0.1914.08.22eHi Car ServicesLtd 17
USD 5.875%
450,000 420,800 0.1722.10.20JiayuanInternational GroupLtd 18
USD 12.000%
1,500,000 1,281,525 0.5330.06.22Kaisa GroupHoldings Ltd 17
USD 8.500%
Securities Marketvalue in
USD
% of netassets*
Quantity Ccy Maturity
2,000,000 250,000 0.1026.06.22Odebrecht FinanceLtd 12
USD 5.125%
1,000,000 131,150 0.0525.04.25Odebrecht FinanceLtd 13
USD 4.375%
2,000,000 265,100 0.1127.06.29Odebrecht FinanceLtd 14
USD 5.250%
2,000,000 1,810,060 0.7416.05.27OmGrid FundingLtd 17
USD 5.196%
3,500,000 3,515,750 1.4415.03.24QIIB Senior SukukLtd 19
USD 4.264%
9.1822,351,481Total - Cayman Islands
3,000,000 2,810,670 1.1530.04.25Empresa ElectricaGuacolda SA 15
USD 4.560%Chile
1.152,810,670Total - Chile
1,200,000 1,311,060 0.5431.01.29EcuadorGovernmentInternational Bond19
USD 10.750%Ecuador
0.541,311,060Total - Ecuador
1,800,000 1,539,180 0.6321.09.22Hong Kong RedStar MacallineUniversal HomeFurnishings Ltd 17
USD 3.375%Hong Kong
0.631,539,180Total - Hong Kong
2,800,000 3,319,178 1.3625.10.25Perusahaan ListrikNegara PT 18
EUR 2.875%Indonesia
1,800,000 1,626,642 0.6710.08.22Gajah Tunggal TbkPT 17 EMTN
USD 8.375%
2.034,945,820Total - Indonesia
2,600,000 2,994,697 1.2320.02.24Credit Bank ofMoscow Via CBOMFinance PLC 19
EUR 5.150%Ireland
2,000,000 3,226,343 1.3325.03.31Russian RailwaysVia RZD CapitalPLC 11
GBP 7.487%
2,500,000 2,222,000 0.9131.12.99Alfa Bank AO ViaAlfa Bond IssuancePLC 18 FRN
USD 6.950%
3,000,000 2,395,110 0.9831.12.99Credit Bank ofMoscow Via CBOMFinance PLC 17FRN
USD 8.875%
2,500,000 2,113,756 0.8730.11.26Saderea DAC 14EMTN
USD 12.500%
2,180,000 2,229,530 0.9131.12.99Tinkoff CreditSystems Via TCSFinance Ltd 17 FRN
USD 9.250%
6.2315,181,436Total - Ireland
780,000 59,995 0.0201.08.22CooperativaMuratori &Cementisti-CMC diRavenna SC 17
EUR 6.875%Italy

180
Vontobel Fund - Emerging Markets Corporate Bond
The accompanying notes form an essential part of these financial statements.
Portfolio as at February 28, 2019
* Any deviations of the percentages of the nets assets are due to rounding.
Securities Marketvalue in
USD
% of netassets*
Quantity Ccy Maturity
1,000,000 89,661 0.0415.02.23CooperativaMuratori &Cementisti-CMC diRavenna SC 17
EUR 6.000%
0.06149,656Total - Italy
1 1 0.0022.12.22Genel EnergyFinance PLC 14
USD 10.000%Jersey
0.001Total - Jersey
1,000,000 947,500 0.3901.03.24First QuantumMinerals Ltd 18
USD 6.500%Canada
2,000,000 2,051,720 0.8425.06.23Frontera EnergyCorp 18
USD 9.700%
1.232,999,220Total - Canada
1,400,000 1,511,328 0.6223.04.48Qatar GovernmentInternational Bond18
USD 5.103%Qatar
0.621,511,328Total - Qatar
1,700,000 910,910 0.3730.06.29CongoleseInternational Bond07
USD 6.000%Congo
0.37910,910Total - Congo
3,300,000 920,419 0.3816.07.32Swiss InsuredBrazil PowerFinance Sarl 18
BRL 9.850%Luxembourg
1,250,000 1,396,345 0.5711.07.22Mogo Finance SA18
EUR 9.500%
3,500,000 3,704,575 1.5202.05.23Gilex Holding Sarl18
USD 8.500%
1,500,000 1,335,090 0.5506.10.24Puma InternationalFinancing SA 17
USD 5.125%
2,000,000 1,716,920 0.7024.01.26Puma InternationalFinancing SA 18
USD 5.000%
2,850,000 2,864,478 1.1826.07.22Topaz Marine SA17
USD 9.125%
4.9011,937,827Total - Luxembourg
400,000 420,748 0.1725.04.24OCP SA 14USD 5.625%Morocco
0.17420,748Total - Morocco
750,000 921,578 0.3824.02.25PetroleosMexicanos 05
EUR 5.500%Mexico
1,000,000 1,127,062 0.4621.02.28PetroleosMexicanos 17EMTN
EUR 4.875%
2,350,000 2,591,332 1.0626.02.29PetroleosMexicanos 18
EUR 4.750%
1,000,000 1,055,890 0.4325.03.44Alfa SAB de CV 14USD 6.875%2,000,000 1,785,160 0.7319.12.22Alpha Holding SA
de CV 17USD 10.000%
Securities Marketvalue in
USD
% of netassets*
Quantity Ccy Maturity
3,400,000 3,532,328 1.4607.02.26Credito Real SABde CV SOFOM ER19
USD 9.500%
2,500,000 2,341,900 0.9611.10.22Docuformas SAPIde CV 17
USD 9.250%
871,000 827,938 0.3401.06.20Grupo Famsa SABde CV 13
USD 7.250%
3,660,000 2,347,085 0.9618.12.20Grupo Idesa SA deCV 13
USD 7.875%
1,500,000 1,209,900 0.5014.01.48InfraestructuraEnergetica NovaSAB de CV 17
USD 4.875%
1,500,000 1,304,790 0.5421.09.47PetroleosMexicanos 17
USD 6.750%
5,350,000 4,805,370 1.9815.01.25Unifin FinancieraSAB de CV SOFOMENR 17
USD 7.000%
9.8023,850,333Total - Mexico
2,000,000 2,023,994 0.8323.11.24NE Property BV 17EMTN
EUR 1.750%Netherlands
2,000,000 1,644,400 0.6714.05.22Ajecorp BV 12USD 6.500%1,000,000 898,550 0.3717.07.24CIMPOR Financial
Operations BV 14USD 5.750%
1,000,000 940,150 0.3910.08.30Minejesa CapitalBV 17
USD 4.625%
1,000,000 954,160 0.3910.08.37Minejesa CapitalBV 17
USD 5.625%
1,500,000 887,730 0.3625.07.22Nostrum Oil & GasFinance BV 17
USD 8.000%
4,700,000 3,428,885 1.4101.10.46TevaPharmaceuticalFinanceNetherlands III BV16
USD 4.100%
4.4210,777,869Total - Netherlands
300,000 294,636 0.1221.05.19Diamond Bank PLC14
USD 8.750%Nigeria
0.12294,636Total - Nigeria
2,700,000 2,765,259 1.1331.05.23DNO ASA 18USD 8.750%Norway
1.132,765,259Total - Norway
2,000,000 1,569,620 0.6420.09.22ZambiaGovernmentInternational Bond12
USD 5.375%Zambia
2,500,000 2,039,625 0.8414.04.24ZambiaGovernmentInternational Bond14
USD 8.500%
1.483,609,245Total - Zambia
5,073,777 4,205,699 1.7411.12.22Eterna Capital PteLtd 17
USD 8.000%Singapore
2,000,000 1,741,940 0.7104.10.22Geo CoalInternational PteLtd 17
USD 8.000%

181
Vontobel Fund - Emerging Markets Corporate Bond
The accompanying notes form an essential part of these financial statements.
Portfolio as at February 28, 2019
* Any deviations of the percentages of the nets assets are due to rounding.
Securities Marketvalue in
USD
% of netassets*
Quantity Ccy Maturity
1,810,000 1,397,266 0.5731.01.23Soechi Capital PteLtd 18
USD 8.375%
2,200,000 1,610,334 0.6611.04.22Theta Capital PteLtd 14
USD 7.000%
1,500,000 1,007,895 0.4131.10.26Theta Capital PteLtd 16
USD 6.750%
4.099,963,134Total - Singapore
2,000,000 2,012,640 0.8315.12.28AI Candelaria SpainSLU 18
USD 7.500%Spain
0.832,012,640Total - Spain
1,000,000 1,011,230 0.4106.08.23Eskom HoldingsSOC Ltd 13 EMTN
USD 6.750%South Africa
0.411,011,230Total - South Africa
1,431,000 1,330,572 0.5514.09.27Republic ofTajikistanInternational Bond17
USD 7.125%Tadzhikistan
0.551,330,572Total -Tadzhikistan
1,000,000 981,210 0.4015.01.36National Gas Co ofTrinidad & TobagoLtd 06
USD 6.050%Trinidad and Tobago
0.40981,210Total - Trinidad and Tobago
2,950,000 2,660,812 1.0927.04.28Akbank Turk AS 18FRN
USD 6.797%Turkey
2,700,000 2,656,665 1.0914.11.21Global LimanIsletmeleri 14
USD 8.125%
8,000,000 6,734,160 2.7726.04.23RonesansGayrimenkulYatirim AS 18
USD 7.250%
2,000,000 1,829,060 0.7511.02.21Turkiye HalkBankasi AS 15
USD 4.750%
1,000,000 918,350 0.3813.07.21Turkiye HalkBankasi AS 16
USD 5.000%
500,000 458,665 0.1925.04.24Turkiye Is Bankasi17
USD 6.125%
1,000,000 874,620 0.3629.06.28Turkiye Is BankasiAS 17 FRN
USD 7.000%
1,700,000 1,518,049 0.6229.03.27Turkiye SinaiKalkinma BankasiAS 17 FRN
USD 7.625%
1,000,000 912,450 0.3716.01.23Turkiye SinaiKalkinma BankasiAS 18 EMTN
USD 5.500%
700,000 648,942 0.2701.11.27Turkiye VakiflarBankasi TAO 17FRN
USD 8.000%
300,000 322,719 0.1331.12.99Yapi ve KrediBankasi AS 19 FRNEMTN
USD 13.875%
8.0219,534,492Total - Turkey
Securities Marketvalue in
USD
% of netassets*
Quantity Ccy Maturity
3,760,000 4,033,313 1.6517.02.24Banque Centralede TunisieInternational Bond17
EUR 5.625%Tunisia
1.654,033,313Total - Tunisia
3,000,000 3,014,250 1.2401.11.28UkraineGovernmentInternational Bond18
USD 9.750%Ukraine
1.243,014,250Total - Ukraine
2,500,000 2,491,250 1.0215.12.39Acwa PowerManagement AndInvestments OneLtd 17
USD 5.950%United Arab Emirates
250,000 253,083 0.1025.09.48DP World PLC 18EMTN
USD 5.625%
3,486,000 3,415,199 1.4124.04.28Oztel Holdings SPCLtd 18
USD 6.625%
2.536,159,532Total - United Arab Emirates
4,700,000 4,642,848 1.9031.12.24DTEK Finance PLC16
USD 10.750%United Kingdom
3,000,000 2,650,800 1.0909.08.24Vedanta ResourcesPLC 17
USD 6.125%
2.997,293,648Total - United Kingdom
5,292,000 4,139,932 1.7027.09.21O1 PropertiesFinance PLC 16
USD 8.250%Cyprus
74.29181,044,592Total - Transferable securities admitted to anofficial exchange
74.29181,044,592Total - Bonds
1.704,139,932Total - Cyprus
1,650,000 1,448,783 0.5904.11.26Banco Macro SA16 FRN
USD 6.750%
Transferable securities and money market instruments dealt in on anotherregulated marketBondsArgentina
3,257,000 2,465,158 1.0120.07.23CiaLatinoamericana deInfraestructura &Servicios SA 16
USD 9.500%
150,000 117,008 0.0501.11.27Province of SantaFe 16
USD 6.900%
1,500,000 1,196,235 0.4908.02.25Provincia de EntreRios Argentina 17
USD 8.750%
3,080,000 2,557,138 1.0524.02.25Provincia de laRioja 17
USD 9.750%
3.197,784,322Total - Argentina

182
Vontobel Fund - Emerging Markets Corporate Bond
The accompanying notes form an essential part of these financial statements.
Portfolio as at February 28, 2019
* Any deviations of the percentages of the nets assets are due to rounding.
Securities Marketvalue in
USD
% of netassets*
Quantity Ccy Maturity
3,000,000 2,878,050 1.1831.12.99Huarong Finance2017 Co Ltd 17FRN EMTN
USD 4.000%British Virgin Islands
650,000 607,393 0.2514.11.22Yunnan EnergyInvestmentOverseas FinanceCo Ltd 17
USD 4.250%
1.433,485,443Total - British Virgin Islands
200,000 195,910 0.0804.03.21Redsun PropertiesGroup Ltd 19
USD 11.500%Cayman Islands
7,800,000 7,739,238 3.1826.02.24Yuzhou PropertiesCo Ltd 19
USD 8.500%
3.267,935,148Total - Cayman Islands
1,605,000 1,625,977 0.6713.01.22Oilflow SPV 1 DAC17
USD 12.000%Ireland
0.671,625,977Total - Ireland
1,781,250 1,773,021 0.7305.07.23ShaMaranPetroleum Corp 18
USD 12.000%Canada
2,000,000 1,916,807 0.7801.03.27Stoneway CapitalCorp 17
USD 10.000%
1.513,689,828Total - Canada
6,600,000 5,889,775 2.4227.07.22Credivalores-Crediservicios SAS17
USD 9.750%Colombia
3,540,000 3,775,658 1.5515.01.35Fideicomiso PAPacifico Tres 16
USD 8.250%
3.979,665,433Total - Colombia
5,404,940 5,535,989 2.2720.08.21Andrade GutierrezInternational SA 18
USD 11.000%Luxembourg
2.275,535,989Total - Luxembourg
1,000,000 1,030,600 0.4215.06.26EquisarInternational Inc 11
USD 6.628%Malaysia
0.421,030,600Total - Malaysia
2,000,000 1,890,401 0.7824.04.35Cometa Energia SAde CV 18
USD 6.375%Mexico
0.781,890,401Total - Mexico
1,000,000 587,800 0.2416.02.25Nostrum Oil & GasFinance BV 18
USD 7.000%Netherlands
0.24587,800Total - Netherlands
Securities Marketvalue in
USD
% of netassets*
Quantity Ccy Maturity
1,000,000 1,060,030 0.4315.01.29Suzano AustriaGmbH 19
USD 6.000%Austria
0.431,060,030Total - Austria
2,600,000 2,651,948 1.0914.05.24Promerica FinancialCorp 18
USD 9.700%Panama
1.092,651,948Total - Panama
2,500,000 1,561,825 0.6406.05.20Yasar Holding AS14
USD 8.875%Turkey
0.641,561,825Total - Turkey
50,000,000 357,145 0.1517.03.31Banque Centralede Tunisie SA 01
JPY 4.200%Tunisia
0.15357,145Total - Tunisia
3,000,000 2,950,041 1.2127.03.22Aabar InvestmentsPJSC 15 EMTN
EUR 1.000%United Arab Emirates
1.212,950,041Total - United Arab Emirates
4,000,000 3,702,600 1.5201.05.22Petra Diamonds USTreasury PLC 17
USD 7.250%United Kingdom
22.7855,514,530Total - Transferable securities and money marketinstruments dealt in on another regulated market
22.7855,514,530Total - Bonds
1.523,702,600Total - United Kingdom
3,200,000 3,200,000 1.3106.03.24HKN Energy Ltd 19USD 11.000%
Other transferable securitiesBondsCayman Islands
1.313,200,000Total - Other transferable securities
1.313,200,000Total - Bonds
1.313,200,000Total - Cayman Islands
98.38239,759,122Total - Investment in securities

183
Vontobel Fund - TwentyFour Absolute Return Credit Fund
AssetsInvestments in securities at market value 1,555,157,634(2)
38,700,309Cash at banks
230Receivable from foreign currencies
4,773,475Receivable from subscriptions
30,726,358Interest and dividends receivable(2)
3,504,740Receivable for investments sold
2,626,109Unrealised gain on forward foreign exchange contracts(9)
Total Assets 1,635,488,855
1,599,652,815Statement of Net Assetsas at February 28, 2019
LiabilitiesBank overdraft 775,177
Provision for expenses 848
Payable for redemptions 1,950,111
Payable for investments purchased 4,601,977
Payable on foreign currencies 230
Audit fees, printing and publishing expenses 24,186
Service Fee payable 107,917(5)
Subscription tax payable 79,347(4)
Management Fee payable 378,678(3)
Other liabilities 2,620Total Liabilities 7,921,091Total net assets at the end of the period 1,627,567,764Net assets at the beginning of the reporting period 1,447,463,829
Net investment income 30,751,048
Change in unrealised appreciation/depreciation on:
Investments -15,353,165
Forward foreign exchange contracts 2,592,637
Net realised gain/loss on investments -10,851,352(2)
Net realised gain/loss on forward foreign exchange contracts -16,114,274(2)
Net realised gain/loss on currency exchange 1,868,413(2)
Increase/Decrease in net assets resulting from operations -7,106,693Subscriptions of shares 365,139,526
Redemptions of shares -164,046,881
Dividend distribution -13,882,017(11)
Total net assets at the end of the period 1,627,567,764
Statement of Operations andChanges in Net Assetsfrom September 1, 2018to February 28, 2019
Notes GBPThe accompanying notes form an essential part of these financial statements.
Cost

184
Vontobel Fund - TwentyFour Absolute Return Credit Fund
IncomeBank interest 86,226
Net interest on bonds 34,026,019(2)
Total Income 34,112,246ExpensesManagement Fees 2,307,627(3)
Audit fees, printing and publishing expenses 37,370
Subscription tax 230,146(4)
Bank interest 4,132
Service Fees 694,529(5)
Other Fees payable 87,393(8)
Total Expenses 3,361,197Net investment income 30,751,048
Statement of Net Incomefrom September 1, 2018to February 28, 2019
Notes GBPThe accompanying notes form an essential part of these financial statements.

185
Vontobel Fund - TwentyFour Absolute Return Credit Fund
The accompanying notes form an essential part of these financial statements.
Portfolio as at February 28, 2019
* Any deviations of the percentages of the nets assets are due to rounding.
Securities Marketvalue in
GBP
% of netassets*
Quantity Ccy Maturity
20,574,000 22,093,205 1.3624.05.42QBE InsuranceGroup Ltd 16 FRN
GBP 6.115%
Transferable securities admitted to an official exchangeBondsAustralia
1.3622,093,205Total - Australia
25,100,000 22,606,873 1.3924.05.26Argenta SpaarbankNV 16 FRN
EUR 3.875%Belgium
1.3922,606,873Total - Belgium
3,338,000 3,276,447 0.2014.12.22Hiscox Ltd 18GBP 2.000%Bermuda Islands
0.203,276,447Total - Bermuda Islands
30,366,000 32,602,410 2.0013.12.22Global SwitchHoldings Ltd 13EMTN
GBP 4.375%British Virgin Islands
2.0032,602,410Total - British Virgin Islands
25,000,000 25,044,250 1.5423.12.19Kreditanstalt fuerWiederaufbau 15EMTN
GBP 1.125%Germany
1.5425,044,250Total - Germany
17,920,000 18,448,998 1.1331.12.99AXA SA 07 FRNEMTN
GBP 6.772%France
10,625,000 11,375,922 0.7031.12.99Orange SA 14 FRNGBP 5.875%20,163,000 21,617,458 1.3331.12.99Orange SA 14 FRN
EMTNGBP 5.750%
3.1651,442,378Total - France
34,322,000 34,865,077 2.1420.07.22PGH Capital PLC17 EMTN
GBP 4.125%Ireland
4,280,000 3,260,146 0.2001.09.24Aquarius &Investments Plc forSwiss ReinsuranceCo Ltd 13 FRN
USD 6.380%
2.3438,125,223Total - Ireland
28,097,000 26,445,177 1.6331.01.22AA Bond Co Ltd 16EMTN
GBP 2.875%Jersey
20,453,000 24,722,564 1.5228.02.24CPUK Finance Ltd12 EMTN
GBP 7.239%
23,503,000 24,545,123 1.5120.03.20Heathrow FundingLtd 12 EMTN
GBP 6.000%
13,223,000 13,692,284 0.8431.12.99HSBC Bank CapitalFunding Sterling 2LP 04 FRN
GBP 5.862%
21,754,000 23,338,344 1.4320.10.20Porterbrook RailFinance Ltd 10EMTN
GBP 6.500%
Securities Marketvalue in
GBP
% of netassets*
Quantity Ccy Maturity
12,360,000 12,421,553 0.7620.04.19Porterbrook RailFinance Ltd 11EMTN
GBP 5.500%
7.69125,165,045Total - Jersey
23,255,000 24,615,418 1.5106.09.73America Movil SABde CV 13 FRN
GBP 6.380%Mexico
1.5124,615,418Total - Mexico
19,400,000 19,574,600 1.2031.12.99ELM BV for SwissReinsurance Co Ltd07 FRN EMTN
GBP 6.300%Netherlands
27,950,000 22,462,063 1.3820.03.23Highbury FinanceBV 00
GBP 7.017%
19,250,000 13,634,445 0.8431.12.99AT Securities BV17 FRN
USD 5.250%
3.4255,671,108Total - Netherlands
16,010,000 13,489,373 0.8315.07.22Intrum Justitia AB17
EUR 2.750%Sweden
0.8313,489,373Total - Sweden
20,818,000 22,722,014 1.3913.10.23Digital StoutHolding LLC 14
GBP 4.750%United States
17,992,000 18,338,526 1.1320.11.20Walgreens BootsAlliance Inc 14
GBP 2.875%
14,444,000 10,568,955 0.6515.01.22American TowerCorp 16
USD 2.250%
5,900,000 4,506,086 0.2805.04.22CNH IndustrialCapital LLC 17
USD 4.375%
3.4556,135,581Total - United States
26,648,000 22,884,216 1.4110.04.76Centrica PLC 15FRN
EUR 3.000%United Kingdom
6,253,000 5,580,122 0.3418.06.76NGG Finance PLC13 FRN
EUR 4.250%
24,804,000 25,417,899 1.5630.06.20Arqiva FinancingPLC 13 EMTN
GBP 4.040%
8,058,000 8,327,218 0.5131.12.99Aviva PLC 03 FRNGBP 6.875%24,495,000 26,581,974 1.6303.06.41Aviva PLC 11 FRN
EMTNGBP 6.625%
8,360,000 9,592,933 0.5915.05.21Bank of ScotlandPLC 96
GBP 9.375%
20,019,000 20,712,438 1.2731.12.99Barclays Bank PLC08 FRN
GBP 14.000%
21,155,000 24,358,713 1.5021.05.21Barclays Bank PLC09 EMTN
GBP 10.000%
14,401,000 15,226,350 0.9431.12.99BUPA Finance PLC04 FRN
GBP 6.125%
15,153,000 16,371,498 1.0125.04.23BUPA Finance PLC13
GBP 5.000%
23,816,000 24,772,474 1.5224.01.27Close BrothersGroup PLC 17
GBP 4.250%
18,352,000 18,403,936 1.1326.04.23Close BrothersGroup PLC 18EMTN
GBP 2.750%
37,325,000 37,846,170 2.3331.12.99Coventry BuildingSociety 14 FRN
GBP 6.380%
9,099,000 8,990,427 0.5509.02.26CYBG PLC 16 FRNGBP 5.000%

186
Vontobel Fund - TwentyFour Absolute Return Credit Fund
The accompanying notes form an essential part of these financial statements.
Portfolio as at February 28, 2019
* Any deviations of the percentages of the nets assets are due to rounding.
Securities Marketvalue in
GBP
% of netassets*
Quantity Ccy Maturity
25,122,000 29,605,021 1.8227.04.42Direct LineInsurance GroupPLC 12 FRN
GBP 9.250%
7,159,000 7,653,472 0.4702.12.20Eversholt FundingPLC 10 EMTN
GBP 5.831%
14,845,000 15,514,658 0.9515.10.21Experian FinancePLC 14 EMTN
GBP 3.500%
5,434,000 5,453,236 0.3413.11.19FCE Bank PLC 14EMTN
GBP 2.760%
2,700,000 3,022,763 0.1908.04.21Firstgroup PLC 09GBP 8.750%10,855,000 11,556,342 0.7129.11.22Firstgroup PLC 12GBP 5.250%8,755,000 9,312,028 0.5719.09.22GKN Holdings PLC
12 EMTNGBP 5.375%
4,005,000 4,120,424 0.2528.10.19GKN Holdings PLC99
GBP 6.750%
16,195,000 17,179,008 1.0627.07.20Great Rolling StockCo Ltd/The 10EMTN
GBP 6.250%
10,000,000 10,284,100 0.6301.03.24Heathrow FinancePLC 18
GBP 4.750%
4,043,000 4,116,542 0.2524.06.19Imperial BrandsFinance PLC 09EMTN
GBP 7.750%
13,845,000 16,243,231 1.0017.02.22Investec Bank PLC11 EMTN
GBP 9.625%
22,415,000 23,674,656 1.4505.05.22Investec PLC 15EMTN
GBP 4.500%
22,224,000 23,557,440 1.4531.12.99J Sainsbury PLC 15FRN
GBP 6.500%
20,704,000 20,781,640 1.2831.12.99Legal & GeneralGroup PLC 04 FRNEMTN
GBP 5.875%
16,195,000 19,087,135 1.1723.07.41Legal & GeneralGroup PLC 09 FRNEMTN
GBP 10.000%
20,675,000 21,956,230 1.3522.05.43Liverpool VictoriaFriendly Society Ltd13 FRN
GBP 6.500%
15,022,000 15,908,899 0.9817.06.20National ExpressGroup PLC 10EMTN
GBP 6.625%
20,121,000 19,924,820 1.2222.09.21National Grid GasFinance PLC 16EMTN
GBP 1.125%
34,925,000 35,292,900 2.1731.12.99NationwideBuilding Society 14FRN EMTN
GBP 6.875%
18,479,000 19,809,654 1.2218.06.73NGG Finance PLC13 FRN
GBP 5.625%
14,041,000 14,677,240 0.9009.09.26Paragon Group ofCos PLC/The 16FRN
GBP 7.250%
23,352,000 23,462,824 1.4431.12.99Pennon Group PLC17 FRN
GBP 2.875%
21,161,000 22,957,865 1.4103.07.24Pension InsuranceCorp PLC 14
GBP 6.500%
21,765,000 22,275,607 1.3729.05.39Prudential PLC 09FRN EMTN
GBP 11.375%
16,277,000 16,020,352 0.9806.05.23RAC Bond Co PLC16 EMTN
GBP 4.565%
21,514,000 23,783,512 1.4630.11.43RL Finance BondsNo. 2 plc 13 FRN
GBP 6.125%
12,075,000 12,013,901 0.7404.12.22Severn TrentUtilities FinancePLC 17 EMTN
GBP 1.625%
18,640,000 18,100,372 1.1130.06.22Skipton BuildingSociety 17 EMTN
GBP 1.750%
13,866,000 13,920,493 0.8631.12.99SSE PLC 15 FRNGBP 3.875%
Securities Marketvalue in
GBP
% of netassets*
Quantity Ccy Maturity
14,087,000 13,811,148 0.8516.09.77SSE PLC 17 FRNGBP 3.625%20,248,000 22,147,769 1.3604.12.42Standard Life
Aberdeen PLC 12FRN EMTN
GBP 5.500%
14,985,000 15,539,895 0.9525.11.19Tate & LyleInternationalFinance PLC 09
GBP 6.750%
12,089,000 12,522,995 0.7710.12.33TelerealSecuritisation PLC12 FRN
GBP 4.090%
17,349,000 17,350,648 1.0706.05.26TSB Banking GroupPLC 14 FRN EMTN
GBP 5.750%
56,950,000 57,166,411 3.5122.07.19United KingdomGilt 13
GBP 1.750%
23,924,000 24,901,870 1.5306.11.23Western PowerDistribution PLC 15
GBP 3.630%
8,350,000 8,446,526 0.5220.11.24Yorkshire BuildingSociety 14 FRNEMTN
GBP 4.130%
86.541,408,487,306Total - Bonds
57.65938,219,995Total - United Kingdom
2,542,000 2,553,439 0.1625.10.44Castell 2017-1 PLC17 FRN
GBP
Mortgage backed securitiesUnited Kingdom
6,924,000 6,836,865 0.4231.03.53Durham MortgagesA PLC 18 FRN
GBP
5,000,000 5,017,145 0.3125.05.53HawksmoorMortgages 2016-1PLC 16 FRN
GBP
1,250,000 1,256,375 0.0815.06.46ResidentialMortgageSecurities 28 Plc 15FRN
GBP
8,135,000 8,073,988 0.5020.08.56Ripon MortgagesPLC 17 FRN
GBP
16,300,000 16,153,690 0.9820.08.56Ripon MortgagesPLC 17 FRN
GBP
13,954,000 13,947,023 0.8621.09.49Warwick FinanceResidentialMortgages No OnePlc 15 FRN
GBP
4,000,000 4,008,000 0.2521.09.49Warwick FinanceResidentialMortgages No TwoPlc 15 FRN
GBP
10,500,000 10,486,875 0.6421.09.49Warwick FinanceResidentialMortgages No TwoPLC 15 FRN
GBP
2,800,000 2,793,700 0.1721.09.49Warwick FinanceResidentialMortgages NumberOne PLC 15 FRN
GBP
90.911,479,614,406Total - Transferable securities admitted to anofficial exchange
4.3771,127,100Total - Mortgage backed securities
4.3771,127,100Total - United Kingdom

187
Vontobel Fund - TwentyFour Absolute Return Credit Fund
The accompanying notes form an essential part of these financial statements.
Portfolio as at February 28, 2019
* Any deviations of the percentages of the nets assets are due to rounding.
Securities Marketvalue in
GBP
% of netassets*
Quantity Ccy Maturity
8,350,000 6,294,351 0.3915.10.21CNH IndustrialCapital LLC 16
USD 3.875%
Transferable securities and money market instruments dealt in on anotherregulated marketBondsUnited States
10,100,000 7,858,630 0.4801.02.21Sabine PassLiquefaction LLC14
USD 5.625%
0.8714,152,981Total - Bonds
0.8714,152,981Total - United States
20,000,000 18,216,687 1.1212.03.55Precise MortgageFunding 2018-2BPLC 18 FRN
GBP
Mortgage backed securitiesUnited Kingdom
7,250,000 7,223,414 0.4420.03.50ResidentialMortgageSecurities 30 PLC17 FRN
GBP
10,000,000 9,860,890 0.6120.03.56Tower BridgeFunding NO 2 PLC18 FRN
GBP
3.0449,453,972Total - Transferable securities and money marketinstruments dealt in on another regulated market
2.1735,300,991Total - Mortgage backed securities
2.1735,300,991Total - United Kingdom
8,107,000 8,133,088 0.5025.05.53HawksmoorMortgages 2016-2PLC 16 FRN
GBP
Other transferable securitiesMortgage backed securitiesUnited Kingdom
3,000,000 3,005,943 0.1825.05.53HawksmoorMortgages 2016-2PLC 16 FRN
GBP
9,000,000 8,925,355 0.5520.08.56Ripon MortgagesPLC 17 FRN
GBP
6,000,000 6,024,870 0.3720.07.46Towd PointMortgage Funding2016-Granite1 PLC16 FRN
GBP
1.6026,089,256Total - Other transferable securities
1.6026,089,256Total - Mortgage backed securities
1.6026,089,256Total - United Kingdom
95.551,555,157,634Total - Investment in securities

188
Vontobel Fund - TwentyFour Strategic Income Fund
AssetsInvestments in securities at market value 1,411,919,590(2)
59,577,005Cash at banks
3,505Receivable from foreign currencies
3,974,286Receivable from subscriptions
20,958,708Interest and dividends receivable(2)
16,579,523Receivable for investments sold
28,026,400Unrealised gain on forward foreign exchange contracts(9)
Total Assets 1,541,039,017
1,468,825,250Statement of Net Assetsas at February 28, 2019
LiabilitiesProvision for expenses 915
Payable for redemptions 4,157,527
Payable for investments purchased 15,871,281
Payable on foreign currencies 3,498
Audit fees, printing and publishing expenses 25,742
Service Fee payable 126,624(5)
Subscription tax payable 50,263(4)
Management Fee payable 722,628(3)
Other liabilities 8,133Total Liabilities 20,966,611Total net assets at the end of the period 1,520,072,406Net assets at the beginning of the reporting period 1,524,977,121
Net investment income 31,625,652
Change in unrealised appreciation/depreciation on:
Investments -43,918,845
Forward foreign exchange contracts 20,605,983
Net realised gain/loss on investments -10,096,026(2)
Net realised gain/loss on forward foreign exchange contracts -63,400,296(2)
Net realised gain/loss on currency exchange 33,748,404(2)
Increase/Decrease in net assets resulting from operations -31,435,128Subscriptions of shares 348,915,045
Redemptions of shares -308,390,518
Dividend distribution -13,994,114(11)
Total net assets at the end of the period 1,520,072,406
Statement of Operations andChanges in Net Assetsfrom September 1, 2018to February 28, 2019
Notes GBPThe accompanying notes form an essential part of these financial statements.
Cost

189
Vontobel Fund - TwentyFour Strategic Income Fund
IncomeBank interest 201,412
Net interest on bonds 37,005,625(2)
Other income 123,172Total Income 37,330,209ExpensesManagement Fees 4,603,591(3)
Audit fees, printing and publishing expenses 59,755
Subscription tax 160,995(4)
Bank interest 17,847
Service Fees 756,918(5)
Other Fees payable 105,451(8)
Total Expenses 5,704,557Net investment income 31,625,652
Statement of Net Incomefrom September 1, 2018to February 28, 2019
Notes GBPThe accompanying notes form an essential part of these financial statements.

190
Vontobel Fund - TwentyFour Strategic Income Fund
The accompanying notes form an essential part of these financial statements.
Portfolio as at February 28, 2019
* Any deviations of the percentages of the nets assets are due to rounding.
Securities Marketvalue in
GBP
% of netassets*
Quantity Ccy Maturity
7,738,000 5,712,804 0.3820.06.24African Export-Import Bank/The17 EMTN
USD 4.125%
Transferable securities admitted to an official exchangeBondsEgypt
0.385,712,804Total - Egypt
94,724,000 51,368,221 3.3821.05.28AustraliaGovernment Bond16
AUD 2.250%Australia
8,700,000 9,342,417 0.6124.05.42QBE InsuranceGroup Ltd 16 FRN
GBP 6.115%
3.9960,710,638Total - Australia
6,200,000 5,864,682 0.3914.01.26Ethias SA 15EUR 5.000%Belgium
16,825,000 14,436,755 0.9431.12.99KBC Group NV 14FRN
EUR 5.625%
1,300,000 1,177,633 0.0831.12.99Solvay SA 18 FRNEUR 4.250%1.4121,479,070Total - Belgium
18,628,000 13,098,211 0.8604.10.31Banco Mercantil delNorte SA/GrandCayman 16 FRN
USD 5.750%Cayman Islands
18,634,000 11,823,995 0.7815.10.24TransoceanPhoenix 2 Ltd 16
USD 7.750%
1.6424,922,206Total - Cayman Islands
13,200,000 11,671,066 0.7731.12.99Aareal Bank AG 14FRN
EUR 7.630%Germany
14,000,000 11,737,676 0.7631.12.99DeutschePfandbriefbank AG18 FRN
EUR 5.750%
2,000,000 1,791,954 0.1213.12.28SC GermanyConsumer 2015-1UGhaftungsbeschraenkt 15 FRN
EUR 10.329%
3,650,000 2,661,235 0.1815.09.23IHO VerwaltungsGmbH 16
USD 4.500%
1.8327,861,931Total - Germany
13,450,000 11,868,416 0.7731.12.99BNP Paribas SA 05EUR 4.875%France
3,130,000 2,820,137 0.1931.12.99Societe GeneraleSA 14 FRN
EUR 6.750%
7,600,000 7,824,352 0.5131.12.99AXA SA 07 FRNEMTN
GBP 6.772%
2,700,000 2,819,449 0.1931.12.99Credit Agricole SA08 FRN
GBP 7.590%
11,700,000 8,821,071 0.5815.05.24Altice FranceSA/France 14
USD 6.250%
3,750,000 2,868,655 0.1931.12.99BNP Paribas SA 07USD 6.500%1,950,000 1,482,583 0.1031.12.99Credit Agricole SA
14 FRNUSD 6.625%
2.5338,504,663Total - France
Securities Marketvalue in
GBP
% of netassets*
Quantity Ccy Maturity
700,000 514,457 0.0329.03.23Lenovo Group Ltd18 EMTN
USD 4.750%Hong Kong
0.03514,457Total - Hong Kong
4,923,000 4,535,772 0.3031.12.99Allied Irish BanksPLC 15 FRN EMTN
EUR 7.375%Ireland
1,000,000 834,747 0.0515.01.30Arbour CLO IVDAC 16 FRN
EUR 5.600%
3,000,000 2,420,990 0.1624.10.30Armada Euro CLO IDAC 17 FRN
EUR 5.350%
4,484,000 4,093,080 0.2731.12.99Bank of Ireland 15FRN
EUR 7.375%
2,812,500 2,115,026 0.1425.10.30Cadogan SquareCLO X DAC 18FRN
EUR 4.400%
1,300,000 1,109,139 0.0715.01.30GLG Euro CLO IIDAC 16 FRN
EUR 8.750%
1,250,000 979,178 0.0617.04.30Penta CLO 3 DAC17 FRN
EUR 4.900%
2,050,000 1,941,405 0.1319.09.27Bank of IrelandGroup PLC 17 FRNEMTN
GBP 3.125%
1,020,000 1,036,139 0.0720.07.22PGH Capital PLC17 EMTN
GBP 4.125%
6,367,000 6,723,294 0.4518.12.25Phoenix GroupHoldings PLC 15
GBP 6.625%
1.7025,788,770Total - Ireland
12,186,000 10,842,429 0.7131.12.99Intesa SanpaoloSpA 16 FRN EMTN
EUR 7.000%Italy
4,494,000 3,743,268 0.2531.12.99Intesa SanpaoloSpA 17 FRN
EUR 6.250%
8,069,000 6,531,885 0.4331.12.99UnipolSaiAssicurazioni SpA14 FRN EMTN
EUR 5.750%
11,950,000 12,356,323 0.8231.12.99AssicurazioniGenerali SpA 07FRN
GBP 6.420%
2,996,000 3,215,576 0.2110.09.75Enel SpA 13 FRNGBP 7.750%8,555,000 9,164,257 0.6015.09.76Enel SpA 14 FRNGBP 6.625%
3.0245,853,738Total - Italy
12,781,000 9,747,968 0.6429.03.49HBOS CapitalFunding LP 03
USD 6.850%Jersey
0.649,747,968Total - Jersey
5,877,000 2,940,169 0.1915.09.24Intralot CapitalLuxembourg SA 17
EUR 5.250%Luxembourg
10,825,000 8,749,507 0.5801.08.23Lecta SA 16EUR 6.500%17,452,000 16,882,613 1.1101.10.23Cabot Financial
Luxembourg SA 16GBP 7.500%
9,800,000 7,422,515 0.4931.01.22Kernel Holding SA17
USD 8.750%
12,480,000 9,250,569 0.6110.05.24MHP SE 17USD 7.750%2.9845,245,373Total - Luxembourg

191
Vontobel Fund - TwentyFour Strategic Income Fund
The accompanying notes form an essential part of these financial statements.
Portfolio as at February 28, 2019
* Any deviations of the percentages of the nets assets are due to rounding.
Securities Marketvalue in
GBP
% of netassets*
Quantity Ccy Maturity
8,067,000 6,927,913 0.4621.08.21PetroleosMexicanos 17EMTN
EUR 2.500%Mexico
4,761,000 5,039,519 0.3306.09.73America Movil SABde CV 13 FRN
GBP 6.380%
8,400,000 6,111,883 0.4013.03.27PetroleosMexicanos 18
USD 6.500%
2,000,000 1,431,565 0.0923.01.29PetroleosMexicanos 18
USD 6.500%
1.2819,510,880Total - Mexico
6,200,000 5,981,003 0.3904.04.43Achmea BV 13 FRNEMTN
EUR 6.000%Netherlands
11,566,000 9,910,414 0.6615.05.22Altice LuxembourgSA 14
EUR 7.250%
5,879,000 4,599,549 0.3031.12.99ASR Nederland NV17 FRN
EUR 4.625%
3,800,000 3,265,847 0.2131.12.99ATF NetherlandsBV 16 FRN
EUR 3.750%
4,000,000 3,508,302 0.2315.11.25Intertrust Group BV18
EUR 3.375%
1,000,000 823,249 0.0504.08.28Penta Clo 2 BV 15FRN
EUR 4.550%
8,500,000 7,416,847 0.4915.08.23PromontoriaHolding 264 BV 18
EUR 6.750%
3,000,000 2,339,795 0.1501.12.30Tikehau CLO III BV17 FRN
EUR 4.850%
3,795,000 5,245,011 0.3531.12.99CooperatieveRabobank UA 08FRN
GBP 6.910%
6,101,000 6,701,523 0.4414.12.26Petrobras GlobalFinance BV 11EMTN
GBP 6.250%
3,610,000 3,889,500 0.2616.01.34Petrobras GlobalFinance BV 14
GBP 6.625%
8,500,000 6,020,404 0.4031.12.99AT Securities BV17 FRN
USD 5.250%
3,900,000 3,009,518 0.2031.12.99CooperatieveRabobank UA 09FRN
USD 11.000%
4,520,000 3,409,201 0.2231.12.99ING Groep NV 15FRN
USD 6.000%
12,910,000 9,792,633 0.6524.06.19Marfrig HoldingsEurope BV 14
USD 6.875%
12,000,000 9,323,617 0.6115.01.24VTR Finance BV 14USD 6.875%5.6185,236,413Total - Netherlands
2,000,000 556,466 0.0408.05.99Banco EspiritoSanto SA 14 EMTN
EUR 0,000%Portugal
0.04556,466Total - Portugal
1,550,000 1,305,967 0.0915.07.22Intrum Justitia AB17
EUR 2.750%Sweden
5,146,000 3,862,390 0.2531.12.99Nordea Bank Abp14 FRN EMTN
USD 5.500%
19,171,000 14,352,142 0.9431.12.99SkandinaviskaEnskilda BankenAB 14 FRN EMTN
USD 5.750%
1.2819,520,499Total - Sweden
Securities Marketvalue in
GBP
% of netassets*
Quantity Ccy Maturity
21,035,000 16,980,928 1.1231.12.99Credit SuisseGroup AG 13 FRN
USD 7.500%Switzerland
3,610,000 2,747,668 0.1831.12.99UBS GroupFundingSwitzerland AG 19FRN
USD 7.000%
1.3019,728,596Total - Switzerland
10,400,000 9,198,749 0.6131.12.99Banco BilbaoVizcaya ArgentariaSA 15 FRN
EUR 6.750%Spain
2,200,000 2,125,152 0.1431.12.99Banco BilbaoVizcaya ArgentariaSA 16 FRN
EUR 8.875%
17,800,000 14,460,862 0.9531.12.99Banco de SabadellSA 17 FRN
EUR 6.500%
3,600,000 2,862,203 0.1931.12.99Banco de SabadellSA 17 FRN
EUR 6.125%
8,700,000 7,643,004 0.5012.12.28Banco de SabadellSA 18 FRN EMTN
EUR 5.375%
4,200,000 3,856,622 0.2531.12.99Banco SantanderSA 17 FRN
EUR 6.750%
3,800,000 3,127,599 0.2131.12.99Banco SantanderSA 17 FRN
EUR 5.250%
1,600,000 1,437,773 0.0931.12.99CaixaBank SA 17FRN
EUR 6.750%
7,871,000 6,228,597 0.4115.11.22Haya Finance 2017SA 17
EUR 5.250%
3.3550,940,561Total - Spain
2,850,000 2,452,166 0.1608.07.19Turkiye GarantiBankasi AS 14EMTN
EUR 3.375%Turkey
15,980,000 11,547,655 0.7515.10.25Turkcell IletisimHizmetleri AS 15
USD 5.750%
2,804,000 1,947,628 0.1311.04.28Turkcell IletisimHizmetleri AS 18
USD 5.800%
3,550,000 2,666,317 0.1817.10.19Turkiye GarantiBankasi AS 14EMTN
USD 4.750%
1.2218,613,766Total - Turkey
1,193,000 929,316 0.0622.04.20BBVA BancomerSA/Texas 10
USD 7.250%United States
8,275,000 6,011,367 0.4031.03.23CHS/CommunityHealth Systems Inc17
USD 6.250%
17,028,000 13,710,190 0.9015.09.23Sprint Corp 14USD 7.875%152,342,400 113,214,735 7.4530.11.19United States
TreasuryNote/Bond 12
USD 1.000%
136,939,700 102,395,418 6.7431.12.19United StatesTreasuryNote/Bond 18
USD 1.875%
83,570,000 65,000,073 4.2815.11.28United StatesTreasuryNote/Bond 18
USD 3.125%

192
Vontobel Fund - TwentyFour Strategic Income Fund
The accompanying notes form an essential part of these financial statements.
Portfolio as at February 28, 2019
* Any deviations of the percentages of the nets assets are due to rounding.
Securities Marketvalue in
GBP
% of netassets*
Quantity Ccy Maturity
45,491,600 36,154,541 2.3815.11.48United StatesTreasuryNote/Bond 18
USD 3.375%
22.21337,415,640Total - United States
3,424,000 2,979,875 0.2031.12.99Barclays PLC 14FRN
EUR 6.500%United Kingdom
3,600,000 3,091,533 0.2010.04.76Centrica PLC 15FRN
EUR 3.000%
7,130,000 7,282,671 0.4831.12.99Aldermore GroupPLC 14 FRN
GBP 11.880%
5,850,000 6,614,986 0.4428.10.26Aldermore GroupPLC 16 FRN
GBP 8.500%
1,500,000 1,442,766 0.0915.09.24Arrow GlobalFinance PLC 16
GBP 5.125%
3,783,000 3,909,390 0.2631.12.99Aviva PLC 03 FRNGBP 6.875%7,782,000 8,066,923 0.5331.12.99Aviva PLC 04 FRNGBP 5.900%3,852,000 3,985,429 0.2631.12.99Barclays Bank PLC
08 FRNGBP 14.000%
8,430,000 8,824,875 0.5831.12.99Barclays PLC 15FRN
GBP 7.875%
15,400,000 14,729,120 0.9715.10.23Bracken MidCo1PLC 18
GBP 8.875%
620,000 655,533 0.0431.12.99BUPA Finance PLC04 FRN
GBP 6.125%
46,118,000 46,761,947 3.0931.12.99Coventry BuildingSociety 14 FRN
GBP 6.380%
6,620,000 5,312,550 0.3531.12.99Direct LineInsurance GroupPLC 17 FRN
GBP 4.750%
6,346,000 6,064,792 0.4019.12.24esure Group PLC14
GBP 6.750%
11,590,000 11,529,814 0.7615.01.24Jerrold Finco Plc 17GBP 6.125%7,864,000 7,893,490 0.5231.12.99Legal & General
Group PLC 04 FRNEMTN
GBP 5.875%
10,251,000 10,886,254 0.7222.05.43Liverpool VictoriaFriendly Society Ltd13 FRN
GBP 6.500%
7,901,000 13,280,337 0.8731.12.99Lloyds Bank PLC09 FRN EMTN
GBP 13.000%
224,646 32,259,589 2.1229.06.49NationwideBuilding Society 13FRN
GBP 10.250%
24,255,000 24,510,502 1.6131.12.99NationwideBuilding Society 14FRN EMTN
GBP 6.875%
5,000,000 4,950,000 0.3301.06.28Oaknorth Bank PLC18 FRN
GBP 7.750%
9,227,000 9,448,448 0.6231.12.99OneSavings BankPLC 17 FRN
GBP 9.125%
9,896,000 10,344,417 0.6809.09.26Paragon Group ofCos PLC/The 16FRN
GBP 7.250%
6,953,000 7,543,407 0.5003.07.24Pension InsuranceCorp PLC 14
GBP 6.500%
1,770,000 2,045,781 0.1323.11.26Pension InsuranceCorp PLC 16
GBP 8.000%
9,165,000 7,506,135 0.4931.12.99Phoenix GroupHoldings 18 FRN
GBP 5.750%
8,570,000 7,943,552 0.5231.12.99Rothesay Life PLC18 FRN
GBP 6.875%
13,300,000 12,530,179 0.8231.12.99Shawbrook GroupPLC 17 FRN
GBP 7.875%
Securities Marketvalue in
GBP
% of netassets*
Quantity Ccy Maturity
2,258,000 2,311,402 0.1531.12.99StandardChartered Bank 05FRN EMTN
GBP 5.375%
1,870,000 1,894,396 0.1231.12.99Virgin MoneyHoldings UK PLC14 FRN
GBP 7.880%
10,710,000 11,440,401 0.7531.12.99Virgin MoneyHoldings UK PLC16 FRN
GBP 8.750%
3,900,000 2,850,092 0.1919.01.25MARB BondCoPLC 18
USD 6.875%
700,000 656,919 0.0431.12.99Royal Bank ofScotland GroupPLC 01 FRN
USD 7.648%
2,800,000 2,208,452 0.1531.12.99StandardChartered PLC 17FRN
USD 7.750%
76.421,161,620,396Total - Bonds
19.98303,755,957Total - United Kingdom
5,000,000 4,922,270 0.3214.02.41ResidentialMortgageSecurities 26 PLC12
GBP
Mortgage backed securitiesUnited Kingdom
10,000,000 9,910,240 0.6520.08.56Ripon MortgagesPLC 17 FRN
GBP
2,600,000 2,359,500 0.1610.10.40Uropa SecuritiesPLC 07 FRN
GBP
77.551,178,812,406Total - Transferable securities admitted to anofficial exchange
1.1317,192,010Total - Mortgage backed securities
1.1317,192,010Total - United Kingdom
1,575,000 1,284,649 0.0815.04.30Aurium CLO IIIDAC 17 FRN
EUR 4.900%
Transferable securities and money market instruments dealt in on anotherregulated marketBondsIreland
3,200,000 2,541,006 0.1715.10.30Avoca CLO XIIIDAC 17 FRN
EUR 4.950%
6,214,000 4,876,576 0.3217.10.30Bain Capital EuroCLO 2017-1 DAC17 FRN
EUR 4.960%
0.578,702,231Total - Ireland
15,450,000 13,264,061 0.8731.12.99AssicurazioniGenerali SpA 09FRN EMTN
EUR 8.500%Italy
0.8713,264,061Total - Italy
8,120,000 7,047,493 0.4615.09.23ARD Finance SA 17EUR 6.625%Luxembourg
5,401,000 4,751,368 0.3101.11.22GarfunkeluxHoldco 3 SA 15
GBP 8.500%
5,808,000 5,925,779 0.3906.04.24Gazprom OAO ViaGaz Capital SA 17
GBP 4.250%

193
Vontobel Fund - TwentyFour Strategic Income Fund
The accompanying notes form an essential part of these financial statements.
Portfolio as at February 28, 2019
* Any deviations of the percentages of the nets assets are due to rounding.
Securities Marketvalue in
GBP
% of netassets*
Quantity Ccy Maturity
14,590,000 10,330,378 0.6924.01.25HidroviasInternationalFinance SARL 18
USD 5.950%
1.8528,055,018Total - Luxembourg
18,089,000 13,340,485 0.8809.08.24TV Azteca SAB deCV 17
USD 8.250%Mexico
0.8813,340,485Total - Mexico
6,870,000 5,396,197 0.3515.01.32ALME LoanFunding IV BV 18FRN
EUR 4.670%Netherlands
1,700,000 1,382,107 0.0915.10.30ARES EUROPEANCLO VII BV 17 FRN
EUR 5.260%
4,400,000 3,474,914 0.2315.10.30Barings Euro CLO2017-1 BV 17 FRN
EUR 4.900%
0.6710,253,218Total - Netherlands
2,600,000 2,062,240 0.1415.11.22Haya Finance 2017SA 17 FRN
EUR 5.125%Spain
0.142,062,240Total - Spain
7,000,000 5,180,532 0.3401.08.21CHS/CommunityHealth Systems Inc14
USD 5.125%United States
7,650,000 5,704,717 0.3815.03.26CNX MidstreamPartners LP / CNXMidstream FinanceCorp 18
USD 6.500%
6,317,000 4,839,800 0.3201.03.24CommScopeFinance LLC 19
USD 5.500%
1,629,000 1,422,971 0.0915.10.25CSC Holdings LLC15
USD 10.875%
2,640,000 2,104,461 0.1415.06.24Dell InternationalLLC / EMC Corp 16
USD 7.125%
11,138,000 5,987,271 0.3929.11.24EP Energy LLC /Everest AcquisitionFinance Inc 16
USD 8.000%
942,000 722,824 0.0515.06.22XPO Logistics Inc15
USD 6.500%
1.7125,962,576Total - United States
6,586,000 5,208,367 0.3415.02.22International GameTechnology PLC 15
USD 6.250%United Kingdom
750,000 556,206 0.0415.03.24MARB BondCoPLC 17
USD 7.000%
7.07107,404,402Total - Transferable securities and money marketinstruments dealt in on another regulated market
7.07107,404,402Total - Bonds
0.385,764,573Total - United Kingdom
Securities Marketvalue in
GBP
% of netassets*
Quantity Ccy Maturity
1,797,000 1,415,358 0.0915.07.31Dryden 51 Euro Clo2017 BV 17 FRN
EUR 4.900%
Other transferable securitiesBondsCayman Islands
0.091,415,358Total - Cayman Islands
4,748,000 4,121,503 0.2715.09.21IHO VerwaltungsGmbH 16
EUR 2.750%Germany
1,800,000 1,604,665 0.1113.12.28SC GermanyConsumer 2015-1UGhaftungsbeschraenkt 15 FRN
EUR 5.080%
3,700,000 3,166,418 0.2113.11.30SC GermanyConsumer 2017-1UG 17 FRN
EUR 2.869%
0.598,892,586Total - Germany
2,935,000 2,295,610 0.1530.04.31Adagio VI CLODAC 17 FRN
EUR 4.900%Ireland
2,050,000 1,679,849 0.1115.04.30ALME LoanFunding IIIDesignated ActivityCo 17 FRN
EUR 5.400%
7,600,000 5,795,106 0.3815.11.31Armada Euro CLOII DAC 18 FRN
EUR 4.820%
1,000,000 782,645 0.0512.01.31Avoca CLO XIVDesignated ActivityCo 17 FRN
EUR 4.700%
2,000,000 1,593,927 0.1015.10.31Avoca CLO XIXDAC 18 FRN
EUR 5.280%
2,500,000 2,029,767 0.1320.01.32Bain Capital EuroCLO 2018-2 DAC18 FRN
EUR 5.500%
2,000,000 1,575,230 0.1020.01.32Black DiamondCLO 2017-2 DAC17 FRN
EUR 5.100%
3,000,000 2,312,147 0.1515.01.31Carlyle Euro CLO2017-3 DAC 17FRN
EUR 4.580%
2,900,000 2,300,346 0.1528.08.31Carlyle Euro CLO2018-2 DAC 18FRN
EUR 5.230%
1,000,000 851,379 0.0615.01.30GLG Euro CLO IIDAC 16 FRN
EUR 6.550%
1,300,000 1,044,650 0.0715.10.30GLG Euro Clo IIIDAC 17 FRN
EUR 5.350%
6,600,000 5,094,087 0.3420.10.30GoldenTree LoanManagement EURCLO 1 DAC 18FRN
EUR 4.730%
3,200,000 2,510,511 0.1720.10.31Harvest Clo XXDAC 18 FRN
EUR 5.300%
1,800,000 1,445,893 0.1006.09.31Hayfin EmeraldCLO I DAC 18 FRN
EUR 5.470%
1,000,000 710,266 0.0515.10.30Man GLG EuroCLO I DAC 18 FRN
EUR 6.450%
1,300,000 999,862 0.0715.10.30Man GLG EuroCLO I DAC 18 FRN
EUR 4.850%
9,100,000 6,905,821 0.4515.10.30Marlay Park CLODAC 18 FRN
EUR 4.500%
4,000,000 3,026,664 0.2016.02.32Newhaven II CLODAC 18 FRN
EUR 4.030%

194
Vontobel Fund - TwentyFour Strategic Income Fund
The accompanying notes form an essential part of these financial statements.
Portfolio as at February 28, 2019
* Any deviations of the percentages of the nets assets are due to rounding.
Securities Marketvalue in
GBP
% of netassets*
Quantity Ccy Maturity
4,500,000 3,486,927 0.2320.01.32Oak Hill EuropeanCredit Partners IVDesignated ActivityCo 18 FRN
EUR 4.710%
3,462,000 2,800,842 0.1818.04.30Palmerston ParkCLO DAC 17 FRN
EUR 5.370%
3,000,000 2,324,720 0.1517.12.30Penta CLO 4 DAC18 FRN
EUR 4.650%
9,800,000 7,515,589 0.4914.05.31Providus CLO IDAC 18 FRN
EUR 4.680%
3,000,000 2,357,353 0.1625.01.31Purple FinanceCLO 1 DAC 18FRN
EUR 5.050%
5,000,000 3,960,037 0.2625.04.30St Paul's CLO IVDAC 18 FRN
EUR 4.970%
4,000,000 3,384,417 0.2220.08.30St Paul's CLO VIDAC 18 FRN
EUR 5.750%
3,500,000 2,891,392 0.1930.04.30St Paul's CLO VIIDAC 18 FRN
EUR 5.650%
4.7171,675,037Total - Ireland
1,000,000 772,661 0.0505.10.31BNPP AM EuroCLO 2017 BV 17FRN
EUR 4.700%Netherlands
2,600,000 2,104,553 0.1415.07.30Cadogan SquareCLO IX DAC 17FRN
EUR 4.900%
3,750,000 2,968,204 0.2015.08.30Carlyle Euro CLO2017-2 DAC 17FRN
EUR 5.230%
6,500,000 5,026,712 0.3217.05.31Carlyle GlobalMarket StrategiesEuro CLO 2016-1DAC 18 FRN
EUR 4.770%
3,000,000 2,382,480 0.1615.10.31Dryden 39 EuroCLO 2015 BV 17FRN
EUR 4.970%
2,000,000 1,552,429 0.1015.05.30Dryden XXVII-REuro CLO 2017 BV17 FRN
EUR 6.850%
4,300,000 3,685,328 0.2417.01.31Euro-Galaxy III CLOBV 17 FRN
EUR 6.250%
2,000,000 1,605,968 0.1115.04.30Halcyon LoanAdvisors EuropeanFunding 2014 BV17 FRN
EUR 5.550%
2,300,000 1,921,250 0.1315.02.30St Pauls CLO IIDAC 18 FRN
EUR 5.500%
1,000,000 805,249 0.0515.10.31Tikehau CLO IV BV18 FRN
EUR 5.330%
1.5022,824,834Total - Netherlands
2,500,000 2,280,385 0.1518.05.35FTA SantanderConsumo 2 16
EUR 6.500%Spain
0.152,280,385Total - Spain
2,196,000 1,697,463 0.1115.07.23CSC Holdings LLC18
USD 5.375%United States
0.111,697,463Total - United States
Securities Marketvalue in
GBP
% of netassets*
Quantity Ccy Maturity
2,000,000 2,000,000 0.1331.12.00Charles StreetConduit AssetBackedSecuritisation 1 Ltd18 FRN
GBP 6.232%United Kingdom
6,000,000 6,000,000 0.4031.12.00Charles StreetConduit AssetBackedSecuritisation 1 Ltd18 FRN
GBP 4.482%
7.68116,785,663Total - Bonds
0.538,000,000Total - United Kingdom
3,000,000 607,736 0.0417.11.26Taurus 2016-1 DEUDAC 16 FRN
EUR
Mortgage backed securitiesIreland
0.04607,736Total - Ireland
10,000,000 6,325,971 0.4212.03.55Precise MortgageFunding 2018-2BPLC 18 FRN
GBPUnited Kingdom
2,000,000 1,983,412 0.1320.08.56Ripon MortgagesPLC 17 FRN
GBP
8.27125,702,782Total - Other transferable securities
0.598,917,119Total - Mortgage backed securities
0.558,309,383Total - United Kingdom
92.891,411,919,590Total - Investment in securities
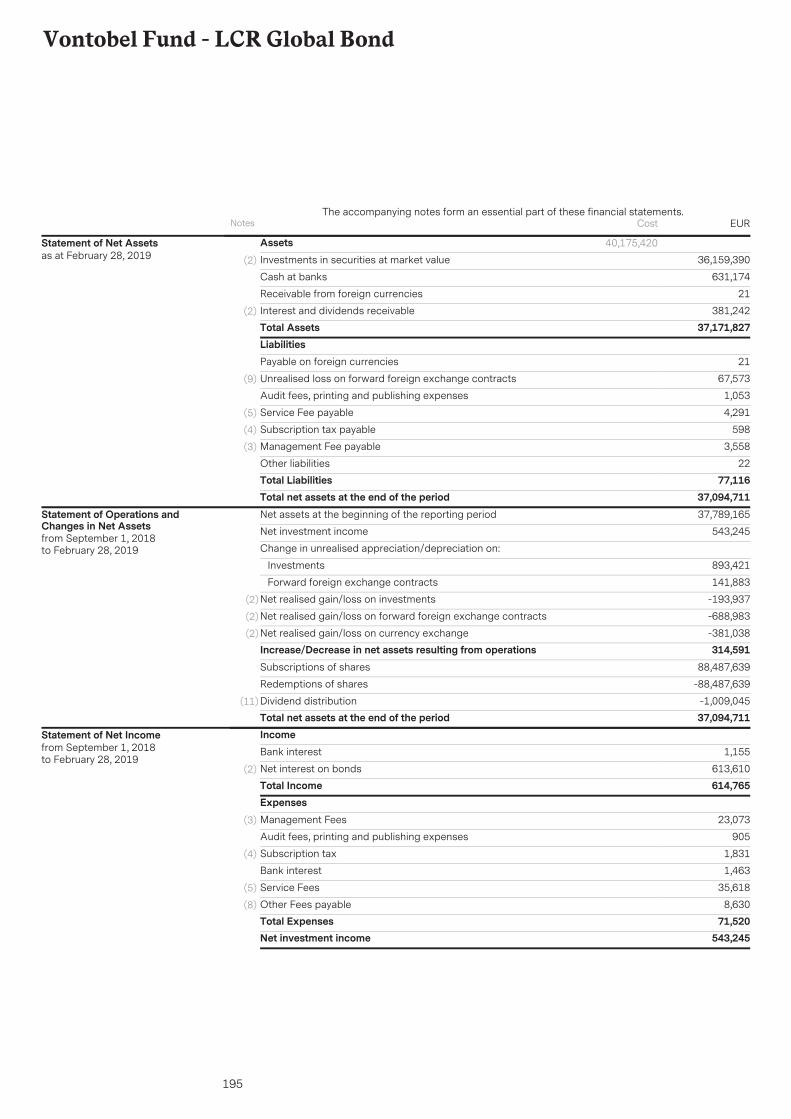
195
Vontobel Fund - LCR Global Bond
AssetsInvestments in securities at market value 36,159,390(2)
631,174Cash at banks
21Receivable from foreign currencies
381,242Interest and dividends receivable(2)
Total Assets 37,171,827
40,175,420Statement of Net Assetsas at February 28, 2019
LiabilitiesPayable on foreign currencies 21
Unrealised loss on forward foreign exchange contracts 67,573(9)
Audit fees, printing and publishing expenses 1,053
Service Fee payable 4,291(5)
Subscription tax payable 598(4)
Management Fee payable 3,558(3)
Other liabilities 22Total Liabilities 77,116Total net assets at the end of the period 37,094,711Net assets at the beginning of the reporting period 37,789,165
Net investment income 543,245
Change in unrealised appreciation/depreciation on:
Investments 893,421
Forward foreign exchange contracts 141,883
Net realised gain/loss on investments -193,937(2)
Net realised gain/loss on forward foreign exchange contracts -688,983(2)
Net realised gain/loss on currency exchange -381,038(2)
Increase/Decrease in net assets resulting from operations 314,591Subscriptions of shares 88,487,639
Redemptions of shares -88,487,639
Dividend distribution -1,009,045(11)
Total net assets at the end of the period 37,094,711
Statement of Operations andChanges in Net Assetsfrom September 1, 2018to February 28, 2019
IncomeBank interest 1,155
Net interest on bonds 613,610(2)
Total Income 614,765ExpensesManagement Fees 23,073(3)
Audit fees, printing and publishing expenses 905
Subscription tax 1,831(4)
Bank interest 1,463
Service Fees 35,618(5)
Other Fees payable 8,630(8)
Total Expenses 71,520Net investment income 543,245
Statement of Net Incomefrom September 1, 2018to February 28, 2019
Notes EURThe accompanying notes form an essential part of these financial statements.
Cost

196
Vontobel Fund - LCR Global Bond
The accompanying notes form an essential part of these financial statements.
Portfolio as at February 28, 2019
* Any deviations of the percentages of the nets assets are due to rounding.
Securities Marketvalue in
EUR
% of netassets*
Quantity Ccy Maturity
875,000 771,717 2.0818.09.24Kingdom ofBelgiumGovernmentInternational Bond14 EMTN
USD 2.875%
Transferable securities admitted to an official exchangeBondsBelgium
2.08771,717Total - Belgium
2,000,000 2,059,120 5.5506.04.23AfricanDevelopment Bank93
USD 7.375%Ivory Coast
5.552,059,120Total - Ivory Coast
2,000,000 1,660,660 4.4808.09.23Province of BritishColumbia Canada93
CAD 8.000%Canada
2,000,000 1,323,025 3.5727.01.23Province of OntarioCanada 16
CAD 1.950%
2,000,000 1,646,977 4.4413.07.22Province of OntarioCanada 92
CAD 9.500%
2,000,000 1,665,261 4.4908.09.23Province of OntarioCanada 93
CAD 8.100%
3,000,000 2,567,085 6.9206.09.22Province ofManitoba Canada12
USD 2.100%
3,250,000 2,835,952 7.6413.02.23Province of QuebecCanada 13
USD 2.625%
31.5411,698,960Total - Canada
5,000,000 493,031 1.3312.05.25EuropeanInvestment Bank 15EMTN
SEK 1.250%Luxembourg
1.33493,031Total - Luxembourg
67,000,000 6,462,678 17.4222.02.23Kommuninvest ISverige AB 17
SEK 0.750%Sweden
17.426,462,678Total - Sweden
2,250,000 2,417,658 6.5215.06.25Inter-AmericanDevelopment Bank95
USD 7.000%United States
64.4423,903,164Total - Transferable securities admitted to anofficial exchange
64.4423,903,164Total - Bonds
6.522,417,658Total - United States
8,000,000 5,403,967 14.5815.12.22Province of AlbertaCanada 12
CAD 2.550%
Transferable securities and money market instruments dealt in on anotherregulated marketBondsCanada
2,000,000 1,399,402 3.7701.12.23Province of AlbertaCanada 13
CAD 3.400%
Securities Marketvalue in
EUR
% of netassets*
Quantity Ccy Maturity
6,000,000 4,048,854 10.9102.06.23Province ofManitoba Canada13
CAD 2.550%
951,000 987,697 2.6615.07.23Province of QuebecCanada 93
USD 7.500%
400,000 416,306 1.1209.02.24Province of QuebecCanada 94
USD 7.125%
33.0412,256,226Total - Transferable securities and money marketinstruments dealt in on another regulated market
33.0412,256,226Total - Bonds
33.0412,256,226Total - Canada
97.4836,159,390Total - Investment in securities

197
Vontobel Fund - Multi Asset Solution
AssetsInvestments in securities at market value 62,291,901(2)
6,992,429Cash at banks
41Receivable from foreign currencies
-208Interest and dividends receivable(2)
4,507,335Receivable for investments sold
12,053Unrealised gain on futures(9)
224,995Options at cost of purchase(9)
Total Assets 74,028,546
60,179,065Statement of Net Assetsas at February 28, 2019
LiabilitiesBank overdraft 20,438
Payable for redemptions 465,778
Payable on foreign currencies 41
Unrealised loss on options 166,146(9)
Audit fees, printing and publishing expenses 1,408
Service Fee payable 5,699(5)
Subscription tax payable 3,749(4)
Management Fee payable 56,604(3)
Performance Fee payable 20,739(3)
Other liabilities 1,326Total Liabilities 741,928Total net assets at the end of the period 73,286,618Net assets at the beginning of the reporting period 80,271,135
Net investment loss on investments -479,317
Change in unrealised appreciation/depreciation on:
Investments 600,073
Futures 60,603
Options -166,296
Net realised gain/loss on investments -420,299(2)
Net realised gain/loss on currency exchange -15,660(2)
Net realised gain/loss on futures -39,347(2)
Net realised gain/loss on options 416,451(2)
Increase/Decrease in net assets resulting from operations -43,792Subscriptions of shares 10,424,302
Redemptions of shares -17,365,027Total net assets at the end of the period 73,286,618
Statement of Operations andChanges in Net Assetsfrom September 1, 2018to February 28, 2019
Notes EURThe accompanying notes form an essential part of these financial statements.
Cost

198
Vontobel Fund - Multi Asset Solution
IncomeNet interest on bonds 31,634(2)
Net dividends 31,175Total Income 62,809ExpensesManagement Fees 397,600(3)
Performance Fee 20,739(3)
Audit fees, printing and publishing expenses 8,286
Subscription tax 2,483(4)
Bank interest 17,918
Service Fees 72,158(5)
Other Fees payable 22,942(8)
Total Expenses 542,126Net investment loss on investments -479,317
Statement of Net Incomefrom September 1, 2018to February 28, 2019
Notes EURThe accompanying notes form an essential part of these financial statements.

199
Vontobel Fund - Multi Asset Solution
The accompanying notes form an essential part of these financial statements.
Portfolio as at February 28, 2019
* Any deviations of the percentages of the nets assets are due to rounding.
Securities Marketvalue in
EUR
% of netassets*
Quantity Ccy Maturity
100,000 394,680 0.54iShares USDTreasury Bond20+yr UCITS ETFUSD Dist
EUR
Transferable securities admitted to an official exchangeInvestment fundsIreland
0.54394,680Total - Ireland
5,000 1,663,520 2.27VONTOBEL/EMERG.MKT EQ-S-/CAP
USDLuxembourg
2.271,663,520Total - Luxembourg
83,000 1,113,196 1.52ETFSCOMM.SEC./GOLD COMM.I
EURUnited Kingdom
4.333,171,396Total - Investment funds
1.521,113,196Total - United Kingdom
5,500 617,760 0.84INVESCO PHYCERT/GOLD.
EUR
Options, Warrants, RightsIreland
5.173,789,156Total - Transferable securities admitted to anofficial exchange
0.84617,760Total - Options, Warrants, Rights
0.84617,760Total - Ireland
15,000 980,100 1.34VON COMM HIHC-HI (HEDGED)-CAP
EUR
Other transferable securitiesInvestment fundsLuxembourg
13,500 1,367,955 1.87VON EM MC BD-HI(HEDGED)- CAP
EUR
31,000 3,296,230 4.50VON MUL AS INC -I- EUR /CAP
EUR
2,500 869,475 1.19VON SUS ASL EXJ-HI (HED)CAP
EUR
32,000 3,240,000 4.42Vontobel Fund -Absolute ReturnBond (EUR) - S
EUR
77,105 8,058,221 11.00Vontobel Fund -Bond GlobalAggregate - S EUR
EUR
12,178 1,295,739 1.77Vontobel Fund -Emerging MarketsDebt - HS EUR
EUR
48,109 5,005,704 6.83Vontobel Fund -EUR CorporateBond Mid Yield - SEUR
EUR
10,660 1,085,295 1.48Vontobel Fund -Euro Bond - S EUR
EUR
37,376 3,760,026 5.13Vontobel Fund -Euro Short TermBond - S EUR
EUR
Securities Marketvalue in
EUR
% of netassets*
Quantity Ccy Maturity
31,256 3,425,658 4.67Vontobel Fund -European Equity -S EUR
EUR
17,330 1,711,684 2.34Vontobel Fund -Global Bond - HSEUR
EUR
99,007 12,671,968 17.28Vontobel Fund -Global Equity - HSEUR
EUR
32,828 3,495,525 4.77Vontobel Fund -TwentyFourAbsolute ReturnCredit Fund - HIEUR
EUR
42,600 4,302,174 5.87Vontobel Fund -TwentyFourMonumentEuropean AssetBacked Securities- I
EUR
29,926 3,256,847 4.44Vontobel Fund -TwentyFourStrategic IncomeFund - HI (hedged)EUR
EUR
6,000 680,144 0.93VON SUS EM L -S-USD/CAP
USD
79.8358,502,745Total - Other transferable securities
79.8358,502,745Total - Investment funds
79.8358,502,745Total - Luxembourg
85.0062,291,901Total - Investment in securities

200
Vontobel Fund - Multi Asset Income
AssetsInvestments in securities at market value 41,008,063(2)
1,996,108Cash at banks
439,743Receivable from foreign currencies
388Receivable from subscriptions
440,943Interest and dividends receivable(2)
1,391,528Receivable for investments sold
60,143Options at cost of purchase(9)
16,911Other assetsTotal Assets 45,353,827
41,753,697Statement of Net Assetsas at February 28, 2019
LiabilitiesBank overdraft 12,618
Payable for redemptions 72,834
Payable on foreign currencies 439,356
Unrealised loss on forward foreign exchange contracts 221,188(9)
Unrealised loss on futures 49,655(9)
Unrealised loss on options 58,493(9)
Audit fees, printing and publishing expenses 713
Service Fee payable 5,085(5)
Subscription tax payable 3,535(4)
Management Fee payable 29,978(3)
Other liabilities 18,041Total Liabilities 911,496Total net assets at the end of the period 44,442,331Net assets at the beginning of the reporting period 42,557,998
Net investment income 490,966
Change in unrealised appreciation/depreciation on:
Investments 969,647
Futures -54,874
Forward foreign exchange contracts -202,842
Options 13,939
Net realised gain/loss on investments -239,563(2)
Net realised gain/loss on forward foreign exchange contracts -281,477(2)
Net realised gain/loss on currency exchange 72,155(2)
Net realised gain/loss on futures -844,695(2)
Net realised gain/loss on options 207,334(2)
Increase/Decrease in net assets resulting from operations 130,590Subscriptions of shares 3,712,340
Redemptions of shares -1,921,195
Dividend distribution -37,402(11)
Total net assets at the end of the period 44,442,331
Statement of Operations andChanges in Net Assetsfrom September 1, 2018to February 28, 2019
Notes EURThe accompanying notes form an essential part of these financial statements.
Cost

201
Vontobel Fund - Multi Asset Income
IncomeBank interest 3,064
Net interest on bonds 655,083(2)
Net dividends 165,632Total Income 823,779ExpensesManagement Fees 191,194(3)
Audit fees, printing and publishing expenses 9,743
Subscription tax 6,495(4)
Bank interest 4,719
Service Fees 46,631(5)
Other Fees payable 74,031(8)
Total Expenses 332,813Net investment income 490,966
Statement of Net Incomefrom September 1, 2018to February 28, 2019
Notes EURThe accompanying notes form an essential part of these financial statements.

202
Vontobel Fund - Multi Asset Income
The accompanying notes form an essential part of these financial statements.
Portfolio as at February 28, 2019
* Any deviations of the percentages of the nets assets are due to rounding.
Securities Marketvalue in
EUR
% of netassets*
Quantity Ccy Maturity
600,000 468,532 1.05ChinaConstruction BankCorp
HKD
Transferable securities admitted to an official exchangeSharesChina
1.05468,532Total - China
2,420 473,352 1.07Allianz SEEURGermany
6,200 415,338 0.93BASF SEEUR9,250 487,106 1.10Daimler AGEUR19,600 440,020 0.99DEUTSCHE
LUFTHANSA/NAM.
EUR
17,500 478,100 1.08Deutsche Post AGEUR4,600 442,198 0.99Siemens AGEUR
6.162,736,114Total - Germany
22,500 501,638 1.13AXA SAEURFrance
10,480 472,176 1.06BNP Paribas SAEUR9,000 438,570 0.99Publicis Groupe
SAEUR
7,500 451,725 1.02Renault SAEUR8,400 419,916 0.94TOTAL SAEUR
5.142,284,025Total - France
48,000 443,562 1.00CHINA MOBILELTD
HKDHong Kong
1.00443,562Total - Hong Kong
310,000 428,463 0.96MIZUHOFINANCIALGROUPINC
JPYJapan
19,700 402,749 0.91NTT DOCOMO IncJPY1.87831,212Total - Japan
8,540 416,502 0.94Bank of NovaScotia
CADCanada
0.94416,502Total - Canada
560 389,989 0.88SAMSUNGEL.144A(1/2N-V)SGDR
USDKorea, Republic Of
0.88389,989Total - Korea, Republic Of
9,800 426,773 0.96Holcim LtdCHFSwitzerland
6,000 477,937 1.07Nestle SACHF1,720 420,458 0.95Roche Holding AGCHF1,200 460,166 1.03Swiss Life Holding
AGCHF
1,087 442,802 1.00Swisscom AGCHF5.012,228,136Total - Switzerland
Securities Marketvalue in
EUR
% of netassets*
Quantity Ccy Maturity
109,000 468,264 1.05Banco SantanderSA
EURSpain
61,071 448,994 1.01Iberdrola SAEUR2.06917,258Total - Spain
15,000 409,941 0.92AT&T IncUSDUnited States
4,400 462,064 1.04Chevron CorpUSD6,587 457,162 1.03Exxon Mobil CorpUSD11,500 437,802 0.99Pfizer IncUSD5,018 434,288 0.98Procter & Gamble
Co/TheUSD
8,650 432,386 0.97VerizonCommunicationsInc
USD
5.932,633,643Total - United States
150,000 491,647 1.10Legal & GeneralGroup PLC
GBPUnited Kingdom
9,000 455,834 1.03Rio Tinto PLCGBP
32.1714,296,454Total - Shares
2.13947,481Total - United Kingdom
600,000 560,388 1.2631.12.99KBC Group NV 18FRN
EUR 4.250%
BondsBelgium
1.26560,388Total - Belgium
400,000 462,132 1.0331.12.99DONG Energy A/S13 FRN
EUR 6.250%Denmark
400,000 424,464 0.9631.12.99Nykredit RealkreditA/S 15 FRN
EUR 6.250%
1.99886,596Total - Denmark
400,000 407,408 0.9201.07.74Bayer AG 14 FRNEUR 3.750%Germany
400,000 397,044 0.8923.04.75Bertelsmann SE &Co KGaA 15 FRNEMTN
EUR 3.500%
1.81804,452Total - Germany
380,000 408,846 0.9231.12.99AXA SA 14 FRNEMTN
EUR 3.880%France
400,000 444,872 1.0005.06.45CNP Assurances14 FRN
EUR 4.250%
360,000 402,235 0.9131.12.99Orange SA 14 FRNEMTN
EUR 5.000%
600,000 670,247 1.5131.12.99Solvay Finance SA13 FRN
EUR 5.425%
400,000 425,548 0.9631.12.99TOTAL SA 16 FRNEMTN
EUR 3.369%
600,000 588,036 1.3231.12.99Unibail-RodamcoSE 18 FRN
EUR 2.875%

203
Vontobel Fund - Multi Asset Income
The accompanying notes form an essential part of these financial statements.
Portfolio as at February 28, 2019
* Any deviations of the percentages of the nets assets are due to rounding.
Securities Marketvalue in
EUR
% of netassets*
Quantity Ccy Maturity
400,000 482,686 1.0931.12.99Electricite deFrance SA 13 FRNEMTN
GBP 6.000%
7.713,422,470Total - France
400,000 502,764 1.1210.07.42AssicurazioniGenerali SpA 12FRN EMTN
EUR 10.125%Italy
400,000 416,012 0.9431.12.99Intesa SanpaoloSpA 16 FRN EMTN
EUR 7.000%
400,000 341,208 0.7731.12.99UniCredit SpA 17FRN
EUR 5.375%
400,000 501,086 1.1310.09.75Enel SpA 13 FRNGBP 7.750%3.961,761,070Total - Italy
400,000 424,312 0.9520.04.23SoftBank GroupCorp 18
EUR 4.000%Japan
427,000 443,252 1.0015.04.28SoftBank GroupCorp 18
EUR 5.000%
600,000 463,096 1.0431.12.99SoftBank GroupCorp 17 FRN
USD 6.875%
2.991,330,660Total - Japan
800,000 191,712 0.4323.01.20EuropeanInvestment Bank 17EMTN
BRL 8.500%Luxembourg
400,000 496,435 1.1124.01.33Telecom ItaliaFinance SA 03EMTN
EUR 7.750%
1,000,000 137,548 0.3103.10.24EuropeanInvestment Bank 14EMTN
TRY 9.250%
1,000,000 141,544 0.3207.03.22EuropeanInvestment Bank 17EMTN
TRY 10.000%
4,000,000 251,317 0.5721.12.26EuropeanInvestment Bank 15EMTN
ZAR 8.125%
2.741,218,556Total - Luxembourg
90,000 359,235 0.8105.03.26Mexican Bonos 15MXN 5.750%Mexico
0.81359,235Total - Mexico
400,000 383,012 0.8631.12.99ABN AMRO BankNV 17 FRN
EUR 4.750%Netherlands
380,000 390,119 0.8831.12.99Achmea BV 15 FRNEMTN
EUR 4.250%
400,000 422,932 0.9630.11.49Gas Natural FenosaFinance BV 14 FRN
EUR 4.125%
300,000 334,821 0.7531.12.99Telefonica EuropeBV 14 FRN
EUR 5.875%
400,000 372,240 0.8431.12.99VolkswagenInternationalFinance NV 15 FRN
EUR 3.500%
400,000 379,804 0.8531.12.99VolkswagenInternationalFinance NV 17 FRN
EUR 3.875%
Securities Marketvalue in
EUR
% of netassets*
Quantity Ccy Maturity
400,000 353,266 0.7931.12.99ING Groep NV 15FRN
USD 6.000%
5.932,636,194Total - Netherlands
400,000 436,160 0.9831.12.99Erste Group BankAG 17 FRN
EUR 6.500%Austria
0.98436,160Total - Austria
400,000 428,820 0.9616.09.75EDP - Energias dePortugal SA 15FRN
EUR 5.380%Portugal
500,000 519,665 1.1730.04.79EDP - Energias dePortugal SA 19FRN
EUR 4.496%
2.13948,485Total - Portugal
600,000 558,840 1.2608.02.38RomanianGovernmentInternational Bond18 EMTN
EUR 3.375%Romania
1.26558,840Total - Romania
400,000 349,746 0.7831.12.99SkandinaviskaEnskilda BankenAB 14 FRN EMTN
USD 5.750%Sweden
400,000 344,586 0.7831.12.99Swedbank AB 16FRN
USD 6.000%
1.56694,332Total - Sweden
500,000 457,301 1.0331.12.99LafargeholcimHelvetia FinanceLtd 18 FRN
CHF 3.500%Switzerland
600,000 542,587 1.2231.12.99Credit SuisseGroup AG 18 FRN
USD 7.500%
400,000 306,560 0.6931.12.99UBS GroupFundingSwitzerland AG 18FRN
USD 5.000%
200,000 177,404 0.4031.12.99UBS GroupFundingSwitzerland AG 19FRN
USD 7.000%
3.341,483,852Total - Switzerland
200,000 225,710 0.5131.12.99Banco BilbaoVizcaya ArgentariaSA 16 FRN
EUR 8.875%Spain
400,000 425,620 0.9631.03.47Mapfre SA 17 FRNEUR 4.375%400,000 317,169 0.7131.12.99Banco Bilbao
Vizcaya ArgentariaSA 17 FRN
USD 6.125%
2.18968,499Total - Spain
400,000 398,040 0.9004.09.36AT&T Inc 17EUR 3.150%United States

204
Vontobel Fund - Multi Asset Income
The accompanying notes form an essential part of these financial statements.
Portfolio as at February 28, 2019
* Any deviations of the percentages of the nets assets are due to rounding.
Securities Marketvalue in
EUR
% of netassets*
Quantity Ccy Maturity
400,000 400,128 0.9031.12.99IberdrolaInternational BV 18FRN EMTN
EUR 2.625%
500,000 596,052 1.3424.01.24Citigroup Inc 19GBP 2.750%45,000,000 554,733 1.2503.06.19International
Finance Corp 14EMTN
INR 7.800%
42,000,000 576,475 1.3021.01.20InternationalFinance Corp 15
RUB 11.000%
344,000 300,709 0.6801.06.22Murphy Oil Corp 12USD 4.000%6.372,826,137Total - United States
400,000 393,808 0.8931.12.99HSBC HoldingsPLC 17 FRN EMTN
EUR 4.750%United Kingdom
400,000 439,794 0.9931.12.99Barclays PLC 17FRN
GBP 5.875%
600,000 708,456 1.5831.12.99NationwideBuilding Society 14FRN EMTN
GBP 6.875%
250,000 238,885 0.5431.12.99Phoenix GroupHoldings 18 FRN
GBP 5.750%
400,000 323,221 0.7331.12.99Prudential PLC 17EMTN
USD 4.875%
51.7523,000,090Total - Bonds
4.732,104,164Total - United Kingdom
3,900 370,963 0.83iShares J.P.Morgan USD EMBond UCITS ETFUSD Dist
USD
Investment fundsIreland
27,000 1,411,531 3.19ISHARES JPMORGEM BD USD /DIS
USD
3,000 294,415 0.66iShares USD CorpBond UCITS ETF
USD
4,800 432,282 0.97iShares USD HighYield Corp BondUCITS ETF USDDist
USD
5.652,509,191Total - Investment funds
5.652,509,191Total - Ireland
400,000 419,384 0.9431.12.99Lloyds BankingGroup PLC 14 FRN
EUR
Convertible Bonds - Floating RateUnited Kingdom
90.5140,225,119Total - Transferable securities admitted to anofficial exchange
0.94419,384Total - Convertible Bonds - Floating Rate
0.94419,384Total - United Kingdom
Securities Marketvalue in
EUR
% of netassets*
Quantity Ccy Maturity
400,000 351,763 0.7931.12.99ING Groep NV 19FRN
USD 6.750%
Transferable securities and money market instruments dealt in on anotherregulated marketBondsNetherlands
0.79351,763Total - Bonds
0.79351,763Total - Netherlands
4,140 431,181 0.97iShares Euro HighYield CorporateBond UCITS ETF
EUR
Investment fundsIreland
1.76782,944Total - Transferable securities and money marketinstruments dealt in on another regulated market
0.97431,181Total - Investment funds
0.97431,181Total - Ireland
92.2741,008,063Total - Investment in securities

205
Vontobel Fund - TwentyFour Monument European Asset BackedSecurities
AssetsInvestments in securities at market value 253,751,373(2)
6,824,501Cash at banks
3Receivable from foreign currencies
210,343Receivable from subscriptions
606,638Interest and dividends receivable(2)
206Receivable for investments soldTotal Assets 261,393,064
252,521,839Statement of Net Assetsas at February 28, 2019
LiabilitiesPayable for redemptions 393,988
Payable for investments purchased 1,500,000
Payable on foreign currencies 3
Unrealised loss on forward foreign exchange contracts 3,385,859(9)
Audit fees, printing and publishing expenses 3,195
Service Fee payable 20,809(5)
Subscription tax payable 4,176(4)
Management Fee payable 98,725(3)
Other liabilities 1,505Total Liabilities 5,408,260Total net assets at the end of the period 255,984,804Net assets at the beginning of the reporting period 338,017,089
Net investment income 2,153,445
Change in unrealised appreciation/depreciation on:
Investments 4,487,665
Forward foreign exchange contracts -2,103,285
Net realised gain/loss on investments -3,034,614(2)
Net realised gain/loss on forward foreign exchange contracts -5,774,340(2)
Net realised gain/loss on currency exchange 1,365,553(2)
Increase/Decrease in net assets resulting from operations -2,905,576Subscriptions of shares 96,377,754
Redemptions of shares -175,504,463Total net assets at the end of the period 255,984,804
Statement of Operations andChanges in Net Assetsfrom September 1, 2018to February 28, 2019
IncomeBank interest 5,799
Net interest on bonds 3,145,670(2)
Total Income 3,151,468ExpensesManagement Fees 767,576(3)
Audit fees, printing and publishing expenses 9,738
Subscription tax 13,780(4)
Bank interest 32,628
Service Fees 146,299(5)
Other Fees payable 28,003(8)
Total Expenses 998,024Net investment income 2,153,445
Statement of Net Incomefrom September 1, 2018to February 28, 2019
Notes EURThe accompanying notes form an essential part of these financial statements.
Cost

206
Vontobel Fund - TwentyFour Monument European Asset BackedSecurities
The accompanying notes form an essential part of these financial statements.
Portfolio as at February 28, 2019
* Any deviations of the percentages of the nets assets are due to rounding.
Securities Marketvalue in
EUR
% of netassets*
Quantity Ccy Maturity
1,200,000 1,131,977 0.4520.01.32Black DiamondCLO 2017-2 DAC17 FRN
EUR 2.950%
Transferable securities admitted to an official exchangeBondsIreland
1,000,000 986,258 0.3925.07.30Halcyon LoanAdvisors EuropeanFunding 2017-1DAC 17 FRN
EUR 3.200%
1,000,000 982,500 0.3818.11.29Harvest CLO XIVDAC 17 FRN
EUR 2.500%
1.223,100,735Total - Ireland
1,500,000 793,940 0.3115.12.43ResLoC UK PLC 07FRN
EUR 0,000%United Kingdom
1,000,000 1,161,112 0.4515.06.23PCL Funding IIIPLC 17 FRN
GBP 1.380%
1.985,055,787Total - Bonds
0.761,955,052Total - United Kingdom
2,000,000 759,652 0.3018.02.27Taurus 2015-1 ITSrl 15 FRN
EUR
Mortgage backed securitiesItaly
0.30759,652Total - Italy
2,500,000 2,219,840 0.8718.11.51CartesianResidentialMortgages 2 SA 17FRN
EURLuxembourg
0.872,219,840Total - Luxembourg
8,000,000 7,628,660 2.9818.11.52CartesianResidentialMortgages 3 SA 18FRN
EURNetherlands
2.987,628,660Total - Netherlands
3,500,000 2,125,845 0.8301.12.35First Flexible No 6PLC 04 FRN
EURUnited Kingdom
4,000,000 2,069,606 0.8114.06.40KensingtonMortgageSecurities PLC 07FRN
EUR
1,400,000 725,405 0.2814.06.40KensingtonMortgageSecurities PLC 07FRN
EUR
1,000,000 915,993 0.3615.01.39Paragon MortgagesNo 13 PLC 06 FRN
EUR
1,885,000 2,200,081 0.8615.08.45Dukinfield PLC 15FRN
GBP
2,986,000 3,444,011 1.3531.03.53Durham MortgagesA PLC 18 FRN
GBP
3,000,000 3,232,795 1.2614.07.45Equity ReleaseFunding No 5 PLC05 FRN
GBP
Securities Marketvalue in
EUR
% of netassets*
Quantity Ccy Maturity
1,300,000 1,498,012 0.5920.08.56Harben Finance2017-1 Plc 17 FRN
GBP
1,344,000 1,555,295 0.6120.08.56Harben Finance2017-1 Plc 17 FRN
GBP
2,150,000 2,526,955 0.9925.05.53HawksmoorMortgages 2016-1PLC 16 FRN
GBP
2,000,000 2,306,386 0.9015.10.54Holmes MasterIssuer PLC 18 FRN
GBP
2,000,000 1,215,715 0.4714.06.40KensingtonMortgageSecurities PLC 07FRN
GBP
1,554,000 1,811,121 0.7112.03.54Precise MortgageFunding 2017-1BPLC 17 FRN
GBP
1,400,000 1,643,661 0.6415.06.46ResidentialMortgageSecurities 28 Plc 15FRN
GBP
2,000,000 2,356,614 0.9215.06.46ResidentialMortgageSecurities 28 Plc 15FRN
GBP
3,848,000 4,454,451 1.7320.08.56Ripon MortgagesPLC 17 FRN
GBP
1,046,000 1,226,725 0.4820.06.45RochesterFinancing No 2 PLC16 FRN
GBP
2,878,000 3,393,688 1.3324.10.44Slate No 2 PLC 14FRN
GBP
4,000,000 4,688,698 1.8224.01.51Slate No.1 Plc 14FRN
GBP
1,539,000 1,808,524 0.7124.01.51Slate No.1 Plc 14FRN
GBP
6,000,000 1,546,813 0.6024.01.51Slate No.1 Plc 14FRN
GBP
2,800,000 3,287,058 1.2812.06.46Stanlington No 1PLC 17 FRN
GBP
3,000,000 3,184,208 1.2412.03.44Stratton MortgageFunding PLC 18FRN
GBP
1,000,000 1,167,502 0.4621.09.49Warwick FinanceResidentialMortgages No OnePlc 15 FRN
GBP
1,100,000 1,283,160 0.5021.09.49Warwick FinanceResidentialMortgages No OnePlc 15 FRN
GBP
2,000,000 1,398,397 0.5521.09.49Warwick FinanceResidentialMortgages No TwoPLC 15 FRN
GBP
1,630,000 1,909,692 0.7521.09.49Warwick FinanceResidentialMortgages No TwoPLC 15 FRN
GBP
29.1674,640,350Total - Transferable securities admitted to anofficial exchange
27.1869,584,563Total - Mortgage backed securities
23.0358,976,411Total - United Kingdom

207
Vontobel Fund - TwentyFour Monument European Asset BackedSecurities
The accompanying notes form an essential part of these financial statements.
Portfolio as at February 28, 2019
* Any deviations of the percentages of the nets assets are due to rounding.
Securities Marketvalue in
EUR
% of netassets*
Quantity Ccy Maturity
2,000,000 1,935,015 0.7622.07.30Oak Hill EuropeanCredit Partners IIILtd 17 FRN
EUR 2.950%
Transferable securities and money market instruments dealt in on anotherregulated marketBondsIreland
0.761,935,015Total - Ireland
2,500,000 2,509,125 0.9808.12.77Aurorus 2017 BV17 FRN
EUR 1.277%Netherlands
1.744,444,140Total - Bonds
0.982,509,125Total - Netherlands
3,500,000 3,353,460 1.3131.10.53BPCE Home LoansFCT 2018 18 FRN
EUR
Mortgage backed securitiesFrance
1.313,353,460Total - France
1,600,000 1,589,074 0.6218.04.57Fastnet Securities13 DAC 17 FRN
EURIreland
0.621,589,074Total - Ireland
5,800,000 4,403,638 1.7228.01.48Dutch PropertyFinance 2017-1 BV17 FRN
EURNetherlands
1.724,403,638Total - Netherlands
500,000 500,000 0.2026.04.64SRF 2016-1 Fondode Titulizacion 16FRN
EURSpain
1,200,000 1,200,360 0.4626.04.63SRF 2017-1 FT 17FRN
EUR
0.661,700,360Total - Spain
2,500,000 1,761,423 0.6901.01.61Ludgate FundingPLC 07 FRN
EURUnited Kingdom
10,000,000 4,036,892 1.5820.08.48Darrowby No. 4 plc16 FRN
GBP
2,004,000 2,108,897 0.8211.10.54Kenrick NO 3 PLC18 FRN
GBP
2,000,000 1,223,445 0.4815.04.49MansardMortgages 2007-1Parent Ltd 07 FRN
GBP
2,000,000 2,127,866 0.8312.03.55Precise MortgageFunding 2018-2BPLC 18 FRN
GBP
4,320,000 5,022,161 1.9720.03.50ResidentialMortgageSecurities 30 PLC17 FRN
GBP
Securities Marketvalue in
EUR
% of netassets*
Quantity Ccy Maturity
2,800,000 3,160,010 1.2320.03.56Tower BridgeFunding No.1 PLC17 FRN
GBP
13.6534,931,366Total - Transferable securities and money marketinstruments dealt in on another regulated market
11.9130,487,226Total - Mortgage backed securities
7.6019,440,694Total - United Kingdom
1,500,000 1,503,750 0.5925.06.38FCT Noria 2018-118 FRN
EUR 1.132%
Other transferable securitiesBondsFrance
1,800,000 1,805,796 0.7025.06.38FCT Noria 2018-118 FRN
EUR 0.882%
1.293,309,546Total - France
2,000,000 1,892,549 0.7430.04.31Adagio VI CLODAC 17 FRN
EUR 2.600%Ireland
7,000,000 6,662,343 2.6012.01.31Avoca CLO XIVDesignated ActivityCo 17 FRN
EUR 2.600%
3,000,000 2,822,826 1.1015.04.31Avoca CLO XVIIIDAC 18 FRN
EUR 2.550%
1,000,000 962,655 0.3817.10.30Bain Capital EuroCLO 2017-1 DAC17 FRN
EUR 2.800%
1,000,000 962,655 0.3817.10.30Bain Capital EuroCLO 2017-1 DAC17 FRN
EUR 2.800%
2,000,000 1,886,630 0.7420.01.32Black DiamondCLO 2017-2 DAC17 FRN
EUR 2.950%
2,000,000 1,919,035 0.7515.02.31Cadogan SquareCLO XI DAC 18FRN
EUR 2.800%
2,000,000 1,952,982 0.7628.08.31Carlyle Euro CLO2018-2 DAC 18FRN
EUR 3.200%
1,750,000 1,715,000 0.6715.01.32Contego CLO VIDAC 18 FRN
EUR 3.300%
1,500,000 1,500,000 0.5922.04.30CVC CordatusLoan Fund IV Ltd19 FRN
EUR 0,000%
4,500,000 4,216,748 1.6515.04.32CVC CordatusLoan Fund VI DAC18 FRN
EUR 2.400%
2,000,000 1,967,217 0.7715.10.30GLG Euro Clo IIIDAC 17 FRN
EUR 3.300%
3,000,000 2,786,829 1.0920.10.30GoldenTree LoanManagement EURCLO 1 DAC 18FRN
EUR 2.350%
1,000,000 947,007 0.3722.11.30Harvest CLO XVDAC 18 FRN
EUR 2.750%
1,500,000 1,469,625 0.5720.10.31Harvest Clo XXDAC 18 FRN
EUR 3.400%
1,000,000 922,500 0.3615.10.30Man GLG EuroCLO I DAC 18 FRN
EUR 2.450%
1,000,000 984,300 0.3815.12.31Man GLG EuroCLO V DAC 18FRN
EUR 3.550%

208
Vontobel Fund - TwentyFour Monument European Asset BackedSecurities
The accompanying notes form an essential part of these financial statements.
Portfolio as at February 28, 2019
* Any deviations of the percentages of the nets assets are due to rounding.
Securities Marketvalue in
EUR
% of netassets*
Quantity Ccy Maturity
1,000,000 928,022 0.3616.02.32Newhaven II CLODAC 18 FRN
EUR 2.300%
1,500,000 1,428,750 0.5617.12.30Penta CLO 4 DAC18 FRN
EUR 2.600%
1,400,000 1,333,500 0.5217.12.30Penta CLO 4 DAC18 FRN
EUR 2.600%
2,500,000 2,480,375 0.9720.10.32Penta CLO 5 DAC18 FRN
EUR 3.600%
2,500,000 2,373,213 0.9325.01.31Purple FinanceCLO 1 DAC 18FRN
EUR 2.800%
17.2444,114,761Total - Ireland
1,000,000 970,000 0.3805.10.31BNPP AM EuroCLO 2017 BV 17FRN
EUR 2.950%Netherlands
1,000,000 958,858 0.3715.12.29Jubilee CLO 2015-XVI BV 17 FRN
EUR 2.300%
0.751,928,858Total - Netherlands
1,000,000 1,160,493 0.4515.06.23PCL Funding IIIPLC 17 FRN
GBP 2.345%United Kingdom
3,000,000 3,489,541 1.3720.02.26Turbo Finance 8PLC 18 FRN
GBP 2.680%
21.1054,003,199Total - Bonds
1.824,650,034Total - United Kingdom
2,000,000 1,992,221 0.7821.01.28FROSN-2018 DAC18 FRN
EUR
Mortgage backed securitiesIreland
1,000,000 992,472 0.3921.01.28FROSN-2018 DAC18 FRN
EUR
2,570,000 2,557,943 1.0022.08.30Kantoor Finance2018 DAC 18 FRN
EUR
2,000,000 1,993,115 0.7822.08.30Kantoor Finance2018 DAC 18 FRN
EUR
2,300,000 2,283,465 0.8922.08.30Kantoor Finance2018 DAC 18 FRN
EUR
2,700,000 2,707,757 1.0522.11.28Oranje EuropeanLoan Conduit NO32 DAC 18 FRN
EUR
1,500,000 1,502,120 0.5922.11.28Oranje EuropeanLoan Conduit NO32 DAC 18 FRN
EUR
1,700,000 1,702,769 0.6722.11.28Oranje EuropeanLoan Conduit NO32 DAC 18 FRN
EUR
6.1515,731,862Total - Ireland
2,000,000 1,990,778 0.7818.11.51CartesianResidentialMortgages 2 SA 17FRN
EURLuxembourg
0.781,990,778Total - Luxembourg
1,650,000 1,655,829 0.6528.01.48Dutch PropertyFinance 2017-1 BV17 FRN
EURNetherlands
Securities Marketvalue in
EUR
% of netassets*
Quantity Ccy Maturity
1,300,000 1,298,830 0.5128.01.48Dutch PropertyFinance 2017-1 BV17 FRN
EUR
3,500,000 3,327,484 1.3028.04.51Dutch PropertyFinance 2018-1 BV18 FRN
EUR
4,000,000 3,933,158 1.5330.10.91SAECURE 16 BV18 FRN
EUR
3.9910,215,301Total - Netherlands
2,000,000 1,503,796 0.5926.04.64SRF 2016-1 FT 16FRN
EURSpain
1,500,000 1,501,125 0.5926.04.64SRF 2016-1 FT 16FRN
EUR
1,000,000 1,000,500 0.3926.04.63SRF 2017-1 FT 17FRN
EUR
2,600,000 2,610,873 1.0226.01.63SRF 2017-2 FT 17FRN
EUR
700,000 700,866 0.2726.01.63SRF 2017-2 FT 17FRN
EUR
2.867,317,160Total - Spain
2,500,000 2,838,670 1.1116.10.59Brass NO 7 PLC 18FRN
GBPUnited Kingdom
1,000,000 1,177,431 0.4625.10.44Castell 2017-1 PLC17 FRN
GBP
1,000,000 1,173,109 0.4625.10.44Castell 2017-1 PLC17 FRN
GBP
4,000,000 4,453,690 1.7425.01.46Castell 2018-1 PLC18 FRN
GBP
1,500,000 1,744,298 0.6825.01.46Castell 2018-1 PLC18 FRN
GBP
1,490,000 1,712,506 0.6731.03.53Durham MortgagesA PLC 18 FRN
GBP
1,500,000 1,725,397 0.6731.03.54Durham MortgagesB PLC 18 FRN
GBP
1,800,000 2,058,993 0.8031.03.54Durham MortgagesB PLC 18 FRN
GBP
4,000,000 4,571,633 1.7822.10.58Elvet Mortgages2018-1 PLC 18FRN
GBP
600,000 692,974 0.2712.09.65Finsbury Square2018-1 PLC 18FRN
GBP
1,500,000 1,741,123 0.6812.09.65Finsbury Square2018-1 PLC 18FRN
GBP
1,500,000 1,755,716 0.6925.05.53HawksmoorMortgages 2016-2PLC 16 FRN
GBP
1,550,000 1,740,084 0.6815.05.50London WallMortgage CapitalPLC 18 FRN
GBP
1,000,000 1,133,335 0.4412.03.55Precise MortgageFunding 2018-2BPLC 18 FRN
GBP
1,000,000 1,136,481 0.4412.03.55Precise MortgageFunding 2018-2BPLC 18 FRN
GBP
1,000,000 1,131,991 0.4412.03.55Precise MortgageFunding 2018-2BPLC 18 FRN
GBP

209
Vontobel Fund - TwentyFour Monument European Asset BackedSecurities
The accompanying notes form an essential part of these financial statements.
Portfolio as at February 28, 2019
* Any deviations of the percentages of the nets assets are due to rounding.
Securities Marketvalue in
EUR
% of netassets*
Quantity Ccy Maturity
2,500,000 2,928,246 1.1420.12.46ResidentialMortgageSecurities 29 PLC17 FRN
GBP
2,000,000 2,258,830 0.8820.04.28Ribbon Finance2018 PLC 18 FRN
GBP
2,500,000 2,841,217 1.1120.04.28Ribbon Finance2018 PLC 18 FRN
GBP
1,000,000 1,170,571 0.4612.03.49Together AssetBackedSecuritisation 1PLC 17 FRN
GBP
2,000,000 1,452,968 0.5712.03.49Together AssetBackedSecuritisation 1PLC 17 FRN
GBP
1,345,000 1,576,347 0.6212.03.49Together AssetBackedSecuritisation 1PLC 17 FRN
GBP
2,500,000 2,583,125 1.0120.07.52Tolkien FundingSukuk NO 1 PLC18 FRN
GBP
3,000,000 3,478,784 1.3620.03.56Tower BridgeFunding NO 2 PLC18 FRN
GBP
2,200,000 2,571,588 1.0020.12.61Tower BridgeFunding No 3 PLC18 FRN
GBP
1,800,000 2,103,501 0.8220.12.61Tower BridgeFunding No 3 PLC18 FRN
GBP
1,000,000 1,168,749 0.4620.03.56Tower BridgeFunding No.1 PLC17 FRN
GBP
56.32144,179,657Total - Other transferable securities
35.2290,176,458Total - Mortgage backed securities
21.4454,921,357Total - United Kingdom
99.13253,751,373Total - Investment in securities

210
Vontobel Fund - Multi Asset Defensive
AssetsInvestments in securities at market value 178,819,226(2)
4,884,705Cash at banks
103Receivable from foreign currencies
97Receivable from subscriptions
682,386Interest and dividends receivable(2)
328,992Options at cost of purchase(9)
Total Assets 184,715,509
179,716,928Statement of Net Assetsas at February 28, 2019
LiabilitiesBank overdraft 4,551
Payable for investments purchased 47,001
Payable on foreign currencies 103
Unrealised loss on forward foreign exchange contracts 107(9)
Unrealised loss on futures 146,352(9)
Unrealised loss on options 28,445(9)
Audit fees, printing and publishing expenses 616
Service Fee payable 9,408(5)
Subscription tax payable 3,277(4)
Management Fee payable 20,932(3)
Other liabilities 184Total Liabilities 260,976Total net assets at the end of the period 184,454,533Net assets at the beginning of the reporting period 185,381,212
Net investment income 818,281
Change in unrealised appreciation/depreciation on:
Investments 1,308,089
Futures 25,265
Forward foreign exchange contracts -2,390
Options -1,713
Net realised gain/loss on investments -700,265(2)
Net realised gain/loss on forward foreign exchange contracts 2,606(2)
Net realised gain/loss on currency exchange 129,236(2)
Net realised gain/loss on futures -1,459,251(2)
Net realised gain/loss on options -570,107(2)
Increase/Decrease in net assets resulting from operations -450,249Subscriptions of shares 184,025
Redemptions of shares -660,455Total net assets at the end of the period 184,454,533
Statement of Operations andChanges in Net Assetsfrom September 1, 2018to February 28, 2019
Notes EURThe accompanying notes form an essential part of these financial statements.
Cost

211
Vontobel Fund - Multi Asset Defensive
IncomeBank interest 17,572
Net interest on bonds 675,312(2)
Net dividends 467,074Total Income 1,159,958ExpensesManagement Fees 136,110(3)
Audit fees, printing and publishing expenses 10,361
Subscription tax 7,951(4)
Bank interest 31,543
Service Fees 75,390(5)
Other Fees payable 80,322(8)
Total Expenses 341,677Net investment income 818,281
Statement of Net Incomefrom September 1, 2018to February 28, 2019
Notes EURThe accompanying notes form an essential part of these financial statements.

212
Vontobel Fund - Multi Asset Defensive
The accompanying notes form an essential part of these financial statements.
Portfolio as at February 28, 2019
* Any deviations of the percentages of the nets assets are due to rounding.
Securities Marketvalue in
EUR
% of netassets*
Quantity Ccy Maturity
5,500 274,945 0.15TOTAL SAEUR
Transferable securities admitted to an official exchangeSharesFrance
0.15274,945Total - France
52,000 236,576 0.13Mitsubishi UFJFinancial Group Inc
JPYJapan
8,200 255,005 0.14Sumitomo MitsuiFinancial Group Inc
JPY
8,500 282,908 0.15SUMITOMOMITSUI TRUSTHOLDINGS
JPY
0.42774,489Total - Japan
2,000 97,542 0.05Bank of NovaScotia
CADCanada
3,000 117,066 0.06BCE IncCAD2,000 148,873 0.08CANAD.IMPER.BK
OF COMMERCECAD
3,000 198,324 0.11FRANCO-NEVADACORP
CAD
2,000 137,164 0.07Royal Bank ofCanada
CAD
10,000 372,880 0.20Agnico EagleMines Ltd
USD
30,000 277,685 0.15Goldcorp IncUSD0.721,349,534Total - Canada
6,200 286,874 0.16OMV AGEURAustria
0.16286,874Total - Austria
7,000 191,306 0.10AT&T IncUSDUnited States
13,000 389,532 0.22Newmont MiningCorp
USD
6,000 299,921 0.16VerizonCommunicationsInc
USD
0.48880,759Total - United States
8,800 241,384 0.13Royal Dutch ShellPLC
EURUnited Kingdom
4,000 202,593 0.11Rio Tinto PLCGBP
2.174,010,578Total - Shares
0.24443,977Total - United Kingdom
1,000,000 1,042,040 0.5610.02.20National AustraliaBank Ltd 10 EMTN
EUR 4.625%
BondsAustralia
0.561,042,040Total - Australia
Securities Marketvalue in
EUR
% of netassets*
Quantity Ccy Maturity
600,000 560,388 0.3031.12.99KBC Group NV 18FRN
EUR 4.250%Belgium
0.30560,388Total - Belgium
1,000,000 1,000,630 0.5426.04.19Export-Import Bankof China/The 16
EUR 0.375%Cayman Islands
0.541,000,630Total - Cayman Islands
1,500,000 1,499,700 0.8103.11.19China DevelopmentBank Corp/HongKong 16 EMTN
EUR 0.125%China
0.811,499,700Total - China
1,000,000 1,641,100 0.8904.07.34BundesrepublikDeutschland 03
EUR 4.750%Germany
1,000,000 1,034,260 0.5611.12.20Deutsche Post AG12 EMTN
EUR 1.875%
1,500,000 1,554,870 0.8420.02.23SAP SE 14 EMTNEUR 1.125%2.294,230,230Total - Germany
3,000,000 3,169,470 1.7115.10.21Air Liquide FinanceSA 12 EMTN
EUR 2.125%France
200,000 229,140 0.1204.07.43AXA SA 13 FRNEMTN
EUR 5.130%
500,000 348,440 0.1931.12.99Banque Federativedu Credit MutuelSA 04 FRN EMTN
EUR 0.924%
200,000 230,764 0.1330.09.41CNP Assurances11 FRN
EUR 6.875%
1,000,000 1,079,830 0.5915.03.23Total CapitalInternational SA 12EMTN
EUR 2.125%
200,000 217,568 0.1231.12.99TOTAL SA 16 FRNEMTN
EUR 3.875%
2.865,275,212Total - France
500,000 450,337 0.2420.12.19Bharat PetroleumCorp Ltd 14 EMTN
CHF 3.000%India
0.24450,337Total - India
300,000 336,357 0.1802.10.43Aquarius &Investments PLCfor ZurichInsurance Co Ltd13 FRN EMTN
EUR 4.250%Ireland
500,000 503,980 0.2718.06.19GE CapitalEuropean FundingUnlimited Co 12EMTN
EUR 2.875%
2,000,000 2,057,160 1.1220.07.20GE CapitalEuropean FundingUnlimited Co 13EMTN
EUR 2.250%
1.572,897,497Total - Ireland

213
Vontobel Fund - Multi Asset Defensive
The accompanying notes form an essential part of these financial statements.
Portfolio as at February 28, 2019
* Any deviations of the percentages of the nets assets are due to rounding.
Securities Marketvalue in
EUR
% of netassets*
Quantity Ccy Maturity
200,000 251,382 0.1410.07.42AssicurazioniGenerali SpA 12FRN EMTN
EUR 10.125%Italy
2,000,000 2,058,860 1.1231.10.19Banca IMI SpA 13EUR 3.150%3,000,000 3,022,110 1.6401.12.19Italy Buoni
Poliennali DelTesoro 14
EUR 1.050%
8,000,000 8,258,480 4.4815.12.21Italy BuoniPoliennali DelTesoro 14
EUR 2.150%
800,000 812,464 0.4419.01.21Mediobanca SpA16 EMTN
EUR 1.630%
200,000 197,022 0.1131.12.99UniCredit SpA 14FRN EMTN
EUR 6.750%
7.9314,600,318Total - Italy
800,000 815,712 0.4413.09.23Glencore FinanceEurope SA 16EMTN
EUR 1.875%Jersey
0.44815,712Total - Jersey
5,000,000 516,534 0.2801.12.20EuropeanInvestment Bank 05EMTN
SEK 5.000%Luxembourg
0.28516,534Total - Luxembourg
1,000,000 974,360 0.5321.04.22PetroleosMexicanos 15EMTN
EUR 1.875%Mexico
800,000 801,232 0.4315.03.19PetroleosMexicanos 16EMTN
EUR 3.750%
0.961,775,592Total - Mexico
500,000 449,631 0.2431.03.20Bharti AirtelInternationalNetherlands BV 14
CHF 3.000%Netherlands
2,000,000 2,003,400 1.1026.03.19ABB Finance BV 12EMTN
EUR 2.625%
500,000 517,080 0.2813.11.23Bayer Capital CorpBV 14 EMTN
EUR 1.250%
800,000 833,848 0.4501.06.23Ren Finance BV 16EMTN
EUR 1.750%
1,000,000 1,032,480 0.5628.05.20RepsolInternationalFinance BV 13EMTN
EUR 2.630%
1,500,000 1,500,180 0.8204.03.19SchlumbergerFinance BV 13EMTN
EUR 1.500%
200,000 209,262 0.1131.12.99Telefonica EuropeBV 14 FRN
EUR 5.000%
3.566,545,881Total - Netherlands
20,000,000 1,936,274 1.0516.12.20Swedbank HypotekAB 14
SEK 1.000%Sweden
Securities Marketvalue in
EUR
% of netassets*
Quantity Ccy Maturity
16,000,000 1,516,276 0.8230.11.20Volvo Treasury AB17 EMTN
SEK 0.340%
1.873,452,550Total - Sweden
500,000 440,772 0.2427.10.21Amag Leasing AG17
CHF 0.350%Switzerland
500,000 450,601 0.2403.07.20Flughafen ZurichAG 12
CHF 1.250%
500,000 547,370 0.3031.12.99UBS GroupFundingSwitzerland AG 15FRN
EUR 5.750%
0.781,438,743Total - Switzerland
1,000,000 1,002,530 0.5403.06.19Bright FoodSingapore HoldingsPte Ltd 16
EUR 1.625%Singapore
0.541,002,530Total - Singapore
1,000,000 625,541 0.3419.03.19First Abu DhabiBank PJSC 14
AUD 4.750%United Arab Emirates
0.34625,541Total - United Arab Emirates
300,000 316,140 0.1717.01.24Apple Inc 15EUR 1.375%United States
2,000,000 2,012,240 1.0907.02.22Bank of AmericaCorp 17 FRN EMTN
EUR 0.471%
300,000 311,274 0.1715.03.24BerkshireHathaway Inc 16
EUR 1.300%
600,000 590,706 0.3226.09.23Goldman SachsGroup Inc/The 17FRN EMTN
EUR 0.291%
3,000,000 3,086,131 1.6726.05.22McDonald's Corp15 EMTN
EUR 1.125%
2,000,000 2,005,240 1.0927.01.22Morgan Stanley 16FRN
EUR 0.373%
2,000,000 2,070,680 1.1228.04.21PepsiCo Inc 14EMTN
EUR 1.750%
1,000,000 1,098,110 0.6019.03.25Philip MorrisInternational Inc 13
EUR 2.750%
1,000,000 1,006,370 0.5526.04.21Wells Fargo & Co16 FRN EMTN
EUR 0.320%
673,000 590,788 0.3201.06.19Dell InternationalLLC / EMC Corp 16
USD 3.480%
5,000,000 4,335,228 2.3615.11.21United StatesTreasuryNote/Bond 11
USD 2.000%
9.4617,422,907Total - United States
800,000 780,688 0.4210.02.22FCE Bank PLC 15EMTN
EUR 1.130%United Kingdom
800,000 849,784 0.4624.03.20Lloyds Bank PLC10 EMTN
EUR 6.500%
800,000 869,464 0.4722.07.20NationwideBuilding Society 10EMTN
EUR 6.750%
100,000 106,766 0.0626.01.27State Grid EuropeDevelopment 2014PLC 15
EUR 2.450%

214
Vontobel Fund - Multi Asset Defensive
The accompanying notes form an essential part of these financial statements.
Portfolio as at February 28, 2019
* Any deviations of the percentages of the nets assets are due to rounding.
Securities Marketvalue in
EUR
% of netassets*
Quantity Ccy Maturity
1,000,000 877,351 0.4810.05.19Deutsche Bank AG16
USD 2.850%
37.2268,636,395Total - Bonds
1.893,484,053Total - United Kingdom
19,000 1,154,060 0.63ISHARES DJ USSELECT DIVI.(DE)
EUR
Investment fundsGermany
20,000 424,500 0.23ISHARES STOXXEUR 600TELECOM
EUR
28,800 774,000 0.42ISHARES SXXGSD100 ANTEILE
EUR
1.282,352,560Total - Germany
30,000 2,443,800 1.32ISH USD SH DURHYCB ETF USD
EURIreland
10,000 465,600 0.25iShares MSCIJapan EURHedged UCITSETF Acc
EUR
10,000 507,900 0.28ISHS MSCI WDEUR-AC ACC ETF
EUR
10,000 621,300 0.34ISHS VS&P500EUR UCICAP/ACC
EUR
5,000 622,500 0.34NOM NIK 225 EURETF /CAP
EUR
12,000 1,355,760 0.74SPDR MSCI USDETF /CAP
EUR
20,000 444,200 0.24VAN FTSE DV ASETF USD/DIST
EUR
50,000 4,502,941 2.43iShares USD HighYield Corp BondUCITS ETF USDDist
USD
5.9410,964,001Total - Ireland
550,000 9,009,000 4.88BlackRock GlobalFunds - Euro ShortDuration BondFund
EURLuxembourg
12.1022,325,561Total - Investment funds
4.889,009,000Total - Luxembourg
45,000 5,029,354 2.73ETFS PhysicalSwiss Gold
USD
Options, Warrants, RightsJersey
54.22100,001,888Total - Transferable securities admitted to anofficial exchange
2.735,029,354Total - Options, Warrants, Rights
2.735,029,354Total - Jersey
Securities Marketvalue in
EUR
% of netassets*
Quantity Ccy Maturity
3,100,000 2,840,074 1.5415.07.25United StatesTreasury InflationIndexed Bonds 15
USD 0.375%
Transferable securities and money market instruments dealt in on anotherregulated marketBondsUnited States
1.542,840,074Total - Bonds
1.542,840,074Total - United States
30,000 3,124,500 1.69iShares Euro HighYield CorporateBond UCITS ETF
EUR
Investment fundsIreland
3.235,964,574Total - Transferable securities and money marketinstruments dealt in on another regulated market
1.693,124,500Total - Investment funds
1.693,124,500Total - Ireland
4,000 8,888,120 4.82CANDRSUST.S.T.BDS-I-/CAP
EUR
Other transferable securitiesInvestment fundsBelgium
4.828,888,120Total - Belgium
90,000 888,594 0.48MANU ASI BD ABS-R- HEDGED EUR
EURIreland
700,000 1,089,130 0.59Old Mutual DublinFunds Plc - OldMutual GlobalEquity AbsoluteReturn Fund
EUR
1.071,977,724Total - Ireland
1,500 255,525 0.14AXA IM FixedIncome InvestmentStrategies - USShort DurationHigh Yield - A EURhedged
EURLuxembourg
5,000 874,100 0.47BELLEV L BB GM -I- CAP
EUR
100,000 1,398,000 0.76BGF EM LOC CURBD -D4- DIS
EUR
7,800 844,584 0.46BRSF GL EV DR -I2EUR HED-CAP
EUR
18,000 2,851,920 1.55CGS FMS GlobalEvolution FrontierMarkets - I
EUR
40,000 4,002,800 2.17N1 LOW D EUR BDSHS BI EUR CAP
EUR
8,500 923,185 0.50RAM SYS LSEU -PI- CAP/EUR
EUR

215
Vontobel Fund - Multi Asset Defensive
The accompanying notes form an essential part of these financial statements.
Portfolio as at February 28, 2019
* Any deviations of the percentages of the nets assets are due to rounding.
Securities Marketvalue in
EUR
% of netassets*
Quantity Ccy Maturity
40,000 6,484,000 3.51Vontobel Fund -EUR CorporateBond Mid Yield - I
EUR
33,000 3,513,840 1.90Vontobel Fund -TwentyFourAbsolute ReturnCredit Fund - HIEUR
EUR
35,000 3,534,650 1.92Vontobel Fund -TwentyFourMonumentEuropean AssetBacked Securities- I
EUR
8,000 870,640 0.47Vontobel Fund -TwentyFourStrategic IncomeFund - HI (hedged)EUR
EUR
30,000 3,471,854 1.88Vontobel Fund -Emerging MarketsDebt
USD
21.6239,890,942Total - Investment funds
15.7329,025,098Total - Luxembourg
70 7,466,515 4.05AMUNDI 12 MPARTS -I-
EUR
French UCITS - general vocationFrance
300 6,748,346 3.66AMUNDI 6M -I-EUR 3DEC
EUR
29.3354,105,803Total - Other transferable securities
7.7114,214,861OPCVM Français à vocation générale
7.7114,214,861Total - France
115,000 3,840,425 2.08iShares EUROSTOXX 50 UCITSETF Inc
EUR
Investment fundsIreland
39,000 6,291,870 3.41Muzinich Funds -EnhancedYieldShort-Term Fund
EUR
100,000 3,557,566 1.93iShares MSCIEmerging MarketsUCITS ETF DIST
USD
7.4213,689,861Total - Ireland
45,000 5,057,100 2.74Vontobel Fund -EURO Money
EURLuxembourg
10.1618,746,961Total - Investment funds
2.745,057,100Total - Luxembourg
96.94178,819,226Total - Investment in securities

216
Vontobel Fund - Multi Asset Alphabet
AssetsInvestments in securities at market value 18,818,611(2)
1,277,340Cash at banks
-3Interest and dividends receivable(2)
110,113Receivable for investments sold
22,885Unrealised gain on futures(9)
15,463Options at cost of purchase(9)
Total Assets 20,244,409
18,638,240Statement of Net Assetsas at February 28, 2019
LiabilitiesBank overdraft 432,142
Payable for investments purchased 109,052
Unrealised loss on forward foreign exchange contracts 110,172(9)
Unrealised loss on options 14,774(9)
Audit fees, printing and publishing expenses 28
Service Fee payable 4,319(5)
Subscription tax payable 322(4)
Management Fee payable 8,932(3)
Other liabilities 17Total Liabilities 679,758Total net assets at the end of the period 19,564,651Net assets at the beginning of the reporting period 0
Net investment loss on investments -59,177
Change in unrealised appreciation/depreciation on:
Investments 180,370
Futures 22,885
Forward foreign exchange contracts -110,172
Options -14,774
Net realised gain/loss on investments -99,633(2)
Net realised gain/loss on forward foreign exchange contracts -129,961(2)
Net realised gain/loss on currency exchange 50,337(2)
Net realised gain/loss on futures -363,937(2)
Net realised gain/loss on options -22,890(2)
Increase/Decrease in net assets resulting from operations -546,952Subscriptions of shares 20,111,603Total net assets at the end of the period 19,564,651
Statement of Operations andChanges in Net Assetsfrom September 28, 2018to February 28, 2019
Notes EURThe accompanying notes form an essential part of these financial statements.
Cost
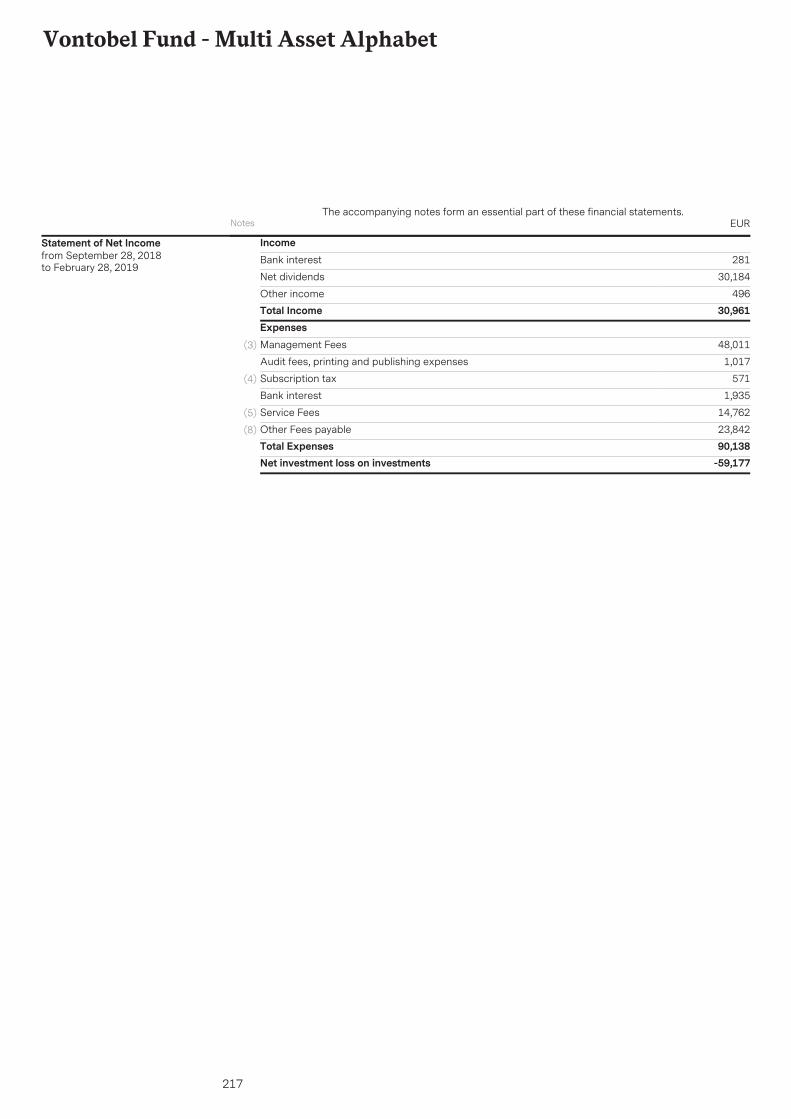
217
Vontobel Fund - Multi Asset Alphabet
IncomeBank interest 281
Net dividends 30,184
Other income 496Total Income 30,961ExpensesManagement Fees 48,011(3)
Audit fees, printing and publishing expenses 1,017
Subscription tax 571(4)
Bank interest 1,935
Service Fees 14,762(5)
Other Fees payable 23,842(8)
Total Expenses 90,138Net investment loss on investments -59,177
Statement of Net Incomefrom September 28, 2018to February 28, 2019
Notes EURThe accompanying notes form an essential part of these financial statements.

218
Vontobel Fund - Multi Asset Alphabet
The accompanying notes form an essential part of these financial statements.
Portfolio as at February 28, 2019
* Any deviations of the percentages of the nets assets are due to rounding.
Securities Marketvalue in
EUR
% of netassets*
Quantity Ccy Maturity
2,900 392,283 2.01ISHS EUR CRP BDLAR CAP EUR ETF
EUR
Transferable securities admitted to an official exchangeInvestment fundsIreland
12,449 1,184,132 6.04iShares J.P.Morgan USD EMBond UCITS ETFUSD Dist
USD
22,400 1,171,048 5.99ISHARES JPMORGEM BD USD /DIS
USD
129,327 592,063 3.03ISHS USD CO BDACC USD ETF
USD
41,595 196,779 1.01ISHS USD HI YLDETF USD/CAP
USD
8,901 501,214 2.56UBS ETFs plc -CMCI CompositeSF UCITS ETF Aacc USD
USD
20.644,037,519Total - Ireland
222 2,991,636 15.29JPMLF EUR LIQ V -C- EUR/CAP
EURLuxembourg
14,055 1,950,931 9.97PICTET-STMMEUR / -I- CAP
EUR
45.908,980,086Total - Investment funds
25.264,942,567Total - Luxembourg
82,000 1,857,368 9.50iShares PhysicalGold ETC
USD
Options, Warrants, RightsIreland
9.501,857,368Total - Ireland
10,700 266,490 1.36ETFS COM PERPCERT
USDJersey
56.7611,103,944Total - Transferable securities admitted to anofficial exchange
10.862,123,858Total - Options, Warrants, Rights
1.36266,490Total - Jersey
7,557 787,062 4.02iShares Euro HighYield CorporateBond UCITS ETF
EUR
Transferable securities and money market instruments dealt in on anotherregulated marketInvestment fundsIreland
4.02787,062Total - Transferable securities and money marketinstruments dealt in on another regulated market
4.02787,062Total - Investment funds
4.02787,062Total - Ireland
Securities Marketvalue in
EUR
% of netassets*
Quantity Ccy Maturity
713 805,269 4.12DC VIETNAM EQUACC-B- EUR
EUR
Other transferable securitiesInvestment fundsIreland
4.12805,269Total - Ireland
6,050 2,989,366 15.28UBS LMM EUR UN-INS- CAP
EURLuxembourg
6,672 855,401 4.37JPMF EM MKT SMIC -I- USD CAP
USD
23.774,650,036Total - Investment funds
19.653,844,767Total - Luxembourg
1 1,053,851 5.39AMUNDI 3 M -I-(3DEC)
EUR
French UCITS - general vocationFrance
12 1,223,718 6.25AMUNDI 3-6 M-IC-3DEC
EUR
35.416,927,605Total - Other transferable securities
11.642,277,569OPCVM Français à vocation générale
11.642,277,569Total - France
96.1918,818,611Total - Investment in securities

219
Vontobel Fund - Vescore Artificial Intelligence Multi Asset
AssetsInvestments in securities at market value 10,970,836(2)
3,879,208Cash at banks
46,524Interest and dividends receivable(2)
4Unrealised gain on forward foreign exchange contracts(9)
295,374Unrealised gain on futures(9)
23,759Other assetsTotal Assets 15,215,705
11,035,630Statement of Net Assetsas at February 28, 2019
LiabilitiesBank overdraft 368,784
Payable interest on Contracts for Difference 53
Unrealised loss on Contracts for Difference 6,492(9)
Audit fees, printing and publishing expenses 4
Service Fee payable 2,401(5)
Subscription tax payable 242(4)
Management Fee payable 5,687(3)
Other liabilities 1,970Total Liabilities 385,633Total net assets at the end of the period 14,830,072Net assets at the beginning of the reporting period 0
Net investment loss on investments -12,359
Change in unrealised appreciation/depreciation on:
Investments -64,794
Futures 295,374
Forward foreign exchange contracts 4
Contracts for Difference -6,492
Net realised gain/loss on forward foreign exchange contracts 42(2)
Net realised gain/loss on currency exchange 1,712(2)
Net realised gain/loss on futures 316,410(2)
Net realised gain/loss on Contracts for Difference 6,253(2)
Increase/Decrease in net assets resulting from operations 536,150Subscriptions of shares 14,293,922Total net assets at the end of the period 14,830,072
Statement of Operations andChanges in Net Assetsfrom October 26, 2018to February 28, 2019
IncomeBank interest 84
Net interest on bonds 37,600(2)
Total Income 37,684ExpensesManagement Fees 24,723(3)
Audit fees, printing and publishing expenses 1,120
Subscription tax 602(4)
Bank interest 5,111
Net interest on Contracts for Difference 53(2)
Service Fees 8,426(5)
Other Fees payable 10,008(8)
Total Expenses 50,043Net investment loss on investments -12,359
Statement of Net Incomefrom October 26, 2018to February 28, 2019
Notes EURThe accompanying notes form an essential part of these financial statements.
Cost

220
Vontobel Fund - Vescore Artificial Intelligence Multi Asset
The accompanying notes form an essential part of these financial statements.
Portfolio as at February 28, 2019
* Any deviations of the percentages of the nets assets are due to rounding.
Securities Marketvalue in
EUR
% of netassets*
Quantity Ccy Maturity
800,000 803,360 5.4220.11.19DZ HYP AG 14EMTN
EUR 0.250%
Transferable securities admitted to an official exchangeBondsGermany
800,000 808,616 5.4511.10.19GemeinsameDeutscheBundeslaender 12
EUR 1.375%
800,000 806,720 5.4415.07.20Land Berlin 15EUR 0.250%800,000 802,272 5.4113.01.20Landesbank
Baden-Wuerttemberg 16
EUR 0.050%
800,000 821,824 5.5411.05.20LandwirtschaftlicheRentenbank 12EMTN
EUR 1.875%
800,000 807,384 5.4416.11.20LFA FoerderbankBayern 15
EUR 0.300%
800,000 830,720 5.6127.01.20NRW Bank 05EMTN
EUR 3.875%
800,000 813,032 5.4805.02.20State of Hesse 13EUR 1.375%800,000 802,856 5.4113.02.20State of Lower
Saxony 17 EMTNEUR 0,000%
800,000 803,280 5.4223.03.20State of Rhineland-Palatinate 17
EUR 0,000%
800,000 804,432 5.4225.09.20State of Schleswig-Holstein Germany17
EUR 0,000%
60.048,904,496Total - Germany
1,000,000 1,006,320 6.7925.05.20French RepublicGovernment BondOAT 15
EUR 0,000%France
6.791,006,320Total - France
1,000,000 1,060,020 7.1515.07.20Republic of AustriaGovernment Bond05
EUR 3.900%Austria
73.9810,970,836Total - Transferable securities admitted to anofficial exchange
73.9810,970,836Total - Bonds
7.151,060,020Total - Austria
73.9810,970,836Total - Investment in securities

221
Vontobel Fund - Vescore Global Equity Multi Factor
AssetsInvestments in securities at market value 45,182,443(2)
206,594Cash at banks
46,532Receivable from foreign currencies
86,710Interest and dividends receivable(2)
258Other assetsTotal Assets 45,522,537
42,658,709Statement of Net Assetsas at February 28, 2019
LiabilitiesPayable for redemptions 74,473
Payable for investments purchased 46,652
Payable on foreign currencies 46,709
Audit fees, printing and publishing expenses 302
Service Fee payable 4,835(5)
Subscription tax payable 735(4)
Management Fee payable 10,479(3)
Other liabilities 25Total Liabilities 184,210Total net assets at the end of the period 45,338,327Net assets at the beginning of the reporting period 0
Net investment income 138,720
Change in unrealised appreciation/depreciation on:
Investments 2,523,734
Net realised gain/loss on investments -27,141(2)
Net realised gain/loss on forward foreign exchange contracts -35,368(2)
Net realised gain/loss on currency exchange 55,719(2)
Increase/Decrease in net assets resulting from operations 2,655,664Subscriptions of shares 42,777,840
Redemptions of shares -95,177Total net assets at the end of the period 45,338,327
Statement of Operations andChanges in Net Assetsfrom December 12, 2018to February 28, 2019
IncomeBank interest 1,750
Net dividends 161,182
Other income 16,950Total Income 179,883ExpensesManagement Fees 27,194(3)
Audit fees, printing and publishing expenses 303
Subscription tax 1,691(4)
Bank interest 46
Service Fees 10,659(5)
Other Fees payable 1,269(8)
Total Expenses 41,162Net investment income 138,720
Statement of Net Incomefrom December 12, 2018to February 28, 2019
Notes USDThe accompanying notes form an essential part of these financial statements.
Cost

222
Vontobel Fund - Vescore Global Equity Multi Factor
The accompanying notes form an essential part of these financial statements.
Portfolio as at February 28, 2019
* Any deviations of the percentages of the nets assets are due to rounding.
Securities Marketvalue in
USD
% of netassets*
Quantity Ccy Maturity
4,091 61,733 0.14AGL ENERGY LTDAUD
Transferable securities admitted to an official exchangeSharesAustralia
45,444 82,444 0.17ALUMINA LIMITEDAUD3,932 42,101 0.09AMCOR LTDAUD4,464 31,791 0.07APA GROUP -
STAPLEDSECURITY
AUD
2,139 56,656 0.12BHP Billiton LtdAUD8,395 80,392 0.18BLUESCOPE
STEEL LTDAUD
4,377 36,621 0.08BRAMBLES LTDAUD3,263 66,394 0.15CALTEX
AUSTRALIA LTDAUD
953 34,002 0.07CIMIC GROUP LTDAUD6,038 34,237 0.08COCA-COLA
AMATIL LTDAUD
248 30,083 0.07COCHLEARLIMITED
AUD
3,756 30,276 0.07COLES GROUPLTD
AUD
2,605 31,970 0.07COMPUTERSHARE LIMITED CPU
AUD
4,377 35,687 0.08CROWN RESORTSSHS
AUD
481 66,306 0.15CSL LtdAUD1,229 36,068 0.08DOMINO S PIZZA
ENTERPRISES LTDAUD
16,910 34,167 0.08MEDIBANKPRIVATE LTD
AUD
1,214 83,054 0.17RIO TINTOLIMITED
AUD
12,851 63,268 0.14SANTOS LTDAUD15,318 42,611 0.09SOUTH32 LTDAUD3,593 34,637 0.08SUNCORP GROUP
LTDAUD
7,292 34,551 0.08TPG TELECOMAUD6,123 54,322 0.12TRANSURBAN
GROUPAUD
1,638 38,666 0.09Wesfarmers - SHSAUD1,953 50,368 0.11WOODSIDE
PETROLEUM LTDAUD
3,189 65,047 0.14WoolworthsAUD2.771,257,452Total - Australia
1,041 51,363 0.11AgeasEURBelgium
1,107 79,035 0.17ETAB COLRUYTEUR521 43,712 0.10UCBEUR
0.38174,110Total - Belgium
2,104 111,870 0.25IHS MARKIT LTDUSDBermuda Islands
0.25111,870Total - Bermuda Islands
1,503 68,537 0.15CAPRI HOLDINGSLTD
USDBritish Virgin Islands
0.1568,537Total - British Virgin Islands
Securities Marketvalue in
USD
% of netassets*
Quantity Ccy Maturity
192 46,699 0.10adidas AGEURGermany
372 34,549 0.08Beiersdorf AGEUR1,553 114,769 0.26BMW AG
/VORZUG.EUR
1,218 69,541 0.15Covestro AGEUR368 46,556 0.10Deutsche Boerse
AGEUR
3,253 83,159 0.18DEUTSCHELUFTHANSA/NAM.
EUR
3,317 36,581 0.08E.ON SEEUR739 33,071 0.07FUCHS PETROLUB
VZ.A.EUR
288 42,961 0.09Hannover RueckSE
EUR
589 43,609 0.10HUGO BOSS AGEUR1,674 77,467 0.17INNOGY SEEUR263 56,452 0.12MTU AERO
ENGINES NNAMEN-AKT
EUR
1,089 72,691 0.16Porsche AutomobilHolding SE
EUR
78 44,010 0.10Puma SEEUR325 34,861 0.08SAP SEEUR253 40,160 0.09SARTORIUS AG
/VORZUG.EUR
1,511 44,064 0.10Uniper SEEUR313 55,387 0.12Volkswagen AGEUR291 50,002 0.11Volkswagen AGEUR424 58,178 0.13Wirecard AGEUR3,421 36,411 0.08TUI AG - NAM.AKTGBP
2.471,121,178Total - Germany
964 40,494 0.09Elisa OYJEURFinland
1,932 42,943 0.09Fortum OYJEUR879 43,009 0.09Kone OYJEUR708 68,124 0.15NESTE OIL OYJEUR4,568 27,652 0.06Nokia OYJEUR1,231 43,594 0.10Nokian Renkaat
OYJEUR
1,681 60,124 0.13ORION CORP(NEW)- SHS-B-
EUR
1,800 86,742 0.20Sampo OyjEUR1,369 41,342 0.09UPM-Kymmene
OYJEUR
1.00454,024Total - Finland
1,860 78,619 0.17Accor SAEURFrance
218 42,349 0.09Aeroports de ParisEUR1,521 66,196 0.15Alstom SAEUR3,703 94,009 0.22AXA SAEUR366 34,654 0.08BICEUR953 50,450 0.11CASINO
GUICHARD-PERRACH
EUR
390 46,852 0.10Cie Generale desEtablissementsMichelin
EUR

223
Vontobel Fund - Vescore Global Equity Multi Factor
The accompanying notes form an essential part of these financial statements.
Portfolio as at February 28, 2019
* Any deviations of the percentages of the nets assets are due to rounding.
Securities Marketvalue in
USD
% of netassets*
Quantity Ccy Maturity
3,378 78,161 0.17CNP AssurancesEUR20 33,706 0.07Dassault Aviation
SAEUR
301 44,095 0.10Dassault SystemesSE
EUR
1,047 46,520 0.10EDENREDEUR2,830 41,152 0.09EDFEUR263 31,879 0.07Essilor
International SAEUR
1,576 31,154 0.07EUTELSATCOMMUNICATIONS PARIS
EUR
1,070 51,100 0.11FaureciaEUR4,566 67,487 0.15GETLINK SEEUR172 109,053 0.25Hermes
InternationalEUR
390 54,002 0.12IPSENEUR85 46,469 0.10KeringEUR138 34,870 0.08L'Oreal SAEUR499 32,956 0.07Legrand SAEUR116 39,891 0.09LVMH Moet
Hennessy LouisVuitton SE
EUR
7,712 42,433 0.09NATIXISEUR293 50,513 0.11Pernod Ricard SAEUR3,596 91,559 0.20Peugeot SAEUR377 51,472 0.11Safran SAEUR464 38,834 0.09SanofiEUR1,213 54,683 0.12SCOR SEEUR2,286 29,245 0.06SuezEUR352 62,929 0.14TeleperformanceEUR519 63,974 0.14THALESEUR718 40,871 0.09TOTAL SAEUR497 35,937 0.08UBISOFT
ENTERTAINMENTEUR
3.791,718,074Total - France
10,096 47,549 0.10AIB GROUP PLCEURIreland
329 33,904 0.07Kerry Group PLCEUR2,895 40,053 0.09Ryanair Holdings
PLCEUR
148 23,884 0.05Accenture PLCUSD2,030 161,933 0.36EATON
CORPORATIONPUBLIC LTD
USD
1,787 161,724 0.36Medtronic PLCUSD2,334 108,671 0.24SEAGATE
TECHNOLOGIEPLC
USD
1.27577,718Total - Ireland
4,151 74,186 0.16AssicurazioniGenerali SpA
EURItaly
4,151 39,634 0.09DAVIDE CAMPARI- MILANO SPA
EUR
3,059 52,827 0.12Eni SpAEUR288 37,107 0.08FERRARI N.V.EUR4,117 41,358 0.09Mediobanca SpAEUR2,010 77,178 0.18MONCLER S.P.A.EUR
Securities Marketvalue in
USD
% of netassets*
Quantity Ccy Maturity
6,752 60,970 0.13POSTE ITALIANESPA
EUR
1,323 49,820 0.11RECORDATI INDCHIMICA/POSTRAG
EUR
0.96433,080Total - Italy
600 34,387 0.08ABC-Mart IncJPYJapan
1,100 23,182 0.05AEON CO LTDJPY900 26,073 0.06ALFRESA HLD
CORP TOKYOJPY
2,400 37,050 0.08Astellas PharmaInc
JPY
600 25,548 0.06BANDAI NAMCOHOLDINGS INC.
JPY
1,100 31,630 0.07Canon IncJPY1,500 20,360 0.04CASIO
COMPUTERCO.LTD
JPY
100 22,435 0.05CENTRAL JAPANRAILWAY CO
JPY
1,500 23,614 0.05CHUBU ELECTRICPOWER C. JPY500
JPY
500 34,001 0.07ChugaiPharmaceutical CoLtd
JPY
4,000 51,995 0.11CHUGOKUELECTR.POWERJPY 500
JPY
1,000 23,158 0.05DAI NIPPONPRINTING CO.LTD
JPY
2,100 31,796 0.07Dai-ichi LifeInsurance CoLtd/The
JPY
500 24,524 0.05Daifuku Co LtdJPY500 18,716 0.04DAIICHI SANKYO
CO LTDJPY
1,500 23,109 0.05DENA CO LTDTOKYO
JPY
500 20,886 0.05Dentsu IncJPY200 27,560 0.06Disco CorpJPY600 35,789 0.08Don Quijote
Holdings Co LtdJPY
300 24,780 0.05Eisai Co LtdJPY800 22,817 0.05FAMILYMT UNY H
--- SHSJPY
200 33,130 0.07FANUC CorpJPY100 46,856 0.10FAST RETAILING
CO LTDJPY
700 47,218 0.10FUJITSU LTDJPY1,500 23,001 0.05HAKUHODO DY
HLD INCJPY
800 28,171 0.06HAMAMATSUPHOTONICS
JPY
200 35,843 0.08HIKARI TSUSHININC.
JPY
900 26,963 0.06Hitachi LtdJPY800 48,904 0.11Hoya CorpJPY1,400 49,677 0.11Idemitsu Kosan Co
LtdJPY
800 21,100 0.05IHI CORPJPY1,700 31,062 0.07IIDA GRP HLDGS
/REITJPY
1,900 34,102 0.08ITOCHU CorpJPY

224
Vontobel Fund - Vescore Global Equity Multi Factor
The accompanying notes form an essential part of these financial statements.
Portfolio as at February 28, 2019
* Any deviations of the percentages of the nets assets are due to rounding.
Securities Marketvalue in
USD
% of netassets*
Quantity Ccy Maturity
900 32,865 0.07Japan Airlines CoLtd
JPY
600 23,823 0.05JAPAN AIRPORTTERMINAL CO
JPY
1,700 30,008 0.07JAPANEXCHANGEGROUP INC
JPY
3,500 39,081 0.09JAPAN POSTBANK CO..LTD.
JPY
5,100 62,079 0.14JAPAN POSTHOLDINGSCO..LTD.
JPY
2,400 41,858 0.09JFE HOLDINGSINC
JPY
7,900 36,952 0.08JX Holdings IncJPY2,000 29,608 0.07KAJIMA CORP.JPY1,900 36,542 0.08KAKAKU COM
INC TOKYOJPY
1,700 25,434 0.06KANSAI ELECTR.POWER C. JPY500
JPY
300 22,702 0.05KAO CORP.JPY1,200 28,981 0.06KDDI CorpJPY800 33,130 0.07KEIHAN
HOLDINGSCO..LTD.
JPY
400 23,500 0.05KEIO CORPJPY100 58,328 0.13Keyence CorpJPY700 34,837 0.08KIKKOMAN CORP.JPY1,100 24,595 0.05KIRIN HOLDINGS
CO LTDJPY
4,600 36,405 0.08Kobe Steel LtdJPY400 23,140 0.05KOITO
MANUFACTURINGCO LTD
JPY
2,800 27,165 0.06KONICA MINOLTAHOLD INC
JPY
200 32,375 0.07KOSE CORPTOKYO
JPY
2,600 30,923 0.07KYUSHUELECTR.POWERCO/JPY 500
JPY
1,000 34,226 0.08KYUSHURAILWAYCOMPANY
JPY
400 24,254 0.05LAWSON INCJPY900 18,458 0.04LION CORP.JPY1,800 29,849 0.07M3 INCJPY6,300 44,975 0.10MARUBENI CORP.JPY1,000 17,598 0.04MARUI GROUP
CO LTDJPY
1,000 44,826 0.10MCDONALD SHOLDINGS CO(JAPAN)
JPY
3,900 28,795 0.06MitsubishiChemical HoldingsCorp
JPY
1,600 45,117 0.10MITSUBISHI CORPJPY1,800 27,521 0.06MITSUBISHI GAS
CHEMICALJPY
1,200 32,986 0.07MitsubishiMaterials Corp
JPY
2,700 42,445 0.09MITSUI & CO LTDJPY900 21,934 0.05MITSUI
CHEMICALS INC.JPY
Securities Marketvalue in
USD
% of netassets*
Quantity Ccy Maturity
1,400 42,043 0.09MS&ADINSURANCEGROUPHOLDINGS
JPY
100 15,563 0.03MurataManufacturing CoLtd
JPY
1,200 40,047 0.09NEC CorpJPY2,400 38,096 0.08NEXON CO LTDJPY500 21,564 0.05Nippon Telegraph
& Telephone CorpJPY
700 35,340 0.08NISSANCHEMICAL IND.
JPY
6,800 58,789 0.13NISSAN MOTORCO.LTD
JPY
200 24,946 0.06NITORI HOLDINGSCO LTD
JPY
400 16,277 0.04NOMURARESEARCH INSTLTD
JPY
1,500 16,399 0.04NTT DATA CORPJPY2,100 48,887 0.11NTT DOCOMO IncJPY400 38,196 0.08OBIC CO LTD
TOKYOJPY
3,100 18,435 0.04OJI HOLDINGSCORPORATION
JPY
900 18,502 0.04ONOPHARMACEUTICAL CO
JPY
500 37,325 0.08ORACLE CORPJAPAN TOKY
JPY
200 21,973 0.05Oriental Land CoLtd/Japan
JPY
1,300 18,825 0.04ORIX CorpJPY900 21,619 0.05PARK24 CO LTD
TOKYOJPY
1,000 27,973 0.06RECRUITHOLDINGSCO.LTD.
JPY
8,800 39,787 0.09Resona HoldingsInc
JPY
100 23,733 0.05Ryohin Keikaku CoLtd
JPY
700 25,782 0.06Sankyo Co LtdJPY1,300 27,373 0.06SBI HOLDINGS
INCJPY
400 34,567 0.08SECOM LTDJPY1,600 24,053 0.05Sekisui House LtdJPY1,000 43,963 0.10Seven & i Holdings
Co LtdJPY
9,000 26,276 0.06SEVEN BANK LTDJPY700 17,261 0.04SHIMADZU CORPJPY300 25,359 0.06SHIMAMURA
CORP.JPY
200 30,381 0.07Shimano IncJPY200 16,656 0.04SHIN-ETSU
CHEMICAL COJPY
900 57,532 0.13Shionogi & Co LtdJPY300 19,802 0.04SHISEIDO CO.LTDJPY500 18,618 0.04SHOWA DENKO
KKJPY
2,900 43,505 0.10SHOWA SHELLSEKIYU KK
JPY
100 34,810 0.08SMC Corp/JapanJPY

225
Vontobel Fund - Vescore Global Equity Multi Factor
The accompanying notes form an essential part of these financial statements.
Portfolio as at February 28, 2019
* Any deviations of the percentages of the nets assets are due to rounding.
Securities Marketvalue in
USD
% of netassets*
Quantity Ccy Maturity
700 26,140 0.06Sompo HoldingsInc
JPY
500 23,989 0.05Sony CorpJPY1,300 24,582 0.05SONY FINANCIAL
HOLDING INCJPY
1,400 17,770 0.04SUMCO CORPJPY900 22,209 0.05SUMI DAI
PHARMA SHSJPY
5,100 25,289 0.06SumitomoChemical Co Ltd
JPY
2,300 33,068 0.07Sumitomo CorpJPY800 30,320 0.07SUMITOMO
MITSUI TRUSTHOLDINGS
JPY
2,300 29,566 0.07SUMITOMORUBBER IND.
JPY
600 32,878 0.07SUZUKEN COJPY400 20,485 0.05SUZUKI MOTOR
CORPJPY
500 30,089 0.07SYSMEX CORP.KOBE
JPY
400 18,900 0.04Taisei CorpJPY200 20,248 0.04TAISHO
PHARMACEUTICAL HOLDINGS
JPY
1,100 15,543 0.03Taiyo NipponSanso Corp
JPY
500 30,632 0.07TERUMO CORP.JPY900 22,120 0.05THK CO LTDJPY500 17,876 0.04TOHO CO LTD
.TOKYOJPY
600 27,273 0.06TOHO GAS COLTD
JPY
500 24,371 0.05TOKIO MARINEHOLDINGS INC
JPY
7,500 46,757 0.10TOKYO EL HLDGSHS
JPY
200 27,219 0.06TOKYOELECTRON COLTD
JPY
1,300 40,756 0.09TOSHIBA CORPJPY2,600 38,374 0.08TOSOH CORPJPY1,000 21,137 0.05TOYO SEIKAN
KAISHA LTDJPY
600 36,096 0.08Toyota Motor CorpJPY600 19,053 0.04Toyota Tsusho
CorpJPY
500 24,659 0.05TREND MICROINC..TOKYO
JPY
1,400 25,505 0.06USS CO LTDTOKAI
JPY
8,900 43,013 0.09YAMADA DENKICO LTD
JPY
600 29,536 0.07YAMAHA CORP.JPY1,300 26,357 0.06Yamaha Motor Co
LtdJPY
900 23,438 0.05YAMATOHOLDINGS COLTD
JPY
700 19,902 0.04YASKAWAELECTRIC CORP.
JPY
900 16,946 0.04ZOZO RGREGISTERED SHS
JPY
9.184,159,105Total - Japan
Securities Marketvalue in
USD
% of netassets*
Quantity Ccy Maturity
3,134 81,849 0.18Experian PLCGBPJersey
12,795 51,728 0.11GLENCOREGBP0.29133,577Total - Jersey
5,988 45,103 0.10AURORACANNABIS INC
CADCanada
669 52,128 0.11BANK OFMONTREAL
CAD
589 32,710 0.07Bank of NovaScotia
CAD
1,778 42,202 0.09BAUSCH HEALTHRG REGISTEREDSHS
CAD
3,085 35,769 0.08CAMECO CORP.CAD824 69,843 0.15CANAD.IMPER.BK
OF COMMERCECAD
719 61,647 0.14Canadian NationalRailway Co
CAD
351 72,471 0.16CANADIANPACIFIC RAILWAYCO
CAD
1,096 29,118 0.06CANADIANUTILIT.LTD-A-N-VOT
CAD
1,781 84,357 0.19CANOPYGROWTH CORP
CAD
520 34,836 0.08CGI INC -A-CAD67 57,168 0.13CONSTELLATION
SOFTWARE INCCAD
87 43,040 0.09FAIRFAX FIN.HLDS/SUB.VOT*OPR*
CAD
804 28,967 0.06FORTIS INCCAD477 35,907 0.08FRANCO-NEVADA
CORPCAD
718 25,656 0.06Gildan ActivewearInc
CAD
2,338 53,719 0.12GREAT WESTLIFECO INC
CAD
3,222 35,792 0.08Husky Energy IncCAD2,822 44,248 0.10HYDRO ONE LTDCAD1,038 39,794 0.09IA FINANCIAL
CORPORATIONINC
CAD
993 26,865 0.06IMPERIAL OIL LTDCAD296 24,723 0.05INTACT FINCAD7,994 40,547 0.09Lundin Mining
CorpCAD
746 39,333 0.09MAGNAINTERNATIONALINC
CAD
847 47,636 0.11METHANEX CORPCAD1,347 50,587 0.11METRO INC /-A-
SUB VTGCAD
809 38,140 0.08NATIONAL BANKOF CANADA
CAD
3,488 74,395 0.16POWERCORP.CANADA
CAD
3,827 85,345 0.19POWERFINANCIAL CORP
CAD
588 32,463 0.07ROGERSCOMMUN./B. N-V.*OPR*
CAD
169 31,988 0.07SHOPIFY INCCAD

226
Vontobel Fund - Vescore Global Equity Multi Factor
The accompanying notes form an essential part of these financial statements.
Portfolio as at February 28, 2019
* Any deviations of the percentages of the nets assets are due to rounding.
Securities Marketvalue in
USD
% of netassets*
Quantity Ccy Maturity
2,948 66,011 0.15TECKRESOURCES / -B-
CAD
789 28,636 0.06TELUS CorpCAD749 40,697 0.09THOMSON
REUTERS CORPCAD
875 50,135 0.11Toronto-DominionBank/The
CAD
1,490 124,121 0.27WASTECONNECTIONSINC
CAD
792 38,951 0.09West FraserTimber Co Ltd
CAD
2,092 45,462 0.10WHEATONPRECIOUSMETALS CORP
CAD
561 29,686 0.07WSP GLOBAL INCCAD4.061,840,196Total - Canada
1,950 44,876 0.10ArcelorMittalEURLuxembourg
869 49,061 0.11RTL GROUP SAEUR2,790 56,121 0.12SES SAEUR
0.33150,058Total - Luxembourg
1,789 43,432 0.10ABN AMRO GroupNV
EURNetherlands
11,472 61,763 0.14Aegon NVEUR497 45,122 0.10AKZO NOBELEUR218 39,996 0.09ASML Holding NVEUR1,883 48,619 0.11Koninklijke Ahold
Delhaize NVEUR
498 53,532 0.12Koninklijke DSMNV
EUR
648 31,721 0.07Koninklijke VopakNV
EUR
1,858 81,031 0.18NN GROUP N.V.EUR873 47,284 0.10Unilever NVEUR1,099 72,558 0.16Wolters Kluwer NVEUR937 42,296 0.09AERCAP
HOLDINGS NVUSD
2,076 177,539 0.38LyondellBasellIndustries NV
USD
1.64744,893Total - Netherlands
733 36,642 0.08ANDRITZ AGEURAustria
824 31,198 0.07ERSTE GROUPBANK AG
EUR
1,634 50,647 0.11VOESTALPINE AGEUR0.26118,487Total - Austria
3,095 178,767 0.39CARNIVAL CORPUSDPanama
0.39178,767Total - Panama
21,923 80,508 0.18EDP - Energias dePortugal SA
EURPortugal
Securities Marketvalue in
USD
% of netassets*
Quantity Ccy Maturity
3,244 48,945 0.11JERONIMOMARTINS SGPSSA
EUR
0.29129,453Total - Portugal
2,368 198,841 0.44GARMINUSDSwitzerland
0.44198,841Total - Switzerland
770 34,178 0.08ACSEURSpain
268 47,881 0.11Aena SAEUR948 71,462 0.16Amadeus IT
Holding SAEUR
1,437 40,990 0.09Enagas SAEUR1,461 36,850 0.08Endesa SAEUR6,355 50,337 0.11INT AIR GROUPEUR14,762 41,755 0.09MAPFRE SAEUR1,484 40,336 0.09NATURGY
ENERGY /SPLITISSUE
EUR
3,631 78,557 0.17RED ELECTRICACORPORACION.SA
EUR
3,695 63,638 0.14Repsol SAEUR1.12505,984Total - Spain
721 55,964 0.12AbbottLaboratories
USDUnited States
98 32,781 0.07ABIOMED IncUSD97 25,463 0.06Adobe Systems
IncUSD
218 35,268 0.08ADVANCE AUTOPARTS INC
USD
1,297 30,518 0.07ADVANCEDMICRO DEVICESINC
USD
3,186 54,895 0.12AES CORP.USD3,406 167,371 0.37AFLAC INC.USD2,168 146,513 0.32AGCO CORP.USD109 28,228 0.06Align Technology
IncUSD
1,338 126,280 0.28Allstate Corp/TheUSD7,528 203,934 0.45ALLY FINANCIAL
INCUSD
1,998 104,715 0.23Altria Group IncUSD14 22,958 0.05Amazon.com IncUSD449 172,681 0.38AMERCOUSD1,818 129,514 0.29Ameren CorpUSD4,722 383,189 0.85American Electric
Power Co IncUSD
1,474 157,659 0.35ANALOG DEVICESINC
USD
312 55,305 0.12ANSYS IncUSD301 90,520 0.20ANTHEM INCUSD206 35,669 0.08Apple IncUSD723 27,720 0.06Applied Materials
IncUSD
3,744 159,120 0.35Archer-Daniels-Midland Co
USD

227
Vontobel Fund - Vescore Global Equity Multi Factor
The accompanying notes form an essential part of these financial statements.
Portfolio as at February 28, 2019
* Any deviations of the percentages of the nets assets are due to rounding.
Securities Marketvalue in
USD
% of netassets*
Quantity Ccy Maturity
2,846 228,477 0.50Arthur J Gallagher& Co
USD
1,393 143,465 0.32ASSURANT INCUSD5,554 172,840 0.38AT&T IncUSD510 50,414 0.11ATMOS ENERGY
CORPUSD
2,032 166,238 0.37AUTOLIV INCUSD164 25,097 0.06AUTOMATIC
DATA PROCES.USD
171 160,564 0.35AUTOZONE INCUSD4,977 144,731 0.32Bank of America
CorpUSD
5,287 269,478 0.59BB&TCORPORATION
USD
1,783 122,742 0.27BEST BUY CO INC.USD101 33,129 0.07Biogen IncUSD75 33,242 0.07BlackRock IncUSD58 98,428 0.22BOOKING
HOLDINGS INCUSD
642 25,757 0.06Boston ScientificCorp
USD
337 34,121 0.08BRDRDG FNCLSOLUTIONS/WH.ISS.
USD
176 48,463 0.11BROADCOM INCUSD509 25,190 0.06BRWN-FRMAN
CORP. B /NON-VOT
USD
1,677 91,128 0.20Cardinal Health IncUSD1,287 123,436 0.27CBOE GLOBAL
MARKETS INCUSD
1,150 107,974 0.24CDW CORPUSD1,079 110,371 0.24Celanese CorpUSD676 41,162 0.09CENTENE CORP.
DEUSD
4,756 143,346 0.32CENTERPOINTENERGY INC
USD
543 24,983 0.06Charles SchwabCorp/The
USD
1,755 209,863 0.46Chevron CorpUSD205 124,544 0.27Chipotle Mexican
Grill IncUSD
625 41,125 0.09Church & DwightCo Inc
USD
5,518 281,252 0.62CIT GROUP INCUSD4,233 156,367 0.34CITIZENS
FINANCIALGROUP INC
USD
2,606 274,933 0.61CITRIX SYSTEMSINC
USD
1,170 212,835 0.47CME Group Inc/ILUSD4,607 250,621 0.55CMS ENERGY
CORP.USD
2,672 121,148 0.27Coca-Cola Co/TheUSD549 29,317 0.06COGNEX CORPUSD1,127 43,581 0.10Comcast CorpUSD678 59,061 0.13COMERICA INC.USD545 59,950 0.13Concho Resources
IncUSD
1,655 112,292 0.25ConocoPhillipsUSD3,382 278,846 0.62Consolidated
Edison IncUSD
643 108,770 0.24CONSTELLATIONBRAND -A-
USD
Securities Marketvalue in
USD
% of netassets*
Quantity Ccy Maturity
476 27,927 0.06COPART INCUSD462 211,379 0.47COSTAR GROUP
INCUSD
240 52,498 0.12Costco WholesaleCorp
USD
346 25,144 0.06CSX CorpUSD1,007 58,235 0.13CVS Health CorpUSD460 51,571 0.11Darden
Restaurants IncUSD
1,803 100,643 0.22DELLTECHNOLOGIESINC
USD
2,100 104,118 0.23DELTA AIR LINESUSD380 39,113 0.09Diamondback
Energy IncUSD
1,312 35,752 0.08DISCOVERY INCRG SERIES-C-
USD
1,144 33,062 0.07DISCOVERY INC/-A-
USD
235 27,838 0.06DOLLARGENERALCORPORATION
USD
3,562 263,909 0.58DominionResources Inc/VA
USD
417 104,642 0.23DOMINO S PIZZAINC
USD
2,176 268,867 0.59DTE ENERGYCOMPANY
USD
4,490 402,572 0.89Duke Energy CorpUSD1,921 126,517 0.28DXC
TECHNOLOGYCOMPANY
USD
467 22,878 0.05E TRADEFINANCIAL CORP
USD
1,494 81,587 0.18EAST-WESTBANCORP
USD
2,374 196,306 0.43EASTMANCHEMICAL CO
USD
551 93,069 0.21Ecolab IncUSD487 82,444 0.18Edwards
Lifesciences CorpUSD
204 25,763 0.06Eli Lilly & CoUSD2,612 243,778 0.54ENTERGY CORP.USD811 76,234 0.17EOG Resources
IncUSD
4,793 267,977 0.59EVERGY INCUSD2,571 179,482 0.40EVERSOURCE
ENERGYUSD
4,530 220,113 0.49Exelon CorpUSD926 114,185 0.25EXPEDIA GROUP
INCUSD
2,413 190,699 0.42Exxon Mobil CorpUSD584 98,194 0.22F5 NETWORKS
INC.USD
678 109,463 0.24Facebook IncUSD417 26,246 0.06Fastenal CoUSD3,138 110,112 0.24FID NAT FIN-A-
FNF GROUPUSD
8,711 240,249 0.53FIFTH THIRDBANCORP
USD
2,110 53,045 0.12FIRST DATA CORPUSD1,490 156,420 0.35First Republic
Bank/CAUSD
3,136 127,792 0.28FirstEnergy CorpUSD647 54,794 0.12FISERV INC.USD

228
Vontobel Fund - Vescore Global Equity Multi Factor
The accompanying notes form an essential part of these financial statements.
Portfolio as at February 28, 2019
* Any deviations of the percentages of the nets assets are due to rounding.
Securities Marketvalue in
USD
% of netassets*
Quantity Ccy Maturity
376 87,713 0.19FLEETCORTECHNOLOGIESINC
USD
2,564 96,406 0.21Fluor CorpUSD452 40,454 0.09FMC CorpUSD327 28,380 0.06FORTINETUSD6,062 153,975 0.34GAP INC.USD158 22,483 0.05GARTNER INC.
*OPA*USD
1,125 122,378 0.27Genuine Parts CoUSD1,343 100,255 0.22GODADDY INCUSD2,044 100,892 0.22HARTFORD
FIN.SERV.GROUPUSD
312 43,380 0.10HCAHEALTHCARE INC
USD
591 35,046 0.08Henry Schein IncUSD11,647 190,778 0.42HEWLETT
PACKARD ENTCO
USD
2,625 218,138 0.48HILTON INCUSD2,830 144,896 0.32HOLLYFRONTIER
CORP ***USD
1,875 81,300 0.18HORMEL FOODSCORPORATION
USD
3,753 74,047 0.16HP IncUSD205 58,433 0.13HUMANA INC.USD15,210 219,176 0.48HUNTINGTON
BANCSHARES INCUSD
318 67,750 0.15IAC/INTERACTIVECORP /W.ISS.
USD
118 24,902 0.05IDEXXLABORATORIESINC.
USD
71 22,207 0.05Illumina IncUSD1,991 153,606 0.34INTERCONT EXCHUSD112 27,679 0.06INTUITUSD59 32,309 0.07Intuitive Surgical
IncUSD
323 50,075 0.11IPG PhotonicsCorp
USD
950 133,095 0.29IQVIA HOLDINGSINC
USD
1,181 156,636 0.35Jack Henry &Associates Inc
USD
671 93,960 0.21JazzPharmaceuticalsPLC
USD
1,582 167,550 0.37JM SMUCKER COUSD288 31,288 0.07KANSAS CITY
SOUTHERNUSD
1,312 110,746 0.24KEYSIGHTTECHNOLOGIESINC
USD
253 29,219 0.06KLA TENCORCORPORATION
USD
2,979 100,184 0.22KNIGHT SWIFTTRANSN HLDGS -A-
USD
2,403 162,275 0.36KOHL S CORP.USD4,899 143,688 0.32KROGER CO.USD3,825 99,986 0.22L Brands IncUSD181 31,872 0.07Lam Research
CorpUSD
2,226 136,743 0.30Las Vegas SandsCorp
USD
Securities Marketvalue in
USD
% of netassets*
Quantity Ccy Maturity
1,606 244,224 0.54LEAR CORPUSD357 31,952 0.07LIBERTY
BROADBANDCORP
USD
2,542 158,926 0.35LINCOLNNATIONAL CORP.
USD
253 38,056 0.08LULULEMONATHLETICA INC
USD
1,940 335,735 0.74M&T Bank CorpUSD5,615 139,196 0.31MACY SUSD2,081 175,324 0.39ManpowerGroup
IncUSD
1,548 25,697 0.06MARATHON OILCORP.
USD
2,860 177,349 0.39MarathonPetroleum Corp
USD
1,386 173,624 0.38MARRIOTT INTLINC. A
USD
2,175 202,319 0.45Marsh &McLennan Cos Inc
USD
120 26,972 0.06Mastercard IncUSD1,158 63,030 0.14MAXIM
INTEGRATEDPRODUCTS
USD
255 34,675 0.08MC-CORMICK&CO/N.VOTING
USD
648 119,128 0.26McDonald's CorpUSD661 53,733 0.12Merck & Co IncUSD4,032 182,206 0.40MetLife IncUSD1,613 65,939 0.15MICRON
TECHNOLOGYINC
USD
219 24,535 0.05Microsoft CorpUSD405 25,851 0.06Monster Beverage
CorpUSD
2,298 96,470 0.21Morgan StanleyUSD1,151 164,731 0.36Motorola Solutions
IncUSD
1,368 125,268 0.28NASDAQ INCUSD619 25,094 0.06Nektar
TherapeuticsUSD
362 23,602 0.05NETAPP INCUSD85 30,439 0.07NETFLIX INCUSD6,265 213,762 0.47Newmont Mining
CorpUSD
1,184 222,260 0.49NextEra Energy IncUSD1,452 68,651 0.15NORDSTROM INCUSD174 31,198 0.07Norfolk Southern
CorpUSD
1,767 107,027 0.24Nucor CorpUSD148 22,830 0.05NVIDIA CorpUSD18 47,160 0.10NVR INCUSD107 39,800 0.09O'Reilly
Automotive IncUSD
1,791 118,475 0.26OccidentalPetroleum Corp
USD
1,977 84,062 0.19OGE ENERGYCORP
USD
1,283 82,446 0.18ONEOK INC (NEW)USD2,370 118,334 0.26OWENS CORNING
INCUSD
785 193,322 0.43Palo Alto NetworksInc
USD
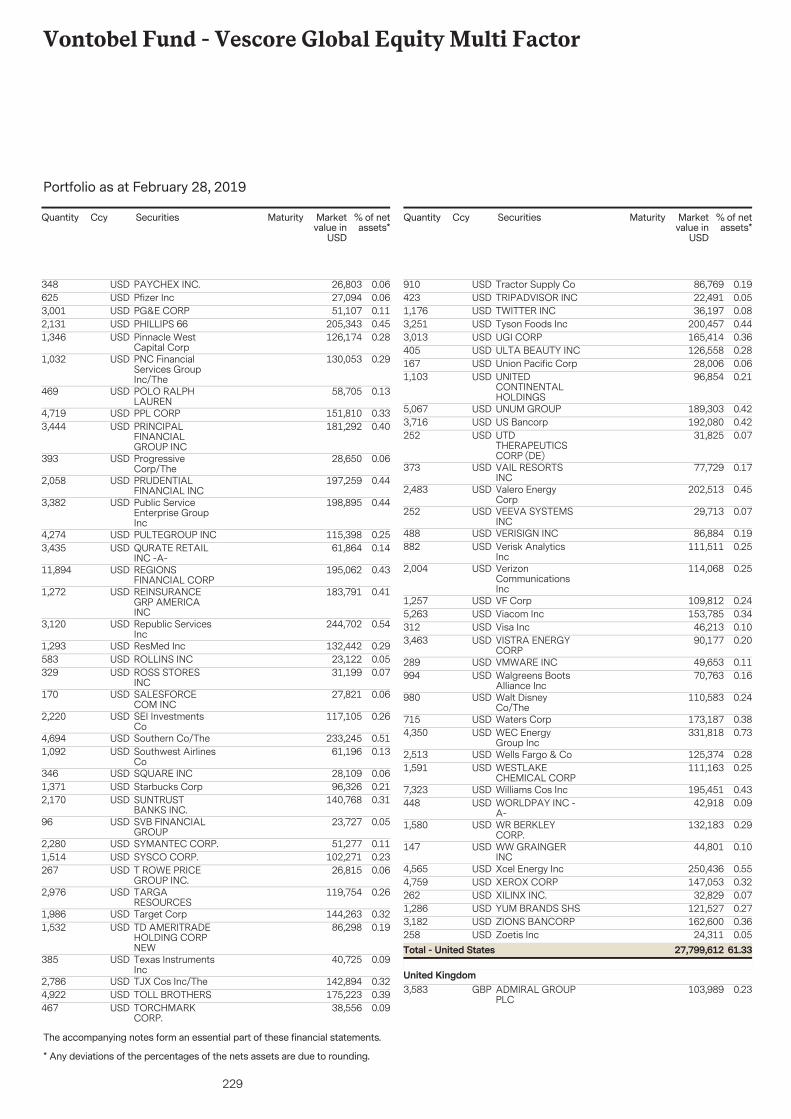
229
Vontobel Fund - Vescore Global Equity Multi Factor
The accompanying notes form an essential part of these financial statements.
Portfolio as at February 28, 2019
* Any deviations of the percentages of the nets assets are due to rounding.
Securities Marketvalue in
USD
% of netassets*
Quantity Ccy Maturity
348 26,803 0.06PAYCHEX INC.USD625 27,094 0.06Pfizer IncUSD3,001 51,107 0.11PG&E CORPUSD2,131 205,343 0.45PHILLIPS 66USD1,346 126,174 0.28Pinnacle West
Capital CorpUSD
1,032 130,053 0.29PNC FinancialServices GroupInc/The
USD
469 58,705 0.13POLO RALPHLAUREN
USD
4,719 151,810 0.33PPL CORPUSD3,444 181,292 0.40PRINCIPAL
FINANCIALGROUP INC
USD
393 28,650 0.06ProgressiveCorp/The
USD
2,058 197,259 0.44PRUDENTIALFINANCIAL INC
USD
3,382 198,895 0.44Public ServiceEnterprise GroupInc
USD
4,274 115,398 0.25PULTEGROUP INCUSD3,435 61,864 0.14QURATE RETAIL
INC -A-USD
11,894 195,062 0.43REGIONSFINANCIAL CORP
USD
1,272 183,791 0.41REINSURANCEGRP AMERICAINC
USD
3,120 244,702 0.54Republic ServicesInc
USD
1,293 132,442 0.29ResMed IncUSD583 23,122 0.05ROLLINS INCUSD329 31,199 0.07ROSS STORES
INCUSD
170 27,821 0.06SALESFORCECOM INC
USD
2,220 117,105 0.26SEI InvestmentsCo
USD
4,694 233,245 0.51Southern Co/TheUSD1,092 61,196 0.13Southwest Airlines
CoUSD
346 28,109 0.06SQUARE INCUSD1,371 96,326 0.21Starbucks CorpUSD2,170 140,768 0.31SUNTRUST
BANKS INC.USD
96 23,727 0.05SVB FINANCIALGROUP
USD
2,280 51,277 0.11SYMANTEC CORP.USD1,514 102,271 0.23SYSCO CORP.USD267 26,815 0.06T ROWE PRICE
GROUP INC.USD
2,976 119,754 0.26TARGARESOURCES
USD
1,986 144,263 0.32Target CorpUSD1,532 86,298 0.19TD AMERITRADE
HOLDING CORPNEW
USD
385 40,725 0.09Texas InstrumentsInc
USD
2,786 142,894 0.32TJX Cos Inc/TheUSD4,922 175,223 0.39TOLL BROTHERSUSD467 38,556 0.09TORCHMARK
CORP.USD
Securities Marketvalue in
USD
% of netassets*
Quantity Ccy Maturity
910 86,769 0.19Tractor Supply CoUSD423 22,491 0.05TRIPADVISOR INCUSD1,176 36,197 0.08TWITTER INCUSD3,251 200,457 0.44Tyson Foods IncUSD3,013 165,414 0.36UGI CORPUSD405 126,558 0.28ULTA BEAUTY INCUSD167 28,006 0.06Union Pacific CorpUSD1,103 96,854 0.21UNITED
CONTINENTALHOLDINGS
USD
5,067 189,303 0.42UNUM GROUPUSD3,716 192,080 0.42US BancorpUSD252 31,825 0.07UTD
THERAPEUTICSCORP (DE)
USD
373 77,729 0.17VAIL RESORTSINC
USD
2,483 202,513 0.45Valero EnergyCorp
USD
252 29,713 0.07VEEVA SYSTEMSINC
USD
488 86,884 0.19VERISIGN INCUSD882 111,511 0.25Verisk Analytics
IncUSD
2,004 114,068 0.25VerizonCommunicationsInc
USD
1,257 109,812 0.24VF CorpUSD5,263 153,785 0.34Viacom IncUSD312 46,213 0.10Visa IncUSD3,463 90,177 0.20VISTRA ENERGY
CORPUSD
289 49,653 0.11VMWARE INCUSD994 70,763 0.16Walgreens Boots
Alliance IncUSD
980 110,583 0.24Walt DisneyCo/The
USD
715 173,187 0.38Waters CorpUSD4,350 331,818 0.73WEC Energy
Group IncUSD
2,513 125,374 0.28Wells Fargo & CoUSD1,591 111,163 0.25WESTLAKE
CHEMICAL CORPUSD
7,323 195,451 0.43Williams Cos IncUSD448 42,918 0.09WORLDPAY INC -
A-USD
1,580 132,183 0.29WR BERKLEYCORP.
USD
147 44,801 0.10WW GRAINGERINC
USD
4,565 250,436 0.55Xcel Energy IncUSD4,759 147,053 0.32XEROX CORPUSD262 32,829 0.07XILINX INC.USD1,286 121,527 0.27YUM BRANDS SHSUSD3,182 162,600 0.36ZIONS BANCORPUSD258 24,311 0.05Zoetis IncUSD
61.3327,799,612Total - United States
3,583 103,989 0.23ADMIRAL GROUPPLC
GBPUnited Kingdom

230
Vontobel Fund - Vescore Global Equity Multi Factor
The accompanying notes form an essential part of these financial statements.
Portfolio as at February 28, 2019
* Any deviations of the percentages of the nets assets are due to rounding.
Securities Marketvalue in
USD
% of netassets*
Quantity Ccy Maturity
2,179 58,067 0.13ANGLOAMERICAN PLC
GBP
733 59,853 0.13ASTRAZENECAPLC
GBP
16,957 107,292 0.24AUTO TRADER GRGBP9,855 55,474 0.12Aviva PLCGBP7,265 45,030 0.10BAE Systems PLCGBP16,100 128,274 0.28Barratt
Developments PLCGBP
2,129 111,855 0.25Berkeley GroupHoldings PLC
GBP
12,460 88,566 0.20BP PLCGBP2,984 94,185 0.21BUNZL PLCGBP1,888 47,450 0.10Burberry Group
PLCGBP
2,280 50,493 0.11COMPASSGROUP PLC
GBP
662 42,362 0.09Croda InternationalPLC
GBP
2,780 107,732 0.24Diageo PLCGBP18,976 90,031 0.20DIRECT LINEGBP2,485 49,494 0.11GlaxoSmithKline
PLCGBP
3,396 78,686 0.17HARGREAVESLANSDOWN PLC
GBP
21,277 64,808 0.14J.SAINSBURY PLCGBP15,420 49,655 0.11Kingfisher PLCGBP25,886 96,613 0.21Legal & General
Group PLCGBP
1,623 97,295 0.21London StockExchange GroupPLC
GBP
11,722 42,565 0.09Marks & SpencerGroup PLC
GBP
7,633 54,743 0.12MEGGITT PLCGBP5,535 62,423 0.14National Grid PLCGBP827 55,968 0.12Next PLCGBP5,215 58,683 0.13Pearson PLCGBP3,647 118,022 0.26Persimmon PLCGBP589 45,180 0.10Reckitt Benckiser
Group PLCGBP
2,409 55,401 0.12RELX PLCGBP1,606 92,623 0.20Rio Tinto PLCGBP1,731 54,440 0.12ROYAL DUTCH
SHELL /-B-GBP
2,431 75,970 0.17ROYAL DUTCHSHELL PLC/-A-
GBP
16,609 62,475 0.14ROYAL MAIL PLCGBP6,820 46,354 0.10RSA INSURANCE
GROUP PLCGBP
2,575 49,200 0.11Smith & NephewPLC
GBP
4,670 73,824 0.16SSE PLCGBP28,822 69,542 0.15TAYLOR WIMPEY
PLCGBP
25,940 77,976 0.17Tesco PLCGBP1,078 57,469 0.13Unilever PLCGBP1,397 90,176 0.20WHITBREAD PLCGBP35,358 108,215 0.24WM Morrison
Supermarkets PLCGBP
758 130,020 0.30AON PLCUSD1,691 79,714 0.18COCA-COLA
EUROP PRNTRUSD
Securities Marketvalue in
USD
% of netassets*
Quantity Ccy Maturity
2,803 119,240 0.26Pentair PLCUSD
99.6645,182,443Total - Transferable securities admitted to anofficial exchange
99.6645,182,443Total - Shares
7.293,307,427Total - United Kingdom
99.6645,182,443Total - Investment in securities

231
Vontobel Fund - Alternative Risk Premia
AssetsInvestments in securities at market value 8,737,940(2)
253,670Cash at banks
8Receivable from foreign currencies
15Interest and dividends receivable(2)
8Unrealised gain on forward foreign exchange contracts(9)
Total Assets 8,991,641
8,590,265Statement of Net Assetsas at February 28, 2019
LiabilitiesPayable on foreign currencies 8
Audit fees, printing and publishing expenses 63
Service Fee payable 1,565(5)
Subscription tax payable 167(4)
Management Fee payable 1,278(3)
Other liabilities 5Total Liabilities 3,086Total net assets at the end of the period 8,988,555Net assets at the beginning of the reporting period 0
Net investment loss on investments -4,572
Change in unrealised appreciation/depreciation on:
Investments 147,675
Forward foreign exchange contracts 7
Net realised gain/loss on forward foreign exchange contracts -15(2)
Net realised gain/loss on currency exchange -1(2)
Increase/Decrease in net assets resulting from operations 143,094Subscriptions of shares 8,845,461Total net assets at the end of the period 8,988,555
Statement of Operations andChanges in Net Assetsfrom December 5, 2018to February 28, 2019
IncomeBank interest 2,480Total Income 2,480ExpensesManagement Fees 3,539(3)
Audit fees, printing and publishing expenses 63
Subscription tax 206(4)
Service Fees 2,217(5)
Other Fees payable 1,027(8)
Total Expenses 7,052Net investment loss on investments -4,572
Statement of Net Incomefrom December 5, 2018to February 28, 2019
Notes USDThe accompanying notes form an essential part of these financial statements.
Cost

232
Vontobel Fund - Alternative Risk Premia
The accompanying notes form an essential part of these financial statements.
Portfolio as at February 28, 2019
* Any deviations of the percentages of the nets assets are due to rounding.
Securities Marketvalue in
USD
% of netassets*
Quantity Ccy Maturity
17,075 1,716,208 19.09MAN ALTERN ST -I- USD/CAP
USD
Other transferable securitiesInvestment fundsIreland
19.091,716,208Total - Ireland
11,581 1,107,259 12.32AB I ALT R PR P -SHS -F- CAP
USDLuxembourg
12,907 1,413,575 15.73AQR STYL PR ---SHS -A- CAP
USD
17,900 1,698,353 18.89BR SF ST ADV ---SHS -I2- CAP
USD
189 1,190,711 13.25NN L MULAFACOP --- SHS -I-CAP
USD
1,589 1,611,834 17.93UNI-GL ALT R PR -IA- USD/CAP
USD
97.218,737,940Total - Other transferable securities
97.218,737,940Total - Investment funds
78.127,021,732Total - Luxembourg
97.218,737,940Total - Investment in securities

233
Shares Summary
Swiss Money CHF 354,881.888 192,353.337 239,823.42977,294.878A CHFLU0120694640142,451.916 219,362.211 762,918.345839,828.640B CHFLU0120694996
8,905.000 49,367.000 187,336.419227,798.419I CHFLU027808662344,699.874 8,380.739 68,240.41931,921.284N CHFLU1683480617
- - 10.00010.000R CHFLU0420001835Euro Short Term Bond EUR 6,259.813 53,779.825 47,140.33994,660.351A EURLU0120688915
4,885.507 - 4,895.50710.000AN EURLU168348975845,767.699 107,819.863 421,396.496483,448.660B EURLU0120689640
972.396 879.340 4,587.3614,494.305C EURLU0137009238112,518.165 105,911.579 382,742.138376,135.552I EURLU0278091037
7,287.076 - 14,961.5337,674.457N EURLU16834818541,690.000 500.000 33,320.00032,130.000NG EURLU1650589689
75.579 - 1,398.5931,323.014R EURLU0420002130- 36,000.000 37,386.00073,386.000S EURLU1502169581
US Dollar Money USD 18,678.720 16,570.542 116,895.622114,787.444A USDLU01206901434,100.000 - 4,110.00010.000AN USDLU1683489162
130,195.430 148,410.098 564,557.431582,772.099B USDLU0120690226147,663.153 69,517.279 160,845.66582,699.791I USDLU1051749858
12,858.000 350.000 14,033.6661,525.666N USDLU1683482316- 250.000 10.000260.000R USDLU0420002486
Swiss Franc Bond CHF 2,114.049 18,623.473 141,616.816158,126.240A CHFLU003573672610,480.000 20,415.000 305,615.000315,550.000AI CHFLU1331778172
3,277.332 - 3,787.533510.201AN CHFLU168348746313,101.395 166,719.381 1,249.967154,867.953AQG CHFLU137430045434,442.470 269,611.726 257,674.116492,843.372B CHFLU003573877112,885.822 2,726.026 25,891.66615,731.870C CHFLU013700311618,837.595 1,099,639.213 220,794.6441,301,596.262G CHFLU1206762293
145,266.529 85,690.350 666,203.657606,627.478I CHFLU027808476811,760.356 1,100.000 22,253.42911,593.073N CHFLU1683481425
- - 810.000810.000R CHFLU0996452701Euro Bond EUR 206.874 4,272.400 47,999.08952,064.615A EURLU0035744233
461.734 1,309.258 8,174.5659,022.089AM USDLU0571063014- - 808.666808.666AN EURLU1683489246
2,727.623 8,591.180 85,724.34391,587.900B EURLU0035744829- 208.334 10.000218.334C EURLU1651443258
137,308.797 252,613.570 76,135.932191,440.705I EURLU02780873575,000.000 869.869 12,227.0668,096.935N EURLU1683481698
35.222 - 1,127.3651,092.143R EURLU0996452024- - 10,670.00010,670.000S EURLU1502168930
EUR Corporate Bond MidYield
EUR 21,616.991 105,078.008 652,275.574735,736.591A EURLU0153585566
26,299.460 32,248.771 584,780.534590,729.845AI EURLU12588896893,955.163 1,792.052 12,655.84710,492.736AN EURLU1683480963
321,411.107 76,258.968 1,601,546.1561,356,394.017AQG EURLU159430251266,412.426 255,947.162 1,467,134.7601,656,669.496B EURLU0153585723
2,190.673 23,794.802 86,604.020108,208.149C EURLU0153585996149,852.257 893,136.289 327,529.4201,070,813.452G EURLU1525532344
10,930.625 62,282.476 627,690.291679,042.142H CHFLU086329026755,628.860 204,935.582 590,651.701739,958.423HI CHFLU104749836274,308.399 82,440.700 114,377.452122,509.753HI USDLU105431422122,554.800 10.628 49,809.73727,265.565HN CHFLU1767066514
5,941.185 5,098.319 44,774.62243,931.756HN GBPLU10923176241,089,898.675 1,813,678.349 5,045,293.2985,769,072.972I EURLU0278087860
26,882.544 83,824.280 107,496.851164,438.587N EURLU161236110245.345 100.000 2,328.6592,383.314R EURLU0420003617
15,700.000 - 53,268.64337,568.643S EURLU1502169235High Yield Bond EUR - 716.123 6,018.0006,734.123AI EURLU1275269402
33.101 16.384 1,050.1521,033.435AMH AUDLU13743002982,732.021 3,405.074 44,728.81745,401.870AMH USDLU1061952005
466.943 75.490 809.383417.930AMH ZARLU1374300371- - 10.00010.000AMHN USDLU1683488354
1,581.461 4,332.460 47,283.96050,034.959AS EURLU07561255966,220.683 77,065.632 352,094.164422,939.113B EURLU0571066462
- 260.324 480.585740.909C EURLU14820636895,578.148 279,094.045 461,377.419734,893.316H CHFLU0571067437
At the beginning of thefinancial period
Subscribed Redeemed At the end of thefinancial period
SHARESVontobel Fund -ISIN-Code

234
Shares Summary
806.500 23,062.995 79,511.718101,768.213H USDLU05710676016,286.043 8,105.895 8,203.00410,022.856HC USDLU10619521875,799.836 73,716.511 94,487.450162,404.125HI CHFLU0571067866
565.000 42,696.461 82,586.243124,717.704HI USDLU05710680888,011.124 - 29,097.54121,086.417HN CHFLU1683481185
230.000 2,400.000 2,045.6714,215.671HN USDLU168348126851,954.518 223,780.149 457,629.528629,455.159I EURLU0571066975
3,280.923 - 8,353.1385,072.215N EURLU1683481342- - 829.685829.685R EURLU0571088516- - 10.00010.000S EURLU1502169318
Bond Global Aggregate EUR 66,658.141 39,295.725 325,056.773297,694.357A EURLU11127507629,209.428 17,222.040 147,371.195155,383.807AH USDLU0035744662
- - 10.00010.000AHN USDLU168348614315,058.000 26,262.000 703,709.525714,913.525AI EURLU1428950999
- - 10.00010.000AN EURLU1683486226- - 10.00010.000AQH1 USDLU1683478470- - 10.00010.000AQHC1 USDLU1683478710
1,609.265 1,452.038 10,790.32610,633.099AS EURLU111663670244,939.655 62,519.910 574,659.408592,239.663B EURLU1112750929
3,099.013 194.201 5,736.2492,831.437C EURLU148206384621,104.384 28,317.099 606,530.149613,742.864H CHFLU1181655199
7,821.150 10,457.435 100,389.409103,025.694H USDLU0035745552- - 10.00010.000H1 USDLU1683478553- - 10.00010.000HC1 USDLU1683478637
97,799.906 166,735.012 309,435.055378,370.161HI USDLU02780913839,339.469 - 42,421.97333,082.504HN CHFLU16834821593,402.368 4,541.058 21,097.78322,236.473HN USDLU1683482076
198,480.767 188,561.536 986,474.446976,555.215I EURLU11127510676,019.347 1,689.032 29,864.07525,533.760N EURLU16123607161,440.000 - 6,900.0005,460.000R EURLU04200039633,000.000 - 85,564.78282,564.782S EURLU1502169409
Eastern European Bond EUR 3,770.399 13,719.460 183,339.238193,288.299A EURLU00802150302,267.254 11,006.181 237,009.756245,748.683AM EURLU04696180367,213.177 90,181.280 756,871.908839,840.011AM USDLU0571068591
- - 930.000930.000AN EURLU16834893292,299.948 15,222.239 89,054.609101,976.900B EURLU0080215204
708.540 141.512 3,889.4373,322.409C EURLU013700460110,880.855 32,202.277 201,106.753222,428.175I EURLU0278087431
3,233.454 - 3,450.121216.667N EURLU1683483801- - 270.000270.000R EURLU0420004268
Value Bond CHF 3,764.319 83,397.575 611,026.907690,660.163A CHFLU0218908985- - 10.00010.000AN CHFLU1683482746
3,482.855 42,764.502 400,355.739439,637.386B CHFLU0218909108- 1,257.000 10,197.25311,454.253I CHFLU0278084842
3,732.554 289.524 15,190.00011,746.970N CHFLU1683480377- 140.000 2,072.7642,212.764R CHFLU0420004698- 190,368.540 10.000190,378.540S CHFLU0571089084
Absolute Return Bond(EUR)
EUR 698.857 16,954.016 120,266.456136,521.615A EURLU0105717663
- - 177.731177.731AM USDLU0571069219- - 10.00010.000AN EURLU1683487117
114,833.710 45,374.136 359,732.840290,273.266B EURLU01057178201,295.012 1,101.435 15,577.99215,384.415C EURLU0137004866
- 310.000 12,130.00012,440.000H USDLU10289019139,627.418 280.000 10,497.4181,150.000HI USDLU1028902051
- - 10.00010.000HN USDLU16834837101,519.338 35,664.330 56,630.41190,775.403I EURLU0278087514
286.018 256.117 2,634.9752,605.074N EURLU1683481003- - 435.848435.848R EURLU0420005075- - 32,010.00032,010.000S EURLU0571089167
Absolute Return BondDynamic
EUR - 500.000 3,994.5514,494.551A EURLU1106543751
- - 10.00010.000AI EURLU1116495612- - 10.00010.000AN EURLU1683486739
130.000 672.733 34,234.00034,776.733B EURLU1106543835
At the beginning of thefinancial period
Subscribed Redeemed At the end of thefinancial period
SHARESVontobel Fund -ISIN-Code

235
Shares Summary
1,175.859 19.774 2,400.6311,244.546C EURLU1106543918- 4,690.000 35,564.79040,254.790H CHFLU1106544130- 2,792.000 2,942.0015,734.001H USDLU1106544213- - 10.00010.000HI CHFLU1106544304
5,038.531 5,038.531 10.00010.000HI USDLU11065444861,080.000 - 1,090.00010.000HN CHFLU1683486812
195.000 - 205.00010.000HN USDLU1683487034104,658.939 1,187.247 113,710.25410,238.562I EURLU1106544056
- - 4,190.0004,190.000N EURLU1683483553- - 10.00010.000R EURLU1106544569
Global Convertible Bond EUR - 8,735.792 25,095.58633,831.378A EURLU0416932159920.137 - 1,785.127864.990AN EURLU1683482829
- - 10.00010.000AS USDLU14820641411,842.260 16,222.193 88,203.012102,582.945B EURLU0414968270
- 732.234 5,752.6736,484.907C EURLU0414968353433.470 35,963.774 86,360.866121,891.170H CHFLU0414968601
- 3,625.000 17,495.32621,120.326H USDLU041496878331,478.124 137,672.258 216,115.594322,309.728HI CHFLU0469619943
- 4,500.000 1,330.0005,830.000HI USDLU046962001614,783.874 33,421.413 95,817.212114,454.751HN CHFLU1683480534
- 440.777 10.000450.777HN USDLU1683483041- 39,435.663 44,332.13783,767.800I EURLU0414968437
868.307 2,391.638 3,353.0964,876.427N EURLU1683480450- 460.000 933.2721,393.272R EURLU0996452610
Sustainable EmergingMarkets Local CurrencyBond
USD 2,671.672 1,261.856 44,222.94242,813.126A USDLU0563307551
13,296.361 23,339.793 49,299.42759,342.859AM USDLU0563307635385.587 19.835 1,412.2301,046.478AMH AUDLU1374299854
1,233.114 829.275 8,629.1138,225.274AMH ZARLU1374299938- 510.000 10.000520.000AN USDLU1683487208
9,221.982 13,440.903 101,590.130105,809.051B CHFLU07520702677,924.021 6,123.638 69,753.53467,953.151B EURLU0752071745
103,466.659 11,231.437 204,969.378112,734.156B USDLU05633077183,858.681 12,994.510 13,734.02622,869.855C USDLU05633078093,852.204 17,608.904 346,842.815360,599.515H CHFLU0563308369
16,491.587 13,902.826 82,576.99579,988.234H EURLU0563308443- - 10,159.64010,159.640HI CHFLU0563308799
41,874.047 23,927.533 62,152.66144,206.147HI EURLU0563308872370.730 - 3,987.9123,617.182HN CHFLU1683483470
- 550.000 260.000810.000HN EURLU168348738045,990.055 79,979.712 338,586.055372,575.712I USDLU0563307981
2,966.283 2,364.513 30,563.09129,961.321N USDLU1683483124- - 1,754.8851,754.885R USDLU0563308013
Swiss Mid and SmallCap Equity
CHF 19,558.754 22,562.364 155,215.037158,218.647A CHFLU0129602552
52,178.168 1,570.000 55,532.7524,924.584AN CHFLU168348070858,592.709 57,430.773 614,605.303613,443.367B CHFLU0129602636
1,626.971 102.734 2,133.070608.833C CHFLU165144350630,902.320 166,362.654 700,182.994835,643.328I CHFLU027808522953,112.485 18,376.037 89,912.33155,175.883N CHFLU1684195974
2,498.983 775.000 4,215.9752,491.992R CHFLU04200056611,100.000 - 117,841.078116,741.078S CHFLU1700372607
European Mid and SmallCap Equity
EUR 765.500 3,996.999 17,466.62820,698.127A EURLU0120692511
3,989.881 - 4,824.783834.902AN EURLU16834853356,521.518 22,094.277 123,204.354138,777.113B EURLU0120694483
509.850 1,595.874 11,491.45712,577.481C EURLU01370057564,168.578 17,897.374 554,150.597567,879.393I EURLU02780894862,110.024 2,270.791 18,044.47418,205.241N EURLU1683480880
127.000 1,111.000 293.4501,277.450R EURLU0996452370Japanese Equity JPY 272.679 502.802 28,829.58229,059.705A JPYLU0035748226
- - 10.00010.000AN JPYLU16834845288,994.958 52,789.268 224,810.811268,605.121B JPYLU00357486554,039.346 11,776.527 448,952.811456,689.992I JPYLU0278094999
At the beginning of thefinancial period
Subscribed Redeemed At the end of thefinancial period
SHARESVontobel Fund -ISIN-Code

236
Shares Summary
2,693,555.688 63,877.079 2,708,273.74978,595.140N JPYLU1683484791- - 10.00010.000R JPYLU0996453188
mtx China Leaders USD 13,562.497 15,358.762 76,155.41677,951.681A USDLU02780918961,410.000 - 6,481.0255,071.025AN USDLU1683484015
32,972.142 34,159.054 238,259.522239,446.434B USDLU027809197965,992.435 75,691.447 398,903.481408,602.493C USDLU0278092191
- - 10.00010.000G USDLU1859275551220,602.062 218,576.990 354,385.201352,360.129I USDLU0278092514
5,001.000 - 5,011.00010.000N GBPLU184536021020,238.511 2,328.750 33,672.91115,763.150N USDLU1683483983
274.000 2,436.516 2,470.8284,633.344R USDLU0420007105European Equity EUR 633.597 1,797.061 24,671.27225,834.736A EURLU0153585053
- - 4,010.0004,010.000AN EURLU16834826627,500.026 66,271.956 313,743.958372,515.888B EURLU01535851371,167.814 7,741.484 49,425.07955,998.749C EURLU0153585210
186,898.719 123,702.557 891,649.297828,453.135G EURLU1506585600- 82,816.000 128,425.377211,241.377HI USDLU1626216706
81,471.365 93,873.561 999,182.9121,011,585.108I EURLU02780850623,187.752 905.874 8,394.9826,113.104N EURLU1683480294
77.000 702.000 956.8001,581.800R EURLU0420007444- - 31,266.00031,266.000S EURLU1502169151
US Equity USD 6,698.709 5,283.776 41,344.83239,929.899A USDLU003576345619,069.000 11,540.000 129,547.000122,018.000AHI EURLU172574262855,353.000 2,020.000 53,843.000510.000AI USDLU1506584975
- 2,318.945 9,110.00011,428.945AN USDLU1683485764136,484.417 95,832.559 613,110.287572,458.429ANG USDLU1550199050
92.634 - 102.63410.000B EURLU171711827490,959.142 72,506.547 426,643.712408,191.117B USDLU003576574117,032.376 4,572.559 30,370.51117,910.694B1 USDLU168347995720,420.061 18,398.763 88,654.64286,633.344C USDLU0137005913
1,066.047 - 1,378.867312.820C1 USDLU16834800211,028,607.078 59,254.512 1,073,999.212104,646.646G EURLU1787046561
66,999.011 26,728.296 258,573.445218,302.730G GBPLU1717118357726,873.687 990,454.461 2,038,164.8132,301,745.587G USDLU1428951294222,213.916 68,978.396 462,446.681309,211.161H EURLU0218912151
10.000 - 10.000-HG EURLU19452922891,063.000 3,074.000 33,445.11035,456.110HI CHFLU0469626211
742,830.585 134,147.723 1,192,017.878583,335.016HI EURLU036855703843,508.019 17,914.878 140,131.586114,538.445HN EURLU1683485848
- - 10.00010.000HS EURLU15021690781,530,121.303 847,213.619 720,669.56137,761.877I EURLU16646357261,169,469.898 1,167,630.126 3,300,738.9083,298,899.136I USDLU0278092605
173,241.426 31,739.710 380,645.525239,143.809N USDLU0897674072207.511 66.091 998.511857.091R USDLU0420007790
312,828.873 - 318,600.5885,771.715U1 USDLU1809221994Global Equity USD 28,351.433 13,460.462 215,064.062200,173.091A USDLU0218910023
490,328.654 20,795.610 2,613,447.1432,143,914.099AI EURLU1121575069- - 10.00010.000AN USDLU1683485921
139.582 800.318 20,461.79721,122.533B SEKLU0979498168387,206.374 351,520.907 3,154,112.2693,118,426.802B USDLU0218910536
- - 238.194238.194B1 USDLU168347936123,174.783 12,635.249 179,812.166169,272.632C USDLU0218910965
- - 10.00010.000C1 USDLU1683479445242,743.287 1,240,244.956 557,086.0811,554,587.750G USDLU1489322047141,327.802 233,186.996 1,340,922.0261,432,781.220H EURLU0218911690
297.302 4.318 45,757.91045,464.926H SEKLU097193959914,097.274 17,098.162 103,159.770106,160.658HC EURLU0333249364
367,323.104 173,075.071 1,168,043.430973,795.397HI EURLU03685557681,091.916 463.956 1,294.565666.605HN EURLU1550202458
19,000.000 - 99,017.48980,017.489HS EURLU1502168773161,766.453 72,363.765 763,812.336674,409.648I EURLU1171709931
- 1,276.235 12,051.12213,327.357I GBPLU0824095136533,199.704 414,553.111 1,597,355.1991,478,708.606I USDLU0278093595
24,440.109 12,408.896 157,422.776145,391.563N USDLU0858753451508.100 365.000 13,205.15513,062.055R USDLU0420007956
At the beginning of thefinancial period
Subscribed Redeemed At the end of thefinancial period
SHARESVontobel Fund -ISIN-Code

237
Shares Summary
41,347.338 90,275.262 1,051,268.2201,100,196.144S USDLU05710914942,597.672 - 2,607.67210.000U1 USDLU1809221721
Global Equity Income USD 772.539 2,763.073 9,754.04711,744.581A Gross USDLU0129603287- - 10.00010.000AN USDLU1683489592- - 10.00010.000AQ Gross USDLU1651442953- - 10.00010.000AQN Gross USDLU1651443092
1,199.788 34,369.192 65,733.40298,902.806B USDLU01296033601,312.793 4,346.198 54,080.70457,114.109H EURLU02190971841,195.155 1,307.915 9,627.6249,740.384HI EURLU0368556063
- - 10.00010.000HN EURLU1683489675- 4,494.814 11,183.66415,678.478I USDLU0278093322
4,106.633 - 4,116.63310.000N USDLU1683481771- - 168.431168.431R USDLU0420008335
Emerging Markets Equity USD 38,510.042 52,853.521 136,814.226151,157.705A USDLU00405067343,000.000 390.000 1,604,097.9141,601,487.914AHI EURLU0858753618
- - 12,240.35512,240.355AI USDLU14718056033,652.089 4,516.713 19,029.40919,894.033AN USDLU1233654372
91,156.677 225,869.819 755,779.894890,493.036B USDLU0040507039- - 10.00010.000B1 USDLU1683479528
12,255.595 28,219.761 165,294.165181,258.331C USDLU0137006218- - 10.00010.000C1 USDLU1683479874
197,763.198 46,835.909 1,024,476.152873,548.863G EURLU1828133469- - 10.00010.000G GBPLU0863298914
7,499.055 16,002.976 129,031.430137,535.351H CHFLU046961811949,225.863 92,176.439 324,209.544367,160.120H EURLU0218912235
7,126.328 6,321.886 55,078.76954,274.327HC EURLU033324910911,319.253 211,885.241 23,530.328224,096.316HG EURLU1828133626
100.000 14,440.000 145,048.365159,388.365HI CHFLU0469618382116,569.046 255,774.377 843,260.656982,465.987HI EURLU0368556220
1,102.000 1,821.000 16,937.77917,656.779HN CHFLU168348606949,269.736 46,608.208 86,679.37284,017.844HN EURLU1179463556
- - 10.00010.000HN GBPLU1179464281- - 463,958.690463,958.690HS CHFLU0773616858- 31,382.000 10.00031,392.000HS EURLU1502168427
81,690.214 7,323.656 92,200.71617,834.158I EURLU11794652541,099.023 1,597.186 176,284.298176,782.461I GBPLU0787641983
488,775.219 1,301,957.093 5,891,285.5776,704,467.451I USDLU027809308234,058.399 51,885.292 217,531.811235,358.704N USDLU0858753535
135.000 2,875.000 11,178.10313,918.103R USDLU042000850973,263.840 113,288.987 2,048,242.1872,088,267.334S USDLU0209301448
- - 10.00010.000U1 USDLU1809222026Asia Pacific Equity USD 600.949 1,157.122 30,271.33430,827.507A USDLU0084450369
- - 590.000590.000AN USDLU168348428831,858.611 42,417.458 260,912.728271,471.575B USDLU0084408755
1,510.533 2,188.477 18,518.75419,196.698C USDLU013700702610.000 - 10.000-G USDLU1917570845
1,614.822 3,818.501 34,016.37936,220.058H EURLU02189124091,432.763 912.939 7,452.8696,933.045HI EURLU0368556733
989.879 - 1,516.453526.574HN EURLU1683484106767,078.291 144,908.607 1,571,363.235949,193.551I USDLU0278091540
46,303.822 17,421.200 563,943.755535,061.133N USDLU0923573769375.000 - 1,854.9841,479.984R USDLU0420008848
- - 435,380.147435,380.147S USDLU1687389434New Power EUR 9,498.855 10,389.765 247,721.600248,612.510A EURLU0138258404
- - 75.00075.000AN EURLU168348649972,812.229 62,379.205 576,197.451565,764.427B EURLU0138259048
1,798.282 2,914.478 27,195.76128,311.957C EURLU0138259550662.409 311.662 3,717.3573,366.610C USDLU0571081347
4,109.977 3,871.003 100,853.431100,614.457H CHFLU0469623622- 31.578 10,033.56410,065.142H GBPLU0469623978
253.359 2,420.000 21,723.92823,890.569H USDLU04696238953,232.750 17.336 12,236.6119,021.197HN CHFLU1368732373
- - 10.00010.000HN GBPLU1683486655288.473 1,250.000 2,019.4952,981.022HN USDLU1683486572
98,761.080 120,857.281 341,021.044363,117.245I EURLU0278090906
At the beginning of thefinancial period
Subscribed Redeemed At the end of thefinancial period
SHARESVontobel Fund -ISIN-Code

238
Shares Summary
3,878.581 9,033.383 28,765.28533,920.087N EURLU0952815248- - 1,119.9401,119.940R EURLU0420009143
14,511.493 365.990 155,540.308141,394.805S EURLU1687389517Clean Technology EUR 5,703.074 4,416.809 119,047.973117,761.708A CHFLU1407930350
7,066.749 11,721.518 72,138.26376,793.032A EURLU0384405519- - 640.000640.000AN CHFLU1683484874
1,907.982 - 3,024.8491,116.867AN EURLU168348517810,007.938 8,453.331 196,252.892194,698.285B CHFLU140793078024,546.542 36,211.374 254,526.942266,191.774B EURLU0384405600
3,136.297 1,052.702 4,133.5952,050.000C EURLU16514431754,423.480 1,547.625 44,808.24141,932.386H CHFLU1407930947
- - 10.00010.000H USDLU16183480791,660.816 12,058.816 9,599.57719,997.577HN CHFLU1683485095
360.000 5,271.688 3,450.0008,361.688HN USDLU168348525141,218.998 45,182.957 202,185.972206,149.931I EURLU0384405949
7,590.454 1.136 8,821.9561,232.638N CHFLU168348495723,518.302 13,199.048 129,805.978119,486.724N EURLU1598842364
3,278.891 - 5,975.9052,697.014N GBPLU161834823618.400 517.038 1,555.7072,054.345R EURLU0385068894
Future Resources EUR 1,170.141 2,454.814 43,880.49745,165.170A CHFLU1407930194291.981 740.105 9,466.5359,914.659A EURLU0384406087
- - 10.00010.000AN EURLU16834854183,783.500 4,851.017 113,526.842114,594.359B CHFLU14079302774,433.113 12,557.939 79,281.74387,406.569B EURLU0384406160
837.480 2,180.924 20,511.32421,854.768C EURLU03844062442,253.285 3,648.487 4,630.5356,025.737C USDLU0571082402
255.000 425.000 5,019.0735,189.073H CHFLU04696233822,000.000 - 2,548.790548.790HN CHFLU1683485509
818.780 44,781.760 76,401.044120,364.024I EURLU03844063278,108.893 4,477.119 18,148.64214,516.868N EURLU0952815594
3.200 860.000 3,737.8924,594.692R EURLU0385069272mtx Sustainable AsianLeaders (ex Japan)
USD 3,187.073 1,967.875 24,334.96923,115.771A USDLU0384409180
21,600.000 - 21,610.00010.000AHI EURLU171139490519,878.219 4,126.187 41,187.97925,435.947AN USDLU168348436185,699.443 16,771.427 288,051.881219,123.865B USDLU038440926335,575.000 - 36,435.000860.000G GBPLU185954803164,773.945 1,120.900 671,663.045608,010.000G USDLU185954765227,865.768 39,141.457 215,926.032227,201.721H EURLU0384409693
6,247.358 21,352.305 54,437.31069,542.257HI EURLU0384409933- - 212,880.920212,880.920HI SEKLU1750111889
28,347.983 4,007.391 36,520.59212,180.000HN EURLU1683482589141,327.414 204,214.913 622,433.196685,320.695I USDLU0384410279
44,203.459 7,626.637 91,378.70854,801.886N USDLU1683484445726.000 22,597.000 266.00022,137.000NG USDLU1806329998167.000 20.000 1,226.6841,079.684R USDLU0385070528
mtx SustainableEmerging MarketsLeaders
USD 72,439.091 58,285.003 710,996.204696,842.116A USDLU0571085330
367,225.041 7,561.147 359,663.894-AG EURLU189225563690.000 - 111.00021.000AH EURLU1725744087
76,867.000 2,419.000 107,747.98333,299.983AHI EURLU171139503542,545.000 38,596.223 350,202.089346,253.312AI EURLU1717117979
119,384.284 124,082.215 1,205,415.8051,210,113.736AI USDLU1609308298700.000 1,196.298 15,210.91815,707.216AN GBPLU1717118191
18,722.379 248,702.866 97,743.647327,724.134AN USDLU1683485681209,884.267 396,958.311 4,391,564.4944,578,638.538B SEKLU1602272657
1,167,779.808 300,779.569 2,962,818.1182,095,817.879B USDLU057108541310.000 - 10.000-B1 USDLU1882611756
1,431.450 55.418 3,842.7022,466.670C USDLU165144333210.000 - 10.000-C1 USDLU1882611830
1,930,590.292 166,465.168 4,973,001.4843,208,876.360G USDLU1767066605144,226.770 23,367.286 295,398.890174,539.406H EURLU1646585114
1,276.312 403.163 4,985.7994,112.650HC EURLU165144341596,199.467 112,641.436 123,614.031140,056.000HI CHFLU1550202615
At the beginning of thefinancial period
Subscribed Redeemed At the end of thefinancial period
SHARESVontobel Fund -ISIN-Code

239
Shares Summary
275,637.618 134,195.678 732,026.665590,584.725HI EURLU16505897621,220.811 67.164 6,896.8785,743.231HN CHFLU1725744830
10.000 - 10.000-HN EURLU19362136821,283,231.087 409,538.691 2,004,002.9931,130,310.597I EURLU16262168883,103,695.607 1,900,372.865 8,498,699.5667,295,376.824I USDLU0571085686
105,686.000 1,058.000 104,628.000-N EURLU191800427339,270.424 8,795.866 128,215.40297,740.844N GBPLU161834858255,094.874 309,506.239 180,415.683434,827.048N USDLU1626216961
431.000 2,092.000 4,240.7975,901.797R USDLU0571092898974,948.395 42,995.958 1,854,195.124922,242.687S USDLU1572142096
1,454.490 - 1,454.490-U1 USDLU1882611913mtx Sustainable GlobalLeaders
USD 1,237.903 1,949.700 45,803.83446,515.631A USDLU0848325295
576.026 - 6,205.2535,629.227AN USDLU1683487547971.068 37,729.557 307,659.171344,417.660B USDLU0848325378638.660 9,159.000 31,215.71939,736.059H CHFLU0848326186
15,512.515 32,561.749 67,636.75184,685.985H EURLU0848326269- 17,790.038 5,387.64823,177.686HI CHFLU0848326772
398.532 2,069.975 7,598.7589,270.201HI EURLU084832685512,012.149 860.153 19,437.8448,285.848HN CHFLU1683482233
4,371.015 9,736.834 13,711.61919,077.438HN EURLU1179465684- 1,642.281 168.2021,810.483HN GBPLU1179465338
2,500.000 57,137.001 50,371.600105,008.601I USDLU08483256187,892.888 1,373.590 22,890.71616,371.418N USDLU0848325709
- 468.400 7,241.7937,710.193R USDLU0848325881Commodity USD 59,880.707 65,948.559 514,579.668520,647.520B USDLU0415414829
3,800.930 4,501.814 43,711.61144,412.495C USDLU0415415123933,503.837 4,853.000 970,265.41141,614.574G GBPLU1495972553
1,363,717.000 26,688.000 1,337,029.000-G USDLU191280121156,281.251 225,013.309 167,143.935335,875.993H CHFLU041541547941,723.465 127,072.815 596,025.870681,375.220H EURLU0415415636
9,843.274 427,208.250 79,529.380496,894.356H SEKLU0505242726101,508.369 6,306.764 309,304.821214,103.216HI CHFLU0415416287
37,087.202 323,806.098 453,524.725740,243.621HI EURLU0415416444- 1,657,177.000 10.0001,657,187.000HI SEKLU0505242999
123.795 123.795 656.280656.280HN CHFLU168348894128,137.873 3,250.140 43,271.44318,383.710HN EURLU168348908951,502.145 - 843,225.500791,723.355HS CHFLU0692735565
776,540.655 1,042,195.742 1,923,982.4262,189,637.513I USDLU041541580014,358.000 145.563 14,368.000155.563N USDLU1683488867
81.368 230.000 1,420.1471,568.779R USDLU0415416790Dynamic Commodity USD 7,227.512 5,740.621 137,226.082135,739.191B USDLU0759371569
330.000 1,750.000 12,571.79713,991.797H CHFLU075937199938,122.024 8,080.188 233,585.570203,543.734H EURLU075937202175,581.734 41,726.023 294,409.289260,553.578HI CHFLU075937245013,924.394 6,949.752 57,078.52250,103.880HI EURLU0759372534
490.000 - 500.00010.000HN CHFLU16834887847,660.857 3,365.866 52,817.14048,522.149HN EURLU1683488602
104,727.612 179,041.218 637,239.875711,553.481I USDLU0759372880- - 110.000110.000N USDLU1683488511- - 3,724.0003,724.000R USDLU0759372963
700.000 - 251,630.000250,930.000S USDLU0759376105Non-Food Commodity USD - - 10.00010.000AHI EURLU1130323832
- - 103.000103.000AI USDLU114075477835.687 404.820 6,204.6196,573.752B USDLU110654464341.861 1,183.848 7,826.4828,968.469H CHFLU1106545293
162.386 72.855 2,942.3552,852.824H EURLU1106545376- - 10.00010.000HI CHFLU1106545533
28,617.147 10,006.347 90,494.91471,884.114HI EURLU110654561626,000.000 74,100.000 10.00048,110.000I USDLU1106544999
- - 10.00010.000N USDLU1683489915- - 10.00010.000R USDLU1106545962
139,665.000 551,488.356 819,502.3781,231,325.734S USDLU1106545020Emerging Markets Debt USD 6,207.728 1,675.285 77,361.99372,829.550AH EURLU1482064224
14,193.274 39,449.719 57,176.30882,432.753AHI CHFLU1572142336
At the beginning of thefinancial period
Subscribed Redeemed At the end of thefinancial period
SHARESVontobel Fund -ISIN-Code

240
Shares Summary
326,611.105 266,800.263 553,001.729493,190.887AHI EURLU15721422522,349.656 - 2,509.656160.000AHN EURLU1684196279
90,968.258 44,156.037 613,051.880566,239.659AI EURLU108676655450,334.840 40,386.646 146,015.382136,067.188AI USDLU1572142179
3,514.203 616.866 28,569.27225,671.935AM USDLU16758672431,092.698 7,370.000 13,968.21720,245.519AQ1 USDLU1683477746
- - 10.00010.000AQC1 USDLU168347839751,369.000 85,036.000 670,437.735704,104.735AQG USDLU142276356219,763.511 20,694.628 58,951.78959,882.906AS USDLU1482064067
422,262.003 146,446.776 1,087,058.443811,243.216B USDLU092643956229,390.405 1,049.136 60,417.88432,076.615B1 USDLU168347782914,046.784 2,180.348 26,332.00514,465.569C USDLU1482063762
2,999.862 - 3,009.86210.000C1 USDLU168347812457,867.595 79,977.509 356,994.378379,104.292G EURLU182812331240,870.846 25,217.410 528,600.358512,946.922H CHFLU0926440065
315,060.237 159,759.006 1,477,090.2811,321,789.050H EURLU092643999236,571.041 16,858.145 86,691.50366,978.607HC EURLU1482063929
895,442.298 193,017.643 1,810,693.9221,108,269.267HI CHFLU09264404952,162,041.559 1,385,515.979 4,781,505.7554,004,980.175HI EURLU0926440222
45,335.899 23,458.320 72,358.67450,481.095HI GBPLU170037324110,316.522 20.877 37,016.34426,720.699HN CHFLU168348193844,224.291 9,844.306 97,891.64163,511.656HN EURLU1683488438
1,084,084.745 290,407.018 1,571,130.400777,452.673HS CHFLU1627767111- - 12,188.00012,188.000HS EURLU1502168690
4,035,047.477 2,391,168.050 10,812,171.9409,168,292.513I USDLU092643972914,486.997 62,880.472 50,347.05398,740.528N USDLU0926439646
1,283.738 2,410.000 6,744.3737,870.635R USDLU0992847904356,570.852 - 2,061,391.0631,704,820.211S USDLU1171709691
- - 10.00010.000U1 USDLU1809222455Global Bond USD 2,047.289 - 164,774.579162,727.290HI CHFLU1246874892
530.431 5,904.361 142,629.216148,003.146HI EURLU1246874629- 196.000 178,118.324178,314.324HS CHFLU1246875196- - 17,340.00017,340.000HS EURLU1502168856- - 1,372.0001,372.000I USDLU1246874462
Credit Oppertunities USD 121,000.000 121,000.000 198,510.000198,510.000X USDLU1242417589Global Corporate BondMid Yield
USD 3,766.038 2,550.000 25,457.02824,240.990A USDLU1395536086
24,280.004 13,929.799 382,559.518372,209.313AH CHFLU13955361692,277.184 1,357.419 27,109.23726,189.472AH EURLU1395536243
- - 10.00010.000AHI EURLU1395536326- - 1,518.9801,518.980AHN CHFLU1683488198- - 10.00010.000AHN EURLU1683488271- - 10.000-AN EURLU1683487976
1,798.759 8,900.996 9,208.47616,310.713B USDLU1395536599375.690 - 6,104.2805,728.590C USDLU1395536672
301,633.101 119,172.603 500,200.549317,740.051G USDLU1309987045890.909 1,093.524 12,152.29612,354.911H EURLU1395536755210.996 99.873 3,108.8192,997.696HC EURLU1395536839
228,023.969 89,843.658 395,774.311257,594.000HG CHFLU1831168353399,068.124 198,000.130 674,831.801473,763.807HG EURLU1291112750
21,503.083 - 69,871.08348,368.000HI CHFLU139553691211,636.358 64,203.759 55,190.588107,757.989HI EURLU1395537050
- - 10.00010.000HN EURLU173407866751,815.325 6,985.000 53,710.2498,879.924I USDLU1395537134
- - 10.000-N EURLU1683487893- - 510.000510.000R USDLU1435047193
Emerging Markets Blend USD 10.000 - 10.000-A USDLU19223478661,010.000 - 1,010.000-HI CHFLU18968478914,310.000 - 4,310.000-HI EURLU1896847628
272,175.154 - 272,175.154-HS CHFLU1896848279743,681.807 550,348.133 665,543.674-I USDLU1256229680
310.000 - 310.000-R USDLU1896847974Emerging MarketsCorporate Bond
USD 14,583.749 14,583.749 --AN USDLU1914926925
10.000 - 10.000-AQ1 USDLU1882612051
At the beginning of thefinancial period
Subscribed Redeemed At the end of thefinancial period
SHARESVontobel Fund -ISIN-Code
10.000
472'210,000, .

241
Shares Summary
10.000 - 10.000-AQC1 USDLU18826123099,793.749 - 9,793.749-AQN USDLU1914926925
139,095.991 1,679.086 163,146.86625,729.961B USDLU175011170732,720.445 - 32,720.445-B1 USDLU1882612135
8,943.404 - 8,943.404-C1 USDLU188261221829,194.858 - 29,194.858-HI CHFLU1923148958
346,844.043 151,788.938 336,826.348141,771.243HI EURLU1750111533562,766.111 355,186.825 1,159,173.641951,594.355I USDLU1305089796
17,871.836 1,911.467 20,312.3694,352.000N USDLU17501116161,390.569 328.000 11,047.9519,985.382R USDLU16465856273,179.216 - 3,179.216-U1 USDLU1882612481
TwentyFour AbsoluteReturn Credit Fund
GBP 12,336.643 41,765.164 167,602.088197,030.609AH CHFLU1380459195
535,763.961 97,615.288 717,471.340279,322.667AH EURLU13804592782,216.227 46,800.000 37,273.93781,857.710AH USDLU1380459351
26,286.000 34,014.000 354,220.000361,948.000AHI EURLU159932010521,609.000 250.000 26,009.1254,650.125AHN CHFLU1734078154
7,504.620 1,400.000 32,690.26426,585.644AHN EURLU16834876201,800.000 - 2,807.8591,007.859AI GBPLU1267852249
322,955.820 82,707.010 1,383,205.0141,142,956.204AQG GBPLU153078840236,416.163 22,901.118 174,915.527161,400.482AQHG EURLU153078823830,106.782 - 30,116.78210.000AQHG USDLU1767065979
- 772.000 4,537.0005,309.000AQHN EURLU133178945037,779.792 121,356.636 257,029.249340,606.093AQHNG USDLU141050249372,826.189 1,182.612 77,513.9065,870.329AQN GBPLU1331789377
886,090.640 303,463.405 6,273,310.3805,690,683.145AQNG GBPLU1368730674894,296.805 166,561.740 3,982,974.7243,255,239.659G GBPLU1273680238
47,129.035 119,961.370 242,896.877315,729.212H EURLU1551754432- - 10.00010.000HC EURLU1706316335
39,992.000 - 39,992.000-HG EURLU19250656554,476.035 63,886.175 48,665.936108,076.076HI CHFLU1599320444
279,260.645 436,095.627 1,670,104.5831,826,939.565HI EURLU133178961719,764.375 24,453.536 83,407.22688,096.387HN EURLU1734078238
- - 1,906.6931,906.693HN USDLU176706635773,152.610 2,864.812 71,385.0221,097.224I GBPLU1267852082
270,333.363 141,165.060 453,248.224324,079.921N GBPLU1267852595- 8,118.000 15,626.89623,744.896R GBPLU1273680154
TwentyFour StrategicIncome Fund
GBP 16,455.931 43,945.659 245,947.662273,437.390AH CHFLU1380459435
93,869.956 16,280.844 360,039.330282,450.218AH EURLU13804595188,414.284 48,735.000 67,915.764108,236.480AH USDLU1380459609
60,775.469 70,973.049 111,504.805121,702.385AHI EURLU132513929054,542.038 2,850.109 121,657.68969,965.760AHN CHFLU168348240780,416.625 7,446.298 106,117.66233,147.335AHN EURLU173407831137,703.706 5,000.000 168,206.795135,503.089AMH EURLU1325137245
1,086.396 - 11,764.19810,677.802AQ GBPLU1695534591173,955.436 595,426.123 3,970,562.8674,392,033.554AQG GBPLU1322872018
25,666.007 19,657.951 55,688.99949,680.943AQH Gross EURLU1695534757- 235,390.470 265,921.513501,311.983AQH Gross HKDLU1695534831
952.000 - 51,802.10050,850.100AQH Gross SGDLU169553491459,216.813 56,103.276 604,635.543601,522.006AQH Gross USDLU169553467493,984.425 - 97,934.3463,949.921AQH1 USDLU168347880118,719.923 - 19,778.0571,058.134AQHC1 USDLU1683479288
- 9,010.163 22,220.08031,230.243AQHG EURLU1816229899174.360 1,962.176 2,234.7474,022.563AQHG USDLU1816230046
39,632.536 42,892.625 340,202.728343,462.817AQHI USDLU13317920824,792.203 19,648.000 32,206.42347,062.220AQHN EURLU1325135033
13,068.323 22,425.325 127,277.995136,634.997AQHNG EURLU132513422683,044.141 9,126.208 274,589.194200,671.261AQHNG USDLU145158052315,520.538 5,641.208 37,947.04328,067.713AQN GBPLU1322871630
1,360.117 1,255.360 26,247.52826,142.771AQNG GBPLU1695534328686,091.844 4,151.839 1,268,378.276586,438.271G GBPLU1322871713495,150.692 529,547.182 1,142,731.9491,177,128.439H EURLU1551754515
- - 10.00010.000H HKDLU1767066191- - 10.00010.000H SGDLU1767066274
At the beginning of thefinancial period
Subscribed Redeemed At the end of thefinancial period
SHARESVontobel Fund -ISIN-Code

242
Shares Summary
340,519.888 117,392.385 609,988.983386,861.480H USDLU1695535135126,338.813 347.131 130,038.8634,047.181H1 USDLU1683479015
- - 10.00010.000HC EURLU170631927170,991.866 - 78,357.8817,366.015HC1 USDLU168347910660,930.921 306,728.237 1,748,943.2801,994,740.596HG EURLU171711762344,703.821 548,775.952 1,432,739.1341,936,811.265HG USDLU171711789649,374.113 156,312.680 349,268.014456,206.581HI CHFLU1325143136
124,231.121 528,602.842 926,514.6421,330,886.363HI EURLU13251415105,223,445.566 222,246.344 5,001,299.222100.000HI NOKLU1820067186
49,893.637 45,421.289 300,552.391296,080.043HI USDLU13251440273,154.443 17,922.455 20,590.33135,358.343HN EURLU1734078584
925.000 - 3,987.0003,062.000HN USDLU176706643155,058.582 46,439.587 663,654.000655,035.005HNG EURLU1325133921
- - 10.00010.000HNG USDLU1695535051164.200 150.000 15,220.90015,206.700HR CHFLU1650589929
126,862.760 7,983.151 288,401.104169,521.495I GBPLU13228713901,542.803 3,695.924 21,752.89423,906.015N GBPLU1322871556
95,427.317 94,863.693 395,138.908394,575.284NG GBPLU13228719864.000 - 18,138.36018,134.360R GBPLU1322872109
398.794 - 398.794-UAQH1 USDLU193383262517,742.891 897.039 18,251.2461,405.394UH1 USDLU1809222539
LCR Global Bond EUR - - 402,010.000402,010.000AG EURLU1504208908- - 10.00010.000I EURLU1481721451
Multi Asset Solution EUR 17,137.924 87,404.964 517,632.309587,899.349B EURLU14817206448,562.946 15,266.043 56,417.64863,120.745C EURLU1481721022
78,338.102 71,385.464 149,583.232142,630.594I EURLU1564308895- - 10.00010.000N EURLU1683490335
Multi Asset Income EUR 2,740.046 1,355.743 22,329.21020,944.907A EURLU1687388899- - 10.00010.000A Gross EURLU1840629767- - 10.00010.000AQ Gross EURLU1840629254
1,724.687 12,883.744 140,353.621151,512.678B EURLU1687388972116.454 1,116.800 3,283.5024,283.848C EURLU1687389194
1,411.646 7,699.585 55,037.58261,325.521H CHFLU1687389277- 351.915 3,254.3113,606.226H USDLU1687389350
31,000.000 - 231,210.025200,210.025I EURLU1515106984- - 1,020.2041,020.204N EURLU1734078824- - 7,271.2297,271.229R EURLU1543561341
TwentyFour MonumentEuropean Asset BackedSecurities
EUR 10.000 - 10.000-A EURLU1882612564
10.000 - 10.000-AH CHFLU188261264810.000 - 10.000-AH GBPLU188261272110.000 - 10.000-AH USDLU1882612994
191,391.876 170,401.507 644,304.094623,313.725HI CHFLU1602256296108,221.410 18,594.410 259,254.869169,627.869HI USDLU1602256700
10.000 - 10.000-HN CHFLU188261329910.000 - 10.000-HN GBPLU188261337210.000 - 10.000-HN USDLU188261345567.000 - 8,049.9947,982.994HR CHFLU1650590000
685,730.743 1,570,791.571 1,726,620.0072,611,680.835I EURLU160225556110.000 - 10.000-N EURLU1882613026
- - 1,128.2171,128.217R EURLU1627767970Multi Asset Defensive EUR 1,832.836 6,739.533 29,399.06034,305.757B EURLU1700372789
42.709 33.692 4,165.4654,156.448C EURLU1737595923- - 1,780,133.4931,780,133.493E EURLU1700372862- - 1,725.0001,725.000H CHFLU1767066860- - 110.000110.000H USDLU1767066944- - 19.28819.288HI CHFLU1767067082- - 1,560.0001,560.000HI USDLU1767067165- - 58,322.36958,322.369I EURLU1700372946- - 10.00010.000N EURLU1767067249- - 244.260244.260R EURLU1700373084
Multi Asset Alphabet EUR 10.000 - 10.000-B EURLU186484819410.000 - 10.000-H CHFLU186484843410.000 - 10.000-H USDLU1864848350
At the beginning of thefinancial period
Subscribed Redeemed At the end of thefinancial period
SHARESVontobel Fund -ISIN-Code

243
Shares Summary
10.000 - 10.000-HN GBPLU18648485171,211.000 - 1,211.000-HR CHFLU1864848608
200,010.000 - 200,010.000-I EURLU1864848277Vescore ArtificialIntelligence Multi Asset
EUR 10.000 - 10.000-A EURLU1879231311
10.000 - 10.000-B EURLU187923140210.000 - 10.000-C EURLU187923158410.000 - 10.000-HI CHFLU187923204610.000 - 10.000-HI GBPLU1879232129
142,645.000 - 142,645.000-I EURLU187923166710.000 - 10.000-N EURLU1879231741
233.000 - 233.000-R EURLU1879231824Vescore Global EquityMulti Factor
USD 10.000 - 10.000-A USDLU1914479057
10.000 - 10.000-B USDLU1914479131376,915.000 900.000 376,015.000-I USDLU1914479305
10.000 - 10.000-N USDLU1914479214241.195 - 241.195-R USDLU1914479560
50,010.000 - 50,010.000-S USDLU1914479487Alternative Risk Premia USD 84,807.812 - 84,807.812-E USDLU1896838635
10.000 - 10.000-HI CHFLU189683880910.000 - 10.000-HI EURLU189683898110.000 - 10.000-I USDLU189683871810.000 - 10.000-N USDLU1896839013
3,360.000 - 3,360.000-R USDLU1896839104
At the beginning of thefinancial period
Subscribed Redeemed At the end of thefinancial period
SHARESVontobel Fund -ISIN-Code

244
Net Asset Value Summary
Swiss Money CHF 132,350,840 128,154,992 132,988,769 89.97 88.37 87.60A CHF114.84 113.83 113.64B CHF
99.84 99.01 98.87I CHF- 99.22 99.08N CHF
100.13 99.41 99.35R CHFEuro Short Term Bond EUR 146,324,696 126,251,464 112,778,291 89.59 87.98 83.90A EUR
- 99.61 100.24AN EUR132.60 131.87 132.52B EUR158.26 156.76 157.23C EUR112.16 111.74 112.41I EUR
- 99.60 100.17N EUR100.01 99.69 100.31NG EUR100.55 100.04 100.57R EUR100.18 99.96 100.62S EUR
US Dollar Money USD 119,074,409 96,364,436 105,078,381 87.72 87.61 86.65A USD- 101.59 103.03AN USD
131.01 132.95 134.69B USD102.82 104.51 105.95I USD
- 101.54 102.94N USD102.74 104.32 105.73R USD
Swiss Franc Bond CHF 417,088,827 398,890,020 229,434,085 126.52 123.68 124.02A CHF100.22 98.03 98.17AI CHF
- 98.98 99.18AN CHF99.35 97.43 97.73AQG CHF
243.76 239.28 240.88B CHF193.53 189.23 190.14C CHF101.27 99.90 100.81G CHF135.70 133.68 134.81I CHF
- 99.04 99.86N CHF106.78 105.23 106.14R CHF
Euro Bond EUR 78,717,505 77,489,583 56,912,692 147.21 144.52 144.85A EUR93.69 89.12 87.36AM USD
- 100.01 100.06AN EUR397.47 394.92 399.80B EUR100.02 99.19 100.30C EUR162.02 161.89 164.35I EUR
- 100.28 101.78N EUR118.12 118.07 119.89R EUR
99.82 100.07 101.75S EUREUR Corporate Bond MidYield
EUR 1,902,035,206 1,805,142,568 1,574,511,319 110.47 106.82 105.52A EUR
105.31 101.85 100.42AI EUR- 99.14 97.93AN EUR
102.29 98.76 98.60AQG EUR175.34 172.72 173.81B EUR216.49 212.43 213.36C EUR104.47 103.66 104.69G EUR118.20 115.89 116.34H CHF113.38 111.78 112.48HI CHF118.64 120.11 122.87HI USD
- 98.68 99.30HN CHF112.36 112.19 113.79HN GBP162.13 160.61 162.07I EUR101.21 100.28 101.17N EUR150.63 149.59 151.14R EUR103.26 102.83 104.04S EUR
High Yield Bond EUR 375,240,164 278,996,693 198,662,014 108.30 109.36 102.38AI EUR101.79 97.88 94.46AMH AUD
87.11 83.96 81.20AMH USD975.07 932.45 896.56AMH ZAR
- 101.90 102.11AMHN USD98.93 92.60 88.85AS EUR
131.67 132.26 130.23B EUR103.40 103.46 101.67C EUR127.91 127.75 125.46H CHF135.36 139.10 138.86H USD106.66 109.11 108.76HC USD112.81 113.33 111.62HI CHF111.38 115.09 115.26HI USD
31.08.2017 31.08.2018 28.02.2019 31.08.2017 31.08.2018 28.02.2019
NET ASSETS NET ASSET VALUE PER SHAREVontobel Fund -

245
Net Asset Value Summary
- 99.29 97.79HN CHF- 101.92 102.00HN USD
135.53 136.91 135.19I EUR- 99.89 98.62N EUR
115.12 116.57 115.26R EUR105.20 106.75 105.65S EUR
Bond Global Aggregate EUR 444,059,556 417,565,405 436,110,553 103.38 97.42 100.14A EUR110.66 106.48 110.43AH USD
- 98.37 105.25AHN USD101.12 95.31 98.31AI EUR
- 96.00 101.96AN EUR- 97.89 104.49AQH1 USD- 97.89 104.46AQHC1 USD
102.22 95.49 98.22AS EUR107.42 103.48 109.66B EUR
98.36 94.35 99.69C EUR102.58 98.34 104.07H CHF319.52 315.42 336.60H USD
- 97.87 104.48H1 USD- 97.89 104.46HC1 USD
145.94 143.97 154.27HI USD- 95.22 100.73HN CHF- 97.83 104.74HN USD
108.49 104.91 111.27I EUR100.66 97.11 103.00N EUR
96.77 93.71 99.40R EUR100.84 97.91 104.67S EUR
Eastern European Bond EUR 124,292,752 88,978,144 84,918,692 41.66 36.80 37.89A EUR50.71 43.36 44.39AM EUR49.28 41.23 41.32AM USD
- 93.09 95.97AN EUR138.84 128.11 136.25B EUR180.55 165.93 176.13C EUR134.13 124.49 132.78I EUR
- 93.05 99.23N EUR111.55 103.81 110.86R EUR
Value Bond CHF 171,942,319 121,505,468 91,999,362 80.47 77.95 77.53A CHF- 98.04 99.12AN CHF
104.78 103.29 104.45B CHF106.28 104.96 106.22I CHF
- 98.12 99.23N CHF104.80 103.45 104.65R CHF104.33 103.33 104.75S CHF
Absolute Return Bond (EUR) EUR 96,837,672 74,511,837 82,059,259 92.66 90.00 91.00A EUR74.18 70.07 69.21AM USD
- 98.62 100.73AN EUR154.58 152.45 155.52B EUR165.34 162.45 165.42C EUR102.99 103.85 107.28H USD104.54 105.94 109.35HI USD
- 100.56 103.92HN USD119.86 118.71 121.36I EUR
- 98.59 100.58N EUR110.98 110.06 112.58R EUR
99.34 98.90 101.34S EURAbsolute Return BondDynamic
EUR 10,391,628 9,158,526 19,406,966 92.20 88.89 90.86A EUR
96.43 96.28 99.67AI EUR- 99.13 102.62AN EUR
96.57 95.94 99.12B EUR143.32 141.85 146.22C EUR
94.34 93.17 96.08H CHF98.71 100.26 104.81H USD95.60 94.87 98.04HI CHF
100.15 102.40 107.02HI USD- 98.91 102.04HN CHF- 101.28 105.93HN USD
97.72 97.51 100.84I EUR- 98.89 102.22N EUR
31.08.2017 31.08.2018 28.02.2019 31.08.2017 31.08.2018 28.02.2019
NET ASSETS NET ASSET VALUE PER SHAREVontobel Fund -

246
Net Asset Value Summary
98.15 98.03 101.50R EURGlobal Convertible Bond EUR 149,578,376 94,759,434 64,740,130 136.83 132.25 127.34A EUR
- 96.26 92.93AN EUR104.83 99.03 93.26AS USD141.42 136.94 131.85B EUR189.83 183.09 175.93C EUR133.80 128.77 123.67H CHF145.63 144.27 140.87H USD127.38 123.32 118.80HI CHF110.28 109.89 107.73HI USD
- 95.73 92.20HN CHF- 98.19 96.11HN USD
148.63 144.77 139.80I EUR- 96.31 92.98N EUR
110.39 107.81 104.24R EURSustainable EmergingMarkets Local CurrencyBond
USD 123,122,089 115,006,096 123,590,192 73.15 62.83 61.76A USD
66.28 55.16 55.69AM USD101.99 84.25 84.78AMH AUD
1,056.05 872.77 869.05AMH ZAR- 91.41 91.18AN USD
96.68 87.75 95.49B CHF102.04 94.04 101.50B EUR
97.26 87.73 92.66B USD142.09 127.65 134.57C USD
87.55 76.48 79.37H CHF91.61 80.27 83.47H EUR91.33 80.29 83.63HI CHF91.77 80.80 84.26HI EUR
- 88.33 92.00HN CHF- 88.84 92.75HN EUR
101.41 92.08 97.58I USD- 90.99 96.41N USD
103.24 94.02 99.78R USDSwiss Mid and Small CapEquity
CHF 246,326,659 348,327,575 290,839,569 211.35 239.62 207.48A CHF
- 110.18 95.81AN CHF214.68 244.16 211.41B CHF100.80 113.98 98.42C CHF146.56 168.13 146.21I CHF
- 110.95 96.47N CHF172.15 198.55 173.12R CHF
- 110.65 96.68S CHFEuropean Mid and Small CapEquity
EUR 149,924,598 156,409,675 131,418,494 222.49 238.99 209.41A EUR
- 101.77 89.29AN EUR236.22 254.66 224.00B EUR208.85 223.81 196.28C EUR179.98 195.72 172.89I EUR
- 101.75 89.87N EUR162.77 177.96 157.60R EUR
Japanese Equity JPY 8,304,170,116 7,041,054,627 6,167,702,889 6,231 6,601 5,907A JPY- 102 92AN JPY
7,581 8,032 7,186B JPY9,617 10,256 9,207I JPY
- 102 92N JPY13,186 14,113 12,693R JPY
mtx China Leaders USD 169,322,450 260,004,679 260,170,214 216.46 215.19 213.67A USD- 96.20 95.88AN USD
242.75 242.20 242.96B USD248.67 246.63 246.66C USD
- 101.43 102.44G USD229.58 231.17 232.95I USD
- 96.73 95.67N GBP- 96.22 96.94N USD
213.91 216.65 218.95R USDEuropean Equity EUR 591,146,326 414,733,350 374,840,091 264.95 270.93 254.87A EUR
- 100.94 94.92AN EUR288.32 297.38 281.76B EUR
31.08.2017 31.08.2018 28.02.2019 31.08.2017 31.08.2018 28.02.2019
NET ASSETS NET ASSET VALUE PER SHAREVontobel Fund -

247
Net Asset Value Summary
201.29 206.38 194.96C EUR109.71 114.76 109.48G EUR
93.04 98.78 95.33HI USD158.99 165.41 157.39I EUR
- 101.52 96.58N EUR265.37 277.58 264.83R EUR109.72 115.09 109.97S EUR
US Equity USD 1,917,713,377 2,338,088,997 2,808,641,569 910.39 1,065.43 1,045.36A USD- 108.07 104.82AHI EUR
119.78 141.55 139.49AI USD- 115.82 114.10AN USD
112.43 133.14 130.87ANG USD- 113.41 113.70B EUR
1,136.87 1,331.94 1,306.85B USD- 116.14 113.93B1 USD
282.67 329.20 322.03C USD- 115.55 113.06C1 USD- 106.87 107.89G EUR- 114.67 110.69G GBP
124.38 147.77 145.98G USD202.63 231.17 223.34H EUR
- - 99.77HG EUR122.68 140.44 135.93HI CHF247.06 284.27 275.78HI EUR
- 113.10 109.70HN EUR121.40 140.90 137.24HS EUR100.21 121.01 121.84I EUR228.37 269.88 265.94I USD175.73 207.59 204.51N USD343.67 408.32 403.42R USD
- 107.81 106.20U1 USDGlobal Equity USD 2,394,802,426 2,842,079,846 2,754,914,487 250.40 278.08 267.63A USD
144.30 164.95 162.56AI EUR- 109.74 106.07AN USD
176.81 225.94 219.69B SEK260.98 290.45 279.53B USD
- 110.59 106.41B1 USD248.82 275.26 264.13C USD
- 110.05 105.59C1 USD118.68 133.78 129.58G USD141.64 153.34 145.24H EUR140.69 151.66 143.63H SEK236.42 254.46 240.27HC EUR163.43 178.34 169.66HI EUR115.44 126.21 120.05HN EUR120.99 133.50 127.62HS EUR123.21 141.34 139.59I EUR211.43 235.31 222.25I GBP199.13 223.54 216.06I USD163.84 183.85 177.67N USD291.21 328.66 318.51R USD188.56 213.74 207.60S USD
- 104.68 101.16U1 USDGlobal Equity Income USD 69,176,690 40,608,215 30,022,163 228.91 225.19 214.49A Gross USD
- 98.81 97.72AN USD100.95 101.98 100.40AQ Gross USD100.99 103.00 101.90AQN Gross USD257.10 259.67 255.67B USD138.17 135.72 131.54H EUR113.81 112.69 109.67HI EUR
- 96.31 93.79HN EUR121.78 124.10 122.73I USD
- 100.52 99.40N USD202.91 207.52 205.60R USD
Emerging Markets Equity USD 4,921,301,384 3,596,925,563 3,300,092,288 674.85 633.73 634.93A USD110.93 102.22 101.17AHI EUR113.77 107.55 108.23AI USD112.20 105.57 105.70AN USD
31.08.2017 31.08.2018 28.02.2019 31.08.2017 31.08.2018 28.02.2019
NET ASSETS NET ASSET VALUE PER SHAREVontobel Fund -

248
Net Asset Value Summary
808.68 762.53 769.62B USD- 95.51 96.41B1 USD
214.77 201.31 202.57C USD- 95.05 95.66C1 USD- 96.69 100.32G EUR
151.90 143.76 142.67G GBP112.65 103.13 102.24H CHF215.24 197.60 196.17H EUR195.73 178.63 176.78HC EUR
- 94.94 94.91HG EUR134.84 124.49 123.96HI CHF139.41 129.09 128.72HI EUR
- 92.43 92.03HN CHF112.27 103.96 103.63HN EUR113.61 106.12 106.47HN GBP135.08 125.81 125.88HS CHF116.22 108.70 108.83HS EUR110.22 107.13 110.97I EUR164.32 154.97 153.51I GBP200.09 190.34 192.96I USD119.86 113.96 115.49N USD239.57 229.08 232.82R USD383.90 368.78 375.65S USD
- 96.44 97.76U1 USDAsia Pacific Equity USD 519,036,356 469,315,752 599,952,212 429.73 443.29 450.43A USD
- 103.89 106.38AN USD493.67 511.51 521.64B USD203.12 209.20 212.71C USD
- - 101.16G USD184.55 186.11 186.75H EUR148.45 150.96 152.10HI EUR
- 101.34 102.12HN EUR183.39 191.67 196.30I USD135.25 141.29 144.68N USD242.81 255.13 261.99R USD
- 104.82 107.88S USDNew Power EUR 245,655,638 194,528,558 192,932,098 136.98 139.27 138.21A EUR
- 98.64 98.29AN EUR137.37 140.49 139.42B EUR124.24 126.30 124.97C EUR153.84 153.07 148.22C USD131.35 133.59 132.26H CHF136.14 140.08 139.68H GBP135.27 141.02 141.86H USD119.52 122.40 121.67HN CHF
- 99.08 99.20HN GBP- 100.04 101.08HN USD
106.37 109.73 109.36I EUR135.02 139.22 138.72N EUR168.15 174.39 174.27R EUR
- 98.85 98.98S EURClean Technology EUR 219,541,947 254,396,736 245,248,555 211.68 215.92 213.35A CHF
292.89 302.85 296.83A EUR- 96.71 95.96AN CHF- 99.11 97.54AN EUR
213.88 218.17 215.58B CHF295.96 306.53 300.45B EUR101.19 104.21 101.84C EUR112.09 115.46 112.87H CHF
96.34 101.67 100.98H USD- 98.46 96.64HN CHF- 100.58 100.44HN USD
319.46 333.76 328.53I EUR- 96.86 96.10N CHF
96.94 101.24 99.63N EUR101.65 103.28 97.32N GBP334.73 351.58 347.00R EUR
Future Resources EUR 67,188,923 74,286,678 56,598,685 129.73 142.15 129.50A CHF181.78 201.28 181.89A EUR
31.08.2017 31.08.2018 28.02.2019 31.08.2017 31.08.2018 28.02.2019
NET ASSETS NET ASSET VALUE PER SHAREVontobel Fund -

249
Net Asset Value Summary
- 99.47 90.26AN EUR129.73 142.15 129.50B CHF181.34 201.75 182.31B EUR171.58 189.75 170.96C EUR117.11 126.72 111.74C USD
92.47 102.31 92.26H CHF- 98.73 89.40HN CHF
195.81 219.75 199.43I EUR100.59 112.84 102.39N EUR205.11 231.41 210.58R EUR
mtx Sustainable AsianLeaders (ex Japan)
USD 180,521,711 547,274,761 544,057,077 346.53 350.13 341.69A USD
- 92.45 89.94AHI EUR- 98.76 96.51AN USD
357.43 361.15 355.26B USD- 98.40 95.49G GBP- 97.80 96.81G USD
337.91 331.18 320.70H EUR362.40 358.00 347.79HI EUR
- 85.68 83.52HI SEK- 95.92 93.24HN EUR
386.08 393.48 388.74I USD- 98.33 97.13N USD- 91.42 90.41NG USD
405.48 415.46 411.54R USDmtx Sustainable EmergingMarkets Leaders
USD 633,780,968 2,505,146,412 3,267,240,262 141.03 140.27 139.43A USD
- - 115.08AG EUR- 92.45 91.37AH EUR- 92.69 90.71AHI EUR- 95.02 96.61AI EUR
115.11 114.92 114.38AI USD- 95.23 92.59AN GBP- 96.57 95.93AN USD
101.46 116.12 117.88B SEK144.45 143.97 144.65B USD
- - 104.91B1 USD105.47 104.54 104.73C USD
- - 104.68C1 USD- 87.79 88.77G USD
105.43 102.41 101.23H EUR105.39 101.68 100.27HC EUR122.31 119.19 118.12HI CHF102.76 100.62 99.88HI EUR
- 92.94 92.17HN CHF- - 101.61HN EUR
106.69 109.61 113.01I EUR152.36 153.17 154.56I USD
- - 111.15N EUR112.58 112.36 110.88N GBP113.27 113.85 114.85N USD157.36 159.05 160.92R USD124.39 126.25 128.00S USD
- - 105.27U1 USDmtx Sustainable GlobalLeaders
USD 153,777,912 101,307,455 78,049,702 141.17 142.51 133.75A USD
- 98.95 92.93AN USD142.20 143.54 137.16B USD134.34 131.14 123.09H CHF136.71 134.07 126.05H EUR114.76 112.88 106.37HI CHF116.86 115.39 108.95HI EUR
- 96.17 90.61HN CHF104.95 103.79 97.95HN EUR106.13 105.85 100.56HN GBP147.60 150.17 144.07I USD108.09 109.94 105.44N USD150.85 154.19 148.26R USD
Commodity USD 481,243,645 527,469,427 594,158,781 57.28 60.62 56.92B USD
31.08.2017 31.08.2018 28.02.2019 31.08.2017 31.08.2018 28.02.2019
NET ASSETS NET ASSET VALUE PER SHAREVontobel Fund -

250
Net Asset Value Summary
94.30 99.21 92.87C USD101.64 107.94 99.62G GBP
- - 104.33G USD48.89 50.04 46.16H CHF37.38 38.50 35.56H EUR
562.11 577.33 532.80H SEK73.03 75.40 69.79HI CHF67.99 70.48 65.32HI EUR
529.24 547.55 508.98HI SEK- 101.06 93.52HN CHF- 101.48 94.11HN EUR
56.77 59.11 54.95HS CHF76.61 81.72 77.02I USD
- 104.14 98.13N USD50.01 53.60 50.64R USD
Dynamic Commodity USD 95,722,178 123,044,628 119,866,743 63.36 65.76 64.67B USD58.92 59.21 57.18H CHF60.00 60.50 58.52H EUR61.27 62.03 60.14HI CHF62.41 63.03 61.19HI EUR
- 95.55 92.65HN CHF- 95.63 92.83HN EUR
65.85 68.80 67.91I USD- 98.37 97.08N USD
75.68 79.46 78.59R USD89.88 95.19 94.38S USD
Non-Food Commodity USD 111,165,786 118,467,936 80,345,546 77.14 77.79 76.46AHI EUR80.67 83.49 83.47AI USD79.03 81.25 80.91B USD74.42 74.20 72.53H CHF75.39 75.48 73.91H EUR75.82 76.06 74.68HI CHF77.21 77.88 76.54HI EUR80.66 83.57 83.53I USD
- 99.00 98.92N USD81.71 84.92 85.02R USD82.72 86.45 86.79S USD
Emerging Markets Debt USD 1,431,456,103 2,757,514,944 3,491,430,025 106.64 95.73 95.67AH EUR106.74 97.04 96.54AHI CHF106.99 97.77 97.35AHI EUR
- 92.20 96.85AHN EUR127.10 119.34 123.67AI EUR107.95 101.25 102.71AI USD
- 89.13 91.85AM USD- 91.88 95.33AQ1 USD- 93.79 99.36AQC1 USD
115.51 105.59 109.56AQG USD108.12 97.47 101.60AS USD125.93 119.93 127.50B USD
- 94.10 99.86B1 USD108.14 102.60 108.87C USD
- 93.79 99.40C1 USD- 98.78 107.71G EUR
118.64 109.56 114.49H CHF121.20 112.34 117.65H EUR106.34 98.26 102.73HC EUR121.16 112.49 117.94HI CHF124.15 115.73 121.42HI EUR
- 93.32 98.50HI GBP- 91.99 96.40HN CHF- 92.20 96.80HN EUR
102.30 95.57 100.45HS CHF107.71 101.05 106.44HS EUR129.10 123.65 131.83I USD128.68 123.21 131.32N USD137.98 132.49 141.42R USD131.22 126.44 135.19S USD
- 96.81 103.07U1 USDGlobal Bond USD 58,009,223 55,029,749 53,556,678 103.56 100.31 100.95HI CHF
31.08.2017 31.08.2018 28.02.2019 31.08.2017 31.08.2018 28.02.2019
NET ASSETS NET ASSET VALUE PER SHAREVontobel Fund -

251
Net Asset Value Summary
104.42 101.64 102.48HI EUR103.37 100.49 101.32HS CHF
99.99 97.73 98.72HS EUR107.17 107.01 109.52I USD
Credit Oppertunities USD 24,797,820 22,010,701 22,408,085 109.96 110.88 112.88X USDGlobal Corporate Bond MidYield
USD 140,887,088 188,316,410 246,544,890 106.42 103.69 103.00A USD
103.61 97.99 95.64AH CHF104.23 99.21 96.97AH EUR105.56 103.15 103.72AHI EUR
- 97.32 95.09AHN CHF- 97.73 98.24AHN EUR- 100.17 102.37AN EUR
107.21 106.99 108.97B USD106.52 105.78 107.48C USD111.99 112.75 115.34G USD105.10 102.20 102.58H EUR104.49 101.22 101.33HC EUR
- 100.95 101.55HG CHF108.91 106.90 107.79HG EUR105.09 102.35 102.81HI CHF105.64 103.33 103.94HI EUR
- 97.16 97.70HN EUR108.01 108.43 110.76I USD
- 100.17 102.37N EUR106.12 106.71 109.14R USD
Emerging Markets Blend USD 20,724,034 64,181,954 127,737,590 - - 106.90A USD- - 105.43HI CHF- - 105.60HI EUR- - 106.40HS CHF- - 147.26I USD- - 106.80R USD
- - 105.78AQ1 USD- - 105.62AQC1 USD- - 106.43AQN USD- 95.54 103.98B USD- - 105.79B1 USD- - 105.67C1 USD- - 105.43HI CHF- 94.38 101.50HI EUR
136.96 138.76 151.46I USD- 95.83 104.57N USD
101.11 102.68 112.21R USD- - 106.11U1 USD
TwentyFour Absolute ReturnCredit Fund
GBP 788,814,328 1,447,463,829 1,627,567,764 104.66 99.40 95.24AH CHF
105.28 100.54 96.47AH EUR109.71 107.10 100.83AH USD101.71 99.56 95.42AHI EUR
- 98.81 95.64AHN CHF- 99.57 95.90AHN EUR
104.53 99.56 95.43AI GBP105.09 103.08 102.17AQG GBP101.94 98.63 97.24AQHG EUR
- 101.07 101.90AQHG USD104.25 101.00 99.73AQHN EUR103.65 102.89 102.82AQHNG USD109.37 108.14 107.63AQN GBP104.70 102.72 102.04AQNG GBP
98.63 - -C EUR110.43 111.09 111.71G GBP103.07 101.85 101.40H EUR
- 98.66 98.01HC EUR- - 101.12HG EUR
101.54 100.32 99.86HI CHF107.51 106.75 106.54HI EUR
- 98.96 98.76HN EUR
31.08.2017 31.08.2018 28.02.2019 31.08.2017 31.08.2018 28.02.2019
NET ASSETS NET ASSET VALUE PER SHAREVontobel Fund -
Emerging Markets CorporateBond
USD 44,663,083 151,511,891 243,704,877
140.02 135.92

252
Net Asset Value Summary
- 101.03 102.31HN USD110.30 110.80 111.34I GBP110.23 110.69 111.20N GBP110.30 110.92 111.51R GBP
TwentyFour Strategic IncomeFund
GBP 483,278,480 1,524,977,121 1,520,072,406 109.23 103.93 99.25AH CHF
109.97 105.29 100.68AH EUR114.11 111.75 106.08AH USD106.26 101.67 96.87AHI EUR
- 99.14 94.87AHN CHF- 98.62 95.22AHN EUR
102.53 98.51 96.51AMH EUR- 97.68 96.18AQ GBP
103.98 100.55 99.08AQG GBP- 96.75 94.66AQH Gross EUR- 97.22 94.91AQH Gross HKD- 97.00 95.07AQH Gross SGD- 97.99 96.46AQH Gross USD- 100.52 97.38AQH1 USD- 100.57 95.67AQHC1 USD- 99.15 96.81AQHG EUR- 99.85 98.99AQHG USD
107.16 104.55 103.73AQHI USD102.42 97.66 95.46AQHN EUR102.26 97.67 95.61AQHNG EUR107.00 104.45 103.69AQHNG USD104.57 101.05 99.37AQN GBP
- 100.65 96.03AQNG GBP98.88 - -C EUR
111.73 112.91 113.39G GBP104.70 103.71 103.05H EUR
- 99.36 100.23H HKD- 99.22 99.76H SGD- 100.99 101.83H USD- 100.47 101.01H1 USD- 98.08 97.31HC EUR- 100.52 101.05HC1 USD- 99.03 98.80HG EUR- 100.93 102.24HG USD
108.50 107.91 107.39HI CHF109.52 109.25 108.91HI EUR
- 99.89 100.26HI NOK112.40 114.79 116.18HI USD
- 98.58 98.27HN EUR- 99.85 101.02HN USD
109.70 109.59 109.37HNG EUR- 101.76 103.03HNG USD
99.88 99.74 99.42HR CHF111.32 112.32 112.72I GBP111.29 112.27 112.64N GBP111.62 112.77 113.23NG GBP111.97 113.35 113.92R GBP
- - 100.86UAQH1 USD- 100.25 101.27UH1 USD
LCR Global Bond EUR 64,071,127 37,789,165 37,094,711 98.18 94.00 92.27AG EUR98.18 - -G EUR98.07 95.92 96.69I EUR
Multi Asset Solution EUR 61,909,254 80,271,135 73,286,618 102.32 101.20 101.31B EUR101.90 100.28 100.16C EUR101.77 101.27 101.58I EUR
- 98.78 99.17N EURMulti Asset Income EUR 21,700,225 42,557,998 44,442,331 - 85.80 84.08A EUR
- 100.11 100.35A Gross EUR- 100.11 100.35AQ Gross EUR- 88.18 88.28B EUR- 87.11 87.07C EUR- 85.92 85.83H CHF- 91.79 93.16H USD
31.08.2017 31.08.2018 28.02.2019 31.08.2017 31.08.2018 28.02.2019
NET ASSETS NET ASSET VALUE PER SHAREVontobel Fund -

253
Net Asset Value Summary
105.30 105.85 106.33I EUR- 97.57 97.99N EUR
104.46 105.35 106.01R EURTwentyFour MonumentEuropean Asset BackedSecurities
EUR 58,659,627 338,017,089 255,984,804 - - 99.01A EUR
- - 98.87AH CHF- - 99.32AH GBP- - 99.91AH USD
100.35 101.10 100.04HI CHF100.77 104.38 104.95HI USD
- - 99.02HN CHF- - 99.45HN GBP- - 100.05HN USD
100.15 101.17 100.21HR CHF100.45 101.84 101.03I EUR
- - 99.20N EUR100.47 102.06 101.36R EUR
Multi Asset Defensive EUR - 185,381,212 184,454,533 - 98.17 97.67B EUR- 137.26 136.42C EUR- 98.53 98.30E EUR- 89.42 88.76H CHF- 96.16 97.01H USD- 98.56 98.06HI CHF- 98.29 99.35HI USD- 98.43 98.10I EUR- 96.65 96.39N EUR- 98.40 98.10R EUR
Multi Asset Alphabet EUR - - 19,564,651 - - 97.12B EUR- - 96.89H CHF- - 98.25H USD- - 97.74HN GBP- - 97.20HR CHF- - 97.28I EUR
Vescore Artificial IntelligenceMulti Asset
EUR - - 14,830,072 - - 103.61A EUR
- - 103.61B EUR- - 103.45C EUR- - 103.61HI CHF- - 104.09HI GBP- - 103.75I EUR- - 103.82N EUR- - 103.82R EUR
Vescore Global Equity MultiFactor
USD - - 45,338,327 - - 106.26A USD
- - 106.26B USD- - 106.34I USD- - 106.34N USD- - 106.34R USD- - 106.42S USD
Alternative Risk Premia USD - - 8,988,555 - - 101.90E USD- - 101.08HI CHF- - 101.10HI EUR- - 101.88I USD- - 101.86N USD- - 101.87R USD
31.08.2017 31.08.2018 28.02.2019 31.08.2017 31.08.2018 28.02.2019
NET ASSETS NET ASSET VALUE PER SHAREVontobel Fund -

Notes to the Financial Statements
254
1 General information
The Vontobel Fund (hereinafter referred to as the “Fund”) is an open-ended investment company with variable
capital under Luxembourg law, incorporated on October 4, 1991 for an indefinite duration as a “Société
d'Investissement à Capital Variable” (“SICAV”) in accordance with the provisions of Part I of the amended
Luxembourg Law of December 17, 2010 on Undertakings for Collective Investment. The Fund's financial year
ends on August 31.
The legal basis for the Fund is laid down by the Articles of Association of the Fund. The Fund's Articles of
Association were published for the first time on November 18, 1991 in the Luxembourg Official Gazette
(“Mémorial C, Recueil des Sociétés et Associations - Mémorial”) and last amended on April 30, 2016. They are
filed with the Trade and Companies Register of the District Court of Luxembourg where they may be consulted
and copies thereof may be obtained.
The Fund is registered in the Trade and Companies Register of the District Court of Luxembourg with registration
number B38170.
The Fund is composed of several sub-funds (“Sub-Funds”), each of which represents a specific portfolio of
assets and liabilities and is managed in accordance with its own specific investment objectives.
The Articles of Association permit the Fund's board of directors (“Board of Directors”) at any time to issue
various share classes (“Share Classes”) within a Sub-Fund, the assets of these Share Classes being managed
jointly. The Share Classes may, however, differ in their specific characteristics, e.g. with respect to their investor
profile, fee structure, minimum investment amount, taxation and their distribution policy.
As of February 28, 2019, the Fund has the following Sub-Funds and Share Classes available:
Vontobel Fund - Currency Distributing Share Classes Accumulating Share Classes
Swiss Money CHF A B, I, N, R
Euro Short Term Bond EUR A, AN, B, C, I, N, NG, R, S
US Dollar Money USD A, AN B, I, N, R
Swiss Franc Bond CHF A, AI, AN, AQG B, C, G, I, N, R
Euro Bond EUR A, AM (USD), AN B, C, I, N, R, S
EUR Corporate Bond Mid Yield EUR A, AI, AN, AQG B, C, G, H (CHF), HI (CHF), HI (USD), HN (CHF), HN (GBP),
I, N, R, S
High Yield Bond EUR AI, AMH (AUD), AMH (USD),
AMH (ZAR), AMHN (USD), AS
B, C, H (CHF), H (USD), HC (USD), HI (CHF), HI (USD), HN
(CHF), HN (USD), I, N, R, S
Bond Global Aggregate EUR A, AH (USD), AHN (USD), AI,
AN, AQH1 (USD), AQHC1
(USD), AS
B, C, H (CHF), H (USD), H1 (USD), HC1 (USD), HI (USD),
HN (CHF), HN (USD), I, N, R, S
Eastern European Bond EUR A, AM, AM (USD), AN B, C, I, N, R
Value Bond CHF A, AN B, I, N, R, S
Absolute Return Bond (EUR) EUR A, AM (USD), AN B, C, H (USD), HI (USD), HN (USD), I, N, R, S
Absolute Return Bond Dynamic EUR A, AI, AN B, C, H (CHF), H (USD), HI (CHF), HI (USD), HN (CHF), HN
(USD), I, N, R
Global Convertible Bond EUR A, AN, AS (USD) B, C, H (CHF), H (USD), HI (CHF), HI (USD), HN (CHF), HN
(USD), I, N, R
Sustainable Emerging Markets
Local Currency Bond
USD A, AM, AMH (AUD), AMH
(ZAR), AN
B, B (CHF), B (EUR), C, H (CHF), H (EUR), HI (CHF), HI
(EUR), HN (CHF), HN (EUR), I, N, R
Swiss Mid and Small Cap Equity CHF A, AN B, C, I, N, R, S
European Mid and Small Cap
Equity
EUR A, AN B, C, I, N, R
Japanese Equity JPY A, AN B, I, N, R
mtx China Leaders USD A, AN B, C, G, I, N, N (GBP), R
European Equity EUR A, AN B, C, G, HI (USD), I, N, R, S
US Equity USD A, AHI (EUR), AI, AN, ANG B, B (EUR), B1, C, C1, G, G (EUR), G (GBP), H (EUR), HG
(EUR), HI (CHF), HI (EUR), HN (EUR), HS (EUR), I, I (EUR),
N, R, U1
Global Equity USD A, AI (EUR), AN B, B (SEK), B1, C, C1, G, H (EUR), H (SEK), HC (EUR), HI
(EUR), HN (EUR), HS (EUR), I, I (EUR), I (GBP), N, R, S, U1
Global Equity Income USD A Gross, AN, AQ Gross, AQN
Gross
B, H (EUR), HI (EUR), HN (EUR), I, N, R

Notes to the Financial Statements
255
1 General information (continued)
Vontobel Fund - Currency Distributing Share Classes Accumulating Share Classes
Emerging Markets Equity USD A, AHI (EUR), AI, AN B, B1, C, C1, G (GBP), G (EUR), H (CHF), H (EUR), HC
(EUR), HG (EUR), HI (CHF), HI (EUR), HN (CHF), HN
(EUR), HN (GBP), HS (CHF), HS (EUR), I, I (EUR), I (GBP),
N, R, S, U1
Asia Pacific Equity USD A, AN B, C, G, H (EUR), HI (EUR), HN (EUR), I, N, R, S
New Power EUR A, AN B, C, C (USD), H (CHF), H (GBP), H (USD),
HN (CHF), HN (GBP), HN (USD), I, N, R, S
Clean Technology EUR A, A (CHF), AN, AN (CHF) B, B (CHF), C, H (CHF), H (USD), HN (CHF), HN (USD), I,
N, N (CHF), N (GBP), R
Future Resources EUR A, A (CHF), AN B, B (CHF), C, C (USD), H (CHF), HN (CHF), I, N, R
mtx Sustainable Asian Leaders
(ex Japan)
USD A, AHI (EUR), AN B, G, G (GBP), H (EUR), HI (EUR), HI (SEK), HN (EUR), I,
N, NG, R
mtx Sustainable Emerging Markets
Leaders
USD A, AH (EUR), AHI (EUR), AG, AI,
AI (EUR), AN, AN (GBP)
B, B (SEK), B1, C, C1, G, H (EUR), HC (EUR), HI (CHF), HI
(EUR), HN (CHF), HN (EUR), I, I (EUR), N (EUR), N (GBP),
N, R, S, U1
mtx Sustainable Global Leaders USD A, AN B, H (CHF), H (EUR), HI (CHF), HI (EUR), HN (CHF), HN
(EUR), HN (GBP), I, N, R
Commodity USD - B, C, G, G (GBP), H (CHF), H (EUR), H (SEK), HI (CHF),
HI (EUR), HI (SEK), HN (CHF), HN (EUR), HS (CHF), I, N, R
Dynamic Commodity USD - B, H (CHF), H (EUR), HI (CHF), HI (EUR), HN (CHF), HN
(EUR), I, N, R, S
Non-Food Commodity USD AHI (EUR), AI B, H (CHF), H (EUR), HI (CHF), HI (EUR), I, N, R, S
Emerging Markets Debt USD AH (EUR), AHI (CHF), AHI
(EUR), AHN (EUR), AI, AI (EUR),
AM, AQ1, AQC1, AQG, AS
B, B1, C, C1, G (EUR), H (CHF), H (EUR), HC (EUR), HI
(CHF), HI (EUR), HI (GBP), HN (CHF), HN (EUR), HS
(CHF), HS (EUR), I, N, R, S, U1
Global Bond USD - HI (CHF), HI (EUR), HS (CHF), HS (EUR), I
Credit Opportunities USD - X
Global Corporate Bond Mid Yield USD A, AH (CHF), AH (EUR), AHI
(EUR), AHN (CHF), AHN (EUR),
AN
B, C, G, H (EUR), HC (EUR), HG (CHF), HG (EUR), HI
(CHF), HI (EUR), HN (EUR), I, N, R
Emerging Markets Blend USD A HI (CHF), HI (EUR), HS (CHF), I, R
Emerging Markets Corporate Bond USD AQ1, AQC1, AQN B, B1, C1, HI (CHF), HI (EUR), I, N, R, U1
TwentyFour Absolute Return Credit
Fund
GBP AH (CHF), AH (EUR), AH (USD),
AHI (EUR), AHN (CHF), AHN
(EUR), AI, AQG, AQHG (EUR),
AQHG (USD), AQHN (EUR),
AQHNG (USD), AQN, AQNG
G, H (EUR), HC (EUR), HG, HI (CHF), HI (EUR), HN (EUR),
HN (USD), I, N, R
TwentyFour Strategic Income Fund GBP AH (CHF), AH (EUR), AH (USD),
AHI (EUR), AHN (CHF), AHN
(EUR), AMH (EUR), AQ, AQG,
AQH Gross (EUR), AQH Gross
(HKD), AQH Gross (SGD), AQH
Gross (USD), AQH1 (USD),
AQHC1 (USD), AQHG
(EUR),AQHG (USD), AQHI
(USD), AQHN (EUR), AQHNG
(EUR), AQHNG (USD), AQN,
AQNG, UAQH1
G, H (EUR), H (HKD), H (SGD), H (USD), H1 (USD), HC
(EUR), HC1 (USD), HG (EUR), HG (USD), HI (CHF), HI
(EUR), HI (NOK), HI (USD), HN (EUR), HN (USD), HNG
(EUR), HNG (USD), HR (CHF), I, N, NG, R, UH1 (USD)
LCR Global Bond EUR AG I
Multi Asset Solution EUR - B, C, I, N
Multi Asset Income EUR A, A Gross, AQ Gross B, C, H (CHF), H (USD), I, N, R
TwentyFour Monument European
Asset Backed Securities
EUR A, AH (CHF), AH (GBP), AH
(USD)
HI (CHF), HI (USD), HN (CHF), HN (GBP), HN (USD), HR
(CHF), I, N, R
Multi Asset Defensive EUR - B, C, E, H (CHF), H (USD), HI (CHF), HI (USD), I, N, R
Multi Asset Alphabet EUR - B, H (CHF), H (USD), HN (GBP), HR (CHF), I
Vescore Artificial Intelligence Multi
Asset
EUR A B, C, HI (CHF), HI (GBP), I, N, R
Vescore Global Equity Multi Factor USD A B, I, N, R, S
Alternative Risk Premia USD - E, HI (CHF), HI (EUR), I, N, R
Notes to the Financial Statements
256
1 General information (continued)
The Board of Directors may at any time decide to issue the Share Classes listed below for any given Sub-Fund.
Share Classes may be issued in the reference currency of the Sub-Fund, but also in alternative currencies. If the
alternative currency is hedged against currency fluctuations against the reference currency of the Sub-Fund, this
is indicated in the name of the Share Class by the addition of the letter “H” and the suffix “(hedged)”. The Net
Asset Value and, accordingly, the performance of the hedged shares may differ from the Net Asset Value of the
shares in the reference currency. In accordance with the provisions below, certain Share Classes are reserved for
specific investors. Not all Share Classes are available in all distribution countries:
a) Distributing Share Classes:
− A shares can be subscribed to by all investors and pay distributions on an annual basis.
− AM shares can be subscribed to by all investors and pay distributions on a monthly basis.
− AQ shares can be subscribed to by all investors and pay distributions on a quarterly basis.
− AS shares can be subscribed to by all investors and pay distributions on a semi-annual basis.
The Board of Directors may decide on the distribution amounts at its sole discretion.
The Board of Directors may decide to launch gross distributing Share Classes that can pay distributions on a
gross basis before fees and expenses. To achieve this, some or all of its fees and expenses may be paid out of
capital; this results in an increase in the distributable income for the payment of dividends to these Share
Classes. This may lead to a distribution of the income and, furthermore, to distribution of both realised and
unrealised capital gains, if applicable, as well as capital attributable to these shares within the limits of
Luxembourg law. The distribution of capital represents a withdrawal of a portion of the investor's original
investment. Over time, such distributions may lead to a reduction in the Net Asset Value per share and the Net
Asset Value per share may fluctuate more sharply than in the case of other Share Classes. These gross
distributing Share Classes are indicated with the addition of the suffix “gross” in the name of the Share Class
entitled to distributions.
The use of income and in particular of the definitive distribution amount to be paid out is decided for each Share
Class by the General Meeting of the Shareholders of the Fund, which may override the distribution provisions
contained in the prospectus.
The Board of Directors may decide at any time to launch distributing classes with characteristics of the
accumulating Share Classes outlined below (e.g. “AQG” Share Classes). These Share Classes pay distributions,
but otherwise have the same characteristics as accumulating Share Classes.
b) Non-distributing Share Classes (accumulating Share Classes):
− B shares can be subscribed to by all investors and are accumulating (no distributions).
− C shares can be subscribed to by all investors and are accumulating (no distributions). They are only
available from specific distributors.
− E shares are exclusively reserved for institutional investors as defined by article 174(2)(c) of the Law of
2010 and are accumulating (no distributions). The Board of Directors may decide at any time to close the
E Share Class to subscription by additional investors if it reaches a certain subscription volume. The
Board of Directors reserves the right to set a different management fee for each Share Class of each
Sub-Fund.

Notes to the Financial Statements
257
1 General information (continued)
− F shares are exclusively reserved for institutional investors as defined in article 174(2)(c) of the Law of
2010 who either invest and hold at least 20 million in the currency of the respective Share Class, or who
have concluded a corresponding agreement with a company in the Vontobel Group. F shares are
accumulating (no distributions) and are only issued by Sub-Funds for which a performance fee is set in
the Special Part of the Sub-Fund description; the management fee charged for F shares is higher than
that of other Share Classes for institutional investors, but no performance fee is calculated or charged for
these shares.
− G shares are exclusively reserved for institutional investors as defined in article 174 (2) (c) of the Law of
2010 who invest and hold at least 50 million in the currency of the Share Class. An investor is entitled to
hold G shares even if the value of their investment falls below the aforementioned minimum investment
amount due to market movements. G shares are accumulating (no distributions).
− H (hedged) shares can be subscribed to by all investors, are accumulating (no distributions) and are
issued in a currency other than the reference currency of the respective Sub-Fund. The subscription
currency is always hedged against the reference currency of the respective Sub-Fund. However, this
hedging may not be comprehensive.
− I shares can only be subscribed to by institutional investors within the meaning of Art. 174(2)(c) of the
Law of 2010 and are accumulating (no distributions).
− N shares can only be subscribed to by the following investors:
− investors who are prohibited under the applicable laws and rules from accepting and retaining
inducements from third parties, such as in Great Britain and the Netherlands, and
− investors who have separate fee agreements with their customers for the provision of discretionary
asset management services or independent advisory services or who, in cases where they have
agreed not to accept and retain inducements from third parties, have a separate fee agreement with
their customers for the provision of non-independent advice.
The shares are accumulating (no distributions);
− R shares are reserved exclusively for investors that are entitled, in accordance with the employee
regulations of a Vontobel Group company, to hold such shares in their account/custody account at Bank
Vontobel AG, Zurich, at employee conditions, or who have concluded a special agreement with a
company in the Vontobel Group. It is therefore possible that these shares may be subscribed to and held
by persons who have access to material non-public information that relates to the relevant Sub-Fund. In
order to prevent conflicts of interest, the Vontobel Group and its affiliates have issued corresponding
instructions, compliance with which is constantly monitored.
− S shares are exclusively reserved for institutional investors as defined in article 174(2)(c) of the Law of
2010 that have concluded a corresponding agreement with a company in the Vontobel Group. S shares
are accumulating (no distributions). No management or performance fees are charged on S shares.
− U shares can be subscribed to by all investors and are accumulating (no distributions). Provisions for the
issuing of fractional shares do not apply to U shares. The conversion of shares in Share Class U into
shares of other Share Classes in the Fund is not permitted.
− V shares are exclusively reserved for institutional investors within the meaning of Art. 174 (2) c) of the
Law of 2010, who are a company in the Vontobel Group. V shares are accumulating (no distributions) and
do not grant any discounts or retrocession fees to investors.
− X shares can only be subscribed to by institutional investors within the meaning of Art. 174(2)(c) of the
Law of 2010 who invest a minimum of 50 million in the Share Class currency at initial subscription and
have concluded a corresponding agreement with a company in the Vontobel Group. X shares are
accumulating (no distributions).
The Board of Directors may decide at any time to issue Share Classes with a combination of Share Class
characteristics.

Notes to the Financial Statements
258
1 General information (continued)
The names of the aforementioned Share Classes or combinations thereof may also include the numbers “1” to
“10”. These shares may only be subscribed to by distributors based in specific countries or operating in these
countries and acting on behalf of their own clients (who can be any kind of investor), insofar as they meet the
general conditions for the respective Share Classes.
In several of the above-mentioned Share Classes there are minimum investment and minimum holding amounts
for the purchase and holding of shares. In individual cases, the Board of Directors may, at its discretion, reduce
the above-mentioned minimum investment and/or minimum holding amounts whilst taking into account the
principle of equal treatment of the investors.
If an investor who holds a Share Class, the holding of which depends on the existence of certain prerequisites,
does not meet or no longer meets one or more of these prerequisites, the Fund shall be entitled to buy back the
shares concerned in accordance with the redemption provisions specified in the prospectus. The shareholder will
then be informed of this measure. Alternatively, the Board of Directors may offer to convert the shares of the
shareholder concerned into another class for which they meet all prerequisites.
Different Share Classes may be issued within a single Sub-Fund.
A Share Class does not contain a separate portfolio of investments. A Share Class of shares is therefore also
exposed to the liability risk of commitments that were specifically entered into for a different Share Class of the
same Sub-Fund, for instance as a result of currency hedging in the case of the issue of currency-hedged Share
Classes. The lack of separation may result in negative effects on the Net Asset Value of the non currency-hedged
Share Classes (so-called infection risk). A list of Share Classes exposed to an infection risk of this kind is
continually updated and can be obtained on request from the management company's registered office.
2 Accounting principles
a) Financial statements
The financial statements have been drawn up in accordance with Luxembourg legal provisions relating to
investment funds.
The financial statements are drawn up on the basis of the Net Asset Value calculated on February 28, 2019.
b) Valuation of the assets
i. The value of any cash on hand or on deposit, bills, demand notes, accounts receivable, pre-paid income
and expenses, cash dividends and interest declared or accrued but not yet received shall be deemed to
be the full amount, unless there is any possibility of this amount not being paid or received in full, in which
case the value shall be obtained after deducting an amount deemed appropriate by the Fund to reflect
the true value of the assets.
ii. The value of all securities and/or derivatives listed or traded on the stock exchange based on the last
known price on the day preceding the valuation day. Exceptions to this are securities and/or derivatives
listed in the Special Part of the prospectus for each Sub-Fund invested in Asia and the Far East in
accordance with the investment policy and the value of which is measured according to the last known
price at the time of valuation on the valuation date.
iii. The value of the securities and/or derivatives traded on other regulated markets is calculated based on
the last price on the day preceding the valuation day.
iv. If any securities and/or derivative financial instruments in the Fund's portfolio on the relevant valuation
day are not listed or traded on an exchange or another regulated market, or if the price calculated in
accordance with sections ii. and iii. is not representative of the fair value of the securities and/or
derivative financial instruments listed or traded on an exchange or another regulated market, the value of
these securities and/or derivative financial instruments shall be estimated with due care and in good faith
based on a selling price that is to be assumed according to rational criteria.
Notes to the Financial Statements
259
2 Accounting principles (continued)
v. In the case of fixed interest and/or floating-rate money market paper and securities with a residual
maturity of less than three months, the valuation price, based on the net acquisition price, shall be
progressively adjusted to the redemption price while keeping the resulting investment return constant.
The valuation price calculated in this way may therefore differ from the actual market price. In the event of
significant changes in market conditions, the valuation principles for the individual investments will be
adjusted in line with the new market returns.
vi. The value of the units or shares in other UCITS/UCIs is based on the last available net asset value.
vii. If the aforementioned valuation methods are inappropriate or misleading, the Board of Directors may
adjust the value of the investments or permit the use of another method of valuing the Fund's assets. If
extraordinary circumstances make a valuation in accordance with the aforementioned valuation criteria
appear impossible or improper, or if it is in the interests of the Fund or a Sub-Fund and/or the
shareholder (e.g. to avoid market timing), the Board of Directors is authorised to temporarily and in good
faith use other generally accepted and auditable valuation methods in relation to the assets of the Fund
or of a Sub-Fund on a uniform basis in order to achieve a proper valuation of the Fund or the relevant
Sub-Fund.
c) Net realised gain/loss on the sale of securities
Realised net profits and net losses from the sale of securities are calculated on the basis of average costs.
Realised profits and losses are reported in the statement of net income under “Net realised
gain/loss on investments”.
d) Income
Dividends are recognised as income in the statement of net income on the day on which the security is first listed
as ex-dividend, provided this information is available to the Fund. Accrued interest is allocated on a daily basis.
Coupons received from the issuers of the underlying securities are included in the position “Net interest on
bonds”. Interest receivable for the Fund is booked to “Interest and dividends receivable”.
e) Net realised gain/loss on futures
Futures are recorded off-balance sheet and valued on the basis of the last available price. Realised net profits and
net losses from the sale of futures are calculated according to the FIFO-principle. Net profits and net losses are
reported net in the statement of net income under “Net realised gains/losses on futures”.
Changes in unrealised gains and losses are reported in the statement of net income under “Change in unrealised
gain/loss on futures”.
f) Net realised gain/loss on forward foreign exchange contracts
Forward foreign exchange contracts are recorded off-balance sheet and valued on the basis of the forward
foreign exchange rates on the valuation date. Realised net profits and net losses are reported in the statement of
net income under “Net realised gain/loss on forward foreign exchange contracts”.
Changes in unrealised gains and losses are reported in the statement of net income under “Change in unrealised
gain/loss on forward foreign exchange contracts”.
g) Net realised gain and loss on options
Options are recorded off-balance sheet and valued on the basis of the last available price. Realised net profits
and net losses are reported in the statement of net income under “Net realised gain/loss on options”.
Changes in unrealised gains and losses are reported in the statement of net income under “Change in unrealised
gain/loss on options”.

Notes to the Financial Statements
260
2 Accounting principles (continued)
h) Valuation of Swaps
The value of the traded swaps is calculated by RBC Investor Services Bank S.A. on the basis of the net asset
value of all monetary flows, both inflows and outflows. This valuation method is used with the Fund's consent. If
extraordinary circumstances render a valuation in accordance with the aforementioned method impracticable or
inadequate, the Fund is authorised to use other generally accepted and auditable valuation methods in good faith
in order to achieve an appropriate valuation of the net assets.
Profits and losses are reported in the statement of net income under “Net realised gain/loss on swaps”. Interest
is recognised as income or expenses and recorded in the statement of net income under “Interest on swaps”.
Changes in unrealised profits and losses are reported in the statement of net income under “Change in
unrealised gain/loss on swaps”.
The outstanding swaps are shown in Note 9.
i) Valuation of contracts for difference
Contracts for difference are agreements between Sub-Funds and third parties which allow the Sub-Fund to
benefit from price movements of shares, commodities, indices, interest rate products or currencies without the
need to own them directly. Upon entering into such contracts, the Sub-Funds are required to deposit with a
broker a one-off cash margin equal to a certain percentage of the contract amount. Variation margin payments
are made or received by the Sub-Fund depending on the movement in the value of the underlying. Contracts for
difference are valued as the difference between the market price of the underlying on the valuation day and the
contract price. The changes in contract values are recorded as unrealised profits or losses and the Sub-Funds
recognise a realised profit or loss when the contract is closed.
Unrealised gains and losses are reported in the statement of net assets under “Unrealised gain/loss on contracts
for difference”.
Realised gains and losses are reported in the statement of net income under “Net realised gain/loss on contracts
for difference”.
Changes in unrealised profits and losses are reported in the statement of net income under “Change in
unrealised gain/loss on contracts for difference”. Interest is recognised as income or expenses and recorded in
the statement of net income under “Interest on contracts for difference”.
The outstanding contracts for difference are shown in Note 9.
j) Combined financial statements
The reference currencies of the Sub-Funds are converted into Swiss francs to produce combined financial
statements that comply with provisions under Luxembourg Law.
Assets and liabilities denominated in foreign currencies are converted into the reference currency using the
exchange rate applicable as at the balance sheet date.
k) Conversion of items in foreign currencies
Cash at banks, other net assets, as well as the valuation of securities in the portfolio that are expressed in
currencies other than the reference currency of the different Sub-Funds, are converted at the last known
exchange rate on the valuation day. Income and expenses expressed in currencies other than the reference
currency of the different Sub-Funds are converted at the exchange rate on the payment day. Realised profits and
losses on currency exchanges are reported in the statement of net income under “Net realised gain/loss on
currency exchange”.
The acquisition cost of securities expressed in currencies other than the reference currency of the different Sub-
Funds will be converted at the exchange rate of the acquisition date.

Notes to the Financial Statements
261
2 Accounting principles (continued)
l) Formation expenses
The formation expenses for the Fund have been allocated to the individual Sub-Funds in proportion to their initial
subscription amounts and were written off in full over a period of five years.
m) Taxation
With the exception of the “taxe d'abonnement” (subscription tax) listed under Note 4, the Fund is not subject to
any Luxembourg taxes. However, in accordance with the applicable foreign legislation, the Fund may be subject
to capital gains taxes and withholding tax on interest and dividend income at differing rates. For the purpose of
disclosure, non-refundable withholding taxes are deducted from the gross dividends/interest amounts. Capital
gains taxes are deducted from sales proceeds as a reduction in realised profits.
n) Swinging single pricing
In order to offset the costs (in particular taxes, fees, spreads or other transactions costs) incurred by the Sub-
Fund’s assets as a result of share subscriptions and redemptions, the Board of Directors may raise or lower the
net asset value per share for each valuation day. The adjustment of the net asset value depends on whether there
is a net asset inflow or outflow that exceeds a defined threshold for each valuation day. The maximum
adjustment is 1% of the net asset value of the Sub-Fund concerned in each case. The effects of swinging single
pricing are detailed under “Other assets” in the statement of net assets.
3 Management fee and performance fee
a) Management fee
The Fund pays a service charge, described as a “management fee”, which covers all costs in respect of the range
of possible services in connection with investment management and distribution and which is payable at the end
of each month. The management fee is divided between the investment managers, the sub-investment managers
and the relevant distributors. This management fee is calculated on the basis of the average daily net asset value
of the relevant Sub-Fund during the relevant month. The applicable rate for the management fee is confirmed by
the Board of Directors and set out in Appendix 1 of the prospectus for the individual Sub-Funds.
The applicable effective rates per annum and per share class as at February 28, 2019 are as follows:
Vontobel Fund -
A, A Gross, AH (hedged), AQ, AQ Gross, B,
H (hedged)
AM, AMH (hedged)
AS, B1 AQ1, C, HC
(hedged)
AG, ANG, AQG, AQHG
(hedged), AQNG, AQHNG
(hedged), G, HG
(hedged), HNG
(hedged), NG
AI, AHI (hedged),
AQHI (hedged),
HI (hedged), I
AHN (hedged),
AMHN (hedged), AN, AQN,
AQN Gross, AQHN
(hedged), HN
(hedged), N
Swiss Money 0.150% - - - - 0.100% 0.100%
Euro Short Term Bond 0.300% - - 0.700% 0.070% 0.150% 0.150%
US Dollar Money 0.300% - - - - 0.150% 0.150%
Swiss Franc Bond 0.650% - - 1.050% 0.220% 0.325% 0.325%
Euro Bond 0.850% 1.250% - 1.250% - 0.325% 0.325%
EUR Corporate Bond Mid Yield 1.100% - - 1.500% 0.400% 0.550% 0.550% High Yield Bond 1.100% 1.500% 1.500% 1.500% - 0.550% 0.550% Bond Global Aggregate 0.800% - 1.200% 1.200% - 0.400% 0.400%
Eastern European Bond 1.100% 1.500% - 1.500% - 0.550% 0.550%
Value Bond 0.340% - - - - 0.220% 0.220%
Absolute Return Bond (EUR) 0.850% 1.250% - 1.250% - 0.425% 0.425%
Absolute Return Bond Dynamic 0.850% - - 1.250% - 0.425% 0.425% Global Convertible Bond 1.100% - 1.500% 1.500% - 0.550% 0.550%

Notes to the Financial Statements
262
3 Management fee and performance fee (continued)
Vontobel Fund -
A, A Gross, AH
(hedged), AQ, AQ
Gross, B, H (hedged)
AM, AMH (hedged)
AS, B1 AQ1, C, HC
(hedged)
AG, ANG, AQG, AQHG
(hedged), AQNG, AQHNG
(hedged), G, HG
(hedged), HNG
(hedged), NG
AI, AHI (hedged),
AQHI (hedged),
HI (hedged), I
AHN (hedged),
AMHN (hedged), AN, AQN,
AQN Gross, AQHN
(hedged), HN
(hedged), N
Sustainable Emerging Markets Local Currency Bond 1.200% 1.600% - 1.600% - 0.600% 0.600%
Swiss Mid and Small Cap Equity 1.650% - - 2.250% - 0.825% 0.825%
European Mid and Small Cap Equity 1.650% - - 2.250% - 0.825% 0.825%
Japanese Equity 1.250% - - - - 0.625% 0.625%
mtx China Leaders 1.750% - - 2.350% 0.650% 0.875% 0.875%
European Equity 1.650% - - 2.250% 0.550% 0.825% 0.825% US Equity 1.650% - 1.700% 2.250% 0.550% 0.825% 0.825%
Global Equity 1.650% - 1.700% 2.250% 0.650% 0.825% 0.825%
Global Equity Income 1.500% - - - - 0.750% 0.750%
Emerging Markets Equity 1.650% - 1.700% 2.250% 0.650% 0.825% 0.825%
Asia Pacific Equity 1.650% - - 2.250% 0.650% 0.825% 0.825%
New Power 1.650% - - 2.250% - 0.825% 0.825% Clean Technology 1.650% - - 2.250% - 0.825% 0.825%
Future Resources 1.650% - - 2.250% - 0.825% 0.825% mtx Sustainable Asian Leaders (ex Japan) 1.650% - - - 0.650% 0.825% 0.825%
mtx Sustainable Emerging Markets Leaders 1.650% - 1.700% 2.250% 0.650% 0.825% 0.825%
mtx Sustainable Global Leaders 1.500% - - - - 0.750% 0.750%
Commodity 1.500% - - 2.100% 0.500% 0.750% 0.750%
Dynamic Commodity 1.500% - - - - 0.750% 0.750%
Non-Food Commodity 1.500% - - - - 0.750% 0.750%
Emerging Markets Debt 1.100% 1.100% 1.500% 1.500% 0.400% 0.550% 0.550%
Global Bond - - - - - 0.350% -
Credit Opportunities - - - - - - - Global Corporate Bond Mid Yield 1.100% - - 1.600% 0.300% 0.550% 0.550%
Emerging Markets Blend 1.100% - - - - 0.550% - Emerging Markets Corporate Bond 1.100% - 1.500% 1.500% - 0.550% 0.550%
TwentyFour Absolute Return Credit Fund 0.800% - - 1.200% 0.250% 0.400% 0.400%
TwentyFour Strategic Income Fund 1.200% 1.200% - 1.600% 0.450% 0.600% 0.600%
LCR Global Bond - - - - 0.125% 0.250% -
Multi Asset Solution 1.400% - - 2.000% - 0.700% 0.700%
Multi Asset Income 1.250% - - 1.600% - 0.625% 0.625% TwentyFour Monument European Asset Backed Securities
1.000% - - - - 0.500% 0.500%
Multi Asset Defensive 0.700% - - 0.950% - 0.350% 0.350%
Multi Asset Alphabet 1.200% - - - - 0.600% 0.600% Vescore Artificial Intelligence Multi Asset 1.000% - - 1.500% - 0.500% 0.500%
Vescore Global Equity Multi Factor 0.700% - - - - 0.350% 0.350%
Alternative Risk Premia - - - - - 0.400% 0.400%

Notes to the Financial Statements
263
3 Management fee and performance fee (continued)
Vontobel Fund - R, HR
(hedged) S, HS
(hedged)
U1, UAQH1 (hedged),
UH1 (hedged)
AQC1, AQHC1
(hedged), C1, HC1 (hedged)
AQH1 (hedged),
H1 (hedged)
AQH (hedged) Gross, E
X
Swiss Money 0.100% - - - - - -
Euro Short Term Bond 0.250% 0.000% - - - - -
US Dollar Money 0.250% - - - - - -
Swiss Franc Bond 0.250% - - - - - -
Euro Bond 0.250% 0.000% - - - - - EUR Corporate Bond Mid Yield 0.250% 0.000% - - - - -
High Yield Bond 0.250% 0.000% - - - - - Bond Global Aggregate 0.250% 0.000% - 1.450% 1.400% - -
Eastern European Bond 0.250% - - - - - -
Value Bond 0.250% 0.000% - - - - -
Absolute Return Bond (EUR) 0.250% 0.000% - - - - - Absolute Return Bond Dynamic 0.250% - - - - - -
Global Convertible Bond 0.250% - - - - - - Sustainable Emerging Markets Local Currency Bond 0.250% - - - - - -
Swiss Mid and Small Cap Equity 0.250% 0.000% - - - - -
European Mid and Small Cap Equity 0.250% - - - - - -
Japanese Equity 0.250% - - - - - -
mtx China Leaders 0.250% - - - - - -
European Equity 0.250% 0.000% - - - - - US Equity 0.250% 0.000% 0.850% 2.250% - - -
Global Equity 0.250% 0.000% 0.850% 2.250% - - -
Global Equity Income 0.250% - - - - - -
Emerging Markets Equity 0.250% 0.000% 0.850% 2.250% - - -
Asia Pacific Equity 0.250% 0.000% - - - - -
New Power 0.250% 0.000% - - - - - Clean Technology 0.250% - - - - - -
Future Resources 0.250% - - - - - - mtx Sustainable Asian Leaders (ex Japan) 0.250% - - - - - -
mtx Sustainable Emerging Markets Leaders 0.250% - 0.850% 2.250% - - -
mtx Sustainable Global Leaders 0.250% 0.000% - - - - -
Commodity 0.250% 0.000% - - - - -
Dynamic Commodity 0.250% 0.000% - - - - -
Non-Food Commodity 0.250% 0.000% - - - - -
Emerging Markets Debt 0.250% 0.000% 0.700% 1.800% - - -
Global Bond - 0.000% - - - - -
Credit Opportunities - - - - - - 0.425% Global Corporate Bond Mid Yield 0.250% - - - - - -
Emerging Markets Blend 0.250% 0.000% - - - - - Emerging Markets Corporate Bond 0.250% - 0.700% 1.800% - - -
TwentyFour Absolute Return Credit Fund 0.250% - - - - - -
TwentyFour Strategic Income Fund 0.250% - 0.700% 1.750% 1.550% 1.200% -
LCR Global Bond - - - - - - -

Notes to the Financial Statements
264
3 Management fee and performance fee (continued)
Vontobel Fund - R, HR
(hedged)
S, HS
(hedged)
U1, UH1
(hedged)
AQC1,
AQHC1
(hedged),
C1, HC1
(hedged)
AQH1
(hedged),
H1 (hedged)
AQH
(hedged)
Gross, E
X
Multi Asset Solution - - - - - - -
Multi Asset Income 0.250% - - - - - - TwentyFour Monument European Asset Backed Securities
0.250% - - - - - -
Multi Asset Defensive 0.250% - - - - 0.150% -
Multi Asset Alphabet 0.250% - - - - - - Vescore Artificial Intelligence Multi Asset 0.250% - - - - - -
Vescore Global Equity Multi Factor 0.250% 0.000% - - - - -
Alternative Risk Premia 0.250% - - - - 0.200% -
The maximum rates of the management fees as at February 28, 2019 at target fund level are as follows:
Sub-Funds Annual management
fee
AB SICAV I Alternative Risk Premia Ptf F Cap 0.600%
AMUNDI 12 M I Cap EUR 0.150%
AMUNDI 3 - 6 M - I EUR 0.150%
AMUNDI 3 M - I EUR 0.150%
AMUNDI 6 M I Dis EUR 0.500%
AQR UCITS Funds - AQR Style Premia UCITS Fund - A (USD) 0.600%
AXA IM FIIS - US Short Duration High Yield A Cap H EUR 0.700%
Bellevue Funds (Lux) - BB Global Macro - I EUR 0.800%
BlackRock BGF - Emerging Markets Local Currency Bond Fund - D4 EUR 0.500%
BlackRock BGF - Euro Short Duration Bond - I2 EUR 0.400%
BlackRock BSF - Global Event Driven - I2 EUR 1.000%
BlackRock BSF - Style Advantage - I2 USD 0.750%
Candriam Sustainable - Euro Short Term Bonds I EUR 0.200%
Celsius Investment Funds SICAV - Barclays Managed Commodity Risk Premia Fund Z USD 0.000%
CGS FMS Global Evolution Frontier Markets I EUR 1.000%
DC Developing Markets Strat. plc - Vietnam Equity (UCITS) - B 1.500%
JPM Funds - Emerging Markets Small Cap Fund - I USD 0.850%
JPMorgan Liquidity Funds - EUR Liquidity VNAV Fund - C EUR 0.160%
Man Funds VI plc - Man Alternative Style Risk Premia - I USD 1.000%
Manulife AM UCITS Series ICAV - Asian Bond Absolute Return R EUR 0.750%
Muzinich Funds - Muzinich Enhancedyield Short-Term Fund - A EUR 0.450%
NN (L) - Multi Asset Factor Opportunities - I Cap USD 0.600%
Nordea 1 - Low Duration European Covered Bond Fund - BI EUR 0.250%
Old Mutual GIS Plc - Old Mutual Gl. Equity Abs. Return Fund - I EUR 0.750%
Pictet - Short-Term Money Market EUR - I 0.150%
RAM (LUX) Systematic Funds - Long/Short European Equities - U EUR 1.280%
UBS (Lux) Money Market Fund - EUR - INSTITUTIONAL-acc 0.140%
Uni-Global - Alternative Risk Premia - IA-USD 0.750%

Notes to the Financial Statements
265
3 Management fee and performance fee (continued)
Sub-Funds Annual management
fee
Vontobel Fund - Emerging Markets Corporate Bond HI EUR Cap 0.550%
Vontobel Fund - Absolute Return Bond (EUR) S EUR Cap 0.000%
Vontobel Fund - Absolute Return Bond Dynamic I EUR 0.425%
Vontobel Fund - Credit Opportunities X USD 0.425%
Vontobel Fund - Bond Global Aggregate S EUR 0.000%
Vontobel Fund - Commodity HI Hedged EUR Cap 0.750%
Vontobel Fund - Dynamic Commodity S USD 0.000%
Vontobel Fund - Emerging Markets Bond X USD 0.550%
Vontobel Fund - Emerging Markets Corporate Bond X USD 0.550%
Vontobel Fund - Emerging Markets Debt - I USD 0.550%
Vontobel Fund - Emerging Markets Debt HS EUR 0.000%
Vontobel Fund - Emerging Markets Equity S USD 0.000%
Vontobel Fund - EUR Corporate Bond Mid Yield - I EUR 0.550%
Vontobel Fund - EUR Corporate Bond Mid Yield S EUR 0.000%
Vontobel Fund - Euro Bond I EUR 0.325%
Vontobel Fund - Euro Bond S EUR 0.000%
Vontobel Fund - Euro Short Term Bond - I EUR 0.150%
Vontobel Fund - Euro Short Term Bond S EUR 0.000%
Vontobel Fund - European Equity S EUR 0.000%
Vontobel Fund - Global Bond HI CHF 0.350%
Vontobel Fund - Global Bond HI EUR 0.350%
Vontobel Fund - Global Bond HS EUR 0.000%
Vontobel Fund - Global Convertible Bond HI CHF 0.550%
Vontobel Fund - Global Convertible Bond I EUR 0.550%
Vontobel Fund - Global Corporate Bond Mid Yield HG USD 0.300%
Vontobel Fund - Global Equity HS EUR 0.000%
Vontobel Fund - High Yield Bond I EUR 0.550%
Vontobel Fund - mtx Sustainable Asian Leaders (ex Japan) HI EUR 0.825%
Vontobel Fund - mtx Sustainable Emerging Markets Leaders S USD Cap 0.000%
Vontobel Fund - Multi Asset Income I EUR 0.625%
Vontobel Fund - TwentyFour Absolute Return Credit Fund HI EUR 0.400%
Vontobel Fund - TwentyFour Monument European Asset Backed Securities I EUR 0.500%
Vontobel Fund - TwentyFour Strategic Income Fund HI EUR 0.600%

Notes to the Financial Statements
266
3 Management fee and performance fee (continued)
b) Performance fee
The performance fee is calculated on each valuation day of the relevant Sub-Fund or corresponding Share Class
in accordance with a period defined for the relevant Sub-Fund (“performance fee period”) and recognised for
accounting purposes as an accrual. Any performance fee owed at the end of the relevant performance fee period
is paid out to the portfolio manager.
Neither equalisation nor multi-series accounting methods are used to calculate the performance fee. This may
mean that under certain circumstances, an investor is unable to participate in a positive performance depending
on the timing of its subscription of shares, although it will nevertheless be charged a performance fee on the
basis of a positive overall performance by the Sub-Fund during the performance fee period.
In the event of a redemption of shares during a performance fee period, the portion of the performance fee that
was accrued during the relevant performance fee period up to the valuation cut-off date for the redemption of the
shares shall also be paid out, regardless of whether a performance fee is due or not at the end of the relevant
performance fee period.
The performance fee is calculated either through cumulative application of the “high-watermark principle”
(“HWM principle”) and “hurdle-rate principle” or alternatively in accordance with one of the aforementioned
principles. The calculation method to be applied for each Sub-Fund is set out in the Special Part of the
prospectus.
According to the prospectus, a performance fee can apply to the following Sub-Funds for the financial period in
question:
Vontobel Fund - High Yield Bond
Vontobel Fund - Bond Global Aggregate
Vontobel Fund - Value Bond
Vontobel Fund - Absolute Return Bond (EUR)
Vontobel Fund - Absolute Return Bond Dynamic
Vontobel Fund - Dynamic Commodity
Vontobel Fund - Emerging Markets Debt
Vontobel Fund - Credit Opportunities
Vontobel Fund - Emerging Markets Corporate Bond
Vontobel Fund - Multi Asset Solution
4 Subscription tax
In accordance with the 2010 Law, as amended, the Fund is currently exempt from income and capital gains taxes
in Luxembourg. However, under this Law the Fund is subject to a subscription tax (“taxe d'abonnement”). For all
Share Classes in all Sub-Funds reserved for the institutional investors, the tax amounts to 0.01%, and for all other
Share Classes of all Sub-Funds to 0.05% of the net assets of the Share Classes concerned. However, the tax rate
for Sub-Funds invested exclusively in money market instruments amounts to 0.01%. The tax is payable quarterly
and is based on the net assets of the Fund at the end of the relevant quarter.
5 Service fee
The Fund pays a “service fee” which covers the costs of central administration, supervision, custodian services
and support services for the Fund. This service fee is calculated on the basis of the average of the Fund's daily
net asset value during the month in question and amounts to a maximum of 0.08745% per month. It is charged to
the Fund at the end of the month.

Notes to the Financial Statements
267
6 Fees applicable to subscriptions and redemptions of target funds
In accordance with the 2010 Law, as amended, no fees were charged for the subscription or redemption of
shares of target funds that are managed by the same management company or by another company that is
affiliated to the management company.
Some Sub-Funds of the Vontobel Fund invest in other Sub-Funds of the Vontobel Fund. As at February 28, 2019,
the value of these investments (known as “cross investments”) amounts to:
Target Funds Market value in
CHF
Vontobel Fund - Absolute Return Bond (EUR) S EUR Cap 3,675,369
Vontobel Fund - Absolute Return Bond Dynamic I EUR 11,651,599
Vontobel Fund - Credit Opportunities X USD 22,309,681
Vontobel Fund - Bond Global Aggregate S EUR 9,141,028
Vontobel Fund - Commodity HI Hedged EUR Cap 1,111,799
Vontobel Fund - Dynamic Commodity S USD 23,612,442
Vontobel Fund - Emerging Markets Bond X USD 91,210,523
Vontobel Fund - Emerging Markets Corporate Bond HI EUR Cap 1,551,771
Vontobel Fund - Emerging Markets Corporate Bond X USD 69,117,477
Vontobel Fund - Emerging Markets Debt - I USD 3,938,379
Vontobel Fund - Emerging Markets Debt HS EUR 1,469,852
Vontobel Fund - Emerging Markets Equity S USD 1,887,053
Vontobel Fund - EUR Corporate Bond Mid Yield - I EUR 7,355,275
Vontobel Fund - EUR Corporate Bond Mid Yield S EUR 5,678,336
Vontobel Fund - Euro Bond I EUR 3,435,403
Vontobel Fund - Euro Bond S EUR 1,231,129
Vontobel Fund - Euro Short Term Bond - I EUR 5,736,638
Vontobel Fund - Euro Short Term Bond S EUR 4,265,272
Vontobel Fund - European Equity S EUR 3,885,973
Vontobel Fund - Global Bond HI CHF Cap 2,723,872
Vontobel Fund - Global Bond HI EUR 13,607,950
Vontobel Fund - Global Bond HS EUR 1,941,688
Vontobel Fund - Global Convertible Bd HI CHF Cap 1,182,799
Vontobel Fund - Global Convertible Bond I EUR 4,368,896
Vontobel Fund - Global Corporate Bond Mid Yield HG USD 13,714,995
Vontobel Fund - Global Equity HS EUR 14,374,739
Vontobel Fund - High Yield Bond I EUR Cap 42,195,714
Vontobel Fund - mtx Sustainable Asian Leaders (Ex Japan) HI EUR 986,309
Vontobel Fund - mtx Sustainable EM Leaders S USD Cap 771,537
Vontobel Fund - Multi Asset Income I EUR 3,739,154
Vontobel Fund - TwentyFour Absolute Return Credit Fund HI EUR 7,951,235
Vontobel Fund - TwentyFour Monument European Asset Backed Securities I EUR 8,889,882
Vontobel Fund - TwentyFour Strategic Income Fund HI EUR 4,682,109
7 Exchange rates When converting balance sheet positions that are denominated in foreign currencies into Swiss Francs as at February 28, 2019, the following exchange rates were used:
1 CHF 39.173229 ARS 1 CHF 278.453575 HUF 1 CHF 4.183395 RON
1 CHF 1.410941 AUD 1 CHF 14120.326347 IDR 1 CHF 104.065312 RSD
1 CHF 84.496128 BDT 1 CHF 71.395021 INR 1 CHF 66.149193 RUB
1 CHF 3.764552 BRL 1 CHF 111.744596 JPY 1 CHF 9.265918 SEK
1 CHF 1.322024 CAD 1 CHF 100.331234 KES 1 CHF 1.356353 SGD
1 CHF 657.376555 CLP 1 CHF 1129.149606 KRW 1 CHF 31.633126 THB
1 CHF 6.720724 CNH 1 CHF 375.678892 KZT 1 CHF 5.354331 TRY
1 CHF 6.711691 CNY 1 CHF 180.672066 LKR 1 CHF 30.894189 TWD
1 CHF 3088.658462 COP 1 CHF 19.343174 MXN 1 CHF 27.042403 UAH
1 CHF 610.221277 CRC 1 CHF 4.082005 MYR 1 CHF 3717.829630 UGX
1 CHF 22.582484 CZK 1 CHF 14.113576 NAD 1 CHF 1.003814 USD
1 CHF 6.577298 DKK 1 CHF 8.579020 NOK 1 CHF 32.809740 UYU
1 CHF 50.772040 DOP 1 CHF 1.472948 NZD 1 CHF 23288.727003 VND
1 CHF 0.881544 EUR 1 CHF 3.318613 PEN 1 CHF 14.113576 ZAR
1 CHF 0.754691 GBP 1 CHF 51.916938 PHP 1 CHF 12.080899 ZMW
1 CHF 5.415571 GHS 1 CHF 139.032410 PKR
1 CHF 7.879726 HKD 1 CHF 3.792915 PLN

Notes to the Financial Statements
268
8 Other expenses
Sub-Funds Description Amount in Sub-
Fund currency
Vontobel Fund - Swiss Money General tax advice 13,227
Other expenses 2,795
Clearing brokerage fees 1,625
Legal fees 8,106
Total CHF 25,753
Vontobel Fund - Euro Short Term Bond General tax advice 11,041
Other expenses 4,712
Clearing brokerage fees 2,454
Legal fees 9,507
Total EUR 27,714
Vontobel Fund - US Dollar Money General tax advice 11,792
Other expenses 3,221
Legal fees 4,070
Total USD 19,083
Vontobel Fund - Swiss Franc Bond General tax advice 17,107
Other expenses 7,523
Clearing brokerage fees 42,848
Legal fees 14,012
Total CHF 81,490
Vontobel Fund - Euro Bond General tax advice 15,063
Other expenses 3,735
Clearing brokerage fees 2,284
Legal fees 11,191
Total EUR 32,273
Vontobel Fund - EUR Corporate Bond Mid Yield General tax advice 15,960
Other expenses 39,286
Clearing brokerage fees 7,604
Legal fees 27,924
Total EUR 90,774
Vontobel Fund - High Yield Bond General tax advice 6,192
Other expenses 6,779
Legal fees 11,049
Total EUR 24,020
Vontobel Fund - Bond Global Aggregate General tax advice 13,162
Other expenses 10,856
Clearing brokerage fees 511,023
Legal fees 16,078
Total EUR 551,119
Vontobel Fund - Eastern European Bond General tax advice 14,210
Other expenses 3,019
Legal fees 10,435
Total EUR 27,664
Vontobel Fund - Value Bond General tax advice 16,991
Other expenses 6,330
Clearing brokerage fees 8,821
Legal fees 4,957
Total CHF 37,099

Notes to the Financial Statements
269
8 Other expenses (continued)
Sub-Funds Description Amount in Sub-
Fund currency
Vontobel Fund - Absolute Return Bond (EUR) General tax advice 12,076
Other expenses 1,558
Clearing brokerage fees 21,747
Legal fees 11,916
Total EUR 47,297
Vontobel Fund - Absolute Return Bond Dynamic General tax advice -1,304
Other expenses 209
Clearing brokerage fees 15,085
Legal fees 7,503
Total EUR 21,493
Vontobel Fund - Global Convertible Bond General tax advice 6,755
Other expenses 3,725
Clearing brokerage fees 12,709
Legal fees 12,522
Total EUR 35,711
Vontobel Fund - Sustainable Emerging
Markets Local Currency Bond
General tax advice 7,160
Other expenses 5,688
Clearing brokerage fees 4,464
Legal fees 18,935
Total USD 36,247
Vontobel Fund - Swiss Mid and Small Cap
Equity
General tax advice 16,244
Other expenses 9,151
Legal fees 31,318
Total CHF 56,713
Vontobel Fund - European Mid and Small Cap
Equity General tax advice 12,818
Other expenses 3,255
Legal fees 9,633
Total EUR 25,706
Vontobel Fund - Japanese Equity General tax advice 755,721
Other expenses 384,094
Legal fees 1,207,743
Total JPY 2,347,558
Vontobel Fund - mtx China Leaders General tax advice 11,333
Other expenses 5,739
Legal fees 14,510
Total USD 31,582
Vontobel Fund - European Equity General tax advice 12,074
Other expenses 9,022
Legal fees 17,353
Total EUR 38,449
Vontobel Fund - US Equity General tax advice 14,012
Other expenses 60,622
Legal fees 45,201
Total USD 119,835

Notes to the Financial Statements
270
8 Other expenses (continued)
Sub-Funds Description Amount in Sub-
Fund currency
Vontobel Fund - Global Equity General tax advice 18,183
Other expenses 64,634
Legal fees 45,432
Total USD 128,249
Vontobel Fund - Global Equity Income General tax advice 15,724
Other expenses 778
Legal fees 17,682
Total USD 34,184
Vontobel Fund - Emerging Markets Equity General tax advice 38,636
Other expenses 81,777
Legal fees 55,027
Total USD 175,440
Vontobel Fund - Asia Pacific Equity
General tax advice 21,605
Other expenses 12,505
Legal fees 24,223
Total USD 58,333
Vontobel Fund - New Power General tax advice 6,311
Other expenses 4,409
Clearing brokerage fees 309
Legal fees 19,024
Total EUR 30,053
Vontobel Fund - Clean Technology General tax advice 7,799
Other expenses 6,422
Legal fees 15,276
Total EUR 29,497
Vontobel Fund - Future Resources General tax advice 5,575
Other expenses 1,665
Legal fees 14,824
Total EUR 22,064
Vontobel Fund - mtx Sustainable Asian Leaders
(ex Japan)
General tax advice 14,094
Other expenses 13,339
Legal fees 25,180
Total USD 52,613
Vontobel Fund - mtx Sustainable Emerging
Markets Leaders
General tax advice 21,071
Other expenses 74,922
Legal fees 43,238
Total USD 139,231
Vontobel Fund - mtx Sustainable Global Leaders General tax advice 8,855
Other expenses 3,638
Legal fees 20,685
Total USD 33,178
Vontobel Fund - Commodity General tax advice 8,599
Other expenses 12,506
Legal fees 18,324
Total USD 39,429

Notes to the Financial Statements
271
8 Other expenses (continued)
Sub-Funds Description Amount in Sub-
Fund currency
Vontobel Fund - Dynamic Commodity General tax advice 8,338
Other expenses 5,650
Legal fees 12,080
Total USD 26,068
Vontobel Fund - Non-Food Commodity General tax advice 7,161
Other expenses 11,000
Legal fees 10,653
Total USD 28,814
Vontobel Fund - Emerging Markets Debt General tax advice 25,628
Other expenses 70,420
Clearing brokerage fees 381,613
Legal fees 49,969
Total USD 527,630
Vontobel Fund - Global Bond General tax advice 6,185
Other expenses 1,086
Clearing brokerage fees 344
Legal fees 5,922
Total USD 13,537
Vontobel Fund - Credit Opportunities General tax advice -5,493
Other expenses 635
Clearing brokerage fees 903
Legal fees 199
Total USD -3,756*
Vontobel Fund - Global Corporate Bond Mid
Yield
General tax advice 15,230
Other expenses 4,454
Clearing brokerage fees 2,315
Legal fees 12,778
Total USD 34,777
Vontobel Fund - Emerging Markets Blend General tax advice 77
Other expenses 53,250
Clearing brokerage fees 13,694
Legal fees 8,523
Total USD 75,544
Vontobel Fund - Emerging Markets Corporate
Bond
General tax advice 3,536
Other expenses 6,345
Clearing brokerage fees 38,517
Legal fees 8,735
Total USD 57,133
Vontobel Fund - TwentyFour Absolute Return
Credit Fund
General tax advice 26,412
Other expenses 34,375
Legal fees 26,606
Total GBP 87,393
Vontobel Fund - TwentyFour Strategic Income
Fund
General tax advice 22,873
Other expenses 39,216
Legal fees 43,362
Total GBP 105,451
Vontobel Fund - LCR Global Bond General tax advice 6,793
Other expenses 759
Clearing brokerage fees 173
Legal fees 905
Total EUR 8,630
* An adjustment to the fee “Audit Tax GmbH” resulted in a negative balance.

Notes to the Financial Statements
272
8 Other expenses (continued)
Sub-Funds Description Amount in Sub-
Fund currency
Vontobel Fund - Multi Asset Solution General tax advice 3,888
Other expenses 1,630
Clearing brokerage fees 13,233
Legal fees 4,191
Total EUR 22,942
Vontobel Fund - Multi Asset Income General tax advice 17,686
Other expenses 6,602
Clearing brokerage fees 43,573
Legal fees 6,170
Total EUR 74,031
Vontobel Fund - TwentyFour Monument
European Asset Backed Securities
General tax advice 6,502
Other expenses 10,586
Legal fees 10,915
Total EUR 28,003
Vontobel Fund - Multi Asset Defensive General tax advice 2,509
Other expenses 17,669
Clearing brokerage fees 47,562
Legal fees 12,582
Total EUR 80,322
Vontobel Fund - Multi Asset Alphabet General tax advice 2,068
Other expenses 411
Clearing brokerage fees 18,101
Legal fees 3,262
Total EUR 23,842
Vontobel Fund - Vescore Artificial Intelligence
Multi Asset
General tax advice 1,027
Other expenses 58
Clearing brokerage fees 2,912
Legal fees 6,011
Total EUR 10,008
Vontobel Fund - Vescore Global Equity Multi
Factor
General tax advice 730
Other expenses 38
Legal fees 501
Total EUR 1,269
Vontobel Fund - Alternative Risk Premia General tax advice 796
Other expenses 6
Legal fees 225
Total EUR 1,027

Notes to the Financial Statements
273
9 Off-balance-sheet transactions
The counterparties to the forward foreign exchange contracts and futures listed below are:
Bank Vontobel AG, Morgan Stanley, RBC IS Bank Luxbg, Société Générale and UBS Limited London.
a) Forward foreign exchange contracts
In order to protect its assets against currency fluctuations, the Fund may carry out transactions to dispose of
foreign exchange forward contracts and call options on currencies, and to acquire put options on currencies. The
arrangement of hedging transactions is subject to the condition that there is a direct connection between the
transaction and the assets to be hedged. This means that transactions concluded in a given currency must not
significantly exceed the total value of the assets denominated in that currency or the period during which the
assets are held.
The following forward foreign exchange contracts were open as at February 28, 2019:
Sub-Funds Maturity Purchase Sale
Unrealised
gain/loss in Sub-Fund
currency
Vontobel Fund - Swiss Money
13.03.2019 CHF 1,429,940 AUD 2,000,000 CHF 13,868
13.03.2019 CHF 10,367,534 EUR 9,200,000 CHF -67,272
13.03.2019 CHF 7,576,081 USD 7,750,000 CHF -135,031
-188,435
Vontobel Fund - Euro Short Term Bond
12.04.2019 EUR 6,829,267 AUD 11,000,000 EUR -22,728
12.04.2019 EUR 4,902,705 CHF 5,500,000 EUR 51,917
12.04.2019 EUR 9,751,892 GBP 8,800,000 EUR -513,127
12.04.2019 EUR 12,990,782 USD 15,000,000 EUR -133,284
-617,222
Vontobel Fund - Swiss Franc Bond
13.03.2019 AUD 4,400,000 CHF 3,126,419 CHF -11,031
13.03.2019 CHF 4,484,681 AUD 6,300,000 CHF 24,036
13.03.2019 CHF 1,119,666 CAD 1,500,000 CHF -13,917
13.03.2019 CHF 26,146,857 EUR 23,200,000 CHF -167,001
13.03.2019 CHF 1,027,284 GBP 800,000 CHF -32,171
13.03.2019 CHF 18,955,690 USD 19,400,000 CHF -346,975
13.03.2019 EUR 11,900,000 CHF 13,500,808 CHF -3,625
13.03.2019 GBP 800,000 CHF 1,042,619 CHF 16,817
13.03.2019 USD 8,000,000 CHF 7,991,076 CHF -31,392
-565,259
Vontobel Fund - EUR Corporate Bond
Mid Yield
01.03.2019 CHF 45,598 EUR 40,128 EUR 70
01.03.2019 GBP 149 EUR 174 EUR 0
04.03.2019 CHF 88,199 EUR 77,625 EUR 130
04.03.2019 EUR 1,275,696 CHF 1,450,573 EUR -3,107
04.03.2019 EUR 1,308 GBP 1,117 EUR 3
04.03.2019 USD 36,136 EUR 31,759 EUR -37
29.03.2019 CHF 144,628,238 EUR 127,275,088 EUR 263,041
29.03.2019 EUR 147,286 CHF 167,386 EUR -320
29.03.2019 EUR 37,772,478 GBP 32,800,000 EUR -504,231
29.03.2019 EUR 80,313,285 USD 92,000,000 EUR -278,533
29.03.2019 GBP 5,088,229 EUR 5,925,592 EUR 12,157
29.03.2019 USD 13,992,759 EUR 12,290,479 EUR -32,956
-543,783
Vontobel Fund - High Yield Bond
01.03.2019 CHF 79,261 EUR 69,753 EUR 121
01.03.2019 EUR 17,241 USD 19,591 EUR 39
01.03.2019 EUR 15,930 ZAR 251,442 EUR 231
01.03.2019 USD 45,524 EUR 40,094 EUR -122
04.03.2019 CHF 138,407 EUR 121,814 EUR 204
04.03.2019 EUR 94 ZAR 1,500 EUR 1

Notes to the Financial Statements
274
9 Off-balance-sheet transactions (continued)
Sub-Funds Maturity Purchase Sale Unrealised gain/loss in
Sub-Fund currency
Vontobel Fund - High Yield Bond
(Fortsetzung)
29.03.2019 AUD 99,089 EUR 62,474 EUR -688
29.03.2019 CHF 70,784,276 EUR 62,291,184 EUR 128,812
29.03.2019 EUR 14,715,303 GBP 12,700,000 EUR -105,165
29.03.2019 EUR 112,480,503 USD 128,000,000 EUR 354,619
29.03.2019 USD 25,186,814 EUR 22,122,726 EUR -59,319
29.03.2019 ZAR 723,896 EUR 45,637 EUR -693
318,040
Vontobel Fund - Bond Global
Aggregate
01.03.2019 CHF 27,462 EUR 24,168 EUR 42
01.03.2019 EUR 2,245 USD 2,551 EUR 5
01.03.2019 USD 23,792 EUR 20,955 EUR -64
04.03.2019 CHF 55,549 EUR 48,890 EUR 82
04.03.2019 EUR 14,002,328 GBP 12,160,602 EUR -200,299
04.03.2019 EUR 56,118,856 USD 63,853,516 EUR 64,344
04.03.2019 GBP 12,160,602 EUR 13,971,181 EUR 231,417
04.03.2019 KRW 56,929,380,400 USD 52,400,000 EUR -1,571,776
04.03.2019 USD 63,986,022 EUR 56,187,782 EUR -16,925
04.03.2019 USD 95,272,967 KRW 107,842,735,000 EUR -526,236
12.03.2019 INR 1,492,519,000 USD 20,380,904 EUR 556,568
12.03.2019 USD 12,600,000 INR 933,156,000 EUR -472,531
14.03.2019 AUD 10,932,439 USD 7,838,865 EUR -51,720
14.03.2019 EUR 11,610,445 CAD 17,380,081 EUR 31,076
14.03.2019 EUR 5,331,351 CHF 6,050,945 EUR -3,619
14.03.2019 EUR 8,368,459 GBP 7,179,962 EUR -14,484
14.03.2019 EUR 3,924,134 HUF 1,244,162,500 EUR -14,300
14.03.2019 EUR 16,338,499 NZD 26,964,095 EUR 215,350
14.03.2019 EUR 4,329,349 SEK 45,786,496 EUR -26,398
14.03.2019 EUR 56,123,088 USD 63,965,279 EUR 16,265
14.03.2019 JPY 4,212,866,495 USD 37,937,415 EUR -44,290
14.03.2019 NOK 297,458,767 USD 34,547,724 EUR 245,841
14.03.2019 RUB 210,125,978 USD 3,189,831 EUR -4,717
14.03.2019 USD 9,308,929 SGD 12,553,947 EUR 13,989
19.03.2019 KRW 23,524,200,000 USD 21,000,000 EUR -55,732
19.03.2019 USD 16,339,956 KRW 18,237,474,220 EUR 95,268
22.03.2019 EUR 5,423,459 CHF 6,100,000 EUR 44,715
22.03.2019 EUR 14,983,919 GBP 13,600,000 EUR -891,087
22.03.2019 EUR 146,420,928 USD 167,420,000 EUR -328,252
25.03.2019 INR 437,140,200 USD 6,090,000 EUR 46,660
25.03.2019 USD 6,090,000 INR 437,079,300 EUR -45,931
28.03.2019 USD 5,600,000 ZAR 78,304,800 EUR 43,567
28.03.2019 ZAR 77,397,600 USD 5,255,552 EUR 202,599
29.03.2019 CHF 67,114,209 EUR 59,061,473 EUR 122,133
29.03.2019 KRW 36,387,400,000 USD 32,900,000 EUR -452,458
29.03.2019 USD 99,325,315 EUR 87,241,955 EUR -233,931
29.03.2019 USD 35,000,000 KRW 39,340,000,000 EUR -11,053
03.04.2019 KRW 1,172,850,000 USD 1,050,894 EUR -6,198
08.04.2019 BRL 59,666,600 USD 16,100,000 EUR -205,860
08.04.2019 USD 14,073,807 BRL 52,813,649 EUR 26,813
10.04.2019 USD 11,419,601 INR 817,650,750 EUR -39,347
12.04.2019 EUR 6,090,000 RUB 518,441,700 EUR -756,839
12.04.2019 INR 1,683,307,500 USD 23,344,502 EUR 219,917
12.04.2019 RUB 961,821,000 EUR 12,600,000 EUR 88,160
12.04.2019 USD 12,250,000 INR 872,506,250 EUR 17,688

Notes to the Financial Statements
275
9 Off-balance-sheet transactions (continued)
Sub-Funds Maturity Purchase Sale
Unrealised
gain/loss in Sub-Fund
currency
Vontobel Fund - Bond Global
Aggregate (continued) 29.04.2019 EUR 7,195,071 MXN 167,090,000 EUR -311,988
29.04.2019 MXN 469,711,200 EUR 20,440,000 EUR 650,338
29.04.2019 USD 13,522,667 MXN 261,982,744 EUR 50,787
30.04.2019 KRW 10,831,940,000 USD 9,800,000 EUR -130,624
08.05.2019 RUB 1,122,769,200 USD 16,800,000 EUR 59,157
08.05.2019 USD 16,100,000 RUB 1,076,285,000 EUR -61,235
17.05.2019 CNH 82,550,300 USD 11,900,000 EUR 377,154
17.05.2019 USD 11,945,250 CNH 82,550,300 EUR -337,425
24.05.2019 TRY 49,450,625 USD 8,858,044 EUR -23,627
24.05.2019 USD 8,890,000 TRY 49,450,625 EUR 54,264
03.06.2019 KRW 36,331,260,000 USD 32,200,000 EUR 150,305
03.06.2019 USD 23,800,000 KRW 25,322,010,000 EUR 1,084,842
05.06.2019 EUR 4,410,000 MXN 112,088,970 EUR -595,072
05.06.2019 KRW 33,864,600,000 USD 30,800,000 EUR -550,313
05.06.2019 MXN 72,482,160 EUR 2,883,959 EUR 343,759
05.06.2019 USD 31,500,000 KRW 35,325,465,000 EUR 21,915
10.06.2019 CNH 256,565,050 USD 37,100,000 EUR 1,069,858
12.06.2019 USD 17,850,000 ZAR 248,115,000 EUR 380,593
12.06.2019 ZAR 249,022,200 USD 17,380,769 EUR 92,273
18.06.2019 TRY 30,184,000 USD 5,370,558 EUR -40,512
18.06.2019 USD 5,600,000 TRY 30,184,000 EUR 257,205
20.06.2019 TRY 19,394,900 USD 3,500,000 EUR -72,044
20.06.2019 USD 3,496,329 TRY 19,394,900 EUR 73,213
28.06.2019 KRW 16,453,999,626 USD 14,700,000 EUR -20,227
28.06.2019 USD 21,700,000 KRW 23,891,700,000 EUR 340,122
12.07.2019 KRW 74,025,000,000 USD 65,800,000 EUR 202,248
16.07.2019 TWD 116,655,000 USD 3,850,000 EUR -37,014
16.07.2019 USD 3,850,000 TWD 116,481,750 EUR 41,787
16.08.2019 TWD 105,595,000 USD 3,500,000 EUR -41,777
16.08.2019 USD 3,500,000 TWD 105,626,500 EUR 40,619
05.09.2019 USD 23,800,000 KRW 26,056,240,000 EUR 441,638
12.09.2019 USD 57,400,000 JPY 6,316,870,000 EUR -217,487
20.09.2019 KRW 60,870,810,000 USD 54,600,000 EUR -105,932
10.10.2019 USD 4,830,000 TRY 32,140,660 EUR -547,880
11.10.2019 TRY 55,655,010 USD 7,834,395 EUR 1,309,772
11.10.2019 USD 3,000,000 TRY 23,550,000 EUR -929,647
15.10.2019 USD 49,700,000 KRW 55,664,000,000 EUR -152,435
22.10.2019 CNH 28,080,000 USD 4,000,000 EUR 168,718
22.10.2019 USD 4,000,000 CNH 28,086,000 EUR -169,583
23.10.2019 AUD 37,800,000 USD 27,158,922 EUR -144,733
30.10.2019 CNH 36,085,760 USD 5,120,000 EUR 234,565
30.10.2019 USD 5,120,000 CNH 36,023,040 EUR -226,456
15.11.2019 USD 4,200,000 RUB 298,410,000 EUR -158,802
26.11.2019 TRY 1,151,572 USD 191,226 EUR -1,609
27.11.2019 SGD 63,855,400 USD 47,600,000 EUR -81,268
09.12.2019 KRW 43,394,400,000 USD 39,200,000 EUR -203,591
09.12.2019 USD 9,800,000 KRW 10,856,512,814 EUR 44,210
10.12.2019 USD 37,100,000 CNH 257,051,025 EUR -1,113,153
12.12.2019 JPY 4,661,559,000 USD 42,700,000 EUR 144,855
20.12.2019 USD 38,500,000 KRW 42,735,000,000 EUR 70,547
23.01.2020 USD 21,151,830 AUD 29,400,000 EUR 108,044
10.02.2020 USD 29,400,000 KRW 32,457,600,000 EUR 134,916
26.02.2020 TRY 37,531,596 USD 6,000,000 EUR -35,673
26.02.2020 USD 6,000,000 TRY 37,560,000 EUR 37,443
27.02.2020 USD 40,600,000 SGD 54,365,430 EUR 61,431
-1,955,077

Notes to the Financial Statements
276
9 Off-balance-sheet transactions (continued)
Sub-Funds Maturity Purchase Sale
Unrealised
gain/loss in Sub-Fund
currency
Vontobel Fund - Eastern European
Bond
22.03.2019 CZK 275,000,000 EUR 10,720,516 EUR 711
22.03.2019 EUR 10,441,222 PLN 45,000,000 EUR -5,165
22.03.2019 EUR 3,154,614 RON 15,000,000 EUR 2,586
22.03.2019 EUR 814,142 TRY 5,000,000 EUR 3,149
22.03.2019 RUB 370,000,000 EUR 4,825,106 EUR 82,119
06.05.2019 TRY 10,000,000 EUR 1,590,336 EUR -15,472
67,928
Vontobel Fund - Value Bond
14.03.2019 JPY 17,256,000 USD 155,393 CHF -206
14.03.2019 USD 155,932 JPY 17,256,000 CHF 743
22.03.2019 CHF 73,042,866 EUR 65,000,000 CHF -673,538
22.03.2019 CHF 464,434 GBP 375,000 CHF -32,004
22.03.2019 CHF 14,747,036 USD 15,000,000 CHF -164,342
22.03.2019 EUR 880,324 CHF 1,000,000 CHF -1,629
22.03.2019 EUR 597,432 GBP 520,000 CHF -10,817
-881,793
Vontobel Fund - Absolute Return Bond
(EUR)
04.03.2019 EUR 1,102,514 GBP 957,500 EUR -15,771
04.03.2019 EUR 5,413,278 USD 6,158,665 EUR 6,827
04.03.2019 GBP 957,500 EUR 1,117,635 EUR 648
04.03.2019 KRW 2,034,900,000 USD 1,812,538 EUR -3,084
04.03.2019 USD 6,174,381 EUR 5,423,832 EUR -3,581
04.03.2019 USD 1,796,821 KRW 2,034,900,000 EUR -10,718
14.03.2019 AUD 815,144 USD 584,481 EUR -3,856
14.03.2019 EUR 498,606 CAD 746,381 EUR 1,335
14.03.2019 EUR 545,479 CHF 619,104 EUR -370
14.03.2019 EUR 1,117,270 GBP 957,500 EUR -656
14.03.2019 EUR 757,419 NZD 1,250,000 EUR 9,983
14.03.2019 EUR 5,419,352 USD 6,174,381 EUR 3,527
14.03.2019 JPY 315,632,956 USD 2,842,316 EUR -3,318
14.03.2019 MXN 15,569,968 USD 811,724 EUR -4,853
22.03.2019 EUR 1,000,997 GBP 890,000 EUR -37,868
22.03.2019 EUR 13,300,000 USD 15,201,202 EUR -24,347
22.03.2019 USD 1,800,000 EUR 1,566,197 EUR 11,556
29.03.2019 USD 2,438,352 EUR 2,141,715 EUR -5,743
30.10.2019 CNH 4,510,720 USD 640,000 EUR 29,321
30.10.2019 USD 640,000 CNH 4,502,880 EUR -28,308
09.12.2019 AUD 4,000,000 JPY 306,880,000 EUR 32,329
09.12.2019 JPY 306,880,000 AUD 3,975,109 EUR -17,383
-64,330
Vontobel Fund - Absolute Return Bond
Dynamic
04.03.2019 EUR 647,000 GBP 561,900 EUR -9,255
04.03.2019 EUR 2,499,834 USD 2,844,051 EUR 3,153
04.03.2019 GBP 561,900 EUR 655,874 EUR 380
04.03.2019 KRW 678,300,000 USD 604,249 EUR -1,089
04.03.2019 USD 2,849,360 EUR 2,502,995 EUR -1,652
04.03.2019 USD 598,940 KRW 678,300,000 EUR -3,573
14.03.2019 AUD 1,056,161 USD 757,297 EUR -4,997
14.03.2019 CAD 457,244 EUR 305,453 EUR -817
14.03.2019 EUR 655,659 GBP 561,900 EUR -385
14.03.2019 EUR 757,419 NZD 1,250,000 EUR 9,983

Notes to the Financial Statements
277
9 Off-balance-sheet transactions (continued)
Sub-Funds Maturity Purchase Sale
Unrealised
gain/loss in Sub-Fund
currency
Vontobel Fund - Absolute Return Bond
Dynamic (continued)
14.03.2019 EUR 2,500,928 USD 2,849,360 EUR 1,627
14.03.2019 JPY 257,652,288 USD 2,320,193 EUR -2,709
14.03.2019 MXN 6,672,844 USD 347,882 EUR -2,080
22.03.2019 EUR 26,677 CHF 30,000 EUR 225
22.03.2019 EUR 463,039 GBP 420,000 EUR -27,218
22.03.2019 EUR 3,642,381 USD 4,170,000 EUR -12,770
29.03.2019 CHF 3,507,365 EUR 3,086,532 EUR 6,383
29.03.2019 USD 328,851 EUR 288,845 EUR -775
30.10.2019 CNH 1,127,680 USD 160,000 EUR 7,330
30.10.2019 USD 160,000 CNH 1,125,720 EUR -7,077
09.12.2019 AUD 1,000,000 JPY 76,720,000 EUR 8,082
09.12.2019 JPY 76,720,000 AUD 993,777 EUR -4,346
-41,580
Vontobel Fund - Global Convertible
Bond
01.03.2019 CHF 13,629 EUR 11,994 EUR 21
29.03.2019 CHF 45,248,457 EUR 39,819,295 EUR 82,342
29.03.2019 USD 2,619,767 EUR 2,301,063 EUR -6,172
12.04.2019 EUR 2,994,980 GBP 2,700,000 EUR -154,510
12.04.2019 EUR 21,609,340 JPY 2,700,000,000 EUR 312,405
12.04.2019 EUR 19,035,986 USD 22,000,000 EUR -212,708
21,378
Vontobel Fund – Sustainable Emerging
Markets Local Currency Bond
01.03.2019 CHF 8,625 USD 8,623 USD 37
01.03.2019 EUR 224,445 USD 255,033 USD 585
01.03.2019 USD 1,210 ZAR 16,811 USD 14
04.03.2019 CHF 42,809 USD 42,893 USD 98
04.03.2019 EUR 31,808 USD 36,219 USD 14
04.03.2019 USD 1,273,031 ZAR 17,756,778 USD 10,760
07.03.2019 RON 16,941,685 USD 4,071,011 USD -6,549
07.03.2019 USD 4,031,786 RON 16,941,685 USD -32,683
29.03.2019 AUD 120,380 USD 86,414 USD -726
29.03.2019 CHF 28,725,377 USD 28,781,472 USD 135,533
29.03.2019 EUR 12,390,737 USD 14,108,584 USD 36,247
29.03.2019 JPY 295,845,355 USD 2,679,067 USD -15,086
29.03.2019 PLN 10,213,303 USD 2,672,818 USD 32,696
29.03.2019 USD 3,036,693 ARS 120,000,000 USD 47,352
29.03.2019 USD 255,492 EUR 224,445 USD -724
29.03.2019 USD 2,780,000 INR 199,006,300 USD -14,861
29.03.2019 USD 1,084,813 KES 110,000,000 USD -11,274
29.03.2019 USD 972,447 ZMW 12,000,000 USD -10,840
29.03.2019 ZAR 7,504,719 USD 538,584 USD -6,687
31.05.2019 UGX 4,300,000,000 USD 1,151,272 USD -7,472
156,434
Vontobel Fund - European Equity
29.03.2019 USD 12,181,005 EUR 10,699,133 EUR -28,689
-28,689
Vontobel Fund - US Equity
01.03.2019 EUR 12,202 USD 13,865 USD 32
01.03.2019 USD 428,785 EUR 377,646 USD -1,312
04.03.2019 EUR 1,508 USD 1,717 USD 1
04.03.2019 USD 5,281,033 EUR 4,641,381 USD -6,110
29.03.2019 CHF 4,580,334 USD 4,589,279 USD 21,611
29.03.2019 EUR 462,697,876 USD 526,856,328 USD 1,343,372
1,357,594

Notes to the Financial Statements
278
9 Off-balance-sheet transactions (continued)
Sub-Funds Maturity Purchase Sale
Unrealised
gain/loss in Sub-Fund
currency
Vontobel Fund - Global Equity
01.03.2019 EUR 1,827,352 USD 2,076,390 USD 4,762
01.03.2019 USD 369,947 EUR 325,825 USD -1,132
01.03.2019 USD 429 SEK 4,000 USD -4
04.03.2019 EUR 67,527 USD 76,892 USD 30
04.03.2019 USD 78,496 EUR 68,988 USD -91
29.03.2019 EUR 434,325,833 USD 494,540,651 USD 1,270,520
29.03.2019 SEK 6,548,213 USD 704,692 USD 6,385
1,280,470
Vontobel Fund - Global Equity Income
29.03.2019 EUR 8,205,437 USD 9,343,031 USD 24,009
24,009
Vontobel Fund - Emerging Markets
Equity
01.03.2019 EUR 80,511 USD 91,483 USD 210
01.03.2019 USD 1,952 CHF 1,955 USD -10
01.03.2019 USD 106,144 EUR 93,484 USD -325
04.03.2019 EUR 121,193 USD 138,000 USD 54
04.03.2019 USD 24,479 CHF 24,458 USD -83
04.03.2019 USD 273,869 EUR 240,697 USD -317
29.03.2019 CHF 91,519,231 USD 91,697,955 USD 431,801
29.03.2019 EUR 358,370,194 USD 408,054,738 USD 1,048,132
29.03.2019 GBP 1,079 USD 1,430 USD 7
29.03.2019 USD 60,913 EUR 53,511 USD -173
1,479,296
Vontobel Fund - Asia Pacific Equity
29.03.2019 EUR 7,624,311 USD 8,674,446 USD 27,867
27,867
Vontobel Fund - New Power
04.03.2019 EUR 23,527 CHF 26,752 EUR -57
29.03.2019 CHF 14,986,975 EUR 13,188,754 EUR 27,273
29.03.2019 GBP 1,421,458 EUR 1,655,386 EUR 3,396
29.03.2019 USD 3,326,417 EUR 2,921,744 EUR -7,834
22,778
Vontobel Fund - Clean Technology
01.03.2019 EUR 8,960 CHF 10,190 EUR -22
29.03.2019 CHF 6,044,477 EUR 5,319,227 EUR 11,000
29.03.2019 USD 351,272 EUR 308,538 EUR -828
10,150
Vontobel Fund - Future Resources
29.03.2019 CHF 697,926 EUR 614,185 EUR 1,270
1,270
Vontobel Fund - mtx Sustainable Asian
Leaders (ex Japan)
29.03.2019 EUR 95,318,595 USD 108,447,307 USD 348,385
29.03.2019 SEK 18,061,271 USD 1,941,648 USD 13,737
29.03.2019 USD 385,083 EUR 337,451 USD -80
362,042
Vontobel Fund - mtx Sustainable
Emerging Markets Leaders
01.03.2019 USD 24,028 CHF 24,060 USD -129
01.03.2019 USD 310,456 EUR 273,430 USD -950
04.03.2019 EUR 23,310 USD 26,542 USD 10
04.03.2019 USD 8,007 CHF 8,000 USD -27

Notes to the Financial Statements
279
9 Off-balance-sheet transactions (continued)
Sub-Funds Maturity Purchase Sale
Unrealised
gain/loss in Sub-Fund
currency
Vontobel Fund - mtx Sustainable
Emerging Markets Leaders (continued)
04.03.2019 USD 538,503 EUR 473,278 USD -623
29.03.2019 CHF 15,500,868 USD 15,531,199 USD 73,076
29.03.2019 EUR 114,871,689 USD 130,798,416 USD 335,084
29.03.2019 USD 136,482 CHF 135,689 USD -111
29.03.2019 USD 172,130 EUR 150,895 USD -126
406,204
Vontobel Fund - mtx Sustainable
Global Leaders
01.03.2019 EUR 66,610 USD 75,688 USD 174
29.03.2019 CHF 6,207,864 USD 6,219,987 USD 29,290
29.03.2019 EUR 10,858,271 USD 12,363,651 USD 31,771
29.03.2019 GBP 16,987 USD 22,523 USD 106
29.03.2019 USD 104,582 EUR 91,662 USD -56
61,285
Vontobel Fund - Commodity
01.03.2019 EUR 16,982 USD 19,296 USD 44
01.03.2019 SEK 511,768 USD 54,973 USD 478
01.03.2019 USD 5,017 EUR 4,418 USD -15
04.03.2019 EUR 35,411 USD 40,322 USD 16
04.03.2019 SEK 81,200 USD 8,783 USD 17
29.03.2019 CHF 76,554,227 USD 76,707,036 USD 357,883
29.03.2019 EUR 55,564,590 USD 63,268,927 USD 161,662
29.03.2019 SEK 43,227,591 USD 4,651,976 USD 42,152
29.03.2019 USD 919,916 CHF 918,455 USD -4,652
29.03.2019 USD 970,545 EUR 852,530 USD -2,666
29.03.2019 USD 129,979 SEK 1,208,184 USD -1,216
553,703
Vontobel Fund - Dynamic Commodity
01.03.2019 USD 5,018 EUR 4,420 USD -15
04.03.2019 EUR 5,677 USD 6,464 USD 3
04.03.2019 USD 17,054 EUR 14,988 USD -20
29.03.2019 CHF 18,882,961 USD 18,920,787 USD 88,143
29.03.2019 EUR 22,516,765 USD 25,639,010 USD 65,340
29.03.2019 USD 333,119 CHF 332,589 USD -1,685
29.03.2019 USD 456,730 EUR 401,192 USD -1,254
150,512
Vontobel Fund - Non Food Commodity
01.03.2019 USD 795 EUR 700 USD -2
29.03.2019 CHF 575,202 USD 576,366 USD 2,673
29.03.2019 EUR 7,228,286 USD 8,230,697 USD 20,859
29.03.2019 USD 6,353 CHF 6,343 USD -32
29.03.2019 USD 89,258 EUR 78,404 USD -245
23,253
Vontobel Fund - Emerging Markets
Debt
01.03.2019 CHF 3,535 USD 3,534 USD 15
01.03.2019 EUR 393,643 USD 447,290 USD 1,026
01.03.2019 USD 90,440 CHF 90,562 USD -485
01.03.2019 USD 689,830 EUR 607,557 USD -2,110
01.03.2019 USD 18,632 GBP 14,079 USD -97
04.03.2019 CHF 9,710 USD 9,729 USD 22
04.03.2019 EUR 275,710 USD 313,947 USD 123
04.03.2019 USD 228,247 CHF 228,053 USD -773
04.03.2019 USD 233,693 EUR 205,388 USD -270

Notes to the Financial Statements
280
9 Off-balance-sheet transactions (continued)
Sub-Funds Maturity Purchase Sale
Unrealised
gain/loss in Sub-Fund
currency
Vontobel Fund - Emerging Markets
Debt (continued)
22.03.2019 USD 54,021,008 CHF 53,300,000 USD 402,104
22.03.2019 USD 6,067,727 GBP 4,805,000 USD -330,476
22.03.2019 USD 11,561,449 JPY 1,300,000,000 USD -137,367
29.03.2019 CHF 437,527,816 USD 438,385,380 USD 2,061,185
29.03.2019 EUR 833,948,312 USD 949,581,889 USD 2,424,317
29.03.2019 GBP 7,098,595 USD 9,412,187 USD 44,263
29.03.2019 USD 1,365,132,000 EUR 1,200,000,000 USD -4,734,089
29.03.2019 USD 102,400,349 GBP 78,300,000 USD -1,904,676
21.06.2019 USD 35,247,561 BRL 139,791,825 USD -1,723,670
21.06.2019 USD 8,000,000 IDR 115,928,000,000 USD -75,923
-3,976,881
Vontobel Fund - Global Bond
29.03.2019 CHF 34,654,587 USD 34,722,261 USD 163,508
29.03.2019 EUR 16,312,911 USD 18,574,517 USD 47,732
18.04.2019 USD 522,435 AUD 725,000 USD 6,207
18.04.2019 USD 793,932 CAD 1,050,000 USD -4,280
18.04.2019 USD 26,767,080 EUR 23,265,000 USD 160,769
18.04.2019 USD 3,492,882 GBP 2,700,000 USD -107,558
18.04.2019 USD 793,268 JPY 85,500,000 USD 21,944
288,322
Vontobel Fund - Credit Opportunities
21.06.2019 USD 10,002,643 EUR 8,700,000 USD -85
21.06.2019 USD 1,936,653 GBP 1,450,000 USD -3,017
-3,102
Vontobel Fund - Global Corporate
Bond Mid Yield
01.03.2019 USD 475,090 CHF 475,731 USD -2,546
01.03.2019 USD 230,188 EUR 202,734 USD -704
04.03.2019 CHF 417,358 USD 418,174 USD 955
04.03.2019 EUR 3,232,724 USD 3,681,055 USD 1,445
04.03.2019 USD 1,237,959 EUR 1,088,014 USD -1,432
29.03.2019 CHF 84,065,999 USD 84,230,310 USD 396,493
29.03.2019 EUR 85,800,884 USD 97,699,149 USD 248,138
29.03.2019 USD 3,691,216 EUR 3,236,642 USD -3,612
17.04.2019 GBP 1,600,000 USD 2,119,321 USD 14,326
17.04.2019 USD 62,304,934 EUR 54,500,000 USD -15,153
17.04.2019 USD 10,427,334 GBP 8,000,000 USD -240,279
397,631
Vontobel Fund - Emerging Markets
Blend
26.02.2019 MXN 84,966,468 USD 4,375,260 USD 34,075
22.03.2019 JPY 109,500,000 USD 973,931 USD 11,320
22.03.2019 USD 2,100,000 CHF 2,071,651 USD 16,237
22.03.2019 USD 23,088,146 EUR 20,200,000 USD 45,359
22.03.2019 USD 2,468,753 GBP 1,955,000 USD -134,297
29.03.2019 CHF 28,828,020 USD 28,884,316 USD 130,481
29.03.2019 EUR 454,533 USD 517,549 USD 1,238
29.03.2019 USD 883 EUR 776 USD -2
26.04.2019 CZK 25,914,485 EUR 1,007,085 USD 1,545
26.04.2019 EUR 6,794,351 USD 7,740,878 USD 31,838
26.04.2019 HUF 649,330,140 EUR 2,040,748 USD 15,839
26.04.2019 JPY 44,732,120 USD 405,364 USD -1,733
26.04.2019 PLN 11,640,266 EUR 2,675,033 USD 24,260

Notes to the Financial Statements
281
9 Off-balance-sheet transactions (continued)
Sub-Funds Maturity Purchase Sale
Unrealised
gain/loss in Sub-Fund
currency
Vontobel Fund - Emerging Markets
Blend (continued)
26.04.2019 RUB 131,354,460 USD 1,991,246 USD -16,332
26.04.2019 ZAR 30,050,000 USD 2,127,870 USD -5,409
21.06.2019 BRL 8,704,820 USD 2,200,000 USD 101,259
21.06.2019 CLP 1,088,123,520 USD 1,602,996 USD 58,569
21.06.2019 IDR 70,399,250,000 USD 4,817,660 USD 114,511
21.06.2019 INR 140,346,000 USD 1,935,593 USD 7,216
21.06.2019 USD 782,122 BRL 3,100,800 USD -37,949
21.06.2019 USD 1,950,000 INR 142,802,400 USD -27,234
370,791
Vontobel Fund - Emerging Markets
Corporate Bond
01.03.2019 USD 36,420 EUR 32,076 USD -111
04.03.2019 USD 90,325 CHF 90,248 USD -306
04.03.2019 USD 295,187 EUR 259,434 USD -342
22.03.2019 EUR 2,882,895 USD 3,290,689 USD -1,701
22.03.2019 USD 24,821,527 EUR 21,700,000 USD 64,677
22.03.2019 USD 3,250,615 GBP 2,500,000 USD -78,423
22.03.2019 USD 317,412 JPY 35,700,000 USD -3,856
29.03.2019 CHF 3,072,007 USD 3,078,194 USD 14,307
29.03.2019 EUR 33,833,573 USD 38,524,226 USD 98,997
29.03.2019 USD 8,087 CHF 8,058 USD -24
28.06.2019 USD 1,000,000 BRL 3,792,670 USD -2,084
91,134
Vontobel Fund - TwentyFour Absolute
Return Credit Fund
01.03.2019 CHF 10,471 GBP 7,908 GBP -5
01.03.2019 EUR 114,635 GBP 98,405 GBP -260
01.03.2019 GBP 460,264 EUR 536,759 GBP 718
01.03.2019 USD 75,707 GBP 57,208 GBP -296
04.03.2019 EUR 1,099,629 GBP 939,097 GBP 2,431
04.03.2019 GBP 96,448 CHF 128,520 GBP -563
04.03.2019 GBP 2,249 USD 3,000 GBP -6
15.03.2019 GBP 66,755,129 EUR 75,976,798 GBP 1,678,200
15.03.2019 GBP 48,460,224 USD 62,237,287 GBP 1,706,935
29.03.2019 CHF 23,337,333 GBP 17,635,412 GBP -104
29.03.2019 EUR 339,004,973 GBP 291,138,825 GBP -635,676
29.03.2019 GBP 23,119 CHF 30,614 GBP -15
29.03.2019 GBP 1,249,021 EUR 1,462,538 GBP -4,266
29.03.2019 USD 33,423,134 GBP 25,210,451 GBP -120,984
2,626,109
Vontobel Fund - TwentyFour Strategic
Income Fund
01.03.2019 CHF 33,172 GBP 25,053 GBP -17
01.03.2019 EUR 2,697,209 GBP 2,315,325 GBP -6,112
01.03.2019 GBP 4,929 CHF 6,536 GBP -3
01.03.2019 GBP 197,900 EUR 230,791 GBP 309
01.03.2019 GBP 448,646 USD 594,200 GBP 1,962
01.03.2019 USD 8,420 GBP 6,363 GBP -33
04.03.2019 CHF 160,890 GBP 120,900 GBP 545
04.03.2019 EUR 1,474,462 GBP 1,259,210 GBP 3,260
04.03.2019 GBP 14,878 CHF 19,826 GBP -87
04.03.2019 GBP 775,638 EUR 909,214 GBP -2,852
04.03.2019 GBP 280,713 NOK 3,195,453 GBP -383
04.03.2019 GBP 1,625,507 USD 2,168,642 GBP -4,545
04.03.2019 USD 41,382 GBP 31,043 GBP 62
14.03.2019 GBP 53,428,073 AUD 96,998,988 GBP 1,569,610

Notes to the Financial Statements
282
9 Off-balance-sheet transactions (continued)
Sub-Funds Maturity Purchase Sale
Unrealised
gain/loss in Sub-Fund
currency
Vontobel Fund - TwentyFour Strategic
Income Fund (continued)
14.03.2019 GBP 378,143,875 EUR 430,651,953 GBP 9,287,340
14.03.2019 GBP 590,272,861 USD 759,556,630 GBP 19,653,273
29.03.2019 CHF 74,763,085 GBP 56,499,080 GBP -2,903
29.03.2019 EUR 565,187,952 GBP 485,379,786 GBP -1,053,913
29.03.2019 GBP 3,429,194 EUR 4,001,711 GBP 12
29.03.2019 HKD 25,085,582 GBP 2,413,602 GBP -12,225
29.03.2019 NOK 496,097,875 GBP 43,564,438 GBP 68,378
29.03.2019 SGD 4,920,476 GBP 2,752,033 GBP -17,135
29.03.2019 USD 406,802,668 GBP 306,829,329 GBP -1,458,143
28,026,400
Vontobel Fund - LCR Global Bond
22.03.2019 EUR 16,802,588 CAD 25,500,000 EUR -178,532
22.03.2019 EUR 7,090,660 SEK 72,800,000 EUR 165,360
22.03.2019 EUR 11,954,155 USD 13,700,000 EUR -54,401
-67,573
Vontobel Fund - Multi Asset Income
29.03.2019 CHF 4,697,633 EUR 4,133,985 EUR 8,549
29.03.2019 USD 301,445 EUR 264,773 EUR -710
16.04.2019 EUR 1,953,786 CHF 2,200,000 EUR 13,396
16.04.2019 EUR 3,344,347 GBP 3,000,000 EUR -154,597
16.04.2019 EUR 7,783,878 USD 9,000,000 EUR -87,826
-221,188
Vontobel Fund -
TwentyFour Monument European
Asset Backed Securities
01.03.2019 CHF 8,698 EUR 7,655 EUR 13
04.03.2019 EUR 22,424 CHF 25,497 EUR -55
21.03.2019 EUR 128,630,446 GBP 113,142,861 EUR -3,440,335
29.03.2019 CHF 65,027,138 EUR 57,224,820 EUR 118,335
29.03.2019 GBP 1,978 EUR 2,303 EUR 5
29.03.2019 USD 27,098,371 EUR 23,801,735 EUR -63,822
-3,385,859
Vontobel Fund - Multi Asset Defensive
29.03.2019 CHF 153,991 EUR 135,514 EUR 280
29.03.2019 USD 164,493 EUR 144,481 EUR -387
-107
Vontobel Fund - Multi Asset Alphabet
21.03.2019 EUR 8,028,450 USD 9,250,000 EUR -80,303
21.03.2019 SEK 7,900,000 EUR 770,377 EUR -18,862
21.03.2019 USD 1,400,000 EUR 1,220,565 EUR 6,684
22.03.2019 EUR 1,159,824 JPY 145,000,000 EUR 16,046
22.03.2019 JPY 195,000,000 EUR 1,572,137 EUR -33,952
29.03.2019 CHF 118,121 EUR 103,948 EUR 215
29.03.2019 GBP 979 EUR 1,140 EUR 2
29.03.2019 USD 981 EUR 861 EUR -2
-110,172
Vontobel Fund – Vescore Artificial
Intelligence Multi Asset
29.03.2019 CHF 1,046 EUR 920 EUR 2
29.03.2019 GBP 1,051 EUR 1,224 EUR 2
4
Vontobel Fund – Alternative risk
Premia
29.03.2019 CHF 1,011 USD 1,013 USD 5
29.03.2019 EUR 1,011 USD 1,151 USD 3
8

Notes to the Financial Statements
283
9 Off-balance-sheet transactions (continued)
b) Futures
The following futures contracts were open as at February 28, 2019:
Sub-Funds Contract Currency Number of
contracts Commitment
Unrealised gain/loss
in Sub-Fund
currency
Vontobel Fund - Swiss Money EURO CHF 3 MONTH
18/03/2019 CHF -30 -7,554,000 CHF 0
EURO SCHATZ
07/03/2019 EUR -75 -8,386,125 CHF 9,359
CHF 9,359
Vontobel Fund - Euro Short
Term Bond
EURO SCHATZ
07/03/2019 EUR -130 -14,535,950 EUR 13,000
EUR 13,000
Vontobel Fund - Swiss Franc
Bond
10Y BTP ITALIAN BOND
07/03/2019 EUR -15 -1,923,600 CHF -2,671
EURO-BUXL-FUTURES
07/03/2019 EUR -5 -920,200 CHF 14,520
CHF 11,849
Vontobel Fund - Euro Bond 10Y BTP ITALIAN BOND
07/03/2019 EUR -7 -897,680 EUR -9,520
EURO BUND 07/03/2019 EUR 5 826,550 EUR -4,950
EUR -14,470
Vontobel Fund - EUR
Corporate Bond Mid Yield
10Y BTP ITALIAN BOND
07/03/2019 EUR 20 2,564,800 EUR 118,400
EURO BUND 07/03/2019 EUR 50 8,265,500 EUR 159,000
TREASURY BONDS USA
19/06/2019 USD 300 43,340,625 EUR -331,391
EUR -53,991
Vontobel Fund - Bond Global
Aggregate
10Y BTP ITALIAN BOND
07/03/2019 EUR -93 -11,926,320 EUR 39,460
10Y TREASURY NOTES
USA 19/06/2019 USD 1,200 146,400,000 EUR -238,759
2Y TREASURY NOTES USA
28/06/2019 USD -444 -94,214,719 EUR 27,416
5Y TREASURY NOTES USA
28/06/2019 USD 2,239 256,505,438 EUR -92,245
AUD/USD SPOT CROSS
18/03/2019 USD -53 -3,760,350 EUR 38,632
CBOE SPX VOLATILITY
INDEX 19/03/2019 USD 911 14,188,825 EUR -934,065
CBOE SPX VOLATILITY
INDEX 19/06/2019 USD -911 -15,259,250 EUR 507,955
CURRENCY FUTURE /CAD
19/03/2019 USD 50 3,806,500 EUR 23,053
EUR/USD SPOT -CROSS
RATES 18/03/2019 USD 27 3,845,306 EUR -593
EURO BUND 07/03/2019 EUR -1,243 -205,480,330 EUR 688,835
GBP/USD SPOT CROSS
18/03/2019 USD -47 -3,900,413 EUR -70,942
LONG GILT STERLING
FUTURES 26/06/2019 GBP 665 83,650,350 EUR -1,322,635
NZD/USD SPOT CROSS
18/03/2019 USD -55 -3,745,500 EUR 28,980
SPOT / CROSS CHF / USD
18/03/2019 USD 30 3,764,250 EUR -17,454
TREASURY BONDS USA
19/06/2019 USD -612 -88,414,875 EUR 671,819
EUR -650,543

Notes to the Financial Statements
284
9 Off-balance-sheet transactions (continued)
Sub-Funds Contract Currency Number of
contracts Commitment
Unrealised gain/loss
in Sub-Fund
currency
Vontobel Fund - Value Bond 10Y TREASURY NOTES
USA 19/06/2019 USD 62 7,564,000 CHF -13,993
5Y TREASURY NOTES USA
28/06/2019 USD 504 57,739,500 CHF -23,535
EURO BUND 07/03/2019 EUR -115 -19,010,650 CHF -408,205
EURO OAT FUT FRENCH
GVT BDS 07/03/2019 EUR -17 -2,599,300 CHF -41,076
LONG GILT STERLING
FUTURES 26/06/2019 GBP 33 4,151,070 CHF -74,454
TREASURY BONDS USA
19/06/2019 USD -93 -13,435,594 CHF 115,808
CHF -445,455
Vontobel Fund - Absolute
Return Bond (EUR)
10Y BTP ITALIAN BOND
07/03/2019 EUR -9 -1,154,160 EUR 3,820
10Y TREASURY NOTES
USA 19/06/2019 USD -28 -3,416,000 EUR 11,142
2Y TREASURY NOTES USA
28/06/2019 USD -12 -2,546,344 EUR 741
5Y TREASURY NOTES USA
28/06/2019 USD 301 34,483,313 EUR -12,391
CBOE SPX VOLATILITY
INDEX 19/03/2019 USD 70 1,090,250 EUR -71,709
CBOE SPX VOLATILITY
INDEX 19/06/2019 USD -70 -1,172,500 EUR 38,970
EURO OAT FUT FRENCH
GVT BDS 07/03/2019 EUR -15 -2,293,500 EUR -31,950
LONG GILT STERLING
FUTURES 26/06/2019 GBP 21 2,641,590 EUR -41,794
TREASURY BONDS USA
19/06/2019 USD -60 -8,668,125 EUR 65,865
EUR -37,306
Vontobel Fund - Absolute
Return Bond Dynamic
10Y BTP ITALIAN BOND
07/03/2019 EUR -6 -769,440 EUR 2,550
10Y TREASURY NOTES
USA 19/06/2019 USD -50 -6,100,000 EUR 19,897
2Y TREASURY NOTES USA
28/06/2019 USD -12 -2,546,344 EUR 741
5Y TREASURY NOTES USA
28/06/2019 USD 81 9,279,563 EUR -3,334
AUD/USD SPOT CROSS
18/03/2019 USD -5 -354,750 EUR 3,645
CBOE SPX VOLATILITY
INDEX 19/03/2019 USD 70 1,090,250 EUR -71,710
CBOE SPX VOLATILITY
INDEX 19/06/2019 USD -70 -1,172,500 EUR 38,970
CURRENCY FUTURE /CAD
19/03/2019 USD 4 304,520 EUR 1,844
EUR/USD SPOT -CROSS
RATES 18/03/2019 USD 2 284,838 EUR -44
EURO BUND 07/03/2019 EUR 30 4,959,300 EUR -10,500
EURO STOXX 50 PR
15/03/2019 EUR -20 -659,600 EUR -65,600
GBP/USD SPOT CROSS
18/03/2019 USD -4 -331,950 EUR -6,038
LONG GILT STERLING
FUTURES 26/06/2019 GBP 5 628,950 EUR -9,940
NZD/USD SPOT CROSS
18/03/2019 USD -5 -340,500 EUR 2,635

Notes to the Financial Statements
285
9 Off-balance-sheet transactions (continued)
Sub-Funds Contract Currency Number of
contracts Commitment
Unrealised gain/loss
in Sub-Fund
currency
Vontobel Fund - Absolute
Return Bond Dynamic
(continued)
S&P 500 EMINI INDEX
15/03/2019
USD -5 -696,188 EUR -19,541
SPOT / CROSS CHF / USD
18/03/2019 USD 3 376,425 EUR -1,745
TOPIX INDEX (TOKYO)
07/03/2019 JPY 5 80,300,000 EUR 34,120
TREASURY BONDS USA
19/06/2019 USD -14 -2,022,563 EUR 15,368
EUR -68,682
Vontobel Fund – Sustainable
Emerging Markets Local
Currency Bond
EURO OAT FUT FRENCH
GVT BDS 07/03/2019
EUR -18 -2,752,200 EUR 7,652
EURO-BUXL-FUTURES
07/03/2019 EUR -26 -4,785,040 EUR -232,340
EUR -224,688
Vontobel Fund - Emerging
Market Debt
10Y TREASURY NOTES
USA 19/06/2019 USD 3,371 411,262,000 USD -763,713
30Y TREASURY NOTES
USA 19/06/2019 USD 543 86,659,406 USD -1,276,899
5Y TREASURY NOTES USA
28/06/2019 USD 3,000 343,687,500 USD -140,797
EURO BOBL 07/03/2019 EUR -250 -33,180,000 USD -167,958
EURO BUND 07/03/2019 EUR -3,180 -525,685,800 USD -8,997,426
EURO-BUXL-FUTURES
07/03/2019 EUR -992 -182,567,680 USD -8,833,397
LONG GILT STERLING
FUTURES 26/06/2019 GBP -853 -107,298,870 USD 1,928,778
TREASURY BONDS USA
19/06/2019 USD 1,960 283,158,750 USD -2,564,875
USD -20,816,287
Vontobel Fund - Emerging
Markets Corporate Bond
10Y TREASURY NOTES
USA 19/06/2019 USD 38 4,636,000 USD -8,609
2Y TREASURY NOTES USA
28/06/2019 USD -50 -10,609,766 USD 3,515
EURO BOBL 07/03/2019 EUR -6 -796,320 USD -4,031
EURO BUND 07/03/2019 EUR -31 -5,124,610 USD 48,908
EURO-BUXL-FUTURES
07/03/2019 EUR -4 -736,160 USD -35,619
USD 4,164
Vontobel Fund - Credit
Opportunities 10Y TREASURY NOTES
USA 19/06/2019 USD -20 -2,440,000 USD 6,876
2Y TREASURY NOTES USA
28/06/2019 USD 43 9,124,398 USD -3,022
EURO BUND 07/03/2019 EUR -10 -1,653,100 USD 13,778
SHORT EURO BTP ITALIAN
BOND 07/03/2019 EUR 12 1,335,600 USD 28,149
USD 45,781
Vontobel Fund - Global
Corporate Bond Mid Yield 30Y TREASURY NOTES
USA 19/06/2019 USD 70 11,171,563 USD -164,609
USD -164,609
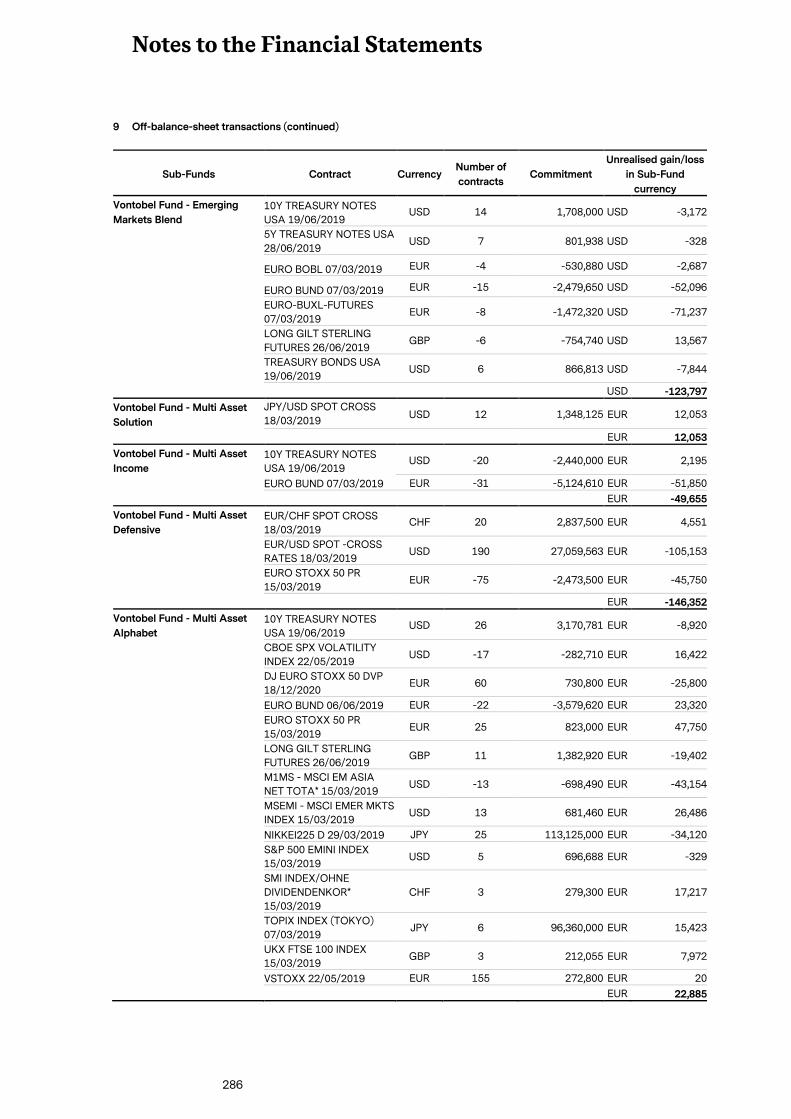
Notes to the Financial Statements
286
9 Off-balance-sheet transactions (continued)
Sub-Funds Contract Currency Number of
contracts Commitment
Unrealised gain/loss
in Sub-Fund
currency
Vontobel Fund - Emerging
Markets Blend
10Y TREASURY NOTES
USA 19/06/2019 USD 14 1,708,000 USD -3,172
5Y TREASURY NOTES USA
28/06/2019 USD 7 801,938 USD -328
EURO BOBL 07/03/2019 EUR -4 -530,880 USD -2,687
EURO BUND 07/03/2019 EUR -15 -2,479,650 USD -52,096
EURO-BUXL-FUTURES
07/03/2019 EUR -8 -1,472,320 USD -71,237
LONG GILT STERLING
FUTURES 26/06/2019 GBP -6 -754,740 USD 13,567
TREASURY BONDS USA
19/06/2019 USD 6 866,813 USD -7,844
USD -123,797
Vontobel Fund - Multi Asset
Solution JPY/USD SPOT CROSS
18/03/2019 USD 12 1,348,125 EUR 12,053
EUR 12,053
Vontobel Fund - Multi Asset
Income
10Y TREASURY NOTES
USA 19/06/2019 USD -20 -2,440,000 EUR 2,195
EURO BUND 07/03/2019 EUR -31 -5,124,610 EUR -51,850
EUR -49,655
Vontobel Fund - Multi Asset
Defensive
EUR/CHF SPOT CROSS
18/03/2019 CHF 20 2,837,500 EUR 4,551
EUR/USD SPOT -CROSS
RATES 18/03/2019 USD 190 27,059,563 EUR -105,153
EURO STOXX 50 PR
15/03/2019 EUR -75 -2,473,500 EUR -45,750
EUR -146,352
Vontobel Fund - Multi Asset
Alphabet
10Y TREASURY NOTES
USA 19/06/2019 USD 26 3,170,781 EUR -8,920
CBOE SPX VOLATILITY
INDEX 22/05/2019 USD -17 -282,710 EUR 16,422
DJ EURO STOXX 50 DVP
18/12/2020 EUR 60 730,800 EUR -25,800
EURO BUND 06/06/2019 EUR -22 -3,579,620 EUR 23,320
EURO STOXX 50 PR
15/03/2019 EUR 25 823,000 EUR 47,750
LONG GILT STERLING
FUTURES 26/06/2019 GBP 11 1,382,920 EUR -19,402
M1MS - MSCI EM ASIA
NET TOTA* 15/03/2019 USD -13 -698,490 EUR -43,154
MSEMI - MSCI EMER MKTS
INDEX 15/03/2019 USD 13 681,460 EUR 26,486
NIKKEI225 D 29/03/2019 JPY 25 113,125,000 EUR -34,120
S&P 500 EMINI INDEX
15/03/2019 USD 5 696,688 EUR -329
SMI INDEX/OHNE
DIVIDENDENKOR*
15/03/2019
CHF 3 279,300 EUR 17,217
TOPIX INDEX (TOKYO)
07/03/2019 JPY 6 96,360,000 EUR 15,423
UKX FTSE 100 INDEX
15/03/2019 GBP 3 212,055 EUR 7,972
VSTOXX 22/05/2019 EUR 155 272,800 EUR 20
EUR 22,885

Notes to the Financial Statements
287
9 Off-balance-sheet transactions (continued)
Sub-Funds Contract Currency Number of
contracts Commitment
Unrealised gain/loss
in Sub-Fund
currency
Vontobel Fund – Vescore
Artificial Intelligence Multi
Asset
10 YEARS CANADIAN
BONDS 19/06/2019
CAD 64 8,685,440 EUR -23,112
10Y BTP ITALIAN BOND
06/06/2019 EUR 15 1,896,000 EUR 750
10Y TREASURY NOTES
USA 19/06/2019 USD 53 6,466,000 EUR -24,727
10Y TSY BD AUSTRALIA
15/03/2019 AUD 72 9,720,887 EUR 126,276
DJ CBOT MINI SIZED DJ
IND AV 15/03/2019 USD 4 518,260 EUR 26,627
EURO BUND 06/06/2019 EUR 17 2,767,090 EUR 680
EURO OAT FUT FRENCH
GVT BDS 06/06/2019 EUR 19 3,005,230 EUR 1,140
EURO STOXX 50 PR
15/03/2019 EUR 19 626,620 EUR 33,760
HONG KONG HANG SENG
INDICES 28/03/2019 HKD 4 5,733,200 EUR 1,365
LONG GILT STERLING
FUTURES 26/06/2019 GBP 38 4,780,020 EUR -60,366
NASDAQ 100 E-MINI
INDEX 15/03/2019 USD 7 994,350 EUR 45,433
S&P / ASX 200 INDEX
21/03/2019 AUD 7 1,076,075 EUR 40,080
S&P 500 EMINI INDEX
15/03/2019 USD 4 556,950 EUR 20,242
S&P INDICES S&P/TSX 60
INDEX 14/03/2019 CAD 7 1,333,360 EUR 46,210
SIMSCI MSCI SINGAPORE
FREE 28/03/2019 SGD 28 1,007,440 EUR -16,125
SMI INDEX/OHNE
DIVIDENDENKOR*
15/03/2019
CHF 9 838,890 EUR 41,914
SWED OPTI OMX
STOCKHOLM 30 I*
15/03/2019
SEK 44 6,916,800 EUR 9,667
TOPIX INDEX (TOKYO)
07/03/2019 JPY 5 80,300,000 EUR 10,334
UKX FTSE 100 INDEX
15/03/2019 GBP 8 566,040 EUR 15,226
EUR 295,374

Notes to the Financial Statements
288
9 Off-balance-sheet transactions (continued)
c) Swaps
The counterparties to the swap contracts listed below are Barclays Bank, Crédit Suisse International London and
JP Morgan Securities.
The following swaps contracts were open as at February 28, 2019:
Vontobel Fund – Euro Short Term Bond
Credit Default Swaps
Type Counterpar
ty
Notional
value Currency
Sub-Fund
pays
to/receives
from the
counterparty
Currency Maturity
Interest
receivable/
Interest payable
on swaps
Unrealised
gain/loss in Sub-
Fund currency
Deposited
collateral
Form Value
CDS Protection
Buyer
BARCLAYS
BK PLC1,973,320 EUR 0 EUR 20.06.2023 -19,185 -178,742
Underlyings: MARKIT ITRX EUR XOVER 06/23
Total EUR -19,185 EUR -178,742
Vontobel Fund - Swiss Franc Bond
Credit Default Swaps
Type Counterpar
ty
Notional
value Currency
Sub-Fund
pays
to/receives
from the
counterparty
Currency Maturity
Interest
receivable/
Interest payable
on swaps
Unrealised
gain/loss in Sub-
Fund currency
Deposited
collateral
Form Value
CDS Protection
Buyer JPM SEC
PLC5,000,000 EUR 0 CHF 20.12.2023 -55,143 -554,849 Cash 540,000
Underlyings: MARKIT ITRX EUR XOVER 12/23
Total CHF -55,143 CHF -554,849 EUR 540,000
Vontobel Fund - Global Corporate Bond Mid Yield
Credit Default Swaps
Type Counterpar
ty
Notional
value Currency
Sub-Fund
pays
to/receives
from the
counterparty
Currency Maturity
Interest
receivable/
Interest payable
on swaps
Unrealised
gain/loss in Sub-
Fund currency
Deposited
collateral
Form Value
CDS Protection
Buyer
BARCLAYS
BK PLC9,866,600 EUR 0 USD 20.12.2023 -109,230 -1,099,072 Cash 886,976
Underlyings: MARKIT ITRX EUR XOVER 12/23
Total USD -109,230 USD -1,099,072 USD 886,976

Notes to the Financial Statements
289
9 Off-balance-sheet transactions (continued)
Vontobel Fund – Bond Global Aggregate
Credit Default Swaps
Type Counterpar
ty
Notional
value Currency
Sub-Fund
pays
to/receives
from the
counterparty
Currency Maturity
Interest
receivable/
Interest payable
on swaps
Unrealised
gain/loss in Sub-
Fund currency
Deposited
collateral
Form Value
CDS Protection
Buyer
CREDIT
SUISSE INT
LDN
9,800,000 USD 0 EUR 20.06.2023 -83,672 -579,265 Cash 613,500
Underlyings: MARKIT CDX.NA.HY.30 06/23
Total EUR -83,672 EUR -579,265 EUR 613,500
Vontobel Fund – Credit Opportunities
Credit Default Swaps
Type Counterpar
ty
Notional
value Currency
Sub-Fund
pays
to/receives
from the
counterparty
Currency Maturity
Interest
receivable/
Interest payable
on swaps
Unrealised
gain/loss in Sub-
Fund currency
Deposited
collateral
Form Value
CDS Protection
Buyer
JPM SEC
PLC7,000,000 USD 0 USD 20.06.2023 -13,611 -130,826 Cash 195,684
CDS Protection
Buyer
JPM SEC
PLC980,000 USD 0 USD 20.06.2023 -9,528 -65,961 Cash 195,684
CDS Protection
Buyer
BARCLAYS
BK PLC1,000,000 USD 0 USD 20.12.2023 -1,944 27,914
Underlyings: MARKIT CDX.NA.IG.30 06/23, MARKIT CDX.NA.HY.30 06/23, MARKIT CDX.EM.30 12/23
Total USD -25,083 USD -168,873 USD 195,684

Notes to the Financial Statements
290
9 Off-balance-sheet transactions (continued)
d) Contracts for Difference
The counterparties of the CFDs listed below are Citi Global London, Goldman Sachs, JPMorgan London
Securities, Macquarie Bank Limited, Morgan Stanley, Société Générale and UBS London.
The following contracts for difference were open as at February 28, 2019:
Vontobel Fund - Commodity - Long Positionen
CFD Counterparty Currency Maturity Notional value
Unrealised
gain/loss in Sub-
Fund currency
Deposited
collateral
Form
BBUXALC INDEX MACQUARIE USD 31.12.2099 23,398,904 0 Cash*
BO3 OW DIVE JPM SEC PLC USD 31.12.2099 15,630,064 8,792 Cash*
C0 OW DIVER JPM SEC PLC USD 31.12.2099 9,709,747 -30,121 Cash*
C3 OW DIVER JPM SEC PLC USD 31.12.2099 16,537,466 -47,353 Cash*
CO0 OW DIVE JPM SEC PLC USD 31.12.2099 33,113,618 -93,084 Cash*
CO3 OW DIVE JPM SEC PLC USD 31.12.2099 31,285,044 -77,501 Cash*
CT0 OW DIVE JPM SEC PLC USD 31.12.2099 25,206,558 46,665 Cash*
CT3 OW DIVE JPM SEC PLC USD 31.12.2099 10,697,888 17,410 Cash*
CVICPRB3 - BCOM F3 CITI GLOBAL LDN USD 31.12.2099 19,685,549 115,335 Cash*
DJUBSCI-F3 GOLDMAN INTL USD 31.12.2099 59,366,021 325,525 Cash*
ETFS COM DJ-UBS PLAT IND SEC CITI GLOBAL LDN USD 31.12.2099 1,640,797 105,947 Cash*
ETFS COM PERP CERT CITI GLOBAL LDN USD 31.12.2099 2,556,529 -15,884 Cash*
ETFS COMM.06-.../ETFS SOYBEANS CITI GLOBAL LDN USD 31.12.2099 6,530,411 -143,097 Cash*
ETFS COMM.SEC./ETFS COPPER CITI GLOBAL LDN USD 31.12.2099 28,898,319 1,434,204 Cash*
ETFS COMMODITY SEC - ETFS
CORN CITI GLOBAL LDN USD 31.12.2099 2,883,863 -95,290 Cash*
ETFS DJ-UBS TIN CITI GLOBAL LDN USD 31.12.2099 2,176,449 -10,861 Cash*
ETFS NICKEL COMMODITY CITI GLOBAL LDN USD 31.12.2099 3,940,346 -10,488 Cash*
GS COMMODIT GOLDMAN INTL USD 31.12.2099 19,991,322 9,950 Cash*
HG0 OW DIVE JPM SEC PLC USD 31.12.2099 28,533,033 -97,815 Cash*
HO0 OW DIVE JPM SEC PLC USD 31.12.2099 146,693,808 -103,678 Cash*
HO3 OW DIVE JPM SEC PLC USD 31.12.2099 26,831,675 -30,761 Cash*
JMABDZB0 - JPM BRENT DZB0 JPM SEC PLC USD 31.12.2099 690,892 -1,463 Cash*
JP MORGAN LV0 UW DIVERSFD
IND JPM SEC PLC USD 31.12.2099 50,229,119 0 Cash*
JPM DCL6 F JPM SEC PLC USD 31.12.2099 70,844,040 -81,724 Cash*
JPM DCO6 F JPM SEC PLC USD 31.12.2099 80,474,601 0 Cash*
JPM DKW6 F JPM SEC PLC USD 31.12.2099 72,154 -179 Cash*
JPM DW6 F6 JPM SEC PLC USD 31.12.2099 1,110,211 -3,950 Cash*
JPM DXB6 F JPM SEC PLC USD 31.12.2099 72,220,497 -203,246 Cash*
JPM 30-0-70 JPM SEC PLC USD 31.12.2099 50,782,236 -145,672 Cash*
JPM KANSAS WHEAT 30-0-70 F3
IND JPM SEC PLC USD 31.12.2099 10,875,329 -21,594 Cash*
KW0 OW DIVE JPM SEC PLC USD 31.12.2099 1,819,506 -2,566 Cash*
LL0 OW DIVE JPM SEC PLC USD 31.12.2099 8,829,446 1,890 Cash*
LL3 OW DIVE JPM SEC PLC USD 31.12.2099 1,624,436 458 Cash*
LP0 OW DIVE JPM SEC PLC USD 31.12.2099 23,641,171 -42,820 Cash*
LX0 OW DIVE JPM SEC PLC USD 31.12.2099 64,063,598 127,273 Cash*
MACQUARIE BK ISS CERT
MQCE0030 MACQUARIE USD 31.12.2099 6,325,371 0 Cash*
MACQUARIE BK ISS CERT
MQCE0031 MACQUARIE USD 31.12.2099 14,962,740 0 Cash*
MACQUARIE BK ISS CERT
MQCE0035 MACQUARIE USD 31.12.2099 30,847,947 0 Cash*
MACQUARIE BK ISS CERT
MQCE0037 MACQUARIE USD 31.12.2099 21,491,513 0 Cash*

Notes to the Financial Statements
291
9 Off-balance-sheet transactions (continued)
Vontobel Fund - Commodity - Long Positionen (continued)
CFD Counterparty Currency Maturity Notional value
Unrealised
gain/loss in Sub-
Fund currency
Deposited
collateral
Form
MACQUARIE BK ISS CERT MQCE0040 MACQUARIE USD 31.12.2099 40,460,398 0 Cash*
MACQUARIE BK ISS CERT MQCE0049 MACQUARIE USD 31.12.2099 7,000,003 -703 Cash*
MACQUARIE BK ISS CERT MQCE0050 MACQUARIE USD 31.12.2099 14,509,734 0 Cash*
MACQUARIE BNK IS CERT MQCE0051 MACQUARIE USD 31.12.2099 25,272,236 0 Cash*
MACQUARIE INVESTOR PROD INDEX MACQUARIE USD 31.12.2099 172,613,435 0 Cash*
MBL ISSUED CERT - MQCE0008 MACQUARIE USD 31.12.2099 7,567,180 0 Cash*
MBL ISSUED CERT-DJUBSHG MACQUARIE USD 31.12.2099 17,475,926 0 Cash*
MORGAN STANLEY 2 B3 B0 INDEX MSCI LDN USD 31.12.2099 8,751,260 1,296 Cash*
MORGAN STANLEY DYNAMIC ROLL MSCI LDN USD 31.12.2099 8,195,674 53,995 Cash*
MQCE0003 - MBL ISSUED CERT MACQUARIE USD 31.12.2099 2,799,997 -277 Cash*
MQCE0007 - MBL ISSUED CERT MACQUARIE USD 31.12.2099 8,940,946 0 Cash*
MQCE0012-MBL ISSUED BCOMNG3 MACQUARIE USD 31.12.2099 32,992,195 -493 Cash*
MQCE0013-MBL ISSUED BCOMNG6 MACQUARIE USD 31.12.2099 10,000,006 -1,006 Cash*
MQCE0014-MBL ISSUED CERT
BCOMCL MACQUARIE USD 31.12.2099 5,761,004 0 Cash*
MQCE0017-MBL ISSUED BCOMC0 MACQUARIE USD 31.12.2099 29,224,221 0 Cash*
MQCE0019-MBL ISSUED BCOMCO6 MACQUARIE USD 31.12.2099 3,293,000 0 Cash*
MQCE0025- MACQUARIE BK ISSUED
CERT MACQUARIE USD 31.12.2099 6,937,353 0 Cash*
MQCE0034 INDEX - MACQUARIE BANK MACQUARIE USD 31.12.2099 4,153,352 0 Cash*
MQCE0039-MACQUARIE BANK
ISSUED CERT MACQUARIE USD 31.12.2099 22,183,119 0 Cash*
MQCE0047 INDEX-MACQUARIE BANK MACQUARIE USD 31.12.2099 33,250,469 0 Cash*
MQCE0053-MACQUARIE BK ISSUED
CERT MACQUARIE USD 31.12.2099 13,468,505 0 Cash*
PL0 OW DIVE JPM SEC PLC USD 31.12.2099 6,317,827 1,461 Cash*
PM0 UW DIVE JPM SEC PLC USD 31.12.2099 44,556,645 0 Cash*
QS0 OW DIVE JPM SEC PLC USD 31.12.2099 250,563,019 0 Cash*
S0 OW DIVER JPM SEC PLC USD 31.12.2099 9,168,398 -26,125 Cash*
SGCARRYPPRF SG PARIS USD 31.12.2099 98,058,616 35,413 Cash*
SOCGEN CARR SG PARIS USD 31.12.2099 92,185,970 -195,514 Cash*
XB3 OW DIVE JPM SEC PLC USD 31.12.2099 6,478 -18 Cash*
TOTAL 802,331

Notes to the Financial Statements
292
9 Off-balance-sheet transactions (continued)
Vontobel Fund – Commodity - Short Positionen
CFD Counterparty Currency Maturity Notional value
Unrealised
gain/loss in Sub-
Fund currency
Deposited
collateral
Form
BM0 UW DIVE JPM SEC PLC USD 31.12.2099 -83,901,988 231,978 Cash*
CL0 OW DIVE JPM SEC PLC USD 31.12.2099 -243,385,311 0 Cash*
DJUBSCI-F3 GOLDMAN INTL USD 31.12.2099 -15,000,000 0 Cash*
EN0 UW DIVE JPM SEC PLC USD 31.12.2099 -211,643,669 0 Cash*
ETFS COM.SEC./06 NATL GAS
COM CITI GLOBAL LDN USD 31.12.2099 -3,474,052 -151,289 Cash*
ETFS COMM.SEC./ETFS COPPER CITI GLOBAL LDN USD 31.12.2099 -2,156,415 -63,089 Cash*
FC0 OW DIVE JPM SEC PLC USD 31.12.2099 -70,525,968 0 Cash*
GC0 OW DIVE JPM SEC PLC USD 31.12.2099 -44,760,666 0 Cash*
GR0 UW DIVE JPM SEC PLC USD 31.12.2099 -48,431,978 53,424 Cash*
J.P. MORGAN LHO OW DIVERSFD
IND JPM SEC PLC USD 31.12.2099 -69,212 -9 Cash*
JPM DHO6 F JPM SEC PLC USD 31.12.2099 -20 0 Cash*
MACQUARIE BK ISS CERT
MQCE0035 MACQUARIE USD 31.12.2099 -9,999,997 -1,003 Cash*
MACQUARIE BK ISS CERT
MQCE0037 MACQUARIE USD 31.12.2099 -13,672,450 -32,051 Cash*
MACQUARIE BK ISS CERT
MQCE0049 MACQUARIE USD 31.12.2099 -12,535,456 0 Cash*
MACQUERIE BK ISSUED CERT
MQCE0046 MACQUARIE USD 31.12.2099 -17,359,228 0 Cash*
MQCE0003 - MBL ISSUED CERT MACQUARIE USD 31.12.2099 -9,021,544 0 Cash*
MQCE0011-MBL ISSUED CERT
BCOMNG MACQUARIE USD 31.12.2099 -12,563,246 0 Cash*
NG0 OW DIVE JPM SEC PLC USD 31.12.2099 -121,666,033 0 Cash*
QS3 OW DIVE JPM SEC PLC USD 31.12.2099 -12 0 Cash*
SI0 OW DIVE JPM SEC PLC USD 31.12.2099 -19,751,782 0 Cash*
SO0 UW DIVE JPM SEC PLC USD 31.12.2099 -15,696,396 -576 Cash*
XB0 OW DIVE JPM SEC PLC USD 31.12.2099 -20,170,753 0 Cash*
TOTAL 37,385
* The total sum of the deposited collateral as at February 28, 2019 amounts to USD 1,240,000 (Citi Global London), USD
490,000 (Goldman Sachs), EUR 7,648,652 (J.P. Morgan Securities), USD 9,600,000 (Macquarie Bank Limited) and USD 70,000
(Morgan Stanley).

Notes to the Financial Statements
293
9 Off-balance-sheet transactions (continued)
Vontobel Fund – Dynamic Commodity - Long Positionen
CFD Counterparty Currency Maturity Notional value
Unrealised
gain/loss in Sub-
Fund currency
Deposited
collateral
Form
BBGCI-F6 INDEX - BCOMF6 GOLDMAN INTL USD 31.12.2099 52,973,409 308,391 Cash*
BBGCI-F6 INDEX - BCOMF6 MACQUARIE USD 31.12.2099 19,057,973 0 Cash*
C3 OW DIVER JPM SEC PLC USD 31.12.2099 12,119,159 -34,702 Cash*
CITI ROLL T CITI GLOBAL LDN USD 31.12.2099 6,922,946 1,584 Cash*
CL0 OW DIVE JPM SEC PLC USD 31.12.2099 5,504,800 -9,782 Cash*
CL3 OW DIVE JPM SEC PLC USD 31.12.2099 40,505,318 -27,247 Cash*
CO3 OW DIVE JPM SEC PLC USD 31.12.2099 20,569,354 -50,955 Cash*
DJUBSCI-F3 GOLDMAN INTL USD 31.12.2099 6,141,350 33,675 Cash*
DJUBSCI-F3 JPM SEC PLC USD 31.12.2099 801,979 -2,148 Cash*
DJUBSCI-F3 MACQUARIE USD 31.12.2099 7,196,258 0 Cash*
EFTS COMMMODITY SEC ON ZINC CITI GLOBAL LDN USD 31.12.2099 6,009,778 256,678 Cash*
EN0 UW DIVE JPM SEC PLC USD 31.12.2099 5,419,200 -9,028 Cash*
ETF COMMODITY 06-.../SILVER CITI GLOBAL LDN USD 31.12.2099 1,200,091 -22,555 Cash*
ETFS CLASSIC COMM SECURITIES CITI GLOBAL LDN USD 31.12.2099 1,087,790 -6,695 Cash*
ETFS COM DJ-UBS PLAT IND SEC CITI GLOBAL LDN USD 31.12.2099 3,657,827 272,740 Cash*
ETFS COMM SEC 06-P/HEATING
OIL CITI GLOBAL LDN USD 31.12.2099
860,162 4,177 Cash*
ETFS COMM.06-.../ETFS SOYBEANS CITI GLOBAL LDN USD 31.12.2099 1,122,478 -10,719 Cash*
ETFS COMM.SEC./GOLD
COM.INDEX CITI GLOBAL LDN USD 31.12.2099
2,644,273 -10,868 Cash*
ETFS NICKEL COMMODITY CITI GLOBAL LDN USD 31.12.2099 1,537,263 34,986 Cash*
FC0 OW DIVE JPM SEC PLC USD 31.12.2099 1,316,843 -4,510 Cash*
GC0 OW DIVE JPM SEC PLC USD 31.12.2099 36,752,667 -104,187 Cash*
HG3 OW DIVE JPM SEC PLC USD 31.12.2099 418,781 -1,412 Cash*
HO0 OW DIVE JPM SEC PLC USD 31.12.2099 30,625,772 0 Cash*
HO3 OW DIVE JPM SEC PLC USD 31.12.2099 9,816,572 -11,254 Cash*
JMABDZW1 - JPM WTI DZW1 JPM SEC PLC USD 31.12.2099 7,953,994 -15,773 Cash*
JMABDZW9 - JPM WTI DZW9 JPM SEC PLC USD 31.12.2099 169,053,540 0 Cash*
JPM DCL6 F JPM SEC PLC USD 31.12.2099 20,804,459 -24,000 Cash*
JPM DCO6 F JPM SEC PLC USD 31.12.2099 7,224,274 -16,539 Cash*
JPM DHO6 F JPM SEC PLC USD 31.12.2099 5,106,764 -6,678 Cash*
JPM DQS6 F JPM SEC PLC USD 31.12.2099 42,411,822 -102,067 Cash*
JPM 30-0-70 - JMABDC04 JPM SEC PLC USD 31.12.2099 414,604 -1,027 Cash*
JPM 30-0-70 - JMABDCO1 JPM SEC PLC USD 31.12.2099 19,740,982 0 Cash*
JPM 30-0-70 - JMABDCO2 JPM SEC PLC USD 31.12.2099 41,193,847 0 Cash*
JPM 30-0-70 - JMABDNG2 JPM SEC PLC USD 31.12.2099 69,795 -12 Cash*
JPM 30-0-70 - JMABDNG4 JPM SEC PLC USD 31.12.2099 1,038,450 327 Cash*
JPM 30-0-70 - JMABDQS5 JPM SEC PLC USD 31.12.2099 10,074,646 -24,292 Cash*
JPM BRENT D - JMABDZB9 JPM SEC PLC USD 31.12.2099 172,785,636 -387,474 Cash*
JPM UK TRD COPPER F3 JPM SEC PLC USD 31.12.2099 27,140,677 -45,333 Cash*
KW0 OW DIVE JPM SEC PLC USD 31.12.2099 90 0 Cash*
LA0 OW DIVE JPM SEC PLC USD 31.12.2099 1,556,072 -5,510 Cash*
LN3 OW DIVE JPM SEC PLC USD 31.12.2099 2,159,831 -4,361 Cash*
LP0 OW DIVE JPM SEC PLC USD 31.12.2099 15,943,513 -28,878 Cash*
LX0 OW DIVE JPM SEC PLC USD 31.12.2099 1,789,847 3,556 Cash*
LX3 OW DIVE JPM SEC PLC USD 31.12.2099 2,178,193 3,253 Cash*
MACQUARIE BK ISS CERT
MQCE0027 MACQUARIE USD 31.12.2099 1,217,027 0 Cash*
MACQUARIE BK ISS CERT
MQCE0028 MACQUARIE USD 31.12.2099 1,633,662 0 Cash*

Notes to the Financial Statements
294
9 Off-balance-sheet transactions (continued)
Vontobel Fund – Dynamic Commodity - Long Positionen (continued)
CFD Counterparty Currency Maturity Notional value
Unrealised
gain/loss in Sub-
Fund currency
Deposited
collateral
Form
MACQUARIE BK ISS CERT
MQCE0030 MACQUARIE USD 31.12.2099 3,435,370 0 Cash*
MACQUARIE BK ISS CERT
MQCE0031 MACQUARIE USD 31.12.2099 838,714 0 Cash*
MACQUARIE BK ISS CERT
MQCE0037 MACQUARIE USD 31.12.2099 689,019 0 Cash*
MACQUARIE BK ISS CERT
MQCE0040 MACQUARIE USD 31.12.2099 805,556 0 Cash*
MACQUARIE BK ISS CERT
MQCE0050 MACQUARIE USD 31.12.2099 1,769,703 0 Cash*
MACQUARIE BNK IS CERT
MQCE0051 MACQUARIE USD 31.12.2099 6,083,483 0 Cash*
MACQUARIE MBL ISSUED CERT MACQUARIE USD 31.12.2099 2,443,295 0 Cash*
MACQUERIE BK ISSUED CERT
MQCE0046 MACQUARIE USD 31.12.2099 642,985 0 Cash*
MBL ISSUED CERT MQCE0002 MACQUARIE USD 31.12.2099 6,528,041 0 Cash*
MBL ISSUED CERT-DJUBSHG MACQUARIE USD 31.12.2099 1,325,463 0 Cash*
MBL ISSUED CERTIFICATE
DJUBSGC MACQUARIE USD 31.12.2099 5,312,326 0 Cash*
MBL ISSUED CERTIFICATE
DJUBSSI MACQUARIE USD 31.12.2099 2,453,562 0 Cash*
MQCE0006 -MBL ISSUED CERT MACQUARIE USD 31.12.2099 1,117,680 0 Cash*
MQCE0011-MBL ISSUED CERT
BCOMNG MACQUARIE USD 31.12.2099 10,766,679 0 Cash*
MQCE0012-MBL ISSUED
BCOMNG3 MACQUARIE USD 31.12.2099 396,403 0 Cash*
MQCE0014-MBL ISSUED CERT
BCOMCL MACQUARIE USD 31.12.2099 5,739,800 21,202 Cash*
MQCE0015-MBL ISSUED CERT
BCOMCL3 MACQUARIE USD 31.12.2099 3,389,261 0 Cash*
MQCE0016-MBL ISSUED BCOMCL6 MACQUARIE USD 31.12.2099 10,056,364 0 Cash*
MQCE0017-MBL ISSUED BCOMC0 MACQUARIE USD 31.12.2099 3,672,057 0 Cash*
MQCE0018-MBL ISSUED
BCOMCO3 MACQUARIE USD 31.12.2099 61,232,414 0 Cash*
MQCE0019-MBL ISSUED
BCOMCO6 MACQUARIE USD 31.12.2099 16,068,227 0 Cash*
MQCE0024 - MACQUARIE BK
ISSUED CERT MACQUARIE USD 31.12.2099 6,967,589 0 Cash*
MQCE0038 INDEX-MACQUARIE
BANK MACQUARIE USD 31.12.2099 1,224,874 0 Cash*
MQCE0048-MACQUARIE BK
ISSUED CERT MACQUARIE USD 31.12.2099 3,888,657 0 Cash*
MQCE0052-MACQUARIE BK
ISSUED CERT MACQUARIE USD 31.12.2099 2,938,436 0 Cash*
MS DYNAMIC ROLL - MOTC3395 MSCI LDN USD 31.12.2099 13,205,756 157,946 Cash*
MW0 OW DIVE JPM SEC PLC USD 31.12.2099 5,131,543 10,057 Cash*
PA0 OW DIVE JPM SEC PLC USD 31.12.2099 12,646,034 47,692 Cash*
PL0 OW DIVE JPM SEC PLC USD 31.12.2099 12,232,799 0 Cash*
QS3 OW DIVE JPM SEC PLC USD 31.12.2099 11,900,859 -27,263 Cash*
SI0 OW DIVE JPM SEC PLC USD 31.12.2099 6,167,511 -25,601 Cash*
UBS LN PERP CERT /BSKT UBS AG LDN USD 31.12.2099 2,259,993 0 Cash*
UBS LN PERP CERT UBS AG LDN USD 31.12.2099 813,666 0 Cash*
UBS LN PERP CERT DJUBSBO3 UBS AG LDN USD 31.12.2099 1,272,452 0 Cash*
UBS LN PERP CERT DJUBSCN3 UBS AG LDN USD 31.12.2099 3,174,587 0 Cash*
UBS LN PERP CERT DJUBSCO UBS AG LDN USD 31.12.2099 11,877,607 0 Cash*

Notes to the Financial Statements
295
9 Off-balance-sheet transactions (continued)
Vontobel Fund – Dynamic Commodity - Long Positionen (continued)
CFD Counterparty Currency Maturity Notional value
Unrealised
gain/loss in Sub-
Fund currency
Deposited
collateral
Form
UBS LN PERP CERT DJUBSKW3 UBS AG LDN USD 31.12.2099 3,040,612 0 Cash*
UBS LN PERP CERT DJUBSNI UBS AG LDN USD 31.12.2099 2,537,920 0 Cash*
UBS LN PERP CERT DJUBSPL UBS AG LDN USD 31.12.2099 586,344 0 Cash*
UBS LN PERP CERT DJUBSRB UBS AG LDN USD 31.12.2099 5,687,122 0 Cash*
UBS LN PERP CERT DJUBSSB UBS AG LDN USD 31.12.2099 1,009,731 0 Cash*
UBS LN PERP CERT DJUBSSB3 UBS AG LDN USD 31.12.2099 349,216 0 Cash*
UBS LN PERP CERT DJUBSSM UBS AG LDN USD 31.12.2099 2,042,637 0 Cash*
UBS LN PERP CERT DJUBSSY UBS AG LDN USD 31.12.2099 3,370,009 0 Cash*
UBS LN PERP CERT/DJUBSGO UBS AG LDN USD 31.12.2099 632,066 0 Cash*
TOTAL 135,394
Vontobel Fund – Dynamic Commodity - Short Positionen
CFD Counterparty Currency Maturity Notional value
Unrealised
gain/loss in Sub-
Fund currency
Deposited
collateral
Form
BBG COM IND - BCOM MACQUARIE USD 31.12.2099 -7,995,419 0 Cash*
BBG COM IND - BCOM SG PARIS USD 31.12.2099 -51,756,500 -277,140 Cash*
BM0 UW DIVE JPM SEC PLC USD 31.12.2099 -25,725,019 71,126 Cash*
CL0 OW DIVE JPM SEC PLC USD 31.12.2099 -28,487,611 0 Cash*
CO0 OW DIVE JPM SEC PLC USD 31.12.2099 -18,535,876 52,106 Cash*
EN0 UW DIVE JPM SEC PLC USD 31.12.2099 -3,786,900 8,431 Cash*
ETFS CLASSIC COMM SECURITIES CITI GLOBAL LDN USD 31.12.2099 -1,011,143 -72,005 Cash*
ETFS COM DJ-UBS PLAT IND SEC CITI GLOBAL LDN USD 31.12.2099 -3,936,145 7,689 Cash*
ETFS COMM SEC 06-P/HEATING
OIL CITI GLOBAL LDN USD
31.12.2099 -2,975,785 3,895 Cash*
GR0 UW DIVE JPM SEC PLC USD 31.12.2099 -12,157,988 13,411 Cash*
HG0 OW DIVE JPM SEC PLC USD 31.12.2099 -11,595,880 39,752 Cash*
JMABDOZ0 - JPM DOZ0 JPM SEC PLC USD 31.12.2099 -562,178 1,261 Cash*
JMABDZB0 - JPM BRENT DZB0
31/12/2099 JPM SEC PLC USD
31.12.2099 -153,747,580 0 Cash*
JMABDZB1 - J.P. MORGAN DZB1 JPM SEC PLC USD 31.12.2099 -66,148,520 151,165 Cash*
JMABDZW0 - JPM WTI DZW0 JPM SEC PLC USD 31.12.2099 -139,455,462 0 Cash*
JP MORGAN LV0 UW DIVERSFD
IND JPM SEC PLC USD
31.12.2099 -586,639 1,030 Cash*
JPM DNG6 F JPM SEC PLC USD 31.12.2099 -8,152,712 -6,944 Cash*
JPM 30-0-70 - JMABDCL2 JPM SEC PLC USD 31.12.2099 -493,728 251 Cash*
JPM 30-0-70 - JMABDNG1 JPM SEC PLC USD 31.12.2099 -23,105,671 11,184 Cash*
JPM 30-0-70 -JMABDCL1 JPM SEC PLC USD 31.12.2099 -26,559,898 6,181 Cash*
JPM BRENT D - JMABDOZ2 JPM SEC PLC USD 31.12.2099 -10,753,675 24,578 Cash*
LL0 OW DIVE JPM SEC PLC USD 31.12.2099 -69,377 -15 Cash*
LL3 OW DIVE JPM SEC PLC USD 31.12.2099 -1,189,521 -335 Cash*
LN0 OW DIVE JPM SEC PLC USD 31.12.2099 -1,421,654 2,888 Cash*
MACQUARIE BANK ISSUED CERT
08.06.18 MACQUARIE USD
31.12.2099 -3,148,935 0 Cash*
MACQUARIE BK ISS CERT
MQCE0035 MACQUARIE USD
31.12.2099 -822,215 0 Cash*
MACQUARIE BK ISS CERT
MQCE0049 MACQUARIE USD
31.12.2099 -1,476,770 0 Cash*
MACQUARIE COMMODITY
INVESTOR MACQUARIE USD
31.12.2099 -730,407 0 Cash*

Notes to the Financial Statements
296
9 Off-balance-sheet transactions (continued)
Vontobel Fund – Dynamic Commodity - Short Positionen (continued)
CFD Counterparty Currency Maturity Notional value
Unrealised
gain/loss in Sub-
Fund currency
Deposited
collateral
Form
MACQUIRE BK ISS CERT
MQCE0033 MACQUARIE USD
31.12.2099 -771,710 0 Cash*
MBL ISSUED CERT - MQCE0008 MACQUARIE USD 31.12.2099 -333,775 0 Cash*
MQCE0003 - MBL ISSUED CERT MACQUARIE USD 31.12.2099 -557,722 0 Cash*
MQCE0007 - MBL ISSUED CERT MACQUARIE USD 31.12.2099 -967,282 0 Cash*
MQCE0013-MBL ISSUED
BCOMNG6 MACQUARIE USD
31.12.2099 -12,019,454 0 Cash*
MQCE0014-MBL ISSUED CERT
BCOMCL MACQUARIE USD
31.12.2099 -29,702,187 0 Cash*
MQCE0017-MBL ISSUED BCOMC0 MACQUARIE USD 31.12.2099 -9,915,451 -31,052 Cash*
MQCE0020 INDEX MACQUARIE USD 31.12.2099 -7,489,286 0 Cash*
MQCE0021 INDEX MACQUARIE USD 31.12.2099 -77,570,392 0 Cash*
MQCE0025- MACQUARIE BK
ISSUED CERT MACQUARIE USD
31.12.2099 -4,887,344 453 Cash*
MQCE0032 INDEX-MACQUARIE BK MACQUARIE USD 31.12.2099 -4,559,865 0 Cash*
MQCE0034 INDEX - MACQUARIE
BANK MACQUARIE USD
31.12.2099 -1,481,884 0 Cash*
MQCE0042- MACQUARIE BK
ISSUED CERT MACQUARIE USD
31.12.2099 -12,306,610 0 Cash*
MQCE0047 INDEX-MACQUARIE
BANK MACQUARIE USD
31.12.2099 -3,794,947 0 Cash*
NG0 OW DIVE JPM SEC PLC USD 31.12.2099 -1,709,929 316 Cash*
NG3 OW DIVE JPM SEC PLC USD 31.12.2099 -1,438,541 -165 Cash*
PM0 UW DIVE JPM SEC PLC USD 31.12.2099 -46,481,270 0 Cash*
QS0 OW DIVE JPM SEC PLC USD 31.12.2099 -12,638,906 17,682 Cash*
S0 OW DIVER JPM SEC PLC USD 31.12.2099 -1,595,168 4,545 Cash*
SEASONAL WT JPM SEC PLC USD 31.12.2099 -63,866,856 135,209 Cash*
SO0 UW DIVE JPM SEC PLC USD 31.12.2099 -184,235 -7 Cash*
UBS LN PERP CERT UBS AG LDN USD 31.12.2099 -4,310,725 0 Cash*
UBS LN PERP CERT BSKT DJPAE UBS AG LDN USD 31.12.2099 -4,320,180 0 Cash*
UBS LN PERP CERT DJUBSSM3 UBS AG LDN USD 31.12.2099 -1,850,801 0 Cash*
UBS LN PERP CERT DJUBSSY3 UBS AG LDN USD 31.12.2099 -2,626,824 0 Cash*
XB0 OW DIVE JPM SEC PLC USD 31.12.2099 -32,762,781 0 Cash*
XB3 OW DIVE JPM SEC PLC USD 31.12.2099 -11,022,826 31,441 Cash*
TOTAL 196,932
* The total sum of the deposited collateral as at February 28, 2019 amounts to USD 40,000 (Citi Global
London), USD 480,000 (Goldman Sachs), EUR 329,084 (J.P. Morgan Securities), USD 1,300,000 (Macquarie
Bank Limited), USD 280,000 (Morgan Stanley), USD 420,000 (Société Générale) and EUR 1,411,989 (UBS AG
London).

Notes to the Financial Statements
297
9 Off-balance-sheet transactions (continued)
Vontobel Fund – Non-Food Commodity - Long Positionen
CFD Counterparty Currency Maturity Notional value
Unrealised
gain/loss in Sub-
Fund currency
Deposited
collateral
Form
CO0 OW EXAL JPM SEC PLC USD 31.12.2099 3,198,600 5,479 Cash*
HG0 OW EXAL JPM SEC PLC USD 31.12.2099 7,123,369 0 Cash*
HO0 OW EXAL JPM SEC PLC USD 31.12.2099 17,286,221 0 Cash*
J.P. MORGAN PA0 DIV INDEX JPM SEC PLC USD 31.12.2099 2,266,469 0 Cash*
JMABYCL3 IN JPM SEC PLC USD 31.12.2099 12,318,403 31,881 Cash*
JMABYCL6-JPM JMABYCL6 INDEX JPM SEC PLC USD 31.12.2099 15,110,090 31,886 Cash*
JMABYCO3 IN JPM SEC PLC USD 31.12.2099 7,819,701 6,257 Cash*
JMABYLX3 IN JPM SEC PLC USD 31.12.2099 14,980 58 Cash*
JMABYNG3 IN JPM SEC PLC USD 31.12.2099 10,893 37 Cash*
JMABYNG6 IN JPM SEC PLC USD 31.12.2099 2,307,287 0 Cash*
JPM 30-0-70 - JMABYCL1 JPM SEC PLC USD 31.12.2099 1,540,626 4,659 Cash*
JPM 30-0-70 - JMABYCO1 JPM SEC PLC USD 31.12.2099 2,628,617 1,610 Cash*
JPM 30-0-70 -JMABYNG2 JPM SEC PLC USD 31.12.2099 6,562,944 20,490 Cash*
LA0 OW EXAL JPM SEC PLC USD 31.12.2099 6,047,864 5,852 Cash*
LP0 OW EXAL JPM SEC PLC USD 31.12.2099 2,682,972 6,946 Cash*
LX0 OW EXAL JPM SEC PLC USD 31.12.2099 1,073,530 4,674 Cash*
MACQUARIE BK ISS CERT MQCE0035 MACQUARIE USD 31.12.2099 2,463,756 0 Cash*
MACQUARIE BK ISS CERT MQCE0037 MACQUARIE USD 31.12.2099 4,654,668 0 Cash*
MBL ISSUED CERT - MQCE0008 MACQUARIE USD 31.12.2099 2,091,721 0 Cash*
MBL ISSUED CERT-DJUBSHG MACQUARIE USD 31.12.2099 1,838,650 0 Cash*
MQ CUSTOM 1 MACQUARIE USD 31.12.2099 49,394,415 0 Cash*
MQCE0003 - MBL ISSUED CERT MACQUARIE USD 31.12.2099 2,950,646 0 Cash*
MQCE0016-MBL ISSUED BCOMCL6 MACQUARIE USD 31.12.2099 2,078,930 0 Cash*
MQCE0017-MBL ISSUED BCOMC0 MACQUARIE USD 31.12.2099 6,223,701 0 Cash*
MQCE0018-MBL ISSUED BCOMCO3 MACQUARIE USD 31.12.2099 4,351,901 0 Cash*
MQCE0039-MACQUARIE BANK
ISSUED CERT MACQUARIE USD
31.12.2099 676,191 0 Cash*
MSCYRXD -MORGAN STANLEY
MSCY MSCI LDN USD
31.12.2099 26,353,861 784,319 Cash*
NB0 UW EXAL JPM SEC PLC USD 31.12.2099 5,487,198 4,164 Cash*
PL0 OW EXAL JPM SEC PLC USD 31.12.2099 4,660,218 14,642 Cash*
PM0 UW EXAL JPM SEC PLC USD 31.12.2099 252,296 0 Cash*
QS0 OW EXAL JPM SEC PLC USD 31.12.2099 7,692,344 0 Cash*
SEASONAL WT JPM SEC PLC USD 31.12.2099 11,907,624 19,737 Cash*
UBS LN PERP CERT DJUBSCO UBS AG LDN USD 31.12.2099 5,999,586 0 Cash*
UBS LN PERP CERT DJUBSCO3 UBS AG LDN USD 31.12.2099 2,475,124 0 Cash*
UBS LN PERP CERT DJUBSNG UBS AG LDN USD 31.12.2099 419,838 0 Cash*
UBS LN PERP CERT DJUBSPB UBS AG LDN USD 31.12.2099 740,289 0 Cash*
UBS LN PERP CERT DJUBSRB UBS AG LDN USD 31.12.2099 4,089,071 0 Cash*
UBS LN PERP CERT/DJUBSAL3 UBS AG LDN USD 31.12.2099 2,931,047 0 Cash*
XB0 OW EXAL JPM SEC PLC USD 31.12.2099 3,520,728 742 Cash*
TOTAL 943,433

Notes to the Financial Statements
298
9 Off-balance-sheet transactions (continued)
Vontobel Fund – Non-Food Commodity - Short Positionen
CFD Counterparty Currency Maturity Notional value
Unrealised
gain/loss in Sub-
Fund currency
Deposited
collateral
Form
CL0 OW EXAL JPM SEC PLC USD 31.12.2099 -4,551,476 0 Cash*
EN0 UW EXAL JPM SEC PLC USD 31.12.2099 -23,177,400 0 Cash*
J.P. MORGAN GC0 OW EXAL DIV IN JPM SEC PLC USD 31.12.2099 -4,616,251 -877 Cash*
JB0 UW EXAL JPM SEC PLC USD 31.12.2099 -3,264,645 0 Cash*
JMABYCO6 IN JPM SEC PLC USD 31.12.2099 -15,897,948 -15,685 Cash*
JMABYLA3 IN JPM SEC PLC USD 31.12.2099 -10,720,624 -9,351 Cash*
JMABYLP3 IN JPM SEC PLC USD 31.12.2099 -50,466 -138 Cash*
JMABYOZ1 - JPM BRENT YOZ1 JPM SEC PLC USD 31.12.2099 -27,172,775 0 Cash*
JPM 30-0-70 - JMABYCL4 JPM SEC PLC USD 31.12.2099 -83,104 -202 Cash*
JPM 30-0-70 - JMABYNG4 JPM SEC PLC USD 31.12.2099 -2,536,013 -9,140 Cash*
LL0 OW EXAL JPM SEC PLC USD 31.12.2099 -7,644,094 -20,085 Cash*
MACQUARIE MBL ISSUED CERT MACQUARIE USD 31.12.2099 -499,845 0 Cash*
MBL ISSUED CERT MQCE0002 MACQUARIE USD 31.12.2099 -488,231 0 Cash*
MBL ISSUED CERTIFICATE
DJUBSGC MACQUARIE USD
31.12.2099 -2,878,998 4,058 Cash*
MBL ISSUED CERTIFICATE
DJUBSSI MACQUARIE USD
31.12.2099 -3,447,999 0 Cash*
MQCE0006 -MBL ISSUED CERT MACQUARIE USD 31.12.2099 -6,853,076 0 Cash*
MQCE0007 - MBL ISSUED CERT MACQUARIE USD 31.12.2099 -369,452 0 Cash*
MQCE0011-MBL ISSUED CERT
BCOMNG MACQUARIE USD
31.12.2099 -1,588,789 0 Cash*
MQCE0012-MBL ISSUED
BCOMNG3 MACQUARIE USD
31.12.2099 -4,470,471 0 Cash*
MQCE0013-MBL ISSUED
BCOMNG6 MACQUARIE USD
31.12.2099 -291,712 0 Cash*
MQCE0014-MBL ISSUED CERT
BCOMCL MACQUARIE USD
31.12.2099 -11,929,006 0 Cash*
MQCE0015-MBL ISSUED CERT
BCOMCL3 MACQUARIE USD
31.12.2099 -2,593,262 0 Cash*
MQCE0019-MBL ISSUED
BCOMCO6 MACQUARIE USD
31.12.2099 -3,228,513 0 Cash*
MQCE0020 INDEX MACQUARIE USD 31.12.2099 -4,576,801 0 Cash*
NG0 OW EXAL JPM SEC PLC USD 31.12.2099 -4,845,555 0 Cash*
SI0 OW EXAL JPM SEC PLC USD 31.12.2099 -2,067,889 2,231 Cash*
UBS LN PERP CERT DJUBSRB3 UBS AG LDN USD 31.12.2099 -3,453,139 0 Cash*
TOTAL -49’189
* The total sum of deposited collateral as at February 28, 2019 amounts to EUR 1,615,816 (J.P. Morgan
Securities), USD 1,250,000 (Macquarie Bank Limited), USD 630,000 (Morgan Stanley) and EUR 732,184 (UBS
AG London).

Notes to the Financial Statements
299
9 Off-balance-sheet transactions (continued)
Vontobel Fund – Vescore Artificial Inteligence Multi Asset - Long Positionen
CFD Counterparty Currency Maturity Notional value
Unrealised
gain/loss in Sub-
Fund currency
Deposited
collateral
Form
CL0 OW DIVE JPM SEC PLC USD 31.12.2099 498,807 262
GC0 OW DIVE JPM SEC PLC USD 31.12.2099 1,194,354 -7,599
HG0 OW DIVE JPM SEC PLC USD 31.12.2099 636,982 -54
TOTAL -7,391
Vontobel Fund – Vescore Artificial Inteligence Multi Asset - Short Positionen
CFD Counterparty Currency Maturity Notional value
Unrealised
gain/loss in Sub-
Fund currency
Deposited
collateral
Form
BM0 UW DIVE JPM SEC PLC USD 31.12.2099 -443,921 1,909
EN0 UW DIVE JPM SEC PLC USD 31.12.2099 -347,924 -101
PM0 UW DIVE JPM SEC PLC USD 31.12.2099 -835,949 -909
TOTAL 899

Notes to the Financial Statements
300
9 Off-balance-sheet transactions (continued)
e) Options
The following options were open as at February 28, 2019:
Vontobel Fund - Bond Global Aggregate
Description Quantity Strike
price Currency Maturity
Market
value Commitment Cost price
Unrealised
gain/loss in Sub-
Fund currency
Put USD/BRL SPOT
CROSS -70,000,000 4 USD 04.04.2019 -23,751 75,295 -196,186 172,435
Call USD/KRW SPOT
CROSS 140,000,000 1,150 USD 26.04.2019 376,443 211,342,338 2,062,424 -1,685,981
Call USD/KRW SPOT
CROSS -245,000,000 1,240 USD 29.07.2019 -196,105 -75,673,071 -1,954,323 1,758,218
Call USD/KRW SPOT
CROSS -360,000,000 1,240 USD 11.10.2019 -883,880 -194,498,512 -3,343,247 2,459,368
Call USD/KRW SPOT
CROSS 215,000,000 1,160 USD 18.09.2019 1,778,097 420,221,663 3,070,942 -1,292,845
Call USD/KRW SPOT
CROSS 245,000,000 1,250 USD 26.06.2019 46,295 39,661,449 821,446 -775,150
Call USD/KRW SPOT
CROSS -140,000,000 1,150 USD 27.03.2019 -129,465 -123,746,500 -1,146,698 1,017,233
Put CAD/JPY CROSS
RATES 260,000,000 76 CAD 04.12.2019 1,670,732 -17,028,298 2,337,078 -666,346
Put CAD/JPY CROSS
RATES -338,000,000 71 CAD 04.02.2020 -1,366,015 12,287,632 -1,933,216 567,201
Put CAD/JPY CROSS
RATES 105,000,000 85 CAD 28.06.2019 1,582,655 -28,726,376 1,503,218 79,437
Put CAD/JPY CROSS
RATES -168,000,000 79 CAD 01.10.2019 -1,141,353 14,051,897 -1,453,380 312,027
Put FUT-10Y TREASURY
NOTES USA-JUN19 -1,950 120 USD 26.04.2019 -133,787 -208,922,455 -138,913 5,126
Put FUT-10Y TREASURY
NOTES USA-JUN19 1,950 121 USD 22.03.2019 160,545 208,922,455 246,235 -85,691
Call USD/TRY SPOT
CROSS -30,000,000 7 USD 23.05.2019 -3,367 -15,037 -488,551 485,183
Call USD/TRY SPOT
CROSS -38,500,000 8 USD 23.05.2019 -865 -10,821 -1,017,832 1,016,967
Put USD/RUB SPOT
CROSS -48,000,000 64 USD 07.05.2019 -171,582 5,192,055 -239,197 67,615
Call USD/ILS SPOT -
CROSS RATES 160,000,000 4 USD 02.05.2019 158,463 322,233 225,881 -67,418
Put USD/INR SPOT
CROSS 105,000,000 67 USD 10.04.2019 1,706 -196,395 309,074 -307,368
Put USD/INR SPOT
CROSS -105,000,000 67 USD 10.04.2019 -1,706 196,395 -169,174 167,468
Put USD/INR SPOT
CROSS 3,500,000 70 USD 08.03.2019 22,160 -2,111,772 343,847 -321,687
Call USD/CNH SPOT
CROSS 140,000,000 7 USD 18.10.2019 130,446 265,879 1,403,655 -1,273,210
Call USD/CNH SPOT
CROSS -280,000,000 8 USD 18.10.2019 -10,719 -144,875 -1,279,373 1,268,655
Call USD/CNH SPOT
CROSS 140,000,000 7 USD 28.10.2019 117,689 241,184 1,593,246 -1,475,557
Call USD/CNH SPOT
CROSS -280,000,000 8 USD 28.10.2019 -7,065 -125,120 -1,457,807 1,450,743
Call USD/CNH SPOT
CROSS 140,000,000 8 USD 06.12.2019 111,367 162,985 1,328,355 -1,216,988
Put EUR/USD SPOT -
CROSS RATES 105,000,000 1 EUR 16.08.2019 2,881 -6,194 361,200 -358,319

Notes to the Financial Statements
301
9 Off-balance-sheet transactions (continued)
Vontobel Fund - Bond Global Aggregate (Fortsetzung)
Description Quantity Strike
price Currency Maturity
Market
value Commitment Cost price
Unrealised
gain/loss in Sub-
Fund currency
Call EUR/PLN SPOT
CROSS -65,000,000 5 EUR 21.02.2020 -195,767 -146,015 -244,400 48,633
Put GBP/JPY CROSS
RATES 252,000,000 132 GBP 22.05.2019 338,779 -16,039,122 4,778,563 -4,439,783
Put AUD/JPY SPOT
CROSS -238,000,000 74 AUD 25.04.2019 -260,416 7,805,239 -1,977,132 1,716,716
Put AUD/JPY SPOT
CROSS 238,000,000 74 AUD 25.04.2019 260,416 -7,805,239 2,458,373 -2,197,957
Put AUD/JPY SPOT
CROSS -140,000,000 79 AUD 06.05.2019 -1,514,598 33,385,730 -3,152,497 1,637,899
Put AUD/JPY SPOT
CROSS 140,000,000 79 AUD 06.05.2019 1,514,598 -33,385,730 2,426,734 -912,136
Put AUD/JPY SPOT
CROSS -224,000,000 69 AUD 25.10.2019 -1,152,910 10,659,057 -2,312,992 1,160,082
Put AUD/JPY SPOT
CROSS 140,000,000 70 AUD 16.10.2019 755,656 -7,181,291 900,327 -144,672
Put AUD/JPY SPOT
CROSS 140,000,000 77 AUD 24.05.2019 965,462 -18,746,146 2,084,710 -1,119,248
Put CHF/JPY SPOT
CROSS 255,000,000 108 CHF 10.04.2019 130,574 -12,315,695 2,994,280 -2,863,706
Put CHF/JPY SPOT
CROSS -255,000,000 111 CHF 22.03.2019 -454,465 44,681,943 -896,374 441,909
Put CHF/JPY SPOT
CROSS 170,000,000 111 CHF 10.04.2019 692,389 -53,084,318 1,537,888 -845,500
Put CHF/JPY SPOT
CROSS -170,000,000 114 CHF 22.03.2019 -3,047,513 160,421,109 -2,769,092 -278,421
Call USD/CAD SPOT
CROSS -291,200,000 1 USD 05.11.2019 -1,015,530 -329,162 -1,184,962 169,432
Call NOK/SEK SPOT
CROSS 700,000,000 1 NOK 15.03.2019 322,930 355,403 239,096 83,834
Call USD/CAD SPOT
CROSS 160,000,000 1 USD 02.08.2019 1,009,349 414,888 1,184,926 -175,577
Call USD/SGD SPOT
CROSS 140,000,000 1 USD 22.03.2019 1,116 8,138 1,057,042 -1,055,925
Call USD/SGD SPOT
CROSS 155,000,000 1 USD 25.11.2019 1,235,239 532,675 1,286,032 -50,794
Call USD/SGD SPOT
CROSS -310,000,000 1 USD 25.02.2020 -1,195,935 -419,594 -1,202,027 6,092
Put GBP/USD SPOT
CROSS -210,000,000 1 GBP 04.04.2019 -1,127,370 687,846 -2,051,350 923,980
Put GBP/USD SPOT
CROSS -280,000,000 1 GBP 12.04.2019 -112,226 66,622 -1,843,517 1,731,292
Put GBP/USD SPOT
CROSS 145,000,000 1 GBP 30.05.2019 9,940 -18,594 324,303 -314,363
Put GBP/USD SPOT
CROSS -140,000,000 1 GBP 28.03.2019 -97,506 98,202 -873,252 775,746
Put GBP/USD SPOT
CROSS -290,000,000 1 GBP 30.05.2019 -19,881 37,189 -1,547,169 1,527,288
Put GBP/USD SPOT
CROSS 145,000,000 1 GBP 28.03.2019 6,079 -17,698 1,746,169 -1,740,090
Put GBP/USD SPOT
CROSS 140,000,000 1 GBP 01.08.2019 595,695 -150,980 2,043,864 -1,448,170
Put GBP/USD SPOT
CROSS -210,000,000 1 GBP 01.11.2019 -736,758 136,596 -2,091,674 1,354,916
Put USD/JPY SPOT
CROSS 140,000,000 107 USD 02.04.2019 28,413 -2,011,461 200,096 -171,683

Notes to the Financial Statements
302
9 Off-balance-sheet transactions (continued)
Vontobel Fund - Bond Global Aggregate (continued)
Description Quantity Strike
price Currency Maturity
Market
value Commitment Cost price
Unrealised
gain/loss in Sub-
Fund currency
Put USD/JPY SPOT
CROSS -315,000,000 101 USD 10.12.2019 -1,961,407 33,435,415 -2,907,309 945,902
Put NZD/JPY SPOT
CROSS 170,000,000 72 NZD 08.08.2019 1,245,505 -192,975 1,944,777 -699,272
Call USD/KRW SPOT
CROSS -325,000,000 1,245 USD 06.02.2020 -1,721,307 -246,921,939 -2,106,780 385,473
Call USD/KRW SPOT
CROSS -315,000,000 1,260 USD 03.09.2019 -291,257 -94,791,210 -2,033,441 1,742,184
Call USD/KRW SPOT
CROSS -354,000,000 1,240 USD 18.12.2019 -1,481,929 -252,782,518 -2,982,840 1,500,911
Put FUT-10Y TREASURY
NOTES USA-JUN19 3,250 121 USD 26.04.2019 535,150 348,204,092 356,766 178,383
Put USD/TRY SPOT
CROSS 4,900,000 4 USD 17.06.2019 1,258 -2,823 431,116 -429,858
Call USD/TRY SPOT
CROSS 30,000,000 7 USD 23.05.2019 3,367 15,037 1,020,437 -1,017,070
Put USD/INR SPOT
CROSS 175,000,000 71 USD 20.03.2019 328,653 -25,077,295 261,757 66,896
Call USD/CNH SPOT
CROSS -210,000,000 8 USD 15.08.2019 -6,759 -108,656 -1,229,834 1,223,075
Put GBP/JPY CROSS
RATES -378,000,000 124 GBP 22.08.2019 -1,003,008 16,932,606 -4,575,220 3,572,212
Put AUD/JPY SPOT
CROSS -252,000,000 63 AUD 16.12.2019 -474,679 5,272,743 -853,658 378,979
Put CHF/JPY SPOT
CROSS 170,000,000 114 CHF 22.03.2019 3,047,513 -160,421,109 1,288,726 1,758,787
Put CHF/JPY SPOT
CROSS 255,000,000 111 CHF 22.03.2019 454,465 -44,681,943 1,909,334 -1,454,868
Put NOK/SEK SPOT
CROSS -700,000,000 1 NOK 15.03.2019 0 0 -211,894 211,894
Call USD/SGD SPOT
CROSS -224,000,000 1 USD 24.07.2019 -59,444 -70,417 -1,045,081 985,638
Put GBP/USD SPOT
CROSS 210,000,000 1 GBP 04.04.2019 1,127,370 -687,846 2,733,678 -1,606,308
Call USD/TWD SPOT
CROSS 70,000,000 32 USD 14.08.2019 126,066 1,537,181 139,255 -13,190
Put NZD/JPY SPOT
CROSS 297,500,000 65 NZD 11.11.2019 1,043,332 -124,871 3,801,556 -2,758,224
Call USD/KRW SPOT
CROSS 195,000,000 1,165 USD 05.12.2019 2,049,687 384,423,569 2,353,504 -303,818
Put CAD/JPY CROSS
RATES -105,000,000 85 CAD 01.07.2019 -1,608,495 28,744,131 -2,398,284 789,789
Put USD/RUB SPOT
CROSS 3,400,000 60 USD 14.11.2019 224,542 1,921,476 248,054 -23,512
Call EUR/CHF SPOT
CROSS 105,000,000 1 EUR 24.05.2019 1 119 354,900 -354,899
Put CHF/JPY SPOT
CROSS -170,000,000 111 CHF 10.04.2019 -692,389 53,084,318 -3,951,952 3,259,564
Put USD/ZAR SPOT
CROSS 10,000,000 12 USD 10.06.2019 75,281 -351,277 1,304,606 -1,229,326
Put GBP/USD SPOT
CROSS -145,000,000 1 GBP 28.03.2019 -6,079 17,698 -605,587 599,508
Put FUT-10Y TREASURY
NOTES USA-JUN19 -4,875 119 USD 26.04.2019 -267,575 -522,306,139 -200,681 -66,894
Put USD/TRY SPOT
CROSS 3,200,000 4 USD 19.06.2019 215 -495 120,567 -120,352
Put EUR/PLN SPOT
CROSS 65,000,000 4 EUR 21.02.2020 343,703 -498,351 301,145 42,558

Notes to the Financial Statements
303
9 Off-balance-sheet transactions (continued)
Vontobel Fund - Bond Global Aggregate (continued)
Description Quantity Strike
price Currency Maturity
Market
value Commitment Cost price
Unrealised
gain/loss in Sub-
Fund currency
Put AUD/JPY SPOT
CROSS -140,000,000 79 AUD 22.04.2019 -1,302,424 32,949,451 -2,649,319 1,346,896
Put USD/JPY SPOT
CROSS 210,000,000 107 USD 10.09.2019 2,129,762 -49,178,179 2,960,840 -831,079
Call USD/CNH SPOT
CROSS -308,000,000 8 USD 08.01.2020 -322,933 -532,417 -1,014,867 691,934
Put AUD/JPY SPOT
CROSS 140,000,000 76 AUD 26.06.2019 1,041,389 -16,128,472 2,326,055 -1,284,666
Call USD/KRW SPOT
CROSS 210,000,000 1,180 USD 03.06.2019 412,854 153,918,400 2,033,441 -1,620,587
Put CAD/JPY CROSS
RATES 168,000,000 79 CAD 01.10.2019 1,141,353 -14,051,897 2,069,040 -927,687
Put USD/TRY SPOT
CROSS 3,500,000 5 USD 10.10.2019 142,408 -153,441 159,635 -17,227
Call USD/CNH SPOT
CROSS 140,000,000 7 USD 15.05.2019 6,472 92,193 1,434,033 -1,427,561
Call USD/CNH SPOT
CROSS -280,000,000 7 USD 05.06.2019 -112,526 -709,559 -1,302,526 1,190,000
Put EUR/USD SPOT -
CROSS RATES 130,000,000 1 EUR 04.03.2019 151 -147 215,670 -215,519
Put AUD/JPY SPOT
CROSS 238,000,000 72 AUD 06.08.2019 1,032,375 -12,867,460 2,623,888 -1,591,513
Call NOK/SEK SPOT
CROSS -700,000,000 1 NOK 15.03.2019 -322,930 -355,403 -258,756 -64,174
Put USD/ZAR SPOT
CROSS 3,200,000 12 USD 26.03.2019 6 -122 294,887 -294,881
Put GBP/USD SPOT
CROSS 140,000,000 1 GBP 28.03.2019 97,506 -98,202 2,913,447 -2,815,941
Put NZD/JPY SPOT
CROSS -170,000,000 72 NZD 08.08.2019 -1,245,505 192,975 -4,482,086 3,236,581
Call USD/KRW SPOT
CROSS -245,000,000 1,250 USD 26.06.2019 -46,295 -39,661,449 -1,989,707 1,943,412
Put USD/TRY SPOT
CROSS 6,100,000 5 USD 25.02.2020 186,538 -151,357 228,464 -41,926
Put AUD/JPY SPOT
CROSS 140,000,000 79 AUD 22.04.2019 1,302,424 -32,949,451 2,297,499 -995,075
Call EUR/HUF SPOT
CROSS 49,000,000 325 EUR 03.04.2019 36,725 26,280 126,420 -89,695
Call USD/KRW SPOT
CROSS -140,000,000 1,150 USD 26.04.2019 -328,884 -211,342,338 -328,884 0
Put EUR/HUF SPOT
CROSS -49,000,000 312 EUR 03.04.2019 -70,406 89,714 -92,610 22,204
Put USD/TRY SPOT
CROSS 7,000,000 4 USD 23.05.2019 1,250 -3,312 595,349 -594,100
Put AUD/JPY SPOT
CROSS -245,000,000 72 AUD 22.07.2019 -778,318 10,446,458 -2,239,020 1,460,702
Call USD/KRW SPOT
CROSS 140,000,000 1,150 USD 27.03.2019 129,465 123,746,500 2,199,819 -2,070,354
Call USD/RUB SPOT
CROSS 48,000,000 72 USD 07.05.2019 164,525 2,115,884 440,437 -275,912
Call -USD/AUD SPOT
CROSS -181,439,953 2 USD 21.01.2020 -962,575 172,453 -1,312,813 350,238
Put CHF/JPY SPOT
CROSS -255,000,000 108 CHF 10.04.2019 -130,574 12,315,695 -1,199,196 1,068,622
Call -USD/AUD SPOT
CROSS 108,800,017 1 USD 21.10.2019 1,223,680 -266,451 1,476,661 -252,982
Call USD/SGD SPOT
CROSS -140,000,000 1 USD 22.03.2019 -1,116 -8,138 -700,092 698,976

Notes to the Financial Statements
304
9 Off-balance-sheet transactions (continued)
Vontobel Fund - Bond Global Aggregate (continued)
Description Quantity Strike
price Currency Maturity
Market
value Commitment Cost price
Unrealised
gain/loss in Sub-
Fund currency
Call USD/CNH SPOT
CROSS 154,000,000 7 USD 08.10.2019 511,488 768,744 1,208,688 -697,200
Call USD/SGD SPOT
CROSS 224,000,000 1 USD 24.07.2019 59,444 70,417 760,929 -701,486
Call USD/TWD SPOT
CROSS 70,000,000 32 USD 12.07.2019 112,218 1,618,583 146,824 -34,605
Call USD/KRW SPOT
CROSS 240,000,000 1,170 USD 10.07.2019 996,475 307,479,266 3,509,733 -2,513,258
Put NZD/JPY SPOT
CROSS -297,500,000 65 NZD 11.11.2019 -1,043,332 124,871 -1,873,085 829,753
Call USD/BRL SPOT
CROSS 70,000,000 4 USD 04.04.2019 115,411 151,289 232,175 -116,764
Put USD/TRY SPOT
CROSS 3,200,000 4 USD 19.06.2019 215 -495 124,524 -124,309
Put AUD/JPY SPOT
CROSS -238,000,000 72 AUD 06.08.2019 -1,032,375 12,867,460 -2,292,608 1,260,233
TOTAL EUR -1,032,375 6,015,175 -2,813,878
Vontobel Fund - Value Bond
Description Quantity Strike
price Currency Maturity
Market
value Commitment Cost price
Unrealised
gain/loss in Sub-
Fund currency
Put CHF/JPY SPOT
CROSS 30,000,000 111 CHF 10.04.2019 138,605 -10,626,608 309,900 -171,295
Put CHF/JPY SPOT
CROSS -30,000,000 114 CHF 22.03.2019 -610,062 32,113,668 -558,000 -52,062
Put CHF/JPY SPOT
CROSS 45,000,000 111 CHF 22.03.2019 90,977 -8,944,590 384,750 -293,774
Put CHF/JPY SPOT
CROSS -45,000,000 108 CHF 10.04.2019 -26,139 2,465,400 -241,650 215,511
Put CHF/JPY SPOT
CROSS 45,000,000 108 CHF 10.04.2019 26,139 -2,465,400 595,575 -569,436
Put CHF/JPY SPOT
CROSS -30,000,000 111 CHF 10.04.2019 -138,605 10,626,608 -786,060 647,455
Put CHF/JPY SPOT
CROSS -45,000,000 111 CHF 22.03.2019 -90,977 8,944,590 -178,200 87,224
Put CHF/JPY SPOT
CROSS 30,000,000 114 CHF 22.03.2019 610,062 -32,113,668 256,200 353,862
TOTAL EUR 0 -217,485 217,485
Vontobel Fund – Absolute Return Bond (EUR)
Description Quantity Strike
price Currency Maturity
Market
value Commitment Cost price
Unrealised
gain/loss in Sub-
Fund currency
Put EUR/USD SPOT -
CROSS RATES 10,000,000 1 EUR 04.03.2019 12 -11 16,590 -16,578
Put AUD/JPY SPOT
CROSS 140,000,000 71 AUD 19.11.2019 1,095,015 -9,611,988 1,463,906 -368,892
Put AUD/JPY SPOT
CROSS 80,000,000 74 AUD 05.12.2019 1,062,327 -9,342,900 1,335,644 -273,317
Put AUD/JPY SPOT
CROSS -80,000,000 79 AUD 18.07.2019 -1,257,231 17,918,106 -1,740,546 483,315
Put CHF/JPY SPOT
CROSS 24,000,000 111 CHF 10.04.2019 97,749 -7,494,257 217,114 -119,365

Notes to the Financial Statements
305
9 Off-balance-sheet transactions (continued)
Vontobel Fund - Absolute Return Bond (EUR) ((continued)
Description Quantity Strike
price Currency Maturity
Market
value Commitment Cost price
Unrealised
gain/loss in
Sub-Fund
currency
Put CHF/JPY SPOT
CROSS 36,000,000 111 CHF 22.03.2019 64,160 -6,308,039 269,553 -205,393
Put CHF/JPY SPOT
CROSS -36,000,000 108 CHF 10.04.2019 -18,434 1,738,686 -169,298 150,864
Put CHF/JPY SPOT
CROSS 36,000,000 108 CHF 10.04.2019 18,434 -1,738,686 422,722 -404,288
Call USD/CAD SPOT
CROSS 15,000,000 1 USD 02.08.2019 94,626 38,896 111,087 -16,460
Call USD/CAD SPOT
CROSS -27,300,000 1 USD 05.11.2019 -95,206 -30,859 -111,090 15,884
Call USD/SGD SPOT
CROSS -30,000,000 1 USD 25.02.2020 -115,735 -40,606 -116,325 590
Put USD/ZAR SPOT
CROSS 300,000 12 USD 26.03.2019 1 -11 27,646 -27,645
Put GBP/USD SPOT
CROSS -25,000,000 1 GBP 28.03.2019 -1,048 3,051 -104,411 103,363
Put GBP/USD SPOT
CROSS 25,000,000 1 GBP 28.03.2019 1,048 -3,051 301,064 -300,016
Put NZD/JPY SPOT
CROSS 14,000,000 72 NZD 08.08.2019 102,571 -15,892 160,158 -57,587
Call USD/KRW SPOT
CROSS -67,500,000 1,240 USD 11.10.2019 -165,727 -36,468,471 -626,859 461,131
Call USD/KRW SPOT
CROSS -33,000,000 1,240 USD 18.12.2019 -138,146 -23,564,472 -278,061 139,915
Call USD/KRW SPOT
CROSS 15,000,000 1,165 USD 05.12.2019 157,668 29,571,044 181,039 -23,371
Call USD/KRW SPOT
CROSS -60,000,000 1,235 USD 30.05.2019 -7,038 -8,044,516 -387,643 380,605
Call USD/KRW SPOT
CROSS 45,000,000 1,170 USD 10.07.2019 186,839 57,652,362 658,075 -471,236
Put FUT-10Y TREASURY
NOTES USA-JUN19 -375 119 USD 26.04.2019 -20,583 -40,177,395 -15,437 -5,146
Put FUT-10Y TREASURY
NOTES USA-JUN19 -150 120 USD 26.04.2019 -10,291 -16,070,958 -10,691 400
Put FUT-10Y TREASURY
NOTES USA-JUN19 250 121 USD 26.04.2019 41,165 26,784,930 27,444 13,722
Put USD/TRY SPOT
CROSS 500,000 5 USD 25.02.2020 15,290 -12,406 18,727 -3,436
Put USD/RUB SPOT
CROSS -4,000,000 64 USD 07.05.2019 -14,299 432,671 -19,933 5,635
Call -USD/AUD SPOT
CROSS 10,200,002 1 USD 21.10.2019 114,720 -24,980 138,437 -23,717
Call USD/ILS SPOT -
CROSS RATES 15,000,000 4 USD 02.05.2019 14,855 30,209 21,176 -6,321
Call USD/CNH SPOT
CROSS 20,000,000 7 USD 08.10.2019 66,427 99,837 156,972 -90,545
Put CHF/JPY SPOT
CROSS -24,000,000 114 CHF 22.03.2019 -430,237 22,647,686 -390,931 -39,306
Put CHF/JPY SPOT
CROSS -24,000,000 111 CHF 10.04.2019 -97,749 7,494,257 -557,923 460,174
Put NZD/JPY SPOT
CROSS 24,500,000 65 NZD 11.11.2019 85,921 -10,283 313,069 -227,148
Call USD/KRW SPOT
CROSS -30,000,000 1,120 USD 27.02.2019 -16,726 -203,496,452 -658,920 642,195
Call USD/KRW SPOT
CROSS 20,000,000 1,160 USD 18.09.2019 165,404 39,090,387 285,669 -120,265

Notes to the Financial Statements
306
9 Off-balance-sheet transactions (continued)
Vontobel Fund – Absolute Return Bond (EUR)
Description Quantity Strike
price Currency Maturity
Market
value Commitment Cost price
Unrealised
gain/loss in Sub-
Fund currency
Call USD/KRW SPOT
CROSS 30,000,000 1,120 USD 27.02.2019 16,726 203,496,452 412,831 -396,105
Put CAD/JPY CROSS
RATES 20,000,000 76 CAD 04.12.2019 128,518 -1,309,869 179,775 -51,257
Put USD/TRY SPOT
CROSS 300,000 4 USD 19.06.2019 20 -46 11,303 -11,283
Call USD/RUB SPOT
CROSS 4,000,000 72 USD 07.05.2019 13,710 176,324 36,703 -22,993
Put EUR/PLN SPOT
CROSS 5,000,000 4 EUR 21.02.2020 26,439 -38,335 23,165 3,274
Call -USD/AUD SPOT
CROSS -17,009,996 2 USD 21.01.2020 -90,241 16,167 -123,076 32,835
Put GBP/JPY CROSS
RATES -45,000,000 124 GBP 22.08.2019 -119,406 2,015,786 -544,669 425,263
Call USD/SGD SPOT
CROSS 15,000,000 1 USD 25.11.2019 119,539 51,549 124,455 -4,916
Put USD/TRY SPOT
CROSS 300,000 4 USD 19.06.2019 0 -46 11,674 -11,674
Call USD/CNH SPOT
CROSS -40,000,000 8 USD 08.01.2020 -41,939 -69,145 -131,801 89,862
Put AUD/JPY SPOT
CROSS -140,000,000 68 AUD 06.02.2020 -1,033,670 7,527,544 -1,303,566 269,896
Put CHF/JPY SPOT
CROSS 24,000,000 114 CHF 22.03.2019 430,237 -22,647,686 181,938 248,299
Put GBP/USD SPOT
CROSS 25,000,000 1 GBP 30.05.2019 1,714 -3,206 55,914 -54,200
Call USD/KRW SPOT
CROSS 60,000,000 1,235 USD 30.05.2019 7,038 8,044,516 379,796 -372,758
Put CAD/JPY CROSS
RATES -26,000,000 71 CAD 04.02.2020 -105,078 945,202 -148,709 43,631
Call EUR/PLN SPOT
CROSS -5,000,000 5 EUR 21.02.2020 -15,059 -11,232 -18,800 3,741
Put AUD/JPY SPOT
CROSS 80,000,000 79 AUD 18.07.2019 1,257,231 -17,918,106 1,261,930 -4,699
Put GBP/USD SPOT
CROSS -50,000,000 1 GBP 30.05.2019 -3,428 6,412 -266,753 263,325
Put AUD/JPY SPOT
CROSS -140,000,000 71 AUD 19.11.2019 -1,095,015 9,611,988 -1,259,112 164,097
Call USD/CNH SPOT
CROSS -32,000,000 8 USD 28.10.2019 -807 -14,299 -166,607 165,799
Call USD/CNH SPOT
CROSS 16,000,000 7 USD 28.10.2019 13,450 27,564 182,085 -168,635
Put GBP/JPY CROSS
RATES 30,000,000 132 GBP 22.05.2019 40,331 -1,909,419 568,877 -528,546
Put NZD/JPY SPOT
CROSS -24,500,000 65 NZD 11.11.2019 -85,921 10,283 -154,254 68,333
Put FUT-10Y
TREASURY NOTES
USA-JUN19 150 121 USD 22.03.2019 12,350 16,070,958 18,946 -6,597
Call USD/KRW SPOT
CROSS -25,000,000 1,245 USD 06.02.2020 -132,408 -18,993,995 -162,060 29,652
Put CHF/JPY SPOT
CROSS -36,000,000 111 CHF 22.03.2019 -64,160 6,308,039 -126,547 62,387
Put NZD/JPY SPOT
CROSS -14,000,000 72 NZD 08.08.2019 -102,571 15,892 -369,113 266,542
TOTAL EUR 173,382 -387,651 561,034

Notes to the Financial Statements
307
9 Off-balance-sheet transactions (continued)
Vontobel Fund – Multi Asset Income
Description Quantity Strike
price Currency Maturity
Market
value Commitment Cost price
Unrealised
gain/loss in Sub-
Fund currency
Put SX5E-EURO
STOXX 50 PR 165 3,000 EUR 15.03.2019 1,650 -97,958 60,143 -58,493
TOTAL EUR 1,650 60,143 -58,493
Vontobel Fund - Absolute Return Bond Dynamic
Description Quantity Strike
price Currency Maturity
Market
value Commitment Cost price
Unrealised
gain/loss in Sub-
Fund currency
Put GBP/JPY CROSS
RATES -12,000,000 124 GBP 22.08.2019 -31,842 537,543 -145,245 113,403
Put AUD/JPY SPOT
CROSS 20,000,000 79 AUD 18.07.2019 314,308 -4,479,527 315,482 -1,175
Put AUD/JPY SPOT
CROSS -35,000,000 71 AUD 19.11.2019 -273,754 2,402,997 -314,778 41,024
Put AUD/JPY SPOT
CROSS 35,000,000 71 AUD 19.11.2019 273,754 -2,402,997 365,977 -92,223
Put AUD/JPY SPOT
CROSS -20,000,000 79 AUD 18.07.2019 -314,308 4,479,527 -435,136 120,829
Put CHF/JPY SPOT
CROSS 6,000,000 111 CHF 10.04.2019 24,437 -1,873,564 54,278 -29,841
Put CHF/JPY SPOT
CROSS -9,000,000 108 CHF 10.04.2019 -4,608 434,672 -42,325 37,716
Call USD/CAD SPOT
CROSS -18,200,000 1 USD 05.11.2019 -63,471 -20,573 -74,060 10,589
Call USD/SGD SPOT
CROSS 10,000,000 1 USD 25.11.2019 79,693 34,366 82,970 -3,277
Call USD/SGD SPOT
CROSS -20,000,000 1 USD 25.02.2020 -77,157 -27,071 -77,550 393
Put GBP/USD SPOT
CROSS -30,000,000 1 GBP 30.05.2019 -2,057 3,847 -160,052 157,995
Put NZD/JPY SPOT
CROSS -10,500,000 65 NZD 11.11.2019 -36,823 4,407 -66,109 29,285
Put NZD/JPY SPOT
CROSS 10,500,000 65 NZD 11.11.2019 36,823 -4,407 134,173 -97,349
Call USD/KRW SPOT
CROSS -20,000,000 1,235 USD 30.05.2019 -2,346 -2,681,505 -129,214 126,868
Call USD/KRW SPOT
CROSS 20,000,000 1,235 USD 30.05.2019 2,346 2,681,505 126,599 -124,253
Call USD/KRW SPOT
CROSS 15,000,000 1,160 USD 18.09.2019 124,053 29,317,790 214,252 -90,198
Call USD/KRW SPOT
CROSS -16,500,000 1,245 USD 06.02.2020 -87,389 -12,536,037 -106,960 19,570
Call USD/KRW SPOT
CROSS 10,000,000 1,165 USD 05.12.2019 105,112 19,714,029 120,693 -15,580
Put CAD/JPY CROSS
RATES -19,500,000 71 CAD 04.02.2020 -78,809 708,902 -111,532 32,723
Put USD/TRY SPOT
CROSS 300,000 5 USD 25.02.2020 9,174 -7,444 11,236 -2,062
Call USD/RUB SPOT
CROSS 4,000,000 72 USD 07.05.2019 13,710 176,324 36,703 -22,993
Call -USD/AUD SPOT
CROSS -11,339,997 2 USD 21.01.2020 -60,161 10,778 -82,051 21,890

Notes to the Financial Statements
308
9 Off-balance-sheet transactions (continued)
Vontobel Fund - Absolute Return Bond Dynamic (continued)
Description Quantity Strike
price
Currenc
y Maturity
Market
value Commitment Cost price
Unrealised
gain/loss in
Sub-Fund
currency
Call USD/ILS SPOT -
CROSS RATES 10,000,000 4 USD 02.05.2019 9,904 20,140 14,118 -4,213
Call USD/CNH SPOT
CROSS 4,000,000 7 USD 28.10.2019 3,363 6,891 45,521 -42,159
Call USD/CNH SPOT
CROSS -20,000,000 8 USD 08.01.2020 -20,970 -34,573 -65,900 44,931
Put EUR/USD SPOT -
CROSS RATES 10,000,000 1 EUR 04.03.2019 12 -11 16,590 -16,578
Put CHF/JPY SPOT
CROSS -6,000,000 111 CHF 10.04.2019 -24,437 1,873,564 -139,481 115,043
Put CHF/JPY SPOT
CROSS 9,000,000 111 CHF 22.03.2019 16,040 -1,577,010 67,388 -51,348
Put USD/ZAR SPOT
CROSS 100,000 12 USD 26.03.2019 0 -4 9,215 -9,215
Put GBP/USD SPOT
CROSS 15,000,000 1 GBP 30.05.2019 1,028 -1,924 33,549 -32,520
Put CAD/JPY CROSS
RATES 15,000,000 76 CAD 04.12.2019 96,388 -982,402 134,831 -38,443
Put FUT-10Y
TREASURY NOTES
USA-JUN19 -150 120 USD 26.04.2019 -10,291 -16,070,958 -10,691 399
Call USD/CNH SPOT
CROSS -8,000,000 8 USD 28.10.2019 -202 -3,575 -41,652 41,450
Call EUR/PLN SPOT
CROSS -5,000,000 5 EUR 21.02.2020 -15,059 -11,232 -18,800 3,741
Put CHF/JPY SPOT
CROSS -6,000,000 114 CHF 22.03.2019 -107,559 5,661,921 -97,733 -9,827
Put FUT-10Y
TREASURY NOTES
USA-JUN19 250 121 USD 26.04.2019 41,165 26,784,930 27,444 13,722
Put RUY-RUSSEL 2000
INDEX -75 1,360 USD 21.06.2019 -73,571 1,462,710 -110,580 37,009
Put RUY-RUSSEL 2000
INDEX 50 1,440 USD 21.06.2019 90,322 -1,359,702 131,201 -40,878
Put EUR/PLN SPOT
CROSS 5,000,000 4 EUR 21.02.2020 26,439 -38,335 23,165 3,274
Put GBP/USD SPOT
CROSS -15,000,000 1 GBP 28.03.2019 -629 1,831 -62,647 62,018
Put AUD/JPY SPOT
CROSS 20,000,000 74 AUD 05.12.2019 265,582 -2,335,725 333,911 -68,329
Put GBP/JPY CROSS
RATES 8,000,000 132 GBP 22.05.2019 10,755 -509,178 151,700 -140,946
Put CHF/JPY SPOT
CROSS 6,000,000 114 CHF 22.03.2019 107,559 -5,661,921 45,484 62,075
Call USD/KRW SPOT
CROSS -22,500,000 1,240 USD 11.10.2019 -55,242 -12,156,157 -208,953 153,710
Put FUT-10Y
TREASURY NOTES
USA-JUN19 150 121 USD 22.03.2019 12,350 16,070,958 18,946 -6,597
Call USD/CNH SPOT
CROSS 10,000,000 7 USD 08.10.2019 33,213 49,918 78,486 -45,273
Call USD/CAD SPOT
CROSS 10,000,000 1 USD 02.08.2019 63,084 25,931 74,058 -10,974
Call -USD/AUD SPOT
CROSS 6,800,001 1 USD 21.10.2019 76,480 -16,653 92,291 -15,811
Put AUD/JPY SPOT
CROSS -35,000,000 68 AUD 06.02.2020 -258,417 1,881,886 -325,891 67,474

Notes to the Financial Statements
309
9 Off-balance-sheet transactions (continued)
Vontobel Fund - Absolute Return Bond Dynamic (continued)
Description Quantity Strike
price
Currenc
y Maturity
Market
value Commitment Cost price
Unrealised
gain/loss in
Sub-Fund
currency
Put NZD/JPY SPOT
CROSS -6,000,000 72 NZD 08.08.2019 -43,959 6,811 -158,191 114,232
Call USD/KRW SPOT
CROSS -25,000,000 1,240 USD 18.12.2019 -104,656 -17,851,873 -210,653 105,997
Put CHF/JPY SPOT
CROSS 9,000,000 108 CHF 10.04.2019 4,608 -434,672 105,680 -101,072
Put USD/TRY SPOT
CROSS 100,000 4 USD 19.06.2019 7 -15 3,891 -3,884
Put USD/RUB SPOT
CROSS 200,000 60 USD 14.11.2019 13,208 113,028 14,591 -1,383
Put NZD/JPY SPOT
CROSS 6,000,000 72 NZD 08.08.2019 43,959 -6,811 68,639 -24,680
Put USD/RUB SPOT
CROSS -4,000,000 64 USD 07.05.2019 -14,299 432,671 -19,933 5,635
Put GBP/USD SPOT
CROSS 15,000,000 1 GBP 28.03.2019 629 -1,831 180,638 -180,009
Put CHF/JPY SPOT
CROSS -9,000,000 111 CHF 22.03.2019 -16,040 1,577,010 -31,637 15,597
Call USD/KRW SPOT
CROSS 15,000,000 1,170 USD 10.07.2019 62,280 19,217,454 219,358 -157,079
Put FUT-10Y
TREASURY NOTES
USA-JUN19 -375 119 USD 26.04.2019 -20,583 -40,177,395 -15,437 -5,146
Put USD/TRY SPOT
CROSS 100,000 4 USD 19.06.2019 7 -15 3,768 -3,761
Total EUR 163,153 93,635 69,516
Vontobel Fund - Global Convertible Bond
Description Quantity Strike
price Currency Maturity
Market
value Commitment Cost price
Unrealised
gain/loss in Sub-
Fund currency
Call DAX-DAX-INDEX 100 11’700 EUR 15.03.2019 24’250 1’571’885 21’500 2’750
Total EUR 24’250 21’500 2’750
Vontobel Fund - Multi Asset Solution
Description Quantity Strike
price Currency Maturity Market value Commitment Cost price
Unrealised
gain/loss in Sub-
Fund currency
Call SX5E-EURO
STOXX 50 PR 100 3,300 EUR 17.05.2019 46,400 1,213,760 38,140 8,260
Put SX5E-EURO
STOXX 50 PR 200 3,000 EUR 15.03.2019 2,000 -118,737 58,000 -56,000
Put SPX-S&P 500
INDICES 12 2,650 USD 15.03.2019 5,375 -267,786 32,020 -26,645
Put SPX-S&P 500
INDICES 20 2,550 USD 15.03.2019 3,074 -176,562 65,735 -62,661
Put SX5E-EURO
STOXX 50 PR 100 3,100 EUR 15.03.2019 2,000 -141,825 31,100 -29,100
Total EUR 58,849 224,995 -166,146

Notes to the Financial Statements
310
9 Off-balance-sheet transactions (continued)
Vontobel Fund - Multi Asset Income
Description Quantity Strike
price Currency Maturity
Market
value Commitment Cost price
Unrealised
gain/loss in Sub-
Fund currency
Put SX5E-EURO
STOXX 50 PR 165 3’000 EUR 15.03.2019 1’650 -97’958 60’143 -58’493
TOTAL EUR 1’650 60’143 -58’493
Vontobel Fund - Multi Asset Defensive
Description Quantity Strike
price Currency Maturity
Market
value Commitment Cost price
Unrealised
gain/loss in Sub-
Fund currency
Call SX7E-DJ EURO
STOXX/BANKS/PRICE
IND 1,600 100 EUR 15.03.2019 104,000 2,913,686 78,000 26,000
Put SX5E-EURO
STOXX 50 PR 250 3,100 EUR 18.04.2019 37,750 -1,269,830 42,818 -5,068
Call FUT-BPA CCY
GBP/USD EUR FX-
JUN19 40 133 USD 05.04.2019 41,934 1,581,303 42,990 -1,056
Put SPX-S&P 500
INDICES 25 2,700 USD 18.04.2019 56,863 -1,624,617 55,107 1,756
Put FUT-EURO-BUND-
JUN19 100 161 EUR 24.05.2019 58,000 -4,750,575 47,000 11,000
Put SX5E-EURO
STOXX 50 PR 200 3,000 EUR 15.03.2019 2,000 -118,737 63,077 -61,077
Total EUR 300,547 328,992 -28,445
Vontobel Fund - Multi Asset Alphabet
Description Quantity Strike
price Currency Maturity Market value Commitment Cost price
Unrealised
gain/loss in Sub-
Fund currency
Call HSCEI-HSCEI -
HKD CHINA ENT 20 11,100 HKD 27.09.2019 78,760 680,377 63,231 15,529
Put -USD/AUD SPOT
CROSS 8,880,002 1 USD 22.04.2019 12,796 17,713 37,553 -24,757
Call HSCEI-HSCEI -
HKD CHINA ENT -60 12,300 HKD 27.09.2019 -88,269 -1,064,440 -64,675 -23,594
Call GBP/USD SPOT
CROSS 850,000 1 GBP 05.04.2019 13,505 7,147 12,016 1,489
Put EUR/CHF SPOT
CROSS 3,500,000 1 EUR 15.04.2019 10 -79 8,575 -8,565
Call USD/CAD SPOT
CROSS -9,000,000 1 USD 09.07.2019 -32,154 -13,238 -65,068 32,914
Call USD/CAD SPOT
CROSS 4,500,000 1 USD 09.07.2019 39,948 21,537 62,897 -22,949
Call -USD/AUD SPOT
CROSS -4,200,001 1 USD 22.04.2019 -23,906 14,267 -39,065 15,159
Total EUR 690 15,464 -14,774

Notes to the Financial Statements
311
10 Securities valuation
Securities valued at 0
The Board of Directors has decided to continue to value certain securities at zero.
Securities ISIN Code Sub-Funds
PEACE MARK (HOLDINGS)
LIMITED BMG6957A2098
Vontobel Fund - Emerging Markets Equity
Vontobel Fund - Asia Pacific Equity
CIA VALE DO RIO DOCE/VAL.DEB BRVALEDBSO28 Vontobel Fund - Emerging Markets Equity
ROMANIA PROPERTY Fund
LTD/GBP GG00B2334D09 Vontobel Fund - mtx Sustainable Emerging Markets Leaders

Notes to the Financial Statements
312
11 Dividend distribution
The Board of Directors declared the following dividends effective as of November 27, 2018. These were approved
at the General Meeting of Shareholders on February 12, 2019.
Vontobel Fund - Share
Class Record date
Ex-dividend
date
Payment
date Currency
Amount
per
share
Swiss Money A 26.11.2018 27.11.2018 30.11.2018 CHF 0.62
Euro Short Term Bond A 26.11.2018 27.11.2018 30.11.2018 EUR 4.48
US Dollar Money A 26.11.2018 27.11.2018 30.11.2018 USD 2.08
Swiss Franc Bond A 26.11.2018 27.11.2018 30.11.2018 CHF 0.48
AI 26.11.2018 27.11.2018 30.11.2018 CHF 0.68
AN 26.11.2018 27.11.2018 30.11.2018 CHF 0.61
Euro Bond A 26.11.2018 27.11.2018 30.11.2018 EUR 1.43
AN 26.11.2018 27.11.2018 30.11.2018 EUR 1.42
EUR Corporate Bond Mid Yield A 26.11.2018 27.11.2018 30.11.2018 EUR 1.93
AI 26.11.2018 27.11.2018 30.11.2018 EUR 2.30
AN 26.11.2018 27.11.2018 30.11.2018 EUR 2.05
Bond Global Aggregate A 26.11.2018 27.11.2018 30.11.2018 EUR 2.93
AH 26.11.2018 27.11.2018 30.11.2018 USD 3.01
AI 26.11.2018 27.11.2018 30.11.2018 EUR 2.71
AS 26.11.2018 27.11.2018 30.11.2018 EUR 2.09
Eastern European Bond A 26.11.2018 27.11.2018 30.11.2018 EUR 1.23
AN 26.11.2018 27.11.2018 30.11.2018 EUR 3.24
Value Bond A 26.11.2018 27.11.2018 30.11.2018 CHF 1.27
Absolute Return Bond (EUR) A 26.11.2018 27.11.2018 30.11.2018 EUR 0.79
Absolute Return Bond Dynamic A 26.11.2018 27.11.2018 30.11.2018 EUR 0.95
Sustainable Emerging Markets
Local Currency Bond A 26.11.2018 27.11.2018 30.11.2018 USD 4.32
AN 26.11.2018 27.11.2018 30.11.2018 USD 5.24
European Mid and Small Cap Equity A 26.11.2018 27.11.2018 30.11.2018 EUR 0.77
AN 26.11.2018 27.11.2018 30.11.2018 EUR 0.58
mtx China Leaders A 26.11.2018 27.11.2018 30.11.2018 USD 2.01
AN 26.11.2018 27.11.2018 30.11.2018 USD 0.95
European Equity A 26.11.2018 27.11.2018 30.11.2018 EUR 1.80
AN 26.11.2018 27.11.2018 30.11.2018 EUR 1.09
US Equity ANG 26.11.2018 27.11.2018 30.11.2018 USD 0.61
Global Equity AI 26.11.2018 27.11.2018 30.11.2018 EUR 0.34
Global Equity Income A Gross 26.11.2018 27.11.2018 30.11.2018 USD 7.05
Emerging Markets Equity A 26.11.2018 27.11.2018 30.11.2018 USD 4.34
AHI 26.11.2018 27.11.2018 30.11.2018 EUR 0.73
AI 26.11.2018 27.11.2018 30.11.2018 USD 0.73
AN 26.11.2018 27.11.2018 30.11.2018 USD 1.19
Asia Pacific Equity A 26.11.2018 27.11.2018 30.11.2018 USD 1.52
mtx Sustainable Asian Leaders
(ex Japan) A 26.11.2018 27.11.2018 30.11.2018 USD 2.54
AN 26.11.2018 27.11.2018 30.11.2018 USD 0.97
mtx Sustainable Emerging Markets
Leaders A 26.11.2018 27.11.2018 30.11.2018 USD 1.39
AHI 26.11.2018 27.11.2018 30.11.2018 EUR 1.19
AI 26.11.2018 27.11.2018 30.11.2018 EUR 1.27
AI 26.11.2018 27.11.2018 30.11.2018 USD 1.46
AN 26.11.2018 27.11.2018 30.11.2018 GBP 1.33
AN 26.11.2018 27.11.2018 30.11.2018 USD 1.37
mtx Sustainable Global Leaders A 26.11.2018 27.11.2018 30.11.2018 USD 2.34
AN 26.11.2018 27.11.2018 30.11.2018 USD 1.91
Emerging Markets Debt AH 26.11.2018 27.11.2018 30.11.2018 EUR 4.26
AHI 26.11.2018 27.11.2018 30.11.2018 CHF 4.78
AHI 26.11.2018 27.11.2018 30.11.2018 EUR 4.95
AI 26.11.2018 27.11.2018 30.11.2018 EUR 5.93
AI 26.11.2018 27.11.2018 30.11.2018 USD 4.85
AS 26.11.2018 27.11.2018 30.11.2018 USD 1.69

Notes to the Financial Statements
313
11 Dividend distribution (continued)
Vontobel Fund - Share Class Record
date
Ex-dividend
date
Payment
date Currency
Amount
per
share
Global Corporate Bond Mid Yield A 26.11.2018 27.11.2018 30.11.2018 USD 2.52
AH 26.11.2018 27.11.2018 30.11.2018 CHF 2.43
AH 26.11.2018 27.11.2018 30.11.2018 EUR 2.52
AHN 26.11.2018 27.11.2018 30.11.2018 CHF 2.55
TwentyFour Absolute Return Credit
Fund AH 26.11.2018 27.11.2018 30.11.2018 CHF 3.55
AH 26.11.2018 27.11.2018 30.11.2018 EUR 3.54
AH 26.11.2018 27.11.2018 30.11.2018 USD 7.38
AHI 26.11.2018 27.11.2018 30.11.2018 EUR 3.94
AHN 26.11.2018 27.11.2018 30.11.2018 CHF 2.70
AHN 26.11.2018 27.11.2018 30.11.2018 EUR 3.44
AI 26.11.2018 27.11.2018 30.11.2018 GBP 4.56
AQHN 26.11.2018 27.11.2018 30.11.2018 EUR 0.11
AQN 26.11.2018 27.11.2018 30.11.2018 GBP 0.04
AQNG 26.11.2018 27.11.2018 30.11.2018 GBP 0.01
TwentyFour Strategic Income Fund AH 26.11.2018 27.11.2018 30.11.2018 CHF 3.78
AH 26.11.2018 27.11.2018 30.11.2018 EUR 3.90
AH 26.11.2018 27.11.2018 30.11.2018 USD 6.52
AHI 26.11.2018 27.11.2018 30.11.2018 EUR 4.40
AHN 26.11.2018 27.11.2018 30.11.2018 CHF 3.73
AHN 26.11.2018 27.11.2018 30.11.2018 EUR 3.04
AQ 26.11.2018 27.11.2018 30.11.2018 GBP 0.06
AQG 26.11.2018 27.11.2018 30.11.2018 GBP 0.01
AQH Gross 26.11.2018 27.11.2018 30.11.2018 USD 0.01
AQHI 26.11.2018 27.11.2018 30.11.2018 USD 0.06
AQHN 26.11.2018 27.11.2018 30.11.2018 EUR 0.10
AQN 26.11.2018 27.11.2018 30.11.2018 GBP 0.04
LCR Global Bond AG 26.11.2018 27.11.2018 30.11.2018 EUR 2.51
Multi Asset Income A 26.11.2018 27.11.2018 30.11.2018 EUR 1.79
High Yield Bond AI 26.11.2018 27.11.2018 30.11.2018 EUR 5.46
AS 26.11.2018 27.11.2018 30.11.2018 EUR 2.09
The following interim dividends were distributed on a monthly basis for the AM Share Class:
Vontobel Fund - Share
Class Record date
Ex-dividend
date Payment date Currency
Amount
per share
Euro Bond AM 24.09.2018 25.09.2018 01.10.2018 USD 0.14
AM 24.10.2018 25.10.2018 31.10.2018 USD 0.13
AM 23.11.2018 26.11.2018 30.11.2018 USD 0.13
AM 24.12.2018 27.12.2018 03.01.2019 USD 0.13
AM 24.01.2019 25.01.2019 31.01.2019 USD 0.13
AM 22.02.2019 25.02.2019 01.03.2019 USD 0.13
Eastern European Bond AM 24.09.2018 25.09.2018 01.10.2018 EUR 0.26
AM 24.10.2018 25.10.2018 31.10.2018 EUR 0.27
AM 23.11.2018 26.11.2018 30.11.2018 EUR 0.27
AM 24.12.2018 27.12.2018 03.01.2019 EUR 0.27
AM 24.01.2019 25.01.2019 31.01.2019 EUR 0.27
AM 22.02.2019 25.02.2019 01.03.2019 EUR 0.27
Eastern European Bond AM 24.09.2018 25.09.2018 01.10.2018 USD 0.25
AM 24.10.2018 25.10.2018 31.10.2018 USD 0.25
AM 23.11.2018 26.11.2018 30.11.2018 USD 0.25
AM 24.12.2018 27.12.2018 03.01.2019 USD 0.25
AM 24.01.2019 25.01.2019 31.01.2019 USD 0.25
AM 22.02.2019 25.02.2019 01.03.2019 USD 0.25

Notes to the Financial Statements
314
11 Dividend distribution (continued)
Vontobel Fund - Share
class Record date
Ex-dividend
date Payment date Currency
Amount
per share
Sustainable Emerging Markets Local
Currency Bond
AM 24.09.2018 25.09.2018 01.10.2018 USD 0.39
AM 24.10.2018 25.10.2018 31.10.2018 USD 0.38
AM 23.11.2018 26.11.2018 30.11.2018 USD 0.38
AM 24.12.2018 27.12.2018 03.01.2019 USD 0.38
AM 24.01.2019 25.01.2019 31.01.2019 USD 0.42
AM 22.02.2019 25.02.2019 01.03.2019 USD 0.42
Absolute Return Bond (EUR) AM 24.09.2018 25.09.2018 01.10.2018 USD 0.11
AM 24.10.2018 25.10.2018 31.10.2018 USD 0.10
AM 23.11.2018 26.11.2018 30.11.2018 USD 0.10
AM 24.12.2018 27.12.2018 03.01.2019 USD 0.10
AM 24.01.2019 25.01.2019 31.01.2019 USD 0.10
AM 22.02.2019 25.02.2019 01.03.2019 USD 0.10
Emerging Markets Debt AM 24.09.2018 25.09.2018 01.10.2018 USD 0.45
AM 24.10.2018 25.10.2018 31.10.2018 USD 0.45
AM 23.11.2018 26.11.2018 30.11.2018 USD 0.44
AM 24.12.2018 27.12.2018 03.01.2019 USD 0.44
AM 24.01.2019 25.01.2019 31.01.2019 USD 0.50
AM 22.02.2019 25.02.2019 01.03.2019 USD 0.50
The following interim dividends were distributed on a monthly basis for the AMH Share Class:
Vontobel Fund - Share
Class Record date
Ex-dividend
date
Payment
date Currency
Amount
per
share
TwentyFour Strategic Income Fund AMH 31.08.2018 03.09.2018 07.09.2018 EUR 0.25
AMH 28.09.2018 01.10.2018 05.10.2018 EUR 0.25
AMH 01.11.2018 02.11.2018 08.11.2018 EUR 0.24
AMH 30.11.2018 03.12.2018 07.12.2018 EUR 0.24
AMH 31.12.2018 02.01.2019 08.01.2019 EUR 0.24
AMH 31.01.2019 01.02.2019 07.02.2019 EUR 0.19
High Yield Bond AMH 24.09.2018 25.09.2018 01.10.2018 USD 0.42
AMH 24.10.2018 25.10.2018 31.10.2018 USD 0.41
AMH 23.11.2018 26.11.2018 30.11.2018 USD 0.40
AMH 24.12.2018 27.12.2018 03.01.2019 USD 0.39
AMH 24.01.2019 25.01.2019 31.01.2019 USD 0.40
AMH 22.02.2019 25.02.2019 01.03.2019 USD 0.41
High Yield Bond AMH 24.09.2018 25.09.2018 01.10.2018 AUD 0.49
AMH 24.10.2018 25.10.2018 31.10.2018 AUD 0.48
AMH 23.11.2018 26.11.2018 30.11.2018 AUD 0.47
AMH 24.12.2018 27.12.2018 03.01.2019 AUD 0.46
AMH 24.01.2019 25.01.2019 31.01.2019 AUD 0.47
AMH 22.02.2019 25.02.2019 01.03.2019 AUD 0.47
High Yield Bond AMH 24.09.2018 25.09.2018 01.10.2018 ZAR 8.62
AMH 24.10.2018 25.10.2018 31.10.2018 ZAR 8.47
AMH 23.11.2018 26.11.2018 30.11.2018 ZAR 8.24
AMH 24.12.2018 27.12.2018 03.01.2019 ZAR 8.04
AMH 24.01.2019 25.01.2019 31.01.2019 ZAR 8.21
AMH 22.02.2019 25.02.2019 01.03.2019 ZAR 8.29

Notes to the Financial Statements
315
11 Dividend distribution (continued)
Vontobel Fund - Share
class Record date Ex-date
Payment
date Currency
Amount
per
share
Sustainable Emerging Markets Local
Currency Bond
AMH 24.09.2018 25.09.2018 01.10.2018 AUD 0.59
AMH 24.09.2018 25.09.2018 01.10.2018 AUD 0.58
AMH 23.11.2018 26.11.2018 30.11.2018 AUD 0.58
AMH 24.12.2018 27.12.2018 03.01.2019 AUD 0.58
AMH 24.01.2019 25.01.2019 31.01.2019 AUD 0.64
AMH 22.02.2019 25.02.2019 01.03.2019 AUD 0.64
Sustainable Emerging Markets Local
Currency Bond
AMH 24.09.2018 25.09.2018 01.10.2018 ZAR 10.49
AMH 24.09.2018 25.09.2018 01.10.2018 ZAR 10.32
AMH 23.11.2018 26.11.2018 30.11.2018 ZAR 10.29
AMH 24.12.2018 27.12.2018 03.01.2019 ZAR 10.31
AMH 24.01.2019 25.01.2019 31.01.2019 ZAR 11.41
AMH 22.02.2019 25.02.2019 01.03.2019 ZAR 11.42
The following interim dividends were distributed on a quarterly basis:
Vontobel Fund - Share Class Record date Ex-date Payment
date Currency
Amount
per
share
Swiss Franc Bond AQG 12.09.2018 13.09.2018 19.09.2018 CHF 0.36
AQG 12.12.2018 13.12.2018 19.12.2018 CHF 0.23
EUR Corporate Bond Mid Yield AQG 12.09.2018 13.09.2018 19.09.2018 EUR 0.54
AQG 12.12.2018 13.12.2018 19.12.2018 EUR 0.59
Emerging Markets Debt AQG 12.09.2018 13.09.2018 19.09.2018 USD 1.38
AQG 12.12.2018 13.12.2018 19.12.2018 USD 1.56
AQ1 12.09.2018 13.09.2018 19.09.2018 USD 0.94
AQ1 12.12.2018 13.12.2018 19.12.2018 USD 1.09
TwentyFour Absolute Return
Credit Fund
AQHNG 12.09.2018 13.09.2018 28.09.2018 USD 0.90
AQHNG 12.12.2018 13.12.2018 31.12.2018 USD 0.52
AQNG 12.09.2018 13.09.2018 28.09.2018 GBP 0.68
AQNG 12.12.2018 13.12.2018 31.12.2018 GBP 0.53
AQHG 12.09.2018 13.09.2018 28.09.2018 EUR 0.77
AQHG 12.12.2018 13.12.2018 31.12.2018 EUR 0.50
AQHG 12.12.2018 13.12.2018 31.12.2018 USD 0.49
AQHN 12.09.2018 13.09.2018 28.09.2018 EUR 0.45
AQHN 12.12.2018 13.12.2018 31.12.2018 EUR 0.48
AQN 12.09.2018 13.09.2018 28.09.2018 GBP 0.44
AQN 12.12.2018 13.12.2018 31.12.2018 GBP 0.52
AQG 12.09.2018 13.09.2018 28.09.2018 GBP 0.93
AQG 12.12.2018 13.12.2018 31.12.2018 GBP 0.54
TwentyFour Strategic Income
Fund AQ 12.09.2018 13.09.2018 28.09.2018 GBP 0.70
AQ 12.12.2018 13.12.2018 31.12.2018 GBP 0.76
AQH Gross 12.09.2018 13.09.2018 28.09.2018 HKD 1.13
AQH Gross 12.12.2018 13.12.2018 31.12.2018 HKD 1.97
AQH Gross 12.09.2018 13.09.2018 28.09.2018 EUR 0.66
AQH Gross 12.12.2018 13.12.2018 31.12.2018 EUR 0.80
AQH Gross 25.09.2018 26.09.2018 01.10.2018 USD 1.53
AQH Gross 12.12.2018 13.12.2018 31.12.2018 USD 0.79
AQH Gross 12.09.2018 13.09.2018 28.09.2018 SGD 1.19
AQH Gross 12.12.2018 13.12.2018 31.12.2018 SGD 1.21

Notes to the Financial Statements
316
11 Dividend distribution (continued)
Vontobel Fund - Share class Record date Ex-date Payment
date Currency
Amount
per
share
TwentyFour Strategic Income
Fund (Fortsetzung) AQHG 12.09.2018 13.09.2018 28.09.2018 EUR 1.10
AQHG 12.12.2018 13.12.2018 31.12.2018 EUR 1.01
AQHG 12.09.2018 13.09.2018 28.09.2018 USD 1.09
AQHG 12.12.2018 13.12.2018 31.12.2018 USD 1.01
AQHI 12.09.2018 13.09.2018 28.09.2018 USD 0.93
AQHI 12.12.2018 13.12.2018 31.12.2018 USD 1.01
AQHN 12.09.2018 13.09.2018 28.09.2018 EUR 0.80
AQHN 12.12.2018 13.12.2018 31.12.2018 EUR 0.95
AQHNG 12.09.2018 13.09.2018 28.09.2018 EUR 0.82
AQHNG 12.12.2018 13.12.2018 31.12.2018 EUR 0.99
AQHNG 12.09.2018 13.09.2018 28.09.2018 USD 1.01
AQHNG 12.12.2018 13.12.2018 31.12.2018 USD 1.05
AQN 12.09.2018 13.09.2018 28.09.2018 GBP 0.95
AQN 12.12.2018 13.12.2018 31.12.2018 GBP 1.00
AQNG 12.09.2018 13.09.2018 28.09.2018 GBP 4.00
AQNG 12.12.2018 13.12.2018 31.12.2018 GBP 1.00
AQG 12.09.2018 13.09.2018 28.09.2018 GBP 0.83
AQG 12.12.2018 13.12.2018 31.12.2018 GBP 1.04
AQH1 12.09.2018 13.09.2018 28.09.2018 USD 2.91
AQH1 12.12.2018 13.12.2018 31.12.2018 USD 0.82
AQHC1 12.09.2018 13.09.2018 28.09.2018 USD 4.20
AQHC1 12.12.2018 13.12.2018 31.12.2018 USD 1.17
12 Events during the period under review
The Sub-Fund Vontobel Fund - Multi Asset Alphabet was launched on September 28, 2018.
The Sub-Fund Vontobel Fund - Vescore Artificial Intelligence Multi Asset was launched on October 26, 2018.
On November 13, 2018, the Sub-Fund Vontobel Fund - Absolute Return Credit Fund was renamed Vontobel Fund
- Credit Opportunities.
The Sub-Fund Vontobel Fund - Alternative Risk Premia was launched on December 5, 2018.
The Sub-Fund Vontobel Fund - Vescore Global Equity Multi Factor was launched on December 12, 2018.
The management company, acting as investment manager through its Munich branch, has appointed Vontobel
Asset Management AG, Zurich as sub-investment manager for the Sub-Funds Vontobel Fund - Vescore Artificial
Intelligence Multi Asset and Vontobel Fund - Vescore Global Equity Multi Factor.

Notes to the Financial Statements
317
13 TER (Total Expense Ratio)
In accordance with the Swiss Funds & Asset Management Association (SFAMA) guidelines, the Fund must show
a TER for the past 12-month period. This figure expresses the total fees and costs which are charged on an
ongoing basis to the Sub-Fund,s assets (operating expenditure) retrospectively as a percentage of net Fund
assets, and is generally calculated according to the following formula:
TER = Total operating expenses in AC*
X 100 Average net Fund assets in AC*
* AC = units in Sub-fund accounting currency
The TER of the Sub-Fund, excluding the performance fee for Classes A to AH (USD), is as follows:
Vontobel Fund -
Distributing
A A
(CHF)
A
(EUR)
A
(JPY)
A
(USD)
A
Gross
AHI
(CHF)
AHI
(EUR)
AH
(CHF)
AH
(EUR)
AH
(GBP)
AH
(USD)
Swiss Money - 0.32% - - - - - - - - - -
Euro Short Term Bond - - 0.53% - - - - - - - - -
US Dollar Money - - - - 0.52% - - - - - - -
Swiss Franc Bond - 0.91% - - - - - - - - - -
Euro Bond - - 1.17% - - - - - - - - -
EUR Corporate Bond Mid Yield - - 1.35% - - - - - - - - -
High Yield Bond - - - - - - - - - - - -
High Yield Bond 1 - - - - - - - - - - - -
Bond Global Aggregate - - 1.11% - - - - - - - - 1.17%
Bond Global Aggregate 1 - - 1.55% - - - - - - - - 1.91%
Eastern European Bond - - 1.43% - - - - - - - - -
Value Bond - 0.66% - - - - - - - - - -
Value Bond 1 - 0.66% - - - - - - - - - -
Absolute Return Bond (EUR) - - 1.25% - - - - - - - - -
Absolute Return Bond (EUR) 1 - - 1.25% - - - - - - - - -
Absolute Return Bond Dynamic - - 1.61% - - - - - - - - -
Absolute Return Bond Dynamic 1 - - 1.73% - - - - - - - - -
Global Convertible Bond - - 1.42% - - - - - - - - -
Sustainable Emerging Markets
Local Currency Bond - - - - 1.63% - - - - - - -
Swiss Mid and Small Cap Equity - 2.05% - - - - - - - - - -
1 TER including the performance fee.

Notes to the Financial Statements
318
13 TER (Total Expense Ratio) (continued)
The TER of the Sub-Fund, excluding the performance fee for Classes A to AH (USD), is as follows:
Vontobel Fund -
Distributing
A A
(CHF)
A
(EUR)
A
(JPY)
A
(USD)
A
Gross
AHI
(CHF)
AHI
(EUR)
AH
(CHF)
AH
(EUR)
AH
(GBP)
AH
(USD)
European Mid and Small Cap Equity - - 2.20% - - - - - - - - -
Japanese Equity - - - 1.71% - - - - - - - -
mtx China Leaders - - - - 2.16% - - - - - - -
European Equity - - 2.05% - - - - - - - - -
US Equity - - - - 2.03% - - 1.22% - - - -
Global Equity - - - - 2.03% - - - - - - -
Global Equity Income - - - - - 2.02% - - - - - -
Emerging Markets Equity - - - - 2.09% - - 1.27% - - - -
Asia Pacific Equity - - - - 2.06% - - - - - - -
New Power - - 2.06% - - - - - - - - -
Clean Technology - 2.05% 2.05% - - - - - - - - -
Future Resources - 2.14% 2.14% - - - - - - - - -
mtx Sustainable Asian Leaders (ex Japan) - - - - 2.04% - - 1.23% - - - -
mtx Sustainable Emerging Markets
Leaders - - - - 2.03% - - 1.22% - 2.09% - -
mtx Sustainable Global Leaders - - - - 2.01% - - - - - - -
Commodity - - - - - - - - - - - -
Dynamic Commodity - - - - - - - - - - - -
Dynamic Commodity 1 - - - - - - - - - - - -
Non-Food Commodity - - - - - - - 1.25% - - - -
Emerging Markets Debt - - - - - - 0.84% 0.84% - 1.43% - -
Global Bond - - - - - - - - - - - -
Credit Opportunities - - - - - - - - - - - -
Global Corporate Bond Mid Yield - - - - 1.38% - - 0.85% 1.44% 1.44% - -
Emerging Markets Blend - - - - 1.42% - - - - - - -
Emerging Markets Corporate Bond - - - - - - - - - - - -
TwentyFour Absolute Return Credit Fund - - - - - - - 0.57% 1.01% 1.01% - 1.01%
TwentyFour Strategic Income Fund - - - - - - - 0.78% 1.42% 1.42% - 1.42%
LCR Global Bond - - - - - - - - - - - -
Multi Asset Solution - - - - - - - - - - - -
Multi Asset Solution 1 - - - - - - - - - - - -
Multi Asset Income - - 1.63% - - 1.63% - - - - - -
TwentyFour Monument European
Asset Backed Securities - - 1.17% - - - - - 1.23% - 1.23% 1.23%
Multi Asset Defensive - - - - - - - - - - - -
Multi Asset Alphabet - - - - - - - - - - - -
Vescore Artificial Intelligence Multi Asset - - 1.24% - - - - - - - - -
Vescore Global Equity Multi Factor - - - - 0.87% - - - - - - -
Alternative Risk Premia - - - - - - - - - - - -
1 TER including the performance fee.

Notes to the Financial Statements
319
13 TER (Total Expense Ratio) (continued)
The TER for the Sub-Fund, excluding the performance fee for Classes AHN (CHF) to AMH (AUD), is as follows:
Vontobel Fund -
Distributing
AHN
(CHF)
AHN
(EUR)
AHN
(CHF)
AHN
(EUR)
AHN
(USD)
AI
(CHF)
AI
(EUR)
AI
(GBP)
AI
(USD)
AM
(EUR)
AM
(USD)
AMH
(AUD)
Swiss Money - - - - - - - - - - - -
Euro Short Term Bond - - - - - - - - - - - -
US Dollar Money - - - - - - - - - - - -
Swiss Franc Bond - - - - - 0.54% - - - - - -
Euro Bond - - - - - - - - - - 1.57% -
EUR Corporate Bond Mid Yield - - - - - - 0.76% - - - - -
High Yield Bond - - - - - - 0.78% - - - - 1.83%
High Yield Bond 1 - - - - - - 0.79% - - - - 1.85%
Bond Global Aggregate - - - - 0.77% - 0.67% - - - - -
Bond Global Aggregate 1 - - - - 1.74% - 1.04% - - - - -
Eastern European Bond - - - - - - - - - 1.83% 1.83% -
Value Bond - - - - - - - - - - - -
Value Bond 1 - - - - - - - - - - - -
Absolute Return Bond (EUR) - - - - - - - - - - 1.65% -
Absolute Return Bond (EUR) 1 - - - - - - - - - - 1.65% -
Absolute Return Bond Dynamic - - - - - - 1.15% - - - - -
Absolute Return Bond Dynamic 1 - - - - - - 1.33% - - - - -
Global Convertible Bond - - - - - - - - - - - -
Sustainable Emerging Markets
Local Currency Bond - - - - - - - - - - 2.03% 2.09%
Swiss Mid and Small Cap Equity - - - - - - - - - - - -
European Mid and Small Cap Equity - - - - - - - - - - - -
Japanese Equity - - - - - - - - - - - -
mtx China Leaders - - - - - - - - - - - -
European Equity - - - - - - - - - - - -
US Equity - - - - - - - - 1.16% - - -
Global Equity - - - - - - 1.16% - - - - -
Global Equity Income - - - - - - - - - - - -
Emerging Markets Equity - - - - - - - - 1.21% - - -
Asia Pacific Equity - - - - - - - - - - - -
New Power - - - - - - - - - - - -
Clean Technology - - - - - - - - - - - -
Future Resources - - - - - - - - - - - -
mtx Sustainable Asian Leaders (ex Japan) - - - - - - - - - - - -
mtx Sustainable Emerging Markets
Leaders - - - - - - 1.16% - 1.16% - - -
mtx Sustainable Global Leaders - - - - - - - - - - - -
Commodity - - - - - - - - - - - -
Dynamic Commodity - - - - - - - - - - - -
Dynamic Commodity 1 - - - - - - - - - - - -
Non-Food Commodity - - - - - - - - 1.19% - - -
Emerging Markets Debt - 0.88% - 0.88% - - 0.78% - 0.78% - 1.37% -
Global Bond - - - - - - - - - - - -
Credit Opportunities - - - - - - - - - - - -
Global Corporate Bond Mid Yield 0.89% 0.89% 0.89% 0.89% - - - - - - - -
Emerging Markets Blend - - - - - - - - - - - -
Emerging Markets Corporate Bond - - - - - - - - - - - -
TwentyFour Absolute Return Credit Fund 0.62% 0.62% 0.62% 0.62% - - - 0.52% - - - -
TwentyFour Strategic Income Fund 0.82% 0.82% 0.82% 0.82% - - - - - - - -
LCR Global Bond - - - - - - - - - - - -
Multi Asset Solution - - - - - - - - - - - -
Multi Asset Solution 1 - - - - - - - - - - - -
Multi Asset Income - - - - - - - - - - - -
TwentyFour Monument European
Asset Backed Securities - - - - - - - - - - - -
Multi Asset Defensive - - - - - - - - - - - -
Multi Asset Alphabet - - - - - - - - - - - -
Vescore Artificial Intelligence Multi Asset - - - - - - - - - - - -
Vescore Global Equity Multi Factor - - - - - - - - - - - -
Alternative Risk Premia - - - - - - - - - - - -
1 TER including the performance fee.

Notes to the Financial Statements
320
13 TER (Total Expense Ratio) (continued)
The TER for the Sub-Fund, excluding the performance fee for Classes AMH (EUR) to AQHG (EUR), is as follows:
Vontobel Fund -
Distributing
AMH
(EUR)
AMH
(USD)
AMH
(ZAR)
AMHN AN AN
(GBP)
ANG AQ AQ1 AQ
Gross
AQG AQHG
(EUR)
Swiss Money - - - - - - - - - - - -
Euro Short Term Bond - - - - 0.38% - - - - - - -
US Dollar Money - - - - 0.37% - - - - - - -
Swiss Franc Bond - - - - 0.58% - - - - - 0.40% -
Euro Bond - - - - 0.65% - - - - - - -
EUR Corporate Bond Mid Yield - - - - 0.80% - - - - - 0.58% -
High Yield Bond - 1.83% 1.83% 0.88% - - - - - - - -
High Yield Bond 1 - 1.88% 2.36% 1.02% - - - - - - - -
Bond Global Aggregate - - - - 0.71% - - - - - - -
Bond Global Aggregate 1 - - - - 1.10% - - - - - - -
Eastern European Bond - - - - 0.88% - - - - - - -
Value Bond - - - - 0.54% - - - - - - -
Value Bond 1 - - - - 0.54% - - - - - - -
Absolute Return Bond (EUR) - - - - 0.82% - - - - - - -
Absolute Return Bond (EUR) 1 - - - - 0.89% - - - - - - -
Absolute Return Bond Dynamic - - - - 1.19% - - - - - - -
Absolute Return Bond Dynamic 1 - - - - 1.38% - - - - - - -
Global Convertible Bond - - - - 0.87% - - - - - - -
Sustainable Emerging Markets
Local Currency Bond - - 2.09% - 1.01% - - - - - - -
Swiss Mid and Small Cap Equity - - - - 1.22% - - - - - - -
European Mid and Small Cap Equity - - - - 1.37% - - - - - - -
Japanese Equity - - - - 1.09% - - - - - - -
mtx China Leaders - - - - 1.29% - - - - - - -
European Equity - - - - 1.22% - - - - - - -
US Equity - - - - 1.20% - 0.69% - - - - -
Global Equity - - - - 1.20% - - - - - - -
Global Equity Income - - - - 1.17% - - - - 2.02% - -
Emerging Markets Equity - - - - 1.27% - - - - - - -
Asia Pacific Equity - - - - 1.24% - - - - - - -
New Power - - - - 1.24% - - - - - - -
Clean Technology - - - - 1.23% - - - - - - -
Future Resources - - - - 1.31% - - - - - - -
mtx Sustainable Asian Leaders (ex
Japan) - - - - 1.21% - - - - - - -
mtx Sustainable Emerging Markets
Leaders - - - - 1.20% 1.01% - - - - - -
mtx Sustainable Global Leaders - - - - 1.26% - - - - - - -
Commodity - - - - - - - - - - - -
Dynamic Commodity - - - - - - - - - - - -
Dynamic Commodity 1 - - - - - - - - - - - -
Non-Food Commodity - - - - - - - - - - - -
Emerging Markets Debt - - - - - - - - 1.77% - 0.56% -
Global Bond - - - - - - - - - - - -
Credit Opportunities - - - - - - - - - - - -
Global Corporate Bond Mid Yield - - - - 0.83% - - - - - - -
Emerging Markets Blend - - - - - - - - - - - -
Emerging Markets Corporate Bond - - - - 0.85% - - - 1.80% - - -
TwentyFour Absolute Return Credit Fund - - - - - - - - - - 0.37% 0.42%
TwentyFour Strategic Income Fund 1.42% - - - - - - 1.36% - - 0.57% 0.63%
LCR Global Bond - - - - - - - - - - - -
Multi Asset Solution - - - - - - - - - - - -
Multi Asset Solution 1 - - - - - - - - - - - -
Multi Asset Income - - - - - - - - - 1.63% - -
TwentyFour Monument European
Asset Backed Securities - - - - - - - - - - - -
Multi Asset Defensive - - - - - - - - - - - -
Multi Asset Alphabet - - - - - - - - - - - -
Vescore Artificial Intelligence Multi Asset - - - - - - - - - - - -
Vescore Global Equity Multi Factor - - - - - - - - - - - -
Alternative Risk Premia - - - - - - - - - - - -
1 TER including the performance fee.

Notes to the Financial Statements
321
13 TER (Total Expense Ratio) (continued)
The TER for the Sub-Fund, excluding the performance fee for Classes AQHG (USD) to AQH Gross, is as follows:
Vontobel Fund -
Distributing
AQHG
(USD)
AQHI
(USD)
AQHN
(EUR)
AQHNG
(EUR)
AQHNG
(USD)
AQN AQN
Gross
AQNG AQC1 AQH1 AQHC1 AQH
Gross
Swiss Money - - - - - - - - - - - -
Euro Short Term Bond - - - - - - - - - - - -
US Dollar Money - - - - - - - - - - - -
Swiss Franc Bond - - - - - - - - - - - -
Euro Bond - - - - - - - - - - - -
EUR Corporate Bond Mid Yield - - - - - - - - - - - -
High Yield Bond - - - - - - - - - - - -
High Yield Bond 1 - - - - - - - - - - - -
Bond Global Aggregate - - - - - - - - - 1.77% 1.82% -
Bond Global Aggregate 1 - - - - - - - - - 2.57% 2.61% -
Eastern European Bond - - - - - - - - - - - -
Value Bond - - - - - - - - - - - -
Value Bond 1 - - - - - - - - - - - -
Absolute Return Bond (EUR) - - - - - - - - - - - -
Absolute Return Bond (EUR) 1 - - - - - - - - - - - -
Absolute Return Bond Dynamic - - - - - - - - - - - -
Absolute Return Bond Dynamic 1 - - - - - - - - - - - -
Global Convertible Bond - - - - - - - - - - - -
Sustainable Emerging Markets
Local Currency Bond - - - - - - - - - - - -
Swiss Mid and Small Cap Equity - - - - - - - - - - - -
European Mid and Small Cap Equity - - - - - - - - - - - -
Japanese Equity - - - - - - - - - - - -
mtx China Leaders - - - - - - - - - - - -
European Equity - - - - - - - - - - - -
US Equity - - - - - - - - - - - -
Global Equity - - - - - - - - - - - -
Global Equity Income - - - - - - 1.17% - - - - -
Emerging Markets Equity - - - - - - - - - - - -
Asia Pacific Equity - - - - - - - - - - - -
New Power - - - - - - - - - - - -
Clean Technology - - - - - - - - - - - -
Future Resources - - - - - - - - - - - -
mtx Sustainable Asian Leaders (ex Japan) - - - - - - - - - - - -
mtx Sustainable Emerging Markets
Leaders - - - - - - - - - - - -
mtx Sustainable Global Leaders - - - - - - - - - - - -
Commodity - - - - - - - - - - - -
Dynamic Commodity - - - - - - - - - - - -
Dynamic Commodity 1 - - - - - - - - - - - -
Non-Food Commodity - - - - - - - - - - - -
Emerging Markets Debt - - - - - - - - 2.07% - - -
Global Bond - - - - - - - - - - - -
Credit Opportunities - - - - - - - - - - - -
Global Corporate Bond Mid Yield - - - - - - - - - - - -
Emerging Markets Blend - - - - - - - - - - - -
Emerging Markets Corporate Bond - - - - - - - - 2.10% - - -
TwentyFour Absolute Return Credit Fund 0.43% - 0.61% - 0.46% 0.56% - 0.40% - - - -
TwentyFour Strategic Income Fund 0.63% 0.78% 0.82% 0.67% 0.67% 0.76% - 0.61% - 1.77% 1.97% 1.42%
LCR Global Bond - - - - - - - - - - - -
Multi Asset Solution - - - - - - - - - - - -
Multi Asset Solution 1 - - - - - - - - - - - -
Multi Asset Income - - - - - - - - - - - -
TwentyFour Monument European
Asset Backed Securities - - - - - - - - - - - -
Multi Asset Defensive - - - - - - - - - - - -
Multi Asset Alphabet - - - - - - - - - - - -
Vescore Artificial Intelligence Multi Asset - - - - - - - - - - - -
Vescore Global Equity Multi Factor - - - - - - - - - - - -
Alternative Risk Premia - - - - - - - - - - - -
1 TER including the performance fee.

Notes to the Financial Statements
322
13 TER (Total Expense Ratio) (continued)
The TER of the Sub-Fund, excluding the performance fee for classes AG to C1, is as follows:
Vontobel Fund -
Distributing
AG AS
(EUR)
AS
(USD)
B B1 B
(CHF)
B
(EUR)
B
(JPY)
B
(SEK)
B
(USD)
C C1
Swiss Money - - - - - 0.32% - - - - - -
Euro Short Term Bond - - - - - - 0.53% - - - - -
US Dollar Money - - - - - - - - - 0.52% - -
Swiss Franc Bond - - - - - 0.91% - - - - - -
Euro Bond - - - - - - 1.17% - - - - -
EUR Corporate Bond Mid Yield - - - - - - 1.35% - - - - -
High Yield Bond - 1.77% - - - - 1.37% - - - - -
High Yield Bond 1 - 1.77% - - - - 1.37% - - - - -
Bond Global Aggregate - 1.51% - - - - 1.11% - - - - -
Bond Global Aggregate 1 - 2.32% - - - - 1.37% - - - - -
Eastern European Bond - - - - - - 1.43% - - - - -
Value Bond - - - - - 0.66% - - - - - -
Value Bond 1 - - - - - 0.66% - - - - - -
Absolute Return Bond (EUR) - - - - - - 1.25% - - - - -
Absolute Return Bond (EUR) 1 - - - - - - 1.25% - - - - -
Absolute Return Bond Dynamic - - - - - - 1.61% - - - - -
Absolute Return Bond Dynamic 1 - - - - - - 1.74% - - - - -
Global Convertible Bond - - 1.82% - - - 1.42% - - - - -
Sustainable Emerging Markets
Local Currency Bond - - - - - 1.63% 1.63% - - 1.63% - -
Swiss Mid and Small Cap Equity - - - - - 2.05% - - - - - -
European Mid and Small Cap Equity - - - - - - 2.20% - - - - -
Japanese Equity - - - - - - - 1.71% - - - -
mtx China Leaders - - - - - - - - - 2.16% - -
European Equity - - - - - - 2.05% - - - - -
US Equity - - - - 2.08% - 2.03% - - 2.03% - 2.63%
Global Equity - - - - 2.08% - - - 2.03% 2.03% - 2.63%
Global Equity Income - - - - - - - - - 2.02% - -
Emerging Markets Equity - - - - 2.14% - - - - 2.09% - 2.69%
Asia Pacific Equity - - - - - - - - - 2.06% - -
New Power - - - - - - 2.06% - - - - -
Clean Technology - - - - - 2.05% 2.05% - - - - -
Future Resources - - - - - 2.14% 2.14% - - - - -
mtx Sustainable Asian Leaders (ex Japan) - - - - - - - - - 2.04% - -
mtx Sustainable Emerging Markets
Leaders 0.75% - - - 2.08% - - - 2.03% 2.03% - 2.63%
mtx Sustainable Global Leaders - - - - - - - - - 2.01% - -
Commodity - - - - - - - - - 1.85% - -
Dynamic Commodity - - - - - - - - - 2.11% - -
Dynamic Commodity 1 - - - - - - - - - 2.11% - -
Non-Food Commodity - - - - - - - - - 1.98% - -
Emerging Markets Debt - - 1.77% - 1.77% - - - - 1.37% - 2.07%
Global Bond - - - - - - - - - - - -
Credit Opportunities - - - - - - - - - - - -
Global Corporate Bond Mid Yield - - - - - - - - - 1.38% - -
Emerging Markets Blend - - - - - - - - - - - -
Emerging Markets Corporate Bond - - - - 1.80% - - - - 1.40% - 2.10%
TwentyFour Absolute Return Credit Fund - - - - - - - - - - - -
TwentyFour Strategic Income Fund - - - - - - - - - - - -
LCR Global Bond 0.45% - - - - - - - - - - -
Multi Asset Solution - - - - - - 1.98% - - - - -
Multi Asset Solution 1 - - - - - - 1.99% - - - - -
Multi Asset Income - - - - - - 1.63% - - - - -
TwentyFour Monument European
Asset Backed Securities - - - - - - - - - - - -
Multi Asset Defensive - - - - - - 1.16% - - - - -
Multi Asset Alphabet - - - - - - 1.65% - - - - -
Vescore Artificial Intelligence Multi Asset - - - 1.24% - - - - - - - -
Vescore Global Equity Multi Factor - - - - - - - - - 0.87% - -
Alternative Risk Premia - - - - - - - - - - - -
1 TER including the performance fee.

Notes to the Financial Statements
323
13 TER (Total Expense Ratio) (continued)
The TER of the Sub-Fund, excluding the performance fee for classes C (CHF) to H (GBP), is as follows:
Vontobel Fund -
Distributing
C
(CHF)
C
(EUR)
C
(USD)
E G G
(CHF)
G
(EUR)
G
(GBP)
G
(USD)
H
(CHF)
H
(EUR)
H
(GBP)
Swiss Money - - - - - - - - - - - -
Euro Short Term Bond - 0.93% - - - - - - - - - -
US Dollar Money - - - - - - - - - - - -
Swiss Franc Bond 1.31% - - - - 0.40% - - - - - -
Euro Bond - 1.57% - - - - - - - - - -
EUR Corporate Bond Mid Yield - 1.75% - - - - 0.58% - - 1.41% - -
High Yield Bond - 1.77% - - - - - - - 1.43% - -
High Yield Bond 1 - 1.78% - - - - - - - 1.43% - -
Bond Global Aggregate - 1.51% - - - - - - - 1.17% - -
Bond Global Aggregate 1 - 2.36% - - - - - - - 1.42% -
Eastern European Bond - 1.83% - - - - - - - - - -
Value Bond - - - - - - - - - - - -
Value Bond 1 - - - - - - - - - - - -
Absolute Return Bond (EUR) - 1.65% - - - - - - - - - -
Absolute Return Bond (EUR) 1 - 1.65% - - - - - - - - - -
Absolute Return Bond Dynamic - 2.01% - - - - - - - 1.67% - -
Absolute Return Bond Dynamic 1 - 2.32% - - - - - - - 1.75% - -
Global Convertible Bond - 1.82% - - - - - - - 1.48% - -
Sustainable Emerging Markets
Local Currency Bond - - 2.03% - - - - - - 1.69% 1.69% -
Swiss Mid and Small Cap Equity 2.65% - - - - - - - - - - -
European Mid and Small Cap Equity - 2.80% - - - - - - - - - -
Japanese Equity - - - - - - - - - - - -
mtx China Leaders - - 2.76% - - - - - 0.79% - - -
European Equity - 2.65% - - - - 0.67% - - - - -
US Equity - - 2.63% - - - 0.65% 0.65% 0.65% - 2.09% -
Global Equity - - 2.63% - - - - - 0.75% - 2.09% -
Global Equity Income - - - - - - - - - - 2.08% -
Emerging Markets Equity - - 2.69% - - - 0.88% 0.88% - 2.15% 2.15% -
Asia Pacific Equity - - 2.66% - - - - - 0.81% - 2.12% -
New Power - 2.66% 2.66% - - - - - - 2.12% - 2.12%
Clean Technology - 2.65% - - - - - - - 2.11% - -
Future Resources - 2.74% 2.74% - - - - - - 2.20% - -
mtx Sustainable Asian Leaders (ex Japan) - - - - - - - 0.79% 0.79% - 2.10% -
mtx Sustainable Emerging Markets
Leaders - - 2.63% - - - - - 0.75% - 2.09% -
mtx Sustainable Global Leaders - - - - - - - - - 2.07% 2.07% -
Commodity - - 2.45% - - - - 0.64% 0.71% 1.91% 1.91% -
Dynamic Commodity - - - - - - - - - 2.17% 2.17% -
Dynamic Commodity 1 - - - - - - - - - 2.17% 2.17% -
Non-Food Commodity - - - - - - - - - 2.04% 2.04% -
Emerging Markets Debt - - 1.77% - - - 0.56% - - 1.43% 1.43% -
Global Bond - - - - - - - - - - - -
Credit Opportunities - - - - - - - - - - - -
Global Corporate Bond Mid Yield - - 1.88% - - - - - 0.50% - 1.44% -
Emerging Markets Blend - - - - - - - - - - - -
Emerging Markets Corporate Bond - - - - - - - - - - - -
TwentyFour Absolute Return Credit Fund - - - - - - - 0.36% - - 1.01% -
TwentyFour Strategic Income Fund - - - - - - - 0.57% - - 1.42% -
LCR Global Bond - - - - - - - - - - - -
Multi Asset Solution - 2.58% - - - - - - - - - -
Multi Asset Solution 1 - 2.58% - - - - - - - - - -
Multi Asset Income - 1.98% - - - - - - - 1.69% - -
TwentyFour Monument European
Asset Backed Securities - - - - - - - - - - - -
Multi Asset Defensive - 1.41% - 0.54% - - - - - 1.22% - -
Multi Asset Alphabet - - - - - - - - - 1.71% - -
Vescore Artificial Intelligence Multi Asset - 1.74% - - - - - - - - - -
Vescore Global Equity Multi Factor - - - - - - - - - - - -
Alternative Risk Premia - - - 0.97% - - - - - - - -
1 TER including the performance fee.

Notes to the Financial Statements
324
13 TER (Total Expense Ratio) (continued)
The TER of the Sub-Fund, excluding the performance fee for Classes H (HKD) to HI (USD), is as follows:
Vontobel Fund -
Distributing
H
(HKD)
H
(SEK)
H
(SGD)
H
(USD)
HC
(EUR)
HC
(USD)
HI
(CHF)
HI
(EUR)
HI
(GBP)
HI
(NOK)
HI
(SEK)
HI
(USD)
Swiss Money - - - - - - - - - - - -
Euro Short Term Bond - - - - - - - - - - - -
US Dollar Money - - - - - - - - - - - -
Swiss Franc Bond - - - - - - - - - - - -
Euro Bond - - - - - - - - - - - -
EUR Corporate Bond Mid Yield - - - - - - 0.82% - - - - 0.82%
High Yield Bond - - - 1.43% - 1.83% 0.84% - - - - 0.84%
High Yield Bond 1 - - - 1.47% - 1.90% 0.84% - - - - 0.93%
Bond Global Aggregate - - - 1.17% - - - - - - - 0.73%
Bond Global Aggregate 1 - - - 2.02% - - - - - - - 1.54%
Eastern European Bond - - - - - - - - - - - -
Value Bond - - - - - - - - - - - -
Value Bond 1 - - - - - - - - - - - -
Absolute Return Bond (EUR) - - - 1.31% - - - - - - - 0.84%
Absolute Return Bond (EUR) 1 - - - 1.47% - - - - - - - 1.01%
Absolute Return Bond Dynamic - - - 1.67% - - 1.21% - - - - 1.21%
Absolute Return Bond Dynamic 1 - - - 1.95% - - 1.21% - - - - 2.62%
Global Convertible Bond - - - 1.48% - - 0.89% - - - - 0.89%
Sustainable Emerging Markets
Local Currency Bond - - - - - - 1.03% 1.03% - - - -
Swiss Mid and Small Cap Equity - - - - - - - - - - - -
European Mid and Small Cap Equity - - - - - - - - - - - -
Japanese Equity - - - - - - - - - - - -
mtx China Leaders - - - - - - - - - - - -
European Equity - - - - - - - - - - - 1.24%
US Equity - - - - - - 1.22% 1.22% - - - -
Global Equity - 2.09% - - 2.69% - - 1.22% - - - -
Global Equity Income - - - - - - - 1.19% - - - -
Emerging Markets Equity - - - - 2.75% - 1.27% 1.27% - - - -
Asia Pacific Equity - - - - - - - 1.26% - - - -
New Power - - - 2.12% - - - - - - - -
Clean Technology - - - 2.11% - - - - - - - -
Future Resources - - - - - - - - - - - -
mtx Sustainable Asian Leaders (ex Japan) - - - - - - - 1.23% - - 1.23% -
mtx Sustainable Emerging Markets
Leaders - - - - 2.69% - 1.22% 1.22% - - - -
mtx Sustainable Global Leaders - - - - - - 1.28% 1.28% - - - -
Commodity - 1.91% - - - - 1.12% 1.12% - - 1.12% -
Dynamic Commodity - - - - - - 1.38% 1.38% - - - -
Dynamic Commodity 1 - - - - - - 1.38% 1.47% - - - -
Non-Food Commodity - - - - - - 1.25% 1.25% - - - -
Emerging Markets Debt - - - - 1.83% - 0.84% 0.84% 0.84% - - -
Global Bond - - - - - - 0.69% 0.69% - - - -
Credit Opportunities - - - - - - - - - - - -
Global Corporate Bond Mid Yield - - - - 1.94% - 0.85% 0.85% - - - -
Emerging Markets Blend - - - - - - 0.89% 0.89% - - - -
Emerging Markets Corporate Bond - - - - - - 0.87% 0.87% - - - -
TwentyFour Absolute Return Credit Fund - - - - 1.42% - 0.57% 0.57% - - - -
TwentyFour Strategic Income Fund 1.38% - 1.42% 1.42% 1.75% - 0.78% 0.78% - 0.78% - 0.78%
LCR Global Bond - - - - - - - - - - - -
Multi Asset Solution - - - - - - - - - - - -
Multi Asset Solution 1 - - - - - - - - - - - -
Multi Asset Income - - - 1.69% - - - - - - - -
TwentyFour Monument European
Asset Backed Securities - - - - - - 0.69% - - - - 0.69%
Multi Asset Defensive - - - 1.22% - - 0.83% - - - - 0.83%
Multi Asset Alphabet - - - 1.71% - - - - - - - -
Vescore Artificial Intelligence Multi Asset - - - - - - 0.76% - 0.76% - - -
Vescore Global Equity Multi Factor - - - - - - - - - - - -
Alternative Risk Premia - - - - - - 1.23% 1.23% - - - -
1 TER including the performance fee.

Notes to the Financial Statements
325
13 TER (Total Expense Ratio) (continued)
The TER of the Sub-Fund, excluding the performance fee for classes HG (CHF) to HS (CHF), is as follows:
Vontobel Fund -
Distributing
HG
(CHF)
HG HG
(EUR)
HG
(USD)
HN
(CHF)
HN
(EUR)
HN
(GBP)
HN
(USD)
HNG
(EUR)
HNG
(USD)
HR
(CHF)
HS
(CHF)
Swiss Money - - - - - - - - - - - -
Euro Short Term Bond - - - - - - - - - - - -
US Dollar Money - - - - - - - - - - - -
Swiss Franc Bond - - - - - - - - - - - -
Euro Bond - - - - - - - - - - - -
EUR Corporate Bond Mid Yield - - - - 0.86% - 0.86% - - - - -
High Yield Bond - - - - 0.88% - - 0.88% - - - -
High Yield Bond 1 - - - - 0.89% - - 1.00% - - - -
Bond Global Aggregate - - - - 0.77% - - 0.77% - - - -
Bond Global Aggregate 1 - - - - 1.53% - - 2.11% - - - -
Eastern European Bond - - - - - - - - - - - -
Value Bond - - - - - - - - - - - -
Value Bond 1 - - - - - - - - - - - -
Absolute Return Bond (EUR) - - - - - - - 0.88% - - - -
Absolute Return Bond (EUR) 1 - - - - - - - 1.25% - - - -
Absolute Return Bond Dynamic - - - - 1.25% - - 1.25% - - - -
Absolute Return Bond Dynamic 1 - - - - 2.40% - - 2.69% - - - -
Global Convertible Bond - - - - 0.93% - - 0.93% - - - -
Sustainable Emerging Markets
Local Currency Bond - - - - 1.07% 1.07% - - - - - -
Swiss Mid and Small Cap Equity - - - - - - - - - - - -
European Mid and Small Cap Equity - - - - - - - - - - - -
Japanese Equity - - - - - - - - - - - -
mtx China Leaders - - - - - - - - - - - -
European Equity - - - - - - - - - - - -
US Equity - - 0.71% - - 1.26% - - - - - -
Global Equity - - - - - 1.26% - - - - - -
Global Equity Income - - - - - 1.23% - - - - - -
Emerging Markets Equity - - 0.94% - 1.31% 1.33% 1.33% - - - - 0.29%
Asia Pacific Equity - - - - - 1.30% - - - - - -
New Power - - - - 1.30% - 1.30% 1.30% - - - -
Clean Technology - - - - 1.29% - - 1.29% - - - -
Future Resources - - - - 1.37% - - - - - - -
mtx Sustainable Asian Leaders (ex Japan) - - - - - 1.27% - - - - - -
mtx Sustainable Emerging Markets
Leaders - - - - 1.26% 1.26% - - - - - -
mtx Sustainable Global Leaders - - - - 1.32% 1.32% 1.32% - - - - -
Commodity - - - - 1.16% 1.16% - - - - - 0.27%
Dynamic Commodity - - - - 1.42% 1.42% - - - - - -
Dynamic Commodity 1 - - - - 1.43% 1.42% - - - - - -
Non-Food Commodity - - - - - - - - - - - -
Emerging Markets Debt - - - - 0.88% 0.88% - - - - - 0.22%
Global Bond - - - - - - - - - - - 0.27%
Credit Opportunities - - - - - - - - - - - -
Global Corporate Bond Mid Yield 0.56% - 0.56% - - 0.89% - - - - - -
Emerging Markets Blend - - - - - - - - - - - 0.27%
Emerging Markets Corporate Bond - - - - - - - - - - - -
TwentyFour Absolute Return Credit Fund - - 0.43% - - 0.61% - 0.61% - - - -
TwentyFour Strategic Income Fund - - 0.63% 0.63% - 0.82% - 0.82% 0.67% 0.61% 0.47% -
LCR Global Bond - - - - - - - - - - - -
Multi Asset Solution - - - - - - - - - - - -
Multi Asset Solution 1 - - - - - - - - - - - -
Multi Asset Income - - - - - - - - - - - -
TwentyFour Monument European
Asset Backed Securities - - - - 0.73% - 0.73% 0.73% - - 0.48% -
Multi Asset Defensive - - - - - - - - - - - -
Multi Asset Alphabet - - - - - - 1.11% - - - 0.76% -
Vescore Artificial Intelligence Multi Asset - - - - - - - - - - - -
Vescore Global Equity Multi Factor - - - - - - - - - - - -
Alternative Risk Premia - - - - - - - - - - - -
1 TER including the performance fee.

Notes to the Financial Statements
326
13 TER (Total Expense Ratio) (continued)
The TER of the Sub-Fund, excluding the performance fee for classes HS (EUR) to N (EUR), is as follows:
Vontobel Fund -
Distributing
HS
(EUR)
H1 HC1 I I
(CHF)
I
(EUR)
I
(GBP)
I
(JPY)
I
(USD)
N N
(CHF)
N
(EUR)
Swiss Money - - - - 0.27% - - - - - 0.27% -
Euro Short Term Bond - - - - - 0.34% - - - - - 0.38%
US Dollar Money - - - - - - - - 0.33% - - -
Swiss Franc Bond - - - - 0.54% - - - - - 0.58% -
Euro Bond - - - - - 0.61% - - - - - 0.65%
EUR Corporate Bond Mid Yield - - - - - 0.76% - - - - - 0.80%
High Yield Bond - - - - - 0.78% - - - - - 0.82%
High Yield Bond 1 - - - - - 0.78% - - - - - 0.83%
Bond Global Aggregate - 1.77% 1.82% - - 0.67% - - - - - 0.71%
Bond Global Aggregate 1 - 2.58% 2.61% - - 1.01% - - - - - 1.25%
Eastern European Bond - - - - - 0.84% - - - - - 0.88%
Value Bond - - - - 0.50% - - - - - 0.54% -
Value Bond 1 - - - - 0.50% - - - - - 0.61% -
Absolute Return Bond (EUR) - - - - - 0.78% - - - - - 0.82%
Absolute Return Bond (EUR) 1 - - - - - 0.78% - - - - - 1.07%
Absolute Return Bond Dynamic - - - - - 1.15% - - - - - 1.19%
Absolute Return Bond Dynamic 1 - - - - - 1.87% - - - - - 1.60%
Global Convertible Bond - - - - - 0.83% - - - - - 0.87%
Sustainable Emerging Markets
Local Currency Bond - - - - - - - - 0.97% - - -
Swiss Mid and Small Cap Equity - - - - 1.18% - - - - - 1.22% -
European Mid and Small Cap Equity - - - - - 1.33% - - - - - 1.37%
Japanese Equity - - - - - - - 1.05% - - - -
mtx China Leaders - - - - - - - - 1.25% - - -
European Equity - - - - - 1.18% - - - - - 1.22%
US Equity 0.40% - - - - 1.16% - - 1.16% - - -
Global Equity 0.25% - - - - 1.16% 1.16% - 1.16% - - -
Global Equity Income - - - - - - - - 1.13% - - -
Emerging Markets Equity 0.29% - - - - 1.21% 1.21% - 1.21% - - -
Asia Pacific Equity - - - - - - - - 1.20% - - -
New Power - - - - - 1.20% - - - - - 1.24%
Clean Technology - - - - - 1.19% - - - - 1.23% 1.23%
Future Resources - - - - - 1.27% - - - - - 1.31%
mtx Sustainable Asian Leaders (ex Japan) - - - - - - - - 1.17% - - -
mtx Sustainable Emerging Markets
Leaders - - - - - 1.16% - - 1.16% - - 1.20%
mtx Sustainable Global Leaders - - - - - - - - 1.22% - - -
Commodity - - - - - - - - 1.06% - - -
Dynamic Commodity - - - - - - - - 1.32% - - -
Dynamic Commodity 1 - - - - - - - - 1.32% - - -
Non-Food Commodity - - - - - - - - 1.19% - - -
Emerging Markets Debt 0.22% - - - - - - - 0.78% - - -
Global Bond 0.30% - - - - - - - 0.63% - - -
Credit Opportunities - - - - - - - - - - - -
Global Corporate Bond Mid Yield - - - - - - - - 0.79% - - -
Emerging Markets Blend - - - - - - - - 0.83% - - -
Emerging Markets Corporate Bond - - - - - - - - 0.81% - - -
TwentyFour Absolute Return Credit Fund - - - - - - 0.52% - - - - -
TwentyFour Strategic Income Fund - 1.77% 1.97% - - - 0.72% - - - - -
LCR Global Bond - - - - - 0.58% - - - - - -
Multi Asset Solution - - - - - 1.24% - - - - - 1.28%
Multi Asset Solution 1 - - - - - 1.35% - - - - - 1.32%
Multi Asset Income - - - - - 0.96% - - - - - 1.00%
TwentyFour Monument European
Asset Backed Securities - - - - - 0.63% - - - - - 0.67%
Multi Asset Defensive - - - - - 0.77% - - - - - 0.81%
Multi Asset Alphabet - - - - - 1.01% - - - - - -
Vescore Artificial Intelligence Multi Asset - - - - - 0.70% - - - - - 0.74%
Vescore Global Equity Multi Factor - - - - - - - - 0.48% - - -
Alternative Risk Premia - - - - - - - - 1.17% - - -
1 TER including the performance fee.

Notes to the Financial Statements
327
13 TER (Total Expense Ratio) (continued)
The TER of the Sub-Fund, excluding the performance fee for classes N (GBP) to UAQH1, is as follows:
Vontobel Fund -
Distributing
N
(GBP)
N
(JPY)
N
(USD)
NG R S X UH1 U1 UAQH1
Swiss Money - - - - 0.27% - - - - -
Euro Short Term Bond - - - 0.29% 0.48% 0.19% - - - -
US Dollar Money - - 0.37% - 0.47% - - - - -
Swiss Franc Bond - - - - 0.51% - - - - -
Euro Bond - - - - 0.57% 0.28% - - - -
EUR Corporate Bond Mid Yield - - - - 0.50% 0.21% - - - -
High Yield Bond - - - - 0.52% 0.23% - - - -
High Yield Bond 1 - - - - 0.52% 0.23% - - - -
Bond Global Aggregate - - - - 0.56% 0.27% - - - -
Bond Global Aggregate 1 - - - - 1.14% 0.27% - - - -
Eastern European Bond - - - - 0.58% - - - - -
Value Bond - - - - 0.57% 0.21% - - - -
Value Bond 1 - - - - 0.57% 0.21% - - - -
Absolute Return Bond (EUR) - - - - 0.65% 0.29% - - - -
Absolute Return Bond (EUR) 1 - - - - 0.65% 0.29% - - - -
Absolute Return Bond Dynamic - - - - 1.01% - - - - -
Absolute Return Bond Dynamic 1 - - - - 1.21% - - - - -
Global Convertible Bond - - - - 0.57% - - - - -
Sustainable Emerging Markets
Local Currency Bond - - 1.01% - 0.68% - - - - -
Swiss Mid and Small Cap Equity - - - - 0.65% 0.23% - - - -
European Mid and Small Cap Equity - - - - 0.80% - - - - -
Japanese Equity - 1.09% - - 0.71% - - - - -
mtx China Leaders 1.07% - 1.29% - 0.66% - - - - -
European Equity - - - - 0.65% 0.36% - - - -
US Equity - - 1.20% - 0.63% - - - 1.23% -
Global Equity - - 1.20% - 0.63% 0.19% - 1.23% -
Global Equity Income - - 1.17% - 0.77% - - - - -
Emerging Markets Equity - - 1.27% - 0.69% 0.23% - - 1.29% -
Asia Pacific Equity - - 1.24% - 0.66% 0.20% - - - -
New Power - - - - 0.66% 0.24% - - - -
Clean Technology 0.98% - - - 0.65% - - - - -
Future Resources - - - - 0.74% - - - - -
mtx Sustainable Asian Leaders (ex Japan) - - 1.21% 0.94% 0.64% - - - - -
mtx Sustainable Emerging Markets
Leaders 1.01% - 1.20% - 0.63% 0.21% - - 1.23% -
mtx Sustainable Global Leaders - - 1.26% - 0.76% - - - - -
Commodity - - 1.10% - 0.60% - - - - -
Dynamic Commodity - - 1.36% - 0.86% 0.47% - - - -
Dynamic Commodity 1 - - 1.36% - 0.86% 0.47% - - - -
Non-Food Commodity - - 1.23% - 0.73% 0.34% - - - -
Emerging Markets Debt - - 0.82% - 0.52% 0.16% - 0.97% -
Global Bond - - - - - - - - - -
Credit Opportunities - - - - - - 0.80% - - -
Global Corporate Bond Mid Yield - - 0.83% - 0.53% - - - - -
Emerging Markets Blend - - - - 0.57% - - - - -
Emerging Markets Corporate Bond - - 0.85% - 0.55% - - - 1.00% -
TwentyFour Absolute Return Credit Fund 0.56% - - - 0.40% - - - - -
TwentyFour Strategic Income Fund 0.76% - - 0.59% 0.41% - - 0.92% - 0.92%
LCR Global Bond - - - - - - - - - -
Multi Asset Solution - - - - - - - - - -
Multi Asset Solution 1 - - - - - - - - - -
Multi Asset Income - - - - 0.63% - - - - -
TwentyFour Monument European
Asset Backed Securities - - - - 0.42% - - - - -
Multi Asset Defensive - - - - 0.71% - - - - -
Multi Asset Alphabet - - - - - - - - - -
Vescore Artificial Intelligence Multi Asset - - - - 0.49% - - - - -
Vescore Global Equity Multi Factor - - 0.52% - 0.42% 0.13% - - - -
Alternative Risk Premia - - 1.21% - 1.06% - - - - -
1 TER including the performance fee.

General information
328
Performance
Historical performance is not an indicator of current or future performance. Performance data do not take
account of any commissions and expenses charged on the issue and redemption of shares, or of possible
safekeeping account management fees or withholding taxes that decrease the value of the assets.
The Fund's return can rise or fall due to currency fluctuations. Investors should note that past performance is not
necessarily indicative of the future performance of the various Sub-Funds.
The unaudited performance figures have been calculated in accordance with the guidelines of the Swiss Funds &
Asset Management Association (SFAMA) of May 16, 2008 (version from July 1, 2013).
Sub-Fund name/Index name Share
class Currency Launch date
31.08.2016 –
31.08.2017
31.08.2017 –
31.08.2018
31.08.2018 –
28.02.2019
Since
Launch
Vontobel Fund - Swiss Money B CHF 24.10.2000 -0,42% -0.88% -0.17% 13.64% Citigroup CHF 3-Month Eurodeposit, (Ex Salomon Brothers CHF-MM Perf. Index)
CHF -0.89% -0.88% -0.43% 9.98%
Vontobel Fund - Euro Money B EUR 24.10.2000 -0.18%* - - -
Citigroup EUR 3-Month Eurodeposit,
(Ex Salomon Brothers EUR-MM Perf. Index)
EUR -0.30%* - - -
Vontobel Fund - Euro Short Term Bond B EUR 24.10.2000 0.02%** -0.55% 0.49% -0.04% Citigroup EUR 3-Month Eurodeposit EUR 0.20%** -0.52% 0.30% -0.04%
Vontobel Fund - US Dollar Money B USD 24.10.2000 1.31% 1.48% 1.31% 34.69%
Citigroup USD 3-Month Eurodeposit USD 1.01% 1.81% 1.25% 40.99%
Vontobel Fund - Swiss Franc Bond B CHF 25.10.1991 -1.97% -1.84% 0.67% 140.88%
SBI ® Foreign Rating AAA Total Return CHF -1.85% -0.67% 0.82% 183.88%
Vontobel Fund - Euro Bond B EUR 25.10.1991 -1.84% -0.64% 1.24% 299.80%
J.P. Morgan EMU Bond Inv Grade Index EUR -2.77% -0.30% 2.08% 397.10%
Vontobel Fund - EUR Corporate Bond Mid Yield B EUR 27.09.2002 1.43% -1.49% 0.63% 73.81%
Merrill Lynch EMU Corporate A-BBB EUR 0.78% 0.11% 0.86% 97.10%
Vontobel Fund - High Yield Bond B EUR 11.06.2012 4.02% 0.45% -1.53% 30.23%
Customized Merrill Lynch High Yield Index EUR 6.19% 0.79% 0.71% 43.39%
Vontobel Fund - Bond Global Aggregate B EUR 03.10.2014 -1.47% -3.67% 5.97% 9.66%
Barclays Global Aggregate Bond Index Hedged EUR EUR -1.61% -1.72% 0.98% 5.88%
Vontobel Fund - Eastern European Bond B EUR 05.09.1997 0.04% -7.73% 6.35% 166.48%
JP Morgan GBI-EM Global Europe EUR 0.48% -14.71% 11.07% 121.91%
Vontobel Fund - Value Bond B CHF 01.07.2005 -1.23% -1.42% 1.12% 4.45%
Vontobel Fund - Absolute Return Bond (EUR) B EUR 09.12.1999 -0.90% -1.38% 2.01% 55.52%
Vontobel Fund - Absolute Return Bond Dynamic B EUR 30.09.2014 1.12% -0.65% 3.31% -0.88%
Vontobel Fund - Global Convertible Bond B EUR 14.04.2009 0.03% -3.17% -3.72% 31.85%
Thomson Reuters Convertible Global Focus
Investment Grade (hedged in EUR)
EUR 2.01% -2.17% -2.60% 68.19%
* Performance until renaming and repositioning of the Sub-Fund on June 30, 2017 ** Performance since renaming and repositioning of the Sub-Fund on June 30, 2017

General information
329
Performance (continued)
Sub-Fund name/Index name Share
class Currency Launch date
31.08.2016 –
31.08.2017
31.08.2017 –
31.08.2018
31.08.2018 –
28.02.2019
Since
Launch
Vontobel Fund - Sustainable Emerging Markets Local
Currency Bond
B USD 25.01.2011 8.65% -9.80% 5.62% -7.34%
J.P. Morgan GBI EM Global Diversified Composite
USD
USD 9.86% -10.05% 9.27% 4.67%
Vontobel Fund - Swiss Mid and Small Cap Equity B CHF 12.06.2001 19.88% 13.73% -13.41% 111.41%
SPI Extra TR CHF 22.11% 12.18% -10.80% 208.50%
Vontobel Fund - European Mid and Small Cap Equity B EUR 08.11.2000 18.82% 7.81% -12.04% 124.00%
MSCI Europe Small Cap Index TR net EUR 15.86% 10.13% -7.67% 279.40%
Vontobel Fund - Japanese Equity B JPY 21.11.1991 17.24% 5.95% -10.53% -28.14%
MSCI Japan Index TR net JPY 20.98% 9.87% -5.90% 28.04%
Vontobel Fund - mtx China Leaders B USD 02.02.2007 38.64% -0.23% 0.31% 142.96%
MSCI China Index TR net USD 35.00% 0.64% 1.19% 116.94%
Vontobel Fund - European Equity B EUR 16.12.2002 4.55% 3.14% -5.25% 181.76%
MSCI Europe Index TR net EUR 11.88% 4.86% -1.40% 169.69%
Vontobel Fund - US Equity B USD 21.11.1991 17.99% 17.16% -1.88% 1206.85%
S&P 500 - TR USD 16.23% 19.66% -3.04% 1176.99%
Vontobel Fund - Global Equity B USD 01.07.2005 16.98% 11.29% -3.76% 179.53%
MSCI All Country World TR net USD 17.11% 11.41% -2.92% 125.43%
Vontobel Fund - Global Equity (ex-US) B USD 12.06.2001 -9.00%* - - -
MSCI EAFE Index TR net USD -0.52%* - - -
Vontobel Fund - Global Equity Income B USD 12.06.2001 15.84%** 1.00% -1.54% 15.20%
MSCI All Country USD 15.03%** 11.41% -2.92% 24.41%
Vontobel Fund - Emerging Markets Equity B USD 03.11.1992 14.25% -5.71% 0.93% 669.62%
MSCI Emerging Market TR net USD 24.53% -0.68% 0.33% 359.44%
Vontobel Fund – Asia Pacific Equity B USD 25.02.1998 13.39% 3.61% 1.98% 421.64%
MSCI All Country Asia Pacific Ex-Japan TR net USD 23.18% 3.08% -1.36% 289.09%
Vontobel Fund - New Power B EUR 12.12.2001 7.72% 2.27% -0.76% 39.42%
MSCI World Index TR net EUR 8.84% 15.57% -1.23% 135.11%
Vontobel Fund - Clean Technology B EUR 17.11.2008 9.44% 3.57% -1.98% 200.45%
MSCI World Index TR net EUR EUR 8.84% 15.57% -1.23% 233.14%
Vontobel Fund - Future Resources B EUR 17.11.2008 -7.01% 11.26% -9.64% 82.31%
MSCI World Index TR net EUR 8.84% 15.57% -1.23% 233.14%
Vontobel Fund - mtx Sustainable Asian Leaders
(ex Japan)
B USD 17.11.2008 32.35% 1.04% -1.63% 255.26%
MSCI AC Asia (ex Japan) net TR USD USD 24.83% 2.76% -1.32% 213.84%
* Performance until renaming and repositioning of the Sub-Fund on December 30, 2016 ** Performance since renaming and repositioning of the Sub-Fund on December 30, 2016

General information
330
Performance (continued)
Sub-Fund name/Index name Share
class Currency Launch date
31.08.2016 –
31.08.2017
31.08.2017 –
31.08.2018
31.08.2018 –
28.02.2019
Since
Launch
Vontobel Fund - mtx Sustainable Emerging Markets
Leaders
B USD 15.07.2011 28.06% -0.33% 0.47% 44.65%
MSCI Emerging Market TR net (USD) USD 24.53% -0.68% 0.33% 11.01%
Vontobel Fund - mtx Sustainable Global Leaders B USD 14.12.2012 15.32% 0.94% -4.44% 37.16%
MSCI All Countries World Index USD 17.11% 11.41% -2.92% 77.35%
Vontobel Fund - Commodity B USD 04.04.2007 2.74% 5.83% -6.10% -43.08%
Bloomberg Commodity Index TR USD 2.99% 0.51% -1.66% -48.52%
Vontobel Fund - Dynamic Commodity B USD 02.05.2012 -1.17% 3.79% -1.66% -35.33%
Bloomberg Commodity Index TR USD 2.99% 0.51% -1.66% -39.23%
Vontobel Fund - Non-Food Commodity B USD 28.11.2014 3.04% 2.81% -0.42% -19.09%
Bloomberg Commodity ex-Agriculture and
Livestock Capped Index TR
USD 8.57% 4.02% 0.34% -20.04%
Vontobel Fund - Emerging Markets Debt B USD 15.05.2013 9.54% -4.76% 6.31% 27.50%
J.P. Morgan EMBI Global Diversified USD 5.02% -3.37% 5.70% 26.37%
Vontobel Fund - Global Bond I USD 30.06.2015 0.39% -0.15% 2.35% 9.52% Barclays Global Aggregate Bond Index Hedged USD 0.20% 0.82% 2.55% 11.84% Vontobel Fund - Credit Opportunities X USD 30.06.2015 4.98% 0.84% 1.80% 12.88% Vontobel Fund - Global Corporate Bond Mid Yield HG EUR 29.10.2015 1.90% -1.85% 0.83% 7.79% ML Global Corporate Index (G0BC) hedged into EUR
-2.25% 0.62% 6.11%
Vontobel Fund - Emerging Markets Blend I USD 24.08.2015 18.90% -2.93% 8.34% 47.26% 40% JPM EMBI Global Diversified & 40% JPM GBI EM Global Diversified & 20% JPM CEMBI Broad Diversified (Corp debt)
6.97% -5.64% 6.95% 22.30%
Vontobel Fund - Emerging Markets Corporate Bond I USD 13.11.2015 13.39% 1.31% 9.15% 51.46% JPM CEMBI Broad Diversified 5.61% -1.52% 4.76% 19.25% Vontobel Fund - TwentyFour Absolute Return Credit Fund
I GBP 28.08.2015 4.03% 0.45% 0.49% 11.34%
GBP 3 month Libor 0.35% Vontobel Fund - TwentyFour Strategic Income Fund G GBP 30.11.2015 7.84% 1.06% 0.43% 13.39% Vontobel Fund - LCR Global Bond AG EUR 14.12.2016 -1.82% ** -4.26% 0.87% -3.02% Vontobel Fund - Multi Asset Solution B EUR 18.10.2016 2.32% ** -1.09% 0.11% 1.31% Vontobel Fund - Multi Asset Income I EUR 16.12.2016 5.30% ** 0.52% 0.45% 6.33% Vontobel Fund - TwentyFour Monument European Asset Backed Securities
I EUR 27.06.2017 0.45% ** 1.38% -0.80% 1.03%
Vontobel Fund - Multi Asset Defensive B EUR 30.11.2017 - -0.51% -2.33%
** Performance since inception date of Sub-Fund

General information
331
Performance (continued)
Sub-Fund name/Index name Share
class Currency Launch date
31.08.2016 –
31.08.2017
31.08.2017 –
31.08.2018
31.08.2018 –
28.02.2019
Since
launch
Vontobel Fund - Multi Asset Alphabet B EUR 28.09.2018 -2.88%* -2.88%
Vontobel Fund - Vescore Artificial Intelligence Multi
Asset
B EUR 26.10.2018 3.61%* 3.61%
Vontobel Fund - Vescore Global Equity Multi Factor B USD 12.12.2018 6.26%* 6.26%
MSCI World Net Total Return Index (USD unhedged) USD 5.94%* 5.94%
Vontobel Fund - Alternative Risk Premia I USD 05.12.2018 1.88%* 1.88%
* Performance since inception date of Sub-Fund

General information
332
Information about remuneration paid to employees (in EUR) of Vontobel Asset Management S.A. for the financial year ended December 31, 2018
Number of employees on December 31, 2018: 62
Total remuneration in 2018 financial year 11,716,473
of which variable components in 2018 4,197,691
Identified employee categories*
Fixed salaries p.a. As at December 31, 2018 942,270
Variable components in 2018 337,156
* Identified employee categories
Senior management: executives, control functions, head of portfolio management
Details of remuneration practices for identified employee categories are described in Vontobel Asset Management S.A.’s
remuneration policy and made available to investors on request. Neither the management company nor the Fund pay
remuneration to identified employees of delegates.
The results of the annual inspection of implementation of the remuneration policy were positive.

General information
333
Regulation on transparency of securities financing transactions
The Fund is subject to Regulation (EU) 2015/2365 of the European Parliament and of the Council on
transparency of securities financing transactions and reuse and amending Regulation (EU) No 648/2012 of the
European Parliament (Securities Financing Transactions Regulation (“SFTR”)).
A securities financing transaction is defined in Article 3 (11) of the SFTR as:
� repurchase transactions or reverse repurchase transactions;
� securities or commodities lending and securities or commodities borrowing;
� a buy-sell back transaction or sell-buy back transaction;
� a margin lending transaction.
The SFTR also covers transactions that are usually described as total return swaps (“TRS”), including contracts
for difference (“CFD”).
In accordance with Article 13 (1) of the SFTR, the Fund is involved in securities financing transactions through its
engagement in CFD for the year ended February 28, 2019 as detailed below:
a) General information
Amount of assets employed for contracts for difference
The following table represents the total value engaged in contracts for difference transactions expressed as an
absolute amount and as a proportion of the Sub-Funds’ Net Asset Value at February 28, 2019:
Sub-Fund name
Gross Unrealised
Gain and Loss
(in Sub-Fund
Currency
AND in absolute
value)
% of total net asset
value
Net unrealised
profit and loss
(in Sub-Fund
Currency
AND in absolute
value)
% of total net asset
value
Vontobel Fund - Commodity USD 4,302,313.85 0.72% USD 839,716.15 0.14%
Vontobel Fund - Dynamic Commodity USD 3,157,177.40 2.63% USD 332,326.29 0.28%
Vontobel Fund - Non-Food Commodity USD 1,006,691.42 1.25% USD 894,244.22 1.11%
Vontobel Fund - Vescore Artificial
Intelligence Multi Asset EUR 10,833.22 0.07% EUR 6,492.24 0.04%
b) Concentration information
Top 10 issuers of collateral
All collateral received in respect of the contracts for difference transactions as at February 28, 2019 is cash
collateral. The ten largest collateral issuers disclosure is therefore not applicable.

General information
334
Regulation on transparency of securities financing transactions (continued)
Top 10 counterparties
The following table provides details of the top ten counterparties (based on gross volume of outstanding
transactions) in respect of the contracts for difference transactions as at February 28, 2019 per Sub-Fund.
Sub-Fund name Counterparty
Counterparty's
country of
incorporation
Gross volume of
outstanding TRS
transactions
Gross Unrealised Gain
and Loss
(in Sub-Fund
Currency
AND in absolute
value)
Vontobel Fund - Commodity
J.P. Morgan
Securities PLC UK USD 1,972,132,288.97 USD 1,499,604.64
Macquarie Bank
Limited Australia USD 630,081,473.25 USD 35,533.17
Société Générale
Paris France USD 190,244,585.11 USD 230,927.03
Goldman Sachs
International UK USD 94,357,343.14 USD 335,474.40
Citigroup Global
Market LDN UK USD 73,942,730.71 USD 2,145,484.11
Morgan Stanley
CIE INTL UK USD 16,946,934.32 USD 55,290.52
Vontobel Fund - Dynamic Commodity
J.P. Morgan
Securities PLC UK USD 1,464,806,632.06 USD 1,614,942.34
Macquarie Bank
Limited Australia USD 369,422,531.39 USD 52,707.19
Goldman Sachs
International UK USD 59,114,758.10 USD 342,065.97
UBS AG London UK USD 51,762,494.12 USD 0
Société Générale
Paris France USD 51,756,500.34 USD 277,140.59
Citigroup Global
Market LDN UK USD 32,965,681.67 USD 712,375.22
Morgan Stanley
CIE INTL UK USD 13,205,756.02 USD 157,946.09
Vontobel Fund - Non-Food
Commodity
J.P. Morgan
Securities PLC UK USD 228,141,212.20 USD 216,820.72
Macquarie Bank
Limited Australia USD 119,940,732.69 USD 5,551.66
Morgan Stanley
CIE INTL UK USD 26, 353,861.35 USD 784,319.04
UBS AG London UK USD 20,108,094.02 USD 0
Vontobel Fund - Vescore Artificial
Intelligence Multi Asset
J.P. Morgan
Securities PLC UK USD 4,491,864.24 EUR 10,833.22
c) Aggregated transaction data
Type and quality of collateral
The following table provides details on the collateral received by each Sub-Fund in respect of the contracts for
difference transactions as at February 28, 2019.
Sub-Fund name Type Quality Market value of collateral
(in Sub-Fund currency)
Vontobel Fund - Commodity Cash N/A USD 19,048,651.66
Vontobel Fund - Dynamic Commodity Cash N/A USD 3,801,073.16
Vontobel Fund - Non-Food Commodity Cash N/A USD 4,228,000.55
Vontobel Fund - Vescore Artificial Intelligence
Multi Asset
No collateral
received N/A No collateral received

General information
335
Regulation on transparency of securities financing transactions (continued)
Maturity tenor of the collateral
As mentioned under the section “Type and quality of collateral”, all collateral received in respect of the contracts
for differences transactions as at February 28, 2019 is cash collateral.
The disclosure of the maturity tenor of the collateral is therefore not applicable.
Currency of collateral
The collateral received for the contracts for difference transactions is received in USD and EUR only.
Maturity tenor of contracts for difference transactions
For all Sub-Funds there are no maturities for the contracts for difference transactions.
Country in which counterparties are established
The country in which counterparties are established is disclosed under the section “Top Ten Counterparties”
above.
Settlement and clearing
All trades open as at February 28, 2019 have been transacted through bilateral settlement.
d) Reuse of collateral
There is no reuse of cash collateral received in respect of the contracts for difference transactions as at February
28, 2019.
e) Safekeeping of collateral
Collateral received
Cash collateral granted by the counterparties is received on the Fund's cash account at RBC Investors Services
Bank S.A., Luxembourg. Luxembourg.
Collateral received per Sub-Fund is disclosed under section “Type and quality of collateral”.
Collateral granted
Cash collateral granted to the counterparties is deposited into a separate cash account for the relevant
counterparty.
The following table provides an analysis of the collateral granted in respect of the contracts for difference
transactions as at February 28, 2019:
Sub-Fund name Depositary bank Market value of collateral
(in Sub-Fund currency)
Vontobel Fund - Commodity No collateral granted by the Sub-Fund
Vontobel Fund - Dynamic Commodity Société Générale Paris USD 420,000.00
Citigroup Global Market LDN USD 40,000.00
Vontobel Fund - Non-Food Commodity No collateral granted by the Sub-Fund
Vontobel Fund - Vescore Artificial
Intelligence Multi Asset No collateral granted by the Sub-Fund
Return and cost
Return and cost of the contracts for difference transactions as at February 28, 2019 are disclosed in the
“Combined Statement of Operations and Changes in Net Assets” under the headings “Net interest on Contracts
for Difference”, “Net realised gain/loss on Contracts for Difference” and “Change in unrealised
appreciation/depreciation on Contracts for Difference”.