2002 - Morningstar
40
HELLABY HOLDINGS LIMITED annual report 2002
-
Upload
khangminh22 -
Category
Documents
-
view
0 -
download
0
Transcript of 2002 - Morningstar

H E L L A B Y H O L D I N G S L I M I T E D
a n n u a l r e p o r t
2002

Directors’ Report 1
Managing Director’s Review 3
Auditors’ Report 10
Statement of Accounting Policies 11
Statements of Financial Performance 15
Statements of Movements in Equity 15
Statements of Financial Position 16
Statements of Cash Flows 17
Notes to the Financial Statements 18
Statutory Information 30
Notice of Annual General Meeting 33
Proxy Form 35
Directory 37
C O N T E N T S

1
The directors of Hellaby Holdings are pleased to present the annual report and financial statements
of the company for the year to 30 June 2002.
Trading ResultsThe company recorded a tax paid surplus of $14.1 million compared with $12.9 million achieved
last year and $11.7 million the year before.
The latest result represents an 18% tax paid return on average shareholders’ funds employed with
earnings per share increasing to 28.4 cents (last year 25.9 cents; prior year 23.3 cents).
Asset backing per share now stands at $1.65 (last year $1.53; prior year $1.34).
Earnings from the group’s automotive and engineering divisions have been extremely pleasing,
reflecting increased business activity and careful cost control.
DividendThe Board of Directors has authorised an increased final dividend of 10 cents per share fully
imputed (last year 8 cents) to be paid on Friday 11 October 2002. The increase reflects the higher
level of Hellaby’s earnings, and the Board’s belief that this is sustainable into next year.
The dividend distributions for the year are summarised as follows:
Interim 8 cents fully imputed (prior year 7 cents), an increase of 14%
Final 10 cents fully imputed (prior year 8 cents), an increase of 25%
Total 18 cents fully imputed (prior year 15 cents), an average increase of 20%
InvestmentsDuring the year the company:
• acquired 100% of the business assets and undertaking of Diesel Distributors
• sold a 39% shareholding interest in New Zealand Wool Services International, reducing
its shareholding to 20%
• sold its swimwear business interests in Expozay International (100% owned) and
Coleman Swim (49% owned)
D I R E C T O R S ’ R E P O R T
Financial performance of the Hellaby Group for the year ended 30 June 2002 is summarised as follows:
2002 2001$000 $000
Gross Trading Surplus 29,867 25,253Administration 1,607 1,638
Trading Surplus before depreciation & interest 28,260 23,615Depreciation 7,201 6,807Amortisation of goodwill 758 652Interest 2,364 5,671
Net Trading Surplus 17,937 10,485
OtherSurplus on sale of assets 920 4,214USA property investment - 152Future tax benefit 642 831Revaluation of investments (1,193) 273Rent abatement (218) (1,703)
Operating surplus before tax 18,088 14,252Taxation 3,973 1,373
Operating surplus after tax 14,115 12,879
Earnings per share 28.4 cents 25.9 cents

2 H E L L A B Y H O L D I N G S L I M I T E D
Diesel Distributors (“DDL”) is New Zealand’s market leader in the importion and distribution ofthe world’s leading brands in the fields of diesel fuel injection, turbocharger replacement parts, anddiesel engine glow plugs and associated products. The acquisition cost $3.3 million and willcomplement Hellaby’s other automotive and related businesses investments. DDL was previouslyowned by parties associated with Hellaby, namely director Tur Borren and Brake & TransmissionCEO Greg Horne (each had family trusts and/or related companies that beneficially owned 40% of DDL).
The sale of a 39% shareholding interest in New Zealand Wool Services International (“WSI”) was a significant transaction, realizing $10.6 million and crystallizing a capital gain of $3.1 million (ofthis $2.8 million had previously been brought to account by way of revaluation since acquisition).
In last year’s Annual Report it was noted that Hellaby was divesting its investments in the lossmaking swimwear sector. Expozay International was a manufacturer and distributor of swimwearproducts with a turnover of $3 million. Last September, Bendon acquired the Expozay name andstock in trade, with the manufacturing business at Tauranga being closed. The disposal of thisbusiness realized $1 million net to Hellaby after settling Expozay’s creditors and bank debt.Expozay was trading at a loss.
Coleman Swim is a small Auckland based business with a turnover of $1 million. As at June 2002the company sold its 49% equity interest in Coleman Swim and its cash advances to related party,Demi Holdings Limited, a private company associated with director Tur Borren. The sale realized$0.4 million and incurred a small loss on sale of $46,000. Coleman Swim’s business was consideredto be too small for Hellaby to retain as an ongoing investment, with limited opportunities forgrowth in the foreseeable future. Coleman Swim was trading at a small loss.
Profit Share Incentive PlanFor the past nine years Hellaby has operated a profit share incentive plan with the respective CEOsof its wholly owned operating subsidiaries. The plan provides for the CEOs to share in the increasein after tax earnings of the subsidiary that they manage providing the subsidiary exceeds the prioryear’s tax paid earnings.
Your directors firmly believe that the incentive plan has been highly effective for Hellaby andshareholders and has been a major factor in driving the increased earnings of the group over thistime period.
Last year the participating subsidiaries contributed 81% of Hellaby’s reported group earnings.
However, whilst the average cost per person of the plan is modest, the amount paid to individualCEOs has on occasions breached the present Listing Rules of the NZ Stock Exchange in respect ofremuneration payable to related parties. The subsidiary CEOs are deemed to be officers of Hellabyand, under the Listing Rules, shareholder approval to the plan is required. A resolution to giveeffect to this will be put to shareholders at the forthcoming AGM scheduled for 15 November 2002.
DirectorsTur Borren has recently retired from the boards of directors of public companies that he served on, including Hellaby Holdings. Tur has made the decision for personal reasons.
Hellaby Holdings wishes to acknowledge the valuable contribution that Tur has given to thecompany over the past nine years, initially as managing director and more recently as a nonexecutive director. His presence on our board will be missed.
In accordance with the company’s constitution, a retirement payment of $76,250 ($51,088 net oftax) has been paid to Tur in recognition of his services to Hellaby. We wish him all the very best in his retirement from public service.
Looking AheadHellaby’s strong earnings performance and financial position is expected to continue for theensuing financial year, and beyond. This view is tempered by the proviso that the domestic marketsare substantially sheltered from any adverse overseas-related economic conditions that may arise.As mentioned earlier, Hellaby will be looking to maintaining, and if possible, enhancing itsincreased dividend distributions to shareholders.
WJ Falconer, Chairman
D I R E C T O R S ’ R E P O R T
3
IntroductionDespite the uncertainties that plagued the international scene over the past year the
Hellaby group achieved a significant increase in profitability during this period.
Hellaby’s operating surplus after tax increased by 9.6%, to $14.1 million, but more
importantly the company’s pre tax trading surplus increased by 70%, to $17.9 million,
reflecting the strong performance of our operating subsidiaries and associate companies.
The profitability of Brake and Transmission and AB Equipment increased substantially
during the year and Hannahs’ profit returned to more acceptable levels.
Specialty Brands recorded a reduced loss despite incurring significant additional
restructuring costs and write-offs during the year.
Whilst Levana Textiles achieved acceptable sales in a difficult market its profit was slightly
below expectation due to the negative impact of the low New Zealand dollar on its margins.
Life assurance company Club Life enjoyed strong growth in new business in its first year
of operations and made a pleasing contribution to the group’s results.
In addition, the majority of the group’s smaller companies traded at a profit level well
ahead of last year.
At the end of April 2002 we acquired the business of Diesel Distributors, which operates
in a market segment that offers growth opportunities and complements our existing
investments in the automotive sector.
Once again, I would like to take the opportunity to acknowledge the contributions of
the operating chief executives and their staff. We are indeed fortunate to have excellent
managers running our companies and producing such strong returns for Hellaby
shareholders.
AB Equipment (100% owned)The AB group of companies (AB Equipment, AB Rental and Eurolift NZ) all achieved
record profits in what was an exceptional trading year.
AB Equipment again maintained its materials handling market leadership with Toyota 1.5
tonne to 8 tonne forklifts, BT battery electric Reach Trucks, Order Pickers, Stackers and
Low Lift Trucks from Sweden and the USA, and Kalmar “Big Trucks” from Sweden with
lifting capacities up to 45 tonne.
All of AB’s materials handling products are market leaders in terms of productivity,
ergonomics and safety (the Toyota 7 Series are the only forklifts in New Zealand to have
an OSH recognition for advanced technology as an engineering solution to control work
place hazards and improve safety).
The materials handling products are complemented by the Italian made Comac range
of floorcare products (sweepers and scrubbers).
AB Equipment is particularly pleased to note that October 2002 marks its 20th year of
successful partnership with Toyota Industries Corporation.
The construction equipment division of AB Equipment also had a strong year, with
significant gains made in the forestry sector with Sumitomo excavators in the 22 and 30
tonne range. All other products (Sakai Road Rollers; JCB Backhoe Loaders and Wheel
Loaders; IHI Mini Excavators and Vermeer tree chipping and underground directional
drilling) contributed strongly to the overall result.
M A N A G I N G D I R E C T O R ’ S R E V I E W
4 H E L L A B Y H O L D I N G S L I M I T E D
AB Rental, New Zealand’s largest forklift rental company with both long term and short-
term rental options, significantly increased revenue and profitability over the previous year.
Short-term rental forklifts are operated from each of the company’s thirteen branches and
the number of units on long term rental increased by 10% during the year.
AB Equipment’s commitment to customer support (service, parts and operator training)
underpins the world leading range of products offered, and continues as the industry
benchmark for customer service.
Eurolift NZ had an exceptional year, with very strong sales of both Linde Forklifts
and Kubota excavators and has clear plans in place for further growth. During
the year Eurolift relocated to its new and larger premises at Mt Wellington,
Auckland, and it also established a service branch at Whakatane. Eurolift’s
Christchurch branch services the South Island.
Turnover $71.1 million (2001 $54.7 million)
Brake & Transmission NZ (100% owned)Automotive parts importer and distributor, Brake and Transmission NZ, trading as BNT
Automotive and Autolign, achieved another record result with sales increasing by 18% and
profit by 40% over last year.
The improved performance is a result of the continuing implementation of the company’s
distribution strategy. The three new branches opened progressively throughout last year
fully contributed to this year’s result, whilst the five new branches opened this financial year
(Te Rapa, Masterton, Onehunga, Mount Maunganui and Mosgeil) will be fully contributing
henceforth. A further four more branches are planned to be opened during the next twelve
months. BNT also intends expanding its product range in the drive to increase sales revenue
even further.
At the end of last year the product range of Autolign, which BNT acquired some fifteen
months earlier, was increased and its management structure re-organized. I’m pleased to
report that as a result Autolign has doubled its profit contribution to the Hellaby group.
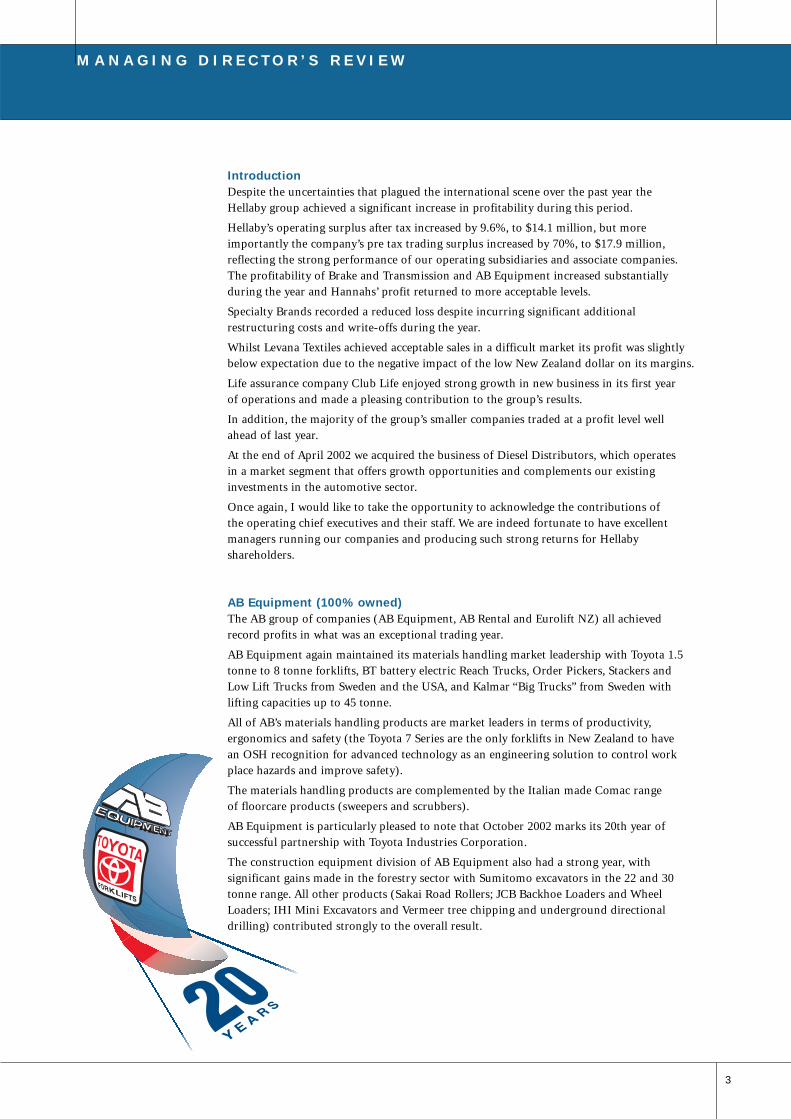
The planned relocation and amalgamation of BNT’s three Auckland based distribution
centres onto a single leased site at the North Harbour Industrial Estate, Auckland, is
scheduled for completion by June 2003. The new design and build distribution center will
also accommodate BNT’s head office, and will allow distribution efficiencies to be achieved
with a fully computerized warehouse management system.
BNT is trading ahead of budget in the current year.
Turnover $70.0 million (2001 $59.5 million)
The new distribution centre
and head office for BNT
is scheduled for completion
next year.
M A N A G I N G D I R E C T O R ’ S R E P O R T
One of the twenty limited
edition 7 series forklifts
commemorating the
20 year association between
AB Equipment and Toyota
Industries Corporation.

5
Hannahs, New Zealand’s largest
specialty shoe retailing chain,
had an excellent result.
Levana Textiles (100%)Levana Textiles is recognised as New Zealand’s
leading manufacturer of high performance
knitted fabrics for Australasian apparel
manufacturers, with a developing export
business further afield. It has strong
relationships with key customers in various
sectors, including swimwear, intimate apparel,
children’s wear, ladies fashion and performance
sportswear.
As a result of the downturn in the retail fashion sector, the trading conditions have been
difficult, particularly in Australia. The fact that the company’s turnover only fell marginally
is a tribute to the strong market position that Levana enjoys.
As reported last year, the low New Zealand dollar is negatively impacting on margins and
as a consequence Levana achieved a profit below budget.
In light of this, Levana’s management has, in particular, focused on reducing stocks and
working capital to reduce funds employed in the business and achieve a profit that
represents an adequate return on actual funds employed.
Levana continues to focus on branded fabrics such as Lycra©, Meryl, Tactel, Strata and
Coolmax, while offering a wide range of standard nylon, polyester, cotton and blended
fabrics. The coming year will see the release of new fabric ranges, with the potential to
sell into supporting markets, and an associated improvement in overall profitability.
The strengthening New Zealand dollar will also have a positive impact on Levana’s gross
margin and we are anticipating an improved result from the company in the current year.
Turnover $15.0 million (2001 $16.5 million)
R Hannah & Co (85% owned)Hannahs, New Zealand’s largest specialty shoe retailing chain, had a very strong
turnaround in profitability following last year’s disappointing result.
Sales in New Zealand showed little growth on the previous year but improved margins,
good inventory management and tight cost control resulted in an excellent profit result
from the New Zealand operations.
Hannahs’ Australian operation achieved strong sales growth but margin and cost pressures,
particularly in the second half of the year, again resulted in an overall loss for the Australian
division, although at a significantly reduced level to last year.
We believe that Hannahs now has the sales momentum to be successful in the Australian
market and a sharp focus on margins this year should put the Australian operation in a
break-even to small loss position. The strategy to focus on our Pulp business in Australia,
which will involve the conversion of the Brisbane stores to Pulp, is currently being
developed. This is expected to achieve smaller, more focused and strategically sound retail
stores.
The outlook for New Zealand is positive as Hannahs continues to leverage its own brands,
a strategy that has been implemented over the last few years. The Steelers trademark and
two new trademark purchases will support the sales drive and gross profit margins over
the coming years. Store numbers have reduced to sixty-two in New Zealand and six in
Australia as older and less desirable stores are closed, with two further closures planned.
The closures will assist the overall growth of same store sales, which have been impacted
by “cannibalization” in recent years. For the first time in many years no new stores are
planned for the ensuing twelve months.
Turnover $65.6 million (2001 $65.6 million)
Levana continues to focus
on branded fabrics
6 H E L L A B Y H O L D I N G S L I M I T E D
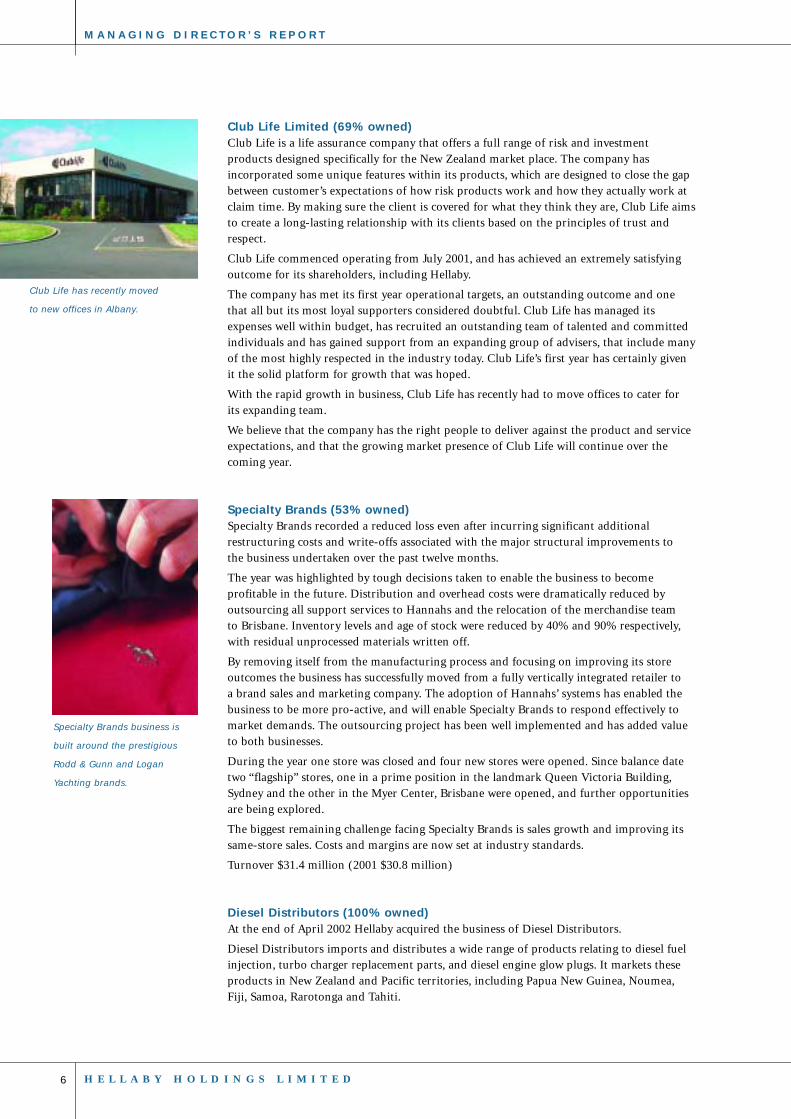
Club Life Limited (69% owned)Club Life is a life assurance company that offers a full range of risk and investment
products designed specifically for the New Zealand market place. The company has
incorporated some unique features within its products, which are designed to close the gap
between customer’s expectations of how risk products work and how they actually work at
claim time. By making sure the client is covered for what they think they are, Club Life aims
to create a long-lasting relationship with its clients based on the principles of trust and
respect.
Club Life commenced operating from July 2001, and has achieved an extremely satisfying
outcome for its shareholders, including Hellaby.
The company has met its first year operational targets, an outstanding outcome and one
that all but its most loyal supporters considered doubtful. Club Life has managed its
expenses well within budget, has recruited an outstanding team of talented and committed
individuals and has gained support from an expanding group of advisers, that include many
of the most highly respected in the industry today. Club Life’s first year has certainly given
it the solid platform for growth that was hoped.
With the rapid growth in business, Club Life has recently had to move offices to cater for
its expanding team.
We believe that the company has the right people to deliver against the product and service
expectations, and that the growing market presence of Club Life will continue over the
coming year.
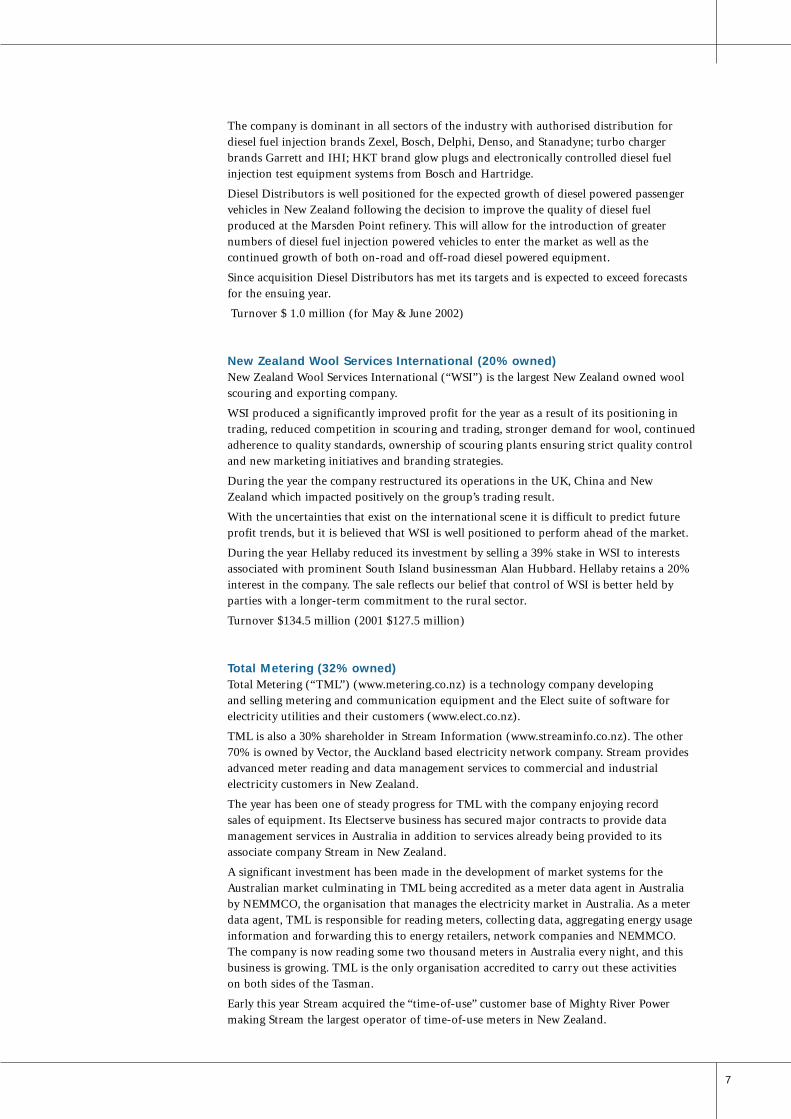
Specialty Brands (53% owned)Specialty Brands recorded a reduced loss even after incurring significant additional
restructuring costs and write-offs associated with the major structural improvements to
the business undertaken over the past twelve months.
The year was highlighted by tough decisions taken to enable the business to become
profitable in the future. Distribution and overhead costs were dramatically reduced by
outsourcing all support services to Hannahs and the relocation of the merchandise team
to Brisbane. Inventory levels and age of stock were reduced by 40% and 90% respectively,
with residual unprocessed materials written off.
By removing itself from the manufacturing process and focusing on improving its store
outcomes the business has successfully moved from a fully vertically integrated retailer to
a brand sales and marketing company. The adoption of Hannahs’ systems has enabled the
business to be more pro-active, and will enable Specialty Brands to respond effectively to
market demands. The outsourcing project has been well implemented and has added value
to both businesses.
During the year one store was closed and four new stores were opened. Since balance date
two “flagship” stores, one in a prime position in the landmark Queen Victoria Building,
Sydney and the other in the Myer Center, Brisbane were opened, and further opportunities
are being explored.
The biggest remaining challenge facing Specialty Brands is sales growth and improving its
same-store sales. Costs and margins are now set at industry standards.
Turnover $31.4 million (2001 $30.8 million)
Diesel Distributors (100% owned)At the end of April 2002 Hellaby acquired the business of Diesel Distributors.
Diesel Distributors imports and distributes a wide range of products relating to diesel fuel
injection, turbo charger replacement parts, and diesel engine glow plugs. It markets these
products in New Zealand and Pacific territories, including Papua New Guinea, Noumea,
Fiji, Samoa, Rarotonga and Tahiti.
Specialty Brands business is
built around the prestigious
Rodd & Gunn and Logan
Yachting brands.
M A N A G I N G D I R E C T O R ’ S R E P O R T
Club Life has recently moved
to new offices in Albany.
7
The company is dominant in all sectors of the industry with authorised distribution for
diesel fuel injection brands Zexel, Bosch, Delphi, Denso, and Stanadyne; turbo charger
brands Garrett and IHI; HKT brand glow plugs and electronically controlled diesel fuel
injection test equipment systems from Bosch and Hartridge.
Diesel Distributors is well positioned for the expected growth of diesel powered passenger
vehicles in New Zealand following the decision to improve the quality of diesel fuel
produced at the Marsden Point refinery. This will allow for the introduction of greater
numbers of diesel fuel injection powered vehicles to enter the market as well as the
continued growth of both on-road and off-road diesel powered equipment.
Since acquisition Diesel Distributors has met its targets and is expected to exceed forecasts
for the ensuing year.
Turnover $ 1.0 million (for May & June 2002)
New Zealand Wool Services International (20% owned)New Zealand Wool Services International (“WSI”) is the largest New Zealand owned wool
scouring and exporting company.
WSI produced a significantly improved profit for the year as a result of its positioning in
trading, reduced competition in scouring and trading, stronger demand for wool, continued
adherence to quality standards, ownership of scouring plants ensuring strict quality control
and new marketing initiatives and branding strategies.
During the year the company restructured its operations in the UK, China and New
Zealand which impacted positively on the group’s trading result.
With the uncertainties that exist on the international scene it is difficult to predict future
profit trends, but it is believed that WSI is well positioned to perform ahead of the market.
During the year Hellaby reduced its investment by selling a 39% stake in WSI to interests
associated with prominent South Island businessman Alan Hubbard. Hellaby retains a 20%
interest in the company. The sale reflects our belief that control of WSI is better held by
parties with a longer-term commitment to the rural sector.
Turnover $134.5 million (2001 $127.5 million)
Total Metering (32% owned)Total Metering (“TML”) (www.metering.co.nz) is a technology company developing
and selling metering and communication equipment and the Elect suite of software for
electricity utilities and their customers (www.elect.co.nz).
TML is also a 30% shareholder in Stream Information (www.streaminfo.co.nz). The other
70% is owned by Vector, the Auckland based electricity network company. Stream provides
advanced meter reading and data management services to commercial and industrial
electricity customers in New Zealand.
The year has been one of steady progress for TML with the company enjoying record
sales of equipment. Its Electserve business has secured major contracts to provide data
management services in Australia in addition to services already being provided to its
associate company Stream in New Zealand.
A significant investment has been made in the development of market systems for the
Australian market culminating in TML being accredited as a meter data agent in Australia
by NEMMCO, the organisation that manages the electricity market in Australia. As a meter
data agent, TML is responsible for reading meters, collecting data, aggregating energy usage
information and forwarding this to energy retailers, network companies and NEMMCO.
The company is now reading some two thousand meters in Australia every night, and this
business is growing. TML is the only organisation accredited to carry out these activities
on both sides of the Tasman.
Early this year Stream acquired the “time-of-use” customer base of Mighty River Power
making Stream the largest operator of time-of-use meters in New Zealand.
8 H E L L A B Y H O L D I N G S L I M I T E D
However, as a result of its ongoing investment in systems and technology TML is
currently cash flow negative. It is also planning to expand its business into Australia,
USA and Europe, which will require new equity. A major capital-raising programme in
the USA is planned to be undertaken over the next few months.
Turnover $4.5 million (2001 $3.1 million)
Bombay Petfoods (49% owned)Bombay Petfoods trades under the brand JIMBO’s and holds the major market share for
“wet” cat pet food in New Zealand.
The brand now enjoys a 77% market share nationally with 84% in the northern region,
42% in the lower North Island and 82% in the South Island. The company’s products are
sold at all the major supermarket chains.
The year was rewarding for Bombay Petfoods with greater market share, a 6% growth in
sales revenue and a significant increase in earnings.
The company intends expanding and upgrading its facility at Bombay, South Auckland,
and has developed new pottles and labels for its Jimbo product range. This will assist the
company to be more aggressive in the market place, and to have a product that is clearly
identifiable.
Bombay Petfoods has also upgraded its IT systems to enable it to be more efficient and
productive. This has easily been the best financial year that Bombay Petfoods has had to
date and we are confident that this growth will continue.
Turnover $ 5.0 million (2001 $4.6 million)
Inteletrac (50% owned)Inteletrac provides mobile data and software solutions for the transport, dairy, service,
utility and security industries. It specialises in providing integrated solutions involving
job processing and dispatch, with the focus on mobile data.
During the year Inteletrac extended its dispatch management software from the Kiwi Dairy
fleet into the Dairy Group fleet on the formation of Fonterra. The software now dispatches
milk collection data to 440 milk tankers nationwide, all of which have Inteletrac’s mobile
data terminal installed.
Inteletrac has redeveloped its operational job processing and dispatch software onto a more
robust and expandable platform, and under the brand name of Zephyr, the software is
suitable for export. The company also further developed its mobile data terminal, branded
MDT-400, improving its functionality, flexibility and performance. This has attracted
strong overseas interest in countries such as Australia, USA, Singapore and Portugal.
During the year most of Inteletrac’s resources were focussed on the Fonterra business and
the product redevelopments. Because of this, the sales and profit budgets were not achieved.
The focus is now on sales and distribution, both domestically and internationally, and the
outlook is positive on both fronts.
Turnover $0.7 million (2001 $0.5 million)
Bert Teubel (49% owned)Bert Teubel is a diverse South Auckland based manufacturing company producing a
range of metal products, mainly associated with the electrical and hardware trades, for
local as well as overseas markets.
The company has enjoyed good sales locally due to new product and increased building
activities.
Exports, albeit modest, were ahead of last year with new customers and orders for new
product.
The outlook is for another busy and successful year.
Turnover $3.1 million (2001 $2.9 million)
M A N A G I N G D I R E C T O R ’ S R E P O R T

9
Taylors Manufacturing (50% owned)Taylors Manufacturing (“Taymac”) is a Christchurch based general engineering company
producing fans, boilers and dust control equipment, The company is jointly owned with
Vortex Engineering.
The association with Vortex has enabled Taymac to increase its business during a period
that would otherwise have been difficult for Taymac.
In May 2002 Taymac acquired a 60% shareholding in Fowlerex Technologies, leading
Australian air pollution control company with whom Taymac has had a 20-year association.
The investment is expected to provide significant additional manufacturing work for
Taymac over the next 12 months.
Turnover $3.5 million (2001 $3.2 million)
Oakleys Plumbing Supplies (75% owned)Oakleys is a general plumbing supplies merchant based in Christchurch.
In the face of strong competition Oakleys took the strategic decision to increase its market
share by meeting market pricing and maintaining a high level of advertising and
promotion.
As a result of this focus Oakleys achieved an increase in sales in a difficult market but at
a cost to gross margins. The company’s profit was slightly below last year.
Oakleys is now better placed for the future and in the first month of the new year record
sales were achieved. It intends to consolidate its position and will seek to restore gross
margins.
Turnover $4.8 million (2001 $4.5 million)
The OutlookIn the first few months of the current year the Hellaby related companies are trading ahead
of last year and we believe that their strong market positions and focus on enhancing core
earnings will lead to continue increases in profitability in the future.
This year has seen Hellaby’s changed focus being applied. For the two previous years the
emphasis was on selling non-core businesses, whereas the strategy going forward is to
further enhance the performance of our existing businesses and to make acquisitions that
either add value to our existing investments or produce superior returns in their own right.
Hellaby is in a very strong financial position and is able to maintain a high dividend
distribution policy while still continuing with the existing share buy-back programme
without impacting on its ability to make further acquisitions.
We believe that these factors will continue to grow shareholder returns in the future.
David Houldsworth
Managing Director
10 H E L L A B Y H O L D I N G S L I M I T E D
A U D I T O R S ’ R E P O R T
Auditors ' Repor t to the Shareholders of Hel laby Holdings L imitedWe have audited the financial statements on pages 11 to 29. The financial statements provide information about the past
financial performance and cash flows of the Company and Group for the year ended 30 June 2002 and their financial position
as at that date. This information is stated in accordance with the accounting policies set out on pages 11 to 14.
Directors ' Responsibi l i t iesThe Company's Directors are responsible for the preparation and presentation of the financial statements which give a true and
fair view of the financial position of the Company and Group as at 30 June 2002 and their financial performance and cash
flows for the year ended on that date.
Auditors ' Responsibi l i t iesWe are responsible for expressing an independent opinion on the financial statements presented by the Directors and reporting
our opinion to you.
Basis of OpinionAn audit includes examining, on a test basis, evidence relevant to the amounts and disclosures in the financial statements.
It also includes assessing:
(a) the significant estimates and judgements made by the Directors in the preparation of the financial statements; and
(b) whether the accounting policies are appropriate to the circumstances of the Company and Group, consistently applied
and adequately disclosed.
We have conducted our audit in accordance with generally accepted auditing standards in New Zealand. We planned and
performed our audit so as to obtain all the information and explanations which we considered necessary to provide us with
sufficient evidence to give reasonable assurance that the financial statements are free from material misstatements, whether
caused by fraud or error. In forming our opinion we also evaluated the overall adequacy of the presentation of information in
the financial statements.
We have no relationship with or interests in the Company or any of its subsidiaries other than in our capacities as auditors and
tax advisers.
Unqual i f ied OpinionWe have obtained all the information and explanations we have required.
In our opinion:
(a) proper accounting records have been kept by the Company as far as appears from our examination of those records; and
(b) the financial statements on pages 11 to 29:
(i) comply with generally accepted accounting practice in New Zealand; and
(ii) give a true and fair view of the financial position of the Company and Group as at 30 June 2002 and their financial
performance and cash flows for the year ended on that date.
Our audit was completed on 9 September 2002 and our unqualified opinion is expressed as at that date.
Chartered Accountants
Auckland
PricewaterhouseCoopers188 Quay StreetPrivate Bag 92162Auckland, New ZealandTelephone +64 9 355 8000Facsimile +64 9 355 8001
11
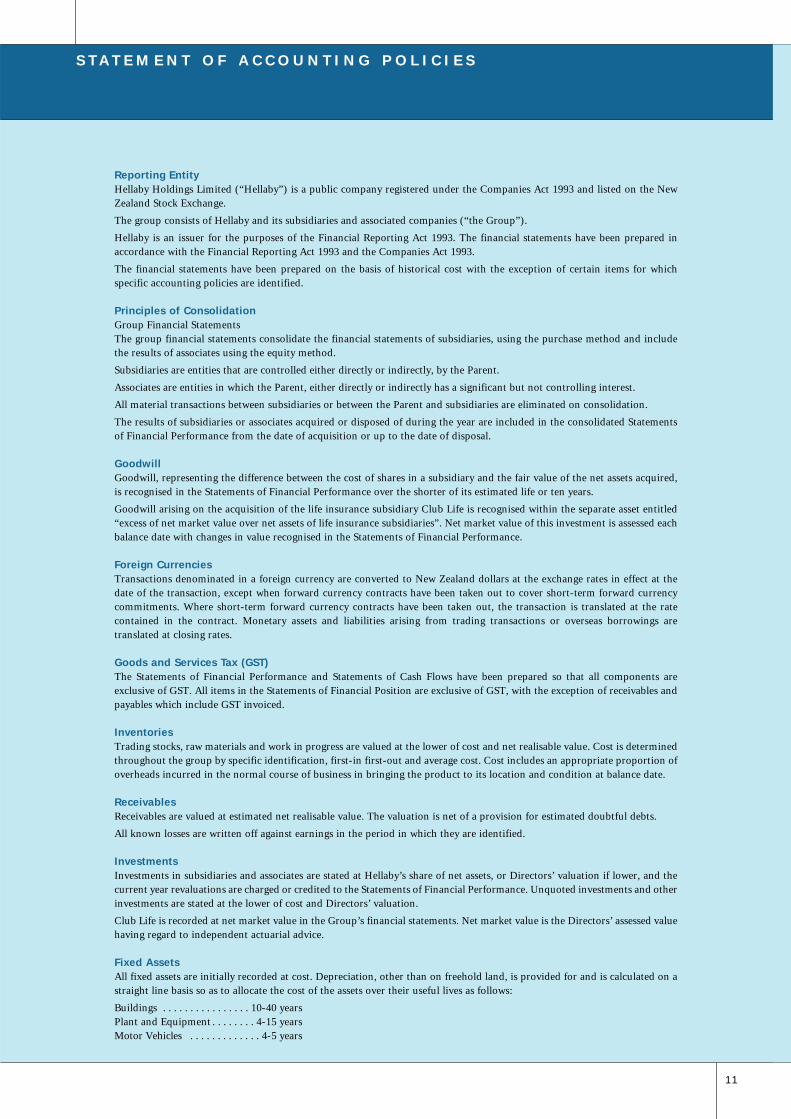
Reporting EntityHellaby Holdings Limited (“Hellaby”) is a public company registered under the Companies Act 1993 and listed on the NewZealand Stock Exchange.
The group consists of Hellaby and its subsidiaries and associated companies (“the Group”).
Hellaby is an issuer for the purposes of the Financial Reporting Act 1993. The financial statements have been prepared inaccordance with the Financial Reporting Act 1993 and the Companies Act 1993.
The financial statements have been prepared on the basis of historical cost with the exception of certain items for whichspecific accounting policies are identified.
Principles of ConsolidationGroup Financial StatementsThe group financial statements consolidate the financial statements of subsidiaries, using the purchase method and includethe results of associates using the equity method.
Subsidiaries are entities that are controlled either directly or indirectly, by the Parent.
Associates are entities in which the Parent, either directly or indirectly has a significant but not controlling interest.
All material transactions between subsidiaries or between the Parent and subsidiaries are eliminated on consolidation.
The results of subsidiaries or associates acquired or disposed of during the year are included in the consolidated Statementsof Financial Performance from the date of acquisition or up to the date of disposal.
GoodwillGoodwill, representing the difference between the cost of shares in a subsidiary and the fair value of the net assets acquired,is recognised in the Statements of Financial Performance over the shorter of its estimated life or ten years.
Goodwill arising on the acquisition of the life insurance subsidiary Club Life is recognised within the separate asset entitled“excess of net market value over net assets of life insurance subsidiaries”. Net market value of this investment is assessed eachbalance date with changes in value recognised in the Statements of Financial Performance.
Foreign CurrenciesTransactions denominated in a foreign currency are converted to New Zealand dollars at the exchange rates in effect at thedate of the transaction, except when forward currency contracts have been taken out to cover short-term forward currencycommitments. Where short-term forward currency contracts have been taken out, the transaction is translated at the ratecontained in the contract. Monetary assets and liabilities arising from trading transactions or overseas borrowings aretranslated at closing rates.
Goods and Services Tax (GST)The Statements of Financial Performance and Statements of Cash Flows have been prepared so that all components areexclusive of GST. All items in the Statements of Financial Position are exclusive of GST, with the exception of receivables andpayables which include GST invoiced.
InventoriesTrading stocks, raw materials and work in progress are valued at the lower of cost and net realisable value. Cost is determinedthroughout the group by specific identification, first-in first-out and average cost. Cost includes an appropriate proportion ofoverheads incurred in the normal course of business in bringing the product to its location and condition at balance date.
ReceivablesReceivables are valued at estimated net realisable value. The valuation is net of a provision for estimated doubtful debts.
All known losses are written off against earnings in the period in which they are identified.
InvestmentsInvestments in subsidiaries and associates are stated at Hellaby’s share of net assets, or Directors’ valuation if lower, and thecurrent year revaluations are charged or credited to the Statements of Financial Performance. Unquoted investments and otherinvestments are stated at the lower of cost and Directors’ valuation.
Club Life is recorded at net market value in the Group’s financial statements. Net market value is the Directors’ assessed valuehaving regard to independent actuarial advice.
Fixed AssetsAll fixed assets are initially recorded at cost. Depreciation, other than on freehold land, is provided for and is calculated on astraight line basis so as to allocate the cost of the assets over their useful lives as follows:
Buildings . . . . . . . . . . . . . . . . 10-40 yearsPlant and Equipment . . . . . . . . 4-15 yearsMotor Vehicles . . . . . . . . . . . . . 4-5 years
S T A T E M E N T O F A C C O U N T I N G P O L I C I E S

12 H E L L A B Y H O L D I N G S L I M I T E D
TaxationIncome tax expense recognises, on a comprehensive basis, the current obligations and all amounts arising from differencesbetween the accounting results and assessable income. Income tax expense includes prepaid non-refundable income tax inrespect of tax credits attached or to be attached to Hellaby dividend distributions, except to the extent that the Directorsbelieve the prepaid non-refundable income tax is recoverable in the forseeable future.
RevenueSales revenue represents revenue earned from the sale of the Group’s products and services, net of returns, allowances andGST. Fees and dividends are recognised when they are received or become receivable.
Leased AssetsOperating lease payments are recognised as an expense in the periods the amounts are payable.
Financial InstrumentsThe Group is party to financial instruments, including forward exchange contracts and forward interest rate agreements, withoff-balance sheet risk to meet financing needs and to reduce exposure to fluctuations in interest rates and foreign exchangerates. Exposure to gains or losses on these contracts is generally offset by a related loss or gain on the item being hedged. Gainsand losses on currency contracts which hedge specific short term foreign currency denominated commitments are recognisedas a component of the related transaction in the period in which the transaction is completed.
Statement of Cash FlowsThe following are the definitions of the terms used in the statement of cash flows:
(a) Operating activities include all transactions and other events that are not investing or financing activities.
(b) Investing activities are those activities relating to the acquisition, holding and disposal of property, plant andequipment and of investments. Investments can include securities not falling within the definition of cash.
(c) Financing activities are those activities that result in changes in the size and composition of the capital structure. Thisincludes both equity and debt not falling within the definition of cash. Dividends paid in relation to the capital structure areincluded in financing activities.
(d) Cash is considered to be cash on hand and current accounts in banks, net of bank overdrafts.
Accounting Policies Applicable to the Life Insurance Subsidiary (Club Life)Life Insurance Financial ReportingFRS-34: Financial Reporting of Life Insurance Business was issued by the Institute of Chartered Accountants of New Zealand(“ICANZ”) in November 1998. This standard prescribed the methods to be used for financial reporting of life insurancebusiness for both life insurers and groups which include life insurers. FRS-34 requires policy liabilities to be measured inaccordance with actuarial standards. Actuarial Professional Standard 3: Determination of Life Insurance Policy Liabilities(“PS3”) which prescribes the Margin on Services (“MoS”) basis was issued in December 1998.
Asset MeasurementThe specific valuation methods adopted for significant asset categories are as follows:
Assets generally are stated at net market value.
Gains and losses arising from the revaluation of assets are included as part of investment income in the Statements ofFinancial Performance.
Net market values are determined as follows:
SubsidiariesSubsidiaries are recorded at net market value, being the Directors’ assessed value having regard to independent actuarialadvice.
Debt SecuritiesDebt securities are stated at net market value including accrued interest based on the market yield of individual securities heldat balance date.
Unit TrustsUnits held in unit trusts are stated at net market value based on the last sale price quoted by the fund manager.
Liability MeasurementPolicy liabilities are calculated using the Margin on Services (“MoS”) methodology in accordance with New Zealand Societyof Actuaries Professional Standard 3: Determination of Life Insurance Policy Liabilities, issued in December 1998.
MoS is designed to recognise profits on life insurance as services are provided to policyholders and income is received. Profitsare deferred and amortised over the life of policies, whereas losses are recognised immediately they arise. Services used todetermine profit recognition include the cost of expected claims, maintaining policies and investment management. Policyliabilities are generally determined as the present value of all future expected payments, expenses, taxes and profit margins
S T A T E M E N T O F A C C O U N T I N G P O L I C I E S

13
reduced by the present value of all future expected premiums, except in the case of some investment business where policyliabilities are determined as the accumulated benefits to policyholders.
Profits emerging under the MoS methodology can be categorised as follows:
(i) Planned margins of revenues over expenses.
At the time of writing a policy and at each balance date, best estimate assumptions are used to determine all expectedfuture payments and premiums. Where actual experience replicates best estimate assumptions, the expected profitmargins will be released to profit over the life of the policy.
(ii) The difference between actual and assumed experience.
Experience profits or losses are realised where actual experience differs from best estimate assumptions. Instancesgiving rise to experience profits or losses include variations in claims, expenses, mortality, discontinuance andinvestment returns. For example, an experience profit will emerge when the expenses of maintaining all in-forcebusiness in a period are lower than the best estimate assumption in respect of those expenses.
(iii) Changes to underlying assumptions.
Assumptions used for measuring policy liabilities are reviewed each period. Where the review leads to a change inassumption the change is deemed to have occurred from the end of the financial period.
The financial effect of changes to the assumptions underlying the measurement of policy liabilities made during thereporting period are recognised in the Statements of Financial Performance over the future reporting periods duringwhich services are provided to policyholders. However if, based on best estimate assumptions, written business for agroup of related products is expected to be unprofitable, the whole expected loss for that related product group isrecognised in the Statements of Financial Performance immediately. When loss making business becomes profitable,it is necessary to reverse previously recognised losses.
(iv) Investment earnings on assets in excess of policy liabilities.Statements of Financial Performance Profits are generated from investment assets which are in excess of thoserequired to meet policy liabilities. Investment earnings are directly influenced by market conditions and as such thiscomponent of MoS will vary from period to period.
Other LiabilitiesOther liabilities are recognised in the Statements of Financial Position at the present value of future cash outflows to beincurred as a result of the Groups’ obligations at balance date.
Income RecognitionPremium incomePremiums are separated into risk and savings components, in accordance with FRS-34. Only risk premiums are recognised inthe Statements of Financial Performance. Savings premiums, including term deposit bonds, are taken directly to the policyliability in the Statements of Financial Position.
Premiums with a regular due date are recognised when the premium becomes due and payable usually on a monthly basis. Theunearned portion of regular premiums payable six monthly or annually is deferred. Premiums with no due date are recognisedon a cash basis.
Investment incomeInterest income is recognised in the Statements of Financial Performance as it accrues. Distributions from unit trusts arerecognised in the Statements of Financial Performance when declared.
Investment income also includes realised and unrealised changes in the net market value of investments including subsidiaries.
Investment income from unit trusts is shown net of the external fund manager’s costs.
ExpensesClaims, surrenders and maturitiesClaims, surrenders and maturities are separated into risk and savings components. In accordance with FRS-34 only claimsarising from risk benefits are recognised in the Statements of Financial Performance. Surrenders of savings products and termdeposit bond maturities are taken directly from the policy liability in the Statements of Financial Position.
Death and all other claims are recognised when the liability to the policyholder under the policy contract has been established.Term deposit bond maturities are recognised on the policy maturity date. Surrenders are recognised when requested by thepolicy holder.
Commissions and Management ExpensesCommission and management expenses incorporate all other expenditure involved in running the subsidiary business,including costs of issuing new business, salaries and related costs and other management expenses which include, for example,office accommodation costs.
For the purposes of determining policy liabilities life insurance expenses are categorised into acquisition, maintenance orinvestment management expenses based on a detailed functional analysis of activities carried out by the subsidiary.
14 H E L L A B Y H O L D I N G S L I M I T E D
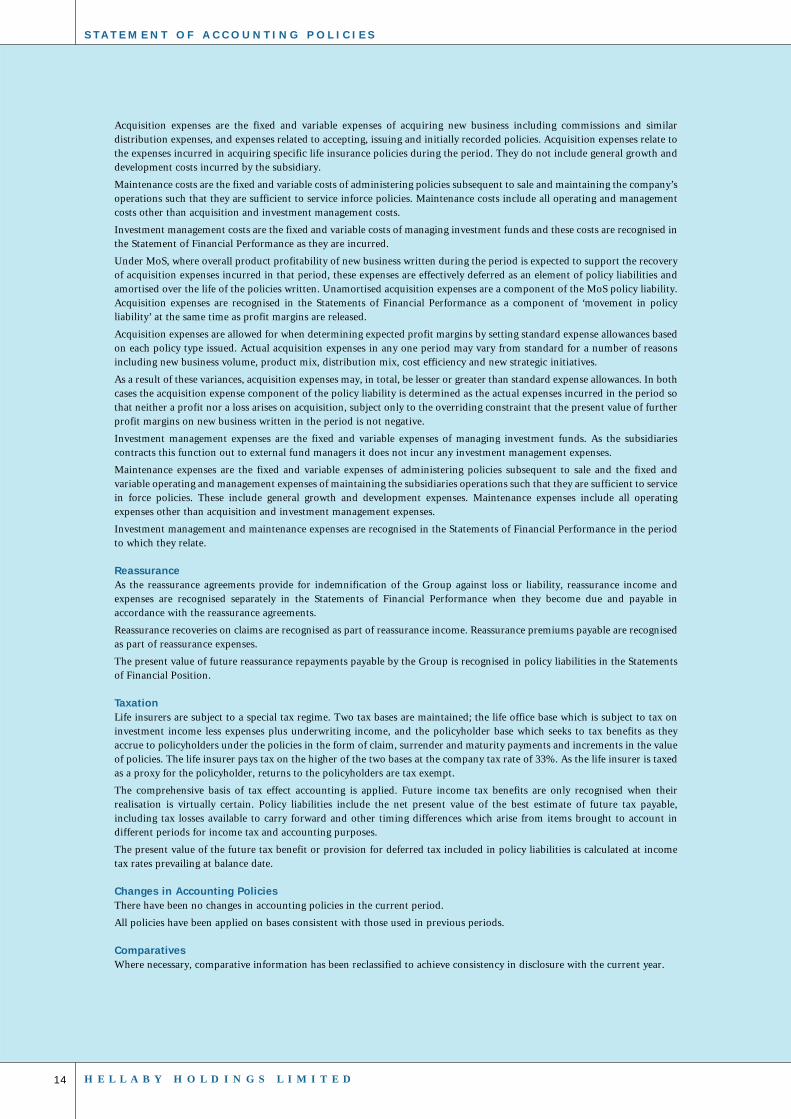
Acquisition expenses are the fixed and variable expenses of acquiring new business including commissions and similardistribution expenses, and expenses related to accepting, issuing and initially recorded policies. Acquisition expenses relate tothe expenses incurred in acquiring specific life insurance policies during the period. They do not include general growth anddevelopment costs incurred by the subsidiary.
Maintenance costs are the fixed and variable costs of administering policies subsequent to sale and maintaining the company’soperations such that they are sufficient to service inforce policies. Maintenance costs include all operating and managementcosts other than acquisition and investment management costs.
Investment management costs are the fixed and variable costs of managing investment funds and these costs are recognised inthe Statement of Financial Performance as they are incurred.
Under MoS, where overall product profitability of new business written during the period is expected to support the recoveryof acquisition expenses incurred in that period, these expenses are effectively deferred as an element of policy liabilities andamortised over the life of the policies written. Unamortised acquisition expenses are a component of the MoS policy liability.Acquisition expenses are recognised in the Statements of Financial Performance as a component of ‘movement in policyliability’ at the same time as profit margins are released.
Acquisition expenses are allowed for when determining expected profit margins by setting standard expense allowances basedon each policy type issued. Actual acquisition expenses in any one period may vary from standard for a number of reasonsincluding new business volume, product mix, distribution mix, cost efficiency and new strategic initiatives.
As a result of these variances, acquisition expenses may, in total, be lesser or greater than standard expense allowances. In bothcases the acquisition expense component of the policy liability is determined as the actual expenses incurred in the period sothat neither a profit nor a loss arises on acquisition, subject only to the overriding constraint that the present value of furtherprofit margins on new business written in the period is not negative.
Investment management expenses are the fixed and variable expenses of managing investment funds. As the subsidiariescontracts this function out to external fund managers it does not incur any investment management expenses.
Maintenance expenses are the fixed and variable expenses of administering policies subsequent to sale and the fixed andvariable operating and management expenses of maintaining the subsidiaries operations such that they are sufficient to servicein force policies. These include general growth and development expenses. Maintenance expenses include all operatingexpenses other than acquisition and investment management expenses.
Investment management and maintenance expenses are recognised in the Statements of Financial Performance in the periodto which they relate.
ReassuranceAs the reassurance agreements provide for indemnification of the Group against loss or liability, reassurance income andexpenses are recognised separately in the Statements of Financial Performance when they become due and payable inaccordance with the reassurance agreements.
Reassurance recoveries on claims are recognised as part of reassurance income. Reassurance premiums payable are recognisedas part of reassurance expenses.
The present value of future reassurance repayments payable by the Group is recognised in policy liabilities in the Statementsof Financial Position.
TaxationLife insurers are subject to a special tax regime. Two tax bases are maintained; the life office base which is subject to tax oninvestment income less expenses plus underwriting income, and the policyholder base which seeks to tax benefits as theyaccrue to policyholders under the policies in the form of claim, surrender and maturity payments and increments in the valueof policies. The life insurer pays tax on the higher of the two bases at the company tax rate of 33%. As the life insurer is taxedas a proxy for the policyholder, returns to the policyholders are tax exempt.
The comprehensive basis of tax effect accounting is applied. Future income tax benefits are only recognised when theirrealisation is virtually certain. Policy liabilities include the net present value of the best estimate of future tax payable,including tax losses available to carry forward and other timing differences which arise from items brought to account indifferent periods for income tax and accounting purposes.
The present value of the future tax benefit or provision for deferred tax included in policy liabilities is calculated at incometax rates prevailing at balance date.
Changes in Accounting PoliciesThere have been no changes in accounting policies in the current period.
All policies have been applied on bases consistent with those used in previous periods.
ComparativesWhere necessary, comparative information has been reclassified to achieve consistency in disclosure with the current year.
S T A T E M E N T O F A C C O U N T I N G P O L I C I E S

15
Group Parent
2002 2001 2002 2001
Notes $000 $000 $000 $000
Sales Revenue 331,152 375,603 - -
Rental Revenue 130 321 - -
Income from Life Insurance Operations 9,782 12
Total Revenue 341,064 375,936 - -
Operating Surplus before Taxation 1 18,939 14,009 15,836 13,890
Taxation 2 (3,331) (542) (1,601) (623)
Operating Surplus after Taxation 15,608 13,467 14,235 13,267
Minority interest in surpluses of subsidiaries (1,373) (200) - -
Share of retained surpluses of associated
companies 10 (120) (388) (120) (388)
Net Surplus attributable to Shareholders of Parent Company 14,115 12,879 14,115 12,879
Comprising
Operating Surplus from continuing activities 13,398 10,139 14,115 12,879
Operating Surplus from discontinued activities 717 2,740 - -
14,115 12,879 14,115 12,879
Group Parent
2002 2001 2002 2001
Notes $000 $000 $000 $000
Equity at beginning of year 92,038 79,998 75,973 66,886
Surplus and RevaluationsNet surplus for the year 14,115 12,879 14,115 12,879
Total recognised revenues and expenses 14,115 12,879 14,115 12,879
Other MovementsMovement in minority interests (11,160) 2,953 - -
Distributions to shareholders 4 (7,943) (3,478) (7,943) (3,478)
Repurchase of shares 3 (342) (314) (342) (314)
Equity at end of the year 86,708 92,038 81,803 75,973
S T A T E M E N T S O F F I N A N C I A L P E R F O R M A N C EFor the year ended 30 June 2002
S T A T E M E N T S O F M O V E M E N T S O F E Q U I T YFor the year ended 30 June 2002
T h e a c c o m p a n y i n g n o t e s f o r m p a r t o f t h e s e f i n a n c i a l s t a t e m e n t s .

16 H E L L A B Y H O L D I N G S L I M I T E D
Group Parent
2002 2001 2002 2001
Notes $000 $000 $000 $000
Share Capital 3 17,062 17,404 17,062 17,404
Retained Earnings 4 64,741 58,569 64,741 58,569
Shareholders' Equity 81,803 75,973 81,803 75,973
Minority Interest 4,905 16,065 - -
Total Equity 86,708 92,038 81,803 75,973
Non-Current Liabilities
Term Liabilities 5 20,850 25,725 14,500 25,585
Policy Liabilities 20 841 - - -
Total Non-Current Liabilities 21,691 25,725 14,500 25,585
Current Liabilities 6 42,417 68,785 12,225 10,520
Total Liabilities 64,108 94,510 26,725 36,105
Total Liabilities and Shareholders' Equity 150,816 186,548 108,528 112,078
Group Parent
2002 2001 2002 2001
Notes $000 $000 $000 $000
Fixed Assets 7 27,180 33,937 244 276
Intangible Assets 8 3,968 2,765 1,856 1,925
Excess of net market value over net assets 5,295 500 - -
of life insurance subsidiaries
Future Tax Benefits 9 3,992 3,722 3,992 3,350
Investments 10 12,242 7,349 65,572 64,980
Total Non-Current Assets 52,677 48,273 71,664 70,531
Current Assets 11 98,139 138,275 36,864 41,547
Total Assets 150,816 186,548 108,528 112,078
The Board of Directors of Hellaby Holdings Limited authorised these financial statements for issue on 9 September 2002.
On behalf of the Board
S T A T E M E N T S O F F I N A N C I A L P O S I T I O NAs at 30 June 2002
Director Director
T h e a c c o m p a n y i n g n o t e s f o r m p a r t o f t h e s e f i n a n c i a l s t a t e m e n t s .

17
Group Parent2002 2001 2002 2001
Notes $000 $000 $000 $000
Cash from OperationsCash was provided from:Receipts from customers 332,124 379,639 - -Receipts relating to life insurance activities 7,294 27 - -Interest received 193 527 3,307 4,104 Dividends received 363 167 3,312 8,370 Other receipts 2,105 1,584 1,282 1,658 Movement in goods and services tax - 519 9 18
Cash was applied to:Payments to suppliers and employees (297,187) (356,523) (3,162) (3,487)Payments relating to life insurance activities (6,862) (946) - -Interest paid (3,137) (6,448) (1,331) (2,492)Taxation paid (3,815) (1,644) (2,736) (1,400)Movement in goods and services tax (530) - - -
Net Cash from Operating Activities 12 30,548 16,902 681 6,771
Cash from Investing ActivitiesCash was provided from: Proceeds from sale of property, plant and equipment 1,602 1,292 26 - Proceeds from sale of shares in subsidiary 8,070 9,000 8,070 9,000 Proceeds from sale of investments 2,037 1,203 1,577 1,203
Cash was applied to: Purchase of property, plant and equipment (9,864) (6,484) (6) (9)Purchase of investments (4,640) (2,689) (4,932) (6,607)Overdraft/cash acquired/disposed with acquisition/disposal of subsidiary 5,740 (352) - -
Net Cash from Investing Activities 2,945 1,970 4,735 3,587
Cash from Financing ActivitiesCash was provided from: New debt 5,935 1,144 - 620 Minority shareholders 887 1,530 - -Advances from subsidiaries - - 8,919 8,762
Cash was applied to: Decrease in borrowings (15,530) (14,908) (12,000) (11,000)Repurchase of shares (342) (314) (342) (314)Dividends paid - Shareholders (7,943) (6,968) (7,943) (6,968)
- Minority Interests (1,089) (798) - -
Net Cash from Financing Activities (18,082) (20,314) (11,366) (8,900)
Net Movement in Cash 15,411 (1,442) (5,950) 1,458 Opening Cash Balance (13,948) (12,693) 2,778 1,320 Exchange Rate Fluctuation on Opening Balance - 187 - -
Closing Cash Balance 1,463 (13,948) (3,172) 2,778
Consisting of:Cash and Deposits 11 5,064 4,291 1 2,778 Bank Overdraft 6 (3,601) (18,239) (3,173) -
Closing Cash Balance 1,463 (13,948) (3,172) 2,778
S T A T E M E N T S O F C A S H F L O W SFor the year ended 30 June 2002
T h e a c c o m p a n y i n g n o t e s f o r m p a r t o f t h e s e f i n a n c i a l s t a t e m e n t s .
18 H E L L A B Y H O L D I N G S L I M I T E D
N O T E S T O T H E F I N A N C I A L S T A T E M E N T SFor the year ended 30 June 2002
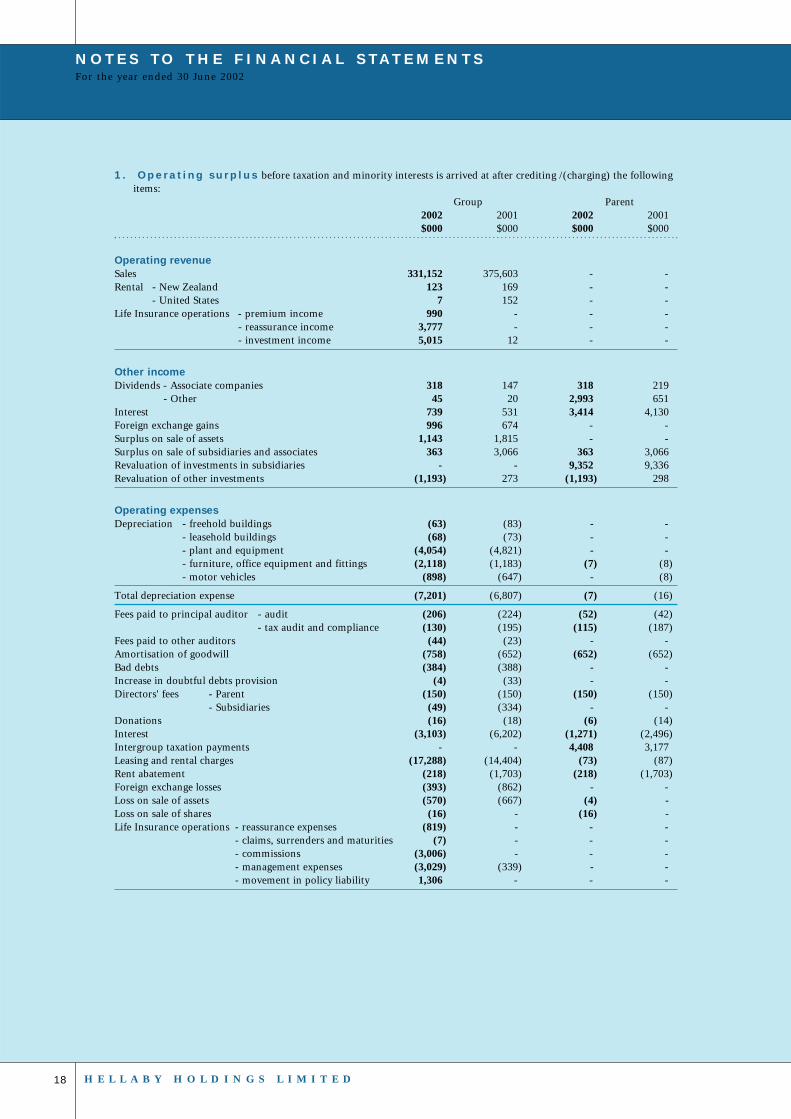
1 . O p e r a t i n g s u r p l u s before taxation and minority interests is arrived at after crediting /(charging) the followingitems:
Group Parent2002 2001 2002 2001$000 $000 $000 $000
Operating revenueSales 331,152 375,603 - - Rental - New Zealand 123 169 - -
- United States 7 152 - - Life Insurance operations - premium income 990 - - -
- reassurance income 3,777 - - -- investment income 5,015 12 - -
Other incomeDividends - Associate companies 318 147 318 219
- Other 45 20 2,993 651 Interest 739 531 3,414 4,130 Foreign exchange gains 996 674 - -Surplus on sale of assets 1,143 1,815 - -Surplus on sale of subsidiaries and associates 363 3,066 363 3,066 Revaluation of investments in subsidiaries - - 9,352 9,336 Revaluation of other investments (1,193) 273 (1,193) 298
Operating expensesDepreciation - freehold buildings (63) (83) - -
- leasehold buildings (68) (73) - -- plant and equipment (4,054) (4,821) - -- furniture, office equipment and fittings (2,118) (1,183) (7) (8)- motor vehicles (898) (647) - (8)
Total depreciation expense (7,201) (6,807) (7) (16)
Fees paid to principal auditor - audit (206) (224) (52) (42)- tax audit and compliance (130) (195) (115) (187)
Fees paid to other auditors (44) (23) - -Amortisation of goodwill (758) (652) (652) (652)Bad debts (384) (388) - -Increase in doubtful debts provision (4) (33) - -Directors' fees - Parent (150) (150) (150) (150)
- Subsidiaries (49) (334) - -Donations (16) (18) (6) (14)Interest (3,103) (6,202) (1,271) (2,496)Intergroup taxation payments - - 4,408 3,177 Leasing and rental charges (17,288) (14,404) (73) (87)Rent abatement (218) (1,703) (218) (1,703)Foreign exchange losses (393) (862) - -Loss on sale of assets (570) (667) (4) -Loss on sale of shares (16) - (16) -Life Insurance operations - reassurance expenses (819) - - -
- claims, surrenders and maturities (7) - - -- commissions (3,006) - - -- management expenses (3,029) (339) - -- movement in policy liability 1,306 - - -
19
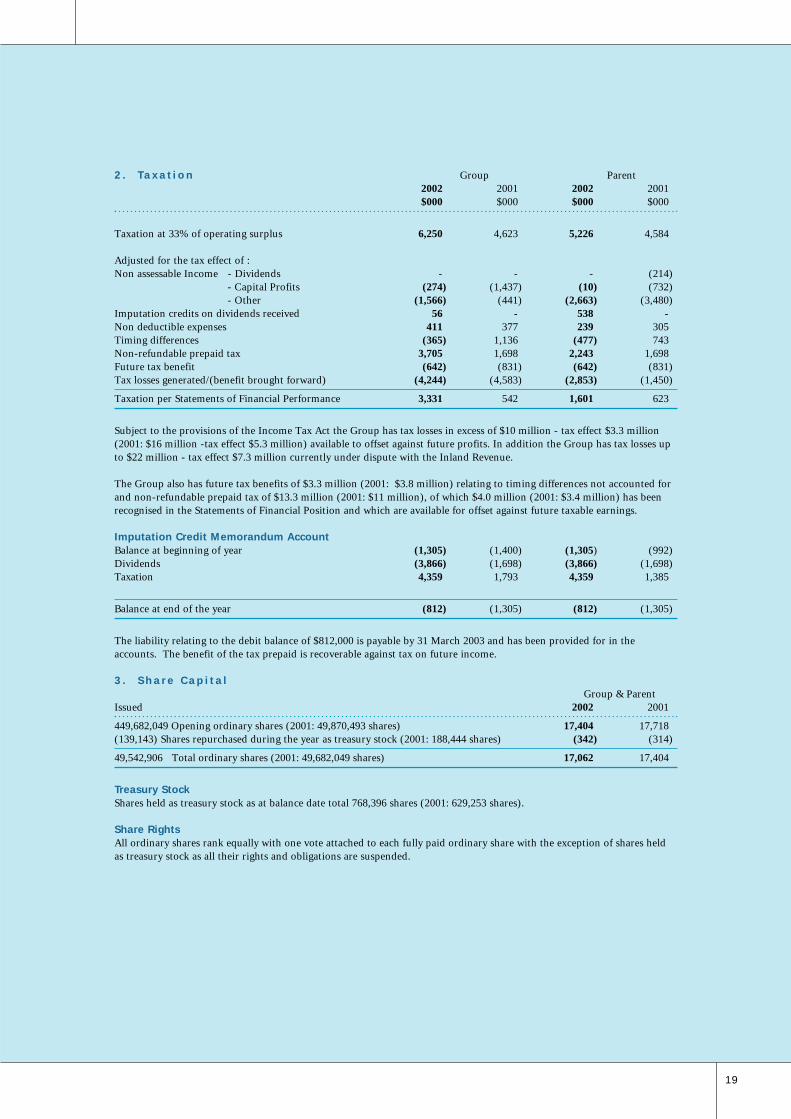
2 . Ta x a t i o n Group Parent2002 2001 2002 2001$000 $000 $000 $000
Taxation at 33% of operating surplus 6,250 4,623 5,226 4,584
Adjusted for the tax effect of :Non assessable Income - Dividends - - - (214)
- Capital Profits (274) (1,437) (10) (732)- Other (1,566) (441) (2,663) (3,480)
Imputation credits on dividends received 56 - 538 -Non deductible expenses 411 377 239 305 Timing differences (365) 1,136 (477) 743 Non-refundable prepaid tax 3,705 1,698 2,243 1,698 Future tax benefit (642) (831) (642) (831)Tax losses generated/(benefit brought forward) (4,244) (4,583) (2,853) (1,450)
Taxation per Statements of Financial Performance 3,331 542 1,601 623
Subject to the provisions of the Income Tax Act the Group has tax losses in excess of $10 million - tax effect $3.3 million(2001: $16 million -tax effect $5.3 million) available to offset against future profits. In addition the Group has tax losses upto $22 million - tax effect $7.3 million currently under dispute with the Inland Revenue.
The Group also has future tax benefits of $3.3 million (2001: $3.8 million) relating to timing differences not accounted forand non-refundable prepaid tax of $13.3 million (2001: $11 million), of which $4.0 million (2001: $3.4 million) has beenrecognised in the Statements of Financial Position and which are available for offset against future taxable earnings.
Imputation Credit Memorandum AccountBalance at beginning of year (1,305) (1,400) (1,305) (992)Dividends (3,866) (1,698) (3,866) (1,698)Taxation 4,359 1,793 4,359 1,385
Balance at end of the year (812) (1,305) (812) (1,305)
The liability relating to the debit balance of $812,000 is payable by 31 March 2003 and has been provided for in theaccounts. The benefit of the tax prepaid is recoverable against tax on future income.
3 . S h a r e C a p i t a lGroup & Parent
Issued 2002 2001
449,682,049 Opening ordinary shares (2001: 49,870,493 shares) 17,404 17,718 (139,143) Shares repurchased during the year as treasury stock (2001: 188,444 shares) (342) (314)
49,542,906 Total ordinary shares (2001: 49,682,049 shares) 17,062 17,404
Treasury StockShares held as treasury stock as at balance date total 768,396 shares (2001: 629,253 shares).
Share RightsAll ordinary shares rank equally with one vote attached to each fully paid ordinary share with the exception of shares heldas treasury stock as all their rights and obligations are suspended.

20 H E L L A B Y H O L D I N G S L I M I T E D
4 . R e t a i n e d E a r n i n g s a n d D i v i d e n d sGroup Parent
2002 2001 2002 2001$000 $000 $000 $000
Retained EarningsBalance at beginning of year 58,569 49,168 58,569 49,168
Net Surplus attributable to Shareholders of Parent Company 14,115 12,879 14,115 12,879 Dividends (7,943) (3,478) (7,943) (3,478)
Balance at end of year 64,741 58,569 64,741 58,569
Group Companies 64,240 58,031 64,240 58,031 Associated Companies 501 538 501 538
64,741 58,569 64,741 58,569
DividendsFinal dividend - prior year (3,974) - (3,974) -Interim dividend - current year (3,969) (3,478) (3,969) (3,478)
(7,943) (3,478) (7,943) (3,478)Supplementary dividends to foreign investors (36) (15) (36) (15)Foreign investor tax credits 36 15 36 15
Total Dividends (7,943) (3,478) (7,943) (3,478)
The dividends are fully imputed.
5 . Te r m L i a b i l i t i e sGroup Parent
Rates 2002 2001 2002 2001% $000 $000 $000 $000
BorrowingsRepayableBetween 1 and 2 years - Secured 6.07 17,850 22,000 11,500 22,000 Between 2 and 3 years - Secured - 140 - -Between 3 and 4 years - Secured - - - -Between 4 and 5 years - Secured - - - -Over 5 years - Secured - - - -
17,850 22,140 11,500 22,000
The interest rate on borrowings is floating.
Provision for Rent AbatementBalance at beginning of year 3,585 2,755 3,585 2,755 Plus transfer from revenue 218 1,703 218 1,703 Less payments (803) (873) (803) (873)
Balance at end of year 3,000 3,585 3,000 3,585
Total Term Liabilities 20,850 25,725 14,500 25,585
The rental payable by Kirkcaldie & Stains has been underwritten to the extent of the difference between rental payableunder the terms of the lease and the higher of market rental or 5% of turnover on the basis that the underwritten paymentby Hellaby Holdings will not be higher than the previous year. The underwriting payments are reflected in the provision forrent abatement on a discounted basis.
N O T E S T O T H E F I N A N C I A L S T A T E M E N T S

21
6 . C u r r e n t L i a b i l i t i e s Group Parent2002 2001 2002 2001$000 $000 $000 $000
Current portion of term liabilities - 40 - -Borrowings 7,405 12,719 - 1,500 Bank overdraft 3,601 18,239 3,173 -Trade creditors and accruals 25,756 32,751 157 1,275 Employee entitlements 4,408 3,520 1,450 900 Provision for taxation 1,245 1,324 812 1,305 Amounts due to associate companies 2 192 2 192 Amounts due to subsidiary companies - - 6,631 5,348
Total Current Liabilities 42,417 68,785 12,225 10,520
Secured 11,006 28,998 3,173 -Unsecured 31,411 39,787 9,052 10,520
Total Current Liabilities 42,417 68,785 12,225 10,520
Security for secured current and term liabilities is provided in the form of:- Charge over specific assets- Mortgage on properties- Floating debenture over assets.The weighted average effective interest rates on bank borrowings was 6.5% (2001: 6.4%)
7. F i x e d A s s e t s Group Parent2002 2001 2002 2001$000 $000 $000 $000
CostLand - Freehold 866 1,220 225 225 Buildings - Freehold 2,039 5,570 - -Buildings- Leasehold 709 618 - -
3,614 7,408 225 225
Plant and Equipment 38,933 30,404 - -Furniture, Office Equipment and Fittings 18,031 30,571 191 149 Motor Vehicles 5,764 5,318 48 89
Total cost 66,342 73,701 464 463
Accumulated DepreciationBuildings - Freehold 969 1,364 - -Buildings - Leasehold 539 471 - -Plant and Equipment 23,760 10,261 - -Furniture, Office Equipment and Fittings 10,788 25,010 172 123 Motor Vehicles 3,106 2,658 48 64
Total accumulated depreciation 39,162 39,764 220 187
Net Book ValueLand - Freehold 866 1,220 225 225 Buildings - Freehold 1,070 4,206 - -Buildings - Leasehold 170 147 - -Plant and Equipment 15,173 20,143 - -Furniture, Office Equipment and Fittings 7,243 5,561 19 26 Motor Vehicles 2,658 2,660 0 25
Total net book value of Fixed Assets 27,180 33,937 244 276
22 H E L L A B Y H O L D I N G S L I M I T E D
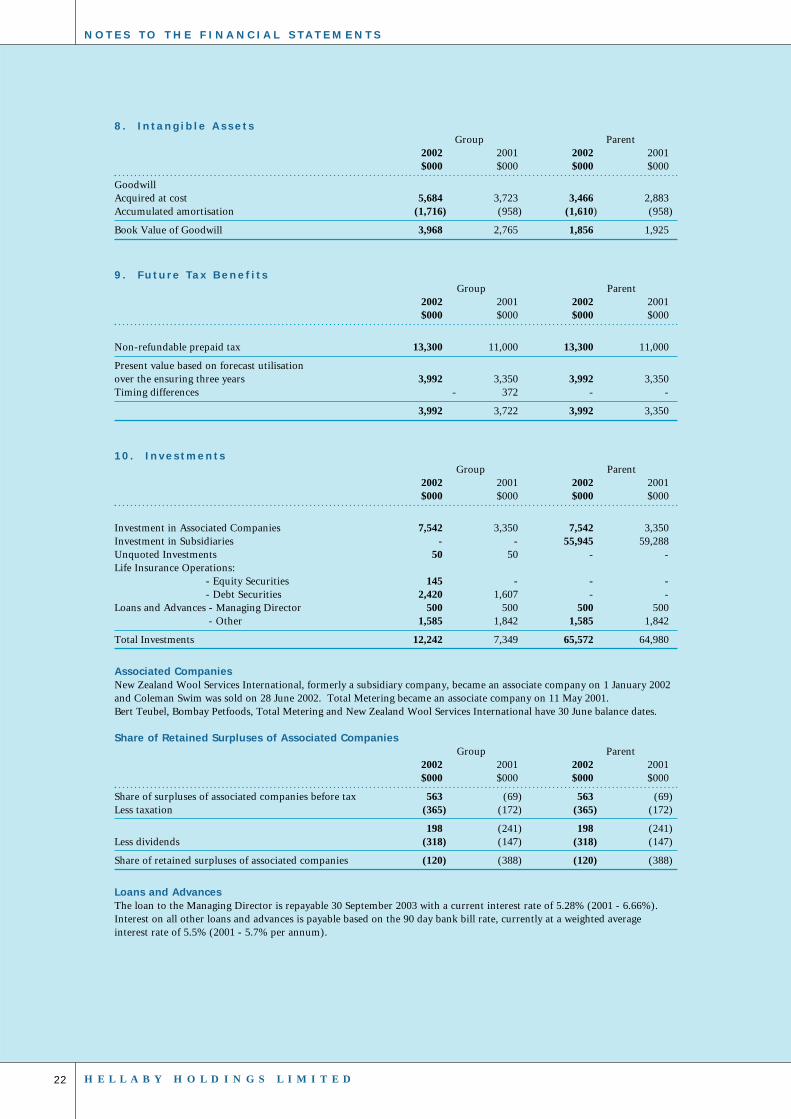
8 . I n t a n g i b l e A s s e t sGroup Parent
2002 2001 2002 2001$000 $000 $000 $000
GoodwillAcquired at cost 5,684 3,723 3,466 2,883 Accumulated amortisation (1,716) (958) (1,610) (958)
Book Value of Goodwill 3,968 2,765 1,856 1,925
9 . F u t u r e Ta x B e n e f i t sGroup Parent
2002 2001 2002 2001$000 $000 $000 $000
Non-refundable prepaid tax 13,300 11,000 13,300 11,000
Present value based on forecast utilisation over the ensuring three years 3,992 3,350 3,992 3,350 Timing differences - 372 - -
3,992 3,722 3,992 3,350
10 . I n v e s t m e n t sGroup Parent
2002 2001 2002 2001$000 $000 $000 $000
Investment in Associated Companies 7,542 3,350 7,542 3,350 Investment in Subsidiaries - - 55,945 59,288 Unquoted Investments 50 50 - -Life Insurance Operations:
- Equity Securities 145 - - -- Debt Securities 2,420 1,607 - -
Loans and Advances - Managing Director 500 500 500 500 - Other 1,585 1,842 1,585 1,842
Total Investments 12,242 7,349 65,572 64,980
Associated CompaniesNew Zealand Wool Services International, formerly a subsidiary company, became an associate company on 1 January 2002and Coleman Swim was sold on 28 June 2002. Total Metering became an associate company on 11 May 2001.Bert Teubel, Bombay Petfoods, Total Metering and New Zealand Wool Services International have 30 June balance dates.
Share of Retained Surpluses of Associated CompaniesGroup Parent
2002 2001 2002 2001$000 $000 $000 $000
Share of surpluses of associated companies before tax 563 (69) 563 (69)Less taxation (365) (172) (365) (172)
198 (241) 198 (241)Less dividends (318) (147) (318) (147)
Share of retained surpluses of associated companies (120) (388) (120) (388)
Loans and AdvancesThe loan to the Managing Director is repayable 30 September 2003 with a current interest rate of 5.28% (2001 - 6.66%).Interest on all other loans and advances is payable based on the 90 day bank bill rate, currently at a weighted averageinterest rate of 5.5% (2001 - 5.7% per annum).
N O T E S T O T H E F I N A N C I A L S T A T E M E N T S

23
10 . I n v e s t m e n t s ( c o n t i n u e d )Debt Securities - maturity analysis Group Parent
2002 2001 2002 2001$000 $000 $000 $000
Within 1 year 153 - - -Within 1 & 2 years 665 - - -Within 2 & 3 years - - - - Within 3 & 4 years - - - -Within 4 & 5 years 1,602 - - -Over 5 years - 1,607 - -
2,420 1,607 - -
The market value of debt securities approximates the book value shown.
Acquisition and Disposition of SubsidiariesSubsidiaries acquired/disposed by Hellaby Holdings during the past two years are listed as follows:
Date Subsidiary Transaction
31 May 2002 Fowlerex Technologies Taylors Manufacturing acquired 60%1 May 2002 Diesel Distributors acquired 100% interest31 Dec 2002 NZ Wool Services sold 39.2% interest, reducing investment to 20%30 June 2001 Capital Valves sold 50% interest30 June 2001 Patton Refrigeration sold 100% interest15 May 2001 Club Life Holdings acquired 72.7% interest, since diluted to 69%22 Nov 2000 Specialty Brands 33.5% interest increased to 82.9%
The movements in assets and liabilities resulting from these transactions are as follows:
Disposition Acquisition Disposition Acquisition2002 2002 2001 2001$000 $000 $000 $000
ConsiderationCash on settlement 4,440 3,557 9,000 5,406 Investment in Associate Companies 5,437 - - 1,494 Receivable 6,116 - 3,632 - (Gain)on disposal/(premium)/discount on acquisition 91 - (2,348) (202)
16,084 3,557 10,284 6,698
Assets and Liabilities Acquired/DisposedCash and Deposits 88 - 315 5,771 Fixed Assets 7,941 84 364 5,405Investments 373 - - 5 Other Assets - - 200 - Receivables 3,874 657 3,199 609 Inventories 25,025 1,339 8,952 9,674 Intangible Assets - 1,795 - - Payables (3,450) (268) (2,186) (8,813)Term Liabilities - - - (3,483)Short Term Liabilities - - - (125)Borrowings (5,828) - (258) (401)Minority Interest (11,939) (50) (302) (2,069)
16,084 3,557 10,284 6,698
Discontinued ActivitiesGroup Parent
2002 2001 2002 2001$000 $000 $000 $000
Operating revenue from discontinued activities 68,238 18,531 - -

24 H E L L A B Y H O L D I N G S L I M I T E D
11 . C u r r e n t A s s e t sGroup Parent
2002 2001 2002 2001$000 $000 $000 $000
Inventories - Raw Materials 2,190 8,316 - -- Work in Progress 1,102 1,336 - -- Finished Goods 52,691 85,370 - -
Total Inventory 55,983 95,022 - - Cash and deposits 5,064 4,291 1 2,778 Loans and advances 6,648 141 6,648 141 Amount due from subsidiaries - - 30,093 33,337 Amount due from associates 103 204 103 204 Amount due from reassurers 249 - - -Trade debtors and prepayments 30,092 38,617 19 5,087
Total Current Assets 98,139 138,275 36,864 41,547
12 . R e c o n c i l i a t i o n o f O p e r a t i n g S u r p l u s w i t h C a s h F l o w s
Group Parent2002 2001 2002 2001$000 $000 $000 $000
Operating Surplus before Taxation 18,939 14,009 15,836 13,890
Non Cash Items:Depreciation 7,201 6,807 7 16 Amoritisation of Goodwill 758 652 652 652 Unrealised Foreign Exchange Gains (25) (346) - -
Other:Taxation (3,331) (542) (2,094) (623)
Classified as Investing:Gain on Sale of Assets (1,143) (1,815) - -Loss on Sale of Fixed Assets 570 667 4 -Gain on Sale of Shares (363) (3,066) (363) (3,066)Loss on Sale of Shares 16 - 16 -Revaluation of investments in subsidiaries and associates 1,193 (273) (8,159) (9,634)Excess of market value over net assets of life insurance subsidiary (4,795) - - -
Movement in Working Capital:Trade Creditors (2,951) (3,299) (13) 1,249 Inventory 15,353 2,912 - - Receivables (874) 1,196 (865) (342) Intercompany Accounts - - (4,340) 4,629
Net Cash from Operating Activities 30,548 16,902 681 6,771
13 . C a p i t a l C o m m i t m e n t sGroup Parent
2002 2001 2002 2001$000 $000 $000 $000
Commitments at the end of the year not provided for in the financial statements 180 567 - -
N O T E S T O T H E F I N A N C I A L S T A T E M E N T S

25
14 . O p e r a t i n g L e a s e C o m m i t m e n t sGroup Parent
2002 2001 2002 2001$000 $000 $000 $000
Gross commitments under non-cancellable operating leases for the Group are due:Within 1 year 20,891 20,047 513 373 Between 1 & 2 years 17,953 16,166 513 513 Between 2 & 5 years 24,970 26,009 1,053 1,504 Over 5 years 4,426 4,141 - 63
68,240 66,363 2,079 2,453
The commitments relate to head and subtenancy agreements for rental accommodation and will be partially offset byreceivables from subtenants.
15 . C o n t i n g e n t L i a b i l i t i e sGroup Parent
2002 2001 2002 2001$000 $000 $000 $000
Contingent liabilities under contracts, guarantees and otheragreements arising in the ordinary course of business on whichno loss is anticipated are as follows:Guarantees in respect of performance of contracts 33,737 28,588 - 1,200 Guarantees in respect of subsidiary company borrowings - - 7,670 879Letters of Credit 3,025 3,248 - - Bills Endorsed and Sold - 1,206 - -
36,762 33,042 7,670 2,079
16 . R e l a t e d P a r t y Tr a n s a c t i o n s
Intra-Group TransactionsDuring the current and previous financial years the Parent company advanced and repaid loans to other entities in theGroup. Amounts due to and from subsidiaries as at balance date are shown in Notes 6 and 11.
Demi HoldingsDuring the year Mr A Borren's private company, Demi Holdings, provided accounting and management support to certainsubsidiary and associate companies for which Demi Holdings was reimbursed $38,000 (2001: $40,000) for actual costsincurred.On 30 June 2002 the 49% interest in Coleman Swim was sold to Demi Holdings for $0.4 million, incurring a small loss onsale.On 1 May 2002 Diesel Distributors was acquired from parties associated with Mr A Borren and the CEO of subsidiary Brake& Transmission, Mr G Horne. The acquisition cost of Diesel Distributors was $3.3 million.
LoansDetails of a loan outstanding to Mr D Houldsworth, Managing Director are shown in Note 10.
17. O p e r a t i n g C o m p a n i e sThe operating subsidiaries of the Company are recorded in the Directory. All subsidiaries have a balance date of 30 June.
26 H E L L A B Y H O L D I N G S L I M I T E D
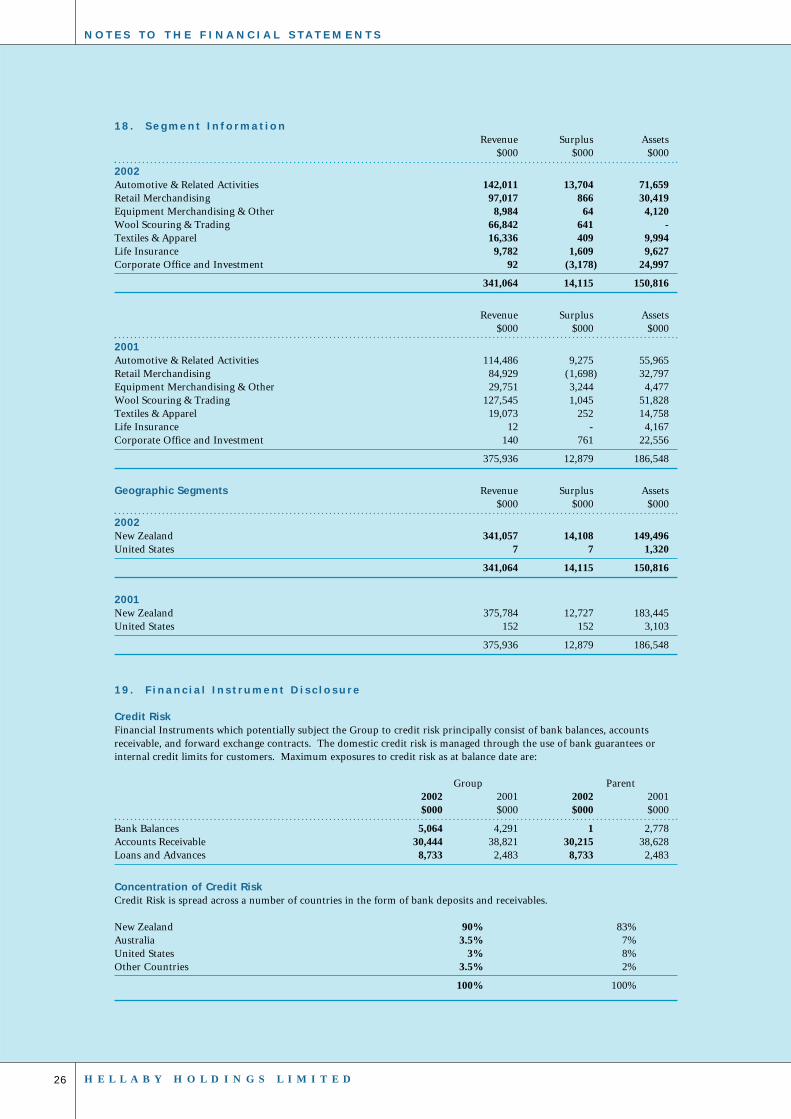
18 . S e g m e n t I n f o r m a t i o nRevenue Surplus Assets
$000 $000 $000
2002Automotive & Related Activities 142,011 13,704 71,659Retail Merchandising 97,017 866 30,419Equipment Merchandising & Other 8,984 64 4,120Wool Scouring & Trading 66,842 641 -Textiles & Apparel 16,336 409 9,994 Life Insurance 9,782 1,609 9,627 Corporate Office and Investment 92 (3,178) 24,997
341,064 14,115 150,816
Revenue Surplus Assets$000 $000 $000
2001Automotive & Related Activities 114,486 9,275 55,965 Retail Merchandising 84,929 (1,698) 32,797 Equipment Merchandising & Other 29,751 3,244 4,477 Wool Scouring & Trading 127,545 1,045 51,828 Textiles & Apparel 19,073 252 14,758 Life Insurance 12 - 4,167 Corporate Office and Investment 140 761 22,556
375,936 12,879 186,548
Geographic Segments Revenue Surplus Assets$000 $000 $000
2002New Zealand 341,057 14,108 149,496United States 7 7 1,320
341,064 14,115 150,816
2001New Zealand 375,784 12,727 183,445 United States 152 152 3,103
375,936 12,879 186,548
19 . F i n a n c i a l I n s t r u m e n t D i s c l o s u r e
Credit RiskFinancial Instruments which potentially subject the Group to credit risk principally consist of bank balances, accountsreceivable, and forward exchange contracts. The domestic credit risk is managed through the use of bank guarantees orinternal credit limits for customers. Maximum exposures to credit risk as at balance date are:
Group Parent2002 2001 2002 2001$000 $000 $000 $000
Bank Balances 5,064 4,291 1 2,778 Accounts Receivable 30,444 38,821 30,215 38,628 Loans and Advances 8,733 2,483 8,733 2,483
Concentration of Credit RiskCredit Risk is spread across a number of countries in the form of bank deposits and receivables.
New Zealand 90% 83%Australia 3.5% 7%United States 3% 8%Other Countries 3.5% 2%
100% 100%
N O T E S T O T H E F I N A N C I A L S T A T E M E N T S
27
Currency RiskCurrency risk is the risk of loss to the Group arising from changes in exchange rates. Foreign currency exposures and risksarise as the Group invests offshore; the investments being denominated in foreign currencies.Foreign currency denominated equity and debt securities amount to 1% (2001: 0%) of total equity and debt securities. Themarket value of these securities is therefore affected by movements in the New Zealand dollar relative to the currency inwhich the securities are denominated.
Foreign Exchange ContractsAt balance date the Group had entered into foreign exchange contracts maturing during 2002 through to 2003 to sell theequivalent of NZ $26.5 million (2001: NZ $48.7 million) and to buy the equivalent of NZ $nil (2001: NZ $2.5 million). Thecarrying value of these contracts represents their fair value.
Interest Rate RiskThe Group has long and short term debt facilities, the interest rates for which are shown in Notes 5 and 6. The weightedaverage yield at 30 June 2002 on debt securities held by the Life Insurance subsidiary is 6.46% (2001: 6.62%). The maturityanalysis of the Life Insurance subsidiary's debt securities is disclosed in Note 10.
Credit FacilitiesThe Group has credit facilities of NZ $61.6 million (2001: $87.0 million). Outstanding borrowings at 30 June 2002 were NZ$28.6 million (2001: $53.0 million).
Fair ValuesThere are no material differences between the fair value and carrying value of assets and liabilities.
2 0 . L i f e I n s u r a n c e D i s c l o s u r e s
(i) Disaggregated InformationFRS 34 requires the disclosure of information between amounts relating to investment linked business and non-investmentlinked business for categories shown below. As there are no legal requirements to maintain separate life insurance fundsand the life insurance subsidiary does not maintain records that provide all of the information required by FRS 34.Accordingly determination of the disaggregated information presented below requires the use of estimates.
Investment Linked Non-Investment LinkedPolicies Policies Total$000 $000 $000
Investment assets 1,307 4,299 5,606 Other assets 24 6,851 6,875Liabilities other than policy liabilities 65 445 510 Policy liabilities (2) 843 841 Retained profits attributable to subsidiary shareholders - 3,050 3,050Premium revenue (inclusive of savings components) 2,584 873 3,457Investment revenue 22 4,993 5,015Claims expense (inclusive of savings components) (288) (40) (328)Commission and management expenses (6,017) (18) (6,035)Investment revenues allocated to policyholders (22) (15) (37)Surplus/(Deficit) before taxation (735) 4,960 4,225 Surplus/(Deficit) after taxation (735) 4,960 4,225
No comparative figures are shown for 2001 as the life insurance subsidiary had not commenced business as a life insurer atthat date.
(ii) Life Insurance Subsidiary Surplus after Taxation2002 2001$000 $000
Life insurance surplus after taxation arose from:
Planned margins of revenues over expenses 12 -Difference between actual and assumed experience (750) -Effect of changes to underlying assumptions - -Expenses incurred prior to the commencement of trading - (1,178)Investment earnings on assets in excess of policy liabilities 4,963 12
4,225 (1,166)
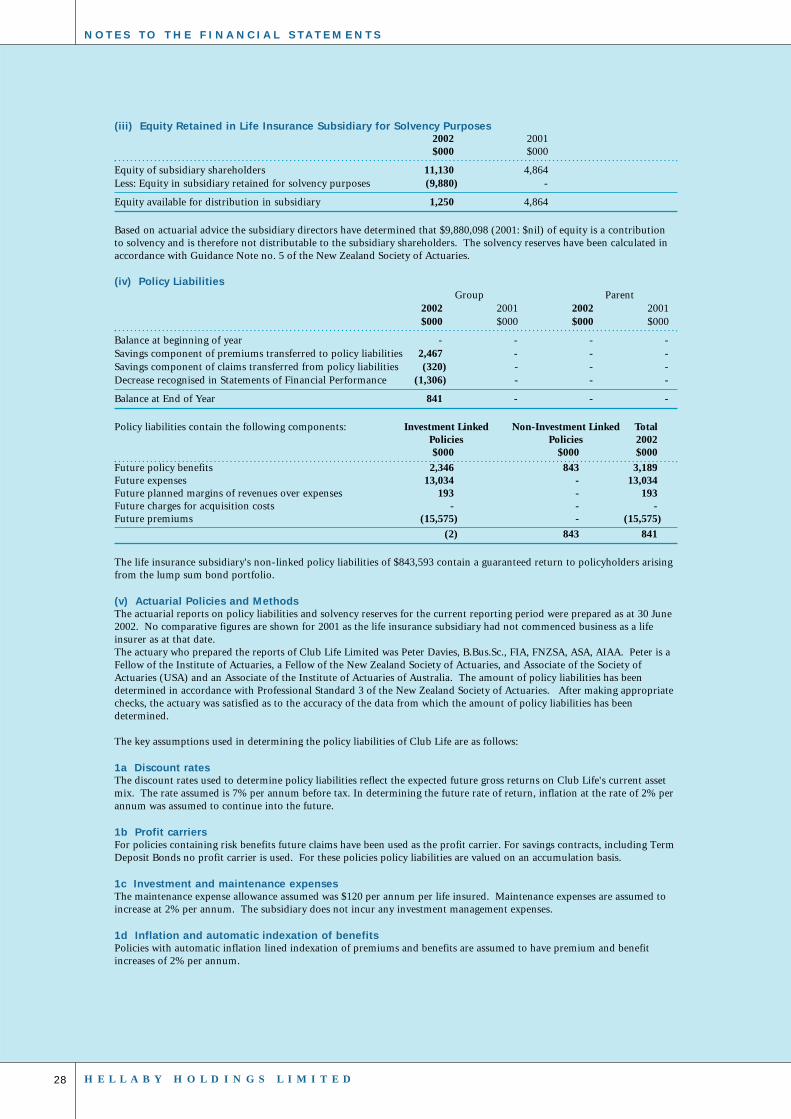
28 H E L L A B Y H O L D I N G S L I M I T E D
(iii) Equity Retained in Life Insurance Subsidiary for Solvency Purposes2002 2001$000 $000
Equity of subsidiary shareholders 11,130 4,864 Less: Equity in subsidiary retained for solvency purposes (9,880) -
Equity available for distribution in subsidiary 1,250 4,864
Based on actuarial advice the subsidiary directors have determined that $9,880,098 (2001: $nil) of equity is a contributionto solvency and is therefore not distributable to the subsidiary shareholders. The solvency reserves have been calculated inaccordance with Guidance Note no. 5 of the New Zealand Society of Actuaries.
(iv) Policy LiabilitiesGroup Parent
2002 2001 2002 2001$000 $000 $000 $000
Balance at beginning of year - - - -Savings component of premiums transferred to policy liabilities 2,467 - - -Savings component of claims transferred from policy liabilities (320) - - -Decrease recognised in Statements of Financial Performance (1,306) - - -
Balance at End of Year 841 - - -
Policy liabilities contain the following components: Investment Linked Non-Investment Linked TotalPolicies Policies 2002$000 $000 $000
Future policy benefits 2,346 843 3,189 Future expenses 13,034 - 13,034 Future planned margins of revenues over expenses 193 - 193Future charges for acquisition costs - - -Future premiums (15,575) - (15,575)
(2) 843 841
The life insurance subsidiary's non-linked policy liabilities of $843,593 contain a guaranteed return to policyholders arisingfrom the lump sum bond portfolio.
(v) Actuarial Policies and MethodsThe actuarial reports on policy liabilities and solvency reserves for the current reporting period were prepared as at 30 June2002. No comparative figures are shown for 2001 as the life insurance subsidiary had not commenced business as a lifeinsurer as at that date.The actuary who prepared the reports of Club Life Limited was Peter Davies, B.Bus.Sc., FIA, FNZSA, ASA, AIAA. Peter is aFellow of the Institute of Actuaries, a Fellow of the New Zealand Society of Actuaries, and Associate of the Society ofActuaries (USA) and an Associate of the Institute of Actuaries of Australia. The amount of policy liabilities has beendetermined in accordance with Professional Standard 3 of the New Zealand Society of Actuaries. After making appropriatechecks, the actuary was satisfied as to the accuracy of the data from which the amount of policy liabilities has beendetermined.
The key assumptions used in determining the policy liabilities of Club Life are as follows:
1a Discount ratesThe discount rates used to determine policy liabilities reflect the expected future gross returns on Club Life's current assetmix. The rate assumed is 7% per annum before tax. In determining the future rate of return, inflation at the rate of 2% perannum was assumed to continue into the future.
1b Profit carriersFor policies containing risk benefits future claims have been used as the profit carrier. For savings contracts, including TermDeposit Bonds no profit carrier is used. For these policies policy liabilities are valued on an accumulation basis.
1c Investment and maintenance expensesThe maintenance expense allowance assumed was $120 per annum per life insured. Maintenance expenses are assumed toincrease at 2% per annum. The subsidiary does not incur any investment management expenses.
1d Inflation and automatic indexation of benefitsPolicies with automatic inflation lined indexation of premiums and benefits are assumed to have premium and benefitincreases of 2% per annum.
N O T E S T O T H E F I N A N C I A L S T A T E M E N T S
29
(v) Actuarial Policies and Methods (continued)1e TaxationThe rates of taxation in effect at the date of the valuation are assumed to continue into the future.
1f Mortality and MorbidityMortality claims have been projected at 65% of NZ97 for non-smokers and 130% of NZ97 for smokers. Morbidity claimshave been projected based on the experience of the subsidiary's reassurers.
1g Rates of discontinuance and surrender valuesProjected rates of discontinuance are based on industry experience. Surrender values are valued on an accumulation basis.
1h Rates of growth in unit pricesNot applicable as surrender values are valued on an accumulation basis.
1i Participating businessClub Life does not issue participating business.
2 1 . S u b s e q u e n t E v e n t sThe Company has declared a final dividend of 10 cents, fully imputed, payable Friday 11 October 2002 (2001: 8 cents).
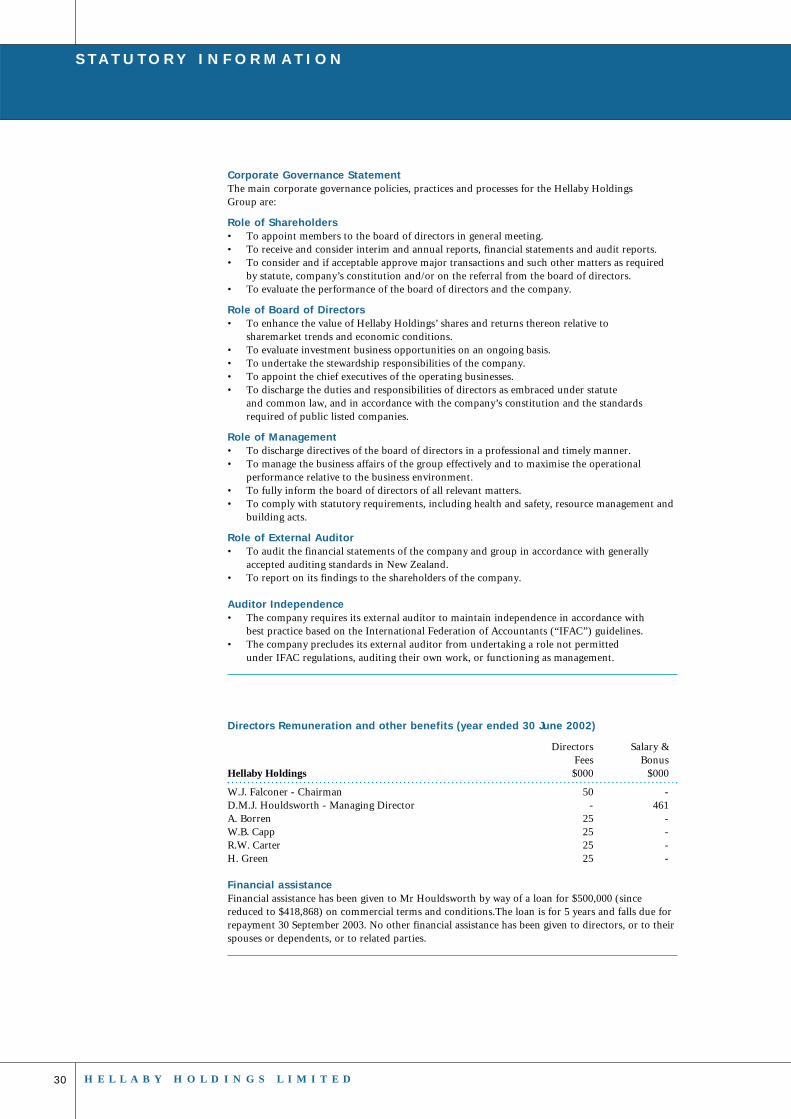
30 H E L L A B Y H O L D I N G S L I M I T E D
Corporate Governance StatementThe main corporate governance policies, practices and processes for the Hellaby Holdings Group are:
Role of Shareholders• To appoint members to the board of directors in general meeting.• To receive and consider interim and annual reports, financial statements and audit reports.• To consider and if acceptable approve major transactions and such other matters as required
by statute, company’s constitution and/or on the referral from the board of directors.• To evaluate the performance of the board of directors and the company.
Role of Board of Directors• To enhance the value of Hellaby Holdings’ shares and returns thereon relative to
sharemarket trends and economic conditions.• To evaluate investment business opportunities on an ongoing basis.• To undertake the stewardship responsibilities of the company.• To appoint the chief executives of the operating businesses.• To discharge the duties and responsibilities of directors as embraced under statute
and common law, and in accordance with the company’s constitution and the standards required of public listed companies.
Role of Management• To discharge directives of the board of directors in a professional and timely manner.• To manage the business affairs of the group effectively and to maximise the operational
performance relative to the business environment.• To fully inform the board of directors of all relevant matters.• To comply with statutory requirements, including health and safety, resource management and
building acts.
Role of External Auditor• To audit the financial statements of the company and group in accordance with generally
accepted auditing standards in New Zealand.• To report on its findings to the shareholders of the company.
Auditor Independence• The company requires its external auditor to maintain independence in accordance with
best practice based on the International Federation of Accountants (“IFAC”) guidelines.• The company precludes its external auditor from undertaking a role not permitted
under IFAC regulations, auditing their own work, or functioning as management.
Directors Remuneration and other benefits (year ended 30 June 2002)
Directors Salary &Fees Bonus
Hellaby Holdings $000 $000
W.J. Falconer - Chairman 50 -D.M.J. Houldsworth - Managing Director - 461A. Borren 25 -W.B. Capp 25 -R.W. Carter 25 -H. Green 25 -
Financial assistanceFinancial assistance has been given to Mr Houldsworth by way of a loan for $500,000 (sincereduced to $418,868) on commercial terms and conditions.The loan is for 5 years and falls due forrepayment 30 September 2003. No other financial assistance has been given to directors, or to theirspouses or dependents, or to related parties.
S T A T U T O R Y I N F O R M A T I O N

31
Directors’ Shareholding30.6.02 30.6.01Shares Shares
W.J. Falconer 440,000 440,000D.W. Houldsworth 213,220 243,220A. Borren - -W.B. Capp - -R.W. Carter - -H. Green - -Holdings by associated parties:• R.W. Carter and H. Green are associated with the Hugh Green Trust,
beneficial owner of 15,234,485 shares (30.3%)• A. Borren’s family trust, Quatro Management, holds 2,000,000 shares (4.0%)• W.B. Capp’s family superannuation fund holds 63,000 shares (0.1%)• R.W. Carter’s family trust holds 234,985 shares (0.5%)
Dealings in Hellaby Shares by Directors & Related Parties
14 November 2001Sale of shares by Castle Investments Limitedat $2.20 per share average 1,000,000 shares
8 January 2002Sale of shares by Castle Investments Limitedat $2.24 per share average 148,515 shares
15 January 2002Sale of shares by Quatro Management Limitedat $2.27 per share average 350,000 shares
6 March 2002Sale of shares by Quatro Management Limitedat $2.60 per share average 204,591 shares
15 April 2002Sale of shares by W.B. Capp’s familly superannuation fundat $2.67 per share average 63,315 shares
6 May 2002Sale of shares by Quatro Management Limitedat $2.52 per share average 1,795,409 shares
13 June 2002Sale of shares by D.M.J Houldsworthat $2.70 per share average 30,000 shares
Employees Remuneration and other benefits of $100,000 or more (year ended 30 June 2002)
Number of EmployeesRemuneration Range Hellaby Holdings Subsidiaries
$860,000 - $870,000 - 1$420,000 - $430,000 - 1$400,000 - $410,000 - 1$260,000 - $270,000 1 -$240,000 - $250,000 - 1$220,000 - $230,000 - 1$200,000 - $210,000 - 6$190,000 - $200,000 - 2$160,000 - $170,000 1 3$140,000 - $150,000 - 2$130,000 - $140,000 - 1$120,000 - $130,000 - 1$110,000 - $120,000 - 2$100,000 - $110,000 - 5
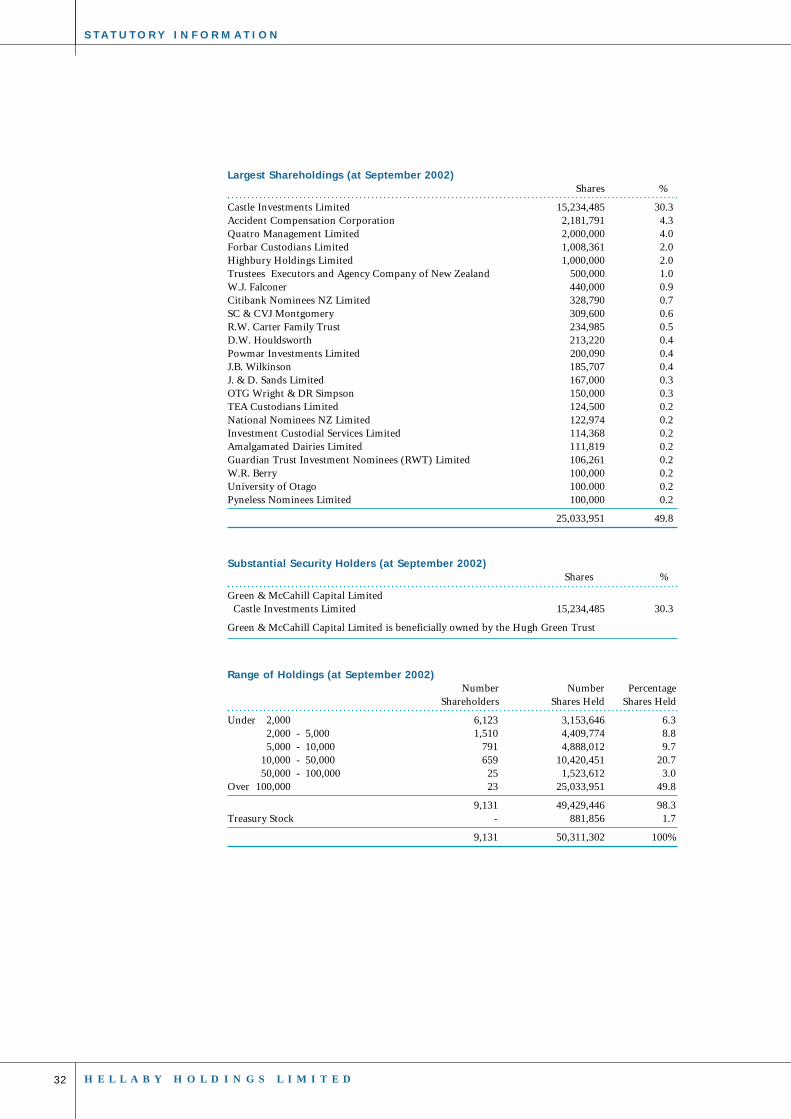
32 H E L L A B Y H O L D I N G S L I M I T E D
Largest Shareholdings (at September 2002)Shares %
Castle Investments Limited 15,234,485 30.3Accident Compensation Corporation 2,181,791 4.3Quatro Management Limited 2,000,000 4.0Forbar Custodians Limited 1,008,361 2.0Highbury Holdings Limited 1,000,000 2.0Trustees Executors and Agency Company of New Zealand 500,000 1.0W.J. Falconer 440,000 0.9Citibank Nominees NZ Limited 328,790 0.7SC & CVJ Montgomery 309,600 0.6R.W. Carter Family Trust 234,985 0.5D.W. Houldsworth 213,220 0.4Powmar Investments Limited 200,090 0.4J.B. Wilkinson 185,707 0.4J. & D. Sands Limited 167,000 0.3OTG Wright & DR Simpson 150,000 0.3TEA Custodians Limited 124,500 0.2National Nominees NZ Limited 122,974 0.2Investment Custodial Services Limited 114,368 0.2Amalgamated Dairies Limited 111,819 0.2Guardian Trust Investment Nominees (RWT) Limited 106,261 0.2W.R. Berry 100,000 0.2University of Otago 100.000 0.2Pyneless Nominees Limited 100,000 0.2
25,033,951 49.8
Substantial Security Holders (at September 2002)Shares %
Green & McCahill Capital LimitedCastle Investments Limited 15,234,485 30.3
Green & McCahill Capital Limited is beneficially owned by the Hugh Green Trust
Range of Holdings (at September 2002)Number Number Percentage
Shareholders Shares Held Shares Held
Under 2,000 6,123 3,153,646 6.32,000 - 5,000 1,510 4,409,774 8.85,000 - 10,000 791 4,888,012 9.7
10,000 - 50,000 659 10,420,451 20.750,000 - 100,000 25 1,523,612 3.0
Over 100,000 23 25,033,951 49.8
9,131 49,429,446 98.3Treasury Stock - 881,856 1.7
9,131 50,311,302 100%
S T A T U T O R Y I N F O R M A T I O N
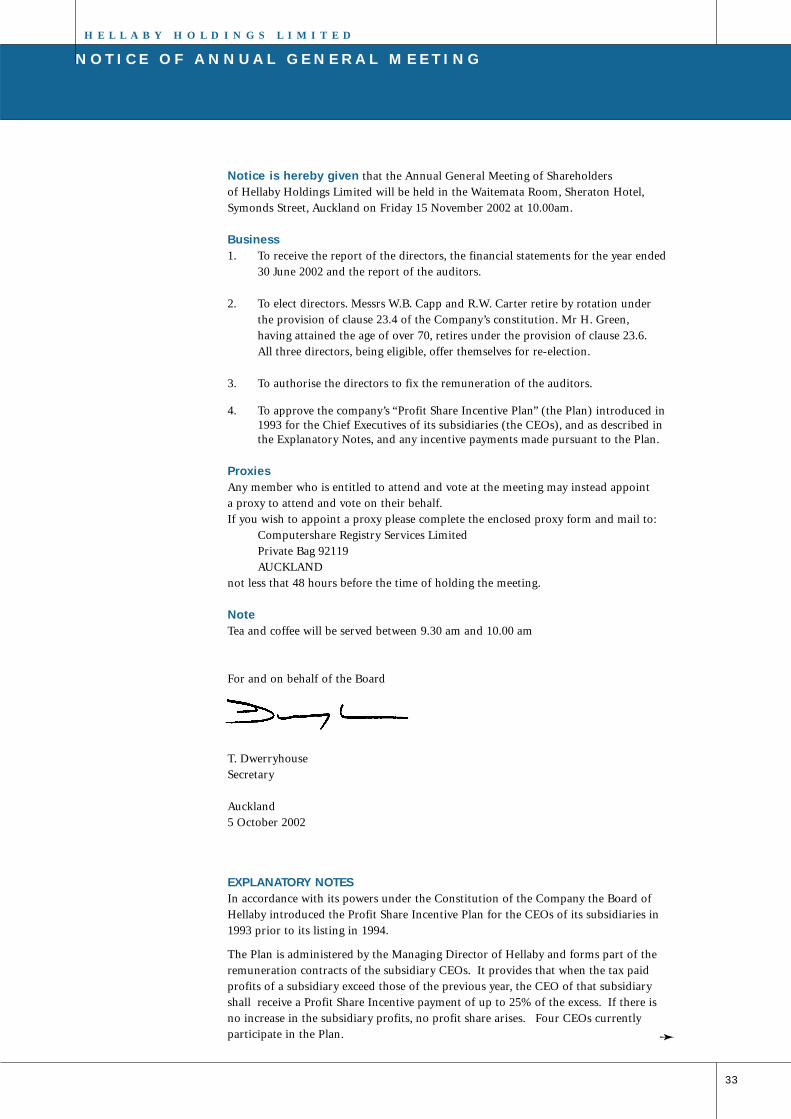
33
Notice is hereby given that the Annual General Meeting of Shareholders
of Hellaby Holdings Limited will be held in the Waitemata Room, Sheraton Hotel,
Symonds Street, Auckland on Friday 15 November 2002 at 10.00am.
Business1. To receive the report of the directors, the financial statements for the year ended
30 June 2002 and the report of the auditors.
2. To elect directors. Messrs W.B. Capp and R.W. Carter retire by rotation under
the provision of clause 23.4 of the Company’s constitution. Mr H. Green,
having attained the age of over 70, retires under the provision of clause 23.6.
All three directors, being eligible, offer themselves for re-election.
3. To authorise the directors to fix the remuneration of the auditors.
4. To approve the company’s “Profit Share Incentive Plan” (the Plan) introduced in 1993 for the Chief Executives of its subsidiaries (the CEOs), and as described in the Explanatory Notes, and any incentive payments made pursuant to the Plan.
ProxiesAny member who is entitled to attend and vote at the meeting may instead appoint
a proxy to attend and vote on their behalf.
If you wish to appoint a proxy please complete the enclosed proxy form and mail to:
Computershare Registry Services Limited
Private Bag 92119
AUCKLAND
not less that 48 hours before the time of holding the meeting.
NoteTea and coffee will be served between 9.30 am and 10.00 am
For and on behalf of the Board
T. Dwerryhouse
Secretary
Auckland
5 October 2002
EXPLANATORY NOTESIn accordance with its powers under the Constitution of the Company the Board of
Hellaby introduced the Profit Share Incentive Plan for the CEOs of its subsidiaries in
1993 prior to its listing in 1994.
The Plan is administered by the Managing Director of Hellaby and forms part of the
remuneration contracts of the subsidiary CEOs. It provides that when the tax paid
profits of a subsidiary exceed those of the previous year, the CEO of that subsidiary
shall receive a Profit Share Incentive payment of up to 25% of the excess. If there is
no increase in the subsidiary profits, no profit share arises. Four CEOs currently
participate in the Plan.
N O T I C E O F A N N U A L G E N E R A L M E E T I N G
H E L L A B Y H O L D I N G S L I M I T E D
➛
34 H E L L A B Y H O L D I N G S L I M I T E D
EXPLANATORY NOTES (continued)Rule 9.2 of the New Zealand Stock Exchange Listing Rules requires either a waiver
from the Exchange or shareholder approval to be obtained for a transaction where the
Company obtains services of an officer where the gross cost to the company in any
financial year is likely to exceed an amount equal to 0.5% of the lesser of the company’s
Shareholders’ Funds or the Average Market Capitalisation, as those terms are defined in
the Listing Rules.
Incentive payments under the plan, together with base salaries for the Chief Executives
concerned, have resulted in the lower threshold (0.5% of Shareholders’ Funds, currently
around $400,000) being exceeded for one quarter of the total number of payments
made over the past nine years, though the average over the period has been less than
the threshold .
The company believed the Plan was approved at the time of listing but this transpires
not to have been the case, and approval is now sought in respect of payments under
the Plan which may exceed the threshold.
The Directors believe the Plan works extremely effectively for Hellaby and its
shareholders. The subsidiaries involved currently contribute 81.9% of Hellaby’s
reported group earnings, and their contribution, pre-tax, has increased from $8.1 to
$14.4 million over the nine year period.
The profit share elements are included in the remuneration bands reported each year
in the company’s Annual Report.

35
Registered Office: Level 9, Sequent House, 8 Whitaker Place, Auckland, New Zealand
I/We .....
(FIRST NAMES) (SURNAME)
of ...
(ADDRESS OF SHAREHOLDER)
being a member of Hellaby Holdings Limited hereby appoint
of ...
or failing him/her . of ....
as my/our proxy to vote for me/us on my/our behalf at the Annual General Meeting of
the Company to be held on Friday 15 November 2002 and at any adjournment thereof.
Signed this day of .... 2002
Signature of Member(s) ......
Resolutions - Please ✓ as appropriate
For the Against the
Business: Resolution Resolution
1. To receive the report of the directors, financial
statements and report of the auditors
2. To re-elect Mr W.B. Capp as a director
3. To re-elect Mr R.W. Carter as a director
4. To re-elect Mr H. Green as a director
5. To authorise the directors to fix the remuneration
of the auditors
6. To approve the Company’s Profit Share Incentive Plan
Individual Shareholder:Sign yourself or by an attorney duly authorised in writing. If the Power of Attorney has not
already been noted by the Company it must accompany this notice.
Limited Liability Company:Sign in accordance with Company Constitution.
Joint Shareholders:All must sign.
Mailing Instructions:If you wish to appoint a proxy please complete this form and mail it to:
Computershare Registry Services Limited, Private Bag 92 119, Auckland
P R O X Y F O R M
H E L L A B Y H O L D I N G S L I M I T E D

36 H E L L A B Y H O L D I N G S L I M I T E D
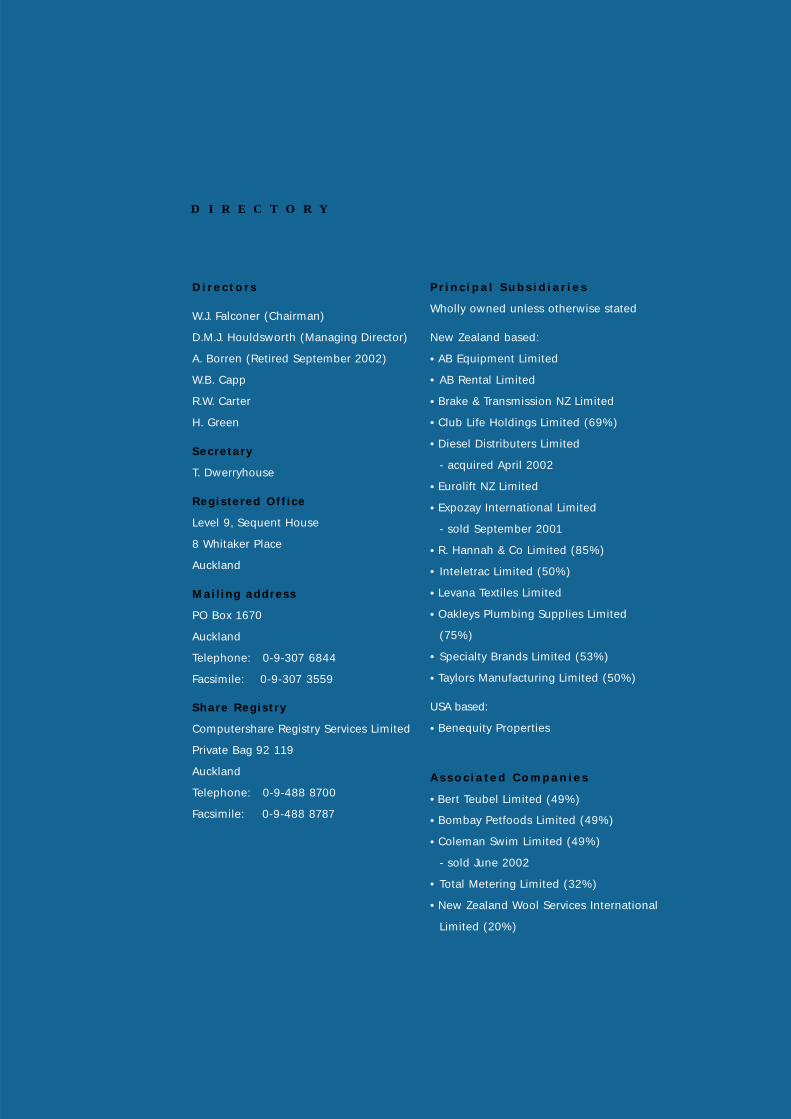
D i r e c t o r s
W.J. Falconer (Chairman)
D.M.J. Houldsworth (Managing Director)
A. Borren (Retired September 2002)
W.B. Capp
R.W. Carter
H. Green
Secretary
T. Dwerryhouse
Reg istered Off ice
Level 9, Sequent House
8 Whitaker Place
Auckland
Mail ing address
PO Box 1670
Auckland
Telephone: 0-9-307 6844
Facsimile: 0-9-307 3559
Share Reg ist ry
Computershare Registry Services Limited
Private Bag 92 119
Auckland
Telephone: 0-9-488 8700
Facsimile: 0-9-488 8787
P r i n c i p a l S u b s i d i a r i e s
Wholly owned unless otherwise stated
New Zealand based:
• AB Equipment Limited
• AB Rental Limited
• Brake & Transmission NZ Limited
• Club Life Holdings Limited (69%)
• Diesel Distributers Limited
- acquired April 2002
• Eurolift NZ Limited
• Expozay International Limited
- sold September 2001
• R. Hannah & Co Limited (85%)
• Inteletrac Limited (50%)
• Levana Textiles Limited
• Oakleys Plumbing Supplies Limited
(75%)
• Specialty Brands Limited (53%)
• Taylors Manufacturing Limited (50%)
USA based:
• Benequity Properties
A s s o c i a t e d C o m p a n i e s
• Bert Teubel Limited (49%)
• Bombay Petfoods Limited (49%)
• Coleman Swim Limited (49%)
- sold June 2002
• Total Metering Limited (32%)
• New Zealand Wool Services International
Limited (20%)
D I R E C T O R Y

H E L L A B Y H O L D I N G S L I M I T E D
a n n u a l r e p o r t 2 0 0 2