Aberdeen Global - Morningstar Document Library
124
Aberdeen Global Interim Report and Accounts For the period ended 31 March 2008
-
Upload
khangminh22 -
Category
Documents
-
view
1 -
download
0
Transcript of Aberdeen Global - Morningstar Document Library

Aberdeen Global Interim Report and Accounts
For the period ended 31 March 2008
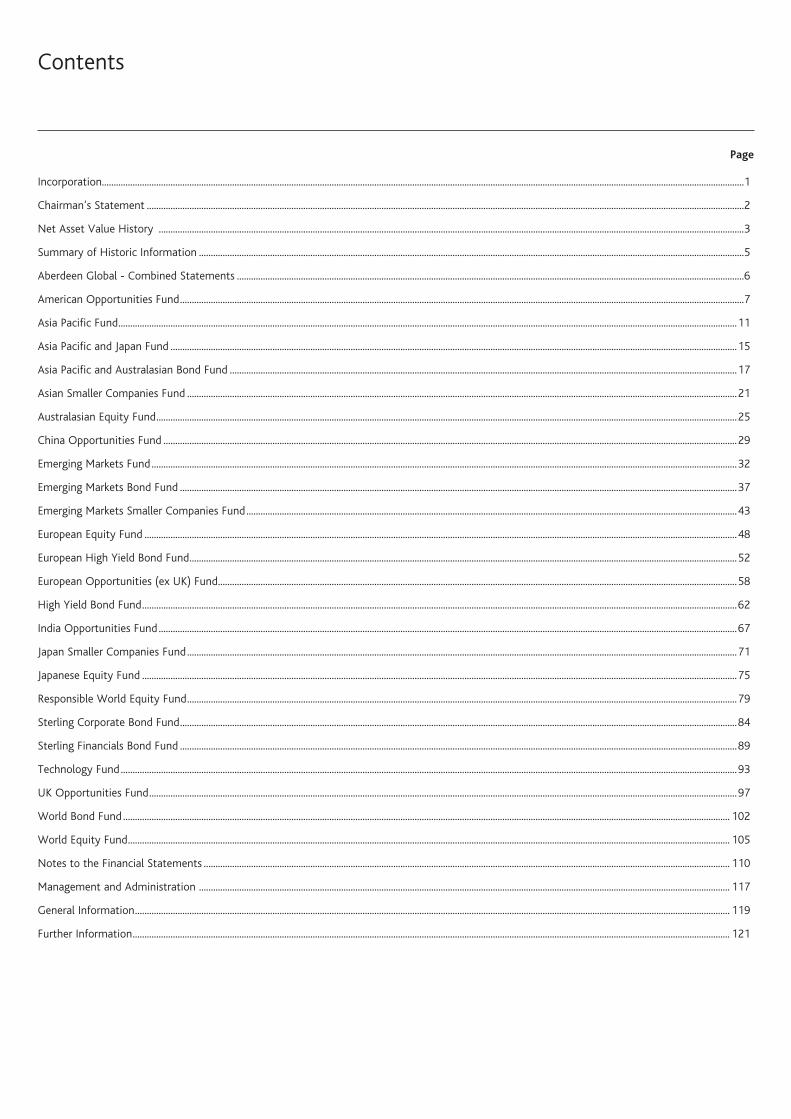
Contents
Page
Incorporation...............................................................................................................................................................................................................................................................................1
Chairman’s Statement ............................................................................................................................................................................................................................................................2
Net Asset Value History .......................................................................................................................................................................................................................................................3
Summary of Historic Information ......................................................................................................................................................................................................................................5
Aberdeen Global - Combined Statements ......................................................................................................................................................................................................................6
American Opportunities Fund ..............................................................................................................................................................................................................................................7
Asia Pacific Fund .....................................................................................................................................................................................................................................................................11
Asia Pacific and Japan Fund ...............................................................................................................................................................................................................................................15
Asia Pacific and Australasian Bond Fund ......................................................................................................................................................................................................................17
Asian Smaller Companies Fund ........................................................................................................................................................................................................................................21
Australasian Equity Fund .....................................................................................................................................................................................................................................................25
China Opportunities Fund ..................................................................................................................................................................................................................................................29
Emerging Markets Fund .......................................................................................................................................................................................................................................................32
Emerging Markets Bond Fund ...........................................................................................................................................................................................................................................37
Emerging Markets Smaller Companies Fund ...............................................................................................................................................................................................................43
European Equity Fund ..........................................................................................................................................................................................................................................................48
European High Yield Bond Fund .......................................................................................................................................................................................................................................52
European Opportunities (ex UK) Fund ...........................................................................................................................................................................................................................58
High Yield Bond Fund ...........................................................................................................................................................................................................................................................62
India Opportunities Fund ....................................................................................................................................................................................................................................................67
Japan Smaller Companies Fund ........................................................................................................................................................................................................................................71
Japanese Equity Fund ...........................................................................................................................................................................................................................................................75
Responsible World Equity Fund ........................................................................................................................................................................................................................................79
Sterling Corporate Bond Fund ...........................................................................................................................................................................................................................................84
Sterling Financials Bond Fund ...........................................................................................................................................................................................................................................89
Technology Fund ....................................................................................................................................................................................................................................................................93
UK Opportunities Fund ........................................................................................................................................................................................................................................................97
World Bond Fund ................................................................................................................................................................................................................................................................ 102
World Equity Fund .............................................................................................................................................................................................................................................................. 105
Notes to the Financial Statements .............................................................................................................................................................................................................................. 110
Management and Administration ................................................................................................................................................................................................................................ 117
General Information ........................................................................................................................................................................................................................................................... 119
Further Information ............................................................................................................................................................................................................................................................ 121

Aberdeen Global 1
Aberdeen Global (“the Company” or “the Fund”) was incorporated as a société anonyme, qualifying as a société d’investissement à capital variable on 25 February 1988 for an unlimited period and commenced operations on 26 April 1988. It is registered under number B27471 at the Register of Commerce at the District Court of Luxembourg.
As at 31 March 2008, the Company has issued shares in the following Funds:
American Opportunities
Asia Pacific
Asia Pacific and Australasian Bond
Asian Smaller Companies
Australasian Equity
China Opportunities
Emerging Markets
Emerging Markets Bond
Emerging Markets Smaller Companies
European Equity
European High Yield Bond
European Opportunities (Ex UK)
High Yield Bond
India Opportunities
Japan Smaller Companies
Japanese Equity
Responsible World Equity
Sterling Corporate Bond
Sterling Financials Bond
Technology
UK Opportunities
World Bond
World Equity
The full name of each Fund is constituted by the name of the Company, Aberdeen Global, followed by a hyphen and then the specific name of the Fund. Throughout the Financial Statements, the Funds are referred to by their short names as indicated above.
No subscriptions can be received on the basis of this document. Subscriptions are only valid if made on the basis of the current prospectus.
Please see the Notes to the Financial Statements for changes during the year.
Incorporation

2 Aberdeen Global
Review of operationsAggregate funds under management for Aberdeen Global (“the Fund”) decreased from $15.4 billion to $12.6 billion during the period. This was mainly attributable to steep falls across stockmarkets, with the MSCI World index, for example, falling over 11% during the six months to end March 2008. The MSCI AC Asia Pacific ex Japan index fell further (by 14% over the same period) and, although the Aberdeen Global - Asia Pacific Fund significantly out-performed the index over the period, there was a knock-on impact to investor sentiment and to client asset allocation decisions, resulting in some net outflows to the Fund.
The Aberdeen Global - Responsible World Equity Fund was launched on 1 November 2007 and has since out-performed its peer group and secured some $64m in investment.
Investment reviewGlobal equity markets experienced increasing volatility in the six months under review, as the US sub-prime turmoil mutated into a full-blown financial crisis. After euphoria that saw markets, particularly in Asia and developing countries, rise to new highs last October, investor reaction turned to shock at the write-downs on Wall Street, as financial deleveraging intensified. This led to steep falls across stockmarkets, with high-fliers such as China and India the worst hit.
Initially, less developed markets had appeared immune to selling pressure because of their very limited exposure to credit derivatives. This, along with strong growth rates, fostered a belief that these emerging markets could “de-couple”. But global growth has been driven by closer economic integration, not less, particularly with the entry of China and India into the trading system.
While a slowdown among these newcomers has yet to materialise, exports have slowed in line with deteriorating US growth, which was apparent from the fourth quarter onwards. US consumer confidence slipped to a two-year low as falling house values and rising inflation squeezed consumption, affecting the job market in turn. In Europe, economic growth also started to decelerate, with a housing market downturn in the UK, Spain and Ireland while Germany alone appeared to make up for this weakness.
In comparison, Asian economies continued to expand at pace, helped by governments that have room to spend. The exception was Japan, where recovery stalled in the face of policy mistakes and flat incomes. Among emerging markets, GDP growth remained relatively healthy, buoyed by record prices for minerals, oil and soft commodities, led by demand from China. However, some of these countries are net importers of commodities, and they faced rising cost-push inflation.
Indeed, the conflicting winds of growth and inflation have made policymaking more difficult everywhere. The Federal Reserve’s first concern was to shore up liquidity in the financial system, as banks withdrew credit. It also cut interest rates aggressively. But like the Bank of England, it now faces rising prices that limit the scope for further stimulus - even as the slowdown bites. In both countries there is a debate over the legitimacy of bailing out firms such as the UK’s Northern Rock and Bear Sterns in America.
In Europe, the European Central Bank (ECB) maintained its hawkish stance and refused to budge from its policy rate. In Asia, responses varied. Many chose to keep the status quo, countering inflation by allowing their currencies to appreciate. This might be the correct response in that rising prices, food especially, are caused by supply side shocks rather than increases in demand but widespread use of subsidies
distorts the market. Should inflation become embedded, wage demands may follow.
Looking ahead, equity markets are likely to remain sensitive to the unravelling of the sub-prime issue in the near term. While the worst may soon be over in terms of provisioning for the banking sector, the effects on the global economy are only now being felt. The US is facing rising unemployment, mortgage foreclosures and slower consumer spending. This could have a significant impact on the world economy in the next quarter or two.
Meanwhile, financial markets are anything but settled. Bond market yields are at present anticipating rising inflation, suggesting that the pace of easing may decelerate, although we believe that rates in the US may continue to decline over the next 12 months. Further out, slower growth will cool demand. This makes today’s record high commodity prices less sustainable. As for equities, earnings growth forecasts are being revised down. Recent poor figures from General Electric, a popular proxy for the health of the US economy, took investors by surprise. Even with recent falls in equity markets, volatility is likely to persist as, on the one hand, hopes are raised that the worst is priced in, and, on the other, bad news continues to keep mainstream investors sidelined. Record withdrawals from mutual funds through the first quarter of the year say much about investors’ state of mind.
The recent sell-off across markets does however restore some order. Stock markets had appreciated strongly over the past five or so years and, in emerging markets, liquidity was a strong factor in demand. The current environment should see more focus on company fundamentals, which should suit the way our funds are managed. There is a natural defensiveness to portfolios, with a focus on company balance sheets, cashflow and operational gearing. We are hopeful that this will sustain relative outperformance across most funds in the first quarter, even if the immediate outlook remains choppy.
Fund developmentsAberdeen Global - Responsible World Equity Fund was launched on 1 November 2007 and has attracted some US$64 million of assets under management. The Fund will consider the environmental, social and governance policies of investee companies. Aberdeen has been providing Socially Responsible Investment management since the early ninties. On the other hand, Aberdeen Global - Asia Pacific and Japan Fund was closed on 26 October 2007 following a re-allocation of assets by the majority shareholder.
The range of sub-funds now offered by the Fund is 23, with 78 share classes available. Authorisations for distributions for many funds are either secured or actively being sought, from 24 territories worldwide.
Finally, it is pleasing to note that we have received a number of awards for our funds, even in light of turbulent market conditions. Aberdeen Global - European High Yield Bond Fund, has won Best Europe High Yield Bond Fund from Lipper over three and five years and also received an A rating by Standard and Poors. Aberdeen Global - World Equity Fund, received the Best Global Large-Cap Equity Fund Award 2008 from Morningstar and an A rating from Standard and Poors and Aberdeen Global - Emerging Markets Fund received a AA rating from Standard and Poors.
C G LittleChairman 20 May 2008
Chairman’s Statement
Aberdeen Global 3
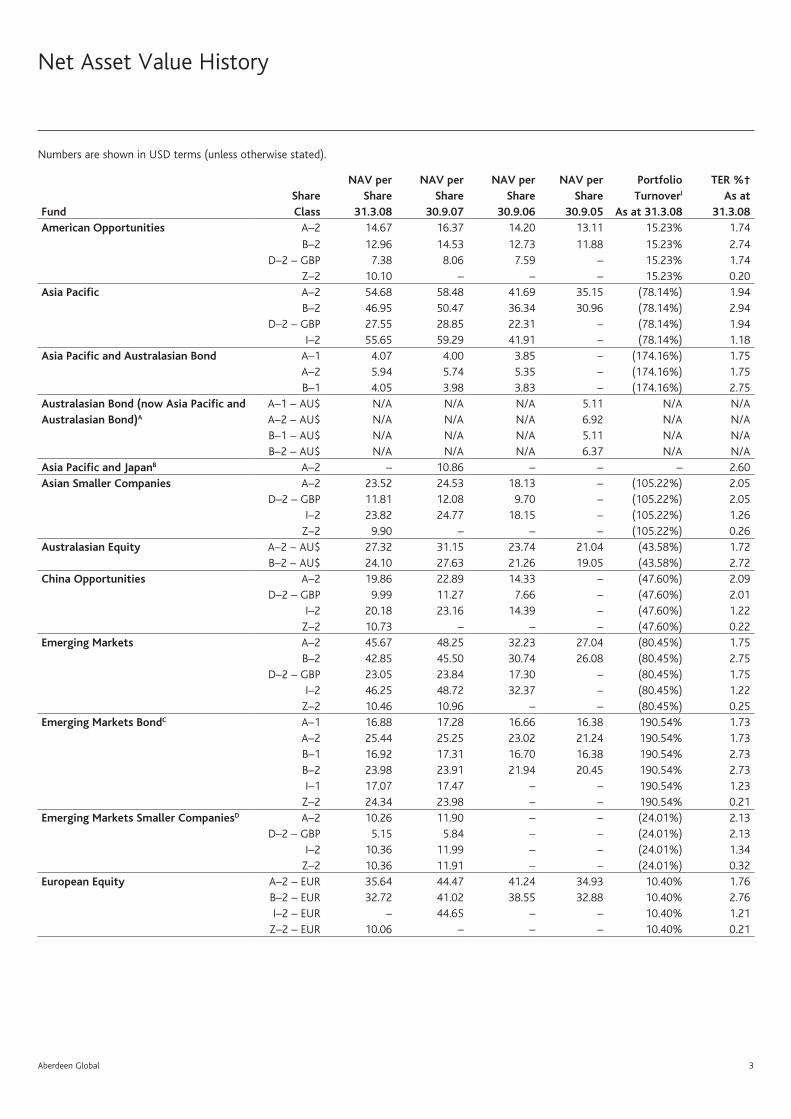
Net Asset Value History
Numbers are shown in USD terms (unless otherwise stated).
FundShare Class
NAV per Share
31.3.08
NAV per Share
30.9.07
NAV per Share
30.9.06
NAV per Share
30.9.05
Portfolio TurnoverI
As at 31.3.08
TER %† As at
31.3.08 American Opportunities A–2 14.67 16.37 14.20 13.11 15.23% 1.74
B–2 12.96 14.53 12.73 11.88 15.23% 2.74D–2 – GBP 7.38 8.06 7.59 – 15.23% 1.74
Z–2 10.10 – – – 15.23% 0.20Asia Pacific A–2 54.68 58.48 41.69 35.15 (78.14%) 1.94
B–2 46.95 50.47 36.34 30.96 (78.14%) 2.94D–2 – GBP 27.55 28.85 22.31 – (78.14%) 1.94
I–2 55.65 59.29 41.91 – (78.14%) 1.18Asia Pacific and Australasian Bond A–1 4.07 4.00 3.85 – (174.16%) 1.75
A–2 5.94 5.74 5.35 – (174.16%) 1.75B–1 4.05 3.98 3.83 – (174.16%) 2.75
Australasian Bond (now Asia Pacific and Australasian Bond)A
A–1 – AU$ N/A N/A N/A 5.11 N/A N/AA–2 – AU$ N/A N/A N/A 6.92 N/A N/AB–1 – AU$ N/A N/A N/A 5.11 N/A N/AB–2 – AU$ N/A N/A N/A 6.37 N/A N/A
Asia Pacific and JapanB A–2 – 10.86 – – – 2.60Asian Smaller Companies A–2 23.52 24.53 18.13 – (105.22%) 2.05
D–2 – GBP 11.81 12.08 9.70 – (105.22%) 2.05I–2 23.82 24.77 18.15 – (105.22%) 1.26
Z–2 9.90 – – – (105.22%) 0.26Australasian Equity A–2 – AU$ 27.32 31.15 23.74 21.04 (43.58%) 1.72
B–2 – AU$ 24.10 27.63 21.26 19.05 (43.58%) 2.72China Opportunities A–2 19.86 22.89 14.33 – (47.60%) 2.09
D–2 – GBP 9.99 11.27 7.66 – (47.60%) 2.01I–2 20.18 23.16 14.39 – (47.60%) 1.22
Z–2 10.73 – – – (47.60%) 0.22Emerging Markets A–2 45.67 48.25 32.23 27.04 (80.45%) 1.75
B–2 42.85 45.50 30.74 26.08 (80.45%) 2.75D–2 – GBP 23.05 23.84 17.30 – (80.45%) 1.75
I–2 46.25 48.72 32.37 – (80.45%) 1.22Z–2 10.46 10.96 – – (80.45%) 0.25
Emerging Markets BondC A–1 16.88 17.28 16.66 16.38 190.54% 1.73A–2 25.44 25.25 23.02 21.24 190.54% 1.73B–1 16.92 17.31 16.70 16.38 190.54% 2.73B–2 23.98 23.91 21.94 20.45 190.54% 2.73I–1 17.07 17.47 – – 190.54% 1.23
Z–2 24.34 23.98 – – 190.54% 0.21Emerging Markets Smaller CompaniesD A–2 10.26 11.90 – – (24.01%) 2.13
D–2 – GBP 5.15 5.84 – – (24.01%) 2.13I–2 10.36 11.99 – – (24.01%) 1.34
Z–2 10.36 11.91 – – (24.01%) 0.32European Equity A–2 – EUR 35.64 44.47 41.24 34.93 10.40% 1.76
B–2 – EUR 32.72 41.02 38.55 32.88 10.40% 2.76I–2 – EUR – 44.65 – – 10.40% 1.21
Z–2 – EUR 10.06 – – – 10.40% 0.21

4 Aberdeen Global
FundShare Class
NAV per Share
31.3.08
NAV per Share
30.9.07
NAV per Share
30.9.06
NAV per Share
30.9.05
Portfolio TurnoverI
As at 31.3.08
TER %† As at
31.3.08 European High Yield Bond A–1 – EUR 6.75 8.73 8.85 8.83 (122.05%) 1.46
A–2 – EUR 11.37 14.05 13.46 12.58 (122.05%) 1.46A–2H – USD 8.11 – – – (122.05%) 1.46
B–1 – EUR 6.73 8.69 8.85 8.83 (122.05%) 2.46B–2 – EUR 10.52 13.10 12.69 11.97 (122.05%) 2.46
D–1 – GBP 5.40 6.07 – – (122.05%) 1.46I–2 – EUR 7.92 – – – (122.05%) 0.92
Z–2 – EUR 11.44 – – – (122.05%) 0.17European Opportunities (Ex UK) A–2 – EUR 9.22 11.07 10.44 – 29.82% 1.70
D–2 – GBP 7.32 7.74 7.07 – 29.82% 1.70Fixed Interest OpportunitiesE D–1 – GBP – – 1.05 – – –High Yield Bond D–1 – GBP 0.9940 1.0944 1.08 – 20.23% 1.48India Opportunities A–2 76.19 82.96 57.09 – (72.85%) 2.16
D–2 – GBP 38.36 40.85 30.55 – (72.85%) 2.16I–2 77.38 83.85 57.37 – (72.85%) 1.37
Z–2 8.49 – – – (72.85%) 0.37Japan Smaller CompaniesF A–2 – JPY 595 772 – – 13.09% 1.74
D–2 – GBP 3.00 3.30 – – 13.09% 1.74I–2 – JPY 546 773 – – 13.09% 1.20
Japanese Equity A–2 – JPY 270 365 391 349 40.71% 1.71B–2 – JPY 233 315 340 307 40.71% 2.71
D–2 – GBP 1.37 1.56 – – 40.71% 1.71Sterling Corporate Bond D–1 – GBP 0.9805 1.0069 1.05 – 50.07% 1.46Sterling Financials Bond A–2 – GBP 1.7334 1.6925 1.64 – 59.25% 0.97Responsible World EquityG A–2 9.23 – – – 3.86% 1.79
I–2 9.08 – – – 3.86% 1.25Z–2 9.08 – – – 3.86% 0.25
Technology A–2 2.79 3.35 2.70 2.40 (29.48%) 2.14B–2 2.57 3.10 2.53 2.28 (29.48%) 3.14
D–2 – GBP 1.40 1.65 1.44 – (29.48%) 2.14UK Opportunities A–2 – GBP 13.86 16.13 14.76 12.55 (9.50%) 1.66
B–2 – GBP 12.18 14.24 13.16 11.31 (9.50%) 2.66D–1 – GBP 13.47 15.79 14.70 – (9.50%) 1.66
World Bond D–1 – GBP 1.2811 1.1405 1.20 – 106.59% 1.12World Equity A–2 14.17 15.11 12.56 10.68 (33.26%) 1.71
B–2 13.08 14.01 11.77 10.10 (33.26%) 2.71D–2 – GBP 7.13 7.44 6.72 – (33.26%) 1.71
I–2 9.28 – – – (33.26%) 1.17Z–2 14.35 15.18 – – (33.26%) 0.17
Net Asset Value History continued
† Source: Aberdeen Asset Management.A The Fund changed its base currency from Australian Dollars to US Dollars from 1 March 2006.B New Fund launched 17 April 2007 and then subsequently closed on 26 October 2007.C The Fund changed its name from Sovereign High Yield Bond from 30 March 2007.D New Fund launched 26 March 2007.E The Fund liquidated on 10 July 2007.F New Fund launched 20 April 2007.G New Fund launched 1 November 2007.H Hedged share classI (Purchase of securities and sales of securities) - (Subscription of units and Redemptions of units)
= Portfolio Turnover(Average fund value over 12 months) x100
Exchange Rates 31.3.08 30.9.07 30.9.06 30.9.05£ - US$ 1.988750 2.031300 1.870000 1.765537US$ - AUD 1.093627 1.134003 1.340856 1.313700£ - € 1.257450 1.431800 1.475950 1.464866€ - US$ 1.581570 1.418704 1.266977 1.205255US$ - JPY 99.590190 115.207010 117.951872 113.4345

Aberdeen Global 5
Net Asset Value
Net Asset Value
Net Asset Value
Net Asset Value
31.3.08 30.9.07 30.9.06 30.9.05
Fund Base Currency (‘000) (‘000) (‘000) (‘000)
American Opportunities US Dollars 71,197 77,160 16,326 15,386
Asia Pacific US Dollars 5,553,054 7,472,634 5,540,149 2,393,628
Asia Pacific and Australasian Bond US Dollars 9,489 6,063 1,170 –
Australasian Bond (now Asia Pacific and Australasian Bond)A Australian Dollars – – – 5,465
Asia Pacific and JapanB US Dollars – 6,192 – –
Asian Smaller Companies US Dollars 531,219 489,709 446,549 –
Australasian Equity Australian Dollars 86,770 82,620 58,729 55,284
China Opportunities US Dollars 606,207 838,690 723,872 –
Emerging Markets US Dollars 841,221 906,993 219,105 70,113
Emerging Markets BondC US Dollars 465,687 537,624 191,399 196,610
Emerging Markets Smaller CompaniesD US Dollars 116,266 113,328 – –
European Equity Euro 65,570 116,918 39,070 33,207
European High Yield Bond Euro 234,814 375,234 112,015 64,401
European Opportunities (Ex UK) Euro 116,850 144,081 64,647 –
Fixed Interest OpportunitiesE Sterling – – 23,857 –
High Yield Bond Sterling 34,370 43,762 49,715 –
India Opportunities US Dollars 2,386,798 2,779,282 1,959,235 –
Japanese Equity Japanese Yen 11,734,037 16,487,626 1,360,239 1,739,788
Japan Smaller CompaniesF Japanese Yen 4,766,113 6,436,584 – –
Sterling Corporate Bond Sterling 12,925 13,740 14,265 –
Sterling Financials Bond Sterling 36,127 36,749 41,419 –
Responsible World EquityG US Dollars 57,925 – – –
Technology US Dollars 62,948 77,257 75,827 15,979
UK Opportunities Sterling 47,440 56,046 35,485 24,946
World Bond Sterling 38,274 34,368 44,066 –
World Equity US Dollars 628,833 604,761 79,739 22,915
Consolidated Total 12,572,120 15,459,269 9,973,099 2,937,902 A The Fund changed its base currency from Australian Dollars to US Dollars from 1 March 2006.B New Fund launched 17 April 2007 and then subsequently closed on 26 October 2007.C The Fund changed its name from Sovereign High Yield Bond from 30 March 2007.D New Fund launched 26 March 2007.E The Fund liquidated on 10 July 2007.F New Fund launched 20 April 2007.G New Fund launched 1 November 2007.
Summary of Historic InformationFor the period ended 31 March 2008

6 Aberdeen Global
Combined Statement of Net Assets
As at 31 March 2008
Assets US$’000
Investments in securities at market value (note 2.2) 12,316,062
Cash at bank 287,973
Interest and dividends receivable 60,273
Subscriptions receivable 46,458
Receivable for investments sold 9,975
Unrealised gain on forward foreign exchange contracts (note 9) 714
Other assets 407
Total assets 12,721,862
Liabilities
Payable for investments purchased 34,049
Taxes and expenses payable 27,245
Redemptions payable 50,671
Unrealised loss on forward foreign exchange contracts (note 9) 3,670
Other liabilities 34,107
Total liabilities 149,742
Net assets at the end of the period 12,572,120
Combined Statement of Changes in Net Assets
For the period from 1 October 2007 to 31 March 2008
US$’000
Net assets at the beginning of the period 15,459,269
Exchange rate effect on opening net assets 129,659
Net gains from investments 22,579
Realised gains on investments 1,220,319
Currency exchange losses (12,379)
Decrease in unrealised appreciation
on investments (2,310,967)
Decrease in unrealised depreciation
on open forward currency positions 510
Proceeds from shares issued 4,438,468
Payments for shares redeemed (6,364,285)
Net equalisation paid (note 11) (576)
Dividends paid (note 5) (10,477)
Net assets at the end of the period 12,572,120
Combined Statement of Operations
For the period from 1 October 2007 to 31 March 2008
Income US$’000
Income from investments 149,692
Bank interest received 3,427
Total income 153,119
Expenses
Gross management fee 112,414
Less: Management fee cross holdings (2,346)
Net management fee (note 4.6) 110,068
Administration fee (note 4.1) 1,811
Custodian fee (note 4.2) 7,227
Distribution fee (note 4.3) 370
Domiciliary agent, registrar, paying and
transfer agent fees (note 4.4) 4,743
Management company fees (note 4.5) 1,088
Operational expenses (note 4.7) 1,678
Expense cap to be refunded by management company (note 4.8) (9)
Mauritius income tax (note 12) 223
Annual tax (note 4.9) 3,311
Bank interest paid 30
Total expenses 130,540
Net gains from investments 22,579
Realised gains on investments 1,220,319
Currency exchange losses (12,379)
Net realised gains 1,230,519
Decrease in unrealised
appreciation on investments (2,310,967)
Decrease in unrealised depreciation
on open forward currency positions 510
Net decrease in assets as a result of operations (1,079,938)
The accompanying notes form an integral part of these financial
statements.
Aberdeen Global - Combined Statements
Aberdeen Global 7American Opportunities Fund
American Opportunities FundFor the period ended 31 March 2008
PerformanceFor the six-month period ended 31 March 2008, the value of the Aberdeen Global - American Opportunities Fund - A Accumulation shares decreased by 10.4% compared to a decrease of 12.5% in the benchmark, the S&P 500 Index.
Manager’s reviewThe six months under review saw the return of volatility to domestic equity markets. Although US equities performed strongly in early October, that positive momentum was short lived as declining house prices and poor underwriting standards exposed the weakness in complex credit derivatives. The write-downs of investment banks were exacerbated across Wall Street as well, totalling US$150bn to date. Financial de-leveraging intensified, culminating in the Bear Stearns debacle as concerns over the investment bank’s liquidity turned to contagion, which led to the Federal Reserve’s intervention and its takeover by JPMorgan Chase.
Despite US equities having posted negative returns, the consumer staples, energy and materials sectors gained on strong global demand. In addition, investors used commodities to hedge against inflation and the weak dollar, with the latter supporting exports. Conversely, financials underperformed.
During this period, the Fed provided unorthodox support to the financial markets, cutting interest rates five times by 2.5% to 2.25%, amid concerns that the mortgage-backed meltdown would slow growth. Additionally, the Fed and other central banks injected liquidity into the markets to control inflation.
Data on the economic front increased the likelihood of an economic recession, which added to anxiety in fragile markets. Fourth-quarter economic growth was weaker than expected: the unemployment rate rose to a two-year high while the manufacturing sector grew at its slowest pace in 10 months. Additionally, consumer confidence fell to a two-year low. Meanwhile, falling house values and rising petrol prices continue to weigh on economic growth, while inflation and a weak dollar affected spending.
Portfolio reviewDuring the period under review, the Fund fell by 10.4%, outperforming the S&P 500 by 2.1%.
In portfolio activity, we trimmed our exposure to energy and industrials where they showed early signs of weakening fundamentals and rich valuations. We added to our under-represented consumer related names, which had significantly discounted weaker consumer activity. In the same vein, we also initiated a position in homebuilder Toll Brothers and airline US Airways. Against this, we sold Trane after Ingersoll Rand made a bid for the maker of heating and air-cooling systems.
OutlookDomestic equities still face near-term risks. Despite improved liquidity in the market, volatility is likely to continue in the coming months. Though the potential for unwelcome surprises in the credit markets has lessened, further write-downs may yet be announced as banks continue to de-leverage. Attention has meanwhile shifted to the knock-on effects in the broad economy. Tight credit conditions will restrict spending growth, compounding weak consumer sentiment. While the market appears to be looking past much of this, it is much too early to speak of a market bottom, let alone a recovery. As such, we remain cautious on our outlook, and will look to top up our favoured holdings only when valuations become more attractive.
8 Aberdeen Global American Opportunities Fund
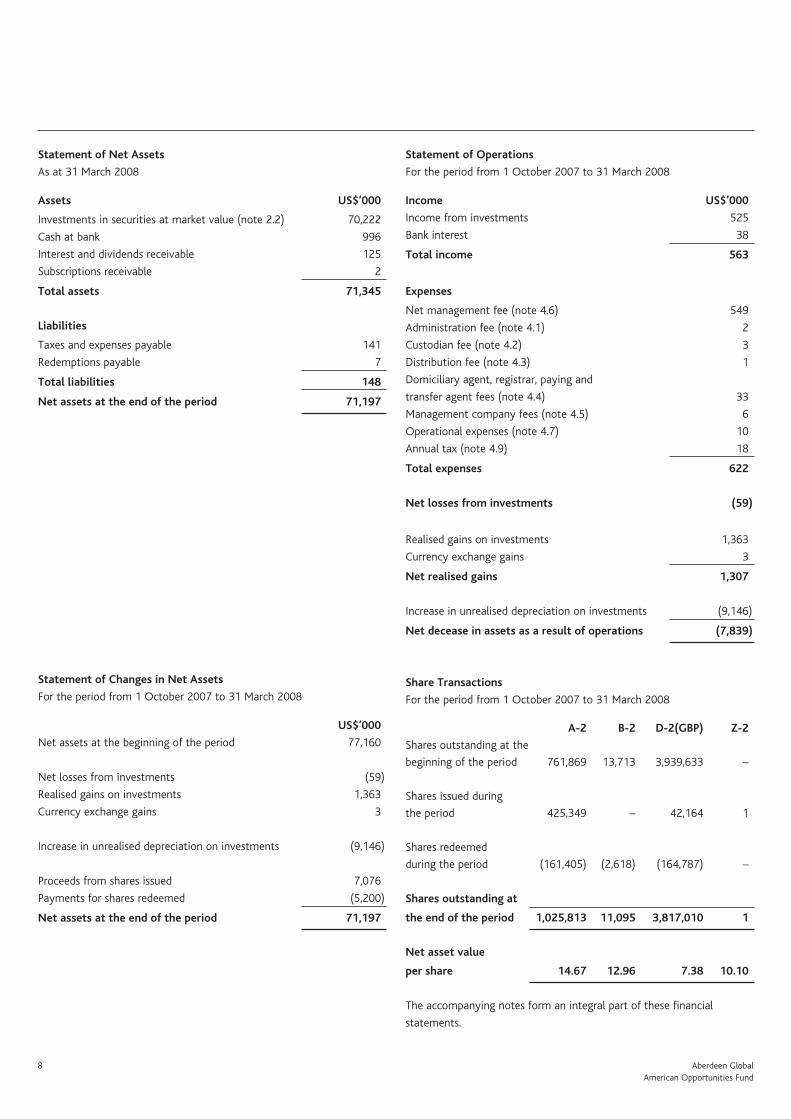
Statement of Net Assets
As at 31 March 2008
Assets US$’000
Investments in securities at market value (note 2.2) 70,222
Cash at bank 996
Interest and dividends receivable 125
Subscriptions receivable 2
Total assets 71,345
Liabilities
Taxes and expenses payable 141
Redemptions payable 7
Total liabilities 148
Net assets at the end of the period 71,197
Statement of Changes in Net Assets
For the period from 1 October 2007 to 31 March 2008
US$’000
Net assets at the beginning of the period 77,160
Net losses from investments (59)
Realised gains on investments 1,363
Currency exchange gains 3
Increase in unrealised depreciation on investments (9,146)
Proceeds from shares issued 7,076
Payments for shares redeemed (5,200)
Net assets at the end of the period 71,197
Statement of Operations
For the period from 1 October 2007 to 31 March 2008
Income US$’000
Income from investments 525
Bank interest 38
Total income 563
Expenses
Net management fee (note 4.6) 549
Administration fee (note 4.1) 2
Custodian fee (note 4.2) 3
Distribution fee (note 4.3) 1
Domiciliary agent, registrar, paying and
transfer agent fees (note 4.4) 33
Management company fees (note 4.5) 6
Operational expenses (note 4.7) 10
Annual tax (note 4.9) 18
Total expenses 622
Net losses from investments (59)
Realised gains on investments 1,363
Currency exchange gains 3
Net realised gains 1,307
Increase in unrealised depreciation on investments (9,146)
Net decease in assets as a result of operations (7,839)
Share Transactions
For the period from 1 October 2007 to 31 March 2008
A-2 B-2 D-2(GBP) Z-2
Shares outstanding at the
beginning of the period 761,869 13,713 3,939,633 –
Shares issued during
the period 425,349 – 42,164 1
Shares redeemed
during the period (161,405) (2,618) (164,787) –
Shares outstanding at
the end of the period 1,025,813 11,095 3,817,010 1
Net asset value
per share 14.67 12.96 7.38 10.10
The accompanying notes form an integral part of these financial
statements.

Aberdeen Global 9American Opportunities Fund
Portfolio StatementAs at 31 March 2008
Percentage of Market value total net assets Description Quantity US$’000 %
Consumer Discretionary - 11.72%BorgWarner 29,000 1,213 1.70Harley Davidson 29,900 1,134 1.59Macys 39,650 871 1.22Stanley Works 20,050 945 1.33Staples 45,300 1,015 1.43TJX Companies 32,411 1,059 1.49Toll Brothers 42,450 953 1.34VF Corp 15,200 1,152 1.62
8,342 11.72
Consumer Staples - 11.65%Altria 17,300 1,277 1.80Kraft 17,300 1,019 1.43PepsiCo 14,500 1,038 1.46Procter & Gamble 20,480 1,422 2.00Reynolds American 24,050 1,460 2.05Supervalu 32,800 952 1.34UST 20,200 1,119 1.57
8,287 11.65
Energy - 13.18%Apache 17,250 2,054 2.89Chevron 17,730 1,498 2.10Ensco 17,500 1,048 1.47EOG Resources 14,950 1,777 2.50Exxon Mobil 21,882 1,865 2.62Hess Corp 12,900 1,140 1.60
9,382 13.18
Financials - 15.86%Aflac 15,811 1,017 1.43Allstate 27,300 1,299 1.82Assurant 21,650 1,304 1.83Citigroup 34,750 724 1.02Goldman Sachs 6,050 995 1.40JPMorgan Chase 32,650 1,395 1.96Royal Bank of Canada 29,445 1,323 1.86Wells Fargo 46,550 1,366 1.92Willis Group 26,850 902 1.27Zions Bancorp 20,900 962 1.35
11,287 15.86
Health Care - 13.80%Aetna 27,100 1,153 1.62Johnson & Johnson 23,450 1,505 2.11Pfizer 48,500 994 1.40Quest Diagnostics 30,700 1,406 1.97St Jude Medical 18,600 806 1.13United Health Group 26,850 924 1.30WellPoint 17,070 738 1.04Wyeth 29,450 1,223 1.72Zimmer Holdings 13,991 1,077 1.51
9,826 13.80

10 Aberdeen Global American Opportunities Fund
Industrials - 10.78%3M 16,489 1,285 1.80Canadian National Railway 27,550 1,347 1.89General Electric 35,057 1,283 1.80ITT Corp 22,700 1,173 1.65Textron Inc 19,100 1,043 1.46United Technologies 22,615 1,550 2.18
7,681 10.78
Information Technology - 11.41%Anixter 14,900 935 1.31Cisco Systems 61,300 1,476 2.07EMC 78,150 1,118 1.57Intel 52,850 1,099 1.54Microsoft 59,600 1,663 2.34Motorola 107,800 993 1.39ON Semiconductor 153,750 850 1.19
8,134 11.41
Materials - 2.85%Dow Chemical 29,450 1,080 1.51Rohm & Haas 17,749 953 1.34
2,033 2.85
Telecommunication Services - 2.79%Telus 20,550 877 1.23Windstream Corp 95,300 1,113 1.56
1,990 2.79
Transport - 0.51%US Airways Group 42,000 360 0.51
Utilities - 4.08%Allegheny Energy 18,000 901 1.27Constellation Energy 10,700 947 1.33PPL Corp 22,900 1,052 1.48
2,900 4.08
Total investments 70,222 98.63
Other net assets 975 1.37
Total 71,197 100.00
All securities held at the period end are transferable except where otherwise stated.All securities are listed on an official exchange except where otherwise stated.All investments are in ordinary or common stocks and shares except where otherwise stated.There are no transferable securities and money market instruments dealt in another regulated market except as otherwise stated.
Portfolio Statement continued
Percentage of Market value total net assets Description Quantity US$’000 %
Aberdeen Global 11Asia Pacific Fund
Asia Pacific FundFor the period ended 31 March 2008
PerformanceFor the six-months ended 31 March 2008, the value of the Aberdeen Global - Asia Pacific Fund - A Accumulation shares decreased by 6.5% compared to a decrease of 14.0% in the benchmark, the MSCI AC Asia Pacific ex Japan Index.
Manager’s reviewAsian equities fell in the six months under review, as stock markets worldwide grew more volatile as the US housing and credit markets imploded, worsening global economic growth prospects. What started out as an issue of illiquidity quickly turned into a full-blown financial crisis. The US Federal Reserve resorted to unprecedented market measures to support the financial system, as well as reducing interest rates five times, to 2.25% which put further downward pressure on the dollar, complicating policy for Asia’s export-driven economies.
Meanwhile, more expensive oil and food prices saw inflation spike across the region, touching multi-year highs in China, Hong Kong and Singapore. Most central banks kept interest rates unchanged, relying on subsidies and price controls to curb headline price growth. Australia, China, Korea, Indonesia, India and Taiwan hiked rates; only the Philippines eased policy.
On the economic front, fourth-quarter GDP growth across the region generally exceeded expectations. In contrast, 2008 growth forecasts were downgraded as the fall out from the credit crunch became more apparent. Thailand, which underperformed because of political paralysis, upgraded its forecast. Elsewhere, India’s budget waived US$15bn in loans to farmers, while Hong Kong and Singapore offered tax breaks, all in an effort to boost growth.
In politics, several countries saw a changing of the guard. In Australia, the opposition Labor Party swept to victory; a pro-Thaksin party formed the government after Thailand’s first general election since the military coup and ex-premier Thaksin returned home after 17 months, but pledged to stay out of politics. Korea’s president Lee Myung-Bak began his term; Taiwanese opposition candidate Ma Ying-jeou won the presidential vote on a pro-growth platform, as expected; but Malaysia’s ruling Umno party suffered a shock loss of its two-third parliamentary majority at the general election, which prevents it now from pushing through laws at state level. The assassination of Pakistan’s opposition leader Benazir Bhutto delayed the general elections.
Portfolio review The Fund fell by 6.5% during the period, whereas the benchmark MSCI AC Asia Pacific ex Japan Index fell 14%.
In portfolio activity, we sold our small holding in Taiwanese lender, Sinopac, whose management failed to live up to expectations. We also top-sliced several holdings after strong runs in their share price, including China’s PetroChina and China Mobile, Australia’s Rio Tinto, Indian utility GAIL and Hong Kong-based Sun Hung Kai Properties.
Conversely, we initiated a position in Singapore-listed Fraser and Neave, a regional food and beverages company with additional interests in property and publishing. We also added to ASM Pacific Technology in Hong Kong and Singapore’s Venture Corp.
OutlookMarket volatility is expected to persist in the near term. A rebound at the end of the period, on optimism that the worst of the credit crisis was over, proved short-lived. The ongoing turmoil has hit not only the key players in the sub-prime segment, but appears now to have permeated the broader economy, with General Electric, widely seen as a proxy, posting its first fall in quarterly results in five years.
Various data would appear to suggest the slowdown is accelerating, with rising job losses, mortgage foreclosures and slower consumer spending in the US. In Asia, exports are experiencing slower demand, fuel and food inflation is squeezing corporate margins and household incomes are being eroded by negative real interest rates. Further downgrades of growth forecasts are likely. However, the portfolio has a natural defensiveness, given our focus on company balance sheets and cashflow. Therefore, we have needed to make few adjustments to the portfolio since markets peaked last October. With the recent price tumbles, we are looking anew at various stocks with a view to adding to positions should prices fall another 10-15%.
12 Aberdeen GlobalAsia Pacific Fund
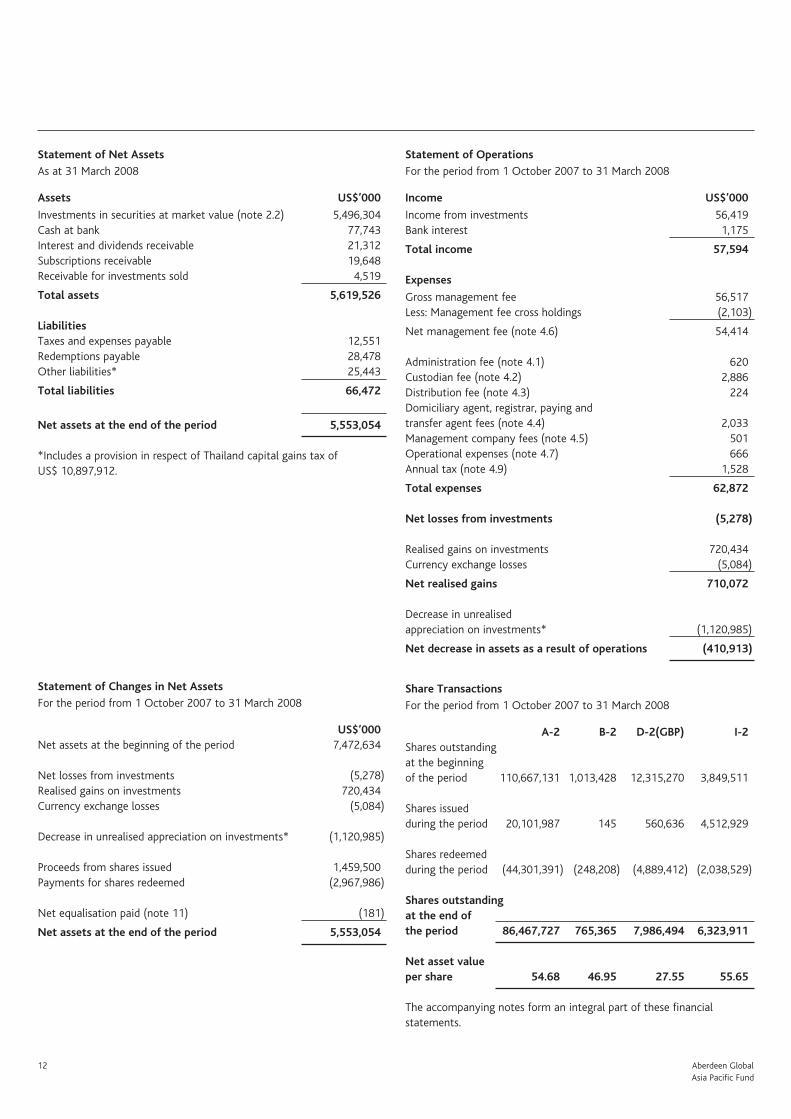
Statement of Net Assets
As at 31 March 2008
Assets US$’000
Investments in securities at market value (note 2.2) 5,496,304 Cash at bank 77,743 Interest and dividends receivable 21,312 Subscriptions receivable 19,648 Receivable for investments sold 4,519
Total assets 5,619,526 Liabilities Taxes and expenses payable 12,551 Redemptions payable 28,478 Other liabilities* 25,443
Total liabilities 66,472
Net assets at the end of the period 5,553,054
*Includes a provision in respect of Thailand capital gains tax of US$ 10,897,912.
Statement of Changes in Net Assets
For the period from 1 October 2007 to 31 March 2008
US$’000Net assets at the beginning of the period 7,472,634
Net losses from investments (5,278) Realised gains on investments 720,434 Currency exchange losses (5,084)
Decrease in unrealised appreciation on investments* (1,120,985)
Proceeds from shares issued 1,459,500 Payments for shares redeemed (2,967,986)
Net equalisation paid (note 11) (181)
Net assets at the end of the period 5,553,054
Statement of Operations
For the period from 1 October 2007 to 31 March 2008
Income US$’000
Income from investments 56,419 Bank interest 1,175
Total income 57,594
Expenses
Gross management fee 56,517 Less: Management fee cross holdings (2,103)
Net management fee (note 4.6) 54,414
Administration fee (note 4.1) 620 Custodian fee (note 4.2) 2,886 Distribution fee (note 4.3) 224 Domiciliary agent, registrar, paying and transfer agent fees (note 4.4) 2,033 Management company fees (note 4.5) 501 Operational expenses (note 4.7) 666 Annual tax (note 4.9) 1,528
Total expenses 62,872
Net losses from investments (5,278)
Realised gains on investments 720,434 Currency exchange losses (5,084)
Net realised gains 710,072
Decrease in unrealisedappreciation on investments* (1,120,985)
Net decrease in assets as a result of operations (410,913)
Share Transactions
For the period from 1 October 2007 to 31 March 2008
A-2 B-2 D-2(GBP) I-2Shares outstanding at the beginning of the period 110,667,131 1,013,428 12,315,270 3,849,511
Shares issued during the period 20,101,987 145 560,636 4,512,929
Shares redeemed during the period (44,301,391) (248,208) (4,889,412) (2,038,529)
Shares outstanding at the end ofthe period 86,467,727 765,365 7,986,494 6,323,911 Net asset value per share 54.68 46.95 27.55 55.65
The accompanying notes form an integral part of these financial statements.

Aberdeen Global 13Asia Pacific Fund
Portfolio StatementAs at 31 March 2008
Percentage of Market value total net assets Description Quantity US$’000 %
Australia - 8.48%QBE Insurance Group 8,804,220 178,922 3.22Rio Tinto 2,100,000 218,550 3.94Tabcorp Holdings 5,710,956 73,683 1.32
471,155 8.48
China - 4.64%China Mobile 9,000,221 133,832 2.41PetroChina 74,798,810 93,160 1.68Zhejiang Expressway 35,000,170 30,417 0.55
257,409 4.64
Hong Kong - 19.69%ASM Pacific Technology 9,815,120 69,917 1.26CLP Holdings 6,500,926 53,366 0.96Dah Sing Banking 10,099,621 17,191 0.31Dah Sing Financial 6,563,009 43,210 0.78Dairy Farm International 15,106,163 66,769 1.20Giordano International 49,557,573 19,927 0.36Hang Lung Group 16,514,186 77,541 1.40Hang Lung Properties 16,500,442 58,452 1.05Jardine Strategic Holdings 10,155,039 169,183 3.05Standard Chartered Bank 3,750,404 129,444 2.33Sun Hung Kai Properties 6,685,426 103,448 1.86Swire Pacific ‘A’ 900,491 10,116 0.18Swire Pacific ‘B’ 77,208,092 171,789 3.09Wing Hang Bank 6,843,239 103,120 1.86
1,093,473 19.69
India - 13.17%Aberdeen Global - India Opportunities Fund † 23,175,093 205,795 3.71GAIL 3,100,060 32,915 0.59GAIL GDR 300,000 19,650 0.35GlaxoSmithKline Pharmaceuticals 1,261,550 32,844 0.59Grasim Industries 1,080,560 69,448 1.25Hero Honda 3,135,500 54,349 0.98Housing Development Finance Corp 1,190,000 70,674 1.27ICICI Bank 2,557,048 49,099 0.88Infosys Technologies 2,100,600 75,484 1.36New India Investment Trust † 4,780,000 13,190 0.24Satyam Computer Services 10,940,500 108,218 1.95
731,666 13.17
Indonesia - 1.10%Unilever Indonesia 82,060,036 61,238 1.10
Malaysia - 5.98%British American Tobacco 4,721,920 63,024 1.13Bumiputra Commerce 22,500,030 70,278 1.27Malayan Banking 22,174,011 58,844 1.06Public Bank (Alien) 41,250,714 140,146 2.52
332,292 5.98

14 Aberdeen GlobalAsia Pacific Fund
Portfolio Statement continued
Philippines - 2.42%Ayala Land 286,209,322 72,885 1.31Bank of the Philippine Islands 48,432,854 61,813 1.11
134,698 2.42
Singapore - 21.10%City Developments 19,400,779 154,828 2.79Fraser & Neave Limited 25,800,000 90,419 1.63Oversea-Chinese Banking Corp 36,069,215 211,640 3.81Singapore Airlines 9,900,600 111,521 2.01Singapore Technologies Engineering 66,710,971 163,923 2.95Singapore Telecommunications 58,750,862 166,295 2.99United Overseas Bank 13,150,929 182,354 3.28Venture Corp 11,876,030 90,559 1.64
1,171,539 21.10
South Korea - 10.69%Daegu Bank 2,924,490 38,989 0.70Hyundai Motor (Pref) 550,290 17,211 0.31Kookmin Bank 2,110,901 117,997 2.12Pusan Bank 3,663,570 45,611 0.82Samsung Electronics (Pref) 539,714 242,524 4.37Shinsegae 208,900 131,303 2.37
593,635 10.69
Sri Lanka - 0.82%Commercial Bank of Ceylon 3,554,187 4,611 0.08DFCC Bank 6,108,073 7,075 0.13Dialog Telekom 73,606,300 11,424 0.21Keells (John) 15,737,023 17,462 0.31National Development Bank 2,857,725 4,406 0.09
44,978 0.82
Taiwan - 6.45%Fubon Financial 69,016,000 78,424 1.41Taiwan Mobile 50,922,975 97,964 1.76TSMC 87,500,000 181,576 3.28
357,964 6.45
Thailand - 4.44%PTT Exploration & Production (Foreign) 23,800,045 114,455 2.06Siam Cement (Foreign) 19,223,036 131,802 2.38
246,257 4.44
Total investments 5,496,304 98.98
Other net assets 56,750 1.02
Total 5,553,054 100.00
All securities held at the period end are transferable except where otherwise stated.All securities are listed on an official exchange except where otherwise stated.All investments are in ordinary or common stocks and shares except where otherwise stated.There are no transferable securities and money market instruments dealt in another regulated market except as otherwise stated.† Managed by subsidiaries of Aberdeen Asset Management PLC.
Percentage of Market value total net assets Description Quantity US$’000 %

Aberdeen Global 15Asia Pacific and Japan Fund
Asia Pacific and Japan FundFor the period ended 31 March 2008
Closure of FundThe Fund was closed on 26 October 2007. The Manager is in the process of winding the Fund up.
PerformanceFor the period 1 October 2007 to 26 October 2007, the value of the Aberdeen Global - Asia Pacific and Japan Fund - A Accumulation shares increased by 1.6% compared to an increase of 3.0% in the benchmark, the MSCI AC Asia Pacific Index.
Manager’s reviewAsian equities fell in the period under review, as stock markets worldwide faced increasing volatility amid heightened credit fears and worsening prospects for global economic growth. As financial market de-leveraging intensified, bond insurers and investment banks faced massive write-downs. Evidence of that distress was JP Morgan’s purchase of beleaguered Bear Stearns for a knock-down sum. Further underlining the severity of the situation, the US Federal Reserve resorted to unprecedented measures to boost liquidity in the financial system, as well as reducing interest rates five times, to 2.25%.
Inflation rose sharply across the region, touching multi-year highs in China, Hong Kong and Singapore, while Japanese prices accelerated at their fastest in a decade. Food and fuel prices were the main causes. Most central banks kept interest rates steady, using subsidies and price controls to suppress headline price growth. Still, Australia, China, Korea, Indonesia, India and Taiwan hiked rates, while the Philippines eased policy.
While fourth-quarter GDP growth generally exceeded expectations across the region, 2008 growth forecasts were downgraded on weakening export demand. Only Thailand raised its forecast. To boost growth, India’s budget waived US$15bn in loans to farmers, while Hong Kong and Singapore offered tax breaks to help the less well off.
In politics, Korea’s president-elect Lee Myung-Bak began his term; Taiwanese opposition candidate Ma Ying-jeou won the presidential vote on a pro-growth platform, as expected; but Malaysia’s ruling Umno party suffered a shock loss of its two-third parliamentary majority at the general election. In Japan, opposition MPs rejected the ruling LDP’s candidates to run the central bank, leaving it rudderless. Former Thai premier Thaksin Shinawatra returned home after 17 months, but pledged to stay out of politics.
Portfolio reviewDuring the review period, the Fund rose by 1.6%, compared to the benchmark MSCI AC Asia Pacific Index’s rise of 3.0%.
The Fund was terminated on 26 October 2007, following the redemption of a major shareholder, and all positions were closed out.

16 Aberdeen GlobalAsia Pacific and Japan Fund
Statement of Net Assets
As at 31 March 2008
Assets US$’000
Cash at bank 45
Other assets 33
Total assets 78
Liabilities
Taxes and expenses payable 9
Other liabilities 69
Total liabilities 78
Net assets at the end of the period -
Statement of Changes in Net Assets
For the period from 1 October 2007 to 31 March 2008
US$’000
Net assets at the beginning of the period 6,192
Net gains from investments 11
Realised gains on investments 518
Currency exchange losses (4)
Decrease in unrealised appreciation on investments (405)
Proceeds from shares issued 176
Payments for shares redeemed (6,487)
Net equalisation paid (note 11) (1)
Net assets at the end of the period –
Statement of Operations
For the period from 1 October 2007 to 31 March 2008
Income US$’000
Income from investments 16
Bank interest 4
Total income 20
Expenses
Net management fee (note 4.6) 9
Administration fee (note 4.1) 9
Domiciliary agent, registrar, paying and
transfer agent fees (note 4.4) 13
Operational expenses (note 4.7) (22)
Total expenses 9
Net gains from investments 11
Realised gains on investments 518
Currency exchange losses (4)
Net realised gains 525
Decrease in unrealised
appreciation on investments (405)
Net increase in assets as a result of operations 120
Share Transactions
For the period from 1 October 2007 to 31 March 2008
A-2
Shares outstanding at the beginning of the period 570,137
Shares issued during the period 12,856
Shares redeemed during the period (582,993)
Shares outstanding at the end of the period –
Net asset value per share –
The accompanying notes form an integral part of these financial
statements.
Aberdeen Global 17Asia Pacific and Australasian Bond Fund
Asia Pacific and Australasian Bond FundFor the period ended 31 March 2008
PerformanceFor the six-months ended 31 March 2008, the value of the Aberdeen Global - Asia Pacific and Australasian Bond Fund - A Accumulation shares increased by 3.5% compared to an increase of 6.2% in the benchmark, the iBoxx Pan-Asia (ex China) Index.
Manager’s reviewThe majority of local currency Asian fixed income markets over the six month period to end March 2008 saw yields moving lower. This was somewhat counterintuitive given that this period was characterised by a sharp rise in regional inflation, driven first and foremost by considerable food price inflation and by record highs in oil prices. In addition, fourth quarter 2007 GDP growth numbers showed reassuring resilience to the US and global slowdown and emerged stronger than expected. The clear trend has been a steepening of yield curves, in most cases a bullish steepening, led by a rally in shorter dated bonds. Longer dated bonds have been under more pressure given the inflation threat, most particularly so in Indonesia where the trend rise in CPI data has been most noticeable and where the market remains vulnerable to weak global sentiment.
There were a number of supporting factors for Asian bond markets. At the start of the period the market was already ignoring the US Fed’s less dovish statements that pointed to potentially a lesser need for policy easing given the latent inflation threat. Instead it firmly focussed on the deteriorating economic data which among other things showed continued housing market weakness, deterioration in Consumer Confidence indices and marked worsening in employment data. Momentum behind the financial market crisis also picked up with key global financial institutions announcing larger than expected asset write-downs. This moved the Fed to ease rates a further fifty basis points to 4.25% during the review period before the year end and an additional two hundred basis points during the review period after the year end, which led to a sharp rally in US yields.
Indonesia, Malaysia, South Korea and Thailand were affected by the marked trend rise in inflation data in the fourth quarter and saw their bond markets selling off. But in the case of the latter three markets, the emergency Fed easing and prevalence of bearish sentiment at the start of 2008 allowed even these markets to recover. At the start of the year, with regional growth forecasts being revised down and pricing pressures expected to stabilise as new food supplies came online and oil prices stabilised, CPI inflation was forecast to recover as well. Further support for bond yields came from a continued sell off in Asian equity markets, with the MSCI Asia Pacific equity index down 15% over the period and continued spikes in volatility.
By February oil prices surged through US$100 pressuring fuel costs and in addition there had been a general pick up in vegetable, grain, cooking oil, livestock and rice prices, a result of dry weather in Europe, drought in Australia and flooding in China aggravating food supplies and prices.
Given the risks to growth from a global slowdown moving forward, policymakers clearly have a preference for easing rates. The inflation risk has largely kept policy rates on hold up till now with policymakers pointing to the supply side nature of the shock as the key reason for not having to tighten policy rates at least in the near term, even as real yields have been seen moving lower or substantially negative, with the exceptions of India and Indonesia. However central banks potentially face a stagflation dilemma should inflation broaden as growth slows moving into the second half of the year. This has meant that some of the recovery in yields was eroded over the last couple of months of the period in review as bond markets priced in a transition from a neutral/easing policy bias to a neutral/tightening policy bias. Lastly given the prevalence of subsidised goods, the higher cost of food and oil has substantially increased the subsidy costs to governments leading to fiscal pressures, again most notably in Indonesia, with the ramifications of higher than expected bond issuance set to hit the market.
Asian currencies have generally performed well against the US dollar. The key drivers have been a) marked dollar bearishness on deteriorating US fundamentals, b) a policy preference to use stronger currency appreciation to counter higher imported prices, and c) better balanced Asian growth drivers and better than expected fourth quarter growth. The main exceptions were India, South Korea and Indonesia. India has been vulnerable to the spike up in oil prices with the market, given higher aversion generally, having a bias against current account deficit currencies. This also impacted the South Korean won, where economic fundamentals have also been seen rolling over. The Indonesian rupiah was hit by poor global sentiment and risk from a foreign bond investor capitulation, which however hasn’t occurred even as bond yields spiked up.
Portfolio reviewThe bias for bond trades over the period were for risk reduction, in particular reducing market exposure to Indonesia rates and increasing it to Singapore, a more defensive allocation. The duration of the overall portfolio was also reduced by 0.65, again primarily via a reduction in both Indonesia and Singapore duration. On the currency side we added risk to Singapore dollar, Thai baht, Philippine peso and Malaysian ringgit and reduced it to Indonesian rupiah.
OutlookReal bond yields are mostly negative across the region. And while tighter monetary policy will not solve supply side shortages particularly in food, we note that many countries still suffer from excessive money supply growth and overly generous credit conditions given the level of domestic growth momentum in their economies. Combined with potentially broader inflation there is a risk central banks have to hike rates as growth slows unless the price pressures ease.

18 Aberdeen GlobalAsia Pacific and Australasian Bond Fund
However we expect growth and inflationary pressures to ease in the second half of 2008 and to see a shift towards more relaxed monetary policy for many countries and a more constructive outlook for fixed income markets.
Overall, we continue to expect potential weakness across the region to be seen firstly in the export sectors of most countries. While numerous policy makers are likely to pin their hopes on China as a buffer to weaker global growth in 2008, we suspect that Chinese imports will also soften as global growth slows. Recent trade data suggests that several Asian countries have managed to diversify their export base towards the middle-east and various emerging markets. The region approaches the pending slowdown in global growth in a much better position than in previous cycles. Positive fiscal balances, strong external accounts, firm corporate balance sheets and ample liquidity support the region’s need to further develop infrastructure in coming years. This should cushion Asia’s growth profile in the coming 12-18 months as global growth slows.
Asian fundamentals remain very positive, however we have seen substantial currency appreciation already so there is a risk that should accommodative policy in the US gain traction and data improves as Asia’s softens, Asian currencies may enter a softer couple of quarters against the US dollar. However it is unlikely that we have seen the end of the US economic and financial market crisis that has driven the dollar bearishness, and with the US Fed still set to ease policy rates substantially, interest rate differentials will increasingly favour Asian currencies.
Aberdeen Global 19Asia Pacific and Australasian Bond Fund
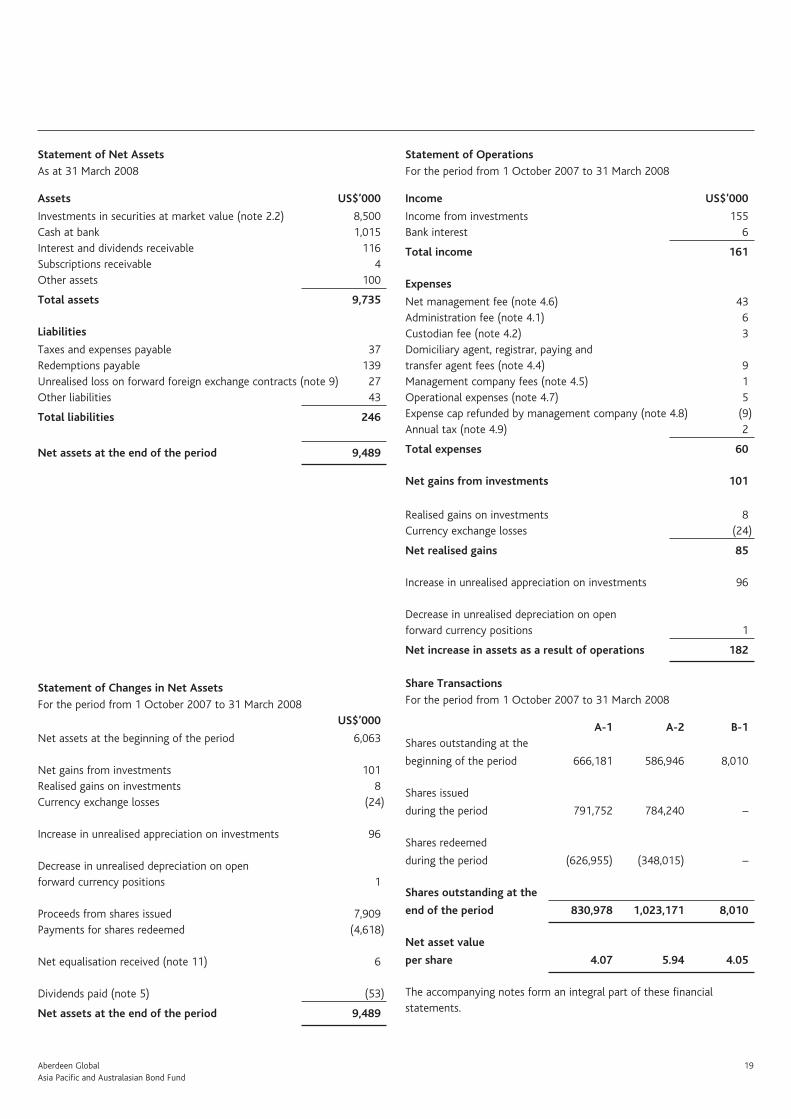
Statement of Net Assets
As at 31 March 2008
Assets US$’000
Investments in securities at market value (note 2.2) 8,500 Cash at bank 1,015 Interest and dividends receivable 116 Subscriptions receivable 4 Other assets 100
Total assets 9,735
Liabilities
Taxes and expenses payable 37 Redemptions payable 139 Unrealised loss on forward foreign exchange contracts (note 9) 27 Other liabilities 43
Total liabilities 246
Net assets at the end of the period 9,489
Statement of Changes in Net Assets
For the period from 1 October 2007 to 31 March 2008 US$’000
Net assets at the beginning of the period 6,063
Net gains from investments 101 Realised gains on investments 8 Currency exchange losses (24)
Increase in unrealised appreciation on investments 96
Decrease in unrealised depreciation on open forward currency positions 1
Proceeds from shares issued 7,909 Payments for shares redeemed (4,618)
Net equalisation received (note 11) 6
Dividends paid (note 5) (53)
Net assets at the end of the period 9,489
Statement of Operations
For the period from 1 October 2007 to 31 March 2008
Income US$’000
Income from investments 155 Bank interest 6
Total income 161
Expenses
Net management fee (note 4.6) 43 Administration fee (note 4.1) 6 Custodian fee (note 4.2) 3 Domiciliary agent, registrar, paying and transfer agent fees (note 4.4) 9 Management company fees (note 4.5) 1 Operational expenses (note 4.7) 5 Expense cap refunded by management company (note 4.8) (9) Annual tax (note 4.9) 2
Total expenses 60
Net gains from investments 101
Realised gains on investments 8 Currency exchange losses (24)
Net realised gains 85
Increase in unrealised appreciation on investments 96
Decrease in unrealised depreciation on open forward currency positions 1
Net increase in assets as a result of operations 182
Share Transactions
For the period from 1 October 2007 to 31 March 2008
A-1 A-2 B-1Shares outstanding at the
beginning of the period 666,181 586,946 8,010
Shares issued
during the period 791,752 784,240 –
Shares redeemed
during the period (626,955) (348,015) –
Shares outstanding at the
end of the period 830,978 1,023,171 8,010
Net asset value
per share 4.07 5.94 4.05
The accompanying notes form an integral part of these financial statements.

20 Aberdeen GlobalAsia Pacific and Australasian Bond Fund
Portfolio StatementAs at 31 March 2008
Percentage of Market value total net assets Description Nominal US$’000 %
Hong Kong - 6.51%Hong Kong Government 3.52% 22/03/10 1,950,000 262 2.76Hong Kong Government 4.33% 07/12/15 1,350,000 197 2.08Hong Kong Government 4.40% 22/08/13 1,100,000 158 1.67
617 6.51
Indonesia - 8.01%Indonesia Government 11% 15/12/12 1,450,000,000 161 1.70Indonesia Government 12.5% 15/03/13 4,137,000,000 483 5.09Indonesia Recapital 10.75% 15/05/16 1,077,000,000 116 1.22
760 8.01
South Korea - 19.72%Korea Treasury Bond 4.75% 10/03/12 1,083,000,000 1,072 11.30Korea Treasury Bond 5.00% 10/09/16 430,200,000 422 4.45Korea Treasury Bond 5.25% 10/12/10 375,100,000 377 3.97
1,871 19.72
Malaysia - 13.94%Malaysia Government 3.50% 31/05/27 450,000 127 1.34Malaysia Government 3.756% 28/04/11 2,941,000 930 9.80Malaysia Government 4.262% 15/09/16 340,000 111 1.17Malaysia Government 4.72% 30/09/15 465,000 155 1.63
1,323 13.94
Philippines - 6.61%Philippine Government 8.50% 17/02/09 2,920,000 72 0.76Philippine Government 7.125% 02/11/13 10,100,000 249 2.62Philippine Government 9.125% 04/09/16 1,920,000 52 0.55Philippine Government 8.5% 03/03/11 10,000,000 254 2.68
627 6.61
Singapore - 19.48%Asia Development Bank 3.27% 08/02/12 1,000,000 760 8.01Singapore Government 3.75% 01/09/16 451,000 364 3.83Singapore T Bills 0% 17/04/08 1,000,000 725 7.64
1,849 19.48
Thailand - 15.31%Asia Development Bank 5.54% 18/09/16 15,000,000 505 5.32Thailand Government 4.5% 11/03/12 13,000,000 428 4.51Thailand Government 5.25% 12/05/14 11,000,000 372 3.92Thailand Government 5.375% 15/05/09 4,550,000 148 1.56
1,453 15.31
Total investments 8,500 89.58
Other net assets 989 10.42
Total 9,489 100.00
All securities held at the period end are transferable except where otherwise stated.All securities are listed on an official exchange except where otherwise stated.All investments are in fixed interest securities and equity securities except where otherwise stated.There are no transferable securities and money market instruments dealt in another regulated market except as otherwise stated.

Aberdeen Global 21Asian Smaller Companies Fund
Asian Smaller Companies FundFor the period ended 31 March 2008
PerformanceFor the six-months ended 31 March 2008, the value of the Aberdeen Global - Asian Smaller Companies Fund - A Accumulation shares decreased by 4.1% compared to a decrease of 15.4% in the benchmark, the MSCI AC Asia Pacific ex Japan Small Cap Index.
Change in benchmarkThe Fund changed its benchmark from the MSCI AC Asia Pacific ex Japan Index to the MSCI AC Asia Pacific ex Japan Small Cap Index on 1 October 2007.
Manager’s reviewIn the half year under review, Asian equities, like their global counterparts, fell amid increasingly volatile market conditions. Sentiment was roiled by rapidly deteriorating economic growth prospects that resulted from the imploding US housing and credit markets. What started out as an issue of illiquidity quickly turned into a full-blown financial crisis. To support the financial system, the US Federal Reserve resorted to unprecedented measures, including five interest rate cuts that brought the policy rate to 2.25%. This, however, led to more downward pressure on the dollar, compounding the difficulty Asian policymakers faced as export competitiveness was eroded.
Meanwhile, inflation, caused by more expensive oil and food prices, spiked across Asia, touching multi-year highs in China, Hong Kong and Singapore. In response, Australia, China, Korea, Indonesia, India and Taiwan hiked rates; only the Philippines eased policy. Most other central banks were happy to keep interest rates stable, relying instead on subsidies and price controls to curb headline price growth.
Regional economic growth generally exceeded expectations in the fourth quarter. In contrast, 2008 forecasts were lowered as the fall out from the credit crunch became more apparent. Only Thailand upgraded its forecast, as it had underperformed its peers while political paralysis gripped the country since the bloodless coup in December 2006. Meanwhile, India’s budget waived US$15bn in loans to farmers, while Hong Kong and Singapore offered tax breaks, all in an effort to boost growth.
Portfolio reviewThe Fund fell by 4.1% over the period, compared to the benchmark MSCI AC Asia Pacific ex Japan Small Cap Index’s 15.4% decline, testimony to our defensive style and earlier unwillingness to chase the market.
In portfolio activity, we sold Hong Kong footwear-maker Kingmaker for better opportunities elsewhere, and stock exchange operator Bursa Malaysia, after a strong run-up in its share price. We also accepted the takeover offers for Singapore’s Robinson & Co, the Ascott Group and Straits Trading, which provided us with good exits. We took partial profits in dry bulk shipper Pacific Basin, Korean Reinsurance, plantations company MP Evans, and Sri Lanka’s Distilleries Co after a strong run.
Conversely, we initiated a holding in Hong Kong’s ASM International, and took advantage of market volatility to top up several holdings, including the Philippines’ Cebu Holdings, India’s Castrol, Malaysia’s Oriental Holdings and WBL Corp in Singapore.
OutlookRecent economic data would appear to suggest the slowdown is accelerating. This is reflected in rising job losses, mortgage foreclosures and slower consumer spending in the US. For smaller companies that generally cater to domestic demand, slower global growth may not be felt as acutely as for their larger counterparts, although they are more susceptible to inflationary pressure due largely to their inability to pass on cost increases, given their lack of pricing power. Meanwhile, negative real interest rates has further eroded household incomes.
We are not overly concerned about the portfolio, because it has a natural defensiveness, given our sharp focus on company balance sheets and cashflow. Accordingly, few adjustments to the portfolio have been required since markets peaked last October. With the recent price tumbles, we are looking anew at various stocks with a view to adding to positions, particularly if prices fall a further 10-15%.

22 Aberdeen GlobalAsian Smaller Companies Fund
Statement of Net Assets
As at 31 March 2008
Assets US$’000
Investments in securities at market value (note 2.2) 481,184
Cash at bank 58,208
Interest and dividends receivable 793
Subscriptions receivable 35
Total assets 540,220
Liabilities
Payable for investments purchased 5,346
Taxes and expenses payable 867
Redemptions payable 54
Other liabilities * 2,734
Total liabilities 9,001
Net assets at the end of the period 531,219
* Includes a provision in respect of Thailand capital gains tax of
US$1,898,184.
Statement of Changes in Net Assets
For the period from 1 October 2007 to 31 March 2008
US$’000
Net assets at the beginning of the period 489,709
Net gains from investments 1,032
Realised gains on investments 30,420
Currency exchange losses (370)
Decrease in unrealised appreciation on investments * (50,859)
Proceeds from shares issued 338,198
Payments for shares redeemed (277,109)
Net equalisation received (note 11) 198
Net assets at the end of the period 531,219
Statement of Operations
For the period from 1 October 2007 to 31 March 2008
Income US$’000
Income from investments 5,307
Bank interest 189
Total income 5,496
Expenses
Net management fee (note 4.6) 3,793
Administration fee (note 4.1) 81
Custodian fee (note 4.2) 230
Domiciliary agent, registrar, paying and
transfer agent fees (note 4.4) 160
Management company fees (note 4.5) 36
Operational expenses (note 4.7) 66
Annual tax (note 4.9) 98
Total expenses 4,464
Net gains from investments 1,032
Realised gains on investments 30,420
Currency exchange losses (370)
Net realised gains 31,082
Decrease in unrealised appreciation on investments * (50,859)
Net decrease in assets as a result of operations (19,777)
Share Transactions
For the period from 1 October 2007 to 31 March 2008
A-2 D-2(GBP) I-2 Z-2
Shares outstanding at
the beginning of the
period 8,213,582 11,573,192 175,868 –
Shares issued
during the period 4,457,733 120,602 20,707 22,769,645
Shares redeemed
during the period (1,770,304) (9,786,854) – –
Shares outstanding
at the end
of the period 10,901,011 1,906,940 196,575 22,769,645
Net asset value
per share 23.52 11.81 23.82 9.90
The accompanying notes form an integral part of these financial
statements.

Aberdeen Global 23Asian Smaller Companies Fund
Portfolio Statement As at 31 March 2008
Percentage of Market value total net assets Description Quantity US$’000 %
Hong Kong - 19.48%Aeon Credit Service 7,430,000 6,157 1.16Aeon Stores 4,100,000 8,190 1.54Asia Satellite Telecommunications 5,166,500 9,869 1.86ASM International 300,000 5,433 1.02Café de Coral 5,000,000 9,776 1.84Convenience Retail Asia 15,950,000 5,737 1.08Fong’s Industries 9,000,000 5,110 0.96Giordano International 33,009,000 13,273 2.49Hong Kong & Shanghai Hotels 2,436,258 3,994 0.75Hong Kong Aircraft Engineering 280,000 4,593 0.86Hong Kong Ferry 5,000,000 4,769 0.90Hung Hing Printing 7,202,000 2,392 0.45Pacific Basin Shipping 2,630,000 4,321 0.81Public Financial Holdings 16,346,000 13,712 2.58Texwinca 8,700,000 6,276 1.18
103,602 19.48
India - 7.51%Aventis Pharma 160,299 3,061 0.58Castrol 800,000 4,827 0.91Godrej Consumer Products 3,000,000 9,284 1.75Godrej Consumer Products Rights 360,000 33 0.01Gujarat Gas 734,659 4,314 0.81Jammu & Kashmir Bank 200,000 3,444 0.65Kansai Nerolac Paints 557,035 10,093 1.90Mphasis BFL 950,000 4,783 0.90
39,839 7.51
Indonesia - 5.31%Bank NISP 141,748,674 13,848 2.61Bank Permata 9,970,500 979 0.18Bank UOB Buana 36,391,659 4,345 0.82Dynaplast 12,093,000 1,011 0.19M.P. Evans 900,250 8,021 1.51
28,204 5.31
Malaysia - 15.55%Aeon 5,100,000 15,051 2.83Fraser & Neave Holdings 1,220,900 3,001 0.56Guinness Anchor 5,180,400 8,881 1.67LPI Capital 2,500,900 8,810 1.66Manulife Insurance 3,511,800 3,161 0.60Oriental Holdings 6,812,000 12,212 2.30Panasonic Manufacturing 892,000 2,975 0.56POS Malaysia & Services 10,000,000 5,902 1.11Star Publications 3,463,100 3,730 0.70United Malacca 2,531,400 6,044 1.14United Plantations 3,123,800 12,863 2.42
82,630 15.55

24 Aberdeen GlobalAsian Smaller Companies Fund
Portfolio Statement continued
Philippines - 3.61%Asian Terminals 58,148,000 4,808 0.91Cebu Holdings 91,646,000 4,745 0.89Ginebra San Miguel 5,080,000 2,420 0.46Jollibee Foods 6,250,200 7,153 1.35
19,126 3.61
Singapore - 22.47%Bukit Sembawang Estates 4,000,500 25,750 4.85Eu Yan Sang 19,554,000 8,043 1.51FJ Benjamin Holdings 10,000,000 2,990 0.56Hong Leong Finance 4,620,000 12,792 2.41Robinson & Co 3,672,000 18,378 3.45SBS Transit 5,251,500 9,478 1.78Sembcorp Marine 1,880,000 5,199 0.98Singapore Food Industries 7,597,000 4,171 0.79Singapore Post 6,000,000 4,980 0.94WBL 4,724,000 18,388 3.46Wheelock Properties 6,650,000 9,231 1.74
119,400 22.47
South Korea - 2.88%Daegu Bank 390,000 5,199 0.98Jeonbuk Bank 798,200 5,934 1.12Korean Reinsurance 408,000 4,144 0.78
15,277 2.88
Sri Lanka - 3.00%Aitken Spence 512,700 2,043 0.38Chevron Lubricants Lanka 3,559,600 3,241 0.61Commercial Bank of Ceylon 2,740,600 3,555 0.67Dialog Telekom 1,660,340 258 0.05Distilleries Co of Sri Lanka 3,201,900 2,908 0.55Keells (John) 3,543,797 3,932 0.74
15,937 3.00
Thailand - 10.77%Bumrungrad Hospital (Foreign) 4,678,200 5,049 0.95Central Pattana (Foreign) 9,400,000 8,317 1.57Hana Microelectronics (Foreign) 22,450,300 13,148 2.47Minor Corporation (Foreign) 870,900 406 0.08Regional Container Line (Foreign) 11,504,800 8,911 1.68Siam Makro (Foreign) 3,600,000 11,399 2.15Tisco Bank (Foreign) 10,751,000 9,939 1.87
57,169 10.77
Total investments 481,184 90.58
Other net assets 50,035 9.42
Total 531,219 100.00
All securities held at the period end are transferable except where otherwise stated.All securities are listed on an official exchange except where otherwise stated.All investments are in ordinary or common stocks and shares except where otherwise stated.There are no transferable securities and money market instruments dealt in another regulated market except as otherwise stated
Percentage of Market value total net assets Description Quantity US$’000 %

Aberdeen Global 25Australasian Equity Fund
Australasian Equity FundFor the period ended 31 March 2008
PerformanceFor the six-months ended 31 March 2008, the value of the Aberdeen Global - Australasian Equity Fund - A Accumulation shares decreased by 12.4% compared to a decrease of 16.2% in the benchmark, the Australia All Ordinaries Index.
Manager’s reviewOver the six months under review, the domestic market experienced extreme volatility, having risen to a record high in October. Although the benchmark fell 16.2% over the period, the last few months were the worst that the markets had seen in 19 years owing to the escalating credit crisis. Global bond insurers and investment banks faced unprecedented write-downs, as financial market de-leveraging intensified and money markets seized up. Underlining the severity of the situation, the US Federal Reserve was forced to inject billions of dollars of emergency funding into the financial system, as well as reducing interest rates five times to 2.25%.
In response to global credit concerns, which drove up corporate borrowing costs, the Reserve Bank of Australia (RBA) injected liquidity into domestic money markets. But unlike in the US, with inflation accelerating, thanks to fuel prices and home rents, the RBA raised rates thrice over the period to a 12-year high of 7.25%. However, the demand for commodities remained resilient, with oil prices rising above US$100 a barrel and gold prices at one stage closing above US$1,000 an ounce.
Economic data presented a mixed picture: on the one hand, business investment rebounded on increased Chinese demand for iron ore; and retail sales rose as higher wages and jobs growth fuelled spending. The housing sector remained strong as well. On the other hand, economic growth decelerated to its slowest in more than a year, as construction declined and bottlenecks at ports hurt exports. In addition, high interest rates caused consumer and business borrowing growth to slow, dragging down confidence.
In politics, the Australian Labor Party ended John Howard’s 11-year rule in the November national elections, with Kevin Rudd becoming prime minister.
Portfolio reviewFor the period under review, the Fund fell by 12.4%, outperforming the benchmark Australia All Ordinaries Index by 3.8%. The top three contributors to performance were Incitec Pivot, Rio Tinto and Woodside Petroleum. Incitec Pivot announced it will acquire all the shares in Dyno Nobel, and continued to benefit from strong fertiliser prices. Rio Tinto’s shares were boosted by the bid from BHP Billiton and strong commodity prices, while Woodside was aided by rising spot oil prices.
Stocks that detracted from performance included QBE, ANZ and Bendigo Bank. QBE’s results were below market expectations although
its insurance profitability remained robust. ANZ and Bendigo bank’s earnings were affected by the continued turmoil in the financial markets. Over the period, we initiated positions in AXA Asia Pacific Holdings due to its proven management, exposure to Asia and appealing valuations. We also introduced a position in Computershare, for its strong revenue and competitive advantage given its global position. In addition, we initiated a position in Orica on valuation grounds, given its exposure to the booming resources sector and quality of management, as well as in Incitec Pivot, whose management has a record of consistent value creation. The company, moreover, provides exposure to the booming soft commodities sector.
Against this, we sold Telstra due to the high implementation risk surrounding its transformation programme, regulatory uncertainty and weak cash flows. We also disposed of Downer EDI because of management credibility and the high risk of further losses on construction projects. We sold Suncorp Metway as well due to the lack of a medium-term catalyst for the stock.
Meanwhile in corporate activity, Nippon Steel and Posco negotiated a significantly higher iron price increase of 65% with Vale, effective from 1 April 2008. Meanwhile, BHP Billiton’s bid for Rio Tinto was rejected on valuation grounds.
OutlookVolatility is likely to persist in the coming months as the global credit crisis continues to unravel. The key risks to corporate earnings are a slowing US economy, strong Australian dollar and the inability of companies to pass on rising costs. Investors continue to be wary of companies that have high gearing levels and low interest rate cover, and continue to favour defensive stocks. With persistent high inflation, strong consumption and record low unemployment, interest rates are likely to rise further. While there are signs that earlier monetary tightening is beginning to work, the RBA still expects inflation to exceed 4% in the short term. However, its work may not be done if record commodity prices continue to feed back into domestic income growth, putting continued upward pressure on prices.
Following the recent correction, we see more attention being paid to fundamental value. Given the uncertain outlook for earnings, we have positioned our portfolio defensively. As such, we continue to monitor companies for buying opportunities and remain committed to good quality companies with strong market position, clear strategy and good cash flows.

26 Aberdeen GlobalAustralasian Equity Fund
Statement of Net Assets
As at 31 March 2008
Assets AU$’000
Investments in securities at market value (note 2.2) 83,428
Cash at bank 3,325
Interest and dividends receivable 637
Subscriptions receivable 212
Receivable for investments sold 195
Total assets 87,797
Liabilities
Taxes and expenses payable 178
Redemptions payable 846
Other liabilities 3
Total liabilities 1,027
Net assets at the end of the period 86,770
Statement of Changes in Net Assets
For the period from 1 October 2007 to 31 March 2008
AU$’000
Net assets at the beginning of the period 82,620
Net gains from investments 1,053
Realised gains on investments 1,657
Currency exchange gains 15
Decrease in unrealised appreciation on investments (15,250)
Proceeds from shares issued 35,634
Payments for shares redeemed (18,959)
Net assets at the end of the period 86,770
Statement of Operations
For the period from 1 October 2007 to 31 March 2008
Income AU$’000
Income from investments 1,755
Bank interest 100
Total income 1,855
Expenses
Net management fee (note 4.6) 685
Administration fee (note 4.1) 10
Custodian fee (note 4.2) 13
Distribution fee (note 4.3) 16
Domiciliary agent, registrar, paying and
transfer agent fees (note 4.4) 36
Management company fees (note 4.5) 7
Operational expenses (note 4.7) 12
Annual tax (note 4.9) 23
Total expenses 802
Net gains from investments 1,053
Realised gains on investments 1,657
Currency exchange gains 15
Net realised gains 2,725
Decrease in unrealised
appreciation on investments (15,250)
Net decrease in assets as a result of operations (12,525)
Share Transactions
For the period from 1 October 2007 to 31 March 2008
A-2 B-2
Shares outstanding at the beginning
of the period 2,544,176 121,708
Shares issued during the period 1,160,151 –
Shares redeemed during the period (628,537) (7,500)
Shares outstanding at the end
of the period 3,075,790 114,208
Net asset value per share 27.32 24.10
The accompanying notes form an integral part of these financial
statements.

Aberdeen Global 27Australasian Equity Fund
Portfolio Statement As at 31 March 2008
Percentage of Market value total net assets Description Quantity AU$’000 %
Consumer Discretionary - 10.00%Billabong International 127,500 1,648 1.90Fairfax Media Ltd 456,800 1,585 1.83Tabcorp Holdings 233,200 3,290 3.79Tatts Group Ltd 618,500 2,149 2.48
8,672 10.00
Consumer Staples - 15.83%Goodman Fielder 793,610 1,423 1.64Lion Nathan 313,500 2,737 3.15Metcash 504,500 2,053 2.37Wesfarmers 94,200 3,757 4.33Woolworths 130,500 3,765 4.34
13,735 15.83
Energy - 4.49%
Woodside Petroleum 71,750 3,895 4.49
Financials - 32.51%Australia & New Zealand Bank 226,600 5,123 5.90Australian Stock Exchange 62,200 2,329 2.68AXA Asia Pacific Holdings 156,200 865 1.00Bendigo Bank 162,000 1,932 2.23Commonwealth Bank of Australia 78,000 3,262 3.76QBE Insurance Group 251,500 5,590 6.44Westfield Group 205,700 3,659 4.22Westpac Bank 229,500 5,446 6.28
28,206 32.51
Health Care - 1.12%
Ramsay Health Care 90,500 969 1.12
Industrials - 5.24%Bradken 98,000 665 0.77Leighton Holdings 47,800 2,037 2.35Toll Holdings 185,500 1,843 2.12
4,545 5.24
Information Technology - 1.10%
Computershare 109,250 957 1.10
Materials - 20.57%BHP Billiton 229,500 8,229 9.48Incitec Pivot 10,800 1,505 1.73Orica 46,800 1,353 1.56Rio Tinto 55,100 6,770 7.80
17,857 20.57
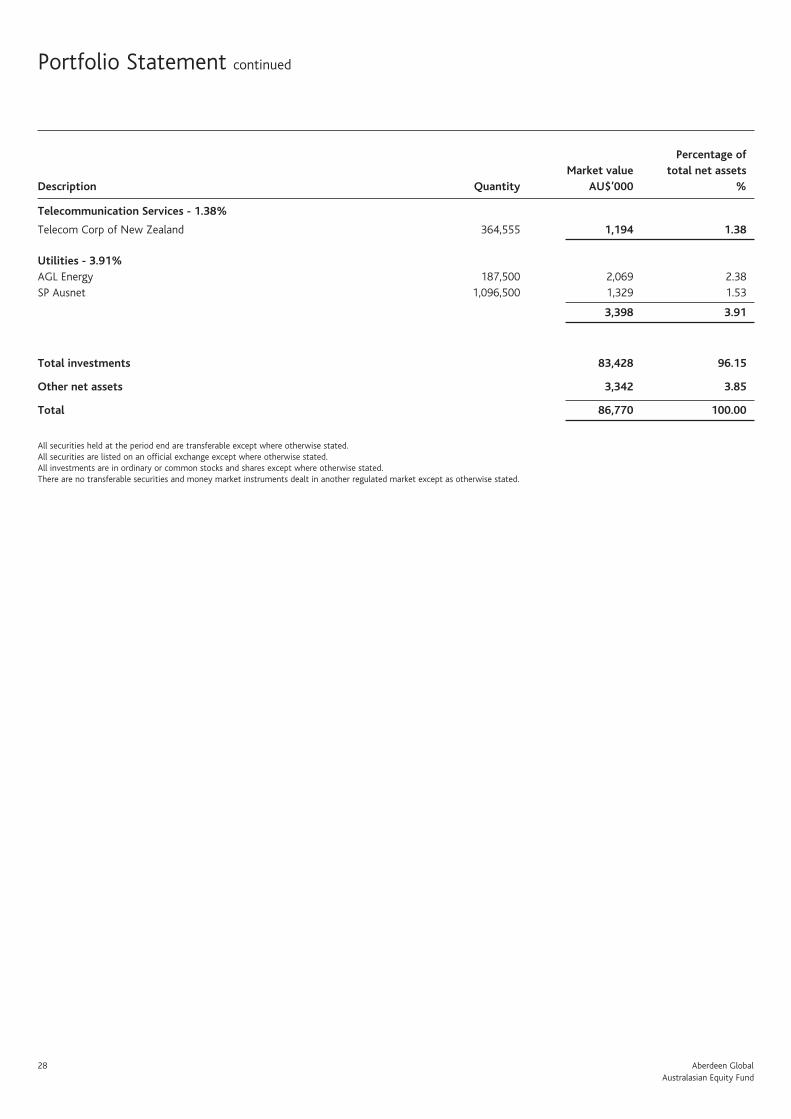
28 Aberdeen GlobalAustralasian Equity Fund
Telecommunication Services - 1.38%
Telecom Corp of New Zealand 364,555 1,194 1.38
Utilities - 3.91%AGL Energy 187,500 2,069 2.38SP Ausnet 1,096,500 1,329 1.53
3,398 3.91
Total investments 83,428 96.15
Other net assets 3,342 3.85
Total 86,770 100.00
All securities held at the period end are transferable except where otherwise stated.All securities are listed on an official exchange except where otherwise stated.All investments are in ordinary or common stocks and shares except where otherwise stated.There are no transferable securities and money market instruments dealt in another regulated market except as otherwise stated.
Portfolio Statement continued
Percentage of Market value total net assets Description Quantity AU$’000 %

Aberdeen Global 29 China Opportunities Fund
China Opportunities FundFor the period ended 31 March 2008
PerformanceFor the six-months ended 31 March 2008, the value of the Aberdeen Global - China Opportunities Fund - A Accumulation shares decreased by 13.2% compared to a decrease of 21.9% in the benchmark, the MSCI Zhong Hua Index.
Change in benchmarkThe Fund changed its benchmark from the MSCI China Index to the MSCI Zhong Hua Index on 1 October 2007.
Manager’s reviewThe sustained run-up in Chinese equities came to a halt during the half-year under review. Credit fears, aggravated inter alia, by troubled investment bank Bear Stearns, sparked a broad global sell-off amid intense volatility, affecting markets worldwide. The US Federal Reserve’s aggressive interest rate cuts and liquidity injections underlined the severity of the crisis. But there were solid domestic reasons for a sell-off too. Beijing’s measures to cool the mainland’s overheating economy followed by weather-related chaos in transport and power further dampened sentiment. Hong Kong shares fared slightly better, but failed to sustain their early gains, as initial hopes of an influx of mainland investment proved ill-founded. Despite a late rebound, both mainland and Hong Kong stock markets ended lower over the reporting period – the former always vulnerable to a reverse given the extreme valuations attained by mid last year.
The market turmoil prompted several companies in Hong Kong to postpone their initial public offerings, while on the mainland, insurer Ping An’s plans to raise fresh capital was substantially reduced after regulators voiced concern over the impact of such fund-raising on the market. Aside from a full schedule of government-backed IPOs, the mainland faces the release of billions of dollars of previously locked up but now tradeable securities later this year. It appears the authorities fear yet more supply might disrupt this queue.
China’s economic growth continued to surpass expectations, with rising domestic consumption pushing the annual GDP growth to more than 11% in 2007. However, export growth and industrial production cooled further, after slowing towards the end of last year, amid easing demand in key markets, in particular the US. In Hong Kong, healthy domestic spending and China’s robust expansion supported growth over the year.
But accelerating inflation became an increasing concern. At the annual National People’s Congress, Chinese premier Wen Jiabao reiterated that cooling inflation remained the government’s top priority and promised to implement tighter measures to prevent the domestic economy from overheating. The mainland authorities had earlier imposed price controls for a range of necessities, such as basic foods and transport, and
repeatedly hiked the reserve requirement for banks. It also continued its policy of allowing an upward revaluation of the renminbi. However, the currency remains heavily undervalued. In Hong Kong, where the dollar is fixed to the US dollar, rate cuts have followed the Fed easing. The government sought to stimulate spending with an expansionary Budget, with both corporate and personal tax breaks. This appears to have helped the all-important property market, where the residential sector is affordable but constrained by lack of supply.
Portfolio reviewThe Fund outperformed the benchmark MSCI Zhong Hua Index during the reporting period. Our preference for better-run and less expensive traditional Hong Kong stocks, instead of H-shares and red chips, contributed to the Fund’s relative performance. There was considerable profit-taking on H-shares in tandem with mainland declines.
In portfolio activity, we topped up our position in Yanlord Land, a Singapore-listed property developer in China, with a good reputation for quality. Against this, we took partial profits in Hong Kong Aircraft Engineering Co, Hang Lung Group and dry bulk shipper Pacific Basin, and sold out of Beijing Capital International Airport following a strong run in their share prices.
Outlook Looking ahead, we expect equity markets in Hong Kong and China to remain volatile in the short term. Mainland shares in particular face downward adjustment. Talk that China could ‘decouple’ from the west has now faded, with the prospects for cyclicals – last year’s big winners – being revised down sharply as the credit crisis ripples through export markets. Meanwhile, underlying economic activity remains brisk. We have some scepticism towards GDP numbers from the mainland but estimated expansion at about 10% appears likely this year. Much of that is being driven by construction and public spending. The big challenge for policymakers is rising inflation along with dollar weakness. For companies, subsidies to a degree shield rises in material costs; but weaker demand is more intractable.
In the markets, the price of mainland A shares has now fallen close to that of their Hong Kong counterparts. But even with the disappearing premium, on an absolute basis, mainland stocks are probably good value only on a very selective basis. We will be watching earnings reports closely in Hong Kong.
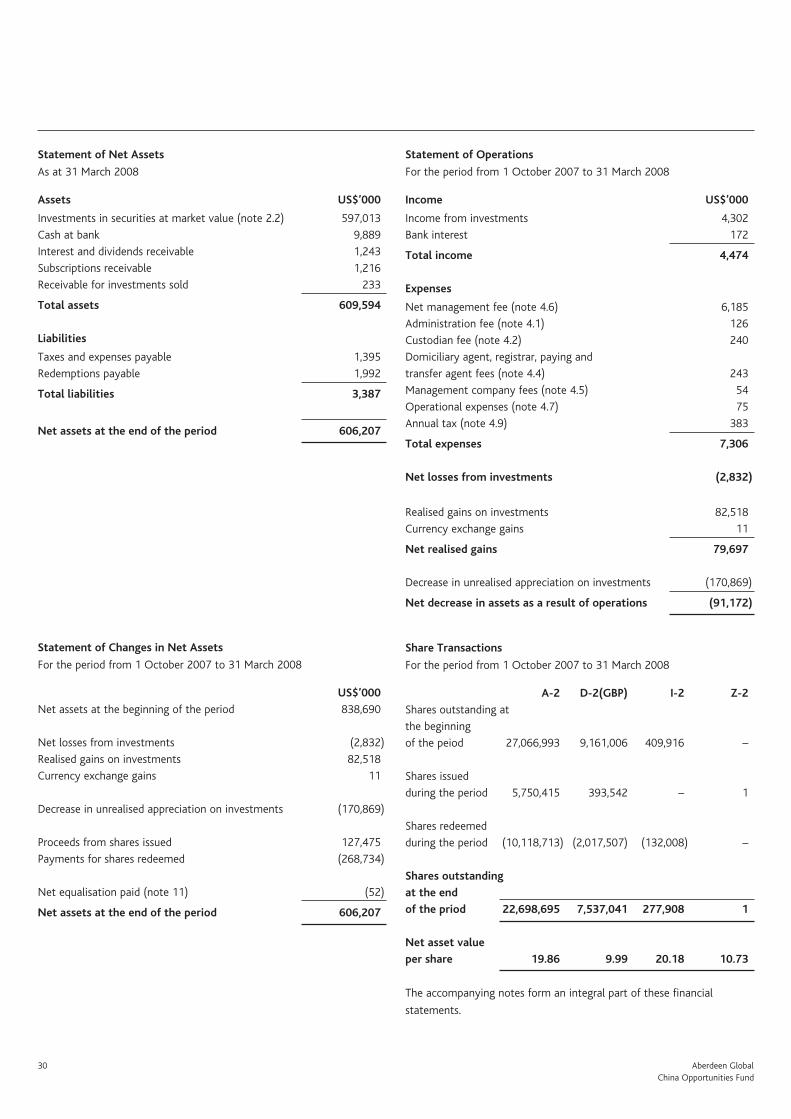
30 Aberdeen GlobalChina Opportunities Fund
Statement of Net Assets
As at 31 March 2008
Assets US$’000
Investments in securities at market value (note 2.2) 597,013
Cash at bank 9,889
Interest and dividends receivable 1,243
Subscriptions receivable 1,216
Receivable for investments sold 233
Total assets 609,594
Liabilities
Taxes and expenses payable 1,395
Redemptions payable 1,992
Total liabilities 3,387
Net assets at the end of the period 606,207
Statement of Changes in Net Assets
For the period from 1 October 2007 to 31 March 2008
US$’000
Net assets at the beginning of the period 838,690
Net losses from investments (2,832)
Realised gains on investments 82,518
Currency exchange gains 11
Decrease in unrealised appreciation on investments (170,869)
Proceeds from shares issued 127,475
Payments for shares redeemed (268,734)
Net equalisation paid (note 11) (52)
Net assets at the end of the period 606,207
Statement of Operations
For the period from 1 October 2007 to 31 March 2008
Income US$’000
Income from investments 4,302
Bank interest 172
Total income 4,474
Expenses
Net management fee (note 4.6) 6,185
Administration fee (note 4.1) 126
Custodian fee (note 4.2) 240
Domiciliary agent, registrar, paying and
transfer agent fees (note 4.4) 243
Management company fees (note 4.5) 54
Operational expenses (note 4.7) 75
Annual tax (note 4.9) 383
Total expenses 7,306
Net losses from investments (2,832)
Realised gains on investments 82,518
Currency exchange gains 11
Net realised gains 79,697
Decrease in unrealised appreciation on investments (170,869)
Net decrease in assets as a result of operations (91,172)
Share Transactions
For the period from 1 October 2007 to 31 March 2008
A-2 D-2(GBP) I-2 Z-2
Shares outstanding at
the beginning
of the peiod 27,066,993 9,161,006 409,916 –
Shares issued
during the period 5,750,415 393,542 – 1
Shares redeemed
during the period (10,118,713) (2,017,507) (132,008) –
Shares outstanding
at the end
of the priod 22,698,695 7,537,041 277,908 1
Net asset value
per share 19.86 9.99 20.18 10.73
The accompanying notes form an integral part of these financial
statements.
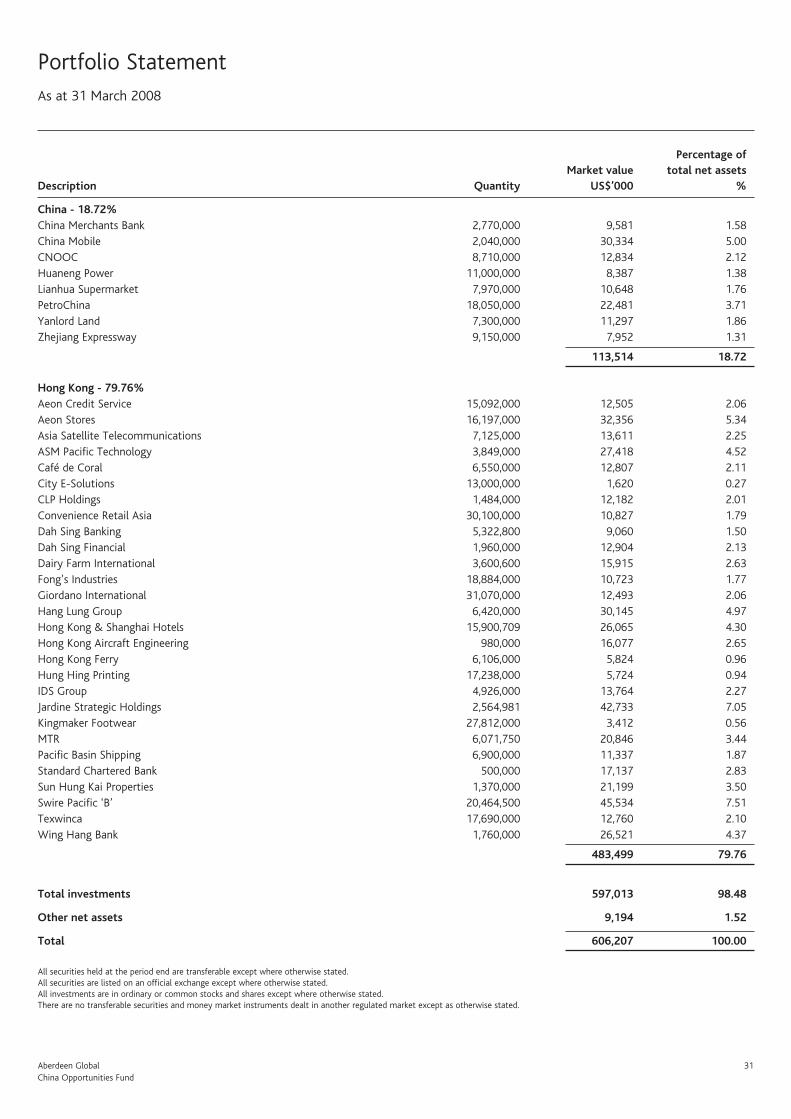
Aberdeen Global 31 China Opportunities Fund
Portfolio Statement As at 31 March 2008
Percentage of Market value total net assets Description Quantity US$’000 %
China - 18.72%China Merchants Bank 2,770,000 9,581 1.58China Mobile 2,040,000 30,334 5.00CNOOC 8,710,000 12,834 2.12Huaneng Power 11,000,000 8,387 1.38Lianhua Supermarket 7,970,000 10,648 1.76PetroChina 18,050,000 22,481 3.71Yanlord Land 7,300,000 11,297 1.86Zhejiang Expressway 9,150,000 7,952 1.31
113,514 18.72
Hong Kong - 79.76%Aeon Credit Service 15,092,000 12,505 2.06Aeon Stores 16,197,000 32,356 5.34Asia Satellite Telecommunications 7,125,000 13,611 2.25ASM Pacific Technology 3,849,000 27,418 4.52Café de Coral 6,550,000 12,807 2.11City E-Solutions 13,000,000 1,620 0.27CLP Holdings 1,484,000 12,182 2.01Convenience Retail Asia 30,100,000 10,827 1.79Dah Sing Banking 5,322,800 9,060 1.50Dah Sing Financial 1,960,000 12,904 2.13Dairy Farm International 3,600,600 15,915 2.63Fong’s Industries 18,884,000 10,723 1.77Giordano International 31,070,000 12,493 2.06Hang Lung Group 6,420,000 30,145 4.97Hong Kong & Shanghai Hotels 15,900,709 26,065 4.30Hong Kong Aircraft Engineering 980,000 16,077 2.65Hong Kong Ferry 6,106,000 5,824 0.96Hung Hing Printing 17,238,000 5,724 0.94IDS Group 4,926,000 13,764 2.27Jardine Strategic Holdings 2,564,981 42,733 7.05Kingmaker Footwear 27,812,000 3,412 0.56MTR 6,071,750 20,846 3.44Pacific Basin Shipping 6,900,000 11,337 1.87Standard Chartered Bank 500,000 17,137 2.83Sun Hung Kai Properties 1,370,000 21,199 3.50Swire Pacific ‘B’ 20,464,500 45,534 7.51Texwinca 17,690,000 12,760 2.10Wing Hang Bank 1,760,000 26,521 4.37
483,499 79.76
Total investments 597,013 98.48
Other net assets 9,194 1.52
Total 606,207 100.00
All securities held at the period end are transferable except where otherwise stated.All securities are listed on an official exchange except where otherwise stated.All investments are in ordinary or common stocks and shares except where otherwise stated.There are no transferable securities and money market instruments dealt in another regulated market except as otherwise stated.

32 Aberdeen GlobalEmerging Markets Fund
Emerging Markets FundFor the period ended 31 March 2008
PerformanceFor the six-months ended 31 March 2008, the value of the Aberdeen Global - Emerging Markets Fund - A Accumulation shares decreased by 5.4% compared to a decrease 7.7% in the benchmark, the MSCI Emerging Markets Index.
Manager’s review The period under review was turbulent for global financial markets, as recurring credit fears caused investor sentiment to swing sharply. Emerging equities were not spared. However, they started off by hitting all-time highs in October, as investors bet that strong growth would immunise them from the unfolding difficulties in the developed world. Buoyant economic expansion, driven by robust domestic demand and steady exports, led to record capital inflows. But in a matter of weeks, investors reversed their assumptions as the worsening credit crunch and growing recessionary fears battered confidence. This, coupled with an anaemic US dollar, led to a widespread sell-off in mid-January. After the US Federal Reserve’s aggressive monetary easing and liquidity injections that same month, most markets rebounded.
The broad decline in emerging equity markets contrasted with the region’s relatively healthy economic expansion, spearheaded by Brazil, Russia, India and China – known colloquially as the BRIC group of economies. Elsewhere, Argentina benefited from higher commodity prices; in Mexico, where the bulk of exports go to the US, the economy remained surprisingly robust. Although escalating oil prices threatened to stall economic expansion in some countries, current account surpluses and strong foreign exchange reserves afforded governments the option of increasing expenditure to boost growth.
Policy decisions were made harder by inflationary pressures which intensified over the review period. A combination of poor harvests, reduced acreage and sustained demand saw prices for food staples soar. A supply-demand squeeze saw energy prices also vault higher, with oil breaching US$100 per barrel. With headline inflation in many countries reaching multi-year highs, several central banks including those of Russia, Hungary and South Africa responded by tightening interest rates. In emerging Asia, policymakers preferred to let currencies appreciate, while using price controls and subsidies to curb inflation. China and India, in particular, repeatedly tightened credit and increased their reserve requirement for banks. Israel, Turkey and the Philippines bucked the trend, easing their policies due to lacklustre growth prospects.
Portfolio reviewThe Fund outperformed the benchmark index during the half year under review.
We introduced Argentina’s Tenaris on upbeat prospects amid an investment boom by oil producers and on compelling valuations. Against this, we trimmed our positions in Brazil’s Vale and Petrobras after their strong performances, and sold out of India’s GAIL and Korea’s Hyundai Motors. We also took the opportunity to top-slice our positions in Indonesian conglomerate Astra International and China Mobile.
OutlookProspects for emerging countries remain clouded in the short term, as the impact on economic growth of global financial de-leveraging is only slowly becoming clearer. Despite the US Fed’s recent moves to inject liquidity into the financial system, there is justifiable nervousness whether enough has been done. This is reflected in share price volatility. Meanwhile, accelerating inflation presents a dilemma for policymakers particularly in emerging markets, limiting the scope for further interest rate cuts.
A key concern for emerging markets is that investors’ expectations are still too optimistic, given decelerating global growth and rising cost pressures. Consensus forecast earnings growth for emerging markets in 2008 is 15%, which is probably too high given decelerating growth and cost pressures. We remain cautious, although stocks now offer reasonable if not yet compelling value. Were markets to correct further it would enable us to buy into what remains a fundamentally sound long-term investment case. But we are prepared for some choppiness first.
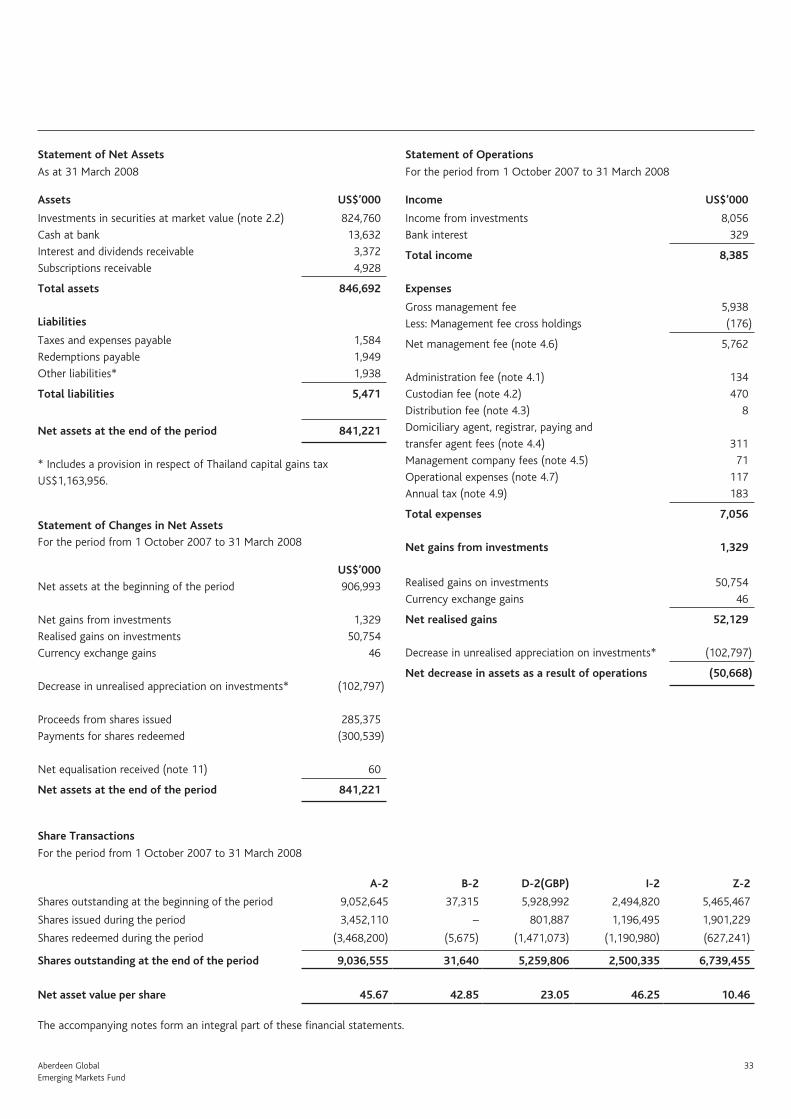
Aberdeen Global 33Emerging Markets Fund
Statement of Net Assets
As at 31 March 2008
Assets US$’000
Investments in securities at market value (note 2.2) 824,760
Cash at bank 13,632
Interest and dividends receivable 3,372
Subscriptions receivable 4,928
Total assets 846,692
Liabilities
Taxes and expenses payable 1,584
Redemptions payable 1,949
Other liabilities* 1,938
Total liabilities 5,471
Net assets at the end of the period 841,221
* Includes a provision in respect of Thailand capital gains tax
US$1,163,956.
Statement of Changes in Net Assets
For the period from 1 October 2007 to 31 March 2008
US$’000
Net assets at the beginning of the period 906,993
Net gains from investments 1,329
Realised gains on investments 50,754
Currency exchange gains 46
Decrease in unrealised appreciation on investments* (102,797)
Proceeds from shares issued 285,375
Payments for shares redeemed (300,539)
Net equalisation received (note 11) 60
Net assets at the end of the period 841,221
Statement of Operations
For the period from 1 October 2007 to 31 March 2008
Income US$’000
Income from investments 8,056
Bank interest 329
Total income 8,385
Expenses
Gross management fee 5,938
Less: Management fee cross holdings (176)
Net management fee (note 4.6) 5,762
Administration fee (note 4.1) 134
Custodian fee (note 4.2) 470
Distribution fee (note 4.3) 8
Domiciliary agent, registrar, paying and
transfer agent fees (note 4.4) 311
Management company fees (note 4.5) 71
Operational expenses (note 4.7) 117
Annual tax (note 4.9) 183
Total expenses 7,056
Net gains from investments 1,329
Realised gains on investments 50,754
Currency exchange gains 46
Net realised gains 52,129
Decrease in unrealised appreciation on investments* (102,797)
Net decrease in assets as a result of operations (50,668)
Share Transactions
For the period from 1 October 2007 to 31 March 2008
A-2 B-2 D-2(GBP) I-2 Z-2
Shares outstanding at the beginning of the period 9,052,645 37,315 5,928,992 2,494,820 5,465,467
Shares issued during the period 3,452,110 – 801,887 1,196,495 1,901,229
Shares redeemed during the period (3,468,200) (5,675) (1,471,073) (1,190,980) (627,241)
Shares outstanding at the end of the period 9,036,555 31,640 5,259,806 2,500,335 6,739,455
Net asset value per share 45.67 42.85 23.05 46.25 10.46
The accompanying notes form an integral part of these financial statements.

34 Aberdeen GlobalEmerging Markets Fund
Portfolio Statement As at 31 March 2008
Percentage of Market value total net assets Description Quantity US$’000 %
Argentina - 1.85%
Tenaris ADR 318,600 15,557 1.85
Brazil - 15.05%Banco Bradesco (Pref) ADR 859,000 23,623 2.81CVRD ADR 1,171,000 33,748 4.01Lojas Renner 808,000 14,875 1.77Petroleo Brasileiro (Pref) ADR 323,460 26,983 3.21Souza Cruz 494,000 12,749 1.52Ultrapar (Pref) 423,000 14,555 1.73
126,533 15.05
Chile - 2.18%
Banco Santander - Chile ADR 354,000 18,316 2.18
China - 5.87%China Mobile 1,907,000 28,357 3.37PetroChina 16,904,575 21,054 2.50
49,411 5.87
Czech Republic - 1.71%
Erste Bank 220,000 14,373 1.71
Hong Kong - 4.49%Hang Lung Group 3,927,000 18,439 2.19Swire Pacific ‘A’ 143,500 1,612 0.19Swire Pacific ‘B’ 7,964,000 17,720 2.11
37,771 4.49
Hungary - 2.94%Danubius Hotel and Spa 45,785 1,707 0.20Gedeon Richter GDR 107,200 23,048 2.74
24,755 2.94
India - 11.34%Aberdeen Global - India Opportunities Fund D2 † 117,498 8,964 1.06Aberdeen Global - India Opportunities Fund Z2 † 1,915,610 16,264 1.93GlaxoSmithKline Pharmaceuticals 386,000 10,049 1.19Grasim Industries 110,853 7,124 0.85Grasim Industries GDR 50,700 3,346 0.40HDFC 185,000 10,987 1.31Hero Honda 592,383 10,268 1.22ICICI Bank 666,703 12,802 1.52Satyam Computer Services 1,581,298 15,641 1.86
95,445 11.34
Indonesia - 1.75%
P.T Astra International 5,551,500 14,598 1.75

Aberdeen Global 35Emerging Markets Fund
Israel - 3.22%Check Point Software 508,000 11,491 1.37Teva Pharmaceuticals ADR 338,000 15,551 1.85
27,042 3.22
Malaysia - 3.40%Bumiputra Commerce 3,335,400 10,418 1.24Public Bank 5,358,100 18,204 2.16
28,622 3.40
Mexico - 10.66%Consorcio ARA 10,853,000 10,858 1.29FEMSA ADR 684,100 27,932 3.32Grupo Aeroportuario del Sureste ADS 185,600 10,353 1.23Grupo Financiero Banorte 5,214,600 21,959 2.61Organizacion Soriana 6,679,000 18,584 2.21
89,686 10.66
Philippines - 1.87%Ayala Land 29,029,300 7,392 0.88Bank of the Philippine Islands 6,554,260 8,365 0.99
15,757 1.87
Russia - 3.26%
Lukoil ADR 326,000 27,417 3.26
South Africa - 4.55%Massmart 2,749,000 22,873 2.72Truworths International 4,865,000 15,400 1.83
38,273 4.55
South Korea - 8.20%Daegu Bank 570,000 7,599 0.90Pusan Bank 607,190 7,559 0.90Samsung Electronics (Pref) 92,000 41,341 4.91Shinsegae 20,000 12,571 1.49
69,070 8.20
Sri Lanka - 0.92%Aitken Spence 327,400 1,305 0.16Commercial Bank of Ceylon 832,000 1,079 0.13DFCC Bank 528,750 612 0.07Dialog Telekom 9,439,210 1,465 0.17Distilleries Co 1,320,000 1,199 0.14Keells (John) 1,891,755 2,099 0.25
7,759 0.92
Percentage of Market value total net assets Description Quantity US$’000 %

36 Aberdeen GlobalEmerging Markets Fund
Taiwan - 5.97%Fubon Financial 11,942,000 13,570 1.61Taiwan Mobile 4,028,235 7,749 0.92TSMC 14,000,640 29,054 3.44
50,373 5.97
Thailand - 5.02%PTT Exploration & Production 4,000,000 19,236 2.29Siam Cement (Alien) 3,348,800 22,961 2.73
42,197 5.02
Turkey - 3.79%Akbank 3,155,000 13,334 1.59Aksigorta 279,400 1,032 0.12BIM Birlesik Magazalar 124,400 9,994 1.19Medya * 86,400 – –Migros 497,500 7,445 0.89
31,805 3.79
Total investments 824,760 98.04
Other net assets 16,461 1.96
Total 841,221 100.00
All securities held at the period end are transferable except where otherwise stated.All securities are listed on an official exchange except where otherwise stated.All investments are in ordinary or common stocks and shares except where otherwise stated.There are no transferable securities and money market instruments dealt in another regulated market except as otherwise stated.* Unlisted transferable security.† Managed by subsidiaries of Aberdeen Asset Management PLC.
Portfolio Statement continued
Percentage of Market value total net assets Description Quantity US$’000 %

Aberdeen Global 37Emerging Markets Bond Fund
Emerging Markets Bond FundFor the period ended 31 March 2008
PerformanceFor the six-months ended 31 March 2008, the value of the Aberdeen Global - Emerging Markets Bond Fund - A Accumulation shares increased by 0.7% compared to an increase of 3.4% in the benchmark, the JP Morgan EMBIGD USD Index.
Manager’s reviewThe tone in emerging market debt over the past six months was mixed, as the asset class continued to post positive returns amid an ongoing bout of global risk aversion. Local currency debt outperformed hard currency debt, with the former supported by a weak US dollar and the latter impacted by the collapse in US Treasury yields. Overall, the fundamental outlook in emerging markets continues to be positive, supported by a healthy growth outlook, strong commodity prices, robust Chinese growth and domestic demand in developing economies, which has helped offset the expected slowdown in the G3 economies.
Portfolio reviewDuring the six month period, the Global Emerging Market Bond Fund returned 0.7%, compared to 3.4% gain on the JPMorgan EMBIGD USD Index. Local currency debt provided much of the positive return, with Uruguay (+29%), Russia (+17.5%), Peru (+12%), Thailand (+10.8%), Mexico (+10.5%) and Egypt (+8.6%) leading the way. Ukraine, the Philippines and Brazil hard currency debt posted gains of 3-5% during the period. Negative contributors to performance were Argentina (-6.4%), Venezuela (-6%) and Uruguay hard currency debt, (-8%) and Turkish local currency debt (-5%). Chinese and Indonesian corporate debt also weighed on performance, declining over 5%.
OutlookThe outlook in Brazil continues to be positive despite a recent inflation uptick that has weighed on local rate positions. Robust growth and domestic demand indicators, coupled with rising food inflation, have reinforced expectations of a series of interest rate hikes commencing at the April 16 Monetary Policy Committee meeting. The 1Q08 Inflation Report signalled a rate hike even with inflation expectations running a touch below the 4.5% official target, opining that the MPC should act pre-emptively. Looking ahead, we still expect Brazil to be upgraded to investment grade, although the timeline may be pushed out to late 2008 or early 2009.
The Presidential election in Argentina that passed the torch from one Kirchner to another in December 2007, had done little to improve investor sentiment. The continued policy of under reporting inflation has done little for the Kirchner credibility index, and the increased taxes on agriculture exports has inflamed the passions of the farmers, who went on strike for three weeks in March, which resulted in food shortages and no resolution of the dispute. The export taxes are one of the key elements of the government’s economic policy, which along with rising soft commodity prices have led to significant increases in the fiscal and trade surpluses in 2008. While the economy is still growing at a very fast pace, and the twin surpluses have continued to improve, the government’s policies are appearing increasingly questionable due to rampant inflation, growing price distortions and the heavy tax burden on the agricultural sector. The negative headlines, along with new supply risk, have weighed on Argentinean external debt, which has been the worst performer in the JPMorgan EMBIGD Index in 2008.
Venezuela country risk remains high despite record-high oil prices, with President Chavez engaging in a new war of words with Colombia after their neighbour ventured into Ecuador on March 1 and killed the second in command of the FARC guerrilla group. Chavez immediately threatened to curb trades ties with Colombia, which would be a big negative for both economies if such a scenario developed, but is unlikely to occur. Relations between Colombia and Ecuador have also been strained, though the market impact from the incident has been negligible. Meanwhile, the dispute between PDVSA and Exxon-Mobil continues to linger over the freeze of £12 billion of offshore assets by a UK Court and an order of attachment of $315 mn of PDVSA’s cash holding at a US bank by a US court in February. The UK court order has since been overturned, but a resolution between the two parties remains uncertain. Exxon is suing the Venezuelan government for having expropriated its oil assets in the Orinoco Basin in 2007 without proper compensation, which depending on the ruling by the World Bank International Court for the Arbitration of Investment Disputes could cost PDVSA in the range of $1.5-4 bn.
The Turkish Constitutional Court agreed to hear the case to ban the ruling AK Party and 71 of its members, including PM Erdogan, who have been accused of anti-secular activities. The decision sparked another round of lira weakness, which hit a 7-month high of 1.34/USD. With the final verdict against the AKP and the members not expected until the end of the year, the government will likely be pre-occupied on political and legal issues instead of its macroeconomic and structural reform agenda. The AKP is seeking to minimize the political risk by amending the constitution in a way that would make it difficult to ban political parties. This will require support from opposition parties and may require a referendum, which could result in a more populist and less market-friendly government. The threat of more political turmoil, combined with rising global risk aversion, will likely to weigh on the lira during the year. This will further complicate matters for the Central Bank, which had been aggressively cutting rates since Q407. The CBT has taken the prudent approach and adopted a cautious tone, keeping the policy rate unchanged in March at 15.25%, but with inflation heading to double digits, and well above their 4% target, they may have to tighten policy rates in the coming months.
The African renaissance continued as Gabon placed a highly successful $1 billion 8.2% 10-year global bond in early December at a spread of +426 over Treasuries. Gabon was priced 25-30bp wide of Ghana, which came to the market in September with a $750 million 10-year bond. Gabon immediately traded up two points, inline with Ghana, which is rated one notch below Gabon. Gabon is using the proceeds from the bond issue to repay Paris Club debt at a deep discount, further reducing what the IMF views as a moderate level of debt.
Looking ahead, ongoing bouts of global risk aversion will at times weigh on emerging market debt. Sentiment in global markets has, however, improved in the aftermath of the Bear Stearns collapse in mid-March, with the rescue by JPMorgan stemming fears of systemic distress within the financial system. Over the near-term, financial markets appear poised for a period of relative calm, which bodes well for emerging market debt.

38 Aberdeen GlobalEmerging Markets Bond Fund
Statement of Net AssetsAs at 31 March 2008
Assets US$’000
Investments in securities at market value (note 2.2) 458,543 Cash at bank 1,128 Interest and dividends receivable 8,788 Subscriptions receivable 2,887 Receivable for investments sold 3,343
Total assets 474,689
Liabilities
Taxes and expenses payable 1,000 Redemptions payable 5,490 Unrealised loss on forward foreign exchange contracts (note 9) 2,300 Other liabilities 212
Total liabilities 9,002
Net assets at the end of the period 465,687
Statement of Changes in Net AssetsFor the period from 1 October 2007 to 31 March 2008
US$’000
Net assets at the beginning of the period 537,624
Net gains from investments 16,002 Realised gains on investments 175 Currency exchange losses (5,786)
Decrease in unrealised appreciation on investments (6,231)
Decrease in unrealised depreciation on open forward currency positions 479
Proceeds from shares issued 146,169 Payments for shares redeemed (221,246)
Net equalisation paid (note 11) (150)
Dividends paid (note 5) (1,349)
Net assets at the end of the period 465,687
Statement of OperationsFor the period from 1 October 2007 to 31 March 2008
Income US$’000
Income from investments 20,555 Bank interest 10
Total income 20,565
Expenses
Net management fee (note 4.6) 3,929 Administration fee (note 4.1) 109 Custodian fee (note 4.2) 180 Distribution fee (note 4.3) 29 Domiciliary agent, registrar, paying and transfer agent fees (note 4.4) 178 Management company fees (note 4.5) 41 Operational expenses (note 4.7) 55 Annual tax (note 4.9) 42
Total expenses 4,563
Net gains from investments 16,002
Realised gains on investments 175 Currency exchange losses (5,786)
Net realised gains 10,391
Decrease in unrealised appreciation on investments (6,231)
Decrease in unrealised depreciation on open forward currency positions 479
Net increase in assets as a result of operations 4,639
Share TransactionsFor the period from 1 October 2007 to 31 March 2008
A-1 A-2 B-1 B-2 I-1 I-2 Z-2
Shares outstanding at the beginning of the period 1,879,008 19,320,570 234,262 103,192 573,149 – 31,990
Shares issued during the period 427,505 5,409,706 552 15,179 19,617 1 12,210
Shares redeemed during the period (778,634) (8,078,912) (52,222) (27,227) (5,714) (1) (1)
Shares outstanding at the end of the period 1,527,879 16,651,364 182,592 91,144 587,052 – 44,199
Net asset value per share 16.88 25.44 16.92 23.98 17.07 – 24.34
The accompanying notes form an integral part of these financial statements.

Aberdeen Global 39Emerging Markets Bond Fund
Percentage of Market value total net assets Description Nominal US$’000 %
Argentina - 9.87%Argentina 0% VAR 15/12/35 36,090,000 4,457 0.96Argentina 10% 07/12/04 1,000,000 482 0.10Argentina 11% 04/12/05 5,400,000 1,674 0.36Argentina 11% 09/10/06 55,000 18 –Argentina 11.75% 07/04/09 8,530,000 2,644 0.57Argentina 11.75% 15/06/15 8,600,000 2,666 0.57Argentina 7% 17/04/17 22,260,000 16,476 3.54Argentina 7% 18/03/04 750,000 192 0.04Argentina 7% 19/12/08 10,900,000 3,543 0.76Argentina 8% 26/02/08 2,100,000 1,063 0.23Argentina 8% Step Up 26/02/08 600,000 291 0.06Argentina 8.5% 01/07/04 570,000 282 0.06Argentina 9% 24/05/05 800,000 401 0.08Argentina 9.25% 21/10/02 2,500,000 1,209 0.26Argentina 9.75% 26/11/03 1,850,000 955 0.21Banco Hipotercario 9.75% 27/04/16 5,290,000 4,802 1.03Argentina 2% 03/01/10 7,438,838 4,820 1.04
45,975 9.87
Bosnia & Herzegovina - 0.55%
Bosnia & Herzegovina 3.5% 11/12/17 2,025,493 2,571 0.55
Brazil - 8.83%Brazil 6% 15/05/45 160,000 143 0.03Independencia Inte 9.875% 31/01/17 2,940,000 2,751 0.59ISA Capital Do Brazil 8.8% 30/01/17 4,580,000 4,803 1.03Nota do Tesouro Nacional 10% 01/01/14 16,900,000 8,655 1.86Nota do Tesouro Nacional 10% 01/01/17 50,670,000 24,109 5.18Odebrecht Finance Ltd 7.5% 18/10/17 610,000 633 0.14
41,094 8.83
China - 2.13%Agile Property 9% 22/09/13 4,450,000 3,426 0.74Parkson Retail Group 7.125% 30/05/12 1,790,000 1,687 0.36Parkson Retail Group 7.875% 14/11/11 4,920,000 4,797 1.03
9,910 2.13
Colombia - 7.44%Colombia 7.375% 18/09/37 16,310,000 17,554 3.77Columbia 11.75% 01/03/10 10,800,000,000 5,976 1.28Columbia 7.375% 27/01/17 7,900,000 8,733 1.87EEB International 8.75% 31/10/14 2,320,000 2,404 0.52
34,667 7.44
Dominican Republic - 1.00%Cerveceria Nacional Dominica 16% 27/03/12 2,830,000 2,691 0.58Dominican Republic 8.625% 20/04/27 1,790,000 1,933 0.42
4,624 1.00
Portfolio StatementAs at 31 March 2008
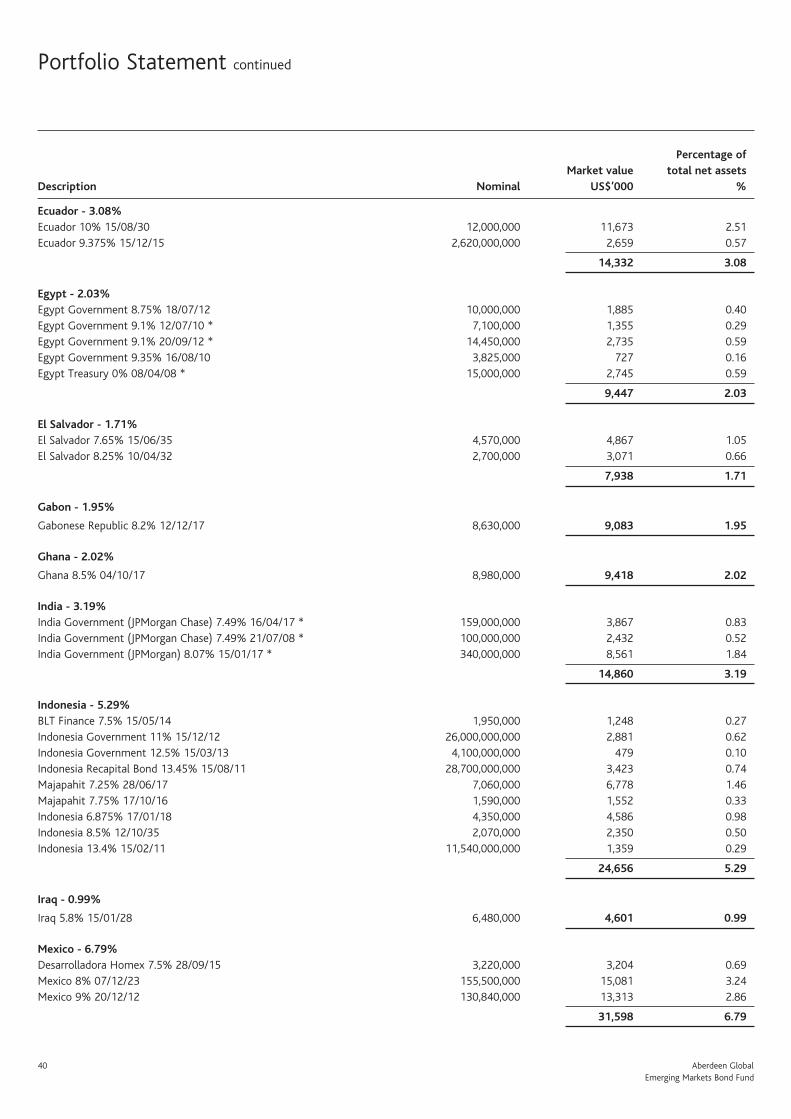
40 Aberdeen GlobalEmerging Markets Bond Fund
Portfolio Statement continued
Ecuador - 3.08%Ecuador 10% 15/08/30 12,000,000 11,673 2.51Ecuador 9.375% 15/12/15 2,620,000,000 2,659 0.57
14,332 3.08
Egypt - 2.03%Egypt Government 8.75% 18/07/12 10,000,000 1,885 0.40Egypt Government 9.1% 12/07/10 * 7,100,000 1,355 0.29Egypt Government 9.1% 20/09/12 * 14,450,000 2,735 0.59Egypt Government 9.35% 16/08/10 3,825,000 727 0.16Egypt Treasury 0% 08/04/08 * 15,000,000 2,745 0.59
9,447 2.03
El Salvador - 1.71%El Salvador 7.65% 15/06/35 4,570,000 4,867 1.05El Salvador 8.25% 10/04/32 2,700,000 3,071 0.66
7,938 1.71
Gabon - 1.95%
Gabonese Republic 8.2% 12/12/17 8,630,000 9,083 1.95
Ghana - 2.02%
Ghana 8.5% 04/10/17 8,980,000 9,418 2.02
India - 3.19%India Government (JPMorgan Chase) 7.49% 16/04/17 * 159,000,000 3,867 0.83India Government (JPMorgan Chase) 7.49% 21/07/08 * 100,000,000 2,432 0.52India Government (JPMorgan) 8.07% 15/01/17 * 340,000,000 8,561 1.84
14,860 3.19
Indonesia - 5.29%BLT Finance 7.5% 15/05/14 1,950,000 1,248 0.27Indonesia Government 11% 15/12/12 26,000,000,000 2,881 0.62Indonesia Government 12.5% 15/03/13 4,100,000,000 479 0.10Indonesia Recapital Bond 13.45% 15/08/11 28,700,000,000 3,423 0.74Majapahit 7.25% 28/06/17 7,060,000 6,778 1.46Majapahit 7.75% 17/10/16 1,590,000 1,552 0.33Indonesia 6.875% 17/01/18 4,350,000 4,586 0.98Indonesia 8.5% 12/10/35 2,070,000 2,350 0.50Indonesia 13.4% 15/02/11 11,540,000,000 1,359 0.29
24,656 5.29
Iraq - 0.99%
Iraq 5.8% 15/01/28 6,480,000 4,601 0.99
Mexico - 6.79%Desarrolladora Homex 7.5% 28/09/15 3,220,000 3,204 0.69Mexico 8% 07/12/23 155,500,000 15,081 3.24Mexico 9% 20/12/12 130,840,000 13,313 2.86
31,598 6.79
Percentage of Market value total net assets Description Nominal US$’000 %
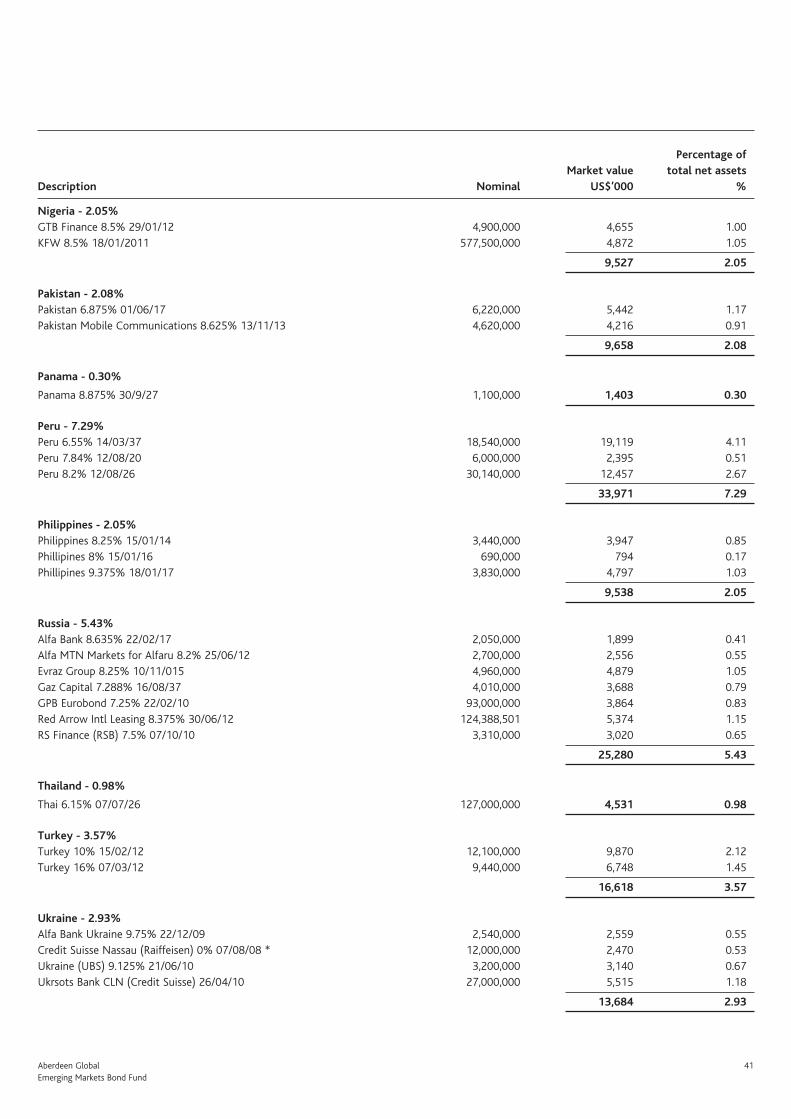
Aberdeen Global 41Emerging Markets Bond Fund
Nigeria - 2.05%GTB Finance 8.5% 29/01/12 4,900,000 4,655 1.00KFW 8.5% 18/01/2011 577,500,000 4,872 1.05
9,527 2.05
Pakistan - 2.08%Pakistan 6.875% 01/06/17 6,220,000 5,442 1.17Pakistan Mobile Communications 8.625% 13/11/13 4,620,000 4,216 0.91
9,658 2.08
Panama - 0.30%
Panama 8.875% 30/9/27 1,100,000 1,403 0.30
Peru - 7.29%Peru 6.55% 14/03/37 18,540,000 19,119 4.11Peru 7.84% 12/08/20 6,000,000 2,395 0.51Peru 8.2% 12/08/26 30,140,000 12,457 2.67
33,971 7.29
Philippines - 2.05%Philippines 8.25% 15/01/14 3,440,000 3,947 0.85Phillipines 8% 15/01/16 690,000 794 0.17Phillipines 9.375% 18/01/17 3,830,000 4,797 1.03
9,538 2.05
Russia - 5.43%Alfa Bank 8.635% 22/02/17 2,050,000 1,899 0.41Alfa MTN Markets for Alfaru 8.2% 25/06/12 2,700,000 2,556 0.55Evraz Group 8.25% 10/11/015 4,960,000 4,879 1.05Gaz Capital 7.288% 16/08/37 4,010,000 3,688 0.79GPB Eurobond 7.25% 22/02/10 93,000,000 3,864 0.83Red Arrow Intl Leasing 8.375% 30/06/12 124,388,501 5,374 1.15RS Finance (RSB) 7.5% 07/10/10 3,310,000 3,020 0.65
25,280 5.43
Thailand - 0.98%
Thai 6.15% 07/07/26 127,000,000 4,531 0.98
Turkey - 3.57%Turkey 10% 15/02/12 12,100,000 9,870 2.12Turkey 16% 07/03/12 9,440,000 6,748 1.45
16,618 3.57
Ukraine - 2.93%Alfa Bank Ukraine 9.75% 22/12/09 2,540,000 2,559 0.55Credit Suisse Nassau (Raiffeisen) 0% 07/08/08 * 12,000,000 2,470 0.53Ukraine (UBS) 9.125% 21/06/10 3,200,000 3,140 0.67Ukrsots Bank CLN (Credit Suisse) 26/04/10 27,000,000 5,515 1.18
13,684 2.93
Percentage of Market value total net assets Description Nominal US$’000 %

42 Aberdeen GlobalEmerging Markets Bond Fund
United States - 2.82%
US Treasury 4.75% 15/02/37 12,260,000 13,112 2.82
Uruguay - 5.07%Republic Orient Uruguay 4.25% 05/04/27 37,860,000 2,057 0.44Uruguay 5% 14/09/18 128,430,000 7,593 1.63Uruguay 7.625% 21/03/36 7,450,000 7,606 1.63Uruguay 7.875% 15/01/33 2,010,000 2,111 0.45Uruguay 8% 18/11/22 4,000,000 4,300 0.92
23,667 5.07
Venezuela - 7.04%Petroleos de Venezuela 5.25% 12/04/17 * 13,330,000 8,734 1.87Venezuela 10.75% 19/09/13 2,416,000 2,495 0.54Venezuela 5.75% 26/02/16 19,030,000 14,939 3.21Venezuela 8.5% 08/10/14 7,110,000 6,612 1.42
32,780 7.04
Total investments 458,543 98.48
Other net assets 7,144 1.52
Total 465,687 100.00
All securities held at the period end are transferable except where otherwise stated.All securities are listed on an official exchange except where otherwise stated.All investments are in fixed interest securities and equity securities except where otherwise stated.There are no transferable securities and money market instruments dealt in another regulated market except as otherwise stated.* Unlisted transferable security.
Portfolio Statement continued
Percentage of Market value total net assets Description Nominal US$’000 %
Aberdeen Global 43Emerging Markets Smaller Companies Fund
Emerging Markets Smaller Companies FundFor the period ended 31 March 2008
PerformanceFor the six-months ended 31 March 2008, the value of the Aberdeen Global - Emerging Markets Smaller Companies Fund - A Accumulation shares decreased by 13.9% compared to a decrease of 15.1% in the benchmark, the MSCI Emerging Markets Small Cap Index.
Change in benchmarkThe Fund changed its benchmark from the MSCI Emerging Markets Index to the MSCI Emerging Markets Small Cap Index on 1 October 2007.
Manager’s reviewEmerging small-cap stocks tracked the broader market lower on volatile trading during the six months under review, weighed down by increasing worries over the liquidity squeeze and recessionary fears. Small-cap stocks were among the hardest hit by the turbulence in global financial markets, as heightened risk aversion prompted a flight into quality assets and the more defensive sectors in the equity markets. Lacking the earnings power and liquidity of the blue-chips, and seen as more exposed to the domestic economy, the share prices of many small-cap stocks suffered disproportionately. The MSCI Emerging Markets Small Cap Index fell 15.1% in US dollar terms over the reporting period, compared with the 7.6% decline in the MSCI Emerging Markets Index.
The broad decline in emerging equity markets contrasted with the region’s relatively healthy economic expansion, spearheaded by Brazil, Russia, India and China – known colloquially as the BRIC group of economies. Elsewhere, Argentina benefited from higher commodity prices; in Mexico, where the bulk of exports go to the US, the economy remained surprisingly robust. Although escalating oil prices threatened to stall economic expansion in some countries, current account surpluses and strong foreign exchange reserves afforded governments the option of increasing expenditure to boost growth.
Inflationary concerns, though, intensified over the review period, with a sustained hike in global food and energy costs pushing headline inflation in some countries, noticeably China and India to multi-year highs. Several central banks including those of Russia, Hungary and South Africa responded by tightening interest rates; in emerging Asia, policymakers preferred to let currencies appreciate, while some also used price controls and subsidies to curb inflation. Israel, Turkey and the Philippines bucked the trend, easing their policies due to lacklustre growth prospects.
Portfolio reviewThe Fund outperformed the benchmark index over the half year under review.
In general, supportive economic conditions in the region underpinned the performance of most of our holdings, as reflected in positive annual results. The exceptions were Danubius Hotels, which suffered from increasing competition and the strengthening currency, and OHL, Cremer and CR2, which reported lower-than-expected earnings. Corporate activity was brisk, despite the tight credit conditions: American Bankote acquired rival InterPrint; City Lodge Hotels is selling a 15% stake to a Black Economic Empowerment consortium led by Vuwa Investments; Saraiva acquired bookstore chain Siciliano for BRL60m; Ablon bought a site to build its maiden residential development in Poland, while toll-road operator OHL won five concessions that will more than double its network.
In portfolio activity, we introduced Indian industrial paint producer Kansai Nerolac. We also initiated a position in Brazilian property developer CR2 on compelling valuations, and Lianhua, an attractively valued supermarket retailer with a strong presence in eastern China. Later in the period, we increased our exposure to Ablon and South African retailer Massmart on price weakness, which made their valuations appear more compelling. Elsewhere, we sold out of Asian Paints on valuation grounds.
OutlookThe immediate outlook for emerging smaller companies remains clouded as the impact on economic growth of financial de-leveraging on the global financial system is only slowly becoming clear. Despite the US Fed’s recent injections of liquidity, there is justifiable nervousness over whether enough has been done. This is reflected in share price volatility. At the same time, accelerating inflation led by rising food and energy prices, poses a dilemma for policymakers particularly in emerging markets, limiting the scope for further interest rate cuts. Another concern for emerging markets is that, in our view, investors are still too optimistic, given decelerating global growth and rising cost pressures.
So, caution is merited, albeit stocks now offer reasonable if not compelling value. We believe that our close attention to quality and disciplined approach to price means the portfolio is in good shape to weather any volatility. It is an open question as to when markets will bottom but further price falls of 10-15% should provide an attractive buying opportunity, the proviso being that earnings growth holds up. If markets were to correct further we believe it will present a good opportunity to buy into what remains a fundamentally sound investment case for emerging markets.
44 Aberdeen GlobalEmerging Markets Smaller Companies Fund
Statement of Net Assets
As at 31 March 2008
Assets US$’000
Investments in securities at market value (note 2.2) 111,363 Cash at bank 5,142 Interest and dividends receivable 311 Subscriptions receivable 70
Total assets 116,886
Liabilities
Payable for investments purchased 421 Taxes and expenses payable 167 Redemptions payable 6 Other liabilities* 26
Total liabilities 620
Net assets at the end of the period 116,266
*Includes a provision in respect of Thailand capital gains tax of US$ 53,659.
Statement of Changes in Net Assets
For the period from 1 October 2007 to 31 March 2008
US$’000Net assets at the beginning of the period 113,328
Net gains from investments 530 Realised gains on investments 1,895 Currency exchange gains 125
Increase in unrealised depreciation on investments* (18,637)
Proceeds from shares issued 46,852 Payments for shares redeemed (27,945)
Net equalisation received (note 11) 118
Net assets at the end of the period 116,266
Statement of Operations
For the period from 1 October 2007 to 31 March 2008
Income US$’000
Income from investments 1,156 Bank interest 42
Total income 1,198
Expenses
Net management fee (note 4.6) 472 Administration fee (note 4.1) 34 Custodian fee (note 4.2) 78 Domiciliary agent, registrar, paying and transfer agent fees (note 4.4) 41 Management company fees (note 4.5) 8 Operational expenses (note 4.7) 25 Annual tax (note 4.9) 10
Total expenses 668
Net gains from investments 530
Realised gains on investments 1,895 Currency exchange gains 125
Net realised gains 2,550
Increase in unrealiseddepreciation on investments* (18,637)
Net decrease in assets as a result of operations (16,087)
Share Transactions
For the period from 1 October 2007 to 31 March 2008
A-2 D-2(GBP) I-2 Z-2Shares outstanding at the beginning of the period 2,867,433 1,969,821 1 4,685,110
Shares issued during the period 851,277 846,133 634,143 1,936,779
Shares redeemed during the period (2,250,981) (842) (2) (270,762)
Shares outstanding at the end of the period 1,467,729 2,815,112 634,142 6,351,127
Net asset value per share 10.26 5.15 10.36 10.36
The accompanying notes form an integral part of these financial statements.
Aberdeen Global 45Emerging Markets Smaller Companies Fund
Portfolio StatementAs at 31 March 2008
Percentage of Market value total net assets Description Quantity US$’000 %
Brazil - 14.95%American Banknote 246,000 2,328 2.00CR2 Empreendim 144,000 908 0.78Cremer 310,000 2,320 2.00Localiza Rent a Car 216,100 1,963 1.69Lojas Renner 151,000 2,780 2.39Multiplan Empreendimentos 215,000 2,335 2.01Obrascon Huarte Lain Brasil 137,000 1,469 1.26Saraiva Livreiros 146,000 2,344 2.02Ultrapar (Pref) 27,000 929 0.80
17,376 14.95
Egypt - 2.20%
National Societe General Bank 314,135 2,568 2.20
Hong Kong - 15.42%Aeon Stores 795,000 1,588 1.37Café de Coral 880,000 1,721 1.48Dah Sing Banking 1,711,600 2,913 2.51Giordano International 5,352,000 2,152 1.85Hong Kong & Shanghai Hotels 1,950,000 3,196 2.75Lianhua Supermarket Holdings 1,131,000 1,511 1.30Pacific Basin Shipping 900,000 1,479 1.27Public Financial Holdings 4,000,000 3,356 2.89
17,916 15.42
Hungary - 1.52%Ablon Group 362,718 1,403 1.21Danubius Hotel and Spa 9,530 355 0.31
1,758 1.52
India - 8.53%Castrol 248,294 1,498 1.29GlaxoSmithKline Pharmaceuticals 50,000 1,302 1.12Godrej Consumer Products 1,030,471 3,189 2.74Godrej Consumer Products Rights 133,638 12 0.01Kansai Nerolac Paints 107,015 1,939 1.67Mphasis Ltd 180,352 908 0.78Nicholas Piramal 140,000 1,069 0.92Piamal Life 14,000 - -
9,917 8.53
Indonesia - 2.88%Bank NISP 15,000,000 1,465 1.26Bank Permata 15,468,000 1,520 1.31Holcim 2,849,000 363 0.31
3,348 2.88
46 Aberdeen GlobalEmerging Markets Smaller Companies Fund
Portfolio Statement continued
Malaysia - 9.96%Aeon 900,000 2,656 2.28Fraser & Neave Holdings 900,000 2,213 1.90Guinness Anchor 636,200 1,091 0.94Oriental Holdings 921,700 1,652 1.42POS Malaysia & Services 1,350,000 797 0.69SP Setia 787,000 914 0.79United Plantations 548,900 2,260 1.94
11,583 9.96
Mexico - 7.50%Grupo Aeroportuario del Spon ADR 132,000 2,846 2.45Grupo Continental 966,000 2,339 2.01Sare Holding 2,658,000 3,529 3.04
8,714 7.50
Philippines - 1.36%
Jollibee Foods 1,394,900 1,596 1.36
Qatar - 1.34%
Qatar Insurance 35,000 1,568 1.34
Singapore - 0.59%
Petra Foods 760,000 697 0.59
South Africa - 6.51%African Oxygen 540,000 1,810 1.56City Lodge Hotels 177,000 1,636 1.41Massmart 293,000 2,438 2.10Truworths International 529,000 1,675 1.44
7,559 6.51
South Korea - 3.17%Daegu Bank 115,000 1,533 1.32Korean Reinsurance 115,433 1,173 1.01Pusan Bank 78,000 971 0.84
3,677 3.17
Sri Lanka - 1.35%Commercial Bank of Ceylon 350,000 454 0.39Dialog Telekom 3,000,000 466 0.40Distilleries Co 156,600 142 0.12Keells (John) 460,000 510 0.44
1,572 1.35
Percentage of Market value total net assets Description Quantity US$’000 %

Aberdeen Global 47Emerging Markets Smaller Companies Fund
Thailand - 10.94%Aeon Thana Sinsap 850,000 1,076 0.93Bumrungrad Hospital 382,800 413 0.36Electricity Generating 395,100 1,267 1.09Hana Microelectronics 4,870,000 2,852 2.45Regional Container Line 1,777,700 1,377 1.18Siam City Cement 243,000 1,751 1.51Siam Makro 780,200 2,470 2.12Thai Stanley Electric 339,600 1,515 1.30
12,721 10.94
Turkey - 7.55%Aksigorta 759,000 2,803 2.40BIM Birlesik Magazalar 33,000 2,651 2.28Cisma Cimento 295,000 1,489 1.28Turk Ekonomi Bankasi 1,793,006 1,850 1.59
8,793 7.55
Total investments 111,363 95.77
Other net assets 4,903 4.23
Total 116,266 100.00
All securities held at the period end are transferable except where otherwise stated.All securities are listed on an official exchange except where otherwise stated.All investments are in ordinary or common stocks and shares except where otherwise stated.There are no transferable securities and money market instruments dealt in another regulated market except as otherwise stated.
Percentage of Market value total net assets Description Quantity US$’000 %

48 Aberdeen GlobalEuropean Equity Fund
European Equity FundFor the period ended 31 March 2008
PerformanceFor the six-months ended 31 March 2008, the value of the Aberdeen Global - European Equity Fund - A Accumulation shares decreased by 19.9% compared to a decrease of 18.0% in the benchmark, the FTSE World Europe Index.
Manager’s review European equity markets fell on volatile trading over the period under review, as growing concerns over the credit crisis overshadowed the UK and US central banks’ efforts to shore up confidence through interest rate cuts and liquidity boosts. Markets in Spain, Denmark and Portugal performed relatively well, while Sweden, Finland and Ireland lagged.
The eurozone economy showed signs of decelerating growth during the period. Manufacturing output growth in the first quarter of 2008 was the weakest since mid-2005. The pace of consumer spending also cooled due to higher food and energy prices, with inflation rising to a 16-year high, despite a tight labour market. The strengthening euro and the deteriorating global outlook added to policymakers’ worries, leading the European Commission to lower its GDP growth target. On the positive side, both the manufacturing and services sectors in Germany remained robust, highlighting the growth disparity between Europe’s largest economy and the rest of the region. Lending to eurozone businesses also accelerated, with business sentiment in Germany and France improving. As for the UK, economic growth for 2007 was slower than expected as the impact of the credit crunch spread beyond the housing and financial sectors to the broader economy. Rising food and energy costs also took their toll on consumer spending, but manufacturing growth unexpectedly held steady.
Against this backdrop, the European Central Bank maintained its hawkish stance and kept interest rates at a six-year high of 4%, signalling that its main concern was inflation. In contrast, the Bank of England cut rates twice and said it was prepared for further easing should conditions merit.
Portfolio reviewThe Fund underperformed the FTSE World Europe Index, declining by 19.9% compared to the benchmark’s fall of 18%. The main reason was the overweight allocation to general retailers and lack of exposure to mining and electricity companies, as well as a negative contribution from holdings in consumer goods, health care and technology sectors.
In portfolio activity, we introduced German ATM maker Wincor Nixdorf, which appeared inexpensive, and British newspaper publisher Daily Mail & General Trust for its earnings growth potential. Against this, we sold UK supermarket chain Sainsbury, after its strong price performance. We also sold UBS, following further write-downs and the opaque nature of its balance sheet, and Cosmote after a bidder emerged.
We also increased our relative weight on several stocks such as Kesa, Puma, Premier Foods and Venture Production on price weakness. Conversely, we pared our positions in Amec, British American Tobacco and Deutsche Postbank on share price strength, and top-sliced BBVA on valuation grounds.
OutlookMarket sentiment has been driven largely by concerns over the still-unfolding global credit crisis. This is unlikely to change in the short term as financial market de-leveraging continues, with more corporate losses due to provisions and write-downs. Although the region’s economies have been relatively resilient so far, downside risks are increasing. Domestic demand is weakening with spending power eroded by rising food and energy prices. Tighter credit conditions and higher input costs are also putting a strain on businesses, with sentiment in the Eurozone economy falling to a 28-month low. In view of this, pressure is mounting on policymakers to cut interest rates; the Bank of England did ease monetary policy again recently. There are, however, some signs that the region could face a gradual slowdown, rather than a sharp downturn. Export growth, surprisingly, has remained robust despite the strong euro, while the German economy is holding up well, with steady industrial output growth and labour demand.
We remain cautious over the short term but will continue to look for value opportunities. We are committed to our disciplined investment approach, favouring well-run companies with healthy balance sheets. With that in mind, we are confident that the Fund will be able to weather the current market volatility.

Aberdeen Global 49European Equity Fund
Statement of Net Assets
As at 31 March 2008
Assets e’000
Investments in securities at market value (note 2.2) 65,129
Cash at bank 526
Interest and dividends receivable 191
Subscriptions receivable 98
Other assets 36
Total assets 65,980
Liabilities
Taxes and expenses payable 145
Redemptions payable 265
Total liabilities 410
Net assets at the end of the period 65,570
Statement of Changes in Net Assets
For the period from 1 October 2007 to 31 March 2008
e’000
Net assets at the beginning of the period 116,918
Net gains from investments 92
Realised gains on investments 1,139
Currency exchange gains 5
Decrease in unrealised appreciation on investments (19,609)
Proceeds from shares issued 3,455
Payments for shares redeemed (36,430)
Net assets at the end of the period 65,570
Statement of Operations
For the period from 1 October 2007 to 31 March 2008
Income e’000
Income from investments 841
Bank interest 15
Total income 856
Expenses
Net management fee (note 4.6) 648
Administration fee (note 4.1) 27
Custodian fee (note 4.2) 11
Distribution fee (note 4.3) 5
Domiciliary agent, registrar, paying and
transfer agent fees (note 4.4) 35
Management company fees (note 4.5) 6
Operational expenses (note 4.7) 13
Annual tax (note 4.9) 19
Total expenses 764
Net gains from investments 92
Realised gains on investments 1,139
Currency exchange gains 5
Net realised gains 1,236
Decrease in unrealised appreciation on investments (19,609)
Net decrease in assets as a result of operations (18,373)
Share Transactions
For the period from 1 October 2007 to 31 March 2008
A-2 B-2 I-2 Z-2
Shares outstanding
at the beginning
of the period 2,600,472 31,083 1 –
Shares issued
during the period 83,315 – – 1
Shares redeemed
during the period (870,219) (2,509) (1) –
Shares outstanding
at the end
of the period 1,813,568 28,574 – 1
Net asset value
per share 35.64 32.72 – 10.06
The accompanying notes form an integral part of these financial
statements.

50 Aberdeen GlobalEuropean Equity Fund
Percentage of Market value total net assets Description Quantity e’000 %
Austria - 6.67%Erste Bank 24,000 992 1.51Flughafen Wien 12,000 918 1.40Immofinanz 178,500 1,191 1.82OMV 30,200 1,269 1.94
4,370 6.67
Belgium - 1.34%Belgacom 31,600 881 1.34
France - 14.74%BNP Paribas 26,200 1,662 2.53Casino 15,600 1,181 1.80Compangie de Saint-Gobain 24,400 1,251 1.91Gaz de France 35,500 1,345 2.05Peugeot 22,000 1,077 1.64Renault 11,800 820 1.25Schneider Electric 13,000 1,067 1.63Total 27,000 1,267 1.93
9,670 14.74
Germany - 18.38%BMW 29,000 1,003 1.53BMW non voting 8,200 227 0.35Commerzbank 88,000 1,731 2.64Deutsche Post 50,300 977 1.49Deutsche Postbank 24,400 1,469 2.24Linde 15,500 1,382 2.11MAN 11,800 978 1.49Praktiker 75,000 1,267 1.93Puma 3,900 950 1.45ThyssenKrupp 32,400 1,162 1.77Wincor Nixdorf 18,300 908 1.38
12,054 18.38
Italy - 5.67%ENI 58,300 1,253 1.91Intesa Sanpaolo 334,500 1,485 2.26Italcementi 107,000 983 1.50
3,721 5.67
Netherlands - 5.03%ING Groep 57,000 1,336 2.04Philips Electronics 44,000 1,071 1.63TNT 38,000 890 1.36
3,297 5.03
Portugal - 1.17%Portugal Telecom 104,000 770 1.17
Portfolio Statement As at 31 March 2008

Aberdeen Global 51European Equity Fund
Spain - 5.40%Baron de Ley 17,500 833 1.27BBVA 64,600 896 1.37Mapfre 570,000 1,804 2.75Valenciana de Cementos Portland 305 4 0.01
3,537 5.40
Sweden - 6.39%AstraZeneca 52,500 1,249 1.90Ericsson 627,000 761 1.16Nordea 121,500 1,229 1.88Skand Enskilda BKN A 57,000 946 1.45
4,185 6.39
Switzerland - 2.45%Zurich Financial Services 8,100 1,607 2.45
United Kingdom - 32.09%Aberdeen European Smaller Companies Fund *† 329,000 3,337 5.09AMEC 87,000 791 1.21Associated British Foods 116,000 1,279 1.95Aviva 172,000 1,329 2.03British American Tobacco 57,500 1,352 2.06BT Group 489,000 1,317 2.01Centrica 247,300 940 1.43Daily Mail & General Trust 135,000 743 1.13Friends Provident 487,100 760 1.16GlaxoSmithKline 82,600 1,121 1.71Kesa Electricals 353,500 918 1.40Millennium & Copthorne 222,000 1,148 1.75Minerva 510,000 608 0.93Mothercare 236,000 1,191 1.82Premier Foods 673,000 956 1.46Schroders (non voting) 94,000 1,016 1.55Tomkins 445,600 998 1.52Venture Production 157,300 1,233 1.88
21,037 32.09
Total investments 65,129 99.33
Other net assets 441 0.67
Total 65,570 100.00
All securities held at the period end are transferable except where otherwise stated.All securities are listed on an official exchange except where otherwise stated.All investments are in ordinary or common stocks and shares except where otherwise stated.There are no transferable securities and money market instruments dealt in another regulated market except as otherwise stated.* Unlisted transferable security.† Managed by subsidiaries of Aberdeen Asset Management PLC.
Percentage of Market value total net assets Description Quantity e’000 %
52 Aberdeen GlobalEuropean High Yield Bond Fund
European High Yield Bond FundFor the period ended 31 March 2008
PerformanceFor the six-months ended 31 March 2008, the value of the Aberdeen Global - European High Yield Bond Fund - A Accumulation shares decreased by 19.5% compared to a decrease of 8.3% in the benchmark, the JP Morgan Euro High Yield Bond Index.
Manager’s reviewA traumatic period for the securities markets with US housing market weakness continuing to affect structured finance vehicles. Banks have made substantial writedowns and all credit markets have been extremely weak. There has been disruption in the money markets with banks seemingly reluctant to lend to one another which still persists despite assistance from the central banks. Government bonds have provided strong returns based on a flight to quality despite inflation worries. Investment grade bonds have been weak with spreads doubling while the high yield market has sustained heavy selling pressure from hedge funds and nervous investors with spreads rising from 362 basis points to 769 basis points, marginally down from the high of 821 basis points.
GDP growth in Europe has been resilient however there is marked disparity between countries. The strength of the Euro has hurt Italy more than other parts of the region and Spain and Ireland are suffering from weakness in their housing markets. The ECB has been increasingly concerned about inflation however short rates have been left on hold at 4% as they have acknowledged likely weakness in the global economy and their need to assist problems in the banking system.
Outside Europe, the news from the US has been significant as monetary and fiscal measures have been taken in an attempt to avoid a damaging recession. Federal Funds rate has been reduced from 4.75% to 2.25% and substantial assistance has been given to banks in the money markets with the remaining investment banks given similar assistance after Bear Sterns had needed a takeover by JP Morgan to survive. Further measures are likely in order that the housing market can stabilise. Although longer term rates have also fallen, the US yield curve has steepened. In the UK short rates have fallen from 5.75% to 5.0% as weakness has finally appeared in the housing market, although inflation remains a problem. The takeover of Northern Rock by the UK Government and stretched budget position leaves little room for fiscal assistance to the economy.
Portfolio reviewThere have been substantial swings in investment sentiment leading to large inflows and outflows over the period with net selling dominating, although October and March were strong positive months. The Fund has generally kept to the same investment themes with notable additions to holdings of Codere, Europcar, Lecta and Beverage Packaging. Major sales came from holdings in Norske Skog, General Motors, Orion, Unity Media, Cablecom, Cell C Holdings, Diversified European Credit, and HTM Sports which were deemed to have less potential.
OutlookThe Fund has had a relatively poor record in the recent market turmoil where indiscriminate and forced selling has got in the way of fundamental value. There have been no new issues or defaults in the six months and company results have mainly been very satisfactory. The European scene looks much more attractive than the US and it would take an economic recession and well above average default levels to justify current valuations. This is not expected and for the longer term investor, current yields are likely to offer the best buying opportunity in the European High Yield market since its inception in the late nineties.

Aberdeen Global 53European High Yield Bond Fund
Statement of Net AssetsAs at 31 March 2008
Assets e’000
Investments in securities at market value (note 2.2) 223,506 Cash at bank 7,036 Interest and dividends receivable 6,478 Subscriptions receivable 3,233
Total assets 240,253
Liabilities
Payable for investments purchased 2,635 Taxes and expenses payable 388 Redemptions payable 1,259 Unrealised loss on forward foreign exchange contracts (note 9) 850 Other liabilities 307
Total liabilities 5,439
Net assets at the end of the period 234,814
Statement of Changes in Net AssetsFor the period from 1 October 2007 to 31 March 2008
e’000
Net assets at the beginning of the period 375,234
Net gains from investments 12,935 Realised losses on investments (20,214) Currency exchange losses (559)
Increase in unrealised depreciation on investments (59,598)
Increase in unrealised depreciation on open forward currency positions (850)
Proceeds from shares issued 195,480 Payments for shares redeemed (264,843)
Net equalisation paid (note 11) (477)
Dividends paid (note 5) (2,294)
Net assets at the end of the period 234,814
Statement of OperationsFor the period from 1 October 2007 to 31 March 2008
Income e’000
Income from investments 14,928 Bank interest 273
Total income 15,201
Expenses
Net management fee (note 4.6) 1,886 Administration fee (note 4.1) 63 Custodian fee (note 4.2) 28 Distribution fee (note 4.3) 46 Domiciliary agent, registrar, paying and transfer agent fees (note 4.4) 117 Management company fees (note 4.5) 24 Operational expenses (note 4.7) 36 Annual tax (note 4.9) 66
Total expenses 2,266
Net gains from investments 12,935
Realised losses on investments (20,214) Currency exchange losses (559)
Net realised losses (7,838)
Increase in unrealised depreciation on investments (59,598)
Increase in unrealised depreciation on open forward currency positions (850)
Net decrease in assets as a result of operations (68,286)
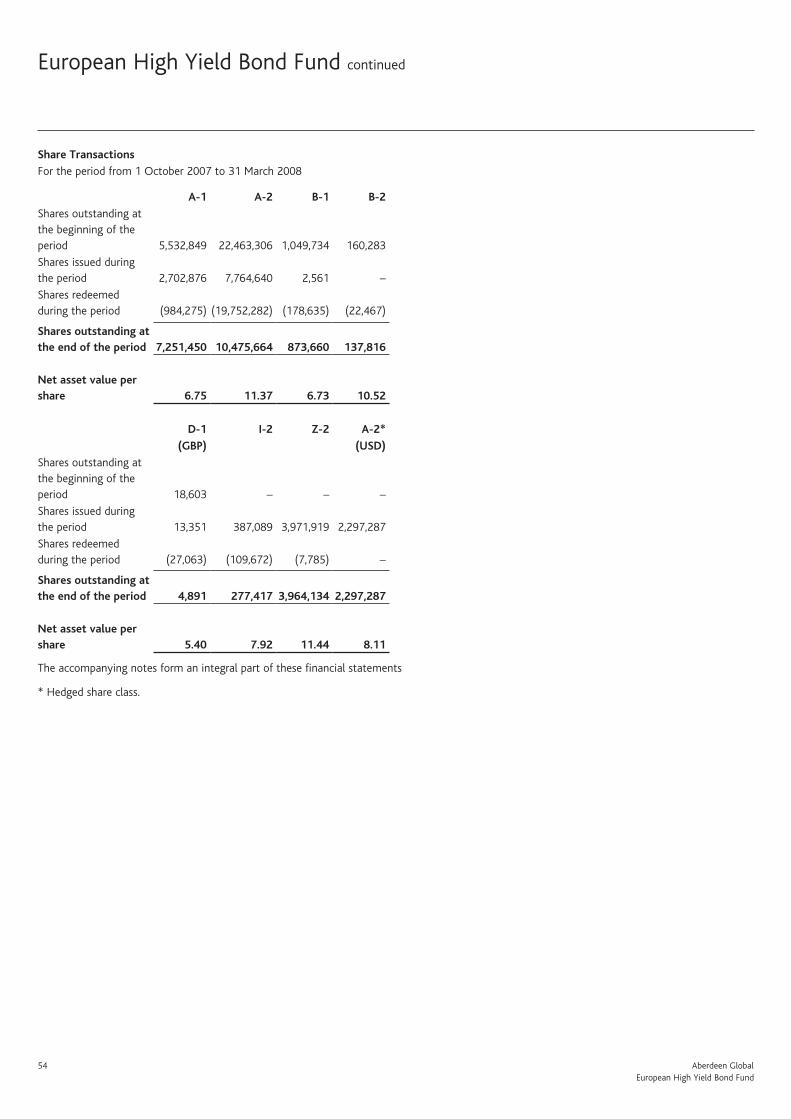
54 Aberdeen GlobalEuropean High Yield Bond Fund
Share Transactions
For the period from 1 October 2007 to 31 March 2008
A-1 A-2 B-1 B-2
Shares outstanding at the beginning of the period 5,532,849 22,463,306 1,049,734 160,283
Shares issued during the period 2,702,876 7,764,640 2,561 –
Shares redeemed during the period (984,275) (19,752,282) (178,635) (22,467)
Shares outstanding at the end of the period 7,251,450 10,475,664 873,660 137,816
Net asset value per share 6.75 11.37 6.73 10.52
D-1 I-2 Z-2 A-2*
(GBP) (USD)
Shares outstanding at the beginning of the period 18,603 – – –
Shares issued during the period 13,351 387,089 3,971,919 2,297,287
Shares redeemed during the period (27,063) (109,672) (7,785) –
Shares outstanding at the end of the period 4,891 277,417 3,964,134 2,297,287
Net asset value per share 5.40 7.92 11.44 8.11
The accompanying notes form an integral part of these financial statements
* Hedged share class.
European High Yield Bond Fund continued
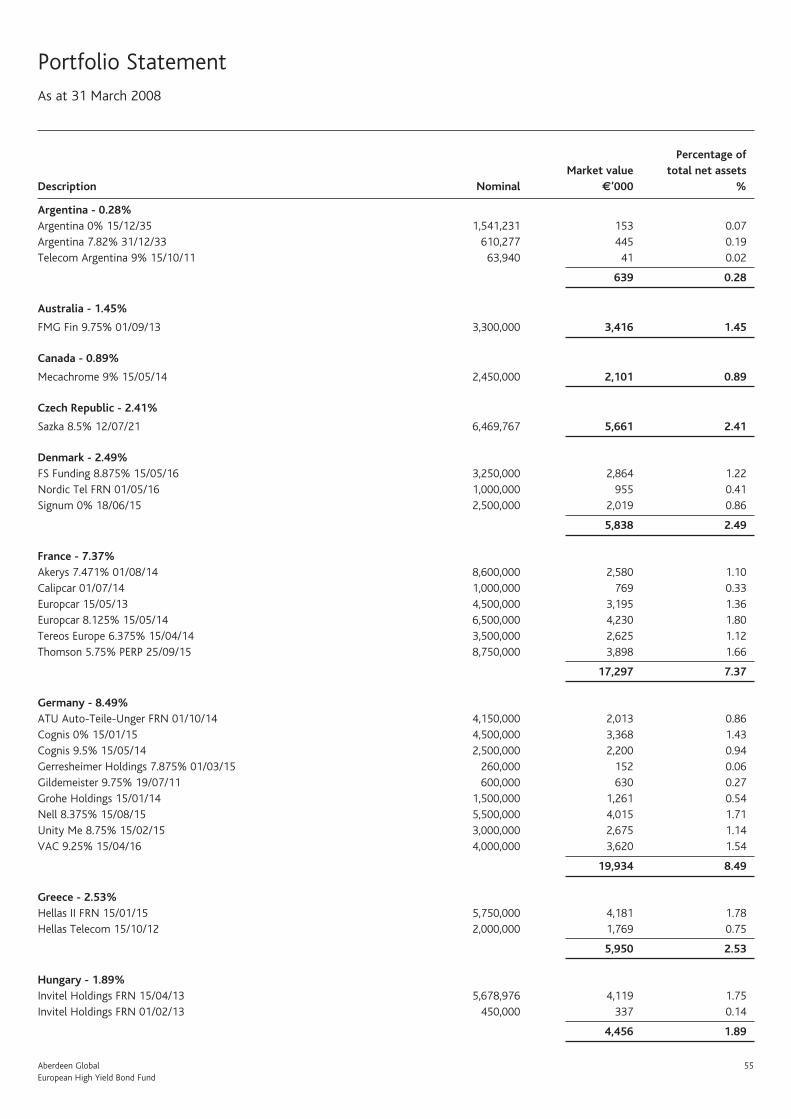
Aberdeen Global 55European High Yield Bond Fund
Portfolio Statement As at 31 March 2008
Percentage of Market value total net assets Description Nominal e’000 %
Argentina - 0.28%Argentina 0% 15/12/35 1,541,231 153 0.07Argentina 7.82% 31/12/33 610,277 445 0.19Telecom Argentina 9% 15/10/11 63,940 41 0.02
639 0.28
Australia - 1.45%
FMG Fin 9.75% 01/09/13 3,300,000 3,416 1.45
Canada - 0.89%
Mecachrome 9% 15/05/14 2,450,000 2,101 0.89
Czech Republic - 2.41%
Sazka 8.5% 12/07/21 6,469,767 5,661 2.41
Denmark - 2.49%FS Funding 8.875% 15/05/16 3,250,000 2,864 1.22Nordic Tel FRN 01/05/16 1,000,000 955 0.41Signum 0% 18/06/15 2,500,000 2,019 0.86
5,838 2.49
France - 7.37%Akerys 7.471% 01/08/14 8,600,000 2,580 1.10Calipcar 01/07/14 1,000,000 769 0.33Europcar 15/05/13 4,500,000 3,195 1.36Europcar 8.125% 15/05/14 6,500,000 4,230 1.80Tereos Europe 6.375% 15/04/14 3,500,000 2,625 1.12Thomson 5.75% PERP 25/09/15 8,750,000 3,898 1.66
17,297 7.37
Germany - 8.49%ATU Auto-Teile-Unger FRN 01/10/14 4,150,000 2,013 0.86Cognis 0% 15/01/15 4,500,000 3,368 1.43Cognis 9.5% 15/05/14 2,500,000 2,200 0.94Gerresheimer Holdings 7.875% 01/03/15 260,000 152 0.06Gildemeister 9.75% 19/07/11 600,000 630 0.27Grohe Holdings 15/01/14 1,500,000 1,261 0.54Nell 8.375% 15/08/15 5,500,000 4,015 1.71Unity Me 8.75% 15/02/15 3,000,000 2,675 1.14VAC 9.25% 15/04/16 4,000,000 3,620 1.54
19,934 8.49
Greece - 2.53%Hellas II FRN 15/01/15 5,750,000 4,181 1.78Hellas Telecom 15/10/12 2,000,000 1,769 0.75
5,950 2.53
Hungary - 1.89%Invitel Holdings FRN 15/04/13 5,678,976 4,119 1.75Invitel Holdings FRN 01/02/13 450,000 337 0.14
4,456 1.89

56 Aberdeen GlobalEuropean High Yield Bond Fund
Ireland - 4.57%Ardagh Glass Finance 7.125% 15/06/17 4,750,000 3,781 1.61BCM Ireland FRN 15/02/17 10,585,848 6,951 2.96
10,732 4.57
Italy - 4.20%IT Holding Finance 9.875% 15/11/12 5,995,000 4,527 1.93Wind Acquisition 0% 21/12/11 5,450,000 5,336 2.27
9,863 4.20
Lithuania - 1.56%Bite Finance International FRN 15/03/14 2,000,000 1,630 0.69Bite Finance International FRN 15/03/17 3,000,000 2,040 0.87
3,670 1.56
Luxembourg - 0.46%
Diversified European Credit 7.25% 17/07/13 1,500,000 1,072 0.46
Malta - 0.06%
Global Cap 5.6% 02/06/16 150,000 131 0.06
Netherlands - 7.56%Carlson Wagonlit FRN 01/05/15 4,945,000 3,585 1.53Louis No1 10% 01/12/16 8,000,000 5,640 2.40Louis No1 8.5% 01/12/14 10,500,000 7,612 3.24UPC Holding 8.625% 15/01/14 1,000,000 911 0.39
17,748 7.56
Poland - 1.32%
Zlomrex International Finance 8.5% 01/02/14 5,000,000 3,100 1.32
South Africa - 11.60%Consol Glass 7.625% 15/04/14 5,450,000 4,250 1.81Edcon Holdings Property Ltd 9.645% 15/06/15 7,750,000 3,565 1.52Edcon Proprietary Ltd 7.395% 15/06/14 7,500,000 5,052 2.15Foodcorp 8.875% 15/06/12 4,250,000 2,720 1.16New Reclamation Group 8.125% 01/02/13 4,973,785 4,029 1.72Peermont Global 7.75% 30/04/14 3,925,000 3,103 1.32Savcio Holdings 8% 15/02/13 5,500,000 4,510 1.92
27,229 11.60
Spain - 10.03%Cirsa Capital 7.875% 15/07/12 6,000,000 4,440 1.89Cirsa Finance 8.75% 15/05/14 5,750,000 4,313 1.84Codere (Boats) PIK FRN 15/12/15 6,250,000 3,751 1.60Codere Finance 8.25% 15/06/15 4,000,000 3,280 1.40Lecta FRN Regs 15/02/14 5,000,000 3,200 1.36Lecta FRN 15/02/14 4,500,000 3,375 1.44Ono Finance 10.5% 15/05/14 1,500,000 1,172 0.50
23,531 10.03
Portfolio Statement continued
Percentage of Market value total net assets Description Nominal e’000 %
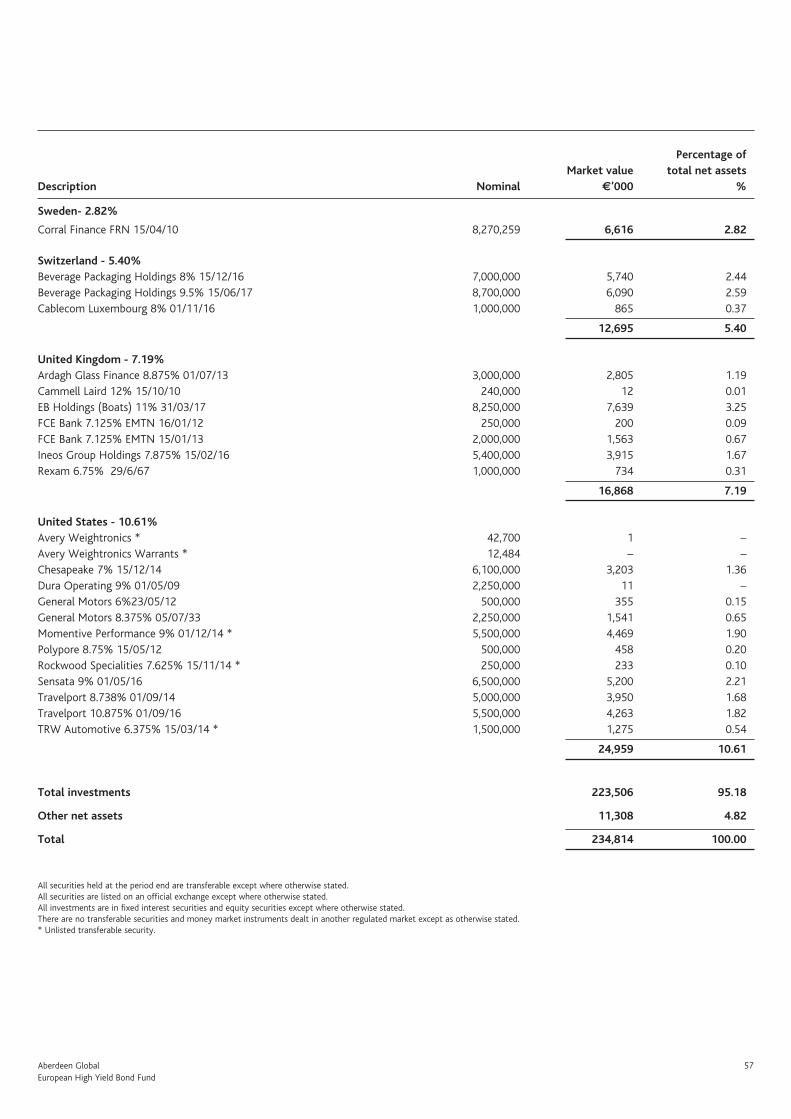
Aberdeen Global 57European High Yield Bond Fund
Sweden- 2.82%
Corral Finance FRN 15/04/10 8,270,259 6,616 2.82
Switzerland - 5.40%Beverage Packaging Holdings 8% 15/12/16 7,000,000 5,740 2.44Beverage Packaging Holdings 9.5% 15/06/17 8,700,000 6,090 2.59Cablecom Luxembourg 8% 01/11/16 1,000,000 865 0.37
12,695 5.40
United Kingdom - 7.19%Ardagh Glass Finance 8.875% 01/07/13 3,000,000 2,805 1.19Cammell Laird 12% 15/10/10 240,000 12 0.01EB Holdings (Boats) 11% 31/03/17 8,250,000 7,639 3.25FCE Bank 7.125% EMTN 16/01/12 250,000 200 0.09FCE Bank 7.125% EMTN 15/01/13 2,000,000 1,563 0.67Ineos Group Holdings 7.875% 15/02/16 5,400,000 3,915 1.67Rexam 6.75% 29/6/67 1,000,000 734 0.31
16,868 7.19
United States - 10.61%Avery Weightronics * 42,700 1 –Avery Weightronics Warrants * 12,484 – –Chesapeake 7% 15/12/14 6,100,000 3,203 1.36Dura Operating 9% 01/05/09 2,250,000 11 –General Motors 6%23/05/12 500,000 355 0.15General Motors 8.375% 05/07/33 2,250,000 1,541 0.65Momentive Performance 9% 01/12/14 * 5,500,000 4,469 1.90Polypore 8.75% 15/05/12 500,000 458 0.20Rockwood Specialities 7.625% 15/11/14 * 250,000 233 0.10Sensata 9% 01/05/16 6,500,000 5,200 2.21Travelport 8.738% 01/09/14 5,000,000 3,950 1.68Travelport 10.875% 01/09/16 5,500,000 4,263 1.82TRW Automotive 6.375% 15/03/14 * 1,500,000 1,275 0.54
24,959 10.61
Total investments 223,506 95.18
Other net assets 11,308 4.82
Total 234,814 100.00
All securities held at the period end are transferable except where otherwise stated.All securities are listed on an official exchange except where otherwise stated.All investments are in fixed interest securities and equity securities except where otherwise stated.There are no transferable securities and money market instruments dealt in another regulated market except as otherwise stated.* Unlisted transferable security.
Percentage of Market value total net assets Description Nominal e’000 %

58 Aberdeen GlobalEuropean Opportunities (ex UK) Fund
European Opportunities (ex UK) FundFor the period ended 31 March 2008
PerformanceFor the six-months ended 31 March 2008, the value of the Aberdeen Global - European Opportunities (Ex UK) Fund - A Accumulation shares decreased by 16.8% compared to a decrease of 16.5% in the benchmark, the FTSE World Europe ex UK Index.
Manager’s reviewEuropean equities fell over the half-year under review, with the benchmark FTSE World Europe ex UK Index declining by more than 16% in euro terms, as central banks’ efforts to boost liquidity in money markets failed to stem deepening worries over the fallout from a slowing US economy and the spreading credit crunch.
On the macroeconomic front, the Eurozone, which had been relatively resilient to the credit crisis, started to show signs of slowing growth. The pace of manufacturing production in the first quarter of 2008 decelerated, while consumer spending weakened on rising food and energy costs as inflation rose to a 16-year high. Policymakers’ concern about the appreciating euro and the worsening global outlook also led to a downgrading in growth forecasts for the region. Among countries, consumer confidence in France fell to a record low, while there was a sharp drop in business activity in Spain on the back of the bursting of its property bubble. There were, however, pockets of positive data. Germany’s manufacturing and services sectors remained healthy, highlighting the growth gap between Europe’s largest economy and the rest of the region. Business borrowings in the Eurozone also reached record levels, as corporate sentiment in both Germany and France improved towards the end of the period.
Against this backdrop, the European Central Bank continued to view rising prices as the main threat to stability, keeping interest rates unchanged at a six-year high of 4%. This hawkish stance, when the global financial turmoil could yet have a far deeper impact on the region than previously thought, may prove problematic for some countries, especially those on the Continent’s fringe, where falling house prices has caused a sharp slowdown already.
Portfolio reviewThe Fund underperformed the benchmark FTSE World Europe ex UK Index over the six-month period.
In portfolio activity, we introduced pharmaceutical company Roche, which appeared increasingly attractive in light of recent price weakness, and Swiss cement maker Holcim, which is well placed to benefit from continued growth, given its large exposure to emerging markets. Conversely, we sold UBS, following further write-downs and the opaque nature of its balance sheet. We also sold Cosmote, Folli Follie Hypo Real Estate, Thomson and Zehnder, in view of better opportunities elsewhere.
In terms of buying, we added to Ericsson, Huhtamaki, Immofinanz, Kesa, MTU and Praktiker and on price weakness. Against this, we top-sliced Air Liquide on valuation grounds, and trimmed our position in MAN.
OutlookMarket sentiment has been driven largely by concerns over the still-unfolding global credit crisis. This is unlikely to change in the short term as financial market de-leveraging continues. There may well be further corporate losses due to provisions and write-downs. Although the Continent’s economies have been relatively resilient so far, downside risks are increasing. Domestic demand is weakening with spending power eroded by rising food and energy prices. Tighter credit conditions and higher input costs are also putting a strain on businesses. But while pressure is mounting on the European Central Bank to cut interest rates, short-term inflation remains naggingly high, which may limit the scope for easing until the second half of the year at the earliest.
We remain cautious over the outlook for corporate earnings, given the uncertain macro backdrop. Even as, say, battered financials could be stabilising, other sectors face problems. Recent figures for car sales, a good proxy for consumer sentiment, were dreadful. In short, news is gloomy. The challenge in this environment is knowing how much to pay for well-run companies. That said, we believe that our portfolio, focused on healthy balance sheets, will be able to weather the current market volatility.

Aberdeen Global 59European Opportunities (ex UK) Fund
Statement of Net Assets
As at 31 March 2008
Assets e’000
Investments in securities at market value (note 2.2) 115,125
Cash at bank 749
Interest and dividends receivable 56
Subscriptions receivable 1,065
Other assets 91
Total assets 117,086
Liabilities
Taxes and expenses payable 236
Total liabilities 236
Net assets at the end of the period 116,850
Statement of Changes in Net Assets
For the period from 1 October 2007 to 31 March 2008
e’000
Net assets at the beginning of the period 144,081
Net losses from investments (283)
Realised losses on investments (5,712)
Currency exchange gains 20
Increase in unrealised depreciation on investments (17,889)
Proceeds from shares issued 6,259
Payments for shares redeemed (9,626)
Net assets at the end of the period 116,850
Statement of Operations
For the period from 1 October 2007 to 31 March 2008
Income e’000
Income from investments 825
Bank interest 21
Total income 846
Expenses
Net management fee (note 4.6) 973
Administration fee (note 4.1) 25
Custodian fee (note 4.2) 21
Domiciliary agent, registrar, paying and
transfer agent fees (note 4.4) 49
Management company fees (note 4.5) 10
Operational expenses (note 4.7) 20
Annual tax (note 4.9) 31
Total expenses 1,129
Net losses from investments (283)
Realised losses on investments (5,712)
Currency exchange gains 20
Net realised losses (5,975)
Increase in unrealised depreciation on investments (17,889)
Net decrease in assets as a result of operations (23,864)
Share Transactions
For the period from 1 October 2007 to 31 March 2008
A-2 D-2(GBP)
Shares outstanding at the beginning
of the period 353,417 12,644,185
Shares issued during the period 639 613,452
Shares redeemed during the period (343,702) (578,775)
Shares outstanding at the end
of the period 10,354 12,678,862
Net asset value per share 9.22 7.32
The accompanying notes form an integral part of these financial
statements.

60 Aberdeen GlobalEuropean Opportunities (ex UK) Fund
Percentage of Market value total net assets Description Quantity e’000 %
Austria - 7.25%Erste Bank 41,000 1,694 1.45Flughafen Wien 29,000 2,217 1.90Immofinanz 312,000 2,081 1.78OMV 59,000 2,480 2.12
8,472 7.25
Belgium - 1.54%Belgacom 64,500 1,799 1.54
European Composite - 4.97%Aberdeen European Smaller Companies Fund *† 573,000 5,812 4.97
Finland - 1.20%Huhtamaki 196,500 1,398 1.20
France - 18.67%Air Liquide 18,000 1,741 1.49BNP Paribas 52,500 3,331 2.85Casino 29,000 2,195 1.88Compagnie de Saint-Gobain 41,500 2,127 1.82Gaz de France 64,000 2,425 2.08Kesa Electricals 613,000 1,593 1.36Peugeot 44,000 2,154 1.84Renault 24,500 1,702 1.46Schneider Electric 24,500 2,011 1.72Total 54,000 2,533 2.17
21,812 18.67
Germany - 28.54%Adidas 51,500 2,155 1.85BMW 63,000 2,179 1.86Commerzbank 154,500 3,040 2.60Deutsche Lufthansa 122,500 2,092 1.79Deutsche Post 113,500 2,205 1.89Deutsche Postbank 47,600 2,866 2.45E.ON 16,500 1,920 1.64Linde 34,400 3,066 2.62MAN 29,500 2,444 2.09Metro 34,200 1,730 1.48MTU Aero Engines 62,500 1,694 1.45Praktiker 128,500 2,171 1.86Puma 7,000 1,705 1.46ThyssenKrupp 67,500 2,422 2.07Wincor Nixdorf 33,500 1,662 1.43
33,351 28.54
Italy - 7.88%ENI 145,000 3,115 2.67Hera 633,000 1,618 1.38Intesa Sanpaolo 580,000 2,574 2.20Italcementi 208,000 1,910 1.63
9,217 7.88
Portfolio StatementAs at 31 March 2008
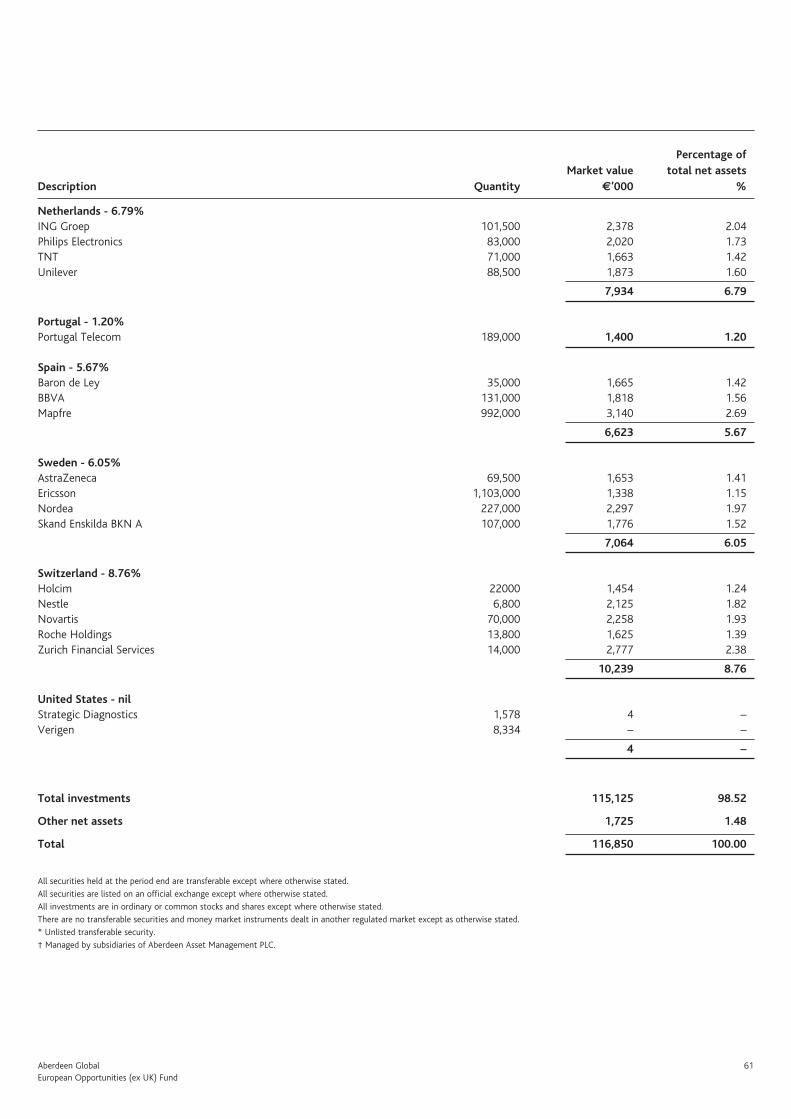
Aberdeen Global 61European Opportunities (ex UK) Fund
Netherlands - 6.79%ING Groep 101,500 2,378 2.04Philips Electronics 83,000 2,020 1.73TNT 71,000 1,663 1.42Unilever 88,500 1,873 1.60
7,934 6.79
Portugal - 1.20%Portugal Telecom 189,000 1,400 1.20
Spain - 5.67%Baron de Ley 35,000 1,665 1.42BBVA 131,000 1,818 1.56Mapfre 992,000 3,140 2.69
6,623 5.67
Sweden - 6.05%AstraZeneca 69,500 1,653 1.41Ericsson 1,103,000 1,338 1.15Nordea 227,000 2,297 1.97Skand Enskilda BKN A 107,000 1,776 1.52
7,064 6.05
Switzerland - 8.76%Holcim 22000 1,454 1.24Nestle 6,800 2,125 1.82Novartis 70,000 2,258 1.93Roche Holdings 13,800 1,625 1.39Zurich Financial Services 14,000 2,777 2.38
10,239 8.76
United States - nilStrategic Diagnostics 1,578 4 –Verigen 8,334 – –
4 –
Total investments 115,125 98.52
Other net assets 1,725 1.48
Total 116,850 100.00
All securities held at the period end are transferable except where otherwise stated.
All securities are listed on an official exchange except where otherwise stated.
All investments are in ordinary or common stocks and shares except where otherwise stated.
There are no transferable securities and money market instruments dealt in another regulated market except as otherwise stated.
* Unlisted transferable security.
† Managed by subsidiaries of Aberdeen Asset Management PLC.
Percentage of Market value total net assets Description Quantity e’000 %

62 Aberdeen GlobalHigh Yield Bond Fund
High Yield Bond FundFor the period ended 31 March 2008
PerformanceFor the six-months ended 31 March 2008, the value of the Aberdeen Global - High Yield Bond Fund – D Income shares decreased by 5.5% compared to a decrease of 2.4% in the benchmark, a composite index made up of 30% JP Morgan Euro High Yield Bond Index and 70% of the JP Morgan Sterling High Yield Index.
Manager’s reviewThe six-month period was very difficult for the securities markets and for corporate bonds in particular. The weak US housing market has continued to affect structured products based on this market and banks have been forced to make substantial writedowns and raise new capital. All credit markets have been weak and there has been severe disruption in the money markets with banks seemingly reluctant to lend to one another. Government bonds have ignored evidence of rising inflation and the flight to quality has given strong returns. Investment grade bonds have been weak as spreads doubled to record levels. The high yield market has come under substantial selling pressure from hedge fund liquidations and nervous investor selling with spreads also more than doubling.
Although GDP growth has been resilient in the UK and Europe, there is increasing disparity between countries. The strength of the Euro has been unhelpful to Italy while Spain and Ireland are now suffering from a weakening housing market which will also soon impact the UK. The ECB has been concerned about inflation; however, short rates have been left at 4% acknowledging weakness in the global economy and their need to assist problems in the banking system. The UK Monetary Policy Committee has had a similar inflation versus future growth issue and has allowed base rates down from 5.75% to 5.0%. Outside Europe, the US has taken significant monetary and fiscal measures in an attempt to avoid a damaging recession. Federal Funds rate has been reduced from 4.75% to 2.25% and substantial money market assistance has been given to banks which now includes investment banks after Bear Stearns was forced into a JP Morgan deal as liquidity disappeared. Further US measures are likely in order that the housing market can stabilise.
In currency markets, sterling has been very weak, losing 2.6% versus the US dollar and 12.4% against the Euro.
Portfolio reviewWith no new issues and some modest liquidation in the Fund we have been a net seller of securities although the redemption of bonds in Chelsea Village, Seehafen Rostock and Pipe Holdings has limited the need for action. We have made more significant sales in holdings of Norske Skog, Premier Farnell, IFCO, Ardagh, AES, Polypore and Johnson Diversey.
We have added to holdings in GMAC and Lecta, and initiated a holding in Anglo Irish Bank.
OutlookThe Fund has had a relatively poor record in the recent market turmoil where indiscriminate and forced selling has got in the way of fundamental value. There have been no new issues or defaults in the six months and company results have mainly been very satisfactory. The European scene looks much more attractive than the US and it would take an economic recession and well above average default levels to justify current valuations. This is not expected and for the longer term investor, current yields are likely to offer the best buying opportunity in the High Yield Bond market since its inception in the late nineties.

Aberdeen Global 63High Yield Bond Fund
Statement of Net Assets
As at 31 March 2008
Assets £’000
Investments in securities at market value (note 2.2) 33,184
Cash at bank 1,093
Interest and dividends receivable 1,037
Subscriptions receivable 15
Receivable for investments sold 1
Total assets 35,330
Liabilities
Payable for investments purchased 139
Taxes and expenses payable 64
Redemptions payable 16
Other liabilities 741
Total liabilities 960
Net assets at the end of the period 34,370
Statement of Changes in Net Assets
For the period from 1 October 2007 to 31 March 2008
£’000
Net assets at the beginning of the period 43,762
Net gains from investments 1,663
Realised gains on investments 374
Currency exchange gains 2
Increase in unrealised depreciation on investments (4,024)
Proceeds from shares issued 2,218
Payments for shares redeemed (7,965)
Net equalisation paid (note 11) (57)
Dividends paid (note 5) (1,603)
Net assets at the end of the period 34,370
Statement of Operations
For the period from 1 October 2007 to 31 March 2008
Income £’000
Income from investments 1,925
Bank interest 25
Total income 1,950
Expenses
Net management fee (note 4.6) 244
Administration fee (note 4.1) 2
Custodian fee (note 4.2) 4
Domiciliary agent, registrar, paying and
transfer agent fees (note 4.4) 18
Management company fees (note 4.5) 3
Operational expenses (note 4.7) 7
Annual tax (note 4.9) 9
Total expenses 287
Net gains from investments 1,663
Realised gains on investments 374
Currency exchange gains 2
Net realised gains 2,039
Increase in unrealised depreciation on investments (4,024)
Net decrease in assets as a result of operations (1,985)
Share Transactions
For the period from 1 October 2007 to 31 March 2008
D-1
Shares outstanding at the beginning of the period 39,985,745
Shares issued during the period 2,128,546
Shares redeemed during the period (7,537,947)
Shares outstanding at the end of the period 34,576,344
Net asset value per share 0.9940
The accompanying notes form an integral part of these financial
statements.

64 Aberdeen GlobalHigh Yield Bond Fund
Portfolio StatementAs at 31 March 2008
Percentage of Market value total net assets Description Nominal £’000 %
Argentina - 4.08%Argentina 0% 15/12/35 3,297,507 261 0.76Argentina 7.82% 31/12/33 1,305,598 758 2.21Inversora De Electrica 6.5% 26/12/17 1,104,411 300 0.87Inversora De Electrica 8.65% 16/09/02 109,463 19 0.06Provincia De Misiones 0% 01/08/06 * 125,000 – –Provincia De Misiones 6% 01/08/06 125,000 2 0.01Telecom Argentina 9% 15/10/11 115,092 58 0.17
1,398 4.08
Australia - 2.40%FMG Fin 9.75% 01/09/13 1,000,000 823 2.40
Canada - 1.30%Mecachrome 9% 15/05/14 650,000 443 1.30
Czech Republic - 2.63%Sazka 8.5% 12/07/21 1,293,953 900 2.63
Denmark - 1.03%FS Funding 8.875% 15/05/16 500,000 350 1.03
France - 3.50%Akerys 7.471% 01/08/14 500,000 119 0.35Europcar 8.125% 15/05/14 400,000 207 0.60Legrand 8.5% 15/02/25 289,000 164 0.48Tereos Europe 6.375% 15/04/14 450,000 268 0.78Thomson 5.75% PERP 25/09/15 1,250,000 443 1.29
1,201 3.50
Germany - 8.70%ATU Auto-Teile-Unger FRN 01/10/14 750,000 289 0.84Cognis 9.5% 15/05/14 750,000 525 1.53Gerresheimer Holdings 7.875% 01/03/15 750,000 349 1.02Gildemeister 9.75% 19/07/11 400,000 334 0.97Kabel Deutschland 10.75% 01/07/14 300,000 234 0.68Nell 8.375% 15/08/15 750,000 436 1.27Unity Me 8.75% 15/02/15 750,000 532 1.55VAC 9.25% 15/04/16 400,000 288 0.84
2,987 8.70
Greece - 1.76%Hellas II FRN 15/01/15 900,000 520 1.51Yioula Glassworks 9% 01/12/15 150,000 87 0.25
607 1.76
Hungary - 2.08%Invitel Holdings FRN 15/04/13 667,842 385 1.12Magyar Telecom 10.75% 15/08/12 500,000 334 0.96
719 2.08
Ireland - 2.63%Anglo Irish Bank 5.25% 200,000 149 0.43Ardagh Glass Finance 7.125% 15/06/17 250,000 158 0.46BCM Ireland FRN 15/02/17 1,146,493 599 1.74
906 2.63

Aberdeen Global 65High Yield Bond Fund
Italy - 4.15%IT Holdings 9.875% 15/11/12 1,400,000 841 2.45Parmalat Capital Finance 9.375% 02/12/17 1,350,000 – –Wind Acquisition 0% 21/12/11 750,000 584 1.70
1,425 4.15
Netherlands - 4.74%Carlson Wagonlit FRN 01/05/15 500,000 288 0.84Louis No1 10% 01/12/16 1,100,000 721 2.10Louis No1 8.5% 01/12/14 1,250,000 617 1.80
1,626 4.74
Poland - 1.09%Zlomrex International Finance 8.5% 01/02/14 750,000 370 1.09
South Africa - 5.10%Cell C Pty 8.625% 01/07/12 250,000 189 0.55Consol Glass 7.625% 15/04/14 500,000 310 0.90Edcon Holdings Proprietary Ltd 7.395% 15/06/14 600,000 321 0.92Edcon Holdings Property Ltd 9.645% 15/06/15 500,000 183 0.53Foodcorp 8.875% 15/06/12 200,000 102 0.30New Reclaimation Group 8.125% 01/02/13* 918,237 592 1.72Peermont Global 7.75% 30/04/14 100,000 63 0.18
1,760 5.10
Spain - 6.36%Cirsa Capital 7.875% 15/07/12 850,000 500 1.45Cirsa Finance 8.75% 15/05/14 800,000 477 1.39Codere (Boats) PIK FRN 15/12/15 500,000 239 0.69Codere Finance 8.25% 15/06/15 600,000 391 1.14Lecta FRN Regs 15/02/14 250,000 127 0.37Lecta FRN 15/02/14 250,000 149 0.42Ono Finance 10.5% 15/05/14 500,000 311 0.90
2,194 6.36
Sweden - 1.90%Corral Finance FRN 15/04/10 1,024,521 652 1.90
Switzerland - 1.37%Beverage Packaging Holdings 8.0% 15/12/16 300,000 196 0.57Beverage Packaging Holdings 9.5% 15/06/17 500,000 278 0.80
474 1.37
United Kingdom - 23.09%Ardagh Glass Finance 8.875% 01/07/13 700,000 521 1.52British Airways 7.25% 23/08/16 500,000 501 1.46Cammell Laird 12% 15/10/10 840,000 33 0.10Carron Energy 30/09/11 650,000 561 1.63Castle Holding FRN 15/05/14 900,000 621 1.81Corporate Services 1,390,512 20 0.06Corporate Services 10% 29/04/11 327,332 327 0.94EB Holdings (Boats) 11% 31/03/17 2,200,000 1,624 4.73Energis / Chelys 9.125% 15/03/10 * 6,250,000 – –Energis / Chelys 9.5% 15/06/06 * 1,975,000 – –
Percentage of Market value total net assets Description Nominal £’000 %

66 Aberdeen GlobalHigh Yield Bond Fund
Greycoat 9.5% 30/09/03 * 1,500,000 38 0.11Heating Finance 7.875% 31/03/14 545,000 169 0.49Ineos Group Holdings 7.875% 15/02/16 1,500,000 865 2.52Mutual Securitisaton 7.3916% 30/09/12 491,179 491 1.43Peel Holdings 9.875% 30/04/11 26,000 29 0.08Pipe Holdings 9.75% 01/11/13 250,000 219 0.64REA Finance 9.5% 31/12/17 350,000 368 1.07Real Estate Opportunities 7.5% 31/05/11 500,000 589 1.71Royal & Sun Alliance 8.5% 08/12/14 300,000 315 0.92Scotia Holdings 8.5% 26/03/02 * 995,000 – –Southend Property Holdings 10.5% 31/03/25 2,553 3 0.01Virgin Media 9.75% 15/04/14 750,000 639 1.86
7,933 23.09
United States - 18.64%AES 8.375% 01/03/11 750,000 739 2.15American Standard 8.25% 01/06/09 225,000 237 0.68Avery Weightronics * 120,750 4 0.01Avery Weightronics Warrants * 31,212 – –Chesapeake 10.375% 15/11/11 750,000 495 1.44Chesapeake 7% 15/12/14 300,000 125 0.36Constellation Brands 8.5% 15/11/09 124,000 125 0.35Dura Operating 9% 01/05/09 1,000,000 4 0.01General Motors 6% 23/05/12 500,000 282 0.82HCA Inc 8.75% 01/11/10 579,000 559 1.63Iron Mountain 7.25% 15/04/14 500,000 463 1.35Johnson Diversey 9.625% 15/05/12 400,000 301 0.87Momentive Performance 9% 01/12/14 600,000 388 1.13Polypore 8.75% 15/05/12 400,000 291 0.85Rockwood Specialities 7.625% 15/11/14 300,000 222 0.65Sensata 9% 01/05/16 750,000 477 1.39Travelport 8.738% 01/09/14 850,000 534 1.55Travelport 10.875% 01/09/16 950,000 586 1.70Viatel 2,031 – –Warner Music 8.125% 15/04/14 800,000 584 1.70
6,416 18.64
Total investments 33,184 96.55
Other net assets 1,186 3.45
Total 34,370 100.00
All securities held at the period end are transferable except where otherwise stated.All securities are listed on an official exchange except where otherwise stated.All investments are in fixed interest securities and equity securities except where otherwise stated.There are no transferable securities and money market instruments dealt in another regulated market except as otherwise stated.* Unlisted transferable security.
Percentage of Market value total net assets Description Nominal £’000 %
Portfolio Statement continued
Aberdeen Global 67India Opportunities Fund
India Opportunities FundFor the period ended 31 March 2008
PerformanceFor the six-months ended 31 March 2008, the value of the Aberdeen Global - India Opportunities Fund - A Accumulation shares decreased by 8.2% compared to a decrease of 10.0% in the benchmark, the MSCI India Index.
Manager’s reviewOver the six months under review, Indian shares fell sharply after reaching a record high in December. Sentiment was initially buoyed by foreign inflows and economic data, which outweighed worries over the global credit crunch. However, the domestic market soon succumbed to rising global risk amnesia as well as local concerns over the sustainability of demand-led growth in the face of rising inflation and tighter monetary policy. However, the trigger for falls was the escalating US housing and credit crunch, with global bond insurers and investment banks facing write-downs across the board. Bear Stearns was the most high profile casualty, as financial market de-leveraging intensified. Underlining the severity of the situation, the US Federal Reserve resorted to unprecedented measures to boost liquidity in the financial system, as well as reducing interest rates five times to 2.25%. Having risen strongly in 2007, India was one of the worst hit markets in the region.
The Reserve Bank of India (RBI), the central bank, held interest rates unchanged at a six-year high due to accelerating inflation, and raised the cash-deposit ratio to 6%. It also restricted loans to mutual funds and foreign institutional investors, signalling its concern over the increased flow of banking funds into the stock market and the effect on the rupee. Yet in the first quarter, these flows reversed, easing pressure on the currency, which fell slightly against the US dollar. A bigger issue, perhaps, with the government’s March budget for the fiscal year 2008-2009, in anticipation of elections, it presented an expansionary agenda including a waiver of US$15bn-worth of loans to farmers, as well as higher income tax exemption limits. The finance minister further emphasised that last year’s 9% GDP growth was sustainable.
While the RBI and the government might appear to be on a collision course, data already suggested the RBI’s measures were taking effect. With wholesale price inflation at a three-year high in March, demand for consumer goods appears to have fallen. Meanwhile, the trade deficit widened in December from a year ago as exports were hurt by the strong rupee.
Despite relatively weaker economic data, corporate earnings for the first half of the period to end December were positive: Hindustan Unilever benefited from strong demand; Bharti Airtel was supported by strong subscriber growth; Hero Honda’s revenues benefited from stable volumes; while Container Corporation of India’s profits rose on lower handling charges. Bank of Baroda also enjoyed strong results.
Portfolio reviewThe Fund fell by 8.2% in US dollar terms over the period, outperforming its benchmark MSCI India Index by 1.8%. In portfolio activity, we initiated a position in Bharti Airtel, one of the leading players in the local cellular market. We top-sliced several stocks that had seen a strong run-up, including Bharat Petroleum, Oil & Natural Gas Corporation and Tata Power.
Against this, we topped up our consumer holdings, including Hindustan Unilever, ITC and Godrej Consumer Products, and our information technology holdings like Infosys after what seemed excessive price falls.
OutlookAfter years of expansion, India is facing slowing growth amid rising inflation, reflecting cyclical and commodity effects. We remain cautious over the short term, as equities are likely to stay volatile amid further unravelling of the global credit crisis. However, India may be relatively insulated from a US recession due to investments and spending in the booming manufacturing and services sectors. Even though we expect growth in India to moderate this year, and the market to fall some more before bottoming out, we continue to believe that India’s long-term growth prospects remain intact. While the government has become more cautious over structural reforms, it has eased foreign direct investment rules to attract more overseas capital into key sectors such as civil aviation, commodity exchanges, mining and petroleum, which should boost economic growth. Exports are well diversified and infrastructure spending should strengthen as the most recent Five Year Plan kicks in. As such, we will take advantage of further volatility in the market to build positions in both stocks we already own and those that had been too expensive in the recent past.

68 Aberdeen GlobalIndia Opportunities Fund
Statement of Net Assets
As at 31 March 2008
Assets US$’000
Investments in securities at market value (note 2.2) 2,347,396
Cash at bank 65,420
Interest and dividends receivable 1,787
Subscriptions receivable 3,201
Total assets 2,417,804
Liabilities
Payable for investments purchased 19,132
Taxes and expenses payable 6,215
Redemptions payable 5,659
Total liabilities 31,006
Net assets at the end of the period 2,386,798
Statement of Changes in Net Assets
For the period from 1 October 2007 to 31 March 2008
US$’000
Net assets at the beginning of the period 2,779,282
Net losses from investments (19,440)
Realised gains on investments 343,360
Currency exchange losses (312)
Decrease in unrealised appreciation on investments (503,846)
Proceeds from shares issued 1,374,691
Payments for shares redeemed (1,587,139)
Net equalisation received (note 11) 202
Net assets at the end of the period 2,386,798
Statement of Operations
For the period from 1 October 2007 to 31 March 2008
Income US$’000
Income from investments 7,579
Bank interest 150
Total income 7,729
Expenses
Net management fee (note 4.6) 21,796
Administration fee (note 4.1) 314
Custodian fee (note 4.2) 2,890
Domiciliary agent, registrar, paying and
transfer agent fees (note 4.4) 890
Management company fees (note 4.5) 201
Operational expenses (note 4.7) 279
Mauritius income tax (note 12) 223
Annual tax (note 4.9) 576
Total expenses 27,169
Net losses from investments (19,440)
Realised gains on investments 343,360
Currency exchange losses (312)
Net realised gains 323,608
Decrease in unrealised appreciation on investments (503,846)
Net decrease in assets as a result of operations (180,238)
Share Transactions
For the period from 1 October 2007 to 31 March 2008
A-2 D-2(GBP) I-2 Z-2
Shares outstanding at
the beginning
of the period 18,553,809 14,694,380 246,878 –
Shares issued
during the period 2,943,024 1,372,967 331,786 110,241,842
Shares redeemed
during the period (13,321,449) (5,241,153) (478,892) (713,137)
Shares outstanding
at the end
of the period 8,175,384 10,826,194 99,772 109,528,705
Net asset value
per share 76.19 38.36 77.38 8.49
The accompanying notes form an integral part of these financial
statements.

Aberdeen Global 69India Opportunities Fund
Portfolio Statement As at 31 March 2008
Percentage of Market value total net assets Description Quantity US$’000 %
Consumer Discretionary - 8.03%Bosch Ltd 794,406 73,927 3.10Hero Honda 6,803,363 117,926 4.93
191,853 8.03
Consumer Staples - 8.46%Godrej Consumer Products 12,485,520 38,638 1.62Godrej Consumer Products Rights 1,783,645 162 0.01Hindustan Lever 14,150,000 80,797 3.39ITC Ltd 16,000,000 82,356 3.44
201,953 8.46
Energy - 4.35%Bharat Petroleum Corporation 5,200,000 53,019 2.22Oil & Natural Gas Corporation 2,080,000 50,900 2.13
103,919 4.35
Financials - 21.76%Bank of Baroda 5,714,670 40,411 1.69DLF 3,880,000 62,528 2.62Housing Development Finance Corp 3,407,000 202,342 8.47ICICI Bank 7,560,000 145,163 6.08ING Vysya Bank 4,726,280 39,514 1.66Jammu & Kashmir Bank 1,718,000 29,584 1.24
519,542 21.76
Health Care - 10.21%Aventis Pharma 1,043,576 19,925 0.83GlaxoSmithKline Pharmaceuticals 2,780,000 72,376 3.03Nicholas Piramal 9,209,946 70,345 2.95Piramal Life 920,994 – –Sun Pharmaceutical 2,646,806 81,204 3.40
243,850 10.21
Industrials - 5.01%ABB India 2,420,000 71,262 2.99Container Corporation of India 1,117,265 48,120 2.02
119,382 5.01
Information Technology - 22.53%CMC 960,000 19,317 0.81Infosys Technologies 5,070,000 182,189 7.63Mphasis Ltd 6,538,000 32,919 1.38Satyam Computer Services 20,020,000 198,027 8.30Tata Consultancy Services 5,200,000 105,175 4.41
537,627 22.53
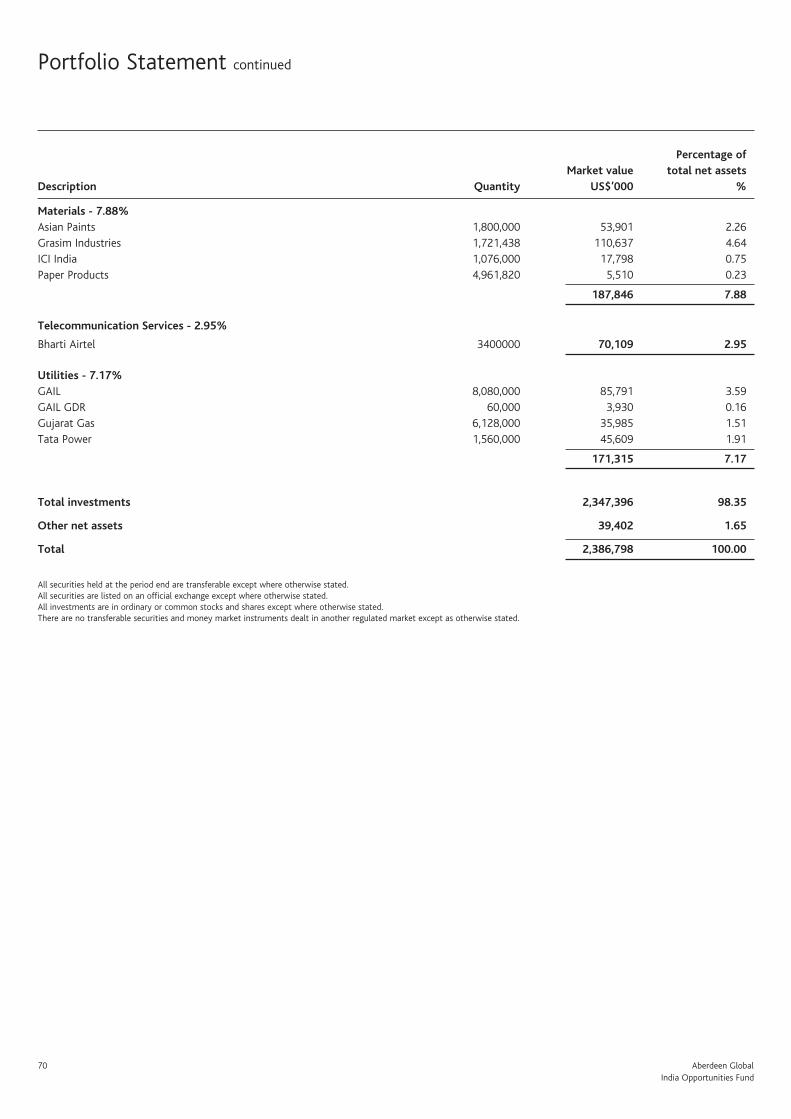
70 Aberdeen GlobalIndia Opportunities Fund
Materials - 7.88%Asian Paints 1,800,000 53,901 2.26Grasim Industries 1,721,438 110,637 4.64ICI India 1,076,000 17,798 0.75Paper Products 4,961,820 5,510 0.23
187,846 7.88
Telecommunication Services - 2.95%
Bharti Airtel 3400000 70,109 2.95
Utilities - 7.17%GAIL 8,080,000 85,791 3.59GAIL GDR 60,000 3,930 0.16Gujarat Gas 6,128,000 35,985 1.51Tata Power 1,560,000 45,609 1.91
171,315 7.17
Total investments 2,347,396 98.35
Other net assets 39,402 1.65
Total 2,386,798 100.00
All securities held at the period end are transferable except where otherwise stated.All securities are listed on an official exchange except where otherwise stated.All investments are in ordinary or common stocks and shares except where otherwise stated.There are no transferable securities and money market instruments dealt in another regulated market except as otherwise stated.
Portfolio Statement continued
Percentage of Market value total net assets Description Quantity US$’000 %

Aberdeen Global 71Japan Smaller Companies Fund
Japan Smaller Companies FundFor the period ended 31 March 2008
PerformanceFor the six-months ended 31 March 2008, the value of the Aberdeen Global - Japan Smaller Companies Fund - D Accumulation shares decreased by 23.3% compared to a decrease of 21.3% in the benchmark, the Russell Nomura Small Cap Index.
Manager’s reviewJapanese equities remained one of Asia’s laggards during the half-year under review, as the fallout from the US housing slump and the credit crisis took a toll on markets. Lingering worries over the domestic economic recovery, the impact of the appreciating yen on exporters and political uncertainties further dampened investor sentiment. Local small-cap stocks tracked the broader market lower, on fears that a US-led recession may exacerbate domestic economic woes. While the benchmark Russell Nomura Small Cap Index fell 21.3% over the period, it still performed better than the broader Topix Index, as the domestically-geared companies benefited from the strengthening currency.
Domestic economic growth, driven by capital investment and exports, remained broadly steady over the period, with GDP growing at an annual rate of around 2%. However, recent leading indicators showed the two growth drivers struggling to maintain momentum, while business sentiment remained fragile, as rising input costs and a stronger yen eroded profitability. Small firms were notably cautious, pressured by their larger counterparts to cut prices and lower margins and many had little option but to absorb rising overheads.
Private consumption remained lacklustre despite showing tentative signs of a pick-up. This is due in part to stagnant wages, which failed to respond to a tightening labour market. Although big companies agreed to marginal wage increases, smaller enterprises which employ more than half the country’s workforce, had less room for manoeuvre. Escalating food and fuel prices further stifled consumer spending, as households were left with lower disposable incomes.
Domestic politics compounded concerns over the murky economic outlook. A rift between the ruling Liberal Democratic Party (LDP) and the opposition-dominated upper house in effect sabotaged any policy initiatives. In the most striking illustration of this standoff, the central bank was left for several weeks without a governor after the opposition vetoed an LDP political appointee to the job – in contravention of the Bank of Japan’s independence. This sparked speculation that prime minister Yasuo Fukuda may be forced to step down before the next general election.
Portfolio reviewThe Fund underperformed the benchmark Russell Nomura Small Cap Index during the six months under review.
In portfolio activity, we introduced several new stocks. These included Musashino Bank, a regional bank, and building maintenance company Aeon Delight, both because of their healthy growth prospects. We also initiated positions in parking lot operator Park 24 and medical equipment manufacturer Mani. Both companies have interesting business models, with prospects for expanding overseas. In addition, we topped up parts makers FCC and Musashi Seimitsu, as valuations fell to attractive levels, while taking partial profits in cosmetic products manufacturer Mandom after its good relative performance on the back of positive earnings.
We also disposed of Bank of Nagoya, whose business prospects appeared limited in a highly competitive environment. We sold engine parts manufacturer Daido Metal, commercial facilities designer Ask Planning Centre and entertainment centre operator Round One, due to their uncertain business prospects.
OutlookWith structural and cyclical factors deteriorating, the outlook for Japan appears bleak. High commodity prices are adding to growth risks, hurting domestic spending and leaving companies unable to pass on costs. This is even the case for smaller firms. The domestic environment will depend heavily on whether consumers can re-discover an appetite for spending. Our best guess is that nervousness which has been building for the past couple of months will continue, with investors watching for any sign of deceleration in exports.
Given the above, the coming months are likely to be challenging for Japanese companies. Still, our holdings have continued to report earnings that either meet or surpass our expectations, suggesting that this remains a stock picker’s market. Having failed to participate in last year’s global rally, Japan is looking cheap by historical standards. The market noticeably outperformed most other indices in the first quarter this year. What is lacking, are any short-term catalysts. Still, while our focus on quality and value was not rewarded recently, we are optimistic that our approach, emphasising strong company fundamentals, will prevail in the long run.

72 Aberdeen GlobalJapan Smaller Companies Fund
Statement of Net Assets
As at 31 March 2008
Assets JP¥’000
Investments in securities at market value (note 2.2) 4,578,674
Cash at bank 172,298
Interest and dividends receivable 50,017
Receivable for investments sold 44,455
Total assets 4,845,444
Liabilities
Payable for investments purchased 66,909
Taxes and expenses payable 10,864
Redemptions payable 1,558
Total liabilities 79,331
Net assets at the end of the period 4,766,113
Statement of Changes in Net Assets
For the period from 1 October 2007 to 31 March 2008
JP¥’000
Net assets at the beginning of the period 6,436,584
Net gains from investments 2,274
Realised losses on investments (131,737)
Currency exchange losses (185)
Increase in unrealised depreciation on investments (1,286,509)
Proceeds from shares issued 450,735
Payments for shares redeemed (705,049)
Net assets at the end of the period 4,766,113
Statement of Operations
For the period from 1 October 2007 to 31 March 2008
Income JP¥’000
Income from investments 53,249
Total income 53,249
Expenses
Net management fee (note 4.6) 41,999
Administration fee (note 4.1) 1,969
Custodian fee (note 4.2) 548
Domiciliary agent, registrar, paying and
transfer agent fees (note 4.4) 1,174
Management company fees (note 4.5) 409
Operational expenses (note 4.7) 1,352
Annual tax (note 4.9) 1,281
Bank interest 2,243
Total expenses 50,975
Net gains from investments 2,274
Realised losses on investments (131,737)
Currency exchange losses (185)
Net realised losses (129,648)
Increase in unrealised depreciation on investments (1,286,509)
Net decrease in assets as a result of operations (1,416,157)
Share Transactions
For the period from 1 October 2007 to 31 March 2008
A-2 D-2(GBP) I-2
Shares outstanding at the
beginning of the period 89,687 8,249,830 1
Shares issued during
the period 21,368 14,499 849,741
Shares redeemed during
the period (24,408) (1,120,412) (1)
Shares outstanding at
the end of the period 86,647 7,143,917 849,741
Net asset value per share 595 3.00 546
The accompanying notes form an integral part of these financial
statements.

Aberdeen Global 73Japan Smaller Companies Fund
Portfolio Statement As at 31 March 2008
Percentage of Market value total net assets Description Quantity JP¥’000 %
Banks - 11.33%Awa Bank 300,000 171,600 3.60Hiroshima Bank 307,000 147,514 3.10Musashino Bank 16,700 67,886 1.42Sapporo Hokuyo 694,500 152,790 3.21
539,790 11.33
Chemicals - 7.36%Kureha Corp 280,000 173,600 3.64Mandom 59,200 177,452 3.72
351,052 7.36
Construction - 5.50%Meisei Industrial Co 283,000 64,524 1.35Okumura Corp 389,000 197,612 4.15
262,136 5.50
Electrical Appliances - 3.92%Daihen Corp 220,000 77,660 1.63Roland DG Corp 45,100 109,142 2.29
186,802 3.92
Electric Power & Gas - 4.37%
Shizuoka Gas Co 331,000 208,695 4.37
Information & Communication - 4.70%Intage 71,900 120,217 2.52Okinawa Cellular Telephone Co 548 104,120 2.18
224,337 4.70
Land Transportation - 1.01%
Seino Holdings Co 74,000 47,989 1.01
Machinery - 12.93%Mani 19,300 132,398 2.78Nabtesco 126,000 170,415 3.58New Tachikawa Aircraft Co 45,300 173,046 3.63Teikoku Piston Ring Co 164,800 140,162 2.94
616,021 12.93
Other Financing Business - 1.83%
Japan Asia Investment Co 221,000 87,295 1.83
Real Estate - 6.52%Park 24 142,000 138,947 2.92Sankei Building 266,900 171,483 3.60
310,430 6.52
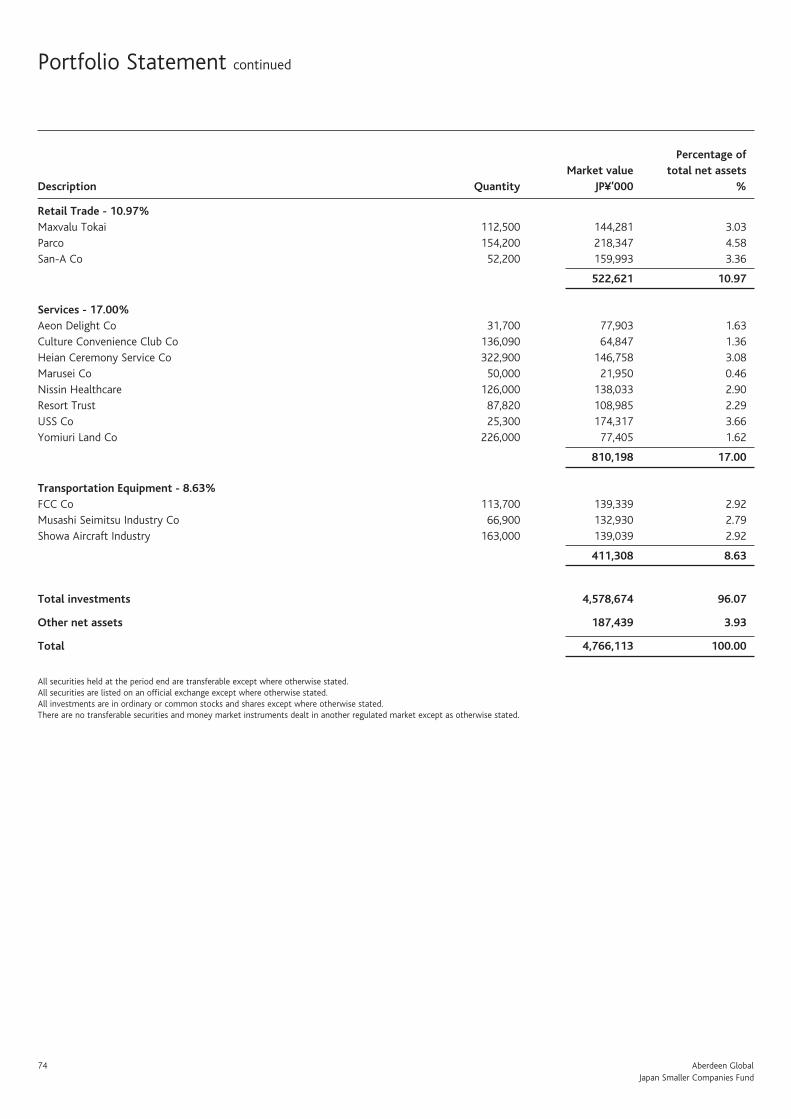
74 Aberdeen GlobalJapan Smaller Companies Fund
Portfolio Statement continued
Retail Trade - 10.97%Maxvalu Tokai 112,500 144,281 3.03Parco 154,200 218,347 4.58San-A Co 52,200 159,993 3.36
522,621 10.97
Services - 17.00%Aeon Delight Co 31,700 77,903 1.63Culture Convenience Club Co 136,090 64,847 1.36Heian Ceremony Service Co 322,900 146,758 3.08Marusei Co 50,000 21,950 0.46Nissin Healthcare 126,000 138,033 2.90Resort Trust 87,820 108,985 2.29USS Co 25,300 174,317 3.66Yomiuri Land Co 226,000 77,405 1.62
810,198 17.00
Transportation Equipment - 8.63%FCC Co 113,700 139,339 2.92Musashi Seimitsu Industry Co 66,900 132,930 2.79Showa Aircraft Industry 163,000 139,039 2.92
411,308 8.63
Total investments 4,578,674 96.07
Other net assets 187,439 3.93
Total 4,766,113 100.00
All securities held at the period end are transferable except where otherwise stated.All securities are listed on an official exchange except where otherwise stated.All investments are in ordinary or common stocks and shares except where otherwise stated.There are no transferable securities and money market instruments dealt in another regulated market except as otherwise stated.
Percentage of Market value total net assets Description Quantity JP¥’000 %
Aberdeen Global 75Japanese Equity Fund
Japanese Equity FundFor the period ended 31 March 2008
PerformanceFor the six months ended 31 March 2008, the value of the Aberdeen Global - Japanese Equity Fund - A Accumulation shares decreased by 26.0% compared to a decrease of 24.2% in the benchmark, the Topix Index.
Manager’s reviewJapanese equities fell for the six months under review on concerns over the slowing US economy, the spreading credit crisis and the strengthening yen, despite five interest rate cuts by the Federal Reserve and liquidity boosts by leading central banks to shore up confidence. Weak domestic economic data and political gridlock compounded the uncertainty.
On the macroeconomic front, the country’s six-year expansion lost steam due to rising oil and commodity prices, which pushed inflation to a 10-year high – albeit not enough to raise interest rates. Ongoing fiscal tightening was negative while structural inflexibility compounded problems. Growing pessimism among households and companies translated into weaker consumption and business investment. Faced with a strengthening yen and rising costs, companies were loath to increase wage levels or headcount, to keep prices competitive and sustain profits. Flat income growth, in turn, affected consumer spending. Big companies, especially exporters, saw the value of their dollar-based earnings shrink due to the yen, while the strain of rising costs and weak domestic demand was particularly telling on small and medium-sized enterprises, which employ around 70% of the workforce. As expected, government figures showed a steady decline in quarterly recurring profits.
Meanwhile, with the opposition in charge of the Upper House, the government’s ability to implement policy was severely impeded. This came to a head in mid-March when the ruling LDP’s choice to become central bank governor was blocked, leaving the Bank of Japan rudderless at a time of acute global financial turmoil. Still, the government has done itself no favours. Prime Minister Yasuo Fukuda has made survival his priority, with the result that the bureaucrats have been left to initiate policy. New rules on consumer finance, building codes and investment protection appear to have deterred investment and growth when precisely the opposite is needed.
Portfolio review The Fund fell by 26% against the Topix Index’s decline of 24.2%, underperforming the benchmark over the period under review, as both asset allocation and stock selection proved negative. In asset allocation, our underweight to basic materials and overweight to financials contributed the most to performance, while our underweight to consumer goods and lack of exposure to utilities detracted from relative return. In stock selection, our holdings in the industrials sector boosted performance, but those in health care and financials cost the Fund.
In portfolio activity, we initiated positions in two companies with proven business models and healthy balance sheets: Bank of Yokhama and robot manufacturer Fanuc. Conversely, we sold down, rubbish incineration plant maker Takuma because of poor earnings prospects and declining corporate governance standards. We also sold banks Mizuho and Mitsubishi UFJ due to their higher exposure to consumer-related bad loans.
OutlookThe slowing US economy is likely to weigh heavily on market sentiment and the economic outlook, given that the country is Japan’s largest export market. Sluggish domestic consumption has meant an increased reliance on exports for growth. Although shipments to China, other emerging markets and Europe have risen, this may be insufficient to offset the decline in US demand. Declining exports only hurt industrial production and capital investment. Such concerns, combined with rising energy and material prices, recently led the Bank of Japan to downgrade its GDP growth outlook, although it left interest rates unchanged.
With reference to valuations, Japanese companies remain among the cheapest in Asia but they have resorted to defensive measures, evidenced by poison-pill defences against hostile takeovers and convoluted cross-shareholding structures, in increasing numbers. This has deterred foreign investors, who remained net sellers of domestic stocks for most of the period under review. On the flip side, Japanese companies have relatively low exposure to sub-prime investments, and hence the widening credit crisis. They have also cleaned up their balance sheets significantly, and the more nimble ones have been adjusting well to market developments.
Against such a backdrop, we are cautious for the short term and continue to be disciplined in our approach, investing only in well-run companies that are attractively valued.

76 Aberdeen GlobalJapanese Equity Fund
Statement of Net Assets
As at 31 March 2008
Assets JP¥’000
Investments in securities at market value (note 2.2) 11,233,125
Cash at bank 191,529
Interest and dividends receivable 120,428
Subscriptions receivable 217,624
Total assets 11,762,706
Liabilities
Payable for investments purchased 685
Taxes and expenses payable 23,379
Redemptions payable 4,605
Total liabilities 28,669
Net assets at the end of the period 11,734,037
Statement of Changes in Net Assets
For the period from 1 October 2007 to 31 March 2008
JP¥’000
Net assets at the beginning of the period 16,487,626
Net gains from investments 10,970
Realised losses on investments (422,129)
Currency exchange losses (12,697)
Increase in unrealised depreciation on investments (3,630,644)
Proceeds from shares issued 986,589
Payments for shares redeemed (1,685,933)
Net equalisation received (note 11) 255
Net assets at the end of the period 11,734,037
Statement of Operations
For the period from 1 October 2007 to 31 March 2008
Income JP¥’000
Income from investments 128,831
Total income 128,831
Expenses
Net management fee (note 4.6) 102,708
Administration fee (note 4.1) 1,329
Custodian fee (note 4.2) 1,363
Distribution fee (note 4.3) 94
Domiciliary agent, registrar, paying and
transfer agent fees (note 4.4) 5,552
Management company fees (note 4.5) 996
Operational expenses (note 4.7) 1,832
Annual tax (note 4.9) 3,235
Bank interest 752
Total expenses 117,861
Net gains from investments 10,970
Realised losses on investments (422,129)
Currency exchange losses (12,697)
Net realised losses (423,856)
Increase in unrealised depreciation on investments (3,630,644)
Net decrease in assets as a result of operations (4,054,500)
Share Transactions
For the period from 1 October 2007 to 31 March 2008
A-2 B-2 D-2(GBP)
Shares outstanding at the
beginning of the period 2,817,926 102,720 42,208,990
Shares issued during
the period 244,482 - 2,960,725
Shares redeemed during
the period (1,266,389) (49,418) (3,637,246)
Shares outstanding at
the end of the period 1,796,019 53,302 41,532,469
Net asset value per share 270 233 1.37
The accompanying notes form an integral part of these financial
statements.

Aberdeen Global 77Japanese Equity Fund
Portfolio StatementAs at 31 March 2008
Percentage of Market value total net assets Description Quantity JP¥’000 %
Banks - 12.96%Bank of Kyoto 355,000 429,727 3.66Bank of Yokohama 460,000 310,730 2.65Hiroshima Bank 814,000 391,127 3.33Sapporo Hokuyo 561 389,615 3.32
1,521,199 12.96
Chemicals - 6.57%Mandom 117,200 351,307 2.99Shin-Etsu Chemical Co 81,400 420,024 3.58
771,331 6.57
Construction - 9.38%Daito Trust Construction 65,000 333,450 2.84Okumura Corp 891,000 452,628 3.86Sekisui House 341,000 314,231 2.68
1,100,309 9.38
Electrical Appliances - 20.01%Canon 131,000 599,980 5.11FANUC 27,000 255,555 2.18Keyence Corp 16,800 384,720 3.28Omron Corp 234,100 475,808 4.05Ricoh 213,000 347,829 2.96Rohm 46,500 285,045 2.43
2,348,937 20.01
Information & Communication - 3.08%
Nippon TV Network 26,600 362,292 3.08
Machinery - 6.61%Amada Co 620,000 466,550 3.98Nabtesco 215,000 290,788 2.48Takuma Co 67,000 17,990 0.15
775,328 6.61
Other Financing Business - 2.65%
Orix Corp 23,040 312,307 2.65
Pharmaceuticals - 7.91%Astellas Pharma 117,700 453,145 3.86Takeda Pharmaceuticals 95,100 473,598 4.05
926,743 7.91
Real Estate - 2.89%
Mitsubishi Estate 140,000 338,800 2.89

78 Aberdeen GlobalJapanese Equity Fund
Portfolio Statement continued
Retail Trade - 7.19%Parco 335,500 503,388 4.29Seven & I Holdings 135,920 339,120 2.90
842,508 7.19
Transportation Equipment - 16.48%Aisin Seiki Co 91,000 337,610 2.88FCC Co 263,700 323,164 2.75Honda Motor Co 147,000 417,113 3.55Toyota Motor Corp 101,000 501,465 4.27Yamaha Motor Co 193,400 354,019 3.03
1,933,371 16.48
Total investments 11,233,125 95.73
Other net assets 500,912 4.27
Total 11,734,037 100.00
All securities held at the period end are transferable except where otherwise stated.All securities are listed on an official exchange except where otherwise stated.All investments are in ordinary or common stocks and shares except where otherwise stated.There are no transferable securities and money market instruments dealt in another regulated market except as otherwise stated.
Percentage of Market value total net assets Description Quantity JP¥’000 %

Aberdeen Global 79Responsible World Equity Fund
Responsible World Equity FundFor the period ended 31 March 2008
Commencement of FundThe Fund was launched in the six-month period ended 31 March 2008. The first net asset value (NAV) calculation for the Fund was on 2 November 2007.
PerformanceFor the period 1 November 2007 to 31 March 2008, the value of the Aberdeen Global - Responsible World Equity Fund - A Accumulation shares decreased by 7.7% compared to a decrease of 13.7% in the benchmark, the MSCI World Index.
Manager’s reviewThe period under review saw global equities dropping sharply. Although they performed well in the first half, recurring credit fears exacerbated the sell down. Investment banks faced write-downs across the board. This culminated in the dramatic takeover of broker Bear Stearns by JPMorgan Chase for a knock-down sum. Bear Stearns was not the only casualty. British bank, Northern Rock’s heavy reliance on the credit markets forced the government into controversial nationalisation. Among sectors, financial stocks were the most badly hit, while commodities maintained their upward trajectory, despite the weaker outlook for growth.
Data on the economic front increased the likelihood of an economic recession, which added to anxiety in fragile markets. In the US, lower-than-expected fourth quarter GDP, poor holiday sales, rising mortgage defaults and tighter bank lending made it clear that the sub-prime fallout had spread to the real economy. While data in the Eurozone has not been as uniformly poor, retails sales have slumped and construction is weakening, especially in the housing boom-led economies of Ireland, Spain and the UK. Conversely, Asia fared better; even though growth forecasts have been downgraded, exporters have been able to shift sales away from the core US market, while corporate earnings growth has been steady.
During this period, central banks resorted to unprecedented measures to boost liquidity. The Federal Reserve cut interest rates five times by 2.5% to 2.25%, while the Bank of England cut rates twice. However, the European Central Bank, with its narrower mandate to preserve price stability, left monetary policy unchanged. Likewise, in Asia, where inflation touched multi-year highs in China, Hong Kong and Singapore, most central banks either kept interest rates steady, or hiked them.
In politics, the US presidential candidates are now down to three, after months of campaigning. In Argentina, former First Lady Cristina Fernandez was elected president; Spain’s ruling Socialist Party won a second term in the general election and Korea’s president-elect Lee Myung-Bak began his term. Italian prime minister Romano Prodi resigned after losing a confidence vote.
Portfolio reviewFor the six months ended March 2008, the value of the Responsible World Equity fell 7.7% compared with a 13.7% decline in the benchmark, MSCI World Index.
We initiated positions in Mapfre, a Spanish insurance company; Takeda, a Japanese pharmaceutical firm and City Developments, a Singapore real estate developer. A sudden drop in the share price of Australian insurance company QBE also gave us the opportunity to initiate a position.
Our thorough Social Responsible Investment (SRI) screening of the new investments highlighted that they all demonstrate strong and positive practices. For example, with a growing global footprint, Mapfre has implemented a robust social responsibility programme, incorporating an extensive set of human rights and labour policies in accordance with the ILO and the UN Declaration of Human Rights. In Japan, Takeda actively monitors its environmental impact and the health and safety of its workforce. The group plans to further enhance its CSR reporting and overall levels of transparency.
Despite the impact of the credit crunch, oil prices continued to press higher, hitting record highs of $110. We used this chance to realise some profits in Petrobras and EOG Resources. Conversely, we sold out of Japanese bank Mitsubishi UFJ, as better value can be found elsewhere.
OutlookIndications of a global slowdown are multiplying by the week. The International Monetary Fund has cut the global growth forecast twice this year to 3.7%. In the US, tight credit conditions are constraining spending growth, compounding weak consumer sentiment; while in the UK, with the credit crisis affecting business confidence and potentially employment growth, there is a risk of downward adjustment to growth. For Asia, fuel and food inflation is also squeezing corporate margins, just as export demand is in danger of slowing.
In view of this picture, we will continue to be disciplined in our investing approach, focusing on well-managed companies with healthy balance sheets and attractive valuations.

80 Aberdeen GlobalResponsible World Equity Fund
Statement of Net Assets
As at 31 March 2008
Assets US$’000
Investments in securities at market value (note 2.2) 57,431 Cash at bank 346 Interest and dividends receivable 177
Total assets 57,954
Liabilities
Taxes and expenses payable 29
Total liabilities 29
Net assets at the end of the period 57,925
Statement of Changes in Net Assets
For the period from 1 November 2007 to 31 March 2008
US$’000
Net assets at the beginning of the period –
Net gains from investments 315 Realised gains on investments 201 Currency exchange losses (87)
Increase in unrealised depreciation on investments (6,039) Proceeds from shares issued 63,532 Net equalisation received (note 11) 3
Net assets at the end of the period 57,925
Statement of Operations
For the period from 1 November 2007 to 31 March 2008
Income US$’000
Income from investments 342 Bank interest 39
Total income 381
Expenses
Net management fee (note 4.6) 7 Administration fee (note 4.1) 25 Custodian fee (note 4.2) 5 Domiciliary agent, registrar, paying and transfer agent fees (note 4.4) 15 Management company fees (note 4.5) 4 Operational expenses (note 4.7) 7 Annual tax (note 4.9) 3
Total expenses 66
Net gains from investments 315
Realised gains on investments 201 Currency exchange losses (87)
Net realised gains 429
Increase in unrealised depreciation on investments (6,039)
Net decrease in assets as a result of operations (5,610)
Share Transactions
For the period from 1 November 2007 to 31 March 2008
A-2 D-2(GBP) I-2 Z-2Shares outstanding at the beginning
of the period – – – –
Shares issued
during the period 179,837 1 1 6,199,485
Shares redeemed
during the period (1) (1) – –
Shares outstanding
at the end of the period 179,836 – 1 6,199,485
Net asset value per share 9.23 – 9.08 9.08
The accompanying notes form an integral part of these financial statements.

Aberdeen Global 81Responsible World Equity Fund
Portfolio Statement As at 31 March 2008
Percentage of Market value total net assets Description Quantity US$’000 %
Argentina - 2.96%
Tenaris ADR 35,100 1,714 2.96
Australia - 1.08%
QBE Insurance Group 30,900 628 1.08
Austria - 1.63%
Flughafen Wien 7,800 943 1.63
Belgium - 2.31%
Belgacom 30,300 1,337 2.31
Brazil - 3.11%
Petroleo Brasileiro (Pref) ADR 21,600 1,802 3.11
Canada - 1.97%
Canadian National Railway 23,300 1,140 1.97
France - 1.11%
Peugeot 8,300 643 1.11
Germany - 10.72%Adidas 19,300 1,277 2.20Commerzbank 39,100 1,217 2.10Deutsche Post 36,500 1,122 1.94Deutsche Postbank 9,500 905 1.56E.ON 9,200 1,693 2.92
6,214 10.72
Hong Kong - 3.67%CLP Holdings 81,500 669 1.16Swire Pacific ‘A’ 129,500 1,455 2.51
2,124 3.67
India - 1.88%ICICI Bank ADR 8,300 328 0.57Satyam Computer Services 33,100 758 1.31
1,086 1.88
Italy - 4.16%ENI 35,000 1,189 2.05Intesa Sanpaolo 174,000 1,221 2.11
2,410 4.16

82 Aberdeen GlobalResponsible World Equity Fund
Portfolio Statement continued
Japan - 12.54%Amada 114,000 861 1.49Bank of Kyoto 65,000 790 1.36Bank of Yokohama 89,000 604 1.04Canon 40,000 1,839 3.17Daito Trust Construction 21,100 1,087 1.88Orix 34,000 463 0.80Takeda Pharmaceuticals 10,700 535 0.92Toyota Motor Corp 21,800 1,087 1.88
7,266 12.54
Mexico - 1.37%
Grupo Aeroportuario del Sureste ADS 14,200 792 1.37
Netherlands - 1.33%
Philips Electronics 20,000 770 1.33
Portugal - 2.10%
Portugal Telecom 103,800 1,216 2.10
Singapore - 2.53%City Developments 70,000 559 0.96Oversea-Chinese Banking Corp 155,000 909 1.57
1,468 2.53
South Korea - 3.09%
Samsung Electronics GDR 8,000 1,789 3.09
Spain - 1.80%
Mapfre 208,800 1,045 1.80
Sweden - 3.43%Ericsson 373,400 716 1.24Nordea 79,300 1,269 2.19
1,985 3.43
Switzerland - 3.68%
Zurich Financial Services 6,800 2,133 3.68
Taiwan - 3.61%
TSMC ADS 205,400 2,089 3.61
United Kingdom - 11.57%AstraZeneca 26,200 985 1.70Centrica 176,800 1,063 1.84John Wood Group 98,300 797 1.38Morrison (W) 155,900 855 1.47Premier Foods 416,400 936 1.62Vodafone 462,300 1,392 2.40Wolseley 63,300 672 1.16
6,700 11.57
Percentage of Market value total net assets Description Quantity US$’000 %
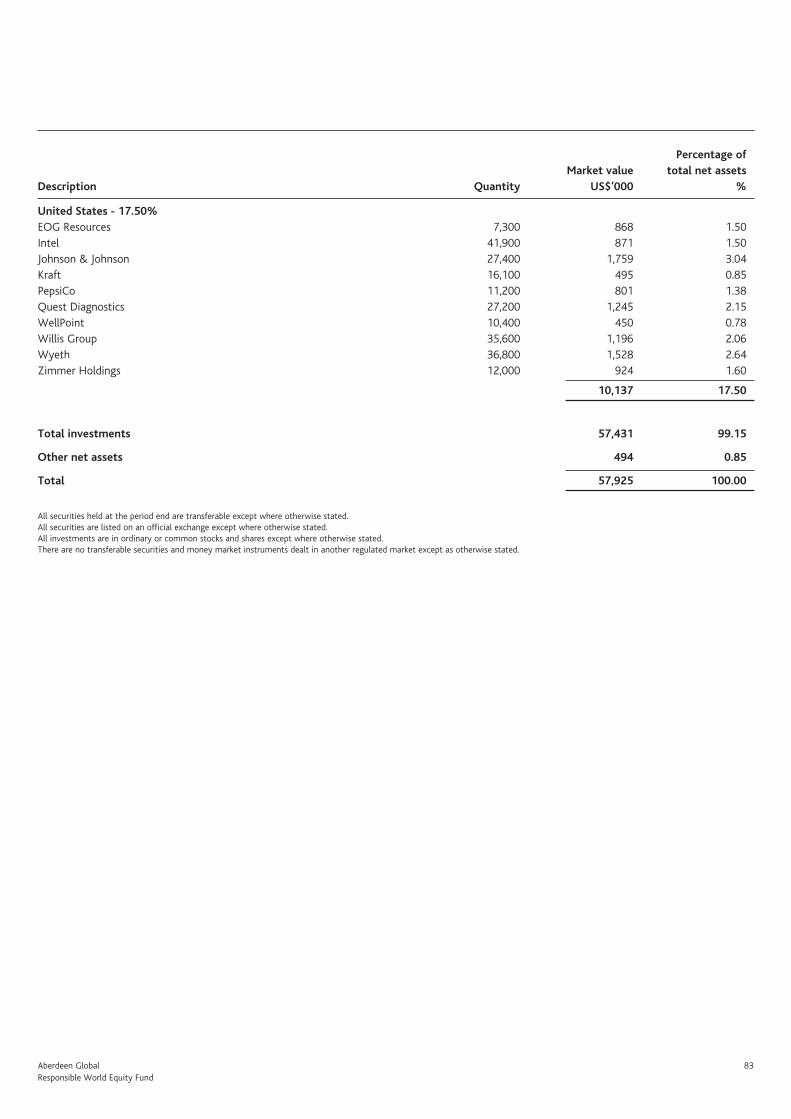
Aberdeen Global 83Responsible World Equity Fund
United States - 17.50%EOG Resources 7,300 868 1.50Intel 41,900 871 1.50Johnson & Johnson 27,400 1,759 3.04Kraft 16,100 495 0.85PepsiCo 11,200 801 1.38Quest Diagnostics 27,200 1,245 2.15WellPoint 10,400 450 0.78Willis Group 35,600 1,196 2.06Wyeth 36,800 1,528 2.64Zimmer Holdings 12,000 924 1.60
10,137 17.50
Total investments 57,431 99.15
Other net assets 494 0.85
Total 57,925 100.00
All securities held at the period end are transferable except where otherwise stated.All securities are listed on an official exchange except where otherwise stated.All investments are in ordinary or common stocks and shares except where otherwise stated.There are no transferable securities and money market instruments dealt in another regulated market except as otherwise stated.
Percentage of Market value total net assets Description Quantity US$’000 %

84 Aberdeen GlobalSterling Corporate Bond Fund
Sterling Corporate Bond FundFor the period ended 31 March 2008
PerformanceFor the six-months ended 31 March 2008, the value of the Aberdeen Global - Sterling Corporate Bond Fund – D Income shares increased by 0.1% compared to an increase of 5.9% in the benchmark, the FTSE British Govt All-Stocks Index.
Change in benchmarkIn order to better align the objectives and holdings within the Fund, from 31 March 2008 the Fund has changed its benchmark to iBoxx Sterling Non-Gilts (all maturities). The new index will provide a more representative investment universe for the Fund, and is therefore more suitable to measure performance against.
Manager’s reviewThe last 6 months has seen an unprecedented period of deterioration in the global financial sector as liquidity and credit issues have escalated across global markets and other asset classes. The effect has been quite devastating on the corporate sector as well as global economies. The US has led the downturn as the complex structures of mortgages, loans and other such assets have been in free fall. The banks have been trying to unravel their exposure to these type of assets which historically have been off balance sheet items, and as such, unaccountable. However, following the escalating housing sector crisis in the US and the rising fear of defaults across these products confidence has been shattered as the problems have spread globally.
The central banks have stepped into help alleviate some of the liquidity problems on several occasions, by injecting large amounts of cash into the banking system to help ease short term rates. This has been met initially with some softening in levels. However, as the crisis has deepened and the banks continue to be wary of ultimate losses, short term financing levels have continued to rise. Other initiatives by the central banks have been to broaden collateral requirements, for borrowing, as well as reduce interest rates as has been the Federal Reserves policy to date. The Federal Reserve has also allowed other financial institutions apart from Banks to borrow directly from them, which has been unheard of in the past. All of this is a result of attempting to prevent other financial institutions running into financial difficulties as has been experienced by Northern Rock in the UK and Bear Stearns in the US.
It has not been easy for the central banks to effect easier monetary policy as in the US, UK and Europe as inflation remains doggedly above target levels with the prospect of higher inflationary levels to come. The Monetary Policy Committee has been laggard with rates, as until recently their focus has been on tackling the increasing risk of higher inflation. However, we have had a 50 basis points (bps) cut during the period and a further 25bps since, as they have acknowledged that there are downside risks now to overall growth. Unlike the Federal Reserve who have slashed rates by 225bps in order to stimulate the economy and ease the housing situation (the effects of which have yet to be felt). In Europe, the European Central Bank has yet to reduce rates, as the economy there has proved more resilient. However, with the US likely in recession and the UK economy clearly slowing, it should only be a matter of time before they cut – although like the UK rates are not expected to be cut as far as those in the US.
The effect on bond markets has taken government bonds yields lower as investors have shunned risk assets in favour of guaranteeing their capital. Short dated government bonds have remained underpinned by
risk averse investors and this has resulted in government bond curves steepening as the longer end is subject more to future inflationary expectations, which remain at elevated levels. The ten year gilt yield has fallen from 5.01% to 4.35%, the thirty year gilt yield is now 4.38% down from 4.6%; the two year gilt yield though is lower by 1.24% at 3.83%. The market is now pricing at least two more rate cuts with a 50% probability of a third over the next 12 months.
Corporate bonds have experienced a catastrophic 6 months as spreads have widened dramatically, the average yield spread of a non-government bond is around 1.9%, up circa 0.85% during the period. The market has effectively been grid-locked; there have been periods of some liquidity when issuers have come to the market around the year-end. Conditions though have worsened and it has been a particularly difficult environment not knowing where spreads will ultimately end up and where corporate debt should now be priced. The move higher in spreads to these new levels has sparked some interest, but until investors are assured the write downs to asset levels is nearing an end, spreads will remain susceptible to further widening, which will not only affect financial bonds but other sectors that will feel the effect of a slowing economy.
Portfolio reviewThe Fund has heavily underperformed relative to its government benchmark, as would be expected, being invested in corporate bonds with only a small exposure to government debt. However, the Fund is diversified across sectors and relative to corporate bond indices has performed very well.
After reducing the holdings in subordinated financial bonds during the early part of 2007, and the subsequent flight to quality away for higher yielding riskier assets as the credit crunch escalated, this short position contributed positively towards performance. The weighting towards secured debt and high rated supra-nationals bonds was also a positive factor. The short duration position to benchmark over the period would have marginally detracted from the general good performance.
As corporate bonds spreads widened the Fund started to increase its exposure to financial bonds, in particular higher quality banks at the short end of the market with attractive yields. With the problems at Northern Rock the Fund took a position in their lower tier 2 bonds, at cheap levels, on the expectation of a restructuring or takeover. Activity has been muted due to the illiquid market conditions.
The Fund continues to have a substantial weighting towards single A and BBB rated issuers including financial bonds which should benefit from any tightening in credit spreads, as these have moved wider than higher rated bonds in the fall out.
OutlookThe key to a stable environment lies in the bottoming of the US housing market, and greater confidence that banks have quantified their exposure and losses. In the meantime though, the economy both here and in the US is expected to continue to slow as an indebted consumer feels the full impact of the tightening credit conditions now in place by the financial sector and a marked fall in the housing market. With the credit market nervous and liquidity thin, uncertainty continues to persist.

Aberdeen Global 85Sterling Corporate Bond Fund
Statement of Net Assets
As at 31 March 2008
Assets £’000
Investments in securities at market value (note 2.2) 12,509
Cash at bank 252
Interest and dividends receivable 307
Subscriptions receivable 8
Total assets 13,076
Liabilities
Payable for investments purchased 48
Taxes and expenses payable 25
Other liabilities 78
Total liabilities 151
Net assets at the end of the period 12,925
Statement of Changes in Net Assets
For the period from 1 October 2007 to 31 March 2008
£’000
Net assets at the beginning of the period 13,740
Net gains from investments 356
Realised losses on investments (31)
Increase in unrealised depreciation on investments (304)
Proceeds from shares issued 1,148
Payments for shares redeemed (1,614)
Net equalisation paid (note 11) (2)
Dividends paid (note 5) (368)
Net assets at the end of the period 12,925
Statement of Operations
For the period from 1 October 2007 to 31 March 2008
Income £’000
Income from investments 444
Bank interest 12
Total income 456
Expenses
Net management fee (note 4.6) 68
Administration fee (note 4.1) 3
Custodian fee (note 4.2) 1
Domiciliary agent, registrar, paying and
transfer agent fees (note 4.4) 9
Management company fees (note 4.5) 1
Operational expenses (note 4.7) 3
Annual tax (note 4.9) 15
Total expenses 100
Net gains from investments 356
Realised losses on investments (31)
Net realised gains 325
Increase in unrealised depreciation on investments (304)
Net increase in assets as a result of operations 21
Share Transactions
For the period from 1 October 2007 to 31 March 2008
D-1
Shares outstanding at the beginning of the period 13,646,292
Shares issued during the period 1,141,208
Shares redeemed during the period (1,605,383)
Shares outstanding at the end of the period 13,182,117
Net asset value per share 0.9805
The accompanying notes form an integral part of these financial
statements.

86 Aberdeen GlobalSterling Corporate Bond Fund
Percentage of Market value total net assets Description Nominal £’000 %
UK Treasury Stock - 1.85%
UK Treasury 4.25% 07/12/27 250,000 239 1.85
Sterling Denominated Bonds - 94.93%Australia - 2.35%
AMP UK Finance 7.125% 06/08/09 * 300,000 304 2.35
Austria - 2.01%
Oesterreich Postsparkasse 6.125% 20/10/14 244,000 260 2.01
Canada - 1.18%
Finning International 5.625% 30/05/13 150,000 153 1.18
Germany - 4.10%KFW 5.75% 07/06/32 270,000 306 2.37Deutsche Telekom 7.125% 26/09/12 218,000 224 1.73RWE Finance 6.375% 03/06/13 – –
530 4.10
Ireland - 2.43%Kilroot Electric 9.5% 31/12/10 140,367 148 1.15Lambay Capital Securities 6.25% FRN Perp 16/06/15 100,000 67 0.52Mutual Securitisation 7.3916% 30/09/12 98,236 98 0.76
313 2.43
Italy - 2.91%Assicurazioni Generali Perp 16/06/26 200,000 160 1.24BCI US Funding Trust III 8.25% 15/07/08 217,000 216 1.67Parmalat Capital Finance 9.375% 02/12/17 14,664 - -
376 2.91
Luxemburg - 0.87%
European Investment Bank 5.625% 07/06/32 100,000 113 0.87
Netherlands - 5.83%Bank Voor Nederlandse Gemeenten 5.75% 18/01/19 300,000 316 2.44Fixed-Link Finance 7.5% 02/02/09 211,000 210 1.62Harsco Finance 7.25% 27/10/10 169,000 175 1.35Neder Waterschapsbank 5.375% 07/06/32 50,000 54 0.42
755 5.83
Switzerland - 0.62%
Credit Suisse Group Financial 6.875% 07/06/49 88,000 80 0.62
United Kingdom - 67.41%Anglian Water Service 5.5% 10/10/40 109,000 101 0.78Anglian Water Service 7.882% 30/07/37 109,000 117 0.91Annington Finance FRN 10/01/23 76,857 75 0.58Argon Capital 8.162% 05/10/12 300,000 285 2.21Asda Property 6.125% 30/09/14 87,987 90 0.70Aviva 6.125% 29/09/22 140,000 119 0.92BAA 5.75% 27/11/13 218,000 192 1.48Barclays 6% 15/12/17 220,000 168 1.30Barclays 6.75% 16/01/23 100,000 97 0.75
Portfolio Statement As at 31 March 2008

Aberdeen Global 87Sterling Corporate Bond Fund
BL Universal 6.75% 31/03/11 117,000 121 0.94BOC Group 6.5% 29/01/16 300,000 302 2.34Bradford & Bingley 5.625% 20/12/13 178,000 145 1.12Britannia 5.75% 02/12/24 211,000 174 1.35Britannia 5.875% 28/03/33 50,000 34 0.26Broadgate FRN 05/10/23 134,075 123 0.95Carnival 7.125% 25/06/12 161,000 166 1.28Daily Mail & General Trust 10% 09/04/21 100,000 122 0.94Daily Mail & General Trust 6.375% 21/06/27 200,000 183 1.42Derbyshire Building Society 5.875% 17/12/15 153,000 148 1.15Derbyshire Building Society 6% 15/12/16 230,000 194 1.50Dignity Finance 6.31% 31/12/23 96,717 95 0.73Dunedin Income Growth 7.875% 30/04/19 † 114,487 134 1.04Edinburgh Investment Trust 11.5% 30/06/14 200,000 265 2.05Edinburgh Investment Trust 7.75% Deb Stock 2022 80,000 95 0.74Enterprise Inns 6% 03/02/14 258,000 244 1.89Eskmuir Properties 7.875% Deb 24/02/20 200,000 225 1.74Fuller Smith & Turner 6.785% 30/04/28 200,000 220 1.70Greycoat 9.5% 30/09/03 * 140,000 4 0.03Ladbokes Group Finance 7.125% 11/07/12 161,000 155 1.20LCR Finance 4.5% 07/12/28 250,000 240 1.86Lloyds TSB Bank 5.125% 09/12/16 236,000 200 1.55Mid-Sussex Water 10% 30/06/17 200,000 249 1.93Mid-Sussex Water 12% 19/03/10 150,000 171 1.32Mitchells & Butlers FRN 15/12/30 250,000 245 1.90MMO2 7.625% 25/01/12 88,000 93 0.72Monks IT 11% 01/06/12 225,000 274 2.12Nationwide 5.769% 28/02/49 50,000 36 0.28Network Rail 4.75% 22/01/24 300,000 294 2.27Northern Gas 4.875% 30/06/27 50,000 41 0.32Northern Rock 10.375% 25/03/18 200,000 181 1.40Northern Rock 9.375% 17/10/21 100,000 97 0.75Peel Holdings 9.875% 30/04/11 318,945 362 2.80Peel South East 11.625% 30/04/18 31,760 46 0.35Punch Taverns Finance 7.274% 15/04/22 220,000 242 1.87Punch Taverns Finance FRN 30/06/35 109,000 82 0.63Scottish Investment Trust 5.75% 17/04/30 129,000 125 0.97Skipton Building Society 5.5% 12/12/13 293,000 292 2.26Spirit Issuer FRN 28/12/31 109,000 98 0.76Sutton Bridge Financing 8.625% 30/06/22 80,853 90 0.70Thistle Hotels 7.875% 20/06/22 131,980 153 1.18THPA Finance 8.241% 15/03/28 109,000 108 0.84Trustco Finance 11.5% 22/02/16 50,000 69 0.53Wessex Water 5.875% 30/03/09 103,000 103 0.80West Bromwich Building Society 6.15% 05/04/21 268,000 221 1.71Wolverhampton & Dudley Brewery 5.1576% 15/07/19 241,000 206 1.59
8,711 67.41
Percentage of Market value total net assets Description Nominal £’000 %

88 Aberdeen GlobalSterling Corporate Bond Fund
Portfolio Statement continued
United States - 5.22%ASIF II 5.625% 01/02/12 218,000 208 1.61New York Global Funding 4.5% 17/01/13 150,000 144 1.11Pacific Life Funding 5.125% 20/01/15 218,000 208 1.61Travelers Ins Co 6.125% 23/02/11 117,000 115 0.89
675 5.22
Total Sterling Denominated Bonds 12,270 94.93
Total investments 12,509 96.78
Other net assets 416 3.22
Total 12,925 100.00
All securities held at the period end are transferable except where otherwise stated.All securities are listed on an official exchange except where otherwise stated.All investments are in fixed interest securities and equity securities except where otherwise stated.There are no transferable securities and money market instruments dealt in another regulated market except as otherwise stated.* Unlisted transferable security.† Managed by subsidiaries of Aberdeen Asset Management PLC.
Percentage of Market value total net assets Description Nominal £’000 %
Aberdeen Global 89Sterling Financials Bond Fund
Sterling Financials Bond FundFor the period ended 31 March 2008
PerformanceFor the six-months ended 31 March 2008, the value of the Aberdeen Global - Sterling Financials Bond Fund - A Accumulation shares increased by 2.4% compared to an increase of 4.8% in the benchmark, the FTSE Actuaries Gilts Up to 5Y Index.
Change in benchmarkIn order to better align the objectives and the holdings within the Fund, from 31 March 2008 the Fund has changed its benchmark to iBoxx Sterling Corporate Financials 1 -5 years. The new index will provide a more representative investment universe for the Fund, and is therefore more suitable to measure performance against.
Manager’s reviewThe last 6 months has seen an unprecedented period of deterioration in the global financial sector as liquidity and credit issues have escalated across global markets and other asset classes. The effect has been quite devastating on the corporate sector as well as global economies. The US has led the downturn as the complex structures of mortgages, loans and other such assets have been in free fall. The banks have been trying to unravel their exposure to these type of assets which historically have been off balance sheet items, and as such, unaccountable. However, following the escalating housing sector crisis in the US and the rising fear of defaults across these products confidence has been shattered as the problems have spread globally.
The central banks have stepped into help alleviate some of the liquidity problems on several occasions, by injecting large amounts of cash into the banking system to help ease short term rates. This has been met initially with some softening in levels. However, as the crisis has deepened and the banks continue to be wary of ultimate losses, short term financing levels have continued to rise. Other initiatives by the central banks have been to broaden collateral requirements, for borrowing, as well as reduce interest rates as has been the Federal Reserves policy to date. The Federal Reserve has also allowed other financial institutions apart from Banks to borrow directly from them, which has been unheard of in the past. All of this is a result of attempting to prevent other financial institutions running into financial difficulties as has been experienced by Northern Rock in the UK and Bear Stearns in the US.
It has not been easy for the central as banks to effect easier monetary policy as in the US, UK and Europe as inflation remains doggedly above target levels with the prospect of higher inflationary levels to come. The Monetary Policy Committee has been laggard with rates, as until recently their focus has been on tackling the increasing risk of higher inflation. However, we have had a 50 basis points (bps) cut during the period and a further 25bps since, as they have acknowledged that there are downside risks now to overall growth. Unlike the Federal Reserve who have slashed rates by 225bps in order to stimulate the economy and ease the housing situation (the effects of which have yet to be felt). In Europe, the European Central Bank has yet to reduce rates, as the economy there has proved more resilient. However, with the US
likely in recession and the UK economy clearly slowing, it should only be a matter of time before they cut – although like the UK rates are not expected to be cut as far as those in the US.
The effect on bond markets has taken government bonds yields lower as investors have shunned risk assets in favour of guaranteeing their capital. Short dated government bonds have remained underpinned by risk averse investors and this has resulted in government bond curves steepening as the longer end is subject more to future inflationary expectations, which remain at elevated levels. The five year gilt yield has fallen from 5.0% to 3.89%, with the two year gilt yield lower by 1.24% at 3.83%. The market is now pricing at least two more rate cuts with a 50% probability of a third over the next 12 months.
Corporate bonds have experienced a catastrophic 6 months as spreads have widened dramatically, the average yield spread of a non-government bond is around 1.9%, up circa 0.85% during the period. The market has effectively been grid-locked; there have been periods of some liquidity when issuers have come to the market around the year-end. Conditions though have worsened and it has been a particularly difficult environment not knowing where spreads will ultimately end up and where corporate debt should now be priced. The move higher in spreads to these new levels has sparked some interest, but until investors are assured the write downs to asset levels is nearing an end, spreads will remain susceptible to further widening, which will not only affect financial bonds but other sectors that will feel the effect of a slowing economy.
Portfolio reviewActivity has been muted due to the illiquid market conditions. With the maturity of Eurohypo 6.375% 2008 in February the cash proceeds were reinvested into a UK Gilt as a safe haven from the continuing credit crisis. On the plus side the Fund holds mainly senior banking debt which has performed better than subordinated (lower quality) financial bonds. However, due to the dislocation in the Libor curve, the Funds holdings of floating rate notes have seen rates re-fixed at exceptionally attractive levels, this however has come, at a cost to their capital value. The average rating within the Fund has increased from AA- to AA, with UK Gilt holdings increasing and Floating Rate Notes remaining constant.
OutlookThe key to a stable environment lies in the bottoming of the US housing market, and greater confidence that banks have quantified their exposure and losses. In the meantime though, the economy both here and in the US is expected to continue to slow as an indebted consumer feels the full impact of the tightening credit conditions now in place by the financial sector and a marked fall in the housing market. With the credit market nervous and liquidity thin, uncertainty continues to persist.

90 Aberdeen GlobalSterling Financials Bond Fund
Statement of Net Assets
As at 31 March 2008
Assets £’000
Investments in securities at market value (note 2.2) 33,690
Cash at bank 1,702
Interest and dividends receivable 809
Total assets 36,201
Liabilities
Taxes and expenses payable 47
Redemptions payable 27
Total liabilities 74
Net assets at the end of the period 36,127
Statement of Changes in Net Assets
For the period from 1 October 2007 to 31 March 2008
£’000
Net assets at the beginning of the period 36,749
Net gains from investments 812
Realised losses on investments (151)
Decrease in unrealised depreciation on investments 205
Proceeds from shares issued 48
Payments for shares redeemed (1,526)
Net equalisation paid (note 11) (10)
Net assets at the end of the period 36,127
Statement of Operations
For the period from 1 October 2007 to 31 March 2008
Income £’000
Income from investments 973
Bank interest 16
Total income 989
Expenses
Net management fee (note 4.6) 136
Administration fee (note 4.1) 3
Custodian fee (note 4.2) 3
Domiciliary agent, registrar, paying and
transfer agent fees (note 4.4) 17
Management company fees (note 4.5) 3
Operational expenses (note 4.7) 6
Annual tax (note 4.9) 9
Total expenses 177
Net gains from investments 812
Realised losses on investments (151)
Net realised gains 661
Decrease in unrealised depreciation on investments 205
Net increase in assets as a result of operations 866
Share Transactions
For the period from 1 October 2007 to 31 March 2008
A-2
Shares outstanding at the beginning of the period 21,711,784
Shares issued during the period 28,345
Shares redeemed during the period (898,238)
Shares outstanding at the end of the period 20,841,891
Net asset value per share 1.7334
The accompanying notes form an integral part of these financial
statements.

Aberdeen Global 91Sterling Financials Bond Fund
Percentage of Market value total net assets Description Nominal £’000 %
Sterling Denominated Bonds - 88.27%Australia - 6.79%National Australia Bank 5.25% 20/01/10 1,000,000 991 2.74Westpac Bank 4.875% 13/04/11 1,500,000 1,462 4.05
2,453 6.79
Canada - 8.22%Ontario 5.375% 28/07/09 1,500,000 1,502 4.16Royal Bank of Canada 4.625% 07/12/10 1,500,000 1,466 4.06
2,968 8.22
Germany - 4.24%
KFW 5.25% 12/01/12 1,500,000 1,530 4.24
Ireland - 6.86%Anglo Irish Bank FRN 28/06/12 1,500,000 1,492 4.13Bank of Ireland 4.75% 30/12/08 1,000,000 987 2.73
2,479 6.86
Italy - 3.31%
Banca Intesa FRN 04/03/10 1,200,000 1,194 3.31
Luxemburg - 3.33%
European Investment Bank 4.75% 06/06/12 1,200,000 1,203 3.33
Netherlands - 8.26%ABN Amro Bank 4.875% 20/01/10 1,500,000 1,483 4.10Bank Nederlandse Gemeenten 4.875% 21/04/10 1,500,000 1,503 4.16
2,986 8.26
Spain - 2.80%
Institut Credito 5.375% 17/03/10 1,000,000 1,012 2.80
United Arab Emirates - 2.05%
Abu Dhabi Commercial Bank 5.625% 06/11/11 750,000 742 2.05
United Kingdom - 11.06%Alliance & Leicester 4.25% 30/12/08 1,000,000 961 2.66HBOS Treasury Services 4.875% 10/02/10 1,500,000 1,470 4.07Lloyds TSB Bank 9.5% 01/06/09 1,500,000 1,566 4.33
3,997 11.06
United States - 31.35%Allstate Life Funding 6.3% 01/07/08 1,500,000 1,496 4.14American Express Credit 5.625% 18/08/09 1,500,000 1,457 4.03ASIF III 5.625% 15/06/09 1,500,000 1,474 4.08Bank of America 6.15188% 02/02/11 1,500,000 1,475 4.08JP Morgan Chase 6% 07/12/09 1,500,000 1,506 4.17Lehman Brothers 5% 26/01/10 1,000,000 936 2.59Pacific Life Funding 6.25% 08/02/11 1,500,000 1,502 4.16Met Life Global Funding I 5.25% 19/12/08 1,500,000 1,482 4.10
11,328 31.35
Portfolio StatementAs at 31 March 2008
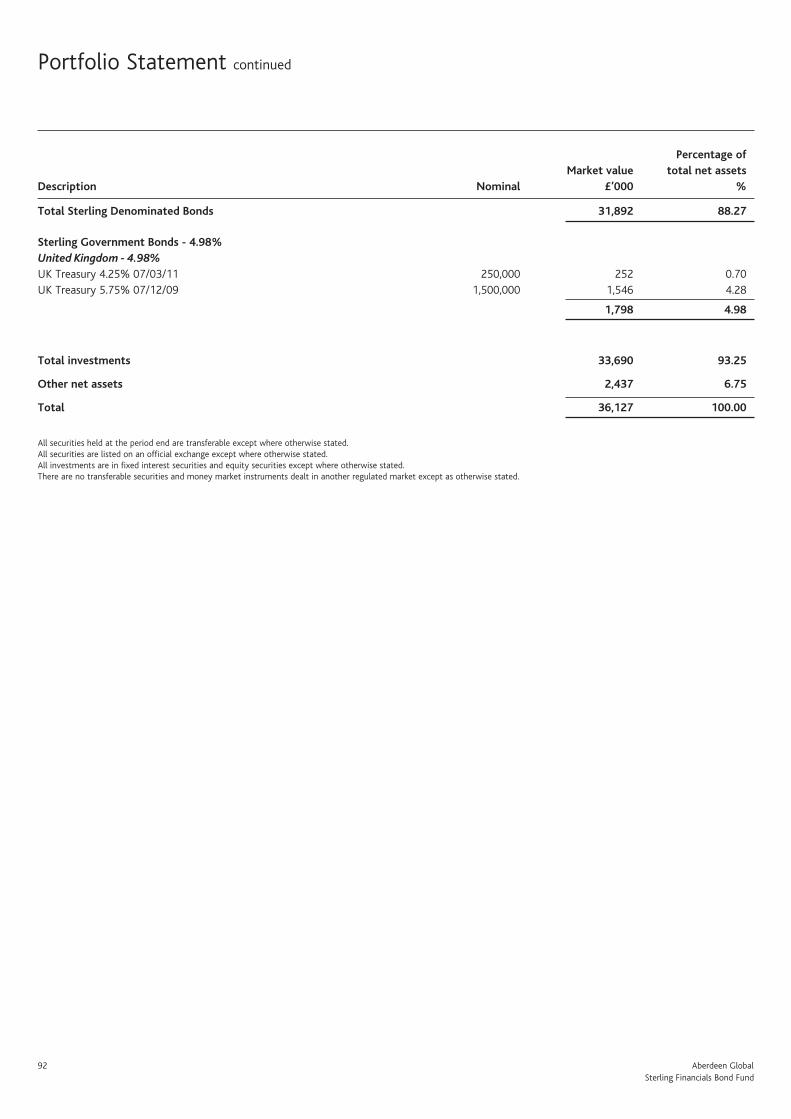
92 Aberdeen GlobalSterling Financials Bond Fund
Total Sterling Denominated Bonds 31,892 88.27
Sterling Government Bonds - 4.98%United Kingdom - 4.98%UK Treasury 4.25% 07/03/11 250,000 252 0.70UK Treasury 5.75% 07/12/09 1,500,000 1,546 4.28
1,798 4.98
Total investments 33,690 93.25
Other net assets 2,437 6.75
Total 36,127 100.00
All securities held at the period end are transferable except where otherwise stated.All securities are listed on an official exchange except where otherwise stated.All investments are in fixed interest securities and equity securities except where otherwise stated.There are no transferable securities and money market instruments dealt in another regulated market except as otherwise stated.
Portfolio Statement continued
Percentage of Market value total net assets Description Nominal £’000 %

Aberdeen Global 93Technology Fund
Technology FundFor the period ended 31 March 2008
PerformanceFor the six-months ended 31 March 2008, the value of the Aberdeen Global - Technology Fund - A Accumulation shares decreased by 16.7% compared to a decrease of 20.2% in the benchmark, the Merrill Lynch Technology 100 Index.
Manager’s reviewTechnology equities were among one of the worst hit sectors in the period under review, on fears that the US slowdown will lead to another meltdown, like the dot-com bust. Despite more prudent asset and cash management in recent years, investors have not been rewarded by tech companies – they shed about 20%, and underperformed the broader market. During the six months, the credit malaise pervaded the financial system, which led to write-downs by major investment banks and bond insurers. Bear Stearns was the most prolific casualty. This, combined with poor global macroeconomic data and some weak corporate news, weighed on tech stocks.
In fact, economic news in this period progressively worsened, starting with unexpectedly slow fourth quarter GDP growth. Disappointing Christmas sales plus rising mortgage defaults further made it clear that the financial problems had spread to the real economy. While data in the Eurozone has not been as uniformly poor, retail sales have slumped and construction is weakening. This is most apparent in the housing boom-led economy of the UK. Conversely, Asia has generally performed better – corporate earnings growth have been steady, and exporters have been nimble enough to shift sales to non-US markets. The exception is Japan, whose economy is lagging so far behind, it may be in a recession already.
To make matters more difficult for governments, spiking inflation limited the scope for interest rate cuts. Prices rose all around the world, driven by food and fuel costs, but most of all in emerging markets. The European Central Bank and Japan both left monetary policy unchanged in the US, where core CPI has been relatively benign, interest rates were cut five times. Nonetheless, all central banks did resort to emergency funding measures to ensure liquidity in the banking system.
The weakness in business activity was broadly spread across IT sectors. Within the telecoms equipment sector, network manufacturers continued to report disappointing results, while handset manufacturers cautioned demand expectations, particularly in developed markets. Takeover activity was also less prevalent than in previous periods, as credit markets froze. The exception was Microsoft’s unsolicited US$41bn bid for Yahoo.
Portfolio reviewFor the six months ended March, the value of the Aberdeen Global Technology Fund – A Accumulation shares declined by 16.7% compared to a fall of 20.2% in the benchmark Merrill Lynch Technology 100 Index.
We initiated a position in On Semiconductor and made use of market volatility to top up a variety of established holdings including Canon, TSMC , Infosys Technologies and Wincor Nixdorf. These were financed by selling our holding in Greek mobile operator Cosmote, after it was taken over by Hellenic Telecommunications. We also sold out of China Mobile, after a very strong run up in its share price.
OutlookA global slowdown is impending. The International Monetary Fund cut its global growth forecast twice this year to 3.7%, while borrowing costs have risen in the US, as banks shore up capital in the face of credit write-downs. However, concerns over the US slowdown are being rapidly surpassed by those over inflation globally. The real worry is that the relationship between accelerating inflation and growth expectations is non-linear and that investors are underestimating the potential impact of rising wages on the long-term quality of corporate profits.
We believe that our technology holdings will continue to perform reasonably well, as we hold some of the leading companies in the world. With their strong balance sheets and good business models, continued robust demand from developing countries should help to prop up growth. With the fall in prices, valuations have come down of late. We will make use of any price dips to add to our existing holdings, or to introduce new companies to the portfolio.
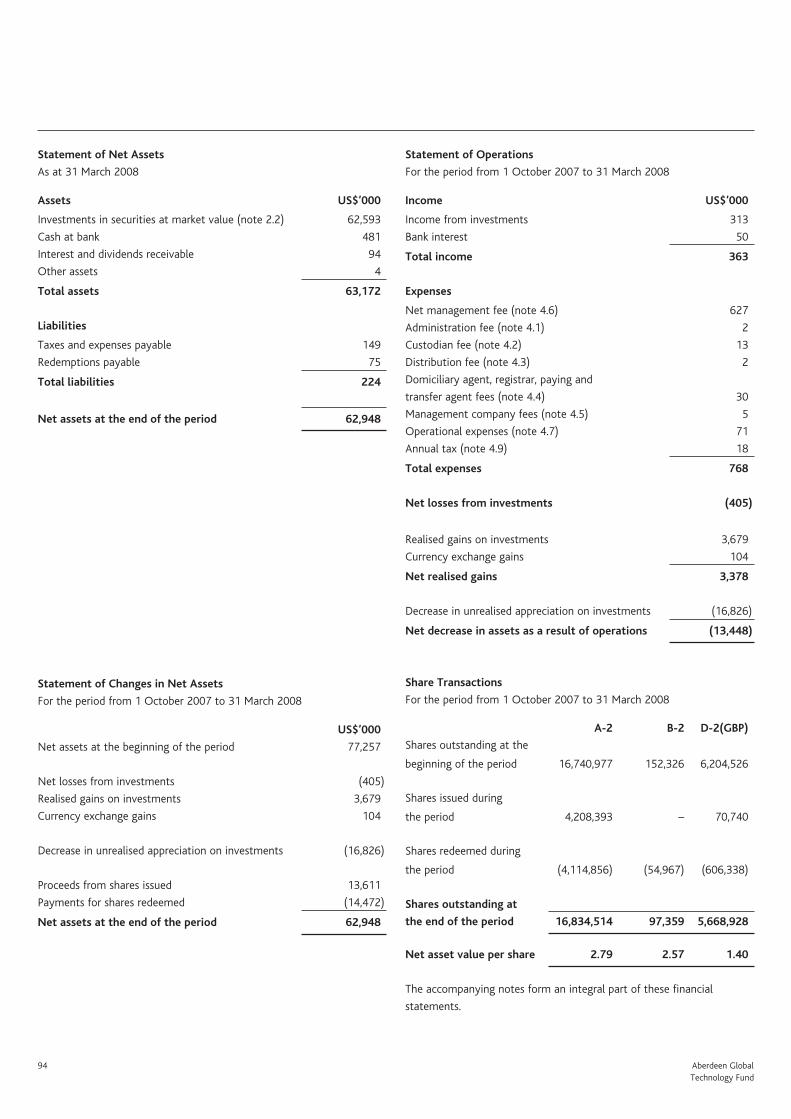
94 Aberdeen GlobalTechnology Fund
Statement of Net Assets
As at 31 March 2008
Assets US$’000
Investments in securities at market value (note 2.2) 62,593
Cash at bank 481
Interest and dividends receivable 94
Other assets 4
Total assets 63,172
Liabilities
Taxes and expenses payable 149
Redemptions payable 75
Total liabilities 224
Net assets at the end of the period 62,948
Statement of Changes in Net Assets
For the period from 1 October 2007 to 31 March 2008
US$’000
Net assets at the beginning of the period 77,257
Net losses from investments (405)
Realised gains on investments 3,679
Currency exchange gains 104
Decrease in unrealised appreciation on investments (16,826)
Proceeds from shares issued 13,611
Payments for shares redeemed (14,472)
Net assets at the end of the period 62,948
Statement of Operations
For the period from 1 October 2007 to 31 March 2008
Income US$’000
Income from investments 313
Bank interest 50
Total income 363
Expenses
Net management fee (note 4.6) 627
Administration fee (note 4.1) 2
Custodian fee (note 4.2) 13
Distribution fee (note 4.3) 2
Domiciliary agent, registrar, paying and
transfer agent fees (note 4.4) 30
Management company fees (note 4.5) 5
Operational expenses (note 4.7) 71
Annual tax (note 4.9) 18
Total expenses 768
Net losses from investments (405)
Realised gains on investments 3,679
Currency exchange gains 104
Net realised gains 3,378
Decrease in unrealised appreciation on investments (16,826)
Net decrease in assets as a result of operations (13,448)
Share Transactions
For the period from 1 October 2007 to 31 March 2008
A-2 B-2 D-2(GBP)
Shares outstanding at the
beginning of the period 16,740,977 152,326 6,204,526
Shares issued during
the period 4,208,393 – 70,740
Shares redeemed during
the period (4,114,856) (54,967) (606,338)
Shares outstanding at
the end of the period 16,834,514 97,359 5,668,928
Net asset value per share 2.79 2.57 1.40
The accompanying notes form an integral part of these financial
statements.
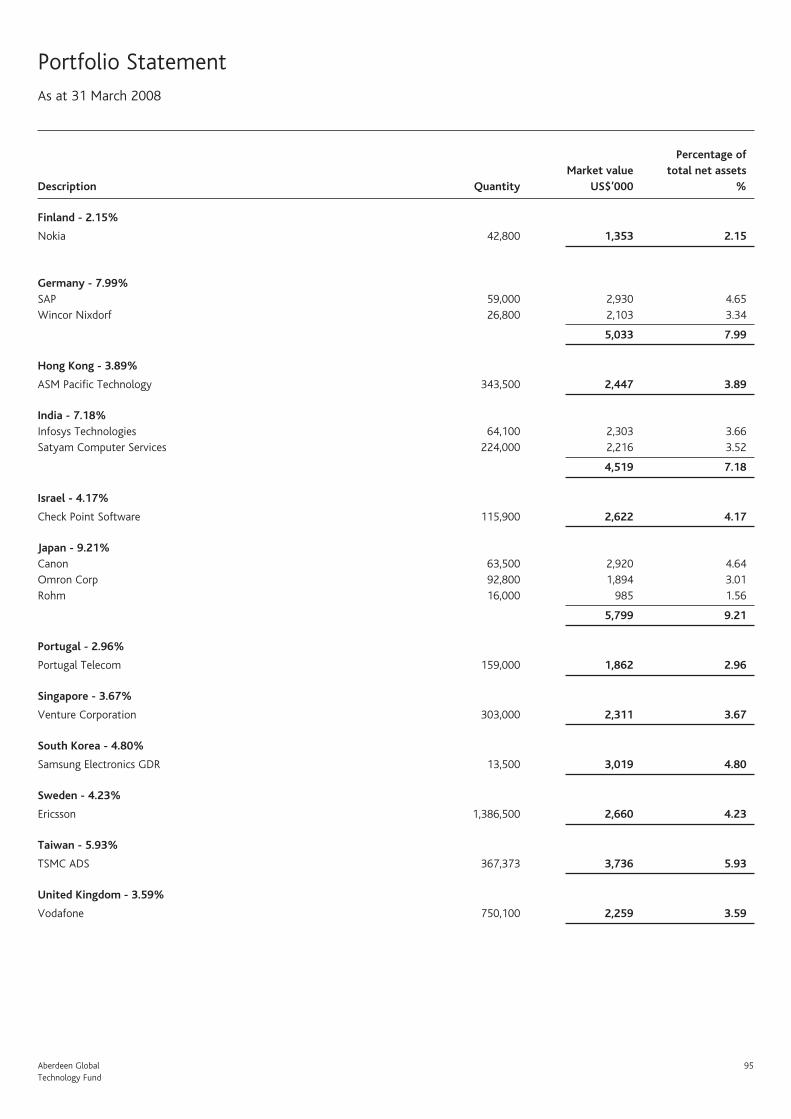
Aberdeen Global 95Technology Fund
Portfolio StatementAs at 31 March 2008
Percentage of Market value total net assets Description Quantity US$’000 %
Finland - 2.15%
Nokia 42,800 1,353 2.15
Germany - 7.99%SAP 59,000 2,930 4.65Wincor Nixdorf 26,800 2,103 3.34
5,033 7.99
Hong Kong - 3.89%
ASM Pacific Technology 343,500 2,447 3.89
India - 7.18%Infosys Technologies 64,100 2,303 3.66Satyam Computer Services 224,000 2,216 3.52
4,519 7.18
Israel - 4.17%
Check Point Software 115,900 2,622 4.17
Japan - 9.21%Canon 63,500 2,920 4.64Omron Corp 92,800 1,894 3.01Rohm 16,000 985 1.56
5,799 9.21
Portugal - 2.96%
Portugal Telecom 159,000 1,862 2.96
Singapore - 3.67%
Venture Corporation 303,000 2,311 3.67
South Korea - 4.80%
Samsung Electronics GDR 13,500 3,019 4.80
Sweden - 4.23%
Ericsson 1,386,500 2,660 4.23
Taiwan - 5.93%
TSMC ADS 367,373 3,736 5.93
United Kingdom - 3.59%
Vodafone 750,100 2,259 3.59
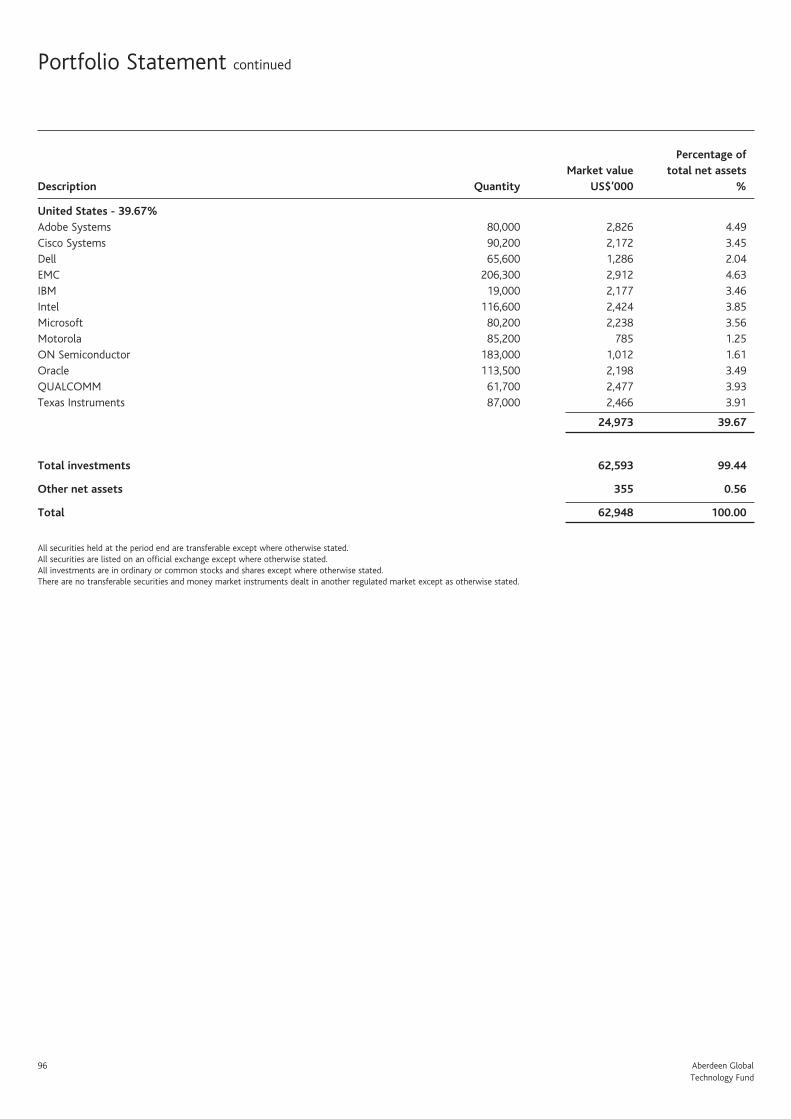
96 Aberdeen GlobalTechnology Fund
United States - 39.67%Adobe Systems 80,000 2,826 4.49Cisco Systems 90,200 2,172 3.45Dell 65,600 1,286 2.04EMC 206,300 2,912 4.63IBM 19,000 2,177 3.46Intel 116,600 2,424 3.85Microsoft 80,200 2,238 3.56Motorola 85,200 785 1.25ON Semiconductor 183,000 1,012 1.61Oracle 113,500 2,198 3.49QUALCOMM 61,700 2,477 3.93Texas Instruments 87,000 2,466 3.91
24,973 39.67
Total investments 62,593 99.44
Other net assets 355 0.56
Total 62,948 100.00
All securities held at the period end are transferable except where otherwise stated.All securities are listed on an official exchange except where otherwise stated.All investments are in ordinary or common stocks and shares except where otherwise stated.There are no transferable securities and money market instruments dealt in another regulated market except as otherwise stated.
Portfolio Statement continued
Percentage of Market value total net assets Description Quantity US$’000 %

Aberdeen Global 97UK Opportunities Fund
UK Opportunities FundFor the period ended 31 March 2008
PerformanceFor the six-months ended 31 March 2008, the value of the Aberdeen Global - UK Opportunities Fund - A Accumulation shares decreased by 13.9% compared to a decrease of 10.2% in the benchmark, the FTSE All-Share Index.
Manager’s reviewThe UK stock market fell more than 10% in volatile trading during the six months under review. Sluggish domestic growth, rising inflation and credit market fears took their toll on investor sentiment despite the easing of monetary policy and fund injections into money markets by both the US and UK central banks. The near-collapse of investment bank Bear Stearns towards the end of the period also contributed to renewed risk aversion.
The UK economy, which had remained relatively resilient to the fallout from the global credit crunch and a slowing US economy, showed signs of easing during the period. GDP growth in the fourth quarter of 2007 was lower than expected, owing to a sharp drop in domestic demand and weaker business investment. Higher food and energy costs affected household spending growth, as inflation rose to a nine-month high; this also hurt consumer confidence which fell to a 15-year low. Retail sales growth, however, showed unexpected strength, while manufacturing activity continued to hold steady. Mortgage approvals hovered near decade lows and home price growth fell to a 12-year low on the back of tighter credit conditions.
Meanwhile, the new chancellor of the exchequer, Alistair Darling, had little room for manoeuvre in his first Budget. With public borrowing already above target, he was forced to reduce spending across departments, while he chose to raise duties on goods like alcohol and tobacco. He also lowered the economic growth forecast to 1.75%-2.25% for this year, but expected 2009 growth to rebound to 2.25%-2.75%.
Portfolio reviewThe Fund underperformed the FTSE All-Share Index over the six months, as the overweight allocation to consumer services and the underweight to basic materials and mining detracted from relative return. Stock selection within the consumer goods, financials and oil and gas segments also detracted from performance.
In portfolio activity, we initiated positions in attractively-valued homebuilder Persimmon, which has a solid land bank and low gearing, and Rolls Royce on price weakness. Conversely, we sold publisher Emap following the bids for its businesses, and BBA on valuation grounds. We also exited Sainsbury and Resolution.
We topped up several of our holdings on compelling valuations: Aviva, Barratt Developments, BT Group, Centrica, Close Brothers, Daily Mail & General Trust, Kesa, Minerva, Premier Foods and Wolseley. We also added to Royal Bank of Scotland, as good results from the banking sector boosted confidence that sub-prime exposure was limited.
On the flip side, we took partial profits in Amec and HSBC on strong share price performance, and trimmed our position in Rio Tinto following an offer from Chinalco and Alcoa.
OutlookWe remain cautious over the short-term outlook for UK equities. The economy is heavily dependent on property-led spending, which has started to fade as fears of a house price slide gather force. Arguably, the UK is even more exposed than the US in terms of mortgage-related debt. House prices had until recently enjoyed a decade-long boom by an average of 170%. But with the credit crisis affecting business confidence and potentially employment growth, there is a risk of downward adjustment. The Bank of England’s recent 0.25% cut in interest rates may buy some time but consumers are being additionally confronted by rising food and energy costs. On the flip side, sterling’s recent weakness could boost exports. Manufacturing growth is so far holding up well.
In view of this, we will continue to be disciplined in our investing approach, focusing on well-managed companies with healthy balance sheets and attractive valuations.

98 Aberdeen GlobalUK Opportunities Fund
Statement of Net Assets
As at 31 March 2008
Assets £’000
Investments in securities at market value (note 2.2) 46,778
Cash at bank 64
Interest and dividends receivable 495
Subscriptions receivable 15
Receivable for investments sold 630
Total assets 47,982
Liabilities
Taxes and expenses payable 92
Redemptions payable 309
Other liabilities 141
Total liabilities 542
Net assets at the end of the period 47,440
Statement of Changes in Assets
For the period from 1 October 2007 to 31 March 2008
£’000
Net assets at the beginning of the period 56,046
Net gains from investments 618
Realised gains on investments 2,110
Decrease in unrealised appreciation on investments (10,909)
Proceeds from shares issued 9,959
Payments for shares redeemed (10,230)
Net equalisation paid (note 11) (13)
Dividends paid (note 5) (141)
Net assets at the end of the period 47,440
Statement of Operations
For the period from 1 October 2007 to 31 March 2008
Income £’000
Income from investments 1,055
Bank interest 12
Total income 1,067
Expenses
Gross management fee 403
Less: Management fee cross holdings (14)
Net management fee (note 4.6) 389
Administration fee (note 4.1) 9
Custodian fee (note 4.2) 1
Distribution fee (note 4.3) 3
Domiciliary agent, registrar, paying and
transfer agent fees (note 4.4) 24
Management company fees (note 4.5) 4
Operational expenses (note 4.7) 6
Annual tax (note 4.9) 13
Total expenses 449
Net gains from investments 618
Realised gains on investments 2,110
Net realised gains 2,728
Decrease in unrealised appreciation on investments (10,909)
Net decrease in assets as a result of operations (8,181)
Share Transactions
For the period from 1 October 2007 to 31 March 2008
A-2 B-2 D-1
Shares outstanding at the
beginning of the period 2,219,297 59,943 1,229,113
Shares issued
during the period 275,496 – 368,523
Shares redeemed
during the period (486,796) (11,935) (186,377)
Shares outstanding at
the end of the period 2,007,997 48,008 1,411,259
Net asset value per share 13.86 12.18 13.47
The accompanying notes form an integral part of these financial
statements.

Aberdeen Global 99UK Opportunities Fund
Portfolio Statement As at 31 March 2008
Percentage of Market value total net assets Description Quantity £’000 %
Basic Materials - 1.19%Mining - 1.19%
Rio Tinto 10,800 565 1.19
Consumer Goods - 16.24%Automobiles & Parts - 2.71%
GKN 420,000 1,287 2.71
Food Producers - 5.85%Associated British Foods 135,000 1,183 2.50Premier Foods 773,000 873 1.84Unilever 42,500 718 1.51
2,774 5.85
Household Goods - 4.29%Barratt Developments 175,000 712 1.50McBride 690,000 708 1.50Persimmon 81,000 613 1.29
2,033 4.29
Tobacco - 3.39%
British American Tobacco 86,000 1,609 3.39
Consumer Services - 22.01%Food & Drug Retailers - 4.05%Morrison (W) 326,000 898 1.89Tesco 270,000 1,023 2.16
1,921 4.05
General Retailers - 6.90%HMV 530,000 680 1.44Kesa Electricals 403,500 834 1.76Marks & Spencer 200,000 774 1.63Mothercare 245,000 984 2.07
3,272 6.90
Media - 2.12%
Daily Mail & General Trust 229,900 1,007 2.12
Travel & Leisure - 8.94%Arriva 155,000 1,070 2.26Ladbrokes 370,000 1,155 2.43Millennium & Copthorne 291,500 1,199 2.53SFI Holdings * 46,000 – –SFI Holdings Litigation Entitlements * 46,000 – –Whitbread 70,000 819 1.72
4,243 8.94

100 Aberdeen GlobalUK Opportunities Fund
Financials - 31.00%Banks - 9.21%Barclays 235,500 1,059 2.23HSBC 153,000 1,269 2.68Royal Bank of Scotland 366,000 1,241 2.62Standard Chartered 46,000 798 1.68
4,367 9.21
Collective Investment Schemes - 6.55%Aberdeen UK Emerging Companies Fund *† 880,000 1,278 2.69Aberdeen UK Mid Cap Fund *† 1,918,000 1,831 3.86
3,109 6.55
General Financial - 4.14%Close Brothers 133,500 829 1.75Schroders (non voting) 132,000 1,135 2.39
1,964 4.14
Life Insurance/Assurance - 6.87%Aviva 260,000 1,598 3.37Friends Provident 585,000 726 1.53Prudential 140,000 933 1.97
3,257 6.87
Real Estate - 4.23% Hammerson 67,500 744 1.57Land Securities 56,000 835 1.76Minerva 450,500 427 0.90
2,006 4.23
Health Care - 4.52%Pharmaceuticals & Biotechnology - 4.52%AstraZeneca 62,000 1,172 2.47GlaxoSmithKline 90,000 972 2.05
2,144 4.52
Industrials - 4.26%Aerospace & Defense - 1.00%Rolls Royce 115,000 464 0.98Rolls Royce B Shares 10,304,000 10 0.02
474 1.00
General Industrials - 1.82%Authoriszor* 28,000 – –Tomkins 485,000 864 1.82
864 1.82
Support Services - 1.44%
Wolseley 128,000 683 1.44
Portfolio Statement continued
Percentage of Market value total net assets Description Quantity £’000 %

Aberdeen Global 101UK Opportunities Fund
Oil & Gas - 9.41%Oil & Gas Producers - 7.63%BP 194,500 984 2.07Royal Dutch Shell ‘B’ 92,500 1,561 3.29Venture Production 172,500 1,076 2.27
3,621 7.63
Oil Equipment & Services - 1.78%
AMEC 117,000 846 1.78
Telecommunications - 4.92%Fixed Line Telecommunications - 2.92%
BT Group 648,000 1,387 2.92
Mobile Telecommunications - 2.00%
Vodafone 627,000 950 2.00
Utilities - 5.05%Gas, Water & Multiutilities - 5.05%Centrica 398,500 1,205 2.54National Grid 170,000 1,190 2.51
2,395 5.05
Total investments 46,778 98.60
Other net assets 662 1.40
Total 47,440 100.00
All securities held at the period end are transferable except where otherwise stated.All securities are listed on an official exchange except where otherwise stated.All investments are in ordinary or common stocks and shares except where otherwise stated.There are no transferable securities and money market instruments dealt in another regulated market except as otherwise stated.* Unlisted transferable security.† Managed by subsidiaries of Aberdeen Asset Management PLC.
Percentage of Market value total net assets Description Quantity £’000 %
102 Aberdeen GlobalWorld Bond Fund
World Bond FundFor the period ended 31 March 2008
PerformanceFor the six-months ended 31 March 2008, the value of the Aberdeen Global - World Bond Fund – D Income shares increased by 14.1% compared to an increase of 16.8% in the benchmark, the Citigroup WGBI Index.
Manager’s reviewThe distress in credit markets dominated activity in G10 government bond yields over the period. The collapse of the market for securitisation and insurance of structured debt which began with sub prime issuance has now engulfed the entire banking system. With banks and investment dealers unable to price or trade the structures created in huge volumes over recent years, and contingent guarantees extended to off balance sheet entities or leveraged trading vehicles being called upon, a severe shortage of capital at highly leveraged financial institutions has lead to illiquidity and fear in the money markets, impacting financing for the broader markets with, as yet unknown consequences for the rest of the economy.
Deleveraging of structured credit portfolios saw the demand for short dated government paper soar in all G10 markets, leading to steeper yield curves and huge spread widening and volatility in swap and credit markets. Federal Reserve interest rate cuts and additional programmes for reliquifing banks and investment dealers by swapping private sector mortgage paper for liquid treasuries from the central banks balance sheet have been implemented to attempt to short circuit the deleveraging process and reduce the risk of a systematic collapse.
The Fed orchestrated JP Morgan takeover of Bear Stearns, appears to have the achieved this, putting a floor under markets for now, although evidence of further looming credit problems with private equity loans and commercial mortgages abounds, and the problems of counterparty risk with over the counter derivatives, particularly credit default swaps, remains unresolved.
The Fed cut rates five times by a total of 225bps to 2.25% and the Bank of England and Bank of Canada three times to 5% and 3.5%. The ECB remained unmoved by calls to reduce the Repo rate, citing rising commodity prices and current inflation as key risks. The divergent nature of current monetary policy settings was further highlighted by increases in policy rates in Australia (to 7.25%) and Sweden (4.25%).
The US, unsurprisingly, had the highest government bond market return (+8.8%), followed by Canada (+7.4%) and the United Kingdom (+6.1%). Japan (+2.8%) and Switzerland (+1.8%) had the lowest return amongst major markets. Eurozone bond markets ranged between the UK and Switzerland. Spreads between Eurozone sovereigns widened as risk aversion affected all areas of markets, with Italy in particular markedly underperforming German bunds.
The divergence between bond yields and commodities has been marked over the period, with Gold touching $1000 an oz. and oil trading
through $100 a barrel. Expectations that weaker US growth would cut demand for commodities have yet to be fulfilled. If commodity prices do not fall, inflation and inflationary expectations are unlikely to moderate substantially in the near term, and the pricing of longer dated G3 government bonds looks ambitious at current levels.
Food price inflation has become a front page story over the period, and while only a modest component in most developed markets, it undoubtedly has a larger impact both on developed markets consumer psychology, and on actual consumption habits in emerging markets, where staple food costs represent a much higher proportion of the average persons income. Despite much talk of a speculative bubble in commodities, stocks of grains and metals continue to remain lean and investment to generate new production and supply remains constrained by a host of factors.
The dollar continued to fall against most currencies over the period, with the veiled verbal threats of intervention from European policy makers far from sufficient to dent its momentum. Commodity producing countries in the G10 have seen their currencies lag the G3 and emerging market commodity producers performance in Q1 2008. Sterling is being targeted by many as being the weakest non-dollar developed market currency, given the UK’s large activity in financial services and the housing markets sensitivity to restricted credit flows.
Portfolio reviewAs a result the portfolios absolute return which was strong over the period (+14.1%), predominantly driven by currency appreciation against sterling, although behind that of the benchmark (+16.8%) due to a lower than benchmark exposure to the Japanese Yen. The portfolios principal overweight was in other Asian currencies, primarily the Singapore Dollar.
OutlookMoney supply growth remains exceptionally high throughout the world, and while many disparate factors are cited as to why individual commodities are seeing sharp price rises, the broader picture appears to be one of very strong money growth leading to soaring input prices across virtually all sectors. In this environment it is unlikely that central banks, with the exception of the Federal Reserve, will be willing to countenance widespread and deep cuts in policy rates or dramatic expansion of budget deficits. Any further deterioration in property markets both in the US and other previously strong markets do not augur well for the performance of banks and financials dependent on continued cheap money and government largesse.

Aberdeen Global 103World Bond Fund
Statement of Net Assets
As at 31 March 2008
Assets £’000
Investments in securities at market value (note 2.2) 34,146 Cash at bank 3,672 Interest and dividends receivable 745 Subscriptions receivable 36 Unrealised gain on forward foreign exchange contracts (note 9) 359
Total assets 38,958
Liabilities
Taxes and expenses payable 57 Redemptions payable 1 Other liabilities 626
Total liabilities 684
Net assets at the end of the period 38,274
Statement of Changes in Net Assets
For the period from 1 October 2007 to 31 March 2008
£’000Net assets at the beginning of the period 34,368
Net gains from investments 647 Realised gains on investments 208 Currency exchange losses (284)
Increase in unrealised appreciation on investments 3,602
Increase in unrealised appreciation on open forward currency positions 691
Proceeds from shares issued 3,841 Payments for shares redeemed (4,168)
Net equalisation paid (note 11) (5)
Dividends paid (note 5) (626)
Net assets at the end of the period 38,274
Statement of Operations
For the period from 1 October 2007 to 31 March 2008
Income £’000
Income from investments 790 Bank interest 61
Total income 851
Expenses
Net management fee (note 4.6) 164 Administration fee (note 4.1) 2 Custodian fee (note 4.2) 3 Domiciliary agent, registrar, paying and transfer agent fees (note 4.4) 17 Management company fees (note 4.5) 3 Operational expenses (note 4.7) 6 Annual tax (note 4.9) 9
Total expenses 204
Net gains from investments 647
Realised gains on investments 208 Currency exchange losses (284)
Net realised gains 571
Increase in unrealised appreciation on investments 3,602
Increase in unrealised appreciation on open forward currency positions 691
Net increase in assets as a result of operations 4,864
Share Transactions
For the period from 1 October 2007 to 31 March 2008
D-1Shares outstanding at the beginning of the period 30,134,871
Shares issued during the period 3,215,082
Shares redeemed during the period (3,473,176)
Shares outstanding at the end of the period 29,876,777
Net asset value per share 1.2811
The accompanying notes form an integral part of these financial statements.

104 Aberdeen GlobalWorld Bond Fund
Percentage of Market value total net assets Description Nominal £’000 %
UK Treasury Stock - 0.67%UK Treasury 4.75% 07/03/20 250,000 255 0.67
Canadian Dollar Denominated - 2.24%Canada - 2.24%Canada 5% 01/06/14 * 1,579,000 858 2.24
Euro Denominated - 39.47%Finland - 8.17%Finland 3% 04/07/08 3,944,000 3,128 8.17
France - 2.37%France 4.25% 25/10/23 1,170,000 907 2.37
Germany - 28.93%Bundesrepublic Deutsche 4.25% 04/07/17 4,000,000 3,265 8.53Bundesrepublic Deutsche 5% 04/07/11 2,356,000 1,953 5.10Bundesrepublic Deutsche 5.5% 04/01/31 2,523,000 2,259 5.90Germany 4% 04/07/16 4,500,000 3,598 9.40
11,075 28.93
Total Euro Denominated 15,110 39.47
New Zealand Dollar Denominated - 6.68%Canada - 4.22%Ontario 6.25% 16/06/15 4,415,000 1,617 4.22
Luxembourg - 2.46%European Investment Bank 6.5% 10/09/14 2,511,000 942 2.46
Total New Zealand Dollar Denominated 2,559 6.68
Japan Yen Denominated - 11.90%Japan - 11.90%DEPFA ACS Bank 1.65% 20/12/16 400,000,000 1,992 5.20Development Bank of Japan 2.3% 19/03/26 290,000,000 1,498 3.91Development Bank of Japan 1.7% 20/09/22 215,000,000 1,063 2.79
4,553 11.90
United States Dollar Denominated - 25.08%United States - 25.08%KFW 5.25% 19/05/09 9,000,000 4,693 12.26KFW 5.25% 10/08/10 2,500,000 1,336 3.49US Treasury 4.875% 15/08/16 4,300,000 2,416 6.31US Treasury 6.25% 15/05/30 1,800,000 1,152 3.02
9,597 25.08
Total ZAR Denominated - 3.17%South Africa - 3.17%European Investment Bank 9% 14/09/09 20,000,000 1,214 3.17
Total investments 34,146 89.21
Other net assets 4,128 10.79
Total 38,274 100.00
All securities held at the period end are transferable except where otherwise stated.All securities are listed on an official exchange except where otherwise stated.All investments are in fixed interest securities and equity securities except where otherwise stated.There are no transferable securities and money market instruments dealt in another regulated market except as otherwise stated.* Unlisted transferable security.
Portfolio Statement As at 31 March 2008
Aberdeen Global 105World Equity Fund
World Equity FundFor the period ended 31 March 2008
PerformanceFor the six-months ended 31 March 2008, the value of the Aberdeen Global - World Equity Fund - A Accumulation shares decreased by 6.2% compared to a decrease of 11.1% in the benchmark, the MSCI World Index.
Manager’s reviewGlobal markets fell sharply over the review period, as recurring credit fears amplified the sell down. Bond insurers and investment banks faced write-downs across the board, with Bear Stearns the most high profile casualty, as financial market de-leveraging intensified. Underlining the severity of the situation, the US Federal Reserve resorted to unprecedented measures to boost liquidity in the financial system, as well as reducing interest rates aggressively. Among the emerging markets, Turkey, China and Korea were the worst hit, as investors took profits and retreated to safe havens. In terms of sectors, financial stocks unsurprisingly underperformed, as sub-prime-related losses forced major banks to make significant write-downs. Commodities maintained their charge, despite the weaker outlook for growth.
Economic data through the period deteriorated progressively, beginning with lower-than-expected fourth quarter GDP in the US. By the time that was released, it was clear the sub-prime fallout had spread to the real economy. Poor Christmas sales, rising mortgage defaults and tighter bank lending had added to the deteriorating picture. While data in the Eurozone has not been as uniformly poor, retail sales slumped and construction weakened, especially in the housing boom-led economies of Ireland, Spain and the UK. In contrast, Asia in general fared relatively well. Although growth forecasts have been downgraded, exporters have been able to shift away from the core US market and corporate earnings growth remains resilient.
Compounding global economic deceleration, inflationary pressures have quickened. Prices spiked higher across the world, but most of all in developing markets, with prices hitting multi-year highs. Jumps in food and fuel costs led to multi-year highs across emerging markets. In the US the authorities have urgently focused on the downside risks to growth, with the Fed lowering rates five times over the period, from 4.5% at the end of October to 2.25%. The Bank of England cut rates twice, but the European Central Bank, with its narrower mandate to preserve price stability, left monetary policy unchanged. Still, all central banks resorted to emergency funding measures to ensure liquidity in the banking system, as the credit crunch revealed stricken lenders around the world.
In politics, the US presidential candidates are now down to three, after months of campaigning. In Argentina, former First Lady Cristina Fernandez was elected president, Spain’s ruling Socialist Party won a second term in the general election and Korea’s president-elect Lee Myung-Bak began his term. Italian prime minister Romano Prodi resigned after losing a confidence vote.
Portfolio reviewFor the six months ended 31 March 2008, the value of the Aberdeen Global World Equity – A Accumulation shares fell 6.2% compared with an 11.1% decline in the benchmark, MSCI World Index.
We initiated positions in Spanish insurance company Mapfre, Japanese firm Takeda Pharmaceutical, Singapore’s City Developments, Argentine seemless steel pipe maker Tenaris, and British building-materials distributor Wolseley. Conversely, we sold Seven & I and Mitsubishi UFJ, as we were not confident about their growth prospects, along with our holdings in PetroChina and China Mobile, following a very strong run up in their share prices. We also sold Resolution, following a takeover bid.
OutlookThere are signs of the global slowdown. The International Monetary Fund has cut the global growth forecast twice this year to 3.7%. In the US, borrowing costs have risen as banks shore up capital in the face of credit write-downs. Rising inflation may limit the scope for further interest rate cuts. Investors now seem keen to conclude that the worst of the financial market dislocation is over, but the real economic effects of the credit crunch are yet to be seen.
Nonetheless, opportunities still exist and we will take advantage of any price dips to add to our existing holdings, or to introduce new companies to the portfolios. We remain just as disciplined on the sell side and have recently exited stocks with unjustifiably high valuations. While uncertainty will likely prevail this year, our holdings consist of a diverse range of quality stocks, and we are relatively confident that these companies can produce decent returns in the year ahead.

106 Aberdeen GlobalWorld Equity Fund
Statement of Net Assets
As at 31 March 2008
Assets US$’000
Investments in securities at market value (note 2.2) 608,312
Cash at bank 20,600
Interest and dividends receivable 2,480
Subscriptions receivable 4,988
Other assets 68
Total assets 636,448
Liabilities
Payable for investments purchased 3,931
Taxes and expenses payable 811
Redemptions payable 2,873
Total liabilities 7,615
Net assets at the end of the period 628,833
Statement of Changes in Net Assets
For the period from 1 October 2007 to 31 March 2008
US$’000
Net assets at the beginning of the period 604,761
Net gains from investments 1,874
Realised gains on investments 23,249
Currency exchange gains 521
Decrease in unrealised appreciation on investments (64,811)
Proceeds from shares issued 162,125
Payments for shares redeemed (99,035)
Net equalisation received (note 11) 149
Net assets at the end of the period 628,833
Statement of Operations
For the period from 1 October 2007 to 31 March 2008
Income US$’000
Income from investments 4,976
Bank interest 392
Total income 5,368
Expenses
Gross management fee 2,907
Less: Management fee cross holdings (39)
Net management fee (note 4.6) 2,868
Administration fee (note 4.1) 105
Custodian fee (note 4.2) 79
Distribution fee (note 4.3) 1
Domiciliary agent, registrar, paying and
transfer agent fees (note 4.4) 226
Management company fees (note 4.5) 49
Operational expenses (note 4.7) 74
Annual tax (note 4.9) 92
Total expenses 3,494
Net gains from investments 1,874
Realised gains on investments 23,249
Currency exchange gains 521
Net realised gains 25,644
Decrease in unrealised appreciation on investments (64,811)
Net decrease in assets as a result of operations (39,167)
Share Transactions
For the period from 1 October 2007 to 31 March 2008
A-2 B-2 D-2(GBP) I-2 Z-2
Shares outstanding at the beginning of the period 8,580,944 14,689 18,432,082 – 12,936,205
Shares issued during the period 3,042,651 – 781,241 4,121,212 4,246,575
Shares redeemed during the period (5,810,365) (3,820) (764,856) – (1)
Shares outstanding at the end of the period 5,813,230 10,869 18,448,467 4,121,212 17,182,779
Net asset value per share 14.17 13.08 7.13 9.28 14.35
The accompanying notes form an integral part of these financial statements.
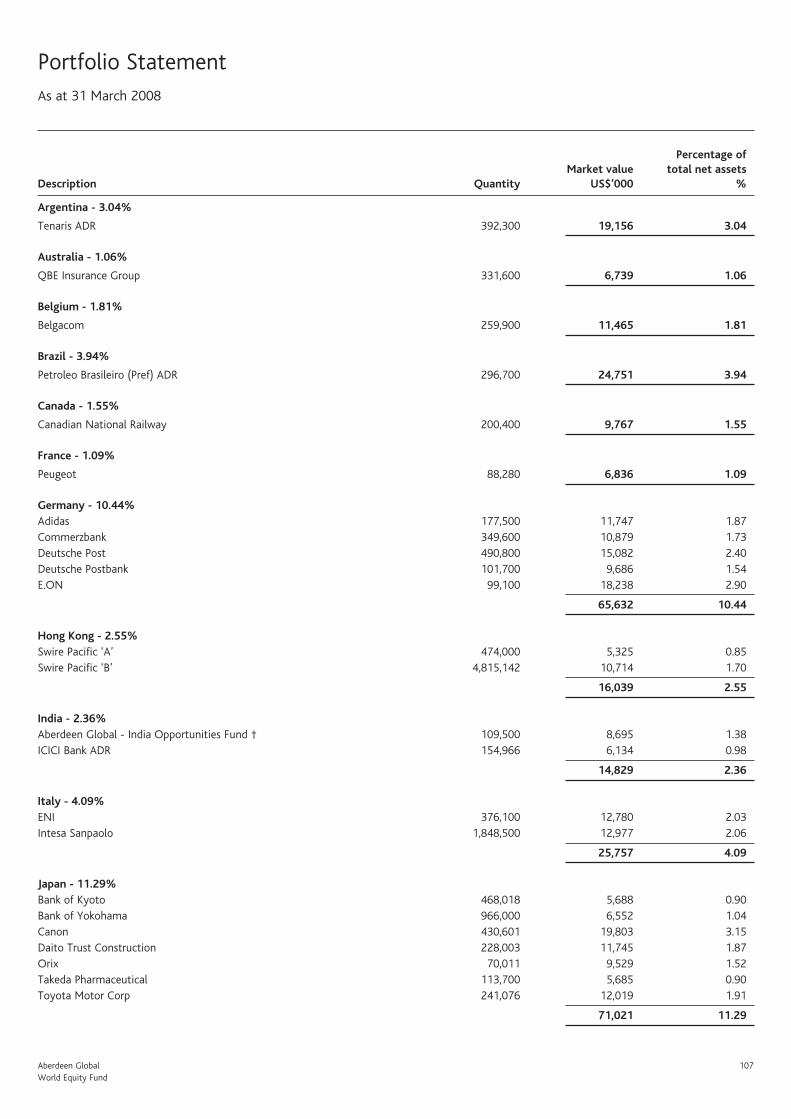
Aberdeen Global 107World Equity Fund
Percentage of Market value total net assets Description Quantity US$’000 %
Argentina - 3.04%
Tenaris ADR 392,300 19,156 3.04
Australia - 1.06%
QBE Insurance Group 331,600 6,739 1.06
Belgium - 1.81%
Belgacom 259,900 11,465 1.81
Brazil - 3.94%
Petroleo Brasileiro (Pref) ADR 296,700 24,751 3.94
Canada - 1.55%
Canadian National Railway 200,400 9,767 1.55
France - 1.09%
Peugeot 88,280 6,836 1.09
Germany - 10.44%Adidas 177,500 11,747 1.87Commerzbank 349,600 10,879 1.73Deutsche Post 490,800 15,082 2.40Deutsche Postbank 101,700 9,686 1.54E.ON 99,100 18,238 2.90
65,632 10.44
Hong Kong - 2.55%Swire Pacific ‘A’ 474,000 5,325 0.85Swire Pacific ‘B’ 4,815,142 10,714 1.70
16,039 2.55
India - 2.36%Aberdeen Global - India Opportunities Fund † 109,500 8,695 1.38ICICI Bank ADR 154,966 6,134 0.98
14,829 2.36
Italy - 4.09%ENI 376,100 12,780 2.03Intesa Sanpaolo 1,848,500 12,977 2.06
25,757 4.09
Japan - 11.29%Bank of Kyoto 468,018 5,688 0.90Bank of Yokohama 966,000 6,552 1.04Canon 430,601 19,803 3.15Daito Trust Construction 228,003 11,745 1.87Orix 70,011 9,529 1.52Takeda Pharmaceutical 113,700 5,685 0.90Toyota Motor Corp 241,076 12,019 1.91
71,021 11.29
Portfolio StatementAs at 31 March 2008

108 Aberdeen GlobalWorld Equity Fund
Portfolio Statement continued
Mexico - 1.61%
Grupo Aeroportuario del Sureste ADS 181,700 10,135 1.61
Netherlands - 1.39%
Philips Electronics 226,300 8,710 1.39
Portugal - 1.84%
Portugal Telecom 986,320 11,551 1.84
Singapore - 0.94%
City Developments 744,000 5,938 0.94
South Korea - 3.22%Samsung Electronics GDR 76,669 17,145 2.73Samsung Electronics (Pref) 6,800 3,056 0.49
20,201 3.22
Spain - 1.80%
Mapfre 2,258,800 11,307 1.80
Sweden - 3.41%Ericsson 5,034,400 9,659 1.54Nordea 735,778 11,773 1.87
21,432 3.41
Switzerland - 3.59%
Zurich Financial Services 71,920 22,560 3.59
Taiwan - 3.73%TSMC 6,868,289 14,253 2.27TSMC ADS 901,815 9,171 1.46
23,424 3.73
United Kingdom - 12.81%AstraZeneca 281,340 10,578 1.68British American Tobacco 160,000 5,952 0.95Centrica 1,862,800 11,202 1.78Morrison (W) 1,511,600 8,286 1.32Premier Foods 4,693,600 10,548 1.68Vodafone 5,035,079 15,165 2.41Weir Group 616,200 9,234 1.47Wolseley 897,800 9,526 1.52
80,491 12.81
Percentage of Market value total net assets Description Quantity US$’000 %

Aberdeen Global 109World Equity Fund
United States - 19.18%Altria Group 181,700 13,415 2.13Exxon Mobil 114,801 9,783 1.56Intel 512,500 10,655 1.69Johnson & Johnson 292,400 18,766 2.98Quest Diagnostics 246,315 11,279 1.79Reynolds American 250,500 15,205 2.42United Technologies 1,805,279 12,358 1.97Willis Group 380,349 12,776 2.03Wyeth 393,400 16,334 2.61
120,571 19.18
Total investments 608,312 96.74
Other net assets 20,521 3.26
Total 628,833 100.00
All securities held at the period end are transferable except where otherwise stated.All securities are listed on an official exchange except where otherwise stated.All investments are in ordinary or common stocks and shares except where otherwise stated.There are no transferable securities and money market instruments dealt in another regulated market except as otherwise stated.† Managed by subsidiaries of Aberdeen Asset Management PLC.
Percentage of Market value total net assets Description Quantity US$’000 %
110 Aberdeen Global
1 PRESENTATION OF THE FINANCIAL STATEMENTS1.1 General
Aberdeen Global is incorporated as a société anonyme under the laws of the Grand Duchy of Luxembourg and qualifies as an open-ended société d’investissement à capital variable (a “SICAV”) with UCITS status (an Undertaking for Collective Investment in Transferable Securities as defined in the European Union Directive 85/611/EEC of 20 December 1985, as amended). The Company comprises various classes of shares, each relating to a separate portfolio (a “Fund”) consisting of securities, cash and other sundry assets and liabilities.
The Company was incorporated under the laws of the Grand Duchy of Luxembourg on 25 February 1988.
Aberdeen Global is authorised as an undertaking for collective investment in transferable securities under part I of the law dated 20 December 2002 on undertakings for collective investment, as amended (the “Law of 2002”).
At 31 March 2008, the Company comprises twenty three separate active funds, providing shareholders with opportunities for investment in a wide variety of markets, securities and currencies.
1.2 Aberdeen Global India-Opportunities Fund (Mauritius) Limited Mauritius is a widely used jurisdiction for investing on a collective basis into India. Hence it has developed an infrastructure to support such vehicles encompassing the full range of administration services. The Mauritian Subsidiary was established to benefit from such infrastructure in a time zone which is in between that of India and Luxembourg. Further, it is expected that the Mauritian Subsidiary should be governed by the provisions of the India-Mauritius Double Tax Avoidance Treaty. The Aberdeen Global - India Opportunities Fund makes almost all of its investments in India through a wholly owned subsidiary, Aberdeen Global - India Opportunities Fund (Mauritius) Limited, a company incorporated in Mauritius. Transactions involving both the Company and its subsidiary are accounted for in accordance with their economic substance and accordingly these financial statements reflect the activities of the Aberdeen Global - India Opportunities Fund and of its subsidiary as if all the activities had been undertaken by the Aberdeen Global - India Opportunities Fund.
1.3 Presentation of financial statements The accompanying financial statements present the assets and liabilities of the individual Funds and of the Company taken as a whole. The financial statements of each individual Fund are expressed in the currency designated in the prospectus for that particular Fund and the financial statements of the Company are expressed in United States Dollars (“USD”). The financial statements have been prepared in accordance with the format prescribed by the Luxembourg authorities for Luxembourg investment companies.
As the financial statements include dividend declarations, effective for the distribution period ended 31 March 2008 and certain accounting adjustments relating to the period ended 31 March 2008, the Net Asset Values (NAV’s) on pages 3 and 4 and those shown throughout the report may differ from those advertised on 31 March 2008 for dealing in these Funds.
Individual financial statements have been prepared for each Fund in its respective Fund currency, while the consolidated financial statements of the Company are expressed in USD. Where appropriate, information pertaining to each class of share is disclosed separately.
1.4 New funds The Company has opened the following new Fund, with an initial Net Asset Value (“NAV”) calculation processed as follows:
• Responsible World Equity Fund, 1 November 2007
1.5 Funds closed On 26 October 2007, Asia Pacific and Japan Fund was closed.
2 ACCOUNTING POLICIES2.1 Accounting convention
The financial statements have been prepared under the historical cost convention modified by the revaluation of investments.
2.2 Assets and portfolio securities valuation The market value of investments has been calculated using the last available prices at 1.00pm (Luxembourg time) on 31 March 2008 quoted on stock exchanges or over-the-counter market or any other organized market on which these investments are traded or admitted for trading.
If such prices are not representative of their fair value, all such securities and all other permitted assets will be valued at their fair value at which it is expected they may be resold as determined in good faith by or under the direction of the Directors.
2.3 Income and expenses Interest is accrued on a day-to-day basis. Dividends are accounted for on an ex-dividend basis. Interest and dividend income are stated net of irrecoverable withholding taxes, if any.
Expenses which do not relate to a particular Fund are allocated between Funds in proportion to the NAV’s of the individual Funds.
Notes to the Financial Statements

Aberdeen Global 111
2.4 Foreign exchange The cost of investments, income and expenses in currencies other than the Fund’s relevant reporting currency have been recorded at the rate of exchange ruling at the time of the transaction. The market value of the investments and other assets and liabilities in currencies other than the relevant reporting currency has been converted at the rates of exchange ruling at 31 March 2008.
Realised and unrealised exchange differences on the revaluation of foreign currencies are taken to the Statement of Operations.
2.5 Realised gains and losses on investments Realised gains and losses on investments is the difference between the historical average cost of the investment and the sale proceeds.
2.6 Forward currency contracts Unsettled forward currency contracts are valued using forward rates of exchange applicable at the balance sheet date for the remaining period until maturity. All unrealised gains and losses are recognised in the Statement of Operations.
3 SHARE CLASS INFORMATION3.1 General
Within each Fund, the Company is entitled to create different share classes. These are distinguished by their distribution policy or by any other criteria stipulated by the Directors. Classes A-1, B-1, D-1, I-1 and Z-1 are Distribution shares and Classes A-2, B-2, D-2, I-2 and Z-2 are Accumulation shares.
The Company issues either Class A-1, A-2, B-1, B-2, D-1, D-2, I-1, I-2, Z-1 and/or Z-2 shares to investors as detailed in the Annual Report and Accounts. They are offered for sale at a price based on NAV adjusted to reflect any applicable dealing charges plus an initial charge. Class A, Class I and Class Z shares may also be made available in Euro, Sterling or US Dollar hedged versions.
3.2 A share class Class A shares are available to all investors.
3.3 B share class Class B Shares are subject to a Contingent Deferred Sales Charge as well as an additional annual Distributor Fee of 1%. Class B Shares were first offered from 19 April 1993 and were closed to new subscriptions from 1 March 2006.
3.4 D share class Class D Shares are available to all investors.
Class D Shares are expressed in British Pounds (“GBP”) and were first offered from 24 March 2006 and it is the intention of the Board of Directors to apply annually for UK Distributor status for such shares. The UK taxation authorities have approved the Distributor status application that the Company made for the year ended 30 September 2007.
Distributor status is granted retrospectively by the UK taxation authorities. The Board of Directors intend to apply to the UK taxation authorities for UK distributor status for the year ended 30 September 2008 and for subsequent periods if the Board of Directors deem it appropriate to do so.
Distributions on the D share class are subject to equalisation.
Equalisation applies only to shares purchased during the distribution period (Group 2 shares). It is the average amount of income included in the purchase price of Group 2 shares.
3.5 I share class Class I Shares are intended for Institutional Investors (as defined in the Prospectus) with an initial minimum investment limit of US$ 1 million and a subsequent minimum limit of US$ 10,000. They are subject to a reduced rate of Taxe d’Abonnement of 0.01% per annum.
3.6 Z share class Class Z Shares are intended for Institutional Investors (as defined in the Prospectus) with an initial minimum investment limit of US$ 1 million and a subsequent minimum limit of US$ 10,000. They are not subject to a management fee or an initial charge and benefit from a reduced rate of Tax D’Abonnement of 0.01% per annum.
3.7 Switches Investors may switch their shares in one Fund into Shares of the same or another Class in another Fund. A charge payable to the Global Distributor of up to 1% of the Net Asset Value of the Shares being switched may be made. Investors may not switch into Class B shares unless they are switching from another class B shareholding and the fund being switched into has Class B shares in issue.
Switches can only be made where the investors meets the investment requirements of the share class they wish to switch into.
Switches into Class D shares within the same Fund from Classes A, B, I or Z shares, are reflected in the number of shares issued and redeemed applicable to each share class but the related monetary value is not included in the total value of proceeds from shares issued and payments for shares redeemed as shown in the Statement of Changes in Net Assets in the financial statements.

112 Aberdeen Global
4 ExPENSES4.1 Administration fee
Administration fees will not exceed 5 basis points per annum (plus VAT, if any) of the NAV of the Fund as determined on the last dealing day of each month with a minimum amount payable of £32,500 per annum.
4.2 Custodian fees The Custodian Bank receives a safekeeping fee based on the market value of the stock involved and where it is registered, with a minimum annual fee rate of 0.04% per annum of the net assets of the Company as determined on the last dealing day of the month (plus VAT if any) up to a maximum fee of 2% per annum (plus VAT, if any).
4.3 Distribution fees Class B shares are subject to an annual distributor fee of 1% in lieu of an initial sales charge. These fees are accrued daily and paid monthly in arrears.
4.4 Domiciliary agent, registrar, paying and transfer agent fees The Domiciliary and Paying Agent fees will not exceed 0.4% per annum of the net assets of the Company as determined on the last dealing day of each month.
The Registrar and Transfer Agent fees will not exceed 0.8% per annum of the net assets of the Company as determined on the last dealing day of each month.
4.5 Management company fees The Management Company receives a fee which will not exceed 0.04% per annum of the net assets of the Company. Currently the fee is 0.015% per annum of the Company’s net assets.
4.6 Management fees Aberdeen International Fund Managers Limited (the “Investment Manager”) is entitled to receive investment management fees calculated on the Net Asset Value of the Funds, accrued daily.
To the extent that any of the net assets are separately managed by subsidiaries of Aberdeen Asset Management PLC then the investment management fee is rebated to the value of the subsidiaries’ management fee charge made to the underlying holding.
The following management fee rates are applicable as at 31 March 2008:
Classes of shares (%)
Fund A B D I
American Opportunities 1.50 1.50 1.50 1.00
Asia Pacific 1.75 1.75 1.75 1.00
Asia Pacific and Australasian Bond 1.25 1.25 1.25 0.75
Asia Pacific and Japan 1.75 n/a 1.75 1.00
Asian Smaller Companies 1.75 n/a 1.75 1.00
Australasian Equity 1.50 1.50 1.50 1.00
China Opportunities 1.75 n/a 1.75 1.00
Emerging Markets 1.50 1.50 1.50 1.00
Emerging Markets Bond 1.50 1.50 1.50 1.00
Emerging Markets Smaller Companies 1.75 n/a 1.75 1.00
European Equity 1.50 1.50 1.50 1.00
European High Yield Bond 1.25 1.25 1.25 0.75
European Opportunities (Ex UK) 1.50 n/a 1.50 1.00
High Yield Bond 1.25 n/a 1.25 0.75
India Opportunities 1.75 n/a 1.75 1.00
Japan Smaller Companies 1.50 n/a 1.50 1.00
Japanese Equity 1.50 1.50 1.50 1.00
Responsible World Equity 1.50 n/a 1.50 1.00
Sterling Corporate Bond 1.00 n/a 1.00 0.50
Sterling Financials Bond 0.75 n/a 0.75 0.50
Technology 1.75 1.75 1.75 1.00
UK Opportunities 1.50 1.50 1.50 1.00
World Bond 0.90 n/a 0.90 0.40
World Equity 1.50 1.50 1.50 1.00
Class Z shares are not subject to any investment management fee charge.
Notes to the Financial Statements continued

Aberdeen Global 113
4.7 Operational Expenses Operational expenses represent other amounts paid by the Company relating to the operation of the Funds. They include legal fees, audit fees, Directors’ fees, cost of printing and distributing the prospectuses and annual and half yearly financial statements, fees in connection with obtaining or maintaining any registration or authorisation of the Company with any governmental agency or stock exchange as well as the cost of publication of share prices.
4.8 Expense Caps On 30 June 2007, the expense cap of 2.75% for each Fund was removed. The Manager now considers the competitive position of each individual fund relative to comparable funds in similar sectors.
It should be noted that Aberdeen Global - Japan Equity Fund still has a cap of 2.25% and Aberdeen Global - Asia Pacific and Australasian Bond Fund has a cap of 1.75% of total net assets which will remain in place until Shareholders are advised otherwise.
4.9 Annual Taxation The Company is liable in Luxembourg to a Tax D’Abonnement of 0.05% per annum for the Class A, B and D Shares and 0.01% per annum for Class I and Z Shares. This is accrued daily and payable quarterly on the basis of the value of the net assets of the Company at the end of the relevant quarter.
5 DIVIDENDS (DISTRIBUTION CLASS ONLY)For the Class D-1 and Class D-2 shares the distributions have been split into Group 1 and Group 2 distributions. Group 1 shares are shares owned prior to the start of the distribution period and Group 2 shares are shares purchased during the distribution period.
Distributions on the Class D shares are also subject to equalisation.
Aberdeen Global - Asia Pacific and Australasian Bond Fund (expressed in USD)The Directors declared quarterly dividends for the Fund as listed below, for the period 1 October 2007 to 31 March 2008 to all shareholders on record on the last day of the relevant quarter.
Date Class A-1 Class B-1
December 2007 0.017372 0.007021
March 2008 0.051458 0.043757
Aberdeen Global - Emerging Markets Bond Fund (expressed in USD)The Directors declared monthly dividends for the Fund as listed below, for the period 1 October 2007 to 31 March 2008 to all shareholders on record on the last day of the relevant month.
Date Class A-1 Class B-1 Class I-1
October 2007 0.082322 0.066100 0.095926
November 2008 0.102040 0.089607 0.111009
December 2008 0.080961 0.066461 0.089991
January 2008 0.072040 0.056899 0.076204
February 2008 0.095467 0.070193 0.103868
March 2008 0.090378 0.088091 0.099149
Aberdeen Global - European High Yield Bond Fund (expressed in EUR)The Directors declared monthly dividends for the Fund as listed below, for the period 1 October 2007 to 31March 2008 to all shareholders on record on the last day of the relevant month.
Date Class A-1 Class B-1Class D-1
GroupClass D-1 Net Income (GBP)
Class D-1Equalisation
DistributionPaid/ Payable
October 2007 0.047135 0.037522 Group 1Group 2
0.0314430.023803
–0.007640
0.0314430.031443
November 2007 0.061116 0.054022 Group 1Group 2
0.0436220.018974
–0.024648
0.0436220.043622
December 2007 0.053071 0.045958 Group 1Group 2
0.0402060.010413
–0.029793
0.0402060.040206
January 2008 0.053329 0.046917 Group 1Group 2
0.0470650.025242
–0.021823
0.0470650.047065
February 2008 0.050466 0.039530 Group 1Group 2
0.0388940.012561
–0.026333
0.0388940.038894
March 2008 0.037876 0.037379 Group 1Group 2
0.0280100.019660
–0.008350
0.0280100.028010

114 Aberdeen Global
Aberdeen Global - High Yield Bond Fund (expressed in GBP)The Directors declared quarterly dividends for the Fund as listed below, for the period 1 October 2007 to 31 March 2008 to all shareholders on record on the last day of the relevant quarter.
DateClass D–1 Net
Income EqualisationDistribution
Paid/Payable
December 2007 Group 1Group 2
0.0236950.004865
–0.018830
0.0236950.023695
March 2008 Group 1Group 2
0.0214040.011998
–0.009406
0.0214040.021404
Aberdeen Global - Sterling Corporate Bond Fund (expressed in GBP)The Directors declared monthly dividends for the Fund as listed below, for the period 1 October 2007 to 31 March 2008 to all shareholders on record on the last day of the relevant month.
DateClass D–1
Net Income EqualisationDistribution
Paid/ Payable
October 2007 Group 1Group 2
0.0025730.002255
–0.000318
0.0025730.002573
November 2007 Group 1Group 2
0.0042400.001244
–0.002996
0.0042400.004240
December 2007 Group 1Group 2
0.0065110.005101
–0.001410
0.0065110.006511
January 2008 Group 1Group 2
0.0045080.002295
–0.002213
0.0045080.004508
February 2008 Group 1Group 2
0.0035960.001406
–0.002190
0.0035960.003596
March 2008 Group 1Group 2
0.0059300.004056
–0.001874
0.0059300.005930
Aberdeen Global - UK Opportunities Fund (expressed in GBP)The Directors declared a six-monthly dividend for the Fund as listed below, for the period 1 October 2007 to 31 March 2008 to all shareholders on record on the last day of the relevant month.
DateClass D–1
Net Income EqualisationDistribution
Paid/ Payable
March 2008 Group 1Group 2
0.1000000.061200
–0.038800
0.1000000.100000
Aberdeen Global - World Bond Fund (expressed in GBP)The Directors declared a six-monthly dividend for the Fund as listed below, for the period 1 October 2007 to 31 March 2008 to all shareholders on record on the last day of the relevant month.
DateClass D–1
Net Income EqualisationDistribution
Paid/ Payable
March 2007 Group 1 Group 2
0.0209510.011791
–0.009160
0.0209510.020951
6 DIRECTORS’ INTERESTSNone of the Directors were materially interested in any contracts of significance subsisting with the Company either during the period or at 31 March 2008.
None of the Directors have service contracts with the Company.
7 CHANGES IN INVESTMENT PORTFOLIOThe schedule of changes in the investment portfolio is available on request from the Registered Office in Luxembourg and from the local agents listed under Management and Administration and in the Prospectus.
Notes to the Financial Statements continued

Aberdeen Global 115
8 TRANSACTIONS WITH CONNECTED PERSONSTransactions with connected persons outlined in the previous notes (4.1, 4.3 and 4.6) have been entered into in the ordinary course of business and on normal commercial terms.
9 FORWARD CURRENCY COMMITMENTSAt 31 March 2008 the Asia Pacific and Australasian Bond Fund had the following open forward currency commitments:
Buy Sell Unrealised gain/(loss) (USD) Maturity Date Contract Rate
IDR 299,840,000 USD 33,022 (649) 14/05/08 9,262.13949
THB 17,476,460 USD 577,543 (22,792) 31/03/08 31.50321
THB 42,389 USD 1,349 (4) 12/05/08 31.51144
USD 555,690 THB 17,476,460 939 31/03/08 31.50321
USD 80,805 THB 2,660,497 (3,625) 12/05/08 31.51138
USD 32,000 IDR 299,840,000 (373) 14/05/08 9,262.13949
(26,504)
At 31 March 2008 the Emerging Markets Bond Fund had the following open forward currency commitments:
Buy Sell Unrealised gain/(loss) (USD) Maturity Date Contract Rate
BRL 8,017,000 USD 4,783,413 (199,738) 17/04/08 1.74903
COP 818,872,000 USD 439,073 5,685 17/04/08 1,841.16165
INR 532,669,000 USD 13,407,224 (135,256) 17/04/08 40.13489
MXN 120,597,000 USD 11,121,790 130,567 17/04/08 10.71749
MXN 9,034,000 USD 841,057 1,865 17/04/08 10.71749
RUB 22,436,000 USD 951,451 2,572 17/04/08 23.51727
THB 133,749,000 USD 4,265,635 (20,472) 17/04/08 31.50621
TRY 6,992,000 USD 5,606,371 (309,979) 17/04/08 1.32014
TRY 10,747,000 USD 8,607,930 (467,151) 17/04/08 1.32014
TRY 1,329,000 USD 1,088,492 (81,783) 17/04/08 1.32014
USD 9,554,592 INR 389,063,000 (139,292) 17/04/08 40.13489
USD 5,459,028 EUR 3,775,000 (508,195) 17/04/08 0.63262
USD 32,523,575 TRY 40,390,000 1,928,429 17/04/08 1.32014
USD 11,269,948 MXN 122,272,000 (138,697) 17/04/08 10.71749
USD 35,268,724 BRL 64,466,000 (1,589,352) 17/04/08 1.74903
USD 5,280,817 COP 10,561,634,000 (455,580) 17/04/08 1,841.16165
USD 14,483,508 INR 574,778,000 162,353 17/04/08 40.13489
USD 8,942,212 RUB 221,047,000 (457,138) 17/04/08 23.51727
USD 4,632,184 MXN 50,317,000 (62,667) 17/04/08 10.71749
USD 4,278,804 THB 133,749,000 33,641 17/04/08 31.50621
(2,300,188)
Forward currency contracts are used to hedge the Class A-2 ($) hedged share class. At 31 March 2008 the European High Yield Bond Fund had the following open forward currency commitments relating to the A-2 ($) hedged share class:
Buy Sell Unrealised gain/(loss) (EUR) Maturity Date Contract Rate
USD 7,668,500 EUR 5,255,097 (403,851) 17/04/08 1.58073
USD 824,000 EUR 558,841 (37,432) 24/04/08 1.58033
USD 166,935 EUR 109,000 (3,310) 07/05/08 1.57947
USD 2,390,692 EUR 1,606,457 (92,852) 07/05/08 1.57947
USD 7,857,000 EUR 5,327,123 (346,687) 30/05/08 1.57757
EUR 326,000 USD 495,866 12,305 17/04/08 1.58073
EUR 194,000 USD 286,711 12,258 30/05/08 1.57757
EUR 148,000 USD 230,042 2,180 30/05/08 1.57757
EUR 354,000 USD 546,743 7,428 30/05/08 1.57757
(849,961)

116 Aberdeen Global
At 31 March 2008 the World Bond Fund had the following open forward currency commitments:
Buy Sell Unrealised gain/(loss) (GBP) Maturity Date Contract Rate
AUD 5,021,000 GBP 2,348,464 (47,156) 30/05/08 2.18180
CHF 865,000 GBP 407,025 32,952 30/05/08 1.96601
EUR 206,000 GBP 155,789 8,392 30/05/08 1.25471
JPY 699,119,000 GBP 3,333,867 224,685 30/05/08 196.46163
MYR 8,069,000 USD 1,281,800 (6,410) 30/05/08 6.32669
NOK 19,393,000 GBP 1,798,645 119,141 17/04/08 10.11219
SEK 9,001,000 GBP 729,831 33,999 30/05/08 11.78403
SGD 6,250,000 GBP 2,244,410 37,568 17/04/08 2.73885
SGD 6,821,000 GBP 2,483,592 20,334 30/05/08 2.72412
TWD 135,880,000 USD 2,201,672 52,611 17/04/08 60.27638
TWD 70,840,000 USD 1,184,324 2,736 30/05/08 59.67685
USD 4,300,000 GBP 2,221,955 (57,418) 17/04/08 1.98657
USD 2,511,000 GBP 1,269,400 (834) 30/05/08 1.97940
GBP 400,634 USD 778,000 9,004 17/04/08 1.98657
GBP 1,957,808 JPY 406,000,000 (96,272) 17/04/08 197.65541
GBP 8,112,330 USD 16,047,000 5,329 30/05/08 1.97940
GBP 679,760 CAD 1,320,000 28,073 30/05/08 2.02552
GBP 2,582,618 EUR 3,415,000 (139,117) 30/05/08 1.25471
GBP 2,644,601 NZD 6,487,000 80,140 30/05/08 2.52958
MYR 1,281,800 USD 2,525,113 6,104 30/05/08 1.97940
TWD 2,201,672 USD 4,300,000 37,135 17/04/08 1.98657
TWD 1,184,324 USD 2,326,437 9,000 30/05/08 1.97940
359,996
Apart from the commitment disclosed above, Aberdeen Global had no other foreign currency commitments at 31 March 2008.
10 SOFT COMMISSION/COMMISSION SHARING The Manager has entered into soft commission/commission sharing arrangements with brokers in respect of which certain goods and services used to support investment decision making were received. The Manager does not make direct payment for these services but transacts an agreed amount of business with the brokers on behalf of the Fund and commission is paid on these transactions. The goods and services utilised for the Fund include research and advisory services; economic and political analysis, portfolio analysis including valuation and performance measurement, market analysis data and quotation services; computer hardware and software incidental to the above goods and services and investment related publications.
11 EQUALISATION ON THE ISSUE AND REDEMPTION OF SHARES Equalisation is operated in connection with the issue and redemption of shares. It represents the income element included in the price for the issue and redemption of shares.
12 ABERDEEN GLOBAL INDIA OPPORTUNITIES FUND (MAURITIUS) LIMITED Aberdeen Global - India Opportunities Fund (Mauritius) Limited, as a Mauritian company, is subject to Mauritian Income tax which is disclosed on page 68.
13 CONTINGENT LIABILITY The company has a US$50 million overdraft facility with Bank of America to finance short-term timing differences arising from subscriptions and redemptions. Any liability arising on this account will be recoverable from subscribers to the Company and is therefore not reflected in the financial statements of the Company.
Notes to the Financial Statements continued
Aberdeen Global 117
Fund Managers
Aberdeen Asset Managers LimitedOne Bow Churchyard, London, EC4M 9HH, UK. Authorised and regulated by the Financial Services Authority.
Aberdeen Global - American Opportunities FundAberdeen Global - Emerging Markets Fund (excluding Asian assets)Aberdeen Global - Emerging Markets Bond Fund Aberdeen Global - Emerging Markets Smaller Companies (excluding Asian assets)Aberdeen Global - European Equity Fund Aberdeen Global - European High Yield Bond Fund Aberdeen Global - European Opportunities (Ex UK) FundAberdeen Global - High Yield Bond FundAberdeen Global - Responsible World Equity FundAberdeen Global - Sterling Corporate Bond FundAberdeen Global - Sterling Financials Bond FundAberdeen Global - Technology FundAberdeen Global - UK Opportunities FundAberdeen Global - World Bond FundAberdeen Global - World Equity Fund
Aberdeen Asset Management Asia Limited,21 Church Street, #01–01 Capital Square Two, Singapore 049480Regulated by the Monetary Authority of Singapore.
Aberdeen Global - Asia Pacific FundAberdeen Global - Asia Pacific and Australasian Bond FundAberdeen Global - Asian Smaller Companies FundAberdeen Global - Australasian Equity FundAberdeen Global - China Opportunities FundAberdeen Global - Emerging Markets Fund (Asian assets only)Aberdeen Global - Emerging Markets Smaller Companies Fund (Asian assets only)Aberdeen Global - India Opportunities FundAberdeen Global - Japan Smaller Companies Fund Aberdeen Global - Japanese Equity Fund
Management and Administration

118 Aberdeen Global
Registered Office Aberdeen Global, 49 Avenue JF Kennedy, L-1855 Luxembourg, Grand Duchy of Luxembourg
Management CompanyRBS (Luxembourg) S.A., 33 rue de Gasperich, Hesperange, L-5826, Luxembourg
The list of the funds managed by the Management Company, may be obtained, on simple request, at the registered office of the Management Company.
AdministratorBNP Paribas Fund Services S.A., 33 rue de Gasperich, Howald - Hesperange, L-1085 Luxembourg, Grand Duchy of Luxembourg
Domiciliary, Paying, Registrar & Transfer AgentState Street Bank Luxembourg S.A., 49 Avenue JF Kennedy, L-1855 Luxembourg, Grand Duchy of Luxembourg
Investment Manager & DistributorAberdeen International Fund Managers Limited, Rooms 26-05-06, 26th Floor, Alexandra House, 18 Chater Road, Central, Hong Kong
Custodian BankBNP Paribas Securities Services Luxembourg Branch, 33 rue de Gasperich, Howald - Hesperange, L-1085 Luxembourg, Grand Duchy of Luxembourg
Auditor KPMG Audit S.à.r l., 9 Allée Scheffer, L–2520 Luxembourg, Grand Duchy of Luxembourg
Legal Advisors to the CompanyElvinger Hoss & Prussen, 2 Place Winston Churchill, L–1340, Luxembourg, Grand Duchy of Luxembourg
German Paying AgentMarcard, Stein & Co AG, Ballindamm 36, 20095 Hamburg, Germany
Dutch Representative Fastnet Netherlands N.V., Herengracht 548, 1000 AG Amsterdam, The Netherlands
Austrian Paying and Information Agent and Tax RepresentativeRaiffeisen Zentralbank Osterreich Aktiengesellschaft (RZB AG), Am Stadtpark 9, 1030 Vienna, Austria
Swiss Representative Fortis Foreign Fund Services AG, Rennweg 57,Postfach CH 8023 Zürich, Switzerland
Swiss Paying Agent Fortis Bank (Switzerland) SA, Niederlassung Zurich, Rennweg 57, Postfach CH 8023 Zürich, Switzerland
Irish Facilities Agent Aberdeen Fund Management Ireland Limited, Guild House, Guild Street, IFSC, Dublin 1, Ireland
Italian Paying Agent and Correspondent Bank Banco Popolare Commercio e Industria SCRL, Via Moscova, 33, 20121, Milan, Italy
Belgian Paying Agent Fastnet Belgium s.a/n.v Avene du Port, Havenlaan 86C b, 320 B-1000 Brussels, Belgium
Spanish DistributorAllfunds Bank SA, Calle Estafeta 6, Complejo Plaza de la Fuente, Edificio 3 (La Moraleja), C.P. 28109, Alcobendas, Madrid, Spain
Christopher G LittleAberdeen Global49 Avenue JF KennedyL-1855LuxembourgGrand Duchy of Luxembourg
Hugh YoungAberdeen Asset Management Asia Limited21 Church Street, #01–01 Capital Square Two, Singapore 049480
Bev HendryAberdeen Asset Management Inc.300 S.E. 2nd Street, Suite 820, Fort LauderdaleFlorida, 33301, USA
Martin J Gilbert Aberdeen Asset Managers Limited10 Queen’s TerraceAberdeen AB10 1YGUnited Kingdom
David van der StoepAberdeen Global49 Avenue JF KennedyL-1855LuxembourgGrand Duchy of Luxembourg
Gary MarshallAberdeen Asset Managers LimitedOne Bow ChurchyardLondon EC4M 9HHUnited Kingdom
Neville MilesAberdeen Asset Management LimitedLevel 6201 Kent StreetSydneyNSW 2000
CHAIRMAN
DIRECTORS
Management and Administration continued
Aberdeen Global 119
Further Information on Aberdeen Global can be obtained from:
Aberdeen Asset Managers Limited, Aberdeen International Fund Managers Limited(UK Distributor) (Global Distributor and Investment Manager)1 Bow Churchyard, Rooms 26-05-06,London EC4M 9HH 26th Floor, Alexandra HouseTelephone: +44 20 7463 6000 18 Chater Roadwww.aberdeen-asset.com Central, Hong Kong Telephone: +852 2103 4700 Fax: +852 2827 8908
Additional information for investors in GermanyApplications for the return and replacement of a Fund’s shares can be submitted to the German paying agent.
All payments intended for a shareholder, including the proceeds of withdrawal and any dividends, can be routed, at the shareholder’s request, via the German paying agent and/or paid out in cash from the German paying agent.
The full and simplified prospectus and the Constitution of Aberdeen Global and the audited end-of-year reports, the non-audited half-yearly reports and the issue withdrawal prices can be obtained free of charge from the information agent. The issue with call price and the interim profit are published in the stock exchange periodical and in the Handelsblatt commercial journal. Any messages to shareholders are published in the stock exchange periodical.
The Schedule of Changes in the investment portfolio is also available from the Paying Agent.
Furthermore, the other documents which can be examined free of charge at the registered office of Aberdeen Global can also be examined free of charge at the information agent.
The payment and information centre for Aberdeen Global in Germany is:
Marcard, Stein & Co AG, Ballindamm 36, 20095 Hamburg, Germany
Supplementary information for investors in SwitzerlandConditions for shares marketed in Switzerland or from a base in Switzerland.
For shares marketed in Switzerland or from a base in Switzerland, the following is applicable in addition to the full and simplified prospectus conditions:
Representative in Switzerland: Swiss Paying Agent: Fortis Foreign Fund Services AG Fortis Bank (Switzerland) SARennweg 57 Niederlassung ZurichPostfach Rennweg 57CH 8023 Zürich PostfachSwitzerland CH 8023 Zürich Switzerland
Place of fulfilment and jurisdictionFor shares marketed in Switzerland, the place of fulfilment and jurisdiction are established at the head office of the representative, in Nyon.
Reference sources for fund publicationsThe constitution documents, full and simplified prospectus, annual and half-yearly reports and a schedule of purchases and sales for the Fund can be obtained free of charge from the representative’s Zürich branch.
Channels of publicationNotices for the Fund in Switzerland are published in the Swiss Handelsamtblatt official commercial journal and in the Neue Zürcher Zeitung.
Rate publications in Switzerland are announced each day in the Neue Zürcher Zeitung.
General Information

120 Aberdeen Global
General Information continued
European Savings Directive From 1 July 2005 distributions and proceeds on redemption from UCITS may be reportable or subject to withholding tax in accordance with Council Directive 2003/48/EC, the EU Savings Directive (“the Directive”). Aberdeen Global is a UCITS for the purposes of the Directive. Only savings income payments are reportable or subject to withholding tax. Distributions are savings income payments if a fund holds more than 15% of its assets in “eligible money debts” and proceeds on redemption are savings income payments if a fund holds more than 40% of its assets in eligible money debts.
For the purposes of the Directive below we show the percentages of each of the Funds’ assets which were invested in ‘eligible money debts’ as defined in Luxembourg.
American Opportunities 5.80%Asia Pacific 0.83%Asia Pacific and Japan 0.47% Asia Pacific and Australasian Bond 99.17%Asian Smaller Companies 1.19%Australasian Equity 3.98%China Opportunities 1.77%Emerging Markets 2.91%Emerging Markets Bond 96.55%Emerging Markets Smaller Companies 15.08%European Equity 1.25%European High Yield Bond 99.67%European Opportunities (ex UK) 0.58%High Yield Bond 88.26%India Opportunities 0.96%Japan Smaller Companies 0.28%Japanese Equity 0.44%Responsible World Equity 0.63%Sterling Corporate Bond 60.85%Sterling Financials Bond 86.80%Technology 1.43%UK Opportunities 0.13%World Bond 97.81%World Equity 3.50%
It should be noted that this is for information purposes only. Responsibility for compliance with the Directive remains that of the ‘paying agent’ as defined by the Directive. The calculation is based on the Luxembourg interpretation of the rules.

Aberdeen Global 121
Further Information
Aberdeen GlobalAberdeen Global is an open-ended investment company incorporated with limited liability under the laws of the Grand Duchy of Luxembourg and organised as a société d’investissement à capital variable (a “SICAV”) with UCITS status (an Undertaking for Collective Investment in Transferable Securities as defined in the European Union Directive 85/611/EEC of 20 December 1985 as amended).
Aberdeen Global aims to provide investors with a broad international range of diversified actively-managed Funds. There are 23 active sub-funds in total, each with its own specific investment objectives and individual portfolios, offering investors the opportunity of exposure to selected areas or to conveniently build a diversified global stock and bond portfolio to meet specific investment goals. The overall strategy of Aberdeen Global and the separate Funds is to seek diversification through investment primarily in transferable securities.
Aberdeen Asset Management PLCAberdeen Asset Management PLC is an international investment management group, managing assets for both institutions and private investors from offices around the world. Our goal is to deliver superior fund performance across diverse asset classes in which we believe we have a sustainable competitive edge. Listed on the London Stock Exchange, we manage fixed income and equities (quoted and private) in segregated, closed and open-ended pooled structures.
Over two decades we have expanded through a combination of organic growth and acquisition, first in the UK, then by seeking selectively to manage and (or) market funds in countries in which we already invest. We operate flat management structures to facilitate local decision-making, underpinned by clear lines of control and central reporting.
Our investment style is driven by fundamental analysis, with an emphasis on active management and team decision-making supported by strong process disciplines.

05 1001_0508
Aberdeen Asset Managers Limited
(UK Distributor)
10 Queen’s Terrace, Aberdeen AB10 1YG
Tel +44 (0)1224 631999 Fax +44 (0)1224 647010
One Bow Churchyard, London EC4M 9HH
Tel +44 (0)20 7463 6000 Fax +44 (0)20 7463 6001
Authorised and regulated by The Financial Services Authority
Member of the Aberdeen Asset Management Group of Companies
Aberdeen Asset Management Asia Limited
21 Church Street, #01-01 Capital Square Two,
Singapore 049480
Tel +65 6395 2700 Fax +65 6535 7159
Regulated by The Monetary Authority of Singapore
Member of the Aberdeen Asset Management Group of Companies
Aberdeen International Fund Managers Limited
(Distributor and Investment Manager)
Rooms 26-05-06, 26th Floor, Alexandra House
18 Chater Road, Central, Hong Kong
Tel +852 2103 4700 Fax +852 2827 8908
Regulated by The Securities and Futures Commission of Hong Kong
Shareholder Service Centre
State Street Bank Luxembourg S.A.
(Domiciliary Agent, Registrar, Paying and Transfer Agent)
(referred to as the “Transfer Agent”)
49, Avenue J. F. Kennedy
L-1855 Luxembourg
Grand Duchy of Luxembourg
For more information on Aberdeen Global. Please contact:
Tel +44 (0)1224 425255 (UK Shareholders)
Tel +325 46 40 1 820 (Outside UK)
Fax 00 325 245 29 056