LG Display Co., Ltd.
268
3/16/22, 10:38 PM Form 6-K https://www.sec.gov/Archives/edgar/data/0001290109/000119312522075294/d288774d6k.htm 1/268 6-K 1 d288774d6k.htm FORM 6-K Table of Contents SECURITIES AND EXCHANGE COMMISSION Washington, D.C. 20549 Form 6-K REPORT OF FOREIGN PRIVATE ISSUER PURSUANT TO RULE 13a-16 OR 15d-16 UNDER THE SECURITIES EXCHANGE ACT OF 1934 For the month of March 2022 LG Display Co., Ltd. (Translation of Registrant’s name into English) LG Twin Towers, 128 Yeoui-daero, Yeongdeungpo-gu, Seoul 07336, Republic of Korea (Address of principal executive offices) Indicate by check mark whether the registrant files or will file annual reports under cover of Form 20-F or Form 40-F. Form 20-F ☒ Form 40-F ☐ Indicate by check mark if the registrant is submitting the Form 6-K in paper as permitted by Regulation S-T Rule 101(b)(1): ☐ Note: Regulation S-T Rule 101(b)(1) only permits the submission in paper of a Form 6-K if submitted solely to provide an attached annual report to security holders. Indicate by check mark if the registrant is submitting the Form 6-K in paper as permitted by Regulation S-T Rule 101(b)(7): ☐ Note: Regulation S-T Rule 101(b)(7) only permits the submission in paper of a Form 6-K if submission to furnish a report or other document that the registration foreign private issuer must furnish and make public under the laws of the jurisdiction in which the registrant is incorporated, domiciled or legally organized (the registrant’s “home country”), or under the rules of the home country exchange on which the registrant’s securities are traded, as long as the report or other document is not a press release, is not required to be and has not been distributed to the registrant’s security holders, and if discussing a material event, has already been the subject of a Form 6-K submission or other Commission filing on EDGAR. Indicate by check mark whether by furnishing the information contained in this Form, the registrant is also thereby furnishing the information to the Commission pursuant to Rule 12g3-2(b) under the Securities Exchange Act of 1934. Yes ☐ No ☒
-
Upload
khangminh22 -
Category
Documents
-
view
1 -
download
0
Transcript of LG Display Co., Ltd.
3/16/22, 10:38 PM Form 6-K
https://www.sec.gov/Archives/edgar/data/0001290109/000119312522075294/d288774d6k.htm 1/268
6-K 1 d288774d6k.htm FORM 6-K
Table of Contents
SECURITIES AND EXCHANGE COMMISSION
Washington, D.C. 20549
Form 6-K
REPORT OF FOREIGN PRIVATE ISSUERPURSUANT TO RULE 13a-16 OR 15d-16
UNDER THE SECURITIES EXCHANGE ACT OF 1934
For the month of March 2022
LG Display Co., Ltd.(Translation of Registrant’s name into English)
LG Twin Towers, 128 Yeoui-daero, Yeongdeungpo-gu, Seoul 07336, Republic of Korea(Address of principal executive offices)
Indicate by check mark whether the registrant files or will file annual reports under cover of Form 20-F or Form 40-F.
Form 20-F ☒ Form 40-F ☐
Indicate by check mark if the registrant is submitting the Form 6-K in paper as permitted by Regulation S-T Rule 101(b)(1): ☐
Note: Regulation S-T Rule 101(b)(1) only permits the submission in paper of a Form 6-K if submitted solely to provide an attached annual reportto security holders.
Indicate by check mark if the registrant is submitting the Form 6-K in paper as permitted by Regulation S-T Rule 101(b)(7): ☐
Note: Regulation S-T Rule 101(b)(7) only permits the submission in paper of a Form 6-K if submission to furnish a report or other document thatthe registration foreign private issuer must furnish and make public under the laws of the jurisdiction in which the registrant is incorporated, domiciledor legally organized (the registrant’s “home country”), or under the rules of the home country exchange on which the registrant’s securities are traded, aslong as the report or other document is not a press release, is not required to be and has not been distributed to the registrant’s security holders, and ifdiscussing a material event, has already been the subject of a Form 6-K submission or other Commission filing on EDGAR.
Indicate by check mark whether by furnishing the information contained in this Form, the registrant is also thereby furnishing the information tothe Commission pursuant to Rule 12g3-2(b) under the Securities Exchange Act of 1934.
Yes ☐ No ☒

3/16/22, 10:38 PM Form 6-K
https://www.sec.gov/Archives/edgar/data/0001290109/000119312522075294/d288774d6k.htm 2/268
Table of Contents
ANNUAL REPORT
(From January 1, 2021 to December 31, 2021)
THIS IS A TRANSLATION OF THE ANNUAL REPORT ORIGINALLY PREPARED IN KOREAN AND IS IN SUCH FORM AS REQUIRED BYTHE KOREAN FINANCIAL SUPERVISORY COMMISSION.
IN THE TRANSLATION PROCESS, SOME PARTS OF THE REPORT WERE REFORMATTED, REARRANGED OR SUMMARIZED ANDCERTAIN NUMBERS WERE ROUNDED FOR THE CONVENIENCE OF READERS. REFERENCES TO “Q1”, “Q2”, “Q3” AND “Q4” OF AFISCAL YEAR ARE REFERENCES TO THE THREE-MONTH PERIODS ENDED MARCH 31, JUNE 30, SEPTEMBER 30 AND DECEMBER 31,RESPECTIVELY, OF SUCH FISCAL YEAR. REFERENCES TO “W” OR “KRW” ARE REFERENCES TO THE KOREAN WON.
UNLESS EXPRESSLY STATED OTHERWISE, ALL INFORMATION CONTAINED HEREIN IS PRESENTED ON A CONSOLIDATED BASIS INACCORDANCE WITH KOREAN INTERNATIONAL FINANCIAL REPORTING STANDARDS, OR K-IFRS, WHICH DIFFER IN CERTAINRESPECTS FROM GENERALLY ACCEPTED ACCOUNTING PRINCIPLES IN CERTAIN OTHER COUNTRIES, INCLUDING THE UNITEDSTATES. K-IFRS ALSO DIFFERS IN CERTAIN RESPECTS FROM THE INTERNATIONAL FINANCIAL REPORTING STANDARDS ASISSUED BY THE INTERNATIONAL ACCOUNTING STANDARDS BOARD. WE HAVE MADE NO ATTEMPT TO IDENTIFY OR QUANTIFYTHE IMPACT OF THESE DIFFERENCES IN THIS DOCUMENT.
Contents
1. Company 3 A. Name and contact information 3 B. Credit rating 3 C. Capitalization 4 D. Voting rights 4 E. Dividends 5 F. Matters relating to Articles of Incorporation 6
2. Business 6 A. Business overview 6 B. Industry 7 C. New businesses 9 D. Customer-oriented marketing activities 9
3. Major Products and Raw Materials 9 A. Major products 9 B. Average selling price trend of major products 10 C. Major raw materials 10
4. Production and Equipment 11 A. Production capacity and output 11 B. Production performance and utilization ratio 11 C. Investment plan 12
5. Sales 12 A. Sales performance 12 B. Sales organization and sales route 12 C. Sales methods and sales terms 13 D. Sales strategy 13 E. Major customers 13
6. Purchase Orders 14
1
3/16/22, 10:38 PM Form 6-K
https://www.sec.gov/Archives/edgar/data/0001290109/000119312522075294/d288774d6k.htm 3/268
Table of Contents
7. Risk Management and Derivative Contracts 14 A. Risk management 14 B. Derivative contracts 14
8. Major Contracts 15
9. Research & Development 16 A. Summary of R&D-related expenditures 16 B. R&D achievements 16
10. Intellectual Property 17
11. Environmental and Safety Matters 17 A. Business environment management 17 B. Product environment management 19 C. Status of sanctions 20
12. Financial Information 23 A. Financial highlights (Based on consolidated K-IFRS) 23 B. Financial highlights (Based on separate K-IFRS) 24 C. Consolidated subsidiaries as of December 31, 2021 25 D. Status of equity investments as of December 31, 2021 25
13. Audit Information 26 A. Audit service 26 B. Non-audit service 27
14. Management’s Discussion and Analysis of Financial Condition and Results of Operations 27 A. Risk relating to forward-looking statements 27 B. Overview 27 C. Financial condition and results of operations 28 D. Liquidity and capital resources 39
15. Board of Directors 44 A. Members of the board of directors 44 B. Committees of the board of directors 45 C. Independence of directors 46
16. Information Regarding Shares 46 A. Total number of shares 46 B. Shareholder list 46
17. Directors and Employees 46 A. Directors 46 B. Employees 50 C. Remuneration for executive officers (excluding directors) 50
18. Other Matters 50 A. Legal proceedings 50 B. Material events subsequent to the reporting period 51
Attachment: 1. Financial Statements in accordance with K-IFRS
2
3/16/22, 10:38 PM Form 6-K
https://www.sec.gov/Archives/edgar/data/0001290109/000119312522075294/d288774d6k.htm 4/268
Table of Contents
1. Company
A. Name and contact information
The name of our company is “EL-GI DISPLAY CHUSIK HOESA,” which shall be “LG Display Co., Ltd.” in English.
Our principal executive office is located at LG Twin Towers, 128 Yeoui-daero, Yeongdeungpo-gu, Seoul 07336, Republic of Korea, and ourtelephone number is +82-2-3777-1010. Our website address is http://www.lgdisplay.com.
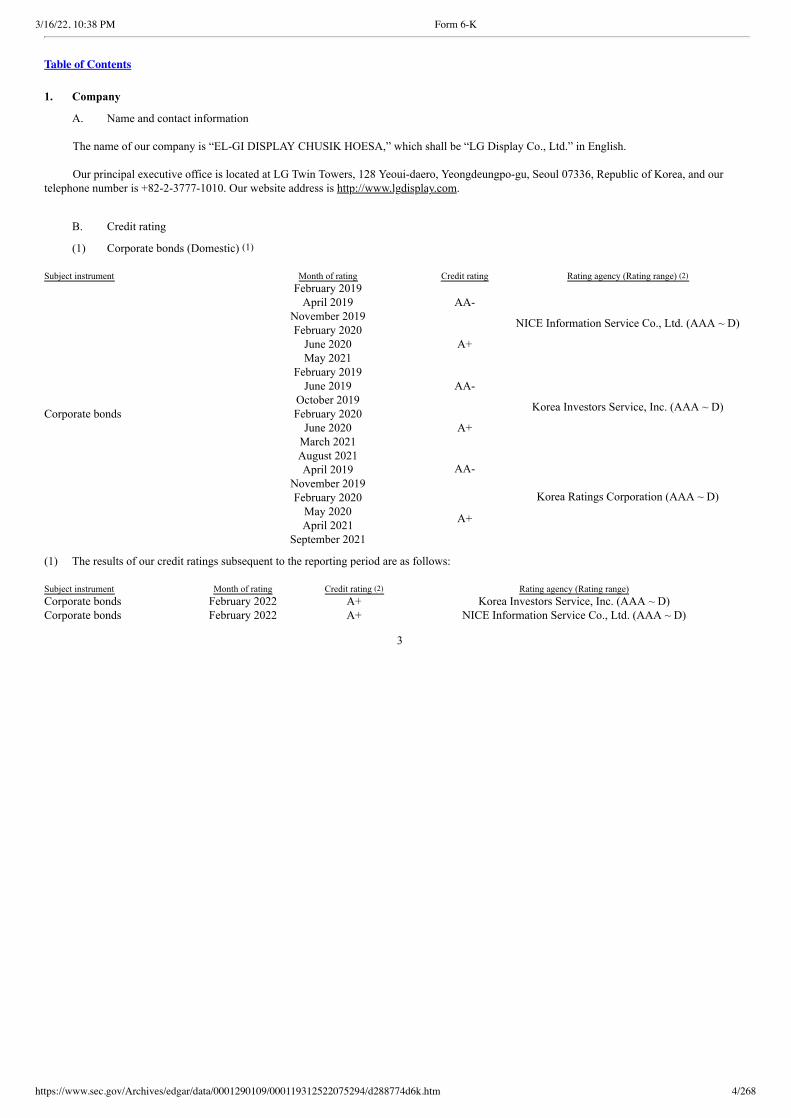
B. Credit rating
(1) Corporate bonds (Domestic) (1)
Subject instrument Month of rating Credit rating Rating agency (Rating range) (2)
Corporate bonds
February 2019
AA-
NICE Information Service Co., Ltd. (AAA ~ D)
April 2019 November 2019 February 2020
A+ June 2020
May 2021 February 2019
AA-
Korea Investors Service, Inc. (AAA ~ D)
June 2019 October 2019 February 2020
A+ June 2020
March 2021 August 2021
AA-
Korea Ratings Corporation (AAA ~ D)
April 2019 November 2019 February 2020
A+ May 2020 April 2021 September 2021
(1) The results of our credit ratings subsequent to the reporting period are as follows: Subject instrument Month of rating Credit rating (2) Rating agency (Rating range)Corporate bonds February 2022 A+ Korea Investors Service, Inc. (AAA ~ D)Corporate bonds February 2022 A+ NICE Information Service Co., Ltd. (AAA ~ D)
3
3/16/22, 10:38 PM Form 6-K
https://www.sec.gov/Archives/edgar/data/0001290109/000119312522075294/d288774d6k.htm 5/268
Table of Contents
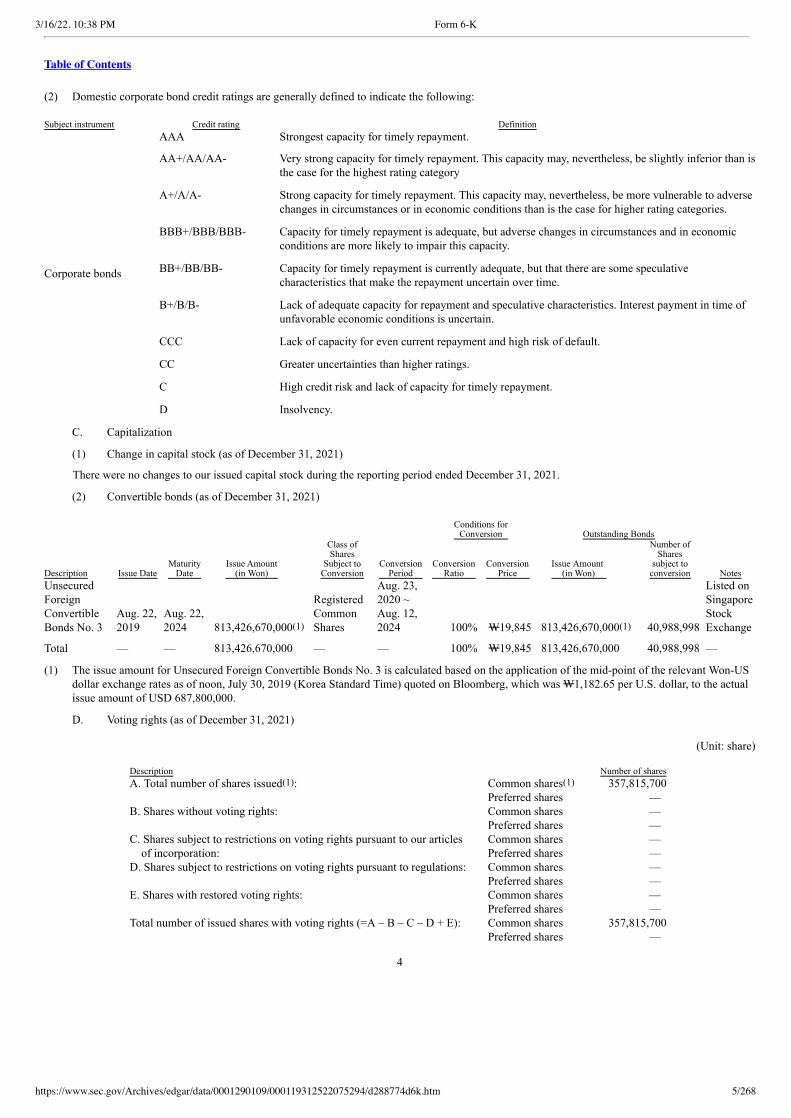
(2) Domestic corporate bond credit ratings are generally defined to indicate the following: Subject instrument Credit rating Definition
Corporate bonds
AAA Strongest capacity for timely repayment.
AA+/AA/AA-
Very strong capacity for timely repayment. This capacity may, nevertheless, be slightly inferior than isthe case for the highest rating category
A+/A/A-
Strong capacity for timely repayment. This capacity may, nevertheless, be more vulnerable to adversechanges in circumstances or in economic conditions than is the case for higher rating categories.
BBB+/BBB/BBB-
Capacity for timely repayment is adequate, but adverse changes in circumstances and in economicconditions are more likely to impair this capacity.
BB+/BB/BB-
Capacity for timely repayment is currently adequate, but that there are some speculativecharacteristics that make the repayment uncertain over time.
B+/B/B-
Lack of adequate capacity for repayment and speculative characteristics. Interest payment in time ofunfavorable economic conditions is uncertain.
CCC
Lack of capacity for even current repayment and high risk of default.
CC
Greater uncertainties than higher ratings.
C
High credit risk and lack of capacity for timely repayment.
D
Insolvency.
C. Capitalization
(1) Change in capital stock (as of December 31, 2021)
There were no changes to our issued capital stock during the reporting period ended December 31, 2021.
(2) Convertible bonds (as of December 31, 2021)
Description Issue Date Maturity
Date Issue Amount
(in Won)
Class of Shares
Subject to Conversion
Conversion Period
Conditions for
Conversion Outstanding Bonds
Notes Conversion
Ratio Conversion
Price Issue Amount
(in Won)
Number of Shares
subject to conversion
UnsecuredForeignConvertibleBonds No. 3
Aug. 22,2019
Aug. 22,2024 813,426,670,000(1)
RegisteredCommonShares
Aug. 23, 2020 ~
Aug. 12, 2024 100% W19,845 813,426,670,000(1) 40,988,998
Listed onSingaporeStockExchange
Total — — 813,426,670,000 — — 100% W19,845 813,426,670,000 40,988,998 —
(1) The issue amount for Unsecured Foreign Convertible Bonds No. 3 is calculated based on the application of the mid-point of the relevant Won-USdollar exchange rates as of noon, July 30, 2019 (Korea Standard Time) quoted on Bloomberg, which was W1,182.65 per U.S. dollar, to the actualissue amount of USD 687,800,000.
D. Voting rights (as of December 31, 2021)
(Unit: share)
Description Number of shares A. Total number of shares issued(1): Common shares(1) 357,815,700
Preferred shares — B. Shares without voting rights: Common shares —
Preferred shares — C. Shares subject to restrictions on voting rights pursuant to our articles
of incorporation: Common shares — Preferred shares —
D. Shares subject to restrictions on voting rights pursuant to regulations: Common shares — Preferred shares —
E. Shares with restored voting rights: Common shares — Preferred shares —
Total number of issued shares with voting rights (=A – B – C – D + E): Common shares 357,815,700 Preferred shares —
4
3/16/22, 10:38 PM Form 6-K
https://www.sec.gov/Archives/edgar/data/0001290109/000119312522075294/d288774d6k.htm 6/268
Table of Contents
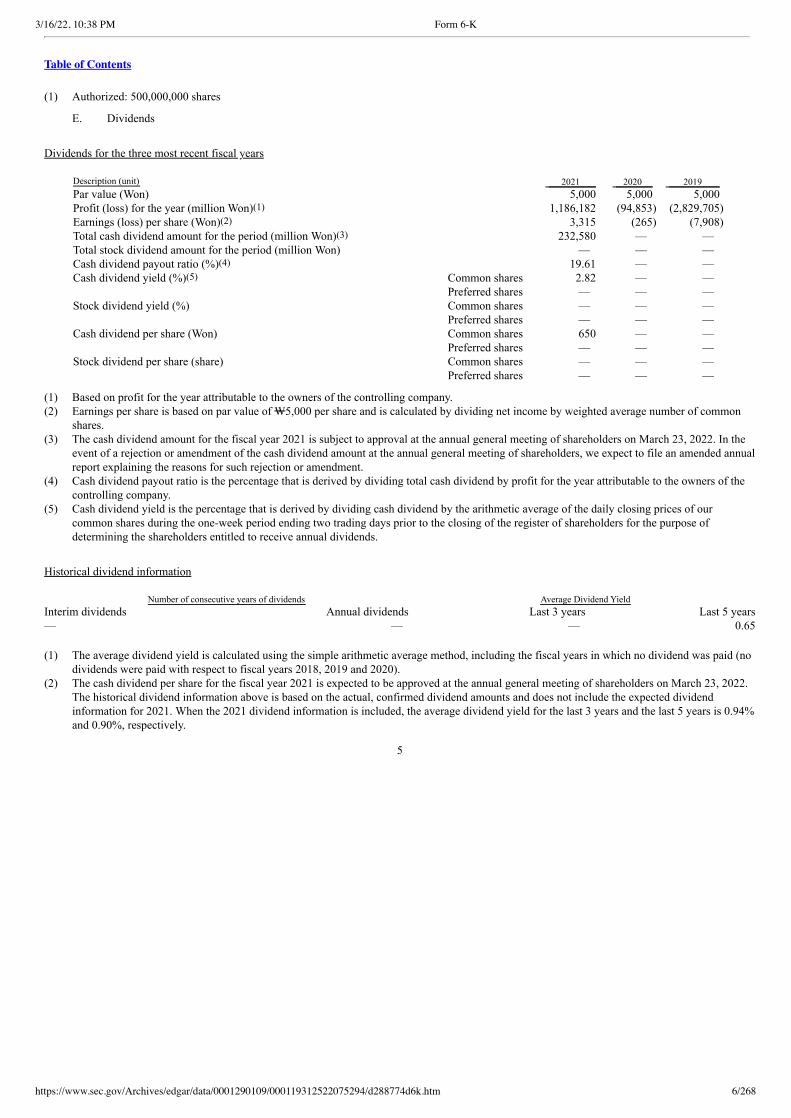
(1) Authorized: 500,000,000 shares
E. Dividends
Dividends for the three most recent fiscal years
Description (unit) 2021 2020 2019 Par value (Won) 5,000 5,000 5,000 Profit (loss) for the year (million Won)(1) 1,186,182 (94,853) (2,829,705) Earnings (loss) per share (Won)(2) 3,315 (265) (7,908) Total cash dividend amount for the period (million Won)(3) 232,580 — — Total stock dividend amount for the period (million Won) — — — Cash dividend payout ratio (%)(4) 19.61 — — Cash dividend yield (%)(5) Common shares 2.82 — —
Preferred shares — — — Stock dividend yield (%) Common shares — — —
Preferred shares — — — Cash dividend per share (Won) Common shares 650 — —
Preferred shares — — — Stock dividend per share (share) Common shares — — —
Preferred shares — — —
(1) Based on profit for the year attributable to the owners of the controlling company.(2) Earnings per share is based on par value of W5,000 per share and is calculated by dividing net income by weighted average number of common
shares.(3) The cash dividend amount for the fiscal year 2021 is subject to approval at the annual general meeting of shareholders on March 23, 2022. In the
event of a rejection or amendment of the cash dividend amount at the annual general meeting of shareholders, we expect to file an amended annualreport explaining the reasons for such rejection or amendment.
(4) Cash dividend payout ratio is the percentage that is derived by dividing total cash dividend by profit for the year attributable to the owners of thecontrolling company.
(5) Cash dividend yield is the percentage that is derived by dividing cash dividend by the arithmetic average of the daily closing prices of ourcommon shares during the one-week period ending two trading days prior to the closing of the register of shareholders for the purpose ofdetermining the shareholders entitled to receive annual dividends.
Historical dividend information
Number of consecutive years of dividends Average Dividend YieldInterim dividends Annual dividends Last 3 years Last 5 years— — — 0.65 (1) The average dividend yield is calculated using the simple arithmetic average method, including the fiscal years in which no dividend was paid (no
dividends were paid with respect to fiscal years 2018, 2019 and 2020).(2) The cash dividend per share for the fiscal year 2021 is expected to be approved at the annual general meeting of shareholders on March 23, 2022.
The historical dividend information above is based on the actual, confirmed dividend amounts and does not include the expected dividendinformation for 2021. When the 2021 dividend information is included, the average dividend yield for the last 3 years and the last 5 years is 0.94%and 0.90%, respectively.
5
3/16/22, 10:38 PM Form 6-K
https://www.sec.gov/Archives/edgar/data/0001290109/000119312522075294/d288774d6k.htm 7/268
Table of Contents
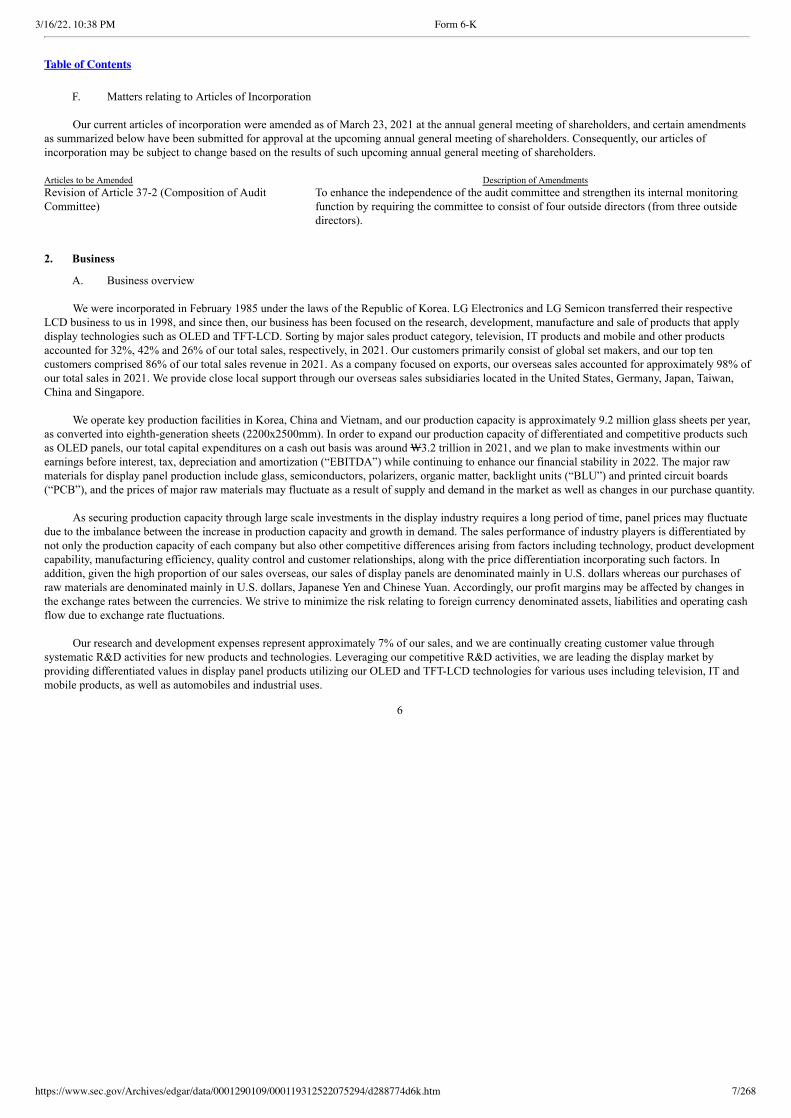
F. Matters relating to Articles of Incorporation
Our current articles of incorporation were amended as of March 23, 2021 at the annual general meeting of shareholders, and certain amendmentsas summarized below have been submitted for approval at the upcoming annual general meeting of shareholders. Consequently, our articles ofincorporation may be subject to change based on the results of such upcoming annual general meeting of shareholders. Articles to be Amended Description of AmendmentsRevision of Article 37-2 (Composition of AuditCommittee)
To enhance the independence of the audit committee and strengthen its internal monitoringfunction by requiring the committee to consist of four outside directors (from three outsidedirectors).
2. Business
A. Business overview
We were incorporated in February 1985 under the laws of the Republic of Korea. LG Electronics and LG Semicon transferred their respectiveLCD business to us in 1998, and since then, our business has been focused on the research, development, manufacture and sale of products that applydisplay technologies such as OLED and TFT-LCD. Sorting by major sales product category, television, IT products and mobile and other productsaccounted for 32%, 42% and 26% of our total sales, respectively, in 2021. Our customers primarily consist of global set makers, and our top tencustomers comprised 86% of our total sales revenue in 2021. As a company focused on exports, our overseas sales accounted for approximately 98% ofour total sales in 2021. We provide close local support through our overseas sales subsidiaries located in the United States, Germany, Japan, Taiwan,China and Singapore.
We operate key production facilities in Korea, China and Vietnam, and our production capacity is approximately 9.2 million glass sheets per year,as converted into eighth-generation sheets (2200x2500mm). In order to expand our production capacity of differentiated and competitive products suchas OLED panels, our total capital expenditures on a cash out basis was around W3.2 trillion in 2021, and we plan to make investments within ourearnings before interest, tax, depreciation and amortization (“EBITDA”) while continuing to enhance our financial stability in 2022. The major rawmaterials for display panel production include glass, semiconductors, polarizers, organic matter, backlight units (“BLU”) and printed circuit boards(“PCB”), and the prices of major raw materials may fluctuate as a result of supply and demand in the market as well as changes in our purchase quantity.
As securing production capacity through large scale investments in the display industry requires a long period of time, panel prices may fluctuatedue to the imbalance between the increase in production capacity and growth in demand. The sales performance of industry players is differentiated bynot only the production capacity of each company but also other competitive differences arising from factors including technology, product developmentcapability, manufacturing efficiency, quality control and customer relationships, along with the price differentiation incorporating such factors. Inaddition, given the high proportion of our sales overseas, our sales of display panels are denominated mainly in U.S. dollars whereas our purchases ofraw materials are denominated mainly in U.S. dollars, Japanese Yen and Chinese Yuan. Accordingly, our profit margins may be affected by changes inthe exchange rates between the currencies. We strive to minimize the risk relating to foreign currency denominated assets, liabilities and operating cashflow due to exchange rate fluctuations.
Our research and development expenses represent approximately 7% of our sales, and we are continually creating customer value throughsystematic R&D activities for new products and technologies. Leveraging our competitive R&D activities, we are leading the display market byproviding differentiated values in display panel products utilizing our OLED and TFT-LCD technologies for various uses including television, IT andmobile products, as well as automobiles and industrial uses.
6
3/16/22, 10:38 PM Form 6-K
https://www.sec.gov/Archives/edgar/data/0001290109/000119312522075294/d288774d6k.htm 8/268
Table of Contents
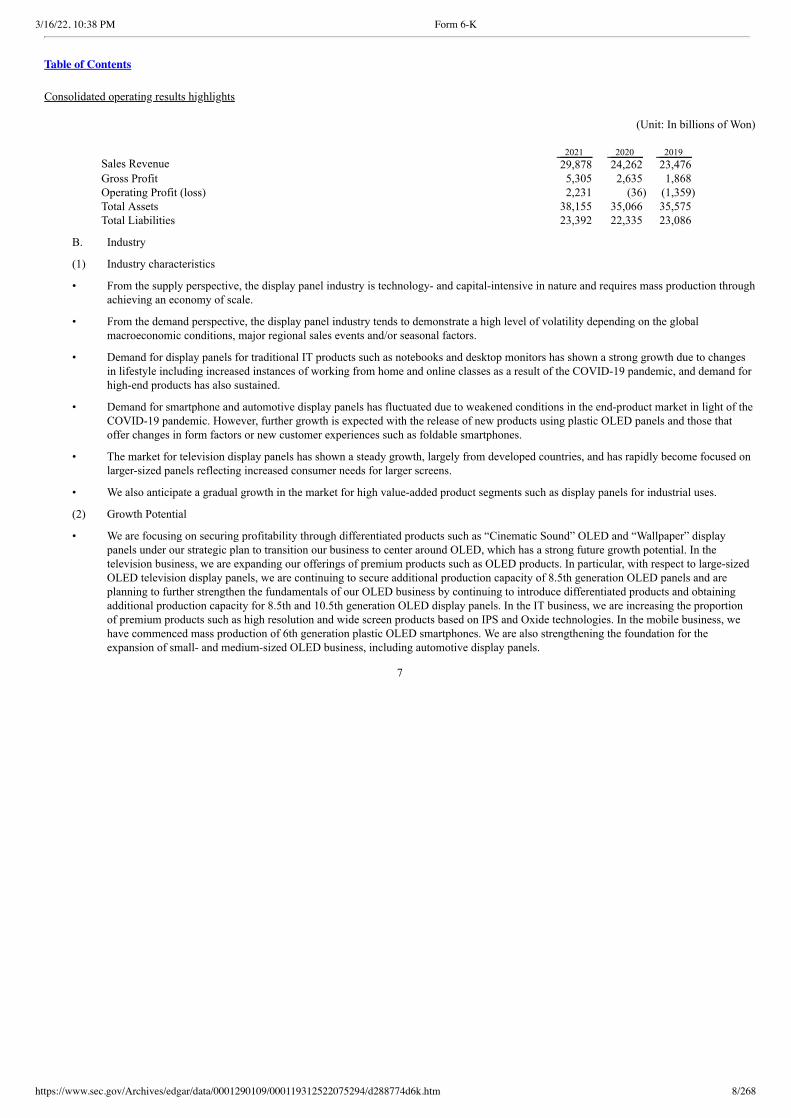
Consolidated operating results highlights
(Unit: In billions of Won)
2021 2020 2019 Sales Revenue 29,878 24,262 23,476 Gross Profit 5,305 2,635 1,868 Operating Profit (loss) 2,231 (36) (1,359) Total Assets 38,155 35,066 35,575 Total Liabilities 23,392 22,335 23,086
B. Industry
(1) Industry characteristics
• From the supply perspective, the display panel industry is technology- and capital-intensive in nature and requires mass production throughachieving an economy of scale.
• From the demand perspective, the display panel industry tends to demonstrate a high level of volatility depending on the globalmacroeconomic conditions, major regional sales events and/or seasonal factors.
• Demand for display panels for traditional IT products such as notebooks and desktop monitors has shown a strong growth due to changes
in lifestyle including increased instances of working from home and online classes as a result of the COVID-19 pandemic, and demand forhigh-end products has also sustained.
• Demand for smartphone and automotive display panels has fluctuated due to weakened conditions in the end-product market in light of the
COVID-19 pandemic. However, further growth is expected with the release of new products using plastic OLED panels and those thatoffer changes in form factors or new customer experiences such as foldable smartphones.
• The market for television display panels has shown a steady growth, largely from developed countries, and has rapidly become focused onlarger-sized panels reflecting increased consumer needs for larger screens.
• We also anticipate a gradual growth in the market for high value-added product segments such as display panels for industrial uses.
(2) Growth Potential
• We are focusing on securing profitability through differentiated products such as “Cinematic Sound” OLED and “Wallpaper” displaypanels under our strategic plan to transition our business to center around OLED, which has a strong future growth potential. In thetelevision business, we are expanding our offerings of premium products such as OLED products. In particular, with respect to large-sizedOLED television display panels, we are continuing to secure additional production capacity of 8.5th generation OLED panels and areplanning to further strengthen the fundamentals of our OLED business by continuing to introduce differentiated products and obtainingadditional production capacity for 8.5th and 10.5th generation OLED display panels. In the IT business, we are increasing the proportionof premium products such as high resolution and wide screen products based on IPS and Oxide technologies. In the mobile business, wehave commenced mass production of 6th generation plastic OLED smartphones. We are also strengthening the foundation for theexpansion of small- and medium-sized OLED business, including automotive display panels.
7

3/16/22, 10:38 PM Form 6-K
https://www.sec.gov/Archives/edgar/data/0001290109/000119312522075294/d288774d6k.htm 9/268
Table of Contents
(3) Cyclicality
• The display panel business is highly cyclical and sensitive to fluctuations in the general economy. The industry experiences recurring
volatility caused by imbalances between supply and demand due to capacity expansion and changing production utilization rates within theindustry.
• Macroeconomic factors and other causes of business cycles can affect the rate of growth in demand for display panels. Accordingly, if
supply exceeds demand, average selling prices of display panels may decrease. Conversely, if growth in demand outpaces growth insupply, average selling prices may increase.
(4) Market conditions
• Most display panel manufacturers are located in Asia as set forth below. Competition in the TFT-LCD sector is intensifying amid activeinvestments in new fabrication facilities led by Chinese panel manufacturers and their expanding level of dominance in the sector. Inresponse, Korean panel manufacturers are continuing their efforts to maintain their market leadership and differentiate themselves bytransitioning their business focus to OLED products and upgrading their TFT-LCD businesses.
a. Korea: LG Display, Samsung Display, etc.
b. Taiwan: AU Optronics, Innolux, CPT, HannStar, etc.
c. Japan: Japan Display, Sharp, Panasonic LCD, etc.
d. China: BOE, CSOT, CEC Panda, HKC, etc.
• Our worldwide market share of large-sized display panels (i.e., panels that are 9 inches or larger) based on revenue is as follows:
2021 2020 2019Panels for Televisions(1)(2) 21.7% 21.6% 28.1%Panels for IT Products(1) 19.0% 21.2% 24.8%Total(1) 19.9% 21.4% 27.2%
(1) Source: Large Area Display Market Tracker (OMDIA). Data for 2021 are based on OMDIA’s estimates, as actual results for 2021 Q4 have not yetbeen made available.
(2) Includes panels for public displays.
(5) Competitiveness and competitive advantages
• Our ability to compete successfully depends on factors both within and outside our control, including the development of new andpremium products through technological advances, timely investments based on visibility of profitability, adaptable product portfolio andflexible fabrication mix, achievement of competitive production costs through enhancing productivity and managing supply costs ofcomponents and raw materials, our relationship with customers, success in marketing to our end-brand customers, general economic andindustry conditions and foreign exchange rates.
• In order for us to compete effectively, it is critical to offer differentiated products that enable us to secure profit margins even during timesof a mismatch in the market supply and demand, to be price- and cost-competitive and to maintain stable relationships with customers.
• A substantial portion of our sales is attributable to a limited number of end-brand customers and their designated system integrators. Assuch, it is important to build a sustained relationship with such customers.
8
3/16/22, 10:38 PM Form 6-K
https://www.sec.gov/Archives/edgar/data/0001290109/000119312522075294/d288774d6k.htm 10/268
Table of Contents
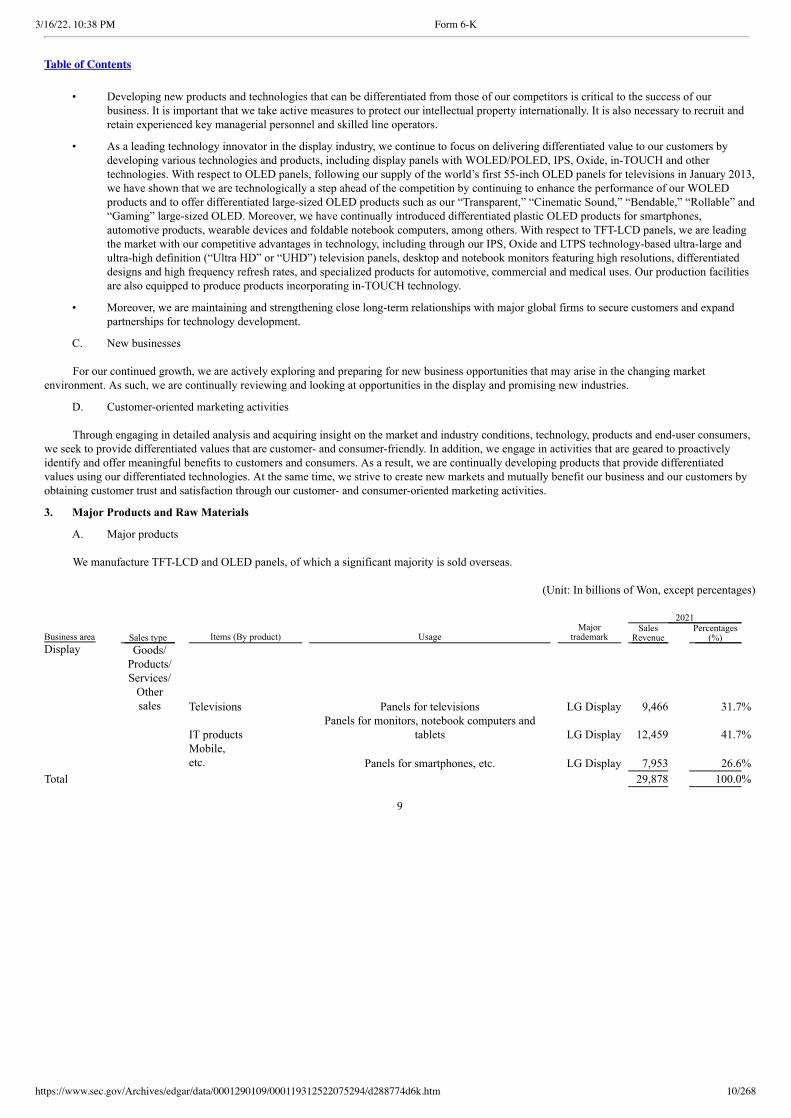
• Developing new products and technologies that can be differentiated from those of our competitors is critical to the success of our
business. It is important that we take active measures to protect our intellectual property internationally. It is also necessary to recruit andretain experienced key managerial personnel and skilled line operators.
• As a leading technology innovator in the display industry, we continue to focus on delivering differentiated value to our customers bydeveloping various technologies and products, including display panels with WOLED/POLED, IPS, Oxide, in-TOUCH and othertechnologies. With respect to OLED panels, following our supply of the world’s first 55-inch OLED panels for televisions in January 2013,we have shown that we are technologically a step ahead of the competition by continuing to enhance the performance of our WOLEDproducts and to offer differentiated large-sized OLED products such as our “Transparent,” “Cinematic Sound,” “Bendable,” “Rollable” and“Gaming” large-sized OLED. Moreover, we have continually introduced differentiated plastic OLED products for smartphones,automotive products, wearable devices and foldable notebook computers, among others. With respect to TFT-LCD panels, we are leadingthe market with our competitive advantages in technology, including through our IPS, Oxide and LTPS technology-based ultra-large andultra-high definition (“Ultra HD” or “UHD”) television panels, desktop and notebook monitors featuring high resolutions, differentiateddesigns and high frequency refresh rates, and specialized products for automotive, commercial and medical uses. Our production facilitiesare also equipped to produce products incorporating in-TOUCH technology.
• Moreover, we are maintaining and strengthening close long-term relationships with major global firms to secure customers and expandpartnerships for technology development.
C. New businesses
For our continued growth, we are actively exploring and preparing for new business opportunities that may arise in the changing marketenvironment. As such, we are continually reviewing and looking at opportunities in the display and promising new industries.
D. Customer-oriented marketing activities
Through engaging in detailed analysis and acquiring insight on the market and industry conditions, technology, products and end-user consumers,we seek to provide differentiated values that are customer- and consumer-friendly. In addition, we engage in activities that are geared to proactivelyidentify and offer meaningful benefits to customers and consumers. As a result, we are continually developing products that provide differentiatedvalues using our differentiated technologies. At the same time, we strive to create new markets and mutually benefit our business and our customers byobtaining customer trust and satisfaction through our customer- and consumer-oriented marketing activities.
3. Major Products and Raw Materials
A. Major products
We manufacture TFT-LCD and OLED panels, of which a significant majority is sold overseas.
(Unit: In billions of Won, except percentages) 2021
Business area Sales type Items (By product) Usage Major
trademark Sales
Revenue Percentages
(%) Display
Goods/ Products/ Services/ Other
sales
Televisions Panels for televisions LG Display 9,466 31.7%
IT products Panels for monitors, notebook computers and
tablets LG Display 12,459 41.7%
Mobile,etc. Panels for smartphones, etc. LG Display 7,953 26.6%
Total 29,878 100.0%
9
3/16/22, 10:38 PM Form 6-K
https://www.sec.gov/Archives/edgar/data/0001290109/000119312522075294/d288774d6k.htm 11/268
Table of Contents
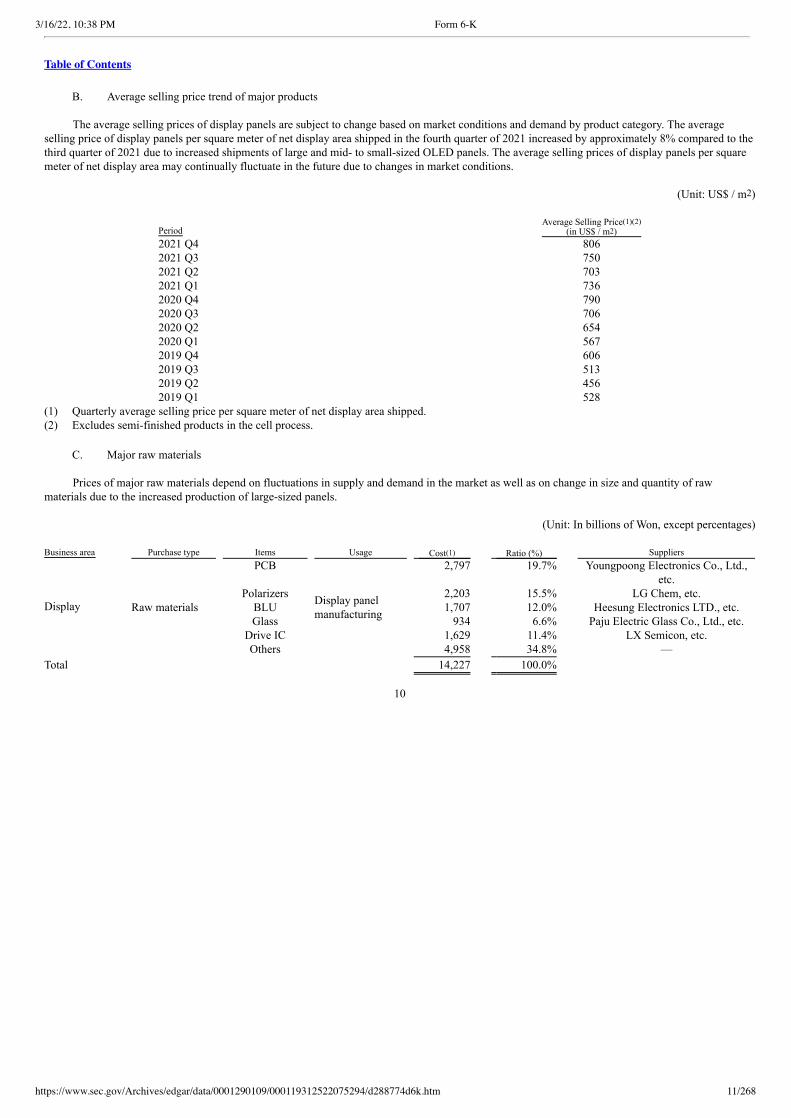
B. Average selling price trend of major products
The average selling prices of display panels are subject to change based on market conditions and demand by product category. The averageselling price of display panels per square meter of net display area shipped in the fourth quarter of 2021 increased by approximately 8% compared to thethird quarter of 2021 due to increased shipments of large and mid- to small-sized OLED panels. The average selling prices of display panels per squaremeter of net display area may continually fluctuate in the future due to changes in market conditions.
(Unit: US$ / m2)
Period Average Selling Price(1)(2)
(in US$ / m2)2021 Q4 8062021 Q3 7502021 Q2 7032021 Q1 7362020 Q4 7902020 Q3 7062020 Q2 6542020 Q1 5672019 Q4 6062019 Q3 5132019 Q2 4562019 Q1 528
(1) Quarterly average selling price per square meter of net display area shipped.(2) Excludes semi-finished products in the cell process. C. Major raw materials
Prices of major raw materials depend on fluctuations in supply and demand in the market as well as on change in size and quantity of rawmaterials due to the increased production of large-sized panels.
(Unit: In billions of Won, except percentages) Business area Purchase type Items Usage Cost(1) Ratio (%) Suppliers
Display
Raw materials
PCB
Display panelmanufacturing
2,797
19.7%
Youngpoong Electronics Co., Ltd.,
etc. Polarizers 2,203 15.5% LG Chem, etc. BLU 1,707 12.0% Heesung Electronics LTD., etc. Glass 934 6.6% Paju Electric Glass Co., Ltd., etc. Drive IC 1,629 11.4% LX Semicon, etc. Others 4,958 34.8% —
Total 14,227 100.0%
10

3/16/22, 10:38 PM Form 6-K
https://www.sec.gov/Archives/edgar/data/0001290109/000119312522075294/d288774d6k.htm 12/268
Table of Contents
- Period: January 1, 2021 ~ December 31, 2021.
(1) Based on total cost for purchase of raw materials which includes manufacturing and development costs, etc.
(2) Among our major suppliers, Paju Electric Glass Co., Ltd. is our affiliate, LG Chem is a member company of the LG Group and LX Semicon is anaffiliate of LX Holdings Corp.
• The average price of electrolytic galvanized iron, which is the main raw material for BLU components, increased by 62.2% in 2021compared to 2020 due to increase in demand following the Chinese government’s economic stimulus measures, a decrease in the supply ofkey raw materials (including iron ores and coal) and issues surrounding the supply of electricity due to the Korean government’s CO2reduction policy. Although the rate of increase in market price is slowing down due to a decrease in purchase demand in China and ageneral decrease in the price of iron ores, the market price is expected to increase due to cuts in steel production in January and February2022 in light of China’s heightened environmental regulations.
• The average price of polymethyl methacrylate increased by 15.2% in 2021 compared to 2020 due to a continued increase in demand and
unstable supply. Although the unit price of naphtha is expected to increase in light of rising international crude oil and petrochemicalproduct prices, the market price of polymethyl methacrylate is expected to remain relatively stable due to a decrease in demand for resin.
• The average price of copper, the main raw material for PCB components, increased by 51% in the 2021 compared to 2020 due to increasedindustrial activities as a result of the global economic recovery and expansion of the electric vehicle market. The market price is expectedto become stronger but remain stable given the rise in demand for investment following the increase in liquidity resulting from China’sinterest rate cut policy as well as tight supply conditions.
4. Production and Equipment
A. Production capacity and output
(1) Production capacity
The table below sets forth the production capacity of our Gumi, Paju and Guangzhou facilities in the periods indicated.
(Unit: 1,000 glass sheets) Business area Items Location of facilities 2021(1) 2020(1) 2019(1) Display Display panel Gumi, Paju, Guangzhou 9,230 8,589 9,408 (1) Calculated based on the maximum monthly input capacity (based on glass input substrate size for eighth-generation glass sheets) during the year
multiplied by the number of months in a year (i.e., 12 months). The production capacity for facilities with adjusted utilization rates have beencalculated based on the maximum input capacity during the period.
(2) Production output
The table below sets forth the production output of our Gumi, Paju and Guangzhou facilities in the periods indicated.
(Unit: 1,000 glass sheets) Business area Items Location of facilities 2021(1) 2020(1) 2019(1)
Display Display panel Gumi, Paju, Guangzhou 8,124 6,815 8,373 (1) Based on the production results (input standard) of each plant converted into eighth-generation glass sheets.
B. Production performance and utilization ratio
(Unit: Hours, except percentages)
Production facilities Available working
hours in 2021 Actual working
hours in 2021 Average utilization ratio Gumi
8,760(1)
(24 hours x 365 days) 8,760(1)
(24 hours x 365 days)(2) 100.0%
Paju 8,760(1)
(24 hours x 365 days) 8,760(1)
(24 hours x 365 days)(2) 100.0%
Guangzhou 8,760(1)
(24 hours x 365 days) 8,760(1)
(24 hours x 365 days)(2) 100.0%
11
3/16/22, 10:38 PM Form 6-K
https://www.sec.gov/Archives/edgar/data/0001290109/000119312522075294/d288774d6k.htm 13/268
Table of Contents
(1) Based on the assumption that all 24 hours in a day have been fully utilized.(2) Number of days is calculated by averaging the number of working days for each facility.
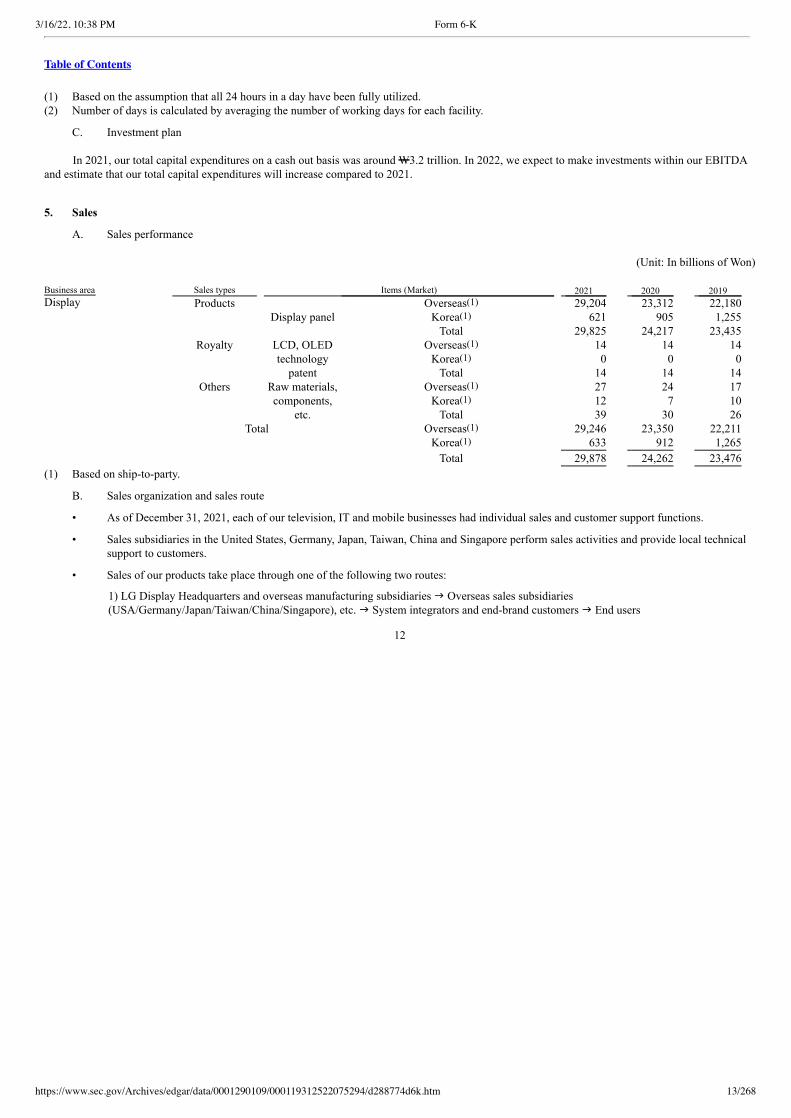
C. Investment plan
In 2021, our total capital expenditures on a cash out basis was around W3.2 trillion. In 2022, we expect to make investments within our EBITDAand estimate that our total capital expenditures will increase compared to 2021.
5. Sales
A. Sales performance
(Unit: In billions of Won) Business area Sales types Items (Market) 2021 2020 2019 Display Products
Display panel
Overseas(1) 29,204 23,312 22,180 Korea(1) 621 905 1,255 Total 29,825 24,217 23,435 Royalty
LCD, OLEDtechnology
patent
Overseas(1) 14 14 14 Korea(1) 0 0 0 Total 14 14 14 Others
Raw materials,components,
etc.
Overseas(1) 27 24 17 Korea(1) 12 7 10 Total 39 30 26 Total Overseas(1) 29,246 23,350 22,211 Korea(1) 633 912 1,265
Total 29,878 24,262 23,476
(1) Based on ship-to-party.
B. Sales organization and sales route
• As of December 31, 2021, each of our television, IT and mobile businesses had individual sales and customer support functions.
• Sales subsidiaries in the United States, Germany, Japan, Taiwan, China and Singapore perform sales activities and provide local technicalsupport to customers.
• Sales of our products take place through one of the following two routes:
1) LG Display Headquarters and overseas manufacturing subsidiaries Overseas sales subsidiaries(USA/Germany/Japan/Taiwan/China/Singapore), etc. System integrators and end-brand customers End users
12
3/16/22, 10:38 PM Form 6-K
https://www.sec.gov/Archives/edgar/data/0001290109/000119312522075294/d288774d6k.htm 14/268
Table of Contents
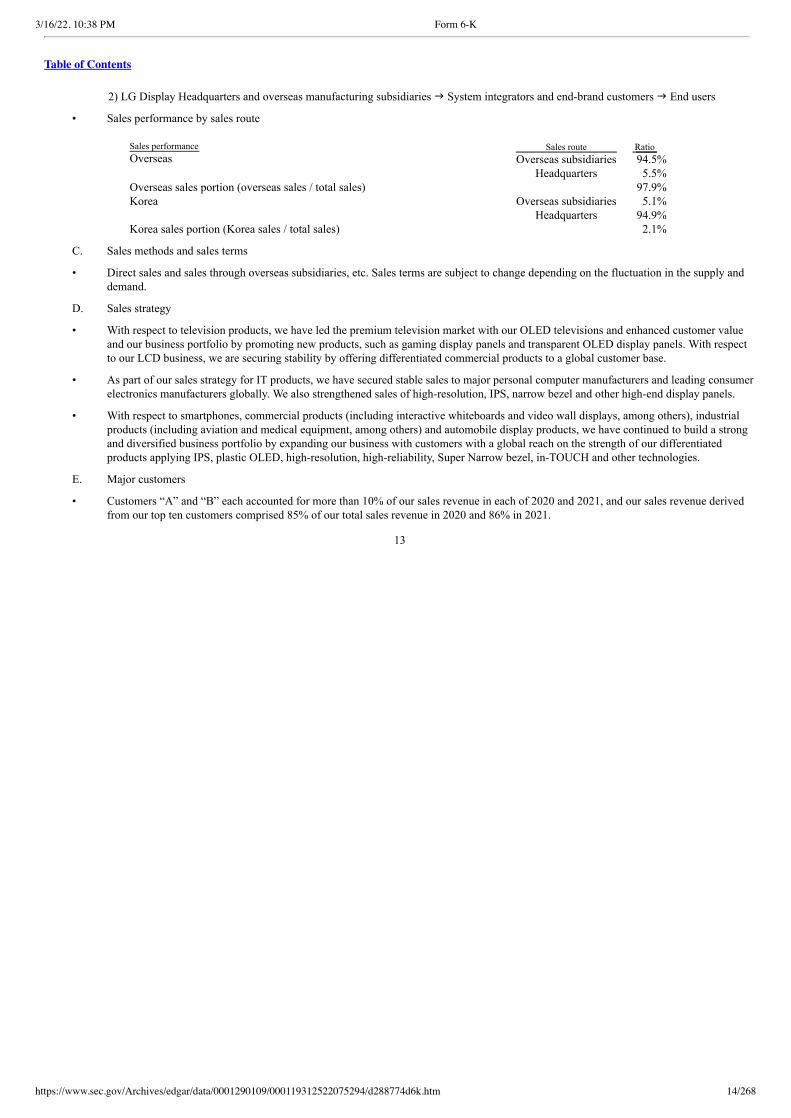
2) LG Display Headquarters and overseas manufacturing subsidiaries System integrators and end-brand customers End users
• Sales performance by sales route
Sales performance Sales route Ratio Overseas Overseas subsidiaries 94.5%
Headquarters 5.5% Overseas sales portion (overseas sales / total sales) 97.9% Korea Overseas subsidiaries 5.1%
Headquarters 94.9% Korea sales portion (Korea sales / total sales) 2.1%
C. Sales methods and sales terms
• Direct sales and sales through overseas subsidiaries, etc. Sales terms are subject to change depending on the fluctuation in the supply anddemand.
D. Sales strategy
• With respect to television products, we have led the premium television market with our OLED televisions and enhanced customer value
and our business portfolio by promoting new products, such as gaming display panels and transparent OLED display panels. With respectto our LCD business, we are securing stability by offering differentiated commercial products to a global customer base.
• As part of our sales strategy for IT products, we have secured stable sales to major personal computer manufacturers and leading consumerelectronics manufacturers globally. We also strengthened sales of high-resolution, IPS, narrow bezel and other high-end display panels.
• With respect to smartphones, commercial products (including interactive whiteboards and video wall displays, among others), industrialproducts (including aviation and medical equipment, among others) and automobile display products, we have continued to build a strongand diversified business portfolio by expanding our business with customers with a global reach on the strength of our differentiatedproducts applying IPS, plastic OLED, high-resolution, high-reliability, Super Narrow bezel, in-TOUCH and other technologies.
E. Major customers
• Customers “A” and “B” each accounted for more than 10% of our sales revenue in each of 2020 and 2021, and our sales revenue derivedfrom our top ten customers comprised 85% of our total sales revenue in 2020 and 86% in 2021.
13
3/16/22, 10:38 PM Form 6-K
https://www.sec.gov/Archives/edgar/data/0001290109/000119312522075294/d288774d6k.htm 15/268
Table of Contents
6. Purchase Orders
• We do not have purchase order contracts that recognize unbilled revenue by implementing the cost-based method.
7. Risk Management and Derivative Contracts
A. Risk management
(1) Major market risks
Our business is exposed to credit risk, liquidity risk and market risk. Accordingly, we operate a risk management system that identifies andanalyzes these risks while monitoring and managing risk level by establishing appropriate risk controls in order to ensure that such risks do not exceedcertain threshold levels.
Market risk refers to the risk that income from the financial instruments that we hold or the fair value of such financial instruments will fluctuatedue to fluctuations in market prices, such as exchange rates, interest rates and prices of equity securities. The objective of our market risk managementsystem is to manage and control our exposure to market risk within an acceptable level while optimizing our profit levels. (2) Risk management method
As the average selling prices of OLED and TFT-LCD panels can continue to decline over time irrespective of industry-wide cyclical fluctuations,we may find it hard to manage risks associated with certain factors that are outside our control. However, we counteract such declines in average sellingprices by increasing the proportion of high value added panels in our product mix while also implementing various cost reduction measures.
In addition, in order to manage our risk against foreign currency fluctuations, we eliminate such risk by adopting a policy of maintaining our netexposure risk within an acceptable level by buying or selling foreign currencies at spot rates, when necessary, to address short-term imbalances in theinflow and outflow of foreign currency funds. We also continually monitor our currency position and risk for other monetary assets and liabilitiesdenominated in foreign currencies, and when needed, we may from time to time enter into cross-currency interest rate swap contracts and foreigncurrency forward contracts. Furthermore, we have adopted a policy aimed at minimizing uncertainty and financial costs arising from interest ratefluctuations and manage our interest rate risk through periodic monitoring of interest rate trends and adoption of appropriate countermeasures. B. Derivative contracts
(1) Currency risks
• We are exposed to currency risks on sales, purchases and borrowings that are denominated in currencies other than in Won, our functionalcurrency. These currencies are primarily the U.S. dollar, the Chinese Yuan and the Japanese Yen.
• Interest on borrowings is denominated in the currency of the borrowing. Generally, borrowings are denominated in currencies that matchthe cash flows generated by our underlying operations, primarily in Won, the U.S. dollar and the Chinese Yuan.
• As of the end of the reporting period, we have entered into a forward currency contract with a short U.S. dollar position in order to hedgethe risk of fluctuations in future cash flows resulting from exchange rate fluctuations in expected export transactions. In the valuation gainsand losses of derivative contracts to which we apply cash flow hedge accounting, there is no ineffective portion, the valuation gain of theeffective portion was Won 905 million and the valuation loss of the effective portion was Won 13,400 million (contracted amount:$1,200 million, contracted exchange rate: Won 1,160.0 ~ 1,202.5), which is reflected as part of our accumulated other comprehensiveincome. In addition, in relation to cash flow hedging, the maximum expected period of exposure to cash flow fluctuation risk due to theexpected transaction to be hedged is six months from the end of this reporting period.
14
3/16/22, 10:38 PM Form 6-K
https://www.sec.gov/Archives/edgar/data/0001290109/000119312522075294/d288774d6k.htm 16/268
Table of Contents
• As of the end of the reporting period, in order to avoid risks of interest rate fluctuations and exchange rate fluctuations on foreign currency
denominated borrowings with floating interest rates, we entered into an aggregate of $1,545 million in Won/US dollar cross currency swapagreements with Standard Chartered Bank and others, for which we have not applied hedge accounting.
• Any rights or obligations arising from derivative contracts that do not apply hedge accounting are measured at fair value and are accounted
for as assets and liabilities, whereas any resulting valuation gain or loss is recognized as profit or loss at the time such valuation gain orloss is incurred.
We recognized a net gain on valuation of derivative instruments in the amount of W210 billion with respect to our foreign exchange derivativeinstruments held during the reporting period.
(2) Interest rate risks
• Our exposure to interest rate risks relates primarily to our floating rate long term loan obligations. We have established and are managing
interest rate risk policies to minimize uncertainty and costs associated with interest rate fluctuations by monitoring cyclical interest ratefluctuations and enacting countermeasures.
• As of the end of the reporting period, we entered into an aggregate of W170 billion in interest rate swap agreements to KB Kookmin Bank
and others, for which we have not applied hedge accounting. We recognized a net gain on valuation of derivative instruments in theamount of W3 billion with respect to our interest rate derivative instruments held during the reporting period.
• A fundamental transition in benchmark reference rates is taking place globally and some interbank lending rates (“IBORs”) are becomingreplaced with new risk-free benchmark rates. While none of our financial instruments currently outstanding are tied to London InterbankOffered Rate (“LIBOR”) rates that have been ceased to date, we plan to replace our existing financial instruments tied to LIBOR rates withthe Secured Overnight Financing Rate (“SOFR”). Following the transition away from the LIBOR, we are exposed to legal risk associatedwith amending the contracts for such financial instruments as well as operational risk associated with managing the transition and itsimpact. In order to manage such risks and monitor the transition to alternative benchmark reference rates, we are assessing the extent towhich each contract references IBOR cash flows, whether such contract should be amended and how to manage communication withcounterparties on benchmark reference rate transition. Moreover, we have inserted replacement clauses for IBORs that have not yet beenconverted to alternative benchmark reference rates. However, even if a replacement clause has been inserted, if the interest rate of thefinancial instrument is still tied to an IBOR, we consider such financial instrument as not yet having been converted. See Note 26 of thenotes to our consolidated financial statements included elsewhere in this report for further information.
8. Major Contracts
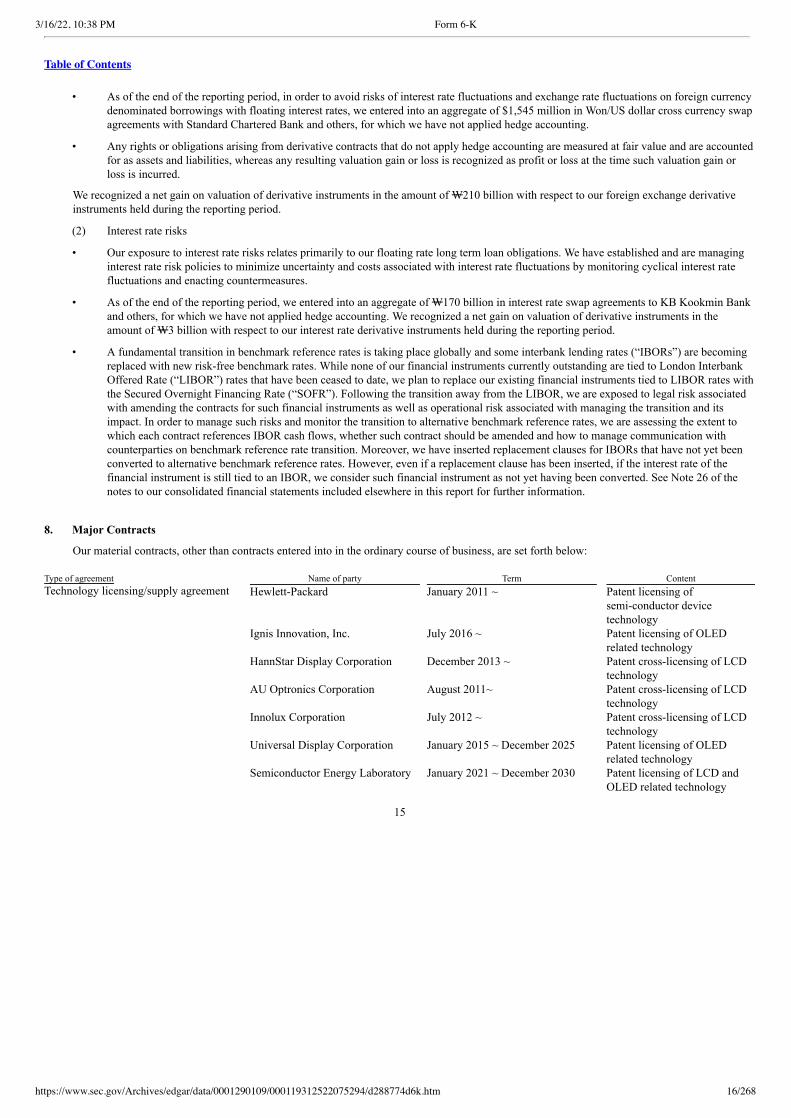
Our material contracts, other than contracts entered into in the ordinary course of business, are set forth below: Type of agreement Name of party Term ContentTechnology licensing/supply agreement
Hewlett-Packard
January 2011 ~
Patent licensing ofsemi-conductor devicetechnology
Ignis Innovation, Inc.
July 2016 ~
Patent licensing of OLEDrelated technology
HannStar Display Corporation
December 2013 ~
Patent cross-licensing of LCDtechnology
AU Optronics Corporation
August 2011~
Patent cross-licensing of LCDtechnology
Innolux Corporation
July 2012 ~
Patent cross-licensing of LCDtechnology
Universal Display Corporation
January 2015 ~ December 2025
Patent licensing of OLEDrelated technology
Semiconductor Energy Laboratory
January 2021 ~ December 2030
Patent licensing of LCD andOLED related technology
15
3/16/22, 10:38 PM Form 6-K
https://www.sec.gov/Archives/edgar/data/0001290109/000119312522075294/d288774d6k.htm 17/268
Table of Contents
9. Research & Development (“R&D”)
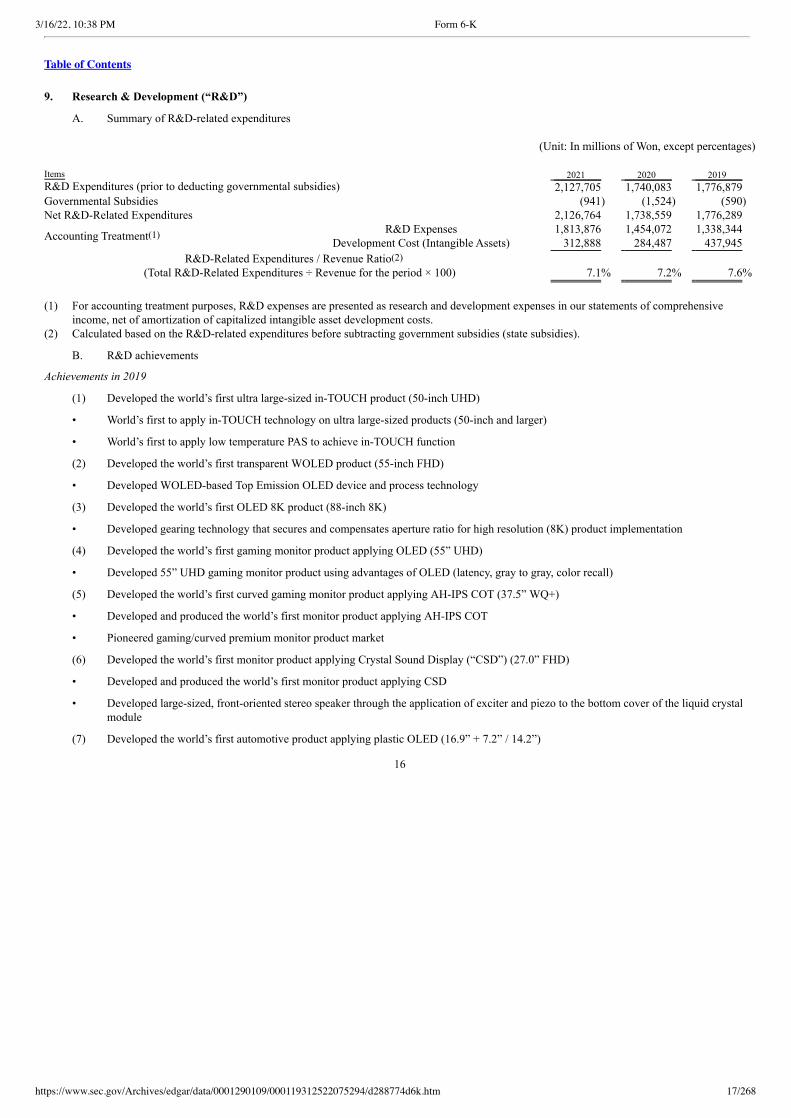
A. Summary of R&D-related expenditures
(Unit: In millions of Won, except percentages) Items 2021 2020 2019 R&D Expenditures (prior to deducting governmental subsidies) 2,127,705 1,740,083 1,776,879 Governmental Subsidies (941) (1,524) (590) Net R&D-Related Expenditures 2,126,764 1,738,559 1,776,289
Accounting Treatment(1) R&D Expenses 1,813,876 1,454,072 1,338,344 Development Cost (Intangible Assets) 312,888 284,487 437,945
R&D-Related Expenditures / Revenue Ratio(2) (Total R&D-Related Expenditures ÷ Revenue for the period × 100) 7.1% 7.2% 7.6%
(1) For accounting treatment purposes, R&D expenses are presented as research and development expenses in our statements of comprehensive
income, net of amortization of capitalized intangible asset development costs.(2) Calculated based on the R&D-related expenditures before subtracting government subsidies (state subsidies).
B. R&D achievements
Achievements in 2019
(1) Developed the world’s first ultra large-sized in-TOUCH product (50-inch UHD)
• World’s first to apply in-TOUCH technology on ultra large-sized products (50-inch and larger)
• World’s first to apply low temperature PAS to achieve in-TOUCH function
(2) Developed the world’s first transparent WOLED product (55-inch FHD)
• Developed WOLED-based Top Emission OLED device and process technology
(3) Developed the world’s first OLED 8K product (88-inch 8K)
• Developed gearing technology that secures and compensates aperture ratio for high resolution (8K) product implementation
(4) Developed the world’s first gaming monitor product applying OLED (55” UHD)
• Developed 55” UHD gaming monitor product using advantages of OLED (latency, gray to gray, color recall)
(5) Developed the world’s first curved gaming monitor product applying AH-IPS COT (37.5” WQ+)
• Developed and produced the world’s first monitor product applying AH-IPS COT
• Pioneered gaming/curved premium monitor product market
(6) Developed the world’s first monitor product applying Crystal Sound Display (“CSD”) (27.0” FHD)
• Developed and produced the world’s first monitor product applying CSD
• Developed large-sized, front-oriented stereo speaker through the application of exciter and piezo to the bottom cover of the liquid crystalmodule
(7) Developed the world’s first automotive product applying plastic OLED (16.9” + 7.2” / 14.2”)
16
3/16/22, 10:38 PM Form 6-K
https://www.sec.gov/Archives/edgar/data/0001290109/000119312522075294/d288774d6k.htm 18/268
Table of Contents
• Developed and produced the world’s first 1CG multi-display product applying plastic OLED (16.9” + 7.2” / 14.2”)
Achievements in 2020
(1) Developed the first products in our Guangzhou OLED panel production facility (77” UHD, 48” UHD)
• Completed the development of the first products in our Guangzhou OLED panel production facility (77” UHD, 48” UHD)
(2) Developed the world’s first rollable television display product (65” UHD)
• Introduced a new form factor (from flat to rollable) to the television market
• Enhanced space utilization through adjusting the display size and ratio based on the purpose of use
(3) Developed the world’s first 2K zone mini-LED & ultra-slim UHD monitor product
• Fulfilled customer needs for top quality monitor products and strengthened our market position in the premium market by developing theworld’s first differentiated 2K zone product
• By leveraging early advantage in the underlying mini-LED technology, explored a new revenue source through applying the technology toall IT products
• Achieved high luminance at HDR 1000 and wide color gamut at 99.8% DCI
Achievements in 2021
(1) Developed the world’s first bendable OLED television display product (65” UHD)
• Implemented both flat and bendable forms based on the scene usage and provided diverse form factors to customers
(2) Developed the world’s first 83” OLED television display product
• Increased the range of options for customers by developing the new 83” UHD
(3) Developed the world’s first QHD 240Hz gaming notebook product (15.6”)
• Developed the world’s first QHD resolution 240Hz high-speed notebook product (obtained panel characteristics through new design andprocess optimization)
• Led the QHD high-speed gaming product market
(4) Developed the world’s first high contrast ratio 2000:1 monitor product (27”, 31.5”)
• Developed the world’s first IPS contrast ratio 2000:1 monitor product through the development of high contrast nega-LC material(Existing product: posi-LC, 1000:1)
• Led the high-end display quality product market
(5) Developed the world’s first 42” OLED television display product
• Expanded the product segment by developing the new 42” UHD display panel
(6) Developed our first Auto LCD 750R extreme curvature product (12.66” FHD)
• Achieved differentiated design by developing LTPS 750R extreme curvature product
10. Intellectual Property
As of December 31, 2021, our cumulative patent portfolio (including patents that have already expired) included 23,109 patents in Korea and30,380 patents in other countries. In 2021, we registered 1,763 patents in Korea and 2,379 patents in other countries.
11. Environmental and Safety Matters
In order to minimize the environmental impact of our business activities, we are actively responding to environmental regulations applicable toour products and business sites.
A. Business environment management
We have installed and operate various types of prevention facilities to minimize the emission of environmental pollutants generated in ourproduction process. With respect to air and water pollutants, we set and manage our internal standard at 70% of the permitted levels under the regulatoryemission standards. In addition, in order to establish a resource circulation system, we operate a proprietary system to monitor waste from its generationto treatment, have developed waste treatment technology and identified suitable recycling companies to reduce the amount of waste we generate andmaximize recycling.
17
3/16/22, 10:38 PM Form 6-K
https://www.sec.gov/Archives/edgar/data/0001290109/000119312522075294/d288774d6k.htm 19/268
Table of Contents
We are subject to a variety of environmental laws and regulations, and operations at our manufacturing plants are subject to regulation andperiodic scheduled and unscheduled on-site inspections by the Ministry of Environment and local environmental protection authorities. The primarytypes of environmental laws applicable to us include the following:
(1) Environmental pollutant emission regulations: Clean Air Conservation Act, Water Quality Conservation Act, Wastes Control Act,Environmental Impact Assessment Act, etc.
(2) Greenhouse gas emission management: Framework Act on Carbon Neutral and Green Growth to Respond to Climate Crisis, Act on theAllocation and Trading of Greenhouse Gas Emission Permits, etc.
(3) Other workplace environment management: Chemicals Control Act, Chemicals Registration and Evaluation Act, Soil EnvironmentConservation Act, etc.
In addition, as we were designated a target company for the greenhouse gas emission trading system in 2015, we allocate and monitor ourgreenhouse gas emissions every year. In order to continually promote the reduction of greenhouse gas emissions, we have set a medium- to long-termgoal to reduce the emission level by continually investing in facility improvements and monitoring our emission levels.
In accordance with the Framework Act on Carbon Neutral and Green Growth to Respond to Climate Crisis, we implemented the greenhouse gasemission and energy consumption target system from 2012 to 2014. In 2015, we implemented the greenhouse gas trading system, under which we areresponsible to meet our emission targets based on the emission credits allocated to us by the Ministry of Environment of the Korean government. As aresult, we have been investing in additional equipment and there may be other costs associated with meeting reduction targets, which may have anegative effect on our profitability or production activities.
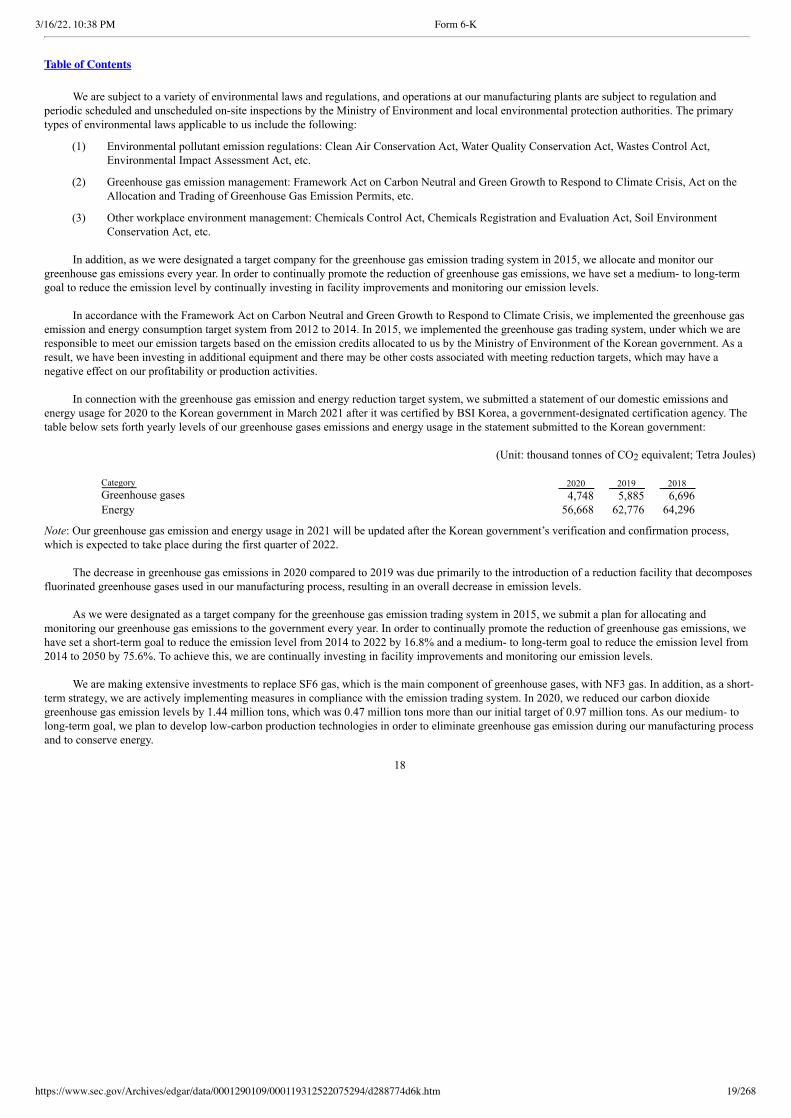
In connection with the greenhouse gas emission and energy reduction target system, we submitted a statement of our domestic emissions andenergy usage for 2020 to the Korean government in March 2021 after it was certified by BSI Korea, a government-designated certification agency. Thetable below sets forth yearly levels of our greenhouse gases emissions and energy usage in the statement submitted to the Korean government:
(Unit: thousand tonnes of CO2 equivalent; Tetra Joules)
Category 2020 2019 2018 Greenhouse gases 4,748 5,885 6,696 Energy 56,668 62,776 64,296
Note: Our greenhouse gas emission and energy usage in 2021 will be updated after the Korean government’s verification and confirmation process,which is expected to take place during the first quarter of 2022.
The decrease in greenhouse gas emissions in 2020 compared to 2019 was due primarily to the introduction of a reduction facility that decomposesfluorinated greenhouse gases used in our manufacturing process, resulting in an overall decrease in emission levels.
As we were designated as a target company for the greenhouse gas emission trading system in 2015, we submit a plan for allocating andmonitoring our greenhouse gas emissions to the government every year. In order to continually promote the reduction of greenhouse gas emissions, wehave set a short-term goal to reduce the emission level from 2014 to 2022 by 16.8% and a medium- to long-term goal to reduce the emission level from2014 to 2050 by 75.6%. To achieve this, we are continually investing in facility improvements and monitoring our emission levels.
We are making extensive investments to replace SF6 gas, which is the main component of greenhouse gases, with NF3 gas. In addition, as a short-term strategy, we are actively implementing measures in compliance with the emission trading system. In 2020, we reduced our carbon dioxidegreenhouse gas emission levels by 1.44 million tons, which was 0.47 million tons more than our initial target of 0.97 million tons. As our medium- tolong-term goal, we plan to develop low-carbon production technologies in order to eliminate greenhouse gas emission during our manufacturing processand to conserve energy.
18
3/16/22, 10:38 PM Form 6-K
https://www.sec.gov/Archives/edgar/data/0001290109/000119312522075294/d288774d6k.htm 20/268
Table of Contents
In order to establish an effective environmental and energy management system, we have acquired and currently operate the environmentalmanagement system ISO14001 for all of our domestic and overseas production sites, and we have also obtained energy management system ISO 50001certifications for our domestic business sites and overseas subsidiaries in Nanjing and Guangzhou.
In recognition of our efforts, we were awarded the highest level, Leadership A, and received the grand prize award at the CDP Water Korea BestAwards in 2016 from the Carbon Disclosure Project, which was presided over by the Carbon Disclosure Project Korea Committee. Since then, we havecontinued to maintain our excellence in water conservation activities and received Leadership A recognition from 2018 to 2021. In addition, we havealso received the Carbon Management Sector Honors every year since 2016 in recognition of our continued greenhouse gas emission reductionactivities. Moreover, in recognition of our efforts to improve our recycling rate and reduce waste, we received a citation in 2020 for being a leadingresource circulation company from the Minister of Environment.
B. Product environment management
In the case of the European Union’s Restriction of Hazardous Substances (RoHS) Directive 2011/65/EU, with the adoption of Directive (EU)2015/863 in 2016, four additional substances (four phthalate substances) have been added to the six already restricted substances, which additionalrestrictions became effective as of July 22, 2019. In order to address the latent risk elements of the four phthalate substances that became restricted in2019 and to establish a more stable management system, we implemented in 2016 a preemptive response process with respect to such four phthalatesubstances. In implementing this process, we collaborated with external agencies to ascertain regulatory trends and establish our response strategy, andwe formulated and applied effective management measures through the collaborative efforts of our development, procurement and quality teams.
While Beryllium (Be) has not been designated internationally as a mandatorily restricted substance, it has continued to be the subject of discussionfor restriction, and certain of our customers have designated it as a restricted substance not to be used in products. Accordingly, we have completedverification of the parts used in products for customers who have banned the use of Beryllium. We have also conducted verification of the parts used inproducts for all customers who are expected to implement a ban and we have established a Beryllium verification process for parts in development.Through such efforts, we have established a voluntary hazardous substance response process that can be expanded to products for all customers, notonly those who have requested a response.
In response to the continued strengthening of regulations governing environmentally-regulated substances, we operate our own verificationprocess for such substances in accordance with international standards. Moreover, we participated in reforming IEC 62321, an international testingstandard published by the International Electrotechnical Commission and used by RoHS, and the commission adopted our halogen-free combustion ionchromatography method in as IEC 62321-3-2, which was published in June 2013. In 2017, in a joint effort with the global product testing/accreditationagency SGS, we became the first display panel company to develop Eco Label, an environmentally friendly accreditation program for television displaymodules, and have since continuously received the SGS Eco Label accreditation for our OLED television models. For the IPS Nano Color for LCD, wereceived the Quality & Performance Mark from Intertek, a global product testing/accreditation agency, by applying a technology to eliminate cadmium(Cd) and indium phosphide (InP). In 2018, we became the first display panel company to receive the “Green Technology Certification” from the KoreanMinistry of Science and ICT for improving the light efficiency technology of OLED to promote energy use reduction. More recently, in 2021, wereceived the “Green Technology Certification” from the Korean Ministry of Science and ICT for our advanced incell touch display technology, aneco-friendly technology with touch-sensing electrodes and transmission lines that reduce carbon emissions and the use of rare metals. We also obtainedan eco-friendly certification from TUV SUD, a globally recognized accreditation agency, for excellence in resource circulation and non-use of specifichazardous substances in our OLED television and PO mobile models, following our co-development of such certification program with such agency.
19
3/16/22, 10:38 PM Form 6-K
https://www.sec.gov/Archives/edgar/data/0001290109/000119312522075294/d288774d6k.htm 21/268
Table of Contents
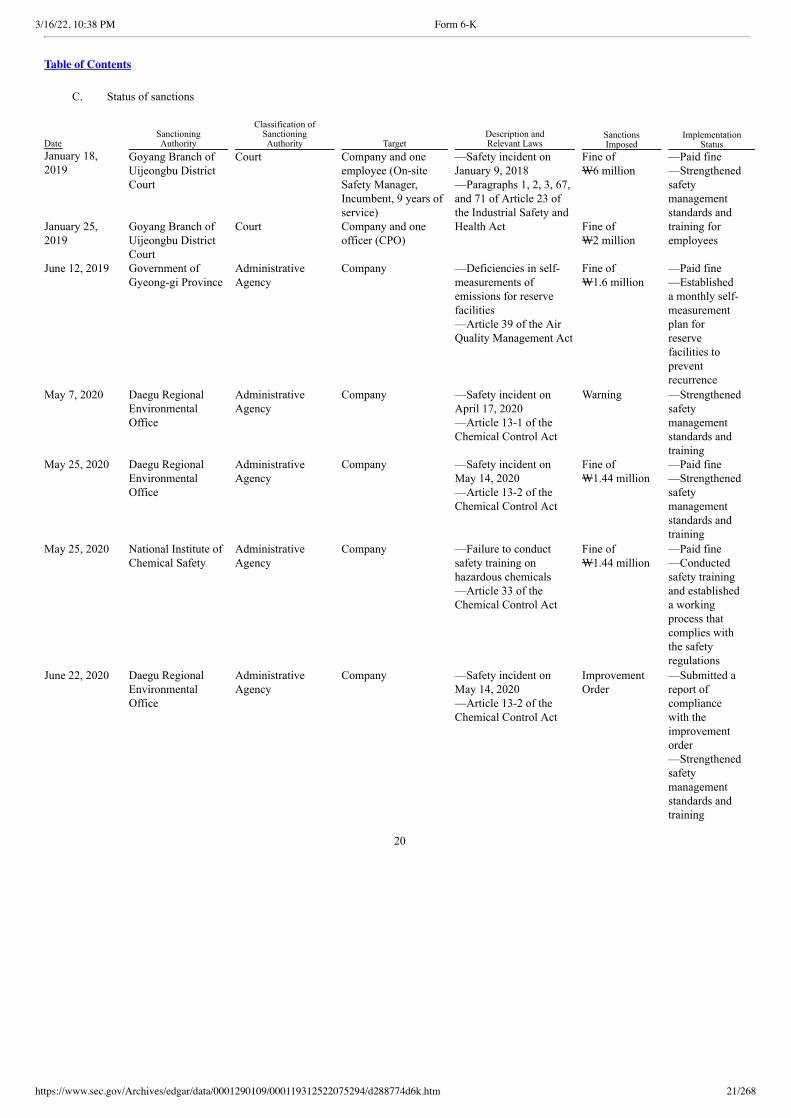
C. Status of sanctions
Date SanctioningAuthority
Classification of Sanctioning
Authority Target Description and
Relevant Laws Sanctions
Imposed Implementation
StatusJanuary 18,2019
Goyang Branch ofUijeongbu DistrictCourt
Court
Company and oneemployee (On-siteSafety Manager,Incumbent, 9 years ofservice)
—Safety incident onJanuary 9, 2018—Paragraphs 1, 2, 3, 67,and 71 of Article 23 ofthe Industrial Safety andHealth Act
Fine of W6 million
—Paid fine —Strengthened
safety management
standards and training for
employeesJanuary 25,2019
Goyang Branch ofUijeongbu DistrictCourt
Court
Company and oneofficer (CPO)
Fine of W2 million
June 12, 2019
Government ofGyeong-gi Province
AdministrativeAgency
Company
—Deficiencies in self-measurements ofemissions for reservefacilities—Article 39 of the AirQuality Management Act
Fine of W1.6 million
—Paid fine —Established
a monthly self- measurement
plan for reserve
facilities to prevent
recurrenceMay 7, 2020
Daegu RegionalEnvironmentalOffice
AdministrativeAgency
Company
—Safety incident onApril 17, 2020—Article 13-1 of theChemical Control Act
Warning
—Strengthened safety
management standards and training
May 25, 2020
Daegu RegionalEnvironmentalOffice
AdministrativeAgency
Company
—Safety incident onMay 14, 2020—Article 13-2 of theChemical Control Act
Fine of W1.44 million
—Paid fine —Strengthened
safety management
standards and training
May 25, 2020
National Institute ofChemical Safety
AdministrativeAgency
Company
—Failure to conductsafety training onhazardous chemicals—Article 33 of theChemical Control Act
Fine of W1.44 million
—Paid fine —Conducted
safety training and established a working
process that complies with
the safety regulations
June 22, 2020
Daegu RegionalEnvironmentalOffice
AdministrativeAgency
Company
—Safety incident onMay 14, 2020—Article 13-2 of theChemical Control Act
Improvement Order
—Submitted a report of
compliance with the
improvement order
—Strengthened safety
management standards and training
20
3/16/22, 10:38 PM Form 6-K
https://www.sec.gov/Archives/edgar/data/0001290109/000119312522075294/d288774d6k.htm 22/268
Table of Contents
November 5,2020
Goyang Branch ofUijeongbu DistrictCourt
Court
Company and oneofficer (CPO)
—Safety incident onJune 24, 2017 (Fineannouncement onNovember 22, 2018,Ruling confirmation onNovember 5, 2020)—Paragraph 1 ofArticle 23, Provision 2of Article 66, andArticle 71 of theIndustrial Safety andHealth Act
Fine of W6 million
—Paid fine —Strengthened
safety management
standards and training for
employees to prevent
recurrence
January 26,2021
Gimcheon Branch ofDaegu District Court
Court
Company and twoemployees (FormerHead of Safety andHealth Management atGumi facilities(Incumbent, 22 yearsof service) and FormerWorking level staff(Incumbent, 21 yearsof service))
—Safety incidents onApril 17, 2020 andMay 14, 2020—Article 59-1 of theChemical Control Act
Fine of W9 million
—Paid fine —Strengthened
safety management
standards and training
April 12, 2021
Goyang Branch ofMinistry ofEmployment andLabor
AdministrativeAgency
Company
—Violation of safetyinformation materialposting and educationrequirements—Provision 1 of Article114 of the IndustrialSafety and Health Act
Fine of W122.6 million
—Paid fine —Complied with the
corrective orders and submitted a report on the implementation
of the corrective
order as of October 1, 2021
April 28, 2021
Paju Fire Station
AdministrativeAgency
Company
—Failure to preserveregular inspectionrecords of firefightingfacilities inspection—Provision 1 of Article18 of the Act on SafetyControl of HazardousSubstances
Fine of W1.2 million
—Paid fine —Established
procedures for conducting
regular inspection of
dangerous substances
according to the inspection
checklist and for consulting with
administrative agencies in
ambiguous situations
21
3/16/22, 10:38 PM Form 6-K
https://www.sec.gov/Archives/edgar/data/0001290109/000119312522075294/d288774d6k.htm 23/268
Table of Contents
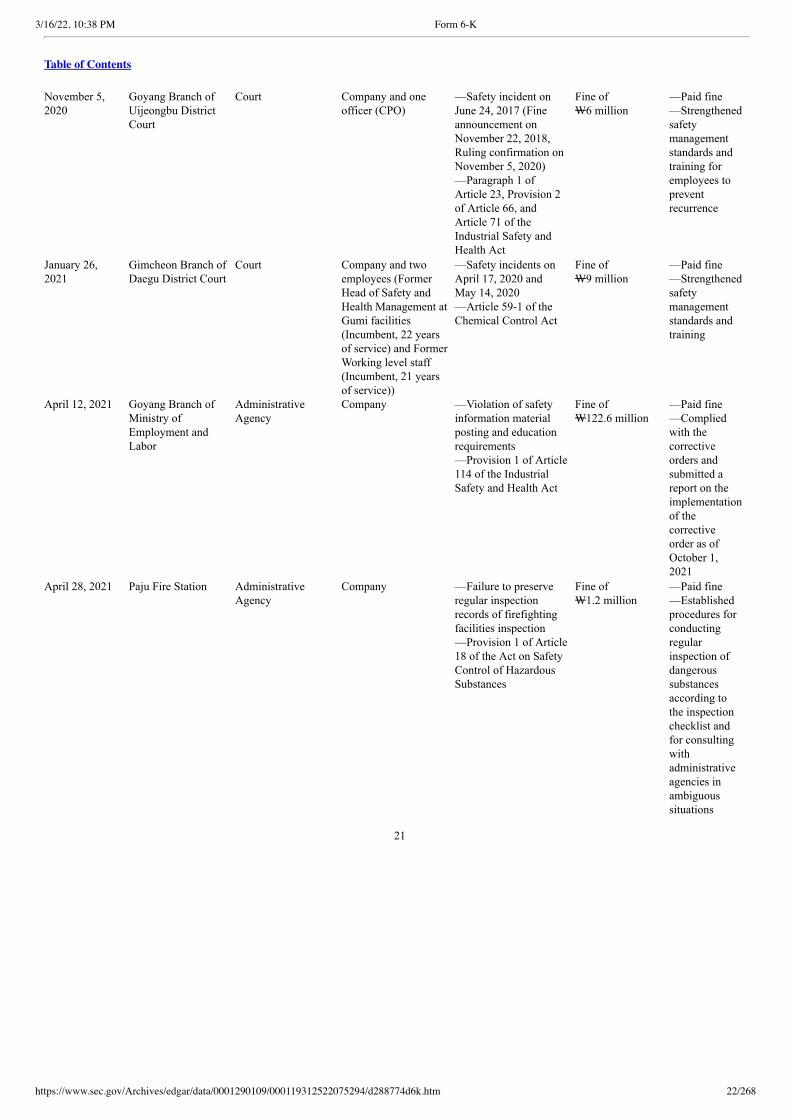
In November 2018, in connection with the occurrence of a safety accident in June 2017, the trial court (Goyang Branch of Uijeongbu DistrictCourt) ordered a fine of W3.0 million on each of us and our chief production officer on the basis of violation of certain provisions of the IndustrialSafety and Health Act, which fines were paid in full after such order was confirmed on November 5, 2020. In order to prevent such accidents fromoccurring again, we are strengthening our safety management standards and training for our employees.
In January 2019, in connection with the occurrence of a safety accident, the trial court (Goyang Branch of Uijeongbu District Court) assessed afine of W1 million as a summary order on each of us and our chief production officer pursuant to certain other provisions of the Industrial Safety andHealth Act. In addition, in January 2019, the trial court sought a fine of W4 million and W2 million on us and the employee in charge of on-site safetymanagement, respectively, on the basis of certain other provisions of the Industrial Safety and Health Act. In order to prevent such accidents fromoccurring again, we are strengthening our safety management standards and training for our employees.
In June 2019, the government of Gyeong-gi Province reviewed the operational history and the number of self-measurements of our emissionoutlets and confirmed that there were certain deficiencies in self-measurements for our reserve facilities. As a result, we were assessed a fine ofW1.6 million by the government of Gyeong-gi Province, which we subsequently paid, for the violation of Article 39 of the Air Quality ManagementAct. To prevent the recurrence, we have established a monthly self-measurement plan for our reserve facilities.
In May 2020, we received a warning from Daegu Regional Environmental Office regarding a safety incident that occurred in April 2020 inviolation of Article 13-1 of the Chemical Control Act. In addition, in connection with another safety incident that occurred in May 2020, we wereassessed an administrative penalty of W1.44 million in May 2020 and an improvement order in June 2020, in each case by Daegu RegionalEnvironmental Office, for a violation of Article 13-2 of the Chemical Control Act. We subsequently paid such fine, and we also submitted a report ofcompliance with such improvement order in July 2020. Regarding these two incidents, Gimcheon Branch of Daegu District Court issued a summaryorder to assess fines of W3 million on each of us and two of our employees (the former head of safety and health management at our Gumi facilities anda former working level staff), which order was subsequently confirmed. In order to prevent recurrence, we are strengthening our safety managementstandards and employee training efforts.
In May 2020, we were assessed a fine of W1.4 million by the National Institute of Chemical Safety for our failure to conduct safety training onhazardous chemicals in violation of Article 33 of the Chemicals Control Act, which we subsequently paid. In order to prevent recurrence, we conductedsafety training on hazardous chemicals for the relevant personnel and newly established a working process that complies with safety regulations.
In January 2021, an incident involving a leakage of tetramethylammonium hydroxide chemicals occurred during refurbishment of equipment atone of our plants in Paju, causing bodily harm to workers. In December 2021, we and one of our employees were prosecuted for violating the IndustrialSafety and Health Act and the Chemicals Control Act, and a criminal trial is currently pending at the Goyang Branch of the Uijeongbu District Court.Government authorities are currently investigating the cause of such incident. In light of such incident, we plan to implement measures to fundamentallyenhance our safety management standards with an aim to ensure health and safety of all workers at our facilities and maintain public trust, includingfour key safety management initiatives comprising (i) performing detailed safety diagnosis at all of our facilities, (ii) internalizing major hazardoustasks, (iii) developing dedicated personnel for safety- and environment-related matters and strengthening our support to our service providers, and(iv) strengthening the authority and capability of our safety management organizations. On March 3, 2022, an accident occurred at our contractedconstruction site in Paju, resulting in injuries of four LS Cable & System workers. Authorities are currently investigating the exact cause of the accidentand we plan to actively cooperate with the investigation of related organizations to determine the cause.
22
3/16/22, 10:38 PM Form 6-K
https://www.sec.gov/Archives/edgar/data/0001290109/000119312522075294/d288774d6k.htm 24/268
Table of Contents
In January 2021, we were audited by the Ministry of Employment and Labor in connection with the occurrence of a safety accident and found tobe in violation of Article 114-1 of the Industrial Safety and Health Act relating to supervisory obligations with respect to the posting of safetyinformation material and employee education. As a result, we were issued a corrective order and assessed a fine of W122.6 million, which wesubsequently paid. We submitted a report on the implementation of the corrective order as of October 1, 2021.
In April 2021, we were assessed a fine of W1.2 million by the Paju Fire Station for failure to preserve regular inspection records of firefightingfacilities related to the joint fire inspection by Gyeong-gi-Province Fire and Disaster Headquarters in violation of Article 18-1 of the Act on SafetyControl of Hazardous Substances, which we subsequently paid. As a result, we have been conducting regular inspections of dangerous substancesaccording to the inspection checklist related to this, and have taken measures to consult with relevant administrative agencies to the extent there are anyambiguous regulations related to performing inspections in order to prevent any legal issues.
12. Financial Information
A. Financial highlights (Based on consolidated K-IFRS).
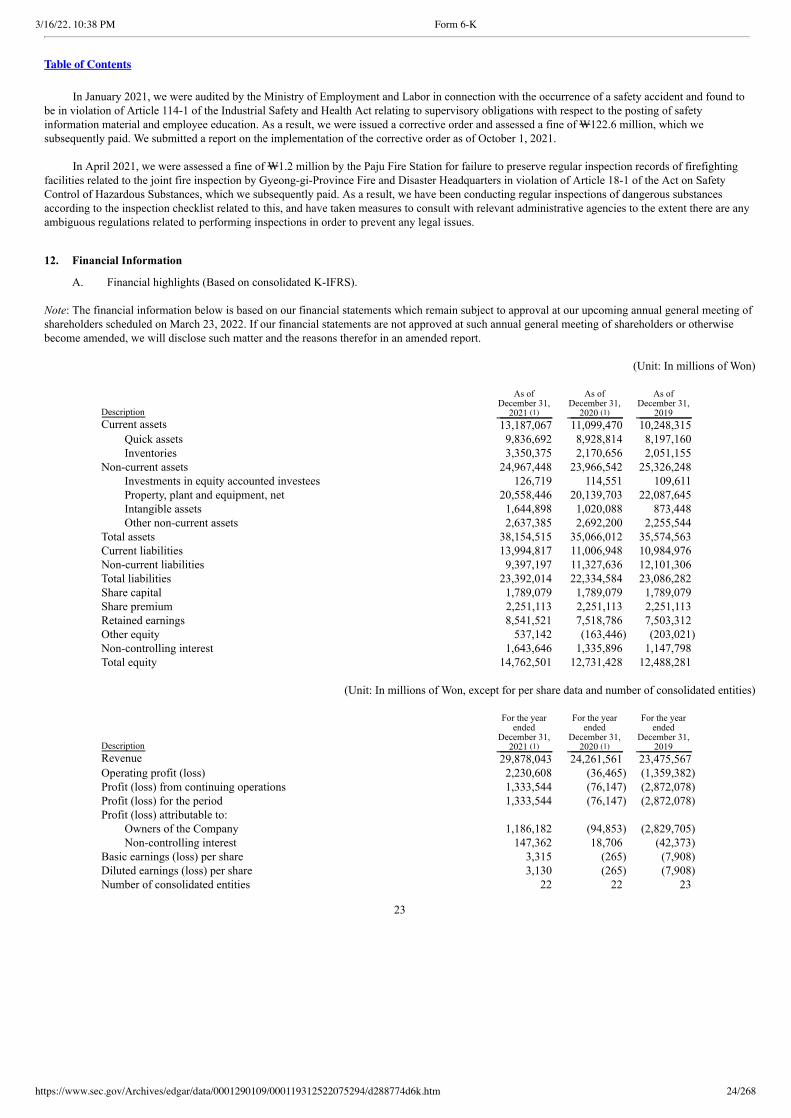
Note: The financial information below is based on our financial statements which remain subject to approval at our upcoming annual general meeting ofshareholders scheduled on March 23, 2022. If our financial statements are not approved at such annual general meeting of shareholders or otherwisebecome amended, we will disclose such matter and the reasons therefor in an amended report.
(Unit: In millions of Won)
Description
As of December 31,
2021 (1)
As of December 31,
2020 (1)
As of December 31,
2019 Current assets 13,187,067 11,099,470 10,248,315
Quick assets 9,836,692 8,928,814 8,197,160 Inventories 3,350,375 2,170,656 2,051,155
Non-current assets 24,967,448 23,966,542 25,326,248 Investments in equity accounted investees 126,719 114,551 109,611 Property, plant and equipment, net 20,558,446 20,139,703 22,087,645 Intangible assets 1,644,898 1,020,088 873,448 Other non-current assets 2,637,385 2,692,200 2,255,544
Total assets 38,154,515 35,066,012 35,574,563 Current liabilities 13,994,817 11,006,948 10,984,976 Non-current liabilities 9,397,197 11,327,636 12,101,306 Total liabilities 23,392,014 22,334,584 23,086,282 Share capital 1,789,079 1,789,079 1,789,079 Share premium 2,251,113 2,251,113 2,251,113 Retained earnings 8,541,521 7,518,786 7,503,312 Other equity 537,142 (163,446) (203,021) Non-controlling interest 1,643,646 1,335,896 1,147,798 Total equity 14,762,501 12,731,428 12,488,281
(Unit: In millions of Won, except for per share data and number of consolidated entities)
Description
For the year ended
December 31, 2021 (1)
For the year ended
December 31, 2020 (1)
For the year ended
December 31, 2019
Revenue 29,878,043 24,261,561 23,475,567 Operating profit (loss) 2,230,608 (36,465) (1,359,382) Profit (loss) from continuing operations 1,333,544 (76,147) (2,872,078) Profit (loss) for the period 1,333,544 (76,147) (2,872,078) Profit (loss) attributable to:
Owners of the Company 1,186,182 (94,853) (2,829,705) Non-controlling interest 147,362 18,706 (42,373)
Basic earnings (loss) per share 3,315 (265) (7,908) Diluted earnings (loss) per share 3,130 (265) (7,908) Number of consolidated entities 22 22 23
23
3/16/22, 10:38 PM Form 6-K
https://www.sec.gov/Archives/edgar/data/0001290109/000119312522075294/d288774d6k.htm 25/268
Table of Contents
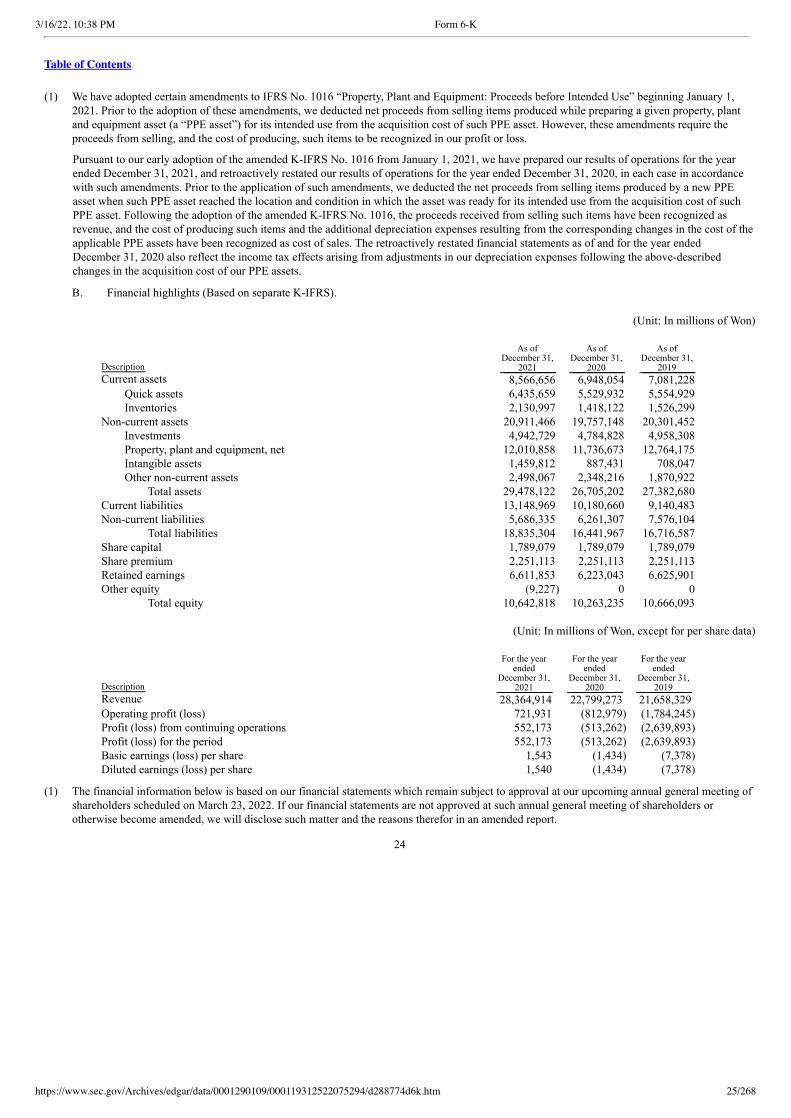
(1) We have adopted certain amendments to IFRS No. 1016 “Property, Plant and Equipment: Proceeds before Intended Use” beginning January 1,2021. Prior to the adoption of these amendments, we deducted net proceeds from selling items produced while preparing a given property, plantand equipment asset (a “PPE asset”) for its intended use from the acquisition cost of such PPE asset. However, these amendments require theproceeds from selling, and the cost of producing, such items to be recognized in our profit or loss.
Pursuant to our early adoption of the amended K-IFRS No. 1016 from January 1, 2021, we have prepared our results of operations for the yearended December 31, 2021, and retroactively restated our results of operations for the year ended December 31, 2020, in each case in accordancewith such amendments. Prior to the application of such amendments, we deducted the net proceeds from selling items produced by a new PPEasset when such PPE asset reached the location and condition in which the asset was ready for its intended use from the acquisition cost of suchPPE asset. Following the adoption of the amended K-IFRS No. 1016, the proceeds received from selling such items have been recognized asrevenue, and the cost of producing such items and the additional depreciation expenses resulting from the corresponding changes in the cost of theapplicable PPE assets have been recognized as cost of sales. The retroactively restated financial statements as of and for the year endedDecember 31, 2020 also reflect the income tax effects arising from adjustments in our depreciation expenses following the above-describedchanges in the acquisition cost of our PPE assets.
B. Financial highlights (Based on separate K-IFRS).
(Unit: In millions of Won)
Description
As of December 31,
2021
As of December 31,
2020
As of December 31,
2019 Current assets 8,566,656 6,948,054 7,081,228
Quick assets 6,435,659 5,529,932 5,554,929 Inventories 2,130,997 1,418,122 1,526,299
Non-current assets 20,911,466 19,757,148 20,301,452 Investments 4,942,729 4,784,828 4,958,308 Property, plant and equipment, net 12,010,858 11,736,673 12,764,175 Intangible assets 1,459,812 887,431 708,047 Other non-current assets 2,498,067 2,348,216 1,870,922
Total assets 29,478,122 26,705,202 27,382,680 Current liabilities 13,148,969 10,180,660 9,140,483 Non-current liabilities 5,686,335 6,261,307 7,576,104
Total liabilities 18,835,304 16,441,967 16,716,587 Share capital 1,789,079 1,789,079 1,789,079 Share premium 2,251,113 2,251,113 2,251,113 Retained earnings 6,611,853 6,223,043 6,625,901 Other equity (9,227) 0 0
Total equity 10,642,818 10,263,235 10,666,093
(Unit: In millions of Won, except for per share data)
Description
For the year ended
December 31, 2021
For the year ended
December 31, 2020
For the year ended
December 31, 2019
Revenue 28,364,914 22,799,273 21,658,329 Operating profit (loss) 721,931 (812,979) (1,784,245) Profit (loss) from continuing operations 552,173 (513,262) (2,639,893) Profit (loss) for the period 552,173 (513,262) (2,639,893) Basic earnings (loss) per share 1,543 (1,434) (7,378) Diluted earnings (loss) per share 1,540 (1,434) (7,378)
(1) The financial information below is based on our financial statements which remain subject to approval at our upcoming annual general meeting ofshareholders scheduled on March 23, 2022. If our financial statements are not approved at such annual general meeting of shareholders orotherwise become amended, we will disclose such matter and the reasons therefor in an amended report.
24
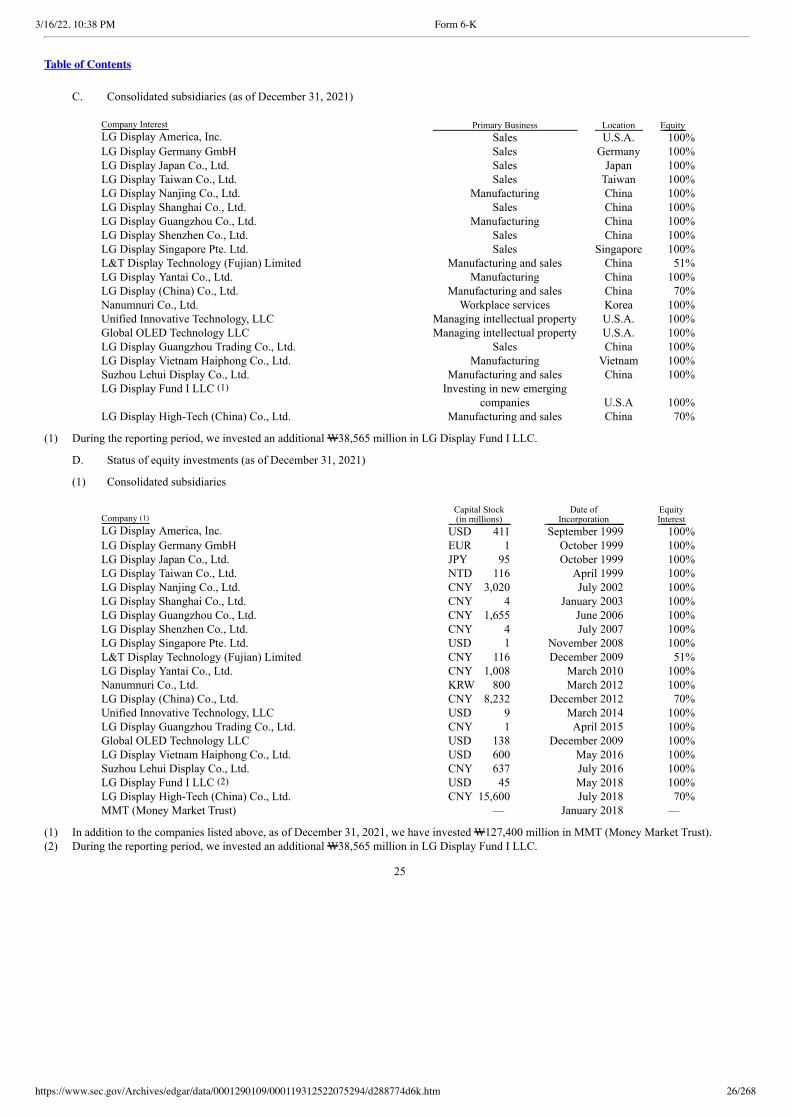
3/16/22, 10:38 PM Form 6-K
https://www.sec.gov/Archives/edgar/data/0001290109/000119312522075294/d288774d6k.htm 26/268
Table of Contents
C. Consolidated subsidiaries (as of December 31, 2021)
Company Interest Primary Business Location Equity LG Display America, Inc. Sales U.S.A. 100% LG Display Germany GmbH Sales Germany 100% LG Display Japan Co., Ltd. Sales Japan 100% LG Display Taiwan Co., Ltd. Sales Taiwan 100% LG Display Nanjing Co., Ltd. Manufacturing China 100% LG Display Shanghai Co., Ltd. Sales China 100% LG Display Guangzhou Co., Ltd. Manufacturing China 100% LG Display Shenzhen Co., Ltd. Sales China 100% LG Display Singapore Pte. Ltd. Sales Singapore 100% L&T Display Technology (Fujian) Limited Manufacturing and sales China 51% LG Display Yantai Co., Ltd. Manufacturing China 100% LG Display (China) Co., Ltd. Manufacturing and sales China 70% Nanumnuri Co., Ltd. Workplace services Korea 100% Unified Innovative Technology, LLC Managing intellectual property U.S.A. 100% Global OLED Technology LLC Managing intellectual property U.S.A. 100% LG Display Guangzhou Trading Co., Ltd. Sales China 100% LG Display Vietnam Haiphong Co., Ltd. Manufacturing Vietnam 100% Suzhou Lehui Display Co., Ltd. Manufacturing and sales China 100% LG Display Fund I LLC (1)
Investing in new emerging
companies U.S.A 100% LG Display High-Tech (China) Co., Ltd. Manufacturing and sales China 70%
(1) During the reporting period, we invested an additional W38,565 million in LG Display Fund I LLC.
D. Status of equity investments (as of December 31, 2021)
(1) Consolidated subsidiaries
Company (1) Capital Stock
(in millions) Date of
Incorporation Equity
Interest LG Display America, Inc. USD 411 September 1999 100% LG Display Germany GmbH EUR 1 October 1999 100% LG Display Japan Co., Ltd. JPY 95 October 1999 100% LG Display Taiwan Co., Ltd. NTD 116 April 1999 100% LG Display Nanjing Co., Ltd. CNY 3,020 July 2002 100% LG Display Shanghai Co., Ltd. CNY 4 January 2003 100% LG Display Guangzhou Co., Ltd. CNY 1,655 June 2006 100% LG Display Shenzhen Co., Ltd. CNY 4 July 2007 100% LG Display Singapore Pte. Ltd. USD 1 November 2008 100% L&T Display Technology (Fujian) Limited CNY 116 December 2009 51% LG Display Yantai Co., Ltd. CNY 1,008 March 2010 100% Nanumnuri Co., Ltd. KRW 800 March 2012 100% LG Display (China) Co., Ltd. CNY 8,232 December 2012 70% Unified Innovative Technology, LLC USD 9 March 2014 100% LG Display Guangzhou Trading Co., Ltd. CNY 1 April 2015 100% Global OLED Technology LLC USD 138 December 2009 100% LG Display Vietnam Haiphong Co., Ltd. USD 600 May 2016 100% Suzhou Lehui Display Co., Ltd. CNY 637 July 2016 100% LG Display Fund I LLC (2) USD 45 May 2018 100% LG Display High-Tech (China) Co., Ltd. CNY 15,600 July 2018 70% MMT (Money Market Trust) — January 2018 —
(1) In addition to the companies listed above, as of December 31, 2021, we have invested W127,400 million in MMT (Money Market Trust).(2) During the reporting period, we invested an additional W38,565 million in LG Display Fund I LLC.
25

3/16/22, 10:38 PM Form 6-K
https://www.sec.gov/Archives/edgar/data/0001290109/000119312522075294/d288774d6k.htm 27/268
Table of Contents
(2) Affiliated companies
Company
Carrying Amount (in
millions) Date of
Incorporation Equity
Interest Paju Electric Glass Co., Ltd. W48,398 January 2005 40% Wooree E&L Co., Ltd. W11,947 June 2008 13% YAS Co., Ltd. W27,337 April 2002 15% Avatec Co., Ltd. W20,708 August 2000 15% Arctic Sentinel, Inc. — June 2008 10% Cynora GmbH (1) — March 2003 11% Material Science Co., Ltd. (2) W 3,679 January 2014 10% Nanosys Inc. (3) W14,650 July 2001 4%
Changes since December 31, 2021:
(1) In 2021, we recognized an impairment loss of W2,609 million as finance cost with respect to the difference between the carrying amount and therecoverable amount of our investment in Cynora GmBH.
(2) In 2021, we recognized a reversal of impairment loss of W636 million as finance income with respect to the difference between the carryingamount and the recoverable amount based on the fair value of our investment in Material Science Co., Ltd.
(3) In 2021, we recognized a reversal of impairment loss of W4,065 million as finance income with respect to the difference between the carryingamount and the recoverable amount based on the fair value of our investment in Nanosys Inc.
Although our respective share interests in Wooree E&L Co., Ltd., YAS Co., Ltd., Avatec Co., Ltd., Arctic Sentinel, Inc., Cynora GmbH, MaterialScience Co., Ltd. and Nanosys Inc. are below 20%, we are able to exercise significant influence through our right to appoint a director to the board ofdirectors of each investee. Accordingly, the investments in these investees have been accounted for using the equity method.
As of December 31, 2021 the market value of our investments in Wooree E&L Co., Ltd., Yas Co., Ltd. and Avatec Co., Ltd., which are listed on theKOSDAQ Market of the Korean Exchange, were W11,424 million, W32,600 million and W40,100 million, respectively.
For the years ended December 31, 2020 and 2021, the aggregate amount of dividends we received from our affiliated companies was W8,239 millionand W4,068 million, respectively.
13. Audit Information
A. Audit service
(Unit: In millions of Won, hours)
Description 2021 2020 2019Auditor KPMG Samjong KPMG Samjong KPMG SamjongActivity
Audit by independent
auditor Audit by independent
auditor Audit by independent
auditorCompensation(1) 1,470 (550)(2) 1,410 (540)(2) 1,280 (500)(2)Time required 19,039 19,777 21,194
(1) Compensation amount is the contracted amount for the full fiscal year.(2) Compensation amount in ( ) is for Form 20-F filing and SOX 404 audit.
26
3/16/22, 10:38 PM Form 6-K
https://www.sec.gov/Archives/edgar/data/0001290109/000119312522075294/d288774d6k.htm 28/268
Table of Contents
B. Non-audit service
(Unit: In millions of Won, hours) Period Date of contract
Description of service Period of service Compensation
2021 — — — — 2020 — — — — 2019
July 23, 2019 Issuance of
comfort letters July 23, 2019 ~
August 31, 2019 120
14. Management’s Discussion and Analysis of Financial Condition and Results of Operations
A. Risk relating to forward-looking statements
This annual report contains forward-looking statements that are, by their nature, subject to significant risks and uncertainties. These forward-looking statements reflect our current views as of the date of this report with respect to future events and are not a guarantee of future performance orresults. Actual results may differ materially from information contained in the forward-looking statements as a result of a number of factors beyond ourcontrol. We have no obligation to update or correct the forward-looking statements contained in these materials subsequent to the date hereof. Allforward-looking statements attributable to us in this report are expressly qualified in their entirety by the cautionary statements contained or referred toin this section.
B. Overview
In 2021, the role and significance of display products became greater, and solid demand, particularly for IT products, was maintained as theculture of contactless and remote interactions became prevalent as a new lifestyle. However, we also faced market-related risks, including heightenedmacroeconomic market volatility, supply chain disruptions and logistics issues. Despite continued market volatility and uncertainty, we quicklyaccommodated the changing needs of consumers and our customers in relation to OLED display panels for televisions and mobile products andTFT-LCD display panels for IT products and restructured our business portfolio accordingly. As a result, our sales in 2021 increased by 23% comparedto 2020, and we recorded a net profit in 2021.
With respect to each of our business areas:
• Television. Consumer awareness of the differentiated value of OLED television display panels has increased due to increased consumptionof high resolution and customized content, and accordingly, the proportion of OLED display panels in the high-end market increasedsubstantially. In order to respond to the growing demand for large-sized OLED display panels, we further increased the eighth-generationproduction capacity of our Guangzhou OLED panel production facility by 30,000 panels per year. In the TFT-LCD television segment, theoverall market experienced a negative growth during the year, but TFT-LCD television display panel prices continued to increase until thefirst half of the year. Our television display panel business achieved an increase of 40% in sales compared to the previous year as a resultof an increase in the sale of OLED television display panels during the year and increase in the average selling price of LCD televisiondisplay panels in the first half of the year.
• IT. The demand for IT products have remained stable in light of continued remote-working and online education, and we increased ourproduction of differentiated products utilizing our strengths in oxide-TFT, IPS and high resolution technologies. Leveraging ourdifferentiated competitiveness, we strengthened our position in the high-end IT market and generated stable financial results based onstrong customer relationships and achieved an increase of more than 20% in sales compared to the previous year.
27

3/16/22, 10:38 PM Form 6-K
https://www.sec.gov/Archives/edgar/data/0001290109/000119312522075294/d288774d6k.htm 29/268
Table of Contents
• Mobile. We strengthened our partnerships with customers by continually promoting timely product development and stable operation ofmass production systems. Accordingly, we achieved sales growth and improved profitability compared to the previous year.
C. Financial condition and results of operations
(1) Changes in Political, Economic, Social, Competitive and Regulatory Environment
Our industry is subject to cyclical fluctuations, including recurring periods of capacity increases, that may adversely affect our results of operations.
Display panel manufacturers are vulnerable to cyclical market conditions. Intense competition and expectations of growth in demand across theindustry may cause display panel manufacturers to make additional investments in manufacturing capacity on similar schedules, resulting in a surge incapacity when production is ramped up at new fabrication facilities. During such surges in capacity growth, as evidenced by past experiences, customerscan exert strong downward pricing pressure, resulting in sharp declines in average selling prices and significant fluctuations in the panel manufacturers’gross margins. Conversely, demand surges and fluctuations in the supply chain can lead to price increases.
We address overcapacity issues by, in the short-term, adjusting the utilization rates of our existing fabrication facilities based on our assessment ofindustry inventory levels and demand for our products and, in the mid- to long-term, by fine-tuning our investment strategies relating to productdevelopment and capacity growth in light of our assessment of future market conditions.
From time to time, we have been affected by overcapacity in the industry relative to the general demand for display panels which, together withuncertainties in the current global economic environment, has contributed to a general decline in the average selling prices of a number of our displaypanel products. However, in light of our ongoing efforts to continue increasing in our product mix the proportion of higher-priced OLED panels, coupledwith an increase in the market price of TFT-LCD panels in 2020 attributable to an increase in demand for television and IT products due to theCOVID-19 pandemic, our average revenue per square meter of net display area increased by 29.5% from W610,716 in 2019 to W790,874 in 2020 andfurther increased by 7.3% to W849,481 in 2021.
While we believe that overcapacity and other cyclical issues in the industry are best addressed by increasing the proportion of high margin,differentiated specialty products based on newer technologies in our product mix that are tailored to our customers’ evolving needs, we cannot provideany assurance that an increase in demand, which helped to mitigate the impact of industry-wide overcapacity in the past, can occur or be sustained infuture periods. We will therefore continue to closely monitor the overcapacity issues in the industry and respond accordingly. However, construction ofnew fabrication facilities and other capacity expansion projects in the display panel industry are undertaken with a multiple-year time horizon based onexpectations of future market trends. Therefore, even if overcapacity issues persist in the industry, there may be continued capacity expansion in the nearfuture due to pre-committed capacity expansion projects in the industry that were undertaken in past years. Any significant industry-wide capacityincreases that are not accompanied by a sufficient increase in demand could further drive down the average selling price of our panels, which wouldnegatively affect our gross margin. Any decline in prices may be further compounded by a seasonal weakening in demand growth for end products suchas personal computer products, consumer electronics products and mobile and other application products. Furthermore, once the differentiated productsthat had a positive impact on our performance mature in their technology cycle, if we are not able to develop and commercialize newer products tooffset the price erosion of such maturing products in a timely manner, our ability to counter the impact of cyclical market conditions on our grossmargins would be further limited. We cannot provide assurance that any future downturns resulting from any large increases in capacity or other factorsaffecting the industry would not have a material adverse effect on our business, financial condition and results of operations.
28
3/16/22, 10:38 PM Form 6-K
https://www.sec.gov/Archives/edgar/data/0001290109/000119312522075294/d288774d6k.htm 30/268
Table of Contents
A global economic downturn may result in reduced demand for our products and adversely affect our profitability.
In recent years, difficulties affecting the global financial sectors, adverse conditions and volatility in the worldwide credit and financial markets,fluctuations in oil and commodity prices and the general weakness of the global economy have increased the uncertainty of global economic prospectsin general and have adversely affected the global and Korean economies. Global economic downturns in the past have adversely affected demand forconsumer products manufactured by our customers in Korea and overseas, including televisions, IT products (comprising notebook computers, desktopmonitors and tablet computers) and mobile and other application products utilizing display panels, which in turn led them to reduce or plan reductions oftheir production.
The overall prospects for the global economy remain uncertain, especially in light of the ongoing COVID-19 pandemic in China, Korea and othercountries. We cannot provide any assurance that demand for our products can be sustained at current levels in future periods or that the demand for ourproducts will not decrease again in the future due to such economic downturns which may adversely affect our profitability. We may decide to adjust ourproduction levels in the future subject to market demand for our products, the production outlook of the global display panel industry, in particular, thedisplay panel industry, any significant disruptions in our supply chain and global economic conditions in general. Any decline in demand for displaypanel products may adversely affect our business, results of operations and/or financial condition.
Earthquakes, tsunamis, floods, infectious diseases and other natural calamities could materially adversely affect our business, results of operations orfinancial condition.
As our main production facilities are concentrated in China, Korea and Vietnam and we are heavily dependent on certain countries includingKorea, Japan and the United States for our major equipment, components and raw materials, any natural calamity that escalate in such regions may havean impact on our production. For such reasons, we experienced temporarily closures of certain of our manufacturing facilities located in those areasaffected by the current outbreak of COVID-19 in order to disinfect such facilities, protect the safety of our employees and prevent the infection fromfurther spreading to the local communities. As our supply chain is generally concentrated in Northeast Asia, there may be delays in the supply of rawmaterials, components and manufacturing equipment as well as disruptions in our production levels due to unforeseen natural calamities that may recurin the future.
In particular, an outbreak of infectious diseases, such as COVID-19, which has had an effect on the global economic activities, may affect ouroperations. The global economy may be adversely affected by a variety of infectious diseases that spreads worldwide, which may impact the marketdemand for finished products that utilize display panels. As a result, any changes in inventory management or purchase adjustment or other changes inthe operational strategies of our end-brand customers, may affect our business performance.
Our industry continues to experience steady declines in the average selling prices of display panels irrespective of cyclical fluctuations in the industry,and our margins would be adversely impacted if prices decrease faster than we are able to reduce our costs.
The average selling prices of display panels have declined in general with time irrespective of industry-wide cyclical fluctuations as a result of,among other factors, enhancements in productivity through technological advancements and cost reductions. While such trend may continue in thefuture, fluctuations that are not consistent with past trends may emerge to the extent new technologies such as OLED expand or the production levels ofhigher value-added and differentiated products increase. Although we may be able to take advantage of the higher selling prices typically associatedwith new products and technologies when they are first introduced in the market, such prices decline over time, and in certain cases, very rapidly, as aresult of market competition or otherwise. If we are unable to effectively anticipate and counter the price erosion that accompanies our products, or if theaverage selling prices of our display panels decrease faster than the speed at which we are able to reduce our manufacturing costs, our gross marginwould decrease and our results of operations and financial condition may be materially and adversely affected.
29
3/16/22, 10:38 PM Form 6-K
https://www.sec.gov/Archives/edgar/data/0001290109/000119312522075294/d288774d6k.htm 31/268
Table of Contents
We operate in a highly competitive environment and we may not be able to sustain our current market position.
The display panel industry is highly competitive. We have experienced pressure on the prices and margins of our major products due largely toadditional capacity from panel makers in Korea, Taiwan, China and Japan.
Some of our competitors may currently, or at some point in the future, have greater financial, sales and marketing, manufacturing, research anddevelopment or technological resources than we do. In addition, our competitors may be able to manufacture panels on a larger scale or with greater costefficiencies than we do and we anticipate increases in production capacity in the future by other display panel manufacturers using similar display paneltechnologies as us. Any price erosion resulting from strong global competition or additional industry capacity may materially adversely affect ourfinancial condition and results of operations.
In addition, consolidation within the industry in which we operate may result in increased competition as the entities emerging from suchconsolidation may have greater financial, manufacturing, research and development and other resources than we do, especially if such mergers orconsolidations result in vertical integration and operational efficiencies, which may have a material adverse effect on our financial condition and resultsof operations.
Our ability to compete successfully also depends on factors both within and outside our control, including product pricing, performance andreliability, our relationship with customers, successful and timely investment and product development, success or failure of our end-brand customers inmarketing their brands and products, component and raw material supply costs, and general economic and industry conditions. We cannot provideassurance that we will be able to maintain a competitive advantage with respect to all these factors and, as a result, we may be unable to sustain ourcurrent market position.
Our operating results fluctuate from period to period, so you should not rely on period-to-period comparisons to predict our future performance.
Our industry is affected by market conditions that are often outside the control of manufacturers. Our results of operations may fluctuatesignificantly from period to period due to a number of factors, including seasonal variations in consumer demand, capacity ramp-up by competitors,industry-wide technological changes, the loss of a key customer and the postponement, rescheduling or cancellation of large orders by a key customer,any of which may or may not reflect a continued trend from one period to the next. As a result of these factors and other risks discussed in this section,you should not rely on period-to-period comparisons to predict our future performance.
Our financial condition may be adversely affected if we cannot introduce new products to adapt to rapidly evolving customer needs on a timely basis.
Our success will depend greatly on our ability to respond quickly to rapidly evolving customer requirements and to develop and efficientlymanufacture new and differentiated products in anticipation of future demand. A failure or delay on our part to develop and efficiently manufactureproducts of such quality and technical specifications that meet our customers’ evolving needs may adversely affect our business.
Close cooperation with our customers to gain insights into their product needs and to understand general trends in the end-product market is a keycomponent of our strategy to produce successful products. In addition, when developing new products, we often work closely with equipment suppliersto design equipment that will make our production processes for such new products more efficient. If we are unable to work together with our customersand equipment suppliers, or to sufficiently understand their respective needs and capabilities or general market trends, we may not be able to introduceor efficiently manufacture new products in a timely manner, which may have a material adverse effect on our financial situation.
In addition, product differentiation, especially the ability to develop and market differentiated specialty products that command higher premiumsin a timely manner, has become a key competitive strategy in the display panel market. This is in part due to trends in consumer electronics and othermarkets, such as televisions, tablet computers and mobile devices, where the growth in demand is led by end products employing newer technologieswith specifications tailored to deliver enhanced performance, convenience and user experience in a cost-efficient and timely manner. Accordingly, wehave focused our efforts on developing and marketing differentiated specialty products, such as “Cinematic Sound OLED” sound integrated panels,rollable OLED display panels, transparent OLED display panels and gaming-specialized display panels. We also strive to deliver differentiated values tomeet our consumers’ demand for various display panels including (i) panels utilizing ultra-high definition, or Ultra HD, technology with low-powerconsumption oxide TFT backplanes, (ii) Advanced High-Performance In-Plane Switching, or AH-IPS, panels for tablet computers, mobile devices,notebook computers, desktop monitors, and (iii) plastic OLED display panels for smartphones, automotive products and wearable devices. We have alsofocused our efforts on cost reductions in the production process, in particular of panels with newer technologies, such as OLED, in order to improve ormaintain our profit margins while offering competitive prices to our customers.
30
3/16/22, 10:38 PM Form 6-K
https://www.sec.gov/Archives/edgar/data/0001290109/000119312522075294/d288774d6k.htm 32/268
Table of Contents
We have developed differentiated sales and marketing strategies to promote our panels for differentiated specialty products as part of our strategyto grow our operations to meet increasing demand for new applications in consumer electronics and other markets. However, we cannot provideassurance that the differentiated products we develop and market will be responsive to our end customers’ needs nor that our products will besuccessfully incorporated into end products or new applications that lead market growth in consumer electronics or other markets.
Problems with product quality, including defects, in our products could result in a decrease in customers and sales, unexpected expenses and loss ofmarket share.
Our products are manufactured using advanced, and often new, technology and must meet stringent quality requirements. Products manufacturedusing advanced and new technology, such as our OLED technology, may contain undetected errors or defects, especially when first introduced. Forexample, our latest display panels may contain defects that are not detected until after they are shipped or installed because we cannot test for allpossible scenarios. Such defects could cause us to incur significant re-designing costs, divert the attention of our technology personnel from productdevelopment efforts and significantly affect our customer relations and business reputation. In addition, future product failures could cause us to incursubstantial expense to repair or replace defective products.
We recognize a provision for warranty obligations based on the estimated costs that we expect to incur under our basic limited warranty for ourproducts, which covers defective products and is normally valid for a certain period from the date of purchase. The warranty provision is largely basedon historical and anticipated rates of warranty claims, and therefore we cannot provide assurance that the provision would be sufficient to cover anysurge in future warranty expenses that significantly exceed historical and anticipated rates of warranty claims. In addition, if we deliver products witherrors or defects, or if there is a perception that our products contain errors or defects, our credibility and the market acceptance and sales of ourproducts could be harmed. Widespread product failures may damage our market reputation and reduce our market share and cause our sales to decline.
If economic conditions in Korea deteriorate, our current business and future growth could be materially and adversely affected.
Developments that could have an adverse impact on Korea’s economy include:
• declines in consumer confidence and a slowdown in consumer spending;
• deterioration in economic or diplomatic relations between Korea and its trading partners or allies, including deterioration resulting fromterritorial or trade disputes or disagreements in foreign policy (such as the ongoing trade disputes with Japan);
• adverse conditions or developments in the economies of countries and regions that are important export markets for Korea, such as China,the United States, Europe and Japan, or in emerging market economies in Asia or elsewhere, including as a result of deterioratingeconomic and trade relations between the United States and China and increased uncertainties resulting from the United Kingdom’s exitfrom the European Union;
• the occurrence of severe health epidemics in Korea and other parts of the world, such as the ongoing COVID-19 pandemic;
• adverse changes or volatility in foreign currency reserve levels, commodity prices (including oil prices), exchange rates (including
fluctuation of the U.S. dollar, Euro or Japanese Yen exchange rates or revaluation of the Chinese Yuan, as well as the impact from theUnited Kingdom’s exit from the European Union on the value of Korean Won), interest rates, inflation rates or stock markets;
31
3/16/22, 10:38 PM Form 6-K
https://www.sec.gov/Archives/edgar/data/0001290109/000119312522075294/d288774d6k.htm 33/268
Table of Contents
• increased sovereign default risk in select countries and the resulting adverse effects on the global financial markets;
• a deterioration in the financial condition or performance of small- and medium-sized enterprises and other companies in Korea due to theKorean government’s policies to increase minimum wages and limit working hours of employees;
• investigations of large Korean business groups and their senior management for possible misconduct;
• a continuing rise in the level of household debt and increasing delinquencies and credit defaults by retail and small- and medium-sizedenterprise borrowers in Korea;
• the economic impact of any pending free trade agreements or changes in existing free trade agreements;
• social and labor unrest;
• volatility in the market prices of Korean real estate;
• geo-political uncertainty and risk of further attacks by terrorist groups around the world;
• a decrease in tax revenues or a substantial increase in the Korean government’s expenditures for fiscal stimulus measures, unemploymentcompensation and other economic and social programs, including in connection with the Korean government’s ongoing efforts to provideemergency relief payments to households and emergency loans to businesses in light of economic difficulties caused by COVID-19, whichmay lead to an increased government budget deficit as well as an increase in the government’s debt level;
• financial problems or lack of progress in the restructuring of Korean business groups, other large troubled companies, their suppliers or thefinancial sector;
• loss of investor confidence arising from corporate accounting irregularities or corporate governance issues at certain Korean companies;
• increases in social expenditures to support an aging population in Korea or decreases in economic productivity due to the decliningpopulation size in Korea;
• natural or man-made disasters that have a significant adverse economic or other impact on Korea or its major trading partners;
• political uncertainty or increasing strife among or within political parties in Korea;
• hostilities or political or social tensions involving oil producing countries in the Middle East (including a potential escalation of hostilities
between the U.S. and Iran) and Northern Africa and any material disruption in the global supply of oil or sudden increase in the price ofoil;
• increased reliance on exports to service foreign currency debts, which could cause friction with Korea’s trading partners;
• the continued growth of the Chinese economy, to the extent its benefits (such as increased exports to China) are outweighed by its costs(such as competition in export markets or for foreign investment and the relocation of manufacturing bases from Korea to China);
• hostilities, political or social tensions involving Russia (including the invasion of Ukraine by Russia and ensuing actions that the United
States and other countries have taken or may take in the future) and any resulting adverse effects on the global supply of oil or the globalfinancial markets; and
• an increase in the level of tensions or an outbreak of hostilities between North Korea and Korea or the United States.
(1) Results of operations
In 2021, the trend of digital transformation and lifestyle diversification accelerated in light of the prolonged COVID-19 pandemic. As such, wequickly responded to the changes in the market environment and opportunities in the industry, while maximizing our efforts to improve all areas of ourbusiness operations, including production, product quality and sales and marketing. Through our such efforts, we recorded our highest-ever annual salesin 2021 of approximately W29.9 trillion, and our operating profit amounted to approximately W2 trillion, marking a meaningful turning point for ourbusiness stabilization and enhancement of our business portfolio.
32
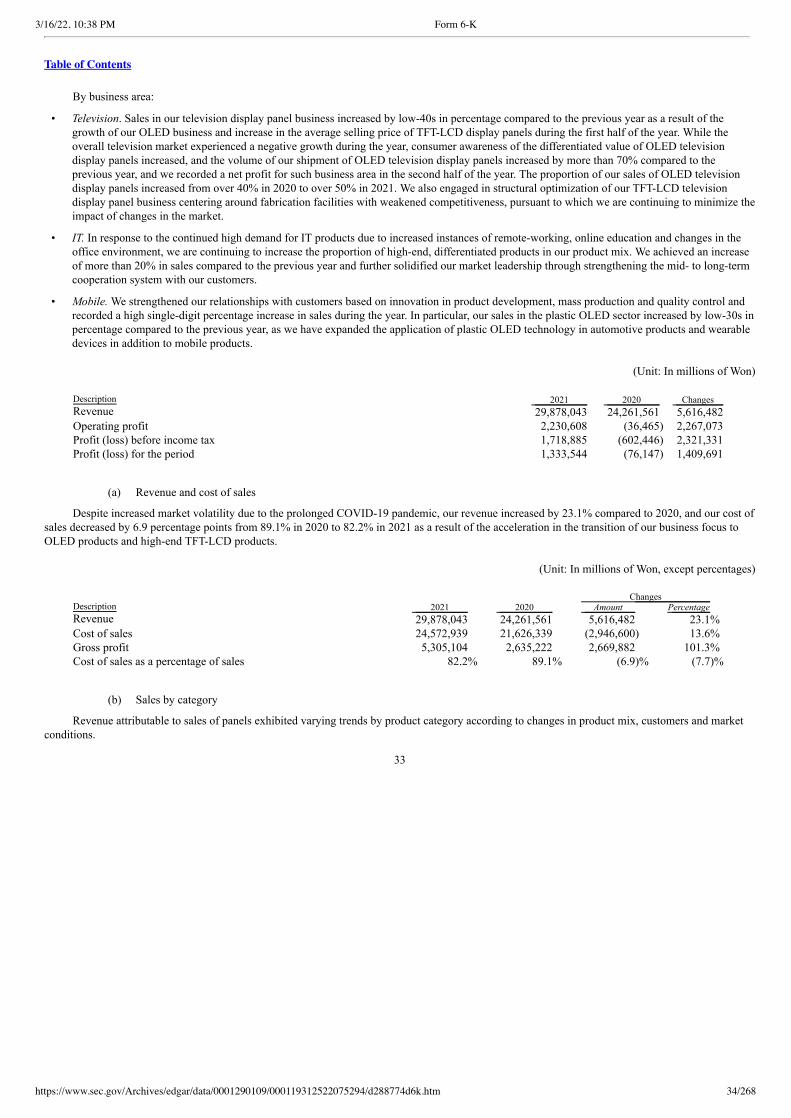
3/16/22, 10:38 PM Form 6-K
https://www.sec.gov/Archives/edgar/data/0001290109/000119312522075294/d288774d6k.htm 34/268
Table of Contents
By business area:
• Television. Sales in our television display panel business increased by low-40s in percentage compared to the previous year as a result of thegrowth of our OLED business and increase in the average selling price of TFT-LCD display panels during the first half of the year. While theoverall television market experienced a negative growth during the year, consumer awareness of the differentiated value of OLED televisiondisplay panels increased, and the volume of our shipment of OLED television display panels increased by more than 70% compared to theprevious year, and we recorded a net profit for such business area in the second half of the year. The proportion of our sales of OLED televisiondisplay panels increased from over 40% in 2020 to over 50% in 2021. We also engaged in structural optimization of our TFT-LCD televisiondisplay panel business centering around fabrication facilities with weakened competitiveness, pursuant to which we are continuing to minimize theimpact of changes in the market.
• IT. In response to the continued high demand for IT products due to increased instances of remote-working, online education and changes in theoffice environment, we are continuing to increase the proportion of high-end, differentiated products in our product mix. We achieved an increaseof more than 20% in sales compared to the previous year and further solidified our market leadership through strengthening the mid- to long-termcooperation system with our customers.
• Mobile. We strengthened our relationships with customers based on innovation in product development, mass production and quality control andrecorded a high single-digit percentage increase in sales during the year. In particular, our sales in the plastic OLED sector increased by low-30s inpercentage compared to the previous year, as we have expanded the application of plastic OLED technology in automotive products and wearabledevices in addition to mobile products.
(Unit: In millions of Won)
Description 2021 2020 Changes Revenue 29,878,043 24,261,561 5,616,482 Operating profit 2,230,608 (36,465) 2,267,073 Profit (loss) before income tax 1,718,885 (602,446) 2,321,331 Profit (loss) for the period 1,333,544 (76,147) 1,409,691
(a) Revenue and cost of sales
Despite increased market volatility due to the prolonged COVID-19 pandemic, our revenue increased by 23.1% compared to 2020, and our cost ofsales decreased by 6.9 percentage points from 89.1% in 2020 to 82.2% in 2021 as a result of the acceleration in the transition of our business focus toOLED products and high-end TFT-LCD products.
(Unit: In millions of Won, except percentages)
Description 2021 2020 Changes Amount Percentage
Revenue 29,878,043 24,261,561 5,616,482 23.1% Cost of sales 24,572,939 21,626,339 (2,946,600) 13.6% Gross profit 5,305,104 2,635,222 2,669,882 101.3% Cost of sales as a percentage of sales 82.2% 89.1% (6.9)% (7.7)%
(b) Sales by category
Revenue attributable to sales of panels exhibited varying trends by product category according to changes in product mix, customers and marketconditions.
33
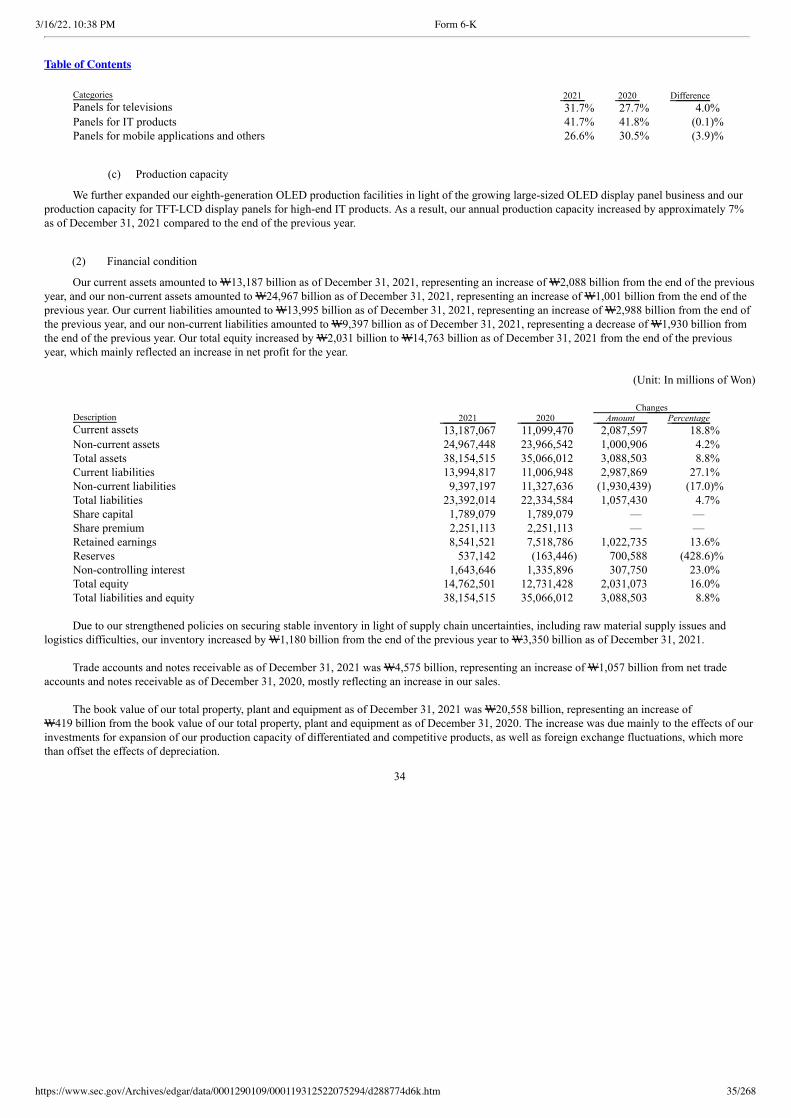
3/16/22, 10:38 PM Form 6-K
https://www.sec.gov/Archives/edgar/data/0001290109/000119312522075294/d288774d6k.htm 35/268
Table of Contents
Categories 2021 2020 Difference Panels for televisions 31.7% 27.7% 4.0% Panels for IT products 41.7% 41.8% (0.1)% Panels for mobile applications and others 26.6% 30.5% (3.9)%
(c) Production capacity
We further expanded our eighth-generation OLED production facilities in light of the growing large-sized OLED display panel business and ourproduction capacity for TFT-LCD display panels for high-end IT products. As a result, our annual production capacity increased by approximately 7%as of December 31, 2021 compared to the end of the previous year.
(2) Financial condition
Our current assets amounted to W13,187 billion as of December 31, 2021, representing an increase of W2,088 billion from the end of the previousyear, and our non-current assets amounted to W24,967 billion as of December 31, 2021, representing an increase of W1,001 billion from the end of theprevious year. Our current liabilities amounted to W13,995 billion as of December 31, 2021, representing an increase of W2,988 billion from the end ofthe previous year, and our non-current liabilities amounted to W9,397 billion as of December 31, 2021, representing a decrease of W1,930 billion fromthe end of the previous year. Our total equity increased by W2,031 billion to W14,763 billion as of December 31, 2021 from the end of the previousyear, which mainly reflected an increase in net profit for the year.
(Unit: In millions of Won)
Description 2021 2020 Changes Amount Percentage
Current assets 13,187,067 11,099,470 2,087,597 18.8% Non-current assets 24,967,448 23,966,542 1,000,906 4.2% Total assets 38,154,515 35,066,012 3,088,503 8.8% Current liabilities 13,994,817 11,006,948 2,987,869 27.1% Non-current liabilities 9,397,197 11,327,636 (1,930,439) (17.0)% Total liabilities 23,392,014 22,334,584 1,057,430 4.7% Share capital 1,789,079 1,789,079 — — Share premium 2,251,113 2,251,113 — — Retained earnings 8,541,521 7,518,786 1,022,735 13.6% Reserves 537,142 (163,446) 700,588 (428.6)% Non-controlling interest 1,643,646 1,335,896 307,750 23.0% Total equity 14,762,501 12,731,428 2,031,073 16.0% Total liabilities and equity 38,154,515 35,066,012 3,088,503 8.8%
Due to our strengthened policies on securing stable inventory in light of supply chain uncertainties, including raw material supply issues andlogistics difficulties, our inventory increased by W1,180 billion from the end of the previous year to W3,350 billion as of December 31, 2021.
Trade accounts and notes receivable as of December 31, 2021 was W4,575 billion, representing an increase of W1,057 billion from net tradeaccounts and notes receivable as of December 31, 2020, mostly reflecting an increase in our sales.
The book value of our total property, plant and equipment as of December 31, 2021 was W20,558 billion, representing an increase ofW419 billion from the book value of our total property, plant and equipment as of December 31, 2020. The increase was due mainly to the effects of ourinvestments for expansion of our production capacity of differentiated and competitive products, as well as foreign exchange fluctuations, which morethan offset the effects of depreciation.
34
3/16/22, 10:38 PM Form 6-K
https://www.sec.gov/Archives/edgar/data/0001290109/000119312522075294/d288774d6k.htm 36/268
Table of Contents
Trade accounts and notes payable as of December 31, 2021 was W4,814 billion, representing an increase of W1,035 billion from trade accountsand notes payable as of December 31, 2020.
(3) Dependence on Key Customers
We sell our products to a select group of key customers, including our largest shareholder, and any significant decrease in their order levels willnegatively affect our financial condition and results of operations.
A substantial portion of our sales is attributable to a limited group of end-brand customers and their designated system integrators. Sales attributedto our end-brand customers are for their end-brand products and do not include sales to these customers for their system integration activities for otherend-brand products, if any. Our top ten end-brand customers, including LG Electronics Inc., our largest shareholder, together accounted forapproximately 80% of our sales in 2019, 85% in 2020 and 86% in 2021.
We benefit from the strong collaborative relationships we maintain with our end-brand customers by participating in the development of theirproducts and gaining insights about levels of future demand for our products and other industry trends. Customers look to us for a dependable supply ofquality products, even during downturns in the industry, and we benefit from the brand recognition of our customers’ end products. The loss of theseend-brand customers, as a result of their entering into strategic supplier arrangements with our competitors or otherwise, would thus result not only inreduced sales, but also in the loss of these benefits. We cannot provide assurance that a select group of key end-brand customers, including our largestshareholder, will continue to place orders with us in the future at the same levels as in prior periods, or at all.
We expect that we will continue to be dependent upon LG Electronics and its affiliates for a significant portion of our revenue for the foreseeablefuture. Our results of operations and financial condition could therefore be affected by the overall performance of LG Electronics and its affiliates.Further details of our transactions with LG Electronics and its affiliates are described in Note 29 to our consolidated annual financial statements as ofand for the years ended December 31, 2020 and 2019, which were furnished on March 4, 2020 as part of the current report on Form 6-K titled“Submission of Audit Report.”
Our revenue depends on continuing demand for IT products (comprising notebook computers, desktop monitors and tablet computers), televisions andmobile and other application products with panels of the type we produce. Our sales may not grow at the rate we expect if consumers do not purchasethese products.
Currently, our total sales are derived principally from customers who use our products in IT products (comprising notebook computers, desktopmonitors and tablet computers), televisions and mobile and other application products with display devices. In particular, a substantial percentage of oursales is derived from end-brand customers, or their designated system integrators, who use our panels in their IT products, which accounted for 38.6%,41.8% and 41.7% of our total revenue in 2019, 2020 and 2021, respectively. A substantial portion of our sales is also derived from end-brand customers,or their designated system integrators, who use our panels in their televisions, which accounted for 34.1%, 27.7% and 31.7% of our total revenue in2019, 2020 and 2021, respectively, and those who use our panels in their mobile and other applications, which accounted for 27.3%, 30.5% and 26.6%of our total revenue in 2019, 2020 and 2021, respectively. We will continue to be dependent on continuing demand from the IT products industry(comprising the personal computer and tablet computer industries), television industry and the mobile device industry for a substantial portion of oursales. Any downturn in any of those industries in which our customers operate would result in reduced demand for our products, which may in turnresult in reduced revenue, lower average selling prices and/or reduced margins.
(4) Changes in Manufacturing Costs and Difficulties in Securing Supply of Raw Material
If we cannot maintain high capacity utilization rates, our profitability will be adversely affected.
The production of display panels entails high fixed costs resulting from considerable expenditures for the construction of complex fabrication andassembly facilities and the purchase of costly equipment. We aim to maintain high capacity utilization rates so that we can allocate these fixed costs overa greater number of panels produced and realize a higher gross margin. However, due to any number of reasons, including fluctuating demand for ourproducts or overcapacity in the display industry, we may need to reduce production, resulting in lower-than-optimal capacity utilization rates. As such,we cannot provide assurance that we will be able to sustain our capacity utilization rates in the future nor can we provide assurance that we will notreduce our utilization rates in the future as market and industry conditions change.
35
3/16/22, 10:38 PM Form 6-K
https://www.sec.gov/Archives/edgar/data/0001290109/000119312522075294/d288774d6k.htm 37/268
Table of Contents
Limited availability of raw materials, components and manufacturing equipment could materially and adversely affect our business, results ofoperations or financial condition.
Our production operations depend on obtaining adequate supplies of quality raw materials and components on a timely basis. As a result, it isimportant for us to control our raw material and component costs and reduce the effects of fluctuations in price and availability. In general, we sourcemost of our raw materials as well as key components, such as glass substrates, driver integrated circuits, polarizers and color filters used in both ourTFT-LCD and OLED products, backlight units and liquid crystal materials used in our TFT-LCD products and emission materials used in our OLEDproducts, from two or more suppliers for each key component. However, we may establish a working relationship with a single supplier if we believe itis advantageous to do so due to performance, quality, support, delivery, capacity, price or other considerations. We may experience shortages in thesupply of these key components, as well as other components or raw materials, as a result of, among other things, anticipated capacity expansion in thedisplay industry or our dependence on a limited number of suppliers. Our results of operations would be adversely affected if we were unable to obtainadequate supplies of high-quality raw materials or components in a timely manner or make alternative arrangements for such supplies in a timelymanner.
Furthermore, we may be limited in our ability to pass on increases in the cost of raw materials and components to our customers. We do nottypically enter into binding long-term contracts with our customers, and even in those cases where we do enter into long-term agreements with certain ofour major end-brand customers, the price terms are contained in the purchase orders. Except under certain special circumstances, the price terms in thepurchase orders are not subject to change. Prices for our products are generally determined through negotiations with our customers, based generally onthe complexity of the product specifications and the labor and technology involved in the design or production processes. However, if we becomesubject to any significant increase in the cost of raw materials or components that were not anticipated when negotiating the price terms after thepurchase orders have been placed, we may be unable to pass on such cost increases to our customers.
We have purchased, and expect to purchase, a substantial portion of our equipment from a limited number of qualified foreign and local suppliers.From time to time, increased demand for new equipment may cause lead times to extend beyond those normally required by the equipment vendors. Theunavailability of equipment, delays in the delivery of equipment, or the delivery of equipment that does not meet our specifications, could delayimplementation of our expansion plans and impair our ability to meet customer orders. This could result in a loss of revenue and cause financial stresson our operations.
(5) Intangible Assets, Including Intellectual Property, and Research and Development Activities
Our business relies on our patent rights which may be narrowed in scope or found to be invalid or otherwise unenforceable.
Our success will depend, to a significant extent, on our ability to obtain and enforce our patent rights both in Korea and worldwide. The coverageclaimed in a patent application can be significantly reduced before a patent is issued, either in Korea or abroad. Consequently, we cannot provideassurance that any of our pending or future patent applications will result in the issuance of patents. Patents issued to us may be subjected to furtherproceedings limiting their scope and may not provide significant proprietary protection or competitive advantage. Our patents also may be challenged,circumvented, invalidated or deemed unenforceable. In addition, because patent applications in certain countries generally are not published until morethan 18 months after they are first filed, and because publication of discoveries in scientific or patent literature often lags behind actual discoveries, wecannot be certain that we were, or any of our licensors was, the first creator of inventions covered by pending patent applications, that we or any of ourlicensors will be entitled to any rights in purported inventions claimed in pending or future patent applications, or that we were, or any of our licensorswas, the first to file patent applications on such inventions.
36
3/16/22, 10:38 PM Form 6-K
https://www.sec.gov/Archives/edgar/data/0001290109/000119312522075294/d288774d6k.htm 38/268
Table of Contents
Furthermore, pending patent applications or patents already issued to us or our licensors may become subject to dispute, and any dispute could beresolved against us. For example, we may become involved in re-examination, reissue or interference proceedings and the result of these proceedingscould be the invalidation or substantial narrowing of our patent claims. We also could be subject to court proceedings that could find our patents invalidor unenforceable or could substantially narrow the scope of our patent claims. In addition, depending on the jurisdiction, statutory differences inpatentable subject matter may limit the protection we can obtain on some of our inventions.
Failure to protect our intellectual property rights could impair our competitiveness and harm our business and future prospects.
We believe that developing new products and technologies that can be differentiated from those of our competitors is critical to the success of ourbusiness. We take active measures to obtain international protection of our intellectual property by obtaining patents and undertaking monitoringactivities in our major markets. However, we cannot assure you that the measures we are taking will effectively deter competitors from improper use ofour proprietary technologies. Our competitors may misappropriate our intellectual property, disputes as to ownership of intellectual property may ariseand our intellectual property may otherwise become known or independently developed by our competitors.
Any failure to protect our intellectual property could impair our competitiveness and harm our business and future prospects.
We rely on technology provided by third parties and our business will suffer if we are unable to renew our licensing arrangements with them.
From time to time, we have obtained licenses for patent, copyright, trademark and other intellectual property rights to process and devicetechnologies used in the production of our display panels. We have entered into key licensing arrangements with third parties, for which we have made,and continue to make, periodic license fee payments. In addition, we also have cross-license agreements with certain other third parties. Theseagreements terminate upon the expiration of the respective terms of the patents.
If we are unable to renew our technology licensing arrangements on acceptable terms, we may lose the legal protection to use certain of theprocesses we employ to manufacture our products and be prohibited from using those processes, which may prevent us from manufacturing and sellingcertain of our products, including our key products. In addition, we could be at a disadvantage if our competitors obtain licenses for protectedtechnologies on more favorable terms than we do.
In the future, we may also need to obtain additional patent licenses for new or existing technologies. We cannot provide assurance that theselicense agreements can be obtained or renewed on acceptable terms or at all, and if not, our business and operating results could be adversely affected.
We rely upon trade secrets and other unpatented proprietary know-how to maintain our competitive position in the display panel industry and any lossof our rights to, or unauthorized disclosure of, our trade secrets or other unpatented proprietary know-how could negatively affect our business.
We also rely upon trade secrets, unpatented proprietary know-how and information, as well as continuing technological innovation in ourbusiness. The information we rely upon includes price forecasts, core technology and key customer information. We enter into confidentialityagreements with each of our employees and consultants upon the commencement of an employment or consulting relationship. These agreementsgenerally provide that all inventions, ideas, discoveries, improvements and copyrightable material made or conceived by the individual arising out of theemployment or consulting relationship and all confidential information developed or made known to the individual during the term of the relationship isour exclusive property. We cannot provide assurance that these types of agreements will be fully enforceable, or that they will not be breached. We alsocannot be certain that we will have adequate remedies for any such breach. The disclosure of our trade secrets or other know-how as a result of such abreach could adversely affect our business. Also, our competitors may come to know about or determine our trade secrets and other proprietaryinformation through a variety of methods. Disputes may arise concerning the ownership of intellectual property or the applicability or enforceability ofour confidentiality agreements, and there can be no assurance that any such disputes would be resolved in our favor. Furthermore, others may acquire orindependently develop similar technology, or if patents are not issued with respect to technologies arising from our research, we may not be able tomaintain information pertinent to such research as proprietary technology or trade secrets and that could have an adverse effect on our competitiveposition within the display panel industry.
37
3/16/22, 10:38 PM Form 6-K
https://www.sec.gov/Archives/edgar/data/0001290109/000119312522075294/d288774d6k.htm 39/268
Table of Contents
We have designated R&D organizations for our research and development activities.
Our research organizations consist of the infrastructure technology research center, next-generation technology research center and theirdesignated departments, all of which are overseen by our chief technology officer. Our research organizations conduct research on differentiated andnext-generation technologies and basic infrastructure technology as well as enhances our competitiveness by conducting research that is geared towardfuture product development. Our development organization comprises of groups and departments dedicated to the development of a wide range oftelevision, IT and mobile products, including product-specific circuits, instrument/optics and panel design.
Our research and development related expenditures amounted to W2,127 billion in 2021, which represented an increase of W388 billion from2020. We plan to continue investing in research and development activities in the future.
The book value of our intangible assets increased by W625 billion compared to the previous year to W1,645 billion as of December 31, 2021.
(6) Sensitivity to Exchange Rates and Inflation
There has been considerable volatility in foreign exchange rates in recent years, including rates between the Korean Won and the U.S. dollar,between the Korean Won and the Chinese Yuan and between the Korean Won and the Japanese Yen. To the extent that we incur costs in one currencyand make sales in another, our profit margins may be affected by changes in the exchange rates between the two currencies.
Our sales of display panels are denominated mainly in U.S. dollars, whereas our purchases of raw materials are denominated mainly in U.S.dollars, Japanese Yen and Chinese Yuan. Our expenditures on capital equipment are primarily denominated in Korean Won, U.S. dollars, Chinese Yuanand Japanese Yen. Accordingly, fluctuations in exchange rates, in particular between the U.S. dollar and the Korean Won, between the Chinese Yuan andthe Korean Won as well as between the Japanese Yen and the Korean Won, affect our pre-tax income, and in recent years, the value of the Won relativeto the U.S. dollar, Chinese Yuan and Japanese Yen has fluctuated widely. Although a depreciation of the Korean Won against the U.S. dollar increasesthe Korean Won value of our export sales and enhances the price-competitiveness of our products in foreign markets in U.S. dollar terms, it alsoincreases the cost of imported raw materials and components in Korean Won terms and our cost in Korean Won of servicing our U.S. dollardenominated debt. A depreciation of the Korean Won against the Chinese Yuan or Japanese Yen increases the Korean Won cost of our Chinese Yuan- orJapanese Yen-denominated purchases of equipment, raw materials or components, as applicable, and, to the extent we have any debt denominated inChinese Yuan or Japanese Yen, our cost in Korean Won of servicing such debt, but has relatively little impact on our sales as most of our sales aredenominated in U.S. dollars. In addition, continued exchange rate volatility may also result in foreign exchange losses for us. Although a depreciation ofthe Korean Won against the U.S. dollar, in general, has a net positive impact on our results of operations that more than offsets the net negative impactcaused by a depreciation of the Korean Won against the Chinese Yuan or Japanese Yen, we cannot provide assurance that the exchange rate of theKorean Won against foreign currencies will not be subject to significant fluctuations, or that the impact of such fluctuations will not adversely affect theresults of our operations.
(7) Changes in Organization and Business Reorganization
In order to secure the fundamental competitiveness of our businesses and to seek sustainable growth, we are accelerating the transition of ourbusiness focus to the OLED business, while simultaneously pursuing activities to restructure our LCD business. From the overall organizational level,we are in the process of establishing an organizational structure geared towards providing value innovations to customers and achieving differentiatedcompetitive strengths and enhanced profitability of our OLED business.
38
3/16/22, 10:38 PM Form 6-K
https://www.sec.gov/Archives/edgar/data/0001290109/000119312522075294/d288774d6k.htm 40/268
Table of Contents
D. Liquidity and capital resources
(1) Liquidity
Our main source for the procurement of funds include operations and financing activities. As of December 31, 2020 and 2021, our cash and cashequivalents amounted to W4,218 billion and W3,542 billion, respectively. Short-term deposits in banks increased by W665 billion from W79 billion asof December 31, 2020 to W743 billion as of December 31, 2021 mainly due to an increase in restricted cash deposits in connection with securedborrowings from our subsidiaries. Our primary use of cash has been to fund capital expenditures related to the expansion and improvement of ourproduction capacity with respect to existing and newly developed products, including the construction and ramping-up of new, or in certain cases,expansion or conversion of existing, fabrication facilities and production lines and the acquisition of new equipment. We also use cash flows fromoperations for our working capital requirements and servicing our debt payments. We expect our cash requirements for 2022 to be primarily for capitalexpenditures and repayment of maturing debt.
The details of the consolidated cash and cash equivalents and deposits in banks as of December 31, 2020 and 2021 are as follows:
(Unit: in millions of won) Description 2021 2020 Current assets
Cash and cash equivalents Cash 1,122 156 Demand deposits 3,540,475 4,217,943
Deposits in banks Time deposits 2,600 1,800 Restricted cash (1) 740,705 76,852
Total current assets 4,284,902 4,296,751
Non-current assets Deposits in banks
Restricted cash (1) 11 11
Total 4,284,913 4,296,762
(1) Restricted cash includes mutual growth fund to aid LG Group’s suppliers, pledge to enforce investment plans following receipt of subsidies fromGumi city and Gyeongsangbuk-do and restricted deposits in connection with secured borrowings by our subsidiaries and others.
(2) Represents derivatives that have not been recognized as hedging instruments and have resulted from currency interest rate swap contracts enteredinto in order to manage risks arising from foreign currency-denominated borrowings and foreign currency-denominated bonds.
(3) Represents derivatives that have been recognized as hedging instruments and have resulted from currency forward contracts entered into in orderto manage risks arising from foreign currency-denominated sales.
As of December 31, 2020, our current assets and current liabilities amounted to W11,099 billion and W11,007 billion, respectively, resulting in netcurrent assets of W93 billion. As of December 31, 2021, our current assets and current liabilities amounted to W13,187 billion and W13,995 billion,respectively, resulting in net current liabilities of W808 billion.
(Unit: in millions of won) Description 2021 2020
Changes Amount Percentage
Current assets 13,187,067 11,099,470 2,087,597 18.8% Current liabilities 13,994,817 11,006,948 2,987,869 27.1% Net current assets (807,750) 92,522 (900,272) N/A
39
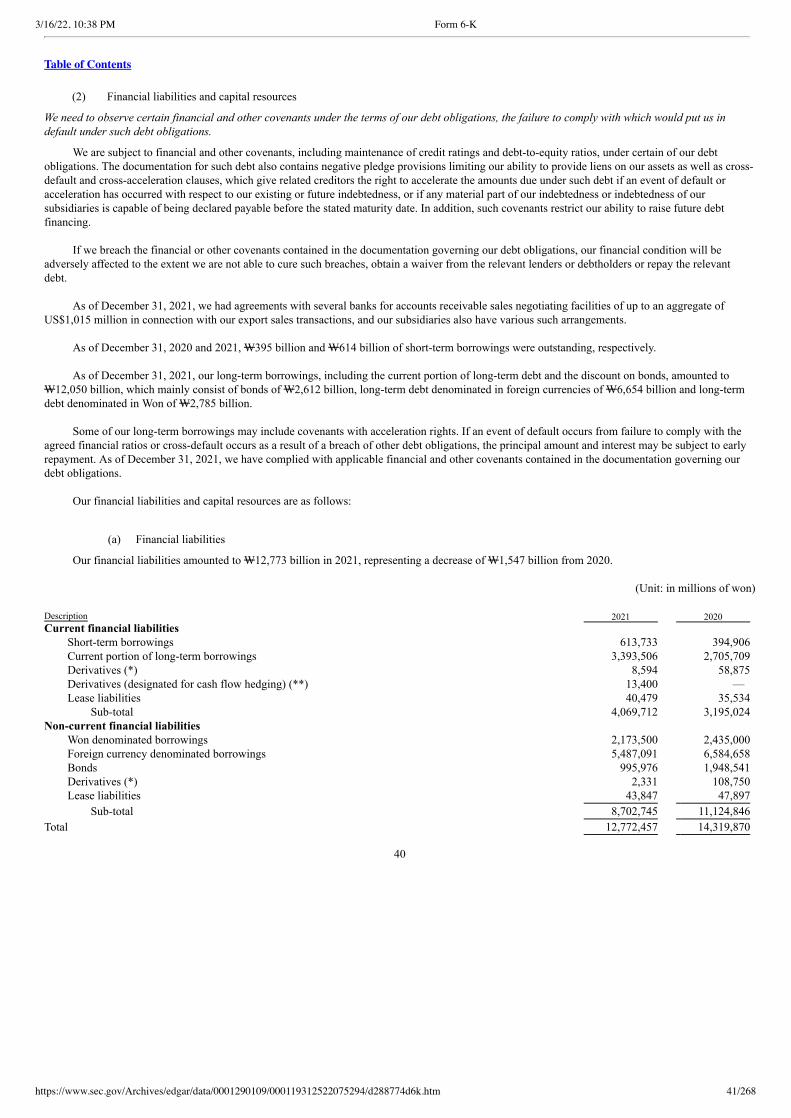
3/16/22, 10:38 PM Form 6-K
https://www.sec.gov/Archives/edgar/data/0001290109/000119312522075294/d288774d6k.htm 41/268
Table of Contents
(2) Financial liabilities and capital resources
We need to observe certain financial and other covenants under the terms of our debt obligations, the failure to comply with which would put us indefault under such debt obligations.
We are subject to financial and other covenants, including maintenance of credit ratings and debt-to-equity ratios, under certain of our debtobligations. The documentation for such debt also contains negative pledge provisions limiting our ability to provide liens on our assets as well as cross-default and cross-acceleration clauses, which give related creditors the right to accelerate the amounts due under such debt if an event of default oracceleration has occurred with respect to our existing or future indebtedness, or if any material part of our indebtedness or indebtedness of oursubsidiaries is capable of being declared payable before the stated maturity date. In addition, such covenants restrict our ability to raise future debtfinancing.
If we breach the financial or other covenants contained in the documentation governing our debt obligations, our financial condition will beadversely affected to the extent we are not able to cure such breaches, obtain a waiver from the relevant lenders or debtholders or repay the relevantdebt.
As of December 31, 2021, we had agreements with several banks for accounts receivable sales negotiating facilities of up to an aggregate ofUS$1,015 million in connection with our export sales transactions, and our subsidiaries also have various such arrangements.
As of December 31, 2020 and 2021, W395 billion and W614 billion of short-term borrowings were outstanding, respectively.
As of December 31, 2021, our long-term borrowings, including the current portion of long-term debt and the discount on bonds, amounted toW12,050 billion, which mainly consist of bonds of W2,612 billion, long-term debt denominated in foreign currencies of W6,654 billion and long-termdebt denominated in Won of W2,785 billion.
Some of our long-term borrowings may include covenants with acceleration rights. If an event of default occurs from failure to comply with theagreed financial ratios or cross-default occurs as a result of a breach of other debt obligations, the principal amount and interest may be subject to earlyrepayment. As of December 31, 2021, we have complied with applicable financial and other covenants contained in the documentation governing ourdebt obligations.
Our financial liabilities and capital resources are as follows:
(a) Financial liabilities
Our financial liabilities amounted to W12,773 billion in 2021, representing a decrease of W1,547 billion from 2020.
(Unit: in millions of won) Description 2021 2020 Current financial liabilities
Short-term borrowings 613,733 394,906 Current portion of long-term borrowings 3,393,506 2,705,709 Derivatives (*) 8,594 58,875 Derivatives (designated for cash flow hedging) (**) 13,400 — Lease liabilities 40,479 35,534
Sub-total 4,069,712 3,195,024 Non-current financial liabilities
Won denominated borrowings 2,173,500 2,435,000 Foreign currency denominated borrowings 5,487,091 6,584,658 Bonds 995,976 1,948,541 Derivatives (*) 2,331 108,750 Lease liabilities 43,847 47,897
Sub-total 8,702,745 11,124,846
Total 12,772,457 14,319,870
40
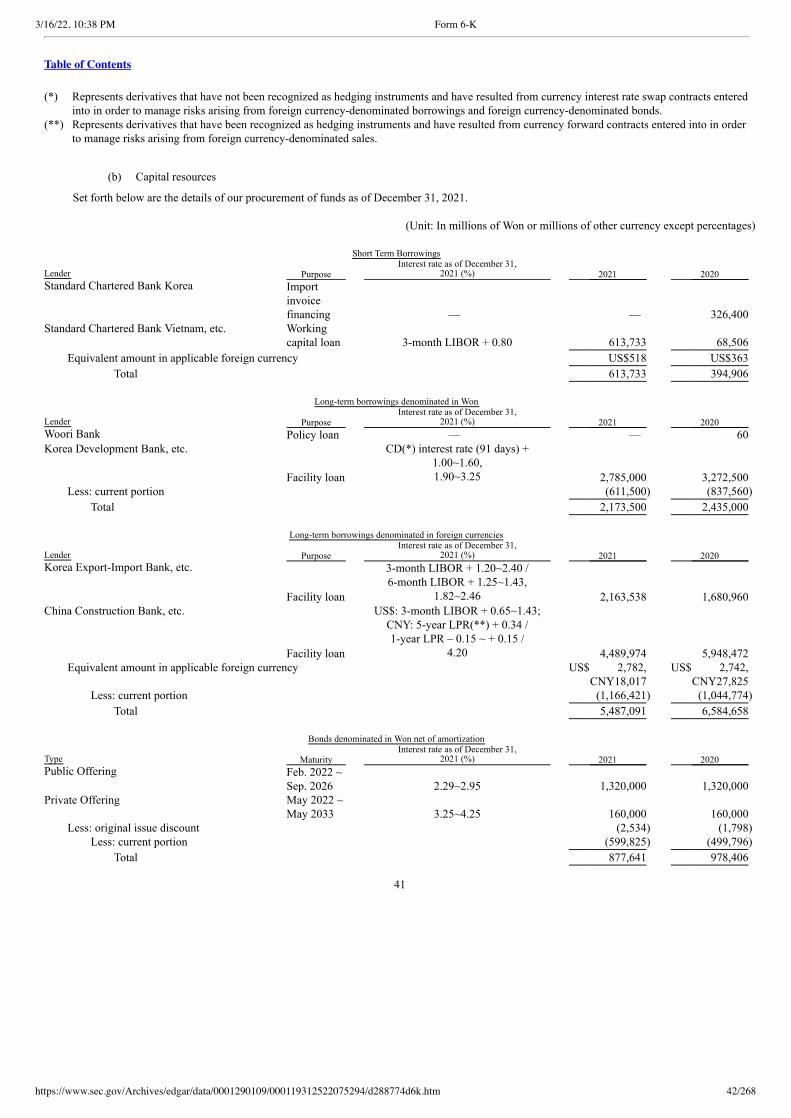
3/16/22, 10:38 PM Form 6-K
https://www.sec.gov/Archives/edgar/data/0001290109/000119312522075294/d288774d6k.htm 42/268
Table of Contents
(*) Represents derivatives that have not been recognized as hedging instruments and have resulted from currency interest rate swap contracts enteredinto in order to manage risks arising from foreign currency-denominated borrowings and foreign currency-denominated bonds.
(**) Represents derivatives that have been recognized as hedging instruments and have resulted from currency forward contracts entered into in orderto manage risks arising from foreign currency-denominated sales.
(b) Capital resources
Set forth below are the details of our procurement of funds as of December 31, 2021.
(Unit: In millions of Won or millions of other currency except percentages)
Short Term Borrowings
Lender Purpose Interest rate as of December 31,
2021 (%) 2021 2020 Standard Chartered Bank Korea
Import invoice financing — — 326,400
Standard Chartered Bank Vietnam, etc.
Working capital loan 3-month LIBOR + 0.80 613,733 68,506
Equivalent amount in applicable foreign currency US$518 US$363
Total 613,733 394,906
Long-term borrowings denominated in Won
Lender Purpose Interest rate as of December 31,
2021 (%) 2021 2020 Woori Bank Policy loan — — 60 Korea Development Bank, etc.
Facility loan
CD(*) interest rate (91 days) +1.00~1.60,
1.90~3.25 2,785,000 3,272,500 Less: current portion (611,500) (837,560)
Total 2,173,500 2,435,000
Long-term borrowings denominated in foreign currencies
Lender Purpose Interest rate as of December 31,
2021 (%) 2021 2020 Korea Export-Import Bank, etc.
Facility loan
3-month LIBOR + 1.20~2.40 /6-month LIBOR + 1.25~1.43,
1.82~2.46 2,163,538 1,680,960 China Construction Bank, etc.
Facility loan
US$: 3-month LIBOR + 0.65~1.43; CNY: 5-year LPR(**) + 0.34 /
1-year LPR – 0.15 ~ + 0.15 /4.20 4,489,974 5,948,472
Equivalent amount in applicable foreign currency
US$
2,782,CNY18,017
US$
2,742,CNY27,825
Less: current portion (1,166,421) (1,044,774)
Total 5,487,091 6,584,658
Bonds denominated in Won net of amortization
Type Maturity Interest rate as of December 31,
2021 (%) 2021 2020 Public Offering
Feb. 2022 ~
Sep. 2026 2.29~2.95 1,320,000 1,320,000 Private Offering
May 2022 ~
May 2033 3.25~4.25 160,000 160,000 Less: original issue discount (2,534) (1,798)
Less: current portion (599,825) (499,796)
Total 877,641 978,406
41
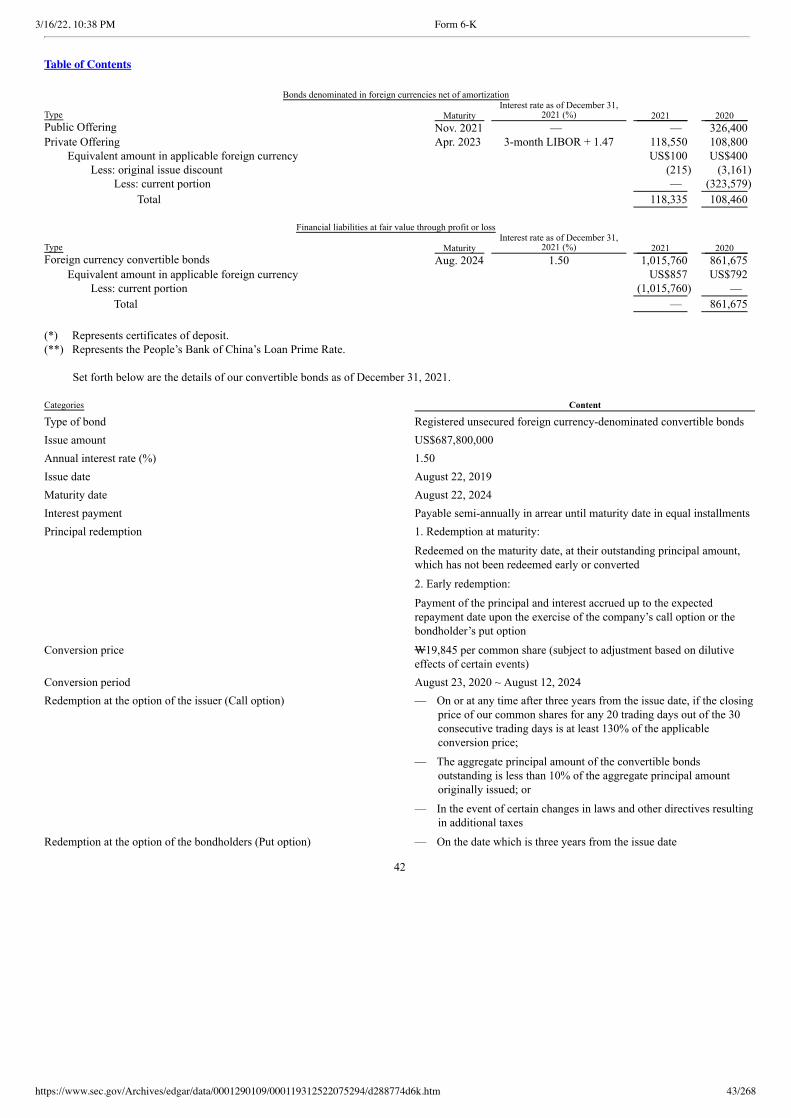
3/16/22, 10:38 PM Form 6-K
https://www.sec.gov/Archives/edgar/data/0001290109/000119312522075294/d288774d6k.htm 43/268
Table of Contents
Bonds denominated in foreign currencies net of amortization
Type Maturity Interest rate as of December 31,
2021 (%) 2021 2020 Public Offering Nov. 2021 — — 326,400 Private Offering Apr. 2023 3-month LIBOR + 1.47 118,550 108,800
Equivalent amount in applicable foreign currency US$100 US$400 Less: original issue discount (215) (3,161)
Less: current portion — (323,579)
Total 118,335 108,460
Financial liabilities at fair value through profit or loss
Type Maturity Interest rate as of December 31,
2021 (%) 2021 2020 Foreign currency convertible bonds Aug. 2024 1.50 1,015,760 861,675
Equivalent amount in applicable foreign currency US$857 US$792 Less: current portion (1,015,760) —
Total — 861,675
(*) Represents certificates of deposit.(**) Represents the People’s Bank of China’s Loan Prime Rate.
Set forth below are the details of our convertible bonds as of December 31, 2021. Categories Content
Type of bond Registered unsecured foreign currency-denominated convertible bondsIssue amount US$687,800,000Annual interest rate (%) 1.50Issue date August 22, 2019Maturity date August 22, 2024Interest payment Payable semi-annually in arrear until maturity date in equal installmentsPrincipal redemption
1. Redemption at maturity:
Redeemed on the maturity date, at their outstanding principal amount,which has not been redeemed early or converted
2. Early redemption:
Payment of the principal and interest accrued up to the expectedrepayment date upon the exercise of the company’s call option or thebondholder’s put option
Conversion price
W19,845 per common share (subject to adjustment based on dilutiveeffects of certain events)
Conversion period August 23, 2020 ~ August 12, 2024Redemption at the option of the issuer (Call option)
— On or at any time after three years from the issue date, if the closingprice of our common shares for any 20 trading days out of the 30consecutive trading days is at least 130% of the applicableconversion price;
— The aggregate principal amount of the convertible bondsoutstanding is less than 10% of the aggregate principal amountoriginally issued; or
— In the event of certain changes in laws and other directives resultingin additional taxes
Redemption at the option of the bondholders (Put option) — On the date which is three years from the issue date
42
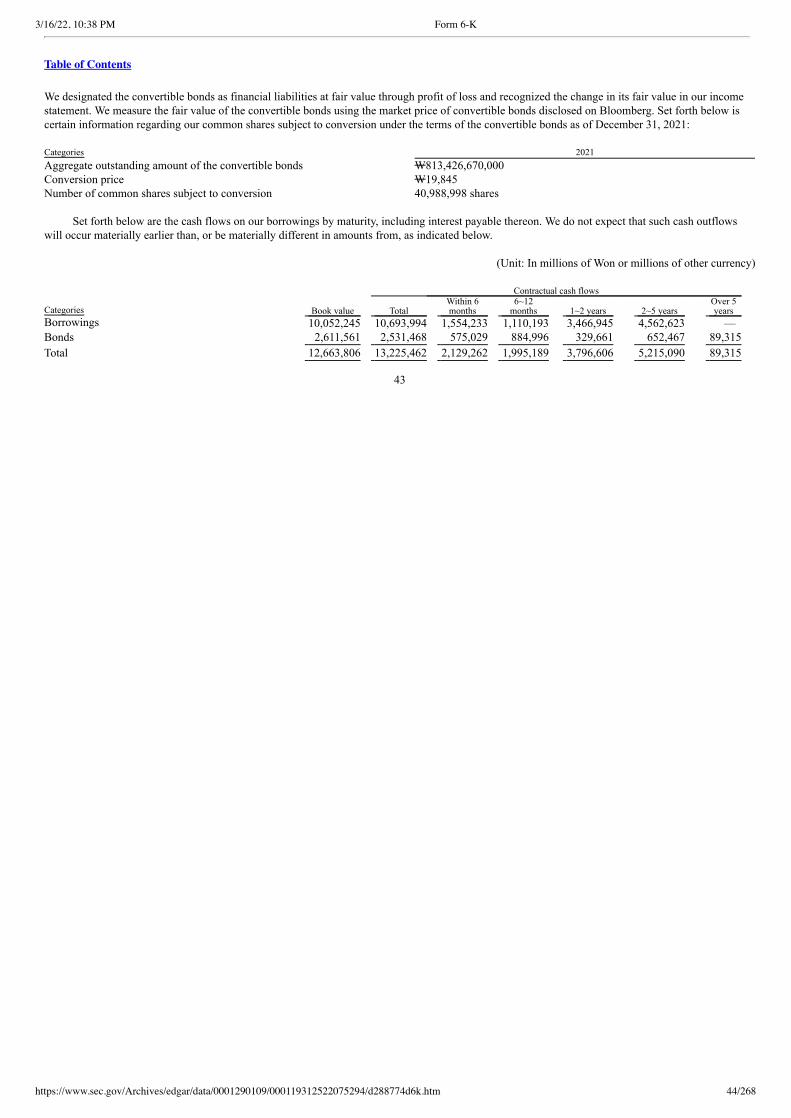
3/16/22, 10:38 PM Form 6-K
https://www.sec.gov/Archives/edgar/data/0001290109/000119312522075294/d288774d6k.htm 44/268
Table of Contents
We designated the convertible bonds as financial liabilities at fair value through profit of loss and recognized the change in its fair value in our incomestatement. We measure the fair value of the convertible bonds using the market price of convertible bonds disclosed on Bloomberg. Set forth below iscertain information regarding our common shares subject to conversion under the terms of the convertible bonds as of December 31, 2021: Categories 2021Aggregate outstanding amount of the convertible bonds W813,426,670,000Conversion price W19,845Number of common shares subject to conversion 40,988,998 shares
Set forth below are the cash flows on our borrowings by maturity, including interest payable thereon. We do not expect that such cash outflowswill occur materially earlier than, or be materially different in amounts from, as indicated below.
(Unit: In millions of Won or millions of other currency)
Categories Book value
Contractual cash flows
Total Within 6
months 6~12
months 1~2 years 2~5 years Over 5
years Borrowings 10,052,245 10,693,994 1,554,233 1,110,193 3,466,945 4,562,623 — Bonds 2,611,561 2,531,468 575,029 884,996 329,661 652,467 89,315
Total 12,663,806 13,225,462 2,129,262 1,995,189 3,796,606 5,215,090 89,315
43
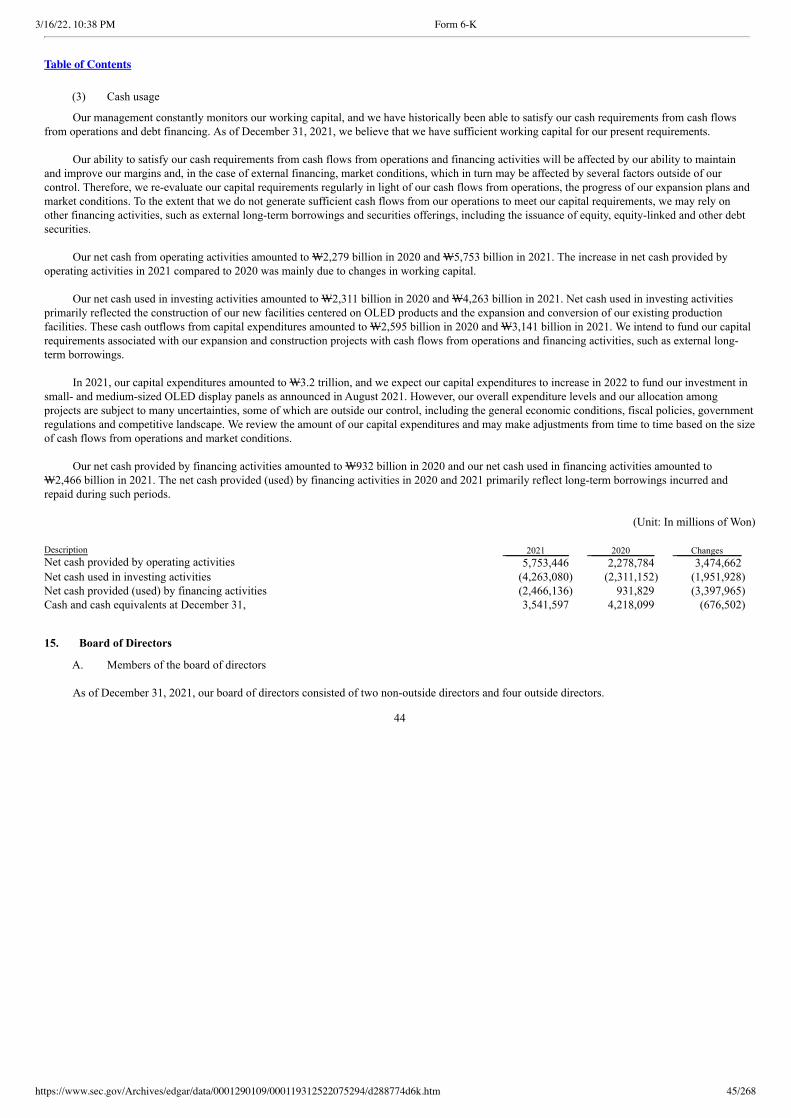
3/16/22, 10:38 PM Form 6-K
https://www.sec.gov/Archives/edgar/data/0001290109/000119312522075294/d288774d6k.htm 45/268
Table of Contents
(3) Cash usage
Our management constantly monitors our working capital, and we have historically been able to satisfy our cash requirements from cash flowsfrom operations and debt financing. As of December 31, 2021, we believe that we have sufficient working capital for our present requirements.
Our ability to satisfy our cash requirements from cash flows from operations and financing activities will be affected by our ability to maintainand improve our margins and, in the case of external financing, market conditions, which in turn may be affected by several factors outside of ourcontrol. Therefore, we re-evaluate our capital requirements regularly in light of our cash flows from operations, the progress of our expansion plans andmarket conditions. To the extent that we do not generate sufficient cash flows from our operations to meet our capital requirements, we may rely onother financing activities, such as external long-term borrowings and securities offerings, including the issuance of equity, equity-linked and other debtsecurities.
Our net cash from operating activities amounted to W2,279 billion in 2020 and W5,753 billion in 2021. The increase in net cash provided byoperating activities in 2021 compared to 2020 was mainly due to changes in working capital.
Our net cash used in investing activities amounted to W2,311 billion in 2020 and W4,263 billion in 2021. Net cash used in investing activitiesprimarily reflected the construction of our new facilities centered on OLED products and the expansion and conversion of our existing productionfacilities. These cash outflows from capital expenditures amounted to W2,595 billion in 2020 and W3,141 billion in 2021. We intend to fund our capitalrequirements associated with our expansion and construction projects with cash flows from operations and financing activities, such as external long-term borrowings.
In 2021, our capital expenditures amounted to W3.2 trillion, and we expect our capital expenditures to increase in 2022 to fund our investment insmall- and medium-sized OLED display panels as announced in August 2021. However, our overall expenditure levels and our allocation amongprojects are subject to many uncertainties, some of which are outside our control, including the general economic conditions, fiscal policies, governmentregulations and competitive landscape. We review the amount of our capital expenditures and may make adjustments from time to time based on the sizeof cash flows from operations and market conditions.
Our net cash provided by financing activities amounted to W932 billion in 2020 and our net cash used in financing activities amounted toW2,466 billion in 2021. The net cash provided (used) by financing activities in 2020 and 2021 primarily reflect long-term borrowings incurred andrepaid during such periods.
(Unit: In millions of Won) Description 2021 2020 Changes Net cash provided by operating activities 5,753,446 2,278,784 3,474,662 Net cash used in investing activities (4,263,080) (2,311,152) (1,951,928) Net cash provided (used) by financing activities (2,466,136) 931,829 (3,397,965) Cash and cash equivalents at December 31, 3,541,597 4,218,099 (676,502)
15. Board of Directors
A. Members of the board of directors
As of December 31, 2021, our board of directors consisted of two non-outside directors and four outside directors.
44
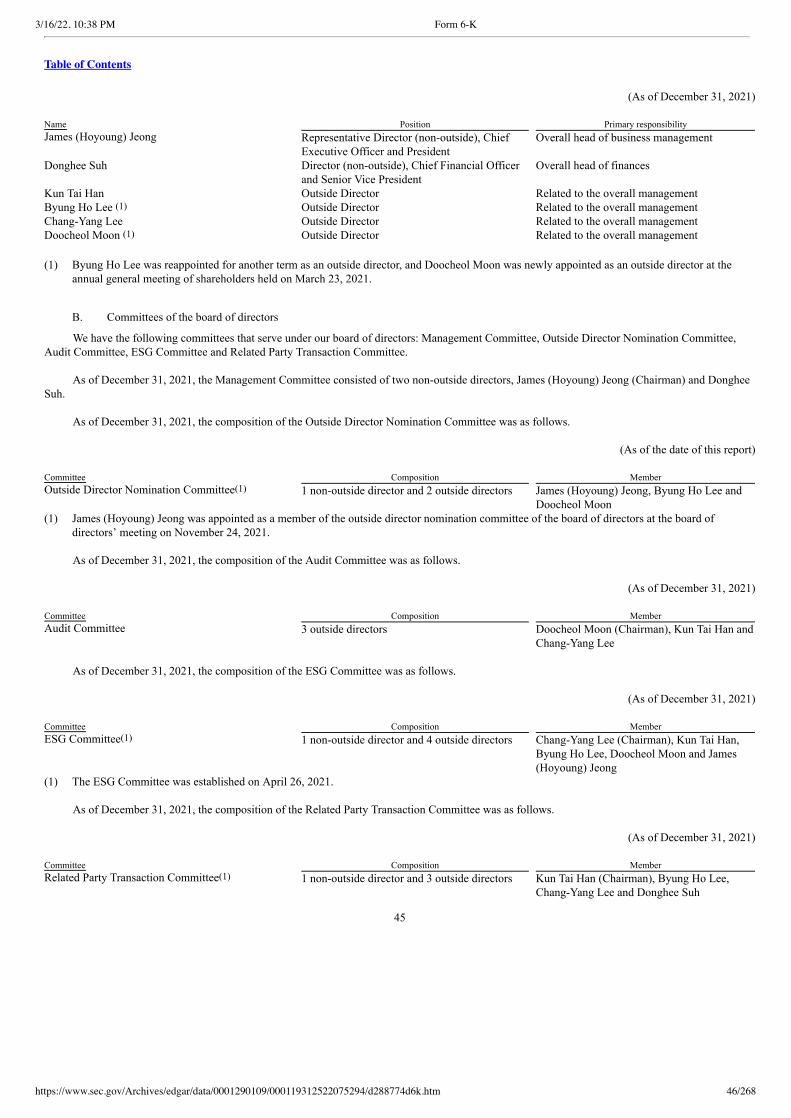
3/16/22, 10:38 PM Form 6-K
https://www.sec.gov/Archives/edgar/data/0001290109/000119312522075294/d288774d6k.htm 46/268
Table of Contents
(As of December 31, 2021) Name Position Primary responsibilityJames (Hoyoung) Jeong
Representative Director (non-outside), ChiefExecutive Officer and President
Overall head of business management
Donghee Suh
Director (non-outside), Chief Financial Officerand Senior Vice President
Overall head of finances
Kun Tai Han Outside Director Related to the overall managementByung Ho Lee (1) Outside Director Related to the overall managementChang-Yang Lee Outside Director Related to the overall managementDoocheol Moon (1) Outside Director Related to the overall management (1) Byung Ho Lee was reappointed for another term as an outside director, and Doocheol Moon was newly appointed as an outside director at the
annual general meeting of shareholders held on March 23, 2021.
B. Committees of the board of directors
We have the following committees that serve under our board of directors: Management Committee, Outside Director Nomination Committee,Audit Committee, ESG Committee and Related Party Transaction Committee.
As of December 31, 2021, the Management Committee consisted of two non-outside directors, James (Hoyoung) Jeong (Chairman) and DongheeSuh.
As of December 31, 2021, the composition of the Outside Director Nomination Committee was as follows.
(As of the date of this report) Committee Composition MemberOutside Director Nomination Committee(1)
1 non-outside director and 2 outside directors
James (Hoyoung) Jeong, Byung Ho Lee andDoocheol Moon
(1) James (Hoyoung) Jeong was appointed as a member of the outside director nomination committee of the board of directors at the board ofdirectors’ meeting on November 24, 2021.
As of December 31, 2021, the composition of the Audit Committee was as follows.
(As of December 31, 2021) Committee Composition MemberAudit Committee
3 outside directors
Doocheol Moon (Chairman), Kun Tai Han andChang-Yang Lee
As of December 31, 2021, the composition of the ESG Committee was as follows.
(As of December 31, 2021) Committee Composition MemberESG Committee(1)
1 non-outside director and 4 outside directors
Chang-Yang Lee (Chairman), Kun Tai Han,Byung Ho Lee, Doocheol Moon and James(Hoyoung) Jeong
(1) The ESG Committee was established on April 26, 2021.
As of December 31, 2021, the composition of the Related Party Transaction Committee was as follows.
(As of December 31, 2021) Committee Composition MemberRelated Party Transaction Committee(1)
1 non-outside director and 3 outside directors
Kun Tai Han (Chairman), Byung Ho Lee,Chang-Yang Lee and Donghee Suh
45
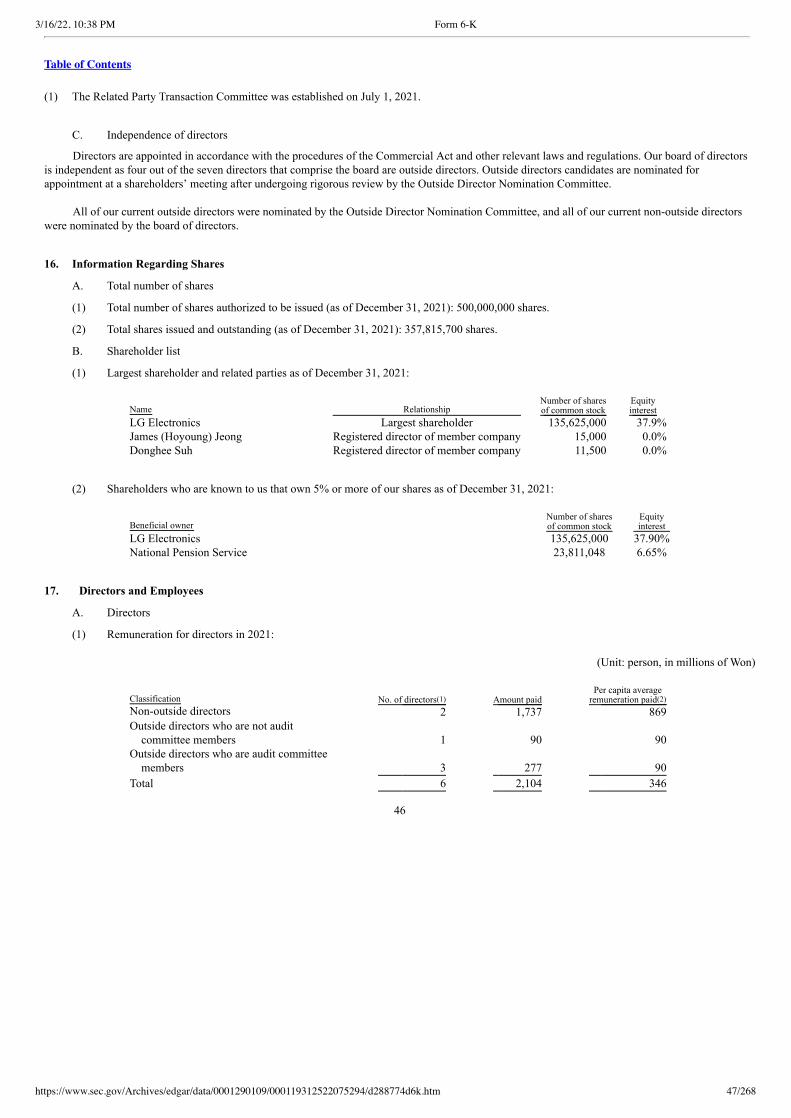
3/16/22, 10:38 PM Form 6-K
https://www.sec.gov/Archives/edgar/data/0001290109/000119312522075294/d288774d6k.htm 47/268
Table of Contents
(1) The Related Party Transaction Committee was established on July 1, 2021.
C. Independence of directors
Directors are appointed in accordance with the procedures of the Commercial Act and other relevant laws and regulations. Our board of directorsis independent as four out of the seven directors that comprise the board are outside directors. Outside directors candidates are nominated forappointment at a shareholders’ meeting after undergoing rigorous review by the Outside Director Nomination Committee.
All of our current outside directors were nominated by the Outside Director Nomination Committee, and all of our current non-outside directorswere nominated by the board of directors.
16. Information Regarding Shares
A. Total number of shares
(1) Total number of shares authorized to be issued (as of December 31, 2021): 500,000,000 shares.
(2) Total shares issued and outstanding (as of December 31, 2021): 357,815,700 shares.
B. Shareholder list
(1) Largest shareholder and related parties as of December 31, 2021:
Name Relationship Number of shares
of common stock Equity
interest LG Electronics Largest shareholder 135,625,000 37.9% James (Hoyoung) Jeong Registered director of member company 15,000 0.0% Donghee Suh Registered director of member company 11,500 0.0%
(2) Shareholders who are known to us that own 5% or more of our shares as of December 31, 2021:
Beneficial owner Number of shares
of common stock Equity
interestLG Electronics 135,625,000 37.90%National Pension Service 23,811,048 6.65%
17. Directors and Employees
A. Directors
(1) Remuneration for directors in 2021:
(Unit: person, in millions of Won)
Classification No. of directors(1) Amount paid Per capita average
remuneration paid(2) Non-outside directors 2 1,737 869 Outside directors who are not audit
committee members 1 90 90 Outside directors who are audit committee
members 3 277 90
Total 6 2,104 346
46
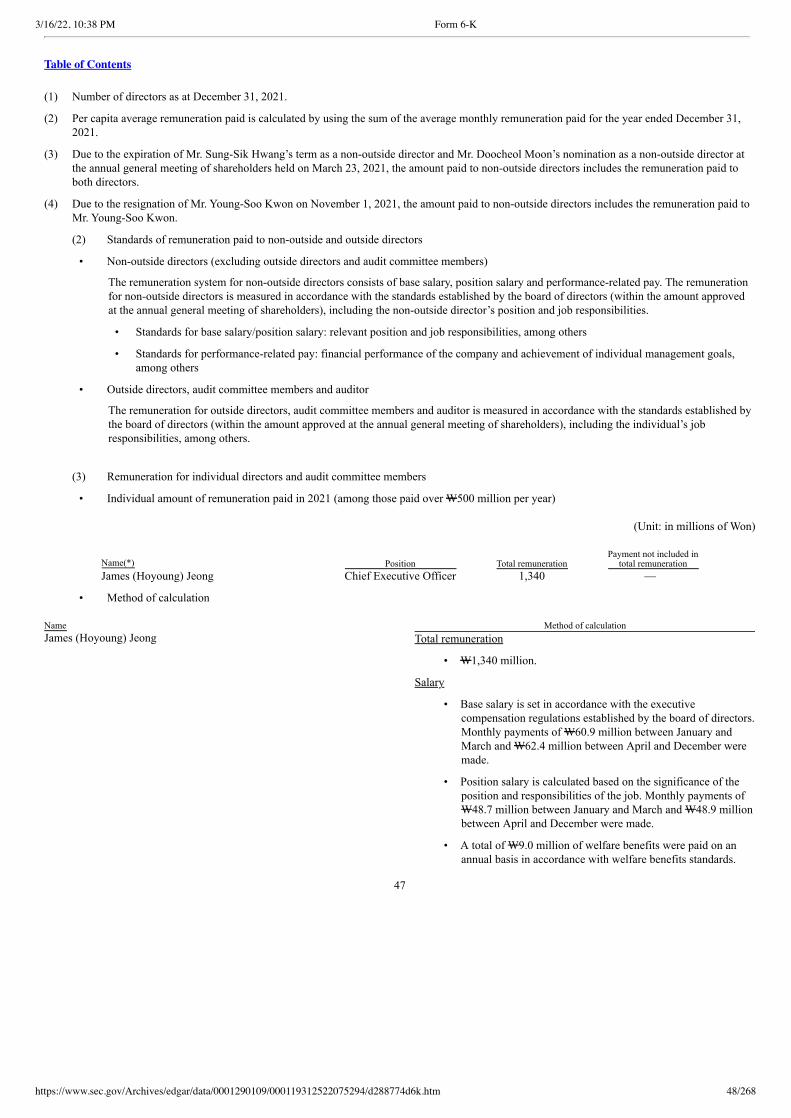
3/16/22, 10:38 PM Form 6-K
https://www.sec.gov/Archives/edgar/data/0001290109/000119312522075294/d288774d6k.htm 48/268
Table of Contents
(1) Number of directors as at December 31, 2021.
(2) Per capita average remuneration paid is calculated by using the sum of the average monthly remuneration paid for the year ended December 31,2021.
(3) Due to the expiration of Mr. Sung-Sik Hwang’s term as a non-outside director and Mr. Doocheol Moon’s nomination as a non-outside director atthe annual general meeting of shareholders held on March 23, 2021, the amount paid to non-outside directors includes the remuneration paid toboth directors.
(4) Due to the resignation of Mr. Young-Soo Kwon on November 1, 2021, the amount paid to non-outside directors includes the remuneration paid toMr. Young-Soo Kwon.
(2) Standards of remuneration paid to non-outside and outside directors
• Non-outside directors (excluding outside directors and audit committee members)
The remuneration system for non-outside directors consists of base salary, position salary and performance-related pay. The remunerationfor non-outside directors is measured in accordance with the standards established by the board of directors (within the amount approvedat the annual general meeting of shareholders), including the non-outside director’s position and job responsibilities.
• Standards for base salary/position salary: relevant position and job responsibilities, among others
• Standards for performance-related pay: financial performance of the company and achievement of individual management goals,among others
• Outside directors, audit committee members and auditor
The remuneration for outside directors, audit committee members and auditor is measured in accordance with the standards established bythe board of directors (within the amount approved at the annual general meeting of shareholders), including the individual’s jobresponsibilities, among others.
(3) Remuneration for individual directors and audit committee members
• Individual amount of remuneration paid in 2021 (among those paid over W500 million per year)
(Unit: in millions of Won)
Name(*) Position Total remuneration Payment not included in
total remunerationJames (Hoyoung) Jeong Chief Executive Officer 1,340 —
• Method of calculation Name Method of calculationJames (Hoyoung) Jeong
Total remuneration
• W1,340 million.
Salary
• Base salary is set in accordance with the executivecompensation regulations established by the board of directors.Monthly payments of W60.9 million between January andMarch and W62.4 million between April and December weremade.
• Position salary is calculated based on the significance of theposition and responsibilities of the job. Monthly payments ofW48.7 million between January and March and W48.9 millionbetween April and December were made.
• A total of W9.0 million of welfare benefits were paid on anannual basis in accordance with welfare benefits standards.
47
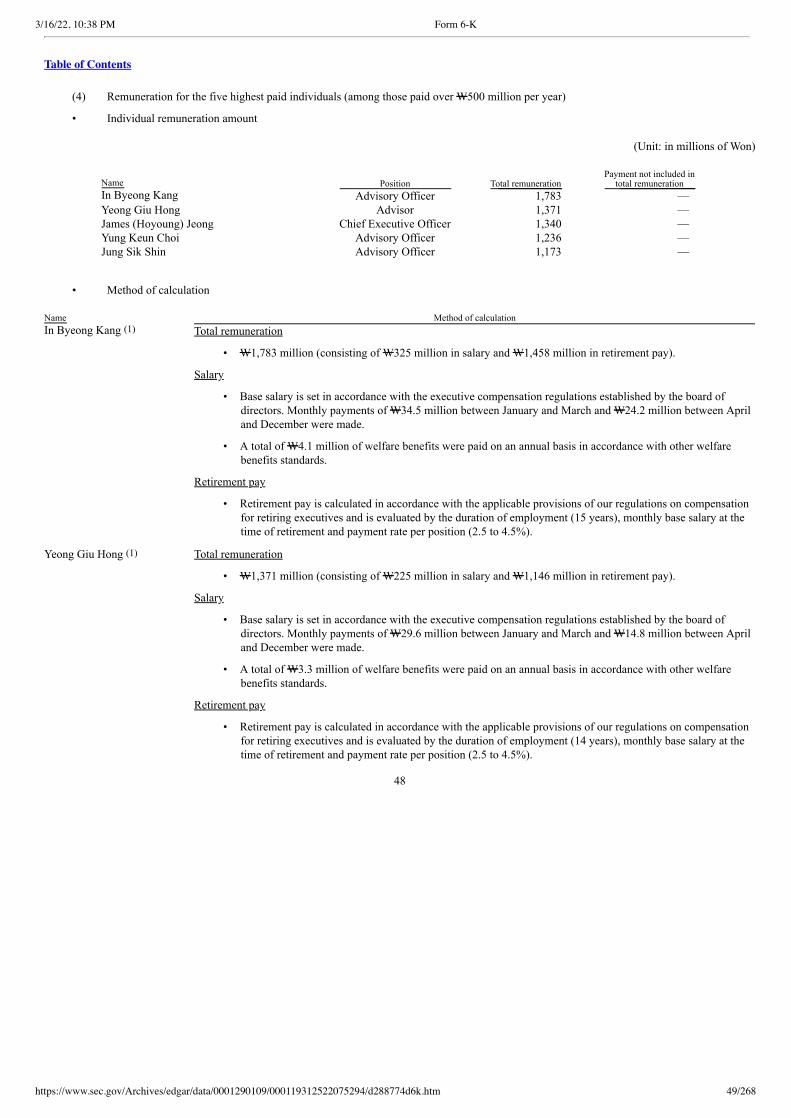
3/16/22, 10:38 PM Form 6-K
https://www.sec.gov/Archives/edgar/data/0001290109/000119312522075294/d288774d6k.htm 49/268
Table of Contents
(4) Remuneration for the five highest paid individuals (among those paid over W500 million per year)
• Individual remuneration amount
(Unit: in millions of Won)
Name Position Total remuneration Payment not included in
total remuneration In Byeong Kang Advisory Officer 1,783 — Yeong Giu Hong Advisor 1,371 — James (Hoyoung) Jeong Chief Executive Officer 1,340 — Yung Keun Choi Advisory Officer 1,236 — Jung Sik Shin Advisory Officer 1,173 —
• Method of calculation Name Method of calculationIn Byeong Kang (1)
Total remuneration
• W1,783 million (consisting of W325 million in salary and W1,458 million in retirement pay).
Salary
• Base salary is set in accordance with the executive compensation regulations established by the board ofdirectors. Monthly payments of W34.5 million between January and March and W24.2 million between Apriland December were made.
• A total of W4.1 million of welfare benefits were paid on an annual basis in accordance with other welfarebenefits standards.
Retirement pay
• Retirement pay is calculated in accordance with the applicable provisions of our regulations on compensationfor retiring executives and is evaluated by the duration of employment (15 years), monthly base salary at thetime of retirement and payment rate per position (2.5 to 4.5%).
Yeong Giu Hong (1)
Total remuneration
• W1,371 million (consisting of W225 million in salary and W1,146 million in retirement pay).
Salary
• Base salary is set in accordance with the executive compensation regulations established by the board ofdirectors. Monthly payments of W29.6 million between January and March and W14.8 million between Apriland December were made.
• A total of W3.3 million of welfare benefits were paid on an annual basis in accordance with other welfarebenefits standards.
Retirement pay
• Retirement pay is calculated in accordance with the applicable provisions of our regulations on compensationfor retiring executives and is evaluated by the duration of employment (14 years), monthly base salary at thetime of retirement and payment rate per position (2.5 to 4.5%).
48

3/16/22, 10:38 PM Form 6-K
https://www.sec.gov/Archives/edgar/data/0001290109/000119312522075294/d288774d6k.htm 50/268
Table of Contents
James (Hoyoung) Jeong
Total remuneration
• W1,340 million.
Salary
• Base salary is set in accordance with the executive compensation regulations established by the board ofdirectors. Monthly payments of W60.9 million between January and March and W62.4 million between Apriland December were made.
• Position salary is calculated based on the significance of the position and responsibilities of the job. Monthlypayments of W48.8 million between January and December were made.
• A total of W9.0 million of welfare benefits were paid on an annual basis in accordance with welfare benefitsstandards.
Yung Keun Choi (1)
Total remuneration
• W1,236 million (consisting of W282 million in salary and W954 million in retirement pay).
Salary
• Base salary is set in accordance with the executive compensation regulations established by the board ofdirectors. Monthly payments of W29.6 million between January and March and W20.7 million between Apriland December were made.
• A total of W6.7 million of welfare benefits were paid on an annual basis in accordance with other welfarebenefits standards.
Retirement pay
• Retirement pay is calculated in accordance with the applicable provisions of our regulations on compensationfor retiring executives and is evaluated by the duration of employment (12 years), monthly base salary at thetime of retirement and payment rate per position (2.5 to 4.5%).
Jung Sik Shin (1)
Total remuneration
• W1,173 million (consisting of W278 million in salary and W895 million in retirement pay).
Salary
• Base salary is set in accordance with the executive compensation regulations established by the board ofdirectors. Monthly payments of W29.6 million between January and March and W20.7 million between Apriland December were made.
• A total of W3.2 million of welfare benefits were paid on an annual basis in accordance with other welfarebenefits standards.
Retirement pay
• Retirement pay is calculated in accordance with the applicable provisions of our regulations on compensationfor retiring executives and is evaluated by the duration of employment (11 years), monthly base salary at thetime of retirement and payment rate per position (2.5 to 4.5%).
49
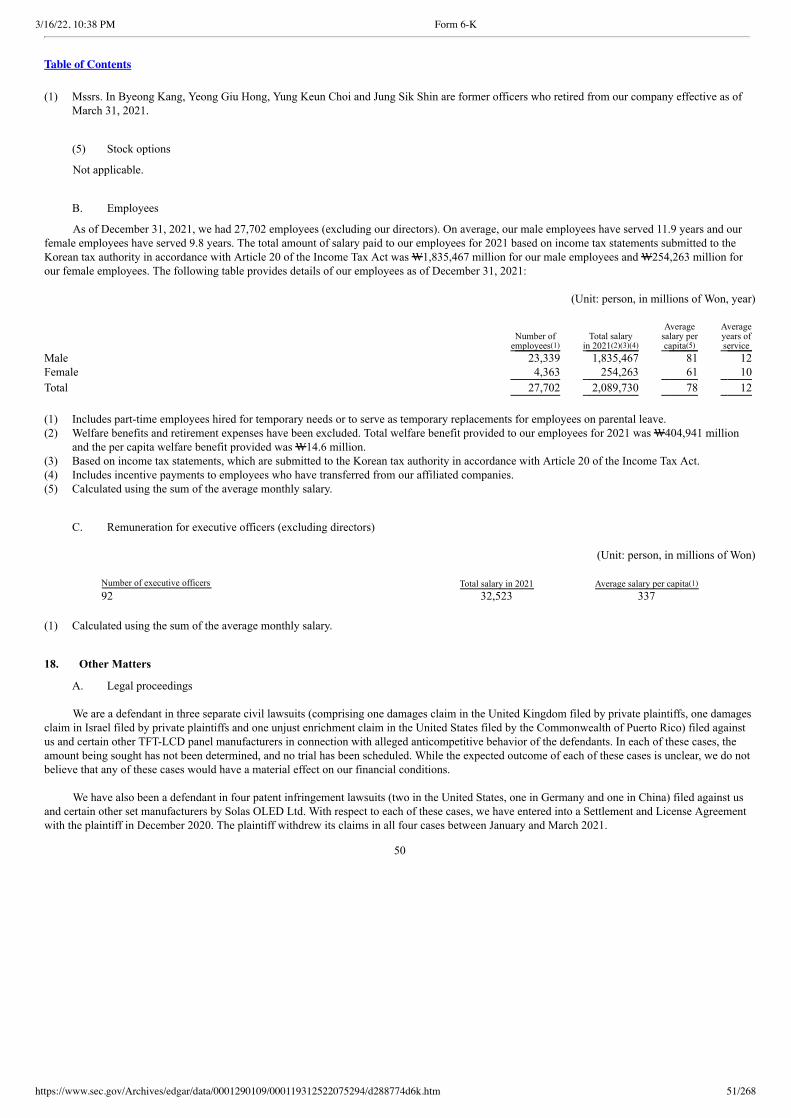
3/16/22, 10:38 PM Form 6-K
https://www.sec.gov/Archives/edgar/data/0001290109/000119312522075294/d288774d6k.htm 51/268
Table of Contents
(1) Mssrs. In Byeong Kang, Yeong Giu Hong, Yung Keun Choi and Jung Sik Shin are former officers who retired from our company effective as ofMarch 31, 2021.
(5) Stock options
Not applicable.
B. Employees
As of December 31, 2021, we had 27,702 employees (excluding our directors). On average, our male employees have served 11.9 years and ourfemale employees have served 9.8 years. The total amount of salary paid to our employees for 2021 based on income tax statements submitted to theKorean tax authority in accordance with Article 20 of the Income Tax Act was W1,835,467 million for our male employees and W254,263 million forour female employees. The following table provides details of our employees as of December 31, 2021:
(Unit: person, in millions of Won, year)
Number of
employees(1) Total salary
in 2021(2)(3)(4)
Average salary per capita(5)
Average years of service
Male 23,339 1,835,467 81 12 Female 4,363 254,263 61 10
Total 27,702 2,089,730 78 12
(1) Includes part-time employees hired for temporary needs or to serve as temporary replacements for employees on parental leave.(2) Welfare benefits and retirement expenses have been excluded. Total welfare benefit provided to our employees for 2021 was W404,941 million
and the per capita welfare benefit provided was W14.6 million.(3) Based on income tax statements, which are submitted to the Korean tax authority in accordance with Article 20 of the Income Tax Act.(4) Includes incentive payments to employees who have transferred from our affiliated companies.(5) Calculated using the sum of the average monthly salary.
C. Remuneration for executive officers (excluding directors)
(Unit: person, in millions of Won)
Number of executive officers Total salary in 2021 Average salary per capita(1)
92 32,523 337 (1) Calculated using the sum of the average monthly salary.
18. Other Matters
A. Legal proceedings
We are a defendant in three separate civil lawsuits (comprising one damages claim in the United Kingdom filed by private plaintiffs, one damagesclaim in Israel filed by private plaintiffs and one unjust enrichment claim in the United States filed by the Commonwealth of Puerto Rico) filed againstus and certain other TFT-LCD panel manufacturers in connection with alleged anticompetitive behavior of the defendants. In each of these cases, theamount being sought has not been determined, and no trial has been scheduled. While the expected outcome of each of these cases is unclear, we do notbelieve that any of these cases would have a material effect on our financial conditions.
We have also been a defendant in four patent infringement lawsuits (two in the United States, one in Germany and one in China) filed against usand certain other set manufacturers by Solas OLED Ltd. With respect to each of these cases, we have entered into a Settlement and License Agreementwith the plaintiff in December 2020. The plaintiff withdrew its claims in all four cases between January and March 2021.
50
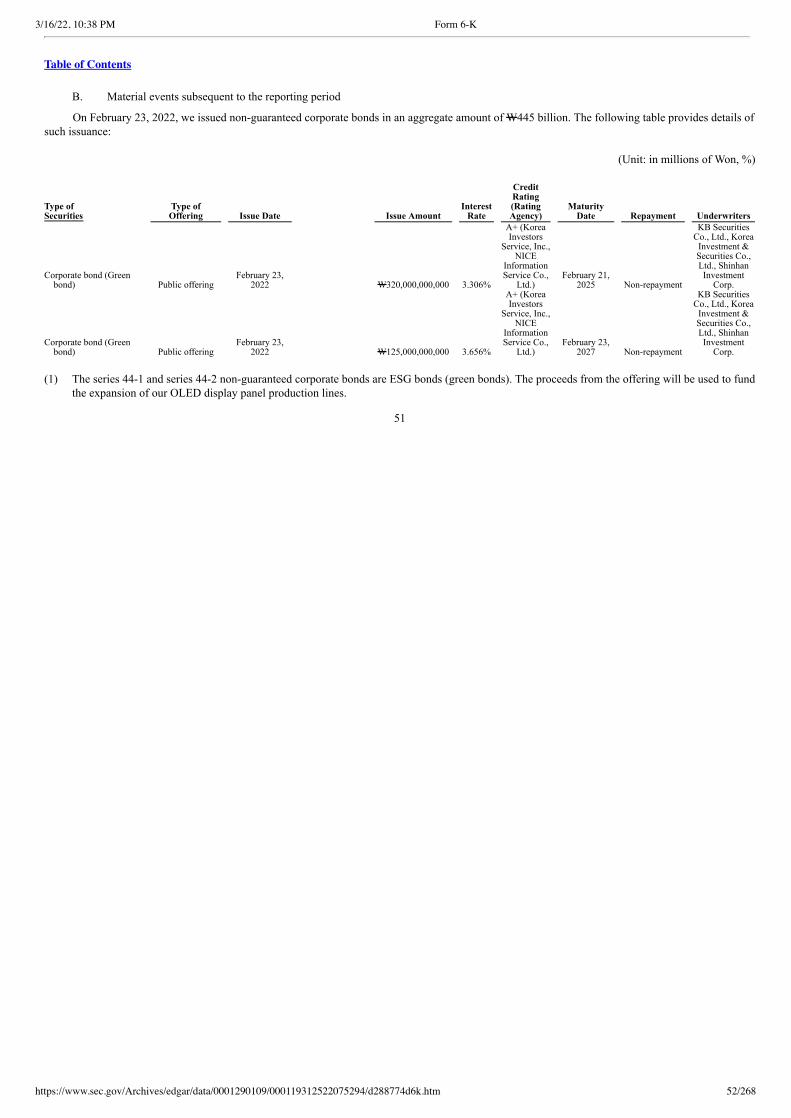
3/16/22, 10:38 PM Form 6-K
https://www.sec.gov/Archives/edgar/data/0001290109/000119312522075294/d288774d6k.htm 52/268
Table of Contents
B. Material events subsequent to the reporting period
On February 23, 2022, we issued non-guaranteed corporate bonds in an aggregate amount of W445 billion. The following table provides details ofsuch issuance:
(Unit: in millions of Won, %)
Type of Securities
Type of Offering Issue Date Issue Amount
Interest Rate
Credit Rating (Rating Agency)
Maturity Date Repayment Underwriters
Corporate bond (Greenbond) Public offering
February 23,2022 W320,000,000,000 3.306%
A+ (KoreaInvestors
Service, Inc.,NICE
InformationService Co.,
Ltd.) February 21,
2025 Non-repayment
KB SecuritiesCo., Ltd., Korea
Investment &Securities Co.,Ltd., ShinhanInvestment
Corp.
Corporate bond (Greenbond) Public offering
February 23,2022 W125,000,000,000 3.656%
A+ (KoreaInvestors
Service, Inc.,NICE
InformationService Co.,
Ltd.) February 23,
2027 Non-repayment
KB SecuritiesCo., Ltd., Korea
Investment &Securities Co.,Ltd., ShinhanInvestment
Corp. (1) The series 44-1 and series 44-2 non-guaranteed corporate bonds are ESG bonds (green bonds). The proceeds from the offering will be used to fund
the expansion of our OLED display panel production lines.
51
3/16/22, 10:38 PM Form 6-K
https://www.sec.gov/Archives/edgar/data/0001290109/000119312522075294/d288774d6k.htm 53/268
Table of Contents
LG DISPLAY CO., LTD. AND SUBSIDIARIES
Consolidated Financial Statements
For the Years Ended December 31, 2021 and 2020
(With Independent Auditors’ Report Thereon)
52
3/16/22, 10:38 PM Form 6-K
https://www.sec.gov/Archives/edgar/data/0001290109/000119312522075294/d288774d6k.htm 54/268
Table of Contents
Contents Page Independent Auditors’ Report 54
Consolidated Statements of Financial Position 58
Consolidated Statements of Comprehensive Income 59
Consolidated Statements of Changes in Equity 60
Consolidated Statements of Cash Flows 61
Notes to the Consolidated Financial Statements 63
53
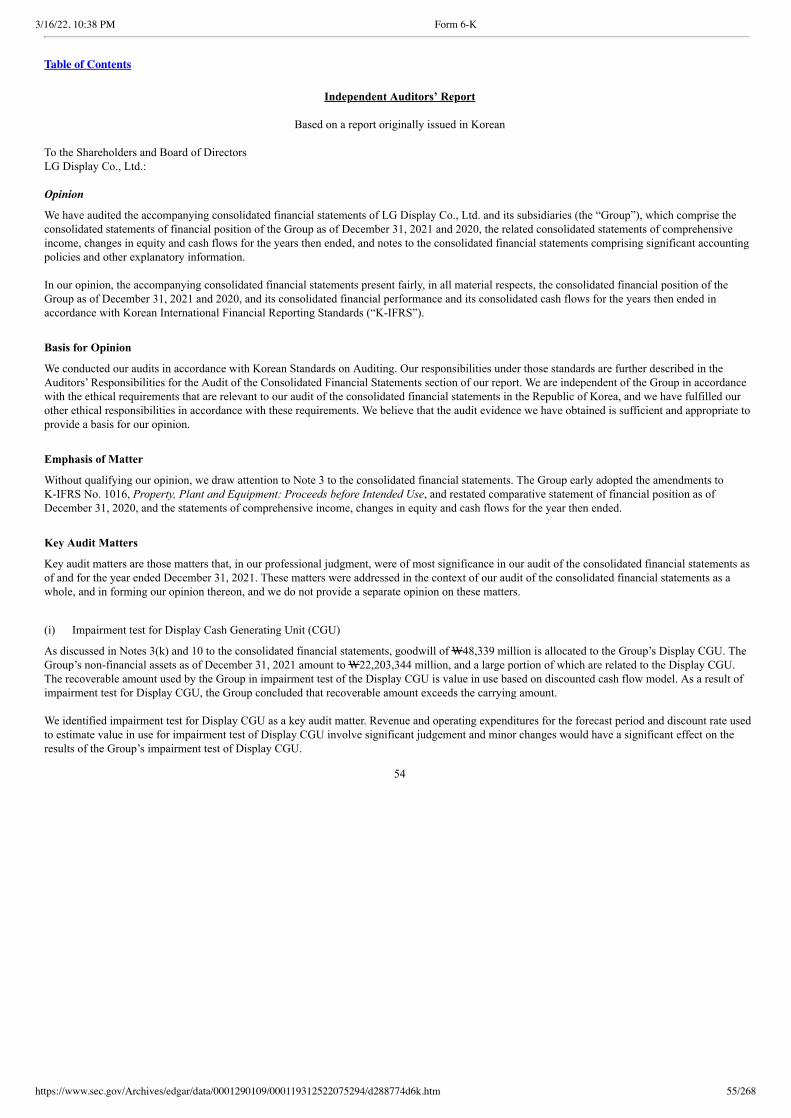
3/16/22, 10:38 PM Form 6-K
https://www.sec.gov/Archives/edgar/data/0001290109/000119312522075294/d288774d6k.htm 55/268
Table of Contents
Independent Auditors’ Report
Based on a report originally issued in Korean
To the Shareholders and Board of DirectorsLG Display Co., Ltd.:
Opinion
We have audited the accompanying consolidated financial statements of LG Display Co., Ltd. and its subsidiaries (the “Group”), which comprise theconsolidated statements of financial position of the Group as of December 31, 2021 and 2020, the related consolidated statements of comprehensiveincome, changes in equity and cash flows for the years then ended, and notes to the consolidated financial statements comprising significant accountingpolicies and other explanatory information.
In our opinion, the accompanying consolidated financial statements present fairly, in all material respects, the consolidated financial position of theGroup as of December 31, 2021 and 2020, and its consolidated financial performance and its consolidated cash flows for the years then ended inaccordance with Korean International Financial Reporting Standards (“K-IFRS”).
Basis for Opinion
We conducted our audits in accordance with Korean Standards on Auditing. Our responsibilities under those standards are further described in theAuditors’ Responsibilities for the Audit of the Consolidated Financial Statements section of our report. We are independent of the Group in accordancewith the ethical requirements that are relevant to our audit of the consolidated financial statements in the Republic of Korea, and we have fulfilled ourother ethical responsibilities in accordance with these requirements. We believe that the audit evidence we have obtained is sufficient and appropriate toprovide a basis for our opinion.
Emphasis of Matter
Without qualifying our opinion, we draw attention to Note 3 to the consolidated financial statements. The Group early adopted the amendments toK-IFRS No. 1016, Property, Plant and Equipment: Proceeds before Intended Use, and restated comparative statement of financial position as ofDecember 31, 2020, and the statements of comprehensive income, changes in equity and cash flows for the year then ended.
Key Audit Matters
Key audit matters are those matters that, in our professional judgment, were of most significance in our audit of the consolidated financial statements asof and for the year ended December 31, 2021. These matters were addressed in the context of our audit of the consolidated financial statements as awhole, and in forming our opinion thereon, and we do not provide a separate opinion on these matters.
(i) Impairment test for Display Cash Generating Unit (CGU)
As discussed in Notes 3(k) and 10 to the consolidated financial statements, goodwill of W48,339 million is allocated to the Group’s Display CGU. TheGroup’s non-financial assets as of December 31, 2021 amount to W22,203,344 million, and a large portion of which are related to the Display CGU.The recoverable amount used by the Group in impairment test of the Display CGU is value in use based on discounted cash flow model. As a result ofimpairment test for Display CGU, the Group concluded that recoverable amount exceeds the carrying amount.
We identified impairment test for Display CGU as a key audit matter. Revenue and operating expenditures for the forecast period and discount rate usedto estimate value in use for impairment test of Display CGU involve significant judgement and minor changes would have a significant effect on theresults of the Group’s impairment test of Display CGU.
54
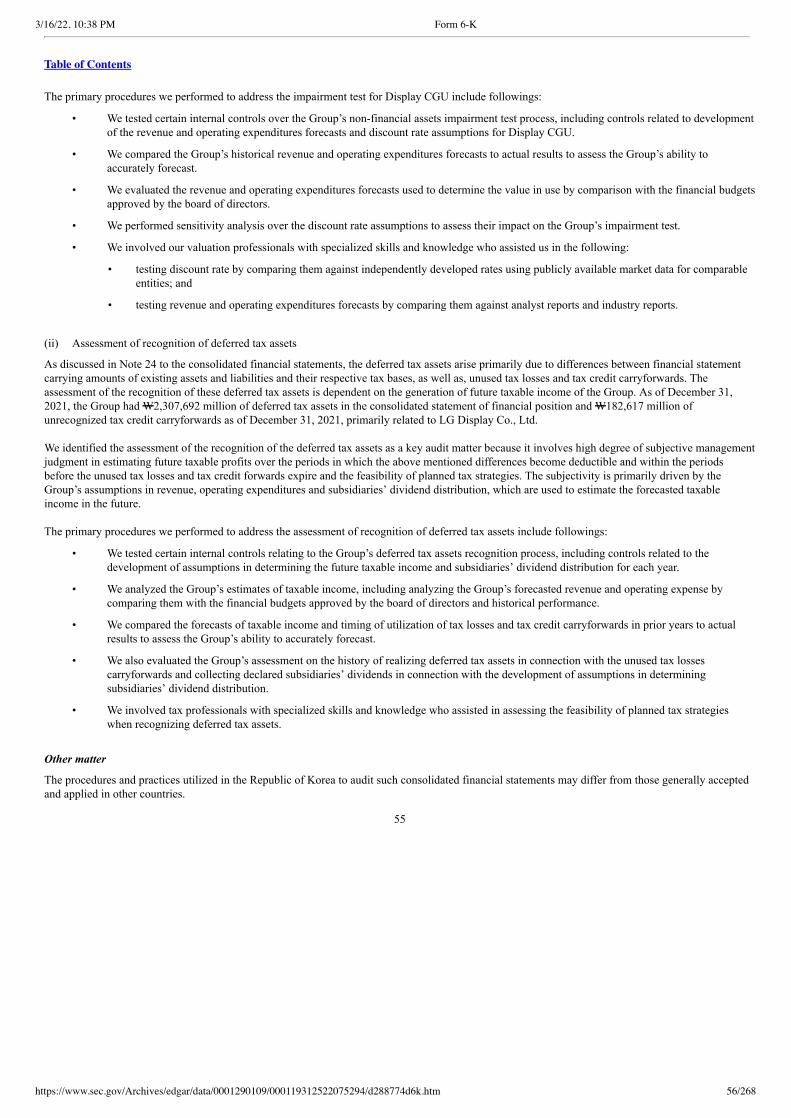
3/16/22, 10:38 PM Form 6-K
https://www.sec.gov/Archives/edgar/data/0001290109/000119312522075294/d288774d6k.htm 56/268
Table of Contents
The primary procedures we performed to address the impairment test for Display CGU include followings:
• We tested certain internal controls over the Group’s non-financial assets impairment test process, including controls related to developmentof the revenue and operating expenditures forecasts and discount rate assumptions for Display CGU.
• We compared the Group’s historical revenue and operating expenditures forecasts to actual results to assess the Group’s ability toaccurately forecast.
• We evaluated the revenue and operating expenditures forecasts used to determine the value in use by comparison with the financial budgetsapproved by the board of directors.
• We performed sensitivity analysis over the discount rate assumptions to assess their impact on the Group’s impairment test.
• We involved our valuation professionals with specialized skills and knowledge who assisted us in the following:
• testing discount rate by comparing them against independently developed rates using publicly available market data for comparableentities; and
• testing revenue and operating expenditures forecasts by comparing them against analyst reports and industry reports.
(ii) Assessment of recognition of deferred tax assets
As discussed in Note 24 to the consolidated financial statements, the deferred tax assets arise primarily due to differences between financial statementcarrying amounts of existing assets and liabilities and their respective tax bases, as well as, unused tax losses and tax credit carryforwards. Theassessment of the recognition of these deferred tax assets is dependent on the generation of future taxable income of the Group. As of December 31,2021, the Group had W2,307,692 million of deferred tax assets in the consolidated statement of financial position and W182,617 million ofunrecognized tax credit carryforwards as of December 31, 2021, primarily related to LG Display Co., Ltd.
We identified the assessment of the recognition of the deferred tax assets as a key audit matter because it involves high degree of subjective managementjudgment in estimating future taxable profits over the periods in which the above mentioned differences become deductible and within the periodsbefore the unused tax losses and tax credit forwards expire and the feasibility of planned tax strategies. The subjectivity is primarily driven by theGroup’s assumptions in revenue, operating expenditures and subsidiaries’ dividend distribution, which are used to estimate the forecasted taxableincome in the future.
The primary procedures we performed to address the assessment of recognition of deferred tax assets include followings:
• We tested certain internal controls relating to the Group’s deferred tax assets recognition process, including controls related to thedevelopment of assumptions in determining the future taxable income and subsidiaries’ dividend distribution for each year.
• We analyzed the Group’s estimates of taxable income, including analyzing the Group’s forecasted revenue and operating expense bycomparing them with the financial budgets approved by the board of directors and historical performance.
• We compared the forecasts of taxable income and timing of utilization of tax losses and tax credit carryforwards in prior years to actualresults to assess the Group’s ability to accurately forecast.
• We also evaluated the Group’s assessment on the history of realizing deferred tax assets in connection with the unused tax losses
carryforwards and collecting declared subsidiaries’ dividends in connection with the development of assumptions in determiningsubsidiaries’ dividend distribution.
• We involved tax professionals with specialized skills and knowledge who assisted in assessing the feasibility of planned tax strategieswhen recognizing deferred tax assets.
Other matter
The procedures and practices utilized in the Republic of Korea to audit such consolidated financial statements may differ from those generally acceptedand applied in other countries.
55
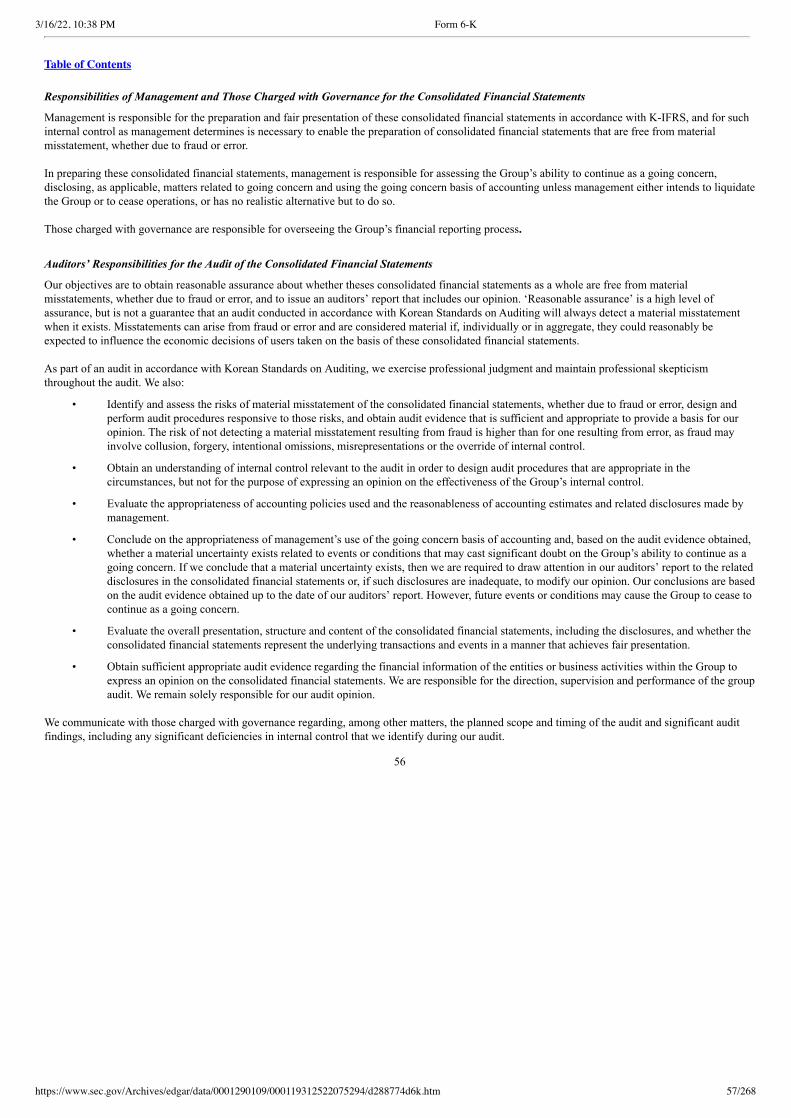
3/16/22, 10:38 PM Form 6-K
https://www.sec.gov/Archives/edgar/data/0001290109/000119312522075294/d288774d6k.htm 57/268
Table of Contents
Responsibilities of Management and Those Charged with Governance for the Consolidated Financial Statements
Management is responsible for the preparation and fair presentation of these consolidated financial statements in accordance with K-IFRS, and for suchinternal control as management determines is necessary to enable the preparation of consolidated financial statements that are free from materialmisstatement, whether due to fraud or error.
In preparing these consolidated financial statements, management is responsible for assessing the Group’s ability to continue as a going concern,disclosing, as applicable, matters related to going concern and using the going concern basis of accounting unless management either intends to liquidatethe Group or to cease operations, or has no realistic alternative but to do so.
Those charged with governance are responsible for overseeing the Group’s financial reporting process.
Auditors’ Responsibilities for the Audit of the Consolidated Financial Statements
Our objectives are to obtain reasonable assurance about whether theses consolidated financial statements as a whole are free from materialmisstatements, whether due to fraud or error, and to issue an auditors’ report that includes our opinion. ‘Reasonable assurance’ is a high level ofassurance, but is not a guarantee that an audit conducted in accordance with Korean Standards on Auditing will always detect a material misstatementwhen it exists. Misstatements can arise from fraud or error and are considered material if, individually or in aggregate, they could reasonably beexpected to influence the economic decisions of users taken on the basis of these consolidated financial statements.
As part of an audit in accordance with Korean Standards on Auditing, we exercise professional judgment and maintain professional skepticismthroughout the audit. We also:
• Identify and assess the risks of material misstatement of the consolidated financial statements, whether due to fraud or error, design andperform audit procedures responsive to those risks, and obtain audit evidence that is sufficient and appropriate to provide a basis for ouropinion. The risk of not detecting a material misstatement resulting from fraud is higher than for one resulting from error, as fraud mayinvolve collusion, forgery, intentional omissions, misrepresentations or the override of internal control.
• Obtain an understanding of internal control relevant to the audit in order to design audit procedures that are appropriate in thecircumstances, but not for the purpose of expressing an opinion on the effectiveness of the Group’s internal control.
• Evaluate the appropriateness of accounting policies used and the reasonableness of accounting estimates and related disclosures made bymanagement.
• Conclude on the appropriateness of management’s use of the going concern basis of accounting and, based on the audit evidence obtained,whether a material uncertainty exists related to events or conditions that may cast significant doubt on the Group’s ability to continue as agoing concern. If we conclude that a material uncertainty exists, then we are required to draw attention in our auditors’ report to the relateddisclosures in the consolidated financial statements or, if such disclosures are inadequate, to modify our opinion. Our conclusions are basedon the audit evidence obtained up to the date of our auditors’ report. However, future events or conditions may cause the Group to cease tocontinue as a going concern.
• Evaluate the overall presentation, structure and content of the consolidated financial statements, including the disclosures, and whether theconsolidated financial statements represent the underlying transactions and events in a manner that achieves fair presentation.
• Obtain sufficient appropriate audit evidence regarding the financial information of the entities or business activities within the Group to
express an opinion on the consolidated financial statements. We are responsible for the direction, supervision and performance of the groupaudit. We remain solely responsible for our audit opinion.
We communicate with those charged with governance regarding, among other matters, the planned scope and timing of the audit and significant auditfindings, including any significant deficiencies in internal control that we identify during our audit.
56
3/16/22, 10:38 PM Form 6-K
https://www.sec.gov/Archives/edgar/data/0001290109/000119312522075294/d288774d6k.htm 58/268
Table of Contents
We also provide those charged with governance with a statement that we have complied with relevant ethical requirements regarding independence, andcommunicate with them all relationships and other matters that may reasonably be thought to bear on our independence and where applicable, relatedsafeguards.
From the matters communicated with those charged with governance, we determine those matters that were of most significance in the audit of theconsolidated financial statements of the current period and are therefore the key audit matters. We describe these matters in our auditors’ report unlesslaw or regulation precludes public disclosure about the matter or when, in extremely rare circumstances, we determine that a matter should not becommunicated in our report because the adverse consequences of doing so would reasonably be expected to outweigh the public interest benefits of suchcommunication.
The engagement partner on the audit resulting in this independent auditors’ report is Sang Hyun Han.
KPMG Samjong Accounting Corp.Seoul, KoreaMarch 8, 2022
This report is effective as of March 8, 2022, the audit report date. Certain subsequent events or circumstances, which may occur between the auditreport date and the time of reading this report, could have a material impact on the accompanying consolidated financial statements and notesthereto. Accordingly, the readers of the audit report should understand that the above audit report has not been updated to reflect the impact of suchsubsequent events or circumstances, if any.
57
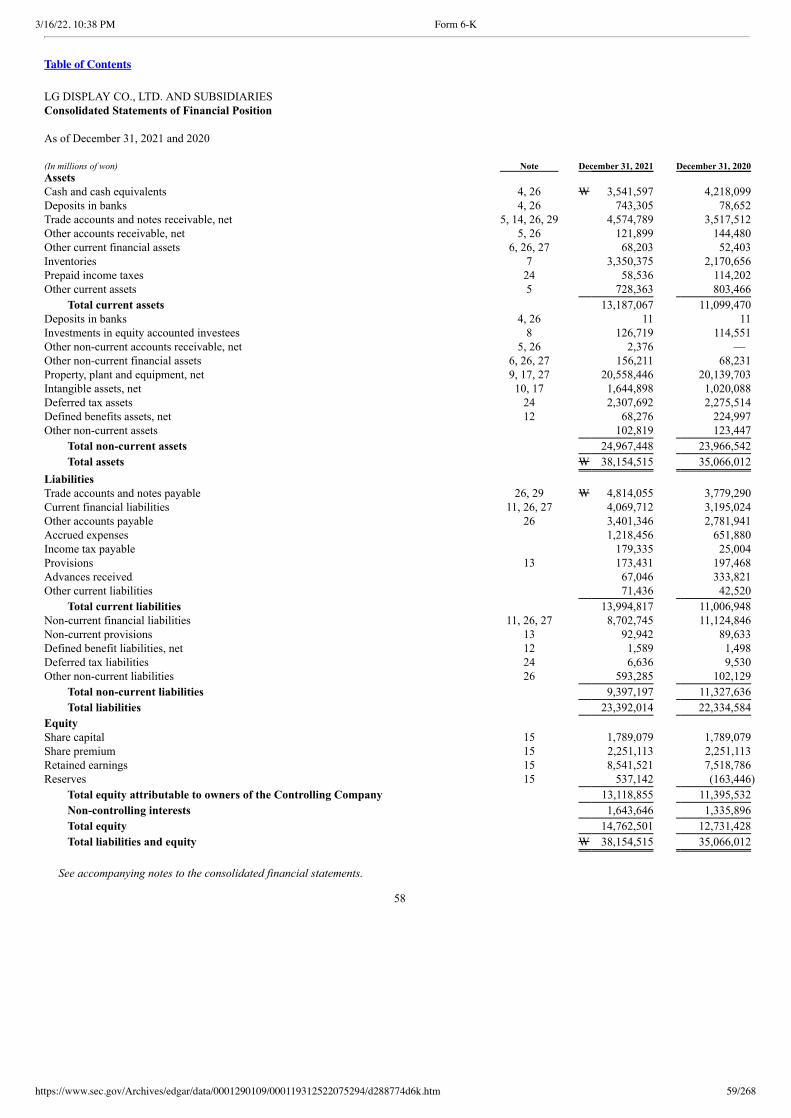
3/16/22, 10:38 PM Form 6-K
https://www.sec.gov/Archives/edgar/data/0001290109/000119312522075294/d288774d6k.htm 59/268
Table of Contents
LG DISPLAY CO., LTD. AND SUBSIDIARIESConsolidated Statements of Financial Position
As of December 31, 2021 and 2020 (In millions of won) Note December 31, 2021 December 31, 2020 Assets Cash and cash equivalents 4, 26 W 3,541,597 4,218,099Deposits in banks 4, 26 743,305 78,652Trade accounts and notes receivable, net 5, 14, 26, 29 4,574,789 3,517,512Other accounts receivable, net 5, 26 121,899 144,480Other current financial assets 6, 26, 27 68,203 52,403Inventories 7 3,350,375 2,170,656Prepaid income taxes 24 58,536 114,202Other current assets 5 728,363 803,466
Total current assets 13,187,067 11,099,470Deposits in banks 4, 26 11 11Investments in equity accounted investees 8 126,719 114,551Other non-current accounts receivable, net 5, 26 2,376 — Other non-current financial assets 6, 26, 27 156,211 68,231Property, plant and equipment, net 9, 17, 27 20,558,446 20,139,703Intangible assets, net 10, 17 1,644,898 1,020,088Deferred tax assets 24 2,307,692 2,275,514Defined benefits assets, net 12 68,276 224,997Other non-current assets 102,819 123,447
Total non-current assets 24,967,448 23,966,542
Total assets W 38,154,515 35,066,012
Liabilities Trade accounts and notes payable 26, 29 W 4,814,055 3,779,290Current financial liabilities 11, 26, 27 4,069,712 3,195,024Other accounts payable 26 3,401,346 2,781,941Accrued expenses 1,218,456 651,880Income tax payable 179,335 25,004Provisions 13 173,431 197,468Advances received 67,046 333,821Other current liabilities 71,436 42,520
Total current liabilities 13,994,817 11,006,948Non-current financial liabilities 11, 26, 27 8,702,745 11,124,846Non-current provisions 13 92,942 89,633Defined benefit liabilities, net 12 1,589 1,498Deferred tax liabilities 24 6,636 9,530Other non-current liabilities 26 593,285 102,129
Total non-current liabilities 9,397,197 11,327,636
Total liabilities 23,392,014 22,334,584
Equity Share capital 15 1,789,079 1,789,079Share premium 15 2,251,113 2,251,113Retained earnings 15 8,541,521 7,518,786Reserves 15 537,142 (163,446)
Total equity attributable to owners of the Controlling Company 13,118,855 11,395,532
Non-controlling interests 1,643,646 1,335,896
Total equity 14,762,501 12,731,428
Total liabilities and equity W 38,154,515 35,066,012
See accompanying notes to the consolidated financial statements.
58
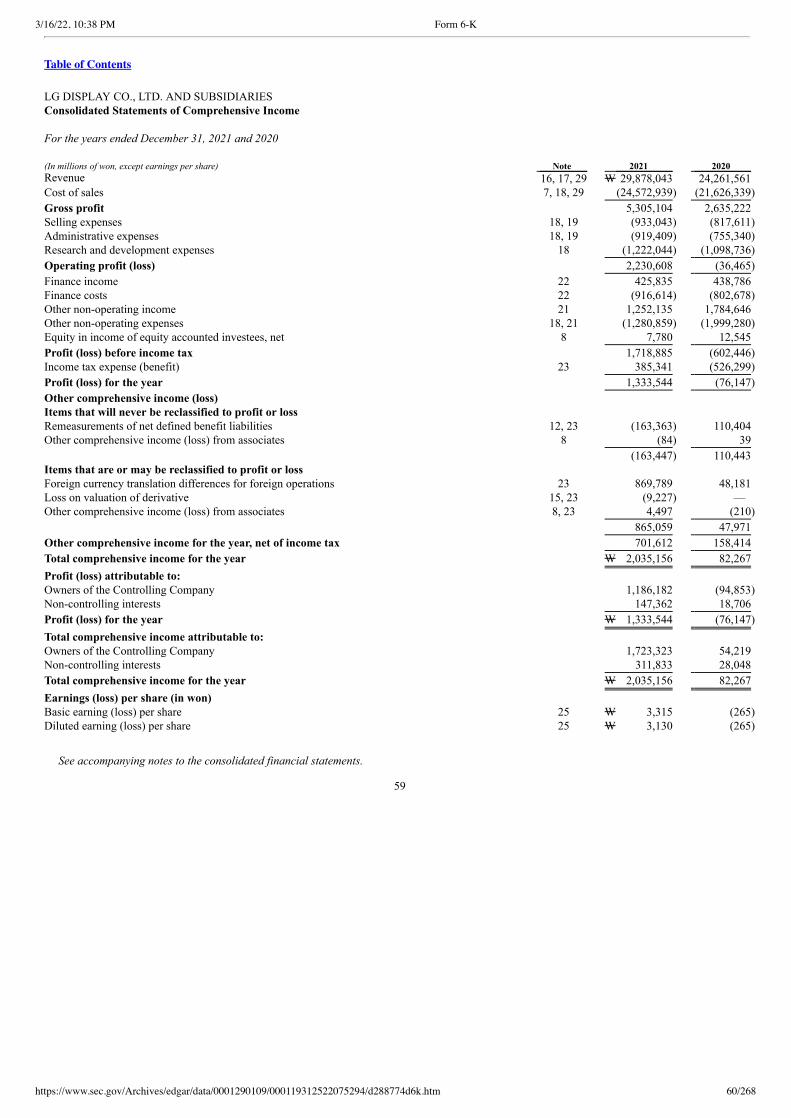
3/16/22, 10:38 PM Form 6-K
https://www.sec.gov/Archives/edgar/data/0001290109/000119312522075294/d288774d6k.htm 60/268
Table of Contents
LG DISPLAY CO., LTD. AND SUBSIDIARIESConsolidated Statements of Comprehensive Income
For the years ended December 31, 2021 and 2020 (In millions of won, except earnings per share) Note 2021 2020 Revenue 16, 17, 29 W 29,878,043 24,261,561Cost of sales 7, 18, 29 (24,572,939) (21,626,339)
Gross profit 5,305,104 2,635,222Selling expenses 18, 19 (933,043) (817,611)Administrative expenses 18, 19 (919,409) (755,340)Research and development expenses 18 (1,222,044) (1,098,736)
Operating profit (loss) 2,230,608 (36,465)
Finance income 22 425,835 438,786Finance costs 22 (916,614) (802,678)Other non-operating income 21 1,252,135 1,784,646Other non-operating expenses 18, 21 (1,280,859) (1,999,280)Equity in income of equity accounted investees, net 8 7,780 12,545
Profit (loss) before income tax 1,718,885 (602,446)Income tax expense (benefit) 23 385,341 (526,299)
Profit (loss) for the year 1,333,544 (76,147)
Other comprehensive income (loss) Items that will never be reclassified to profit or loss Remeasurements of net defined benefit liabilities 12, 23 (163,363) 110,404Other comprehensive income (loss) from associates 8 (84) 39
(163,447) 110,443Items that are or may be reclassified to profit or loss Foreign currency translation differences for foreign operations 23 869,789 48,181Loss on valuation of derivative 15, 23 (9,227) — Other comprehensive income (loss) from associates 8, 23 4,497 (210)
865,059 47,971
Other comprehensive income for the year, net of income tax 701,612 158,414
Total comprehensive income for the year W 2,035,156 82,267
Profit (loss) attributable to: Owners of the Controlling Company 1,186,182 (94,853)Non-controlling interests 147,362 18,706
Profit (loss) for the year W 1,333,544 (76,147)
Total comprehensive income attributable to: Owners of the Controlling Company 1,723,323 54,219Non-controlling interests 311,833 28,048
Total comprehensive income for the year W 2,035,156 82,267
Earnings (loss) per share (in won) Basic earning (loss) per share 25 W 3,315 (265)Diluted earning (loss) per share 25 W 3,130 (265)
See accompanying notes to the consolidated financial statements.
59
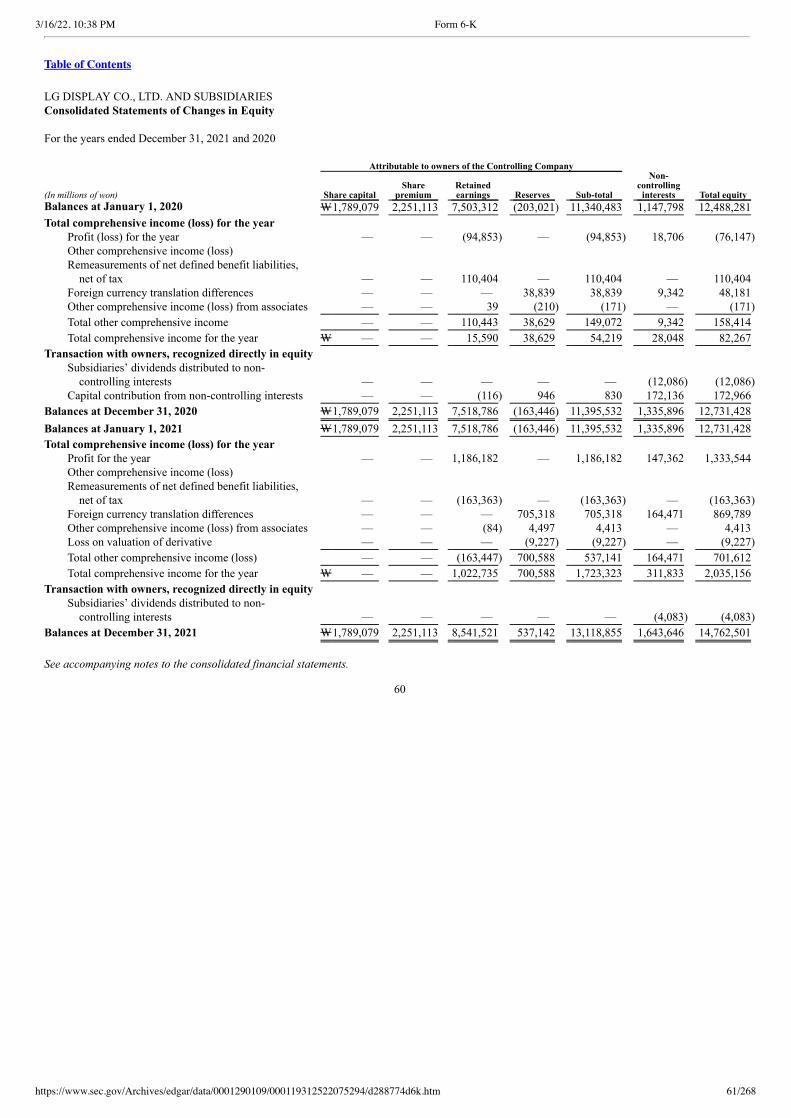
3/16/22, 10:38 PM Form 6-K
https://www.sec.gov/Archives/edgar/data/0001290109/000119312522075294/d288774d6k.htm 61/268
Table of Contents
LG DISPLAY CO., LTD. AND SUBSIDIARIESConsolidated Statements of Changes in Equity
For the years ended December 31, 2021 and 2020 Attributable to owners of the Controlling Company
(In millions of won) Share capital Share
premium Retained
earnings Reserves Sub-total
Non-controlling
interests Total equity Balances at January 1, 2020 W1,789,079 2,251,113 7,503,312 (203,021) 11,340,483 1,147,798 12,488,281
Total comprehensive income (loss) for the year Profit (loss) for the year — — (94,853) — (94,853) 18,706 (76,147)Other comprehensive income (loss) Remeasurements of net defined benefit liabilities,
net of tax — — 110,404 — 110,404 — 110,404Foreign currency translation differences — — — 38,839 38,839 9,342 48,181Other comprehensive income (loss) from associates — — 39 (210) (171) — (171)
Total other comprehensive income — — 110,443 38,629 149,072 9,342 158,414
Total comprehensive income for the year W — — 15,590 38,629 54,219 28,048 82,267
Transaction with owners, recognized directly in equity Subsidiaries’ dividends distributed to non-
controlling interests — — — — — (12,086) (12,086)Capital contribution from non-controlling interests — — (116) 946 830 172,136 172,966
Balances at December 31, 2020 W1,789,079 2,251,113 7,518,786 (163,446) 11,395,532 1,335,896 12,731,428
Balances at January 1, 2021 W1,789,079 2,251,113 7,518,786 (163,446) 11,395,532 1,335,896 12,731,428
Total comprehensive income (loss) for the year Profit for the year — — 1,186,182 — 1,186,182 147,362 1,333,544Other comprehensive income (loss) Remeasurements of net defined benefit liabilities,
net of tax — — (163,363) — (163,363) — (163,363)Foreign currency translation differences — — — 705,318 705,318 164,471 869,789Other comprehensive income (loss) from associates — — (84) 4,497 4,413 — 4,413Loss on valuation of derivative — — — (9,227) (9,227) — (9,227)
Total other comprehensive income (loss) — — (163,447) 700,588 537,141 164,471 701,612
Total comprehensive income for the year W — — 1,022,735 700,588 1,723,323 311,833 2,035,156
Transaction with owners, recognized directly in equity Subsidiaries’ dividends distributed to non-
controlling interests — — — — — (4,083) (4,083)
Balances at December 31, 2021 W1,789,079 2,251,113 8,541,521 537,142 13,118,855 1,643,646 14,762,501
See accompanying notes to the consolidated financial statements.
60
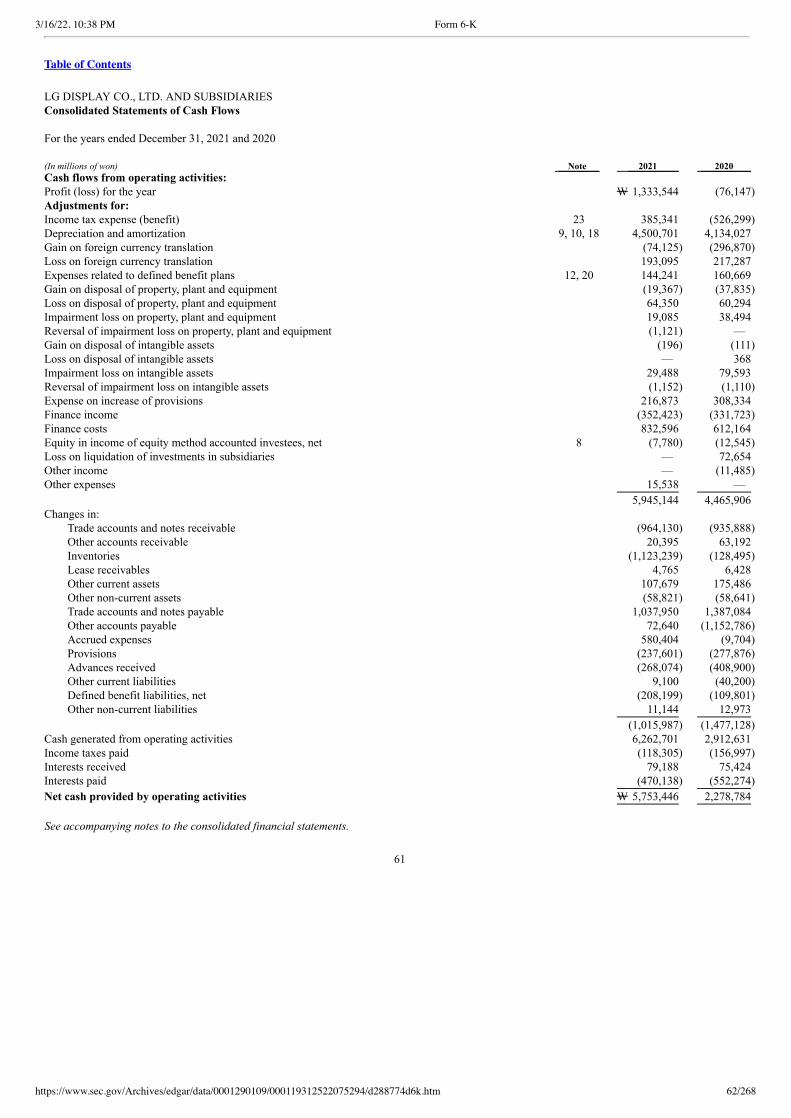
3/16/22, 10:38 PM Form 6-K
https://www.sec.gov/Archives/edgar/data/0001290109/000119312522075294/d288774d6k.htm 62/268
Table of Contents
LG DISPLAY CO., LTD. AND SUBSIDIARIESConsolidated Statements of Cash Flows
For the years ended December 31, 2021 and 2020 (In millions of won) Note 2021 2020 Cash flows from operating activities: Profit (loss) for the year W 1,333,544 (76,147)Adjustments for: Income tax expense (benefit) 23 385,341 (526,299)Depreciation and amortization 9, 10, 18 4,500,701 4,134,027Gain on foreign currency translation (74,125) (296,870)Loss on foreign currency translation 193,095 217,287Expenses related to defined benefit plans 12, 20 144,241 160,669Gain on disposal of property, plant and equipment (19,367) (37,835)Loss on disposal of property, plant and equipment 64,350 60,294Impairment loss on property, plant and equipment 19,085 38,494Reversal of impairment loss on property, plant and equipment (1,121) — Gain on disposal of intangible assets (196) (111)Loss on disposal of intangible assets — 368Impairment loss on intangible assets 29,488 79,593Reversal of impairment loss on intangible assets (1,152) (1,110)Expense on increase of provisions 216,873 308,334Finance income (352,423) (331,723)Finance costs 832,596 612,164Equity in income of equity method accounted investees, net 8 (7,780) (12,545)Loss on liquidation of investments in subsidiaries — 72,654Other income — (11,485)Other expenses 15,538 —
5,945,144 4,465,906Changes in:
Trade accounts and notes receivable (964,130) (935,888)Other accounts receivable 20,395 63,192Inventories (1,123,239) (128,495)Lease receivables 4,765 6,428Other current assets 107,679 175,486Other non-current assets (58,821) (58,641)Trade accounts and notes payable 1,037,950 1,387,084Other accounts payable 72,640 (1,152,786)Accrued expenses 580,404 (9,704)Provisions (237,601) (277,876)Advances received (268,074) (408,900)Other current liabilities 9,100 (40,200)Defined benefit liabilities, net (208,199) (109,801)Other non-current liabilities 11,144 12,973
(1,015,987) (1,477,128)Cash generated from operating activities 6,262,701 2,912,631Income taxes paid (118,305) (156,997)Interests received 79,188 75,424Interests paid (470,138) (552,274)
Net cash provided by operating activities W 5,753,446 2,278,784
See accompanying notes to the consolidated financial statements.
61

3/16/22, 10:38 PM Form 6-K
https://www.sec.gov/Archives/edgar/data/0001290109/000119312522075294/d288774d6k.htm 63/268
Table of Contents
LG DISPLAY CO., LTD. AND SUBSIDIARIESConsolidated Statements of Cash Flows
For the years ended December 31, 2021 and 2020 (In millions of won) Note 2021 2020 Cash flows from investing activities: Dividends received W 4,068 8,239Increase in deposits in banks (694,313) (78,452)Proceeds from withdrawal of deposits in banks 77,152 78,557Acquisition of financial assets at fair value through profit or loss (34,418) (3,227)Proceeds from disposal of financial assets at fair value through profit or loss 5,226 99Proceeds from disposal of financial assets at fair value through other comprehensive income 24 6Proceeds from disposal of investments in equity accounted investees 4,363 2,400Acquisition of property, plant and equipment (3,141,430) (2,595,381)Proceeds from disposal of property, plant and equipment 65,711 446,193Acquisition of intangible assets (635,805) (353,313)Proceeds from disposal of intangible assets 2,946 16,996Government grants received 85,983 118,341Receipt from settlement of derivatives 8,344 24,468Proceeds from collection of short-term loans 14,533 13,720Increase in long-term loans (26,473) — Increase in deposits (7,145) (2,084)Decrease in deposits 8,154 1,286Proceeds from disposal of other assets — 11,000
Net cash used in investing activities (4,263,080) (2,311,152)
Cash flows from financing activities: 28 Proceeds from short-term borrowings 2,573,757 2,238,806Repayments of short-term borrowings (2,425,117) (2,506,420)Proceeds from issuance of bonds 498,027 49,949Proceeds from long-term borrowings 1,298,346 2,329,013Repayments of current portion of long-term borrowings and bonds (4,344,208) (1,278,199)Repayment of lease liabilities (66,941) (62,200)Capital contribution from non-controlling interests — 172,966Subsidiaries’ dividends distributed to non-controlling interests — (12,086)
Net cash provided by (used in) financing activities (2,466,136) 931,829
Net increase (decrease) in cash and cash equivalents (975,770) 899,461Cash and cah equivalents at January 1 4,218,099 3,336,003Effect of exchange rate fluctuations on cash held 299,268 (17,365)
Cash and cash equivalents at December 31 W 3,541,597 4,218,099
See accompanying notes to the consolidated financial statements.
62
3/16/22, 10:38 PM Form 6-K
https://www.sec.gov/Archives/edgar/data/0001290109/000119312522075294/d288774d6k.htm 64/268
Table of Contents
LG DISPLAY CO., LTD. AND SUBSIDIARIESNotes to the Consolidated Financial Statements
For the years ended December 31, 2021 and 2020 1. Reporting Entity
(a) Description of the Controlling Company
LG Display Co., Ltd. (the “Controlling Company”) was incorporated in February 1985 and the Controlling Company is a public corporation listedin the Korea Exchange since 2004. The main business of the Controlling Company and its subsidiaries (the “Group”) is to manufacture and selldisplays and its related products. As of December 31, 2021, the Group is operating Thin Film Transistor Liquid Crystal Display (“TFT-LCD”) andOrganic Light Emitting Diode (“OLED”) panel manufacturing plants in Gumi, Paju and China and TFT-LCD and OLED module manufacturingplants in Gumi, Paju, China and Vietnam. The Controlling Company is domiciled in the Republic of Korea with its address at 128 Yeouidae-ro,Yeongdeungpo-gu, Seoul, the Republic of Korea. As of December 31, 2021, LG Electronics Inc., a major shareholder of the ControllingCompany, owns 37.9% (135,625,000 shares) of the Controlling Company’s common stock.
The Controlling Company’s common stock is listed on the Korea Exchange under the identifying code 034220. As of December 31, 2021, thereare 357,815,700 shares of common stock outstanding. The Controlling Company’s common stock is also listed on the New York Stock Exchangein the form of American Depository Shares (“ADSs”) under the symbol “LPL”. One ADS represents one-half of one share of common stock. Asof December 31, 2021, there are 15,910,934 ADSs outstanding.
63

3/16/22, 10:38 PM Form 6-K
https://www.sec.gov/Archives/edgar/data/0001290109/000119312522075294/d288774d6k.htm 65/268
Table of Contents
LG DISPLAY CO., LTD. AND SUBSIDIARIESNotes to the Consolidated Financial Statements
For the years ended December 31, 2021 and 2020 1. Reporting Entity, Continued (b) Consolidated Subsidiaries as of December 31, 2021 (In millions)
Subsidiaries Location Percentage of
ownership Fiscal year
end Date of
incorporation Business Capital stocks LG Display America, Inc. San Jose, U.S.A. 100% December 31 September 24, 1999 Sell display products USD 411 LG Display Germany GmbH Eschborn, Germany 100% December 31 October 15, 1999 Sell display products EUR 1 LG Display Japan Co., Ltd. Tokyo, Japan 100% December 31 October 12, 1999 Sell display products JPY 95 LG Display Taiwan Co., Ltd. Taipei, Taiwan 100% December 31 April 12, 1999 Sell display products NTD 116 LG Display Nanjing Co., Ltd. Nanjing, China 100% December 31 July 15, 2002 Manufacture display products CNY 3,020 LG Display Shanghai Co., Ltd. Shanghai, China 100% December 31 January 16, 2003 Sell display products CNY 4 LG Display Guangzhou Co., Ltd. Guangzhou, China 100% December 31 June 30, 2006 Manufacture display products CNY 1,655 LG Display Shenzhen Co., Ltd. Shenzhen, China 100% December 31 July 27, 2007 Sell display products CNY 4 LG Display Singapore Pte. Ltd. Singapore 100% December 31 November 4, 2008 Sell display products USD 1
L&T Display Technology (Fujian) Limited Fujian, China 51% December 31 December 7, 2009 Manufacture and sell LCD
module and LCD monitor sets CNY 116 LG Display Yantai Co., Ltd. Yantai, China 100% December 31 March 17, 2010 Manufacture display products CNY 1,008 Nanumnuri Co., Ltd. Gumi, South Korea 100% December 31 March 21, 2012 Provide janitorial services KRW 800
LG Display (China) Co., Ltd. Guangzhou, China 70% December 31 December 10, 2012 Manufacture and sell display
products CNY 8,232 Unified Innovative Technology, LLC Wilmington, U.S.A. 100% December 31 March 12, 2014 Manage intellectual property USD 9 LG Display Guangzhou Trading Co., Ltd. Guangzhou, China 100% December 31 April 28, 2015 Sell display products CNY 1
Global OLED Technology, LLC Sterling, U.S.A. 100% December 31 December 18, 2009 Manage OLED intellectual
property USD 138 LG Display Vietnam Haiphong Co., Ltd. Haiphong, Vietnam 100% December 31 May 5, 2016 Manufacture display products USD 600
Suzhou Lehui Display Co., Ltd. Suzhou, China 100% December 31 July 1, 2016 Manufacture and sell LCD
module and LCD monitor sets CNY 637
LG DISPLAY FUND I LLC(*) Wilmington, U.S.A. 100% December 31 May 1, 2018 Invest in venture business and
acquire technologies USD 45
LG Display High-Tech (China) Co., Ltd. Guangzhou, China 70% December 31 July 11, 2018 Manufacture and sell display
products CNY 15,600
(*) For the year ended December 31, 2021, the Controlling Company contributed W38,565 million in cash for the capital increase of LG DISPLAYFUND I LLC. There was no change in the Controlling Company’s percentage of ownership in LG DISPLAY FUND I LLC as a result of thisadditional investment.
In addition to the above subsidiaries, the Controlling Company has invested W127,400 million in MMT (Money Market Trust), which iscontrolled by the Controlling Company.
64
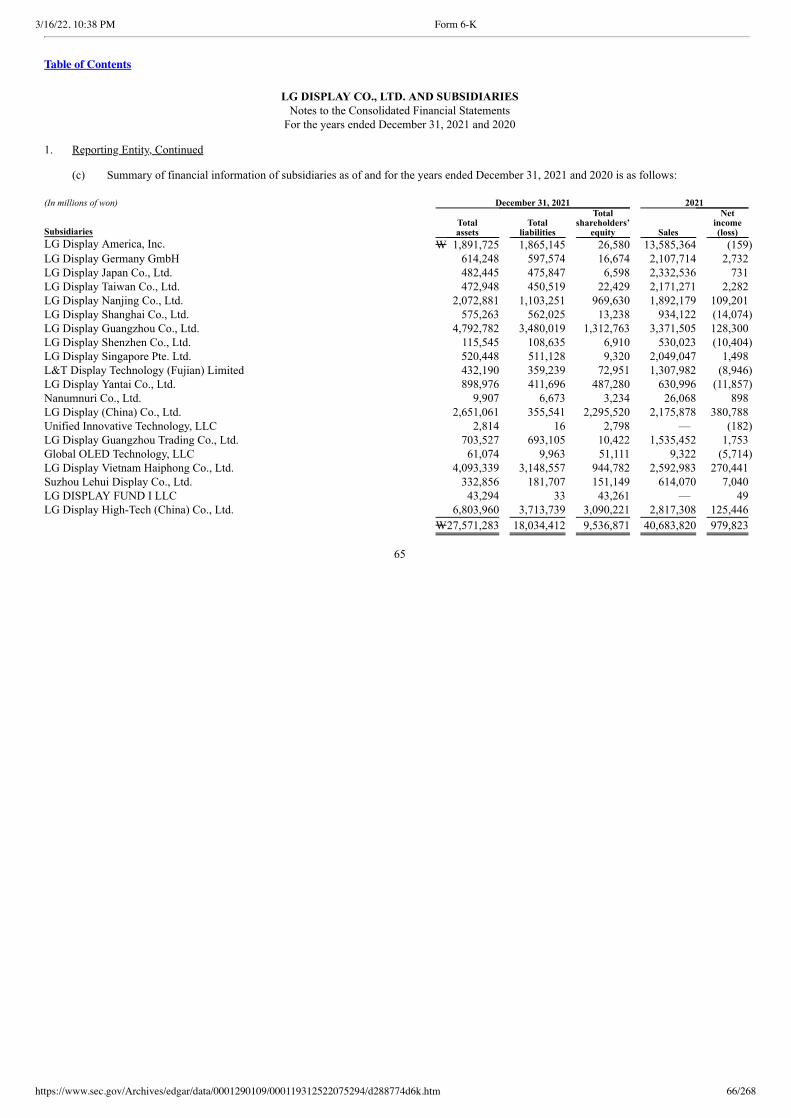
3/16/22, 10:38 PM Form 6-K
https://www.sec.gov/Archives/edgar/data/0001290109/000119312522075294/d288774d6k.htm 66/268
Table of Contents
LG DISPLAY CO., LTD. AND SUBSIDIARIESNotes to the Consolidated Financial Statements
For the years ended December 31, 2021 and 2020 1. Reporting Entity, Continued (c) Summary of financial information of subsidiaries as of and for the years ended December 31, 2021 and 2020 is as follows: (In millions of won) December 31, 2021 2021
Subsidiaries Total
assets Total
liabilities
Total shareholders’
equity Sales
Net income
(loss) LG Display America, Inc. W 1,891,725 1,865,145 26,580 13,585,364 (159) LG Display Germany GmbH 614,248 597,574 16,674 2,107,714 2,732 LG Display Japan Co., Ltd. 482,445 475,847 6,598 2,332,536 731 LG Display Taiwan Co., Ltd. 472,948 450,519 22,429 2,171,271 2,282 LG Display Nanjing Co., Ltd. 2,072,881 1,103,251 969,630 1,892,179 109,201 LG Display Shanghai Co., Ltd. 575,263 562,025 13,238 934,122 (14,074) LG Display Guangzhou Co., Ltd. 4,792,782 3,480,019 1,312,763 3,371,505 128,300 LG Display Shenzhen Co., Ltd. 115,545 108,635 6,910 530,023 (10,404) LG Display Singapore Pte. Ltd. 520,448 511,128 9,320 2,049,047 1,498 L&T Display Technology (Fujian) Limited 432,190 359,239 72,951 1,307,982 (8,946) LG Display Yantai Co., Ltd. 898,976 411,696 487,280 630,996 (11,857) Nanumnuri Co., Ltd. 9,907 6,673 3,234 26,068 898 LG Display (China) Co., Ltd. 2,651,061 355,541 2,295,520 2,175,878 380,788 Unified Innovative Technology, LLC 2,814 16 2,798 — (182) LG Display Guangzhou Trading Co., Ltd. 703,527 693,105 10,422 1,535,452 1,753 Global OLED Technology, LLC 61,074 9,963 51,111 9,322 (5,714) LG Display Vietnam Haiphong Co., Ltd. 4,093,339 3,148,557 944,782 2,592,983 270,441 Suzhou Lehui Display Co., Ltd. 332,856 181,707 151,149 614,070 7,040 LG DISPLAY FUND I LLC 43,294 33 43,261 — 49 LG Display High-Tech (China) Co., Ltd. 6,803,960 3,713,739 3,090,221 2,817,308 125,446
W27,571,283 18,034,412 9,536,871 40,683,820 979,823
65
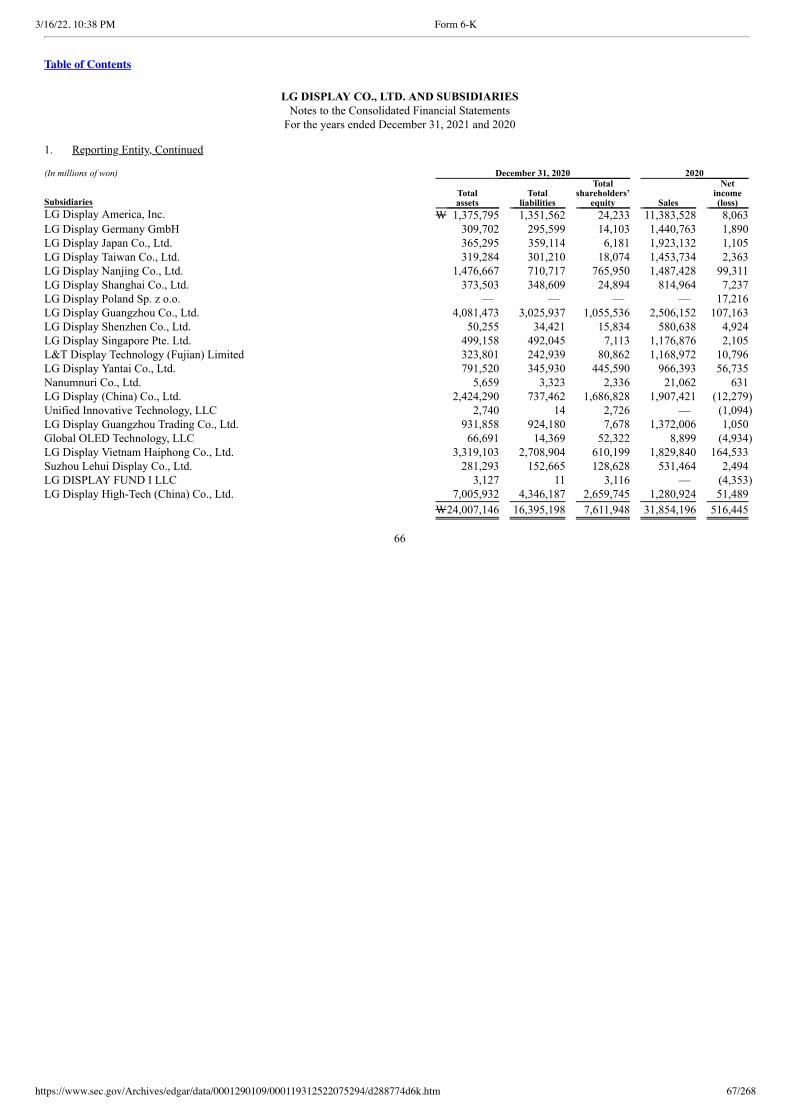
3/16/22, 10:38 PM Form 6-K
https://www.sec.gov/Archives/edgar/data/0001290109/000119312522075294/d288774d6k.htm 67/268
Table of Contents
LG DISPLAY CO., LTD. AND SUBSIDIARIESNotes to the Consolidated Financial Statements
For the years ended December 31, 2021 and 2020 1. Reporting Entity, Continued (In millions of won) December 31, 2020 2020
Subsidiaries Total
assets Total
liabilities
Total shareholders’
equity Sales
Net income
(loss) LG Display America, Inc. W 1,375,795 1,351,562 24,233 11,383,528 8,063 LG Display Germany GmbH 309,702 295,599 14,103 1,440,763 1,890 LG Display Japan Co., Ltd. 365,295 359,114 6,181 1,923,132 1,105 LG Display Taiwan Co., Ltd. 319,284 301,210 18,074 1,453,734 2,363 LG Display Nanjing Co., Ltd. 1,476,667 710,717 765,950 1,487,428 99,311 LG Display Shanghai Co., Ltd. 373,503 348,609 24,894 814,964 7,237 LG Display Poland Sp. z o.o. — — — — 17,216 LG Display Guangzhou Co., Ltd. 4,081,473 3,025,937 1,055,536 2,506,152 107,163 LG Display Shenzhen Co., Ltd. 50,255 34,421 15,834 580,638 4,924 LG Display Singapore Pte. Ltd. 499,158 492,045 7,113 1,176,876 2,105 L&T Display Technology (Fujian) Limited 323,801 242,939 80,862 1,168,972 10,796 LG Display Yantai Co., Ltd. 791,520 345,930 445,590 966,393 56,735 Nanumnuri Co., Ltd. 5,659 3,323 2,336 21,062 631 LG Display (China) Co., Ltd. 2,424,290 737,462 1,686,828 1,907,421 (12,279) Unified Innovative Technology, LLC 2,740 14 2,726 — (1,094) LG Display Guangzhou Trading Co., Ltd. 931,858 924,180 7,678 1,372,006 1,050 Global OLED Technology, LLC 66,691 14,369 52,322 8,899 (4,934) LG Display Vietnam Haiphong Co., Ltd. 3,319,103 2,708,904 610,199 1,829,840 164,533 Suzhou Lehui Display Co., Ltd. 281,293 152,665 128,628 531,464 2,494 LG DISPLAY FUND I LLC 3,127 11 3,116 — (4,353) LG Display High-Tech (China) Co., Ltd. 7,005,932 4,346,187 2,659,745 1,280,924 51,489
W24,007,146 16,395,198 7,611,948 31,854,196 516,445
66
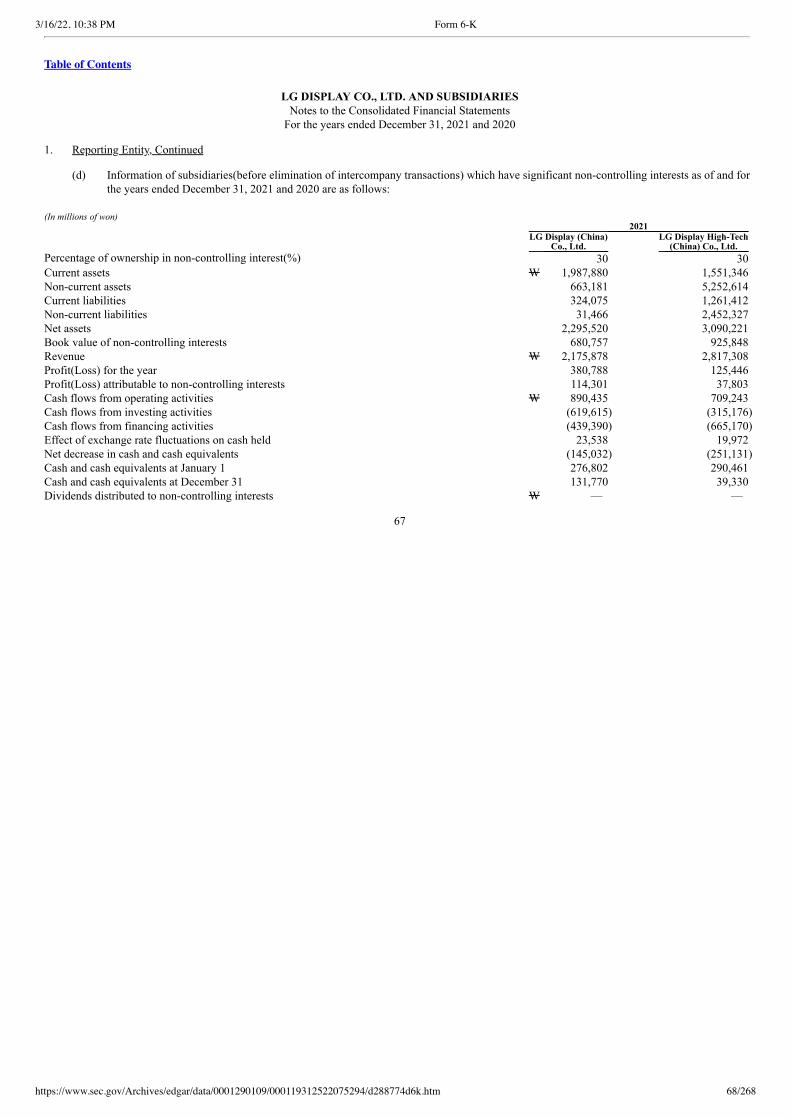
3/16/22, 10:38 PM Form 6-K
https://www.sec.gov/Archives/edgar/data/0001290109/000119312522075294/d288774d6k.htm 68/268
Table of Contents
LG DISPLAY CO., LTD. AND SUBSIDIARIESNotes to the Consolidated Financial Statements
For the years ended December 31, 2021 and 2020 1. Reporting Entity, Continued
(d) Information of subsidiaries(before elimination of intercompany transactions) which have significant non-controlling interests as of and forthe years ended December 31, 2021 and 2020 are as follows:
(In millions of won) 2021
LG Display (China)
Co., Ltd. LG Display High-Tech
(China) Co., Ltd. Percentage of ownership in non-controlling interest(%) 30 30 Current assets W 1,987,880 1,551,346 Non-current assets 663,181 5,252,614 Current liabilities 324,075 1,261,412 Non-current liabilities 31,466 2,452,327 Net assets 2,295,520 3,090,221 Book value of non-controlling interests 680,757 925,848 Revenue W 2,175,878 2,817,308 Profit(Loss) for the year 380,788 125,446 Profit(Loss) attributable to non-controlling interests 114,301 37,803 Cash flows from operating activities W 890,435 709,243 Cash flows from investing activities (619,615) (315,176) Cash flows from financing activities (439,390) (665,170) Effect of exchange rate fluctuations on cash held 23,538 19,972 Net decrease in cash and cash equivalents (145,032) (251,131) Cash and cash equivalents at January 1 276,802 290,461 Cash and cash equivalents at December 31 131,770 39,330 Dividends distributed to non-controlling interests W — —
67
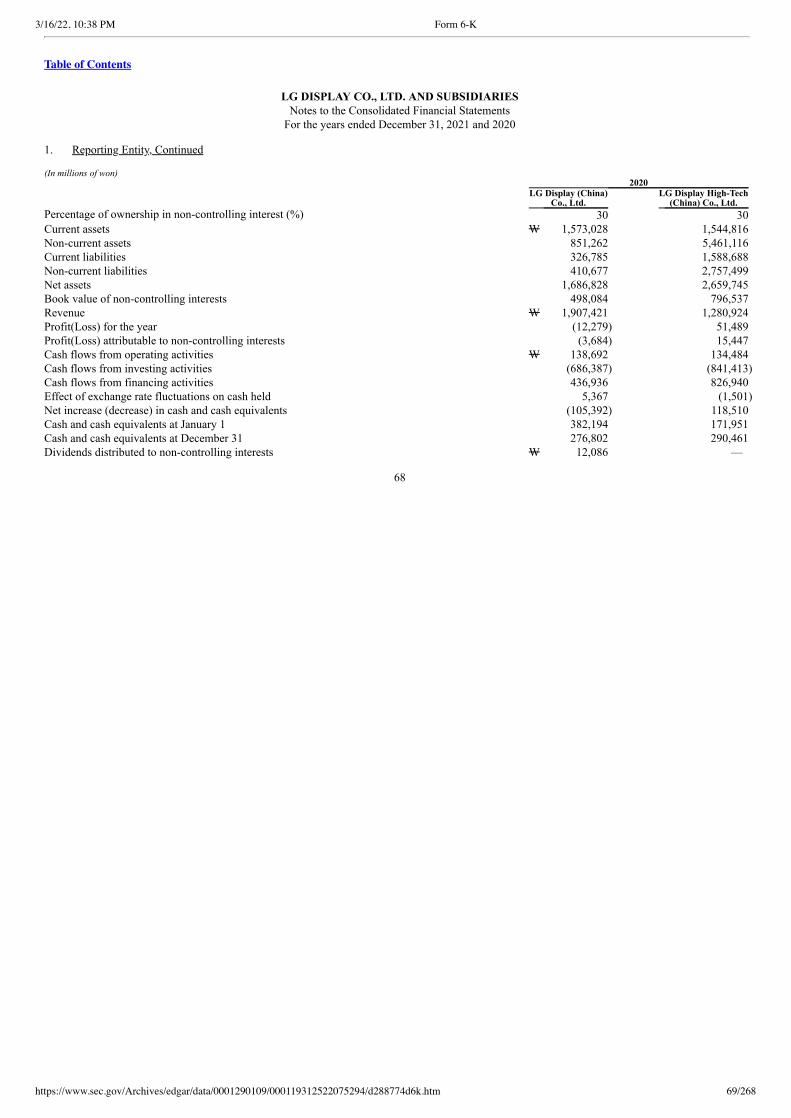
3/16/22, 10:38 PM Form 6-K
https://www.sec.gov/Archives/edgar/data/0001290109/000119312522075294/d288774d6k.htm 69/268
Table of Contents
LG DISPLAY CO., LTD. AND SUBSIDIARIESNotes to the Consolidated Financial Statements
For the years ended December 31, 2021 and 2020 1. Reporting Entity, Continued (In millions of won) 2020
LG Display (China)
Co., Ltd. LG Display High-Tech
(China) Co., Ltd. Percentage of ownership in non-controlling interest (%) 30 30 Current assets W 1,573,028 1,544,816 Non-current assets 851,262 5,461,116 Current liabilities 326,785 1,588,688 Non-current liabilities 410,677 2,757,499 Net assets 1,686,828 2,659,745 Book value of non-controlling interests 498,084 796,537 Revenue W 1,907,421 1,280,924 Profit(Loss) for the year (12,279) 51,489 Profit(Loss) attributable to non-controlling interests (3,684) 15,447 Cash flows from operating activities W 138,692 134,484 Cash flows from investing activities (686,387) (841,413) Cash flows from financing activities 436,936 826,940 Effect of exchange rate fluctuations on cash held 5,367 (1,501) Net increase (decrease) in cash and cash equivalents (105,392) 118,510 Cash and cash equivalents at January 1 382,194 171,951 Cash and cash equivalents at December 31 276,802 290,461 Dividends distributed to non-controlling interests W 12,086 —
68

3/16/22, 10:38 PM Form 6-K
https://www.sec.gov/Archives/edgar/data/0001290109/000119312522075294/d288774d6k.htm 70/268
Table of Contents
LG DISPLAY CO., LTD. AND SUBSIDIARIESNotes to the Consolidated Financial Statements
For the years ended December 31, 2021 and 2020 2. Basis of Presenting Financial Statements
(a) Statement of Compliance
In accordance with the Act on External Audits of Stock Companies, Etc., these consolidated financial statements have been prepared inaccordance with Korean International Financial Reporting Standards (“K-IFRS”).
The consolidated financial statements were authorized for issuance by the Board of Directors on January 26, 2022, which will besubmitted for approval to the shareholders’ meeting to be held on March 23, 2022.
(b) Basis of Measurement
The consolidated financial statements have been prepared on the historical cost basis except for the following material items in theconsolidated statement of financial position:
• derivative financial instruments at fair value, financial assets at fair value through profit or loss (“FVTPL”), financial assets at fairvalue through other comprehensive income (“FVOCI”), financial liabilities at fair value through profit or loss (“FVTPL”), and
• net defined benefit liabilities (defined benefit assets) recognized at the present value of defined benefit obligations less the fair valueof plan assets
(c) Functional and Presentation Currency
Each subsidiary’s financial statements within the Group are presented in the subsidiary’s functional currency, which is the currency of theprimary economic environment in which each subsidiary operates.
The consolidated financial statements are presented in Korean won, which is the Controlling Company’s functional currency.
(d) Use of Estimates and Judgments
The preparation of the consolidated financial statements in conformity with K-IFRSs requires management to make judgments, estimatesand assumptions that affect the application of accounting policies and the reported amounts of assets, liabilities, income and expenses.Actual results may differ from these estimates.
Estimates and underlying assumptions are reviewed on an ongoing basis. Revisions to accounting estimates are recognized in the period inwhich the estimates are revised and in any future periods affected.
Information about critical judgments in applying accounting policies that have the most significant effect on the amounts recognized in theconsolidated financial statements is included in the following notes:
• Financial instruments (Note 3(f))
• Impairment assessment of non-financial assets (Note 3(k), 10)
• Deferred tax assets and liabilities (Note 3(s), 24)
69
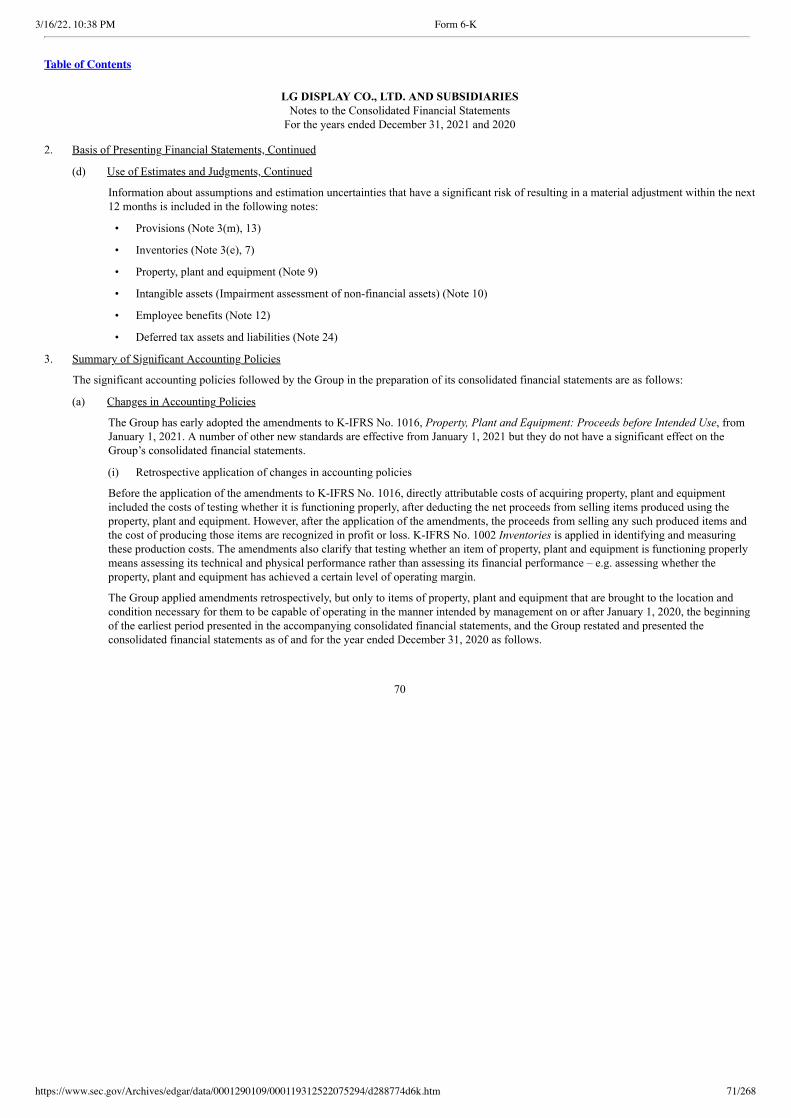
3/16/22, 10:38 PM Form 6-K
https://www.sec.gov/Archives/edgar/data/0001290109/000119312522075294/d288774d6k.htm 71/268
Table of Contents
LG DISPLAY CO., LTD. AND SUBSIDIARIESNotes to the Consolidated Financial Statements
For the years ended December 31, 2021 and 2020 2. Basis of Presenting Financial Statements, Continued
(d) Use of Estimates and Judgments, Continued
Information about assumptions and estimation uncertainties that have a significant risk of resulting in a material adjustment within the next12 months is included in the following notes:
• Provisions (Note 3(m), 13)
• Inventories (Note 3(e), 7)
• Property, plant and equipment (Note 9)
• Intangible assets (Impairment assessment of non-financial assets) (Note 10)
• Employee benefits (Note 12)
• Deferred tax assets and liabilities (Note 24)
3. Summary of Significant Accounting Policies
The significant accounting policies followed by the Group in the preparation of its consolidated financial statements are as follows:
(a) Changes in Accounting Policies
The Group has early adopted the amendments to K-IFRS No. 1016, Property, Plant and Equipment: Proceeds before Intended Use, fromJanuary 1, 2021. A number of other new standards are effective from January 1, 2021 but they do not have a significant effect on theGroup’s consolidated financial statements.
(i) Retrospective application of changes in accounting policies
Before the application of the amendments to K-IFRS No. 1016, directly attributable costs of acquiring property, plant and equipmentincluded the costs of testing whether it is functioning properly, after deducting the net proceeds from selling items produced using theproperty, plant and equipment. However, after the application of the amendments, the proceeds from selling any such produced items andthe cost of producing those items are recognized in profit or loss. K-IFRS No. 1002 Inventories is applied in identifying and measuringthese production costs. The amendments also clarify that testing whether an item of property, plant and equipment is functioning properlymeans assessing its technical and physical performance rather than assessing its financial performance – e.g. assessing whether theproperty, plant and equipment has achieved a certain level of operating margin.
The Group applied amendments retrospectively, but only to items of property, plant and equipment that are brought to the location andcondition necessary for them to be capable of operating in the manner intended by management on or after January 1, 2020, the beginningof the earliest period presented in the accompanying consolidated financial statements, and the Group restated and presented theconsolidated financial statements as of and for the year ended December 31, 2020 as follows.
70
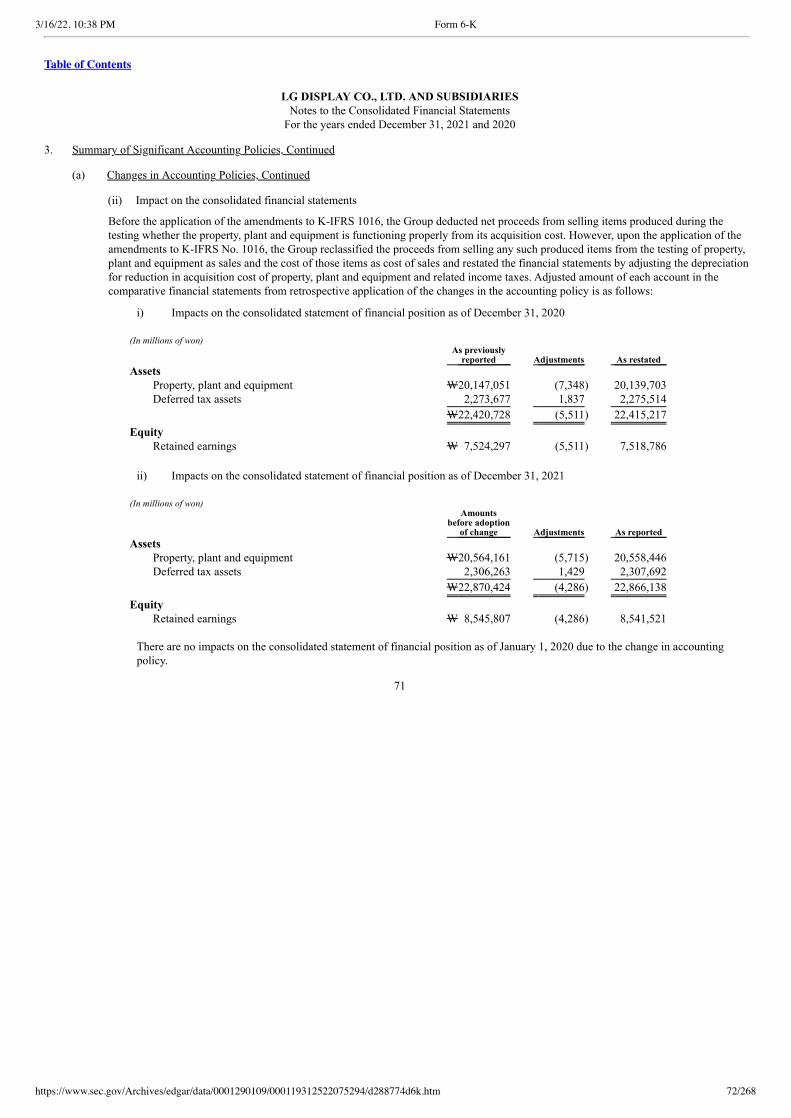
3/16/22, 10:38 PM Form 6-K
https://www.sec.gov/Archives/edgar/data/0001290109/000119312522075294/d288774d6k.htm 72/268
Table of Contents
LG DISPLAY CO., LTD. AND SUBSIDIARIESNotes to the Consolidated Financial Statements
For the years ended December 31, 2021 and 2020 3. Summary of Significant Accounting Policies, Continued (a) Changes in Accounting Policies, Continued (ii) Impact on the consolidated financial statements
Before the application of the amendments to K-IFRS 1016, the Group deducted net proceeds from selling items produced during thetesting whether the property, plant and equipment is functioning properly from its acquisition cost. However, upon the application of theamendments to K-IFRS No. 1016, the Group reclassified the proceeds from selling any such produced items from the testing of property,plant and equipment as sales and the cost of those items as cost of sales and restated the financial statements by adjusting the depreciationfor reduction in acquisition cost of property, plant and equipment and related income taxes. Adjusted amount of each account in thecomparative financial statements from retrospective application of the changes in the accounting policy is as follows:
i) Impacts on the consolidated statement of financial position as of December 31, 2020
(In millions of won)
As previously
reported Adjustments As restated Assets
Property, plant and equipment W20,147,051 (7,348) 20,139,703 Deferred tax assets 2,273,677 1,837 2,275,514
W22,420,728 (5,511) 22,415,217
Equity Retained earnings W 7,524,297 (5,511) 7,518,786
ii) Impacts on the consolidated statement of financial position as of December 31, 2021
(In millions of won)
Amounts before adoption
of change Adjustments As reported Assets
Property, plant and equipment W20,564,161 (5,715) 20,558,446 Deferred tax assets 2,306,263 1,429 2,307,692
W22,870,424 (4,286) 22,866,138
Equity Retained earnings W 8,545,807 (4,286) 8,541,521
There are no impacts on the consolidated statement of financial position as of January 1, 2020 due to the change in accountingpolicy.
71

3/16/22, 10:38 PM Form 6-K
https://www.sec.gov/Archives/edgar/data/0001290109/000119312522075294/d288774d6k.htm 73/268
Table of Contents
LG DISPLAY CO., LTD. AND SUBSIDIARIESNotes to the Consolidated Financial Statements
For the years ended December 31, 2021 and 2020 3. Summary of Significant Accounting Policies, Continued (a) Changes in Accounting Policies, Continued (ii) Impact on the consolidated financial statements, Continued
iii) Impacts on the consolidated statement of comprehensive income for the year ended December 31, 2020
(In millions of won, except earnings per share)
As previously
reported Adjustments As restated Revenue W 24,230,124 31,437 24,261,561 Cost of sales (21,587,554) (38,785) (21,626,339)
Gross profit W 2,642,570 (7,348) 2,635,222
Operating loss W (29,117) (7,348) (36,465) Loss before income tax W (595,098) (7,348) (602,446) Income tax benefit (524,462) (1,837) (526,299)
Loss for the year W (70,636) (5,511) (76,147)
Basic and diluted earnings (loss) per share (in won) W (250) (15) (265) iv) Impacts on the consolidated statement of comprehensive income for the year ended December 31, 2021
(In millions of won, except earnings per share)
Amounts before
adoption of change Adjustments As reported Revenue W 29,878,043 — 29,878,043 Cost of sales (24,574,572) 1,633 (24,572,939)
Gross profit W 5,303,471 1,633 5,305,104
Operating Income W 2,228,975 1,633 2,230,608 Profit before income tax W 1,717,252 1,633 1,718,885 Income tax expense 384,933 408 385,341
Profit for the year W 1,332,319 1,225 1,333,544
Basic earnings per share (in won) W 3,312 3 3,315 Diluted earnings per share (in won) W 3,126 4 3,130
72
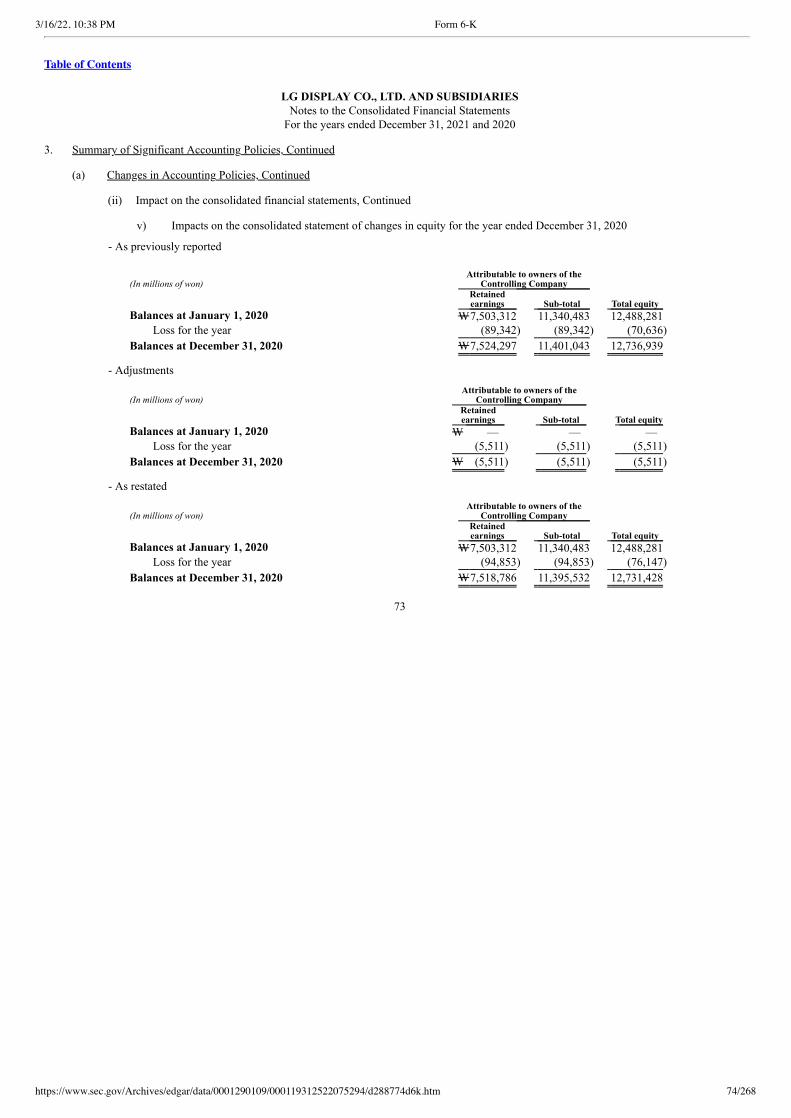
3/16/22, 10:38 PM Form 6-K
https://www.sec.gov/Archives/edgar/data/0001290109/000119312522075294/d288774d6k.htm 74/268
Table of Contents
LG DISPLAY CO., LTD. AND SUBSIDIARIESNotes to the Consolidated Financial Statements
For the years ended December 31, 2021 and 2020 3. Summary of Significant Accounting Policies, Continued (a) Changes in Accounting Policies, Continued (ii) Impact on the consolidated financial statements, Continued v) Impacts on the consolidated statement of changes in equity for the year ended December 31, 2020
- As previously reported
(In millions of won) Attributable to owners of the
Controlling Company
Retained
earnings Sub-total Total equity Balances at January 1, 2020 W7,503,312 11,340,483 12,488,281
Loss for the year (89,342) (89,342) (70,636)
Balances at December 31, 2020 W7,524,297 11,401,043 12,736,939
- Adjustments
(In millions of won) Attributable to owners of the
Controlling Company
Retained
earnings Sub-total Total equity Balances at January 1, 2020 W — — —
Loss for the year (5,511) (5,511) (5,511)
Balances at December 31, 2020 W (5,511) (5,511) (5,511)
- As restated
(In millions of won) Attributable to owners of the
Controlling Company
Retained
earnings Sub-total Total equity Balances at January 1, 2020 W7,503,312 11,340,483 12,488,281
Loss for the year (94,853) (94,853) (76,147)
Balances at December 31, 2020 W7,518,786 11,395,532 12,731,428
73
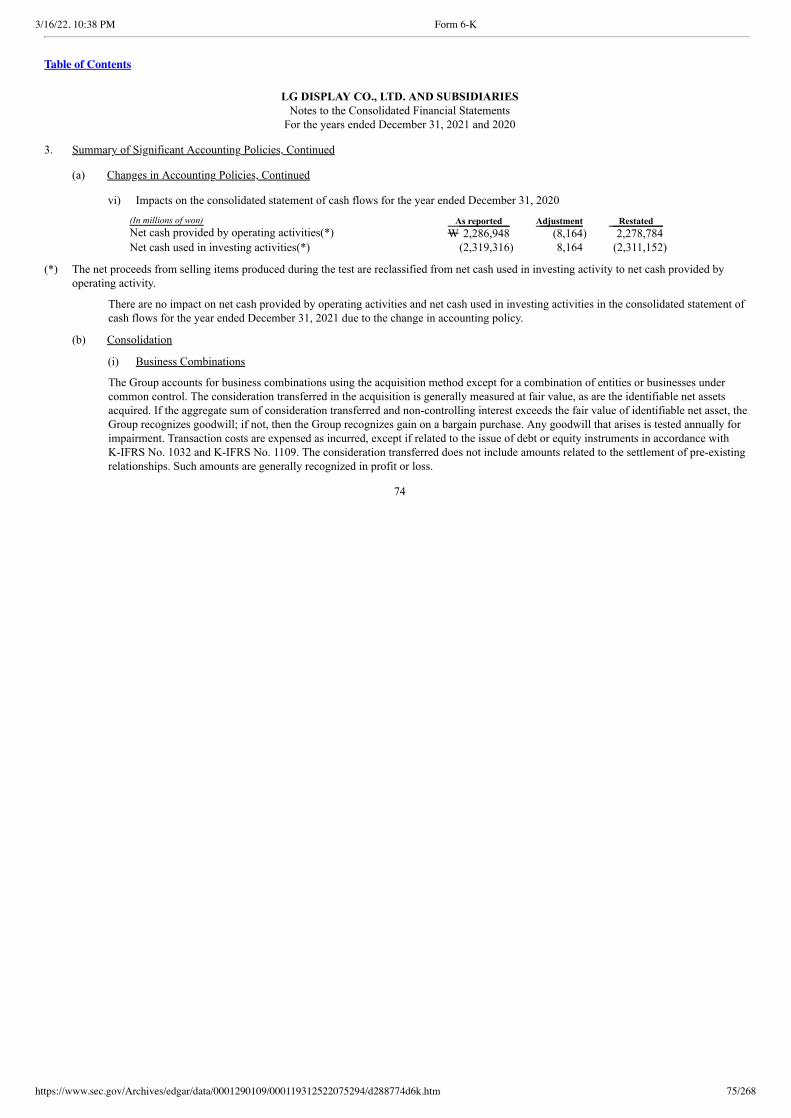
3/16/22, 10:38 PM Form 6-K
https://www.sec.gov/Archives/edgar/data/0001290109/000119312522075294/d288774d6k.htm 75/268
Table of Contents
LG DISPLAY CO., LTD. AND SUBSIDIARIESNotes to the Consolidated Financial Statements
For the years ended December 31, 2021 and 2020 3. Summary of Significant Accounting Policies, Continued (a) Changes in Accounting Policies, Continued vi) Impacts on the consolidated statement of cash flows for the year ended December 31, 2020
(In millions of won) As reported Adjustment Restated Net cash provided by operating activities(*) W 2,286,948 (8,164) 2,278,784 Net cash used in investing activities(*) (2,319,316) 8,164 (2,311,152)
(*) The net proceeds from selling items produced during the test are reclassified from net cash used in investing activity to net cash provided byoperating activity.
There are no impact on net cash provided by operating activities and net cash used in investing activities in the consolidated statement ofcash flows for the year ended December 31, 2021 due to the change in accounting policy.
(b) Consolidation
(i) Business Combinations
The Group accounts for business combinations using the acquisition method except for a combination of entities or businesses undercommon control. The consideration transferred in the acquisition is generally measured at fair value, as are the identifiable net assetsacquired. If the aggregate sum of consideration transferred and non-controlling interest exceeds the fair value of identifiable net asset, theGroup recognizes goodwill; if not, then the Group recognizes gain on a bargain purchase. Any goodwill that arises is tested annually forimpairment. Transaction costs are expensed as incurred, except if related to the issue of debt or equity instruments in accordance withK-IFRS No. 1032 and K-IFRS No. 1109. The consideration transferred does not include amounts related to the settlement of pre-existingrelationships. Such amounts are generally recognized in profit or loss.
74
3/16/22, 10:38 PM Form 6-K
https://www.sec.gov/Archives/edgar/data/0001290109/000119312522075294/d288774d6k.htm 76/268
Table of Contents
LG DISPLAY CO., LTD. AND SUBSIDIARIESNotes to the Consolidated Financial Statements
For the years ended December 31, 2021 and 2020 3. Summary of Significant Accounting Policies, Continued (b) Consolidation, Continued (ii) Subsidiaries
Subsidiaries are entities controlled by the Group. The Group controls an entity when it is exposed, or has right to, variable returns from itsinvolvement with the entity and has the ability to affect those returns through its power over the entity. The financial statements ofsubsidiaries are included in the consolidated financial statements from the date on which control commences until the date on whichcontrol ceases.
(iii) Non-controlling interests
Non-controlling interests (“NCI”) are measured at their proportionate share of the acquiree’s identifiable net assets at the acquisition date.Profit or loss and other comprehensive income (loss) of subsidiaries are attributed to owners of the Controlling Company and non-controlling interests.
Changes in the Group’s interest in subsidiaries that do not result in a loss of control are accounted for as equity transactions.
(iv) Loss of Control
If the Controlling Company loses control of subsidiaries, the Controlling Company derecognizes the assets and liabilities of the formersubsidiaries from the consolidated statement of financial position and recognizes the gain or loss associated with the loss of controlattributable to the former controlling interest. Meanwhile, the Controlling Company recognizes any investment retained in the formersubsidiaries at its fair value when control is lost.
(v) Associates and joint ventures (equity method investees)
Associates are those entities in which the Group has significant influence, but not control or joint control, over the financial and operatingpolicies. A joint venture is an arrangement in which the parties have joint control, whereby the parties has rights to the net assets of thearrangement, rather than rights to its assets and obligations for its liabilities.
Investments in associates and joint ventures are initially recognized at cost and subsequently accounted for using the equity method ofaccounting. The carrying amount of investments in associates and joint ventures is increased or decreased to recognize the Group’s shareof the profits or losses and changes in the Group’s proportionate interest of the investee after the date of acquisition. Distributions receivedfrom an investee reduce the carrying amount of the investment.
If an associate or a joint venture uses accounting policies different from those of the Controlling Company for like transactions and eventsin similar circumstances, appropriate adjustments are made to the consolidated financial statements. As of and during the periods presentedin the consolidated financial statements, no adjustments were made in applying the equity method.
When the Group’s share of losses exceeds its interest in an equity accounted investee, the carrying amount of that interest, including anylong-term investments, is reduced to nil, and the recognition of further losses is discontinued except to the extent that the Group has anobligation or has made payments on behalf of the investee.
75

3/16/22, 10:38 PM Form 6-K
https://www.sec.gov/Archives/edgar/data/0001290109/000119312522075294/d288774d6k.htm 77/268
Table of Contents
LG DISPLAY CO., LTD. AND SUBSIDIARIESNotes to the Consolidated Financial Statements
For the years ended December 31, 2021 and 2020 3. Summary of Significant Accounting Policies, Continued (b) Consolidation, Continued (vi) Transactions eliminated on consolidation
Intra-group balances and transactions, including income and expenses and any unrealized income and expenses and balance of tradeaccounts and notes receivable and payable arising from intra-group transactions, are eliminated. Unrealized gains arising from transactionswith equity-accounted investees are eliminated against the investment to the extent of the Group’s interest in the investee. Unrealizedlosses are eliminated in the same way as unrealized gains, but only to the extent that there is no evidence of impairment.
(c) Foreign Currency Transaction and Translation
Transactions in foreign currencies are translated to the respective functional currencies of the Group entities at exchange rates at the datesof the transactions. Monetary assets and liabilities denominated in foreign currencies are retranslated to the functional currency at theexchange rate on the reporting date. Non-monetary assets and liabilities denominated in foreign currencies that are measured at fair valueare retranslated to the functional currency at the exchange rate at the date that the fair value was originally determined. Foreign currencydifferences arising on retranslation are recognized in profit or loss, except for differences arising on an investment in equity instrumentsdesignated as at FVOCI and a financial asset and liability designated as a cash flow hedge, which are recognized in other comprehensiveincome. Exchange differences arising on the settlement of monetary items or on translating monetary items at rates different from those atwhich they were translated on initial recognition are recognized in profit or loss in the period in which they arise. Foreign currencydifferences arising from assets and liabilities in relation to the investing and financing activities including borrowings, bonds and cash andcash equivalents are recognized in finance income (costs) in the consolidated statement of comprehensive income (loss) and foreigncurrency differences arising from assets and liabilities in relation to activities other than investing and financing activities are recognizedin other non-operating income (expense) in the consolidated statement of comprehensive income (loss). Foreign currency differences arepresented in gross amounts in the consolidated statement of comprehensive income (loss).
If the presentation currency of the Group is different from a foreign operation’s functional currency, the financial position and financialperformance of the foreign operation are translated into the presentation currency using the following methods. The assets and liabilities offoreign operations, whose functional currency is not the currency of a hyperinflationary economy are translated to the Group’s functionalcurrency at exchange rates at the reporting date. The income and expenses of foreign operations are translated to the Group’s functionalcurrency at exchange rates at the dates of the transactions and foreign currency differences are recognized in other comprehensive income(loss). Relevant proportionate shares of foreign currency differences are allocated to the controlling interests and non-controlling interests.When a foreign operation is disposed of in its entirety or partially such that control, significant influence or joint control is lost, thecumulative amount in the translation reserve related to that foreign operation is reclassified to profit or loss as part of the gain or loss ondisposal. If the Group disposes part of its interest in a subsidiary but retains control, then the relevant proportion of the cumulative amountis reattributed to NCI. When the Group disposes of only part of an associate or joint venture while retaining significant influence or jointcontrol, the relevant proportion of the cumulative amount is reclassified to profit or loss.
Any goodwill arising on the acquisition of a foreign operation and any fair value adjustments to the carrying amounts of assets andliabilities arising on the acquisition of that foreign operation is treated as assets and liabilities of the foreign operation. Thus, they areexpressed in the functional currency of the foreign operation and translated at the at each reporting date’s exchange rate.
76
3/16/22, 10:38 PM Form 6-K
https://www.sec.gov/Archives/edgar/data/0001290109/000119312522075294/d288774d6k.htm 78/268
Table of Contents
LG DISPLAY CO., LTD. AND SUBSIDIARIESNotes to the Consolidated Financial Statements
For the years ended December 31, 2021 and 2020 3. Summary of Significant Accounting Policies, Continued (d) Cash and cash equivalents
Cash and cash equivalents include all cash balances and short-term highly liquid investments with an original maturity of three months orless that are readily convertible into known amounts of cash.
(e) Inventories
Inventories are measured at the lower of cost and net realizable value. The cost of inventories is based on the weighted-average method,and includes expenditures incurred in acquiring the inventories, production or conversion costs and other costs incurred in bringing themto their existing location and condition. Net realizable value is the estimated selling price in the ordinary course of business less theestimated costs of completion and the estimated selling expenses. In the case of manufactured inventories and work-in-process, costincludes an appropriate share of production overheads based on the actual capacity of production facilities. However, the normal capacityis used for the allocation of fixed production overheads if the actual level of production is lower than the normal capacity.
(f) Financial Instruments
(i) Non-derivative financial assets
Recognition and initial measurement
Trade receivables and debt instruments issued are initially recognized when they are originated. All other financial assets are recognized instatement of financial position when, and only when, the Group becomes a party to the contractual provisions of the instrument.
A financial asset (unless it is a trade receivable without a significant financing component) is initially measured at fair value plus, for anitem not at FVTPL, transaction costs that are directly attributable to its acquisition or issue. A trade receivable without a significantfinancing component is initially measured at the transaction price.
Classification and subsequent measurement
i) Financial assets
On initial recognition, a financial asset is classified as measured at: amortized cost; FVOCI – debt investment; FVOCI – equityinvestments; or FVTPL. Financial assets are not reclassified subsequent to their initial recognition unless the Group changes its businessmodel for managing financial assets, in which case all affected financial assets are reclassified on the first day of the subsequent reportingperiod following the change in the business model.
A financial asset is measured as at amortized cost if it meets both of the following conditions and is not designated as at FVTPL:
• it is held within a business model whose objective is to hold assets to collect contractual cash flows; and
• its contractual terms give rise on specified dates to cash flows that are solely payments of principal and interest on the principalamount outstanding.
77
3/16/22, 10:38 PM Form 6-K
https://www.sec.gov/Archives/edgar/data/0001290109/000119312522075294/d288774d6k.htm 79/268
Table of Contents
LG DISPLAY CO., LTD. AND SUBSIDIARIESNotes to the Consolidated Financial Statements
For the years ended December 31, 2021 and 2020 3. Summary of Significant Accounting Policies, Continued (f) Financial Instruments, Continued
A debt investment is measured at FVOCI if it meets both of the following conditions and is not designated as at FVTPL:
• it is held within a business model whose objective is achieved by both collecting contractual cash flows and selling financial assets;and
• the contractual terms give rise on specified dates to cash flows that are solely payments of principal and interest on the principalamount outstanding.
On initial recognition of an equity investments that is not held for trading, the Group may irrevocably elect to present subsequent changesin the investment’s fair value in OCI. This election is made on an investment-by-investment basis.
All financial assets not classified as measured at amortized cost or FVOCI as described above are measured as at FVTPL. This includes allderivative financial assets. At initial recognition, the Group may irrevocably designate a financial asset that otherwise meets therequirements to be measured at amortized cost or at FVOCI as at FVTPL if doing so eliminates or significantly reduces an accountingmismatch that would otherwise arise.
ii) Financial assets: business model
The Group makes an assessment of the objective of the business model in which a financial asset is held at a portfolio level because thisbest reflects the way the business is managed and information is provided to management. The information considered includes:
• the stated policies and objectives for the portfolio and the operation of those policies in practice (these include whethermanagement’s strategy focuses on earning contractual interest income, maintaining a particular interest rate profile, matching theduration of the financial assets to the duration of any related liabilities or expected cash outflows or realizing cash flows through thesale of the assets);
• how the performance of the portfolio is evaluated and reported to the Group’s management;
• the risks that affect the performance of the business model (and the financial assets held within that business model) and how thoserisks are managed; and
• the frequency, volume and timing of sales of financial assets in prior periods, the reasons for such sales and expectations about futuresales activity.
Transfers of financial assets to third parties in transaction that do not qualify for derecognition are not considered sale for this purpose.
A financial asset that is held for trading or is managed and whose performance is evaluated on a fair value basis is measured at FVTPL.
78
3/16/22, 10:38 PM Form 6-K
https://www.sec.gov/Archives/edgar/data/0001290109/000119312522075294/d288774d6k.htm 80/268
Table of Contents
LG DISPLAY CO., LTD. AND SUBSIDIARIESNotes to the Consolidated Financial Statements
For the years ended December 31, 2021 and 2020 3. Summary of Significant Accounting Policies, Continued (f) Financial Instruments, Continued iii) Financial assets: Assessment whether contractual cash flows are solely payments of principal and interest
For the purpose of the assessment, “principal” is defined as the fair value of the financial asset on initial recognition. ‘Interest’ is definedas consideration for the time value of money and for the credit risk associated with the principal amount outstanding during a particularperiod of time and for other basic lending risks and cost (e.g. liquidity risk and administrative costs), as well as profit margin.
In assessing whether the contractual cash flows are solely payments of principal and interest, the Group considers the contractual terms ofthe instrument. This includes assessing whether the financial asset contains a contractual term that could change the timing or amount ofcontractual cash flows such that it would not meet this condition. In making this assessment, the Group considers:
• contingent events that would change the amount or timing of cash flows:
• terms that may adjust the contractual coupon rate, including variable-rate features;
• prepayment and extension features; and
• terms that limit the Group’s claim to cash flows from specified assets (e.g. non-recourse features)
A prepayment feature is consistent with the solely payments of principal and interest criterion if the prepayment amount substantiallyrepresents unpaid amounts of principal and interest or the principal amount outstanding, which may include reasonable additionalcompensation for early termination of the contract.
Additionally, for a financial asset acquired at a discount or premium to its contractual par amount, a feature that permits or requiresprepayment at an amount that substantially represents the contractual par amount plus accrued but unpaid contractual interest (which mayalso include reasonable additional compensation for early termination) is treated as consistent with this criterion if the fair value of theprepayment feature is insignificant at initial recognition.
iv) Financial assets: Subsequent measurement and gains and losses Financial assets at FVTPL
These assets are subsequently measured at fair value. Net gains and losses, including any interest or dividend income, arerecognized in profit or loss.
Financial assets at amortizedcost
These assets are subsequently measured at amortized cost using the effective interest method. The amortized cost isreduced by impairment losses. Interest income, foreign exchange gains and losses and impairment are recognized in profitor loss. Any gain or loss on derecognition is recognized in profit or loss.
Debt investments at FVOCI
These assets are subsequently measured at fair value. Interest income calculated using the effective interest method,foreign exchange gains and losses and impairment are recognized in profit or loss. Other net gains and losses arerecognized in OCI. On derecognition, gains and losses accumulated in OCI are reclassified to profit or loss.
79
3/16/22, 10:38 PM Form 6-K
https://www.sec.gov/Archives/edgar/data/0001290109/000119312522075294/d288774d6k.htm 81/268
Table of Contents
LG DISPLAY CO., LTD. AND SUBSIDIARIESNotes to the Consolidated Financial Statements
For the years ended December 31, 2021 and 2020 3. Summary of Significant Accounting Policies, Continued (f) Financial Instruments, Continued
Derecognition
The Group derecognizes a financial asset when the contractual rights to the cash flows from the asset expire, it transfers the rights toreceive the contractual cash flows of the financial asset in a transaction in which substantially all the risks and rewards of ownership of thefinancial asset are transferred, or it transfers or does not retain substantially all the risks and rewards of ownership of a transferred asset,and does not retain control of the transferred asset.
If the Group has retained substantially all the risks and rewards of ownership of the transferred asset, the Group continues to recognize thetransferred asset.
Interest rate benchmark reform
In case the basis for determining the contractual cash flows of a financial asset or financial liability measured at amortized cost changed asa result of interest rate benchmark reform, the Group updates the effective interest rate of the financial asset or financial liability to reflectthe change that is required by the reform if both of the following conditions are met:
• the change is necessary as a direct consequence of the reform; and
• the new basis for determining the contractual cash flows is economically equivalent to the previous basis – i.e. the basis immediatelybefore the change.
When changes were made to a financial asset or financial liability in addition to changes to the basis for determining the contractual cashflows required by interest rate benchmark reform, the Group first updates the effective interest rate of the financial asset or financialliability to reflect the change that is required by interest rate benchmark reform. After that, the Group applies the policies on accounting formodifications to the additional changes.
Offset
Financial assets and liabilities are offset and the net amount is presented in the consolidated statement of financial position when, and onlywhen, the Group has a legal right to offset the amounts and intends either to settle them on a net basis or to realize the asset and settle theliability simultaneously.
(ii) Non-derivative financial liabilities
The Group classifies financial liabilities into two categories, financial liabilities at FVTPL and other financial liabilities in accordance withthe substance of the contractual arrangement and the definitions of financial liabilities, and recognizes them in the consolidated statementof financial position when the Group becomes a party to the contractual provisions of the instrument.
Financial liabilities at FVTPL include financial liabilities held for trading or designated as such upon initial recognition at FVTPL. Afterinitial recognition, financial liabilities at FVTPL are measured at fair value, and changes therein are recognized in profit or loss. Uponinitial recognition, transaction costs that are directly attributable to the issuance of financial liabilities are recognized in profit or loss asincurred.
80
3/16/22, 10:38 PM Form 6-K
https://www.sec.gov/Archives/edgar/data/0001290109/000119312522075294/d288774d6k.htm 82/268
Table of Contents
LG DISPLAY CO., LTD. AND SUBSIDIARIESNotes to the Consolidated Financial Statements
For the years ended December 31, 2021 and 2020 3. Summary of Significant Accounting Policies, Continued (f) Financial Instruments, Continued
Non-derivative financial liabilities other than financial liabilities classified as at FVTPL are classified as other financial liabilities andmeasured initially at fair value minus transaction costs that are directly attributable to the issuance of financial liabilities. Subsequent toinitial recognition, these financial liabilities are measured at amortized cost using the effective interest method. As of December 31, 2020,non-derivative financial liabilities comprise borrowings, bonds, trade accounts and notes payable, other accounts payable and others.
The Group derecognizes a financial liability when its contractual obligations are discharged, cancelled or expired.
(iii) Share Capital
The Group issued common stocks and they are classified as equity. Incremental costs directly attributable to the issuance of commonstocks are recognized as a deduction from equity, net of tax effects. Capital contributed in excess of par value upon issuance of commonstocks is classified as share premium within equity.
(iv) Derivative financial instruments
Derivatives are initially recognized at fair value. Subsequent to initial recognition, derivatives are measured at fair value, and changestherein are accounted for as described below.
Hedge Accounting
If necessary, the Group designates derivatives as hedging items to hedge the risk of changes in the fair value of assets, liabilities or firmcommitments (a fair value hedge) and foreign currency risk of highly probable forecasted transactions or firm commitments (a cash flowhedge).
On initial designation of the hedge, the Group’s management formally designates and documents the relationship between the hedginginstrument(s) and hedged item(s), including the risk management objectives and strategy in undertaking the hedge transaction, togetherwith the methods that will be used to assess the effectiveness of the hedging relationship, both at the inception of the hedge relationship aswell as on an ongoing basis.
i) Fair value hedges
Change in the fair value of a derivative hedging instrument designated as a fair value hedge and the hedged item is recognized in profit orloss, respectively. The gain or loss from remeasuring the hedging instrument at fair value and the gain or loss on the hedged itemattributable to the hedged risk are recognized in profit or loss in the same line item of the statement of comprehensive income (loss). TheGroup discontinues fair value hedge accounting if it does not designate the derivative hedging instrument and the hedged item as the hedgerelationship between them anymore; if the hedging instrument expires or is sold, terminated or exercised; or if the hedge no longer meetsthe criteria for hedge accounting.
81
3/16/22, 10:38 PM Form 6-K
https://www.sec.gov/Archives/edgar/data/0001290109/000119312522075294/d288774d6k.htm 83/268
Table of Contents
LG DISPLAY CO., LTD. AND SUBSIDIARIESNotes to the Consolidated Financial Statements
For the years ended December 31, 2021 and 2020 3. Summary of Significant Accounting Policies, Continued (f) Financial Instruments, Continued ii) Cash flow hedges
When a derivative designated as a cash flow hedging instrument meets the criteria of cash flow hedge accounting, the effective portion ofchanges in the fair value of the derivative is recognized in other comprehensive income and the ineffective portion of changes in the fairvalue of the derivative is recognized in profit or loss. The Group discontinues cash flow hedge accounting if it does not designate thederivative hedging instrument and the hedged item as the hedge relationship between them anymore; if the hedging instruments expires oris sold, terminated or exercised; or if the hedge no longer meets the criteria for hedge accounting. The cumulative gain or loss on thehedging instrument that has been recognized in other comprehensive income is reclassified to profit or loss in the periods during which theforecasted transaction occurs. If the forecasted transaction is no longer expected to occur, then the balance in other comprehensive incomeis recognized immediately in profit or loss.
The Group is applying cash flow hedge accounting by designating expected foreign currency denominated sales arising from forecastexport transactions as hedging items and the derivative instruments related to forward exchange as hedging instruments. The effectiveportion of changes in the fair value of the derivative is recognized in equity and the amount accumulated in equity is reclassified torevenue in the same period which forecast sales occur.
Embedded derivative
Embedded derivatives are separated from the host contract and accounted for separately if the host contract is not a financial asset andcertain criteria are met.
Other derivative financial instruments
Other derivative financial instruments are measured at fair value and changes of their fair value are recognized in profit or loss.
(g) Property, Plant and Equipment
(i) Recognition and measurement
Items of property, plant and equipment are measured at cost less accumulated depreciation and accumulated impairment losses. Costincludes an expenditure that is directly attributable to the acquisition of the asset. The cost of self-constructed assets includes the cost ofmaterials and direct labor, any costs directly attributable to bringing the assets to a working condition for their intended use, the costs ofdismantling and removing the items and restoring the site on which they are located and borrowing costs on qualifying assets.
The gain or loss arising from the derecognition of an item of property, plant and equipment is determined as the difference between the netdisposal proceeds, if any, and the carrying amount of the item and recognized in other non-operating income or other non-operatingexpenses.
82
3/16/22, 10:38 PM Form 6-K
https://www.sec.gov/Archives/edgar/data/0001290109/000119312522075294/d288774d6k.htm 84/268
Table of Contents
LG DISPLAY CO., LTD. AND SUBSIDIARIESNotes to the Consolidated Financial Statements
For the years ended December 31, 2021 and 2020 3. Summary of Significant Accounting Policies, Continued (g) Property, Plant and Equipment, Continued (ii) Subsequent costs
Subsequent expenditure on an item of property, plant and equipment is recognized as part of its cost only if it is probable that futureeconomic benefits associated with the item will flow to the Group and the cost of the item can be measured reliably. The costs of the day-to-day servicing of property, plant and equipment are recognized in profit or loss as incurred.
(iii) Depreciation
Land is not depreciated and depreciation of other items of property, plant and equipment is recognized in profit or loss on a straight-linebasis, reflecting the pattern in which the asset’s future economic benefits are expected to be consumed by the Group. The residual value ofproperty, plant and equipment is zero.
Estimated useful lives of the assets are as follows:
Estimateduseful lives
(years)Buildings and structures 20~40Machinery 4, 5Furniture and fixtures 4Equipment, tools and vehicles 2, 4, 12Right-of-use assets (*)
(*) The Group depreciates the right-of-use assets from the commencement date to the earlier of the end of the useful life of the right-of-use asset orthe end of the lease term.
Depreciation methods, useful lives and residual values are reviewed at each financial year-end and adjusted if appropriate and any changesare accounted for as changes in accounting estimates.
(h) Borrowing Costs
The Group capitalizes borrowing costs, which includes interests and exchange differences arising from foreign currency borrowings to theextent that they are regarded as an adjustment to interest costs, directly attributable to the acquisition, construction or production of aqualifying asset as part of the cost of that asset. A qualifying asset is an asset that necessarily takes a substantial period of time to get readyfor its intended use or sale. To the extent that the Group borrows funds specifically for the purpose of obtaining a qualifying asset, theGroup determines the amount of borrowing costs eligible for capitalization as the actual borrowing costs incurred on that borrowing duringthe period less any investment income on the temporary investment of those borrowings. The Group immediately recognizes otherborrowing costs as an expense.
83
3/16/22, 10:38 PM Form 6-K
https://www.sec.gov/Archives/edgar/data/0001290109/000119312522075294/d288774d6k.htm 85/268
Table of Contents
LG DISPLAY CO., LTD. AND SUBSIDIARIESNotes to the Consolidated Financial Statements
For the years ended December 31, 2021 and 2020 3. Summary of Significant Accounting Policies, Continued (i) Government Grants
In case there is reasonable assurance that the Group will comply with the conditions attached to a government grant, the government grantis recognized as follows:
(i) Grants related to the purchase or construction of assets
A government grant related to the purchase or construction of assets is deducted in calculating the carrying amount of the asset. The grantis recognized in profit or loss over the life of a depreciable asset as a reduced depreciation expense and cash related to grant received ispresented in investing activities in the statement of cash flows.
(ii) Grants for compensating the Group’s expenses incurred
A government grant that compensates the Group for expenses incurred is recognized in profit or loss as a deduction from relevantexpenses on a systematic basis in the periods in which the expenses are recognized.
(iii) Other government grants
A government grant that becomes receivable for the purpose of giving immediate financial support to the Group with no compensation forexpenses or losses already incurred or no future related costs is recognized as income of the period in which it becomes receivable.
(j) Intangible Assets
Intangible assets are initially measured at cost. Subsequently, intangible assets are measured at cost less accumulated amortization andaccumulated impairment losses.
(i) Goodwill
Goodwill arising from business combinations is recognized as the excess of the acquisition cost of a business over the net fair value of theidentifiable assets acquired and liabilities assumed. Any deficit is a bargain purchase that is recognized in profit or loss. Goodwill ismeasured at cost less accumulated impairment losses.
(ii) Research and development
Expenditure on research activities, undertaken with the prospect of gaining new scientific or technical knowledge and understanding, isrecognized in profit or loss as incurred. Development activities involve a plan or design of the production of new or substantially improvedproducts and processes. Development expenditure is capitalized as intangible assets only if the Group can demonstrate all of the following:
84
3/16/22, 10:38 PM Form 6-K
https://www.sec.gov/Archives/edgar/data/0001290109/000119312522075294/d288774d6k.htm 86/268
Table of Contents
LG DISPLAY CO., LTD. AND SUBSIDIARIESNotes to the Consolidated Financial Statements
For the years ended December 31, 2021 and 2020 3. Summary of Significant Accounting Policies, Continued (j) Intangible Assets, Continued • the technical feasibility of completing the intangible asset so that it will be available for use or sale,
• its intention to complete the intangible asset and use or sell it,
• its ability to use or sell the intangible asset,
• how the intangible asset will generate probable future economic benefits (among other things, the Group can demonstrate the
usefulness of the intangible asset by existence of a market for the output of the intangible asset or the intangible asset itself if it is tobe used internally),
• the availability of adequate technical, financial and other resources to complete the development and to use or sell the intangibleasset, and
• its ability to measure reliably the expenditure attributable to the intangible asset during its development.
Development projects are divided into research activities and development activities. Expenditures on research activities are recognized inprofit or loss and qualifying development expenditures on development activities are capitalized.
The expenditure capitalized includes the cost of materials, direct labor and overhead costs that are directly attributable to preparing theasset for its intended use, and borrowing costs on qualifying assets.
(iii) Other intangible assets
Other intangible assets include intellectual property rights, software, customer relationships, technology, memberships and others.
(iv) Subsequent costs
Subsequent expenditures are capitalized only when they increase the future economic benefits embodied in the specific intangible asset towhich they relate. All other expenditures, including expenditures on internally generated goodwill and brands, are recognized in profit orloss as incurred.
(v) Amortization
Amortization is calculated on a straight-line basis over the estimated useful lives of intangible assets, other than goodwill, from the datethat they are available for use. The residual value of intangible assets is zero. However, as there are no foreseeable limits to the periodsover which condominium and golf club memberships are expected to be available for use, these intangible assets are regarded as havingindefinite useful lives and not amortized.
85
3/16/22, 10:38 PM Form 6-K
https://www.sec.gov/Archives/edgar/data/0001290109/000119312522075294/d288774d6k.htm 87/268
Table of Contents
LG DISPLAY CO., LTD. AND SUBSIDIARIESNotes to the Consolidated Financial Statements
For the years ended December 31, 2021 and 2020 3. Summary of Significant Accounting Policies, Continued (j) Intangible Assets, Continued
Estimateduseful lives
(years)Intellectual property rights 5, 10, (*1)Rights to use electricity, water and gas supply facilities 10Software 4, (*1)Customer relationships 7, 10Technology 10Development costs (*2)Condominium and golf club memberships Indefinite
(*1) Software license and patent royalty are amortized over the useful lives considering the contract period.(*2) Capitalized development costs are amortized over the useful lives considering the life cycle of the developed products. Amortization of capitalized
development costs are recognized in research and development expenses in the consolidated statement of comprehensive income (loss).
Amortization periods and the amortization methods for intangible assets with finite useful lives are reviewed at each financial year-end.The useful lives of intangible assets with indefinite useful lives are reviewed at each financial year-end to determine whether events andcircumstances continue to support indefinite useful life assessments for those assets. If appropriate, the changes are accounted for aschanges in accounting estimates.
(k) Impairment
(i) Financial assets
Financial instruments and contract assets
The Group recognizes loss allowance for financial assets measured at amortized cost and debt investments at FVOCI at the ‘expectedcredit loss’ (ECL).
The Group recognizes a loss allowance for the life-time expected credit losses except for following, which are measured at 12-monthECLs:
• debt instruments that are determined to have low credit risk at the reporting date; and
• other debt instruments and bank deposits for which credit risk (i.e. the risk of default occurring over the expected life of the financialinstrument) has not increased significantly since initial recognition.
When determining whether the credit risk of a financial asset has increased significantly since initial recognition and when estimatingECLs, the Group considers reasonable and supportable information that is relevant and available without undue cost or effort. Thisincludes both qualitative and quantitative information and analysis, based on the Group’s historical experience and informed creditassessment including forward-looking information.
Lifetime ECLs are the ECLs that result from all possible default events over the expected life of a financial instrument.
86
3/16/22, 10:38 PM Form 6-K
https://www.sec.gov/Archives/edgar/data/0001290109/000119312522075294/d288774d6k.htm 88/268
Table of Contents
LG DISPLAY CO., LTD. AND SUBSIDIARIESNotes to the Consolidated Financial Statements
For the years ended December 31, 2021 and 2020 3. Summary of Significant Accounting Policies, Continued (k) Impairment, Continued
12-month ECLs are the portion of the ECLs that result from default events that are possible within the 12 months after the reporting date(or a shorter period if the expected life of the instrument is less than 12 months).
The maximum period considered when estimating ECLs is the maximum contractual period over which the Group is exposed to creditrisk.
Estimation of expected credit losses
Expected credit losses are a probability-weighted estimate of credit losses. Credit losses are measured using the present value of thedifference between the contractual cash flows and the expected contractual cash flows. The expected credit losses are discounted usingeffective interest rate of the financial assets.
Credit-impaired financial assets
At each reporting period-end, the Group assesses whether financial assets carried at amortized cost and debt instruments at FVOCI arecredit-impaired. A financial asset is ‘credit-impaired’ when one or more events that have a detrimental impact on the estimated future cashflows of the financial asset have occurred.
Evidence that a financial asset is credit-impaired includes the following observable data:
• significant financial difficulty of the issuer or the borrower;
• the lender(s) of the borrower, for economic or contractual reasons relating to the borrower’s financial difficulty, having granted to theborrower a concession(s) that the lender(s) would not otherwise consider;
• it is probable that the borrower will enter bankruptcy or other financial reorganization; or
• the disappearance of an active market for a security because of financial difficulties.
Presentation of loss allowance for ECL in the consolidated statement of financial position
Loss allowances for financial assets measured at amortized cost are deducted from the gross carrying amount of the assets. For debtinstruments at FVOCI, the loss allowance is charged to profit or loss and is recognized in OCI instead of reducing the carrying amount offinancial assets in the consolidated statement of financial position.
Write-off
The gross carrying amount of a financial asset is written off when the Group has no reasonable expectations for recovering the financialasset in its entirety or a portion thereof. The Group assess whether there are reasonable expectations of recovering the contractual cashflows from customers and individually assess the timing and amount of write-off. The Group expects no significant recovery from theamount written-off. However, financial assets that are written off could still be subject to enforcement activities in order to comply withthe Group’s procedures for recovery of amounts due.
87
3/16/22, 10:38 PM Form 6-K
https://www.sec.gov/Archives/edgar/data/0001290109/000119312522075294/d288774d6k.htm 89/268
Table of Contents
LG DISPLAY CO., LTD. AND SUBSIDIARIESNotes to the Consolidated Financial Statements
For the years ended December 31, 2021 and 2020 3. Summary of Significant Accounting Policies, Continued (k) Impairment, Continued (ii) Non-financial assets
The carrying amounts of the Group’s non-financial assets, other than assets arising from employee benefits, inventories and deferred taxassets, are reviewed at each reporting date to determine whether there is any indication of impairment. If any such indication exists, thenthe asset’s recoverable amount is estimated. For goodwill, and intangible assets that have indefinite useful lives or that are not yet availablefor use, irrespective of whether there is any indication of impairment, the recoverable amount is estimated each year.
Recoverable amount is estimated for the individual asset. If it is not possible to estimate the recoverable amount of the individual asset, theGroup determines the recoverable amount of the cash-generating unit to which the asset belongs. The cash-generating unit (“CGU”) is thesmallest group of assets that includes the asset and generates cash inflows that are largely independent of the cash inflows from otherassets or groups of assets. Goodwill arising from a business combination is allocated to CGUs or groups of CGUs that are expected tobenefit from the synergies of the combination. The recoverable amount of an asset or cash-generating unit is determined as the greater ofits value in use and its fair value less costs to sell. In assessing value in use, the estimated future cash flows are discounted to their presentvalue using a pre-tax discount rate that reflects current market assessments of the time value of money and the risks specific to the asset orCGU. Fair value less costs to sell is based on the best information available to reflect the amount that the Group could obtain from thedisposal of the asset in an arm’s length transaction between knowledgeable, willing parties, after deducting the costs of disposal.
An impairment loss is recognized if the carrying amount of an asset or its CGU exceeds its estimated recoverable amount. Impairmentlosses are recognized in profit or loss. Impairment losses recognized in respect of a CGU are allocated first to reduce the carrying amountof any goodwill allocated to the unit, and then to reduce the carrying amounts of the other assets in the unit on a pro rata basis.
In respect of assets other than goodwill, impairment losses recognized in prior periods are assessed at each reporting date for anyindications that the loss has decreased or no longer exists. An impairment loss is reversed if there has been a change in the estimates usedto determine the recoverable amount. An impairment loss is reversed only to the extent that the asset’s carrying amount does not exceedthe carrying amount that would have been determined, net of accumulated depreciation or amortization, if no impairment loss had beenrecognized from the acquisition cost. An impairment loss in respect of goodwill is not reversed.
88
3/16/22, 10:38 PM Form 6-K
https://www.sec.gov/Archives/edgar/data/0001290109/000119312522075294/d288774d6k.htm 90/268
Table of Contents
LG DISPLAY CO., LTD. AND SUBSIDIARIESNotes to the Consolidated Financial Statements
For the years ended December 31, 2021 and 2020 3. Summary of Significant Accounting Policies, Continued (l) Leases
A contract is, or contains, a lease if the contract conveys the right to control the use of an identified asset for a period of time in exchangefor consideration.
(i) As a lessee
At commencement or on modification of a contract that contains a lease component, the Group allocates the consideration in the contractto each lease and non-lease component on the basis of its relative stand-alone price. For certain leases, the Group accounts for the leaseand non-lease components as a single lease component by applying the practical expedient not to separate non-lease components.
The Group recognizes a right-of-use asset and lease liability at the lease commencement date. The right-of-use asset is initially measuredat cost, which comprises the initial amount of the lease liability adjusted for any lease payments made at of before the commencementdate, plus any initial direct costs incurred and an estimate of costs to dismantle and remove the underlying asset or to restore theunderlying asset or the site on which it is located less any lease incentives received.
The right-of-use asset is subsequently depreciated using the straight-line method from the commencement date to the end of the lease term,unless the lease transfers ownership of the underlying asset to the Group by the end of the lease term or the cost of the right-of-use assetreflects that the Group will exercise a purchase option. In that case, the right-of-use asset will be depreciated over the useful life of theunderlying asset, which is determined on the same basis as those of property and equipment. In addition, the right-of-use asset isperiodically reduced by impairment losses, if any, and adjusted for certain remeasurements of the lease liability.
The lease liability is initially measured at the present value of the lease payments that are not paid at the commencement date, discountedusing the interest rate implicit in the lease or, if that rate cannot be readily determined, the Group’s incremental borrowing rate. Generally,the Group uses its incremental borrowing rate as the discount rate.
The Group determines its incremental borrowing rate by obtaining interest rates from various external financing sources and makes certainadjustments to reflect the terms of the lease and type of the asset leased.
Lease payments included in the measurement of the lease liability comprise the following:
• fixed payments, including in-substance fixed payments;
• variable lease payments that depend on an index or a rate, initially measured using the index or rate as at the commencement date;
• amounts expected to be payable under a residual value guarantee; and
• the exercise price under a purchase option that the Group is reasonably certain to exercise, lease payments in an optional renewal
period if the Group is reasonably certain to exercise an extension option, and penalties for early termination of a lease unless theGroup is reasonably certain not to terminate early.
89
3/16/22, 10:38 PM Form 6-K
https://www.sec.gov/Archives/edgar/data/0001290109/000119312522075294/d288774d6k.htm 91/268
Table of Contents
LG DISPLAY CO., LTD. AND SUBSIDIARIESNotes to the Consolidated Financial Statements
For the years ended December 31, 2021 and 2020 3. Summary of Significant Accounting Policies, Continued (l) Leases, Continued
The lease liability is measured at amortized cost using the effective interest method. It is remeasured when there is a change in future leasepayments arising from a change in an index or rate, if there is a change in the Group’s estimate of the amount expected to be payable undera residual value guarantee, if the Group changes its assessment of whether it will exercise a purchase, extension or termination option or ifthere is a revised in-substance fixed lease payment.
When the lease liability is remeasured, the Group recognizes the amount of the remeasurement of the lease liability as an adjustment to theright-of-use asset. However, if the carrying amount of the right-of-use asset is reduced to zero and there is a further reduction in themeasurement of the lease liability, the Group recognizes any remaining amount of the remeasurement in profit or loss.
The Group presents right-of-use assets in ‘property, plant and equipment’ and lease liabilities in ‘financial liabilities’ in the consolidatedstatement of financial position.
The Group has elected not to recognize right-of-use assets and lease liabilities for leases of low-value assets and short-term leases. TheGroup recognizes the lease payments associated with these leases as an expense on a straight-line basis over the lease term.
(ii) As a lessor
When the Group acts as a lessor, it determines at lease inception whether each lease is a finance lease or an operating lease.
To classify each lease, the Group makes an overall assessment of whether the lease transfers substantially all of the risks and rewardsincidental to ownership of the underlying asset. If the lease transfers substantially all of the risks and rewards incidental to ownership ofthe underlying asset, then the lease is a finance lease; if not, then it is an operating lease. As part of this assessment, the Group considerscertain indicators such as whether the lease is for the major part of the economic life of the asset.
When the Group is an intermediate lessor, it accounts for its interests in the head lease and the sub-lease separately. It assesses the leaseclassification of a sub-lease with reference to the right-of-use asset arising from the head lease, not with reference to the underlying asset.If a head lease is a short-term lease to which the Group applies the exemption described above, then it classifies the sub-lease as anoperating lease.
If an arrangement contains lease and non-lease components, then the Group applies K-IFRS No. 1115 to allocate the consideration in thecontract.
At the commencement date, the Group recognizes assets held under a finance lease in its statement of financial position and present themas a receivable at an amount equal to the net investment in the lease and recognize finance income over the lease term, based on a patternreflecting a constant periodic rate of return on the lessor’s net investment in the lease.
The Group recognizes lease payments received under operating leases as income on a straight-line basis over the lease term as part of‘other revenue’.
90
3/16/22, 10:38 PM Form 6-K
https://www.sec.gov/Archives/edgar/data/0001290109/000119312522075294/d288774d6k.htm 92/268
Table of Contents
LG DISPLAY CO., LTD. AND SUBSIDIARIESNotes to the Consolidated Financial Statements
For the years ended December 31, 2021 and 2020 3. Summary of Significant Accounting Policies, Continued (m) Provisions
A provision is recognized as a result of a past event, if the Group has a present legal or constructive obligation that can be estimatedreliably, and it is probable that an outflow of economic benefits will be required to settle the obligation.
The risks and uncertainties that inevitably surround events and circumstances are taken into account in reaching the best estimate of aprovision. Where the effect of the time value of money is material, provisions are determined at the present value of the expected futurecash flows. The unwinding of the discount is recognized as finance cost.
Provisions are reviewed at the end of each reporting period and adjusted to reflect the current best estimate. If it is no longer probable thatan outflow of resources embodying economic benefits will be required to settle the obligation, the provision is reversed.
The Group recognizes a liability for warranty obligations based on the estimated costs expected to be incurred under its basic limitedwarranty. This warranty covers defective products and is normally applicable for a warranty period from the date of purchase. Theseliabilities are accrued when product revenues are recognized. Factors that affect the Group’s warranty liability include historical andanticipated rates of warranty claims on those repairs and cost per claim to satisfy the Group’s warranty obligation. Warranty costsprimarily include raw materials and labor costs. As these factors are impacted by actual experience and future expectations, managementperiodically assesses the adequacy of its recorded warranty liabilities and adjusts the amounts as necessary. Accrued warranty obligationsare included in the current and non-current provisions.
Liabilities for loss contingencies arising from claims, assessments, litigation, fines, penalties and other sources, are recorded when it isprobable that a liability has been incurred and the amount of the assessment and/or remediation can be reasonably estimated.
(n) Non-current Assets Held for Sale
Non-current assets, or disposal groups comprising assets and liabilities, are classified as held-for-sale if it is highly probable that they willbe recovered primarily from sale rather than through continuing use. In order to be classified as held for sale, the asset (or disposal group)is available for immediate sale in its present condition and its sale is highly probable. The assets (or disposal groups) that are classified asnon-current assets held for sale are measured at the lower of their carrying amount and fair value less costs to sell on initial classification.The Group recognizes an impairment loss for any subsequent decrease in fair value of the asset (or disposal group) for which animpairment loss was recognized on initial classification as held-for-sale and a gain for any subsequent increase in fair value in profit orlosses, up to the cumulative impairment loss previously recognized.
The Group does not depreciate a non-current asset while it is classified as held for sale or while it is part of a disposal group classified asheld for sale.
91

3/16/22, 10:38 PM Form 6-K
https://www.sec.gov/Archives/edgar/data/0001290109/000119312522075294/d288774d6k.htm 93/268
Table of Contents
LG DISPLAY CO., LTD. AND SUBSIDIARIESNotes to the Consolidated Financial Statements
For the years ended December 31, 2021 and 2020 3. Summary of Significant Accounting Policies, Continued (o) Employee Benefits
(i) Short-term employee benefits
Short-term employee benefits that are due to be settled within twelve months after the end of the period in which the employees render therelated service are recognized in profit or loss on an undiscounted basis. The expected cost of profit-sharing and bonus plans and others arerecognized when the Group has a present legal or constructive obligation to make payments as a result of past events and a reliableestimate of the obligation can be made.
(ii) Other long-term employee benefits
The Group’s net obligation in respect of long-term employee benefits other than pension plans is the amount of future benefit thatemployees have earned in return for their service in the current and prior periods.
(iii) Defined contribution plan
A defined contribution plan is a post-employment benefit plan under which an entity pays fixed contributions into a separate entity andwill have no legal or constructive obligation to pay further amounts. Obligations for contributions to defined contribution pension plansare recognized as an employee benefit expense in profit or loss in the period during which services are rendered by employees.
(iv) Defined benefit plan
A defined benefit plan is a post-employment benefit plan other than defined contribution plans. The Group’s net obligation in respect of itsdefined benefit plan is calculated by estimating the amount of future benefit that employees have earned in return for their service in thecurrent and prior periods; that benefit is discounted to determine its present value. The fair value of any plan assets is deducted.
The calculation is performed annually by an independent actuary using the projected unit credit method. The discount rate is the yield atthe reporting date on high quality corporate bonds that have maturity dates approximating the terms of the Group’s obligations and that aredenominated in the same currency in which the benefits are expected to be paid. The Group recognizes all actuarial gains and lossesarising from defined benefit plans in retained earnings immediately.
The Group determines the net interest expense (income) on the net defined benefit liability (asset) for the period by applying the discountrate used to measure the defined benefit obligation at the beginning of the annual period to the then-net defined benefit liability (asset),taking into account any changes in the net defined benefit liability (asset) during the period as a result of contributions and benefitpayments. Consequently, the net interest on the net defined benefit liability (asset) now comprises: interest cost on the defined benefitobligation, interest income on plan assets, and interest on the effect on the asset ceiling.
When the benefits of a plan are changed or when a plan is curtailed, the resulting change in benefit that relates to past service or the gain orloss on curtailment is recognized immediately in profit or loss. The Group recognizes gains and losses on the settlement of a definedbenefit plan when the settlement occurs.
92
3/16/22, 10:38 PM Form 6-K
https://www.sec.gov/Archives/edgar/data/0001290109/000119312522075294/d288774d6k.htm 94/268
Table of Contents
LG DISPLAY CO., LTD. AND SUBSIDIARIESNotes to the Consolidated Financial Statements
For the years ended December 31, 2021 and 2020 3. Summary of Significant Accounting Policies, Continued (o) Employee Benefits, Continued (v) Termination benefits
The Group recognizes expense for termination benefits at the earlier of the date when the entity can no longer withdraw the offer of thosebenefits and when the entity recognizes costs for a restructuring involving the payment of termination benefits. If the termination benefitsare not expected to be settled wholly before twelve months after the end of the annual reporting period, the Group measures thetermination benefit with present value of future cash payments.
(p) Revenue from contracts with customers
Revenue from the sale of goods in the course of ordinary activities is measured at the fair value of the consideration received or receivable,net of estimated returns, trade discounts, volume rebates and other cash incentives paid to customers.
The Group recognizes revenue according to the five stage revenue recognition model ( Identifying the contract Identifyingperformance obligations Determining transaction price Allocating the transaction price to performance obligations Recognizing revenue for performance obligations).
The Group generates revenue primarily from sale of display panels. Product revenue is recognized when a customer obtains control overthe Group’s products, which typically occurs upon shipment or delivery depending on the terms of the contracts with the customer.
The Group includes return option in the sales contract of display panels with its customers and the consideration receivable from thecustomer is subject to change due to returns. The Group estimates an amount of variable consideration by using the expected value methodwhich the Group expects to better predict the amount of consideration. The Group includes in the transaction price an amount of variableconsideration estimated only to the extent that it is highly probable that a significant reversal in the amount of cumulative revenuerecognized will not occur during the return period when the uncertainty associated with the variable consideration is subsequentlyresolved. The Group recognizes a refund liability and an asset for its right to recover products from customers if the Group receivesconsideration from a customer and expects to refund some or all of that consideration to the customer. Sales taxes or value-added taxescollected from customers and remitted to governmental authorities are accounted for on a net basis and are excluded from revenues in theconsolidated statement of comprehensive income (loss).
(q) Operating Segments
An operating segment is a component of the Group that: 1) engages in business activities from which it may earn revenues and incurexpenses, including revenues and expenses that relate to transactions with other components of the group, 2) whose operating results arereviewed regularly by the Group’s chief operating decision maker (“CODM”) in order to allocate resources and assess its performance,and 3) for which discrete financial information is available. Management has determined that the CODM of the Group is the Board ofDirectors. The CODM does not receive and therefore does not review discrete financial information for any component of the Group.Consequently, no operating segment information is included in these consolidated financial statements. Entity wide disclosures ofgeographic and product revenue information are provided in Note 17 to these consolidated financial statements.
93
3/16/22, 10:38 PM Form 6-K
https://www.sec.gov/Archives/edgar/data/0001290109/000119312522075294/d288774d6k.htm 95/268
Table of Contents
LG DISPLAY CO., LTD. AND SUBSIDIARIESNotes to the Consolidated Financial Statements
For the years ended December 31, 2021 and 2020 3. Summary of Significant Accounting Policies, Continued (r) Finance Income and Finance Costs
Finance income comprises interest income on funds invested (including debt instruments measured at FVOCI), dividend income, gains ondisposal of debt instruments measured at FVOCI, changes in fair value of financial assets at FVTPL, and gains on hedging instrumentsthat are recognized in profit or loss. Interest income is recognized as it accrues in profit or loss, using the effective interest method.Dividend income is recognized in profit or loss on the date that the Group’s right to receive payment is established.
Finance costs comprise interest expense on borrowings, unwinding of the discount on provisions, gain and losses from financial assetsmeasured at FVTPL, impairment losses recognized on financial assets, and losses on hedging instruments that are recognized in profit orloss. Borrowing costs directly attributable to the acquisition, construction or production of a qualifying asset are capitalized as part of thecost of that asset.
(s) Income Tax
Income tax expense comprises current and deferred tax. Current tax and deferred tax are recognized in profit or loss except to the extentthat it relates to a business combination, or items recognized directly in equity or in other comprehensive income.
(i) Current tax
Current tax comprises the expected tax payable or receivable on the taxable profit or loss for the year, using tax rates enacted orsubstantively enacted at the reporting date and any adjustment to tax payable in respect of previous years. The amount of current taxpayable or receivable is the best estimate of the tax amount expected to be paid or received that reflects uncertainty related to incometaxes, if any. The taxable profit is different from the accounting profit for the period since the taxable profit is calculated excluding thetemporary differences, which will be taxable or deductible in determining taxable profit (tax loss) of future periods, and non-taxable ornon-deductible items from the accounting profit.
(ii) Deferred tax
Deferred tax is recognized, using the asset and liability method, in respect of temporary differences between the carrying amounts ofassets and liabilities for financial reporting purposes and the amounts used for taxation purposes. Deferred tax assets and liabilities aremeasured at the tax rates that are expected to apply to the period when the asset is realized or the liability is settled, based on tax ratesand tax laws that have been enacted or substantively enacted by the end of the reporting period. The measurement of deferred taxliabilities and deferred tax assets reflects the tax consequences that would follow from the manner in which the Group expects, at the endof the reporting period, to recover or settle the carrying amount of its assets and liabilities.
94
3/16/22, 10:38 PM Form 6-K
https://www.sec.gov/Archives/edgar/data/0001290109/000119312522075294/d288774d6k.htm 96/268
Table of Contents
LG DISPLAY CO., LTD. AND SUBSIDIARIESNotes to the Consolidated Financial Statements
For the years ended December 31, 2021 and 2020 3. Summary of Significant Accounting Policies, Continued (s) Income Tax, Continued
The Group recognizes a deferred tax liability for all taxable temporary differences associated with investments in subsidiaries, associates,and interests in joint ventures, except to the extent that the Group is able to control the timing of the reversal of the temporary differencesand it is probable that the temporary differences will not reverse in the foreseeable future. A deferred tax asset is recognized for alldeductible temporary differences to the extent that it is probable that the differences relating to investments in subsidiaries, associates andjoint ventures will reverse in the foreseeable future and taxable profit will be available against which the temporary difference can beutilized.
Deferred tax assets are reviewed at each reporting date and are reduced to the extent that it is no longer probable that the related tax benefitwill be realized.
The Group offsets deferred tax assets and deferred tax liabilities if, and only if the Group has a legally enforceable right to set off currenttax assets against current tax liabilities and the deferred tax assets and the deferred tax liabilities relate to income taxes levied by the sametaxation authority on either the same taxable entity or different taxable entities which intend either to settle current tax liabilities and assetson a net basis, or to realize the assets and settle the liabilities simultaneously.
(t) Earnings (Loss) Per Share
The Controlling Company presents basic and diluted earnings (loss) per share (“EPS”) data for its common stocks. Basic EPS is calculatedby dividing the profit or loss attributable to ordinary shareholders of the Controlling Company by the weighted average number ofcommon stocks outstanding during the period. Diluted EPS is determined by adjusting the profit or loss attributable to ordinaryshareholders and the weighted average number of common stocks outstanding, adjusted for the effects of all dilutive potential commonstocks such as convertible bonds and others.
(u) Standards issued but not yet effective
A number of amended standards are effective for annual periods beginning after January 1, 2021 and earlier application is permitted;however, the Group has not early adopted the amended standards in preparing these consolidated financial statements.
(i) Amendment of Reference to the Definition of an Asset and a Liability in the Conceptual Framework (Amendments to K-IFRSNo. 1103, Business Combinations);
These amendments replace the reference to the definitions of an asset and a liability in the Conceptual Framework issued in 2007 to 2018and added an exception to the recognition principle in K-IFRS No. 1103, Business Combinations, for liabilities and contingent liabilitiesthat would be within the scope of K-IFRS No. 1037, Provisions, Contingent Liabilities and Contingent Assets, and K-IFRS No. 2121,Levies, to apply the recognition criteria specified in those standards.
These amendments are effective for annual periods beginning on January 1, 2022, with early adoption permitted.
95
3/16/22, 10:38 PM Form 6-K
https://www.sec.gov/Archives/edgar/data/0001290109/000119312522075294/d288774d6k.htm 97/268
Table of Contents
LG DISPLAY CO., LTD. AND SUBSIDIARIESNotes to the Consolidated Financial Statements
For the years ended December 31, 2021 and 2020 3. Summary of Significant Accounting Policies, Continued (u) Standards issued but not yet effective, Continued (ii) Classification of Liabilities as Current or Non-current (Amendments to K-IFRS No. 1001, Presentation of Financial Statements)
These amendments clarify that an entity has a right to defer settlement of the liability at the end of the reporting period if it complies withthe conditions at that date and classification of a liability is unaffected by the likelihood that the entity will exercise its right to defersettlement of the liability for at least 12 months after the reporting period.
In addition, settlement of a liability includes transferring the Group’s own equity instruments to the counterparty but they do not affect itsclassification as current or non-current if the entity classifies the option as an equity instrument, recognizing it separately from the liabilityas an equity component of a compound financial instrument.
These amendments are effective for annual periods beginning on January 1, 2023, with early adoption permitted. The Group is currentlyassessing the impacts of the application.
(iii) Onerous Contracts – Cost of Fulfilling a Contract (Amendments to K-IFRS No. 1037, Provisions, Contingent Liabilities andContingent Assets)
These amendments specify the scope of “the unavoidable costs of meeting the obligations under the contract” is “the costs that relatedirectly to the contracts” (the incremental costs of fulfilling the contract and an allocation of other costs that relate directly to fulfillingcontracts).
These amendments are effective for annual periods beginning on January 1, 2022, with early adoption permitted.
(iv) Deferred Tax related to Assets and Liabilities arising from a Single Transaction (Amendments to K-IFRS No. 1012, Income Taxes)
These amendments specify the scope of the initial recognition exemption when assets and liabilities arise to equal amount from a singletransaction. These amendments require an entity to recognize the resulting deferred tax liability or asset if the transaction give rise to equaltaxable and deductible temporary differences although it is not a business combination and affects neither accounting profit nor taxableprofit(loss). These amendments are effective for annual periods beginning on January 1, 2023, with early adoption permitted.
Of deferred taxes which give rise to a right-of-use asset and lease liability, the Group is currently applying an approach which results insimilar conclusion to these amendments except that deferred tax is presented on a net basis. Upon the adoption of the amendments, theGroup expects to recognize separate deferred tax assets and liabilities for right of use assets and lease liabilities and it will be appliedretrospectively.
96
3/16/22, 10:38 PM Form 6-K
https://www.sec.gov/Archives/edgar/data/0001290109/000119312522075294/d288774d6k.htm 98/268
Table of Contents
LG DISPLAY CO., LTD. AND SUBSIDIARIESNotes to the Consolidated Financial Statements
For the years ended December 31, 2021 and 2020 3. Summary of Significant Accounting Policies, Continued (u) Standards issued but not yet effective, Continued (v) Definition of Materiality (Amendments to K-IFRS No. 1001, Presentation of Financial Statement)
These amendments specify the definition of materiality. Information is material if omitting, misstating or obscuring it could reasonably beexpected to influence decisions that the primary users of general purpose financial statements make on the basis of those financialstatements. These amendments are effective for annual periods beginning on January 1, 2023, with early adoption permitted.
(vi) Definition of Accounting Estimates (Amendments to K-IFRS No. 1008, Accounting Policies, Changes in Accounting Estimates andErrors)
These amendments removed the definition of ‘change in accounting estimates’, and introduced the term ‘accounting estimates’ by definingthem as monetary amounts in financial statements that are subject to measurement uncertainty and clarifying that a change in an estimationtechnique or a valuation technique used to develop accounting estimates is a change in accounting estimate. These amendments areeffective for annual periods beginning on January 1, 2023, with early adoption permitted.
(vii) Annual Improvements to K-IFRS Standards 2018-2020
Annual improvements to K-IFRS standards 2018-2020 is effective for annual periods beginning on January 1, 2022, with early adoptionpermitted. The Group does not expect that such amendments have a material effect on the Group’s consolidated financial statements.
• K-IFRS No. 1001, First-time Adoption of International Financial Reporting Standards: Subsidiary as a First-time Adopter
• K-IFRS No. 1009, Financial Instruments: Fees in the ‘10 percent’ Test for Derecognition of Financial Liabilities
• K-IFRS No. 1116, Leases: Lease Incentives
• K-IFRS No. 1041, Agriculture: Taxation in Fair Value Measurements
The Group is currently assessing the impacts of the application of above amended standards on the Group’s financial position and businessperformance and management believes that the application of the amended standards are expected to have no significant impact on theconsolidated financial statements of the Group, except for the amendments to K-IFRS No. 1001, Presentation of Financial Statements.
97
3/16/22, 10:38 PM Form 6-K
https://www.sec.gov/Archives/edgar/data/0001290109/000119312522075294/d288774d6k.htm 99/268
Table of Contents
LG DISPLAY CO., LTD. AND SUBSIDIARIESNotes to the Consolidated Financial Statements
For the years ended December 31, 2021 and 2020 4. Cash and Cash Equivalents and Deposits in Banks
Cash and cash equivalents and deposits in banks as of December 31, 2021 and December 31, 2020 are as follows:
(In millions of won) December 31, 2021 December 31, 2020 Current assets
Cash and cash equivalents Cash W 1,122 156 Demand deposits 3,540,475 4,217,943
W 3,541,597 4,218,099
Deposits in banks Time deposits W 2,600 1,800 Restricted deposits (*) 740,705 76,852
W 743,305 78,652
Non-current assets Deposits in banks
Restricted deposits (*) W 11 11 (*) Includes funds deposited under agreements on mutually beneficial cooperation to aid LG Group companies’ suppliers, restricted deposits pledged
to enforce the Group’s investment plans upon the receipt of grants from Gumi city and Gyeongsangbuk-do, restricted deposits pledged toguarantee a subsidiary’s borrowings and others.
98
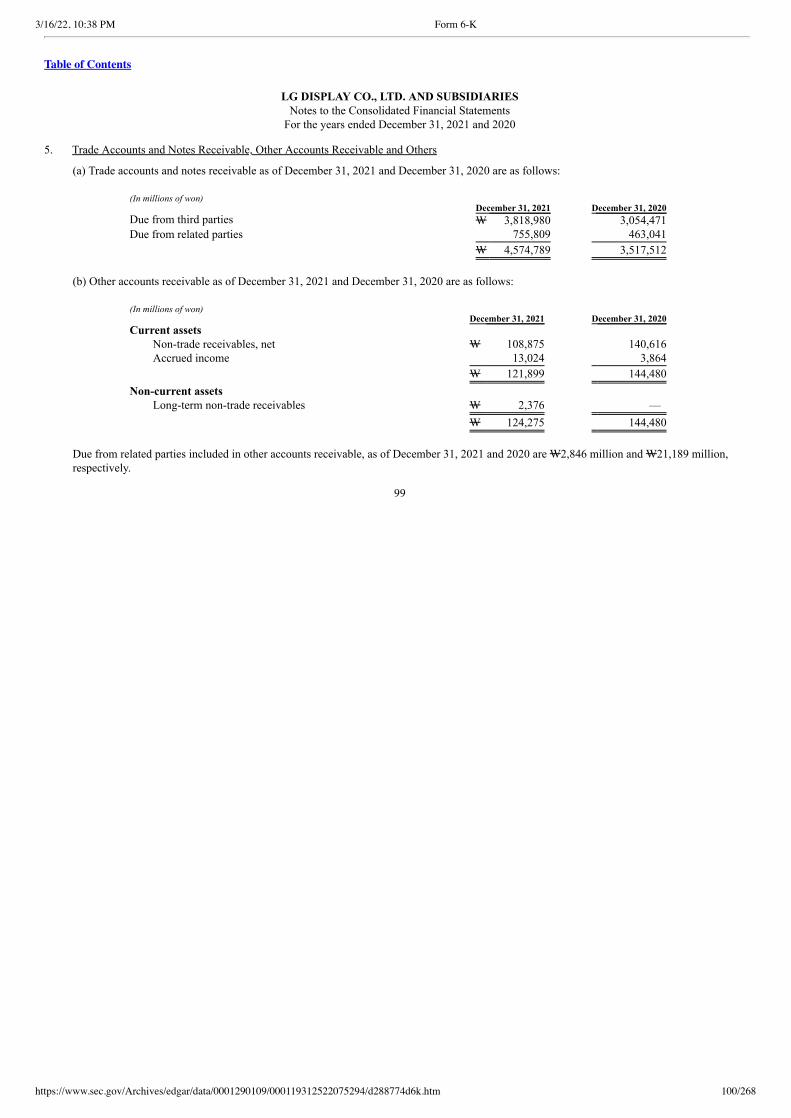
3/16/22, 10:38 PM Form 6-K
https://www.sec.gov/Archives/edgar/data/0001290109/000119312522075294/d288774d6k.htm 100/268
Table of Contents
LG DISPLAY CO., LTD. AND SUBSIDIARIESNotes to the Consolidated Financial Statements
For the years ended December 31, 2021 and 2020 5. Trade Accounts and Notes Receivable, Other Accounts Receivable and Others
(a) Trade accounts and notes receivable as of December 31, 2021 and December 31, 2020 are as follows:
(In millions of won) December 31, 2021 December 31, 2020 Due from third parties W 3,818,980 3,054,471 Due from related parties 755,809 463,041
W 4,574,789 3,517,512
(b) Other accounts receivable as of December 31, 2021 and December 31, 2020 are as follows:
(In millions of won) December 31, 2021 December 31, 2020 Current assets
Non-trade receivables, net W 108,875 140,616 Accrued income 13,024 3,864
W 121,899 144,480
Non-current assets Long-term non-trade receivables W 2,376 —
W 124,275 144,480
Due from related parties included in other accounts receivable, as of December 31, 2021 and 2020 are W2,846 million and W21,189 million,respectively.
99
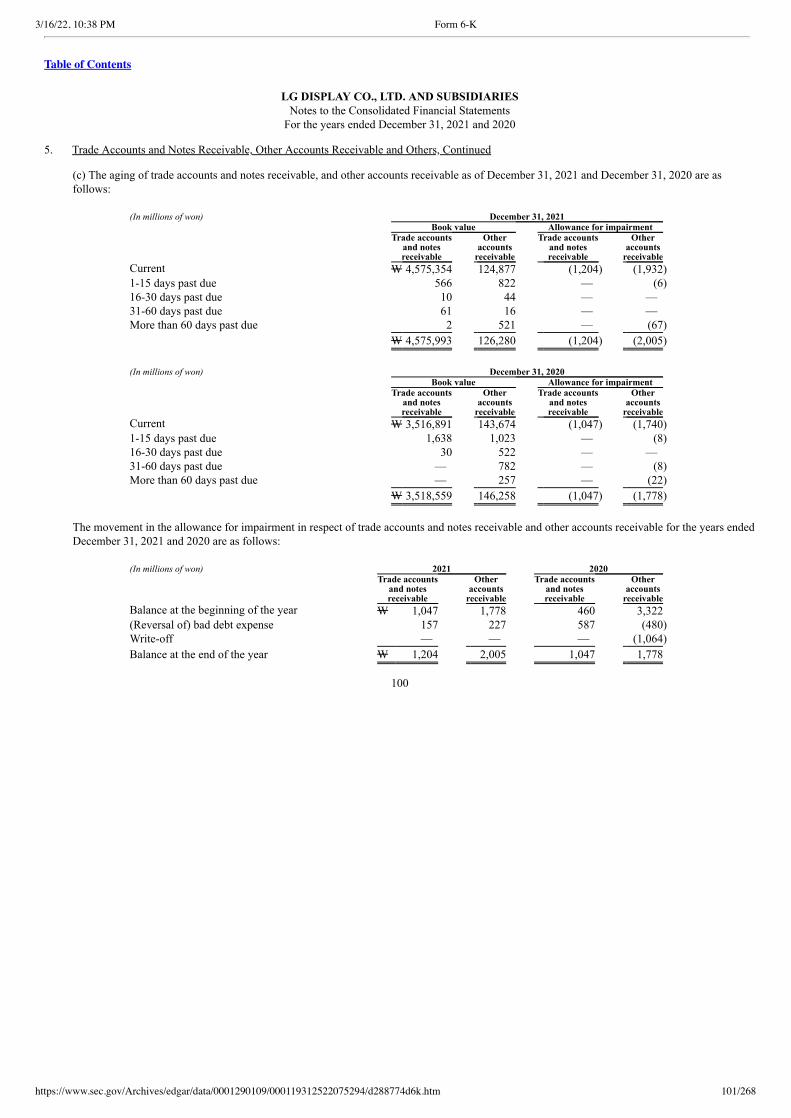
3/16/22, 10:38 PM Form 6-K
https://www.sec.gov/Archives/edgar/data/0001290109/000119312522075294/d288774d6k.htm 101/268
Table of Contents
LG DISPLAY CO., LTD. AND SUBSIDIARIESNotes to the Consolidated Financial Statements
For the years ended December 31, 2021 and 2020 5. Trade Accounts and Notes Receivable, Other Accounts Receivable and Others, Continued
(c) The aging of trade accounts and notes receivable, and other accounts receivable as of December 31, 2021 and December 31, 2020 are asfollows:
(In millions of won) December 31, 2021 Book value Allowance for impairment
Trade accounts and notes
receivable
Other accounts
receivable
Trade accounts and notes
receivable
Other accounts
receivable Current W 4,575,354 124,877 (1,204) (1,932) 1-15 days past due 566 822 — (6) 16-30 days past due 10 44 — — 31-60 days past due 61 16 — — More than 60 days past due 2 521 — (67)
W 4,575,993 126,280 (1,204) (2,005)
(In millions of won) December 31, 2020 Book value Allowance for impairment
Trade accounts and notes
receivable
Other accounts
receivable
Trade accounts and notes
receivable
Other accounts
receivable Current W 3,516,891 143,674 (1,047) (1,740) 1-15 days past due 1,638 1,023 — (8) 16-30 days past due 30 522 — — 31-60 days past due — 782 — (8) More than 60 days past due — 257 — (22)
W 3,518,559 146,258 (1,047) (1,778)
The movement in the allowance for impairment in respect of trade accounts and notes receivable and other accounts receivable for the years endedDecember 31, 2021 and 2020 are as follows:
(In millions of won) 2021 2020
Trade accounts and notes
receivable
Other accounts
receivable
Trade accounts and notes
receivable
Other accounts
receivable Balance at the beginning of the year W 1,047 1,778 460 3,322 (Reversal of) bad debt expense 157 227 587 (480) Write-off — — — (1,064)
Balance at the end of the year W 1,204 2,005 1,047 1,778
100
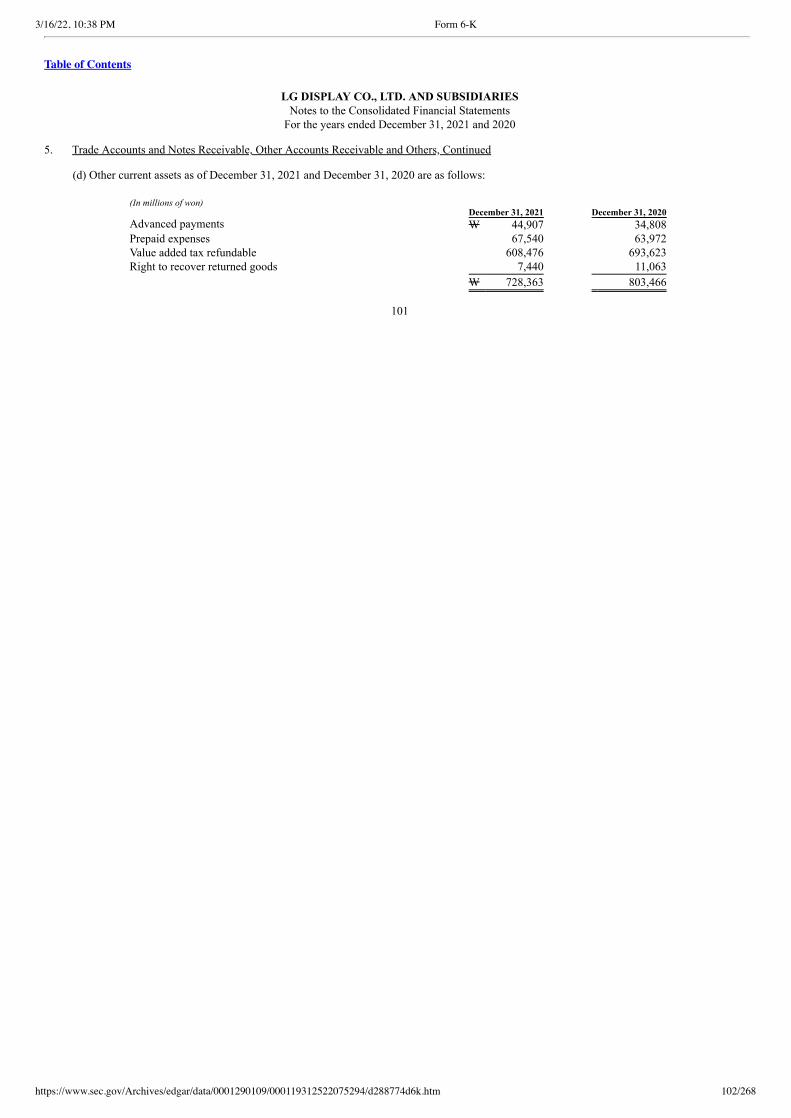
3/16/22, 10:38 PM Form 6-K
https://www.sec.gov/Archives/edgar/data/0001290109/000119312522075294/d288774d6k.htm 102/268
Table of Contents
LG DISPLAY CO., LTD. AND SUBSIDIARIESNotes to the Consolidated Financial Statements
For the years ended December 31, 2021 and 2020 5. Trade Accounts and Notes Receivable, Other Accounts Receivable and Others, Continued
(d) Other current assets as of December 31, 2021 and December 31, 2020 are as follows:
(In millions of won) December 31, 2021 December 31, 2020 Advanced payments W 44,907 34,808 Prepaid expenses 67,540 63,972 Value added tax refundable 608,476 693,623 Right to recover returned goods 7,440 11,063
W 728,363 803,466
101
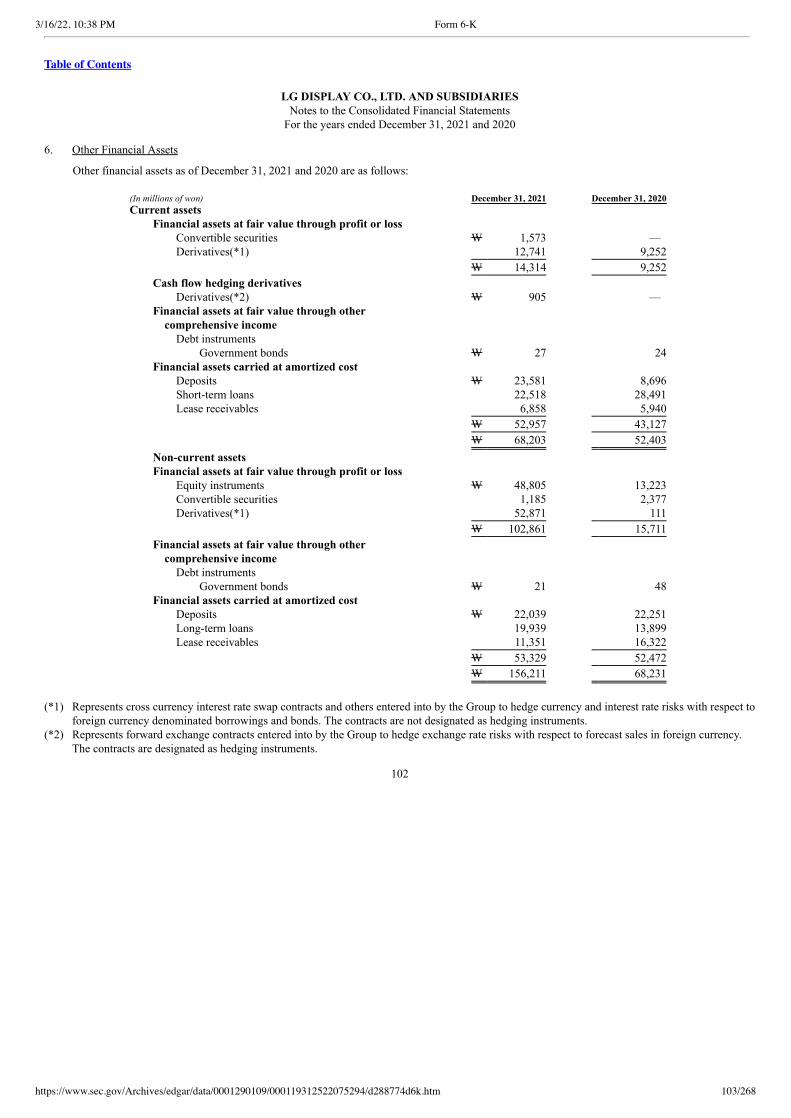
3/16/22, 10:38 PM Form 6-K
https://www.sec.gov/Archives/edgar/data/0001290109/000119312522075294/d288774d6k.htm 103/268
Table of Contents
LG DISPLAY CO., LTD. AND SUBSIDIARIESNotes to the Consolidated Financial Statements
For the years ended December 31, 2021 and 2020 6. Other Financial Assets
Other financial assets as of December 31, 2021 and 2020 are as follows:
(In millions of won) December 31, 2021 December 31, 2020 Current assets
Financial assets at fair value through profit or loss Convertible securities W 1,573 — Derivatives(*1) 12,741 9,252
W 14,314 9,252
Cash flow hedging derivatives Derivatives(*2) W 905 —
Financial assets at fair value through othercomprehensive income
Debt instruments Government bonds W 27 24
Financial assets carried at amortized cost Deposits W 23,581 8,696 Short-term loans 22,518 28,491 Lease receivables 6,858 5,940
W 52,957 43,127
W 68,203 52,403
Non-current assets Financial assets at fair value through profit or loss
Equity instruments W 48,805 13,223 Convertible securities 1,185 2,377 Derivatives(*1) 52,871 111
W 102,861 15,711
Financial assets at fair value through othercomprehensive income
Debt instruments Government bonds W 21 48
Financial assets carried at amortized cost Deposits W 22,039 22,251 Long-term loans 19,939 13,899 Lease receivables 11,351 16,322
W 53,329 52,472
W 156,211 68,231
(*1) Represents cross currency interest rate swap contracts and others entered into by the Group to hedge currency and interest rate risks with respect to
foreign currency denominated borrowings and bonds. The contracts are not designated as hedging instruments.(*2) Represents forward exchange contracts entered into by the Group to hedge exchange rate risks with respect to forecast sales in foreign currency.
The contracts are designated as hedging instruments.
102

3/16/22, 10:38 PM Form 6-K
https://www.sec.gov/Archives/edgar/data/0001290109/000119312522075294/d288774d6k.htm 104/268
Table of Contents
LG DISPLAY CO., LTD. AND SUBSIDIARIESNotes to the Consolidated Financial Statements
For the years ended December 31, 2021 and 2020 7. Inventories
Inventories as of December 31, 2021 and December 31, 2020 are as follows:
(In millions of won) December 31, 2021 December 31, 2020 Finished goods W 1,180,329 785,282 Work-in-process 1,202,548 733,071 Raw materials 786,739 491,432 Supplies 180,759 160,871
W 3,350,375 2,170,656
For the years ended December 31, 2021 and 2020, the amount of inventories recognized as cost of sales including inventory write-downs andusage of inventory write-downs are as follows:
(In millions of won) 2021 2020 Inventories recognized as cost of sales W24,572,939 21,626,339
Inventory write-downs 224,576 213,932 Usage of inventory write-downs (213,932) (472,885)
There were no significant reversals of inventory write-downs recognized during the years ended December 31, 2021 and 2020.
103
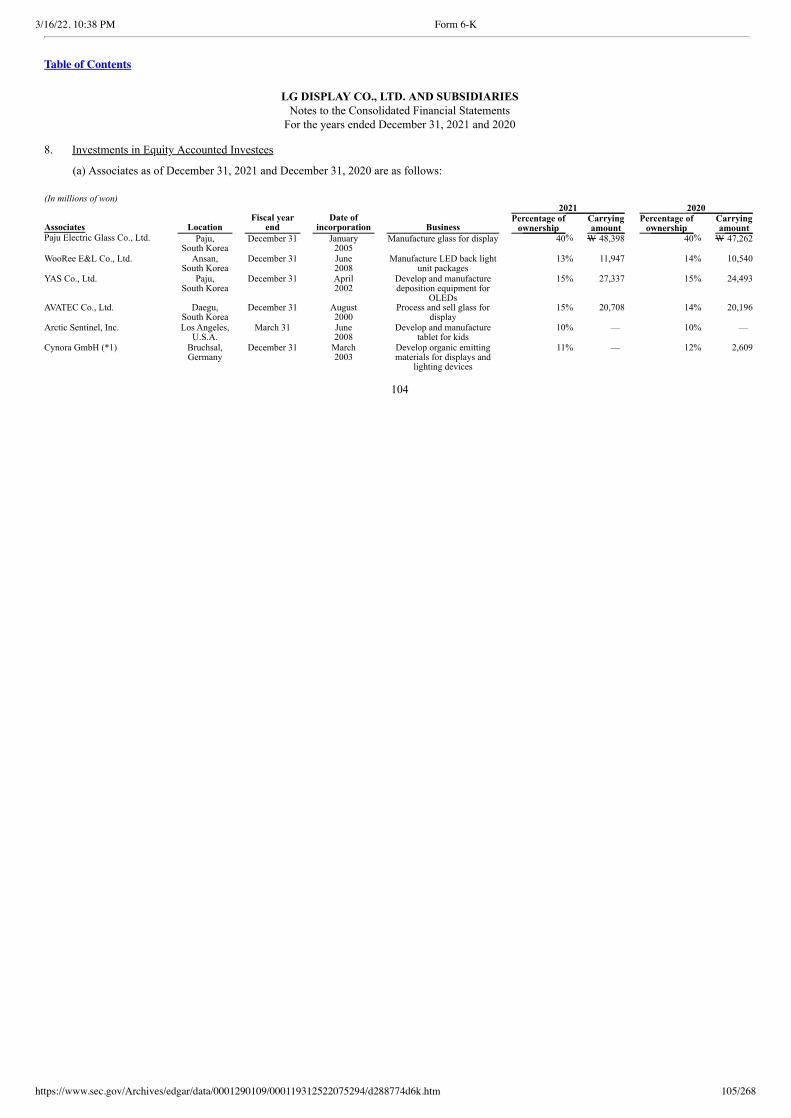
3/16/22, 10:38 PM Form 6-K
https://www.sec.gov/Archives/edgar/data/0001290109/000119312522075294/d288774d6k.htm 105/268
Table of Contents
LG DISPLAY CO., LTD. AND SUBSIDIARIESNotes to the Consolidated Financial Statements
For the years ended December 31, 2021 and 2020 8. Investments in Equity Accounted Investees
(a) Associates as of December 31, 2021 and December 31, 2020 are as follows: (In millions of won)
Associates Location Fiscal year
end Date of
incorporation Business
2021 2020
Percentage of
ownership Carrying
amount Percentage of
ownership Carrying
amount Paju Electric Glass Co., Ltd.
Paju,
South Korea December 31
January
2005 Manufacture glass for display
40%
W 48,398
40%
W 47,262
WooRee E&L Co., Ltd.
Ansan,South Korea
December 31
June2008
Manufacture LED back lightunit packages
13%
11,947
14%
10,540
YAS Co., Ltd.
Paju,South Korea
December 31
April2002
Develop and manufacturedeposition equipment for
OLEDs
15%
27,337
15%
24,493
AVATEC Co., Ltd.
Daegu,South Korea
December 31
August2000
Process and sell glass fordisplay
15%
20,708
14%
20,196
Arctic Sentinel, Inc.
Los Angeles,U.S.A.
March 31
June2008
Develop and manufacturetablet for kids
10%
—
10%
—
Cynora GmbH (*1)
Bruchsal,Germany
December 31
March2003
Develop organic emittingmaterials for displays and
lighting devices
11%
—
12%
2,609
104

3/16/22, 10:38 PM Form 6-K
https://www.sec.gov/Archives/edgar/data/0001290109/000119312522075294/d288774d6k.htm 106/268
Table of Contents
LG DISPLAY CO., LTD. AND SUBSIDIARIESNotes to the Consolidated Financial Statements
For the years ended December 31, 2021 and 2020 8. Investments in Equity Accounted Investees, Continued (In millions of won) 2021 2020
Associates Location Fiscal year
end Date of
incorporation Business Percentage of
ownership Carrying
amount Percentage of
ownership Carrying
amount Material Science Co., Ltd. (*2)
Seoul, South Korea
December 31
January 2014
Develop, manufacture, and sellmaterials for display 10% W 3,679 10% W 3,791
Nanosys Inc. (*3)
Milpitas, U.S.A.
December 31
July 2001
Develop, manufacture, and sellmaterials for display 4% 14,650 3% 5,660
W126,719 W 114,551
(*1) During 2021, the Controlling Company recognized an impairment loss of W2,609 million as finance cost for the investments in Cynora GmbH.(*2) During 2021, the Controlling Company recognized a reversal of impairment loss of W636 million as finance income for the difference between
the carrying amount and the recoverable amount of investments in Material Science Co., Ltd.(*3) During 2021, the Controlling Company recognized a reversal of impairment loss of W4,065 million as finance income for the difference between
the carrying amount and the recoverable amount of investments in Nanosys Inc.
105
3/16/22, 10:38 PM Form 6-K
https://www.sec.gov/Archives/edgar/data/0001290109/000119312522075294/d288774d6k.htm 107/268
Table of Contents
LG DISPLAY CO., LTD. AND SUBSIDIARIESNotes to the Consolidated Financial Statements
For the years ended December 31, 2021 and 2020 8. Investments in Equity Accounted Investees, Continued
Although the Controlling Company’s respective share interests in WooRee E&L Co., Ltd., YAS Co., Ltd., AVATEC Co., Ltd., Arctic Sentinel,Inc., Cynora GmbH, Material Science Co., Ltd. and Nanosys Inc. are below 20%, the Controlling Company is able to exercise significantinfluence through its right to appoint a director to the board of directors of each investee. Accordingly, the investments in these investees havebeen accounted for using the equity method.
As of December 31, 2021, the market value of the Group’s share in WooRee E&L Co., Ltd., YAS Co., Ltd., and AVATEC Co., Ltd., all of whichare listed in KOSDAQ, are W11,424 million, W32,600 million and W40,100 million, respectively.
Dividends income recognized from equity method investees for the years ended December 31, 2021 and 2020 amounted to W4,068 million andW8,239 million, respectively.
106
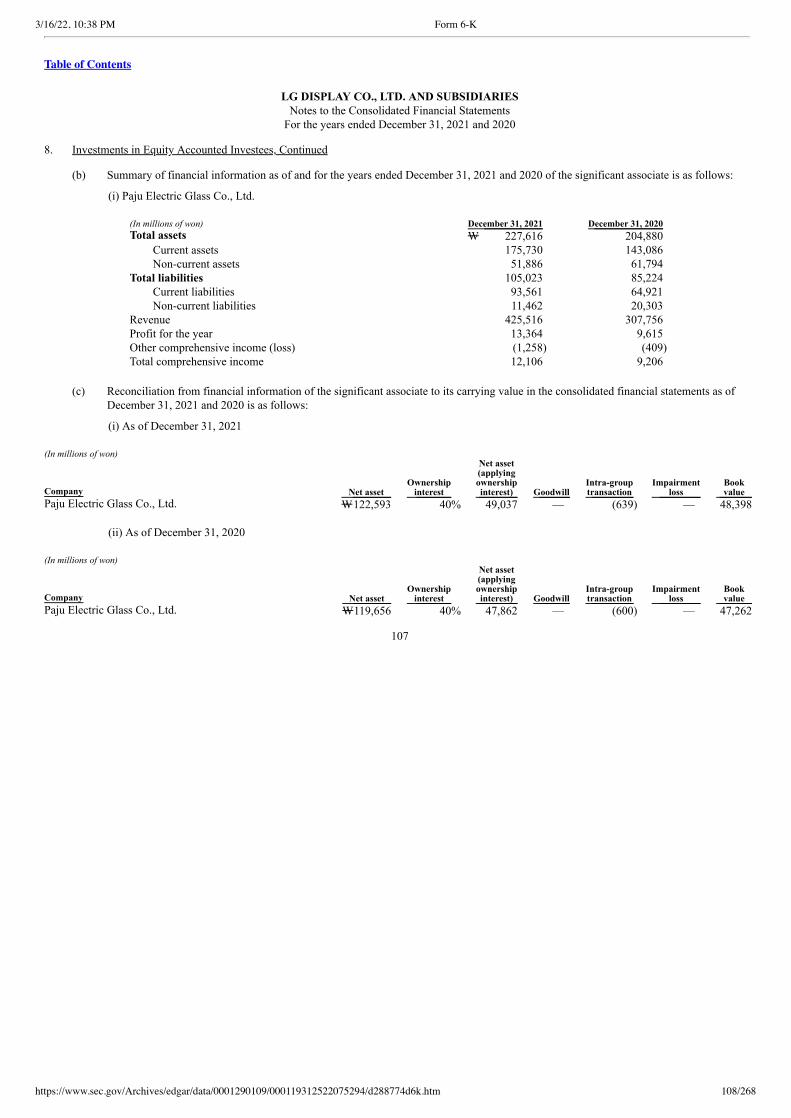
3/16/22, 10:38 PM Form 6-K
https://www.sec.gov/Archives/edgar/data/0001290109/000119312522075294/d288774d6k.htm 108/268
Table of Contents
LG DISPLAY CO., LTD. AND SUBSIDIARIESNotes to the Consolidated Financial Statements
For the years ended December 31, 2021 and 2020 8. Investments in Equity Accounted Investees, Continued (b) Summary of financial information as of and for the years ended December 31, 2021 and 2020 of the significant associate is as follows:
(i) Paju Electric Glass Co., Ltd.
(In millions of won) December 31, 2021 December 31, 2020 Total assets W 227,616 204,880
Current assets 175,730 143,086 Non-current assets 51,886 61,794
Total liabilities 105,023 85,224 Current liabilities 93,561 64,921 Non-current liabilities 11,462 20,303
Revenue 425,516 307,756 Profit for the year 13,364 9,615 Other comprehensive income (loss) (1,258) (409) Total comprehensive income 12,106 9,206
(c) Reconciliation from financial information of the significant associate to its carrying value in the consolidated financial statements as of
December 31, 2021 and 2020 is as follows:
(i) As of December 31, 2021 (In millions of won)
Company Net asset Ownership
interest
Net asset (applying ownership interest) Goodwill
Intra-group transaction
Impairment loss
Book value
Paju Electric Glass Co., Ltd. W122,593 40% 49,037 — (639) — 48,398
(ii) As of December 31, 2020 (In millions of won)
Company Net asset Ownership
interest
Net asset (applying ownership interest) Goodwill
Intra-group transaction
Impairment loss
Book value
Paju Electric Glass Co., Ltd. W119,656 40% 47,862 — (600) — 47,262
107
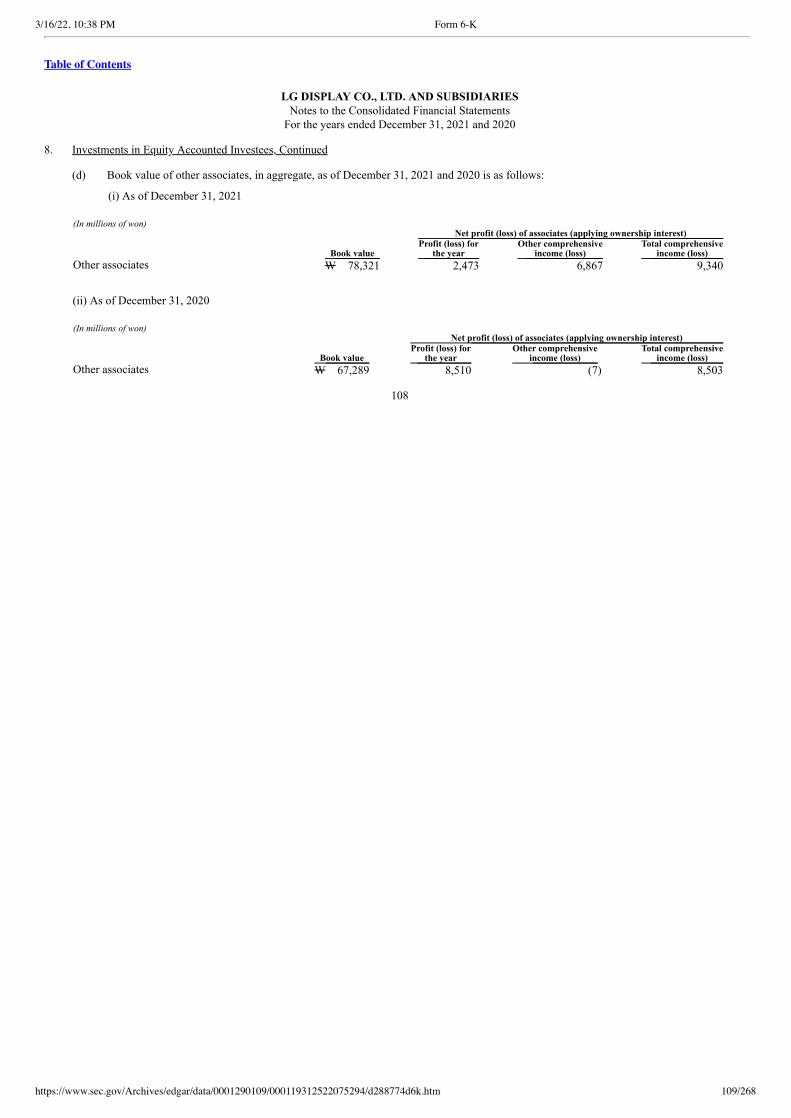
3/16/22, 10:38 PM Form 6-K
https://www.sec.gov/Archives/edgar/data/0001290109/000119312522075294/d288774d6k.htm 109/268
Table of Contents
LG DISPLAY CO., LTD. AND SUBSIDIARIESNotes to the Consolidated Financial Statements
For the years ended December 31, 2021 and 2020 8. Investments in Equity Accounted Investees, Continued (d) Book value of other associates, in aggregate, as of December 31, 2021 and 2020 is as follows:
(i) As of December 31, 2021
(In millions of won)
Book value
Net profit (loss) of associates (applying ownership interest)
Profit (loss) for
the year Other comprehensive
income (loss) Total comprehensive
income (loss) Other associates W 78,321 2,473 6,867 9,340
(ii) As of December 31, 2020
(In millions of won)
Book value
Net profit (loss) of associates (applying ownership interest)
Profit (loss) for
the year Other comprehensive
income (loss) Total comprehensive
income (loss) Other associates W 67,289 8,510 (7) 8,503
108
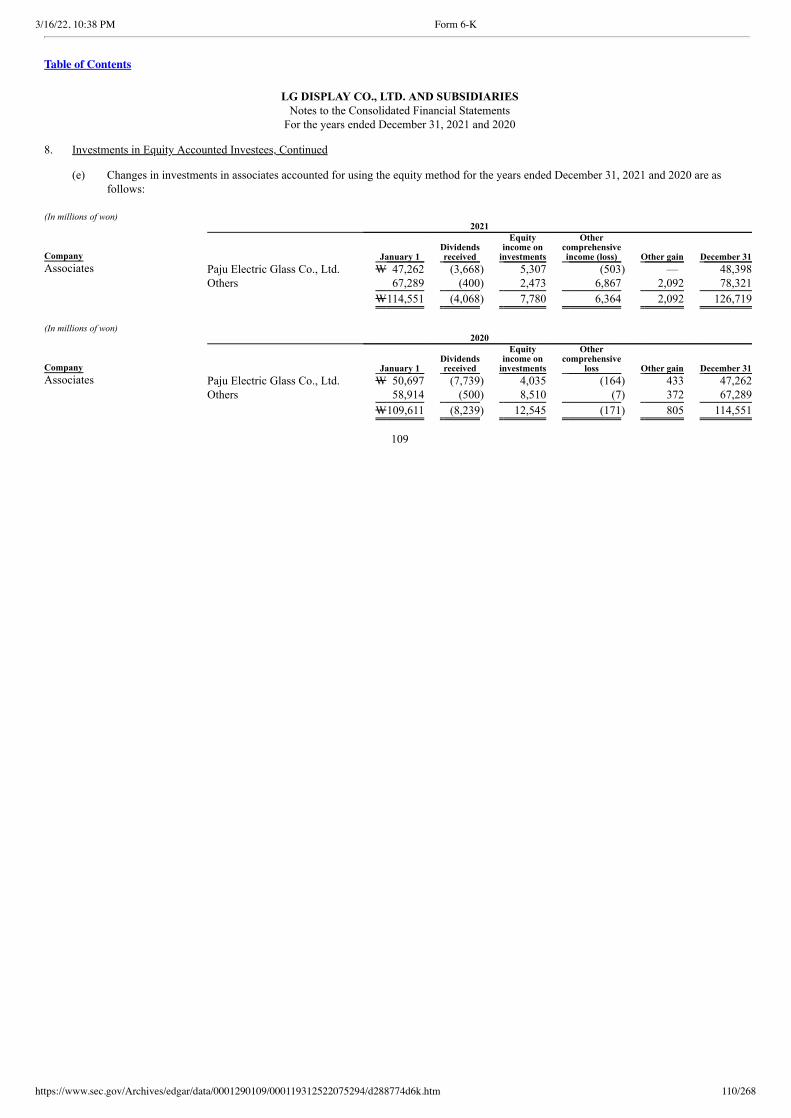
3/16/22, 10:38 PM Form 6-K
https://www.sec.gov/Archives/edgar/data/0001290109/000119312522075294/d288774d6k.htm 110/268
Table of Contents
LG DISPLAY CO., LTD. AND SUBSIDIARIESNotes to the Consolidated Financial Statements
For the years ended December 31, 2021 and 2020 8. Investments in Equity Accounted Investees, Continued
(e) Changes in investments in associates accounted for using the equity method for the years ended December 31, 2021 and 2020 are asfollows:
(In millions of won) 2021
Company January 1 Dividends
received
Equity income on
investments
Other comprehensive
income (loss) Other gain December 31 Associates Paju Electric Glass Co., Ltd. W 47,262 (3,668) 5,307 (503) — 48,398
Others 67,289 (400) 2,473 6,867 2,092 78,321
W114,551 (4,068) 7,780 6,364 2,092 126,719
(In millions of won) 2020
Company January 1 Dividends
received
Equity income on
investments
Other comprehensive
loss Other gain December 31 Associates Paju Electric Glass Co., Ltd. W 50,697 (7,739) 4,035 (164) 433 47,262
Others 58,914 (500) 8,510 (7) 372 67,289
W109,611 (8,239) 12,545 (171) 805 114,551
109
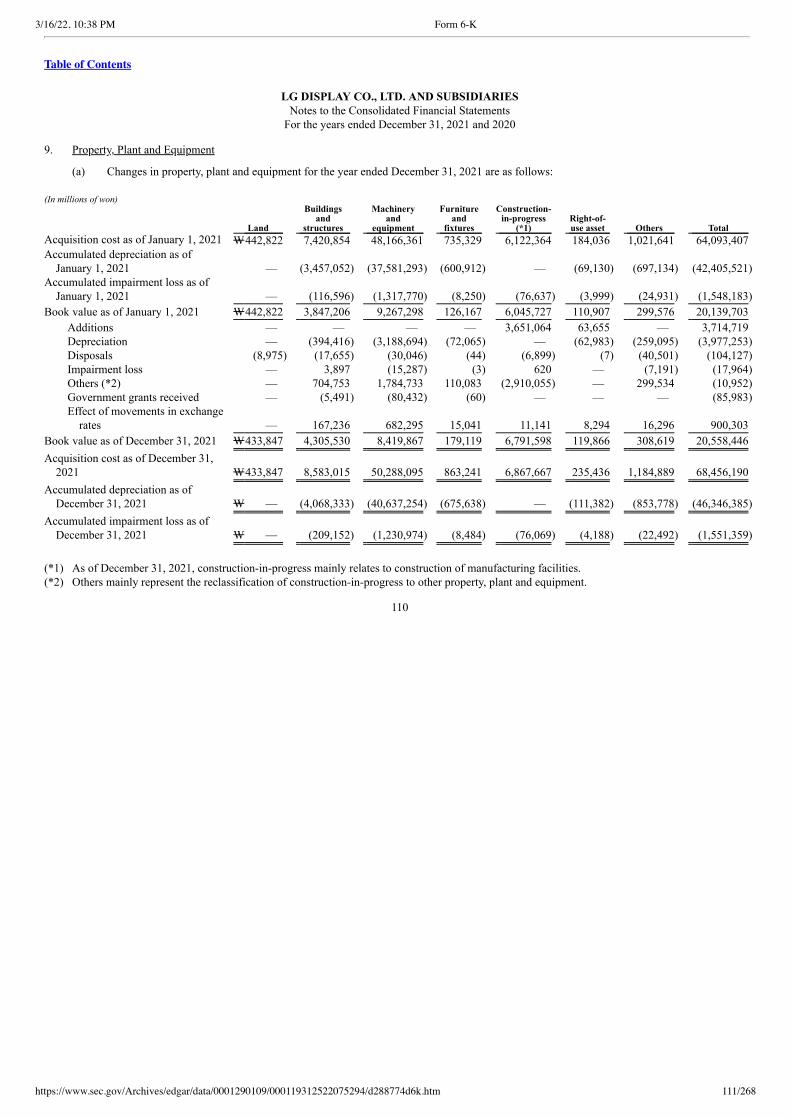
3/16/22, 10:38 PM Form 6-K
https://www.sec.gov/Archives/edgar/data/0001290109/000119312522075294/d288774d6k.htm 111/268
Table of Contents
LG DISPLAY CO., LTD. AND SUBSIDIARIESNotes to the Consolidated Financial Statements
For the years ended December 31, 2021 and 2020 9. Property, Plant and Equipment
(a) Changes in property, plant and equipment for the year ended December 31, 2021 are as follows: (In millions of won)
Land
Buildings and
structures
Machinery and
equipment
Furniture and
fixtures
Construction- in-progress
(*1) Right-of-
use asset Others Total Acquisition cost as of January 1, 2021 W442,822 7,420,854 48,166,361 735,329 6,122,364 184,036 1,021,641 64,093,407 Accumulated depreciation as of
January 1, 2021 — (3,457,052) (37,581,293) (600,912) — (69,130) (697,134) (42,405,521) Accumulated impairment loss as of
January 1, 2021 — (116,596) (1,317,770) (8,250) (76,637) (3,999) (24,931) (1,548,183)
Book value as of January 1, 2021 W442,822 3,847,206 9,267,298 126,167 6,045,727 110,907 299,576 20,139,703
Additions — — — — 3,651,064 63,655 — 3,714,719 Depreciation — (394,416) (3,188,694) (72,065) — (62,983) (259,095) (3,977,253) Disposals (8,975) (17,655) (30,046) (44) (6,899) (7) (40,501) (104,127) Impairment loss — 3,897 (15,287) (3) 620 — (7,191) (17,964) Others (*2) — 704,753 1,784,733 110,083 (2,910,055) — 299,534 (10,952) Government grants received — (5,491) (80,432) (60) — — — (85,983) Effect of movements in exchange
rates — 167,236 682,295 15,041 11,141 8,294 16,296 900,303
Book value as of December 31, 2021 W433,847 4,305,530 8,419,867 179,119 6,791,598 119,866 308,619 20,558,446
Acquisition cost as of December 31,2021 W433,847 8,583,015 50,288,095 863,241 6,867,667 235,436 1,184,889 68,456,190
Accumulated depreciation as ofDecember 31, 2021 W — (4,068,333) (40,637,254) (675,638) — (111,382) (853,778) (46,346,385)
Accumulated impairment loss as ofDecember 31, 2021 W — (209,152) (1,230,974) (8,484) (76,069) (4,188) (22,492) (1,551,359)
(*1) As of December 31, 2021, construction-in-progress mainly relates to construction of manufacturing facilities.(*2) Others mainly represent the reclassification of construction-in-progress to other property, plant and equipment.
110
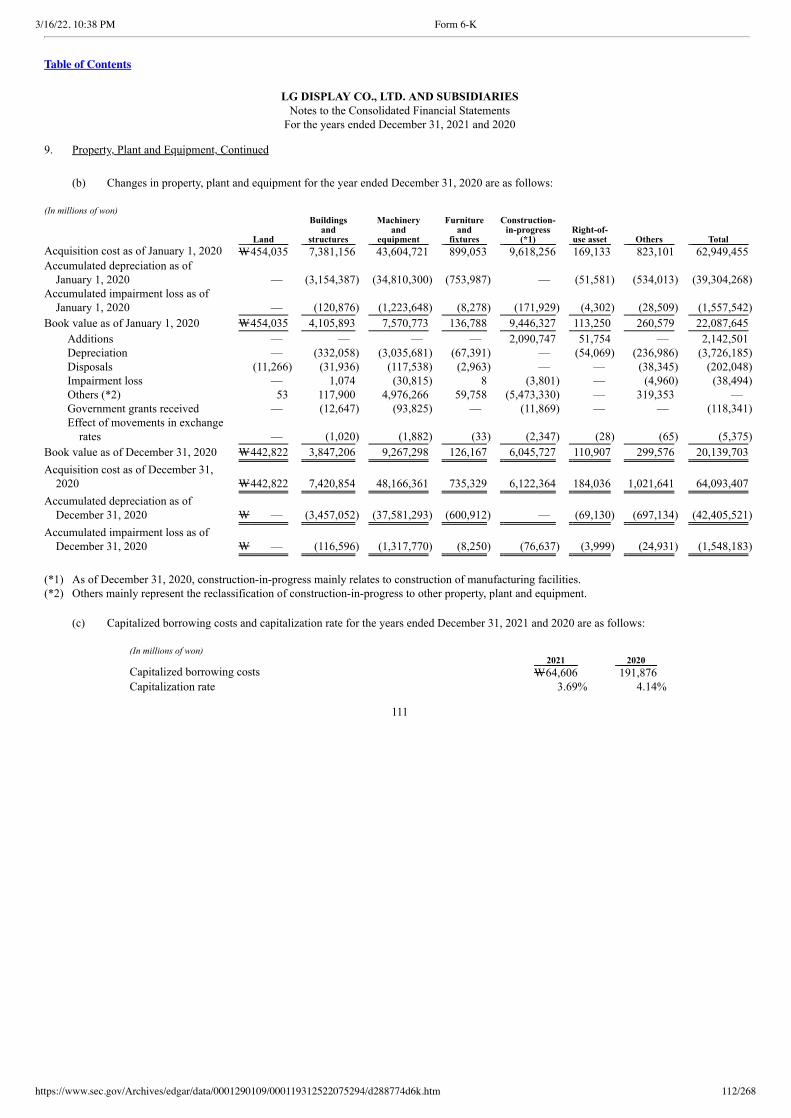
3/16/22, 10:38 PM Form 6-K
https://www.sec.gov/Archives/edgar/data/0001290109/000119312522075294/d288774d6k.htm 112/268
Table of Contents
LG DISPLAY CO., LTD. AND SUBSIDIARIESNotes to the Consolidated Financial Statements
For the years ended December 31, 2021 and 2020 9. Property, Plant and Equipment, Continued
(b) Changes in property, plant and equipment for the year ended December 31, 2020 are as follows: (In millions of won)
Land
Buildings and
structures
Machinery and
equipment
Furniture and
fixtures
Construction- in-progress
(*1) Right-of-
use asset Others Total Acquisition cost as of January 1, 2020 W454,035 7,381,156 43,604,721 899,053 9,618,256 169,133 823,101 62,949,455 Accumulated depreciation as of
January 1, 2020 — (3,154,387) (34,810,300) (753,987) — (51,581) (534,013) (39,304,268) Accumulated impairment loss as of
January 1, 2020 — (120,876) (1,223,648) (8,278) (171,929) (4,302) (28,509) (1,557,542)
Book value as of January 1, 2020 W454,035 4,105,893 7,570,773 136,788 9,446,327 113,250 260,579 22,087,645
Additions — — — — 2,090,747 51,754 — 2,142,501 Depreciation — (332,058) (3,035,681) (67,391) — (54,069) (236,986) (3,726,185) Disposals (11,266) (31,936) (117,538) (2,963) — — (38,345) (202,048) Impairment loss — 1,074 (30,815) 8 (3,801) — (4,960) (38,494) Others (*2) 53 117,900 4,976,266 59,758 (5,473,330) — 319,353 — Government grants received — (12,647) (93,825) — (11,869) — — (118,341) Effect of movements in exchange
rates — (1,020) (1,882) (33) (2,347) (28) (65) (5,375)
Book value as of December 31, 2020 W442,822 3,847,206 9,267,298 126,167 6,045,727 110,907 299,576 20,139,703
Acquisition cost as of December 31,2020 W442,822 7,420,854 48,166,361 735,329 6,122,364 184,036 1,021,641 64,093,407
Accumulated depreciation as ofDecember 31, 2020 W — (3,457,052) (37,581,293) (600,912) — (69,130) (697,134) (42,405,521)
Accumulated impairment loss as ofDecember 31, 2020 W — (116,596) (1,317,770) (8,250) (76,637) (3,999) (24,931) (1,548,183)
(*1) As of December 31, 2020, construction-in-progress mainly relates to construction of manufacturing facilities.(*2) Others mainly represent the reclassification of construction-in-progress to other property, plant and equipment. (c) Capitalized borrowing costs and capitalization rate for the years ended December 31, 2021 and 2020 are as follows:
(In millions of won) 2021 2020 Capitalized borrowing costs W64,606 191,876 Capitalization rate 3.69% 4.14%
111
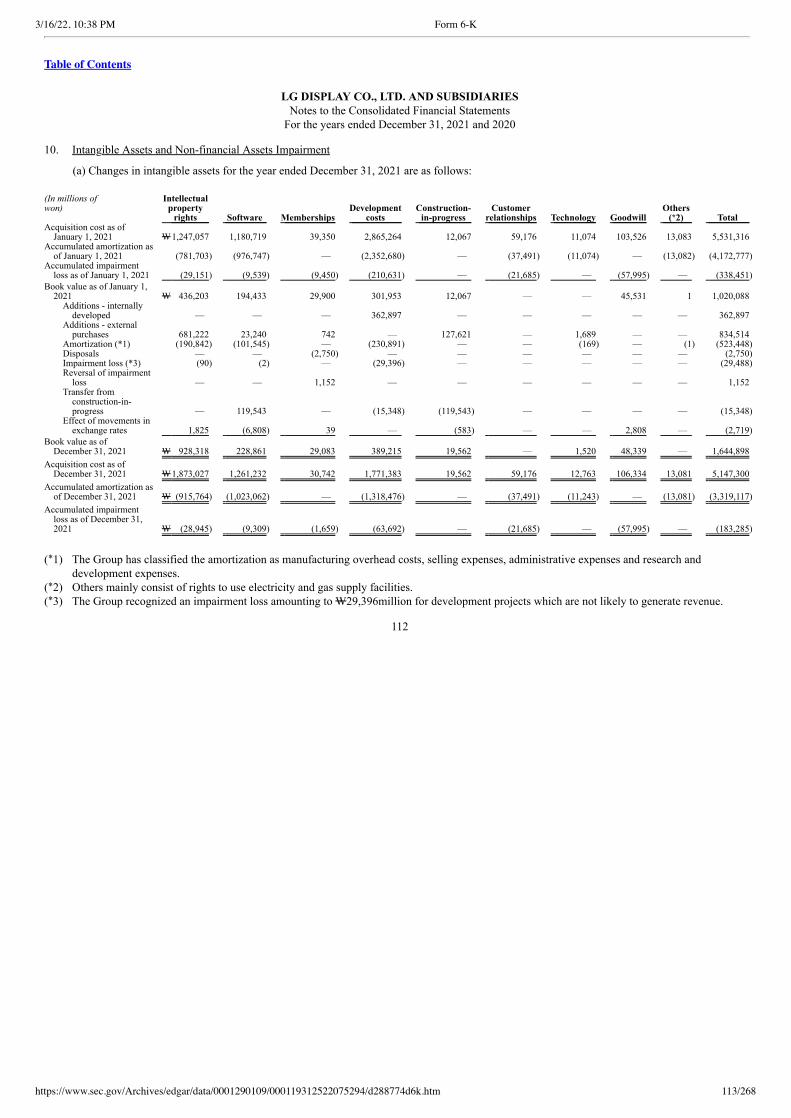
3/16/22, 10:38 PM Form 6-K
https://www.sec.gov/Archives/edgar/data/0001290109/000119312522075294/d288774d6k.htm 113/268
Table of Contents
LG DISPLAY CO., LTD. AND SUBSIDIARIESNotes to the Consolidated Financial Statements
For the years ended December 31, 2021 and 2020 10. Intangible Assets and Non-financial Assets Impairment
(a) Changes in intangible assets for the year ended December 31, 2021 are as follows: (In millions ofwon)
Intellectual property
rights Software Memberships Development
costs Construction-
in-progress Customer
relationships Technology Goodwill Others
(*2) Total Acquisition cost as of
January 1, 2021 W1,247,057 1,180,719 39,350 2,865,264 12,067 59,176 11,074 103,526 13,083 5,531,316 Accumulated amortization as
of January 1, 2021 (781,703) (976,747) — (2,352,680) — (37,491) (11,074) — (13,082) (4,172,777) Accumulated impairment
loss as of January 1, 2021 (29,151) (9,539) (9,450) (210,631) — (21,685) — (57,995) — (338,451)
Book value as of January 1,2021 W 436,203 194,433 29,900 301,953 12,067 — — 45,531 1 1,020,088
Additions - internallydeveloped — — — 362,897 — — — — — 362,897
Additions - externalpurchases 681,222 23,240 742 — 127,621 — 1,689 — — 834,514
Amortization (*1) (190,842) (101,545) — (230,891) — — (169) — (1) (523,448) Disposals — — (2,750) — — — — — — (2,750) Impairment loss (*3) (90) (2) — (29,396) — — — — — (29,488) Reversal of impairment
loss — — 1,152 — — — — — — 1,152 Transfer from
construction-in-progress — 119,543 — (15,348) (119,543) — — — — (15,348)
Effect of movements inexchange rates 1,825 (6,808) 39 — (583) — — 2,808 — (2,719)
Book value as ofDecember 31, 2021 W 928,318 228,861 29,083 389,215 19,562 — 1,520 48,339 — 1,644,898
Acquisition cost as ofDecember 31, 2021 W1,873,027 1,261,232 30,742 1,771,383 19,562 59,176 12,763 106,334 13,081 5,147,300
Accumulated amortization asof December 31, 2021 W (915,764) (1,023,062) — (1,318,476) — (37,491) (11,243) — (13,081) (3,319,117)
Accumulated impairmentloss as of December 31,2021 W (28,945) (9,309) (1,659) (63,692) — (21,685) — (57,995) — (183,285)
(*1) The Group has classified the amortization as manufacturing overhead costs, selling expenses, administrative expenses and research and
development expenses.(*2) Others mainly consist of rights to use electricity and gas supply facilities.(*3) The Group recognized an impairment loss amounting to W29,396million for development projects which are not likely to generate revenue.
112

3/16/22, 10:38 PM Form 6-K
https://www.sec.gov/Archives/edgar/data/0001290109/000119312522075294/d288774d6k.htm 114/268
Table of Contents
LG DISPLAY CO., LTD. AND SUBSIDIARIESNotes to the Consolidated Financial Statements
For the years ended December 31, 2021 and 2020 10. Intangible Assets and Non-financial Assets Impairment, Continued (b) Changes in intangible assets for the year ended December 31, 2020 are as follows: (In millions ofwon)
Intellectual property
rights Software Memberships Development
costs Construction-
in-progress Customer
relationships Technology Goodwill Others
(*2) Total Acquisition cost as of
January 1, 2020 W 959,683 1,097,290 56,612 2,580,777 15,245 59,176 11,074 105,414 13,080 4,898,351 Accumulated amortization as
of January 1, 2020 (739,498) (890,281) — (2,073,881) — (37,491) (10,705) — (13,079) (3,764,935) Accumulated impairment loss
as of January 1, 2020 (29,151) (8,864) (10,560) (131,713) — (21,685) — (57,995) — (259,968)
Book value as of January 1,2020 W 191,034 198,145 46,052 375,183 15,245 — 369 47,419 1 873,448
Additions - internallydeveloped — — — 284,487 — — — — — 284,487
Additions - externalpurchases 291,405 27,789 — — 51,520 — — — 3 370,717
Amortization (*1) (42,205) (86,466) — (278,799) — — (369) — (3) (407,842) Disposals — — (17,252) — — — — — — (17,252) Impairment loss (*3) — (675) — (78,918) — — — — — (79,593) Reversal of impairment
loss — — 1,110 — — — — — — 1,110 Transfer from
construction-in-progress — 54,753 — — (54,753) — — — — —
Effect of movements inexchange rates (4,031) 887 (10) — 55 — — (1,888) — (4,987)
Book value as ofDecember 31, 2020 W 436,203 194,433 29,900 301,953 12,067 — — 45,531 1 1,020,088
Acquisition cost as ofDecember 31, 2020 W1,247,057 1,180,719 39,350 2,865,264 12,067 59,176 11,074 103,526 13,083 5,531,316
Accumulated amortization asof December 31, 2020 W (781,703) (976,747) — (2,352,680) — (37,491) (11,074) — (13,082) (4,172,777)
Accumulated impairment lossas of December 31, 2020 W (29,151) (9,539) (9,450) (210,631) — (21,685) — (57,995) — (338,451)
113
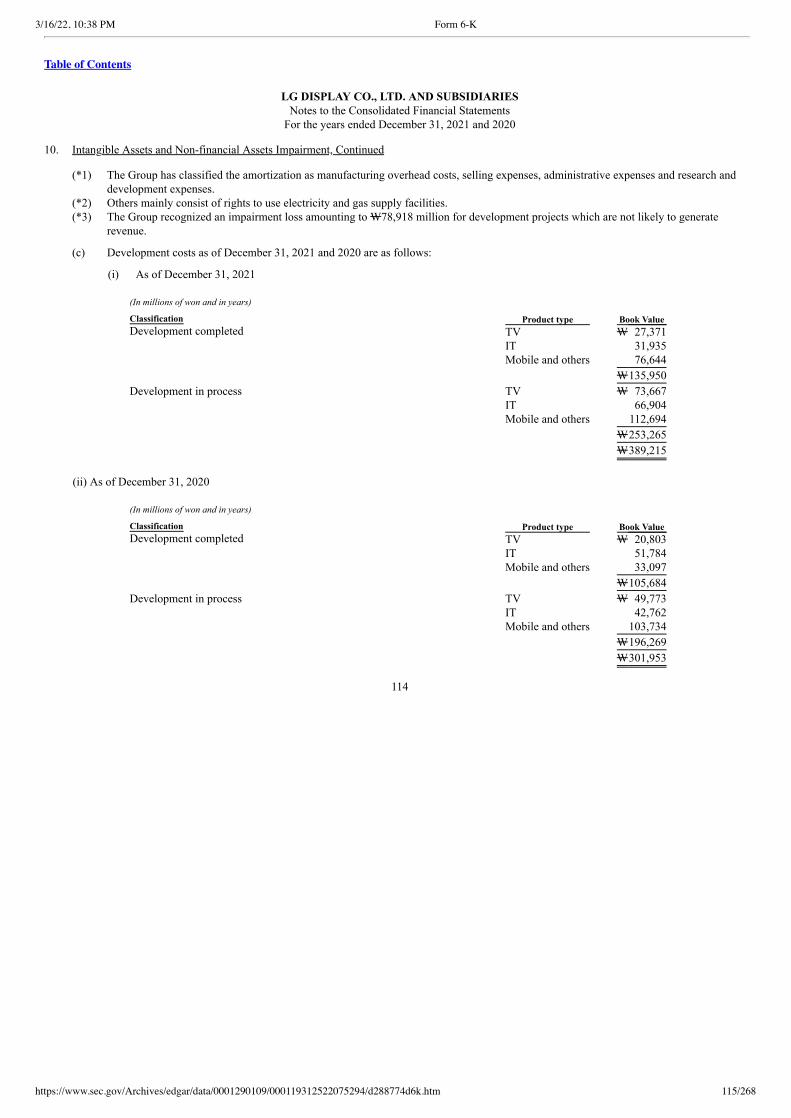
3/16/22, 10:38 PM Form 6-K
https://www.sec.gov/Archives/edgar/data/0001290109/000119312522075294/d288774d6k.htm 115/268
Table of Contents
LG DISPLAY CO., LTD. AND SUBSIDIARIESNotes to the Consolidated Financial Statements
For the years ended December 31, 2021 and 2020 10. Intangible Assets and Non-financial Assets Impairment, Continued
(*1) The Group has classified the amortization as manufacturing overhead costs, selling expenses, administrative expenses and research anddevelopment expenses.
(*2) Others mainly consist of rights to use electricity and gas supply facilities.
(*3) The Group recognized an impairment loss amounting to W78,918 million for development projects which are not likely to generaterevenue.
(c) Development costs as of December 31, 2021 and 2020 are as follows:
(i) As of December 31, 2021
(In millions of won and in years)
Classification Product type Book Value Development completed TV W 27,371
IT 31,935 Mobile and others 76,644
W135,950
Development in process TV W 73,667 IT 66,904 Mobile and others 112,694
W253,265
W389,215
(ii) As of December 31, 2020
(In millions of won and in years)
Classification Product type Book Value Development completed TV W 20,803
IT 51,784 Mobile and others 33,097
W105,684
Development in process TV W 49,773 IT 42,762 Mobile and others 103,734
W196,269
W301,953
114
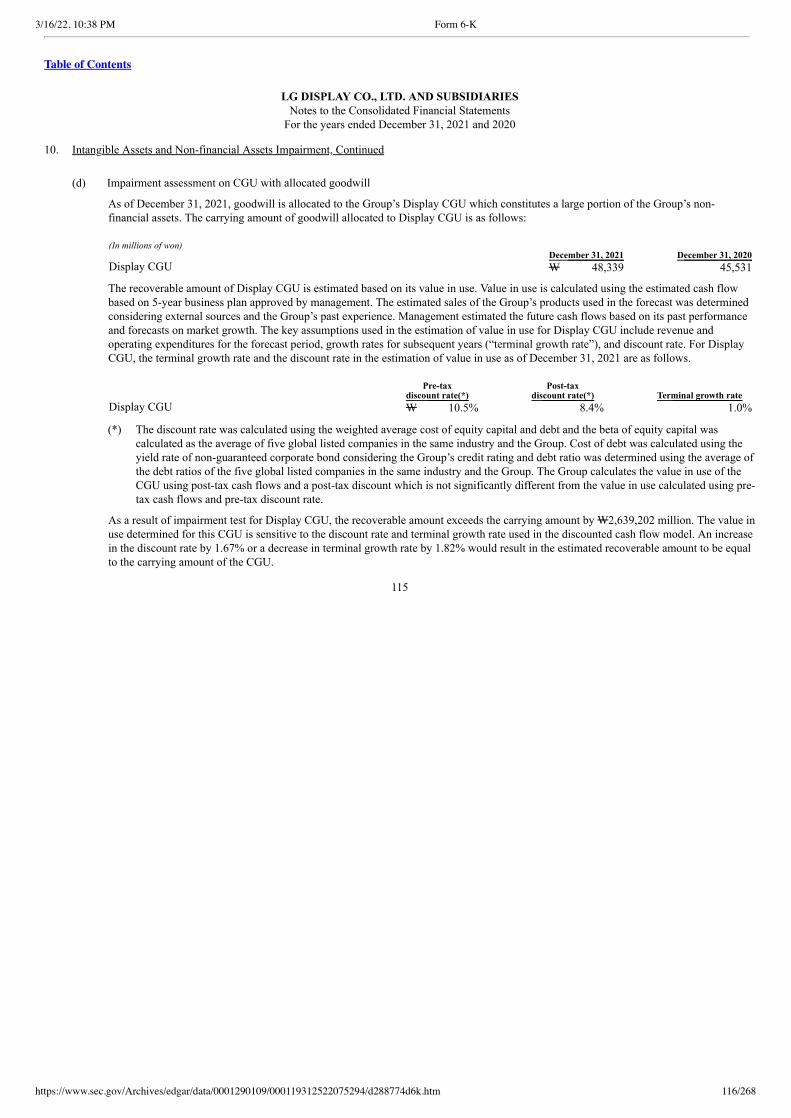
3/16/22, 10:38 PM Form 6-K
https://www.sec.gov/Archives/edgar/data/0001290109/000119312522075294/d288774d6k.htm 116/268
Table of Contents
LG DISPLAY CO., LTD. AND SUBSIDIARIESNotes to the Consolidated Financial Statements
For the years ended December 31, 2021 and 2020 10. Intangible Assets and Non-financial Assets Impairment, Continued
(d) Impairment assessment on CGU with allocated goodwill
As of December 31, 2021, goodwill is allocated to the Group’s Display CGU which constitutes a large portion of the Group’s non-financial assets. The carrying amount of goodwill allocated to Display CGU is as follows:
(In millions of won) December 31, 2021 December 31, 2020 Display CGU W 48,339 45,531
The recoverable amount of Display CGU is estimated based on its value in use. Value in use is calculated using the estimated cash flowbased on 5-year business plan approved by management. The estimated sales of the Group’s products used in the forecast was determinedconsidering external sources and the Group’s past experience. Management estimated the future cash flows based on its past performanceand forecasts on market growth. The key assumptions used in the estimation of value in use for Display CGU include revenue andoperating expenditures for the forecast period, growth rates for subsequent years (“terminal growth rate”), and discount rate. For DisplayCGU, the terminal growth rate and the discount rate in the estimation of value in use as of December 31, 2021 are as follows.
Pre-tax discount rate(*)
Post-tax discount rate(*) Terminal growth rate
Display CGU W 10.5% 8.4% 1.0%
(*) The discount rate was calculated using the weighted average cost of equity capital and debt and the beta of equity capital wascalculated as the average of five global listed companies in the same industry and the Group. Cost of debt was calculated using theyield rate of non-guaranteed corporate bond considering the Group’s credit rating and debt ratio was determined using the average ofthe debt ratios of the five global listed companies in the same industry and the Group. The Group calculates the value in use of theCGU using post-tax cash flows and a post-tax discount which is not significantly different from the value in use calculated using pre-tax cash flows and pre-tax discount rate.
As a result of impairment test for Display CGU, the recoverable amount exceeds the carrying amount by W2,639,202 million. The value inuse determined for this CGU is sensitive to the discount rate and terminal growth rate used in the discounted cash flow model. An increasein the discount rate by 1.67% or a decrease in terminal growth rate by 1.82% would result in the estimated recoverable amount to be equalto the carrying amount of the CGU.
115
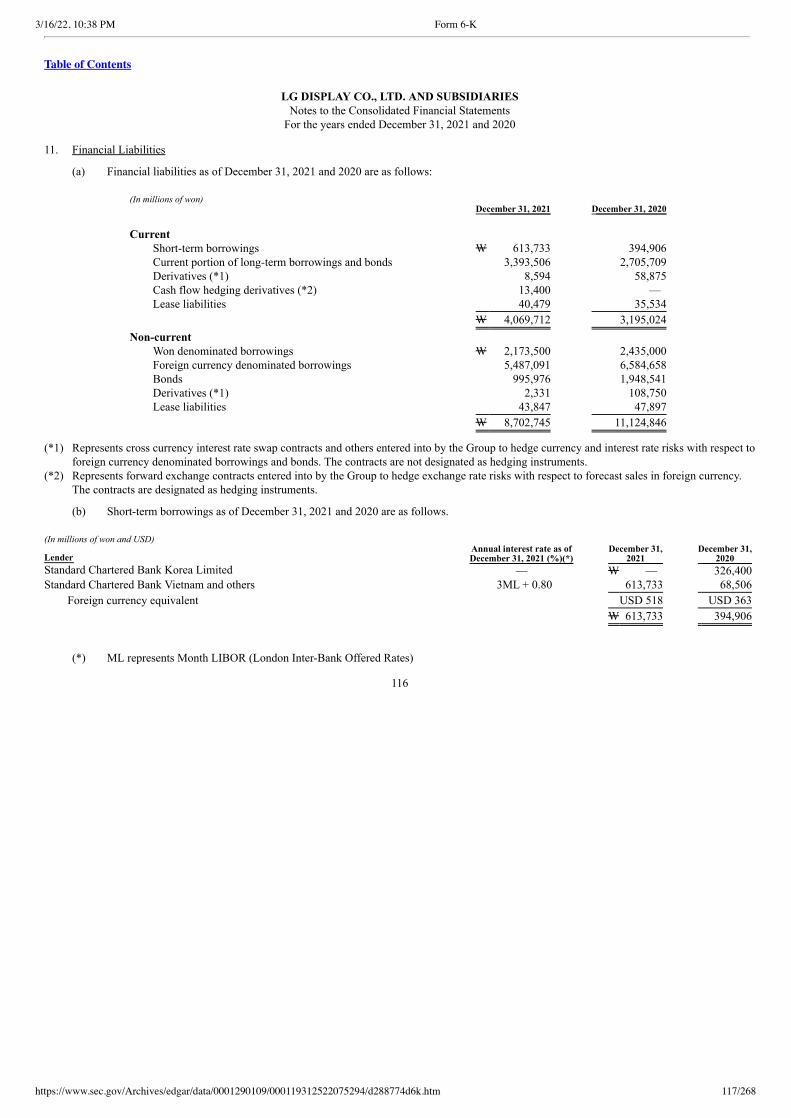
3/16/22, 10:38 PM Form 6-K
https://www.sec.gov/Archives/edgar/data/0001290109/000119312522075294/d288774d6k.htm 117/268
Table of Contents
LG DISPLAY CO., LTD. AND SUBSIDIARIESNotes to the Consolidated Financial Statements
For the years ended December 31, 2021 and 2020 11. Financial Liabilities
(a) Financial liabilities as of December 31, 2021 and 2020 are as follows:
(In millions of won) December 31, 2021 December 31, 2020
Current
Short-term borrowings W 613,733 394,906 Current portion of long-term borrowings and bonds 3,393,506 2,705,709 Derivatives (*1) 8,594 58,875 Cash flow hedging derivatives (*2) 13,400 — Lease liabilities 40,479 35,534
W 4,069,712 3,195,024
Non-current Won denominated borrowings W 2,173,500 2,435,000 Foreign currency denominated borrowings 5,487,091 6,584,658 Bonds 995,976 1,948,541 Derivatives (*1) 2,331 108,750 Lease liabilities 43,847 47,897
W 8,702,745 11,124,846
(*1) Represents cross currency interest rate swap contracts and others entered into by the Group to hedge currency and interest rate risks with respect toforeign currency denominated borrowings and bonds. The contracts are not designated as hedging instruments.
(*2) Represents forward exchange contracts entered into by the Group to hedge exchange rate risks with respect to forecast sales in foreign currency.The contracts are designated as hedging instruments.
(b) Short-term borrowings as of December 31, 2021 and 2020 are as follows. (In millions of won and USD)
Lender Annual interest rate as of
December 31, 2021 (%)(*) December 31,
2021 December 31,
2020 Standard Chartered Bank Korea Limited — W — 326,400 Standard Chartered Bank Vietnam and others 3ML + 0.80 613,733 68,506
Foreign currency equivalent USD 518 USD 363
W 613,733 394,906
(*) ML represents Month LIBOR (London Inter-Bank Offered Rates)
116

3/16/22, 10:38 PM Form 6-K
https://www.sec.gov/Archives/edgar/data/0001290109/000119312522075294/d288774d6k.htm 118/268
Table of Contents
LG DISPLAY CO., LTD. AND SUBSIDIARIESNotes to the Consolidated Financial Statements
For the years ended December 31, 2021 and 2020 11. Financial Liabilities, Continued (c) Won denominated long-term borrowings as of December 31, 2021 and 2020 are as follows:
(In millions of won)
Lender
Annual interest rateas of
December 31, 2021 (%)(*) December 31,
2021 December 31,
2020 Woori Bank — W — 60 Korea Development Bank and others
CD rate (91days) + 1.00~1.60,
1.90~3.25 2,785,000 3,272,500 Less current portion of long-term borrowings (611,500) (837,560)
W2,173,500 2,435,000
(*) CD represents certificate of deposit.
(d) Foreign currency denominated long-term borrowings as of December 31, 2021 and 2020 are as follows:
(In millions of won, USD and CNY)
Lender
Annual interest rateas of
December 31, 2021 (%)(*) December 31,
2021 December 31,
2020 The Export-Import Bank of Korea and others
3ML + 1.20~2.40 6ML + 1.25~1.43, 1.82~2.46 W 2,163,538 1,680,960
China Construction Bank and others
USD : 3ML+0.65~1.43CNY : LPR(5Y) + 0.34,LPR(1Y) -0.15~+ 0.15,
4.20 4,489,974 5,948,472
Foreign currency equivalent USD 2,782 USD 2,742 CNY 18,017 CNY 27,825
Less current portion of long-term borrowings W (1,166,421) (1,044,774)
W 5,487,091 6,584,658
(*) LPR represents Loan Prime Rate of People’s Bank of China.
117
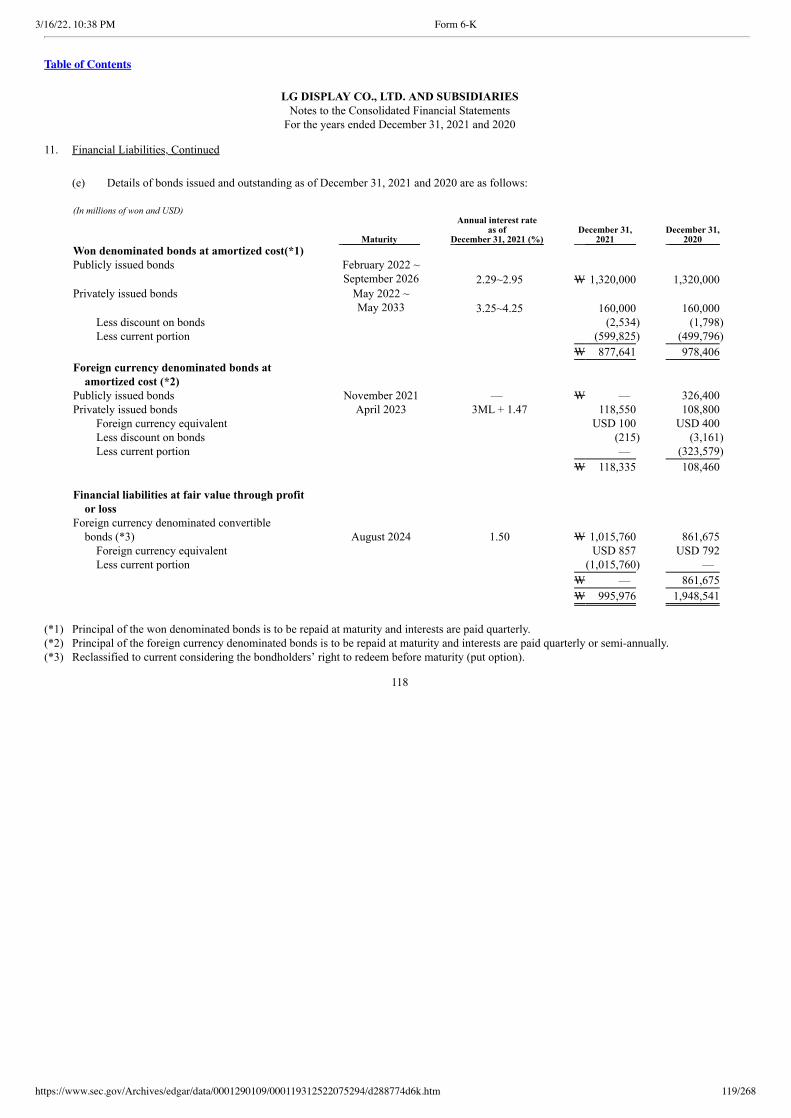
3/16/22, 10:38 PM Form 6-K
https://www.sec.gov/Archives/edgar/data/0001290109/000119312522075294/d288774d6k.htm 119/268
Table of Contents
LG DISPLAY CO., LTD. AND SUBSIDIARIESNotes to the Consolidated Financial Statements
For the years ended December 31, 2021 and 2020 11. Financial Liabilities, Continued
(e) Details of bonds issued and outstanding as of December 31, 2021 and 2020 are as follows:
(In millions of won and USD)
Maturity
Annual interest rate as of
December 31, 2021 (%) December 31,
2021 December 31,
2020 Won denominated bonds at amortized cost(*1) Publicly issued bonds
February 2022 ~ September 2026 2.29~2.95 W 1,320,000 1,320,000
Privately issued bonds
May 2022 ~ May 2033
3.25~4.25 160,000 160,000
Less discount on bonds (2,534) (1,798) Less current portion (599,825) (499,796)
W 877,641 978,406
Foreign currency denominated bonds atamortized cost (*2)
Publicly issued bonds November 2021 — W — 326,400 Privately issued bonds April 2023 3ML + 1.47 118,550 108,800
Foreign currency equivalent USD 100 USD 400 Less discount on bonds (215) (3,161) Less current portion — (323,579)
W 118,335 108,460
Financial liabilities at fair value through profitor loss
Foreign currency denominated convertible bonds (*3) August 2024 1.50 W 1,015,760 861,675
Foreign currency equivalent USD 857 USD 792 Less current portion (1,015,760) —
W — 861,675
W 995,976 1,948,541
(*1) Principal of the won denominated bonds is to be repaid at maturity and interests are paid quarterly.(*2) Principal of the foreign currency denominated bonds is to be repaid at maturity and interests are paid quarterly or semi-annually.(*3) Reclassified to current considering the bondholders’ right to redeem before maturity (put option).
118
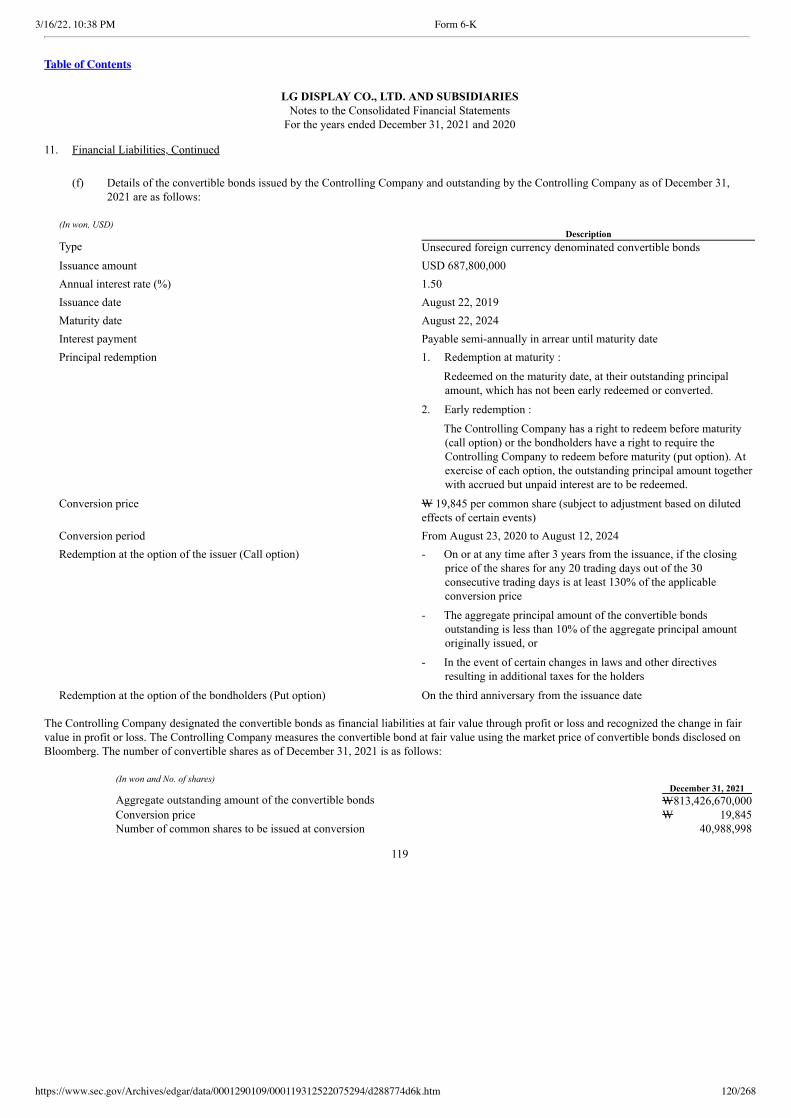
3/16/22, 10:38 PM Form 6-K
https://www.sec.gov/Archives/edgar/data/0001290109/000119312522075294/d288774d6k.htm 120/268
Table of Contents
LG DISPLAY CO., LTD. AND SUBSIDIARIESNotes to the Consolidated Financial Statements
For the years ended December 31, 2021 and 2020 11. Financial Liabilities, Continued
(f) Details of the convertible bonds issued by the Controlling Company and outstanding by the Controlling Company as of December 31,2021 are as follows:
(In won, USD) DescriptionType Unsecured foreign currency denominated convertible bondsIssuance amount USD 687,800,000Annual interest rate (%) 1.50Issuance date August 22, 2019Maturity date August 22, 2024Interest payment Payable semi-annually in arrear until maturity datePrincipal redemption
1. Redemption at maturity :
Redeemed on the maturity date, at their outstanding principalamount, which has not been early redeemed or converted.
2. Early redemption :
The Controlling Company has a right to redeem before maturity(call option) or the bondholders have a right to require theControlling Company to redeem before maturity (put option). Atexercise of each option, the outstanding principal amount togetherwith accrued but unpaid interest are to be redeemed.
Conversion price
W 19,845 per common share (subject to adjustment based on dilutedeffects of certain events)
Conversion period From August 23, 2020 to August 12, 2024Redemption at the option of the issuer (Call option)
- On or at any time after 3 years from the issuance, if the closingprice of the shares for any 20 trading days out of the 30consecutive trading days is at least 130% of the applicableconversion price
- The aggregate principal amount of the convertible bondsoutstanding is less than 10% of the aggregate principal amountoriginally issued, or
- In the event of certain changes in laws and other directivesresulting in additional taxes for the holders
Redemption at the option of the bondholders (Put option) On the third anniversary from the issuance date
The Controlling Company designated the convertible bonds as financial liabilities at fair value through profit or loss and recognized the change in fairvalue in profit or loss. The Controlling Company measures the convertible bond at fair value using the market price of convertible bonds disclosed onBloomberg. The number of convertible shares as of December 31, 2021 is as follows:
(In won and No. of shares) December 31, 2021 Aggregate outstanding amount of the convertible bonds W813,426,670,000 Conversion price W 19,845 Number of common shares to be issued at conversion 40,988,998
119
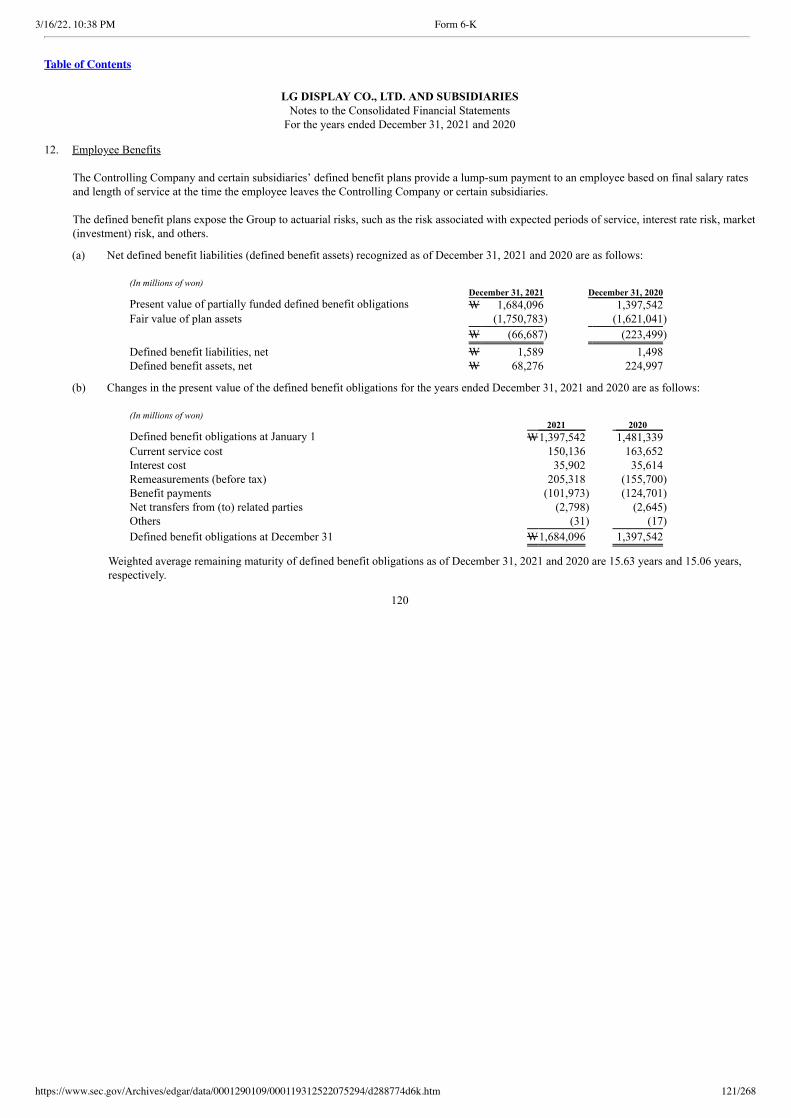
3/16/22, 10:38 PM Form 6-K
https://www.sec.gov/Archives/edgar/data/0001290109/000119312522075294/d288774d6k.htm 121/268
Table of Contents
LG DISPLAY CO., LTD. AND SUBSIDIARIESNotes to the Consolidated Financial Statements
For the years ended December 31, 2021 and 2020 12. Employee Benefits
The Controlling Company and certain subsidiaries’ defined benefit plans provide a lump-sum payment to an employee based on final salary ratesand length of service at the time the employee leaves the Controlling Company or certain subsidiaries.
The defined benefit plans expose the Group to actuarial risks, such as the risk associated with expected periods of service, interest rate risk, market(investment) risk, and others.
(a) Net defined benefit liabilities (defined benefit assets) recognized as of December 31, 2021 and 2020 are as follows:
(In millions of won) December 31, 2021 December 31, 2020 Present value of partially funded defined benefit obligations W 1,684,096 1,397,542 Fair value of plan assets (1,750,783) (1,621,041)
W (66,687) (223,499)
Defined benefit liabilities, net W 1,589 1,498 Defined benefit assets, net W 68,276 224,997
(b) Changes in the present value of the defined benefit obligations for the years ended December 31, 2021 and 2020 are as follows:
(In millions of won) 2021 2020 Defined benefit obligations at January 1 W1,397,542 1,481,339 Current service cost 150,136 163,652 Interest cost 35,902 35,614 Remeasurements (before tax) 205,318 (155,700) Benefit payments (101,973) (124,701) Net transfers from (to) related parties (2,798) (2,645) Others (31) (17)
Defined benefit obligations at December 31 W1,684,096 1,397,542
Weighted average remaining maturity of defined benefit obligations as of December 31, 2021 and 2020 are 15.63 years and 15.06 years,respectively.
120
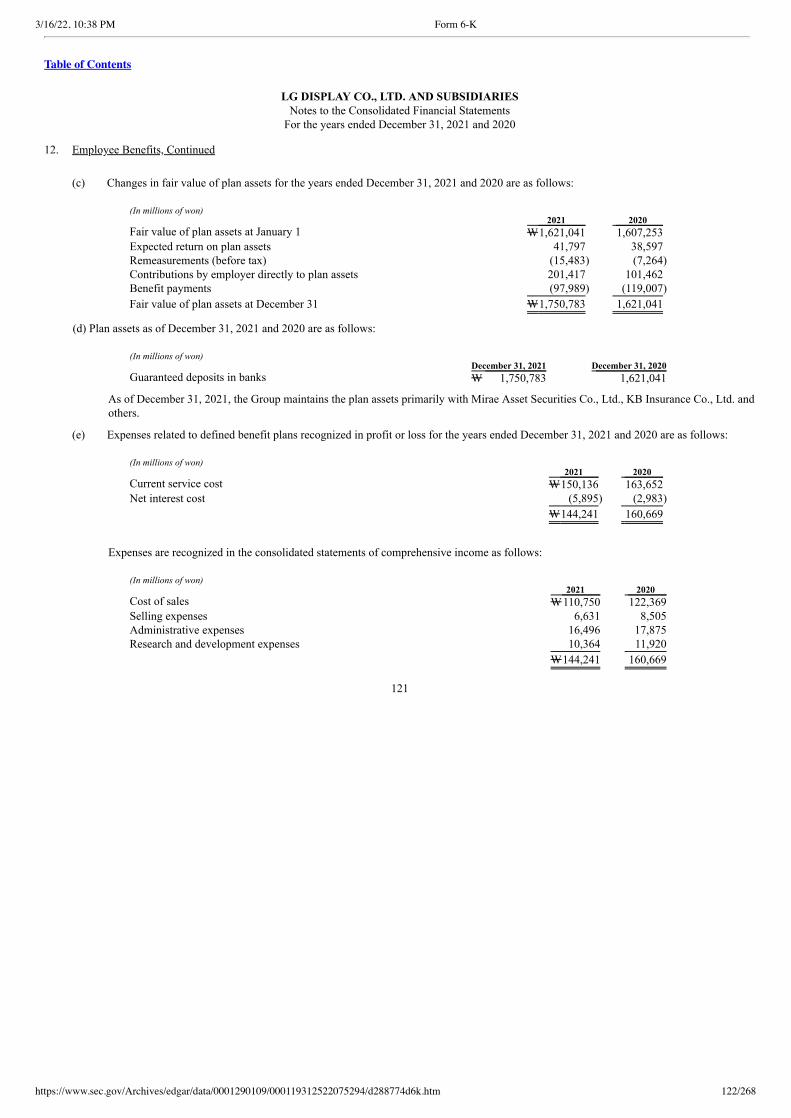
3/16/22, 10:38 PM Form 6-K
https://www.sec.gov/Archives/edgar/data/0001290109/000119312522075294/d288774d6k.htm 122/268
Table of Contents
LG DISPLAY CO., LTD. AND SUBSIDIARIESNotes to the Consolidated Financial Statements
For the years ended December 31, 2021 and 2020 12. Employee Benefits, Continued
(c) Changes in fair value of plan assets for the years ended December 31, 2021 and 2020 are as follows:
(In millions of won) 2021 2020 Fair value of plan assets at January 1 W1,621,041 1,607,253 Expected return on plan assets 41,797 38,597 Remeasurements (before tax) (15,483) (7,264) Contributions by employer directly to plan assets 201,417 101,462 Benefit payments (97,989) (119,007)
Fair value of plan assets at December 31 W1,750,783 1,621,041
(d) Plan assets as of December 31, 2021 and 2020 are as follows:
(In millions of won) December 31, 2021 December 31, 2020 Guaranteed deposits in banks W 1,750,783 1,621,041
As of December 31, 2021, the Group maintains the plan assets primarily with Mirae Asset Securities Co., Ltd., KB Insurance Co., Ltd. andothers.
(e) Expenses related to defined benefit plans recognized in profit or loss for the years ended December 31, 2021 and 2020 are as follows:
(In millions of won) 2021 2020 Current service cost W150,136 163,652 Net interest cost (5,895) (2,983)
W144,241 160,669
Expenses are recognized in the consolidated statements of comprehensive income as follows:
(In millions of won) 2021 2020 Cost of sales W110,750 122,369 Selling expenses 6,631 8,505 Administrative expenses 16,496 17,875 Research and development expenses 10,364 11,920
W144,241 160,669
121
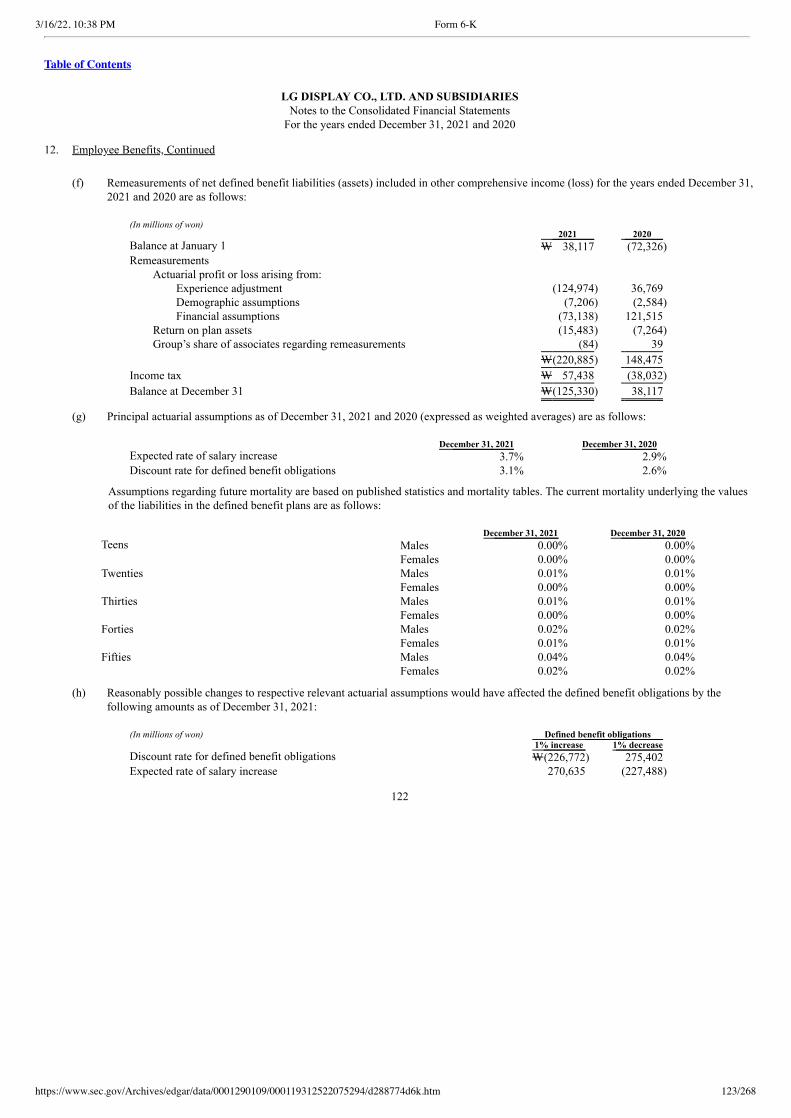
3/16/22, 10:38 PM Form 6-K
https://www.sec.gov/Archives/edgar/data/0001290109/000119312522075294/d288774d6k.htm 123/268
Table of Contents
LG DISPLAY CO., LTD. AND SUBSIDIARIESNotes to the Consolidated Financial Statements
For the years ended December 31, 2021 and 2020 12. Employee Benefits, Continued
(f) Remeasurements of net defined benefit liabilities (assets) included in other comprehensive income (loss) for the years ended December 31,2021 and 2020 are as follows:
(In millions of won) 2021 2020 Balance at January 1 W 38,117 (72,326) Remeasurements
Actuarial profit or loss arising from: Experience adjustment (124,974) 36,769 Demographic assumptions (7,206) (2,584) Financial assumptions (73,138) 121,515
Return on plan assets (15,483) (7,264) Group’s share of associates regarding remeasurements (84) 39
W(220,885) 148,475
Income tax W 57,438 (38,032)
Balance at December 31 W(125,330) 38,117
(g) Principal actuarial assumptions as of December 31, 2021 and 2020 (expressed as weighted averages) are as follows:
December 31, 2021 December 31, 2020 Expected rate of salary increase 3.7% 2.9% Discount rate for defined benefit obligations 3.1% 2.6%
Assumptions regarding future mortality are based on published statistics and mortality tables. The current mortality underlying the valuesof the liabilities in the defined benefit plans are as follows:
December 31, 2021 December 31, 2020 Teens Males 0.00% 0.00%
Females 0.00% 0.00% Twenties Males 0.01% 0.01%
Females 0.00% 0.00% Thirties Males 0.01% 0.01%
Females 0.00% 0.00% Forties Males 0.02% 0.02%
Females 0.01% 0.01% Fifties Males 0.04% 0.04%
Females 0.02% 0.02%
(h) Reasonably possible changes to respective relevant actuarial assumptions would have affected the defined benefit obligations by thefollowing amounts as of December 31, 2021:
(In millions of won) Defined benefit obligations 1% increase 1% decrease Discount rate for defined benefit obligations W(226,772) 275,402 Expected rate of salary increase 270,635 (227,488)
122
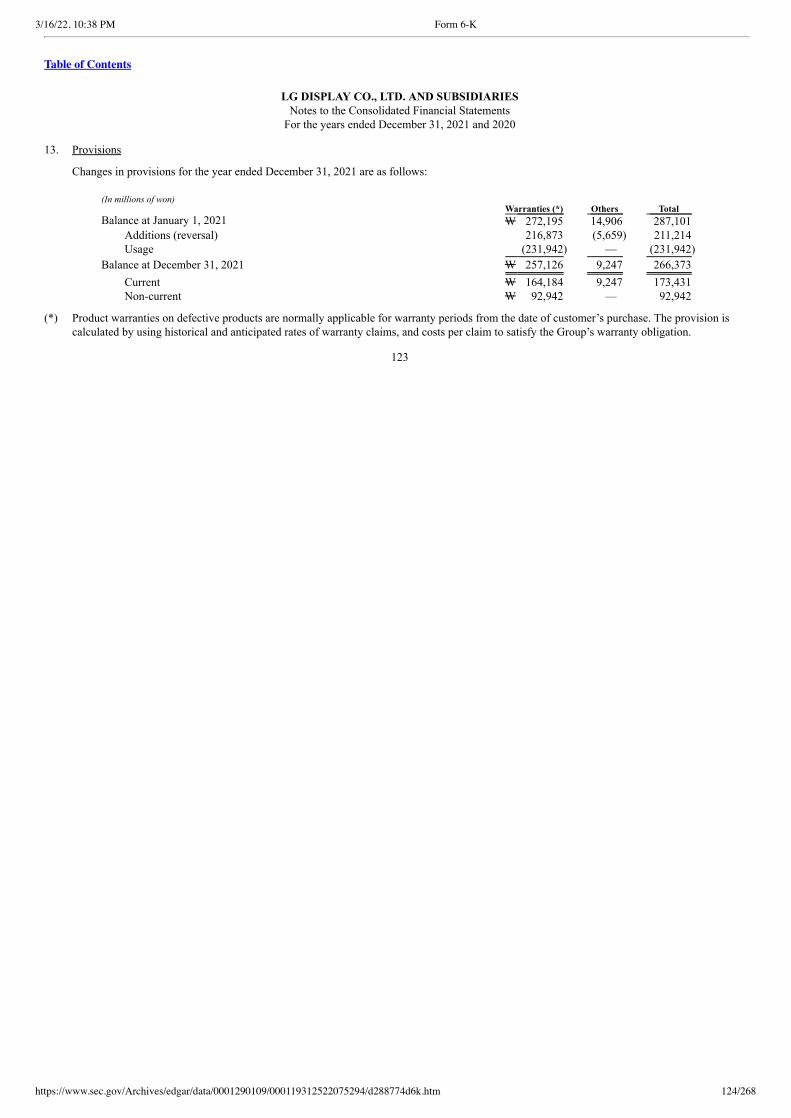
3/16/22, 10:38 PM Form 6-K
https://www.sec.gov/Archives/edgar/data/0001290109/000119312522075294/d288774d6k.htm 124/268
Table of Contents
LG DISPLAY CO., LTD. AND SUBSIDIARIESNotes to the Consolidated Financial Statements
For the years ended December 31, 2021 and 2020 13. Provisions
Changes in provisions for the year ended December 31, 2021 are as follows:
(In millions of won) Warranties (*) Others Total Balance at January 1, 2021 W 272,195 14,906 287,101
Additions (reversal) 216,873 (5,659) 211,214 Usage (231,942) — (231,942)
Balance at December 31, 2021 W 257,126 9,247 266,373
Current W 164,184 9,247 173,431 Non-current W 92,942 — 92,942
(*) Product warranties on defective products are normally applicable for warranty periods from the date of customer’s purchase. The provision iscalculated by using historical and anticipated rates of warranty claims, and costs per claim to satisfy the Group’s warranty obligation.
123
3/16/22, 10:38 PM Form 6-K
https://www.sec.gov/Archives/edgar/data/0001290109/000119312522075294/d288774d6k.htm 125/268
Table of Contents
LG DISPLAY CO., LTD. AND SUBSIDIARIESNotes to the Consolidated Financial Statements
For the years ended December 31, 2021 and 2020 14. Contingent Liabilities and Commitments
(a) Legal Proceedings
Anti-trust litigations
Some individual claimants filed “follow-on” damages claims against the Group and other TFT-LCD manufacturers alleging violations ofEU competition law. While the Group continues its vigorous defense of the various pending proceedings described above, as ofDecember 31, 2021, the Group cannot reliably estimate the timing and amount of outflows of resources embodying economic benefitsrelating to the proceedings.
Solas OLED Ltd. Litigations
Between April 2019 and September 2020, Solas OLED Ltd. filed altogether four patent infringement actions, with two in the United StatesDistrict Court for the Western District of Texas, one in the Mannheim District Court in Germany and one in the Beijing IntellectualProperty Court in China, against the Controlling Company and television manufacturers. The actions in the United States and Germanyalso included the Controlling Company’s subsidiaries, LG Display America, Inc. and LG Display Germany GmbH, as defendants,respectively. In December 2020, the parties reached an agreement to amicably settle all claims and all patent infringement actions havebeen formally dismissed during the year ended December 31, 2021.
Others
The Group is involved in various lawsuits and disputes in addition to the pending proceedings described above. The Group cannot reliablyestimate the timing and amount of outflows of resources embodying economic benefits relating to the disputes.
(b) Commitments
Factoring and securitization of accounts receivable
The Controlling Company has agreements with Korea Development Bank and several other banks for accounts receivable salesnegotiating facilities of up to an aggregate of USD 1,015 million (W1,203,283 million) in connection with the Controlling Company’sexport sales transactions with its subsidiaries. As of December 31, 2021, there are no short-term borrowings that are outstanding but pastdue in connection with these agreements. In connection with all of the contracts in this paragraph, the Controlling Company has sold itsaccounts receivable with recourse.
124

3/16/22, 10:38 PM Form 6-K
https://www.sec.gov/Archives/edgar/data/0001290109/000119312522075294/d288774d6k.htm 126/268
Table of Contents
LG DISPLAY CO., LTD. AND SUBSIDIARIESNotes to the Consolidated Financial Statements
For the years ended December 31, 2021 and 2020 14. Contingent Liabilities and Commitments, Continued
The Controlling Company and overseas subsidiaries have agreements with financial institutions for accounts receivables sales negotiatingfacilities. The respective maximum amount of accounts receivables that could be sold under the agreement and the amount of sold but not yet dueaccounts receivables by contract are as follows:
(In millions of USD and KRW) Classification Financial institutions Credit limit Not yet due
Contractual
amount KRW
equivalent Contractual
amount KRW
equivalent Controlling Company KRW 90,000 90,000 — —
Shinhan Bank USD 10 11,855 USD 7 8,334
Sumitomo Mitsui BankingCorporation USD 20 23,710 — —
MUFG Bank USD 180 213,390 USD 20 23,757 BNP Paribas USD 65 77,058 USD 9 10,839 ING Bank USD 90 106,695 — —
USD 365 USD 36 KRW 90,000 522,708 — 42,930
Subsidiaries LG Display Singapore Pte. Ltd. Standard Chartered Bank USD 330 391,215 USD 110 130,400
United Overseas Bank Limited USD 100 118,550 USD 70 82,983
JPMorgan Chase Bank, N.A.,Singapore Branch USD 50 59,275 — —
LG Display Taiwan Co., Ltd. BNP Paribas USD 15 17,783 — —
Australia and New ZealandBanking Group Ltd. USD 70 82,985 USD 22 26,081
KGI Bank Co., Ltd. USD 30 35,565 — —
LG Display Germany GmbH BNP Paribas USD 135 160,043 USD 50 59,289 Commerzbank AG USD 12 14,262 USD 5 6,141 DZ Bank AG USD 12 14,007 USD 9 10,103 UniCredit Bank USD 19 22,196 USD 8 10,012
LG Display America, Inc.
Hong Kong & Shanghai BankingCorp. USD 400 474,200 USD 400 474,200
Standard Chartered Bank USD 600 711,300 USD 285 337,868
Sumitomo Mitsui BankingCorporation USD 150 177,825 USD 5 5,928
LG Display Japan Co., Ltd.
Chelsea Capital CorporationTokyo Branch USD 120 142,260 — —
LG Display Guangzhou Trading Co., Ltd.
KEB Hana Bank (China)Company Limited USD 30 35,565 — —
USD 2,073 2,457,031 USD 964 1,143,005
USD 2,438 USD 1,000 KRW 90,000 2,979,739 — 1,185,935
In connection with all of the contracts in the above table, the Group has sold its accounts receivable without recourse.
125
3/16/22, 10:38 PM Form 6-K
https://www.sec.gov/Archives/edgar/data/0001290109/000119312522075294/d288774d6k.htm 127/268
Table of Contents
LG DISPLAY CO., LTD. AND SUBSIDIARIESNotes to the Consolidated Financial Statements
For the years ended December 31, 2021 and 2020 14. Contingent Liabilities and Commitments, Continued
Letters of credit
As of December 31, 2021, the Group entered into agreements with financial institutions in relation to the opening of letters of credit and therespective credit limits under the agreements are as follows:
(In millions of won and USD) Contractual amount KRW equivalent KEB Hana Bank USD 250 W 296,375 Sumitomo Mitsui Banking Corporation USD 50 59,275 Industrial Bank of Korea USD 100 118,550 Industrial and Commercial Bank of China USD 200 237,100 Shinhan Bank USD 400 474,200 KB Kookmin Bank USD 100 118,550 MUFG Bank USD 100 118,550 The Export–Import Bank of Korea USD 200 237,100 Standard Chartered Bank USD 400 474,200
USD 1,800 W 2,133,900
Payment guarantees
The Controlling Company obtained payment guarantees amounting to USD 2 million (W2,371 million) from Shinhan Bank for value added taxpayments in Poland.
LG Display (China) Co., Ltd. and other subsidiaries are provided with payment guarantees from the China Construction Bank and other variousbanks amounting to CNY 1,189 million (W221,463 million), JPY 900 million (W9,272 million), EUR 2.5 million (W3,356 million), VND51,408 million (W2,678 million), and USD 0.5 million (W593 million), respectively, for their local tax payments and utility payments.
License agreements
As of December 31, 2021, the Group has technical license agreements with Hitachi Display, Ltd. and others in relation to its LCD business andpatent license agreement with Universal Display Corporation in relation to its OLED business. Also, the Group has a trademark license agreementwith LG Corp. and other intellectual property license agreements with various companies as of December 31, 2021.
Pledged Assets
In connection with the borrowings amounting to CNY 14,494 million (W2,699,652 million) from China Construction Bank and others, as ofDecember 31, 2021, the Group is providing its property, plant and equipment with carrying amount of W1,001,126 million as pledged assets.
126
3/16/22, 10:38 PM Form 6-K
https://www.sec.gov/Archives/edgar/data/0001290109/000119312522075294/d288774d6k.htm 128/268
Table of Contents
LG DISPLAY CO., LTD. AND SUBSIDIARIESNotes to the Consolidated Financial Statements
For the years ended December 31, 2021 and 2020 15. Share Capital, Share Premium and Reserves
(a) Share capital and Share Premium
The Controlling Company is authorized to issue 500,000,000 shares of capital stock (par value W5,000), and as of December 31, 2021 andDecember 31, 2020, the number of issued common shares is 357,815,700. There have been no changes in the capital stock from January 1,2020 to December 31, 2021.
The Group’s capital surplus consists of share premium. There have been no changes in share premium from January 1, 2020 toDecember 31, 2021.
(b) Reserves
Reserves consist mainly of the following:
Translation reserve
The translation reserve comprises all foreign currency differences arising from the translation of the financial statements of foreignoperations.
Other comprehensive income (loss) from associates
The other comprehensive income (loss) from associates comprises the amount related to change in equity of investments in equityaccounted investees.
Gain or loss on valuation of derivatives
Gain or loss on valuation of derivatives is the effective portion of the gains or losses from derivatives to which cash flow hedgingaccounting has been applied.
Reserves as of December 31, 2021 and 2020 are as follows:
(In millions of won) December 31, 2021 December 31, 2020 Loss on valuation of derivatives W (9,227) — Foreign currency translation differences for foreign operations 566,651 (138,667) Other comprehensive loss from associates (20,282) (24,779)
W 537,142 (163,446)
127
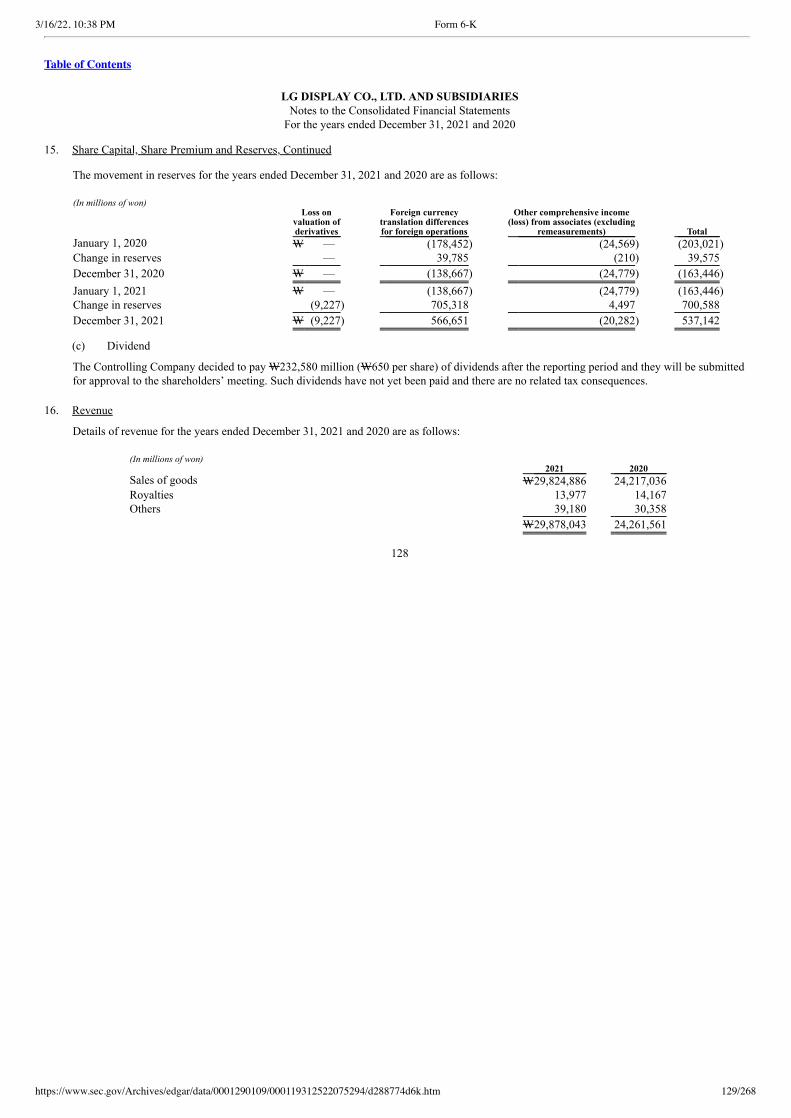
3/16/22, 10:38 PM Form 6-K
https://www.sec.gov/Archives/edgar/data/0001290109/000119312522075294/d288774d6k.htm 129/268
Table of Contents
LG DISPLAY CO., LTD. AND SUBSIDIARIESNotes to the Consolidated Financial Statements
For the years ended December 31, 2021 and 2020 15. Share Capital, Share Premium and Reserves, Continued
The movement in reserves for the years ended December 31, 2021 and 2020 are as follows:
(In millions of won)
Loss on valuation of
derivatives
Foreign currency translation differences
for foreign operations
Other comprehensive income (loss) from associates (excluding
remeasurements) Total January 1, 2020 W — (178,452) (24,569) (203,021) Change in reserves — 39,785 (210) 39,575
December 31, 2020 W — (138,667) (24,779) (163,446)
January 1, 2021 W — (138,667) (24,779) (163,446) Change in reserves (9,227) 705,318 4,497 700,588
December 31, 2021 W (9,227) 566,651 (20,282) 537,142
(c) Dividend
The Controlling Company decided to pay W232,580 million (W650 per share) of dividends after the reporting period and they will be submittedfor approval to the shareholders’ meeting. Such dividends have not yet been paid and there are no related tax consequences.
16. Revenue
Details of revenue for the years ended December 31, 2021 and 2020 are as follows:
(In millions of won) 2021 2020 Sales of goods W29,824,886 24,217,036 Royalties 13,977 14,167 Others 39,180 30,358
W29,878,043 24,261,561
128

3/16/22, 10:38 PM Form 6-K
https://www.sec.gov/Archives/edgar/data/0001290109/000119312522075294/d288774d6k.htm 130/268
Table of Contents
LG DISPLAY CO., LTD. AND SUBSIDIARIESNotes to the Consolidated Financial Statements
For the years ended December 31, 2021 and 2020 17. Geographic and Other Information
The following is a summary of the Group’s operation by region based on the location of customers for the years ended December 31, 2021 and2020.
(a) Revenue by geography
(In millions of won) 2021 2020 Domestic W 632,531 912,049 Foreign
China 19,866,707 16,685,746 Asia (excluding China) 3,256,126 2,297,290 United States 3,263,055 2,070,944 Europe (excluding Poland) 1,159,669 1,215,345 Poland 1,699,955 1,080,187
W29,245,512 23,349,512
W29,878,043 24,261,561
Sales to Company A and Company B amount to W12,019,534 million and W5,924,262 million, respectively, for the year ended December 31,2021 (2020: W10,380,138 million and W4,252,696 million, respectively). The Group’s top ten end-brand customers together accounted for 86%of sales for the year ended December 31, 2021 (2020: 85%).
129
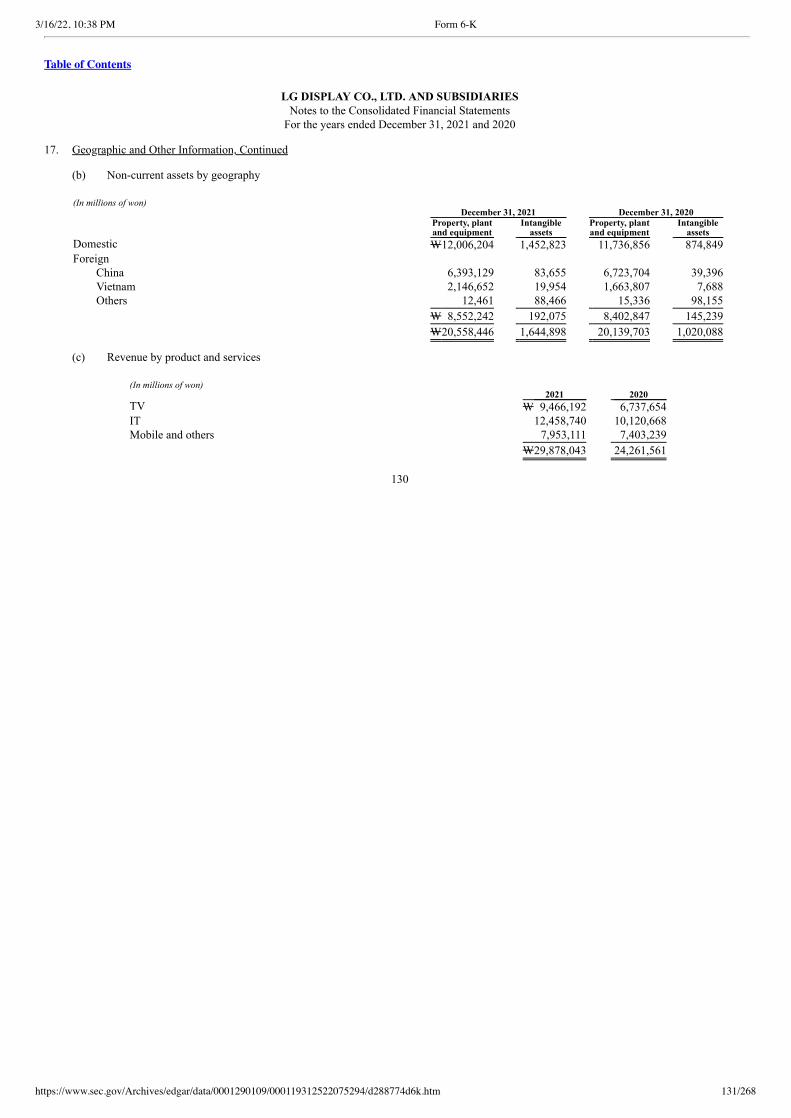
3/16/22, 10:38 PM Form 6-K
https://www.sec.gov/Archives/edgar/data/0001290109/000119312522075294/d288774d6k.htm 131/268
Table of Contents
LG DISPLAY CO., LTD. AND SUBSIDIARIESNotes to the Consolidated Financial Statements
For the years ended December 31, 2021 and 2020 17. Geographic and Other Information, Continued (b) Non-current assets by geography
(In millions of won)
December 31, 2021 December 31, 2020
Property, plant
and equipment Intangible
assets Property, plant
and equipment Intangible
assets Domestic W12,006,204 1,452,823 11,736,856 874,849 Foreign
China 6,393,129 83,655 6,723,704 39,396 Vietnam 2,146,652 19,954 1,663,807 7,688 Others 12,461 88,466 15,336 98,155
W 8,552,242 192,075 8,402,847 145,239
W20,558,446 1,644,898 20,139,703 1,020,088
(c) Revenue by product and services
(In millions of won) 2021 2020 TV W 9,466,192 6,737,654 IT 12,458,740 10,120,668 Mobile and others 7,953,111 7,403,239
W29,878,043 24,261,561
130
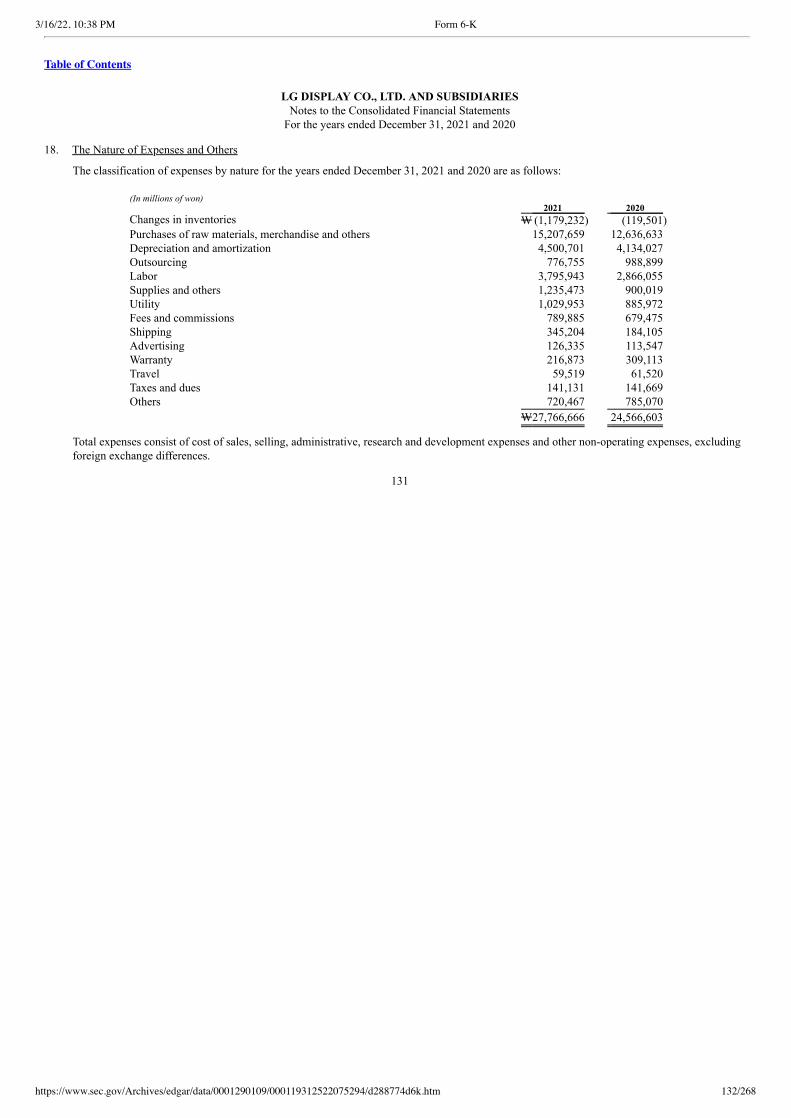
3/16/22, 10:38 PM Form 6-K
https://www.sec.gov/Archives/edgar/data/0001290109/000119312522075294/d288774d6k.htm 132/268
Table of Contents
LG DISPLAY CO., LTD. AND SUBSIDIARIESNotes to the Consolidated Financial Statements
For the years ended December 31, 2021 and 2020 18. The Nature of Expenses and Others
The classification of expenses by nature for the years ended December 31, 2021 and 2020 are as follows:
(In millions of won) 2021 2020 Changes in inventories W (1,179,232) (119,501) Purchases of raw materials, merchandise and others 15,207,659 12,636,633 Depreciation and amortization 4,500,701 4,134,027 Outsourcing 776,755 988,899 Labor 3,795,943 2,866,055 Supplies and others 1,235,473 900,019 Utility 1,029,953 885,972 Fees and commissions 789,885 679,475 Shipping 345,204 184,105 Advertising 126,335 113,547 Warranty 216,873 309,113 Travel 59,519 61,520 Taxes and dues 141,131 141,669 Others 720,467 785,070
W27,766,666 24,566,603
Total expenses consist of cost of sales, selling, administrative, research and development expenses and other non-operating expenses, excludingforeign exchange differences.
131
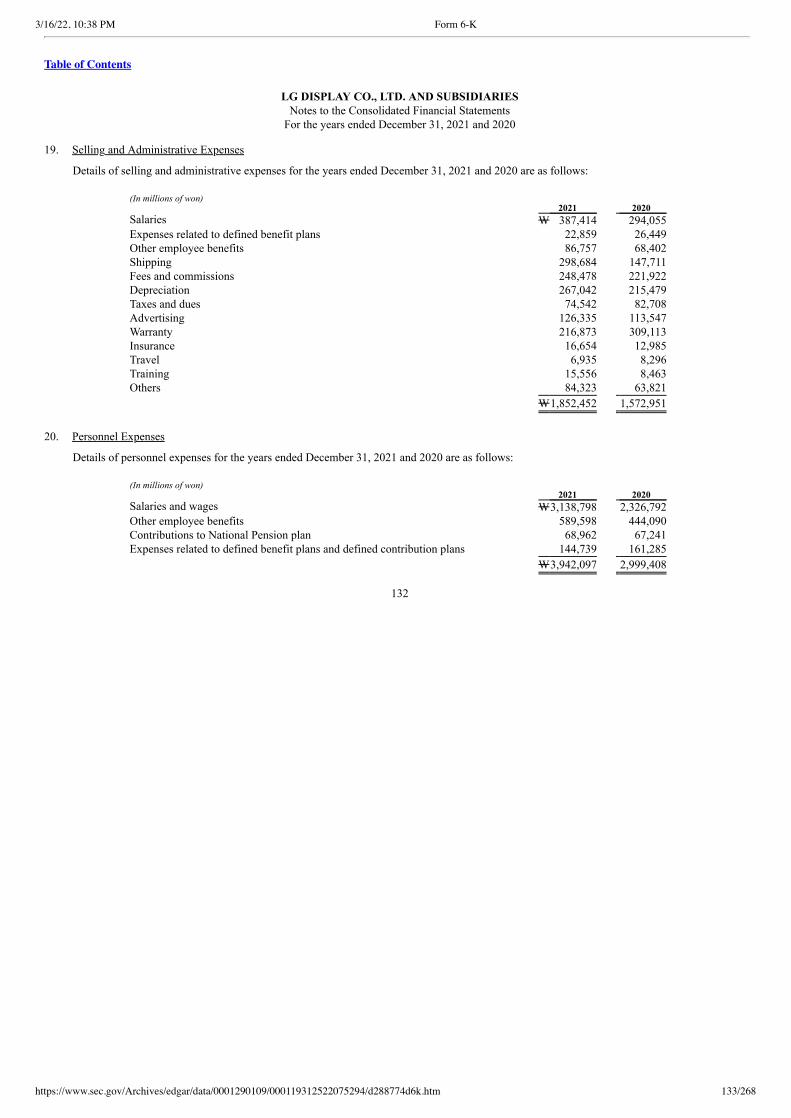
3/16/22, 10:38 PM Form 6-K
https://www.sec.gov/Archives/edgar/data/0001290109/000119312522075294/d288774d6k.htm 133/268
Table of Contents
LG DISPLAY CO., LTD. AND SUBSIDIARIESNotes to the Consolidated Financial Statements
For the years ended December 31, 2021 and 2020 19. Selling and Administrative Expenses
Details of selling and administrative expenses for the years ended December 31, 2021 and 2020 are as follows:
(In millions of won) 2021 2020 Salaries W 387,414 294,055 Expenses related to defined benefit plans 22,859 26,449 Other employee benefits 86,757 68,402 Shipping 298,684 147,711 Fees and commissions 248,478 221,922 Depreciation 267,042 215,479 Taxes and dues 74,542 82,708 Advertising 126,335 113,547 Warranty 216,873 309,113 Insurance 16,654 12,985 Travel 6,935 8,296 Training 15,556 8,463 Others 84,323 63,821
W1,852,452 1,572,951
20. Personnel Expenses
Details of personnel expenses for the years ended December 31, 2021 and 2020 are as follows:
(In millions of won) 2021 2020 Salaries and wages W3,138,798 2,326,792 Other employee benefits 589,598 444,090 Contributions to National Pension plan 68,962 67,241 Expenses related to defined benefit plans and defined contribution plans 144,739 161,285
W3,942,097 2,999,408
132
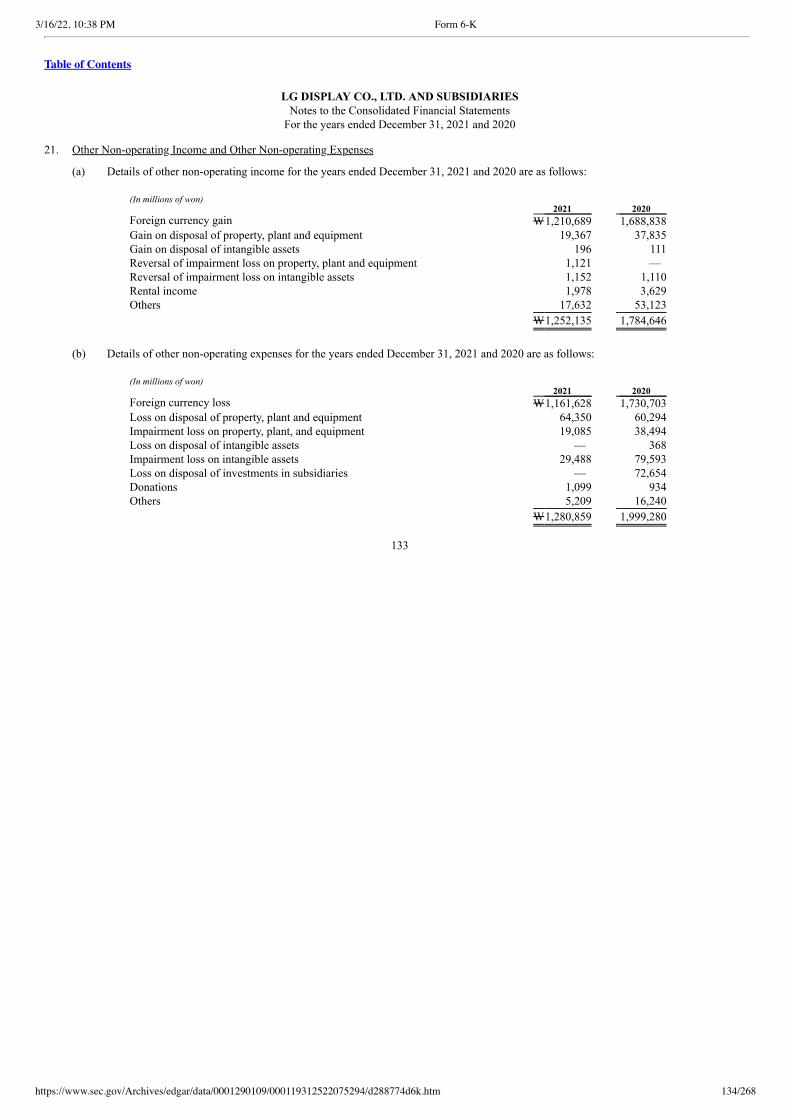
3/16/22, 10:38 PM Form 6-K
https://www.sec.gov/Archives/edgar/data/0001290109/000119312522075294/d288774d6k.htm 134/268
Table of Contents
LG DISPLAY CO., LTD. AND SUBSIDIARIESNotes to the Consolidated Financial Statements
For the years ended December 31, 2021 and 2020 21. Other Non-operating Income and Other Non-operating Expenses
(a) Details of other non-operating income for the years ended December 31, 2021 and 2020 are as follows:
(In millions of won) 2021 2020 Foreign currency gain W1,210,689 1,688,838 Gain on disposal of property, plant and equipment 19,367 37,835 Gain on disposal of intangible assets 196 111 Reversal of impairment loss on property, plant and equipment 1,121 — Reversal of impairment loss on intangible assets 1,152 1,110 Rental income 1,978 3,629 Others 17,632 53,123
W1,252,135 1,784,646
(b) Details of other non-operating expenses for the years ended December 31, 2021 and 2020 are as follows:
(In millions of won) 2021 2020 Foreign currency loss W1,161,628 1,730,703 Loss on disposal of property, plant and equipment 64,350 60,294 Impairment loss on property, plant, and equipment 19,085 38,494 Loss on disposal of intangible assets — 368 Impairment loss on intangible assets 29,488 79,593 Loss on disposal of investments in subsidiaries — 72,654 Donations 1,099 934 Others 5,209 16,240
W1,280,859 1,999,280
133

3/16/22, 10:38 PM Form 6-K
https://www.sec.gov/Archives/edgar/data/0001290109/000119312522075294/d288774d6k.htm 135/268
Table of Contents
LG DISPLAY CO., LTD. AND SUBSIDIARIESNotes to the Consolidated Financial Statements
For the years ended December 31, 2021 and 2020 22. Finance Income and Finance Costs
(a) Finance income and costs recognized in profit or loss for the years ended December 31, 2021 and 2020 are as follows:
(In millions of won) 2021 2020 Finance income Interest income W 88,888 69,651 Foreign currency gain 81,600 336,155 Reversal of impairment loss on investments 4,701 4,149 Gain on transaction of derivatives 9,393 24,759 Gain on valuation of derivatives 234,742 — Gain on valuation of financial assets at fair value through profit or loss 6,511 4,072
W425,835 438,786
Finance costs Interest expense W434,089 370,479 Foreign currency loss 381,132 194,384 Impairment loss on investments in equity accounted investees 2,609 3,344 Loss on repayment of borrowings 250 794 Loss on sale of trade accounts and notes receivable 4,877 5,258 Loss on transaction of derivatives 1,049 291 Loss on valuation of derivatives 21,795 187,344 Loss on valuation of financial assets at fair value through profit or loss 704 2,311 Loss on valuation of financial liabilities at fair value through profit or loss 68,421 36,798 Others 1,688 1,675
W916,614 802,678
134
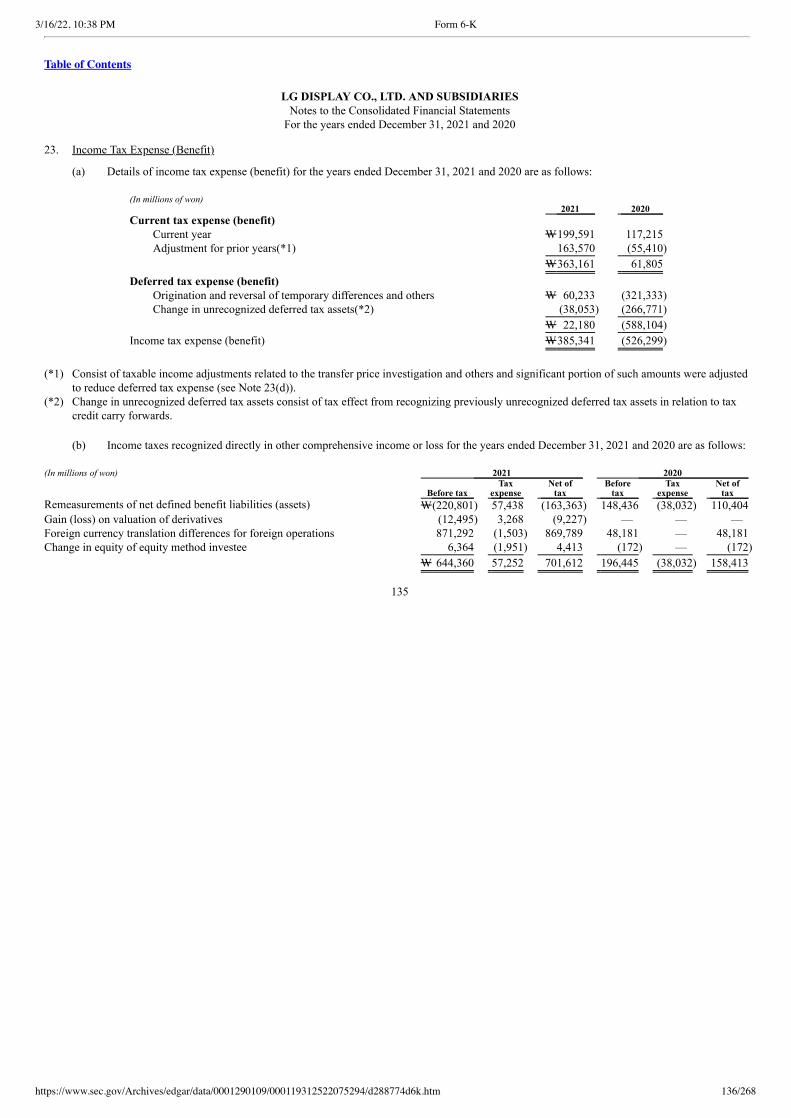
3/16/22, 10:38 PM Form 6-K
https://www.sec.gov/Archives/edgar/data/0001290109/000119312522075294/d288774d6k.htm 136/268
Table of Contents
LG DISPLAY CO., LTD. AND SUBSIDIARIESNotes to the Consolidated Financial Statements
For the years ended December 31, 2021 and 2020 23. Income Tax Expense (Benefit)
(a) Details of income tax expense (benefit) for the years ended December 31, 2021 and 2020 are as follows:
(In millions of won) 2021 2020 Current tax expense (benefit)
Current year W199,591 117,215 Adjustment for prior years(*1) 163,570 (55,410)
W363,161 61,805
Deferred tax expense (benefit) Origination and reversal of temporary differences and others W 60,233 (321,333) Change in unrecognized deferred tax assets(*2) (38,053) (266,771)
W 22,180 (588,104)
Income tax expense (benefit) W385,341 (526,299)
(*1) Consist of taxable income adjustments related to the transfer price investigation and others and significant portion of such amounts were adjusted
to reduce deferred tax expense (see Note 23(d)).(*2) Change in unrecognized deferred tax assets consist of tax effect from recognizing previously unrecognized deferred tax assets in relation to tax
credit carry forwards. (b) Income taxes recognized directly in other comprehensive income or loss for the years ended December 31, 2021 and 2020 are as follows: (In millions of won) 2021 2020
Before tax Tax
expense Net of
tax Before
tax Tax
expense Net of
tax Remeasurements of net defined benefit liabilities (assets) W(220,801) 57,438 (163,363) 148,436 (38,032) 110,404 Gain (loss) on valuation of derivatives (12,495) 3,268 (9,227) — — — Foreign currency translation differences for foreign operations 871,292 (1,503) 869,789 48,181 — 48,181 Change in equity of equity method investee 6,364 (1,951) 4,413 (172) — (172)
W 644,360 57,252 701,612 196,445 (38,032) 158,413
135
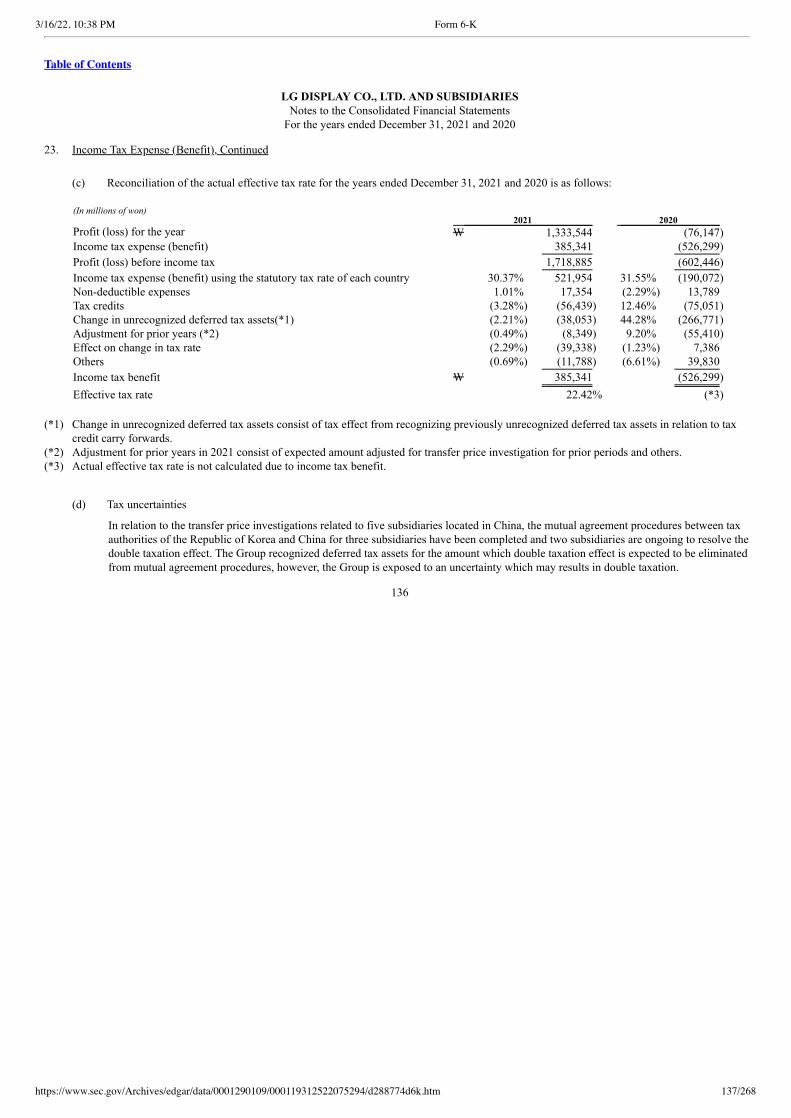
3/16/22, 10:38 PM Form 6-K
https://www.sec.gov/Archives/edgar/data/0001290109/000119312522075294/d288774d6k.htm 137/268
Table of Contents
LG DISPLAY CO., LTD. AND SUBSIDIARIESNotes to the Consolidated Financial Statements
For the years ended December 31, 2021 and 2020 23. Income Tax Expense (Benefit), Continued
(c) Reconciliation of the actual effective tax rate for the years ended December 31, 2021 and 2020 is as follows:
(In millions of won) 2021 2020 Profit (loss) for the year W 1,333,544 (76,147) Income tax expense (benefit) 385,341 (526,299)
Profit (loss) before income tax 1,718,885 (602,446)
Income tax expense (benefit) using the statutory tax rate of each country 30.37% 521,954 31.55% (190,072) Non-deductible expenses 1.01% 17,354 (2.29%) 13,789 Tax credits (3.28%) (56,439) 12.46% (75,051) Change in unrecognized deferred tax assets(*1) (2.21%) (38,053) 44.28% (266,771) Adjustment for prior years (*2) (0.49%) (8,349) 9.20% (55,410) Effect on change in tax rate (2.29%) (39,338) (1.23%) 7,386 Others (0.69%) (11,788) (6.61%) 39,830
Income tax benefit W 385,341 (526,299)
Effective tax rate 22.42% (*3) (*1) Change in unrecognized deferred tax assets consist of tax effect from recognizing previously unrecognized deferred tax assets in relation to tax
credit carry forwards.(*2) Adjustment for prior years in 2021 consist of expected amount adjusted for transfer price investigation for prior periods and others.(*3) Actual effective tax rate is not calculated due to income tax benefit.
(d) Tax uncertainties
In relation to the transfer price investigations related to five subsidiaries located in China, the mutual agreement procedures between taxauthorities of the Republic of Korea and China for three subsidiaries have been completed and two subsidiaries are ongoing to resolve thedouble taxation effect. The Group recognized deferred tax assets for the amount which double taxation effect is expected to be eliminatedfrom mutual agreement procedures, however, the Group is exposed to an uncertainty which may results in double taxation.
136
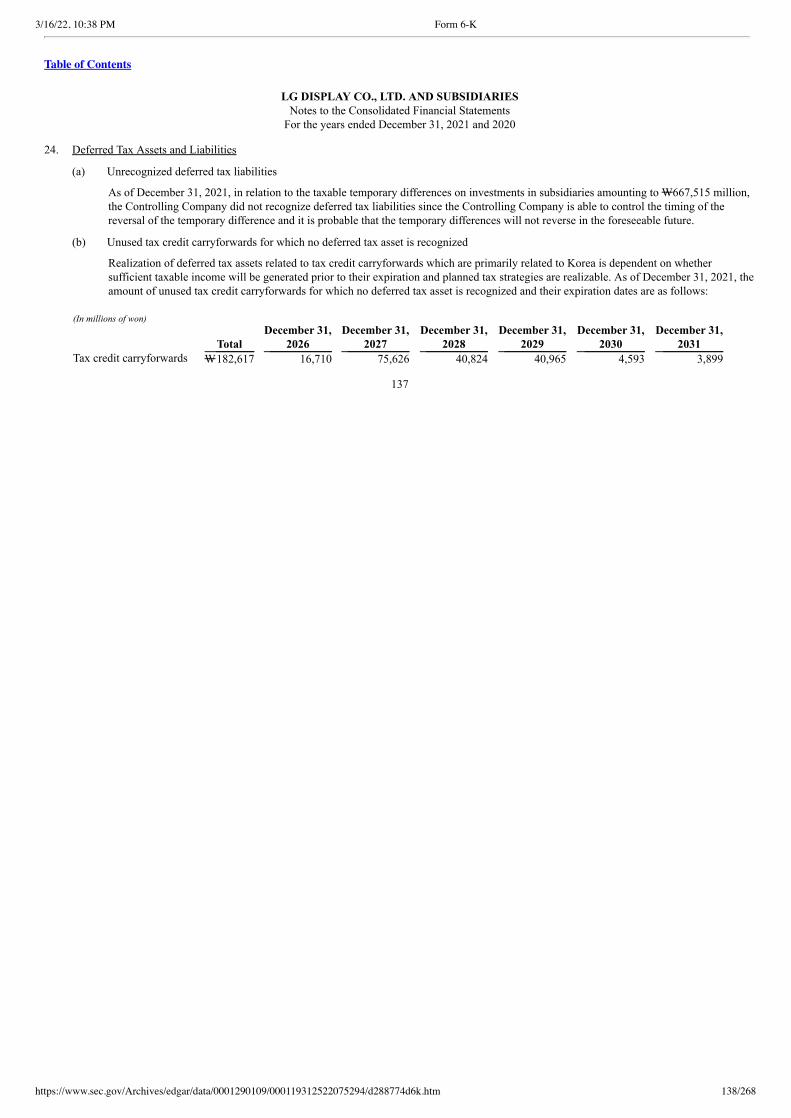
3/16/22, 10:38 PM Form 6-K
https://www.sec.gov/Archives/edgar/data/0001290109/000119312522075294/d288774d6k.htm 138/268
Table of Contents
LG DISPLAY CO., LTD. AND SUBSIDIARIESNotes to the Consolidated Financial Statements
For the years ended December 31, 2021 and 2020 24. Deferred Tax Assets and Liabilities
(a) Unrecognized deferred tax liabilities
As of December 31, 2021, in relation to the taxable temporary differences on investments in subsidiaries amounting to W667,515 million,the Controlling Company did not recognize deferred tax liabilities since the Controlling Company is able to control the timing of thereversal of the temporary difference and it is probable that the temporary differences will not reverse in the foreseeable future.
(b) Unused tax credit carryforwards for which no deferred tax asset is recognized
Realization of deferred tax assets related to tax credit carryforwards which are primarily related to Korea is dependent on whethersufficient taxable income will be generated prior to their expiration and planned tax strategies are realizable. As of December 31, 2021, theamount of unused tax credit carryforwards for which no deferred tax asset is recognized and their expiration dates are as follows:
(In millions of won)
Total December 31,
2026 December 31,
2027 December 31,
2028 December 31,
2029 December 31,
2030 December 31,
2031 Tax credit carryforwards W182,617 16,710 75,626 40,824 40,965 4,593 3,899
137
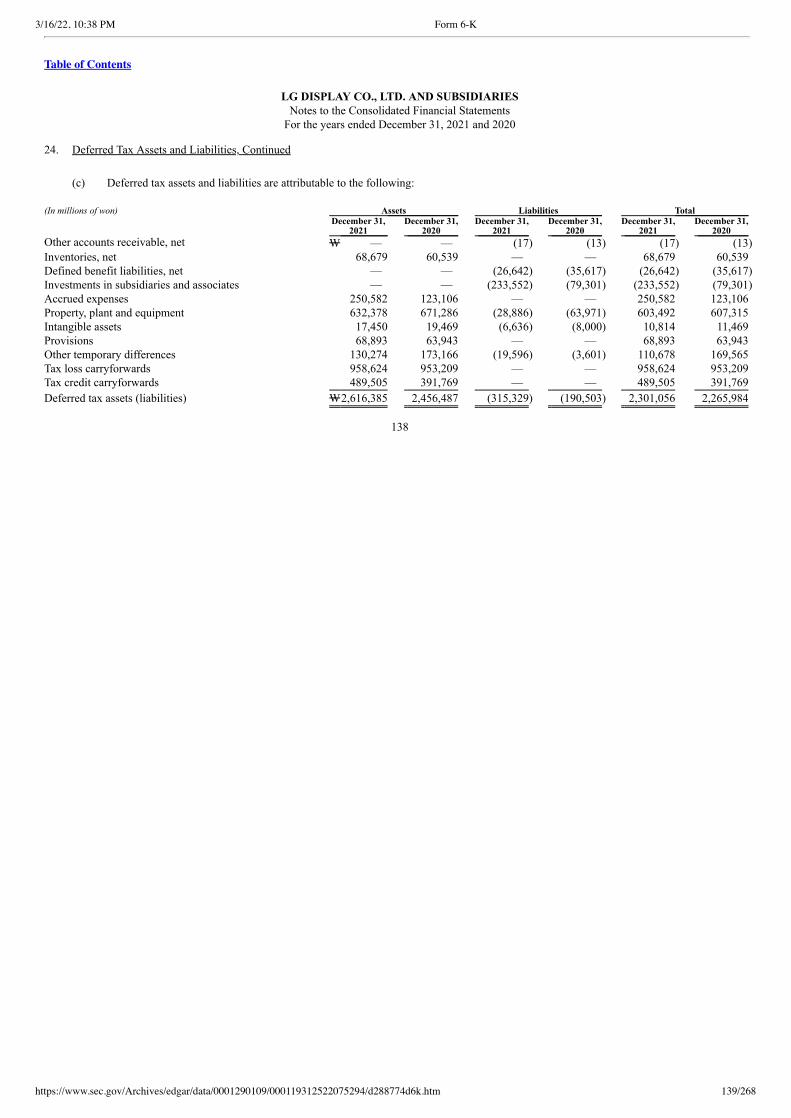
3/16/22, 10:38 PM Form 6-K
https://www.sec.gov/Archives/edgar/data/0001290109/000119312522075294/d288774d6k.htm 139/268
Table of Contents
LG DISPLAY CO., LTD. AND SUBSIDIARIESNotes to the Consolidated Financial Statements
For the years ended December 31, 2021 and 2020 24. Deferred Tax Assets and Liabilities, Continued
(c) Deferred tax assets and liabilities are attributable to the following: (In millions of won) Assets Liabilities Total
December 31,
2021 December 31,
2020 December 31,
2021 December 31,
2020 December 31,
2021 December 31,
2020 Other accounts receivable, net W — — (17) (13) (17) (13) Inventories, net 68,679 60,539 — — 68,679 60,539 Defined benefit liabilities, net — — (26,642) (35,617) (26,642) (35,617) Investments in subsidiaries and associates — — (233,552) (79,301) (233,552) (79,301) Accrued expenses 250,582 123,106 — — 250,582 123,106 Property, plant and equipment 632,378 671,286 (28,886) (63,971) 603,492 607,315 Intangible assets 17,450 19,469 (6,636) (8,000) 10,814 11,469 Provisions 68,893 63,943 — — 68,893 63,943 Other temporary differences 130,274 173,166 (19,596) (3,601) 110,678 169,565 Tax loss carryforwards 958,624 953,209 — — 958,624 953,209 Tax credit carryforwards 489,505 391,769 — — 489,505 391,769
Deferred tax assets (liabilities) W2,616,385 2,456,487 (315,329) (190,503) 2,301,056 2,265,984
138
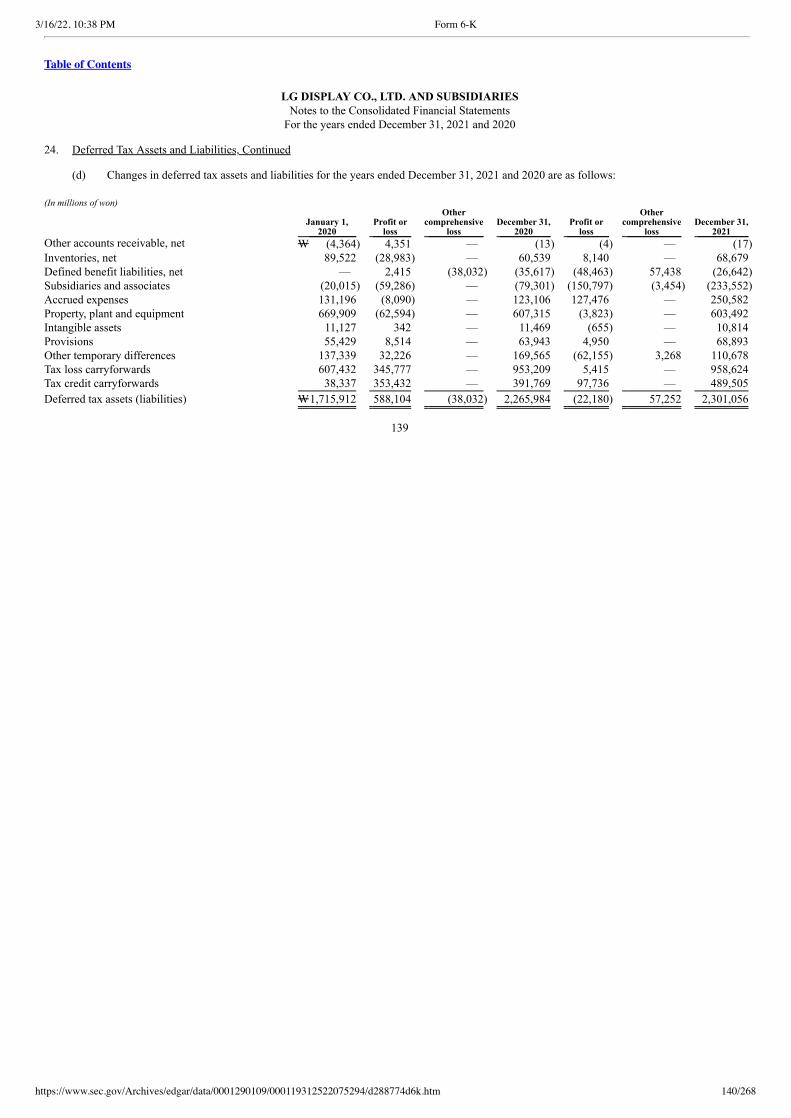
3/16/22, 10:38 PM Form 6-K
https://www.sec.gov/Archives/edgar/data/0001290109/000119312522075294/d288774d6k.htm 140/268
Table of Contents
LG DISPLAY CO., LTD. AND SUBSIDIARIESNotes to the Consolidated Financial Statements
For the years ended December 31, 2021 and 2020 24. Deferred Tax Assets and Liabilities, Continued (d) Changes in deferred tax assets and liabilities for the years ended December 31, 2021 and 2020 are as follows: (In millions of won)
January 1,
2020 Profit or
loss
Other comprehensive
loss December 31,
2020 Profit or
loss
Other comprehensive
loss December 31,
2021 Other accounts receivable, net W (4,364) 4,351 — (13) (4) — (17) Inventories, net 89,522 (28,983) — 60,539 8,140 — 68,679 Defined benefit liabilities, net — 2,415 (38,032) (35,617) (48,463) 57,438 (26,642) Subsidiaries and associates (20,015) (59,286) — (79,301) (150,797) (3,454) (233,552) Accrued expenses 131,196 (8,090) — 123,106 127,476 — 250,582 Property, plant and equipment 669,909 (62,594) — 607,315 (3,823) — 603,492 Intangible assets 11,127 342 — 11,469 (655) — 10,814 Provisions 55,429 8,514 — 63,943 4,950 — 68,893 Other temporary differences 137,339 32,226 — 169,565 (62,155) 3,268 110,678 Tax loss carryforwards 607,432 345,777 — 953,209 5,415 — 958,624 Tax credit carryforwards 38,337 353,432 — 391,769 97,736 — 489,505
Deferred tax assets (liabilities) W1,715,912 588,104 (38,032) 2,265,984 (22,180) 57,252 2,301,056
139
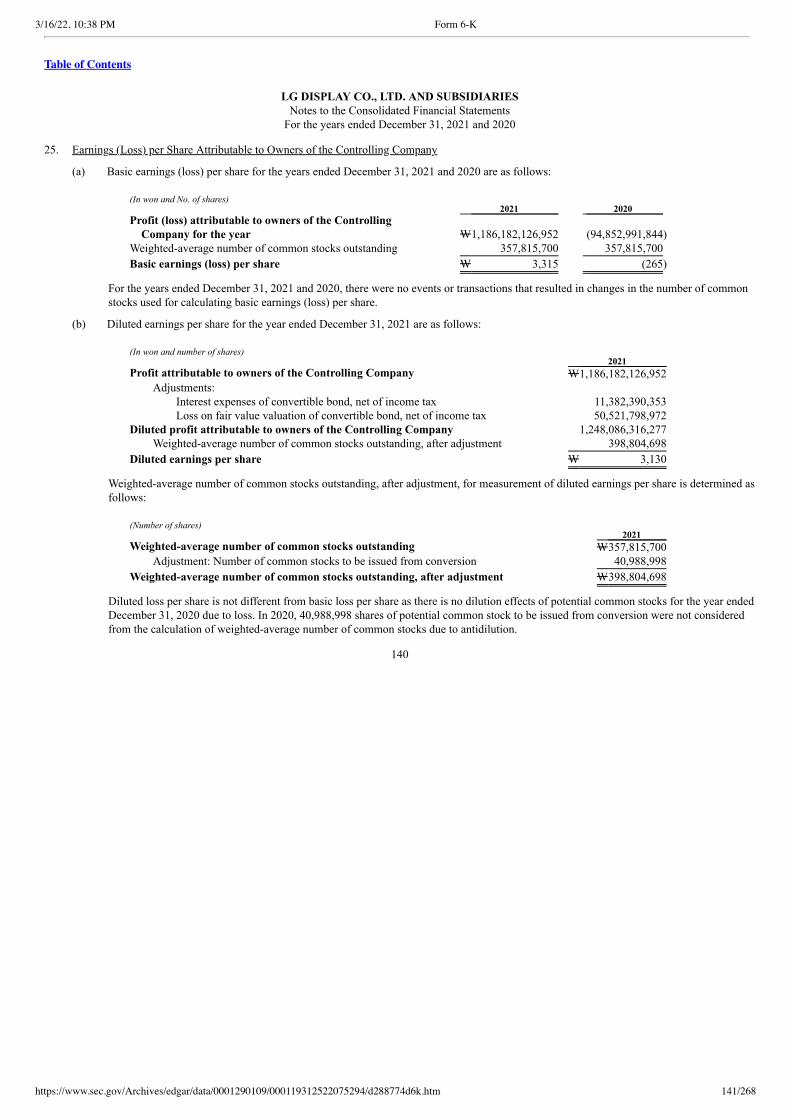
3/16/22, 10:38 PM Form 6-K
https://www.sec.gov/Archives/edgar/data/0001290109/000119312522075294/d288774d6k.htm 141/268
Table of Contents
LG DISPLAY CO., LTD. AND SUBSIDIARIESNotes to the Consolidated Financial Statements
For the years ended December 31, 2021 and 2020 25. Earnings (Loss) per Share Attributable to Owners of the Controlling Company
(a) Basic earnings (loss) per share for the years ended December 31, 2021 and 2020 are as follows:
(In won and No. of shares) 2021 2020 Profit (loss) attributable to owners of the Controlling
Company for the year W1,186,182,126,952 (94,852,991,844) Weighted-average number of common stocks outstanding 357,815,700 357,815,700
Basic earnings (loss) per share W 3,315 (265)
For the years ended December 31, 2021 and 2020, there were no events or transactions that resulted in changes in the number of commonstocks used for calculating basic earnings (loss) per share.
(b) Diluted earnings per share for the year ended December 31, 2021 are as follows:
(In won and number of shares) 2021 Profit attributable to owners of the Controlling Company W1,186,182,126,952
Adjustments: Interest expenses of convertible bond, net of income tax 11,382,390,353 Loss on fair value valuation of convertible bond, net of income tax 50,521,798,972
Diluted profit attributable to owners of the Controlling Company 1,248,086,316,277 Weighted-average number of common stocks outstanding, after adjustment 398,804,698
Diluted earnings per share W 3,130
Weighted-average number of common stocks outstanding, after adjustment, for measurement of diluted earnings per share is determined asfollows:
(Number of shares) 2021 Weighted-average number of common stocks outstanding W357,815,700
Adjustment: Number of common stocks to be issued from conversion 40,988,998
Weighted-average number of common stocks outstanding, after adjustment W398,804,698
Diluted loss per share is not different from basic loss per share as there is no dilution effects of potential common stocks for the year endedDecember 31, 2020 due to loss. In 2020, 40,988,998 shares of potential common stock to be issued from conversion were not consideredfrom the calculation of weighted-average number of common stocks due to antidilution.
140
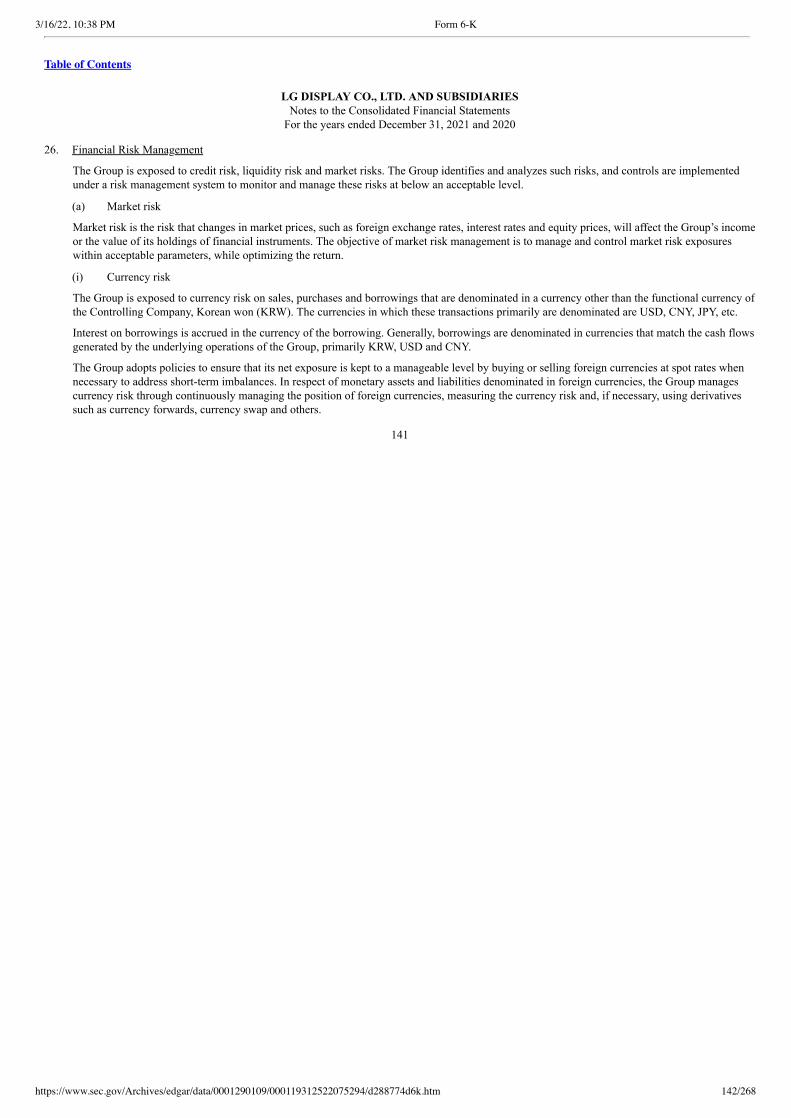
3/16/22, 10:38 PM Form 6-K
https://www.sec.gov/Archives/edgar/data/0001290109/000119312522075294/d288774d6k.htm 142/268
Table of Contents
LG DISPLAY CO., LTD. AND SUBSIDIARIESNotes to the Consolidated Financial Statements
For the years ended December 31, 2021 and 2020 26. Financial Risk Management
The Group is exposed to credit risk, liquidity risk and market risks. The Group identifies and analyzes such risks, and controls are implementedunder a risk management system to monitor and manage these risks at below an acceptable level.
(a) Market risk
Market risk is the risk that changes in market prices, such as foreign exchange rates, interest rates and equity prices, will affect the Group’s incomeor the value of its holdings of financial instruments. The objective of market risk management is to manage and control market risk exposureswithin acceptable parameters, while optimizing the return.
(i) Currency risk
The Group is exposed to currency risk on sales, purchases and borrowings that are denominated in a currency other than the functional currency ofthe Controlling Company, Korean won (KRW). The currencies in which these transactions primarily are denominated are USD, CNY, JPY, etc.
Interest on borrowings is accrued in the currency of the borrowing. Generally, borrowings are denominated in currencies that match the cash flowsgenerated by the underlying operations of the Group, primarily KRW, USD and CNY.
The Group adopts policies to ensure that its net exposure is kept to a manageable level by buying or selling foreign currencies at spot rates whennecessary to address short-term imbalances. In respect of monetary assets and liabilities denominated in foreign currencies, the Group managescurrency risk through continuously managing the position of foreign currencies, measuring the currency risk and, if necessary, using derivativessuch as currency forwards, currency swap and others.
141
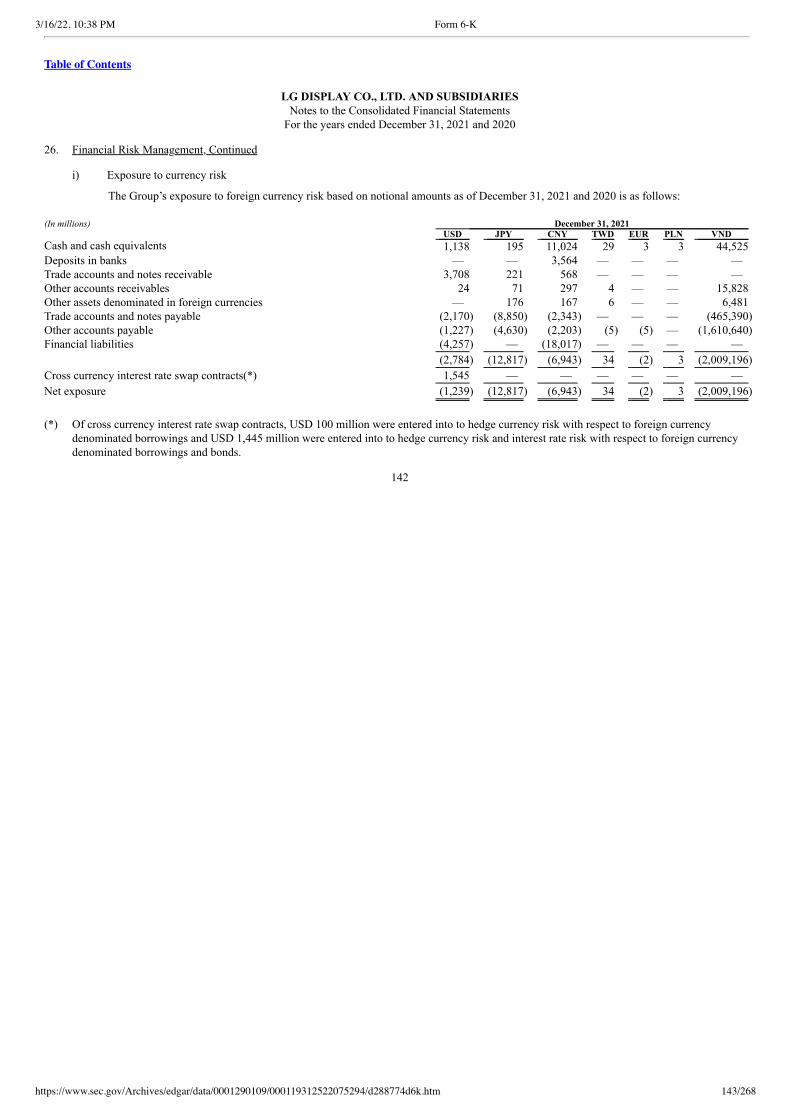
3/16/22, 10:38 PM Form 6-K
https://www.sec.gov/Archives/edgar/data/0001290109/000119312522075294/d288774d6k.htm 143/268
Table of Contents
LG DISPLAY CO., LTD. AND SUBSIDIARIESNotes to the Consolidated Financial Statements
For the years ended December 31, 2021 and 2020 26. Financial Risk Management, Continued i) Exposure to currency risk
The Group’s exposure to foreign currency risk based on notional amounts as of December 31, 2021 and 2020 is as follows: (In millions) December 31, 2021 USD JPY CNY TWD EUR PLN VND Cash and cash equivalents 1,138 195 11,024 29 3 3 44,525 Deposits in banks — — 3,564 — — — — Trade accounts and notes receivable 3,708 221 568 — — — — Other accounts receivables 24 71 297 4 — — 15,828 Other assets denominated in foreign currencies — 176 167 6 — — 6,481 Trade accounts and notes payable (2,170) (8,850) (2,343) — — — (465,390) Other accounts payable (1,227) (4,630) (2,203) (5) (5) — (1,610,640) Financial liabilities (4,257) — (18,017) — — — —
(2,784) (12,817) (6,943) 34 (2) 3 (2,009,196)
Cross currency interest rate swap contracts(*) 1,545 — — — — — —
Net exposure (1,239) (12,817) (6,943) 34 (2) 3 (2,009,196)
(*) Of cross currency interest rate swap contracts, USD 100 million were entered into to hedge currency risk with respect to foreign currency
denominated borrowings and USD 1,445 million were entered into to hedge currency risk and interest rate risk with respect to foreign currencydenominated borrowings and bonds.
142
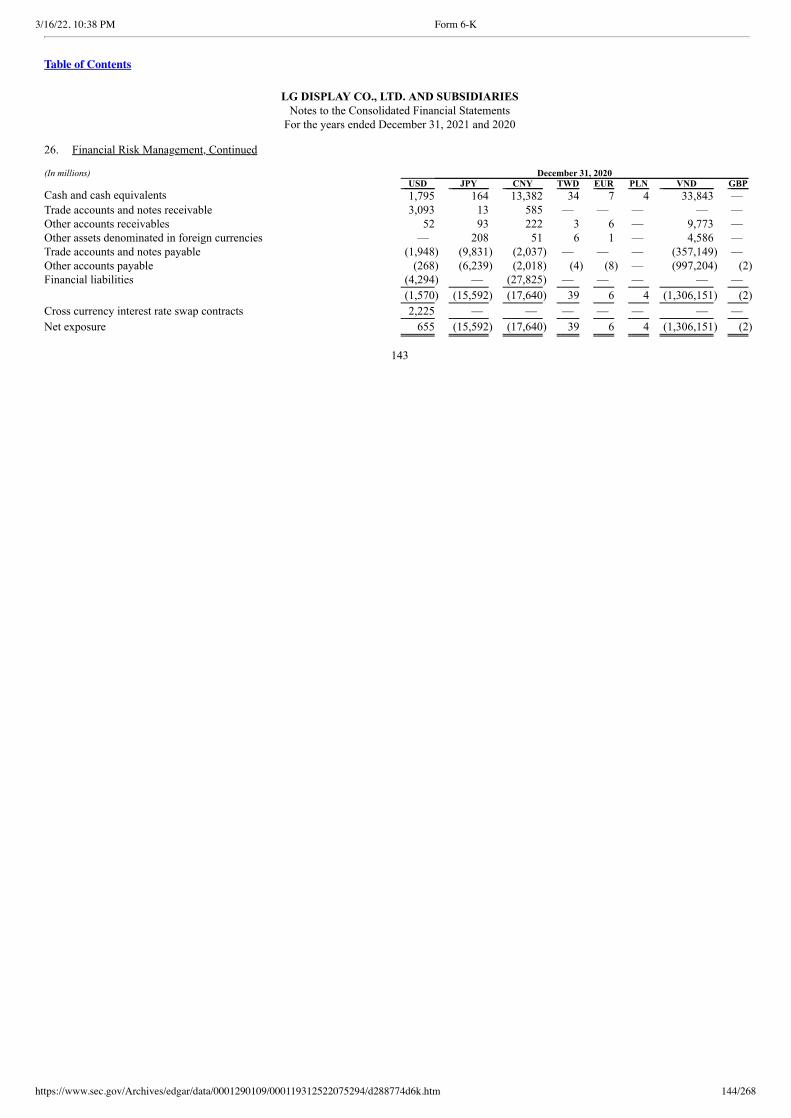
3/16/22, 10:38 PM Form 6-K
https://www.sec.gov/Archives/edgar/data/0001290109/000119312522075294/d288774d6k.htm 144/268
Table of Contents
LG DISPLAY CO., LTD. AND SUBSIDIARIESNotes to the Consolidated Financial Statements
For the years ended December 31, 2021 and 2020 26. Financial Risk Management, Continued (In millions) December 31, 2020 USD JPY CNY TWD EUR PLN VND GBP Cash and cash equivalents 1,795 164 13,382 34 7 4 33,843 — Trade accounts and notes receivable 3,093 13 585 — — — — — Other accounts receivables 52 93 222 3 6 — 9,773 — Other assets denominated in foreign currencies — 208 51 6 1 — 4,586 — Trade accounts and notes payable (1,948) (9,831) (2,037) — — — (357,149) — Other accounts payable (268) (6,239) (2,018) (4) (8) — (997,204) (2) Financial liabilities (4,294) — (27,825) — — — — —
(1,570) (15,592) (17,640) 39 6 4 (1,306,151) (2)
Cross currency interest rate swap contracts 2,225 — — — — — — —
Net exposure 655 (15,592) (17,640) 39 6 4 (1,306,151) (2)
143
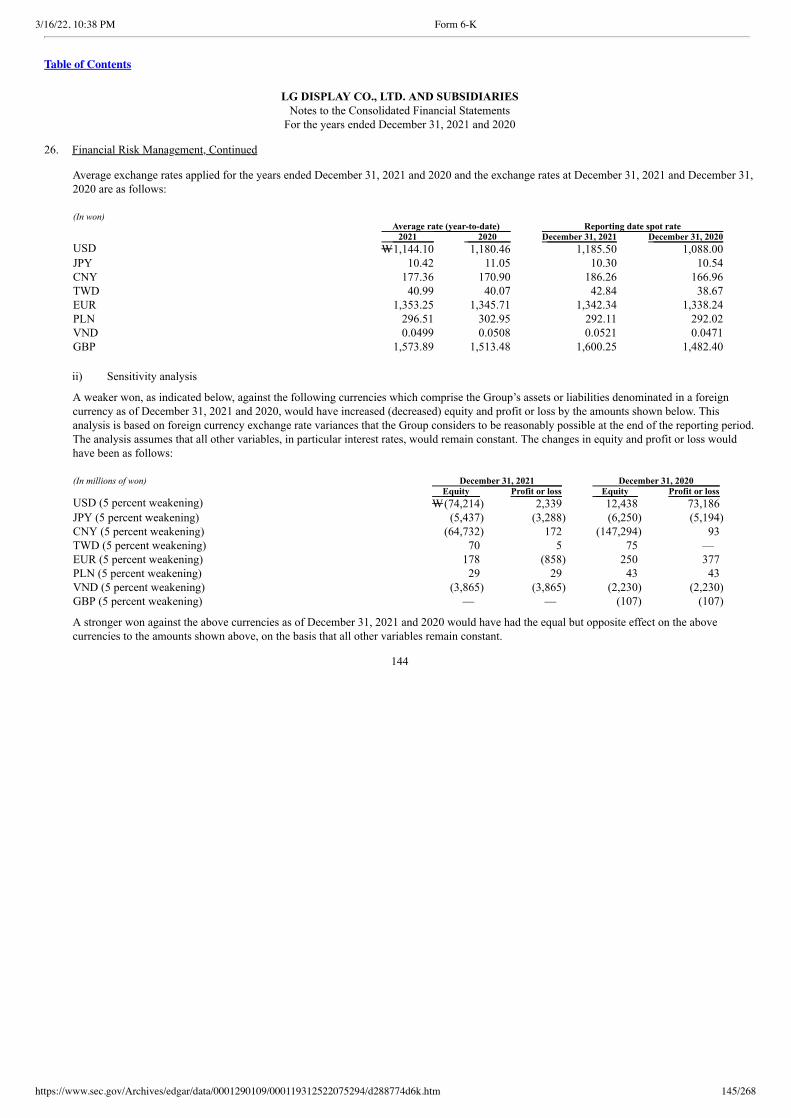
3/16/22, 10:38 PM Form 6-K
https://www.sec.gov/Archives/edgar/data/0001290109/000119312522075294/d288774d6k.htm 145/268
Table of Contents
LG DISPLAY CO., LTD. AND SUBSIDIARIESNotes to the Consolidated Financial Statements
For the years ended December 31, 2021 and 2020 26. Financial Risk Management, Continued
Average exchange rates applied for the years ended December 31, 2021 and 2020 and the exchange rates at December 31, 2021 and December 31,2020 are as follows:
(In won) Average rate (year-to-date) Reporting date spot rate 2021 2020 December 31, 2021 December 31, 2020 USD W1,144.10 1,180.46 1,185.50 1,088.00 JPY 10.42 11.05 10.30 10.54 CNY 177.36 170.90 186.26 166.96 TWD 40.99 40.07 42.84 38.67 EUR 1,353.25 1,345.71 1,342.34 1,338.24 PLN 296.51 302.95 292.11 292.02 VND 0.0499 0.0508 0.0521 0.0471 GBP 1,573.89 1,513.48 1,600.25 1,482.40
ii) Sensitivity analysis
A weaker won, as indicated below, against the following currencies which comprise the Group’s assets or liabilities denominated in a foreigncurrency as of December 31, 2021 and 2020, would have increased (decreased) equity and profit or loss by the amounts shown below. Thisanalysis is based on foreign currency exchange rate variances that the Group considers to be reasonably possible at the end of the reporting period.The analysis assumes that all other variables, in particular interest rates, would remain constant. The changes in equity and profit or loss wouldhave been as follows:
(In millions of won) December 31, 2021 December 31, 2020 Equity Profit or loss Equity Profit or loss USD (5 percent weakening) W(74,214) 2,339 12,438 73,186 JPY (5 percent weakening) (5,437) (3,288) (6,250) (5,194) CNY (5 percent weakening) (64,732) 172 (147,294) 93 TWD (5 percent weakening) 70 5 75 — EUR (5 percent weakening) 178 (858) 250 377 PLN (5 percent weakening) 29 29 43 43 VND (5 percent weakening) (3,865) (3,865) (2,230) (2,230) GBP (5 percent weakening) — — (107) (107)
A stronger won against the above currencies as of December 31, 2021 and 2020 would have had the equal but opposite effect on the abovecurrencies to the amounts shown above, on the basis that all other variables remain constant.
144
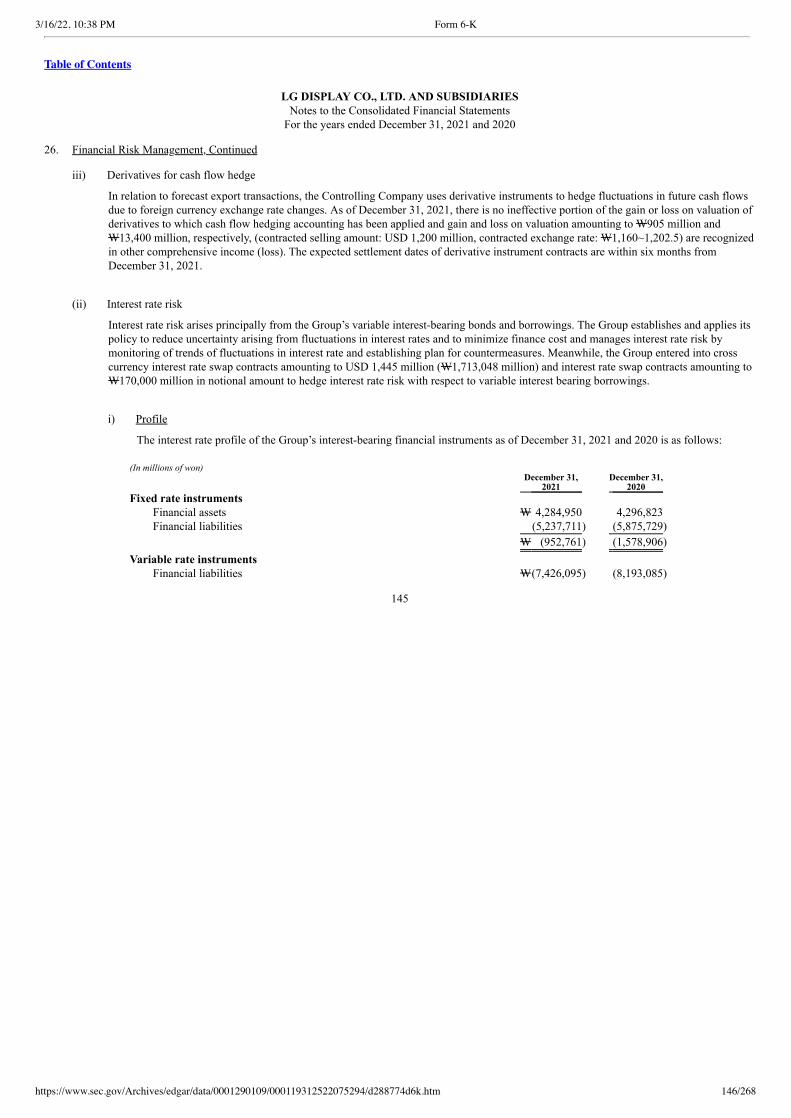
3/16/22, 10:38 PM Form 6-K
https://www.sec.gov/Archives/edgar/data/0001290109/000119312522075294/d288774d6k.htm 146/268
Table of Contents
LG DISPLAY CO., LTD. AND SUBSIDIARIESNotes to the Consolidated Financial Statements
For the years ended December 31, 2021 and 2020 26. Financial Risk Management, Continued iii) Derivatives for cash flow hedge
In relation to forecast export transactions, the Controlling Company uses derivative instruments to hedge fluctuations in future cash flowsdue to foreign currency exchange rate changes. As of December 31, 2021, there is no ineffective portion of the gain or loss on valuation ofderivatives to which cash flow hedging accounting has been applied and gain and loss on valuation amounting to W905 million andW13,400 million, respectively, (contracted selling amount: USD 1,200 million, contracted exchange rate: W1,160~1,202.5) are recognizedin other comprehensive income (loss). The expected settlement dates of derivative instrument contracts are within six months fromDecember 31, 2021.
(ii) Interest rate risk
Interest rate risk arises principally from the Group’s variable interest-bearing bonds and borrowings. The Group establishes and applies itspolicy to reduce uncertainty arising from fluctuations in interest rates and to minimize finance cost and manages interest rate risk bymonitoring of trends of fluctuations in interest rate and establishing plan for countermeasures. Meanwhile, the Group entered into crosscurrency interest rate swap contracts amounting to USD 1,445 million (W1,713,048 million) and interest rate swap contracts amounting toW170,000 million in notional amount to hedge interest rate risk with respect to variable interest bearing borrowings.
i) Profile
The interest rate profile of the Group’s interest-bearing financial instruments as of December 31, 2021 and 2020 is as follows:
(In millions of won)
December 31,
2021 December 31,
2020 Fixed rate instruments
Financial assets W 4,284,950 4,296,823 Financial liabilities (5,237,711) (5,875,729)
W (952,761) (1,578,906)
Variable rate instruments Financial liabilities W(7,426,095) (8,193,085)
145

3/16/22, 10:38 PM Form 6-K
https://www.sec.gov/Archives/edgar/data/0001290109/000119312522075294/d288774d6k.htm 147/268
Table of Contents
LG DISPLAY CO., LTD. AND SUBSIDIARIESNotes to the Consolidated Financial Statements
For the years ended December 31, 2021 and 2020 26. Financial Risk Management, Continued ii) Equity and profit or loss sensitivity analysis for variable rate instruments
As of December 31, 2021 and 2020, a change of 100 basis points in interest rates at the reporting date would have increased(decreased) equity and profit or loss by the amounts shown below for the respective following 12 month periods. This analysisassumes that all other variables, in particular foreign currency rates, remain constant.
(In millions of won) Equity Profit or loss
1%p
increase 1%p
decrease 1%p
increase 1%p
decrease December 31, 2021
Variable rate instruments (*) W(40,931) 40,931 (40,931) 40,931 December 31, 2020
Variable rate instruments (*) W(45,352) 45,352 (45,352) 45,352 (*) Financial instruments related to non-hedging interest rate swap are excluded from the calculation. (iii) Managing interest rate benchmark reform and associated risks
A fundamental reform of major interest rate benchmarks is being undertaken globally, including the replacement of some interbank offeredrates (IBORs) with alternative risk-free rates (referred to as ‘IBOR reform’). The publication of LIBOR, except overnight, 1-month, 3-month, 6-month, and 12-month USD LIBORs, was terminated as of December 31, 2021 and the five LIBORs, as mentioned above, will bediscontinued by June 30, 2023.
The Group does not have financial instruments affected by discontinued LIBORs. The Group plans to change benchmark interest rateapplied to some of its financial instruments from LIBORs to Secured Overnight Financing Rates (SOFRs), an alternative indicator interestrate. For these LIBOR-related financial instruments, the LIBORs are continued to be published. Meanwhile, in the case of the CD rate, analternative reference rate was selected as the Korea Overnight Financing Repo Rate (KOFR) as part of the reform of the interest ratebenchmark. However, unlike LIBOR, the termination of the publication of the CD rate is not scheduled, and the Group does not have planto change to KOFR.
The Group is exposed to the legal risk of changing the contract of financial instruments due to the reform of the interest rate indicator, aswell as the process and operational risks to deal with such changes. In addition, the Group is also exposed to the risk of monitoring themarket trend on the alternative index interest rate and establishing a risk management strategy accordingly to manage the risk of the newalternative index interest rate. The Group manages and monitors the transition to alternative interest rate benchmark by evaluating theextent to which a contract references IBOR cash flows, whether such contracts will need to be amended as a result of IBOR reform andhow to manage communication about IBOR reform with counterparties.
The Group monitors the transition to an alternative interest rate benchmark by reviewing the total amounts of contracts that have yet totransition to an alternative benchmark rate and the amounts of such contracts that include an appropriate fallback clause. The Groupconsiders that a contract is not yet transitioned to an alternative benchmark rate when interest rate under the contract is indexed to abenchmark rate that is still subject to IBOR reform, even if it includes a fallback clause that deals with the cessation of the existing IBOR.As of December 31, 2021, the total amounts of unreformed contracts and those with appropriate fallback language are as follows, and thefinancial instruments that will be settled before June 30, 2023 are excluded:
146
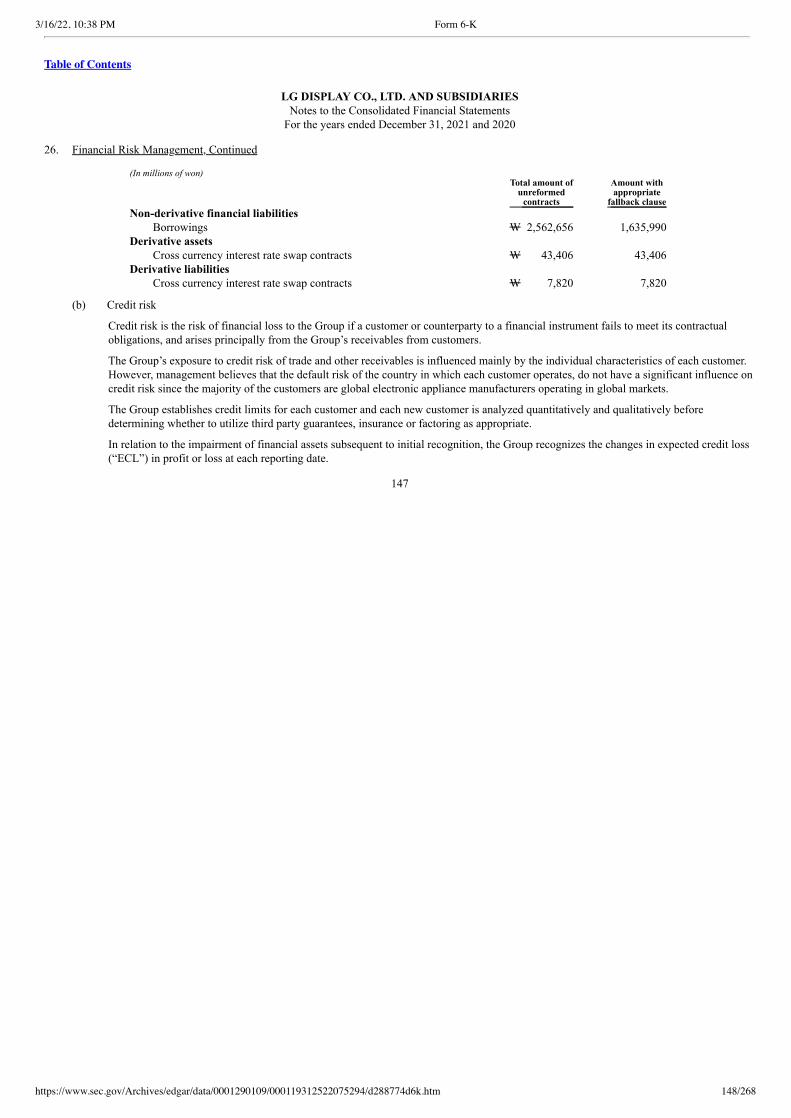
3/16/22, 10:38 PM Form 6-K
https://www.sec.gov/Archives/edgar/data/0001290109/000119312522075294/d288774d6k.htm 148/268
Table of Contents
LG DISPLAY CO., LTD. AND SUBSIDIARIESNotes to the Consolidated Financial Statements
For the years ended December 31, 2021 and 2020 26. Financial Risk Management, Continued
(In millions of won)
Total amount of unreformed
contracts
Amount with appropriate
fallback clause Non-derivative financial liabilities
Borrowings W 2,562,656 1,635,990 Derivative assets
Cross currency interest rate swap contracts W 43,406 43,406 Derivative liabilities
Cross currency interest rate swap contracts W 7,820 7,820
(b) Credit risk
Credit risk is the risk of financial loss to the Group if a customer or counterparty to a financial instrument fails to meet its contractualobligations, and arises principally from the Group’s receivables from customers.
The Group’s exposure to credit risk of trade and other receivables is influenced mainly by the individual characteristics of each customer.However, management believes that the default risk of the country in which each customer operates, do not have a significant influence oncredit risk since the majority of the customers are global electronic appliance manufacturers operating in global markets.
The Group establishes credit limits for each customer and each new customer is analyzed quantitatively and qualitatively beforedetermining whether to utilize third party guarantees, insurance or factoring as appropriate.
In relation to the impairment of financial assets subsequent to initial recognition, the Group recognizes the changes in expected credit loss(“ECL”) in profit or loss at each reporting date.
147
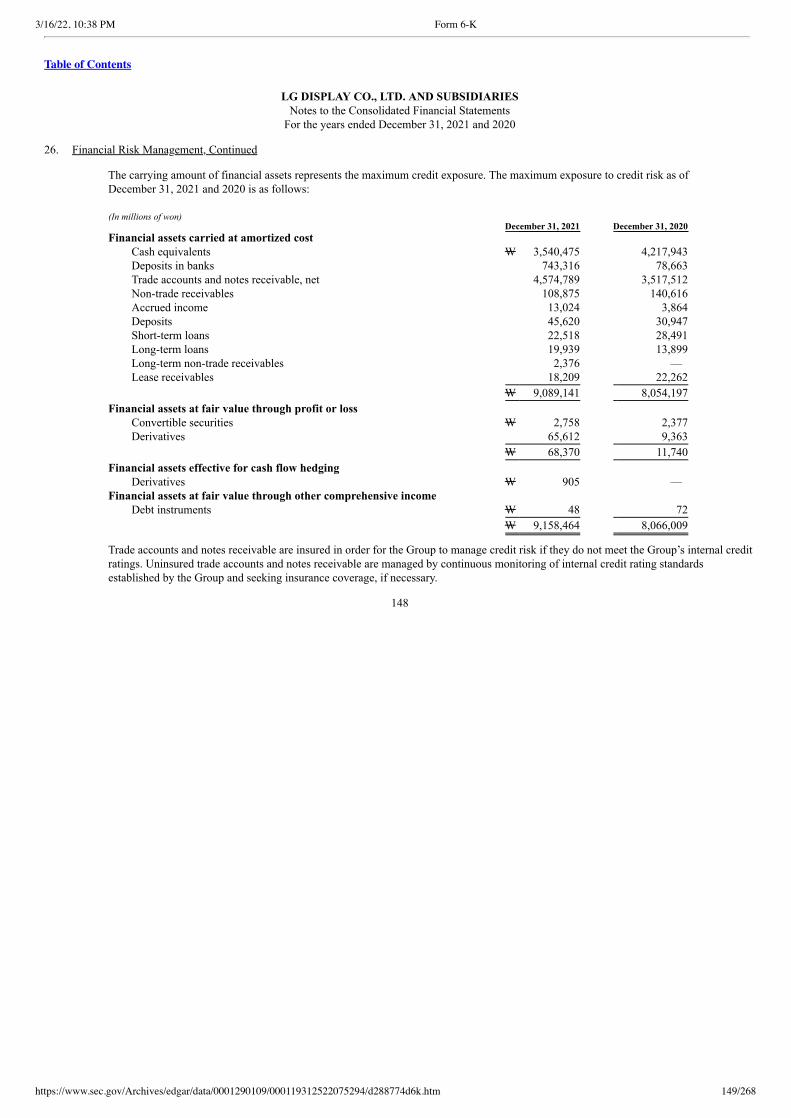
3/16/22, 10:38 PM Form 6-K
https://www.sec.gov/Archives/edgar/data/0001290109/000119312522075294/d288774d6k.htm 149/268
Table of Contents
LG DISPLAY CO., LTD. AND SUBSIDIARIESNotes to the Consolidated Financial Statements
For the years ended December 31, 2021 and 2020 26. Financial Risk Management, Continued
The carrying amount of financial assets represents the maximum credit exposure. The maximum exposure to credit risk as ofDecember 31, 2021 and 2020 is as follows:
(In millions of won) December 31, 2021 December 31, 2020 Financial assets carried at amortized cost
Cash equivalents W 3,540,475 4,217,943 Deposits in banks 743,316 78,663 Trade accounts and notes receivable, net 4,574,789 3,517,512 Non-trade receivables 108,875 140,616 Accrued income 13,024 3,864 Deposits 45,620 30,947 Short-term loans 22,518 28,491 Long-term loans 19,939 13,899 Long-term non-trade receivables 2,376 — Lease receivables 18,209 22,262
W 9,089,141 8,054,197
Financial assets at fair value through profit or loss Convertible securities W 2,758 2,377 Derivatives 65,612 9,363
W 68,370 11,740
Financial assets effective for cash flow hedging Derivatives W 905 —
Financial assets at fair value through other comprehensive income Debt instruments W 48 72
W 9,158,464 8,066,009
Trade accounts and notes receivable are insured in order for the Group to manage credit risk if they do not meet the Group’s internal creditratings. Uninsured trade accounts and notes receivable are managed by continuous monitoring of internal credit rating standardsestablished by the Group and seeking insurance coverage, if necessary.
148
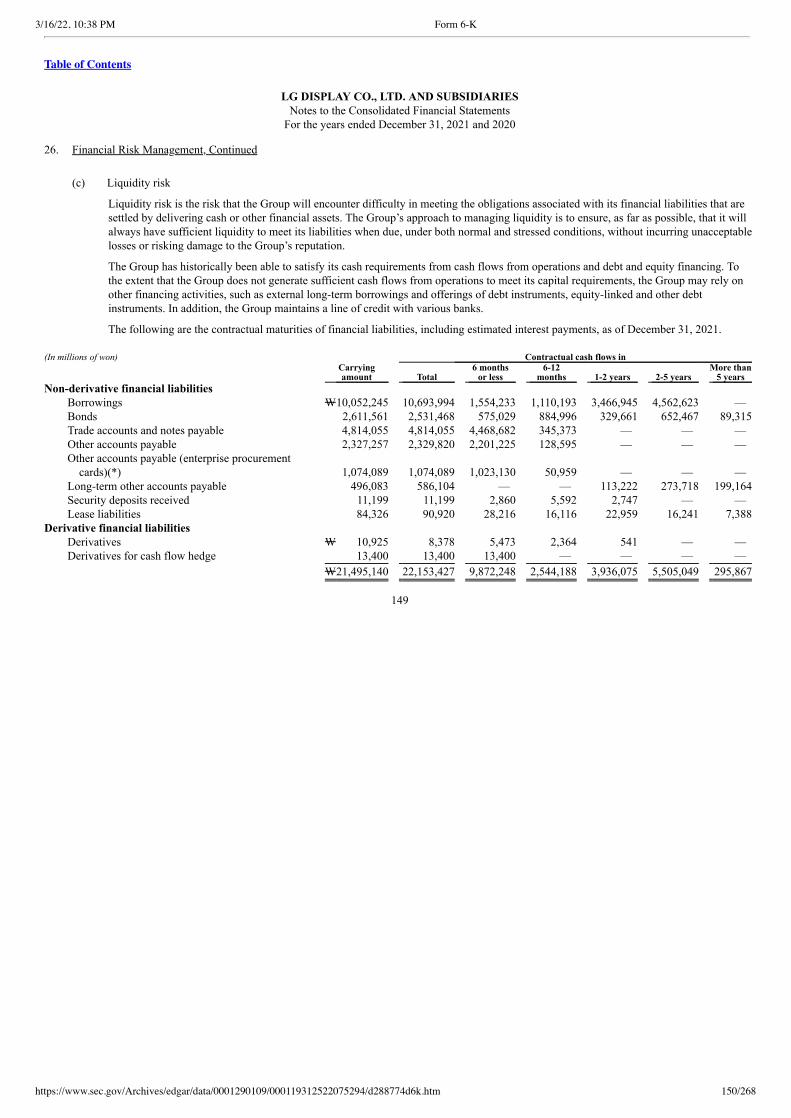
3/16/22, 10:38 PM Form 6-K
https://www.sec.gov/Archives/edgar/data/0001290109/000119312522075294/d288774d6k.htm 150/268
Table of Contents
LG DISPLAY CO., LTD. AND SUBSIDIARIESNotes to the Consolidated Financial Statements
For the years ended December 31, 2021 and 2020 26. Financial Risk Management, Continued
(c) Liquidity risk
Liquidity risk is the risk that the Group will encounter difficulty in meeting the obligations associated with its financial liabilities that aresettled by delivering cash or other financial assets. The Group’s approach to managing liquidity is to ensure, as far as possible, that it willalways have sufficient liquidity to meet its liabilities when due, under both normal and stressed conditions, without incurring unacceptablelosses or risking damage to the Group’s reputation.
The Group has historically been able to satisfy its cash requirements from cash flows from operations and debt and equity financing. Tothe extent that the Group does not generate sufficient cash flows from operations to meet its capital requirements, the Group may rely onother financing activities, such as external long-term borrowings and offerings of debt instruments, equity-linked and other debtinstruments. In addition, the Group maintains a line of credit with various banks.
The following are the contractual maturities of financial liabilities, including estimated interest payments, as of December 31, 2021. (In millions of won) Contractual cash flows in
Carrying
amount Total 6 months
or less 6-12
months 1-2 years 2-5 years More than
5 years Non-derivative financial liabilities
Borrowings W10,052,245 10,693,994 1,554,233 1,110,193 3,466,945 4,562,623 — Bonds 2,611,561 2,531,468 575,029 884,996 329,661 652,467 89,315 Trade accounts and notes payable 4,814,055 4,814,055 4,468,682 345,373 — — — Other accounts payable 2,327,257 2,329,820 2,201,225 128,595 — — — Other accounts payable (enterprise procurement
cards)(*) 1,074,089 1,074,089 1,023,130 50,959 — — — Long-term other accounts payable 496,083 586,104 — — 113,222 273,718 199,164 Security deposits received 11,199 11,199 2,860 5,592 2,747 — — Lease liabilities 84,326 90,920 28,216 16,116 22,959 16,241 7,388
Derivative financial liabilities Derivatives W 10,925 8,378 5,473 2,364 541 — — Derivatives for cash flow hedge 13,400 13,400 13,400 — — — —
W21,495,140 22,153,427 9,872,248 2,544,188 3,936,075 5,505,049 295,867
149
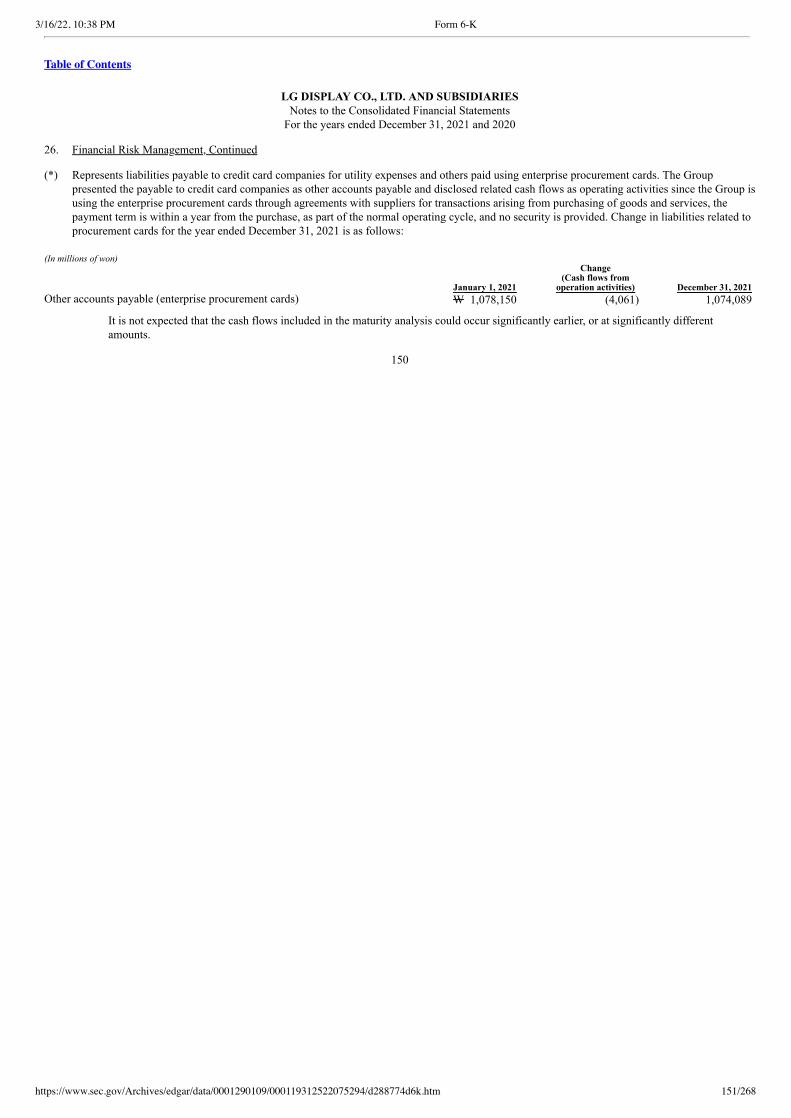
3/16/22, 10:38 PM Form 6-K
https://www.sec.gov/Archives/edgar/data/0001290109/000119312522075294/d288774d6k.htm 151/268
Table of Contents
LG DISPLAY CO., LTD. AND SUBSIDIARIESNotes to the Consolidated Financial Statements
For the years ended December 31, 2021 and 2020 26. Financial Risk Management, Continued (*) Represents liabilities payable to credit card companies for utility expenses and others paid using enterprise procurement cards. The Group
presented the payable to credit card companies as other accounts payable and disclosed related cash flows as operating activities since the Group isusing the enterprise procurement cards through agreements with suppliers for transactions arising from purchasing of goods and services, thepayment term is within a year from the purchase, as part of the normal operating cycle, and no security is provided. Change in liabilities related toprocurement cards for the year ended December 31, 2021 is as follows:
(In millions of won)
January 1, 2021
Change (Cash flows from
operation activities) December 31, 2021 Other accounts payable (enterprise procurement cards) W 1,078,150 (4,061) 1,074,089
It is not expected that the cash flows included in the maturity analysis could occur significantly earlier, or at significantly differentamounts.
150
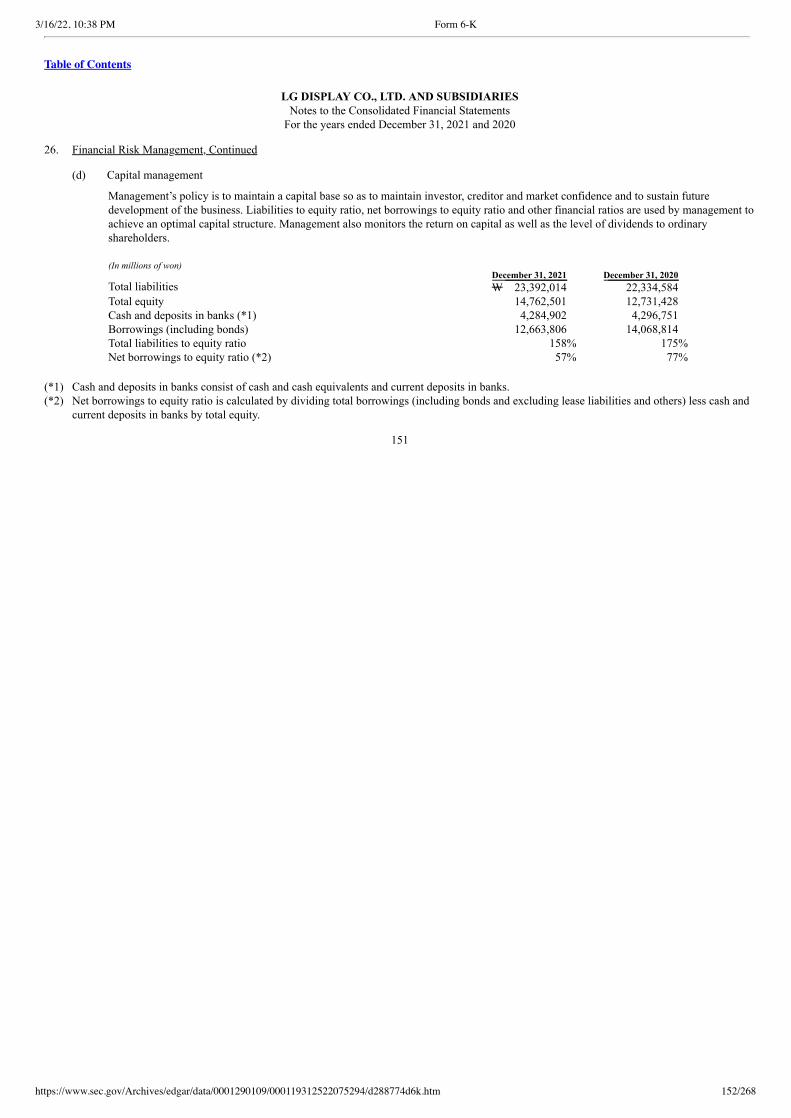
3/16/22, 10:38 PM Form 6-K
https://www.sec.gov/Archives/edgar/data/0001290109/000119312522075294/d288774d6k.htm 152/268
Table of Contents
LG DISPLAY CO., LTD. AND SUBSIDIARIESNotes to the Consolidated Financial Statements
For the years ended December 31, 2021 and 2020 26. Financial Risk Management, Continued (d) Capital management
Management’s policy is to maintain a capital base so as to maintain investor, creditor and market confidence and to sustain futuredevelopment of the business. Liabilities to equity ratio, net borrowings to equity ratio and other financial ratios are used by management toachieve an optimal capital structure. Management also monitors the return on capital as well as the level of dividends to ordinaryshareholders.
(In millions of won) December 31, 2021 December 31, 2020 Total liabilities W 23,392,014 22,334,584 Total equity 14,762,501 12,731,428 Cash and deposits in banks (*1) 4,284,902 4,296,751 Borrowings (including bonds) 12,663,806 14,068,814 Total liabilities to equity ratio 158% 175% Net borrowings to equity ratio (*2) 57% 77%
(*1) Cash and deposits in banks consist of cash and cash equivalents and current deposits in banks.(*2) Net borrowings to equity ratio is calculated by dividing total borrowings (including bonds and excluding lease liabilities and others) less cash and
current deposits in banks by total equity.
151
3/16/22, 10:38 PM Form 6-K
https://www.sec.gov/Archives/edgar/data/0001290109/000119312522075294/d288774d6k.htm 153/268
Table of Contents
LG DISPLAY CO., LTD. AND SUBSIDIARIESNotes to the Consolidated Financial Statements
For the years ended December 31, 2021 and 2020 26. Financial Risk Management, Continued (e) Determination of fair value
(i) Measurement of fair value
A number of the Group’s accounting policies and disclosures require the determination of fair value, for both financial and non-financialassets and liabilities. Fair values have been determined for measurement and/or disclosure purposes based on the following methods.When applicable, further information about the assumptions made in determining fair values is disclosed in the notes specific to that assetor liability.
i) Current assets and liabilities
The carrying amounts approximate their fair value because of the short maturity of these instruments.
ii) Trade receivables and other receivables
The fair value of trade and other receivables is estimated as the present value of future cash flows, discounted at the market rate of interestat the reporting date. This fair value is determined for disclosure purposes. The carrying amounts of current receivables approximate theirfair value.
iii) Investments in equity and debt securities
The fair value of marketable financial assets at FVTPL and FVOCI is determined by reference to their quoted closing bid price at thereporting date. The fair value of non-marketable instruments is determined using the results of fair value assessment performed by externalvaluation institutions and others.
iv) Non-derivative financial liabilities
Fair value, which is determined for disclosure purposes, except for the liabilities at FVTPL, is calculated based on the present value offuture principal and interest cash flows, discounted at the market rate of interest at the reporting date.
v) Derivatives
The inputs used to measure the fair value of currency forward and cross currency interest rate swap are calculated based on the exchangerates and interest rates observable in the market at the reporting date.
152
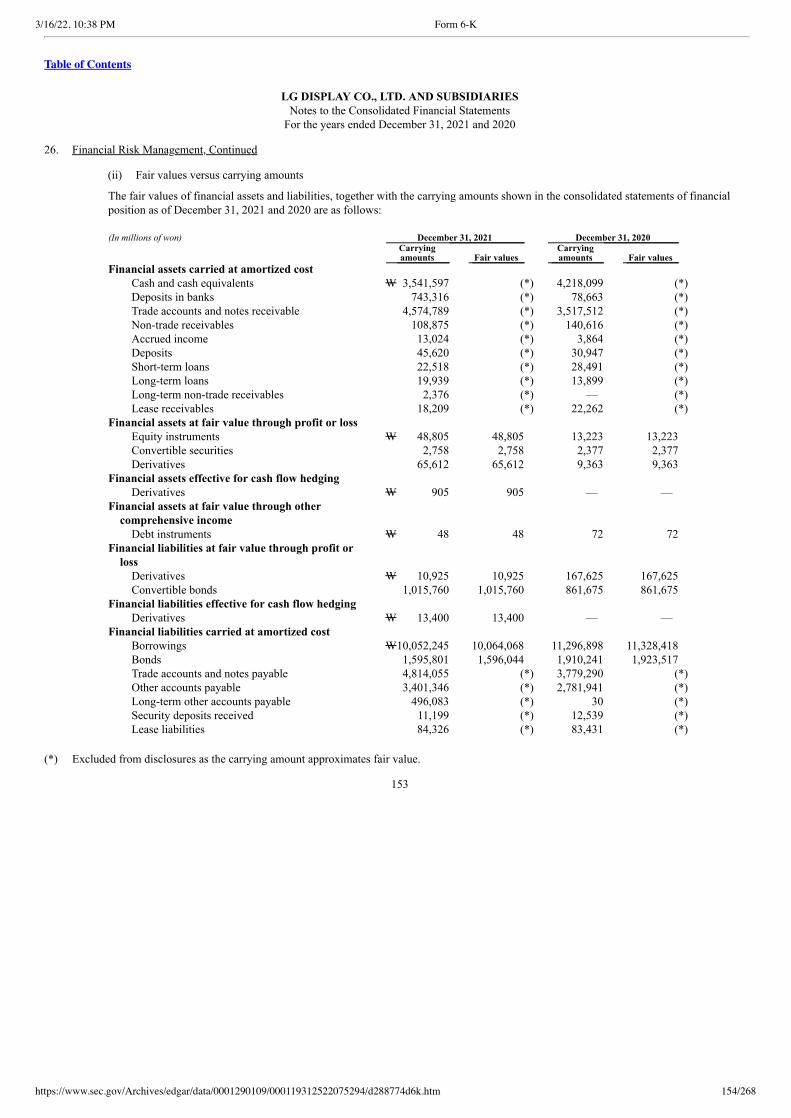
3/16/22, 10:38 PM Form 6-K
https://www.sec.gov/Archives/edgar/data/0001290109/000119312522075294/d288774d6k.htm 154/268
Table of Contents
LG DISPLAY CO., LTD. AND SUBSIDIARIESNotes to the Consolidated Financial Statements
For the years ended December 31, 2021 and 2020 26. Financial Risk Management, Continued (ii) Fair values versus carrying amounts
The fair values of financial assets and liabilities, together with the carrying amounts shown in the consolidated statements of financialposition as of December 31, 2021 and 2020 are as follows:
(In millions of won) December 31, 2021 December 31, 2020
Carrying
amounts Fair values Carrying
amounts Fair values Financial assets carried at amortized cost
Cash and cash equivalents W 3,541,597 (*) 4,218,099 (*) Deposits in banks 743,316 (*) 78,663 (*) Trade accounts and notes receivable 4,574,789 (*) 3,517,512 (*) Non-trade receivables 108,875 (*) 140,616 (*) Accrued income 13,024 (*) 3,864 (*) Deposits 45,620 (*) 30,947 (*) Short-term loans 22,518 (*) 28,491 (*) Long-term loans 19,939 (*) 13,899 (*) Long-term non-trade receivables 2,376 (*) — (*) Lease receivables 18,209 (*) 22,262 (*)
Financial assets at fair value through profit or loss Equity instruments W 48,805 48,805 13,223 13,223 Convertible securities 2,758 2,758 2,377 2,377 Derivatives 65,612 65,612 9,363 9,363
Financial assets effective for cash flow hedging Derivatives W 905 905 — —
Financial assets at fair value through othercomprehensive income
Debt instruments W 48 48 72 72 Financial liabilities at fair value through profit or
loss Derivatives W 10,925 10,925 167,625 167,625 Convertible bonds 1,015,760 1,015,760 861,675 861,675
Financial liabilities effective for cash flow hedging Derivatives W 13,400 13,400 — —
Financial liabilities carried at amortized cost Borrowings W10,052,245 10,064,068 11,296,898 11,328,418 Bonds 1,595,801 1,596,044 1,910,241 1,923,517 Trade accounts and notes payable 4,814,055 (*) 3,779,290 (*) Other accounts payable 3,401,346 (*) 2,781,941 (*) Long-term other accounts payable 496,083 (*) 30 (*) Security deposits received 11,199 (*) 12,539 (*) Lease liabilities 84,326 (*) 83,431 (*)
(*) Excluded from disclosures as the carrying amount approximates fair value.
153
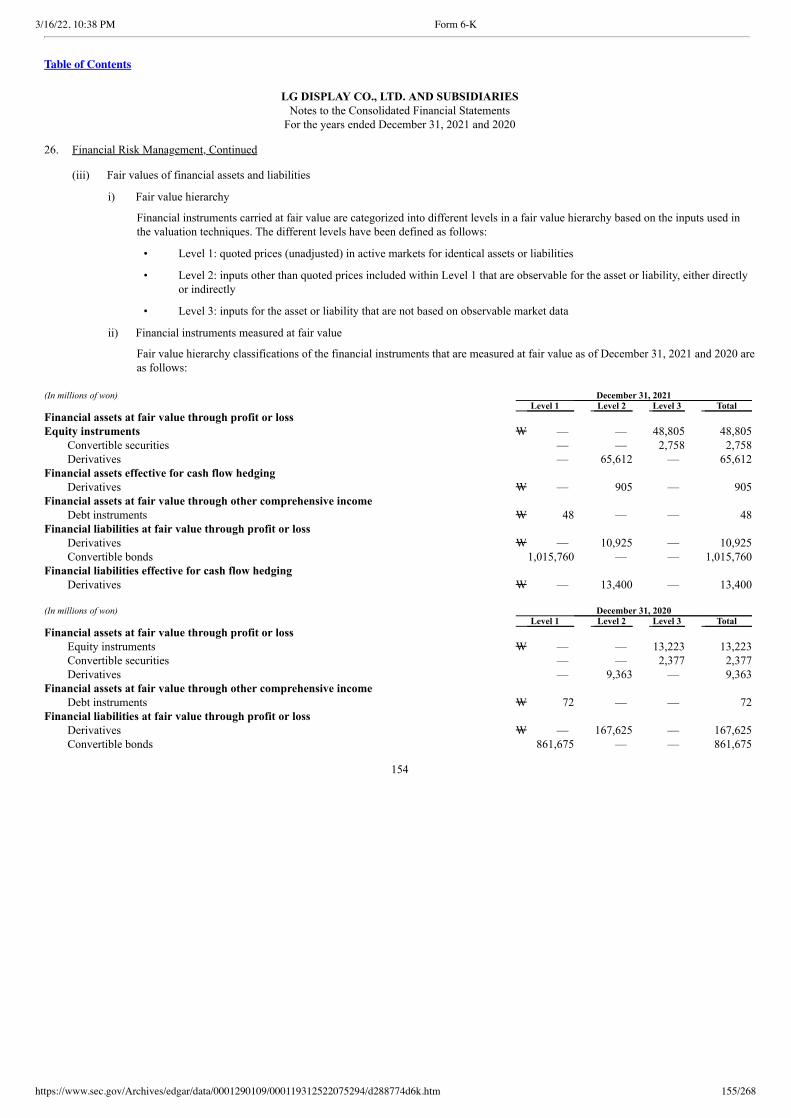
3/16/22, 10:38 PM Form 6-K
https://www.sec.gov/Archives/edgar/data/0001290109/000119312522075294/d288774d6k.htm 155/268
Table of Contents
LG DISPLAY CO., LTD. AND SUBSIDIARIESNotes to the Consolidated Financial Statements
For the years ended December 31, 2021 and 2020 26. Financial Risk Management, Continued (iii) Fair values of financial assets and liabilities
i) Fair value hierarchy
Financial instruments carried at fair value are categorized into different levels in a fair value hierarchy based on the inputs used inthe valuation techniques. The different levels have been defined as follows:
• Level 1: quoted prices (unadjusted) in active markets for identical assets or liabilities
• Level 2: inputs other than quoted prices included within Level 1 that are observable for the asset or liability, either directlyor indirectly
• Level 3: inputs for the asset or liability that are not based on observable market data
ii) Financial instruments measured at fair value
Fair value hierarchy classifications of the financial instruments that are measured at fair value as of December 31, 2021 and 2020 areas follows:
(In millions of won) December 31, 2021 Level 1 Level 2 Level 3 Total Financial assets at fair value through profit or loss Equity instruments W — — 48,805 48,805
Convertible securities — — 2,758 2,758 Derivatives — 65,612 — 65,612
Financial assets effective for cash flow hedging Derivatives W — 905 — 905
Financial assets at fair value through other comprehensive income Debt instruments W 48 — — 48
Financial liabilities at fair value through profit or loss Derivatives W — 10,925 — 10,925 Convertible bonds 1,015,760 — — 1,015,760
Financial liabilities effective for cash flow hedging Derivatives W — 13,400 — 13,400
(In millions of won) December 31, 2020 Level 1 Level 2 Level 3 Total Financial assets at fair value through profit or loss
Equity instruments W — — 13,223 13,223 Convertible securities — — 2,377 2,377 Derivatives — 9,363 — 9,363
Financial assets at fair value through other comprehensive income Debt instruments W 72 — — 72
Financial liabilities at fair value through profit or loss Derivatives W — 167,625 — 167,625 Convertible bonds 861,675 — — 861,675
154
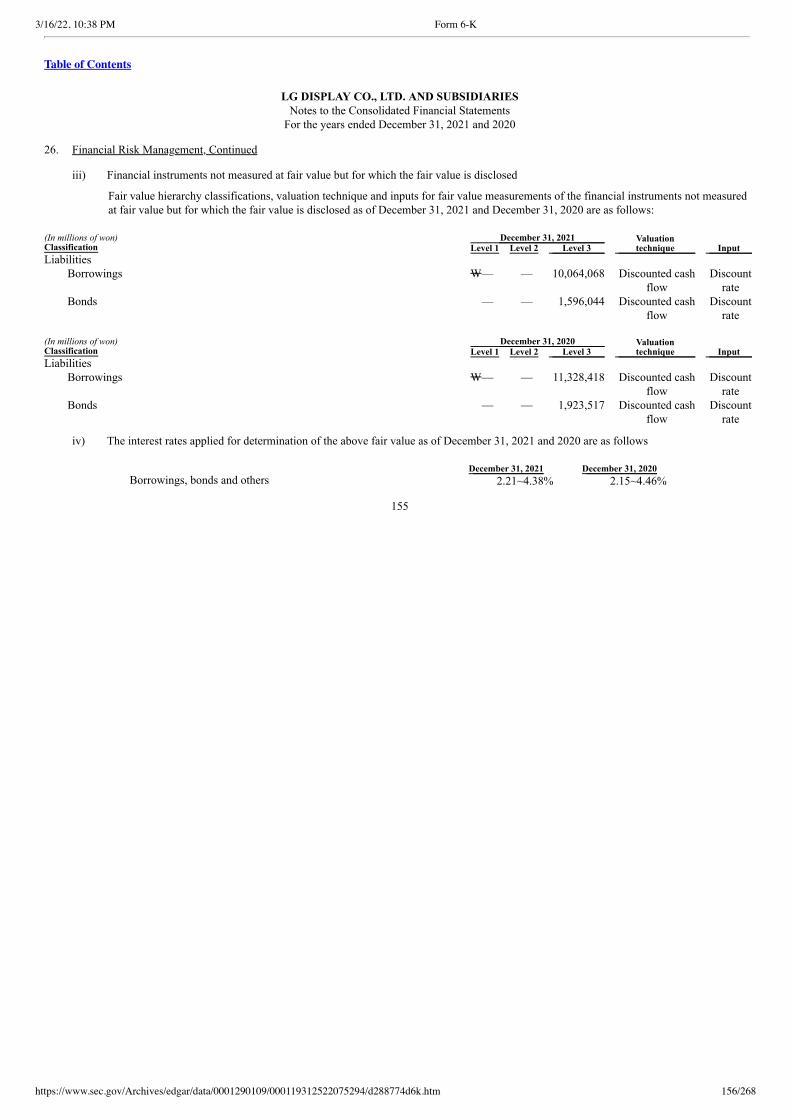
3/16/22, 10:38 PM Form 6-K
https://www.sec.gov/Archives/edgar/data/0001290109/000119312522075294/d288774d6k.htm 156/268
Table of Contents
LG DISPLAY CO., LTD. AND SUBSIDIARIESNotes to the Consolidated Financial Statements
For the years ended December 31, 2021 and 2020 26. Financial Risk Management, Continued iii) Financial instruments not measured at fair value but for which the fair value is disclosed
Fair value hierarchy classifications, valuation technique and inputs for fair value measurements of the financial instruments not measuredat fair value but for which the fair value is disclosed as of December 31, 2021 and December 31, 2020 are as follows:
(In millions of won) December 31, 2021
Valuation
technique Input Classification Level 1 Level 2 Level 3 Liabilities
Borrowings
W—
—
10,064,068
Discounted cash
flow
Discount rate
Bonds
—
—
1,596,044
Discounted cash
flow
Discount
rate
(In millions of won) December 31, 2020
Valuation technique Input Classification Level 1 Level 2 Level 3
Liabilities Borrowings
W—
—
11,328,418
Discounted cash
flow
Discount
rate
Bonds
—
—
1,923,517
Discounted cash
flow
Discount
rate
iv) The interest rates applied for determination of the above fair value as of December 31, 2021 and 2020 are as follows
December 31, 2021 December 31, 2020 Borrowings, bonds and others 2.21~4.38% 2.15~4.46%
155
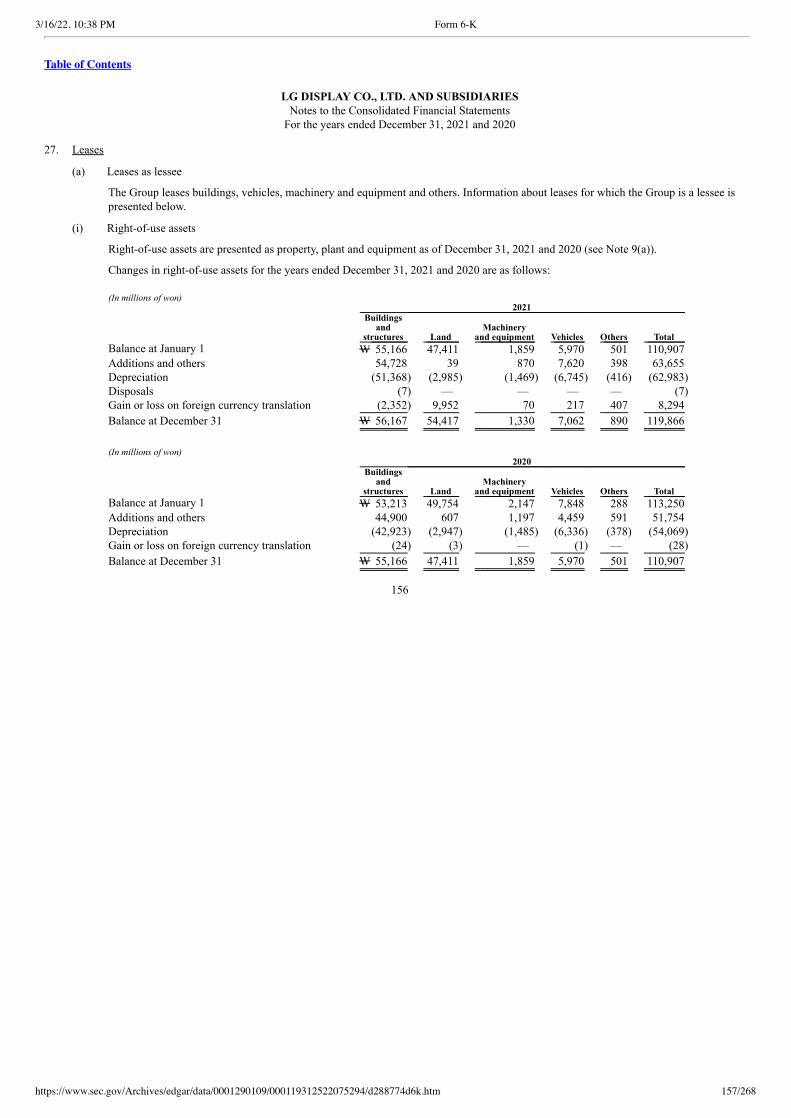
3/16/22, 10:38 PM Form 6-K
https://www.sec.gov/Archives/edgar/data/0001290109/000119312522075294/d288774d6k.htm 157/268
Table of Contents
LG DISPLAY CO., LTD. AND SUBSIDIARIESNotes to the Consolidated Financial Statements
For the years ended December 31, 2021 and 2020 27. Leases
(a) Leases as lessee
The Group leases buildings, vehicles, machinery and equipment and others. Information about leases for which the Group is a lessee ispresented below.
(i) Right-of-use assets
Right-of-use assets are presented as property, plant and equipment as of December 31, 2021 and 2020 (see Note 9(a)).
Changes in right-of-use assets for the years ended December 31, 2021 and 2020 are as follows:
(In millions of won) 2021
Buildings and
structures Land Machinery
and equipment Vehicles Others Total Balance at January 1 W 55,166 47,411 1,859 5,970 501 110,907 Additions and others 54,728 39 870 7,620 398 63,655 Depreciation (51,368) (2,985) (1,469) (6,745) (416) (62,983) Disposals (7) — — — — (7) Gain or loss on foreign currency translation (2,352) 9,952 70 217 407 8,294
Balance at December 31 W 56,167 54,417 1,330 7,062 890 119,866
(In millions of won) 2020
Buildings and
structures Land Machinery
and equipment Vehicles Others Total Balance at January 1 W 53,213 49,754 2,147 7,848 288 113,250 Additions and others 44,900 607 1,197 4,459 591 51,754 Depreciation (42,923) (2,947) (1,485) (6,336) (378) (54,069) Gain or loss on foreign currency translation (24) (3) — (1) — (28)
Balance at December 31 W 55,166 47,411 1,859 5,970 501 110,907
156
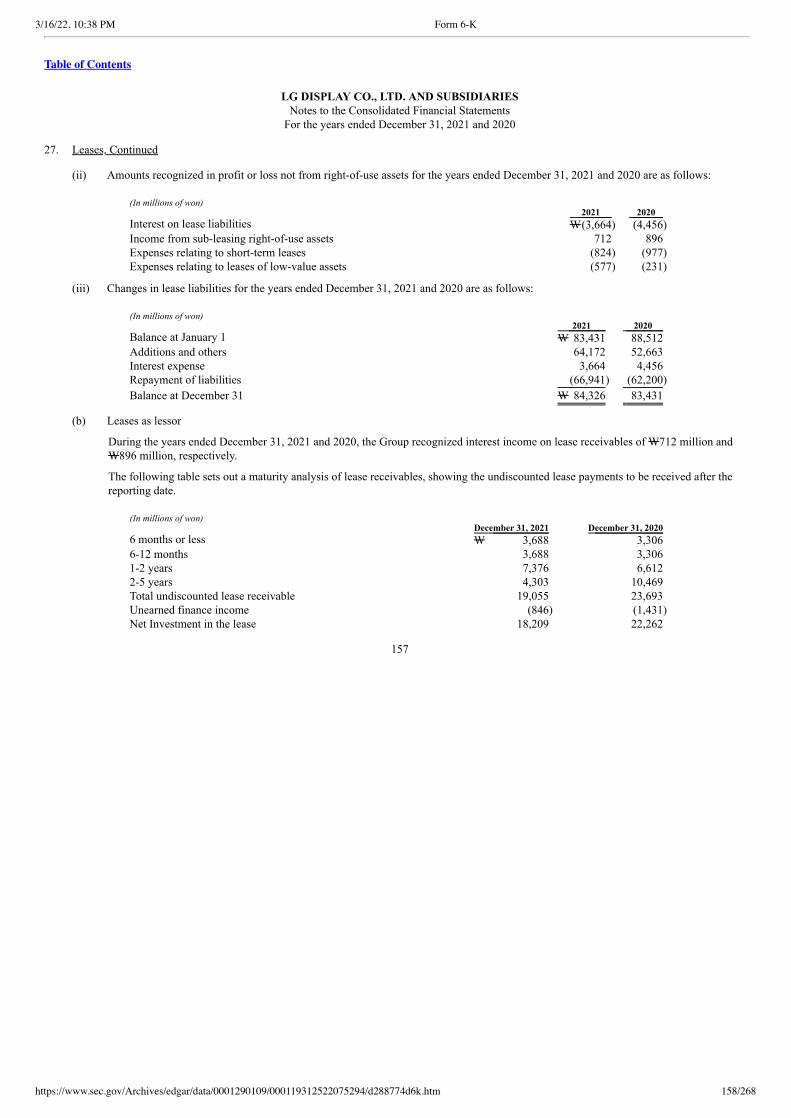
3/16/22, 10:38 PM Form 6-K
https://www.sec.gov/Archives/edgar/data/0001290109/000119312522075294/d288774d6k.htm 158/268
Table of Contents
LG DISPLAY CO., LTD. AND SUBSIDIARIESNotes to the Consolidated Financial Statements
For the years ended December 31, 2021 and 2020 27. Leases, Continued (ii) Amounts recognized in profit or loss not from right-of-use assets for the years ended December 31, 2021 and 2020 are as follows:
(In millions of won) 2021 2020 Interest on lease liabilities W(3,664) (4,456) Income from sub-leasing right-of-use assets 712 896 Expenses relating to short-term leases (824) (977) Expenses relating to leases of low-value assets (577) (231)
(iii) Changes in lease liabilities for the years ended December 31, 2021 and 2020 are as follows:
(In millions of won) 2021 2020 Balance at January 1 W 83,431 88,512 Additions and others 64,172 52,663 Interest expense 3,664 4,456 Repayment of liabilities (66,941) (62,200)
Balance at December 31 W 84,326 83,431
(b) Leases as lessor
During the years ended December 31, 2021 and 2020, the Group recognized interest income on lease receivables of W712 million andW896 million, respectively.
The following table sets out a maturity analysis of lease receivables, showing the undiscounted lease payments to be received after thereporting date.
(In millions of won) December 31, 2021 December 31, 2020 6 months or less W 3,688 3,306 6-12 months 3,688 3,306 1-2 years 7,376 6,612 2-5 years 4,303 10,469 Total undiscounted lease receivable 19,055 23,693 Unearned finance income (846) (1,431) Net Investment in the lease 18,209 22,262
157

3/16/22, 10:38 PM Form 6-K
https://www.sec.gov/Archives/edgar/data/0001290109/000119312522075294/d288774d6k.htm 159/268
Table of Contents
LG DISPLAY CO., LTD. AND SUBSIDIARIESNotes to the Consolidated Financial Statements
For the years ended December 31, 2021 and 2020 28. Changes in liabilities arising from financing activities
Changes in liabilities arising from financing activities for the year ended December 31, 2021 are as follows: (In millions of won)
January 1,
2021
Cash flows from
financing activities
Non-cash transactions
Reclassification
Gain or loss on foreign currency translation
Effective interest adjustment Others
December 31, 2021
Short-term borrowings W 394,906 148,640 — 70,187 — — 613,733 Current portion of long-term
borrowings and bonds 2,705,709 (4,344,208) 4,582,430 370,826 10,078 68,671 3,393,506 Long-term borrowings 9,019,658 1,298,346 (3,112,568) 455,155 — — 7,660,591 Bonds 1,948,541 498,027 (1,469,862) 9,732 9,538 — 995,976 Lease liabilities 83,431 (66,941) — 4,181 — 63,655 84,326
W14,152,245 (2,466,136) — 910,081 19,616 132,326 12,748,132
(*) Others include W68,421 million of loss on valuation of financial liabilities at fair value through profit or loss.
158
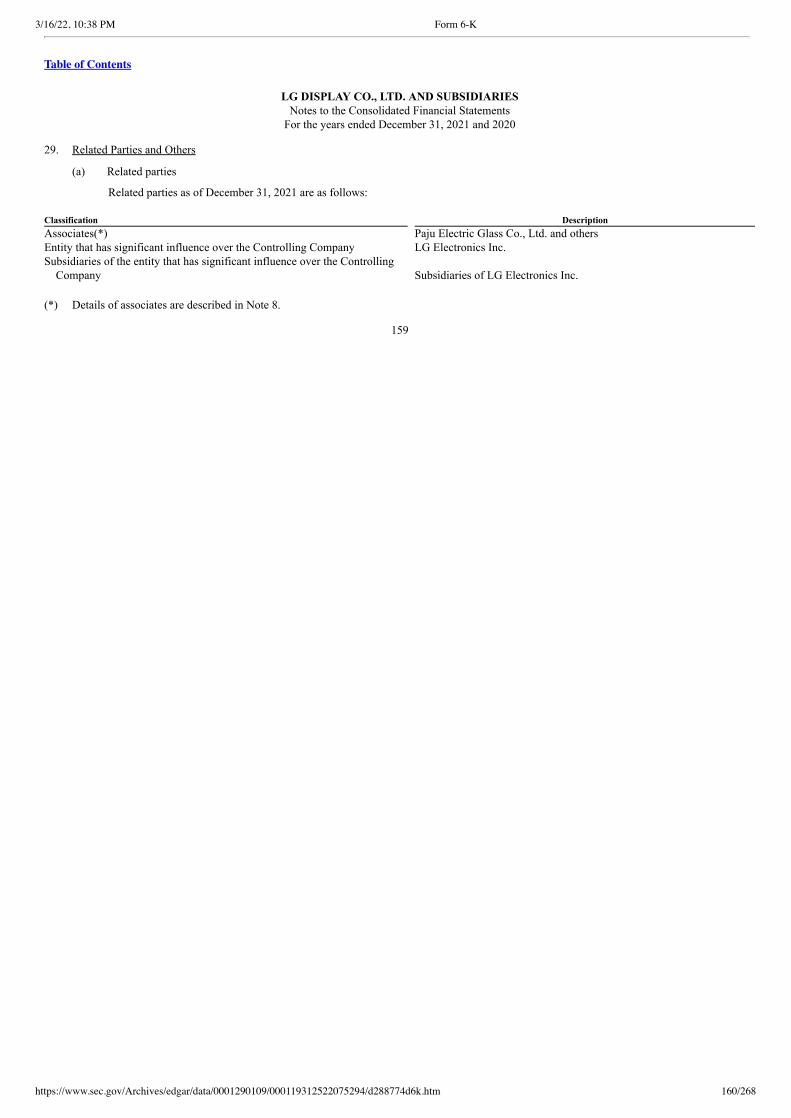
3/16/22, 10:38 PM Form 6-K
https://www.sec.gov/Archives/edgar/data/0001290109/000119312522075294/d288774d6k.htm 160/268
Table of Contents
LG DISPLAY CO., LTD. AND SUBSIDIARIESNotes to the Consolidated Financial Statements
For the years ended December 31, 2021 and 2020 29. Related Parties and Others
(a) Related parties
Related parties as of December 31, 2021 are as follows: Classification DescriptionAssociates(*) Paju Electric Glass Co., Ltd. and othersEntity that has significant influence over the Controlling Company LG Electronics Inc.Subsidiaries of the entity that has significant influence over the Controlling
Company Subsidiaries of LG Electronics Inc. (*) Details of associates are described in Note 8.
159
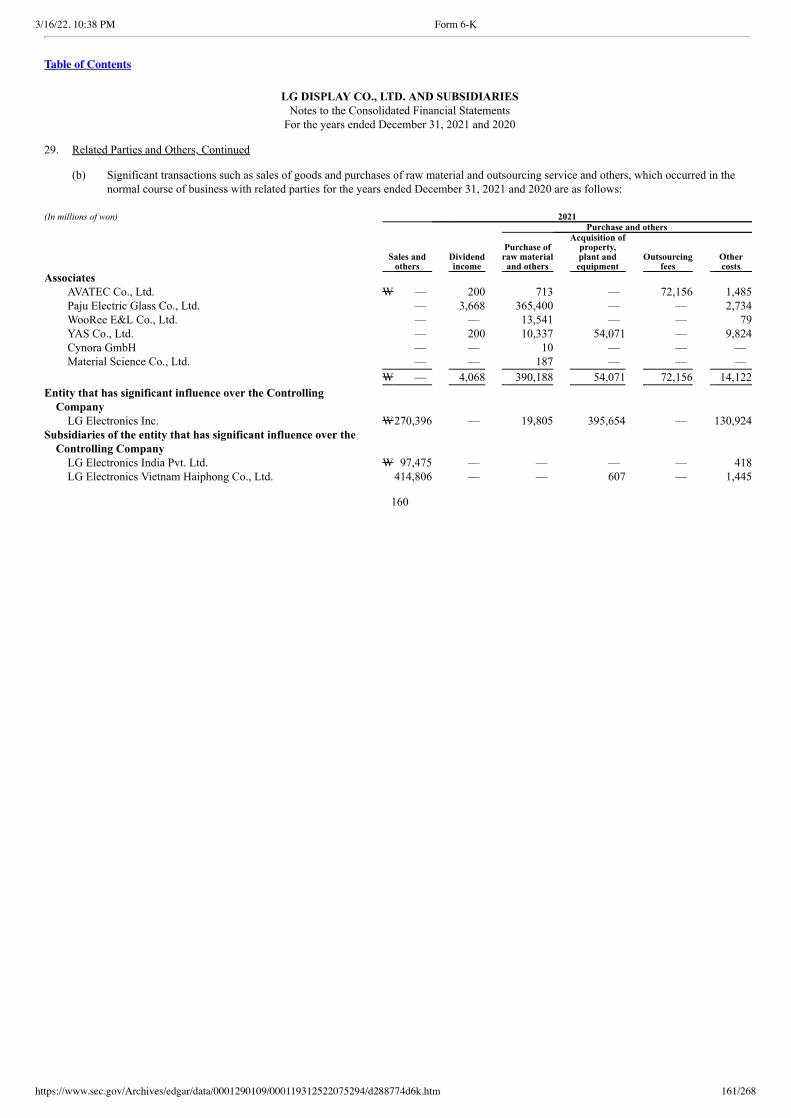
3/16/22, 10:38 PM Form 6-K
https://www.sec.gov/Archives/edgar/data/0001290109/000119312522075294/d288774d6k.htm 161/268
Table of Contents
LG DISPLAY CO., LTD. AND SUBSIDIARIESNotes to the Consolidated Financial Statements
For the years ended December 31, 2021 and 2020 29. Related Parties and Others, Continued
(b) Significant transactions such as sales of goods and purchases of raw material and outsourcing service and others, which occurred in thenormal course of business with related parties for the years ended December 31, 2021 and 2020 are as follows:
(In millions of won) 2021
Sales and
others Dividend
income
Purchase and others
Purchase of raw material and others
Acquisition of property,
plant and equipment
Outsourcing fees
Other costs
Associates AVATEC Co., Ltd. W — 200 713 — 72,156 1,485 Paju Electric Glass Co., Ltd. — 3,668 365,400 — — 2,734 WooRee E&L Co., Ltd. — — 13,541 — — 79 YAS Co., Ltd. — 200 10,337 54,071 — 9,824 Cynora GmbH — — 10 — — — Material Science Co., Ltd. — — 187 — — —
W — 4,068 390,188 54,071 72,156 14,122
Entity that has significant influence over the ControllingCompany
LG Electronics Inc. W270,396 — 19,805 395,654 — 130,924 Subsidiaries of the entity that has significant influence over the
Controlling Company LG Electronics India Pvt. Ltd. W 97,475 — — — — 418 LG Electronics Vietnam Haiphong Co., Ltd. 414,806 — — 607 — 1,445
160
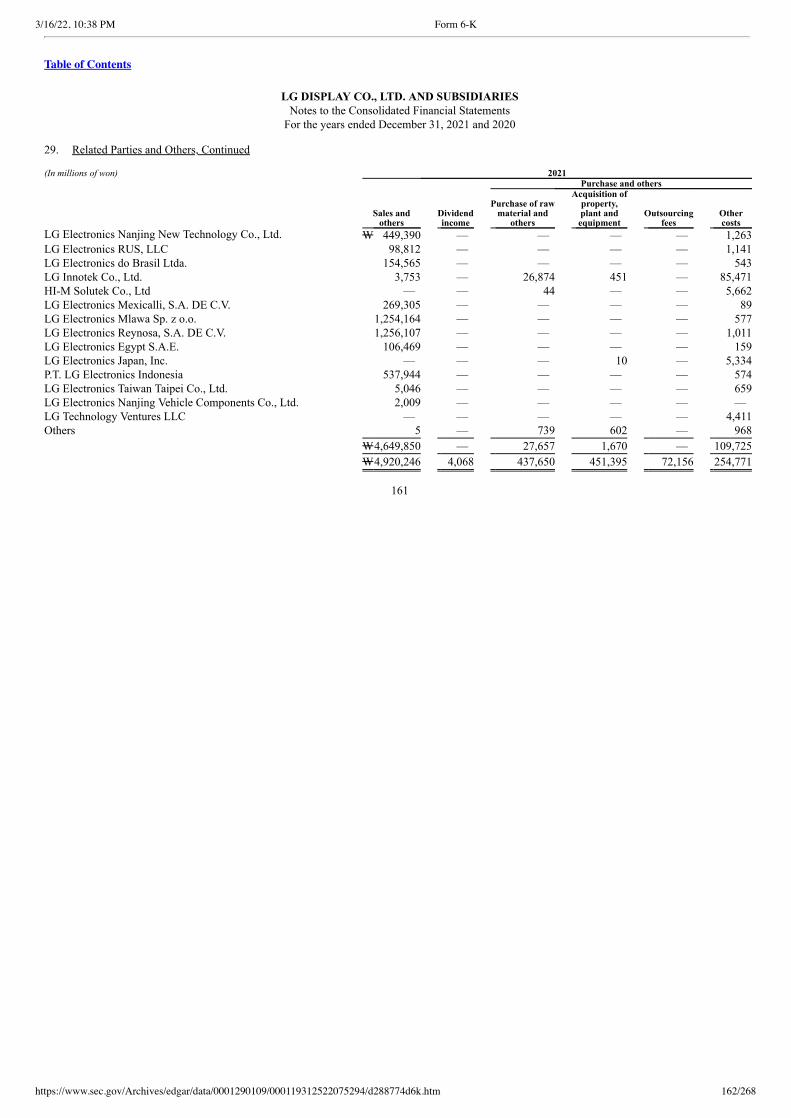
3/16/22, 10:38 PM Form 6-K
https://www.sec.gov/Archives/edgar/data/0001290109/000119312522075294/d288774d6k.htm 162/268
Table of Contents
LG DISPLAY CO., LTD. AND SUBSIDIARIESNotes to the Consolidated Financial Statements
For the years ended December 31, 2021 and 2020 29. Related Parties and Others, Continued (In millions of won) 2021
Sales and
others Dividend
income
Purchase and others
Purchase of raw material and
others
Acquisition of property,
plant and equipment
Outsourcing fees
Other costs
LG Electronics Nanjing New Technology Co., Ltd. W 449,390 — — — — 1,263 LG Electronics RUS, LLC 98,812 — — — — 1,141 LG Electronics do Brasil Ltda. 154,565 — — — — 543 LG Innotek Co., Ltd. 3,753 — 26,874 451 — 85,471 HI-M Solutek Co., Ltd — — 44 — — 5,662 LG Electronics Mexicalli, S.A. DE C.V. 269,305 — — — — 89 LG Electronics Mlawa Sp. z o.o. 1,254,164 — — — — 577 LG Electronics Reynosa, S.A. DE C.V. 1,256,107 — — — — 1,011 LG Electronics Egypt S.A.E. 106,469 — — — — 159 LG Electronics Japan, Inc. — — — 10 — 5,334 P.T. LG Electronics Indonesia 537,944 — — — — 574 LG Electronics Taiwan Taipei Co., Ltd. 5,046 — — — — 659 LG Electronics Nanjing Vehicle Components Co., Ltd. 2,009 — — — — — LG Technology Ventures LLC — — — — — 4,411 Others 5 — 739 602 — 968
W4,649,850 — 27,657 1,670 — 109,725
W4,920,246 4,068 437,650 451,395 72,156 254,771
161
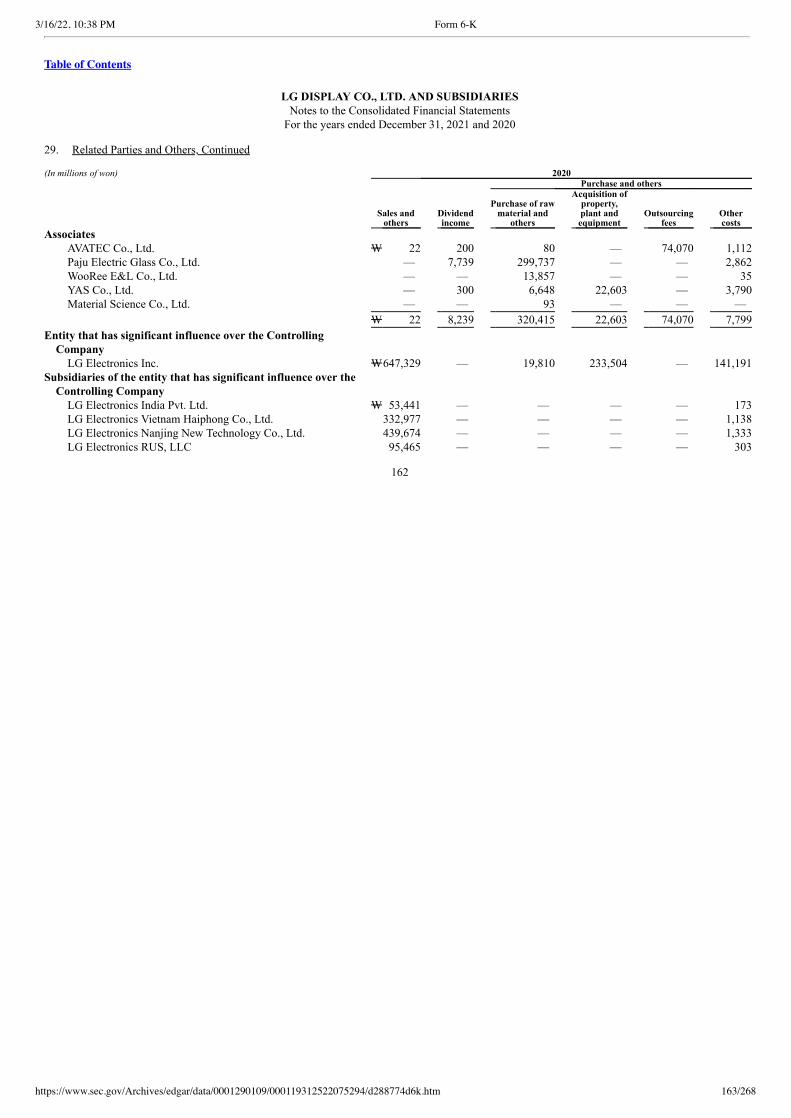
3/16/22, 10:38 PM Form 6-K
https://www.sec.gov/Archives/edgar/data/0001290109/000119312522075294/d288774d6k.htm 163/268
Table of Contents
LG DISPLAY CO., LTD. AND SUBSIDIARIESNotes to the Consolidated Financial Statements
For the years ended December 31, 2021 and 2020 29. Related Parties and Others, Continued (In millions of won) 2020
Sales and
others Dividend
income
Purchase and others
Purchase of raw material and
others
Acquisition of property,
plant and equipment
Outsourcing fees
Other costs
Associates AVATEC Co., Ltd. W 22 200 80 — 74,070 1,112 Paju Electric Glass Co., Ltd. — 7,739 299,737 — — 2,862 WooRee E&L Co., Ltd. — — 13,857 — — 35 YAS Co., Ltd. — 300 6,648 22,603 — 3,790 Material Science Co., Ltd. — — 93 — — —
W 22 8,239 320,415 22,603 74,070 7,799
Entity that has significant influence over the ControllingCompany
LG Electronics Inc. W647,329 — 19,810 233,504 — 141,191 Subsidiaries of the entity that has significant influence over the
Controlling Company LG Electronics India Pvt. Ltd. W 53,441 — — — — 173 LG Electronics Vietnam Haiphong Co., Ltd. 332,977 — — — — 1,138 LG Electronics Nanjing New Technology Co., Ltd. 439,674 — — — — 1,333 LG Electronics RUS, LLC 95,465 — — — — 303
162
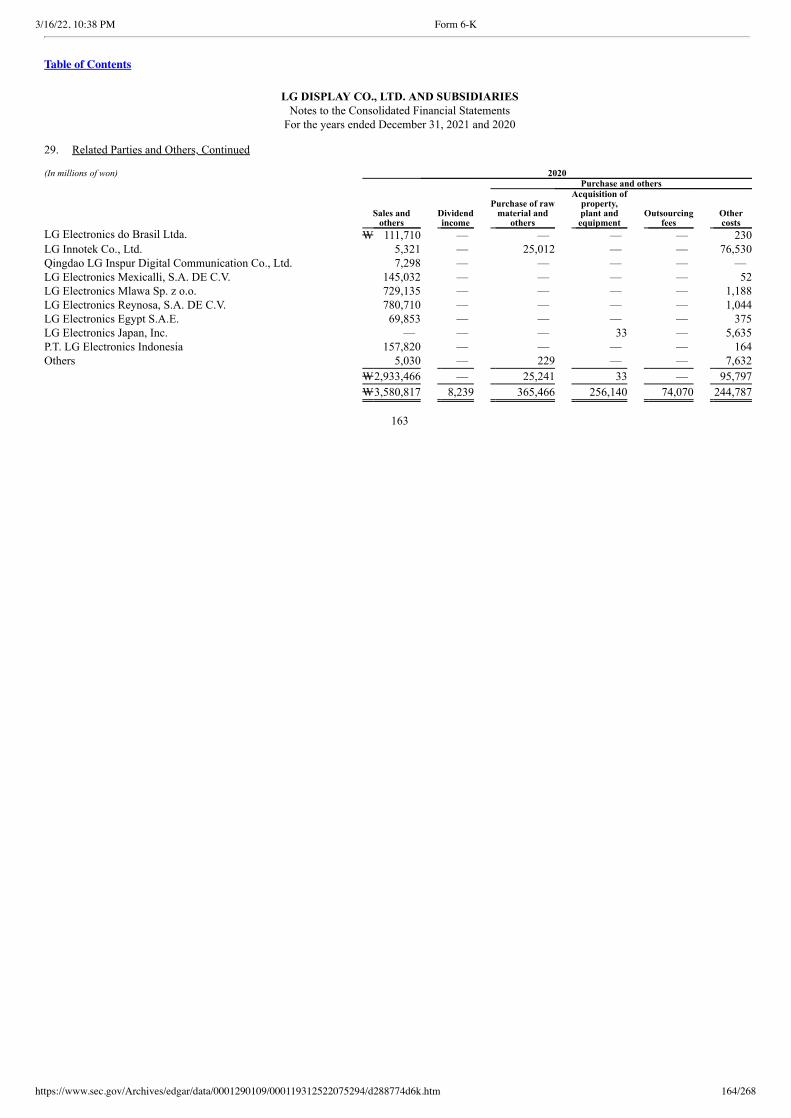
3/16/22, 10:38 PM Form 6-K
https://www.sec.gov/Archives/edgar/data/0001290109/000119312522075294/d288774d6k.htm 164/268
Table of Contents
LG DISPLAY CO., LTD. AND SUBSIDIARIESNotes to the Consolidated Financial Statements
For the years ended December 31, 2021 and 2020 29. Related Parties and Others, Continued (In millions of won) 2020
Sales and
others Dividend
income
Purchase and others
Purchase of raw material and
others
Acquisition of property,
plant and equipment
Outsourcing fees
Other costs
LG Electronics do Brasil Ltda. W 111,710 — — — — 230 LG Innotek Co., Ltd. 5,321 — 25,012 — — 76,530 Qingdao LG Inspur Digital Communication Co., Ltd. 7,298 — — — — — LG Electronics Mexicalli, S.A. DE C.V. 145,032 — — — — 52 LG Electronics Mlawa Sp. z o.o. 729,135 — — — — 1,188 LG Electronics Reynosa, S.A. DE C.V. 780,710 — — — — 1,044 LG Electronics Egypt S.A.E. 69,853 — — — — 375 LG Electronics Japan, Inc. — — — 33 — 5,635 P.T. LG Electronics Indonesia 157,820 — — — — 164 Others 5,030 — 229 — — 7,632
W2,933,466 — 25,241 33 — 95,797
W3,580,817 8,239 365,466 256,140 74,070 244,787
163
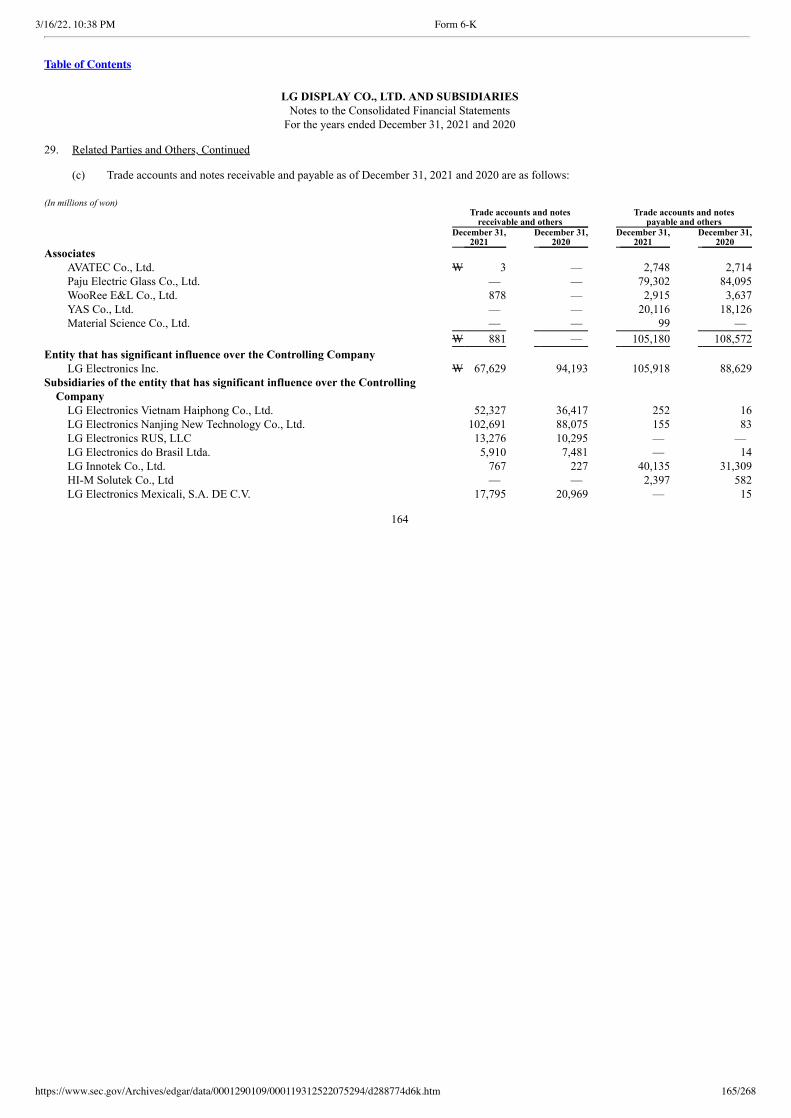
3/16/22, 10:38 PM Form 6-K
https://www.sec.gov/Archives/edgar/data/0001290109/000119312522075294/d288774d6k.htm 165/268
Table of Contents
LG DISPLAY CO., LTD. AND SUBSIDIARIESNotes to the Consolidated Financial Statements
For the years ended December 31, 2021 and 2020 29. Related Parties and Others, Continued (c) Trade accounts and notes receivable and payable as of December 31, 2021 and 2020 are as follows: (In millions of won)
Trade accounts and notes
receivable and others Trade accounts and notes
payable and others
December 31,
2021 December 31,
2020 December 31,
2021 December 31,
2020 Associates
AVATEC Co., Ltd. W 3 — 2,748 2,714 Paju Electric Glass Co., Ltd. — — 79,302 84,095 WooRee E&L Co., Ltd. 878 — 2,915 3,637 YAS Co., Ltd. — — 20,116 18,126 Material Science Co., Ltd. — — 99 —
W 881 — 105,180 108,572
Entity that has significant influence over the Controlling Company LG Electronics Inc. W 67,629 94,193 105,918 88,629
Subsidiaries of the entity that has significant influence over the ControllingCompany
LG Electronics Vietnam Haiphong Co., Ltd. 52,327 36,417 252 16 LG Electronics Nanjing New Technology Co., Ltd. 102,691 88,075 155 83 LG Electronics RUS, LLC 13,276 10,295 — — LG Electronics do Brasil Ltda. 5,910 7,481 — 14 LG Innotek Co., Ltd. 767 227 40,135 31,309 HI-M Solutek Co., Ltd — — 2,397 582 LG Electronics Mexicali, S.A. DE C.V. 17,795 20,969 — 15
164
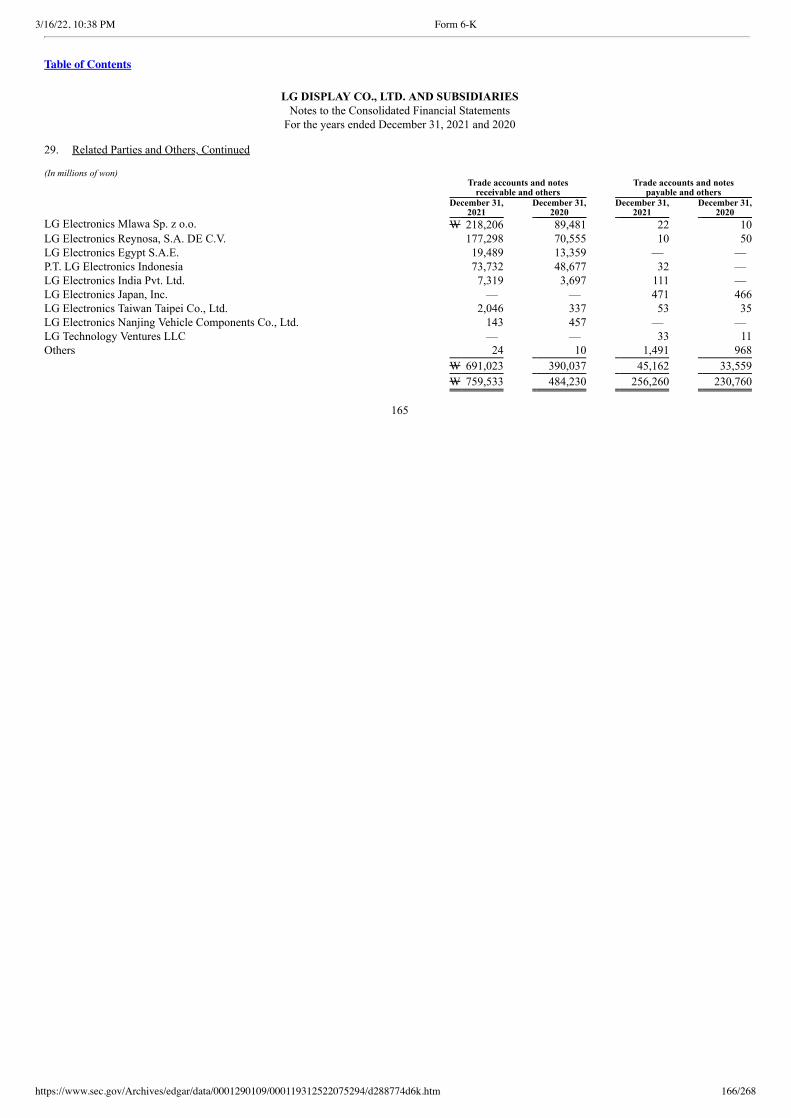
3/16/22, 10:38 PM Form 6-K
https://www.sec.gov/Archives/edgar/data/0001290109/000119312522075294/d288774d6k.htm 166/268
Table of Contents
LG DISPLAY CO., LTD. AND SUBSIDIARIESNotes to the Consolidated Financial Statements
For the years ended December 31, 2021 and 2020 29. Related Parties and Others, Continued (In millions of won)
Trade accounts and notes
receivable and others Trade accounts and notes
payable and others
December 31,
2021 December 31,
2020 December 31,
2021 December 31,
2020 LG Electronics Mlawa Sp. z o.o. W 218,206 89,481 22 10 LG Electronics Reynosa, S.A. DE C.V. 177,298 70,555 10 50 LG Electronics Egypt S.A.E. 19,489 13,359 — — P.T. LG Electronics Indonesia 73,732 48,677 32 — LG Electronics India Pvt. Ltd. 7,319 3,697 111 — LG Electronics Japan, Inc. — — 471 466 LG Electronics Taiwan Taipei Co., Ltd. 2,046 337 53 35 LG Electronics Nanjing Vehicle Components Co., Ltd. 143 457 — — LG Technology Ventures LLC — — 33 11 Others 24 10 1,491 968
W 691,023 390,037 45,162 33,559
W 759,533 484,230 256,260 230,760
165
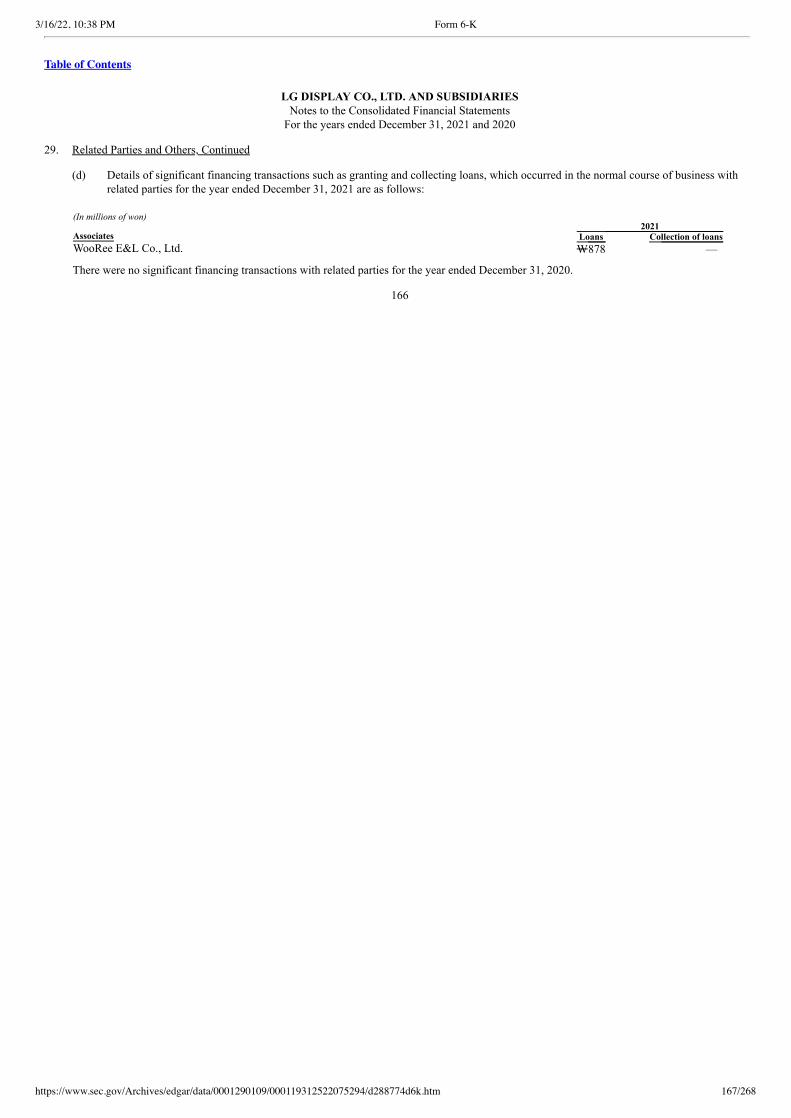
3/16/22, 10:38 PM Form 6-K
https://www.sec.gov/Archives/edgar/data/0001290109/000119312522075294/d288774d6k.htm 167/268
Table of Contents
LG DISPLAY CO., LTD. AND SUBSIDIARIESNotes to the Consolidated Financial Statements
For the years ended December 31, 2021 and 2020 29. Related Parties and Others, Continued
(d) Details of significant financing transactions such as granting and collecting loans, which occurred in the normal course of business withrelated parties for the year ended December 31, 2021 are as follows:
(In millions of won) 2021 Associates Loans Collection of loans WooRee E&L Co., Ltd. W878 —
There were no significant financing transactions with related parties for the year ended December 31, 2020.
166

3/16/22, 10:38 PM Form 6-K
https://www.sec.gov/Archives/edgar/data/0001290109/000119312522075294/d288774d6k.htm 168/268
Table of Contents
LG DISPLAY CO., LTD. AND SUBSIDIARIESNotes to the Consolidated Financial Statements
For the years ended December 31, 2021 and 2020 29. Related Parties and Others, Continued (e) Conglomerate Transactions
Transactions, trade accounts and notes receivable and payable, and others between the Group and certain companies and their subsidiariesincluded in LG Group, one of the conglomerates in the Republic of Korea according to the Monopoly Regulation and Fair Trade Act as ofand for the years ended December 31, 2021 and 2020 are as follows. These entities are not related parties according to K-IFRS No. 1024,Related Party Disclosures.
(In millions of won)
For the year ended
December 31, 2021 December 31, 2021
Sales
and others Purchase
and others
Trade accounts and notes receivable
and others
Trade accounts and notes payable and
others LX International Corp. and its subsidiaries(formerly, LG International Corp.)(*1) W570,716 287,203 48,955 41,355 LG Uplus Corp. — 2,355 — 163 LG Chem Ltd. and its subsidiaries 172 634,886 2,974 111,761 S&I Corp. and its subsidiaries 313 409,845 5,862 171,870 LX Semicon Co., Ltd.(formerly, Silicon Works Co., Ltd)(*2) 2,551 1,356,864 117 112,572 LG Corp. — 68,420 6,754 11,193 LG Management Development Institute — 21,069 3,480 205 LG CNS Co., Ltd. and its subsidiaries 118 329,724 100 186,784 LG Household & Health Care Ltd. and its subsidiaries — 335 — 55 LG Holdings Japan Co., Ltd. — 512 — — G2R Inc. and its subsidiaries — 23,521 — 11,933 Robostar Co., Ltd. — 7,600 — 2,006
W573,870 3,142,334 68,242 649,897
(*1) LG International Corp. renamed its name as LX International Corp. on July 1, 2021.(*2) Silicon Work Co., Ltd. renamed its name as LX Semicon Co., Ltd. on July 1, 2021.
167
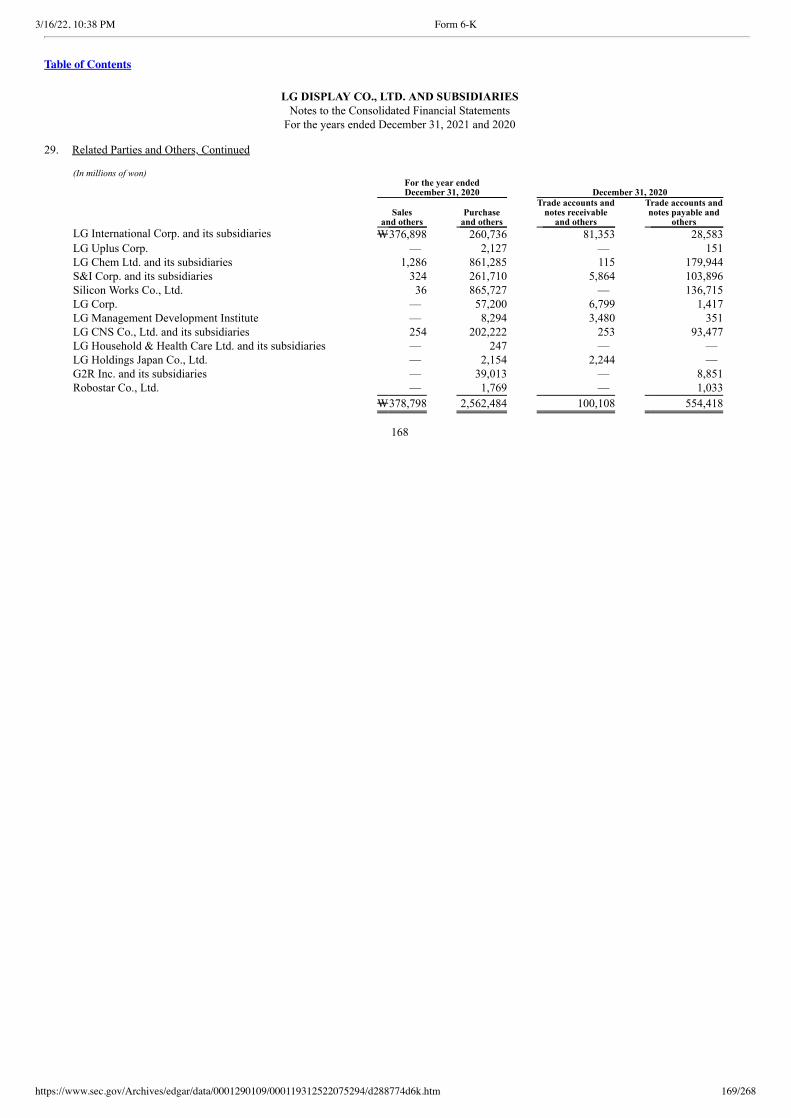
3/16/22, 10:38 PM Form 6-K
https://www.sec.gov/Archives/edgar/data/0001290109/000119312522075294/d288774d6k.htm 169/268
Table of Contents
LG DISPLAY CO., LTD. AND SUBSIDIARIESNotes to the Consolidated Financial Statements
For the years ended December 31, 2021 and 2020 29. Related Parties and Others, Continued
(In millions of won)
For the year ended
December 31, 2020 December 31, 2020
Sales
and others Purchase
and others
Trade accounts and notes receivable
and others
Trade accounts and notes payable and
others LG International Corp. and its subsidiaries W376,898 260,736 81,353 28,583 LG Uplus Corp. — 2,127 — 151 LG Chem Ltd. and its subsidiaries 1,286 861,285 115 179,944 S&I Corp. and its subsidiaries 324 261,710 5,864 103,896 Silicon Works Co., Ltd. 36 865,727 — 136,715 LG Corp. — 57,200 6,799 1,417 LG Management Development Institute — 8,294 3,480 351 LG CNS Co., Ltd. and its subsidiaries 254 202,222 253 93,477 LG Household & Health Care Ltd. and its subsidiaries — 247 — — LG Holdings Japan Co., Ltd. — 2,154 2,244 — G2R Inc. and its subsidiaries — 39,013 — 8,851 Robostar Co., Ltd. — 1,769 — 1,033
W378,798 2,562,484 100,108 554,418
168
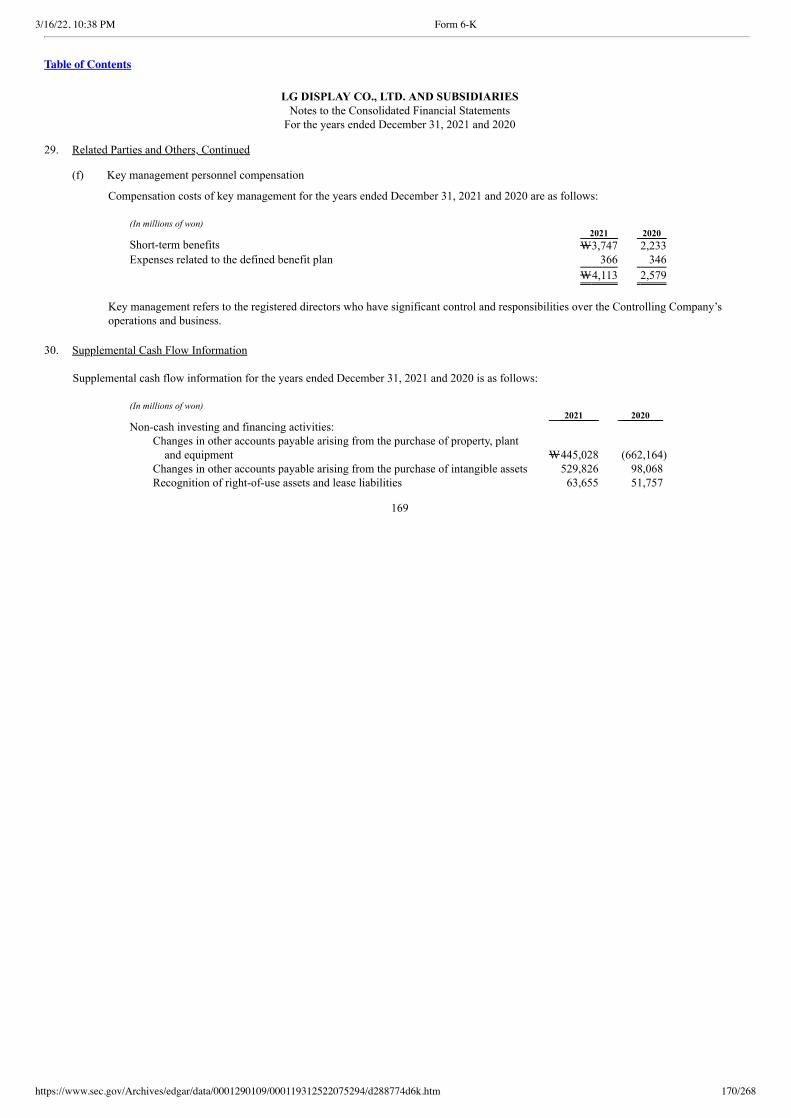
3/16/22, 10:38 PM Form 6-K
https://www.sec.gov/Archives/edgar/data/0001290109/000119312522075294/d288774d6k.htm 170/268
Table of Contents
LG DISPLAY CO., LTD. AND SUBSIDIARIESNotes to the Consolidated Financial Statements
For the years ended December 31, 2021 and 2020 29. Related Parties and Others, Continued (f) Key management personnel compensation
Compensation costs of key management for the years ended December 31, 2021 and 2020 are as follows:
(In millions of won) 2021 2020 Short-term benefits W3,747 2,233 Expenses related to the defined benefit plan 366 346
W4,113 2,579
Key management refers to the registered directors who have significant control and responsibilities over the Controlling Company’soperations and business.
30. Supplemental Cash Flow Information
Supplemental cash flow information for the years ended December 31, 2021 and 2020 is as follows:
(In millions of won) 2021 2020 Non-cash investing and financing activities:
Changes in other accounts payable arising from the purchase of property, plantand equipment W445,028 (662,164)
Changes in other accounts payable arising from the purchase of intangible assets 529,826 98,068 Recognition of right-of-use assets and lease liabilities 63,655 51,757
169
3/16/22, 10:38 PM Form 6-K
https://www.sec.gov/Archives/edgar/data/0001290109/000119312522075294/d288774d6k.htm 171/268
Table of Contents
LG DISPLAY CO., LTD.
Separate Financial Statements
For the Years Ended December 31, 2021 and 2020
(With Independent Auditors’ Report Thereon)
170
3/16/22, 10:38 PM Form 6-K
https://www.sec.gov/Archives/edgar/data/0001290109/000119312522075294/d288774d6k.htm 172/268
Table of Contents
Contents Page
Independent Auditors’ Report 172
Separate Statements of Financial Position 176
Separate Statements of Comprehensive Income (Loss) 177
Separate Statements of Changes in Equity 178
Separate Statements of Cash Flows 179
Notes to the Separate Financial Statements 181
Independent Auditors’ Report on Internal Control over Financial Reporting
Report on the Operation of Internal Control over Financial Reporting
171
3/16/22, 10:38 PM Form 6-K
https://www.sec.gov/Archives/edgar/data/0001290109/000119312522075294/d288774d6k.htm 173/268
Table of Contents
Independent Auditors’ Report
Based on a report originally issued in Korean
To the Shareholders and Board of DirectorsLG Display Co., Ltd.:
Opinion
We have audited the accompanying separate financial statements of LG Display Co., Ltd. (the “Company”), which comprise the separate statements offinancial position of the Company as of December 31, 2021 and 2020, the related separate statements of comprehensive income(loss), changes in equityand cash flows for the years then ended, and notes to the separate financial statements comprising significant accounting policies and other explanatoryinformation.
In our opinion, the accompanying separate financial statements present fairly, in all material respects, the separate financial position of the Company asof December 31, 2021 and 2020, and its separate financial performance and its separate cash flows for the years then ended in accordance with KoreanInternational Financial Reporting Standards (“K-IFRS”).
We also have audited, in accordance with the Standards on Auditing, the Company’s Internal Control over Financial Reporting as of December 31,2021, based on criteria established in Conceptual Framework for Designing and Operating Internal Control over Financial Reporting issued by theOperating Committee of Internal Control over Financial Reporting in Korea, and our report dated March 8, 2022 expressed an unqualified opinion onthe effectiveness of the Company’s internal control over financial reporting.
Basis for Opinion
We conducted our audits in accordance with Korean Standards on Auditing. Our responsibilities under those standards are further described in theAuditors’ Responsibilities for the Audit of the Separate Financial Statements section of our report. We are independent of the Company in accordancewith the ethical requirements that are relevant to our audit of the separate financial statements in the Republic of Korea, and we have fulfilled our otherethical responsibilities in accordance with these requirements. We believe that the audit evidence we have obtained is sufficient and appropriate toprovide a basis for our opinion.
Key Audit Matters
Key audit matters are those matters that, in our professional judgment, were of most significance in our audit of the separate financial statements as ofand for the year ended December 31, 2021. These matters were addressed in the context of our audit of the separate financial statements as a whole, andin forming our opinion thereon, and we do not provide a separate opinion on these matters.
(i) Impairment test for Display Cash Generating Unit(CGU)
As discussed in Notes 3(k) and 10 to the separate financial statements, goodwill of W14,593 million is allocated to the Company’s Display CGU. TheCompany’s non-financial assets as of December 31, 2021 amount to W13,470,670 million, and a large portion of which are related to the Display CGU.The recoverable amount used by the Company in impairment test of the Display CGU is value in use based on discounted cash flow model. As a resultof impairment test for Display CGU, the Company concluded that recoverable amount exceeds the carrying amount.
We identified impairment test for Display CGU as a key audit matter. Revenue and operating expenditures for the forecast period, and discount rate usedto estimate value in use for impairment test of Display CGU involve significant judgement and minor changes would have a significant effect on theresults of the Company’s impairment test of Display CGU.
172
3/16/22, 10:38 PM Form 6-K
https://www.sec.gov/Archives/edgar/data/0001290109/000119312522075294/d288774d6k.htm 174/268
Table of Contents
The primary procedures we performed to address the impairment test for Display CGU include followings:
• We tested certain internal controls over the Company’s non-financial assets impairment test process, including controls related todevelopment of the revenue and operating expenditures forecasts and discount rate assumptions for Display CGU.
• We compared the Company’s historical revenue and operating expenditures forecasts to actual results to assess the Company’s ability toaccurately forecast.
• We evaluated the revenue and operating expenditures forecasts used to determine the value in use by comparison with the financial budgetsapproved by the board of directors.
• We performed sensitivity analysis over the discount rate assumptions to assess their impact on the Company’s impairment test.
• We involved our valuation professionals with specialized skills and knowledge who assisted us in the following:
• testing discount rate by comparing them against independently developed rates using publicly available market data for comparableentities; and
• testing revenue and operating expenditures forecasts by comparing them against analyst reports and industry reports.
(ii) Assessment of recognition of deferred tax assets
As discussed in Note 24 to the separate financial statements, the deferred tax assets arise primarily due to differences between financial statementcarrying amounts of existing assets and liabilities and their respective tax bases, as well as, unused tax losses and tax credit carryforwards. Theassessment of the recognition of these deferred tax assets is dependent on the generation of future taxable income of the Company. As of December 31,2021, the Company had W2,238,410 million of deferred tax assets in the separate statement of financial position and W182,617 million of unrecognizedtax credit carryforwards as of December 31, 2021.
We identified the assessment of the recognition of the deferred tax assets as a key audit matter because it involves high degree of subjective managementjudgment in estimating future taxable profits over the periods in which the above mentioned differences become deductible and within the periodsbefore the unused tax losses and tax credit forwards expire and the feasibility of planned tax strategies. The subjectivity is primarily driven by theCompany’s assumptions in revenue, operating expenditures and subsidiaries’ dividend distribution, which are used to estimate the forecasted taxableincome in the future.
The primary procedures we performed to address the assessment of recognition of deferred tax assets include followings:
• We tested certain internal controls relating to the Company’s deferred tax assets recognition process, including controls related to thedevelopment of assumptions in determining the future taxable income and subsidiaries’ dividend distribution for each year.
• We analyzed the Company’s estimates of taxable income, including analyzing the Company’s forecasted revenue and operating expense bycomparing them with the financial budgets approved by the board of directors and historical performance.
• We compared the forecasts of taxable income and timing of utilization of tax losses and tax credit carryforwards in prior years to actualresults to assess the Company’s ability to accurately forecast.
• We also evaluated the Company’s assessment on the history of realizing deferred tax assets in connection with the unused tax losses
carryforwards and collecting declared subsidiaries’ dividends in connection with the development of assumptions in determiningsubsidiaries’ dividend distribution.
• We involved tax professionals with specialized skills and knowledge who assisted in assessing the feasibility of planned tax strategieswhen recognizing deferred tax assets.
Other matter
The procedures and practices utilized in the Republic of Korea to audit such separate financial statements may differ from those generally accepted andapplied in other countries.
173

3/16/22, 10:38 PM Form 6-K
https://www.sec.gov/Archives/edgar/data/0001290109/000119312522075294/d288774d6k.htm 175/268
Table of Contents
Responsibilities of Management and Those Charged with Governance for the Separate Financial Statements
Management is responsible for the preparation and fair presentation of these separate financial statements in accordance with K-IFRS, and for suchinternal control as management determines is necessary to enable the preparation of separate financial statements that are free from materialmisstatement, whether due to fraud or error.
In preparing these separate financial statements, management is responsible for assessing the Company’s ability to continue as a going concern,disclosing, as applicable, matters related to going concern and using the going concern basis of accounting unless management either intends to liquidatethe Company or to cease operations, or has no realistic alternative but to do so.
Those charged with governance are responsible for overseeing the Company’s financial reporting process.
Auditors’ Responsibilities for the Audit of the Separate Financial Statements
Our objectives are to obtain reasonable assurance about whether theses separate financial statements as a whole are free from material misstatements,whether due to fraud or error, and to issue an auditors’ report that includes our opinion. ‘Reasonable assurance’ is a high level of assurance, but is not aguarantee that an audit conducted in accordance with Korean Standards on Auditing will always detect a material misstatement when it exists.Misstatements can arise from fraud or error and are considered material if, individually or in aggregate, they could reasonably be expected to influencethe economic decisions of users taken on the basis of these separate financial statements.
As part of an audit in accordance with Korean Standards on Auditing, we exercise professional judgment and maintain professional skepticismthroughout the audit. We also:
• Identify and assess the risks of material misstatement of the separate financial statements, whether due to fraud or error, design andperform audit procedures responsive to those risks, and obtain audit evidence that is sufficient and appropriate to provide a basis for ouropinion. The risk of not detecting a material misstatement resulting from fraud is higher than for one resulting from error, as fraud mayinvolve collusion, forgery, intentional omissions, misrepresentations or the override of internal control.
• Obtain an understanding of internal control relevant to the audit in order to design audit procedures that are appropriate in thecircumstances.
• Evaluate the appropriateness of accounting policies used and the reasonableness of accounting estimates and related disclosures made bymanagement.
• Conclude on the appropriateness of management’s use of the going concern basis of accounting and, based on the audit evidence obtained,whether a material uncertainty exists related to events or conditions that may cast significant doubt on the Company’s ability to continue asa going concern. If we conclude that a material uncertainty exists, then we are required to draw attention in our auditors’ report to therelated disclosures in the separate financial statements or, if such disclosures are inadequate, to modify our opinion. Our conclusions arebased on the audit evidence obtained up to the date of our auditors’ report. However, future events or conditions may cause the Companyto cease to continue as a going concern.
• Evaluate the overall presentation, structure and content of the separate financial statements, including the disclosures, and whether theseparate financial statements represent the underlying transactions and events in a manner that achieves fair presentation.
We communicate with those charged with governance regarding, among other matters, the planned scope and timing of the audit and significant auditfindings, including any significant deficiencies in internal control that we identify during our audit.
174
3/16/22, 10:38 PM Form 6-K
https://www.sec.gov/Archives/edgar/data/0001290109/000119312522075294/d288774d6k.htm 176/268
Table of Contents
We also provide those charged with governance with a statement that we have complied with relevant ethical requirements regarding independence, andcommunicate with them all relationships and other matters that may reasonably be thought to bear on our independence and where applicable, relatedsafeguards.
From the matters communicated with those charged with governance, we determine those matters that were of most significance in the audit of theseparate financial statements of the current period and are therefore the key audit matters. We describe these matters in our auditors’ report unless law orregulation precludes public disclosure about the matter or when, in extremely rare circumstances, we determine that a matter should not becommunicated in our report because the adverse consequences of doing so would reasonably be expected to outweigh the public interest benefits of suchcommunication.
The engagement partner on the audit resulting in this independent auditors’ report is Sang Hyun Han.
KPMG Samjong Accounting Corp.Seoul, KoreaMarch 8, 2022
This report is effective as of March 8, 2022, the audit report date. Certain subsequent events or circumstances, which may occur between the auditreport date and the time of reading this report, could have a material impact on the accompanying separate financial statements and notes thereto.Accordingly, the readers of the audit report should understand that the above audit report has not been updated to reflect the impact of suchsubsequent events or circumstances, if any.
175
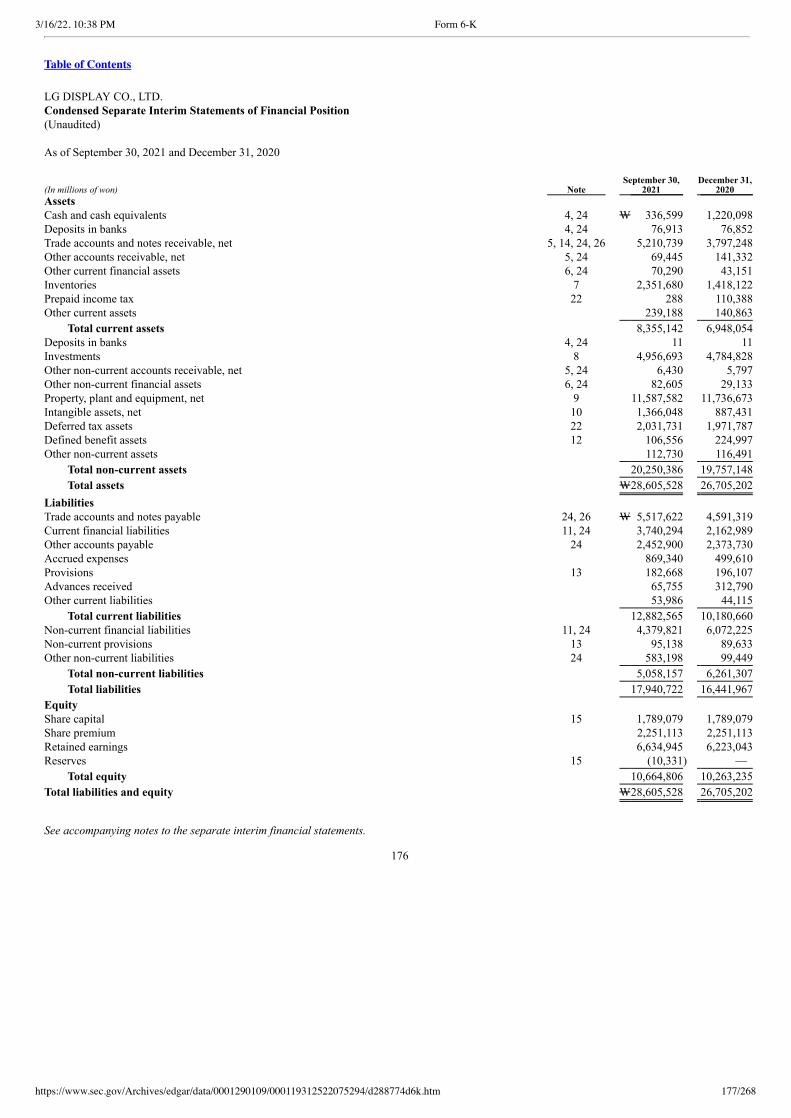
3/16/22, 10:38 PM Form 6-K
https://www.sec.gov/Archives/edgar/data/0001290109/000119312522075294/d288774d6k.htm 177/268
Table of Contents
LG DISPLAY CO., LTD.Condensed Separate Interim Statements of Financial Position(Unaudited)
As of September 30, 2021 and December 31, 2020 (In millions of won) Note
September 30, 2021
December 31, 2020
Assets Cash and cash equivalents 4, 24 W 336,599 1,220,098Deposits in banks 4, 24 76,913 76,852Trade accounts and notes receivable, net 5, 14, 24, 26 5,210,739 3,797,248Other accounts receivable, net 5, 24 69,445 141,332Other current financial assets 6, 24 70,290 43,151Inventories 7 2,351,680 1,418,122Prepaid income tax 22 288 110,388Other current assets 239,188 140,863
Total current assets 8,355,142 6,948,054Deposits in banks 4, 24 11 11Investments 8 4,956,693 4,784,828Other non-current accounts receivable, net 5, 24 6,430 5,797Other non-current financial assets 6, 24 82,605 29,133Property, plant and equipment, net 9 11,587,582 11,736,673Intangible assets, net 10 1,366,048 887,431Deferred tax assets 22 2,031,731 1,971,787Defined benefit assets 12 106,556 224,997Other non-current assets 112,730 116,491
Total non-current assets 20,250,386 19,757,148
Total assets W28,605,528 26,705,202
Liabilities Trade accounts and notes payable 24, 26 W 5,517,622 4,591,319Current financial liabilities 11, 24 3,740,294 2,162,989Other accounts payable 24 2,452,900 2,373,730Accrued expenses 869,340 499,610Provisions 13 182,668 196,107Advances received 65,755 312,790Other current liabilities 53,986 44,115
Total current liabilities 12,882,565 10,180,660Non-current financial liabilities 11, 24 4,379,821 6,072,225Non-current provisions 13 95,138 89,633Other non-current liabilities 24 583,198 99,449
Total non-current liabilities 5,058,157 6,261,307
Total liabilities 17,940,722 16,441,967
Equity Share capital 15 1,789,079 1,789,079Share premium 2,251,113 2,251,113Retained earnings 6,634,945 6,223,043Reserves 15 (10,331) —
Total equity 10,664,806 10,263,235
Total liabilities and equity W28,605,528 26,705,202
See accompanying notes to the separate interim financial statements.
176
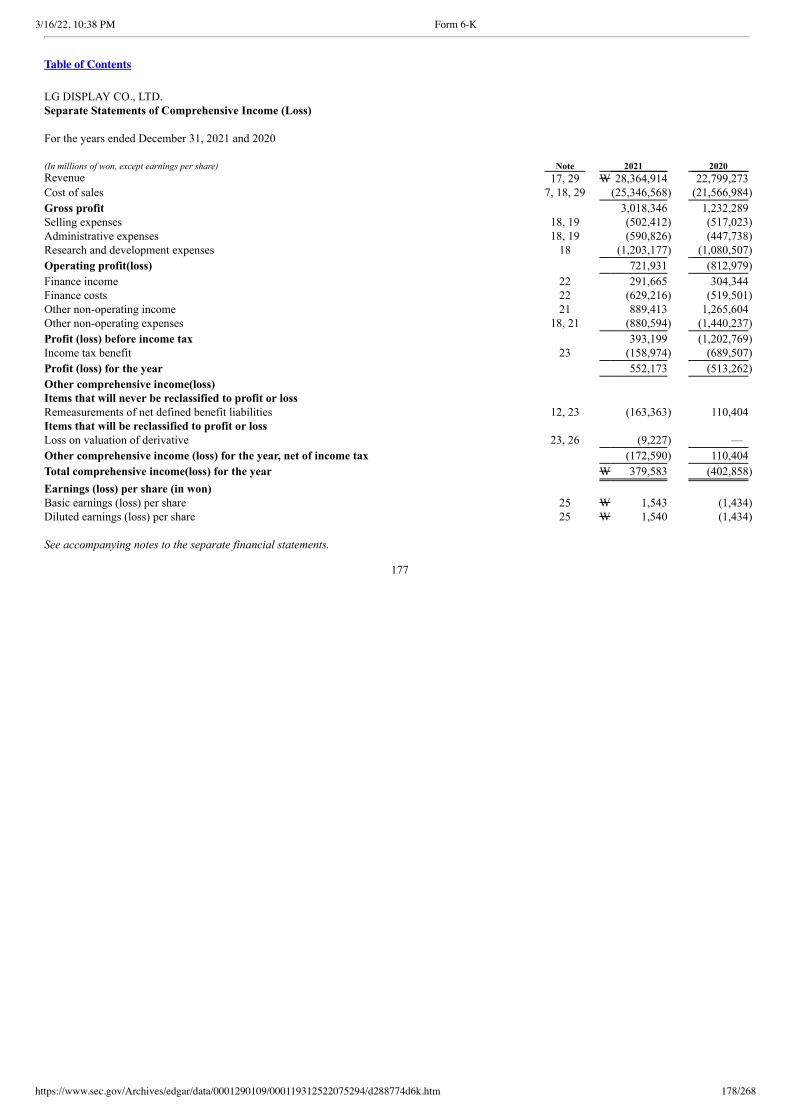
3/16/22, 10:38 PM Form 6-K
https://www.sec.gov/Archives/edgar/data/0001290109/000119312522075294/d288774d6k.htm 178/268
Table of Contents
LG DISPLAY CO., LTD.Separate Statements of Comprehensive Income (Loss)
For the years ended December 31, 2021 and 2020 (In millions of won, except earnings per share) Note 2021 2020 Revenue 17, 29 W 28,364,914 22,799,273Cost of sales 7, 18, 29 (25,346,568) (21,566,984)
Gross profit 3,018,346 1,232,289Selling expenses 18, 19 (502,412) (517,023) Administrative expenses 18, 19 (590,826) (447,738) Research and development expenses 18 (1,203,177) (1,080,507)
Operating profit(loss) 721,931 (812,979)
Finance income 22 291,665 304,344Finance costs 22 (629,216) (519,501) Other non-operating income 21 889,413 1,265,604Other non-operating expenses 18, 21 (880,594) (1,440,237)
Profit (loss) before income tax 393,199 (1,202,769) Income tax benefit 23 (158,974) (689,507)
Profit (loss) for the year 552,173 (513,262)
Other comprehensive income(loss) Items that will never be reclassified to profit or loss Remeasurements of net defined benefit liabilities 12, 23 (163,363) 110,404Items that will be reclassified to profit or loss Loss on valuation of derivative 23, 26 (9,227) —
Other comprehensive income (loss) for the year, net of income tax (172,590) 110,404
Total comprehensive income(loss) for the year W 379,583 (402,858)
Earnings (loss) per share (in won) Basic earnings (loss) per share 25 W 1,543 (1,434) Diluted earnings (loss) per share 25 W 1,540 (1,434)
See accompanying notes to the separate financial statements.
177
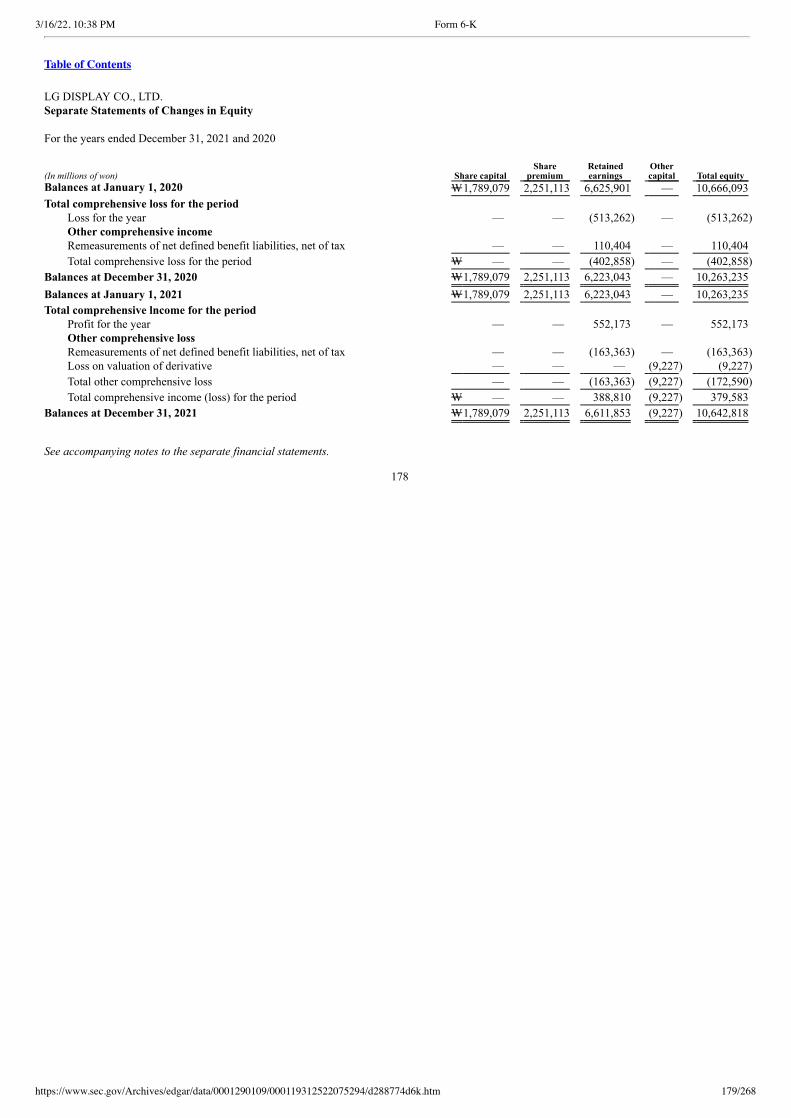
3/16/22, 10:38 PM Form 6-K
https://www.sec.gov/Archives/edgar/data/0001290109/000119312522075294/d288774d6k.htm 179/268
Table of Contents
LG DISPLAY CO., LTD.Separate Statements of Changes in Equity
For the years ended December 31, 2021 and 2020 (In millions of won) Share capital
Share premium
Retained earnings
Other capital Total equity
Balances at January 1, 2020 W1,789,079 2,251,113 6,625,901 — 10,666,093
Total comprehensive loss for the period Loss for the year — — (513,262) — (513,262) Other comprehensive income Remeasurements of net defined benefit liabilities, net of tax — — 110,404 — 110,404
Total comprehensive loss for the period W — — (402,858) — (402,858)
Balances at December 31, 2020 W1,789,079 2,251,113 6,223,043 — 10,263,235
Balances at January 1, 2021 W1,789,079 2,251,113 6,223,043 — 10,263,235
Total comprehensive lncome for the period Profit for the year — — 552,173 — 552,173Other comprehensive loss Remeasurements of net defined benefit liabilities, net of tax — — (163,363) — (163,363) Loss on valuation of derivative — — — (9,227) (9,227)
Total other comprehensive loss — — (163,363) (9,227) (172,590)
Total comprehensive income (loss) for the period W — — 388,810 (9,227) 379,583
Balances at December 31, 2021 W1,789,079 2,251,113 6,611,853 (9,227) 10,642,818
See accompanying notes to the separate financial statements.
178
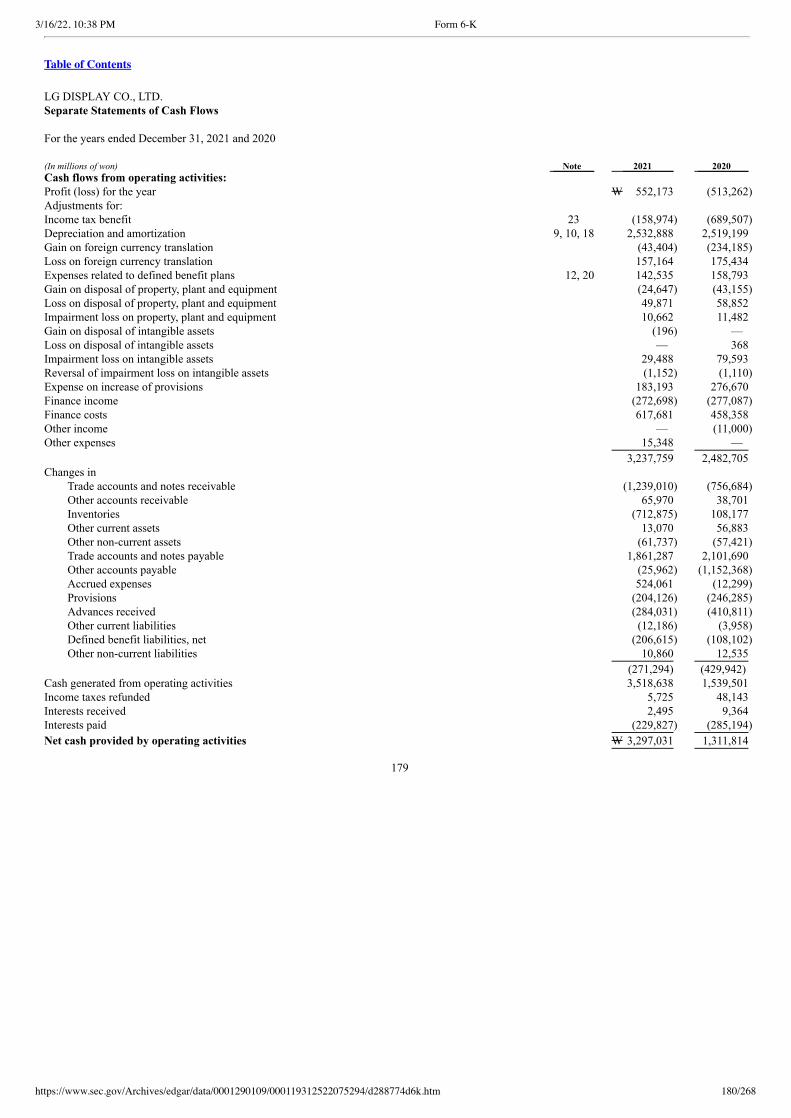
3/16/22, 10:38 PM Form 6-K
https://www.sec.gov/Archives/edgar/data/0001290109/000119312522075294/d288774d6k.htm 180/268
Table of Contents
LG DISPLAY CO., LTD.Separate Statements of Cash Flows
For the years ended December 31, 2021 and 2020 (In millions of won) Note 2021 2020 Cash flows from operating activities: Profit (loss) for the year W 552,173 (513,262) Adjustments for: Income tax benefit 23 (158,974) (689,507) Depreciation and amortization 9, 10, 18 2,532,888 2,519,199Gain on foreign currency translation (43,404) (234,185) Loss on foreign currency translation 157,164 175,434Expenses related to defined benefit plans 12, 20 142,535 158,793Gain on disposal of property, plant and equipment (24,647) (43,155) Loss on disposal of property, plant and equipment 49,871 58,852Impairment loss on property, plant and equipment 10,662 11,482Gain on disposal of intangible assets (196) — Loss on disposal of intangible assets — 368Impairment loss on intangible assets 29,488 79,593Reversal of impairment loss on intangible assets (1,152) (1,110) Expense on increase of provisions 183,193 276,670Finance income (272,698) (277,087) Finance costs 617,681 458,358Other income — (11,000) Other expenses 15,348 —
3,237,759 2,482,705Changes in
Trade accounts and notes receivable (1,239,010) (756,684) Other accounts receivable 65,970 38,701Inventories (712,875) 108,177Other current assets 13,070 56,883Other non-current assets (61,737) (57,421) Trade accounts and notes payable 1,861,287 2,101,690Other accounts payable (25,962) (1,152,368) Accrued expenses 524,061 (12,299) Provisions (204,126) (246,285) Advances received (284,031) (410,811) Other current liabilities (12,186) (3,958) Defined benefit liabilities, net (206,615) (108,102) Other non-current liabilities 10,860 12,535
(271,294) (429,942) Cash generated from operating activities 3,518,638 1,539,501Income taxes refunded 5,725 48,143Interests received 2,495 9,364Interests paid (229,827) (285,194)
Net cash provided by operating activities W 3,297,031 1,311,814
179
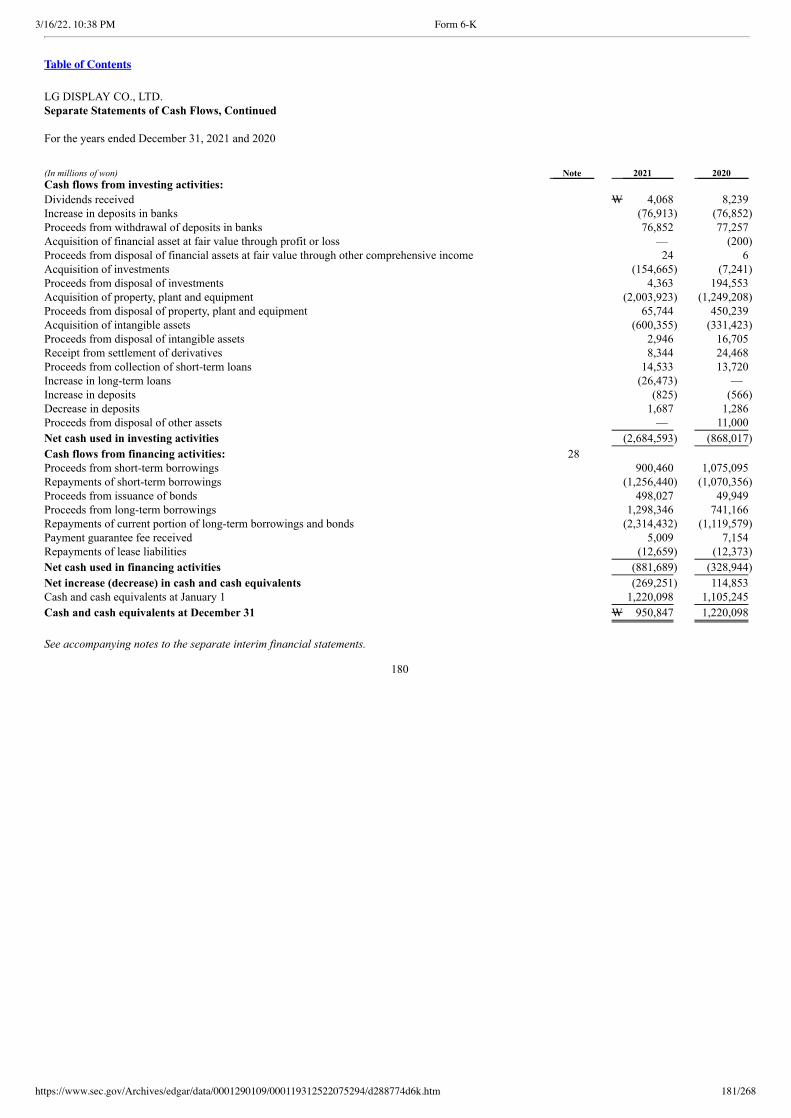
3/16/22, 10:38 PM Form 6-K
https://www.sec.gov/Archives/edgar/data/0001290109/000119312522075294/d288774d6k.htm 181/268
Table of Contents
LG DISPLAY CO., LTD.Separate Statements of Cash Flows, Continued
For the years ended December 31, 2021 and 2020 (In millions of won) Note 2021 2020 Cash flows from investing activities: Dividends received W 4,068 8,239Increase in deposits in banks (76,913) (76,852) Proceeds from withdrawal of deposits in banks 76,852 77,257Acquisition of financial asset at fair value through profit or loss — (200) Proceeds from disposal of financial assets at fair value through other comprehensive income 24 6Acquisition of investments (154,665) (7,241) Proceeds from disposal of investments 4,363 194,553Acquisition of property, plant and equipment (2,003,923) (1,249,208) Proceeds from disposal of property, plant and equipment 65,744 450,239Acquisition of intangible assets (600,355) (331,423) Proceeds from disposal of intangible assets 2,946 16,705Receipt from settlement of derivatives 8,344 24,468Proceeds from collection of short-term loans 14,533 13,720Increase in long-term loans (26,473) — Increase in deposits (825) (566) Decrease in deposits 1,687 1,286Proceeds from disposal of other assets — 11,000
Net cash used in investing activities (2,684,593) (868,017)
Cash flows from financing activities: 28 Proceeds from short-term borrowings 900,460 1,075,095Repayments of short-term borrowings (1,256,440) (1,070,356) Proceeds from issuance of bonds 498,027 49,949Proceeds from long-term borrowings 1,298,346 741,166Repayments of current portion of long-term borrowings and bonds (2,314,432) (1,119,579) Payment guarantee fee received 5,009 7,154Repayments of lease liabilities (12,659) (12,373)
Net cash used in financing activities (881,689) (328,944)
Net increase (decrease) in cash and cash equivalents (269,251) 114,853Cash and cash equivalents at January 1 1,220,098 1,105,245
Cash and cash equivalents at December 31 W 950,847 1,220,098
See accompanying notes to the separate interim financial statements.
180
3/16/22, 10:38 PM Form 6-K
https://www.sec.gov/Archives/edgar/data/0001290109/000119312522075294/d288774d6k.htm 182/268
Table of Contents
LG DISPLAY CO., LTD.Notes to the Separate Financial Statements
For the years ended December 31, 2021 and 2020 1. Organization and Description of Business
LG Display Co., Ltd. (the “Company”) was incorporated in February 1985 and the Company is a public corporation listed in the KoreaExchange since 2004. The main business of the Company is to manufacture and sell displays and its related products. As of December 31,2021, the Company is operating Thin Film Transistor Liquid Crystal Display (“TFT-LCD”) and Organic Light Emitting Diode (“OLED”)panel manufacturing plants in Gumi, Paju and China and TFT-LCD and OLED module manufacturing plants in Gumi, Paju, China andVietnam. The Company is domiciled in the Republic of Korea with its address at 128 Yeouidae-ro, Yeongdeungpo-gu, Seoul, the Republicof Korea. As of December 31, 2021, LG Electronics Inc., a major shareholder of the Company, owns 37.9% (135,625,000 shares) of theCompany’s common stock.
The Company’s common stock is listed on the Korea Exchange under the identifying code 034220. As of December 31, 2021, there are357,815,700 shares of common stock outstanding. The Company’s common stock is also listed on the New York Stock Exchange in theform of American Depository Shares (“ADSs”) under the symbol “LPL”. One ADS represents one-half of one share of common stock. Asof December 31, 2021, there are 15,910,934 ADSs outstanding.
2. Basis of Presenting Financial Statements
(a) Statement of Compliance
In accordance with the Act on External Audits of Stock Companies, Etc., these separate financial statements have been prepared inaccordance with Korean International Financial Reporting Standards (“K-IFRS”).
These financial statements are separate financial statements prepared in accordance with K-IFRS No.1027, Separate Financial Statements,presented by a parent, an investor in an associate or a venture in a joint ventures, in which the investments are accounted for on the basis ofthe direct equity interest rather than on the basis of the reported results and net assets of the investees.
The separate financial statements were authorized for issuance by the Board of Directors on January 26, 2022, which will be submitted forapproval to the shareholders’ meeting to be held on March 23, 2022.
(b) Basis of Measurement
The separate financial statements have been prepared on the historical cost basis except for the following material items in the separatestatement of financial position:
• derivative financial instruments at fair value, financial assets at fair value through profit or loss(“FVTPL”), financial assets at fairvalue through other comprehensive income (“FVOCI”), financial liabilities at fair value through profit or loss(“FVTPL”), and
• net defined benefit liabilities (defined benefit assets) recognized at the present value of defined benefit obligations less the fair valueof plan assets
181
3/16/22, 10:38 PM Form 6-K
https://www.sec.gov/Archives/edgar/data/0001290109/000119312522075294/d288774d6k.htm 183/268
Table of Contents
LG DISPLAY CO., LTD.Notes to the Separate Financial Statements
For the years ended December 31, 2021 and 2020 2. Basis of Presenting Financial Statements, Continued (c) Functional and Presentation Currency
The separate financial statements are presented in Korean won, which is the Company’s functional currency.
(d) Use of Estimates and Judgments
The preparation of the separate financial statements in conformity with K-IFRSs requires management to make judgments, estimates andassumptions that affect the application of accounting policies and the reported amounts of assets, liabilities, income and expenses. Actualresults may differ from these estimates.
Estimates and underlying assumptions are reviewed on an ongoing basis. Revisions to accounting estimates are recognized in the period inwhich the estimates are revised and in any future periods affected.
Information about critical judgments in applying accounting policies that have the most significant effect on the amounts recognized in theseparate financial statements is included in the following notes:
• Financial instruments (Note 3(f))
• Impairment assessment of non-financial assets (Note 3(k), 10)
• Deferred tax assets and liabilities (Note3(r), 24)
Information about assumptions and estimation uncertainties that have a significant risk of resulting in a material adjustment within the next12 months is included in the following notes:
• Provisions (Note 3(m), 13)
• Inventories (Note 3(e), 7)
• Property, plant and equipment (Note 9)
• Intangible assets (Impairment assessment of non-financial assets) (Note 10)
• Employee benefits (Note 12)
• Deferred tax assets and liabilities (Note 24)
3. Summary of Significant Accounting Policies
The significant accounting policies followed by the Company in the preparation of its separate financial statements are as follows:
(a) Changes in Accounting Policies
The Company has early adopted the amendments to K-IFRS No. 1016, Property, Plant and Equipment: Proceeds before Intended Use,from January 1, 2021. A number of other new standards are effective from January 1, 2021 but they do not have a significant effect on theCompany’s separate financial statements.
182
3/16/22, 10:38 PM Form 6-K
https://www.sec.gov/Archives/edgar/data/0001290109/000119312522075294/d288774d6k.htm 184/268
Table of Contents
LG DISPLAY CO., LTD.Notes to the Separate Financial Statements
For the years ended December 31, 2021 and 2020 3. Summary of Significant Accounting Policies, Continued (a) Changes in Accounting Policies, Continued
Before the application of the amendments to K-IFRS No. 1016, directly attributable costs of acquiring property, plant and equipmentincluded the costs of testing whether it is functioning properly, after deducting the net proceeds from selling items produced using theproperty, plant and equipment. However, after the application of the amendments, the proceeds from selling any such produced items andthe cost of producing those items are recognized in profit or loss. K-IFRS No. 1002 Inventories is applied in identifying and measuringthese production costs.
The Company applied amendments retrospectively, but only to items of property, plant and equipment that are brought to the location andcondition necessary for them to be capable of operating in the manner intended by management on or after January 1, 2020, the beginningof the earliest period presented in the accompanying separate financial statements. There is no impact on the Company’s separate financialstatements as a result of the retrospective application of the amendments. The amendments also clarify that testing whether an item ofproperty, plant and equipment is functioning properly means assessing its technical and physical performance rather than assessing itsfinancial performance – e.g. assessing whether the property, plant and equipment has achieved a certain level of operating margin.
(b) Interest in subsidiaries, associates and joint ventures
These separate financial statements are prepared and presented in accordance with K-IFRS No.1027, Separate Financial Statements. TheCompany applied the cost method to investments in subsidiaries, associates and joint ventures. Dividends from subsidiaries, associates orjoint ventures are recognized in profit or loss when the right to receive the dividend is established.
(c) Foreign Currency Transaction and Translation
Transactions in foreign currencies are translated to the functional currency of the Company at exchange rates at the dates of thetransactions. Monetary assets and liabilities denominated in foreign currencies are retranslated to the functional currency at the exchangerate on the reporting date. Non-monetary assets and liabilities denominated in foreign currencies that are measured at fair value areretranslated to the functional currency at the exchange rate at the date that the fair value was originally determined. Foreign currencydifferences arising on retranslation are recognized in profit or loss, except for differences arising on an investment in equity instrumentsdesignated as at FVOCI and a financial asset and liability designated as a cash flow hedge, which are recognized in other comprehensiveincome. Exchange differences arising on the settlement of monetary items or on translating monetary items at rates different from those atwhich they were translated on initial recognition are recognized in profit or loss in the period in which they arise. Foreign currencydifferences arising from assets and liabilities in relation to the investing and financing activities including borrowings, bonds and cash andcash equivalents are recognized in finance income (costs) in the separate statement of comprehensive income (loss) and foreign currencydifferences arising from assets and liabilities in relation to activities other than investing and financing activities are recognized in othernon-operating income (expense) in the separate statement of comprehensive income (loss). Foreign currency differences are presented ingross amounts in the separate statement of comprehensive income (loss).
183
3/16/22, 10:38 PM Form 6-K
https://www.sec.gov/Archives/edgar/data/0001290109/000119312522075294/d288774d6k.htm 185/268
Table of Contents
LG DISPLAY CO., LTD.Notes to the Separate Financial Statements
For the years ended December 31, 2021 and 2020 3. Summary of Significant Accounting Policies, Continued (d) Cash and cash equivalents
Cash and cash equivalents include all cash balances and short-term highly liquid investments with an original maturity of three months orless that are readily convertible into known amounts of cash.
(e) Inventories
Inventories are measured at the lower of cost and net realizable value. The cost of inventories is based on the weighted-average method,and includes expenditures incurred in acquiring the inventories, production or conversion costs and other costs incurred in bringing themto their existing location and condition. Net realizable value is the estimated selling price in the ordinary course of business less theestimated costs of completion and the estimated selling expenses. In the case of manufactured inventories and work-in-process, costincludes an appropriate share of production overheads based on the actual capacity of production facilities. However, the normal capacityis used for the allocation of fixed production overheads if the actual level of production is lower than the normal capacity.
(f) Financial Instruments
(i) Non-derivative financial assets
Recognition and initial measurement
Trade receivables and debt instruments issued are initially recognized when they are originated. All other financial assets are recognized instatement of financial position when, and only when, the Company becomes a party to the contractual provisions of the instrument.
A financial asset (unless it is a trade receivable without a significant financing component) is initially measured at fair value plus, for anitem not at FVTPL, transaction costs that are directly attributable to its acquisition or issue. A trade receivable without a significantfinancing component is initially measured at the transaction price.
Classification and subsequent measurement
i) Financial assets
On initial recognition, a financial asset is classified as measured at: amortized cost; FVOCI – debt investment; FVOCI – equityinvestments; or FVTPL. Financial assets are not reclassified subsequent to their initial recognition unless the Company changes itsbusiness model for managing financial assets, in which case all affected financial assets are reclassified on the first day of the subsequentreporting period following the change in the business model.
A financial asset is measured as at amortized cost if it meets both of the following conditions and is not designated as at FVTPL:
• it is held within a business model whose objective is to hold assets to collect contractual cash flows; and
• its contractual terms give rise on specified dates to cash flows that are solely payments of principal and interest on the principalamount outstanding.
184
3/16/22, 10:38 PM Form 6-K
https://www.sec.gov/Archives/edgar/data/0001290109/000119312522075294/d288774d6k.htm 186/268
Table of Contents
LG DISPLAY CO., LTD.Notes to the Separate Financial Statements
For the years ended December 31, 2021 and 2020 3. Summary of Significant Accounting Policies, Continued (f) Financial Instruments, Continued
A debt investment is measured at FVOCI if it meets both of the following conditions and is not designated as at FVTPL:
• it is held within a business model whose objective is achieved by both collecting contractual cash flows and selling financial assets;and
• the contractual terms give rise on specified dates to cash flows that are solely payments of principal and interest on the principalamount outstanding.
On initial recognition of an equity investments that is not held for trading, the Company may irrevocably elect to present subsequentchanges in the investment’s fair value in OCI. This election is made on an investment-by-investment basis.
All financial assets not classified as measured at amortized cost or FVOCI as described above are measured as at FVTPL. This includes allderivative financial assets. At initial recognition, the Company may irrevocably designate a financial asset that otherwise meets therequirements to be measured at amortized cost or at FVOCI as at FVTPL if doing so eliminates or significantly reduces an accountingmismatch that would otherwise arise.
ii) Financial assets: business model
The Company makes an assessment of the objective of the business model in which a financial asset is held at a portfolio level becausethis best reflects the way the business is managed and information is provided to management. The information considered includes:
• the stated policies and objectives for the portfolio and the operation of those policies in practice (these include whethermanagement’s strategy focuses on earning contractual interest income, maintaining a particular interest rate profile, matching theduration of the financial assets to the duration of any related liabilities or expected cash outflows or realizing cash flows through thesale of the assets);
• how the performance of the portfolio is evaluated and reported to the Company’s management;
• the risks that affect the performance of the business model (and the financial assets held within that business model) and how thoserisks are managed; and
• the frequency, volume and timing of sales of financial assets in prior periods, the reasons for such sales and expectations about futuresales activity.
Transfers of financial assets to third parties in transaction that do not qualify for derecognition are not considered sale for this purpose.
A financial asset that is held for trading or is managed and whose performance is evaluated on a fair value basis is measured at FVTPL.
iii) Financial assets: Assessment whether contractual cash flows are solely payments of principal and interest
For the purpose of the assessment, “principal” is defined as the fair value of the financial asset on initial recognition. ‘Interest’ is definedas consideration for the time value of money and for the credit risk associated with the principal amount outstanding during a particularperiod of time and for other basic lending risks and cost (e.g. liquidity risk and administrative costs), as well as profit margin.
185
3/16/22, 10:38 PM Form 6-K
https://www.sec.gov/Archives/edgar/data/0001290109/000119312522075294/d288774d6k.htm 187/268
Table of Contents
LG DISPLAY CO., LTD.Notes to the Separate Financial Statements
For the years ended December 31, 2021 and 2020 3. Summary of Significant Accounting Policies, Continued (f) Financial Instruments, Continued
In assessing whether the contractual cash flows are solely payments of principal and interest, the Company considers the contractual termsof the instrument. This includes assessing whether the financial asset contains a contractual term that could change the timing or amount ofcontractual cash flows such that it would not meet this condition. In making this assessment, the Company considers.
• contingent events that would change the amount or timing of cash flows:
• terms that may adjust the contractual coupon rate, including variable-rate features;
• prepayment and extension features; and
• terms that limit the Company’s claim to cash flows from specified assets (e.g. non-recourse features)
A prepayment feature is consistent with the solely payments of principal and interest criterion if the prepayment amount substantiallyrepresents unpaid amounts of principal and interest or the principal amount outstanding, which may include reasonable additionalcompensation for early termination of the contract.
Additionally, for a financial asset acquired at a discount or premium to its contractual par amount, a feature that permits or requiresprepayment at an amount that substantially represents the contractual par amount plus accrued but unpaid contractual interest (which mayalso include reasonable additional compensation for early termination) is treated as consistent with this criterion if the fair value of theprepayment feature is insignificant at initial recognition.
iv) Financial assets: Subsequent measurement and gains and losses Financial assets at FVTPL
These assets are subsequently measured at fair value. Net gains and losses, including anyinterest or dividend income, are recognized in profit or loss.
Financial assets at amortized cost
These assets are subsequently measured at amortized cost using the effective interest method.The amortized cost is reduced by impairment losses. Interest income, foreign exchange gainsand losses and impairment are recognized in profit or loss. Any gain or loss on derecognition isrecognized in profit or loss.
Debt investments at FVOCI
These assets are subsequently measured at fair value. Interest income calculated using theeffective interest method, foreign exchange gains and losses and impairment are recognized inprofit or loss. Other net gains and losses are recognized in OCI. On derecognition, gains andlosses accumulated in OCI are reclassified to profit or loss.
Derecognition
The Company derecognizes a financial asset when the contractual rights to the cash flows from the asset expire, it transfers the rights toreceive the contractual cash flows of the financial asset in a transaction in which substantially all the risks and rewards of ownership of thefinancial asset are transferred, or it transfers or does not retain substantially all the risks and rewards of ownership of a transferred asset,and does not retain control of the transferred asset.
If the Company has retained substantially all the risks and rewards of ownership of the transferred asset, the Company continues torecognize the transferred asset.
186
3/16/22, 10:38 PM Form 6-K
https://www.sec.gov/Archives/edgar/data/0001290109/000119312522075294/d288774d6k.htm 188/268
Table of Contents
LG DISPLAY CO., LTD.Notes to the Separate Financial Statements
For the years ended December 31, 2021 and 2020 3. Summary of Significant Accounting Policies, Continued (f) Financial Instruments, Continued
Interest rate benchmark reform
In case the basis for determining the contractual cash flows of a financial asset or financial liability measured at amortized cost changed asa result of interest rate benchmark reform, the Company updates the effective interest rate of the financial asset or financial liability toreflect the change that is required by the reform if both of the following conditions are met:
• the change is necessary as a direct consequence of the reform; and
• the new basis for determining the contractual cash flows is economically equivalent to the previous basis – i.e. the basis immediatelybefore the change.
When changes were made to a financial asset or financial liability in addition to changes to the basis for determining the contractual cashflows required by interest rate benchmark reform, the Company first updates the effective interest rate of the financial asset or financialliability to reflect the change that is required by interest rate benchmark reform. After that, the Company applies the policies on accountingfor modifications to the additional changes.
Offset
Financial assets and liabilities are offset and the net amount is presented in the separate statement of financial position when, and onlywhen, the Company has a legal right to offset the amounts and intends either to settle them on a net basis or to realize the asset and settlethe liability simultaneously.
(ii) Non-derivative financial liabilities
The Company classifies financial liabilities into two categories, financial liabilities at FVTPL and other financial liabilities in accordancewith the substance of the contractual arrangement and the definitions of financial liabilities, and recognizes them in the separate statementof financial position when the Company becomes a party to the contractual provisions of the instrument.
Financial liabilities at FVTPL include financial liabilities held for trading or designated as such upon initial recognition at FVTPL. Afterinitial recognition, financial liabilities at FVTPL are measured at fair value, and changes therein are recognized in profit or loss. Uponinitial recognition, transaction costs that are directly attributable to the issuance of financial liabilities are recognized in profit or loss asincurred.
Non-derivative financial liabilities other than financial liabilities classified as at FVTPL are classified as other financial liabilities andmeasured initially at fair value minus transaction costs that are directly attributable to the issuance of financial liabilities. Subsequent toinitial recognition, these financial liabilities are measured at amortized cost using the effective interest method. As of December 31, 2020,non-derivative financial liabilities comprise borrowings, bonds, trade accounts and notes payable, other accounts payable and others.
The Company derecognizes a financial liability when its contractual obligations are discharged, cancelled or expired.
187
3/16/22, 10:38 PM Form 6-K
https://www.sec.gov/Archives/edgar/data/0001290109/000119312522075294/d288774d6k.htm 189/268
Table of Contents
LG DISPLAY CO., LTD.Notes to the Separate Financial Statements
For the years ended December 31, 2021 and 2020 3. Summary of Significant Accounting Policies, Continued (f) Financial Instruments, Continued (iii) Share Capital
The Company issued common stocks and they are classified as equity. Incremental costs directly attributable to the issuance of commonstocks are recognized as a deduction from equity, net of tax effects. Capital contributed in excess of par value upon issuance of commonstocks is classified as share premium within equity.
(iv) Derivative financial instruments
Derivatives are initially recognized at fair value. Subsequent to initial recognition, derivatives are measured at fair value, and changestherein are accounted for as described below.
Hedge Accounting
If necessary, the Company designates derivatives as hedging items to hedge the risk of changes in the fair value of assets, liabilities or firmcommitments (a fair value hedge) and foreign currency risk of highly probable forecasted transactions or firm commitments (a cash flowhedge).
On initial designation of the hedge, the Company’s management formally designates and documents the relationship between the hedginginstrument(s) and hedged item(s), including the risk management objectives and strategy in undertaking the hedge transaction, togetherwith the methods that will be used to assess the effectiveness of the hedging relationship, both at the inception of the hedge relationship aswell as on an ongoing basis.
i) Fair value hedges
Change in the fair value of a derivative hedging instrument designated as a fair value hedge and the hedged item is recognized in profit orloss, respectively. The gain or loss from remeasuring the hedging instrument at fair value and the gain or loss on the hedged itemattributable to the hedged risk are recognized in profit or loss in the same line item of the statement of comprehensive income (loss). TheCompany discontinues fair value hedge accounting if it does not designate the derivative hedging instrument and the hedged item as thehedge relationship between them anymore; if the hedging instrument expires or is sold, terminated or exercised; or if the hedge no longermeets the criteria for hedge accounting.
188
3/16/22, 10:38 PM Form 6-K
https://www.sec.gov/Archives/edgar/data/0001290109/000119312522075294/d288774d6k.htm 190/268
Table of Contents
LG DISPLAY CO., LTD.Notes to the Separate Financial Statements
For the years ended December 31, 2021 and 2020 3. Summary of Significant Accounting Policies, Continued (f) Financial Instruments, Continued ii) Cash flow hedges
When a derivative designated as a cash flow hedging instrument meets the criteria of cash flow hedge accounting, the effective portion ofchanges in the fair value of the derivative is recognized in other comprehensive income and the ineffective portion of changes in the fairvalue of the derivative is recognized in profit or loss. The Company discontinues cash flow hedge accounting if it does not designate thederivative hedging instrument and the hedged item as the hedge relationship between them anymore; if the hedging instruments expires oris sold, terminated or exercised; or if the hedge no longer meets the criteria for hedge accounting. The cumulative gain or loss on thehedging instrument that has been recognized in other comprehensive income is reclassified to profit or loss in the periods during which theforecasted transaction occurs. If the forecasted transaction is no longer expected to occur, then the balance in other comprehensive incomeis recognized immediately in profit or loss.
The Company is applying cash flow hedge accounting by designating expected foreign currency denominated sales arising from forecastexport transactions as hedging items and the derivative instruments related to forward exchange as hedging instruments. The effectiveportion of changes in the fair value of the derivative is recognized in equity and the amount accumulated in equity is reclassified torevenue in the same period which forecast sales occur.
Embedded derivative
Embedded derivatives are separated from the host contract and accounted for separately if the host contract is not a financial asset andcertain criteria are met.
Other derivative financial instruments
Other derivative financial instruments are measured at fair value and changes of their fair value are recognized in profit or loss.
(g) Property, Plant and Equipment
(i) Recognition and measurement
Items of property, plant and equipment are measured at cost less accumulated depreciation and accumulated impairment losses. Costincludes an expenditure that is directly attributable to the acquisition of the asset. The cost of self-constructed assets includes the cost ofmaterials and direct labor, any costs directly attributable to bringing the assets to a working condition for their intended use, the costs ofdismantling and removing the items and restoring the site on which they are located and borrowing costs on qualifying assets.
The gain or loss arising from the derecognition of an item of property, plant and equipment is determined as the difference between the netdisposal proceeds, if any, and the carrying amount of the item and recognized in other non-operating income or other non-operatingexpenses.
189
3/16/22, 10:38 PM Form 6-K
https://www.sec.gov/Archives/edgar/data/0001290109/000119312522075294/d288774d6k.htm 191/268
Table of Contents
LG DISPLAY CO., LTD.Notes to the Separate Financial Statements
For the years ended December 31, 2021 and 2020 3. Summary of Significant Accounting Policies, Continued (g) Property, Plant and Equipment, Continued (ii) Subsequent costs
Subsequent expenditure on an item of property, plant and equipment is recognized as part of its cost only if it is probable that futureeconomic benefits associated with the item will flow to the Company and the cost of the item can be measured reliably. The costs of theday-to-day servicing of property, plant and equipment are recognized in profit or loss as incurred.
(iii) Depreciation
Land is not depreciated and depreciation of other items of property, plant and equipment is recognized in profit or loss on a straight-linebasis, reflecting the pattern in which the asset’s future economic benefits are expected to be consumed by the Company. The residual valueof property, plant and equipment is zero.
Estimated useful lives of the assets are as follows:
Estimated useful lives (years)Buildings and structures 20~40Machinery 4, 5Furniture and fixtures 4Equipment, tools and vehicles 2, 4, 12Right-of-use assets (*)
(*) The Company depreciates the right-of-use assets from the commencement date to the earlier of the end of the useful life of the right-of-use asset orthe end of the lease term.
Depreciation methods, useful lives and residual values are reviewed at each financial year-end and adjusted if appropriate and any changesare accounted for as changes in accounting estimates.
(h) Borrowing Costs
The Company capitalizes borrowing costs, which includes interests and exchange differences arising from foreign currency borrowings tothe extent that they are regarded as an adjustment to interest costs, directly attributable to the acquisition, construction or production of aqualifying asset as part of the cost of that asset. A qualifying asset is an asset that necessarily takes a substantial period of time to get readyfor its intended use or sale. To the extent that the Company borrows funds specifically for the purpose of obtaining a qualifying asset, theCompany determines the amount of borrowing costs eligible for capitalization as the actual borrowing costs incurred on that borrowingduring the period less any investment income on the temporary investment of those borrowings. The Company immediately recognizesother borrowing costs as an expense.
190
3/16/22, 10:38 PM Form 6-K
https://www.sec.gov/Archives/edgar/data/0001290109/000119312522075294/d288774d6k.htm 192/268
Table of Contents
LG DISPLAY CO., LTD.Notes to the Separate Financial Statements
For the years ended December 31, 2021 and 2020 3. Summary of Significant Accounting Policies, Continued (i) Government Grants
In case there is reasonable assurance that the Company will comply with the conditions attached to a government grant, the governmentgrant is recognized as follows:
(i) Grants related to the purchase or construction of assets
A government grant related to the purchase or construction of assets is deducted in calculating the carrying amount of the asset. The grantis recognized in profit or loss over the life of a depreciable asset as a reduced depreciation expense and cash related to grant received ispresented in investing activities in the statement of cash flows.
(ii) Grants for compensating the Company’s expenses incurred
A government grant that compensates the Company for expenses incurred is recognized in profit or loss as a deduction from relevantexpenses on a systematic basis in the periods in which the expenses are recognized.
(iii) Other government grants
A government grant that becomes receivable for the purpose of giving immediate financial support to the Company with no compensationfor expenses or losses already incurred or no future related costs is recognized as income of the period in which it becomes receivable.
(j) Intangible Assets
Intangible assets are initially measured at cost. Subsequently, intangible assets are measured at cost less accumulated amortization andaccumulated impairment losses.
(i) Goodwill
Goodwill arising from business combinations is recognized as the excess of the acquisition cost of a business over the net fair value of theidentifiable assets acquired and liabilities assumed. Any deficit is a bargain purchase that is recognized in profit or loss. Goodwill ismeasured at cost less accumulated impairment losses.
191
3/16/22, 10:38 PM Form 6-K
https://www.sec.gov/Archives/edgar/data/0001290109/000119312522075294/d288774d6k.htm 193/268
Table of Contents
LG DISPLAY CO., LTD.Notes to the Separate Financial Statements
For the years ended December 31, 2021 and 2020 3. Summary of Significant Accounting Policies, Continued (j) Intangible Assets, Continued (ii) Research and development
Expenditure on research activities, undertaken with the prospect of gaining new scientific or technical knowledge and understanding, isrecognized in profit or loss as incurred.
Development activities involve a plan or design of the production of new or substantially improved products and processes. Developmentexpenditure is capitalized as intangible assets only if the Company can demonstrate all of the following:
• the technical feasibility of completing the intangible asset so that it will be available for use or sale,
• its intention to complete the intangible asset and use or sell it,
• its ability to use or sell the intangible asset,
• how the intangible asset will generate probable future economic benefits (among other things, the Company can demonstrate the
usefulness of the intangible asset by existence of a market for the output of the intangible asset or the intangible asset itself if it is tobe used internally),
• the availability of adequate technical, financial and other resources to complete the development and to use or sell the intangibleasset, and
• its ability to measure reliably the expenditure attributable to the intangible asset during its development.
Development projects are divided into research activities and development activities. Expenditures on research activities are recognized inprofit or loss and qualifying development expenditures on development activities are capitalized.
The expenditure capitalized includes the cost of materials, direct labor and overhead costs that are directly attributable to preparing theasset for its intended use, and borrowing costs on qualifying assets.
(iii) Other intangible assets
Other intangible assets include intellectual property rights, software, customer relationships, technology, memberships and others.
(iv) Subsequent costs
Subsequent expenditures are capitalized only when they increase the future economic benefits embodied in the specific intangible asset towhich they relate. All other expenditures, including expenditures on internally generated goodwill and brands, are recognized in profit orloss as incurred.
(v) Amortization
Amortization is calculated on a straight-line basis over the estimated useful lives of intangible assets, other than goodwill, from the datethat they are available for use. The residual value of intangible assets is zero. However, as there are no foreseeable limits to the periodsover which condominium and golf club memberships are expected to be available for use, these intangible assets are regarded as havingindefinite useful lives and not amortized.
192
3/16/22, 10:38 PM Form 6-K
https://www.sec.gov/Archives/edgar/data/0001290109/000119312522075294/d288774d6k.htm 194/268
Table of Contents
LG DISPLAY CO., LTD.Notes to the Separate Financial Statements
For the years ended December 31, 2021 and 2020 3. Summary of Significant Accounting Policies, Continued (j) Intangible Assets, Continued
Estimated useful
lives (years)Intellectual property rights 5, 10, (*1)Rights to use electricity, water and gas supply facilities 10Software 4, (*1)Customer relationships 7, 10Technology 10Development costs (*2)Condominium and golf club memberships Indefinite
(*1) Software license and patent royalty are amortized over the useful lives considering the contract period.(*2) Capitalized development costs are amortized over the useful lives considering the life cycle of the developed products. Amortization of capitalized
development costs are recognized in research and development expenses in the separate statement of comprehensive income (loss).
Amortization periods and the amortization methods for intangible assets with finite useful lives are reviewed at each financial year-end.The useful lives of intangible assets with indefinite useful lives are reviewed at each financial year-end to determine whether events andcircumstances continue to support indefinite useful life assessments for those assets. If appropriate, the changes are accounted for aschanges in accounting estimates.
(k) Impairment
(i) Financial assets
Financial instruments and contract assets
The Company recognizes loss allowance for financial assets measured at amortized cost and debt investments at FVOCI at the ‘expectedcredit loss’ (ECL).
The Company recognizes a loss allowance for the life-time expected credit losses except for following, which are measured at 12-monthECLs:
• debt instruments that are determined to have low credit risk at the reporting date; and
• other debt instruments and bank deposits for which credit risk (i.e. the risk of default occurring over the expected life of the financialinstrument) has not increased significantly since initial recognition.
When determining whether the credit risk of a financial asset has increased significantly since initial recognition and when estimatingECLs, the Company considers reasonable and supportable information that is relevant and available without undue cost or effort. Thisincludes both qualitative and quantitative information and analysis, based on the Company’s historical experience and informed creditassessment including forward-looking information.
Lifetime ECLs are the ECLs that result from all possible default events over the expected life of a financial instrument.
193
3/16/22, 10:38 PM Form 6-K
https://www.sec.gov/Archives/edgar/data/0001290109/000119312522075294/d288774d6k.htm 195/268
Table of Contents
LG DISPLAY CO., LTD.Notes to the Separate Financial Statements
For the years ended December 31, 2021 and 2020 3. Summary of Significant Accounting Policies, Continued (k) Impairment, Continued
12-month ECLs are the portion of the ECLs that result from default events that are possible within the 12 months after the reporting date(or a shorter period if the expected life of the instrument is less than 12 months).
The maximum period considered when estimating ECLs is the maximum contractual period over which the Company is exposed to creditrisk.
Estimation of expected credit losses
Expected credit losses are a probability-weighted estimate of credit losses. Credit losses are measured using the present value of thedifference between the contractual cash flows and the expected contractual cash flows. The expected credit losses are discounted usingeffective interest rate of the financial assets.
Credit-impaired financial assets
At each reporting period-end, the Company assesses whether financial assets carried at amortized cost and debt instruments at FVOCI arecredit-impaired. A financial asset is ‘credit-impaired’ when one or more events that have a detrimental impact on the estimated future cashflows of the financial asset have occurred.
Evidence that a financial asset is credit-impaired includes the following observable data:
• significant financial difficulty of the issuer or the borrower;
• the lender(s) of the borrower, for economic or contractual reasons relating to the borrower’s financial difficulty, having granted to theborrower a concession(s) that the lender(s) would not otherwise consider;
• it is probable that the borrower will enter bankruptcy or other financial reorganization; or
• the disappearance of an active market for a security because of financial difficulties.
Presentation of loss allowance for ECL in the separate statement of financial position
Loss allowances for financial assets measured at amortized cost are deducted from the gross carrying amount of the assets. For debtinstruments at FVOCI, the loss allowance is charged to profit or loss and is recognized in OCI instead of reducing the carrying amount offinancial assets in the separate statement of financial position.
Write-off
The gross carrying amount of a financial asset is written off when the Company has no reasonable expectations for recovering the financialasset in its entirety or a portion thereof. The Company assess whether there are reasonable expectations of recovering the contractual cashflows from customers and individually assess the timing and amount of write-off. The Company expects no significant recovery from theamount written-off. However, financial assets that are written off could still be subject to enforcement activities in order to comply withthe Company’s procedures for recovery of amounts due.
194
3/16/22, 10:38 PM Form 6-K
https://www.sec.gov/Archives/edgar/data/0001290109/000119312522075294/d288774d6k.htm 196/268
Table of Contents
LG DISPLAY CO., LTD.Notes to the Separate Financial Statements
For the years ended December 31, 2021 and 2020 3. Summary of Significant Accounting Policies, Continued (k) Impairment, Continued (ii) Non-financial assets
The carrying amounts of the Company’s non-financial assets, other than assets arising from employee benefits, inventories and deferredtax assets, are reviewed at each reporting date to determine whether there is any indication of impairment. If any such indication exists,then the asset’s recoverable amount is estimated. For goodwill, and intangible assets that have indefinite useful lives or that are not yetavailable for use, irrespective of whether there is any indication of impairment, the recoverable amount is estimated each year.
Recoverable amount is estimated for the individual asset. If it is not possible to estimate the recoverable amount of the individual asset, theCompany determines the recoverable amount of the cash-generating unit to which the asset belongs. The cash-generating unit (“CGU”) isthe smallest group of assets that includes the asset and generates cash inflows that are largely independent of the cash inflows from otherassets or groups of assets. Goodwill arising from a business combination is allocated to CGUs or groups of CGUs that are expected tobenefit from the synergies of the combination. The recoverable amount of an asset or cash-generating unit is determined as the greater ofits value in use and its fair value less costs to sell. In assessing value in use, the estimated future cash flows are discounted to their presentvalue using a pre-tax discount rate that reflects current market assessments of the time value of money and the risks specific to the asset orCGU. Fair value less costs to sell is based on the best information available to reflect the amount that the Company could obtain from thedisposal of the asset in an arm’s length transaction between knowledgeable, willing parties, after deducting the costs of disposal.
An impairment loss is recognized if the carrying amount of an asset or its CGU exceeds its estimated recoverable amount. Impairmentlosses are recognized in profit or loss. Impairment losses recognized in respect of a CGU are allocated first to reduce the carrying amountof any goodwill allocated to the unit, and then to reduce the carrying amounts of the other assets in the unit on a pro rata basis.
In respect of assets other than goodwill, impairment losses recognized in prior periods are assessed at each reporting date for anyindications that the loss has decreased or no longer exists. An impairment loss is reversed if there has been a change in the estimates usedto determine the recoverable amount. An impairment loss is reversed only to the extent that the asset’s carrying amount does not exceedthe carrying amount that would have been determined, net of accumulated depreciation or amortization, if no impairment loss had beenrecognized from the acquisition cost. An impairment loss in respect of goodwill is not reversed.
195
3/16/22, 10:38 PM Form 6-K
https://www.sec.gov/Archives/edgar/data/0001290109/000119312522075294/d288774d6k.htm 197/268
Table of Contents
LG DISPLAY CO., LTD.Notes to the Separate Financial Statements
For the years ended December 31, 2021 and 2020 3. Summary of Significant Accounting Policies, Continued (l) Leases
A contract is, or contains, a lease if the contract conveys the right to control the use of an identified asset for a period of time in exchangefor consideration.
(i) As a lessee
At commencement or on modification of a contract that contains a lease component, the Company allocates the consideration in thecontract to each lease and non-lease component on the basis of its relative stand-alone price. For certain leases, the Company accounts forthe lease and non-lease components as a single lease component by applying the practical expedient not to separate non-lease components.
The Company recognizes a right-of-use asset and lease liability at the lease commencement date. The right-of-use asset is initiallymeasured at cost, which comprises the initial amount of the lease liability adjusted for any lease payments made at of before thecommencement date, plus any initial direct costs incurred and an estimate of costs to dismantle and remove the underlying asset or torestore the underlying asset or the site on which it is located less any lease incentives received.
The right-of-use asset is subsequently depreciated using the straight-line method from the commencement date to the end of the lease term,unless the lease transfers ownership of the underlying asset to the Company by the end of the lease term or the cost of the right-of-useasset reflects that the Company will exercise a purchase option. In that case, the right-of-use asset will be depreciated over the useful lifeof the underlying asset, which is determined on the same basis as those of property and equipment. In addition, the right-of-use asset isperiodically reduced by impairment losses, if any, and adjusted for certain remeasurements of the lease liability.
The lease liability is initially measured at the present value of the lease payments that are not paid at the commencement date, discountedusing the interest rate implicit in the lease or, if that rate cannot be readily determined, the Company’s incremental borrowing rate.Generally, the Company uses its incremental borrowing rate as the discount rate.
The Company determines its incremental borrowing rate by obtaining interest rates from various external financing sources and makescertain adjustments to reflect the terms of the lease and type of the asset leased.
196
3/16/22, 10:38 PM Form 6-K
https://www.sec.gov/Archives/edgar/data/0001290109/000119312522075294/d288774d6k.htm 198/268
Table of Contents
LG DISPLAY CO., LTD.Notes to the Separate Financial Statements
For the years ended December 31, 2021 and 2020 3. Summary of Significant Accounting Policies, Continued (l) Lease, Continued
Lease payments included in the measurement of the lease liability comprise the following:
• fixed payments, including in-substance fixed payments;
• variable lease payments that depend on an index or a rate, initially measured using the index or rate as at the commencement date;
• amounts expected to be payable under a residual value guarantee; and
• the exercise price under a purchase option that the Company is reasonably certain to exercise, lease payments in an optional renewal
period if the Company is reasonably certain to exercise an extension option, and penalties for early termination of a lease unless theCompany is reasonably certain not to terminate early.
The lease liability is measured at amortized cost using the effective interest method. It is remeasured when there is a change in future leasepayments arising from a change in an index or rate, if there is a change in the Company’s estimate of the amount expected to be payableunder a residual value guarantee, if the Company changes its assessment of whether it will exercise a purchase, extension or terminationoption or if there is a revised in-substance fixed lease payment.
When the lease liability is remeasured the Company recognizes the amount of the remeasurement of the lease liability as an adjustment tothe right-of-use asset. However, if the carrying amount of the right-of-use asset is reduced to zero and there is a further reduction in themeasurement of the lease liability, the Company recognizes any remaining amount of the remeasurement in profit or loss.
The Company presents right-of-use assets in ‘property, plant and equipment’ and lease liabilities in ‘financial liabilities’ in the separatestatement of financial position.
The Company has elected not to recognize right-of-use assets and lease liabilities for leases of low-value assets and short-term leases. TheCompany recognizes the lease payments associated with these leases as an expense on a straight-line basis over the lease term.
(ii) As a lessor
When the Company acts as a lessor, it determines at lease inception whether each lease is a finance lease or an operating lease.
To classify each lease, the Company makes an overall assessment of whether the lease transfers substantially all of the risks and rewardsincidental to ownership of the underlying asset. If the lease transfers substantially all of the risks and rewards incidental to ownership ofthe underlying asset, then the lease is a finance lease; if not, then it is an operating lease. As part of this assessment, the Companyconsiders certain indicators such as whether the lease is for the major part of the economic life of the asset.
When the Company is an intermediate lessor, it accounts for its interests in the head lease and the sub-lease separately. It assesses the leaseclassification of a sub-lease with reference to the right-of-use asset arising from the head lease, not with reference to the underlying asset.If a head lease is a short-term lease to which the Company applies the exemption described above, then it classifies the sub-lease as anoperating lease.
197
3/16/22, 10:38 PM Form 6-K
https://www.sec.gov/Archives/edgar/data/0001290109/000119312522075294/d288774d6k.htm 199/268
Table of Contents
LG DISPLAY CO., LTD.Notes to the Separate Financial Statements
For the years ended December 31, 2021 and 2020 3. Summary of Significant Accounting Policies, Continued (l) Lease, Continued
If an arrangement contains lease and non-lease components, then the Company applies K-IFRS No. 1115 to allocate the consideration inthe contract.
At the commencement date, the Company recognizes assets held under a finance lease in its statement of financial position and presentthem as a receivable at an amount equal to the net investment in the lease and recognize finance income over the lease term, based on apattern reflecting a constant periodic rate of return on the lessor’s net investment in the lease.
The Company recognizes lease payments received under operating leases as income on a straight-line basis over the lease term as part of‘other revenue’.
(m) Provisions
A provision is recognized, as a result of a past event, if the Company has a present legal or constructive obligation that can be estimatedreliably, and it is probable that an outflow of economic benefits will be required to settle the obligation.
The risks and uncertainties that inevitably surround events and circumstances are taken into account in reaching the best estimate of aprovision. Where the effect of the time value of money is material, provisions are determined at the present value of the expected futurecash flows. The unwinding of the discount is recognized as finance cost.
Provisions are reviewed at the end of each reporting period and adjusted to reflect the current best estimate. If it is no longer probable thatan outflow of resources embodying economic benefits will be required to settle the obligation, the provision is reversed.
The Company recognizes a liability for warranty obligations based on the estimated costs expected to be incurred under its basic limitedwarranty. This warranty covers defective products and is normally applicable for a warranty period from the date of purchase. Theseliabilities are accrued when product revenues are recognized. Factors that affect the Company’s warranty liability include historical andanticipated rates of warranty claims on those repairs and cost per claim to satisfy the Company’s warranty obligation. Warranty costsprimarily include raw materials and labor costs. As these factors are impacted by actual experience and future expectations, managementperiodically assesses the adequacy of its recorded warranty liabilities and adjusts the amounts as necessary. Accrued warranty obligationsare included in the current and non-current provisions.
Liabilities for loss contingencies arising from claims, assessments, litigation, fines, penalties and other sources, are recorded when it isprobable that a liability has been incurred and the amount of the assessment and/or remediation can be reasonably estimated.
198
3/16/22, 10:38 PM Form 6-K
https://www.sec.gov/Archives/edgar/data/0001290109/000119312522075294/d288774d6k.htm 200/268
Table of Contents
LG DISPLAY CO., LTD.Notes to the Separate Financial Statements
For the years ended December 31, 2021 and 2020 3. Summary of Significant Accounting Policies, Continued (n) Employee Benefits
(i) Short-term employee benefits
Short-term employee benefits that are due to be settled within twelve months after the end of the period in which the employees render therelated service are recognized in profit or loss on an undiscounted basis. The expected cost of profit-sharing and bonus plans and others arerecognized when the Company has a present legal or constructive obligation to make payments as a result of past events and a reliableestimate of the obligation can be made.
(ii) Other long-term employee benefits
The Company’s net obligation in respect of long-term employee benefits other than pension plans is the amount of future benefit thatemployees have earned in return for their service in the current and prior periods.
(iii) Defined contribution plan
A defined contribution plan is a post-employment benefit plan under which an entity pays fixed contributions into a separate entity andwill have no legal or constructive obligation to pay further amounts. Obligations for contributions to defined contribution pension plansare recognized as an employee benefit expense in profit or loss in the period during which services are rendered by employees.
(iv) Defined benefit plan
A defined benefit plan is a post-employment benefit plan other than defined contribution plans. The Company’s net obligation in respect ofits defined benefit plan is calculated by estimating the amount of future benefit that employees have earned in return for their service in thecurrent and prior periods; that benefit is discounted to determine its present value. The fair value of any plan assets is deducted.
The calculation is performed annually by an independent actuary using the projected unit credit method. The discount rate is the yield atthe reporting date on high quality corporate bonds that have maturity dates approximating the terms of the Company’s obligations and thatare denominated in the same currency in which the benefits are expected to be paid. The Company recognizes all actuarial gains and lossesarising from defined benefit plans in retained earnings immediately.
The Company determines the net interest expense (income) on the net defined benefit liability (asset) for the period by applying thediscount rate used to measure the defined benefit obligation at the beginning of the annual period to the then-net defined benefit liability(asset), taking into account any changes in the net defined benefit liability (asset) during the period as a result of contributions and benefitpayments. Consequently, the net interest on the net defined benefit liability (asset) now comprises: interest cost on the defined benefitobligation, interest income on plan assets, and interest on the effect on the asset ceiling.
When the benefits of a plan are changed or when a plan is curtailed, the resulting change in benefit that relates to past service or the gain orloss on curtailment is recognized immediately in profit or loss. The Company recognizes gains and losses on the settlement of a definedbenefit plan when the settlement occurs.
199

3/16/22, 10:38 PM Form 6-K
https://www.sec.gov/Archives/edgar/data/0001290109/000119312522075294/d288774d6k.htm 201/268
Table of Contents
LG DISPLAY CO., LTD.Notes to the Separate Financial Statements
For the years ended December 31, 2021 and 2020 3. Summary of Significant Accounting Policies, Continued (n) Employee Benefits, Continued (v) Termination benefits
The Company recognizes expense for termination benefits at the earlier of the date when the entity can no longer withdraw the offer ofthose benefits and when the entity recognizes costs for a restructuring involving the payment of termination benefits. If the terminationbenefits are not expected to be settled wholly before twelve months after the end of the annual reporting period, the Company measuresthe termination benefit with present value of future cash payments.
(o) Revenue from contracts with customers
Revenue from the sale of goods in the course of ordinary activities is measured at the fair value of the consideration received or receivable,net of estimated returns, trade discounts, volume rebates and other cash incentives paid to customers.
The Company recognizes revenue according to the five-stage revenue recognition model (① Identifying the contract ② Identifyingperformance obligations ③ Determining transaction price ④ Allocating the transaction price to performance obligations ⑤Recognizing revenue for performance obligations).
The Company generates revenue primarily from sale of display panels. Product revenue is recognized when a customer obtains controlover the Company’s products, which typically occurs upon shipment or delivery depending on the terms of the contracts with thecustomer.
The Company includes return option in the sales contract of display panels with its customers and the consideration receivable from thecustomer is subject to change due to returns. The Company estimates an amount of variable consideration by using the expected valuemethod which the Company expects to better predict the amount of consideration. The Company includes in the transaction price anamount of variable consideration estimated only to the extent that it is highly probable that a significant reversal in the amount ofcumulative revenue recognized will not occur during the return period when the uncertainty associated with the variable consideration issubsequently resolved. The Company recognizes a refund liability and an asset for its right to recover products from customers if theCompany receives consideration from a customer and expects to refund some or all of that consideration to the customer. Sales taxes orvalue-added taxes collected from customers and remitted to governmental authorities are accounted for on a net basis and are excludedfrom revenues in the separate statement of comprehensive income (loss).
(p) Operating Segments
In accordance with K-IFRS No. 1108, Operating Segments, entity wide disclosures of geographic and product revenue information areprovided in the separate financial statements.
(q) Finance Income and Finance Costs
Finance income comprises interest income on funds invested (including debt instruments measured at FVOCI), dividend income, gains ondisposal of debt instruments measured at FVOCI, changes in fair value of financial assets at FVTPL, and gains on hedging instrumentsthat are recognized in profit or loss. Interest income is recognized as it accrues in profit or loss, using the effective interest method.Dividend income is recognized in profit or loss on the date that the Company’s right to receive payment is established.
200

3/16/22, 10:38 PM Form 6-K
https://www.sec.gov/Archives/edgar/data/0001290109/000119312522075294/d288774d6k.htm 202/268
Table of Contents
LG DISPLAY CO., LTD.Notes to the Separate Financial Statements
For the years ended December 31, 2021 and 2020 3. Summary of Significant Accounting Policies, Continued (q) Finance Income and Finance Costs, Continued
Finance costs comprise interest expense on borrowings, unwinding of the discount on provisions, gain and losses from financial assetsmeasured at FVTPL, impairment losses recognized on financial assets, and losses on hedging instruments that are recognized in profit orloss. Borrowing costs directly attributable to the acquisition, construction or production of a qualifying asset are capitalized as part of thecost of that asset.
(r) Income Tax
Income tax expense comprises current and deferred tax. Current tax and deferred tax are recognized in profit or loss except to the extentthat it relates to a business combination, or items recognized directly in equity or in other comprehensive income.
(i) Current tax
Current tax comprises the expected tax payable or receivable on the taxable profit or loss for the year, using tax rates enacted orsubstantively enacted at the reporting date and any adjustment to tax payable in respect of previous years. The amount of current taxpayable or receivable is the best estimate of the tax amount expected to be paid or received that reflects uncertainty related to incometaxes, if any. The taxable profit is different from the accounting profit for the period since the taxable profit is calculated excluding thetemporary differences, which will be taxable or deductible in determining taxable profit (tax loss) of future periods, and non-taxable ornon-deductible items from the accounting profit.
(ii) Deferred tax
Deferred tax is recognized, using the asset and liability method, in respect of temporary differences between the carrying amounts of assetsand liabilities for financial reporting purposes and the amounts used for taxation purposes. Deferred tax assets and liabilities are measuredat the tax rates that are expected to apply to the period when the asset is realized or the liability is settled, based on tax rates and tax lawsthat have been enacted or substantively enacted by the end of the reporting period. The measurement of deferred tax liabilities and deferredtax assets reflects the tax consequences that would follow from the manner in which the Company expects, at the end of the reportingperiod, to recover or settle the carrying amount of its assets and liabilities.
The Company recognizes a deferred tax liability for all taxable temporary differences associated with investments in subsidiaries,associates, and interests in joint ventures, except to the extent that the Company is able to control the timing of the reversal of thetemporary differences and it is probable that the temporary differences will not reverse in the foreseeable future. A deferred tax asset isrecognized for all deductible temporary differences to the extent that it is probable that the differences relating to investments insubsidiaries, associates and joint ventures will reverse in the foreseeable future and taxable profit will be available against which thetemporary difference can be utilized.
Deferred tax assets are reviewed at each reporting date and are reduced to the extent that it is no longer probable that the related tax benefitwill be realized.
The Company offsets deferred tax assets and deferred tax liabilities if, and only if, the Company has a legally enforceable right to set offcurrent tax assets against current tax liabilities and the deferred tax assets and the deferred tax liabilities relate to income taxes levied bythe same taxation authority.
201
3/16/22, 10:38 PM Form 6-K
https://www.sec.gov/Archives/edgar/data/0001290109/000119312522075294/d288774d6k.htm 203/268
Table of Contents
LG DISPLAY CO., LTD.Notes to the Separate Financial Statements
For the years ended December 31, 2021 and 2020 3. Summary of Significant Accounting Policies, Continued (s) Earnings (Loss) Per Share
The Company presents basic and diluted earnings (loss) per share (“EPS”) data for its common stocks. Basic EPS is calculated by dividingthe profit or loss attributable to ordinary shareholders of the Company by the weighted average number of common stocks outstandingduring the period. Diluted EPS is determined by adjusting the profit or loss attributable to ordinary shareholders and the weighted averagenumber of common stocks outstanding, adjusted for the effects of all dilutive potential common stocks such as convertible bonds andothers.
(t) Business Combinations
The Company accounts for business combinations using the acquisition method when control is transferred to the Company. Theconsideration transferred in the acquisition and the identifiable net assets acquired from business combinations are measured at fair value.If the consideration transferred exceeds the fair value of identifiable net asset, the Company recognizes goodwill; if not, then the Companyrecognizes gain on a bargain purchase. Any goodwill that arises is tested annually for impairment. Transaction costs are expensed asincurred, except if related to the issue of debt or equity instruments in accordance with K-IFRS No. 1032 and K-IFRS No. 1109. Theconsideration transferred does not include amounts related to the settlement of pre-existing relationships. Such amounts are generallyrecognized in profit or loss.
(u) Standards issued but not yet effective
A number of amended standards are effective for annual periods beginning after January 1, 2021 and earlier application is permitted;however, the Company has not early adopted the amended standards in preparing these separate financial statements.
(i) Amendment of Reference to the Definition of an Asset and a Liability in the Conceptual Framework (Amendments to K-IFRSNo. 1103, Business Combinations);
These amendments replace the reference to the definitions of an asset and a liability in the Conceptual Framework issued in 2007 to 2018and added an exception to the recognition principle in K-IFRS No. 1103, Business Combinations, for liabilities and contingent liabilitiesthat would be within the scope of K-IFRS No. 1037, Provisions, Contingent Liabilities and Contingent Assets, and K-IFRS No. 2121,Levies, to apply the recognition criteria specified in those standards.
These amendments are effective for annual periods beginning on January 1, 2022, with early adoption permitted.
202
3/16/22, 10:38 PM Form 6-K
https://www.sec.gov/Archives/edgar/data/0001290109/000119312522075294/d288774d6k.htm 204/268
Table of Contents
LG DISPLAY CO., LTD.Notes to the Separate Financial Statements
For the years ended December 31, 2021 and 2020 3. Summary of Significant Accounting Policies, Continued (u) Standards issued but not yet effective, Continued (ii) Classification of Liabilities as Current or Non-current (Amendments to K-IFRS No. 1001, Presentation of Financial Statements)
These amendments clarify that an entity has a right to defer settlement of the liability at the end of the reporting period if it complies withthe conditions at that date and classification of a liability is unaffected by the likelihood that the entity will exercise its right to defersettlement of the liability for at least 12 months after the reporting period.
In addition, settlement of a liability includes transferring the company’s own equity instruments to the counterparty but they do not affectits classification as current or non-current if the entity classifies the option as an equity instrument, recognizing it separately from theliability as an equity component of a compound financial instrument.
These amendments are effective for annual periods beginning on January 1, 2023, with early adoption permitted. The Company iscurrently assessing the impacts of the application.
(iii) Onerous Contracts – Cost of Fulfilling a Contract (Amendments to K-IFRS No. 1037, Provisions, Contingent Liabilities andContingent Assets)
These amendments specify the scope of “the unavoidable costs of meeting the obligations under the contract” is “the costs that relatedirectly to the contracts” (the incremental costs of fulfilling the contract and an allocation of other costs that relate directly to fulfillingcontracts).
These amendments are effective for annual periods beginning on January 1, 2022, with early adoption permitted.
(iv) Deferred Tax related to Assets and Liabilities arising from a Single Transaction (Amendments to K-IFRS No. 1012, Income Taxes)
These amendments specify the scope of the initial recognition exemption when assets and liabilities arise to equal amount from a singletransaction. These amendments require an entity to recognize the resulting deferred tax liability or asset if the transaction give rise to equaltaxable and deductible temporary differences although it is not a business combination and affects neither accounting profit nor taxableprofit (loss). These amendments are effective for annual periods beginning on January 1, 2023, with early adoption permitted.
Of deferred taxes which give rise to a right-of-use asset and lease liability, the Company is applying an approach which results in similarconclusion to these amendments except that deferred tax is presented on a net basis. Upon the adoption of the amendments, the Companyexpects to recognize separate deferred tax assets and liabilities for right of use assets and lease liabilities and it will be appliedretrospectively.
(v) Definition of Materiality (Amendments to K-IFRS No. 1001, Presentation of Financial Statement)
These amendments specify the definition of materiality. Information is material if omitting, misstating or obscuring it could reasonably beexpected to influence decisions that the primary users of general purpose financial statements make on the basis of those financialstatements. These amendments are effective for annual periods beginning on January 1, 2023, with early adoption permitted.
203
3/16/22, 10:38 PM Form 6-K
https://www.sec.gov/Archives/edgar/data/0001290109/000119312522075294/d288774d6k.htm 205/268
Table of Contents
LG DISPLAY CO., LTD.Notes to the Separate Financial Statements
For the years ended December 31, 2021 and 2020 3. Summary of Significant Accounting Policies, Continued (u) Standards issued but not yet effective, Continued
(vi) Definition of Accounting Estimates (Amendments to K-IFRS No. 1008, Accounting Policies, Changes in Accounting Estimates andErrors)
These amendments removed the definition of ‘change in accounting estimates’, and introduced the term ‘accounting estimates’ by definingthem as monetary amounts in financial statements that are subject to measurement uncertainty and clarifying that a change in an estimationtechnique or a valuation technique used to develop accounting estimates is a change in accounting estimate. These amendments areeffective for annual periods beginning on January 1, 2023, with early adoption permitted.
(vii) Annual Improvements to K-IFRS Standards 2018-2020
Annual improvements to K-IFRS standards 2018-2020 is effective for annual periods beginning on January 1, 2022, with early adoptionpermitted. The Company does not expect that such amendments have a material effect on the Company’s separate financial statements.
• K-IFRS No. 1001, First-time Adoption of International Financial Reporting Standards: Subsidiary as a First-time Adopter
• K-IFRS No. 1009, Financial Instruments: Fees in the ‘10 percent’ Test for Derecognition of Financial Liabilities
• K-IFRS No. 1116, Leases: Lease Incentives
• K-IFRS No. 1041, Agriculture: Taxation in Fair Value Measurements
The Company is currently assessing the impacts of the application of above amended standards on the Company’s financial position andbusiness performance and management believes that the application of the amended standards are expected to have no significant impacton the separate financial statements of the Company, except for the Amendments to K-IFRS No. 1001, Presentation of FinancialStatements.
204
3/16/22, 10:38 PM Form 6-K
https://www.sec.gov/Archives/edgar/data/0001290109/000119312522075294/d288774d6k.htm 206/268
Table of Contents
LG DISPLAY CO., LTD.Notes to the Separate Financial Statements
For the years ended December 31, 2021 and 2020 4. Cash and Cash Equivalents and Deposits in Banks
Cash and cash equivalents and deposits in banks as of December 31, 2021 and December 31, 2020 are as follows:
(In millions of won) December 31, 2021 December 31, 2020 Current assets
Cash and cash equivalents Demand deposits W 950,847 1,220,098
Deposits in banks Restricted deposits (*) W 76,913 76,852
Non-current assets Deposits in banks
Restricted deposits (*) W 11 11 (*) Includes funds deposited under agreements on mutually beneficial cooperation to aid LG Group companies’ suppliers, restricted deposits pledged
to enforce the Company’s investment plans upon the receipt of grants from Gumi city and Gyeongsangbuk-do, and others. 5. Trade Accounts and Notes Receivable and Other Accounts Receivable
(a) Trade accounts and notes receivable as of December 31, 2021 and December 31, 2020 are as follows:
(In millions of won) December 31, 2021 December 31, 2020 Due from third parties W 203,963 201,640 Due from related parties 4,847,873 3,595,608
W 5,051,836 3,797,248
(b) Other accounts receivable as of December 31, 2021 and December 31, 2020 are as follows:
(In millions of won) December 31, 2021 December 31, 2020 Current assets
Non-trade receivables, net W 77,147 130,217 Accrued income 2,792 11,115
W 79,939 141,332
Non-current assets Long-term non-trade receivables W 5,122 5,797
W 85,061 147,129
Due from related parties included in other accounts receivable, as of December 31, 2021 and 2020 are W24,618 million and W59,620 million,respectively.
205
3/16/22, 10:38 PM Form 6-K
https://www.sec.gov/Archives/edgar/data/0001290109/000119312522075294/d288774d6k.htm 207/268
Table of Contents
LG DISPLAY CO., LTD.Notes to the Separate Financial Statements
For the years ended December 31, 2021 and 2020 5. Trade Accounts and Notes Receivable and Other Accounts Receivable, Continued
(c) The aging of trade accounts and notes receivable and other accounts receivable as of December 31, 2021 and December 31, 2020 are asfollows:
(In millions of won) December 31, 2021
Book value Allowance for
impairment
Trade accounts
and notes receivable
Other accounts
receivable
Trade accounts
and notes receivable
Other accounts
receivable Current W5,051,778 85,154 (11) (1,423) 1-15 days past due 6 822 — (6) 16-30 days past due — 44 — — 31-60 days past due 61 16 — — More than 60 days past due 2 521 — (67)
W5,051,847 86,557 (11) (1,496)
(In millions of won) December 31, 2020
Book value Allowance for
impairment
Trade accounts
and notes receivable
Other accounts
receivable
Trade accounts
and notes receivable
Other accounts
receivable Current W3,796,830 146,153 (27) (1,466) 1-15 days past due 415 919 — (7) 16-30 days past due 30 521 — — 31-60 days past due — 782 — (8) More than 60 days past due — 257 — (22)
W3,797,275 148,632 (27) (1,503)
The movement in the allowance for impairment in respect of trade accounts and notes receivable and other accounts receivable for the years endedDecember 31, 2021 and 2020 are as follows:
(In millions of won) 2021 2020
Trade accounts
and notes receivable
Other accounts
receivable
Trade accounts
and notes receivable
Other accounts
receivable Balance at the beginning of the year W 27 1,503 5 2,978 (Reversal of) bad debt expense (16) (7) 22 (411)
Write-off — — — (1,064) Balance at the end of the year W 11 1,496 27 1,503
206
3/16/22, 10:38 PM Form 6-K
https://www.sec.gov/Archives/edgar/data/0001290109/000119312522075294/d288774d6k.htm 208/268
Table of Contents
LG DISPLAY CO., LTD.Notes to the Separate Financial Statements
For the years ended December 31, 2021 and 2020 6. Other Financial Assets
Other financial assets as of December 31, 2021 and 2020 are as follows:
(In millions of won) December 31, 2021 December 31, 2020 Current assets
Financial assets at fair value through profit or loss Convertible bonds W 1,573 — Derivatives(*1) 12,741 9,252
W 14,314 9,252
Cash flow hedging derivatives Derivatives(*2) W 905 —
Financial assets at fair value through othercomprehensive income
Debt instruments Government bonds W 27 24
Financial assets carried at amortized cost Short-term loans W 22,518 28,491 Deposits — 5,384
W 22,518 33,875
W 37,764 43,151
Non-current assets Financial assets at fair value through profit or loss
Equity instruments W 3,096 1,381 Convertible bonds — 1,289 Derivatives(*1) 52,871 111
W 55,967 2,781
Financial assets at fair value through othercomprehensive income
Debt instruments Government bonds W 21 48
Financial assets carried at amortized cost Deposits W 11,542 12,405 Long-term loans 19,939 13,899
W 31,481 26,304
W 87,469 29,133
(*1) Represents cross currency interest rate swap contracts and others entered into by the Company to hedge currency and interest rate risks withrespect to foreign currency denominated borrowings and bonds. The contracts are not designated as hedging instruments.
(*2) Represents forward exchange contracts entered into by the Company to hedge exchange rate risks with respect to forecast sales in foreigncurrency. The contracts are designated as hedging instruments.
207
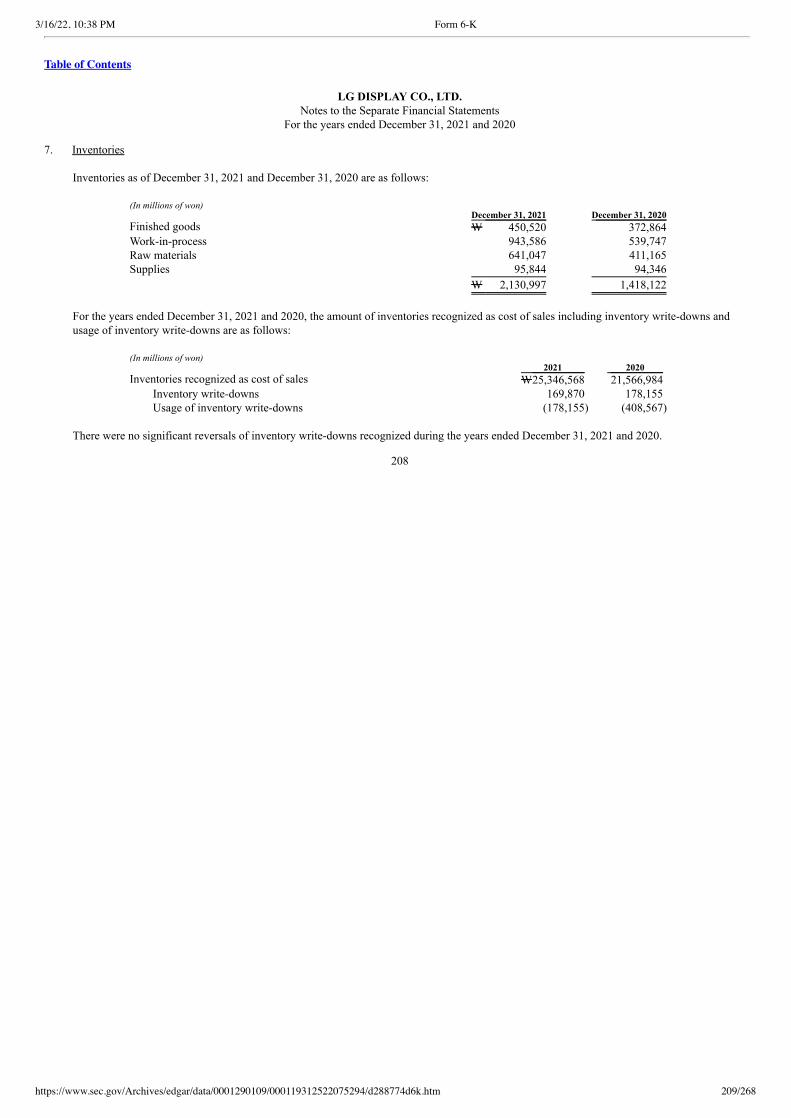
3/16/22, 10:38 PM Form 6-K
https://www.sec.gov/Archives/edgar/data/0001290109/000119312522075294/d288774d6k.htm 209/268
Table of Contents
LG DISPLAY CO., LTD.Notes to the Separate Financial Statements
For the years ended December 31, 2021 and 2020 7. Inventories
Inventories as of December 31, 2021 and December 31, 2020 are as follows:
(In millions of won) December 31, 2021 December 31, 2020 Finished goods W 450,520 372,864 Work-in-process 943,586 539,747 Raw materials 641,047 411,165 Supplies 95,844 94,346
W 2,130,997 1,418,122
For the years ended December 31, 2021 and 2020, the amount of inventories recognized as cost of sales including inventory write-downs andusage of inventory write-downs are as follows:
(In millions of won) 2021 2020 Inventories recognized as cost of sales W25,346,568 21,566,984
Inventory write-downs 169,870 178,155 Usage of inventory write-downs (178,155) (408,567)
There were no significant reversals of inventory write-downs recognized during the years ended December 31, 2021 and 2020.
208
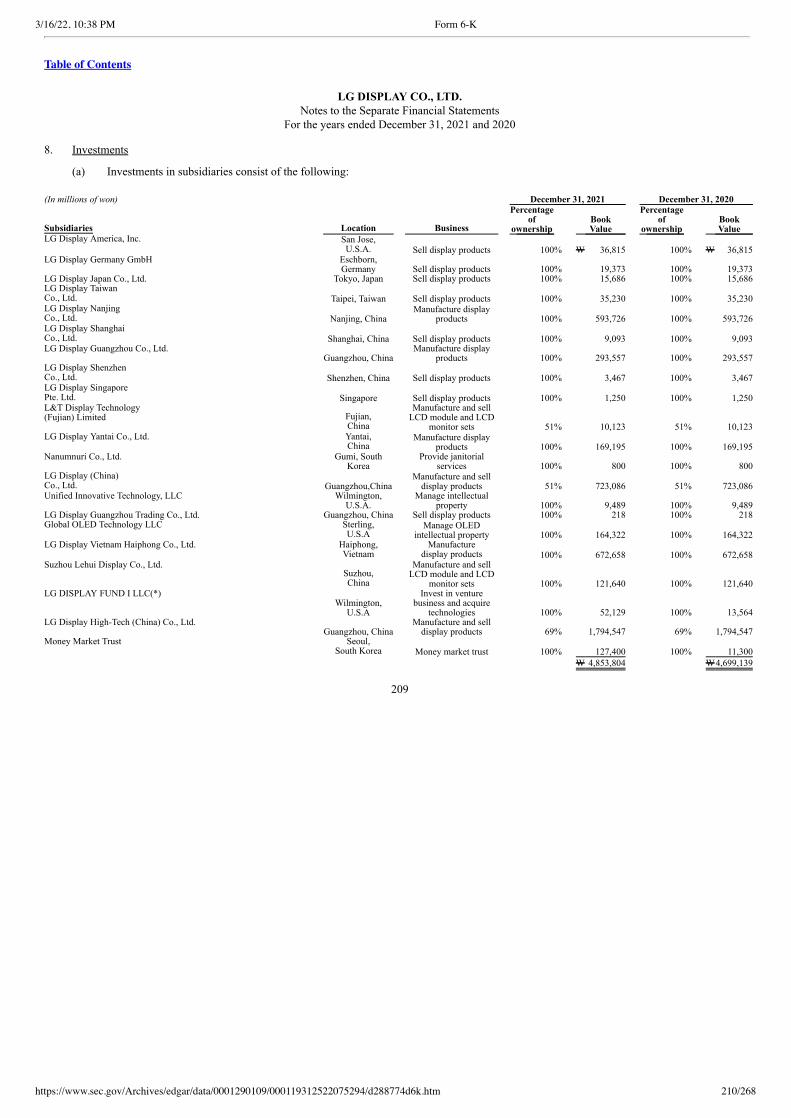
3/16/22, 10:38 PM Form 6-K
https://www.sec.gov/Archives/edgar/data/0001290109/000119312522075294/d288774d6k.htm 210/268
Table of Contents
LG DISPLAY CO., LTD.Notes to the Separate Financial Statements
For the years ended December 31, 2021 and 2020 8. Investments
(a) Investments in subsidiaries consist of the following: (In millions of won) December 31, 2021 December 31, 2020
Subsidiaries Location Business
Percentage of
ownership Book
Value
Percentage of
ownership Book
Value LG Display America, Inc.
San Jose,U.S.A. Sell display products 100% W 36,815 100% W 36,815
LG Display Germany GmbH
Eschborn,Germany Sell display products 100% 19,373 100% 19,373
LG Display Japan Co., Ltd. Tokyo, Japan Sell display products 100% 15,686 100% 15,686 LG Display TaiwanCo., Ltd. Taipei, Taiwan Sell display products 100% 35,230 100% 35,230 LG Display NanjingCo., Ltd. Nanjing, China
Manufacture displayproducts 100% 593,726 100% 593,726
LG Display ShanghaiCo., Ltd. Shanghai, China Sell display products 100% 9,093 100% 9,093 LG Display Guangzhou Co., Ltd.
Guangzhou, China Manufacture display
products 100% 293,557 100% 293,557 LG Display ShenzhenCo., Ltd. Shenzhen, China Sell display products 100% 3,467 100% 3,467 LG Display SingaporePte. Ltd. Singapore Sell display products 100% 1,250 100% 1,250 L&T Display Technology(Fujian) Limited
Fujian,China
Manufacture and sellLCD module and LCD
monitor sets 51% 10,123 51% 10,123 LG Display Yantai Co., Ltd.
Yantai,China
Manufacture displayproducts 100% 169,195 100% 169,195
Nanumnuri Co., Ltd.
Gumi, SouthKorea
Provide janitorialservices 100% 800 100% 800
LG Display (China)Co., Ltd. Guangzhou,China
Manufacture and selldisplay products 51% 723,086 51% 723,086
Unified Innovative Technology, LLC
Wilmington,U.S.A.
Manage intellectualproperty 100% 9,489 100% 9,489
LG Display Guangzhou Trading Co., Ltd. Guangzhou, China Sell display products 100% 218 100% 218 Global OLED Technology LLC
Sterling,U.S.A
Manage OLEDintellectual property 100% 164,322 100% 164,322
LG Display Vietnam Haiphong Co., Ltd.
Haiphong,Vietnam
Manufacturedisplay products 100% 672,658 100% 672,658
Suzhou Lehui Display Co., Ltd.
Suzhou,China
Manufacture and sellLCD module and LCD
monitor sets 100% 121,640 100% 121,640 LG DISPLAY FUND I LLC(*)
Wilmington,
U.S.A
Invest in venturebusiness and acquire
technologies 100% 52,129 100% 13,564 LG Display High-Tech (China) Co., Ltd.
Guangzhou, China Manufacture and sell
display products 69% 1,794,547 69% 1,794,547 Money Market Trust
Seoul,
South Korea Money market trust 100% 127,400 100% 11,300
W 4,853,804 W4,699,139
209
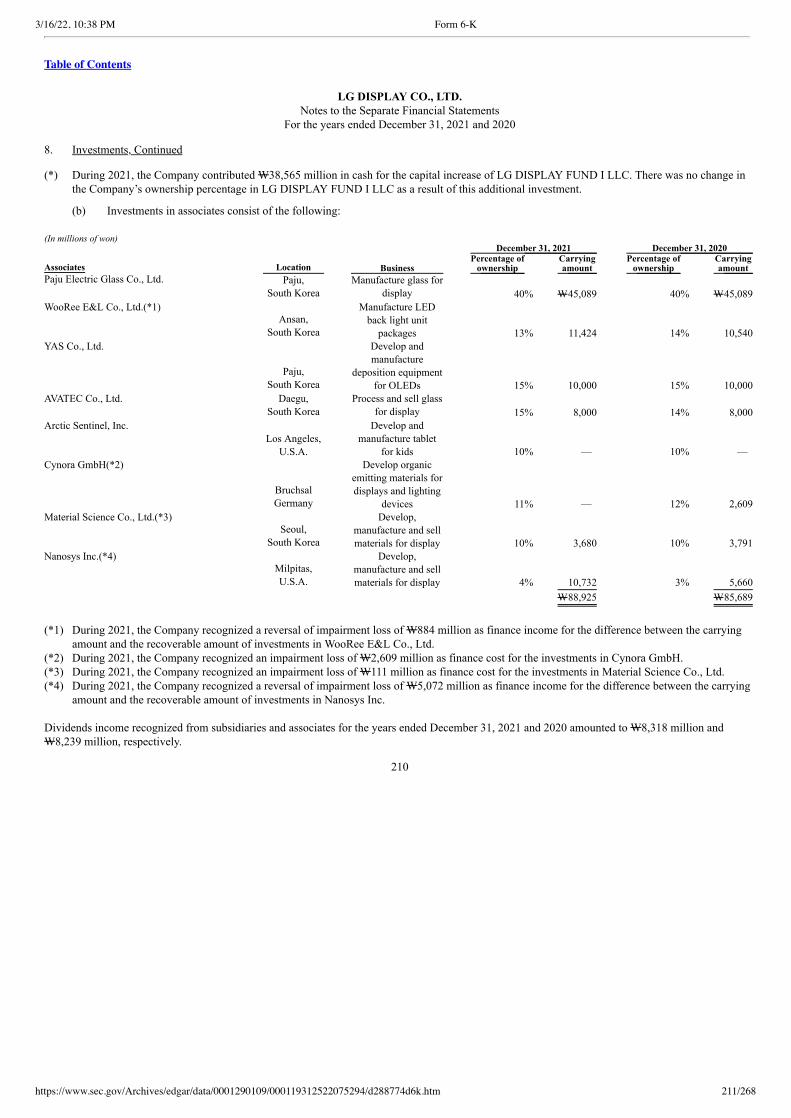
3/16/22, 10:38 PM Form 6-K
https://www.sec.gov/Archives/edgar/data/0001290109/000119312522075294/d288774d6k.htm 211/268
Table of Contents
LG DISPLAY CO., LTD.Notes to the Separate Financial Statements
For the years ended December 31, 2021 and 2020 8. Investments, Continued (*) During 2021, the Company contributed W38,565 million in cash for the capital increase of LG DISPLAY FUND I LLC. There was no change in
the Company’s ownership percentage in LG DISPLAY FUND I LLC as a result of this additional investment.
(b) Investments in associates consist of the following: (In millions of won) December 31, 2021 December 31, 2020
Associates Location Business Percentage of
ownership Carrying
amount Percentage of
ownership Carrying
amount Paju Electric Glass Co., Ltd.
Paju,
South Korea Manufacture glass for
display 40% W45,089 40% W45,089 WooRee E&L Co., Ltd.(*1)
Ansan,
South Korea
Manufacture LED back light unit
packages 13% 11,424 14% 10,540 YAS Co., Ltd.
Paju,
South Korea
Develop and manufacture deposition equipment
for OLEDs 15% 10,000 15% 10,000 AVATEC Co., Ltd.
Daegu,
South Korea Process and sell glass
for display 15% 8,000 14% 8,000 Arctic Sentinel, Inc.
Los Angeles,
U.S.A.
Develop and manufacture tablet
for kids 10% — 10% — Cynora GmbH(*2)
BruchsalGermany
Develop organic emitting materials for
displays and lighting devices 11% — 12% 2,609
Material Science Co., Ltd.(*3)
Seoul,
South Korea
Develop, manufacture and sell
materials for display 10% 3,680 10% 3,791 Nanosys Inc.(*4)
Milpitas,U.S.A.
Develop, manufacture and sell
materials for display 4% 10,732 3% 5,660
W88,925 W85,689
(*1) During 2021, the Company recognized a reversal of impairment loss of W884 million as finance income for the difference between the carrying
amount and the recoverable amount of investments in WooRee E&L Co., Ltd.(*2) During 2021, the Company recognized an impairment loss of W2,609 million as finance cost for the investments in Cynora GmbH.(*3) During 2021, the Company recognized an impairment loss of W111 million as finance cost for the investments in Material Science Co., Ltd.(*4) During 2021, the Company recognized a reversal of impairment loss of W5,072 million as finance income for the difference between the carrying
amount and the recoverable amount of investments in Nanosys Inc.
Dividends income recognized from subsidiaries and associates for the years ended December 31, 2021 and 2020 amounted to W8,318 million andW8,239 million, respectively.
210
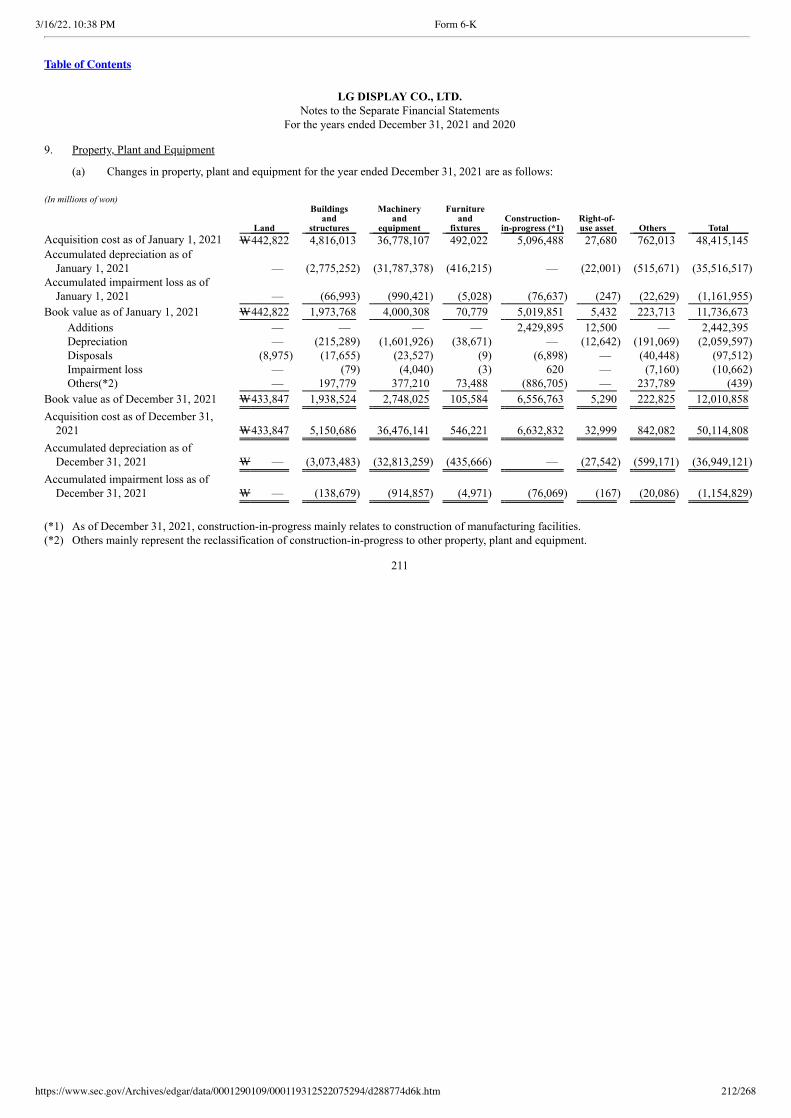
3/16/22, 10:38 PM Form 6-K
https://www.sec.gov/Archives/edgar/data/0001290109/000119312522075294/d288774d6k.htm 212/268
Table of Contents
LG DISPLAY CO., LTD.Notes to the Separate Financial Statements
For the years ended December 31, 2021 and 2020 9. Property, Plant and Equipment
(a) Changes in property, plant and equipment for the year ended December 31, 2021 are as follows: (In millions of won)
Land
Buildings and
structures
Machinery and
equipment
Furniture and
fixtures Construction-
in-progress (*1) Right-of-
use asset Others Total Acquisition cost as of January 1, 2021 W442,822 4,816,013 36,778,107 492,022 5,096,488 27,680 762,013 48,415,145 Accumulated depreciation as of
January 1, 2021 — (2,775,252) (31,787,378) (416,215) — (22,001) (515,671) (35,516,517) Accumulated impairment loss as of
January 1, 2021 — (66,993) (990,421) (5,028) (76,637) (247) (22,629) (1,161,955)
Book value as of January 1, 2021 W442,822 1,973,768 4,000,308 70,779 5,019,851 5,432 223,713 11,736,673
Additions — — — — 2,429,895 12,500 — 2,442,395 Depreciation — (215,289) (1,601,926) (38,671) — (12,642) (191,069) (2,059,597) Disposals (8,975) (17,655) (23,527) (9) (6,898) — (40,448) (97,512) Impairment loss — (79) (4,040) (3) 620 — (7,160) (10,662) Others(*2) — 197,779 377,210 73,488 (886,705) — 237,789 (439)
Book value as of December 31, 2021 W433,847 1,938,524 2,748,025 105,584 6,556,763 5,290 222,825 12,010,858
Acquisition cost as of December 31,2021 W433,847 5,150,686 36,476,141 546,221 6,632,832 32,999 842,082 50,114,808
Accumulated depreciation as ofDecember 31, 2021 W — (3,073,483) (32,813,259) (435,666) — (27,542) (599,171) (36,949,121)
Accumulated impairment loss as ofDecember 31, 2021 W — (138,679) (914,857) (4,971) (76,069) (167) (20,086) (1,154,829)
(*1) As of December 31, 2021, construction-in-progress mainly relates to construction of manufacturing facilities.(*2) Others mainly represent the reclassification of construction-in-progress to other property, plant and equipment.
211
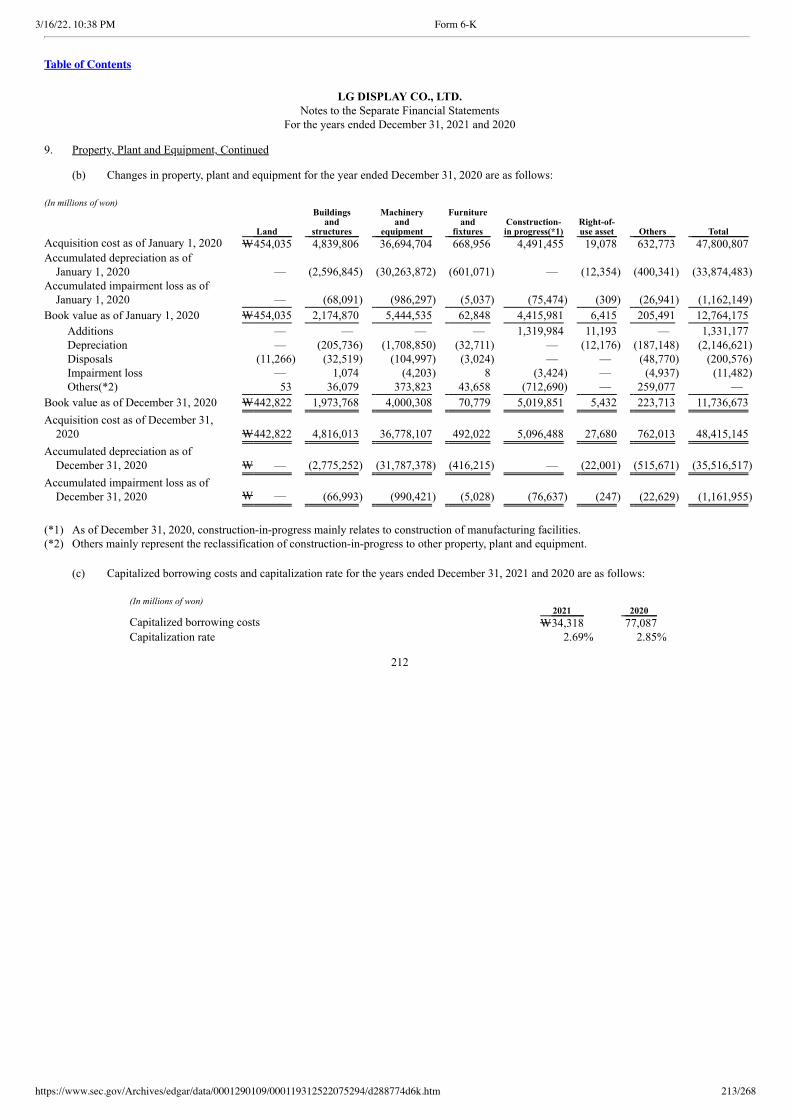
3/16/22, 10:38 PM Form 6-K
https://www.sec.gov/Archives/edgar/data/0001290109/000119312522075294/d288774d6k.htm 213/268
Table of Contents
LG DISPLAY CO., LTD.Notes to the Separate Financial Statements
For the years ended December 31, 2021 and 2020 9. Property, Plant and Equipment, Continued (b) Changes in property, plant and equipment for the year ended December 31, 2020 are as follows: (In millions of won)
Land
Buildings and
structures
Machinery and
equipment
Furniture and
fixtures Construction-
in progress(*1) Right-of-
use asset Others Total Acquisition cost as of January 1, 2020 W454,035 4,839,806 36,694,704 668,956 4,491,455 19,078 632,773 47,800,807 Accumulated depreciation as of
January 1, 2020 — (2,596,845) (30,263,872) (601,071) — (12,354) (400,341) (33,874,483) Accumulated impairment loss as of
January 1, 2020 — (68,091) (986,297) (5,037) (75,474) (309) (26,941) (1,162,149)
Book value as of January 1, 2020 W454,035 2,174,870 5,444,535 62,848 4,415,981 6,415 205,491 12,764,175
Additions — — — — 1,319,984 11,193 — 1,331,177 Depreciation — (205,736) (1,708,850) (32,711) — (12,176) (187,148) (2,146,621) Disposals (11,266) (32,519) (104,997) (3,024) — — (48,770) (200,576) Impairment loss — 1,074 (4,203) 8 (3,424) — (4,937) (11,482) Others(*2) 53 36,079 373,823 43,658 (712,690) — 259,077 —
Book value as of December 31, 2020 W442,822 1,973,768 4,000,308 70,779 5,019,851 5,432 223,713 11,736,673
Acquisition cost as of December 31,2020 W442,822 4,816,013 36,778,107 492,022 5,096,488 27,680 762,013 48,415,145
Accumulated depreciation as ofDecember 31, 2020 W — (2,775,252) (31,787,378) (416,215) — (22,001) (515,671) (35,516,517)
Accumulated impairment loss as ofDecember 31, 2020 W — (66,993) (990,421) (5,028) (76,637) (247) (22,629) (1,161,955)
(*1) As of December 31, 2020, construction-in-progress mainly relates to construction of manufacturing facilities.(*2) Others mainly represent the reclassification of construction-in-progress to other property, plant and equipment. (c) Capitalized borrowing costs and capitalization rate for the years ended December 31, 2021 and 2020 are as follows:
(In millions of won) 2021 2020 Capitalized borrowing costs W34,318 77,087 Capitalization rate 2.69% 2.85%
212
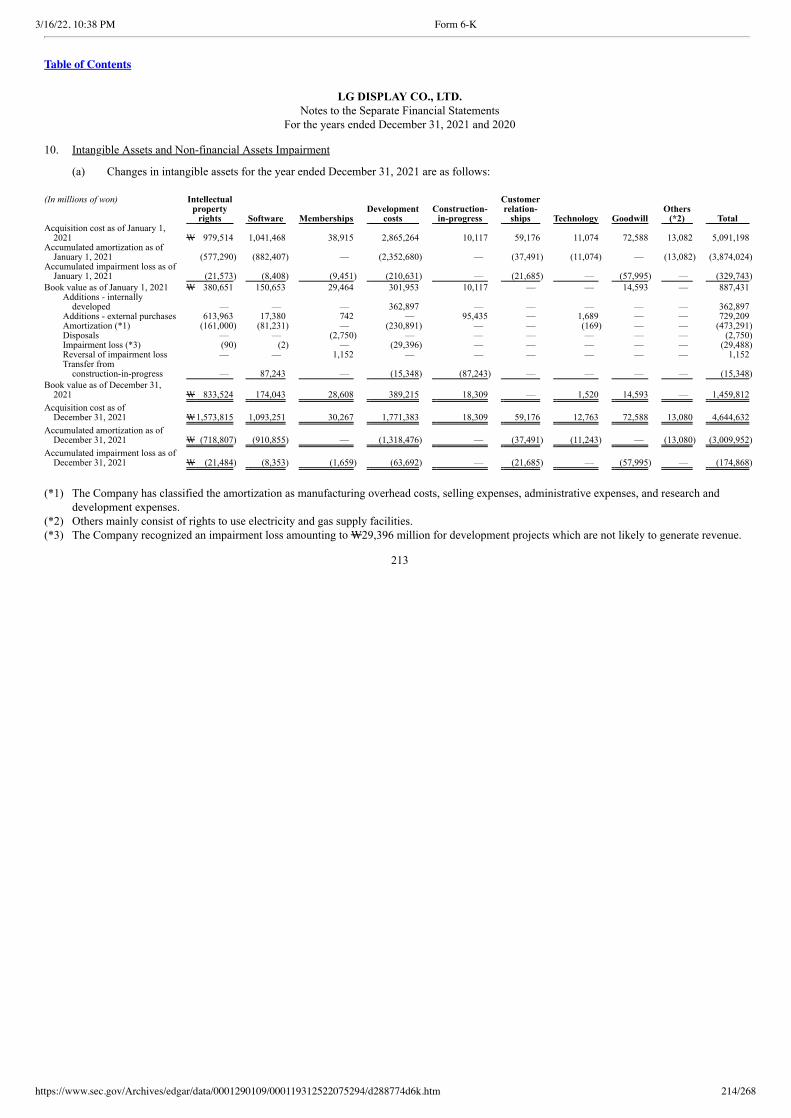
3/16/22, 10:38 PM Form 6-K
https://www.sec.gov/Archives/edgar/data/0001290109/000119312522075294/d288774d6k.htm 214/268
Table of Contents
LG DISPLAY CO., LTD.Notes to the Separate Financial Statements
For the years ended December 31, 2021 and 2020 10. Intangible Assets and Non-financial Assets Impairment
(a) Changes in intangible assets for the year ended December 31, 2021 are as follows: (In millions of won)
Intellectual property
rights Software Memberships Development
costs Construction-
in-progress
Customer relation-
ships Technology Goodwill Others
(*2) Total Acquisition cost as of January 1,
2021 W 979,514 1,041,468 38,915 2,865,264 10,117 59,176 11,074 72,588 13,082 5,091,198 Accumulated amortization as of
January 1, 2021 (577,290) (882,407) — (2,352,680) — (37,491) (11,074) — (13,082) (3,874,024) Accumulated impairment loss as of
January 1, 2021 (21,573) (8,408) (9,451) (210,631) — (21,685) — (57,995) — (329,743)
Book value as of January 1, 2021 W 380,651 150,653 29,464 301,953 10,117 — — 14,593 — 887,431 Additions - internally
developed — — — 362,897 — — — — — 362,897 Additions - external purchases 613,963 17,380 742 — 95,435 — 1,689 — — 729,209 Amortization (*1) (161,000) (81,231) — (230,891) — — (169) — — (473,291) Disposals — — (2,750) — — — — — — (2,750) Impairment loss (*3) (90) (2) — (29,396) — — — — — (29,488) Reversal of impairment loss — — 1,152 — — — — — — 1,152 Transfer from
construction-in-progress — 87,243 — (15,348) (87,243) — — — — (15,348)
Book value as of December 31,2021 W 833,524 174,043 28,608 389,215 18,309 — 1,520 14,593 — 1,459,812
Acquisition cost as ofDecember 31, 2021 W1,573,815 1,093,251 30,267 1,771,383 18,309 59,176 12,763 72,588 13,080 4,644,632
Accumulated amortization as ofDecember 31, 2021 W (718,807) (910,855) — (1,318,476) — (37,491) (11,243) — (13,080) (3,009,952)
Accumulated impairment loss as ofDecember 31, 2021 W (21,484) (8,353) (1,659) (63,692) — (21,685) — (57,995) — (174,868)
(*1) The Company has classified the amortization as manufacturing overhead costs, selling expenses, administrative expenses, and research and
development expenses.(*2) Others mainly consist of rights to use electricity and gas supply facilities.(*3) The Company recognized an impairment loss amounting to W29,396 million for development projects which are not likely to generate revenue.
213
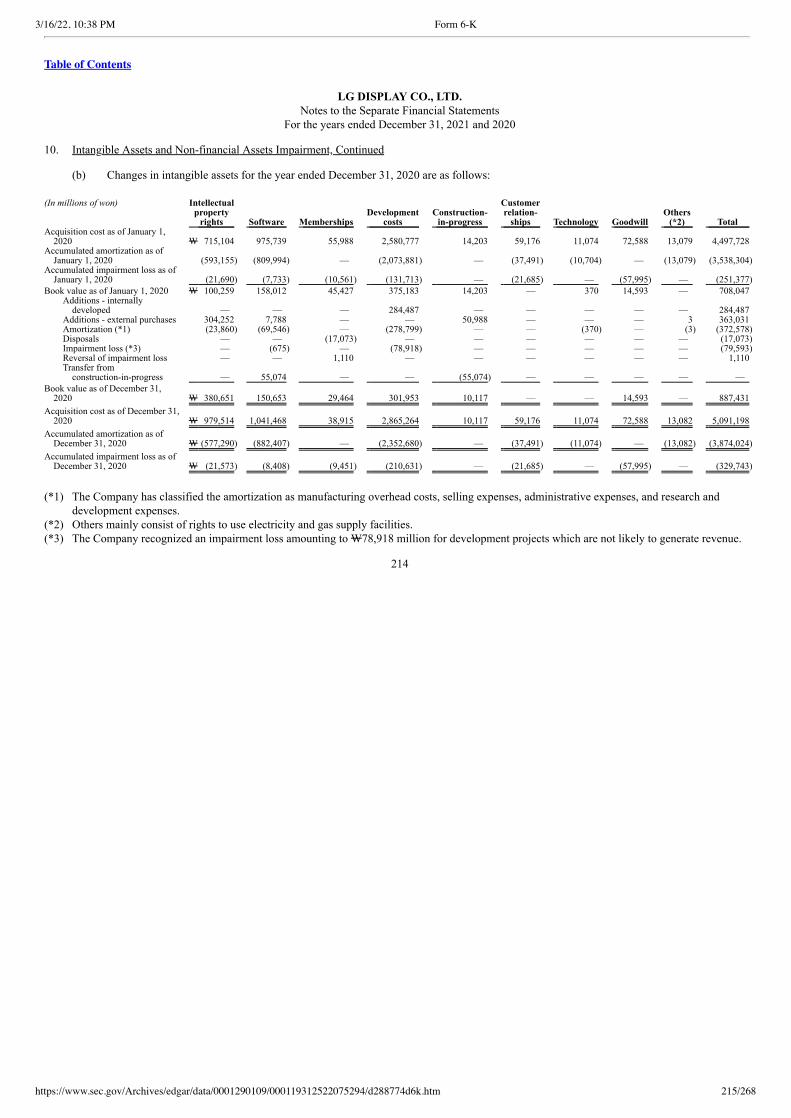
3/16/22, 10:38 PM Form 6-K
https://www.sec.gov/Archives/edgar/data/0001290109/000119312522075294/d288774d6k.htm 215/268
Table of Contents
LG DISPLAY CO., LTD.Notes to the Separate Financial Statements
For the years ended December 31, 2021 and 2020 10. Intangible Assets and Non-financial Assets Impairment, Continued (b) Changes in intangible assets for the year ended December 31, 2020 are as follows: (In millions of won)
Intellectual property
rights Software Memberships Development
costs Construction-
in-progress
Customer relation-
ships Technology Goodwill Others
(*2) Total Acquisition cost as of January 1,
2020 W 715,104 975,739 55,988 2,580,777 14,203 59,176 11,074 72,588 13,079 4,497,728 Accumulated amortization as of
January 1, 2020 (593,155) (809,994) — (2,073,881) — (37,491) (10,704) — (13,079) (3,538,304) Accumulated impairment loss as of
January 1, 2020 (21,690) (7,733) (10,561) (131,713) — (21,685) — (57,995) — (251,377)
Book value as of January 1, 2020 W 100,259 158,012 45,427 375,183 14,203 — 370 14,593 — 708,047 Additions - internally
developed — — — 284,487 — — — — — 284,487 Additions - external purchases 304,252 7,788 — — 50,988 — — — 3 363,031 Amortization (*1) (23,860) (69,546) — (278,799) — — (370) — (3) (372,578) Disposals — — (17,073) — — — — — — (17,073) Impairment loss (*3) — (675) — (78,918) — — — — — (79,593) Reversal of impairment loss — — 1,110 — — — — — — 1,110 Transfer from
construction-in-progress — 55,074 — — (55,074) — — — — —
Book value as of December 31,2020 W 380,651 150,653 29,464 301,953 10,117 — — 14,593 — 887,431
Acquisition cost as of December 31,2020 W 979,514 1,041,468 38,915 2,865,264 10,117 59,176 11,074 72,588 13,082 5,091,198
Accumulated amortization as ofDecember 31, 2020 W (577,290) (882,407) — (2,352,680) — (37,491) (11,074) — (13,082) (3,874,024)
Accumulated impairment loss as ofDecember 31, 2020 W (21,573) (8,408) (9,451) (210,631) — (21,685) — (57,995) — (329,743)
(*1) The Company has classified the amortization as manufacturing overhead costs, selling expenses, administrative expenses, and research and
development expenses.(*2) Others mainly consist of rights to use electricity and gas supply facilities.(*3) The Company recognized an impairment loss amounting to W78,918 million for development projects which are not likely to generate revenue.
214
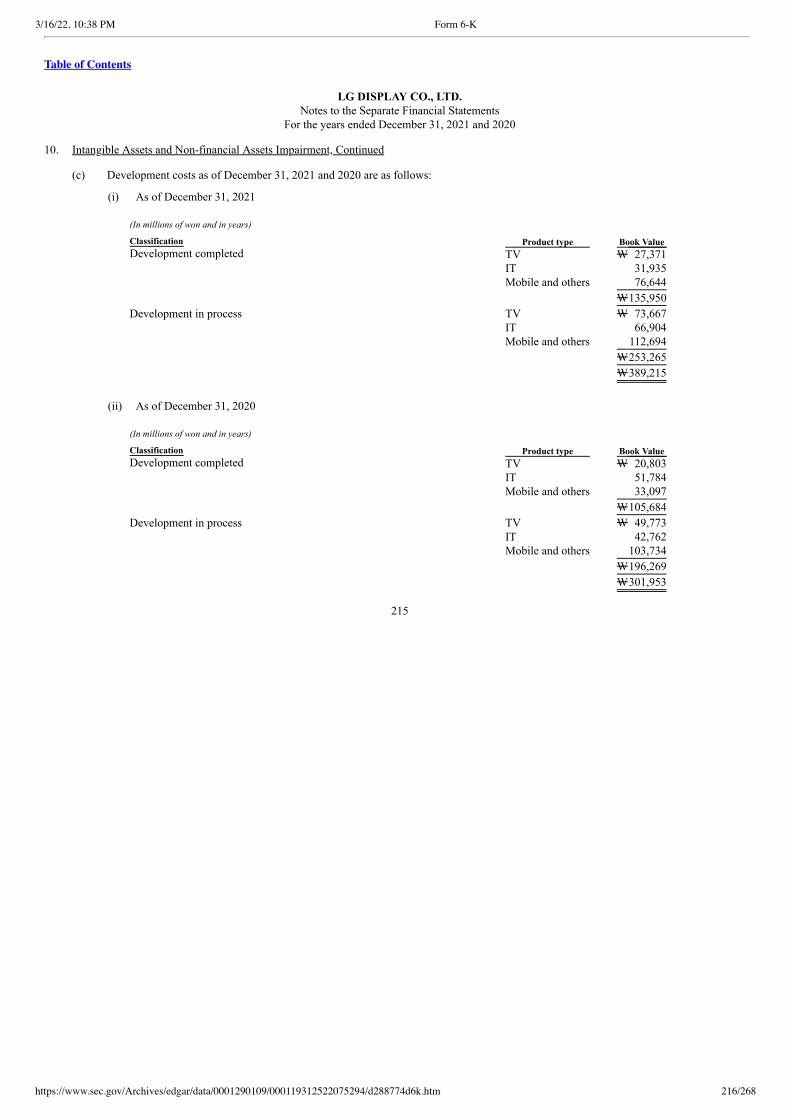
3/16/22, 10:38 PM Form 6-K
https://www.sec.gov/Archives/edgar/data/0001290109/000119312522075294/d288774d6k.htm 216/268
Table of Contents
LG DISPLAY CO., LTD.Notes to the Separate Financial Statements
For the years ended December 31, 2021 and 2020 10. Intangible Assets and Non-financial Assets Impairment, Continued (c) Development costs as of December 31, 2021 and 2020 are as follows:
(i) As of December 31, 2021
(In millions of won and in years)
Classification Product type Book Value Development completed TV W 27,371
IT 31,935 Mobile and others 76,644
W135,950
Development in process TV W 73,667 IT 66,904 Mobile and others 112,694
W253,265
W389,215
(ii) As of December 31, 2020
(In millions of won and in years)
Classification Product type Book Value Development completed TV W 20,803
IT 51,784 Mobile and others 33,097
W105,684
Development in process TV W 49,773 IT 42,762 Mobile and others 103,734
W196,269
W301,953
215
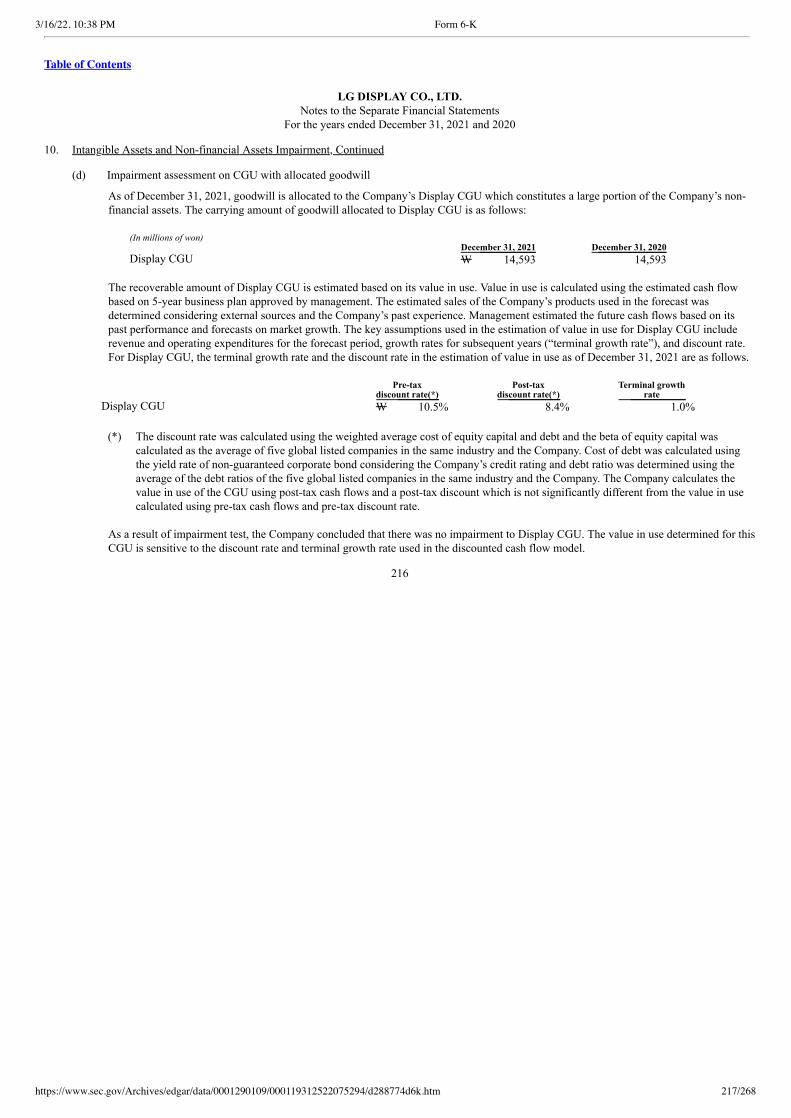
3/16/22, 10:38 PM Form 6-K
https://www.sec.gov/Archives/edgar/data/0001290109/000119312522075294/d288774d6k.htm 217/268
Table of Contents
LG DISPLAY CO., LTD.Notes to the Separate Financial Statements
For the years ended December 31, 2021 and 2020 10. Intangible Assets and Non-financial Assets Impairment, Continued (d) Impairment assessment on CGU with allocated goodwill
As of December 31, 2021, goodwill is allocated to the Company’s Display CGU which constitutes a large portion of the Company’s non-financial assets. The carrying amount of goodwill allocated to Display CGU is as follows:
(In millions of won) December 31, 2021 December 31, 2020 Display CGU W 14,593 14,593
The recoverable amount of Display CGU is estimated based on its value in use. Value in use is calculated using the estimated cash flowbased on 5-year business plan approved by management. The estimated sales of the Company’s products used in the forecast wasdetermined considering external sources and the Company’s past experience. Management estimated the future cash flows based on itspast performance and forecasts on market growth. The key assumptions used in the estimation of value in use for Display CGU includerevenue and operating expenditures for the forecast period, growth rates for subsequent years (“terminal growth rate”), and discount rate.For Display CGU, the terminal growth rate and the discount rate in the estimation of value in use as of December 31, 2021 are as follows.
Pre-tax discount rate(*)
Post-tax discount rate(*)
Terminal growth rate
Display CGU W 10.5% 8.4% 1.0%
(*) The discount rate was calculated using the weighted average cost of equity capital and debt and the beta of equity capital wascalculated as the average of five global listed companies in the same industry and the Company. Cost of debt was calculated usingthe yield rate of non-guaranteed corporate bond considering the Company’s credit rating and debt ratio was determined using theaverage of the debt ratios of the five global listed companies in the same industry and the Company. The Company calculates thevalue in use of the CGU using post-tax cash flows and a post-tax discount which is not significantly different from the value in usecalculated using pre-tax cash flows and pre-tax discount rate.
As a result of impairment test, the Company concluded that there was no impairment to Display CGU. The value in use determined for thisCGU is sensitive to the discount rate and terminal growth rate used in the discounted cash flow model.
216
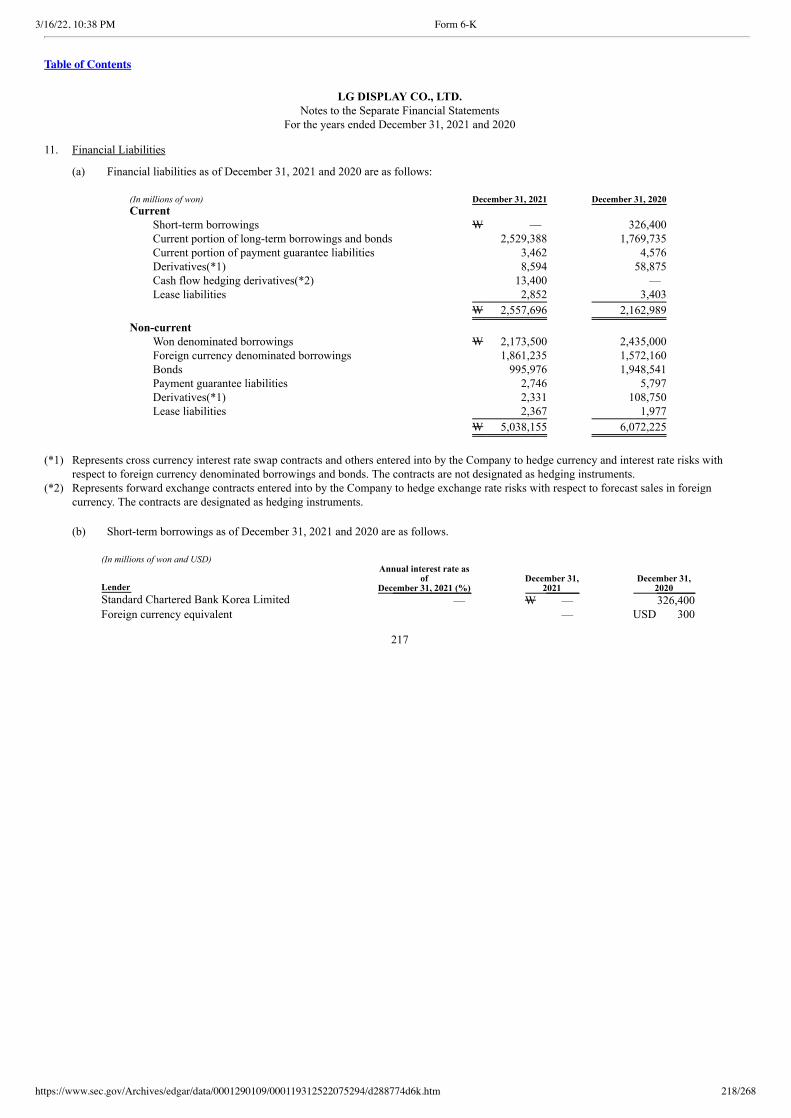
3/16/22, 10:38 PM Form 6-K
https://www.sec.gov/Archives/edgar/data/0001290109/000119312522075294/d288774d6k.htm 218/268
Table of Contents
LG DISPLAY CO., LTD.Notes to the Separate Financial Statements
For the years ended December 31, 2021 and 2020 11. Financial Liabilities
(a) Financial liabilities as of December 31, 2021 and 2020 are as follows:
(In millions of won) December 31, 2021 December 31, 2020 Current
Short-term borrowings W — 326,400 Current portion of long-term borrowings and bonds 2,529,388 1,769,735 Current portion of payment guarantee liabilities 3,462 4,576 Derivatives(*1) 8,594 58,875 Cash flow hedging derivatives(*2) 13,400 — Lease liabilities 2,852 3,403
W 2,557,696 2,162,989
Non-current Won denominated borrowings W 2,173,500 2,435,000 Foreign currency denominated borrowings 1,861,235 1,572,160 Bonds 995,976 1,948,541 Payment guarantee liabilities 2,746 5,797 Derivatives(*1) 2,331 108,750 Lease liabilities 2,367 1,977
W 5,038,155 6,072,225
(*1) Represents cross currency interest rate swap contracts and others entered into by the Company to hedge currency and interest rate risks with
respect to foreign currency denominated borrowings and bonds. The contracts are not designated as hedging instruments.(*2) Represents forward exchange contracts entered into by the Company to hedge exchange rate risks with respect to forecast sales in foreign
currency. The contracts are designated as hedging instruments. (b) Short-term borrowings as of December 31, 2021 and 2020 are as follows.
(In millions of won and USD)
Lender
Annual interest rate as of
December 31, 2021 (%) December 31,
2021 December 31,
2020 Standard Chartered Bank Korea Limited — W — 326,400 Foreign currency equivalent — USD 300
217

3/16/22, 10:38 PM Form 6-K
https://www.sec.gov/Archives/edgar/data/0001290109/000119312522075294/d288774d6k.htm 219/268
Table of Contents
LG DISPLAY CO., LTD.Notes to the Separate Financial Statements
For the years ended December 31, 2021 and 2020 11. Financial Liabilities, Continued (c) Won denominated long-term borrowings as of December 31, 2021 and 2020 are as follows :
(In millions of won)
Lender
Annual interest rate as of
December 31, 2021 (%)(*) December 31,
2021 December 31,
2020 Woori Bank — W — 60 Korea Development Bank and others
CD rate (91days) + 1.00~1.60, 1.90~3.25 2,785,000 3,272,500
Less current portion of long-term borrowings (611,500) (837,560)
W 2,173,500 2,435,000
(*) CD represents certificate of deposit. (d) Foreign currency denominated long-term borrowings as of December 31, 2021 and 2020 are as follows :
(In millions of won and USD)
Lender
Annual interest rate as of
December 31, 2021 (%)(*) December 31,
2021 December 31,
2020 The Export-Import Bank of Korea and others
3ML+1.20 ~ 2.40 6ML+1.25 ~1.43 1.82~2.46
W 2,163,538 1,680,960
Foreign currency equivalent USD 1,825 USD 1,545 Less current portion of long-term borrowings (302,303) (108,800)
W 1,861,235 1,572,160
(*) ML represents Month LIBOR(London Inter-Bank Offered Rates).
218
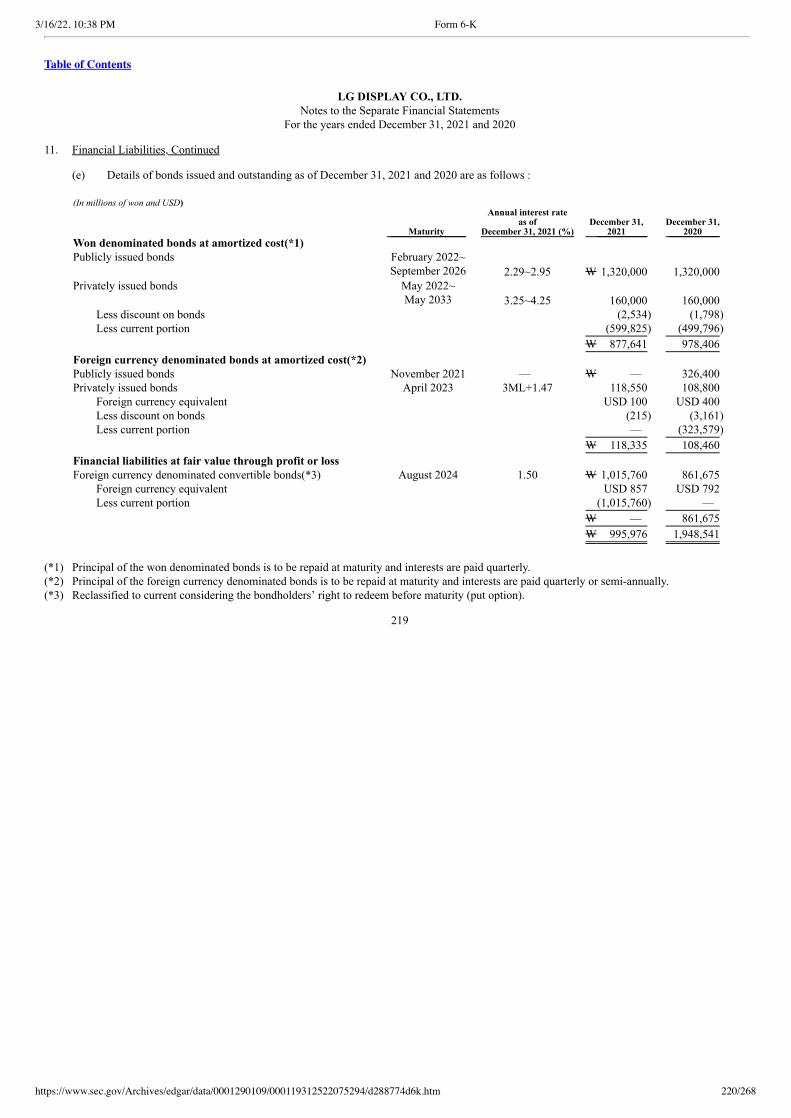
3/16/22, 10:38 PM Form 6-K
https://www.sec.gov/Archives/edgar/data/0001290109/000119312522075294/d288774d6k.htm 220/268
Table of Contents
LG DISPLAY CO., LTD.Notes to the Separate Financial Statements
For the years ended December 31, 2021 and 2020 11. Financial Liabilities, Continued (e) Details of bonds issued and outstanding as of December 31, 2021 and 2020 are as follows :
(In millions of won and USD)
Maturity
Annual interest rate as of
December 31, 2021 (%) December 31,
2021 December 31,
2020 Won denominated bonds at amortized cost(*1) Publicly issued bonds
February 2022~
September 2026 2.29~2.95 W 1,320,000 1,320,000
Privately issued bonds
May 2022~ May 2033
3.25~4.25 160,000 160,000
Less discount on bonds (2,534) (1,798) Less current portion (599,825) (499,796)
W 877,641 978,406
Foreign currency denominated bonds at amortized cost(*2) Publicly issued bonds November 2021 — W — 326,400 Privately issued bonds April 2023 3ML+1.47 118,550 108,800
Foreign currency equivalent USD 100 USD 400 Less discount on bonds (215) (3,161) Less current portion — (323,579)
W 118,335 108,460
Financial liabilities at fair value through profit or loss Foreign currency denominated convertible bonds(*3) August 2024 1.50 W 1,015,760 861,675
Foreign currency equivalent USD 857 USD 792 Less current portion (1,015,760) —
W — 861,675
W 995,976 1,948,541
(*1) Principal of the won denominated bonds is to be repaid at maturity and interests are paid quarterly.(*2) Principal of the foreign currency denominated bonds is to be repaid at maturity and interests are paid quarterly or semi-annually.(*3) Reclassified to current considering the bondholders’ right to redeem before maturity (put option).
219
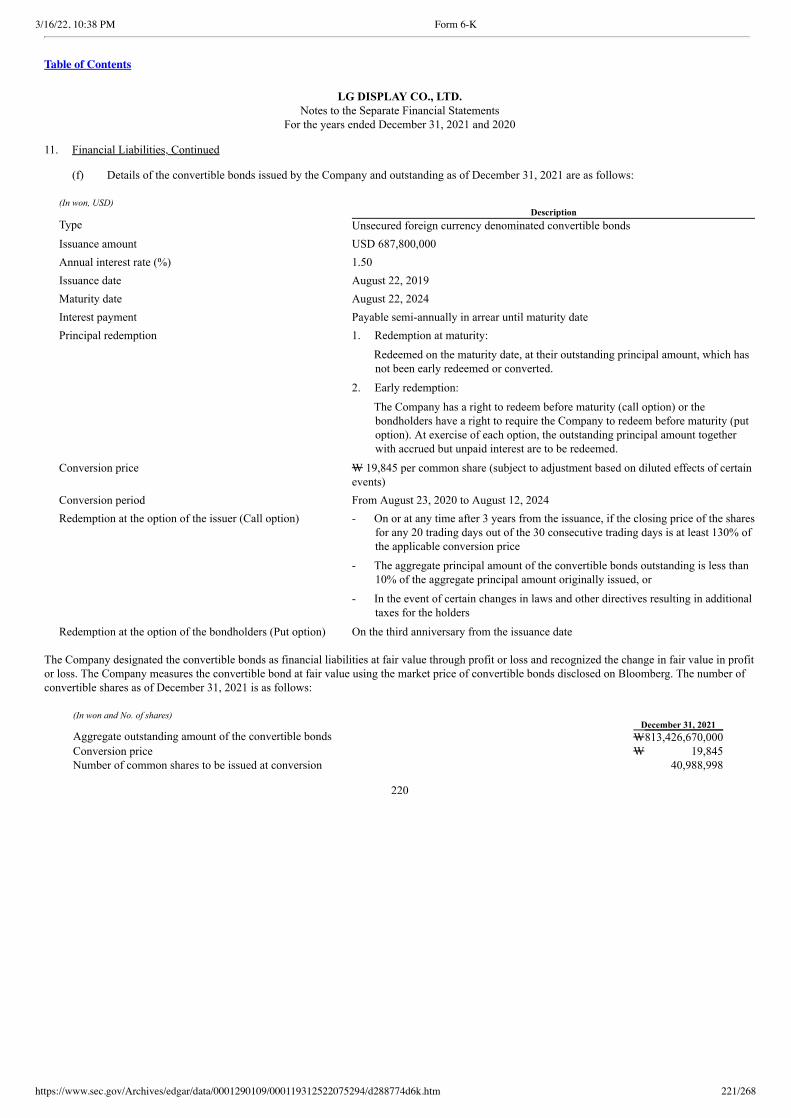
3/16/22, 10:38 PM Form 6-K
https://www.sec.gov/Archives/edgar/data/0001290109/000119312522075294/d288774d6k.htm 221/268
Table of Contents
LG DISPLAY CO., LTD.Notes to the Separate Financial Statements
For the years ended December 31, 2021 and 2020 11. Financial Liabilities, Continued (f) Details of the convertible bonds issued by the Company and outstanding as of December 31, 2021 are as follows:
(In won, USD) DescriptionType Unsecured foreign currency denominated convertible bondsIssuance amount USD 687,800,000Annual interest rate (%) 1.50Issuance date August 22, 2019Maturity date August 22, 2024Interest payment Payable semi-annually in arrear until maturity datePrincipal redemption
1. Redemption at maturity:
Redeemed on the maturity date, at their outstanding principal amount, which hasnot been early redeemed or converted.
2. Early redemption:
The Company has a right to redeem before maturity (call option) or thebondholders have a right to require the Company to redeem before maturity (putoption). At exercise of each option, the outstanding principal amount togetherwith accrued but unpaid interest are to be redeemed.
Conversion price
W 19,845 per common share (subject to adjustment based on diluted effects of certainevents)
Conversion period From August 23, 2020 to August 12, 2024Redemption at the option of the issuer (Call option)
- On or at any time after 3 years from the issuance, if the closing price of the sharesfor any 20 trading days out of the 30 consecutive trading days is at least 130% ofthe applicable conversion price
- The aggregate principal amount of the convertible bonds outstanding is less than10% of the aggregate principal amount originally issued, or
- In the event of certain changes in laws and other directives resulting in additionaltaxes for the holders
Redemption at the option of the bondholders (Put option) On the third anniversary from the issuance date
The Company designated the convertible bonds as financial liabilities at fair value through profit or loss and recognized the change in fair value in profitor loss. The Company measures the convertible bond at fair value using the market price of convertible bonds disclosed on Bloomberg. The number ofconvertible shares as of December 31, 2021 is as follows:
(In won and No. of shares) December 31, 2021 Aggregate outstanding amount of the convertible bonds W813,426,670,000 Conversion price W 19,845 Number of common shares to be issued at conversion 40,988,998
220
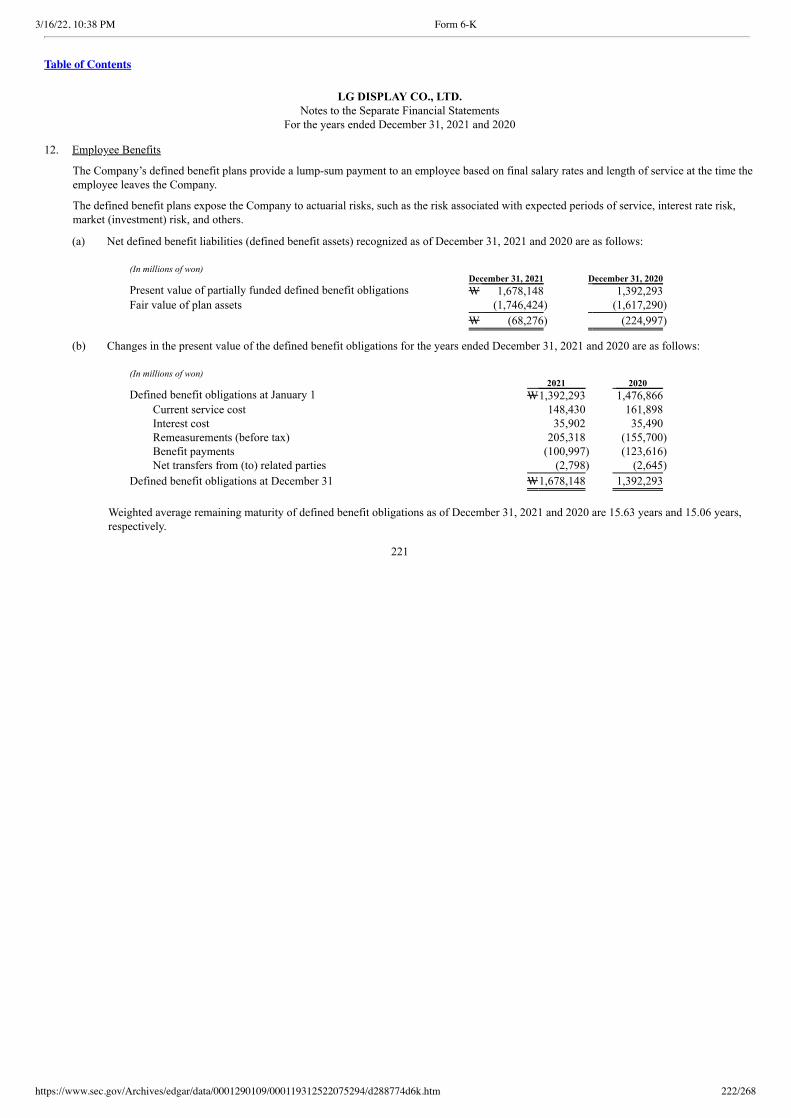
3/16/22, 10:38 PM Form 6-K
https://www.sec.gov/Archives/edgar/data/0001290109/000119312522075294/d288774d6k.htm 222/268
Table of Contents
LG DISPLAY CO., LTD.Notes to the Separate Financial Statements
For the years ended December 31, 2021 and 2020 12. Employee Benefits
The Company’s defined benefit plans provide a lump-sum payment to an employee based on final salary rates and length of service at the time theemployee leaves the Company.
The defined benefit plans expose the Company to actuarial risks, such as the risk associated with expected periods of service, interest rate risk,market (investment) risk, and others.
(a) Net defined benefit liabilities (defined benefit assets) recognized as of December 31, 2021 and 2020 are as follows:
(In millions of won) December 31, 2021 December 31, 2020 Present value of partially funded defined benefit obligations W 1,678,148 1,392,293 Fair value of plan assets (1,746,424) (1,617,290)
W (68,276) (224,997)
(b) Changes in the present value of the defined benefit obligations for the years ended December 31, 2021 and 2020 are as follows:
(In millions of won) 2021 2020 Defined benefit obligations at January 1 W1,392,293 1,476,866
Current service cost 148,430 161,898 Interest cost 35,902 35,490 Remeasurements (before tax) 205,318 (155,700) Benefit payments (100,997) (123,616) Net transfers from (to) related parties (2,798) (2,645)
Defined benefit obligations at December 31 W1,678,148 1,392,293
Weighted average remaining maturity of defined benefit obligations as of December 31, 2021 and 2020 are 15.63 years and 15.06 years,respectively.
221
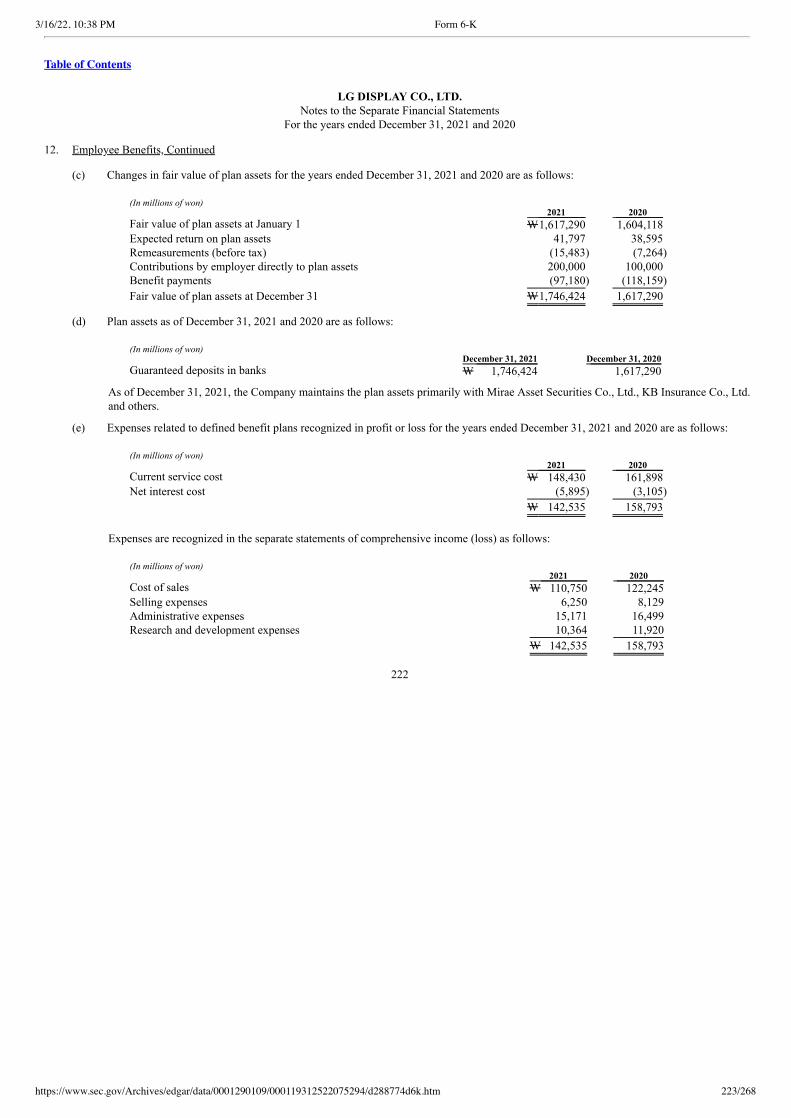
3/16/22, 10:38 PM Form 6-K
https://www.sec.gov/Archives/edgar/data/0001290109/000119312522075294/d288774d6k.htm 223/268
Table of Contents
LG DISPLAY CO., LTD.Notes to the Separate Financial Statements
For the years ended December 31, 2021 and 2020 12. Employee Benefits, Continued (c) Changes in fair value of plan assets for the years ended December 31, 2021 and 2020 are as follows:
(In millions of won) 2021 2020 Fair value of plan assets at January 1 W1,617,290 1,604,118 Expected return on plan assets 41,797 38,595 Remeasurements (before tax) (15,483) (7,264) Contributions by employer directly to plan assets 200,000 100,000 Benefit payments (97,180) (118,159)
Fair value of plan assets at December 31 W1,746,424 1,617,290
(d) Plan assets as of December 31, 2021 and 2020 are as follows:
(In millions of won) December 31, 2021 December 31, 2020 Guaranteed deposits in banks W 1,746,424 1,617,290
As of December 31, 2021, the Company maintains the plan assets primarily with Mirae Asset Securities Co., Ltd., KB Insurance Co., Ltd.and others.
(e) Expenses related to defined benefit plans recognized in profit or loss for the years ended December 31, 2021 and 2020 are as follows:
(In millions of won) 2021 2020 Current service cost W 148,430 161,898 Net interest cost (5,895) (3,105)
W 142,535 158,793
Expenses are recognized in the separate statements of comprehensive income (loss) as follows:
(In millions of won) 2021 2020 Cost of sales W 110,750 122,245 Selling expenses 6,250 8,129 Administrative expenses 15,171 16,499 Research and development expenses 10,364 11,920
W 142,535 158,793
222
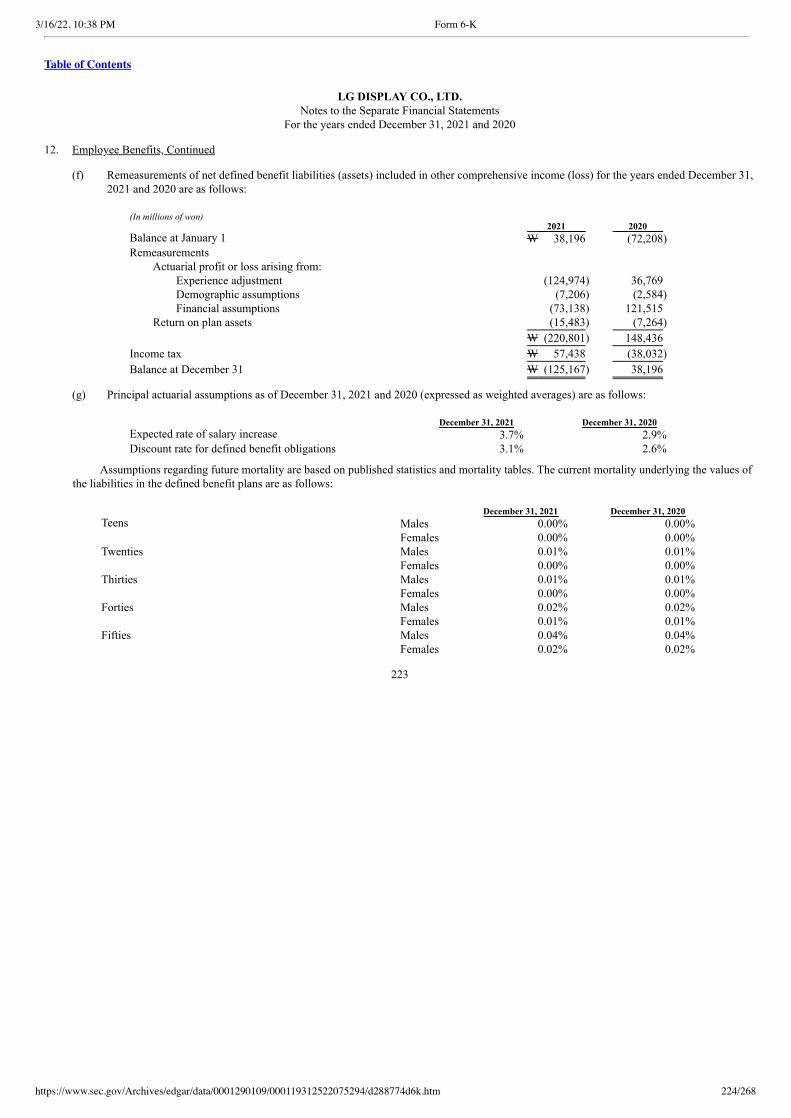
3/16/22, 10:38 PM Form 6-K
https://www.sec.gov/Archives/edgar/data/0001290109/000119312522075294/d288774d6k.htm 224/268
Table of Contents
LG DISPLAY CO., LTD.Notes to the Separate Financial Statements
For the years ended December 31, 2021 and 2020 12. Employee Benefits, Continued
(f) Remeasurements of net defined benefit liabilities (assets) included in other comprehensive income (loss) for the years ended December 31,2021 and 2020 are as follows:
(In millions of won) 2021 2020 Balance at January 1 W 38,196 (72,208) Remeasurements
Actuarial profit or loss arising from: Experience adjustment (124,974) 36,769 Demographic assumptions (7,206) (2,584) Financial assumptions (73,138) 121,515
Return on plan assets (15,483) (7,264)
W (220,801) 148,436
Income tax W 57,438 (38,032)
Balance at December 31 W (125,167) 38,196
(g) Principal actuarial assumptions as of December 31, 2021 and 2020 (expressed as weighted averages) are as follows:
December 31, 2021 December 31, 2020 Expected rate of salary increase 3.7% 2.9% Discount rate for defined benefit obligations 3.1% 2.6%
Assumptions regarding future mortality are based on published statistics and mortality tables. The current mortality underlying the values ofthe liabilities in the defined benefit plans are as follows:
December 31, 2021 December 31, 2020 Teens Males 0.00% 0.00%
Females 0.00% 0.00% Twenties Males 0.01% 0.01%
Females 0.00% 0.00% Thirties Males 0.01% 0.01%
Females 0.00% 0.00% Forties Males 0.02% 0.02%
Females 0.01% 0.01% Fifties Males 0.04% 0.04%
Females 0.02% 0.02%
223
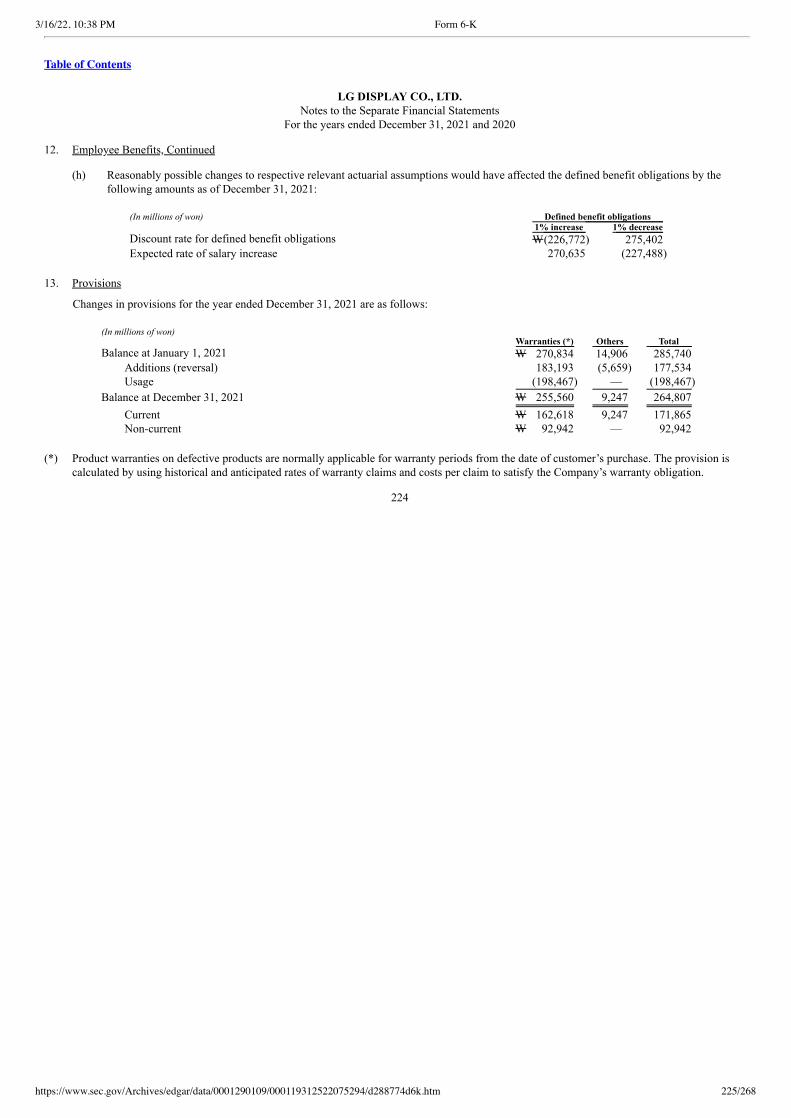
3/16/22, 10:38 PM Form 6-K
https://www.sec.gov/Archives/edgar/data/0001290109/000119312522075294/d288774d6k.htm 225/268
Table of Contents
LG DISPLAY CO., LTD.Notes to the Separate Financial Statements
For the years ended December 31, 2021 and 2020 12. Employee Benefits, Continued
(h) Reasonably possible changes to respective relevant actuarial assumptions would have affected the defined benefit obligations by thefollowing amounts as of December 31, 2021:
(In millions of won) Defined benefit obligations 1% increase 1% decrease Discount rate for defined benefit obligations W(226,772) 275,402 Expected rate of salary increase 270,635 (227,488)
13. Provisions
Changes in provisions for the year ended December 31, 2021 are as follows:
(In millions of won) Warranties (*) Others Total Balance at January 1, 2021 W 270,834 14,906 285,740
Additions (reversal) 183,193 (5,659) 177,534 Usage (198,467) — (198,467)
Balance at December 31, 2021 W 255,560 9,247 264,807
Current W 162,618 9,247 171,865 Non-current W 92,942 — 92,942
(*) Product warranties on defective products are normally applicable for warranty periods from the date of customer’s purchase. The provision is
calculated by using historical and anticipated rates of warranty claims and costs per claim to satisfy the Company’s warranty obligation.
224
3/16/22, 10:38 PM Form 6-K
https://www.sec.gov/Archives/edgar/data/0001290109/000119312522075294/d288774d6k.htm 226/268
Table of Contents
LG DISPLAY CO., LTD.Notes to the Separate Financial Statements
For the years ended December 31, 2021 and 2020 14. Contingent Liabilities and Commitments
(a) Legal Proceedings
Anti-trust litigations
Some individual claimants filed “follow-on” damages claims against the Company and other TFT-LCD manufacturers alleging violationsof EU competition law. While the Company continues its vigorous defense of the various pending proceedings described above, as ofDecember 31, 2021, the Company cannot reliably estimate the timing and amount of outflows of resources embodying economic benefitsrelating to the proceedings.
Solas OLED Ltd. Litigations
Between April 2019 and September 2020, Solas OLED Ltd. filed altogether four patent infringement actions, with two in the United StatesDistrict Court for the Western District of Texas, one in the Mannheim District Court in Germany and one in the Beijing IntellectualProperty Court in China, against the Company and television manufacturers. In December 2020, the parties reached an agreement toamicably settle all claims and all patent infringement actions have been formally dismissed during the year ended December 31, 2021.
Others
The Company is involved in various lawsuits and disputes in addition to the pending proceedings described above. The Company cannotreliably estimate the timing and amount of outflows of resources embodying economic benefits relating to the disputes.
(b) Commitments
Factoring and securitization of accounts receivable
The Company has agreements with Korea Development Bank and several other banks for accounts receivable sales negotiating facilities ofup to an aggregate of USD 1,015 million (W1,203,283 million) in connection with the Company’s export sales transactions with itssubsidiaries. As of December 31, 2021, there are no short-term borrowings that are outstanding but past due in connection with theseagreements. In connection with all of the contracts in this paragraph, the Company has sold its accounts receivable with recourse.
The Company has a credit facility agreement with Shinhan Bank and several other banks pursuant to which the Company could sell itsaccounts receivables up to an aggregate of W522,708 million in connection with its domestic and export sales transactions and, as ofDecember 31, 2021, W42,930 million accounts and notes receivable sold to Shinhan Bank and several other banks were outstanding inconnection with the agreement. In connection with the contract above, the Company has sold its accounts receivable without recourse.
225
3/16/22, 10:38 PM Form 6-K
https://www.sec.gov/Archives/edgar/data/0001290109/000119312522075294/d288774d6k.htm 227/268
Table of Contents
LG DISPLAY CO., LTD.Notes to the Separate Financial Statements
For the years ended December 31, 2021 and 2020 14. Contingent Liabilities and Commitments, Continued
Letters of credit
As of December 31, 2021, the Company entered into agreements with financial institutions in relation to the opening of letters of credit and therespective credit limits under the agreements are as follows:
(In millions of won and USD)
Contractual
amount KRW
equivalent KEB Hana Bank USD 250 W 296,375 Sumitomo Mitsui Banking Corporation USD 50 59,275 Industrial Bank of Korea USD 100 118,550 Industrial and Commercial Bank of China USD 200 237,100 Shinhan Bank USD 300 355,650 KB Kookmin Bank USD 100 118,550 MUFG Bank USD 100 118,550 The Export–Import Bank of Korea USD 200 237,100
USD 1,300 W1,541,150
Payment guarantees
The Company provides payment guarantees to LG Display Vietnam Haiphong Co., Ltd. in connection with the principal amount of term loancredit facilities amounting to USD 957 million (W1,134,128 million).
In addition, the Company obtained payment guarantees amounting to USD 2 million (W2,371 million) from Shinhan Bank for value added taxpayments in Poland.
License agreements
As of December 31, 2021, the Company has technical license agreements with Hitachi Display, Ltd. and others in relation to its LCD business andpatent license agreement with Universal Display Corporation in relation to its OLED business. Also, the Company has a trademark licenseagreement with LG Corp. and other intellectual property license agreements with various companies as of December 31, 2021.
15. Share Capital and Share Premium
The Company is authorized to issue 500,000,000 shares of capital stock (par value W5,000), and as of December 31, 2021 and December 31,2020 the number of issued common shares is 357,815,700. There have been no changes in the capital stock from January 1, 2020 to December 31,2021
The Company’s capital surplus consists of share premium. There have been no changes in share premium from January 1, 2020 to December 31,2021
226
3/16/22, 10:38 PM Form 6-K
https://www.sec.gov/Archives/edgar/data/0001290109/000119312522075294/d288774d6k.htm 228/268
Table of Contents
LG DISPLAY CO., LTD.Notes to the Separate Financial Statements
For the years ended December 31, 2021 and 2020 16. Retained earnings and Reserves
(a) Retained earnings as of December 31, 2021 and 2020 are as follows:
(In millions of won) December 31, 2021 December 31, 2020 Legal reserve W 212,158 212,158 Other reserve 68,251 68,251 Defined benefit plan actuarial income (loss) (125,167) 38,196 Unappropriated retained earnings 6,456,611 5,904,438
W 6,611,853 6,223,043
(b) For the years ended December 31, 2021 and 2020, details of the Company’s appropriations of retained earnings are as follows:
(In millions of won, except for cash dividend per common stock) 2021 2020 Retained earnings before appropriations
Unappropriated retained earnings carried over from prior year W 5,904,438 6,417,700 Profit(Loss) for the year 552,173 (513,262)
W 6,456,611 5,904,438
Appropriation of retained earnings (*) Earned surplus reserve W 23,258 — Cash dividend (Dividend per share
(Dividend ratio): W650(13% of par value)) 232,580 —
W 255,838 —
Unappropriated retained earnings carried forward to the following year W 6,200,773 5,904,438
(*) Expected date of appropriation for the year ended December 31, 2021 is March 23, 2022 and the date of appropriation for the year ended
December 31, 2020 is March 23, 2021.
(c) Reserves
Reserves as of December 31, 2021 and 2020 are as follows:
(In millions of won) December 31, 2021 December 31, 2020 Gain or loss on valuation of derivatives(*) W (9,227) —
(*) Gain or loss on valuation of derivatives is the effective portion of the gains or losses from derivatives to which cash flow hedging accounting has
been applied.
227
3/16/22, 10:38 PM Form 6-K
https://www.sec.gov/Archives/edgar/data/0001290109/000119312522075294/d288774d6k.htm 229/268
Table of Contents
LG DISPLAY CO., LTD.Notes to the Separate Financial Statements
For the years ended December 31, 2021 and 2020 17. Revenue
Details of revenue for the years ended December 31, 2021 and 2020 are as follows:
(In millions of won) 2021 2020 Sales of goods W28,307,144 22,719,575 Royalties 29,706 50,681 Others 28,064 29,017
W28,364,914 22,799,273
18. The Nature of Expenses and Others
The classification of expenses by nature for the years ended December 31, 2021 and 2020 are as follows:
(In millions of won) 2021 2020 Changes in inventories W (712,875) 108,177 Purchases of raw materials, merchandise and others 9,262,023 8,539,506 Depreciation and amortization 2,532,888 2,519,199 Outsourcing 10,712,848 7,612,513 Labor 2,826,561 2,116,004 Supplies and others 843,200 643,432 Utility 717,347 664,869 Fees and commissions 445,531 370,041 Shipping 78,566 55,959 Advertising 125,992 112,678 Warranty 183,193 277,448 Travel 54,754 57,210 Taxes and dues 63,502 57,199 Others 603,281 637,071
W27,736,811 23,771,306
Total expenses consist of cost of sales, selling, administrative, research and development expenses and other non-operating expenses, excludingforeign exchange differences.
228

3/16/22, 10:38 PM Form 6-K
https://www.sec.gov/Archives/edgar/data/0001290109/000119312522075294/d288774d6k.htm 230/268
Table of Contents
LG DISPLAY CO., LTD.Notes to the Separate Financial Statements
For the years ended December 31, 2021 and 2020 19. Selling and Administrative Expenses
Details of selling and administrative expenses for the years ended December 31, 2021 and 2020 are as follows:
(In millions of won) 2021 2020 Salaries W 265,397 191,932 Expenses related to defined benefit plans 21,530 24,697 Other employee benefits 53,857 42,475 Shipping 53,955 38,106 Fees and commissions 167,244 125,125 Depreciation 137,906 88,315 Taxes and dues 3,351 3,099 Advertising 125,992 112,678 Warranty 183,193 277,448 Insurance 8,755 7,806 Travel 4,681 6,070 Training 12,261 6,941 Others 55,116 40,069
W 1,093,238 964,761
20. Personnel Expenses
Details of personnel expenses for the years ended December 31, 2021 and 2020 are as follows:
(In millions of won) 2021 2020 Salaries and wages W 2,423,319 1,765,366 Other employee benefits 337,808 257,427 Contributions to National Pension plan 68,177 67,241 Expenses related to defined benefit plans and defined contribution plans 143,382 159,409
W 2,972,686 2,249,443
229

3/16/22, 10:38 PM Form 6-K
https://www.sec.gov/Archives/edgar/data/0001290109/000119312522075294/d288774d6k.htm 231/268
Table of Contents
LG DISPLAY CO., LTD.Notes to the Separate Financial Statements
For the years ended December 31, 2021 and 2020 21. Other Non-operating Income and Other Non-operating Expenses
(a) Details of other non-operating income for the years ended December 31, 2021 and 2020 are as follows:
(In millions of won) 2021 2020 Foreign currency gain W 852,692 1,204,657 Gain on disposal of property, plant and equipment 24,647 43,155 Gain on disposal of intangible assets 196 — Reversal of impairment loss on intangible assets 1,152 1,110 Rental income 1,803 1,692 Others 8,923 14,990
W 889,413 1,265,604
(b) Details of other non-operating expenses for the years ended December 31, 2021 and 2020 are as follows:
(In millions of won) 2021 2020 Foreign currency loss W 786,766 1,281,183 Loss on disposal of property, plant and equipment 49,871 58,852 Impairment loss on property, plant and equipment 10,662 11,482 Loss on disposal of intangible assets — 368 Impairment loss on intangible assets 29,488 79,593 Donations 422 378 Others 3,385 8,381
W 880,594 1,440,237
230
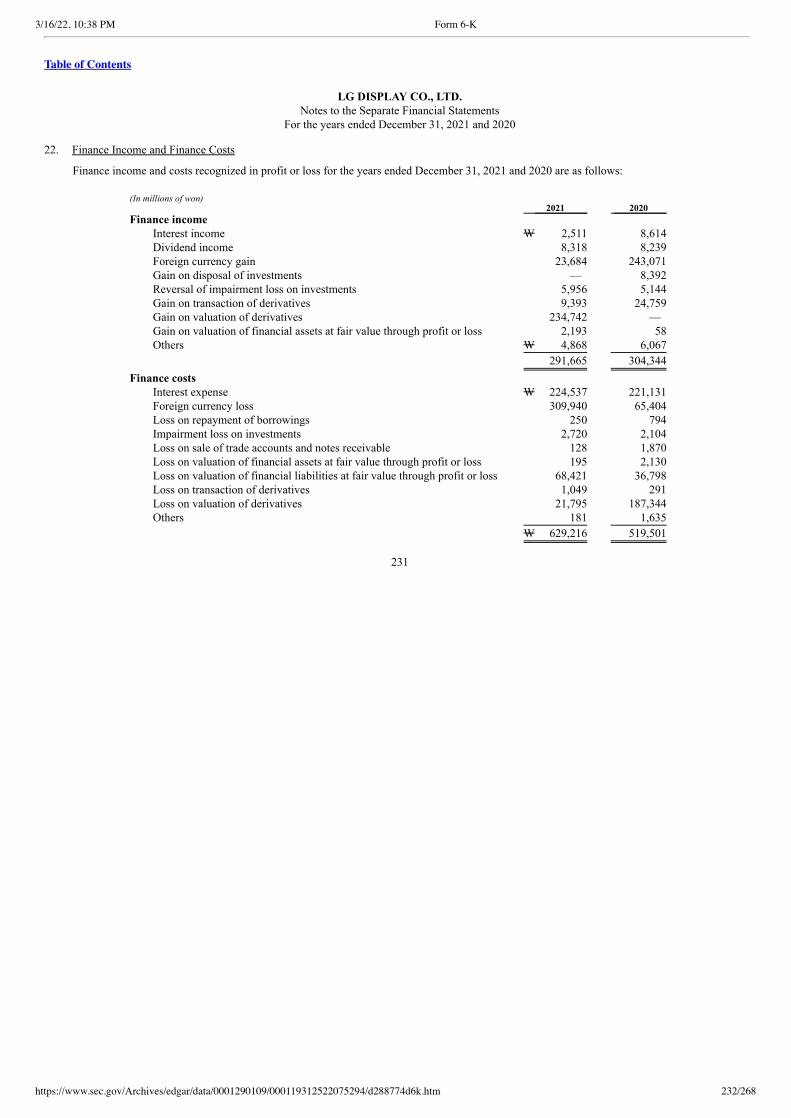
3/16/22, 10:38 PM Form 6-K
https://www.sec.gov/Archives/edgar/data/0001290109/000119312522075294/d288774d6k.htm 232/268
Table of Contents
LG DISPLAY CO., LTD.Notes to the Separate Financial Statements
For the years ended December 31, 2021 and 2020 22. Finance Income and Finance Costs
Finance income and costs recognized in profit or loss for the years ended December 31, 2021 and 2020 are as follows:
(In millions of won) 2021 2020 Finance income
Interest income W 2,511 8,614 Dividend income 8,318 8,239 Foreign currency gain 23,684 243,071 Gain on disposal of investments — 8,392 Reversal of impairment loss on investments 5,956 5,144 Gain on transaction of derivatives 9,393 24,759 Gain on valuation of derivatives 234,742 — Gain on valuation of financial assets at fair value through profit or loss 2,193 58 Others W 4,868 6,067
291,665 304,344
Finance costs Interest expense W 224,537 221,131 Foreign currency loss 309,940 65,404 Loss on repayment of borrowings 250 794 Impairment loss on investments 2,720 2,104 Loss on sale of trade accounts and notes receivable 128 1,870 Loss on valuation of financial assets at fair value through profit or loss 195 2,130 Loss on valuation of financial liabilities at fair value through profit or loss 68,421 36,798 Loss on transaction of derivatives 1,049 291 Loss on valuation of derivatives 21,795 187,344 Others 181 1,635
W 629,216 519,501
231

3/16/22, 10:38 PM Form 6-K
https://www.sec.gov/Archives/edgar/data/0001290109/000119312522075294/d288774d6k.htm 233/268
Table of Contents
LG DISPLAY CO., LTD.Notes to the Separate Financial Statements
For the years ended December 31, 2021 and 2020 23. Income Tax Expense (Benefit)
(a) Details of income tax expense (benefit) for the years ended December 31, 2021 and 2020 are as follows:
(In millions of won) 2021 2020 Current tax expense (benefit)
Current year W 4,089 5,172 Adjustment for prior years(*1) 42,854 (52,574)
W 46,943 (47,402) Deferred tax expense (benefit)
Origination and reversal of temporary differences and others W (167,864) (361,075) Change in unrecognized deferred tax assets(*2) (38,053) (281,030)
W (205,917) (642,105)
Income tax benefit W (158,974) (689,507)
(*1) Consist of taxable income adjustments related to the transfer price investigation and others and significant portion of such amounts wereadjusted to reduce deferred tax expense (see Note 23(d)).
(*2) Change in unrecognized deferred tax assets consist of tax effect from recognizing previously unrecognized deferred tax assets in relation totax credit carry forwards.
(b) Income taxes recognized directly in other comprehensive income or loss for the years ended December 31, 2021 and 2020 are as follows: (In millions of won) 2021 2020 Before tax Tax expense Net of tax Before tax Tax expense Net of tax Remeasurements of net defined benefit liabilities (assets) W(220,801) 57,438 (163,363) 148,436 (38,032) 110,404 Gain (loss) on valuation of derivatives (12,495) 3,268 (9,227) — — —
W(233,296) 60,706 (172,590) 148,436 (38,032) 110,404
232
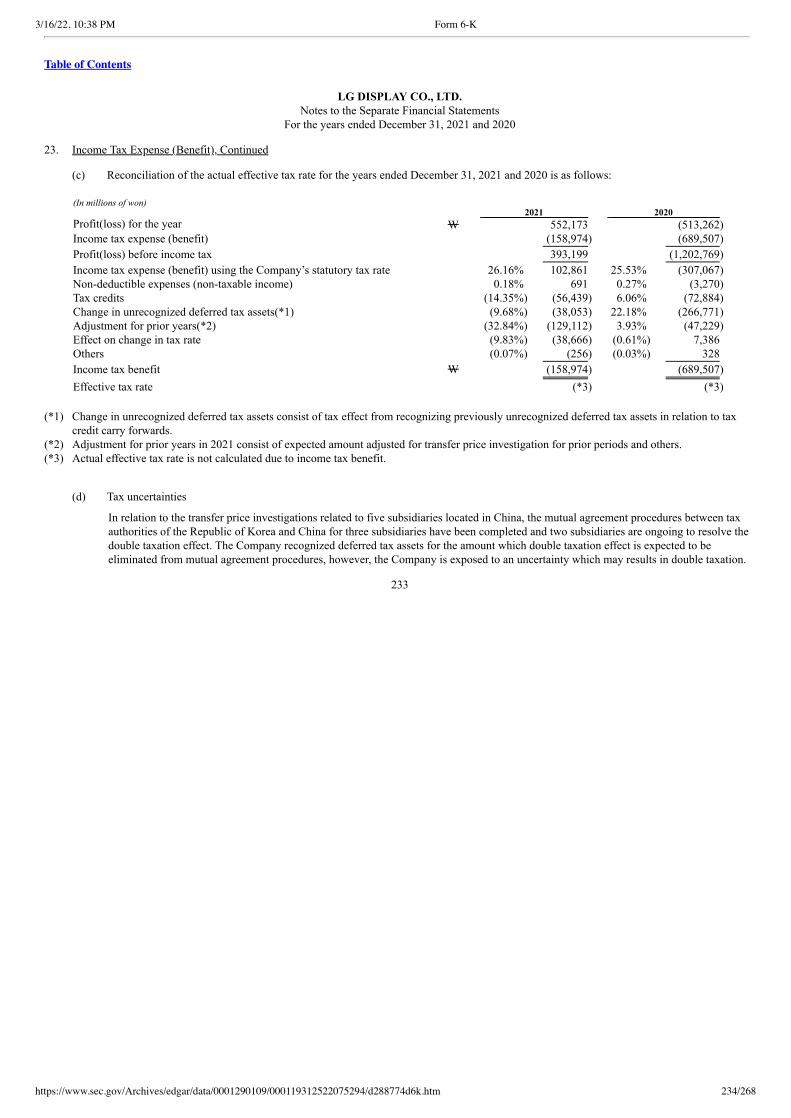
3/16/22, 10:38 PM Form 6-K
https://www.sec.gov/Archives/edgar/data/0001290109/000119312522075294/d288774d6k.htm 234/268
Table of Contents
LG DISPLAY CO., LTD.Notes to the Separate Financial Statements
For the years ended December 31, 2021 and 2020 23. Income Tax Expense (Benefit), Continued (c) Reconciliation of the actual effective tax rate for the years ended December 31, 2021 and 2020 is as follows:
(In millions of won) 2021 2020 Profit(loss) for the year W 552,173 (513,262) Income tax expense (benefit) (158,974) (689,507)
Profit(loss) before income tax 393,199 (1,202,769)
Income tax expense (benefit) using the Company’s statutory tax rate 26.16% 102,861 25.53% (307,067) Non-deductible expenses (non-taxable income) 0.18% 691 0.27% (3,270) Tax credits (14.35%) (56,439) 6.06% (72,884) Change in unrecognized deferred tax assets(*1) (9.68%) (38,053) 22.18% (266,771) Adjustment for prior years(*2) (32.84%) (129,112) 3.93% (47,229) Effect on change in tax rate (9.83%) (38,666) (0.61%) 7,386 Others (0.07%) (256) (0.03%) 328
Income tax benefit W (158,974) (689,507)
Effective tax rate (*3) (*3) (*1) Change in unrecognized deferred tax assets consist of tax effect from recognizing previously unrecognized deferred tax assets in relation to tax
credit carry forwards.(*2) Adjustment for prior years in 2021 consist of expected amount adjusted for transfer price investigation for prior periods and others.(*3) Actual effective tax rate is not calculated due to income tax benefit.
(d) Tax uncertainties
In relation to the transfer price investigations related to five subsidiaries located in China, the mutual agreement procedures between taxauthorities of the Republic of Korea and China for three subsidiaries have been completed and two subsidiaries are ongoing to resolve thedouble taxation effect. The Company recognized deferred tax assets for the amount which double taxation effect is expected to beeliminated from mutual agreement procedures, however, the Company is exposed to an uncertainty which may results in double taxation.
233
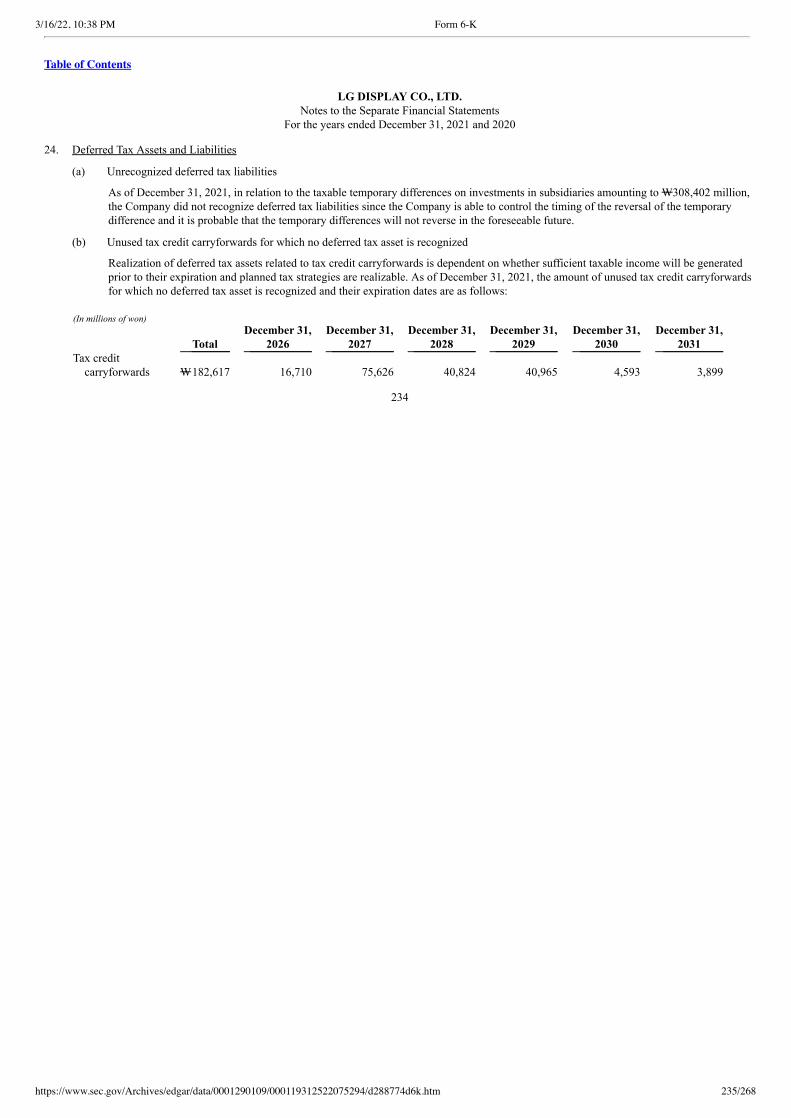
3/16/22, 10:38 PM Form 6-K
https://www.sec.gov/Archives/edgar/data/0001290109/000119312522075294/d288774d6k.htm 235/268
Table of Contents
LG DISPLAY CO., LTD.Notes to the Separate Financial Statements
For the years ended December 31, 2021 and 2020 24. Deferred Tax Assets and Liabilities
(a) Unrecognized deferred tax liabilities
As of December 31, 2021, in relation to the taxable temporary differences on investments in subsidiaries amounting to W308,402 million,the Company did not recognize deferred tax liabilities since the Company is able to control the timing of the reversal of the temporarydifference and it is probable that the temporary differences will not reverse in the foreseeable future.
(b) Unused tax credit carryforwards for which no deferred tax asset is recognized
Realization of deferred tax assets related to tax credit carryforwards is dependent on whether sufficient taxable income will be generatedprior to their expiration and planned tax strategies are realizable. As of December 31, 2021, the amount of unused tax credit carryforwardsfor which no deferred tax asset is recognized and their expiration dates are as follows:
(In millions of won)
Total December 31,
2026 December 31,
2027 December 31,
2028 December 31,
2029 December 31,
2030 December 31,
2031 Tax credit
carryforwards W182,617 16,710 75,626 40,824 40,965 4,593 3,899
234
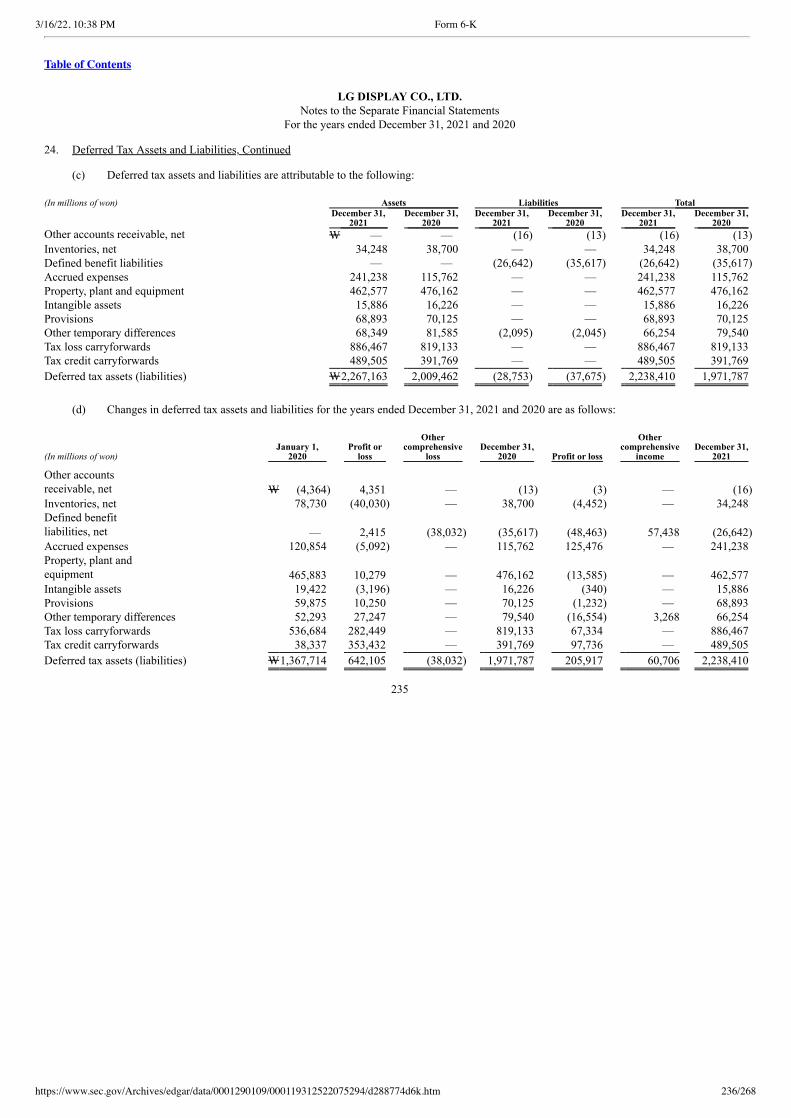
3/16/22, 10:38 PM Form 6-K
https://www.sec.gov/Archives/edgar/data/0001290109/000119312522075294/d288774d6k.htm 236/268
Table of Contents
LG DISPLAY CO., LTD.Notes to the Separate Financial Statements
For the years ended December 31, 2021 and 2020 24. Deferred Tax Assets and Liabilities, Continued (c) Deferred tax assets and liabilities are attributable to the following: (In millions of won) Assets Liabilities Total
December 31,
2021 December 31,
2020 December 31,
2021 December 31,
2020 December 31,
2021 December 31,
2020 Other accounts receivable, net W — — (16) (13) (16) (13) Inventories, net 34,248 38,700 — — 34,248 38,700 Defined benefit liabilities — — (26,642) (35,617) (26,642) (35,617) Accrued expenses 241,238 115,762 — — 241,238 115,762 Property, plant and equipment 462,577 476,162 — — 462,577 476,162 Intangible assets 15,886 16,226 — — 15,886 16,226 Provisions 68,893 70,125 — — 68,893 70,125 Other temporary differences 68,349 81,585 (2,095) (2,045) 66,254 79,540 Tax loss carryforwards 886,467 819,133 — — 886,467 819,133 Tax credit carryforwards 489,505 391,769 — — 489,505 391,769
Deferred tax assets (liabilities) W2,267,163 2,009,462 (28,753) (37,675) 2,238,410 1,971,787
(d) Changes in deferred tax assets and liabilities for the years ended December 31, 2021 and 2020 are as follows:
(In millions of won) January 1,
2020 Profit or
loss
Other comprehensive
loss December 31,
2020 Profit or loss
Other comprehensive
income December 31,
2021
Other accountsreceivable, net W (4,364) 4,351 — (13) (3) — (16) Inventories, net 78,730 (40,030) — 38,700 (4,452) — 34,248 Defined benefitliabilities, net — 2,415 (38,032) (35,617) (48,463) 57,438 (26,642) Accrued expenses 120,854 (5,092) — 115,762 125,476 — 241,238 Property, plant andequipment 465,883 10,279 — 476,162 (13,585) — 462,577 Intangible assets 19,422 (3,196) — 16,226 (340) — 15,886 Provisions 59,875 10,250 — 70,125 (1,232) — 68,893 Other temporary differences 52,293 27,247 — 79,540 (16,554) 3,268 66,254 Tax loss carryforwards 536,684 282,449 — 819,133 67,334 — 886,467 Tax credit carryforwards 38,337 353,432 — 391,769 97,736 — 489,505
Deferred tax assets (liabilities) W1,367,714 642,105 (38,032) 1,971,787 205,917 60,706 2,238,410
235
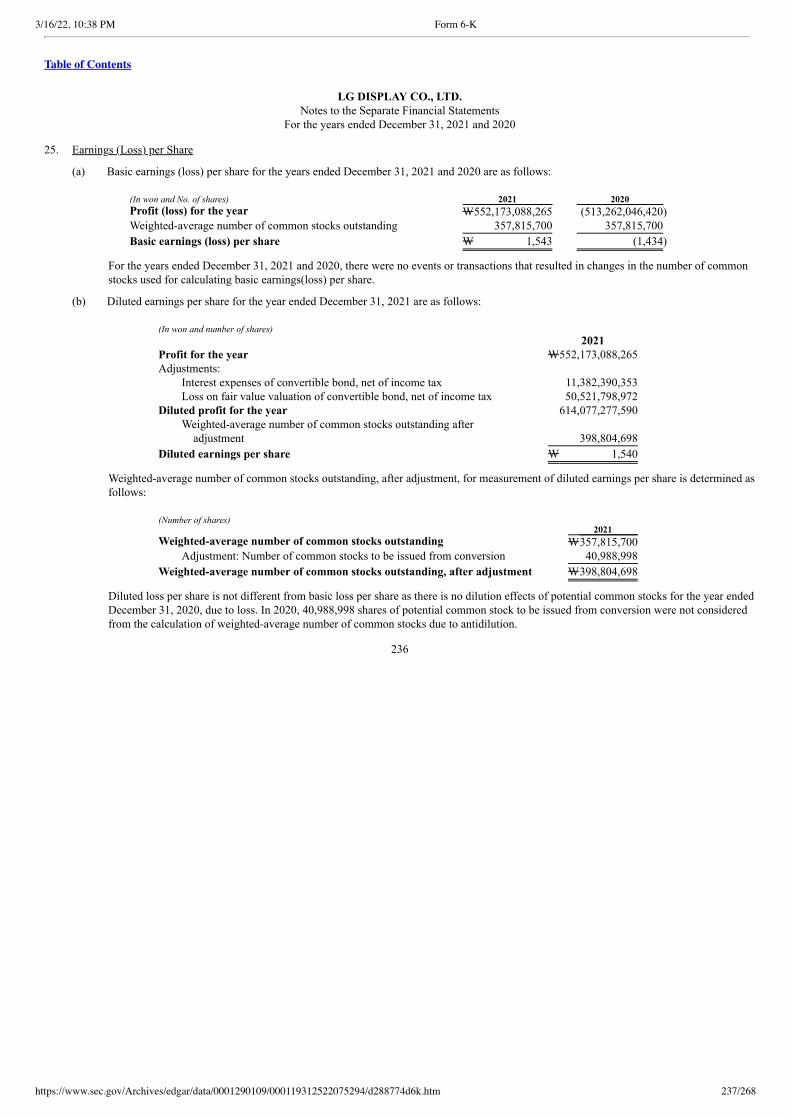
3/16/22, 10:38 PM Form 6-K
https://www.sec.gov/Archives/edgar/data/0001290109/000119312522075294/d288774d6k.htm 237/268
Table of Contents
LG DISPLAY CO., LTD.Notes to the Separate Financial Statements
For the years ended December 31, 2021 and 2020 25. Earnings (Loss) per Share
(a) Basic earnings (loss) per share for the years ended December 31, 2021 and 2020 are as follows:
(In won and No. of shares) 2021 2020 Profit (loss) for the year W552,173,088,265 (513,262,046,420) Weighted-average number of common stocks outstanding 357,815,700 357,815,700
Basic earnings (loss) per share W 1,543 (1,434)
For the years ended December 31, 2021 and 2020, there were no events or transactions that resulted in changes in the number of commonstocks used for calculating basic earnings(loss) per share.
(b) Diluted earnings per share for the year ended December 31, 2021 are as follows:
(In won and number of shares) 2021 Profit for the year W552,173,088,265 Adjustments:
Interest expenses of convertible bond, net of income tax 11,382,390,353 Loss on fair value valuation of convertible bond, net of income tax 50,521,798,972
Diluted profit for the year 614,077,277,590 Weighted-average number of common stocks outstanding after
adjustment 398,804,698
Diluted earnings per share W 1,540
Weighted-average number of common stocks outstanding, after adjustment, for measurement of diluted earnings per share is determined asfollows:
(Number of shares) 2021 Weighted-average number of common stocks outstanding W357,815,700
Adjustment: Number of common stocks to be issued from conversion 40,988,998
Weighted-average number of common stocks outstanding, after adjustment W398,804,698
Diluted loss per share is not different from basic loss per share as there is no dilution effects of potential common stocks for the year endedDecember 31, 2020, due to loss. In 2020, 40,988,998 shares of potential common stock to be issued from conversion were not consideredfrom the calculation of weighted-average number of common stocks due to antidilution.
236
3/16/22, 10:38 PM Form 6-K
https://www.sec.gov/Archives/edgar/data/0001290109/000119312522075294/d288774d6k.htm 238/268
Table of Contents
LG DISPLAY CO., LTD.Notes to the Separate Financial Statements
For the years ended December 31, 2021 and 2020 26. Financial Risk Management
The Company is exposed to credit risk, liquidity risk and market risks. The Company identifies and analyzes such risks, and controls areimplemented under a risk management system to monitor and manage these risks at below an acceptable level.
(a) Market risk
Market risk is the risk that changes in market prices, such as foreign exchange rates, interest rates and equity prices will affect theCompany’s income or the value of its holdings of financial instruments. The objective of market risk management is to manage and controlmarket risk exposures within acceptable parameters, while optimizing the return.
(i) Currency risk
The Company is exposed to currency risk on sales, purchases and borrowings that are denominated in a currency other than the functionalcurrency of the Company, Korean won (KRW). The currencies in which these transactions primarily are denominated are USD, JPY, etc.
Interest on borrowings is accrued in the currency of the borrowing. Generally, borrowings are denominated in currencies that match thecash flows generated by the underlying operations of the Company, primarily KRW and USD.
The Company adopts policies to ensure that its net exposure is kept to a manageable level by buying or selling foreign currencies at spotrates when necessary to address short-term imbalances. In respect of monetary assets and liabilities denominated in foreign currencies, theCompany manages currency risk through continuously managing the position of foreign currencies, measuring the currency risk and, ifnecessary, using derivatives such as currency forwards, currency swap and others.
237

3/16/22, 10:38 PM Form 6-K
https://www.sec.gov/Archives/edgar/data/0001290109/000119312522075294/d288774d6k.htm 239/268
Table of Contents
LG DISPLAY CO., LTD.Notes to the Separate Financial Statements
For the years ended December 31, 2021 and 2020 26. Financial Risk Management, Continued i) Exposure to currency risk
The Company’s exposure to foreign currency risk based on notional amounts as of December 31, 2021 and 2020 is as follows: (In millions) December 31, 2021 USD JPY CNY PLN EUR Cash and cash equivalents 800 80 4 1 — Trade accounts and notes receivable 4,167 4,462 — — — Other accounts receivables 47 70 22 — — Trade accounts and notes payable (4,014) (8,296) — — — Other accounts payable (1,144) (4,274) — — (3) Financial liabilities (2,782) — — — —
(2,926) (7,958) 26 1 (3)
Cross currency interest rate swap contracts(*) 1,545 — — — —
Net exposure (1,381) (7,958) 26 1 (3)
(*) Of cross currency interest rate swap contracts, USD 100 million were entered into to hedge currency risk with respect to foreign currencydenominated borrowings and USD 1,445 million were entered into to hedge currency risk and interest rate risk with respect to foreign currencydenominated borrowings and bonds.
(In millions) December 31, 2020 USD JPY CNY PLN EUR GBP Cash and cash equivalents 1,112 7 41 2 — — Trade accounts and notes receivable 3,425 1,782 — — — — Other accounts receivables 79 90 — — 6 — Trade accounts and notes payable (3,035) (8,853) — — — — Other accounts payable (266) (4,765) (25) — (1) (2) Financial liabilities (3,034) — — — — —
(1,719) (11,739) 16 2 5 (2)
Cross currency interest rate swap contracts 2,225 — — — — —
Net exposure 506 (11,739) 16 2 5 (2)
238
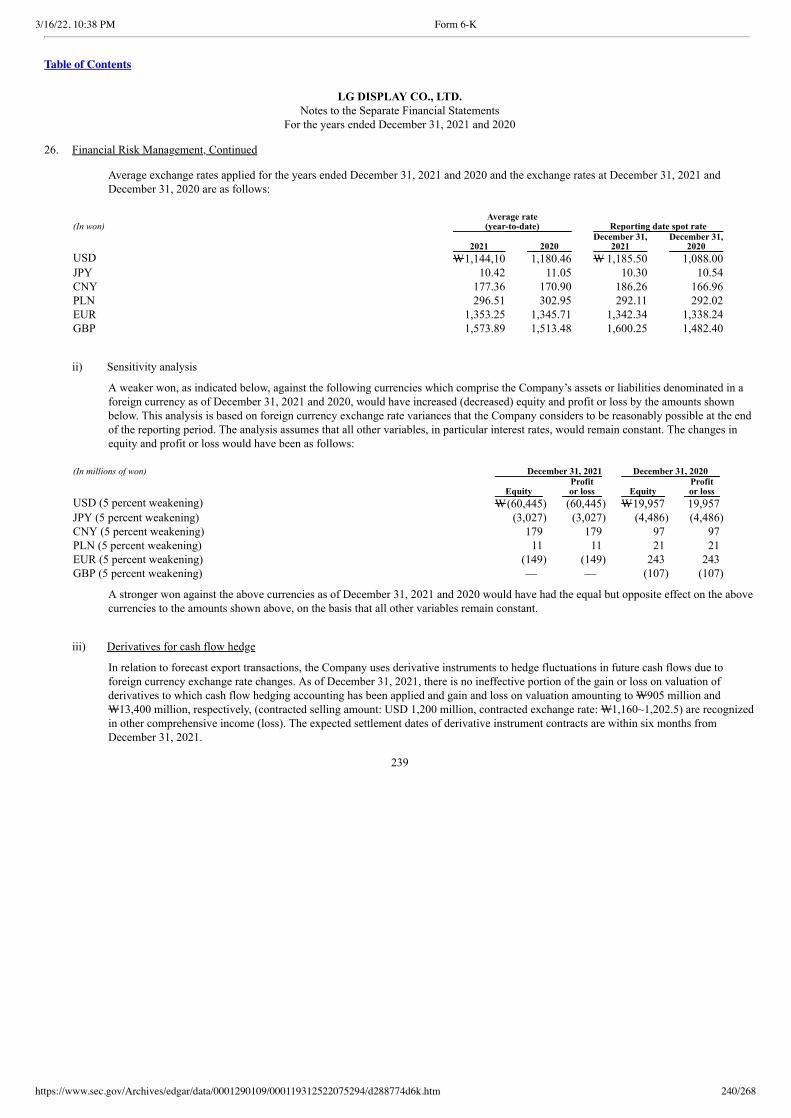
3/16/22, 10:38 PM Form 6-K
https://www.sec.gov/Archives/edgar/data/0001290109/000119312522075294/d288774d6k.htm 240/268
Table of Contents
LG DISPLAY CO., LTD.Notes to the Separate Financial Statements
For the years ended December 31, 2021 and 2020 26. Financial Risk Management, Continued
Average exchange rates applied for the years ended December 31, 2021 and 2020 and the exchange rates at December 31, 2021 andDecember 31, 2020 are as follows:
(In won)
Average rate (year-to-date) Reporting date spot rate
2021 2020 December 31,
2021 December 31,
2020 USD W1,144,10 1,180.46 W 1,185.50 1,088.00 JPY 10.42 11.05 10.30 10.54 CNY 177.36 170.90 186.26 166.96 PLN 296.51 302.95 292.11 292.02 EUR 1,353.25 1,345.71 1,342.34 1,338.24 GBP 1,573.89 1,513.48 1,600.25 1,482.40
ii) Sensitivity analysis
A weaker won, as indicated below, against the following currencies which comprise the Company’s assets or liabilities denominated in aforeign currency as of December 31, 2021 and 2020, would have increased (decreased) equity and profit or loss by the amounts shownbelow. This analysis is based on foreign currency exchange rate variances that the Company considers to be reasonably possible at the endof the reporting period. The analysis assumes that all other variables, in particular interest rates, would remain constant. The changes inequity and profit or loss would have been as follows:
(In millions of won) December 31, 2021 December 31, 2020
Equity Profit
or loss Equity Profit
or loss USD (5 percent weakening) W(60,445) (60,445) W19,957 19,957 JPY (5 percent weakening) (3,027) (3,027) (4,486) (4,486) CNY (5 percent weakening) 179 179 97 97 PLN (5 percent weakening) 11 11 21 21 EUR (5 percent weakening) (149) (149) 243 243 GBP (5 percent weakening) — — (107) (107)
A stronger won against the above currencies as of December 31, 2021 and 2020 would have had the equal but opposite effect on the abovecurrencies to the amounts shown above, on the basis that all other variables remain constant.
iii) Derivatives for cash flow hedge
In relation to forecast export transactions, the Company uses derivative instruments to hedge fluctuations in future cash flows due toforeign currency exchange rate changes. As of December 31, 2021, there is no ineffective portion of the gain or loss on valuation ofderivatives to which cash flow hedging accounting has been applied and gain and loss on valuation amounting to W905 million andW13,400 million, respectively, (contracted selling amount: USD 1,200 million, contracted exchange rate: W1,160~1,202.5) are recognizedin other comprehensive income (loss). The expected settlement dates of derivative instrument contracts are within six months fromDecember 31, 2021.
239
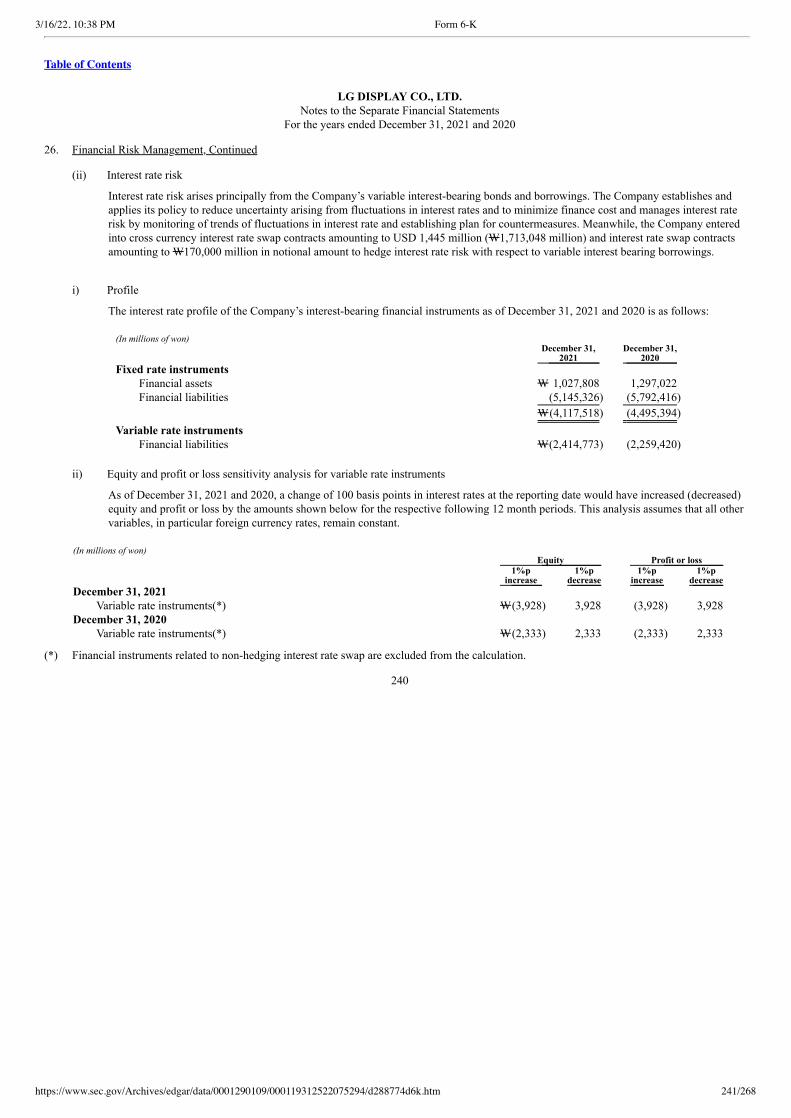
3/16/22, 10:38 PM Form 6-K
https://www.sec.gov/Archives/edgar/data/0001290109/000119312522075294/d288774d6k.htm 241/268
Table of Contents
LG DISPLAY CO., LTD.Notes to the Separate Financial Statements
For the years ended December 31, 2021 and 2020 26. Financial Risk Management, Continued (ii) Interest rate risk
Interest rate risk arises principally from the Company’s variable interest-bearing bonds and borrowings. The Company establishes andapplies its policy to reduce uncertainty arising from fluctuations in interest rates and to minimize finance cost and manages interest raterisk by monitoring of trends of fluctuations in interest rate and establishing plan for countermeasures. Meanwhile, the Company enteredinto cross currency interest rate swap contracts amounting to USD 1,445 million (W1,713,048 million) and interest rate swap contractsamounting to W170,000 million in notional amount to hedge interest rate risk with respect to variable interest bearing borrowings.
i) Profile
The interest rate profile of the Company’s interest-bearing financial instruments as of December 31, 2021 and 2020 is as follows:
(In millions of won)
December 31,
2021 December 31,
2020 Fixed rate instruments
Financial assets W 1,027,808 1,297,022 Financial liabilities (5,145,326) (5,792,416)
W(4,117,518) (4,495,394)
Variable rate instruments Financial liabilities W(2,414,773) (2,259,420)
ii) Equity and profit or loss sensitivity analysis for variable rate instruments
As of December 31, 2021 and 2020, a change of 100 basis points in interest rates at the reporting date would have increased (decreased)equity and profit or loss by the amounts shown below for the respective following 12 month periods. This analysis assumes that all othervariables, in particular foreign currency rates, remain constant.
(In millions of won) Equity Profit or loss
1%p
increase 1%p
decrease 1%p
increase 1%p
decrease December 31, 2021
Variable rate instruments(*) W(3,928) 3,928 (3,928) 3,928 December 31, 2020
Variable rate instruments(*) W(2,333) 2,333 (2,333) 2,333
(*) Financial instruments related to non-hedging interest rate swap are excluded from the calculation.
240
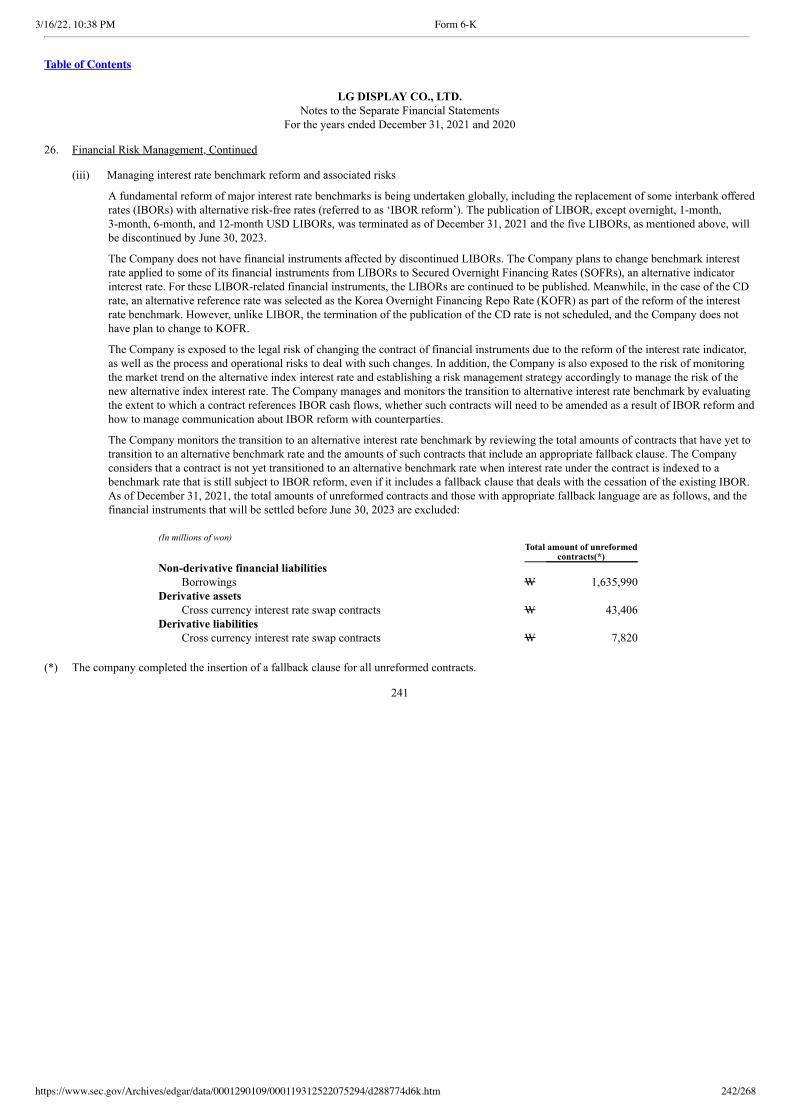
3/16/22, 10:38 PM Form 6-K
https://www.sec.gov/Archives/edgar/data/0001290109/000119312522075294/d288774d6k.htm 242/268
Table of Contents
LG DISPLAY CO., LTD.Notes to the Separate Financial Statements
For the years ended December 31, 2021 and 2020 26. Financial Risk Management, Continued (iii) Managing interest rate benchmark reform and associated risks
A fundamental reform of major interest rate benchmarks is being undertaken globally, including the replacement of some interbank offeredrates (IBORs) with alternative risk-free rates (referred to as ‘IBOR reform’). The publication of LIBOR, except overnight, 1-month,3-month, 6-month, and 12-month USD LIBORs, was terminated as of December 31, 2021 and the five LIBORs, as mentioned above, willbe discontinued by June 30, 2023.
The Company does not have financial instruments affected by discontinued LIBORs. The Company plans to change benchmark interestrate applied to some of its financial instruments from LIBORs to Secured Overnight Financing Rates (SOFRs), an alternative indicatorinterest rate. For these LIBOR-related financial instruments, the LIBORs are continued to be published. Meanwhile, in the case of the CDrate, an alternative reference rate was selected as the Korea Overnight Financing Repo Rate (KOFR) as part of the reform of the interestrate benchmark. However, unlike LIBOR, the termination of the publication of the CD rate is not scheduled, and the Company does nothave plan to change to KOFR.
The Company is exposed to the legal risk of changing the contract of financial instruments due to the reform of the interest rate indicator,as well as the process and operational risks to deal with such changes. In addition, the Company is also exposed to the risk of monitoringthe market trend on the alternative index interest rate and establishing a risk management strategy accordingly to manage the risk of thenew alternative index interest rate. The Company manages and monitors the transition to alternative interest rate benchmark by evaluatingthe extent to which a contract references IBOR cash flows, whether such contracts will need to be amended as a result of IBOR reform andhow to manage communication about IBOR reform with counterparties.
The Company monitors the transition to an alternative interest rate benchmark by reviewing the total amounts of contracts that have yet totransition to an alternative benchmark rate and the amounts of such contracts that include an appropriate fallback clause. The Companyconsiders that a contract is not yet transitioned to an alternative benchmark rate when interest rate under the contract is indexed to abenchmark rate that is still subject to IBOR reform, even if it includes a fallback clause that deals with the cessation of the existing IBOR.As of December 31, 2021, the total amounts of unreformed contracts and those with appropriate fallback language are as follows, and thefinancial instruments that will be settled before June 30, 2023 are excluded:
(In millions of won)
Total amount of unreformed
contracts(*) Non-derivative financial liabilities
Borrowings W 1,635,990 Derivative assets
Cross currency interest rate swap contracts W 43,406 Derivative liabilities
Cross currency interest rate swap contracts W 7,820 (*) The company completed the insertion of a fallback clause for all unreformed contracts.
241
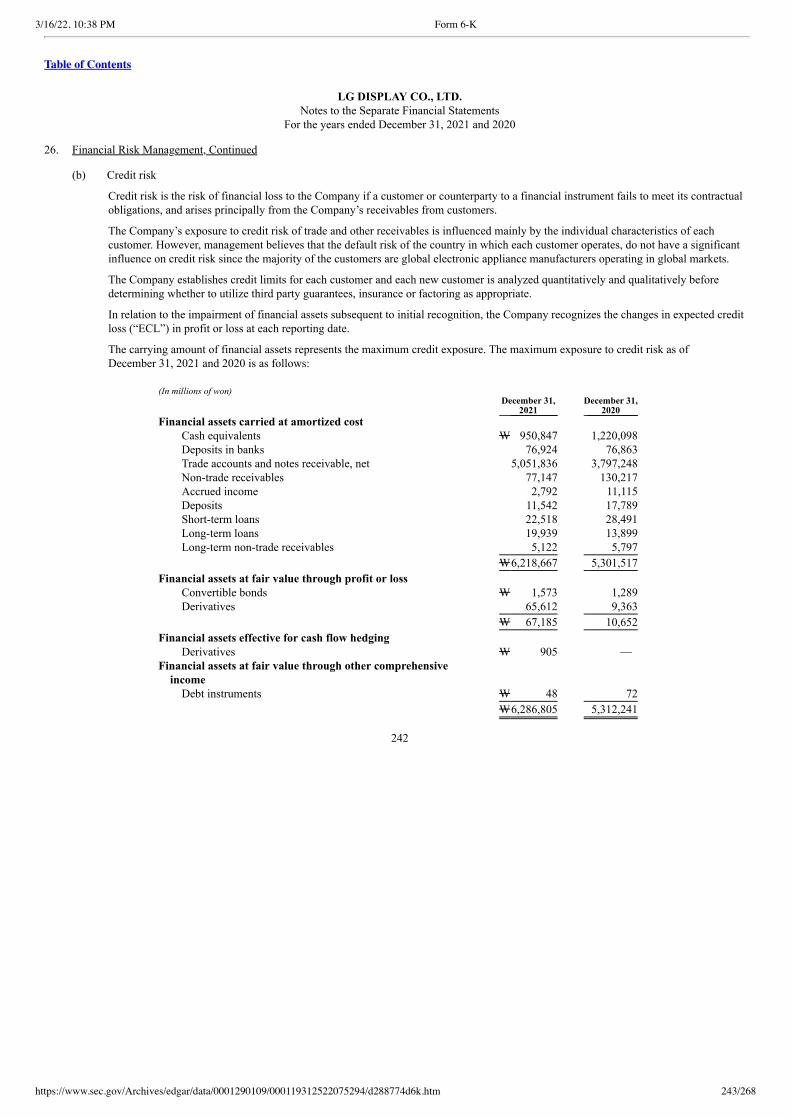
3/16/22, 10:38 PM Form 6-K
https://www.sec.gov/Archives/edgar/data/0001290109/000119312522075294/d288774d6k.htm 243/268
Table of Contents
LG DISPLAY CO., LTD.Notes to the Separate Financial Statements
For the years ended December 31, 2021 and 2020 26. Financial Risk Management, Continued (b) Credit risk
Credit risk is the risk of financial loss to the Company if a customer or counterparty to a financial instrument fails to meet its contractualobligations, and arises principally from the Company’s receivables from customers.
The Company’s exposure to credit risk of trade and other receivables is influenced mainly by the individual characteristics of eachcustomer. However, management believes that the default risk of the country in which each customer operates, do not have a significantinfluence on credit risk since the majority of the customers are global electronic appliance manufacturers operating in global markets.
The Company establishes credit limits for each customer and each new customer is analyzed quantitatively and qualitatively beforedetermining whether to utilize third party guarantees, insurance or factoring as appropriate.
In relation to the impairment of financial assets subsequent to initial recognition, the Company recognizes the changes in expected creditloss (“ECL”) in profit or loss at each reporting date.
The carrying amount of financial assets represents the maximum credit exposure. The maximum exposure to credit risk as ofDecember 31, 2021 and 2020 is as follows:
(In millions of won)
December 31,
2021 December 31,
2020 Financial assets carried at amortized cost
Cash equivalents W 950,847 1,220,098 Deposits in banks 76,924 76,863 Trade accounts and notes receivable, net 5,051,836 3,797,248 Non-trade receivables 77,147 130,217 Accrued income 2,792 11,115 Deposits 11,542 17,789 Short-term loans 22,518 28,491 Long-term loans 19,939 13,899 Long-term non-trade receivables 5,122 5,797
W6,218,667 5,301,517
Financial assets at fair value through profit or loss Convertible bonds W 1,573 1,289 Derivatives 65,612 9,363
W 67,185 10,652
Financial assets effective for cash flow hedging Derivatives W 905 —
Financial assets at fair value through other comprehensiveincome
Debt instruments W 48 72
W6,286,805 5,312,241
242
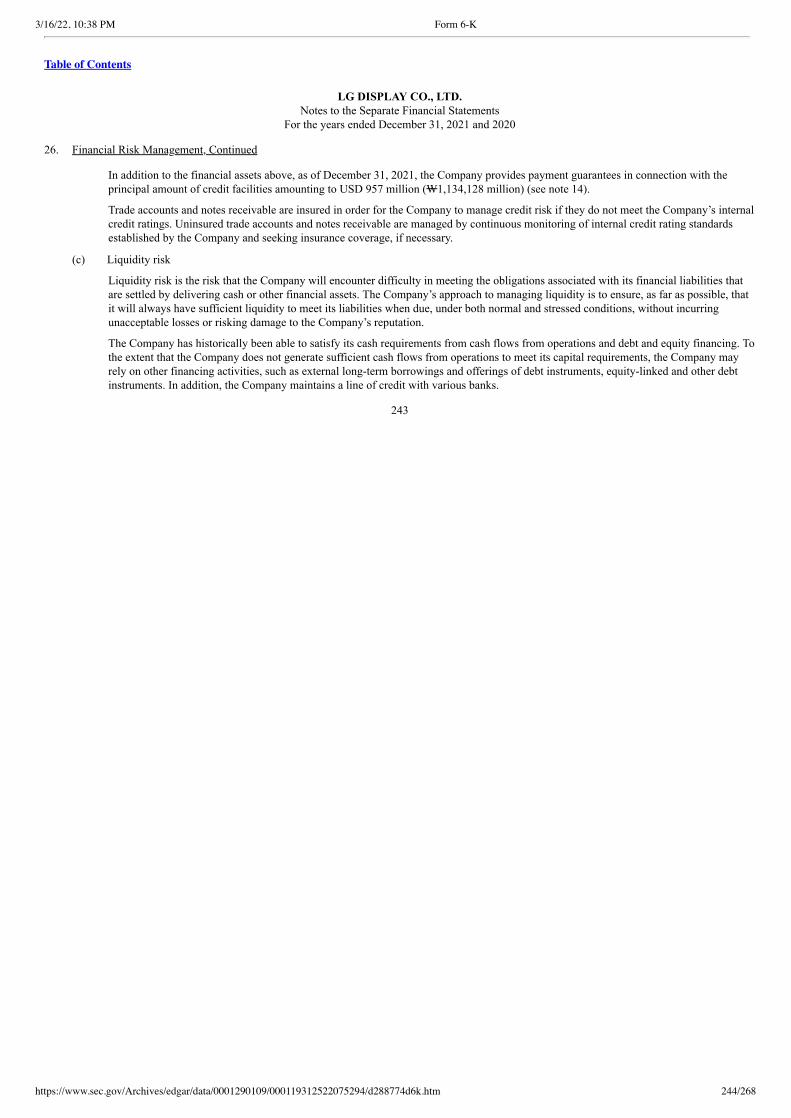
3/16/22, 10:38 PM Form 6-K
https://www.sec.gov/Archives/edgar/data/0001290109/000119312522075294/d288774d6k.htm 244/268
Table of Contents
LG DISPLAY CO., LTD.Notes to the Separate Financial Statements
For the years ended December 31, 2021 and 2020 26. Financial Risk Management, Continued
In addition to the financial assets above, as of December 31, 2021, the Company provides payment guarantees in connection with theprincipal amount of credit facilities amounting to USD 957 million (W1,134,128 million) (see note 14).
Trade accounts and notes receivable are insured in order for the Company to manage credit risk if they do not meet the Company’s internalcredit ratings. Uninsured trade accounts and notes receivable are managed by continuous monitoring of internal credit rating standardsestablished by the Company and seeking insurance coverage, if necessary.
(c) Liquidity risk
Liquidity risk is the risk that the Company will encounter difficulty in meeting the obligations associated with its financial liabilities thatare settled by delivering cash or other financial assets. The Company’s approach to managing liquidity is to ensure, as far as possible, thatit will always have sufficient liquidity to meet its liabilities when due, under both normal and stressed conditions, without incurringunacceptable losses or risking damage to the Company’s reputation.
The Company has historically been able to satisfy its cash requirements from cash flows from operations and debt and equity financing. Tothe extent that the Company does not generate sufficient cash flows from operations to meet its capital requirements, the Company mayrely on other financing activities, such as external long-term borrowings and offerings of debt instruments, equity-linked and other debtinstruments. In addition, the Company maintains a line of credit with various banks.
243

3/16/22, 10:38 PM Form 6-K
https://www.sec.gov/Archives/edgar/data/0001290109/000119312522075294/d288774d6k.htm 245/268
Table of Contents
LG DISPLAY CO., LTD.Notes to the Separate Financial Statements
For the years ended December 31, 2021 and 2020 26. Financial Risk Management, Continued
The following are the contractual maturities of financial liabilities, including estimated interest payments, as of December 31, 2021. (In millions of won) Contractual cash flows in
Carrying
amount Total 6 months or
less 6-12
months 1-2
years 2-5
years
More than 5 years
Non-derivative financial liabilities Borrowings W 4,948,538 5,179,140 582,466 441,859 1,769,319 2,385,496 — Bonds 2,611,561 2,531,468 575,029 884,996 329,661 652,467 89,315 Trade accounts and notes payable 6,528,451 6,528,451 6,183,078 345,373 — — — Other accounts payable 1,726,734 1,728,654 1,623,312 105,342 — — — Other accounts payable (enterprise procurement
cards)(*1) 1,074,089 1,074,089 1,023,130 50,959 — — — Long-term other accounts payable 460,995 547,774 — — 99,606 249,004 199,164 Payment guarantee(*2) 6,208 1,154,117 278,049 159,208 403,596 313,264 — Security deposits received 11,180 11,180 2,860 5,590 2,730 — — Lease liabilities 5,219 5,385 1,644 1,383 1,891 467 —
Derivative financial liabilities Derivatives W 10,925 8,378 5,473 2,364 541 — — Derivatives for cash flow hedge 13,400 13,400 13,400 — — — —
W17,397,300 18,782,036 10,288,441 1,997,074 2,607,344 3,600,698 288,479
(*1) Represents liabilities payable to credit card companies for utility expenses and others paid using enterprise procurement cards. The Company
presented the payable to credit card companies as other accounts payable and disclosed related cash flows as operating activities since theCompany is using the enterprise procurement cards through agreements with suppliers for transactions arising from purchasing of goods andservices, the payment term is within a year from the purchase, as part of the normal operating cycle, and no security is provided. Change inliabilities related to procurement cards for the year ended December 31, 2021 is as follows:
(In millions of won)
January 1, 2021
Change (Cash flows from
operation activities) December 31, 2021 Other accounts payable (enterprise procurement cards) W 1,078,150 (4,061) 1,074,089 (*2) Contractual cash flows of payment guarantee is identical to timing of principal and interest payment and represent the maximum amount that the
Company could be required to pay the guarantee amount.
244
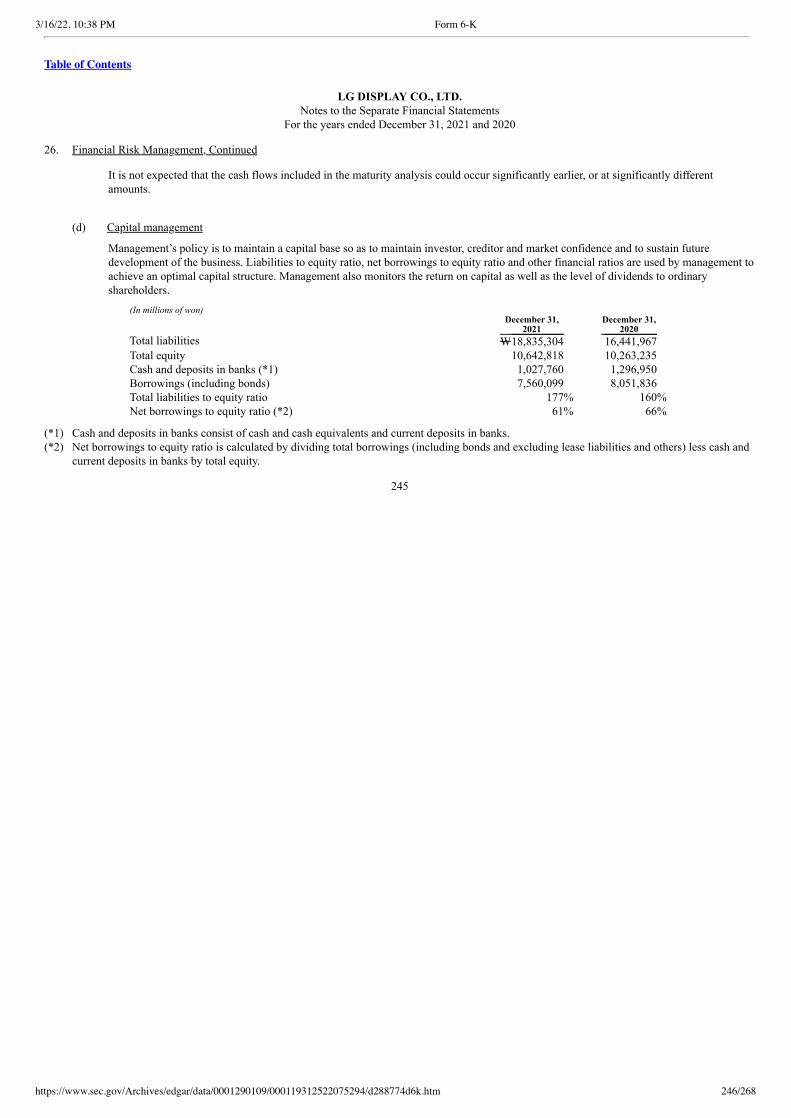
3/16/22, 10:38 PM Form 6-K
https://www.sec.gov/Archives/edgar/data/0001290109/000119312522075294/d288774d6k.htm 246/268
Table of Contents
LG DISPLAY CO., LTD.Notes to the Separate Financial Statements
For the years ended December 31, 2021 and 2020 26. Financial Risk Management, Continued
It is not expected that the cash flows included in the maturity analysis could occur significantly earlier, or at significantly differentamounts.
(d) Capital management
Management’s policy is to maintain a capital base so as to maintain investor, creditor and market confidence and to sustain futuredevelopment of the business. Liabilities to equity ratio, net borrowings to equity ratio and other financial ratios are used by management toachieve an optimal capital structure. Management also monitors the return on capital as well as the level of dividends to ordinaryshareholders.
(In millions of won)
December 31,
2021 December 31,
2020 Total liabilities W18,835,304 16,441,967 Total equity 10,642,818 10,263,235 Cash and deposits in banks (*1) 1,027,760 1,296,950 Borrowings (including bonds) 7,560,099 8,051,836 Total liabilities to equity ratio 177% 160% Net borrowings to equity ratio (*2) 61% 66%
(*1) Cash and deposits in banks consist of cash and cash equivalents and current deposits in banks.(*2) Net borrowings to equity ratio is calculated by dividing total borrowings (including bonds and excluding lease liabilities and others) less cash and
current deposits in banks by total equity.
245
3/16/22, 10:38 PM Form 6-K
https://www.sec.gov/Archives/edgar/data/0001290109/000119312522075294/d288774d6k.htm 247/268
Table of Contents
LG DISPLAY CO., LTD.Notes to the Separate Financial Statements
For the years ended December 31, 2021 and 2020 26. Financial Risk Management, Continued (e) Determination of fair value
(i) Measurement of fair value
A number of the Company’s accounting policies and disclosures require the determination of fair value, for both financial andnon-financial assets and liabilities. Fair values have been determined for measurement and/or disclosure purposes based on the followingmethods. When applicable, further information about the assumptions made in determining fair values is disclosed in the notes specific tothat asset or liability.
i) Current assets and liabilities
The carrying amounts approximate their fair value because of the short maturity of these instruments.
ii) Trade receivables and other receivables
The fair value of trade and other receivables is estimated as the present value of future cash flows, discounted at the market rate of interestat the reporting date. This fair value is determined for disclosure purposes. The carrying amounts of current receivables approximate theirfair value.
iii) Investments in equity and debt instruments
The fair value of marketable financial assets at FVTPL and FVOCI is determined by reference to their quoted closing bid price at thereporting date. The fair value of non-marketable instruments is determined using the results of fair value assessment performed by externalvaluation institutions and others.
iv) Non-derivative financial liabilities
Fair value, which is determined for disclosure purposes, except for the liabilities at FVTPL, is calculated based on the present value offuture principal and interest cash flows, discounted at the market rate of interest at the reporting date.
v) Derivatives
The inputs used to measure the fair value of currency forward and cross currency interest rate swap are calculated based on the exchangerates and interest rates observable in the market at the reporting date.
246
3/16/22, 10:38 PM Form 6-K
https://www.sec.gov/Archives/edgar/data/0001290109/000119312522075294/d288774d6k.htm 248/268
Table of Contents
LG DISPLAY CO., LTD.Notes to the Separate Financial Statements
For the years ended December 31, 2021 and 2020 26. Financial Risk Management, Continued (ii) Fair values versus carrying amounts
The fair values of financial assets and liabilities, together with the carrying amounts shown in the separate statements of financialposition as of December 31, 2021 and 2020 are as follows:
(In millions of won) December 31, 2021 December 31, 2020
Carrying
amounts Fair
values Carrying
amounts Fair
values Financial assets carried at amortized cost
Cash and cash equivalents W 950,847 (*) 1,220,098 (*) Deposits in banks 76,924 (*) 76,863 (*) Trade accounts and notes receivable 5,051,836 (*) 3,797,248 (*) Non-trade receivables 77,147 (*) 130,217 (*) Accrued income 2,792 (*) 11,115 (*) Deposits 11,542 (*) 17,789 (*) Short-term loans 22,518 (*) 28,491 (*) Long-term loans 19,939 (*) 13,899 (*) Long-term non-trade receivables 5,122 (*) 5,797 (*)
Financial assets at fair value through profit orloss
Equity instruments W 3,096 3,096 1,381 1,381 Convertible bonds 1,573 1,573 1,289 1,289 Derivatives 65,612 65,612 9,363 9,363
Financial assets effective for cash flow hedging Derivatives W 905 905 — —
Financial assets at fair value through othercomprehensive income
Debt instruments W 48 48 72 72 Financial liabilities at fair value through profit
or loss Derivatives W 10,925 10,925 167,625 167,625 Convertible bonds 1,015,760 1,015,760 861,675 861,675
Financial liabilities effective for cash flowhedging
Derivatives W 13,400 13,400 — — Financial liabilities carried at amortized cost
Borrowings W4,948,538 4,960,360 5,279,920 5,311,440 Bonds 1,595,801 1,596,044 1,910,241 1,923,517 Trade accounts and notes payable 6,528,451 (*) 4,591,319 (*) Other accounts payable 2,800,823 (*) 2,373,730 (*) Long-term other accounts payable 460,995 (*) — (*) Payment guarantee liabilities 6,208 (*) 10,373 (*) Security deposits received 11,180 (*) 12,350 (*) Lease liabilities 5,219 (*) 5,380 (*)
(*) Excluded from disclosures as the carrying amount approximates fair value.
247
3/16/22, 10:38 PM Form 6-K
https://www.sec.gov/Archives/edgar/data/0001290109/000119312522075294/d288774d6k.htm 249/268
Table of Contents
LG DISPLAY CO., LTD.Notes to the Separate Financial Statements
For the years ended December 31, 2021 and 2020 26. Financial Risk Management, Continued (iii) Fair values of financial assets and liabilities
i) Fair value hierarchy
Financial instruments carried at fair value are categorized into different levels in a fair value hierarchy based on the inputsused in the valuation techniques. The different levels have been defined as follows:
• Level 1: quoted prices (unadjusted) in active markets for identical assets or liabilities
• Level 2: inputs other than quoted prices included within Level 1 that are observable for the asset or liability, eitherdirectly or indirectly
• Level 3: inputs for the asset or liability that are not based on observable market data
248

3/16/22, 10:38 PM Form 6-K
https://www.sec.gov/Archives/edgar/data/0001290109/000119312522075294/d288774d6k.htm 250/268
Table of Contents
LG DISPLAY CO., LTD.Notes to the Separate Financial Statements
For the years ended December 31, 2021 and 2020 26. Financial Risk Management, Continued ii) Financial instruments measured at fair value
Fair value hierarchy classifications of the financial instruments that are measured at fair value as of December 31, 2021 and2020 are as follows:
(In millions of won) December 31, 2021 Level 1 Level 2 Level 3 Total Financial assets at fair value through profit or loss
Equity instruments W — — 3,096 3,096 Convertible bonds — — 1,573 1,573 Derivatives — 65,612 — 65,612
Financial assets effective for cash flow hedging Derivatives W — 905 — 905
Financial assets at fair value through other comprehensive income Debt instruments W 48 — — 48
Financial liabilities at fair value through profit or loss Derivatives W — 10,925 — 10,925 Convertible bonds 1,015,760 — — 1,015,760
Financial liabilities effective for cash flow hedging Derivatives W — 13,400 — 13,400
(In millions of won) December 31, 2020 Level 1 Level 2 Level 3 Total Financial assets at fair value through profit or loss
Equity instruments W — — 1,381 1,381 Convertible bonds — — 1,289 1,289 Derivatives — 9,363 — 9,363
Financial assets at fair value through other comprehensive income Debt instruments W 72 — — 72
Financial liabilities at fair value through profit or loss Derivatives W — 167,625 — 167,625 Convertible bonds 861,675 — — 861,675
249

3/16/22, 10:38 PM Form 6-K
https://www.sec.gov/Archives/edgar/data/0001290109/000119312522075294/d288774d6k.htm 251/268
Table of Contents
LG DISPLAY CO., LTD.Notes to the Separate Financial Statements
For the years ended December 31, 2021 and 2020 26. Financial Risk Management, Continued iii) Financial instruments not measured at fair value but for which the fair value is disclosed
Fair value hierarchy classifications, valuation technique and inputs for fair value measurements of the financial instrumentsnot measured at fair value but for which the fair value is disclosed as of December 31, 2021 and December 31, 2020 are asfollows:
(In millions of won) December 31, 2021
Valuation
technique Input Classification Level 1 Level 2 Level 3 Liabilities
Borrowings W— — 4,960,360
Discounted cash flow
Discount rate
Bonds — — 1,596,044
Discounted cash flow
Discount rate
(In millions of won) December 31, 2020
Valuation technique Input Classification Level 1 Level 2 Level 3
Liabilities Borrowings
W— — 5,311,440
Discounted cash flow
Discount rate
Bonds — — 1,923,517
Discounted cash flow
Discount rate
iv) The interest rates applied for determination of the above fair value as of December 31, 2021 and 2020 are as follows:
December 31,
2021 December 31,
2020Borrowings, bonds and others 2.21~4.38% 2.15~4.46%
250
3/16/22, 10:38 PM Form 6-K
https://www.sec.gov/Archives/edgar/data/0001290109/000119312522075294/d288774d6k.htm 252/268
Table of Contents
LG DISPLAY CO., LTD.Notes to the Separate Financial Statements
For the years ended December 31, 2021 and 2020 27. Leases
The Company leases buildings, vehicles, machinery and equipment and others. Information about leases for which the Company is a lessee ispresented below.
(i) Right-of-use assets
Right-of-use assets are presented as property, plant and equipment as of December 31, 2021 and 2020 (see Note 9(a)).
Changes in right-of-use assets for the years ended December 31, 2021 and 2020 are as follows: (In millions of won) 2021
Buildings Land Machinery and
equipment Vehicles Others Total Balance at January 1 W 682 36 1,213 3,501 — 5,432 Additions 7,759 40 867 3,785 49 12,500 Depreciation (8,409) (40) (1,097) (3,088) (8) (12,642)
Balance at December 31 W 32 36 983 4,198 41 5,290
(In millions of won) 2020
Buildings Land Machinery
and equipment Vehicles Others Total Balance at January 1 W 922 1 1,180 4,282 30 6,415 Additions 7,748 39 1,163 2,241 2 11,193 Depreciation (7,988) (4) (1,130) (3,022) (32) (12,176)
Balance at December 31 W 682 36 1,213 3,501 — 5,432
(ii) Amounts recognized in profit or loss not from right-of-use assets for the years ended December 31, 2021 and 2020 are as follows: (In millions of won) 2021 2020 Interest on lease liabilities W(298) (590) Expenses relating to short-term leases (330) (976) Expenses relating to leases of low-value assets (554) (70)
(iii) Changes in lease liabilities for the years ended December 31, 2021 and 2020 are as follows: (In millions of won) 2021 2020 Balance at January 1 W 5,380 6,557 Additions 12,200 10,606 Interest expense 298 590 Repayment of liabilities (12,659) (12,373)
Balance at December 31 W 5,219 5,380
251
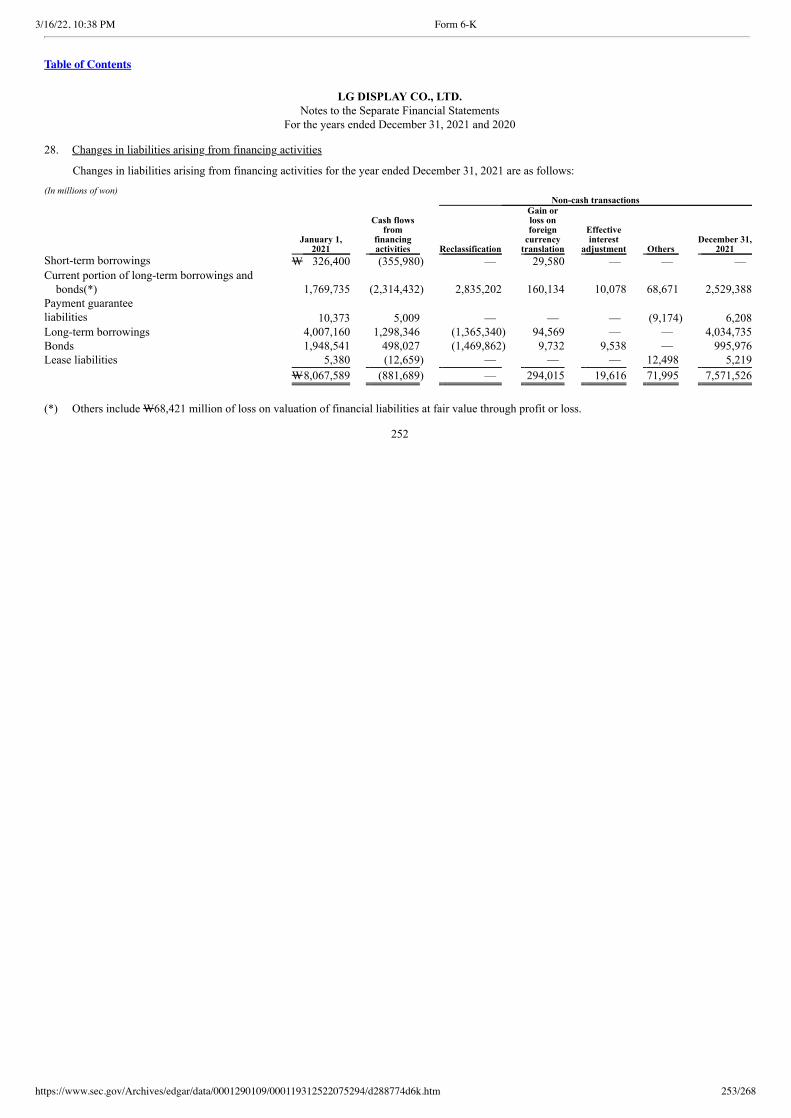
3/16/22, 10:38 PM Form 6-K
https://www.sec.gov/Archives/edgar/data/0001290109/000119312522075294/d288774d6k.htm 253/268
Table of Contents
LG DISPLAY CO., LTD.Notes to the Separate Financial Statements
For the years ended December 31, 2021 and 2020 28. Changes in liabilities arising from financing activities
Changes in liabilities arising from financing activities for the year ended December 31, 2021 are as follows: (In millions of won)
January 1,
2021
Non-cash transactions
Cash flows from
financing activities Reclassification
Gain or loss on foreign currency translation
Effective interest
adjustment Others December 31,
2021 Short-term borrowings W 326,400 (355,980) — 29,580 — — — Current portion of long-term borrowings and
bonds(*) 1,769,735 (2,314,432) 2,835,202 160,134 10,078 68,671 2,529,388 Payment guaranteeliabilities 10,373 5,009 — — — (9,174) 6,208 Long-term borrowings 4,007,160 1,298,346 (1,365,340) 94,569 — — 4,034,735 Bonds 1,948,541 498,027 (1,469,862) 9,732 9,538 — 995,976 Lease liabilities 5,380 (12,659) — — — 12,498 5,219
W8,067,589 (881,689) — 294,015 19,616 71,995 7,571,526
(*) Others include W68,421 million of loss on valuation of financial liabilities at fair value through profit or loss.
252
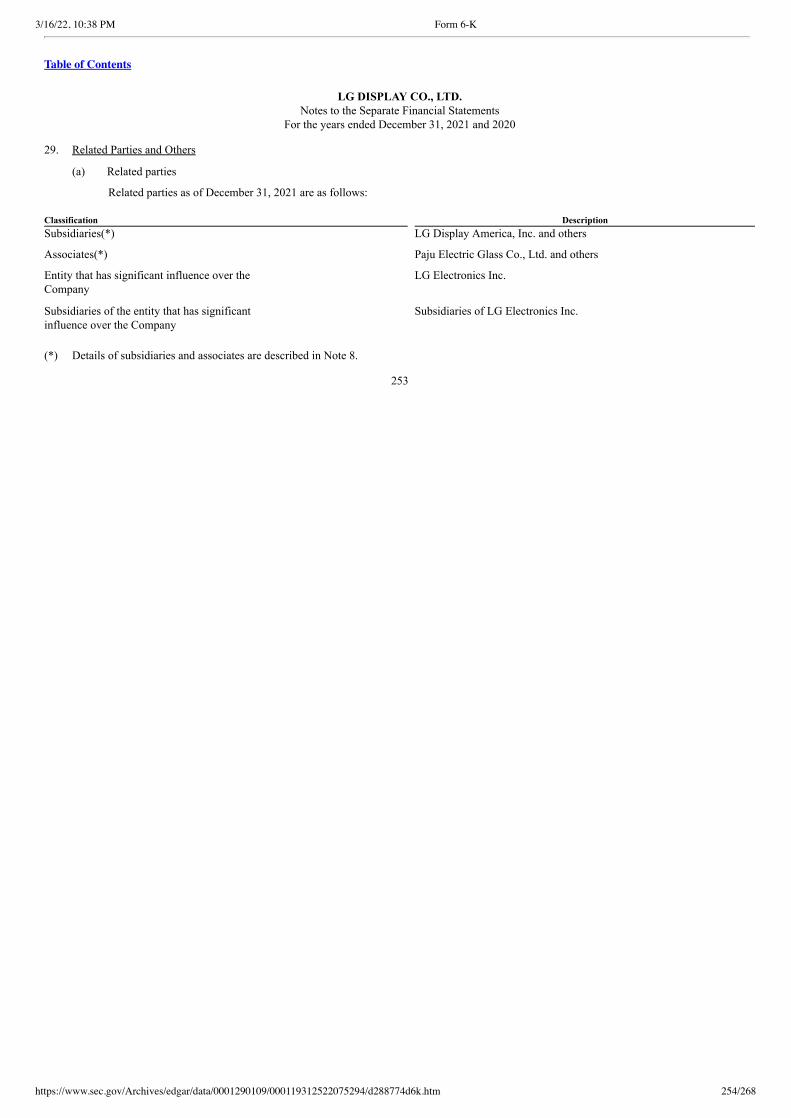
3/16/22, 10:38 PM Form 6-K
https://www.sec.gov/Archives/edgar/data/0001290109/000119312522075294/d288774d6k.htm 254/268
Table of Contents
LG DISPLAY CO., LTD.Notes to the Separate Financial Statements
For the years ended December 31, 2021 and 2020 29. Related Parties and Others
(a) Related parties
Related parties as of December 31, 2021 are as follows: Classification DescriptionSubsidiaries(*) LG Display America, Inc. and others
Associates(*) Paju Electric Glass Co., Ltd. and others
Entity that has significant influence over theCompany
LG Electronics Inc.
Subsidiaries of the entity that has significantinfluence over the Company
Subsidiaries of LG Electronics Inc.
(*) Details of subsidiaries and associates are described in Note 8.
253
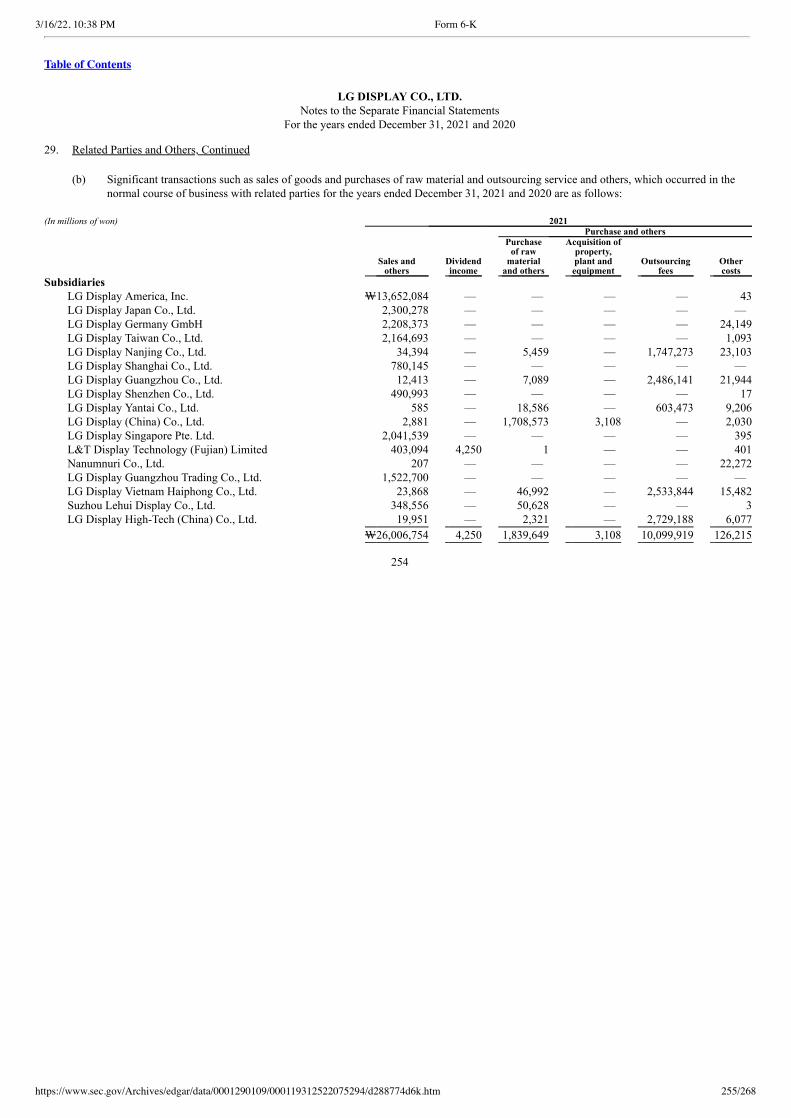
3/16/22, 10:38 PM Form 6-K
https://www.sec.gov/Archives/edgar/data/0001290109/000119312522075294/d288774d6k.htm 255/268
Table of Contents
LG DISPLAY CO., LTD.Notes to the Separate Financial Statements
For the years ended December 31, 2021 and 2020 29. Related Parties and Others, Continued (b) Significant transactions such as sales of goods and purchases of raw material and outsourcing service and others, which occurred in the
normal course of business with related parties for the years ended December 31, 2021 and 2020 are as follows: (In millions of won) 2021 Purchase and others
Sales and
others Dividend
income
Purchase of raw
material and others
Acquisition of property,
plant and equipment
Outsourcing fees
Other costs
Subsidiaries LG Display America, Inc. W13,652,084 — — — — 43 LG Display Japan Co., Ltd. 2,300,278 — — — — — LG Display Germany GmbH 2,208,373 — — — — 24,149 LG Display Taiwan Co., Ltd. 2,164,693 — — — — 1,093 LG Display Nanjing Co., Ltd. 34,394 — 5,459 — 1,747,273 23,103 LG Display Shanghai Co., Ltd. 780,145 — — — — — LG Display Guangzhou Co., Ltd. 12,413 — 7,089 — 2,486,141 21,944 LG Display Shenzhen Co., Ltd. 490,993 — — — — 17 LG Display Yantai Co., Ltd. 585 — 18,586 — 603,473 9,206 LG Display (China) Co., Ltd. 2,881 — 1,708,573 3,108 — 2,030 LG Display Singapore Pte. Ltd. 2,041,539 — — — — 395 L&T Display Technology (Fujian) Limited 403,094 4,250 1 — — 401 Nanumnuri Co., Ltd. 207 — — — — 22,272 LG Display Guangzhou Trading Co., Ltd. 1,522,700 — — — — — LG Display Vietnam Haiphong Co., Ltd. 23,868 — 46,992 — 2,533,844 15,482 Suzhou Lehui Display Co., Ltd. 348,556 — 50,628 — — 3 LG Display High-Tech (China) Co., Ltd. 19,951 — 2,321 — 2,729,188 6,077
W26,006,754 4,250 1,839,649 3,108 10,099,919 126,215
254

3/16/22, 10:38 PM Form 6-K
https://www.sec.gov/Archives/edgar/data/0001290109/000119312522075294/d288774d6k.htm 256/268
Table of Contents
LG DISPLAY CO., LTD.Notes to the Separate Financial Statements
For the years ended December 31, 2021 and 2020 29. Related Parties and Others, Continued (In millions of won) 2021 Purchase and others
Sales and
Others Dividend
income
Purchase of raw material and
others
Acquisition of property, plant and equipment
Outsourcing fees
Other costs
Associates WooRee E&L Co., Ltd. W — — 492 — — 79 AVATEC Co., Ltd. — 200 713 — 72,156 1,485 Paju Electric Glass Co., Ltd. — 3,668 365,400 — — 2,734 YAS Co., Ltd. — 200 10,337 44,732 — 9,824 Cynora — — 10 — — — Material Science Co., Ltd. — — 187 — — —
W — 4,068 377,139 44,732 72,156 14,122
Entity that has significant influence over the Company LG Electronics Inc. W264,044 — 11,666 195,222 — 119,639
255
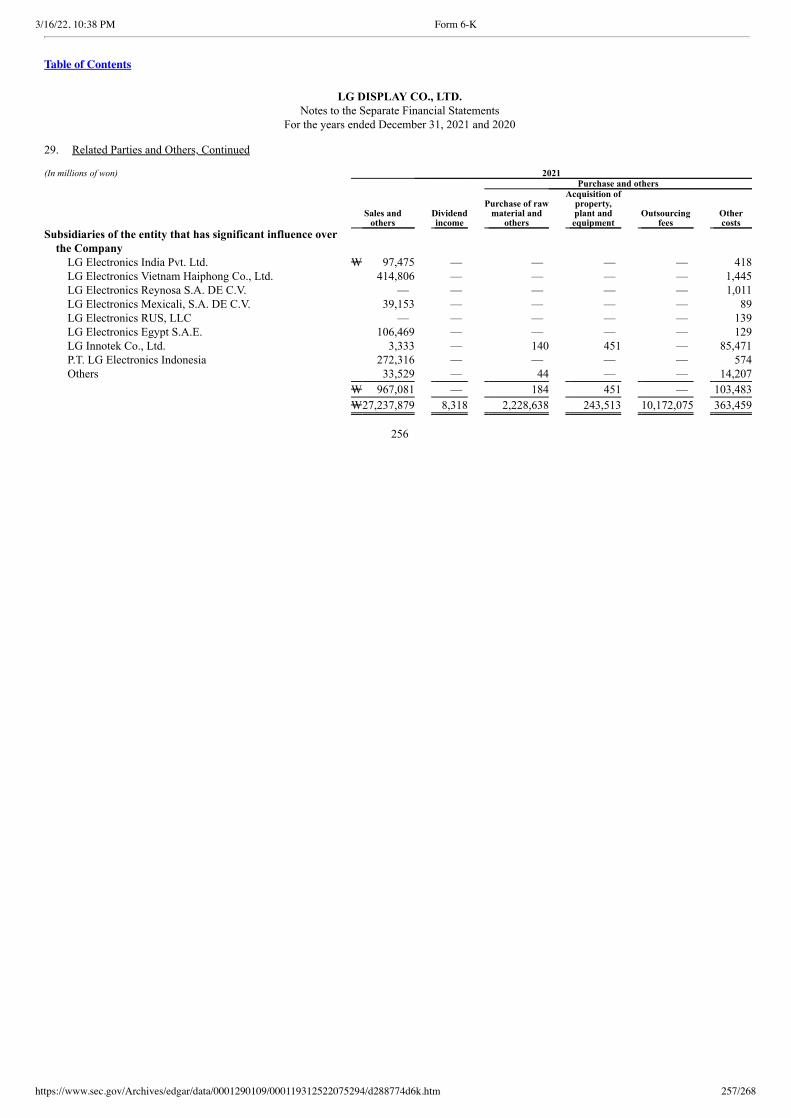
3/16/22, 10:38 PM Form 6-K
https://www.sec.gov/Archives/edgar/data/0001290109/000119312522075294/d288774d6k.htm 257/268
Table of Contents
LG DISPLAY CO., LTD.Notes to the Separate Financial Statements
For the years ended December 31, 2021 and 2020 29. Related Parties and Others, Continued (In millions of won) 2021 Purchase and others
Sales and
others Dividend
income
Purchase of raw material and
others
Acquisition of property,
plant and equipment
Outsourcing fees
Other costs
Subsidiaries of the entity that has significant influence overthe Company
LG Electronics India Pvt. Ltd. W 97,475 — — — — 418 LG Electronics Vietnam Haiphong Co., Ltd. 414,806 — — — — 1,445 LG Electronics Reynosa S.A. DE C.V. — — — — — 1,011 LG Electronics Mexicali, S.A. DE C.V. 39,153 — — — — 89 LG Electronics RUS, LLC — — — — — 139 LG Electronics Egypt S.A.E. 106,469 — — — — 129 LG Innotek Co., Ltd. 3,333 — 140 451 — 85,471 P.T. LG Electronics Indonesia 272,316 — — — — 574 Others 33,529 — 44 — — 14,207
W 967,081 — 184 451 — 103,483
W27,237,879 8,318 2,228,638 243,513 10,172,075 363,459
256
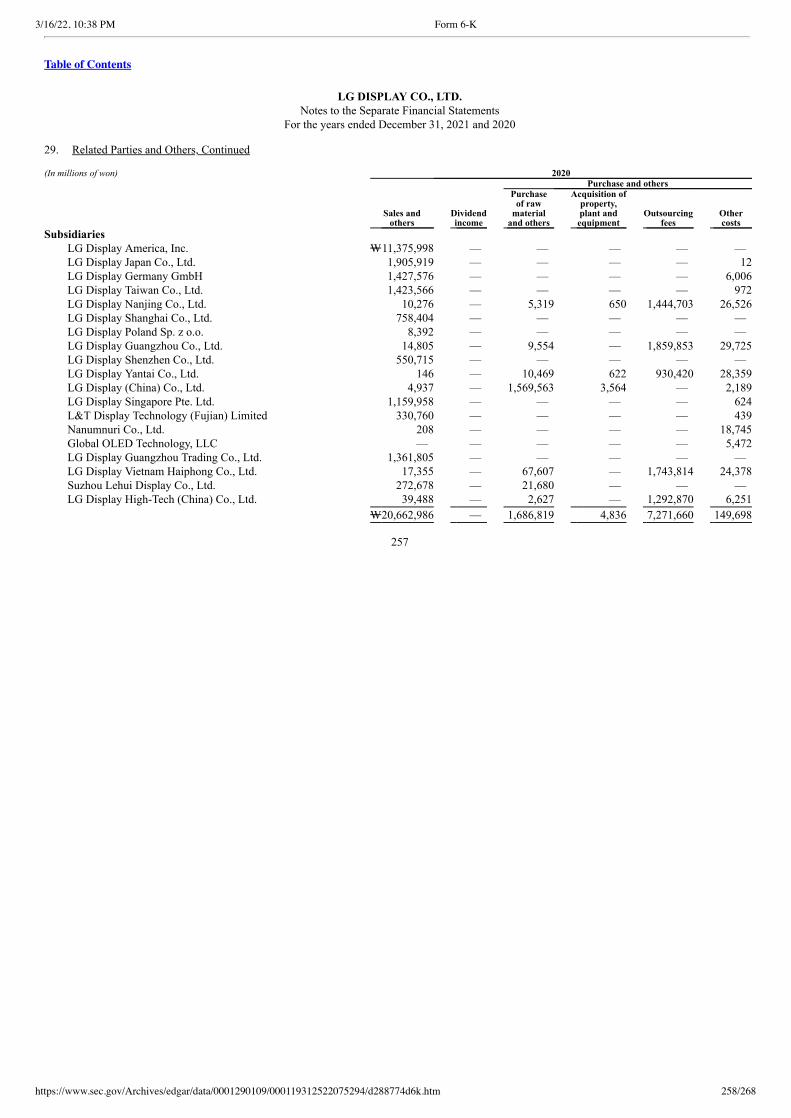
3/16/22, 10:38 PM Form 6-K
https://www.sec.gov/Archives/edgar/data/0001290109/000119312522075294/d288774d6k.htm 258/268
Table of Contents
LG DISPLAY CO., LTD.Notes to the Separate Financial Statements
For the years ended December 31, 2021 and 2020 29. Related Parties and Others, Continued (In millions of won) 2020 Purchase and others
Sales and
others Dividend
income
Purchase of raw
material and others
Acquisition of property,
plant and equipment
Outsourcing fees
Other costs
Subsidiaries LG Display America, Inc. W11,375,998 — — — — — LG Display Japan Co., Ltd. 1,905,919 — — — — 12 LG Display Germany GmbH 1,427,576 — — — — 6,006 LG Display Taiwan Co., Ltd. 1,423,566 — — — — 972 LG Display Nanjing Co., Ltd. 10,276 — 5,319 650 1,444,703 26,526 LG Display Shanghai Co., Ltd. 758,404 — — — — — LG Display Poland Sp. z o.o. 8,392 — — — — — LG Display Guangzhou Co., Ltd. 14,805 — 9,554 — 1,859,853 29,725 LG Display Shenzhen Co., Ltd. 550,715 — — — — — LG Display Yantai Co., Ltd. 146 — 10,469 622 930,420 28,359 LG Display (China) Co., Ltd. 4,937 — 1,569,563 3,564 — 2,189 LG Display Singapore Pte. Ltd. 1,159,958 — — — — 624 L&T Display Technology (Fujian) Limited 330,760 — — — — 439 Nanumnuri Co., Ltd. 208 — — — — 18,745 Global OLED Technology, LLC — — — — — 5,472 LG Display Guangzhou Trading Co., Ltd. 1,361,805 — — — — — LG Display Vietnam Haiphong Co., Ltd. 17,355 — 67,607 — 1,743,814 24,378 Suzhou Lehui Display Co., Ltd. 272,678 — 21,680 — — — LG Display High-Tech (China) Co., Ltd. 39,488 — 2,627 — 1,292,870 6,251
W20,662,986 — 1,686,819 4,836 7,271,660 149,698
257
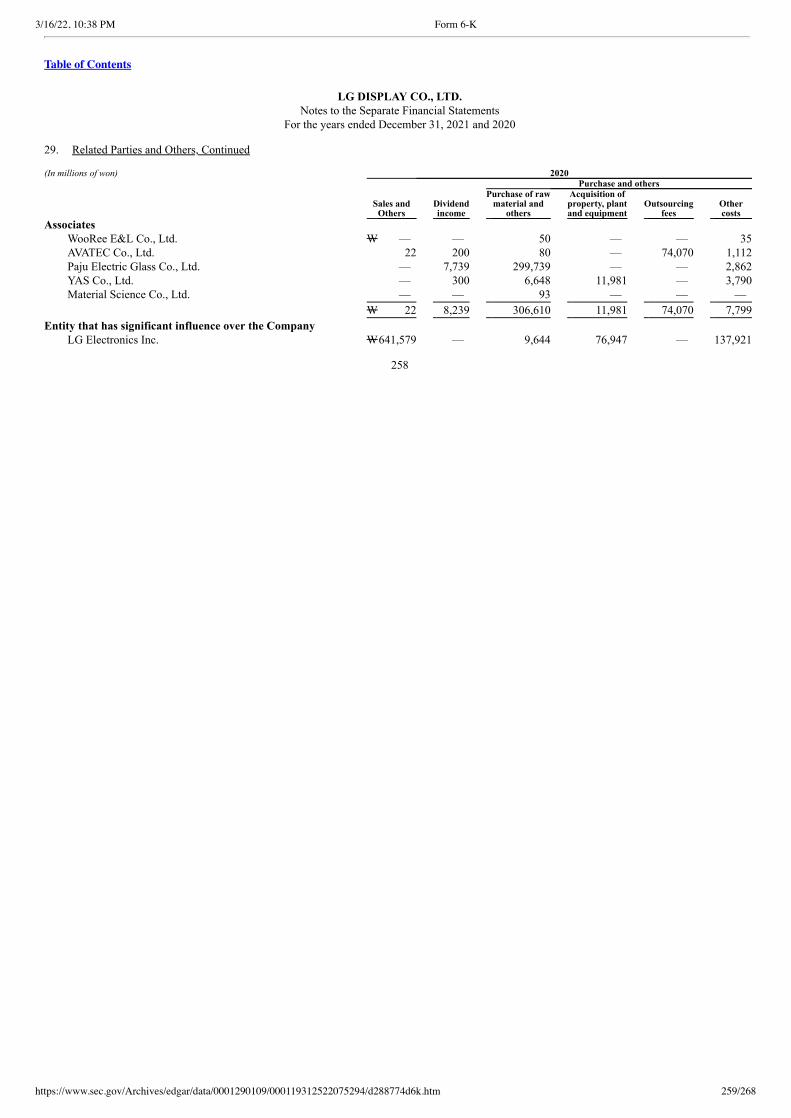
3/16/22, 10:38 PM Form 6-K
https://www.sec.gov/Archives/edgar/data/0001290109/000119312522075294/d288774d6k.htm 259/268
Table of Contents
LG DISPLAY CO., LTD.Notes to the Separate Financial Statements
For the years ended December 31, 2021 and 2020 29. Related Parties and Others, Continued (In millions of won) 2020 Purchase and others
Sales and
Others Dividend
income
Purchase of raw material and
others
Acquisition of property, plant and equipment
Outsourcing fees
Other costs
Associates WooRee E&L Co., Ltd. W — — 50 — — 35 AVATEC Co., Ltd. 22 200 80 — 74,070 1,112 Paju Electric Glass Co., Ltd. — 7,739 299,739 — — 2,862 YAS Co., Ltd. — 300 6,648 11,981 — 3,790 Material Science Co., Ltd. — — 93 — — —
W 22 8,239 306,610 11,981 74,070 7,799
Entity that has significant influence over the Company LG Electronics Inc. W641,579 — 9,644 76,947 — 137,921
258
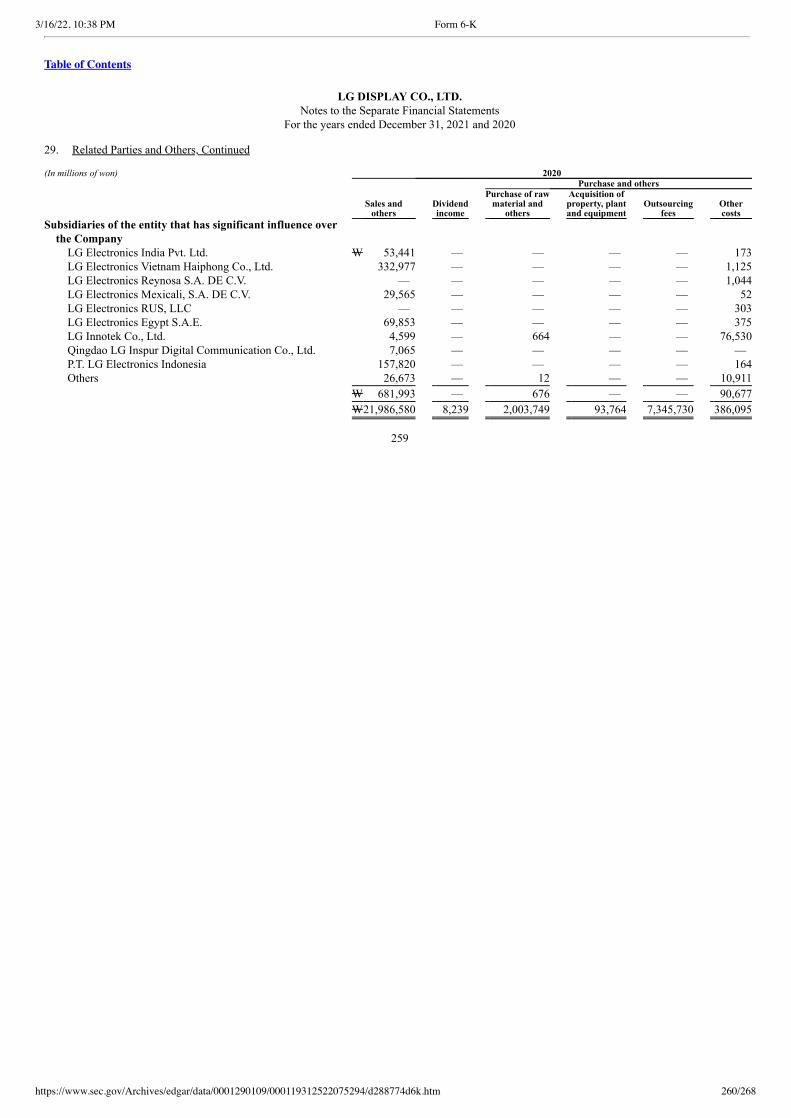
3/16/22, 10:38 PM Form 6-K
https://www.sec.gov/Archives/edgar/data/0001290109/000119312522075294/d288774d6k.htm 260/268
Table of Contents
LG DISPLAY CO., LTD.Notes to the Separate Financial Statements
For the years ended December 31, 2021 and 2020 29. Related Parties and Others, Continued (In millions of won) 2020 Purchase and others
Sales and
others Dividend
income
Purchase of raw material and
others
Acquisition of property, plant and equipment
Outsourcing fees
Other costs
Subsidiaries of the entity that has significant influence overthe Company
LG Electronics India Pvt. Ltd. W 53,441 — — — — 173 LG Electronics Vietnam Haiphong Co., Ltd. 332,977 — — — — 1,125 LG Electronics Reynosa S.A. DE C.V. — — — — — 1,044 LG Electronics Mexicali, S.A. DE C.V. 29,565 — — — — 52 LG Electronics RUS, LLC — — — — — 303 LG Electronics Egypt S.A.E. 69,853 — — — — 375 LG Innotek Co., Ltd. 4,599 — 664 — — 76,530 Qingdao LG Inspur Digital Communication Co., Ltd. 7,065 — — — — — P.T. LG Electronics Indonesia 157,820 — — — — 164 Others 26,673 — 12 — — 10,911
W 681,993 — 676 — — 90,677
W21,986,580 8,239 2,003,749 93,764 7,345,730 386,095
259

3/16/22, 10:38 PM Form 6-K
https://www.sec.gov/Archives/edgar/data/0001290109/000119312522075294/d288774d6k.htm 261/268
Table of Contents
LG DISPLAY CO., LTD.Notes to the Separate Financial Statements
For the years ended December 31, 2021 and 2020 29. Related Parties and Others, Continued (c) Trade accounts and notes receivable and payable as of December 31, 2021 and 2020 are as follows: (In millions of won)
Trade accounts and notes receivable and
others Trade accounts and notes payable
and others December 31, 2021 December 31, 2020 December 31, 2021 December 31, 2020 Subsidiaries
LG Display America, Inc. W 1,851,411 1,341,210 25 5 LG Display Japan Co., Ltd. 462,618 344,276 5 12 LG Display Germany GmbH 586,120 287,359 23,593 7 LG Display Taiwan Co., Ltd. 445,830 296,556 151 95 LG Display Nanjing Co., Ltd. 334 2,465 613,161 385,925 LG Display Shanghai Co., Ltd. 499,770 319,033 5 11 LG Display Guangzhou Co., Ltd. 691 1,337 774,672 341,389 LG Display Guangzhou Trading Co., Ltd. 418,302 498,483 — — LG Display Shenzhen Co., Ltd. 97,129 27,327 15 — LG Display Yantai Co., Ltd. — — 76,722 140,076 LG Display (China) Co., Ltd. 3,805 1,394 215,709 314,934 LG Display Singapore Pte. Ltd. 172,755 218,280 1 10 L&T Display Technology (Fujian) Limited 72,298 41,971 224,941 149,845 Nanumnuri Co., Ltd. — — 5,261 1,773 LG Display Vietnam Haiphong Co., Ltd. 9,088 16,632 993,392 605,531 Suzhou Lehui Display Co., Ltd. 76,396 46,760 8,863 16,047 LG Display High-Tech (China) Co., Ltd. 4,914 10,821 715,930 388,053
W 4,701,461 3,453,904 3,652,446 2,343,713
260
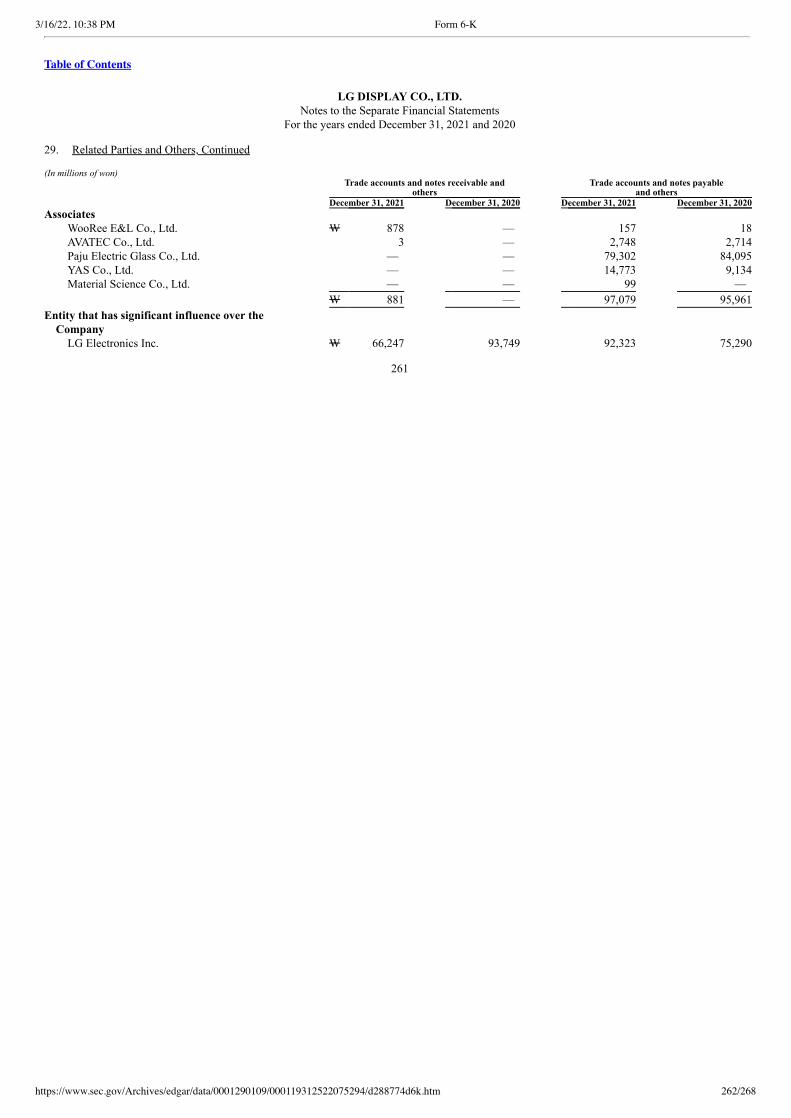
3/16/22, 10:38 PM Form 6-K
https://www.sec.gov/Archives/edgar/data/0001290109/000119312522075294/d288774d6k.htm 262/268
Table of Contents
LG DISPLAY CO., LTD.Notes to the Separate Financial Statements
For the years ended December 31, 2021 and 2020 29. Related Parties and Others, Continued (In millions of won)
Trade accounts and notes receivable and
others Trade accounts and notes payable
and others December 31, 2021 December 31, 2020 December 31, 2021 December 31, 2020 Associates
WooRee E&L Co., Ltd. W 878 — 157 18 AVATEC Co., Ltd. 3 — 2,748 2,714 Paju Electric Glass Co., Ltd. — — 79,302 84,095 YAS Co., Ltd. — — 14,773 9,134 Material Science Co., Ltd. — — 99 —
W 881 — 97,079 95,961
Entity that has significant influence over theCompany
LG Electronics Inc. W 66,247 93,749 92,323 75,290
261
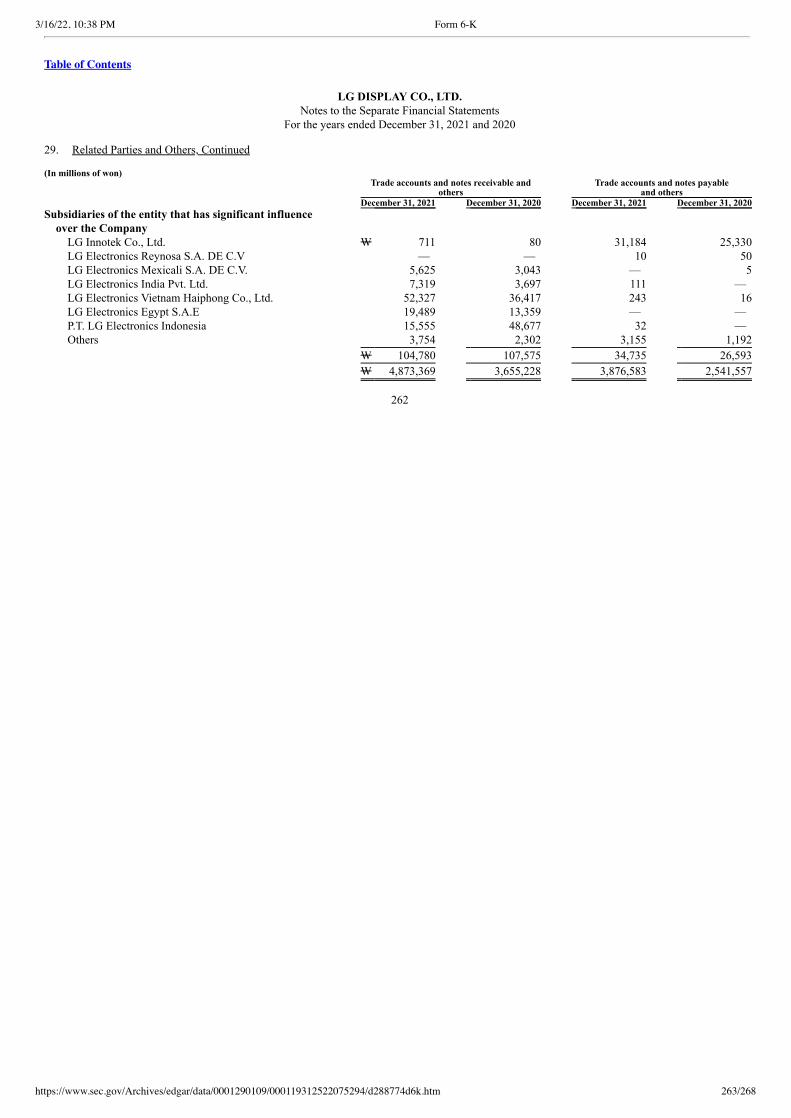
3/16/22, 10:38 PM Form 6-K
https://www.sec.gov/Archives/edgar/data/0001290109/000119312522075294/d288774d6k.htm 263/268
Table of Contents
LG DISPLAY CO., LTD.Notes to the Separate Financial Statements
For the years ended December 31, 2021 and 2020 29. Related Parties and Others, Continued (In millions of won)
Trade accounts and notes receivable and
others Trade accounts and notes payable
and others December 31, 2021 December 31, 2020 December 31, 2021 December 31, 2020 Subsidiaries of the entity that has significant influence
over the Company LG Innotek Co., Ltd. W 711 80 31,184 25,330 LG Electronics Reynosa S.A. DE C.V — — 10 50 LG Electronics Mexicali S.A. DE C.V. 5,625 3,043 — 5 LG Electronics India Pvt. Ltd. 7,319 3,697 111 — LG Electronics Vietnam Haiphong Co., Ltd. 52,327 36,417 243 16 LG Electronics Egypt S.A.E 19,489 13,359 — — P.T. LG Electronics Indonesia 15,555 48,677 32 — Others 3,754 2,302 3,155 1,192
W 104,780 107,575 34,735 26,593
W 4,873,369 3,655,228 3,876,583 2,541,557
262
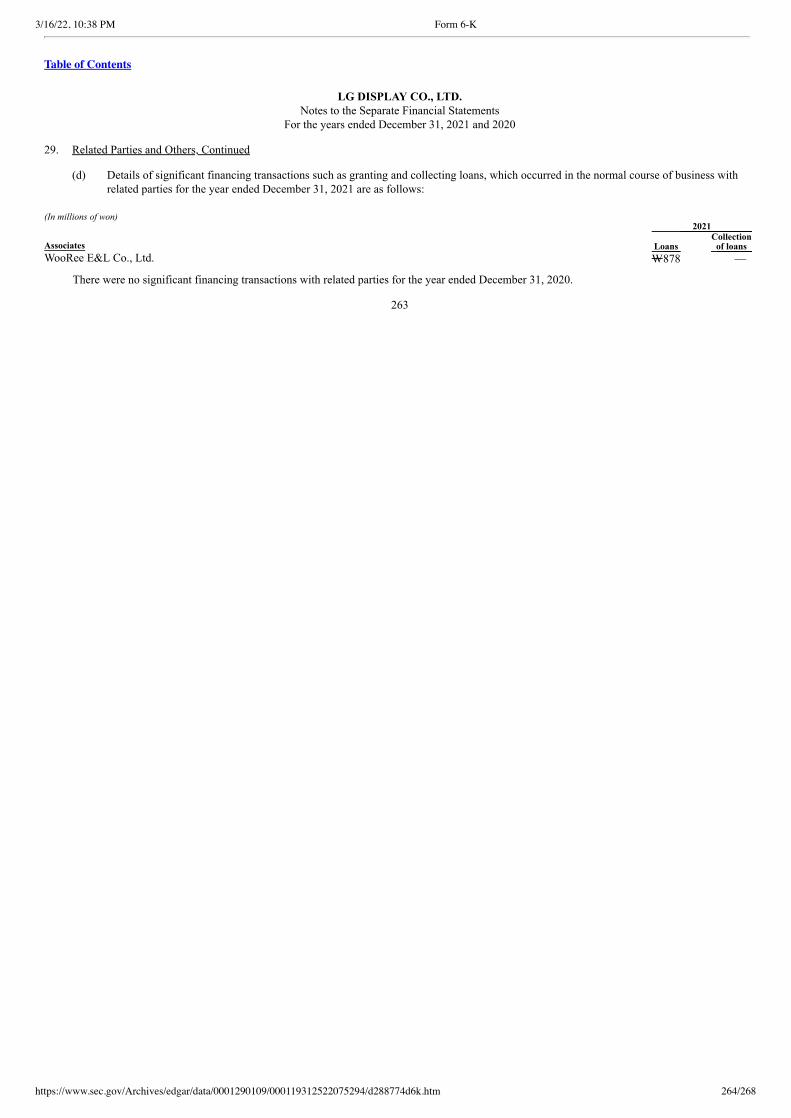
3/16/22, 10:38 PM Form 6-K
https://www.sec.gov/Archives/edgar/data/0001290109/000119312522075294/d288774d6k.htm 264/268
Table of Contents
LG DISPLAY CO., LTD.Notes to the Separate Financial Statements
For the years ended December 31, 2021 and 2020 29. Related Parties and Others, Continued
(d) Details of significant financing transactions such as granting and collecting loans, which occurred in the normal course of business withrelated parties for the year ended December 31, 2021 are as follows:
(In millions of won) 2021
Associates Loans Collection
of loans WooRee E&L Co., Ltd. W878 —
There were no significant financing transactions with related parties for the year ended December 31, 2020.
263
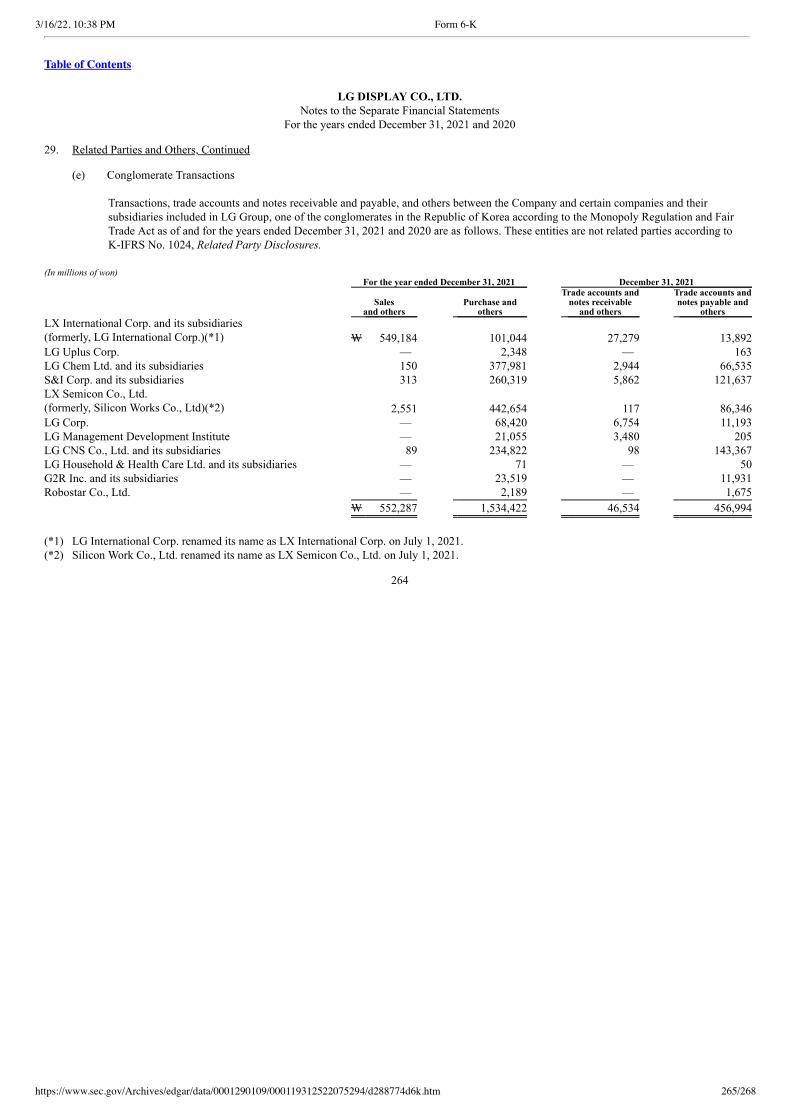
3/16/22, 10:38 PM Form 6-K
https://www.sec.gov/Archives/edgar/data/0001290109/000119312522075294/d288774d6k.htm 265/268
Table of Contents
LG DISPLAY CO., LTD.Notes to the Separate Financial Statements
For the years ended December 31, 2021 and 2020 29. Related Parties and Others, Continued (e) Conglomerate Transactions
Transactions, trade accounts and notes receivable and payable, and others between the Company and certain companies and theirsubsidiaries included in LG Group, one of the conglomerates in the Republic of Korea according to the Monopoly Regulation and FairTrade Act as of and for the years ended December 31, 2021 and 2020 are as follows. These entities are not related parties according toK-IFRS No. 1024, Related Party Disclosures.
(In millions of won) For the year ended December 31, 2021 December 31, 2021
Sales
and others Purchase and
others
Trade accounts and notes receivable
and others
Trade accounts and notes payable and
others LX International Corp. and its subsidiaries(formerly, LG International Corp.)(*1) W 549,184 101,044 27,279 13,892 LG Uplus Corp. — 2,348 — 163 LG Chem Ltd. and its subsidiaries 150 377,981 2,944 66,535 S&I Corp. and its subsidiaries 313 260,319 5,862 121,637 LX Semicon Co., Ltd.(formerly, Silicon Works Co., Ltd)(*2) 2,551 442,654 117 86,346 LG Corp. — 68,420 6,754 11,193 LG Management Development Institute — 21,055 3,480 205 LG CNS Co., Ltd. and its subsidiaries 89 234,822 98 143,367 LG Household & Health Care Ltd. and its subsidiaries — 71 — 50 G2R Inc. and its subsidiaries — 23,519 — 11,931 Robostar Co., Ltd. — 2,189 — 1,675
W 552,287 1,534,422 46,534 456,994
(*1) LG International Corp. renamed its name as LX International Corp. on July 1, 2021.(*2) Silicon Work Co., Ltd. renamed its name as LX Semicon Co., Ltd. on July 1, 2021.
264
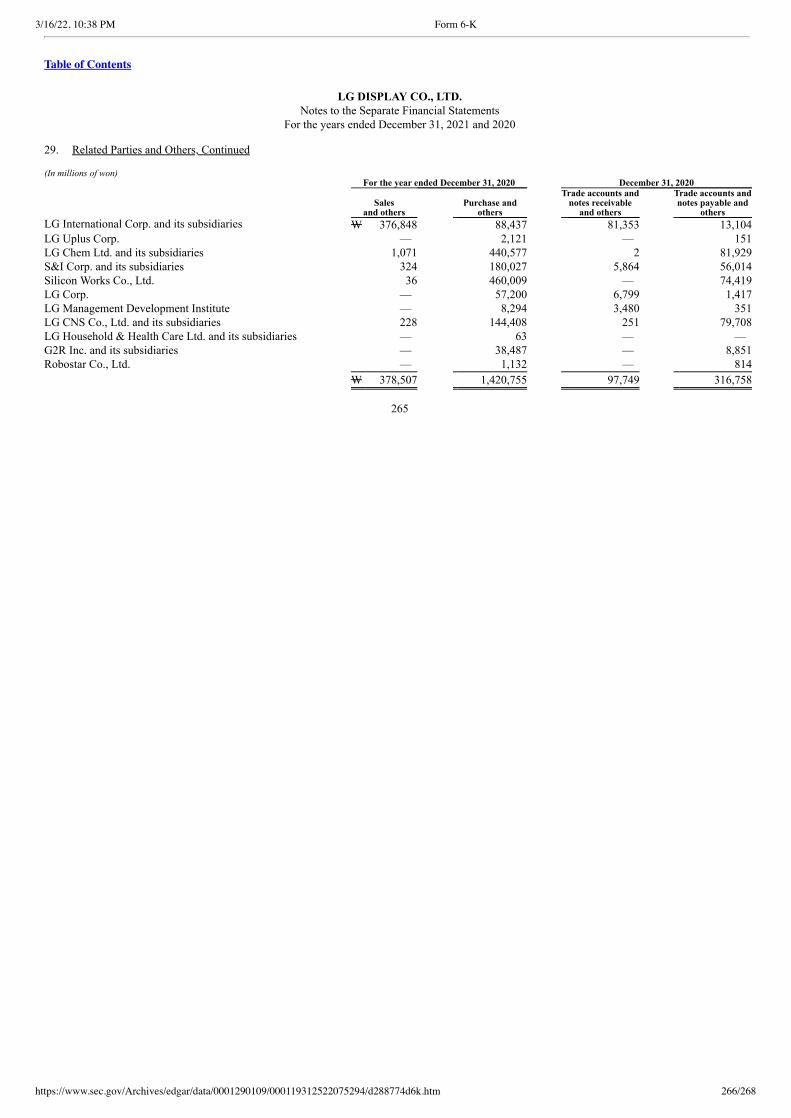
3/16/22, 10:38 PM Form 6-K
https://www.sec.gov/Archives/edgar/data/0001290109/000119312522075294/d288774d6k.htm 266/268
Table of Contents
LG DISPLAY CO., LTD.Notes to the Separate Financial Statements
For the years ended December 31, 2021 and 2020 29. Related Parties and Others, Continued (In millions of won) For the year ended December 31, 2020 December 31, 2020
Sales
and others Purchase and
others
Trade accounts and notes receivable
and others
Trade accounts and notes payable and
others LG International Corp. and its subsidiaries W 376,848 88,437 81,353 13,104 LG Uplus Corp. — 2,121 — 151 LG Chem Ltd. and its subsidiaries 1,071 440,577 2 81,929 S&I Corp. and its subsidiaries 324 180,027 5,864 56,014 Silicon Works Co., Ltd. 36 460,009 — 74,419 LG Corp. — 57,200 6,799 1,417 LG Management Development Institute — 8,294 3,480 351 LG CNS Co., Ltd. and its subsidiaries 228 144,408 251 79,708 LG Household & Health Care Ltd. and its subsidiaries — 63 — — G2R Inc. and its subsidiaries — 38,487 — 8,851 Robostar Co., Ltd. — 1,132 — 814
W 378,507 1,420,755 97,749 316,758
265
3/16/22, 10:38 PM Form 6-K
https://www.sec.gov/Archives/edgar/data/0001290109/000119312522075294/d288774d6k.htm 267/268
Table of Contents
LG DISPLAY CO., LTD.Notes to the Separate Financial Statements
For the years ended December 31, 2021 and 2020 29. Related Parties and Others, Continued (f) Key management personnel compensation
Compensation costs of key management for the years ended December 31, 2021 and 2020 are as follows: (In millions of won) 2021 2020 Short-term benefits W3,747 2,233 Expenses related to the defined benefit plan 366 346
W4,113 2,579
Key management refers to the registered directors who have significant control and responsibilities over the Company’s operations andbusiness.
30. Supplemental Cash Flow Information
Supplemental cash flow information for the years ended December 31, 2021 and 2020 is as follows: (In millions of won) 2021 2020 Non-cash investing and financing activities:
Changes in other accounts payable arising from the purchase of property, plant and equipment W391,653 (8,824) Changes in other accounts payable arising from the purchase of intangible assets 459,972 99,693 Recognition of right-of-use assets and lease liabilities 12,500 11,193
266
3/16/22, 10:38 PM Form 6-K
https://www.sec.gov/Archives/edgar/data/0001290109/000119312522075294/d288774d6k.htm 268/268
Table of Contents
SIGNATURES
Pursuant to the requirements of the Securities Exchange Act of 1934, the registrant has duly caused this report to be signed on its behalf by theundersigned, thereunto duly authorized.
LG Display Co., Ltd.
(Registrant)
Date: March 15, 2022 By: /s/ Suk Heo (Signature) Name: Suk Heo Title: Director / Head of IR Division