LG Display Co., Ltd.
165
6-K 1 d52916d6k.htm FORM 6-K Table of Contents SECURITIES AND EXCHANGE COMMISSION Washington, D.C. 20549 Form 6-K REPORT OF FOREIGN PRIVATE ISSUER PURSUANT TO RULE 13a-16 OR 15d-16 UNDER THE SECURITIES EXCHANGE ACT OF 1934 For the month of August 2020 LG Display Co., Ltd. (Translation of Registrant’s name into English) LG Twin Towers, 128 Yeoui-daero, Yeongdeungpo-gu, Seoul 07336, Republic of Korea (Address of principal executive offices) Indicate by check mark whether the registrant files or will file annual reports under cover of Form 20-F or Form 40-F. Form 20-F ☒ Form 40-F ☐ Indicate by check mark if the registrant is submitting the Form 6-K in paper as permitted by Regulation S-T Rule 101(b)(1): ☐ Note: Regulation S-T Rule 101(b)(1) only permits the submission in paper of a Form 6-K if submitted solely to provide an attached annual report to security holders. Indicate by check mark if the registrant is submitting the Form 6-K in paper as permitted by Regulation S-T Rule 101(b)(7): ☐ Note: Regulation S-T Rule 101(b)(7) only permits the submission in paper of a Form 6-K if submission to furnish a report or other document that the registration foreign private issuer must furnish and make public under the laws of the jurisdiction in which the registrant is incorporated, domiciled or legally organized (the registrant’s “home country”), or under the rules of the home country exchange on which the registrant’s securities are traded, as long as the report or other document is not a press release, is not required to be and has not been distributed to the registrant’s security holders, and if discussing a material event, has already been the subject of a Form 6-K submission or other Commission filing on EDGAR. Indicate by check mark whether by furnishing the information contained in this Form, the registrant is also thereby furnishing the information to the Commission pursuant to Rule 12g3-2(b) under the Securities Exchange Act of 1934. Yes ☐ No ☒
-
Upload
khangminh22 -
Category
Documents
-
view
0 -
download
0
Transcript of LG Display Co., Ltd.

6-K 1 d52916d6k.htm FORM 6-K
Table of Contents
SECURITIES AND EXCHANGE COMMISSIONWashington, D.C. 20549
Form 6-K
REPORT OF FOREIGN PRIVATE ISSUERPURSUANT TO RULE 13a-16 OR 15d-16
UNDER THE SECURITIES EXCHANGE ACT OF 1934
For the month of August 2020
LG Display Co., Ltd.(Translation of Registrant’s name into English)
LG Twin Towers, 128 Yeoui-daero, Yeongdeungpo-gu, Seoul 07336, Republic of Korea(Address of principal executive offices)
Indicate by check mark whether the registrant files or will file annual reports under cover of Form 20-F or Form 40-F.
Form 20-F ☒ Form 40-F ☐
Indicate by check mark if the registrant is submitting the Form 6-K in paper as permitted by Regulation S-T Rule 101(b)(1): ☐
Note: Regulation S-T Rule 101(b)(1) only permits the submission in paper of a Form 6-K if submitted solely to provide an attached annual reportto security holders.
Indicate by check mark if the registrant is submitting the Form 6-K in paper as permitted by Regulation S-T Rule 101(b)(7): ☐
Note: Regulation S-T Rule 101(b)(7) only permits the submission in paper of a Form 6-K if submission to furnish a report or other document thatthe registration foreign private issuer must furnish and make public under the laws of the jurisdiction in which the registrant is incorporated, domiciledor legally organized (the registrant’s “home country”), or under the rules of the home country exchange on which the registrant’s securities are traded, aslong as the report or other document is not a press release, is not required to be and has not been distributed to the registrant’s security holders, and ifdiscussing a material event, has already been the subject of a Form 6-K submission or other Commission filing on EDGAR.
Indicate by check mark whether by furnishing the information contained in this Form, the registrant is also thereby furnishing the information tothe Commission pursuant to Rule 12g3-2(b) under the Securities Exchange Act of 1934.
Yes ☐ No ☒
Table of Contents
SEMI-ANNUAL REPORT
(From January 1, 2020 to June 30, 2020)
THIS IS A TRANSLATION OF THE SEMI-ANNUAL REPORT ORIGINALLY PREPARED IN KOREAN AND IS IN SUCH FORM ASREQUIRED BY THE KOREAN FINANCIAL SUPERVISORY COMMISSION.
IN THE TRANSLATION PROCESS, SOME PARTS OF THE REPORT WERE REFORMATTED, REARRANGED OR SUMMARIZED ANDCERTAIN NUMBERS WERE ROUNDED FOR THE CONVENIENCE OF READERS. REFERENCES TO “Q1”, “Q2”, “Q3” AND “Q4” OF AFISCAL YEAR ARE REFERENCES TO THE THREE-MONTH PERIODS ENDED MARCH 31, JUNE 30, SEPTEMBER 30 AND DECEMBER 31,RESPECTIVELY, OF SUCH FISCAL YEAR. REFERENCES TO “H1” OF A FISCAL YEAR ARE REFERENCES TO THE SIX-MONTH PERIODENDED JUNE 30 OF SUCH FISCAL YEAR.
UNLESS EXPRESSLY STATED OTHERWISE, ALL INFORMATION CONTAINED HEREIN IS PRESENTED ON A CONSOLIDATED BASIS INACCORDANCE WITH KOREAN INTERNATIONAL FINANCIAL REPORTING STANDARDS, OR K-IFRS, WHICH DIFFER IN CERTAINRESPECTS FROM GENERALLY ACCEPTED ACCOUNTING PRINCIPLES IN CERTAIN OTHER COUNTRIES, INCLUDING THE UNITEDSTATES. K-IFRS ALSO DIFFERS IN CERTAIN RESPECTS FROM THE INTERNATIONAL FINANCIAL REPORTING STANDARDS ASISSUED BY THE INTERNATIONAL ACCOUNTING STANDARDS BOARD. WE HAVE MADE NO ATTEMPT TO IDENTIFY OR QUANTIFYTHE IMPACT OF THESE DIFFERENCES IN THIS DOCUMENT.
Contents
1. Company 4 A. Name and contact information 4 B. Credit rating 4 C. Capitalization 6 D. Voting rights (as of June 30, 2020) 7 E. Dividends 7
2. Business 7 A. Business overview 7 B. Industry 8 C. New businesses 10
3. Major Products and Raw Materials 10 A. Major products 10 B. Average selling price trend of major products 11 C. Major raw materials 11
4. Production and Equipment 12 A. Production capacity and output 12 B. Production performance and utilization ratio 12 C. Investment plan 13
5. Sales 13 A. Sales performance 13 B. Sales organization and sales route 13 C. Sales methods and sales terms 14 D. Sales strategy 14 E. Major customers 14
6. Purchase Orders 14
7. Market Risks and Risk Management 15
2
Table of Contents
A. Market risks 15 B. Risk management 15
8. Derivative Contracts 15 A. Currency risks 15 B. Interest rate risks 16
9. Major Contracts 16
10. Research & Development 17 A. Summary of R&D-related expenditures 17 B. R&D achievements 17
11. Intellectual Property 19
12. Environmental and Safety Matters 19
13. Financial Information 22 A. Financial highlights (Based on consolidated K-IFRS) 22 B. Financial highlights (Based on separate K-IFRS) 23 C. Consolidated subsidiaries as of June 30, 2020 24 D. Status of equity investments as of June 30, 2020 24
14. Audit Information 25 A. Audit service 25 B. Non-audit service 26
15. Management’s Discussion and Analysis of Financial Condition and Results of Operations 26
16. Board of Directors 26 A. Members of the board of directors 26 B. Committees of the board of directors 26 C. Independence of directors 27
17. Information Regarding Shares 27 A. Total number of shares 27 B. Shareholder list 27
18. Directors and Employees 28 A. Directors 28 B. Employees 31
19. Other Matters 32 A. Legal proceedings 32 B. Material events subsequent to the reporting period 32 C. Material change in management 32
Attachment: 1. Financial Statements in accordance with K-IFRS
3

Table of Contents
1. Company A. Name and contact information
The name of our company is “EL-GI DISPLAY CHUSIK HOESA,” which shall be “LG Display Co., Ltd.” in English.
Our principal executive office is located at LG Twin Towers, 128 Yeoui-daero, Yeongdeungpo-gu, Seoul 07336, Republic of Korea, and ourtelephone number is +82-2-3777-1010. Our website address is http://www.lgdisplay.com.
B. Credit rating (1) Corporate bonds (Domestic) Subject instrument Month of rating Credit rating(1) Rating agency (Rating range)
Corporate bonds
February 2018 AA
NICE Information Service Co., Ltd. (AAA ~ D)
May 2018 February 2019
AA- April 2019
November 2019 February 2020
A+ June 2020 May 2018 AA
Korea Investors Service, Inc. (AAA ~ D)
February 2019
AA- June 2019
October 2019 February 2020
A+ June 2020 February 2018
AA
Korea Ratings Corporation (AAA ~ D)
April 2018 April 2019
AA- November 2019 February 2020
A+ May 2020
4

Table of Contents
(1) Domestic corporate bond credit ratings are generally defined to indicate the following: Subject instrument Credit rating Definition
Corporate bonds
AAA Strongest capacity for timely repayment.
AA+/AA/AA-
Very strong capacity for timely repayment. This capacity may, nevertheless, be slightlyinferior than is the case for the highest rating category
A+/A/A-
Strong capacity for timely repayment. This capacity may, nevertheless, be more vulnerable toadverse changes in circumstances or in economic conditions than is the case for higher ratingcategories.
BBB+/BBB/BBB-
Capacity for timely repayment is adequate, but adverse changes in circumstances and ineconomic conditions are more likely to impair this capacity.
BB+/BB/BB-
Capacity for timely repayment is currently adequate, but that there are some speculativecharacteristics that make the repayment uncertain over time.
B+/B/B-
Lack of adequate capacity for repayment and speculative characteristics. Interest payment intime of unfavorable economic conditions is uncertain.
CCC Lack of capacity for even current repayment and high risk of default. CC Greater uncertainties than higher ratings. C High credit risk and lack of capacity for timely repayment. D Insolvency.
(2) Corporate bonds (Overseas) Subject instrument Month of rating Credit rating(2) Rating agency (Rating range)Corporate bonds(1) November 2018 AA Standard & Poor’s Rating Services (AAA ~ D) (1) Represents credit rating for our overseas corporate bonds guaranteed by the Korea Development Bank.(2) Overseas corporate bond credit ratings are generally defined to indicate the following: Subject instrument Credit rating Definition
Corporate bonds
AAA Highest level of stability.
AA+/AA/AA-
Very high level of stability. This stability may be slightly more risky than is the case for the highestrating category but presents no issues.
A+/A/A-
High level of stability. There are no issues with repaying the principal, but there are characteristicsthat could be subject to future deterioration.
BBB+/BBB/BBB-
Level of stability is adequate. Current level of stability and profitability is adequate, but requiresspecial attention during times of economic downturns.
BB+/BB/BB-
Speculative characteristics. There is no guarantee on future stability. Expected businessperformance is uncertain.
B+/B/B-
Inadequate as an investment target. Ability to make principal repayments or comply withcontractual terms and conditions is uncertain.
CCC/CC/C
Very low level of stability. Ability to make payments of principal and interest is highly unlikely.Extremely speculative. Currently in default or undergoing a serious problem.
D Bankruptcy. (3) Commercial paper Subject instrument Month of rating Credit rating(1) Rating agency (Rating range)
Commercial paper
May 2018 A1 Korea Investors Service, Inc. (A1 ~ D) May 2018 A1 NICE Information Service Co., Ltd. (A1 ~ D) November 2018 Cancelled(2) Korea Investors Service, Inc. (A1 ~ D) November 2018 Cancelled(2) NICE Information Service Co., Ltd. (A1 ~ D)
5

Table of Contents
(1) Domestic commercial paper credit ratings are generally defined to indicate the following: Subject instrument Credit rating Definition
Commercial paper
A1
Timely repayment capability is at the highest level with extremely low investment risk and isstable such that it will not be influenced by any reasonably foreseeable changes in external factors.
A2
Strong capacity for timely repayment with very low investment risk. This capacity may,nevertheless, be slightly inferior than is the case for the highest rating category.
A3
Capacity for timely repayment is adequate with low investment risk. This capacity may,nevertheless, be somewhat influenced by sudden changes in external factors.
B Capacity for timely repayment is acknowledged, but there are some speculative characteristics. C Capacity for timely repayment is questionable. D Insolvency.
(2) Ratings have been cancelled due to repayment of our outstanding commercial paper on October 22, 2018 upon maturity.
‘+’ or ‘-’ modifier can be attached to ratings A2 through B to differentiate ratings within broader rating categories. C. Capitalization (1) Change in capital stock (as of June 30, 2020)
There were no changes to our issued capital stock during the reporting period ended June 30, 2020. (2) Convertible bonds (as of June 30, 2020)
Description Issue
Date Maturity
Date
Issue Amount
(in Won)
Class of Shares
Subject to Conversion
Conversion Period
Conditions for Conversion Outstanding Bonds
Notes Conversion
Ratio Conversion
Price Issue Amount
(in Won)
Number of Shares subject to
conversion Unsecured
ForeignConvertibleBondsNo. 3
Aug. 22, 2019
Aug. 22, 2024 813,426,670,000(1)(2)
RegisteredCommonShares
Aug. 23, 2020 ~
Aug. 12, 2024
100% W19,845 813,426,670,000(1) 40,988,998
Listed onSingaporeStock
Exchange
Total — — 813,426,670,000 — — 100% W19,845 813,426,670,000 40,988,998 —
(1) The issue amount for Unsecured Foreign Convertible Bonds No. 3 is calculated based on the application of the mid-point of the relevant Won-US
dollar exchange rates as of noon, July 30, 2019 (Korea Standard Time) quoted on Bloomberg, which was W1,182.65 per U.S. dollar, to the actualissue amount of USD 687,800,000.
6

Table of Contents
(2) The proceeds of our Unsecured Foreign Convertible Bonds No. 3 were used for general corporate purposes. D. Voting rights (as of June 30, 2020)
(Unit: share) Description Number of shares A. Total number of shares issued(1): Common shares(1) 357,815,700
Preferred shares — B. Shares without voting rights: Common shares —
Preferred shares — C. Shares subject to restrictions on voting rights pursuant to our articles of
incorporation: Common shares — Preferred shares —
D. Shares subject to restrictions on voting rights pursuant to regulations: Common shares — Preferred shares —
E. Shares with restored voting rights: Common shares — Preferred shares —
Total number of issued shares with voting rights (=A – B – C – D + E): Common shares 357,815,700 Preferred shares —
(1) Authorized: 500,000,000 shares E. Dividends
Dividends for the three most recent fiscal years
Description (unit) 2020 H1 2019 2018 Par value (Won) 5,000 5,000 5,000 Profit (loss) for the year (million Won)(1) (688,112) (2,829,705) (207,239) Earnings (loss) per share (Won)(2) (1,923) (7,908) (579)
Total cash dividend amount for the period (million Won) — — —
Total stock dividend amount for the period (million Won) — — —
Cash dividend payout ratio (%)(3) — — — Cash dividend yield (%)(4) Common shares — — —
Preferred shares — — — Stock dividend yield (%) Common shares — — —
Preferred shares — — — Cash dividend per share (Won) Common shares — — —
Preferred shares — — — Stock dividend per share (share) Common shares — — —
Preferred shares — — — (1) Based on profit for the year attributable to the owners of the controlling company.(2) Earnings per share is based on par value of W5,000 per share and is calculated by dividing net income by weighted average number of common
shares.(3) Cash dividend payout ratio is the percentage that is derived by dividing total cash dividend by profit for the year attributable to the owners of the
controlling company.(4) Cash dividend yield is the percentage that is derived by dividing cash dividend by the arithmetic average of the daily closing prices of our
common shares during the one-week period ending two trading days prior to the closing of the register of shareholders for the purpose ofdetermining the shareholders entitled to receive annual dividends.
2. Business A. Business overview
We were incorporated in February 1985 under the laws of the Republic of Korea. LG Electronics and LG Semicon transferred their respectiveLCD business to us in 1998, and since then, our business has been focused on the research, development, manufacture and sale of display panels,applying technologies such as TFT-LCD and OLED.
7

Table of Contents
As of June 30, 2020, in order to support our business activities, we operated TFT-LCD and OLED production and research facilities in Paju andGumi in Korea, and we have also established subsidiaries in the Americas, Europe and Asia.
As of June 30, 2020, our business consisted of the manufacture and sale of display and display related products utilizing TFT-LCD, OLED andother technologies under a single reporting business segment.
Consolidated operating results highlights
(Unit: In billions of Won) 2020 H1 2019 2018 Sales Revenue 10,031 23,476 24,337 Gross Profit 406 1,868 3,085 Operating Profit (loss) (879) (1,359) 93 Total Assets 35,054 35,575 33,176 Total Liabilities 22,953 23,086 18,289
B. Industry (1) Industry characteristics
• From the supply perspective, the display panel industry is technology- and capital-intensive in nature and requires mass production throughachieving an economy of scale.
• From the demand perspective, the display panel industry tends to demonstrate a high level of volatility depending on the globalmacroeconomic conditions, major regional sales events and/or seasonal factors.
• While the overall growth in the market for display panels for televisions in terms of quantity has become somewhat stagnant, there is
emerging demand for premium products with high resolution and large-sized display panels in developed countries, while demand forlower-end products has sustained in developing countries.
• While the growth in the market for display panels for IT products, which include laptops, desktop monitors and tablet products, has sloweddown or declined in terms of quantity, demand for high-end products has consistently sustained. In addition, there have been increased newopportunities from the demand side of IT products due to an expanding social tendency to avoid face-to-face contact resulting in increasedinstances of online classes and working from home in light of the COVID-19 pandemic.
• While the growth in the market for small- and medium-sized display panels, which is centered around smartphones, has somewhat slowed
down, further growth is expected with the release of new products using plastic OLED panels and products that offer changes in formfactors or new customer experiences such as foldable smartphones.
• As the scope of application of display panels gradually expand to products other than traditional IT devices, we also expect to see growthin the market for new and high value-added product segments such as display panels for industrial uses and automobiles.
(2) Growth Potential
• We are focusing on securing profitability through differentiated products such as “Cinematic Sound” OLED and “Wallpaper” displaypanels under our strategic plan to transition our business to center around OLED, which has a strong future growth potential. In thetelevision business, we are expanding our offerings of premium products such as OLED and UHD products. In particular, with respect tolarge-sized OLED television display panels, we are continuing to secure additional production capacity of 8.5th generation OLED panelsand are planning to further strengthen the fundamentals of our OLED business through building a successful line-up of new products andinvestments in the 8.5th and 10.5th generation OLED display panel production. In the IT business, we are increasing the proportion ofpremium products such as high resolution and wide screen products based on IPS and Oxide technologies. In the mobile business, we arecontinuously striving to secure mass production capabilities for 6th generation plastic OLED smartphones through additional investments.We are also strengthening the foundation for the expansion of small- and medium-sized OLED business.
8
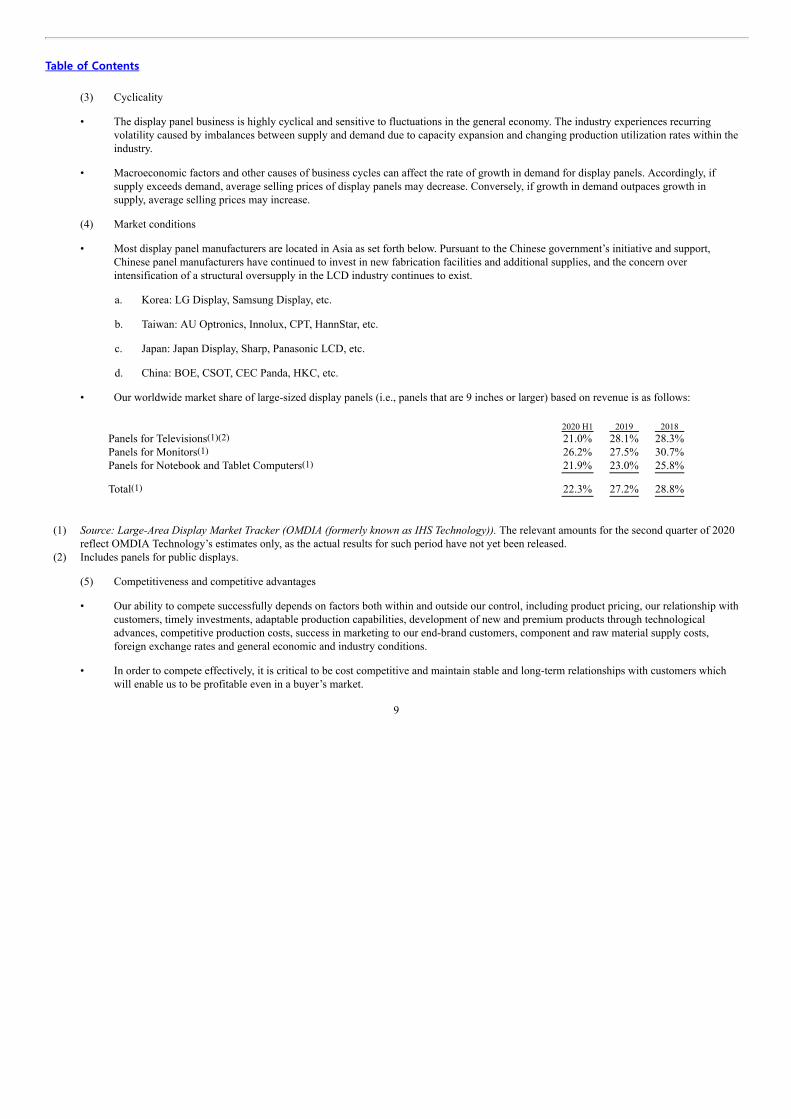
Table of Contents
(3) Cyclicality
• The display panel business is highly cyclical and sensitive to fluctuations in the general economy. The industry experiences recurring
volatility caused by imbalances between supply and demand due to capacity expansion and changing production utilization rates within theindustry.
• Macroeconomic factors and other causes of business cycles can affect the rate of growth in demand for display panels. Accordingly, if
supply exceeds demand, average selling prices of display panels may decrease. Conversely, if growth in demand outpaces growth insupply, average selling prices may increase.
(4) Market conditions
• Most display panel manufacturers are located in Asia as set forth below. Pursuant to the Chinese government’s initiative and support,
Chinese panel manufacturers have continued to invest in new fabrication facilities and additional supplies, and the concern overintensification of a structural oversupply in the LCD industry continues to exist.
a. Korea: LG Display, Samsung Display, etc. b. Taiwan: AU Optronics, Innolux, CPT, HannStar, etc. c. Japan: Japan Display, Sharp, Panasonic LCD, etc. d. China: BOE, CSOT, CEC Panda, HKC, etc. • Our worldwide market share of large-sized display panels (i.e., panels that are 9 inches or larger) based on revenue is as follows:
2020 H1 2019 2018Panels for Televisions(1)(2) 21.0% 28.1% 28.3%Panels for Monitors(1) 26.2% 27.5% 30.7%Panels for Notebook and Tablet Computers(1) 21.9% 23.0% 25.8%
Total(1) 22.3% 27.2% 28.8%
(1) Source: Large-Area Display Market Tracker (OMDIA (formerly known as IHS Technology)). The relevant amounts for the second quarter of 2020
reflect OMDIA Technology’s estimates only, as the actual results for such period have not yet been released.(2) Includes panels for public displays. (5) Competitiveness and competitive advantages
• Our ability to compete successfully depends on factors both within and outside our control, including product pricing, our relationship withcustomers, timely investments, adaptable production capabilities, development of new and premium products through technologicaladvances, competitive production costs, success in marketing to our end-brand customers, component and raw material supply costs,foreign exchange rates and general economic and industry conditions.
• In order to compete effectively, it is critical to be cost competitive and maintain stable and long-term relationships with customers whichwill enable us to be profitable even in a buyer’s market.
9
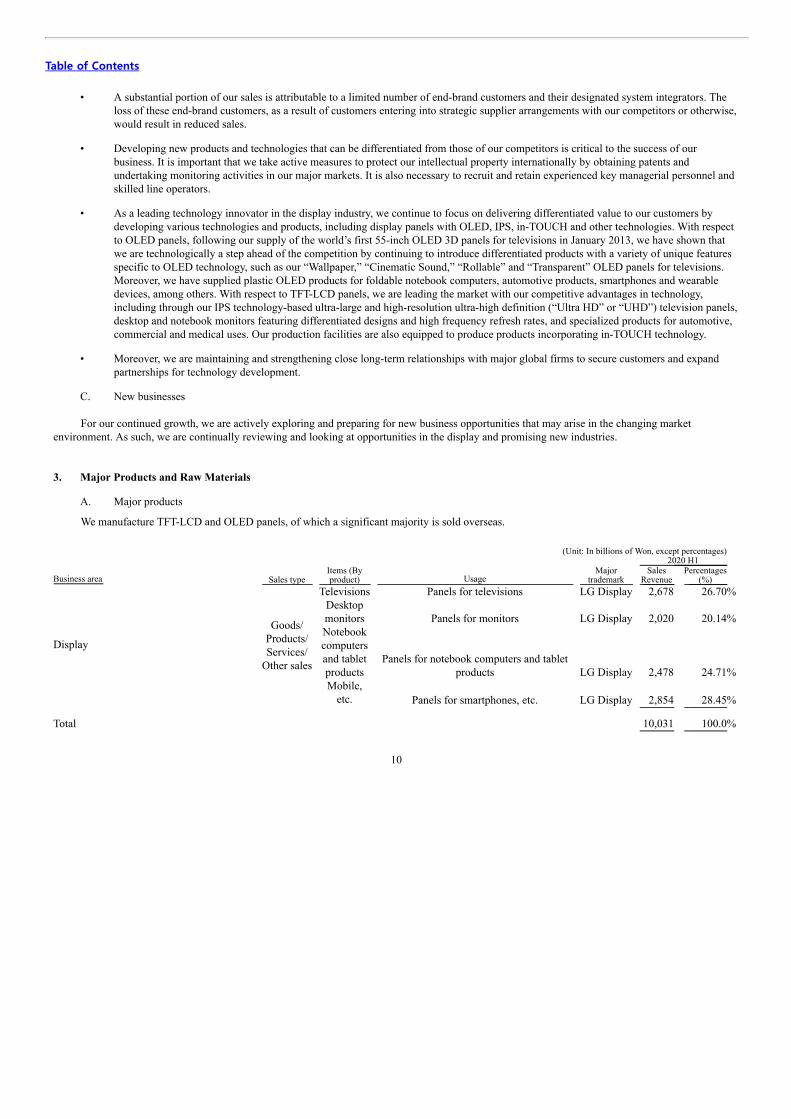
Table of Contents
• A substantial portion of our sales is attributable to a limited number of end-brand customers and their designated system integrators. The
loss of these end-brand customers, as a result of customers entering into strategic supplier arrangements with our competitors or otherwise,would result in reduced sales.
• Developing new products and technologies that can be differentiated from those of our competitors is critical to the success of ourbusiness. It is important that we take active measures to protect our intellectual property internationally by obtaining patents andundertaking monitoring activities in our major markets. It is also necessary to recruit and retain experienced key managerial personnel andskilled line operators.
• As a leading technology innovator in the display industry, we continue to focus on delivering differentiated value to our customers bydeveloping various technologies and products, including display panels with OLED, IPS, in-TOUCH and other technologies. With respectto OLED panels, following our supply of the world’s first 55-inch OLED 3D panels for televisions in January 2013, we have shown thatwe are technologically a step ahead of the competition by continuing to introduce differentiated products with a variety of unique featuresspecific to OLED technology, such as our “Wallpaper,” “Cinematic Sound,” “Rollable” and “Transparent” OLED panels for televisions.Moreover, we have supplied plastic OLED products for foldable notebook computers, automotive products, smartphones and wearabledevices, among others. With respect to TFT-LCD panels, we are leading the market with our competitive advantages in technology,including through our IPS technology-based ultra-large and high-resolution ultra-high definition (“Ultra HD” or “UHD”) television panels,desktop and notebook monitors featuring differentiated designs and high frequency refresh rates, and specialized products for automotive,commercial and medical uses. Our production facilities are also equipped to produce products incorporating in-TOUCH technology.
• Moreover, we are maintaining and strengthening close long-term relationships with major global firms to secure customers and expandpartnerships for technology development.
C. New businesses
For our continued growth, we are actively exploring and preparing for new business opportunities that may arise in the changing marketenvironment. As such, we are continually reviewing and looking at opportunities in the display and promising new industries.
3. Major Products and Raw Materials A. Major products
We manufacture TFT-LCD and OLED panels, of which a significant majority is sold overseas. (Unit: In billions of Won, except percentages)
Business area Sales type Items (By
product) Usage Major
trademark
2020 H1
Sales
Revenue Percentages
(%)
Display
Goods/ Products/ Services/ Other sales
Televisions Panels for televisions LG Display 2,678 26.70%
Desktop
monitors Panels for monitors LG Display 2,020 20.14%
Notebook computers and tablet products
Panels for notebook computers and tabletproducts LG Display 2,478 24.71%
Mobile,
etc. Panels for smartphones, etc. LG Display 2,854 28.45%
Total 10,031 100.0%
10
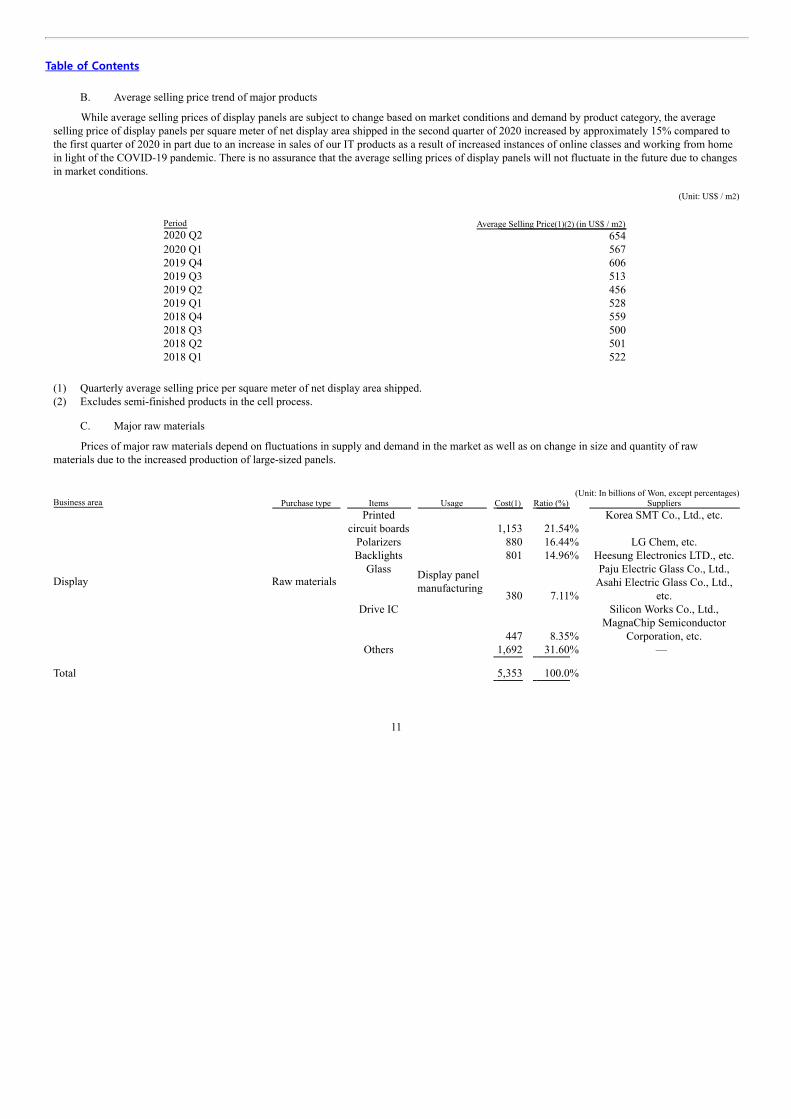
Table of Contents
B. Average selling price trend of major products
While average selling prices of display panels are subject to change based on market conditions and demand by product category, the averageselling price of display panels per square meter of net display area shipped in the second quarter of 2020 increased by approximately 15% compared tothe first quarter of 2020 in part due to an increase in sales of our IT products as a result of increased instances of online classes and working from homein light of the COVID-19 pandemic. There is no assurance that the average selling prices of display panels will not fluctuate in the future due to changesin market conditions.
(Unit: US$ / m2)
Period Average Selling Price(1)(2) (in US$ / m2) 2020 Q2 654 2020 Q1 567 2019 Q4 606 2019 Q3 513 2019 Q2 456 2019 Q1 528 2018 Q4 559 2018 Q3 500 2018 Q2 501 2018 Q1 522
(1) Quarterly average selling price per square meter of net display area shipped.(2) Excludes semi-finished products in the cell process. C. Major raw materials
Prices of major raw materials depend on fluctuations in supply and demand in the market as well as on change in size and quantity of rawmaterials due to the increased production of large-sized panels. (Unit: In billions of Won, except percentages)Business area Purchase type Items Usage Cost(1) Ratio (%) Suppliers
Display
Raw materials
Printed
circuit boards
Display panel manufacturing
1,153 21.54% Korea SMT Co., Ltd., etc.
Polarizers 880 16.44% LG Chem, etc. Backlights 801 14.96% Heesung Electronics LTD., etc.
Glass
380 7.11%
Paju Electric Glass Co., Ltd., Asahi Electric Glass Co., Ltd., etc.
Drive IC
447 8.35%
Silicon Works Co., Ltd., MagnaChip Semiconductor
Corporation, etc. Others 1,692 31.60% —
Total 5,353 100.0%
11

Table of Contents
- Period: January 1, 2020 ~ June 30, 2020. (1) Based on total cost for purchase of raw materials which includes manufacturing and development costs, etc. (2) Among our major suppliers, LG Chem and Silicon Works Co., Ltd. are member companies of the LG Group, and Paju Electric Glass Co., Ltd. is
our affiliate.
– The average price of EGI (Electrolytic Galvanized Iron), which is the main raw material for BLU components, decreased by 8.6%from 2018 to 2019 and by 3.2% from 2019 to the second quarter of 2020. Such decrease in the second quarter of 2020 was mainlydue to the effects of the COVID-19 pandemic. The average price of resin decreased by 38.2% from 2018 to 2019 and by 16.2% from2019 to the second quarter of 2020. Such decrease in the second quarter of 2020 was also mainly due to the effects of the COVID-19pandemic. The average price of copper, the main raw material for PCB components, decreased by 8.0% from 2018 to 2019 and by8.7% from 2019 to the second quarter of 2020. Such decrease in the second quarter of 2020 was also mainly due to the effects of theCOVID-19 pandemic.
4. Production and Equipment A. Production capacity and output (1) Production capacity
The table below sets forth the production capacity of our Gumi, Paju and Guangzhou facilities in the periods indicated.
(Unit: 1,000 glass sheets)
Business area Items Location of facilities 2020 H1(1) 2019(2) 2018(2) Display
Display
panel Gumi, Paju,
Guangzhou 3,744 9,408 10,161 (1) Calculated based on the maximum monthly input capacity (based on glass input substrate size for eighth-generation glass sheets) during the period
multiplied by the number of months in the period (i.e., 6 months). The production capacity for facilities with adjusted utilization rates have beencalculated based on the maximum input capacity during the period.
(2) Calculated based on the maximum monthly input capacity (based on glass input substrate size for eighth-generation glass sheets) during the yearmultiplied by the number of months in a year (i.e., 12 months). The production capacity for facilities with adjusted utilization rates have beencalculated based on the maximum input capacity during the period.
(2) Production output
The table below sets forth the production output of our Gumi, Paju and Guangzhou facilities in the periods indicated.
(Unit: 1,000 glass sheets)
Business area Items Location of facilities 2020 H1(1) 2019(1) 2018(1) Display
Display
panel Gumi, Paju,
Guangzhou 2,997 8,373 9,428 (1) Based on the production results (input standard) of each plant converted into eighth-generation glass sheets. B. Production performance and utilization ratio
(Unit: Hours, except percentages)
Production facilities Available working hours in
2020 H1 Actual working hours in 2020
H1 Average utilization ratio
Gumi 4,368(1)
(24 hours x 182 days)(2) 4,320(1)
(24 hours x 180 days)(2) 98.9%
Paju 4,368(1)
(24 hours x 182 days)(2) 4,340(1)
(24 hours x 181 days)(2) 99.4%
Guangzhou 4,368(1)
(24 hours x 182 days)(2) 4,368(1)
(24 hours x 182 days)(2) 100.0% (1) Based on the assumption that all 24 hours in a day have been fully utilized.(2) Number of days is calculated by averaging the number of working days for each facility.
12

Table of Contents
C. Investment plan
In 2019, our total capital expenditures on a cash out basis was approximately W7 trillion. In 2020, given that our investment in large OLED andplastic OLED technology is nearly completed, we plan to reduce our capital expenditures by at least half as that compared to 2019 to an amount slightlyabove W3 trillion.
5. Sales A. Sales performance
(Unit: In billions of Won) Business area Sales types Items (Market) 2020 H1 2019 2018
Display
Products
Display panel
Overseas(1) 9,523 22,180 22,722 Korea(1) 487 1,255 1,572 Total 10,009 23,435 24,294
Royalty
LCD, OLED technology
patent
Overseas(1) 8 14 18 Korea(1) 0 0 0 Total 8 14 18
Others
Raw materials, components,
etc.
Overseas(1) 11 17 13 Korea(1) 3 10 1 Total 14 26 25
Overseas(1) 9,542 22,211 22,747 Total Korea(1) 490 1,265 1,590 Total 10,031 23,476 24,337
(1) Based on ship-to-party. B. Sales organization and sales route • As of June 30, 2020, each of our television, IT, mobile and OLED businesses had individual sales and customer support functions.
• Sales subsidiaries in the United States, Germany, Japan, Taiwan, China and Singapore perform sales activities and provide local technicalsupport to customers.
• Sales of our products take place through one of the following two routes:
1) LG Display Headquarters and overseas manufacturing subsidiaries g Overseas sales subsidiaries(USA/Germany/Japan/Taiwan/China/Singapore), etc. g System integrators and end-brand customers g End users
2) LG Display Headquarters and overseas manufacturing subsidiaries g System integrators and end-brand customers g End users • Sales performance by sales route
13

Table of Contents
Sales performance Sales route Ratio
Overseas Overseas subsidiaries 95.3% Headquarters 4.7%
Overseas sales portion (overseas sales / total sales) 95.1%
Korea Overseas subsidiaries 3.1% Headquarters 96.9%
Korea sales portion (Korea sales / total sales) 4.9% C. Sales methods and sales terms
• Direct sales and sales through overseas subsidiaries, etc. Sales terms are subject to change depending on the fluctuation in the supply ofand demand for panels.
D. Sales strategy
• As part of our sales strategy, we have secured stable sales to major personal computer manufacturers and leading consumer electronicsmanufacturers globally.
• With respect to television products, we have led the premium television market with our OLED TVs and strengthened the differentiation ofour OLED products through unique designs and integration of additional technologies (wallpaper, cinematic sound, rollable, etc.). We arealso continuing to strengthen sales of high-resolution, IPS, narrow bezel and other high-end display panels in the monitor, notebookcomputer and tablet markets.
• With respect to smartphones, commercial products (including interactive whiteboards and video wall displays, among others), industrialproducts (including aviation and medical equipment, among others) and automobile display products, we have continued to build a strongand diversified business portfolio by expanding our business with customers with a global reach on the strength of our differentiatedproducts applying IPS, plastic OLED, high-resolution, high-reliability, Super Narrow bezel, in-TOUCH and other technologies.
E. Major customers
• Customers “A” and “B” each accounted for more than 10% of our sales revenue in each of the first half of 2019 and 2020, and our sales
revenue derived from our top ten customers comprised 83% of our total sales revenue in the first half of 2020 and 78% in the first half of2019.
6. Purchase Orders • We do not have purchase order contracts that recognize unbilled revenue by implementing the cost-based method.
14

Table of Contents
7. Market Risks and Risk Management A. Market risks
The display industry continues to experience continued declines in the average selling prices of TFT-LCD and OLED panels irrespective ofcyclical fluctuations in the industry, and our margins would be adversely impacted if prices decrease faster than we are able to reduce our costs.
The display industry is highly competitive. We have experienced pressure on the prices and margins of our major products due largely toadditional industry capacity from panel manufacturers in Korea, Taiwan, China and Japan coupled with changes in the production mix of suchmanufacturers.
Our ability to compete successfully depends on factors both within and outside our control, including product pricing, performance and reliability,timely investments, adaptable production capabilities, utilization of differentiated technologies in product development, success or failure of ourend-brand customers in marketing their brands and products, component and raw material supply costs, and general economic and industry conditions.We cannot provide assurance that we will be able to compete successfully with our competitors on these fronts and, as a result, we may be unable tosustain our current market position.
Our results of operations are subject to exchange rate fluctuations. To the extent that we incur costs in one currency and generate sales in adifferent currency, our profit margins may be affected by changes in the exchange rates between the two currencies. Our sales of display panels aredenominated mainly in U.S. dollars, whereas our foreign currency denominated purchases of raw materials are denominated mainly in U.S. dollars andJapanese Yen. Seeking to achieve stable management, we take every precaution in our foreign currency risk management to minimize the risk of foreigncurrency fluctuations on our foreign currency denominated assets and liabilities. B. Risk management
As the average selling prices of TFT-LCD and OLED panels can continue to decline over time irrespective of industry-wide cyclical fluctuations,we may find it hard to manage risks associated with certain factors that are outside our control. However, we counteract such declines in average sellingprices by increasing the proportion of high value added panels in our product mix while also implementing various cost reduction measures. In addition,in order to manage our risk against foreign currency fluctuations, we eliminate such risk by matching foreign currency inflow and outflow by currency.We also continually monitor our currency position and risk, and when needed, we may from time to time enter into cross-currency interest rate swapcontracts and foreign currency forward contracts.
8. Derivative Contracts A. Currency risks
• We are exposed to currency risks on sales, purchases and borrowings that are denominated in currencies other than in Won, our functionalcurrency. These currencies are primarily the U.S. dollar, the Chinese Yuan and the Japanese Yen.
• Interest on borrowings is denominated in the currency of the borrowing. Generally, borrowings are denominated in currencies that matchthe cash flows generated by our underlying operations, primarily in Won, the U.S. dollar and the Chinese Yuan.
• In respect of other monetary assets and liabilities denominated in foreign currencies, we have adopted a policy to maintain our netexposure within an acceptable level by buying or selling foreign currencies at spot rates, when necessary, to address short-term imbalances.
• As of the end of the reporting period, in order to avoid risks of interest rate fluctuations and exchange rate fluctuations on foreign currency
denominated borrowings with floating interest rates, we entered into an aggregate of $2,085 million in Won/US dollar cross currency swapagreements with Standard Chartered Bank and others, for which we have not applied hedge accounting.
15

Table of Contents
• Any rights or obligations arising from derivative contracts that do not apply hedge accounting are measured at fair value and are accounted
for as assets and liabilities, whereas any resulting valuation gain or loss is recognized as profit or loss at the time such valuation gain orloss is incurred.
We recognized a net gain on valuation of derivative instruments in the amount of W36,035 million with respect to our currency risk derivativeinstruments held during the reporting period.
B. Interest rate risks
• Our exposure to interest rate risks relates primarily to our floating rate long term loan obligations. We have established and are managing
interest rate risk policies to minimize uncertainty and costs associated with interest rate fluctuations by monitoring cyclical interest ratefluctuations and enacting countermeasures.
• As of the end of the reporting period, in order to mitigate risks of interest rate fluctuations and exchange rate fluctuations on foreigncurrency denominated borrowings with floating interest rates, we have entered into interest rate swap and cross currency swap agreements.
• As of the end of the reporting period, we have entered into an aggregate of W120 billion in interest rate swap agreement with KBKookmin Bank, for which we have not applied hedge accounting.
We recognized a net loss on valuation of derivative instruments in the amount of W2,117 million with respect to our interest rate risk derivativeinstruments held during the reporting period.
9. Major Contracts
Our material contracts, other than contracts entered into in the ordinary course of business, are set forth below: Type of agreement Name of party Term Content
Technology licensing agreement
Semiconductor EnergyLaboratory October 2005 ~
Patent licensing of LCD andOLED related technology
Hewlett-Packard January 2011 ~
Patent licensing ofsemi-conductor devicetechnology
Ignis Innovation, Inc. July 2016 ~ Patent licensing of OLEDrelated technology
Technology licensing/supply agreement
HannStar Display Corporation December 2013 ~ Patent cross-licensing of LCDtechnology
AU Optronics Corporation August 2011~ Patent cross-licensing of LCDtechnology
Innolux Corporation July 2012 ~ Patent cross-licensing of LCDtechnology
Universal Display Corporation January 2015 ~ December 2022 Patent cross-licensing of OLEDrelated technology
16

Table of Contents
10. Research & Development A. Summary of R&D-related expenditures
(Unit: In millions of Won, except percentages) Items(1) 2020 H1 2019 2018
Material Cost 193,395 388,444 496,789 Labor Cost 297,057 618,187 630,695
Depreciation Expense 286,271 523,631 351,936 Others 128,171 246,027 277,699
Total R&D-Related Expenditures 904,894 1,776,289 1,757,119
Accounting Treatment(2)
Selling & AdministrativeExpenses 405,986 924,020 918,512
Manufacturing Cost 321,787 414,324 465,772
Development Cost(Intangible Assets) 177,121 437,945 372,835
R&D-Related Expenditures / Revenue Ratio (Total R&D-Related Expenditures ÷ Revenue for the period × 100) 9.0% 7.6% 7.2%
(1) Calculated based on the total R&D-related expenditures before subtracting government subsidies (state subsidies).(2) For accounting treatment purposes, selling & administrative expenses are presented as research and development expenses in our statements of
comprehensive income, net of amortization of capitalized intangible asset development costs. B. R&D achievements
Achievements in 2018 (1) Developed the world’s first glass-integrated LCD television product (Art Glass Series)
• Achieved LCD modular appearance and simplicity in design by using glass material throughout product (including the panel, light guideplate and back cover)
• Strengthened competitiveness of frameless design by decreasing bezel size from 7.8mm to 5.9mm (2) Developed our first 5.8-inch Ultra HD Mobile 4K product • Developed our first Ultra HD mobile product • Achieved high luminance, low power consumption and HD resolution by applying Ultra HD RGBW (M+) pixel structure (3) Developed the world’s first 5.8-inch mobile FHD product applying M+ • Our first product applying camera notch concept technology (4) Developed the world’s first four-side borderless curved monitor with 1900R curvature radius • Our first product applying glass 0.25T (etching) bezel printing/reverse bonding process technology • Strengthened product competitiveness with our first shared design applying three-side/four-side borderless TFT Mask • Achieved high-speed driving at 144Hz, high color recall (DCI 98%) and HDR (peak luminance 550nit) (5) Developed the world’s first 34-inch large-screen monitor/high-resolution four-sided borderless HDR • Pioneered HD Premium 21:9 monitor market through development of the world’s first WUHD(5K2K), four-side borderless monitor • Delivered Ultra HD (DCI 98Z%, sRGB 135%) by applying Adv. KSF LED PKG technology • Achieved high luminance (HDR 600); typ. 450 nit, maximum 600nit (6) Developed LGD 6.01QHD+M+ Full Screen Display (LG Electronics) • Developed a full screen display concept smartphone product (G7) through strategic collaboration with other LG Group companies
17

Table of Contents
• Implemented a full screen display product concept through achievement of our first 19.5:9 screen aspect ratio and lower bezel of 2.7mm (7) Developed the world’s narrowest bezel videowall product (0.44mm bezel, 55-inch FHD) • Achieved product competitiveness by developing the world’s narrowest bezel (originally 0.9mm ® 0.44mm, Even Bezel) (8) Developed the world’s first automotive glassless 3D cluster product • Developed FHD glassless barrier type 3D model (12.3 inches, 167 ppi level) • Achieved customers’ eye-tracking movement by applying a top moving barrier panel at the top of the panel • Improved adhesion accuracy of image panel and barrier panel by using OCA bonding technology • Improved barrier contrast ratio by applying a copper-based metal barrier panel (9) Developed the world’s first 6th generation a-Si Indirect DXD product (21.9-inch, 14 x 17 resolution, 14 pixel pitches) • Entered the DXD market through development of the world’s first 6th generation a-Si Indirect DXD product • Set up infrastructure for DXD product development through the development of our first DXD product (10) Developed the world’s first 17-inch large-sized and lightweight notebook monitor • Developed large-sized (17-inch) product with a new screen aspect ratio (16:10) • Developed light-weight product (268g) through securing 17-inch+ Slim Design model technology
Achievements in 2019 (1) Developed the world’s first ultra large-sized in-TOUCH product (50-inch UHD) • World’s first to apply in-TOUCH technology on ultra large-sized products (50-inch and larger) • World’s first to apply low temperature PAS to achieve in-TOUCH function (2) Developed the world’s first transparent WOLED product (55-inch FHD) • Developed WOLED-based Top Emission OLED device and process technology (3) Developed the world’s first OLED 8K product (88-inch 8K) • Developed gearing technology that secures and compensates aperture ratio for high resolution (8K) product implementation (4) Developed the world’s first gaming monitor product applying OLED (55” UHD) • Developed 55” UHD gaming monitor product using advantages of OLED (latency, gray to gray, color recall) (5) Developed the world’s first curved gaming monitor product applying AH-IPS COT (37.5” WQ+) • Developed and produced the world’s first monitor product applying AH-IPS COT • Pioneered gaming/curved premium monitor product market (6) Developed the world’s first monitor product applying Crystal Sound Display (“CSD”) (27.0” FHD) • Developed and produced the world’s first monitor product applying CSD
• Developed large-sized, front-oriented stereo speaker through the application of exciter and piezo to the bottom cover of the liquid crystalmodule
(7) Developed the world’s first automotive product applying plastic OLED (16.9” + 7.2” / 14.2”) • Developed and produced the world’s first 1CG multi-display product applying plastic OLED (16.9” + 7.2” / 14.2”)
Achievements in 2020 (1) Developed the first products in our Guangzhou OLED panel production facility (77” UHD, 48” UHD) • Completed the development of the first products in our Guangzhou OLED panel production facility (77” UHD, 48” UHD)
18

Table of Contents
11. Intellectual Property
As of June 30, 2020, our cumulative patent portfolio (including patents that have already expired) included a total of 47,067 patents, consisting of20,573 in Korea and 26,494 in other countries.
12. Environmental and Safety Matters
We are subject to a variety of environmental laws and regulations, and we may be subject to fines or restrictions that could cause our operations tobe interrupted. Our manufacturing processes generate worksite waste, including water and air pollutants, at various stages in the manufacturing process,and we are subject to relevant laws and regulations in each area of the environment, including with respect to the treatment of chemical by-products. Wehave installed and currently operate various types of anti-pollution equipment, consistent with environmental standards, for the treatment of chemicalwaste and equipment for the recycling of treated waste water at our various facilities. However, we cannot provide assurance that environmental claimswill not be brought against us or that the local or national governments will not take steps toward adopting more stringent environmental standards. Anyfailure on our part to comply with any present or future environmental regulations could result in the assessment of damages or imposition of finesagainst us, suspension of production or a cessation of operations. In addition, environmental regulations could require us to acquire costly equipment orto incur other significant compliance expenses that may materially and negatively affect our financial condition and results of operations.
In accordance with the Framework Act on Low Carbon, Green Growth, we implemented the greenhouse gas emission and energy consumptiontarget system from 2012 to 2014. In 2015, we implemented the greenhouse gas trading system, under which we are responsible to meet our emissiontargets based on the emission credits allocated to us by the Ministry of Environment of the Korean government. As a result, we have been investing inadditional equipment and there may be other costs associated with meeting reduction targets, which may have a negative effect on our profitability orproduction activities.
In connection with the greenhouse gas emission and energy reduction target system, we submitted a statement of our domestic emissions andenergy usage for 2019 to the Korean government in April 2020 after it was certified by BSI Korea, a government-designated certification agency. Thetable below sets forth yearly levels of our greenhouse gases emissions and energy usage in the statement submitted to the Korean government:
(Unit: thousand tonnes of CO2 equivalent; Tetra Joules) Category 2019 2018 2017 Greenhouse gases 5,885 6,696 6,314 Energy 62,776 64,296 63,451
As we were designated as a target company for the greenhouse gas emission trading system in 2015, we submit a plan for allocating andmonitoring our greenhouse gas emissions to the government every year. In order to continually promote the reduction of greenhouse gas emissions, wehave set a short-term goal to reduce the emission level from 2014 to 2022 by 16.8% and a medium- to long-term goal to reduce the emission level from2014 to 2045 by 65.1%. To achieve this, we are continually investing in facility improvements and monitoring our emission levels.
We are making extensive investments to replace SF6 gas, which is the main component of greenhouse gases, with NF3 gas. In addition, as a short-term strategy, we are actively implementing measures in compliance with the emission trading system. In 2019, we reduced our carbon dioxidegreenhouse gas emission levels by 1.21 million tons, which was 0.40 million tons more than our initial target of 0.81 million tons. As our medium- tolong-term goal, we plan to develop low-carbon production technologies in order to eliminate greenhouse gas emission during our manufacturing processand to conserve energy.
The increase in greenhouse gas emission in 2018 is due to the inclusion of certain other greenhouse gas emissions (N2O used in depositionfacilities and CO2 in cleaning facilities) during the second planning period (2018 to 2020) that were not included during the first planning period (2015to 2017) in the overall amount of greenhouse gas emissions in accordance with guidelines issued by the Korean government.
19

Table of Contents
Operations at our manufacturing plants are subject to regulation and periodic scheduled and unscheduled on-site inspections by the Ministry ofEnvironment and local environmental protection authorities. We believe that we have adopted adequate anti-pollution measures and have minimized ourimpact on the environment by improving existing and developing new technologies for the effective maintenance of environmental protection standardsconsistent with local industry practice. In addition, we have continually monitored, and we believe that we are in compliance in all material respectswith, the applicable environmental laws and regulations in Korea. Expenditures related to such compliance may be substantial. Such expenditures aregenerally included in capital expenditures. As required by Korean law, we employ licensed environmental specialists to manage our water and airpollution, toxic materials and waste. In December 2013, to ensure safe water quality and reduce costs, we entered into a contract with a specialistcompany to operate our waste water treatment facilities. In stages beginning in November 1997, we have obtained environmental management systemISO 14001 certifications for the operation of our domestic panel and module production facilities and our overseas module production plants in Paju,Gumi, Nanjing, Yantai, Guangzhou and Vietnam, and in December 2013, we have obtained energy management system ISO 50001 certifications for theoperation of our domestic panel and module production plants and our overseas module production plants in Nanjing and Guangzhou and are operatingsuch facilities in accordance with such certifications.
In addition, in August 2014, GP1, our newest 8th generation panel fabrication facility located in Guangzhou, China, was the first electronics plantin China to receive the “Green Plant” designation under China’s Green China Policy, in addition to receiving ISO 14001, ISO 50001, OHSAS 18001,ISO 9001, PAS 2050 and ISO 14064-1 certifications. Furthermore, with respect to our production facilities in Gumi, we were first certified by theMinistry of Environment as a “Green Company” for P1 in 1997, and we currently continue to maintain such certification. In recognition of our efforts toreduce greenhouse gas emissions, we were awarded a commendation from the Minister of Environment in the efforts against climate change category inthe 2013 Green Management Awards, which was jointly hosted by the Ministry of Environment and the Ministry of Trade, Industry and Energy. Inaddition, in recognition of our efforts to improve recycling and reduce waste, we received a citation in 2014 for being a leading recycling company fromthe Prime Minister of Korea and, in recognition of our continued water conservation activities (reuse system investments, etc.), we attained the highestlevel, Leadership A, and received the grand prize award at the CDP Water Korea Best Awards in 2016 from the Carbon Disclosure Project, which waspresided over by the Carbon Disclosure Project Korea Committee. Since then, we have continued to maintain our excellence in water conservationactivities in 2018 and 2019. In addition, our continued efforts to reduce greenhouse gas emissions have been recognized from 2017 to 2019 by becomingthe only domestic information technology company to attain the Leadership A level and again receiving carbon management honors by ranking in thetop five among all eligible companies. In May 2017, we were awarded a commendation from the Minister of Environment for having scored the highestgrade among companies in the low- and medium-volume pollutant emitters category that had entered into voluntary agreements with the MetropolitanAir Quality Management Office, in recognition of having successfully met our voluntary targets for reduction of air pollutants as well as our overallefforts to enhance our relevant facilities and operational systems. In addition, in recognition of efficient control, management and operating systemsimplemented in our manufacturing facilities, we received the top-level certification, Level 1, in 2017 under the Factory Energy Management Systemevaluation presided by the Korea Energy Agency. Furthermore, in November 2017, we received the highest commendation, the Presidential Award, inthe Korean Energy Efficiency Awards presided by the Ministry of Trade, Industry and Energy in recognition of our energy management practices andenergy saving measures. In May 2018, we received the CEM Insight Award, presented at the Clean Energy Ministerial Meetings, and also receivedcertification for our energy business management (Energy Champion) presided by the Ministry of Trade, Industry and Energy and the Korea EnergyAgency in November 2018. Since 2019, we have been carrying out forest development activities around our manufacturing facilities after signing anagreement with Gyeong-gi Province to surround our facilities with forests to reduce air pollutants such as fine dust and have received a commendationfor such efforts.
In the case of the European Union’s Restriction of Hazardous Substances (RoHS) Directive 2011/65/EU, with the adoption of Directive (EU)2015/863 in 2016, four additional substances (four phthalate substances) have been added to the six already restricted substances, which additionalrestrictions became effective as of July 22, 2019. In order to address the latent risk elements of the four phthalate substances that became restricted in2019 and to establish a more stable management system, we implemented in 2016 a preemptive response process with respect to such four phthalatesubstances. In implementing this process, we collaborated with external agencies to ascertain regulatory trends and establish our response strategy, andwe formulated and applied effective management measures through the collaborative efforts of our development, procurement and quality teams.Beryllium (Be) was not designated internationally as a mandatorily restricted substance but has continued to be the subject of discussion for restriction,and certain of our customers have designated it as a restricted substance not to be used in products. Accordingly, we have completed verification of theparts used in products for customers who have banned the use of Beryllium. We have also conducted verification of the parts used in products for allcustomers who are expected to implement a ban and we have established a Beryllium verification process for parts in development. Through suchefforts, we have established a voluntary hazardous substance response process that can be expanded to products for all customers, not only those whohave requested a response.
20

Table of Contents
In October 2005, we became the first display panel company to receive accreditation as an International Accredited Testing Laboratory by theKorea Laboratory Accreditation Scheme, which is operated by the Korean Ministry of Trade, Industry & Energy. In September 2006, we receivedinternational accreditation from TUV SUD, EU’s German accreditation agency, as a RoHS testing laboratory. Our efforts to keep pace with theincreasingly stringent accreditation standards and to receive and maintain such accreditations are part of our on-going efforts to systematically monitorenvironmentally controlled substances in our component parts inventory. Moreover, we participated in reforming IEC 62321, an international testingstandard published by the International Electrotechnical Commission and used by RoHS, and the commission adopted our halogen-free combustion ionchromatography method in as IEC 62321-3-2, which was published in June 2013. In 2017, in a joint effort with the global product testing/accreditationagency SGS, we became the first display panel company to develop Eco Label, an environmentally friendly accreditation program for television displaymodules, and have since continuously received the SGS Eco Label accreditation for our OLED television models. For the IPS Nano Color for LCD, wereceived the Quality & Performance Mark from Intertek, a global product testing/accreditation agency, by applying a technology to eliminate cadmium(Cd) and indium phosphide (InP). In 2018, we became the first display panel company to receive the “Green Technology Certification” from the KoreanMinistry of Science and ICT for improving the light efficiency technology of OLED to promote energy use reduction.
In June 2017, we were assessed a fine of W1 million, which we subsequently paid, for failure to meet certain waste disposal subcontractorrequirements under the Waste Management Act. To prevent such violations from occurring again, we are strengthening the periodic evaluation processfor our waste management subcontractors.
In June 2017, we were audited by the Ministry of Employment and Labor in connection with the occurrence of a safety accident and found to bein violation of certain provisions of the Industrial Safety and Health Act relating to supervisory obligations. As a result, we were issued a correctiveorder and assessed a fine of W2.4 million. In addition, the trial court ordered a fine of W0.5 million on each of us and our chief production officer on thebasis of certain other applicable provisions of the Industrial Safety and Health Act. In relation to the same matter, in May 2018, the Prosecutor’s Officesought a fine of W3.0 million on each of us and our chief production officer on the basis of certain other applicable provisions of the Industrial Safetyand Health Act. The trial court (Goyang Branch of Uijeongbu District Court) issued a summary order confirming the same fine of W3.0 million onNovember 22, 2018. We and our chief production officer appealed the trial court’s decision, and the case is currently pending appeal at the UijeongbuDistrict Court. In order to prevent such accidents from occurring again, we are strengthening our safety management standards and training for ouremployees.
In January 2018, we were audited by the Ministry of Employment and Labor in connection with the occurrence of another safety accident andfound to be in violation of certain provisions of the Industrial Safety and Health Act relating to supervisory obligations. As a result, we were issued acorrective order and assessed a fine of W14.4 million. In relation to this matter, in January 2019, the trial court (Goyang Branch of Uijeongbu DistrictCourt) assessed a fine of W1 million as a summary order on each of us and our chief production officer pursuant to certain other provisions of theIndustrial Safety and Health Act. In addition, in January 2019, the trial court sought a fine of W4 million and W2 million on us and the employee incharge of on-site safety management, respectively, on the basis of certain other provisions of the Industrial Safety and Health Act. Relevant authoritiesare currently conducting further investigations. In order to prevent such accidents from occurring again, we are strengthening our safety managementstandards and training for our employees.
Also in January 2018, the government of Gyeong-gi Province issued a warning and assessed a fine of W1 million on us, which we subsequentlypaid, for the failure to comply with certain requirements relating to air pollutant emission and prevention facilities under the Air Quality ManagementAct. To prevent such violations from occurring again, we have shortened the air pollutant emission maintenance reporting period and strengthened theverification process for relevant data.
21

Table of Contents
In February 2018, we were assessed a fine of W0.04 million by Paju City for stopping a vehicle in front of a day care center in violation of certainprovisions of the Road Traffic Law. We have since paid the fine and are in the process of strengthening our parking guidance procedures to prevent suchrecurrence.
In March 2018, we were audited by the Ministry of Employment and Labor in connection with our health and safety training practices, and wewere found to have omitted requisite health and safety training sessions for certain employees in our P9 facilities in 2016 and 2017. As a result, we wereassessed a fine of W6.95 million, which we subsequently paid, and have strengthened our efforts to promote health and safety training programs inadvance as well as our management and supervision activities to ensure such programs are conducted.
In April 2018, we were assessed a fine of W0.24 million by Yeongdeungpo-gu Office for our failure to keep one of our rescue vehicles currentwith its statutory inspection requirements, which we subsequently paid. In order to prevent recurrence, we are continually monitoring the compliance ofinspection requirements for our vehicles.
In June 2019, the government of Gyeong-gi Province reviewed the operational history and the number of self-measurements of our emissionoutlets and confirmed that there were certain deficiencies in self-measurements for our reserve facilities. As a result, we were assessed a fine ofW1.6 million by the government of Gyeong-gi Province, which we subsequently paid, for the violation of Article 39 of the Air Quality ManagementAct. To prevent the recurrence, we have established a monthly self-measurement plan for our reserve facilities.
In May 2020, we were assessed a fine of W1.4 million by the National Institute of Chemical Safety for our failure to conduct safety training onhazardous chemicals in violation of Article 33 of the Chemicals Control Act, which we subsequently paid. In order to prevent recurrence, we conductedsafety training on hazardous chemicals for the relevant personnel and newly established a working process that complies with safety regulations.
13. Financial Information A. Financial highlights (Based on consolidated K-IFRS).
(Unit: In millions of Won) Description As of June 30, 2020 As of December 31, 2019 As of December 31, 2018 Current assets 9,826,257 10,248,315 8,800,127
Quick assets 7,786,872 8,197,160 6,108,924 Inventories 2,039,385 2,051,155 2,691,203
Non-current assets 25,227,997 25,326,248 24,375,583 Investments in equity accounted
investees 110,868 109,611 113,989 Property, plant and equipment, net 21,725,224 22,087,645 21,600,130 Intangible assets 847,401 873,448 987,642 Other non-current assets 2,544,504 2,255,544 1,673,822
Total assets 35,054,254 35,574,563 33,175,710 Current liabilities 11,160,360 10,984,976 9,954,483 Non-current liabilities 11,793,121 12,101,306 8,334,981 Total liabilities 22,953,481 23,086,282 18,289,464 Share capital 1,789,079 1,789,079 1,789,079 Share premium 2,251,113 2,251,113 2,251,113 Retained earnings 6,812,370 7,503,312 10,239,965 Other equity 1,812 (203,021) (300,968) Non-controlling interest 1,246,399 1,147,798 907,057
Total equity 12,100,773 12,488,281 14,886,246
22

Table of Contents
(Unit: In millions of Won, except for per share data and number of consolidated entities)
Description For the six months ended
June 30, 2020 For the year ended
December 31, 2019 For the year ended
December 31, 2018 Revenue 10,031,270 23,475,567 24,336,571 Operating profit (loss) (878,942) (1,359,382) 92,891 Operating profit (loss) from
continuing operations (702,727) (2,872,078) (179,443) Profit (loss) for the period (702,727) (2,872,078) (179,443) Profit (loss) attributable to:
Owners of the Company (688,112) (2,829,705) (207,239) Non-controlling interest (14,615) (42,373) 27,796
Basic earnings (loss) per share (1,923) (7,908) (579) Diluted earnings (loss) per share (1,923) (7,908) (579) Number of consolidated entities 21 22 22
B. Financial highlights (Based on separate K-IFRS).
(Unit: In millions of Won) Description As of June 30, 2020 As of December 31, 2019 As of December 31, 2018 Current assets 6,465,839 7,081,228 6,378,339
Quick assets 5,017,246 5,554,929 4,427,184 Inventories 1,448,593 1,526,299 1,951,155
Non-current assets 19,835,618 20,301,452 20,683,767 Investments 4,848,926 4,958,308 3,602,214 Property, plant and equipment, net 12,174,549 12,764,175 14,984,564 Intangible assets 681,839 708,047 816,808 Other non-current assets 2,130,304 1,870,922 1,280,181
Total assets 26,301,457 27,382,680 27,062,106 Current liabilities 9,810,910 9,140,483 7,416,630 Non-current liabilities 6,620,925 7,576,104 6,432,895
Total liabilities 16,431,835 16,716,587 13,849,525 Share capital 1,789,079 1,789,079 1,789,079 Share premium 2,251,113 2,251,113 2,251,113 Retained earnings 5,829,430 6,625,901 9,172,389 Other equity 0 0 0
Total equity 9,869,622 10,666,093 13,212,581
(Unit: In millions of Won, except for per share data)
Description For the six months ended
June 30, 2020 For the year ended
December 31, 2019 For the year ended
December 31, 2018 Revenue 9,372,529 21,658,329 22,371,687 Operating profit (loss) (1,104,977) (1,784,245) (472,995) Operating profit (loss) from continuing
operations (793,661) (2,639,893) (442,291) Profit (loss) for the period (793,661) (2,639,893) (442,291) Basic earnings (loss) per share (2,218) (7,378) (1,236) Diluted earnings (loss) per share (2,218) (7,378) (1,236)
23

Table of Contents
C. Consolidated subsidiaries (as of June 30, 2020)
Company Interest Primary Business Location Equity LG Display America, Inc. Sales U.S.A. 100% LG Display Germany GmbH Sales Germany 100% LG Display Japan Co., Ltd. Sales Japan 100% LG Display Taiwan Co., Ltd. Sales Taiwan 100% LG Display Nanjing Co., Ltd. Manufacturing China 100% LG Display Shanghai Co., Ltd. Sales China 100% LG Display Guangzhou Co., Ltd. Manufacturing China 100% LG Display Shenzhen Co., Ltd. Sales China 100% LG Display Singapore Pte. Ltd. Sales Singapore 100% L&T Display Technology (Fujian) Limited Manufacturing and sales China 51% LG Display Yantai Co., Ltd. Manufacturing China 100% LG Display (China) Co., Ltd. Manufacturing and sales China 70% Nanumnuri Co., Ltd. Workplace services Korea 100% Unified Innovative Technology, LLC Managing intellectual property U.S.A. 100% Global OLED Technology LLC Managing intellectual property U.S.A. 100% LG Display Guangzhou Trading Co., Ltd. Sales China 100% LG Display Vietnam Haiphong Co., Ltd. Manufacturing Vietnam 100% Suzhou Lehui Display Co., Ltd. Manufacturing and sales China 100% LG Display Fund I LLC (1)
Investing in new emerging
companies U.S.A 100% LG Display High-Tech (China) Co., Ltd. (2) Manufacturing China 70% MMT (Money Market Trust) Money market trust Korea 100%
(1) During the reporting period, we invested an additional W1,979 million in LG Display Fund I LLC.(2) During the reporting period, the non-controlling shareholders invested an additional W84,829 million. Due to such additional investment, our
interest in LG Display High-Tech (China) Co., Ltd. has decreased from 75% as of the end of 2019 to 72% as of the end of the reporting period.
Additionally, the liquidation process of LG Display Poland Sp. z o.o., our former consolidated subsidiary, was completed in May 2020.
D. Status of equity investments (as of June 30, 2020) (1) Consolidated subsidiaries
Company
Book Value of Investment Amount
(in millions of Won) Initial Equity
Investment Date Equity
Interest LG Display America, Inc. 36,815 September 24, 1999 100% LG Display Germany GmbH 19,373 November 5, 1999 100% LG Display Japan Co., Ltd. 15,686 October 12, 1999 100% LG Display Taiwan Co., Ltd. 35,230 April 12, 1999 100% LG Display Nanjing Co., Ltd. 593,726 July 15, 2002 100% LG Display Shanghai Co., Ltd. 9,093 January 16, 2003 100% LG Display Guangzhou Co., Ltd. 293,557 June 30, 2006 100% LG Display Shenzhen Co., Ltd. 3,467 August 28, 2007 100% LG Display Singapore Pte. Ltd. 1,250 January 12, 2009 100% L&T Display Technology (Fujian) Limited 10,123 January 5, 2010 51%
24

Table of Contents
Company
Book Value of Investment Amount
(in millions of Won) Initial Equity
Investment Date Equity
Interest LG Display Yantai Co., Ltd. 169,195 April 19, 2010 100% Nanumnuri Co., Ltd. 800 March 19, 2012 100% LG Display (China) Co., Ltd. 723,086 December 10, 2012 70% Unified Innovative Technology, LLC 9,489 March 12, 2014 100% LG Display Guangzhou Trading Co., Ltd. 218 April 28, 2015 100% Global OLED Technology LLC 164,322 December 18, 2009 100% LG Display Vietnam Haiphong Co., Ltd. 672,658 May 5, 2016 100% Suzhou Lehui Display Co., Ltd. 121,640 July 1, 2016 100% LG Display Fund I LLC (1) 8,301 May 1, 2018 100% LG Display High-Tech (China) Co., Ltd. (2) 1,794,547 July 11, 2018 72% MMT (Money Market Trust) 83,700 January 2, 2018 100%
(1) During the reporting period, we invested an additional W1,979 million in LG Display Fund I LLC.(2) During the reporting period, the non-controlling shareholders invested an additional W84,829 million. Due to such additional investment, our
interest in LG Display High-Tech (China) Co., Ltd. has decreased from 75% as of the end of 2019 to 72% as of the end of the reporting period.
Additionally, the liquidation process of LG Display Poland Sp. z o.o., our former consolidated subsidiary, was completed in May 2020.
(2) Affiliated companies
Company Carrying Amount
(in millions) Date of
Incorporation Equity
Interest Paju Electric Glass Co., Ltd. W 48,860 January 2005 40% Wooree E&L Co., Ltd. W 7,382 June 2008 14% YAS Co., Ltd. W 23,159 April 2002 15% Avatec Co., Ltd. W 19,326 August 2000 14% Arctic Sentinel, Inc. — June 2008 10% CYNORA GmbH W 4,714 March 2003 12% Material Science Co., Ltd. W 2,501 January 2014 10% Nanosys Inc. W 4,926 July 2001 4%
For the six months ended June 30, 2019 and 2020, the aggregate amount of dividends we received from our affiliated companies was W7,502 millionand W8,239 million, respectively.
14. Audit Information A. Audit service (Unit: In millions of Won)
Period Auditor Description of
service
Audit contract details Actual performance details
Compensation Hours of
service(1) Compensation Hours of
service(1) 2020 H1 KPMG Samjong Audit by independent auditor 1,410 (540)(2) 20,426 510 6,167 2019 KPMG Samjong Audit by independent auditor 1,280 (500)(2) 20,000 1,280 (500)(2) 21,194 2018 KPMG Samjong Audit by independent auditor 1,170 (450)(2) 19,000 1,170 (450)(2) 17,269 (1) Total hours of service includes the number of hours for work related to the English audit and/or review reports and SOX 404 audit.(2) Compensation amount in ( ) is for work related to the English audit and/or review reports (including Form 20-F and 6-K filings) and SOX 404
audit.
25

Table of Contents
B. Non-audit service (Unit: In millions of Won, hours)
Period Date of contract Description of
service Period of service Compensation 2020 H1 — — — — 2019 July 23, 2019 Issuance of comfort letters July 23, 2019 ~ August 31, 2019 120 2018 September 11, 2018 Green bond verification September 11, 2018 ~ October 9, 2018 45
15. Management’s Discussion and Analysis of Financial Condition and Results of Operations
Omitted in quarterly and semi-annual reports in accordance with Korean disclosure rules.
16. Board of Directors A. Members of the board of directors
As of the date of this report, our board of directors consisted of two non-outside directors, one non-standing director and four outside directors. (As of the date of this report)Name Position Primary responsibilityJames (Hoyoung) Jeong(1) Representative Director (non-outside), Chief Executive Officer and President Overall head of business managementDonghee Suh(2) Director (non-outside), Chief Financial Officer and Senior Vice President Overall head of financesYoung-Soo Kwon Director (non-standing) Chairman of the board of directorsSung-Sik Hwang Outside Director Related to the overall managementKun Tai Han Outside Director Related to the overall managementByung Ho Lee Outside Director Related to the overall managementChang-Yang Lee Outside Director Related to the overall management (1) James (Hoyoung) Jeong was newly appointed as a non-outside director at the annual general meeting of shareholders and as the representative
director at the board of directors’ meeting, both held on March 20, 2020.(2) Donghee Suh was reappointed for another term as a non-outside director at the annual general meeting of shareholders held on March 20, 2020.
B. Committees of the board of directors
We have the following committees that serve under our board of directors: Audit Committee, Outside Director Nomination Committee andManagement Committee. The Management Committee consists of two non-outside directors, James (Hoyoung) Jeong and Donghee Suh.
As of March 20, 2020, the composition of the Outside Director Nomination Committee was as follows.
26

Table of Contents
(As of March 20, 2020)Committee Composition MemberOutside Director Nomination Committee(1)
1 non-standing director and 2 outside directors
Young-Soo Kwon, Kun Tai Han,
Chang-Yang Lee (1) Each of Young-Soo Kwon, Kun Tai Han, Chang-Yang Lee was appointed as a member of the outside director nomination committee of the board
of directors at the board of directors’ meeting on March 20, 2020.
As of June 30, 2020, the composition of the Audit Committee was as follows.
(As of June 30, 2020)Committee Composition MemberAudit Committee 3 outside directors Sung-Sik Hwang(1), Kun Tai Han, Chang-Yang Lee(2) (1) Sung-Sik Hwang is the audit committee chairman.(2) Chang-Yang Lee was newly appointed as an audit committee member at the annual general meeting of shareholders held on March 15, 2019.
C. Independence of directors
Directors are appointed in accordance with applicable procedures under the Commercial Act, other relevant laws and regulations, our articles ofassociation and our other internal regulations, and we do not maintain separate independence standards for the election of directors. However, in order toensure fairness and independence in appointing our directors, our non-outside directors and other non-executive directors are nominated by the board ofdirectors, and our outside directors are nominated by our Outside Director Nomination Committee, in each case for appointment at our shareholders’meeting, in accordance with the relevant laws and regulations, our articles of association, board regulations and standards governing our OutsideDirector Nomination Committee. As part of such process, our board of directors and our Outside Director Nomination Committee conducts a rigorousreview of each candidate for his or her independence, expertise and suitability as a director, among other factors.
17. Information Regarding Shares A. Total number of shares (1) Total number of shares authorized to be issued (as of June 30, 2020): 500,000,000 shares. (2) Total shares issued and outstanding (as of June 30, 2020): 357,815,700 shares. B. Shareholder list (1) Largest shareholder and related parties as of June 30, 2020:
Name(1) Relationship Number of shares of common stock Equity interest LG Electronics Largest shareholder 135,625,000 37.9% Donghee Suh(2)
Officer of member
company 5,000 0.0% (1) Following the end of the reporting period, James (Hoyoung) Jeong, our current chief executive officer and president, acquired 10,000 shares of
our common stock, which purchase was publicly disclosed on August 5, 2020.(2) Following the end of the reporting period, Donghee Suh acquired an additional 4,000 shares of our common stock, which purchase was publicly
disclosed on August 5, 2020. As a result, he currently holds 9,000 shares of our common stock as of the end of the reporting period. (2) Shareholders who are known to us that own 5% or more of our shares as of June 30, 2020:
Beneficial owner Number of shares of common stock Equity interest LG Electronics 135,625,000 37.90% National Pension Service(1) 18,161,082 5.08%
(1) As of May 2, 2020.
27

Table of Contents
18. Directors and Employees A. Directors (1) Remuneration for directors in 2020 H1:
(Unit: person, in millions of Won)
Classification No. of directors(1) Amount paid(2) Per capita average
remuneration paid(3) Non-outside directors 3 1,387 462 Outside directors who are not audit committee
members 1 39 39 Outside directors who are audit committee members 3 117 39
Total 7 1,543(4) 220 (1) Number of directors as at June 30, 2020.(2) Amount paid is calculated on the basis of amount of cash actually paid.(3) Per capita average remuneration paid is calculated by dividing total amount paid by the average number of directors for the six months ended
June 30, 2020.(4) Due to Mr. Sang Beom Han’s resignation as a non-outside director and Mr. James (Hoyoung) Jeong’s nomination as a non-outside director at the
annual general meeting of shareholders held on March 20, 2020, the total amount paid includes the remuneration paid to both directors. (2) Standards of remuneration paid to non-outside and outside directors — Non-outside directors (excluding outside directors and audit committee members)
The remuneration system for non-outside directors consists of base salary, position salary and performance-related pay. The remuneration
for non-outside directors is measured in accordance with the standards established by the board of directors (within the amount approved atthe annual general meeting of shareholders), including the non-outside director’s position and job responsibilities.
• Standards for base salary/position salary: relevant position and job responsibilities, among others
• Standards for performance-related pay: financial performance of the company and achievement of individual managementgoals, among others
— Outside directors, audit committee members and auditor
The remuneration for outside directors, audit committee members and auditor is measured in accordance with the standards established by
the board of directors (within the amount approved at the annual general meeting of shareholders), including the individual’s jobresponsibilities, among others.
(3) Remuneration for individual directors and audit committee members — Individual remuneration amount
(Unit: in millions of Won)
Name Position Total remuneration Payment not included in
total remuneration James (Hoyoung) Jeong Chief Executive Officer 659 —
28

Table of Contents
— Method of calculation Name Method of calculationJames (HoYoung) Jeong
Total remuneration
• W659 million. Salary
• Base salary is set in accordance with the executive compensation regulations established by the board ofdirectors. Monthly payments of W61 million between January and June were made.
• Position salary is calculated based on the significance of the position and responsibilities of the job.
Monthly payments of W49 million between January and June were made.
• A total of W1 million of welfare benefits were paid on an annual basis in accordance with welfarebenefits standards.
(4) Remuneration for the five highest paid individuals (among those paid over W500 million per year) — Individual remuneration amount
(Unit: in millions of Won)
Name Position Total remuneration Payment not included in
total remuneration Sang Beom Han Senior Advisor 4,979 — Kyung Ho Lee Advisor 1,440 — Chul Gu Lee Advisor 1,200 — Sang Hoon Lee Advisor 1,032 — Sang Eon Jeon Advisor 1,001 —
— Method of calculation Name Method of calculationSang Beom Han(1)
Total remuneration
• W4,979 million (consisting of W512 million in salary and W4,467 million in retirement pay). Salary
• Base salary is set in accordance with the executive compensation regulations established by the board ofdirectors. Monthly payments of W72 million between January and March and W36 million between Apriland June were made.
• Position salary is calculated based on the significance of the position and responsibilities of the job.
Monthly payments of W57 million between January and March were made.
• A total of W18 million of welfare benefits were paid on an annual basis in accordance with other welfarebenefits standards.
Retirement pay
• Retirement pay is calculated in accordance with the applicable provisions of our regulations oncompensation for retiring executives and is evaluated by the duration of employment (18 years), monthlybase salary at the time of retirement and payment rate per position (2.5 to 4.5%).
29

Table of Contents
Kyung Ho Lee(1)
Total remuneration
• W1,440 million (consisting of W137 million in salary and W1,303 million in retirement pay). Salary
• Base salary is set in accordance with the executive compensation regulations established by the board ofdirectors. Monthly payments of W30 million between January and March and W15 million between Apriland June were made.
• A total of W4 million of welfare benefits were paid on an annual basis in accordance with other welfare
benefits standards. Retirement pay
• Retirement pay is calculated in accordance with the applicable provisions of our regulations oncompensation for retiring executives and is evaluated by the duration of employment (16 years), monthlybase salary at the time of retirement and payment rate per position (2.5 to 4.5%).
Chul Gu Lee(1)
Total remuneration
• W1,200 million (consisting of W157 million in salary and W1,043 million in retirement pay). Salary
• Base salary is set in accordance with the executive compensation regulations established by the board ofdirectors. Monthly payments of W30 million between January and March and W15 million between Apriland June were made.
• A total of W24 million of welfare benefits were paid on an annual basis in accordance with other welfare
benefits standards. Retirement pay
• Retirement pay is calculated in accordance with the applicable provisions of our regulations oncompensation for retiring executives and is evaluated by the duration of employment (13 years), monthlybase salary at the time of retirement and payment rate per position (2.5 to 4.5%).
Sang Hoon Lee(1)
Total remuneration
• W1,032 million (consisting of W138 million in salary and W894 million in retirement pay). Salary
• Base salary is set in accordance with the executive compensation regulations established by the board ofdirectors. Monthly payments of W30 million between January and March and W15 million between Apriland June were made.
• A total of W5 million of welfare benefits were paid on an annual basis in accordance with other welfare
benefits standards. Retirement pay
• Retirement pay is calculated in accordance with the applicable provisions of our regulations oncompensation for retiring executives and is evaluated by the duration of employment (11 years), monthlybase salary at the time of retirement and payment rate per position (2.5 to 4.5%).
30

Table of Contents
Sang Eon Jeon(1)
Total remuneration
• W1,001 million (consisting of W136 million in salary and W865 million in retirement pay). Salary
• Base salary is set in accordance with the executive compensation regulations established by the board ofdirectors. Monthly payments of W30 million between January and March and W15 million between Apriland June were made.
• A total of W3 million of welfare benefits were paid on an annual basis in accordance with other welfare
benefits standards. Retirement pay
• Retirement pay is calculated in accordance with the applicable provisions of our regulations oncompensation for retiring executives and is evaluated by the duration of employment (11 years), monthlybase salary at the time of retirement and payment rate per position (2.5 to 4.5%).
(1) Mssrs. Sang Beom Han, Kyung Ho Lee, Chul Gu Lee, Sang Hoon Lee and Sang Eon Jeon are former officers who retired from our company
effective as of March 31, 2020.
(5) Stock options
Not applicable.
B. Employees
As of June 30, 2020, we had 26,231 employees (excluding our directors). On average, our male employees have served 11.5 years and our femaleemployees have served 9.4 years. The total amount of salary paid to our employees for the six months ended June 30, 2020 based on income taxstatements submitted to the Korean tax authority in accordance with Article 20 of the Income Tax Act was W846,795 million for our male employeesand W116,335 million for our female employees. The following table provides details of our employees as of June 30, 2020:
(Unit: person, in millions of Won, year)
Number of
employees(1) Total salary in 2019(2)(3)(4)
Average salary per capita(5)
Average years ofservice
Male 22,151 846,795 38 11.5 Female 4,080 116,335 28 9.4 Total 26,231 963,131 37 11.1
(1) Includes part-time employees and employees hired for temporary needs or to serve as temporary replacements for employees on parental leave.(2) Welfare benefits and retirement expenses have been excluded. Total welfare benefit provided to our employees for the six months ended June 30,
2020 was W160,736 million and the per capita welfare benefit provided was W6.1 million.(3) Based on income tax statements, which are submitted to the Korean tax authority in accordance with Article 20 of the Income Tax Act.(4) Includes incentive payments to employees who have transferred from our affiliated companies.(5) Calculated using the cumulative salary and the average number of employees (male: 22,204, female: 4,096) for the six months ended June 30,
2020.
In December 2017, we were audited by the Ministry of Employment and Labor regarding our human resource practices (including in relation toemployment contracts, hours of work, outsourcing and employees in pregnancy), and we were found to be in violation of certain provisions of the LaborStandard Act relating to overtime, night and holiday work. As a result, we were issued a corrective order in January 2018 and paid additional overtimewages of W2,893 million to 16,106 administrative employees of our Paju facilities for their nighttime work
31

Table of Contents
between January 1, 2015 to December 31, 2017. In addition, we reviewed nighttime work records of our administrative employees outside of our Pajufacilities during the same period and paid additional overtime wages of W2,166 million to eligible employees. In order to prevent such violation fromoccurring again, we are periodically monitoring the nighttime work records of our employees.
From December 2017 to January 2018, we were audited by the Ministry of Employment and Labor regarding our human resource practicesrelating to temporary and part-time employees, and we were found to have omitted certain required information (including the number of break hoursand vacation days) in the employment contracts of 82 temporary employees. As a result, we were assessed a fine of W27 million, which wesubsequently paid. In order to prevent such violation from occurring again, we have amended the relevant provisions of the applicable employmentcontracts.
19. Other Matters A. Legal proceedings
We are a defendant in three separate civil lawsuits (comprising one damages claim in the United Kingdom filed by private plaintiffs, one damagesclaim in Israel filed by private plaintiffs and one unjust enrichment claim in the United States filed by the Commonwealth of Puerto Rico) filed againstus and certain other TFT-LCD panel manufacturers in connection with alleged anticompetitive behavior of the defendants. In each of these cases, theamount being sought has not been determined, and no trial has been scheduled. While the expected outcome of each of these cases is unclear, we do notbelieve that any of these cases would have a material effect on our financial conditions.
We are also a defendant in two patent infringement lawsuits (one in the United States and the other in Germany) filed against us by Solas OLEDLtd. In each of these cases, the amount being sought has not been determined. A court hearing for the case in Germany has been scheduled forSeptember 11, 2020. A pre-trial hearing for the case in the United States was held on May 22, 2020 and the case is currently in the discovery phase. Theexpected outcome of each of these cases is currently unclear.
B. Material events subsequent to the reporting period
None.
C. Material change in management
At our annual general meeting of shareholders held on March 20, 2020, Mr. Sang Beom Han resigned as a non-outside director, Mr. James(Hoyoung) Jeong was newly appointed as a non-outside director and Donghee Suh was reappointed for another term as a non-outside director. At ourmeeting of the board of directors held on March 20, 2020, Mr. James (Hoyoung) Jeong was appointed as our Representative Director.
32

Table of Contents
LG DISPLAY CO., LTD. AND SUBSIDIARIES
Condensed Consolidated Interim Financial Statements
(Unaudited)
June 30, 2020 and 2019
(With Independent Auditors’ Review Report Thereon)
33

Table of Contents
Table of Contents
Page
Independent Auditors’ Review Report 35
Condensed Consolidated Interim Statements of Financial Position 37
Condensed Consolidated Interim Statements of Comprehensive Loss 38
Condensed Consolidated Interim Statements of Changes in Equity 39
Condensed Consolidated Interim Statements of Cash Flows 40
Notes to the Condensed Consolidated Interim Financial Statements 42
34

Table of Contents
Independent Auditors’ Review Report
Based on a report originally issued in Korean
To the Board of Directors and ShareholdersLG Display Co., Ltd.:
Reviewed Financial Statements
We have reviewed the accompanying condensed consolidated interim financial statements of LG Display Co., Ltd. and subsidiaries (the “Group”) whichcomprise the condensed consolidated interim statement of financial position as of June 30, 2020, the condensed consolidated interim statements ofcomprehensive loss for the three-month and six-month periods ended June 30, 2020 and 2019, and statements of changes in equity and cash flows forthe six-month periods ended June 30, 2020 and 2019, and notes comprising a summary of significant accounting policies and other explanatoryinformation.
Management’s Responsibility for the Condensed Consolidated Interim Financial Statements
Management is responsible for the preparation and fair presentation of these condensed consolidated interim financial statements in accordance withKorean International Financial Reporting Standards No. 1034, Interim Financial Reporting, and for such internal controls as management determinesnecessary to enable the preparation of condensed consolidated interim financial statements that are free from material misstatement, whether due tofraud or error.
Auditors’ Responsibility
Our responsibility is to issue a report on these condensed consolidated interim financial statements based on our reviews.
We conducted our reviews in accordance with the Review Standards for Quarterly and Semiannual Financial Statements established by the Security andFutures Commission of the Republic of Korea. A review of interim financial information consists principally of making inquiries, primarily of personsresponsible for financial and accounting matters, and applying analytical and other review procedures. A review is substantially less in scope than anaudit conducted in accordance with Korean Standards on Auditing and consequently does not enable us to obtain assurance that we would becomeaware of all significant matters that might be identified in an audit. Accordingly, we do not express an audit opinion.
Conclusion
Based on our reviews, nothing has come to our attention that causes us to believe that the condensed consolidated interim financial statements referredto above are not presented fairly, in all material respects, in accordance with Korean International Financial Reporting Standards No. 1034, InterimFinancial Reporting.
Other Matters
The procedures and practices utilized in the Republic of Korea to review such condensed consolidated interim financial statements may differ fromthose generally accepted and applied in other countries.
We audited the consolidated statement of financial position as of December 31, 2019 and the related consolidated statements of comprehensive loss,changes in equity and cash flows for the year then ended, which are not accompanying this review report, in accordance with Korean Standards onAuditing, and our report thereon, dated March 11, 2020, expressed an unmodified opinion. The accompanying condensed consolidated statement offinancial position of the Group as of December 31, 2019, presented for comparative purposes, is not different from that audited by us from which it wasderived in all material respects.
35

Table of Contents
KPMG Samjong Accounting Corp.Seoul, KoreaAugust 12, 2020
This report is effective as of August 12, 2020 the review report date. Certain subsequent events or circumstances, which may occur between thereview report date and the time of reading this report, could have a material impact on the accompanying condensed consolidated interim financialstatements and notes thereto. Accordingly, the readers of the review report should understand that the above review report has not been updated toreflect the impact of such subsequent events or circumstances, if any.
36

Table of Contents
LG DISPLAY CO., LTD. AND SUBSIDIARIESCondensed Consolidated Interim Statements of Financial Position(Unaudited)As of June 30, 2020 and December 31, 2019 (In millions of won) Note June 30, 2020 December 31, 2019 Assets Cash and cash equivalents 4, 25 W 3,520,803 3,336,003Deposits in banks 4, 25 78,252 78,757Trade accounts and notes receivable, net 5, 14, 25, 27 2,802,830 3,154,080Other accounts receivable, net 5, 25 145,532 474,048Other current financial assets 6, 25 63,324 70,945Inventories 7 2,039,385 2,051,155Prepaid income taxes 116,878 114,143Other current assets 5 1,059,253 969,184
Total current assets 9,826,257 10,248,315
Deposits in banks 4, 25 11 11Investments in equity accounted investees 8 110,868 109,611Other non-current accounts receivable, net 5, 25 7,883 9,072Other non-current financial assets 6, 25 140,066 111,510Property, plant and equipment, net 9, 14, 17 21,725,224 22,087,645Intangible assets, net 10, 17 847,401 873,448Deferred tax assets 23 2,059,838 1,727,122Defined benefits assets, net 12 49,562 127,252Other non-current assets 5 287,144 280,577
Total non-current assets 25,227,997 25,326,248
Total assets W35,054,254 35,574,563
Liabilities Trade accounts and notes payable 25, 27 W 3,466,222 2,618,261Current financial liabilities 11, 25 3,146,882 1,977,084Other accounts payable 25 2,980,909 4,397,121Accrued expenses 567,977 675,270Income tax payable 31,912 120,034Provisions 13 165,071 189,525Advances received 14 751,632 925,662Other current liabilities 13 49,755 82,019
Total current liabilities 11,160,360 10,984,976
Non-current financial liabilities 11, 25 11,606,109 11,612,910Non-current provisions 13 66,076 67,118Defined benefit liabilities, net 12 1,539 1,338Long-term advances received 14 16,086 320,582Deferred tax liabilities 23 10,586 11,210Other non-current liabilities 13 92,725 88,148
Total non-current liabilities 11,793,121 12,101,306
Total liabilities 22,953,481 23,086,282
Equity Share capital 15 1,789,079 1,789,079Share premium 2,251,113 2,251,113Retained earnings 6,812,370 7,503,312Reserves 15 1,812 (203,021)
Total equity attributable to owners of the Controlling Company 10,854,374 11,340,483
Non-controlling interests 1,246,399 1,147,798
Total equity 12,100,773 12,488,281
Total liabilities and equity W35,054,254 35,574,563
See accompanying notes to the consolidated financial statements.
37

Table of Contents
LG DISPLAY CO., LTD. AND SUBSIDIARIESCondensed Consolidated Interim Statements of Comprehensive Loss(Unaudited)For the three-month and six-month periods ended June 30, 2020 and 2019
(In millions of won, except earnings per share) Note For the three-month periods
ended June 30 For the six-month periods
ended June 30 2020 2019 2020 2019 Revenue 16, 17, 27 W 5,307,021 5,353,410 10,031,270 11,232,191Cost of sales 7, 18, 27 (5,178,834) (4,871,729) (9,624,930) (10,117,750)
Gross profit 128,187 481,681 406,340 1,114,441
Selling expenses 19 (163,791) (242,591) (363,645) (474,808) Administrative expenses 19 (193,902) (183,558) (367,191) (383,006) Research and development expenses (287,517) (424,276) (554,446) (757,389)
Operating loss (517,023) (368,744) (878,942) (500,762)
Finance income 22 103,536 75,454 346,734 135,264Finance costs 22 (142,464) (109,910) (356,302) (193,607) Other non-operating income 21 182,637 419,606 724,468 667,000Other non-operating expenses 21 (299,365) (461,250) (806,243) (685,504) Equity in income of equity accounted investees, net 3,732 2,446 6,465 6,553
Loss before income tax (668,947) (442,398) (963,820) (571,056) Income tax expense (benefit) 23 (165,117) 107,782 (261,093) 41,764
Loss for the period (503,830) (550,180) (702,727) (612,820)
Other comprehensive income (loss) Items that will never be reclassified to profit or loss Remeasurements of net defined benefit liabilities 12 (1,208) (1,935) (3,782) (4,848) Other comprehensive income (loss) from associates (52) (4) 39 133Related income tax 12 310 (4,328) 972 (3,551)
(950) (6,267) (2,771) (8,266)
Items that are or may be reclassified to profit or loss Foreign currency translation differences for foreign operations (43,734) (1,694) 230,169 189,438Other comprehensive income from associates 1,397 3,706 2,992 4,106
(42,337) 2,012 233,161 193,544
Other comprehensive income (loss) for the period, net of income tax (43,287) (4,255) 230,390 185,278
Total comprehensive loss for the period W (547,117) (554,435) (472,337) (427,542)
Loss attributable to: Owners of the Controlling Company (489,121) (548,377) (688,112) (609,310) Non-controlling interests (14,709) (1,803) (14,615) (3,510)
Loss for the period W (503,830) (550,180) (702,727) (612,820)
Total comprehensive income (loss) attributable to: Owners of the Controlling Company (514,853) (547,644) (486,525) (455,741) Non-controlling interests (32,264) (6,791) 14,188 28,199
Total comprehensive loss for the period W (547,117) (554,435) (472,337) (427,542)
Loss per share (in won) Basic and diluted loss per share 24 W (1,367) (1,533) (1,923) (1,703)
See accompanying notes to the consolidated financial statements.
38

Table of Contents
LG DISPLAY CO., LTD. AND SUBSIDIARIESCondensed Consolidated Interim Statements of Changes in EquityFor the six-month periods ended June 30, 2020 and 2019(Unaudited) Attributable to owners of the Controlling Company
(In millions of won) Share
capital Share
premium Retained
earnings Reserves Sub-total Non-controlling
interests Total equity Balances at January 1, 2019 W1,789,079 2,251,113 10,239,965 (300,968) 13,979,189 907,057 14,886,246
Total comprehensive income (loss) for the year
Loss for the period — — (609,310) — (609,310) (3,510) (612,820)
Other comprehensive income (loss) Remeasurements of net defined benefit liabilities,
net of tax — — (8,399) — (8,399) — (8,399) Foreign currency translation differences — — — 157,729 157,729 31,709 189,438Other comprehensive income from associates — — 133 4,106 4,239 — 4,239
Total other comprehensive income (loss) — — (8,266) 161,835 153,569 31,709 185,278
Total comprehensive income (loss) for the period W — — (617,576) 161,835 (455,741) 28,199 (427,542)
Transaction with owners, recognized directly in
equity Capital contribution from non-controlling interests — — (91) (176) (267) 276,662 276,395Subsidiaries’ dividends distributed to
non-controlling interests — — — — — (6,541) (6,541)
Balances at June 30, 2019 W1,789,079 2,251,113 9,622,298 (139,309) 13,523,181 1,205,377 14,728,558
Balances at January 1, 2020 W1,789,079 2,251,113 7,503,312 (203,021) 11,340,483 1,147,798 12,488,281
Total comprehensive income (loss) for the period Loss for the period — — (688,112) — (688,112) (14,615) (702,727)
Other comprehensive income (loss) Remeasurements of net defined benefit liabilities,
net of tax — — (2,810) — (2,810) — (2,810) Foreign currency translation differences — — — 201,366 201,366 28,803 230,169Other comprehensive income from associates — — 39 2,992 3,031 — 3,031
Total other comprehensive income (loss) — — (2,771) 204,358 201,587 28,803 230,390
Total comprehensive income (loss) for the period W — — (690,883) 204,358 (486,525) 14,188 (472,337)
Transaction with owners, recognized directly in
equity Capital contribution from non-controlling interests — — (59) 475 416 84,413 84,829
Balances at June 30, 2020 W1,789,079 2,251,113 6,812,370 1,812 10,854,374 1,246,399 12,100,773
See accompanying notes to the consolidated financial statements.
39

Table of Contents
LG DISPLAY CO., LTD. AND SUBSIDIARIESCondensed Consolidated Interim Statements of Cash Flows(Unaudited)For the six-month periods ended June 30, 2020 and 2019 (In millions of won) Note 2020 2019 Cash flows from operating activities: Loss for the period W (702,727) (612,820) Adjustments for: Income tax expense (benefit) 23 (261,093) 41,764Depreciation and amortization 18 1,921,928 1,713,172Gain on foreign currency translation (104,474) (107,510) Loss on foreign currency translation 175,139 199,176Expenses related to defined benefit plans 12 80,274 98,499Gain on disposal of property, plant and equipment (9,046) (8,625) Loss on disposal of property, plant and equipment 18,619 21,999Impairment loss on property, plant and equipment 9,326 9,765Gain on disposal of intangible assets — (552) Loss on disposal of intangible assets 7 139Impairment loss on intangible assets 30,511 — Reversal of impairment loss on intangible assets (600) (201) Gain on disposal of non-current assets held for sale — (8,353) Expense on increase of provisions 113,120 198,357Finance income (266,116) (93,278) Finance costs 304,419 138,817Equity in income of equity method accounted investees, net 8 (6,465) (6,553) Other income (17,332) (552) Other expenses 72,655 3,472
2,060,872 2,199,536
Changes in: Trade accounts and notes receivable (215,123) (139,708) Other accounts receivable 112,422 34,767Inventories 8,518 119,151Lease receivables 2,707 2,895Other current assets (69,266) (206,160) Other non-current assets (44,245) (7,489) Trade accounts and notes payable 898,742 (228,703) Other accounts payable (592,911) 461,043Accrued expenses (94,148) 189,725Provisions (126,836) (156,613) Other current liabilities (40,504) (26,936) Defined benefit liabilities, net (6,227) (21,736) Short-term advances received (35,783) — Long-term advances received — 63,672Other non-current liabilities 6,372 6,173
(196,282) 90,081
Cash generated from operating activities 1,161,863 1,676,797Income taxes paid (156,159) (231,703) Interests received 33,324 26,749Interests paid (291,395) (181,814)
Net cash provided by operating activities W 747,633 1,290,029
See accompanying notes to the consolidated interim financial statements.
40

Table of Contents
LG DISPLAY CO., LTD. AND SUBSIDIARIESCondensed Consolidated Interim Statements of Cash Flows, Continued(Unaudited)For the six-month periods ended June 30, 2020 and 2019
(In millions of won) Note 2020 2019 Cash flows from investing activities: Dividends received W 8,239 1,445Increase in deposits in banks (7,452) (41,180) Proceeds from withdrawal of deposits in banks 7,957 41,180Acquisition of financial asset at fair value through profit or loss (29) (80) Proceeds from disposal of financial asset at fair value through profit or loss 90 59Acquisition of financial assets at fair value through other comprehensive income — (21) Proceeds from disposal of financial assets at fair value through other comprehensive income 6 — Proceeds from disposal of investments in equity accounted investees 1,200 1,200Acquisition of property, plant and equipment (1,829,385) (4,313,847) Proceeds from disposal of property, plant and equipment 275,436 21,224Acquisition of intangible assets (216,218) (253,482) Proceeds from disposal of intangible assets 300 2,349Government grants received 19,035 248,124Proceeds from disposal of non-current assets held for sale — 81,351Receipt from settlement of derivatives 27,551 13,167Proceeds from collection of short-term loans 7,759 11,772Increase in short-term loans — (8,225) Increase in long-term loans — (6,465) Increase in deposits (1,115) (26,328) Decrease in deposits 1,217 1,386Proceeds from disposal of other assets 11,000 —
Net cash used in investing activities (1,694,409) (4,226,371)
Cash flows from financing activities: 26 Proceeds from short-term borrowings 1,599,298 1,374,123Repayments of short-term borrowings (1,267,503) (688,143) Proceeds from issuance of bonds 49,949 503,665Proceeds from long-term borrowings 1,294,452 2,499,192Repayments of current portion of long-term borrowings and bonds (646,786) (995,460) Payment of lease liabilities (34,443) (30,311) Capital contribution from non-controlling interests 84,829 276,395Subsidiaries’ dividends distributed to non-controlling interests — (6,541)
Net cash provided by financing activities 1,079,796 2,932,920
Net increase (decrease) in cash and cash equivalents 133,020 (3,422) Cash and cash equivalents at January 1 3,336,003 2,365,022Effect of exchange rate fluctuations on cash held 51,780 61,811
Cash and cash equivalents at June 30 W 3,520,803 2,423,411
See accompanying notes to the consolidated interim financial statements.
41

Table of Contents
1. Reporting Entity (a) Description of the Controlling Company
LG Display Co., Ltd. (the “Controlling Company”) was incorporated in February 1985 and the Controlling Company is a publiccorporation listed in the Korea Exchange since 2004. The main business of the Controlling Company and its subsidiaries (the “Group”) isto manufacture and sell displays and its related products. As of June 30, 2020, the Group is operating Thin Film Transistor Liquid CrystalDisplay (“TFT-LCD”) and Organic Light Emitting Diode (“OLED”) panel manufacturing plants in Gumi, Paju and China and TFT-LCDand OLED module manufacturing plants in Gumi, Paju, China and Vietnam. The Controlling Company is domiciled in the Republic ofKorea with its address at 128 Yeouidae-ro, Yeongdeungpo-gu, Seoul, the Republic of Korea. As of June 30, 2020, LG Electronics Inc., amajor shareholder of the Controlling Company, owns 37.9% (135,625,000 shares) of the Controlling Company’s common stock.
The Controlling Company’s common stock is listed on the Korea Exchange under the identifying code 034220. As of June 30, 2020, thereare 357,815,700 shares of common stock outstanding. The Controlling Company’s common stock is also listed on the New York StockExchange in the form of American Depository Shares (“ADSs”) under the symbol “LPL”. One ADS represents one-half of one share ofcommon stock. As of June 30, 2020, there are 21,176,408 ADSs outstanding.
42
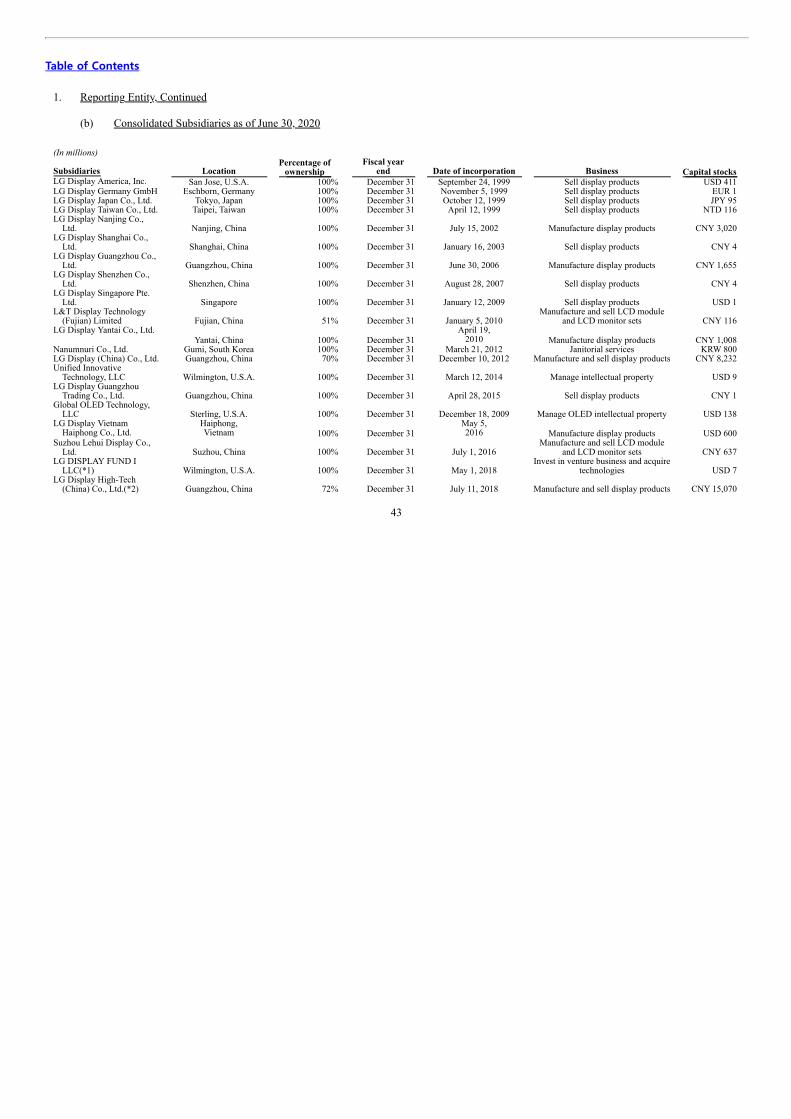
Table of Contents
1. Reporting Entity, Continued (b) Consolidated Subsidiaries as of June 30, 2020 (In millions)
Subsidiaries Location Percentage of
ownership Fiscal year
end Date of incorporation Business Capital stocks LG Display America, Inc. San Jose, U.S.A. 100% December 31 September 24, 1999 Sell display products USD 411 LG Display Germany GmbH Eschborn, Germany 100% December 31 November 5, 1999 Sell display products EUR 1 LG Display Japan Co., Ltd. Tokyo, Japan 100% December 31 October 12, 1999 Sell display products JPY 95 LG Display Taiwan Co., Ltd. Taipei, Taiwan 100% December 31 April 12, 1999 Sell display products NTD 116 LG Display Nanjing Co.,
Ltd. Nanjing, China 100% December 31 July 15, 2002 Manufacture display products CNY 3,020 LG Display Shanghai Co.,
Ltd. Shanghai, China 100% December 31 January 16, 2003 Sell display products CNY 4 LG Display Guangzhou Co.,
Ltd. Guangzhou, China 100% December 31 June 30, 2006 Manufacture display products CNY 1,655 LG Display Shenzhen Co.,
Ltd. Shenzhen, China 100% December 31 August 28, 2007 Sell display products CNY 4 LG Display Singapore Pte.
Ltd. Singapore 100% December 31 January 12, 2009 Sell display products USD 1 L&T Display Technology
(Fujian) Limited Fujian, China 51% December 31 January 5, 2010 Manufacture and sell LCD module
and LCD monitor sets CNY 116 LG Display Yantai Co., Ltd.
Yantai, China 100% December 31 April 19,
2010 Manufacture display products CNY 1,008 Nanumnuri Co., Ltd. Gumi, South Korea 100% December 31 March 21, 2012 Janitorial services KRW 800 LG Display (China) Co., Ltd. Guangzhou, China 70% December 31 December 10, 2012 Manufacture and sell display products CNY 8,232 Unified Innovative
Technology, LLC Wilmington, U.S.A. 100% December 31 March 12, 2014 Manage intellectual property USD 9 LG Display Guangzhou
Trading Co., Ltd. Guangzhou, China 100% December 31 April 28, 2015 Sell display products CNY 1 Global OLED Technology,
LLC Sterling, U.S.A. 100% December 31 December 18, 2009 Manage OLED intellectual property USD 138 LG Display Vietnam
Haiphong Co., Ltd. Haiphong,Vietnam 100% December 31
May 5,2016 Manufacture display products USD 600
Suzhou Lehui Display Co.,Ltd. Suzhou, China 100% December 31 July 1, 2016
Manufacture and sell LCD moduleand LCD monitor sets CNY 637
LG DISPLAY FUND ILLC(*1) Wilmington, U.S.A. 100% December 31 May 1, 2018
Invest in venture business and acquiretechnologies USD 7
LG Display High-Tech(China) Co., Ltd.(*2) Guangzhou, China 72% December 31 July 11, 2018 Manufacture and sell display products CNY 15,070
43

Table of Contents
1. Reporting Entity, Continued
(*1) For the six-month period ended June 30, 2020, the Controlling Company contributed W1,979 million in cash for the capital increase by LG
DISPLAY FUND I LLC. There was no change in the Controlling Company’s ownership percentage in LG DISPLAY FUND I LLC as aresult of this additional investment.
(*2) For the six-month period ended June 30, 2020, non-controlling shareholders contributed W84,829 million in cash for the stocks issued by
LG Display High-Tech (China) Co., Ltd. (“LGDCO”). The Group’s ownership percentage in LGDCO decreased from 75% to 72% as aresult of the additional shares issue.
Meanwhile, the liquidation process of LG Display Poland Sp. z.o.o., a subsidiary of the Controlling Company, was completed in May 2020 andthe Group reclassified the comprehensive loss amounting to W72,654 million from foreign currency translation differences to profit or loss.
In addition to the above subsidiaries, the Controlling Company has invested W83,700 million in MMT (Money Market Trust), which is controlledby the Controlling Company.
2. Basis of Presenting Financial Statements (a) Statement of Compliance
The condensed consolidated interim financial statements have been prepared in accordance with Korean International Financial ReportingStandards (“K-IFRSs”) No.1034, Interim Financial Reporting. They do not include all of the information required for full annual financialstatements and should be read in conjunction with the consolidated financial statements of the Group as of and for the year endedDecember 31, 2019.
(b) Basis of Measurement
The condensed consolidated interim financial statements have been prepared on the historical cost basis except for the following materialitems in the statement of financial position:
• derivative financial instruments at fair value, financial assets at fair value through profit or loss (“FVTPL”), financial assets at fairvalue through other comprehensive income (“FVOCI”), financial liabilities at fair value through profit or loss (“FVTPL”), and
• net defined benefit liabilities (defined benefit assets) recognized at the present value of defined benefit obligations less the fair valueof plan assets.
(c) Functional and Presentation Currency
The condensed consolidated interim financial statements are presented in Korean won, which is the Controlling Company’s functionalcurrency.
(d) Use of Estimates and Judgments
The preparation of the condensed consolidated interim financial statements in conformity with K-IFRSs requires management to makejudgments, estimates and assumptions that affect the application of accounting policies and the reported amounts of assets, liabilities,income and expenses. Actual results may differ from these estimates.
44

Table of Contents
3. Summary of Significant Accounting Policies
The accounting policies applied in these condensed consolidated interim financial statements are the same as those applied in the Group’sconsolidated financial statements as of and for the year ended December 31, 2019, except for the application of K-IFRS No.1034, InterimFinancial Reporting. A number of amended standards are effective from January 1, 2020 but they do not have a material effect on the Group’sfinancial statements.
4. Cash and Cash Equivalents and Deposits in Banks
Cash and cash equivalents and deposits in banks as of June 30, 2020 and December 31, 2019 are as follows:
(In millions of won) June 30, 2020 December 31, 2019 Current assets
Cash and cash equivalents Demand deposits W 3,520,803 3,336,003
Deposits in banks Time deposits W 1,400 1,500 Restricted deposits (*) 76,852 77,257
W 78,252 78,757
Non-current assets Deposits in banks
Restricted deposits (*) W 11 11 W 3,599,066 3,414,771
(*) Include funds deposited under agreements on mutually beneficial cooperation to aid LG Group companies’ suppliers, restricted deposits pledged
to enforce the Group’s investment plans upon the receipt of grants from Gumi city and Gyeongsangbuk-do, and others.
45
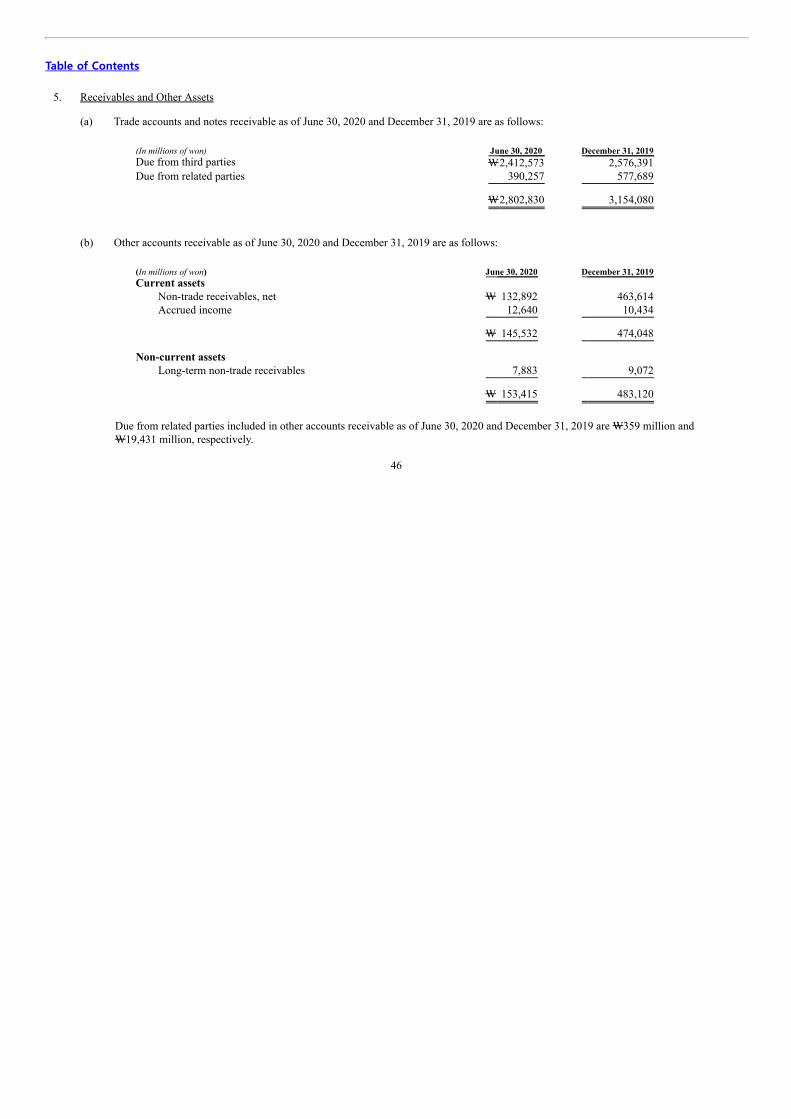
Table of Contents
5. Receivables and Other Assets (a) Trade accounts and notes receivable as of June 30, 2020 and December 31, 2019 are as follows:
(In millions of won) June 30, 2020 December 31, 2019 Due from third parties W2,412,573 2,576,391 Due from related parties 390,257 577,689
W2,802,830 3,154,080
(b) Other accounts receivable as of June 30, 2020 and December 31, 2019 are as follows:
(In millions of won) June 30, 2020 December 31, 2019 Current assets
Non-trade receivables, net W 132,892 463,614 Accrued income 12,640 10,434
W 145,532 474,048
Non-current assets Long-term non-trade receivables 7,883 9,072
W 153,415 483,120
Due from related parties included in other accounts receivable as of June 30, 2020 and December 31, 2019 are W359 million andW19,431 million, respectively.
46

Table of Contents
5. Receivables and Other Assets, Continued (c) The aging of trade accounts and notes receivable and other accounts receivable as of June 30, 2020 and December 31, 2019 are as follows:
June 30, 2020 Book value Allowance for impairment
(In millions of won)
Trade accounts and notes
receivable
Other accounts
receivable
Trade accounts and notes
receivable
Other accounts
receivable Current W 2,801,030 154,734 (2,240) (2,854) 1-15 days past due 3,835 339 (2) (1) 16-30 days past due 207 10 — — 31-60 days past due — 25 — — More than 60 days past due — 1,196 — (34)
W 2,805,072 156,304 (2,242) (2,889)
December 31, 2019 Book value Allowance for impairment
(In millions of won)
Trade accounts and notes
receivable
Other accounts
receivable
Trade accounts and notes
receivable
Other accounts
receivable Current W 3,119,914 208,086 (454) (3,292) 1-15 days past due 34,626 3,512 (6) (1) 16-30 days past due — 598 — (4) 31-60 days past due — 61 — — More than 60 days past due — 274,185 — (25)
W 3,154,540 486,442 (460) (3,322)
The movement in the allowance for impairment in respect of trade accounts and notes receivable and other accounts receivable for the six-monthperiod ended June 30, 2020 and the year ended December 31, 2019 are as follows:
June 30, 2020 December 31, 2019
(In millions of won)
Trade accounts and notes
receivable
Other accounts
receivable
Trade accounts and notes
receivable
Other accounts
receivable Balance at the beginning of the period W 460 3,322 477 1,281 (Reversal of) bad debt expense 1,782 (433) (17) 2,041
Balance at the end of the reporting period W 2,242 2,889 460 3,322
47

Table of Contents
5. Receivables and Other Assets, Continued (d) Other assets as of June 30, 2020 and December 31, 2019 are as follows:
(In millions of won) June 30, 2020 December 31, 2019 Current assets
Advanced payments W 31,730 6,203 Prepaid expenses 130,133 114,145 Value added tax refundable 877,856 826,730 Right to recover returned goods 19,534 22,106
W1,059,253 969,184
Non-current assets Long-term prepaid expenses W 253,727 272,835 Long-term advanced payments 33,417 7,742
W 287,144 280,577
48

Table of Contents
6. Other Financial Assets
Other financial assets as of June 30, 2020 and December 31, 2019 are as follows:
(In millions of won) June 30, 2020 December 31, 2019 Current assets
Financial assets at fair value through profit or loss Derivatives(*) W 21,088 34,036
Financial assets at fair value through other comprehensiveincome
Debt instruments Government bonds W 24 6
Financial assets carried at amortized cost Deposits W 10,146 9,585 Short-term loans 26,134 21,623 Lease receivables 5,932 5,695
W 42,212 36,903 W 63,324 70,945
Non-current assets Financial assets at fair value through profit or loss
Equity instruments Intellectual Discovery, Ltd. W 1,104 1,104 Kyulux, Inc. 396 1,889 Fineeva Co., Ltd. 4 4 ARCH Venture Fund Vll, L.P. 6,477 6,302 Sierra Ventures Fund XII, L.P. 600 580
W 8,581 9,879
Convertible bonds W 1,544 1,544 Derivatives(*) 62,734 15,640
W 72,859 27,063
Financial assets at fair value through other comprehensiveincome
Debt instruments Government bonds W 48 70
Financial assets carried at amortized cost Deposits W 21,344 21,451 Long-term loans 26,187 40,827 Lease receivables 19,628 22,099
W 67,159 84,377 W 140,066 111,510
(*) Represents valuation gain from currency interest rate swap contracts related to foreign currency denominated borrowings and bonds. Thecontracts are not designated as hedging instruments.
49
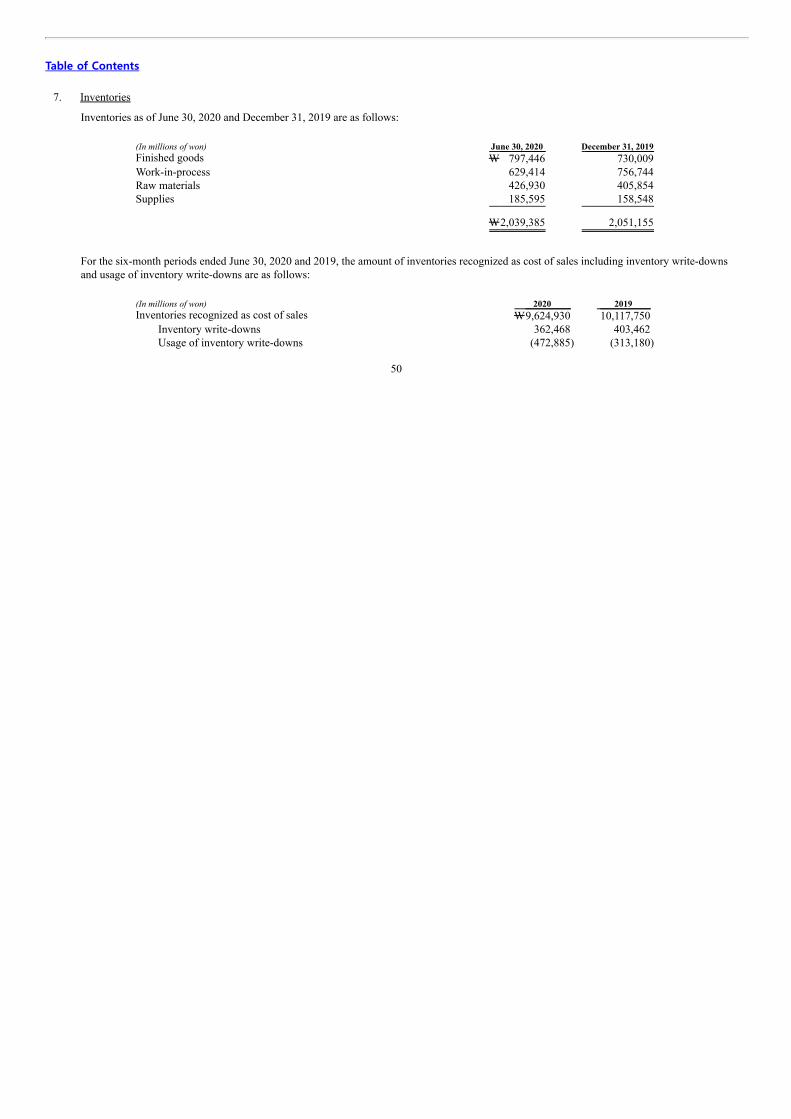
Table of Contents
7. Inventories
Inventories as of June 30, 2020 and December 31, 2019 are as follows:
(In millions of won) June 30, 2020 December 31, 2019 Finished goods W 797,446 730,009 Work-in-process 629,414 756,744 Raw materials 426,930 405,854 Supplies 185,595 158,548
W2,039,385 2,051,155
For the six-month periods ended June 30, 2020 and 2019, the amount of inventories recognized as cost of sales including inventory write-downsand usage of inventory write-downs are as follows:
(In millions of won) 2020 2019 Inventories recognized as cost of sales W9,624,930 10,117,750
Inventory write-downs 362,468 403,462 Usage of inventory write-downs (472,885) (313,180)
50

Table of Contents
8. Investments in Equity Accounted Investees
Associates as of June 30, 2020 and December 31, 2019 are as follows:
(In millions of won)Associates Location Fiscal year end
Date of incorporation Business
June 30, 2020 December 31, 2019
Percentage
of ownership Carrying
amount Percentage
of ownership Carrying
amount Paju Electric Glass Co.,
Ltd. Paju,
South Korea December 31
January
2005 Manufacture glass for
display 40%
W48,860
40%
W50,697
WooRee E&L Co., Ltd.
Ansan,South Korea
December 31
June 2008
Manufacture LED backlight unit packages
14%
7,382
14%
7,310
YAS Co., Ltd.
Paju,South Korea
December 31
April 2002
Develop and manufacturedeposition equipment for
OLEDs
15%
23,159
15%
19,424
AVATEC Co., Ltd.
Daegu,South Korea
December 31
August 2000
Process and sell glass fordisplay
14%
19,326
14%
19,929
Arctic Sentinel, Inc.
Los Angeles,U.S.A.
March 31
June 2008
Develop and manufacturetablet for kids
10%
—
10%
—
Cynora GmbH(*)
Bruchsal,Germany
December 31
March 2003
Develop organic emittingmaterials for displays and
lighting devices
12%
4,714
12%
4,714
51

Table of Contents
8. Investments in Equity Accounted Investees, Continued
(In millions of won)Associates Location Fiscal year end
Date of incorporation Business
June 30, 2020 December 31, 2019
Percentage
of ownership Carrying
amount Percentage
of ownership Carrying
amount Material Science Co.,
Ltd.
Seoul,South Korea
December 31
January 2014
Develop, manufacture,and sell materials for
display
10%
W 2,501
10%
W 2,354
Nanosys Inc.
Milpitas,U.S.A.
December 31
July 2001
Develop, manufacture,and sell materials for
display
4%
4,926
4%
5,183
W110,868 W109,611
(*) For the six-month period ended June 30, 2020, the Controlling Company’s ownership percentage in Cynora GmbH decreased from 12.2%to 11.6% as the Controlling Company did not participate in the rights issue.
Although the Controlling Company’s respective share interests in WooRee E&L Co., Ltd., YAS Co., Ltd., AVATEC Co., Ltd., Arctic Sentinel,Inc., Cynora GmbH, Material Science and Nanosys Inc. are below 20%, the Controlling Company is able to exercise significant influence throughits right to appoint a director to the board of directors of each investee. Accordingly, the investments in these investees have been accounted forusing the equity method.
Dividends income recognized from equity method investees for the six-month periods ended June 30, 2020 and 2019 amounted to W8,239 millionand W7,502 million, respectively.
52

Table of Contents
9. Property, Plant and Equipment
For the six-month periods ended June 30, 2020 and 2019, the Group purchased property, plant and equipment of W1,193,675 million andW3,771,126 million, respectively. The capitalized borrowing costs and the annualized capitalization rate were W143,782 million and 4.14%, andW142,957 million and 3.40% for the six-month periods ended June 30, 2020 and 2019, respectively. In addition, for the six-month periods endedJune 30, 2020 and 2019, the Group disposed of property, plant and equipment with carrying amounts of W67,341 million and W96,467 million,respectively, and recognized W9,046 million and W18,619 million, respectively, as gain and loss on disposal of property, plant and equipment forthe six-month period ended June 30, 2020 (gain and loss for the six-month period ended June 30, 2019: W8,625 million and W21,999 million,respectively).
10. Intangible Assets
The Group capitalizes expenditures related to development activities, such as expenditures incurred on designing, manufacturing and testing ofproducts after those related activities meet the capitalization criteria of development costs including technical feasibility, future economic benefitsand others. The balances of capitalized development costs as of June 30, 2020 and December 31, 2019 are W374,007 million andW375,183 million, respectively. In addition, for the six-month period ended June 30, 2020, the Group recognized an impairment loss amounting toW29,838 million in connection with development projects.
53

Table of Contents
11. Financial Liabilities (a) Financial liabilities as of June 30, 2020 and December 31, 2019 are as follows:
(In millions of won) June 30, 2020 December 31, 2019 Current
Short-term borrowings W 1,049,865 696,793 Current portion of long-term borrowings and bonds 2,049,429 1,242,904 Derivatives (*) 12,530 — Lease liabilities 35,058 37,387
W 3,146,882 1,977,084
Non-current Won denominated borrowings W 2,343,750 2,692,560 Foreign currency denominated borrowings 6,785,569 6,107,117 Bonds 2,415,285 2,741,516 Derivatives (*) 8,291 20,592 Lease liabilities 53,214 51,125
W11,606,109 11,612,910
(*) Represents currency interest rate swap contracts and others entered into the Group to hedge currency and interest rate risks with respect toforeign currency denominated borrowings and bonds.
(b) Short-term borrowings as of June 30, 2020 and December 31, 2019 are as follows:
(In millions of won, USD and CNY)Lender
Annual interest rate as of
June 30, 2020 (%)(*) June 30, 2020 December 31, 2019 Standard Chartered Bank Korea Limited
12ML + 0.98 6ML + 2.00
W 480,030
347,340
The Export-Import Bank of Korea 1.55 200,000 — Bank of China 6ML + 1.50 82,858 — Standard Chartered Bank Vietnam and others 3ML + 0.80~0.90 75,602 61,613 Standard Chartered Bank (China) Limited and
others PBOC LPR + 0.25~0.45
3.71
211,375
287,840
Foreign currency equivalent USD 532 USD 353
CNY 1,246 CNY 1,737 W 1,049,865 696,793
(*) ML represents Month LIBOR (London Inter-Bank Offered Rates), PBOC represents the benchmark interest rate of People’s Bank of Chinaand PBOC LPR represents Loan Prime Rate of People’s Bank of China.
54

Table of Contents
11. Financial Liabilities, Continued (c) Won denominated long-term borrowings as of June 30, 2020 and December 31, 2019 are as follows:
(In millions of won)Lender
Annual interest rate as of
June 30, 2020 (%)(*) June 30, 2020 December 31, 2019 Woori Bank 2.75 W 282 608 Korea Development Bank and others
CD rate (91days) + 1.00~1.60,
2.21~3.40 3,381,250 3,330,000 Less current portion of long-term
borrowings (1,037,782) (638,048) W 2,343,750 2,692,560
(*) CD represents certificate of deposit. (d) Foreign currency denominated long-term borrowings as of June 30, 2020 and December 31, 2019 are as follows:
(In millions of won, USD and CNY)Lender
Annual interest rateas of
June 30, 2020 (%) June 30, 2020 December 31,
2019 The Export-Import Bank of Korea and
others 3ML+0.75~1.706ML+1.25~1.35 W 1,723,005 1,696,177
China Construction Bank and others
USD: 3ML+0.65~1.43CNY: PBOC x (0.95~1.05)
PBOC LPR + 0.00~0.504.70 5,624,531 4,606,094
Foreign currency equivalent USD 2,717 USD 2,767
CNY 24,081 CNY 18,699 Less current portion of long-term
borrowings (561,967) (195,154) W 6,785,569 6,107,117
55

Table of Contents
11. Financial Liabilities, Continued (e) Details of bonds issued and outstanding as of June 30, 2020 and December 31, 2019 are as follows:
(In millions of won and USD) Maturity
Annual interest rate as of
June 30, 2020 (%) June 30, 2020 December 31, 2019 Won denominated bonds at amortized
cost (*1) Publicly issued bonds
October 2020 ~ February 2024 1.95~2.95 W 1,470,000 1,730,000
Privately issued bonds
May 2022 ~ May 2033
3.25~4.25 160,000 110,000
Less discount on bonds (2,554) (3,404) Less current portion (449,680) (409,702)
W 1,177,766 1,426,894
Foreign currency denominated bonds atamortized cost (*2)
Publicly issued bonds
November 2021
3.88 W 360,210 347,340
Privately issued bonds April 2023 3ML+1.47 120,070 115,780 Foreign currency equivalent USD 400 USD 400 Less discount on bonds (5,376) (6,883)
W 474,904 456,237
Financial liabilities at fair value throughprofit or loss
Foreign currency denominated convertiblebonds August 2024 1.50 W 762,615 858,385
Foreign currency equivalent USD 635 USD 741 W 2,415,285 2,741,516
(*1) Principal of the won denominated bonds is to be repaid at maturity and interests are paid quarterly. (*2) Principal of the foreign currency denominated bonds is to be repaid at maturity and interests are paid quarterly or semi-annually.
56
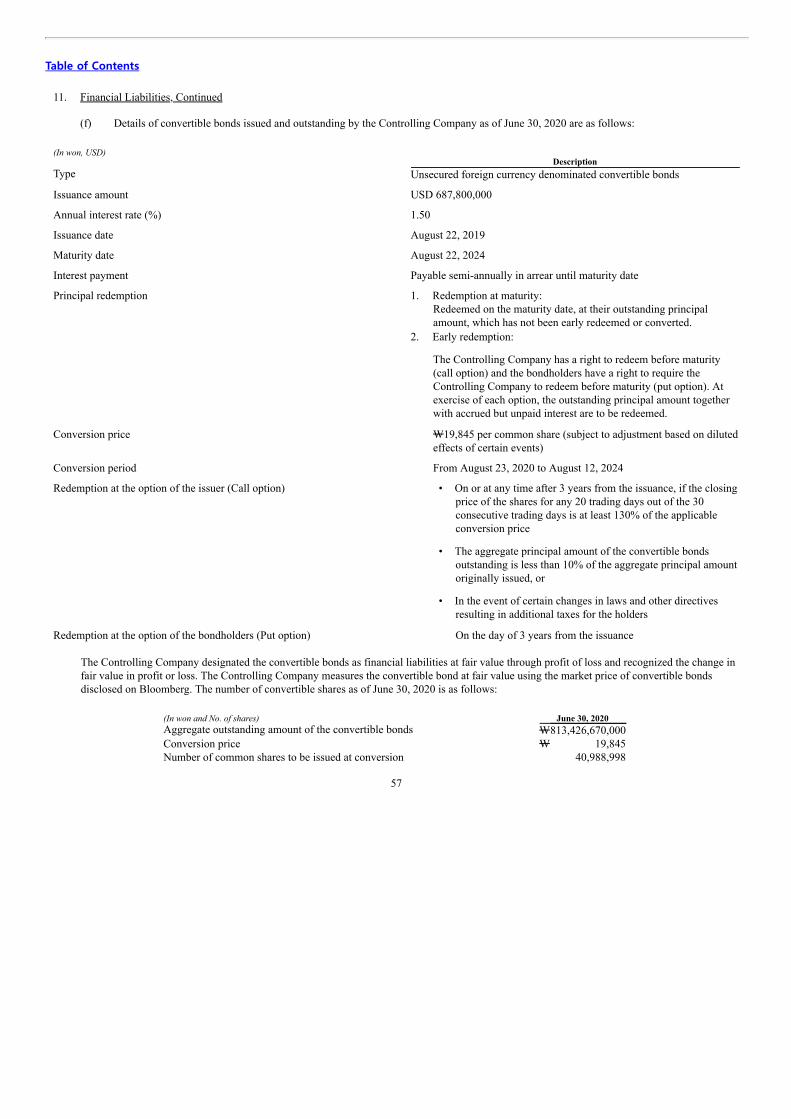
Table of Contents
11. Financial Liabilities, Continued (f) Details of convertible bonds issued and outstanding by the Controlling Company as of June 30, 2020 are as follows: (In won, USD) DescriptionType Unsecured foreign currency denominated convertible bonds
Issuance amount USD 687,800,000
Annual interest rate (%) 1.50
Issuance date August 22, 2019
Maturity date August 22, 2024
Interest payment Payable semi-annually in arrear until maturity date
Principal redemption
1. Redemption at maturity:Redeemed on the maturity date, at their outstanding principalamount, which has not been early redeemed or converted.
2. Early redemption:
The Controlling Company has a right to redeem before maturity(call option) and the bondholders have a right to require theControlling Company to redeem before maturity (put option). Atexercise of each option, the outstanding principal amount togetherwith accrued but unpaid interest are to be redeemed.
Conversion price
W19,845 per common share (subject to adjustment based on dilutedeffects of certain events)
Conversion period From August 23, 2020 to August 12, 2024
Redemption at the option of the issuer (Call option)
• On or at any time after 3 years from the issuance, if the closingprice of the shares for any 20 trading days out of the 30consecutive trading days is at least 130% of the applicableconversion price
• The aggregate principal amount of the convertible bonds
outstanding is less than 10% of the aggregate principal amountoriginally issued, or
• In the event of certain changes in laws and other directives
resulting in additional taxes for the holders
Redemption at the option of the bondholders (Put option) On the day of 3 years from the issuance
The Controlling Company designated the convertible bonds as financial liabilities at fair value through profit of loss and recognized the change infair value in profit or loss. The Controlling Company measures the convertible bond at fair value using the market price of convertible bondsdisclosed on Bloomberg. The number of convertible shares as of June 30, 2020 is as follows:
(In won and No. of shares) June 30, 2020 Aggregate outstanding amount of the convertible bonds W813,426,670,000 Conversion price W 19,845 Number of common shares to be issued at conversion 40,988,998
57

Table of Contents
12. Employee Benefits
The Controlling Company and certain subsidiaries’ defined benefit plans provide a lump-sum payment to an employee based on final salary ratesand length of service at the time the employee leaves the Controlling Company and certain subsidiaries.
(a) Net defined benefit liabilities (defined benefit assets) recognized as of June 30, 2020 and December 31, 2019 are as follows:
(In millions of won) June 30, 2020 December 31, 2019 Present value of partially funded defined benefit obligations W 1,492,711 1,481,339 Fair value of plan assets (1,540,734) (1,607,253)
W (48,023) (125,914)
Defined benefit liabilities, net W 1,539 1,338 Defined benefit assets, net W 49,562 127,252
(b) Expenses recognized in profit or loss for the three-month and six-month periods ended June 30, 2020 and 2019 are as follows:
For the three-month
periods ended June 30, For the six-month
periods ended June 30, (In millions of won) 2020 2019 2020 2019 Current service cost W40,828 48,973 81,827 97,891 Net interest cost (777) 304 (1,553) 608
W40,051 49,277 80,274 98,499
(c) Plan assets as of June 30, 2020 and December 31, 2019 are as follows:
(In millions of won) June 30, 2020 December 31, 2019 Guaranteed deposits in banks W1,540,734 1,607,253
As of June 30, 2020, the Controlling Company maintains the plan assets primarily with Mirae Asset Daewoo Co., Ltd., KB Insurance Co., Ltd.and others.
(d) Remeasurements of the net defined benefit liabilities (assets) included in other comprehensive income (loss) for the three-month andsix-month periods ended June 30, 2020 and 2019 are as follows:
For the three-month
periods ended June 30, For the six-month
periods ended June 30, (In millions of won) 2020 2019 2020 2019 Remeasurements of net defined benefit liabilities W(1,208) (1,935) (3,782) (4,848)
Tax effect 310 (4,328) 972 (3,551)
Remeasurements of net defined benefit liabilities, net of income tax W (898) (6,263) (2,810) (8,399)
58

Table of Contents
13. Provisions and Other Liabilities (a) Changes in provisions for the six-month period ended June 30, 2020 are as follows:
(In millions of won) Warranties (*) Others Total Balance at January 1, 2020 W 230,262 26,381 256,643
Additions (reversal) 102,119 (3,916) 98,203 Usage (122,921) (778) (123,699)
Balance at June 30, 2020 W 209,460 21,687 231,147
Current W 143,384 21,687 165,071 Non-current W 66,076 — 66,076
(*) Product warranties on defective products is normally applicable for 18~36 months from the date of customer’s purchase. The provision iscalculated by using historical and anticipated rates of warranty claims and costs per claim to satisfy the Group’s warranty obligation.
(b) Other liabilities as of June 30, 2020 and December 31, 2019 are as follows:
(In millions of won) June 30, 2020 December 31, 2019 Current liabilities
Withholdings W 26,903 28,376 Unearned revenue 16,612 44,333 Security deposits received 6,240 9,310
W 49,755 82,019
Non-current liabilities Long-term accrued expenses W 83,146 78,537 Long-term other accounts payable 7 1,069 Long-term unearned revenue 4,502 6,852 Security deposits received 5,070 1,690
W 92,725 88,148
59

Table of Contents
14. Contingencies and Commitments (a) Legal Proceedings
Anti-trust Litigations
Some individual claimants filed “follow-on” damages claims against the Group and other TFT-LCD manufacturers alleging violations of EUcompetition law. While the Group continues its vigorous defense of the various pending proceedings described above, as of June 30, 2020, theGroup cannot reliably estimate the timing and amount of outflows of resources embodying economic benefits relating to the proceedings.
Solas OLED Ltd. Litigations
In April 2019, Solas OLED Ltd. filed patent infringement actions against the Controlling Company and television manufacturers in the UnitedStates District Court for the Western District of Texas as well as the Controlling Company and its subsidiary, LG Display Germany GmbH, andtelevision manufacturers in the Mannheim District Court in Germany. As of June 30, 2020, the Group cannot reliably estimate the timing andamount of outflows of resources embodying economic benefits relating to the proceedings.
Others
The Group is involved in various disputes in addition to the pending proceedings described above. The Group cannot reliably estimate the timingand amount of outflows of resources embodying economic benefits relating to the disputes.
(b) Commitments
Factoring and securitization of accounts receivable
The Controlling Company has agreements with Korea Development Bank and several other banks for accounts receivable sales negotiatingfacilities of up to an aggregate of USD 1,110 million (W1,332,777 million) in connection with the Controlling Company’s export salestransactions with its subsidiaries. As of June 30, 2020, there are no short-term borrowings that are outstanding but past due in connection withthese agreements. In connection with all of the contracts in this paragraph, the Controlling Company has sold its accounts receivable withrecourse.
60

Table of Contents
14. Contingencies and Commitments, Continued
The Controlling Company and overseas subsidiaries entered into agreements with financial institutions for accounts receivables sales negotiatingfacilities. The respective maximum amount of accounts receivables that could be sold under the agreements and the amount of sold but not yet dueaccounts receivables by contract are as follows:
(In millions of USD and KRW) Credit limit Not yet due
Classification Financial institutions Contractual
amount KRW
equivalent Contractual
amount KRW
equivalent Controlling Company Shinhan Bank KRW 90,000 90,000 — —
USD 25 30,018 — — Sumitomo Mitsui Banking Corporation USD 20 24,014 — — MUFG Bank KRW 130,000 130,000 — — USD 70 84,049 — — BNP Paribas USD 125 150,087 USD 32 38,559 ING Bank USD 150 180,105 USD 9 10,993 USD 390 USD 41 KRW 220,000 688,273 — 49,552
Subsidiaries LG Display Singapore Pte. Ltd. Standard Chartered Bank USD 300 360,210 USD 150 180,071
LG Display Taiwan Co., Ltd. BNP Paribas USD 15 18,011 — —
Australia and New Zealand Banking
Group Ltd. USD 70 84,049 — —
LG Display Germany GmbH BNP Paribas USD 75 90,052 — — Commerzbank AG USD 2 2,056 USD 2 1,956 DZ Bank AG USD 9 10,576 USD 1 795 Oddo Bank USD 2 1,885 USD 0.1 76
LG Display America, Inc. Hong Kong & Shanghai Banking Corp. USD 800 960,560 USD 100 120,073 Standard Chartered Bank USD 600 720,420 USD 287 344,361 Sumitomo Mitsui Banking Corporation USD 200 240,140 USD 20 24,016 USD 2,073 2,487,959 USD 560.1 671,348 USD 2,463 USD 601.1 720,900 KRW 220,000 3,176,232 —
In connection with all of the contracts in the above table, the Group has sold its accounts receivable without recourse.
61

Table of Contents
14. Contingencies and Commitments, Continued
Letters of credit
As of June 30, 2020, the Controlling Company has agreements in relation to the opening of letters of credit up to USD 150 million (W180,105million) with KEB Hana Bank, USD 50 million (W60,035 million) with Sumitomo Mitsui Banking Corporation, USD 100 million (W120,070million) with Industrial Bank of Korea, USD 100 million (W120,070 million) with Industrial and Commercial Bank of China, USD 200 million(W240,140 million) with Shinhan Bank, USD 100 million (W120,070 million) with KB Kookmin Bank, USD 50 million (W60,035 million) withMUFG Bank, and USD 200 million (W240,140 million) with the Export-Import Bank of Korea.
Meanwhile, LG Display Guangzhou Co., Ltd. has an agreement in relation to the opening of letters of credit up to CNY 500 million (W84,830million) with Bank of China.
Payment guarantees
The Controlling Company obtained payment guarantees amounting to USD 675 million (W810,473 million) from KEB Hana Bank and others foradvances received related to the long-term supply agreements. The Controlling Company also obtained payment guarantees amounting to USD306 million (W367,189 million) from Korea Development Bank for foreign currency denominated bonds.
LG Display (China) Co., Ltd. and other subsidiaries are provided with payment guarantees from the China Construction Bank Corporation andother various banks amounting to CNY 1,334 million (W226,326 million), JPY 900 million (W10,044 million), EUR 2.5 million (W3,375million), VND 47,554 million (W2,463 million), and USD 0.5 million (W600 million), respectively, for their local tax payments and utilitypayments.
License agreements
As of June 30, 2020, the Group has technical license agreements with Hitachi Display, Ltd. and others in relation to its LCD business and patentcross license agreement with Universal Display Corporation in relation to its OLED business. Also, the Group has a trademark license agreementwith LG Corp. as of June 30, 2020.
Long-term supply agreement
As of June 30, 2020, in connection with long-term supply agreements with customers, the Controlling Company recognized USD 475 million(W570,333 million) in advances received. The advances received will be offset against outstanding accounts receivable balances after a givenperiod of time, as well as those arising from the supply of products thereafter. The Controlling Company received payment guarantees amountingto USD 675 million (W810,473 million) from KEB Hana Bank and other various banks relating to advances received (see note 14(b) paymentguarantees).
Pledged Assets
Regarding the secured bank borrowing amounting to CNY 18,650 million (W3,164,159 million) from China Construction Bank, as of June 30,2020, the Group provided its property, plant and equipment with carrying amount of W652,584 million as pledged assets.
62

Table of Contents
15. Capital and Reserves (a) Share capital
The Controlling Company is authorized to issue 500,000,000 shares of capital stock (par value W5,000), and as of June 30, 2020 andDecember 31, 2019, the number of issued common shares is 357,815,700. There have been no changes in the capital stock from January 1, 2019to June 30, 2020.
(b) Reserves
Reserves consist mainly of the following:
Translation reserve
The translation reserve comprises all foreign currency differences arising from the translation of the financial statements of foreign operations.
Other comprehensive income (loss) from associates
The other comprehensive income (loss) from associates comprises the amount related to change in equity of equity accounted investees.
Reserves as of June 30, 2020 and December 31, 2019 are as follows:
(In millions of won) June 30, 2020 December 31, 2019 Foreign currency translation differences for foreign operations W 23,389 (178,452) Other comprehensive loss from associates (21,577) (24,569)
W 1,812 (203,021)
63

Table of Contents
16. Revenue
Details of revenue for the three-month and six-month periods ended June 30, 2020 and 2019 are as follows:
(In millions of won) For the three-month periods
ended June 30 For the six-month periods
ended June 30 2020 2019 2020 2019 Sales of goods W5,296,446 5,344,359 10,009,244 11,213,364 Royalties 2,981 3,080 7,698 6,649 Others 7,594 5,971 14,328 12,178
W5,307,021 5,353,410 10,031,270 11,232,191
17. Geographic and Other Information
The following is a summary of sales by region based on the location of the customers for the three-month and six-month periods ended June 30,2020 and 2019.
(a) Revenue by geography
(In millions of won) For the three-month
periods ended June 30 For the six-month
periods ended June 30 Region 2020 2019 2020 2019 Domestic W 217,437 336,073 489,488 729,846 Foreign
China 3,803,261 3,369,694 6,846,322 7,123,259 Asia (excluding China) 495,996 626,884 1,083,681 1,237,479 United States 390,970 483,375 737,946 973,558 Europe (excluding Poland) 225,985 368,997 529,633 712,192 Poland 173,372 168,387 344,200 455,857
W5,089,584 5,017,337 9,541,782 10,502,345 W5,307,021 5,353,410 10,031,270 11,232,191
Sales to Company A and Company B amount to W3,873,614 million and W1,594,870 million, respectively, for the six-month period endedJune 30, 2020 (the six-month period ended June 30, 2019: W3,557,468 million and W2,389,400 million). The Group’s top ten end-brandcustomers together accounted for 83% of revenue for the six-month period ended June 30, 2020 (the six-month period ended June 30, 2019: 78%).
64
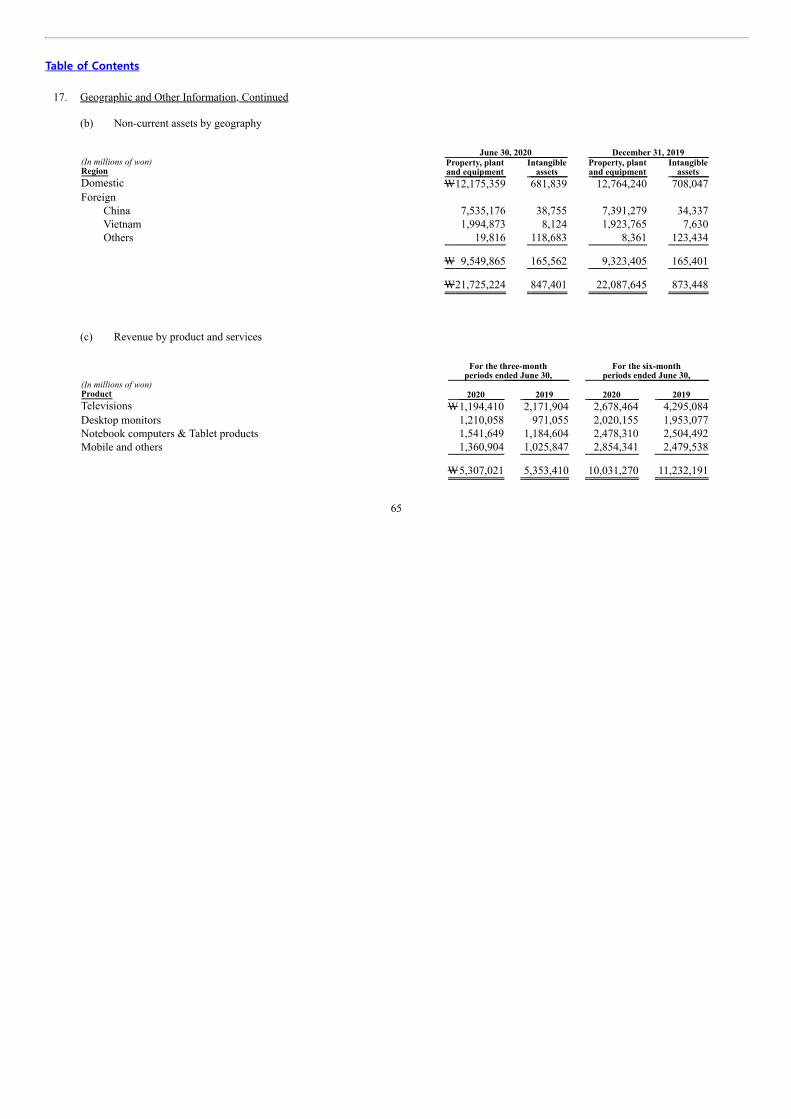
Table of Contents
17. Geographic and Other Information, Continued (b) Non-current assets by geography
June 30, 2020 December 31, 2019 (In millions of won)Region
Property, plant and equipment
Intangible assets
Property, plant and equipment
Intangible assets
Domestic W12,175,359 681,839 12,764,240 708,047 Foreign
China 7,535,176 38,755 7,391,279 34,337 Vietnam 1,994,873 8,124 1,923,765 7,630 Others 19,816 118,683 8,361 123,434
W 9,549,865 165,562 9,323,405 165,401 W21,725,224 847,401 22,087,645 873,448
(c) Revenue by product and services
For the three-month
periods ended June 30, For the six-month
periods ended June 30, (In millions of won)Product 2020 2019 2020 2019 Televisions W1,194,410 2,171,904 2,678,464 4,295,084 Desktop monitors 1,210,058 971,055 2,020,155 1,953,077 Notebook computers & Tablet products 1,541,649 1,184,604 2,478,310 2,504,492 Mobile and others 1,360,904 1,025,847 2,854,341 2,479,538
W5,307,021 5,353,410 10,031,270 11,232,191
65

Table of Contents
18. The Nature of Expenses and Others
The classification of expenses by nature for the three-month and six-month periods ended June 30, 2020 and 2019 are as follows:
For the three-month
periods ended June 30, For the six-month
periods ended June 30, (In millions of won) 2020 2019 2020 2019 Changes in inventories W 270,706 60,619 11,770 121,982 Purchases of raw materials, merchandise and others 2,814,740 2,769,537 5,486,182 5,929,508 Depreciation and amortization 929,486 901,932 1,921,928 1,713,172 Outsourcing 257,507 219,877 423,576 433,542 Labor 710,017 775,435 1,391,416 1,562,436 Supplies and others 203,552 242,240 370,301 448,264 Utility 194,525 213,226 404,356 432,854 Fees and commissions 152,010 175,940 303,039 356,973 Shipping 38,524 52,999 81,266 106,704 Advertising 26,920 20,022 69,458 34,486 Warranty 43,474 101,117 102,120 198,357 Travel 10,250 26,324 23,321 49,708 Taxes and dues 45,585 22,744 72,945 55,012 Impairment loss on property, plant, and equipment 3,413 5,583 9,326 9,765 Impairment loss on intangible assets 26,165 — 30,511 — Others 216,610 161,039 351,756 320,340
W5,943,484 5,748,634 11,053,271 11,773,103
Total expenses consist of cost of sales, selling, administrative, research and development expenses and other non-operating expenses, excludingforeign exchange differences.
66

Table of Contents
19. Selling and Administrative Expenses
Details of selling and administrative expenses for the three-month and six-month periods ended June 30, 2020 and 2019 are as follows:
For the three-month
periods ended June 30, For the six-month
periods ended June 30, (In millions of won) 2020 2019 2020 2019 Salaries W 73,280 86,667 145,752 172,690 Expenses related to defined benefit plans 6,501 8,530 13,256 16,656 Other employee benefits 16,630 20,346 33,850 42,832 Shipping 29,338 44,448 63,028 89,588 Fees and commissions 53,340 53,320 105,533 110,813 Depreciation 54,784 54,511 110,494 108,866 Taxes and dues 31,880 8,431 44,776 24,937 Advertising 26,920 20,022 69,458 34,486 Warranty 43,474 101,117 102,120 198,357 Insurance 3,176 2,841 5,977 5,487 Travel 1,207 6,435 4,592 11,926 Training 2,155 3,414 3,055 6,750 Others 15,008 16,067 28,945 34,426
W357,693 426,149 730,836 857,814
20. Personnel Expenses
Details of personnel expenses for the three-month and six-month periods ended June 30, 2020 and 2019 are as follows:
For the three-month
periods ended June 30, For the six-month
periods ended June 30, (In millions of won) 2020 2019 2020 2019 Salaries and wages W562,068 652,177 1,116,965 1,308,371 Other employee benefits 103,265 118,721 209,508 242,322 Contributions to National Pension plan 16,943 18,003 33,970 36,153 Expenses related to defined benefit plans and defined contribution plans 40,399 49,277 80,675 98,516
W722,675 838,178 1,441,118 1,685,362
67

Table of Contents
21. Other Non-operating Income and Other Non-operating Expenses (a) Details of other non-operating income for the three-month and six-month periods ended June 30, 2020 and 2019 are as follows:
For the three-month
periods ended June 30, For the six-month
periods ended June 30, (In millions of won) 2020 2019 2020 2019 Foreign currency gain W168,360 400,551 696,100 642,344 Gain on disposal of property, plant and equipment 5,467 5,335 9,046 8,625 Gain on disposal of intangible assets — — — 552 Reversal of impairment loss on intangible assets 50 — 600 201 Rental income 1,004 764 2,037 1,390 Gain on disposal of non-current assets held for sale — 8,353 — 8,353 Others 7,756 4,603 16,685 5,535
W182,637 419,606 724,468 667,000
(b) Details of other non-operating expenses for the three-month and six-month periods ended June 30, 2020 and 2019 are as follows:
For the three-month
periods ended June 30, For the six-month
periods ended June 30, (In millions of won) 2020 2019 2020 2019 Foreign currency loss W179,926 434,771 663,184 645,354 Other bad debt expense — — — 398 Loss on disposal of property, plant and equipment 14,243 15,080 18,619 21,999 Loss on disposal of intangible assets 7 121 7 139 Impairment loss on property, plant and equipment 3,413 5,583 9,326 9,765 Impairment loss on intangible assets 26,165 — 30,511 — Loss on disposal of investments in subsidiaries 72,654 — 72,654 — Donations 353 411 426 425 Others 2,604 5,284 11,516 7,424
W299,365 461,250 806,243 685,504
68

Table of Contents
22. Finance Income and Finance Costs
Finance income and costs recognized in profit and loss for the three-month and six-month periods ended June 30, 2020 and 2019 are as follows:
For the three-month
periods ended June 30, For the six-month
periods ended June 30, (In millions of won) 2020 2019 2020 2019 Finance income Interest income W 15,854 11,129 36,050 21,927 Foreign currency gain 79,901 29,008 88,637 47,286 Gain on transaction of derivatives 5,937 7,782 27,551 13,167 Gain on valuation of derivatives — 27,533 60,917 52,878 Gain on valuation of financial assets at fair value through profit or loss — 2 — 6 Gain on valuation of financial liabilities at fair value through profit or loss 1,844 — 133,579 —
W103,536 75,454 346,734 135,264
Finance costs Interest expense W 73,386 32,881 146,294 51,582 Foreign currency loss 27,211 54,547 176,995 108,313 Loss on repayment of borrowings 498 — 498 — Loss on sale of trade accounts and notes receivable 879 5,921 2,941 12,224 Loss on valuation of derivatives 39,740 15,542 27,000 15,542 Loss on valuation of financial assets at fair value through profit or loss 240 — 1,492 3,960 Others 510 1,019 1,082 1,986
W142,464 109,910 356,302 193,607
23. Income Taxes (a) Details of income tax expense (benefit) for the three-month and six-month periods ended June 30, 2020 and 2019 are as follows:
For the three-month
periods ended June 30, For the six-month
periods ended June 30, (In millions of won) 2020 2019 2020 2019 Current tax expense W15,558 82,118 71,276 111,228 Deferred tax expense (benefit) (180,675) 25,664 (332,369) (69,464)
Income tax expense (benefit) W (165,117) 107,782 (261,093) 41,764
69

Table of Contents
23. Income Taxes, Continued (b) Deferred Tax Assets and Liabilities
The carrying amount of deferred tax assets are reviewed at each reporting date and reduced to the extent that it is no longer probable thatthe deferred tax assets at the reporting date will be realized with the Group’s estimated future taxable income. The Group’s deferred taxassets and liabilities may differ from actual refundable or payable amount.
Deferred tax assets and liabilities as of June 30, 2020 and December 31, 2019 are attributable to the following: Assets Liabilities Total
(In millions of won) June 30,
2020 December 31,
2019 June 30,
2020 December 31,
2019 June 30,
2020 December 31,
2019 Other accounts receivable, net W — — (97) (4,364) (97) (4,364) Inventories, net 98,325 89,522 — — 98,325 89,522 Defined benefit liabilities, net — — (24,132) — (24,132) — Investments in subsidiaries and associates — — (64,330) (20,015) (64,330) (20,015) Accrued expenses 114,579 131,196 — — 114,579 131,196 Property, plant and equipment 709,222 691,599 (16,263) (21,690) 692,959 669,909 Intangible assets 18,877 21,886 (10,103) (10,759) 8,774 11,127 Provisions 46,726 59,875 — (4,446) 46,726 55,429 Other temporarydifferences 94,632 137,667 (803) (328) 93,829 137,339 Tax losses carryforwards 1,003,307 607,432 — — 1,003,307 607,432 Tax credit carryforwards 79,312 38,337 — — 79,312 38,337
Deferred tax assets (liabilities) W2,164,980 1,777,514 (115,728) (61,602) 2,049,252 1,715,912
70

Table of Contents
24. Loss Per Share (a) Basic loss per share for the three-month and six-month periods ended June 30, 2020 and 2019 are as follows:
(In won and number of shares) For the three-month
periods ended June 30, For the six-month
periods ended June 30, 2020 2019 2020 2019 Loss attributable to owners of the
Controlling Company W(489,121,168,535) (548,377,244,386) (688,111,821,200) (609,310,453,775) Weighted-average number ofcommon stocks outstanding 357,815,700 357,815,700 357,815,700 357,815,700
Loss per share W (1,367) (1,533) (1,923) (1,703)
For the three-month and six-month periods ended June 30, 2020 and 2019, there were no events or transactions that resulted in changes inthe number of common stocks used for calculating loss per share.
(b) Diluted loss per share is not different from basic loss per share due to loss for the six-month period ended June 30, 2020. As of June 30,
2020, 40,988,998 shares of potential common stock to be issued from conversion were excluded from the calculation of weighted-averagenumber of common stocks due to antidilution.
71

Table of Contents
25. Financial Risk Management
The Group is exposed to credit risk, liquidity risk and market risks. The Group identifies and analyzes such risks, and controls are implementedunder a risk management system to monitor and manage these risks at below an acceptable level.
(a) Market risk
Market risk is the risk that changes in market prices, such as foreign exchange rates, interest rates and equity prices, will affect the Group’s incomeor the value of its holdings of financial instruments. The objective of market risk management is to manage and control market risk exposureswithin acceptable parameters, while optimizing the return.
(i) Currency risk
The Group is exposed to currency risk on sales, purchases and borrowings that are denominated in a currency other than the functional currency ofthe Controlling Company, Korean won (KRW). The currencies in which these transactions primarily are denominated are USD, CNY, JPY, etc.
Interest on borrowings is accrued in the currency of the borrowing. Generally, borrowings are denominated in currencies that match the cash flowsgenerated by the underlying operations of the Group, primarily KRW, USD and CNY.
In respect of other monetary assets and liabilities denominated in foreign currencies, the Group adopts policies to ensure that its net exposure iskept to an acceptable level by buying or selling foreign currencies at spot rates when necessary to address short-term imbalances. Meanwhile, theGroup entered into currency interest rate swap contracts to hedge currency risk with respect to foreign currency denominated borrowings andbonds.
72

Table of Contents
25. Financial Risk Management, Continued
i) Exposure to currency risk
The Group’s exposure to foreign currency risk based on notional amounts as of June 30, 2020 and December 31, 2019 is as follows: (In millions) June 30, 2020 USD JPY CNY TWD EUR PLN VND Cash and cash equivalents 1,638 115 8,292 15 4 2 40,859 Trade accounts and notes receivable 2,184 763 393 — — — — Non-trade receivables 43 83 220 4 1 — 9,904 Other assets denominated in foreign currencies — 207 93 6 — — 4,329 Trade accounts and notes payable (1,425) (7,190) (1,614) — — — (306,548) Other accounts payable (255) (5,801) (1,759) (3) (5) — (497,695) Financial liabilities (4,279) — (25,327) — — — —
(2,094) (11,823) (19,702) 22 — 2 (749,151)
Currency swap contracts 2,085 — — — — — —
Net exposure (9) (11,823) (19,702) 22 — 2 (749,151)
(In millions) December 31, 2019 USD JPY CNY TWD EUR PLN VND Cash and cash equivalents 1,594 68 8,360 33 5 25 28,663 Trade accounts and notes receivable 2,485 19 550 — — — — Non-trade receivables 276 455 230 3 2 — 13,131 Other assets denominated in foreign currencies 29 526 5,668 369 5 503 4,032 Trade accounts and notes payable (628) (9,043) (2,289) — — — (291,891) Other accounts payable (488) (12,396) (3,239) (4) (10) — (786,356) Financial liabilities (4,255) — (20,436) — — — —
(987) (20,371) (11,156) 401 2 528 (1,032,421)
Currency swap contracts 2,085 — — — — — —
Net exposure 1,098 (20,371) (11,156) 401 2 528 (1,032,421)
73

Table of Contents
25. Financial Risk Management, Continued
Average exchange rates applied for the six-month periods ended June 30, 2020 and 2019 and the exchange rates at June 30, 2020 andDecember 31, 2019 are as follows:
(In won) Average rate Reporting date spot rate
2020 2019 June 30,
2020 December 31,
2019 USD W1,206.72 1,145.44 1,200.70 1,157.80 JPY 11.15 10.41 11.16 10.63 CNY 171.36 168.62 169.66 165.74 TWD 40.23 36.99 40.74 38.48 EUR 1,329.43 1,293.61 1,350.19 1,297.43 PLN 301.39 301.47 303.09 304.87 VND 0.0518 0.0493 0.0518 0.0500
ii) Sensitivity analysis
A weaker won, as indicated below, against the following currencies which comprise the Group’s assets or liabilities denominated in foreigncurrency as of June 30, 2020 and December 31, 2019, would have increased (decreased) equity and profit or loss by the amounts shown below.This analysis is based on foreign currency exchange rate variances that the Group considers to be reasonably possible as of the end of reportingperiod. The analysis assumes that all other variables, in particular interest rates, would remain constant. The changes in equity and profit or losswould have been as follows:
(In millions of won) June 30, 2020 December 31, 2019 Equity Profit or loss Equity Profit or loss USD (5 percent weakening) W (25,514) 65,927 23,570 105,398 JPY (5 percent weakening) (5,236) (3,589) (8,397) (6,418) CNY (5 percent weakening) (167,126) 7 (92,454) 11 TWD (5 percent weakening) 45 — 772 — EUR (5 percent weakening) 19 (41) 221 (278) PLN (5 percent weakening) 21 21 8,036 28 VND (5 percent weakening) (1,407) (1,407) (1,871) (1,871)
A stronger won against the above currencies as of June 30, 2020 and December 31, 2019 would have had the equal but opposite effect on theabove currencies to the amounts shown above, on the basis that all other variables remain constant.
74
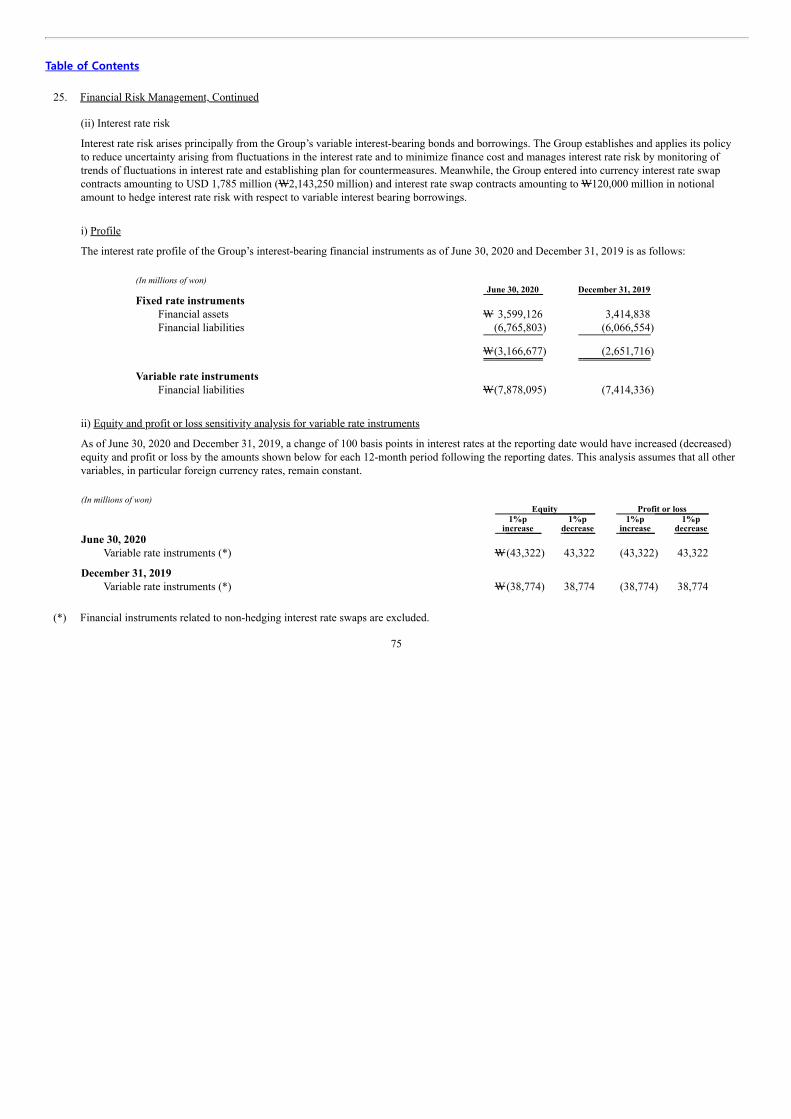
Table of Contents
25. Financial Risk Management, Continued
(ii) Interest rate risk
Interest rate risk arises principally from the Group’s variable interest-bearing bonds and borrowings. The Group establishes and applies its policyto reduce uncertainty arising from fluctuations in the interest rate and to minimize finance cost and manages interest rate risk by monitoring oftrends of fluctuations in interest rate and establishing plan for countermeasures. Meanwhile, the Group entered into currency interest rate swapcontracts amounting to USD 1,785 million (W2,143,250 million) and interest rate swap contracts amounting to W120,000 million in notionalamount to hedge interest rate risk with respect to variable interest bearing borrowings.
i) Profile
The interest rate profile of the Group’s interest-bearing financial instruments as of June 30, 2020 and December 31, 2019 is as follows:
(In millions of won) June 30, 2020 December 31, 2019 Fixed rate instruments
Financial assets W 3,599,126 3,414,838 Financial liabilities (6,765,803) (6,066,554)
W(3,166,677) (2,651,716)
Variable rate instruments Financial liabilities W(7,878,095) (7,414,336)
ii) Equity and profit or loss sensitivity analysis for variable rate instruments
As of June 30, 2020 and December 31, 2019, a change of 100 basis points in interest rates at the reporting date would have increased (decreased)equity and profit or loss by the amounts shown below for each 12-month period following the reporting dates. This analysis assumes that all othervariables, in particular foreign currency rates, remain constant.
(In millions of won) Equity Profit or loss
1%p
increase 1%p
decrease 1%p
increase 1%p
decrease June 30, 2020
Variable rate instruments (*) W(43,322) 43,322 (43,322) 43,322
December 31, 2019 Variable rate instruments (*) W(38,774) 38,774 (38,774) 38,774
(*) Financial instruments related to non-hedging interest rate swaps are excluded.
75

Table of Contents
25. Financial Risk Management, Continued (b) Credit risk
Credit risk is the risk of financial loss to the Group if a customer or counterparty to a financial instrument fails to meet its contractualobligations, and arises principally from the Group’s receivables from customers.
The Group’s exposure to credit risk of trade and other receivables is influenced mainly by the individual characteristics of each customer.However, management believes that the default risk of the country in which each customer operates do not have a significant influence oncredit risk since the majority of the customers are global electronic appliance manufacturers operating in global markets.
The Group establishes credit limits for each customer and each new customer is analyzed quantitatively and qualitatively beforedetermining whether to utilize third party guarantees, insurance or factoring as appropriate.
In relation to the impairment of financial assets subsequent to initial recognition, the Group recognizes the changes in expected credit loss(“ECL”) in profit or loss at each reporting date.
The carrying amount of financial assets represents the maximum credit exposure. The maximum exposures to credit risk as of June 30,2020 and December 31, 2019 are as follows:
(In millions of won) June 30, 2020 December 31, 2019 Financial assets carried at amortized cost
Cash and cash equivalents W3,520,803 3,336,003 Deposits in banks 78,263 78,768 Trade accounts and notes receivable, net 2,802,830 3,154,080 Non-trade receivables 132,892 463,614 Accrued income 12,640 10,434 Deposits 31,490 31,036 Short-term loans 26,134 21,623 Long-term loans 26,187 40,827 Long-term non-trade receivables 7,883 9,072 Lease receivables 25,560 27,794
W6,664,682 7,173,251
Financial assets at fair value through profit or loss Convertible bonds W 1,544 1,544 Derivatives 83,822 49,676
W 85,366 51,220
Financial assets at fair value through other comprehensive income Debt instruments W 72 76
W6,750,120 7,224,547
Trade accounts and notes receivable are insured in order for the Group to manage credit risk if they do not meet the Group’s internal creditratings. Uninsured trade accounts and notes receivables are managed by continuous monitoring of internal credit rating standardsestablished by the Group and seeking insurance coverage, if necessary.
76

Table of Contents
25. Financial Risk Management, Continued (c) Liquidity risk
Liquidity risk is the risk that the Group will encounter difficulty in meeting the obligations associated with its financial liabilities that aresettled by delivering cash or other financial assets. The Group’s approach to managing liquidity is to ensure, as far as possible, that it willalways have sufficient liquidity to meet its liabilities when due, under both normal and stressed conditions, without incurring unacceptablelosses or risking damage to the Group’s reputation.
The Group has historically been able to satisfy its cash requirements from cash flows from operations and debt and equity financing. Tothe extent that the Group does not generate sufficient cash flows from operations to meet its capital requirements, the Group may rely onfinancing activities, such as external long-term borrowings and offerings of debt instruments, equity-linked and other debt securities. Inaddition, the Group maintains a line of credit with various banks.
The following are the contractual maturities of financial liabilities, including estimated interest payments, as of June 30, 2020. (In millions of won) Contractual cash flows in
Carrying
amount Total 6 months
or less 6-12
months 1-2 years 2-5 years More than
5 years Non-derivative financial liabilities
Borrowings W11,778,933 12,896,954 1,315,878 1,711,964 2,605,654 6,517,937 745,521 Bonds 2,864,965 3,110,842 186,172 332,939 1,160,673 1,337,286 93,772 Trade accounts and notes payable 3,466,222 3,466,222 2,553,057 913,165 — — — Other accounts payable 1,189,771 1,189,771 1,188,669 1,102 — — — Other accounts payable (enterprise procurement
cards)(*) 1,791,138 1,810,605 1,170,555 640,050 — — — Long-term other accounts payable 7 7 — — 7 — — Security deposits received 11,310 11,310 6,240 — 5,070 — — Lease liabilities 88,272 96,161 23,624 14,226 18,815 30,013 9,483
Derivative financial liabilities Derivatives 20,821 10,748 5,179 7,264 3,146 (4,841) —
W21,211,439 22,592,620 6,449,374 3,620,710 3,793,365 7,880,395 848,776
(*) Represents the amount of utility expenses and others paid by enterprise procurement cards and the outstanding payables are settled at the end of
the billing cycle. The payments to the card company arises from operating activities of purchasing of goods and services thus the related cash flowis disclosed as operating activities.
It is not expected that the cash flows included in the maturity analysis could occur significantly earlier, or at significantly differentamounts.
77

Table of Contents
25. Financial Risk Management, Continued (d) Capital management
Management’s policy is to maintain a capital base so as to maintain investor, creditor and market confidence and to sustain futuredevelopment of the business. Liabilities to equity ratio, net borrowings to equity ratio and other financial ratios are used by management toachieve an optimal capital structure. Management also monitors the return on capital as well as the level of dividends to ordinaryshareholders.
(In millions of won) June 30, 2020 December 31, 2019 Total liabilities W22,953,481 23,086,282 Total equity 12,100,773 12,488,281 Cash and deposits in banks (*1) 3,599,055 3,414,760 Borrowings (including bonds) 14,643,898 13,480,889 Total liabilities to equity ratio 190% 185% Net borrowings to equity ratio (*2) 91% 81%
(*1) Cash and deposits in banks consist of cash and cash equivalents and current deposits in banks.(*2) Net borrowings to equity ratio is calculated by dividing total borrowings (including bonds and excluding lease liabilities) less cash and current
deposits in banks by total equity.
78

Table of Contents
25. Financial Risk Management, Continued (e) Determination of fair value
(i) Measurement of fair value
A number of the Group’s accounting policies and disclosures require the determination of fair value, for both financial and non-financialassets and liabilities. Fair values have been determined for measurement and/or disclosure purposes based on the following methods.When applicable, further information about the assumptions made in determining fair values is disclosed in the notes specific to that assetor liability.
i) Current assets and liabilities
The carrying amounts approximate their fair value because of the short maturity of these instruments.
ii) Trade receivables and other receivables
The fair value of trade and other receivables is estimated as the present value of future cash flows, discounted at the market rate of interestat the reporting date. This fair value is determined for disclosure purposes. The carrying amounts of current receivables approximate theirfair value.
iii) Investments in equity and debt instruments
The fair value of marketable financial assets at FVTPL and FVOCI is determined by reference to their quoted closing bid price at thereporting date. The fair value of non-marketable instruments is determined using the results of fair value assessment performed by externalvaluation institution and others.
iv) Non-derivative financial liabilities
Fair value, which is determined for disclosure purposes, except for the liabilities at FVTPL, is calculated based on the present value offuture principal and interest cash flows, discounted at the market rate of interest at the reporting date.
79

Table of Contents
25. Financial Risk Management, Continued (ii) Fair values versus carrying amounts
The fair values of financial assets and liabilities, together with the carrying amounts shown in the condensed consolidated interimstatements of financial position as of June 30, 2020 and December 31, 2019 are as follows:
(In millions of won) June 30, 2020 December 31, 2019
Carrying
amounts Fair values Carrying
amounts Fair values Financial assets carried at amortized cost
Cash and cash equivalents W 3,520,803 (*) 3,336,003 (*) Deposits in banks 78,263 (*) 78,768 (*) Trade accounts and notes receivable 2,802,830 (*) 3,154,080 (*) Non-trade receivables 132,892 (*) 463,614 (*) Accrued income 12,640 (*) 10,434 (*) Deposits 31,490 (*) 31,036 (*) Short-term loans 26,134 (*) 21,623 (*) Long-term loans 26,187 (*) 40,827 (*) Long-term non-trade receivables 7,883 (*) 9,072 (*) Lease receivables 25,560 (*) 27,794 (*)
Financial assets at fair value through profit or loss Equity instruments W 8,581 8,581 9,879 9,879 Convertible bonds 1,544 1,544 1,544 1,544 Derivatives 83,822 83,822 49,676 49,676
Financial assets at fair value through other comprehensive income Debt instruments W 72 72 76 76
Financial liabilities at fair value through profit or loss Derivatives W 20,821 20,821 20,592 20,592 Convertible bonds 762,615 762,615 858,385 858,385
Financial liabilities carried at amortized cost Borrowings W11,778,933 11,800,495 10,329,671 10,394,498 Bonds 2,102,350 2,122,950 2,292,833 2,345,867 Trade accounts and notes payable 3,466,222 (*) 2,618,261 (*) Other accounts payable 2,980,909 (*) 4,397,121 (*) Long-term other accounts payable 7 (*) 1,069 (*) Security deposits received 11,310 (*) 11,000 (*) Lease liabilities 88,272 (*) 88,512 (*)
(*) Excluded from disclosures as the carrying amount approximates fair value.
80

Table of Contents
25. Financial Risk Management, Continued (iii) Fair values of financial assets and liabilities
i) Fair value hierarchy
Financial instruments carried at fair value are categorized into different levels in a fair value hierarchy based on the inputs used in thevaluation techniques as follows. The levels have been defined as follows:
• Level 1: quoted prices (unadjusted) in active markets for identical assets or liabilities
• Level 2: inputs other than quoted prices included within Level 1 that are observable for the asset or liability, either directly orindirectly
• Level 3: inputs for the asset or liability that are not based on observable market data
ii) Financial instruments measured at fair value
Fair value hierarchy classifications of the financial instruments that are measured at fair value as of June 30, 2020 and December 31, 2019are as follows:
(In millions of won) June 30, 2020 Level 1 Level 2 Level 3 Total Financial assets at fair value through profit or loss
Equity instruments W — — 8,581 8,581 Convertible bonds — — 1,544 1,544 Derivatives — — 83,822 83,822
Financial assets at fair value through other comprehensive income Debt instruments W 72 — — 72
Financial liabilities at fair value through profit or loss Derivatives W — — 20,821 20,821 Convertible bonds 762,615 — — 762,615
(In millions of won) December 31, 2019 Level 1 Level 2 Level 3 Total Financial assets at fair value through profit or loss
Equity instruments W — — 9,879 9,879 Convertible bonds — — 1,544 1,544 Derivatives — — 49,676 49,676
Financial assets at fair value through other comprehensive income Debt instruments W 76 — — 76
Financial liabilities at fair value through profit or loss Derivatives W — — 20,592 20,592 Convertible bonds 858,385 — — 858,385
81

Table of Contents
25. Financial Risk Management, Continued iii) Financial instruments not measured at fair value but for which the fair value is disclosed
Fair value hierarchy classifications, valuation technique and inputs for fair value measurements of the financial instruments not measuredat fair value but for which the fair value is disclosed as of June 30, 2020 and December 31, 2019 are as follows:
(In millions of won) June 30, 2020
Valuation
technique InputClassification Level 1 Level 2 Level 3 Liabilities
Borrowings W— — 11,800,495
Discounted cash flow
Discount rate
Bonds — — 2,122,950
Discounted cash flow
Discount rate
(In millions of won) December 31, 2019
Valuation
technique InputClassification Level 1 Level 2 Level 3 Liabilities
Borrowings W— — 10,394,498
Discounted cash flow
Discount rate
Bonds — — 2,345,867
Discounted cash flow
Discount rate
iv) The interest rates applied for determination of the above fair value as of June 30, 2020 and December 31, 2019 are as follows:
June 30, 2020 December 31, 2019Borrowings, bonds and others 2.34~4.40% 1.87~3.56%
82

Table of Contents
26. Changes in liabilities arising from financing activities
Changes in liabilities arising from financing activities for the six-month period ended June 30, 2020 are as follows: (In millions of won) Non-cash transactions
January 1,
2020
Cash flows from financing
activities Reclassification
Gain or loss on foreign currency translation
Effective interest adjustment Others
June 30, 2020
Short-term borrowings W 696,793 331,795 — 21,277 — — 1,049,865 Current portion of long-term
borrowings and bonds 1,242,904 (646,786) 1,434,682 18,271 358 — 2,049,429 Long-term borrowings 8,799,677 1,294,452 (1,135,062) 170,252 — — 9,129,319 Bonds(*) 2,741,516 49,949 (299,620) 46,974 10,045 (133,579) 2,415,285 Lease liabilities 88,512 (34,443) — 11,029 — 23,174 88,272
W13,569,402 994,967 — 267,803 10,403 (110,405) 14,732,170
(*) Others include gain on valuation of financial liabilities at fair value through profit or loss amounting to W133,579 million.
83
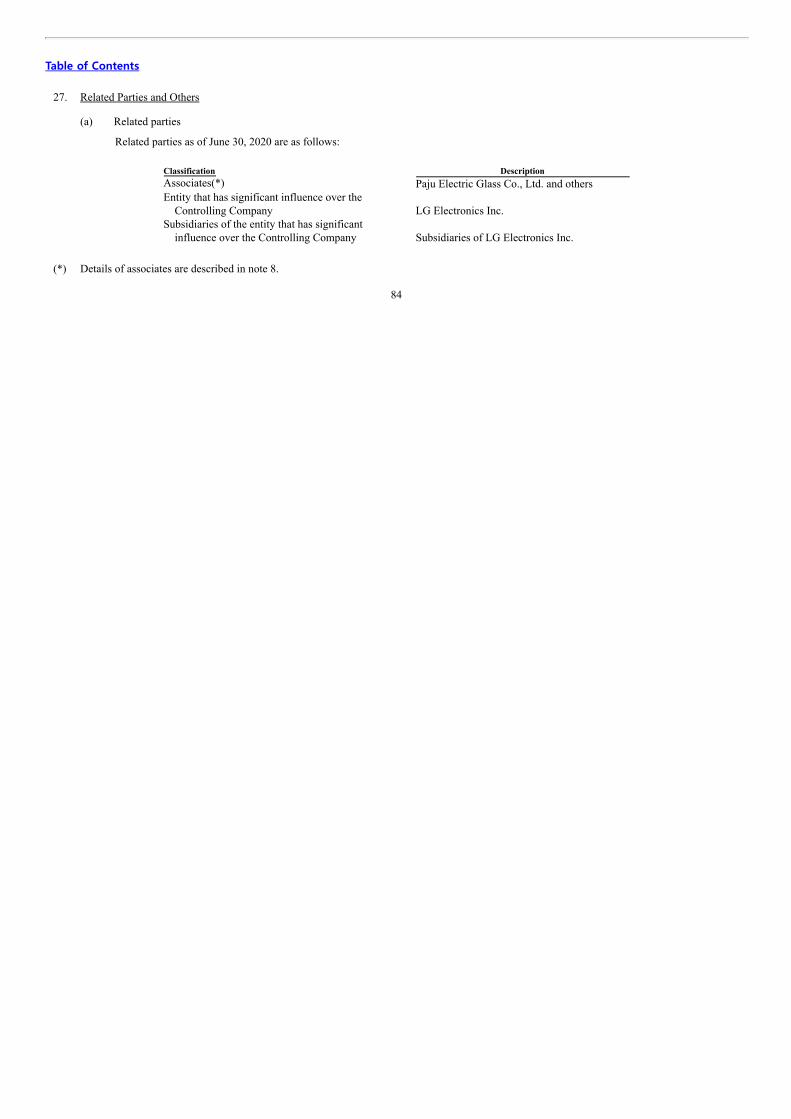
Table of Contents
27. Related Parties and Others (a) Related parties
Related parties as of June 30, 2020 are as follows:
Classification DescriptionAssociates(*) Paju Electric Glass Co., Ltd. and othersEntity that has significant influence over the
Controlling Company LG Electronics Inc.Subsidiaries of the entity that has significant
influence over the Controlling Company Subsidiaries of LG Electronics Inc. (*) Details of associates are described in note 8.
84

Table of Contents
27. Related Parties and Others, Continued
(b) Significant transactions such as sales of goods and purchases of raw material and outsourcing service and others, which occurred in thenormal course of business with related parties for the three-month and six-month periods ended June 30, 2020 and 2019 are as follows:
(In millions of won) For the three-month period ended June 30, 2020 Purchase and others
Sales
and others Dividend
income
Purchase of raw material and others
Acquisition of property, plant and equipment
Outsourcing fees Other costs
Associates and their subsidiaries AVATEC Co., Ltd. W — — — — 18,832 217 Paju Electric Glass Co., Ltd. — — 64,097 — — 653 WooRee E&L Co., Ltd. — — 3,735 — — 14 YAS Co., Ltd. — — 1,844 2,544 — 681 Material Science Co., Ltd. — — 9 — — —
W — — 69,685 2,544 18,832 1,565
Entity that has significant influence over the ControllingCompany
LG Electronics Inc. W133,977 — 6,748 28,283 — 37,926
Subsidiaries of the entity that has significant influenceover the Controlling Company
LG Electronics India Pvt. Ltd. W 3,013 — — — — — LG Electronics Vietnam Haiphong Co., Ltd. 54,019 — — — — 247
85
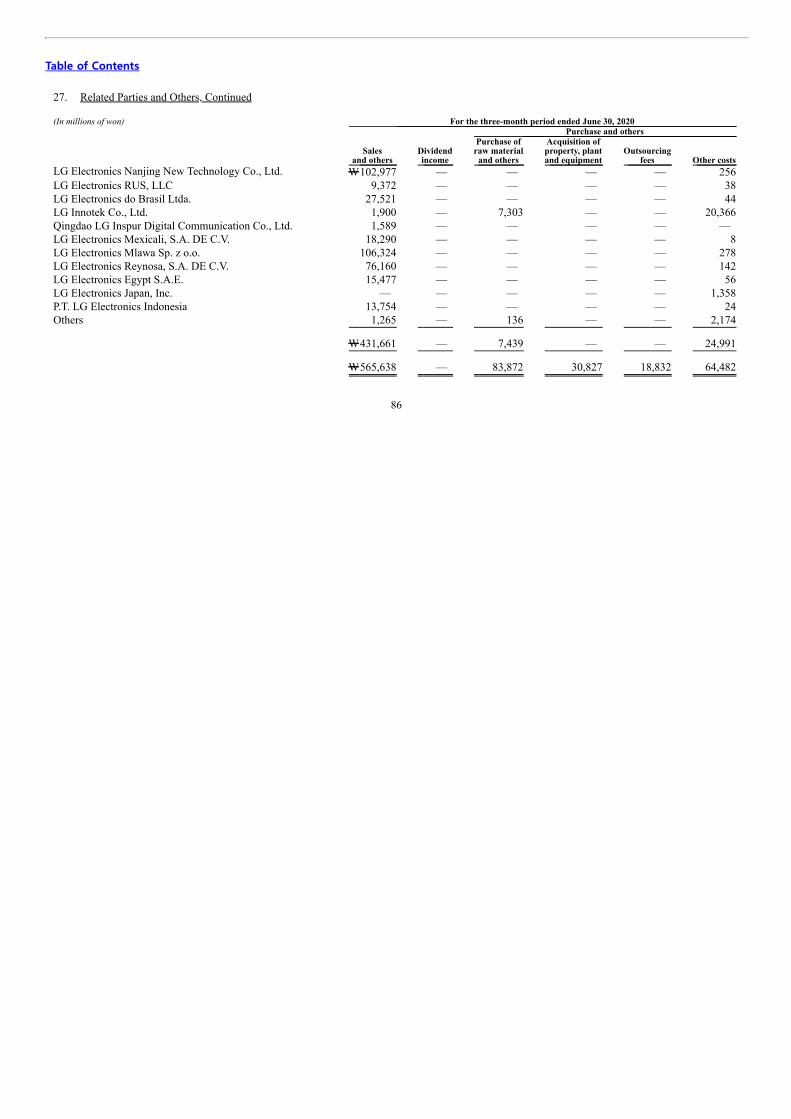
Table of Contents
27. Related Parties and Others, Continued (In millions of won) For the three-month period ended June 30, 2020 Purchase and others
Sales
and others Dividend
income
Purchase of raw material and others
Acquisition of property, plant and equipment
Outsourcing fees Other costs
LG Electronics Nanjing New Technology Co., Ltd. W102,977 — — — — 256 LG Electronics RUS, LLC 9,372 — — — — 38 LG Electronics do Brasil Ltda. 27,521 — — — — 44 LG Innotek Co., Ltd. 1,900 — 7,303 — — 20,366 Qingdao LG Inspur Digital Communication Co., Ltd. 1,589 — — — — — LG Electronics Mexicali, S.A. DE C.V. 18,290 — — — — 8 LG Electronics Mlawa Sp. z o.o. 106,324 — — — — 278 LG Electronics Reynosa, S.A. DE C.V. 76,160 — — — — 142 LG Electronics Egypt S.A.E. 15,477 — — — — 56 LG Electronics Japan, Inc. — — — — — 1,358 P.T. LG Electronics Indonesia 13,754 — — — — 24 Others 1,265 — 136 — — 2,174
W431,661 — 7,439 — — 24,991 W565,638 — 83,872 30,827 18,832 64,482
86

Table of Contents
27. Related Parties and Others, Continued (In millions of won) For the six-month period ended June 30, 2020 Purchase and others
Sales
and others Dividend
income
Purchase of raw material and others
Acquisition of property, plant and equipment
Outsourcing fees
Other costs
Associates and their subsidiaries AVATEC Co., Ltd. W — 200 — — 33,815 416 Paju Electric Glass Co., Ltd. — 7,739 138,377 — — 1,626 WooRee E&L Co., Ltd. — — 5,318 — — 19 YAS Co., Ltd. — 300 3,328 3,658 — 1,651 Material Science Co., Ltd. — — 69 — — —
W — 8,239 147,092 3,658 33,815 3,712
Entity that has significant influence over the ControllingCompany
LG Electronics Inc. W330,272 — 10,369 155,075 — 67,763
Subsidiaries of the entity that has significant influence over theControlling Company
LG Electronics India Pvt. Ltd. W 17,005 — — — — 65 LG Electronics Vietnam Haiphong Co., Ltd. 125,920 — — — — 446 LG Electronics Nanjing New Technology Co., Ltd. 192,627 — — — — 497 LG Electronics RUS, LLC 34,457 — — — — 155 LG Electronics do Brasil Ltda. 57,545 — — — — 84 LG Innotek Co., Ltd. 3,092 — 14,871 — — 40,718
87

Table of Contents
27. Related Parties and Others, Continued (In millions of won) For the six-month period ended June 30, 2020 Purchase and others
Sales
and others Dividend
income
Purchase of raw material and others
Acquisition of property, plant and equipment
Outsourcing fees Other costs
Qingdao LG Inspur Digital Communication Co., Ltd. W 6,899 — — — — — LG Electronics Mexicali, S.A. DE C.V. 53,394 — — — — 17 LG Electronics Mlawa Sp. z o.o. 206,562 — — — — 806 LG Electronics Reynosa, S.A. DE C.V. 205,460 — — — — 672 LG Electronics Egypt S.A.E 35,889 — — — — 302 LG Electronics Japan, Inc. — — — 8 — 2,861 P.T. LG Electronics Indonesia 34,533 — — — — 122 Others 2,645 — 153 — — 3,595
W 976,028 — 15,024 8 — 50,340 W1,306,300 8,239 172,485 158,741 33,815 121,815
88

Table of Contents
27. Related Parties and Others, Continued (In millions of won) For the three-month period ended June 30, 2019 Purchase and others
Sales
and others Dividend
income
Purchase of raw material and others
Acquisition of property, plant and equipment
Outsourcing fees Other costs
Associates and their subsidiaries INVENIA Co., Ltd.(*1) W — — 419 7,856 — 49 AVATEC Co., Ltd. — — — — 16,062 219 Paju Electric Glass Co., Ltd. — — 89,238 — — 1,138 WooRee E&L Co., Ltd. — — 1,382 — — — YAS Co., Ltd. — — 1,923 10,194 — 1,025
W — — 92,962 18,050 16,062 2,431
Entity that has significant influence over the ControllingCompany
LG Electronics Inc. W246,515 — 3,947 192,159 — 44,560
Subsidiaries of the entity that has significant influence over theControlling Company
LG Electronics India Pvt. Ltd. W 22,571 — — — — 39 LG Electronics Vietnam Haiphong Co., Ltd. 65,828 — — 1,425 — 4 LG Electronics Nanjing New Technology Co., Ltd. W 77,832 — — 1 — 75 LG Electronics RUS, LLC 15,215 — — — — 682 LG Electronics do Brasil Ltda. 36,874 — — — — 86
89

Table of Contents
27. Related Parties and Others, Continued (In millions of won) For the three-month period ended June 30, 2019 Purchase and others
Sales
and others Dividend
income
Purchase of raw material and others
Acquisition of property, plant and equipment
Outsourcing fees Other costs
LG Innotek Co., Ltd. W 1,201 — 17,152 — — 17,340 Qingdao LG Inspur Digital Communication Co., Ltd. 208 — — — — — Inspur LG Digital Mobile Communications Co., Ltd. 20,007 — — — — — LG Electronics Mexicali, S.A. DE C.V. 30,264 — — — — 23 LG Electronics Mlawa Sp. z o.o. 117,347 — — — — 289 LG Electronics Taiwan Taipei Co., Ltd. 956 — — 31 — 89 LG Hitachi Water Solutions Co., Ltd.(*2) — — — 23,467 — — LG Electronics Reynosa, S.A. DE C.V. 176,612 — — — — 265 LG Electronics Air-Conditioning (Shandong) Co., Ltd. — — 126 145 — 58 HiEntech Co., Ltd.(*2) 18 — — 2,347 — 7,080 HiEntech (Tianjin) Co., Ltd.(*2) — — — 18,296 — 4,116 LG Electronics Egypt S.A.E. 30,613 — — — — — LG Electronics Alabama Inc. 2,537 — — — — — LG Electronics Japan, Inc. — — — 11 — 1,510 LG Electronics U.S.A., Inc. 350 — — — — — Others 1,544 — — — — 1,539
W599,977 — 17,278 45,723 — 33,195 W846,492 — 114,187 255,932 16,062 80,186
(*1) Represents transactions occurred prior to the Group’s disposal of the entire investments.(*2) Represents transactions occurred prior to LG Electronics Inc.’s disposal of the entire investments.
90

Table of Contents
27. Related Parties and Others, Continued (In millions of won) For the six-month period ended June 30, 2019 Purchase and others
Sales
and others Dividend
income
Purchase of raw material and others
Acquisition of property, plant and equipment
Outsourcing fees Other costs
Associates and their subsidiaries INVENIA Co., Ltd.(*1) W — 180 762 36,060 — 102 AVATEC Co., Ltd. — 265 — — 37,219 420 Paju Electric Glass Co., Ltd. — 6,057 179,854 — — 2,102 WooRee E&L Co., Ltd. — — 2,687 — — 1 YAS Co., Ltd. — 1,000 3,570 90,612 — 1,983 Material Science Co., Ltd. — — — — — 313
W — 7,502 186,873 126,672 37,219 4,921
Entity that has significant influence over the ControllingCompany
LG Electronics Inc. W532,049 — 7,780 614,434 — 72,602
Subsidiaries of the entity that has significant influence over theControlling Company
LG Electronics India Pvt. Ltd. W 45,435 — — — — 40 LG Electronics Vietnam Haiphong Co., Ltd. 128,611 — — 2,940 — 125 LG Electronics Nanjing New Technology Co., Ltd. 134,390 — — 30 — 174 LG Electronics RUS, LLC 42,193 — — — — 1,425 LG Electronics do Brasil Ltda. 80,228 — — — — 131 LG Innotek Co., Ltd. 4,234 — 32,712 — — 42,071
91

Table of Contents
27. Related Parties and Others, Continued (In millions of won) For the six-month period ended June 30, 2019 Purchase and others
Sales
and others Dividend
income
Purchase of raw material and others
Acquisition of property, plant and equipment
Outsourcing fees Other costs
Qingdao LG Inspur Digital Communication Co., Ltd. W 2,796 — — — — — Inspur LG Digital Mobile Communications Co., Ltd. 40,424 — — — — — LG Electronics Mexicali, S.A. DE C.V. 68,736 — — — — 50 LG Electronics Mlawa Sp. z o.o. 308,857 — — — — 864 LG Electronics Taiwan Taipei Co., Ltd. 3,639 — — 31 — 178 LG Hitachi Water Solutions Co., Ltd.(*2) — — — 50,975 — — LG Electronics Reynosa, S.A. DE C.V. 344,626 — — — — 523 LG Electronics Air-Conditioning (Shandong) Co., Ltd. — — 159 4,159 — 75 HiEntech Co., Ltd.(*2) 36 — — 6,013 — 14,191 HiEntech (Tianjin) Co., Ltd.(*2) — — — 22,351 — 9,790 LG Electronics Egypt S.A.E 58,526 — — — — — LG Electronics Alabama Inc. 5,100 — — — — — LG Electronics Japan, Inc. — — — 14 — 3,062 LG Electronics U.S.A., Inc. 2,920 — — — — — Others 3,815 — 1 — — 3,136
W1,274,566 — 32,872 86,513 — 75,835 W1,806,615 7,502 227,525 827,619 37,219 153,358
(*1) Represents transactions occurred prior to the Group’s disposal of the entire investments.(*2) Represents transactions occurred prior to LG Electronics Inc.’s disposal of the entire investments.
92

Table of Contents
27. Related Parties and Others, Continued (c) Trade accounts and notes receivable and payable and others as of June 30, 2020 and December 31, 2019 are as follows: (In millions of won)
Trade accounts and notes receivable
and others Trade accounts and notes payable
and others June 30, 2020 December 31, 2019 June 30, 2020 December 31, 2019 Associates and their subsidiaries
AVATEC Co., Ltd. W — — 4,857 1,029 Paju Electric Glass Co., Ltd. — — 60,610 62,853 WooRee E&L Co., Ltd. — — 3,526 1,888 YAS Co., Ltd. — — 4,520 27,489 Material Science Co., Ltd. — — — 8
W — — 73,513 93,267
Entity that has significant influence over the ControllingCompany
LG Electronics Inc. W 115,457 209,939 91,000 157,713
Subsidiaries of the entity that has significant influence over theControlling Company
LG Electronics Vietnam Haiphong Co., Ltd. W 47,608 47,740 28 75 LG Electronics Nanjing New Technology Co., Ltd. 82,193 55,343 122 49 LG Electronics RUS, LLC 6,118 17,600 37 83 LG Electronics do Brasil Ltda. 11,280 14,805 14 26 LG Innotek Co., Ltd. 225 267 35,149 36,426
93

Table of Contents
27. Related Parties and Others, Continued
(In millions of won)
Trade accounts and notes receivable
and others Trade accounts and notes payable
and others June 30, 2020 December 31, 2019 June 30, 2020 December 31, 2019 LG Electronics Mexicali, S.A. DE C.V. W 13,336 11,195 — 17 LG Electronics Mlawa Sp. z o.o. 66,923 124,390 86 75 LG Electronics Reynosa, S.A. DE C.V. 32,306 82,927 71 62 P.T. LG Electronics Indonesia 9,986 7,696 6 16 Others 5,184 25,218 3,101 3,548
W 275,159 387,181 38,614 40,377 W 390,616 597,120 203,127 291,357
.
94

Table of Contents
27. Related Parties and Others, Continued
(d) Details of significant financing transactions such as loans and collection of loans, which occurred in the normal course of business withrelated parties for the six-month period ended June 30, 2019 are as follows:
(In millions of won) 2019 Associates Loans Collection of loans INVENIA Co., Ltd.(*) W1,000 —
(*) Excluded from related parties due to disposal of equity investments during the year ended December 31, 2019.
95

Table of Contents
27. Related Parties and Others, Continued (e) Conglomerate Transactions
Transactions, trade accounts and notes receivable and payable, and others between the Group and certain companies and their subsidiariesincluded in LG Group, one of conglomerates according to the Monopoly Regulation and Fair Trade Act, for the three-month and six-monthperiods ended June 30, 2020 and 2019 and as of June 30, 2020 and December 31, 2019 are as follows. These entities are not related partiesaccording to K-IFRS No. 1024, Related Party Disclosures.
(In millions of won)
For the three-month period
ended June 30, 2020 For the six-month period
ended June 30, 2020 June 30, 2020
Sales
and others Purchase
and others Sales
and others Purchase
and others
Trade accounts and notes receivable
and others
Trade accounts and notes payable
and others LG International Corp. and its subsidiaries W 56,690 66,424 172,015 143,466 45,362 29,097 LG Uplus Corp. — 557 — 1,118 — 132 LG Chem Ltd. and its subsidiaries 968 193,054 1,139 406,676 173 156,042 S&I Corp. and its subsidiaries 83 19,873 167 83,095 21,332 27,371 Silicon Works Co., Ltd. — 151,841 36 304,329 — 88,590 LG Corp. — 12,634 — 24,417 10,250 — LG Management Development Institute — 1,987 — 3,584 3,480 224 LG CNS Co., Ltd. and its subsidiaries 11 35,067 13 59,298 2 24,763 LG Household & Health Care and its subsidiaries — 7 — 84 — — LG Holdings Japan Co., Ltd. — 553 — 1,086 2,375 — G2R Inc. and its subsidiaries — 8,724 — 10,507 — 9,017 Robostar Co., Ltd. — 131 — 537 — 27
W 57,752 490,852 173,370 1,038,197 82,974 335,263
96

Table of Contents
27. Related Parties and Others, Continued (In millions of won)
For the three-month period
ended June 30, 2019 For the six-month period
ended June 30, 2019 December 31, 2019
Sales
and others Purchase
and others Sales
and others Purchase
and others
Trade accounts and notes receivable
and others
Trade accounts and notes payable
and others LG International Corp. and its subsidiaries W 156,629 106,638 351,829 224,783 93,623 77,721 LG Uplus Corp. — 579 — 1,139 — 208 LG Chem Ltd. and its subsidiaries 81,614 302,544 82,335 589,151 97 128,636 S&I Corp. and its subsidiaries 100 184,659 184 514,222 21,307 159,202 Silicon Works Co., Ltd. — 156,264 92 306,556 — 126,856 LG Corp. — 13,096 — 26,369 8,781 — LG Management Development Institute — 1,915 — 4,385 3,480 231 LG CNS Co., Ltd. and its subsidiaries 4 57,683 9 93,605 2 75,850 LG Hausys Ltd. 1 1 1 1 — — LG Household & Health Care and its subsidiaries — 2 — 97 — 6 LG Holdings Japan Co., Ltd. — 495 — 987 2,264 — G2R Inc. and its subsidiaries — 839 — 1,903 — 29,540 Robostar Co., Ltd. — 1,553 — 6,900 — 2,332 Other(*) 4 119,763 4 119,763 — —
W 238,352 946,031 434,454 1,889,861 129,554 600,582
(*) Due to S&I Corp.’s disposal of partial interests in Serveone in May 2019, Serveone was reclassified from one of the S&I Corp.’s subsidiaries to
associates. Accordingly, transactions with S&I Corp. after the disposal are classified as other.
97
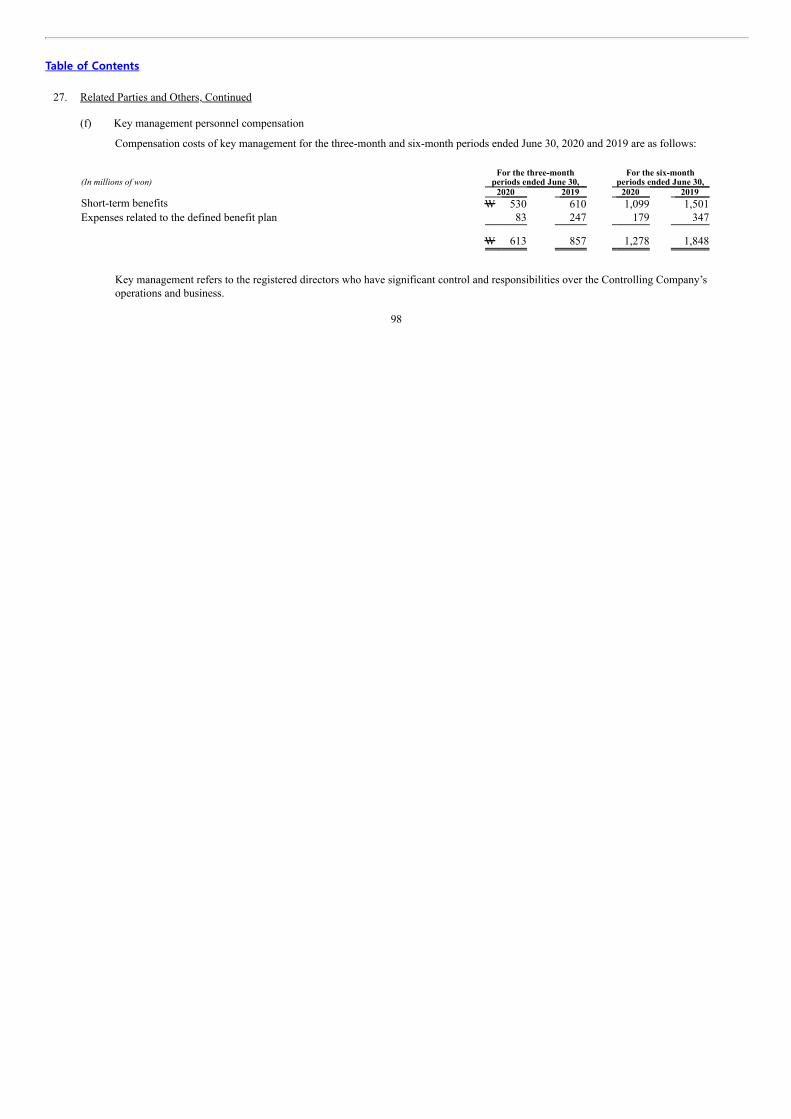
Table of Contents
27. Related Parties and Others, Continued (f) Key management personnel compensation
Compensation costs of key management for the three-month and six-month periods ended June 30, 2020 and 2019 are as follows:
(In millions of won) For the three-month
periods ended June 30, For the six-month
periods ended June 30, 2020 2019 2020 2019 Short-term benefits W 530 610 1,099 1,501Expenses related to the defined benefit plan 83 247 179 347
W 613 857 1,278 1,848
Key management refers to the registered directors who have significant control and responsibilities over the Controlling Company’soperations and business.
98

Table of Contents
LG DISPLAY CO., LTD.
Condensed Separate Interim Financial Statements
(Unaudited)
June 30, 2020 and 2019
(With Independent Auditors’ Review Report Thereon)
99

Table of Contents
Table of Contents Page Independent Auditors’ Review Report 101
Condensed Separate Interim Statements of Financial Position 103
Condensed Separate Interim Statements of Comprehensive Loss 104
Condensed Separate Interim Statements of Changes in Equity 105
Condensed Separate Interim Statements of Cash Flows 106
Notes to the Condensed Separate Interim Financial Statements 108
100

Table of Contents
Independent Auditors’ Review Report
Based on a report originally issued in Korean
To the Board of Directors and ShareholdersLG Display Co., Ltd.:
Reviewed Financial Statements
We have reviewed the accompanying condensed separate interim financial statements of LG Display Co., Ltd. (the “Company”) which comprise thecondensed separate interim statement of financial position as of June 30, 2020, the condensed separate interim statements of comprehensive loss for thethree-month and six-month periods ended June 30, 2020 and 2019, and statements of changes in equity and cash flows for the six-month periods endedJune 30, 2020 and 2019, and notes, comprising a summary of significant accounting policies and other explanatory information.
Management’s Responsibility for the Condensed Separate Interim Financial Statements
Management is responsible for the preparation and fair presentation of these condensed separate interim financial statements in accordance with KoreanInternational Financial Reporting Standards No. 1034, Interim Financial Reporting, and for such internal controls as management determines necessaryto enable the preparation of condensed separate interim financial statements that are free from material misstatement, whether due to fraud or error.
Auditors’ Responsibility
Our responsibility is to issue a report on these condensed separate interim financial statements based on our reviews.
We conducted our reviews in accordance with the Review Standards for Quarterly and Semiannual Financial Statements established by the Security andFutures Commission of the Republic of Korea. A review of interim financial information consists principally of making inquiries, primarily of personsresponsible for financial and accounting matters, and applying analytical and other review procedures. A review is substantially less in scope than anaudit conducted in accordance with Korean Standards on Auditing and consequently does not enable us to obtain assurance that we would becomeaware of all significant matters that might be identified in an audit. Accordingly, we do not express an audit opinion.
Conclusion
Based on our reviews, nothing has come to our attention that causes us to believe that the condensed separate interim financial statements referred toabove are not presented fairly, in all material respects, in accordance with Korean International Financial Reporting Standards No. 1034, InterimFinancial Reporting.
Other Matters
The procedures and practices utilized in the Republic of Korea to review such condensed separate interim financial statements may differ from thosegenerally accepted and applied in other countries.
We audited the separate statement of financial position as of December 31, 2019, and the related separate statements of comprehensive loss, changes inequity and cash flows for the year then ended, which are not accompanying this review report, in accordance with Korean Standards on Auditing, andour report thereon, dated March 11, 2020, expressed an unmodified opinion. The accompanying condensed separate statement of financial position ofthe Company as of December 31, 2019, presented for comparative purposes, is not different from that audited by us from which it was derived in allmaterial respects.
101

Table of Contents
KPMG Samjong Accounting Corp.Seoul, KoreaAugust 12, 2020
This report is effective as of August 12, 2020, the review report date. Certain subsequent events or circumstances, which may occur between thereview report date and the time of reading this report, could have a material impact on the accompanying condensed separate interim financialstatements and notes thereto. Accordingly, the readers of the review report should understand that the above review report has not been updated toreflect the impact of such subsequent events or circumstances, if any.
102

Table of Contents
LG DISPLAY CO., LTD.Condensed Separate Interim Statements of Financial Position(Unaudited)As of June 30, 2020 and December 31, 2019 (In millions of won) Note June 30, 2020 December 31, 2019 Assets Cash and cash equivalents 4, 24 W 918,639 1,105,245Deposits in banks 4, 24 76,852 77,257Trade accounts and notes receivable, net 5, 14, 24, 26 3,525,187 3,565,860Other accounts receivable, net 5, 24 114,165 439,940Other current financial assets 6, 24 47,246 55,665Inventories 7 1,448,593 1,526,299Prepaid income tax 110,112 111,129Other current assets 5 225,045 199,833
Total current assets 6,465,839 7,081,228
Deposits in banks 4, 24 11 11Investments 8 4,848,926 4,958,308Other non-current accounts receivable, net 5, 24 16,511 19,899Other non-current financial assets 6, 24 104,283 74,203Property, plant and equipment, net 9 12,174,549 12,764,175Intangible assets, net 10 681,839 708,047Deferred tax assets 22 1,672,845 1,367,714Defined benefits assets 12 49,562 127,252Other non-current assets 5 287,092 281,843
Total non-current assets 19,835,618 20,301,452
Total assets W26,301,457 27,382,680
Liabilities Trade accounts and notes payable 24, 26 W 3,679,767 2,682,403Current financial liabilities 11, 24 2,253,402 1,474,589Other accounts payable 24 2,531,620 3,329,040Accrued expenses 427,990 520,395Provisions 13 163,754 188,238Advances received 14 721,942 898,447Other current liabilities 13 32,435 47,371
Total current liabilities 9,810,910 9,140,483
Non-current financial liabilities 11, 24 6,441,300 7,094,405Non-current provisions 13 66,076 67,118Long-term advances received 14 23,251 328,677Other non-current liabilities 13 90,298 85,904
Total non-current liabilities 6,620,925 7,576,104
Total liabilities 16,431,835 16,716,587
Equity Share capital 15 1,789,079 1,789,079Share premium 2,251,113 2,251,113Retained earnings 5,829,430 6,625,901
Total equity 9,869,622 10,666,093
Total liabilities and equity W26,301,457 27,382,680
See accompanying notes to the separate interim financial statements.
103

Table of Contents
LG DISPLAY CO., LTD.Condensed Separate Interim Statements of Comprehensive Loss(Unaudited)For the three-month and six-month periods ended June 30, 2020 and 2019
(In millions of won, except earnings per share) Note For the three-month periods
ended June 30 For the six-month periods
ended June 30 2020 2019 2020 2019 Revenue 16, 26 W 4,891,108 4,935,961 9,372,529 10,319,565Cost of sales 7, 17, 26 (4,960,160) (4,649,658) (9,493,536) (9,624,904)
Gross profit (loss) (69,052) 286,303 (121,007) 694,661
Selling expenses 18 (94,297) (160,281) (229,767) (312,211) Administrative expenses 18 (105,538) (120,269) (208,143) (249,869) Research and development expenses (282,381) (420,411) (546,060) (750,021)
Operating loss (551,268) (414,658) (1,104,977) (617,440)
Finance income 21 79,484 59,111 274,367 106,981Finance costs 21 (106,354) (82,544) (281,084) (134,540) Other non-operating income 20 130,043 304,317 580,790 445,713Other non-operating expenses 20 (174,031) (315,138) (566,664) (437,341)
Loss before income tax (622,126) (448,912) (1,097,568) (636,627) Income tax expense (benefit) 22 (166,042) (41,148) (303,907) (114,921)
Loss for the period (456,084) (407,764) (793,661) (521,706)
Other comprehensive income (loss) Items that will never be reclassified to profit or loss Remeasurements of net defined benefit liabilities 12 (1,208) (1,935) (3,782) (4,848) Related income tax 12 310 (4,328) 972 (3,551)
Other comprehensive loss for the period, net of income tax (898) (6,263) (2,810) (8,399)
Total comprehensive loss for the period W (456,982) (414,027) (796,471) (530,105)
Loss per share (in won) Basic and diluted loss per share 23 W (1,275) (1,140) (2,218) (1,458)
See accompanying notes to the separate interim financial statements.
104
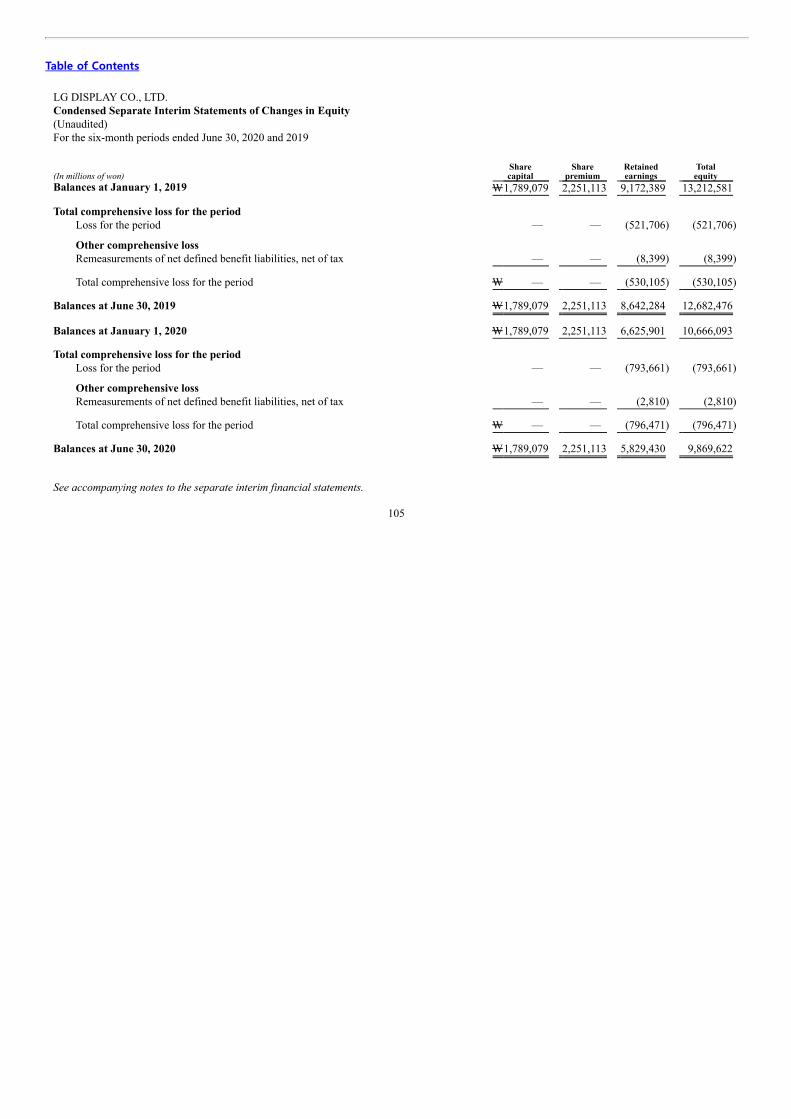
Table of Contents
LG DISPLAY CO., LTD. Condensed Separate Interim Statements of Changes in Equity (Unaudited) For the six-month periods ended June 30, 2020 and 2019
(In millions of won) Share
capital Share
premium Retained
earnings Total
equity Balances at January 1, 2019 W1,789,079 2,251,113 9,172,389 13,212,581
Total comprehensive loss for the period
Loss for the period — — (521,706) (521,706)
Other comprehensive loss Remeasurements of net defined benefit liabilities, net of tax — — (8,399) (8,399)
Total comprehensive loss for the period W — — (530,105) (530,105)
Balances at June 30, 2019 W1,789,079 2,251,113 8,642,284 12,682,476
Balances at January 1, 2020 W1,789,079 2,251,113 6,625,901 10,666,093
Total comprehensive loss for the period
Loss for the period — — (793,661) (793,661)
Other comprehensive loss Remeasurements of net defined benefit liabilities, net of tax — — (2,810) (2,810)
Total comprehensive loss for the period W — — (796,471) (796,471)
Balances at June 30, 2020 W1,789,079 2,251,113 5,829,430 9,869,622
See accompanying notes to the separate interim financial statements.
105

Table of Contents
LG DISPLAY CO., LTD. Condensed Separate Interim Statements of Cash Flows (Unaudited) For the six-month periods ended June 30, 2020 and 2019 (In millions of won) Note 2020 2019 Cash flows from operating activities: Loss for the period W (793,661) (521,706) Adjustments for: Income tax expense (benefit) 22 (303,907) (114,921) Depreciation and amortization 17 1,296,487 1,209,059Gain on foreign currency translation (83,171) (77,872) Loss on foreign currency translation 152,312 153,273Expenses related to defined benefit plans 12 79,397 97,553Gain on disposal of property, plant and equipment (12,148) (27,963) Loss on disposal of property, plant and equipment 17,886 6,747Impairment loss on disposal of property, plant and equipment 5,576 5,943Gain on disposal of intangible assets — (552) Loss on disposal of intangible assets 7 18Impairment loss on intangible assets 30,511 — Reversal of impairment loss on intangible assets (600) (201) Expense on increase of provisions 99,155 175,711Finance income (253,139) (97,645) Finance costs 262,661 123,175Other income (16,889) (127) Other expenses — 4,169
1,274,138 1,456,367
Changes in Trade accounts and notes receivable (513,093) (165,385) Other accounts receivable 105,521 3,687Inventories 77,706 93,651Other current assets (3,850) (12,106) Other non-current assets (42,927) (13,529) Trade accounts and notes payable 1,045,005 66,643Other accounts payable (587,626) 428,153Accrued expenses (81,246) 168,658Provisions (112,902) (134,182) Advances received (39,189) (51,773) Other current liabilities (23,175) (6,722) Defined benefit liabilities, net (5,489) (20,861) Long-term advances received — 63,672Other non-current liabilities 6,188 6,318
(175,077) 426,224
Cash generated from operating activities 305,400 1,360,885Income taxes refunded 763 17,859Interests received 7,274 5,363Interests paid (156,479) (104,707)
Net cash provided by operating activities W 156,958 1,279,400
See accompanying notes to the separate interim financial statements.
106

Table of Contents
LG DISPLAY CO., LTD. Condensed Separate Interim Statements of Cash Flows (Unaudited) For the six-month periods ended June 30, 2020 and 2019 (In millions of won) Note 2020 2019 Cash flows from investing activities: Dividends received W 8,239 12,565Increase in deposits in banks (6,852) (41,180) Proceeds from withdrawal of deposits in banks 7,257 41,180Acquisition of financial assets at fair value through other comprehensive income — (21) Proceeds from disposal of financial assets at fair value through other comprehensive income 6 — Acquisition of investments (50,979) (1,102,607) Proceeds from disposal of investments 169,953 1,200Acquisition of property, plant and equipment (715,069) (1,314,030) Proceeds from disposal of property, plant and equipment 278,048 55,796Acquisition of intangible assets (204,556) (243,779) Proceeds from disposal of intangible assets 300 2,349Government grants received — 3,979Receipt from settlement of derivatives 27,551 13,167Proceeds from collection of short-term loans 7,759 11,772Increase in short-term loans — (8,225) Increase in long-term loans — (6,465) Increase in deposits (358) (500) Decrease in deposits 1,217 1,000Proceeds from disposal other assets 11,000 —
Net cash used in investing activities (466,484) (2,573,799)
Cash flows from financing activities: 25 Proceeds from short-term borrowings 775,095 1,024,723Repayments of short-term borrowings (453,549) (688,143) Proceeds from issuance of bonds 49,949 503,665Proceeds from long-term borrowings● 370,000 1,136,968Repayments of current portion of long-term borrowings and bonds● (616,482) (708,097) Payment guarantee fee received 4,029 3,756Payment of lease liabilities (6,122) (7,175)
Net cash provided by financing activities 122,920 1,265,697
Net decrease in cash and cash equivalents (186,606) (28,702) Cash and cash equivalents at January 1 1,105,245 473,283
Cash and cash equivalents at June 30 W 918,639 444,581
See accompanying notes to the separate interim financial statements.
107

Table of Contents
1. Organization and Description of Business
LG Display Co., Ltd. (the “Company”) was incorporated in February 1985 and the Company is a public corporation listed in the KoreaExchange since 2004. The main business of the Company is to manufacture and sell displays and its related products. As of June 30, 2020,the Company is operating Thin Film Transistor Liquid Crystal Display (“TFT-LCD”) and Organic Light Emitting Diode (“OLED”) panelmanufacturing plants in Gumi, Paju and China and TFT-LCD and OLED module manufacturing plants in Gumi, Paju, China and Vietnam.The Company is domiciled in the Republic of Korea with its address at 128 Yeouidae-ro, Yeongdeungpo-gu, Seoul, the Republic of Korea.As of June 30, 2020, LG Electronics Inc., a major shareholder of the Company, owns 37.9% (135,625,000 shares) of the Company’scommon stock.
The Company’s common stock is listed on the Korea Exchange under the identifying code 034220. As of June 30, 2020, there are357,815,700 shares of common stock outstanding. The Company’s common stock is also listed on the New York Stock Exchange in theform of American Depository Shares (“ADSs”) under the symbol “LPL”. One ADS represents one-half of one share of common stock. Asof June 30, 2020, there are 21,176,408 ADSs outstanding.
2. Basis of Presenting Financial Statements (a) Statement of Compliance
The condensed separate interim financial statements have been prepared in accordance with Korean International Financial ReportingStandards (“K-IFRSs”) No.1034, Interim Financial Reporting. They do not include all of the information required for full annual financialstatements and should be read in conjunction with the separate financial statements of the Company as of and for the year endedDecember 31, 2019.
These condensed interim financial statements are separate interim financial statements prepared in accordance with K-IFRS No.1027,Separate Financial Statements, presented by a parent, an investor in an associate, in which the investments are accounted for on the basisof the direct equity interest rather than on the basis of the reported results and net assets of the investees.
(b) Basis of Measurement
The condensed separate interim financial statements have been prepared on the historical cost basis except for the following material itemsin the statement of financial position:
• derivative financial instruments at fair value, financial assets at fair value through profit or loss (“FVTPL”), financial assets at fairvalue through other comprehensive income (“FVOCI”), financial liabilities at fair value through profit or loss (“FVTPL”), and
• net defined benefit liabilities (defined benefit assets) recognized at the present value of defined benefit obligations less the fair valueof plan assets
108

Table of Contents
2. Basis of Presenting Financial Statements, Continued (c) Functional and Presentation Currency
The condensed separate interim financial statements are presented in Korean won, which is the Company’s functional currency.
(d) Use of Estimates and Judgments
The preparation of the condensed separate interim financial statements in conformity with K-IFRSs requires management to makejudgments, estimates and assumptions that affect the application of accounting policies and the reported amounts of assets, liabilities,income and expenses. Actual results may differ from these estimates.
3. Summary of Significant Accounting Policies
The accounting policies applied in these condensed separate interim financial statements are the same as those applied in the Company’s separatefinancial statements as of and for the year ended December 31, 2019, except for the application of K-IFRS No.1034, Interim Financial Reporting.A number of amended standards are effective from January 1, 2020 but they do not have a material effect on the Company’s financial statements.
109

Table of Contents
4. Cash and Cash Equivalents and Deposits in Banks
Cash and cash equivalents and deposits in banks as of June 30, 2020 and December 31, 2019 are as follows:
(In millions of won) June 30, 2020 December 31, 2019 Current assets
Cash and cash equivalents Demand deposits W 918,639 1,105,245
Deposits in banks Restricted deposits (*) W 76,852 77,257
Non-current assets Deposits in banks
Restricted deposits (*) W 11 11 W 995,502 1,182,513
(*) Include funds deposited under agreements on mutually beneficial cooperation to aid LG Group companies’ suppliers, restricted deposits pledged
to enforce the Company’s investment plans upon the receipt of grants from Gumi city and Gyeongsangbuk-do, and others.
5. Receivables and Other Assets (a) Trade accounts and notes receivable as of June 30, 2020 and December 31, 2019 are as follows:
(In millions of won) June 30, 2020 December 31, 2019 Due from third parties W 127,372 221,243 Due from related parties 3,397,815 3,344,617
W3,525,187 3,565,860
(b) Other accounts receivable as of June 30, 2020 and December 31, 2019 are as follows:
(In millions of won) June 30, 2020 December 31, 2019 Current assets
Non-trade receivables, net W 113,401 438,659 Accrued income 764 1,281
W 114,165 439,940
Non-current assets Long-term non-trade receivables W 16,511 19,899
W 130,676 459,839
Due from related parties included in other accounts receivable as of June 30, 2020 and December 31, 2019 are W24,734 million andW45,518 million, respectively.
110
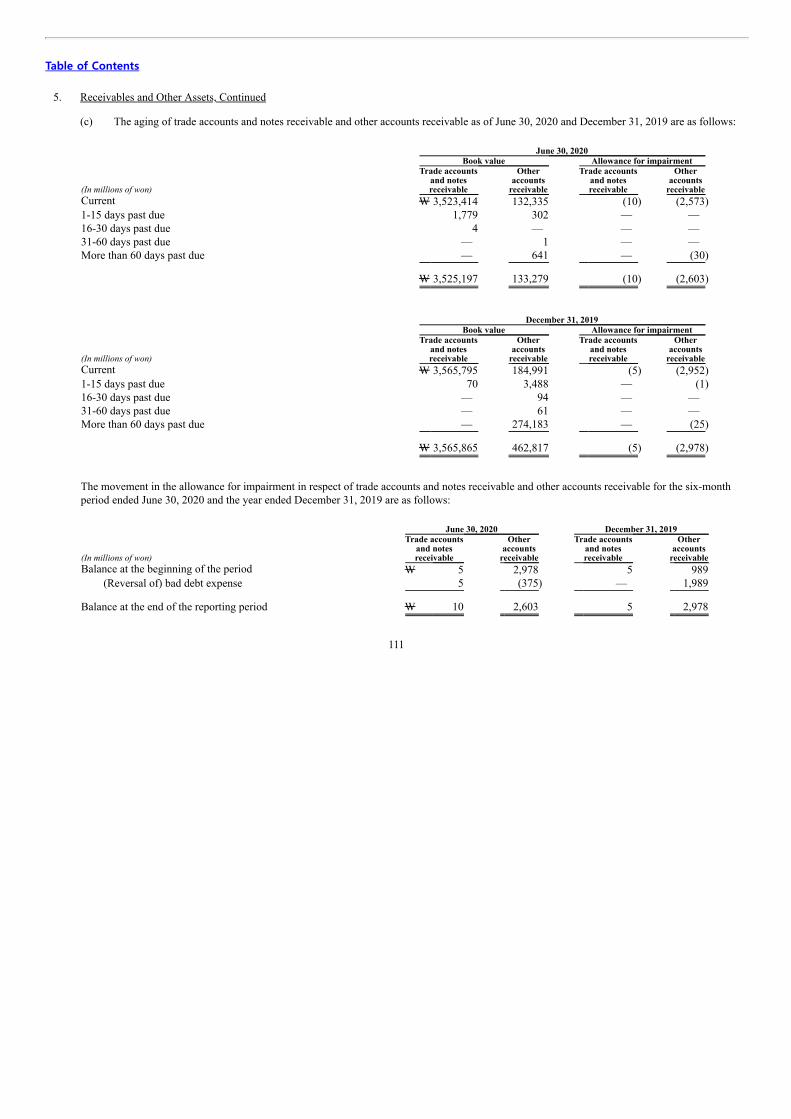
Table of Contents
5. Receivables and Other Assets, Continued (c) The aging of trade accounts and notes receivable and other accounts receivable as of June 30, 2020 and December 31, 2019 are as follows:
June 30, 2020 Book value Allowance for impairment
(In millions of won)
Trade accounts and notes
receivable
Other accounts
receivable
Trade accounts and notes
receivable
Other accounts
receivable Current W 3,523,414 132,335 (10) (2,573) 1-15 days past due 1,779 302 — — 16-30 days past due 4 — — — 31-60 days past due — 1 — — More than 60 days past due — 641 — (30)
W 3,525,197 133,279 (10) (2,603)
December 31, 2019 Book value Allowance for impairment
(In millions of won)
Trade accounts and notes
receivable
Other accounts
receivable
Trade accounts and notes
receivable
Other accounts
receivable Current W 3,565,795 184,991 (5) (2,952) 1-15 days past due 70 3,488 — (1) 16-30 days past due — 94 — — 31-60 days past due — 61 — — More than 60 days past due — 274,183 — (25)
W 3,565,865 462,817 (5) (2,978)
The movement in the allowance for impairment in respect of trade accounts and notes receivable and other accounts receivable for the six-monthperiod ended June 30, 2020 and the year ended December 31, 2019 are as follows:
June 30, 2020 December 31, 2019
(In millions of won)
Trade accounts and notes
receivable
Other accounts
receivable
Trade accounts and notes
receivable
Other accounts
receivable Balance at the beginning of the period W 5 2,978 5 989
(Reversal of) bad debt expense 5 (375) — 1,989
Balance at the end of the reporting period W 10 2,603 5 2,978
111

Table of Contents
5. Receivables and Other Assets, Continued (d) Other assets as of June 30, 2020 and December 31, 2019 are as follows:
(In millions of won) June 30, 2020 December 31, 2019 Current assets
Advanced payments W 29,388 1,849 Prepaid expenses 117,828 100,561 Value added tax refundable 58,295 75,317 Right to recover returned goods 19,534 22,106
W 225,045 199,833
Non-current assets Long-term prepaid expenses W 253,675 274,101 Long-term advanced payments 33,417 7,742
W 287,092 281,843
112

Table of Contents
6. Other Financial Assets
Other financial assets as of June 30, 2020 and December 31, 2019 are as follows:
(In millions of won) June 30, 2020 December 31, 2019 Current assets
Financial assets at fair value through profit or loss Derivatives(*) W 21,088 34,036
Financial assets at fair value through other comprehensiveincome
Debt instruments Government bonds W 24 6
Financial assets carried at amortized cost Short-term loans W 26,134 21,623
W 47,246 55,665
Non-current assets Financial assets at fair value through profit or loss
Equity instruments Intellectual Discovery, Ltd. W 1,104 1,104 Kyulux, Inc. 396 1,889 Fineeva Co., Ltd. 4 4
W 1,504 2,997
Convertible bonds W 1,544 1,544 Derivatives(*) 62,734 15,640
W 65,782 20,181
Financial assets at fair value through other comprehensiveincome
Debt instruments Government bonds W 48 70
Financial assets carried at amortized cost Deposits W 12,266 13,125 Long-term loans 26,187 40,827
W 38,453 53,952 W 104,283 74,203
(*) Represents valuation gain from currency interest rate swap contracts related to foreign currency denominated borrowings and bonds. The contracts
are not designated as hedging instruments.
113

Table of Contents
7. Inventories
Inventories as of June 30, 2020 and December 31, 2019 are as follows:
(In millions of won) June 30, 2020 December 31, 2019 Finished goods W 414,818 394,069 Work-in-process 563,016 696,993 Raw materials 361,253 341,004 Supplies 109,506 94,233
W1,448,593 1,526,299
For the six-month periods ended June 30, 2020 and 2019, the amount of inventories recognized as cost of sales including inventory write-downsand usage of inventory write-downs are as follows:
(In millions of won) 2020 2019 Inventories recognized as cost of sales W9,493,536 9,624,904
Inventory write-downs 297,115 321,418 Usage of inventory write-downs (408,567) (280,323)
114

Table of Contents
8. Investments (a) Investments in subsidiaries consist of the following: June 30, 2020 December 31, 2019
(In millions of won)Subsidiaries Location Business
Percentage of
ownership Book
Value
Percentage of
ownership Book
Value LG Display America, Inc.
San Jose,U.S.A. Sell display products 100% W 36,815 100% W 36,815
LG Display Germany GmbH
Eschborn,Germany Sell display products 100% 19,373 100% 19,373
LG Display Japan Co., Ltd. Tokyo, Japan Sell display products 100% 15,686 100% 15,686 LG Display Taiwan Co., Ltd. Taipei, Taiwan Sell display products 100% 35,230 100% 35,230 LG Display Nanjing Co., Ltd.
Nanjing, China Manufacture display
products 100% 593,726 100% 593,726 LG Display Shanghai Co., Ltd. Shanghai, China Sell display products 100% 9,093 100% 9,093 LG Display Poland Sp. z o.o.(*1)
Wroclaw, Poland Manufacture display
products — — 100% 160,361 LG Display Guangzhou Co., Ltd.
Guangzhou, China Manufacture display
products 100% 293,557 100% 293,557 LG Display Shenzhen Co., Ltd. Shenzhen, China Sell display products 100% 3,467 100% 3,467 LG Display Singapore Pte. Ltd. Singapore Sell display products 100% 1,250 100% 1,250 L&T Display Technology (Fujian) Limited
Fujian,China
Manufacture and sellLCD module and LCD
monitor sets 51% 10,123 51% 10,123 LG Display Yantai Co., Ltd.
Yantai,China
Manufacture displayproducts 100% 169,195 100% 169,195
Nanumnuri Co., Ltd.
Gumi, SouthKorea
Provide janitorialservices 100% 800 100% 800
LG Display (China) Co., Ltd. Guangzhou,China
Manufacture and selldisplay products 51% 723,086 51% 723,086
Unified Innovative Technology, LLC
Wilmington,U.S.A.
Manage intellectualproperty 100% 9,489 100% 9,489
LG Display Guangzhou Trading Co., Ltd. Guangzhou, China Sell display products 100% 218 100% 218 Global OLED Technology LLC
Sterling,U.S.A
Manage OLEDintellectual property 100% 164,322 100% 164,322
LG Display Vietnam Haiphong Co., Ltd.
Haiphong, Vietnam
Manufacture display products 100% 672,658 100% 672,658
Suzhou Lehui Display Co., Ltd.
Suzhou,China
Manufacture and sellLCD module and LCD
monitor sets 100% 121,640 100% 121,640 LG DISPLAY FUND I LLC(*2)
Wilmington, U.S.A
Invest in venturebusiness and acquire
technologies 100% 8,301 100% 6,322 LG Display High-Tech (China) Co., Ltd.
(*3) Guangzhou, China Manufacture and sell
display products 71% 1,794,547 74% 1,794,547 Money Market Trust
Seoul,Korea Money market trust 100% 83,700 100% 34,700
W4,766,276 W4,875,658
115

Table of Contents
8. Investments, Continued (*1) In May 2020, LG Display Poland Sp. z o.o. completed the liquidation process.(*2) For the six-month period ended June 30, 2020, the Company contributed W1,979 million in cash for the capital increase by LG DISPLAY FUND
I LLC. There was no change in the Company’s ownership percentage in LG DISPLAY FUND I LLC as a result of this additional investment.(*3) For the six-month period ended June 30, 2020, non-controlling shareholders contributed W84,829 million in cash for the stocks issued by LG
Display High-Tech (China) Co., Ltd. (“LGDCO”). The Company’s ownership percentage in LGDCO decreased from 74% to 71% as a result ofthe additional shares issue.
116
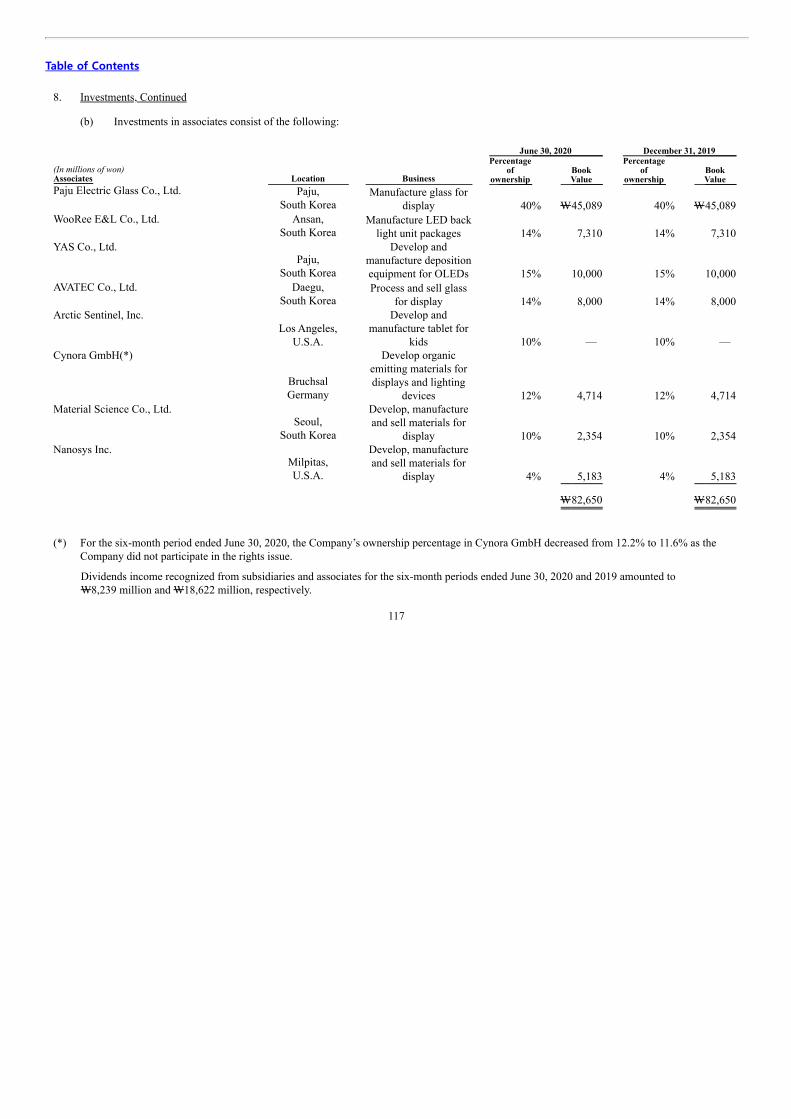
Table of Contents
8. Investments, Continued (b) Investments in associates consist of the following: June 30, 2020 December 31, 2019
(In millions of won)Associates Location Business
Percentage of
ownership Book
Value
Percentage of
ownership Book
Value Paju Electric Glass Co., Ltd.
Paju,
South Korea Manufacture glass for
display 40% W45,089 40% W45,089 WooRee E&L Co., Ltd.
Ansan,
South Korea Manufacture LED back
light unit packages 14% 7,310 14% 7,310 YAS Co., Ltd.
Paju,
South Korea
Develop andmanufacture depositionequipment for OLEDs 15% 10,000 15% 10,000
AVATEC Co., Ltd.
Daegu,South Korea
Process and sell glassfor display 14% 8,000 14% 8,000
Arctic Sentinel, Inc.
Los Angeles,
U.S.A.
Develop andmanufacture tablet for
kids 10% — 10% — Cynora GmbH(*)
BruchsalGermany
Develop organicemitting materials fordisplays and lighting
devices 12% 4,714 12% 4,714 Material Science Co., Ltd.
Seoul,
South Korea
Develop, manufactureand sell materials for
display 10% 2,354 10% 2,354 Nanosys Inc.
Milpitas,U.S.A.
Develop, manufactureand sell materials for
display 4% 5,183 4% 5,183 W82,650 W82,650
(*) For the six-month period ended June 30, 2020, the Company’s ownership percentage in Cynora GmbH decreased from 12.2% to 11.6% as the
Company did not participate in the rights issue.
Dividends income recognized from subsidiaries and associates for the six-month periods ended June 30, 2020 and 2019 amounted toW8,239 million and W18,622 million, respectively.
117

Table of Contents
9. Property, Plant and Equipment
For the six-month periods ended June 30, 2020 and 2019, the Company purchased property, plant and equipment of W581,766 million andW1,079,423 million, respectively. The capitalized borrowing costs and the annualized capitalization rate were W50,071 million and 2.99%, andW77,335 million and 2.78%, for the six-month periods ended June 30, 2020 and 2019, respectively. In addition, for the six-month periods endedJune 30, 2020 and 2019, the Company disposed of property, plant and equipment with carrying amounts of W66,393 million andW90,794 million, respectively, and recognized W12,148 million and W17,886 million, respectively, as gain and loss on disposal of property, plantand equipment for the six-month period ended June 30, 2020 (gain and loss for the six-month period ended June 30, 2019: W27,963 million andW6,747 million, respectively).
10. Intangible Assets
The Company capitalizes expenditures related to development activities, such as expenditures incurred on designing, manufacturing and testing ofproducts after those related activities meet the capitalization criteria of development costs including technical feasibility, future economic benefitsand others. The balances of capitalized development costs as of June 30, 2020 and December 31, 2019, are W374,007 million andW375,183 million, respectively. In addition, for the six-month period ended June 30, 2020, the Company recognized an impairment lossamounting to W29,838 million in connection with development projects.
118

Table of Contents
11. Financial Liabilities (a) Financial liabilities as of June 30, 2020 and December 31, 2019 are as follows:
(In millions of won) June 30, 2020 December 31, 2019 Current
Short-term borrowings W 680,030 347,340 Current portion of long-term borrowings and bonds 1,547,497 1,117,218 Current portion of payment guarantee liabilities 5,529 5,674 Derivatives(*) 12,530 — Lease liabilities 7,816 4,357
W2,253,402 1,474,589
Non-current Won denominated borrowings W2,343,750 2,692,560 Foreign currency denominated borrowings 1,662,970 1,626,709 Bonds 2,415,285 2,741,516 Payment guarantee liabilities 8,627 10,828 Derivatives(*) 8,291 20,592 Lease liabilities 2,377 2,200
W6,441,300 7,094,405
(*) Represents currency interest rate swap contracts and others entered into by the Company to hedge currency and interest rate risks with respect to
foreign currency denominated borrowings and bonds. (b) Short-term borrowings as of June 30, 2020 and December 31, 2019 as follows:
(In millions of won and USD)Lender
Annual interest rate as of
June 30, 2020 (%)(*) June 30, 2020 December 31, 2019 Standard Chartered Bank Korea Limited
12ML + 0.98 6ML + 2.00
W 480,030 347,340
The Export-Import Bank of Korea 1.55 200,000 —
Foreign currency equivalent USD 400 USD 300 W 680,030 347,340
(*) ML represents Month LIBOR (London Inter-Bank Offered Rates).
119

Table of Contents
11. Financial Liabilities, Continued (c) Won denominated long-term borrowings as of June 30, 2020 and December 31, 2019 are as follows:
(In millions of won)Lender
Annual interest rate as of
June 30, 2020 (%)(*) June 30,
2020 December 31,
2019 Woori Bank 2.75 W 282 608 Korea Development Bank and others
CD rate (91days) + 1.00~1.60,
2.21~3.40 3,381,250 3,330,000
Less current portion of long-term borrowings (1,037,782) (638,048) W 2,343,750 2,692,560
(*) CD represents certificate of deposit. (d) Foreign currency denominated long-term borrowings as of June 30, 2020 and December 31, 2019 are as follows:
(In millions of won and USD)Lender
Annual interest rate as of
June 30, 2020 (%) June 30,
2020 December 31,
2019 The Export-Import Bank of Korea and others
3ML+0.75 ~1.70 6ML+1.25 ~1.35 W 1,723,005 1,696,177
Foreign currency equivalent USD 1,435 USD 1,465 Less current portion of long-term borrowings (60,035) (69,468)
W 1,662,970 1,626,709
120

Table of Contents
11. Financial Liabilities, Continued (e) Details of bonds issued and outstanding as of June 30, 2020 and December 31, 2019 are as follows:
(In millions of won and USD) Maturity
Annual interest rate as of
June 30, 2020 (%) June 30, 2020 December 31,
2019 Won denominated bonds at amortized
cost (*1) Publicly issued bonds
October 2020~February 2024 1.95~2.95 W 1,470,000 1,730,000
Privately issued bonds
May 2022~May 2033 3.25~4.25 160,000 110,000
Less discount on bonds (2,554) (3,404) Less current portion (449,680) (409,702)
W 1,177,766 1,426,894
Foreign currency denominated bonds atamortized cost (*2)
Publicly issued bonds November 2021 3.88 W 360,210 347,340 Privately issued bonds April 2023 3ML+1.47 120,070 115,780
Foreign currency equivalent USD 400 USD 400
Less discount on bonds (5,376) (6,883)
W 474,904 456,237
Financial liabilities at fair value throughprofit or loss
Foreign currency denominated convertiblebonds August 2024 1.50 W 762,615 858,385
Foreign currency equivalent USD 635 USD 741
W 2,415,285 2,741,516
(*1) Principal of the won denominated bonds is to be repaid at maturity and interests are paid quarterly.(*2) Principal of the foreign currency denominated bonds is to be repaid at maturity and interests are paid quarterly or semi-annually.
121
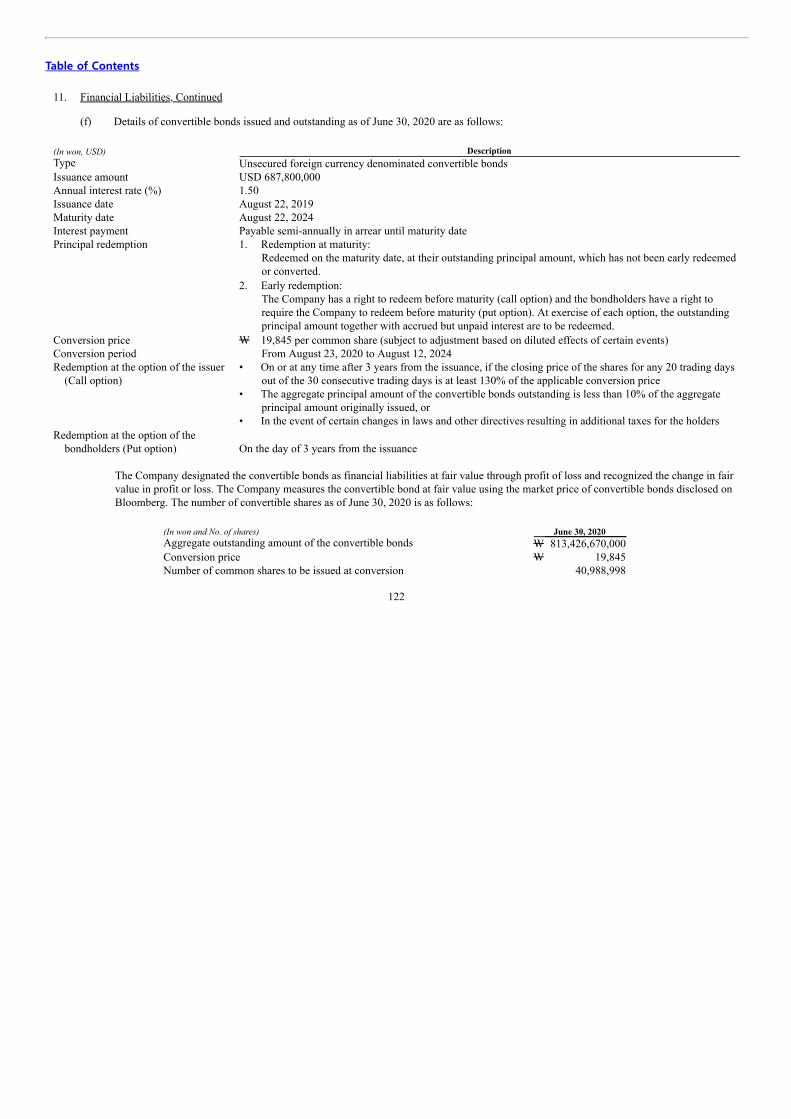
Table of Contents
11. Financial Liabilities, Continued (f) Details of convertible bonds issued and outstanding as of June 30, 2020 are as follows: (In won, USD) DescriptionType Unsecured foreign currency denominated convertible bondsIssuance amount USD 687,800,000Annual interest rate (%) 1.50Issuance date August 22, 2019Maturity date August 22, 2024Interest payment Payable semi-annually in arrear until maturity datePrincipal redemption
1. Redemption at maturity:Redeemed on the maturity date, at their outstanding principal amount, which has not been early redeemedor converted.
2. Early redemption:The Company has a right to redeem before maturity (call option) and the bondholders have a right torequire the Company to redeem before maturity (put option). At exercise of each option, the outstandingprincipal amount together with accrued but unpaid interest are to be redeemed.
Conversion price W 19,845 per common share (subject to adjustment based on diluted effects of certain events)Conversion period From August 23, 2020 to August 12, 2024Redemption at the option of the issuer
(Call option)
• On or at any time after 3 years from the issuance, if the closing price of the shares for any 20 trading daysout of the 30 consecutive trading days is at least 130% of the applicable conversion price
• The aggregate principal amount of the convertible bonds outstanding is less than 10% of the aggregateprincipal amount originally issued, or
• In the event of certain changes in laws and other directives resulting in additional taxes for the holdersRedemption at the option of the
bondholders (Put option) On the day of 3 years from the issuance
The Company designated the convertible bonds as financial liabilities at fair value through profit of loss and recognized the change in fairvalue in profit or loss. The Company measures the convertible bond at fair value using the market price of convertible bonds disclosed onBloomberg. The number of convertible shares as of June 30, 2020 is as follows:
(In won and No. of shares) June 30, 2020 Aggregate outstanding amount of the convertible bonds W 813,426,670,000 Conversion price W 19,845 Number of common shares to be issued at conversion 40,988,998
122

Table of Contents
12. Employee Benefits
The Company’s defined benefit plans provide a lump-sum payment to an employee based on final salary rates and length of service at the time theemployee leaves the Company.
(a) Net defined benefit liabilities (defined benefit assets) recognized as of June 30, 2020 and December 31, 2019 are as follows:
(In millions of won) June 30, 2020 December 31, 2019 Present value of partially funded defined benefit obligations W 1,487,784 1,476,866 Fair value of plan assets (1,537,346) (1,604,118)
W (49,562) (127,252)
(b) Expenses recognized in profit or loss for the three-month and six-month periods ended June 30, 2020 and 2019 are as follows:
For the three-month
periods ended June 30 For the six-month
periods ended June 30 (In millions of won) 2020 2019 2020 2019 Current service cost W40,475 48,472 80,949 96,945 Net interest cost (776) 304 (1,552) 608
W39,699 48,776 79,397 97,553
(c) Plan assets as of June 30, 2020 and December 31, 2019 are as follows:
(In millions of won) June 30, 2020 December 31, 2019 Guaranteed deposits in banks W1,537,346 1,604,118
As of June 30, 2020, the Company maintains the plan assets primarily with Mirae Asset Daewoo Co., Ltd., KB Insurance Co., Ltd. andothers.
(d) Remeasurements of the net defined benefit liabilities (assets) included in other comprehensive income (loss) for the three-month andsix-month periods ended June 30, 2020 and 2019 are as follows:
For the three-month
periods ended June 30 For the six-month
periods ended June 30 (In millions of won) 2020 2019 2020 2019 Remeasurements of net defined benefit liabilities W(1,208) (1,935) (3,782) (4,848)
Tax effect 310 (4,328) 972 (3,551)
Remeasurements of net defined benefit liabilities, net of income tax W (898) (6,263) (2,810) (8,399)
123

Table of Contents
13. Provisions and Other Liabilities (a) Changes in provisions for the six-month period ended June 30, 2020 are as follows:
(In millions of won) Warranties (*) Others Total Balance at January 1, 2020 W 228,975 26,381 255,356
Additions (reversal) 88,155 (3,916) 84,239 Usage (108,987) (778) (109,765)
Balance at June 30, 2020 W 208,143 21,687 229,830
Current W 142,067 21,687 163,754 Non-current W 66,076 — 66,076
(*) Product warranties on defective products is normally applicable for 18~36 months from the date of customer’s purchase. The provision is
calculated by using historical and anticipated rates of warranty claims and costs per claim to satisfy the Company’s warranty obligation. (b) Other liabilities as of June 30, 2020 and December 31, 2019 are as follows:
(In millions of won) June 30, 2020 December 31, 2019 Current liabilities
Withholdings W 12,988 13,049 Unearned revenue 13,207 25,012 Security deposits received 6,240 9,310
W 32,435 47,371
Non-current liabilities Long-term accrued expenses W 80,726 76,300 Long-term other accounts payable — 1,062 Long-term unearned revenue 4,502 6,852 Security deposits received 5,070 1,690
W 90,298 85,904
124
Table of Contents
14. Contingencies and Commitments (a) Legal Proceedings
Anti-trust Litigations
Some individual claimants filed “follow-on” damages claims against the Company and other TFT-LCD manufacturers alleging violationsof EU competition law. While the Company continues its vigorous defense of the various pending proceedings described above, as of June30, 2020, the Company cannot reliably estimate the timing and amount of outflows of resources embodying economic benefits relating tothe proceedings.
Solas OLED Ltd. Litigations
In April 2019, Solas OLED Ltd. filed patent infringement actions against the Company and television manufacturers in the UnitedStates District Court for the Western District of Texas as well as the Company and its subsidiary, LG Display Germany GmbH, andtelevision manufacturers in the Mannheim District Court in Germany. As of June 30, 2020, the Company cannot reliably estimate thetiming and amount of outflows of resources embodying economic benefits relating to the proceedings.
Others
The Company is involved in various disputes in addition to the pending proceedings described above. The Company cannot reliablyestimate the timing and amount of outflows of resources embodying economic benefits relating to the disputes.
(b) Commitments
Factoring and securitization of accounts receivable
The Company has agreements with Korea Development Bank and several other banks for accounts receivable sales negotiating facilities ofup to an aggregate of USD 1,110 million (W1,332,777 million) in connection with the Company’s export sales transactions with itssubsidiaries. As of June 30, 2020, there are no short-term borrowings that are outstanding but past due in connection with theseagreements. In connection with all of the contracts in this paragraph, the Company has sold its accounts receivable with recourse.
The Company has credit facility agreements with Shinhan Bank and several other banks pursuant to which the Company could sell itsaccounts receivables up to an aggregate of W688,273 million in connection with its domestic and export sales transactions and, as ofJune 30, 2020, W49,552 million accounts and notes receivable sold were outstanding in connection with the agreement. In connection withthe contracts above, the Company has sold its accounts receivable without recourse.
Letters of credit
As of June 30, 2020, the Company has agreements in relation to the opening of letters of credit up to USD 150 million (W180,105 million)with KEB Hana Bank, USD 50 million (W60,035 million) with Sumitomo Mitsui Banking Corporation, USD 100 million (W120,070million) with Industrial Bank of Korea, USD 100 million (W120,070 million) with Industrial and Commercial Bank of China, USD200 million (W240,140 million) with Shinhan Bank, USD 100 million (W120,070 million) with KB Kookmin Bank, USD 50 million(W60,035 million) with MUFG Bank and USD 200 million (W240,140 million) with the Export-Import Bank of Korea.
125
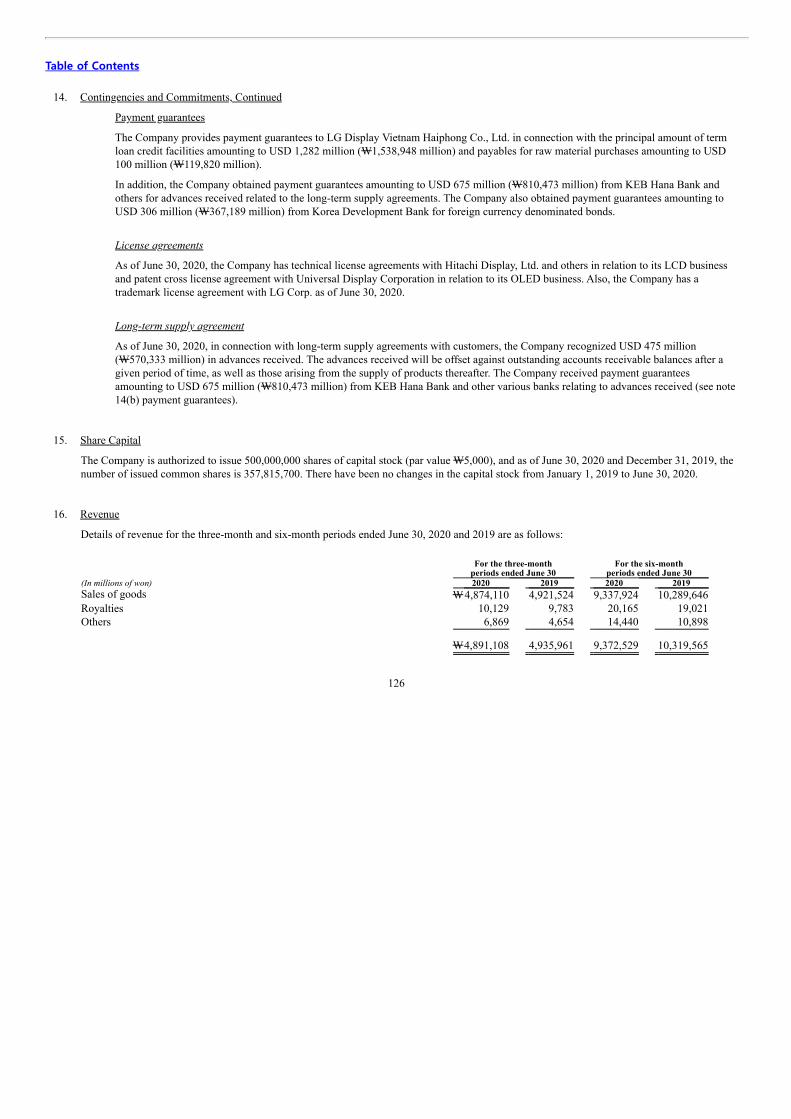
Table of Contents
14. Contingencies and Commitments, Continued
Payment guarantees
The Company provides payment guarantees to LG Display Vietnam Haiphong Co., Ltd. in connection with the principal amount of termloan credit facilities amounting to USD 1,282 million (W1,538,948 million) and payables for raw material purchases amounting to USD100 million (W119,820 million).
In addition, the Company obtained payment guarantees amounting to USD 675 million (W810,473 million) from KEB Hana Bank andothers for advances received related to the long-term supply agreements. The Company also obtained payment guarantees amounting toUSD 306 million (W367,189 million) from Korea Development Bank for foreign currency denominated bonds.
License agreements
As of June 30, 2020, the Company has technical license agreements with Hitachi Display, Ltd. and others in relation to its LCD businessand patent cross license agreement with Universal Display Corporation in relation to its OLED business. Also, the Company has atrademark license agreement with LG Corp. as of June 30, 2020.
Long-term supply agreement
As of June 30, 2020, in connection with long-term supply agreements with customers, the Company recognized USD 475 million(W570,333 million) in advances received. The advances received will be offset against outstanding accounts receivable balances after agiven period of time, as well as those arising from the supply of products thereafter. The Company received payment guaranteesamounting to USD 675 million (W810,473 million) from KEB Hana Bank and other various banks relating to advances received (see note14(b) payment guarantees).
15. Share Capital
The Company is authorized to issue 500,000,000 shares of capital stock (par value W5,000), and as of June 30, 2020 and December 31, 2019, thenumber of issued common shares is 357,815,700. There have been no changes in the capital stock from January 1, 2019 to June 30, 2020.
16. Revenue
Details of revenue for the three-month and six-month periods ended June 30, 2020 and 2019 are as follows:
For the three-month
periods ended June 30 For the six-month
periods ended June 30 (In millions of won) 2020 2019 2020 2019 Sales of goods W4,874,110 4,921,524 9,337,924 10,289,646 Royalties 10,129 9,783 20,165 19,021 Others 6,869 4,654 14,440 10,898
W4,891,108 4,935,961 9,372,529 10,319,565
126

Table of Contents
17. The Nature of Expenses and Others
The classification of expenses by nature for the three-month and six-month periods ended June 30, 2020 and 2019 are as follows:
For the three-month
periods ended June 30 For the six-month
periods ended June 30 (In millions of won) 2020 2019 2020 2019 Changes in inventories W 154,890 70,903 77,706 93,651 Purchases of raw materials, merchandise and others 1,781,935 1,965,852 3,540,109 4,112,732 Depreciation and amortization 633,217 645,827 1,296,487 1,209,059 Outsourcing 1,716,116 1,276,488 3,252,729 2,740,641 Labor 540,820 613,432 1,056,735 1,243,123 Supplies and others 159,473 192,535 284,969 347,850 Utility 152,360 167,197 318,987 343,917 Fees and commissions 90,133 120,849 187,085 251,284 Shipping 13,515 19,635 26,791 38,197 Advertising 26,839 19,969 68,824 34,311 Warranty 33,917 89,410 88,155 175,711 Travel 9,426 23,618 21,048 44,737 Taxes and dues 13,005 14,515 27,155 29,622 Impairment loss on property, plant and equipment 82 5,583 5,576 5,943 Impairment loss on intangible assets 26,164 — 30,511 — Others 131,190 143,113 251,675 287,055
W5,483,082 5,368,926 10,534,542 10,957,833
Total expenses consist of cost of sales, selling, administrative, research and development expenses and other non-operating expenses, excludingforeign exchange differences.
127

Table of Contents
18. Selling and Administrative Expenses
Details of selling and administrative expenses for the three-month and six-month periods ended June 30, 2020 and 2019 are as follows:
For the three-month
periods ended June 30 For the six-month
periods ended June 30 (In millions of won) 2020 2019 2020 2019 Salaries W 47,467 58,418 95,301 116,991 Expenses related to defined benefit plans 6,084 8,374 12,315 16,053 Other employee benefits 10,773 12,437 21,141 27,335 Shipping 8,893 15,319 17,748 29,395 Fees and commissions 31,102 30,860 63,784 68,326 Depreciation 21,944 27,125 43,729 55,439 Taxes and dues 502 740 1,056 1,287 Advertising 26,839 19,969 68,824 34,311 Warranty 33,917 89,410 88,155 175,711 Insurance 1,932 1,516 3,563 2,867 Travel 870 4,698 3,333 8,697 Training 1,859 2,592 2,531 5,354 Others 7,653 9,092 16,430 20,314
W199,835 280,550 437,910 562,080
19. Personnel Expenses
Details of personnel expenses for the three-month and six-month periods ended June 30, 2020 and 2019 are as follows:
For the three-month
periods ended June 30 For the six-month
periods ended June 30 (In millions of won) 2020 2019 2020 2019 Salaries and wages W433,384 536,093 865,257 1,080,246 Other employee benefits 63,170 73,303 127,477 152,080 Contributions to National Pension plan 16,943 18,003 33,970 36,153 Expenses related to defined benefit plans and defined contribution plans 39,983 48,776 79,734 97,570
W553,480 676,175 1,106,438 1,366,049
128

Table of Contents
20. Other Non-operating Income and Other Non-operating Expenses (a) Details of other non-operating income for the three-month and six-month periods ended June 30, 2020 and 2019 are as follows:
For the three-month
periods ended June 30 For the six-month
periods ended June 30 (In millions of won) 2020 2019 2020 2019 Foreign currency gain W120,443 289,070 564,022 414,022 Gain on disposal of property, plant and equipment 7,867 12,863 12,148 27,963 Gain on disposal of intangible assets — — — 552 Reversal of impairment loss on intangible assets 50 — 600 201 Rental income 438 523 848 1,010 Others 1,245 1,861 3,172 1,965
W130,043 304,317 580,790 445,713
(b) Details of other non-operating expenses for the three-month and six-month periods ended June 30, 2020 and 2019 are as follows:
For the three-month
periods ended June 30 For the six-month
periods ended June 30 (In millions of won) 2020 2019 2020 2019 Foreign currency loss W133,325 296,829 509,628 416,513 Other bad debt expense — 10 — 10 Loss on disposal of property, plant and equipment 13,512 6,745 17,886 6,747 Impairment loss on property, plant and equipment 82 5,583 5,576 5,943 Loss on disposal of intangible assets 7 — 7 18 Impairment loss on intangible assets 26,164 — 30,511 — Donations 312 382 318 382 Others 629 5,589 2,738 7,728
W174,031 315,138 566,664 437,341
129

Table of Contents
21. Finance Income and Finance Costs
Finance income and costs recognized in profit and loss for the three-month and six-month periods ended June 30, 2020 and 2019 are as follows:
For the three-month
periods ended June 30 For the six-month
periods ended June 30 (In millions of won) 2020 2019 2020 2019 Finance income
Interest income W 2,235 2,484 6,663 5,269 Dividend income — 11,120 8,239 18,622 Foreign currency gain 59,463 8,894 25,779 14,452 Gain on disposal of investments 8,392 — 8,392 — Gain on transaction of derivatives 5,937 7,782 27,551 13,167 Gain on valuation of derivatives — 27,533 60,917 52,878 Gain on valuation of financial liabilities at fair value through profit or loss 1,844 — 133,579 — Other 1,613 1,298 3,247 2,593
W 79,484 59,111 274,367 106,981
Finance costs Interest expense W 51,748 26,617 107,075 39,689 Foreign currency loss 12,707 38,427 142,709 71,867 Loss on repayment of borrowings 498 — 498 — Loss on sale of trade accounts and notes receivable 937 941 1,205 1,447 Loss on valuation of financial assets at fair value through profit or loss 240 — 1,492 3,960 Loss on valuation of derivatives 39,740 15,542 27,000 15,542 Others 484 1,017 1,105 2,035
W106,354 82,544 281,084 134,540
130
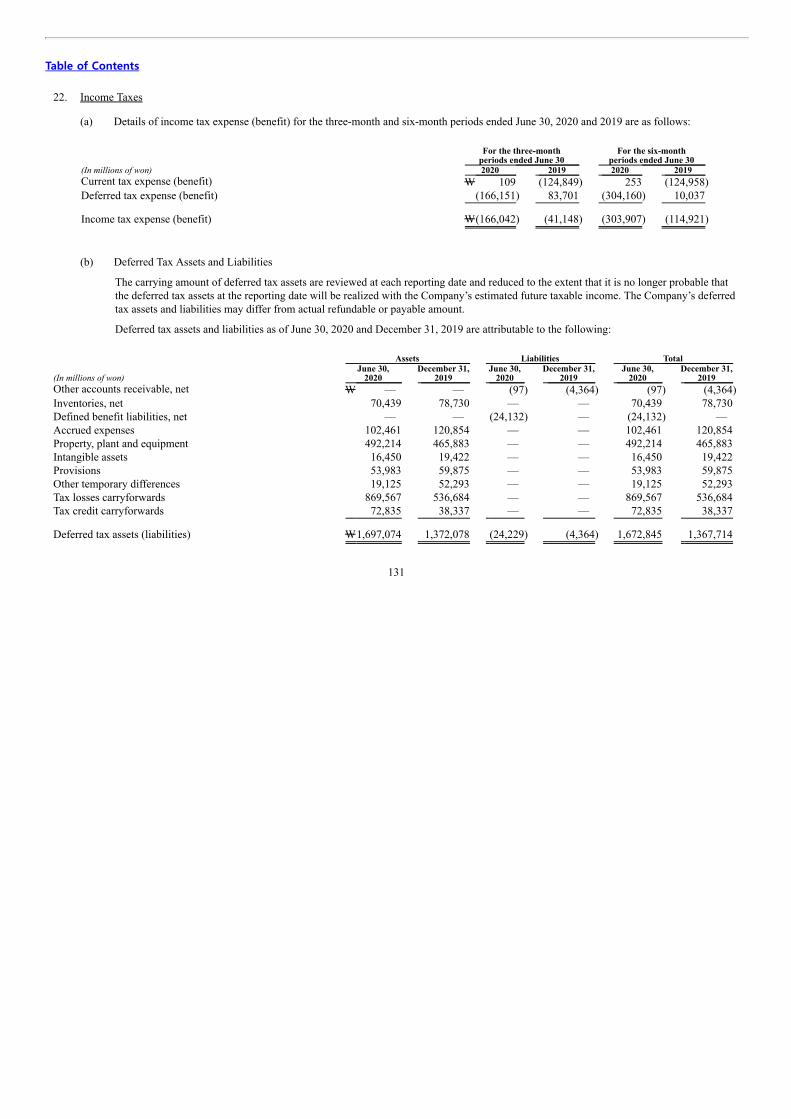
Table of Contents
22. Income Taxes (a) Details of income tax expense (benefit) for the three-month and six-month periods ended June 30, 2020 and 2019 are as follows:
For the three-month
periods ended June 30 For the six-month
periods ended June 30 (In millions of won) 2020 2019 2020 2019 Current tax expense (benefit) W 109 (124,849) 253 (124,958) Deferred tax expense (benefit) (166,151) 83,701 (304,160) 10,037
Income tax expense (benefit) W(166,042) (41,148) (303,907) (114,921)
(b) Deferred Tax Assets and Liabilities
The carrying amount of deferred tax assets are reviewed at each reporting date and reduced to the extent that it is no longer probable thatthe deferred tax assets at the reporting date will be realized with the Company’s estimated future taxable income. The Company’s deferredtax assets and liabilities may differ from actual refundable or payable amount.
Deferred tax assets and liabilities as of June 30, 2020 and December 31, 2019 are attributable to the following: Assets Liabilities Total
(In millions of won) June 30,
2020 December 31,
2019 June 30,
2020 December 31,
2019 June 30,
2020 December 31,
2019 Other accounts receivable, net W — — (97) (4,364) (97) (4,364) Inventories, net 70,439 78,730 — — 70,439 78,730 Defined benefit liabilities, net — — (24,132) — (24,132) — Accrued expenses 102,461 120,854 — — 102,461 120,854 Property, plant and equipment 492,214 465,883 — — 492,214 465,883 Intangible assets 16,450 19,422 — — 16,450 19,422 Provisions 53,983 59,875 — — 53,983 59,875 Other temporary differences 19,125 52,293 — — 19,125 52,293 Tax losses carryforwards 869,567 536,684 — — 869,567 536,684 Tax credit carryforwards 72,835 38,337 — — 72,835 38,337
Deferred tax assets (liabilities) W1,697,074 1,372,078 (24,229) (4,364) 1,672,845 1,367,714
131

Table of Contents
23. Loss Per Share (a) Basic loss per share for the three-month and six-month periods ended June 30, 2020 and 2019 are as follows:
For the three-month
periods ended June 30 For the six-month
periods ended June 30 (In won and number of shares) 2020 2019 2020 2019 Loss for the period W(456,084,231,516) (407,764,101,091) (793,660,585,626) (521,705,305,640) Weighted-average number of common stocks
outstanding 357,815,700 357,815,700 357,815,700 357,815,700
Loss per share W (1,275) (1,140) (2,218) (1,458)
For the three-month and six-month periods ended June 30, 2020 and 2019, there were no events or transactions that resulted in changes inthe number of common stocks used for calculating loss per share.
(b) Diluted loss per share is not different from basic loss per share due to loss for the six-month period ended June 30, 2020. As of June 30,
2020, 40,988,998 shares of potential common stock to be issued from conversion were excluded from the calculation of weighted-averagenumber of common stocks due to antidilution.
24. Financial Risk Management
The Company is exposed to credit risk, liquidity risk and market risks. The Company identifies and analyzes such risks, and controls areimplemented under a risk management system to monitor and manage these risks at below an acceptable level.
(a) Market risk
Market risk is the risk that changes in market prices, such as foreign exchange rates, interest rates and equity prices will affect theCompany’s income or the value of its holdings of financial instruments. The objective of market risk management is to manage and controlmarket risk exposures within acceptable parameters, while optimizing the return.
(i) Currency risk
The Company is exposed to currency risk on sales, purchases and borrowings that are denominated in a currency other than the functionalcurrency of the Company, Korean won (KRW). The currencies in which these transactions primarily are denominated are USD, JPY, etc.
Interest on borrowings is accrued in the currency of the borrowing. Generally, borrowings are denominated in currencies that match thecash flows generated by the underlying operations of the Company, primarily KRW and USD.
In respect of other monetary assets and liabilities denominated in foreign currencies, the Company adopts policies to ensure that its netexposure is kept to an acceptable level by buying or selling foreign currencies at spot rates when necessary to address short-termimbalances. Meanwhile, the Company entered into currency interest rate swap contracts to hedge currency risk with respect to foreigncurrency denominated borrowings and bonds.
132

Table of Contents
24. Financial Risk Management, Continued i) Exposure to currency risk
The Company’s exposure to foreign currency risk based on notional amounts as of June 30, 2020 and December 31, 2019 is as follows:
June 30, 2020 (In millions) USD JPY CNY EUR Cash and cash equivalents 721 75 1 — Trade accounts and notes receivable 2,813 3,688 — — Non-trade receivables 61 83 — — Trade accounts and notes payable (1,847) (7,013) — — Other accounts payable (164) (4,687) — (3) Financial liabilities (2,865) — — —
(1,281) (7,854) 1 (3)
Currency swap contracts 2,085 — — —
Net exposure 804 (7,854) 1 (3)
December 31, 2019 (In millions) USD JPY CNY PLN EUR Cash and cash equivalents 907 3 2 1 2 Trade accounts and notes receivable 2,880 3,974 — — — Non-trade receivables 306 452 — — — Trade accounts and notes payable (1,035) (7,346) — — — Other accounts payable (145) (3,619) — — (9) Financial liabilities (2,900) — — — —
13 (6,536) 2 1 (7)
Currency swap contracts 2,085 — — — —
Net exposure 2,098 (6,536) 2 1 (7)
133

Table of Contents
24. Financial Risk Management, Continued
Average exchange rates applied for the six-month periods ended June 30, 2020 and 2019 and the exchange rates at June 30, 2020 andDecember 31, 2019 are as follows:
Average rate Reporting date spot rate (In won) 2020 2019 June 30, 2020 December 31, 2019 USD W1,206.72 1,145.44 1,200.70 1,157.80 JPY 11.15 10.41 11.16 10.63 CNY 171.36 168.62 169.66 165.74 PLN 301.39 301.47 303.09 304.87 EUR 1,329.43 1,293.61 1,350.19 1,297.43
ii) Sensitivity analysis
A weaker won, as indicated below, against the following currencies which comprise the Company’s assets or liabilities denominated in foreigncurrency as of June 30, 2020 and December 31, 2019, would have increased (decreased) equity and profit or loss by the amounts shown below.This analysis is based on foreign currency exchange rate variances that the Company considers to be reasonably possible as of the end of reportingperiod. The analysis assumes that all other variables, in particular interest rates, would remain constant. The changes in equity and profit or losswould have been as follows:
June 30, 2020 December 31, 2019 (In millions of won) Equity Profit or loss Equity Profit or loss USD (5 percent weakening) W34,994 34,994 88,054 88,054 JPY (5 percent weakening) (3,177) (3,177) (2,520) (2,520) CNY (5 percent weakening) 6 6 12 12 PLN (5 percent weakening) — — 11 11 EUR (5 percent weakening) (147) (147) (329) (329)
A stronger won against the above currencies as of June 30, 2020 and December 31, 2019 would have had the equal but opposite effect on theabove currencies to the amounts shown above, on the basis that all other variables remain constant.
134

Table of Contents
24. Financial Risk Management, Continued (ii) Interest rate risk
Interest rate risk arises principally from the Company’s variable interest-bearing bonds and borrowings. The Company establishes and applies itspolicy to reduce uncertainty arising from fluctuations in the interest rate and to minimize finance cost and manages interest rate risk by monitoringof trends of fluctuations in interest rate and establishing plan for countermeasures. Meanwhile, the Company entered into currency interest rateswap contracts amounting to USD 1,785 million (W2,143,250 million) and interest rate swap contracts amounting to W120,000 million innotional amount to hedge interest rate risk with respect to variable interest bearing borrowings.
i) Profile
The interest rate profile of the Company’s interest-bearing financial instruments as of June 30, 2020 and December 31, 2019 is as follows:
(In millions of won) June 30, 2020 December 31, 2019 Fixed rate instruments
Financial assets W 995,563 1,182,579 Financial liabilities (6,386,909) (6,066,554)
W(5,391,346) (4,883,975)
Variable rate instruments Financial liabilities W(2,262,623) (2,458,789)
ii) Equity and profit or loss sensitivity analysis for variable rate instruments
As of June 30, 2020 and December 31, 2019, a change of 100 basis points in interest rates at the reporting date would have increased (decreased)equity and profit or loss by the amounts shown below for each 12-month period following the reporting dates. This analysis assumes that all othervariables, in particular foreign currency rates, remain constant.
Equity Profit or loss
(In millions of won) 1%p
increase 1%p
decrease 1%p
increase 1%p
decrease June 30, 2020
Variable rate instruments (*) W(2,610) 2,610 (2,610) 2,610
December 31, 2019 Variable rate instruments (*) W(2,847) 2,847 (2,847) 2,847
(*) Financial instruments related to non-hedging interest rate swaps are excluded.
135

Table of Contents
24. Financial Risk Management, Continued (b) Credit risk
Credit risk is the risk of financial loss to the Company if a customer or counterparty to a financial instrument fails to meet its contractualobligations, and arises principally from the Company’s receivables from customers.
The Company’s exposure to credit risk of trade and other receivables is influenced mainly by the individual characteristics of eachcustomer. However, management believes that the default risk of the country in which each customer operates do not have a significantinfluence on credit risk since the majority of the customers are global electronic appliance manufacturers operating in global markets.
The Company establishes credit limits for each customer and each new customer is analyzed quantitatively and qualitatively beforedetermining whether to utilize third party guarantees, insurance or factoring as appropriate.
In relation to the impairment of financial assets subsequent to initial recognition, the Company recognizes the changes in expected creditloss (“ECL”) in profit or loss at each reporting date.
The carrying amount of financial assets represents the maximum credit exposure. The maximum exposures to credit risk as of June 30,2020 and December 31, 2019 are as follows:
(In millions of won) June 30, 2020 December 31, 2019 Financial assets carried at amortized cost
Cash and cash equivalents W 918,639 1,105,245 Deposits in banks 76,863 77,268 Trade accounts and notes receivable, net 3,525,187 3,565,860 Non-trade receivables 113,401 438,659 Accrued income 764 1,281 Deposits 12,266 13,125 Short-term loans 26,134 21,623 Long-term loans 26,187 40,827 Long-term non-trade receivables 16,511 19,899
W4,715,952 5,283,787
Financial assets at fair value through profit or loss Convertible bonds W 1,544 1,544 Derivatives 83,822 49,676
W 85,366 51,220
Financial assets at fair value through other comprehensive income Debt instruments W 72 76
W4,801,390 5,335,083
136

Table of Contents
24. Financial Risk Management, Continued
In addition to the financial assets above, as of June 30, 2020, the Company provides payment guarantees in connection with the principal amountof credit facilities amounting to USD 1,282 million (W1,538,948 million) and payables for raw material purchases amounting to USD 100 million(W119,820 million), for its subsidiary (see note 14).
Trade accounts and notes receivable are insured in order for the Company to manage credit risk if they do not meet the Company’s internal creditratings. Uninsured trade accounts and notes receivables are managed by continuous monitoring of internal credit rating standards established bythe Company and seeking insurance coverage, if necessary.
(c) Liquidity risk
Liquidity risk is the risk that the Company will encounter difficulty in meeting the obligations associated with its financial liabilities thatare settled by delivering cash or other financial assets. The Company’s approach to managing liquidity is to ensure, as far as possible, thatit will always have sufficient liquidity to meet its liabilities when due, under both normal and stressed conditions, without incurringunacceptable losses or risking damage to the Company’s reputation.
The Company has historically been able to satisfy its cash requirements from cash flows from operations and debt and equity financing. Tothe extent that the Company does not generate sufficient cash flows from operations to meet its capital requirements, the Company mayrely on financing activities, such as external long-term borrowings and offerings of debt instruments, equity-linked and other debtsecurities. In addition, the Company maintains a line of credit with various banks.
137

Table of Contents
24. Financial Risk Management, Continued
The following are the contractual maturities of financial liabilities, including estimated interest payments, as of June 30, 2020. Contractual cash flows in
(In millions of won) Carrying
amount Total 6 months
or less 6-12
months 1-2
years 2-5
years More than
5 years Non-derivative financial liabilities
Borrowings W 5,784,567 6,152,948 746,304 1,176,144 1,184,854 2,976,597 69,049 Bonds 2,864,965 3,110,842 186,172 332,939 1,160,673 1,337,286 93,772 Trade accounts and notes payable 3,679,767 3,679,767 2,766,602 913,165 — — — Other accounts payable 740,482 740,482 739,380 1,102 — — — Other accounts payable (enterprise procurement
cards)(*1) 1,791,138 1,810,605 1,170,555 640,050 — — — Payment guarantee(*2) 14,156 1,606,689 114,350 126,770 470,379 895,190 — Security deposits received 11,310 11,310 6,240 — 5,070 — — Lease liabilities 10,193 10,430 6,024 1,977 1,824 605 —
Derivative financial liabilities
Derivatives W 20,821 10,748 5,179 7,264 3,146 (4,841) — W14,917,399 17,133,821 5,740,806 3,199,411 2,825,946 5,204,837 162,821
(*1) Represents the amount of utility expenses and others paid by enterprise procurement cards and the outstanding payables are settled at the end of
the billing cycle. The payments to the card company arises from operating activities of purchasing of goods and services thus the related cash flowis disclosed as operating activities.
(*2) Contractual cash flows of payment guarantee is identical to timing of principal and interest payment and represent the maximum amount that theCompany could be required to pay the guarantee amount.
It is not expected that the cash flows included in the maturity analysis could occur significantly earlier, or at significantly different amounts.
138

Table of Contents
24. Financial Risk Management, Continued (d) Capital management
Management’s policy is to maintain a capital base so as to maintain investor, creditor and market confidence and to sustain futuredevelopment of the business. Liabilities to equity ratio, net borrowings to equity ratio and other financial ratios are used by management toachieve an optimal capital structure. Management also monitors the return on capital as well as the level of dividends to ordinaryshareholders.
(In millions of won) June 30, 2020 December 31, 2019 Total liabilities W16,431,835 16,716,587 Total equity 9,869,622 10,666,093 Cash and deposits in banks (*1) 995,491 1,182,502 Borrowings (including bonds) 8,649,532 8,525,343 Total liabilities to equity ratio 166% 157% Net borrowings to equity ratio (*2) 78% 69%
(*1) Cash and deposits in banks consist of cash and cash equivalents and current deposits in banks.(*2) Net borrowings to equity ratio is calculated by dividing total borrowings (including bonds and excluding lease liabilities) less cash and current
deposits in banks by total equity.
139

Table of Contents
24. Financial Risk Management, Continued (e) Determination of fair value
(i) Measurement of fair value
A number of the Company’s accounting policies and disclosures require the determination of fair value, for both financial andnon-financial assets and liabilities. Fair values have been determined for measurement and/or disclosure purposes based on the followingmethods. When applicable, further information about the assumptions made in determining fair values is disclosed in the notes specific tothat asset or liability.
i) Current assets and liabilities
The carrying amounts approximate their fair value because of the short maturity of these instruments.
ii) Trade receivables and other receivables
The fair value of trade and other receivables is estimated as the present value of future cash flows, discounted at the market rate of interestat the reporting date. This fair value is determined for disclosure purposes. The carrying amounts of current receivables approximate theirfair value.
iii) Investments in equity and debt instruments
The fair value of marketable financial assets at FVTPL and FVOCI is determined by reference to their quoted closing bid price at thereporting date. The fair value of non-marketable instruments is determined using the results of fair value assessment performed by externalvaluation institution and others.
iv) Non-derivative financial liabilities
Fair value, which is determined for disclosure purposes, except for the liabilities at FVTPL, is calculated based on the present value offuture principal and interest cash flows, discounted at the market rate of interest at the reporting date.
140

Table of Contents
24. Financial Risk Management, Continued (ii) Fair values versus carrying amounts
The fair values of financial assets and liabilities, together with the carrying amounts shown in the condensed separate interim statements offinancial position as of June 30, 2020 and December 31, 2019 are as follows:
June 30, 2020 December 31, 2019
(In millions of won) Carrying
amounts Fair
values Carrying
amounts Fair
values Financial assets carried at amortized cost
Cash and cash equivalents W 918,639 (*) 1,105,245 (*) Deposits in banks 76,863 (*) 77,268 (*) Trade accounts and notes receivable 3,525,187 (*) 3,565,860 (*) Non-trade receivables 113,401 (*) 438,659 (*) Accrued income 764 (*) 1,281 (*) Deposits 12,266 (*) 13,125 (*) Short-term loans 26,134 (*) 21,623 (*) Long-term loans 26,187 (*) 40,827 (*) Long-term non-trade receivables 16,511 (*) 19,899 (*)
Financial assets at fair value through profit or loss Equity instruments W 1,504 1,504 2,997 2,997 Convertible bonds 1,544 1,544 1,544 1,544 Derivatives 83,822 83,822 49,676 49,676
Financial assets at fair value through other comprehensive income Debt instruments W 72 72 76 76
Financial liabilities at fair value through profit or loss Derivatives W 20,821 20,821 20,592 20,592 Convertible bonds 762,615 762,615 858,385 858,385
Financial liabilities carried at amortized cost Borrowings W5,784,567 5,806,129 5,374,125 5,438,952 Bonds 2,102,350 2,122,950 2,292,833 2,345,867 Trade accounts and notes payable 3,679,767 (*) 2,682,403 (*) Other accounts payable 2,531,620 (*) 3,329,040 (*) Long-term other accounts payable — (*) 1,062 (*) Payment guarantee liabilities 14,156 (*) 16,502 (*) Security deposits received 11,310 (*) 11,000 (*) Lease liabilities 10,193 (*) 6,557 (*)
(*) Excluded from disclosures as the carrying amount approximates fair value.
141

Table of Contents
24. Financial Risk Management, Continued (iii) Fair values of financial assets and liabilities
i) Fair value hierarchy
Financial instruments carried at fair value are categorized into different levels in a fair value hierarchy based on the inputs used in thevaluation techniques as follows. The levels have been defined as follows:
• Level 1: quoted prices (unadjusted) in active markets for identical assets or liabilities
• Level 2: inputs other than quoted prices included within Level 1 that are observable for the asset or liability, either directly orindirectly
• Level 3: inputs for the asset or liability that are not based on observable market data
ii) Financial instruments measured at fair value
Fair value hierarchy classifications of the financial instruments that are measured at fair value as of June 30, 2020 and December 31, 2019are as follows:
June 30, 2020 (In millions of won) Level 1 Level 2 Level 3 Total Financial assets at fair value through profit or loss
Equity instruments W — — 1,504 1,504 Convertible bonds — — 1,544 1,544 Derivatives — — 83,822 83,822
Financial assets at fair value through other comprehensive income Debt instruments W 72 — — 72
Financial liabilities at fair value through profit or loss Derivatives W — — 20,821 20,821 Convertible bonds 762,615 — — 762,615
December 31, 2019 (In millions of won) Level 1 Level 2 Level 3 Total Financial assets at fair value through profit or loss
Equity instruments W — — 2,997 2,997 Convertible bonds — — 1,544 1,544 Derivatives — — 49,676 49,676
Financial assets at fair value through other comprehensive income Debt instruments W 76 — — 76
Financial liabilities at fair value through profit or loss Derivatives W — — 20,592 20,592 Convertible bonds 858,385 — — 858,385
142
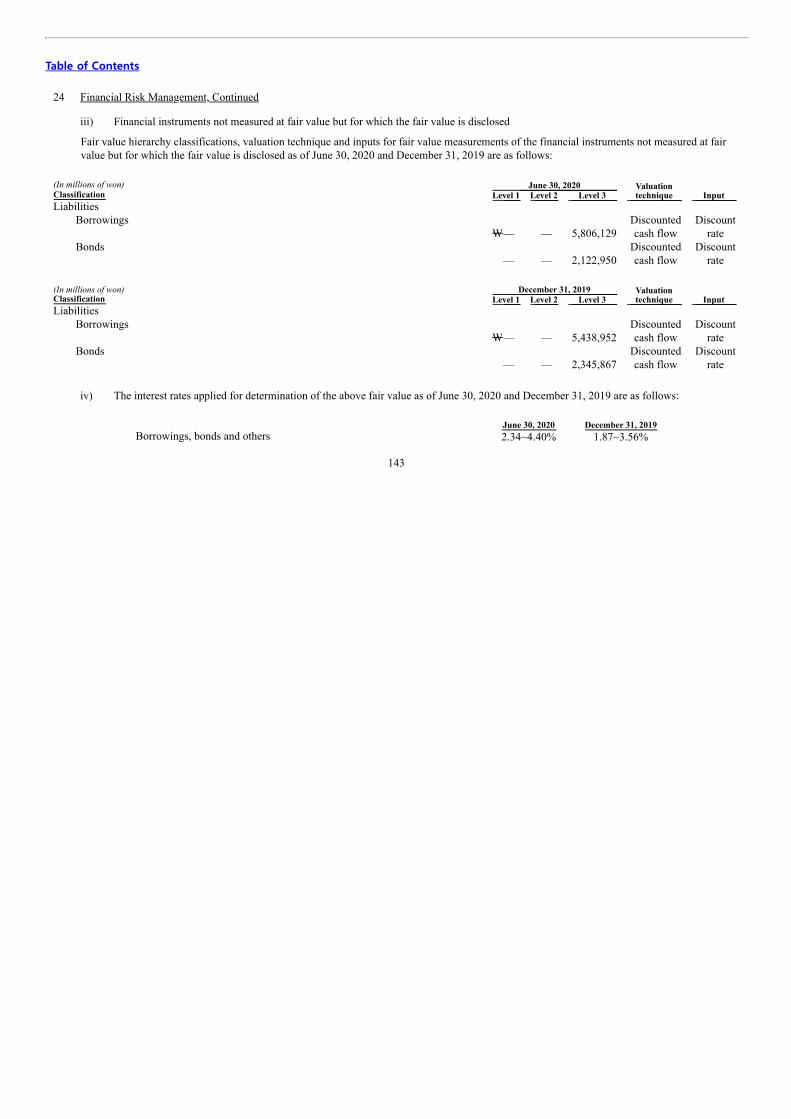
Table of Contents
24 Financial Risk Management, Continued iii) Financial instruments not measured at fair value but for which the fair value is disclosed
Fair value hierarchy classifications, valuation technique and inputs for fair value measurements of the financial instruments not measured at fairvalue but for which the fair value is disclosed as of June 30, 2020 and December 31, 2019 are as follows:
(In millions of won) June 30, 2020
Valuation
technique Input Classification Level 1 Level 2 Level 3 Liabilities
Borrowings W— — 5,806,129
Discounted cash flow
Discount rate
Bonds — — 2,122,950
Discounted cash flow
Discount rate
(In millions of won) December 31, 2019
Valuation
technique Input Classification Level 1 Level 2 Level 3 Liabilities
Borrowings W— — 5,438,952
Discounted cash flow
Discount rate
Bonds — — 2,345,867
Discounted cash flow
Discount rate
iv) The interest rates applied for determination of the above fair value as of June 30, 2020 and December 31, 2019 are as follows:
June 30, 2020 December 31, 2019Borrowings, bonds and others 2.34~4.40% 1.87~3.56%
143

Table of Contents
25. Changes in liabilities arising from financing activities
Changes in liabilities arising from financing activities for the six-month period ended June 30, 2020 are as follows:
January 1,
2020
Non-cash transactions
(In millions of won) Cash flows from
financing activities Reclassification
Gain or loss on foreign currency translation
Effective interest
adjustment Others June 30, 2020 Short-term borrowings W 347,340 321,546 — 11,144 — — 680,030 Current portion of long-term
borrowings and bonds 1,117,218 (616,482) 1,041,586 4,320 357 498 1,547,497 Payment guarantee liabilities 16,502 4,029 — — — (6,375) 14,156 Long-term borrowings 4,319,269 370,000 (741,966) 59,417 — — 4,006,720 Bonds (*) 2,741,516 49,949 (299,620) 46,974 10,045 (133,579) 2,415,285 Lease liabilities 6,557 (6,122) — — — 9,758 10,193
W8,548,402 122,920 — 121,855 10,402 (129,698) 8,673,881
(*) Others include gain on valuation of financial liabilities at fair value through profit or loss amounting to W133,579 million.
144
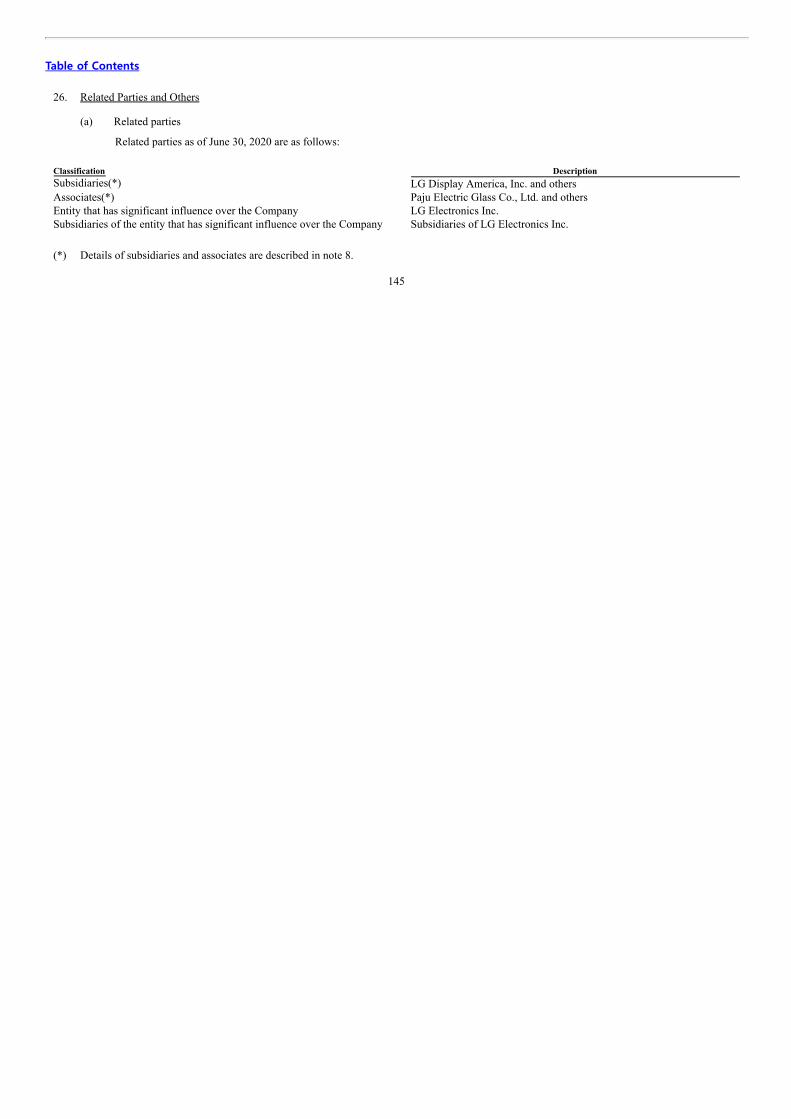
Table of Contents
26. Related Parties and Others (a) Related parties
Related parties as of June 30, 2020 are as follows: Classification DescriptionSubsidiaries(*) LG Display America, Inc. and othersAssociates(*) Paju Electric Glass Co., Ltd. and othersEntity that has significant influence over the Company LG Electronics Inc.Subsidiaries of the entity that has significant influence over the Company Subsidiaries of LG Electronics Inc. (*) Details of subsidiaries and associates are described in note 8.
145

Table of Contents
26. Related Parties and Others, Continued
(b) Significant transactions such as sales of goods and purchases of raw material and outsourcing service and others, which occurred in thenormal course of business with related parties for the three-month and six-month periods ended June 30, 2020 and 2019 are as follows:
For the three-month period ended June 30, 2020 Purchase and others
(In millions of won) Sales
and others Dividend
income
Purchase of raw material and others
Acquisition of property, plant and equipment
Outsourcing fees
Other costs
Subsidiaries LG Display America, Inc. W2,369,574 — — — — — LG Display Japan Co., Ltd. 408,731 — — — — — LG Display Germany GmbH 206,705 — — — — 262 LG Display Taiwan Co., Ltd. 252,031 — — — — 180 LG Display Nanjing Co., Ltd. 2,113 — 784 — 323,387 5,713 LG Display Shanghai Co., Ltd. 316,655 — — — — — LG Display Poland Sp. z o.o. 8,392 — — — — — LG Display Guangzhou Co., Ltd. 6,363 — 2,783 — 483,222 8,423 LG Display Shenzhen Co., Ltd. 176,083 — — — — — LG Display Yantai Co., Ltd. 21 — 2,343 — 208,951 11,260 LG Display (China) Co., Ltd. 961 — 257,934 — — 860 LG Display Singapore Pte. Ltd. 348,619 — — — — 161 L&T Display Technology (Fujian) Limited 91,640 — — — — 179 Nanumnuri Co., Ltd. 52 — — — — 4,694 Global OLED Technology LLC — — — — — 1,393 LG Display Guangzhou Trading Co., Ltd. 216,470 — — — — — LG Display Vietnam Haiphong Co., Ltd. 4,424 — 28,261 — 350,846 5,864 Suzhou Lehui Display Co., Ltd. 63,885 — 96 — — — LG Display High-Tech (China) Co., Ltd. 4,831 — 633 — 248,647 1,876
W4,477,550 — 292,834 — 1,615,053 40,865
146

Table of Contents
26. Related Parties and Others, Continued For the three-month period ended June 30, 2020
Sales
and others Dividend
income
Purchase and others
(In millions of won)
Purchase of raw material and others
Acquisition of property, plant and equipment
Outsourcing fees Other costs
Associates and their subsidiaries WooRee E&L Co., Ltd. W — — 5 — — 14 AVATEC Co., Ltd. — — — — 18,832 217 Paju Electric Glass Co., Ltd. — — 64,097 — — 653 YAS Co., Ltd. — — 1,844 2,302 — 681 Material Science Co., Ltd. — — 9 — — —
W — — 65,955 2,302 18,832 1,565
Entity that has significant influence over the Company LG Electronics Inc. W132,430 — 2,939 13,350 — 36,180
Subsidiaries of the entity that has significant influenceover the Company
LG Electronics India Pvt. Ltd. W 3,013 — — — — — LG Electronics Vietnam Haiphong Co., Ltd. 54,019 — — — — 247 LG Electronics Reynosa S.A. DE C.V. — — — — — 142 LG Electronics Mexicali S.A.DE C.V. 5,992 — — — — 8 LG Electronics RUS, LLC — — — — — 38
147

Table of Contents
26. Related Parties and Others, Continued For the three-month period ended June 30, 2020
Sales
and others Dividend
income
Purchase and others
(In millions of won)
Purchase of raw material and others
Acquisition of property, plant and equipment
Outsourcing fees Other costs
Subsidiaries of the entity that has significant influence overthe Company
LG Electronics Egypt S.A.E. W 15,477 — — — — 56 LG Innotek Co., Ltd. 1,677 — 7 — — 20,366 Qingdao LG Inspur Digital Communication Co., Ltd. 1,588 — — — — — Others 19,295 — 7 — — 2,884
W 101,061 — 14 — — 23,741 W4,711,041 — 361,742 15,652 1,633,885 102,351
148

Table of Contents
26. Related Parties and Others, Continued For the six-month period ended June 30, 2020 Purchase and others
(In millions of won) Sales
and others Dividend
income
Purchase of raw material and others
Acquisition of property, plant and equipment
Outsourcing fees Other costs
Subsidiaries LG Display America, Inc. W4,221,867 — — — — — LG Display Japan Co., Ltd. 871,404 — — — — — LG Display Germany GmbH 536,704 — — — — 5,749 LG Display Taiwan Co., Ltd. 545,340 — — — — 315 LG Display Nanjing Co., Ltd. 3,626 — 1,293 — 629,287 11,863 LG Display Shanghai Co., Ltd. 516,469 — — — — — LG Display Poland Sp. z o.o. 8,392 — — — — — LG Display Guangzhou Co., Ltd. 9,706 — 5,059 — 933,545 13,935 LG Display Shenzhen Co., Ltd. 389,233 — — — — — LG Display Yantai Co., Ltd. 106 — 3,835 — 462,867 19,881 LG Display (China) Co., Ltd. 1,798 — 662,113 — — 1,211 LG Display Singapore Pte. Ltd. 568,689 — — — — 238 L&T Display Technology (Fujian) Limited 159,482 — — — — 277 Nanumnuri Co., Ltd. 104 — — — — 11,415 Global OLED Technology LLC — — — — — 2,668 LG Display Guangzhou Trading Co., Ltd. 443,542 — — — — — LG Display Vietnam Haiphong Co., Ltd. 9,975 — 41,733 — 741,523 13,425 Suzhou Lehui Display Co., Ltd. 94,851 — 147 — — — LG Display High-Tech (China) Co., Ltd. 12,064 — 1,293 — 344,106 2,870
W8,393,352 — 715,473 — 3,111,328 83,847
149

Table of Contents
26. Related Parties and Others, Continued For the six-month period ended June 30, 2020
Sales
and others Dividend
income
Purchase and others
(In millions of won)
Purchase of raw material and others
Acquisition of property, plant and equipment
Outsourcing fees Other costs
Associates and their subsidiaries WooRee E&L Co., Ltd. W — — 30 — — 19 AVATEC Co., Ltd. — 200 — — 33,815 416 Paju Electric Glass Co., Ltd. — 7,739 138,377 — — 1,626 YAS Co., Ltd. — 300 3,328 2,352 — 1,651 Material Science Co., Ltd. — — 69 — — —
W — 8,239 141,804 2,352 33,815 3,712
Entity that has significant influence over the Company LG Electronics Inc. W326,449 — 4,978 32,889 — 65,841
Subsidiaries of the entity that has significant influence over theCompany
LG Electronics India Pvt. Ltd. W 17,005 — — — — 65 LG Electronics Vietnam Haiphong Co., Ltd. 125,920 — — — — 446 LG Electronics Reynosa S.A. DE C.V. — — — — — 672 LG Electronics Mexicali S.A.DE C.V. 16,037 — — — — 17 LG Electronics RUS, LLC — — — — — 155
150

Table of Contents
26. Related Parties and Others, Continued For the six-month period ended June 30, 2020 Purchase and others
(In millions of won) Sales
and others Dividend
income
Purchase of raw material and others
Acquisition of property, plant and equipment
Outsourcing fees Other costs
Subsidiaries of the entity that has significant influence overthe Company
LG Electronics Egypt S.A.E. W 35,889 — — — — 302 LG Innotek Co., Ltd. 2,761 — 653 — — 40,718 Qingdao LG Inspur Digital Communication Co., Ltd. 6,665 — — — — — Others 48,667 — 7 — — 5,593
W 252,944 — 660 — — 47,968 W8,972,745 8,239 862,915 35,241 3,145,143 201,368
151

Table of Contents
26. Related Parties and Others, Continued For the three-month period ended June 30, 2019 Purchase and others
(In millions of won) Sales
and others Dividend
income
Purchase of raw material and others
Acquisition of property, plant and equipment
Outsourcing fees
Other costs
Subsidiaries LG Display America, Inc. W1,785,403 — — — — 5 LG Display Japan Co., Ltd. 636,294 — — — — 5 LG Display Germany GmbH 353,500 — — — — — LG Display Taiwan Co., Ltd. 317,904 — — — — 129 LG Display Nanjing Co., Ltd. 5,241 — 1,413 — 331,183 7,383 LG Display Shanghai Co., Ltd. 290,572 — — — — — LG Display Poland Sp. z o.o. 8 — — — 2,682 1,111 LG Display Guangzhou Co., Ltd. 33,438 — 3,283 — 495,595 10,320 LG Display Shenzhen Co., Ltd. 78,495 — — — — — LG Display Yantai Co., Ltd. 515 — 5,506 — 150,847 3,419 LG Display (China) Co., Ltd. — 11,120 354,838 — — 115 LG Display Singapore Pte. Ltd. 256,076 — — — — 315 L&T Display Technology (Fujian) Limited 98,190 — — — — 579 Nanumnuri Co., Ltd. 48 — — — — 5,557 Global OLED Technology LLC — — — — — 1,459 LG Display Guangzhou Trading Co., Ltd. 378,757 — — — — — LG Display Vietnam Haiphong Co., Ltd. 11,518 — 22,366 — 160,923 6,129 Suzhou Lehui Display Co., Ltd. 35,771 — — — — — LG Display High-Tech (China) Co., Ltd. 7,209 — — — — —
W4,288,939 11,120 387,406 — 1,141,230 36,526
152

Table of Contents
26. Related Parties and Others, Continued For the three-month period ended June 30, 2019
Dividend
income
Purchase and others
(In millions of won) Sales
and others
Purchase of raw material and others
Acquisition of property, plant and equipment
Outsourcing fees Other costs
Associates and their subsidiaries WooRee E&L Co., Ltd. W — — 11 — — — INVENIA Co., Ltd.(*1) — — 419 7,428 — 49 AVATEC Co., Ltd. — — — — 16,062 219 Paju Electric Glass Co., Ltd. — — 89,238 — — 1,138 YAS Co., Ltd. — — 1,923 4,566 — 1,025
W — — 91,591 11,994 16,062 2,431
Entity that has significant influence over the Company LG Electronics Inc. W245,118 — 3,188 71,175 — 36,347
Subsidiaries of the entity that has significant influenceover the Company
LG Electronics India Pvt. Ltd. W 22,571 — — — — 39 LG Electronics Vietnam Haiphong Co., Ltd. 65,828 — — — — 4 LG Electronics Reynosa S.A. DE C.V. — — — — — 265 LG Electronics S.A. (Pty) Ltd 389 — — — — 4 LG Electronics Mexicali S.A.DE C.V. 167 — — — — 23 LG Electronics RUS, LLC 2 — — — — 682
153

Table of Contents
26. Related Parties and Others, Continued For the three-month period ended June 30, 2019
Sales
and others Dividend
income
Purchase and others
(In millions of won)
Purchase of raw material and others
Acquisition of property, plant and equipment
Outsourcing fees Other costs
Subsidiaries of the entity that has significant influence overthe Company
LG Electronics Egypt S.A.E. W 30,613 — — — — — LG Innotek Co., Ltd. 1,037 — 10,194 — — 17,340 LG Hitachi Water Solutions Co., Ltd.(*2) — — — 21,898 — — Inspur LG Digital Mobile Communications Co., Ltd. 18,328 — — — — — Qingdao LG Inspur Digital Communication Co., Ltd. 208 — — — — — HiEntech Co., Ltd.(*2) 18 — — — — 7,080 Others 3,604 — — — — 2,588
W 142,765 — 10,194 21,898 — 28,025 W4,676,822 11,120 492,379 105,067 1,157,292 103,329
(*1) Represents transactions occurred prior to the Company’s disposal of the entire investments.(*2) Represents transactions occurred prior to LG Electronics Inc.’s disposal of the entire investments.
154
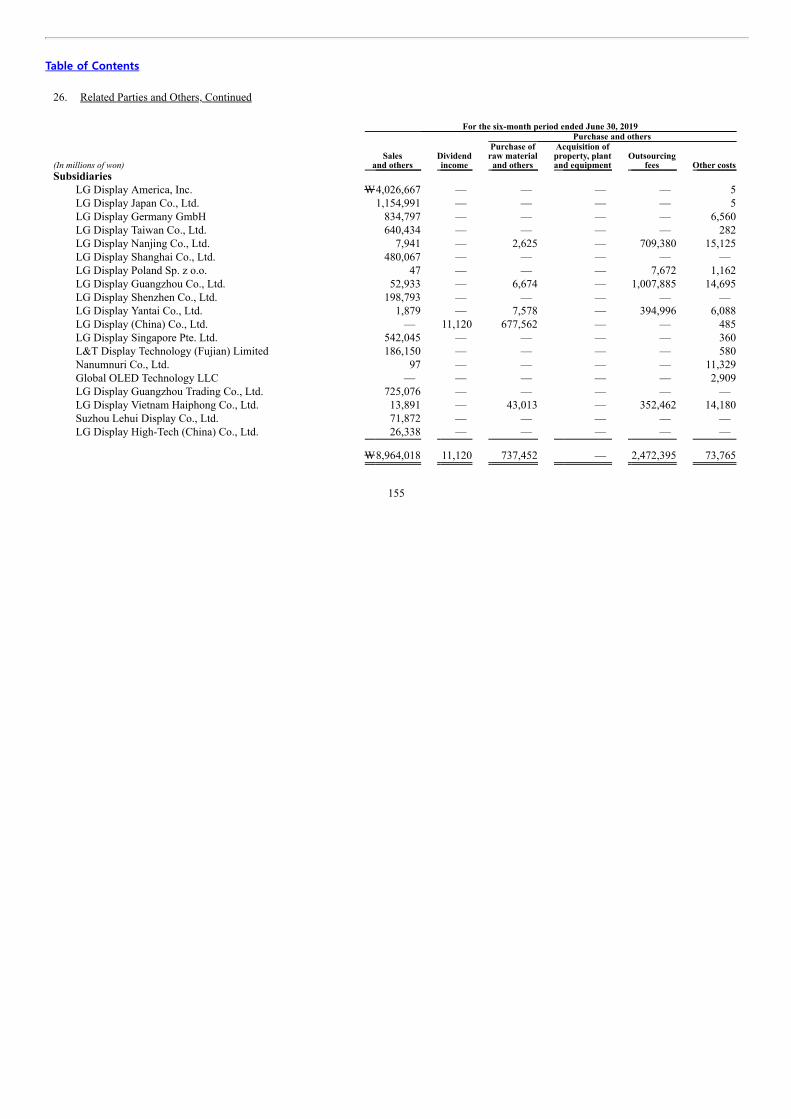
Table of Contents
26. Related Parties and Others, Continued For the six-month period ended June 30, 2019 Purchase and others
(In millions of won) Sales
and others Dividend
income
Purchase of raw material and others
Acquisition of property, plant and equipment
Outsourcing fees Other costs
Subsidiaries LG Display America, Inc. W4,026,667 — — — — 5 LG Display Japan Co., Ltd. 1,154,991 — — — — 5 LG Display Germany GmbH 834,797 — — — — 6,560 LG Display Taiwan Co., Ltd. 640,434 — — — — 282 LG Display Nanjing Co., Ltd. 7,941 — 2,625 — 709,380 15,125 LG Display Shanghai Co., Ltd. 480,067 — — — — — LG Display Poland Sp. z o.o. 47 — — — 7,672 1,162 LG Display Guangzhou Co., Ltd. 52,933 — 6,674 — 1,007,885 14,695 LG Display Shenzhen Co., Ltd. 198,793 — — — — — LG Display Yantai Co., Ltd. 1,879 — 7,578 — 394,996 6,088 LG Display (China) Co., Ltd. — 11,120 677,562 — — 485 LG Display Singapore Pte. Ltd. 542,045 — — — — 360 L&T Display Technology (Fujian) Limited 186,150 — — — — 580 Nanumnuri Co., Ltd. 97 — — — — 11,329 Global OLED Technology LLC — — — — — 2,909 LG Display Guangzhou Trading Co., Ltd. 725,076 — — — — — LG Display Vietnam Haiphong Co., Ltd. 13,891 — 43,013 — 352,462 14,180 Suzhou Lehui Display Co., Ltd. 71,872 — — — — — LG Display High-Tech (China) Co., Ltd. 26,338 — — — — —
W8,964,018 11,120 737,452 — 2,472,395 73,765
155

Table of Contents
26. Related Parties and Others, Continued For the six-month period ended June 30, 2019
Sales
and others Dividend
income
Purchase and others
(In millions of won)
Purchase of raw material and others
Acquisition of property, plant and equipment
Outsourcing fees Other costs
Associates and their subsidiaries WooRee E&L Co., Ltd. W — — 12 — — 1 INVENIA Co., Ltd. (*1) — 180 762 7,682 — 102 AVATEC Co., Ltd. — 265 — — 37,219 420 Paju Electric Glass Co., Ltd. — 6,057 179,854 — — 2,102 YAS Co., Ltd. — 1,000 3,570 11,908 — 1,983 Material Science Co., Ltd. — — — — — 313
W — 7,502 184,198 19,590 37,219 4,921
Entity that has significant influence over the Company LG Electronics Inc. W529,775 — 6,544 132,825 — 64,297
Subsidiaries of the entity that has significant influence over theCompany
LG Electronics India Pvt. Ltd. W 45,435 — — — — 40 LG Electronics Vietnam Haiphong Co., Ltd. 128,611 — — — — 125 LG Electronics Reynosa S.A. DE C.V. — — — — — 523 LG Electronics S.A. (Pty) Ltd 2,117 — — — — 9 LG Electronics Mexicali S.A.DE C.V. 1,266 — — — — 50 LG Electronics RUS, LLC 276 — — — — 1,425
156

Table of Contents
26. Related Parties and Others, Continued For the six-month period ended June 30, 2019
Sales
and others Dividend
income
Purchase and others
(In millions of won)
Purchase of raw material and others
Acquisition of property, plant and equipment
Outsourcing fees Other costs
Subsidiaries of the entity that has significant influence overthe Company
LG Electronics Egypt S.A.E. W 58,526 — — — — — LG Electronics (Kunshan) Computer Co., Ltd. 385 — — — — — LG Innotek Co., Ltd. 4,033 — 23,036 — — 42,071 LG Hitachi Water Solutions Co., Ltd.(*2) — — — 46,259 — — Inspur LG Digital Mobile Communications Co., Ltd. 35,258 — — — — — Qingdao LG Inspur Digital Communication Co., Ltd. 2,796 — — — — — HiEntech Co., Ltd.(*2) 36 — — — — 14,191 Others 9,336 — — — — 5,576
W 288,075 — 23,036 46,259 — 64,010 W9,781,868 18,622 951,230 198,674 2,509,614 206,993
(*1) Represents transactions occurred prior to the Company’s disposal of the entire investments.(*2) Represents transactions occurred prior to LG Electronics Inc.’s disposal of the entire investments.
157

Table of Contents
26. Related Parties and Others, Continued (c) Trade accounts and notes receivable and payable and others as of June 30, 2020 and December 31, 2019 are as follows:
Trade accounts and notes receivable
and others Trade accounts and notes payable
and others (In millions of won) June 30, 2020 December 31, 2019 June 30, 2020 December 31, 2019 Subsidiaries
LG Display America, Inc. W1,041,295 937,409 — — LG Display Japan Co., Ltd. 324,970 274,964 — 5 LG Display Germany GmbH 255,609 382,463 898 2,794 LG Display Taiwan Co., Ltd. 417,378 454,563 43 104 LG Display Nanjing Co., Ltd. 3,371 1,358 25,537 220,327 LG Display Shanghai Co., Ltd. 358,426 172,259 — 3 LG Display Guangzhou Co., Ltd. 12,468 12,465 196,816 313,756 LG Display Guangzhou Trading Co., Ltd. 355,187 351,322 — — LG Display Shenzhen Co., Ltd. 165,023 116,494 5 2 LG Display Yantai Co., Ltd. — — 211,574 149,715 LG Display (China) Co., Ltd. 961 22 121,399 112,053 LG Display Singapore Pte. Ltd. 173,462 298,132 82 21 L&T Display Technology (Fujian) Limited 61,981 46,375 221,462 199,349 Nanumnuri Co., Ltd. — — 1,897 3,866 LG Display Vietnam Haiphong Co., Ltd. 25,522 24,385 413,123 395,429 Suzhou Lehui Display Co., Ltd. 45,894 24,830 93 46 LG Display High-Tech (China) Co., Ltd. 8 1,722 182,243 54,662
W3,241,555 3,098,763 1,375,172 1,452,132
158

Table of Contents
26. Related Parties and Others, Continued
Trade accounts and notes receivable
and others Trade accounts and notes payable
and others (In millions of won) June 30, 2020 December 31, 2019 June 30, 2020 December 31, 2019 Associates and their subsidiaries
WooRee E&L Co., Ltd. W — — 9 8 AVATEC Co., Ltd. — — 4,857 1,029 Paju Electric Glass Co., Ltd. — — 60,610 62,853 YAS Co., Ltd. — — 4,225 4,533 Material Science Co., Ltd. — — — 8
W — — 69,701 68,431
Entity that has significant influence over theCompany
LG Electronics Inc. W 114,748 208,870 41,223 110,784
159

Table of Contents
26. Related Parties and Others, Continued
Trade accounts and notes receivable
and others Trade accounts and notes payable
and others (In millions of won) June 30, 2020 December 31, 2019 June 30, 2020 December 31, 2019 Subsidiaries of the entity that has significant influence
over the Company LG Innotek Co., Ltd. W 4 4 26,343 29,613 LG Electronics Reynosa S.A. DE C.V — — 71 62 LG Electronics India Pvt. Ltd. 604 6,113 — — LG Electronics Vietnam Haiphong Co., Ltd. 47,608 47,740 28 29 LG Electronics RUS, LLC — — 37 67 LG Electronics Egypt S.A.E 3,026 9,432 — — Qingdao LG Inspur Digital Communication Co.,
Ltd. 646 6,456 — — Others 14,358 12,757 1,371 1,768
W 66,246 82,502 27,850 31,539 W3,422,549 3,390,135 1,513,946 1,662,886
160

Table of Contents
26. Related Parties and Others, Continued
Details of significant financing transactions such as loans and collection of loans, which occurred in the normal course of business with relatedparties for the six-month period ended June 30, 2019 are as follows:
(In millions of won) 2019 Associates Loans Collection of loans INVENIA Co., Ltd.(*) W1,000 —
(*) Excluded from related parties due to disposal of equity investments during the year ended December 31, 2019.
161
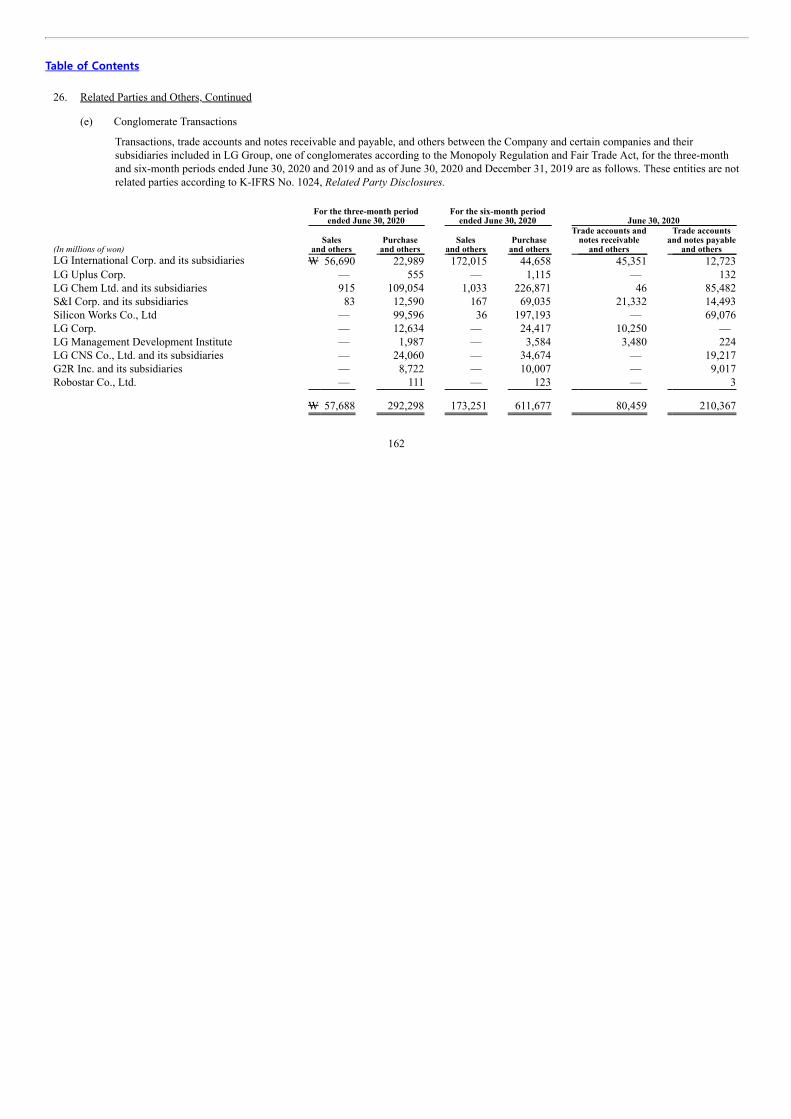
Table of Contents
26. Related Parties and Others, Continued (e) Conglomerate Transactions
Transactions, trade accounts and notes receivable and payable, and others between the Company and certain companies and theirsubsidiaries included in LG Group, one of conglomerates according to the Monopoly Regulation and Fair Trade Act, for the three-monthand six-month periods ended June 30, 2020 and 2019 and as of June 30, 2020 and December 31, 2019 are as follows. These entities are notrelated parties according to K-IFRS No. 1024, Related Party Disclosures.
For the three-month period
ended June 30, 2020 For the six-month period
ended June 30, 2020 June 30, 2020
(In millions of won) Sales
and others Purchase
and others Sales
and others Purchase
and others
Trade accounts and notes receivable
and others
Trade accounts and notes payable
and others LG International Corp. and its subsidiaries W 56,690 22,989 172,015 44,658 45,351 12,723 LG Uplus Corp. — 555 — 1,115 — 132 LG Chem Ltd. and its subsidiaries 915 109,054 1,033 226,871 46 85,482 S&I Corp. and its subsidiaries 83 12,590 167 69,035 21,332 14,493 Silicon Works Co., Ltd — 99,596 36 197,193 — 69,076 LG Corp. — 12,634 — 24,417 10,250 — LG Management Development Institute — 1,987 — 3,584 3,480 224 LG CNS Co., Ltd. and its subsidiaries — 24,060 — 34,674 — 19,217 G2R Inc. and its subsidiaries — 8,722 — 10,007 — 9,017 Robostar Co., Ltd. — 111 — 123 — 3
W 57,688 292,298 173,251 611,677 80,459 210,367
162
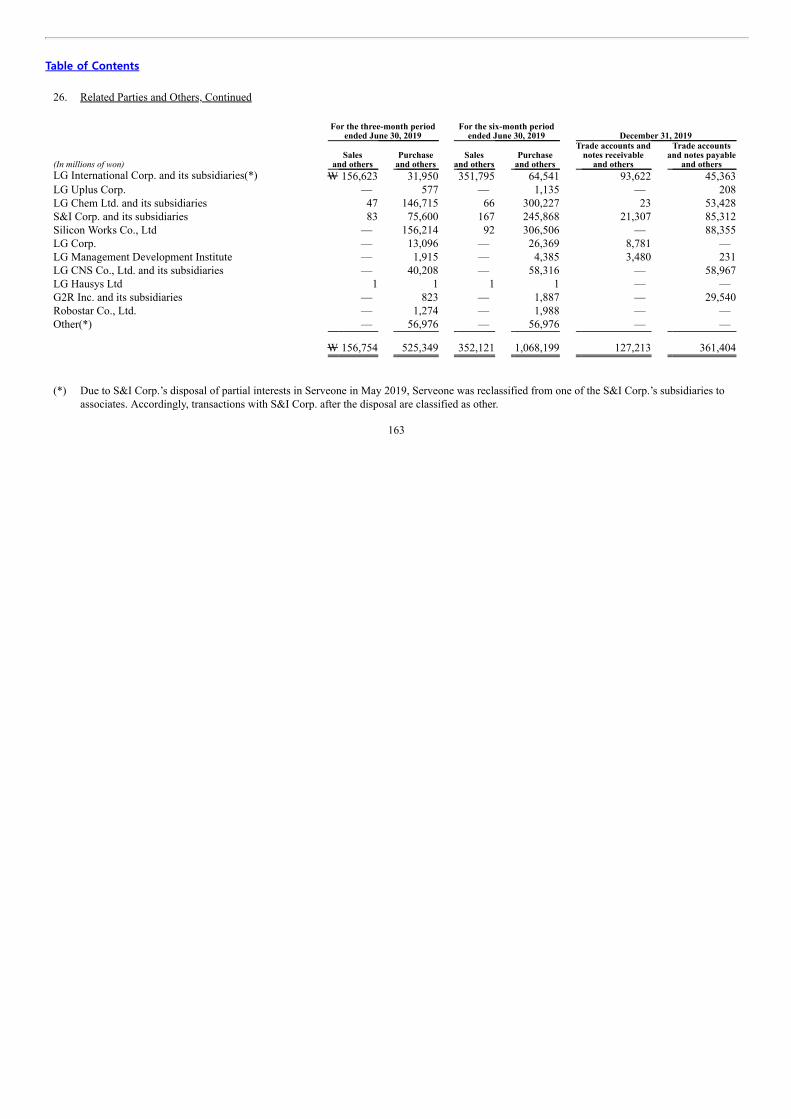
Table of Contents
26. Related Parties and Others, Continued
For the three-month period
ended June 30, 2019 For the six-month period
ended June 30, 2019 December 31, 2019
(In millions of won) Sales
and others Purchase
and others Sales
and others Purchase
and others
Trade accounts and notes receivable
and others
Trade accounts and notes payable
and others LG International Corp. and its subsidiaries(*) W 156,623 31,950 351,795 64,541 93,622 45,363 LG Uplus Corp. — 577 — 1,135 — 208 LG Chem Ltd. and its subsidiaries 47 146,715 66 300,227 23 53,428 S&I Corp. and its subsidiaries 83 75,600 167 245,868 21,307 85,312 Silicon Works Co., Ltd — 156,214 92 306,506 — 88,355 LG Corp. — 13,096 — 26,369 8,781 — LG Management Development Institute — 1,915 — 4,385 3,480 231 LG CNS Co., Ltd. and its subsidiaries — 40,208 — 58,316 — 58,967 LG Hausys Ltd 1 1 1 1 — — G2R Inc. and its subsidiaries — 823 — 1,887 — 29,540 Robostar Co., Ltd. — 1,274 — 1,988 — — Other(*) — 56,976 — 56,976 — —
W 156,754 525,349 352,121 1,068,199 127,213 361,404
(*) Due to S&I Corp.’s disposal of partial interests in Serveone in May 2019, Serveone was reclassified from one of the S&I Corp.’s subsidiaries to
associates. Accordingly, transactions with S&I Corp. after the disposal are classified as other.
163

Table of Contents
26. Related Parties and Others, Continued (f) Key management personnel compensation
Compensation costs of key management for the three-month and six-month periods ended June 30, 2020 and 2019 are as follows:
For the three-month
periods ended June 30 For the six-month
periods ended June 30 (In millions of won) 2020 2019 2020 2019 Short-term benefits W 530 610 1,099 1,501 Expenses related to the defined benefit plan 83 247 179 347
W 613 857 1,278 1,848
Key management refers to the registered directors who have significant control and responsibilities over the Company’s operations andbusiness.
164

Table of Contents
SIGNATURES
Pursuant to the requirements of the Securities Exchange Act of 1934, the registrant has duly caused this report to be signed on its behalf by theundersigned, thereunto duly authorized.
LG Display Co., Ltd.
(Registrant)
Date: August 14, 2020 By: /s/ Heeyeon Kim (Signature)
Name: Heeyeon Kim Title: Head of IR / Vice President
165