Sundaram Finance Ltd. - HDFC securities
12
30-March-2021 Initiating Coverage Sundaram Finance Ltd.
-
Upload
khangminh22 -
Category
Documents
-
view
4 -
download
0
Transcript of Sundaram Finance Ltd. - HDFC securities

Sundaram Finance Ltd.
1
Lorem ipsum dolor sit amet, consectetuer adipiscing elit, sed diam nonummy nibh euismod tincidunt ut laoreet dolore magna aliquam erat volutpat. Ut wisi enim ad minim veniam, quis nostrud exerci tation ullamcorper suscipit lobortis nisl ut aliquip ex ea commodo consequat. Duis autem vel eum iriure dolor in hendrerit in vulputate velit esse molestie consequat, vel illum dolore eu feugiat nulla
Lorem ipsum dolor sit amet, consectetuer adipiscing elit, sed diam nonummy
nibh euismod tincidunt ut laoreet dolore magna aliquam erat volutpat. Ut wisi enim ad minim veniam,
quis nostrud exerci tation ullamcorper suscipit lobortis nisl ut aliquip ex ea commodo consequat. Duis autem vel eum iriure dolor in hendrerit in vulputate velit esse molestie consequat,
vel illum dolore eu feugiat nulla facilisis at vero eros et accumsan et iusto odio dignissim qui blandit praesent luptatum zzril delenit augue duis dolore te feugait nulla facilisi. et iusto odio dignissim qui blandit praesent luptatum zzril delenit augue duis dolore te feugait nulla facilisLorem ipsum dolor sit amet,
Initiating Coverage ICICI Prudential Life Insurance Company Ltd.
30-March-2021
Initiating Coverage
Sundaram Finance Ltd.

Sundaram Finance Ltd.
2
Industry LTP Recommendation Base Case Fair Value Bull Case Fair Value Time Horizon
NBFC Rs.2487 Buy on dips to Rs.2131 and add further at Rs.1880 Rs.2387 Rs.2639 2 quarters
Our Take:
Sundaram Finance Limited (SFL) is a six decade old established player in the vehicle finance business. Consistently high RoAAs and best in class asset quality represents vast experience and deep understanding of the market which the management possesses. Over the years, the company has established strong relationships with its customers- around 60% of the CV borrowers are repeat customers. This also helps company in managing risk profile. The company is an integrated financial services conglomerate with a diversified business model, which helps them hedging against downturns in specific segments and access multiple growth avenues. All three subsidiaries of the companies are performing well. The liquidity position of the company is also sound to tackle current down trend. Despite distressed economic environment the company has posted a decent set of H1FY21 numbers. With monsoon progressing well, the rural economy outlook seems promising. Management has also indicated that the demand is beginning to look up. Consistent dividend payment and no equity dilution demands premium valuation. Valuations & Recommendation: We have envisaged growth of 16% CAGR in NII, 13% CAGR in Pre-Provisioning Operating Profit and 7% in Net Profit over FY20-23E for standalone business. Advance growth is estimated at ~8.4% CAGR over the same period. Asset Quality might deteriorate in FY21E but we feel that the situation will start normalizing from FY22E. The core business of the company is currently trading at 4.5x and 4.0x for FY22E and FY23E P/ABV respectively. We like SFL for its sustainable performance. We have valued SFL on SoTP basis to arrive base case fair value of Rs. 2387 (4.08x FY23E Net worth Adjusted for NPA and subsidiaries cost of investment of FY23E + Rs.549 subsidiaries value after giving 20% holding company discount). Our bull case fair value stands at Rs.2639 (4.64x FY23E Net worth Adjusted for NPA and subsidiaries cost of investment of FY23E + Rs.549 subsidiaries value after giving 20% holding company discount). Investors can buy on dips Buy on dips to Rs.2131 and add further at Rs.1880. The targets are for next six months.
HDFC Scrip Code SUNFINEQNR
BSE Code 590071
NSE Code SUNDARMFIN
Bloomberg SUFIN
CMP Mar 26, 2021 2487
Equity Capital (RsCr) 111
Face Value (Rs) 10
Equity Share O/S (Cr) 11.1
Market Cap (Rs Cr) 27,632
Book Value (Rs) 548
Avg. 52 Wk Volumes 82507
52 Week High 2,883.95
52 Week Low 1,073.00
Share holding Pattern % (Dec, 2020)
Promoters 35.93
Institutions 22.29
Non Institutions 40.96
Total 100.0
Fundamental Research Analyst Nisha Sankhala [email protected]

Sundaram Finance Ltd.
3
Financial Summary (Standalone Financials) Particulars (RsCr) Q3FY21 Q3FY20 YoY-% Q2FY21 QoQ-% FY19 FY20 FY21E FY22E FY23E
NII 398.1 344.3 15.6 347.0 14.7 1171 1334 1534 1784 2096
PPOP 408 312 30.9 351 16.1 1003 1232 1399 1571 1846
PAT 242.1 166.5 45.4 191.9 26.1 1126 724 710 826 1002
EPS (Rs) 101.4 65.2 63.9 74.3 90.2
ABV (Rs) 433.4 456.8 496.9 555.2 627.5
P/E (x)
24.5 38.1 38.9 33.4 27.5
P/ABV (x)
5.7 5.4 5.0 4.5 4.0
RoAA (%) 4.0 2.3 2.1 2.3 2.6
(Source: Company, HDFC sec)
Q3FY21 highlights: The company registered a net profit of Rs. 242 Cr for the quarter ended Dec,2020 as compared to Rs.166.5 Cr last year same quarter. Margins have improved on higher yields on better portfolio mix and reduced cost of funds. Net Interest Income (NII) reported growth of 15.6%/14.7% YoY/QoQ. Assets Under Management (AUM) stood at Rs. 31226Cr compared to Rs. 30,572 Cr same quarter last year. Disbursements stood at Rs 4334Cr, up 8% YoY, though still down 31% YoY on YTD basis at Rs 8437cr. The segments that showed disbursement growth in Q3FY21 were passenger cars(11% YoY), tractor(8% YoY) and Construction equipment (8% YoY) though CV segment remained subdued with decline of 25% YoY. CV disbursements has gradually gone up from 25.1% in Q1FY21 to 29.6% in 9MFY21, though still lower than 52% in 9MFY20. Car disbursements share have also picked up from 25.1% in Q1FY21 to 27.9% in Q3FY21. The Management suggested that overall business could revive to 100% of pre-COVID levels by Q4FY21E. NIM continues to outperform and the company expects this trend to continue. The company’s deposits have seen strong growth in 9MFY21. Deposit stood at Rs.4112 Cr as on Dec,2020, registering a net accretion of Rs.390 Cr. The overall collection efficiency has reached pre-COVID levels. GNPA and NNPA improved from 2.14% and 1.17% in Q2FY21 to 1.59% and 0.83% in Q2FY21. During the quarter, the company has restructured 2.47% of loans outstanding, which were impacted severely by Covid -19. If we don’t take the Supreme Court order in our calculation the GNPA and NNPA would have been at 2.47% and 1.51% respectively in Q3FY21.

Sundaram Finance Ltd.
4
Recent Developments Change in Leadership Mr. Rajiv C Lochan has recently been appointed as MD of Sundaram Finance. He would be taking over from Mr. T.T. Srinivasaraghavan who is retiring from service after 38 years with the company, of which the last 18 years as managing director. Under his leadership, the company had grown its balance sheet from under Rs. 800 crore to over Rs. 30,000 Mr. Lochan brings over 25 years of experience in financial services and was an independent director of Sundaram Finance since 2016 and in June 2020 he was designated as Director-Strategy His past experiences are Partner in Mckinsey & Co., Director in American Express and MD of Kasturi & Sons.
Sundaram AMC acquires Principal AMC Sundaram through its wholly owned subsidiary Sundaram AMC is a significant player in the fund management space with a 25-year track record. It has over Rs 40,000cr in AUM, the majority of which is in equity-oriented schemes. Recently the company had announced the purchase of the asset management businesses of Principal Asset Management for a consideration of Rs. 338Cr. As per the agreement, Sundaram will acquire the schemes managed by Principal and acquires 100% share capital of Principal Asset, Principal Trustee Company and Principal Retirement Advisors. Principal Asset Management has assets under management of Rs 7,447Cr as on December 31, 2020, with about 90% of this in equity-oriented schemes. Improving Vehicle Sales With good monsoon, the rural economy outlook seems promising. According to the management, the passenger car sales are beginning to look up, tractors sales are robust and the Government’s investment in infrastructure sector could provide boost to the construction equipment segment. Rising e-commerce deliveries are also leading to some volumes in the Commercial Vehicle (CV) segment, especially Light Commercial Vehicles (LCVs). The demand for personal vehicles has risen sharply especially because of COVID-19 led social distancing need.
The lockdown had immediately impacted these road transport operators choking their cash flows, thereby creating asset quality challenges for the lenders. But after gradual re-opening of the economy post the lock down, the transportation of goods has started to recover fast. We expect this will revive the demand for commercial vehicles. It has been observed that post transitions to BS-6, CV prices have increased ~10-15%; which will help company in getting higher demand for its products.
Sundaram Finance Ltd.
5
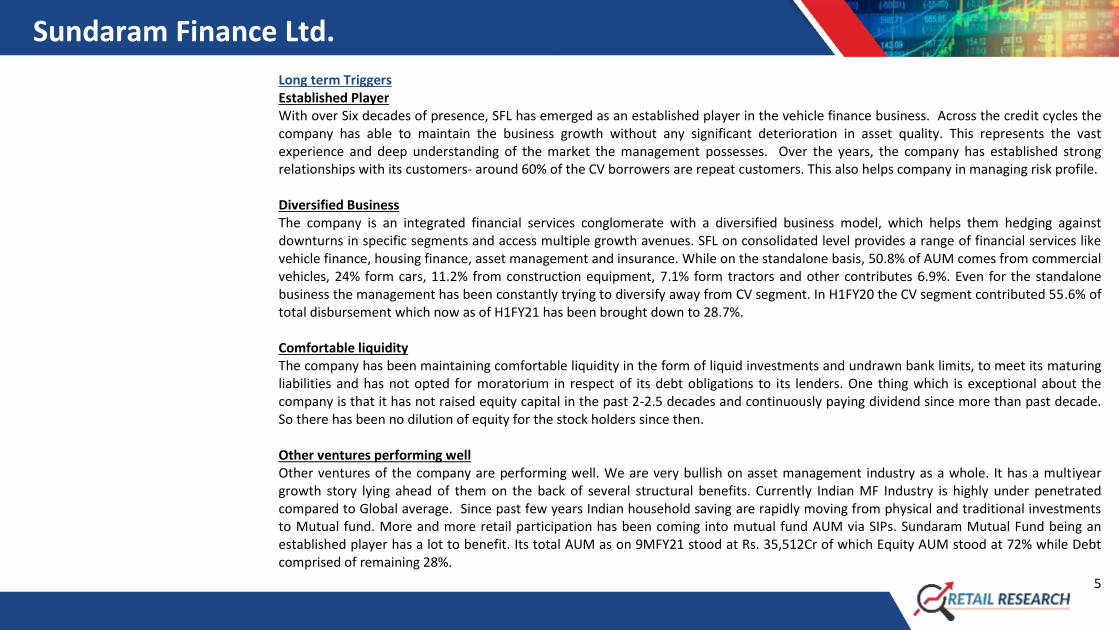
Long term Triggers Established Player With over Six decades of presence, SFL has emerged as an established player in the vehicle finance business. Across the credit cycles the company has able to maintain the business growth without any significant deterioration in asset quality. This represents the vast experience and deep understanding of the market the management possesses. Over the years, the company has established strong relationships with its customers- around 60% of the CV borrowers are repeat customers. This also helps company in managing risk profile. Diversified Business The company is an integrated financial services conglomerate with a diversified business model, which helps them hedging against downturns in specific segments and access multiple growth avenues. SFL on consolidated level provides a range of financial services like vehicle finance, housing finance, asset management and insurance. While on the standalone basis, 50.8% of AUM comes from commercial vehicles, 24% form cars, 11.2% from construction equipment, 7.1% form tractors and other contributes 6.9%. Even for the standalone business the management has been constantly trying to diversify away from CV segment. In H1FY20 the CV segment contributed 55.6% of total disbursement which now as of H1FY21 has been brought down to 28.7%. Comfortable liquidity The company has been maintaining comfortable liquidity in the form of liquid investments and undrawn bank limits, to meet its maturing liabilities and has not opted for moratorium in respect of its debt obligations to its lenders. One thing which is exceptional about the company is that it has not raised equity capital in the past 2-2.5 decades and continuously paying dividend since more than past decade. So there has been no dilution of equity for the stock holders since then. Other ventures performing well Other ventures of the company are performing well. We are very bullish on asset management industry as a whole. It has a multiyear growth story lying ahead of them on the back of several structural benefits. Currently Indian MF Industry is highly under penetrated compared to Global average. Since past few years Indian household saving are rapidly moving from physical and traditional investments to Mutual fund. More and more retail participation has been coming into mutual fund AUM via SIPs. Sundaram Mutual Fund being an established player has a lot to benefit. Its total AUM as on 9MFY21 stood at Rs. 35,512Cr of which Equity AUM stood at 72% while Debt comprised of remaining 28%.

Sundaram Finance Ltd.
6
The company’s focus on prudent underwriting and effective risk management has helped in growing the general insurance business profitably. Royal Sundaram reported a decline of 26% in GWP for 9MFY21 v/s previous year corresponding period, however PAT for the same period stood at 289Cr v/s a loss of 12Cr in 9MFY21. The headwinds in the real estate sector make us cautious about the growth perspective of the Housing finance business of the company. In the last five years the AUM growth in this segment has been at mere 6% CAGR and the asset quality pressure is also quite sizeable. Risk Management Policy The Company has a comprehensive Risk Management Policy in place and has laid down a well-defined risk management framework to identify, assess and monitor risks and strengthen controls to mitigate risks. Established procedures are periodically place before the Risk Management Committee. It is based on a meticulous assessment of risks through proper analysis and understanding of the underlying risks before undertaking any transactions and changing or implementing processes and systems. We believe that the company's long track record in the vehicle financing business, understanding of the target customer segment and robust underwriting practices should help company in this troubled time of asset quality deterioration. What could go wrong?
The company has high regional concentration. Almost 63% of the business comes from the southern states. Any adverse developments in these states could have an adverse effect business conditions.
The competition from banks and other NBFCs are already high while growing competition from digital disruptors poses pricing risk especially form general insurance business.
The switch over to BS 6 norms, effective April 1 2020 could not have come at a worse time for the Indian automotive industry. Commercial vehicle sales were already projected to be muted in light of the economic slowdown and the capacity overhang in the haulage segment. With the COVID-19 imposed lockdown coming into play, this situation has been greatly exacerbated. The revival of the sustained demand will be a key thing to watch out.
The prospects of Commercial Vehicle industry are largely linked to economic activity, so any prolonged slowdown in the economy will impact the sale of Commercial Vehicles and ultimately to the vehicle financing companies both in terms of loan growth and asset quality.

Sundaram Finance Ltd.
7
Prolonged COVID-19 lead slow down might impact negatively to the company on multiple fronts i.e. liquidity, asset quality, loan growth etc.
SFL through its wholly owned subsidiary Sundaram AMC and its JV Company Royal Sundaram General Insurance has been Insurance and the AMC business which is highly competitive business and mainly dominated by top Banks. Inability of the company to scale-up and have a profitable growth can impact earnings.
In the Home Finance business in the prevailing lower interest rate scenario, there can be higher competition from PSU and private sector banks from short to medium term point of view until and unless the corporate capex cycle picks up. This can be detrimental to the interest of HFC’s like Sundaram Housing Finance.
Peer Comparison:
Mcap (Rs bn) CMP P/E P/BV
AUM(Rs. Bn) FY20 NIM FY20 FY20
FY21 FY22 FY23 FY21 FY22 FY23 NNPA ROAA
CIFC 455 555 27.8 27.3 17.9 5.7 4.4 3.6 606 6.2 2.2 1.6
MMFS 255 207 25.9 15 12.9 2.5 1.9 1.6 772 7 6 1.3
SHTF 361 1428 14.7 11.1 9.4 2.4 1.9 1.5 1098 7.5 5.6 2.3
SFL * 276 2487 38.9 33.5 27.6 5 4.5 4 299 4.8 1.7 2.3 *standalone (Source: Company, HDFC sec Research)
Company Profile: Sundaram Finance was established in 1954 by Sri T. S. Santhanam. It was started with the primary objective of financing the purchase of commercial vehicles. But today the company has grown into one of the most trusted financial services groups in India. It has a nation-wide presence of nearly 588 branches, over two lakh depositors and three lakh commercial vehicle and car finance customers. Sundaram Finance Limited (SFL) has a diversified presence in Asset Management, Housing Finance, and General Insurance. Both Sundaram Asset Management Company Ltd and Sundaram Asset Management Company Ltd are wholly-owned subsidiaries of the company. Insurance business is carried through Royal Sundaram and recently Ageas International NV bought 40% stake in the Royal Sundaram General Insurance Company Ltd (RSGI), post which SFL holds 50% stake in the RSGI.

Sundaram Finance Ltd.
8
SOTP Valuation Table
Business segments % stake Metric Valuation (Rs/share)
Base Case Bull Case
CV Finance 100 4.08x/4.64x Net worth Adjusted for NPA and subsidiaries cost of investment of FY23E 1837 2089
Home Finance 100 1.9x FY23E Net Worth 342 342
Sundaram AMC 100 5% of AUM of FY23 171 171
Royal Sundaram General Insurance 50 25x FY23E Net Profit 174 174
Total Value of Subsidiaries 687 687
Less: Holding Co Discount 137 137
Target Price 2387 2639

Sundaram Finance Ltd.
9
AUM Mix (%) Branch Network Funding Mix
NIM Trend NPA Trend RoAA Trend
(Source: Company, HDFC sec)

Sundaram Finance Ltd.
10
Financials
Income Statement (Standalone Financials)
Balance Sheet
(Rs Cr) FY19 FY20 FY21E FY22E FY23E
(Rs Cr) FY19 FY20 FY21E FY22E FY23E
Interest Income 2937.9 3406.4 3407.4 3790.9 4261.6
Share Capital 111.1 111.1 111.1 111.1 111.1
Interest Expenses 1766.5 2072.0 1873.1 2006.9 2165.6
Reserves & Surplus 4932.7 5436.3 5979.8 6616.7 7407.6
Net Interest Income 1171.4 1334.4 1534.4 1783.9 2096.0
Shareholder funds 5043.8 5547.4 6090.9 6727.8 7518.7
Non interest income 404.2 520.5 533.8 576.2 608.8
Borrowings 25005.8 27336.7 28889.5 29101.3 32814.0
Operating Income 1575.6 1854.9 2068.2 2360.2 2704.8
Other Liab & Prov. 599.6 535.5 690.8 759.9 835.9
Operating Expenses 573.0 623.4 669.4 789.2 858.7
SOURCES OF FUNDS 30649.2 33419.6 35671.2 36588.9 41168.6
PPP 1002.6 1231.5 1398.8 1570.9 1846.2
Fixed Assets 293.2 350.5 400.0 475.0 475.0
Prov & Cont 107.3 286.4 425.9 439.7 473.5
intangible assets 11.9 9.1 10.0 10.0 10.0
Profit Before Tax 895.3 945.1 972.9 1131.2 1372.7
Investment 1866.3 3937.7 5461.7 2871.7 3395.0
Tax 361.4 221.2 262.7 305.4 370.6
Cash & Bank Balance 838.6 629.8 622.5 845.7 1015.8
PAT 533.9 723.9 710.2 825.8 1002.0
Advances 27271.5 28044.7 28745.8 31907.9 35736.8
Other Assets 367.7 447.7 431.2 478.6 536.1
TOTAL ASSETS 30649.2 33419.6 35671.2 36588.9 41168.6 (Source: Company, HDFC sec Research )

Sundaram Finance Ltd.
11
Key Ratios:
Key Ratios:
FY19 FY20 FY21E FY22E FY23E FY19 FY20 FY21E FY22E FY23E
Return Ratios Valuation Ratios
Calc. Yield on adv 11.9% 12.3% 12.0% 12.5% 12.6% EPS 101.4 65.2 63.9 74.3 90.2
Calc. Cost of borr 7.1% 7.6% 6.5% 6.9% 6.6% P/E 24.5 38.1 38.9 33.5 27.6
NIM 4.8% 4.8% 5.4% 5.9% 6.2% Adj. BVPS 433.4 456.8 496.9 555.2 627.5
RoAE 24.5% 13.7% 12.2% 12.9% 14.1% P/ABV 5.7 5.4 5 4.5 4
RoAA 4.0% 2.3% 2.1% 2.3% 2.6% Dividend per share 17.5 13 15 17 19
Asset Quality Ratios Dividend Yield (%) 1 0.7 0.8 1 1.1
GNPA 1.3% 2.5% 2.9% 2.6% 2.3% Other Ratios
NNPA 0.8% 1.7% 2.0% 1.8% 1.5% Cost-Income 36.4 33.6 32.4 33.4 31.7
PCR 38.0% 33.0% 33.0% 33.0% 33.0% Leverage 5.4 5.1 4.7 4.7 4.8
Growth Ratios
Advances 23.9% 2.8% 2.5% 11.0% 12.0%
Borrowings 18.5% 9.3% 5.7% 0.7% 12.8%
NII 11.8% 13.9% 15.0% 16.3% 17.5%
PPP 7.2% 22.8% 13.6% 12.3% 17.5%
PAT 99.9% -35.7% -1.9% 16.3% 21.3%
(Source: Company, HDFC sec Research )
One Year Price Chart

Sundaram Finance Ltd.
12
Disclosure:
I, Nisha Sankhala, MBA, author and the names subscribed to this report, hereby certify that all of the views expressed in this research report accurately reflect our views about the subject issuer(s) or securities. HSL has no material adverse disciplinary history as on the date of publication
of this report. We also certify that no part of our compensation was, is, or will be directly or indirectly related to the specific recommendation(s) or view(s) in this report.
Research Analyst or her relative or HDFC Securities Ltd. does not have any financial interest in the subject company. Also Research Analyst or her relative or HDFC Securities Ltd. or its Associate may have beneficial ownership of 1% or more in the subject company at the end of the
month immediately preceding the date of publication of the Research Report. Further Research Analyst or her relative or HDFC Securities Ltd. or its associate does not have any material conflict of interest.
Any holding in stock –No
HDFC Securities Limited (HSL) is a SEBI Registered Research Analyst having registration no. INH000002475.
Disclaimer:
This report has been prepared by HDFC Securities Ltd and is meant for sole use by the recipient and not for circulation. The information and opinions contained herein have been compiled or arrived at, based upon information obtained in good faith from sources believed to be reliable.
Such information has not been independently verified and no guaranty, representation of warranty, express or implied, is made as to its accuracy, completeness or correctness. All such information and opinions are subject to change without notice. This document is for information
purposes only. Descriptions of any company or companies or their securities mentioned herein are not intended to be complete and this document is not, and should not be construed as an offer or solicitation of an offer, to buy or sell any securities or other financial instruments.
This report is not directed to, or intended for display, downloading, printing, reproducing or for distribution to or use by, any person or entity who is a citizen or resident or located in any locality, state, country or other jurisdiction where such distribution, publication, reproduction,
availability or use would be contrary to law or regulation or what would subject HSL or its affiliates to any registration or licensing requirement within such jurisdiction.
If this report is inadvertently sent or has reached any person in such country, especially, United States of America, the same should be ignored and brought to the attention of the sender. This document may not be reproduced, distributed or published in whole or in part, directly or
indirectly, for any purposes or in any manner.
Foreign currencies denominated securities, wherever mentioned, are subject to exchange rate fluctuations, which could have an adverse effect on their value or price, or the income derived from them. In addition, investors in securities such as ADRs, the values of which are influenced
by foreign currencies effectively assume currency risk.
It should not be considered to be taken as an offer to sell or a solicitation to buy any security. HSL may from time to time solicit from, or perform broking, or other services for, any company mentioned in this mail and/or its attachments.
HSL and its affiliated company(ies), their directors and employees may; (a) from time to time, have a long or short position in, and buy or sell the securities of the company(ies) mentioned herein or (b) be engaged in any other transaction involving such securities and earn brokerage or
other compensation or act as a market maker in the financial instruments of the company(ies) discussed herein or act as an advisor or lender/borrower to such company(ies) or may have any other potential conflict of interests with respect to any recommendation and other related
information and opinions.
HSL, its directors, analysts or employees do not take any responsibility, financial or otherwise, of the losses or the damages sustained due to the investments made or any action taken on basis of this report, including but not restricted to, fluctuation in the prices of shares and bonds,
changes in the currency rates, diminution in the NAVs, reduction in the dividend or income, etc.
HSL and other group companies, its directors, associates, employees may have various positions in any of the stocks, securities and financial instruments dealt in the report, or may make sell or purchase or other deals in these securities from time to time or may deal in other securities
of the companies / organizations described in this report.
HSL or its associates might have managed or co-managed public offering of securities for the subject company or might have been mandated by the subject company for any other assignment in the past twelve months.
HSL or its associates might have received any compensation from the companies mentioned in the report during the period preceding twelve months from t date of this report for services in respect of managing or co-managing public offerings, corporate finance, investment banking or
merchant banking, brokerage services or other advisory service in a merger or specific transaction in the normal course of business.
HSL or its analysts did not receive any compensation or other benefits from the companies mentioned in the report or third party in connection with preparation of the research report. Accordingly, neither HSL nor Research Analysts have any material conflict of interest at the time of
publication of this report. Compensation of our Research Analysts is not based on any specific merchant banking, investment banking or brokerage service transactions. HSL may have issued other reports that are inconsistent with and reach different conclusion from the information
presented in this report.
Research entity has not been engaged in market making activity for the subject company. Research analyst has not served as an officer, director or employee of the subject company. We have not received any compensation/benefits from the subject company or third party in
connection with the Research Report.
HDFC securities Limited, I Think Techno Campus, Building - B, "Alpha", Office Floor 8, Near Kanjurmarg Station, Opp. Crompton Greaves, Kanjurmarg (East), Mumbai 400 042 Phone: (022) 3075 3400 Fax: (022) 2496 5066
Compliance Officer: Binkle R. Oza Email: [email protected] Phone: (022) 3045 3600
HDFC Securities Limited, SEBI Reg. No.: NSE, BSE, MSEI, MCX: INZ000186937; AMFI Reg. No. ARN: 13549; PFRDA Reg. No. POP: 11092018; IRDA Corporate Agent License No.: CA0062; SEBI Research Analyst Reg. No.: INH000002475; SEBI Investment Adviser Reg. No.: INA000011538; CIN -
U67120MH2000PLC152193
Mutual Funds Investments are subject to market risk. Please read the offer and scheme related documents carefully before investing.