SIHUAN PHARMACEUTICAL HOLDINGS GROUP LTD. 四環 ...
43
Hong Kong Exchanges and Clearing Limited and The Stock Exchange of Hong Kong Limited take no responsibility for the contents of this announcement, make no representation as to its accuracy or completeness and expressly disclaim any liability whatsoever for any loss howsoever arising from or in reliance upon the whole or any part of the contents of this announcement. SIHUAN PHARMACEUTICAL HOLDINGS GROUP LTD. 四環醫藥控股集團有限公司 (incorporated in Bermuda with limited liability) (Stock Code: 0460) ANNOUNCEMENT OF ANNUAL RESULTS FOR THE YEAR ENDED 31 DECEMBER 2017 Year ended 31 December 2017 2016 Change RMB’000 RMB’000 Key Income Statement Items Revenue 2,745,809 3,185,699 -13.8% Gross profit 1,986,853 2,188,946 -9.2% Operating profit 1,688,256 2,131,156 -20.8% Profit attributable to owners of the Company 1,448,935 1,708,239 -15.2% Key Financial Ratios Gross profit margin 72.4% 68.7% Net profit margin 53.9% 52.7% Earnings per share - Basic (RMB cents) 15.3 16.8 Receivable Turnover (days) 69 63 Inventory Turnover (days) 102 78 Proposed final cash dividend per share (RMB cents) 1.3 3.8 2017 FINANCIAL HIGHLIGHTS • Revenue of the Group decreased by 13.8% from RMB3,185.7 million to RMB2,745.8 million in 2017. • Profit attributable to owners of the Company decreased by 15.2% to RMB1,448.9 million in 2017. • Basic earnings per share decreased by approximately 8.9% over 2016 to approximately RMB15.3 cents in 2017. • The Board recommends the declaration and payment of a final cash dividend of RMB1.3 cents per share which is subject to the approval of the shareholders of the Company (the “ Shareholders ”) at the forthcoming annual general meeting. —1—
-
Upload
khangminh22 -
Category
Documents
-
view
3 -
download
0
Transcript of SIHUAN PHARMACEUTICAL HOLDINGS GROUP LTD. 四環 ...

Hong Kong Exchanges and Clearing Limited and The Stock Exchange of Hong Kong Limited take noresponsibility for the contents of this announcement, make no representation as to its accuracy orcompleteness and expressly disclaim any liability whatsoever for any loss howsoever arising from orin reliance upon the whole or any part of the contents of this announcement.
SIHUAN PHARMACEUTICAL HOLDINGS GROUP LTD.四 環 醫 藥 控 股 集 團 有 限 公 司
(incorporated in Bermuda with limited liability)
(Stock Code: 0460)
ANNOUNCEMENT OF ANNUAL RESULTSFOR THE YEAR ENDED 31 DECEMBER 2017
Year ended31 December
2017 2016 ChangeRMB’000 RMB’000
Key Income Statement ItemsRevenue 2,745,809 3,185,699 -13.8%Gross profit 1,986,853 2,188,946 -9.2%Operating profit 1,688,256 2,131,156 -20.8%Profit attributable to owners of the Company 1,448,935 1,708,239 -15.2%
Key Financial RatiosGross profit margin 72.4% 68.7%Net profit margin 53.9% 52.7%Earnings per share - Basic (RMB cents) 15.3 16.8Receivable Turnover (days) 69 63Inventory Turnover (days) 102 78Proposed final cash dividend per share (RMB cents) 1.3 3.8
2017 FINANCIAL HIGHLIGHTS
• Revenue of the Group decreased by 13.8% from RMB3,185.7 million toRMB2,745.8 million in 2017.
• Profit attributable to owners of the Company decreased by 15.2% to RMB1,448.9million in 2017.
• Basic earnings per share decreased by approximately 8.9% over 2016 toapproximately RMB15.3 cents in 2017.
• The Board recommends the declaration and payment of a final cash dividend ofRMB1.3 cents per share which is subject to the approval of the shareholders ofthe Company (the “Shareholders”) at the forthcoming annual general meeting.
— 1 —

The board (the “Board”) of directors (the “Directors”) of Sihuan Pharmaceutical
Holdings Group Ltd. (“Sihuan Pharmaceutical” or the “Company”) is pleased to
announce the audited consolidated results of the Company and its subsidiaries
(collectively the “Group”) for the year ended 31 December 2017 (the “Year”)
together with the comparative figures for the previous year as follows:
CONSOLIDATED STATEMENT OF FINANCIAL POSITION
As at 31 December2017 2016
Notes RMB’000 RMB’000
AssetsNon-current assetsProperty, plant and equipment 2,453,594 2,104,299Investment properties 17,814 29,103Goodwill 2,843,903 2,247,728Intangible assets 4 1,338,006 578,998Land use rights 702,661 647,769Investments accounted for using the equity
method 16 1,012,091 1,272,851Deferred income tax assets 127,514 35,883Available-for-sale financial assets 6 39,076 20,000Other non-current assets 282,880 56,000
8,817,539 6,992,631
Current assetsInventories 227,970 200,680Trade and other receivables 5 747,141 877,256Available-for-sale financial assets 6 2,967,354 1,709,964Cash and cash equivalents 831,859 2,407,073
4,774,324 5,194,973
Total assets 13,591,863 12,187,604
— 2 —
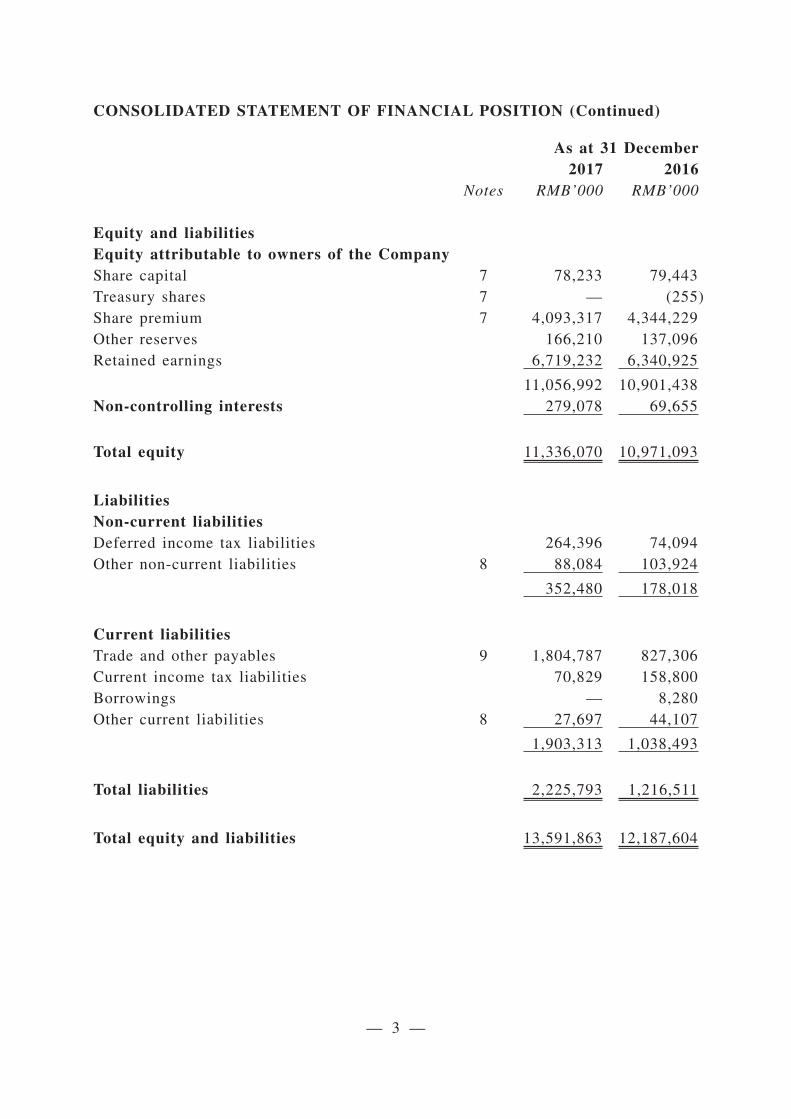
CONSOLIDATED STATEMENT OF FINANCIAL POSITION (Continued)
As at 31 December2017 2016
Notes RMB’000 RMB’000
Equity and liabilitiesEquity attributable to owners of the CompanyShare capital 7 78,233 79,443Treasury shares 7 — (255)Share premium 7 4,093,317 4,344,229Other reserves 166,210 137,096Retained earnings 6,719,232 6,340,925
11,056,992 10,901,438Non-controlling interests 279,078 69,655
Total equity 11,336,070 10,971,093
LiabilitiesNon-current liabilitiesDeferred income tax liabilities 264,396 74,094Other non-current liabilities 8 88,084 103,924
352,480 178,018
Current liabilitiesTrade and other payables 9 1,804,787 827,306Current income tax liabilities 70,829 158,800Borrowings — 8,280Other current liabilities 8 27,697 44,107
1,903,313 1,038,493
Total liabilities 2,225,793 1,216,511
Total equity and liabilities 13,591,863 12,187,604
— 3 —

CONSOLIDATED STATEMENT OF PROFIT OR LOSS AND OTHERCOMPREHENSIVE INCOME
Year ended 31 December2017 2016
Notes RMB’000 RMB’000
Revenue 10 2,745,809 3,185,699Cost of sales 11 (758,956) (996,753)
Gross profit 1,986,853 2,188,946
Other income 10 136,534 166,434Other gains - net 10 313,917 486,289Gain on derecognition of associates — 3,851Gain on derecognition of subsidiaries 125,771 871Distribution costs 11 (227,633) (145,765)Administrative expenses 11 (629,028) (540,467)Other expenses 11 (18,158) (29,003)
Operating profit 1,688,256 2,131,156
Finance expenses (46) (210)
Share of profits of investments accounted forusing the equity method 16 40,865 21,624
Profit before income tax 1,729,075 2,152,570Income tax expense 12 (250,167) (472,732)
Profit for the year 1,478,908 1,679,838
Profit attributable to:Owners of the Company 1,448,935 1,708,239Non-controlling interests 29,973 (28,401)
1,478,908 1,679,838
— 4 —

CONSOLIDATED STATEMENT OF PROFIT OR LOSS AND OTHERCOMPREHENSIVE INCOME (Continued)
Year ended 31 December2017 2016
Notes RMB’000 RMB’000
Profit for the year 1,478,908 1,679,838
Other comprehensive incomeOther comprehensive income to be reclassified to
profit or loss in subsequent periods:Available-for-sale investments:Changes in fair value 93,138 87,260Reclassification adjustments for gains included in
the consolidated statement of profit or loss- Gain on disposal (85,137) (97,676)
Other comprehensive income/(loss) for theyear, net of tax 8,001 (10,416)
Total comprehensive income for the year 1,486,909 1,669,422
Attributable to:Owners of the Company 1,456,936 1,697,823Non-controlling interests 29,973 (28,401)
Total comprehensive income for the year 1,486,909 1,669,422
Earnings per share attributable to ordinaryequity holders of the Company
Basic and diluted earnings per share for profit forthe year 13 15.3 cents 16.8 cents
— 5 —

CONSOLIDATED STATEMENT OF CASH FLOWSYear ended 31 December
2017 2016Notes RMB’000 RMB’000
Cash flows from operating activitiesCash generated from operations 2,359,243 2,613,776Income tax paid (441,653) (595,750)
Net cash flows from operating activities 1,917,590 2,018,026
Cash flows from investing activitiesCapital contribution to associates (110,831) (108,000)Net cash inflow from disposal of subsidiaries 139,646 20,624Net cash inflow from disposal of associates — 75,336Acquisition of subsidiaries (576,114) —Payment for purchase of property, plant and equipment (406,304) (241,116)Purchase of intangible assets (22,165) (38,334)Purchase of land use rights (58,564) (85,143)Purchase of available-for-sale financial assets 6 (12,434,239) (9,513,100)Proceeds from disposal of available-for-sale financial assets 6 11,284,850 9,752,000Proceeds from disposal of property, plant and equipment 229 408Dividend received from a joint venture — 40,000Interest received 86,238 97,676
Net cash flows (used in)/from investing activities (2,097,254) 351
Cash flows from financing activitiesRepayment from borrowings (3,500) —Repurchase and cancellation of shares (251,867) (1,237,041)Acquisition of an additional interest in a subsidiary — (52,662)Non-controlling interests arising on establishing new
subsidiaries 3,907 —Capital contribution by non-controlling shareholders of a
subsidiary — 3,298Dividends paid 14 (1,144,090) (607,059)Interest paid — (210)
Net cash flows used in financing activities (1,395,550) (1,893,674)
Net (decrease)/increase in cash and cash equivalents (1,575,214) 124,703Cash and cash equivalents at beginning of year 2,407,073 2,282,370
Cash and cash equivalents at end of year 831,859 2,407,073
— 6 —

Notes:
1. GENERAL INFORMATION
Sihuan Pharmaceutical Holdings Group Ltd. (the “Company”) is incorporated in Bermuda under
the Bermuda Companies Act as an exempted company.
The Company is an investment holding company. The principal activities of the Company and its
subsidiaries (together, the “Group”) are research and development (“R&D”), and manufacture
and sale of pharmaceutical products in the People’s Republic of China (the “PRC”).
The holding company and the ultimate holding company of the Company is Plenty Gold
Enterprises Limited (“Plenty Gold”), a limited liability company incorporated under the laws of
the British Virgin Islands on 10 March 2004.
The address of the Company’s registered office is Clarendon House, 2 Church Street, P.O. Box
HM 1022, Hamilton HM DX, Bermuda. The address of the principal place of business of the
Group in Hong Kong is Room 4905, Office Tower, Convention Plaza, 1 Harbour Road, Wanchai,
Hong Kong, and the address of the principal place of business in Beijing is 21/F, Building 2,
Zhubang 2000, West Balizhuang, Chaoyang District, Beijing 100025, the PRC.
The Company had its primary listing on The Stock Exchange of Hong Kong Limited (the “Stock
Exchange”) on 28 October 2010.
These consolidated financial statements have been approved for issue by the board of directors
on 26 March 2018.
2. BASIS OF PREPARATION
These consolidated financial statements have been prepared in accordance with International
Financial Reporting Standards (“IFRSs”), which include all IFRSs, International Accounting
Standards (“IASs”) and interpretations, promulgated by the International Accounting Standards
Board (the “IASB”). These financial statements also complied with the disclosure requirements
of the Hong Kong Companies Ordinance, and applicable disclosure provisions of the Rules
Governing the Listing of Securities on the Stock Exchange.
They have been prepared under the historical cost convention, modified by the revaluation of
available-for-sale financial assets, which are carried at fair value.
The preparation of financial statements in conformity with IFRSs requires the use of certain
critical accounting estimates. It also requires management to exercise its judgement in the
process of applying the Group’s accounting policies.
These financial statements are presented in Renminbi (“RMB”) and all values are rounded to the
nearest thousand except when otherwise indicated.
— 7 —

2. BASIS OF PREPARATION (Continued)
Changes in accounting policies and disclosures
The Group has adopted the following revised IFRSs for the first time for the current year’s
financial statements.
Amendments to IAS 7 Disclosure Initiative
Amendments to IAS 12 Recognition of Deferred Tax Assets for Unrealised Losses
Amendments to IFRS 12
included in Annual
Improvements to IFRSs
2014-2016 cycle
Disclosure of Interests in Other Entities: Clarification
of the Scope of IFRS 12
The adoption of the revised IFRSs has had no significant financial effect on these financial
statements.
3. SEGMENT INFORMATION
The chief operating decision-maker has been identified as the executive directors of the board
of the Company. The executive directors of the board of the Company reviews the Group’s
internal reporting in order to assess performance and allocate resources. Management has
determined the operating segments based on these reports.
The executive directors of the board of the Company consider the business from product
perspective. The Group is engaged in only one business segment, being the research and
development, manufacturing and sale of pharmaceutical products in the PRC. During the year
ended 31 December 2017, all sales were from distributors and there were no distributors of the
Group from which the revenue amounted to 10% or more of the Group’s revenue (2016: None).
— 8 —

4. INTANGIBLE ASSETS
Customerrelationship
Deferreddevelopment
costs
Productdevelopment
in progress
Trademarkand
software TotalRMB’000 RMB’000 RMB’000 RMB’000 RMB’000
Cost at 1 January 2016,net of accumulatedamortisation andimpairment 117,188 215,693 229,222 7,234 569,337
Additions — 99,867 25,456 24,667 149,990Amortisation charge (77,293) (30,865) — (3,661) (111,819)Impairment — (969) (27,541) — (28,510)
Net carrying amountat 31 December 2016 39,895 283,726 227,137 28,240 578,998
At 31 December 2016:Cost 433,932 551,689 350,767 48,132 1,384,520Accumulated
amortisation (394,037) (265,931) — (19,892) (679,860)Impairment — (2,032) (123,630) — (125,662)
Net carrying amount 39,895 283,726 227,137 28,240 578,998
Cost at 1 January 2017,net of accumulatedamortisation andimpairment 39,895 283,726 227,137 28,240 578,998
Additions — 13,797 — 2,808 16,605Acquisition of
subsidiaries — 856,228 — 1,130 857,358Amortisation charge (39,895) (69,477) — (5,583) (114,955)
Net carrying amountat 31 December 2017 — 1,084,274 227,137 26,595 1,338,006
At 31 December 2017:Cost 433,932 1,421,714 350,767 52,070 2,258,483Accumulated
amortisation (433,932) (335,408) — (25,475) (794,815)Impairment — (2,032) (123,630) — (125,662)
Net carrying amount — 1,084,274 227,137 26,595 1,338,006
— 9 —

5. TRADE AND OTHER RECEIVABLES
2017 2016
RMB’000 RMB’000
Trade receivables — third parties (i) 167,854 97,455
Notes receivables 290,589 493,731
Prepayments to suppliers 112,594 172,404
Amounts due from associates 107,959 13,500
Amount due from a joint venture — 74,519
Amount due from other related party 9,675 9,673
Other receivables 58,470 15,974
747,141 877,256
(i) Trade and other receivables that were neither past due nor impaired were assessed by
referring to historical information about default rates, reputation, liquidity and other
financial information of the counterparties.
The Group’s credit terms granted to customers range from one month to one year. Trade
receivables that are aged less than one year are not considered impaired. The Group seeks
to maintain strict control over its outstanding receivables. In view of the aforementioned
and the fact that the Group’s trade receivables relate to a large number of diversified
customers, there is no significant concentration of credit risk. The Group does not hold any
collateral or other credit enhancements over its trade receivable balances. Trade receivables
are non-interest-bearing.
An ageing analysis of the trade receivables as at the end of the reporting period, based on
the invoice date and net of provisions, is as follows:
2017 2016
RMB’000 RMB’000
Within 3 months 161,537 93,942
3 to 6 months 2,613 3,211
6 months to 1 year 3,700 3
More than 1 year 4 299
167,854 97,455
As at 31 December 2017 and 2016, no trade receivables were impaired and no allowance
was made. The trade receivables are fully performing.
The maximum exposure to credit risk at the reporting date is the carrying value of every
class of receivables mentioned above.
— 10 —

6. AVAILABLE-FOR-SALE FINANCIAL ASSETS
2017 2016
RMB’000 RMB’000
At 1 January 1,729,964 1,959,280
Additions 12,553,315 9,533,100
Disposals (11,284,850) (9,752,000)
Change in fair value of available-for-sale financial assets 8,001 (10,416)
At 31 December 3,006,430 1,729,964
Available-for-sale financial assets include the following:
As at 31 December
2017 2016
RMB’000 RMB’000
Unquoted equity share, at cost (i) 39,076 20,000
Short-term investments (ii) 2,967,354 1,709,964
3,006,430 1,729,964
(i) The amount represents equity investments in the unquoted equity shares of Jiangsu Antai
Biotechnology Co., Ltd. and Orion TC Holdings Limited. The investments are accounted
for using cost method, because the Group has no representative on the board of directors
of these entities and no significant impact on them.
(ii) The amount representing short-term investments are the bank financial products issued by
certain PRC reputable banking institutions with maturity of less than 6 months,
non-determinable return rate and part of the principle guaranteed. These investments are all
denominated in RMB.
The fair values of these investments are based on an average estimated return rate of 4.5%
(2016:3.9%).
The maximum exposure to credit risk at the reporting date is the carrying values of these
investments.
The credit quality of available-for-sale financial assets that are neither past due nor
impaired can be assessed by reference to the banking institutions internal credit ratings.
None of these financial assets is either past due or impaired.
— 11 —

7. SHARE CAPITAL, TREASURY SHARES AND SHARE PREMIUM
Number ofauthorised
ordinaryshares
Number ofissued andfully paidordinary
sharesShare
capitalTreasury
SharesShares
premium Total
Share‘000 Share‘000 RMB’000 RMB’000 RMB’000 RMB’000
As at 1 January 2016 (HK$0.01per share) 100,000,000 10,364,182 85,610 — 5,574,848 5,660,458
Movement from 1 January 2016 to31 December 2016:
Repurchase and cancellation ofshares — (777,498) (6,167) (255) (1,230,619) (1,237,041)
As at 31 December 2016 (HK$0.01per share) 100,000,000 9,586,684 79,443 (255) 4,344,229 4,423,417
As at 1 January 2017 (HK$0.01per share) 100,000,000 9,586,684 79,443 (255) 4,344,229 4,423,417
Movement from 1 January 2017 to31 December 2017:
Repurchase and cancellation ofshares — (115,602) (1,210) 255 (250,912) (251,867)
As at 31 December 2017
(HK$0.01 per share) 100,000,000 9,471,082 78,233 — 4,093,317 4,171,550
Note:
The Company purchased 115,602,000 of its shares on the Stock Exchange Limited at a total
consideration of HKD282,283,000 (equivalent to RMB251,867,000), which was paid wholly out
of share premium in accordance with section 257 of the Hong Kong Companies Ordinance. As
at 31 December 2017, all purchased shares were cancelled.
— 12 —

8. OTHER LIABILITIES
As at 31 December2017 2016
RMB’000 RMB’000
Deferred revenue for sales of distribution rights 44,222 82,592Deferred government grants 71,559 65,439
115,781 148,031
Less: current portionDeferred revenue for sales of distribution rights 21,300 39,501Deferred government grants 6,397 4,606
27,697 44,107
Non-current portion 88,084 103,924
9. TRADE AND OTHER PAYABLES
As at 31 December2017 2016
RMB’000 RMB’000
Trade payables 34,320 82,662Advances from customers 360,594 235,401Costs of construction and purchase of equipment payables 51,857 68,703Payable for acquisition of a subsidiary 300,000 —Amount due to a joint venture — 69,302Amount due to other related party 83 83Deposit payables 241,225 149,486Accrued reimbursement to distributors 505,833 47,369Other taxes payable 180,749 58,230Salaries payable 52,891 57,074Other payables 77,235 58,996
1,804,787 827,306
— 13 —
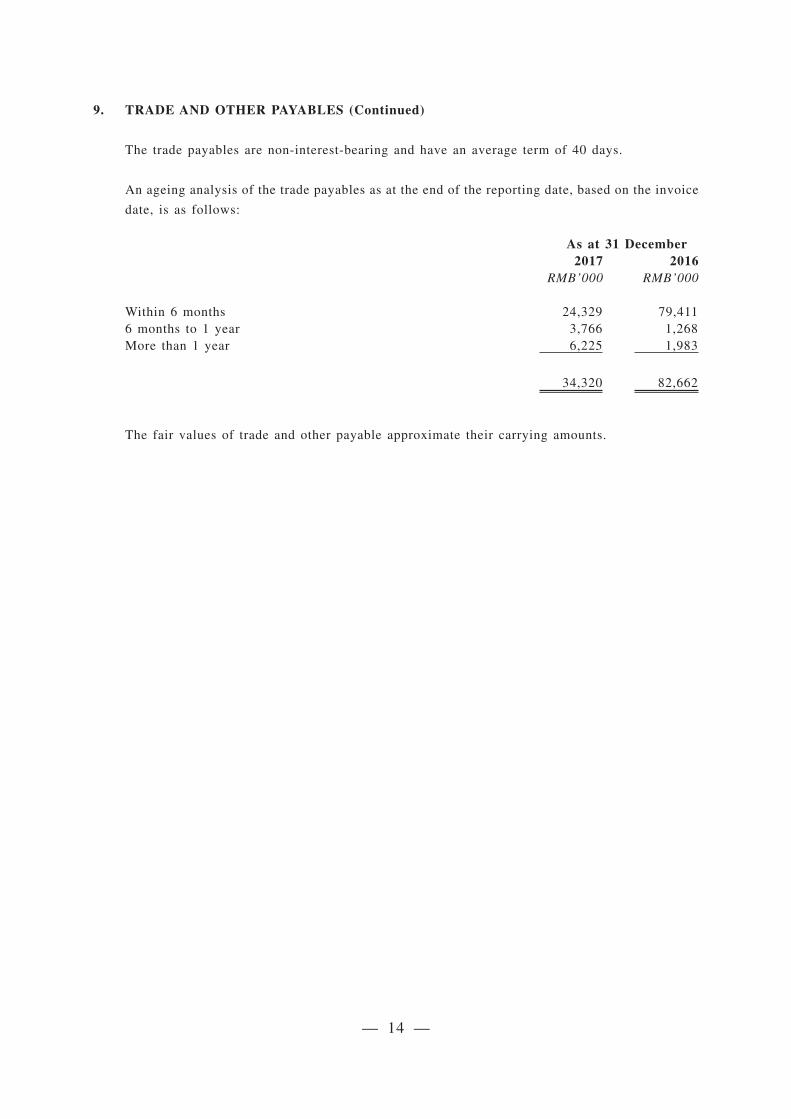
9. TRADE AND OTHER PAYABLES (Continued)
The trade payables are non-interest-bearing and have an average term of 40 days.
An ageing analysis of the trade payables as at the end of the reporting date, based on the invoice
date, is as follows:
As at 31 December2017 2016
RMB’000 RMB’000
Within 6 months 24,329 79,4116 months to 1 year 3,766 1,268More than 1 year 6,225 1,983
34,320 82,662
The fair values of trade and other payable approximate their carrying amounts.
— 14 —

10. REVENUE, OTHER INCOME AND GAINS
Year ended 31 December2017 2016
RMB’000 RMB’000
Revenue:Sales of pharmaceutical products (a) 2,743,803 3,170,469
Revenue from general hospital services 2,006 15,230
2,745,809 3,185,699
Other income:Sales of distribution rights 35,256 51,118
Rental income 3,803 3,785
Interest income 97,475 111,531
136,534 166,434
Other gains — net:Government grants (b) 304,963 374,058
Exchange gain — 79,513
Others 8,954 32,718
313,917 486,289
Notes:
(a) Sales of pharmaceutical products represent the sales value of goods supplied to customers,
net of sales tax, value added tax, sales returns and commercial discounts.
(b) The total government grants represented the subsidies received from the local government
and no specific conditions were attached to them.
— 15 —

11. EXPENSES BY NATURE
Year ended 31 December
2017 2016
RMB’000 RMB’000
Research and development costs
Research expenses 163,932 109,997
Amortisation of deferred development costs 69,477 30,865
233,409 140,862
Raw materials used 401,607 577,408
Changes in inventories of finished goods and work in progress 10,399 61,339
Employee benefit expenses
Wages and salaries 309,967 270,435
Welfares 63,538 46,281
Share-based payments 1,775 (469)
Depreciation of property, plant and equipment 167,779 163,176
Depreciation of investment properties 1,180 1,778
Amortisation of intangible assets excluding the amortisation
of deferred development costs 45,478 80,954
Impairment of intangible assets — 28,510
Tax surcharges 90,238 54,184
Office expenses 43,022 38,197
Travelling expenses 28,649 23,130
Professional services expense 48,258 62,274
Transportation expenses 24,600 24,355
Utilities and property management fee 9,476 9,192
Rental expenses 8,673 19,685
Amortisation of land use rights 13,131 14,244
Advertising and promotional expenses 47,885 14,856
Auditor’s remuneration 5,500 5,500
Entertainment expenses 8,131 6,928
Bank charge 561 493
Others 70,519 68,676
Total cost of sales, distribution costs, administrativeexpenses and other expenses 1,633,775 1,711,988
— 16 —

12. INCOME TAX EXPENSE
The income tax expense of the Group for the years ended 2017 and 2016 is analysed as follows:
Year ended 31 December
2017 2016
RMB’000 RMB’000
Current taxation:
- Provision for the year 326,858 387,721
- Provision for withholding tax 25,001 154,430
Deferred tax (101,692) (69,519)
Income tax expense 250,167 472,732
The tax on the Group’s profit before tax differs from the theoretical amount that would arise from
using the statutory tax rate applicable to profits of the consolidated entities as follows:
Year ended 31 December
2017 2016
RMB’000 RMB’000
Profit before tax 1,729,075 2,152,570
Tax calculated at the PRC applicable statutory tax rate of 25%
(2016: 25%) 432,269 538,142
Tax effects of:
— Utilisation of previously unrecognised tax losses (1,415) (1,634)
— Effect of tax concessions and exemption (201,366) (229,038)
— Expenses not deductible for tax purposes 25,641 27,056
— Profits and losses attributable to joint ventures and
associates (10,216) (5,406)
— Income not subject to tax (31,443) —
— Tax losses for which no deferred income tax asset was
recognised 11,696 35,712
— Effect of withholding tax at 5% on the distributable
profits of the Group’s PRC subsidiaries 25,001 107,900
Income tax expense 250,167 472,732
Bermuda profits tax
The Group is not subject to any taxation in this jurisdiction during the year (2016: Nil).
— 17 —
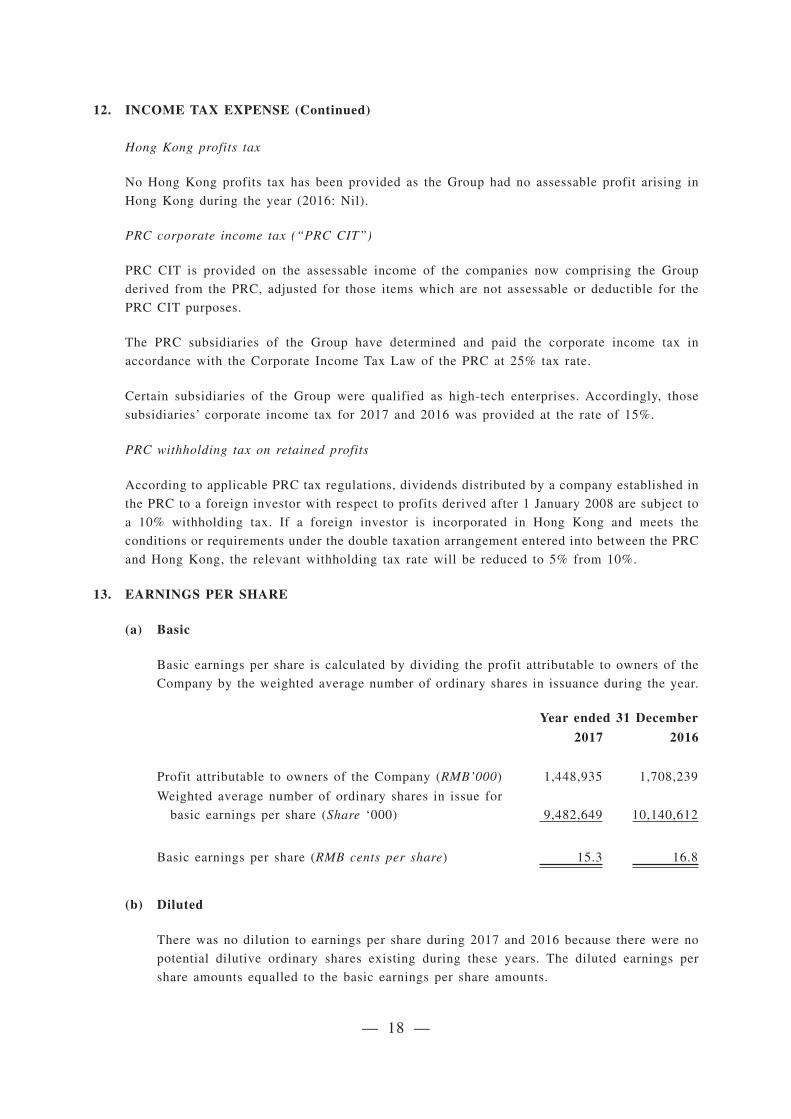
12. INCOME TAX EXPENSE (Continued)
Hong Kong profits tax
No Hong Kong profits tax has been provided as the Group had no assessable profit arising in
Hong Kong during the year (2016: Nil).
PRC corporate income tax (“PRC CIT”)
PRC CIT is provided on the assessable income of the companies now comprising the Group
derived from the PRC, adjusted for those items which are not assessable or deductible for the
PRC CIT purposes.
The PRC subsidiaries of the Group have determined and paid the corporate income tax in
accordance with the Corporate Income Tax Law of the PRC at 25% tax rate.
Certain subsidiaries of the Group were qualified as high-tech enterprises. Accordingly, those
subsidiaries’ corporate income tax for 2017 and 2016 was provided at the rate of 15%.
PRC withholding tax on retained profits
According to applicable PRC tax regulations, dividends distributed by a company established in
the PRC to a foreign investor with respect to profits derived after 1 January 2008 are subject to
a 10% withholding tax. If a foreign investor is incorporated in Hong Kong and meets the
conditions or requirements under the double taxation arrangement entered into between the PRC
and Hong Kong, the relevant withholding tax rate will be reduced to 5% from 10%.
13. EARNINGS PER SHARE
(a) Basic
Basic earnings per share is calculated by dividing the profit attributable to owners of the
Company by the weighted average number of ordinary shares in issuance during the year.
Year ended 31 December
2017 2016
Profit attributable to owners of the Company (RMB’000) 1,448,935 1,708,239
Weighted average number of ordinary shares in issue for
basic earnings per share (Share ‘000) 9,482,649 10,140,612
Basic earnings per share (RMB cents per share) 15.3 16.8
(b) Diluted
There was no dilution to earnings per share during 2017 and 2016 because there were no
potential dilutive ordinary shares existing during these years. The diluted earnings per
share amounts equalled to the basic earnings per share amounts.
— 18 —

14. DIVIDENDS
The dividends paid in 2017 and 2016 were RMB1,051,290,000 and RMB607,059,000,
respectively. A final cash dividend for the year ended 31 December 2017 of RMB123,124,000
was recommended by the Board and subject to approval at the forthcoming annual general
meeting of the Company.
Dividends approved and paid to owners of the Company during the year:
2017 2016
RMB’000 RMB’000
Final 2016 dividend of RMB3.8 (2015: RMB4.5) cents per
ordinary share for the previous year, paid during the year 359,901 463,750
Final 2016 special cash dividend of RMB5.5 (2015: Nil) cents
per ordinary share for the previous year, paid during the
year 520,910 —
Interim dividend of RMB1.8 (2016: RMB1.4) cents per
ordinary share, declared and paid during the year 170,479 143,309
1,051,290 607,059
Dividends proposed by the Company during the year:
Proposed final cash dividend of RMB1.3 (2016: RMB3.8)
cents per ordinary share 123,124 360,243
Proposed special cash dividend (2016: RMB5.5 cents per
ordinary share) — 521,405
123,124 881,648
15. COMMITMENTS
(a) Capital commitments
Capital expenditure contracted for but not yet provided at the end of the reporting period
is as follows:
As at 31 December
2017 2016
RMB’000 RMB’000
Property, plant and equipment 148,135 219,791
Intangible assets - product development in progress 73,875 50,782
222,010 270,573
— 19 —

15. COMMITMENTS (Continued)
(b) Operating lease commitments
The Group leases various office premises under non-cancellable operating leaseagreements. The lease terms are between 1 and 5 years and the majority of lease agreementsare renewable at the end of the lease period at market rate.
The future aggregate minimum lease payments under non-cancellable operating leases areas follows:
As at 31 December2017 2016
RMB’000 RMB’000
Within 1 year 1,460 15,379Between 2 and 5 years 654 18,180More than 5 years — 98,508
2,114 132,067
16. INVESTMENTS ACCOUNTED FOR USING THE EQUITY METHOD
2017 2016RMB’000 RMB’000
Opening balance at 1 January 1,272,851 1,189,118Addition of associates (i) 90,832 108,030Capital contributions to an existing associate (ii) 19,999 65,564Derecognition of associates (19,076) (71,485)Derecognition of a joint venture (393,380) —Share of post-tax profit of associates and a joint venture 40,865 21,624Dividend from Jilin Sichang Pharmaceutical Co., Ltd. (“Jilin
Sichang”) — (40,000)
Closing balance at 31 December 1,012,091 1,272,851
(i) In September 2017, the Group acquired a 19.99% equity interest in Pharmadax (Foshan)
Co., Ltd. from PharmaDax (Hong Kong) Limited at a consideration of RMB80,000,000.
In July 2017, the Group subscribed a 18.57% equity interest in Medifood International SA
and paid EUR742,856 (equivalent to RMB5,832,553) by cash to partners of Medifood
International SA.
(ii) In May 2017, the Group recognised an additional investment in an existing associate,
Shanghai Lide Biotech Co., Ltd. (“Shanghai Lide”). The capital was injected to Shanghai
Lide by cash at the end of June 2017, and the legal and substance modification procedures
was completed in 2017.
— 20 —

MANAGEMENT DISCUSSION AND ANALYSIS
A. BUSINESS REVIEW
In 2017, the Chinese government took further steps to reform the country’shealthcare services, medical insurance and pharmaceuticals (三醫聯動) , throughthe implementation of a raft of initiatives such as the Two-invoice System,regulation on drug prescription, mandatory bioequivalent tests, and tighteningcontrol of hospital expenditure. The Group’s sales performance was negativelyimpacted. Meanwhile, policies such as Marketing Authorization Holder (MAH),improvement of the evaluation and approval system and encouragement of druginnovation are expected to enhance the structure and standard of the country’sR&D system. The changes have presented challenges and brought about a waveof industry consolidation, while creating supply-and-demand imbalances andimmense growth potentials for quality corporations.
In view of that, the Group focused on building a stronger operational foundationfor sustainable development in the year 2017. The Group implemented a seriesof internal adjustments with the aim to “strengthen R&D capabilities, optimizeproduct resources and accelerate market expansion”. With these efforts, theGroup mitigated policy impacts and strengthened its fundamentals, dedicated totransforming the challenges into opportunities.
Strengthen R&D capabilities
1. Established clear innovative drug pipeline
The Group increased its investment in R&D and allocated more resources intherapeutic areas of major unmet clinical needs, such as oncology,immuno-oncology, diabetes and non-alcoholic steatohepatitis (“NASH”). Bydoing so, the Group successfully accelerated the progress of multiple innovativedrug projects and established a clear R&D pipeline. Two of its major projects,Birociclib and Janagliflozin, are expected to enter Phase III clinical trial in thesecond half of 2019 and submit New Drug Application (“NDA”) in 2021. Inaddition, there is one ongoing insulin analogue project currently in IND stage.
In addition, the Group established the United States (“U.S.”) Innovative DrugResearch and Development Centre (“U.S. R&D Centre”) in the San FranciscoBay Area, which is an important milestone for entering the high-end biologicpharmaceutical field. It will help promote internationalization of the Group’sinnovative drugs and accelerate their marketization in China, throughsimultaneous applications to U.S. Food and Drug Administration (“U.S. FDA”)and the China Food and Drug Administration (“CFDA”).
— 21 —

2. Sound generic drug development
The Group pushed forward development of key projects after assessing theircompetitive landscape and clinical demand. A number of new products arescheduled to be launched in the coming few years. A few oral solid dosageproducts were selected to conduct bioequivalence test and have achieved soundprogress, targeting to become the first or among the first two products to pass thetest.
Optimize product resources
3. Cooperation with international pharmaceutical companies for betterproduct portfolio
The Group continued its efforts in international collaboration and established ajoint venture with Austria-based pharmaceutical company Croma-Pharma GmbH(“Croma Pharma”), and thus extended into China’s aesthetic medicine marketwhich has been growing at a rate of over 20% annually. The joint venture’s firstproduct Princess� VOLUME dermal filler received CFDA approval and hascommenced sales. The Group has begun clinical trials for other aestheticmedicine products. Further product diversification is expected in the near future.
4. Continued to seek M&A opportunities amid industry consolidation
The Group acquired 100% equity interest in Ambest Pharmaceutical (China) Co.Ltd, (弘和製藥(中國)有限公司) (“Ambest Pharmaceutical (China)”) atRMB1.1 billion (the “Share Aquisition”). The Group currently holds drugproduction approvals of Monoammonium Glycyrrhizinate and Cysteine andSodium Chloride Injection (甘草酸單銨半胱氨酸氯化鈉注射液) with the brandname “Huineng (回能)”, and Floium Ginkgo Extract and Tertram EthypyrazineSodium Chloride Injection (杏芎氯化鈉注射液) with “Mainuokang (邁諾康)” asthe brand name. Both products have been launched in most provinces andmunicipalities in China and their sales have shortly reached considerable scale.
5. Strengthened evidence-based research to prolong product life span
The Group conducted evidence-based research to reinforce the clinical efficacy,safety and indications of its major products (such as Kelinao, Oudimei,Roxatidine, Yuanzhijiu etc.), of which the results have been published. TheGroup promoted inclusion of its major products in official clinical guidelines,expert consensus, and interpretation of clinical pathways, successfully listed allmajor products in county level interpretation of clinical pathways andinterpretation of clinical pathway and therapeutic drugs. The Group has alsostarted the re-evaluation research of its exclusive and major products, includingKelinao.
— 22 —

Tapping unexplored markets
6. Accelerated expansion in lower-end markets
In view of the government’s promotion of a hierarchical healthcare system to
direct resources to primary healthcare institutions, the Group concentrated its
marketing efforts on the expansion in lower-end markets while consolidating its
position in high-end markets. The Group focused on small- and medium-sized
hospitals in lower-tier cities and community-level healthcare institutions.
According to data from IMS Health Incorporated (“IMS”) for the fourth quarter
of 2017, Sihuan Pharmaceutical ranked sixth in the county market development
with its purchase amount reaching RMB3.2 billion, with a year-on-year growth
of 3.6%, presenting higher growth than other domestic companies.
7. Strengthened academic promotions to enhance marketing capabilities
The Group continued to step up its national academic promotions, resulting in
improved market recognition and coverage. Its growth stage products achieved
satisfactory growth, attributable to expansion into extended markets through
winning tenders and being listed in more provincial reimbursement drug list
(“RDL”). Tender price of major products such as Oudimei, Kelinao and
Yuanzhijiu remained stable. The Group has raised the expertise of the sales team
by providing systematic trainings to its salespersons and distributors. The Group
also further unlock potential of its products by market segmentation, i.e.
assigning specific strategies and targets for products in different stages.
Sales Performance
With the aforementioned strategies, along with the Group’s solid foundation in
the cardio-cerebral vascular (“CCV”) prescription drug and hospital market in
China, Sihuan Pharmaceutical combated the unfavorable policies and minimized
their impacts.
The Group recorded revenue of approximately RMB2,745.8 million in 2017,
representing a year-on-year decrease of 13.8%. Profit attributable to owners of
the Company was RMB1,448.9 million, representing a year-on-year decrease of
15.2%. Net profit margin was 53.9%.
— 23 —

According to data from IMS, the Group remained the largest CCV drug
manufacturer in China’s prescription drug market with a market share of 10.6%
in terms of hospital purchases. Moreover, the Group was the sixth largest
pharmaceutical company in China’s entire hospital market with a market share
of 1.8%
CCV products
During 2017, revenue contributed by CCV drugs decreased 14.1% year-on-year
to RMB2,582.9 million, accounting for 94.1% of the Group’s total revenue,
caused by tightening control of hospital budget.
Revenue of Mainuokang, a growth stage product, surged to RMB65.8 million,
accounting for 2.4% of the Group’s total revenue. The product has been included
in 11 provincial RDLs as compared to 9 last year, and has won tenders in a total
of 18 provinces. Oudimei’s revenue reduced by 15.9% year-on-year to
RMB686.9 million, accounting for 25% of the Group’s total revenue.
Yuanzhijiu’s revenue dropped 5.6% to RMB463.9 million, accounting for 16.9%
of the Group’s total revenue.
Combined revenue of Kelinao and Anjieli (Cinepazide Maleate) was RMB390.0
million, accounting for 14.2% of the Group’s total revenue. Bejing Sihuan
Pharmaceutical Co., Ltd. (“Beijing Sihuan”) won the lawsuit against Qilu
Pharmaceutical Co., Ltd. (“Qilu Pharma”) regarding the infringement of patents
of Cinepazide Maleate, which have been exclusive products of Beijing Sihuan
before other companies, such as Qilu Pharma, conducted their manufacturing and
sales. The favorable decision towards the Group demonstrated the validity of the
patents, and will help to rebuild the exclusivity of Kelinao and Anjieli, and
therefore enhance the advantages in the process of tendering.
— 24 —

Sales of key CCV products:
Product NameRevenue for the yearended 31 December
Changein sales
year-on-year2016 2017(RMB’000) (RMB’000)
Oudimei/Aofutai/Weitong/Jielixin(Cerebroside-kinin injection) 817,239 686,909 -15.9%
Yuanzhijiu/Xingwei (Troxerutin andcerebroproptein hydrolysate injection) 491,600 463,879 -5.6%
Kelinao/Anjieli (Cinepazide maleateinjection) 494,624 389,969 -21.2%
Yimaining/Yikangning (Alprostadil lipidemulsion injection) 247,341 216,460 -12.5%
Wei’Ao (Salviae miltiorrhizae andligustrazine hydrochloride injection) 222,414 216,549 -2.6%
Aogan/Xiangtong (Monosialotetradeosylganglioside sodium injection) 189,677 151,400 -20.2%
Yeduojia (Compound trivitamin B forinjection (II)) 147,644 126,487 -14.3%
Qu’ Ao (Cerebroprotein hydrolysate) 124,000 78,909 -36.4%Chuanqing (Ligustrazine hydrochloride
for injection) 66,770 43,176 -35.3%Mainuokang (Floium ginkgo extract and
tertram ethypyrazine sodium chlorideinjection) — 65,774 —
Salivae miltiorrhizae liguspyraginehydrochloride and glucose injection 3,291 4,233 28.6%
The Group was engaged in the sales of the Salviae miltiorrhizae and ligustrazine hydrochloride
injection in both 2016 and 2017. As Jilin Sichang was consolidated into the Group since November
2017, Jilin Sichang’s product revenue from January to October 2017 was approximately RMB40.1
million and its annual revenue of RMB11.1 million in 2016 was not reflected in the Group’s
consolidated revenue. Taking into account of Jilin Sichang’s annual revenue in 2016 and 2017, the
annual revenue from this product was approximately RMB233.6 million and RMB256.7 million in
2016 and 2017 respectively, representing an increase of 9.9%.
— 25 —

Non-CCV products
During 2017, revenue from non-CCV drugs decreased by 9.3% year-on-year toRMB162.9 million, accounting for 5.9% of the Group’s total revenue.
Roxatidine’s revenue grew 64% year-on-year to RMB35.3 million. The number ofprovincial RDLs which the product is included in increased by 3 to 5 and it has wontender in 23 provinces in total. It is expected to contribute more revenue along withRDL inclusion in more provinces.
Huineng’s revenue grew 139.5% year-on-year to RMB19.3 million. The number ofprovincial RDLs which the product is included in increased by 2 to 11. It has wontender in 6 more provinces, making it 17 in total. The product is expected tocontribute more revenue along with RDL inclusion in more provinces.
The Group’s growth stage products are expected to grow along with more provincialtender wins and increased hospital coverage, thus making more significantcontribution to the Group’s overall performance.
Sales of key Non-CCV products:
Product Name Revenue for the yearended 31 December
Changesin sales
year-on-year2016 2017
(RMB’000) (RMB’000)
Ren’ Ao (Oxcarbazepine) 28,417 28,079 -1.2%Roxatidine 21,511 35,269 64.0%Clindamycin 19,808 17,534 -11.5%Huineng (Monoammonium
glycyrrhizinate and cysteine andsodium chloride injection) 8,054 19,289 139.5%
Nilestriol 280 422 50.6%
R&D
The CFDA has devised a Green Channel Fast Track for drugs complying with certainstandards, allowing shortened evaluation timeframe and therefore acceleratedlaunching of the drugs. The Group has established a clear innovative drug pipelinewith focuses on therapeutic areas with substantial clinical demand, such asoncology/immuno-oncology, diabetes and NASH, especially drugs with newtherapeutic targets and immuno-oncology drugs, among which the Group has beeninvesting more of its efforts and resources in eight key Category I new drugs, whichhave achieved positive results.
— 26 —

Innovative Drugs
Second
Tier
4 Oncology Category 1 Pirotinib
5 Gastrointestin al disease Category 1 AnaprazoleSodium
6 CCV Category 1 Tylerdipine
7 Oncology Category 1 XZP-3621-1001
8 BPH - LUTS,ED Category 1 Fadanafil
9 Diabetes
Category 7 Therapeutic
BiologicsInsulin
analogue
*
Rank Therapeuticarea
Registrationclassification Project
Pre -clinicalTrials
INDapplication
Clinical TrialsNDA
Phase I Phase II Phase III
First T
ier
1 Diabetes Category 1 Janagliflozin
2 Oncology Category 1 Birociclib
3Anti -infective Category 1 Benapenem
U.S
* Phase I clinical trial of Pirotinib progressed smoothly in the U.S. and in China
Birociclib was granted CFDA approval for Phase I-III clinical trials, with indications
in breast cancer and malignant brain tumor. To date, there is no drug in the same class
launched in China. Phase III clinical trial is scheduled to commence in the second
half of 2019.
Janagliflozin is an innovative anti-diabetic drug classified in the SGLT-2 inhibitor
category, which is one of the most popular new targets for treating Type 2 diabetes
globally. Phase III clinical trial is scheduled to commence in the second half of 2019.
Benapenem is a drug in the carbapenem family, a class of broad spectrum �-lactam
antibiotics which are widely used to treat multiple drug resistance (“MDR”) inhospitals. Its efficacy is significantly higher than similar drugs. Phase II clinical trialis about to commence.
Pipeline Internationalization
The Group established its U.S. R&D Centre in the San Francisco Bay Area in theU.S., strategically positioned as a part of the innovative drug R&D system. The U.S.R&D Centre leads the frontier of the Group to the field of biological drug, especiallyfirst-in-class immuno-oncology drugs. The Group targets to promoteinternationalization of its innovative drugs and to accelerate their marketization,through simultaneous applications to U.S. FDA and the CFDA.
— 27 —

On 3 September 2017, the Group entered into a series of agreements (the
“Agreements”) with PharmaDax Inc (“PharmaDax”) to invest in PharmaDax
(FoShan) Co., Ltd (“PharmaDax Foshan”), a subsidiary of PharmaDax, in phases.
Through the strategic collaboration with PharmaDax, Sihuan Pharmaceutical can
inject products that fit the European Union (“EU”) and the U.S. markets developed
by its generic drug R&D center into the production line of PharmaDax Foshan, and
submit applications to the EU and the U.S. with the aim to further promote global
development of its drug preparations, and embrace global markets. This collaboration
not only gives the Group the first-mover advantages in China’s generic drug market
that will speed up the marketing of its products in China, but is also a key step in
entering global market and will promote its international development.
As at the end of 2017, the innovative drug R&D platform has submitted applications
for over 600 domestic patents, 39 PCT international patents, 1 Paris Convention
patent (consisting of six countries) and 2 U.S. patents submitted individually. To
date, the Group has been granted 158 domestic patents and 52 overseas patents. In
2017, the Group received 5 national, provincial and municipal R&D awards for its
innovative drug R&D.
Generic Drugs
The Group focuses in major therapeutic areas, especially drugs with substantial
clinical demand such as oncology and diabetes. The Group’s generic drug R&D team
has initiated projects of children’s medicine and special formulations, which are
encouraged by national policies.
The Group’s generic drug R&D has achieved encouraging progress during the Year.
There are 28 Category 3 drug projects (7 under development, 21 granted clinical trial
approvals) and 39 Category 4 drug projects. The 3 key projects (Bolutinum toxin
(肉毒素), Ambroxol (氨溴索), and Hyaluronic acid (玻尿酸)) are in Phase III clinical
trial and will be launched to market in the coming few years. To date, the Group has
submitted applications for production approvals for 15 generic drugs. During the year
of 2017, the Group received 2 provincial and municipal R&D awards for its generic
drug R&D.
The Group selected a few oral solid form drugs for bioequivalence tests. Metformin
hydrochloride tablet (鹽酸二甲雙胍片) was the first in the industry to pass
bioequivalent test and to complete submission. Azithromycin capsule (阿奇黴素膠囊) and Oxcarbazepine tablet (奧卡西平片) are expected to become the first and first
two products in the industry, respectively, to pass bioequivalent test.
— 28 —
The Group has recorded sound progress in the development of biological drugs
during the year, expecting clinical trial approval in the near future.
R&D Strategies
The CFDA has devised a Green Channel Fast Track for drugs complying with certain
standards, allowing shortened evaluation timeframe and therefore accelerated
launching of the drugs. In accordance with principles of “Market oriented, project
based and differentiated products”, the Group adopted a new system to bring
innovative products to market in an efficient and cost-effective manner.
1. Market oriented approach: The Group initiated projects based on thorough
studies on market composition, development potential, market demand,
regulatory system and competitive landscape.
2. Selective screening system: The Group set up individual unit for each
therapeutic area, such as oncology/immuno-oncology, diabetes and NASH to
monitor global R&D trends, establish screening system and to integrate
comprehensive information of each specific therapeutic area.
3. Set up modified form drug project unit: The Group comprehensively studied
the biochemical characteristics, pharmacology and drug action of selected
blockbuster drugs, and developed a modified form that is more applicable in
clinical medicine based on the deficiency and drawback of the original form.
4. Focus on products with high technical barrier: The Group will focus on
products with longer life span.
5. Resource integration: The Group integrated internal and external resources to
expedite product launch. Leveraging collaboration with PharmaDax Foshan, the
Group plans to accelerate product commercialization in China through priority
evaluation channel while capturing both the EU and the U.S. markets.
6. Building the A-team: The Group continued to recruit high calibre talents and
strengthen internal training.
— 29 —

B. FUTURE PROSPECTS
The government’s continued push to promote healthcare sector reform will keep
the industry under pressure. While the Group sees challenges in the industry’s
development in the short term, the Group believes that the higher visibility and
further industry consolidation will put the industry on the path of healthy
growth.
Sihuan Pharmaceutical aims to outpace the market with an optimized product
portfolio and strengthened marketing capabilities. In the future, the Group will
be investing significant resources into developing a sustainable pipeline of
innovative and generic products, through in-house R&D, mergers and
acquisitions and international cooperation. In terms of marketing, the Group will
continue to increase penetration in lower-end markets for its mature products,
and boost market coverage of its growth stage products by tender wins and
inclusion in more provincial RDLs.
FINANCIAL REVIEW
Turnover
For the Year, the Group continued to strengthen its CCV drug business while
promoting sales of its products of other therapeutic areas. Total revenue decreased by
13.8% or approximately RMB439.9 million from RMB3,185.7 million for 2016 to
RMB2,745.8 million for the Year, in which sales of CCV drugs amounted to
approximately RMB2,582.9 million, representing a decrease of approximately
RMB423.1 million when compared with 2016, accounting for approximately 94.1%
of the Group’s total revenue.
Revenue contributed by non-CCV drugs decreased by approximately 9.3% from
RMB179.7 million for 2016 to RMB162.9 million for the Year, accounting for
approximately 5.9% of the Group’s total revenue.
Cost of sales
The Group’s cost of sales for the Year amounted to approximately RMB759.0 million,
accounting for approximately 27.6% of the total revenue.
— 30 —

Gross profit
Gross profit was RMB1,986.9 million for the Year, representing a decrease ofRMB202.0 million when compared with RMB2,188.9 million for 2016. Gross profitmargin increased from 68.7% for 2016 to 72.4% for the Year, which was mainly dueto streamlined production processes and effective cost control measures resultedfrom systematic management in the Group’s production units.
Other net gains
Other net gains decreased by RMB172.4 million from RMB486.3 million for 2016 toRMB313.9 million for the Year. The decrease was mainly due to a reduction ingovernment grants and exchange gains as compared with last year.
Distribution costs
Distribution costs for the Year increased by RMB81.9 million to RMB227.6 millionover last year due to significant increase in national academic promotion activities,which were conducted in order to strengthen brand awareness of the Group’sproducts.
Administrative expenses
Administrative expenses increased by 16.4% from RMB540.5 million for 2016 toRMB629.0 million for the Year, in which R&D cost increased by 50.0% fromRMB162.9 million (including labor cost) for 2016 to RMB244.4 million (includinglabor cost) for the Year. This was mainly due to larger investment in R&D ascompared to last year.
Other Expenses
Other expenses decreased from RMB29.0 million for 2016 to RMB18.2 million forthe Year. The decrease was mainly due to the impairment of certain products underdevelopment in last year.
Profit before income tax
Due to the aforesaid, the Group’s profit before income tax decreased by 19.7% fromRMB2,152.6 million for 2016 to RMB1,729.1 million for the Year.
Income tax expenses
The Group’s income tax expenses decreased by 47.1% from RMB472.7 million for2016 to RMB250.2 million for the Year.
— 31 —
Profit for the year
Due to the aforesaid, the Group’s net profit decreased by 12.0% from RMB1,679.8million for 2016 to RMB1,478.9 million for the Year.
Profit attributable to owners of the Company
Profit attributable to owners of the Company decreased by 15.2% from RMB1,708.2million for 2016 to RMB1,448.9 million for the Year.
Non-controlling interests
Non-controlling interests increased from losses of RMB28.4 million for 2016 togains of RMB30.0 million for the Year.
Liquidity and financial resources
As at 31 December 2017, the Group’s cash and cash equivalents amounted toRMB831.9 million (as at 31 December 2016: RMB2,407.1 million) andavailable-for-sale financial assets amounted to RMB2,967.4 million (as at 31December 2016: RMB1,710.0 million).
The Group generally deposits its excess cash in interest-bearing bank accounts andcurrent accounts. The Group may use extra cash for short-term investments in orderto obtain better returns. Therefore, members of the Group entered into agreementswith certain banking institutions to invest extra cash. According to such agreements,during the Year, the total amount of investment of members of the Group amountedto RMB2,944.5 million. The investments made by the Group according to theseagreements were categorized as short-term investments, which mainly consisted offinancial planning products purchased from certain state-owned banks. For the saidfinancial planning products, the issuing banks of such financial planning productsmay invest the Group’s funds at their discretion into financial instruments such astreasury bonds, discounted bank acceptances, commercial acceptance bills and bankdeposits. The investment principal of RMB2,944.5 million plus interest ofapproximately RMB22.9 million in aggregate amounted to approximatelyRMB2,967.4 million, which was recognized as available-for-sale financial assets inthe consolidated balance sheet of the Group as at 31 December 2017. As at the dateof this announcement, total amount of sold/repaid investment principal amounted toRMB2,832.5 million.
Save as disclosed below, the Group did not have other liabilities and bank loans, asa result of which, its gearing ratio (net debt to equity attributable to owners of theGroup plus net debt) is less than 1%.
— 32 —

The Group has sufficient cash as at 31 December 2017. The Directors are of theopinion that the Group does not have any significant capital risk.
31 December 31 December2017 2016
RMB’000 RMB’000
Cash and cash equivalent 831,859 2,407,073Less: Borrowings — (8,280)
831,859 2,398,793
Trade and other receivables
The Group’s trade receivables consist of credit sales of its products to be paid by itsdistributors. Other receivables of the Group consist of other receivables, notesreceivable, amount due from associates, joint venture and other related parties andprepayments to suppliers. The Group’s trade and other receivables were RMB747.1million as at 31 December 2017, representing a decrease of RMB130.2 million whencompared with trade and other receivables of RMB877.3 million as at 31 December2016, mainly due to a decrease of notes receivable for the year.
Inventory
Inventory as at 31 December 2017 amounted to RMB228.0 million (as at 31December 2016: RMB200.7 million). Inventory turnover days were 102 days for theYear (for the year ended 31 December 2016: 78 days). The Group had no inventoryimpairments during the Year.
Property, plant and equipment
Our property, plant and equipment consist of buildings, production and electronicequipment, office equipment, motor vehicles and construction in progress. As at 31December 2017, the net book value of property, plant and equipment amounted toRMB2,453.6 million, representing an increase of RMB349.3 million, orapproximately 16.6%, when compared with the net book value of property, plant andequipment as at 31 December 2016. The increase was mainly attributable to theexpansion or construction of existing and new production facilities, and the purchaseof equipment.
Goodwill
The Group’s goodwill arose from the acquisition of subsidiaries. As at 31 December2017, the net carrying amount of goodwill was RMB2,843.9 million (as at 31December 2016: RMB2,247.7 million).
— 33 —

Intangible assets
The Group’s intangible assets mainly consist of customer relationships, deferreddevelopment costs, product development in progress, trademark and software. Thedeferred development costs and product development in progress mainly representedthe acquisition of certain pharmaceutical R&D projects from external researchinstitutions and self-developed R&D projects. As at 31 December 2017, netintangible assets amounted to RMB1,338.0 million (as at 31 December 2016:RMB579.0 million).
Trade and other payables
The Group’s trade and other payables primarily consist of trade payables, advancesfrom customers, cost of construction and purchase of equipment payables, depositpayables, accrued reimbursement to distributors, other payables, accrued expensesand payables to employee remuneration. As at 31 December 2017, trade and otherpayables amounted to RMB1,804.8 million, representing an increase of RMB977.5million when compared with the trade and other payables as at 31 December 2016,mainly due to the increase in payables for acquisition and other payables as a resultof implementation of Two-invoice System.
Contingent liabilities and guarantees
As at 31 December 2017, the Group had no material contingent liabilities orguarantees (31 December 2016: nil).
Off-balance sheet commitments and arrangements
As at 31 December 2017, apart from the contingent liabilities disclosed, the Grouphas not entered into any off-balance sheet arrangements or commitments to provideguarantees for any payment liabilities of any third parties. The Group did not haveany variable interests in any unconsolidated entities that provide financing orliquidity, create market risk or offer credit support to us or engage in the provisionof leasing, hedging or R&D services to the Group.
Capital commitment
As at 31 December 2017, the Group had a total capital commitment of RMB222.0million, mainly set aside for the acquisition of property, plant and equipment andintangible assets.
Credit risk
Credit risk arises from cash and cash equivalents, trade receivables, available-for-sale financial assets and other receivables.
— 34 —

All the cash equivalents and bank deposits are placed in certain PRC reputablefinancial institutions and high-quality international financial institutions outside theMainland China. All those irrevocable bank bills, classified as notes receivable, areissued by the banks in the PRC with high credit rating. There was no recent historyof default of cash equivalents and bank deposits in relation to these financialinstitutions.
In relation to trade receivables, the Group has no significant concentrations of creditrisk and has policies in place to ensure that certain cash advance has been receivedupon the agreement of the related sales orders with customers. For those with creditperiod granted, the credit quality of the counterparties is assessed by taking intoaccount their financial position, credit history and other factors. It also undertakescertain monitoring procedures to ensure that proper follow-up action is taken torecover overdue debts. The Group regularly performs ageing analysis, assesses creditrisks and estimates the recoverability of groups of trade receivables bearing similarcredit risk based on historical data and cash collection history.
Available-for-sale financial assets are the bank financial products issued by certainPRC reputable banking institutions. There was no recent history of default and theexecutive directors of the board of the Company are of the opinion that the credit riskrelated to the investments is low.
In relation to other receivables, the credit quality of the debtors is assessed by takinginto account their financial position, relationship with the Group, credit history andother factors. Management will also regularly review the recoverability of these otherreceivables and follow up the disputes or amounts overdue, if any. The executivedirectors of the board of the Company are of the opinion that the default bycounterparties is low.
No other financial assets bear a significant exposure to credit risk.
Foreign exchange risk
The functional currency of the Company and its subsidiaries is RMB. All of therevenues of the Group are derived from operations in the PRC. The financialinstruments of the Group are mainly denominated in RMB. The conversion of RMBinto foreign currencies is subject to the rules and regulations of foreign exchangecontrol promulgated by the PRC government. The main foreign currencydenominated assets and liabilities of the Group were certain cash and cashequivalents, which were denominated in United States Dollars (“USD”), Hong KongDollars (“HKD”), Great Britain Pound (“GBP”) and Euro (“EUR”). In the opinionof the executive directors of the board of the Company, the Group does not havesignificant exposure to foreign exchange risk.
— 35 —
Treasury Policies
The Group finances its ordinary operations with internally generated resources.
Capital expenditure
The Group’s capital expenditure primarily consists of purchase of property, plant and
equipment, land use rights and intangible assets. For the Year, the Group’s capital
expenditure amounted to RMB487.1 million, of which expense on property, plant and
equipment, acquisition of land use rights and purchase or in-house development of
intangible assets amounted to RMB406.3 million, RMB58.6 million and RMB22.2
million.
For the Year, the Group’s investment in capital expenditure for R&D was RMB70.4
million, of which RMB51.6 million was spent on property, plant and equipment. The
remaining RMB18.8 million was for purchasing and self-developed intangible assets.
Material acquisition and disposal
On 22 March 2017, Sun Moral International (HK) Ltd., a wholly-owned subsidiary
of the Company, entered into an equity acquisition agreement with Ambest
Pharmaceutical Company Limited (弘和製藥集團有限公司) to acquire the 100%
equity interest held by it in Ambest Pharmaceutical (China), for a consideration of
RMB1,100 million. Upon completion of the Share Acquisition, Ambest
Pharmaceutical (China) has become a wholly-owned subsidiary of the Group.
Ambest Pharmaceutical (China) is engaged in the manufacturing of large volume
injections, and research, technology transfer and technology services of
pharmaceutical products. The drug production approvals it currently holds include
Monoammonium Glycyrrhizinate and Cysteine and Sodium Chloride Injection (甘草酸單銨半胱氨酸氯化鈉注射液), with the brand name “Huineng” (回能), and Floium
Ginkgo Extract and Tertram Ethypyrazine Sodium Chloride Injection (杏芎氯化鈉注射液) with “Mainuokang (邁諾康)” as the brand name. Other than commitment to
sales, research and development, the Group has been constantly looking for
opportunities to acquire companies owning exclusive products with large market
potential, especially CCV products, in hope of further improving its market share and
competitiveness. Ambest Pharmaceutical (China), the acquired target company, meets
such requirements of the Group. Please refer to the Company’s announcement dated
22 March 2017 for details.
— 36 —

On 3 September 2017, Hainan Sihuan Pharmaceutical, a wholly-owned subsidiary ofthe Company, entered into the Agreements with PharmaDax. According to theAgreements, the Group will invest in PharmaDax Foshan, a subsidiary of thePharmaDax, in phases. In the first phase, the Group will subscribe for 19.99% equityinterests in, and corporate bonds issued by, PharmaDax Foshan at the considerationof RMB200 million. In the second phase, the Group will convert the aforementionedcorporate bonds into equity interest in PharmaDax Foshan (the “Conversion”) uponsatisfaction of certain conditions stipulated in the Agreements. Furthermore, theGroup shall make an additional investment of up to RMB200 million (the“Additional Investment”) upon satisfaction of certain conditions stipulated in theAgreements. The Group will hold 51% equity interest in PharmaDax Foshan uponcompletion of the Conversion and the Additional Investment.
Through the strategic collaboration with PharmaDax, Sihuan Pharmaceutical caninject products that fits the EU and the US markets developed by its generic drug(research R&D and development) center into the production line of PharmaDaxFoshan, and submit applications to the EU and the US with the aim to further promoteglobal development of its drug preparations, and embrace global markets. Thiscollaboration not only gives the Group the first-mover advantages in China’s genericdrug market that will speed up the marketing of its products in China, but is also akey step to entering international market and will promote its internationaldevelopment. Please refer to the Company’s announcement dated 4 September 2017for details.
During the year, the Group entered into an equity disposal agreement with BeijingGaobo Hospital Management Co., Ltd., and disposed of its entire equity interest of95% in Beijing Boren Hospital at the consideration of RMB140 million.
Pledge of assets
As at 31 December 2017, none of the Group’s assets was pledged.
Human Resources and Remuneration of Employees
Human resources are indispensable assets to the success of the Group in acompetitive environment. The Group provides competitive remuneration package toall employees. The Group reviews its own human resources and remuneration policyregularly, to encourage employee to work towards enhancing the value of theCompany and promoting the long-term growth of the Company.
As at 31 December 2017, the Group had 3,445 employees. For the Year, total salaryand related costs of the Group was approximately RMB375.3 million (for the yearended 31 December 2016: RMB316.2 million).
— 37 —

PRE-EMPTIVE RIGHTS
There are no provisions for pre-emptive rights under the Company’s bye-laws or the
laws of the Bermuda, being the jurisdiction in which the Company was incorporated,
which would oblige the Company to offer new shares on a pro rata basis to the
existing Shareholders.
DIRECTORS’ INTERESTS IN COMPETING BUSINESSES
During the Year, no Directors or their respective associates (as defined in the Rules
Governing the Listing of Securities (the “Listing Rules”) on The Hong Kong Stock
Exchange Limited (the “Stock Exchange”) are considered to have an interest in a
business which competes or is likely to compete, either directly or indirectly, with the
business of the Group.
PUBLIC FLOAT
Based on the information that is publicly available to the Company and to the best
knowledge of the Directors, at least 25% of the Company’s issued share capital were
held by members of the public as at the date of this announcement as required under
the Listing Rules.
— 38 —

PURCHASE, SALE OR REDEMPTION OF THE COMPANY’S LISTEDSECURITIES
During the Year, the Company repurchased 115,602,000 shares through the Stock
Exchange at a total consideration, before expenses, of approximately HK$281.8
million. Such shares have been cancelled as at the date of this announcement. Details
of repurchase are as follows:
Date of repurchase
Number ofordinary shares
repurchasedHighest
HK$Lowest
HK$Consideration paid
HK$ MillionEquivalent toRMB Million
5 January 2017 17,000,000 2.23 2.21 37.8 33.8
6 January 2017 5,000,000 2.20 2.18 11.0 9.8
9 January 2017 154,000 2.19 2.19 0.3 0.3
13 January 2017 13,002,000 2.19 2.15 28.4 25.4
16 January 2017 4,830,000 2.18 2.15 10.5 9.4
19 January 2017 8,888,000 2.24 2.21 19.9 17.8
6 February 2017 2,907,000 2.30 2.24 6.6 5.9
13 February 2017 6,458,000 2.50 2.47 16.1 14.3
16 February 2017 7,277,000 2.57 2.46 18.4 16.2
17 February 2017 13,000,000 2.53 2.43 32.2 28.5
20 February 2017 9,504,000 2.49 2.42 23.5 20.7
21 February 2017 5,506,000 2.54 2.49 13.9 12.3
22 February 2017 10,000,000 2.57 2.49 25.5 22.5
23 February 2017 3,076,000 2.59 2.55 7.9 7.0
19 April 2017 9,000,000 3.34 3.25 29.8 26.5
Total: 115,602,000 281.8 250.4
Save as disclosed above, neither the Company nor any of its subsidiaries purchased,
sold or redeemed any of the Company’s listed securities during the year ended 31
December 2017.
EVENTS AFTER THE REPORTING PERIOD
Save as disclosed, the Group has no significant events after the reporting period up
to the date of this announcement.
— 39 —
CORPORATE GOVERNANCE CODE
The Company recognises the importance of corporate transparency and
accountability. The Company is committed in achieving a high standard of corporate
governance and leading the Group to attain better results and improve its corporate
image with effective corporate governance procedures.
The Company has complied with all the applicable code provisions as set out in the
Corporate Governance Code (the “Code”) contained in Appendix 14 to the Listing
Rules.
MODEL CODE FOR SECURITIES TRANSACTIONS BY THE DIRECTORS
The Company has adopted the Model Code for Securities Transactions by Directors
of Listed Issuers (“Model Code”) set out in Appendix 10 to the Listing Rules. Having
made specific enquiries, all Directors confirmed that they have complied with the
required standard set out in the Model Code during the Year.
AUDIT COMMITTEE
The Company established an audit committee (the “Audit Committee”) in
accordance with the requirements of Rule 3.21 of the Listing Rules and with written
terms of reference in compliance with the Code. The primary duties of the Audit
Committee are to assist the Board to provide an independent view on the
effectiveness of the financial reporting procedures, internal control and risk
management system of the Group, to oversee the audit process and to perform other
duties and responsibilities as assigned by the Board. As at the date of this
announcement, the Audit Committee consists of one non-executive Director (Mr. Kim
Jin Ha) and three independent non-executive Directors (Mr. Patrick Sun, Mr. Tsang
Wah Kwong and Mr. Zhu Xun), and is chaired by Mr. Patrick Sun who has a
professional qualification in accountancy.
The Audit Committee had reviewed the Group’s financial reporting matters and the
internal control system in relation to finance and accounting and submitted
improvement proposals to the Board.
The annual results of the Group for the year ended 31 December 2017 have been
reviewed by the Audit Committee.
— 40 —

NOMINATION COMMITTEE
The Company established a nomination committee (the “Nomination Committee”)
with written terms of reference in compliance with the Code. The primary duties of
the Nomination Committee are, among others, to review the structure, size and
composition of the Board, to assess the independence of the independent
non-executive Directors and to make recommendations to the Board on matters
relating to the appointment of Directors. As at the date of this announcement, the
Nomination Committee consists of one executive Director (Dr. Guo Weicheng) and
three independent non-executive Directors (Mr. Patrick Sun, Mr. Tsang Wah Kwong
and Mr. Zhu Xun), and is chaired by Mr. Tsang Wah Kwong.
REMUNERATION COMMITTEE
The Company established a remuneration committee (the “RemunerationCommittee”) in accordance with the requirements of Rule 3.25 of the Listing Rules
and with written terms of reference in compliance with the Code. The primary duties
of the Remuneration Committee are, among others, to review and determine the terms
of remuneration packages, bonuses and other compensation payable to our Directors
and senior management and to make recommendations to the Board on the Group’s
policy and structure for remuneration of all our Directors and senior management. As
at the date of this announcement, the Remuneration Committee consists of one
executive Director (Dr. Che Fengsheng) and three independent non-executive
Directors (Mr. Patrick Sun, Mr. Tsang Wah Kwong and Mr. Zhu Xun), and is chaired
by Mr. Zhu Xun.
RISK MANAGEMENT COMMITTEE
The risk management committee of the Company (the “Risk ManagementCommittee”) was established on 13 December 2015 with written terms of reference.
The primary duties of the Risk Management Committee are, among others, to review
the Company’s risk management, internal control system and environmental, social
and governance (“ESG”) strategies, policies, guidelines and procedures and to
review the effectiveness of the work on risk management, internal control systems
and ESG. As at the date of this announcement, the Risk Management Committee
consists of two executive Directors (Dr. Guo Weicheng and Mr. Choi Yiau Chong)
and two independent non-executive Directors (Mr. Patrick Sun and Mr. Tsang Wah
Kwong), and is chaired by Mr. Choi Yiau Chong.
— 41 —

ANNUAL GENERAL MEETING
It is proposed that the forthcoming annual general meeting of the Company (the
“Annual General Meeting”) will be held on Friday, 1 June 2018. The notice of the
Annual General Meeting will be published on the Company’s website and the Stock
Exchange’s website and sent to the Shareholders in due course.
CLOSURE OF REGISTER OF MEMBERS FOR ANNUAL GENERALMEETING
The register of members of the Company will be closed from Tuesday, 29 May 2018
to Friday, 1 June 2018 (both dates inclusive). In order to determine the identity of the
Shareholders who are entitled to attend and vote at the Annual General Meeting, all
transfers accompanied by the relevant share certificates must be lodged with the
Company’s Hong Kong branch share registrar and transfer office, Tricor Investor
Services Limited, at Level 22, Hopewell Centre, 183 Queen’s Road East, Hong Kong
not later than 4:30 p.m. on Monday, 28 May 2018.
INFORMATION FOR FINAL DIVIDEND
The Board recommended the declaration and payment of a final cash dividend of
RMB1.3 cents per share (equivalent to HK$1.6 cents per share) for the year ended 31
December 2017 in return for Shareholders’ support, subject to approval by the
Shareholders at the forthcoming Annual General Meeting. Together with an interim
cash dividend of RMB1.8 cents per share, the total cash dividend for the year ended
31 December 2017 will be RMB3.1 cents per share.
CLOSURE OF THE REGISTER OF MEMBERS FOR THE ENTITLEMENT OFFINAL CASH DIVIDEND
The register of members of the Company will be closed from Monday, 11 June 2018
to Wednesday, 13 June 2018 (both dates inclusive). In order to qualify for the final
cash dividend, all transfers accompanied by the relevant share certificates must be
lodged with the Company’s Hong Kong branch share registrar and transfer office,
Tricor Investor Services Limited, at Level 22, Hopewell Centre, 183 Queen’s Road
East, Hong Kong not later than 4:30 p.m. on Friday, 8 June 2018. The final cash
dividend subject to the approval of the Shareholders at the Annual General Meeting,
will be payable on or around Wednesday, 20 June 2018 to the Shareholders whose
names appear on the register of members of the Company on Wednesday, 13 June
2018.
— 42 —
SCOPE OF WORK OF THE GROUP’S AUDITOR
The figures in respect of the preliminary announcement of the Group’s results for the
year ended 31 December 2017 have been agreed by the Group’s auditor, Ernst &
Young (“EY”), to the amounts set out in the Group’s audited consolidated financial
statements for the Year. The work performed by EY in this respect did not constitute
an assurance engagement in accordance with Hong Kong Standards on Auditing,
Hong Kong Standards on Review Engagements or Hong Kong Standards on
Assurance Engagements issued by the Hong Kong Institute of Certified Public
Accountants and consequently no assurance has been expressed by EY on the
preliminary announcement.
PUBLICATION OF INFORMATION ON THE STOCK EXCHANGE WEBSITE
This announcement is published on the websites of the Company
(www.sihuanpharm.com) and the Stock Exchange (www.hkexnews.hk). The annual
report of the Company for the year ended 31 December 2017 will be dispatched to
Shareholders and available on the above websites in due course.
APPRECIATION
The Board would like to express its sincere appreciation to our Shareholders,
customers and suppliers for their continued support of the Group. The Board also
wishes to thank the Group’s management and staff for achieving remarkable progress
in the Group’s business and their dedication and commitment for improving the
Group’s management.
By order of the BoardSihuan Pharmaceutical Holdings Group Ltd.
Che FengshengChairman and Executive Director
Hong Kong, 26 March 2018
As at the date of this announcement, the executive directors of the Company are Dr. Che Fengsheng
(Chairman), Dr. Guo Weicheng (Deputy Chairman and Chief Executive Officer), Mr. Choi Yiau Chong,
and Dr. Guo Feng; the non-executive directors of the Company are Mr. Homer Sun and Mr. Kim Jin
Ha; and the independent non-executive directors of the Company are Mr. Patrick Sun, Mr. Tsang Wah
Kwong and Mr. Zhu Xun.
— 43 —